trade reforms and food security
627
-
Upload
khangminh22 -
Category
Documents
-
view
0 -
download
0
Transcript of trade reforms and food security
TRADE REFORMS AND FOOD SECURITY
Country Case Studies and Synthesis
Harmon Thomas
Editor
FOOD AND AGRICULTURE ORGANIZATION OF THE UNITED NATIONS Rome, 2006
The designations employed and the presentation of material in this information product do not imply the expression of any opinion whatsoever on the part of the Food and Agriculture Organization of the United Nations concerning the legal or development status of any country, territory, city or area or of its authorities, or concerning the delimitation of its frontiers or boundaries
All rights reserved. Reproduction and dissemination of material in this information product for educational or other non-commercial purposes are authorized without any prior written permission from the copyright holders provided the source is fully acknowledged. Reproduction of material in this information product for resale or other commercial purposes is prohibited without written permission of the copyright holders. Applications for such permission should be addressed to the Chief, Publishing Management Service, Information Division, FAO, Viale delle Terme di Caracalla, 00100 Rome, Italy or by e-mail to [email protected]
© FAO 2006
iii
Contents
Preface vAbbreviations and acronyms x
PART 1 TRADE RELATED REFORMS AND FOOD SECURITY: A SYNTHESIS OF CASE STUDY FINDINGS 1Harmon Thomas and Jamie Morrison
1. Introduction to the study 3
2. Policy reforms in the case study countries 9
3. The impact of reform on agricultural prices, production and trade 21
4. Consequences of reform for food security 53
5. Summary and conclusions 71
References 79
Annexes 81
A Limits of the case study approach 83
B Price decomposition analysis 85
C Domestic prices and the real effective exchange rate 93
D Price transmission analysis 99
PART 2 COUNTRY CASE STUDIES 119
Cameroon 121Ernest Bamou, Jean Pierre Tchanou, François Honoré Mkouonga andDominique Njinkeu
Chile 145
Eugenia Muchnik and Rosa Camhi
China 183Jikun Huang, Scott Rozelle, Hongxing Ni and Ninghui Li
Ghana 223Abena D. Oduro and George T-M Kwadzo

iv
Guatemala 265Pablo-Rodas-Martini, Luis Gerardo Cifuentas and Juan Pablo Pira
Guyana 297C.Y. Thomas and M. Bynoe
India 329Ramesh Chand and Praduman Kumar
Kenya 365Hezron O. Nyangito, Jonathan Nzuma, Hellen Ommeh and Mary Mbithi
Malawi 399Ephraim W. Chirwa and Christina Zakeyo
Morocco 435Abdelaziz Sbai, Mohamed Jaoad and Azzouz Jakhjoukhi
Nigeria 465T. Ademola Oyejide, E. Olawale Ogunkola and Olumuyiwa B. Alaba
Peru 503Jorge Torres Zorrilla and Julio Paz Cafferata
Senegal 539Abdoulaye Diagne, François Joseph Cabral, Ben Omar Ndiaye,Mamadou Danskhand and Malick Sane
United Republic of Tanzania 559Flora Mndeme Musonda and Godwill George Wanga
Uganda 587Jacob Opolot, Augustine Wandera and Yusuf Atiku Abdalla
v
Preface
Between 1999 and 2002 FAO undertook a series of 23 country case studies toevaluate the impact of the WTO Agreement on Agriculture (AoA) on agriculturaltrade and food security in developing countries.1 The objectives of these studies wereto assess the extent to which the AoA commitments had led to changes in domesticagricultural policy, to evaluate the impact on trade flows (imports and exports) ofdeveloping countries and to assess whether implementing the AoA commitmentshad had any impact on food security. An important finding was that for most of thecountries in the sample, the implementation of AoA commitments did not imply anymajor change to domestic agricultural policy, including trade policy. The main reasonwas that most of the countries had implemented during the 1980s and early 1990sunilateral reforms including the liberalization of international trade, often as part ofthe conditionality of adjustment loans. Some of these were bound as part of theirmultilateral commitments in Uruguay Round. In other cases, commitments weremade in terms of ceiling bindings or reduction from bound rates which divergedconsiderably from existing applied levels. It became clear that in order to make arealistic assessment of the impact of trade-related policy reforms on food security, itwas necessary to extend the analysis over a period that included the implementationof substantial unilateral reforms.
It was in this context that FAO launched in 2002 a further series of 15 countrycase studies on the experience more broadly with trade-related reforms and foodsecurity. The coverage included countries at different states of development withthe main focus on low-income countries that are likely to be at greater risk of foodinsecurity.2 The purpose of this analysis was forward looking: to draw lessons frompast policy reform processes at the country level in order to inform future nationaland multilateral policy reform efforts about likely implications for food security. Itwas anticipated that the studies would help to clarify broadly some of the followingquestions:
What trade and associated economic reforms affecting the agricultural sectorwere implemented over the past 20 years or so?What were the institutional setting and policy environment in which thesereforms took place?How did the reforms affect the incentives (e.g. output and input prices, accessto credit, etc.) facing agricultural producers?
1 FAO, WTO Agreement on Agriculture: the implementation experience – developing country case ctudies. Rome, 2003.
2 The case studies covered the following countries: in Asia: China, India; in Latin America and the Caribbean:
Chile, Guatemala, Guyana, Peru; in North Africa/Near East: Morocco; and in Sub-Saharan Africa: Cameroon,Ghana, Kenya, Malawi, Nigeria, Senegal, United Republic of Tanzania, Uganda.
vi
What was the response and impact on the agricultural sector’s performance (e.g.production, productivity, trade)?What was the impact on small and resource-poor farmers?What was the impact on food security at the national level and for ruralhouseholds?
In the context of policy reform efforts at the multilateral level, of immediaterelevance are the current WTO negotiation on agriculture and actions to achievethe Millennium Development Goals (MDGs). The mandate for the Doha Roundof multilateral trade negotiations, and the WTO framework agreement of 1 August2004 on modalities for the negotiations in agriculture, specified that operationallyeffective and meaningful provisions for special and differential treatment fordeveloping countries are to be provided to enable them “to pursue agriculturalpolicies that are supportive of their development goals, poverty reduction strategies,food security and livelihood concerns”. These goals and concerns are also reflectedin the set of eight MDGs (and 18 targets),3 the first of which is that of reducing byhalf, by the year 2015, the proportion of the world’s people that live in extremepoverty as well as those who suffer from hunger.
Therefore, an immediate issue of interest in the context of these case studiesis the identification of appropriate trade-related policies that would support suchmultilaterally agreed goals, strategies and concerns.
As a prelude to undertaking the country case studies, several papers werecommissioned, and an expert consultation was held in Rome in July 2002, to reviewcritically the existing relevant literature on trade and food security developments,including assessments of the outcome of past policies on national and household foodsecurity, e.g. trade liberalization and related economic reforms. The stock-takingof existing relevant research also included a review of alternative methodologicalapproaches and conceptual frameworks for investigating the relationship betweentrade and food security. A volume based on the papers and the debate that tookplace during the expert consultation was published in 2003.4 This volume is a sequelto that publication.
Any study attempting to analyse the impact of policies faces a number ofmethodological issues. While it is relatively straightforward, where data exist(including at the household level), to track changes over time in economic andpolicy variables including food security indicators at the national and householdlevels (and, hence, in the ‘before’ and ‘after’ reform situations), it is more difficultto disentangle the effects of specific policy reforms from other factors (other policyactions, events and shocks) that have contributed to the observed economic andfood security outcomes. It is for this reason that most of the existing relevant
3 See: In larger freedom: towards development, security and human rights for all, report of the Secretary-General(UN General Assembly, A/59/2005, 21 March 2005).
4 See: FAO, Trade reforms and food security: conceptualizing the linkages, Rome, 2003.
vii
studies (e.g. on the impact of trade reforms on economic growth or the relationshipbetween economic growth and poverty reduction) use simple correlation analysis orsimulation models.5
The analytical approach taken in the 15 FAO studies is an adaptation of thecase-study methodology which combines both qualitative and quantitative analysesin a framework designed to capture more completely the micro-level factors thatinfluence the direction and strength of the relationship between agriculture-relatedreforms and food security in country-specific contexts. Country-level research andanalysis was undertaken by national consultants to investigate the various linkagesand the influence of modifying factors. The method adopted for examining aparticular aspect of the linkage differed from country to country depending upon thedata and expertise available and the complexity of the particular relationship beinginvestigated. Both quantitative and qualitative methods were used, including keyinformant interviews and rapid appraisal surveys.
A study of this scope would have been impossible without the collaboration ofmany able researchers, particularly those who prepared the country reports, and alsothose who acted as resource persons in the review of the draft studies. The countriesincluded in the project and the researchers who prepared the country studies wereas follows:Cameroon Ernest Bamou and Jean Pierre Tchanou, Department of Economics,
University of Yaounde II-Soa; François Honoré Mkouonga, Ministryof Agriculture, Cameroon and Dominique Njinkeu, Consortium pourla Recherche Economique en Afrique (CREA)
Chile Eugenia Muchnik and Rosa Camhi, Fundación Chile, AgribusinessDepartment
China Jikun Huang, Center for Chinese Agricultural Policy (CCAP), ChineseAcademy of Sciences; Scott Rozelle, Department of Agricultural andResource Economics, University of California, Davis; Hongxing NiOffice of Agricultural Trade, Ministry of Agriculture, and Ninghui Li,Agricultural Economics Institute, Chinese Academy of AgriculturalSciences. The authors would like to acknowledge the research assistanceprovided by Ping Qin Ping and Haomiao Liu from CCAP
Ghana Abena D. Oduro, Centre for Policy Analysis, Accra and George T-MKwadzo, Department of Agriculture Economics and Agribusiness,University of Ghana, Legon
Guatemala Pablo Rodas-Martini with Luis Gerardo Cifuentas and Juan PabloPira, and the assistance of Claudia Garcia – Research and Social StudyAssociation, Guatemala
5 For further discussion, see: FAO, Trade reforms and food security: conceptualizing the linkages, FAO, Rome,2003, chapter 11; L.A. Winters, N. McCulloch and A. McKay, Trade liberalization and poverty: the evidenceso far, Journal of Economic Literature, 42(1): 72-115.
viii
Guyana C.Y. Thomas and M. Bynoe, Institute of Development Studies,University of Guyana, Guyana
India Ramesh Chand, National Centre for Agricultural Economics and PolicyResearch, New Delhi, and Praduman Kumar, Division of AgriculturalEconomics, Indian Agricultural Research Institute, New Delhi
Kenya Hezron O. Nyangito, Jonathan Nzuma, Hellen Ommeh and MaryMbithi, Kenya Institute for Public Policy Research and Analysis,Nairobi
Malawi Ephraim W. Chirwa, University of Malawi, Chancellor College, andChristina Zakeyo, Ministry of Commerce and Industry, Malawi
Morocco Abdelaziz Sbai, Département des Sciences Humaines, InstitutAgronomique et Vétérinaire Hassan II; Mohamed Jaoad, Ministry ofAgriculture, and Azzouz Jakhjoukhi, Agroconcept, Morocco
Nigeria T. Ademola Oyejide, E. Olawale Ogunkola and Olumuyiwa B. Alaba,Trade Policy Research and Training Programme and Department ofEconomics, University of Ibadan, Nigeria
Peru Jorge Torres Zorrilla and Julio Paz Cafferata, Departamento deEconomía, Universidad Católica, Peru
Senegal Abdoulaye Diagne, François Joseph Cabral, Ben Omar Ndiaye,Mamadou Danskho, Malick Sane (CREA), and Ndioba Diene (DAPS)
Tanzania Flora Mndeme Musonda, East African Community, Tanzania andGodwill George Wanga, Daima Associates –Tanzania
Uganda Jacob Opolot, Augustine Wandera and Yusuf Atiku Abdalla, ResearchDepartment, Bank of Uganda
Several persons contributed to the review of the country reports in two meetingswith country team leaders held in Rome. These included: Roger Norton (InternationalConsultant, Panama), Anna Strutt (University of Waikato, New Zealand), RichardPearce (Imperial College London), Julio Paz Cafferata (International Consultant,Peru), Jamie Morrison (Imperial College London), Jean-Louis Arcand (Universitéd’Auvergne, France), Alexander Sarris (Director, Commodities and Trade Division,FAO) and Ramesh Sharma (Senior Economist, Commodities and Trade Division,FAO).
Many other persons helped to bring the project to a successful conclusion. Theseincluded the FAO Representatives in each of the countries covered in the studies, thecoordinator of the country teams, Julio Paz Cafferata, who handled a voluminousflow of communications between Rome and the country teams, Hansdeep Khairawho provided statistical assistance and the secretaries of ESCP who providedadministrative support to the project.
This volume was prepared under the direction of Harmon Thomas, Chief of theEconomic Policy and Projections Service in the Commodities and Trade Division ofFAO until 31 December 2005, who was the project coordinator and editor of thisvolume. Jamie Morrison, in addition to co-authoring the synthesis chapter, assisted

ix
in reducing the length of the studies for publication. Olwen Gotts, Emily Carrolland Hansdeep Khaira provided invaluable assistance during the editing process andin preparing this volume for printing.
Financial support for the project and for the preparation of this volume wasprovided by the Netherlands under an FAO project on Trade and Food Security(FNPP/GLO/001/NET-01).
Alexander SarrisDirector
FAO Commodities and Trade Division
x
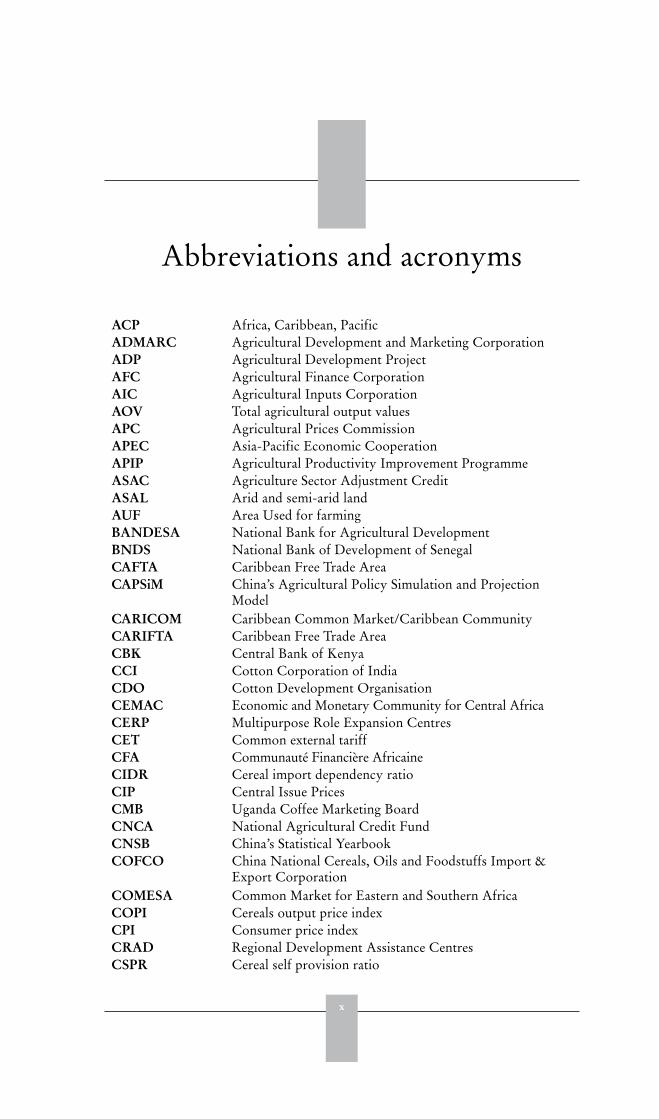
Abbreviations and acronyms
ACP Africa, Caribbean, PacificADMARC Agricultural Development and Marketing CorporationADP Agricultural Development ProjectAFC Agricultural Finance CorporationAIC Agricultural Inputs CorporationAOV Total agricultural output valuesAPC Agricultural Prices CommissionAPEC Asia-Pacific Economic CooperationAPIP Agricultural Productivity Improvement ProgrammeASAC Agriculture Sector Adjustment CreditASAL Arid and semi-arid landAUF Area Used for farmingBANDESA National Bank for Agricultural DevelopmentBNDS National Bank of Development of SenegalCAFTA Caribbean Free Trade AreaCAPSiM China’s Agricultural Policy Simulation and Projection
ModelCARICOM Caribbean Common Market/Caribbean CommunityCARIFTA Caribbean Free Trade AreaCBK Central Bank of KenyaCCI Cotton Corporation of IndiaCDO Cotton Development OrganisationCEMAC Economic and Monetary Community for Central AfricaCERP Multipurpose Role Expansion CentresCET Common external tariffCFA Communauté Financière AfricaineCIDR Cereal import dependency ratioCIP Central Issue PricesCMB Uganda Coffee Marketing BoardCNCA National Agricultural Credit FundCNSB China’s Statistical YearbookCOFCO China National Cereals, Oils and Foodstuffs Import &
Export CorporationCOMESA Common Market for Eastern and Southern AfricaCOPI Cereals output price indexCPI Consumer price indexCRAD Regional Development Assistance CentresCSPR Cereal self provision ratio
xi
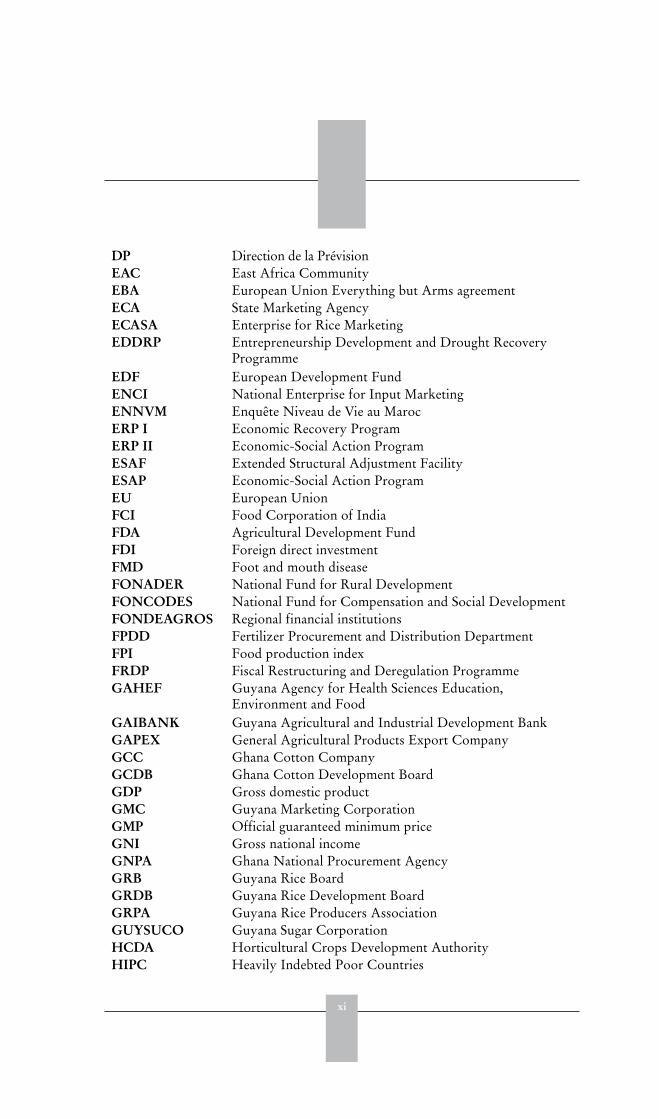
DP Direction de la PrévisionEAC East Africa CommunityEBA European Union Everything but Arms agreementECA State Marketing AgencyECASA Enterprise for Rice MarketingEDDRP Entrepreneurship Development and Drought Recovery
ProgrammeEDF European Development FundENCI National Enterprise for Input MarketingENNVM Enquête Niveau de Vie au MarocERP I Economic Recovery ProgramERP II Economic-Social Action ProgramESAF Extended Structural Adjustment FacilityESAP Economic-Social Action ProgramEU European UnionFCI Food Corporation of IndiaFDA Agricultural Development FundFDI Foreign direct investmentFMD Foot and mouth diseaseFONADER National Fund for Rural DevelopmentFONCODES National Fund for Compensation and Social DevelopmentFONDEAGROS Regional financial institutionsFPDD Fertilizer Procurement and Distribution DepartmentFPI Food production indexFRDP Fiscal Restructuring and Deregulation ProgrammeGAHEF Guyana Agency for Health Sciences Education,
Environment and FoodGAIBANK Guyana Agricultural and Industrial Development BankGAPEX General Agricultural Products Export CompanyGCC Ghana Cotton CompanyGCDB Ghana Cotton Development BoardGDP Gross domestic productGMC Guyana Marketing CorporationGMP Official guaranteed minimum priceGNI Gross national incomeGNPA Ghana National Procurement AgencyGRB Guyana Rice BoardGRDB Guyana Rice Development BoardGRPA Guyana Rice Producers AssociationGUYSUCO Guyana Sugar CorporationHCDA Horticultural Crops Development AuthorityHIPC Heavily Indebted Poor Countries
xii
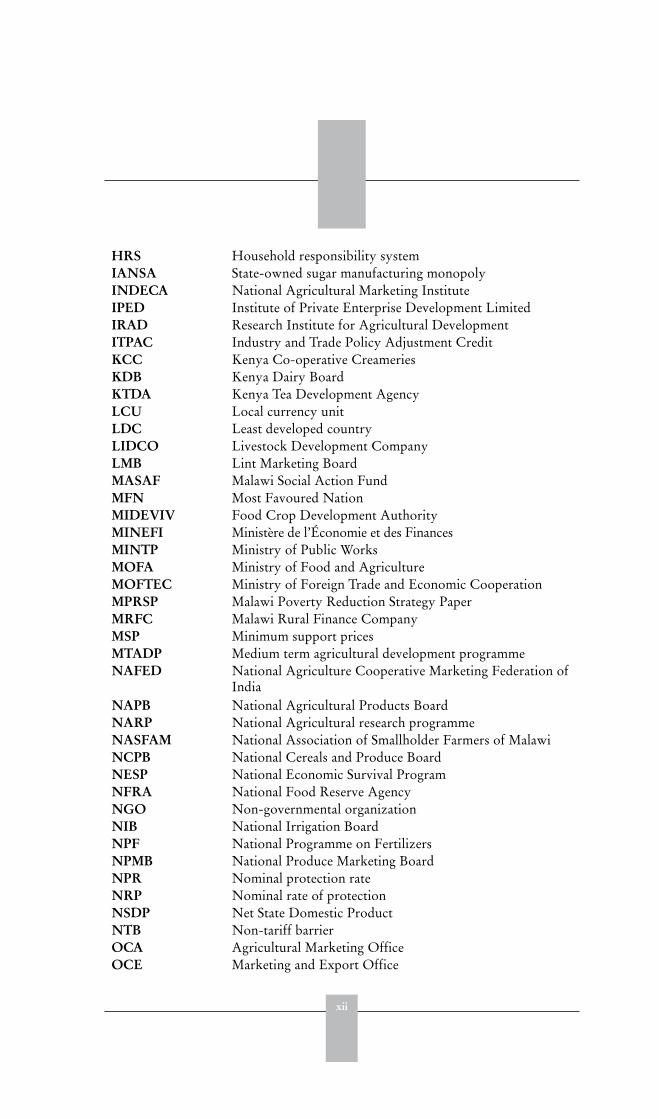
HRS Household responsibility systemIANSA State-owned sugar manufacturing monopolyINDECA National Agricultural Marketing InstituteIPED Institute of Private Enterprise Development LimitedIRAD Research Institute for Agricultural DevelopmentITPAC Industry and Trade Policy Adjustment CreditKCC Kenya Co-operative CreameriesKDB Kenya Dairy BoardKTDA Kenya Tea Development AgencyLCU Local currency unitLDC Least developed countryLIDCO Livestock Development CompanyLMB Lint Marketing BoardMASAF Malawi Social Action FundMFN Most Favoured NationMIDEVIV Food Crop Development AuthorityMINEFI Ministère de l’Économie et des FinancesMINTP Ministry of Public WorksMOFA Ministry of Food and AgricultureMOFTEC Ministry of Foreign Trade and Economic CooperationMPRSP Malawi Poverty Reduction Strategy PaperMRFC Malawi Rural Finance CompanyMSP Minimum support pricesMTADP Medium term agricultural development programmeNAFED National Agriculture Cooperative Marketing Federation of
IndiaNAPB National Agricultural Products BoardNARP National Agricultural research programmeNASFAM National Association of Smallholder Farmers of MalawiNCPB National Cereals and Produce BoardNESP National Economic Survival ProgramNFRA National Food Reserve AgencyNGO Non-governmental organizationNIB National Irrigation BoardNPF National Programme on FertilizersNPMB National Produce Marketing BoardNPR Nominal protection rateNRP Nominal rate of protectionNSDP Net State Domestic ProductNTB Non-tariff barrierOCA Agricultural Marketing OfficeOCE Marketing and Export Office
xiii
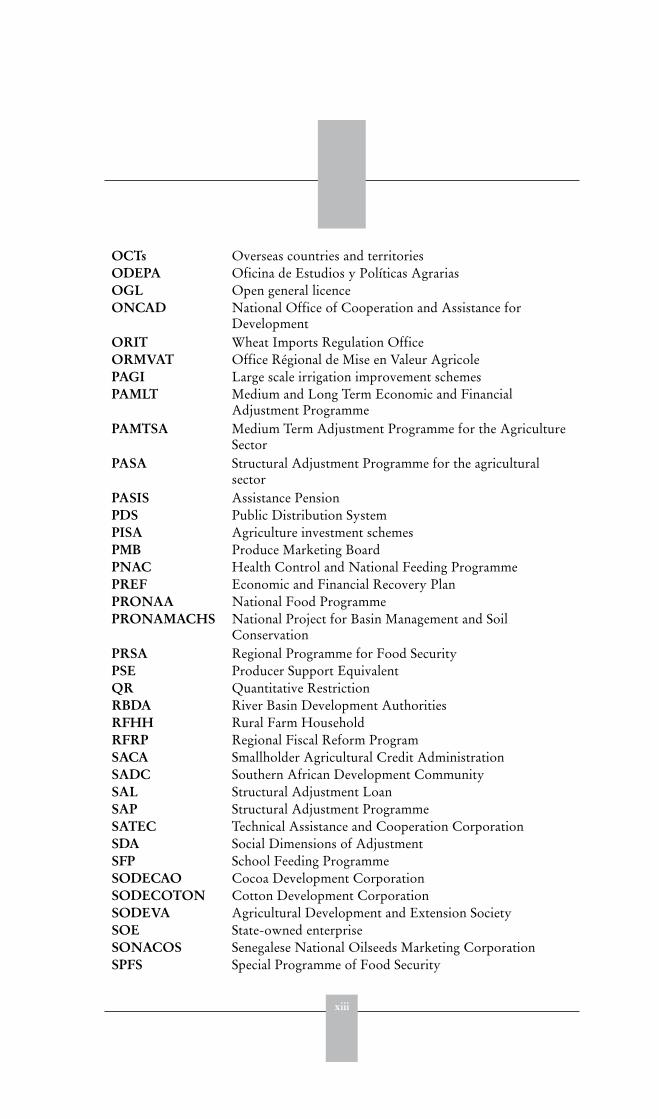
OCTs Overseas countries and territoriesODEPA Oficina de Estudios y Políticas AgrariasOGL Open general licenceONCAD National Office of Cooperation and Assistance for
DevelopmentORIT Wheat Imports Regulation OfficeORMVAT Office Régional de Mise en Valeur AgricolePAGI Large scale irrigation improvement schemesPAMLT Medium and Long Term Economic and Financial
Adjustment ProgrammePAMTSA Medium Term Adjustment Programme for the Agriculture
SectorPASA Structural Adjustment Programme for the agricultural
sectorPASIS Assistance PensionPDS Public Distribution SystemPISA Agriculture investment schemesPMB Produce Marketing BoardPNAC Health Control and National Feeding ProgrammePREF Economic and Financial Recovery PlanPRONAA National Food ProgrammePRONAMACHS National Project for Basin Management and Soil
ConservationPRSA Regional Programme for Food SecurityPSE Producer Support EquivalentQR Quantitative RestrictionRBDA River Basin Development AuthoritiesRFHH Rural Farm HouseholdRFRP Regional Fiscal Reform ProgramSACA Smallholder Agricultural Credit AdministrationSADC Southern African Development CommunitySAL Structural Adjustment LoanSAP Structural Adjustment ProgrammeSATEC Technical Assistance and Cooperation CorporationSDA Social Dimensions of AdjustmentSFP School Feeding ProgrammeSODECAO Cocoa Development CorporationSODECOTON Cotton Development CorporationSODEVA Agricultural Development and Extension SocietySOE State-owned enterpriseSONACOS Senegalese National Oilseeds Marketing CorporationSPFS Special Programme of Food Security
xiv
SPIF Special Programme for the Importation of FertilizersSPS Special Preferential SugarsSPS Sanitary and Phytosanitary standardsSSFRP Sub-Sector Fertilizer Reform ProgrammeSUF Family SubsidiesTDL Tanzania Dairies LimitedUCDA Uganda Coffee Development AuthorityUDEAC Central African Economic and Customs UnionUSAID United States Agency for International DevelopmentVAM Minimum Customs ValueWAEMU West African Economic and Monetary UnionWPI Wages price indexWTO World Trade Organization
Part 1
Trade-related reforms andfood security: a synthesis of
case study findings
Harmon Thomas and Jamie Morrison1
1 Harmon Thomas, Chief, Commodity Policy and Projections Service, Commodities and Trade Division, FAO,Jamie Morrison, Economist, Commodities and Trade Division, FAO. The authors would like to thank RogerNorton and Anna Strutt for inputs and Tim Josling and Gérard Viatte for their extensive comments on anearlier draft, without implicating them in any remaining shortcoming of this synthesis. The statistical assistanceof Hansdeep Khaira is gratefully acknowledged. Annex D was prepared by Suffyan Koroma.

3
1
Introduction to the study
RATIONALE AND APPROACH
The linkage between trade-related policy reforms and food security is of vitalconcern to many developing countries. The first part of this volume summarizesthe results of a study designed to show how trade and associated economic policyreforms have affected the agriculture sector and food security of farmers in a rangeof developing countries. It brings together insights from country case studies, eachof which analyses the reform process over time and identifies economic changesassociated with the reforms as well as other factors that may have contributed to theobserved outcomes.
Trade reforms are in most countries an integral part of a package of policymeasures implemented to correct perceived imbalances in an economy and/or toachieve specific sectoral objectives. It is therefore necessary to consider both tradeand associated economic reforms, particularly those at the macroeconomic level, thathave occurred over an extended period of time.
In spite of the prevalence of reform packages in developing countries over the lasttwo decades, relatively little has been done to try to identify the consequences forfood security and in particular, the factors that may influence those consequences.Existing reviews of experience point out many uncertainties, even with regard toissues as basic as the effects of policy reforms on economic growth: “while there isfairly convincing cross-country evidence that exports are associated with growth, theevidence that liberalization increases growth is much weaker” (FAO, 2003a, p. 47).The same volume also argues that in Africa “substantial controversy remains overthe effects of agricultural market reform” (p. 182). It attributes the mixed nature ofthe results to the fact that reforms often have been implemented only partially andinconsistently. On the other hand, Kydd (idem, Chapter 8) concludes that poorperformance following reform has been the result of inappropriate design. For LatinAmerica, Valdés and Foster link improvements in food security to the presence ofprogrammes targeted on the poor as well as trade reforms, concluding that “tradepolicy instruments [alone] are now seen as being inadequate to deal with the goal ofincreasing household income and food security” (FAO 2003a, p. 219). Similarly, forCentral and Eastern Europe and the ex-Soviet Union, “trade was only one of severalkey reforms that affected agricultural performance and food security in transitioncountries” (p. 229). The present study represents an attempt to provide furtherempirical evidence on these vital unresolved issues at a country level.
The approach taken is to observe actual performance in fifteen countries thathave undergone policy reform in the past few years, and to search for explanatoryfactors, rather than to project the presumed consequences of reforms throughmodels of economic behaviour. Focusing on the country-specific socio-economic,
4
Trade reforms and food security – country case studies and synthesis
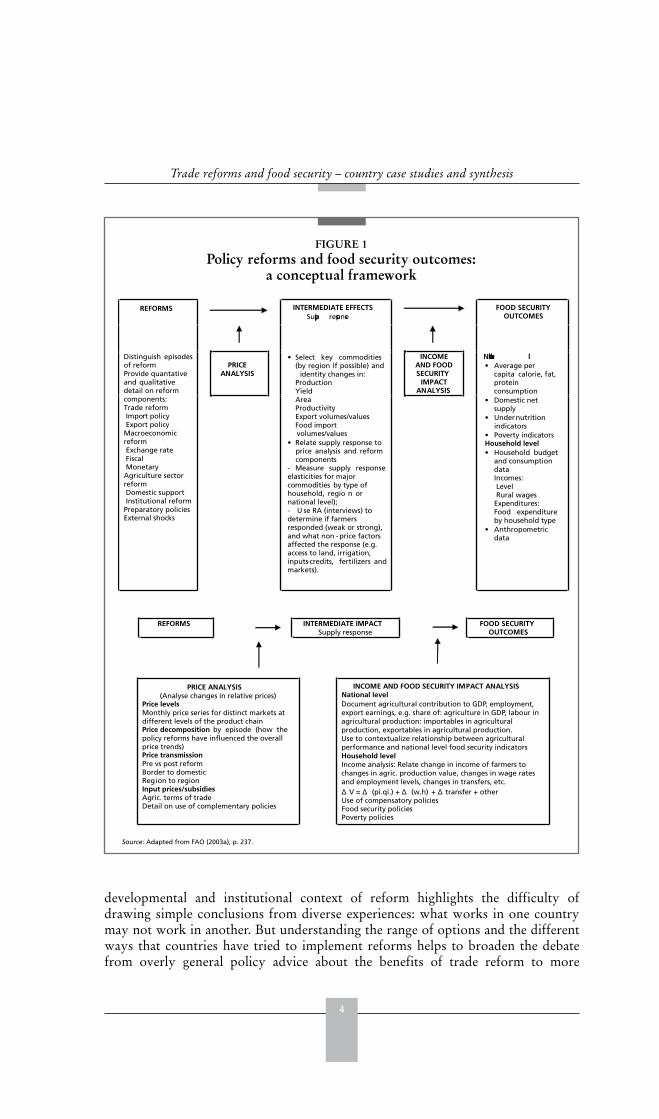
FIGURE 1Policy reforms and food security outcomes:
a conceptual framework
REFORMS INTERMEDIATE EFFECTSSupply response
FOOD SECURITYOUTCOMES
PRICE ANALYSIS
INCOMEAND FOODSECURITY
IMPACTANALYSIS
Distinguish episodesof reformProvide quantativeand qualitative detail on reformcomponents: Trade reformImport policy Export policy
MacroeconomicreformExchange rateFiscalMonetary
Agriculture sectorreformDomestic support Institutional reform
Preparatory policies External shocks
• Select key commodities(by region if possible) and
identity changes in: ProductionYield AreaProductivityExport volumes/valuesFood import volumes/values
• Relate supply response toprice analysis and reformcomponents
- Measure supply responseelasticities for major commodities by type ofhousehold, regio n ornational level); - U se RA (interviews) todetermine if farmers responded (weak or strong), and what non -price factors affected the response (e.g. access to land, irrigation, inputs-credits, fertilizers and markets).
National leve l• Average per
capita calorie, fat,protein consumption
• Domestic net supply
• Undernutritionindicators
• Poverty indicatorsHousehold level• Household budget
and consumption dataIncomes:Level Rural wages
Expenditures: Food expenditureby household type
• Anthropometricdata
REFORMS INTERMEDIATE IMPACTSupply response
FOOD SECURITYOUTCOMES
PRICE ANALYSIS(Analyse changes in relative prices)
Price levelsMonthly price series for distinct markets atdifferent levels of the product chainPrice decomposition by episode (how the policy reforms have influenced the overall price trends)Price transmissionPre vs post reformBorder to domesticRegion to regionInput prices/subsidiesAgric. terms of tradeDetail on use of complementary policies
INCOME AND FOOD SECURITY IMPACT ANALYSISNational level
V = (pi.qi.) + (w.h) + transfer + otherUse of compensatory policiesFood security policiesPoverty policies
Document agricultural contribution to GDP, employment,export earnings, e.g. share of: agriculture in GDP, labour inagricultural production: importables in agricultural production, exportables in agricultural production.Use to contextualize relationship between agriculturalperformance and national level food security indicatorsHousehold levelIncome analysis: Relate change in income of farmers tochanges in agric. production value, changes in wage ratesand employment levels, changes in transfers, etc.
Source: Adapted from FAO (2003a), p. 237.
developmental and institutional context of reform highlights the difficulty ofdrawing simple conclusions from diverse experiences: what works in one countrymay not work in another. But understanding the range of options and the differentways that countries have tried to implement reforms helps to broaden the debatefrom overly general policy advice about the benefits of trade reform to more
5
Introduction to the study
sophisticated discussion of the importance of appropriately sequenced and pacedreforms to minimize the adjustment costs.
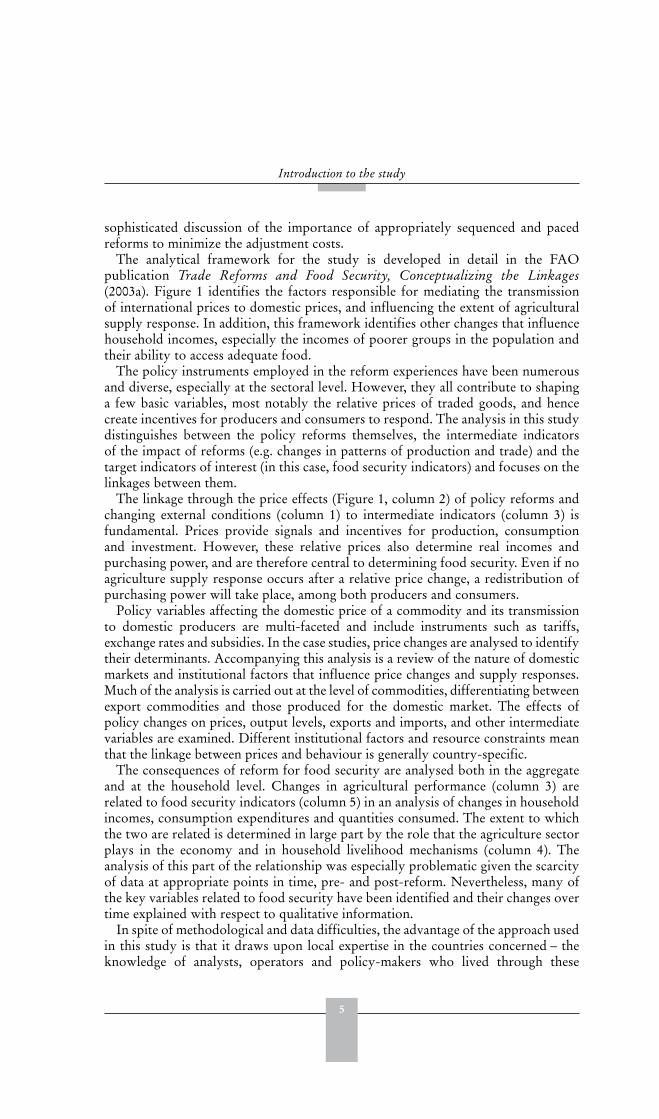
The analytical framework for the study is developed in detail in the FAOpublication Trade Reforms and Food Security, Conceptualizing the Linkages (2003a). Figure 1 identifies the factors responsible for mediating the transmissionof international prices to domestic prices, and influencing the extent of agriculturalsupply response. In addition, this framework identifies other changes that influencehousehold incomes, especially the incomes of poorer groups in the population andtheir ability to access adequate food.
The policy instruments employed in the reform experiences have been numerousand diverse, especially at the sectoral level. However, they all contribute to shapinga few basic variables, most notably the relative prices of traded goods, and hencecreate incentives for producers and consumers to respond. The analysis in this studydistinguishes between the policy reforms themselves, the intermediate indicatorsof the impact of reforms (e.g. changes in patterns of production and trade) and thetarget indicators of interest (in this case, food security indicators) and focuses on thelinkages between them.
The linkage through the price effects (Figure 1, column 2) of policy reforms andchanging external conditions (column 1) to intermediate indicators (column 3) isfundamental. Prices provide signals and incentives for production, consumptionand investment. However, these relative prices also determine real incomes andpurchasing power, and are therefore central to determining food security. Even if noagriculture supply response occurs after a relative price change, a redistribution ofpurchasing power will take place, among both producers and consumers.
Policy variables affecting the domestic price of a commodity and its transmissionto domestic producers are multi-faceted and include instruments such as tariffs,exchange rates and subsidies. In the case studies, price changes are analysed to identifytheir determinants. Accompanying this analysis is a review of the nature of domesticmarkets and institutional factors that influence price changes and supply responses.Much of the analysis is carried out at the level of commodities, differentiating betweenexport commodities and those produced for the domestic market. The effects ofpolicy changes on prices, output levels, exports and imports, and other intermediatevariables are examined. Different institutional factors and resource constraints meanthat the linkage between prices and behaviour is generally country-specific.
The consequences of reform for food security are analysed both in the aggregateand at the household level. Changes in agricultural performance (column 3) arerelated to food security indicators (column 5) in an analysis of changes in householdincomes, consumption expenditures and quantities consumed. The extent to whichthe two are related is determined in large part by the role that the agriculture sectorplays in the economy and in household livelihood mechanisms (column 4). Theanalysis of this part of the relationship was especially problematic given the scarcityof data at appropriate points in time, pre- and post-reform. Nevertheless, many ofthe key variables related to food security have been identified and their changes overtime explained with respect to qualitative information.
In spite of methodological and data difficulties, the advantage of the approach usedin this study is that it draws upon local expertise in the countries concerned – theknowledge of analysts, operators and policy-makers who lived through these
6
Trade reforms and food security – country case studies and synthesis
events – and it utilizes diverse sources of information that could not be used if themethodology required complete time series for all variables. The richness of theinsights obtained, particularly in highlighting reasons for responses that have beencounter to a priori expectations or which demonstrate differential responses bydifferent sets of producers in different environments, compensates for some of thelimitations of the study.
The remainder of this chapter outlines the key parameters characterizing theselected countries. Chapter 2 discusses the motivations for, and the types of, reformimplemented in these countries. Chapter 3 examines evidence of the impact of reformon intermediate variables in order to draw out possible reasons for the differentresponses between countries. Chapter 4 uses the case study evidence to examine therelationship between changing agriculture sector performance and national level andhousehold level food security indicators. Finally, Chapter 5 draws policy implicationsfrom the findings, and concludes by suggesting areas for future research.
It is hoped this will stimulate discussion and further work on the linkages betweenreform and food security. The aim is to help forge a clearer understanding of notsimply what happened during the periods of reform, but why it happened and howfuture policy reforms may be designed in a way that they will make a strongercontribution to enhancing agricultural performance and hence food security indeveloping nations.
COUNTRY SAMPLE AND PROFILES
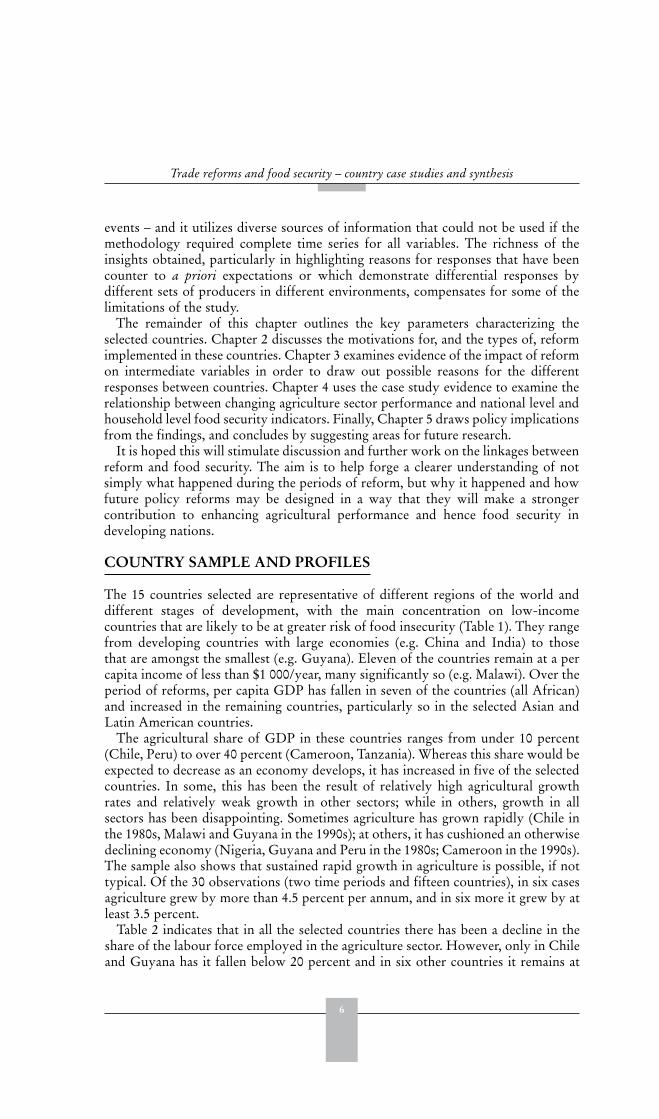
The 15 countries selected are representative of different regions of the world anddifferent stages of development, with the main concentration on low-incomecountries that are likely to be at greater risk of food insecurity (Table 1). They rangefrom developing countries with large economies (e.g. China and India) to thosethat are amongst the smallest (e.g. Guyana). Eleven of the countries remain at a percapita income of less than $1 000/year, many significantly so (e.g. Malawi). Over theperiod of reforms, per capita GDP has fallen in seven of the countries (all African)and increased in the remaining countries, particularly so in the selected Asian andLatin American countries.
The agricultural share of GDP in these countries ranges from under 10 percent(Chile, Peru) to over 40 percent (Cameroon, Tanzania). Whereas this share would beexpected to decrease as an economy develops, it has increased in five of the selectedcountries. In some, this has been the result of relatively high agricultural growthrates and relatively weak growth in other sectors; while in others, growth in allsectors has been disappointing. Sometimes agriculture has grown rapidly (Chile inthe 1980s, Malawi and Guyana in the 1990s); at others, it has cushioned an otherwisedeclining economy (Nigeria, Guyana and Peru in the 1980s; Cameroon in the 1990s).The sample also shows that sustained rapid growth in agriculture is possible, if nottypical. Of the 30 observations (two time periods and fifteen countries), in six casesagriculture grew by more than 4.5 percent per annum, and in six more it grew by atleast 3.5 percent.
Table 2 indicates that in all the selected countries there has been a decline in theshare of the labour force employed in the agriculture sector. However, only in Chileand Guyana has it fallen below 20 percent and in six other countries it remains at
7
Introduction to the study
TABLE 1 Key development indicators in the selected case study countries, 1980-2001
GDP(billion US$)
GNI per capita (US$)
Agriculture,value added (as percent
of GDP)
Real GDPgrowth
(average annual percent)
Growth in agriculture,real value
added1980 1990 2001 1980 1990 2001 1980 1990 2001 1980-
901990-2002
1980-90
1990-2002
AfricaCameroon 6.7 11.2 8.6 620 950 570 31 25 43 3.3 1.9 2.4 4.9Ghana 4.4 5.9 5.3 420 380 290 58 45 35 2.2 4.3 0.3 3.4Kenya 7.3 8.6 11.2 440 380 350 33 29 19 4.1 1.6 3.7 0.7Malawi 1.2 1.9 1.7 190 200 160 44 45 36 2.2 2.6 1.4 5.4Nigeria 64.2 28.5 42.7 780 270 300 21 33 35 1.1 2.4 1.9 3.5Senegal 3 5.7 4.6 530 720 490 19 20 20 3.1 3.4 2.8 0.3Tanzania - 4.3 9.3 - 190 270 - 46 45 - 3.5 - 3.5Uganda 1.2 4.3 5.6 - 320 250 72 57 37 - 6.6 - 3.9Morocco 18.8 25.8 33.9 970 1 030 1 190 18 18 16 3.9 2.7 3.8 0.4AsiaChina 188.2 354.6 1175.7 220 320 900 30 27 16 9.3 9.7 6.2 3.7India 181.2 316.9 478.5 270 390 460 39 31 25 5.8 5.4 3.4 2.2Latin AmericaChile 27.6 30.3 66.5 2 250 2 190 4 600 7 9 9 3.8 5.8 5.6 2.4Guatemala 7.6 7.7 21 1 220 970 1 700 25 26 23 0.9 3.8 1.3 2.6Guyana 0.6 0.4 0.7 780 380 860 23 38 30 -3.4 4.3 -1.3 5.2Peru 20.7 26.3 53.6 1 050 780 1 970 10 9 8 -0.8 3.7 2.3 4.7
Source: World Bank, 2003 and 2004.
TABLE 2The role of agriculture in employment and trade, 1980-2001
Agricultural employment as percentage of total employment
Share of agricultural exports in total merchandise exports
1980 1990 2001 1980 1990 2001Africa Sub-Saharan Africa
Cameroon 73 70 58 52 28 24Ghana 61 59 57 65 46 20Kenya 82 80 75 50 63 56Malawi 87 87 83 88 90 93Nigeria 54 43 32 2 2 2Senegal 81 77 73 24 29 13Tanzania 86 84 80 71 69 53Uganda 87 85 80 100 91 31 North Africa
Morocco 56 45 35 25 15 10AsiaChina 74 72 66 12 8 3India 70 64 59 30 17 12Latin AmericaChile 21 19 15 9 14 18Guatemala 54 52 45 70 69 52Guyana 27 22 17 43 39 30Peru 40 36 30 8 9 9
Source: FAOSTAT, (FAO, 2004).
8
Trade reforms and food security – country case studies and synthesis
two thirds or more. In all cases the share of employment in agriculture exceeds itscontribution to GDP.
Table 2 also indicates the significant variation among countries in both the agriculturalexport shares, ranging from 2 to 3 percent in Nigeria and China to 93 percent in Malawi;and in the rates at which the share has changed. In Malawi, Chile and Peru the share hasincreased, but in most other countries, the share has decreased rapidly.
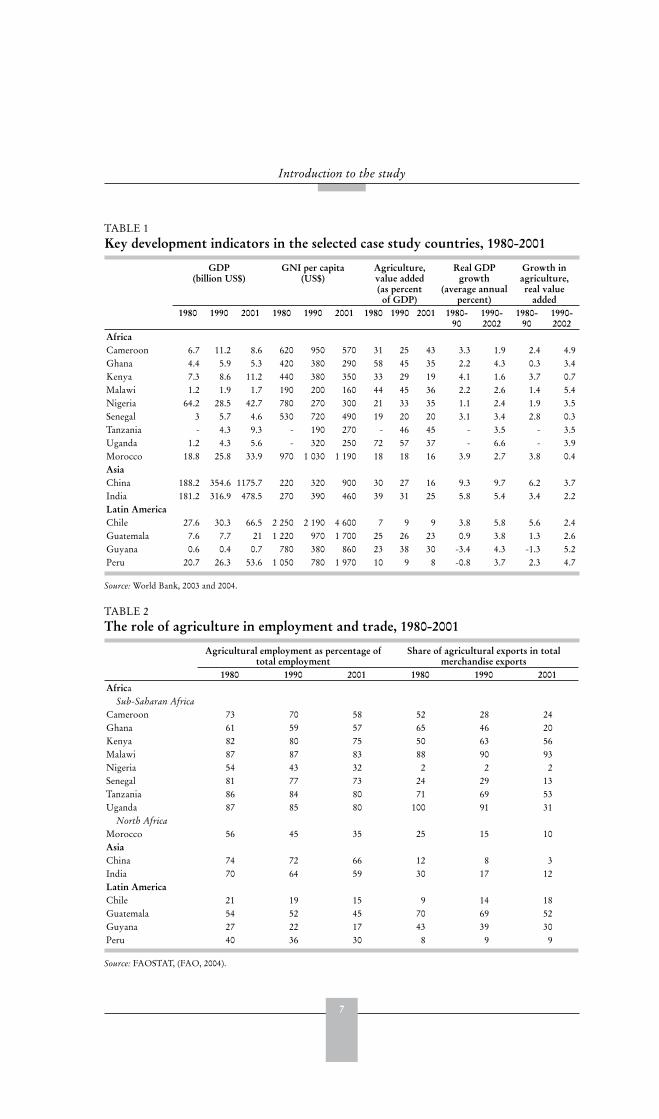
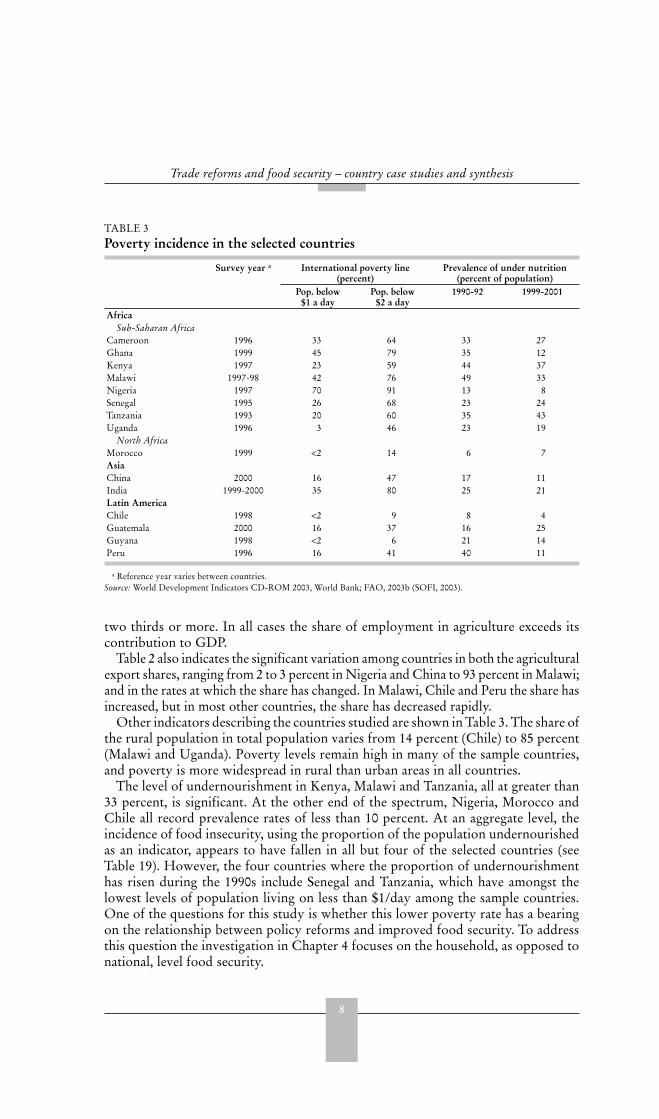
Other indicators describing the countries studied are shown in Table 3. The share ofthe rural population in total population varies from 14 percent (Chile) to 85 percent(Malawi and Uganda). Poverty levels remain high in many of the sample countries,and poverty is more widespread in rural than urban areas in all countries.
The level of undernourishment in Kenya, Malawi and Tanzania, all at greater than33 percent, is significant. At the other end of the spectrum, Nigeria, Morocco andChile all record prevalence rates of less than 10 percent. At an aggregate level, theincidence of food insecurity, using the proportion of the population undernourishedas an indicator, appears to have fallen in all but four of the selected countries (seeTable 19). However, the four countries where the proportion of undernourishmenthas risen during the 1990s include Senegal and Tanzania, which have amongst thelowest levels of population living on less than $1/day among the sample countries.One of the questions for this study is whether this lower poverty rate has a bearingon the relationship between policy reforms and improved food security. To addressthis question the investigation in Chapter 4 focuses on the household, as opposed tonational, level food security.
TABLE 3 Poverty incidence in the selected countries
Survey year a International poverty line (percent)
Prevalence of under nutrition (percent of population)
Pop. below $1 a day
Pop. below $2 a day
1990-92 1999-2001
Africa Sub-Saharan Africa
Cameroon 1996 33 64 33 27Ghana 1999 45 79 35 12Kenya 1997 23 59 44 37Malawi 1997-98 42 76 49 33Nigeria 1997 70 91 13 8Senegal 1995 26 68 23 24Tanzania 1993 20 60 35 43Uganda 1996 3 46 23 19 North Africa
Morocco 1999 <2 14 6 7AsiaChina 2000 16 47 17 11India 1999-2000 35 80 25 21Latin AmericaChile 1998 <2 9 8 4Guatemala 2000 16 37 16 25Guyana 1998 <2 6 21 14Peru 1996 16 41 40 11
a Reference year varies between countries.Source: World Development Indicators CD-ROM 2003, World Bank; FAO, 2003b (SOFI, 2003).
9
2
Policy reforms in the case studycountries
COMPONENTS OF REFORM
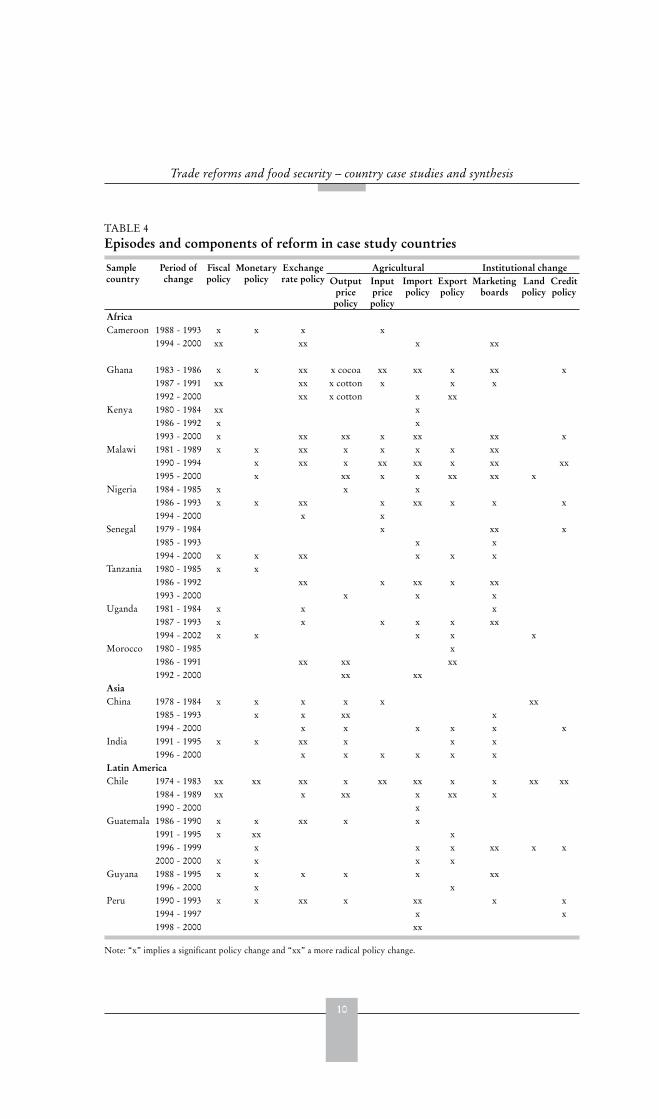
Economic reforms in the countries studied tended to concentrate on restoring fiscalhealth, liberalizing the foreign exchange and trade regimes, and reducing what wereperceived to be unproductive state interventions in the economy (Table 4). Emphasiswas placed on reducing direct government controls over prices, production andmarketing. Usually the reforms were supported and encouraged by internationallending operations of the Bretton Woods institutions, through advice and policyconditionality. In the case of Malawi, for example, policy reforms have beensupported by eight structural adjustment loans (five of them sectoral) from theseinstitutions.
Sectoral reforms accompanied these economy-wide measures. In most cases,macroeconomic reforms were initiated before sectoral and institutional reforms,although notable exceptions are the West African countries of Cameroon andSenegal where the significant macroeconomic reforms came later, and Ghana andMalawi where reforms occurred simultaneously.
Macroeconomic and trade instruments of policy reformThe major instruments of reform identified in the case studies have been thefollowing:
1) exchange rate regime liberalization;2) foreign exchange liberalization: elimination of restrictions on foreign exchange
earnings;3) tariffication of quantitative restrictions on imports and removal or reduction
of import licensing requirements;4) lowering of tariffs and reduction of their dispersion;5) reduction or elimination of the use of export prohibitions, licensing
requirements and other export restrictions;6) reductions of export taxes and surcharges;7) loosening of controls on interest rates and, generally, an increase in real lending
rates. Financial sector reform has often been accompanied by a widening offinancial intermediation margins;
8) reducing the rate of expansion of the money supply through instruments ofmonetary policy;
9) increasing the government’s revenue base, strengthening tax collection efforts,and raising tax rates, especially tariffs on public services;
10) reducing real government outlays.
10
Trade reforms and food security – country case studies and synthesis
TABLE 4 Episodes and components of reform in case study countries
Samplecountry
Period of change
Fiscalpolicy
Monetarypolicy
Exchangerate policy
Agricultural Institutional changeOutput
pricepolicy
Inputpricepolicy
Importpolicy
Exportpolicy
Marketingboards
Landpolicy
Creditpolicy
AfricaCameroon 1988 - 1993 x x x x
1994 - 2000 xx xx x xx
Ghana 1983 - 1986 x x xx x cocoa xx xx x xx x1987 - 1991 xx xx x cotton x x x1992 - 2000 xx x cotton x xx
Kenya 1980 - 1984 xx x1986 - 1992 x x1993 - 2000 x xx xx x xx xx x
Malawi 1981 - 1989 x x xx x x x x xx1990 - 1994 x xx x xx xx x xx xx1995 - 2000 x xx x x xx xx x
Nigeria 1984 - 1985 x x x1986 - 1993 x x xx x xx x x x1994 - 2000 x x
Senegal 1979 - 1984 x xx x1985 - 1993 x x1994 - 2000 x x xx x x x
Tanzania 1980 - 1985 x x1986 - 1992 xx x xx x xx1993 - 2000 x x x
Uganda 1981 - 1984 x x x1987 - 1993 x x x x x xx1994 - 2002 x x x x x
Morocco 1980 - 1985 x1986 - 1991 xx xx xx1992 - 2000 xx xx
AsiaChina 1978 - 1984 x x x x x xx
1985 - 1993 x x xx x1994 - 2000 x x x x x x
India 1991 - 1995 x x xx x x x1996 - 2000 x x x x x x
Latin AmericaChile 1974 - 1983 xx xx xx x xx xx x x xx xx
1984 - 1989 xx x xx x xx x1990 - 2000 x
Guatemala 1986 - 1990 x x xx x x1991 - 1995 x xx x1996 - 1999 x x x xx x x2000 - 2000 x x x x
Guyana 1988 - 1995 x x x x x xx1996 - 2000 x x
Peru 1990 - 1993 x x xx x xx x x1994 - 1997 x x1998 - 2000 xx
Note: “x” implies a significant policy change and “xx” a more radical policy change.
11
Policy reforms in the case study countries
Of these instruments, the ones that most favour agriculture and agro-industry inthe short and medium term are likely to be the liberalization of the exchange rateand export regimes. These measures tend to raise prices to farmers and open exportmarkets to them, or to agro-industries that purchase their harvests. Often, butnot always, this has meant a real devaluation at the beginning of a reform process,with a revaluation occurring later in several cases. In Kenya, the real exchange rateappreciated until 1998. In Peru, the new policy stabilized the real exchange rate at alevel which resulted in a substantial real appreciation of the currency with respect toits average level in the pre-reform period. Exchange rate reform has sometimes meantmoving temporarily from a fixed exchange rate to a dual or multiple rate system, andmore commonly from multiple rates to a unified floating rate. However, the caseof Peru illustrates the tendency of the multiple exchange rate systems to be highlyunfavourable for agriculture. More subtle forms of exchange rate liberalizationinclude reduction or elimination of requirements for making advance deposits in thecentral bank for the right to draw foreign exchange for imports.
The reduction of import barriers, by contrast, might be expected to have negativeeffects on agricultural incentives, at least in the short run, but the net effect dependson what happens to industrial protection rates and to tariffs on agricultural inputs aswell, i.e. what happens to effective protection for agriculture. India’s tariff reformsin the early 1990s improved agriculture’s effective protection rates.
The economic argument in favour of import liberalization is that it eventually helpspush a country’s allocation of economic resources into areas of greater comparativeadvantage, and out of areas with a comparative disadvantage. In the long run, thisstrengthens growth prospects. However, the issue concerning these instruments isthat low-income producers may not be in a situation to alter their cropping mix inthe short term, or even in the long term, and in the meantime their incomes may bereduced. As discussed later in the report broader agricultural and rural growth canbe negatively affected by tariff reduction in some situations.
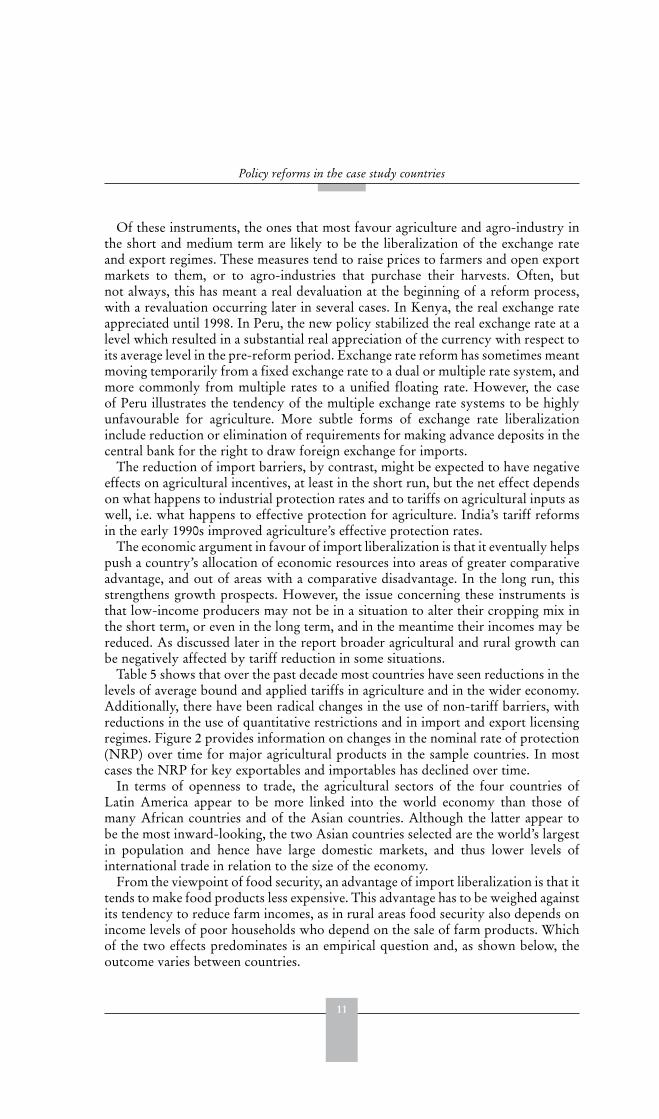
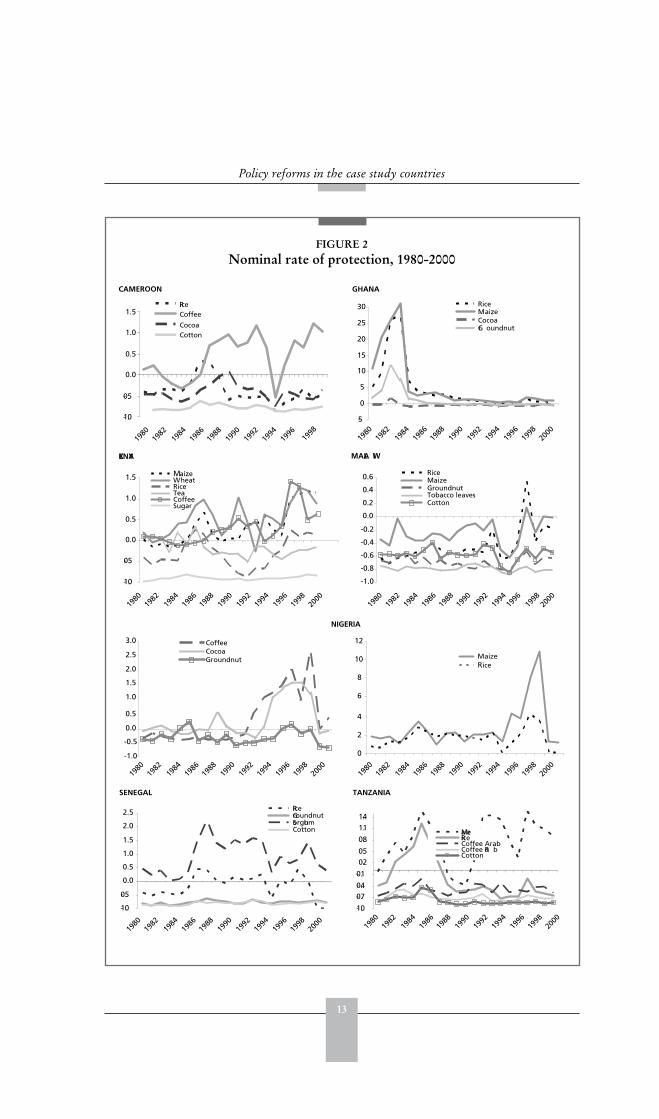
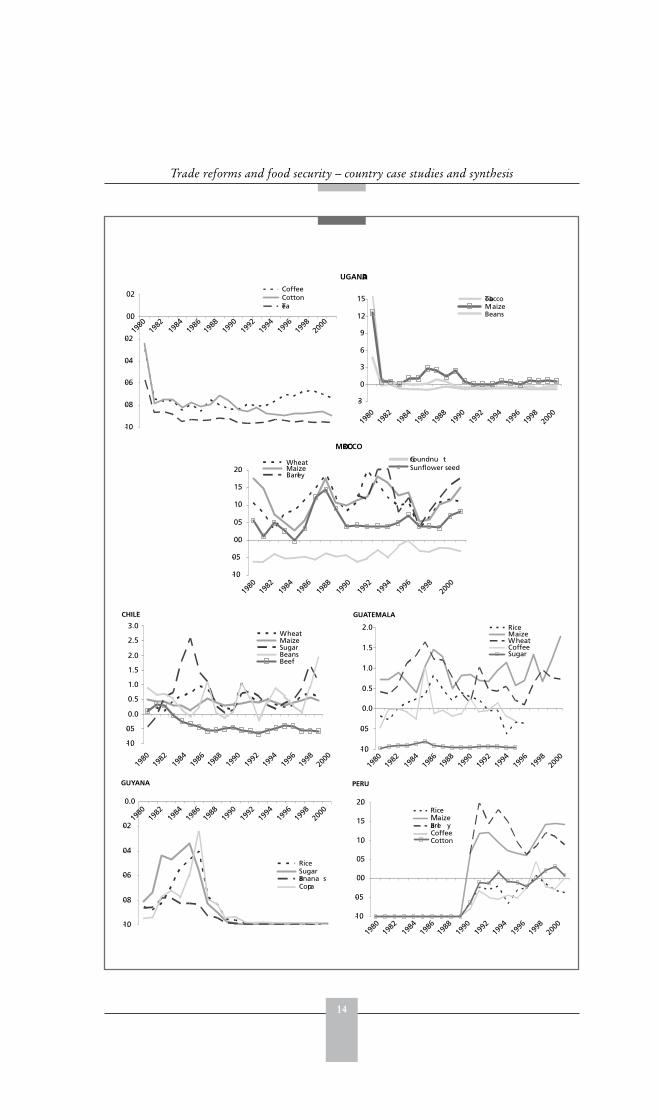
Table 5 shows that over the past decade most countries have seen reductions in thelevels of average bound and applied tariffs in agriculture and in the wider economy.Additionally, there have been radical changes in the use of non-tariff barriers, withreductions in the use of quantitative restrictions and in import and export licensingregimes. Figure 2 provides information on changes in the nominal rate of protection(NRP) over time for major agricultural products in the sample countries. In mostcases the NRP for key exportables and importables has declined over time.
In terms of openness to trade, the agricultural sectors of the four countries ofLatin America appear to be more linked into the world economy than those ofmany African countries and of the Asian countries. Although the latter appear tobe the most inward-looking, the two Asian countries selected are the world’s largestin population and hence have large domestic markets, and thus lower levels ofinternational trade in relation to the size of the economy.
From the viewpoint of food security, an advantage of import liberalization is that ittends to make food products less expensive. This advantage has to be weighed againstits tendency to reduce farm incomes, as in rural areas food security also depends onincome levels of poor households who depend on the sale of farm products. Whichof the two effects predominates is an empirical question and, as shown below, theoutcome varies between countries.
12
Trade reforms and food security – country case studies and synthesis
Policies aimed at strengthening a country’s financial sector can result in restrictingcredit to agriculture. In spite of widespread emphasis on building microfinanceinstitutions, reform of financial institutions has often left agriculture withsubstantially less access to credit than before. In the case of Uganda, financial sectorreforms have led to a reduction of the flow of credit to the agricultural sector. InPeru, the estimated number of small farmers (less than 10 ha) served by the formalfinancial system has been reduced dramatically from 184 920 in 1989 to 21 457 in2000. However, it should be noted that in Nigeria mandatory credit allocations toagriculture were increased in the 1980s and early 1990s, grace periods for repaymentwere lengthened, and other measures were implemented to increase the flow ofcredit to the sector. In Senegal agricultural interest rates were reduced substantiallyfor the crop year 1997/98.
TABLE 5 Applied and WTO bound average MFN tariffs by year of application
Applied MFN tariffs (percent) Bound MFN tariffs (percent)Year Agricultural
productsAll products Year Agricultural
productsAll products
AfricaCameroon 1994 24 19
2002 24 18 1998 80 -Ghana 1993 20 15 1995 97 92
2000 20 15Kenya 1994 43 35 1996 97 96
2001 23 19Malawi 1994 31 31 1996 111 76
2001 16 13Nigeria 1988 37 34
2002 53 30 1995 150 119Senegal 2001 15 12 1996 30 30Tanzania 1993 28 20 1995 120 120
2003 20 14Uganda 1994 25 17 1996 77 73
2003 13 9Morocco 1993 29 25 1997 66 43
2003 52 33AsiaChina 1992 46 43
2001 19 16 2001 14 10India 1990 66 66
2001 42 32 1996 115 49Latin AmericaChile 1992 11 11
2002 7 7 1999 26 25Guatemala 1995 14 10
2002 11 7 1999 51 38Guyana 1996 23 12 1998 93 58
2003 23 12Peru 1993 18 18
2000 17 14 1998 31 30
Source: WITS, 2003.
13
Policy reforms in the case study countries
FIGURE 2Nominal rate of protection, 1980-2000
CAMEROON
-1.0
-0.5
0.0
0.5
1.0
1.5RiceCoffee
CocoaCotton
1980
1982
1984
1986
1992
1988
1990
1994
1996
1998
-5
0
5
10
15
20
25
30 RiceMaizeCocoaGr oundnut
KENYA MALA WI
-1.0
-0.5
0.0
0.5
1.0
1.5 MaizeWheatRiceTeaCoffeeSugar
-1.0
-0.8
-0.6
-0.4
-0.2
0.0
0.2
0.4
0.6 RiceMaizeGroundnutTobacco leavesCotton
NIGERIA
-1.0
-0.5
0.0
0.5
1.0
1.5
2.0
2.5
3.0 CoffeeCocoaGroundnut
0
2
4
6
8
10
12
MaizeRice
GHANA
1980
1982
1984
1986
1992
1988
1990
1994
1996
1998
2000
1980
1982
1984
1986
1992
1988
1990
1994
1996
1998
2000
1980
1982
1984
1986
1992
1988
1990
1994
1996
1998
2000
1980
1982
1984
1986
1992
1988
1990
1994
1996
1998
2000
1980
1982
1984
1986
1992
1988
1990
1994
1996
1998
2000
SENEGAL TANZANIA
-1.0
-0.5
0.0
0.5
1.0
1.5
2.0
2.5 RiceGroundnutSorghumCotton
-1.0
-0.7-0.4
-0.1
0.20.5
0.8
1.11.4
MaizeRiceCoffee ArabCoffee Ro bCotton
1980
1982
1984
1986
1992
1988
1990
1994
1996
1998
2000
1980
1982
1984
1986
1992
1988
1990
1994
1996
1998
2000
14
Trade reforms and food security – country case studies and synthesis
UGANDA
-1.0
-0.8
-0.6
-0.4
-0.2
0.0
0.2CoffeeCottonTea
-3
0
3
6
9
12
15 TobaccoMaizeBeans
MOROCCO
-1.0
-0.5
0.0
0.5
1.0
1.5
2.0WheatMaizeBarley
Groundnu tSunflower seed
-1.0
-0.5
0.0
0.5
1.0
1.5
2.0
2.5
3.0WheatMaizeSugarBeansBeef
-1.0
-0.5
0.0
0.5
1.0
1.5
2.0 RiceMaizeWheatCoffeeSugar
-1.0
-0.8
-0.6
-0.4
-0.2
0.0
RiceSugarBanana sCopra
-1.0
-0.5
0.0
0.5
1.0
1.5
2.0RiceMaizeBarle yCoffeeCotton
1980
1982
1984
1986
1992
1988
1990
1994
1996
1998
2000
1980
1982
1984
1986
1992
1988
1990
1994
1996
1998
2000
1980
1982
1984
1986
1992
1988
1990
1994
1996
1998
2000
CHILE
1980
1982
1984
1986
1992
1988
1990
1994
1996
1998
2000
1980
1982
1984
1986
1992
1988
1990
1994
1996
1998
2000
GUATEMALA
1980
1982
1984
1986
1992
1988
1990
1994
1996
1998
2000
1980
1982
1984
1986
1992
1988
1990
1994
1996
1998
2000
GUYANA PERU

15
Policy reforms in the case study countries
Fiscal reforms often imply greater tax and fee payments for producers and this canmean less funding for infrastructure investments, agricultural research and extension,and other public sector activities in agriculture. Hence the short-run effects of suchreforms are often negative for the sector. A typical experience was that of Tanzaniawhere the budget savings associated with the elimination of input subsidies and loss-making government commercial activities have not been redirected to vital publicsupport for the agricultural sector.
INDIA
-0.8
-0.6
-0.4
-0.2
0.0
0.2
0.4
0.6
0.8
1.0 Whea tRiceMaiz eLamb meat
0
1
2
3
4
5
6
Coconut oil
CHINAa
Quota procurement prices
-50
-40
-30
-20
-10
0
10
20
1978-79 1980-84 1985-89 1990-94 1995-99 2000-01
Rice
Whea t
Maize
Soybean
-20
0
20
40
60
80
1978-79 1980-84 1985-89 1990-94 1995-99 2000-01
Rice
Wheat
MaizeSoybea n
-20
0
20
40
60
80
100
1978-79 1980-84 1985-89 1990-94 1995-99 2000-01
Rice
Whea t
Maize
Soybean
-30
-15
0
15
30
1995 1996 1997 1998 1999 2000 2001
CottonPorkBee fChicke n
Negotiated procurement prices
1980
1982
1984
1986
1992
1988
1990
1994
1996
1998
2000
1980
1982
1984
1986
1992
1988
1990
1994
1996
1998
2000
Wholesale market prices Other selected commodities
a 1979-2001 Source: Calculated from country study data
16
Trade reforms and food security – country case studies and synthesis
In part, the net effect of economic policy reforms on rural incomes and foodsecurity depends on which instruments have the strongest effects, and how soontheir consequences are felt. The impact also depends on how the sector responds tochanges in agricultural and other policies as well as on exogenous factors outside thecontrol of governments.
Sectoral instruments of policy reformThe key agricultural sector policy and institutional reforms in the countries studiedinclude the following:
1) elimination of state monopolies on agricultural marketing in specified inputsand outputs. Sometimes the monopoly had controlled both internal andexternal trade, and in other cases either one or the other only.
2) elimination of price controls on foods. Interpretation of the effects of reformsis complicated by the fact that pricing reforms were sometimes ambiguous.For example, in Kenya price controls on sugar, maize and wheat were replacedwith a set of floor prices and variable import levies designed to enforce thefloor prices.
3) elimination of pan-territorial pricing and support prices for farmers;4) elimination of subsidies on agricultural inputs;5) privatization or closure of state agricultural banks, or reduction of their
lending activities (along with elimination of credit subsidies and restructuringof loan portfolios);
6) privatization or closure of state-owned agroprocessing and storage facilitiesand of state agricultural marketing boards and trading companies.
MOTIVATION FOR REFORMS
One significant motivation for economic policy reform was the slowdown of growthin the 1980s accompanied by growing debt and the poor performance of traditionalexport markets. Many of the countries in the study had experienced periods ofrelatively rapid economic growth in the 1960s and 1970s, but economic deteriorationhad emphasized the need for policy reforms in more recent decades. Cameroon’seconomy grew at 7 percent per annum between 1970 and 1987 before subsequentlydeclining. The Tanzanian economy grew at an annual rate of 6 percent in the 1960s,as did Uganda’s, whose balance of payments was also in surplus, but where nationalincome declined in the 1970s. Malawi, China and Guatemala experienced a long-termannual growth rate of 5 percent or more between 1960 and 1982. Kenya’s growth ratewas in excess of 5.5 percent during that period but then dropped markedly.
Some countries studied did not however experience any period of rapid growth,and for the most part suffered declines in per capita real income throughout the1960s, 1970s and 1980s (e.g. Ghana, Senegal, Guyana). In the case of India and Peru,per capita income levels did not actually decline but neither was growth very rapid.Sometimes the most evident cause of economic decline was internal conflict (e.g.Uganda in the 1970s, Guatemala in the 1980s). More often, the proximate causesof crises were macroeconomic imbalances that became a drag on the economy (e.g.Kenya, India, Peru), unsustainable exchange rates (Nigeria), and the gradual butdefinite undermining of economic efficiency as a result of interventionist policies.
17
Policy reforms in the case study countries
For many countries, the early post-independence burst of growth proved difficultto maintain.
In some cases the reforms were precipitated by a specific crisis in the economy,often signalled by a spike in inflation, shortages of foreign exchange and importedgoods, declines in export commodity prices, a worsening of unemployment andunderemployment, or a combination of these occurrences. In other cases cumulativeconcern over continuation of poor economic performance made reform seeminescapable. External payments crises, in the sense of explicit inability to serviceforeign currency obligations, did not characterize this group of countries, althoughsometimes instruments of foreign exchange rationing were employed in the pre-reform period. India had to pledge its gold reserves to assure payment of foreignobligations during the economic crisis of 1991, and in Nigeria a sudden and sharpdecline in petroleum export revenues was the main cause of the crisis that began in1981. These two events each precipitated economic reforms.
THE PACE AND SEQUENCING OF REFORMS
The process of reform has often taken place over a long period, in some cases morethan twenty years. Nevertheless, it is possible to identify periods when reformintensified. Table 4 indicates the significant policy change during the periods ofreform identified for each country in terms of macroeconomic and sectoral policyand institutional reforms.
The sequence of reforms generally began with macroeconomic measures (especiallyexchange rate and trade liberalization as well as fiscal reforms) and then moved tosectoral measures, although sometimes both kinds of reform were included in asingle package. The reform process is still underway in most of the countries in thissample. In some cases, components of reform common in other countries have notbeen undertaken. In China, for example, grain trading is still controlled by stateenterprises and export subsidies are still significant − as high as 34 percent for maizein 2001. For India, domestic trade is still regulated by various provisions that restrictthe movement of goods among states.
Most of the policy reforms in this sample of countries have taken place overextended periods of time, and periods of inconsistencies and policy reversals werenot uncommon. Stability of import tariff regimes, which is important for providingclear, stable expectations to producers and investors, has often been an elusivegoal.
Another common problem in agriculture has been the liberalization of input pricesbefore output prices. In Malawi, the removal of subsidies on inputs came in advanceof increases in maize producer price. Agricultural produce price controls were stillin place until 1995 while subsidies on fertilizers were completely removed in 1990.This sequence of reforms squeezed producer incomes and often resulted in declinesin the use of purchased inputs.
1) Ghana: the initial emphasis of the reform was on stabilization. The WorldBank pushed for liberalization of the cocoa sector, but the Government hadconcerns about the weakness of the financial system and the poor state ofroad infrastructure in most of the cocoa growing areas. A compromise wasreached, with partial reform of the sector in the early phases of the economy’s
18
Trade reforms and food security – country case studies and synthesis
transformation. A gradualist approach was also followed with respect tochanges in the formula for pricing cotton.
2) Malawi: the Government has tended to be hesitant in implementing policy, attimes leading to policy reversals. Such actions created uncertainties about thedirection of reforms and the degree of government commitment to the process,thus creating an unfavourable environment for private sector-led developmentand growth. The case of Malawi demonstrates the importance of implementingan appropriate sequence of market reforms. For example, agricultural pricecontrols were left in place, while input subsidies were removed and a largecurrency devaluation implemented that put fertilizer prices out of reach ofmost smallholder farmers. Controls on the marketing system were lifted in1987, but price controls along with import and export licensing requirementswere still in place in the first half of the 1990s. This resulted in limited priceincentives for the private sector to engage in agricultural trade.
3) Nigeria: the policy environment has also been unstable, with policy reversalsand a lack of internal consistency generating confusing signals. For example,the sudden decision to disengage the state from the Commodity Boardsand encourage the private sector meant that farmers were exposed to sharpfluctuations in world commodity prices and exchange rate risk without anycompensating policies. Also, without quality control services provided by theCommodity Boards, there was some deterioration in produce quality thatadversely affected export sales, particularly in the case of cocoa. Fertilizersubsidies were reduced in the 1980s but then reintroduced in 1997 (butwithout achieving the goal of reducing fertilizer prices for most farmers).In 1980, import duties were reduced significantly for agricultural inputs atthe same time that several food products were placed under import licence.In 1984, duties on selected agricultural imports were raised while duties onwheat and tea were reduced. Two years later, the importation of vegetable oilwas banned; this was followed in 1989 by the banning of imports of poultryproducts, fruit and vegetables, rice and rice products, as well as wheat andwheat products. The inconsistency was also marked at the macro level, wherethe country’s progressive abandonment of its reform programmes acceleratedin 1993, in the restoration of the fixed exchange rate system. It was completedin 1994 with further foreign exchange and financial market controls as well asthe forfeiture of fiscal discipline.
4) Uganda: the reforms were initiated in 1980-84 but confusion on macro-policies and reversals of exchange rate reforms occurred between 1984 and1987. From 1981 to 1984 there was a managed float of the exchange rate and anattempt to unify it, but during the period 1984-1987 a fixed exchange rate wasre-instituted. Then from 1987 to 1993 the exchange rate was devalued in realterms and unified. The period 1994 to 2002 was characterized as the unifiedexchange rate regime. The real exchange rate fluctuated around a stable trendand then depreciated again in 1999 and 2000.
5) China: after increasing food prices in 1994, the Government re-imposed aproduction quota system in 1995, under which farmers were required tosell part of their harvests to the Government. More drastically, it initiated in1998 a controversial policy of prohibiting individuals and private companies
19
Policy reforms in the case study countries
from procuring grain from farmers, but the policy failed because publicgrain bureaus did not have sufficient financial resources to purchase all theharvests. On the whole, reforms in China have followed a gradual approachthat appears to have worked well. In the initial stages, measures providingincentives to rural institutions were implemented. As reform experience wasgained, broader reform policies followed.
6) India: customs duties on agricultural commodities have varied considerablyin the last decade, and after the freeing up of cereal imports in 1999, a surge ofwheat imports caused the Government to re-institute a variable wheat tarifffor the express purpose of regulating volumes of wheat imports.
7) Chile: after the severe economic crisis of 1982-83, previous sharp tariffreductions were reversed and tariff levels raised, although subsequently theywere put on a downward path.
8) Guyana: radical reforms from 1986 to 1995 re-oriented the state-led andinward-looking economy, to a market-driven and deregulated one in a relativelyshort period. However, the social consequences of a massive compression ofnational expenditure and the rapid increase in the cost of living caused bycurrency devaluations were underestimated. More recently, the currency wasallowed to appreciate again in real terms, with deleterious consequences forthe competitiveness of agriculture, which in Guyana is particularly exposed tointernational market forces. In several reform experiences real devaluation wasa key element of the early stages of the process, but subsequently the exchangerate appreciated in real terms, undermining the initial achievements.
The mid-1980s saw a widespread tendency to institute or increase export taxes,which could be justified on fiscal grounds but which had markedly deleteriouseffects on producer incomes and the efficiency of resource allocation. However, thesetaxes were subsequently removed. Examples of countries where export taxes wereimposed or increased in this period (with the support of international institutions)include Ghana (1985) and Guatemala (1986).
Another common source of disruption to the reform process was a temporaryloss of macroeconomic stability, owing mainly to increases in fiscal imbalances (e.g.Nigeria, Uganda and Guatemala).

21
3
The impact of reform on agriculturalprices, production and trade
METHODOLOGY
Causal relationships between changes in policies and changes in the level and structureof economic activities are complex and often difficult to identify unambiguously.However, prices are recognized as being the key channels of transmission of policyeffects because they represent incentives that influence production and investmentdecisions. In the policy reforms studied here, the principal avenues of causalityflow through output and input prices, but both their transmission and the abilityof agricultural producers to respond to those incentives are modified by theinstitutional and policy environment. This environment is characterized by the rulesand regulations that shape factors such as the validity of contractual relationships, thefunctionality of markets, the access to and availability of credit, and access to land.
Food security implications depend on the reaction of producers to these incentivechanges. The principal intermediate variables of relevance to the agricultural sectorthat are affected by trade and economic policy reforms are agricultural productprices, production levels and international trade flows. This chapter discussestheir relevance as indicators and explains the methods adopted for examining theirrelationship with policy change. The evidence from the case studies is then presentedand analysed.
It is important to note that for reasons elaborated in Annex A, and in the companionvolume Trade reforms and food security: conceptualising the linkages, that the studiesuse a before and after approach rather than a with and without approach. A difficultyin adopting the former is that causal relationships can be inadvertently implied. Asfar as possible, the synthesis of case study results attempts to avoid such attributionfrom a simple reading of the evidence presented on trends in key indicators.
Price analysisTo understand the influence of policy reforms on the relative prices faced byproducers and consumers, the case studies examined changes in real prices byepisode of reform and then investigated the determinants of domestic price change,and the extent of price transmission and of market integration.
Domestic prices are influenced by a number of factors, notably world prices,exchange rates, tariffs, domestic marketing margins and the institutional environment.Price decomposition analysis was used to determine the percentage contribution ofthese various factors to changes in market prices in order to draw conclusions aboutthe relationship between changes in price incentives and the reform process. Themethod used and tabulated results are presented in Annex B.
22
Trade reforms and food security – country case studies and synthesis
If reform increases the openness of the economy, then one may expect thetransmission of changes in international price levels to be more fully reflected inchanges to domestic prices . Where feasible, the country studies use price transmissionanalysis to determine the degree of integration of two or more markets, notably theworld and domestic markets, but also spatially separated markets within a country(see Annex D). For example, changes in world market prices would be more stronglyreflected in domestic prices following the removal of quantitative controls on trade.Similarly, competitive procurement and free internal trade following the removal ofthe monopoly rights of marketing boards is often claimed to result in much strongertransmission of price signals across domestic markets.
Production analysisProduction responses to price changes are strongly influenced by relative prices, butalso by a range of other factors, including market opportunities, the functionality ofthese markets, credit availability, and the effectiveness of the agricultural technologysystem. Thus the production response to policy reform is conditioned in part onpolicies that influence markets, both domestic and foreign. Different sets of producerswill be more or less responsive to identical changes in output prices depending on thepolicy and institutional environment that they face and upon agro-climatic constraints.Establishing the determinants of such differential supply response is critical inexplaining the impact of reforms on income levels and on food security status.
Because in most cases the quantification of supply elasticities was not feasible,insights were gained through other techniques, such as interviews with farmers,key informants and extension workers to reveal whether producers responded toincentives following a policy change, whether the response was weak or strong, andwhat non-price factors were important for facilitating the response.
In order to identify potential constraints to production response, several studiesdecomposed production change into area and productivity changes. Data onaggregate commodity production were analysed to determine the proportion ofchanges in the level of production that can be attributed to changes in the harvestedarea and the proportion attributed to changes in yield. The reasons for agriculturalproduction growth vary widely across commodities and across countries as a resultof the different incentives, opportunities and constraints faced.
Trade responsesInternational trade flows can be as much a consequence as a cause of other changesin the economy. Imports, for example, respond rapidly to changes in the ratio ofdomestic to foreign prices, and that relationship in turn is strongly influenced bythe real exchange rate, tariffs and movements in international prices. Quantitativerestrictions imposed by policy also influence import levels. Increases in import levelscan contribute to greater food security, by making food available, but they can alsotend to undermine it if they are associated with a decline in a country’s real farmprices and a consequent reduction in real rural household incomes.
Exports respond to many of the same price signals that imports do, as well as toexport incentive policies or quantitative restrictions on exports. Since increases inexports usually require a domestic supply response they also are affected by thefactors that influence production. In addition, product quality control programmes
23
The impact of reform on agricultural prices, production and trade
are increasingly important for the success of exports from developing countries,which need to meet increasingly stringent standards.
While the benefits of higher export levels are clear, export markets can be vulnerableto sharp international price fluctuations. Coffee and sugar are notable examples ofthis phenomenon. Also, in some cases, concerns are raised about the distribution ofthe benefits of export expansion: do they tend to remain with a small group of moresophisticated, better-off farmers, or are they widely distributed among smallholders?The answer varies considerably by crop and country. In the cases analysed here,tobacco in Malawi and coffee in Guatemala are mainly smallholder crops, whilesugar in Peru has been mostly a plantation crop.
In light of these considerations, the level of import and export activity may beconsidered to be an intermediate variable in the sense that it is part of the chainof transmission of policy effects to target variables. Their levels are reflections ofchanges in relative prices, domestic production and some types of trade policies.
Other variablesThe level of investment is another intermediate variable that is central to aneconomy’s response to policy reforms. However, time series data on investmentin agriculture are not available in most developing countries, so this variable couldnot be included in the analysis. Where there is partial or anecdotal evidence aboutthe response of investment, it is mentioned in the case studies. Other intermediatevariables are important as well. For example, it has been observed that investmentin capacity building and skills is critical. Whilst it was beyond the scope of thesecase studies to investigate all of the relevant variables and policies, the importanceof complementary and compensating measures was recognized and clear gaps areidentified and discussed later in this chapter.
THE IMPACT OF REFORM ON DOMESTIC PRICES
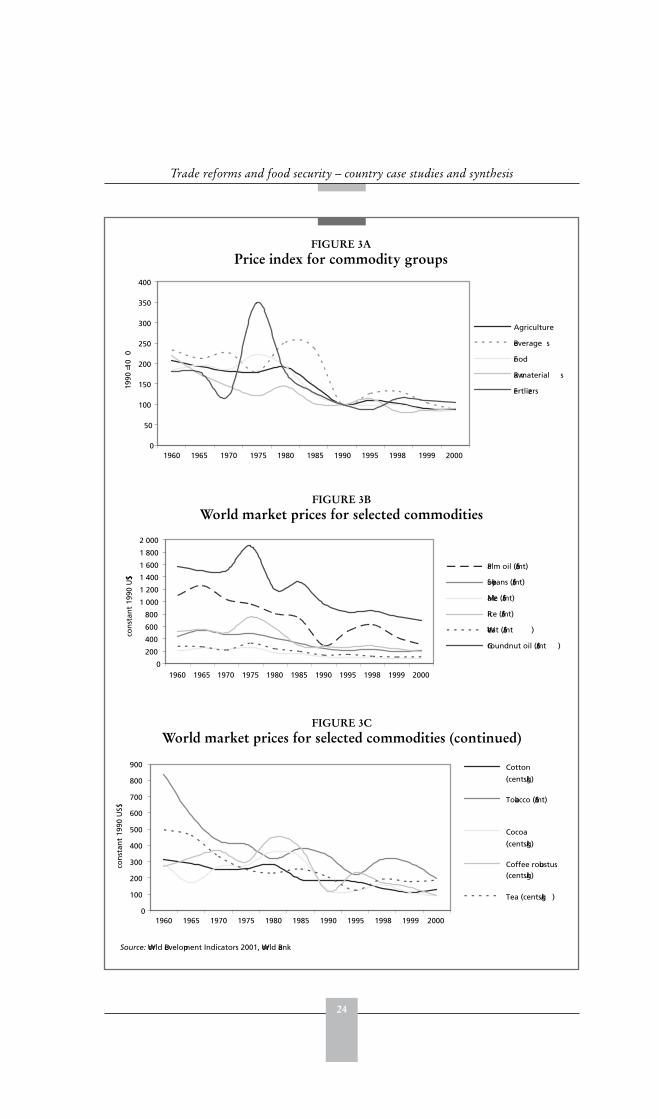
The impact of world pricesThe past twenty years have seen a secular downward trend in the real internationalmarket prices of many agricultural commodities, particularly maize, rice, coffee,cocoa, groundnuts and cotton (Figure 3). These declines have, however, beenperiodically reversed. For example, coffee prices increased in the mid 1990s, as didtobacco prices at the end of the decade. Tea prices have been an exception to thegeneral trend, remaining relatively static in real terms since the early 1980s.
The movement in international prices over the past 20 years is due to many factors.For most tropical commodities such as coffee, cocoa and tea – typically the exportagricultural products of most of the sample countries – oversupply in relation todemand at the global level (due to increased productivity and the emergence of majornew producers) has been the principal cause of the downward trend in internationalprices. However, for basic foodstuffs such as cereals, meat, dairy products andedible oils, which are typically import-competing in the sample countries, depressedinternational prices have been partly due to the high levels of domestic and exportsubsidies applied by developed countries. Between 1980 and 2002, an estimatedUS$6.5 trillion of support was provided to the agricultural sector in OECDcountries (OECD, 2003). The international agricultural markets most distorted by
24
Trade reforms and food security – country case studies and synthesis
FIGURE 3APrice index for commodity groups
0
50
100
150
200
250
300
350
400
1960 1965 1970 1975 1980 1985 1990 1995 1998 1999 2000
1990
= 10
0
Agriculture
Beverage s
Food
Raw material s
Fertlizers
0
200
400
600
800
1 000
1 200
1 400
1 600
1 800
2 000
1960 1965 1975 1980 1985 1990 1995 1998 1999 2000
con
stan
t 19
90 U
S$
Palm oil ($/mt)
Soybeans ($/mt)
Maize ($/mt)
Rice ($/mt)
Wheat ($/mt )
Groundnut oil ($/mt )
1970
FIGURE 3BWorld market prices for selected commodities
FIGURE 3CWorld market prices for selected commodities (continued)
0
100
200
300
400
500
600
700
800
900
1960 1965 1970 1975 1980 1985 1990 1995 1998 1999 2000
con
stan
t 19
90 U
S$
Cotton
(cents/kg)
Tobacco ($/mt)
Cocoa
(cents/kg)
Coffee robustus(cents/kg)
Tea (cents/kg )
Source: World Development Indicators 2001, World Bank
25
The impact of reform on agricultural prices, production and trade
high levels of support and protection, included cereals (wheat, maize and rice), sugar,dairy products, meats and oilseeds.
In the absence of domestic policy measures aimed at maintaining agriculturalprices, the downward trend in international prices of tradable farm products such asgrains and tropical beverages would translate to a downward trend in real farm gateprices. This can also apply to semi tradable products like sorghum, millet, cassavaand yams, whose prices tend to follow those of grains in the longer run. As depictedin Annex C, domestic prices did not always follow international prices.
A wide number of possible explanations for these results are suggested in the studies.The periods of rising real prices were generally associated with real exchange ratedevaluations. Relaxation of government controls over prices and market systems also ledto gains in producer prices in some cases. In other instances, import liberalization appearsto have contributed to a decline in the real domestic prices of some commodities.
To help investigate more fully the relationship between the components ofpolicy reform and domestic price levels, the results of the decomposition analysisreported in Annex B are presented graphically for the following selected exportand food crops: coffee, cotton, tobacco, maize and rice. Figures 4 to 8 show therelative importance of changes in world prices, exchange rates and other policies ininfluencing domestic prices. They demonstrate that although facing similar patternsof decline in world price levels, the levels of domestic prices were significantly anddifferentially affected by changes in other policies, and particularly by changes innational exchange rates.
Coffee1) Cameroon: the decline in the international coffee price since the 1980s was
mirrored in the domestic price during the pre-reform period, but offset tosome extent by the effect of other policies which acted to dampen the declineseffect. As expected, with the CFA pegged to the French Franc, there was noexchange rate effect in the first reform period. However, in the followingperiod, characterized by the significant devaluation of the CFAF, the declinein the world price was almost completely offset by the positive exchange rateeffect, resulting in a much improved domestic prices vis-à-vis other, non CFA,case study countries.
2) Kenya: the pre-reform period was characterized by the suppressing effect ofother policies, which offset the positive impacts of exchange rate movements.In the post-reform period, the other policies contributed to a small increasein domestic coffee prices. The liberalization of controls over domestic pricesin the early 1990s in Kenya appears to have been the decisive factor for pricetrends, along with the real devaluation of the exchange rate that occurredduring the period 1992-98. Real agricultural prices rose, for most crops, inresponse to these changes.
3) Uganda: the coffee price in both the pre- and post-reform periods benefitedgreatly from the depreciation of the currency. Before and in the first period ofreform, this effect was offset to some extent by the falling international priceand by other policy influences. However, these policies became favourable,with liberalization in 1991: private exporters were allowed to buy and exportcoffee, and the lifting of the withholding tax and the transport monopoly
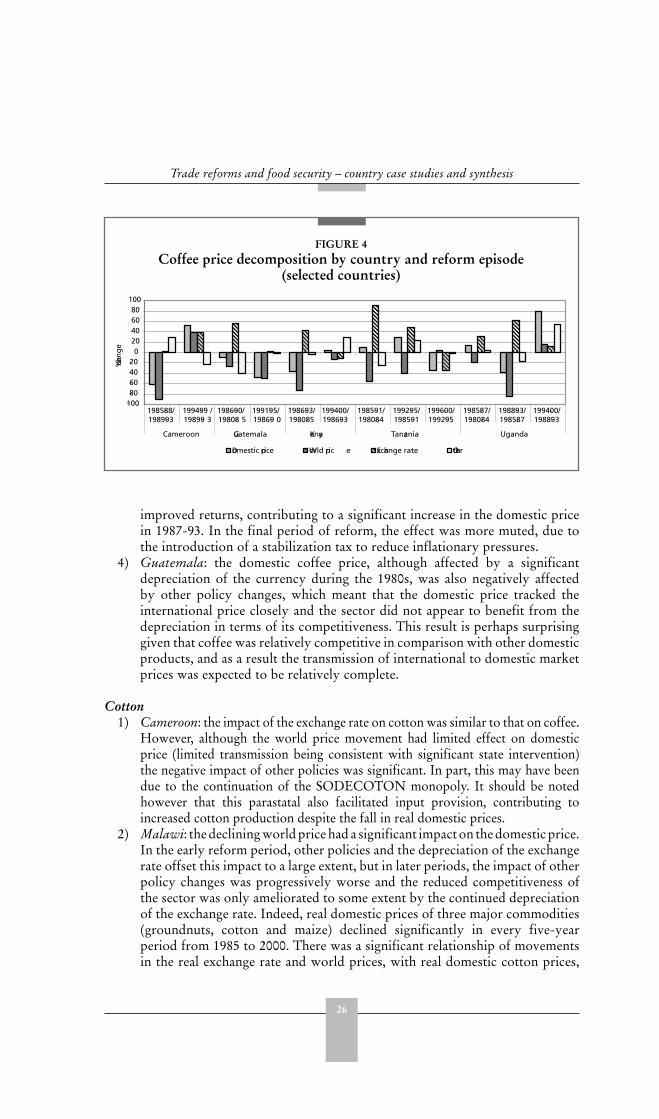
26
Trade reforms and food security – country case studies and synthesis
improved returns, contributing to a significant increase in the domestic pricein 1987-93. In the final period of reform, the effect was more muted, due tothe introduction of a stabilization tax to reduce inflationary pressures.
4) Guatemala: the domestic coffee price, although affected by a significantdepreciation of the currency during the 1980s, was also negatively affectedby other policy changes, which meant that the domestic price tracked theinternational price closely and the sector did not appear to benefit from thedepreciation in terms of its competitiveness. This result is perhaps surprisinggiven that coffee was relatively competitive in comparison with other domesticproducts, and as a result the transmission of international to domestic marketprices was expected to be relatively complete.
Cotton1) Cameroon: the impact of the exchange rate on cotton was similar to that on coffee.
However, although the world price movement had limited effect on domesticprice (limited transmission being consistent with significant state intervention)the negative impact of other policies was significant. In part, this may have beendue to the continuation of the SODECOTON monopoly. It should be notedhowever that this parastatal also facilitated input provision, contributing toincreased cotton production despite the fall in real domestic prices.
2) Malawi: the declining world price had a significant impact on the domestic price.In the early reform period, other policies and the depreciation of the exchangerate offset this impact to a large extent, but in later periods, the impact of otherpolicy changes was progressively worse and the reduced competitiveness ofthe sector was only ameliorated to some extent by the continued depreciationof the exchange rate. Indeed, real domestic prices of three major commodities(groundnuts, cotton and maize) declined significantly in every five-yearperiod from 1985 to 2000. There was a significant relationship of movementsin the real exchange rate and world prices, with real domestic cotton prices,
FIGURE 4Coffee price decomposition by country and reform episode
(selected countries)
-100-80-60-40-20
020406080
100
% chan
ge
Domestic price World pric e Exchange rate Other
Cameroon Guatemala Kenya Tanzania Uganda
1985-88/1989-93
1994-99 /1989-9 3
1986-90/1980-8 5
1991-95/1986-9 0
1986-93/1980-85
1994-00/1986-93
1985-91/1980-84
1992-95/1985-91
1996-00/1992-95
1985-87/1980-84
1988-93/1985-87
1994-00/1988-93
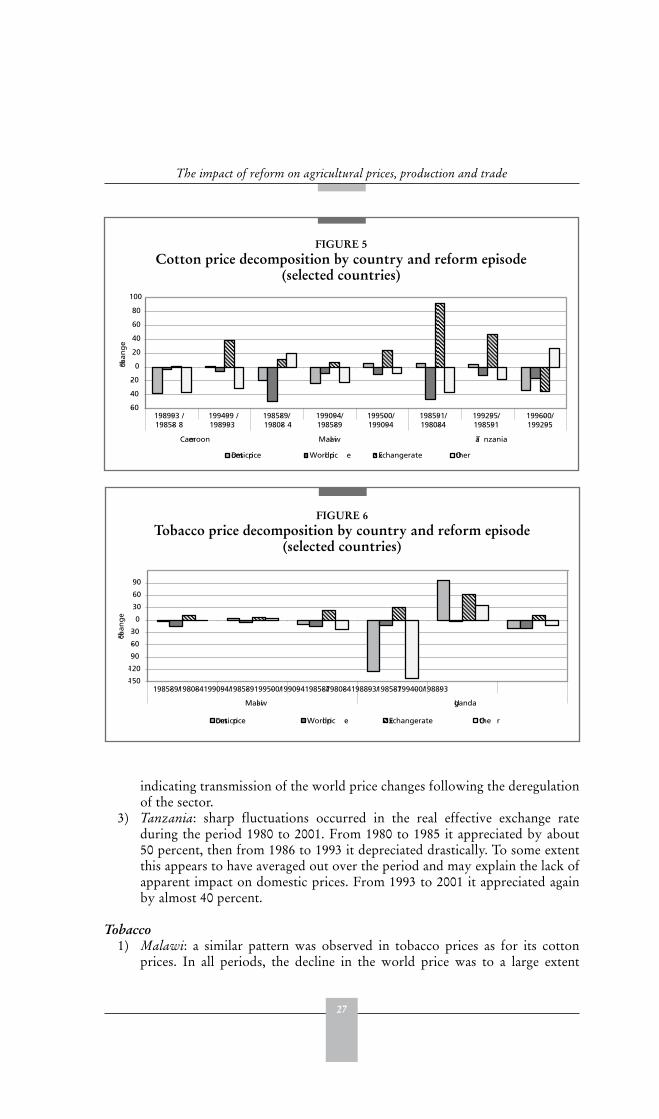
27
The impact of reform on agricultural prices, production and trade
indicating transmission of the world price changes following the deregulationof the sector.
3) Tanzania: sharp fluctuations occurred in the real effective exchange rateduring the period 1980 to 2001. From 1980 to 1985 it appreciated by about50 percent, then from 1986 to 1993 it depreciated drastically. To some extentthis appears to have averaged out over the period and may explain the lack ofapparent impact on domestic prices. From 1993 to 2001 it appreciated againby almost 40 percent.
Tobacco1) Malawi: a similar pattern was observed in tobacco prices as for its cotton
prices. In all periods, the decline in the world price was to a large extent
FIGURE 5Cotton price decomposition by country and reform episode
(selected countries)
-60
-40
-20
0
20
40
60
80
100
% chan
ge
Domestic price World pric e Exchange rate Other
Ta nzaniaCameroon Malawi
1989-93 /1985-8 8
1994-99 /1989-93
1985-89/1980-8 4
1990-94/1985-89
1995-00/1990-94
1985-91/1980-84
1992-95/1985-91
1996-00/1992-95
FIGURE 6Tobacco price decomposition by country and reform episode
(selected countries)
-150
-120
-90
-60
-30
0
30
60
90
1985-89/1980-84 1990-94/1985-89 1995-00/1990-94 1985-87/1980-84 1988-93/1985-87 1994-00/1988-93
Malawi Uganda
% chan
ge
Domestic price World pric e Exchange rate Othe r
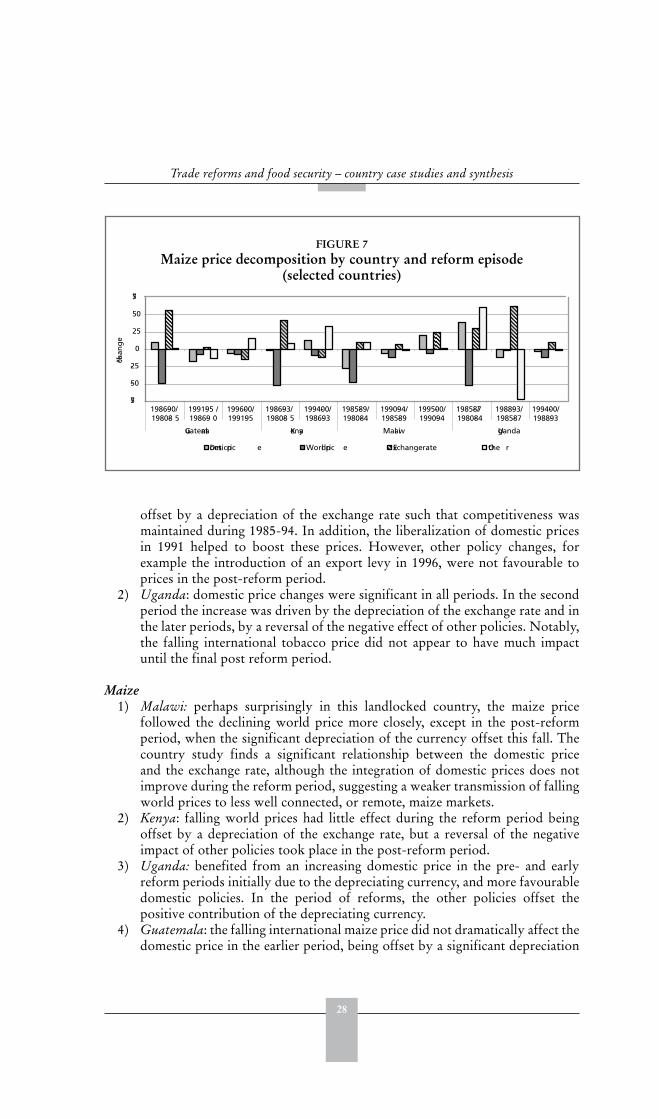
28
Trade reforms and food security – country case studies and synthesis
offset by a depreciation of the exchange rate such that competitiveness wasmaintained during 1985-94. In addition, the liberalization of domestic pricesin 1991 helped to boost these prices. However, other policy changes, forexample the introduction of an export levy in 1996, were not favourable toprices in the post-reform period.
2) Uganda: domestic price changes were significant in all periods. In the secondperiod the increase was driven by the depreciation of the exchange rate and inthe later periods, by a reversal of the negative effect of other policies. Notably,the falling international tobacco price did not appear to have much impactuntil the final post reform period.
Maize1) Malawi: perhaps surprisingly in this landlocked country, the maize price
followed the declining world price more closely, except in the post-reformperiod, when the significant depreciation of the currency offset this fall. Thecountry study finds a significant relationship between the domestic priceand the exchange rate, although the integration of domestic prices does notimprove during the reform period, suggesting a weaker transmission of fallingworld prices to less well connected, or remote, maize markets.
2) Kenya: falling world prices had little effect during the reform period beingoffset by a depreciation of the exchange rate, but a reversal of the negativeimpact of other policies took place in the post-reform period.
3) Uganda: benefited from an increasing domestic price in the pre- and earlyreform periods initially due to the depreciating currency, and more favourabledomestic policies. In the period of reforms, the other policies offset thepositive contribution of the depreciating currency.
4) Guatemala: the falling international maize price did not dramatically affect thedomestic price in the earlier period, being offset by a significant depreciation
FIGURE 7Maize price decomposition by country and reform episode
(selected countries)
-75
-50
-25
0
25
50
75
% chan
ge
Domestic pric e World pric e Exchange rate Othe r
1986-90/1980-8 5
1991-95 /1986-9 0
1996-00/1991-95
1986-93/1980-8 5
1994-00/1986-93
1985-89/1980-84
1990-94/1985-89
1995-00/1990-94
1985-87/1980-84
1988-93/1985-87
1994-00/1988-93
Guatemala Kenya Malawi Uganda
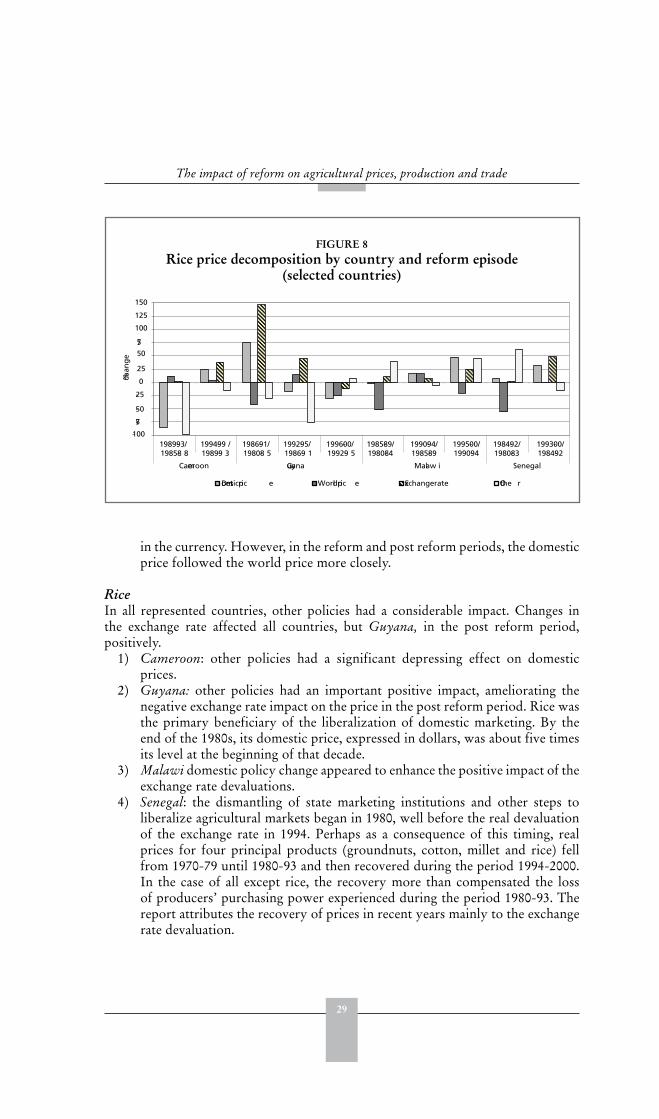
29
The impact of reform on agricultural prices, production and trade
in the currency. However, in the reform and post reform periods, the domesticprice followed the world price more closely.
RiceIn all represented countries, other policies had a considerable impact. Changes inthe exchange rate affected all countries, but Guyana, in the post reform period,positively.
1) Cameroon: other policies had a significant depressing effect on domesticprices.
2) Guyana: other policies had an important positive impact, ameliorating thenegative exchange rate impact on the price in the post reform period. Rice wasthe primary beneficiary of the liberalization of domestic marketing. By theend of the 1980s, its domestic price, expressed in dollars, was about five timesits level at the beginning of that decade.
3) Malawi domestic policy change appeared to enhance the positive impact of theexchange rate devaluations.
4) Senegal: the dismantling of state marketing institutions and other steps toliberalize agricultural markets began in 1980, well before the real devaluationof the exchange rate in 1994. Perhaps as a consequence of this timing, realprices for four principal products (groundnuts, cotton, millet and rice) fellfrom 1970-79 until 1980-93 and then recovered during the period 1994-2000.In the case of all except rice, the recovery more than compensated the lossof producers’ purchasing power experienced during the period 1980-93. Thereport attributes the recovery of prices in recent years mainly to the exchangerate devaluation.
FIGURE 8Rice price decomposition by country and reform episode
(selected countries)
Domestic pric e World pric e Exchange rate Othe r
150
125
100
7550
25
0
-25
-50
-75
-100
% chan
ge
1989-93/1985-8 8
1994-99 /1989-9 3
1986-91/1980-8 5
1992-95/1986-9 1
1996-00/1992-9 5
1985-89/1980-84
1990-94/1985-89
1995-00/1990-94
1984-92/1980-83
1993-00/1984-92
Cameroon Guyana Malaw i Senegal
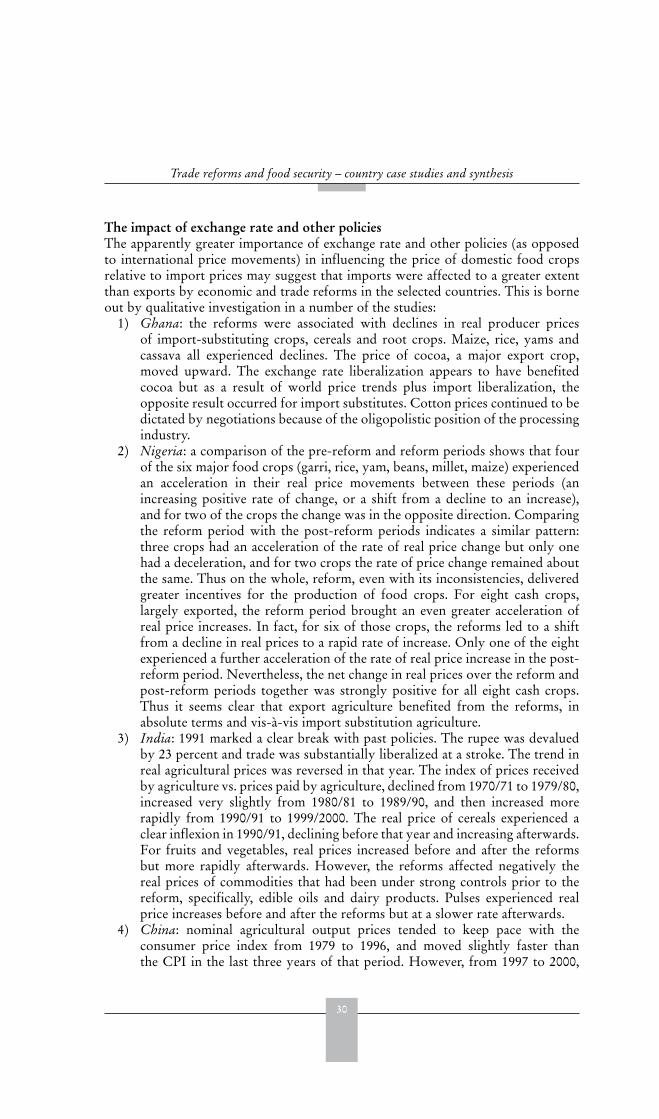
30
Trade reforms and food security – country case studies and synthesis
The impact of exchange rate and other policiesThe apparently greater importance of exchange rate and other policies (as opposedto international price movements) in influencing the price of domestic food cropsrelative to import prices may suggest that imports were affected to a greater extentthan exports by economic and trade reforms in the selected countries. This is borneout by qualitative investigation in a number of the studies:
1) Ghana: the reforms were associated with declines in real producer pricesof import-substituting crops, cereals and root crops. Maize, rice, yams andcassava all experienced declines. The price of cocoa, a major export crop,moved upward. The exchange rate liberalization appears to have benefitedcocoa but as a result of world price trends plus import liberalization, theopposite result occurred for import substitutes. Cotton prices continued to bedictated by negotiations because of the oligopolistic position of the processingindustry.
2) Nigeria: a comparison of the pre-reform and reform periods shows that fourof the six major food crops (garri, rice, yam, beans, millet, maize) experiencedan acceleration in their real price movements between these periods (anincreasing positive rate of change, or a shift from a decline to an increase),and for two of the crops the change was in the opposite direction. Comparingthe reform period with the post-reform periods indicates a similar pattern:three crops had an acceleration of the rate of real price change but only onehad a deceleration, and for two crops the rate of price change remained aboutthe same. Thus on the whole, reform, even with its inconsistencies, deliveredgreater incentives for the production of food crops. For eight cash crops,largely exported, the reform period brought an even greater acceleration ofreal price increases. In fact, for six of those crops, the reforms led to a shiftfrom a decline in real prices to a rapid rate of increase. Only one of the eightexperienced a further acceleration of the rate of real price increase in the post-reform period. Nevertheless, the net change in real prices over the reform andpost-reform periods together was strongly positive for all eight cash crops.Thus it seems clear that export agriculture benefited from the reforms, inabsolute terms and vis-à-vis import substitution agriculture.
3) India: 1991 marked a clear break with past policies. The rupee was devaluedby 23 percent and trade was substantially liberalized at a stroke. The trend inreal agricultural prices was reversed in that year. The index of prices receivedby agriculture vs. prices paid by agriculture, declined from 1970/71 to 1979/80,increased very slightly from 1980/81 to 1989/90, and then increased morerapidly from 1990/91 to 1999/2000. The real price of cereals experienced aclear inflexion in 1990/91, declining before that year and increasing afterwards.For fruits and vegetables, real prices increased before and after the reformsbut more rapidly afterwards. However, the reforms affected negatively thereal prices of commodities that had been under strong controls prior to thereform, specifically, edible oils and dairy products. Pulses experienced realprice increases before and after the reforms but at a slower rate afterwards.
4) China: nominal agricultural output prices tended to keep pace with theconsumer price index from 1979 to 1996, and moved slightly faster thanthe CPI in the last three years of that period. However, from 1997 to 2000,
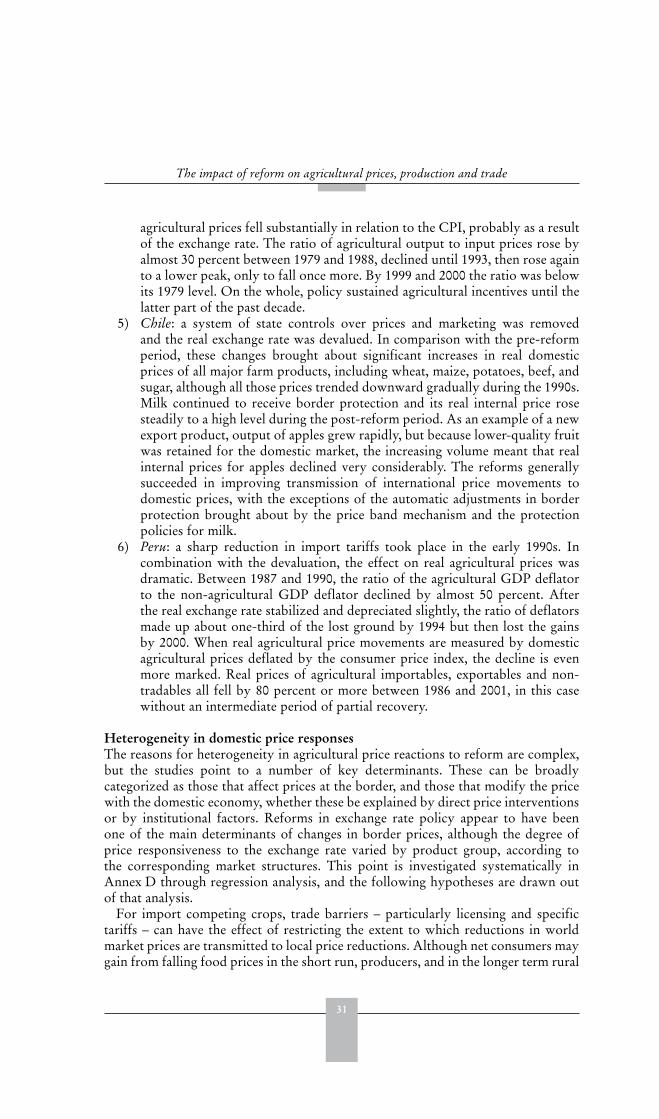
31
The impact of reform on agricultural prices, production and trade
agricultural prices fell substantially in relation to the CPI, probably as a resultof the exchange rate. The ratio of agricultural output to input prices rose byalmost 30 percent between 1979 and 1988, declined until 1993, then rose againto a lower peak, only to fall once more. By 1999 and 2000 the ratio was belowits 1979 level. On the whole, policy sustained agricultural incentives until thelatter part of the past decade.
5) Chile: a system of state controls over prices and marketing was removedand the real exchange rate was devalued. In comparison with the pre-reformperiod, these changes brought about significant increases in real domesticprices of all major farm products, including wheat, maize, potatoes, beef, andsugar, although all those prices trended downward gradually during the 1990s.Milk continued to receive border protection and its real internal price rosesteadily to a high level during the post-reform period. As an example of a newexport product, output of apples grew rapidly, but because lower-quality fruitwas retained for the domestic market, the increasing volume meant that realinternal prices for apples declined very considerably. The reforms generallysucceeded in improving transmission of international price movements todomestic prices, with the exceptions of the automatic adjustments in borderprotection brought about by the price band mechanism and the protectionpolicies for milk.
6) Peru: a sharp reduction in import tariffs took place in the early 1990s. Incombination with the devaluation, the effect on real agricultural prices wasdramatic. Between 1987 and 1990, the ratio of the agricultural GDP deflatorto the non-agricultural GDP deflator declined by almost 50 percent. Afterthe real exchange rate stabilized and depreciated slightly, the ratio of deflatorsmade up about one-third of the lost ground by 1994 but then lost the gainsby 2000. When real agricultural price movements are measured by domesticagricultural prices deflated by the consumer price index, the decline is evenmore marked. Real prices of agricultural importables, exportables and non-tradables all fell by 80 percent or more between 1986 and 2001, in this casewithout an intermediate period of partial recovery.
Heterogeneity in domestic price responsesThe reasons for heterogeneity in agricultural price reactions to reform are complex,but the studies point to a number of key determinants. These can be broadlycategorized as those that affect prices at the border, and those that modify the pricewith the domestic economy, whether these be explained by direct price interventionsor by institutional factors. Reforms in exchange rate policy appear to have beenone of the main determinants of changes in border prices, although the degree ofprice responsiveness to the exchange rate varied by product group, according tothe corresponding market structures. This point is investigated systematically inAnnex D through regression analysis, and the following hypotheses are drawn outof that analysis.
For import competing crops, trade barriers – particularly licensing and specifictariffs – can have the effect of restricting the extent to which reductions in worldmarket prices are transmitted to local price reductions. Although net consumers maygain from falling food prices in the short run, producers, and in the longer term rural
32
Trade reforms and food security – country case studies and synthesis
economic growth, can be negatively affected by changes in trade policies that allowgreater levels of exchange between world and domestic markets. In many smallereconomies (e.g. Malawi) it is, however, unclear as to how effective border policywill be, given the significant proportion of output that is informally traded acrossborders.
It is not just changes in trade policy that affect domestic prices. In the 1980s,substantial amounts of food aid were allowed onto domestic markets, resulting inreduced food import bills. However, downward pressure on local market pricesreduced incentives to local producers to invest in intensification of food cropproduction. Following the implementation of the Uruguay Round agreement,a greater proportion of food imports have been made on a commercial basis,increasing the food import bill, but potentially offsetting the downward pressure onproducer prices.
For export crops in particular, profitability is not driven simply by world marketprices. Market structures and conditions are increasingly important. For example,the role of transnational corporations in determining both world market pricesand domestic prices is increasing (FAO, 2003a). For instance, three companies nowcontrol 90 percent of world exports of coffee, and whilst in 1990, the world coffeeeconomy was worth US$30 billion, of which producers received $12 billion, in2002 it was worth $50 billion, but producers received only $8 billion. In such cases,relaxing export controls does not necessarily benefit the producer or the domesticeconomy.
Within the domestic economy, market functionality, or lack of it, underpins manyof the factors that modify the extent of transmission to domestic producers. Pre-reform price controls in many countries were assumed to have inhibited the efficientworkings of agricultural markets, and many state activities related to these marketswere assumed to be inefficient and to have discouraged the entry of the private sector.However, as the experiences reviewed in the case studies indicate, the private sectorhas not always been ready to step fully into the breach, because of lack of capital,lack of prior experience, and/or lack of confidence that the government would notchange its policy. Hence the transition to a more efficient grain trading system,for example, has often taken many years and is sometimes still incomplete. This isreflected in the fact that prices may not have moved as expected in some countries.
In Kenya, after years of government monopolies in production and marketing,private entrepreneurs lack the managerial skill, financial capacity, and physicalinfrastructure to take over. In Malawi, markets for agricultural produce do not seemto operate effectively and efficiently. Private traders continue to experience problemsof transport due to the poor infrastructure, and lack of financial capital. As a resultmany private traders operate in local markets and behave oligopolistically, therebytaking advantage of the unorganized farmers.
China’s experience was unusual in this regard. With surprisingly little disruption,privatized fertilizer markets supplanted planned distribution networks. Risingcompetition raised the efficiency of markets, made traders more responsive toconsumer demands and reduced transaction costs. In a number of cases, the reducedrole of the state in input and output markets has caused farmers to pay higher pricesfor their inputs while receiving lower prices for their outputs (e.g. Cameroon). Suchan outcome may be defended in that prices move toward market levels, but in these
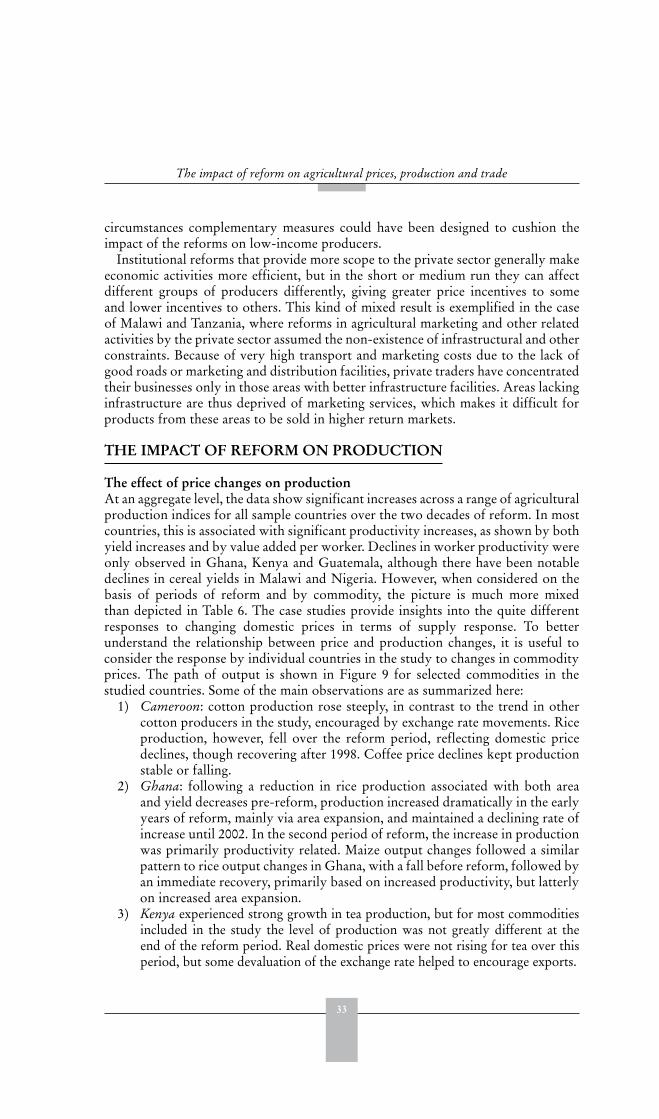
33
The impact of reform on agricultural prices, production and trade
circumstances complementary measures could have been designed to cushion theimpact of the reforms on low-income producers.
Institutional reforms that provide more scope to the private sector generally makeeconomic activities more efficient, but in the short or medium run they can affectdifferent groups of producers differently, giving greater price incentives to someand lower incentives to others. This kind of mixed result is exemplified in the caseof Malawi and Tanzania, where reforms in agricultural marketing and other relatedactivities by the private sector assumed the non-existence of infrastructural and otherconstraints. Because of very high transport and marketing costs due to the lack ofgood roads or marketing and distribution facilities, private traders have concentratedtheir businesses only in those areas with better infrastructure facilities. Areas lackinginfrastructure are thus deprived of marketing services, which makes it difficult forproducts from these areas to be sold in higher return markets.
THE IMPACT OF REFORM ON PRODUCTION
The effect of price changes on productionAt an aggregate level, the data show significant increases across a range of agriculturalproduction indices for all sample countries over the two decades of reform. In mostcountries, this is associated with significant productivity increases, as shown by bothyield increases and by value added per worker. Declines in worker productivity wereonly observed in Ghana, Kenya and Guatemala, although there have been notabledeclines in cereal yields in Malawi and Nigeria. However, when considered on thebasis of periods of reform and by commodity, the picture is much more mixedthan depicted in Table 6. The case studies provide insights into the quite differentresponses to changing domestic prices in terms of supply response. To betterunderstand the relationship between price and production changes, it is useful toconsider the response by individual countries in the study to changes in commodityprices. The path of output is shown in Figure 9 for selected commodities in thestudied countries. Some of the main observations are as summarized here:
1) Cameroon: cotton production rose steeply, in contrast to the trend in othercotton producers in the study, encouraged by exchange rate movements. Riceproduction, however, fell over the reform period, reflecting domestic pricedeclines, though recovering after 1998. Coffee price declines kept productionstable or falling.
2) Ghana: following a reduction in rice production associated with both areaand yield decreases pre-reform, production increased dramatically in the earlyyears of reform, mainly via area expansion, and maintained a declining rate ofincrease until 2002. In the second period of reform, the increase in productionwas primarily productivity related. Maize output changes followed a similarpattern to rice output changes in Ghana, with a fall before reform, followed byan immediate recovery, primarily based on increased productivity, but latterlyon increased area expansion.
3) Kenya experienced strong growth in tea production, but for most commoditiesincluded in the study the level of production was not greatly different at theend of the reform period. Real domestic prices were not rising for tea over thisperiod, but some devaluation of the exchange rate helped to encourage exports.

34
Trade reforms and food security – country case studies and synthesis
4) Malawi: production of export crops such as tobacco and cotton expanded inspite of world price weakness, and stronger domestic prices for rice and maizedid not translate into significant production growth.
5) Nigeria experienced a significant increase in maize production, peaking in1995, reflecting a depreciation of the real exchange rate over that period.Groundnut output increased strongly through the period of reforms, andrice and cocoa also performed well, although coffee output did not appear torespond to the higher import costs.
6) Senegal: rice production responded most to price incentives, along with cottonfor much of the period, but groundnuts and sorghum output was stagnant. Adepreciating real exchange rate helped to make Senegalese farm products morecompetitive with imports and in export markets.
7) Tanzania: real exchange rates also helped to lift domestic prices in the 1990s,benefiting rice and maize production in particular, though coffee and cottonproduction stagnated.
8) Uganda: productivity levels in maize production fell in the early- to mid-1980s, despite a significant increase in the domestic maize price, but recoveredin the late reform and post-reform periods. From 1980 to 1984, the output
TABLE 6Aggregate indicators of agriculture production trends, selected countries, 1979-2001
Crop production index
(1989-91=100)
Food production index
(1989-91=100)
Livestockproduction index
(1989-91=100)
Cereal yield (kg per ha)
Agricultureproductivity(agriculturalvalue-addedper worker) US$, 1995
1979-81 2001 1979-81 2001 1979-81 2001 1979-81 2001 1979-81 2001AfricaSub-Saharan Africa
Cameroon 87 141 80 138 61 123 849 1 709 826 1 242Ghana 67 183 69 175 79 127 807 1 186 671 575Kenya 75 124 68 125 60 118 1 364 1 606 265 212Malawi 86 170 93 191 78 125 1 161 1 098 96 119Nigeria 51 153 57 153 84 145 1 265 1 047 417 742Senegal 77 122 74 130 66 148 690 834 336 363Tanzania 82 108 77 113 69 128 1 063 1 483 - 190Uganda 68 141 70 139 82 134 1 555 1 641 - 350North Africa
Morocco 55 93 56 104 60 123 811 895 1 146 1 693AsiaChina 67 156 61 186 45 227 3 027 4 801 161 342India 71 127 68 134 63 150 1 324 2 429 269 411Latin America Chile 71 135 72 143 76 155 2 124 4 936 3 488 6 412Guatemala 87 134 68 137 76 129 1 578 1 825 2 143 2 104Guyana 126 171 138 188 167 176 2 953 3 917 2 310 4 267Peru 82 176 77 173 78 158 1 946 3 262 1 273 1 851
Source: World Development Indicators, 2003, World Bank; World Development Indicators CD-ROM 2003, World Bank.

35
The impact of reform on agricultural prices, production and trade
of coffee, tea and tobacco increased following price increases. Whilst cottonsaw a significant decline in area, this was more than compensated for byincreased productivity. Expansion in tea production resulted from both areaand yield increases, but for tobacco this came exclusively from productivityimprovement. The 1984-87 period was characterized by a fall in cotton output(fall in yields) and in tobacco (area decrease), but a modest growth in teaproduction as a result of yield increases. By contrast, 1987-93 saw a return togrowth, with significant increases in the areas of tea and tobacco, and the shiftaway from cotton area compensated for by productivity increases. In the finalperiod, there was limited change in area but significant yield increase. Relatingthis back to the price analysis, it is notable that the 1984-87 period wasassociated with negative impacts of other policies in both coffee and cottonwhich suppressed the positive impact on price that would have been broughtabout by the exchange rate devaluation. In the periods where the output ofthese crops increased, domestic price increases were significant.
9) Morocco experienced relatively stable agricultural output growth (exceptfor the growth of sunflower production from a small base), but wheat hasexpanded at the expense of maize. In contrast to several other countries inthe study, real exchange rates have not given Moroccan farmers a competitiveedge, and domestic prices have declined in real terms.
10) India has shown a significant rise in production of wheat, rice, maize andcoconut despite weaker real domestic prices. Production of sheepmeat hasresponded to increases in real prices. Tradable goods have benefited from asteady depreciation of the real exchange rate until the mid-1990s.
11) Chile has seen significant output shifts, with maize increasing until the late1990s, and wheat also showing periods of output gain. Some traditionalcrops, such as beans, have declined in importance, as the growth of exportcommodities has dominated Chilean agriculture. Real prices of staplecommodities have fallen steadily and exchange rate benefits to agriculture inthe 1980s have been offset by a steady appreciation in the real exchange ratesince 1990.
12) Guatemala also experienced a period of lowered real domestic prices forthe commodities studied here, and this has contributed to a relatively stablelevel of production. An exception to this is steady growth in sugar output,responding to emerging export opportunities.
13) Guyana: rice production rose significantly during the period of reforms, asdid the output of bananas (from a limited base). The data show significantreductions in rice area during the reform period, with some recovery afterthe reform period, indicating substantial yield increases. As there was limitedchange in domestic prices, the area decrease is most likely explained by achange in the relative price of rice.
14) Peru has experienced more general growth, particularly of rice, maize andbarley, despite a significant fall in real domestic prices from the mid 1980s.
Given the heterogeneity in price movements across countries, it is unsurprising thatthe countries in the sample showed markedly different behaviour in regard to changesin the level and structure of agricultural production, particularly during the 1990swhen the effects of policy reforms and world market conditions were most felt.

36
Trade reforms and food security – country case studies and synthesis
FIGURE 9Growth in production of selected commodities, 1980-2000 (1980=100)
CAMEROON GHANA
0
50
100
150
200
250
Ind
ex
CocoaCoffee
CottonRice
0
50
100
150
200
250
300
350
Ind
ex
RiceMaiz e
CocoaGroundnut
0
50
100
150
200
250
300
350
Ind
ex
Maize
RiceTeaCoffeeSuga r
0
100
200
300
400
Ind
ex
RiceMaiz eGroundnutTobaccoCotton
NIGERIA
0
200
400
600
800
Ind
ex
RiceCoffee
CocoaGroundnut
0
200
400
600
800
1000
1200
Ind
ex
Maiz e
0
100
200
300
400
Ind
ex
RiceGroundnutSorghumCotton
0
50
100
150
200
250
300
Ind
ex
RiceMaiz eCoffee ara.Coffee rob.Cotton
1980
1982
1984
1986
1992
1988
1990
1994
1996
1998
1980
1982
1984
1986
1992
1988
1990
1994
1996
1998
2000
KENYA
Whea t
MALAWi
1980
1982
1984
1986
1992
1988
1990
1994
1996
1998
2000
1980
1982
1984
1986
1992
1988
1990
1994
1996
1998
2000
1980
1982
1984
1986
1992
1988
1990
1994
1996
1998
2000
1980
1982
1984
1986
1992
1988
1990
1994
1996
1998
2000
1980
1982
1984
1986
1992
1988
1990
1994
1996
1998
2000
1980
1982
1984
1986
1992
1988
1990
1994
1996
1998
2000
SENEGAL TANZANIA
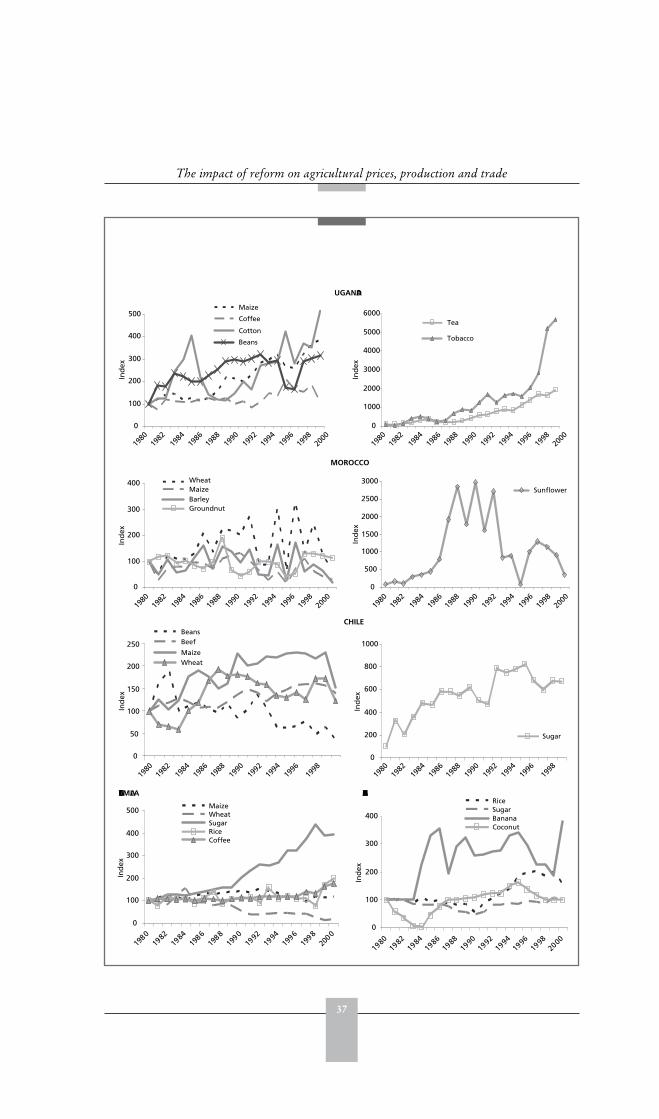
37
The impact of reform on agricultural prices, production and trade
UGANDA
0
100
200
300
400
500
Ind
ex
Maize
Coffee
Cotton
Beans
0
1000
2000
3000
4000
5000
6000
Ind
ex
Tea
Tobacco
MOROCCO
0
100
200
300
400
Ind
ex
WheatMaizeBarleyGroundnut
0
500
1000
1500
2000
2500
3000
Ind
ex
Sunflower
CHILE
0
50
100
150
200
250
Ind
ex
BeansBeef
MaizeWheat
0
200
400
600
800
1000
Ind
ex
Sugar
GUATEMALA GUYANA
0
100
200
300
400
500
1980
1982
1984
1986
1988
1990
1992
1994
1996
1998
2000
Ind
ex
MaizeWheatSugarRiceCoffee
0
100
200
300
400
1980
1982
1984
1986
1988
1990
1992
1994
1996
1998
2000
Ind
ex
RiceSugarBananaCoconut
1980
1982
1984
1986
1992
1988
1990
1994
1996
1998
2000
1980
1982
1984
1986
1992
1988
1990
1994
1996
1998
2000
1980
1982
1984
1986
1992
1988
1990
1994
1996
1998
2000
1980
1982
1984
1986
1992
1988
1990
1994
1996
1998
2000
1980
1982
1984
1986
1992
1988
1990
1994
1996
1998
1980
1982
1984
1986
1992
1988
1990
1994
1996
1998
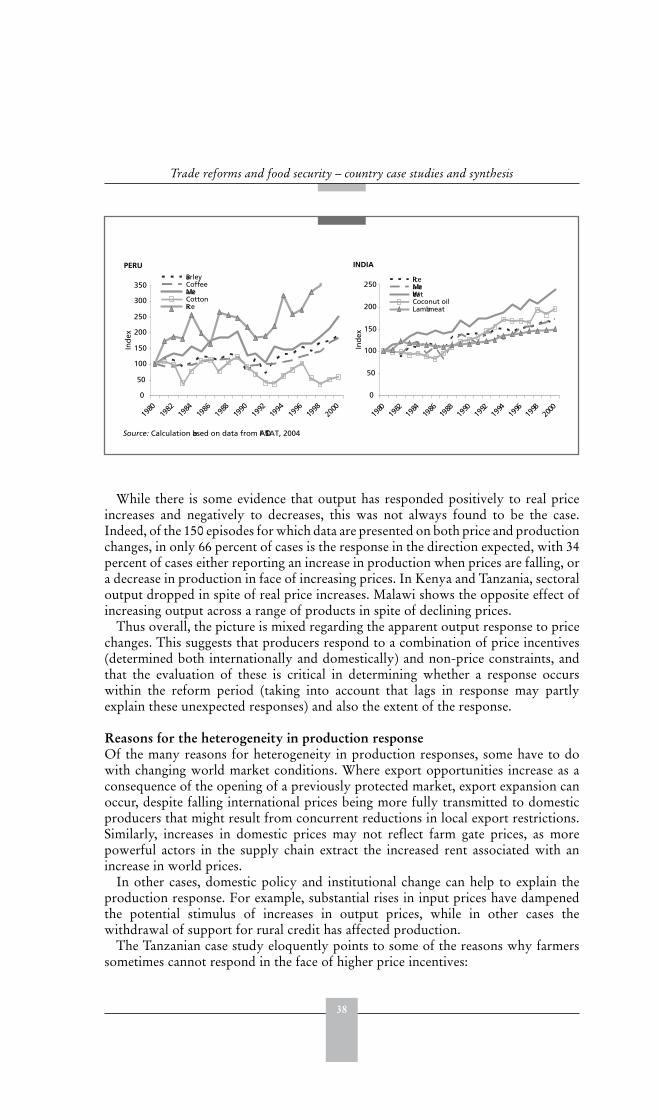
38
Trade reforms and food security – country case studies and synthesis
While there is some evidence that output has responded positively to real priceincreases and negatively to decreases, this was not always found to be the case.Indeed, of the 150 episodes for which data are presented on both price and productionchanges, in only 66 percent of cases is the response in the direction expected, with 34percent of cases either reporting an increase in production when prices are falling, ora decrease in production in face of increasing prices. In Kenya and Tanzania, sectoraloutput dropped in spite of real price increases. Malawi shows the opposite effect ofincreasing output across a range of products in spite of declining prices.
Thus overall, the picture is mixed regarding the apparent output response to pricechanges. This suggests that producers respond to a combination of price incentives(determined both internationally and domestically) and non-price constraints, andthat the evaluation of these is critical in determining whether a response occurswithin the reform period (taking into account that lags in response may partlyexplain these unexpected responses) and also the extent of the response.
Reasons for the heterogeneity in production responseOf the many reasons for heterogeneity in production responses, some have to dowith changing world market conditions. Where export opportunities increase as aconsequence of the opening of a previously protected market, export expansion canoccur, despite falling international prices being more fully transmitted to domesticproducers that might result from concurrent reductions in local export restrictions.Similarly, increases in domestic prices may not reflect farm gate prices, as morepowerful actors in the supply chain extract the increased rent associated with anincrease in world prices.
In other cases, domestic policy and institutional change can help to explain theproduction response. For example, substantial rises in input prices have dampenedthe potential stimulus of increases in output prices, while in other cases thewithdrawal of support for rural credit has affected production.
The Tanzanian case study eloquently points to some of the reasons why farmerssometimes cannot respond in the face of higher price incentives:
PERU INDIA
0
50
100
150
200
250
300
350
1980
1982
1984
1986
1988
1990
1992
1994
1996
1998
2000
Ind
ex
BarleyCoffeeMaizeCottonRice
0
50
100
150
200
250
1980
1982
1984
1986
1988
1990
1992
1994
1996
1998
2000
Ind
ex
RiceMaizeWheatCoconut oilLamb meat
Source: Calculation based on data from FAOSTAT, 2004
39
The impact of reform on agricultural prices, production and trade
“The role of public institutions in the supply of inputs and the marketing of crops
has been left to the private sector. The efficiency and capability of the private sector
to fill this role has been impaired by several factors. ... there is no incentive for
committing resources for longer term investment in such things as storage facilities,
processing plants, quality assurance systems, marketing capabilities and farmer
support programmes. ... some smallholder farmers have failed to purchase the
required quantity and quality of seeds, pesticides, equipment and chemicals due to
the removal of subsidies. Educational crop promotion seminars and extension services
for peasants have largely been weakened by cuts in the budgetary allocations for
such activities. ... Since infrastructure difficulties may lead to very high transport
costs hence increased prices, private traders have concentrated business only in those
areas with better facilities. Any area with ailing infrastructure has been deprived of
marketing services...”
These remarks would be applicable at least in part to several of the countriesstudied.
The output increases in Uganda were significantly greater than in many othercountries (in part this may be explained by a recovery from a low base beforereform). However, the more recent flattening off in output is symptomatic of the factthat in Uganda, as in many of the other countries, there are severe constraints to boththe expansion of, and to the modernisation of, agricultural production.
Physical constraints to increased productionSmallholder agricultural production dominates in Uganda, where farmers with anaverage land holding of less than two hectares produce more than 90 percent of totalfood production. Their activity is often characterized by the use of low productivitytechnology, minimal use of inputs including fertilizers, problems with marketingsystems, and high crop losses. The 1998 Land Act in Uganda was intended to improveland tenure security through issuance of certificates of customary ownership andcertificates of occupancy for tenants. However, the institutional framework for itseffective implementation is not yet in place.
Similar observations are made in the Guatemalan study, where a large proportionof the country’s population works in subsistence farming or derives its income fromthe sale of farm products or on-farm work. Smallholder farmers using rudimentarytechnology produce about 80 percent of agricultural production in Ghana. Populationpressure has resulted in fragmentation of land holdings in Malawi and land holdingin Nigeria is also fragmented, with only about 30 percent of the country’s arable landcurrently under cultivation.
Whilst production increases in many African countries are the result of areaexpansion, net sown area in India has increased little since the early 1970s andarea expansion is unlikely to be an option to increase output. A similar pattern isobserved in China.
There has been some success in the support of technological development ofagriculture. For example in Cameroon, a policy of actively promoting the use ofinputs is considered important in maintaining soil fertility and increasing production.Reform of the state monopoly over imported inputs started in 1987. Problems thathave led to low use of chemical fertilizers relative to the average for African countriesinclude the lack of a credit mechanism and, above all, high input costs resulting from
40
Trade reforms and food security – country case studies and synthesis
price decontrol. The Research Institute for Agricultural Development (IRAD) wascreated for the purpose of supporting research and development in Cameroonianagriculture and assessing the quality of agricultural inputs. However, problemsincluding the poor state of equipment and a shortage of adequately qualifiedpersonnel have been obstacles to its proper functioning.
Low productivity also tends to characterize agriculture in Kenya, Malawi, Nigeria,Tanzania and Uganda, a common constraint being low levels of irrigation. In Nigeriaagricultural yields have remained relatively unchanged, with much farming conductedby the aged with little or no knowledge of modern farming practices. Input use bysmallholders in Kenya remains low and constrains productivity. However access toinputs has improved with reforms: there are more licensed dealers and inputs areavailable for purchase in smaller quantities.
Productivity in the food crop sector is also low in Ghana because of significantconstraints to the adoption of improved technologies, such as shortage of locallyimproved seeds, planting materials and other inputs. In Tanzania, technologicaldevelopment in agriculture is poor, with rudimentary equipment and weakextension-research linkages. Removal of subsidies on inputs in Tanzania has led tosome smallholder farmers not purchasing adequate seeds, chemicals and equipment.A lack of support has discouraged cultivation of cash crops such as cotton andencouraged a movement into food crops, which do not require such high usage ofexpensive imported inputs. In the majority of these countries, the incentives forinvestment in terms of adequate and stable levels of profitability have been lacking.
Research and extensionResearch and extension programmes have the potential to improve agriculturalproductivity. The extension system in Cameroon was launched in 1990 by thegovernment, with World Bank assistance, which has improved rural information,communication systems and transfer of appropriate technologies to farmers. InGhana, research and extension has had limited success, with the extension servicestill severely constrained. A project aimed at improving the research-extension-farmer linkage was funded by external donor support from 1995 to 1999. But the endof this external funding has led to difficulty in sustaining the project. In Uganda, theNational Agricultural Research Organization was established in 1992 to undertake,promote and co-ordinate research in various aspects of agricultural development.The benefits of this are slowly trickling to the smallholder farmers; for example,most rural smallholder coffee farmers have adopted improved coffee varieties.
InfrastructureDevelopment of physical infrastructure appears to be of particular importance inmany of the countries. Well-developed infrastructure can facilitate the marketingof output, purchase of inputs and shift of labour from one geographical area toanother. The China case study notes that during the 1980s and early 1990s one ofthe major constraints on the stability of the food supply was the poor marketing andtransportation infrastructure.
Deficiencies in transport infrastructure are a major constraint to the agriculture,limiting access to domestic and international markets. In Cameroon, the railwayis the oldest in Africa and the infrastructure has seriously deteriorated with the
41
The impact of reform on agricultural prices, production and trade
monopoly enjoyed by the private operator, leading to a low quality and expensiveservice. Despite restructuring of the marine transport sector, costs remain relativelyhigh, with the main port of Douala the most expensive on the West African coast.Storage and processing infrastructure for food crops in rural areas is inadequate andlargely responsible for food insecurity in some regions of the country, such as theNorth. The few major rural and urban markets are poorly equipped and managed.
Ghana has been described as a “footpath economy” because of the poor feederroad network, with the World Bank identifying the poor transportation networkas a constraint on agriculture production. Market access has improved for thosecommunities where the road network has been upgraded but actual annualachievements of rehabilitating 212 -1080 km fall well short of the target of 1 200-2 000 km per annum.
Infrastructure in Tanzania is noted as a particular constraint to agriculturalperformance, with inadequate roads probably one of the factors most limitingeconomic growth. Of the total road network in the country, only 5.5 percentare paved and most of the unpaved roads are in poor condition. This weak baseof infrastructure reduces the country’s competitiveness since transport costs addsignificantly to production costs. In addition, some areas have inadequate telephones,electricity and storage facilities.
Issues related to market infrastructure have not been adequately addressed in thereform process in Uganda. The Government has invested substantial resources overthe past decade in the construction and maintenance of rural feeder roads to openup rural areas, but, it is estimated that a quarter of the country’s feeder roads arestill impassable during the rainy season, limiting the opportunities for rural farmersto deliver their produce to the market. Transport costs are also high because of thehigh cost of fuel and a lack of competition. Other post-harvest costs, includingstorage, processing and handling costs, are also so high that they affect the sector’scompetitiveness. Although rural markets operate in most parts of the country, theylack basic facilities such as roof cover and secure storage.
In Malawi, infrastructure is inadequate and was given low priority during theadjustment period. Agricultural opportunities in India are also hindered by poorinfrastructure including power, roads, markets, warehousing and processing facilities.Much improvement is also required for Nigeria in developing an efficient and effectivetransportation system and in the provision of storage and distribution facilities.
Credit availabilityCredit markets facilitate production, consumption smoothing, and the developmentof new enterprises. They are an important mechanism to assist the poor to adjust toa changed economic environment. Limited access to financial services (both creditand savings) has exacerbated vulnerability to shocks. However, most structuraladjustment programmes have reduced the availability of credit to rural householdsand raised its cost.
Many of the case studies report difficulties for rural farmers in accessing credit.Rural small-scale farmers in Cameroon have little access to credit. Micro financeinstitutions were set up in 1992, but they remain poorly distributed throughout thecountry and sometimes lack credibility and professionalism. Smallholder farmers inMalawi face credit constraints, with micro finance institutions tending to emphasize
42
Trade reforms and food security – country case studies and synthesis
finance for off-farm business activities, and much of the available agricultural creditis confined to the tobacco sector. Small- and medium-scale traders in Tanzania cannotaccess the credit that would enable them to purchase stocks of produce and sell out ofseason at higher prices. Some farmers shifted away from the production of cash cropssuch as cotton because food crops can more easily be sold on cash terms. In Uganda,the only source of credit for rural dwellers is the micro finance industry, whichfavours non-agricultural activities. Attempts are currently underway in Uganda todevelop financial services that meet the needs of the rural population and integratethem into the national financial system. In Guatemala, agricultural credit availabilityis low and declining. Most available credit is channelled towards export products(traditional and non-traditional) with little support for basic grains production.
Guyana attempted to overcome the problems in obtaining acceptable forms ofcollateral security faced by many small farmers. The Institute of Private EnterpriseDevelopment Limited (IPED) was established in 1986 as a local NGO to provideloans to small entrepreneurs. It uses a cross guarantee system, whereby each memberof a small group is liable for the debts of the others. IPED has been instrumental infacilitating output increases for a number of small producers. On the other hand, theexperience with government credit provision schemes in Peru has been disappointing,with massive losses in capital reported. Most of the credit to the agricultural sectornow comes from commercial banks and there was a dramatic reduction in the numberof small farmers supported by the formal financial system during the 1990s.
Climatic conditionsNot all factors are under the control of policy makers. Adverse climatic conditionscan have devastating effects, particularly when poverty levels are high, making itdifficult for producers to protect against risks through means such as irrigating landor insuring against losses. For example, India has not developed effective mechanismsfor crop insurance to reduce the impact of crop failure on farm incomes.
While climatic events can affect all sectors of an economy, the impact on agricultureis often relatively large. Too much rain caused by the El Niño phenomenon was aproblem for Kenya, with heavy rain destroying infrastructure. But too little rain hasalso been a problem, with droughts a major factor reducing agricultural productionin 1980, 1984, 1994 and 1999. This problem is particularly serious given the country’sdependence on rainfed agriculture. Climatic risks are sometimes relatively region-specific, for example, in Nigeria, the northern half of the country is much moresusceptible to drought and only one crop per year can be grown under rainfedagriculture. Interviews in Tanzania confirm that food production has deteriorateddue to poor climatic conditions, with many interviewees also mentioning that the ElNiño rainfalls of 1997/98 were a critical factor interrupting food security.
Almost 60 percent of the cost of the 2001 drought in Guatemala was estimated tohave fallen on agriculture. Other recent adverse climatic events include severe hotspells in 1991 and 1994, prolonged droughts in 1997 and hurricane Mitch in 1998. Theeffects on agriculture of these events were not homogenous, with self-consumptionhardest hit, particularly in basic grains such as maize or beans. It is suggested thatclimate changes in Guatemala have become the principal determinant of agriculturalproduction, with a more significant impact than prices. Peru and Uganda are alsovulnerable to adverse weather and natural conditions.
43
The impact of reform on agricultural prices, production and trade
While production risk remains an important source of risk affecting the ruralpopulation in China, the risks are thought to be lower than for many other nations,since a relatively high proportion of China’s land is irrigated. Also a high proportionof households are diversified, with on average at least one family member in off farmemployment. This is a rather different situation from most of the other countries thattend to be heavily dependent on rainfed agriculture and not so diversified in termsof sources of income.
Terms of tradeAt the aggregate sectoral level, as shown in Figure 10, there appears to be a positiveif not strong correlation between changes in the agricultural terms of trade and thegrowth rate of the agricultural sector. However, the correlation is much weaker inthe last decade or so, raising questions about the main determinants of agriculturaloutput. Conditions in other sectors, along with productivity changes and investmentdecisions, may be as important as the agricultural terms of trade itself.
THE IMPACT OF REFORM ON TRADE FLOWS
This section examines trade flows in relation to the relative growth of agriculturalexports and food imports, and to the dependence on primary commodities andchanges in the structure of agricultural trade.
Relative growth of exports and importsAs discussed in the section on price analysis, most countries have seen a depreciationof their currency, which has had the effect of making their exports more competitive,and ceteris paribus, their food imports more expensive in local currency terms.
However, there have been significant differences in the direction of change of theratio of food imports to agricultural exports (Table 7). In many African countries,food import bills have increased not only because of the exchange rate change butbecause in the 1990s, greater quantities of food grains have been imported on acommercial basis rather than as subsidized food aid. In most of these countries, thefood import bill has increased at a greater rate than the increase in export earnings.By contrast, a declining trend was observed in a number of Asian and Latin Americancountries in the later years of the period of study.
In aggregate, food imports measured in current prices increased in all countriesacross the three decades illustrated in Table 8, but there were significant differences inthe magnitude and direction of change between periods. Between the periods 1974-84and 1985-94, food imports fell in Nigeria, Chile and Guyana and remained static inIndia, but increased significantly in Cameroon, Kenya and Malawi. In the period to1995-2002 the pattern was quite different, with a decline in Malawi and a small increasein Cameroon, but significant increases in the majority of other countries, reflecting inpart, the higher proportion of trade on commercial rather than food aid terms.
When examined in constant prices (Table 9), the broad pattern across countriesremains the same. In all countries the percentage increase in imports was positive andsignificant, particularly those in sub-Saharan Africa.
The pattern of changes in export value across the period is much more mixed(Tables 10 and 11). Although both Kenya and Malawi appear to have increased
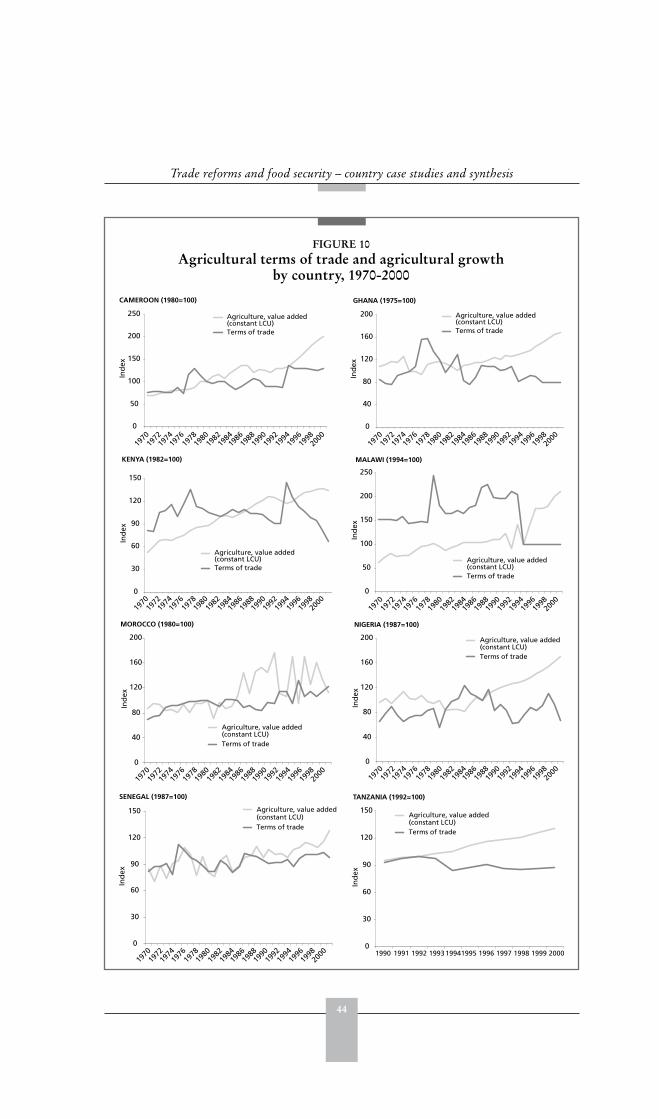
44
Trade reforms and food security – country case studies and synthesis
FIGURE 10Agricultural terms of trade and agricultural growth
by country, 1970-2000
0
50
100
150
200
250
Ind
ex
Agriculture, value added(constant LCU)Terms of trade
0
40
80
120
160
200
Ind
ex
Agriculture, value added(constant LCU)Terms of trade
0
30
60
90
120
150
Ind
ex
Agriculture, value added(constant LCU)Terms of trade
0
50
100
150
200
250
Ind
ex
Agriculture, value added(constant LCU)Terms of trade
0
40
80
120
160
200
Ind
ex
Agriculture, value added(constant LCU)Terms of trade
0
40
80
120
160
200
Ind
ex
Agriculture, value added(constant LCU)Terms of trade
0
30
60
90
120
150
Ind
ex
Agriculture, value added(constant LCU)Terms of trade
0
30
60
90
120
150
Ind
ex
Agriculture, value added(constant LCU)Terms of trade
CAMEROON (1980=100) GHANA (1975=100)
1970
1972
1974
1976
1978
1980
1982
1984
1986
1988
1990
1992
1994
1996
1998
2000
1970
1972
1974
1976
1978
1980
1982
1984
1986
1988
1990
1992
1994
1996
1998
2000
KENYA (1982=100) MALAWI (1994=100)
1970
1972
1974
1976
1978
1980
1982
1984
1986
1988
1990
1992
1994
1996
1998
2000
1970
1972
1974
1976
1978
1980
1982
1984
1986
1988
1990
1992
1994
1996
1998
2000
MOROCCO (1980=100) NIGERIA (1987=100)
1970
1972
1974
1976
1978
1980
1982
1984
1986
1988
1990
1992
1994
1996
1998
2000
1970
1972
1974
1976
1978
1980
1982
1984
1986
1988
1990
1992
1994
1996
1998
2000
SENEGAL (1987=100) TANZANIA (1992=100)
1970
1972
1974
1976
1978
1980
1982
1984
1986
1988
1990
1992
1994
1996
1998
2000 1990 1991 1992 199319941995 1996 1997 1998 1999 2000
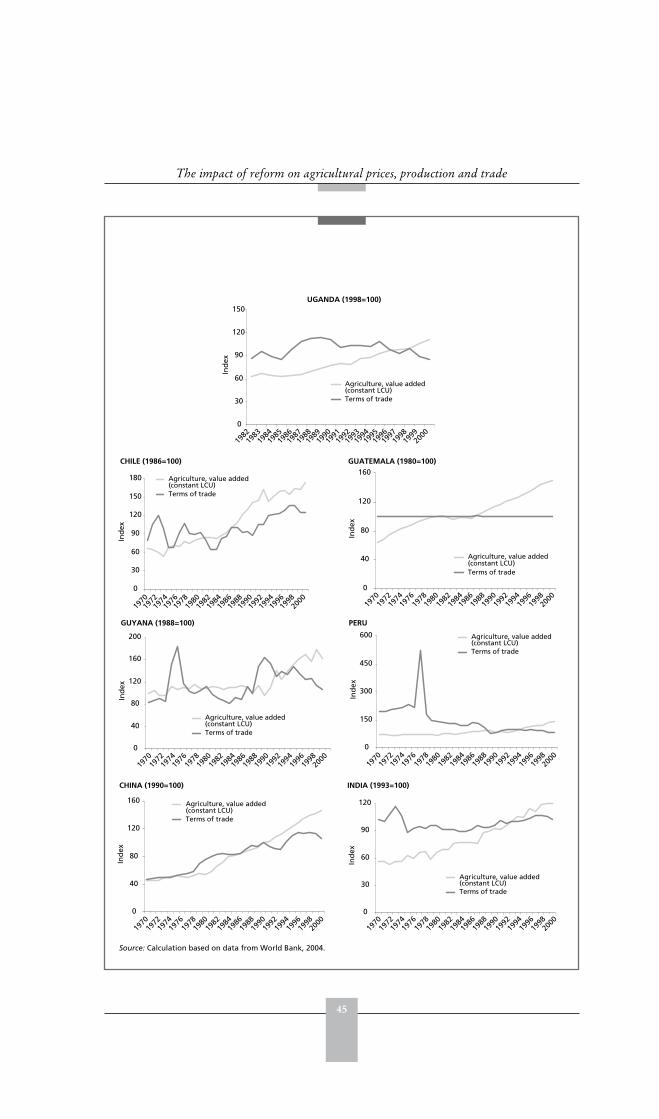
45
The impact of reform on agricultural prices, production and trade
UGANDA (1998=100)
0
30
60
90
120
150
Ind
ex
Agriculture, value added(constant LCU)Terms of trade
0
30
60
90
120
150
180
Ind
ex
Agriculture, value added(constant LCU)Terms of trade
0
40
80
120
160
Ind
ex
Agriculture, value added(constant LCU)Terms of trade
0
40
80
120
160
200
Ind
ex
Agriculture, value added(constant LCU)Terms of trade
0
150
300
450
600
Ind
ex
Agriculture, value added(constant LCU)Terms of trade
0
40
80
120
160
Ind
ex
Agriculture, value added(constant LCU)Terms of trade
0
30
60
90
120
Ind
ex
Agriculture, value added(constant LCU)Terms of trade
Source: Calculation based on data from World Bank, 2004.
1970
1972
1974
1976
1978
1980
1982
1984
1986
1988
1990
1992
1994
1996
1998
2000
1982
1983
198419
8519
8619
8719
8819
8919
9019
9119
9219
9319
9419
9519
9619
9720
0019
9819
99
CHILE (1986=100) GUATEMALA (1980=100)
197019
7219
7419
7619
7819
8019
8219
8419
8619
8819
9019
9219
9419
9619
9820
00
GUYANA (1988=100) PERU
1970
1972
1974
1976
1978
1980
1982
1984
1986
1988
1990
1992
1994
1996
1998
2000
1970
1972
1974
1976
1978
1980
1982
1984
1986
1988
1990
1992
1994
1996
1998
2000
CHINA (1990=100) INDIA (1993=100)
1970
1972
1974
1976
1978
1980
1982
1984
1986
1988
1990
1992
1994
1996
1998
2000
1970
1972
1974
1976
1978
1980
1982
1984
1986
1988
1990
1992
1994
1996
1998
2000

46
Trade reforms and food security – country case studies and synthesis
TABLE 7 Ratio of total value of food imports to total value of agricultural exports, 1970-2002
Country Average ratio1970-84 (a) 1985-94 (b) 1995-2002 (c)
AfricaCameroon 0.2 0.3 0.3Ghana 0.2 0.4 0.6Kenya 0.2 0.2 0.4Malawi 0.1 0.2 0.2Nigeria 2.2 2.5 3.0Senegal 1.2 2.1 3.7Tanzania 0.2 0.3 0.5Uganda 0.1 0.2 0.4Morocco 1.3 1.1 1.6AsiaChina 0.8 0.5 0.7India 0.6 0.4 0.5Latin AmericaChile 2.8 0.2 0.3Guatemala 0.1 0.2 0.3Guyana 0.3 0.2 0.3Peru 1.2 1.9 1.4
Source: FAOSTAT, (FAO, 2004).
TABLE 8 Total food imports, 1970-2002 (current prices)
Country Average annual value(in current prices)
(US$ million)
Change between periods (percent)(current values)
1970-84 (a) 1985-94 (b) 1995-2002 (c) (b-a/a) (c-b/b) (c-a/a)AfricaCameroon 63 153 164 142 7 159Ghana 76 139 282 83 103 271Kenya 77 180 388 134 115 403Malawi 15 77 71 412 -7 375Nigeria 1 045 666 1 287 -36 93 23Senegal 162 271 424 67 57 162Tanzania 80 86 262 8 205 229Uganda 21 34 135 63 297 543Morocco 486 594 1 234 22 108 154AsiaChina 2 822 5 296 9 321 88 76 230India 1 072 1 069 2 403 0 125 124Latin AmericaChile 357 286 872 -20 205 145Guatemala 67 163 479 142 193 615Guyana 29 27 68 -7 152 134Peru 325 605 971 86 60 199
Source: Computed from FAOSTAT, (FAO, 2004).
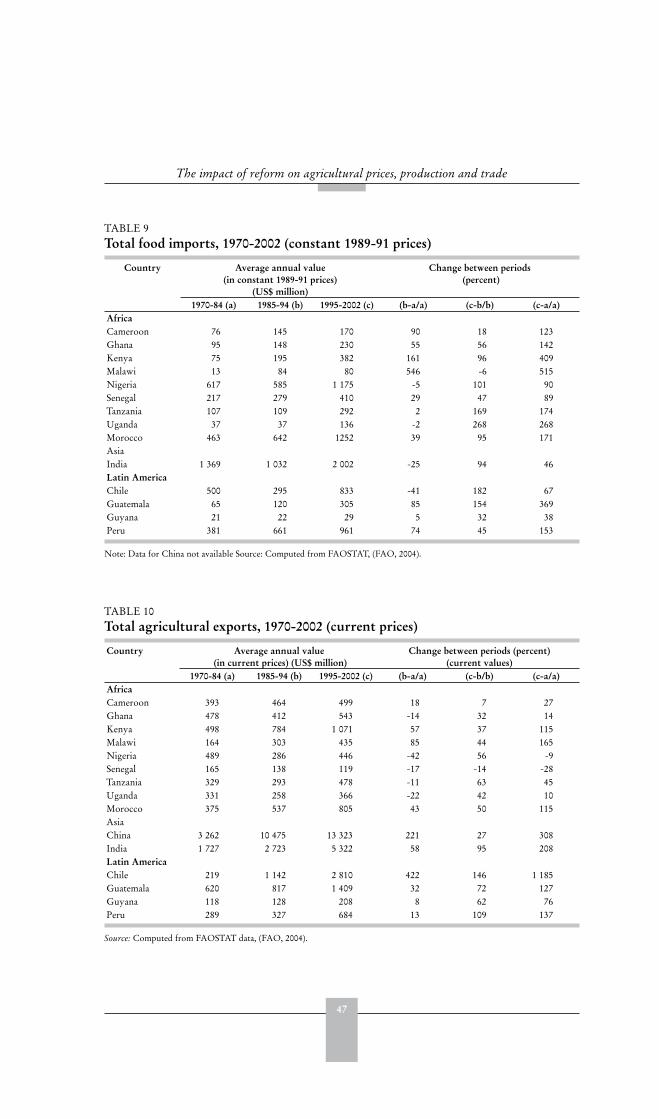
47
The impact of reform on agricultural prices, production and trade
TABLE 9 Total food imports, 1970-2002 (constant 1989-91 prices)
Country Average annual value(in constant 1989-91 prices)
(US$ million)
Change between periods (percent)
1970-84 (a) 1985-94 (b) 1995-2002 (c) (b-a/a) (c-b/b) (c-a/a)AfricaCameroon 76 145 170 90 18 123Ghana 95 148 230 55 56 142Kenya 75 195 382 161 96 409Malawi 13 84 80 546 -6 515Nigeria 617 585 1 175 -5 101 90Senegal 217 279 410 29 47 89Tanzania 107 109 292 2 169 174Uganda 37 37 136 -2 268 268Morocco 463 642 1252 39 95 171AsiaIndia 1 369 1 032 2 002 -25 94 46Latin AmericaChile 500 295 833 -41 182 67Guatemala 65 120 305 85 154 369Guyana 21 22 29 5 32 38Peru 381 661 961 74 45 153
Note: Data for China not available Source: Computed from FAOSTAT, (FAO, 2004).
TABLE 10 Total agricultural exports, 1970-2002 (current prices)
Country Average annual value (in current prices) (US$ million)
Change between periods (percent)(current values)
1970-84 (a) 1985-94 (b) 1995-2002 (c) (b-a/a) (c-b/b) (c-a/a)AfricaCameroon 393 464 499 18 7 27Ghana 478 412 543 -14 32 14Kenya 498 784 1 071 57 37 115Malawi 164 303 435 85 44 165Nigeria 489 286 446 -42 56 -9Senegal 165 138 119 -17 -14 -28Tanzania 329 293 478 -11 63 45Uganda 331 258 366 -22 42 10Morocco 375 537 805 43 50 115AsiaChina 3 262 10 475 13 323 221 27 308India 1 727 2 723 5 322 58 95 208Latin AmericaChile 219 1 142 2 810 422 146 1 185Guatemala 620 817 1 409 32 72 127Guyana 118 128 208 8 62 76Peru 289 327 684 13 109 137
Source: Computed from FAOSTAT data, (FAO, 2004).
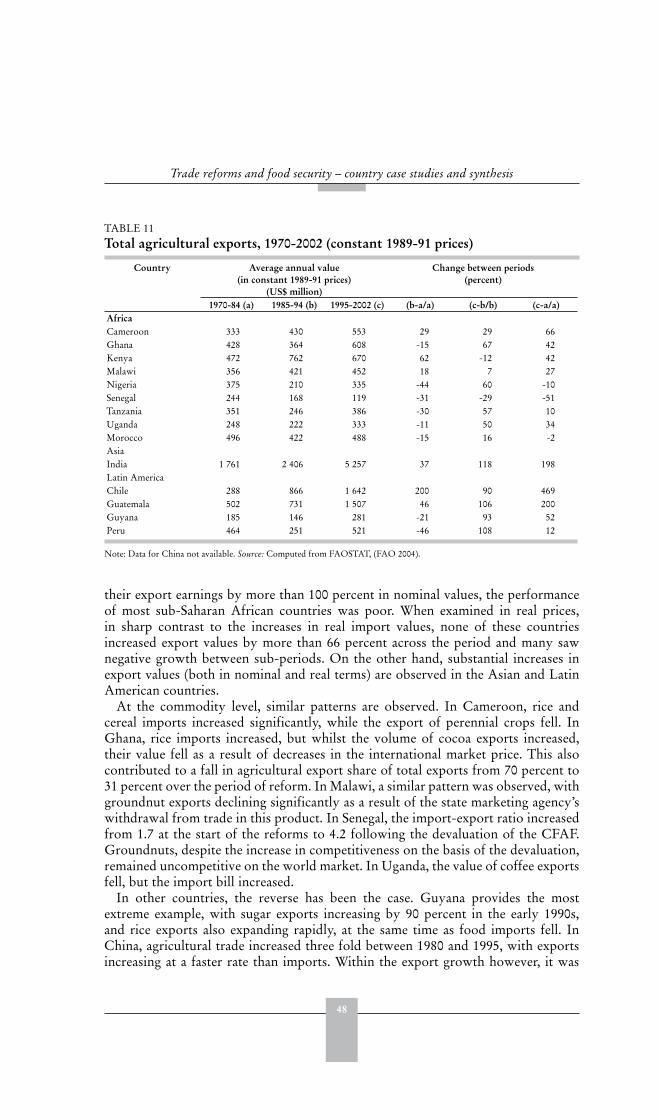
48
Trade reforms and food security – country case studies and synthesis
their export earnings by more than 100 percent in nominal values, the performanceof most sub-Saharan African countries was poor. When examined in real prices,in sharp contrast to the increases in real import values, none of these countriesincreased export values by more than 66 percent across the period and many sawnegative growth between sub-periods. On the other hand, substantial increases inexport values (both in nominal and real terms) are observed in the Asian and LatinAmerican countries.
At the commodity level, similar patterns are observed. In Cameroon, rice andcereal imports increased significantly, while the export of perennial crops fell. InGhana, rice imports increased, but whilst the volume of cocoa exports increased,their value fell as a result of decreases in the international market price. This alsocontributed to a fall in agricultural export share of total exports from 70 percent to31 percent over the period of reform. In Malawi, a similar pattern was observed, withgroundnut exports declining significantly as a result of the state marketing agency’swithdrawal from trade in this product. In Senegal, the import-export ratio increasedfrom 1.7 at the start of the reforms to 4.2 following the devaluation of the CFAF.Groundnuts, despite the increase in competitiveness on the basis of the devaluation,remained uncompetitive on the world market. In Uganda, the value of coffee exportsfell, but the import bill increased.
In other countries, the reverse has been the case. Guyana provides the mostextreme example, with sugar exports increasing by 90 percent in the early 1990s,and rice exports also expanding rapidly, at the same time as food imports fell. InChina, agricultural trade increased three fold between 1980 and 1995, with exportsincreasing at a faster rate than imports. Within the export growth however, it was
TABLE 11Total agricultural exports, 1970-2002 (constant 1989-91 prices)
Country Average annual value (in constant 1989-91 prices)
(US$ million)
Change between periods(percent)
1970-84 (a) 1985-94 (b) 1995-2002 (c) (b-a/a) (c-b/b) (c-a/a)AfricaCameroon 333 430 553 29 29 66Ghana 428 364 608 -15 67 42Kenya 472 762 670 62 -12 42Malawi 356 421 452 18 7 27Nigeria 375 210 335 -44 60 -10Senegal 244 168 119 -31 -29 -51Tanzania 351 246 386 -30 57 10Uganda 248 222 333 -11 50 34Morocco 496 422 488 -15 16 -2AsiaIndia 1 761 2 406 5 257 37 118 198Latin AmericaChile 288 866 1 642 200 90 469Guatemala 502 731 1 507 46 106 200Guyana 185 146 281 -21 93 52Peru 464 251 521 -46 108 12
Note: Data for China not available. Source: Computed from FAOSTAT, (FAO 2004).
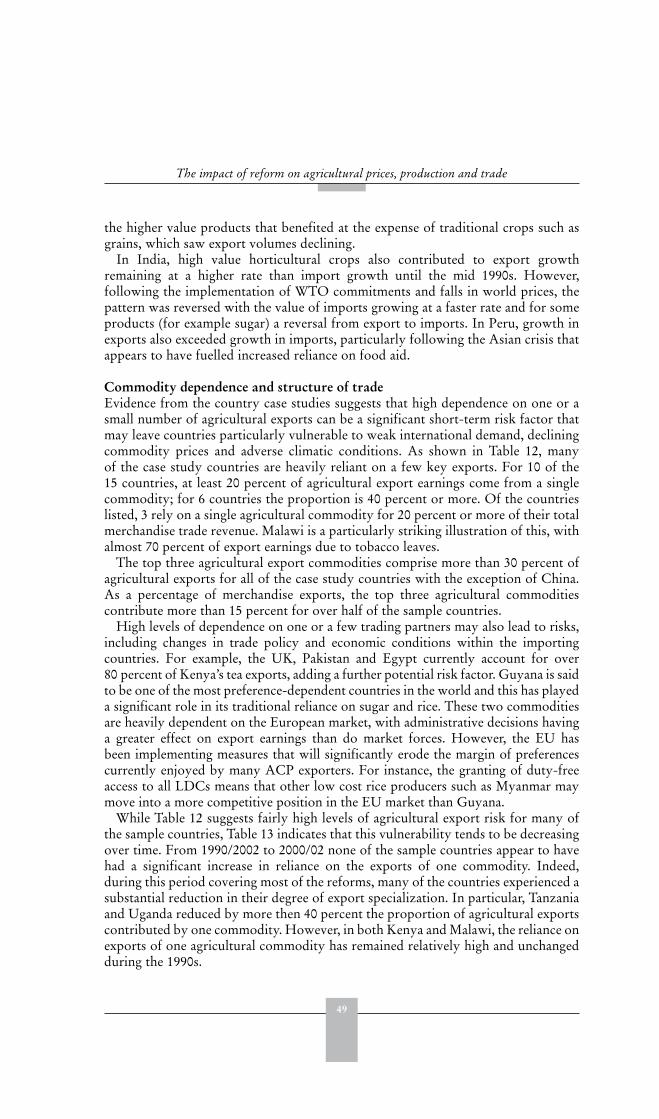
49
The impact of reform on agricultural prices, production and trade
the higher value products that benefited at the expense of traditional crops such asgrains, which saw export volumes declining.
In India, high value horticultural crops also contributed to export growthremaining at a higher rate than import growth until the mid 1990s. However,following the implementation of WTO commitments and falls in world prices, thepattern was reversed with the value of imports growing at a faster rate and for someproducts (for example sugar) a reversal from export to imports. In Peru, growth inexports also exceeded growth in imports, particularly following the Asian crisis thatappears to have fuelled increased reliance on food aid.
Commodity dependence and structure of tradeEvidence from the country case studies suggests that high dependence on one or asmall number of agricultural exports can be a significant short-term risk factor thatmay leave countries particularly vulnerable to weak international demand, decliningcommodity prices and adverse climatic conditions. As shown in Table 12, manyof the case study countries are heavily reliant on a few key exports. For 10 of the15 countries, at least 20 percent of agricultural export earnings come from a singlecommodity; for 6 countries the proportion is 40 percent or more. Of the countrieslisted, 3 rely on a single agricultural commodity for 20 percent or more of their totalmerchandise trade revenue. Malawi is a particularly striking illustration of this, withalmost 70 percent of export earnings due to tobacco leaves.
The top three agricultural export commodities comprise more than 30 percent ofagricultural exports for all of the case study countries with the exception of China.As a percentage of merchandise exports, the top three agricultural commoditiescontribute more than 15 percent for over half of the sample countries.
High levels of dependence on one or a few trading partners may also lead to risks,including changes in trade policy and economic conditions within the importingcountries. For example, the UK, Pakistan and Egypt currently account for over80 percent of Kenya’s tea exports, adding a further potential risk factor. Guyana is saidto be one of the most preference-dependent countries in the world and this has playeda significant role in its traditional reliance on sugar and rice. These two commoditiesare heavily dependent on the European market, with administrative decisions havinga greater effect on export earnings than do market forces. However, the EU hasbeen implementing measures that will significantly erode the margin of preferencescurrently enjoyed by many ACP exporters. For instance, the granting of duty-freeaccess to all LDCs means that other low cost rice producers such as Myanmar maymove into a more competitive position in the EU market than Guyana.
While Table 12 suggests fairly high levels of agricultural export risk for many ofthe sample countries, Table 13 indicates that this vulnerability tends to be decreasingover time. From 1990/2002 to 2000/02 none of the sample countries appear to havehad a significant increase in reliance on the exports of one commodity. Indeed,during this period covering most of the reforms, many of the countries experienced asubstantial reduction in their degree of export specialization. In particular, Tanzaniaand Uganda reduced by more then 40 percent the proportion of agricultural exportscontributed by one commodity. However, in both Kenya and Malawi, the reliance onexports of one agricultural commodity has remained relatively high and unchangedduring the 1990s.
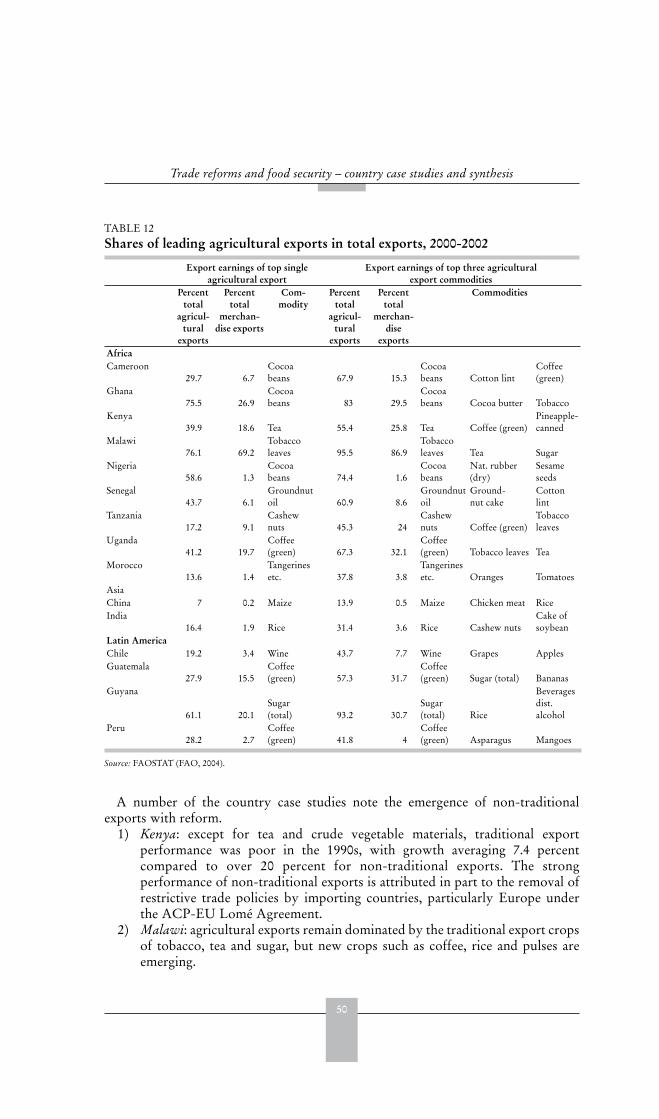
50
Trade reforms and food security – country case studies and synthesis
A number of the country case studies note the emergence of non-traditionalexports with reform.
1) Kenya: except for tea and crude vegetable materials, traditional exportperformance was poor in the 1990s, with growth averaging 7.4 percentcompared to over 20 percent for non-traditional exports. The strongperformance of non-traditional exports is attributed in part to the removal ofrestrictive trade policies by importing countries, particularly Europe underthe ACP-EU Lomé Agreement.
2) Malawi: agricultural exports remain dominated by the traditional export cropsof tobacco, tea and sugar, but new crops such as coffee, rice and pulses areemerging.
TABLE 12 Shares of leading agricultural exports in total exports, 2000-2002
Export earnings of top single agricultural export
Export earnings of top three agricultural export commodities
Percent total
agricul-tural
exports
Percent total
merchan-dise exports
Com-modity
Percent total
agricul-tural
exports
Percent total
merchan-dise
exports
Commodities
AfricaCameroon
29.7 6.7Cocoabeans 67.9 15.3
Cocoabeans Cotton lint
Coffee(green)
Ghana75.5 26.9
Cocoabeans 83 29.5
Cocoabeans Cocoa butter Tobacco
Kenya39.9 18.6 Tea 55.4 25.8 Tea Coffee (green)
Pineapple-canned
Malawi76.1 69.2
Tobaccoleaves 95.5 86.9
Tobaccoleaves Tea Sugar
Nigeria58.6 1.3
Cocoabeans 74.4 1.6
Cocoabeans
Nat. rubber(dry)
Sesameseeds
Senegal43.7 6.1
Groundnutoil 60.9 8.6
Groundnutoil
Ground-nut cake
Cottonlint
Tanzania17.2 9.1
Cashewnuts 45.3 24
Cashewnuts Coffee (green)
Tobaccoleaves
Uganda41.2 19.7
Coffee(green) 67.3 32.1
Coffee(green) Tobacco leaves Tea
Morocco13.6 1.4
Tangerinesetc. 37.8 3.8
Tangerinesetc. Oranges Tomatoes
AsiaChina 7 0.2 Maize 13.9 0.5 Maize Chicken meat RiceIndia
16.4 1.9 Rice 31.4 3.6 Rice Cashew nutsCake ofsoybean
Latin AmericaChile 19.2 3.4 Wine 43.7 7.7 Wine Grapes ApplesGuatemala
27.9 15.5Coffee(green) 57.3 31.7
Coffee(green) Sugar (total) Bananas
Guyana
61.1 20.1Sugar(total) 93.2 30.7
Sugar(total) Rice
Beveragesdist.alcohol
Peru28.2 2.7
Coffee(green) 41.8 4
Coffee(green) Asparagus Mangoes
Source: FAOSTAT (FAO, 2004).

51
The impact of reform on agricultural prices, production and trade
3) Tanzania: although dependence on income from agricultural exports has beena major source of short-term economic instability, due to fluctuations in bothprices and output, exports remain dominated by seven primary agriculturalcommodities, which traditionally constituted more than half of total exports.However, non-agricultural exports have been increasing, particularly mineralsand tourism.
4) Uganda: although the share of coffee, which constituted more than 90 percentof total export earnings in 1981, declined to 20 percent in 2001, the exportsector remains highly concentrated in commodity exports.
5) Guatemala is in transition from specializing in a few to many crops, and in thefuture the country will no longer depend on the success or failure of one ortwo products for foreign exchange earnings. However, non-traditional exportshave grown at the cost of production of basic grains such as the maize, riceand beans that are basic to the Guatemalan diet. This may have implicationsfor food security in that households will depend increasingly on income, andhence on market participation, rather than production for their own foodrequirements.
6) Peru: the main traditional agricultural exports have been coffee, sugar, cottonand cocoa. However, the country study notes that exports of sugar and cottonhave been decreasing in the post-reform period and replaced in importanceby non-traditional exports such as fruits (mangoes, grapes) and vegetables(asparagus and onions). There has also been diversification into new exportmarkets, including APEC countries.
In all these countries where exports have been diversified, the opening of marketopportunities for non-traditional exports, and of greater access to technology for
TABLE 13 Dependence on a single agricultural export, as a proportion of total agricultural exports, 1980/82-2000/02 (percent)
1980-82 1990-92 2000-02 Change (percent)
1980/82-1990/92
Change(percent)
1990/92-2000/02Africa Cameroon 43 31 30 -27 -5
Ghana 90 86 75 -5 -12Kenya 42 40 40 -6 0.6Malawi 53 77 76 46 -2Nigeria 61 60 59 -2 -2Senegal 53 53 44 0 -18Tanzania 34 29 17 -15 -41Uganda 98 75 41 -24 -45Morocco 31 20 14 -36 -31
Asia China 8 11 7 38 -35India 20 16 16 -16 0
Latin America Chile 19 23 19 23 -18Guatemala 43 36 28 -18 -21Guyana 72 78 61 9 -21Peru 44 31 28 -29 -9
Source: FAOSTAT, (FAO, 2004).
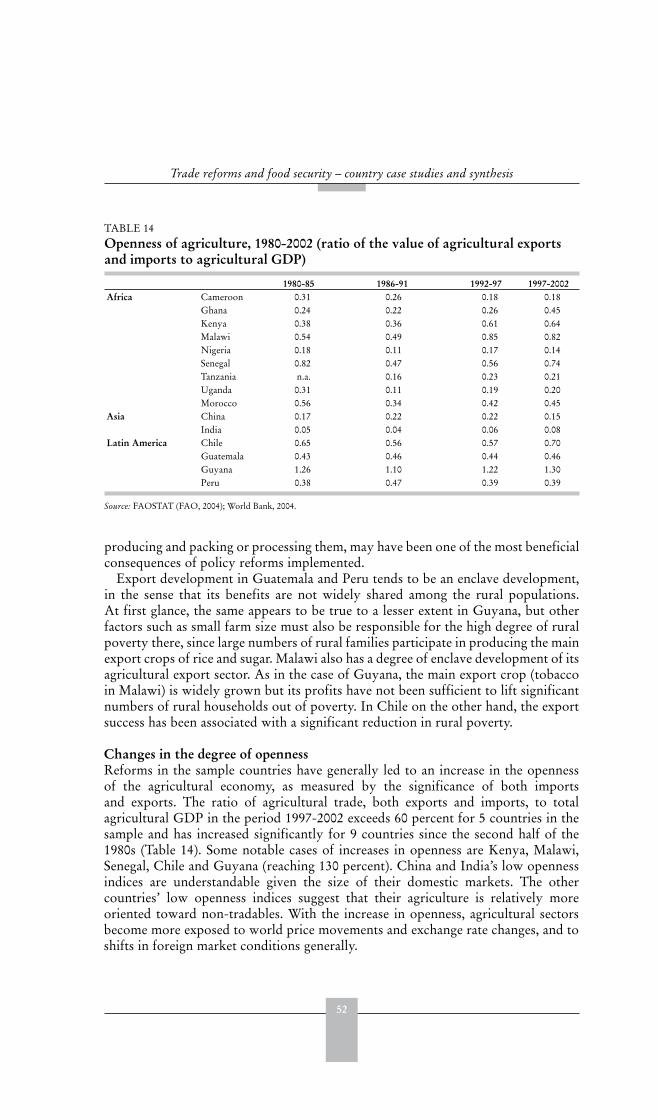
52
Trade reforms and food security – country case studies and synthesis
producing and packing or processing them, may have been one of the most beneficialconsequences of policy reforms implemented.
Export development in Guatemala and Peru tends to be an enclave development,in the sense that its benefits are not widely shared among the rural populations.At first glance, the same appears to be true to a lesser extent in Guyana, but otherfactors such as small farm size must also be responsible for the high degree of ruralpoverty there, since large numbers of rural families participate in producing the mainexport crops of rice and sugar. Malawi also has a degree of enclave development of itsagricultural export sector. As in the case of Guyana, the main export crop (tobaccoin Malawi) is widely grown but its profits have not been sufficient to lift significantnumbers of rural households out of poverty. In Chile on the other hand, the exportsuccess has been associated with a significant reduction in rural poverty.
Changes in the degree of opennessReforms in the sample countries have generally led to an increase in the opennessof the agricultural economy, as measured by the significance of both importsand exports. The ratio of agricultural trade, both exports and imports, to totalagricultural GDP in the period 1997-2002 exceeds 60 percent for 5 countries in thesample and has increased significantly for 9 countries since the second half of the1980s (Table 14). Some notable cases of increases in openness are Kenya, Malawi,Senegal, Chile and Guyana (reaching 130 percent). China and India’s low opennessindices are understandable given the size of their domestic markets. The othercountries’ low openness indices suggest that their agriculture is relatively moreoriented toward non-tradables. With the increase in openness, agricultural sectorsbecome more exposed to world price movements and exchange rate changes, and toshifts in foreign market conditions generally.
TABLE 14 Openness of agriculture, 1980-2002 (ratio of the value of agricultural exports and imports to agricultural GDP)
1980-85 1986-91 1992-97 1997-2002Africa Cameroon 0.31 0.26 0.18 0.18
Ghana 0.24 0.22 0.26 0.45Kenya 0.38 0.36 0.61 0.64Malawi 0.54 0.49 0.85 0.82Nigeria 0.18 0.11 0.17 0.14Senegal 0.82 0.47 0.56 0.74Tanzania n.a. 0.16 0.23 0.21Uganda 0.31 0.11 0.19 0.20Morocco 0.56 0.34 0.42 0.45
Asia China 0.17 0.22 0.22 0.15India 0.05 0.04 0.06 0.08
Latin America Chile 0.65 0.56 0.57 0.70Guatemala 0.43 0.46 0.44 0.46Guyana 1.26 1.10 1.22 1.30Peru 0.38 0.47 0.39 0.39
Source: FAOSTAT (FAO, 2004); World Bank, 2004.
53
4
Consequences of reformfor food security
METHODOLOGY
The implications of economic and trade reforms for food security are difficult togauge directly, and are best captured through a series of indicators that apply toboth the national and household level. Such indicators may be usefully categorizedaccording to the three main facets of food security: availability, stability andaccessibility. Information on availability at the national level can be providedby data describing average nutrient availability (for example as contained in theFAO food balance sheets); and by data on domestic production, food aid and netimports. National indicators on the stability of supplies can include information onthe seasonality of both prices and quantities; while an indication with respect toaccessibility can be gained from food import price levels and the ratio of food importsto total export earnings. The latter describes the cost of maintaining access to foodsupplies through imports.
However, in many respects the most relevant definition of food security is atthe household level rather than the national level. Household food security canbe interpreted as the ability of individual households, particularly low-incomehouseholds, to sustain adequate levels of calories, proteins and other essentialnutrients. Key indicators here include local availability; including householdproduction; the stability in real income from all sources, including their ownproduction, and the accessibility that the level of real income provides.
The household level relationship between reform and food security can beconsidered in two stages: the impact of agriculture sector change on householdincome and expenditure of farmers, and the effect of changes in household incomeand expenditure on household food security.
To understand how households have been differentially affected by agriculturesector change brought about by reform, it is necessary to categorize householdtypes. Though the most appropriate classification may vary among countries, it wasdecided to use a common system for comparison. Farm households were groupedunder the following criteria:
1) degree of commercialization (subsistence, pre-commercial, commercial);2) types of main products (export crops, import crops, non-tradables);3) organization of farming (owner-operated, cooperative, contract farming,
sharecropping, plantation);4) mode of market access (e.g. how output and credit markets are accessed);5) location;
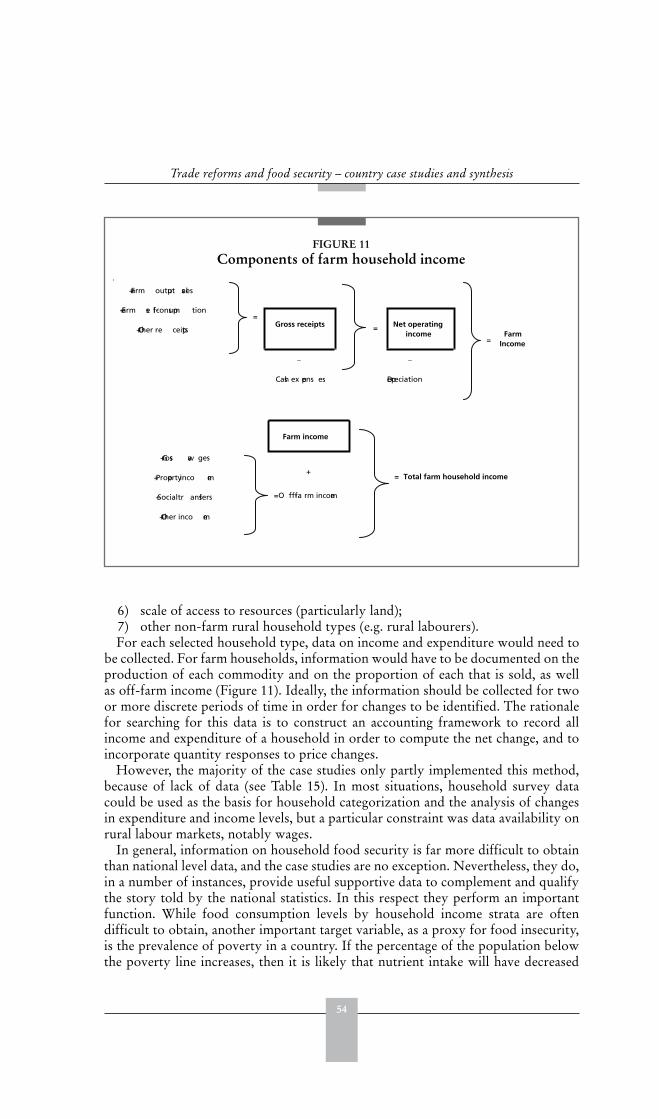
54
Trade reforms and food security – country case studies and synthesis
6) scale of access to resources (particularly land);7) other non-farm rural household types (e.g. rural labourers).For each selected household type, data on income and expenditure would need to
be collected. For farm households, information would have to be documented on theproduction of each commodity and on the proportion of each that is sold, as wellas off-farm income (Figure 11). Ideally, the information should be collected for twoor more discrete periods of time in order for changes to be identified. The rationalefor searching for this data is to construct an accounting framework to record allincome and expenditure of a household in order to compute the net change, and toincorporate quantity responses to price changes.
However, the majority of the case studies only partly implemented this method,because of lack of data (see Table 15). In most situations, household survey datacould be used as the basis for household categorization and the analysis of changesin expenditure and income levels, but a particular constraint was data availability onrural labour markets, notably wages.
In general, information on household food security is far more difficult to obtainthan national level data, and the case studies are no exception. Nevertheless, they do,in a number of instances, provide useful supportive data to complement and qualifythe story told by the national statistics. In this respect they perform an importantfunction. While food consumption levels by household income strata are oftendifficult to obtain, another important target variable, as a proxy for food insecurity,is the prevalence of poverty in a country. If the percentage of the population belowthe poverty line increases, then it is likely that nutrient intake will have decreased
FIGURE 11Components of farm household income
Gross receipts = Net operating income
=Farm
Income
+ Farm output sales
+ Farm se lf-consump tion
+ Other re ceipts
=
_
Cash ex pens es
_
Depreciation
Farm income
+ Gross wa ges
+ Property inco me
+ Social tr ansfers
+ Other inco me
+
=O ff-fa rm income
= Total farm household income
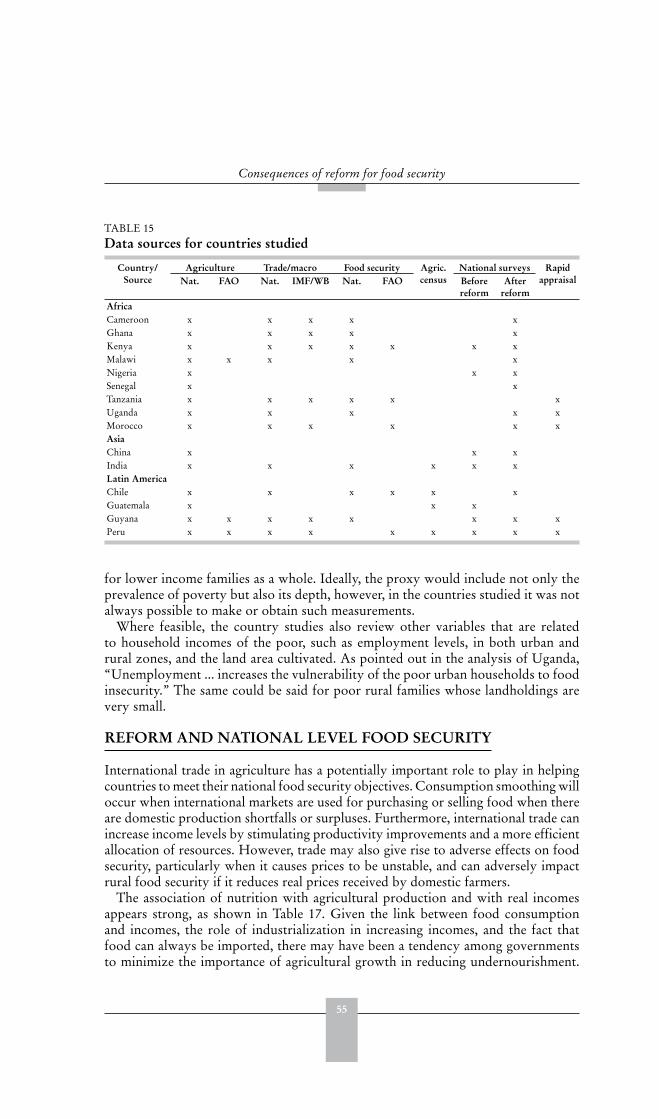
55
Consequences of reform for food security
for lower income families as a whole. Ideally, the proxy would include not only theprevalence of poverty but also its depth, however, in the countries studied it was notalways possible to make or obtain such measurements.
Where feasible, the country studies also review other variables that are relatedto household incomes of the poor, such as employment levels, in both urban andrural zones, and the land area cultivated. As pointed out in the analysis of Uganda,“Unemployment ... increases the vulnerability of the poor urban households to foodinsecurity.” The same could be said for poor rural families whose landholdings arevery small.
REFORM AND NATIONAL LEVEL FOOD SECURITY
International trade in agriculture has a potentially important role to play in helpingcountries to meet their national food security objectives. Consumption smoothing willoccur when international markets are used for purchasing or selling food when thereare domestic production shortfalls or surpluses. Furthermore, international trade canincrease income levels by stimulating productivity improvements and a more efficientallocation of resources. However, trade may also give rise to adverse effects on foodsecurity, particularly when it causes prices to be unstable, and can adversely impactrural food security if it reduces real prices received by domestic farmers.
The association of nutrition with agricultural production and with real incomesappears strong, as shown in Table 17. Given the link between food consumptionand incomes, the role of industrialization in increasing incomes, and the fact thatfood can always be imported, there may have been a tendency among governmentsto minimize the importance of agricultural growth in reducing undernourishment.
TABLE 15 Data sources for countries studied
Country/Source
Agriculture Trade/macro Food security Agric.census
National surveys RapidappraisalNat. FAO Nat. IMF/WB Nat. FAO Before
reformAfter
reformAfricaCameroon x x x x xGhana x x x x xKenya x x x x x x xMalawi x x x x xNigeria x x xSenegal x xTanzania x x x x x xUganda x x x x xMorocco x x x x x xAsiaChina x x xIndia x x x x x xLatin AmericaChile x x x x x xGuatemala x x xGuyana x x x x x x x xPeru x x x x x x x x x
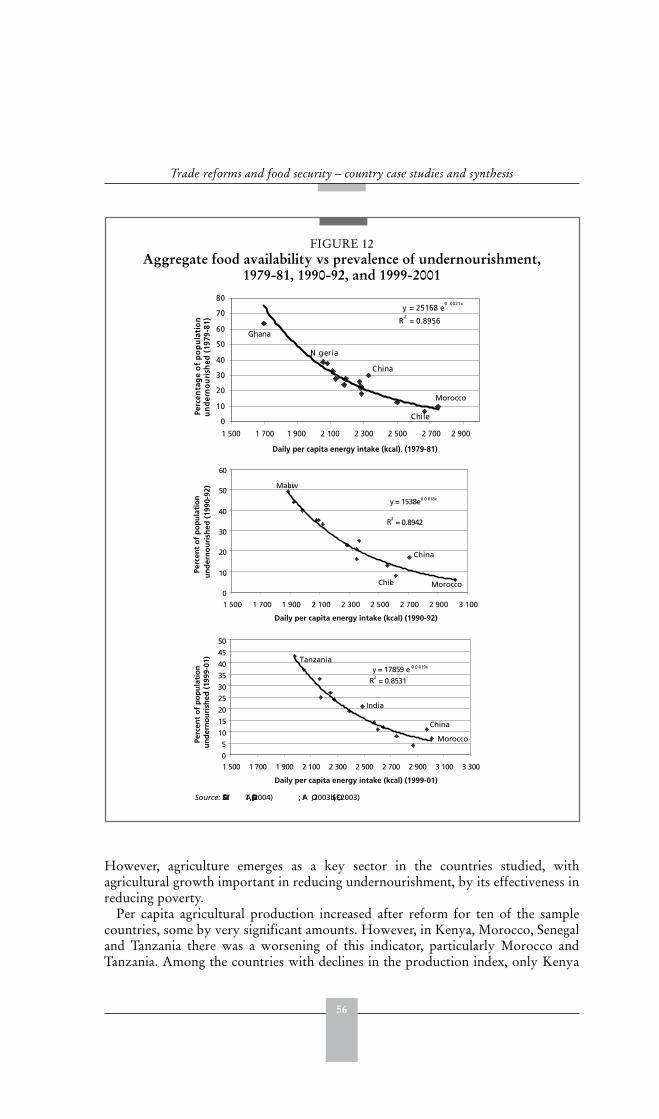
56
Trade reforms and food security – country case studies and synthesis
However, agriculture emerges as a key sector in the countries studied, withagricultural growth important in reducing undernourishment, by its effectiveness inreducing poverty.
Per capita agricultural production increased after reform for ten of the samplecountries, some by very significant amounts. However, in Kenya, Morocco, Senegaland Tanzania there was a worsening of this indicator, particularly Morocco andTanzania. Among the countries with declines in the production index, only Kenya
FIGURE 12Aggregate food availability vs prevalence of undernourishment,
1979-81, 1990-92, and 1999-2001
y = 2516.8 e-0 .0021x
R2
= 0.8956
0
10
20
30
40
50
60
70
80
1 500 1 700 1 900 2 100 2 300 2 500 2 700 2 900
Daily per capita energy intake (kcal), (1979-81)
Perc
enta
ge
of
po
pu
lati
on
un
der
no
uri
shed
(197
9-81
)
Ghana
China
Ni geria
Chile
Morocco
Malawi
y = 1538e-0 .0 018x
R2= 0.8942
0
10
20
30
40
50
60
1 500 1 700 1 900 2 100 2 300 2 500 2 700 2 900 3 100
Daily per capita energy intake (kcal) (1990-92)
China
Chile
Perc
ent
of
po
pu
lati
on
un
der
no
uri
shed
(19
90-9
2)
Morocco
Tanzaniay = 1785.9 e -0 .0 019x
R2= 0.8531
0
5
10
15
20
25
30
35
40
45
50
1 500 1 700 1 900 2 100 2 300 2 500 2 700 2 900 3 100 3 300
Daily per capita energy intake (kcal) (1999-01)
China
India
Perc
ent
of
po
pu
lati
on
u
nd
ern
ou
rish
ed (
1999
-01)
Source: FAOST AT, (FAO, 2004) ; FA O, 2003b (SOFI, 2003).
Morocco
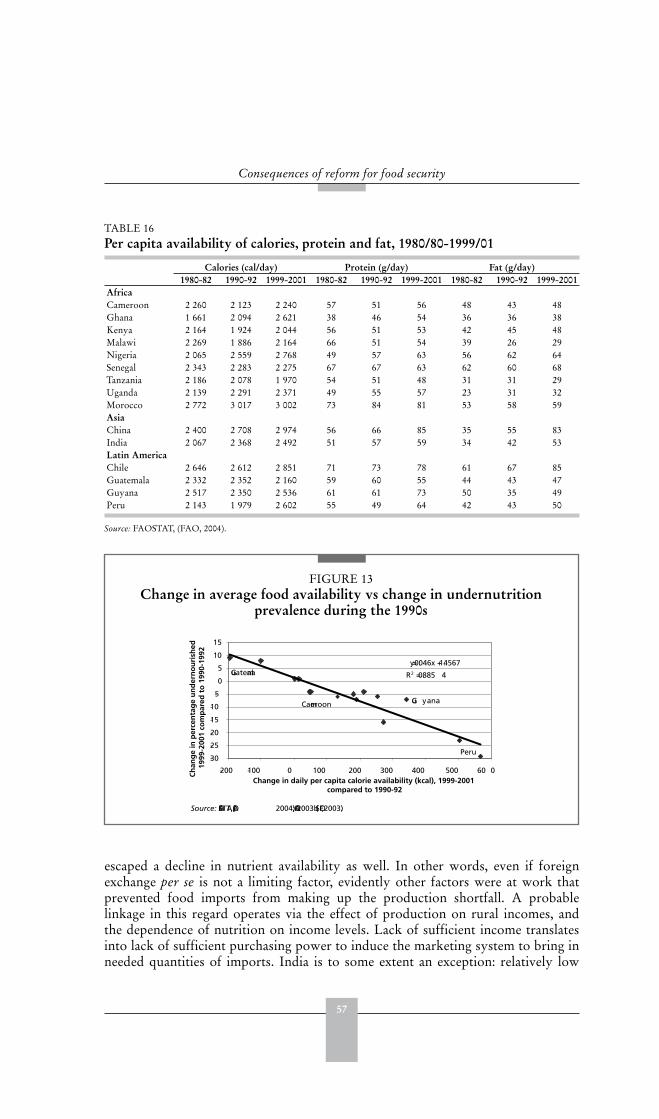
57
Consequences of reform for food security
escaped a decline in nutrient availability as well. In other words, even if foreignexchange per se is not a limiting factor, evidently other factors were at work thatprevented food imports from making up the production shortfall. A probablelinkage in this regard operates via the effect of production on rural incomes, andthe dependence of nutrition on income levels. Lack of sufficient income translatesinto lack of sufficient purchasing power to induce the marketing system to bring inneeded quantities of imports. India is to some extent an exception: relatively low
TABLE 16Per capita availability of calories, protein and fat, 1980/80-1999/01
Calories (cal/day) Protein (g/day) Fat (g/day)1980-82 1990-92 1999-2001 1980-82 1990-92 1999-2001 1980-82 1990-92 1999-2001
AfricaCameroon 2 260 2 123 2 240 57 51 56 48 43 48Ghana 1 661 2 094 2 621 38 46 54 36 36 38Kenya 2 164 1 924 2 044 56 51 53 42 45 48Malawi 2 269 1 886 2 164 66 51 54 39 26 29Nigeria 2 065 2 559 2 768 49 57 63 56 62 64Senegal 2 343 2 283 2 275 67 67 63 62 60 68Tanzania 2 186 2 078 1 970 54 51 48 31 31 29Uganda 2 139 2 291 2 371 49 55 57 23 31 32Morocco 2 772 3 017 3 002 73 84 81 53 58 59AsiaChina 2 400 2 708 2 974 56 66 85 35 55 83India 2 067 2 368 2 492 51 57 59 34 42 53Latin AmericaChile 2 646 2 612 2 851 71 73 78 61 67 85Guatemala 2 332 2 352 2 160 59 60 55 44 43 47Guyana 2 517 2 350 2 536 61 61 73 50 35 49Peru 2 143 1 979 2 602 55 49 64 42 43 50
Source: FAOSTAT, (FAO, 2004).
FIGURE 13Change in average food availability vs change in undernutrition
prevalence during the 1990s
y = -0.046x + 1.4567
R2 = 0.885 4
-30
-25
-20
-15
-10
-5
0
5
10
15
-200 -100 0 100 200 300 400 500 60 0Change in daily per capita calorie availability (kcal), 1999-2001
compared to 1990-92
Guatemala
Peru
Cameroon Gu yana
Source: FAOSTAT, (FAO, 2004); FAO 2003b (SOFI, 2003).
Ch
ang
e in
per
cen
tag
e u
nd
ern
ou
rish
ed19
99-2
001
com
par
ed t
o 1
990-
1992
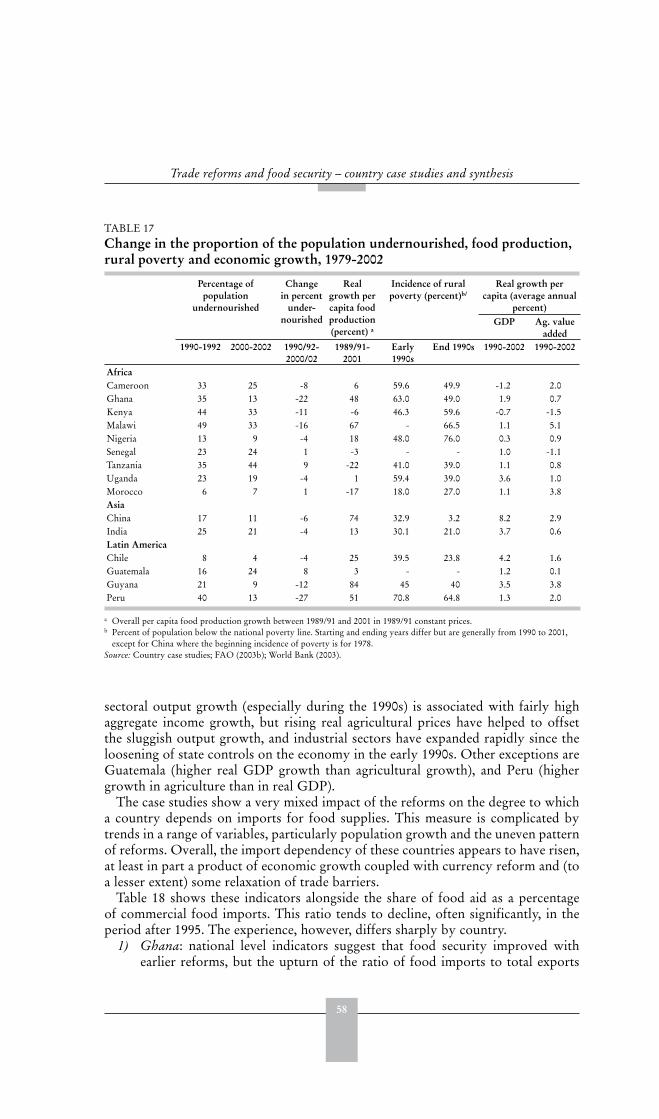
58
Trade reforms and food security – country case studies and synthesis
sectoral output growth (especially during the 1990s) is associated with fairly highaggregate income growth, but rising real agricultural prices have helped to offsetthe sluggish output growth, and industrial sectors have expanded rapidly since theloosening of state controls on the economy in the early 1990s. Other exceptions areGuatemala (higher real GDP growth than agricultural growth), and Peru (highergrowth in agriculture than in real GDP).
The case studies show a very mixed impact of the reforms on the degree to whicha country depends on imports for food supplies. This measure is complicated bytrends in a range of variables, particularly population growth and the uneven patternof reforms. Overall, the import dependency of these countries appears to have risen,at least in part a product of economic growth coupled with currency reform and (toa lesser extent) some relaxation of trade barriers.
Table 18 shows these indicators alongside the share of food aid as a percentageof commercial food imports. This ratio tends to decline, often significantly, in theperiod after 1995. The experience, however, differs sharply by country.1) Ghana: national level indicators suggest that food security improved with
earlier reforms, but the upturn of the ratio of food imports to total exports
TABLE 17 Change in the proportion of the population undernourished, food production, rural poverty and economic growth, 1979-2002
Percentage of population
undernourished
Changein percent
under-nourished
Realgrowth per capita food production(percent) a
Incidence of rural poverty (percent)b/
Real growth per capita (average annual
percent)GDP Ag. value
added1990-1992 2000-2002 1990/92-
2000/021989/91-
2001Early1990s
End 1990s 1990-2002 1990-2002
AfricaCameroon 33 25 -8 6 59.6 49.9 -1.2 2.0Ghana 35 13 -22 48 63.0 49.0 1.9 0.7Kenya 44 33 -11 -6 46.3 59.6 -0.7 -1.5Malawi 49 33 -16 67 - 66.5 1.1 5.1Nigeria 13 9 -4 18 48.0 76.0 0.3 0.9Senegal 23 24 1 -3 - - 1.0 -1.1Tanzania 35 44 9 -22 41.0 39.0 1.1 0.8Uganda 23 19 -4 1 59.4 39.0 3.6 1.0Morocco 6 7 1 -17 18.0 27.0 1.1 3.8AsiaChina 17 11 -6 74 32.9 3.2 8.2 2.9India 25 21 -4 13 30.1 21.0 3.7 0.6Latin AmericaChile 8 4 -4 25 39.5 23.8 4.2 1.6Guatemala 16 24 8 3 - - 1.2 0.1Guyana 21 9 -12 84 45 40 3.5 3.8Peru 40 13 -27 51 70.8 64.8 1.3 2.0
a Overall per capita food production growth between 1989/91 and 2001 in 1989/91 constant prices.b Percent of population below the national poverty line. Starting and ending years differ but are generally from 1990 to 2001,
except for China where the beginning incidence of poverty is for 1978.Source: Country case studies; FAO (2003b); World Bank (2003).

59
Consequences of reform for food security
and the slow down in the growth of food production per capita from themid-1990s suggests a recent deterioration. While food imports constituted adeclining share of total exports between 1992 and 1996, this trend has sincebeen reversed, although the ratio remained below the 1992 level. Maizeproduction appeared to keep pace with demand, whereas domestic productionof rice rose marginally but not enough to offset growing demand. Theproportion of rice imports to consumption has risen substantially. This can beat least partially explained by falling food aid volumes, the fall in the worldprice of rice, and exchange rate appreciation.
2) Kenya: national production of food crops increased slowly following thereforms of the mid-1990s, although this growth has primarily been in outputof traditional crops, rather than in that of the main staple, maize, which hasdeclined. The per capita trend has been less apparent, reflected in an increasingdependency on food imports and a persistent rise in the ratio of food importsto total merchandise exports, all of which suggests that food security at thenational level has become increasingly compromised since the reforms.
3) Malawi: the most significant reforms took place in the 1990s, and correlatewith increases, though variable, in total cereal and food production. However,strong population growth has meant that any increases in per capita foodproduction have been marginal, and in the case of the main staple, maize, thesupply has fallen. However, this has been compensated by increases in thesupply of other food crops, particularly cassava and potatoes.
TABLE 18 Indicators of food import dependence, 1985-2001
Food imports as a percent of total
merchandise imports
Changebetween1985-89
and 1995-2001
Food imports as a percent of total
exports of goods and services minus debt
service
Changebetween1985-89
and 1995-2001
Food aid as a percentage of commercial food import bill
1985-89 1995-2001 1985-89 1995-2001 1980-89 1990-95 1996-2001AfricaCameroon 11 12 1 8 8 0 2 1 1Ghana 9 10 1 19 14 -5 31 16 7Kenya 4 9 5 9 17 8 28 17 10Malawi 7 9 2 15 16 1 94 170 29Nigeria 12 13 1 19 9 -10 0 0 0Senegal 22 26 4 29 33 4 9 3 2Tanzania 5 14 9 23* 26 3 83 9 9Uganda 4 7 3 11 23 12 46 42 24Morocco 11 12 1 19 18 -1 12 6 1AsiaChina 4 2 -2 13 5 -8 1 1 0India 4 2 -2 11 6 -5 11 12 3Latin AmericaChile 4 5 1 3 5 2 2 0 0Guatemala 7 11 4 12 15 3 30 18 16Guyana 8 13 5 9* 11 2 49 30 29Peru 16 13 -3 20 17 -3 13 16 7
* Data for 1990-94.Source: FAOSTAT (FAO, 2004); World Bank, 2003.
60
Trade reforms and food security – country case studies and synthesis
4) Tanzania: per capita availability of the main nutrients has fallen post-reform,partly highlighting the adverse impact of currency appreciation on domesticproduction and subsequent consumption, and also reflecting the high rate ofpopulation growth. This has occurred in spite of an expansion of internationaltrade in food products.
5) China: per capita supplies of the main nutrients have risen substantially duringthe post-reform period, and this has been accompanied by a rapid increasein the supply and consumption of non-staple foods such as meat, vegetablesand edible oils. Rising incomes were reflected in the fact that the proportionof grain consumed as animal feed nearly doubled. By the late 1990s, rapideconomic growth had ensured that food imports as a share of total exports fallsubstantially. Thus, although food imports rose and were playing a bigger rolein supplementing national food supply, the relative cost to the economy wassubstantially lower.
6) India: there has been no overall trend in production over the last decade.Economic reforms initiated during 1991 resulted in a sharp increase in realprocurement and market prices of cereals, and an increase in public stockholding.Consequently, consumer prices rose relatively fast, impacting negativelyeffective demand and per capita consumption and hence food security.
7) Latin America: the supply of main nutrients per capita has fallen in Guatemaladuring the last decade, while in Guyana the aggregate supply of food percapita has remained stable and the ratio of food imports to total exports hasfallen following the reforms - although even here the picture is quite uneven asthe immediate positive impact of trade policy reforms appears to have peaked.In Peru, aggregate food availability has increased since the period of economicreform, but this has been through increasing imports rather than domesticproduction. This trend has weakened as economic growth has slowed.
REFORM AND HOUSEHOLD FOOD SECURITY
Indicators of household food insecurityThe aggregate level analyses depicted in Figures 12 and 13 display a strong (inverse)relationship between levels of per capita food availability and the prevalence ofundernourishment. However, the most fundamental indicators of food security arethose that reflect change at the household level. Any implication of policy for theavailability, accessibility and stability of food supplies at the national level will bemediated by a range of institutional and regional parameters that can transform thesituation for individual households.
Information at this level of disaggregation is often difficult to obtain, and is bestaccessed through household surveys. Although there is some evidence from the casestudies in this respect, the coverage is not complete. Instead, a number of proxyvariables are used. Given that entitlements to food are closely correlated with
2 It should be noted that only a few case studies attempt to investigate the differential impacts on netconsuming as opposed to net food producing households. It is increasingly recognized that rural householdsare characterized by a diversity of consumption/production positions and that the impact of reform will bedifferent for these different household types.
61
Consequences of reform for food security
effective demand for food products, trends in per capita income levels will give someindication of changes in the ability of households to access food. Similarly, data onpoverty can be illustrative, if one makes the assumption that any increase or decreasein those households estimated to exist below the poverty line will have concomitantimplications for food security.
Other indicators that can reflect trends in household food security are thenational estimates of the number of malnourished. Although undernourishment isonly part of the impact of food insecurity, reflecting a worst case scenario, levels ofhousehold food security will be likely to move in the same direction as trends inundernourishment, although the correlation may not necessarily be close.
Poverty and reformThose countries which have experienced relatively strong levels of growth in realGDP over the past decade tend to report positive outcomes with respect to reducingthe number of people below the poverty line (Table 17). For example Ghana,Uganda, China and Guyana all report fairly significant reductions in poverty levelsin the last decade. Peru and Tanzania experienced more moderate increases in realGDP and this appears to be reflected in more moderate reductions in poverty.1) Ghana: the incidence of poverty declined from 51.9 percent in 1991/92 to
39.5 percent in 1998/99, but increased in the Central, Northern and UpperEast regions.
2) Tanzania: the population below the basic needs poverty line declined from39 to 36 percent between 1991/92 and 2000/01 and rural poverty droppedfrom 41 to 39 percent.
3) Uganda: poverty trends and human development indicators have improved,with both rural and urban poverty declining. The headcount ratio declinedfrom 55 percent in 1992/93 to 35 percent of the population in 1999/2000 at thenational level, and from 59 percent to 39 percent in rural areas.
4) China: since the start of the economic reforms in 1979, remarkable progresshas been made in reducing rural poverty, from 260 million people to 29 million.This represents a fall from 32.9 to 3.2 percent of the rural population between1978 and 2001. The greatest reductions in poverty came in the early years ofreforms but the rate has continued to fall gradually since then.
5) Guyana: the country saw a reduction in absolute poverty from 43 percentin 1992 to 36 percent in 1999 (28 percent to 19 percent for critical poverty).However, there was no real improvement in the situation for the rural interiorarea between 1992/93 and 1999. Overall poverty levels remain high and, giventhe economic reverses since 1999, the improvements that occurred may nothave been sustained.
6) Peru reported a moderate reduction in poverty during the 1990s, withnational poverty falling from 57 percent in 1991 to 50 percent in 2001, andextreme poverty from 26.8 to 24.4 percent. Between 1991 and 1997, ruralpoverty dropped from 71 to 65 percent and urban poverty from 52 percent to49 percent.
Table 17 also shows that in those countries experiencing relatively small increasesin real GDP over the past decade, the indicators for the poor are generally lessencouraging. Cameroon reports some negative trends, although a reduction in
62
Trade reforms and food security – country case studies and synthesis
poverty levels took place during the second stage of reform, from 1996-2001. Kenya,Malawi and Nigeria all experienced an increase in poverty rates during the 1990s.1) Cameroon: per capita real income declined from 1984, followed by a relative
improvement in the second phase of reforms. A similar trend is apparentin the household survey analysis of poverty trends, with an approximately13 percent reduction of income poverty during the second phase of reform.However, poverty in the rural areas only fell by around 10 percent, stillremaining at almost 50 percent of the rural population in 2001.
2) Kenya: the national incidence of poverty increased from 46 percent of thepopulation in 1992 to 57 percent in 2000, with rural poverty over this periodincreasing from 46 percent to 60 percent. The rise in urban poverty for Kenyawas even greater, from 29 percent in 1992 to over 51 percent in 2000. Householdexpenditure also decreased in real terms during the reform period.
3) Malawi: is one of the poorest countries in the world, with recent estimatesindicating that 65 percent of the population fall below the poverty line and29 percent are at bare subsistence levels. Changes in expenditure for a matchedsample of Malawi farm households suggests that welfare may have declined inthe post-reform period, with real expenditures for households in all sizes offarms declining between 1998 and 2002.
4) Nigeria: the real income of rural households rose by 60 percent on averagebetween the pre-reform and the reform period. Estimates of the proportion ofthe population living below the poverty line in Nigeria show an increase from28 percent in 1980 to 46 percent in 1985. This declined to 43 percent in 1992but increased to 66 percent in 1996. Reform appeared to narrow the incomegap between rural and urban households but the subsequent reversal of reformappears to have widened the gap again.
In summary, the effects of structural policy reforms on household incomes tend todepend on the overall response of the economy to the reforms. In those countries inwhich post-reform economic growth was inadequate, there was a greater possibilityof poverty deepening.
Undernourishment and reformIn addition to being closely associated with poverty levels, food security is reflectedin data on undernourishment. While data in this paper are generally presented from1980 onward, the analysis here tends to focus on what has happened between 1990 and2001 or 2002. These years cover the period, for most of the sample countries, whenthe effects of reforms were being felt or reforms were getting underway (Table 19).In 1999-2001, Tanzania had the highest rate of undernourishment, at 43 percent ofthe population. Kenya and Malawi each had at least one third of their populationsestimated to be undernourished. For Cameroon, Guatemala, Senegal and India the ratewas at least 20 percent of the population. Between 10 and 20 percent of the populationsof Uganda, Guyana, Ghana, China and Peru were undernourished. Estimates for theremaining countries indicate that undernourishment was less than 10 percent of thepopulation in Nigeria and Morocco and less than 5 percent in the case of Chile.
Over the period from 1979/81 to 1999/2001, the proportion of peopleundernourished was reduced in eight of the countries, with particularly significantdeclines for Ghana and Nigeria. The more recent trends are more encouraging.
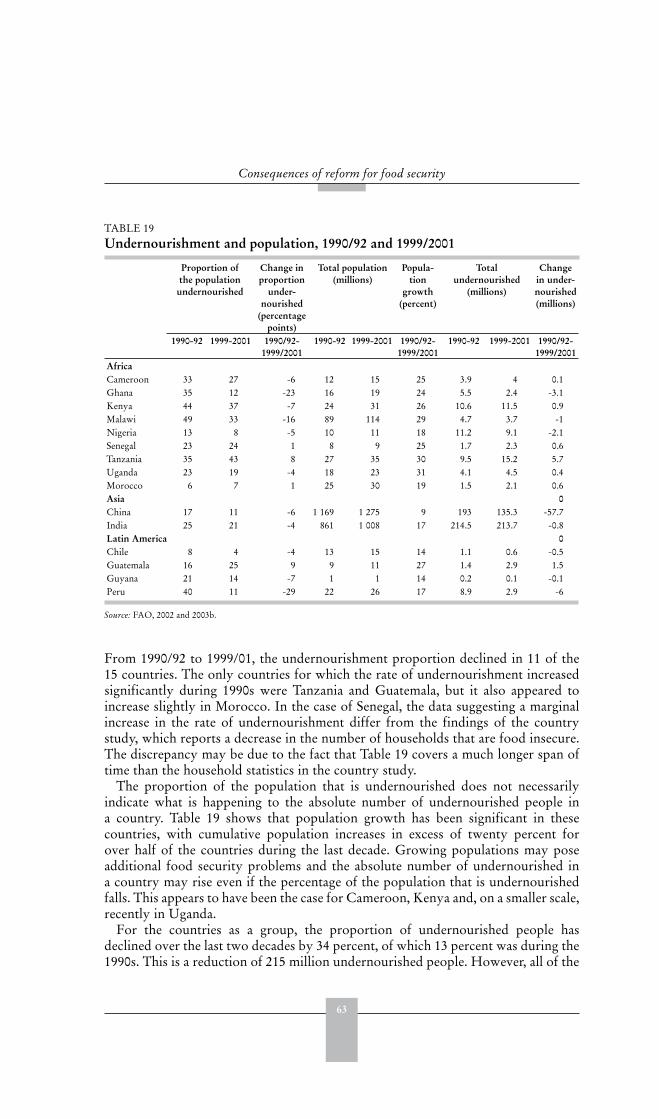
63
Consequences of reform for food security
From 1990/92 to 1999/01, the undernourishment proportion declined in 11 of the15 countries. The only countries for which the rate of undernourishment increasedsignificantly during 1990s were Tanzania and Guatemala, but it also appeared toincrease slightly in Morocco. In the case of Senegal, the data suggesting a marginalincrease in the rate of undernourishment differ from the findings of the countrystudy, which reports a decrease in the number of households that are food insecure.The discrepancy may be due to the fact that Table 19 covers a much longer span oftime than the household statistics in the country study.
The proportion of the population that is undernourished does not necessarilyindicate what is happening to the absolute number of undernourished people ina country. Table 19 shows that population growth has been significant in thesecountries, with cumulative population increases in excess of twenty percent forover half of the countries during the last decade. Growing populations may poseadditional food security problems and the absolute number of undernourished ina country may rise even if the percentage of the population that is undernourishedfalls. This appears to have been the case for Cameroon, Kenya and, on a smaller scale,recently in Uganda.
For the countries as a group, the proportion of undernourished people hasdeclined over the last two decades by 34 percent, of which 13 percent was during the1990s. This is a reduction of 215 million undernourished people. However, all of the
TABLE 19 Undernourishment and population, 1990/92 and 1999/2001
Proportion of the population
undernourished
Change in proportion
under-nourished
(percentagepoints)
Total population (millions)
Popula-tion
growth (percent)
Totalundernourished
(millions)
Changein under-nourished(millions)
1990-92 1999-2001 1990/92-1999/2001
1990-92 1999-2001 1990/92-1999/2001
1990-92 1999-2001 1990/92-1999/2001
AfricaCameroon 33 27 -6 12 15 25 3.9 4 0.1Ghana 35 12 -23 16 19 24 5.5 2.4 -3.1Kenya 44 37 -7 24 31 26 10.6 11.5 0.9Malawi 49 33 -16 89 114 29 4.7 3.7 -1Nigeria 13 8 -5 10 11 18 11.2 9.1 -2.1Senegal 23 24 1 8 9 25 1.7 2.3 0.6Tanzania 35 43 8 27 35 30 9.5 15.2 5.7Uganda 23 19 -4 18 23 31 4.1 4.5 0.4Morocco 6 7 1 25 30 19 1.5 2.1 0.6Asia 0China 17 11 -6 1 169 1 275 9 193 135.3 -57.7India 25 21 -4 861 1 008 17 214.5 213.7 -0.8Latin America 0Chile 8 4 -4 13 15 14 1.1 0.6 -0.5Guatemala 16 25 9 9 11 27 1.4 2.9 1.5Guyana 21 14 -7 1 1 14 0.2 0.1 -0.1Peru 40 11 -29 22 26 17 8.9 2.9 -6
Source: FAO, 2002 and 2003b.
64
Trade reforms and food security – country case studies and synthesis
improvement on this score was accounted for by China and India. When they areexcluded from the sample, the other 13 countries show a very small decline in theaggregate number of undernourished.
In spite of this overall trend, a few countries have achieved significant percentagereductions in the total numbers undernourished in the past decade, particularlyChile, China, Guyana, Ghana, and Peru. In Malawi and Nigeria, there was also adecrease in the numbers of undernourished people in the more recent period. Thecountries which appear to have experienced significant percentage increases in thenumbers of undernourished people during the 1990s include Guatemala, Morocco,Senegal and Tanzania. Surprisingly, India’s rapid pace of progress by this measureduring the 1980s declined to almost nil in the 1990s.
Income distribution and reformIndicators of income distribution and of growth in the agriculture sector cancomplement the indicators based on undernourishment and poverty. Figure 14shows income distribution for the countries in this study. While the Gini coefficientsrange from 30 in Ghana to 57 in Chile, there appears to be little correlation betweenthese coefficients and the most recent data for the proportion of the populationundernourished (as shown in Table 17). It is conceivable that trade reform mayincrease income inequality while at the same time reducing poverty and foodinsecurity.
DIFFERENTIATED EFFECTS WITHIN COUNTRIES
The proxy variables used above to indicate trends in household food securitymay mask the real picture by ignoring distributional and other variations withincountries in response to macro-policy changes. The case studies identify a range ofsuch differentiated effects, including by location, by region, by type of commodityproduced as well as by particular groups of the population.
Urban, rural and regional disparitiesThe direction in which food security indicators change in response to shifts ineconomic policy is likely to vary with the level of development. Among thecountries examined, there are wide differences in both the level of development andthe urban/rural split. Chile has the highest per capita income level and is the mosturbanised, with only 14 percent of the population being rural dwellers. The lowerincome countries tend to have high rural populations: 85 percent of the populationin the case of Malawi and Uganda.
In all countries with available data, poverty rates are significantly higher in ruralthan urban areas. In Malawi for instance, it is estimated that 67 percent of the ruralpopulation and 55 percent of the urban population lie below the poverty line. Giventhat 85 percent of the total population is rural, poverty is predominantly a ruralproblem.
A number of the case studies report a widening of income disparities with reform.In Ghana, the proportion of households not able to meet minimum nutritionalrequirements declined by more than 80 percent in Accra, the capital city, whilethe proportion of households not able to meet minimum nutritional requirements
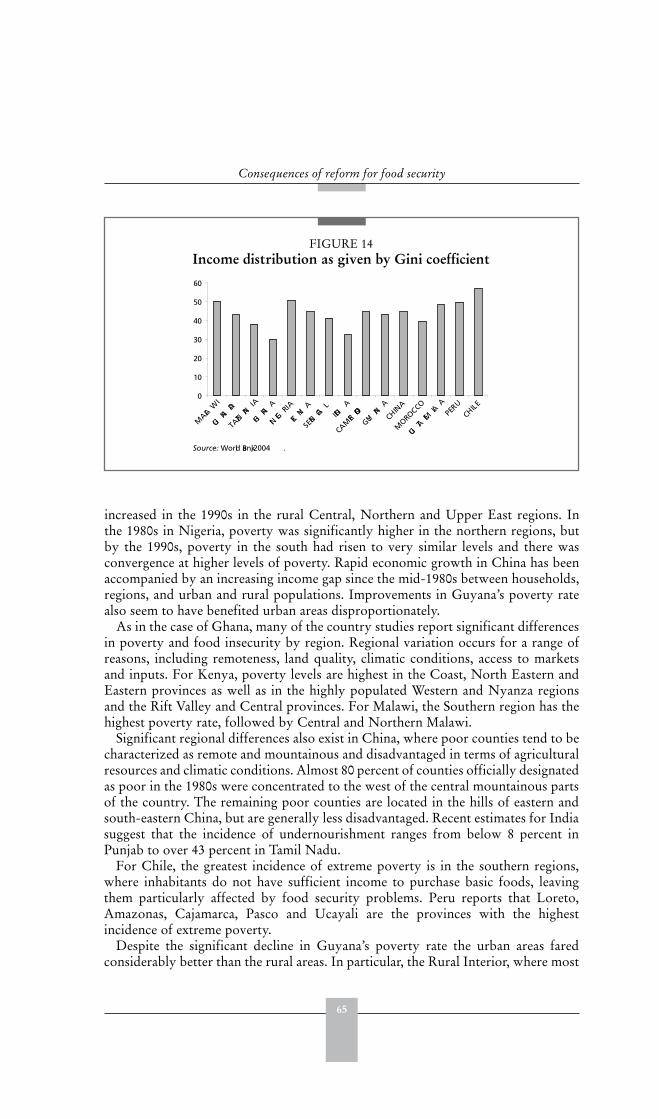
65
Consequences of reform for food security
increased in the 1990s in the rural Central, Northern and Upper East regions. Inthe 1980s in Nigeria, poverty was significantly higher in the northern regions, butby the 1990s, poverty in the south had risen to very similar levels and there wasconvergence at higher levels of poverty. Rapid economic growth in China has beenaccompanied by an increasing income gap since the mid-1980s between households,regions, and urban and rural populations. Improvements in Guyana’s poverty ratealso seem to have benefited urban areas disproportionately.
As in the case of Ghana, many of the country studies report significant differencesin poverty and food insecurity by region. Regional variation occurs for a range ofreasons, including remoteness, land quality, climatic conditions, access to marketsand inputs. For Kenya, poverty levels are highest in the Coast, North Eastern andEastern provinces as well as in the highly populated Western and Nyanza regionsand the Rift Valley and Central provinces. For Malawi, the Southern region has thehighest poverty rate, followed by Central and Northern Malawi.
Significant regional differences also exist in China, where poor counties tend to becharacterized as remote and mountainous and disadvantaged in terms of agriculturalresources and climatic conditions. Almost 80 percent of counties officially designatedas poor in the 1980s were concentrated to the west of the central mountainous partsof the country. The remaining poor counties are located in the hills of eastern andsouth-eastern China, but are generally less disadvantaged. Recent estimates for Indiasuggest that the incidence of undernourishment ranges from below 8 percent inPunjab to over 43 percent in Tamil Nadu.
For Chile, the greatest incidence of extreme poverty is in the southern regions,where inhabitants do not have sufficient income to purchase basic foods, leavingthem particularly affected by food security problems. Peru reports that Loreto,Amazonas, Cajamarca, Pasco and Ucayali are the provinces with the highestincidence of extreme poverty.
Despite the significant decline in Guyana’s poverty rate the urban areas faredconsiderably better than the rural areas. In particular, the Rural Interior, where most
FIGURE 14Income distribution as given by Gini coefficient
0
10
20
30
40
50
60
MALA
WI
UGAN
DA
TANZ
ANIA
GHAN
A
NIGE
RIA
KENY
A
SENE
GAL
INDIA
CAM
EROON
GUYAN
A
CHIN
A
MORO
CCO
GUAT
EMAL
APE
RUCH
ILE
Source: World Bank, 2004 .
66
Trade reforms and food security – country case studies and synthesis
of the indigenous population lives, has seen no real improvement. As much as 78percent of the Rural Interior population remained poor in 1999 and poverty in theRural Coastal area was also considerably above the national average. In Uganda,there were significant reductions in poverty almost across the board, with theexception of the Northern region, where the persistence of poverty appears largelythe result of more than fifteen years of civil conflict.
Similar findings on the geographical variation of benefits from reform werereported, on the basis of analysis of household data in eight African countries:
“. . . recent work on poverty dynamics has shown that some regions, by virtue of their sheer
remoteness, have been left behind as growth has picked up. Households with limited access
to markets and public services have not benefited from growth during the 1990s.”
(Christiaensen et al., 2003).
Disparities related to commoditiesSpecialization in the production of different commodities can also account forvariation in the impact of reform. The Chinese study shows clearly some key gainersand losers from trade reform at the regional level, as a function of cropping patterns.While both western and particularly the eastern regions of China have benefitedfrom trade, liberalization appears to have hurt producers in central China, which isthe largest producer of soybean and edible oil, two of the commodities most affectedby liberalization of imports. The poor suffered, since they were large producersof these products. In recent years, however, the poor have probably gained fromChina’s protection of the maize, cotton and wheat that they produce.
In Kenya, the less lucrative cash crops such as sugar and cotton are produced inthe Coast, Western and Nyanza provinces. The more lucrative export crops such astea and coffee are mainly produced in the Central Province, which in 2000 had thelowest poverty incidence estimate of any region. Reduction of poverty in Chile wasgreater in regions with more modern agricultural systems. During the 1990s, thepoverty rates were lower and reduced by a larger proportion in the central zone,where agriculture is modern and export-oriented. This contrasts with higher povertyrates in the southern zone, where farmers mainly engage in traditional agriculture.
Export-oriented policies for agriculture may have a selective influence on foodsecurity, since greater export success appears to enhance food security among thoseable to participate in these markets, through the linkage with the higher rural incomesgenerated. For instance in Ghana the price incentives resulting from economic reformappear to have favoured export crop farmers, particularly those in cocoa. Exportcrop farmers tend to have higher real household incomes and expenditure, as wellas higher real food expenditure per capita than do households headed by food cropfarmers. For Nigerian farmers, 1996 data suggests that diversification was important.Those farmers specializing in both food and export crops had significantly lowerpoverty levels than those specializing in either food crops or export crops. Theexport crop producers had slightly higher levels of non-poor than the food cropproducers, though it is possible that access to own-consumption may lead to betterfood security for the latter than poverty measures would indicate.
Similarly, subsistence farmers in Guatemala have lower incomes than in thoseregions where the focus is on producing export crops.

67
Consequences of reform for food security
Gender related disparitiesThe evidence of increased poverty and food insecurity rates for female-headedhouseholds is mixed. The Cameroon study reveals that female-headed householdstend to be particularly poor and therefore vulnerable. Female-headed householdsexperienced strong growth in real household food consumption between 1984 and1996, but weaker growth than households headed by men during the period 1996-2001. This may be due to more concentration on food crops by women, comparedwith a relative focus on cash crop production by men. The Kenya study also notesthat households headed by males had higher incomes than those headed by femalesin all regions in 1997. Although for China poverty does not appear to be a problemparticularly associated with women, in general poverty does adversely influencefemale schooling, female infant mortality and maternal mortality.
In Ghana, the proportion of rural households unable to meet minimum nutritionalrequirements is lower for women than for men. In Guatemala, it appears that thegender of the household head is not as important a risk factor now as in the past,because of remittances to wives and mothers as larger numbers of men have migratedoverseas. Similarly for Guyana, the data suggest that female-headed householdsgenerally do better than male-headed households. However, a significant genderdisparity occurring in Guyana that affects food security outcomes is the relativelylow labour force participation rate of 39 percent for women compared with76 percent for men. In Guatemala also, rural employment is mostly male, thoughfemale participation in the labour force appears to be increasing.
Disparities related to other groupsSeveral country case studies highlight higher poverty and food insecurity forminorities and indigenous populations. In Chile, the poorest rural southern regionsinclude many Mapuches, indigenous inhabitants who are constrained by a lack ofcultural, educational and productive abilities to integrate themselves into marketsand access modern agriculture. Similarly for Peru, both general and extreme povertyrates are higher in those provinces where large parts of the population speak theirnative language (Quechua, Aymara and Amazonian dialects) rather than Spanish. InChina minorities also represent a disproportionate proportion of the poor.
SOCIAL SAFETY NETS AND OTHER MEASURES
Any period of transition, particularly one that involves structural economic change,is likely to lead to hardships for those unable to adapt to change swiftly andseamlessly. Frequently such households are those that are most disadvantaged in thefirst place. Thus, trade and associated reforms can cause adverse effects, especially inthe short term. Social safety nets, compensatory policies, and appropriate sequencingof reforms can be useful means of reducing short-term transition costs, allowingpoor households greater opportunity to adjust to changing social and economicenvironments.
However, the poorer the country, the higher the proportion of vulnerablehouseholds, and also the fewer are the resources at the disposal of government toprovide ameliorative measures of this kind. Although some case studies discussincreased government expenditure on social safety nets (Guyana and Peru), or
68
Trade reforms and food security – country case studies and synthesis
mention the importance of donor support (Malawi and Guatemala), nevertheless,given their very low income levels and tax bases, most of the countries under studyface severe financial constraints in implementing effective social safety nets capableof shielding the vulnerable poor from the transition costs associated with reform.In addition to general social safety nets and policies to compensate for losses fromreform, there are also examples of policies implemented specifically to enhance foodsecurity and health.
Social safety nets are integrated into policy design in India and China, as theyare part of macro and sectoral policy rather than specifically targeted programmes.Targeted programmes are a burden on scarce fiscal resources, and have beenintroduced mainly in Latin America, and almost none in the relatively impoverishedcountries of sub-Saharan Africa.
Two of the case studies from sub-Saharan Africa do, however, show the use of safetynets in the region. The poor have access to some safety nets in Malawi, includingNGO food-for-work programmes and supplementary feeding programmes. In thelate 1990s, the Malawian Government (supported by donors) introduced a series ofsafety nets for poor smallholders to minimize costs of adjustment. These includedfree inputs, credit for inputs, and cash-for-work public programmes in food insecureareas.
None of the policy reform programmes adopted and implemented in Nigeriaexplicitly included social safety nets, but several government programmes related topoverty were initiated during the policy reform period. The Nigerian Governmentprovided some ad hoc social safety nets, but they were not systematicallyimplemented. Furthermore, there was a lack of clear targeting to the most vulnerablegroups to address negative impacts of the policy reforms.
Among the Latin American countries, Chile has explicitly recognized thatvulnerable groups might require special programmes to ensure continued foodsecurity, health and nutrition. The main programmes have focused on human capitalinvestment, nutrition and education, with great efforts made to target programmesto the poorest geographical areas. Peru also followed a strategy of providing foodand nutrition as well as basic health, sanitation and education to targeted sections ofthe population, as well as funding social emergency programmes during the 1990s.It is estimated that between 1997 and 1998, social assistance programmes reachedmore than 56 percent of households, with particularly strong coverage for ruralhouseholds. Targeting problems, however, meant that fewer than 70 percent of thebeneficiary households were considered poor.
Nutrition and nutrition-related support became necessary in the stabilizationphase of the structural adjustment programme in Guyana. Two major safety netswere introduced to provide compensatory social support for the economic reforms:the Social Impact Amelioration Programme and Basic Needs Trust Fund. Safetynets provide cash, food and other benefits designed to alleviate the worst effectsof poverty. The Government has supported a reduction in poverty, with spendingincreasing from 0.4 percent of GDP in 1989 to a peak of 3.2 percent of GDP in1997. However, there appear to have been targeting problems, with the pattern ofexpenditure by the two major safety nets not matching the distribution of regionalpoverty. Government schemes to improve health and food security include foodand micronutrient supplementation for infants, children and pregnant and lactating
69
Consequences of reform for food security
women in addition to awareness campaigns on healthy cooking and the role of abalanced diet. A “third generation” set of reforms is presently being formulated tofocus on areas including research, education, nutrition, food supplementation andconcentration on key target groups. Specific goals will be identified and quantitativetargets set.
Since the mid 1980s, successive governments in Guatemala have made itcompulsory to fortify foodstuffs such as salt with iodine, sugar with vitamin A,wheat flour with iron and B complex vitamins. In 1997, the national school foodprovision programme evolved into a school breakfast for all students in rural primaryschools. This programme provided an estimated 65 percent of rural children’s dailynutritional needs. In urban areas, where children tend to enjoy better nutrition, amore modest programme was implemented. Nevertheless, the case study also notesthat social protection schemes were poorly targeted and inefficient.
Some countries have made efforts to improve food security outcomes bymaintaining strategic food reserves, for example, Kenya and Malawi. Tanzaniaalso established a Strategic Grain Reserve to purchase and store maize in times ofsurplus, with resale as necessary to meet local market shortages. Other countries,including Uganda, do not have national food reserves to help the country cope withunexpected shortages. However, in the cases of Kenya and Tanzania, the presence ofstrategic food reserves has not prevented a deterioration of food security. Access tointernational markets to sell surplus crops and to purchase during times of shortagemay lessen the need to keep domestic food reserves and may represent a moreefficient option.

71
5
Summary and conclusions
FOOD SECURITY IMPACTS OF REFORM: A SUMMARY
In all the countries for which case studies have been presented, there has been avariety of macroeconomic and sectoral reforms that in some cases stretch back overmore than a decade. Trade policy reforms have usually been only a part of this reformprocess, and in some cases have been introduced piecemeal alongside other shifts inpolicy. In this context it is difficult, if not impossible, to disentangle the effects onfood security of one element of policy reform from the effects of others.
What the studies do demonstrate is the changing nature of food security againstan ongoing process of policy change. In general the direction of these changes isthe same for all: towards greater openness and competition in national marketswith respect to both internal trade and international trade. But the institutional andinfrastructural environments in which these reforms have taken place are widelydifferent, as are the pace and sequence with which reforms have been introduced.The extent to which individual policy shifts can be associated directly with specificfood security outcomes is limited. The case studies have highlighted the complex andindividual nature of the reform process.
Table 20 reflects the impact of reforms on farmers in the countries studied. Manyincluding Ghana, Nigeria, Uganda, China, Chile, Guyana, and Peru, appear tohave experienced fairly positive food security outcomes over the past decade, inconjunction with trade reforms, while the consequences in Cameroon, Malawi, andIndia appear to have been more ambiguous. For the remaining countries (Kenya,Morocco, Senegal, Tanzania and Guatemala) food security outcomes appear to havebeen disappointing (though the exact nature of the changes in Senegal is still unclear).Although trade reform has not been the only change, there are indications that therehas been some spill-over from these reforms to the level of food security.
1) Cameroon: results from reform have been somewhat disappointing to date.The proportion of children suffering from severe undernourishment morethan doubled, from 3 percent to 6.4 percent, in the ten years after 1991.The number of undernourished increased. There have been some relativelysmall improvements in the agricultural production index and in per capitaavailability of calories and protein. Income growth was negative duringthe early 1990s, but has been reasonably steady and positive from 1995. Inaddition to the challenge of further improving growth rates, a major problemappears to be distribution of benefits from growth.
2) Kenya: the case study notes a dismal response to reform. Climatic factorssuch as drought are important in explaining the country’s disappointing
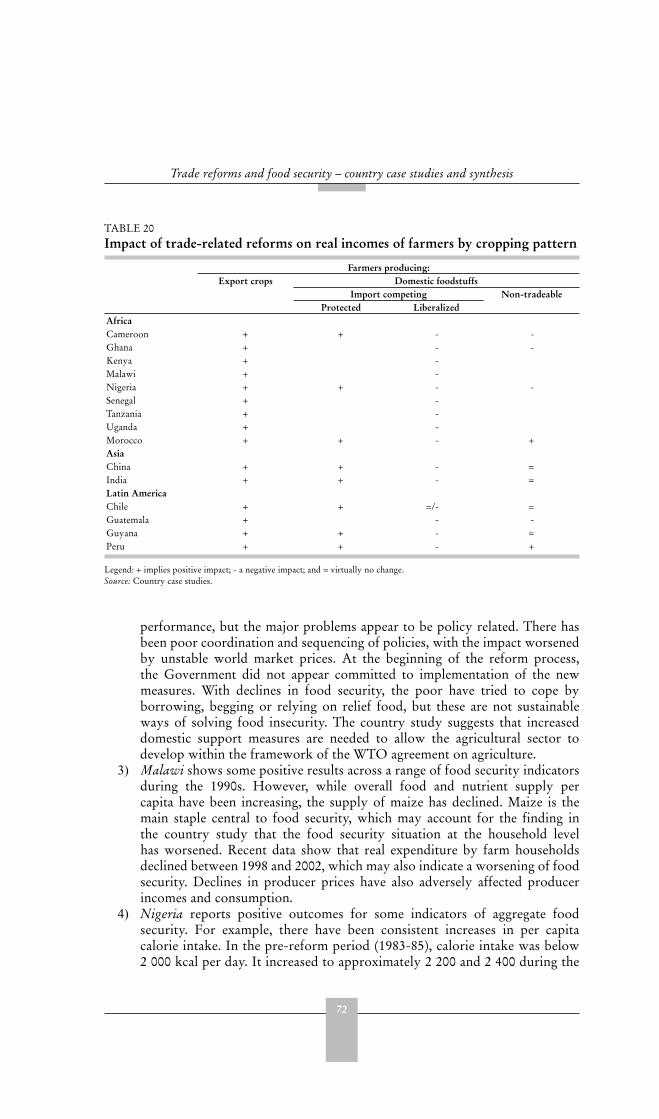
72
Trade reforms and food security – country case studies and synthesis
performance, but the major problems appear to be policy related. There hasbeen poor coordination and sequencing of policies, with the impact worsenedby unstable world market prices. At the beginning of the reform process,the Government did not appear committed to implementation of the newmeasures. With declines in food security, the poor have tried to cope byborrowing, begging or relying on relief food, but these are not sustainableways of solving food insecurity. The country study suggests that increaseddomestic support measures are needed to allow the agricultural sector todevelop within the framework of the WTO agreement on agriculture.
3) Malawi shows some positive results across a range of food security indicatorsduring the 1990s. However, while overall food and nutrient supply percapita have been increasing, the supply of maize has declined. Maize is themain staple central to food security, which may account for the finding inthe country study that the food security situation at the household levelhas worsened. Recent data show that real expenditure by farm householdsdeclined between 1998 and 2002, which may also indicate a worsening of foodsecurity. Declines in producer prices have also adversely affected producerincomes and consumption.
4) Nigeria reports positive outcomes for some indicators of aggregate foodsecurity. For example, there have been consistent increases in per capitacalorie intake. In the pre-reform period (1983-85), calorie intake was below2 000 kcal per day. It increased to approximately 2 200 and 2 400 during the
TABLE 20 Impact of trade-related reforms on real incomes of farmers by cropping pattern
Farmers producing:Export crops Domestic foodstuffs
Import competing Non-tradeableProtected Liberalized
AfricaCameroon + + - -Ghana + - -Kenya + -Malawi + -Nigeria + + - -Senegal + -Tanzania + -Uganda + -Morocco + + - +AsiaChina + + - =India + + - =Latin AmericaChile + + =/- =Guatemala + - -Guyana + + - =Peru + + - +
Legend: + implies positive impact; - a negative impact; and = virtually no change.Source: Country case studies.
73
Summary and conclusions
reform periods (1986-88 and 1989-91) and to almost 2 800 in the post-reformperiod (1994-97). Food security, as measured by this indicator, appeared tobe a problem for Nigeria prior to the reform, but not afterwards. Nigeriaalso reports that food self-sufficiency increased for most products andperiods from the early 1980s, with the country maintaining a high level ofself-sufficiency in major cereals. However, while reforms generated improvedincentives to agricultural commodity producers, the response to incentiveswas below expectations. Declines in world prices for major agriculturalproducts had an adverse impact and improvements in average calorie intakedo not necessarily imply improvements in the nutritional status of thepoorest households.
5) Senegal: the available time series on household food security was short,but a rather marked decrease was registered between 1992 and 1995 in theproportion of food insecure households, from 42.5 percent to 34.3 percent.Nevertheless, this indicator moved in the opposite direction in two regions,with food security deteriorating sharply in Saint-Louis and to some degreein Diourbel. A finding of concern is that in the aggregate, female-headedhouseholds experienced a worsening of food insecurity.
6) Tanzania: the overall picture appears to be a significant worsening acrossa range of food security indicators. Although some households reportedimproved food security due to higher levels of earnings and access to buycheap imported foods, others reported that food security has been worsenedby policy changes. Adverse climatic events such as El Niño rainfalls alsoappear to have been critical in hindering food security. A marginal reductionin the percentage of the population below the poverty line has been achieved,but the relatively slow rate of economic growth has been a major hindrance toimproving the status of the poor.
7) Uganda: here policies have been relatively successful in regard to improvingfood security. Economic reforms have resulted in increased total income,agricultural output and farm household incomes. There has been someimprovement in per capita availability of calories in the aggregate, and theproportion of the population that is undernourished has decreased. There hasalso been a small increase in the absolute number of undernourished from1979-91 to 1999-01, but the total population increased by far more duringthat time. Furthermore, the country study presents data showing that thepercentage of food secure households increased from 60.9 percent in 1995 to71.8 percent in 2003.
8) Morocco has experienced problems with economic reforms that havesignificance for other countries. Per capita nutrient levels have not noticeablyimproved, in part due to drought and also because they were previously highrelative to other countries. It has the lowest level of undernourishment ofthe 15 countries apart from Chile. The distributional impacts of reform areinteresting: the high level of protection tended to serve the interests of thelarger farmers and families in areas of high production potential but did notbenefit the small producers in the semi-arid zones who mainly farm to meettheir own subsistence requirements. These social and regional differences werefurther compounded by high domestic costs of production and inefficient
74
Trade reforms and food security – country case studies and synthesis
resource use. Hence, whatever problems arose from reform, protection wasnot a policy that benefited the poor or enhanced food security.
9) China: economic reforms have generated outstanding results for economic growth,poverty reduction and food security at both the national and the household level.Sharp falls in poverty rates have dramatically improved household food securityand the incidence of undernourishment has dropped. Both trade and domesticreforms have been important. Foreign trade has been a vital part of China’sgrowth story, expanding even more rapidly than GDP. Overall, the impact oftrade policy change appears to have been smaller than that of domestic reform.Furthermore, domestic policy reforms have tended to stimulate growth across allsectors, whereas trade reform has had more sector-specific effects. In aggregate,the net gains from trade reform in China are positive, but there have been largedifferences in effects for particular groups of farmers.
10) Guatemala: reform has shown mixed results and the country has not overcomefood vulnerability problems. This is despite the successful substitution ofagricultural production with more profitable products, and the many naturalresources. Falling coffee prices have been a principal reason for the poorperformance, and growth in non-traditional products has not been sufficientto compensate for employment lost in the coffee sector. Some adverse climaticevents have occurred and the distribution of benefits from new sources ofincome has not been even: tourism is concentrated in certain areas, clothingfactories tend not to locate in remote areas, and remittances only reach thosewith relatives abroad. Furthermore, there have been problems with distributingassistance, with allegations of corruption in the process. Guatemala may be acase in which greater transparency and accountability in government arenecessary conditions for improvement of the lot of the poor.
11) Guyana has seen some significant improvements, with reforms leading toeconomic growth and a positive impact on food security. While there isnot a problem with resource or food availability, a major conclusion of thecountry study is that remaining food security problems are “first and foremostsituated at the level of policy failure to ensure adequate access to food for thewhole population”. Distribution and poverty are key problems and whileadequate supplies exist in the aggregate, strong pockets of poverty and foodsecurity problems have persisted. Although Guyana imports food to meetits requirements, there has been no scarcity of foreign exchange in the post-reform period. Following liberalization, economic growth was rapid up to1997. However, there has been a slippage in economic growth rates since 1997,attributable at least in part to exhaustion of the reform benefits. This leads toconcern for the sustainability of the improvements in food security.
12) Peru: the food security picture showed important overall improvements acrossa range of food security indicators during the 1990s. With a resumption ofeconomic growth, access to food improved, particularly after the mid 1990s,and poverty, especially extreme poverty, diminished. These achievements gaverise to significant gains in nourishment during most of the 1990s. However,during 1998-2001, the economic situation in Peru deteriorated dramatically,with an increase in extreme poverty from 15 to almost 25 percent of thepopulation. In short, the gains in food security in the mid-1990s did not prove
75
Summary and conclusions
to be sustainable. Other problems noted in the country study include somedeterioration in the situation of most small rural farmers during the 1980s,with little improvement for them during the subsequent reforms. This was duein part to the downward price trend for small farm outputs, combined withincreased agricultural input prices. However, social safety nets improved foodaccess and even small farm households with declining agricultural incomewere able to improve their food security situation with the implementation ofthe reform measures.
While there have been varied experiences from similar kinds of policy reform,the underlying message is clear. Trade and associated domestic policy reforms arenot intrinsically antithetic to food security. However, they should be seen as a partof a policy package governing the incentives and opportunities facing agriculturalproducers. This package needs to be subtly designed and carefully sequenced toensure that positive results from greater trade openness are not offset by negativeimpacts on poor and food-insecure segments of the population.
POLICY LESSONS
The results of this study suggest that, particularly for countries at earlier levels ofdevelopment, trade reform can be damaging to food security in the short to mediumterm if it is introduced without a policy package designed to offset the negativeeffects of liberalization.
Although trade policy reform has been only a part, and often a small part, of widerreform packages, nevertheless, some useful pointers emerge from the case studies:
The underlying premise of the domestic and trade policy reforms undertakenby countries in the sample was, with respect to the agricultural sector, thatgreater market orientation would improve the sector’s performance. However,the results from the reform experiences of the countries have been mixed.Where reform packages are carefully designed and implemented to ensure thatpositive results are generated for the poor, in the short and medium run as wellas the long run, reforms are condusive to poverty reduction and improved foodsecurity.Greater attention needs to be paid to the sequencing of reforms in markets forinputs and outputs. Appropriate incentives on the side of outputs should beassured before (or at the same time as) input prices are raised, even at the cost ofmaintaining some well-targeted input subsidies during a transitional adjustmentperiod.More thought should be given to ways to assist the private sector to fill morecompletely the gap left by dismantling State agricultural marketing institutions,including support for the development of effective marketing and distributionsystems.Improving rural infrastructure is an important concomitant for successful policyreform in most countries, but it is particularly needed in low-income areas,along with support for productive investments by small farmers. Without suchinvestments it is difficult for such farmers to respond to price incentives.Policies to encourage the development of rural non-farm employment are alsoimportant for the rural poor. These can include the development of micro-
76
Trade reforms and food security – country case studies and synthesis
finance, simplification of regulatory regimes, infrastructure improvement, andspecial incentives for rural industrialization in poor areas.As complementary policies to facilitate adjustment of the kind mentioned abovecan take time to bear fruit, transitional compensatory measures, targeted onlower-income groups, may be needed. The absence of measures to protect thepoor, and the problems of targeting the most vulnerable groups, were noted inseveral of the case studies.Looking to the WTO negotiations on agriculture, the most sensitive domestictrade policy debates centre on policy instruments to deal with import competingsectors. This is particularly so in those cases where international markets aredistorted due to high levels of support and export subsidies by rich countriesthat can afford them.For countries with a large proportion of low income and resource poor peopleliving in rural areas and who depend on agriculture, reforms aimed at raisingproductivity and at non-agricultural employment creation are essential forenhancing food security in the medium to long term. However, since suchreforms may take some time to yield results, it seems preferable that thesereforms be set in motion before (or at least at the same time as) implementingmeasures such as removing subsidies on agricultural inputs, and reducing tariffson key crops grown by low-income households.
AREAS FOR FURTHER RESEARCH
This synthesis has brought out the main elements of reform experiences in a numberof countries and has yielded some tentative conclusions. Some of the issues whichcould benefit from further research are outlined here.
The relative weight to be assigned to different components of macroeconomicand sectoral policy reforms in an adjustment package.
It is important to understand the relevance of the stage of agriculturaldevelopment to the contribution that the sector is making, or could potentiallymake, to broader growth, poverty reduction and levels of food security. A betterunderstanding of the significance of sequencing on the agricultural sector, inparticular of the balance between trade reform and domestic policy changes,would be useful.
The fact that reforms were often initiated in response to a macro-economic crisisadds weight to arguments that specific sectoral policy interventions or reformsshould not necessarily be put in place simultaneously. Rather, they should beimplemented following the alleviation of the factors contributing to the crisis.The transmission mechanisms between policy reforms and real producer pricesand the constraints that modify these.
Such transmission mechanisms are a function of the marketing institutions andthe structure of the market, but they are also influenced by price discoverymechanisms and information channels. The question of how farmers formexpectations about future prices and how these expectations can be made moreinformed is vital to the promotion of transparency in reform.The differential supply response of different types of producers in differentinstitutional and policy environments.

77
Summary and conclusions
Understanding the impact of price changes on different groups of consumers isimportant for understanding the impact on food security. It is clear that the farmsector can be divided into a number of categories from the viewpoint of supplyresponse: by size, by region and by household circumstance. Consumer groupscan also be identified. A more complete understanding of the way in which eachgroup responds to price incentives would make empirical estimation much moreuseful.The dynamic effects of reforms can be quite different to the static effects.
The assessment of the impacts of reforms in the case studies is generally madein a static manner, comparing the relative size and distribution of costs andbenefits before and after reform. Further attention needs to be paid both todynamic benefits where reform has been successful in stimulating growth and/orproductivity increases and to the transitional costs associated with the process.The role of the state and the private sector in the provision of services andfacilitation of access to agricultural input and output markets.
The relation between public and private institutions is often complex. Therole of state trading agencies is often obscure and is in any case changing inmany countries. From the point of view of analysis of reform policies a clearunderstanding of the ways in which the state determines the prices of inputsand outputs, and the way that the private sector is involved in these activities isessential.The appropriate criteria for prioritizing fiscal expenditures on compensatoryand complementary policy measures in an adjustment programme at differentstages in the reform process.
More understanding of the best use of funds to assist agriculture to takeadvantage of the benefits of reform and avoid the costs that come from theinability to adjust would be a significant contribution.

79
References
Baffes, J. & Gardner, B. 2003. The transmission of world commodity prices to domesticmarkets under policy reforms in developing countries. Policy Reform, 6(3): 159-180.
Christiaensen, L., Demery, L. & Paternostro, S. 2003. Macro and micro perspectives ofgrowth and poverty in Africa. The World Bank Economic Review, 17(3): 341.
FAO. 2004a. Socio-economic analysis and policy implications of the roles of agriculture in
developing countries – research programme summary report. Rome.FAO. 2002. SOFI – The state of food insecurity in the world 2002. Rome.FAO. 2003a. Trade reforms and food security: conceptualizing the linkages. Rome.FAO. 2003b. SOFI – The state of food insecurity in the world 2003. Rome.FAO. 2004. FAOSTAT database. Rome.IMF. 2004. International financial statistics CD-ROM 2004. Washington, DC.OECD. 2003. Agricultural policies in OECD countries – monitoring and evaluation 2003.
Paris.Winters, L.A. 2002. Trade policies for poverty alleviation. In B. Hoekman, A. Mattoo &
P. English (eds.) Development, trade and the WTO: a handbook. Chapter 5. Washington,DC, World Bank.
Winters L.A., McCulloch, N. & McKay, A. 2004. Trade liberalization and poverty: theevidence so far. Journal of Economic Literature, XL11(1): 72-115.
WITS. 2003. World integrated trade solution.Washington, DC, World Bank.World Bank. 2001, 2003, 2004. World development indicators database. Washington, DC.


81
Annexes

83
A
Limits of the case study approach
The case study approach to examining policy reform and its impact on the farmsector poses a number of difficulties, many of which also apply to alternativemethodologies.
A principal difficulty in establishing linkages between changes in policy variablesand target variables is that policy change is usually a process that occurs over anumber of years, even decades, and often in an intermittent and even inconsistentmanner, such as raising import tariffs that had been reduced, or re-imposing controlson imports or exports. In Peru, for example, the number of items whose importationwas restricted increased from 107 at the end of 1980 to 4 715 at the end of 1987 andthen fell to 535 at the end of 1989 and zero in 1990. Variations in exchange ratepolicy also have been experienced in the countries in the sample. Nigeria liberalizedits exchange rate beginning in the 1980s, re-instituted a fixed exchange rate in 1993,implemented a dual exchange rate system in 1995 and finally restored a marketexchange rate in 1999. To a certain extent, the case study approach allows thesefactors to be internalized in the investigation of the relationship, but establishinga causal link is not possible. The fact that some key policy reforms are difficult toquantify, as in the case of removal (full or partial) of State monopolies over graintrade or agricultural input supply, makes their occurrence difficult to introduce intoquantitative studies. Case studies can be useful in providing the detail to rationalizeproducer response in the light of such reforms.
It is also difficult to separate the effects of policy reforms from other structuralchanges that may be occurring in an economy and from exogenous events thatare beyond the control of policy-makers. Sometimes non-economic factors alsoinfluence the course of the economy in a significant way. Additionally, some policyreforms do not necessarily generate the intended effects in the short or medium run.For example, the Malawi and Ghana studies found that the private sector has notresponded to the withdrawal of State marketing services in the less well-connectedareas, with the result that marketing channels remained weakened for several yearsafter the policy reform. The same has been observed for rural financial services.In some cases, the reforms have not had the full set of intended effects becausesupporting changes have not been put into effect. In these circumstances, the timehorizon of the study may not be sufficient to capture the full set of intended effectsof policy reform.
Another fundamental limitation facing all approaches to the impact of reforms isthat data are scarce in regard to household food consumption levels, especially forpoor rural families who are most at risk of food insecurity. The case studies havemade an effort to utilize the available survey evidence, but the data are sometimesweak and contradictory, and annual time series on this variable do not exist in mostof the countries studied. This is one reason why poverty estimates also are used inregard to measuring policy effects, since they tend to be closely correlated with food
84
Trade reforms and food security – country case studies and synthesis
insecurity. However, care must be exercised in assuming that this correlation is astrict one, and some of the case studies explore differences in the response of povertylevels and food security indicators.
Finally, in regard to the individual country studies it should be noted thatcomplete, multiple-equation regression estimates have not been used to quantify therelationships between policy variables, transmission variables and target variables.This is due in part to specification problems given that some key policy variablesare not easily quantifiable. How, for example, would the effect on agriculture of thewithdrawal of government from rural credit provision be quantified? In addition,for some relationships a complete specification would require inclusion of variablesthat go beyond the scope of the present study. The decision not to employ completeregression models is also explained by incompleteness of key data series. Somepartial regressions are presented in the case studies but on the whole the analysis ismore numerical in character with the intention of bringing out a clearer picture ofstylized facts and refining or strengthening hypotheses for future consideration.
Nevertheless, in spite of these difficulties, the studies have brought out some broadtrends and results that appear reasonably robust.
85
B
Price decomposition analysis
This annex presents the results of a decomposition of domestic price changes into thethree components: world price changes, exchange rate movements and other effects(including policy shifts).
The domestic price of a product, for some period “0”, is determined by theequation:
Pd0 = Pw
0 * E0 * (1+t0 ) * (1+ c0 ),
where Pd is domestic price, Pw is world price, E is the exchange rate, (1+t) representsthe ad valorem tariff and (1+c) represents other costs (e.g. transport and marketingcosts). A similar relationship is defined for some other period (period “1”):
Pd1 = Pw
1 * E1 * (1 + t1) * (1+c1).
Taking logs (ln) of both equations and subtracting, one obtains the equation:
(lnPd1 - lnPd
0) = (lnPw1 - lnPw
0) + (lnE1 - lnE0) + (lnt1- lnt0) + (lnc1- lnc0)
The first-order difference gives the (approximate) percentage change. In view of datalimitations, most of the case studies combined the last two terms when conducting thedecomposition. Time series and cross-section regression analyses using commoditiesfor which relevant time series data were available in the case study countries showthese equations to be highly significant in explaining domestic prices.
The tables illustrate that real domestic price movements varied significantly bycommodity and by reform episode. This was despite the fact that international priceswere generally declining, indicating that changes in the latter were being significantlymodified, and often reversed, by domestic economic and trade policies.
In the case studies, the presentation of the price decomposition analysis ispresented either as a change in the domestic price as a percentage change with respectto previous period, or as a percentage change with respect to a base period, or both.In this annex, the results are presented with respect to the previous period and thediscussion constructed on that basis. Whilst the interpretation of results in the casestudy narrative holds irrespective of the end points compared, the results presentedin Annex B should be used for comparative purposes.
It should be noted that the analysis in the case studies is often undertaken in termsof real price series. The interpretation of changes in the real exchange rate (RER)can be ambiguous where this is the case. Where studies deflate domestic pricesby the domestic price index and the international price index by an internationalprice deflator, the real exchange rate change should be calculated by dividing the
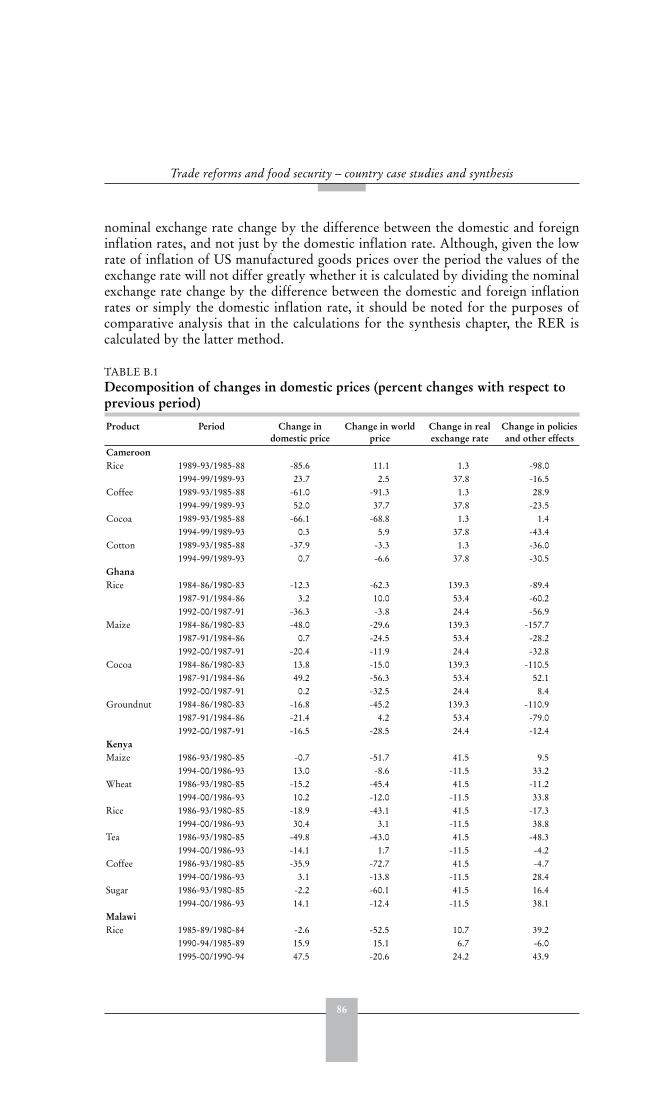
86
Trade reforms and food security – country case studies and synthesis
nominal exchange rate change by the difference between the domestic and foreigninflation rates, and not just by the domestic inflation rate. Although, given the lowrate of inflation of US manufactured goods prices over the period the values of theexchange rate will not differ greatly whether it is calculated by dividing the nominalexchange rate change by the difference between the domestic and foreign inflationrates or simply the domestic inflation rate, it should be noted for the purposes ofcomparative analysis that in the calculations for the synthesis chapter, the RER iscalculated by the latter method.
TABLE B.1Decomposition of changes in domestic prices (percent changes with respect to previous period)
Product Period Change in domestic price
Change in world price
Change in real exchange rate
Change in policies and other effects
CameroonRice 1989-93/1985-88 -85.6 11.1 1.3 -98.0
1994-99/1989-93 23.7 2.5 37.8 -16.5Coffee 1989-93/1985-88 -61.0 -91.3 1.3 28.9
1994-99/1989-93 52.0 37.7 37.8 -23.5Cocoa 1989-93/1985-88 -66.1 -68.8 1.3 1.4
1994-99/1989-93 0.3 5.9 37.8 -43.4Cotton 1989-93/1985-88 -37.9 -3.3 1.3 -36.0
1994-99/1989-93 0.7 -6.6 37.8 -30.5GhanaRice 1984-86/1980-83 -12.3 -62.3 139.3 -89.4
1987-91/1984-86 3.2 10.0 53.4 -60.21992-00/1987-91 -36.3 -3.8 24.4 -56.9
Maize 1984-86/1980-83 -48.0 -29.6 139.3 -157.71987-91/1984-86 0.7 -24.5 53.4 -28.21992-00/1987-91 -20.4 -11.9 24.4 -32.8
Cocoa 1984-86/1980-83 13.8 -15.0 139.3 -110.51987-91/1984-86 49.2 -56.3 53.4 52.11992-00/1987-91 0.2 -32.5 24.4 8.4
Groundnut 1984-86/1980-83 -16.8 -45.2 139.3 -110.91987-91/1984-86 -21.4 4.2 53.4 -79.01992-00/1987-91 -16.5 -28.5 24.4 -12.4
KenyaMaize 1986-93/1980-85 -0.7 -51.7 41.5 9.5
1994-00/1986-93 13.0 -8.6 -11.5 33.2Wheat 1986-93/1980-85 -15.2 -45.4 41.5 -11.2
1994-00/1986-93 10.2 -12.0 -11.5 33.8Rice 1986-93/1980-85 -18.9 -43.1 41.5 -17.3
1994-00/1986-93 30.4 3.1 -11.5 38.8Tea 1986-93/1980-85 -49.8 -43.0 41.5 -48.3
1994-00/1986-93 -14.1 1.7 -11.5 -4.2Coffee 1986-93/1980-85 -35.9 -72.7 41.5 -4.7
1994-00/1986-93 3.1 -13.8 -11.5 28.4Sugar 1986-93/1980-85 -2.2 -60.1 41.5 16.4
1994-00/1986-93 14.1 -12.4 -11.5 38.1MalawiRice 1985-89/1980-84 -2.6 -52.5 10.7 39.2
1990-94/1985-89 15.9 15.1 6.7 -6.01995-00/1990-94 47.5 -20.6 24.2 43.9
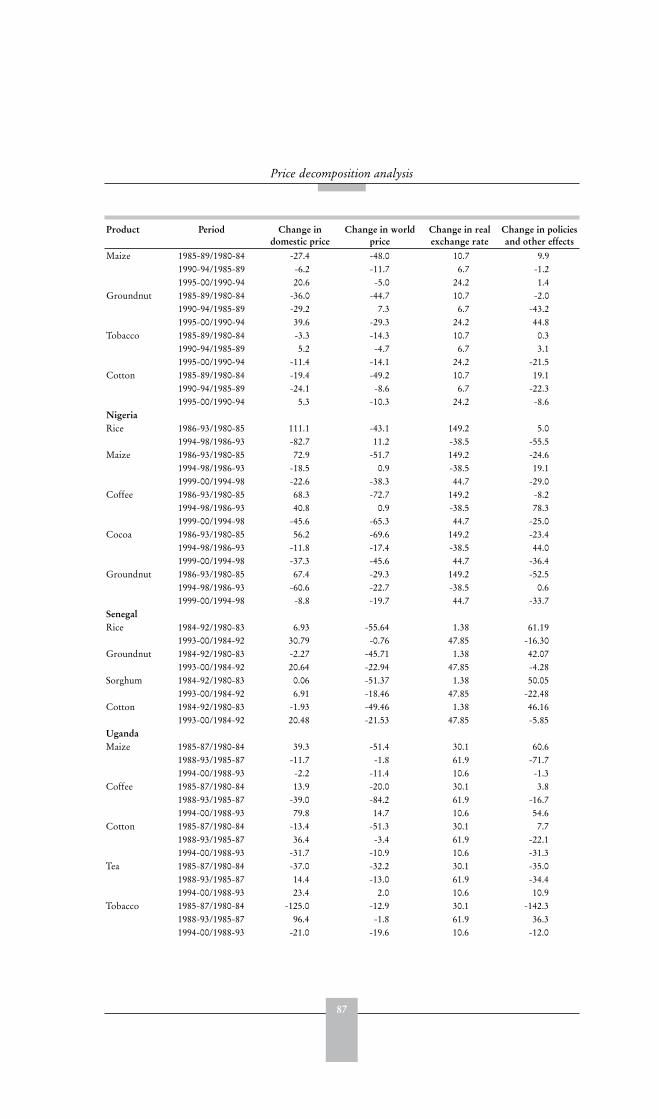
87
Price decomposition analysis
Product Period Change in domestic price
Change in world price
Change in real exchange rate
Change in policies and other effects
Maize 1985-89/1980-84 -27.4 -48.0 10.7 9.91990-94/1985-89 -6.2 -11.7 6.7 -1.21995-00/1990-94 20.6 -5.0 24.2 1.4
Groundnut 1985-89/1980-84 -36.0 -44.7 10.7 -2.01990-94/1985-89 -29.2 7.3 6.7 -43.21995-00/1990-94 39.6 -29.3 24.2 44.8
Tobacco 1985-89/1980-84 -3.3 -14.3 10.7 0.31990-94/1985-89 5.2 -4.7 6.7 3.11995-00/1990-94 -11.4 -14.1 24.2 -21.5
Cotton 1985-89/1980-84 -19.4 -49.2 10.7 19.11990-94/1985-89 -24.1 -8.6 6.7 -22.31995-00/1990-94 5.3 -10.3 24.2 -8.6
NigeriaRice 1986-93/1980-85 111.1 -43.1 149.2 5.0
1994-98/1986-93 -82.7 11.2 -38.5 -55.5Maize 1986-93/1980-85 72.9 -51.7 149.2 -24.6
1994-98/1986-93 -18.5 0.9 -38.5 19.11999-00/1994-98 -22.6 -38.3 44.7 -29.0
Coffee 1986-93/1980-85 68.3 -72.7 149.2 -8.21994-98/1986-93 40.8 0.9 -38.5 78.31999-00/1994-98 -45.6 -65.3 44.7 -25.0
Cocoa 1986-93/1980-85 56.2 -69.6 149.2 -23.41994-98/1986-93 -11.8 -17.4 -38.5 44.01999-00/1994-98 -37.3 -45.6 44.7 -36.4
Groundnut 1986-93/1980-85 67.4 -29.3 149.2 -52.51994-98/1986-93 -60.6 -22.7 -38.5 0.61999-00/1994-98 -8.8 -19.7 44.7 -33.7
SenegalRice 1984-92/1980-83 6.93 -55.64 1.38 61.19
1993-00/1984-92 30.79 -0.76 47.85 -16.30Groundnut 1984-92/1980-83 -2.27 -45.71 1.38 42.07
1993-00/1984-92 20.64 -22.94 47.85 -4.28Sorghum 1984-92/1980-83 0.06 -51.37 1.38 50.05
1993-00/1984-92 6.91 -18.46 47.85 -22.48Cotton 1984-92/1980-83 -1.93 -49.46 1.38 46.16
1993-00/1984-92 20.48 -21.53 47.85 -5.85UgandaMaize 1985-87/1980-84 39.3 -51.4 30.1 60.6
1988-93/1985-87 -11.7 -1.8 61.9 -71.71994-00/1988-93 -2.2 -11.4 10.6 -1.3
Coffee 1985-87/1980-84 13.9 -20.0 30.1 3.81988-93/1985-87 -39.0 -84.2 61.9 -16.71994-00/1988-93 79.8 14.7 10.6 54.6
Cotton 1985-87/1980-84 -13.4 -51.3 30.1 7.71988-93/1985-87 36.4 -3.4 61.9 -22.11994-00/1988-93 -31.7 -10.9 10.6 -31.3
Tea 1985-87/1980-84 -37.0 -32.2 30.1 -35.01988-93/1985-87 14.4 -13.0 61.9 -34.41994-00/1988-93 23.4 2.0 10.6 10.9
Tobacco 1985-87/1980-84 -125.0 -12.9 30.1 -142.31988-93/1985-87 96.4 -1.8 61.9 36.31994-00/1988-93 -21.0 -19.6 10.6 -12.0
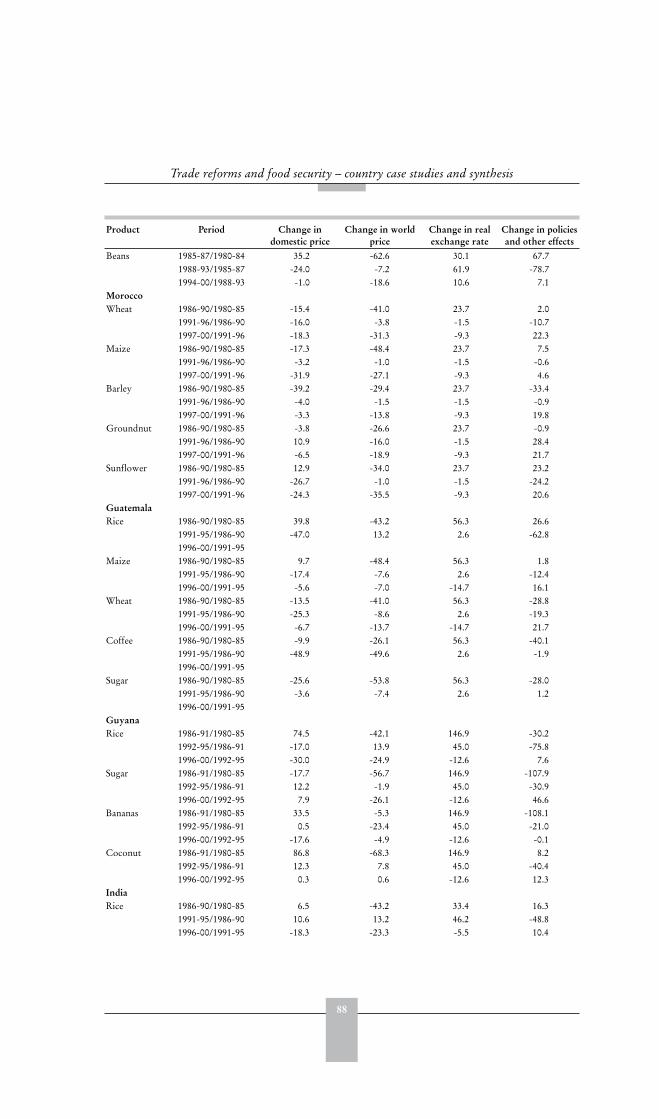
88
Trade reforms and food security – country case studies and synthesis
Product Period Change in domestic price
Change in world price
Change in real exchange rate
Change in policies and other effects
Beans 1985-87/1980-84 35.2 -62.6 30.1 67.71988-93/1985-87 -24.0 -7.2 61.9 -78.71994-00/1988-93 -1.0 -18.6 10.6 7.1
MoroccoWheat 1986-90/1980-85 -15.4 -41.0 23.7 2.0
1991-96/1986-90 -16.0 -3.8 -1.5 -10.71997-00/1991-96 -18.3 -31.3 -9.3 22.3
Maize 1986-90/1980-85 -17.3 -48.4 23.7 7.51991-96/1986-90 -3.2 -1.0 -1.5 -0.61997-00/1991-96 -31.9 -27.1 -9.3 4.6
Barley 1986-90/1980-85 -39.2 -29.4 23.7 -33.41991-96/1986-90 -4.0 -1.5 -1.5 -0.91997-00/1991-96 -3.3 -13.8 -9.3 19.8
Groundnut 1986-90/1980-85 -3.8 -26.6 23.7 -0.91991-96/1986-90 10.9 -16.0 -1.5 28.41997-00/1991-96 -6.5 -18.9 -9.3 21.7
Sunflower 1986-90/1980-85 12.9 -34.0 23.7 23.21991-96/1986-90 -26.7 -1.0 -1.5 -24.21997-00/1991-96 -24.3 -35.5 -9.3 20.6
GuatemalaRice 1986-90/1980-85 39.8 -43.2 56.3 26.6
1991-95/1986-90 -47.0 13.2 2.6 -62.81996-00/1991-95
Maize 1986-90/1980-85 9.7 -48.4 56.3 1.81991-95/1986-90 -17.4 -7.6 2.6 -12.41996-00/1991-95 -5.6 -7.0 -14.7 16.1
Wheat 1986-90/1980-85 -13.5 -41.0 56.3 -28.81991-95/1986-90 -25.3 -8.6 2.6 -19.31996-00/1991-95 -6.7 -13.7 -14.7 21.7
Coffee 1986-90/1980-85 -9.9 -26.1 56.3 -40.11991-95/1986-90 -48.9 -49.6 2.6 -1.91996-00/1991-95
Sugar 1986-90/1980-85 -25.6 -53.8 56.3 -28.01991-95/1986-90 -3.6 -7.4 2.6 1.21996-00/1991-95
GuyanaRice 1986-91/1980-85 74.5 -42.1 146.9 -30.2
1992-95/1986-91 -17.0 13.9 45.0 -75.81996-00/1992-95 -30.0 -24.9 -12.6 7.6
Sugar 1986-91/1980-85 -17.7 -56.7 146.9 -107.91992-95/1986-91 12.2 -1.9 45.0 -30.91996-00/1992-95 7.9 -26.1 -12.6 46.6
Bananas 1986-91/1980-85 33.5 -5.3 146.9 -108.11992-95/1986-91 0.5 -23.4 45.0 -21.01996-00/1992-95 -17.6 -4.9 -12.6 -0.1
Coconut 1986-91/1980-85 86.8 -68.3 146.9 8.21992-95/1986-91 12.3 7.8 45.0 -40.41996-00/1992-95 0.3 0.6 -12.6 12.3
IndiaRice 1986-90/1980-85 6.5 -43.2 33.4 16.3
1991-95/1986-90 10.6 13.2 46.2 -48.81996-00/1991-95 -18.3 -23.3 -5.5 10.4
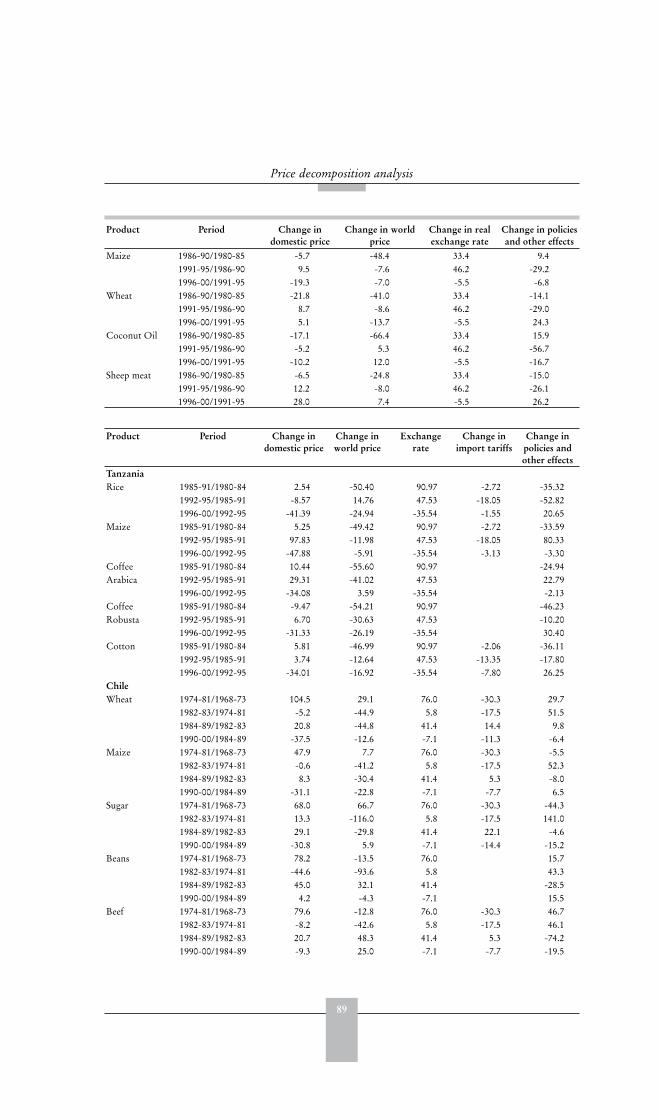
89
Price decomposition analysis
Product Period Change in domestic price
Change in world price
Change in real exchange rate
Change in policies and other effects
Maize 1986-90/1980-85 -5.7 -48.4 33.4 9.41991-95/1986-90 9.5 -7.6 46.2 -29.21996-00/1991-95 -19.3 -7.0 -5.5 -6.8
Wheat 1986-90/1980-85 -21.8 -41.0 33.4 -14.11991-95/1986-90 8.7 -8.6 46.2 -29.01996-00/1991-95 5.1 -13.7 -5.5 24.3
Coconut Oil 1986-90/1980-85 -17.1 -66.4 33.4 15.91991-95/1986-90 -5.2 5.3 46.2 -56.71996-00/1991-95 -10.2 12.0 -5.5 -16.7
Sheep meat 1986-90/1980-85 -6.5 -24.8 33.4 -15.01991-95/1986-90 12.2 -8.0 46.2 -26.11996-00/1991-95 28.0 7.4 -5.5 26.2
Product Period Change in domestic price
Change in world price
Exchangerate
Change in import tariffs
Change in policies and other effects
TanzaniaRice 1985-91/1980-84 2.54 -50.40 90.97 -2.72 -35.32
1992-95/1985-91 -8.57 14.76 47.53 -18.05 -52.821996-00/1992-95 -41.39 -24.94 -35.54 -1.55 20.65
Maize 1985-91/1980-84 5.25 -49.42 90.97 -2.72 -33.591992-95/1985-91 97.83 -11.98 47.53 -18.05 80.331996-00/1992-95 -47.88 -5.91 -35.54 -3.13 -3.30
Coffee 1985-91/1980-84 10.44 -55.60 90.97 -24.94Arabica 1992-95/1985-91 29.31 -41.02 47.53 22.79
1996-00/1992-95 -34.08 3.59 -35.54 -2.13Coffee 1985-91/1980-84 -9.47 -54.21 90.97 -46.23Robusta 1992-95/1985-91 6.70 -30.63 47.53 -10.20
1996-00/1992-95 -31.33 -26.19 -35.54 30.40Cotton 1985-91/1980-84 5.81 -46.99 90.97 -2.06 -36.11
1992-95/1985-91 3.74 -12.64 47.53 -13.35 -17.801996-00/1992-95 -34.01 -16.92 -35.54 -7.80 26.25
ChileWheat 1974-81/1968-73 104.5 29.1 76.0 -30.3 29.7
1982-83/1974-81 -5.2 -44.9 5.8 -17.5 51.51984-89/1982-83 20.8 -44.8 41.4 14.4 9.81990-00/1984-89 -37.5 -12.6 -7.1 -11.3 -6.4
Maize 1974-81/1968-73 47.9 7.7 76.0 -30.3 -5.51982-83/1974-81 -0.6 -41.2 5.8 -17.5 52.31984-89/1982-83 8.3 -30.4 41.4 5.3 -8.01990-00/1984-89 -31.1 -22.8 -7.1 -7.7 6.5
Sugar 1974-81/1968-73 68.0 66.7 76.0 -30.3 -44.31982-83/1974-81 13.3 -116.0 5.8 -17.5 141.01984-89/1982-83 29.1 -29.8 41.4 22.1 -4.61990-00/1984-89 -30.8 5.9 -7.1 -14.4 -15.2
Beans 1974-81/1968-73 78.2 -13.5 76.0 15.71982-83/1974-81 -44.6 -93.6 5.8 43.31984-89/1982-83 45.0 32.1 41.4 -28.51990-00/1984-89 4.2 -4.3 -7.1 15.5
Beef 1974-81/1968-73 79.6 -12.8 76.0 -30.3 46.71982-83/1974-81 -8.2 -42.6 5.8 -17.5 46.11984-89/1982-83 20.7 48.3 41.4 5.3 -74.21990-00/1984-89 -9.3 25.0 -7.1 -7.7 -19.5
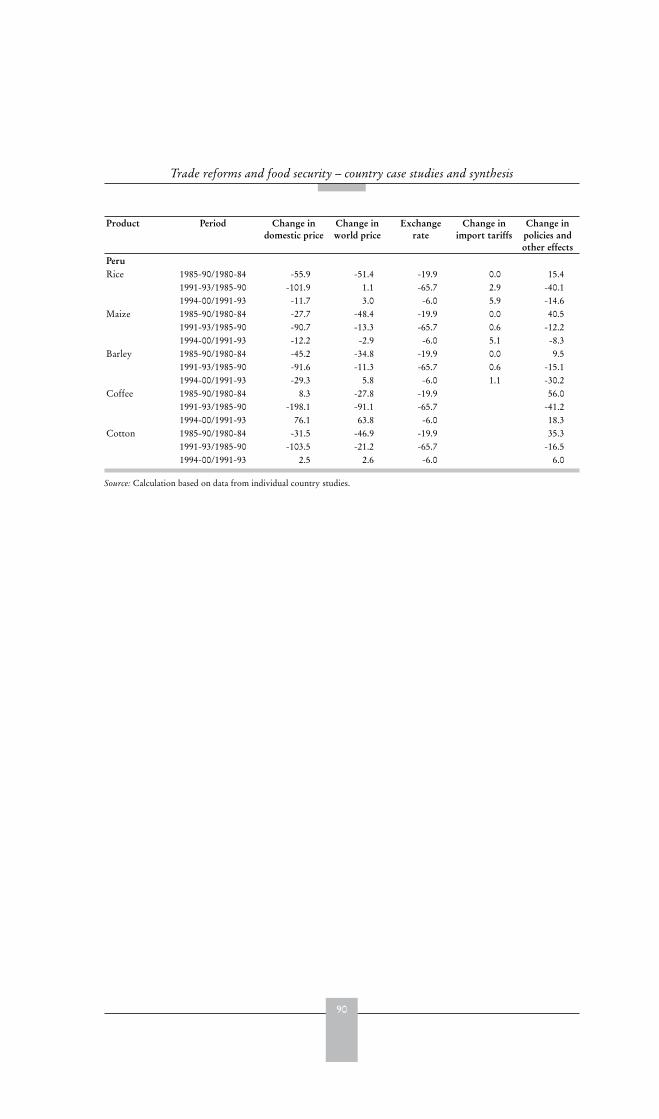
90
Trade reforms and food security – country case studies and synthesis
Product Period Change in domestic price
Change in world price
Exchangerate
Change in import tariffs
Change in policies and other effects
PeruRice 1985-90/1980-84 -55.9 -51.4 -19.9 0.0 15.4
1991-93/1985-90 -101.9 1.1 -65.7 2.9 -40.11994-00/1991-93 -11.7 3.0 -6.0 5.9 -14.6
Maize 1985-90/1980-84 -27.7 -48.4 -19.9 0.0 40.51991-93/1985-90 -90.7 -13.3 -65.7 0.6 -12.21994-00/1991-93 -12.2 -2.9 -6.0 5.1 -8.3
Barley 1985-90/1980-84 -45.2 -34.8 -19.9 0.0 9.51991-93/1985-90 -91.6 -11.3 -65.7 0.6 -15.11994-00/1991-93 -29.3 5.8 -6.0 1.1 -30.2
Coffee 1985-90/1980-84 8.3 -27.8 -19.9 56.01991-93/1985-90 -198.1 -91.1 -65.7 -41.21994-00/1991-93 76.1 63.8 -6.0 18.3
Cotton 1985-90/1980-84 -31.5 -46.9 -19.9 35.31991-93/1985-90 -103.5 -21.2 -65.7 -16.51994-00/1991-93 2.5 2.6 -6.0 6.0
Source: Calculation based on data from individual country studies.
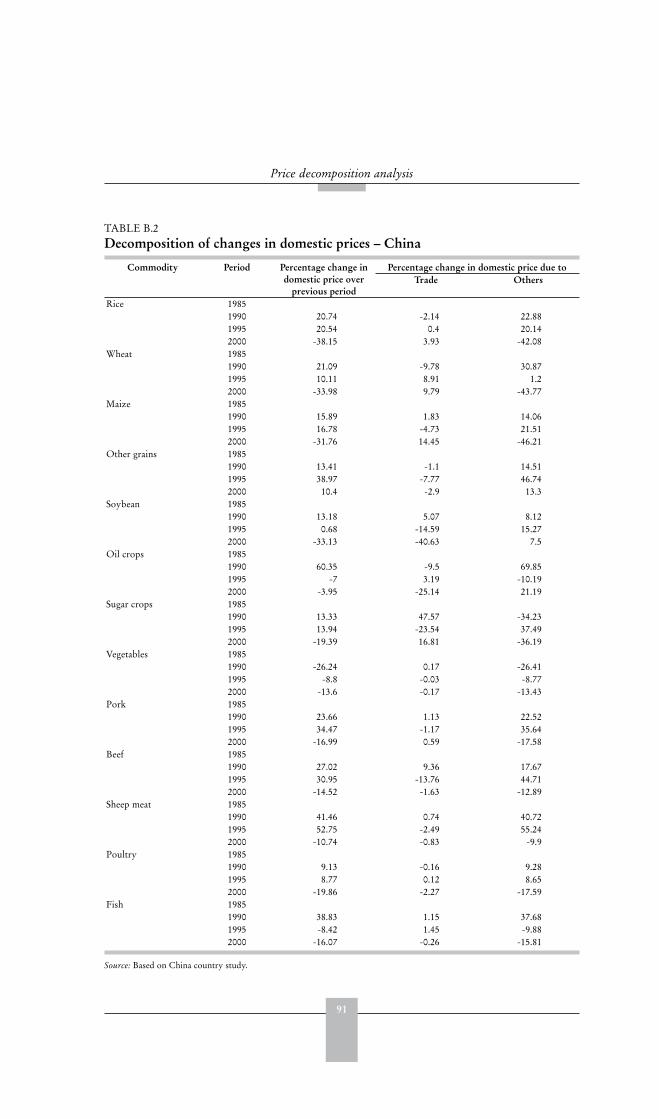
91
Price decomposition analysis
TABLE B.2Decomposition of changes in domestic prices – China
Commodity Period Percentage change in domestic price over
previous period
Percentage change in domestic price due toTrade Others
Rice 19851990 20.74 -2.14 22.881995 20.54 0.4 20.142000 -38.15 3.93 -42.08
Wheat 19851990 21.09 -9.78 30.871995 10.11 8.91 1.22000 -33.98 9.79 -43.77
Maize 19851990 15.89 1.83 14.061995 16.78 -4.73 21.512000 -31.76 14.45 -46.21
Other grains 19851990 13.41 -1.1 14.511995 38.97 -7.77 46.742000 10.4 -2.9 13.3
Soybean 19851990 13.18 5.07 8.121995 0.68 -14.59 15.272000 -33.13 -40.63 7.5
Oil crops 19851990 60.35 -9.5 69.851995 -7 3.19 -10.192000 -3.95 -25.14 21.19
Sugar crops 19851990 13.33 47.57 -34.231995 13.94 -23.54 37.492000 -19.39 16.81 -36.19
Vegetables 19851990 -26.24 0.17 -26.411995 -8.8 -0.03 -8.772000 -13.6 -0.17 -13.43
Pork 19851990 23.66 1.13 22.521995 34.47 -1.17 35.642000 -16.99 0.59 -17.58
Beef 19851990 27.02 9.36 17.671995 30.95 -13.76 44.712000 -14.52 -1.63 -12.89
Sheep meat 19851990 41.46 0.74 40.721995 52.75 -2.49 55.242000 -10.74 -0.83 -9.9
Poultry 19851990 9.13 -0.16 9.281995 8.77 0.12 8.652000 -19.86 -2.27 -17.59
Fish 19851990 38.83 1.15 37.681995 -8.42 1.45 -9.882000 -16.07 -0.26 -15.81
Source: Based on China country study.

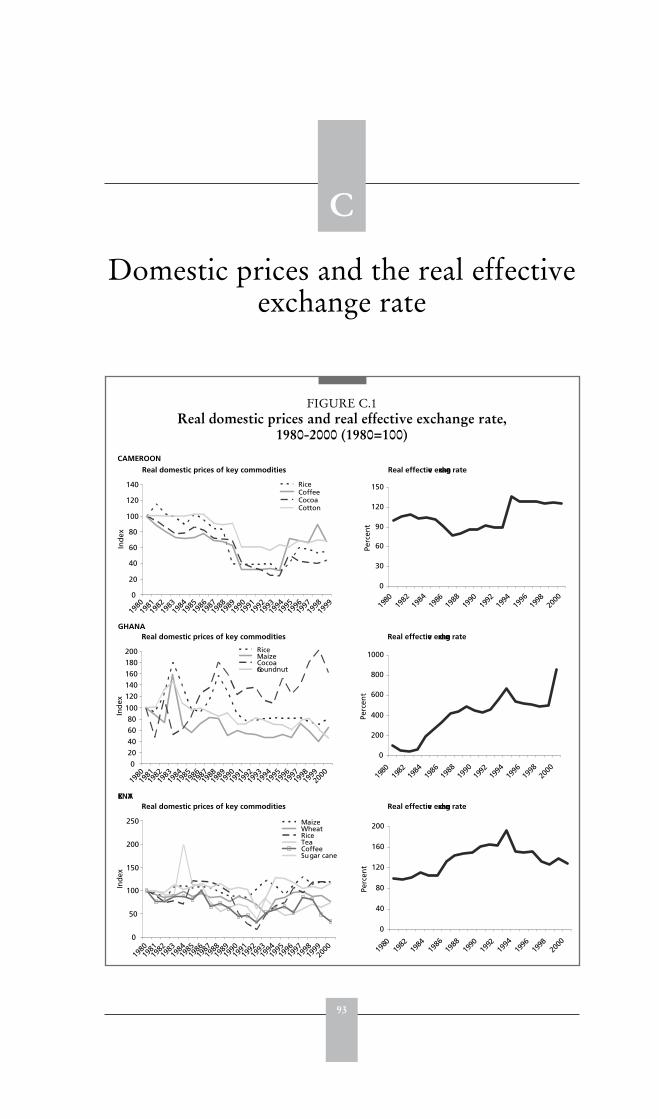
93
C
Domestic prices and the real effectiveexchange rate
FIGURE C.1Real domestic prices and real effective exchange rate,
1980-2000 (1980=100)
CAMEROON
Real domestic prices of key commodities
0
20
40
60
80
100
120
140
Ind
ex
RiceCoffeeCocoaCotton
0
30
60
90
120
150
1980
1982
1984
1986
1988
1990
1992
1994
1996
1998
2000
Perc
ent
GHANA
0
2040
6080
100
120
140160
180200
Ind
ex
RiceMaizeCocoaGroundnut
0
200
400
600
800
1000
1980
1982
1984
1986
1988
1990
1992
1994
1996
1998
2000
Perc
ent
0
50
100
150
200
250
Ind
ex
MaizeWheatRiceTeaCoffeeSugar cane
0
40
80
120
160
200
1980
1982
1984
1986
1988
1990
1992
1994
1996
1998
2000
Perc
ent
1982
1983
198419
8519
8619
8719
8819
8919
9019
9119
9219
9319
9419
9519
9619
9719
8119
9819
9919
80
Real effective exchange rate
Real domestic prices of key commodities Real effective exchange rate
198219
8319
8419
8519
8619
8719
8819
8919
9019
9119
9219
9319
9419
9519
9619
9719
8119
9819
9919
8020
00
KENYA Real domestic prices of key commodities Real effective exchange rate
198219
8319
8419
8519
8619
8719
8819
8919
9019
9119
9219
9319
9419
9519
9619
9719
8119
9819
9919
8020
00
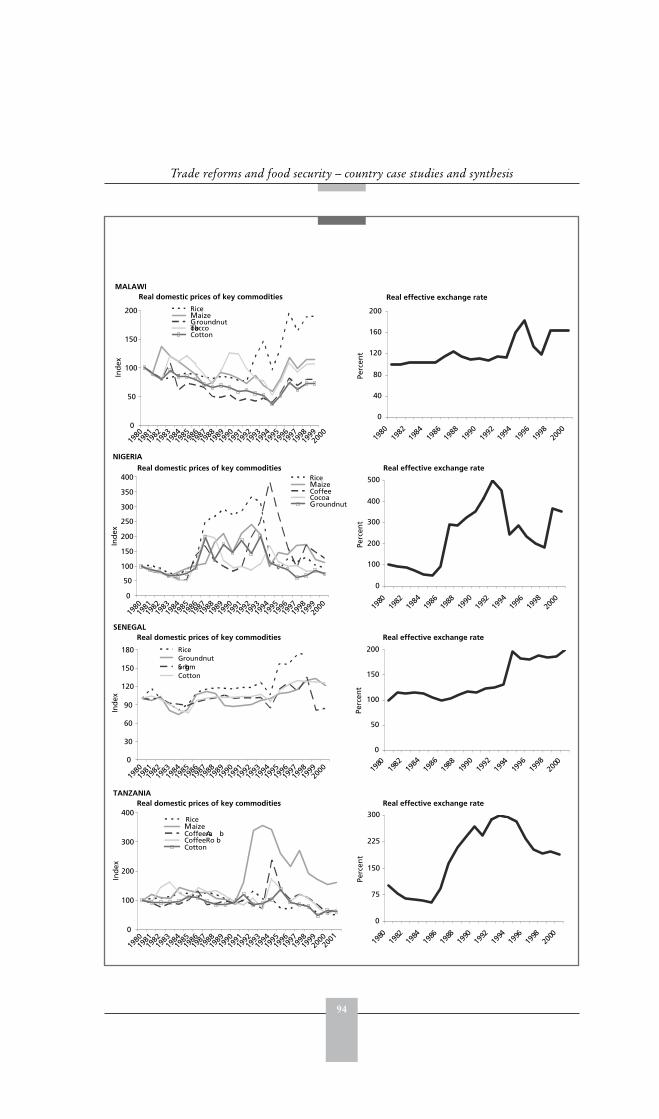
94
Trade reforms and food security – country case studies and synthesis
NIGERIA
Real domestic prices of key commodities
SENEGAL
Real effective exchange rate
Real domestic prices of key commodities Real effective exchange rate
TANZANIA Real domestic prices of key commodities Real effective exchange rate
0
50
100
150
200
250
300
350
400
Ind
ex
RiceMaizeCoffeeCocoaGroundnut
198219
8319
8419
8519
8619
8719
8819
8919
9019
9119
9219
9319
9419
9519
9619
9719
8119
9819
9919
8020
00
0
100
200
300
400
500
1980
1982
1984
1986
1988
1990
1992
1994
1996
1998
2000
Perc
ent
0
30
60
90
120
150
180
Ind
ex
RiceGroundnutSorghumCotton
198219
8319
8419
8519
8619
8719
8819
8919
9019
9119
9219
9319
9419
9519
9619
9719
8119
9819
9919
8020
00
0
50
100
150
200
1980
1982
1984
1986
1988
1990
1992
1994
1996
1998
2000
Perc
ent
0
100
200
300
400
Ind
ex
RiceMaizeCoffee Ara bCoffee Ro bCotton
198219
8319
8419
8519
8619
8719
8819
8919
9019
9119
9219
9319
9419
9519
9619
9719
8119
9819
9919
8020
0020
01
0
75
150
225
300
1980
1982
1984
1986
1988
1990
1992
1994
1996
1998
2000
Perc
ent
0
50
100
150
200
Ind
ex
RiceMaizeGroundnutTobaccoCotton
0
40
80
120
160
200
1980
1982
1984
1986
1988
1990
1992
1994
1996
1998
2000
Perc
ent
MALAWI Real domestic prices of key commodities Real effective exchange rate
198219
8319
8419
8519
8619
8719
8819
8919
9019
9119
9219
9319
9419
9519
9619
9719
8119
9819
9919
8020
00
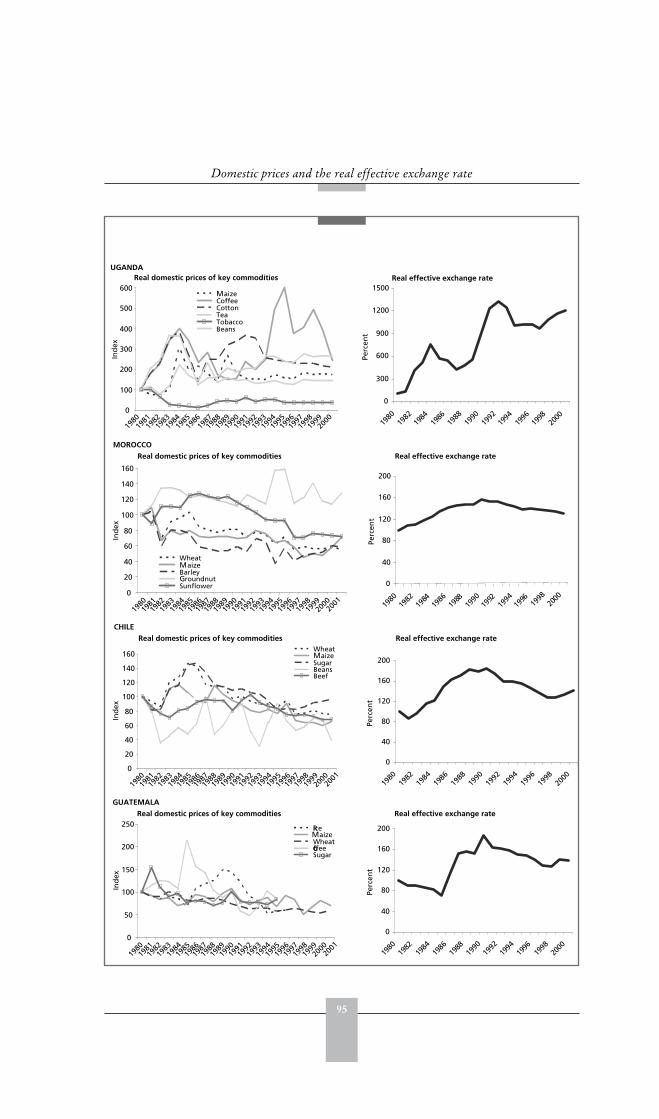
95
Domestic prices and the real effective exchange rate
MOROCCO
Real domestic prices of key commodities Real effective exchange rate
0
20
40
60
80
100
120
140
160
Ind
ex
WheatMaizeBarleyGroundnutSunflower 0
40
80
120
160
200
1980
1982
1984
1986
1988
1990
1992
1994
1996
1998
2000
Perc
ent
198219
8319
8419
8519
8619
8719
8819
8919
9019
9119
9219
9319
9419
9519
9619
9719
8119
9819
9919
8020
0020
01
0
20
40
60
80
100
120
140
160
Ind
ex
WheatMaizeSugarBeansBeef
0
40
80
120
160
200
1980
1982
1984
1986
1988
1990
1992
1994
1996
1998
2000
Perc
ent
0
50
100
150
200
250
Ind
ex
RiceMaizeWheatCoffeeSugar
0
40
80
120
160
200
1980
1982
1984
1986
1988
1990
1992
1994
1996
1998
2000
Perc
ent
CHILE
Real domestic prices of key commodities Real effective exchange rate
198219
8319
8419
8519
8619
8719
8819
8919
9019
9119
9219
9319
9419
9519
9619
9719
8119
9819
9919
8020
0020
01
GUATEMALA
Real domestic prices of key commodities Real effective exchange rate
198219
8319
8419
8519
8619
8719
8819
8919
9019
9119
9219
9319
9419
9519
9619
9719
8119
9819
9919
8020
0020
01
UGANDA Real domestic prices of key commodities Real effective exchange rate
0
100
200
300
400
500
600
Ind
ex
MaizeCoffeeCottonTeaTobaccoBeans
198219
8319
8419
8519
8619
8719
8819
8919
9019
9119
9219
9319
9419
9519
9619
9719
8119
9819
9919
8020
00
0
300
600
900
1200
1500
1980
1982
1984
1986
1988
1990
1992
1994
1996
1998
2000
Perc
ent
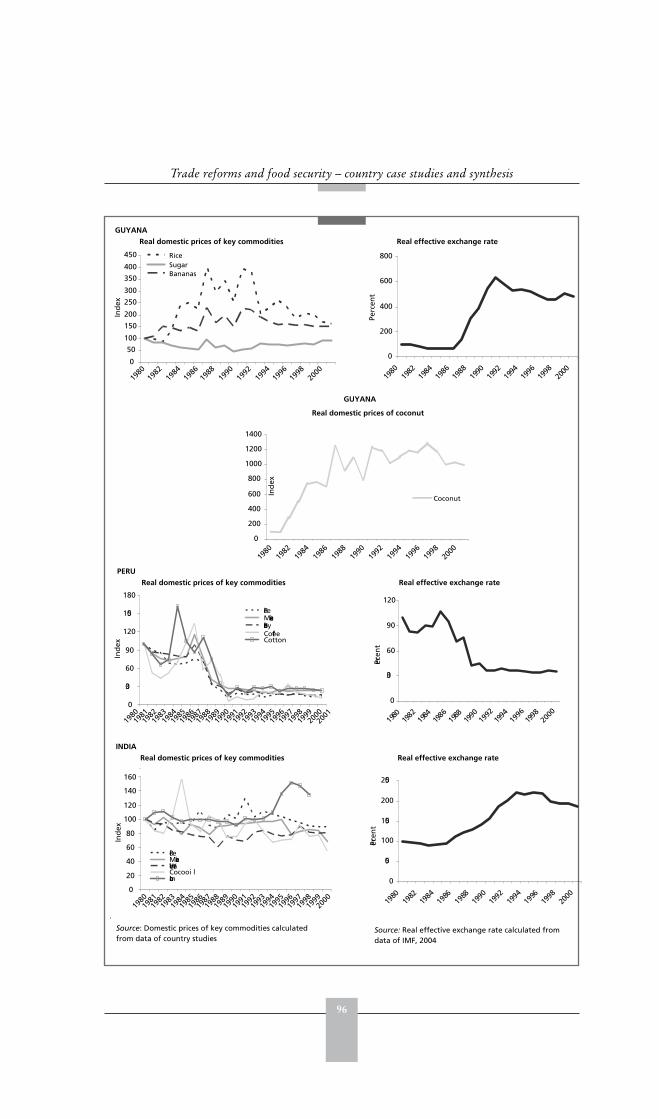
96
Trade reforms and food security – country case studies and synthesis
GUYANA
Real domestic prices of coconut
PERU
Real domestic prices of key commodities Real effective exchange rate
INDIA
Real domestic prices of key commodities Real effective exchange rate
0
200
400
600
800
1000
1200
1400
1980
1982
1984
1986
1988
1990
1992
1994
1996
1998
2000
Ind
ex
Coconut
0
30
60
90
120
150
180
Ind
ex
RiceMaizeBarleyCoffeeCotton
0
30
60
90
120
1980
1982
1984
1986
1988
1990
1992
1994
1996
1998
2000
Percen
t
198219
8319
8419
8519
8619
8719
8819
8919
9019
9119
9219
9319
9419
9519
9619
9719
8119
9819
9919
8020
0020
01
0
20
40
60
80
100
120
140
160
Ind
ex
RiceMaizeWheatCoco oi lLamb 0
50
100
150
200
250
1980
1982
1984
1986
1988
1990
1992
1994
1996
1998
2000
Percen
t
Source: Domestic prices of key commodities calculated from data of country studies
Source: Real effective exchange rate calculated from data of IMF, 2004
198219
8319
8419
8519
8619
8719
8819
8919
9019
9119
9219
9319
9419
9519
9619
9719
8119
9819
9919
8020
00
0
50
100
150
200
250
300
350
400
450
Ind
ex
RiceSugarBananas
0
200
400
600
800
1980
1982
1984
1986
1988
1990
1992
1994
1996
1998
2000
Perc
ent
GUYANA
Real domestic prices of key commodities Real effective exchange rate
1982
1984
1986
1988
1990
1992
1994
1996
1998
1980
2000
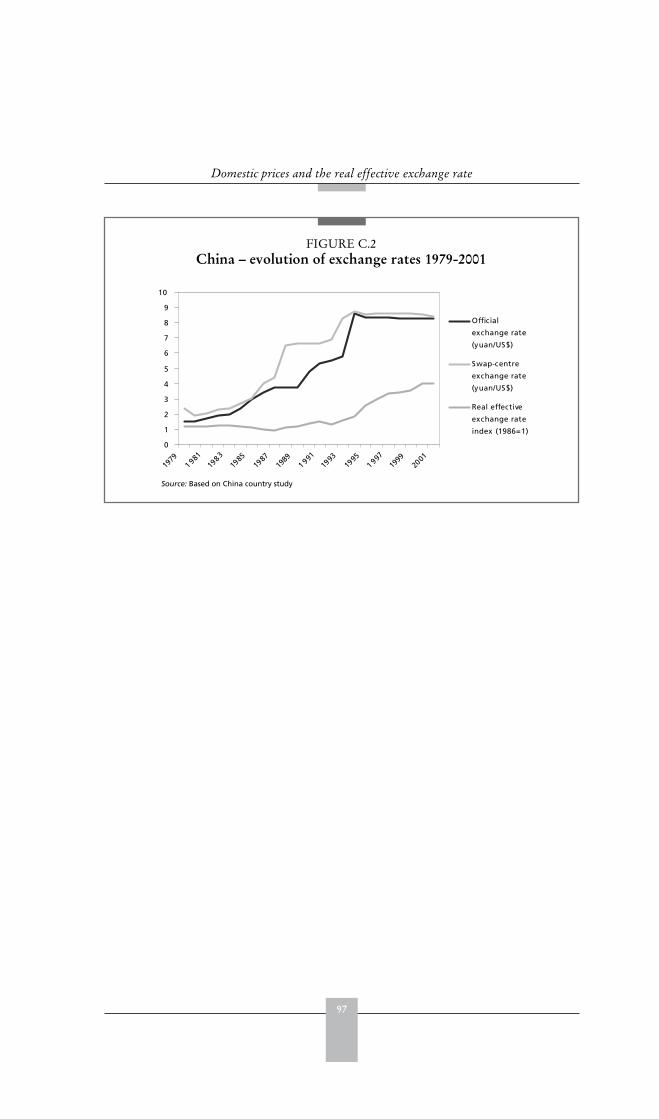
97
Domestic prices and the real effective exchange rate
FIGURE C.2China – evolution of exchange rates 1979-2001
0
1
2
3
4
5
6
7
8
9
10
1979
1 98119
8319
8519
8719
891 991
1993
1995
1 99719
9920
01
Official
exchange rate
(yuan/US$)
Swap-centre
exchange rate
(yuan/US$)
Real effective
exchange rate
index (1986=1)
Source: Based on China country study


99
D
Price transmission analysis
INTRODUCTION
This annex describes the method used to investigate econometrically the extent towhich world market prices and the real exchange rate influence the domestic price in65 country/commodity pairs. The number of observations in each series was 20 yearsof annual data. First, the degree to which world price signals have been transmittedto domestic markets over the past two decades is examined. Then whether domesticprices were closer to world prices following the implementation of policy reforms isinvestigated. The expectation is that following reforms: (i) domestic price levels willbe closer to world price level; and (ii) changes in world prices will be transmitted todomestic markets more completely and more rapidly. Following this, a logarithmicregression of the world price on the domestic price with and without the inclusionof the real exchange rate is considered.
THE MODEL
To examine the relationship between sets of prices, most studies have looked atcorrelation coefficients or have used the following type of regression
d wt t tp p (1)
wheredtp and
wtp represent the domestic and world prices of the commodities and
and are parameters to be estimated with t denoting the error term. From theabove regression, the hypothesis that the slope coefficient equals unity and (possibly)the intercept term equals zero can be tested; formally, 0 : 1 1H . Under 0H thedeterministic part of equation (1) becomes
d wt tp p , which implies that the difference
d wt tp p is a white noise process.Estimating equation (1) and testing 0H presents two problems:(i) because of extensive government interventions in primary commodity markets
of developing economies, it is unlikely that domestic and world prices willonly differ by a white noise as 0H of (1) dictates. Therefore, 0H is expectedto be rejected without necessarily ruling out some degree of co-movementbetween domestic and world prices;
(ii) statistical properties of the series involved in the regression, most importantlynon-stationarity, may invalidate standard econometric tests and thus givemisleading results regarding the degree to which world signals are beingconsidered by domestic market participants or policy makers.
Consequently, it was decided to employ a model that relaxes the restrictivenature of (1) and accounts for non-stationarity. Correlation between the two prices
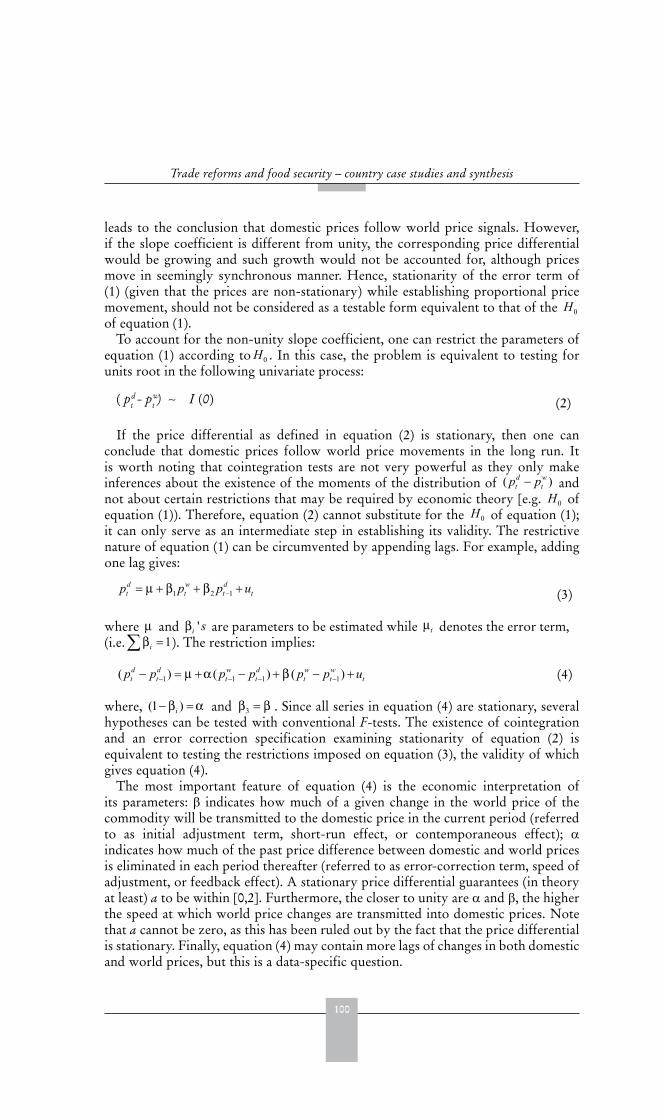
100
Trade reforms and food security – country case studies and synthesis
leads to the conclusion that domestic prices follow world price signals. However,if the slope coefficient is different from unity, the corresponding price differentialwould be growing and such growth would not be accounted for, although pricesmove in seemingly synchronous manner. Hence, stationarity of the error term of(1) (given that the prices are non-stationary) while establishing proportional pricemovement, should not be considered as a testable form equivalent to that of the 0Hof equation (1).
To account for the non-unity slope coefficient, one can restrict the parameters ofequation (1) according to 0H . In this case, the problem is equivalent to testing forunits root in the following univariate process:
( pt- p
t) I (0)d w
(2)
If the price differential as defined in equation (2) is stationary, then one canconclude that domestic prices follow world price movements in the long run. Itis worth noting that cointegration tests are not very powerful as they only makeinferences about the existence of the moments of the distribution of ( )d w
t tp p andnot about certain restrictions that may be required by economic theory [e.g. 0H ofequation (1)). Therefore, equation (2) cannot substitute for the 0H of equation (1);it can only serve as an intermediate step in establishing its validity. The restrictivenature of equation (1) can be circumvented by appending lags. For example, addingone lag gives:
1 2 1d w dt t t tp p p u (3)
where and 'i s are parameters to be estimated while t denotes the error term, 3(i.e. 1i ). The restriction implies:
1 1 1 1( ) ( ) ( )d d w d w wt t t t t t tp p p p p p u (4)
where, (1 )i and 3 . Since all series in equation (4) are stationary, severalhypotheses can be tested with conventional F-tests. The existence of cointegrationand an error correction specification examining stationarity of equation (2) isequivalent to testing the restrictions imposed on equation (3), the validity of whichgives equation (4).
The most important feature of equation (4) is the economic interpretation ofits parameters: indicates how much of a given change in the world price of thecommodity will be transmitted to the domestic price in the current period (referredto as initial adjustment term, short-run effect, or contemporaneous effect); indicates how much of the past price difference between domestic and world pricesis eliminated in each period thereafter (referred to as error-correction term, speed ofadjustment, or feedback effect). A stationary price differential guarantees (in theoryat least) a to be within [0,2]. Furthermore, the closer to unity are and , the higherthe speed at which world price changes are transmitted into domestic prices. Notethat a cannot be zero, as this has been ruled out by the fact that the price differentialis stationary. Finally, equation (4) may contain more lags of changes in both domesticand world prices, but this is a data-specific question.
101
Price transmission analysis
Equation (5) is used to determine how long it takes (n is the adjustment period inyears) for the domestic price of the commodity in question to adjust to a given pricechange in world price (see Baffes and Gardner 2003 for details).
1 (1 )(1 )nk (5)
SUMMARY OF RESULTS
The model was applied to 65 commodity/country cases. Stationarity properties of theworld prices are examined first (Table D.1). World prices of beans, coconut, coconutoil, groundnut, sheep meat, rice, and sugar prices appear to be trend-stationary. Onlybanana, cocoa and coffee (including robusta and arabica) prices indicate trend non-stationarity. Barley, beef, cotton, tea, tobacco, sorghum, sunflower oil and wheatprices show signs of weak stationarity.
The stationarity properties of the domestic prices are reported in Table D.2. Themajority of the domestic prices were found to be non-stationary. For Cameroon,Nigeria and Peru all the commodity prices are non-stationary. The followingcountry/commodity prices were also found to be stationary: Chile, beans; Ghana,rice, maize and groundnut; Guatemala, maize and wheat; rice; India, coconut oil;Kenya, maize and sugar cane; Morocco, wheat, maize, barley and groundnut;Senegal, rice; Uganda, cotton. Evidence of weak stationarity was also observed inseveral cases.
Since most of the commodity prices are non-stationary, the stationarity propertiesof the price differentials (last two columns of Table D.2) were examined. For caseswhere world and domestic prices have different stationarity properties, the evidencesuggests that the respective domestic market commodity market has been isolated.
Results from the estimation of equation (4) without allowing for structural breakfor all 14 countries are presented in Table D.3. Table D.4 presents the results fromthe log specification of equation (1). However, when the exchange rate variablewas included in this equation (Table D.5b), the results improved dramatically.Thus, these results will be used in the analysis. Although (1) is only relevant whenthe price differential is non-stationary or when there is no co-movement underit the co-integration parameter is unity, the results for all cases are presented forcomparison.
The estimation of world vs domestic price linkages presents mixed results thatvary with country/commodity relationships. Using the R2 as the proportion ofdomestic price variability attributable to world price changes, for Cameroon, onlycocoa shows a significant variability of domestic prices being explained by worldprices (53 percent) while the entire adjustment process (99 percent) takes placewithin three years. The price differential is stationary at the 5 percent level, thuspointing to strong integration. The logarithmic regression in levels reported in TableD.5 pointed to strong integration as all stationary statistics were below -3.00. Theadjusted R2 indicates that 36 percent of domestic price variability for cotton (76percent for cocoa and 49 percent coffee) are explained by world price movements.For rice, only about 8 percent of the variability in domestic prices is explained byworld prices (Table D.3). Domestic cocoa prices adjust faster to the world pricevariability that the other prices (99 percent within three years) with slope closer to

102
Trade reforms and food security – country case studies and synthesis
unity. The speed of adjustment within the three-year horizon is slower for domesticcotton price (28 percent) followed by domestic rice prices (40 percent). Coffee pricesadjust by about 81 percent within three years.
For Chile, 54 percent and 57 percent of the domestic price variability for maize andbeef are explained by world prices with adjustments within a three year period of78 percent and 25 percent respectively. Domestic prices of beans almost completelyadjust (98 percent) within three years although only about 40 percent of its domesticprice variability is explained by world prices. All stationarity statistics are below-3.00, indicating strong integration with world prices (Table D.5).
For Ghana, 27 percent of the domestic price movements for maize are explainedby world prices but with complete adjustment within three years. The adjustmentcoefficient is 0.84 and is highly significant. The short-run effects are also positiveand significant. However, in the case of cocoa, which is the most important exportcrop, the logarithmic regression reports a negative co-integration parameter buta significant and positive exchange rate coefficient. The co-integration parameterindicates strong convergence with world price movements and the adjusted R2
suggests that about 55 percent of the variability in domestic prices is accounted forby world prices (Table D.5). In the case of groundnuts a high level of adjustment toworld price variability was observed even though world prices only explain about 16percent of domestic price variability. The co-integration parameters for all the othercommodities indicate some degree of integration with world prices.
For Guatemala, although 66 percent and 35 percent of adjustments of world pricemovements for maize and wheat respectively occurs within three years, both theadjustment and short-run effects are not significantly different from zero. The stationaritystatistics of the price differentials indicate that both domestic and world prices of bothmaize and wheat indicated strong movements between world and domestic prices(Table D.5). The exchange rate parameter is highly significant for maize.
Tobacco in Malawi and barley in Morocco show almost complete adjustmentswithin three years with significant adjustment coefficients and short-run effects. Theco-integration parameters given in Table D.5 are also significant and greater than-3.00 in both cases, with strong co-movement between world and domestic prices.
In the case of Nigeria, although none of the commodities indicate any significantadjustment or short-run effects, the logarithmic regression that includes the exchangerate indicates co-movement between domestic and world prices. The exchange rateis significant for all commodities. The R2 in some cases is about 40-60 percent,indicating some transmission between world and domestic prices.
In the case of Kenya, tea, wheat and coffee prices show significant adjustmentand short run effects. Domestic tea prices adjust completely to world price shockswithin three years, while for wheat and coffee about 92 percent and 87 percent of theadjustment takes place respectively within three years. The world price coefficientfor tea is close to unity with the co-integration parameter indicating strong co-movement for all domestic prices with their respective world prices (Table D.5).
For Peru, only coffee gives a highly significant adjustment coefficient and short-run effect, with 48 percent of the variability in domestic prices accounted for byworld price movements. Domestic prices adjust completely within three years.The exchange rate is highly significant for all commodities with the co-integrationparameter indicating strong convergence between domestic and world prices.
103
Price transmission analysis
For Tanzania, both arabica and robusta coffee show a highly significant adjustmentcoefficient and short run effects with over 50 percent of domestic price variabilityaccounted for by world price movements. For both, 95 percent of the adjustmenttook place within three years. Stationarity statistics of the price differentials indicatestrong co-movement.
For Guyana, only the domestic coconut price indicates significant adjustmentand short-run effects. World price movements accounted for 38 percent of domesticprice variability with 72 percent of the adjustment completed within three years. Forsugar and rice, the results are not surprising since the bulk of both commodities areexported under the ACP quota at EU pre-determined prices.
POLICY REFORMS AND PRICE TRANSMISSION
The effects of policy reforms undertaken by these countries on the transmission of worldprice changes to domestic prices are considered. The appropriate choice and dating ofreform actions is not straightforward. Many price policy reforms have been partial,introduced in stages over several years, and subject to delays and temporary reversals.
Since most of the countries in the study have undertaken various forms of reformsince the early 1980s, it is assumed here that by the early 1990s, if these reforms aresuccessful, their effects should have been noticed in form of structural shifts in therelevant commodity sectors. In this regard, testing is for structural shift using 1993as the break point. Furthermore, as the number of observations is not sufficient toestimate both the pre- and post-reform parameter, we use a Predictive Chow Test that is designed to test for breaks in such situations.
“Predictive” Chow TestsThe Chow test is used to test for break points or structural changes in a model. Theproblem is posed as a partitioning of the data into two parts of size n1 and n2. Thenull hypothesis to be tested is
0 1 2:H
where1
is estimated using the first part of the data and2is estimated using the
second part.
The test is performed as follows (refer to Russell Davidson and James G.MacKinnon, Estimation and inference in econometrics, 1993, p. 380).
1. The p parameters of the model are estimated.2. A second linear regression is performed on the residuals; u from the nonlinear
estimation in step one.
u X b residuals
where X is Jacobian columns that are evaluated at the parameter estimates.If the estimation is an instrumental variables estimation with matrix ofinstruments W, then the following regression is performed:
*u Pw X b residuals
where Pw is the projection matrix.
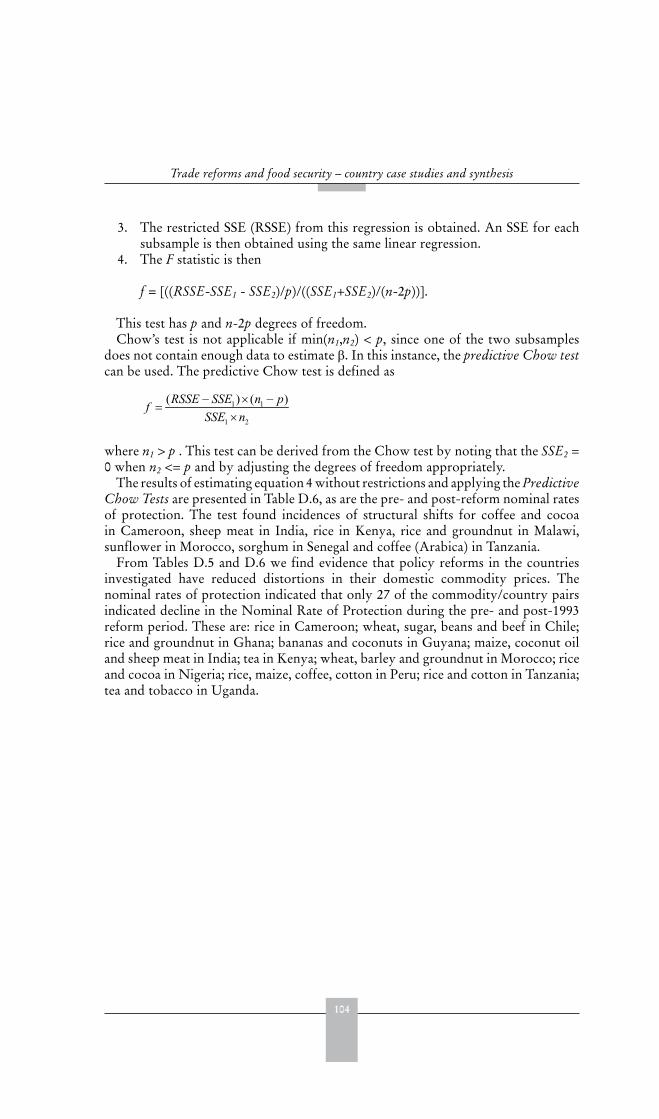
104
Trade reforms and food security – country case studies and synthesis
3. The restricted SSE (RSSE) from this regression is obtained. An SSE for eachsubsample is then obtained using the same linear regression.
4. The F statistic is then
f = [((RSSE-SSE1 - SSE2)/p)/((SSE1+SSE2)/(n-2p))].
This test has p and n-2p degrees of freedom.Chow’s test is not applicable if min(n1,n2) < p, since one of the two subsamples
does not contain enough data to estimate . In this instance, the predictive Chow testcan be used. The predictive Chow test is defined as
1 1
1 2
( ) ( )RSSE SSE n pf
SSE n
where n1 > p . This test can be derived from the Chow test by noting that the SSE2 =0 when n2 <= p and by adjusting the degrees of freedom appropriately.
The results of estimating equation 4 without restrictions and applying the Predictive Chow Tests are presented in Table D.6, as are the pre- and post-reform nominal ratesof protection. The test found incidences of structural shifts for coffee and cocoain Cameroon, sheep meat in India, rice in Kenya, rice and groundnut in Malawi,sunflower in Morocco, sorghum in Senegal and coffee (Arabica) in Tanzania.
From Tables D.5 and D.6 we find evidence that policy reforms in the countriesinvestigated have reduced distortions in their domestic commodity prices. Thenominal rates of protection indicated that only 27 of the commodity/country pairsindicated decline in the Nominal Rate of Protection during the pre- and post-1993reform period. These are: rice in Cameroon; wheat, sugar, beans and beef in Chile;rice and groundnut in Ghana; bananas and coconuts in Guyana; maize, coconut oiland sheep meat in India; tea in Kenya; wheat, barley and groundnut in Morocco; riceand cocoa in Nigeria; rice, maize, coffee, cotton in Peru; rice and cotton in Tanzania;tea and tobacco in Uganda.

105
Price transmission analysis
TABLE D.1Stationarity tests – world prices
Without trend With trendADF PP ADF PP
Bananas -1.37 -1.3 -2.33 -2.22Barley -2.62* -1.94 -3.31** -2.39Beans -6.01*** -3.01** -5.95*** -3.07**Beef -2.15 -1.84 -2.72* -2.45Cocoa -0.55 -1.24 -2.42 -2.18Coconut -2.59 -2.66* -3.48** -3.11**Coconut oil -2.87* -2.93** -3.29** -3.12Coffee -1.30 -1.76 -2.24 -2.11Coffee arabica -1.68 -1.85 -2.1 -2.33Coffee robusta -0.87 -1.32 -2.38 -2.18Cotton -1.79 -1.98 -3.09** -2.9Groundnut -2.91* -2.86* -4.05*** -4.18***Lamb meat -3.6*** -3.38** -3.71*** -3.18**Maize -1.74 -1.54 -2.93** -2.53Rice -3.35** -2.91* -3.07** -3.09**Sorghum -1.84 -1.84 -2.75* -2.47Sugar -3.58*** -3.82*** -3.44** -3.33**Sunflower -1.4 -1.05 -2.88* -2.06Tea -2.28 -2.43 -2.92* -2.64*Tobacco -1.39 -1.53 -3.16** -2.68*Wheat -2.73* -2.17 -3.05** -2.31
Notes: ADF is the augmented –Dickey Fuller test and PP is the Phillips-Perron test. The critical values for 50 observations are:-2.60 (10 percent), -2.93 (5 percent), and -3.58 (1 percent). Asterisks denote levels of significance (*for 10 percent, ** for 5percent, and *** for 1 percent).
TABLE D.2Stationarity tests – domestic prices and price differentials
Without trend With trend Price differentials
ADF PP ADF PP ADF PPCameroonRice -1.62 -1.39 -1.27 -1.41 -1.63 -1.93Coffee -1.66 1.9 -1.24 -1.57 -1.3 -1.87Cocoa -1.48 -1.51 -1.58 -1.64 -3.05** -3.33**Cotton -1.11 -1.16 -1.12 -1.52 -2.48 -2.58ChileWheat -0.91 -1.03 -2.55 -2.06 -3.18** -2.32Maize -0.72 -1.14 -2.98** -2.40 -4.29*** -2.00Sugar -2.13 -1.49 -3.43** -1.71 -3.92*** -3.05**Beans -5.78*** -3.99*** -6.00*** -3.94** -5.00*** -2.73*Beef -1.62 -1.79 -1.84 -1.89 -1.36 -1.27GhanaRice -2.69* -1.95 7.16*** -2.86* -3.4** -2.82*Maize -2.26 -3.08** -3.42** -4.2*** -3.68*** -3.55**Cocoa -1.69 -2.07 -1.95 -3.84*** -1.31 -0.96Groundnut -0.71 -0.63 -4.79*** -2.93** -4.25*** -3.91***GuatemalaMaize -3.4** -3.42** -4.1*** -3.75*** -2.16 -2.03Wheat -0.51 -0.87 -4.29*** -2.86* -3.24** -2.26GuyanaRice -2.2 -2.06 -1.6 -1.53 -3.26** -2.5Sugar -2.29 -3.26** -2.2 -3.03** -2.43 -2.85*Bananas -2.76* -3.29** -2.18 -2.93** -3.15** -3.09**
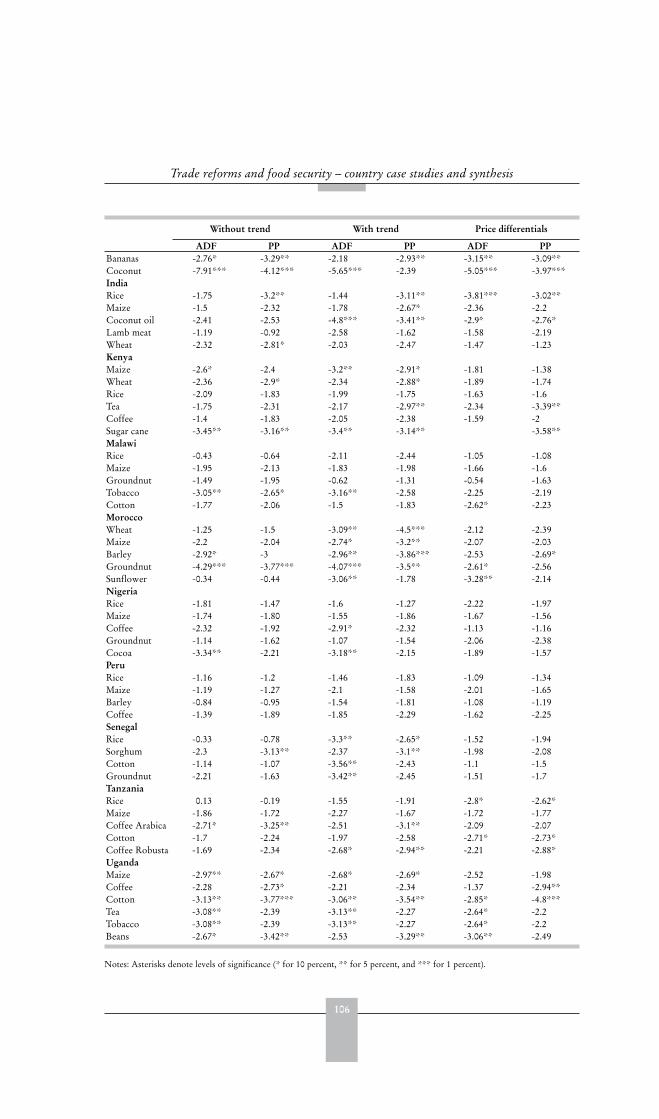
106
Trade reforms and food security – country case studies and synthesis
Without trend With trend Price differentials
ADF PP ADF PP ADF PPBananas -2.76* -3.29** -2.18 -2.93** -3.15** -3.09**Coconut -7.91*** -4.12*** -5.65*** -2.39 -5.05*** -3.97***IndiaRice -1.75 -3.2** -1.44 -3.11** -3.81*** -3.02**Maize -1.5 -2.32 -1.78 -2.67* -2.36 -2.2Coconut oil -2.41 -2.53 -4.8*** -3.41** -2.9* -2.76*Lamb meat -1.19 -0.92 -2.58 -1.62 -1.58 -2.19Wheat -2.32 -2.81* -2.03 -2.47 -1.47 -1.23KenyaMaize -2.6* -2.4 -3.2** -2.91* -1.81 -1.38Wheat -2.36 -2.9* -2.34 -2.88* -1.89 -1.74Rice -2.09 -1.83 -1.99 -1.75 -1.63 -1.6Tea -1.75 -2.31 -2.17 -2.97** -2.34 -3.39**Coffee -1.4 -1.83 -2.05 -2.38 -1.59 -2Sugar cane -3.45** -3.16** -3.4** -3.14** -3.58**MalawiRice -0.43 -0.64 -2.11 -2.44 -1.05 -1.08Maize -1.95 -2.13 -1.83 -1.98 -1.66 -1.6Groundnut -1.49 -1.95 -0.62 -1.31 -0.54 -1.63Tobacco -3.05** -2.65* -3.16** -2.58 -2.25 -2.19Cotton -1.77 -2.06 -1.5 -1.83 -2.62* -2.23MoroccoWheat -1.25 -1.5 -3.09** -4.5*** -2.12 -2.39Maize -2.2 -2.04 -2.74* -3.2** -2.07 -2.03Barley -2.92* -3 -2.96** -3.86*** -2.53 -2.69*Groundnut -4.29*** -3.77*** -4.07*** -3.5** -2.61* -2.56Sunflower -0.34 -0.44 -3.06** -1.78 -3.28** -2.14NigeriaRice -1.81 -1.47 -1.6 -1.27 -2.22 -1.97Maize -1.74 -1.80 -1.55 -1.86 -1.67 -1.56Coffee -2.32 -1.92 -2.91* -2.32 -1.13 -1.16Groundnut -1.14 -1.62 -1.07 -1.54 -2.06 -2.38Cocoa -3.34** -2.21 -3.18** -2.15 -1.89 -1.57PeruRice -1.16 -1.2 -1.46 -1.83 -1.09 -1.34Maize -1.19 -1.27 -2.1 -1.58 -2.01 -1.65Barley -0.84 -0.95 -1.54 -1.81 -1.08 -1.19Coffee -1.39 -1.89 -1.85 -2.29 -1.62 -2.25SenegalRice -0.33 -0.78 -3.3** -2.65* -1.52 -1.94Sorghum -2.3 -3.13** -2.37 -3.1** -1.98 -2.08Cotton -1.14 -1.07 -3.56** -2.43 -1.1 -1.5Groundnut -2.21 -1.63 -3.42** -2.45 -1.51 -1.7TanzaniaRice 0.13 -0.19 -1.55 -1.91 -2.8* -2.62*Maize -1.86 -1.72 -2.27 -1.67 -1.72 -1.77Coffee Arabica -2.71* -3.25** -2.51 -3.1** -2.09 -2.07Cotton -1.7 -2.24 -1.97 -2.58 -2.71* -2.73*Coffee Robusta -1.69 -2.34 -2.68* -2.94** -2.21 -2.88*UgandaMaize -2.97** -2.67* -2.68* -2.69* -2.52 -1.98Coffee -2.28 -2.73* -2.21 -2.34 -1.37 -2.94**Cotton -3.13** -3.77*** -3.06** -3.54** -2.85* -4.8***Tea -3.08** -2.39 -3.13** -2.27 -2.64* -2.2Tobacco -3.08** -2.39 -3.13** -2.27 -2.64* -2.2Beans -2.67* -3.42** -2.53 -3.29** -3.06** -2.49
Notes: Asterisks denote levels of significance (* for 10 percent, ** for 5 percent, and *** for 1 percent).

107
Price transmission analysis
TABLE D.3Restricted error correction model
Constant Adjustmentcoefficient
Short-runeffect
Adj. R2 3 year adjustment
CameroonRice 0.1684
(1.2)0.1828(1.6)
-0.1039(0.54)
0.0819 40 percent
Coffee 0.2748**(1.98)
0.358**(2.2)
0.2767(1.34)
0.1942 81 percent
Cocoa 0.3268***(3.65)
0.8098***(4.7)
-0.0239(-1.10)
0.5291 99 percent
Cotton -0.01059(-0.34)
0.1193(1.04)
-0.05404(-0.39)
0.0039 28 percent
ChileWheat 0.002352
(0.07)0.093107(1.17)
0.023379(0.15)
-0.0270 27 percent
Maize 0.017077(0.73)
0.135084(1.41)
0.654577***(4.97)
0.5447 78 percent
Sugar -0.0647*(-1.65)
-0.11457(-1.89)
-0.21378(-1.87)
0.0983 -68 percent
Beans -0.15042(1.55)
0.651833**(2.67)
0.591629**(2.94)
0.4029 98 percent
Beef -0.02482(-1.42)
-0.02714(-0.48)
0.310526***(4.71)
0.5675 25 percent
GhanaRice -0.00929
--0.0001-
0.030947(0.18)
-0.0537 3 percent
Maize 0.104836(1.27)
0.842465**(2.97)
0.625954(1.43)
0.2663 100 percent
Cocoa -0.07652(-0.64)
0.134495(1.18)
-0.22239(-0.41)
-0.0203 21 percent
Groundnut -0.04611(-1.3)
0.326754**(2.07)
0.045386(0.26)
0.1572 71 percent
GuatemalaMaize 0.020942
(0.4)0.229037(1.26)
0.257038(0.89)
-0.0098 66 percent
Wheat -0.00013(0.00)
0.106393(1.16)
0.084811(0.69)
-0.0321 35 percent
MalawiRice 0.03373
(0.71)-0.01045(-0.10)
0.03436(0.19)
-0.1131 -
Maize 0.09879(1.44)
0.27317(1.88)
-0.04199(-0.17)
0.0794 60 percent
Cotton 0.08685(0.76)
0.14655(1.05)
-0.07933(-0.39)
-0.009 33 percent
Tobacco 0.16253**(2.12)
0.48018**(1.96)
1.037**(2.51)
0.4042 100 percent
Groundnut 0.23886(0.36)
0.14771(0.82)
0.14454(0.61)
-0.0696 47 percent
MoroccoWheat -0.02377 0.0001 0.069288
(0.29)-0.0507 7 percent
Maize -0.01602(0.43)
0.144293(0.80)
0.371928*(1.66)
0.0383 61 percent
Barley 0.061125(1.12)
0.617409**(2.77)
0.505291(1.54)
0.303 97 percent
Sunflower -0.02319(-0.98)
0.093892(1.01)
-0.02605(-0.17)
-0.0337 24 percent
Groundnut -0.010307**(-2.98)
0.227645**(2.7)
0.064759(0.53)
0.2349 57 percent
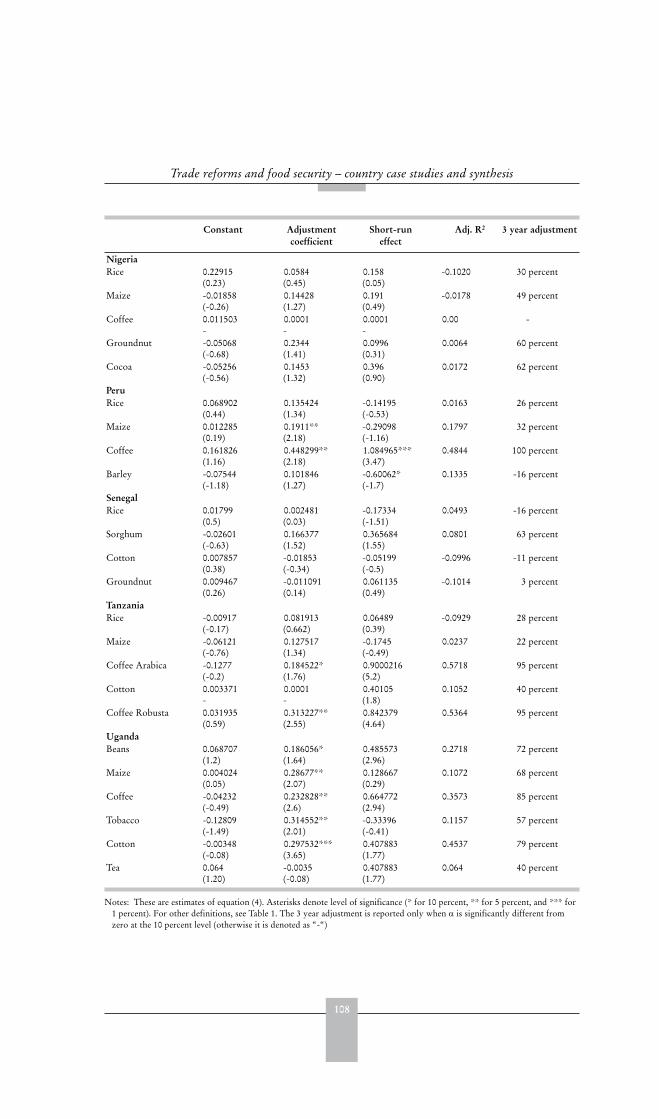
108
Trade reforms and food security – country case studies and synthesis
Constant Adjustmentcoefficient
Short-runeffect
Adj. R2 3 year adjustment
NigeriaRice 0.22915
(0.23)0.0584(0.45)
0.158(0.05)
-0.1020 30 percent
Maize -0.01858(-0.26)
0.14428(1.27)
0.191(0.49)
-0.0178 49 percent
Coffee 0.011503-
0.0001-
0.0001-
0.00 -
Groundnut -0.05068(-0.68)
0.2344(1.41)
0.0996(0.31)
0.0064 60 percent
Cocoa -0.05256(-0.56)
0.1453(1.32)
0.396(0.90)
0.0172 62 percent
PeruRice 0.068902
(0.44)0.135424(1.34)
-0.14195(-0.53)
0.0163 26 percent
Maize 0.012285(0.19)
0.1911**(2.18)
-0.29098(-1.16)
0.1797 32 percent
Coffee 0.161826(1.16)
0.448299**(2.18)
1.084965***(3.47)
0.4844 100 percent
Barley -0.07544(-1.18)
0.101846(1.27)
-0.60062*(-1.7)
0.1335 -16 percent
SenegalRice 0.01799
(0.5)0.002481(0.03)
-0.17334(-1.51)
0.0493 -16 percent
Sorghum -0.02601(-0.63)
0.166377(1.52)
0.365684(1.55)
0.0801 63 percent
Cotton 0.007857(0.38)
-0.01853(-0.34)
-0.05199(-0.5)
-0.0996 -11 percent
Groundnut 0.009467(0.26)
-0.011091(0.14)
0.061135(0.49)
-0.1014 3 percent
TanzaniaRice -0.00917
(-0.17)0.081913(0.662)
0.06489(0.39)
-0.0929 28 percent
Maize -0.06121(-0.76)
0.127517(1.34)
-0.1745(-0.49)
0.0237 22 percent
Coffee Arabica -0.1277(-0.2)
0.184522*(1.76)
0.9000216(5.2)
0.5718 95 percent
Cotton 0.003371-
0.0001-
0.40105(1.8)
0.1052 40 percent
Coffee Robusta 0.031935(0.59)
0.313227**(2.55)
0.842379(4.64)
0.5364 95 percent
UgandaBeans 0.068707
(1.2)0.186056*(1.64)
0.485573(2.96)
0.2718 72 percent
Maize 0.004024(0.05)
0.28677**(2.07)
0.128667(0.29)
0.1072 68 percent
Coffee -0.04232(-0.49)
0.232828**(2.6)
0.664772(2.94)
0.3573 85 percent
Tobacco -0.12809(-1.49)
0.314552**(2.01)
-0.33396(-0.41)
0.1157 57 percent
Cotton -0.00348(-0.08)
0.297532***(3.65)
0.407883(1.77)
0.4537 79 percent
Tea 0.064(1.20)
-0.0035(-0.08)
0.407883(1.77)
0.064 40 percent
Notes: These are estimates of equation (4). Asterisks denote level of significance (* for 10 percent, ** for 5 percent, and *** for1 percent). For other definitions, see Table 1. The 3 year adjustment is reported only when is significantly different fromzero at the 10 percent level (otherwise it is denoted as “-“)
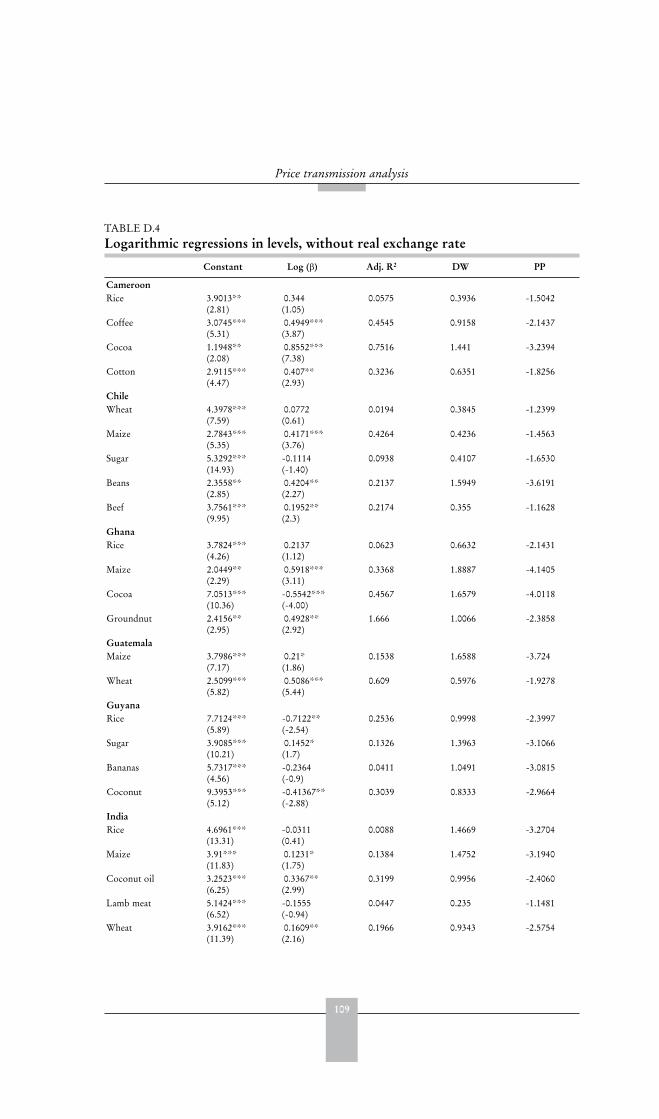
109
Price transmission analysis
TABLE D.4Logarithmic regressions in levels, without real exchange rate
Constant Log ( ) Adj. R2 DW PP
CameroonRice 3.9013**
(2.81)0.344(1.05)
0.0575 0.3936 -1.5042
Coffee 3.0745***(5.31)
0.4949***(3.87)
0.4545 0.9158 -2.1437
Cocoa 1.1948**(2.08)
0.8552***(7.38)
0.7516 1.441 -3.2394
Cotton 2.9115***(4.47)
0.407**(2.93)
0.3236 0.6351 -1.8256
ChileWheat 4.3978***
(7.59)0.0772(0.61)
0.0194 0.3845 -1.2399
Maize 2.7843***(5.35)
0.4171***(3.76)
0.4264 0.4236 -1.4563
Sugar 5.3292***(14.93)
-0.1114(-1.40)
0.0938 0.4107 -1.6530
Beans 2.3558**(2.85)
0.4204**(2.27)
0.2137 1.5949 -3.6191
Beef 3.7561***(9.95)
0.1952**(2.3)
0.2174 0.355 -1.1628
GhanaRice 3.7824***
(4.26)0.2137(1.12)
0.0623 0.6632 -2.1431
Maize 2.0449**(2.29)
0.5918***(3.11)
0.3368 1.8887 -4.1405
Cocoa 7.0513***(10.36)
-0.5542***(-4.00)
0.4567 1.6579 -4.0118
Groundnut 2.4156**(2.95)
0.4928**(2.92)
1.666 1.0066 -2.3858
GuatemalaMaize 3.7986***
(7.17)0.21*(1.86)
0.1538 1.6588 -3.724
Wheat 2.5099***(5.82)
0.5086***(5.44)
0.609 0.5976 -1.9278
GuyanaRice 7.7124***
(5.89)-0.7122**(-2.54)
0.2536 0.9998 -2.3997
Sugar 3.9085***(10.21)
0.1452*(1.7)
0.1326 1.3963 -3.1066
Bananas 5.7317***(4.56)
-0.2364(-0.9)
0.0411 1.0491 -3.0815
Coconut 9.3953***(5.12)
-0.41367**(-2.88)
0.3039 0.8333 -2.9664
IndiaRice 4.6961***
(13.31)-0.0311(0.41)
0.0088 1.4669 -3.2704
Maize 3.91***(11.83)
0.1231*(1.75)
0.1384 1.4752 -3.1940
Coconut oil 3.2523***(6.25)
0.3367**(2.99)
0.3199 0.9956 -2.4060
Lamb meat 5.1424***(6.52)
-0.1555(-0.94)
0.0447 0.235 -1.1481
Wheat 3.9162***(11.39)
0.1609**(2.16)
0.1966 0.9343 -2.5754

110
Trade reforms and food security – country case studies and synthesis
Constant Log ( ) Adj. R2 DW PP
KenyaRice 5.2169*
(2.91)-0.1187(-0.31)
0.005 0.5685 -1.9408
Maize 5.4169***(13.66)
-0.1477*(-1.75)
0.1382 1.19 -2.9344
Coffee 2.3575***(7.88)
0.5024***(7.48)
0.7465 1.6316 -3.6166
Sugar cane 4.5132***(14.97)
-0.022(-0.33)
0.0056 1.4332 -3.297
Wheat 3.8552***(7.92)
0.1593(1.51)
0.1069 1.2826 -3.0435
Tea -0.5206(-0.44)
1.1561***(4.72)
0.5401 1.6083 -3.6871
MalawiRice 6.2852***
(5.88)-0.3402(-1.49)
0.1041 0.5073 -1.3094
Maize 4.3824***(5.99)
0.1448(0.93)
0.0433 0.8839 -2.2056
Cotton 3.8956***(5.78)
0.3**(2)
0.1735 0.7433 -2.1602
Tobacco 1.6862(1.35)
0.7153**(2.78)
0.2896 1.079 -2.604
Groundnut 3.4227***(3.3)
0.3366(1.57)
0.1151 0.6558 -1.6363
MoroccoWheat 2.5459***
(4.93)0.4591***(4.1)
0.4693 1.0767 -2.5918
Maize 2.4091***(4.51)
0.4746***(4.17)
0.4777 0.917 -2.4214
Barley 1.677*(1.79)
0.6573**(3.019)
0.3489 1.2664 -3.0684
Sunflower 3.1204***(4.79)
0.3288**(2.39)
0.2309 0.4015 -1.5952
Groundnut 4.9368***(12.78)
-0.1202(-1.51)
0.1068 1.5224 -3.647
NigeriaRice 6.531***
(3.6)-0.3108(-0.80)
0.0326 0.3675 -1.4204
Maize 7.3105***(6.59)
-0.6091**(-2.58)
0.2588 0.919 -2.3334
Coffee 5.2928***(5.96)
-0.3332*(-1.67)
0.1284 0.8273 -2.3879
Groundnut 4.2542***(3.06)
0.085(0.30)
0.0046 0.6608 -1.7246
Cocoa 5.0311***(6.11)
-0.1243(-0.74)
0.0281 0.7743 -2.3229
PeruRice 0.9757
(0.42)0.6785**(1.97)
0.1696 0.413 -1.4395
Maize -1.0665(-0.63)
0.3343***(3.81)
0.433 0.5154 -1.9012
Coffee -2.8402**(-2.9)
0.7127***(7.99)
0.7705 1.5802 -3.6393
Barley -4.2358(-1.45)
-0.9540**(-3.26)
0.3583 0.506 -1.7583
SenegalRice 5.9069***
(8.17)-0.3336**(-2.16)
0.1965 0.3507 -1.2025
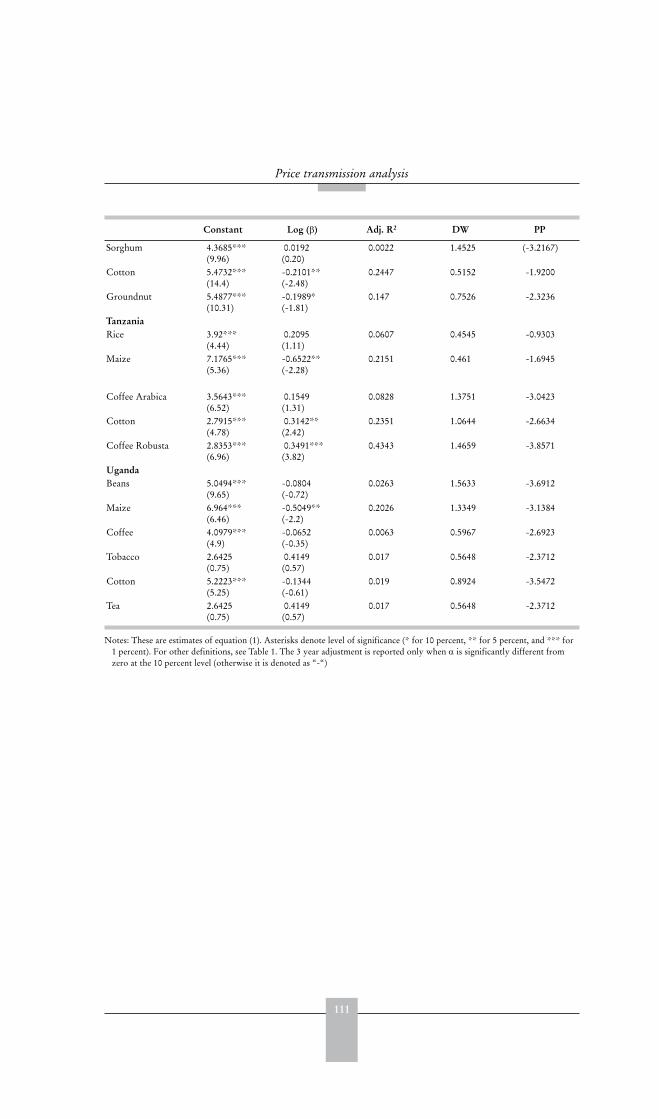
111
Price transmission analysis
Constant Log ( ) Adj. R2 DW PP
Sorghum 4.3685***(9.96)
0.0192(0.20)
0.0022 1.4525 (-3.2167)
Cotton 5.4732***(14.4)
-0.2101**(-2.48)
0.2447 0.5152 -1.9200
Groundnut 5.4877***(10.31)
-0.1989*(-1.81)
0.147 0.7526 -2.3236
TanzaniaRice 3.92***
(4.44)0.2095(1.11)
0.0607 0.4545 -0.9303
Maize 7.1765***(5.36)
-0.6522**(-2.28)
0.2151 0.461 -1.6945
Coffee Arabica 3.5643***(6.52)
0.1549(1.31)
0.0828 1.3751 -3.0423
Cotton 2.7915***(4.78)
0.3142**(2.42)
0.2351 1.0644 -2.6634
Coffee Robusta 2.8353***(6.96)
0.3491***(3.82)
0.4343 1.4659 -3.8571
UgandaBeans 5.0494***
(9.65)-0.0804(-0.72)
0.0263 1.5633 -3.6912
Maize 6.964***(6.46)
-0.5049**(-2.2)
0.2026 1.3349 -3.1384
Coffee 4.0979***(4.9)
-0.0652(-0.35)
0.0063 0.5967 -2.6923
Tobacco 2.6425(0.75)
0.4149(0.57)
0.017 0.5648 -2.3712
Cotton 5.2223***(5.25)
-0.1344(-0.61)
0.019 0.8924 -3.5472
Tea 2.6425(0.75)
0.4149(0.57)
0.017 0.5648 -2.3712
Notes: These are estimates of equation (1). Asterisks denote level of significance (* for 10 percent, ** for 5 percent, and *** for1 percent). For other definitions, see Table 1. The 3 year adjustment is reported only when is significantly different fromzero at the 10 percent level (otherwise it is denoted as “-“)
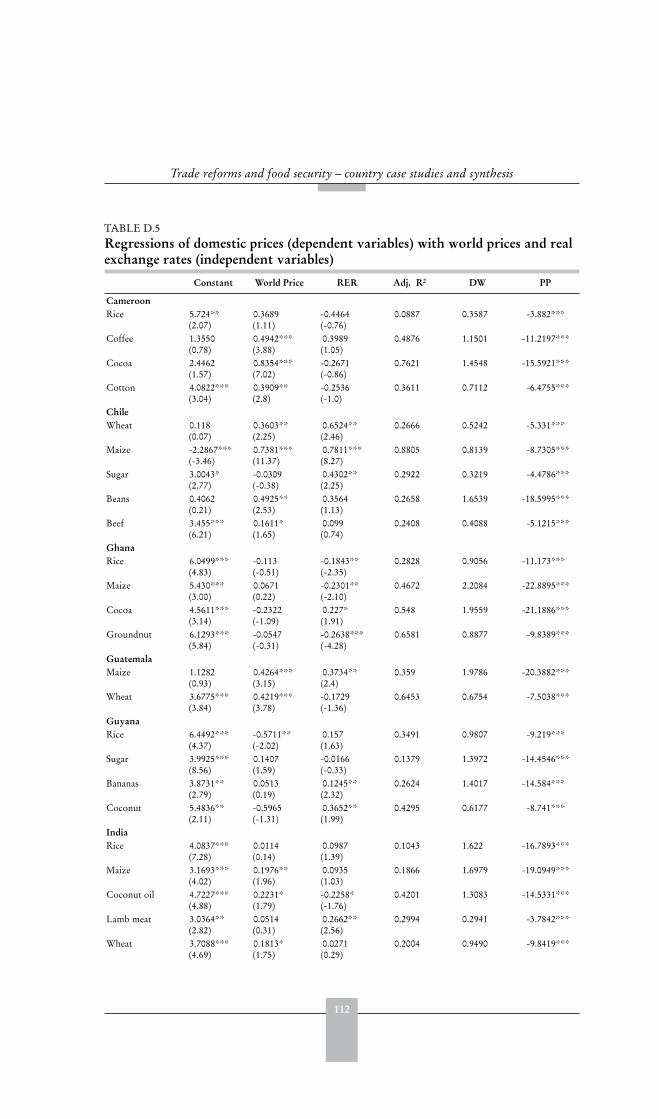
112
Trade reforms and food security – country case studies and synthesis
TABLE D.5Regressions of domestic prices (dependent variables) with world prices and real exchange rates (independent variables)
Constant World Price RER Adj. R2 DW PP
CameroonRice 5.724**
(2.07)0.3689(1.11)
-0.4464(-0.76)
0.0887 0.3587 -3.882***
Coffee 1.3550(0.78)
0.4942***(3.88)
0.3989(1.05)
0.4876 1.1501 -11.2197***
Cocoa 2.4462(1.57)
0.8354***(7.02)
-0.2671(-0.86)
0.7621 1.4548 -15.5921***
Cotton 4.0822***(3.04)
0.3909**(2.8)
-0.2536(-1.0)
0.3611 0.7112 -6.4755***
ChileWheat 0.118
(0.07)0.3603**(2.25)
0.6524**(2.46)
0.2666 0.5242 -5.331***
Maize -2.2867***(-3.46)
0.7381***(11.37)
0.7811***(8.27)
0.8805 0.8139 -8.7305***
Sugar 3.0043*(2.77)
-0.0309(-0.38)
0.4302**(2.25)
0.2922 0.3219 -4.4786***
Beans 0.4062(0.21)
0.4925**(2.53)
0.3564(1.13)
0.2658 1.6539 -18.5995***
Beef 3.455***(6.21)
0.1611*(1.65)
0.099(0.74)
0.2408 0.4088 -5.1215***
GhanaRice 6.0499***
(4.83)-0.113(-0.51)
-0.1843**(-2.35)
0.2828 0.9056 -11.173***
Maize 5.430***(3.00)
0.0671(0.22)
-0.2301**(-2.10)
0.4672 2.2084 -22.8895***
Cocoa 4.5611***(3.14)
-0.2322(-1.09)
0.227*(1.91)
0.548 1.9559 -21.1886***
Groundnut 6.1293***(5.84)
-0.0547(-0.31)
-0.2638***(-4.28)
0.6581 0.8877 -9.8389***
GuatemalaMaize 1.1282
(0.93)0.4264***(3.15)
0.3734**(2.4)
0.359 1.9786 -20.3882***
Wheat 3.6775***(3.84)
0.4219***(3.78)
-0.1729(-1.36)
0.6453 0.6754 -7.5038***
GuyanaRice 6.4492***
(4.37)-0.5711**(-2.02)
0.157(1.63)
0.3491 0.9807 -9.219***
Sugar 3.9925***(8.56)
0.1407(1.59)
-0.0166(-0.33)
0.1379 1.3972 -14.4546***
Bananas 3.8731**(2.79)
0.0513(0.19)
0.1245**(2.32)
0.2624 1.4017 -14.584***
Coconut 5.4836**(2.11)
-0.5965(-1.31)
0.3652**(1.99)
0.4295 0.6177 -8.741***
IndiaRice 4.0837***
(7.28)0.0114(0.14)
0.0987(1.39)
0.1043 1.622 -16.7893***
Maize 3.1693***(4.02)
0.1976**(1.96)
0.0935(1.03)
0.1866 1.6979 -19.0949***
Coconut oil 4.7227***(4.88)
0.2231*(1.79)
-0.2258*(-1.76)
0.4201 1.3083 -14.5331***
Lamb meat 3.0364**(2.82)
0.0514(0.31)
0.2662**(2.56)
0.2994 0.2941 -3.7842***
Wheat 3.7088***(4.69)
0.1813*(1.75)
0.0271(0.29)
0.2004 0.9490 -9.8419***

113
Price transmission analysis
Constant World Price RER Adj. R2 DW PP
KenyaRice 14.3886***
(3.75)-0.5565(-1.49)
-1.5887**(-2.62)
0.2796 1.0595 -11.5994***
Maize 6.672***(5.57)
-0.2255**(-2.06)
-0.1985(-1.11)
0.1934 1.4716 -15.6465***
Coffee 2.5301(1.56)
0.4949***(5.08)
-0.0311(-0.11)
0.7466 1.6459 -16.9233***
Sugarcane 4.9449***(5.03)
-0.0306(-0.43)
-0.0877(-0.46)
0.0173 1.4713 -15.6558***
Wheat 6.9443***(5.88)
-0.207(-0.19)
-0.5039**(-2.80)
0.3776 1.5153 -15.9674***
Tea 2.8138(0.71)
0.8692**(2.14)
-0.4334(-0.89)
0.5594 1.7585 -17.9193***
MalawiRice 0.8998
(0.50)-0.1293(-0.67)
1.0486***(3.38)
0.4514 1.3693 -14.7577***
Maize 6.3483**(2.77)
0.0091(0.04)
-0.317(-0.91)
0.0851 0.6879 -6.9542***
Cotton 8.2221***(5.06)
0.0453(0.29)
-0.759**(-2.84)
0.4298 0.5215 -5.0042***
Tobacco 1.7592(0.43)
0.7071(1.39)
-0.0079(-0.02)
0.2896 1.0753 -11.9502***
Groundnut 3.4876(1.12)
0.3322(1.11)
-0.0103(-0.02)
0.1152 0.6524 -5.164***
MoroccoWheat 0.5904
(0.27)0.5426***(3.75)
0.3437(0.92)
0.493 1.1353 -10.9705***
Maize 0.5358(0.23)
0.555***(3.70)
0.3269(0.83)
0.4971 0.9769 -10.4574***
Barley 6.8511**(2.03)
0.3629(1.34)
-0.8398(-1.59)
0.4291 1.5069 -14.7706***
Sunflower -0.8529(-0.44)
0.4491***(3.27)
0.7447**(2.18)
0.3915 0.618 -6.4423***
Groundnut 5.2242***(3.65)
-0.1311(-1.35)
-0.0513(-0.21)
0.109 1.5296 -17.5272***
NigeriaRice 2.0882
(1.28)0.1425(0.48)
0.5537***(4.44)
0.5387 0.4731 -4.4295***
Maize 1.956(1.30)
0.1351(0.55)
0.4451***(4.24)
0.6288 1.6542 -18.0143***
Coffee -1.6758(-0.81)
0.5051*(1.79)
0.7754***(3.57)
0.4892 0.8844 -9.0167***
Groundnut 0.205(0.16)
0.5488**(2.46)
0.4293***(4.64)
0.5471 1.1056 -9.0635***
Cocoa -2.086(1.27)
0.7459***(3.38)
0.6812***(4.64)
0.5575 1.1873 -13.277***
PeruRice -3.6848***
(-3.60)0.233(1.00)
1.6421***(10.15)
0.8764 2.438 -24.68***
Maize -1.4575**(-2.32)
-0.0305(-0.17)
1.3849***(10.91)
0.9256 2.3669 -23.0569***
Coffee -4.2315***(-4.12)
1.1904***(4.22)
0.7518**(2.51)
0.8299 2.0471 -20.8908***
Barley -3.6185***(-3.41)
0.2074(0.77)
1.5755***(11.23)
0.9199 2.8497 -28.7378***
SenegalRice 2.4543***
(3.03)-0.1939*(-1.87)
0.6519***(5.23)
0.6813 1.1772 -12.4004***
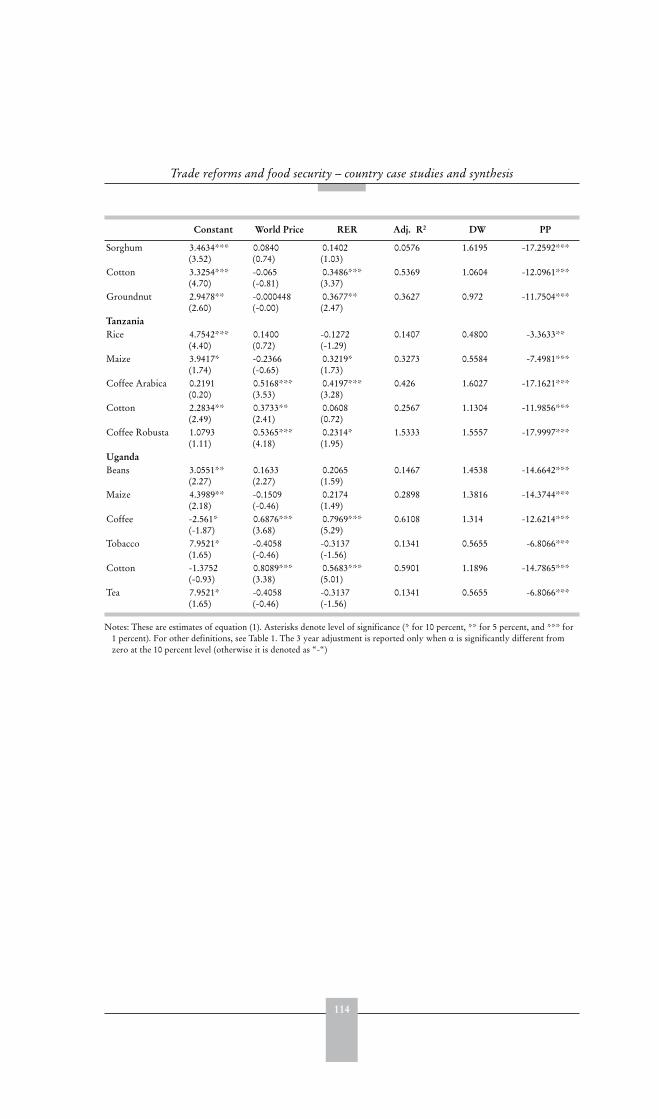
114
Trade reforms and food security – country case studies and synthesis
Constant World Price RER Adj. R2 DW PP
Sorghum 3.4634***(3.52)
0.0840(0.74)
0.1402(1.03)
0.0576 1.6195 -17.2592***
Cotton 3.3254***(4.70)
-0.065(-0.81)
0.3486***(3.37)
0.5369 1.0604 -12.0961***
Groundnut 2.9478**(2.60)
-0.000448(-0.00)
0.3677**(2.47)
0.3627 0.972 -11.7504***
TanzaniaRice 4.7542***
(4.40)0.1400(0.72)
-0.1272(-1.29)
0.1407 0.4800 -3.3633**
Maize 3.9417*(1.74)
-0.2366(-0.65)
0.3219*(1.73)
0.3273 0.5584 -7.4981***
Coffee Arabica 0.2191(0.20)
0.5168***(3.53)
0.4197***(3.28)
0.426 1.6027 -17.1621***
Cotton 2.2834**(2.49)
0.3733**(2.41)
0.0608(0.72)
0.2567 1.1304 -11.9856***
Coffee Robusta 1.0793(1.11)
0.5365***(4.18)
0.2314*(1.95)
1.5333 1.5557 -17.9997***
UgandaBeans 3.0551**
(2.27)0.1633(2.27)
0.2065(1.59)
0.1467 1.4538 -14.6642***
Maize 4.3989**(2.18)
-0.1509(-0.46)
0.2174(1.49)
0.2898 1.3816 -14.3744***
Coffee -2.561*(-1.87)
0.6876***(3.68)
0.7969***(5.29)
0.6108 1.314 -12.6214***
Tobacco 7.9521*(1.65)
-0.4058(-0.46)
-0.3137(-1.56)
0.1341 0.5655 -6.8066***
Cotton -1.3752(-0.93)
0.8089***(3.38)
0.5683***(5.01)
0.5901 1.1896 -14.7865***
Tea 7.9521*(1.65)
-0.4058(-0.46)
-0.3137(-1.56)
0.1341 0.5655 -6.8066***
Notes: These are estimates of equation (1). Asterisks denote level of significance (* for 10 percent, ** for 5 percent, and *** for1 percent). For other definitions, see Table 1. The 3 year adjustment is reported only when is significantly different fromzero at the 10 percent level (otherwise it is denoted as “-“)
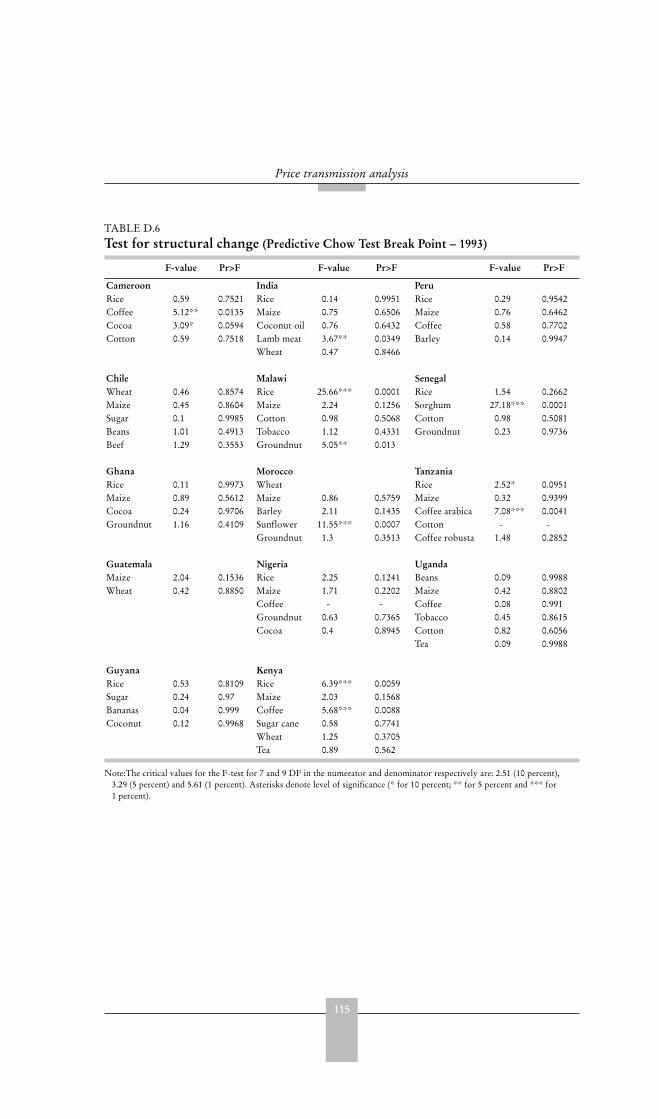
115
Price transmission analysis
TABLE D.6Test for structural change (Predictive Chow Test Break Point – 1993)
F-value Pr>F F-value Pr>F F-value Pr>F
Cameroon India PeruRice 0.59 0.7521 Rice 0.14 0.9951 Rice 0.29 0.9542Coffee 5.12** 0.0135 Maize 0.75 0.6506 Maize 0.76 0.6462Cocoa 3.09* 0.0594 Coconut oil 0.76 0.6432 Coffee 0.58 0.7702Cotton 0.59 0.7518 Lamb meat 3.67** 0.0349 Barley 0.14 0.9947
Wheat 0.47 0.8466
Chile Malawi SenegalWheat 0.46 0.8574 Rice 25.66*** 0.0001 Rice 1.54 0.2662Maize 0.45 0.8604 Maize 2.24 0.1256 Sorghum 27.18*** 0.0001Sugar 0.1 0.9985 Cotton 0.98 0.5068 Cotton 0.98 0.5081Beans 1.01 0.4913 Tobacco 1.12 0.4331 Groundnut 0.23 0.9736Beef 1.29 0.3553 Groundnut 5.05** 0.013
Ghana Morocco TanzaniaRice 0.11 0.9973 Wheat Rice 2.52* 0.0951Maize 0.89 0.5612 Maize 0.86 0.5759 Maize 0.32 0.9399Cocoa 0.24 0.9706 Barley 2.11 0.1435 Coffee arabica 7.08*** 0.0041Groundnut 1.16 0.4109 Sunflower 11.55*** 0.0007 Cotton - -
Groundnut 1.3 0.3513 Coffee robusta 1.48 0.2852
Guatemala Nigeria UgandaMaize 2.04 0.1536 Rice 2.25 0.1241 Beans 0.09 0.9988Wheat 0.42 0.8850 Maize 1.71 0.2202 Maize 0.42 0.8802
Coffee - - Coffee 0.08 0.991Groundnut 0.63 0.7365 Tobacco 0.45 0.8615Cocoa 0.4 0.8945 Cotton 0.82 0.6056
Tea 0.09 0.9988
Guyana KenyaRice 0.53 0.8109 Rice 6.39*** 0.0059Sugar 0.24 0.97 Maize 2.03 0.1568Bananas 0.04 0.999 Coffee 5.68*** 0.0088Coconut 0.12 0.9968 Sugar cane 0.58 0.7741
Wheat 1.25 0.3705Tea 0.89 0.562
Note:The critical values for the F-test for 7 and 9 DF in the numerator and denominator respectively are: 2.51 (10 percent),3.29 (5 percent) and 5.61 (1 percent). Asterisks denote level of significance (* for 10 percent; ** for 5 percent and *** for1 percent).
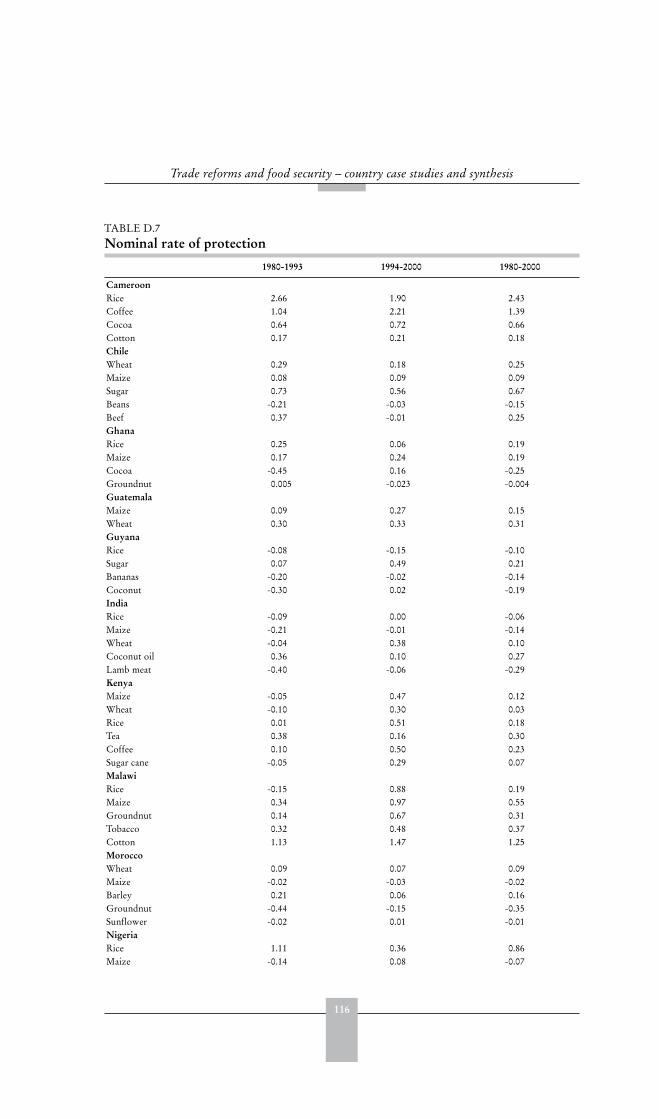
116
Trade reforms and food security – country case studies and synthesis
TABLE D.7Nominal rate of protection
1980-1993 1994-2000 1980-2000
CameroonRice 2.66 1.90 2.43Coffee 1.04 2.21 1.39Cocoa 0.64 0.72 0.66Cotton 0.17 0.21 0.18ChileWheat 0.29 0.18 0.25Maize 0.08 0.09 0.09Sugar 0.73 0.56 0.67Beans -0.21 -0.03 -0.15Beef 0.37 -0.01 0.25GhanaRice 0.25 0.06 0.19Maize 0.17 0.24 0.19Cocoa -0.45 0.16 -0.25Groundnut 0.005 -0.023 -0.004GuatemalaMaize 0.09 0.27 0.15Wheat 0.30 0.33 0.31GuyanaRice -0.08 -0.15 -0.10Sugar 0.07 0.49 0.21Bananas -0.20 -0.02 -0.14Coconut -0.30 0.02 -0.19IndiaRice -0.09 0.00 -0.06Maize -0.21 -0.01 -0.14Wheat -0.04 0.38 0.10Coconut oil 0.36 0.10 0.27Lamb meat -0.40 -0.06 -0.29KenyaMaize -0.05 0.47 0.12Wheat -0.10 0.30 0.03Rice 0.01 0.51 0.18Tea 0.38 0.16 0.30Coffee 0.10 0.50 0.23Sugar cane -0.05 0.29 0.07MalawiRice -0.15 0.88 0.19Maize 0.34 0.97 0.55Groundnut 0.14 0.67 0.31Tobacco 0.32 0.48 0.37Cotton 1.13 1.47 1.25MoroccoWheat 0.09 0.07 0.09Maize -0.02 -0.03 -0.02Barley 0.21 0.06 0.16Groundnut -0.44 -0.15 -0.35Sunflower -0.02 0.01 -0.01NigeriaRice 1.11 0.36 0.86Maize -0.14 0.08 -0.07

Part 2
Trade-related reforms andfood security: country case
studies

121
CameroonErnest Bamou, Jean Pierre Tchanou, François Honoré Mkouonga
and Dominique Njinkeu1
EXECUTIVE SUMMARY
Following independence in 1960, the Government intervened heavily in the ruraland agricultural sectors to promote development. An economic crisis beginning in1987 led to a series of Structural Adjustment Programmes (SAPs) aimed at correctingmacroeconomic disequilibria, reducing microeconomic rigidities, limiting economicvulnerability to external shocks and improving competitiveness. All of these provedineffective. An Extended Structural Adjustment Facility (ESAF) was implementedin August 1997. At a sectoral level, the main focus of the reforms was progressiveliberalization of agricultural input and output markets and the withdrawal of thestate from key areas of economic activity.
Two of the most significant reforms in terms of the impact on producer incentiveswere the devaluation of the exchange rate in 1994 and the implementation ofthe Uruguay Round Agreement on Agriculture which led to an erosion of thepreferential tariff margins enjoyed by producers.
Impact on intermediate variablesBoth the domestic producer and international prices of the main export cropsdeclined in real terms during the period to 1993. They recorded a rise only afterthe 1994 devaluation. The devaluation had its most pronounced effect on cocoaand coffee prices which more than doubled in 1995. They then remained relativelystable until 1998 before rising again due to relatively favourable international marketconditions. During the first phase of reforms (prior to devaluation) parastatalmarketing boards continued to intervene in prices by seeking to stabilize them in theface of falling international prices. During the second phase (following devaluation)upward price movements can be mostly explained by exchange rate devaluation,although downward pressure was still being maintained by international prices(which continued to fall) and domestic market liberalization.
For food crops (notably rice) the producer prices were pegged to world prices.Liberalization provoked a fall in both consumer and producer prices. The fall inproducer price intensified during the second phase of reforms with the restructuringof public enterprises.
1 Ernest Bamou and Jean Pierre Tchanou, Department of Economics, University of Yaounde II-Soa, FrançoisHonoré Mkouonga, Ministry of Agriculture, Cameroon, Dominique Njinkeu, Consortium pour la RechercheEconomique en Afrique (CREA).
122
Trade reforms and food security – country case studies and synthesis
Although output fell in all agricultural sub-sectors in the period to 1993, cash cropproduction decreased at 9 percent on average while food crop production remainedrelatively stable with an average 0.5 percent decrease. Export crops suffered heavilyfrom external shocks, whilst subsistence agriculture benefited from a switch awayfrom cash crops and the arrival of new producers in response to salary cuts and otherreforms in public sector working conditions.
From 1994 to 2000 the production of the food crop sub-sector increased at anannual average rate of 4 percent. Yields have however stagnated. The relatively positiveproduction trends observed can be attributed to the increase in area under production.
The fall in exports during the economic crisis continued despite the structuraladjustment measures. Only the devaluation and fiscal reforms of 1994 stimulatedan increase in export earnings. With the continuous reduction in oil exploitation,agriculture has assumed a more important role in the country’s international trade.The share of agrifood products in total imports is decreasing, falling significantlyafter the 1994 devaluation.
Impact on target variablesAn increase in some national level food security indicators has been recorded forthe period 1996 to 2000. The food imports to agricultural exports ratio declined andthe total supply of key commodities increased significantly between 1990/1991 and1998/2000. However, a decrease was recorded in per capita food supply due to therising population and the proportion of children suffering from severe malnutritionhas more than doubled, from 3 percent in 1991 to 6.4 percent in 2001.
There was a 13 percent reduction in the number of people living below the povertyline during the second phase of reforms, but this obscures an uneven distributionof income improvements. Generally, farmers have benefited little from priceincreases caused by devaluation. Inflation and reductions in the payroll of publicand private employers greatly reduced the purchasing power of households. The fallin purchasing power was closely followed by a reduction in food expenditure andconsumption. Real income instability has also worsened due to the withdrawal ofstate price controls in 1990.
On the whole, male-headed farm households benefited more from the reforms thanfemale-headed households. This is because men are more involved in the productionof tradable commodities whose prices have tended to rise during the reform period.Women are traditionally associated with non-tradable subsistence crops.
Policy lessonsThe fact that malnutrition is mainly observed in rural areas supports the contentionthat the improvement observed in the national food security indicators is moreattributable to the wider economic growth than to changes in agricultural performance.Additionally, the benefits of growth accrue to a minority of the (mainly urban)population. Reform should not only focus on direct income distribution channels(including transfers, salary increments, etc.) but must also take into accountindirect channels like improving support structures for production and marketing,developing enabling institutions for the integration of the most vulnerable intomarkets, improving access to credit, and creating incentives for greater labourmobility and the creation of small scale enterprises.

123
Cameroon
INTRODUCTION: CONTEXT AND NATURE OF THE REFORMS
The role and level of development of the agriculture sectorBefore 1978 agriculture accounted for more than 50 percent of GDP, more than 70percent of employment and for most of the country’s export earnings. Although, thesector’s relative contribution diminished somewhat after 1978, following the start ofoil exploitation, its direct contribution to GDP, employment and exports remains high.If one includes agricultural processing and marketing activities, the sector accounts forat least 50 percent of national GDP and more than 60 percent of total employment.The devaluation of the CFA (the Communauté Financière Africaine franc) in January1994 had a positive effect on the sector’s share of GDP (Tables 1 and 2).
During the oil boom (1978-86) the agricultural sector registered an average annualgrowth rate of 3.5 percent. This fell to -5.2 percent during the economic crisis of1987-93. It was during this period that the majority of structural and stabilizationreforms were implemented. However, the negative growth rate cannot be attributedsolely to the reforms. A number of external shocks, including a sharp fall ininternational commodity prices and a large rise in the real effective exchange rate,contributed to the problem (Ghura, 1997).2
Cocoa, coffee and cotton are the country’s most important cash crops. They arean essential source of income for poor rural households and an import source of
2 Between 1985 and 1987, the export price indexes for cocoa, coffee and rubber fell, respectively, by 24 percent,11 percent and 20 percent (Blandford et al., 1995).
TABLE 1 Contribution of agriculture sector to GDP, 1988-2000 (percentage of GDP)
1988 1989 1990 1993 1994 1995 1996 1997 1998 1999 2000Primary sector 49.9 50.5 36.4 32.9 37.1 39.9 38.6 42.9 44.4 46.0 47.8Subsistence agriculture 24.1 23.9 22.7 22.2 24.6 25.0 24.2 26.3 27.1 28.4 29.4Perennial agriculture 10.7 11.8 3.0 1.9 1.6 1.9 1.2 2.1 2.4 2.3 2.4Breeding and hunting 9.0 7.6 4.8 3.6 4.1 4.1 4.1 4.3 4.6 4.4 4.6Fishery 0.3 0.3 3.1 2.8 2.8 3.0 2.9 3.0 2.7 2.8 2.9Forestry 5.8 6.9 2.7 2.3 4.0 6.0 6.2 7.2 7.5 8.1 8.5
Source: World Bank database.
TABLE 2 Contribution of agriculture to total employment, 1989/90 - 1996/97
1989/90 1994/95 1995/96 1996/97Employment
(‘000)Share(%)
Employment (‘000)
Share(%)
Employment (‘000)
Share(%)
Employment (‘000)
Share(%)
Modern 342.4 10.2 304.0 8.0 312.4 8.0 325.1 8.1Informal 3 019.2 89.8 3 487.4 92.0 3 583.3 92.0 3 676.4 91.9Agriculture 2 162.6 64.3 2 451.0 64.5 2 517.0 64.6 2 587.3 64.7Total employment 3 361.6 100.0 3 791.4 100.0 3 895.7 100.0 4 001.5 100.0
Source: Mkouonga and Gasas, 2001.
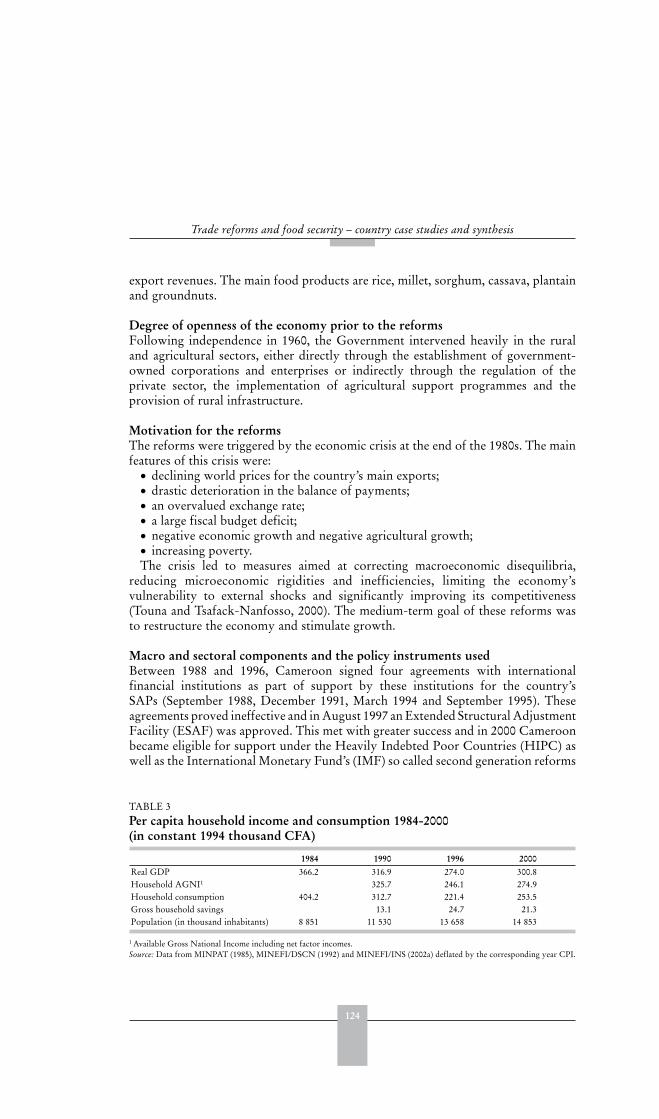
124
Trade reforms and food security – country case studies and synthesis
export revenues. The main food products are rice, millet, sorghum, cassava, plantainand groundnuts.
Degree of openness of the economy prior to the reformsFollowing independence in 1960, the Government intervened heavily in the ruraland agricultural sectors, either directly through the establishment of government-owned corporations and enterprises or indirectly through the regulation of theprivate sector, the implementation of agricultural support programmes and theprovision of rural infrastructure.
Motivation for the reformsThe reforms were triggered by the economic crisis at the end of the 1980s. The mainfeatures of this crisis were:
declining world prices for the country’s main exports;drastic deterioration in the balance of payments;an overvalued exchange rate;a large fiscal budget deficit;negative economic growth and negative agricultural growth;increasing poverty.
The crisis led to measures aimed at correcting macroeconomic disequilibria,reducing microeconomic rigidities and inefficiencies, limiting the economy’svulnerability to external shocks and significantly improving its competitiveness(Touna and Tsafack-Nanfosso, 2000). The medium-term goal of these reforms wasto restructure the economy and stimulate growth.
Macro and sectoral components and the policy instruments usedBetween 1988 and 1996, Cameroon signed four agreements with internationalfinancial institutions as part of support by these institutions for the country’sSAPs (September 1988, December 1991, March 1994 and September 1995). Theseagreements proved ineffective and in August 1997 an Extended Structural AdjustmentFacility (ESAF) was approved. This met with greater success and in 2000 Cameroonbecame eligible for support under the Heavily Indebted Poor Countries (HIPC) aswell as the International Monetary Fund’s (IMF) so called second generation reforms
TABLE 3 Per capita household income and consumption 1984-2000(in constant 1994 thousand CFA)
1984 1990 1996 2000Real GDP 366.2 316.9 274.0 300.8Household AGNI1 325.7 246.1 274.9Household consumption 404.2 312.7 221.4 253.5Gross household savings 13.1 24.7 21.3Population (in thousand inhabitants) 8 851 11 530 13 658 14 853
1 Available Gross National Income including net factor incomes.Source: Data from MINPAT (1985), MINEFI/DSCN (1992) and MINEFI/INS (2002a) deflated by the corresponding year CPI.
125
Cameroon
programme. These initiatives led to the cancellation of a significant portion of thecountry’s external debt.
Various reforms have been implemented as part of the economic stabilization andstructural adjustment process. These have included: (1) fiscal and monetary policyreforms; (2) exchange rate devaluation; (3) banking and financial sector reform;(4) trade liberalization and (5) agricultural policy reform. The aims were to:
reduce inflation through tight fiscal and monetary policy;rationalize public sector spending through cuts and better budget management;progressively liberalize interest rates;stimulate private initiative and reduce production costs through marketderegulation and improved price incentives;shift the bias in production incentives away from non-tradable goods andservices towards tradables;revive agricultural productivity through market liberalization and the reform ofpublic sector enterprises;revitalize international trade by consolidating the process of sub-regionalintegration and diversifying foreign trading partners.
Reform of the public sector focused on reforming public finances, restructuringpublic services, and redefining the role of the state in order to free resources for theprovision of public goods and essential infrastructure and services. Measures weretaken to control state expenditure, increase state revenue and reduce public sectordebt. Efforts to control public sector spending included:
a freeze and cuts in public sector salaries and allowances;early retirement programmes programme for state personnel;cuts in the student population in government vocational schools;a reduction of embassy staff as well as ‘costly’ and ‘non-profitable’ economicmissions;restrictions on the mobility of public sector personnel to reduce travel costs.
Following these reforms, the state wage bill fell by 12 percent in 1992 (Tsafack-Nanfosso, 1999). Further salary cuts in January and November 1993 led to a sharp fall ofalmost 35 percent in the payroll during the 1993/94 fiscal year (MINEFI/DP, 2000).
At the national level, a net deterioration of per capita real income and householdconsumption expenditures is recorded as from 1984, despite the relative recoveryrecorded in 2000 as shown in Table 3.
Macroeconomic reformsFiscal policiesCameroon is a member of Economic and Monetary Community for Central Africa(CEMAC), which in 1998 took over from the Central African Economic andCustoms Union (UDEAC) which was created in 1964 with five members (Cameroon,Congo, Gabon, Central African Republic and Chad). UDEAC’s objectives involvedthe creation of a common market, support for the economic development of itsmembers, and cross-country harmonization of development policies (includingfiscal policy). The most significant initiative of the Customs Union has been theRegional Fiscal Reform Programme (RFRP) framework, which was adopted byCameroon in 1994, and aimed to simplify and harmonize the setting and collectingof indirect taxes and international tariffs.
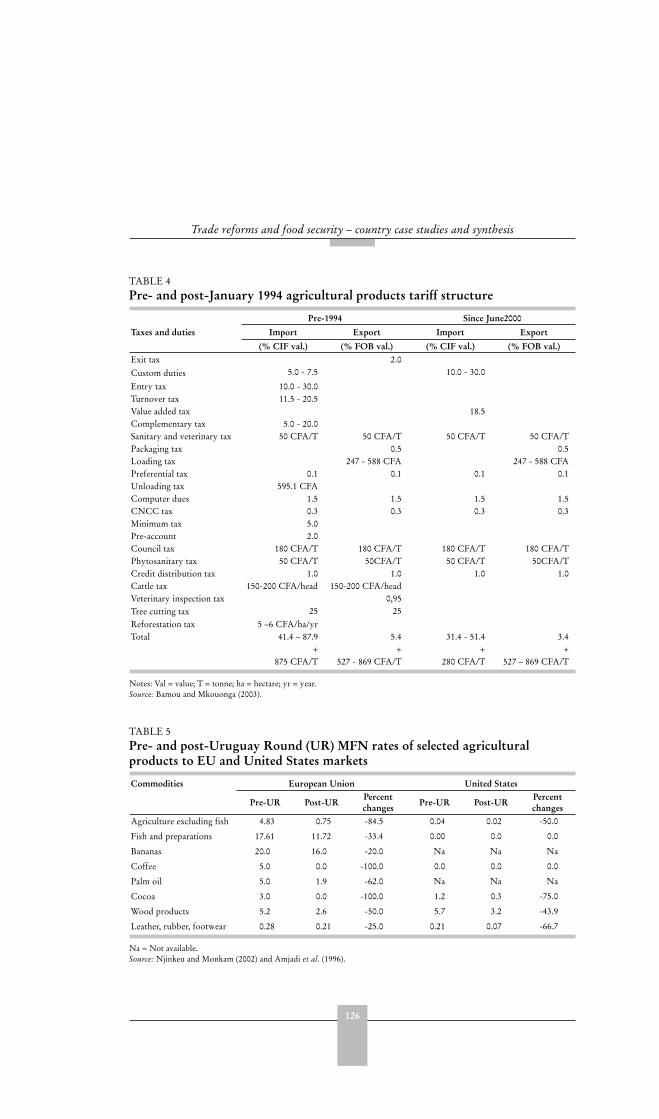
126
Trade reforms and food security – country case studies and synthesis
TABLE 4 Pre- and post-January 1994 agricultural products tariff structure
Taxes and duties
Pre-1994 Since June2000
Import Export Import Export
(% CIF val.) (% FOB val.) (% CIF val.) (% FOB val.)Exit tax 2.0
Custom duties 5.0 - 7.5 10.0 - 30.0
Entry tax 10.0 - 30.0Turnover tax 11.5 - 20.5Value added tax 18.5Complementary tax 5.0 - 20.0Sanitary and veterinary tax 50 CFA/T 50 CFA/T 50 CFA/T 50 CFA/TPackaging tax 0.5 0.5Loading tax 247 - 588 CFA 247 - 588 CFAPreferential tax 0.1 0.1 0.1 0.1Unloading tax 595.1 CFAComputer dues 1.5 1.5 1.5 1.5CNCC tax 0.3 0.3 0.3 0.3Minimum tax 5.0Pre-account 2.0Council tax 180 CFA/T 180 CFA/T 180 CFA/T 180 CFA/TPhytosanitary tax 50 CFA/T 50CFA/T 50 CFA/T 50CFA/TCredit distribution tax 1.0 1.0 1.0 1.0Cattle tax 150-200 CFA/head 150-200 CFA/headVeterinary inspection tax 0,95Tree cutting tax 25 25Reforestation tax 5 –6 CFA/ha/yrTotal 41.4 – 87.9 5.4 31.4 - 51.4 3.4
+ + + +875 CFA/T 527 - 869 CFA/T 280 CFA/T 527 – 869 CFA/T
Notes: Val = value; T = tonne; ha = hectare; yr = year.Source: Bamou and Mkouonga (2003).
TABLE 5 Pre- and post-Uruguay Round (UR) MFN rates of selected agricultural products to EU and United States markets
Commodities European Union United States
Pre-UR Post-URPercent changes
Pre-UR Post-URPercent changes
Agriculture excluding fish
Fish and preparations
Bananas
Coffee
Palm oil
Cocoa
Wood products
Leather, rubber, footwear
4.83
17.61
20.0
5.0
5.0
3.0
5.2
0.28
0.75
11.72
16.0
0.0
1.9
0.0
2.6
0.21
-84.5
-33.4
-20.0
-100.0
-62.0
-100.0
-50.0
-25.0
0.04
0.00
Na
0.0
Na
1.2
5.7
0.21
0.02
0.0
Na
0.0
Na
0.3
3.2
0.07
-50.0
0.0
Na
0.0
Na
-75.0
-43.9
-66.7
Na = Not available.Source: Njinkeu and Monkam (2002) and Amjadi et al. (1996).
127
Cameroon
Financial and banking sector reformsFinancial and banking sector reforms involved a number of measures including(a) reform of the banking system by liquidating non-profitable establishments;(b) emergency measures to relieve the liquidity crisis by discharging arrears andrescheduling credits at the Central Bank; (c) restructuring agricultural credit; and(d) better control over banks by supranational authorities.
In 1997 the Cameroon Agricultural Bank (Crédit Agricole) was liquidated, withthe result that only a few parastatal and agro-industrial enterprises are today ableto satisfy the credit needs of agricultural producers. Most smallholders are unableto access credit from formal financial institutions and rely on relatives and informalmoneylenders. Some donor-funded microfinance programmes also supply creditto smallholders, but these are not widespread, nor well developed, and they lackcoordination with the formal banking sector.
Monetary policiesThrough monetary policy agreements with France, the currency of the CEMAC,like that of all the other countries of the CFA zone, has since 1948 been freelyconvertible into French francs (FF) at a fixed parity of CFA 50 per FF 1. After1985, the economic and financial situation of the zone worsened following: (1) thedeterioration in terms of trade due to the collapse in the international prices of majorexports, (2) a decline in competitiveness due to the appreciation of the FF against thecurrencies of the zone’s major trading partners and (3) other constraints includingthe very high cost of labour (Clément et al., 1996).
From the early 1990s, persistent poor macroeconomic performance showedthat internal adjustments alone (carried out as part of SAPs) could not sufficientlyrevitalize the economy and that monetary adjustment should be also considered.Countries of the CFA agreed on the virtues of a stable common currency comparedto national currencies and in January 1994, therefore, decided to devalue the CFA.
Trade policiesTrade reforms have involved the harmonization of policy across CEMAC memberstates and the simplification of tariff structures. Import duties are fixed by CEMACauthorities according to the following schedule: (1) 5 percent for basic commodities,(2) 15 percent for raw materials and equipment goods, (3) 35 percent for intermediategoods and, (4) 50 percent for final consumption goods. Apart from exemptionsdecided by the regional authorities, these duties apply to all imports from outsidethe Customs Union (Table 4).
Thanks to the Lomé Convention trade agreements with the European Union(EU), Cameroon’s agricultural products have traditionally received preferentialaccess to European markets. One of the consequences of the EU’s adherence toWTO agreements is an erosion of the preferential margins (Table 5).
Sectoral reformThe Public and Parastatal Sector Enterprises Rehabilitation authority that was setup to undertake and monitor the Government’s restructuring programme concludedthat there was a need to restructure those enterprises that were to remain in the state
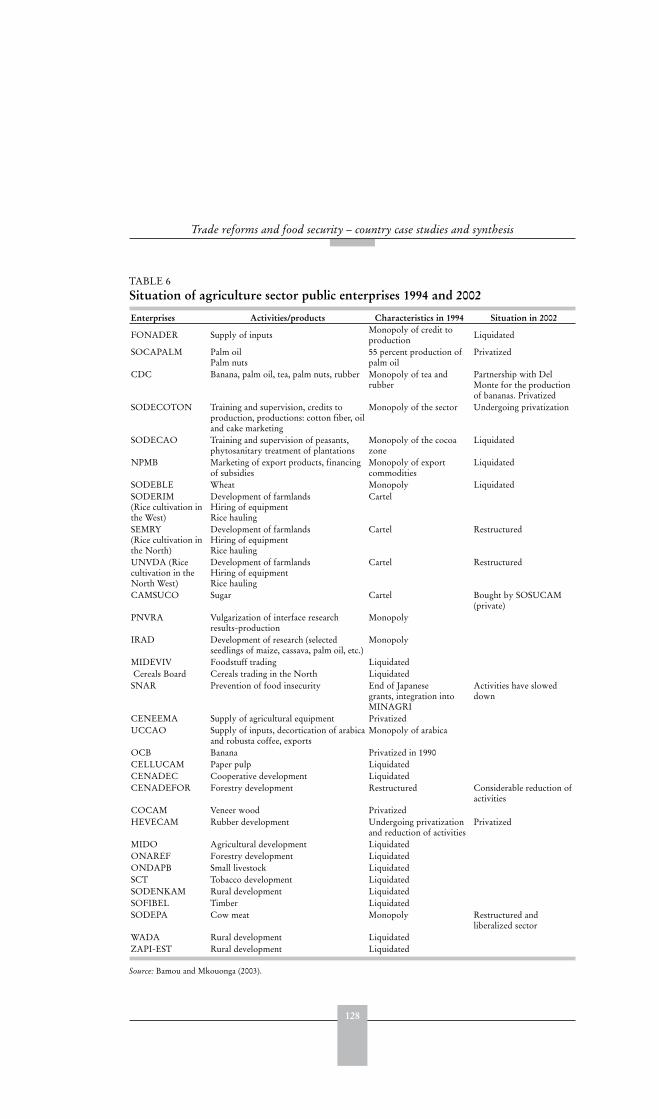
128
Trade reforms and food security – country case studies and synthesis
TABLE 6 Situation of agriculture sector public enterprises 1994 and 2002
Enterprises Activities/products Characteristics in 1994 Situation in 2002
FONADER Supply of inputs Monopoly of credit toproduction Liquidated
SOCAPALM Palm oilPalm nuts
55 percent production ofpalm oil
Privatized
CDC Banana, palm oil, tea, palm nuts, rubber Monopoly of tea andrubber
Partnership with DelMonte for the productionof bananas. Privatized
SODECOTON Training and supervision, credits toproduction, productions: cotton fiber, oiland cake marketing
Monopoly of the sector Undergoing privatization
SODECAO Training and supervision of peasants,phytosanitary treatment of plantations
Monopoly of the cocoazone
Liquidated
NPMB Marketing of export products, financingof subsidies
Monopoly of exportcommodities
Liquidated
SODEBLE Wheat Monopoly LiquidatedSODERIM(Rice cultivation inthe West)
Development of farmlandsHiring of equipmentRice hauling
Cartel
SEMRY(Rice cultivation inthe North)
Development of farmlandsHiring of equipmentRice hauling
Cartel Restructured
UNVDA (Ricecultivation in theNorth West)
Development of farmlandsHiring of equipmentRice hauling
Cartel Restructured
CAMSUCO Sugar Cartel Bought by SOSUCAM(private)
PNVRA Vulgarization of interface researchresults-production
Monopoly
IRAD Development of research (selectedseedlings of maize, cassava, palm oil, etc.)
Monopoly
MIDEVIV Foodstuff trading LiquidatedCereals Board Cereals trading in the North Liquidated
SNAR Prevention of food insecurity End of Japanesegrants, integration intoMINAGRI
Activities have sloweddown
CENEEMA Supply of agricultural equipment PrivatizedUCCAO Supply of inputs, decortication of arabica
and robusta coffee, exportsMonopoly of arabica
OCB Banana Privatized in 1990CELLUCAM Paper pulp LiquidatedCENADEC Cooperative development LiquidatedCENADEFOR Forestry development Restructured Considerable reduction of
activitiesCOCAM Veneer wood PrivatizedHEVECAM Rubber development Undergoing privatization
and reduction of activitiesPrivatized
MIDO Agricultural development LiquidatedONAREF Forestry development LiquidatedONDAPB Small livestock LiquidatedSCT Tobacco development LiquidatedSODENKAM Rural development LiquidatedSOFIBEL Timber LiquidatedSODEPA Cow meat Monopoly Restructured and
liberalized sectorWADA Rural development LiquidatedZAPI-EST Rural development Liquidated
Source: Bamou and Mkouonga (2003).
129
Cameroon
portfolio, and that others should either be privatized or liquidated. Table 6 shows theresults of this process for the agricultural sector.
The marketing of agricultural products was progressively liberalized. TheNational Produce Marketing Board (NPMB) and the Food Crop DevelopmentAuthority (MIDEVIV), both public enterprises formerly controlling marketingof agricultural products, were liquidated. For many producers, liberalization wasaccompanied by a deterioration of marketing conditions (varying according to theproduce and region). Faced with a small number of powerful and well-organizedprivate enterprises, producers no longer received prices sufficient to compensatetheir efforts and encourage farm investment.
Agricultural trade liberalization involved gradual removal of existing QuantitativeRestrictions (QRs).
Input policyThe agricultural input sub-sector has continuously attracted the attention of publicauthorities whose strategies to promote tradable input use cover two periods: 1960–1987 and 1988-present (Ntsama, 2000).
The first period was characterized by state intervention in the supply of inputsto agricultural producers. A National Programme on Fertilizers (NPF) was setup with the assistance of FAO following independence in 1960, with the objectiveof importing fertilizers and promoting their use. In 1980 the National Fund forRural Development (FONADER) took over from the role of the NPF, as well assupplying other inputs such as phytosanitary products. Agricultural inputs were fullysubsidized and distributed to producers either through the services of the Ministry ofAgriculture or development corporations like the Cocoa Development Corporation(SODECAO) and the Cotton Development Corporation (SODECOTON). Subsidyrates for fertilizers and sanitary/phytosanitary products averaged 75 and 100 percentrespectively. The subsidization policy lasted until 1990 (Varlet, 1997).
Demand for fertilizers rose sharply under the subsidy programmes, from 15 000tonnes in 1974/75, to around 80 000 tonnes in 1986. Nevertheless, the state monopolyover input imports often resulted in late deliveries to users and proved ineffective andincreasingly costly to public finances (Ntsama, 2000). The agricultural campaign of1986/87 marked a turning point in terms of government strategy, due to severe fiscalpressure and a drastic fall in the world price of Cameroon’s main agricultural exports.
The second period started in 1987 with the help of donors. Directed towardsliberalizing and privatizing the sub-sector, it led to the launching of two fertilizerprogrammes to cover the northern and southern part of the country. The firstprogramme, named the Sub-Sector Fertilizer Reform Programme (SSFRP) wasset up in 1987 with the assistance of USAID. Meanwhile, the Special Programmefor the Importation of Fertilizers (SPIF) took off in 1988 with the support of theEuropean Development Fund (EDF). The two programmes had as their objective theestablishment of a durable and effective private sector system for importing, distributingand using fertilizers (Ntsama, 2000). The aim in the long run was to eliminate directfertilizer subsidies and promote the efficient use of fertilizers (Table 7).
Imports followed a downward trend up to 1994/95 (Table 8). This can be explainedby the progressive elimination of subsidies, which raised the cost of fertilizers; and bythe collapse in agricultural product prices, both of which reduced the purchasing power
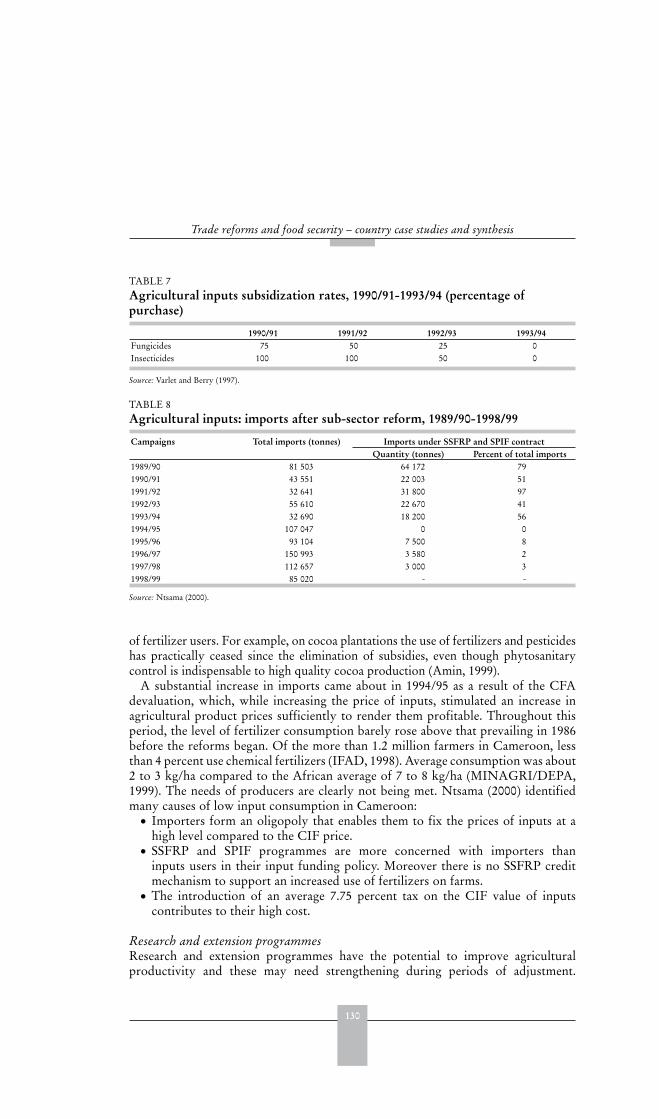
130
Trade reforms and food security – country case studies and synthesis
of fertilizer users. For example, on cocoa plantations the use of fertilizers and pesticideshas practically ceased since the elimination of subsidies, even though phytosanitarycontrol is indispensable to high quality cocoa production (Amin, 1999).
A substantial increase in imports came about in 1994/95 as a result of the CFAdevaluation, which, while increasing the price of inputs, stimulated an increase inagricultural product prices sufficiently to render them profitable. Throughout thisperiod, the level of fertilizer consumption barely rose above that prevailing in 1986before the reforms began. Of the more than 1.2 million farmers in Cameroon, lessthan 4 percent use chemical fertilizers (IFAD, 1998). Average consumption was about2 to 3 kg/ha compared to the African average of 7 to 8 kg/ha (MINAGRI/DEPA,1999). The needs of producers are clearly not being met. Ntsama (2000) identifiedmany causes of low input consumption in Cameroon:
Importers form an oligopoly that enables them to fix the prices of inputs at ahigh level compared to the CIF price.SSFRP and SPIF programmes are more concerned with importers thaninputs users in their input funding policy. Moreover there is no SSFRP creditmechanism to support an increased use of fertilizers on farms.The introduction of an average 7.75 percent tax on the CIF value of inputscontributes to their high cost.
Research and extension programmes Research and extension programmes have the potential to improve agriculturalproductivity and these may need strengthening during periods of adjustment.
TABLE 7 Agricultural inputs subsidization rates, 1990/91-1993/94 (percentage of purchase)
1990/91 1991/92 1992/93 1993/94Fungicides 75 50 25 0Insecticides 100 100 50 0
Source: Varlet and Berry (1997).
TABLE 8 Agricultural inputs: imports after sub-sector reform, 1989/90-1998/99
Campaigns Total imports (tonnes) Imports under SSFRP and SPIF contractQuantity (tonnes) Percent of total imports
1989/90 81 503 64 172 791990/91 43 551 22 003 511991/92 32 641 31 800 971992/93 55 610 22 670 411993/94 32 690 18 200 561994/95 107 047 0 01995/96 93 104 7 500 81996/97 150 993 3 580 21997/98 112 657 3 000 31998/99 85 020 - -
Source: Ntsama (2000).
131
Cameroon
However, in Cameroon, funding for agricultural research decreased under theadjustment programme. World Bank support efforts were put into strengthening theextension system from 1990 onward. This has helped to improve the availability ofagricultural extension services, including rural information, communication systemsand transfer of appropriate technologies to farmers, though with mixed results. TheResearch Institute for Agricultural Development (IRAD) was created for the purposeof supporting research and development in Cameroonian agriculture and assessingthe quality of agricultural inputs. However, problems including the poor state ofequipment and a shortage of adequately qualified personnel have been obstacles toits proper functioning. Many agricultural and rural training schemes exist, but itis not clear how effective they are. For example, some training facilities are highlydegraded, some programmes do not offer the most suitable types of training, andthere have been problems with budgets and equipment.
InfrastructurePoorly developed and maintained transport infrastructure constitutes a majorconstraint to agricultural sector productivity and output. It leads to high transportcosts, limited access to markets (including those of neighbouring countries) andhigh post-harvest losses. Responsibility for the road network is shared betweenthe Ministry of Public Works (MINTP), local authorities, road users and theirassociations. The railway sector is bound by a 20-year concession, signed with aprivate operator, CAMRAIL. The railway line, almost 1 000 km long, is the oldestin Central Africa. No major improvement has been made to the network since theearly 1980s, and the quality of infrastructure has seriously deteriorated, with themonopoly enjoyed by the private operator leading to poor and expensive service.Despite quite advanced restructuring of the marine transport sector, costs remainrelatively high and the main port of Douala is the most expensive on the WestAfrican coast. Storage and processing infrastructure for food crops in rural areas isinadequate and appears largely responsible for food insecurity in some regions ofthe country, such as the north. The few major rural and urban markets are poorlyequipped and managed.
CONSEQUENCES OF REFORMS: INTERMEDIATE VARIABLES
In assessing the effects of reform on output incentives, the impact of changes ininternational and domestic prices are investigated in relation to other possible driverssuch as the exchange rate, improvements in the efficiency of domestic marketingsystems etc. It should be noted that many of the reforms that have been implementedsimultaneously or/and sequentially are aimed at removing structural bottlenecks thatimpede the proper functioning of the market mechanism. It is therefore difficult toisolate policies that have been beneficial or harmful to agricultural performance.
Trends in international and domestic pricesPrice trends are given in Table 9. Producer and international prices of all the fourmain export crops declined up to 1993. They recorded a rise only after the 1994devaluation. The effects of devaluation on cocoa and coffee prices were especiallypronounced in 1995. Their prices more than doubled in 1995 and were relatively
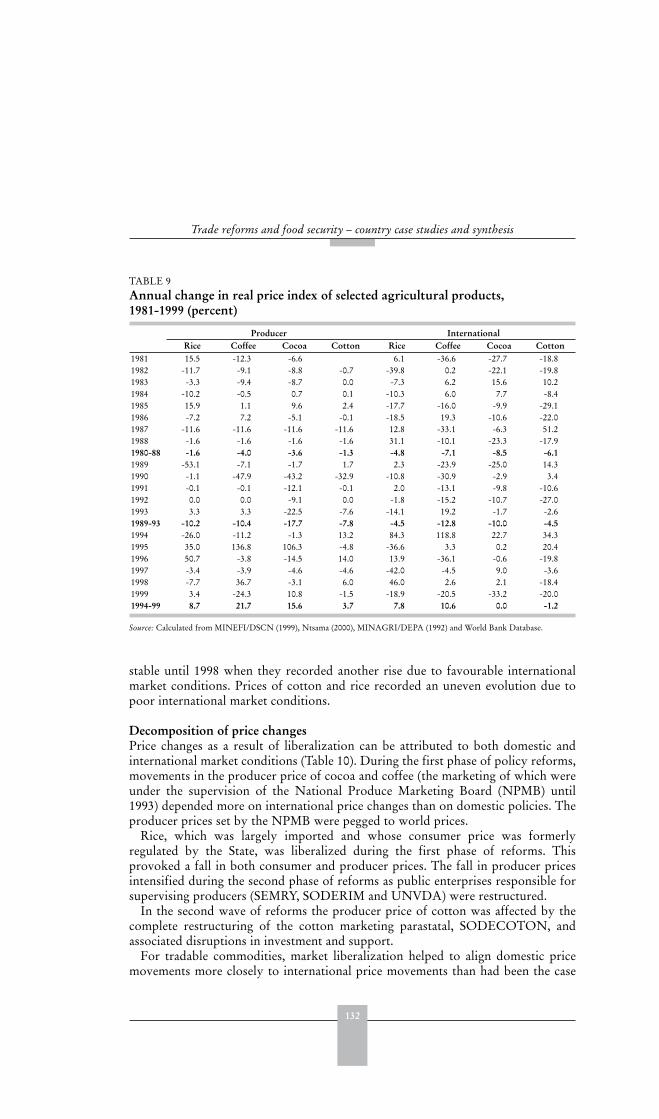
132
Trade reforms and food security – country case studies and synthesis
stable until 1998 when they recorded another rise due to favourable internationalmarket conditions. Prices of cotton and rice recorded an uneven evolution due topoor international market conditions.
Decomposition of price changesPrice changes as a result of liberalization can be attributed to both domestic andinternational market conditions (Table 10). During the first phase of policy reforms,movements in the producer price of cocoa and coffee (the marketing of which wereunder the supervision of the National Produce Marketing Board (NPMB) until1993) depended more on international price changes than on domestic policies. Theproducer prices set by the NPMB were pegged to world prices.
Rice, which was largely imported and whose consumer price was formerlyregulated by the State, was liberalized during the first phase of reforms. Thisprovoked a fall in both consumer and producer prices. The fall in producer pricesintensified during the second phase of reforms as public enterprises responsible forsupervising producers (SEMRY, SODERIM and UNVDA) were restructured.
In the second wave of reforms the producer price of cotton was affected by thecomplete restructuring of the cotton marketing parastatal, SODECOTON, andassociated disruptions in investment and support.
For tradable commodities, market liberalization helped to align domestic pricemovements more closely to international price movements than had been the case
TABLE 9 Annual change in real price index of selected agricultural products, 1981-1999 (percent)
Producer InternationalRice Coffee Cocoa Cotton Rice Coffee Cocoa Cotton
1981 15.5 -12.3 -6.6 6.1 -36.6 -27.7 -18.81982 -11.7 -9.1 -8.8 -0.7 -39.8 0.2 -22.1 -19.81983 -3.3 -9.4 -8.7 0.0 -7.3 6.2 15.6 10.21984 -10.2 -0.5 0.7 0.1 -10.3 6.0 7.7 -8.41985 15.9 1.1 9.6 2.4 -17.7 -16.0 -9.9 -29.11986 -7.2 7.2 -5.1 -0.1 -18.5 19.3 -10.6 -22.01987 -11.6 -11.6 -11.6 -11.6 12.8 -33.1 -6.3 51.21988 -1.6 -1.6 -1.6 -1.6 31.1 -10.1 -23.3 -17.91980-88 -1.6 -4.0 -3.6 -1.3 -4.8 -7.1 -8.5 -6.11989 -53.1 -7.1 -1.7 1.7 2.3 -23.9 -25.0 14.31990 -1.1 -47.9 -43.2 -32.9 -10.8 -30.9 -2.9 3.41991 -0.1 -0.1 -12.1 -0.1 2.0 -13.1 -9.8 -10.61992 0.0 0.0 -9.1 0.0 -1.8 -15.2 -10.7 -27.01993 3.3 3.3 -22.5 -7.6 -14.1 19.2 -1.7 -2.61989-93 -10.2 -10.4 -17.7 -7.8 -4.5 -12.8 -10.0 -4.51994 -26.0 -11.2 -1.3 13.2 84.3 118.8 22.7 34.31995 35.0 136.8 106.3 -4.8 -36.6 3.3 0.2 20.41996 50.7 -3.8 -14.5 14.0 13.9 -36.1 -0.6 -19.81997 -3.4 -3.9 -4.6 -4.6 -42.0 -4.5 9.0 -3.61998 -7.7 36.7 -3.1 6.0 46.0 2.6 2.1 -18.41999 3.4 -24.3 10.8 -1.5 -18.9 -20.5 -33.2 -20.01994-99 8.7 21.7 15.6 3.7 7.8 10.6 0.0 -1.2
Source: Calculated from MINEFI/DSCN (1999), Ntsama (2000), MINAGRI/DEPA (1992) and World Bank Database.
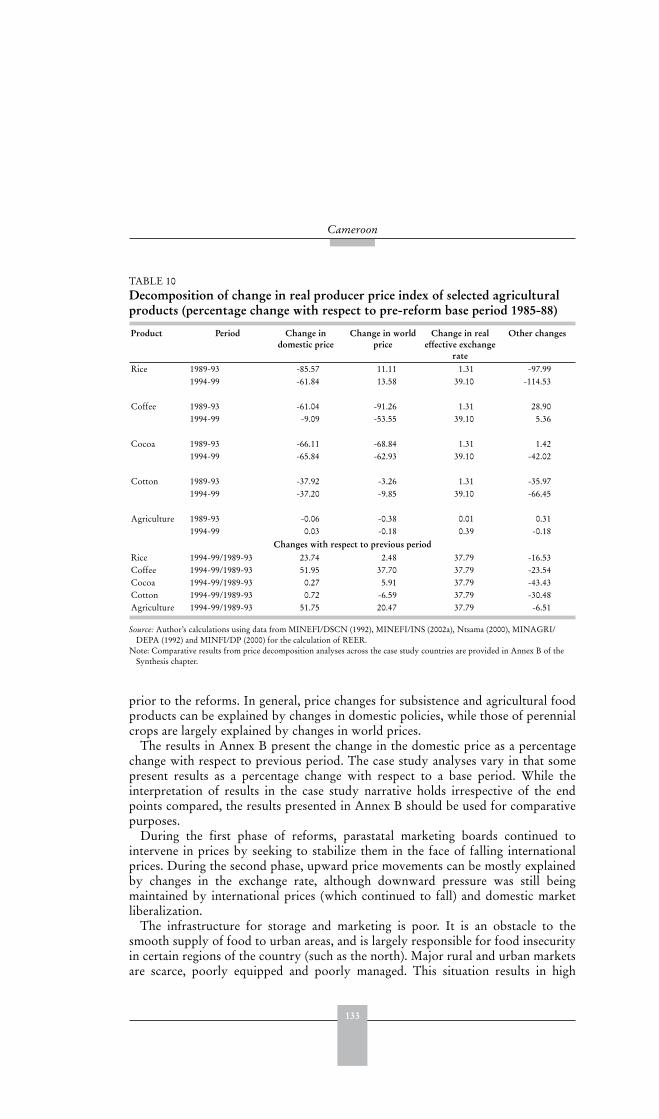
133
Cameroon
prior to the reforms. In general, price changes for subsistence and agricultural foodproducts can be explained by changes in domestic policies, while those of perennialcrops are largely explained by changes in world prices.
The results in Annex B present the change in the domestic price as a percentagechange with respect to previous period. The case study analyses vary in that somepresent results as a percentage change with respect to a base period. While theinterpretation of results in the case study narrative holds irrespective of the endpoints compared, the results presented in Annex B should be used for comparativepurposes.
During the first phase of reforms, parastatal marketing boards continued tointervene in prices by seeking to stabilize them in the face of falling internationalprices. During the second phase, upward price movements can be mostly explainedby changes in the exchange rate, although downward pressure was still beingmaintained by international prices (which continued to fall) and domestic marketliberalization.
The infrastructure for storage and marketing is poor. It is an obstacle to thesmooth supply of food to urban areas, and is largely responsible for food insecurityin certain regions of the country (such as the north). Major rural and urban marketsare scarce, poorly equipped and poorly managed. This situation results in high
TABLE 10 Decomposition of change in real producer price index of selected agricultural products (percentage change with respect to pre-reform base period 1985-88)
Product Period Change in domestic price
Change in world price
Change in real effective exchange
rate
Other changes
Rice 1989-93 -85.57 11.11 1.31 -97.991994-99 -61.84 13.58 39.10 -114.53
Coffee 1989-93 -61.04 -91.26 1.31 28.901994-99 -9.09 -53.55 39.10 5.36
Cocoa 1989-93 -66.11 -68.84 1.31 1.421994-99 -65.84 -62.93 39.10 -42.02
Cotton 1989-93 -37.92 -3.26 1.31 -35.971994-99 -37.20 -9.85 39.10 -66.45
Agriculture 1989-93 -0.06 -0.38 0.01 0.311994-99 0.03 -0.18 0.39 -0.18
Changes with respect to previous periodRice 1994-99/1989-93 23.74 2.48 37.79 -16.53Coffee 1994-99/1989-93 51.95 37.70 37.79 -23.54Cocoa 1994-99/1989-93 0.27 5.91 37.79 -43.43Cotton 1994-99/1989-93 0.72 -6.59 37.79 -30.48Agriculture 1994-99/1989-93 51.75 20.47 37.79 -6.51
Source: Author’s calculations using data from MINEFI/DSCN (1992), MINEFI/INS (2002a), Ntsama (2000), MINAGRI/DEPA (1992) and MINFI/DP (2000) for the calculation of REER.
Note: Comparative results from price decomposition analyses across the case study countries are provided in Annex B of theSynthesis chapter.
134
Trade reforms and food security – country case studies and synthesis
transaction costs, limits the negotiating capacity of producers (particularly small-scale producers), reduces farm revenues and constrains farm investment.
Effects on agricultural output and value addedThis section highlights the possible relation between the reforms and agriculturalsector performance during the three main periods covering: (1) from the oil boom in1978 to 1987, (2) the beginning of the economic crisis in 1988 to 1993, and (3) sincethe CFA devaluation in 1994.
Agricultural production contracted by an average of 3 percent per annum duringthe economic crisis of 1991-93 (Table 11). Although all sub-sectors recorded negativegrowth, perennial agriculture suffered greatly from external shocks and decreased bymore than others (- 9 percent on average). Subsistence agriculture remained relativelystable with an average annual decrease of only 0.5 percent. It benefited from thearrival of new producers: farmers abandoned perennial crops in favour of subsistenceagriculture, which at the time generated more income and food. Furthermore, due tosalary cuts and changes in working hours in the public sector,3 civil servants turnedto subsistence agriculture in order to make ends meet.
From 1994 to 2000 the production of the food crop sub-sector increased at anannual average rate of 4 percent. The growth can be attributed to the economic crisisand the long-term effects of the arrival of new producers. Close to 70 percent of foodproduction is self-consumed.
Perennial crop production (coffee, cocoa, cotton, etc.) has been stagnating for morethan a decade because of price instability, low productivity, poor use of agriculturalinputs, poor negotiating capacity of farmers, and new opportunities offered by thenational market for food products. Perennial crops also suffered most from thewithdrawal of government support. Even the relative gains in competitiveness dueto the CFA devaluation of 1994 were short-lived.
Growth in the production of food products has slowed down in recent years andis even falling for some important products like rice, groundnuts and plantain, asshown in Table 12.
Yield trends of some of the selected products show that, in the past tenyears, subsistence agricultural yields stagnated and remained low (Table 13). Thediminishing yield in cotton is characteristic of the situation of other perennialproducts. The low use of inputs (partially due to input sector reform) and decliningsoil fertility are the main reasons.
Given the stagnation of yields, the relatively positive production trends observedin the subsistence sector can mostly be attributed to the increases in area.
Effects on imports and exportsThe decrease in exports has continued despite the structural adjustment measures.Only the devaluation of 1994 stimulated an increase in export earnings.
With the continuous drop in oil exploitation, agriculture assumed a very importantrole in the country’s international trade. Table 14 shows that its share in total exports
3 In the early 1990s, the official eight hour day, from 8.00 to 16.00, with a two hour break between 12 noon and14 hours, was brought back to 7.30 to 15.30 with a one hour break at 13.00. This new arrangement allowedworkers and others to devote their afternoons to farming activities.
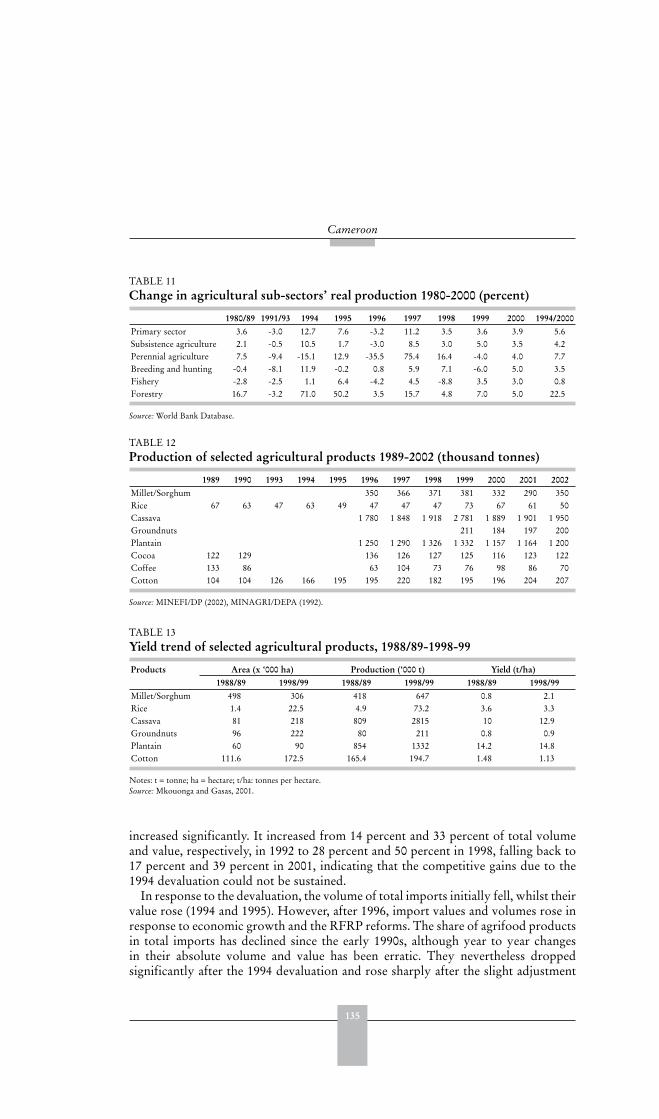
135
Cameroon
increased significantly. It increased from 14 percent and 33 percent of total volumeand value, respectively, in 1992 to 28 percent and 50 percent in 1998, falling back to17 percent and 39 percent in 2001, indicating that the competitive gains due to the1994 devaluation could not be sustained.
In response to the devaluation, the volume of total imports initially fell, whilst theirvalue rose (1994 and 1995). However, after 1996, import values and volumes rose inresponse to economic growth and the RFRP reforms. The share of agrifood productsin total imports has declined since the early 1990s, although year to year changesin their absolute volume and value has been erratic. They nevertheless droppedsignificantly after the 1994 devaluation and rose sharply after the slight adjustment
TABLE 11 Change in agricultural sub-sectors’ real production 1980-2000 (percent)
1980/89 1991/93 1994 1995 1996 1997 1998 1999 2000 1994/2000Primary sector 3.6 -3.0 12.7 7.6 -3.2 11.2 3.5 3.6 3.9 5.6Subsistence agriculture 2.1 -0.5 10.5 1.7 -3.0 8.5 3.0 5.0 3.5 4.2Perennial agriculture 7.5 -9.4 -15.1 12.9 -35.5 75.4 16.4 -4.0 4.0 7.7Breeding and hunting -0.4 -8.1 11.9 -0.2 0.8 5.9 7.1 -6.0 5.0 3.5Fishery -2.8 -2.5 1.1 6.4 -4.2 4.5 -8.8 3.5 3.0 0.8Forestry 16.7 -3.2 71.0 50.2 3.5 15.7 4.8 7.0 5.0 22.5
Source: World Bank Database.
TABLE 12 Production of selected agricultural products 1989-2002 (thousand tonnes)
1989 1990 1993 1994 1995 1996 1997 1998 1999 2000 2001 2002Millet/Sorghum 350 366 371 381 332 290 350Rice 67 63 47 63 49 47 47 47 73 67 61 50Cassava 1 780 1 848 1 918 2 781 1 889 1 901 1 950Groundnuts 211 184 197 200Plantain 1 250 1 290 1 326 1 332 1 157 1 164 1 200Cocoa 122 129 136 126 127 125 116 123 122Coffee 133 86 63 104 73 76 98 86 70Cotton 104 104 126 166 195 195 220 182 195 196 204 207
Source: MINEFI/DP (2002), MINAGRI/DEPA (1992).
TABLE 13 Yield trend of selected agricultural products, 1988/89-1998-99
Products Area (x ‘000 ha) Production (‘000 t) Yield (t/ha)1988/89 1998/99 1988/89 1998/99 1988/89 1998/99
Millet/Sorghum 498 306 418 647 0.8 2.1Rice 1.4 22.5 4.9 73.2 3.6 3.3Cassava 81 218 809 2815 10 12.9Groundnuts 96 222 80 211 0.8 0.9Plantain 60 90 854 1332 14.2 14.8Cotton 111.6 172.5 165.4 194.7 1.48 1.13
Notes: t = tonne; ha = hectare; t/ha: tonnes per hectare.Source: Mkouonga and Gasas, 2001.

136
Trade reforms and food security – country case studies and synthesis
of the salaries of civil servants in 1996. On average, rice and cereal imports increasedsharply in the 1990s despite price hikes due to the devaluation (Table 15).
CONSEQUENCES OF REFORMS
National food securityVarious indicators are used to provide insights into the national food securitysituation. From 1996 to 2001 the ratio of food imports to agricultural exports
TABLE 14 Agricultural and agrifood products export and import indicators, 1992-2001
1992 1993 1994 1995 1996 1997 1998 1999 2000 2001Total exports growth rateQuantities -10.9 5.0 -12.7 1.1 10.7 4.8 2.5 -3.3 -4.3Value -19.2 44.2 34.4 1.3 19.6 10.3 -14.2 22.9 8.6Agricultural shares in total exportsQuantities 14.1 14.4 18.9 20.9 22.7 24.9 27.9 23.5 19.5 17.2Value 33.4 36.4 46.3 46.4 47.1 43.7 50.4 54.3 41.2 39.3Agricultural exports growth rateQuantities -8.7 37.3 -3.1 9.7 21.4 17.3 -13.7 -19.6 -15.6Value -11.8 83.1 34.7 2.9 11.0 27.1 -7.6 -6.7 3.6Total imports growth rateQuantities 7.6 -3.2 -3.9 48.4 22.3 31.5 5.5 -0.1 17.7Value -6.4 7.2 48.8 23.2 23.7 23.5 -5.4 9.4 32.1Agrifood shares in total importsQuantities 43.1 32.2 39.0 31.0 14.6 13.5 18.8 17.7 20.1 19.2Value 34.5 26.8 29.0 23.6 17.4 16.6 19.4 20.8 21.4 18.7Growth in agrifood importsQuantities -19.6 17.2 -23.7 -30.2 12.9 88.4 -03 13.0 12.6Value -27.2 16.0 21.0 -9.4 13.3 44.5 1.5 12.5 15.6
Source: Authors’ computation from data provided by the Customs Department.
TABLE 15 International trade indicators of selected agricultural products, 1993-2001(percentage annual change)
Exports 1993 1994 1995 1996 1997 1998 1999 2000 2001
CoffeeQ -27.1 -10.6 -25.9 33.0 9.3 -11.6 -15.8 65.5 -27.0V -34.6 110.0 37.9 16.3 -1.3 -2.6 -16.4 43.9 -29.5
CocoaQ -5.8 -6.6 20.6 21.2 -11.5 0.2 -4.3 -7.1 17.8V -18.4 17.9 78.8 33.0 -13.0 42.0 -4.7 -29.5 22.1
CottonQ 11.5 -1.0 -4.9 -7.8 81.7 -10.4 -15.1 32.9 4.1V 4.9 60.9 4.8 16.1 82.7 -9.8 -20.2 4.4 27.7
Imports
RiceQ nd 69.6 -37.58 -38.7 4.1 130.5 -22.5 6.1 37.5V nd 152.1 -45.52 2.3 -2.1 88.3 -2.3 -7.6 46.9
CerealsQ -20.7 77.1 -33.52 -43.2 18.9 153.0 -11.3 24.9 19.5V -1.4 151.7 -31.50 -23.1 34.5 130.0 -3.1 14.1 31.0
CottonQ 13.2 -10.0 -17.78 27.2 27.0 -9.0 6.0 -32.8 3.3V -10.0 0.1 34.84 -8.0 26.6 -8.0 0.3 -33.8 -17.9
Notes: Q: Quantities and V: Values.Source: Authors’ computation from data provided by the Customs Department.
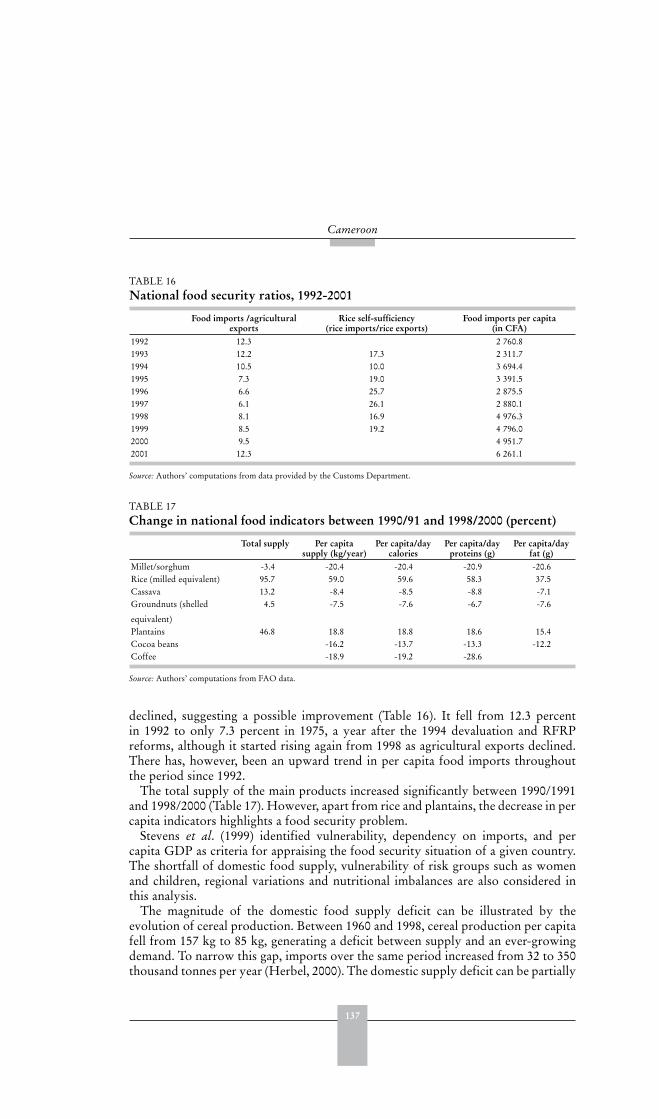
137
Cameroon
declined, suggesting a possible improvement (Table 16). It fell from 12.3 percentin 1992 to only 7.3 percent in 1975, a year after the 1994 devaluation and RFRPreforms, although it started rising again from 1998 as agricultural exports declined.There has, however, been an upward trend in per capita food imports throughoutthe period since 1992.
The total supply of the main products increased significantly between 1990/1991and 1998/2000 (Table 17). However, apart from rice and plantains, the decrease in percapita indicators highlights a food security problem.
Stevens et al. (1999) identified vulnerability, dependency on imports, and percapita GDP as criteria for appraising the food security situation of a given country.The shortfall of domestic food supply, vulnerability of risk groups such as womenand children, regional variations and nutritional imbalances are also considered inthis analysis.
The magnitude of the domestic food supply deficit can be illustrated by theevolution of cereal production. Between 1960 and 1998, cereal production per capitafell from 157 kg to 85 kg, generating a deficit between supply and an ever-growingdemand. To narrow this gap, imports over the same period increased from 32 to 350thousand tonnes per year (Herbel, 2000). The domestic supply deficit can be partially
TABLE 16 National food security ratios, 1992-2001
Food imports /agricultural exports
Rice self-sufficiency (rice imports/rice exports)
Food imports per capita (in CFA)
1992 12.3 2 760.81993 12.2 17.3 2 311.71994 10.5 10.0 3 694.41995 7.3 19.0 3 391.51996 6.6 25.7 2 875.51997 6.1 26.1 2 880.11998 8.1 16.9 4 976.31999 8.5 19.2 4 796.02000 9.5 4 951.72001 12.3 6 261.1
Source: Authors’ computations from data provided by the Customs Department.
TABLE 17 Change in national food indicators between 1990/91 and 1998/2000 (percent)
Total supply Per capita supply (kg/year)
Per capita/day calories
Per capita/day proteins (g)
Per capita/day fat (g)
Millet/sorghum -3.4 -20.4 -20.4 -20.9 -20.6Rice (milled equivalent) 95.7 59.0 59.6 58.3 37.5Cassava 13.2 -8.4 -8.5 -8.8 -7.1Groundnuts (shelled
equivalent)
4.5 -7.5 -7.6 -6.7 -7.6
Plantains 46.8 18.8 18.8 18.6 15.4Cocoa beans -16.2 -13.7 -13.3 -12.2Coffee -18.9 -19.2 -28.6
Source: Authors’ computations from FAO data.
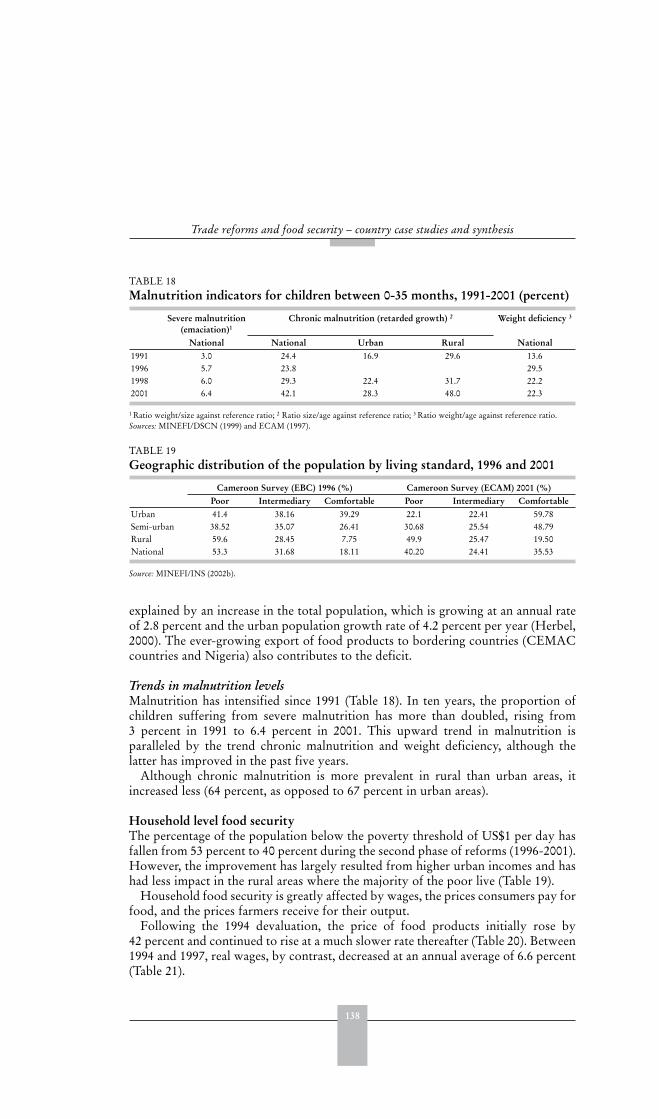
138
Trade reforms and food security – country case studies and synthesis
explained by an increase in the total population, which is growing at an annual rateof 2.8 percent and the urban population growth rate of 4.2 percent per year (Herbel,2000). The ever-growing export of food products to bordering countries (CEMACcountries and Nigeria) also contributes to the deficit.
Trends in malnutrition levelsMalnutrition has intensified since 1991 (Table 18). In ten years, the proportion ofchildren suffering from severe malnutrition has more than doubled, rising from3 percent in 1991 to 6.4 percent in 2001. This upward trend in malnutrition isparalleled by the trend chronic malnutrition and weight deficiency, although thelatter has improved in the past five years.
Although chronic malnutrition is more prevalent in rural than urban areas, itincreased less (64 percent, as opposed to 67 percent in urban areas).
Household level food security The percentage of the population below the poverty threshold of US$1 per day hasfallen from 53 percent to 40 percent during the second phase of reforms (1996-2001).However, the improvement has largely resulted from higher urban incomes and hashad less impact in the rural areas where the majority of the poor live (Table 19).
Household food security is greatly affected by wages, the prices consumers pay forfood, and the prices farmers receive for their output.
Following the 1994 devaluation, the price of food products initially rose by42 percent and continued to rise at a much slower rate thereafter (Table 20). Between1994 and 1997, real wages, by contrast, decreased at an annual average of 6.6 percent(Table 21).
TABLE 18 Malnutrition indicators for children between 0-35 months, 1991-2001 (percent)
Severe malnutrition (emaciation)1
Chronic malnutrition (retarded growth) 2 Weight deficiency 3
National National Urban Rural National1991 3.0 24.4 16.9 29.6 13.61996 5.7 23.8 29.51998 6.0 29.3 22.4 31.7 22.22001 6.4 42.1 28.3 48.0 22.3
1 Ratio weight/size against reference ratio; 2 Ratio size/age against reference ratio; 3 Ratio weight/age against reference ratio.Sources: MINEFI/DSCN (1999) and ECAM (1997).
TABLE 19 Geographic distribution of the population by living standard, 1996 and 2001
Cameroon Survey (EBC) 1996 (%) Cameroon Survey (ECAM) 2001 (%)Poor Intermediary Comfortable Poor Intermediary Comfortable
Urban 41.4 38.16 39.29 22.1 22.41 59.78Semi-urban 38.52 35.07 26.41 30.68 25.54 48.79Rural 59.6 28.45 7.75 49.9 25.47 19.50National 53.3 31.68 18.11 40.20 24.41 35.53
Source: MINEFI/INS (2002b).
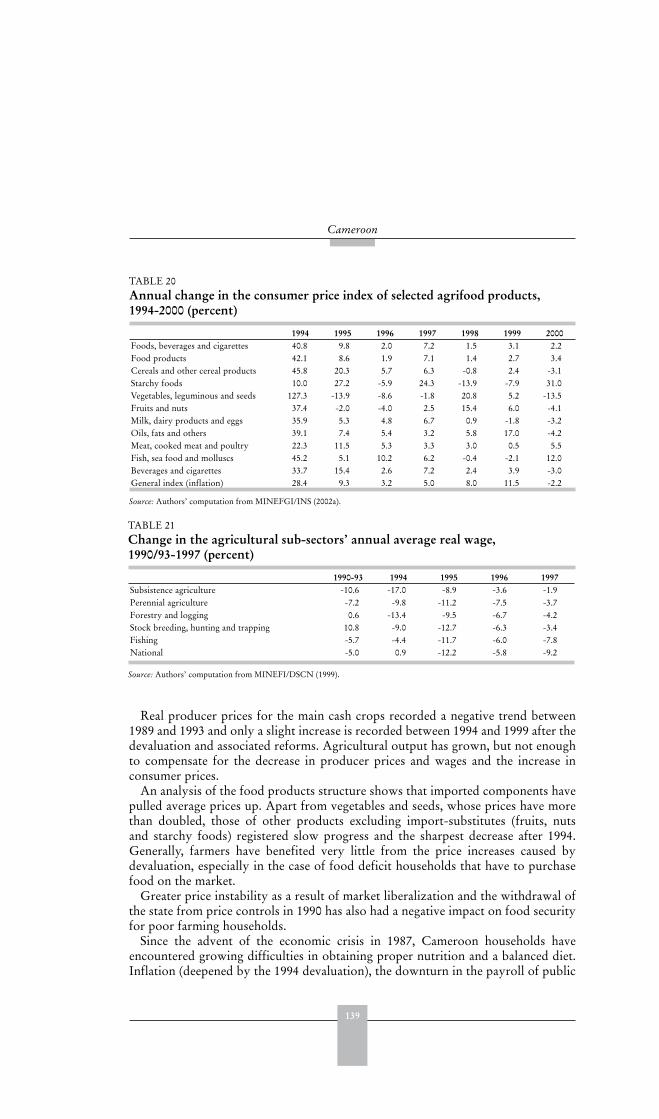
139
Cameroon
Real producer prices for the main cash crops recorded a negative trend between1989 and 1993 and only a slight increase is recorded between 1994 and 1999 after thedevaluation and associated reforms. Agricultural output has grown, but not enoughto compensate for the decrease in producer prices and wages and the increase inconsumer prices.
An analysis of the food products structure shows that imported components havepulled average prices up. Apart from vegetables and seeds, whose prices have morethan doubled, those of other products excluding import-substitutes (fruits, nutsand starchy foods) registered slow progress and the sharpest decrease after 1994.Generally, farmers have benefited very little from the price increases caused bydevaluation, especially in the case of food deficit households that have to purchasefood on the market.
Greater price instability as a result of market liberalization and the withdrawal ofthe state from price controls in 1990 has also had a negative impact on food securityfor poor farming households.
Since the advent of the economic crisis in 1987, Cameroon households haveencountered growing difficulties in obtaining proper nutrition and a balanced diet.Inflation (deepened by the 1994 devaluation), the downturn in the payroll of public
TABLE 20 Annual change in the consumer price index of selected agrifood products, 1994-2000 (percent)
1994 1995 1996 1997 1998 1999 2000Foods, beverages and cigarettes 40.8 9.8 2.0 7.2 1.5 3.1 2.2Food products 42.1 8.6 1.9 7.1 1.4 2.7 3.4Cereals and other cereal products 45.8 20.3 5.7 6.3 -0.8 2.4 -3.1Starchy foods 10.0 27.2 -5.9 24.3 -13.9 -7.9 31.0Vegetables, leguminous and seeds 127.3 -13.9 -8.6 -1.8 20.8 5.2 -13.5Fruits and nuts 37.4 -2.0 -4.0 2.5 15.4 6.0 -4.1Milk, dairy products and eggs 35.9 5.3 4.8 6.7 0.9 -1.8 -3.2Oils, fats and others 39.1 7.4 5.4 3.2 5.8 17.0 -4.2Meat, cooked meat and poultry 22.3 11.5 5.3 3.3 3.0 0.5 5.5Fish, sea food and molluscs 45.2 5.1 10.2 6.2 -0.4 -2.1 12.0Beverages and cigarettes 33.7 15.4 2.6 7.2 2.4 3.9 -3.0General index (inflation) 28.4 9.3 3.2 5.0 8.0 11.5 -2.2
Source: Authors’ computation from MINEFGI/INS (2002a).
TABLE 21 Change in the agricultural sub-sectors’ annual average real wage, 1990/93-1997 (percent)
1990-93 1994 1995 1996 1997Subsistence agriculture -10.6 -17.0 -8.9 -3.6 -1.9Perennial agriculture -7.2 -9.8 -11.2 -7.5 -3.7Forestry and logging 0.6 -13.4 -9.5 -6.7 -4.2Stock breeding, hunting and trapping 10.8 -9.0 -12.7 -6.3 -3.4Fishing -5.7 -4.4 -11.7 -6.0 -7.8National -5.0 0.9 -12.2 -5.8 -9.2
Source: Authors’ computation from MINEFI/DSCN (1999).
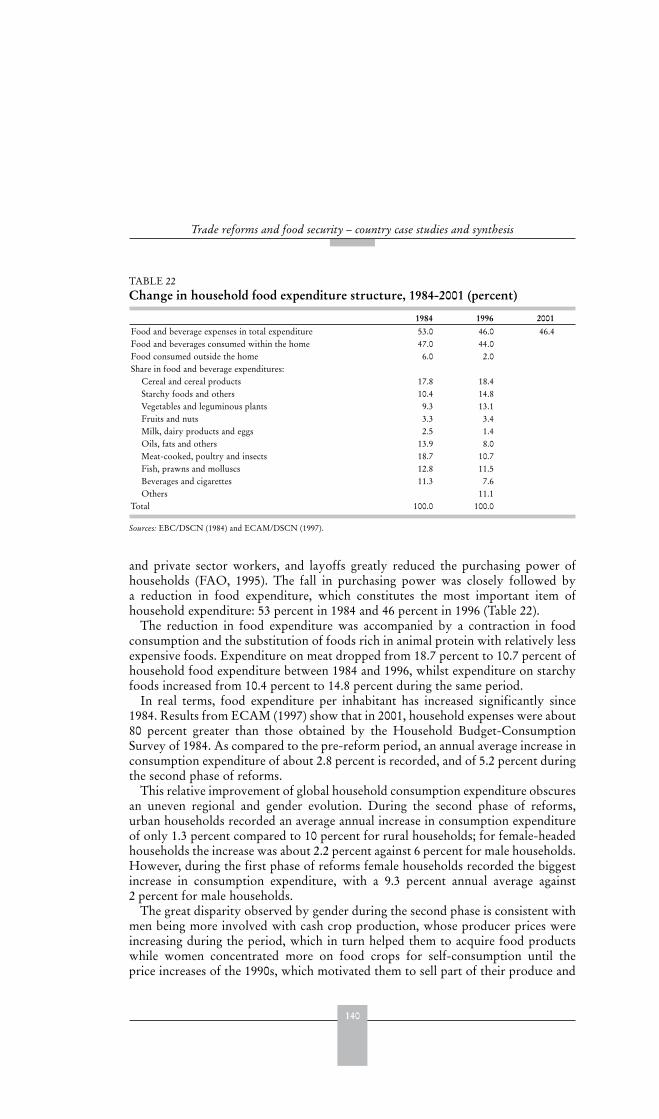
140
Trade reforms and food security – country case studies and synthesis
and private sector workers, and layoffs greatly reduced the purchasing power ofhouseholds (FAO, 1995). The fall in purchasing power was closely followed bya reduction in food expenditure, which constitutes the most important item ofhousehold expenditure: 53 percent in 1984 and 46 percent in 1996 (Table 22).
The reduction in food expenditure was accompanied by a contraction in foodconsumption and the substitution of foods rich in animal protein with relatively lessexpensive foods. Expenditure on meat dropped from 18.7 percent to 10.7 percent ofhousehold food expenditure between 1984 and 1996, whilst expenditure on starchyfoods increased from 10.4 percent to 14.8 percent during the same period.
In real terms, food expenditure per inhabitant has increased significantly since1984. Results from ECAM (1997) show that in 2001, household expenses were about80 percent greater than those obtained by the Household Budget-ConsumptionSurvey of 1984. As compared to the pre-reform period, an annual average increase inconsumption expenditure of about 2.8 percent is recorded, and of 5.2 percent duringthe second phase of reforms.
This relative improvement of global household consumption expenditure obscuresan uneven regional and gender evolution. During the second phase of reforms,urban households recorded an average annual increase in consumption expenditureof only 1.3 percent compared to 10 percent for rural households; for female-headedhouseholds the increase was about 2.2 percent against 6 percent for male households.However, during the first phase of reforms female households recorded the biggestincrease in consumption expenditure, with a 9.3 percent annual average against2 percent for male households.
The great disparity observed by gender during the second phase is consistent withmen being more involved with cash crop production, whose producer prices wereincreasing during the period, which in turn helped them to acquire food productswhile women concentrated more on food crops for self-consumption until theprice increases of the 1990s, which motivated them to sell part of their produce and
TABLE 22 Change in household food expenditure structure, 1984-2001 (percent)
1984 1996 2001Food and beverage expenses in total expenditure 53.0 46.0 46.4Food and beverages consumed within the home 47.0 44.0Food consumed outside the home 6.0 2.0Share in food and beverage expenditures:
Cereal and cereal products 17.8 18.4Starchy foods and others 10.4 14.8Vegetables and leguminous plants 9.3 13.1Fruits and nuts 3.3 3.4Milk, dairy products and eggs 2.5 1.4Oils, fats and others 13.9 8.0Meat-cooked, poultry and insects 18.7 10.7Fish, prawns and molluscs 12.8 11.5Beverages and cigarettes 11.3 7.6Others 11.1
Total 100.0 100.0
Sources: EBC/DSCN (1984) and ECAM/DSCN (1997).
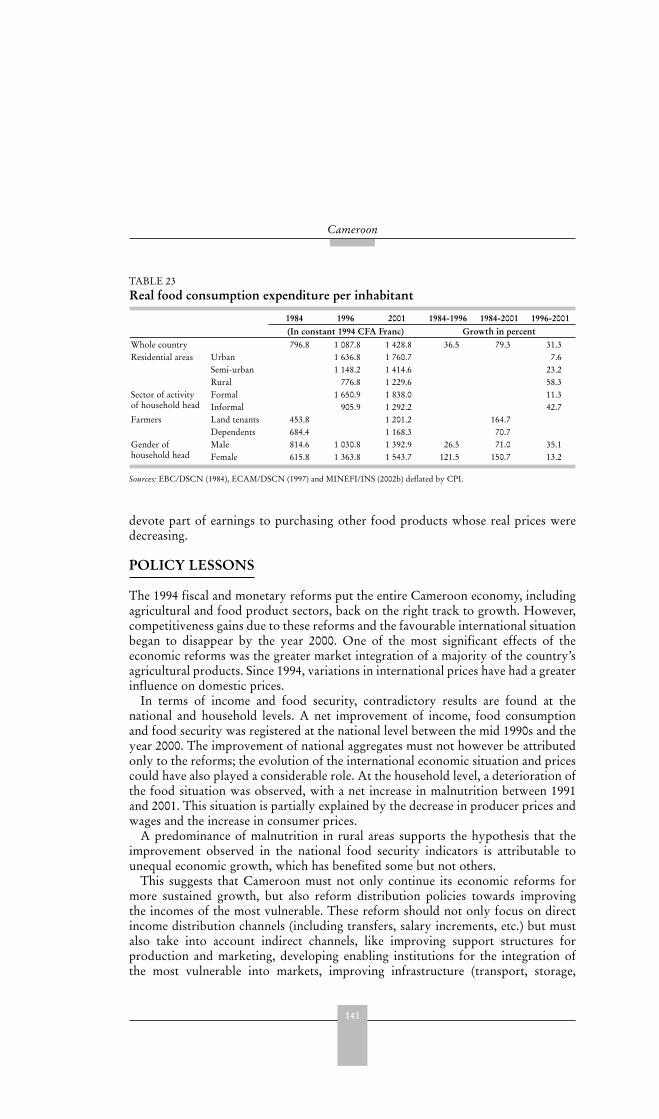
141
Cameroon
devote part of earnings to purchasing other food products whose real prices weredecreasing.
POLICY LESSONS
The 1994 fiscal and monetary reforms put the entire Cameroon economy, includingagricultural and food product sectors, back on the right track to growth. However,competitiveness gains due to these reforms and the favourable international situationbegan to disappear by the year 2000. One of the most significant effects of theeconomic reforms was the greater market integration of a majority of the country’sagricultural products. Since 1994, variations in international prices have had a greaterinfluence on domestic prices.
In terms of income and food security, contradictory results are found at thenational and household levels. A net improvement of income, food consumptionand food security was registered at the national level between the mid 1990s and theyear 2000. The improvement of national aggregates must not however be attributedonly to the reforms; the evolution of the international economic situation and pricescould have also played a considerable role. At the household level, a deterioration ofthe food situation was observed, with a net increase in malnutrition between 1991and 2001. This situation is partially explained by the decrease in producer prices andwages and the increase in consumer prices.
A predominance of malnutrition in rural areas supports the hypothesis that theimprovement observed in the national food security indicators is attributable tounequal economic growth, which has benefited some but not others.
This suggests that Cameroon must not only continue its economic reforms formore sustained growth, but also reform distribution policies towards improvingthe incomes of the most vulnerable. These reform should not only focus on directincome distribution channels (including transfers, salary increments, etc.) but mustalso take into account indirect channels, like improving support structures forproduction and marketing, developing enabling institutions for the integration ofthe most vulnerable into markets, improving infrastructure (transport, storage,
TABLE 23 Real food consumption expenditure per inhabitant
1984 1996 2001 1984-1996 1984-2001 1996-2001(In constant 1994 CFA Franc) Growth in percent
Whole country 796.8 1 087.8 1 428.8 36.5 79.3 31.3Residential areas Urban 1 636.8 1 760.7 7.6
Semi-urban 1 148.2 1 414.6 23.2Rural 776.8 1 229.6 58.3
Sector of activityof household head
Formal 1 650.9 1 838.0 11.3Informal 905.9 1 292.2 42.7
Farmers Land tenants 453.8 1 201.2 164.7Dependents 684.4 1 168.3 70.7
Gender ofhousehold head
Male 814.6 1 030.8 1 392.9 26.5 71.0 35.1Female 615.8 1 363.8 1 543.7 121.5 150.7 13.2
Sources: EBC/DSCN (1984), ECAM/DSCN (1997) and MINEFI/INS (2002b) deflated by CPI.
142
Trade reforms and food security – country case studies and synthesis
marketing) and access to credit, and creating incentives for greater labour mobilityand the creation of small scale enterprises.
The lack of credit mechanisms and, even more importantly, high input costsresulting from price decontrol have led to the low use of chemical fertilizers A policyof actively promoting the use of inputs is important in maintaining soil fertility andincreasing production. The reduction in the role of the State in input and outputmarkets has caused some farmers to pay higher prices for their inputs while receivinglower prices for their outputs. Such an outcome may be advocated for prices tomove toward market levels, but in these circumstances complementary measurescould have been designed to cushion the impact of the reforms on low-incomeproducers. For example, access to credit may have assisted rural small-scale farmers.Microfinance institutions were set up in 1992, but they remain poorly distributedthroughout the country and sometimes lack credibility and professionalism.
More careful design and implementation of policy reform measures appears to bevery important for this country. As well as helping to improve and sustain economicgrowth, they can assist with improving food security for the most vulnerable groupsin the country.
REFERENCES
Amjadi, A., Reincke, U. &Yeats, A.J. 1996. Did external barriers cause the marginalization of
Sub-Saharan Africa in World Trade? World Bank Discussion Paper, No. 348. The WorldBank, Washington, D.C.
Amin, A. A. 1999. Policy changes and agricultural sector in Cameroon, ISNAR, The Hague,The Netherlands.
Blandford, D., Friedman, D., Lynch, S., Mukherjee, N. & Sahn, D.E. 1995. Oil Boom andbust: the harsh realities of adjustment in Cameroon. In David E. Sahn ed., Adjusting to
policy failure in African economies. Ithaca, New York: Cornell University Press.Bamou, E. & Mkouonga, H. F. 2003. Impératifs africains dans le nouvel ordre mondial du
commerce:cas du secteur agricole du Cameroon. Rapport intérimaire de recherche encollaboration du CREA (Nairobi, Kenya). Kampala, Ouganda, du 13 au 16 novembre.
Clément, A. P., Mueller, J. & Le Dem, J. 1996. Aftermath of the CFA/CFAFCs devaluation.IMF Occasional Paper, No. 138. Washington D.C.
EBC/DSCN (Enquête Budget Consommation/Direction de la Statistique et de la ComptabilitéNationale). 1984. Principaux Résultats: Tome 1. Yaoundé, Cameroun.
ECAM/DSCN (Enquête du Cameroun). 1997. Présentation des Principaux Résultats.Yaoundé, Cameroun.
FAO. 1995. Analyse de l’impact de la dévaluation du franc C.F.A. sur la production agricole
et la sécurité alimentaire et proposition d’action: Cameroun. Rapport Technique TCP/CMR/3452 (A).
IFAD. 1998. Rapport d’évaluation: Appui au programme national de recherche et de
vulgarisation agricoles. CAM/PSAA/98/01. République du Cameroun.Ghura, D. 1997. Private investment and endogenous growth: evidence from Cameroon. IMF
Staff Working Paper No.165. Washington, DC.Herbel, D. 2000. Note pour la préparation et l’évaluation des politiques agricoles: Outils et
méthodes. CAPA, MINAGRI. Yaoundé, Cameroun.
143
Cameroon
MINAGRI/DEPA. 1992. AGRI-Stats: Production et Consommation. Ministère del’Agriculture/Direction des Etudes et Projets Agricoles. Yaoundé, Cameroun
MINAGRI/DEPA. 1999. AGRI-Stats: production et consommation. Yaoundé, Cameroun.MINEFI/DSCN. 1992. Annuaire statistique du Cameroun. Ministère de l’Économie et
des Finances/Direction de la Statistique et de la Comptabilité Nationale. Yaoundé,Cameroun.
MINEFI/DSCN. 1999. Indicators for children and women in Cameroon: A statistical
reference guide. Yaoundé, Cameroon.MINEFI/DP. 2000. Rapport économique et financier: Exercice 1999/2000. Direction de la
Prévision. Yaoundé, Cameroun.MINEFI/DP. 2002. Rapport Economique et Financier: Exercice 2001/2002. Yaoundé,
Cameroun.MINEFI/INS. 2002a. Comptes nationaux. Institut de la Statistique. Yaoundé, Cameroun.MINEFI/INS. 2002b. Evolution de la pauvreté entre 1996 et 2002: Note de synthèse. Yaoundé,
Cameroun.MINPAT. 1985. Plan quinquennal du Cameroun. Ministère du Plan et de l’Aménagement du
Territoire. Yaoundé, Cameroun.Mkouonga, F. H. & Gasas, J. 2001. Compilation Statistique des indicateurs du secteur
agricole. Document de travail.Njinkeu, D. & Monkam, A. 2002. Africa and the world trading system: the case of Cameroon.
In Oyejide, A. and Njinkeu, D. eds. Africa and the world trading system: case studies.Africa World Press, New Jersey.
Ntsama, E. 2000. Etude relative à l’évaluation et à la révision du système de financement du
PRSSE. Rapport Définitif, MINEFI, Yaoundé, Cameroun.Stevens, C., McQueen, M. & Kennan, J. 1999. After Lome IV: A strategy for ACP-EU
relations in the 21st century. Commonwealth Secretariat and IDS, (December).Touna, Mama & Tsafack-Nanfosso, R.A. 2000. L’Economie Camerounaise: de la crise à la
reprise. Dans Etudes Africaines. Cameroun 2001: Politique, langues, économie et santé.L’Harmattan, Paris, France, pp. 137-164.
Tsafack-Nanfosso, R. A. 1999. Mondialisation et détermination des salaires dans le secteur
public au Cameroun. Revue Africaine des Sciences Economiques et de Gestion. Vol. 1:1,juillet, pp. 107-131.
Varlet, F. & Berry, D. 1997. Réhabilitation de la protection phytosanitaire des cacaoyers et
caféiers du Cameroun: Tome 1. Rapport No. 96/97/SAR, CIRAD, Yaoundé, Cameroun.

145
ChileEugenia Muchnik and Rosa Camhi1
EXECUTIVE SUMMARY
By the end of 1973, the Chilean economy was practically isolated from the world andhighly regulated in many sectors including food and agriculture. In the first phase ofreform (1974–1983) numerous measures to deregulate trade, privatize the economy,create a free capital market and reform fiscal and monetary policy were introduced.The second phase of reforms (1984–1989), was characterized by adjustments toexchange rate policies, an expansionary fiscal policy, a debt conversion programmeand an active policy of export promotion.
Impact on intermediate variables After the economic crisis of 1982/83, the domestic price of wheat and maize hasfollowed changes in world prices, but in the reform period 1984-89 the upwardincrease in the exchange rate helped to off-set the negative impact on prices of thereduction in tariffs and other policy effects, while in the post-reform period the fallin domestic prices was even greater as a result of a decrease in the exchange rate andcontinued tariff reductions. These effects were partially offset by added protectionfrom other factors.
Agricultural GDP has grown twice as fast as it did during the pre-reform decadeas the sector has diversified away from traditional import-competing crops towardsthe production of high value-added products, particularly for the export market, andas land and labour productivity have increased.
Impact on target variables Food security indicators show a positive evolution between 1980 and 2000.Malnutrition, declined. Between 1990 and 1998 poverty was reduced in all fourregions selected for this study, and in the rural sector, the reduction of poverty wasgreater in regions linked to a more modern agriculture.
The size of the labour force employed in agriculture increased between 1976and 1998 period, but the share of agricultural employment in total employment isdecreasing.
Incomes derived from farming the land are insufficient to provide food securityfor small rural households, who have mainly benefited from the reforms by off-farmemployment opportunities created in the commercial export-oriented segment ofagriculture.
1 Eugenia Muchnik and Rosa Camhi, Fundación Chile, Agribusiness Department.

146
Trade reforms and food security – country case studies and synthesis
Policy lessons Openness to trade and the elimination of policy distortions affecting the terms oftrade contributed to agricultural and economic growth. Nevertheless, poverty andfood insecurity have not been eliminated for all groups within society. Vulnerablegroups remain among those lacking sufficient education and physical assets,particularly in some areas of the country, where the benefits of economic growthhave been lower.
The impact of economic reforms on the food insecure, mediated by the priceand output changes for the main commodities produced or consumed by the poor,are of much less significance than other mechanisms, such as the off-farm incomegeneration opportunities derived from growth in the agricultural sector and thebroader economy.
In the regions that remain linked to traditional, less-competitive agriculture,such as the southern regions, the incidence of poverty continues to be higher thanelsewhere. Those left behind are the ones with the least schooling. This limits theirown farm productivity as well as opportunities for earning off-farm incomes.
INTRODUCTION: CONTEXT AND NATURE OF THE REFORMS
The role and level of development of the agriculture sector Tables 1 and 2 show some key changes which took place after the reforms wereintroduced (between the mid 1970s and the end of the 1980s). Despite a reductionin annual cropping land, agricultural output grew at a higher rate during and afterthe reforms, than in the pre-reform period. Agricultural value added increasedsignificantly after 1974, on average doubling the growth rate of the pre-reformperiod. This is due to a significant improvement in yields and diversification towardsexport crops. Diversification and the adoption of new technologies have significantlyimproved efficiency in the use of all resources, especially land. The area sown toannual or traditional crops has diminished, whilst the production of fruits, vineyardsand horticulture and flowers has expanded.
Exports grew rapidly at over 14 percent annually during the first stage of thereforms (1974–1980), growing from US$300 to US$790 million over this period.During the economic crisis of 1982–1983 exports declined drastically (-9.8 percent)but resumed growth afterwards, totalling US$18 428 million in 2000.
Farmland in the hands of smallholders decreased during the post-reform era.While in 1976 smallholders (with less than 20 basic irrigation ha.) owned 53 percentof agricultural land2, they controlled only 23 percent in 1997 (Table 3). Of this total,10 percent is used in annual cropping and 70 percent in prairies for cattle production.The commercial farms (medium-sized and large farms) control 77 percent ofagricultural land.
Smallholders are more involved in traditional crop farming, vegetables andlivestock than commercial farms. In the case of vineyards, they are associated withthe traditional low quality varieties, grown under upland conditions, and used forlocally consumed, low priced wines.
2 Source: Valdés, Hurtado and Muchnik, 1990.
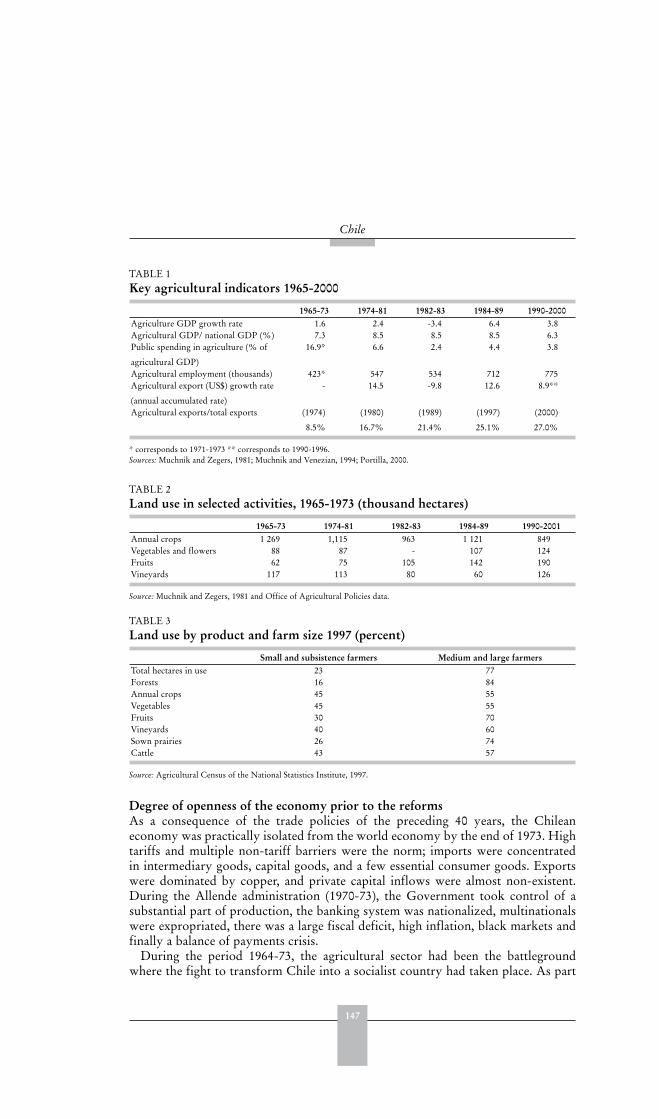
147
Chile
Degree of openness of the economy prior to the reforms As a consequence of the trade policies of the preceding 40 years, the Chileaneconomy was practically isolated from the world economy by the end of 1973. Hightariffs and multiple non-tariff barriers were the norm; imports were concentratedin intermediary goods, capital goods, and a few essential consumer goods. Exportswere dominated by copper, and private capital inflows were almost non-existent.During the Allende administration (1970-73), the Government took control of asubstantial part of production, the banking system was nationalized, multinationalswere expropriated, there was a large fiscal deficit, high inflation, black markets andfinally a balance of payments crisis.
During the period 1964-73, the agricultural sector had been the battlegroundwhere the fight to transform Chile into a socialist country had taken place. As part
TABLE 1 Key agricultural indicators 1965-2000
1965-73 1974-81 1982-83 1984-89 1990-2000Agriculture GDP growth rate 1.6 2.4 -3.4 6.4 3.8Agricultural GDP/ national GDP (%) 7.3 8.5 8.5 8.5 6.3Public spending in agriculture (% of
agricultural GDP)
16.9* 6.6 2.4 4.4 3.8
Agricultural employment (thousands) 423* 547 534 712 775Agricultural export (US$) growth rate
(annual accumulated rate)
- 14.5 -9.8 12.6 8.9**
Agricultural exports/total exports (1974)
8.5%
(1980)
16.7%
(1989)
21.4%
(1997)
25.1%
(2000)
27.0%
* corresponds to 1971-1973 ** corresponds to 1990-1996.Sources: Muchnik and Zegers, 1981; Muchnik and Venezian, 1994; Portilla, 2000.
TABLE 2 Land use in selected activities, 1965-1973 (thousand hectares)
1965-73 1974-81 1982-83 1984-89 1990-2001Annual crops 1 269 1,115 963 1 121 849Vegetables and flowers 88 87 - 107 124Fruits 62 75 105 142 190Vineyards 117 113 80 60 126
Source: Muchnik and Zegers, 1981 and Office of Agricultural Policies data.
TABLE 3 Land use by product and farm size 1997 (percent)
Small and subsistence farmers Medium and large farmersTotal hectares in use 23 77Forests 16 84Annual crops 45 55Vegetables 45 55Fruits 30 70Vineyards 40 60Sown prairies 26 74Cattle 43 57
Source: Agricultural Census of the National Statistics Institute, 1997.
148
Trade reforms and food security – country case studies and synthesis
of this process, a vast programme of land reform was initiated in the second half ofthe 1960s and intensified during the Allende administration. Food prices were fixedby the authorities and food marketing and trade were regulated. Agricultural credit,interest rates and input markets were also controlled by the government.
Motivations for the reforms The reform of the Chilean economy took place after a military coup in late 1973 andthe process continued until the end of the 1980s. A profound transformation tookplace during the second half of the 1970s.
During the initial years of the reforms (1975–77), and in the context of aninternational oil crisis, fiscal reforms and price liberalization policies led to economiccrisis, with high unemployment, high inflation, and a sharp fall in wages. Duringthe ensuing years there was a period of rapid recovery and economic growth duringwhich inflation declined. However, in 1982 and 1983, the country experienceda second economic crisis, probably the most severe in its history. GDP fell by15 percent during this period and unemployment rose by 30 percent. As a result, asecond phase of reform was implemented during the 1980s.
Macro and sectoral components and the policy instruments used Structural adjustment was initiated in Chile in 1974, earlier than in other LatinAmerican countries, with the process lasting a decade and a half. The economic andsocial reforms have been maintained over time, allowing macroeconomic and socialstability.
First phase of reforms and the economic crisis (1974-1983)Trade liberalization and economic deregulation All non-tariff barriers to trade were lifted, tariffs were reduced from an averagerate of 105 percent in 1973 down to a uniform 10 percent in 1979; imports andexports were freed; the multiple exchange rate system was abolished as were foreignexchange controls; price controls and subsidies were eliminated; import operationswere deregulated and a crawling peg system for determining the exchange rate wasintroduced. Reforms were also implemented in the labour market to make it moreflexible, by drastically reducing the power of labour unions and restricting collectivewage and salary negotiations. Direct government interventions in salary negotiationswere also eliminated.
Privatization of the economy Land and industries seized during the former period were returned to their originalowners in the latter case and/or distributed to smallholders in the case of land,and the principle of private property was restored. Many public enterprises wereprivatized, as well as the banks and the national pension funds, and in general,there was a drastic reduction of the size of the public sector and its participation ineconomic activities.
Financial liberalization and the creation of a capital market Credit controls and interest rate restrictions were eliminated, and the creationof financial intermediary institutions was promoted. Until then, bank credit was
149
Chile
virtually the monopoly of the public sector and subject to legal ceilings; real interestrates were often negative. By 1981, these reforms had created a spectacular stimulusto private banking activity and to financial inflows. However, after the economicrecession of 1982-83 strict regulations on the financial sector were put in place.
Stabilization programme introducing fiscal and monetary reforms Stabilization policies dominated policy-making during this period, as efforts werefocused on reducing high rates of inflation. In order to eliminate the fiscal deficit,government spending was drastically reduced and tax reforms, including measures toincrease tax collection, were implemented. Monetary policy gave the Central Bankcontrol over the money supply.
Second phase of reforms (1984-1989)The economic crisis of 1982–83 underlined weaknesses in macroeconomic policyand parts of the institutional setting, leading to the introduction of a further set ofreforms:
Further reforms in exchange rate policy were introduced, involving an initiallylarge currency devaluation followed by the introduction of a flexible exchangerate system.An expansionary fiscal policy was initially pursued in response to the crisis,though as the economy recovered fiscal policy was adjusted to target key socialexpenditures.Bank regulation was improved and a major, IMF-supported, debt conversionprogramme was implemented (involving debt-for-equity swaps and allowing theGovernment to purchase its external debt in the secondary debt market).Tariffs were initially raised, before being gradually reduced to an average of11 percent.During the 1990s, unilateral reductions brought import tariffs down to anaverage of 6 percent in 2003. Tariffs have also been decreased or eliminated aspart of several bilateral trade agreements during the last decade.Further privatization of key businesses in industries such as energy, mining, steeland telecommunications took place.A more active policy of export promotion was initiated in 1985 and Prochile, thestate export development agency, was strengthened.
Post reform period (1990-2000)The post-reform period coincides with a return to democratic government after1990, and has not involved any major macroeconomic policy changes. It was alsoassociated until 1997 with a period of fast economic growth. GDP grew at an averageannual rate of 7.8 percent and GDP per capita at an average rate of 6 percent. Since1998, and as a consequence of lower international economic activity, the economy hasgrown at a slower rate (2–3 percent), raising unemployment to nearly 10 percent.
Economic growth during and after structural adjustment has been significant andwithout precedence in the country (Table 4). Since 1994, inflation has been at theone-digit level and decreasing over time. This was in line with the drastic reductionin the fiscal deficit and rapid export growth. Investment as a percentage of GDP hasalso doubled since the pre-reform period.
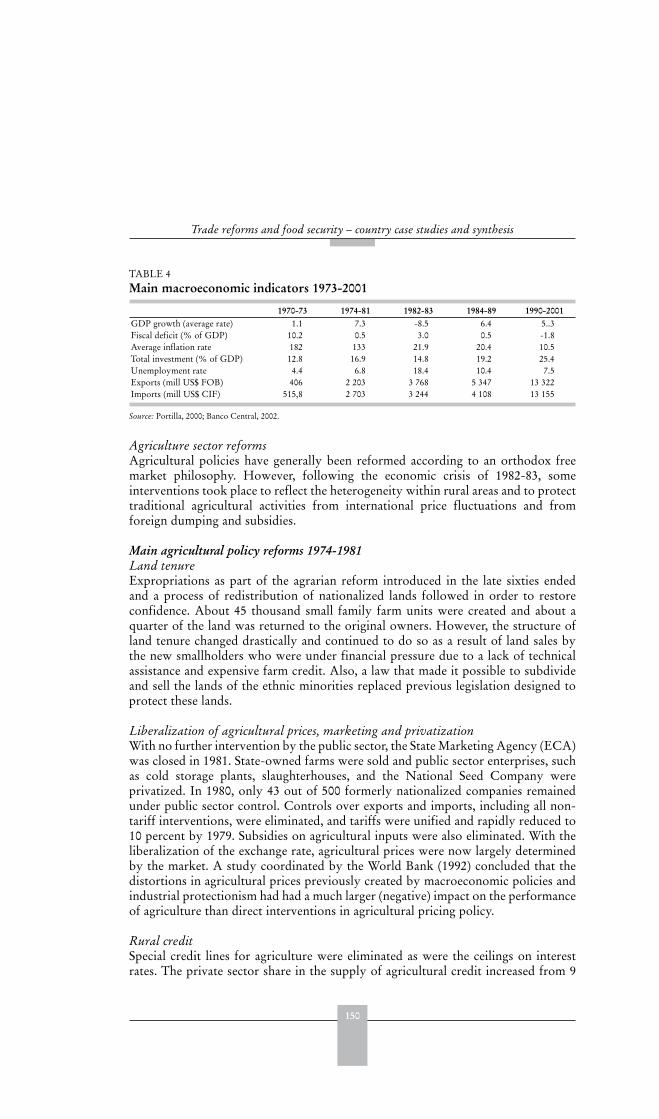
150
Trade reforms and food security – country case studies and synthesis
Agriculture sector reforms Agricultural policies have generally been reformed according to an orthodox freemarket philosophy. However, following the economic crisis of 1982-83, someinterventions took place to reflect the heterogeneity within rural areas and to protecttraditional agricultural activities from international price fluctuations and fromforeign dumping and subsidies.
Main agricultural policy reforms 1974-1981Land tenure Expropriations as part of the agrarian reform introduced in the late sixties endedand a process of redistribution of nationalized lands followed in order to restoreconfidence. About 45 thousand small family farm units were created and about aquarter of the land was returned to the original owners. However, the structure ofland tenure changed drastically and continued to do so as a result of land sales bythe new smallholders who were under financial pressure due to a lack of technicalassistance and expensive farm credit. Also, a law that made it possible to subdivideand sell the lands of the ethnic minorities replaced previous legislation designed toprotect these lands.
Liberalization of agricultural prices, marketing and privatization With no further intervention by the public sector, the State Marketing Agency (ECA)was closed in 1981. State-owned farms were sold and public sector enterprises, suchas cold storage plants, slaughterhouses, and the National Seed Company wereprivatized. In 1980, only 43 out of 500 formerly nationalized companies remainedunder public sector control. Controls over exports and imports, including all non-tariff interventions, were eliminated, and tariffs were unified and rapidly reduced to10 percent by 1979. Subsidies on agricultural inputs were also eliminated. With theliberalization of the exchange rate, agricultural prices were now largely determinedby the market. A study coordinated by the World Bank (1992) concluded that thedistortions in agricultural prices previously created by macroeconomic policies andindustrial protectionism had had a much larger (negative) impact on the performanceof agriculture than direct interventions in agricultural pricing policy.
Rural credit Special credit lines for agriculture were eliminated as were the ceilings on interestrates. The private sector share in the supply of agricultural credit increased from 9
TABLE 4 Main macroeconomic indicators 1973-2001
1970-73 1974-81 1982-83 1984-89 1990-2001GDP growth (average rate) 1.1 7.3 -8.5 6.4 5..3Fiscal deficit (% of GDP) 10.2 0.5 3.0 0.5 -1.8Average inflation rate 182 133 21.9 20.4 10.5Total investment (% of GDP) 12.8 16.9 14.8 19.2 25.4Unemployment rate 4.4 6.8 18.4 10.4 7.5Exports (mill US$ FOB) 406 2 203 3 768 5 347 13 322Imports (mill US$ CIF) 515,8 2 703 3 244 4 108 13 155
Source: Portilla, 2000; Banco Central, 2002.

151
Chile
percent in 1974 to 76 percent in 1981. The principle of non-discrimination betweeneconomic sectors required that interest rates be determined by the market. INDAP,the institution within the Ministry of Agriculture in charge of aiding small farmers,was given the responsibility of providing credit to small farmers.
Labour policies During the agrarian reform process, about 280 thousand farm workers had beenorganized under 800 communal syndicates, grouped into 85 federations and fivenational confederations. After 1973, collective bargaining was suspended and non-affiliated peasants were no longer obliged to contribute to the syndicates. By 1982,the number of affiliated peasants to syndicates had decreased to 25 thousand, andthe size of cooperative membership had diminished from 90 000 in 1973 to 12 000.As a result of new farm labour regulations, the number of permanent farm workersdeclined sharply in favour of temporary workers.
Main agricultural policy reforms (1984-1989)After the economic crisis of 1982-83, a number of more interventionist agriculturalpolicies were introduced.
Price band mechanism A price band mechanism involving floor and ceiling prices for wheat, sugar andedible oil was introduced, and expanded later to include wheat flour and oilseedcakes. The purpose was to eliminate extreme price fluctuations for these sensitivecommodities without isolating domestic prices from longer-term movement ininternational prices. In general, the bands have protected farmers rather thanconsumers, except for some years in the case of sugar. Chile’s price band system hasrecently been challenged under WTO rules as a result of a petition by Argentina andhas also been challenged by the on-going negotiations for a free trade agreementwith the United States of America.
Public procurement agency A public procurement agency (COTRISA) was created to support the pricestabilization scheme for wheat, Chile’s single most important agricultural crop.
Safeguards and international market distortions Since 1986, legislation has allowed additional tariffs when allegations of foreigndumping or distortions in import prices which may cause severe damage todomestic production have been accepted by the Anti-monopoly Commission. Thesesafeguards have been applied for restricted periods of time to wheat flour, rice,powdered milk and sugar.
Decrease in government’s role with respect to agricultural research and extension During the reform period, agricultural research and extension came under pressurefrom fiscal reforms and reductions in public sector spending. Public provision ofextension services to small farmers was replaced by private consulting services withonly a fraction of their cost being subsidized. Large farmers were serviced by theNational Institute of Agricultural Research.
152
Trade reforms and food security – country case studies and synthesis
Export promotion Tax rebates on agricultural exports were implemented from 1985, and in 1991 wereestimated to be equivalent to only 2 percent of agricultural exports, but this mayhave provided some stimulus to non-traditional exports. The system was abandonedin 2002 as part of the Uruguay Round negotiations. There was very little directbenefit to small farmers, given their small participation in exports, although theymay have benefited as farm labourers, for example, in the fruit sector.
Irrigation policy Subsidies for investment in irrigation were introduced, and between 1983 and 1989,amounted to US$34 million, benefiting 900 farmers and including about 300 000hectares. Only about 4 percent of this amount benefited peasant farmers. After 1990the programme was widened to include more small farmers.
Other reforms Social reforms were initiated in the mid-1970s as part of structural adjustment.However, the main reforms were introduced in the 1980s with the principal purposeof targeting the poorest segments of society, especially in the poorest geographicalareas, and of improving the efficiency of social services. An initial survey showedthat in the late 1970s, 21 percent of the population was classified as extremely poor,and concluded that the main social programmes did not reach the poorest people3.Programmes focused on human capital investments, including investments innutrition and education.
The main components of social reforms can be summarized as follows:Social expenditure rationalization to ensure fiscal sustainability. In the early1970s, social expenditure represented nearly 20 percent of the GDP and led tolarge fiscal deficits.Reduction of universal social programmes and their replacement with targetedprogrammes and means-testing.Creation of compensatory social programmes to help the families affected by theeconomic crisis of the early 1980s, including monetary transfers and employmentprogrammes.Decentralization of public sector services, such as education and primary healthcare.Greater participation of the private sector in the production and delivery ofsocial services.
A number of pre-reform programmes were re-designed to improve food security,health and nutrition among the poorest children and households. These includedthe Health Control and National Feeding Programme (PNAC); the School FeedingProgramme (SFP); Pre-School Centres; Monetary Transfers; Family Subsidies(SUF); the Assistance Pension (PASIS) and employment programmes.
Programmes to help poor farmers, implemented by the Institute for AgriculturalDevelopment of the Ministry of Agriculture (INDAP), consisted mainly ofproviding technical assistance and low-cost loans to small farmers.
3 National Planning Office, 1975.
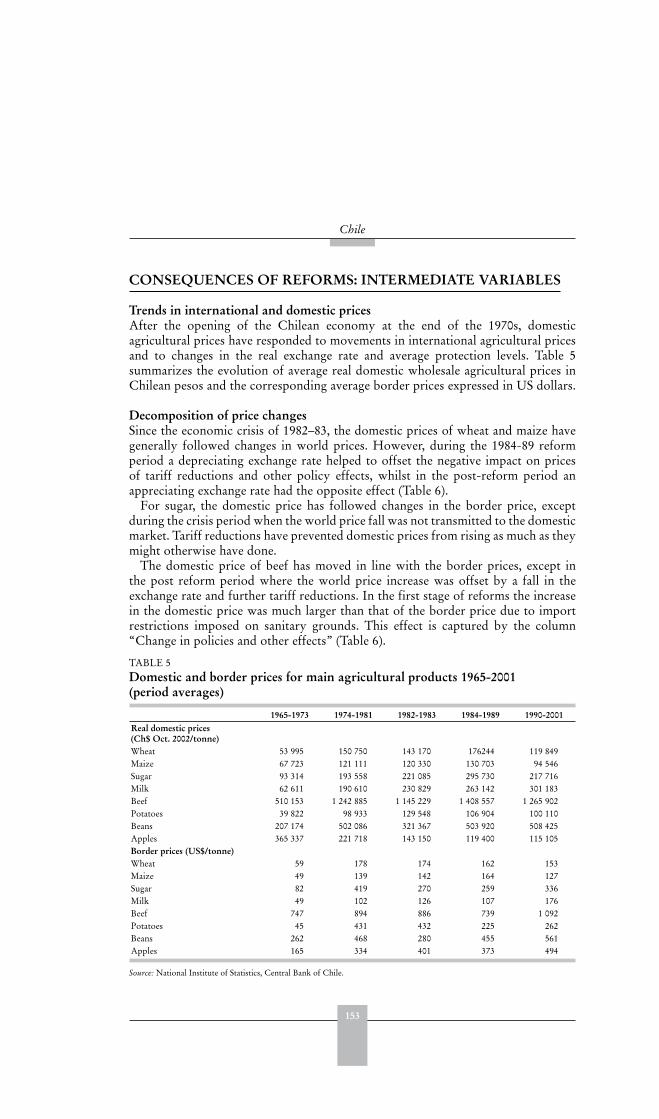
153
Chile
CONSEQUENCES OF REFORMS: INTERMEDIATE VARIABLES
Trends in international and domestic prices After the opening of the Chilean economy at the end of the 1970s, domesticagricultural prices have responded to movements in international agricultural pricesand to changes in the real exchange rate and average protection levels. Table 5summarizes the evolution of average real domestic wholesale agricultural prices inChilean pesos and the corresponding average border prices expressed in US dollars.
Decomposition of price changes Since the economic crisis of 1982–83, the domestic prices of wheat and maize havegenerally followed changes in world prices. However, during the 1984-89 reformperiod a depreciating exchange rate helped to offset the negative impact on pricesof tariff reductions and other policy effects, whilst in the post-reform period anappreciating exchange rate had the opposite effect (Table 6).
For sugar, the domestic price has followed changes in the border price, exceptduring the crisis period when the world price fall was not transmitted to the domesticmarket. Tariff reductions have prevented domestic prices from rising as much as theymight otherwise have done.
The domestic price of beef has moved in line with the border prices, except inthe post reform period where the world price increase was offset by a fall in theexchange rate and further tariff reductions. In the first stage of reforms the increasein the domestic price was much larger than that of the border price due to importrestrictions imposed on sanitary grounds. This effect is captured by the column“Change in policies and other effects” (Table 6).
TABLE 5 Domestic and border prices for main agricultural products 1965-2001(period averages)
1965-1973 1974-1981 1982-1983 1984-1989 1990-2001Real domestic prices (Ch$ Oct. 2002/tonne)Wheat 53 995 150 750 143 170 176244 119 849Maize 67 723 121 111 120 330 130 703 94 546Sugar 93 314 193 558 221 085 295 730 217 716Milk 62 611 190 610 230 829 263 142 301 183Beef 510 153 1 242 885 1 145 229 1 408 557 1 265 902Potatoes 39 822 98 933 129 548 106 904 100 110Beans 207 174 502 086 321 367 503 920 508 425Apples 365 337 221 718 143 150 119 400 115 105Border prices (US$/tonne)Wheat 59 178 174 162 153Maize 49 139 142 164 127Sugar 82 419 270 259 336Milk 49 102 126 107 176Beef 747 894 886 739 1 092Potatoes 45 431 432 225 262Beans 262 468 280 455 561Apples 165 334 401 373 494
Source: National Institute of Statistics, Central Bank of Chile.
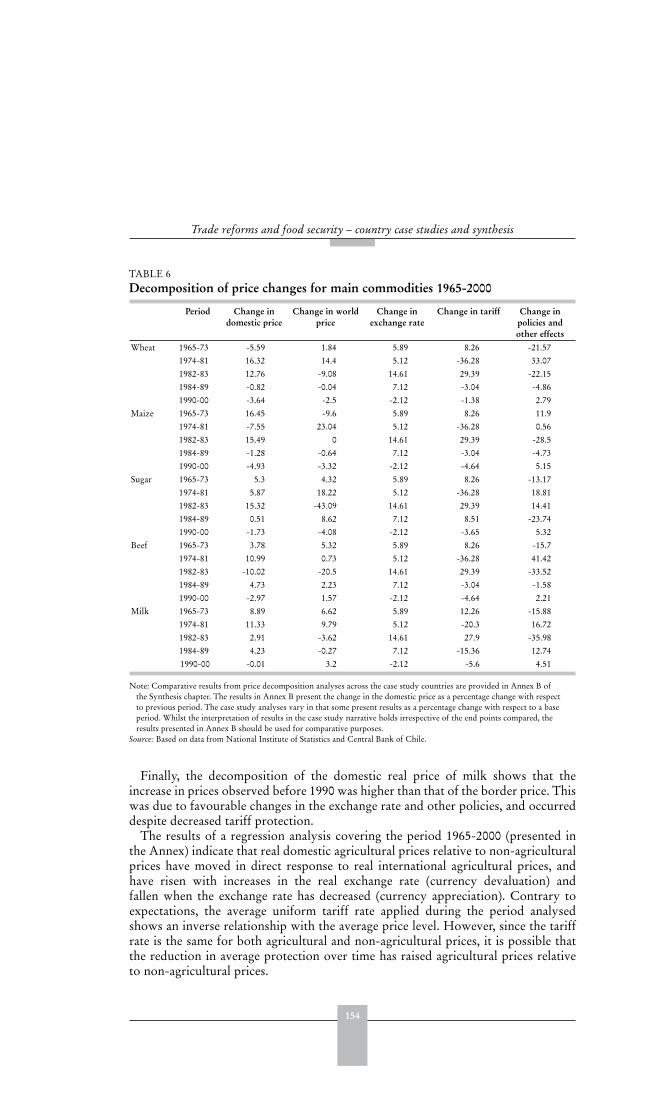
154
Trade reforms and food security – country case studies and synthesis
Finally, the decomposition of the domestic real price of milk shows that theincrease in prices observed before 1990 was higher than that of the border price. Thiswas due to favourable changes in the exchange rate and other policies, and occurreddespite decreased tariff protection.
The results of a regression analysis covering the period 1965-2000 (presented inthe Annex) indicate that real domestic agricultural prices relative to non-agriculturalprices have moved in direct response to real international agricultural prices, andhave risen with increases in the real exchange rate (currency devaluation) andfallen when the exchange rate has decreased (currency appreciation). Contrary toexpectations, the average uniform tariff rate applied during the period analysedshows an inverse relationship with the average price level. However, since the tariffrate is the same for both agricultural and non-agricultural prices, it is possible thatthe reduction in average protection over time has raised agricultural prices relativeto non-agricultural prices.
TABLE 6 Decomposition of price changes for main commodities 1965-2000
Period Change in domestic price
Change in world price
Change in exchange rate
Change in tariff Change in policies and other effects
Wheat 1965-73 -5.59 1.84 5.89 8.26 -21.571974-81 16.32 14.4 5.12 -36.28 33.071982-83 12.76 -9.08 14.61 29.39 -22.151984-89 -0.82 -0.04 7.12 -3.04 -4.861990-00 -3.64 -2.5 -2.12 -1.38 2.79
Maize 1965-73 16.45 -9.6 5.89 8.26 11.91974-81 -7.55 23.04 5.12 -36.28 0.561982-83 15.49 0 14.61 29.39 -28.51984-89 -1.28 -0.64 7.12 -3.04 -4.731990-00 -4.93 -3.32 -2.12 -4.64 5.15
Sugar 1965-73 5.3 4.32 5.89 8.26 -13.171974-81 5.87 18.22 5.12 -36.28 18.811982-83 15.32 -43.09 14.61 29.39 14.411984-89 0.51 8.62 7.12 8.51 -23.741990-00 -1.73 -4.08 -2.12 -3.65 5.32
Beef 1965-73 3.78 5.32 5.89 8.26 -15.71974-81 10.99 0.73 5.12 -36.28 41.421982-83 -10.02 -20.5 14.61 29.39 -33.521984-89 4.73 2.23 7.12 -3.04 -1.581990-00 -2.97 1.57 -2.12 -4.64 2.21
Milk 1965-73 8.89 6.62 5.89 12.26 -15.881974-81 11.33 9.79 5.12 -20.3 16.721982-83 2.91 -3.62 14.61 27.9 -35.981984-89 4.23 -0.27 7.12 -15.36 12.74
1990-00 -0.01 3.2 -2.12 -5.6 4.51
Note: Comparative results from price decomposition analyses across the case study countries are provided in Annex B ofthe Synthesis chapter. The results in Annex B present the change in the domestic price as a percentage change with respectto previous period. The case study analyses vary in that some present results as a percentage change with respect to a baseperiod. Whilst the interpretation of results in the case study narrative holds irrespective of the end points compared, theresults presented in Annex B should be used for comparative purposes.
Source: Based on data from National Institute of Statistics and Central Bank of Chile.

155
Chile
Effects on agricultural output and value added Eight products have been selected for a deeper analysis of how trade reforms haveimpacted on income and food security (Table 7). Selection was based on theirimportance in the production and consumption baskets of small farmers and togetherthey constituted close to 50 percent of the gross value of agricultural production in1997. Five of them are import competing products (wheat, maize, sugar, milk, beef), onecould be labelled as non-tradable (potatoes), and two are exportables (beans, apples).
In assessing the ability of producers to respond to price changes it is important torecognize the agroclimatic context within which they operate (Box 1).
WheatThis is the main agricultural commodity in terms of area planted, the number offarms involved in its production, and its geographical spread. The total area sown towheat has diminished drastically (especially in Central Chile) from about 1 200 000hectares in 1965 to approximately 776 000 by the end of the 1990s. At the same time,imports have increased, particularly from the Mercosur region.
Wheat production grew rapidly during the second reform period in response to thenewly implemented price band scheme and a very favourable trend in the exchange
TABLE 7 Production and trade in main agricultural products (period averages in thousand tonnes)
1965-1973 1974-1981 1982-1983 1984-1989 1990-2001Production:Wheat 1 190.7 912.4 618.2 1 525.4 1 481.0Maize 272.9 371.0 497.8 738.5 838.5Sugar 143.8 192.7 190.7 419.5 455.9Milk 479.0 579.5 534.5 661.6 1 296.7Beef 162.2 180.2 201.3 190.3 236.8Potatoes 714.1 859.8 762.6 878.8 959.0Beans 68.3 97.8 123.4 89.7 62.6Apples 121.0 184.3 355.0 536.7 891.3Trade:Wheat exports 0.0 0.1 0.0 4.0 0.2Wheat imports 503.4 828.1 1 076.0 286.9 362.5Maize exports 0.0 0.2 0.0 4.9 0.2Maize imports 149.1 168.0 270.4 87.9 666.1Sugar exports 0.0 24.7 0.8 0.0 0.0Sugar imports 184.6 168.4 191.8 45.1 153.6Milk exports 0.0 2.9 0.2 3.9 48.0Milk imports 132.8 147.7 143.6 55.2 166.8Beef exports 0.0 0.1 0.1 0.0 0.1Beef imports 18.4 197.6 208.1 197.2 338.9Potatoes exports 0.0 0.2 0.3 0.6 8.1Potatoes imports 8.9 4.1 0.0 0.0 21.1Beans exports 10.5 38.6 45.1 52.9 31.8Beans imports 0.2 0.1 0.0 0.1 0.2Apples exports 21.3 99.2 206.6 367.0 721.3Apples imports 0.0 0.0 0.0 0.0 0.0
Source: National Institute of Statistics and Central Bank of Chile.
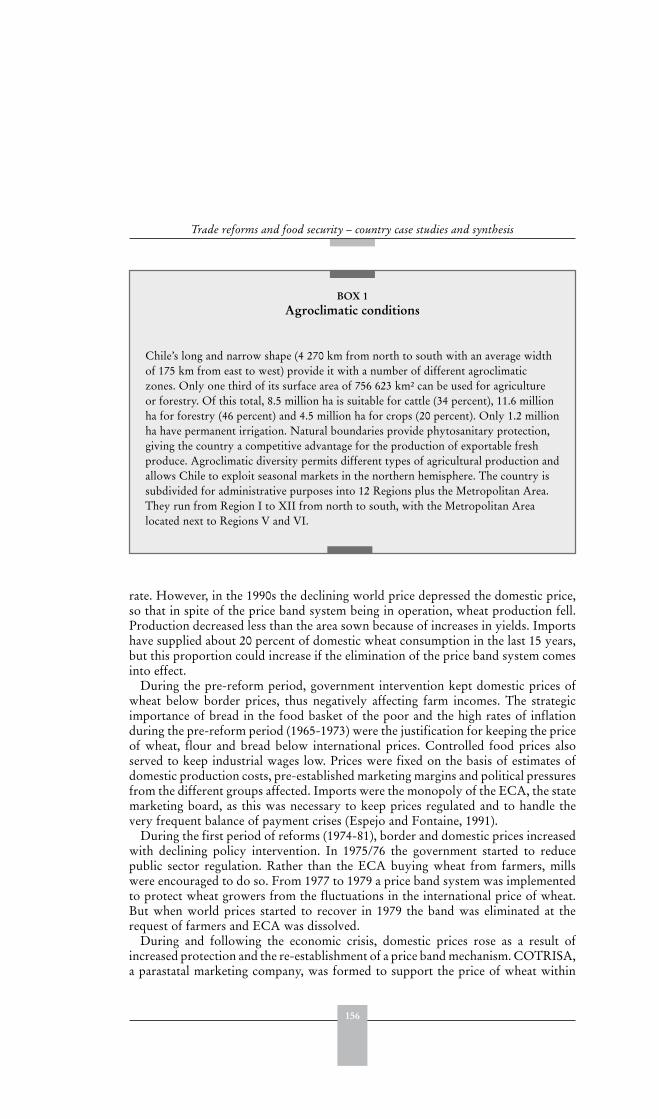
156
Trade reforms and food security – country case studies and synthesis
rate. However, in the 1990s the declining world price depressed the domestic price,so that in spite of the price band system being in operation, wheat production fell.Production decreased less than the area sown because of increases in yields. Importshave supplied about 20 percent of domestic wheat consumption in the last 15 years,but this proportion could increase if the elimination of the price band system comesinto effect.
During the pre-reform period, government intervention kept domestic prices ofwheat below border prices, thus negatively affecting farm incomes. The strategicimportance of bread in the food basket of the poor and the high rates of inflationduring the pre-reform period (1965-1973) were the justification for keeping the priceof wheat, flour and bread below international prices. Controlled food prices alsoserved to keep industrial wages low. Prices were fixed on the basis of estimates ofdomestic production costs, pre-established marketing margins and political pressuresfrom the different groups affected. Imports were the monopoly of the ECA, the statemarketing board, as this was necessary to keep prices regulated and to handle thevery frequent balance of payment crises (Espejo and Fontaine, 1991).
During the first period of reforms (1974-81), border and domestic prices increasedwith declining policy intervention. In 1975/76 the government started to reducepublic sector regulation. Rather than the ECA buying wheat from farmers, millswere encouraged to do so. From 1977 to 1979 a price band system was implementedto protect wheat growers from the fluctuations in the international price of wheat.But when world prices started to recover in 1979 the band was eliminated at therequest of farmers and ECA was dissolved.
During and following the economic crisis, domestic prices rose as a result ofincreased protection and the re-establishment of a price band mechanism. COTRISA,a parastatal marketing company, was formed to support the price of wheat within
BOX 1Agroclimatic conditions
Chile’s long and narrow shape (4 270 km from north to south with an average widthof 175 km from east to west) provide it with a number of different agroclimaticzones. Only one third of its surface area of 756 623 km2 can be used for agricultureor forestry. Of this total, 8.5 million ha is suitable for cattle (34 percent), 11.6 millionha for forestry (46 percent) and 4.5 million ha for crops (20 percent). Only 1.2 millionha have permanent irrigation. Natural boundaries provide phytosanitary protection,giving the country a competitive advantage for the production of exportable freshproduce. Agroclimatic diversity permits different types of agricultural production andallows Chile to exploit seasonal markets in the northern hemisphere. The country issubdivided for administrative purposes into 12 Regions plus the Metropolitan Area.They run from Region I to XII from north to south, with the Metropolitan Arealocated next to Regions V and VI.
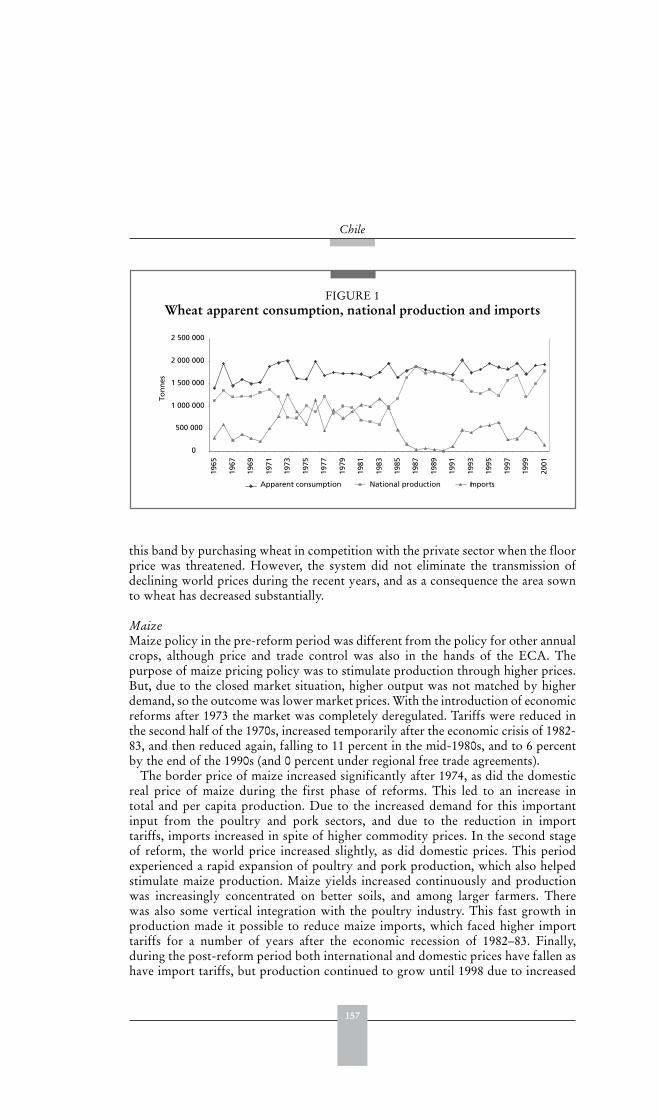
157
Chile
this band by purchasing wheat in competition with the private sector when the floorprice was threatened. However, the system did not eliminate the transmission ofdeclining world prices during the recent years, and as a consequence the area sownto wheat has decreased substantially.
MaizeMaize policy in the pre-reform period was different from the policy for other annualcrops, although price and trade control was also in the hands of the ECA. Thepurpose of maize pricing policy was to stimulate production through higher prices.But, due to the closed market situation, higher output was not matched by higherdemand, so the outcome was lower market prices. With the introduction of economicreforms after 1973 the market was completely deregulated. Tariffs were reduced inthe second half of the 1970s, increased temporarily after the economic crisis of 1982-83, and then reduced again, falling to 11 percent in the mid-1980s, and to 6 percentby the end of the 1990s (and 0 percent under regional free trade agreements).
The border price of maize increased significantly after 1974, as did the domesticreal price of maize during the first phase of reforms. This led to an increase intotal and per capita production. Due to the increased demand for this importantinput from the poultry and pork sectors, and due to the reduction in importtariffs, imports increased in spite of higher commodity prices. In the second stageof reform, the world price increased slightly, as did domestic prices. This periodexperienced a rapid expansion of poultry and pork production, which also helpedstimulate maize production. Maize yields increased continuously and productionwas increasingly concentrated on better soils, and among larger farmers. Therewas also some vertical integration with the poultry industry. This fast growth inproduction made it possible to reduce maize imports, which faced higher importtariffs for a number of years after the economic recession of 1982–83. Finally,during the post-reform period both international and domestic prices have fallen ashave import tariffs, but production continued to grow until 1998 due to increased
FIGURE 1Wheat apparent consumption, national production and imports
0
500 000
1 000 000
1 500 000
2 000 000
2 500 000
1965
1967
1969
1971
1973
1975
1977
1979
1981
1983
1985
1987
1989
1991
1993
1995
1997
1999
2001
Ton
nes
Apparent consumption National production Imports
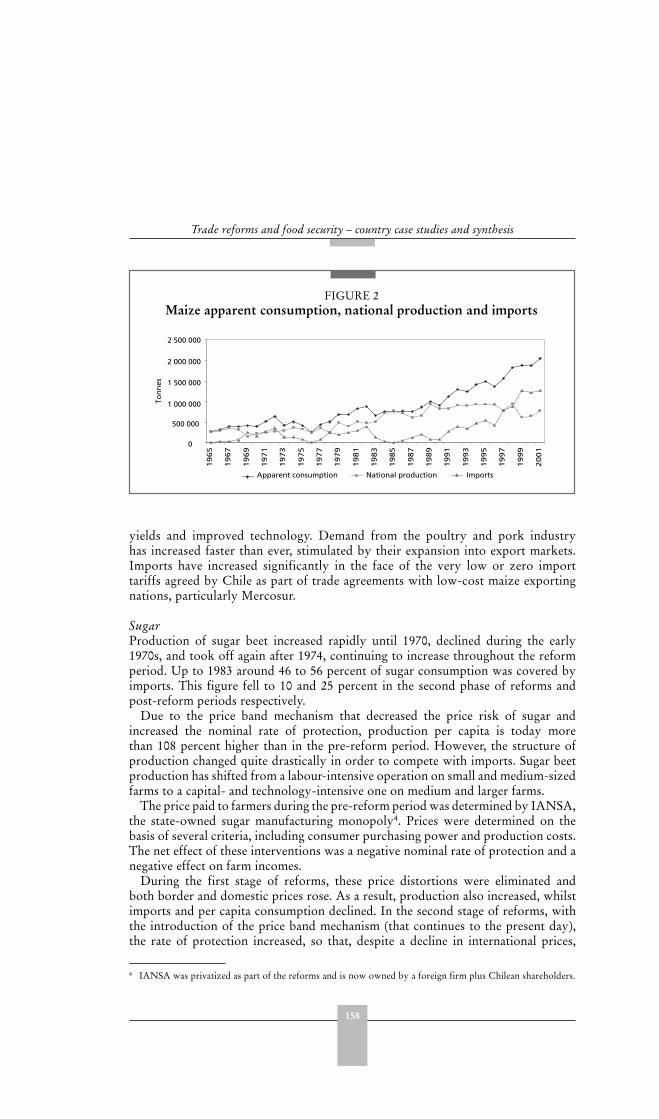
158
Trade reforms and food security – country case studies and synthesis
yields and improved technology. Demand from the poultry and pork industryhas increased faster than ever, stimulated by their expansion into export markets.Imports have increased significantly in the face of the very low or zero importtariffs agreed by Chile as part of trade agreements with low-cost maize exportingnations, particularly Mercosur.
Sugar Production of sugar beet increased rapidly until 1970, declined during the early1970s, and took off again after 1974, continuing to increase throughout the reformperiod. Up to 1983 around 46 to 56 percent of sugar consumption was covered byimports. This figure fell to 10 and 25 percent in the second phase of reforms andpost-reform periods respectively.
Due to the price band mechanism that decreased the price risk of sugar andincreased the nominal rate of protection, production per capita is today morethan 108 percent higher than in the pre-reform period. However, the structure ofproduction changed quite drastically in order to compete with imports. Sugar beetproduction has shifted from a labour-intensive operation on small and medium-sizedfarms to a capital- and technology-intensive one on medium and larger farms.
The price paid to farmers during the pre-reform period was determined by IANSA,the state-owned sugar manufacturing monopoly4. Prices were determined on thebasis of several criteria, including consumer purchasing power and production costs.The net effect of these interventions was a negative nominal rate of protection and anegative effect on farm incomes.
During the first stage of reforms, these price distortions were eliminated andboth border and domestic prices rose. As a result, production also increased, whilstimports and per capita consumption declined. In the second stage of reforms, withthe introduction of the price band mechanism (that continues to the present day),the rate of protection increased, so that, despite a decline in international prices,
4 IANSA was privatized as part of the reforms and is now owned by a foreign firm plus Chilean shareholders.
FIGURE 2Maize apparent consumption, national production and imports
19
65
19
67
19
69
19
71
19
73
19
75
19
77
19
79
19
81
19
83
19
85
19
87
19
89
19
91
19
93
19
95
19
97
19
99
20
01
0
500 000
1 000 000
1 500 000
2 000 000
2 500 000
Ton
nes
Apparent consumption National production Imports
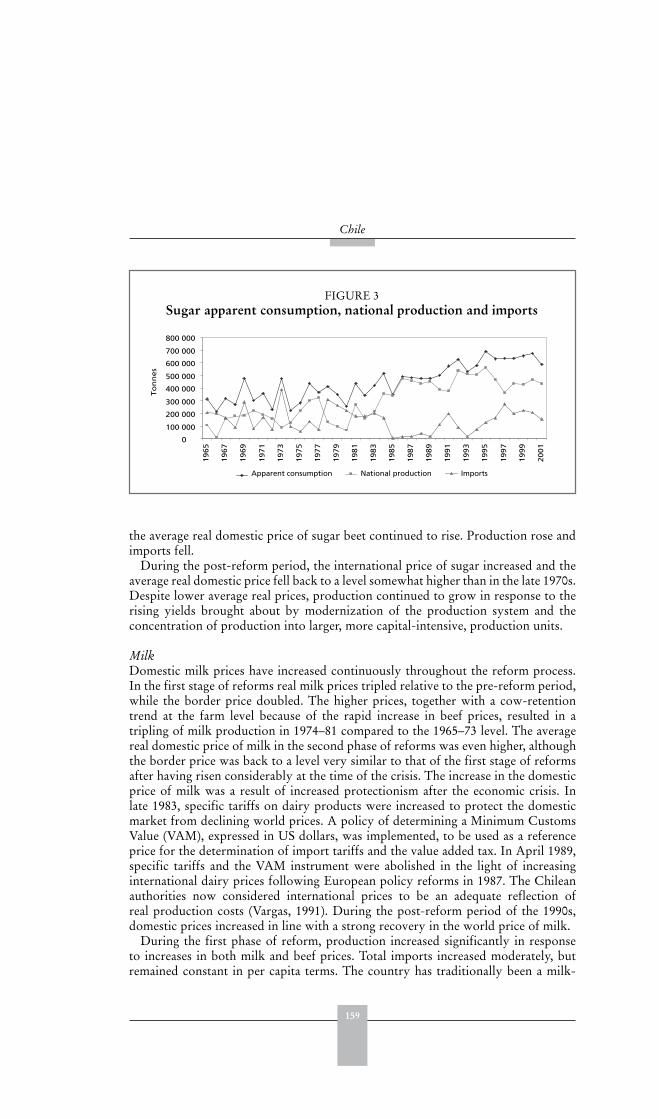
159
Chile
the average real domestic price of sugar beet continued to rise. Production rose andimports fell.
During the post-reform period, the international price of sugar increased and theaverage real domestic price fell back to a level somewhat higher than in the late 1970s.Despite lower average real prices, production continued to grow in response to therising yields brought about by modernization of the production system and theconcentration of production into larger, more capital-intensive, production units.
MilkDomestic milk prices have increased continuously throughout the reform process.In the first stage of reforms real milk prices tripled relative to the pre-reform period,while the border price doubled. The higher prices, together with a cow-retentiontrend at the farm level because of the rapid increase in beef prices, resulted in atripling of milk production in 1974–81 compared to the 1965–73 level. The averagereal domestic price of milk in the second phase of reforms was even higher, althoughthe border price was back to a level very similar to that of the first stage of reformsafter having risen considerably at the time of the crisis. The increase in the domesticprice of milk was a result of increased protectionism after the economic crisis. Inlate 1983, specific tariffs on dairy products were increased to protect the domesticmarket from declining world prices. A policy of determining a Minimum CustomsValue (VAM), expressed in US dollars, was implemented, to be used as a referenceprice for the determination of import tariffs and the value added tax. In April 1989,specific tariffs and the VAM instrument were abolished in the light of increasinginternational dairy prices following European policy reforms in 1987. The Chileanauthorities now considered international prices to be an adequate reflection ofreal production costs (Vargas, 1991). During the post-reform period of the 1990s,domestic prices increased in line with a strong recovery in the world price of milk.
During the first phase of reform, production increased significantly in responseto increases in both milk and beef prices. Total imports increased moderately, butremained constant in per capita terms. The country has traditionally been a milk-
FIGURE 3Sugar apparent consumption, national production and imports
0
100 000
200 000
300 000
400 000
500 000
600 000
700 000
800 000
19
65
19
67
19
69
19
71
19
73
19
75
19
77
19
79
19
81
19
83
19
85
19
87
19
89
19
91
19
93
19
95
19
97
19
99
20
01
To
nn
es
Apparent consumption National production Imports
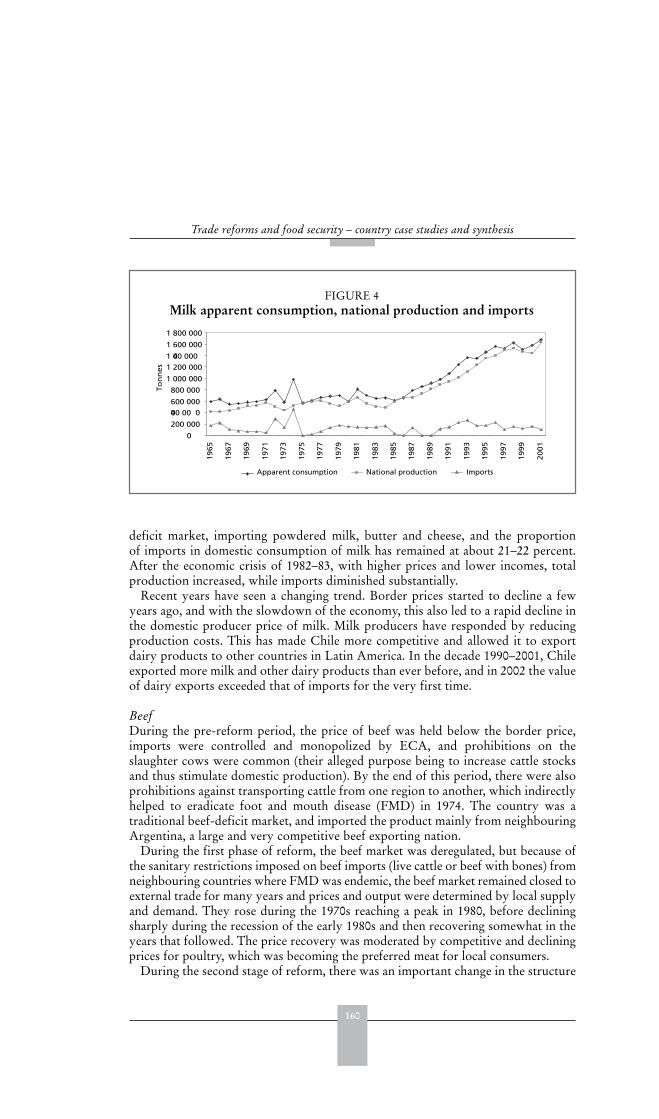
160
Trade reforms and food security – country case studies and synthesis
deficit market, importing powdered milk, butter and cheese, and the proportionof imports in domestic consumption of milk has remained at about 21–22 percent.After the economic crisis of 1982–83, with higher prices and lower incomes, totalproduction increased, while imports diminished substantially.
Recent years have seen a changing trend. Border prices started to decline a fewyears ago, and with the slowdown of the economy, this also led to a rapid decline inthe domestic producer price of milk. Milk producers have responded by reducingproduction costs. This has made Chile more competitive and allowed it to exportdairy products to other countries in Latin America. In the decade 1990–2001, Chileexported more milk and other dairy products than ever before, and in 2002 the valueof dairy exports exceeded that of imports for the very first time.
BeefDuring the pre-reform period, the price of beef was held below the border price,imports were controlled and monopolized by ECA, and prohibitions on theslaughter cows were common (their alleged purpose being to increase cattle stocksand thus stimulate domestic production). By the end of this period, there were alsoprohibitions against transporting cattle from one region to another, which indirectlyhelped to eradicate foot and mouth disease (FMD) in 1974. The country was atraditional beef-deficit market, and imported the product mainly from neighbouringArgentina, a large and very competitive beef exporting nation.
During the first phase of reform, the beef market was deregulated, but because ofthe sanitary restrictions imposed on beef imports (live cattle or beef with bones) fromneighbouring countries where FMD was endemic, the beef market remained closed toexternal trade for many years and prices and output were determined by local supplyand demand. They rose during the 1970s reaching a peak in 1980, before decliningsharply during the recession of the early 1980s and then recovering somewhat in theyears that followed. The price recovery was moderated by competitive and decliningprices for poultry, which was becoming the preferred meat for local consumers.
During the second stage of reform, there was an important change in the structure
FIGURE 4Milk apparent consumption, national production and imports
0
200 000
400 00 0600 000
800 000
1 000 000
1 200 0001 400 000
1 600 000
1 800 000
19
65
19
67
19
69
19
71
19
73
19
75
19
77
19
79
19
81
19
83
19
85
19
87
19
89
19
91
19
93
19
95
19
97
19
99
20
01
To
nn
es
Apparent consumption National production Imports
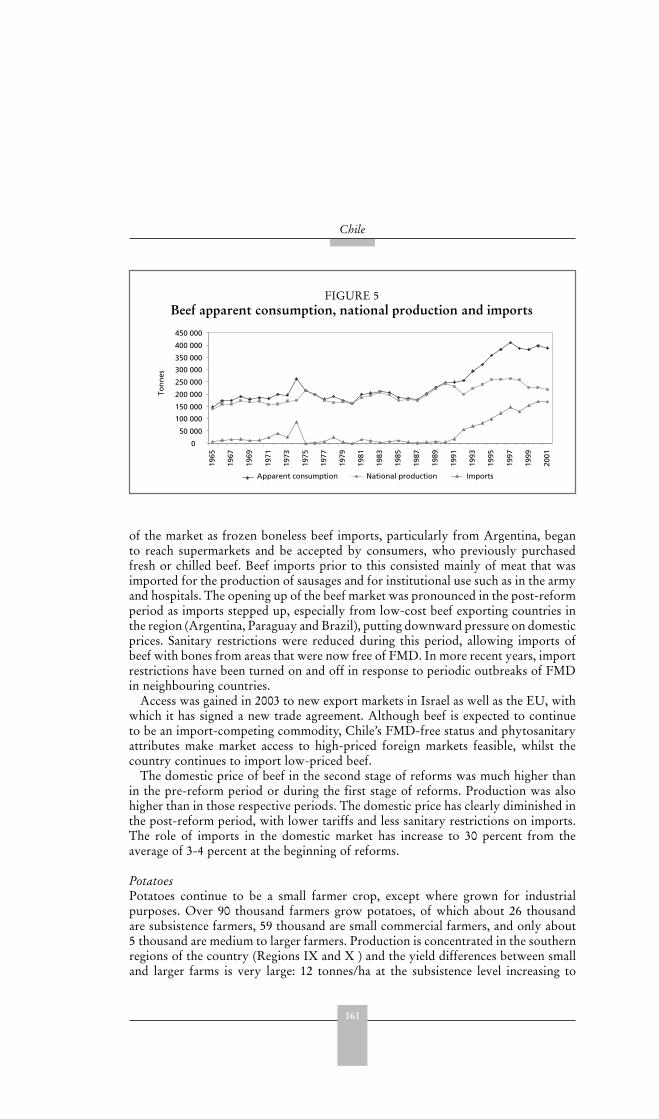
161
Chile
of the market as frozen boneless beef imports, particularly from Argentina, beganto reach supermarkets and be accepted by consumers, who previously purchasedfresh or chilled beef. Beef imports prior to this consisted mainly of meat that wasimported for the production of sausages and for institutional use such as in the armyand hospitals. The opening up of the beef market was pronounced in the post-reformperiod as imports stepped up, especially from low-cost beef exporting countries inthe region (Argentina, Paraguay and Brazil), putting downward pressure on domesticprices. Sanitary restrictions were reduced during this period, allowing imports ofbeef with bones from areas that were now free of FMD. In more recent years, importrestrictions have been turned on and off in response to periodic outbreaks of FMDin neighbouring countries.
Access was gained in 2003 to new export markets in Israel as well as the EU, withwhich it has signed a new trade agreement. Although beef is expected to continueto be an import-competing commodity, Chile’s FMD-free status and phytosanitaryattributes make market access to high-priced foreign markets feasible, whilst thecountry continues to import low-priced beef.
The domestic price of beef in the second stage of reforms was much higher thanin the pre-reform period or during the first stage of reforms. Production was alsohigher than in those respective periods. The domestic price has clearly diminished inthe post-reform period, with lower tariffs and less sanitary restrictions on imports.The role of imports in the domestic market has increase to 30 percent from theaverage of 3-4 percent at the beginning of reforms.
PotatoesPotatoes continue to be a small farmer crop, except where grown for industrialpurposes. Over 90 thousand farmers grow potatoes, of which about 26 thousandare subsistence farmers, 59 thousand are small commercial farmers, and only about5 thousand are medium to larger farmers. Production is concentrated in the southernregions of the country (Regions IX and X ) and the yield differences between smalland larger farms is very large: 12 tonnes/ha at the subsistence level increasing to
FIGURE 5Beef apparent consumption, national production and imports
0
50 000
100 000
150 000
200 000
250 000
300 000
350 000
400 000
450 000
1965
1967
1969
1971
1973
1975
1977
1979
1981
1983
1985
1987
1989
1991
1993
1995
1997
1999
2001
Ton
nes
Apparent consumption National production Imports

162
Trade reforms and food security – country case studies and synthesis
22 tonnes/ha on large farms. About 20 percent of domestic production is producedon medium or large farms for industrial processing.
With deregulation, the area sown to potatoes decreased by 50 percent between1975 and 1987, but yield increases allowed average production per person to increasemoderately to 80 kg. The production levels of the pre-reform period have neverrecovered, even though domestic prices are considerably higher than they were.During the reform period, average yields increased from 71 kg per hectare in 1976 to104 in 1991/94, but have remained stagnant since then.
During the pre-reform period domestic prices were kept below border pricesby government intervention aimed at controlling inflation and food costs. Withderegulation, prices increased substantially. Potatoes are largely non-tradable(although tradable as semi-processed or processed products such as frozen pre-cutpotatoes, and as potato seed). The potato market has therefore behaved like a closedmarket with annual fluctuations in prices and production.
Imports of potatoes have increased recently with changes in diets and the rapidincrease in processed potatoes, such as French fries, and with the diffusion of fastfood restaurants. Imports of frozen pre-cut potatoes and potato snacks increasedduring the 1990s. Chile has been able to export fresh potatoes, potato seed, anddehydrated potatoes to neighbouring countries. But the value of exports is no morethan about 30 percent of potato imports and these trade flows have depended onthe production and trade policies of the large multinational firms, such as Nestléand McCain. High transport cost of refrigerated products by road to Brazil has alsomade it difficult to compete in that market with imports from Holland, the worldleader in processed potatoes.
BeansBeans have traditionally been one of the most popular items in the food basket of thepopulation. Due to good climate and soil conditions, beans have also traditionallybeen exported to other Latin American nations. Over the last 20 years, however, percapita consumption, particularly in the urban areas, has declined, due to the time
FIGURE 6Potatoes apparent consumption, national production and imports
1 400 000
1 200 000
1 000 000
800 000
600 000
400 000
200 000
Ton
nes
0
1965
1967
1969
1971
1973
1975
1977
1979
1981
1983
1985
1987
1989
1991
1993
1995
1997
1999
2001
Apparent consumption National production Imports Exports
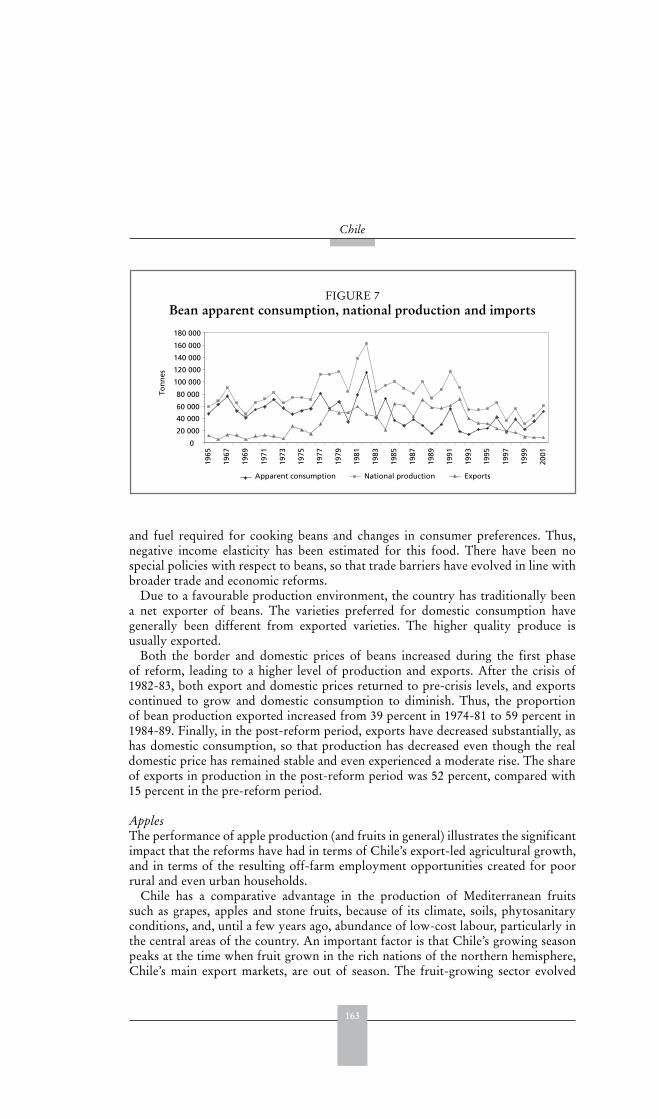
163
Chile
and fuel required for cooking beans and changes in consumer preferences. Thus,negative income elasticity has been estimated for this food. There have been nospecial policies with respect to beans, so that trade barriers have evolved in line withbroader trade and economic reforms.
Due to a favourable production environment, the country has traditionally beena net exporter of beans. The varieties preferred for domestic consumption havegenerally been different from exported varieties. The higher quality produce isusually exported.
Both the border and domestic prices of beans increased during the first phaseof reform, leading to a higher level of production and exports. After the crisis of1982-83, both export and domestic prices returned to pre-crisis levels, and exportscontinued to grow and domestic consumption to diminish. Thus, the proportionof bean production exported increased from 39 percent in 1974-81 to 59 percent in1984-89. Finally, in the post-reform period, exports have decreased substantially, ashas domestic consumption, so that production has decreased even though the realdomestic price has remained stable and even experienced a moderate rise. The shareof exports in production in the post-reform period was 52 percent, compared with15 percent in the pre-reform period.
ApplesThe performance of apple production (and fruits in general) illustrates the significantimpact that the reforms have had in terms of Chile’s export-led agricultural growth,and in terms of the resulting off-farm employment opportunities created for poorrural and even urban households.
Chile has a comparative advantage in the production of Mediterranean fruitssuch as grapes, apples and stone fruits, because of its climate, soils, phytosanitaryconditions, and, until a few years ago, abundance of low-cost labour, particularly inthe central areas of the country. An important factor is that Chile’s growing seasonpeaks at the time when fruit grown in the rich nations of the northern hemisphere,Chile’s main export markets, are out of season. The fruit-growing sector evolved
FIGURE 7Bean apparent consumption, national production and imports
0
20 000
40 000
60 000
80 000
100 000
120 000
140 000
160 000
180 000
1965
1967
1969
1971
1973
1975
1977
1979
1981
1983
1985
1987
1989
1991
1993
1995
1997
1999
2001
Ton
nes
Apparent consumption National production Exports
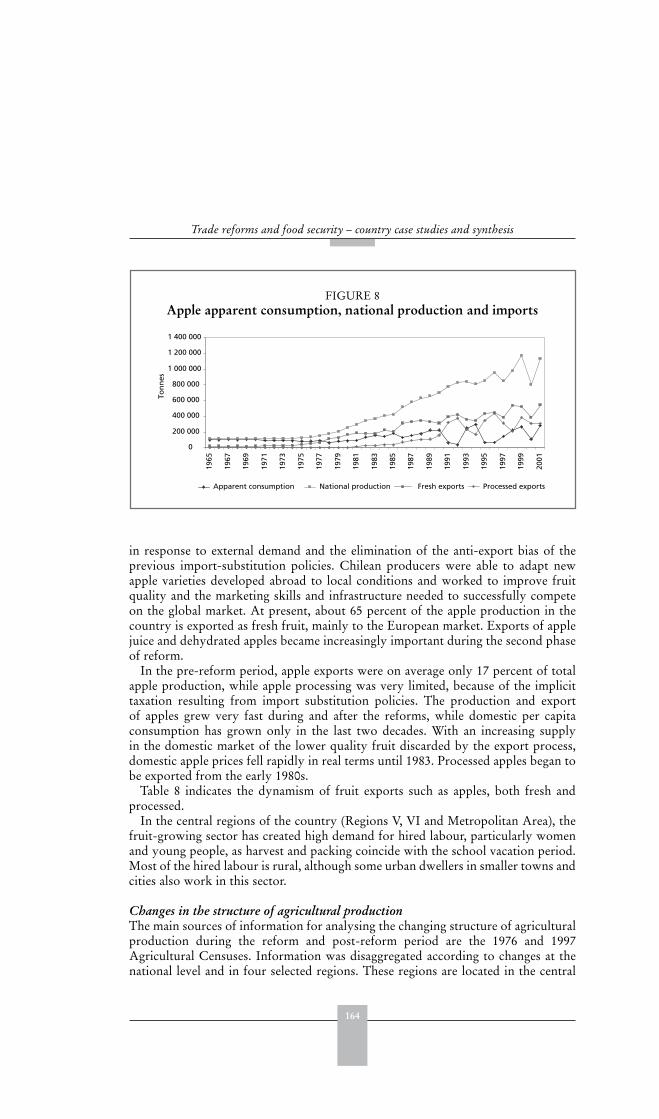
164
Trade reforms and food security – country case studies and synthesis
in response to external demand and the elimination of the anti-export bias of theprevious import-substitution policies. Chilean producers were able to adapt newapple varieties developed abroad to local conditions and worked to improve fruitquality and the marketing skills and infrastructure needed to successfully competeon the global market. At present, about 65 percent of the apple production in thecountry is exported as fresh fruit, mainly to the European market. Exports of applejuice and dehydrated apples became increasingly important during the second phaseof reform.
In the pre-reform period, apple exports were on average only 17 percent of totalapple production, while apple processing was very limited, because of the implicittaxation resulting from import substitution policies. The production and exportof apples grew very fast during and after the reforms, while domestic per capitaconsumption has grown only in the last two decades. With an increasing supplyin the domestic market of the lower quality fruit discarded by the export process,domestic apple prices fell rapidly in real terms until 1983. Processed apples began tobe exported from the early 1980s.
Table 8 indicates the dynamism of fruit exports such as apples, both fresh andprocessed.
In the central regions of the country (Regions V, VI and Metropolitan Area), thefruit-growing sector has created high demand for hired labour, particularly womenand young people, as harvest and packing coincide with the school vacation period.Most of the hired labour is rural, although some urban dwellers in smaller towns andcities also work in this sector.
Changes in the structure of agricultural production The main sources of information for analysing the changing structure of agriculturalproduction during the reform and post-reform period are the 1976 and 1997Agricultural Censuses. Information was disaggregated according to changes at thenational level and in four selected regions. These regions are located in the central
FIGURE 8Apple apparent consumption, national production and imports
0
200 000
400 000
600 000
800 000
1 000 000
1 200 000
1 400 000
1965
1967
1969
1971
1973
1975
1977
1979
1981
1983
1985
1987
1989
1991
1993
1995
1997
1999
2001
Ton
nes
Apparent consumption National production Fresh exports Processed exports
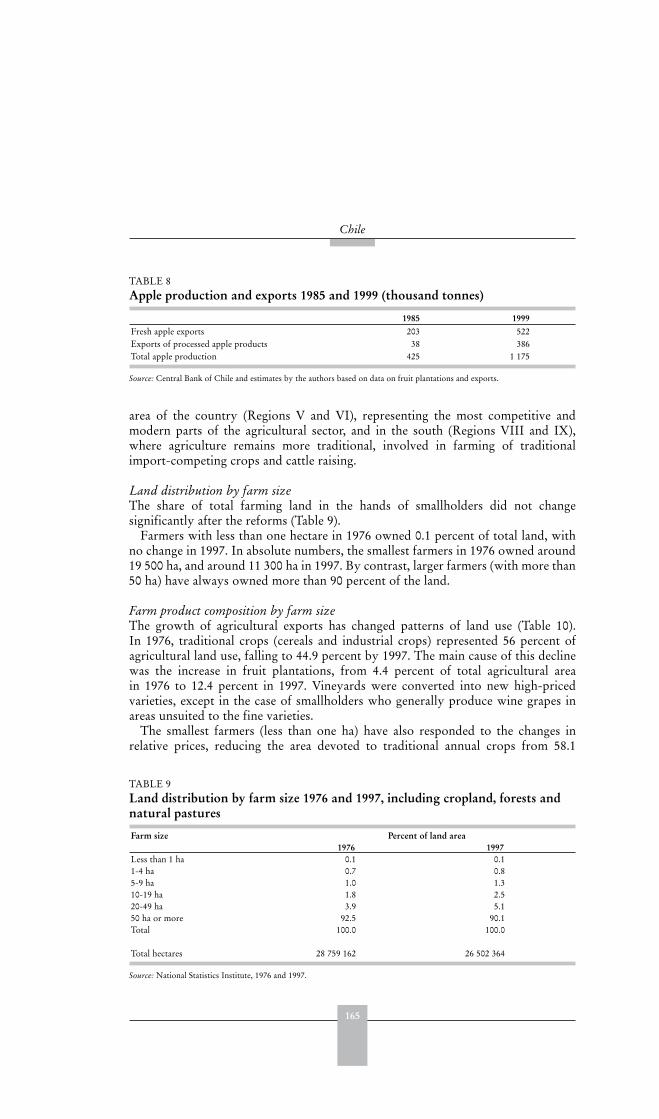
165
Chile
area of the country (Regions V and VI), representing the most competitive andmodern parts of the agricultural sector, and in the south (Regions VIII and IX),where agriculture remains more traditional, involved in farming of traditionalimport-competing crops and cattle raising.
Land distribution by farm size The share of total farming land in the hands of smallholders did not changesignificantly after the reforms (Table 9).
Farmers with less than one hectare in 1976 owned 0.1 percent of total land, withno change in 1997. In absolute numbers, the smallest farmers in 1976 owned around19 500 ha, and around 11 300 ha in 1997. By contrast, larger farmers (with more than50 ha) have always owned more than 90 percent of the land.
Farm product composition by farm size The growth of agricultural exports has changed patterns of land use (Table 10).In 1976, traditional crops (cereals and industrial crops) represented 56 percent ofagricultural land use, falling to 44.9 percent by 1997. The main cause of this declinewas the increase in fruit plantations, from 4.4 percent of total agricultural areain 1976 to 12.4 percent in 1997. Vineyards were converted into new high-pricedvarieties, except in the case of smallholders who generally produce wine grapes inareas unsuited to the fine varieties.
The smallest farmers (less than one ha) have also responded to the changes inrelative prices, reducing the area devoted to traditional annual crops from 58.1
TABLE 8Apple production and exports 1985 and 1999 (thousand tonnes)
1985 1999Fresh apple exports 203 522Exports of processed apple products 38 386Total apple production 425 1 175
Source: Central Bank of Chile and estimates by the authors based on data on fruit plantations and exports.
TABLE 9 Land distribution by farm size 1976 and 1997, including cropland, forests and natural pastures
Farm size Percent of land area1976 1997
Less than 1 ha 0.1 0.11-4 ha 0.7 0.85-9 ha 1.0 1.310-19 ha 1.8 2.520-49 ha 3.9 5.150 ha or more 92.5 90.1Total 100.0 100.0
Total hectares 28 759 162 26 502 364
Source: National Statistics Institute, 1976 and 1997.
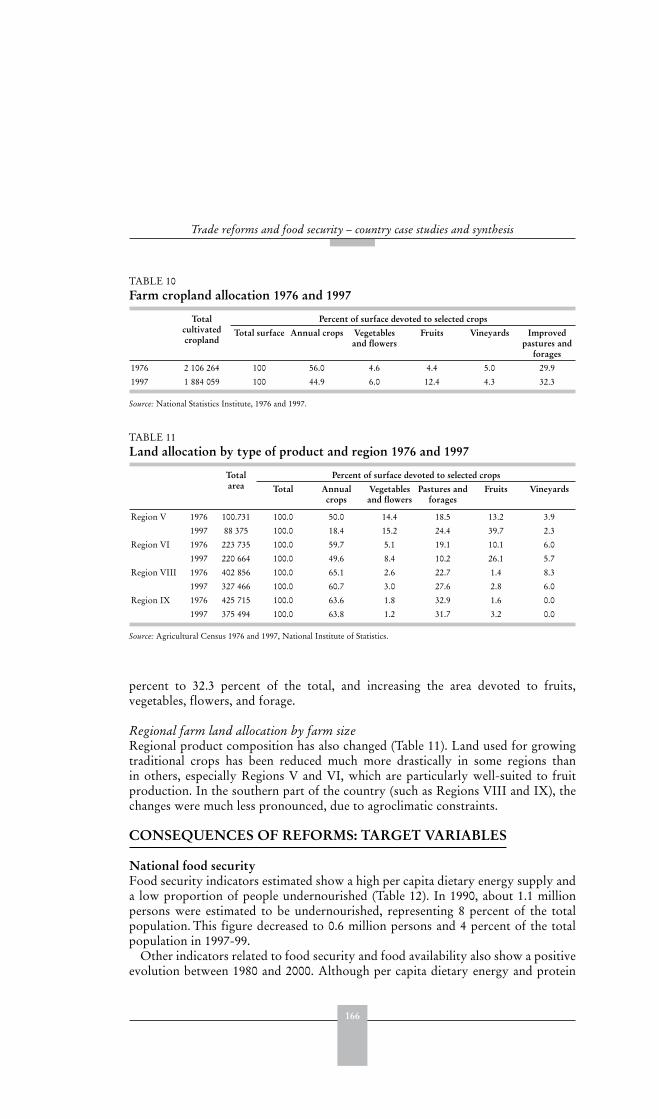
166
Trade reforms and food security – country case studies and synthesis
percent to 32.3 percent of the total, and increasing the area devoted to fruits,vegetables, flowers, and forage.
Regional farm land allocation by farm size Regional product composition has also changed (Table 11). Land used for growingtraditional crops has been reduced much more drastically in some regions thanin others, especially Regions V and VI, which are particularly well-suited to fruitproduction. In the southern part of the country (such as Regions VIII and IX), thechanges were much less pronounced, due to agroclimatic constraints.
CONSEQUENCES OF REFORMS: TARGET VARIABLES
National food securityFood security indicators estimated show a high per capita dietary energy supply anda low proportion of people undernourished (Table 12). In 1990, about 1.1 millionpersons were estimated to be undernourished, representing 8 percent of the totalpopulation. This figure decreased to 0.6 million persons and 4 percent of the totalpopulation in 1997-99.
Other indicators related to food security and food availability also show a positiveevolution between 1980 and 2000. Although per capita dietary energy and protein
TABLE 10 Farm cropland allocation 1976 and 1997
Totalcultivatedcropland
Percent of surface devoted to selected crops
Total surface Annual crops Vegetables and flowers
Fruits Vineyards Improved pastures and
forages
1976 2 106 264 100 56.0 4.6 4.4 5.0 29.9
1997 1 884 059 100 44.9 6.0 12.4 4.3 32.3
Source: National Statistics Institute, 1976 and 1997.
TABLE 11 Land allocation by type of product and region 1976 and 1997
Totalarea
Percent of surface devoted to selected crops
Total Annualcrops
Vegetables and flowers
Pastures and forages
Fruits Vineyards
Region V 1976 100.731 100.0 50.0 14.4 18.5 13.2 3.9
1997 88 375 100.0 18.4 15.2 24.4 39.7 2.3
Region VI 1976 223 735 100.0 59.7 5.1 19.1 10.1 6.0
1997 220 664 100.0 49.6 8.4 10.2 26.1 5.7
Region VIII 1976 402 856 100.0 65.1 2.6 22.7 1.4 8.3
1997 327 466 100.0 60.7 3.0 27.6 2.8 6.0
Region IX 1976 425 715 100.0 63.6 1.8 32.9 1.6 0.0
1997 375 494 100.0 63.8 1.2 31.7 3.2 0.0
Source: Agricultural Census 1976 and 1997, National Institute of Statistics.
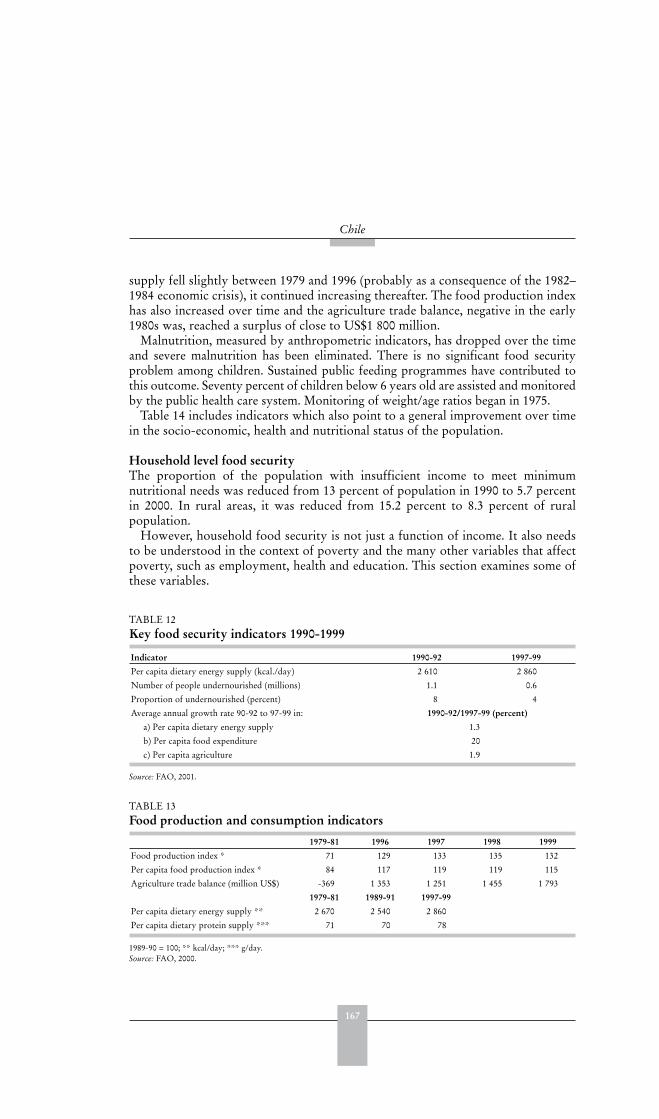
167
Chile
supply fell slightly between 1979 and 1996 (probably as a consequence of the 1982–1984 economic crisis), it continued increasing thereafter. The food production indexhas also increased over time and the agriculture trade balance, negative in the early1980s was, reached a surplus of close to US$1 800 million.
Malnutrition, measured by anthropometric indicators, has dropped over the timeand severe malnutrition has been eliminated. There is no significant food securityproblem among children. Sustained public feeding programmes have contributed tothis outcome. Seventy percent of children below 6 years old are assisted and monitoredby the public health care system. Monitoring of weight/age ratios began in 1975.
Table 14 includes indicators which also point to a general improvement over timein the socio-economic, health and nutritional status of the population.
Household level food security The proportion of the population with insufficient income to meet minimumnutritional needs was reduced from 13 percent of population in 1990 to 5.7 percentin 2000. In rural areas, it was reduced from 15.2 percent to 8.3 percent of ruralpopulation.
However, household food security is not just a function of income. It also needsto be understood in the context of poverty and the many other variables that affectpoverty, such as employment, health and education. This section examines some ofthese variables.
TABLE 13 Food production and consumption indicators
1979-81 1996 1997 1998 1999
Food production index * 71 129 133 135 132
Per capita food production index * 84 117 119 119 115
Agriculture trade balance (million US$) -369 1 353 1 251 1 455 1 793
1979-81 1989-91 1997-99
Per capita dietary energy supply ** 2 670 2 540 2 860
Per capita dietary protein supply *** 71 70 78
1989-90 = 100; ** kcal/day; *** g/day.Source: FAO, 2000.
TABLE 12 Key food security indicators 1990-1999
Indicator 1990-92 1997-99
Per capita dietary energy supply (kcal./day) 2 610 2 860
Number of people undernourished (millions) 1.1 0.6
Proportion of undernourished (percent) 8 4
Average annual growth rate 90-92 to 97-99 in: 1990-92/1997-99 (percent)
a) Per capita dietary energy supply 1.3
b) Per capita food expenditure 20
c) Per capita agriculture 1.9
Source: FAO, 2001.
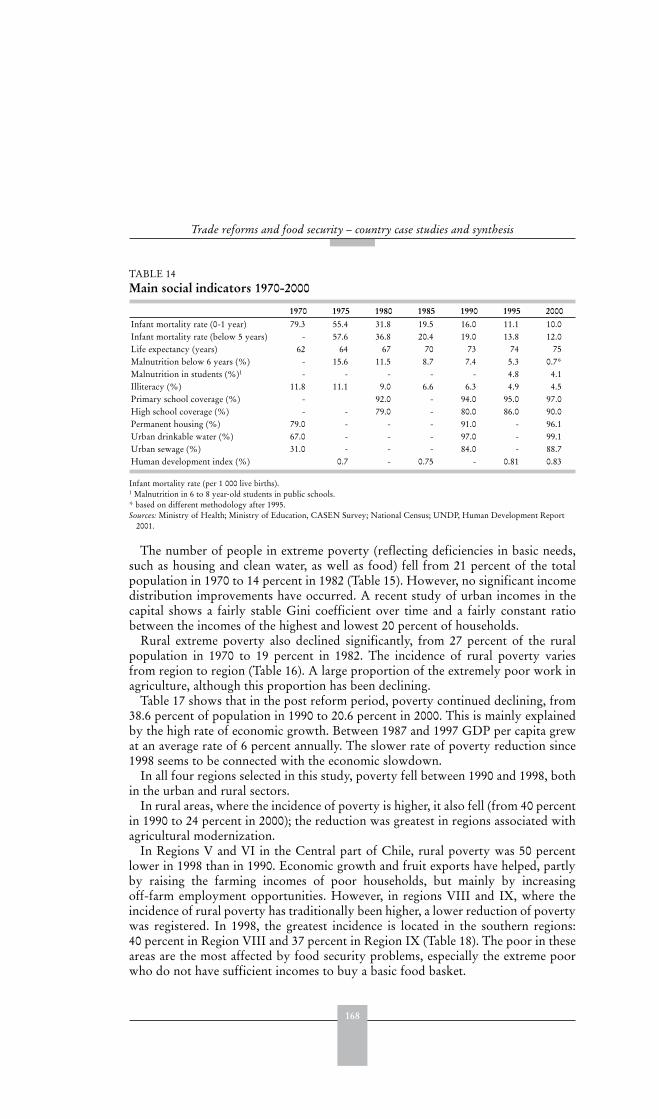
168
Trade reforms and food security – country case studies and synthesis
The number of people in extreme poverty (reflecting deficiencies in basic needs,such as housing and clean water, as well as food) fell from 21 percent of the totalpopulation in 1970 to 14 percent in 1982 (Table 15). However, no significant incomedistribution improvements have occurred. A recent study of urban incomes in thecapital shows a fairly stable Gini coefficient over time and a fairly constant ratiobetween the incomes of the highest and lowest 20 percent of households.
Rural extreme poverty also declined significantly, from 27 percent of the ruralpopulation in 1970 to 19 percent in 1982. The incidence of rural poverty variesfrom region to region (Table 16). A large proportion of the extremely poor work inagriculture, although this proportion has been declining.
Table 17 shows that in the post reform period, poverty continued declining, from38.6 percent of population in 1990 to 20.6 percent in 2000. This is mainly explainedby the high rate of economic growth. Between 1987 and 1997 GDP per capita grewat an average rate of 6 percent annually. The slower rate of poverty reduction since1998 seems to be connected with the economic slowdown.
In all four regions selected in this study, poverty fell between 1990 and 1998, bothin the urban and rural sectors.
In rural areas, where the incidence of poverty is higher, it also fell (from 40 percentin 1990 to 24 percent in 2000); the reduction was greatest in regions associated withagricultural modernization.
In Regions V and VI in the Central part of Chile, rural poverty was 50 percentlower in 1998 than in 1990. Economic growth and fruit exports have helped, partlyby raising the farming incomes of poor households, but mainly by increasingoff-farm employment opportunities. However, in regions VIII and IX, where theincidence of rural poverty has traditionally been higher, a lower reduction of povertywas registered. In 1998, the greatest incidence is located in the southern regions:40 percent in Region VIII and 37 percent in Region IX (Table 18). The poor in theseareas are the most affected by food security problems, especially the extreme poorwho do not have sufficient incomes to buy a basic food basket.
TABLE 14 Main social indicators 1970-2000
1970 1975 1980 1985 1990 1995 2000Infant mortality rate (0-1 year) 79.3 55.4 31.8 19.5 16.0 11.1 10.0Infant mortality rate (below 5 years) - 57.6 36.8 20.4 19.0 13.8 12.0Life expectancy (years) 62 64 67 70 73 74 75Malnutrition below 6 years (%) - 15.6 11.5 8.7 7.4 5.3 0.7*Malnutrition in students (%)1 - - - - - 4.8 4.1Illiteracy (%) 11.8 11.1 9.0 6.6 6.3 4.9 4.5Primary school coverage (%) - 92.0 - 94.0 95.0 97.0High school coverage (%) - - 79.0 - 80.0 86.0 90.0Permanent housing (%) 79.0 - - - 91.0 - 96.1Urban drinkable water (%) 67.0 - - - 97.0 - 99.1Urban sewage (%) 31.0 - - - 84.0 - 88.7Human development index (%) 0.7 - 0.75 - 0.81 0.83
Infant mortality rate (per 1 000 live births).1 Malnutrition in 6 to 8 year-old students in public schools.* based on different methodology after 1995.Sources: Ministry of Health; Ministry of Education, CASEN Survey; National Census; UNDP, Human Development Report
2001.
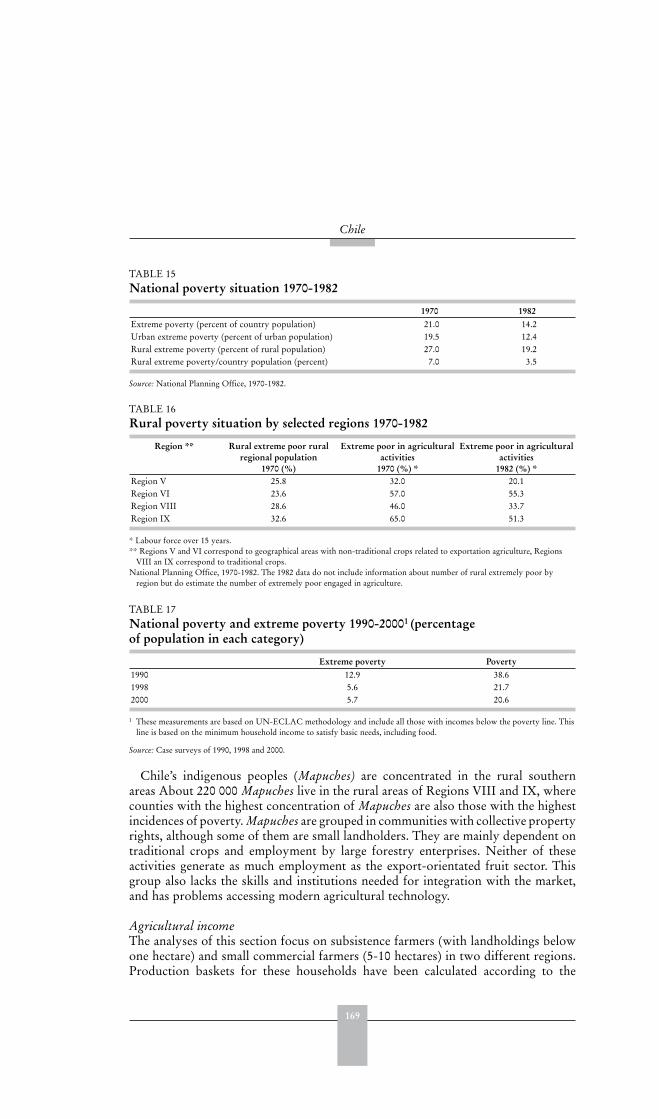
169
Chile
Chile’s indigenous peoples (Mapuches) are concentrated in the rural southernareas About 220 000 Mapuches live in the rural areas of Regions VIII and IX, wherecounties with the highest concentration of Mapuches are also those with the highestincidences of poverty. Mapuches are grouped in communities with collective propertyrights, although some of them are small landholders. They are mainly dependent ontraditional crops and employment by large forestry enterprises. Neither of theseactivities generate as much employment as the export-orientated fruit sector. Thisgroup also lacks the skills and institutions needed for integration with the market,and has problems accessing modern agricultural technology.
Agricultural income The analyses of this section focus on subsistence farmers (with landholdings belowone hectare) and small commercial farmers (5-10 hectares) in two different regions.Production baskets for these households have been calculated according to the
TABLE 15 National poverty situation 1970-1982
1970 1982Extreme poverty (percent of country population) 21.0 14.2Urban extreme poverty (percent of urban population) 19.5 12.4Rural extreme poverty (percent of rural population) 27.0 19.2Rural extreme poverty/country population (percent) 7.0 3.5
Source: National Planning Office, 1970-1982.
TABLE 16 Rural poverty situation by selected regions 1970-1982
Region ** Rural extreme poor rural regional population
1970 (%)
Extreme poor in agricultural activities
1970 (%) *
Extreme poor in agricultural activities
1982 (%) *Region V 25.8 32.0 20.1Region VI 23.6 57.0 55.3Region VIII 28.6 46.0 33.7Region IX 32.6 65.0 51.3
* Labour force over 15 years.** Regions V and VI correspond to geographical areas with non-traditional crops related to exportation agriculture, Regions
VIII an IX correspond to traditional crops.National Planning Office, 1970-1982. The 1982 data do not include information about number of rural extremely poor by
region but do estimate the number of extremely poor engaged in agriculture.
TABLE 17National poverty and extreme poverty 1990-20001 (percentageof population in each category)
Extreme poverty Poverty1990 12.9 38.61998 5.6 21.72000 5.7 20.6
1 These measurements are based on UN-ECLAC methodology and include all those with incomes below the poverty line. Thisline is based on the minimum household income to satisfy basic needs, including food.
Source: Case surveys of 1990, 1998 and 2000.
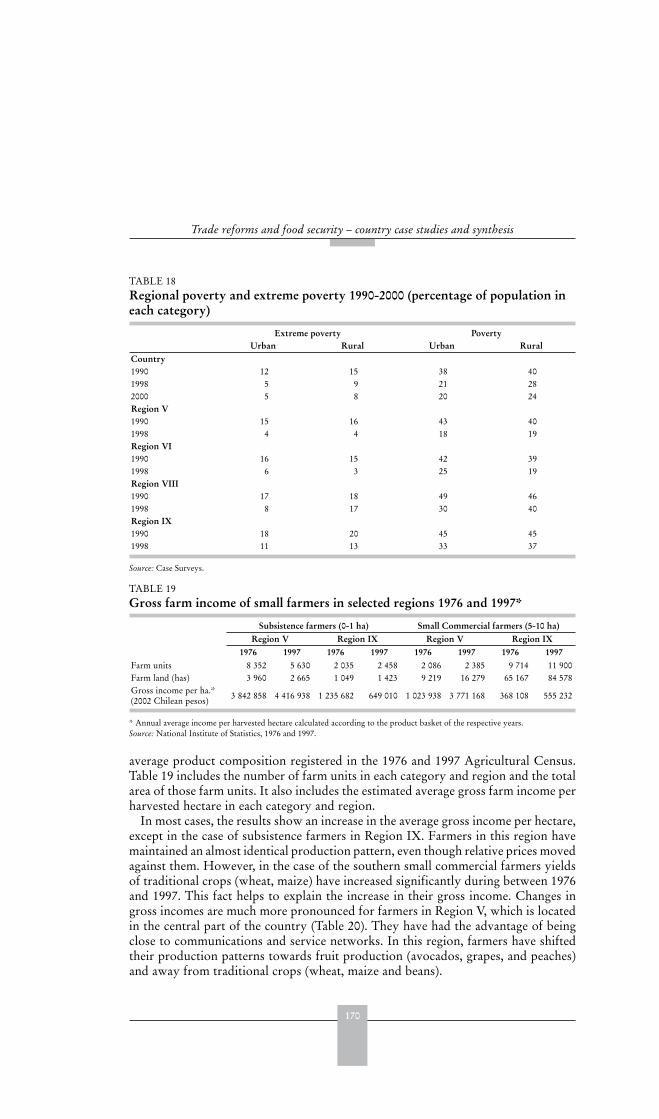
170
Trade reforms and food security – country case studies and synthesis
average product composition registered in the 1976 and 1997 Agricultural Census.Table 19 includes the number of farm units in each category and region and the totalarea of those farm units. It also includes the estimated average gross farm income perharvested hectare in each category and region.
In most cases, the results show an increase in the average gross income per hectare,except in the case of subsistence farmers in Region IX. Farmers in this region havemaintained an almost identical production pattern, even though relative prices movedagainst them. However, in the case of the southern small commercial farmers yieldsof traditional crops (wheat, maize) have increased significantly during between 1976and 1997. This fact helps to explain the increase in their gross income. Changes ingross incomes are much more pronounced for farmers in Region V, which is locatedin the central part of the country (Table 20). They have had the advantage of beingclose to communications and service networks. In this region, farmers have shiftedtheir production patterns towards fruit production (avocados, grapes, and peaches)and away from traditional crops (wheat, maize and beans).
TABLE 18 Regional poverty and extreme poverty 1990-2000 (percentage of population in each category)
Extreme poverty PovertyUrban Rural Urban Rural
Country1990 12 15 38 401998 5 9 21 282000 5 8 20 24Region V1990 15 16 43 401998 4 4 18 19Region VI1990 16 15 42 391998 6 3 25 19Region VIII1990 17 18 49 461998 8 17 30 40Region IX1990 18 20 45 451998 11 13 33 37
Source: Case Surveys.
TABLE 19 Gross farm income of small farmers in selected regions 1976 and 1997*
Subsistence farmers (0-1 ha) Small Commercial farmers (5-10 ha)Region V Region IX Region V Region IX
1976 1997 1976 1997 1976 1997 1976 1997Farm units 8 352 5 630 2 035 2 458 2 086 2 385 9 714 11 900Farm land (has) 3 960 2 665 1 049 1 423 9 219 16 279 65 167 84 578Gross income per ha.*(2002 Chilean pesos) 3 842 858 4 416 938 1 235 682 649 010 1 023 938 3 771 168 368 108 555 232
* Annual average income per harvested hectare calculated according to the product basket of the respective years.Source: National Institute of Statistics, 1976 and 1997.

171
Chile
Evolution of labour force in agriculture With the growth in agricultural exports, the number of people employed inagriculture increased significantly between 1976 and 1998, although there has been adecline in agriculture’s share of total employment (Table 21).
The structure of employment also changed significantly over the period, with a largeshift from self-employment to wage labour, particularly permanent employment,and especially in the small farm sector (Table 22). The participation of women in theagricultural labour force is low and has not risen very much between 1976 and 1997,except in permanent employment.
Self-employment is still important in Region IX and to a lesser extent in regionVIII (Table 23). Temporary employment is especially important in central Chile,
TABLE 20 Real price indices for small farm production baskets in selected regions (1976 and 1997 production weights)
Subsistence farmers (0-1 ha) Commercial farmers (5-10 ha)Region V Region IX Region V Region IX
1976 Prod. weights
1997 Prod. weights
1976 Prod. weights
1997 Prod. weights
1976 Prod. weights
1997 Prod. weights
1976 Prod. weights
1997 Prod. weights
1975 90.6 111.4 88.2 91.6 116.0 97.7 97.7 96.81976 100.0 100.0 100.0 100.0 100.0 100.0 100.0 100.01980 145.4 140.0 115.7 100.4 138.4 125.1 106.1 100.01981 123.0 110.3 98.5 86.6 109.5 101.6 94.0 88.31982 106.5 95.4 93.0 85.1 89.4 80.0 87.6 86.51984 114.2 111.6 95.4 89.1 106.6 89.4 94.9 87.71986 125.9 101.2 114.9 110.0 104.5 98.4 113.7 109.31987 140.3 113.2 124.8 114.5 133.3 110.9 115.7 111.81989 132.5 132.0 110.5 99.4 118.3 117.6 102.2 97.11991 136.1 142.1 111.2 101.0 127.6 124.3 103.3 98.11992 144.7 148.4 106.5 94.1 129.1 125.8 98.1 94.11994 123.6 139.1 97.5 83.7 110.2 116.7 88.1 84.41996 115.7 143.1 97.3 89.4 112.0 119.0 90.9 88.51998 113.6 122.7 92.0 80.0 111.5 109.7 80.7 79.51999 104.4 120.1 83.0 71.1 91.9 110.1 76.6 71.82000 110.0 148.7 84.0 72.8 114.5 118.0 85.9 79.02002 108.4 118.9 93.5 84.9 97.1 106.2 84.3 84.4
Source: Calculation based on product baskets taken from Agricultural Census, 1974 and 1997, and agricultural prices from theMinistry of Agriculture.
TABLE 21 Labour force in agriculture 1976-1998*
Year Agricultural employment(million)
Percent of total employment
1976 481 17.31980 530 16.31985 523 15.81990 873 19.51998 713 13.4
* For harvest period, November-January.Source: Portilla, 2000.

172
Trade reforms and food security – country case studies and synthesis
particularly in Region VI, with the incorporation of women into the labour force atharvest time.
In very small farms (less than 1 ha), there has been a very large increase in theproportion of permanent wage earners and a more modest increase in the proportionof temporary wage earners, except in the region V where this proportion has beenreduced (Table 24).
The only available indicator that can reflect wage income evolution for ruralhouseholds in the pre-reform, reform, and post-reform period is the minimum ruraldaily wage fixed by the Government and representatives of unskilled agriculturalworkers. Following a sharp fall during the reform period, it has grown steadily since1987. However, the minimum wage does not reflect the wages of the poorest ruralhouseholds who are usually not formally employed.
Among rural households, wages from non-agricultural activities have grown asmuch, if not more, than wages from agriculture. About 60 percent of the income ofsmall farm households is from off-farm activities (Lopez, 1996). Those poor ruralhouseholds that have been able to obtain off-farm employment have seen theirincomes rise over time.
TABLE 22Changes in the structure of employment (percentage of total employment)
1976 1997 1976 1997All farm households Farms less than 1 ha
Permanent wage earners (total) 23 55 3 73Men 22 48 3 56Women 1 7 0 17Self-employed in farming (total) 58 15 95 20Men 46 8 82 10Women 12 7 13 10Temporary wage earners (total) 19 30 2 7Men 17 22 2 6Women 2 8 0 1Total employment (number.) 718 000 939 000 191 000 334 000
* Employed for at least six months in a year.Source: National Statistics Institute, 1976 and1997.
TABLE 23 Structure of farmers’ employment by region 1976-1997 (percentage of farmers)
Region V Region VI Region VIII Region IX1976 1997 1976 1997 1976 1997 1976 1997
Permanent wage earners * 28 69 23 47 20 57 13 60Men 27 60 23 42 20 48 13 51Women 1 10 0 5 1 9 1 9Self-employed in farm 42 8 35 4 56 19 78 28Men 37 5 32 3 45 10 58 13Women 5 3 3 2 11 8 20 14Temporary wage earners 30 23 41 49 24 24 9 12Men 24 13 37 34 23 21 9 10Women 6 9 4 15 1 4 0 2
* Employed for at least six months in a year.Source: National Statistics Institute 1976 and 1997.

173
Chile
The impact of reforms on the main socioeconomic characteristics of small farmers The socioeconomic impact of the reforms in terms of food security and othervariables has varied geographically, depending upon the level of agriculturalrestructuring and the degree of engagement with the export sector. In order to assessthis variation, comparisons between the central and southern regions of the countrywere made using 1998 data for rural inhabitants in the lowest 40 percent incomebracket (Table 25).5
The following points are worth highlighting:• In both zones the average number of years in schooling is low relative to the
national average and the 8 years associated with completed primary education.• In the central zone, a high proportion of poor rural inhabitants are wage
earners (92 percent) and in temporary employment, associated with seasonal
5 The characteristics of the sample do not allow more disaggregation of information for rural sectors of regionsselected.
TABLE 24 Structure of employment by region on farms of less than one hectare, 1976-1997
0 - 1 ha farmers Region V Region VI Region VIII Region IX1976 1997 1976 1997 1976 1997 1976 1997
Permanent wage earners (total) 6 78 4 74 3 62 3 69Men 6 63 4 59 3 49 3 50Women 0 15 0 16 0 13 1 19Self-employed in farm (total) 86 17 87 16 93 22 92 29Men 70 10 74 9 65 12 57 11Women 16 7 13 6 28 11 35 18Temporary wage earners (total) 8 6 9 10 4 16 5 2Men 8 4 9 9 4 14 3 2Women 1 1 0 1 0 2 2 1
Source: National Statistics Institute 1976 and 1997.
FIGURE 9Minimum rural salary evolution: 1965-2002 (CH $ Oct. 2002)
Source: ODEPA data, Ministry of Agriculture.
0
1 000
2 000
3 000
4 000
5 000
6 000
7 000
8 000
9 000
1965
1967
1969
1971
1973
1975
1977
1979
1981
1983
1985
1987
1989
1991
1993
1995
1997
1999
2001

174
Trade reforms and food security – country case studies and synthesis
fruit harvesting and packing. In the south, by contrast, a higher proportion ispermanent (60 percent), corresponding to farmers that work all year-round ontheir own land or as employees on commercial farms.
• In both areas the level of malnutrition among poor households is low affectingonly 1 percent of children below 6 years of age. This is due to the safety netprogrammes that reach a high percentage of target groups in rural areas. Tenpercent of the rural infant population are overweight.
TABLE 25Socio-economic indicators for rural inhabitants in the lowest 40 percent income bracket, 1998
Central rural zone* South rural zone*EducationAverage schooling (years) 6.7 5.8Schooling household head (years) 6.0 5.4Occupational category (percent of employees)Self-employed 7 35Wage-earners 92 58Dependents 1º 7Type of employment (percent of total employment)Permanent 41 60Temporary 56 36Other 3 4Nutritional status of children (according to NCHS-WHO
parameters)Normal 80 83Low weight 5 4Malnourished 1 1Over weight 11 10Without information 3 2
* Central Rural Zone includes Region V and VI, South Rural Zone includes Region VIII and IX.Source. Data from Casen Survey 1998.
TABLE 26 Small farmers by income quintiles: Main socio-economic characteristics, 1994
Quintiles 1* 2 3 4 5 Sampleaverage
Annual household income (US$) 861 2 103 3 388 4 924 16 474 5 018Annual per capita income (US$) 166 466 804 1 312 4 480 1 300Off-farm income (percent of householdincome)
67 68 66 59 30 59
Family size (average number of members) 5.2 4.6 4.3 3.8 3.7 4.4Farm size (hectares) 9.8 8.6 15 13 26 13.7Share of traditional crops in total value ofagricultural output (%)
79 63 60 56 52 63
Average output price (US$/kg)Wheat 0.21 0.23 0.25 0.24 0.37 0.24Corn 0.20 0.24 0.25 0.35 0.54 0.32
* 20 percent lowest quintile.Source: Lopez, 1996.
175
Chile
It can be concluded that there are no serious food security problems in the ruralareas of central and southern Chile.
Income differences, off-farm employment and alternative livelihood strategiesSmall farmers (farming less than 12 hectares) are highly dependent upon traditionalcrops. For the poorest quintile of smallholders the share of traditional crops in theproduction basket reached nearly 80 percent. In the highest quintile it decreasedto 52 percent, and on average it was 63 percent (Table 26). This is an importantfeature because producers of traditional crops are dependent on a limited domesticmarket.6
The average annual per capita income for the total sample was about US$1 300, butincomes differ widely across quintiles, with the lowest registering an average incomeof US$166 whilst the highest quintile registered US$4 480, nearly 27 times larger thatof the lowest quintile.
The data shows a large dependence on off-farm income sources. In fact, thepoorest group derives more than 66 percent of their income from off-farm sources,the sample average being almost 60 percent. Average family size is small (4.4) but inthe lowest quintile is 5.2.
Another important feature is the disparity between the prices received by differentgroups for their output. The average prices of wheat and corn are illustrative giventhe homogeneous nature of these products. The average price received by thepoorest farmers tends to be much lower than that of the others. Part of this disparityis associated with unit transaction costs, which are higher for small farmers, giventheir smaller volume of output and the fact that they are often located further awayfrom markets.
Another study (Berdegué et al., 2001), focusing on the coastal highlands inthe central and southern zones of the country, also concluded that the copingability of the rural poor depended on their ability to complement income fromself-employment in agriculture with other income sources. Moreover, this studyconcludes that between 1990 and 1996 income improvements have been greatest forhouseholds without access to land but with a greater participation in wage-jobs.
In conclusion, the evidence concerning the impact of policy reforms on the ruralpoor indicates that although rural poverty still exists, the dynamic sectors of theeconomy, especially the export-oriented ones, have created many new jobs andimproved the incomes of poor households. However, in the regions that remaindependent upon traditional agriculture, such as the southern regions, the incidenceof poverty is higher than elsewhere.
Household food consumption The main sources of information on food consumption are the HouseholdExpenditures Surveys of the National Statistics Institute conducted every ten years.This survey, however, is based on a sample of urban Santiago, the capital city, and doesnot provide rural information. The data for Santiago points to increased expenditureon food consumption for all income groups, including the poorest, between 1978
6 Traditional crops include mostly commodities produced for the domestic market including wheat, corn,potatoes, legumes and sugar beets.
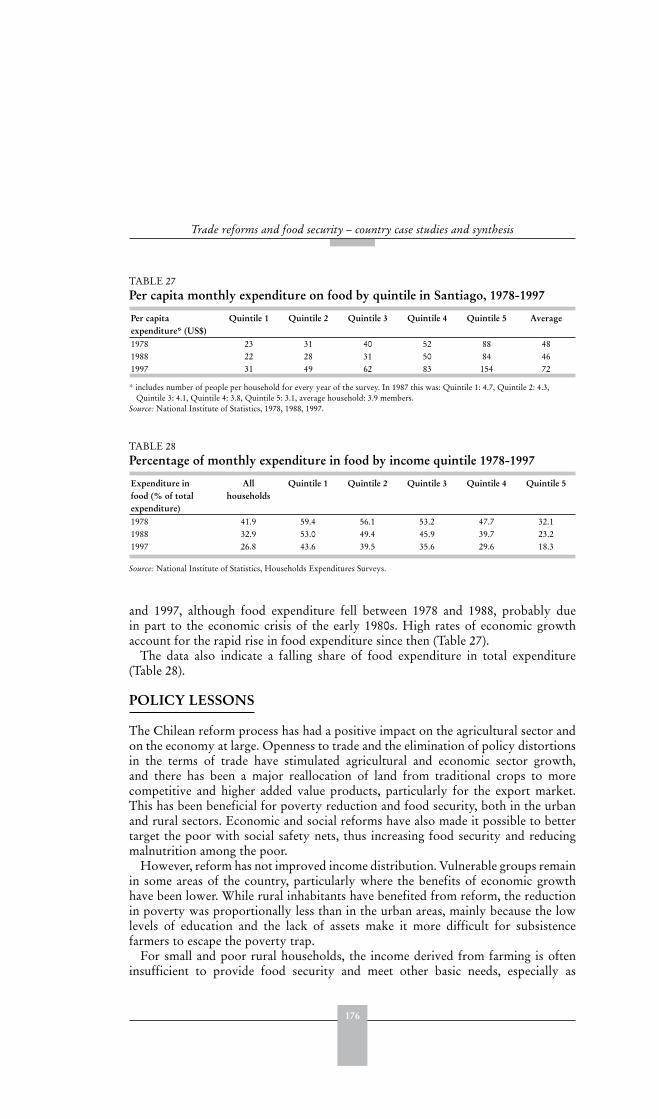
176
Trade reforms and food security – country case studies and synthesis
and 1997, although food expenditure fell between 1978 and 1988, probably duein part to the economic crisis of the early 1980s. High rates of economic growthaccount for the rapid rise in food expenditure since then (Table 27).
The data also indicate a falling share of food expenditure in total expenditure(Table 28).
POLICY LESSONS
The Chilean reform process has had a positive impact on the agricultural sector andon the economy at large. Openness to trade and the elimination of policy distortionsin the terms of trade have stimulated agricultural and economic sector growth,and there has been a major reallocation of land from traditional crops to morecompetitive and higher added value products, particularly for the export market.This has been beneficial for poverty reduction and food security, both in the urbanand rural sectors. Economic and social reforms have also made it possible to bettertarget the poor with social safety nets, thus increasing food security and reducingmalnutrition among the poor.
However, reform has not improved income distribution. Vulnerable groups remainin some areas of the country, particularly where the benefits of economic growthhave been lower. While rural inhabitants have benefited from reform, the reductionin poverty was proportionally less than in the urban areas, mainly because the lowlevels of education and the lack of assets make it more difficult for subsistencefarmers to escape the poverty trap.
For small and poor rural households, the income derived from farming is ofteninsufficient to provide food security and meet other basic needs, especially as
TABLE 27 Per capita monthly expenditure on food by quintile in Santiago, 1978-1997
Per capita expenditure* (US$)
Quintile 1 Quintile 2 Quintile 3 Quintile 4 Quintile 5 Average
1978 23 31 40 52 88 481988 22 28 31 50 84 461997 31 49 62 83 154 72
* includes number of people per household for every year of the survey. In 1987 this was: Quintile 1: 4.7, Quintile 2: 4.3,Quintile 3: 4.1, Quintile 4: 3.8, Quintile 5: 3.1, average household: 3.9 members.
Source: National Institute of Statistics, 1978, 1988, 1997.
TABLE 28 Percentage of monthly expenditure in food by income quintile 1978-1997
Expenditure in food (% of total expenditure)
Allhouseholds
Quintile 1 Quintile 2 Quintile 3 Quintile 4 Quintile 5
1978 41.9 59.4 56.1 53.2 47.7 32.11988 32.9 53.0 49.4 45.9 39.7 23.21997 26.8 43.6 39.5 35.6 29.6 18.3
Source: National Institute of Statistics, Households Expenditures Surveys.
177
Chile
landholdings continue to be fragmented as a result of laws and practices concerninginheritance. The impact of the economic reforms on the food insecure, mediatedby the price and output changes for the main commodities produced or consumedby the poor, is of much less significance than off-farm employment opportunitiescreated in the commercial sectors of agriculture (many of which are export-oriented)as well as in other activities such as services and trade in small towns and villages.The labour intensity of export-oriented commercial activities is substantially greaterthan that of traditional agriculture, creating new opportunities for poor women andother marginalized groups, especially at harvest time.
The differences between regions in the degree of poverty reduction are largelyexplained by the degree to which different regions have been able to shift agricultureaway from traditional production patterns towards more commercially and exportorientated ones. During the 1990s, the poverty rates were lower and reduced by alarger proportion in the central zone where modern, export-oriented, agriculturethrives. This contrasts with higher poverty and food insecurity in the southern zonewhere farmers mainly engage in traditional agriculture.
The vulnerable are typically those with least schooling, which limits their ownfarm productivity as well as opportunities for off-farm employment. Rural-urbanmigration in response to wage differentials continues to provide opportunities forthe younger and better-educated population. Those that remain in the rural areasare typically older and less educated. The southern regions are also home to thelargest concentration of indigenous peoples, who find it especially difficult to accessmarkets and integrate with the modern economy.
Chile has explicitly recognized the need for special programmes to ensureadequate health and nutrition for vulnerable groups. The main social programmeshave focused on human capital investment, nutrition and education. These remainkey policies for addressing the problems of poverty and food insecurity faced bythose who have not benefited from market reforms.
REFERENCES
Berdegué J., Ramirez, E., Reardon, T. & Escobar, G. 2000. World RIMISP. DevelopmentRural Non-farm Employment and Incomes in Chile. RIMISP, Santiago, Chile.
Banco Central de Chile. 2002. Series de indicadores económicos (On Line). http://www.bcentral.cl.
Camhi, R. 2002. Qué ha pasado con la Pobreza y Distribución del Ingreso durante los 90,Instituto Libertad y Desarrollo, Serie Informe Social, enero del 2002.
Camhi, R. & Domper, M. 2002. Análisis de la Situación Económica y Social de los Pueblos
Indígenas: Reformas Pendientes, Instituto Libertad y Desarrollo, Serie Social, octubre de2002.
Comité de Inversiones Extranjeras Chile. 1998. Oportunidades de Inversión en Agronegocios.Santiago, Chile.
ECLAC-UN (Ferez J.C.). 2001. Poverty in Chile in the year 2000.
Espejo, A. & Fontaine, E. 1991. El mecanismo de banda de precios para el trigo y su aplicaciónen Chile, 1974/1990. Cuadernos de Economía 28(84): 203 - 219
Centro de Estudios Públicos. Estudios Públicos N° 61. Santiago, Chile. pp. 141-188.FAO. 2000a. Food and Agricultural Indicators for Chile.
178
Trade reforms and food security – country case studies and synthesis
FAO. 2000b. Nutrition Country Profiles.FAO. 2001. The State of Food Insecurity in the World 2001, Rome.López, R. 1995. Determinants of Rural Poverty: A quantitative Analysis for Chile.
Commissioned Paper for the Technical Department, Rural Poverty and Natural Resources,Latin American Region. World Bank.
Ministry of National Planning. 1990,1998,2000. CASEN Survey.Muchnik, E. & Allué, M. 1991. The Chilean Experience with Agricultural Price Bands: The
Case of Wheat. Food Policy, 16(1) 67-73.Muchnik, E. & Venezian, E. 1994. Structural Adjustment and Agricultural Research in Chile.
International Service for National Agricultural Research (ISNAR). Santiago, Chile. 38 pp.( ISNAR Discussion Paper 94).
Muchnik, E. & Vial, I. 1990. Impact of P.N.A.C. on Pre- School Children in Santiago. Mar delPlata Editions. Santiago, Chile. 112 p.
Muchnik, E. & Zegers, A. 1981. The Agricultural Sector 1974-1980. Pontificia UniversidadCatólica de Chile-Programa de Postgrado en Economía Agraria. Santiago, Chile.
National Planning Office. 1975. The Map of Extreme Poverty 1975. Santiago, Chile.National Planning Office. 2002. Socioeconomic Situation of the Rural Sector in Chile.National Statistics Institute. 1976 and 1997. Agricultural Census.
National Statistics Institute. 1978, 1988, 1997. Household Expenditures Survey (ODEPA.Office of Agricultural Policies), Ministry of Agriculture (www.odepa.cl).
ODEPA. 2000. Clasificación de las explotaciones agrícolas del VI Censo Nacional Agropecuario
según tipo de productor y localización geográfica. Documento de trabajo N°5. Santiago,Chile. 92 pp. Oficina de Estudios y Políticas Agrarias.
ODEPA. 2001. Una política de estado para la agricultura chilena: período 2000-2010. Santiago,Chile. 140 pp. Oficina de Estudios y Políticas Agrarias.
ODEPA. 2002a. Series de Estadísticas Silvoagropecuarias (On Line). http://www.odepa.cl.Oficina de Estudios y Políticas Agrarias.
ODEPA. 2002b. Agricultura Chilena: Rubros según Tipo de Productor y Localización
Geográfica. Documento de trabajo Nº8. Santiago, Chile. Oficina de Estudios y PolíticasAgrarias.
Oficina de Planificación Nacional. 1970-1982. Mapa de la Extrema Pobreza.Pontificia Universidad Católica de Chile. 1976. Programa de Postgrado en Economía
Agraria.. El sector agrícola chileno: 1964 – 1974. Santiago, Chile.Portilla, B. 2000. La política agrícola en Chile: Lecciones de tres décadas. Comisión Económica
para América Latina y el Caribe. Serie de Desarrollo Productivo N°68. Santiago, Chile.83 pp.
Vargas, G. 1991. Efectos de la Política Arancelaria en el Sector Lechero Chileno 1976-1989: Un
Estudio Econométrico. Serie de Investigación N?57. Departamento de Economía Agraria,P. Católica de Chile, Santiago, Chile.
FURTHER READING
Anriquez, G., Cowan, K. & De Gregorio, J. 1995. Pobreza y políticas macroeconómicas:
Chile, 1987-1994. Proyecto UNIDP-IDB-CEPAL sobre alivio de la pobreza y desarrolloeconómico. Santiago, Chile. 52 pp.
Errázuriz, F. & Muchnik, E. 1996. Visión crítica de la agricultura chilena y sus políticas, in
Estudios Públicos Nº 61. Centro de Estudios Públicos, Santiago, pp.141-188.
179
Chile
Hachette, D. & Rosas, P. August 1993. The liberalization of Chilean Agricultural 1974-1990.
Instituto de Economía, Universidad Católica. Doc. De Trabajo No. 157.Larrañaga, O. 1999. Income Distribution and Economic Growth in Chile. University of
Chile, Economic Department.Ramirez E., Berdegué J., Caro, J. & Frigolett, D. 2001. Estrategia de Generación de Ingresos
de Hogares Rurales en Zonas de Concentración de Pobreza. Mayo del 2001. RIMISP,Santiago, Chile.
UNDP (United Nations Development Programme. 2001. Human Development Report.Valdés, A., Hurtado, H. & Muchnik, E. 1990. Economía Política de las Intervenciones
de Precios Agrícolas en América Latina: Capítulo III – Chile. Banco Mundial, CentroInternacional para el Desarrollo Económico. Santiago, Chile. 470 pp.
Vial, I. & Camhi, R. 1992. Chilean Evolution and Targeting of National Feeding and School
Feeding Programmes. In Human Resources Division - World Bank Case Studies: From
Platitude to Practice, M. Grosh, ed.
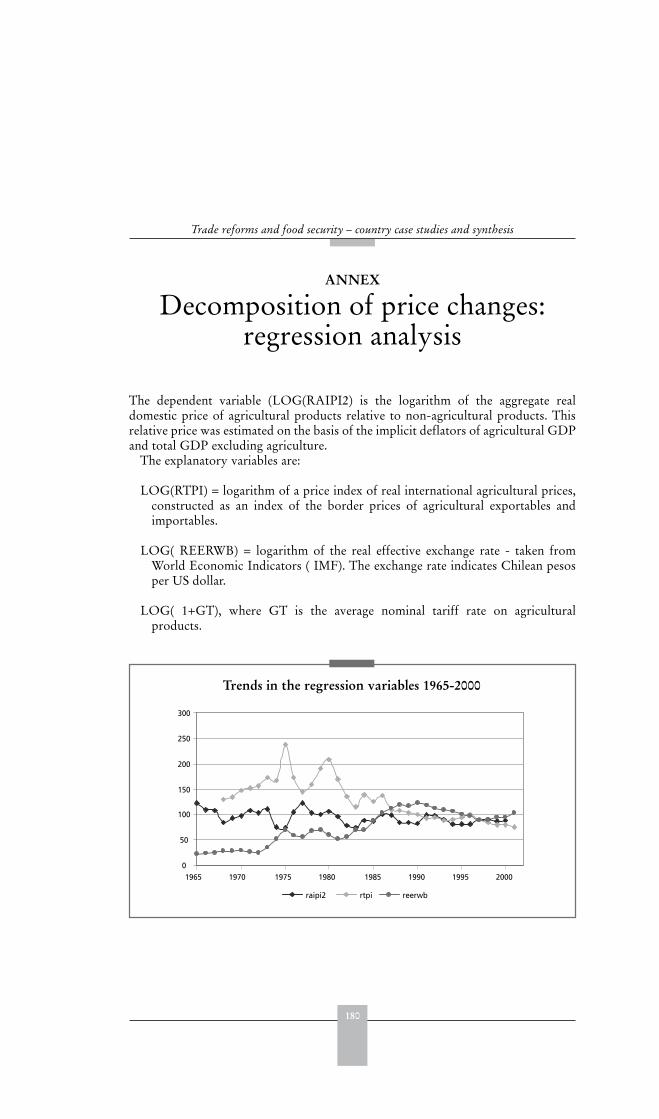
180
Trade reforms and food security – country case studies and synthesis
ANNEX
Decomposition of price changes:regression analysis
The dependent variable (LOG(RAIPI2) is the logarithm of the aggregate realdomestic price of agricultural products relative to non-agricultural products. Thisrelative price was estimated on the basis of the implicit deflators of agricultural GDPand total GDP excluding agriculture.
The explanatory variables are:
LOG(RTPI) = logarithm of a price index of real international agricultural prices,constructed as an index of the border prices of agricultural exportables andimportables.
LOG( REERWB) = logarithm of the real effective exchange rate - taken fromWorld Economic Indicators ( IMF). The exchange rate indicates Chilean pesosper US dollar.
LOG( 1+GT), where GT is the average nominal tariff rate on agriculturalproducts.
Trends in the regression variables 1965-2000
0
50
100
150
200
250
300
1965 1970 1975 1980 1985 1990 1995 2000
raipi2 rtpi reerwb
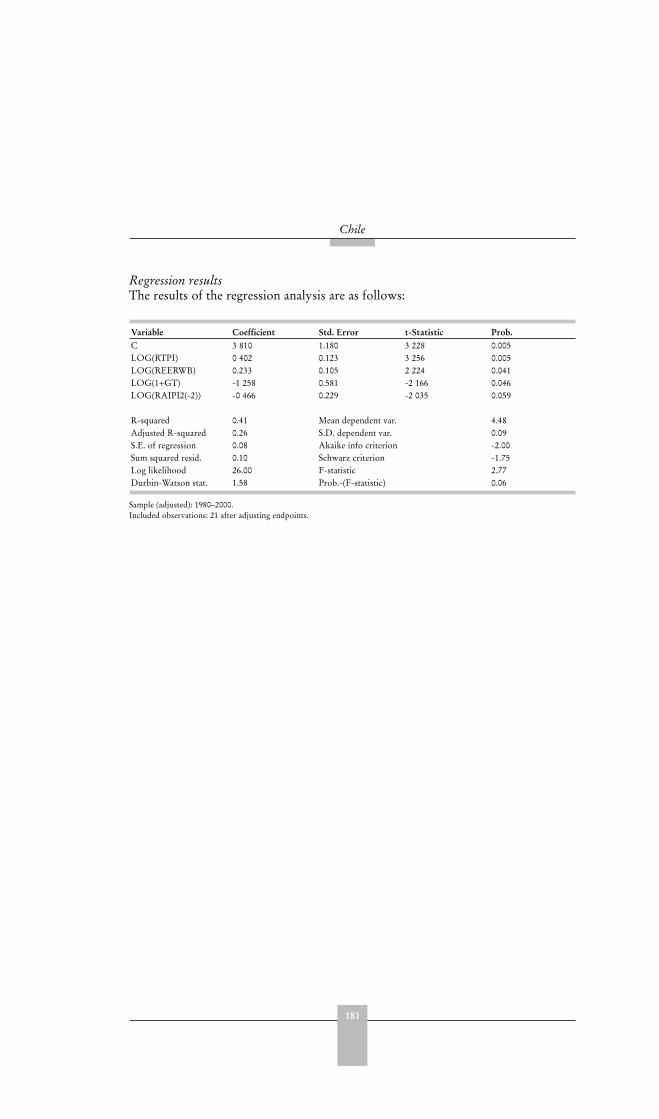
181
Chile
Regression resultsThe results of the regression analysis are as follows:
Variable Coefficient Std. Error t-Statistic Prob.C 3 810 1.180 3 228 0.005LOG(RTPI) 0 402 0.123 3 256 0.005LOG(REERWB) 0.233 0.105 2 224 0.041LOG(1+GT) -1 258 0.581 -2 166 0.046LOG(RAIPI2(-2)) -0 466 0.229 -2 035 0.059
R-squared 0.41 Mean dependent var. 4.48Adjusted R-squared 0.26 S.D. dependent var. 0.09S.E. of regression 0.08 Akaike info criterion -2.00Sum squared resid. 0.10 Schwarz criterion -1.75Log likelihood 26.00 F-statistic 2.77Durbin-Watson stat. 1.58 Prob.-(F-statistic) 0.06
Sample (adjusted): 1980–2000.Included observations: 21 after adjusting endpoints.

183
ChinaJikun Huang, Scott Rozelle, Hongxing Ni and Ninghui Li1
EXECUTIVE SUMMARY
The reformsThe liberalization of agricultural trade in China has occurred simultaneously with anumber of domestic economic reforms and these have been implemented graduallybut continuously since the late 1970s.
At the macro level, fiscal expenditures on agriculture have been consistently higherthan the fiscal revenues from agricultural taxes and fees. However, a significantoutflow of capital from agriculture to industry has occurred over the last twodecades, particularly through Rural Credit Cooperatives. Exchange rate policychanges have significantly affected the production and trade incentives for producersand traders of imported and exported agricultural commodities. The exchange ratepolicy during the reform period has clearly been successful in effecting substantialdepreciation (increase) in the real exchange rate.
In the initial years, the reduction in protection resulted from a reduction in thenumber of commodities that were controlled by single desk state traders. Althoughmany commodities were not included in the move to decentralize trade, the movesspurred the export of many agricultural goods. In addition, policy shifts in the1980s and 1990s changed the trading behaviour of state traders who were allowed toincrease imports in the 1980s and 1990s.
At the sectoral level, China’s rural economic reform, first initiated in 1979, wasfounded on the household responsibility system (HRS). Price and market reformsinitiated in the late 1970s were aimed at raising farm level procurement prices and alsoincluded reductions in procurement quota levels. A second stage of price and marketreforms announced in 1985 aimed at radically limiting the scope of government priceand market interventions. In the late 1990s market intervention policy shifted fromtaxing grain producers (by maintaining the government quota procurement pricebelow the market price) to supporting the grain price via a grain protection price setabove the market price level.
In terms of input policy, machinery, fertilizer and the seed systems were virtuallyunchanged to begin with, and remained heavily planned. Since the mid-1980s, market
1 Jikun Huang, Center for Chinese Agricultural Policy (CCAP), Chinese Academy of Sciences; Scott Rozelle,Department of Agricultural and Resource Economics, University of California, Davis; Hongxing Ni, Office ofAgricultural Trade, Ministry of Agriculture; Ninghui Li, Agricultural Economics Institute, Chinese Academyof Agricultural Sciences. The authors would like to acknowledge the research assistance provided by Ping QinPing and Haomiao Liu from CCAP.

184
Trade reforms and food security – country case studies and synthesis
liberalization has been implemented gradually, and meaningful liberalization onlyoccurred in the early 1990s for fertilizer and the late 1990s for the seed industry.
Impact on intermediate variablesBefore the mid-1980s, the domestic wholesale price of all four major commoditiesfar exceeded the world price, but over the next two decades, the protection ratesdecreased. Although maize prices fluctuated, they declined between 1995 and 2000.The annual price variation has fallen, as have the price gaps between producing andconsuming regions not only for maize, but for all other grains.
Domestic policy reforms account for 95 percent of price changes and trade reformsfor at most 5 percent.
Because the one-off efficiency gains from the shift to the household responsibilitysystem were essentially reaped by the mid 1980s, the growth rate of the food andagriculture sectors has decelerated since then. However, rapid economic growth,urbanization and food market development have boosted the demand for meat,fruits and other non-staple foods, changes that have stimulated sharp shifts in thestructure of agriculture.
Agricultural trade nearly tripled from 1980 to 1995, with exports rising faster thanimports. Since the early 1980s, China has been a net food exporter.
Impact on target variablesNational food security status has improved and the level of protein and fatconsumption exceeds average nutrient availability in countries with a comparableper capita GNP, mainly because of rapid growth in the supply and consumption ofnon-staple foods since the early 1980s. By the late 1990s, China had strengthened itsability to import food.
The income of poor farmers depends more on agriculture than does that of richerfarmers. The share of agricultural income in total income ranged from 69-76 percentin the poorest groups in all regions to only 26 to 55 percent in the richest groups. Farmhouseholds in the poorest group consume less than half the quantity of rice consumedby the average household but more maize and other coarse grains. In the westernregion the production of wheat, maize and cotton, three traditionally protectedcommodities, exceeds that of rice in terms of the output values for farmers in lowerincome categories. Since these commodities are mostly marketed, they represent amajor source of agricultural cash income for poor farmers. The reliance on these cropssuggests that future trade liberalization of these commodities will affect poor farmersnegatively since it will invariably lead to lower prices. On the other hand, recentprotection of domestic maize and cotton has benefited the poor in the west.
Income and expenditure trends for the average household and for the poor showrapid improvements. What the average household lost from the liberalization of theimportable sector in 1995-2000, it gained back from the protection of maize, wheatand cotton and from the liberalization of the exportable sector. Only 1.9 percent ofthe change in overall output is due to trade policy.
While both eastern and western regions have benefited from trade policy,liberalization has hurt producers in central China primarily because the region isthe largest producer of soybean and edible oil, two of the commodities most hurtby liberalization.
185
China
Policy lessonsThe rise in yields is explained by domestic policy reforms, decollectivization, newagricultural technologies, irrigation investments and rising access to inputs whichhave all helped provide the incentives and materials for raising production per fixedunit of land.
Through nearly 20 years of reform, the trade regime has gradually changed froma highly centralized, planned, import substitution regime to a more decentralized,market-oriented and export orientated regime. In the initial stage, reformers onlyimplemented measures that provided incentives to particular sets of corporationsand institutions. As experience was gained from the reform, trade liberalization hasprogressed steadily since the late 1980s.
Domestic reforms have boosted growth in all sectors. They have also increasedfood security, primarily by increasing food availability. Because of rising output,there has also been a large, negative price effect that has benefited consumers,both rural and urban. By contrast, trade liberalization has had both positiveand negative impacts. Although there has been less of an impact on aggregateproduction and consumption, trade policy reforms have had powerful impacts onstructural change, and in improving allocation efficiency. Because they are morecommodity specific than domestic reforms, they have a sharper regional and crop-specific impact.
Trade liberalization and domestic reforms have also affected the access ofhouseholds to non-farm employment and associated wages. Raising the demandfor off farm labour is probably the most important thing that can happen in theeconomy.
INTRODUCTION: CONTEXT AND NATURE OF THE REFORMS
The role and level of development of the agriculture sectorSuccessive transformations of China’s economy have been based on agriculturalgrowth (Nyberg and Rozelle, 1999). Agriculture has made important, but decliningcontributions to national economic development in terms of gross value added,employment, capital accumulation, urban welfare, foreign exchange earnings andpoverty alleviation.
Before 1980, agriculture contributed more than 30 percent of GDP and half ofexport earnings. By 2000, these shares had fallen to 16 and 10 percent (Table 1).
The shifts in the economy can also be seen in employment (NSBC, 2001). Whilethe share of employment accounted for by the industrial sector has doubled overthe past three decades, in the service sector it has tripled. During the same period,employment in the agricultural sector (including part-time agricultural labour) fellfrom 81 percent in 1970 to 69 percent in 1980, and continued to fall throughout thereform era, reaching about 50 percent in 2000. In the late 1990s, more than 40 percentof the rural labour force was employed in the non-agricultural sector (deBrauw et al.,2002). Expanding non-agricultural employment has contributed substantially to thegrowth of farmer incomes. Non-agricultural income exceeded agricultural incomein 2000 for the first time, accounting for just over 50 percent of the total income offarmers. In 2001, the share rose to 51 percent (NSBC, 2002).

186
Trade reforms and food security – country case studies and synthesis
Macro and sectoral components and the policy instruments usedTrade liberalization has occurred simultaneously with a number of domesticeconomic reforms. Both external and domestic policy reforms have been implementedgradually, but continuously over the past two decades.
In the early reform period, annual GDP growth rates increased dramatically from4.9 percent in 1970-78 to 8.8 percent in 1979-84. During this period, as economicgrowth and family planning lowered the nation’s population growth rates, the annualgrowth rate of GDP per capita more than doubled, from 3.1 percent to 7.1 percent.
In the late 1980s, in response to an overheated economy and unprecedentedinflation rates, a set of stringent macroeconomic policies was adopted (Naughton,
TABLE 1 Changes in structure (percent) of China’s economy, 1970-2000
1970 1980 1985 1990 1995 2000Share in GDPAgriculture 40 30 28 27 20 16Industry 46 49 43 42 49 51Services 13 21 29 31 31 33Share in employmentAgriculture 81 69 62 60 52 50Industry 10 18 21 21 23 22.5Services 9 13 17 19 25 27.5Share in exportsPrimary products Na 50 51 26 14 10Foods Na 17 14 11 7 5Share in importsPrimary products Na 35 13 19 18 21Foods Na 15 4 6 5 2Share of rural
population 83 81 76 74 71 64
Source: NSBC, Statistical Yearbook and Rural Statistical Yearbook, various issues.
TABLE 2 Annual growth rates (percent), 1970-2000
Pre-reform1970-78
Reform period1979-84 1985-95 1996-00
Gross domestic product 4.9 8.8 9.7 8.2Agriculture 2.7 7.1 4.0 3.4Industry 6.8 8.2 12.8 9.6Service na 11.6 9.7 8.2Foreign trade 20.5 14.3 15.2 9.8Import 21.7 12.7 13.4 9.5Export 19.4 15.9 17.2 10.0
Rural enterprises output n.a. 12.3 24.1 14.0Population 1.8 1.4 1.4 0.9Per capita GDP 3.1 7.1 8.3 7.1
Note: Figure for GDP in 1970-78 is the growth rate of national income in real terms. Growth rates are computed usingthe regression method.
Source: NSBC.
187
China
1995). After two years of high inflation, economic growth slowed sharply in 1989-1990. After the brief slowdown, the Government implemented a series of policymeasures to re-stimulate the economy through the use of fiscal and financialexpansion, the devaluation of the exchange rate, the expansion of special economiczones, and higher agricultural prices. The economy quickly rebounded and theannual growth rate of GDP accelerated to 14 percent in 1992, maintaining rates of10 to 13 percent during the mid-1990s.
Although the economy was growing rapidly, inflation was high in the mid 1990s.In order to avoid a repeat of the previous slowdown, a range of measures aimedat achieving a soft landing was implemented (Zhu and Brandt, 2001). As before,financial and credit policies were tightened. Administrative controls over newinvestments were also implemented. Growth decelerated gradually, falling onlymarginally, in contrast to the late 1980s. During the late 1990s, economic growthremained high at about 8 percent annually.
Foreign trade has played an increasing role since the beginning of the reforms. Thetrade to GDP ratio increased from less than 13 percent in 1980 to 45 percent in 2001(NSBC, 2002). During the same period, the total value of China’s primary goodstrade (mainly agriculture) increased from US$16.1 billion to US$72.1 billion, anannual growth rate of 7.4 percent (NSBC, 2002). With China’s entry into the WTOin late 2001, the growth of foreign trade is likely to remain high and even acceleratein the coming years.
Macroeconomic policyFiscal and financial investment policyFiscal expenditure on agriculture has been consistently higher than the revenue fromagricultural taxes and fees. However, this type of revenue is only a small portion ofagriculture’s contribution: rural enterprise development has contributed significantfiscal income and has led to a net capital outflow from rural to urban areas since theearly 1980s, particularly through Rural Credit Cooperatives.
Exchange rate policyBefore economic reform, the Government strictly controlled the earnings andallocation of all foreign exchange to support the nation’s import-substitutionindustrialization strategy (Lardy, 1995). In 1979, China introduced a foreignexchange retention system, aimed at providing incentives to various enterprises andlocal governments to increase foreign exchange earnings through the expansion ofexports.
From 1988, local governments and enterprises were allowed to control and use allof the foreign exchange that they earned as long as they did so in accordance withstate regulations. This provided strong incentives to exports from Northeast China.For example, when maize exports led to increased foreign exchange earnings, officialswere able to relax the severe constraints that existed on the import of technology,capital and other commodities. Annual maize exports reached an average of about4 million tonnes in the late 1980s. After the incentives were strengthened, exportsnearly doubled to 7.7 million tonnes in the early 1990s.
Exchange rate management was controlled by a two-tiered foreign exchange ratesystem. One rate, the official foreign exchange rate, was set by policy. The other rate

188
Trade reforms and food security – country case studies and synthesis
was set by a swap centre, based mainly on supply and demand forces. The swap ratewas about 20 percent higher than the official rate in the mid-1980s and was as highas 75 percent higher in the late 1980s. A devaluation of the official rate by more than40 percent in the early 1990s caused the gap between the swap and official rates tofall to 25 percent.
The official exchange rate and the swap market exchange rate were unified in 1994to a single currency, managed exchange rate system, at a rate that was supposedto be consistent with supply and demand in that year. As a result, the renminbi(RMB, Chinese Yuan or CNY) exchange rate was effectively devalued from theofficial exchange rate of CNY5.76 per US dollar in 1993 to the managed floatingmarket exchange rate of CNY8.61 per US dollar in 1994. This shift was a one stepdevaluation of more than 50 percent. In December 1996, after the currency stabilizedat that rate, the RMB became convertible on China’s current account. Black-marketor unofficial secondary markets for foreign exchange have moved closely with theofficial exchange rates since 1996 and stayed remarkably constant.
The exchange rate policy changes have significantly affected the production andtrade incentives for producers and traders of imported and exported agriculturalcommodities. While a nominal exchange rate devaluation is only effective in raisingthe price of tradables relative to non-tradable goods, if inflation does not erode theincrease in the exchange rate, a real depreciation of the domestic currency raisesthe local currency prices of tradable relative to non-tradable and contributes to theprice competitiveness of domestic exports. Since agricultural products are generallytradable, agricultural incentives may be expected to increase with real depreciationof the domestic currency.
The exchange rate policy during the reform period has clearly been successfulin effecting substantial depreciation (increase) in the real exchange rate. Whereasnominal exchange rates remained constant, and even appreciated over three decadesprior to the reform period, real exchange rates rapidly depreciated during the entire
FIGURE 1Evolution of exchange rates 1979-2001
0
1
2
3
4
5
6
7
8
9
10
1979
1981
1983
1985
1987
1989
1991
1993
1995
1997
1999
2001
Official exchange rate
(yuan/US$)
Swap-centre exchange
rate (yuan/US$)
Real effective exchange
rate index (1994=1)

189
China
reform period except for a couple of years after 1985. From 1979 to 1993, the realexchange rate depreciated by 422 percent.
The success of the exchange rate adjustments stemmed mainly from the productivityeffects of economic reforms and technological innovations in agriculture, foreigntrade and industry that contributed to relatively low inflation. The favourable trendsin the real exchange rate sharply increased export competitiveness.
However, after adopting the managed floating exchange rate system in 1994, thevalue of RMB has appreciated slightly. The official exchange rate declined fromCNY8.61 per US dollar in 1994 to about CNY8.28 in 1998-2001. It is widelybelieved that the domestic currency has gradually become overvalued since 1994,providing a disincentive to the tradable agricultural sector.
Trade policyLower tariffs and rising imports and exports of agricultural products began to affectdomestic terms of trade in the 1980s. In the initial years, most of the fall in protectioncame from a reduction in the commodities that were controlled by single desk statetraders (Huang and Chen, 1999). Although many agricultural commodities wereexcluded from the move to decentralize trade, the initiative did stimulate the exportof others (e.g. moving oil and oil seed imports away from state trading firms). Policyshifts also changed the trading behaviour of state traders who were allowed toincrease imports in the 1980s and 1990s.
Moves to deregulate access to import and export markets were matched byreductions in border taxes. From 1992 to 1998, the simple average agriculturalimport tariff fell from 42.2 percent in 1992 to 23.6 percent in 1998 to 21 percent in2001 (MOFTEC, 2002). However, much of the reduced protection in agriculture hascome from decentralizing authority for imports and exports, relaxing the licensingprocedures for some crops, and exchange rate reforms.
Overall, trade distortions in the agricultural sector have declined over the past20 years (Huang and Rozelle, 2003). Non-tariff barriers (NTBs) have been reducedalong with tariffs, and quotas have been reformed (Huang and Chen, 1999). Despitethis real, and in some areas, rapid set of reforms, the Government retains controlover commodities of national strategic importance, such as rice, wheat and maize(Nyberg and Rozelle, 1999).
In the case of grain, although the import tariff rate has been low, importationhas been restricted to those agencies and enterprises that hold licences and importquotas. When traders bring in grain within the quota, the tariff was only about3 percent, whereas above the quota it was as high as 114 percent. No above-quotagrain has entered China because grain imports have to be arranged by state traders.The China National Cereals, Oils and Foodstuffs Import & Export Corporation(COFCO) has been the nation’s single-desk state trading company for grain. Italso manages the import of edible oils. Since the late 1990s, officials have tried tostreamline importing procedures by commercializing COFCO and demonopolizingthe trade of a number of commodities.
Despite the above efforts in commercializing grain trade, trade liberalization inmaize and to some extent cotton, is still minimal (Huang, Rozelle and Chang, 2004).For example, China used export subsidies to increase exports of maize and cotton.This has helped to support domestic prices, thereby protecting producers. Maize
190
Trade reforms and food security – country case studies and synthesis
exporters, especially those in Northeast China, received subsidies that averaged34 percent of the export price.
Institutional reformRural economic reform, first initiated in 1979, was founded on the householdresponsibility system (HRS), which dismantled the communes, and contractedagricultural land to households, mostly on the basis of family size and number ofpeople in the household’s labour force. Although individuals controlled the landunder HRS and enjoyed the associated income rights, land ownership remainedcollective. The HRS reforms were completed in 1984, with average farm size about0.6 hectare. The size of farms varies between regions, ranging from more than onehectare in the Northeast and nearly one hectare in the North, to about 0.5 hectarein the Southwest and 0.2 to 0.3 hectare in the South. Because the multiple croppingindex (the number of crops planted per year on a single plot of land) varies from onecrop in the Northeast to two to three in South China, variations of sown area amongChina’s regions are less than those of farm size.
Commodity price and marketing policiesThe price and market reforms initiated in the late 1970s included gradual increasesin agricultural procurement prices toward market prices; reductions in compulsoryprocurement quota levels; the introduction of above-quota bonuses for cotton,tobacco, and other cash crops; negotiated procurement of surplus production of rice,wheat, maize, soybean, edible oils, livestock, and most other commodities at price levelshigher than those for quota procurement; and greater freedom for private traders.
After a record growth in grain production in 1984 and 1985, a second stage of priceand market reforms was announced in 1985 aimed at radically limiting the scopeof government price and market interventions and further enlarging the role of themarket. Other than for rice, wheat, maize and cotton, the intention was to graduallyeliminate planned procurement of agricultural products. For grain, productionincentives were raised by reducing the volume of compulsory procurement quotasand increasing procurement prices. As result, the share of compulsory grainprocurement in total grain production fell from 29 percent in 1984 to 13 percent in1990, whilst the share of negotiated procurement at market prices increased fromonly 3 percent in 1985 to 12 percent in 1990.
Because of the sharp drop in the growth rate of grain output and the rise in foodprices in the late 1980s, the pace of marketing reform stalled. Mandatory procurementof grain, oil crops and cotton continued. To provide incentives for farmers to raiseproductivity and to encourage sales to the Government, quota procurement priceswere raised over time. The increase in the nominal agricultural procurement price,however, was lower than the inflation rate, which led to a decline in the real grainprice (Huang and Rozelle, 2002).
As grain production and prices stabilized in the early 1990s, however, anotherattempt was made to abolish the rationing of grain. Urban officials discontinued salesat ration prices to consumers in early 1993. For a year and a half the liberalizationprocess succeeded. Then, when it appeared that both the state grain distribution andprocurement systems had been successfully liberalized, food prices rose sharply. Asa result, the state compulsory quota system was re-imposed in most areas in 1995,
191
China
but at a lower procurement level. The share of compulsory grain quota procurementin total production remained at 11 percent in 1995-97.
Since the mid 1990s, several new policies have been implemented. Immediately afterthe price rises in the mid-1990s, China started the “Rice Bag” responsibility system.2
The policy was designed to strengthen food security and grain markets by makingprovincial governments responsible for balancing supply and demand of cereals andfor stabilizing local food markets and prices. Policies under the system included re-introducing grain rations for poor consumers, investing in production bases inside theprovince and attempting to keep grain from being shipped outside the province.
In the late 1990s, market intervention policy shifted from taxing grain producersthrough low procurement prices to preventing grain prices from falling too low byimplementing a grain protection price (higher than the market price). To reducethe financial burden of this policy, the central government in 1998 initiated acontroversial policy prohibiting individuals and private companies from procuringgrain from farmers.3 In contrast to past policies, grain quota procurement priceswere for the first time set at a higher level than market prices, favouring thosefarmers able to sell at that price.
If the State could have exercised a monopoly over grain markets, it is possible thatit could have implemented the price supports without suffering a major fiscal drain.The loser under this policy would have been the consumer paying a higher pricefor grain. However, the fiscal burden rose to historic highs as stocks accumulated.In 1998, the Government’s grain marketing subsidies in the form of payments tofarmers reached nearly CNY100 billion CNY. Yielding once again to market forces,the Government launched another round of liberalization in 2000, eliminating thegrain procurement quotas in grain deficit regions (such as, in the coastal provinces ofZhejiang, Jiangsu and Shandong). By 2001, the liberalization efforts spread to inland,surplus regions.
In addition to the development of China’s grain markets, the gradual – albeit stopand go – marketing reforms have also slowly reduced the heavy tax burden on grainfarmers due to the grain procurement policy.
Livestock was one of a few major agricultural commodities that was mainlyliberalized by the mid-1980s. Currently, market prices are based entirely on domesticdemand and supply and a limited amount of trade.
Input price and marketing policiesIn the first stage of reforms, policy concerning machinery, fertilizer and seeds remainedheavily planned, with little change. Since the mid-1980s, market liberalization hasbeen implemented gradually, with meaningful liberalization only occurring in theearly 1990s for fertilizer and the late 1990s for the seed industry.
In the 1980s, the Agricultural Inputs Corporations (AICs), a state-ownedenterprise with local trade and retail monopolies, rationed subsidized fertilizer andcontrolled the flow of fertilizer into and out of each jurisdiction in almost the sameway they had done in the 1970s (Stone, 1988). In the early years of reform, poorly
2 “Rice” in China, sometimes means staple food. “Rice Bag” here includes rice, wheat, maize and soybean.3 Farmers were supposed to deal solely with the commercial arm of grain bureaus and the grain reserve system,
although traders were allowed to operate in wholesale and retail markets.
192
Trade reforms and food security – country case studies and synthesis
developed markets often made government sales agencies the only viable marketingchannel for agricultural inputs, and it is doubtful that the input markets would haveemerged quickly or effectively even if the sector had been liberalized. The nominalprice of subsidized fertilizer was constant for the entire 1970s and 1980s, and thestate-run system dominated fertilizer markets, even when trade was allowed. In realterms, urea prices declined by 50 percent between 1970 and 1990.
Fiscal deterioration and commercialization of the state-owned fertilizer industrystarted in the late 1980s. When farmers lost access to inexpensive fertilizer fromthe State, new opportunities opened up for private traders and markets began todevelop. One of the most important policy reforms was the fundamental shift inincentives provided to state-owned fertilizer trading and retailing enterprises in thelate 1980s and the early 1990s (Xiao and Fulton, 1997). Government officials offeredAIC managers and employees use of the system’s trucks and warehouses and a shareof trading profits in exchange for keeping workers on the payroll, supporting retireesand keeping their local retail outlets open. Following a similar pattern to that of grainmarketing reform, a two-tiered price system was implemented. Fertilizer becameavailable at in-quota and above-quota prices. Above-quota prices of fertilizer wereabout twice as much as in-quota ones. The amount of fertilizers that farmers couldpurchase at in-quota prices depended on the amount of grain they sold to thegovernment grain procurement agency.
Although at first, there were few traders in the late 1980s, gradual liberalization offertilizer markets seemed to work well. Private traders multiplied quickly. Fertilizerbecame available to farmers, even those in poorer areas, to a greater extent than everbefore (Stone, 1993) Soon, AIC-based companies were not only competing withprivate individuals, but also with each other.
In the early 1990s, private trading was authorized and other state agencies wereallowed to join the commercial fertilizer trade. Fertilizer markets supplantedplanned distribution networks (Xiao and Fulton, 1997). Rising competition raisedthe efficiency of markets, made traders more responsive to consumer demands andreduced transaction costs. The only perceived disruption caused by the reformsoccurred in the mid-1990s, when the country experienced an imbalance in the supplyand demand for food and fertilizer. Fertilizer prices doubled between 1993 and 1996.In part, this was a result of the phasing out of the in-quota fertilizer programme.
Meaningful reform of the seed industry began later than in almost any other sub-sector. However, the seed industry is now being commercialized by encouragingthe entry of new domestic firms. The lack of separation between policy goals andcommercial activities is one of the main problems facing seed industry managerswho, under complete liberalization, might be better positioned to make their firmsmore efficient and service-oriented (Pray et al., 1998). Although prices have risenrecently in international terms, they are still low and many observers believe thisis a major constraint to expansion of the seed industry (Pray et al., 1998). Prices ofhybrid rice and maize seed in China rank among the lowest in the world.
Rural creditFinancial markets have been liberalized slowly (Nyberg and Rozelle, 1999).Regulated interest rates imply credit rationing, often making it difficult for privateentrepreneurs and farmers, especially the poor, to access credit. In many poor
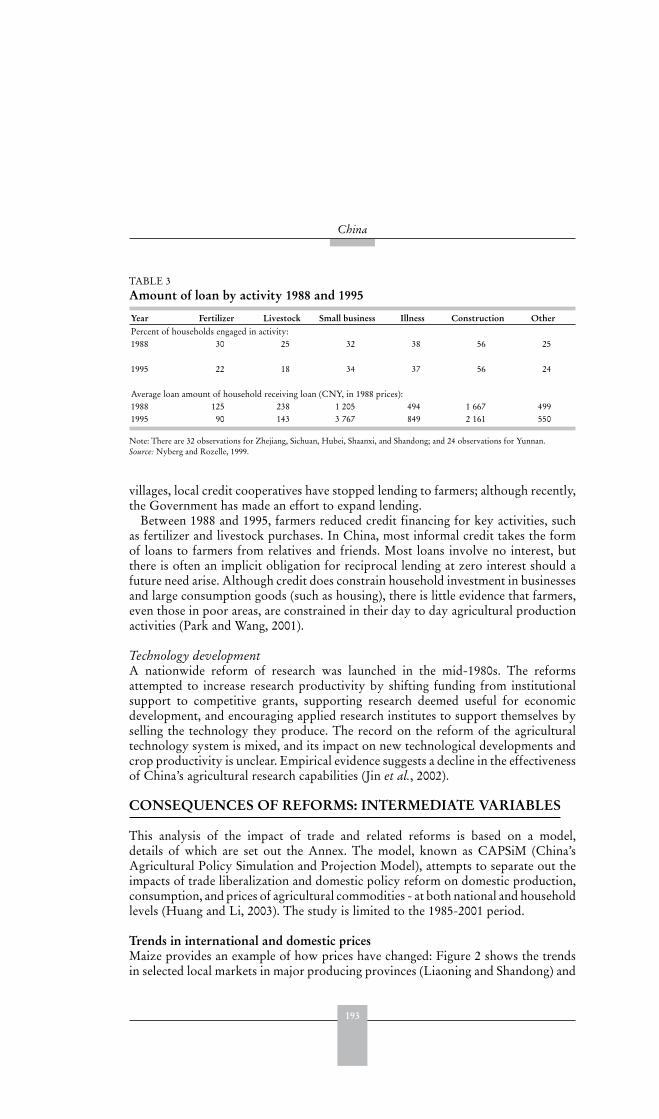
193
China
villages, local credit cooperatives have stopped lending to farmers; although recently,the Government has made an effort to expand lending.
Between 1988 and 1995, farmers reduced credit financing for key activities, suchas fertilizer and livestock purchases. In China, most informal credit takes the formof loans to farmers from relatives and friends. Most loans involve no interest, butthere is often an implicit obligation for reciprocal lending at zero interest should afuture need arise. Although credit does constrain household investment in businessesand large consumption goods (such as housing), there is little evidence that farmers,even those in poor areas, are constrained in their day to day agricultural productionactivities (Park and Wang, 2001).
Technology developmentA nationwide reform of research was launched in the mid-1980s. The reformsattempted to increase research productivity by shifting funding from institutionalsupport to competitive grants, supporting research deemed useful for economicdevelopment, and encouraging applied research institutes to support themselves byselling the technology they produce. The record on the reform of the agriculturaltechnology system is mixed, and its impact on new technological developments andcrop productivity is unclear. Empirical evidence suggests a decline in the effectivenessof China’s agricultural research capabilities (Jin et al., 2002).
CONSEQUENCES OF REFORMS: INTERMEDIATE VARIABLES
This analysis of the impact of trade and related reforms is based on a model,details of which are set out the Annex. The model, known as CAPSiM (China’sAgricultural Policy Simulation and Projection Model), attempts to separate out theimpacts of trade liberalization and domestic policy reform on domestic production,consumption, and prices of agricultural commodities - at both national and householdlevels (Huang and Li, 2003). The study is limited to the 1985-2001 period.
Trends in international and domestic pricesMaize provides an example of how prices have changed: Figure 2 shows the trendsin selected local markets in major producing provinces (Liaoning and Shandong) and
TABLE 3 Amount of loan by activity 1988 and 1995
Year Fertilizer Livestock Small business Illness Construction OtherPercent of households engaged in activity:1988 30 25 32 38 56 25
1995 22 18 34 37 56 24
Average loan amount of household receiving loan (CNY, in 1988 prices):1988 125 238 1 205 494 1 667 4991995 90 143 3 767 849 2 161 550
Note: There are 32 observations for Zhejiang, Sichuan, Hubei, Shaanxi, and Shandong; and 24 observations for Yunnan.Source: Nyberg and Rozelle, 1999.
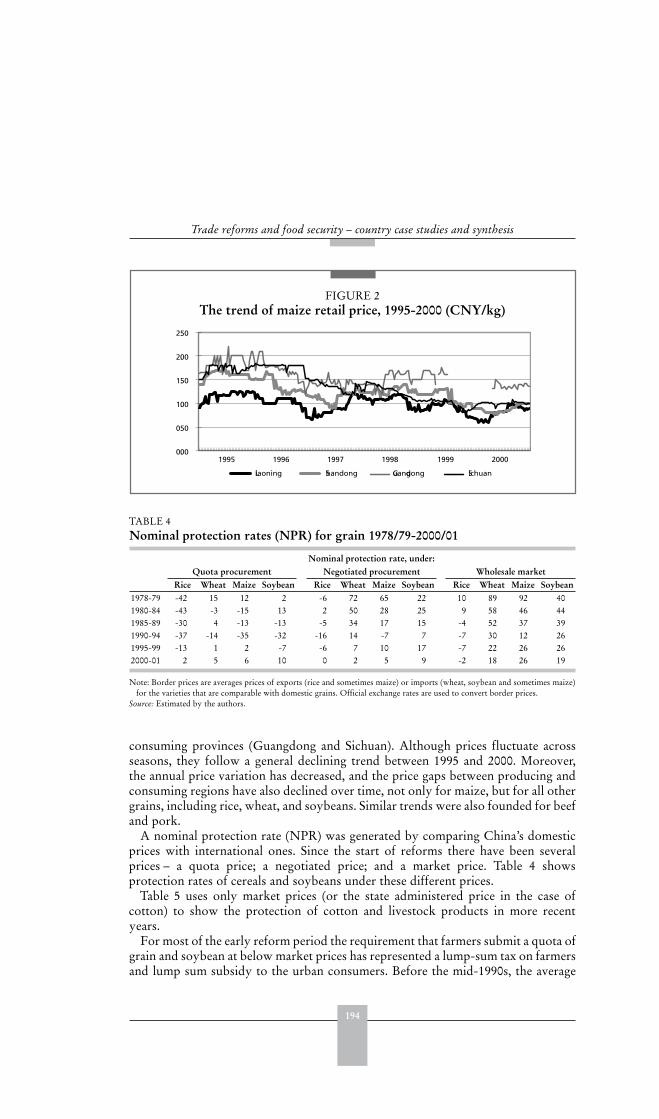
194
Trade reforms and food security – country case studies and synthesis
consuming provinces (Guangdong and Sichuan). Although prices fluctuate acrossseasons, they follow a general declining trend between 1995 and 2000. Moreover,the annual price variation has decreased, and the price gaps between producing andconsuming regions have also declined over time, not only for maize, but for all othergrains, including rice, wheat, and soybeans. Similar trends were also founded for beefand pork.
A nominal protection rate (NPR) was generated by comparing China’s domesticprices with international ones. Since the start of reforms there have been severalprices – a quota price; a negotiated price; and a market price. Table 4 showsprotection rates of cereals and soybeans under these different prices.
Table 5 uses only market prices (or the state administered price in the case ofcotton) to show the protection of cotton and livestock products in more recentyears.
For most of the early reform period the requirement that farmers submit a quota ofgrain and soybean at below market prices has represented a lump-sum tax on farmersand lump sum subsidy to the urban consumers. Before the mid-1990s, the average
TABLE 4 Nominal protection rates (NPR) for grain 1978/79-2000/01
Nominal protection rate, under:Quota procurement Negotiated procurement Wholesale market
Rice Wheat Maize Soybean Rice Wheat Maize Soybean Rice Wheat Maize Soybean1978-79 -42 15 12 2 -6 72 65 22 10 89 92 401980-84 -43 -3 -15 13 2 50 28 25 9 58 46 441985-89 -30 4 -13 -13 -5 34 17 15 -4 52 37 391990-94 -37 -14 -35 -32 -16 14 -7 7 -7 30 12 261995-99 -13 1 2 -7 -6 7 10 17 -7 22 26 262000-01 2 5 6 10 0 2 5 9 -2 18 26 19
Note: Border prices are averages prices of exports (rice and sometimes maize) or imports (wheat, soybean and sometimes maize)for the varieties that are comparable with domestic grains. Official exchange rates are used to convert border prices.
Source: Estimated by the authors.
FIGURE 2The trend of maize retail price, 1995-2000 (CNY/kg)
0.00
0.50
1.00
1.50
2.00
2.50
1995 1996 1997 1998 1999 2000
Liaoning Shandong Guangdong Sichuan

195
China
price farmers received for compulsorily delivered grains and soybean was far belowthe border price. Although all of the major crops were affected by the state grainquota procurement policy, wheat, the main imported farm commodity, receivedfavourable treatment relative to rice. Between 1995-99 and 2000-01 domestic pricesbegan to rise above the border price, except in the case of rice.
Before the mid-1980s, the domestic wholesale price of all four major commoditiesfar exceeded the world price. The rice market price was 10 percent above the worldmarket price. Wheat and maize prices exceeded the world price around 90 percent.However, over the next two decades, the protection rate on rice became negative andthat for wheat and maize fell to around 30 percent.
The case of livestock is different. In all periods, for all major commodities, pork,beef and chicken, the NPRs are negative and producers have received less than theywould have if they could have sold their output on the domestic and world marketsat international prices.
Decomposition of price changesCAPSiM was used to simulate how trade and domestic policies have affecteddomestic agricultural prices (Tables 6 and 7).
For most commodities, prices increased steadily between the mid-1980s and mid1990s. After 1995, however, the price for all commodities (except coarse grains)declined. The fraction of the overall effect that is due to domestic economic reformfar exceeds that of trade reforms. On average, while the direct impacts of domesticpolicies account for 95 percent of the change in price, trade reform only accountsfor at most 5 percent, since the changes in trade are also partially due to domesticpolicy reforms.
While the patterns over time for all commodities are remarkably similar, theextent of price changes due to domestic reforms and trade vary significantly betweencommodities. The prices of lightly traded commodities, such as rice, sweet potato,minor coarse grains, vegetables and all livestock products, have been little affected bytrade liberalization. For other commodities, trade liberalization has had more effecton domestic prices. For example, after significant tariff reductions and eliminationof non-tariff barriers for soybean from the late 1990s, imports of soybeans surged
TABLE 5 Nominal protection rates (NPR) for cotton and livestock products, 1995 to 2001
Cotton Pork Beef Chicken1995 17 -14 -14 -221996 23 -16 -8 -151997 28 -18 -3 -161998 18 -25 -15 -161999 -3 -13 0 -152000 14 -16 -2 -152001 14 -21 -11 -17
Note: Export prices of pork, beef and chicken, and import prices of cotton are used as border prices. Domestic prices areprices at urban wholesale markets. The cotton wholesale price is estimated as the state procurement price times 1.25. Officialexchange rates are used to convert border prices.
Source: Estimated by the authors.
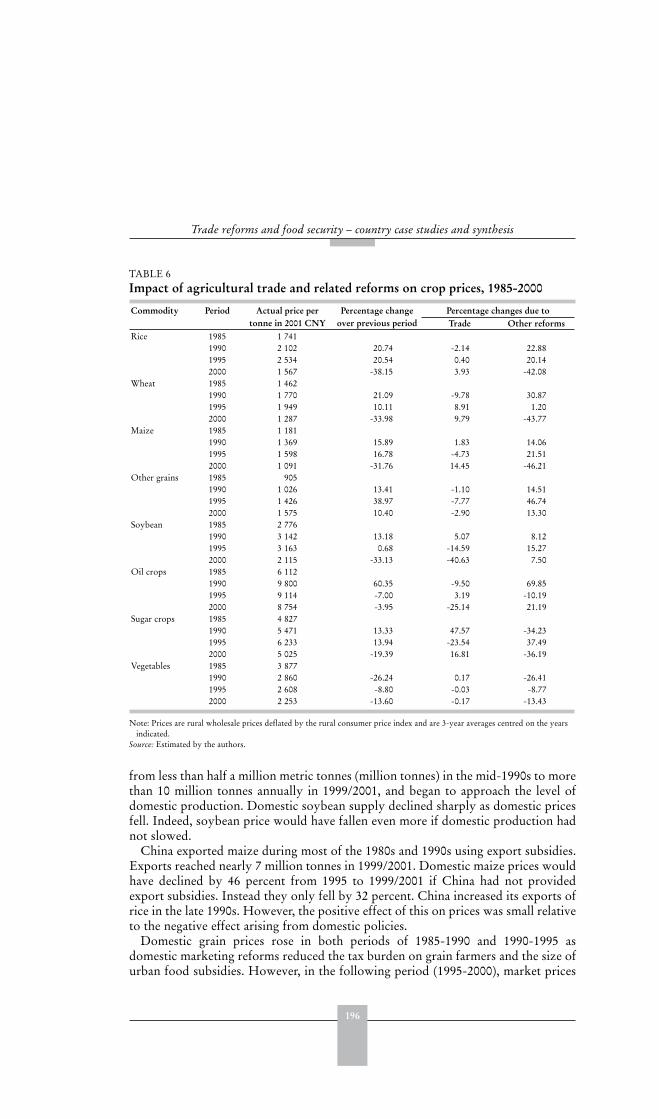
196
Trade reforms and food security – country case studies and synthesis
from less than half a million metric tonnes (million tonnes) in the mid-1990s to morethan 10 million tonnes annually in 1999/2001, and began to approach the level ofdomestic production. Domestic soybean supply declined sharply as domestic pricesfell. Indeed, soybean price would have fallen even more if domestic production hadnot slowed.
China exported maize during most of the 1980s and 1990s using export subsidies.Exports reached nearly 7 million tonnes in 1999/2001. Domestic maize prices wouldhave declined by 46 percent from 1995 to 1999/2001 if China had not providedexport subsidies. Instead they only fell by 32 percent. China increased its exports ofrice in the late 1990s. However, the positive effect of this on prices was small relativeto the negative effect arising from domestic policies.
Domestic grain prices rose in both periods of 1985-1990 and 1990-1995 asdomestic marketing reforms reduced the tax burden on grain farmers and the size ofurban food subsidies. However, in the following period (1995-2000), market prices
TABLE 6 Impact of agricultural trade and related reforms on crop prices, 1985-2000
Commodity Period Actual price per tonne in 2001 CNY
Percentage change over previous period
Percentage changes due toTrade Other reforms
Rice 1985 1 7411990 2 102 20.74 -2.14 22.881995 2 534 20.54 0.40 20.142000 1 567 -38.15 3.93 -42.08
Wheat 1985 1 4621990 1 770 21.09 -9.78 30.871995 1 949 10.11 8.91 1.202000 1 287 -33.98 9.79 -43.77
Maize 1985 1 1811990 1 369 15.89 1.83 14.061995 1 598 16.78 -4.73 21.512000 1 091 -31.76 14.45 -46.21
Other grains 1985 9051990 1 026 13.41 -1.10 14.511995 1 426 38.97 -7.77 46.742000 1 575 10.40 -2.90 13.30
Soybean 1985 2 7761990 3 142 13.18 5.07 8.121995 3 163 0.68 -14.59 15.272000 2 115 -33.13 -40.63 7.50
Oil crops 1985 6 1121990 9 800 60.35 -9.50 69.851995 9 114 -7.00 3.19 -10.192000 8 754 -3.95 -25.14 21.19
Sugar crops 1985 4 8271990 5 471 13.33 47.57 -34.231995 6 233 13.94 -23.54 37.492000 5 025 -19.39 16.81 -36.19
Vegetables 1985 3 8771990 2 860 -26.24 0.17 -26.411995 2 608 -8.80 -0.03 -8.772000 2 253 -13.60 -0.17 -13.43
Note: Prices are rural wholesale prices deflated by the rural consumer price index and are 3-year averages centred on the yearsindicated.
Source: Estimated by the authors.

197
China
fell in response to the large grain stocks accumulated as a result of the re-impositionof compulsory procurement (Huang and Rozelle, 2002).
Trade reforms have affected livestock prices much less than the cropping sector.The main impact has come from domestic market reforms. Before the mid-1990s,demand for livestock products grew faster than livestock production. As a result,market prices rose by about 30 percent every five years for pork and 40-50 percentfor mutton. Poultry prices increased much less than other livestock prices becauseof faster production growth.
Market integration and price transmissionIn the late 1990s, the co-movement of prices between pairs of markets reflected anincrease in the number of integrated markets. For maize, prices in one market moveat the same time as in another in 89 percent of the cases, compared to only 28 percentin the early 1990s. The results for soybeans, japonica and indica rice show similarimprovements. The results are impressive because in many cases the market pairs areseparated by more than a 1 000 kilometres (Table 8).
Despite significant progress, the results also show that there are pairs of marketsthat are less integrated, especially in the case of rice. One explanation relates toconstraints based on institutions, policy and poor infrastructure/communication(Park, Jin, Rozelle and Huang, 2002). However, since rice is produced and consumedthroughout China, it is also plausible that moderate price movements will nottransmit between regions when there is a balance between supply and demandwithin individual regions.
TABLE 7 Impact of agricultural trade and related reforms on livestock prices, 1985-2000
Commodity Period Actual real price per tonne (CNY)
Percentage change over previous period
Percentage changes due toTrade Other reforms
Pork 1985 8 7011990 10 759 23.66 1.13 22.521995 14 468 34.47 -1.17 35.642000 12 010 -16.99 0.59 -17.58
Beef 1985 10 1151990 12 848 27.02 9.36 17.671995 16 825 30.95 -13.76 44.712000 14 381 -14.52 -1.63 -12.89
Mutton 1985 9 0551990 12 809 41.46 0.74 40.721995 19 566 52.75 -2.49 55.242000 17 465 -10.74 -0.83 -9.90
Poultry 1985 10 8941990 11 888 9.13 -0.16 9.281995 12 931 8.77 0.12 8.652000 10 363 -19.86 -2.27 -17.59
Fish 1985 8 3081990 11 534 38.83 1.15 37.681995 10 562 -8.42 1.45 -9.882000 8 865 -16.07 -0.26 -15.81
Note: Prices are rural wholesale prices deflated by the rural consumer price index (normalized in 2001) and are three-yearaverages centred on the years indicated.
Source: Estimated by the authors.
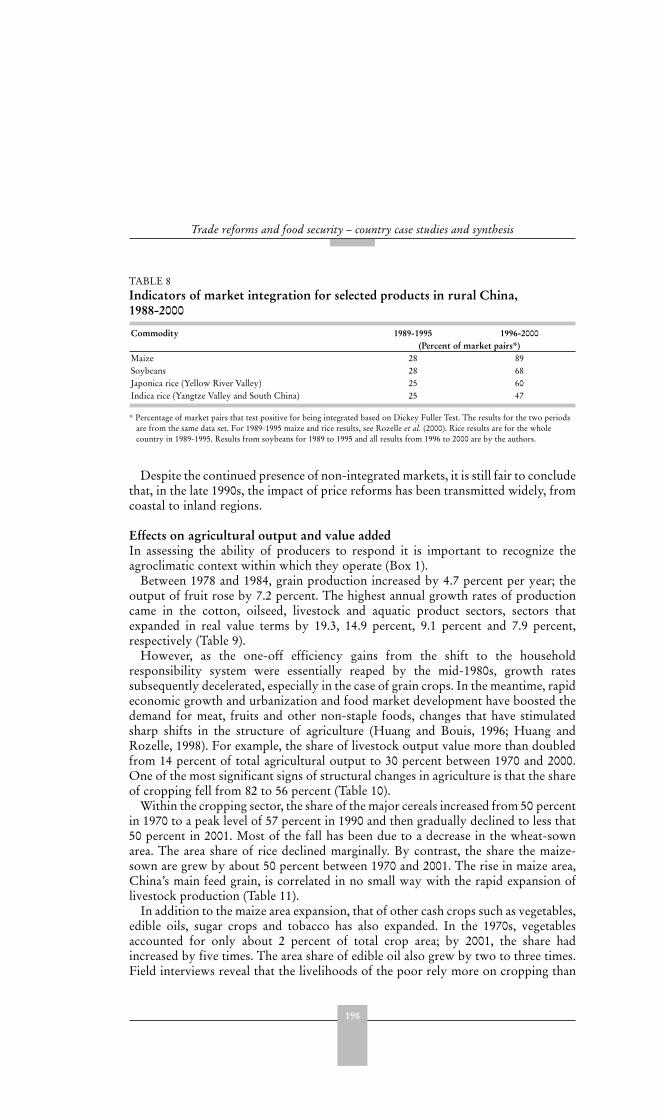
198
Trade reforms and food security – country case studies and synthesis
Despite the continued presence of non-integrated markets, it is still fair to concludethat, in the late 1990s, the impact of price reforms has been transmitted widely, fromcoastal to inland regions.
Effects on agricultural output and value addedIn assessing the ability of producers to respond it is important to recognize theagroclimatic context within which they operate (Box 1).
Between 1978 and 1984, grain production increased by 4.7 percent per year; theoutput of fruit rose by 7.2 percent. The highest annual growth rates of productioncame in the cotton, oilseed, livestock and aquatic product sectors, sectors thatexpanded in real value terms by 19.3, 14.9 percent, 9.1 percent and 7.9 percent,respectively (Table 9).
However, as the one-off efficiency gains from the shift to the householdresponsibility system were essentially reaped by the mid-1980s, growth ratessubsequently decelerated, especially in the case of grain crops. In the meantime, rapideconomic growth and urbanization and food market development have boosted thedemand for meat, fruits and other non-staple foods, changes that have stimulatedsharp shifts in the structure of agriculture (Huang and Bouis, 1996; Huang andRozelle, 1998). For example, the share of livestock output value more than doubledfrom 14 percent of total agricultural output to 30 percent between 1970 and 2000.One of the most significant signs of structural changes in agriculture is that the shareof cropping fell from 82 to 56 percent (Table 10).
Within the cropping sector, the share of the major cereals increased from 50 percentin 1970 to a peak level of 57 percent in 1990 and then gradually declined to less that50 percent in 2001. Most of the fall has been due to a decrease in the wheat-sownarea. The area share of rice declined marginally. By contrast, the share the maize-sown are grew by about 50 percent between 1970 and 2001. The rise in maize area,China’s main feed grain, is correlated in no small way with the rapid expansion oflivestock production (Table 11).
In addition to the maize area expansion, that of other cash crops such as vegetables,edible oils, sugar crops and tobacco has also expanded. In the 1970s, vegetablesaccounted for only about 2 percent of total crop area; by 2001, the share hadincreased by five times. The area share of edible oil also grew by two to three times.Field interviews reveal that the livelihoods of the poor rely more on cropping than
TABLE 8 Indicators of market integration for selected products in rural China,1988-2000
Commodity 1989-1995 1996-2000(Percent of market pairs*)
Maize 28 89Soybeans 28 68Japonica rice (Yellow River Valley) 25 60Indica rice (Yangtze Valley and South China) 25 47
* Percentage of market pairs that test positive for being integrated based on Dickey Fuller Test. The results for the two periodsare from the same data set. For 1989-1995 maize and rice results, see Rozelle et al. (2000). Rice results are for the wholecountry in 1989-1995. Results from soybeans for 1989 to 1995 and all results from 1996 to 2000 are by the authors.
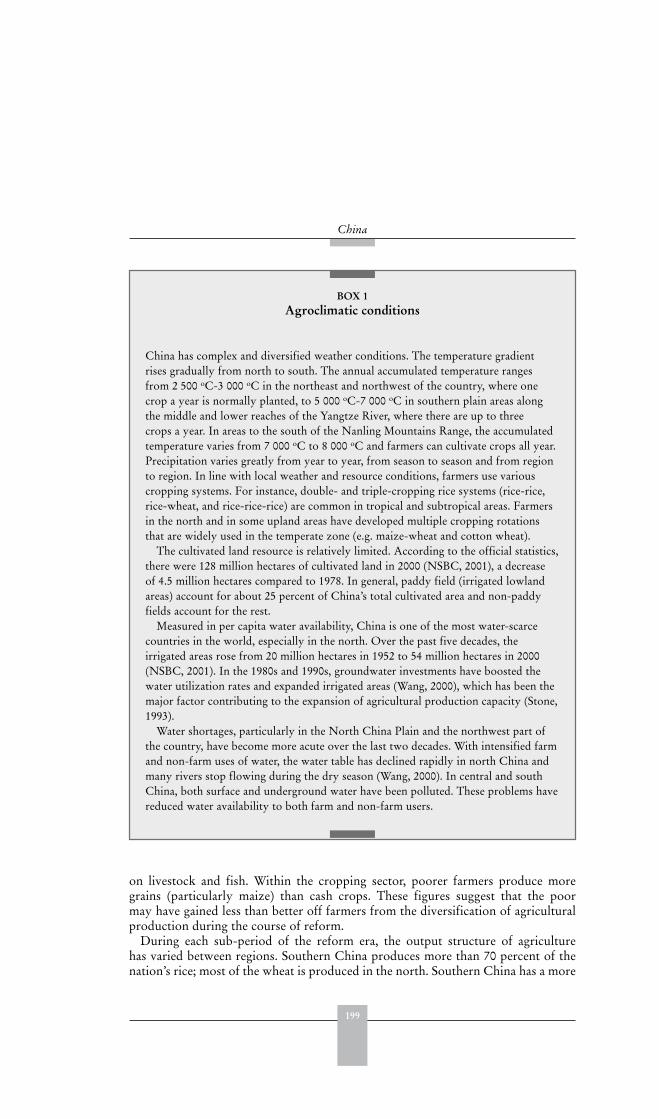
199
China
on livestock and fish. Within the cropping sector, poorer farmers produce moregrains (particularly maize) than cash crops. These figures suggest that the poormay have gained less than better off farmers from the diversification of agriculturalproduction during the course of reform.
During each sub-period of the reform era, the output structure of agriculturehas varied between regions. Southern China produces more than 70 percent of thenation’s rice; most of the wheat is produced in the north. Southern China has a more
BOX 1Agroclimatic conditions
China has complex and diversified weather conditions. The temperature gradientrises gradually from north to south. The annual accumulated temperature rangesfrom 2 500 oC-3 000 oC in the northeast and northwest of the country, where onecrop a year is normally planted, to 5 000 oC-7 000 oC in southern plain areas alongthe middle and lower reaches of the Yangtze River, where there are up to threecrops a year. In areas to the south of the Nanling Mountains Range, the accumulatedtemperature varies from 7 000 oC to 8 000 oC and farmers can cultivate crops all year.Precipitation varies greatly from year to year, from season to season and from regionto region. In line with local weather and resource conditions, farmers use variouscropping systems. For instance, double- and triple-cropping rice systems (rice-rice,rice-wheat, and rice-rice-rice) are common in tropical and subtropical areas. Farmersin the north and in some upland areas have developed multiple cropping rotationsthat are widely used in the temperate zone (e.g. maize-wheat and cotton wheat).
The cultivated land resource is relatively limited. According to the official statistics,there were 128 million hectares of cultivated land in 2000 (NSBC, 2001), a decreaseof 4.5 million hectares compared to 1978. In general, paddy field (irrigated lowlandareas) account for about 25 percent of China’s total cultivated area and non-paddyfields account for the rest.
Measured in per capita water availability, China is one of the most water-scarcecountries in the world, especially in the north. Over the past five decades, theirrigated areas rose from 20 million hectares in 1952 to 54 million hectares in 2000(NSBC, 2001). In the 1980s and 1990s, groundwater investments have boosted thewater utilization rates and expanded irrigated areas (Wang, 2000), which has been themajor factor contributing to the expansion of agricultural production capacity (Stone,1993).
Water shortages, particularly in the North China Plain and the northwest part ofthe country, have become more acute over the last two decades. With intensified farmand non-farm uses of water, the water table has declined rapidly in north China andmany rivers stop flowing during the dry season (Wang, 2000). In central and southChina, both surface and underground water have been polluted. These problems havereduced water availability to both farm and non-farm users.
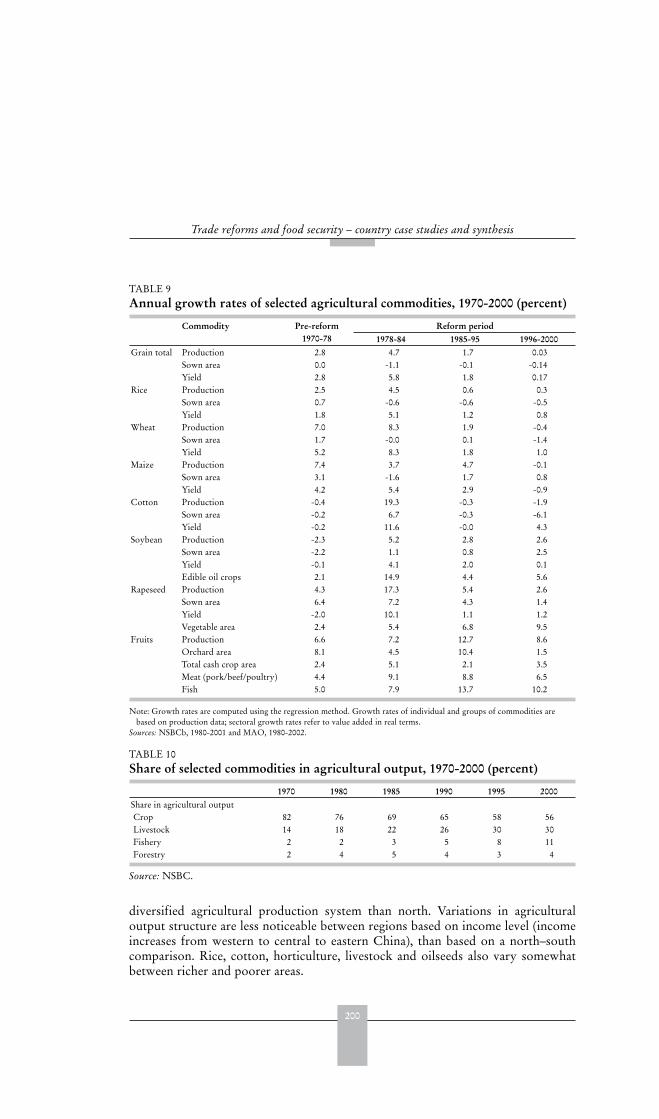
200
Trade reforms and food security – country case studies and synthesis
diversified agricultural production system than north. Variations in agriculturaloutput structure are less noticeable between regions based on income level (incomeincreases from western to central to eastern China), than based on a north–southcomparison. Rice, cotton, horticulture, livestock and oilseeds also vary somewhatbetween richer and poorer areas.
TABLE 9 Annual growth rates of selected agricultural commodities, 1970-2000 (percent)
Commodity Pre-reform1970-78
Reform period1978-84 1985-95 1996-2000
Grain total Production 2.8 4.7 1.7 0.03Sown area 0.0 -1.1 -0.1 -0.14Yield 2.8 5.8 1.8 0.17
Rice Production 2.5 4.5 0.6 0.3Sown area 0.7 -0.6 -0.6 -0.5Yield 1.8 5.1 1.2 0.8
Wheat Production 7.0 8.3 1.9 -0.4Sown area 1.7 -0.0 0.1 -1.4Yield 5.2 8.3 1.8 1.0
Maize Production 7.4 3.7 4.7 -0.1Sown area 3.1 -1.6 1.7 0.8Yield 4.2 5.4 2.9 -0.9
Cotton Production -0.4 19.3 -0.3 -1.9Sown area -0.2 6.7 -0.3 -6.1Yield -0.2 11.6 -0.0 4.3
Soybean Production -2.3 5.2 2.8 2.6Sown area -2.2 1.1 0.8 2.5Yield -0.1 4.1 2.0 0.1Edible oil crops 2.1 14.9 4.4 5.6
Rapeseed Production 4.3 17.3 5.4 2.6Sown area 6.4 7.2 4.3 1.4Yield -2.0 10.1 1.1 1.2Vegetable area 2.4 5.4 6.8 9.5
Fruits Production 6.6 7.2 12.7 8.6Orchard area 8.1 4.5 10.4 1.5Total cash crop area 2.4 5.1 2.1 3.5Meat (pork/beef/poultry) 4.4 9.1 8.8 6.5Fish 5.0 7.9 13.7 10.2
Note: Growth rates are computed using the regression method. Growth rates of individual and groups of commodities arebased on production data; sectoral growth rates refer to value added in real terms.
Sources: NSBCb, 1980-2001 and MAO, 1980-2002.
TABLE 10 Share of selected commodities in agricultural output, 1970-2000 (percent)
1970 1980 1985 1990 1995 2000Share in agricultural outputCrop 82 76 69 65 58 56Livestock 14 18 22 26 30 30Fishery 2 2 3 5 8 11Forestry 2 4 5 4 3 4
Source: NSBC.

201
China
More recent studies show that since the HRS was completed in 1984, technologicalchange has been the primary engine of agricultural growth (Huang and Rozelle, 1996;Fan, 1997; Fan and Pardey, 1997; Huang et al. 1999). Improvements in technologyhave contributed by far the largest share of crop production growth even during theearly reform period. The results of these studies show that further reforms beyonddecollectivization also have high potential for affecting agricultural growth. Pricepolicy has been shown to have a sharp influence on the growth (and deceleration)of both grain and cash crops during the post-reform period. Favourable outputto input price ratios contributed to the rapid growth in the early 1980s. However,a deteriorating price ratio caused by slowly increasing output prices in the faceof sharply rising input prices was an important factor behind the slowdown inagricultural production in the late 1980s and early 1990s. Rising wages and the higheropportunity cost of land have also held back the growth of grain output throughoutthe period, and that of cash crops since 1985.
Decomposing the impact of domestic policy reforms and trade reforms on productionPrevious studies demonstrate a significant output response to price changes (e.g.deBrauw et al., 2004), and provide data which (based on the CAPSiM model) can beused to model the relative effects of trade and domestic policy reforms on production.Tables 12 and 13 show that trade reforms have affected domestic production, butusually to a much lesser degree than domestic policy reforms. However, the relativeeffect of non-trade versus trade policies differs between commodities: for example,the 1.39 percent rise in rice production between 1995 and 2000 resulted from a2.17 percent contribution by trade policy reform as compared to –0.79 percent fromdomestic policy reforms.
Trade liberalization has benefited domestic production of rice and vegetables,but hurt the domestic production of soybean, oil crops and coarse grains. Increasesin protection, such as export subsidies and export tax rebates, have benefited theproduction of maize, cotton and sugar crops.
The production of meat and fish grew substantially over the entire reform period,mainly due to domestic factors, whereas the impact of international trade on
TABLE 11 Share of crop sown areas, 1970-2001 (percent)
1970 1980 1985 1990 1995 2000 2001Rice 22.1 23.1 21.9 22.3 20.5 19.2 18.5Wheat 17.4 19.7 20.0 20.7 19.3 17.1 15.8Maize 10.8 13.7 12.1 14.4 15.2 14.8 15.6Soybean 5.5 4.9 5.3 5.1 5.4 6.0 6.1Sweet potato 5.9 5.1 4.2 4.2 4.1 3.7 3.3Cotton 3.4 3.4 3.5 3.8 3.6 2.6 3.1Rapeseed 1.0 1.9 3.1 3.7 4.6 4.8 4.6Peanut 1.2 1.6 2.3 2.0 2.5 3.1 3.2Sugar crops 0.4 0.6 1.0 1.2 1.3 1.0 1.1Tobacco 0.2 0.3 0.9 0.9 0.9 0.8 0.8Vegetable 2.0 2.2 3.2 4.3 6.3 9.7 10.5Others 30.1 23.5 22.5 17.4 16.3 17.2 17.4Total 100 100 100 100 100 100 100
Source: NSBC.

202
Trade reforms and food security – country case studies and synthesis
livestock and fish production has been much smaller and seems to have shifted frompositive to negative. Such a result is consistent with the increase in maize and otherfeed prices due to rising trade protection in these commodities, leading to a negativeproduction response.
TABLE 12 Impact of agricultural trade and related reforms on crop production, 1985-2000
Commodity Period Production(thousand tonnes)
Percentage output change over
previous period
Percentage change due toTrade Other policies
Rice 1985 121 1111990 129 097 6.59 -0.72 7.321995 129 794 0.54 0.21 0.332000 131 595 1.39 2.17 -0.79
Wheat 1985 87 8881990 94 996 8.09 -4.86 12.951995 104 024 9.50 4.19 5.322000 102 463 -1.50 5.96 -7.46
Maize 1985 69 3641990 89 234 28.65 1.41 27.231995 106 758 19.64 -2.78 22.422000 116 063 8.72 9.90 -1.19
Other grains 1985 25 1491990 22 777 -9.43 -1.27 -8.161995 22 740 -0.16 -4.08 3.922000 19 746 -13.16 -1.07 -12.09
Sweet potato 1985 21 1711990 20 864 -1.45 0.34 -1.791995 23 246 11.41 -0.01 11.422000 23 804 2.40 1.08 1.33
Soybean 1985 10 6051990 10 313 -2.75 4.49 -7.231995 14 242 38.09 -9.28 47.372000 15 022 5.48 -22.78 28.26
Cotton 1985 4 6481990 4 657 0.19 0.88 -0.701995 4 437 -4.72 1.16 -5.872000 4 522 1.91 2.10 -0.19
Oil crops 1985 3 5961990 5 081 41.28 -5.03 46.321995 8 052 58.47 2.67 55.792000 7 611 -5.48 -10.51 5.04
Sugar crops 1985 4 5461990 5 743 26.35 18.77 7.571995 5 969 3.93 -9.62 13.562000 7 433 24.53 13.83 10.70
Vegetables 1985 173 1621990 184 351 6.46 1.25 5.211995 202 871 10.05 0.23 9.812000 281 346 38.68 0.20 38.48
Note: Figures are three-year averages centred on the years indicated.Source: Estimated by the authors.
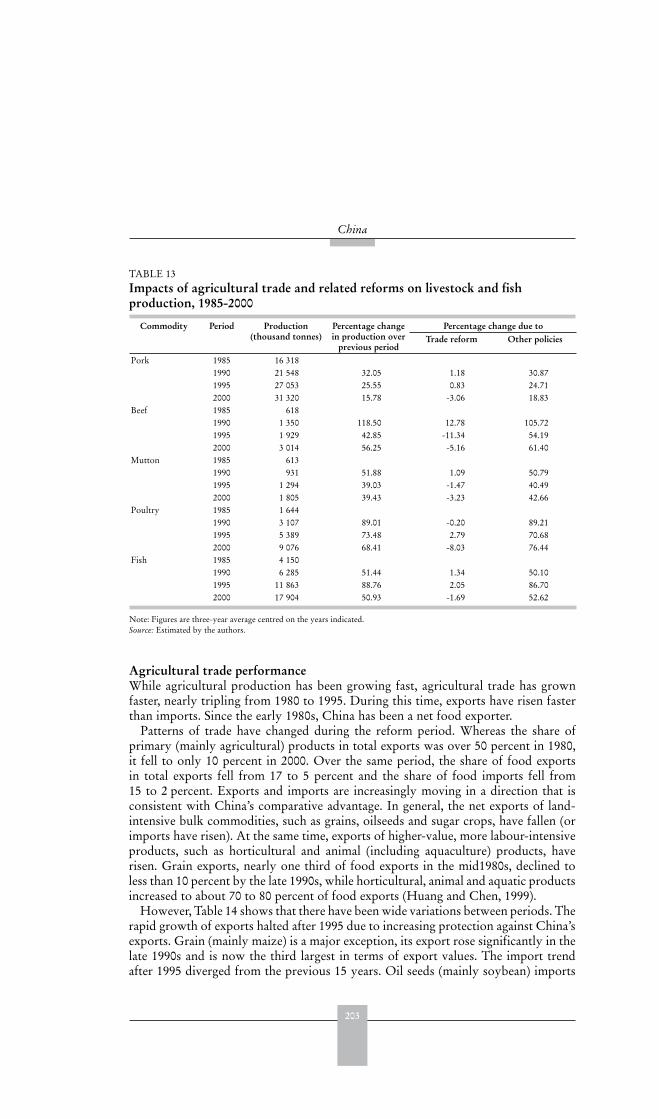
203
China
Agricultural trade performanceWhile agricultural production has been growing fast, agricultural trade has grownfaster, nearly tripling from 1980 to 1995. During this time, exports have risen fasterthan imports. Since the early 1980s, China has been a net food exporter.
Patterns of trade have changed during the reform period. Whereas the share ofprimary (mainly agricultural) products in total exports was over 50 percent in 1980,it fell to only 10 percent in 2000. Over the same period, the share of food exportsin total exports fell from 17 to 5 percent and the share of food imports fell from15 to 2 percent. Exports and imports are increasingly moving in a direction that isconsistent with China’s comparative advantage. In general, the net exports of land-intensive bulk commodities, such as grains, oilseeds and sugar crops, have fallen (orimports have risen). At the same time, exports of higher-value, more labour-intensiveproducts, such as horticultural and animal (including aquaculture) products, haverisen. Grain exports, nearly one third of food exports in the mid1980s, declined toless than 10 percent by the late 1990s, while horticultural, animal and aquatic productsincreased to about 70 to 80 percent of food exports (Huang and Chen, 1999).
However, Table 14 shows that there have been wide variations between periods. Therapid growth of exports halted after 1995 due to increasing protection against China’sexports. Grain (mainly maize) is a major exception, its export rose significantly in thelate 1990s and is now the third largest in terms of export values. The import trendafter 1995 diverged from the previous 15 years. Oil seeds (mainly soybean) imports
TABLE 13 Impacts of agricultural trade and related reforms on livestock and fish production, 1985-2000
Commodity Period Production(thousand tonnes)
Percentage change in production over
previous period
Percentage change due toTrade reform Other policies
Pork 1985 16 3181990 21 548 32.05 1.18 30.871995 27 053 25.55 0.83 24.712000 31 320 15.78 -3.06 18.83
Beef 1985 6181990 1 350 118.50 12.78 105.721995 1 929 42.85 -11.34 54.192000 3 014 56.25 -5.16 61.40
Mutton 1985 6131990 931 51.88 1.09 50.791995 1 294 39.03 -1.47 40.492000 1 805 39.43 -3.23 42.66
Poultry 1985 1 6441990 3 107 89.01 -0.20 89.211995 5 389 73.48 2.79 70.682000 9 076 68.41 -8.03 76.44
Fish 1985 4 1501990 6 285 51.44 1.34 50.101995 11 863 88.76 2.05 86.702000 17 904 50.93 -1.69 52.62
Note: Figures are three-year average centred on the years indicated.Source: Estimated by the authors.
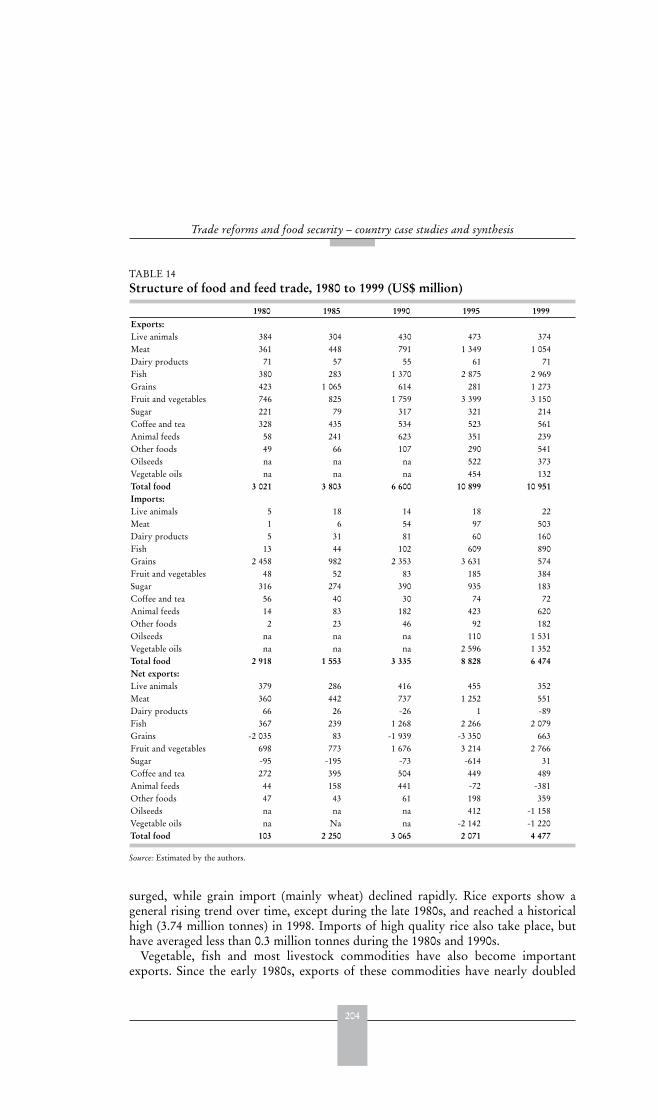
204
Trade reforms and food security – country case studies and synthesis
surged, while grain import (mainly wheat) declined rapidly. Rice exports show ageneral rising trend over time, except during the late 1980s, and reached a historicalhigh (3.74 million tonnes) in 1998. Imports of high quality rice also take place, buthave averaged less than 0.3 million tonnes during the 1980s and 1990s.
Vegetable, fish and most livestock commodities have also become importantexports. Since the early 1980s, exports of these commodities have nearly doubled
TABLE 14 Structure of food and feed trade, 1980 to 1999 (US$ million)
1980 1985 1990 1995 1999Exports:Live animals 384 304 430 473 374Meat 361 448 791 1 349 1 054Dairy products 71 57 55 61 71Fish 380 283 1 370 2 875 2 969Grains 423 1 065 614 281 1 273Fruit and vegetables 746 825 1 759 3 399 3 150Sugar 221 79 317 321 214Coffee and tea 328 435 534 523 561Animal feeds 58 241 623 351 239Other foods 49 66 107 290 541Oilseeds na na na 522 373Vegetable oils na na na 454 132Total food 3 021 3 803 6 600 10 899 10 951Imports:Live animals 5 18 14 18 22Meat 1 6 54 97 503Dairy products 5 31 81 60 160Fish 13 44 102 609 890Grains 2 458 982 2 353 3 631 574Fruit and vegetables 48 52 83 185 384Sugar 316 274 390 935 183Coffee and tea 56 40 30 74 72Animal feeds 14 83 182 423 620Other foods 2 23 46 92 182Oilseeds na na na 110 1 531Vegetable oils na na na 2 596 1 352Total food 2 918 1 553 3 335 8 828 6 474Net exports:Live animals 379 286 416 455 352Meat 360 442 737 1 252 551Dairy products 66 26 -26 1 -89Fish 367 239 1 268 2 266 2 079Grains -2 035 83 -1 939 -3 350 663Fruit and vegetables 698 773 1 676 3 214 2 766Sugar -95 -195 -73 -614 31Coffee and tea 272 395 504 449 489Animal feeds 44 158 441 -72 -381Other foods 47 43 61 198 359Oilseeds na na na 412 -1 158Vegetable oils na Na na -2 142 -1 220Total food 103 2 250 3 065 2 071 4 477
Source: Estimated by the authors.
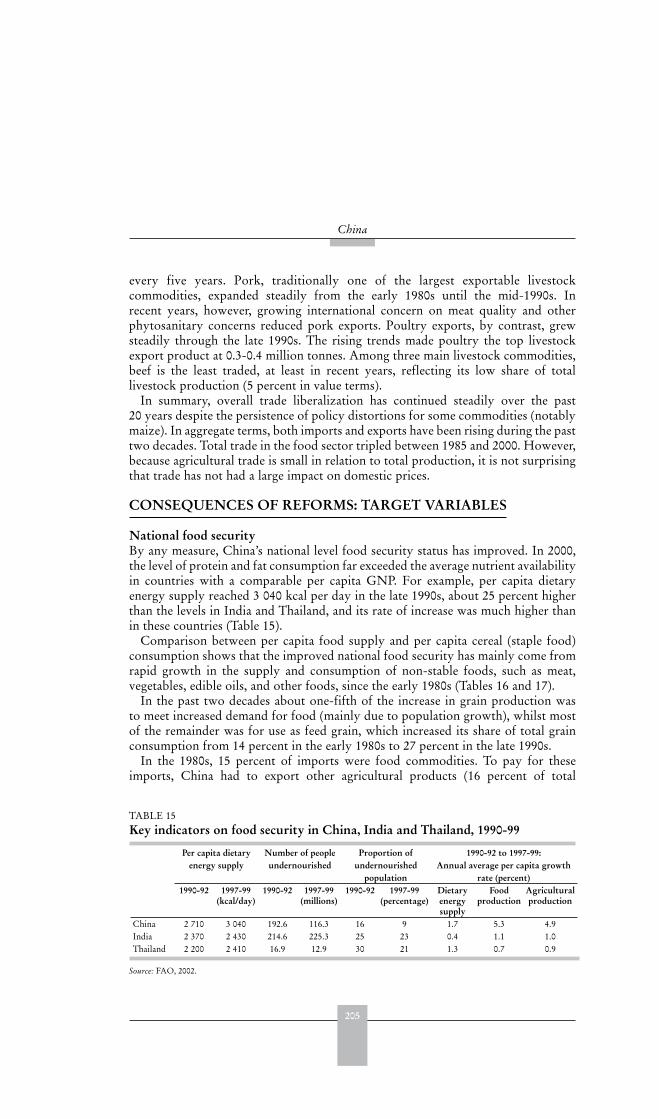
205
China
every five years. Pork, traditionally one of the largest exportable livestockcommodities, expanded steadily from the early 1980s until the mid-1990s. Inrecent years, however, growing international concern on meat quality and otherphytosanitary concerns reduced pork exports. Poultry exports, by contrast, grewsteadily through the late 1990s. The rising trends made poultry the top livestockexport product at 0.3-0.4 million tonnes. Among three main livestock commodities,beef is the least traded, at least in recent years, reflecting its low share of totallivestock production (5 percent in value terms).
In summary, overall trade liberalization has continued steadily over the past20 years despite the persistence of policy distortions for some commodities (notablymaize). In aggregate terms, both imports and exports have been rising during the pasttwo decades. Total trade in the food sector tripled between 1985 and 2000. However,because agricultural trade is small in relation to total production, it is not surprisingthat trade has not had a large impact on domestic prices.
CONSEQUENCES OF REFORMS: TARGET VARIABLES
National food securityBy any measure, China’s national level food security status has improved. In 2000,the level of protein and fat consumption far exceeded the average nutrient availabilityin countries with a comparable per capita GNP. For example, per capita dietaryenergy supply reached 3 040 kcal per day in the late 1990s, about 25 percent higherthan the levels in India and Thailand, and its rate of increase was much higher thanin these countries (Table 15).
Comparison between per capita food supply and per capita cereal (staple food)consumption shows that the improved national food security has mainly come fromrapid growth in the supply and consumption of non-stable foods, such as meat,vegetables, edible oils, and other foods, since the early 1980s (Tables 16 and 17).
In the past two decades about one-fifth of the increase in grain production wasto meet increased demand for food (mainly due to population growth), whilst mostof the remainder was for use as feed grain, which increased its share of total grainconsumption from 14 percent in the early 1980s to 27 percent in the late 1990s.
In the 1980s, 15 percent of imports were food commodities. To pay for theseimports, China had to export other agricultural products (16 percent of total
TABLE 15 Key indicators on food security in China, India and Thailand, 1990-99
Per capita dietary energy supply
Number of people undernourished
Proportion of undernourished
population
1990-92 to 1997-99:Annual average per capita growth
rate (percent)1990-92 1997-99
(kcal/day)1990-92 1997-99
(millions)1990-92 1997-99
(percentage)Dietaryenergy supply
Foodproduction
Agriculturalproduction
China 2 710 3 040 192.6 116.3 16 9 1.7 5.3 4.9India 2 370 2 430 214.6 225.3 25 23 0.4 1.1 1.0Thailand 2 200 2 410 16.9 12.9 30 21 1.3 0.7 0.9
Source: FAO, 2002.
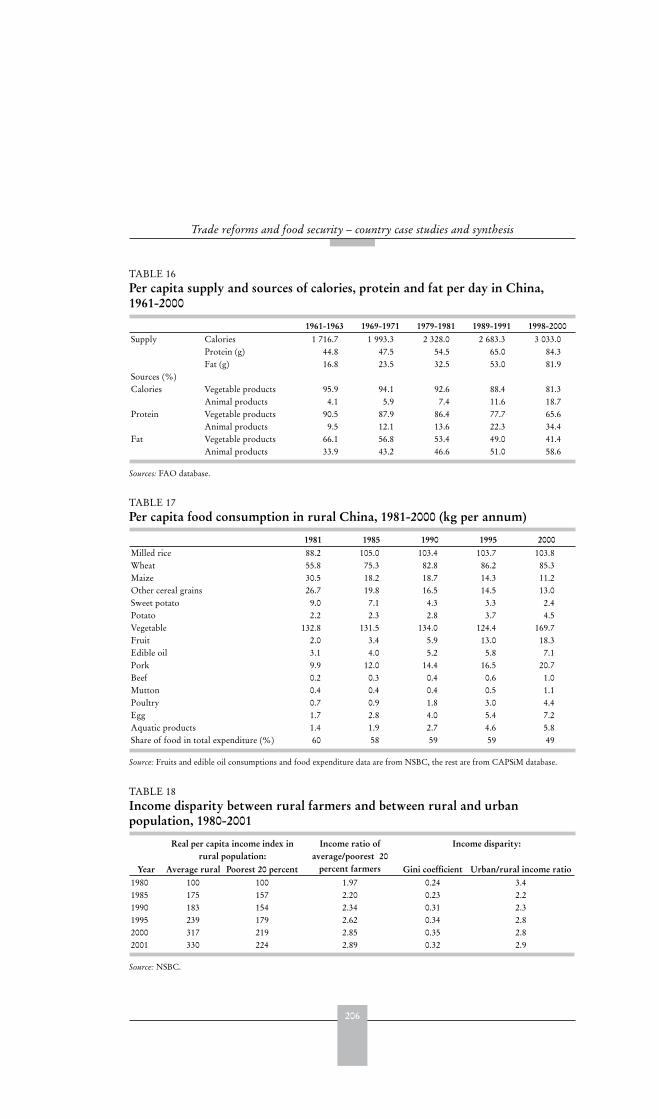
206
Trade reforms and food security – country case studies and synthesis
TABLE 17 Per capita food consumption in rural China, 1981-2000 (kg per annum)
1981 1985 1990 1995 2000Milled rice 88.2 105.0 103.4 103.7 103.8Wheat 55.8 75.3 82.8 86.2 85.3Maize 30.5 18.2 18.7 14.3 11.2Other cereal grains 26.7 19.8 16.5 14.5 13.0Sweet potato 9.0 7.1 4.3 3.3 2.4Potato 2.2 2.3 2.8 3.7 4.5Vegetable 132.8 131.5 134.0 124.4 169.7Fruit 2.0 3.4 5.9 13.0 18.3Edible oil 3.1 4.0 5.2 5.8 7.1Pork 9.9 12.0 14.4 16.5 20.7Beef 0.2 0.3 0.4 0.6 1.0Mutton 0.4 0.4 0.4 0.5 1.1Poultry 0.7 0.9 1.8 3.0 4.4Egg 1.7 2.8 4.0 5.4 7.2Aquatic products 1.4 1.9 2.7 4.6 5.8Share of food in total expenditure (%) 60 58 59 59 49
Source: Fruits and edible oil consumptions and food expenditure data are from NSBC, the rest are from CAPSiM database.
TABLE 16 Per capita supply and sources of calories, protein and fat per day in China,1961-2000
1961-1963 1969-1971 1979-1981 1989-1991 1998-2000Supply Calories 1 716.7 1 993.3 2 328.0 2 683.3 3 033.0
Protein (g) 44.8 47.5 54.5 65.0 84.3Fat (g) 16.8 23.5 32.5 53.0 81.9
Sources (%)Calories Vegetable products 95.9 94.1 92.6 88.4 81.3
Animal products 4.1 5.9 7.4 11.6 18.7Protein Vegetable products 90.5 87.9 86.4 77.7 65.6
Animal products 9.5 12.1 13.6 22.3 34.4Fat Vegetable products 66.1 56.8 53.4 49.0 41.4
Animal products 33.9 43.2 46.6 51.0 58.6
Sources: FAO database.
TABLE 18 Income disparity between rural farmers and between rural and urban population, 1980-2001
Real per capita income index in rural population:
Income ratio of average/poorest 20
percent farmers
Income disparity:
Year Average rural Poorest 20 percent Gini coefficient Urban/rural income ratio1980 100 100 1.97 0.24 3.41985 175 157 2.20 0.23 2.21990 183 154 2.34 0.31 2.31995 239 179 2.62 0.34 2.82000 317 219 2.85 0.35 2.82001 330 224 2.89 0.32 2.9
Source: NSBC.
207
China
exports). Even when in 1985 the share of food in total imports had fallen, China stillneeded 59 percent of its foreign exchange reserves to pay for food imports, limitingits ability to import other goods.
By the late 1990s, total exports far exceeded imports and China had accumulatedthe second largest foreign exchange reserves in the world (after Japan). It had,therefore, greatly strengthened its ability to import food, and these rose from US$3billion in the 1980s to US$6-8 billion a decade later. Only about 5 percent of itsforeign exchange earnings were needed to pay for them, so that although importswere playing a greater role in supplementing the national food supply, their relativecost to the economy was substantially lower than in the past.
Household level food securityMore than two-thirds of the population (1.3 billion in 2001) resides in rural areas.The annual growth rate of the population was as high as 1.8 percent in the 1970s,slowing to 0.9 percent in the late 1990s.
Poverty in China has always been essentially a rural phenomenon. In 1978, about260 million people, all of whom lived in rural areas, were below the absolute povertyline. In the two decades since then, more than 220 million people have escapedpoverty. The number of people in absolute poverty fell to less than a 100 million bythe mid-1980s, to about 50 million by the mid-1990s and to 29 million in 2001. Theincidence of rural poverty has fallen equally fast, plunging from 32.9 percent in 1978to about 3.2 percent in 2001. Although the greatest reductions in poverty came in theearly years of reform, the rate has continued to fall steadily since then.
At the same time, income disparities within rural areas have risen (World Bank,1997). Per capita rural income increased by 330 percent between 1980 and 2001.While the increase in the income levels of poorer farmers (the bottom 20 percentof the population) increased by 224 percent, this growth was more than 30 percentlower than the national average. The rising income disparity among rural residentscan be shown by rising Gini coefficients, which increased from 0.24 in 1980 to 0.35in 2000 and 0.32 in 2001.
In the 1980s, most of China’s poor were among the more than 200 million living inofficially designated poor counties in 23 of China’s 27 provinces. About 78 percentof the counties were concentrated to the west of a north-south line that runs throughthe central mountainous parts of the country from Heilongjiang, Gansu, and InnerMongolia in the north to Guangxi and Yunnan in the south (World Bank, 1992).The remaining poor counties, generally better off, were located in less contiguouspockets of poverty in the hills of eastern and southeastern China. Poor countiesin the first wave of officially designated counties were normally characterized asbeing poorly endowed by geographic location (remote and mountainous) and at adisadvantage in terms of agricultural resources (such as soil, rainfall, and climate).Many of these areas suffer from severe ecological damage such as deforestation anderosion (Li, 1994). Poor counties also tend to have more variable yields (Weersinkand Rozelle, 1997). Partly as a result of these poor natural conditions, and partly asa result of poverty itself, farmers in poor areas suffer from below average irrigationfacilities, fertilizer use, and infrastructure (Tong et al., 1994). Poor counties in the1980s were still highly subsistent in grain, and in net terms, often needed to procuregrain to meet household demand (Piazza and Liang, 1997).
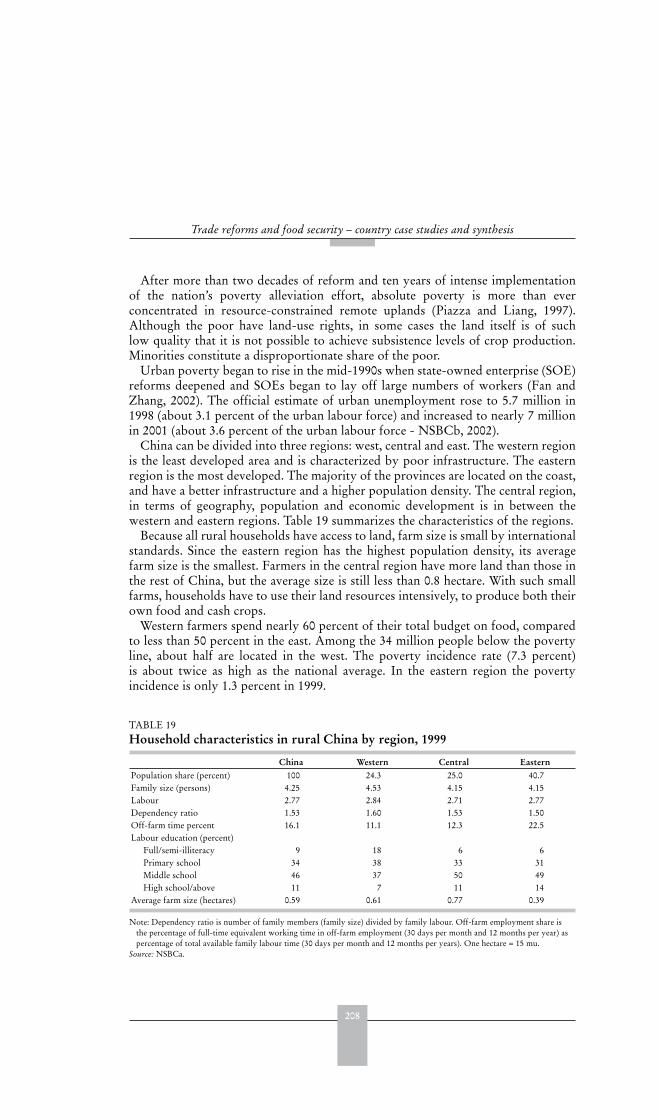
208
Trade reforms and food security – country case studies and synthesis
After more than two decades of reform and ten years of intense implementationof the nation’s poverty alleviation effort, absolute poverty is more than everconcentrated in resource-constrained remote uplands (Piazza and Liang, 1997).Although the poor have land-use rights, in some cases the land itself is of suchlow quality that it is not possible to achieve subsistence levels of crop production.Minorities constitute a disproportionate share of the poor.
Urban poverty began to rise in the mid-1990s when state-owned enterprise (SOE)reforms deepened and SOEs began to lay off large numbers of workers (Fan andZhang, 2002). The official estimate of urban unemployment rose to 5.7 million in1998 (about 3.1 percent of the urban labour force) and increased to nearly 7 millionin 2001 (about 3.6 percent of the urban labour force - NSBCb, 2002).
China can be divided into three regions: west, central and east. The western regionis the least developed area and is characterized by poor infrastructure. The easternregion is the most developed. The majority of the provinces are located on the coast,and have a better infrastructure and a higher population density. The central region,in terms of geography, population and economic development is in between thewestern and eastern regions. Table 19 summarizes the characteristics of the regions.
Because all rural households have access to land, farm size is small by internationalstandards. Since the eastern region has the highest population density, its averagefarm size is the smallest. Farmers in the central region have more land than those inthe rest of China, but the average size is still less than 0.8 hectare. With such smallfarms, households have to use their land resources intensively, to produce both theirown food and cash crops.
Western farmers spend nearly 60 percent of their total budget on food, comparedto less than 50 percent in the east. Among the 34 million people below the povertyline, about half are located in the west. The poverty incidence rate (7.3 percent)is about twice as high as the national average. In the eastern region the povertyincidence is only 1.3 percent in 1999.
TABLE 19 Household characteristics in rural China by region, 1999
China Western Central EasternPopulation share (percent) 100 24.3 25.0 40.7Family size (persons) 4.25 4.53 4.15 4.15Labour 2.77 2.84 2.71 2.77Dependency ratio 1.53 1.60 1.53 1.50Off-farm time percent 16.1 11.1 12.3 22.5Labour education (percent)
Full/semi-illiteracy 9 18 6 6Primary school 34 38 33 31Middle school 46 37 50 49High school/above 11 7 11 14
Average farm size (hectares) 0.59 0.61 0.77 0.39
Note: Dependency ratio is number of family members (family size) divided by family labour. Off-farm employment share isthe percentage of full-time equivalent working time in off-farm employment (30 days per month and 12 months per year) aspercentage of total available family labour time (30 days per month and 12 months per years). One hectare = 15 mu.
Source: NSBCa.

209
China
Table 20 shows that disparities among income groups within a region are evengreater. The income of the richest farmers in the east (group 11) is about 8 timeshigher than the bottom 10 percent in the western region (groups 1 and 2).
Sources of incomeWage income contributes more to the disparities than other sources of income. Forexample, poor farmers earn a much smaller fraction of their income from wages andother off-farm activities, and also depend more on agriculture than is the case forricher farmers. In 1999, the share of agricultural income in total income ranged from69-76 percent in group 1 in all regions; by contrast, the share was only 26-50 percentin group 11.
Farmers spent more than their earnings in 1999, signifying that they were eitherreceiving transfers from the Government, their relatives or friends, or were dis-saving. Farmers with average income levels less than CNY600 spent about 60 to70 percent of their total expenditure on food, whereas for income groups aboveCNY2500 this proportion was less than half, and these richer farmers also hadpositive savings. Clearly, higher incomes for the poor could dramatically improvetheir food security.
Household agricultural productionFor China as a whole, rice is the dominant crop. Maize surpassed wheat as the secondmost important crops in the late 1990s. Vegetables have also become increasinglyimportant, having the highest output simply because it is measured in fresh weight.Among livestock commodities, pork dominates all others. The average householdproduces about one hog per year (Table 21).
National production figures hide many regional and income-based variations. Therichest group (group 11) produces about five times more rice than the poorest group(group 1). The poor produce much more maize than other crops and cotton is alsoimportant for this group. . Despite the fact that farm sizes are similar, per capitaagricultural output for group 1 is only about half of the national average and lessthan 30 percent of the rich. It is clear that increasing agricultural productivity of thepoor is an essential way to increase their income.
In the poor western region the output value of wheat, maize and cotton (three ofthe commodities that China has protected despite its low comparative advantage)surpasses that of rice and other commodities for the farmers in lower incomecategories. These commodities represent a major source of cash income for poorfarmers. Recent protection of domestic maize and cotton should have benefited thepoor in the west, but future liberalization in the trade of these commodities maynegatively affect them by lowering prices. Liberalization of soybean and edibleoil crops will have less negative impact, but this group has probably not benefitedmuch from past trade liberalization, since the production of more competitivecommodities (e.g. rice, horticulture, livestock and fish) is much lower in the westthan in the rest of China.
In central China, maize has become the single most important crop in terms ofproduction, followed by sweet potatoes and other coarse grains. Soybeans and edibleoil are also more important in this region than in the other two regions. Since thepoor depend relatively more on these commodities for their earnings than the rich,
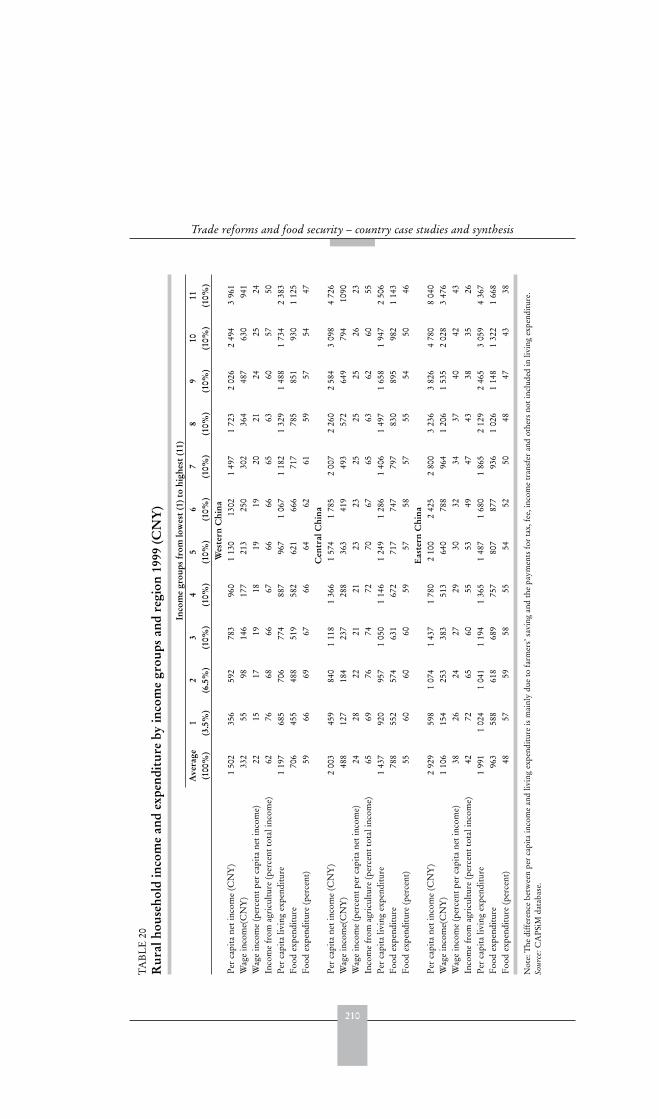
210
Trade reforms and food security – country case studies and synthesis
TA
BL
E20
R
ural
hou
seho
ld in
com
e an
d ex
pend
itur
e by
inco
me
grou
ps a
nd r
egio
n 19
99 (C
NY
)
Inco
me
grou
ps fr
om lo
wes
t (1
) to
high
est
(11)
Ave
rage
(100
%)
1(3
.5%
)2
(6.5
%)
3(1
0%)
4(1
0%)
5(1
0%)
6(1
0%)
7(1
0%)
8(1
0%)
9(1
0%)
10(1
0%)
11(1
0%)
Wes
tern
Chi
naP
erca
pita
net
inco
me
(CN
Y)
150
235
659
278
396
01
130
1302
149
71
723
202
62
494
396
1W
age
inco
me(
CN
Y)
332
5598
146
177
213
250
302
364
487
630
941
Wag
ein
com
e(p
erce
ntpe
rca
pita
net
inco
me)
2215
1719
1819
1920
2124
2524
Inco
me
from
agri
cult
ure
(per
cent
tota
linc
ome)
6276
6866
6766
6665
6360
5750
Per
capi
taliv
ing
expe
ndit
ure
119
768
570
677
488
796
71
067
118
21
329
148
81
734
238
3F
ood
expe
ndit
ure
706
455
488
519
582
621
666
717
785
851
930
112
5F
ood
expe
ndit
ure
(per
cent
)59
6669
6766
6462
6159
5754
47C
entr
alC
hina
Per
capi
tane
tin
com
e(C
NY
)2
003
459
840
111
81
366
157
41
785
200
72
260
258
43
098
472
6W
age
inco
me(
CN
Y)
488
127
184
237
288
363
419
493
572
649
794
1090
Wag
ein
com
e(p
erce
ntpe
rca
pita
net
inco
me)
2428
2221
2123
2325
2525
2623
Inco
me
from
agri
cult
ure
(per
cent
tota
linc
ome)
6569
7674
7270
6765
6362
6055
Per
capi
taliv
ing
expe
ndit
ure
143
792
095
71
050
114
61
249
128
61
406
149
71
658
194
72
506
Foo
dex
pend
itur
e78
855
257
463
167
271
774
779
783
089
598
21
143
Foo
dex
pend
itur
e(p
erce
nt)
5560
6060
5957
5857
5554
5046
Eas
tern
Chi
naP
erca
pita
net
inco
me
(CN
Y)
292
959
81
074
143
71
780
210
02
425
280
03
236
382
64
780
804
0W
age
inco
me(
CN
Y)
110
615
425
338
351
364
078
896
41
206
153
52
028
347
6W
age
inco
me
(per
cent
per
capi
tane
tin
com
e)38
2624
2729
3032
3437
4042
43In
com
efr
omag
ricu
ltur
e(p
erce
ntto
tali
ncom
e)42
7265
6055
5349
4743
3835
26P
erca
pita
livin
gex
pend
itur
e1
991
102
41
041
119
41
365
148
71
680
186
52
129
246
53
059
436
7F
ood
expe
ndit
ure
963
588
618
689
757
807
877
936
102
61
148
132
21
668
Foo
dex
pend
itur
e(p
erce
nt)
4857
5958
5554
5250
4847
4338
Not
e:T
hedi
ffer
ence
betw
een
per
capi
tain
com
ean
dliv
ing
expe
ndit
ure
ism
ainl
ydu
eto
farm
ers’
savi
ngan
dth
epa
ymen
tsfo
rta
x,fe
e,in
com
etr
ansf
eran
dot
hers
not
incl
uded
inliv
ing
expe
ndit
ure.
Sou
rce:
CA
PSi
Mda
taba
se.
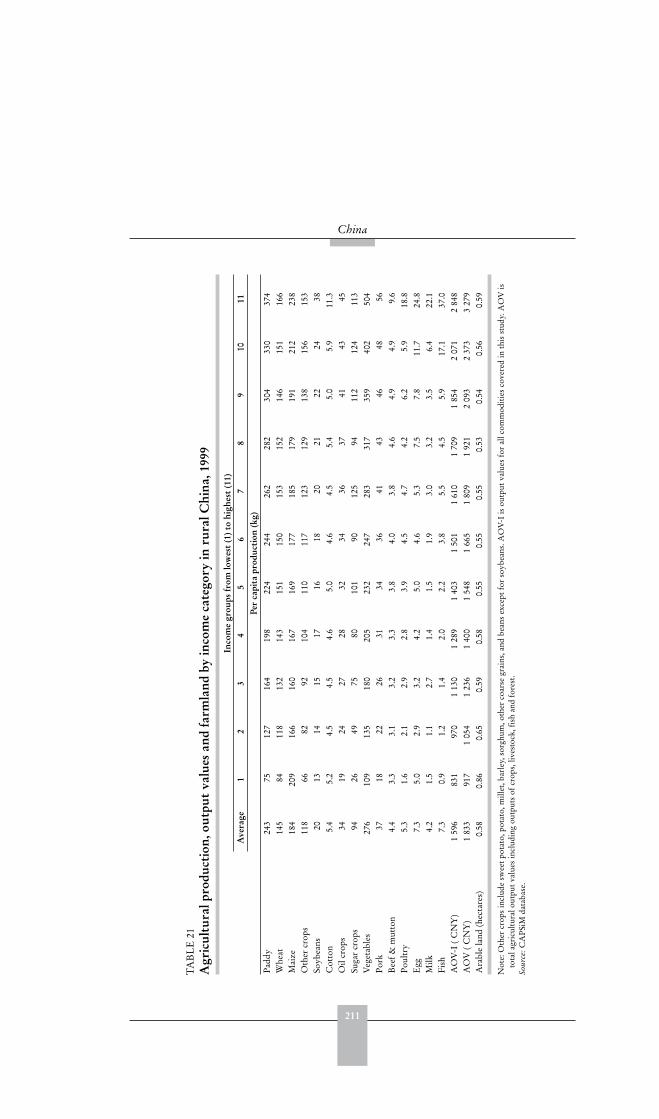
211
China
TA
BL
E21
A
gric
ultu
ral p
rodu
ctio
n, o
utpu
t va
lues
and
farm
land
by
inco
me
cate
gory
in r
ural
Chi
na, 1
999
Inco
me
grou
ps fr
om lo
wes
t (1
) to
high
est
(11)
Ave
rage
12
34
56
78
910
11Pe
r ca
pita
pro
duct
ion
(kg)
Pad
dy24
375
127
164
198
224
244
262
282
304
330
374
Whe
at14
584
118
132
143
151
150
153
152
146
151
166
Mai
ze18
420
916
616
016
716
917
718
517
919
121
223
8O
ther
crop
s11
866
8292
104
110
117
123
129
138
156
153
Soyb
eans
2013
1415
1716
1820
2122
2438
Cot
ton
5.4
5.2
4.5
4.5
4.6
5.0
4.6
4.5
5.4
5.0
5.9
11.3
Oil
crop
s34
1924
2728
3234
3637
4143
45Su
gar
crop
s94
2649
7580
101
9012
594
112
124
113
Veg
etab
les
276
109
135
180
205
232
247
283
317
359
402
504
Por
k37
1822
2631
3436
4143
4648
56B
eef
&m
utto
n4.
43.
33.
13.
23.
33.
84.
03.
84.
64.
94.
99.
6P
oult
ry5.
31.
62.
12.
92.
83.
94.
54.
74.
26.
25.
918
.8E
gg7.
35.
02.
93.
24.
25.
04.
65.
37.
57.
811
.724
.8M
ilk4.
21.
51.
12.
71.
41.
51.
93.
03.
23.
56.
422
.1F
ish
7.3
0.9
1.2
1.4
2.0
2.2
3.8
5.5
4.5
5.9
17.1
37.0
AO
V-I
(C
NY
)1
596
831
970
113
01
289
140
31
501
161
01
709
185
42
071
284
8A
OV
(C
NY
)1
833
917
105
41
236
140
01
548
166
51
809
192
12
093
237
33
279
Ara
ble
land
(hec
tare
s)0.
580.
860.
650.
590.
580.
550.
550.
550.
530.
540.
560.
59
Not
e:O
ther
crop
sin
clud
esw
eet
pota
to,p
otat
o,m
illet
,bar
ley,
sorg
hum
,oth
erco
arse
grai
ns,a
ndbe
ans
exce
ptfo
rso
ybea
ns.A
OV
-Iis
outp
utva
lues
for
allc
omm
odit
ies
cove
red
inth
isst
udy.
AO
Vis
tota
lagr
icul
tura
lout
put
valu
esin
clud
ing
outp
uts
ofcr
ops,
lives
tock
,fis
han
dfo
rest
.So
urc
e:C
AP
SiM
data
base
.
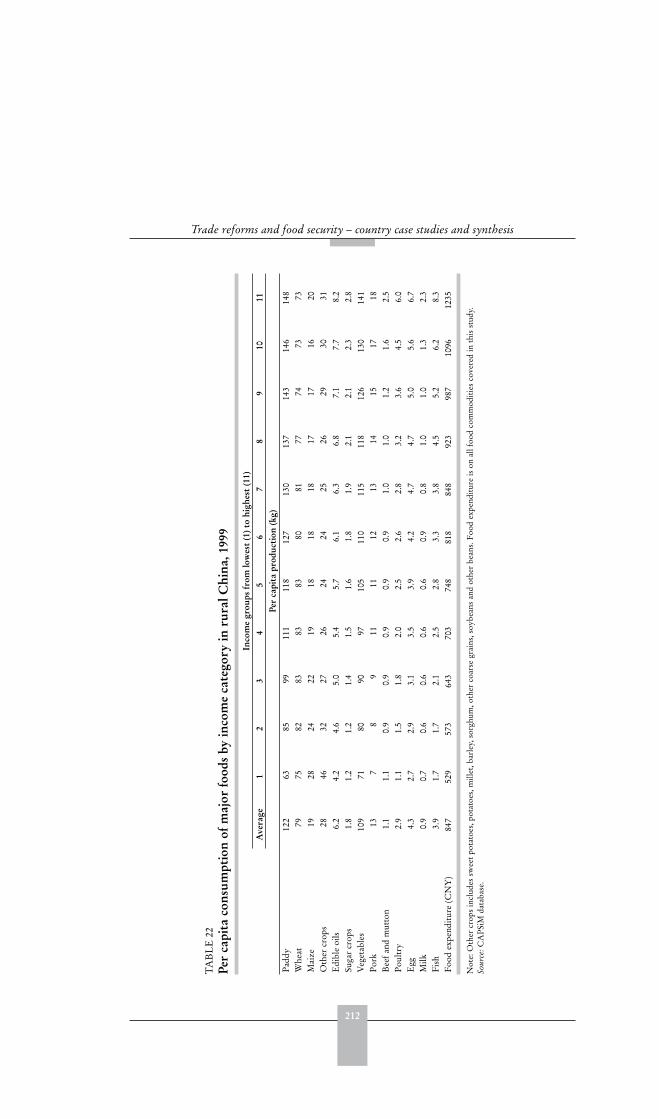
212
Trade reforms and food security – country case studies and synthesis
TA
BL
E22
Pe
r ca
pita
con
sum
ptio
n of
maj
or fo
ods
by in
com
e ca
tego
ry in
rur
al C
hina
, 199
9
Inco
me
grou
ps fr
om lo
wes
t (1
) to
high
est
(11)
Ave
rage
12
34
56
78
910
11Pe
r ca
pita
pro
duct
ion
(kg)
Pad
dy12
263
8599
111
118
127
130
137
143
146
148
Whe
at79
7582
8383
8380
8177
7473
73M
aize
1928
2422
1918
1818
1717
1620
Oth
ercr
ops
2846
3227
2624
2425
2629
3031
Edi
ble
oils
6.2
4.2
4.6
5.0
5.4
5.7
6.1
6.3
6.8
7.1
7.7
8.2
Suga
rcr
ops
1.8
1.2
1.2
1.4
1.5
1.6
1.8
1.9
2.1
2.1
2.3
2.8
Veg
etab
les
109
7180
9097
105
110
115
118
126
130
141
Por
k13
78
911
1112
1314
1517
18B
eef
and
mut
ton
1.1
1.1
0.9
0.9
0.9
0.9
0.9
1.0
1.0
1.2
1.6
2.5
Pou
ltry
2.9
1.1
1.5
1.8
2.0
2.5
2.6
2.8
3.2
3.6
4.5
6.0
Egg
4.3
2.7
2.9
3.1
3.5
3.9
4.2
4.7
4.7
5.0
5.6
6.7
Milk
0.9
0.7
0.6
0.6
0.6
0.6
0.9
0.8
1.0
1.0
1.3
2.3
Fis
h3.
91.
71.
72.
12.
52.
83.
33.
84.
55.
26.
28.
3F
ood
expe
ndit
ure
(CN
Y)
847
529
573
643
703
748
818
848
923
987
1096
1235
Not
e:O
ther
crop
sin
clud
essw
eet
pota
toes
,pot
atoe
s,m
illet
,bar
ley,
sorg
hum
,oth
erco
arse
grai
ns,s
oybe
ans
and
othe
rbe
ans.
Foo
dex
pend
itur
eis
onal
lfoo
dco
mm
odit
ies
cove
red
inth
isst
udy.
Sou
rce:
CA
PSi
Mda
taba
se.
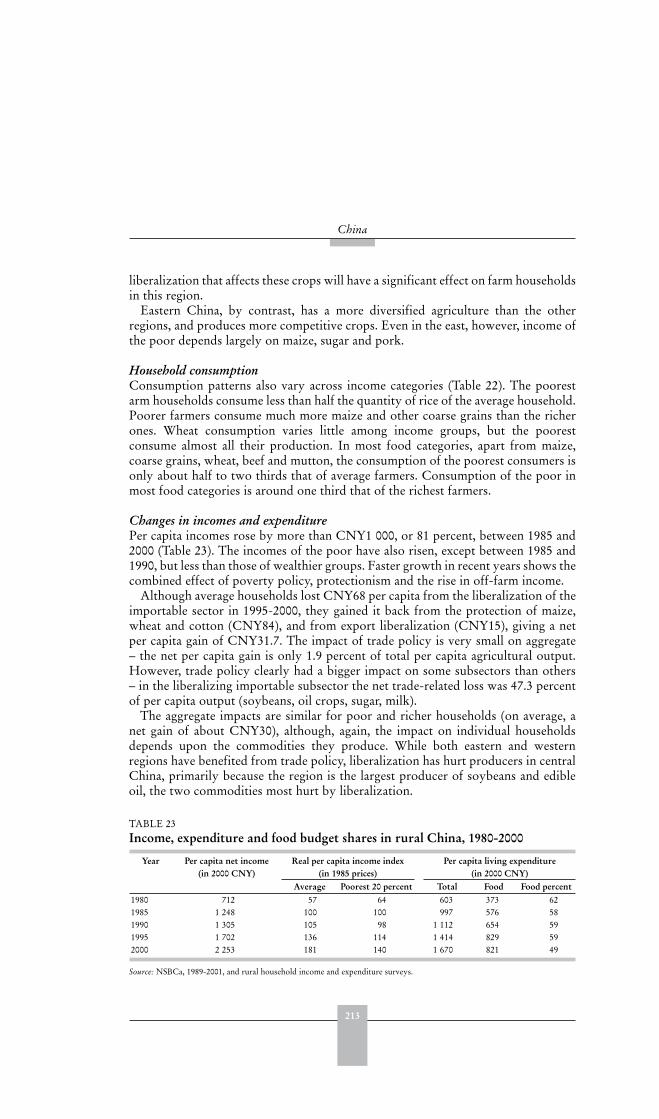
213
China
liberalization that affects these crops will have a significant effect on farm householdsin this region.
Eastern China, by contrast, has a more diversified agriculture than the otherregions, and produces more competitive crops. Even in the east, however, income ofthe poor depends largely on maize, sugar and pork.
Household consumptionConsumption patterns also vary across income categories (Table 22). The poorestarm households consume less than half the quantity of rice of the average household.Poorer farmers consume much more maize and other coarse grains than the richerones. Wheat consumption varies little among income groups, but the poorestconsume almost all their production. In most food categories, apart from maize,coarse grains, wheat, beef and mutton, the consumption of the poorest consumers isonly about half to two thirds that of average farmers. Consumption of the poor inmost food categories is around one third that of the richest farmers.
Changes in incomes and expenditurePer capita incomes rose by more than CNY1 000, or 81 percent, between 1985 and2000 (Table 23). The incomes of the poor have also risen, except between 1985 and1990, but less than those of wealthier groups. Faster growth in recent years shows thecombined effect of poverty policy, protectionism and the rise in off-farm income.
Although average households lost CNY68 per capita from the liberalization of theimportable sector in 1995-2000, they gained it back from the protection of maize,wheat and cotton (CNY84), and from export liberalization (CNY15), giving a netper capita gain of CNY31.7. The impact of trade policy is very small on aggregate– the net per capita gain is only 1.9 percent of total per capita agricultural output.However, trade policy clearly had a bigger impact on some subsectors than others– in the liberalizing importable subsector the net trade-related loss was 47.3 percentof per capita output (soybeans, oil crops, sugar, milk).
The aggregate impacts are similar for poor and richer households (on average, anet gain of about CNY30), although, again, the impact on individual householdsdepends upon the commodities they produce. While both eastern and westernregions have benefited from trade policy, liberalization has hurt producers in centralChina, primarily because the region is the largest producer of soybeans and edibleoil, the two commodities most hurt by liberalization.
TABLE 23 Income, expenditure and food budget shares in rural China, 1980-2000
Year Per capita net income (in 2000 CNY)
Real per capita income index (in 1985 prices)
Per capita living expenditure (in 2000 CNY)
Average Poorest 20 percent Total Food Food percent1980 712 57 64 603 373 621985 1 248 100 100 997 576 581990 1 305 105 98 1 112 654 591995 1 702 136 114 1 414 829 592000 2 253 181 140 1 670 821 49
Source: NSBCa, 1989-2001, and rural household income and expenditure surveys.
214
Trade reforms and food security – country case studies and synthesis
Aggregate rises in income have led to growth in expenditure. Although per capitaexpenditure has followed a similar pattern to income, its slightly lower growth ratemeans that savings have increased. Part of the rise in expenditure shifted from foodto non-food.
There are many reasons for income and expenditure growth, and access to marketsis one of them. Although the production-to-consumption ratios for almost all majorcommodities (except fish) and all income categories exceed 1, households have begunto buy more food from markets (Huang and Rozelle, 1998). Farmers use traditionalmarketing venues, such as periodic markets and government-sponsored outlets, andthe number of private traders and stores buying and selling food commodities inrural areas - even the most poor and remote areas - is also increasing. On average, theproportion of production marketed ranged from 54 percent for grain to more than90 percent for fish, and even the poor market a significant share of their production.
During the early 1980s, villagers spent about 60 percent of their total outlays onfood. This share has fallen over time, but was still about 50 percent in 2000. Althoughrural consumers in poorer provinces in the western regions spend nearly 60 percentof their income on food, those in the eastern provinces spend less then 50 percent. Forthe average rural household, per capita food expenditure increased by 11.2 percentin 1985-1990 and 14.4 percent in 1990-1995, but declined by 17.9 percent in 1995-2000. Most of the change has been come from domestic policy reforms rather thantrade reforms. Nevertheless, the trade impact on food expenditure was negative in1985-1990 (mainly due to a significant increase in wheat imports in the late 1980s)but positive since the early 1990s. Table 24 shows the striking similarity of impactsof trade policy on food consumption for farmers in different income categories.
The effect of trade-induced price changes on rural residents as producers istypically larger than the effect on them as consumers. Income shifts (both positiveand negative) are larger than shifts in expenditure because while rural residents asproducers enjoy (suffer) all of the gain (loss) from the price rise (fall), as consumersthey are only affected by a fraction of it due to a large proportion of output beingsold to consumers in the city.
In summary, farmers that grew crops that belonged to the protected importedsector (e.g. maize) or the exportable sector (e.g. horticulture crops) gained on average.Those who cultivated crops in the liberalized importable sector (e.g. soybeans) lost.On aggregate, however, trade policies have helped food security. Richer farmers havebenefited the most in net terms. They are the ones who produce the crops in whichChina has a comparative advantage, and these are the crops that have seen their pricerise as a result of more relaxed trade rules. The poor have also benefited.
The poorest of the poor are estimated to have gained around 2 to 3 percent ofaverage household income as a result of trade-induced changes in net income.Whether a conscious decision or not, interventions to protect maize and cottonmarkets have aided the poor. Reliability of food supplies and access to food bythe poor is another important dimension of food security. In this regard, theGovernment has developed its own disaster relief programme. It also runs a nationalfood-for-work scheme, although this is less for disaster relief and more for long-runinvestments. The nation’s capacity to deal with emergencies has been demonstratedrepeatedly during the reform period. For example, the Government respondedmassively and in a timely fashion during the floods in 1990s.
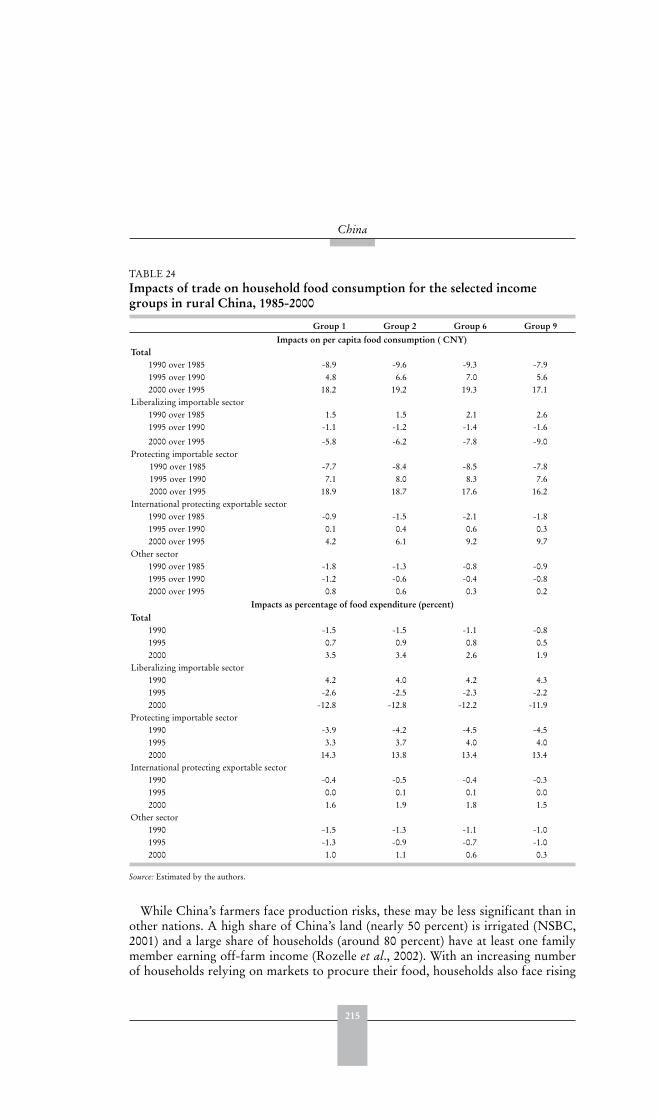
215
China
While China’s farmers face production risks, these may be less significant than inother nations. A high share of China’s land (nearly 50 percent) is irrigated (NSBC,2001) and a large share of households (around 80 percent) have at least one familymember earning off-farm income (Rozelle et al., 2002). With an increasing numberof households relying on markets to procure their food, households also face rising
TABLE 24 Impacts of trade on household food consumption for the selected income groups in rural China, 1985-2000
Group 1 Group 2 Group 6 Group 9
Impacts on per capita food consumption ( CNY)Total
1990 over 1985 -8.9 -9.6 -9.3 -7.91995 over 1990 4.8 6.6 7.0 5.62000 over 1995 18.2 19.2 19.3 17.1
Liberalizing importable sector1990 over 1985 1.5 1.5 2.1 2.61995 over 1990 -1.1 -1.2 -1.4 -1.6
2000 over 1995 -5.8 -6.2 -7.8 -9.0Protecting importable sector
1990 over 1985 -7.7 -8.4 -8.5 -7.81995 over 1990 7.1 8.0 8.3 7.62000 over 1995 18.9 18.7 17.6 16.2
International protecting exportable sector1990 over 1985 -0.9 -1.5 -2.1 -1.81995 over 1990 0.1 0.4 0.6 0.32000 over 1995 4.2 6.1 9.2 9.7
Other sector1990 over 1985 -1.8 -1.3 -0.8 -0.91995 over 1990 -1.2 -0.6 -0.4 -0.82000 over 1995 0.8 0.6 0.3 0.2
Impacts as percentage of food expenditure (percent)Total
1990 -1.5 -1.5 -1.1 -0.81995 0.7 0.9 0.8 0.52000 3.5 3.4 2.6 1.9
Liberalizing importable sector1990 4.2 4.0 4.2 4.31995 -2.6 -2.5 -2.3 -2.22000 -12.8 -12.8 -12.2 -11.9
Protecting importable sector1990 -3.9 -4.2 -4.5 -4.51995 3.3 3.7 4.0 4.02000 14.3 13.8 13.4 13.4
International protecting exportable sector1990 -0.4 -0.5 -0.4 -0.31995 0.0 0.1 0.1 0.02000 1.6 1.9 1.8 1.5
Other sector1990 -1.5 -1.3 -1.1 -1.01995 -1.3 -0.9 -0.7 -1.02000 1.0 1.1 0.6 0.3
Source: Estimated by the authors.
216
Trade reforms and food security – country case studies and synthesis
market price risk. When farmers are hit by adverse shocks, they cope mainly byborrowing from informal sources (Park, Brandt and Giles, 2002). Most of theseloans are among family members. Few loans, especially for emergency consumptionneeds, are available from formal sources but farmers are still able to go to the localgovernment for help. Although this safety net is low in rural areas, it does at leastexist in most areas. However, the local government is more likely to try and coercefamily, relatives and friends to help a farmer under food stress, than to provide directcash or food subsidies.
Rural labour and off-farm employmentFarm households need to find off-farm employment, and this expanded steadilybetween 1981 and 1995. About 32 percent of the rural labour force found someoff-farm work in 1995 compared to 15 percent in 1981 surveys (e.g. State StatisticalBureau, 1996; and our own 1995 survey). By 1999, the average farmer allocated16.1 percent of his time to off-farm activities and earned 45 percent of householdincome from the non-agricultural sector. Most off-farm earnings were in the formof wages. More than 40 percent of rural labourers were employed in some kind ofoff-farm job, typically part-time, although full-time off-farm employment throughregional migration has been increasing (deBrauw et al., 2002; Zhao, 1999). Off-farmemployment in richer provinces is both historically higher and has grown faster thanin poorer provinces, such as Sichuan and Hubei, where migration has emerged as thedominant form of off-farm labour.
The rise in labour markets has already begun to have a positive impact on theoff-farm employment rates of women, which have been much lower than those ofmen over the last 20 years, but which have risen since the early 1990s. The risingparticipation of women in the labour market has involved all job categories, althoughthe most striking absolute gains have come in migration. Throughout the entire1980s, less than 1 percent of women left their homes to work for a wage or becomeengaged in self-employed activities. By 2000, nearly 6 percent of the female labourforce was working as a wage earning migrant and nearly 3 percent was working as aself employed migrant. One interpretation of this rise in the participation of womenis that as labour markets have become more competitive, the scope for managers toexercise their discriminatory preferences has declined.
While China’s success at generating off-farm work opportunities for its ruralworkers is well known, what is less well known is that many of the new jobs are inrural areas. Whereas in 1988, only about 1 percent of the rural labour force foundemployment in another rural village, by 1995, this had risen to 5 percent.
The increase in the size of the rural labour force and the increasing share of ruralworkers heading to other rural villages has contributed to the expansion in rural-to-rural labour movement, which has grown at 27 percent annually compared to13 percent growth in local employment and 9 percent growth in rural-to-urbanmigration. There were 12.9 million rural-to-rural migrants in 1995, up from 2 millionin 1988. An additional 9.8 million rural workers in 1995 commuted to other villages,up from 3 million in 1988. The 22.7 million workers who found non-agriculturalemployment through rural-to-rural labour movement make China’s developmentpath quite unprecedented.
217
China
POLICY LESSONS
During the period under review, China’s economic reforms have generatedoutstanding results for economic growth, poverty reduction and food securityat both the national and the household level. Sharp falls in poverty rates havedramatically improved household food security, and the incidence of malnutrition hasdropped. For China, both trade reforms and domestic reforms have been importantand reforms have followed a gradual approach that appears to have worked well.In the initial stages, measures that provided incentives to rural institutions wereimplemented. As reform experience was gained, broader reform policies followed.
Many different factors, including domestic policies, have helped China improve itsfood security over the past 20 years. The rise in yields has undoubtedly contributedand China’s domestic policy has played a major role. Decollectivization, newagricultural technologies, irrigation investments, and rising access to inputs have allhelped provide the incentives and materials for raising production per hectare (Lin,1992; Fan, 1991; Huang and Rozelle, 1996). Given the equal distribution of land,the higher yields have meant that the incomes of farmers have risen from increasedquantities of output.
Foreign trade has also been a vital part of China’s growth story, with tradeexpanding even more rapidly than GDP. External reforms have paralleled those indomestic reform. Through nearly 20 years of reform, China’s foreign trade regimehas gradually changed from a highly centralized, planned, import substitutionregime to a more decentralized, market-oriented, export promotion regime. Inthe initial stage, reformers only implemented measures that provided incentives toparticular sets of corporations and institutions. As experience was gained from thereform and the objectives of trade could be achieved through alternative institutionsand policies, trade liberalization has progressed smoothly since the late 1980s.However, in the late 1990s, China used various means to protect some of its cropssuch as maize and cotton.
Overall, the impact of changes in trade policy on domestic agricultural productionand food security appears to have been smaller than that of domestic policy reform.However, the nature of impacts of trade and non-trade domestic policies differs.Domestic policy reforms have tended to stimulate growth across all sectors. Theyhave increased food security primarily by increasing food availability (at boththe national and household levels). Because of rising output, there has also been alarge, negative price effect that has benefited both rural and urban consumers (and,particularly the urban poor). In contrast, trade liberalization has had more sector-specific effects. Although there has been less of an impact on aggregate productionand consumption, trade policy reforms have had powerful structural change impacts,moving the country towards sectors in which it has a comparative advantage. Assuch, trade policies have been useful in improving allocative efficiency and makingthe sector more competitive.
Although the overall gains from trade reform in China are positive, there havebeen large differences in the effects on particular groups of farmers. Because tradeimpacts are more commodity specific, they have more sharp regional and crop-specific impacts. This also means that they affect equality. China’s agriculturalmarkets have been highly integrated since the mid-1990s and any impacts (either
218
Trade reforms and food security – country case studies and synthesis
positive or negative) could be largely transmitted to the farmers in differentregions. Specialization in the production of different commodities accounts formuch variation: while both eastern and western regions have benefited from trade,liberalization appears to have hurt producers in central China, primarily because thisregion is the largest producer of soybean and edible oil, the two commodities mosthurt by liberalization of imports. The poor suffered, since they were large producersof these products. In recent years, however, the poor have probably gained fromprotection of the maize, cotton and wheat that they produce.
Production trends are increasingly moving in a direction consistent with China’scomparative advantage. The richer farmers producing crops in which the countryis inherently competitive have gained from trade reform. However, the poor tendto allocate a large share of their land to crops with less of a comparative advantage.Poorer farmers producing crops such as maize and cotton may need assistance toshift production towards products in which the country has a clearer comparativeadvantage. For example, the Government could assist by providing better trainingand extension services, marketing information, and by promoting credit availabilityand facilitating productivity-enhancing investments.
The impact on agriculture, however, is only part of the reform story. Tradeliberalization and domestic reforms have also affected the access of households tonon-farm employment and the wages they earn for being in the off farm market.Raising the demand for off-farm labour is probably the most important thing thatcan happen in the economy.
REFERENCES
CCAP (Centre for Chinese Agricultural Policy) CAPSiM database, Chinese Academy ofSciences, Beijing.
deBrauw, A., Huang, J., Rozelle, S., Zhang, L. & Zhang, Y. 2002. China’s rural labourmarkets, The China Business Review, March-April 2002: 2-8.
deBrauw, Alan, Huang, Jikun & Rozelle, Scott. 2004. The sequencing of reform policies inChina’s agricultural transition, The Economics of Transition Vol.12, No.3 (2004):427-465.
FAO. 2002. The State of Food Insecurity in the World. Rome.Fan, S. 1991. Effects of technological change and institutional reform on production growth
in Chinese agriculture. Am. J. Agric. Econ. 73:266-275.Fan, S. 1997. Production and Productivity Growth in Chinese Agriculture: New Measurement
and Evidence. Food Policy 22: 213-228.Fan, S. & Pardey, P. 1997. Research Productivity and Output Growth in Chinese Agriculture.
Journal of Development Economics 53:115-137.Fan, Shenggen & Zhang, Xiaobo. 2002. Urban Poverty in China: The Evidence. Paper
presented at the 2002 American Economics Association annual meetings, WashingtonDC, January 3 - 6.
Huang, J. & Bouis, H. 1996. Structural changes in demand for food in Asia. Food, Agriculture,
and the Environment Discussion Paper. Washington, D.C., International Food PolicyResearch Institute.
Huang, J. & Chen, C. 1999. Effects of trade liberalization on agriculture in China: commodity
and local agricultural studies. United Nations ESCAP CGPRT Centre, Bogor, Indonesia.
219
China
Huang, J. & Li, N. 2003. China’s agricultural policy analysis and simulation model – CAPSiM.Journal of Najing Agricultural University, Vol.3 (No.2, 2003):30-41.
Huang, J., Li, N. & Rozelle, S. 2003. Trade reform, household effects and poverty in ruralChina. American Journal of Agricultural Economics, Vol.85 (No.5, 2003): 1292-1298.
Huang, J. & Rozelle, S. 1996. Technological change: rediscovering the engine of productivitygrowth in China’s agricultural economy. J. Dev. Econ., 49:337-369.
Huang, J. & Rozelle, S. 1998. Market development and food consumption in rural China.China Econ. Rev. 9:25-45.
Huang, J. & Rozelle, S. 2003. Trade Reform, WTO and China’s Food Economy in the 21stCentury. Pacific Economic Review, 8(2): 143-156.
Huang, J. & Rozelle, S. 2002. China’s Accession to WTO and Likely Shifts in the Agriculture
Policy. A report submitted to FAO, Rome.Huang, J., Rozelle, S. & Chang, Min. 2004. Tracking Distortions in Agriculture: China
and Its Accession to the World Trade Organization. The World Bank Economic Review,18(1):59-84.
Huang, J., Rozelle, S. & Xie, Y. 2003. Distortion at the Border; Integration Inland: Assessingthe Effect of WTO Accession on China’s Agriculture. Journal of Chinese Economics and
Business Studies, Vol., 1(2003): 95-114.Huang, J., Rozelle, S., & Rosegrant, M. 1999. China’s food economy to the 21st century:
supply, demand, and trade. Econ. Dev. Cult. Change. 47:737-766.Jin, S., J. Huang, Hu, R. & Rozelle, S.. 2002. The creation and spread of technology and
total factor productivity in China’s agriculture. Am. J. of Agric. Econ. 84(4) (November2002):916-939.
Lardy, N.R. 1995. The role of foreign trade and investment in China’s economic transition.China Quarterly, 144:1065-1082.
Li, Zhou. 1994: Adjusting agricultural production practices in econologically sensitive regions.In Promoting economic development in China’s poor areas: a collection of policy briefs,Albert Park and Scott Rozelle (eds.) China Poverty Research Association, Beijing,China.
Lin, J. 1992. Rural reforms and agricultural growth in China. Am. Econ. Rev. 82:34-51.MOA (Ministry of Agriculture). 1980-2002. China Agricultural Yearbook. Beijing (China):
China Agricultural Press.MOFTEC (Ministry of Foreign Trade and Economic Cooperation). 2002. Foreign trade and
economic yearbook of China, China Statistical Press.Naughton, B. 1995. China’s Macroeconomy in Transition. The China Quarterly. 144
(December): 1 083-1 104.NSBCa (National Statistical Bureau of China). China rural household survey yearbook,
various issues from 1982 to 2002. Beijing (China): State Statistical Press.NSBCb (National Statistical Bureau of China). Statistical yearbook of China, various issues
from 1981 to 2002. Beijing (China): China Statistical Press.Nyberg, A. & Rozelle, S. 1999. Accelerating China’s Rural Transformation. The World Bank,
Washington DC.Park, A., Jin, H., Rozelle, S., & Huang, J. 2002. Market emergence and transition: arbitrage,
transition costs, and autarky in China’s grain market. Am. J. Agri. Econ. Vol.84(1)(February 2002):67-82.
Park, A. & Wang, S. 2001: China’s Poverty Statistics. China Economic Review, 12, 384-98.
220
Trade reforms and food security – country case studies and synthesis
Park, A., Brandt, L. & Giles, J. 2002. Competition and Credit Rationing: Theory and
Evidence from Rural China. Working Paper, University of Michigan, Ann Arbor, MI.Piazza, Alan, Liang, Echo H. 1997. The state of poverty in China: its causes and remedies.
Paper presented at a conference on unintended social consequences of economic reformin China, Fairbanks Center, Harvard University, May.
Pray, C., Rozelle, S. & Huang, J. 1998. China’s maize seed industries. In Michael L. Morris,ed. Maize seed industries in developing countries. Chapter 19, pp. 335-351, Boulder, LynneRienner Publishers Inc.
Rozelle, S., Park A., Jin, H. & Huang, J. 2000. Bureaucrats to entrepreneurs: The changingrole of the state in China’s transitional commodity economy. Econ. Dev. Cult. Change
48:227-252.Rozelle, S., deBrauw, A., Zhang, L., Huang, J. & Zhang, Y. 2002. The evolution of China’s
rural labor markets during the reforms: rapid, accelerating, transforming. Journal of
Comparative Economics, 30(2): 329-353.Stone, B. 1988. Developments in agricultural technology. China Quarterly 116(December).Stone, B. 1993. Basic agricultural technology under reform. In Y.-Y. Kueh & Robert F.
Ash, eds. Studies on contemporary China, pp. 311-59. Oxford, New York, Toronto andMelbourne, Oxford University Press, Clarendon Press.
Tong, Z., Rozelle, S., Stone, B. Dehua, J., Jiyuan, C. & Xu, Z. 1994. China’s experiencewith market reform for commercialization of agriculture in poor areas. In Joaquim vonBraun & Eileen Kennedy, eds. Agricultural commercialization, economic development and
nutrition, pp. 119-140. John Hopkins Press, Baltimore, MD.Wang, J. 2000. Property right innovation, technical efficiency and groundwater management:
Case study of groundwater irrigation system in Hebei, China, 2000, Ph.D. Thesis, ChineseAcademy of Agricultural Sciences.
Weersink, A. & Rozelle, S. 1997: Market reforms, market development, and agriculturalproduction in China. Agricultural Economics 17, 2-3: 95-114.
World Bank. 1992. China: strategy for reducing poverty in the 1990s. Washington, DC, WorldBank.
World Bank. 1997. Sharing rising incomes. Washington, DC, World Bank.Xiao Y, & Fulton, M. 1997. Fertilizer reform and market development in China. Paper
presented at the 1997 Association of Asian Studies Annual Meetings, Chicago, IL, March13-15.
Zhao, Y. 1999. Labour migration and earnings differences: The case of rural China. Economic
Development and Cultural Change, 47(4), 767-82.Zhu, X., & Brandt, L. 2001. Soft budget constraints and inflation cycles: a positive model of
the macro-dynamics in China during transition. Journal of Development Economics, 64,2:437-457, April 2001.

221
China
ANNEX
A framework for analysis of impactsof reforms
Analysis based on the original CAPSiM framework can only be done at the nationallevel. It was designed to simulate the future effects of policy shifts. A number ofmodifications were made to the original model (Huang and Li 2003; Huang, Liand Rozelle, 2003) in order to allow disaggregation of the national impacts intohousehold production, consumption and food security at the regional level and toassess the impact that trade liberalization has had on households in different incomegroups.
1. Creating a database on production, consumption, price and trade for the studyperiod (1984-2001) at the national level;
2. generating a database for household food consumption, production, farmgateprices of agricultural products and procurement prices of foods by incomegroup and by region.
3. estimating a set of demand and supply elasticities for the entire period ofreform(income elasticities of demand for various foods decline over time).
4. separating the impacts of trade from other impacts;5. ensuring the results of CAPSiM’s “backward projection or simulation” be
largely consistent with the actual realizations of agricultural production,consumption, price and trade patterns during the reform period;
6. testing market integration and price transmissions from national to regionaland to households, and using the findings of these analyses to adjust theresults of impact studies based on CAPSiM simulations.
Any change in the economy (i.e., in production, consumption or price) betweentime period t-1 and time period t, dYt, can be decomposed into the impacts of tradeand other factors as:
Y t = Yt-1 + ∆YAt + ∆YBt, (1) or
dY t = dYAt + dYBt
where d denotes the difference that occurred during the time period; subscriptA refers to trade shocks, which could be both trade policy and domestic policy;subscript B refers to all other shocks, which are mainly domestic policies.
The effect of trade on the economy is simulated by examining the effects ofchanges in imports or exports. Let Xt be the volume of trade in time t. A change intrade will be reflected in external trade changes, that is, X will change. Changes indomestic policy (B) could also lead to changes in X. For this reason, the results ofthe study may overstate the pure impacts from trade reform.
Given these assumptions, the impacts of trade changes and trade liberalizing reformson the economy are fairly easy to analyse with the revised CAPSiM framework. To
222
Trade reforms and food security – country case studies and synthesis
do so, we assume that there are two alternative, mutually exclusive scenarios thatcould have occurred in the case of trade in China’s external economy:
dXtI = X t - Xt-1 0 which we call Scenario I, and (2)
dXtII = 0 and Xt 0 which we call Scenario II. (3)
Scenario I is used to simulate the economy in which trade changed over time toexamine what actually happened. If we set X equal to the actual trade that occurredin the country during each time period, then the outcomes that occur during thesimulations periods embody the impacts of trade and trade related policies. Incontrast, scenario II seeks to replicate an economy in which there was no changein trade. If the period between t-1 and t covers each of the three five-year periodsbetween 1985 and 2000, scenario II attempts to project what would have happenedto production, consumption and prices had there been no trade changes.
To quantify the impact of trade, we can use CAPSiM to simulate separately theeconomy when the conditions are imposed in either condition (2) or (3). We can thenexamine the difference in the differences of the outcome variables during the studysub-periods (from t-1 to t), and summarize the results with the following equation:
dYAt = dYtI - dYt
II = dYAt |dXt = Xt - Xt-1 0 - dYAt |Xt = Xt-1 0 (4)
In other words, equation (3.4) calculates the impacts of trade on Yt in t over t-1. Ifwe know the actual changes, we can then use equation (1) to generate the residual ofthe change between the actual performance of the economy (dY t) and the changesdue to trade (dYAt). This residual can be interpreted as the impact of all other factorsbesides trade (trade and trade-related policies). In other words:
dYBt = dYt - dYAt
In summary, to simulate the impacts of trade changes on production, consumption,and price, two scenarios are formulated based on conditions (2) and (3).
223
GhanaAbena D. Oduro and George T-M Kwadzo1
EXECUTIVE SUMMARY
Pre-reformEconomic policy during most of the 1970s was highly interventionist. Price and non-price control measures pervaded the economy. Parastatal organizations were involvedin the distribution and marketing of inputs and some agricultural products. Most ofthese operated in competition with the private sector, the major exception being theCocoa Marketing Board. The Ghana Food Distribution Corporation was responsiblefor buying agricultural products from the farm gate for distribution, importing andexporting agricultural products, and stabilizing food prices but did not purchase morethan 10 percent of the marketed food surplus. The import tariff regime was subject tofrequent changes and the cocoa tax varied between 27 percent and 60 percent. An exportretention programme was imposed and a fixed exchange rate regime was maintained.
Economic growth decelerated in the late 1970s and turned negative in the early1980s. By 1983 real GNP per capita had contracted considerably.
The reformsThe economic reform programme began in 1983. In the first three years price controlswere lifted, the currency was devalued and fiscal measures were introduced toreduce the deficit. Improvements were recorded in most important macroeconomicindicators. The second phase of the reforms began in 1987 with the emphasis ofthe agriculture strategy being on liberalization and privatization. 1992 marked thebeginning of a democratic political regime but also the start of a new period ofmacroeconomic instability.
Impact on intermediate variablesThe withdrawal of the minimum guaranteed producer price policy for maize andrice did not have an appreciable impact on the wholesale prices of these commoditiesas the minimum price policy had had little impact on prices to begin with. The realprices of food declined after 1984 and it was not until 1984/85 that an increase in thereal producer price of cocoa was observed.
Price indices show smaller variation during the reform and post-reform periodthan has been observed for the pre-reform period. The continued existence ofseasonal variations in prices for most food crops, however, indicates that households
1 Abena D. Oduro, Centre for Policy Analysis, Accra and George T-M Kwadzo, Department of AgricultureEconomics and Agribusiness, University of Ghana, Legon.
224
Trade reforms and food security – country case studies and synthesis
that do not have stores of food during the lean periods or access to non-farm sourcesof income experience a decline in food consumption during the lean season whenfood prices are rising.
Tariff reforms reduced the nominal protection of the agriculture sector. Thedepreciation of the real exchange rate that occurred during most of the 1980s and thefirst half of the 1990s counterbalanced to some extent the decline in protection.
The cocoa sector was taxed for the entire period but the proportion of the exportprice received by farmers was higher in the 1990s compared to the 1980s. Decliningworld prices between 1987 and 1991 are largely responsible for the decline in realprices, and counteracted the positive impact of the depreciation of the real exchangerate and the decline in the cocoa tax rate, as measured by the increase in the share ofthe world price going to farmers. The real exchange rate appreciated in the period1995-1997 but the positive impact of other policies and the decline in the export taxcontributed to the positive change in real prices in 1992-1998.
There was an upsurge in food production per capita in the period 1984-1986, butthe increase in the rate of growth was not maintained. Per capita food productionlevels did not attain their mid-1970s levels until the mid-1990s.
The volume of rice imports increased with growth in demand from the risingpopulation and real incomes. Growth rates in agriculture export volumes havetended to be positive during the entire reform period. Some diversification ofagriculture exports has occurred although cocoa exports still predominate.
Impact on target variablesNational level indicators suggest that food security improved. Food importsconstituted a declining share of total exports between 1992 and 1996. The downwardtrend was reversed after 1996, although the ratio remained below the 1992 level.There has been a decline in the proportion of underweight children. However, fiveregions experienced an increase in the proportion of underweight children.
The incidence of poverty declined from 51.9 percent in 1991/92 to 39.5 percent in1998/99, but not all regions benefited. When households are classified by ecologicalzone, the distinct urban-rural divide in terms of household income breaks down.Rural forest households (export crop farmers) had higher mean real incomes thanurban coastal and savannah households. Households headed by men consistentlyhad higher mean real incomes than those headed by women, although the latter’sgrew faster. The mean real incomes of rural households also grew faster compared tothose of urban households. The proportion of households not able to meet minimumnutritional requirements increased in three regions.
There was a decline in the proportion of rural household members employed inagriculture in the 1990s. This, and the decline in real prices of the major agriculturalproducts, coincided with a decline in the share of household income originating fromagriculture for households headed by food crop farmers. Agricultural income’s shareof total household income of households headed by export crop farmers on the otherhand increased.
Policy lessons Early assessments lauded the trade, exchange rate and monetary reforms in thecontext of improving macro aggregates.
225
Ghana
The increase in agricultural production occurred despite the decline in real prices.The expansion in food production occurred largely through an expansion of the areacultivated with marginal changes in yield for most crops. Trade liberalization didnot improve price incentives for food crop farmers and neither did the agriculturespecific reforms. The expected private sector response did not materialize.
Opportunities for non-farm employment have increased as real incomes haveincreased. This is because an increase in real incomes brings with it an increase in thedemand for non-food items. An increase in real incomes provides a pool of resourcesfor investment in non-farm activities. Expansion in the rural road network, ruralelectrification and potable water supply are important for the development of non-farm activities and agro-processing. The expansion in non-farm businesses has beenmore rapid in the rural forest zones compared to the rural savannah.
Measures need to be implemented to maintain the incentives for food cropproduction. The increase in the real cost of production highlights how criticalit is that agricultural productivity also increases if real prices facing farmers aredeclining.
INTRODUCTION: CONTEXT AND NATURE OF REFORMS
Role and level of development of the agriculture sector Agriculture’s share of GDP has varied substantially over the period since 1980.In 1980, at the time when the economy was experiencing negative growth rates,agriculture’s share of GDP was 36 percent. It rose to 54 percent in 1984 beforedeclining to 43.5 percent in 1990 and now contributes approximately 36 percent toGDP. About 51 percent of the population aged 15 years and older is employed inthe sector, but with wide regional variation: 10 percent in the Greater Accra regioncompared to 43.8 percent in Ashanti region and 67.1 percent in the Upper East region.A slightly lower proportion of women than men are employed in agriculture.
TABLE 1Indicators of the extent of subsistence agriculture in Ghana, 1991/92-1998/99
Harvest sold 1991/92 (%)
Production000 tonnes
Harvest sold 1998/99 (%)
Production000 tonnes
Cocoa 91.2 243.0 89.2 397.7Maize 44.5 730.6 42.2 1 015.0Rice 55.6 131.5 42.3 281.0Beans 34.2 14.3 42.9 70.4Groundnuts 49.0 113.0 41.2 212.0Cassava 20.0 5 662.0 21.4 7 845.4Yam 18.4 2 331.4 22.3 3 249.0Plantain 27.8 1 082.0 43.0 2 046.0Oil palm 41.2 42.2 1 022.0Proportion of rural household selling1 :Less than 20% of output 46.72 35.50Between 20% and 50% of output 23.68 24.57More than 50% of output 29.59 39.91
1 Sample does not include households that recorded a negative value of agriculture output.Source: Ghana Statistical Service, 1991/92 and 1998/99.
226
Trade reforms and food security – country case studies and synthesis
The sector’s contribution to tax revenue as measured by trade taxes has declined,from 25 percent in 1985 to 19 percent in 1988 and 4.1 percent in 2000, and is nowmainly limited to taxes on cocoa. The decline is explained by the trade liberalizationprogramme that has reduced export taxes and limited the emergence of alternativesources of taxation.
Smallholder farmers on family-operated farms produce about 80 percent of totalagricultural output. A limited number of crops, such as oil palm, rubber, banana andpineapple, are produced on large corporate-managed estates, although smallholdersalso produce significant shares of these crops, especially oil palm. Production forown consumption is still important in the food crop sector. The low proportion ofthe harvest that is sold is indicative of low production levels by a large proportionof farmers and a weak marketing system. Nevertheless, an increasing number ofhouseholds are selling more than half of their output.
Degree of openness of the economy prior to reformEconomic policy during most of the 1970s was highly interventionist. Pricecontrols and non-price control measures which pervaded the economy were largelyresponses by policy makers to inflation and balance of payments difficulties.Parastatal organizations were involved in the distribution and marketing ofinputs and some agricultural products. Most of these organizations operated incompetition with the private sector. The major exception was the Cocoa MarketingBoard established in 1947 with exclusive rights to the export of cocoa beans. In theimmediate pre-reform period it was the only domestic purchaser of cocoa beans.Apart from the domestic purchase and export of cocoa, the Cocoa Board providedresearch and extension services to farmers. The domestic price of cocoa was anadministered price. The Producer Price Review Committee determined in whichproportions the world price would be divided between farmers, government andthe Cocoa Board.
The Ghana Food Distribution Corporation was established in 1971 to buyagricultural products from the farm gate for distribution, to import agriculturalproducts to supplement local production if there was a shortfall, and to exportagricultural products and stabilize food prices. It traded mainly in rice, maize,beans, groundnuts and meat products but did not purchase more than 10 percentof the marketed food surplus. The corporation was handicapped in its ability toperform its functions. Although it was the institution through which the minimumguaranteed price policy was implemented, these prices were lower than those offeredby private traders, and the farmers’ preference was to sell to the traders. In addition,the corporation did not have an adequate fleet of vehicles to collect the food cropsfrom farmers or adequate storage facilities.
The Ghana National Procurement Agency (GNPA) was set up in 1976 and wasresponsible for the import and export of agricultural products. Its customers aregovernment, public organizations, and private wholesalers and retailers. The GNPAdid not have exclusive rights or privileges in the purchase or sale of any of thecommodities it traded in.
Cotton production was promoted as an import substitution measure to supplynewly established textile mills in the south with raw materials. From 1968onwards, smallholder cotton production was encouraged by the Ghana Cotton
227
Ghana
Development Board (GCDB), which aimed to spread the benefits from productionof the crop as widely as possible. The GCDB offered farmers a complete packageof services, from ploughing, supply of seed and fertilizer, through extensionadvice, chemical supply and application, to marketing. Farmers made no explicitpayment for pre-harvest services, with the exception of ploughing. Rather, GCDBadjusted the per kilo price of seed cotton to take account of the cost of servicesprovided, the calculation assuming an average yield of seed cotton. However,cotton production experienced steady decline as a result of a vicious circle oflow producer prices, unreliable services and late payment, and the poor financialstate of GCDB (Seini, 1985). By the early 1980s Ghanaian cotton production hadalmost collapsed.
State farms were established to produce a wide range of agricultural commoditiesincluding cocoa. Departments in the Ministry of Agriculture provided some servicesto farmers, such as extension services.
External trade regimeThe import tariff regime was subject to frequent changes. Ghana had an escalatedtariff regime with tariff rates lower for raw materials and higher for processed goods.Capital equipment entered under the lowest tariff schedules. By 1981 the tariff rateswere 35 percent, 60 percent and 100 percent. Import controls were pervasive, with allgoods except for trade samples, gifts and personal effects requiring approval beforethey could enter the country.
The cocoa tax rates vary with the world price and the marketing costs of the CocoaBoard. In the 1970s the cocoa tax varied between 27 percent and 60 percent.
An export retention programme became operational in 1982 whereby exporters ofnon-traditional exports could hold 20 percent of their foreign exchange earnings inan account with the Ghana Commercial Branch in the United Kingdom. The use towhich the retained earnings could be put was limited to the purchase of equipment,spare parts and raw materials. The foreign exchange retention scheme was aimed atreducing the impact that the foreign exchange constraint had on production.
A fixed exchange rate regime was maintained. The nominal exchange rate remainedconstant between 1978 and 1982. The real exchange rate appreciated during theperiod and there was considerable real exchange rate misalignment (Harrigan andOduro, 2000). Excess demand pressures for foreign exchange built up with theappreciation of the real exchange rate. Foreign exchange had to be rationed. Aparallel market in foreign exchange had emerged in the early 1970s. The period 1978-1982 recorded rapid increases in the size of the premium on foreign exchange in theparallel market.
Motivations for the reformsEconomic growth had decelerated in the late 1970s and turned negative in theearly 1980s. By 1983 real GNP per capita had contracted by 37 percent since 1970,investment rates were a fraction of the 1960 rates, import and export volumeshad declined precipitously and inflation was accelerating to three digits. Externalfinancial flows had diminished and there was an urgent need for foreign exchange forbudgetary and balance of payments support as well as to purchase essential importsfor the productive sectors, in particular agriculture, manufacturing and mining.
228
Trade reforms and food security – country case studies and synthesis
The controls that had been introduced to address macroeconomic problems hadencouraged the development of a parallel economy2, which eroded the governmenttax base. Tax revenue and government expenditure declined as a ratio of GDP andin real terms. It was against this backdrop that the Economic Recovery Programme(ERP) was negotiated between the Government of Ghana and the InternationalMonetary Fund. The economic strategy pursued since 1983 is an outward orientedone with a focus on private sector development.
Macro and sectoral components of reformThe reforms begun in 1983 had as their main objectives to increase production,particularly of food, industrial raw materials and exports, through an improvementin the structure of incentives; to increase the availability of consumer goods; torehabilitate physical infrastructure; to increase the overall availability of foreignexchange and improve its allocation; and to lower the rate of inflation.
In the first three years of the programme price controls were lifted, the currency wasdevalued and fiscal measures were introduced to reduce the deficit. Improvementswere recorded in most important macroeconomic indicators. From a growth rate ofnegative 4.3 percent in 1983 the economy grew by 8 percent in 1984. The growthrate fell to 5.2 percent in 1986. The inflation rate declined from 123 percent in 1983to 10 percent in 1985 rising to 24 percent in 1986. Central government expendituresand revenues increased in real terms and as a share of GDP.
The second phase of the reforms began in 1987 and covered agriculture, education,the financial sector, state enterprises and the civil service. Macroeconomic aggregatesremained fairly favourable. Despite this, concerns were expressed about the limitedimpact of the reforms on employment creation and export diversification. Non-traditional exports had been growing quite rapidly but from a very small base. Theeconomy was still dependent on external inflows, raising doubts about the sustainabilityof the reforms (Jebuni, Oduro and Tutu, 1992). External financial flows as a ratio ofGDP grew from 2.8 percent in 19833 to 11.8 percent in 1988 and to 16 percent in 1993.
In the 1990s, growth rates never exceeded 5 percent. Inflation rates began torise after 1992, reaching an average of 59 percent in 1995. Stabilization concernspredominated. Average inflation rates for 1997 declined to 27 percent. Macro-instability re-emerged in the third quarter of 1999. The economy was hit by acombination of shocks: the decline in cocoa and gold prices, rising oil prices and ashortfall in expected external inflows. The nominal exchange rate doubled between1999 and 2000 as did the rate of inflation. Government ran large budgetary deficitsbeginning from the second half of 1998. The central bank had instituted a policywhereby it did not automatically honour government cheques. This led to the buildup of arrears estimated at approximately 5 percent of GDP at the end of 1999.4
The 1999 fiscal crisis revealed major shortcomings of the reforms, i.e. the inabilityto diversify the structure of the economy and the continuing dependence of theeconomy on external inflows.
2 See Bulir (2000) for estimates of the effect of the pricing policy on cocoa production and the volumes smuggled.3 The estimates of external financial flows used for this analysis includes long and medium term loans to central
government and official transfers.4 CEPA, 2000.
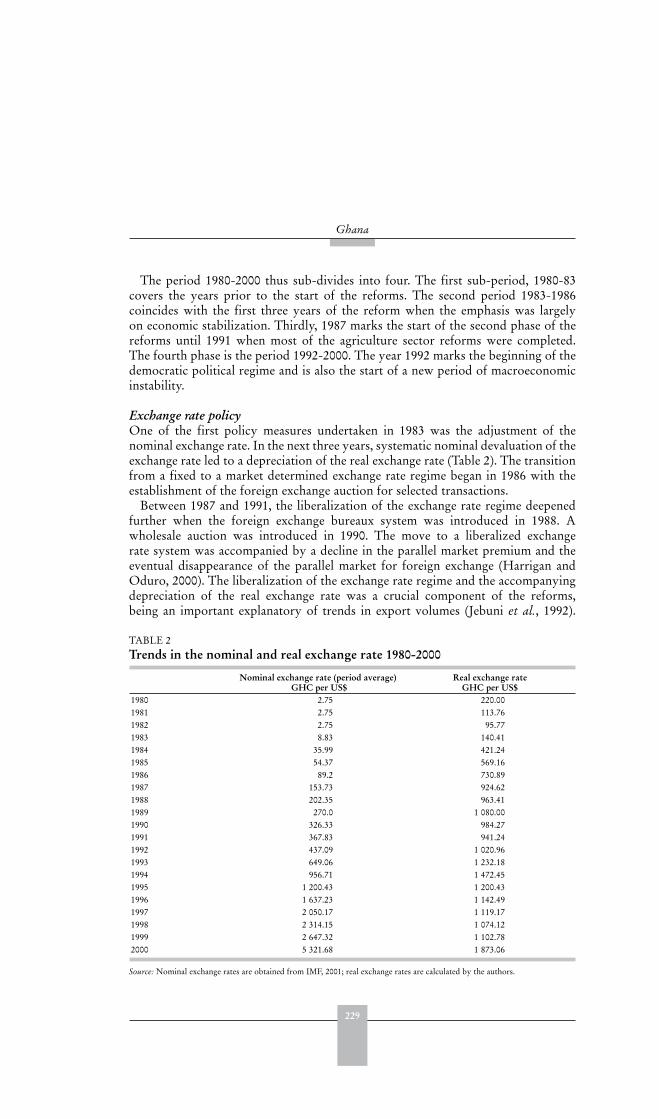
229
Ghana
The period 1980-2000 thus sub-divides into four. The first sub-period, 1980-83covers the years prior to the start of the reforms. The second period 1983-1986coincides with the first three years of the reform when the emphasis was largelyon economic stabilization. Thirdly, 1987 marks the start of the second phase of thereforms until 1991 when most of the agriculture sector reforms were completed.The fourth phase is the period 1992-2000. The year 1992 marks the beginning of thedemocratic political regime and is also the start of a new period of macroeconomicinstability.
Exchange rate policyOne of the first policy measures undertaken in 1983 was the adjustment of thenominal exchange rate. In the next three years, systematic nominal devaluation of theexchange rate led to a depreciation of the real exchange rate (Table 2). The transitionfrom a fixed to a market determined exchange rate regime began in 1986 with theestablishment of the foreign exchange auction for selected transactions.
Between 1987 and 1991, the liberalization of the exchange rate regime deepenedfurther when the foreign exchange bureaux system was introduced in 1988. Awholesale auction was introduced in 1990. The move to a liberalized exchangerate system was accompanied by a decline in the parallel market premium and theeventual disappearance of the parallel market for foreign exchange (Harrigan andOduro, 2000). The liberalization of the exchange rate regime and the accompanyingdepreciation of the real exchange rate was a crucial component of the reforms,being an important explanatory of trends in export volumes (Jebuni et al., 1992).
TABLE 2Trends in the nominal and real exchange rate 1980-2000
Nominal exchange rate (period average)GHC per US$
Real exchange rateGHC per US$
1980 2.75 220.001981 2.75 113.761982 2.75 95.771983 8.83 140.411984 35.99 421.241985 54.37 569.161986 89.2 730.891987 153.73 924.621988 202.35 963.411989 270.0 1 080.001990 326.33 984.271991 367.83 941.241992 437.09 1 020.961993 649.06 1 232.181994 956.71 1 472.451995 1 200.43 1 200.431996 1 637.23 1 142.491997 2 050.17 1 119.171998 2 314.15 1 074.121999 2 647.32 1 102.782000 5 321.68 1 873.06
Source: Nominal exchange rates are obtained from IMF, 2001; real exchange rates are calculated by the authors.
230
Trade reforms and food security – country case studies and synthesis
In addition, the devaluation was important in contributing to an increase in centralgovernment revenues (Oduro and Tutu, 1999).
In 1992, an interbank market in foreign exchange replaced the wholesale auctionmarket. The real exchange rate appreciated between 1995 and 1998, partly throughthe use of the nominal exchange rate as an instrument to achieve inflation rate targets,and also because of improved terms of trade as world cocoa prices increased in 1998.With the terms of trade shock and slow down in donor disbursements in 1999, thenominal exchange rate nearly doubled causing an almost 70 percent depreciation inthe real exchange rate in 2000.
Import restrictionsThe economic reforms begun in 1983 brought about a decline in nominal tariffrates. The tariff schedules were adjusted downwards to 10 percent, 20 percent and30 percent in 1983 (Jebuni, Oduro and Tutu, 1994). A special tax of 20 percent hadbeen introduced in 1981. It was revised upwards to 50 percent in 1985. In additionto the import tariff and special tax, there was an import sales tax.
During the reform period 1987-1991, the major change was the decline in the tariffon luxury goods in 1988. To constrain the importation of luxury goods, a supersales tax was introduced in 1990 and ranged from 50 percent-500 percent. Importedfruits such as bananas, plantain, pineapples and guavas were subject to a tax of500 percent. Vegetables such as onions, potatoes and beans were subject to a tax of100 percent. The range was reduced to between 10-100 percent in 1991. The importlicensing regime was abolished in 1989 and with it special tariffs on import licensing.The import duties and taxes on lint cotton was 40 percent till 1987 and reduced to15 percent after 1987.
During 1992-2000, the major changes in the import tariff regime were the increasein the tariff on raw materials to 20 percent and its reduction to 10 percent in 1992.The super sales tax was replaced with a special tax of 20 percent, which was laterreduced to 17.5 percent in 1998. The sales tax was replaced with a value-added taxof 10 percent in 1998.
Export promotionThe export bonus scheme was withdrawn in 1983. The other elements of the exportpromotion package remained. The proportion of foreign exchange earnings thatcould be retained was increased to 35 percent in 1987. Restrictions on how the fundscould be utilized were removed during the 1987-1991 period. Exporters of non-traditional exports could retain 100 percent of their foreign exchange earnings.
The Government gave approval for the introduction of partial liberalization of theexternal marketing of cocoa, with effect from the 2000/01 cocoa season. This policy hasallowed the licensed buying companies to export up to 30 percent of their purchases.
The cocoa tax rate stood at 31 percent in 1984. It rose to 44 percent in 1985.Between 1987 and 1991, restrictions on the export of cotton and palm oil wereremoved.
Agriculture policy The emphasis of the agriculture strategy during the period of reforms was onliberalization and privatization. The privatization of the supply of inputs was

231
Ghana
expected to increase their availability. The expected increase in competition wouldreduce input prices to farmers. The liberalization of the food marketing systemwas expected to result in higher prices being offered farmers compared to what theGovernment could offer. Another reason for the privatization of the sector was toredirect the business of the Ministry of Food and Agriculture towards policy issuesand monitoring. Finally, several parastatals were making losses. There has been adefinite movement in agricultural strategy away from the supply driven agricultureof the state’s direct involvement in the production, distribution and marketing ofoutput and inputs. There is also a clear movement away from actions that directlyintervene in the market through administered prices and the provision of productionand/or input subsidies.
Output price measuresThe reforms in 1983 involved the upward adjustment of cocoa producer prices. Thiswas made possible largely because of the devaluation of the exchange rate, withoutwhich the Government would not have generated any revenues from the cocoasector. The producer prices of commodities such as coffee, cotton and tobacco alsoincreased during this period. In 1990 the guaranteed minimum price scheme formaize and rice was ended.
Since 1985, the prices of seed cotton and the majority of other components ofthe cotton package have been set collectively by the companies. When there werefew companies, the companies themselves decided the price they would pay forseed cotton the following season, based on projections for the international lintprice. As the number of companies increased, this system of pricing gave way toprice leadership by the Ghana Cotton Company (GCC), with the other companiesfollowing suit. One disadvantage of the system was that farmers did not know theprice they would receive for seed cotton at harvest time until after critical resourceallocation decisions had been made. This collective price setting, it was argued,reduced the incentives for farmers to divert their seed cotton from the companythat had provided them with pre-harvest services to a competitor, thus avoidingrepayment of the farmer’s debt. This, however, did not prevent a price war betweenthe GCC and the other companies in 1996/97 when GCC offered to pay a bonus tofarmers selling their seed cotton before Christmas, an attempt to encourage pickingbefore the Hamattan winds set in. This resulted in crop diversion. To prevent arepeat of the 1996/97 crop diversion experience, the other companies pressurisedGCC to return to the system of price setting by joint discussion.
The medium term agricultural development programme (MTADP) for the period1991-2000 indicated the re-thinking of the direction and bias in agricultural strategyand policy-making: the objectives were food security, rural employment, increasedagricultural exports and increased production of raw materials.
The general design of the MTADP for the period 1991-2000 was to establishmarket-led growth in agriculture. Support was to take the form of providing anenabling environment in the way of feeder roads, marketing infrastructure, irrigation,research and development. Actions were required in five main areas: improving theincentive framework, improving agriculture support services, increasing privatesector participation, strengthening agriculture sector management, and establishinga framework for a more rational allocation of public sector resources.
232
Trade reforms and food security – country case studies and synthesis
Cotton sector policyIn the 1997/98 cropping season, a change was introduced whereby the seed cottonprice was announced to farmers before planting began. A combination of factors –falling world lint cotton prices in the second half of the 1990s; the fierce competitionprovided by the cheap import of textile from China and other Asian countries; andthe increasing import of second hand cloths due to the liberalized trade regime – ledto falling demand for lint cotton by local textile companies.
The GCC sought ways of exporting the excess cotton lint and in 1999, a new systemof pricing seed cotton was introduced. This involves annual price negotiations beforethe cropping season begins between cotton farmers and cotton companies, with theMinistry of Food and Agriculture (MOFA) mediating. The negotiations establishcotton prices as well as the prices for inputs and ploughing. Since both the cropbudget and the world market prices are factored in the determination of the seedcotton price, both companies and farmers are satisfied with the new arrangement.This is a more transparent system than all the previous pricing arrangements.
Cocoa sector policyThe producer price of cocoa is also fixed through negotiations. The negotiatingcommittee involves representatives of COCBOD, the Ghana Cocoa and CoffeeFarmers Association, the Ministry of Finance and Economic Planning and the cocoaprocessing companies. The floor price is fixed and bonuses paid to farmers based onthe actual fob prices received for the crop relative to the announced producer price.
The Government has continued the policy of raising the producer price of cocoa.It was increased by 65 percent in 1985/86 and in 1988 farmers were paid bonuses onproduction in the previous two years. By 1988/89, farmers’ share of the world pricehad increased but had not reached the target set by the World Bank. Subsidies oncocoa inputs were removed in 1990.
A means of achieving an increase in farmers’ share of the world price withoutjeopardizing revenues was to reduce the cost of the COCOBOD. The World Banksuggested that this could be done by liberalizing the cocoa sector through thereduction in the activities of the COCOBOD, greater participation of the privatesector and reduction in the work force of the COCOBOD, but the Governmentwas concerned that private traders and haulers would probably be unwilling toevacuate cocoa from areas where road infrastructure was poor and that the bankingsystem in Ghana would find it difficult to provide financing to private traders forthe purchase of cocoa. A compromise was reached: the COCOBOD was to restrictitself to activities that could not be performed by other public institutions or theprivate sector, including purchasing, marketing, extension and research functions.Twelve thousand workers were retrenched in 1987, and the COCOBOD divestedthe majority of its shares in the insecticide plant and its plantations.
Input policy measuresThe fertilizer subsidy rate declined to 42 percent in 1987 and to zero in 1990. Thesubsidy removal was a precondition for the privatization of the fertilizer trade,which took place in 1991. Government turned over the import/wholesale functionsto four companies one of which controlled over 50 percent of all imports. A specialunit of MOFA, created in 1988 to manage the removal of the fertilizer subsidy
233
Ghana
and privatization, encouraged private retailers to fill the vacuum created in ruraltowns and villages. Initially, the unit received large numbers of applications fromprospective wholesalers and retailers wishing to enter the trade. Within two years,practically all the retailers had withdrawn their applications. The combined resultof the sharp and continuous reduction in the value of the cedi, of subsidy removal,and of the privatization programme initially had traumatic effects on fertilizer usage,cropping patterns, areas sown and yields, raising questions about the appropriatenessof the mechanism and the scheduling of subsidy and privatization actions. However,this downward trend was reversed in the mid-1990s.
In 1987, state provision of wheeled tractor services was ended. The then existingfleet of equipment was auctioned or retired. A year later the combined-harvestservice came to an end and in 1991 state provision of land clearing services wasterminated.
Agricultural creditThe removal of the requirement in 1990 that at least 25 percent of bank loans be madeto the agriculture sector has been accompanied by a decline in the share of agriculturein total bank lending, which in 1992 fell to 9.7 percent but rose to 12.2 percent in1998. Rural banking was introduced in the 1970s to address the credit needs of small-scale entrepreneurs and farmers who have traditionally been unable to access creditfrom the formal banking sector. Subsidized credit to agriculture ended in 1987. Theeffect of this was for rates to increase from 18.5 percent in 1985 to range between22.75-30 percent in 1988. Comparable rates for manufacturing were 20.5 percent in1985 and between 25-30 percent in 1988). The economic reform programme has notmade it any easier for farmers to access formal credit.
Marketing and distributionIn 1985, the GCDB was privatized and other companies were allowed to enter themarket, but the GCDB (which became the Ghana Cotton Company) remained thedominant player. The Ghana Seed Company, responsible for the production anddistribution of seeds to farmers was abolished in 1986. The monopoly of the ProduceBuying Company of the Cocoa Board in cocoa haulage was removed during theperiod 1987 to 1991. The Livestock Marketing Board was closed down and theGhana Food Distribution Corporation ceased to expand its storage facilities forprice stabilization purposes and food distribution.
Despite the new competitive environment, the companies all adopted the samebasic contractual package that the GCDB had supplied to farmers. In part this mayhave been because the new companies relied heavily on the experience of ex-GCDBstaff to establish themselves in business. The “take-it-or leave-it” package offeredto cotton farmers allowed the companies to specify and also enforce desired inputlevels for cotton production at a time when smallholders in general were reducingthe quantity of purchased inputs because of devaluation and the removal of subsidieson agricultural inputs. This system of payment for inputs guaranteed cotton farmerssome return even in bad years.
Subsequently, the method of payment for inputs has evolved, such that farmersnow make explicit payment for fertilizer, thereby bearing more of the risk associatedwith fertilizer use. However, pre-harvest services are still provided on a credit basis
234
Trade reforms and food security – country case studies and synthesis
within a “take-it-or leave-it” package. Whilst the lack of competition in price settingcontributed to the control of output diversion, it also removed any dynamics to raisereal prices for farmers. It has been shown that there has been a steady decline in theseed cotton price relative to prices of major competing crops in the north since theliberalization of the cotton sector in 1985 (Blench, 1999).
Agricultural researchResearch facilities had deteriorated and funding of research and extension were solow that after paying staff salaries nothing was left for operations, maintenance andreplacement of equipment. Improvements introduced into the national agriculturalresearch system have created an enabling environment for scientists to conductsustainable research that is addressing the constraints in agricultural development.The national agricultural research programme (NARP) has lifted the moral ofagricultural scientists and has made them more effective partners with scientists ofregional and international agricultural research centres.
Central government spending on agricultureThe devaluation and fiscal measures introduced as part of the reform programmemade it possible to increase central government spending in real terms and as a shareof GDP. Spending on agriculture as a share of central government spending howeverhas registered a steady decline since the start of the reforms (Table 3).
Real spending on agriculture has fallen considerably during the period. Donorlending has become important for the sector, contributing at least half of the publicsector resources allocated to the sector in most years, and over 60 percent in 2002and 2003.
TABLE 3 Central government spending on agriculture*, 1983-2000
Percent share of total spending Real spending GHC million1983 10.4 586.51984 4.9 361.81985 4.2 419.01986 4.5 636.11989 0.5 790.81990 4.1 658.11991 3.6 661.21992 3.1 760.21993 2.8 769.41994 1.7 513.71995 1.7 455.11996 1.5 425.21997 1.9 785.11998 1.5 661.21999 1.3 536.72000 0.9 374.2
* Based on information on budgetary allocations to the Ministry of Food and Agriculture. This does not capture total centralgovernment support to the sector, since spending on feeder roads for example, that comes under a separate ministry, has adirect impact on agriculture activities.
Source: Calculated from data of the Statistical Service Quarterly Digest of Statistics, various issues.
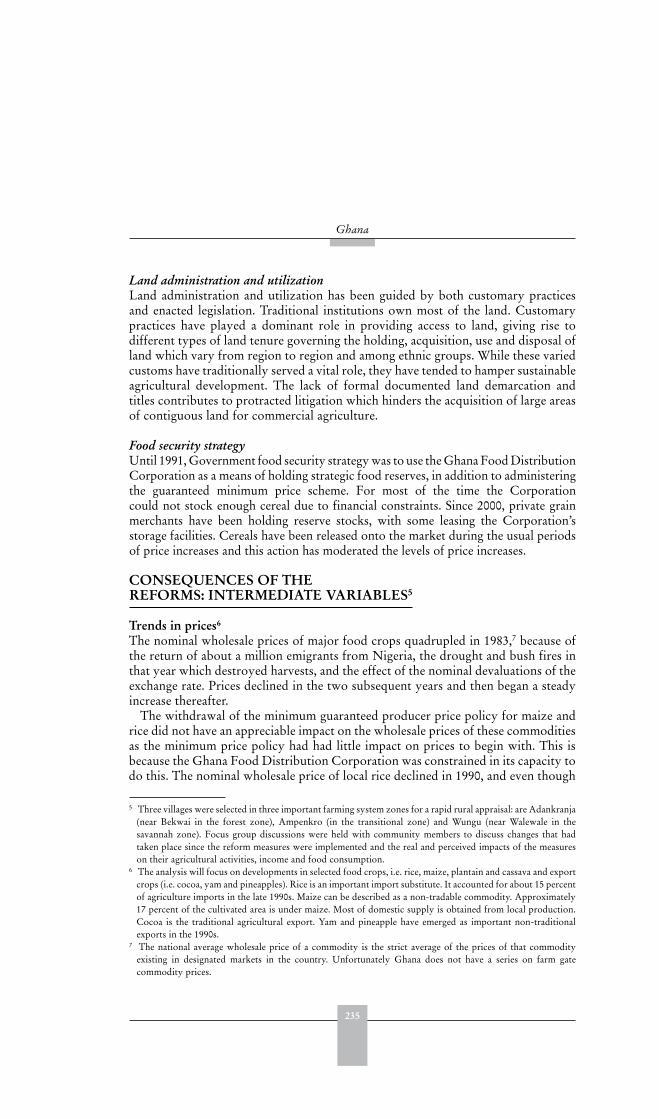
235
Ghana
Land administration and utilizationLand administration and utilization has been guided by both customary practicesand enacted legislation. Traditional institutions own most of the land. Customarypractices have played a dominant role in providing access to land, giving rise todifferent types of land tenure governing the holding, acquisition, use and disposal ofland which vary from region to region and among ethnic groups. While these variedcustoms have traditionally served a vital role, they have tended to hamper sustainableagricultural development. The lack of formal documented land demarcation andtitles contributes to protracted litigation which hinders the acquisition of large areasof contiguous land for commercial agriculture.
Food security strategyUntil 1991, Government food security strategy was to use the Ghana Food DistributionCorporation as a means of holding strategic food reserves, in addition to administeringthe guaranteed minimum price scheme. For most of the time the Corporationcould not stock enough cereal due to financial constraints. Since 2000, private grainmerchants have been holding reserve stocks, with some leasing the Corporation’sstorage facilities. Cereals have been released onto the market during the usual periodsof price increases and this action has moderated the levels of price increases.
CONSEQUENCES OF THEREFORMS: INTERMEDIATE VARIABLES5
Trends in prices6
The nominal wholesale prices of major food crops quadrupled in 1983,7 because ofthe return of about a million emigrants from Nigeria, the drought and bush fires inthat year which destroyed harvests, and the effect of the nominal devaluations of theexchange rate. Prices declined in the two subsequent years and then began a steadyincrease thereafter.
The withdrawal of the minimum guaranteed producer price policy for maize andrice did not have an appreciable impact on the wholesale prices of these commoditiesas the minimum price policy had had little impact on prices to begin with. This isbecause the Ghana Food Distribution Corporation was constrained in its capacity todo this. The nominal wholesale price of local rice declined in 1990, and even though
5 Three villages were selected in three important farming system zones for a rapid rural appraisal: are Adankranja(near Bekwai in the forest zone), Ampenkro (in the transitional zone) and Wungu (near Walewale in thesavannah zone). Focus group discussions were held with community members to discuss changes that hadtaken place since the reform measures were implemented and the real and perceived impacts of the measureson their agricultural activities, income and food consumption.
6 The analysis will focus on developments in selected food crops, i.e. rice, maize, plantain and cassava and exportcrops (i.e. cocoa, yam and pineapples). Rice is an important import substitute. It accounted for about 15 percentof agriculture imports in the late 1990s. Maize can be described as a non-tradable commodity. Approximately17 percent of the cultivated area is under maize. Most of domestic supply is obtained from local production.Cocoa is the traditional agricultural export. Yam and pineapple have emerged as important non-traditionalexports in the 1990s.
7 The national average wholesale price of a commodity is the strict average of the prices of that commodityexisting in designated markets in the country. Unfortunately Ghana does not have a series on farm gatecommodity prices.
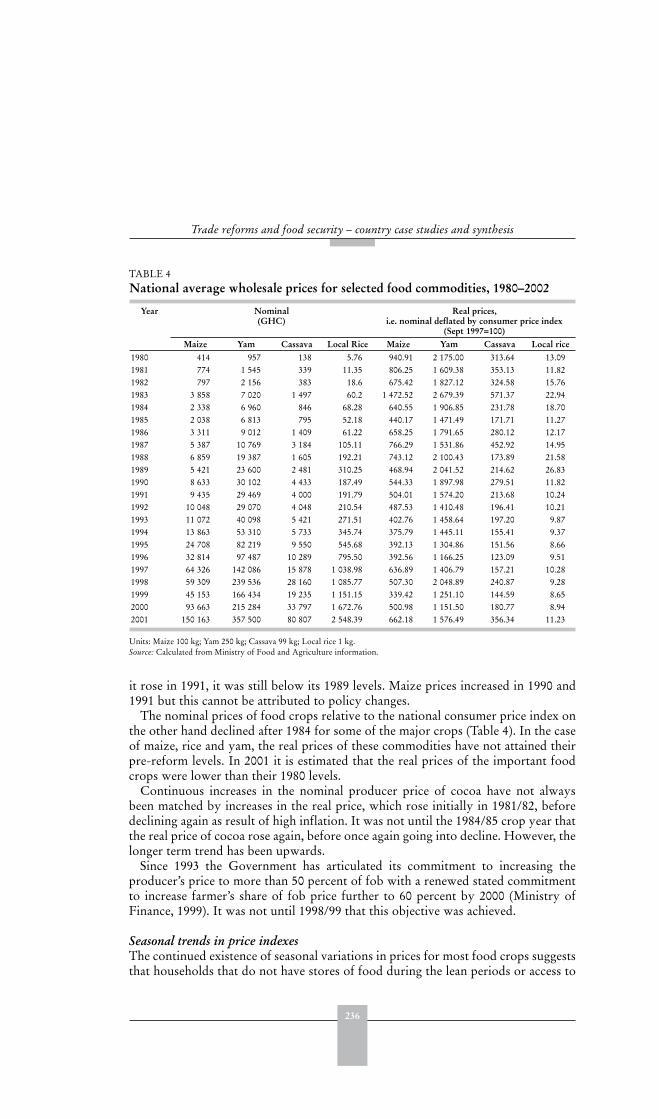
236
Trade reforms and food security – country case studies and synthesis
it rose in 1991, it was still below its 1989 levels. Maize prices increased in 1990 and1991 but this cannot be attributed to policy changes.
The nominal prices of food crops relative to the national consumer price index onthe other hand declined after 1984 for some of the major crops (Table 4). In the caseof maize, rice and yam, the real prices of these commodities have not attained theirpre-reform levels. In 2001 it is estimated that the real prices of the important foodcrops were lower than their 1980 levels.
Continuous increases in the nominal producer price of cocoa have not alwaysbeen matched by increases in the real price, which rose initially in 1981/82, beforedeclining again as result of high inflation. It was not until the 1984/85 crop year thatthe real price of cocoa rose again, before once again going into decline. However, thelonger term trend has been upwards.
Since 1993 the Government has articulated its commitment to increasing theproducer’s price to more than 50 percent of fob with a renewed stated commitmentto increase farmer’s share of fob price further to 60 percent by 2000 (Ministry ofFinance, 1999). It was not until 1998/99 that this objective was achieved.
Seasonal trends in price indexesThe continued existence of seasonal variations in prices for most food crops suggeststhat households that do not have stores of food during the lean periods or access to
TABLE 4 National average wholesale prices for selected food commodities, 1980–2002
Year Nominal(GHC)
Real prices,i.e. nominal deflated by consumer price index
(Sept 1997=100)Maize Yam Cassava Local Rice Maize Yam Cassava Local rice
1980 414 957 138 5.76 940.91 2 175.00 313.64 13.091981 774 1 545 339 11.35 806.25 1 609.38 353.13 11.821982 797 2 156 383 18.6 675.42 1 827.12 324.58 15.761983 3 858 7 020 1 497 60.2 1 472.52 2 679.39 571.37 22.941984 2 338 6 960 846 68.28 640.55 1 906.85 231.78 18.701985 2 038 6 813 795 52.18 440.17 1 471.49 171.71 11.271986 3 311 9 012 1 409 61.22 658.25 1 791.65 280.12 12.171987 5 387 10 769 3 184 105.11 766.29 1 531.86 452.92 14.951988 6 859 19 387 1 605 192.21 743.12 2 100.43 173.89 21.581989 5 421 23 600 2 481 310.25 468.94 2 041.52 214.62 26.831990 8 633 30 102 4 433 187.49 544.33 1 897.98 279.51 11.821991 9 435 29 469 4 000 191.79 504.01 1 574.20 213.68 10.241992 10 048 29 070 4 048 210.54 487.53 1 410.48 196.41 10.211993 11 072 40 098 5 421 271.51 402.76 1 458.64 197.20 9.871994 13 863 53 310 5 733 345.74 375.79 1 445.11 155.41 9.371995 24 708 82 219 9 550 545.68 392.13 1 304.86 151.56 8.661996 32 814 97 487 10 289 795.50 392.56 1 166.25 123.09 9.511997 64 326 142 086 15 878 1 038.98 636.89 1 406.79 157.21 10.281998 59 309 239 536 28 160 1 085.77 507.30 2 048.89 240.87 9.281999 45 153 166 434 19 235 1 151.15 339.42 1 251.10 144.59 8.652000 93 663 215 284 33 797 1 672.76 500.98 1 151.50 180.77 8.942001 150 163 357 500 80 807 2 548.39 662.18 1 576.49 356.34 11.23
Units: Maize 100 kg; Yam 250 kg; Cassava 99 kg; Local rice 1 kg.Source: Calculated from Ministry of Food and Agriculture information.
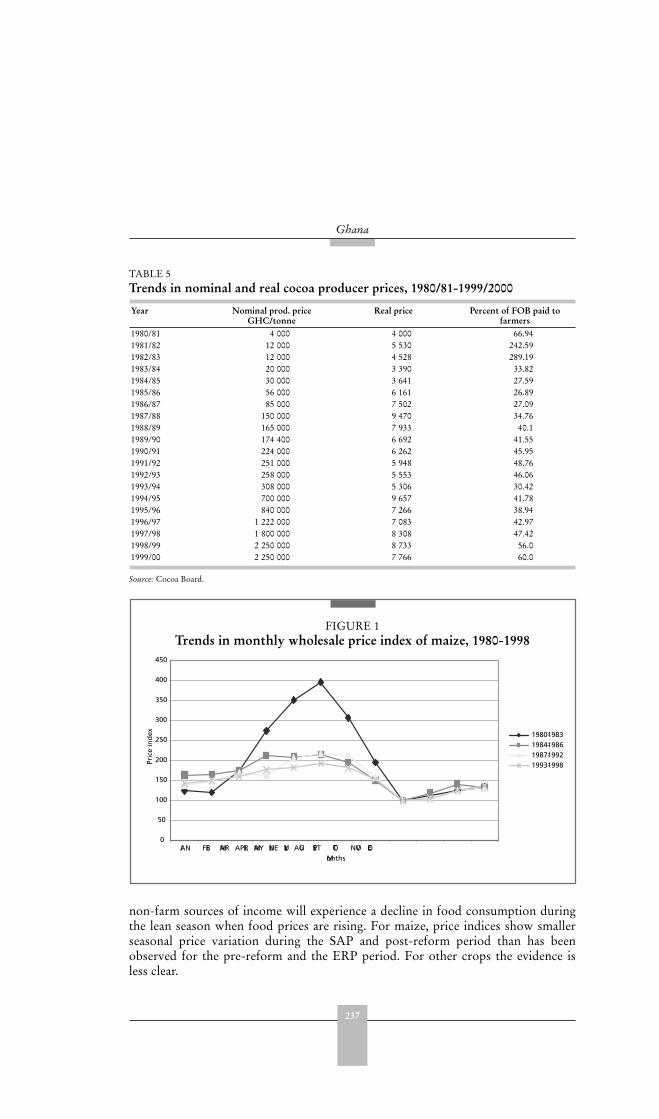
237
Ghana
non-farm sources of income will experience a decline in food consumption duringthe lean season when food prices are rising. For maize, price indices show smallerseasonal price variation during the SAP and post-reform period than has beenobserved for the pre-reform and the ERP period. For other crops the evidence isless clear.
TABLE 5Trends in nominal and real cocoa producer prices, 1980/81-1999/2000
Year Nominal prod. price GHC/tonne
Real price Percent of FOB paid to farmers
1980/81 4 000 4 000 66.941981/82 12 000 5 530 242.591982/83 12 000 4 528 289.191983/84 20 000 3 390 33.821984/85 30 000 3 641 27.591985/86 56 000 6 161 26.891986/87 85 000 7 502 27.091987/88 150 000 9 470 34.761988/89 165 000 7 933 40.11989/90 174 400 6 692 41.551990/91 224 000 6 262 45.951991/92 251 000 5 948 48.761992/93 258 000 5 553 46.061993/94 308 000 5 306 30.421994/95 700 000 9 657 41.781995/96 840 000 7 266 38.941996/97 1 222 000 7 083 42.971997/98 1 800 000 8 308 47.421998/99 2 250 000 8 733 56.01999/00 2 250 000 7 766 60.0
Source: Cocoa Board.
FIGURE 1Trends in monthly wholesale price index of maize, 1980-1998
0
50
100
150
200
250
300
350
400
450
JAN FEB MAR APRIL MAY JUNE JULY AUG SEPT OCT NOV DECMonths
Pric
e in
dex 1980-1983
1984-19861987-19921993-1998
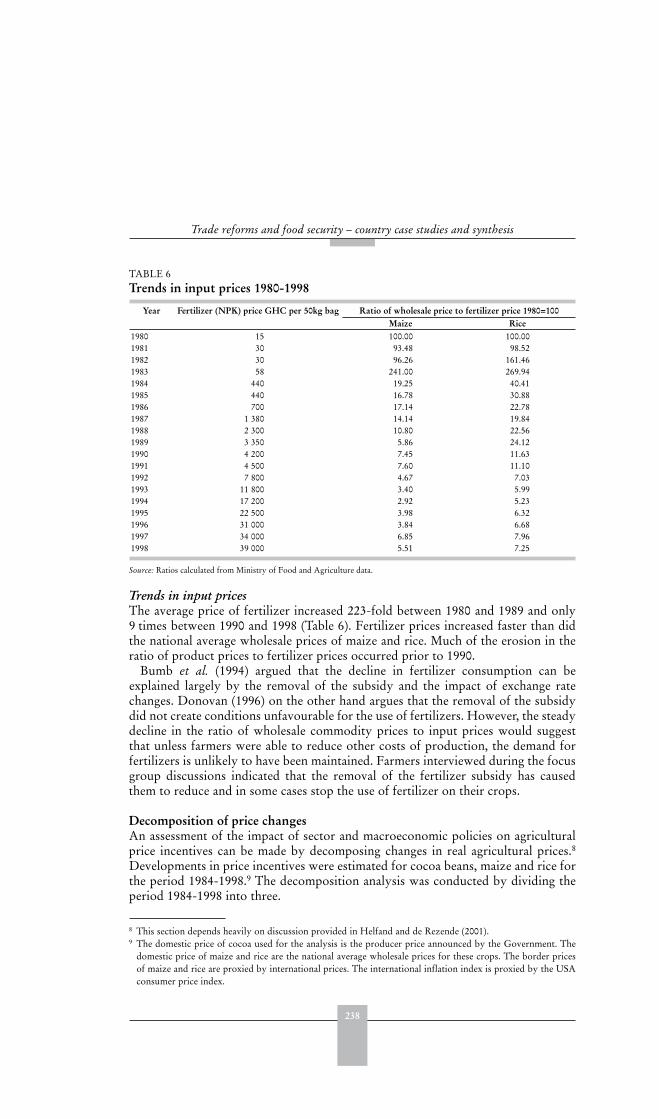
238
Trade reforms and food security – country case studies and synthesis
Trends in input pricesThe average price of fertilizer increased 223-fold between 1980 and 1989 and only9 times between 1990 and 1998 (Table 6). Fertilizer prices increased faster than didthe national average wholesale prices of maize and rice. Much of the erosion in theratio of product prices to fertilizer prices occurred prior to 1990.
Bumb et al. (1994) argued that the decline in fertilizer consumption can beexplained largely by the removal of the subsidy and the impact of exchange ratechanges. Donovan (1996) on the other hand argues that the removal of the subsidydid not create conditions unfavourable for the use of fertilizers. However, the steadydecline in the ratio of wholesale commodity prices to input prices would suggestthat unless farmers were able to reduce other costs of production, the demand forfertilizers is unlikely to have been maintained. Farmers interviewed during the focusgroup discussions indicated that the removal of the fertilizer subsidy has causedthem to reduce and in some cases stop the use of fertilizer on their crops.
Decomposition of price changesAn assessment of the impact of sector and macroeconomic policies on agriculturalprice incentives can be made by decomposing changes in real agricultural prices.8
Developments in price incentives were estimated for cocoa beans, maize and rice forthe period 1984-1998.9 The decomposition analysis was conducted by dividing theperiod 1984-1998 into three.
8 This section depends heavily on discussion provided in Helfand and de Rezende (2001).9 The domestic price of cocoa used for the analysis is the producer price announced by the Government. The
domestic price of maize and rice are the national average wholesale prices for these crops. The border pricesof maize and rice are proxied by international prices. The international inflation index is proxied by the USAconsumer price index.
TABLE 6 Trends in input prices 1980-1998
Year Fertilizer (NPK) price GHC per 50kg bag Ratio of wholesale price to fertilizer price 1980=100Maize Rice
1980 15 100.00 100.001981 30 93.48 98.521982 30 96.26 161.461983 58 241.00 269.941984 440 19.25 40.411985 440 16.78 30.881986 700 17.14 22.781987 1 380 14.14 19.841988 2 300 10.80 22.561989 3 350 5.86 24.121990 4 200 7.45 11.631991 4 500 7.60 11.101992 7 800 4.67 7.031993 11 800 3.40 5.991994 17 200 2.92 5.231995 22 500 3.98 6.321996 31 000 3.84 6.681997 34 000 6.85 7.961998 39 000 5.51 7.25
Source: Ratios calculated from Ministry of Food and Agriculture data.
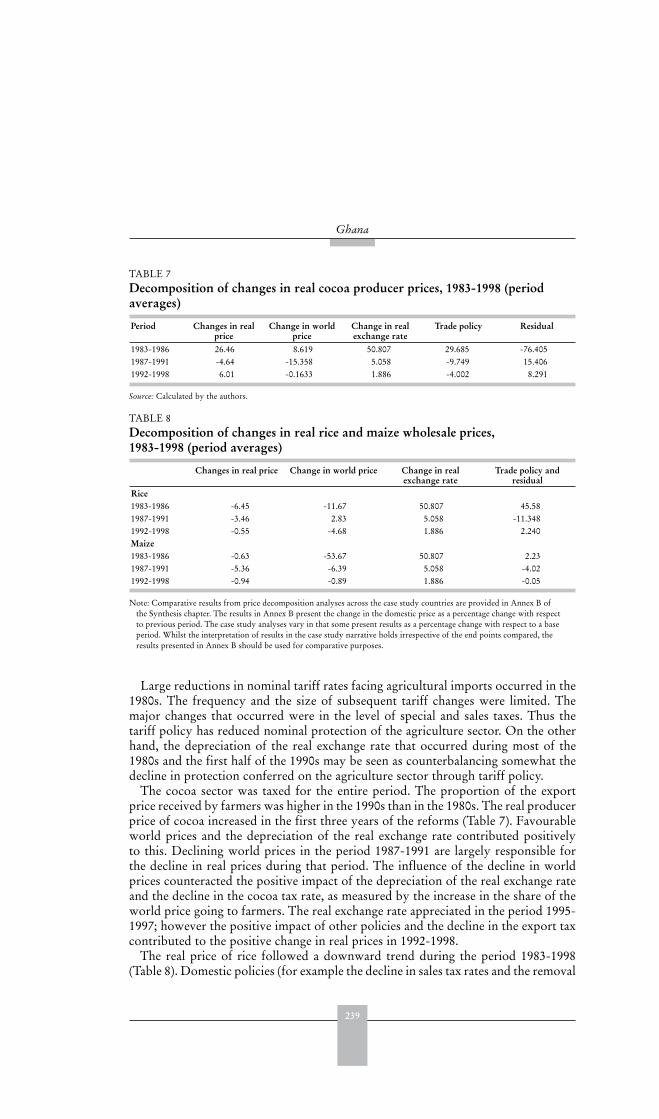
239
Ghana
Large reductions in nominal tariff rates facing agricultural imports occurred in the1980s. The frequency and the size of subsequent tariff changes were limited. Themajor changes that occurred were in the level of special and sales taxes. Thus thetariff policy has reduced nominal protection of the agriculture sector. On the otherhand, the depreciation of the real exchange rate that occurred during most of the1980s and the first half of the 1990s may be seen as counterbalancing somewhat thedecline in protection conferred on the agriculture sector through tariff policy.
The cocoa sector was taxed for the entire period. The proportion of the exportprice received by farmers was higher in the 1990s than in the 1980s. The real producerprice of cocoa increased in the first three years of the reforms (Table 7). Favourableworld prices and the depreciation of the real exchange rate contributed positivelyto this. Declining world prices in the period 1987-1991 are largely responsible forthe decline in real prices during that period. The influence of the decline in worldprices counteracted the positive impact of the depreciation of the real exchange rateand the decline in the cocoa tax rate, as measured by the increase in the share of theworld price going to farmers. The real exchange rate appreciated in the period 1995-1997; however the positive impact of other policies and the decline in the export taxcontributed to the positive change in real prices in 1992-1998.
The real price of rice followed a downward trend during the period 1983-1998(Table 8). Domestic policies (for example the decline in sales tax rates and the removal
TABLE 7 Decomposition of changes in real cocoa producer prices, 1983-1998 (period averages)
Period Changes in real price
Change in world price
Change in real exchange rate
Trade policy Residual
1983-1986 26.46 8.619 50.807 29.685 -76.4051987-1991 -4.64 -15.358 5.058 -9.749 15.4061992-1998 6.01 -0.1633 1.886 -4.002 8.291
Source: Calculated by the authors.
TABLE 8 Decomposition of changes in real rice and maize wholesale prices, 1983-1998 (period averages)
Changes in real price Change in world price Change in real exchange rate
Trade policy and residual
Rice1983-1986 -6.45 -11.67 50.807 45.581987-1991 -3.46 2.83 5.058 -11.3481992-1998 -0.55 -4.68 1.886 2.240Maize1983-1986 -0.63 -53.67 50.807 2.231987-1991 -5.36 -6.39 5.058 -4.021992-1998 -0.94 -0.89 1.886 -0.05
Note: Comparative results from price decomposition analyses across the case study countries are provided in Annex B ofthe Synthesis chapter. The results in Annex B present the change in the domestic price as a percentage change with respectto previous period. The case study analyses vary in that some present results as a percentage change with respect to a baseperiod. Whilst the interpretation of results in the case study narrative holds irrespective of the end points compared, theresults presented in Annex B should be used for comparative purposes.
240
Trade reforms and food security – country case studies and synthesis
of quantitative restrictions) and the decline in tariff rates contributed the most to thisdecline in real price. The decline in the real wholesale price of rice occurred despitethe depreciation of the real exchange rate. Import tariff rates hardly changed at allin the years 1992 to 1998. During this period the effect of domestic policy was lessthan that of international prices.
The trend of real maize prices was downwards in each of the three periods(Table 8). The declining world price and the trade and other policies account for this.Unlike the case of rice, declining world prices, and not domestic policy, was largelyresponsible for the fall that occurred.
A further analysis of the effect of macroeconomic and sector policies on priceincentives was conducted by estimating an econometric relationship between thesevariables and the ratio of the price of cocoa to the price of manufactured products(see Annex). The results suggest that a 1 percent change in the real exchange ratewould generate a similar proportional change in the ratio of cocoa producer priceto manufactured goods price. A negative relationship between the export tax oncocoa and the cocoa producer price to manufactured goods price ratio is found.The terms of trade between cocoa and manufactured goods tend to favour cocoaproducers after the reform programme. However, with the passage of time theterms of trade between cocoa and manufactured goods tends to favour producersof the latter. Lastly, the findings show that the past relative price ratio betweencocoa and manufactured goods does exert some influence on the current relativeprice ratio.
Price margins and market integrationThe price spread between wholesale and retail prices appears to be constantin absolute and percentage terms (Austin Associates Inc, 1990, Aniwa, 1996).Marketing margins expressed as a percentage of the retail price range between8 percent and 87 percent for the various commodities. Generally, market margins arehigher for starchy staples and rice compared to other commodities. The main reasonfor this is the bulky nature and low value of the starchy commodities and the greaterprocessing requirement in the case of rice.
There is also evidence of market integration, with little segmentation in the maizemarket Prices were transmitted from the net importing areas to the net producingcentres. The improving transportation network has been important in explainingthe relatively high degree of price transmission: market connectedness was greaterfor those centres that had better transportation links compared to those that did not(Badiane and Shively, 1998).
Effect on agricultural output and value addedIn this section, the findings from the price analysis are related to evidence ofchanges in output levels. These are presented on an annual basis by changes inarea and in yield the aim being to attempt to establish a link between prices (andnon-price factors) and output by examining the nature of the output response (orlack of).
In assessing the ability of producers to respond it is important to recognize theagroclimatic context within which they operate, as illustrated in Box 1.
241
Ghana
BOX 1Agroclimatic conditions
About 57 percent of the land area of Ghana, estimated at 23 853 900 hectares, isavailable for agriculture, of which 42 percent was under cultivation in 2001 (including0.08 percent land under irrigation). Although this may suggest an excess supply ofagricultural land, there are many indications of land scarcity, including: the virtualelimination of shifting cultivation and the dominance of fallow rotation; increased land-use intensity as reflected in a shortening of the fallow period, and in some areas (e.g.Upper East Region) a total elimination of fallow; the changing mix of crops in favourof low input crops (e.g. the replacement of yam by cassava); increasing migration offarmers from areas of low productivity to areas such as Brong Ahafo and the WesternRegions where there is more fertile land; and changes in the method of land acquisition.The lack of management of land as a common property resource is a major constraintto agricultural land use. This is most critical in the livestock producing areas whereanimals are reared using free-range systems. The destruction of crops by grazinglivestock is also a major source of conflict between herdsmen and crop farmers.
There are four major ecological zones in Ghana. The coastal zone has mean rainfallof between 800-1 200 mm. Cereals, in particular maize, are important in this zone.The forest zone comprises about a third of the country. Mean rainfall ranges between1 500 and 2 000 mm and there is a bi-modal rainfall pattern. The major crops tobe found here are tree crops (for example cocoa), plantains, cocoyam and cassava.The transition zone, lying between the forest and savannah zone, is important forthe production of grain for commerce, and also produces root crops such as yamand cassava. This zone has two rainy seasons with a mean rainfall of 1 300 mm perannum. The savannah zone, in the northern part of the country, comprises almosttwo thirds of the land area. There is one rainy season and mean rainfall averages800-1 100 mm. The major crops here are cereals, pulses, cotton and yam.
Soil fertility between zones, but is generally low as a result of extensive soildegradation caused by various degrees of erosion and nutrient mining fromcontinuous cropping. Most soils are old and have been leached over an extendedperiod of time, resulting in low organic matter contents, and require carefulmanagement to support good crop yields. To crop yields, the soils require inputs,such as mineral and organic fertilizers, and on-farm organic recycling practices.
Rainfall levels make it possible to have at least one successful cropping every yearthroughout Ghana. However, poor distribution and the erratic nature of rainfall makethe achievement of successful cropping difficult. For instance, the interior savannahzone has between 90 and 120 days when soil moisture is favourable for crop growth.Within this growing period dry spells often occur at critical stages of plant growth,thus increasing the probability of crop failure. Supplementary irrigation wouldtherefore reduce this risk. Furthermore, irrigation would allow more than one crop tobe produced within the year and also increase productivity by making it possible forgreater use of purchased inputs such as fertilizer.
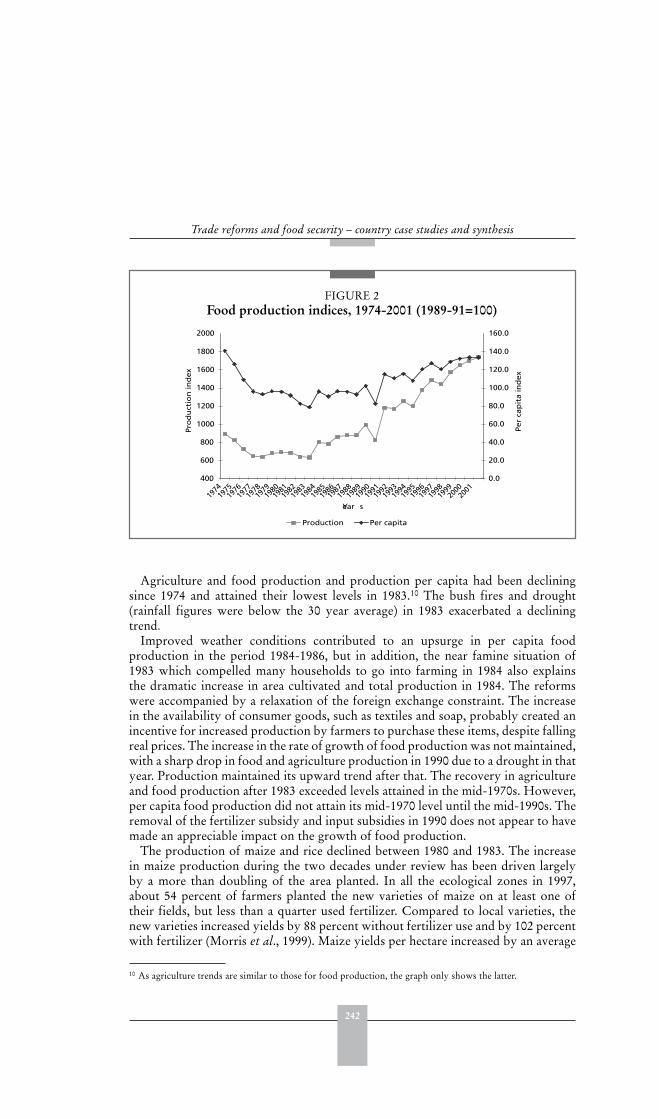
242
Trade reforms and food security – country case studies and synthesis
Agriculture and food production and production per capita had been decliningsince 1974 and attained their lowest levels in 1983.10 The bush fires and drought(rainfall figures were below the 30 year average) in 1983 exacerbated a decliningtrend.
Improved weather conditions contributed to an upsurge in per capita foodproduction in the period 1984-1986, but in addition, the near famine situation of1983 which compelled many households to go into farming in 1984 also explainsthe dramatic increase in area cultivated and total production in 1984. The reformswere accompanied by a relaxation of the foreign exchange constraint. The increasein the availability of consumer goods, such as textiles and soap, probably created anincentive for increased production by farmers to purchase these items, despite fallingreal prices. The increase in the rate of growth of food production was not maintained,with a sharp drop in food and agriculture production in 1990 due to a drought in thatyear. Production maintained its upward trend after that. The recovery in agricultureand food production after 1983 exceeded levels attained in the mid-1970s. However,per capita food production did not attain its mid-1970 level until the mid-1990s. Theremoval of the fertilizer subsidy and input subsidies in 1990 does not appear to havemade an appreciable impact on the growth of food production.
The production of maize and rice declined between 1980 and 1983. The increasein maize production during the two decades under review has been driven largelyby a more than doubling of the area planted. In all the ecological zones in 1997,about 54 percent of farmers planted the new varieties of maize on at least one oftheir fields, but less than a quarter used fertilizer. Compared to local varieties, thenew varieties increased yields by 88 percent without fertilizer use and by 102 percentwith fertilizer (Morris et al., 1999). Maize yields per hectare increased by an average
10 As agriculture trends are similar to those for food production, the graph only shows the latter.
FIGURE 2Food production indices, 1974-2001 (1989-91=100)
40.0
60.0
80.0
100.0
120.0
140.0
160.0
180.0
200.0
Year s
Pro
du
ctio
n i
nd
ex
0.0
20.0
40.0
60.0
80.0
100.0
120.0
140.0
160.0
Pe
r ca
pit
a i
nd
ex
Production Per capita
198219
8319
8419
8519
8619
8719
8819
8919
9019
9119
9219
9319
9419
9519
9619
9719
8119
9819
9919
8020
0020
0119
7919
7819
7719
7619
7519
74

243
Ghana
of just under 2 percent per annum between 1980 and 2002. The major improvementsin output per hectare occurred in the 1980s. Little if any change in productivity tookplace in the 1990s. The trend in real maize prices was downwards between 1980 and1998. Input prices and the minimum daily wage have risen faster than have maizewholesale prices over the same period. The low contribution of intensification tothe increase in production can be explained by the high cost of inputs needed forintensification faced by the average maize farmer.
Productivity in the food crop sector is quite low. Estimates of achievable yieldsshow that there is a wide gap between actual yields and the potential (Table 10).
The expansion in rice production has been due to a combination of increasingarea under cultivation and a growth in productivity. Indeed, in the period since1999, there has been limited expansion in the area planted to rice. Any increase inrice production that has been recorded is due largely to improvements in yields.Approximately 400 000 hectares is suitable for the development of lowland rice butonly a fraction of this potential is currently being cultivated. A number of projectshave been implemented to increase rice yields through improved farming practices
TABLE 9 Decomposition of sources of growth of selected food crops, 1980-2002
Crop Period Output growth Hectarage ProductivityMaize 1980-1983 -0.196 -0.029 -0.167
1984-1986 0.460 0.174 0.2851987-1991 0.102 0.051 0.0511992-1998 0.011 0.017 -0.0061999-2002 0.108 0.100 0.0081980-2002 0.066 0.048 0.018
Rice 1980-1983 -0.213 -0.113 -0.1001984-1986 0.319 0.226 0.0931987-1991 0.154 0.034 0.1201992-1998 0.089 0.053 0.0361999-2002 -0.001 -0.015 0.0141980-2002 0.065 0.031 0.034
Cassava 1980-1983 -0.131 -0.036 -0.0941984-1986 0.246 0.157 0.0891987-1991 0.137 0.065 0.0721992-1998 0.033 0.023 0.0101999-2002 0.076 0.058 0.0181980-2002 0.062 0.045 0.017
Plantain 1980-1983 -0.010 0.014 -0.0241984-1986 0.122 0.101 0.0211987-1991 0.016 -0.018 0.0341992-1998 0.069 0.049 0.0201999-2002 0.044 0.030 0.0141980-2002 0.046 0.032 0.015
Yam 1980-1983 -0.110 -0.082 -0.0281984-1986 0.362 0.288 0.0741987-1991 0.184 0.048 0.1361992-1998 0.004 -0.011 0.0141999-2002 0.092 0.088 0.0041980-2002 0.085 0.046 0.039
Source: Calculated from Ministry of Food and Agriculture data.
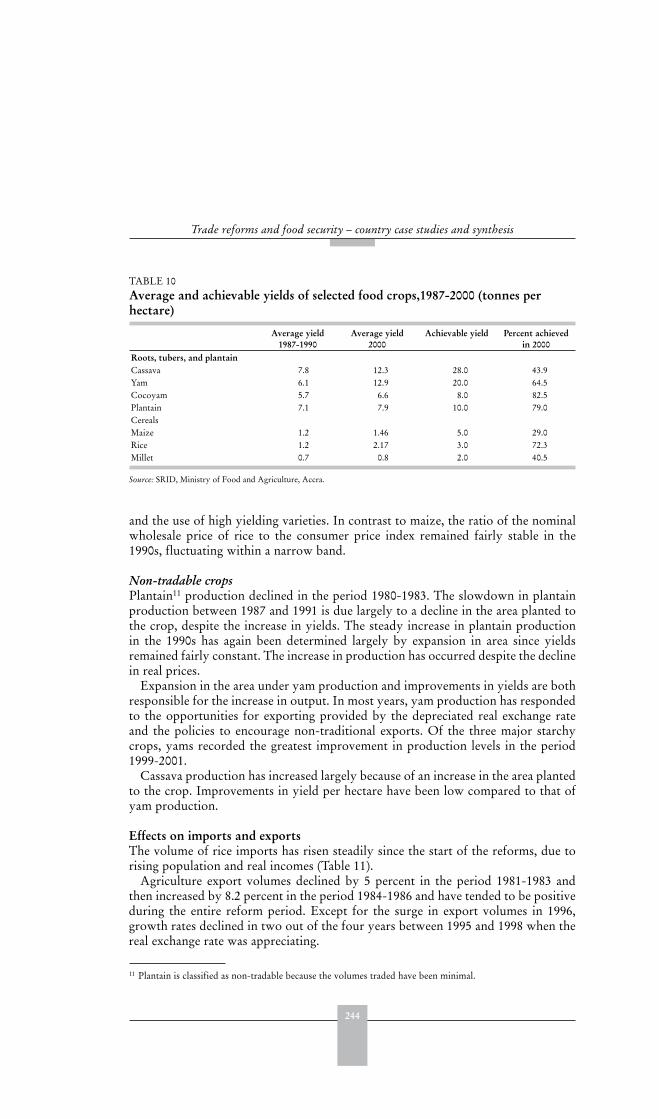
244
Trade reforms and food security – country case studies and synthesis
and the use of high yielding varieties. In contrast to maize, the ratio of the nominalwholesale price of rice to the consumer price index remained fairly stable in the1990s, fluctuating within a narrow band.
Non-tradable crops Plantain11 production declined in the period 1980-1983. The slowdown in plantainproduction between 1987 and 1991 is due largely to a decline in the area planted tothe crop, despite the increase in yields. The steady increase in plantain productionin the 1990s has again been determined largely by expansion in area since yieldsremained fairly constant. The increase in production has occurred despite the declinein real prices.
Expansion in the area under yam production and improvements in yields are bothresponsible for the increase in output. In most years, yam production has respondedto the opportunities for exporting provided by the depreciated real exchange rateand the policies to encourage non-traditional exports. Of the three major starchycrops, yams recorded the greatest improvement in production levels in the period1999-2001.
Cassava production has increased largely because of an increase in the area plantedto the crop. Improvements in yield per hectare have been low compared to that ofyam production.
Effects on imports and exportsThe volume of rice imports has risen steadily since the start of the reforms, due torising population and real incomes (Table 11).
Agriculture export volumes declined by 5 percent in the period 1981-1983 andthen increased by 8.2 percent in the period 1984-1986 and have tended to be positiveduring the entire reform period. Except for the surge in export volumes in 1996,growth rates declined in two out of the four years between 1995 and 1998 when thereal exchange rate was appreciating.
11 Plantain is classified as non-tradable because the volumes traded have been minimal.
TABLE 10 Average and achievable yields of selected food crops,1987-2000 (tonnes per hectare)
Average yield 1987-1990
Average yield 2000
Achievable yield Percent achieved in 2000
Roots, tubers, and plantainCassava 7.8 12.3 28.0 43.9Yam 6.1 12.9 20.0 64.5Cocoyam 5.7 6.6 8.0 82.5Plantain 7.1 7.9 10.0 79.0CerealsMaize 1.2 1.46 5.0 29.0Rice 1.2 2.17 3.0 72.3Millet 0.7 0.8 2.0 40.5
Source: SRID, Ministry of Food and Agriculture, Accra.

245
Ghana
Some diversification of agricultural exports has occurred since the start of theeconomic reforms. Although cocoa exports still dominate, the share of cocoa beansand products has declined from 96 percent in 1986 to 76 percent in 2001. Pineapples,fish and fish products have emerged as important non-traditional agricultureexports (Table 12). The depreciation of the real exchange rate has been a significantexplanation of the expansion of non-traditional exports (Jebuni et al., 1992).
There has been a significant drop in the share of agriculture exports in total exportssince the start of the reforms. From a share of almost 70 percent in 1986, agricultureexports averaged approximately 31 percent for the period 1999-2000. The trendin export volumes has been positive for most of the period since the start of thereforms. Thus the decline in the share of export value can be attributed to fallingworld prices for major agriculture exports and faster growth in non-agriculture
TABLE 11 Trends in rice import volumes, 1980-2001 (period averages)
Year Rice imports (volumes)
Imports as percent of production
Growth in rice imports
1980-1983 32.33 92.87 7.061984-1986 55.20 82.89 36.351987-1991 106.08 98.24 108.611992-1998 148.13 100.77 11.001999-2001 265.80 106.27 19.53
Source: Ministry of Food and Agriculture.
FIGURE 3Volume of agricultural exports and imports, 1980-2000 (1989-91 = 100)
0
50
100
150
200
250
1980 1981 1982 1983 1984 1985 1986 1987 1988 1989 1990 1991 1992 1993 1994 1995 1996 1997 1998 1999 2000
Year s
Ind
ex 1
989-9
1=10
0
Exports Imports
Source: FAOSTAT
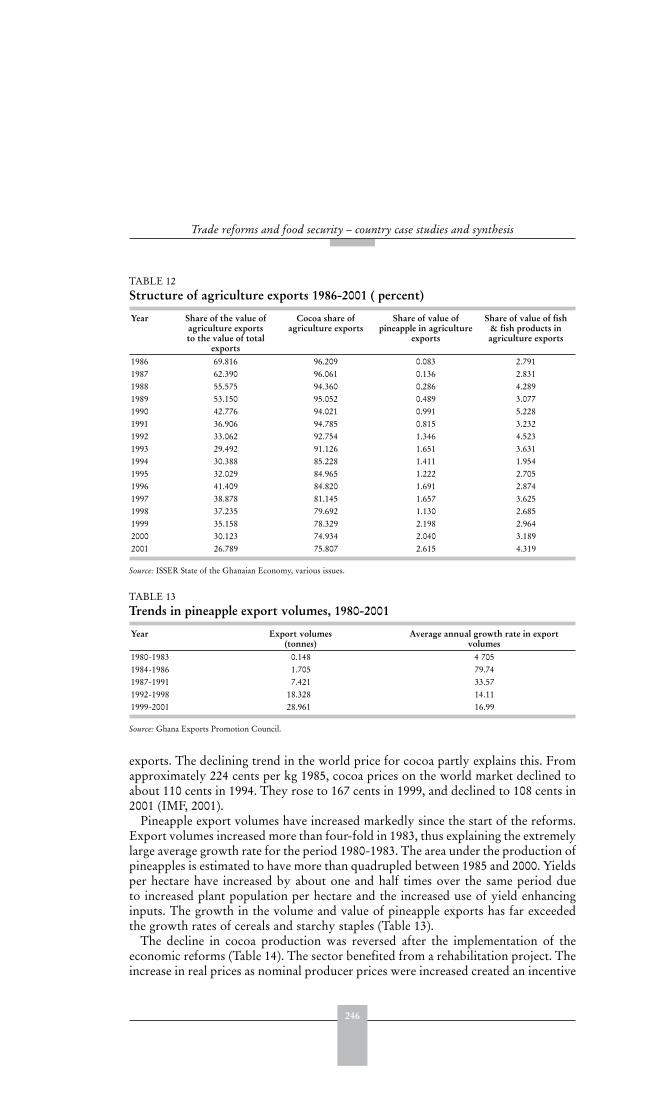
246
Trade reforms and food security – country case studies and synthesis
exports. The declining trend in the world price for cocoa partly explains this. Fromapproximately 224 cents per kg 1985, cocoa prices on the world market declined toabout 110 cents in 1994. They rose to 167 cents in 1999, and declined to 108 cents in2001 (IMF, 2001).
Pineapple export volumes have increased markedly since the start of the reforms.Export volumes increased more than four-fold in 1983, thus explaining the extremelylarge average growth rate for the period 1980-1983. The area under the production ofpineapples is estimated to have more than quadrupled between 1985 and 2000. Yieldsper hectare have increased by about one and half times over the same period dueto increased plant population per hectare and the increased use of yield enhancinginputs. The growth in the volume and value of pineapple exports has far exceededthe growth rates of cereals and starchy staples (Table 13).
The decline in cocoa production was reversed after the implementation of theeconomic reforms (Table 14). The sector benefited from a rehabilitation project. Theincrease in real prices as nominal producer prices were increased created an incentive
TABLE 12 Structure of agriculture exports 1986-2001 ( percent)
Year Share of the value of agriculture exports to the value of total
exports
Cocoa share of agriculture exports
Share of value of pineapple in agriculture
exports
Share of value of fish & fish products in agriculture exports
1986 69.816 96.209 0.083 2.7911987 62.390 96.061 0.136 2.8311988 55.575 94.360 0.286 4.2891989 53.150 95.052 0.489 3.0771990 42.776 94.021 0.991 5.2281991 36.906 94.785 0.815 3.2321992 33.062 92.754 1.346 4.5231993 29.492 91.126 1.651 3.6311994 30.388 85.228 1.411 1.9541995 32.029 84.965 1.222 2.7051996 41.409 84.820 1.691 2.8741997 38.878 81.145 1.657 3.6251998 37.235 79.692 1.130 2.6851999 35.158 78.329 2.198 2.9642000 30.123 74.934 2.040 3.1892001 26.789 75.807 2.615 4.319
Source: ISSER State of the Ghanaian Economy, various issues.
TABLE 13 Trends in pineapple export volumes, 1980-2001
Year Export volumes(tonnes)
Average annual growth rate in export volumes
1980-1983 0.148 4 7051984-1986 1.705 79.741987-1991 7.421 33.571992-1998 18.328 14.111999-2001 28.961 16.99
Source: Ghana Exports Promotion Council.

247
Ghana
to expand production and reduce smuggling, and real cocoa prices and productionfigures have tended to move in tandem. Production levels in 2000 have more thandoubled over the 1983 level. Cocoa export values declined between 1987 until 1993and again between 1998 and 2000, largely because of the fall in world prices.
CONSEQUENCES OF REFORM: TARGET VARIABLES
National food securityNational level indicators suggest that food security improved with the reforms.However, the upturn of the ratio of food imports to total exports (Table 15) and theslow down in the growth of food production per capita, and of cereal productionin particular, beginning in the mid-1990s is suggestive of a deterioration of nationallevel indicators.12 The value of cereal imports began rising in 1997 and in 2001accounted for almost half the value of food imports. For the first time in more than20 years, Ghana, a traditional net food exporter became a net food importer.
Domestic production dominates the supply of maize on the local market. Maizeimports are quite small and did not exceed 1 percent of total domestic supplyover the period 1995-1999 (Table 16). The price of maize on the world market hasdeclined since 1995. Despite this it does not appear that imports have substituteddomestic production.
12 The average growth in food production per capita fell from 4.4 percent during the period 1992-1998 to2.6 percent in the period 1999-2001.
TABLE 14 Trends in cocoa production and exports, 1980/81-2000/01
Crop year Production (tonnes) Exports (tonnes) Cocoa export values 1
(million US$)1980/81 257 974 240 9741981/82 224 882 230 7801982/83 178 626 162 4791983/84 158 956 148 973 268.611984/85 174 813 162 122 381.691985/86 219 044 193 170 411.991986/87 227 764 205 397 503.301987/88 188 176 154 585 495.401988/89 300 101 281 200 462.001989/90 295 051 226 580 407.801990/91 293 352 245 210 360.601991/92 242 817 254 444 349.001992/93 312 123 273 250 302.461993/94 254 655 261 074 285.871994/95 309 456 256 088 320.221995/96 403 824 330 646 389.481996/97 322 500 373 808 551.821997/98 409 400 229 100 470.031998/99 397 700 269 608 620.411999/00 436 800 317 134 552.302000/01 389 800 296 493 437.05
1 For the calendar year.Source : Cocoa Board.
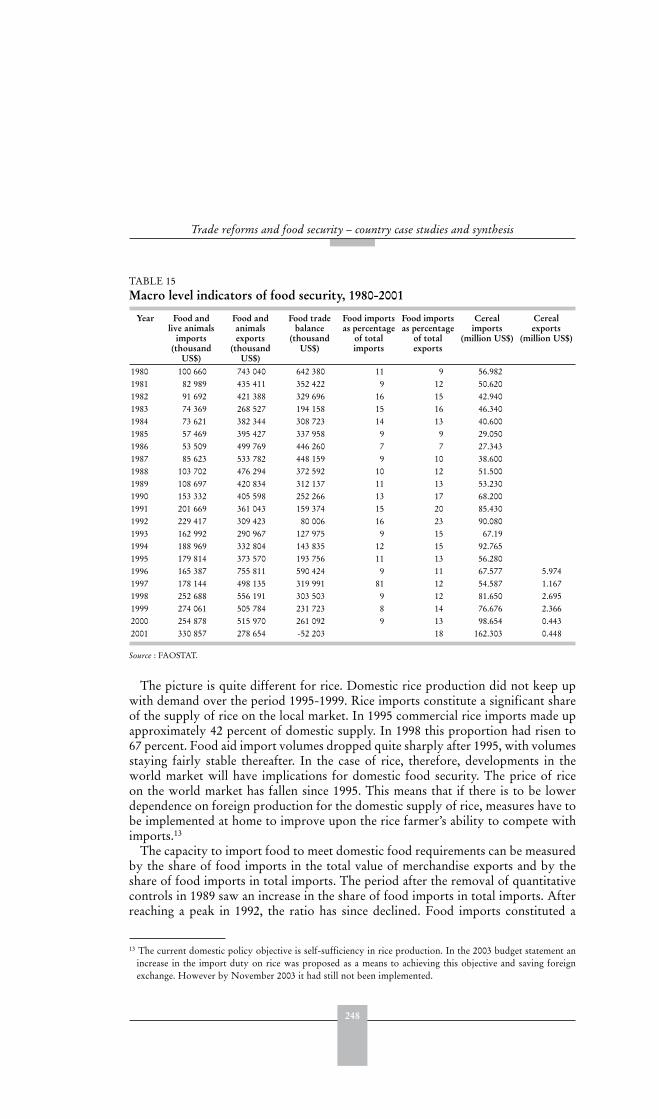
248
Trade reforms and food security – country case studies and synthesis
The picture is quite different for rice. Domestic rice production did not keep upwith demand over the period 1995-1999. Rice imports constitute a significant share
TABLE 15 Macro level indicators of food security, 1980-2001
Year Food and live animals
imports(thousand
US$)
Food and animalsexports
(thousandUS$)
Food trade balance
(thousandUS$)
Food imports as percentage
of total imports
Food imports as percentage
of total exports
Cerealimports
(million US$)
Cerealexports
(million US$)
1980 100 660 743 040 642 380 11 9 56.9821981 82 989 435 411 352 422 9 12 50.6201982 91 692 421 388 329 696 16 15 42.9401983 74 369 268 527 194 158 15 16 46.3401984 73 621 382 344 308 723 14 13 40.6001985 57 469 395 427 337 958 9 9 29.0501986 53 509 499 769 446 260 7 7 27.3431987 85 623 533 782 448 159 9 10 38.6001988 103 702 476 294 372 592 10 12 51.5001989 108 697 420 834 312 137 11 13 53.2301990 153 332 405 598 252 266 13 17 68.2001991 201 669 361 043 159 374 15 20 85.4301992 229 417 309 423 80 006 16 23 90.0801993 162 992 290 967 127 975 9 15 67.191994 188 969 332 804 143 835 12 15 92.7651995 179 814 373 570 193 756 11 13 56.2801996 165 387 755 811 590 424 9 11 67.577 5.9741997 178 144 498 135 319 991 81 12 54.587 1.1671998 252 688 556 191 303 503 9 12 81.650 2.6951999 274 061 505 784 231 723 8 14 76.676 2.3662000 254 878 515 970 261 092 9 13 98.654 0.4432001 330 857 278 654 -52 203 18 162.303 0.448
Source : FAOSTAT.
of the supply of rice on the local market. In 1995 commercial rice imports made upapproximately 42 percent of domestic supply. In 1998 this proportion had risen to67 percent. Food aid import volumes dropped quite sharply after 1995, with volumesstaying fairly stable thereafter. In the case of rice, therefore, developments in theworld market will have implications for domestic food security. The price of riceon the world market has fallen since 1995. This means that if there is to be lowerdependence on foreign production for the domestic supply of rice, measures have tobe implemented at home to improve upon the rice farmer’s ability to compete withimports.13
The capacity to import food to meet domestic food requirements can be measuredby the share of food imports in the total value of merchandise exports and by theshare of food imports in total imports. The period after the removal of quantitativecontrols in 1989 saw an increase in the share of food imports in total imports. Afterreaching a peak in 1992, the ratio has since declined. Food imports constituted a
13 The current domestic policy objective is self-sufficiency in rice production. In the 2003 budget statement anincrease in the import duty on rice was proposed as a means to achieving this objective and saving foreignexchange. However by November 2003 it had still not been implemented.
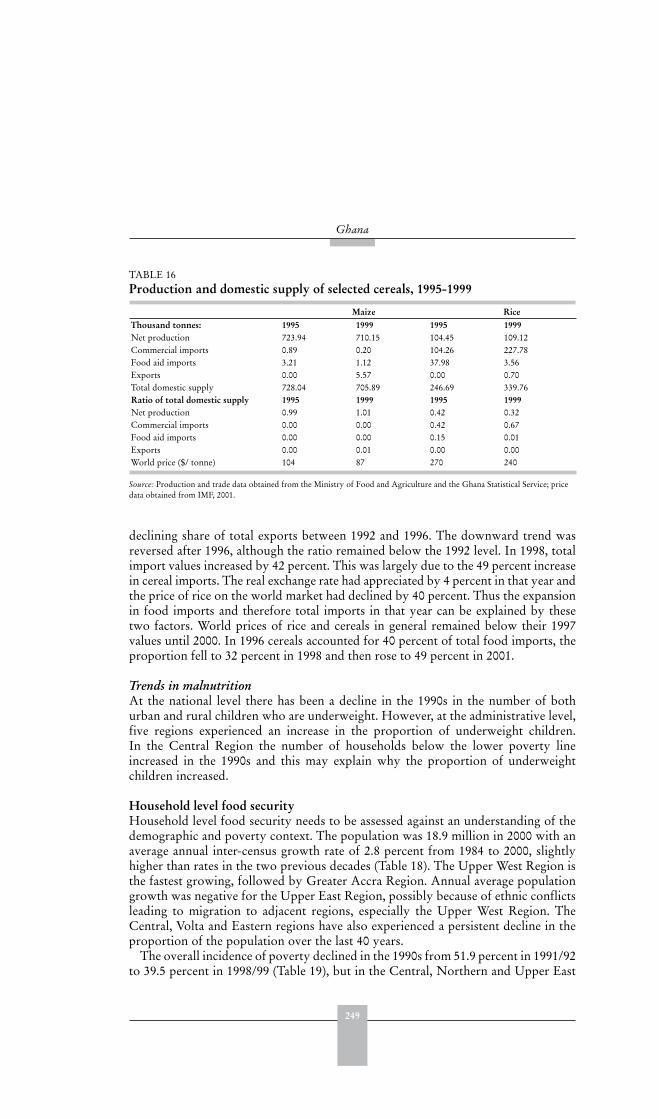
249
Ghana
declining share of total exports between 1992 and 1996. The downward trend wasreversed after 1996, although the ratio remained below the 1992 level. In 1998, totalimport values increased by 42 percent. This was largely due to the 49 percent increasein cereal imports. The real exchange rate had appreciated by 4 percent in that year andthe price of rice on the world market had declined by 40 percent. Thus the expansionin food imports and therefore total imports in that year can be explained by thesetwo factors. World prices of rice and cereals in general remained below their 1997values until 2000. In 1996 cereals accounted for 40 percent of total food imports, theproportion fell to 32 percent in 1998 and then rose to 49 percent in 2001.
Trends in malnutritionAt the national level there has been a decline in the 1990s in the number of bothurban and rural children who are underweight. However, at the administrative level,five regions experienced an increase in the proportion of underweight children.In the Central Region the number of households below the lower poverty lineincreased in the 1990s and this may explain why the proportion of underweightchildren increased.
Household level food securityHousehold level food security needs to be assessed against an understanding of thedemographic and poverty context. The population was 18.9 million in 2000 with anaverage annual inter-census growth rate of 2.8 percent from 1984 to 2000, slightlyhigher than rates in the two previous decades (Table 18). The Upper West Region isthe fastest growing, followed by Greater Accra Region. Annual average populationgrowth was negative for the Upper East Region, possibly because of ethnic conflictsleading to migration to adjacent regions, especially the Upper West Region. TheCentral, Volta and Eastern regions have also experienced a persistent decline in theproportion of the population over the last 40 years.
The overall incidence of poverty declined in the 1990s from 51.9 percent in 1991/92to 39.5 percent in 1998/99 (Table 19), but in the Central, Northern and Upper East
TABLE 16 Production and domestic supply of selected cereals, 1995-1999
Maize RiceThousand tonnes: 1995 1999 1995 1999Net production 723.94 710.15 104.45 109.12Commercial imports 0.89 0.20 104.26 227.78Food aid imports 3.21 1.12 37.98 3.56Exports 0.00 5.57 0.00 0.70Total domestic supply 728.04 705.89 246.69 339.76Ratio of total domestic supply 1995 1999 1995 1999Net production 0.99 1.01 0.42 0.32Commercial imports 0.00 0.00 0.42 0.67Food aid imports 0.00 0.00 0.15 0.01Exports 0.00 0.01 0.00 0.00World price ($/ tonne) 104 87 270 240
Source: Production and trade data obtained from the Ministry of Food and Agriculture and the Ghana Statistical Service; pricedata obtained from IMF, 2001.

250
Trade reforms and food security – country case studies and synthesis
regions it increased. The incidence of poverty declined in all ecological zones withthe exception of the urban savannah.
Households which cannot meet their minimum nutritional requirements even iftheir entire consumption expenditure is spent on food are defined as falling belowthe lower poverty line. With an extreme poverty rate of approximately 27 percentthis implies that over one-quarter of the poor is food insecure. The proportion ofhouseholds in extreme poverty remained the same in the two periods for householdsin the urban coastal and urban savannah regions and increased in rural savannah. Italso increased in the Central, Northern and Upper East regions.
Household income: distribution and changes over timeHousehold surveys conducted in 1991/92 and 1998/99 show that urban householdstend to have higher mean real income levels than rural households (Table 20).However, when households are classified by ecological zone, the distinct urban-
TABLE 17 Underweight children, 1993-1998
Region 1993 1998 Percent change 1993-1998Western 33.1 25.6 -22.7Central 21.5 26.3 22.3Greater Accra 16.9 12.2 -27.8Volta 24.0 24.7 2.9Eastern 20.6 22.3 8.3Ashanti 22.6 24.7 9.3Brong-Ahafo 33.2 24.1 -27.4Northern 41.3 38.1 -7.7Upper West 47.6 28.4 -40.3Upper East 32.8 34.0 3.7Rural 31.4 27.9 -11.1Boys 28.8 25.4 -11.8Girls 25.9 24.3 -6.2National 27.4 24.9 -9.1
Source: Ghana Statistical Service, 1993 and 1998.
TABLE 18 Population distribution by region, 1960-2000
RegionPopulation Percentage distribution
1960 1970 1984 2000 1960 1970 1984 2000
All regions 6 726 800 8 559 313 12 205 574 18 912 079 100.0 100.0 100.0 100.0Western 626 200 770 087 1 116 930 1 924 577 9.3 9.0 9.2 10.2Central 751400 890 135 1 145 520 1 593 823 11.2 10.4 9.4 8.4Greater Accra 541900 903 447 1 420 066 2 905 726 8.1 10.6 11.6 15.4Volta 777300 947 268 1 201 095 1 635 421 11.6 11.1 9.8 8.6Eastern 1 044 100 1 209 828 1 679 483 2 106 696 15.5 14.1 13.8 11.1Ashanti 1 109 100 1 481 698 2 089 683 3 612 950 16.5 17.3 17.1 19.1Brong Ahafo 587 900 766 509 1 179 407 1 815 408 8.7 9.0 9.7 9.6Northern 531 600 727 618 1 162 645 1 820 806 7.9 8.5 9.5 9.6Upper East 468 600 542 858 771 584 576 583 7.0 6.3 6.3 3.0Upper West 288 700 319 865 439 161 920 089 4.3 3.7 3.6 4.9
Source: Ghana Statistical Service, 2002.
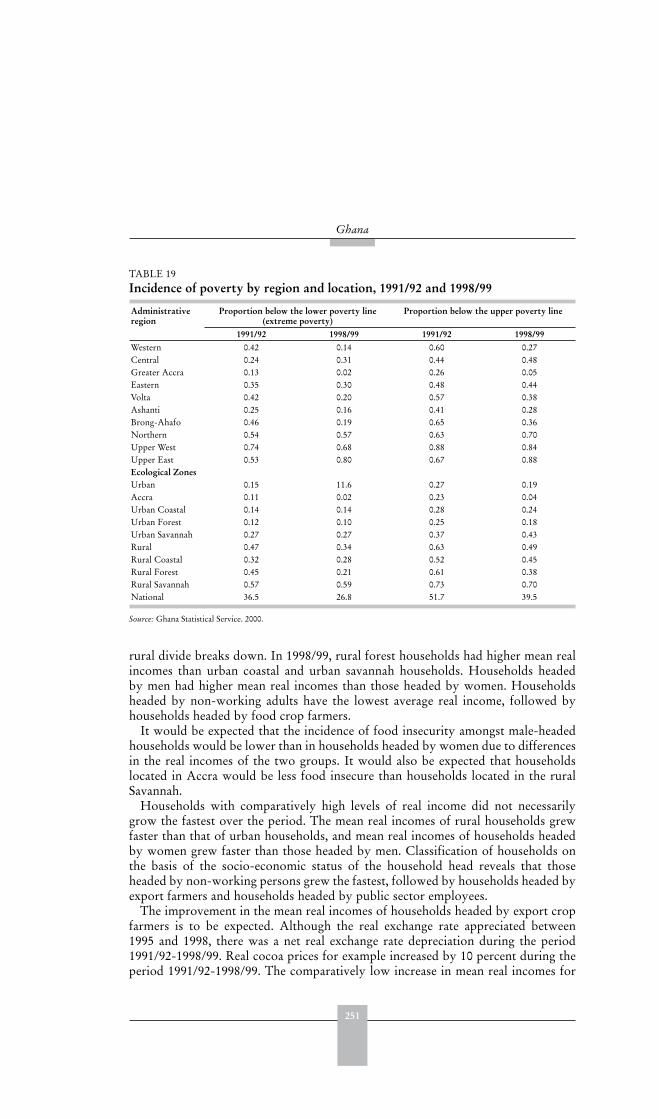
251
Ghana
rural divide breaks down. In 1998/99, rural forest households had higher mean realincomes than urban coastal and urban savannah households. Households headedby men had higher mean real incomes than those headed by women. Householdsheaded by non-working adults have the lowest average real income, followed byhouseholds headed by food crop farmers.
It would be expected that the incidence of food insecurity amongst male-headedhouseholds would be lower than in households headed by women due to differencesin the real incomes of the two groups. It would also be expected that householdslocated in Accra would be less food insecure than households located in the ruralSavannah.
Households with comparatively high levels of real income did not necessarilygrow the fastest over the period. The mean real incomes of rural households grewfaster than that of urban households, and mean real incomes of households headedby women grew faster than those headed by men. Classification of households onthe basis of the socio-economic status of the household head reveals that thoseheaded by non-working persons grew the fastest, followed by households headed byexport farmers and households headed by public sector employees.
The improvement in the mean real incomes of households headed by export cropfarmers is to be expected. Although the real exchange rate appreciated between1995 and 1998, there was a net real exchange rate depreciation during the period1991/92-1998/99. Real cocoa prices for example increased by 10 percent during theperiod 1991/92-1998/99. The comparatively low increase in mean real incomes for
TABLE 19 Incidence of poverty by region and location, 1991/92 and 1998/99
Administrativeregion
Proportion below the lower poverty line (extreme poverty)
Proportion below the upper poverty line
1991/92 1998/99 1991/92 1998/99Western 0.42 0.14 0.60 0.27Central 0.24 0.31 0.44 0.48Greater Accra 0.13 0.02 0.26 0.05Eastern 0.35 0.30 0.48 0.44Volta 0.42 0.20 0.57 0.38Ashanti 0.25 0.16 0.41 0.28Brong-Ahafo 0.46 0.19 0.65 0.36Northern 0.54 0.57 0.63 0.70Upper West 0.74 0.68 0.88 0.84Upper East 0.53 0.80 0.67 0.88Ecological ZonesUrban 0.15 11.6 0.27 0.19Accra 0.11 0.02 0.23 0.04Urban Coastal 0.14 0.14 0.28 0.24Urban Forest 0.12 0.10 0.25 0.18Urban Savannah 0.27 0.27 0.37 0.43Rural 0.47 0.34 0.63 0.49Rural Coastal 0.32 0.28 0.52 0.45Rural Forest 0.45 0.21 0.61 0.38Rural Savannah 0.57 0.59 0.73 0.70National 36.5 26.8 51.7 39.5
Source: Ghana Statistical Service. 2000.

252
Trade reforms and food security – country case studies and synthesis
households headed by food crop farmers could be explained by the fact that for mostof the food crops, real average wholesale prices tended to decline during the period.Real prices for maize, rice and cassava declined during most of the period 1991/92and 1998/99. Thus it is to be expected that over the period households headed byexport crop farmers would be more likely to experience an improvement in foodsecurity than would those headed by food crop farmers.
Farmers interviewed in the forest zone during the rapid rural appraisal indicatedthat they had experienced increasing incomes from cocoa and oil palm. In thetransitional zone most of the increased income was from tomato production.Farmers in the savannah zone did not indicate that their incomes had increasedsubstantially since the start of the reforms. In all instances they indicated that therewas improved access to the market. Traders came to these communities to purchasetheir items for resale in the larger markets. A major complaint of most of the farmerswas that prices offered were low.
Thus the relatively faster growth in real incomes of export crop farmers comparedto food crop farmers can be explained partly by macroeconomic and sector policiesthat resulted in a faster increase in the real prices of export products compared tofood crops. An objective of the reforms was to shift to an outward oriented economywith export-led growth. It seems that the incentive structure was sending out theintended signals.
TABLE 20 Trends in household real income, 1991/92 and 1998/991
Mean real income1991/92 1998/99 Percent change
Gender of household head Male 3 071 948 3 259 713 6.1Female 2 170 161 2 354 208 8.5
Sector of employment of Public sector employee 3 908 895 4 602 600 17.7household head Private formal sector employee 4 159 039 4 403 754 5.9
Private informal sector employee 3 308 995 2 779 164 -16.0Export farmer 2 699 629 3 791 284 40.4Food crop farmer 2 075 806 2 169 628 4.5Non-farm self employment 3 402 077 3 209 280 -5.7Non-working 1 028 217 1 708 039 66.1
Location of household Urban 3 698 861 3 446 233 -6.8Rural 2 397 632 2 796 115 16.6
Location by ecological Accra 3 935 522 4 243 397 7.8zone2 Urban Coastal 3 416 579 3 067 274 -10.2
Urban Forest 3 967 812 3 504 320 -11.7Urban Savannah 3 239 770 2 456 267 -24.2Rural Coastal 1 924 253 2 210 871 14.9Rural Forest 2 779 092 3 171 764 14.1Rural Savannah 2 198 324 2 634 477 19.8Mean income for entire sample 2 829 020 3 012 326 6.5
1 Household income comprises income from employment (cash or kind), agricultural income that includes value of homeconsumption, non-farm self employment income, income from rent, remittances and other incomes. Other incomes includepensions, social security, interest on savings and dividends on investment.
2 The definition of ecological zone developed by the Ghana Statistical Services does not identify the transition zone.Source: Estimated from Ghana Statistical Service, 1995 and 2000.
253
Ghana
Sources of farm household income and structure of employmentAgriculture is the sector that employs the largest proportion of economically activerural household members (Table 21). There was a decline in the proportion employedin agriculture in the 1990s, in favour of manufacturing and trading. The decline inthe proportion of household members employed in agriculture was pronouncedamongst rural coastal and forest households (Table 21). In these households therewas an increase in the proportion involved in fishing activities. Households headedby export crop farmers registered a larger decline in the proportion of householdmembers employed in agriculture compared to food crop farmers. This may bebecause this category of households was able to accumulate resources to invest innon-farm businesses. Most of the export crop farmers are to be found in the ruralforest zone. Compared to other rural locations, households in the rural forest zonehad the largest percentage point increase in non-farm businesses.
Over 80 percent of household members in rural savannah were employed inagriculture in both years, and the decline was smallest here among the tree ecologicalzones. The proportion of households operating a non-farm business amongstrural savannah households is estimated at 31.6 percent in 1998/99, a decline from50 percent of households in 1991/92 (Ghana Statistical Service, 1995 and 2000). Inthat year it is estimated that a greater proportion of rural savannah households hadnon-farm enterprises compared to rural forest households. In 1998/99 however, ruralsavannah households had the lowest proportion of non-farm business enterprises.The distribution of employment within rural savannah households suggests thatopportunities for employment outside of agriculture are limited compared to otherlocations.
The decline in the share of household labour employed in agriculture and thedecline in real prices of the major agricultural products coincided with a decline inthe share of household income originating from agriculture for households headedby food crop farmers. Agriculture income’s share of total household income ofhouseholds headed by export crop farmers on the other hand increased.
The share of income from agriculture decreased for all categories of ruralhouseholds with the exception of households headed by export crop farmers(Table 22). The mean real value of agricultural income increased by 21 percentfor rural households. This contrasts with an increase of 47 percent for householdsheaded by export farmers. Thus the increasing importance of agricultural incomeamong households headed by export crop farmers was because of an increase inthe absolute values of real agricultural income. The mean real value of agriculturalincome amongst households headed by food crop farmers increased by less than2 percent. The limited growth in real agriculture income of food crop farmers isnot unsurprising given the decline in real food crop prices that was registered in the1990s. Thus, even though production of food crops increased, at the household level,this did not translate into significant increases in real agricultural income because ofthe decline in real prices.
The trend of the real daily minimum wage has been positive (Table 23). There wasa sharp drop in the real value of the minimum wage in 1983 when inflation reached 3digit numbers. In that year the daily minimum wage of twelve cedis was equivalentto 0.3 kilograms of maize. The increase in the nominal daily minimum wages insubsequent years translated into an increase in real wages so that by 1986 the daily

254
Trade reforms and food security – country case studies and synthesis
minimum wage could purchase 1.9 kilograms of maize. The next substantial increasein the real value of the daily minimum wage occurred in 1992, when prior to the firstdemocratically held national elections in almost two decades, nominal wage increaseswere offered to labour. By 2000, the quantity of maize that the daily minimum wagecould buy was about 17 times the 1983 quantities.
Almost all farm households utilize family labour. Many use hired labour during thepeak farming season (land preparation, weeding and harvesting). During the rapidrural appraisal, many of the farmers complained about the lack of labour during thepeak season. This can be explained by migration into the urban areas. Thus, coupledwith the real increase in input prices the real cost of production would appear to haveincreased since the start of the reform.
Household expenditures: distribution and changes over timeThe patterns of real household expenditure tend to follow closely the pattern ofreal household income (Table 24). Mean real household expenditure is higher forhouseholds headed by men and for urban households. However, real householdexpenditure per capita is higher for households headed by women than for thoseheaded by men. Also, in 1998/99, expenditure in rural forest locations was higheron average compared to urban savannah for the whole household and per capita.Central, Upper East and Northern administrative regions registered declines in both
TABLE 21 Distribution of rural household members by main sector of employment,11991/92 and 1998/99
Rural households Male headed household Female headed household1991/92 1998/99 % change 1991/92 1998/99 % change 1991/92 1998/99 % change
Agriculture 0.776 0.674 -13.144 0.801 0.695 -13.233 0.694 0.612 -11.816Fishing 0.007 0.014 100.000 0.009 0.018 100.000 0.000 0.002 0.000Manufacturing 0.069 0.096 39.130 0.060 0.096 60.000 0.098 0.097 -1.020Trading 0.087 0.132 51.724 0.067 0.101 50.746 0.156 0.228 46.154Restaurant/food sellers 0.002 0.003 50.000 0.002 0.002 0.000 0.003 0.007 133.333Others 0.054 0.081 50.000 0.061 0.088 44.262 0.049 0.054 10.204
Rural coastal Rural forest Rural savannah1991/92 1998/99 % change 1991/92 1998/99 % change 1991/92 1998/99 % change
Agriculture 0.642 0.524 -18.380 0.787 0.655 -16.773 0.843 0.81 -3.915Fishing 0.015 0.017 11.842 0.002 0.001 -50.000 0.009 0.031 244.444Manufacturing 0.105 0.162 54.286 0.067 0.093 38.806 0.05 0.056 12.000Trading 0.157 0.207 31.847 0.076 0.139 82.895 0.059 0.07 18.644Restaurant/food sellers 0.001 0.005 400.000 0.003 0.004 33.333 0.001 0.001 0.000Others 0.080 0.085 6.516 0.065 0.108 66.154 0.038 0.032 -15.789
Export farmer Food crop farmer1991/92 1998/99 % change 1991/92 1998/99 % change
Agriculture 0.978 0.911 -6.851 0.973 0.945 -2.878Fishing 0.000 0.000 0.000 0.000 0.000 0.000Manufacturing 0.007 0.017 142.857 0.015 0.017 12.583Trading 0.009 0.040 344.444 0.007 0.028 300.000Restaurant/food sellers 0.001 0.001 0.000 0.000 0.001 0.000Others 0.005 0.031 520.000 0.005 0.009 83.673
1 The employment classifications are based on the international standard classification of occupations.Source: Calculated from Ghana Statistical Service, 1995 and 2000
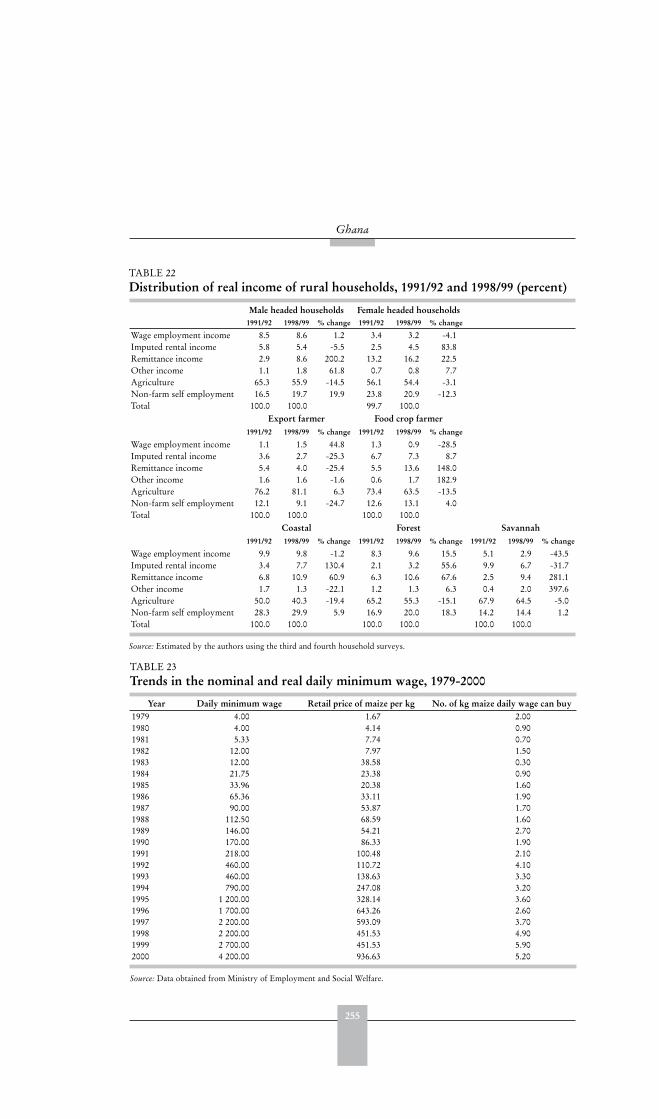
255
Ghana
TABLE 22 Distribution of real income of rural households, 1991/92 and 1998/99 (percent)
Male headed households Female headed households1991/92 1998/99 % change 1991/92 1998/99 % change
Wage employment income 8.5 8.6 1.2 3.4 3.2 -4.1Imputed rental income 5.8 5.4 -5.5 2.5 4.5 83.8Remittance income 2.9 8.6 200.2 13.2 16.2 22.5Other income 1.1 1.8 61.8 0.7 0.8 7.7Agriculture 65.3 55.9 -14.5 56.1 54.4 -3.1Non-farm self employment 16.5 19.7 19.9 23.8 20.9 -12.3Total 100.0 100.0 99.7 100.0
Export farmer Food crop farmer1991/92 1998/99 % change 1991/92 1998/99 % change
Wage employment income 1.1 1.5 44.8 1.3 0.9 -28.5Imputed rental income 3.6 2.7 -25.3 6.7 7.3 8.7Remittance income 5.4 4.0 -25.4 5.5 13.6 148.0Other income 1.6 1.6 -1.6 0.6 1.7 182.9Agriculture 76.2 81.1 6.3 73.4 63.5 -13.5Non-farm self employment 12.1 9.1 -24.7 12.6 13.1 4.0Total 100.0 100.0 100.0 100.0
Coastal Forest Savannah1991/92 1998/99 % change 1991/92 1998/99 % change 1991/92 1998/99 % change
Wage employment income 9.9 9.8 -1.2 8.3 9.6 15.5 5.1 2.9 -43.5Imputed rental income 3.4 7.7 130.4 2.1 3.2 55.6 9.9 6.7 -31.7Remittance income 6.8 10.9 60.9 6.3 10.6 67.6 2.5 9.4 281.1Other income 1.7 1.3 -22.1 1.2 1.3 6.3 0.4 2.0 397.6Agriculture 50.0 40.3 -19.4 65.2 55.3 -15.1 67.9 64.5 -5.0Non-farm self employment 28.3 29.9 5.9 16.9 20.0 18.3 14.2 14.4 1.2Total 100.0 100.0 100.0 100.0 100.0 100.0
Source: Estimated by the authors using the third and fourth household surveys.
TABLE 23 Trends in the nominal and real daily minimum wage, 1979-2000
Year Daily minimum wage Retail price of maize per kg No. of kg maize daily wage can buy1979 4.00 1.67 2.001980 4.00 4.14 0.901981 5.33 7.74 0.701982 12.00 7.97 1.501983 12.00 38.58 0.301984 21.75 23.38 0.901985 33.96 20.38 1.601986 65.36 33.11 1.901987 90.00 53.87 1.701988 112.50 68.59 1.601989 146.00 54.21 2.701990 170.00 86.33 1.901991 218.00 100.48 2.101992 460.00 110.72 4.101993 460.00 138.63 3.301994 790.00 247.08 3.201995 1 200.00 328.14 3.601996 1 700.00 643.26 2.601997 2 200.00 593.09 3.701998 2 200.00 451.53 4.901999 2 700.00 451.53 5.902000 4 200.00 936.63 5.20
Source: Data obtained from Ministry of Employment and Social Welfare.
256
Trade reforms and food security – country case studies and synthesis
mean household expenditure and mean household expenditure per person betweenthe two periods.
Mean real household expenditure and household expenditure per person increasedfor all categories of households with the exception of urban savannah households thatregistered an absolute decline.14 This contrasts with trends in real urban householdincomes which with the exception of Accra declined between the two periods.
Households headed by export crop farmers recorded a larger increase in mean realhousehold expenditure per person compared to households headed by food cropfarmers. Rural forest households recorded the highest percentage change in meanreal household expenditure per person.
It is expected therefore that the incidence of and improvement in food security willbe higher amongst households headed by export crop farmers, households located inthe rural forest zone, households headed by persons employed in the private formalsector, and the more commercialized households (as measured by the share of outputthat is sold).
Using food consumption per adult-equivalent15 as the measure, access to foodimproved on average for all categories of household (Table 25). The average urbanhousehold experienced a larger increase than did the average rural household. Ruralforest households tended to do better than the national average, in contrast to ruralsavannah and coastal households. In three administrative regions, mean real foodexpenditure per adult equivalent was lower in 1998/99 compared to 1991/92. In theUpper East Region, there was an almost 50 percent fall. Rural households headedby women had a higher mean real expenditure on food per adult equivalent than didmale households in the two periods. Women generally give priority to provision ofhousehold food before any other expenditure items. The percentage increases forhouseholds headed by export farmers were about double those of food crop farmers.
Cereals make up on average about 15 percent of the household food budget.However in some parts of the country the dependence on cereals is much higherthan the national average. In the rural savannah zone, cereals comprise 20 percent ofthe food budget share.
Proportion of households with insufficient food consumptionHouseholds falling below the lower poverty line cannot meet their minimumnutritional needs, even if their entire consumption expenditure is used to purchasefood. If the lower poverty line of GHC700 000 is kept fixed in constant prices acrossthe two periods, it is not surprising that the proportion of households with totalconsumption expenditure below nutritional food requirements declines, given theincrease in real spending on food for the average household (Table 26). Howeverthis decline did not occur evenly across the different groups that are the focus ofthis study.
Most of the improvement in food sufficiency amongst urban households must
14 Expenditure per person increased faster than did household expenditure, because the average household sizedeclined between the two periods.
15 Food expenditure is measured as the sum of spending on food and the imputed value of consumption ofhome production. The adult equivalent measure takes into account the gender and age composition of thehousehold.
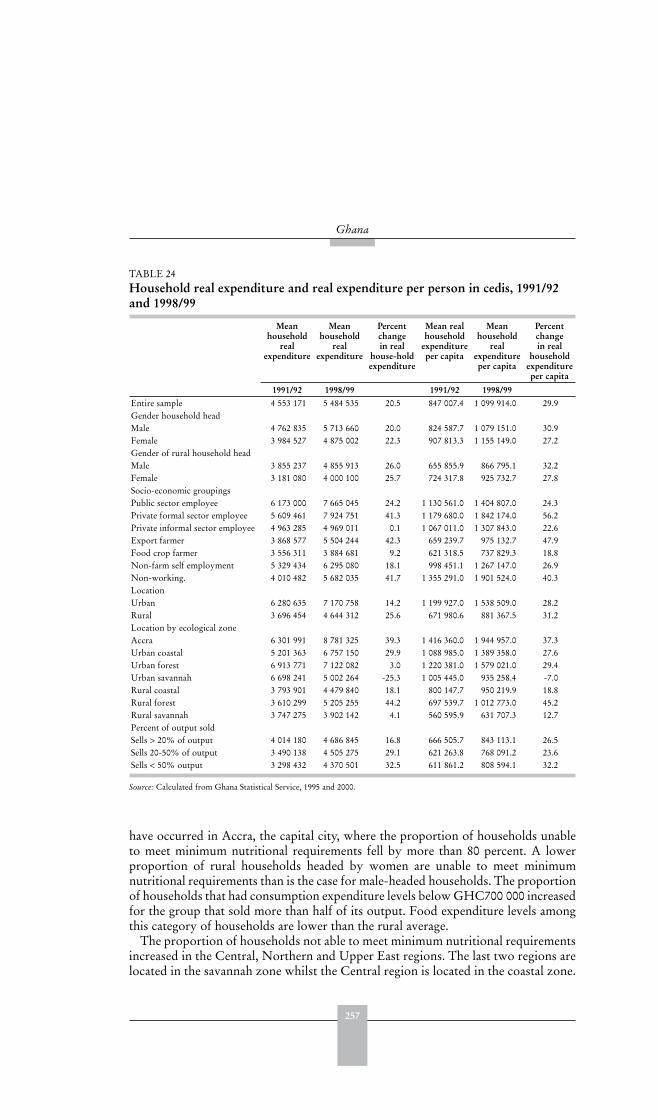
257
Ghana
have occurred in Accra, the capital city, where the proportion of households unableto meet minimum nutritional requirements fell by more than 80 percent. A lowerproportion of rural households headed by women are unable to meet minimumnutritional requirements than is the case for male-headed households. The proportionof households that had consumption expenditure levels below GHC700 000 increasedfor the group that sold more than half of its output. Food expenditure levels amongthis category of households are lower than the rural average.
The proportion of households not able to meet minimum nutritional requirementsincreased in the Central, Northern and Upper East regions. The last two regions arelocated in the savannah zone whilst the Central region is located in the coastal zone.
TABLE 24 Household real expenditure and real expenditure per person in cedis, 1991/92 and 1998/99
Meanhousehold
realexpenditure
Meanhousehold
realexpenditure
Percent changein real
house-holdexpenditure
Mean real household
expenditure per capita
Meanhousehold
realexpenditure per capita
Percent changein real
householdexpenditure per capita
1991/92 1998/99 1991/92 1998/99Entire sample 4 553 171 5 484 535 20.5 847 007.4 1 099 914.0 29.9Gender household headMale 4 762 835 5 713 660 20.0 824 587.7 1 079 151.0 30.9Female 3 984 527 4 875 002 22.3 907 813.3 1 155 149.0 27.2Gender of rural household headMale 3 855 237 4 855 913 26.0 655 855.9 866 795.1 32.2Female 3 181 080 4 000 100 25.7 724 317.8 925 732.7 27.8Socio-economic groupingsPublic sector employee 6 173 000 7 665 045 24.2 1 130 561.0 1 404 807.0 24.3Private formal sector employee 5 609 461 7 924 751 41.3 1 179 680.0 1 842 174.0 56.2Private informal sector employee 4 963 285 4 969 011 0.1 1 067 011.0 1 307 843.0 22.6Export farmer 3 868 577 5 504 244 42.3 659 239.7 975 132.7 47.9Food crop farmer 3 556 311 3 884 681 9.2 621 318.5 737 829.3 18.8Non-farm self employment 5 329 434 6 295 080 18.1 998 451.1 1 267 147.0 26.9Non-working. 4 010 482 5 682 035 41.7 1 355 291.0 1 901 524.0 40.3LocationUrban 6 280 635 7 170 758 14.2 1 199 927.0 1 538 509.0 28.2Rural 3 696 454 4 644 312 25.6 671 980.6 881 367.5 31.2Location by ecological zoneAccra 6 301 991 8 781 325 39.3 1 416 360.0 1 944 957.0 37.3Urban coastal 5 201 363 6 757 150 29.9 1 088 985.0 1 389 358.0 27.6Urban forest 6 913 771 7 122 082 3.0 1 220 381.0 1 579 021.0 29.4Urban savannah 6 698 241 5 002 264 -25.3 1 005 445.0 935 258.4 -7.0Rural coastal 3 793 901 4 479 840 18.1 800 147.7 950 219.9 18.8Rural forest 3 610 299 5 205 255 44.2 697 539.7 1 012 773.0 45.2Rural savannah 3 747 275 3 902 142 4.1 560 595.9 631 707.3 12.7Percent of output soldSells > 20% of output 4 014 180 4 686 845 16.8 666 505.7 843 113.1 26.5Sells 20-50% of output 3 490 138 4 505 275 29.1 621 263.8 768 091.2 23.6Sells < 50% output 3 298 432 4 370 501 32.5 611 861.2 808 594.1 32.2
Source: Calculated from Ghana Statistical Service, 1995 and 2000.
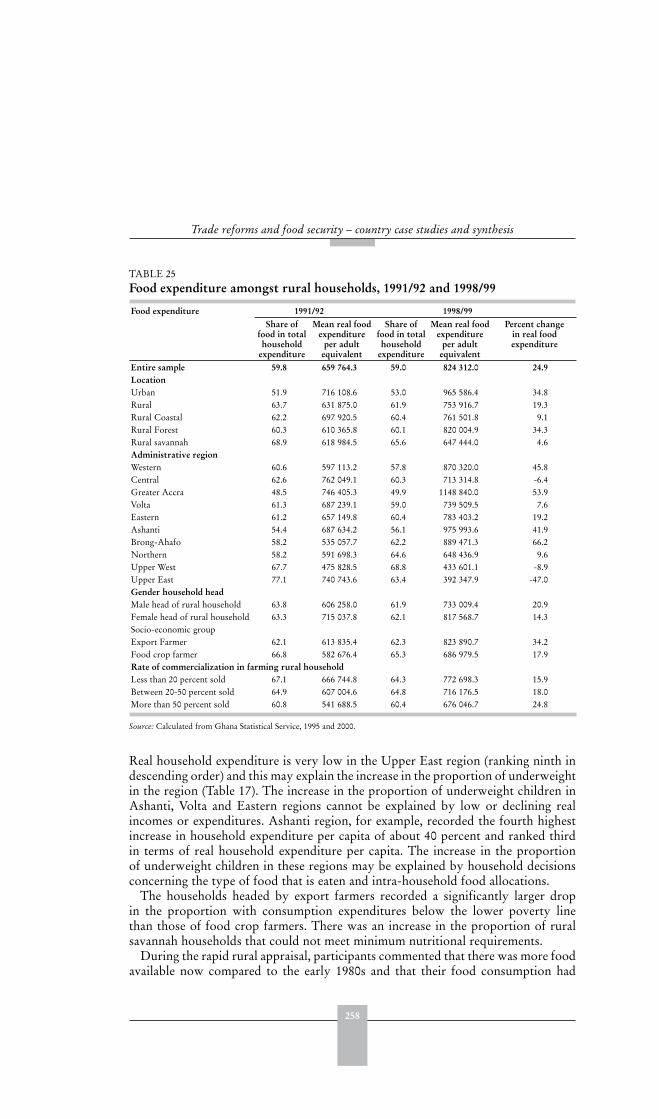
258
Trade reforms and food security – country case studies and synthesis
Real household expenditure is very low in the Upper East region (ranking ninth indescending order) and this may explain the increase in the proportion of underweightin the region (Table 17). The increase in the proportion of underweight children inAshanti, Volta and Eastern regions cannot be explained by low or declining realincomes or expenditures. Ashanti region, for example, recorded the fourth highestincrease in household expenditure per capita of about 40 percent and ranked thirdin terms of real household expenditure per capita. The increase in the proportionof underweight children in these regions may be explained by household decisionsconcerning the type of food that is eaten and intra-household food allocations.
The households headed by export farmers recorded a significantly larger dropin the proportion with consumption expenditures below the lower poverty linethan those of food crop farmers. There was an increase in the proportion of ruralsavannah households that could not meet minimum nutritional requirements.
During the rapid rural appraisal, participants commented that there was more foodavailable now compared to the early 1980s and that their food consumption had
TABLE 25 Food expenditure amongst rural households, 1991/92 and 1998/99
Food expenditure 1991/92 1998/99Share of
food in total household
expenditure
Mean real food expenditure
per adult equivalent
Share of food in total household
expenditure
Mean real food expenditure
per adult equivalent
Percent change in real food expenditure
Entire sample 59.8 659 764.3 59.0 824 312.0 24.9LocationUrban 51.9 716 108.6 53.0 965 586.4 34.8Rural 63.7 631 875.0 61.9 753 916.7 19.3Rural Coastal 62.2 697 920.5 60.4 761 501.8 9.1Rural Forest 60.3 610 365.8 60.1 820 004.9 34.3Rural savannah 68.9 618 984.5 65.6 647 444.0 4.6Administrative regionWestern 60.6 597 113.2 57.8 870 320.0 45.8Central 62.6 762 049.1 60.3 713 314.8 -6.4Greater Accra 48.5 746 405.3 49.9 1148 840.0 53.9Volta 61.3 687 239.1 59.0 739 509.5 7.6Eastern 61.2 657 149.8 60.4 783 403.2 19.2Ashanti 54.4 687 634.2 56.1 975 993.6 41.9Brong-Ahafo 58.2 535 057.7 62.2 889 471.3 66.2Northern 58.2 591 698.3 64.6 648 436.9 9.6Upper West 67.7 475 828.5 68.8 433 601.1 -8.9Upper East 77.1 740 743.6 63.4 392 347.9 -47.0Gender household headMale head of rural household 63.8 606 258.0 61.9 733 009.4 20.9Female head of rural household 63.3 715 037.8 62.1 817 568.7 14.3Socio-economic groupExport Farmer 62.1 613 835.4 62.3 823 890.7 34.2Food crop farmer 66.8 582 676.4 65.3 686 979.5 17.9Rate of commercialization in farming rural householdLess than 20 percent sold 67.1 666 744.8 64.3 772 698.3 15.9Between 20-50 percent sold 64.9 607 004.6 64.8 716 176.5 18.0More than 50 percent sold 60.8 541 688.5 60.4 676 046.7 24.8
Source: Calculated from Ghana Statistical Service, 1995 and 2000.
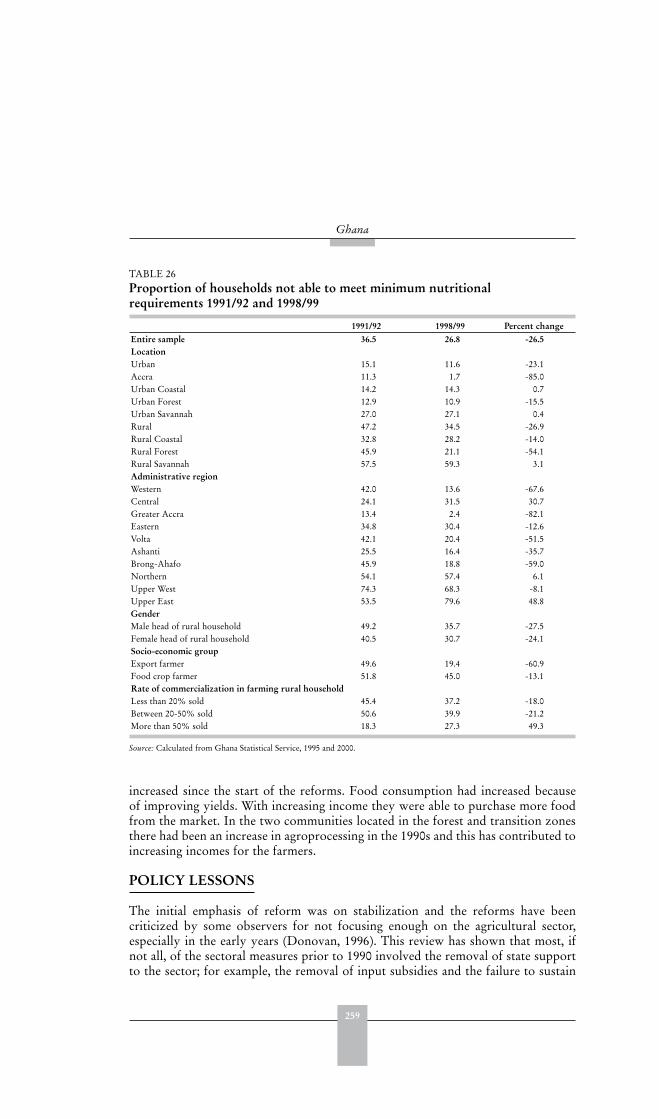
259
Ghana
increased since the start of the reforms. Food consumption had increased becauseof improving yields. With increasing income they were able to purchase more foodfrom the market. In the two communities located in the forest and transition zonesthere had been an increase in agroprocessing in the 1990s and this has contributed toincreasing incomes for the farmers.
POLICY LESSONS
The initial emphasis of reform was on stabilization and the reforms have beencriticized by some observers for not focusing enough on the agricultural sector,especially in the early years (Donovan, 1996). This review has shown that most, ifnot all, of the sectoral measures prior to 1990 involved the removal of state supportto the sector; for example, the removal of input subsidies and the failure to sustain
TABLE 26 Proportion of households not able to meet minimum nutritional requirements 1991/92 and 1998/99
1991/92 1998/99 Percent changeEntire sample 36.5 26.8 -26.5LocationUrban 15.1 11.6 -23.1Accra 11.3 1.7 -85.0Urban Coastal 14.2 14.3 0.7Urban Forest 12.9 10.9 -15.5Urban Savannah 27.0 27.1 0.4Rural 47.2 34.5 -26.9Rural Coastal 32.8 28.2 -14.0Rural Forest 45.9 21.1 -54.1Rural Savannah 57.5 59.3 3.1Administrative regionWestern 42.0 13.6 -67.6Central 24.1 31.5 30.7Greater Accra 13.4 2.4 -82.1Eastern 34.8 30.4 -12.6Volta 42.1 20.4 -51.5Ashanti 25.5 16.4 -35.7Brong-Ahafo 45.9 18.8 -59.0Northern 54.1 57.4 6.1Upper West 74.3 68.3 -8.1Upper East 53.5 79.6 48.8GenderMale head of rural household 49.2 35.7 -27.5Female head of rural household 40.5 30.7 -24.1Socio-economic groupExport farmer 49.6 19.4 -60.9Food crop farmer 51.8 45.0 -13.1Rate of commercialization in farming rural householdLess than 20% sold 45.4 37.2 -18.0Between 20-50% sold 50.6 39.9 -21.2More than 50% sold 18.3 27.3 49.3
Source: Calculated from Ghana Statistical Service, 1995 and 2000.
260
Trade reforms and food security – country case studies and synthesis
real government spending in the sector. Because of the critical role it plays in externaltrade and government finances, the cocoa sector was an exception to the early lackof focus on the agricultural sector. The World Bank pushed for liberalization of thecocoa sector, but the Government had concerns about the weakness of the financialsystem and road infrastructure in most of the cocoa growing areas; partial reform ofthe sector occurred in the early phases of the economy’s transformation.
Although the real exchange rate depreciated during the post-reform period, therewere periods during which it appreciated. Thus, encouragement of the tradablegoods sector through the exchange rate was not consistent. However, the exchangerate measures have been important in explaining cocoa production and the export ofnon-tradable goods. Without depreciation of the real exchange rate, real wholesaleprices of maize and rice would have been lower than they actually were. Thecontribution of the real exchange rate to real product prices since 1983 has tendedto be positive. The cocoa sector, in particular, benefited from the depreciation ofthe real exchange rate. However, trade liberalization and other policy measurescounteracted the positive impact that the depreciating real exchange rate could havehad on real wholesale food prices.
Not only did trade liberalization fail to improve price incentives for food cropfarmers, but neither did the agriculture-specific reforms. These tended to beaccompanied by an increase in the input/output price ratio, reduced access to inputsin some localities because of privatization of input distribution, and reduced centralgovernment funding of the sector. Indeed, the cost of labour and inputs (fertilizers)tended to rise faster than food crop prices. Thus, as the ratio of input to output pricesincreased, it was unlikely that farmers would increase production using methods thatwere intensive in the use of these inputs.
Food production has increased since 1983, when the economic reform programmebegan despite the decline in real wholesale prices. This suggests that even thoughprice incentives are important for increasing food production they are not sufficient.The expansion in food production occurred largely through an expansion of the areacultivated, with marginal changes in yields for most crops. The manner in whichfood production was increased is not unexpected given the nature of the reformsthat took place.
Nominal food prices were relatively stable after 1993 compared to the previousyears. The advantage of this relative price stability is that it facilitates planning andreduces uncertainty. However, the continued existence of seasonal variation in foodprices suggests that households that do not have stores of food or access to non-farmsources of income will experience a decline in food consumption during the leanseason when food prices are rising.
The expected private sector response to the measures that were implemented didnot materialize. It was expected that about 40 percent of cocoa purchasing wouldbe carried out by the private sector, but it took about a decade to reach this target.Involvement of the private sector required fairly significant up-front investmentsand the high prevailing bank rates made borrowing to invest in the cocoa trade orinput marketing unattractive. Uncertainty about the future actions of donors in theprovision of subsidized inputs as part of an international aid project also explains thereluctance to invest in the input distribution trade. Also, some issues have been socomplex that, against the backdrop of changing world market conditions, it has not
261
Ghana
been easy to arrive at the appropriate policy and revisions have been inescapable, asthe example of cotton pricing shows.
The reform period has been associated with an improvement in national levelfood security indicators. However, the developments in the second half of the1990s suggest a reversal of this trend. Household level indicators also registered animprovement but did not occur evenly across different groups.
Households headed by export crop farmers registered significant improvementsin food security, thanks to the positive impact that the depreciating exchange ratehad on the prices of export crops, especially cocoa. In contrast, real prices of mostfood crops declined during most of the period of reform. For those householdsthat were net sellers of food crops, the relatively slower growth in real incomes andimprovement in food security indicators may be attributed to this.
The findings suggest that measures need to be implemented to maintain theincentives for food crop production. The increase in the real cost of productionhighlights how critical it is that agricultural productivity also increase if real pricesfacing farmers are on the decline. Productivity in the food crop sector is quite low.Significant constraints to the adoption of improved technologies are the shortage oflocally improved seeds, planting materials and other inputs.
Agricultural research spending increased as a share of GDP during the 1980s, thatis, relatively early in the reform experience, but research and extension have hadlimited success. Farmers need to obtain assistance in the form of extension advice, forexample, to reduce their costs of production in the context of declining real outputprices. A project aimed at improving the research-extension-farmer linkage wasfunded by external donor support from 1995-99, but the end of this external fundinghas impeded sustaining the project.
Efforts to improve the competitiveness of markets can cause problems if theprocess is not well designed. The private sector has not responded to the withdrawalof state distribution and marketing services in the less well-connected areas.
The reforms have been accompanied by some expansion in the feeder roadnetwork, although much remains to be done. Ghana has been described as a“footpath economy” where the poor transportation network is a constraint onagriculture production. Some improvements in infrastructure have occurred, butthe actual annual achievement of rehabilitating 212 to 1 080 km fall well short of thetarget of rehabilitating 1 200 to 2 000 km per annum. Market access has improvedfor those communities where the road network has been upgraded; it was confirmedin the rapid rural appraisal that traders came from distant parts of the country andthe West African sub-region to purchase produce. The certainty of buyers for theirproduce has been an incentive for farmers to increase production.
Opportunities for non-farm employment have increased as real incomes haveincreased: a rise in real incomes not only brings with it an increase in the demandfor non-food items but it also provides a pool of resources for investment in non-farm activities. The expansion in the rural road network, rural electrification andportable water supply are important for the development of non-farm activities andagroprocessing. This study has found that the expansion in non-farm businesses hasbeen more rapid in the rural forest zones compared to the rural savannah.
Opportunities for non-farm employment need to be enhanced for rural households,especially those in the rural savannah. This is important to provide income to
262
Trade reforms and food security – country case studies and synthesis
households during the lean season. More investigation needs to be conducted intothe reasons for the reported decline in the proportion of non-farm enterprises inthese households. The northern sector (savannah zone) of the country where theincidence of food insecurity is highest has only one farming season. Food securitywould be enhanced with the establishment of irrigation schemes, dug out wells andwater management systems that make possible a second farming season in this partof the country.
REFERENCES
Aniwa, R. 1996. Wholesale-retail price spread of some agricultural food commodities in
Ghana. Unpublished B.Sc. Dissertation, Dept. of Agricultural Economics and FarmManagement, University of Ghana, Legon.
Austin Associates Inc. 1990. Agricultural marketing in Ghana: status and recommendation
for improvement. Consultancy report.Badiane, O. & Shively, G.E. 1998. Spatial integration, transport costs and the response of
local prices to policy changes in Ghana. Journal of Development Economics, 56: 411-431.Bumb, B.L., Teboh, J.F., Attah, J.K. & Asenso-Okyere, W.K. 1994. Ghana Policy
Environment and Fertilizer Sector Development. International Fertilizer DevelopmentCentre and Ghana Institute of Statistical, Social and Economic Research.
CEPA. 2000. Macroeconomic review and outlook, Accra.Donovan, W.M. 1996. Agriculture and economic reforms in Sub-Saharan Africa. AFTES
Working Paper No. 18. Washington, DC, World Bank.Fosu, K. Y. 1992. The real exchange rate and Ghana’s agricultural export. African Economic
Research Consortium, Research Paper 9, Nairobi.Ghana Statistical Service. 1993, 1998. Demographic and health surveys 1993 and 1998,
Accra.Ghana Statistical Service. 2000. Ghana living standards survey. Report of the Fourth Round
(GLSS4), Accra.Ghana Statistical Service. 1995. Ghana living standards survey. Report of the Third Round
(GLSS3), Accra.Ghana Statistical Service. 2000. The pattern of poverty in the 1990s, Accra.Harrigan,J. & Oduro, A.D. 2000. Exchange rate policy and the balance of payments 1972-
1986. In E. Aryeetey, J. Harrigan & M. Nissanke, eds. Economic reforms in Ghana. the
miracle and the mirage. James Currey, Oxford.IMF 2001. International Financial Statistics Yearbook. Washington D.C.Jebuni, C.D., Oduro, A., Asante, Y. & Tsikata, G.K. 1992. Diversifying export. The supply
response of non-traditional exports to Ghana’s economic recovery programme.ODI/University of Ghana. London.
Jebuni, C.D., Oduro, A.D., & Tutu, K.A. 1994 Trade, Payments Liberalization and Economic
Performance in Ghana. AERC Research Paper No. 27, Nairobi .Ministry of Finance. 1999. Ghana cocoa sector development strategy. Accra.Morris, M.L., Tripp, R. & Dankyi, A.A. 1999. Adoption and impacts of improved maize
production technology: A case study of the Ghana grains development project. EconomicsProgram Paper 99-01, D.F: CIMMYT, Mexico.
263
Ghana
Seini, Wayo, A. 1985. Economic Analysis of the Responsiveness of Peasant Cotton Farmers to
Price Incentive in Ghana. ISSER University of Ghana, Technical Publications Series No.51. Legon.
FURTHER READING
Blench, R. M. 1999. Agriculture and the environment in northeastern Ghana: a comparison
of high and medium population density areas. In R.M. Blench, ed. Natural resource
management and socio-economic factors in Ghana, pp. 21-43. London: OverseasDevelopment Institute. (see page 10 of the report).
Bulir, A. 2000 Can price incentives to smuggle explain the contraction of the cocoa supply inGhana? Journal of African Economies, 11: 413-439.
Ghana Statistical Service. 2000. Population and housing census. Summary report of final
results, Accra.Helfand, S.M. & de Rezende, G.C. 2001. The impact of sector-specific and economy-wide
policy reforms on agriculture: the case of Brazil, 1990-98 Working Paper No. 01-34,Department of Economics, University of California Riverside.
IMF. 2001. International Financial Statistics Yearbook, Washington D.C.ISSER (Institute for statistical, social and economic research). State of the Ghanaian economy,
various issues, Accra.Oduro, A.D. & Tutu, K.A. 1999. Ghana. In A. Oyejide, B. Ndulu & J. Gunning, eds.
Regional integration and trade liberalisation in sub-Saharan Africa, Vol. 2. Country case
studies. MacMillan, London.

264
Trade reforms and food security – country case studies and synthesis
ANNEX
The manufacture price index was proxied by the price of clothing and footwear.The econometric relationship that was estimated is based on the derivation in Fosu(1992):
Ln(Pc/Pm) = f(lnRER, ln (1- TAX), DUM, e)
Where Pc is the producer price of cocoa, Pm is the price of clothing and footwear,RER is the real exchange rate, TAX is the cocoa export tax rate, DUM is a dummyvariable introduced to capture the economic reforms. It takes a value of 1 for yearsafter 1983.
The findings of the estimated dynamic equation are summarized below. Thecoefficients are all statistically significant at the 1 percent level with the expectedsigns, except the first lag of 2Ln(RER) which is insignificant even though it hasthe appropriate sign. The adjusted R-squared indicates that about 40 percent ofthe variations in Ln(Pc/Pm ) can be explained by joint variations in the independentvariables contained in the model.
Modelling Ln(Pc/Pm ) Sample : 1973 –1997
Variable Coefficient S. E. H.C.S.E. t –value t –prob Beta–coefficient
Constant 5.8987 0.7618 1.198 7.743 0.0000 N/ALn(1-Tax)t 1.0064 0.3354 0.4975 3.000 0.0077 0.5204
2Ln(RER)t 1.0650 0.3174 0.39 3.355 0.0035 0.6764DUM 1.1181 0.3761 0.4819 2.973 0.0082 0.9741Ln(Pcc/Pn)t-1 -0.7831 0.2121 0.2707 -3.692 0.0017 0.7793
2Ln(RER)t-1 0.2270 0.2635 0.2063 0.862 0.4002 N/ATrend -0.0888 0.0260 0.0425 -3.412 0.0031 -1.1388
R2=0.5608 F(6,18)=3.8305[0.0123] =0.4392R2–adjusted=0.4144 RSS=3.4723 DW=1.9
265
GuatemalaPablo Rodas-Martini, Luis Gerardo Cifuentas and Juan Pablo Pira1
EXECUTIVE SUMMARY
Pre-reformThe degree of intervention and support in the agriculture sector has always beenmodest. The institutional structure that was in effect during the 1980s and a goodpart of the 1990s had been in place since the beginning of the 1970s.
The reformsWith the return to democracy in January 1986, a process of economic reformwas started in the country, marked by structural adjustment, liberalization of theeconomy and, to a lesser extent, institutional reform.
The principal macroeconomic measure adopted was the devaluation of thequetzal. In addition, high tariffs were reduced, as were price controls, particularlyceiling prices on basic commodities. Tariff contingents began to be used followingGuatemala’s accession to GATT.
Direct support to the agricultural sector, which was already minimal, was reducedunder the reforms and marketing boards were abolished.
Impact on intermediate variablesFor almost all commodities there was an appreciable domestic price reduction,explained mainly by the fall in international prices. The depreciation in the rate ofexchange positively affected domestic prices but this impact was counteracted by thefall in international prices and changes in other policies, which also tended to exerta negative effect on domestic prices. Despite the reforms, domestic markets remainpartially isolated from international markets.
Maize production and the area allocated to production have fallen, explaining inpart the strong growth in imports. The area allocated to wheat cultivation has alsoplummeted in recent years. Production and area cultivated of beans are also lowerthan those existing at the beginning of the 1990s. Imports have generally been higherthan exports.
Coffee production has grown continuously during the period. An increase in theproduction of sugar has been even more marked, in particular throughout the 1990s,reaching its maximum value in 1997. The production of bananas was stagnant up to1993 and the area under cultivation today is much lower than in the 1980s. However,
1 Pablo Rodas-Martini with Luis Gerardo Cifuentes and Juan Pablo Pira, and the assistance of Claudia García –Research and Social Study Association, Guatemala.
266
Trade reforms and food security – country case studies and synthesis
the growth of non-traditional crops – vegetables, fruit and flowers – is helping toreduce the country’s excessive dependence on a few products, such as coffee orsugar.
Impact on target variablesThe food security situation improved during the 1980s, but worsened in the 1990s.Nevertheless, malnutrition of children declined throughout the period studied.
Agricultural wages dropped sharply in the mid-1980s. By 1995, wages, andpossibly income as well, had risen to the levels of the early 1980s. Even thoughthe income in rural farm households increased in 1991, the differences between thesehouseholds and other households have increased greatly. Women are less dependenton wages and sales and more on remittances and other transfers, while men havemaintained the same income structure as in previous years.
Some changes in the pattern of food expenditure are observed with an increase inthe proportions spent meat and poultry, and on health and education.
Policy lessonsThe country no longer depends on the success or failure of one or two productsfor its foreign exchange earnings. A more diversified commodity base has providedgreater stability in the receipt of foreign resources, resulting in less volatile aggregaterevenue. Many small farmers in the western highlands and other parts of the country,as well as medium size-farmers, are switching from the traditional cultivation ofgrains, such as maize, to new export crops. Nevertheless, the rural food securitystatus has worsened, and in some specific cases there have been famines. This islargely due to the fall in coffee prices and the unequal distribution of the benefitsfrom the growth in non-traditional crops and the growth in non-agriculturalactivities, particularly in the interior of the country.
INTRODUCTION: CONTEXT AND NATURE OF THE REFORMS
The role and level of development of the agriculture sectorIn spite of rising production, agriculture’s contribution to GDP has declined fromalmost 26 percent in 1989-91, to 23 percent in 2000 (Table 1). This is explained bygrowth in the service sector rather than in the industrial sector, which makes a lowercontribution than agriculture.
Guatemala continues to have a large rural population. In the past 20 years, itsproportion of the population has fallen by only 3 percent: in 2000 it was still 60percent of the total population. Rural employment was 57 percent of the total inthe same year, having fallen slightly from 59 percent at the beginning of the 1980s.Rural employment is mostly male, although female participation has increased from7 percent in 1980 to 17 percent in 2000.
Agricultural wages have been lower than wages in the rest of the economy. Thetrends, however, have been similar: a fall from the beginning of the 1980s to 1990(the year in which inflation reached 60 percent) followed by a recovery to date. Inreal terms, present wages hardly recovered their lost value, standing in 2000 at a levelsimilar to that that which existed between 1982 and 1983.

267
Guatemala
In relation to foreign trade, the country has traditionally produced a surplus inthe agricultural sector. In the last six years, this has ranged between US$800 andUS$1 000 million, which contrasts with the permanent, and growing, deficit in thetotal balance of trade.
Guatemala is, however, no longer dependent on the export of two or threetraditional products or on exports to the Central American market. Three keydevelopments have been the increased export of clothing, which has become theprincipal export to the United States; family remittances from migrants, whichare the principal source of foreign exchange; and tourism, thanks to Guatemala’sarchaeological sites and geographic closeness to the markets of North America.There has also been a recovery of intraregional trade.
Agriculture is dominated by small scale producers, as depicted in Table 2.
Degree of openness of the economy prior to the reformsPrior to the reforms, the Government sought to control the price of basiccommodities. However interventions were not always successful and led to parallel
TABLE 1 Agricultural indicators, 1980-2001
1980-82 1983-85 1986-88 1989-91 1992-94 1995-97 1998-00 2001Structure of GDPAgriculture (percent of GDP) 25.0 25.6 25.8 25.8 24.9 24.0 23.1 22.6Industry (percent of GDP) 21.7 20.0 20.0 19.8 19.9 19.8 20.0 19.7Services (percent of GDP) 53.4 54.4 54.1 54.4 55.3 56.2 56.9 57.7PopulationTotal population (millions) 7.0 7.5 8.1 8.8 9.5 10.2 11.1 -Rural population (millions) 4.4 4.7 5.1 5.4 5.8 6.2 6.6 -Rural (percent total population) 62.5 62.4 62.2 62.0 61.5 60.8 59.9 -Economically active population (EAP)EAP rural/EAP total 59.2 59.0 58.6 58.3 57.9 57.5 57.0 -EAP rural women/EAP rural total 7.8 9.2 11.0 12.6 14.1 15.6 17.0 -
Sources: World Bank and Economic Commission for Latin America and the Caribbean (ECLAC).
TABLE 2 Production of principal basic grains by size of farm, 1996
Farms(percent)
Area harvested (percent)
Production in grain (percent)
Yield(quintals per M)
White maizeLess than 10 M 90.2 61.1 55.8 23.3From 10-64 M 5.8 13.9 13.9 25.5More than 64 M 4.1 25.0 30.4 31.0Yellow maizeLess than 10 M 97.5 86.5 84.5 21.1From 10-64 M 2.0 8.4 8.2 21.1More than 64 M 0.5 5.1 7.3 30.9Black beansLess than 10 M 86.6 66.3 53.5 6.5From 10-64 M 9.0 15.6 18.6 9.7More than 64 M 4.4 18.2 27.8 12.4
Note: M (manzana) = 1.7 acres.Source: Agricultural Survey 1996, Ministry of Agriculture, Guatemala.
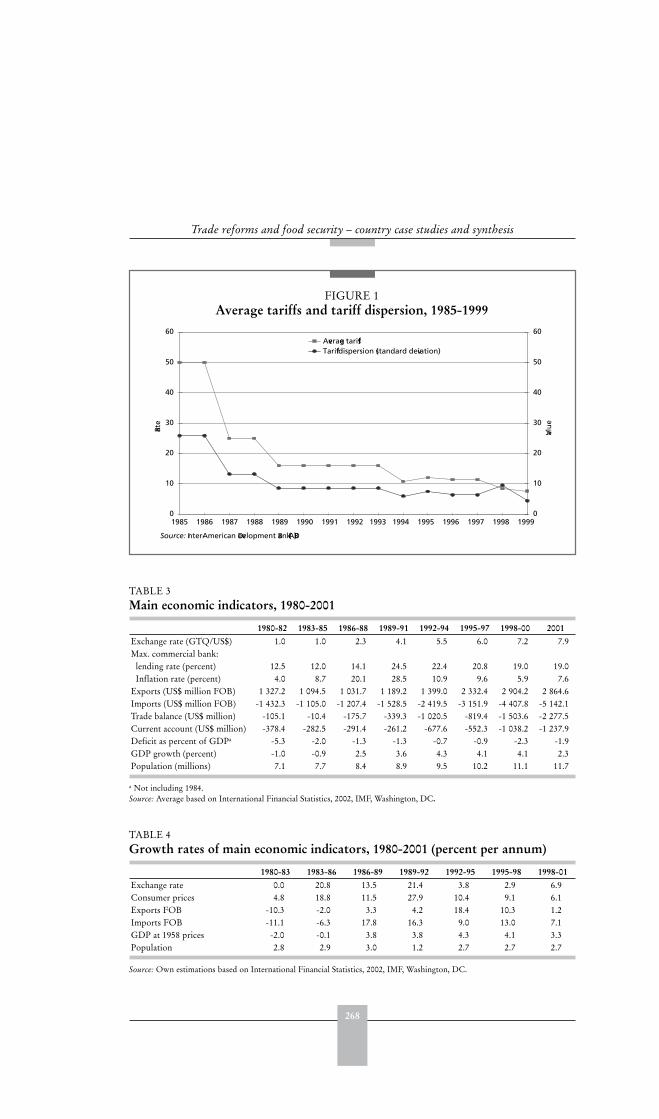
268
Trade reforms and food security – country case studies and synthesis
FIGURE 1Average tariffs and tariff dispersion, 1985-1999
0
10
20
30
40
50
60
1985 1986 1987 1988 1989 1990 1991 1992 1993 1994 1995 1996 1997 1998 1999
Rate
0
10
20
30
40
50
60
Valu
e
Average tariffsTariff dispersion (standard deviation)
Source: Inter-American Development Bank (IADB).
TABLE 3 Main economic indicators, 1980-2001
1980-82 1983-85 1986-88 1989-91 1992-94 1995-97 1998-00 2001Exchange rate (GTQ/US$) 1.0 1.0 2.3 4.1 5.5 6.0 7.2 7.9Max. commercial bank: lending rate (percent) 12.5 12.0 14.1 24.5 22.4 20.8 19.0 19.0 Inflation rate (percent) 4.0 8.7 20.1 28.5 10.9 9.6 5.9 7.6Exports (US$ million FOB) 1 327.2 1 094.5 1 031.7 1 189.2 1 399.0 2 332.4 2 904.2 2 864.6Imports (US$ million FOB) -1 432.3 -1 105.0 -1 207.4 -1 528.5 -2 419.5 -3 151.9 -4 407.8 -5 142.1Trade balance (US$ million) -105.1 -10.4 -175.7 -339.3 -1 020.5 -819.4 -1 503.6 -2 277.5Current account (US$ million) -378.4 -282.5 -291.4 -261.2 -677.6 -552.3 -1 038.2 -1 237.9Deficit as percent of GDPa -5.3 -2.0 -1.3 -1.3 -0.7 -0.9 -2.3 -1.9GDP growth (percent) -1.0 -0.9 2.5 3.6 4.3 4.1 4.1 2.3Population (millions) 7.1 7.7 8.4 8.9 9.5 10.2 11.1 11.7
a Not including 1984.Source: Average based on International Financial Statistics, 2002, IMF, Washington, DC.
TABLE 4 Growth rates of main economic indicators, 1980-2001 (percent per annum)
1980-83 1983-86 1986-89 1989-92 1992-95 1995-98 1998-01Exchange rate 0.0 20.8 13.5 21.4 3.8 2.9 6.9Consumer prices 4.8 18.8 11.5 27.9 10.4 9.1 6.1Exports FOB -10.3 -2.0 3.3 4.2 18.4 10.3 1.2Imports FOB -11.1 -6.3 17.8 16.3 9.0 13.0 7.1GDP at 1958 prices -2.0 -0.1 3.8 3.8 4.3 4.1 3.3Population 2.8 2.9 3.0 1.2 2.7 2.7 2.7
Source: Own estimations based on International Financial Statistics, 2002, IMF, Washington, DC.

269
Guatemala
markets. Policies were generally unsupportive of agricultural producers, and tradeand exchange rate policies were biased against the production of exports and othertradable commodities.
The National Agricultural Marketing Institute (INDECA) was responsible forbuying, selling, transporting and storing farm products and for importing grain.The Wheat Imports Regulation Office (ORIT) and the National Association ofWheat Growers controlled national production and authorized import quotas andspecific support programmes for dairy products was provided through PROLAC.The National Bank for Agricultural Development (BANDESA) lent to small andmedium farmers who were not eligible for loans from private banks. The DirectoratesGeneral of Agricultural Services (DIGESA) and of Livestock Services (DIGESEPE)provided development and extension services for crop and livestock products, andtechnical support to small producers.
Motivations for the reformsIn 1985, a new national constitution was approved and general elections were called.The elected government took office in January 1986, bringing to an end the militaryregimes that had been in power since the early 1970s.
With the return to democracy, a process of economic reform was started, markedby structural adjustment, liberalization of the economy and, to a lesser extent,institutional reform. The process has not been without interruptions and setbacks.
Macro and sectoral components and the policy instruments usedMacroeconomic reformsTrade reform did not occur in clearly distinguishable phases. Figure 1 shows thatboth the average tariff and tariff dispersion have fallen almost uninterruptedly,without evident breaks from one year to the other, except for the initial fall whenthe reforms started.
The reform period can however be divided into four stages based on differentpolitical regimes. In the first period, 1986-90, trade reforms were started, but theperiod ended in a deep macroeconomic crisis.
Between 1990 and 1995, macroeconomic stability was recovered and importantsteps were taken in the area of trade, such as accession to GATT.
From 1996 to 1999, trade reform continued. In particular, bilateral negotiationswere started with Mexico, Dominican Republic and Panama; and two key sectors inthe economy were privatized and deregulated: electricity and telecommunications.
The last period, 2000-2003, witnessed the start of negotiations with Canada forthe signing of a free trade agreement, while negotiations were started and concludedwith the United States.
First phase of reform: 1986-90As can be seen in Table 3, in the first half of the 1980s Guatemala fell into recession.GDP and exports and imports contracted and there were serious fiscal deficits. Therate of exchange with the US dollar was kept at 1 to 1 on the official market, but wasat higher levels in the growing black market.
The two principal macroeconomic targets in this phase were to pursue stabilityand recover economic growth. The principal measure adopted was the devaluation
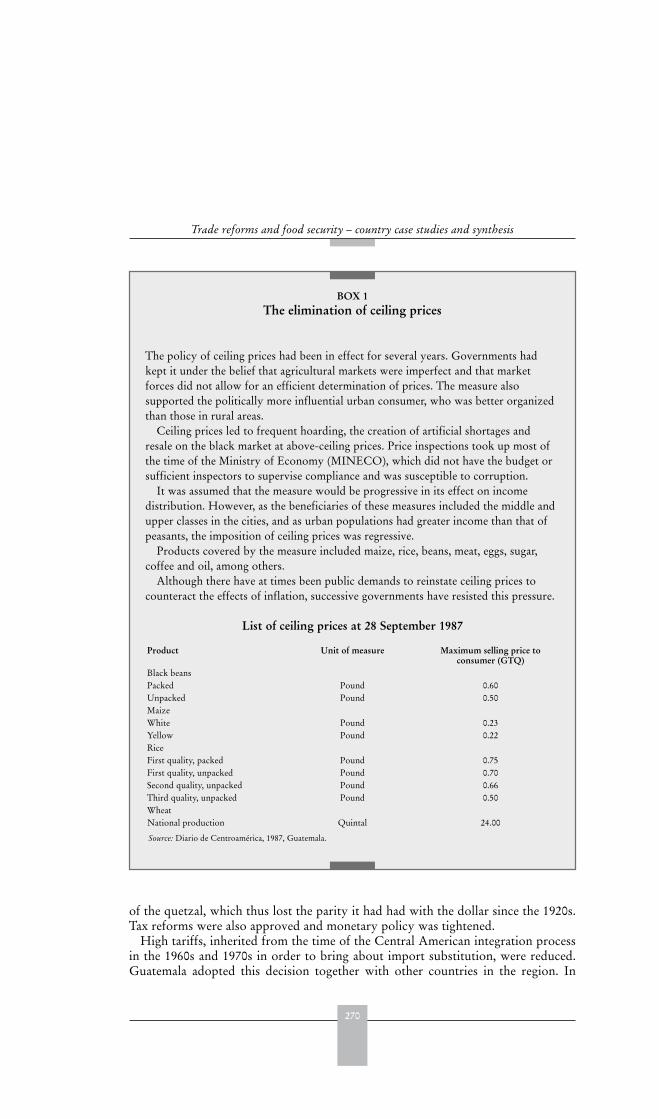
270
Trade reforms and food security – country case studies and synthesis
of the quetzal, which thus lost the parity it had had with the dollar since the 1920s.Tax reforms were also approved and monetary policy was tightened.
High tariffs, inherited from the time of the Central American integration processin the 1960s and 1970s in order to bring about import substitution, were reduced.Guatemala adopted this decision together with other countries in the region. In
BOX 1The elimination of ceiling prices
The policy of ceiling prices had been in effect for several years. Governments hadkept it under the belief that agricultural markets were imperfect and that marketforces did not allow for an efficient determination of prices. The measure alsosupported the politically more influential urban consumer, who was better organizedthan those in rural areas.
Ceiling prices led to frequent hoarding, the creation of artificial shortages andresale on the black market at above-ceiling prices. Price inspections took up most ofthe time of the Ministry of Economy (MINECO), which did not have the budget orsufficient inspectors to supervise compliance and was susceptible to corruption.
It was assumed that the measure would be progressive in its effect on incomedistribution. However, as the beneficiaries of these measures included the middle andupper classes in the cities, and as urban populations had greater income than that ofpeasants, the imposition of ceiling prices was regressive.
Products covered by the measure included maize, rice, beans, meat, eggs, sugar,coffee and oil, among others.
Although there have at times been public demands to reinstate ceiling prices tocounteract the effects of inflation, successive governments have resisted this pressure.
List of ceiling prices at 28 September 1987
Product Unit of measure Maximum selling price to consumer (GTQ)
Black beansPacked Pound 0.60Unpacked Pound 0.50MaizeWhite Pound 0.23Yellow Pound 0.22RiceFirst quality, packed Pound 0.75First quality, unpacked Pound 0.70Second quality, unpacked Pound 0.66Third quality, unpacked Pound 0.50WheatNational production Quintal 24.00
Source: Diario de Centroamérica, 1987, Guatemala.
271
Guatemala
1984, the Caribbean Basin Initiative of the United States came into effect, providinga more favourable preferential treatment than that granted under the General Systemof Preferences and expected, in the medium term, to stimulate the production of awider range of non-traditional products.
In domestic markets, the decision at the end of the 1990s to eliminate pricecontrol on food products (see Box 1) was of great relevance. The policy of ceilingprices, deeply rooted for decades, discouraged production and reinforced the anti-agricultural bias of trade policy.
The economy reacted positively to the reforms. Relative stability was broughtabout and there was a modest growth in GDP. In 1990, however, stability was lostand Guatemala experienced the highest inflation rate in its history. The growth ofexports was slow, while imports grew more rapidly due to the fall in tariffs, thusincreasing the trade deficit.
Second phase of reform: 1991-95The first task of the new administration was to reduce macro instability. This waspursued via tax reform aimed at controlling the fiscal deficit and tight monetarypolicy which took interest rates to above 20 percent by the end of the period.Despite monetary contraction, the devaluation of the quetzal continued, although ata slower pace than in the previous phase.
At an institutional level, the first steps were taken towards de-monopolizingelectricity generation. Given the shortages of energy at the time, private and foreignparticipation was permitted.
The accession of Guatemala and the other Central American countries to theGATT occurred towards the conclusion of the Uruguay Round.
Third phase of reform: 1996-99As part of the peace accords signed with the guerrillas in 1996, a wide-ranging socialexpenditure agenda was agreed. This led once again to an increase in the tax burden,not so much for purposes of economic stabilization, but with the objective of takingbasic infrastructure and public services to the interior of the country. In order toincrease tax collection, a new inland revenue institution, the SAT, was created, withpartial autonomy from the central government.
Parallel to this socio-economic agenda, the Government also implementedtwo important privatization and deregulation initiatives – in the electricity andtelecommunications sectors. Both led to greater foreign investment than the countryhad ever recorded, primarily from Spain and Mexico.
As the United States continued to refuse to grant the so-called NAFTA-parityrequested by Central America, which would have consisted of giving the area thesame treatment as given Mexico, Guatemala decided to negotiate free trade treatieswith other trading partners. It thus opened negotiations with Mexico, the DominicanRepublic, Panama and Chile, in some cases in a common front with other CentralAmerican countries.
In 1999, macroeconomic instability returned and the quetzal depreciatedsignificantly as monetary expansion led to currency depreciation. The authoritiesreacted with monetary restrictions, which in turn kept the interest rate high. GDPand exports continued to grow at moderate rates.
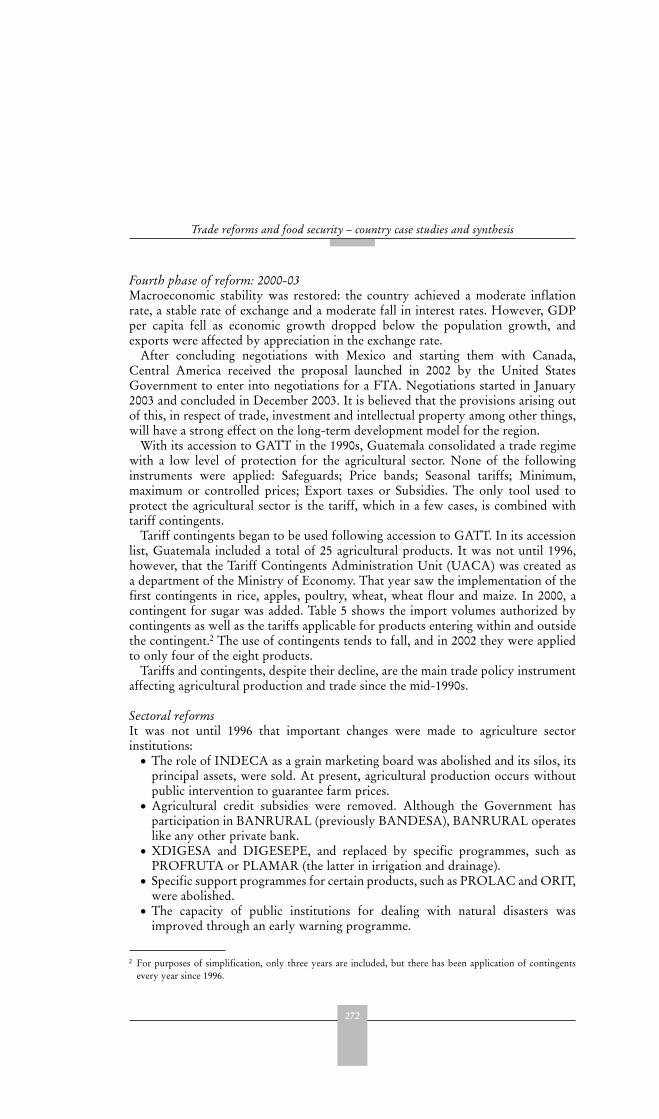
272
Trade reforms and food security – country case studies and synthesis
Fourth phase of reform: 2000-03Macroeconomic stability was restored: the country achieved a moderate inflationrate, a stable rate of exchange and a moderate fall in interest rates. However, GDPper capita fell as economic growth dropped below the population growth, andexports were affected by appreciation in the exchange rate.
After concluding negotiations with Mexico and starting them with Canada,Central America received the proposal launched in 2002 by the United StatesGovernment to enter into negotiations for a FTA. Negotiations started in January2003 and concluded in December 2003. It is believed that the provisions arising outof this, in respect of trade, investment and intellectual property among other things,will have a strong effect on the long-term development model for the region.
With its accession to GATT in the 1990s, Guatemala consolidated a trade regimewith a low level of protection for the agricultural sector. None of the followinginstruments were applied: Safeguards; Price bands; Seasonal tariffs; Minimum,maximum or controlled prices; Export taxes or Subsidies. The only tool used toprotect the agricultural sector is the tariff, which in a few cases, is combined withtariff contingents.
Tariff contingents began to be used following accession to GATT. In its accessionlist, Guatemala included a total of 25 agricultural products. It was not until 1996,however, that the Tariff Contingents Administration Unit (UACA) was created asa department of the Ministry of Economy. That year saw the implementation of thefirst contingents in rice, apples, poultry, wheat, wheat flour and maize. In 2000, acontingent for sugar was added. Table 5 shows the import volumes authorized bycontingents as well as the tariffs applicable for products entering within and outsidethe contingent.2 The use of contingents tends to fall, and in 2002 they were appliedto only four of the eight products.
Tariffs and contingents, despite their decline, are the main trade policy instrumentaffecting agricultural production and trade since the mid-1990s.
Sectoral reformsIt was not until 1996 that important changes were made to agriculture sectorinstitutions:
The role of INDECA as a grain marketing board was abolished and its silos, itsprincipal assets, were sold. At present, agricultural production occurs withoutpublic intervention to guarantee farm prices.Agricultural credit subsidies were removed. Although the Government hasparticipation in BANRURAL (previously BANDESA), BANRURAL operateslike any other private bank.XDIGESA and DIGESEPE, and replaced by specific programmes, such asPROFRUTA or PLAMAR (the latter in irrigation and drainage).Specific support programmes for certain products, such as PROLAC and ORIT,were abolished.The capacity of public institutions for dealing with natural disasters wasimproved through an early warning programme.
2 For purposes of simplification, only three years are included, but there has been application of contingentsevery year since 1996.
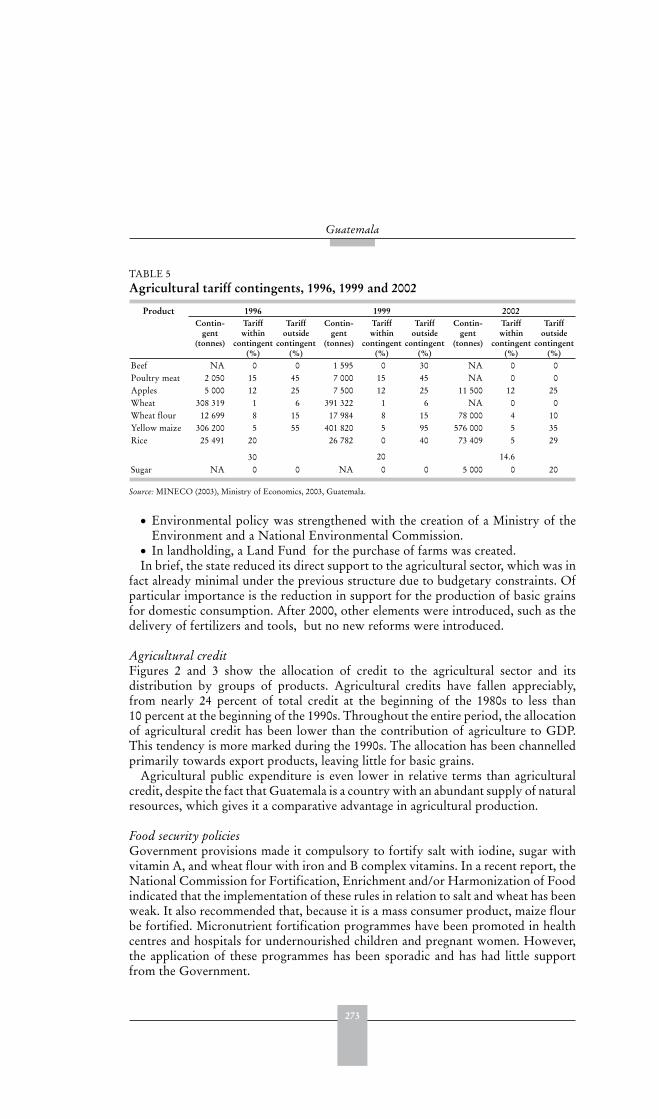
273
Guatemala
Environmental policy was strengthened with the creation of a Ministry of theEnvironment and a National Environmental Commission.In landholding, a Land Fund for the purchase of farms was created.
In brief, the state reduced its direct support to the agricultural sector, which was infact already minimal under the previous structure due to budgetary constraints. Ofparticular importance is the reduction in support for the production of basic grainsfor domestic consumption. After 2000, other elements were introduced, such as thedelivery of fertilizers and tools, but no new reforms were introduced.
Agricultural creditFigures 2 and 3 show the allocation of credit to the agricultural sector and itsdistribution by groups of products. Agricultural credits have fallen appreciably,from nearly 24 percent of total credit at the beginning of the 1980s to less than10 percent at the beginning of the 1990s. Throughout the entire period, the allocationof agricultural credit has been lower than the contribution of agriculture to GDP.This tendency is more marked during the 1990s. The allocation has been channelledprimarily towards export products, leaving little for basic grains.
Agricultural public expenditure is even lower in relative terms than agriculturalcredit, despite the fact that Guatemala is a country with an abundant supply of naturalresources, which gives it a comparative advantage in agricultural production.
Food security policiesGovernment provisions made it compulsory to fortify salt with iodine, sugar withvitamin A, and wheat flour with iron and B complex vitamins. In a recent report, theNational Commission for Fortification, Enrichment and/or Harmonization of Foodindicated that the implementation of these rules in relation to salt and wheat has beenweak. It also recommended that, because it is a mass consumer product, maize flourbe fortified. Micronutrient fortification programmes have been promoted in healthcentres and hospitals for undernourished children and pregnant women. However,the application of these programmes has been sporadic and has had little supportfrom the Government.
TABLE 5 Agricultural tariff contingents, 1996, 1999 and 2002
Product 1996 1999 2002Contin-
gent(tonnes)
Tariffwithin
contingent(%)
Tariffoutside
contingent(%)
Contin-gent
(tonnes)
Tariffwithin
contingent(%)
Tariffoutside
contingent(%)
Contin-gent
(tonnes)
Tariffwithin
contingent(%)
Tariffoutside
contingent(%)
Beef NA 0 0 1 595 0 30 NA 0 0Poultry meat 2 050 15 45 7 000 15 45 NA 0 0Apples 5 000 12 25 7 500 12 25 11 500 12 25Wheat 308 319 1 6 391 322 1 6 NA 0 0Wheat flour 12 699 8 15 17 984 8 15 78 000 4 10Yellow maize 306 200 5 55 401 820 5 95 576 000 5 35Rice 25 491 20 26 782 0 40 73 409 5 29
30 20 14.6Sugar NA 0 0 NA 0 0 5 000 0 20
Source: MINECO (2003), Ministry of Economics, 2003, Guatemala.
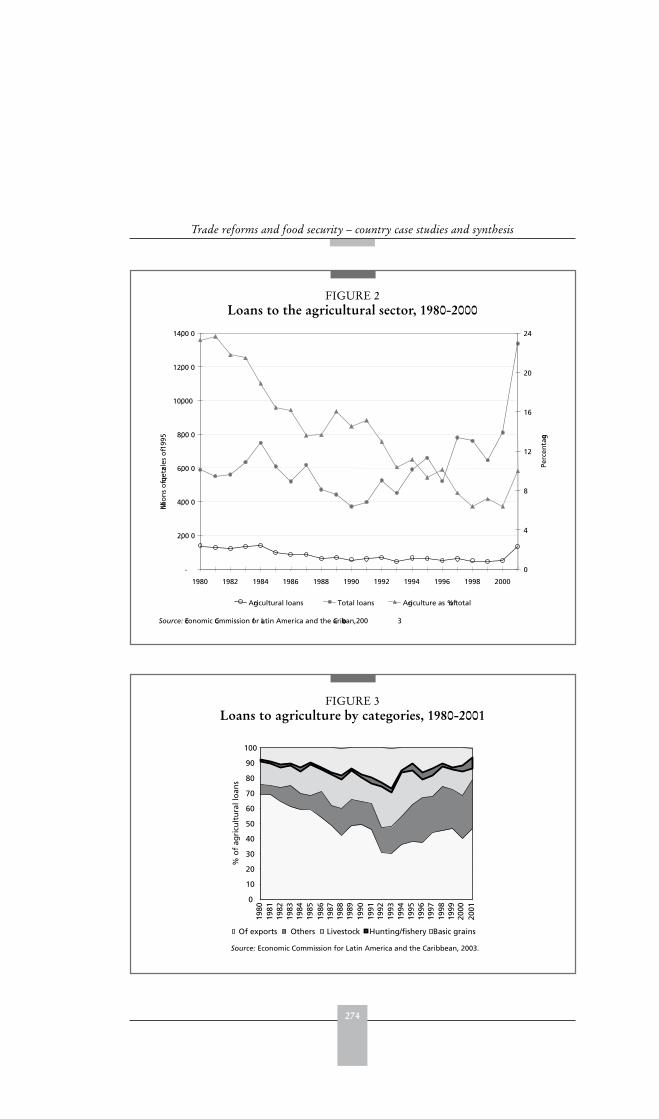
274
Trade reforms and food security – country case studies and synthesis
FIGURE 2Loans to the agricultural sector, 1980-2000
-
2,00 0
4,00 0
6,00 0
8,00 0
10,000
12,00 0
14,00 0
1980 1982 1984 1986 1988 1990 1992 1994 1996 1998 2000
Millio
ns
of qu
etzal
es o
f 199
5
0
4
8
12
16
20
24
Perc
enta
ge
Agricultural loans Total loans Agriculture as % of total
Source: Economic Commission for Latin America and the Caribbean, 200 3
0
10
20
30
40
50
60
70
80
90
100
1980
1981
1982
1983
1984
1985
1986
1987
1988
1989
1990
1991
1992
1993
1994
1995
1996
1997
1998
1999
2000
2001
Of exports Others Livestock Hunting/fishery Basic grains
Source: Economic Commission for Latin America and the Caribbean, 2003.
% o
f ag
ricu
ltu
ral l
oan
s
FIGURE 3Loans to agriculture by categories, 1980-2001
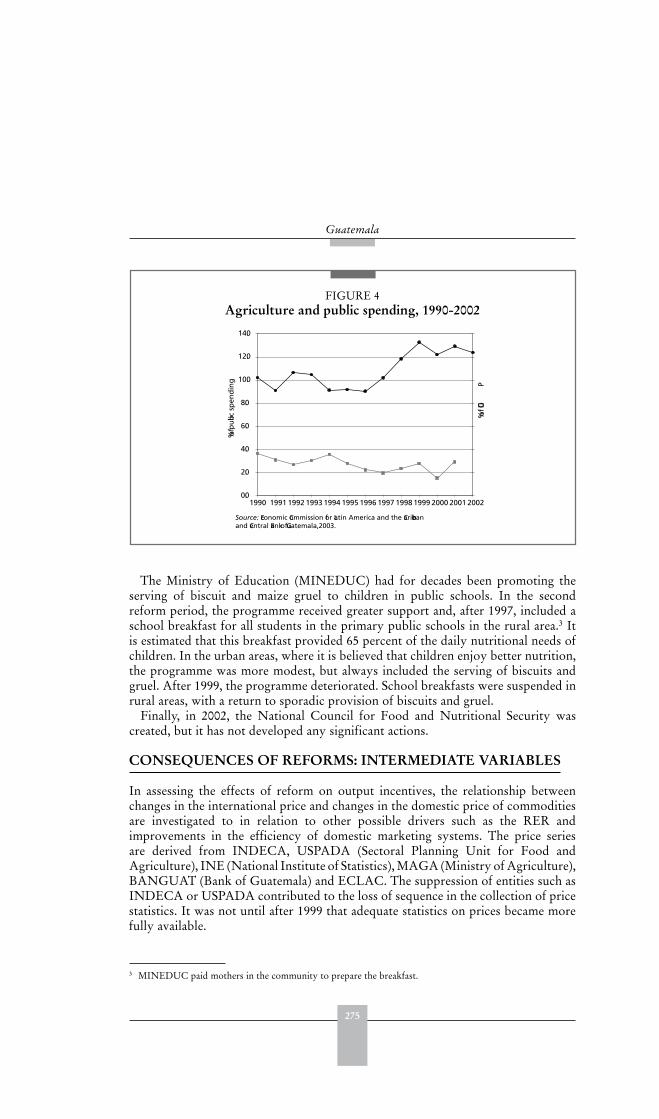
275
Guatemala
The Ministry of Education (MINEDUC) had for decades been promoting theserving of biscuit and maize gruel to children in public schools. In the secondreform period, the programme received greater support and, after 1997, included aschool breakfast for all students in the primary public schools in the rural area.3 Itis estimated that this breakfast provided 65 percent of the daily nutritional needs ofchildren. In the urban areas, where it is believed that children enjoy better nutrition,the programme was more modest, but always included the serving of biscuits andgruel. After 1999, the programme deteriorated. School breakfasts were suspended inrural areas, with a return to sporadic provision of biscuits and gruel.
Finally, in 2002, the National Council for Food and Nutritional Security wascreated, but it has not developed any significant actions.
CONSEQUENCES OF REFORMS: INTERMEDIATE VARIABLES
In assessing the effects of reform on output incentives, the relationship betweenchanges in the international price and changes in the domestic price of commoditiesare investigated to in relation to other possible drivers such as the RER andimprovements in the efficiency of domestic marketing systems. The price seriesare derived from INDECA, USPADA (Sectoral Planning Unit for Food andAgriculture), INE (National Institute of Statistics), MAGA (Ministry of Agriculture),BANGUAT (Bank of Guatemala) and ECLAC. The suppression of entities such asINDECA or USPADA contributed to the loss of sequence in the collection of pricestatistics. It was not until after 1999 that adequate statistics on prices became morefully available.
3 MINEDUC paid mothers in the community to prepare the breakfast.
FIGURE 4Agriculture and public spending, 1990-2002
Source: Economic Commission for Latin America and the Caribbean and Central Bank of Guatemala, 2003.
0.0
2.0
4.0
6.0
8.0
10.0
12.0
14.0
1990 1991 1992 1993 1994 1995 1996 1997 1998 1999 2000 2001 2002
% of p
ublic
sp
end
ing
% of GD
P
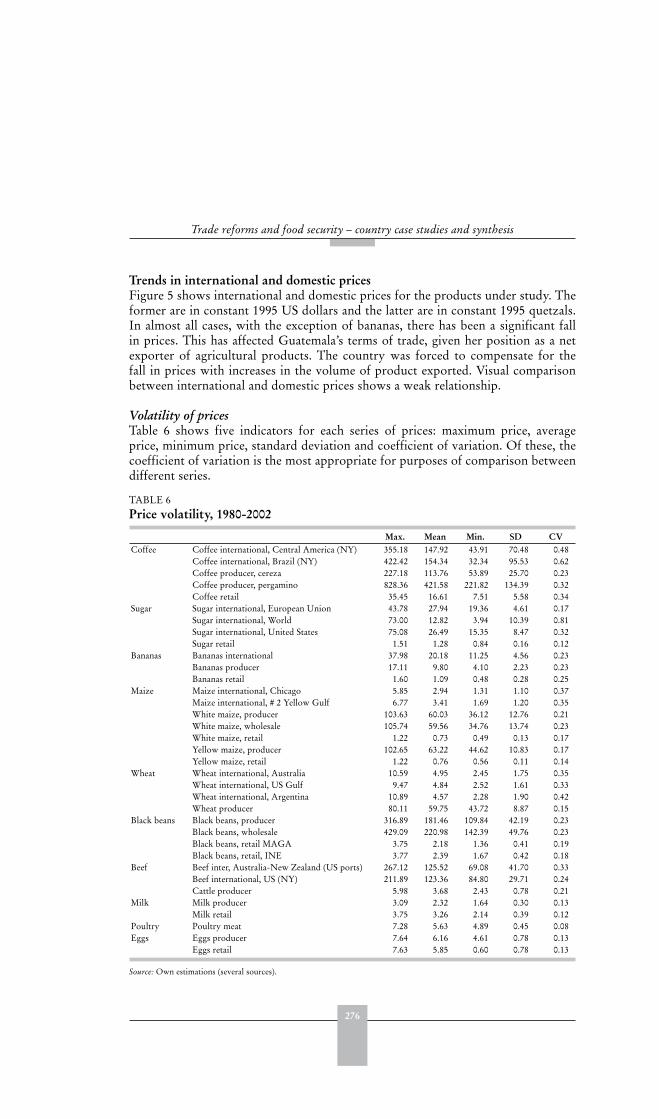
276
Trade reforms and food security – country case studies and synthesis
Trends in international and domestic pricesFigure 5 shows international and domestic prices for the products under study. Theformer are in constant 1995 US dollars and the latter are in constant 1995 quetzals.In almost all cases, with the exception of bananas, there has been a significant fallin prices. This has affected Guatemala’s terms of trade, given her position as a netexporter of agricultural products. The country was forced to compensate for thefall in prices with increases in the volume of product exported. Visual comparisonbetween international and domestic prices shows a weak relationship.
Volatility of pricesTable 6 shows five indicators for each series of prices: maximum price, averageprice, minimum price, standard deviation and coefficient of variation. Of these, thecoefficient of variation is the most appropriate for purposes of comparison betweendifferent series.
TABLE 6 Price volatility, 1980-2002
Max. Mean Min. SD CVCoffee Coffee international, Central America (NY) 355.18 147.92 43.91 70.48 0.48
Coffee international, Brazil (NY) 422.42 154.34 32.34 95.53 0.62Coffee producer, cereza 227.18 113.76 53.89 25.70 0.23Coffee producer, pergamino 828.36 421.58 221.82 134.39 0.32Coffee retail 35.45 16.61 7.51 5.58 0.34
Sugar Sugar international, European Union 43.78 27.94 19.36 4.61 0.17Sugar international, World 73.00 12.82 3.94 10.39 0.81Sugar international, United States 75.08 26.49 15.35 8.47 0.32Sugar retail 1.51 1.28 0.84 0.16 0.12
Bananas Bananas international 37.98 20.18 11.25 4.56 0.23Bananas producer 17.11 9.80 4.10 2.23 0.23Bananas retail 1.60 1.09 0.48 0.28 0.25
Maize Maize international, Chicago 5.85 2.94 1.31 1.10 0.37Maize international, # 2 Yellow Gulf 6.77 3.41 1.69 1.20 0.35White maize, producer 103.63 60.03 36.12 12.76 0.21White maize, wholesale 105.74 59.56 34.76 13.74 0.23White maize, retail 1.22 0.73 0.49 0.13 0.17Yellow maize, producer 102.65 63.22 44.62 10.83 0.17Yellow maize, retail 1.22 0.76 0.56 0.11 0.14
Wheat Wheat international, Australia 10.59 4.95 2.45 1.75 0.35Wheat international, US Gulf 9.47 4.84 2.52 1.61 0.33Wheat international, Argentina 10.89 4.57 2.28 1.90 0.42Wheat producer 80.11 59.75 43.72 8.87 0.15
Black beans Black beans, producer 316.89 181.46 109.84 42.19 0.23Black beans, wholesale 429.09 220.98 142.39 49.76 0.23Black beans, retail MAGA 3.75 2.18 1.36 0.41 0.19Black beans, retail, INE 3.77 2.39 1.67 0.42 0.18
Beef Beef inter, Australia-New Zealand (US ports) 267.12 125.52 69.08 41.70 0.33Beef international, US (NY) 211.89 123.36 84.80 29.71 0.24Cattle producer 5.98 3.68 2.43 0.78 0.21
Milk Milk producer 3.09 2.32 1.64 0.30 0.13Milk retail 3.75 3.26 2.14 0.39 0.12
Poultry Poultry meat 7.28 5.63 4.89 0.45 0.08Eggs Eggs producer 7.64 6.16 4.61 0.78 0.13
Eggs retail 7.63 5.85 0.60 0.78 0.13
Source: Own estimations (several sources).
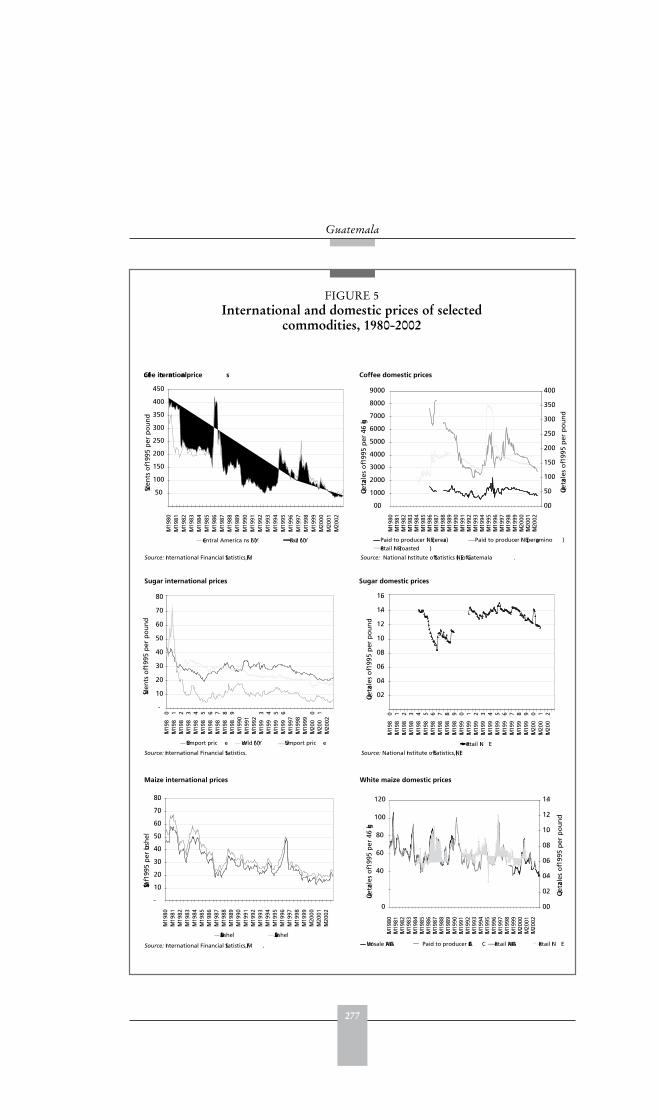
277
Guatemala
FIGURE 5International and domestic prices of selected
commodities, 1980-2002
Coffee international price s
50
100
150
200
250
300
350
400
450
M1 19
80M1
1981
M1 19
82M1
1983
M1 19
84M1
1985
M1 19
86M1
1987
M1 19
88M1
1989
M1 19
90M1
1991
M1 19
92M1
1993
M1 19
94M1
1995
M1 19
96M1
1997
M1 19
98M1
1999
M1 20
00M1
2001
M1 20
02
US cen
ts o
f 199
5 p
er p
ou
nd
Central America ns (NY) Brazil (NY)
Source: International Financial Statistics, IMF.
Coffee domestic prices
0.0
100.0
200.0
300.0
400.0
500.0
600.0
700.0
800.0
900.0M1
1980
M1 19
81M1
1982
M1 19
83M1
1984
M1 19
85M1
1986
M1 19
87M1
1988
M1 19
89M1
1990
M1 19
91M1
1992
M1 19
93M1
1994
M1 19
95M1
1996
M1 19
97M1
1998
M1 19
99M1
2000
M1 20
01M1
2002
Quet
zales
of 1
995
per
46
kg
0.0
5.0
10.0
15.0
20.0
25.0
30.0
35.0
40.0
Quet
zales
of 1
995
per
po
un
d
Paid to producer INE (cereza) Paid to producer INE (pergamino )
Retail INE (roasted )
Source: National Institute of Statistics (INE) of Guatemala .
Sugar international prices
-
10
20
30
40
50
60
70
80
M1 19
80
M1 19
81
M1 19
82
M1 19
83
M1 19
84
M1 19
85
M1 19
86
M1 19
87
M1 19
88
M1 19
89
M1 19
90M1
1991
M1 19
92M1
199
3M1
199
4M1
199
5M1
199
6M1
1997
M1 19
98M1
1999
M1 20
00
M1 20
01
M1 20
02
US cen
ts o
f 199
5 p
er p
ou
nd
EU import pric e World (NY) US import pric e
Source: International Financial Statistics.
Sugar domestic prices
0.2
0.4
0.6
0.8
1.0
1.2
1.4
1.6
M1 19
80
M1 19
81
M1 19
82
M1 19
83
M1 19
84
M1 19
85
M1 19
86
M1 19
87
M1 19
88
M1 19
89
M1 19
90
M1 19
91
M1 19
92
M1 19
93
M1 19
94
M1 19
95
M1 19
96
M1 19
97
M1 19
98
M1 19
99
M1 20
00
M1 20
01
M1 20
02
Quet
zales
of 1
995
per
po
un
d
Retail IN E
Source: National Institute of Statistics, (INE).
Maize international prices
-
1.0
2.0
3.0
4.0
5.0
6.0
7.0
8.0
M1 19
80M1
1981
M1 19
82M1
1983
M1 19
84M1
1985
M1 19
86M1
1987
M1 19
88M1
1989
M1 19
90M1
1991
M1 19
92M1
1993
M1 19
94M1
1995
M1 19
96M1
1997
M1 19
98M1
1999
M1 20
00M1
2001
M1 20
02
US$ of 1
995
per
bush
el
US$/bushel US$/bushel
Source: International Financial Statistics, IMF .
White maize domestic prices
0
40
60
80
100
120
M1 19
80M1
1981
M1 19
82M1
1983
M1 19
84M1
1985
M1 19
86M1
1987
M1 19
88M1
1989
M1 19
90M1
1991
M1 19
92M1
1993
M1 19
94M1
1995
M1 19
96M1
1997
M1 19
98M1
1999
M1 20
00M1
2001
M1 20
02
Quet
zales
of 1
995
per
46
kg
0.0
0.2
0.4
0.6
0.8
1.0
1.2
1.4
Quet
zales
of 1
995
per
po
un
d
Whosale MAGA Paid to producer ECLA C Retail MAGA Retail IN E
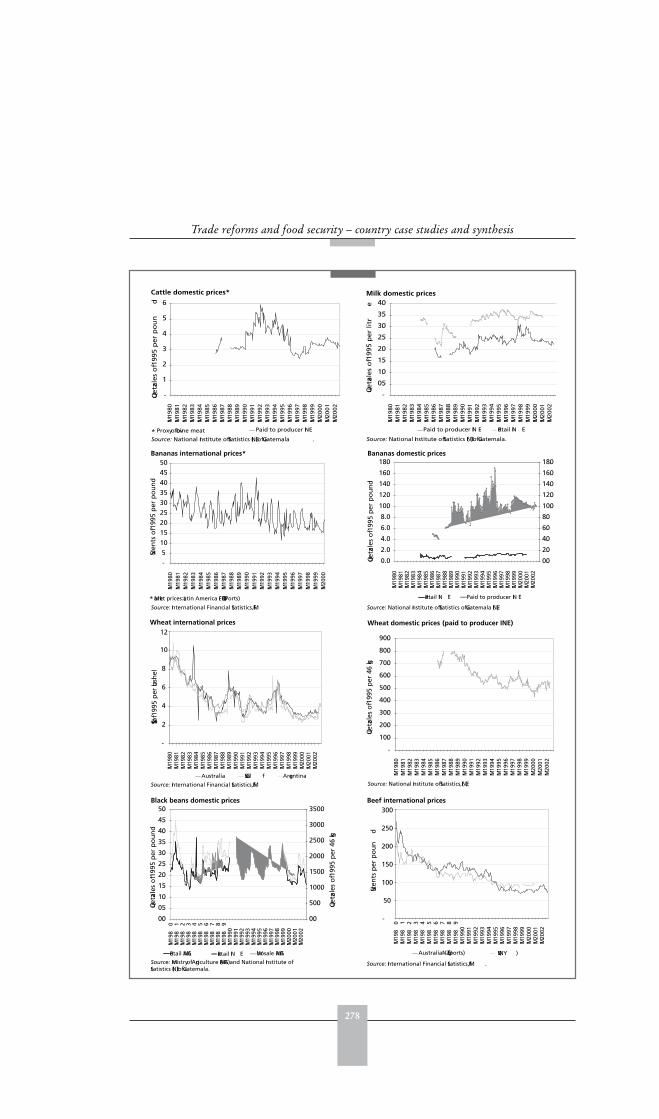
278
Trade reforms and food security – country case studies and synthesis
Bananas domestic prices
0.0
2.0
4.0
6.0
8.0
10.0
12.0
14.0
16.0
18.0
M1 19
80M1
1981
M1 19
82M1
1983
M1 19
84M1
1985
M1 19
86M1
1987
M1 19
88M1
1989
M1 19
90M1
1991
M1 19
92M1
1993
M1 19
94M1
1995
M1 19
96M1
1997
M1 19
98M1
1999
M1 20
00M1
2001
M1 20
02
Quet
zales
of 1
995
per
po
un
d
0.0
2.0
4.0
6.0
8.0
10.0
12.0
14.0
16.0
18.0
Retail IN E Paid to producer IN E
Source: National Institute of Statistics of Guatemala (INE).
Cattle domestic prices*
-
1
2
3
4
5
6
M1 19
80M1
1981
M1 19
82M1
1983
M1 19
84M1
1985
M1 19
86M1
1987
M1 19
88M1
1989
M1 19
90M1
1991
M1 19
92M1
1993
M1 19
94M1
1995
M1 19
96M1
1997
M1 19
98M1
1999
M1 20
00M1
2001
M1 20
02
Quet
zales
of 1
995
per
po
un
d
Paid to producer INE
Source: National Institute of Statistics (INE) of Guatemala .* Proxy of bovine meat
Milk domestic prices
-
0.5
1.0
1.5
2.0
2.5
3.0
3.5
4.0
M1 19
80M1
1981
M1 19
82M1
1983
M1 19
84M1
1985
M1 19
86M1
1987
M1 19
88M1
1989
M1 19
90M1
1991
M1 19
92M1
1993
M1 19
94M1
1995
M1 19
96M1
1997
M1 19
98M1
1999
M1 20
00M1
2001
M1 20
02
Quet
zales
of 1
995
per
litr
e
Paid to producer IN E Retail IN E
Source: National Institute of Statistics (INE) of Guatemala.
Wheat international prices
-
2
4
6
8
10
12
M1 19
80M1
1981
M1 19
82M1
1983
M1 19
84M1
1985
M1 19
86M1
1987
M1 19
88M1
1989
M1 19
90M1
1991
M1 19
92M1
1993
M1 19
94M1
1995
M1 19
96M1
1997
M1 19
98M1
1999
M1 20
00M1
2001
M1 20
02
US$ of 1
995
per
bush
el
Australia US Gul f Argentina
Source: International Financial Statistics, IMF.
Wheat domestic prices (paid to producer INE)
-
10.0
20.0
30.0
40.0
50.0
60.0
70.0
80.0
90.0
M1 19
80M1
1981
M1 19
82M1
1983
M1 19
84M1
1985
M1 19
86M1
1987
M1 19
88M1
1989
M1 19
90M1
1991
M1 19
92M1
1993
M1 19
94M1
1995
M1 19
96M1
1997
M1 19
98M1
1999
M1 20
00M1
2001
M1 20
02
Quet
zales
of 1
995
per
46
kg
Source: National Institute of Statistics, (INE).
Bananas international prices*
-5101520253035404550
M1 19
80M1
1981
M1 19
82M1
1983
M1 19
84M1
1985
M1 19
86M1
1987
M1 19
88M1
1989
M1 19
90M1
1991
M1 19
92M1
1993
M1 19
94M1
1995
M1 19
96M1
1997
M1 19
98M1
1999
M1 20
00
US cen
ts o
f 199
5 p
er p
ou
nd
Source: International Financial Statistics, IMF.* Market prices: Latin America (FOB US Ports)
Black beans domestic prices
0.0
0.5
1.0
1.5
2.0
2.5
3.0
3.5
4.0
4.5
5.0
M1 19
80
M1 19
81
M1 19
82
M1 19
83
M1 19
84
M1 19
85
M1 19
86
M1 19
87
M1 19
88
M1 19
89
M1 19
90M1
1991
M1 19
92M1
1993
M1 19
94M1
1995
M1 19
96M1
1997
M1 19
98M1
1999
M1 20
00M1
2001
M1 20
02
Quet
zales
of 1
995
per
po
un
d
0.0
50.0
100.0
150.0
200.0
250.0
300.0
350.0
Quet
zales
of 1
995
per
46
kg
Retail MAGA Retail IN E Whosale MAGA
Source: Ministry of Agriculture (MAGA) and National Institute of Statistics (INE) of Guatemala.
Beef international prices
-
50
100
150
200
250
300
M1 19
80
M1 19
81
M1 19
82
M1 19
83
M1 19
84
M1 19
85
M1 19
86
M1 19
87
M1 19
88
M1 19
89
M1 19
90M1
1991
M1 19
92M1
1993
M1 19
94M1
1995
M1 19
96M1
1997
M1 19
98M1
1999
M1 20
00M1
2001
M1 20
02
US cen
ts p
er p
ou
nd
Australia-NZ (US ports) US (NY )
Source: International Financial Statistics, IMF .
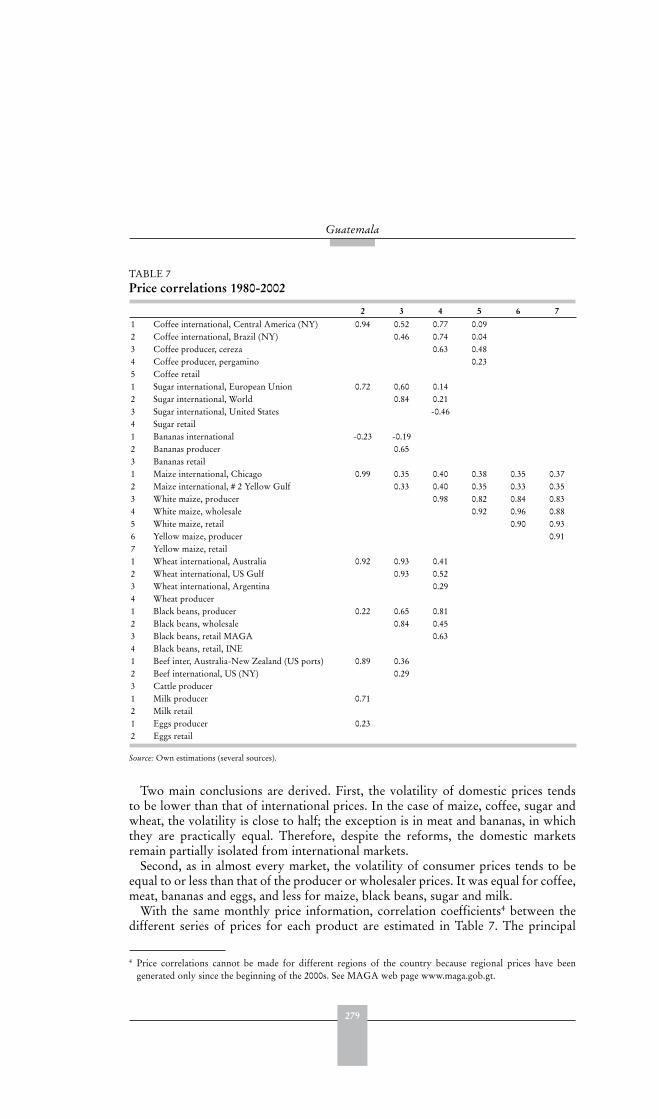
279
Guatemala
Two main conclusions are derived. First, the volatility of domestic prices tendsto be lower than that of international prices. In the case of maize, coffee, sugar andwheat, the volatility is close to half; the exception is in meat and bananas, in whichthey are practically equal. Therefore, despite the reforms, the domestic marketsremain partially isolated from international markets.
Second, as in almost every market, the volatility of consumer prices tends to beequal to or less than that of the producer or wholesaler prices. It was equal for coffee,meat, bananas and eggs, and less for maize, black beans, sugar and milk.
With the same monthly price information, correlation coefficients4 between thedifferent series of prices for each product are estimated in Table 7. The principal
4 Price correlations cannot be made for different regions of the country because regional prices have beengenerated only since the beginning of the 2000s. See MAGA web page www.maga.gob.gt.
TABLE 7 Price correlations 1980-2002
2 3 4 5 6 71 Coffee international, Central America (NY) 0.94 0.52 0.77 0.092 Coffee international, Brazil (NY) 0.46 0.74 0.043 Coffee producer, cereza 0.63 0.484 Coffee producer, pergamino 0.235 Coffee retail1 Sugar international, European Union 0.72 0.60 0.142 Sugar international, World 0.84 0.213 Sugar international, United States -0.464 Sugar retail1 Bananas international -0.23 -0.192 Bananas producer 0.653 Bananas retail1 Maize international, Chicago 0.99 0.35 0.40 0.38 0.35 0.372 Maize international, # 2 Yellow Gulf 0.33 0.40 0.35 0.33 0.353 White maize, producer 0.98 0.82 0.84 0.834 White maize, wholesale 0.92 0.96 0.885 White maize, retail 0.90 0.936 Yellow maize, producer 0.917 Yellow maize, retail1 Wheat international, Australia 0.92 0.93 0.412 Wheat international, US Gulf 0.93 0.523 Wheat international, Argentina 0.294 Wheat producer1 Black beans, producer 0.22 0.65 0.812 Black beans, wholesale 0.84 0.453 Black beans, retail MAGA 0.634 Black beans, retail, INE1 Beef inter, Australia-New Zealand (US ports) 0.89 0.362 Beef international, US (NY) 0.293 Cattle producer1 Milk producer 0.712 Milk retail1 Eggs producer 0.232 Eggs retail
Source: Own estimations (several sources).
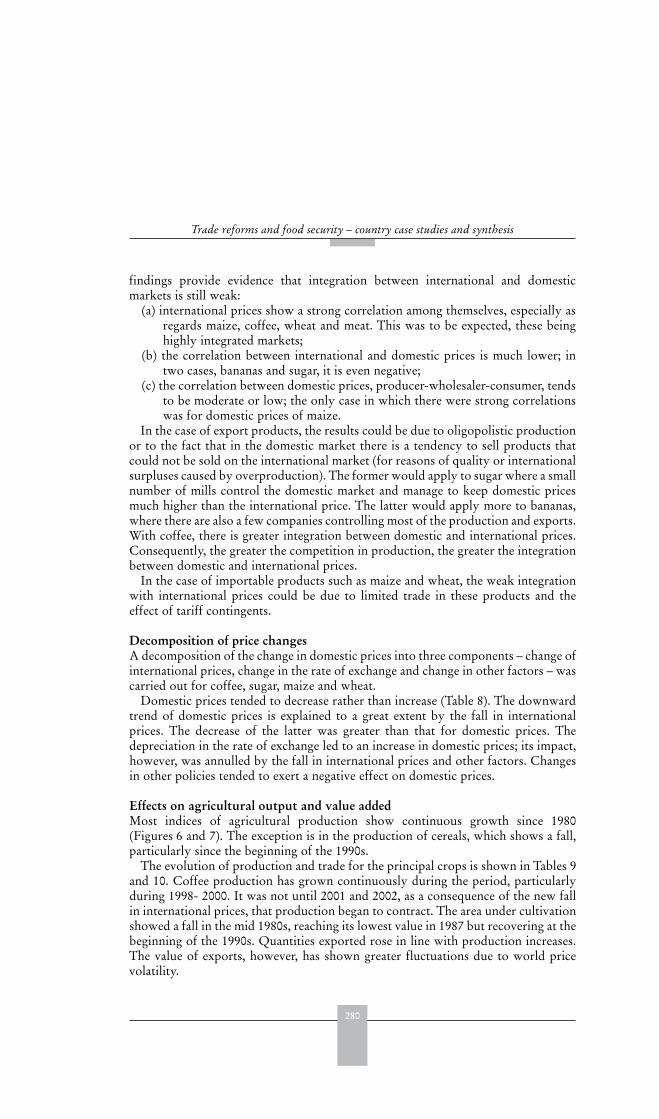
280
Trade reforms and food security – country case studies and synthesis
findings provide evidence that integration between international and domesticmarkets is still weak:
(a) international prices show a strong correlation among themselves, especially asregards maize, coffee, wheat and meat. This was to be expected, these beinghighly integrated markets;
(b) the correlation between international and domestic prices is much lower; intwo cases, bananas and sugar, it is even negative;
(c) the correlation between domestic prices, producer-wholesaler-consumer, tendsto be moderate or low; the only case in which there were strong correlationswas for domestic prices of maize.
In the case of export products, the results could be due to oligopolistic productionor to the fact that in the domestic market there is a tendency to sell products thatcould not be sold on the international market (for reasons of quality or internationalsurpluses caused by overproduction). The former would apply to sugar where a smallnumber of mills control the domestic market and manage to keep domestic pricesmuch higher than the international price. The latter would apply more to bananas,where there are also a few companies controlling most of the production and exports.With coffee, there is greater integration between domestic and international prices.Consequently, the greater the competition in production, the greater the integrationbetween domestic and international prices.
In the case of importable products such as maize and wheat, the weak integrationwith international prices could be due to limited trade in these products and theeffect of tariff contingents.
Decomposition of price changes A decomposition of the change in domestic prices into three components – change ofinternational prices, change in the rate of exchange and change in other factors – wascarried out for coffee, sugar, maize and wheat.
Domestic prices tended to decrease rather than increase (Table 8). The downwardtrend of domestic prices is explained to a great extent by the fall in internationalprices. The decrease of the latter was greater than that for domestic prices. Thedepreciation in the rate of exchange led to an increase in domestic prices; its impact,however, was annulled by the fall in international prices and other factors. Changesin other policies tended to exert a negative effect on domestic prices.
Effects on agricultural output and value addedMost indices of agricultural production show continuous growth since 1980(Figures 6 and 7). The exception is in the production of cereals, which shows a fall,particularly since the beginning of the 1990s.
The evolution of production and trade for the principal crops is shown in Tables 9and 10. Coffee production has grown continuously during the period, particularlyduring 1998- 2000. It was not until 2001 and 2002, as a consequence of the new fallin international prices, that production began to contract. The area under cultivationshowed a fall in the mid 1980s, reaching its lowest value in 1987 but recovering at thebeginning of the 1990s. Quantities exported rose in line with production increases.The value of exports, however, has shown greater fluctuations due to world pricevolatility.
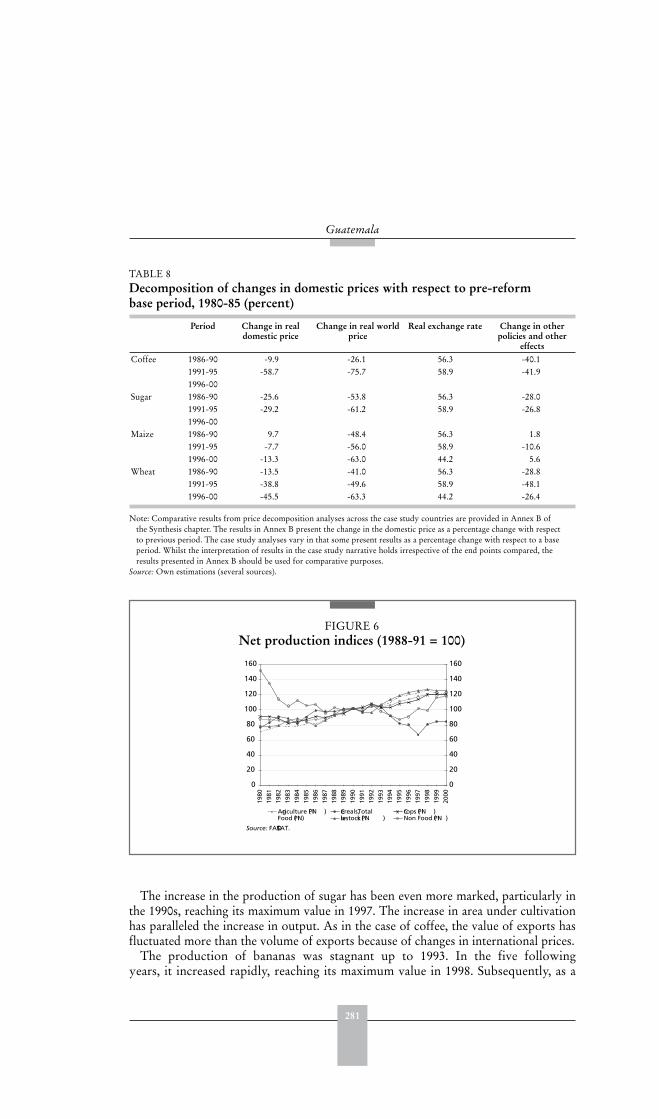
281
Guatemala
The increase in the production of sugar has been even more marked, particularly inthe 1990s, reaching its maximum value in 1997. The increase in area under cultivationhas paralleled the increase in output. As in the case of coffee, the value of exports hasfluctuated more than the volume of exports because of changes in international prices.
The production of bananas was stagnant up to 1993. In the five followingyears, it increased rapidly, reaching its maximum value in 1998. Subsequently, as a
TABLE 8 Decomposition of changes in domestic prices with respect to pre-reform base period, 1980-85 (percent)
Period Change in real domestic price
Change in real world price
Real exchange rate Change in other policies and other
effectsCoffee 1986-90 -9.9 -26.1 56.3 -40.1
1991-95 -58.7 -75.7 58.9 -41.91996-00
Sugar 1986-90 -25.6 -53.8 56.3 -28.01991-95 -29.2 -61.2 58.9 -26.81996-00
Maize 1986-90 9.7 -48.4 56.3 1.81991-95 -7.7 -56.0 58.9 -10.61996-00 -13.3 -63.0 44.2 5.6
Wheat 1986-90 -13.5 -41.0 56.3 -28.81991-95 -38.8 -49.6 58.9 -48.11996-00 -45.5 -63.3 44.2 -26.4
Note: Comparative results from price decomposition analyses across the case study countries are provided in Annex B ofthe Synthesis chapter. The results in Annex B present the change in the domestic price as a percentage change with respectto previous period. The case study analyses vary in that some present results as a percentage change with respect to a baseperiod. Whilst the interpretation of results in the case study narrative holds irrespective of the end points compared, theresults presented in Annex B should be used for comparative purposes.
Source: Own estimations (several sources).
FIGURE 6Net production indices (1988-91 = 100)
0
20
40
60
80
100
120
140
160
1980
1981
1982
1983
1984
1985
1986
1987
1988
1989
1990
1991
1992
1993
1994
1995
1996
1997
1998
1999
2000
0
20
40
60
80
100
120
140
160
Agriculture (PIN ) Cereals,Total Crops (PIN )Food (PIN) Livestocks (PIN ) Non Food (PIN )
Source: FAOSTAT.
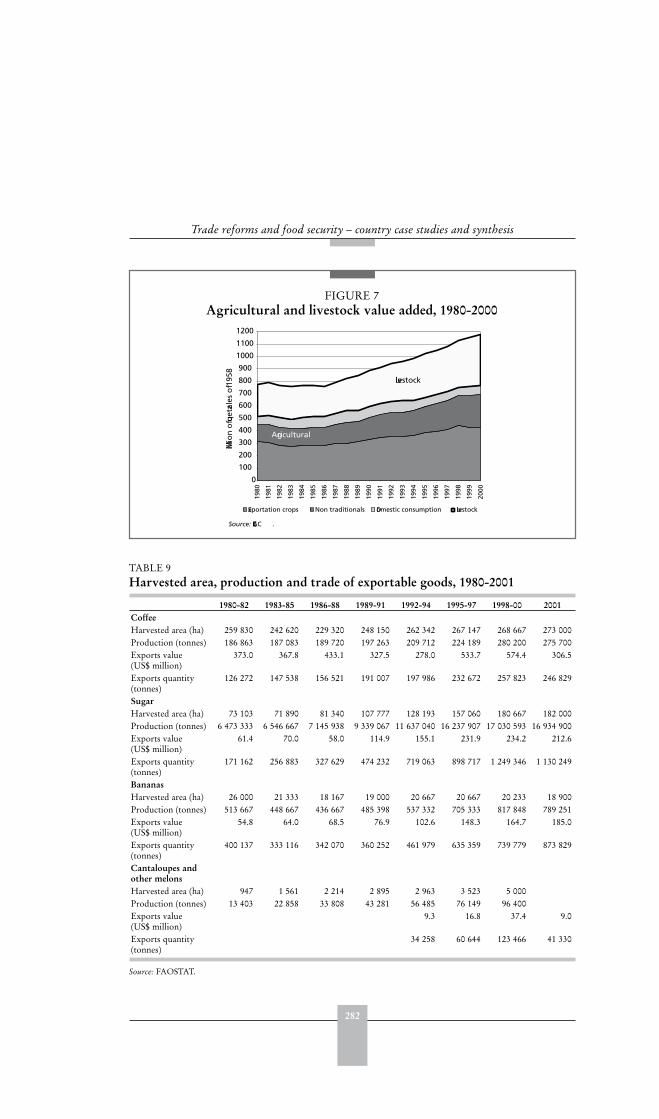
282
Trade reforms and food security – country case studies and synthesis
0
100
200
300
400
500
600
700
800
900
1000
1100
1200
1980
1981
1982
1983
1984
1985
1986
1987
1988
1989
1990
1991
1992
1993
1994
1995
1996
1997
1998
1999
2000
Millio
n o
f quet
zales
of 1
958
Exportation crops Non traditionals Domestic consumption Livestock
Source: ECLAC .
Agricultural
Livestock
FIGURE 7Agricultural and livestock value added, 1980-2000
TABLE 9 Harvested area, production and trade of exportable goods, 1980-2001
1980-82 1983-85 1986-88 1989-91 1992-94 1995-97 1998-00 2001CoffeeHarvested area (ha) 259 830 242 620 229 320 248 150 262 342 267 147 268 667 273 000Production (tonnes) 186 863 187 083 189 720 197 263 209 712 224 189 280 200 275 700Exports value(US$ million)
373.0 367.8 433.1 327.5 278.0 533.7 574.4 306.5
Exports quantity(tonnes)
126 272 147 538 156 521 191 007 197 986 232 672 257 823 246 829
SugarHarvested area (ha) 73 103 71 890 81 340 107 777 128 193 157 060 180 667 182 000Production (tonnes) 6 473 333 6 546 667 7 145 938 9 339 067 11 637 040 16 237 907 17 030 593 16 934 900Exports value(US$ million)
61.4 70.0 58.0 114.9 155.1 231.9 234.2 212.6
Exports quantity(tonnes)
171 162 256 883 327 629 474 232 719 063 898 717 1 249 346 1 130 249
BananasHarvested area (ha) 26 000 21 333 18 167 19 000 20 667 20 667 20 233 18 900Production (tonnes) 513 667 448 667 436 667 485 398 537 332 705 333 817 848 789 251Exports value(US$ million)
54.8 64.0 68.5 76.9 102.6 148.3 164.7 185.0
Exports quantity(tonnes)
400 137 333 116 342 070 360 252 461 979 635 359 739 779 873 829
Cantaloupes and other melonsHarvested area (ha) 947 1 561 2 214 2 895 2 963 3 523 5 000Production (tonnes) 13 403 22 858 33 808 43 281 56 485 76 149 96 400Exports value(US$ million)
9.3 16.8 37.4 9.0
Exports quantity(tonnes)
34 258 60 644 123 466 41 330
Source: FAOSTAT.
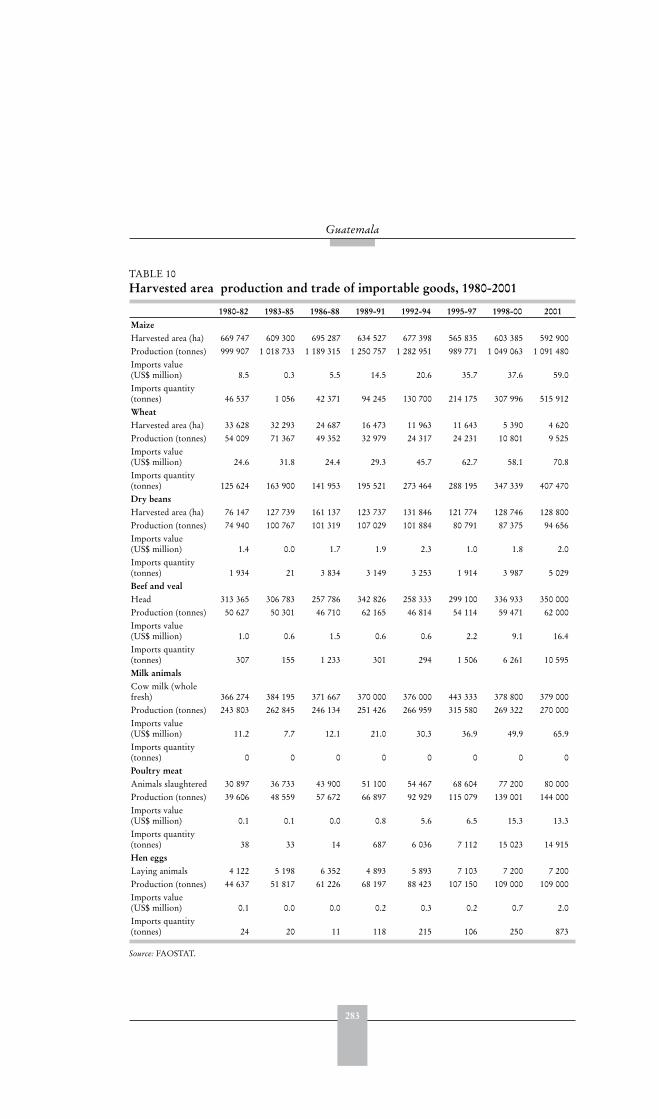
283
Guatemala
TABLE 10 Harvested area production and trade of importable goods, 1980-2001
1980-82 1983-85 1986-88 1989-91 1992-94 1995-97 1998-00 2001
MaizeHarvested area (ha) 669 747 609 300 695 287 634 527 677 398 565 835 603 385 592 900Production (tonnes) 999 907 1 018 733 1 189 315 1 250 757 1 282 951 989 771 1 049 063 1 091 480Imports value(US$ million) 8.5 0.3 5.5 14.5 20.6 35.7 37.6 59.0Imports quantity(tonnes) 46 537 1 056 42 371 94 245 130 700 214 175 307 996 515 912WheatHarvested area (ha) 33 628 32 293 24 687 16 473 11 963 11 643 5 390 4 620Production (tonnes) 54 009 71 367 49 352 32 979 24 317 24 231 10 801 9 525Imports value(US$ million) 24.6 31.8 24.4 29.3 45.7 62.7 58.1 70.8Imports quantity(tonnes) 125 624 163 900 141 953 195 521 273 464 288 195 347 339 407 470Dry beansHarvested area (ha) 76 147 127 739 161 137 123 737 131 846 121 774 128 746 128 800Production (tonnes) 74 940 100 767 101 319 107 029 101 884 80 791 87 375 94 656Imports value(US$ million) 1.4 0.0 1.7 1.9 2.3 1.0 1.8 2.0Imports quantity(tonnes) 1 934 21 3 834 3 149 3 253 1 914 3 987 5 029Beef and vealHead 313 365 306 783 257 786 342 826 258 333 299 100 336 933 350 000Production (tonnes) 50 627 50 301 46 710 62 165 46 814 54 114 59 471 62 000Imports value(US$ million) 1.0 0.6 1.5 0.6 0.6 2.2 9.1 16.4Imports quantity(tonnes) 307 155 1 233 301 294 1 506 6 261 10 595Milk animals Cow milk (wholefresh) 366 274 384 195 371 667 370 000 376 000 443 333 378 800 379 000Production (tonnes) 243 803 262 845 246 134 251 426 266 959 315 580 269 322 270 000Imports value(US$ million) 11.2 7.7 12.1 21.0 30.3 36.9 49.9 65.9Imports quantity(tonnes) 0 0 0 0 0 0 0 0Poultry meatAnimals slaughtered 30 897 36 733 43 900 51 100 54 467 68 604 77 200 80 000Production (tonnes) 39 606 48 559 57 672 66 897 92 929 115 079 139 001 144 000Imports value(US$ million) 0.1 0.1 0.0 0.8 5.6 6.5 15.3 13.3Imports quantity(tonnes) 38 33 14 687 6 036 7 112 15 023 14 915Hen eggsLaying animals 4 122 5 198 6 352 4 893 5 893 7 103 7 200 7 200Production (tonnes) 44 637 51 817 61 226 68 197 88 423 107 150 109 000 109 000Imports value(US$ million) 0.1 0.0 0.0 0.2 0.3 0.2 0.7 2.0Imports quantity(tonnes) 24 20 11 118 215 106 250 873
Source: FAOSTAT.
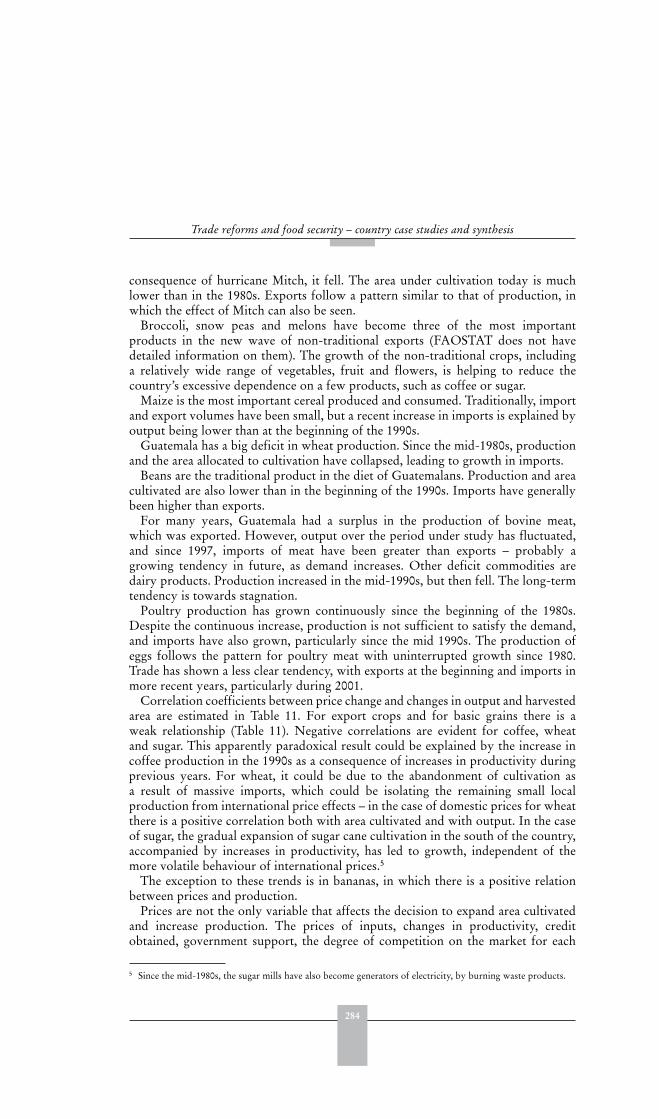
284
Trade reforms and food security – country case studies and synthesis
consequence of hurricane Mitch, it fell. The area under cultivation today is muchlower than in the 1980s. Exports follow a pattern similar to that of production, inwhich the effect of Mitch can also be seen.
Broccoli, snow peas and melons have become three of the most importantproducts in the new wave of non-traditional exports (FAOSTAT does not havedetailed information on them). The growth of the non-traditional crops, includinga relatively wide range of vegetables, fruit and flowers, is helping to reduce thecountry’s excessive dependence on a few products, such as coffee or sugar.
Maize is the most important cereal produced and consumed. Traditionally, importand export volumes have been small, but a recent increase in imports is explained byoutput being lower than at the beginning of the 1990s.
Guatemala has a big deficit in wheat production. Since the mid-1980s, productionand the area allocated to cultivation have collapsed, leading to growth in imports.
Beans are the traditional product in the diet of Guatemalans. Production and areacultivated are also lower than in the beginning of the 1990s. Imports have generallybeen higher than exports.
For many years, Guatemala had a surplus in the production of bovine meat,which was exported. However, output over the period under study has fluctuated,and since 1997, imports of meat have been greater than exports – probably agrowing tendency in future, as demand increases. Other deficit commodities aredairy products. Production increased in the mid-1990s, but then fell. The long-termtendency is towards stagnation.
Poultry production has grown continuously since the beginning of the 1980s.Despite the continuous increase, production is not sufficient to satisfy the demand,and imports have also grown, particularly since the mid 1990s. The production ofeggs follows the pattern for poultry meat with uninterrupted growth since 1980.Trade has shown a less clear tendency, with exports at the beginning and imports inmore recent years, particularly during 2001.
Correlation coefficients between price change and changes in output and harvestedarea are estimated in Table 11. For export crops and for basic grains there is aweak relationship (Table 11). Negative correlations are evident for coffee, wheatand sugar. This apparently paradoxical result could be explained by the increase incoffee production in the 1990s as a consequence of increases in productivity duringprevious years. For wheat, it could be due to the abandonment of cultivation asa result of massive imports, which could be isolating the remaining small localproduction from international price effects – in the case of domestic prices for wheatthere is a positive correlation both with area cultivated and with output. In the caseof sugar, the gradual expansion of sugar cane cultivation in the south of the country,accompanied by increases in productivity, has led to growth, independent of themore volatile behaviour of international prices.5
The exception to these trends is in bananas, in which there is a positive relationbetween prices and production.
Prices are not the only variable that affects the decision to expand area cultivatedand increase production. The prices of inputs, changes in productivity, creditobtained, government support, the degree of competition on the market for each
5 Since the mid-1980s, the sugar mills have also become generators of electricity, by burning waste products.
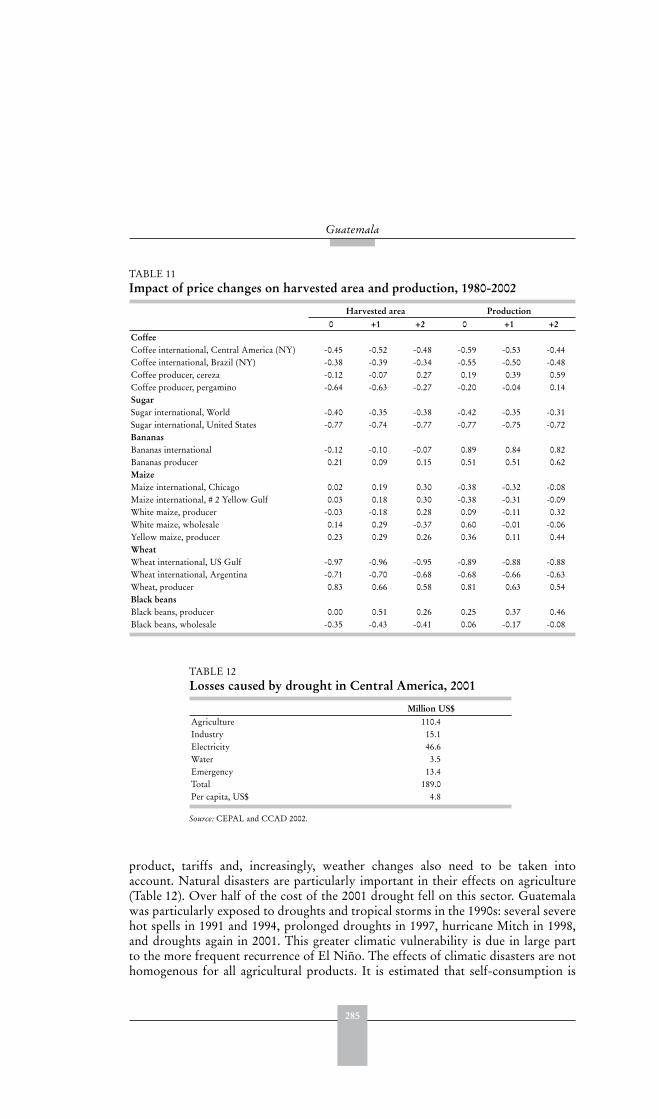
285
Guatemala
product, tariffs and, increasingly, weather changes also need to be taken intoaccount. Natural disasters are particularly important in their effects on agriculture(Table 12). Over half of the cost of the 2001 drought fell on this sector. Guatemalawas particularly exposed to droughts and tropical storms in the 1990s: several severehot spells in 1991 and 1994, prolonged droughts in 1997, hurricane Mitch in 1998,and droughts again in 2001. This greater climatic vulnerability is due in large partto the more frequent recurrence of El Niño. The effects of climatic disasters are nothomogenous for all agricultural products. It is estimated that self-consumption is
TABLE 11 Impact of price changes on harvested area and production, 1980-2002
Harvested area Production0 +1 +2 0 +1 +2
CoffeeCoffee international, Central America (NY) -0.45 -0.52 -0.48 -0.59 -0.53 -0.44Coffee international, Brazil (NY) -0.38 -0.39 -0.34 -0.55 -0.50 -0.48Coffee producer, cereza -0.12 -0.07 0.27 0.19 0.39 0.59Coffee producer, pergamino -0.64 -0.63 -0.27 -0.20 -0.04 0.14SugarSugar international, World -0.40 -0.35 -0.38 -0.42 -0.35 -0.31Sugar international, United States -0.77 -0.74 -0.77 -0.77 -0.75 -0.72BananasBananas international -0.12 -0.10 -0.07 0.89 0.84 0.82Bananas producer 0.21 0.09 0.15 0.51 0.51 0.62MaizeMaize international, Chicago 0.02 0.19 0.30 -0.38 -0.32 -0.08Maize international, # 2 Yellow Gulf 0.03 0.18 0.30 -0.38 -0.31 -0.09White maize, producer -0.03 -0.18 0.28 0.09 -0.11 0.32White maize, wholesale 0.14 0.29 -0.37 0.60 -0.01 -0.06Yellow maize, producer 0.23 0.29 0.26 0.36 0.11 0.44WheatWheat international, US Gulf -0.97 -0.96 -0.95 -0.89 -0.88 -0.88Wheat international, Argentina -0.71 -0.70 -0.68 -0.68 -0.66 -0.63Wheat, producer 0.83 0.66 0.58 0.81 0.63 0.54Black beansBlack beans, producer 0.00 0.51 0.26 0.25 0.37 0.46Black beans, wholesale -0.35 -0.43 -0.41 0.06 -0.17 -0.08
TABLE 12 Losses caused by drought in Central America, 2001
Million US$Agriculture 110.4Industry 15.1Electricity 46.6Water 3.5Emergency 13.4Total 189.0Per capita, US$ 4.8
Source: CEPAL and CCAD 2002.
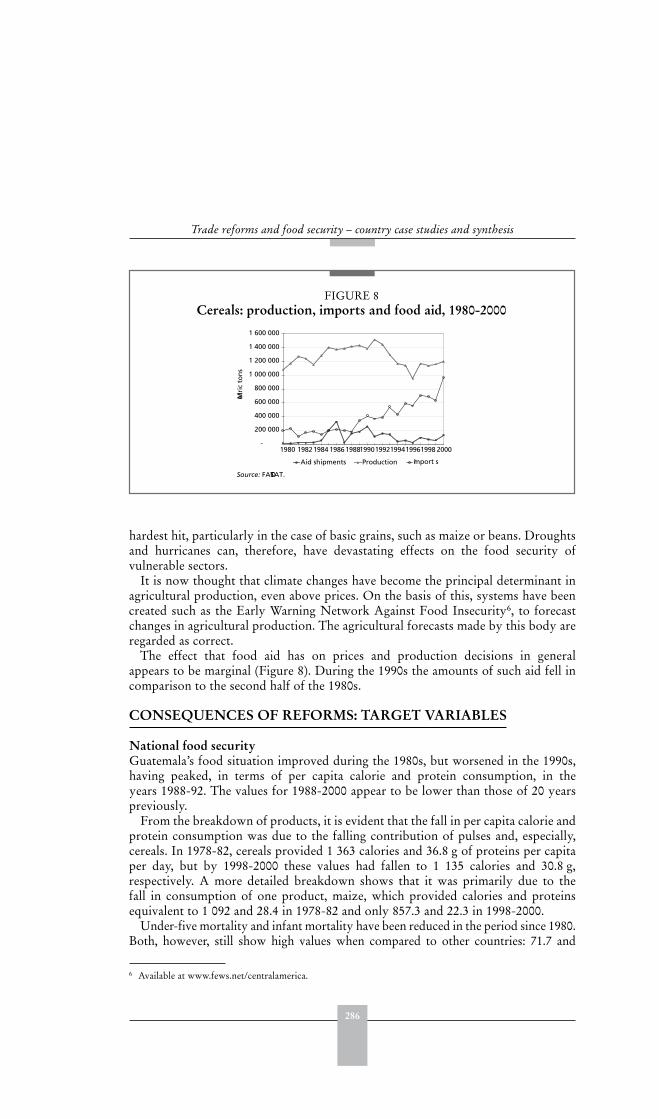
286
Trade reforms and food security – country case studies and synthesis
hardest hit, particularly in the case of basic grains, such as maize or beans. Droughtsand hurricanes can, therefore, have devastating effects on the food security ofvulnerable sectors.
It is now thought that climate changes have become the principal determinant inagricultural production, even above prices. On the basis of this, systems have beencreated such as the Early Warning Network Against Food Insecurity6, to forecastchanges in agricultural production. The agricultural forecasts made by this body areregarded as correct.
The effect that food aid has on prices and production decisions in generalappears to be marginal (Figure 8). During the 1990s the amounts of such aid fell incomparison to the second half of the 1980s.
CONSEQUENCES OF REFORMS: TARGET VARIABLES
National food securityGuatemala’s food situation improved during the 1980s, but worsened in the 1990s,having peaked, in terms of per capita calorie and protein consumption, in theyears 1988-92. The values for 1988-2000 appear to be lower than those of 20 yearspreviously.
From the breakdown of products, it is evident that the fall in per capita calorie andprotein consumption was due to the falling contribution of pulses and, especially,cereals. In 1978-82, cereals provided 1 363 calories and 36.8 g of proteins per capitaper day, but by 1998-2000 these values had fallen to 1 135 calories and 30.8 g,respectively. A more detailed breakdown shows that it was primarily due to thefall in consumption of one product, maize, which provided calories and proteinsequivalent to 1 092 and 28.4 in 1978-82 and only 857.3 and 22.3 in 1998-2000.
Under-five mortality and infant mortality have been reduced in the period since 1980.Both, however, still show high values when compared to other countries: 71.7 and
6 Available at www.fews.net/centralamerica.
FIGURE 8Cereals: production, imports and food aid, 1980-2000
-
200 000
400 000
600 000
800 000
1 000 000
1 200 000
1 400 000
1 600 000
Metri
c to
ns
Aid shipments Production Import s
Source: FAOSTAT.
1982 19941986 19901984 1988 1992 19961998 20001980
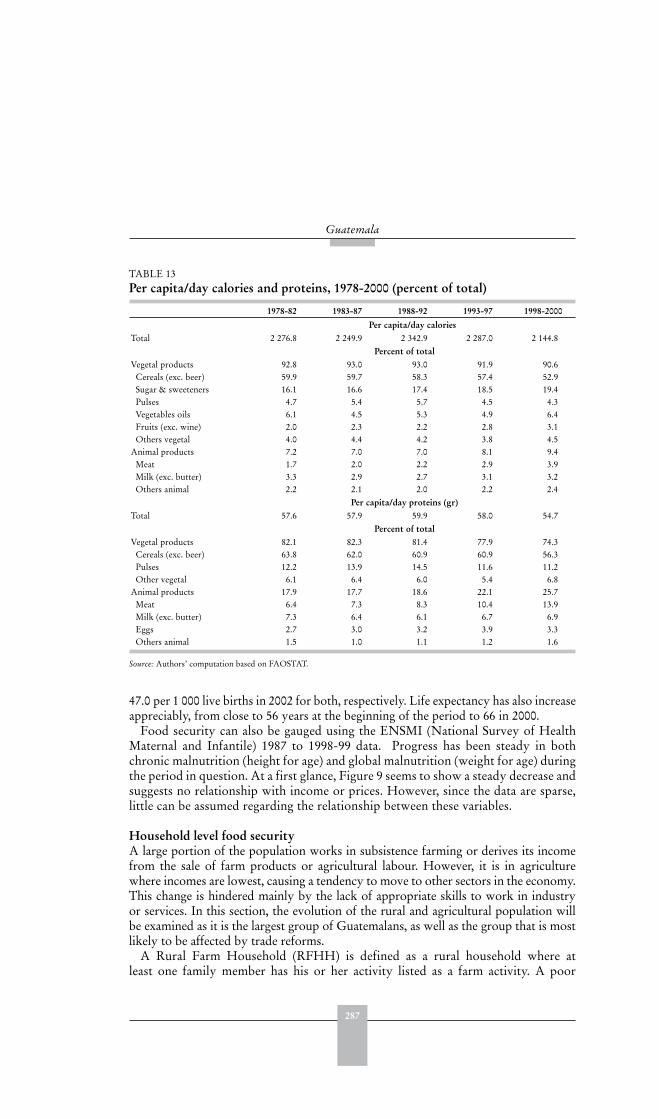
287
Guatemala
47.0 per 1 000 live births in 2002 for both, respectively. Life expectancy has also increaseappreciably, from close to 56 years at the beginning of the period to 66 in 2000.
Food security can also be gauged using the ENSMI (National Survey of HealthMaternal and Infantile) 1987 to 1998-99 data. Progress has been steady in bothchronic malnutrition (height for age) and global malnutrition (weight for age) duringthe period in question. At a first glance, Figure 9 seems to show a steady decrease andsuggests no relationship with income or prices. However, since the data are sparse,little can be assumed regarding the relationship between these variables.
Household level food securityA large portion of the population works in subsistence farming or derives its incomefrom the sale of farm products or agricultural labour. However, it is in agriculturewhere incomes are lowest, causing a tendency to move to other sectors in the economy.This change is hindered mainly by the lack of appropriate skills to work in industryor services. In this section, the evolution of the rural and agricultural population willbe examined as it is the largest group of Guatemalans, as well as the group that is mostlikely to be affected by trade reforms.
A Rural Farm Household (RFHH) is defined as a rural household where atleast one family member has his or her activity listed as a farm activity. A poor
TABLE 13 Per capita/day calories and proteins, 1978-2000 (percent of total)
1978-82 1983-87 1988-92 1993-97 1998-2000
Per capita/day caloriesTotal 2 276.8 2 249.9 2 342.9 2 287.0 2 144.8
Percent of totalVegetal products 92.8 93.0 93.0 91.9 90.6 Cereals (exc. beer) 59.9 59.7 58.3 57.4 52.9 Sugar & sweeteners 16.1 16.6 17.4 18.5 19.4 Pulses 4.7 5.4 5.7 4.5 4.3 Vegetables oils 6.1 4.5 5.3 4.9 6.4 Fruits (exc. wine) 2.0 2.3 2.2 2.8 3.1 Others vegetal 4.0 4.4 4.2 3.8 4.5Animal products 7.2 7.0 7.0 8.1 9.4 Meat 1.7 2.0 2.2 2.9 3.9 Milk (exc. butter) 3.3 2.9 2.7 3.1 3.2 Others animal 2.2 2.1 2.0 2.2 2.4
Per capita/day proteins (gr)Total 57.6 57.9 59.9 58.0 54.7
Percent of totalVegetal products 82.1 82.3 81.4 77.9 74.3 Cereals (exc. beer) 63.8 62.0 60.9 60.9 56.3 Pulses 12.2 13.9 14.5 11.6 11.2 Other vegetal 6.1 6.4 6.0 5.4 6.8Animal products 17.9 17.7 18.6 22.1 25.7 Meat 6.4 7.3 8.3 10.4 13.9 Milk (exc. butter) 7.3 6.4 6.1 6.7 6.9 Eggs 2.7 3.0 3.2 3.9 3.3 Others animal 1.5 1.0 1.1 1.2 1.6
Source: Authors’ computation based on FAOSTAT.
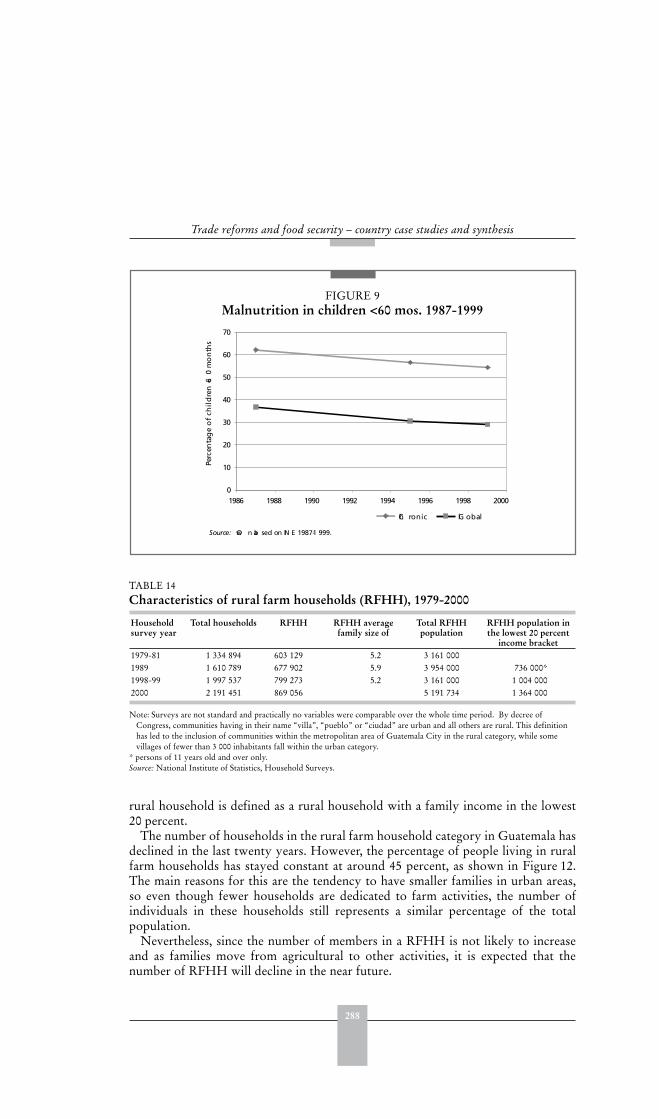
288
Trade reforms and food security – country case studies and synthesis
rural household is defined as a rural household with a family income in the lowest20 percent.
The number of households in the rural farm household category in Guatemala hasdeclined in the last twenty years. However, the percentage of people living in ruralfarm households has stayed constant at around 45 percent, as shown in Figure 12.The main reasons for this are the tendency to have smaller families in urban areas,so even though fewer households are dedicated to farm activities, the number ofindividuals in these households still represents a similar percentage of the totalpopulation.
Nevertheless, since the number of members in a RFHH is not likely to increaseand as families move from agricultural to other activities, it is expected that thenumber of RFHH will decline in the near future.
FIGURE 9Malnutrition in children <60 mos. 1987-1999
0
10
20
30
40
50
60
70
1986 1988 1990 1992 1994 1996 1998 2000
Perc
enta
ge
of
chil
dre
n<6
0 m
on
ths
Ch ronic Gl obal
Source: Ow n ba sed on IN E 1987-1 999.
TABLE 14 Characteristics of rural farm households (RFHH), 1979-2000
Householdsurvey year
Total households RFHH RFHH average family size of
Total RFHHpopulation
RFHH population in the lowest 20 percent
income bracket1979-81 1 334 894 603 129 5.2 3 161 0001989 1 610 789 677 902 5.9 3 954 000 736 000*1998-99 1 997 537 799 273 5.2 3 161 000 1 004 0002000 2 191 451 869 056 5 191 734 1 364 000
Note: Surveys are not standard and practically no variables were comparable over the whole time period. By decree ofCongress, communities having in their name “villa”, “pueblo” or “ciudad” are urban and all others are rural. This definitionhas led to the inclusion of communities within the metropolitan area of Guatemala City in the rural category, while somevillages of fewer than 3 000 inhabitants fall within the urban category.
* persons of 11 years old and over only.Source: National Institute of Statistics, Household Surveys.
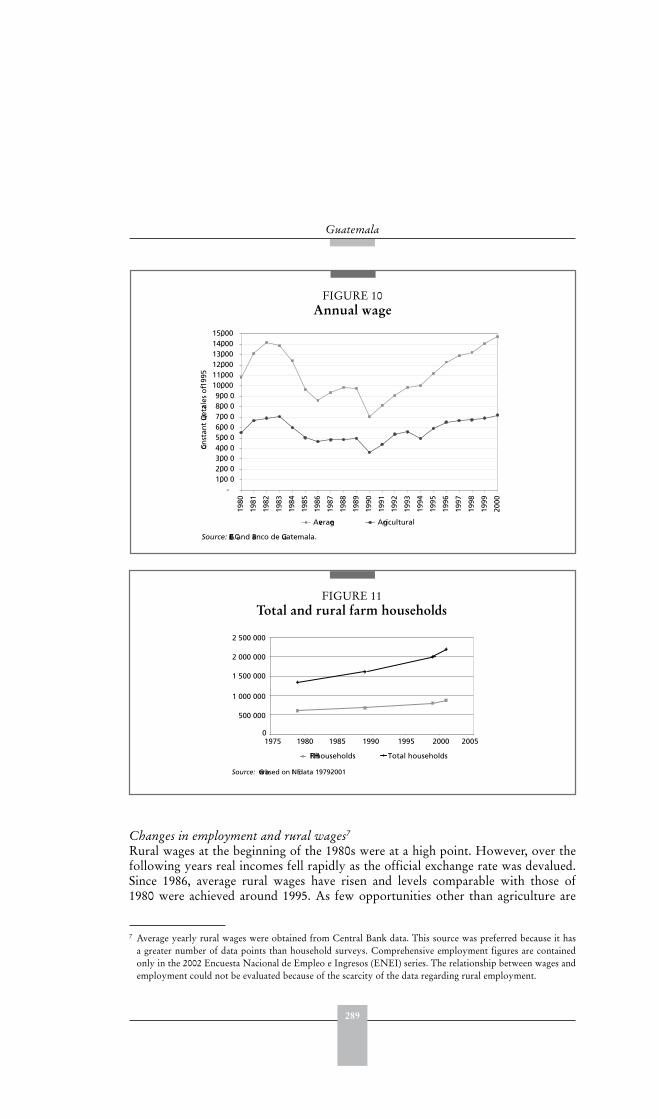
289
Guatemala
Changes in employment and rural wages7
Rural wages at the beginning of the 1980s were at a high point. However, over thefollowing years real incomes fell rapidly as the official exchange rate was devalued.Since 1986, average rural wages have risen and levels comparable with those of1980 were achieved around 1995. As few opportunities other than agriculture are
7 Average yearly rural wages were obtained from Central Bank data. This source was preferred because it hasa greater number of data points than household surveys. Comprehensive employment figures are containedonly in the 2002 Encuesta Nacional de Empleo e Ingresos (ENEI) series. The relationship between wages andemployment could not be evaluated because of the scarcity of the data regarding rural employment.
-1,00 02,00 03,00 04,00 05,00 06,00 07,00 08,00 09,00 0
10,00011,00012,00013,00014,00015,000
1980
1981
1982
1983
1984
1985
1986
1987
1988
1989
1990
1991
1992
1993
1994
1995
1996
1997
1998
1999
2000
Con
stan
t Qu
etzal
es o
f 199
5
Average Agricultural
Source: ECLAC and Banco de Guatemala.
0
500 000
1 000 000
1 500 000
2 000 000
2 500 000
1975 1980 1985 1990 1995 2000 2005
RFHH households Total households
Source: Own based on INE data 1979-2001
FIGURE 10Annual wage
FIGURE 11Total and rural farm households
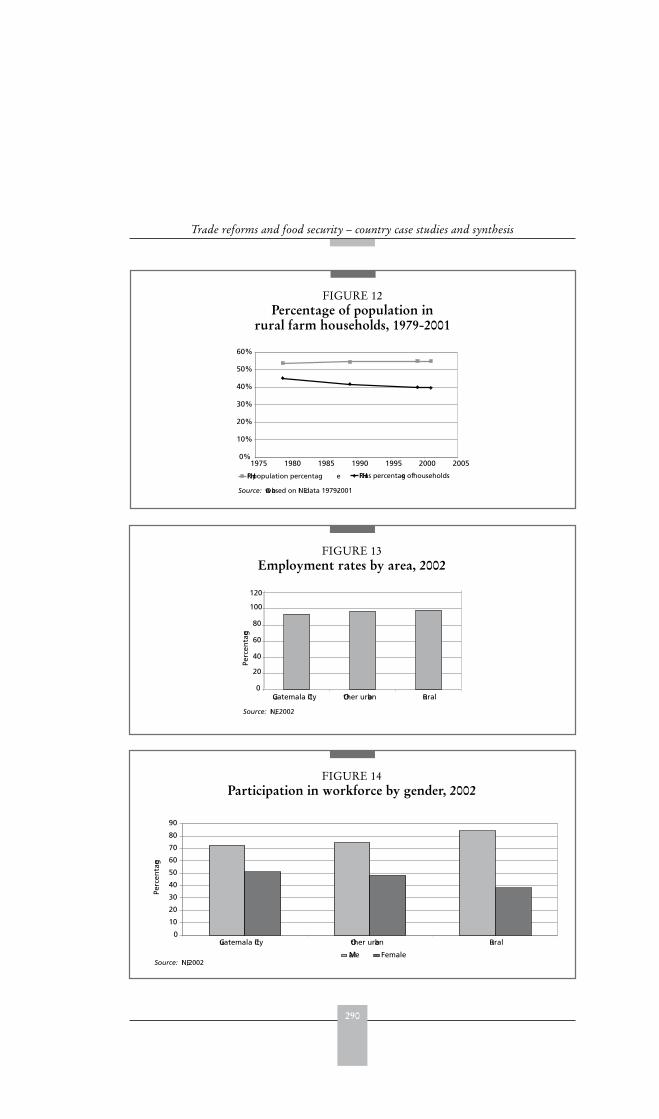
290
Trade reforms and food security – country case studies and synthesis
0%
10%
20%
30%
40%
50%
60%
1975 1980 1985 1990 1995 2000 2005
RFHH population percentag e RFHH as percentage of households
Source: Own based on INE data 1979-2001
0
20
40
60
80
100
120
Guatemala City Other urban Rural
Perc
enta
ge
Source: INE, 2002
FIGURE 12Percentage of population in
rural farm households, 1979-2001
FIGURE 13Employment rates by area, 2002
FIGURE 14Participation in workforce by gender, 2002
0
10
20
30
40
50
60
70
80
90
Perc
enta
ge
Male FemaleSource: INE, 2002
Guatemala City Other urban Rural
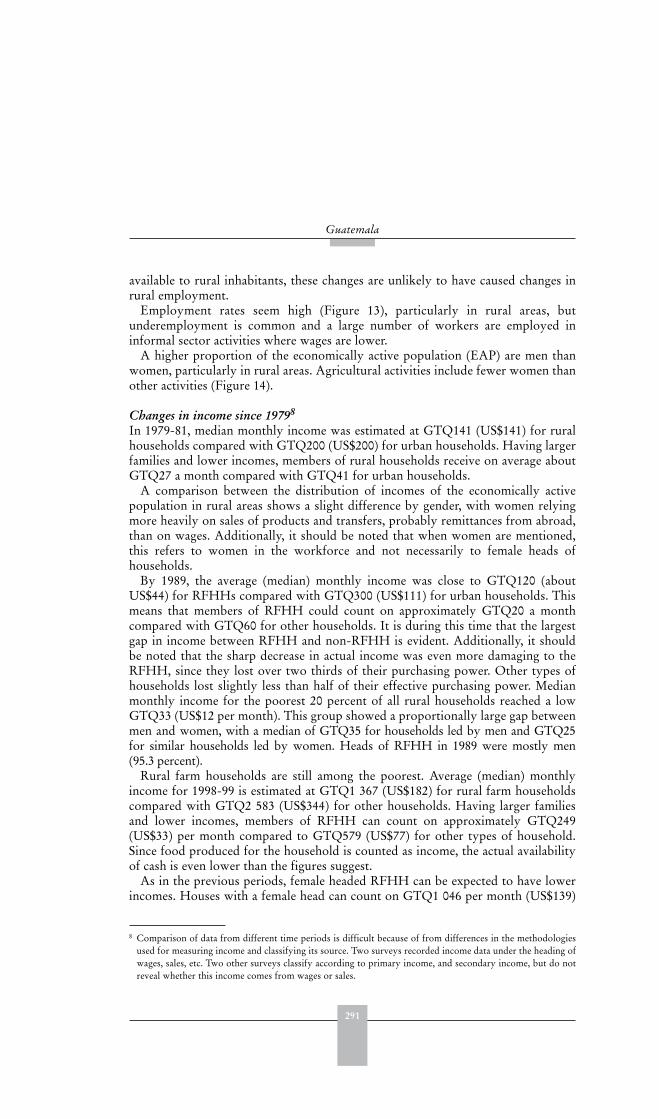
291
Guatemala
available to rural inhabitants, these changes are unlikely to have caused changes inrural employment.
Employment rates seem high (Figure 13), particularly in rural areas, butunderemployment is common and a large number of workers are employed ininformal sector activities where wages are lower.
A higher proportion of the economically active population (EAP) are men thanwomen, particularly in rural areas. Agricultural activities include fewer women thanother activities (Figure 14).
Changes in income since 19798
In 1979-81, median monthly income was estimated at GTQ141 (US$141) for ruralhouseholds compared with GTQ200 (US$200) for urban households. Having largerfamilies and lower incomes, members of rural households receive on average aboutGTQ27 a month compared with GTQ41 for urban households.
A comparison between the distribution of incomes of the economically activepopulation in rural areas shows a slight difference by gender, with women relyingmore heavily on sales of products and transfers, probably remittances from abroad,than on wages. Additionally, it should be noted that when women are mentioned,this refers to women in the workforce and not necessarily to female heads ofhouseholds.
By 1989, the average (median) monthly income was close to GTQ120 (aboutUS$44) for RFHHs compared with GTQ300 (US$111) for urban households. Thismeans that members of RFHH could count on approximately GTQ20 a monthcompared with GTQ60 for other households. It is during this time that the largestgap in income between RFHH and non-RFHH is evident. Additionally, it shouldbe noted that the sharp decrease in actual income was even more damaging to theRFHH, since they lost over two thirds of their purchasing power. Other types ofhouseholds lost slightly less than half of their effective purchasing power. Medianmonthly income for the poorest 20 percent of all rural households reached a lowGTQ33 (US$12 per month). This group showed a proportionally large gap betweenmen and women, with a median of GTQ35 for households led by men and GTQ25for similar households led by women. Heads of RFHH in 1989 were mostly men(95.3 percent).
Rural farm households are still among the poorest. Average (median) monthlyincome for 1998-99 is estimated at GTQ1 367 (US$182) for rural farm householdscompared with GTQ2 583 (US$344) for other households. Having larger familiesand lower incomes, members of RFHH can count on approximately GTQ249(US$33) per month compared to GTQ579 (US$77) for other types of household.Since food produced for the household is counted as income, the actual availabilityof cash is even lower than the figures suggest.
As in the previous periods, female headed RFHH can be expected to have lowerincomes. Houses with a female head can count on GTQ1 046 per month (US$139)
8 Comparison of data from different time periods is difficult because of from differences in the methodologiesused for measuring income and classifying its source. Two surveys recorded income data under the heading ofwages, sales, etc. Two other surveys classify according to primary income, and secondary income, but do notreveal whether this income comes from wages or sales.
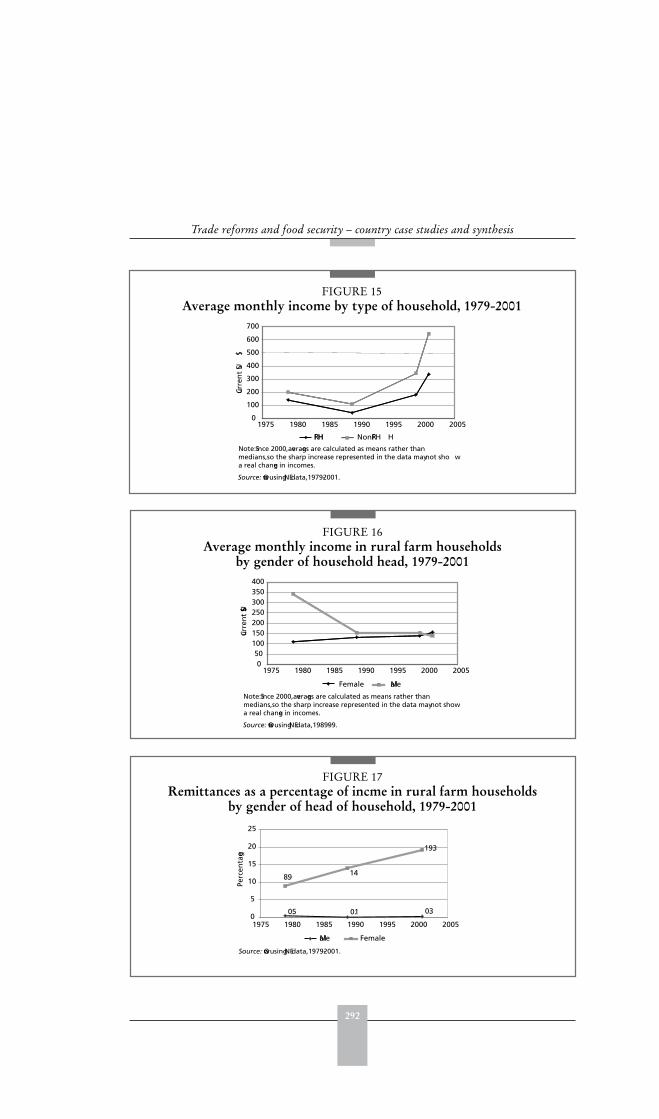
292
Trade reforms and food security – country case studies and synthesis
FIGURE 15Average monthly income by type of household, 1979-2001
0
100
200
300
400
500
600
700
1975 1980 1985 1990 1995 2000 2005
Curr
ent
US$
RFHH Non-RFH H
Source: Own using INE data, 1979-2001.
Note: Since 2000, averages are calculated as means rather thanmedians, so the sharp increase represented in the data may not sho wa real change in incomes.
FIGURE 16Average monthly income in rural farm households
by gender of household head, 1979-2001
FIGURE 17Remittances as a percentage of incme in rural farm households
by gender of head of household, 1979-2001
Source: Own using INE data, 1989-99.
Note: Since 2000, averages are calculated as means rather thanmedians, so the sharp increase represented in the data may not showa real change in incomes.
050
100150200250300350400
1975 1980 1985 1990 1995 2000 2005
Curr
ent
US$
Female Male
Source: Own using INE data, 1979-2001.
0.5 0.1 0.3
8.9 14
19.3
0
5
10
15
20
25
Perc
enta
ge
Male Female
1975 1980 1985 1990 1995 2000 2005
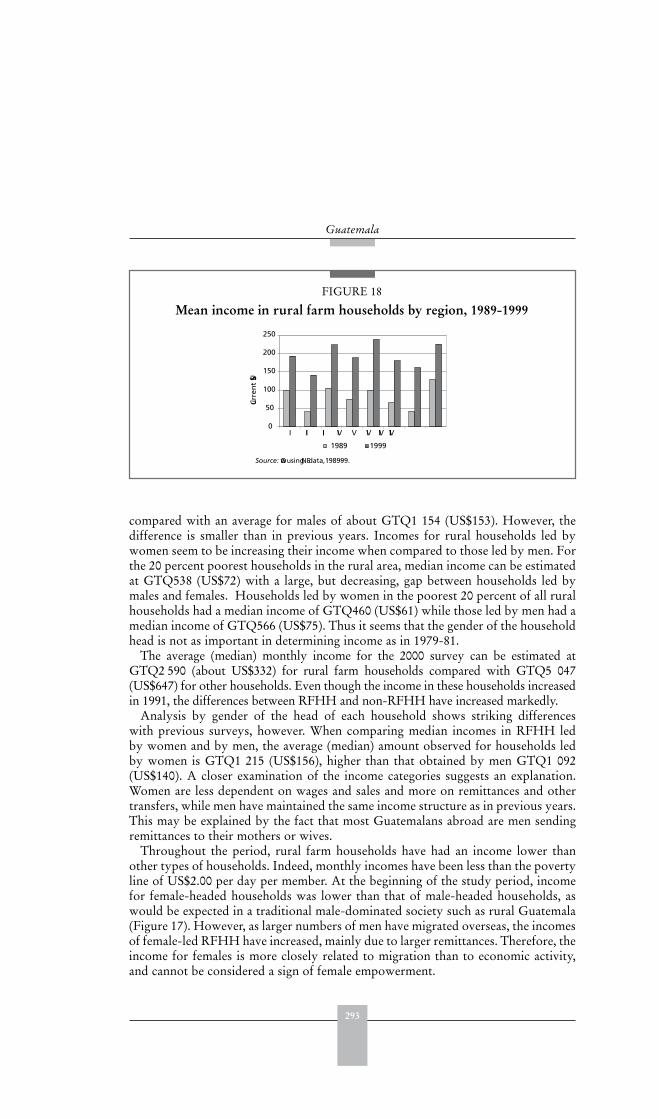
293
Guatemala
compared with an average for males of about GTQ1 154 (US$153). However, thedifference is smaller than in previous years. Incomes for rural households led bywomen seem to be increasing their income when compared to those led by men. Forthe 20 percent poorest households in the rural area, median income can be estimatedat GTQ538 (US$72) with a large, but decreasing, gap between households led bymales and females. Households led by women in the poorest 20 percent of all ruralhouseholds had a median income of GTQ460 (US$61) while those led by men had amedian income of GTQ566 (US$75). Thus it seems that the gender of the householdhead is not as important in determining income as in 1979-81.
The average (median) monthly income for the 2000 survey can be estimated atGTQ2 590 (about US$332) for rural farm households compared with GTQ5 047(US$647) for other households. Even though the income in these households increasedin 1991, the differences between RFHH and non-RFHH have increased markedly.
Analysis by gender of the head of each household shows striking differenceswith previous surveys, however. When comparing median incomes in RFHH ledby women and by men, the average (median) amount observed for households ledby women is GTQ1 215 (US$156), higher than that obtained by men GTQ1 092(US$140). A closer examination of the income categories suggests an explanation.Women are less dependent on wages and sales and more on remittances and othertransfers, while men have maintained the same income structure as in previous years.This may be explained by the fact that most Guatemalans abroad are men sendingremittances to their mothers or wives.
Throughout the period, rural farm households have had an income lower thanother types of households. Indeed, monthly incomes have been less than the povertyline of US$2.00 per day per member. At the beginning of the study period, incomefor female-headed households was lower than that of male-headed households, aswould be expected in a traditional male-dominated society such as rural Guatemala(Figure 17). However, as larger numbers of men have migrated overseas, the incomesof female-led RFHH have increased, mainly due to larger remittances. Therefore, theincome for females is more closely related to migration than to economic activity,and cannot be considered a sign of female empowerment.
FIGURE 18
Mean income in rural farm households by region, 1989-1999
Source: Own using INE data, 1989-99.
0
50
100
150
200
250
I II III IV V VI VII VIII
Curr
ent
US$
1989 1999

294
Trade reforms and food security – country case studies and synthesis
Regional analysis for the 1998-99 survey suggests that income differences amongregions for RFHH are dependent on types of crops. As with the 1989 data, regionswhere most of the agriculture is subsistence farming show lower incomes than thosewhere export crops are grown. The increases seem similar in all regions.
Food security and food expendituresIn 1979-81, more than half (54.79 percent) of all expenses were on food and beverages(Table 15). However, as incomes increased, the expenses shifted to other categories.Most changes can be considered positive: health expenses have more than doubled inthe intervening twenty years and education expenses have quadrupled.
The largest group, food expenditure, is broken down in Table 16 to disclose theproportion of each of the main farm products. One of the largest categories is flour,cereals and their products, because of the extensive use of maize in the Guatemalandiet. Out of the 26.6 percent spent on flour and cereals, slightly less than half is maizeand maize products. A slight shift towards more processed foods is also visible.Importantly, at the end of the period, a larger amount of money was spent on meatand poultry. (From the 2000 survey it was impossible to assess the percentage spenton food).
TABLE 16 Monthly food expenditures for rural households, 1979-81 and 1998-99 (percent)
1979-81 1998-991 Flours, cereals and their products 26.58 19.192 Meat, fish, and poultry 18.22 20.293 Oils and fats 3.53 1.564 Eggs and dairy products 9.68 10.105 Fruits 3.10 3.406 Vegetables 14.81 9.987 Sugar and molasses 6.01 3.608 Non alcoholic drinks and prepared food 17.55 30.849 Alcoholic drinks 0.53 1.04
Source: Own calculations based of ENIGF 79-81, INE.
TABLE 15 Monthly expenditure for all households, 1979-81 and 1998-99 (percent of total expenditure)
1979-81 1998-991 Food and beverages 54.79 38.752 Household expenditure 12.43 10.003 Furniture and equipment 6.53 7.954 Clothing 9.96 7.945 Health and medicines 2.02 5.486 Education 1.20 5.607 Transportation 6.30 10.928 Reading and recreation 2.20 6.839 Other 4.55 6.52
Source: Authors’ computations based on ENIGF (National Survey of Income and Expenditure) 1979-1981, Guatemala, andENIGFAM (National Survey of Household Income and Expenditure) 1998-99, Guatemala.
295
Guatemala
POLICY LESSONS
Historically, Guatemala has been a country with a surplus in agricultural productionfor almost the entire range of products that it produced. The country has the potentialto continue as a net exporter of agricultural production. Crucial negotiations, such asthe Dominican Republic and Central America Free Trade Agreement (DR-CAFTA)with the United States, the ratification of which was expected in 2004, will accentuatestructural change in agriculture. It is expected that the dynamic sectors, such assugar, will increase their exports to the United States, while others which have beenaffected by growing imports, including dairy products and poultry products, may beseriously affected by DR-CAFTA.
Guatemala is still in transition from exporting a few to many crops, but it isevident that in one or two decades it will have a different farm export pattern fromthat which dominated during most of the 20th century. Diversification providesgreater revenue stability and cushions the effects of international price volatility.
However, non-traditional exports have grown at the cost of basic grain production,such as maize, wheat, rice and beans, products that are essential for the Guatemalandiet. Many small farmers in the western highlands and other parts of the country,as well as medium-size farmers, are switching production to new export crops,thus abandoning the traditional cultivation of grains such as maize. This mayhave implications for food security in that households will depend increasingly onincome, and hence on market participation, rather than own production in order tosatisfy their food consumption requirements.
Despite the fact that the country has successfully substituted its agriculturalproduction with more profitable products and despite the fact that it has othersources of resources apart from those of a few traditional products, the country’sfood security has worsened, and in some specific cases there have even beenfamines. The reasons for this are first, the fall in coffee prices affected numerouscommunities. The number of migrants to the United States increased, but thetransition was painful. Thousands of persons lost their main source of income andthe non-traditional products were not generating employment fast enough to keepup with the decline in coffee income. To this must be added the negative effects ofclimatic phenomena, which were marked during the 1990s. Those most affected bythe droughts and tropical storms tend to be subsistence farmers, who rely heavily onthe production of maize and beans. Some communities have been doubly affected,by the fall in coffee income, and by a decline in their own food production due tothe unfavourable weather conditions.
Secondly, whilst the country has certainly generated new sources of income, suchas tourism, manufacturing and family remittances, this has not benefited all sectorsor all geographic zones. Tourism, for example, is concentrated in certain areas.Manufacturing is concentrated in the capital and surroundings, or near ports in thefree zones. Clothing manufacturers are located near airports or seaports in order toship their products on time. As to the remittances, the dollars that come reach onlythose who have relatives in the United States, Canada or Mexico. In brief, poorhouseholds living in the interior of the country where tourists do not come, and whodo not have the option of employment in the clothing industry, and do not receiveremittances, can be at serious food insecurity risk.

297
GuyanaC.Y. Thomas and M. Bynoe1
EXECUTIVE SUMMARY
Pre-reformSince independence in 1966, the Guyanese economy has gone through a numberof major policy phases. The first phase (1970-85) was marked by considerable stateintervention in the economy. While the country showed some measured success,the state failed to control spending as commodity prices declined and the economybegan experiencing major economic problems. This period culminated in a processof increasingly inward-oriented development, and crisis. Existing policy were unableto sustain real increases in living standards, foreign debt mounted, and massiveemigration took place.
The reformsThe reform period commenced in the late 1980s. In a relatively short period of time,economic and trade policy reforms shifted the economy away from state-led, inward-looking, commandist policies, to a de-regulated, liberalized, open, private sector-led,market-driven economic system. The main reforms consisted of eliminating priceand other controls in the food industry sectors; the private management contractunder which the state-owned sugar industry is now operated; the unification ofthe exchange rate and opening up of private transactions in foreign currency; theliberalization of capital flows; better water resources management; and promotionof land markets.
The reforms (particularly the WTO/AOA and the CET provisions of CARICOM)have substantially transformed agricultural arrangements in Guyana. Food importshave been liberalized as the regime of quotas, licences and other administrativecontrols has been abolished.
After 1991, the country registered impressive growth rates, improved GDP percapita, received substantial debt write-offs, and improved agricultural output inmost major commodities. However, since 1997, the country has entered a phasecharacterized by a combination of political and social unrest, adverse weatherconditions, deterioration in the terms of trade, and slow economic growth. Thedrive therefore remains one centred on food security and improvement in the socialwelfare of the populace.
1 C.Y. Thomas and M. Bynoe, Institute of Development Studies, University of Guyana, Guyana.

298
Trade reforms and food security – country case studies and synthesis
Impact on intermediate variablesThe initial economic response to reform was not positive. Inflation rates soared asprice controls were removed, the fiscal situation of the Government came underimmense stress, and the real minimum wage reached its lowest level for the period1970-2001. The situation was further frustrated by exogenous shocks. However, by1991 there was improvement as the economy began to grow at 6 percent per annum,inflation was reduced and the government finances improved. The agricultural sectorshowed substantial increases in both production and exports, particularly in the caseof the two main crops, rice and sugar, both of which contributed substantially to thehigh rate of economic growth. In the period 1991-1995, agricultural GDP grew bynearly 7 percent per annum.
Real producer prices for both sugar and rice increased in response to the reformswhereas the price of many other crops fell. In recent years, the prices of most ofcommodities have been declining. Changes in the exchange rate devaluation have hada major influence on domestic price movements. For most crops the period after thereform saw an increase in output.
Impact on target variablesThe value of agricultural exports nearly doubled between 1986 and 1995 and the
value of imports grew even faster. This exceptional import surge after 1991 reflectedthe liberalization of the economy and an increased dependence on food imports.
Although imported food items (many of which were being subsidized in exportingcountries) put some agricultural sub-sectors under pressure, consumers benefitedthrough reduced prices, greater choice and better quality products.
Overall poverty rates improved, but disproportionately for the urban population.In particular, absolute poverty did not change in rural areas in the interior, which isalso where most of the indigenous population live.
For the entire 1970-2000 period, the per capita supply of calories averaged2 487, 4 percent above the recommended intake of 2 400 calories. The number ofundernourished people has, however, remained constant and is high compared to theLatin American Caribbean average.
Policy lessonsThere were various design flaws in the approach to reform in Guyana. Plannersunderestimated the social consequences of massive cuts in national expenditure andthe rapid increase in the cost-of-living which followed the currency devaluations.This prompted the introduction of social adjustment provisions to counterbalancethese effects. The trade reforms had liberalized the economy so rapidly that whenthe WTO Agreement came into force in 1995 no significant challenges remained forGuyana’s implementation of its Agreement on Agriculture (AOA). Guyana cameunder considerable pressure from the international financial institutions and donorcountries to follow what was at the time a standard one-size-fits-all approach to itseconomic recovery programme. The reforms were in some cases enacted too rapidly,resulting in increased hardship in the short term. This was particularly so in the caseof the rice industry due to price adjustments and the elimination of subsidies.
Guyana’s food security difficulties arise from failure to ensure adequate accessto food for the whole population. Distribution is a key problem, and the countrydepends significantly on food imports to meet its food requirements. Broad-based
299
Guyana
rural reform, sustained economic growth, and better targeting are identified asbeing essential components for a successful programme. This would need to directattention to the assets of the rural poor, including land access, land improvement,infrastructure, credit, training, technical support, improved community services, aswell as overall institutional support and strengthening.
Finally, two of Guyana’s export commodities that are heavily dependent onthe European market – sugar and rice - are among the most heavily administeredproducts in the world. The preferential access arrangements for these products aretotally bound up with the support arrangements in the EU, and the fortunes of therice industry in Guyana in recent years have been determined largely by changesin the EU quotas. For this reason, administrative decisions have a greater effect onexport earnings than do market forces.
INTRODUCTION: CONTEXT AND NATURE OF THE REFORMS
The role and level of development of the agriculture sectorThe agricultural sector (excluding forestry and fishing), accounts for 23 percentof GDP and is the most important export sector, accounting in 2001 for about30 percent of the value of total exports. The main products are sugar and rice, both ofwhich are produced mainly for export and enjoy special marketing arrangements.
Most agriculture production takes place on the low-lying coastal plain becauseof a complex drainage/irrigation and sea/river defence system. Not only is theagricultural sector dualistic in its spatial location but its structure of productionis also dualistic. Export agriculture is typically organized on a fairly extensive andhighly mechanized large estate basis, while the bulk of the farming population ismade up of small farmers involved with domestic food and livestock production.The food-processing sector is also dualistic. The emphasis on sugar and, to a lesserextent, rice has left a legacy of skewed distribution of land holdings, with some75 percent of farm households classified as small (less than 15 acres in size) andaccounting for only 23 percent of the agricultural land.
Sugar is the largest net earner of foreign exchange and the biggest source of publicrevenue. It is produced by a state-owned enterprise, the Guyana Sugar Corporation(Guysuco), which came into existence in 1976 following the nationalization ofthe then foreign-owned sugar plantations. This company is responsible for over90 percent of the cultivated cane and all of the cane milling and processing. Smalland medium farmers contribute about 9-10 percent of the cane for the mills. Rice isthe second most important agricultural crop in terms of foreign exchange earnings,and the largest user of agricultural land. It is also the major source of income andemployment in rural areas. Rice is also the main staple of the population, withconsumption estimated at around 50 kg per capita. Its by-products, bran and brokenrice, are used to produce animal feed, in the brewery industry, as fuel for paddydryers, and for electricity generation. Both small and large farmers are engaged inrice cultivation and farm sizes vary from less than 10 acres to over 1 000 acres.
While Guyana is a major producer and exporter of food products, it also importssubstantial quantities, and food insecurity remains a major public policy issue.Agricultural exports recently averaged US$175 million. Food imports declinedsubstantially in the 1980s, to less than US$20 million, but have now increased to
300
Trade reforms and food security – country case studies and synthesis
approximately US$55 million as foreign exchange has become more readily available.The main food imports are wheat obtained under the United States PL480 food aidscheme, which is milled locally; poultry; dairy products; and a wide range of otherfoods and beverages.
Degree of openness of the economy prior to the reforms During the period 1970 to 1985, the Government pursued a policy of cooperativesocialism, with the three pillars of the economy identified as the state, the privatesector and the cooperatives, with the state being the dominant player. This wasalso a period in which the Government set itself the objective to “feed, clotheand house” the nation, and in pursuit of this objective a number of agriculturalprogrammes were introduced with supporting finance, marketing, livestock and landdevelopment schemes.
Growth in both agriculture and manufacturing was substantial during the earlyyears. Self-sufficiency in agricultural and food production was a key policy objective.There was massive investment in large agricultural projects, such as the TapacumaIrrigation Project and the Mahaica-Mahaicony-Abary Rice Development Scheme,and in rural infrastructure such as farm-to-market roads and marketing centres.The Guyana Marketing Corporation (GMC) and the Guyana Rice Board (GRB)were established to buy and sell agricultural produce at highly subsidized prices,the Livestock Development Company (LIDCO) was established to promote thedevelopment and expansion of the dairy industry, and the Guyana Agricultural andIndustrial Development Bank (GAIBANK) was established to provide agriculturalcredit.
However, high dependence on primary commodity exports made the economyparticularly vulnerable to cyclical movements in commodity prices, and it was partlythe decline of world commodity prices (especially, for sugar and bauxite) that causedeconomic decline in the latter half of the 1970s. Falling revenues from bauxite andsugar led to growing fiscal and balance of payments problems. This prompted pricecontrols, trade and foreign exchange restrictions, high rates of taxation and a steadyappreciation of the real exchange rate.
Prior to the reforms the public sector’s role in the economy grew steadily andseverely distorted incentives for private sector involvement. State control extendedthroughout the financial sector and even to consumer marketing. Governmentcontrolled the prices of most food items, while the maintenance of overvaluedexchange rates and the rationing of foreign exchange further limited private sectoractivity and discouraged domestic agricultural production. This led to a seculardecline in output, large government deficits, accelerating inflation and an increasedreliance on external borrowing. Maintenance of vital infrastructure to support theagricultural sector and to fulfil the goal of food self-sufficiency was neglected,thereby further constricting the productive capacity of the country.
It is estimated that the parallel economy grew during this time to be at least as largeas the official economy.2 At the same time, the inability of the public sector to provideadequate economic and social infrastructure, and unemployment in the official
2 Thomas (1989) and Faal (2003).
301
Guyana
economy led to growing emigration of skilled labour and qualified managers.3 Theeffect of these developments was to reduce output in most agricultural sub-sectors,particularly sugar.
The pre-reform period saw the emergence of the Caribbean Free Trade Area andin 1973 the Caribbean Common Market (CARICOM), (later changed to CaribbeanCommunity) in 1973. Guyana was a founding member of this trading bloc, althoughthe major export markets were still in Europe and North America. During thisperiod, natural resource products dominated the country’s exports (90 percent),led by sugar, with the major markets being in the United States and Europe whichaccounted for more than 80 percent of total exports.
Licensing requirements for rice exporters were instituted under the 1974 TradeOrder to preserve the monopolistic powers of the Guyana Rice Board (GRB).During this period, farmers’ representation was mainly through the Guyana RiceProducers Association (GRPA), which also helped the GRB in its research andextension activities.
The pre-reform period was marked by emphasis on land reform under theGovernment’s “land to the tiller” programme, as well as drainage and irrigationschemes. The Black Bush Polder Scheme, a major land development scheme, wasexpected to become the bread-basket of the Caribbean. The thrust of agriculturalpolicy for the rice sector was to promote rice production through state support.This approach had little success, however, with average rice output remaining largelyunchanged as acreage sown declined when the severe foreign exchange squeeze andrestrictive trade policies began to adversely affect the sector. Absentee farmers, theconversion of land to cash crops or pasture, and land left idle became increasinglycommon.
Agricultural producers were paid artificially low prices for their produce as theGovernment sought to make food available in both rural and urban locations. TheGovernment also demonstrated a reluctance to promote private sector involvementin agricultural service provision and neglected measures to increase cost-recovery inthe sector. The most important policy that affected the sector was the Government'sreluctance to devalue the currency as domestic and external macroeconomicimbalances grew larger. This led to an appreciation of the real exchange rate thataltered the country's relative price structure to the detriment of exportables (e.g.sugar and rice). This was magnified by the existence of dual exchange rate regimesthat resulted in an implicit export tax, since most private imports (including inputs)were financed at the parallel exchange rate while export revenues had to be convertedinto domestic currency at the official exchange rate.
Motivations for the reformsAs the value of exports fell, external debt mounted, foreign exchange, spare parts,equipment and other imports became increasingly scarce, and the nation’s socialand economic infrastructure began to collapse. The Government’s response to thecontinuous decline in exports was the implementation of increasingly restrictivetrade policies. For example, there was a complete prohibition of imports on severalfood items, including wheat, Irish potatoes, peas, and chicken.
3 IDB (1990).
302
Trade reforms and food security – country case studies and synthesis
The economy was slipping into deep recession and national output fell at anannual average of 7 percent during 1979-85, mainly as a result of sharp contractionsin bauxite production. This affected agricultural production and food security whichwas already adversely affected by an overvalued exchange rate and price controls.Output levels fell in most agricultural sub-sectors, particularly sugar, leading tochanging household consumption patterns, and increasing poverty (IDB, 1990).
At the beginning of 1986, the Government began lifting some of its tradeembargoes, including those on imports of wheat, peas and Irish potatoes. It alsobegan a gradual devaluation of the Guyana dollar, commencing with a six percentdepreciation. Nevertheless, economic policies continued to rely heavily on price andexchange rate controls, despite evidence of their ineffectiveness and the growing sizeof the parallel economy. Uncontrolled current expenditures continued to producelarge public sector deficits ranging from 40 to 60 percent of recorded GDP. Inflationwas 8 percent in 1986 and rose to 40 percent by 1988. Despite improved commodityprices in the 1980s, there was only modest growth in real GDP, which averaged lessthan 1 percent annually from 1986-88.
Guyana’s large external debt was a problem, with about 60 percent of revenuesgoing towards debt repayments. The Government sought debt relief but about aquarter of the debt was owed to multilateral agencies and were therefore not subjectto such relief.
Macro and sectoral components and the policy instruments usedWith the economic crisis entering its second decade, efforts to reduce growingimbalances in the economy and expand output were intensified. In 1989 theGovernment formally launched a three year Economic Recovery Programme (ERP)aimed initially at financial stabilization, with emphasis on demand management, andfollowed by a period of structural adjustment. The ERP aimed to:
create a basis for sustained economic growth;restore the balance of payments to a sustainable level;reintegrate the parallel economy, in particular the unofficial foreign exchangemarket;normalize relations with external creditors.
It required a reversal of previous policies, and placed emphasis on private sectorled development and a reduction of state intervention in the economy.
Macroeconomic policyFiscal policyFiscal policy focused on expenditure cuts. Between 1989 and 1991 employment inthe public sector fell by nearly 18 percent and real public sector wages declined by18 percent between 1986 and 1991, to between one-third and a quarter of those inthe private sector.
Direct allocations of Government resources to agriculture, as a percentage of GDP,declined between 1989 and 1991, as the Government cut capital expenditures anddivested itself of some previously subsidized public enterprises. Despite emphasison private sector activities, transfers to agricultural parastatals in 1989 continued toaccount for the largest allocation of expenditures in the sector.
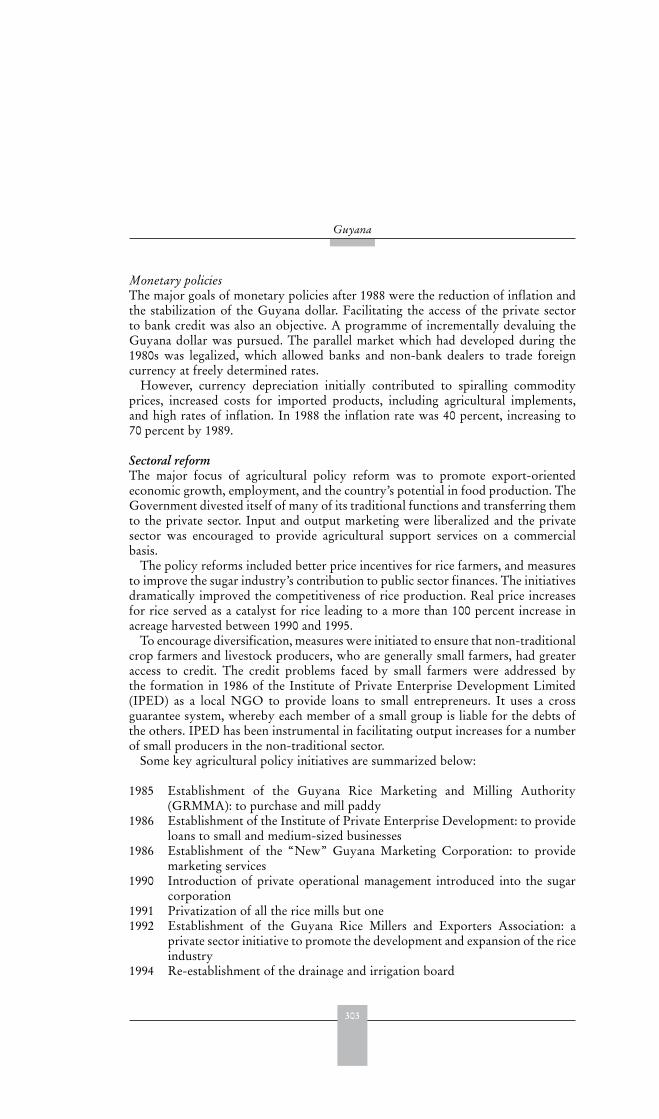
303
Guyana
Monetary policiesThe major goals of monetary policies after 1988 were the reduction of inflation andthe stabilization of the Guyana dollar. Facilitating the access of the private sectorto bank credit was also an objective. A programme of incrementally devaluing theGuyana dollar was pursued. The parallel market which had developed during the1980s was legalized, which allowed banks and non-bank dealers to trade foreigncurrency at freely determined rates.
However, currency depreciation initially contributed to spiralling commodityprices, increased costs for imported products, including agricultural implements,and high rates of inflation. In 1988 the inflation rate was 40 percent, increasing to70 percent by 1989.
Sectoral reformThe major focus of agricultural policy reform was to promote export-orientedeconomic growth, employment, and the country’s potential in food production. TheGovernment divested itself of many of its traditional functions and transferring themto the private sector. Input and output marketing were liberalized and the privatesector was encouraged to provide agricultural support services on a commercialbasis.
The policy reforms included better price incentives for rice farmers, and measuresto improve the sugar industry’s contribution to public sector finances. The initiativesdramatically improved the competitiveness of rice production. Real price increasesfor rice served as a catalyst for rice leading to a more than 100 percent increase inacreage harvested between 1990 and 1995.
To encourage diversification, measures were initiated to ensure that non-traditionalcrop farmers and livestock producers, who are generally small farmers, had greateraccess to credit. The credit problems faced by small farmers were addressed bythe formation in 1986 of the Institute of Private Enterprise Development Limited(IPED) as a local NGO to provide loans to small entrepreneurs. It uses a crossguarantee system, whereby each member of a small group is liable for the debts ofthe others. IPED has been instrumental in facilitating output increases for a numberof small producers in the non-traditional sector.
Some key agricultural policy initiatives are summarized below:
1985 Establishment of the Guyana Rice Marketing and Milling Authority(GRMMA): to purchase and mill paddy
1986 Establishment of the Institute of Private Enterprise Development: to provideloans to small and medium-sized businesses
1986 Establishment of the “New” Guyana Marketing Corporation: to providemarketing services
1990 Introduction of private operational management introduced into the sugarcorporation
1991 Privatization of all the rice mills but one1992 Establishment of the Guyana Rice Millers and Exporters Association: a
private sector initiative to promote the development and expansion of the riceindustry
1994 Re-establishment of the drainage and irrigation board
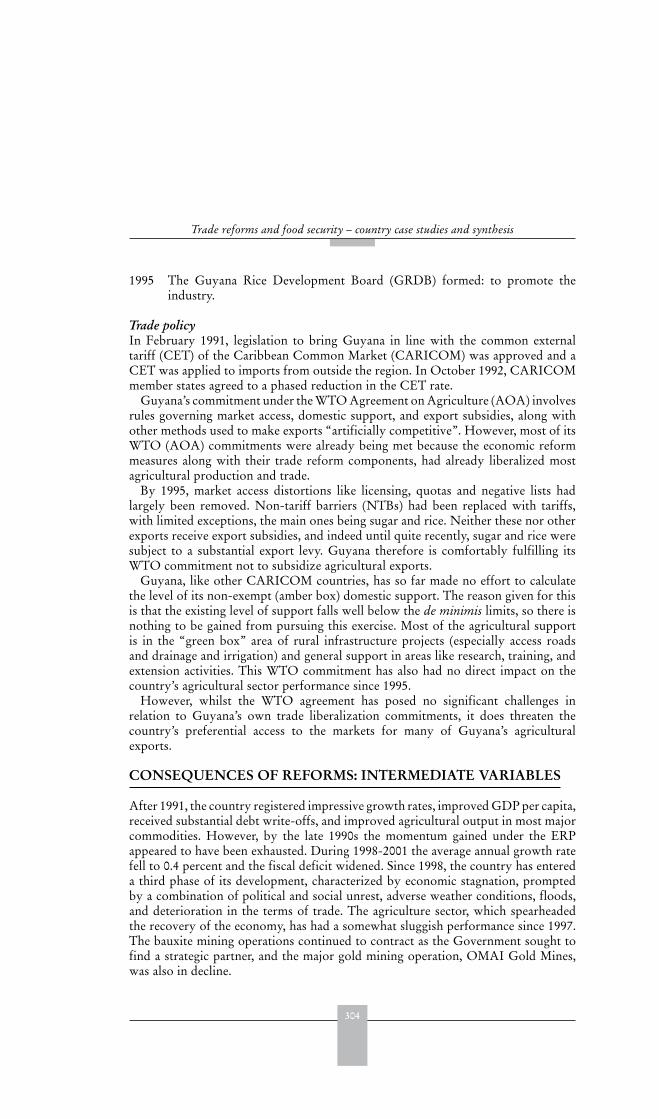
304
Trade reforms and food security – country case studies and synthesis
1995 The Guyana Rice Development Board (GRDB) formed: to promote theindustry.
Trade policyIn February 1991, legislation to bring Guyana in line with the common externaltariff (CET) of the Caribbean Common Market (CARICOM) was approved and aCET was applied to imports from outside the region. In October 1992, CARICOMmember states agreed to a phased reduction in the CET rate.
Guyana’s commitment under the WTO Agreement on Agriculture (AOA) involvesrules governing market access, domestic support, and export subsidies, along withother methods used to make exports “artificially competitive”. However, most of itsWTO (AOA) commitments were already being met because the economic reformmeasures along with their trade reform components, had already liberalized mostagricultural production and trade.
By 1995, market access distortions like licensing, quotas and negative lists hadlargely been removed. Non-tariff barriers (NTBs) had been replaced with tariffs,with limited exceptions, the main ones being sugar and rice. Neither these nor otherexports receive export subsidies, and indeed until quite recently, sugar and rice weresubject to a substantial export levy. Guyana therefore is comfortably fulfilling itsWTO commitment not to subsidize agricultural exports.
Guyana, like other CARICOM countries, has so far made no effort to calculatethe level of its non-exempt (amber box) domestic support. The reason given for thisis that the existing level of support falls well below the de minimis limits, so there isnothing to be gained from pursuing this exercise. Most of the agricultural supportis in the “green box” area of rural infrastructure projects (especially access roadsand drainage and irrigation) and general support in areas like research, training, andextension activities. This WTO commitment has also had no direct impact on thecountry’s agricultural sector performance since 1995.
However, whilst the WTO agreement has posed no significant challenges inrelation to Guyana’s own trade liberalization commitments, it does threaten thecountry’s preferential access to the markets for many of Guyana’s agriculturalexports.
CONSEQUENCES OF REFORMS: INTERMEDIATE VARIABLES
After 1991, the country registered impressive growth rates, improved GDP per capita,received substantial debt write-offs, and improved agricultural output in most majorcommodities. However, by the late 1990s the momentum gained under the ERPappeared to have been exhausted. During 1998-2001 the average annual growth ratefell to 0.4 percent and the fiscal deficit widened. Since 1998, the country has entereda third phase of its development, characterized by economic stagnation, promptedby a combination of political and social unrest, adverse weather conditions, floods,and deterioration in the terms of trade. The agriculture sector, which spearheadedthe recovery of the economy, has had a somewhat sluggish performance since 1997.The bauxite mining operations continued to contract as the Government sought tofind a strategic partner, and the major gold mining operation, OMAI Gold Mines,was also in decline.
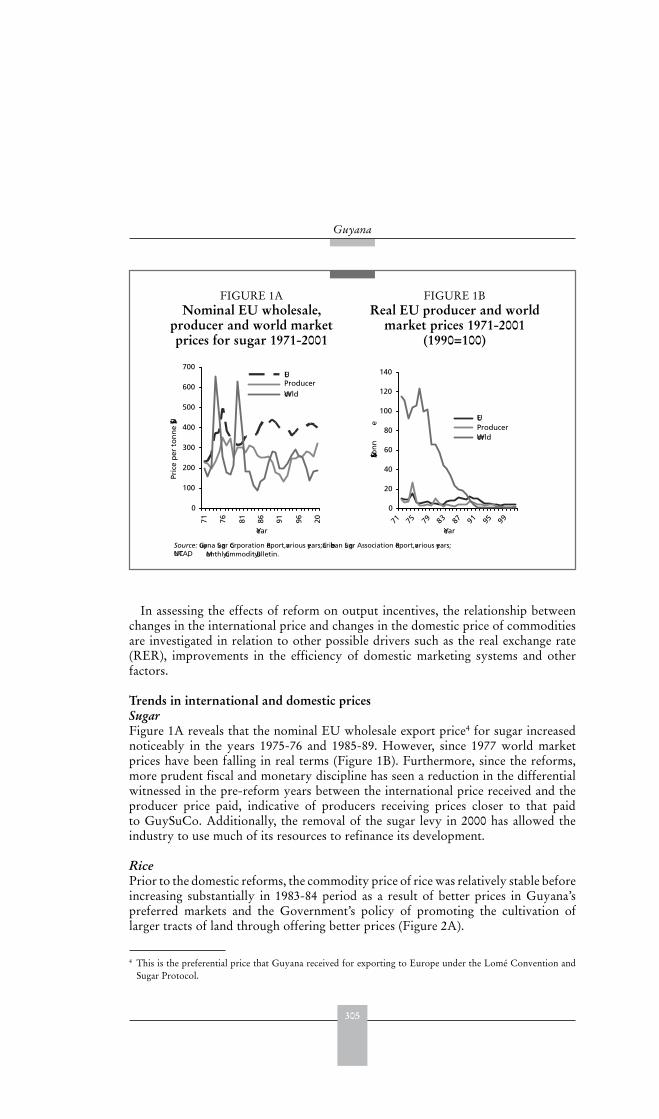
305
Guyana
In assessing the effects of reform on output incentives, the relationship betweenchanges in the international price and changes in the domestic price of commoditiesare investigated in relation to other possible drivers such as the real exchange rate(RER), improvements in the efficiency of domestic marketing systems and otherfactors.
Trends in international and domestic pricesSugarFigure 1A reveals that the nominal EU wholesale export price4 for sugar increasednoticeably in the years 1975-76 and 1985-89. However, since 1977 world marketprices have been falling in real terms (Figure 1B). Furthermore, since the reforms,more prudent fiscal and monetary discipline has seen a reduction in the differentialwitnessed in the pre-reform years between the international price received and theproducer price paid, indicative of producers receiving prices closer to that paidto GuySuCo. Additionally, the removal of the sugar levy in 2000 has allowed theindustry to use much of its resources to refinance its development.
RicePrior to the domestic reforms, the commodity price of rice was relatively stable beforeincreasing substantially in 1983-84 period as a result of better prices in Guyana’spreferred markets and the Government’s policy of promoting the cultivation oflarger tracts of land through offering better prices (Figure 2A).
4 This is the preferential price that Guyana received for exporting to Europe under the Lomé Convention andSugar Protocol.
0
20
40
60
80
100
120
140
71 75 79 83 87 91 95 99
Year
US$/ton
ne
EUProducerWorld
Source: Guyana Sugar Corporation Report, various years; Caribbean Sugar Association Report, various years; UNCTAD, Monthly Commodity Bulletin.
0
100
200
300
400
500
600
700
71 76 81 86 91 96 20
Year
Pric
e p
er t
on
ne
(US$)
EUProducerWorld
FIGURE 1ANominal EU wholesale,
producer and world market prices for sugar 1971-2001
FIGURE 1BReal EU producer and world
market prices 1971-2001(1990=100)
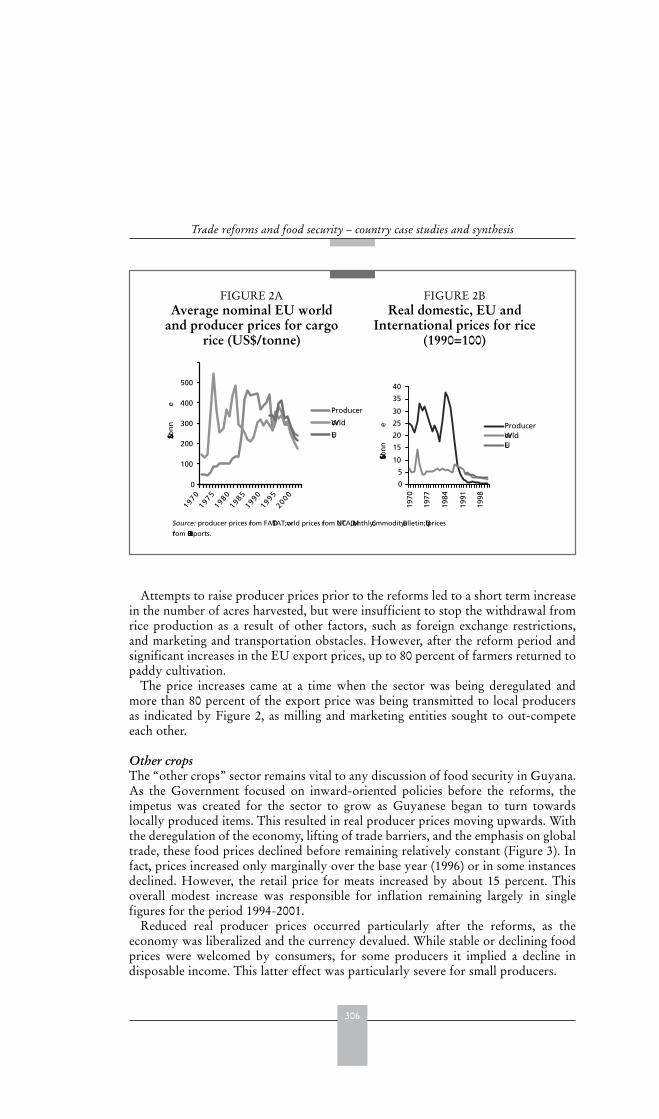
306
Trade reforms and food security – country case studies and synthesis
Attempts to raise producer prices prior to the reforms led to a short term increasein the number of acres harvested, but were insufficient to stop the withdrawal fromrice production as a result of other factors, such as foreign exchange restrictions,and marketing and transportation obstacles. However, after the reform period andsignificant increases in the EU export prices, up to 80 percent of farmers returned topaddy cultivation.
The price increases came at a time when the sector was being deregulated andmore than 80 percent of the export price was being transmitted to local producersas indicated by Figure 2, as milling and marketing entities sought to out-competeeach other.
Other cropsThe “other crops” sector remains vital to any discussion of food security in Guyana.As the Government focused on inward-oriented policies before the reforms, theimpetus was created for the sector to grow as Guyanese began to turn towardslocally produced items. This resulted in real producer prices moving upwards. Withthe deregulation of the economy, lifting of trade barriers, and the emphasis on globaltrade, these food prices declined before remaining relatively constant (Figure 3). Infact, prices increased only marginally over the base year (1996) or in some instancesdeclined. However, the retail price for meats increased by about 15 percent. Thisoverall modest increase was responsible for inflation remaining largely in singlefigures for the period 1994-2001.
Reduced real producer prices occurred particularly after the reforms, as theeconomy was liberalized and the currency devalued. While stable or declining foodprices were welcomed by consumers, for some producers it implied a decline indisposable income. This latter effect was particularly severe for small producers.
0
100
200
300
400
500
1970
1975
19801985199019952000
US$/ton
ne
Producer
World
EU
0
5
10
15
20
25
30
35
40
1970
1977
1984
1991
1998
US$/ton
ne Producer
WorldEU
Source: producer prices from FAOSTAT; world prices from UNCTAD, Monthly Commodity Bulletin; EU prices
from GRDB Reports.
FIGURE 2AAverage nominal EU world
and producer prices for cargo rice (US$/tonne)
FIGURE 2BReal domestic, EU and
International prices for rice (1990=100)
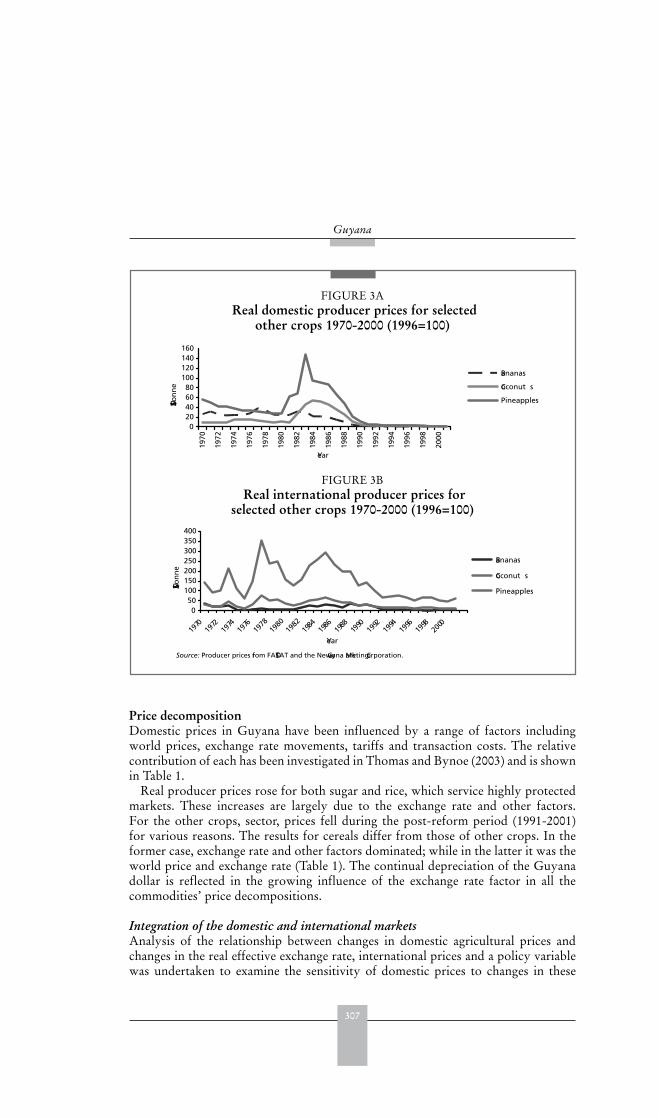
307
Guyana
Price decompositionDomestic prices in Guyana have been influenced by a range of factors includingworld prices, exchange rate movements, tariffs and transaction costs. The relativecontribution of each has been investigated in Thomas and Bynoe (2003) and is shownin Table 1.
Real producer prices rose for both sugar and rice, which service highly protectedmarkets. These increases are largely due to the exchange rate and other factors.For the other crops, sector, prices fell during the post-reform period (1991-2001)for various reasons. The results for cereals differ from those of other crops. In theformer case, exchange rate and other factors dominated; while in the latter it was theworld price and exchange rate (Table 1). The continual depreciation of the Guyanadollar is reflected in the growing influence of the exchange rate factor in all thecommodities’ price decompositions.
Integration of the domestic and international marketsAnalysis of the relationship between changes in domestic agricultural prices andchanges in the real effective exchange rate, international prices and a policy variablewas undertaken to examine the sensitivity of domestic prices to changes in these
FIGURE 3AReal domestic producer prices for selected
other crops 1970-2000 (1996=100)
020406080
100120140160
1970
1972
1974
1976
1978
1980
1982
1984
1986
1988
1990
1992
1994
1996
1998
2000
Year
US$/Ton
ne
Bananas
Coconut s
Pineapples
FIGURE 3BReal international producer prices for
selected other crops 1970-2000 (1996=100)
050
100150200250300350400
1970
1972
1974
1976
1978
1980
1982
1984
1986
1988
1990
1992
1994
1996
1998
2000
Year
US$/Ton
ne
Bananas
Coconut s
Pineapples
Source: Producer prices from FAOSTAT and the New Guyana Marketing Corporation.
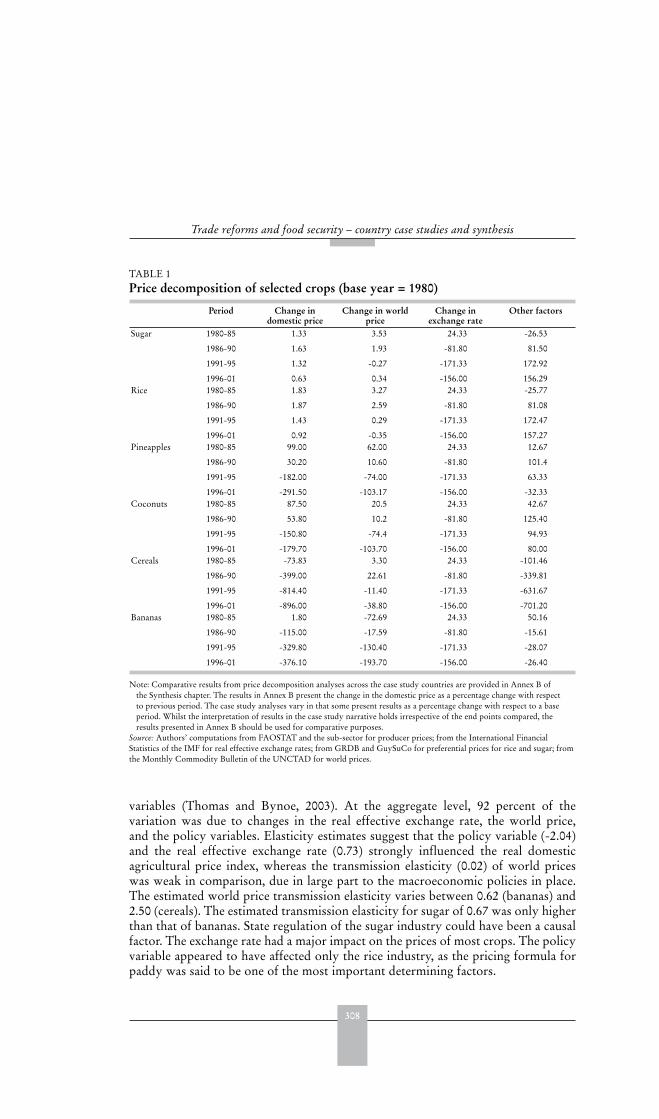
308
Trade reforms and food security – country case studies and synthesis
variables (Thomas and Bynoe, 2003). At the aggregate level, 92 percent of thevariation was due to changes in the real effective exchange rate, the world price,and the policy variables. Elasticity estimates suggest that the policy variable (-2.04)and the real effective exchange rate (0.73) strongly influenced the real domesticagricultural price index, whereas the transmission elasticity (0.02) of world priceswas weak in comparison, due in large part to the macroeconomic policies in place.The estimated world price transmission elasticity varies between 0.62 (bananas) and2.50 (cereals). The estimated transmission elasticity for sugar of 0.67 was only higherthan that of bananas. State regulation of the sugar industry could have been a causalfactor. The exchange rate had a major impact on the prices of most crops. The policyvariable appeared to have affected only the rice industry, as the pricing formula forpaddy was said to be one of the most important determining factors.
TABLE 1 Price decomposition of selected crops (base year = 1980)
Period Change in domestic price
Change in world price
Change in exchange rate
Other factors
Sugar 1980-85
1986-90
1991-95
1996-01
1.33
1.63
1.32
0.63
3.53
1.93
-0.27
0.34
24.33
-81.80
-171.33
-156.00
-26.53
81.50
172.92
156.29Rice 1980-85
1986-90
1991-95
1996-01
1.83
1.87
1.43
0.92
3.27
2.59
0.29
-0.35
24.33
-81.80
-171.33
-156.00
-25.77
81.08
172.47
157.27Pineapples 1980-85
1986-90
1991-95
1996-01
99.00
30.20
-182.00
-291.50
62.00
10.60
-74.00
-103.17
24.33
-81.80
-171.33
-156.00
12.67
101.4
63.33
-32.33Coconuts 1980-85
1986-90
1991-95
1996-01
87.50
53.80
-150.80
-179.70
20.5
10.2
-74.4
-103.70
24.33
-81.80
-171.33
-156.00
42.67
125.40
94.93
80.00Cereals 1980-85
1986-90
1991-95
1996-01
-73.83
-399.00
-814.40
-896.00
3.30
22.61
-11.40
-38.80
24.33
-81.80
-171.33
-156.00
-101.46
-339.81
-631.67
-701.20Bananas 1980-85
1986-90
1991-95
1996-01
1.80
-115.00
-329.80
-376.10
-72.69
-17.59
-130.40
-193.70
24.33
-81.80
-171.33
-156.00
50.16
-15.61
-28.07
-26.40
Note: Comparative results from price decomposition analyses across the case study countries are provided in Annex B ofthe Synthesis chapter. The results in Annex B present the change in the domestic price as a percentage change with respectto previous period. The case study analyses vary in that some present results as a percentage change with respect to a baseperiod. Whilst the interpretation of results in the case study narrative holds irrespective of the end points compared, theresults presented in Annex B should be used for comparative purposes.
Source: Authors’ computations from FAOSTAT and the sub-sector for producer prices; from the International FinancialStatistics of the IMF for real effective exchange rates; from GRDB and GuySuCo for preferential prices for rice and sugar; fromthe Monthly Commodity Bulletin of the UNCTAD for world prices.
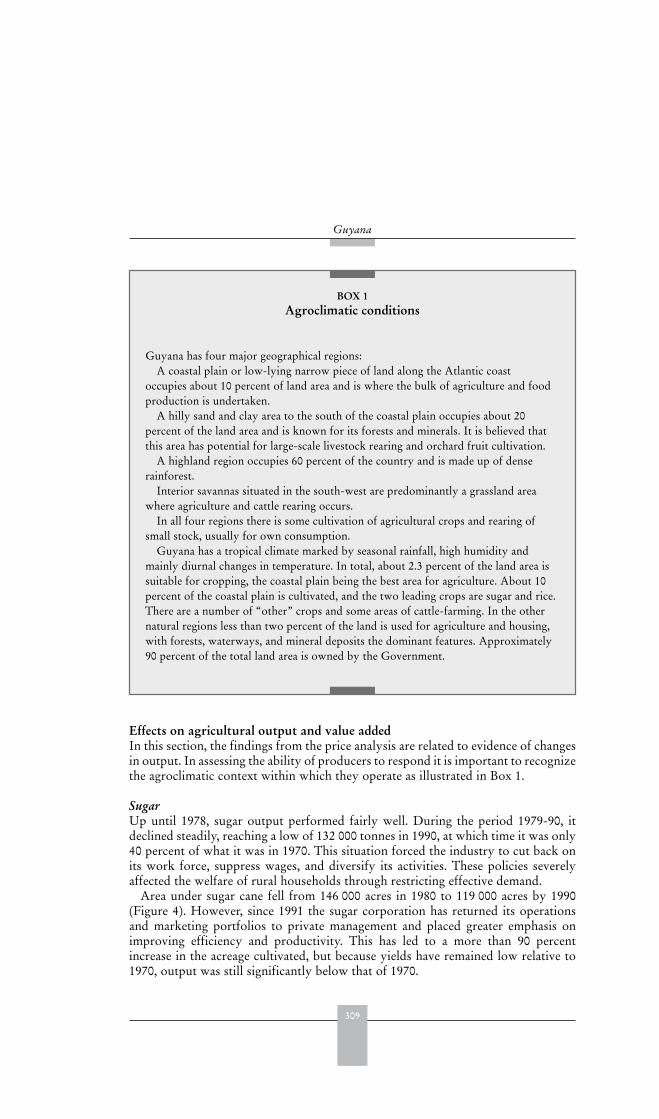
309
Guyana
Effects on agricultural output and value added In this section, the findings from the price analysis are related to evidence of changesin output. In assessing the ability of producers to respond it is important to recognizethe agroclimatic context within which they operate as illustrated in Box 1.
SugarUp until 1978, sugar output performed fairly well. During the period 1979-90, itdeclined steadily, reaching a low of 132 000 tonnes in 1990, at which time it was only40 percent of what it was in 1970. This situation forced the industry to cut back onits work force, suppress wages, and diversify its activities. These policies severelyaffected the welfare of rural households through restricting effective demand.
Area under sugar cane fell from 146 000 acres in 1980 to 119 000 acres by 1990(Figure 4). However, since 1991 the sugar corporation has returned its operationsand marketing portfolios to private management and placed greater emphasis onimproving efficiency and productivity. This has led to a more than 90 percentincrease in the acreage cultivated, but because yields have remained low relative to1970, output was still significantly below that of 1970.
BOX 1Agroclimatic conditions
Guyana has four major geographical regions:A coastal plain or low-lying narrow piece of land along the Atlantic coast
occupies about 10 percent of land area and is where the bulk of agriculture and foodproduction is undertaken.
A hilly sand and clay area to the south of the coastal plain occupies about 20percent of the land area and is known for its forests and minerals. It is believed thatthis area has potential for large-scale livestock rearing and orchard fruit cultivation.
A highland region occupies 60 percent of the country and is made up of denserainforest.
Interior savannas situated in the south-west are predominantly a grassland areawhere agriculture and cattle rearing occurs.
In all four regions there is some cultivation of agricultural crops and rearing ofsmall stock, usually for own consumption.
Guyana has a tropical climate marked by seasonal rainfall, high humidity andmainly diurnal changes in temperature. In total, about 2.3 percent of the land area issuitable for cropping, the coastal plain being the best area for agriculture. About 10percent of the coastal plain is cultivated, and the two leading crops are sugar and rice.There are a number of “other” crops and some areas of cattle-farming. In the othernatural regions less than two percent of the land is used for agriculture and housing,with forests, waterways, and mineral deposits the dominant features. Approximately90 percent of the total land area is owned by the Government.
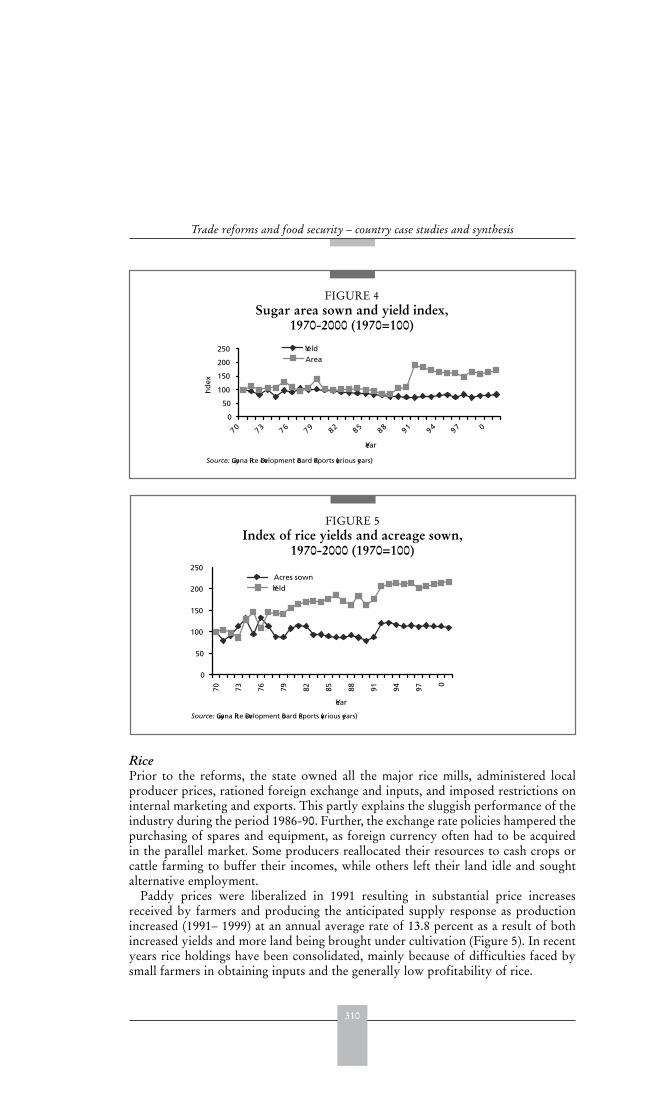
310
Trade reforms and food security – country case studies and synthesis
RicePrior to the reforms, the state owned all the major rice mills, administered localproducer prices, rationed foreign exchange and inputs, and imposed restrictions oninternal marketing and exports. This partly explains the sluggish performance of theindustry during the period 1986-90. Further, the exchange rate policies hampered thepurchasing of spares and equipment, as foreign currency often had to be acquiredin the parallel market. Some producers reallocated their resources to cash crops orcattle farming to buffer their incomes, while others left their land idle and soughtalternative employment.
Paddy prices were liberalized in 1991 resulting in substantial price increasesreceived by farmers and producing the anticipated supply response as productionincreased (1991– 1999) at an annual average rate of 13.8 percent as a result of bothincreased yields and more land being brought under cultivation (Figure 5). In recentyears rice holdings have been consolidated, mainly because of difficulties faced bysmall farmers in obtaining inputs and the generally low profitability of rice.
FIGURE 4Sugar area sown and yield index,
1970-2000 (1970=100)
0
50
100
150
200
250
70 73 76 79 82 85 88 91 94 97 0
Year
Ind
ex
YieldArea
Source: Guyana Rice Development Board Reports (various years)
FIGURE 5Index of rice yields and acreage sown,
1970-2000 (1970=100)
Source: Guyana Rice Development Board Reports (various years)
0
50
100
150
200
250
70 73 76 79 82 85 88 91 94 97
0
Year
Acres sownYield
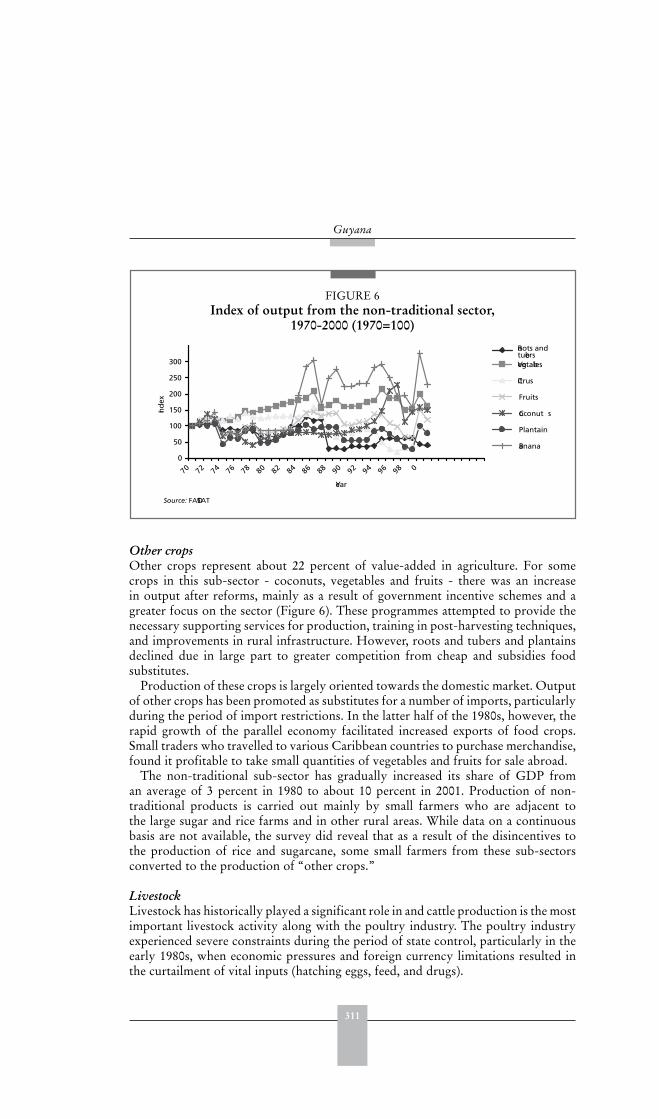
311
Guyana
Other cropsOther crops represent about 22 percent of value-added in agriculture. For somecrops in this sub-sector - coconuts, vegetables and fruits - there was an increasein output after reforms, mainly as a result of government incentive schemes and agreater focus on the sector (Figure 6). These programmes attempted to provide thenecessary supporting services for production, training in post-harvesting techniques,and improvements in rural infrastructure. However, roots and tubers and plantainsdeclined due in large part to greater competition from cheap and subsidies foodsubstitutes.
Production of these crops is largely oriented towards the domestic market. Outputof other crops has been promoted as substitutes for a number of imports, particularlyduring the period of import restrictions. In the latter half of the 1980s, however, therapid growth of the parallel economy facilitated increased exports of food crops.Small traders who travelled to various Caribbean countries to purchase merchandise,found it profitable to take small quantities of vegetables and fruits for sale abroad.
The non-traditional sub-sector has gradually increased its share of GDP froman average of 3 percent in 1980 to about 10 percent in 2001. Production of non-traditional products is carried out mainly by small farmers who are adjacent tothe large sugar and rice farms and in other rural areas. While data on a continuousbasis are not available, the survey did reveal that as a result of the disincentives tothe production of rice and sugarcane, some small farmers from these sub-sectorsconverted to the production of “other crops.”
LivestockLivestock has historically played a significant role in and cattle production is the mostimportant livestock activity along with the poultry industry. The poultry industryexperienced severe constraints during the period of state control, particularly in theearly 1980s, when economic pressures and foreign currency limitations resulted inthe curtailment of vital inputs (hatching eggs, feed, and drugs).
FIGURE 6Index of output from the non-traditional sector,
1970-2000 (1970=100)
0
50
100
150
200
250
300
70 72 74 76 78 80 82 84 86 88 90 92 94 96 98 0
Year
Ind
ex
Roots andtubersVegetables
Citrus
Fruits
Coconut s
Plantain
Banana
Source: FAOSTAT
312
Trade reforms and food security – country case studies and synthesis
During the early 1990s the local poultry industry was faced with an equallyserious problem in the form of competition from imported poultry meat and tableeggs. Import concessions on equipment purchased, however, resulted in a revival.5
Further, the Government raised the bound rate on imported chicken parts, in orderto offer the industry some protection to reduce over reliance on imported chicken.The production of poultry meat increased by some 135 percent between 1992 and1995, and more than 200 percent between 1996 and 2001. The production of eggshad a similar trajectory.
Effect on imports and exportsExports are led by sugar which accounts for approximately a quarter of totalexports. Other important exports are rice, fish and shrimp. The high dependenceon a small number of commodity exports means that the economy is extremelyvulnerable to cyclical movements in commodity prices. This is despite the existenceof preferential markets for its agricultural exports, since even these markets are notimmune to the vagaries of world market prices. In recent years, the prices of mostof the commodities that are important to Guyana have been declining. This has hadsignificant effects on the trade balance, on consumption and on private investment:between 1997 and 1999, imports of consumer goods, intermediate goods and capitalgoods all declined. For the same period, total imports declined from US$628 millionto US$550 million.
In 2001, 84 percent of sugar and 49 percent of rice exports went to the EU.High trade dependence on a few trading partners clearly opens the economy torisks associated with changes in trade policy and economic conditions within theimporting countries. In Guyana’s case, two of the commodities that are heavilydependent on the European market – sugar and rice – are among the most heavilyadministered products in the world. The preferential access arrangements for theseproducts are totally bound up with the support arrangements in the EU, and forthat reason, administrative decisions have a greater effect on export earnings than domarket forces. The fortunes of the rice industry in recent years have been determinedlargely by changes in the EU quota arrangements.
SugarThe bulk of Guyana’s sugar exports enter the EU under the ACP Sugar Protocol as well asunder an arrangement known as the Special Preferential Sugars (SPS). There they receivea higher price than they would on the world market. Exports to the EU accounted for 90percent of the total value with the rest going to the United States, under that country’sSugar Agreement for Caribbean Basin countries, and to the CARICOM.
The quantity of sugar exported from Guyana increased from 134 103 tonnes in1990 to 255 000 tonnes in 1994. This represented an increase of some 90 percent. Thetrend since 1991 has been an increasing one, and with production on the increase,this trend is anticipated to continue for some time.
The market provided by the Sugar Protocol is secured for an unlimited duration.The SPS Agreement provided a substantial new market at a good price until theyear 2001 with the likelihood of renewal. The 1996 United States Farm Bill included
5 This concession is mainly in the form of waivers on import duties.
313
Guyana
provisions that secured Guyana’s sugar quota in this market for seven years. At thesame time, there remain several pressures that may result in an erosion of the valueof sugar preferences, including the reform of the EU sugar regime, the renegotiationof the SPS, limitations imposed on the EU agricultural budget Agenda 2000, and theEU’s agricultural support reduction commitments under the WTO.
RiceIn the period between 1989 and 1991 over 75 percent of rice exports went to theEU market. In 1992 the pattern changed, and direct exports to the EU dropped toonly 17 percent of total exports. The major change in that year was the reappearanceof Jamaica as a major destination for Guyanese rice, accounting for 46 percent ofexports. With increasing rice production in the 1990s, Guyana has had a much largerexport surplus.
Rice exports enter Europe under a quota arrangement for ACP producers thatattracts a 35 percent levy in accordance with MFN provisions. In addition, in theearly 1990s, a new arrangement was provided by the EU for its overseas countriesand territories (OCTs) where rice that was partially milled in those territories wouldenter the EU duty free and in unrestricted amounts. Guyanese producers tookadvantage of this arrangement and, as a result, almost the entire output was shippedto the EU during 1994 and 1995. However, following complaints from the southernEuropean producers, the EU in 1996 instituted safeguard measures that limitedthe OCT exports to 35 000 tonnes. During the high point of the OCT sales, theCARICOM market was almost totally abandoned. Currently, however, this market(Jamaica in particular) remains the most important for Guyana’s rice.
At present, the most important issue concerns the impact of deliveries of UnitedStates PL480 rice on Guyana’s share of the Jamaican market. In 1999, PL480 ricedeliveries to Jamaica surged to more than 34 000 tonnes, from 13 180 tonnes in 1998,thereby taking up more than 45 percent of that market. The recent provisions withinthe 2002 US Farm Bill are expected to further threaten Guyana’s exports. It shouldbe noted that, coming under a food aid programme, PL480 commodities do notattract the CARICOM CET tariff.
General issuesDespite the conclusion in 2000 of the ACP/EU Cotonou Agreement that purportedto provide for stable market access arrangements during the “preparatory period”,the EU has been moving swiftly to implement measures that will significantly erodethe margin of preferences currently enjoyed by many ACP exporters. One suchmeasure is the granting of duty-free access to all LDCs, a group to which Guyanadoes not belong. This would mean that low cost rice producers like Myanmar andIndonesia, would be in a position to out-compete ACP producers on the EU marketthat do not fall within the LDC ranking.
Plans are also in train for the reform of the EU rice regime, which would have theeffect of increasing import duties faced by Guyana and other ACP rice exporters.More importantly, rice imports from ACP countries are limited by quota, whilepresumably imports from LDCs will eventually be quota free. Taken together,the LDC initiative and the rice regime to the EU could have negative implicationsfor Guyana’s rice exports to the EU and for the economy as a whole, given the
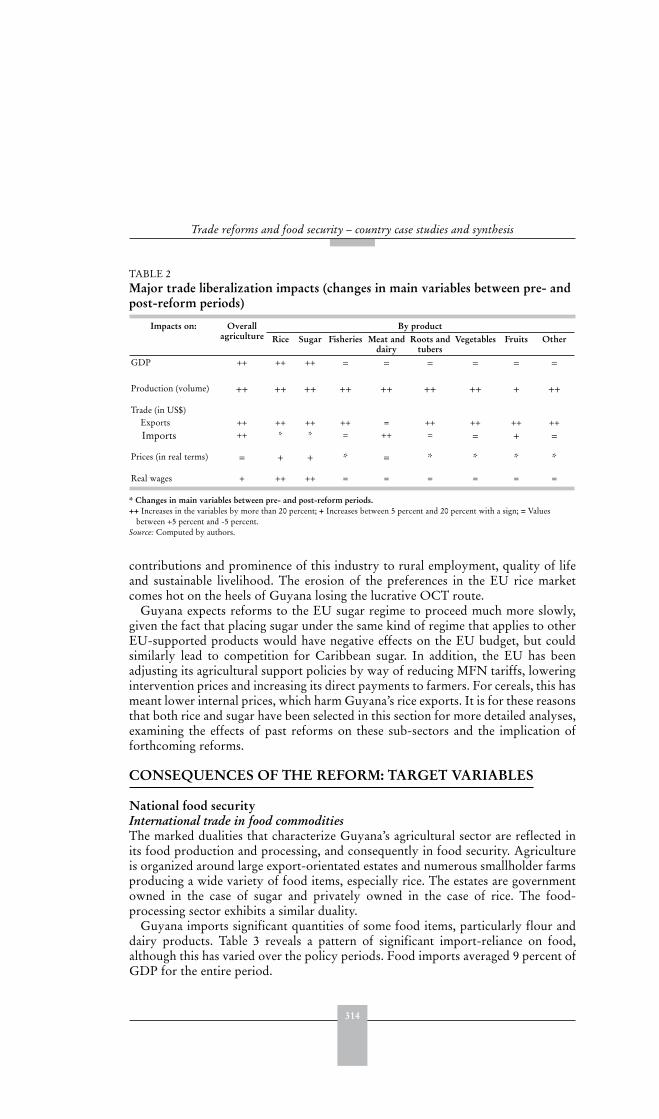
314
Trade reforms and food security – country case studies and synthesis
contributions and prominence of this industry to rural employment, quality of lifeand sustainable livelihood. The erosion of the preferences in the EU rice marketcomes hot on the heels of Guyana losing the lucrative OCT route.
Guyana expects reforms to the EU sugar regime to proceed much more slowly,given the fact that placing sugar under the same kind of regime that applies to otherEU-supported products would have negative effects on the EU budget, but couldsimilarly lead to competition for Caribbean sugar. In addition, the EU has beenadjusting its agricultural support policies by way of reducing MFN tariffs, loweringintervention prices and increasing its direct payments to farmers. For cereals, this hasmeant lower internal prices, which harm Guyana’s rice exports. It is for these reasonsthat both rice and sugar have been selected in this section for more detailed analyses,examining the effects of past reforms on these sub-sectors and the implication offorthcoming reforms.
CONSEQUENCES OF THE REFORM: TARGET VARIABLES
National food securityInternational trade in food commoditiesThe marked dualities that characterize Guyana’s agricultural sector are reflected inits food production and processing, and consequently in food security. Agricultureis organized around large export-orientated estates and numerous smallholder farmsproducing a wide variety of food items, especially rice. The estates are governmentowned in the case of sugar and privately owned in the case of rice. The food-processing sector exhibits a similar duality.
Guyana imports significant quantities of some food items, particularly flour anddairy products. Table 3 reveals a pattern of significant import-reliance on food,although this has varied over the policy periods. Food imports averaged 9 percent ofGDP for the entire period.
TABLE 2 Major trade liberalization impacts (changes in main variables between pre- and post-reform periods)
Impacts on: Overallagriculture
By productRice Sugar Fisheries Meat and
dairyRoots and
tubersVegetables Fruits Other
GDP ++ ++ ++ = = = = = =
Production (volume) ++ ++ ++ ++ ++ ++ ++ + ++
Trade (in US$) Exports ++ ++ ++ ++ = ++ ++ ++ ++
Imports ++ * * = ++ = = + =
Prices (in real terms) = + + * = * * * *
Real wages + ++ ++ = = = = = =
* Changes in main variables between pre- and post-reform periods.++ Increases in the variables by more than 20 percent; + Increases between 5 percent and 20 percent with a sign; = Values
between +5 percent and -5 percent.Source: Computed by authors.
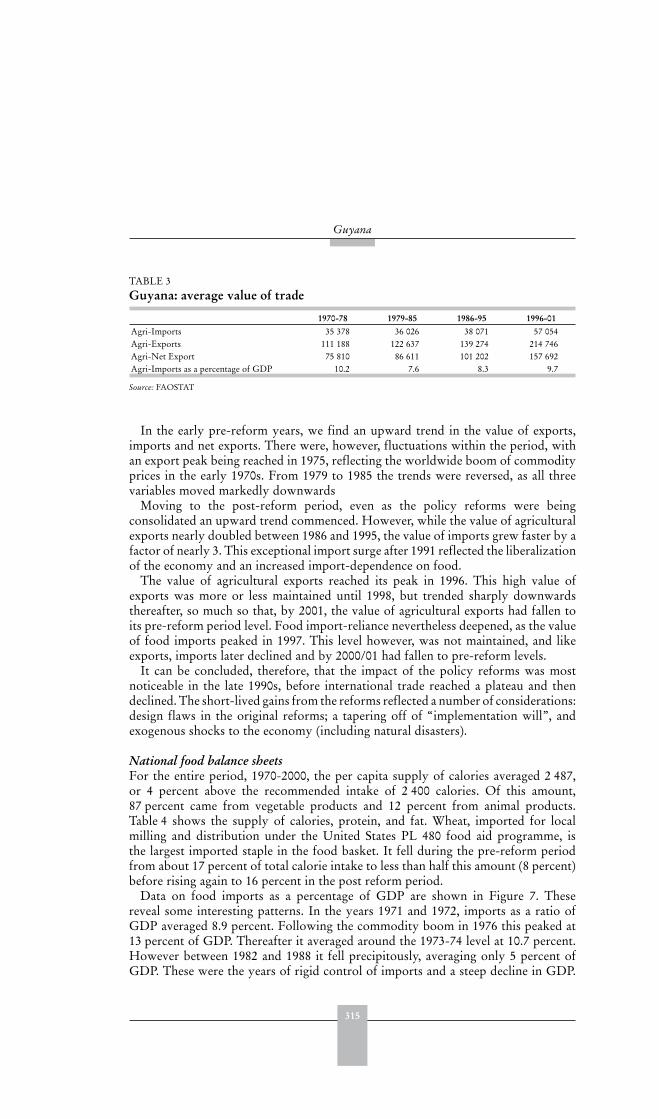
315
Guyana
In the early pre-reform years, we find an upward trend in the value of exports,imports and net exports. There were, however, fluctuations within the period, withan export peak being reached in 1975, reflecting the worldwide boom of commodityprices in the early 1970s. From 1979 to 1985 the trends were reversed, as all threevariables moved markedly downwards
Moving to the post-reform period, even as the policy reforms were beingconsolidated an upward trend commenced. However, while the value of agriculturalexports nearly doubled between 1986 and 1995, the value of imports grew faster by afactor of nearly 3. This exceptional import surge after 1991 reflected the liberalizationof the economy and an increased import-dependence on food.
The value of agricultural exports reached its peak in 1996. This high value ofexports was more or less maintained until 1998, but trended sharply downwardsthereafter, so much so that, by 2001, the value of agricultural exports had fallen toits pre-reform period level. Food import-reliance nevertheless deepened, as the valueof food imports peaked in 1997. This level however, was not maintained, and likeexports, imports later declined and by 2000/01 had fallen to pre-reform levels.
It can be concluded, therefore, that the impact of the policy reforms was mostnoticeable in the late 1990s, before international trade reached a plateau and thendeclined. The short-lived gains from the reforms reflected a number of considerations:design flaws in the original reforms; a tapering off of “implementation will”, andexogenous shocks to the economy (including natural disasters).
National food balance sheetsFor the entire period, 1970-2000, the per capita supply of calories averaged 2 487,or 4 percent above the recommended intake of 2 400 calories. Of this amount,87 percent came from vegetable products and 12 percent from animal products.Table 4 shows the supply of calories, protein, and fat. Wheat, imported for localmilling and distribution under the United States PL 480 food aid programme, isthe largest imported staple in the food basket. It fell during the pre-reform periodfrom about 17 percent of total calorie intake to less than half this amount (8 percent)before rising again to 16 percent in the post reform period.
Data on food imports as a percentage of GDP are shown in Figure 7. Thesereveal some interesting patterns. In the years 1971 and 1972, imports as a ratio ofGDP averaged 8.9 percent. Following the commodity boom in 1976 this peaked at13 percent of GDP. Thereafter it averaged around the 1973-74 level at 10.7 percent.However between 1982 and 1988 it fell precipitously, averaging only 5 percent ofGDP. These were the years of rigid control of imports and a steep decline in GDP.
TABLE 3 Guyana: average value of trade
1970-78 1979-85 1986-95 1996-01Agri-Imports 35 378 36 026 38 071 57 054Agri-Exports 111 188 122 637 139 274 214 746Agri-Net Export 75 810 86 611 101 202 157 692Agri-Imports as a percentage of GDP 10.2 7.6 8.3 9.7
Source: FAOSTAT
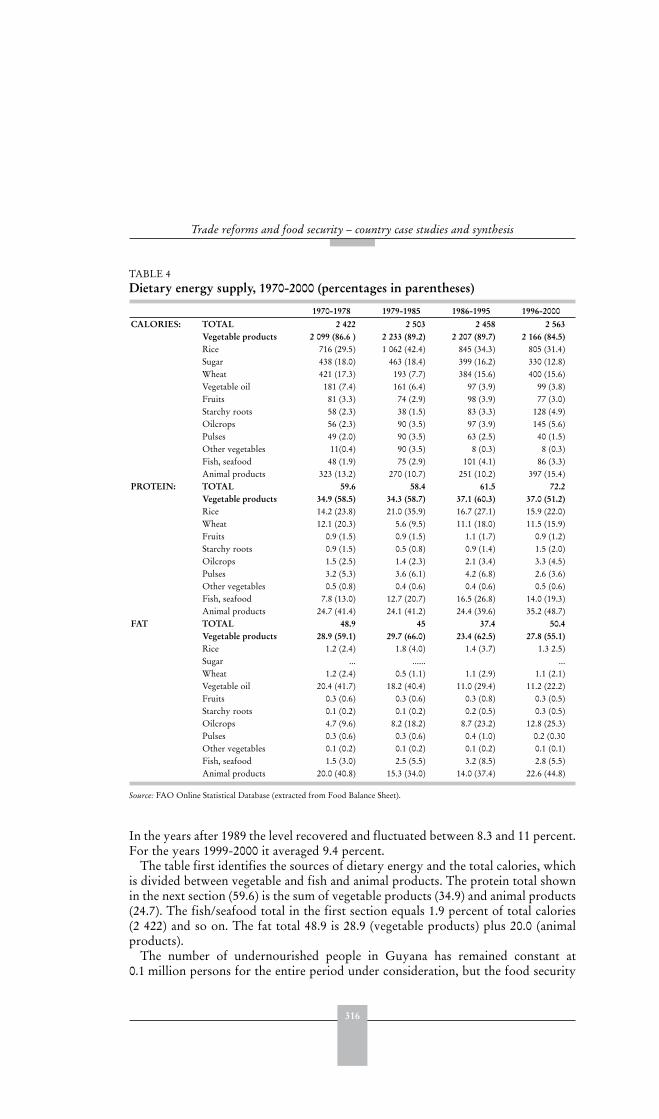
316
Trade reforms and food security – country case studies and synthesis
In the years after 1989 the level recovered and fluctuated between 8.3 and 11 percent.For the years 1999-2000 it averaged 9.4 percent.
The table first identifies the sources of dietary energy and the total calories, whichis divided between vegetable and fish and animal products. The protein total shownin the next section (59.6) is the sum of vegetable products (34.9) and animal products(24.7). The fish/seafood total in the first section equals 1.9 percent of total calories(2 422) and so on. The fat total 48.9 is 28.9 (vegetable products) plus 20.0 (animalproducts).
The number of undernourished people in Guyana has remained constant at0.1 million persons for the entire period under consideration, but the food security
TABLE 4 Dietary energy supply, 1970-2000 (percentages in parentheses)
1970-1978 1979-1985 1986-1995 1996-2000CALORIES: TOTAL 2 422 2 503 2 458 2 563
Vegetable products 2 099 (86.6 ) 2 233 (89.2) 2 207 (89.7) 2 166 (84.5)Rice 716 (29.5) 1 062 (42.4) 845 (34.3) 805 (31.4)Sugar 438 (18.0) 463 (18.4) 399 (16.2) 330 (12.8)Wheat 421 (17.3) 193 (7.7) 384 (15.6) 400 (15.6)Vegetable oil 181 (7.4) 161 (6.4) 97 (3.9) 99 (3.8)Fruits 81 (3.3) 74 (2.9) 98 (3.9) 77 (3.0)Starchy roots 58 (2.3) 38 (1.5) 83 (3.3) 128 (4.9)Oilcrops 56 (2.3) 90 (3.5) 97 (3.9) 145 (5.6)Pulses 49 (2.0) 90 (3.5) 63 (2.5) 40 (1.5)Other vegetables 11(0.4) 90 (3.5) 8 (0.3) 8 (0.3)Fish, seafood 48 (1.9) 75 (2.9) 101 (4.1) 86 (3.3)Animal products 323 (13.2) 270 (10.7) 251 (10.2) 397 (15.4)
PROTEIN: TOTAL 59.6 58.4 61.5 72.2Vegetable products 34.9 (58.5) 34.3 (58.7) 37.1 (60.3) 37.0 (51.2)Rice 14.2 (23.8) 21.0 (35.9) 16.7 (27.1) 15.9 (22.0)Wheat 12.1 (20.3) 5.6 (9.5) 11.1 (18.0) 11.5 (15.9)Fruits 0.9 (1.5) 0.9 (1.5) 1.1 (1.7) 0.9 (1.2)Starchy roots 0.9 (1.5) 0.5 (0.8) 0.9 (1.4) 1.5 (2.0)Oilcrops 1.5 (2.5) 1.4 (2.3) 2.1 (3.4) 3.3 (4.5)Pulses 3.2 (5.3) 3.6 (6.1) 4.2 (6.8) 2.6 (3.6)Other vegetables 0.5 (0.8) 0.4 (0.6) 0.4 (0.6) 0.5 (0.6)Fish, seafood 7.8 (13.0) 12.7 (20.7) 16.5 (26.8) 14.0 (19.3)Animal products 24.7 (41.4) 24.1 (41.2) 24.4 (39.6) 35.2 (48.7)
FAT TOTAL 48.9 45 37.4 50.4Vegetable products 28.9 (59.1) 29.7 (66.0) 23.4 (62.5) 27.8 (55.1)Rice 1.2 (2.4) 1.8 (4.0) 1.4 (3.7) 1.3 2.5)Sugar ... ...... ...Wheat 1.2 (2.4) 0.5 (1.1) 1.1 (2.9) 1.1 (2.1)Vegetable oil 20.4 (41.7) 18.2 (40.4) 11.0 (29.4) 11.2 (22.2)Fruits 0.3 (0.6) 0.3 (0.6) 0.3 (0.8) 0.3 (0.5)Starchy roots 0.1 (0.2) 0.1 (0.2) 0.2 (0.5) 0.3 (0.5)Oilcrops 4.7 (9.6) 8.2 (18.2) 8.7 (23.2) 12.8 (25.3)Pulses 0.3 (0.6) 0.3 (0.6) 0.4 (1.0) 0.2 (0.30Other vegetables 0.1 (0.2) 0.1 (0.2) 0.1 (0.2) 0.1 (0.1)Fish, seafood 1.5 (3.0) 2.5 (5.5) 3.2 (8.5) 2.8 (5.5)Animal products 20.0 (40.8) 15.3 (34.0) 14.0 (37.4) 22.6 (44.8)
Source: FAO Online Statistical Database (extracted from Food Balance Sheet).
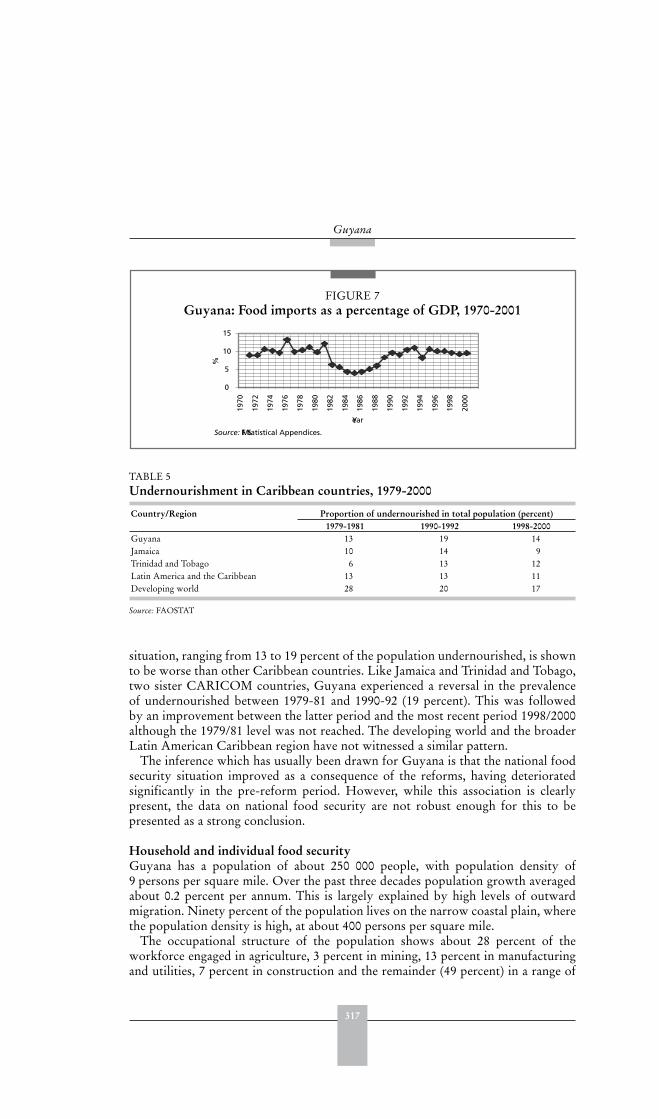
317
Guyana
situation, ranging from 13 to 19 percent of the population undernourished, is shownto be worse than other Caribbean countries. Like Jamaica and Trinidad and Tobago,two sister CARICOM countries, Guyana experienced a reversal in the prevalenceof undernourished between 1979-81 and 1990-92 (19 percent). This was followedby an improvement between the latter period and the most recent period 1998/2000although the 1979/81 level was not reached. The developing world and the broaderLatin American Caribbean region have not witnessed a similar pattern.
The inference which has usually been drawn for Guyana is that the national foodsecurity situation improved as a consequence of the reforms, having deterioratedsignificantly in the pre-reform period. However, while this association is clearlypresent, the data on national food security are not robust enough for this to bepresented as a strong conclusion.
Household and individual food securityGuyana has a population of about 250 000 people, with population density of9 persons per square mile. Over the past three decades population growth averagedabout 0.2 percent per annum. This is largely explained by high levels of outwardmigration. Ninety percent of the population lives on the narrow coastal plain, wherethe population density is high, at about 400 persons per square mile.
The occupational structure of the population shows about 28 percent of theworkforce engaged in agriculture, 3 percent in mining, 13 percent in manufacturingand utilities, 7 percent in construction and the remainder (49 percent) in a range of
FIGURE 7Guyana: Food imports as a percentage of GDP, 1970-2001
Source: IMF Statistical Appendices.
0
5
10
15
1970
1972
1974
1976
1978
1980
1982
1984
1986
1988
1990
1992
1994
1996
1998
2000
Year
%
TABLE 5 Undernourishment in Caribbean countries, 1979-2000
Country/Region Proportion of undernourished in total population (percent)1979-1981 1990-1992 1998-2000
Guyana 13 19 14Jamaica 10 14 9Trinidad and Tobago 6 13 12Latin America and the Caribbean 13 13 11Developing world 28 20 17
Source: FAOSTAT
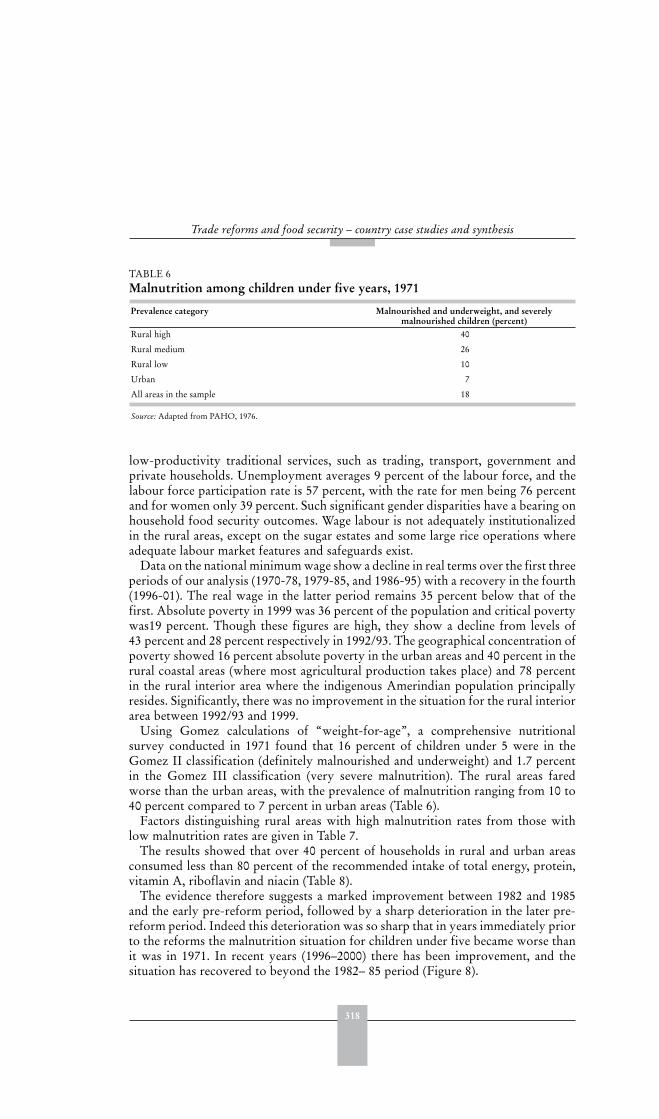
318
Trade reforms and food security – country case studies and synthesis
low-productivity traditional services, such as trading, transport, government andprivate households. Unemployment averages 9 percent of the labour force, and thelabour force participation rate is 57 percent, with the rate for men being 76 percentand for women only 39 percent. Such significant gender disparities have a bearing onhousehold food security outcomes. Wage labour is not adequately institutionalizedin the rural areas, except on the sugar estates and some large rice operations whereadequate labour market features and safeguards exist.
Data on the national minimum wage show a decline in real terms over the first threeperiods of our analysis (1970-78, 1979-85, and 1986-95) with a recovery in the fourth(1996-01). The real wage in the latter period remains 35 percent below that of thefirst. Absolute poverty in 1999 was 36 percent of the population and critical povertywas19 percent. Though these figures are high, they show a decline from levels of43 percent and 28 percent respectively in 1992/93. The geographical concentration ofpoverty showed 16 percent absolute poverty in the urban areas and 40 percent in therural coastal areas (where most agricultural production takes place) and 78 percentin the rural interior area where the indigenous Amerindian population principallyresides. Significantly, there was no improvement in the situation for the rural interiorarea between 1992/93 and 1999.
Using Gomez calculations of “weight-for-age”, a comprehensive nutritionalsurvey conducted in 1971 found that 16 percent of children under 5 were in theGomez II classification (definitely malnourished and underweight) and 1.7 percentin the Gomez III classification (very severe malnutrition). The rural areas faredworse than the urban areas, with the prevalence of malnutrition ranging from 10 to40 percent compared to 7 percent in urban areas (Table 6).
Factors distinguishing rural areas with high malnutrition rates from those withlow malnutrition rates are given in Table 7.
The results showed that over 40 percent of households in rural and urban areasconsumed less than 80 percent of the recommended intake of total energy, protein,vitamin A, riboflavin and niacin (Table 8).
The evidence therefore suggests a marked improvement between 1982 and 1985and the early pre-reform period, followed by a sharp deterioration in the later pre-reform period. Indeed this deterioration was so sharp that in years immediately priorto the reforms the malnutrition situation for children under five became worse thanit was in 1971. In recent years (1996–2000) there has been improvement, and thesituation has recovered to beyond the 1982– 85 period (Figure 8).
TABLE 6 Malnutrition among children under five years, 1971
Prevalence category Malnourished and underweight, and severely malnourished children (percent)
Rural high
Rural medium
Rural low
Urban
All areas in the sample
40
26
10
7
18
Source: Adapted from PAHO, 1976.

319
Guyana
TABLE 7 Differences between rural high and rural low under 5 malnutrition areas, 1971
Significant differences found No significant differences foundHousehold income
Distance from piped water
Education of mothers
Patterns of child care
Attendance at clinics
Employment of main providers
Religious prohibitions
Time of giving first supplement to breast-feeding
Reported child mortality rates
Household calorie consumption in relation to recommended intake
Source: Adapted from PAHO (1976) Table 10, p 14.
TABLE 8 Percentage of households consuming less than recommended intakes of energy and nutrients, 1971
Less than recommended intakes Less than 80 percent of recommended intakes
Rural (%) Urban (%) Rural (%) Urban (%)Energy
Protein
Calcium
Iron
Vitamin A
Thiamine
Riboflavin
Niacin
Ascorbic acid
77.1
65.1
28.0
26.9
62.6
22.4
88.0
60.3
35.9
71.2
61.4
29.3
38.3
40.7
39.7
76.5
68.7
32.4
54.3
44.5
17.9
13.6
52.1
14.8
75.9
39.5
27.3
48.5
39.7
20.5
21.2
28.2
19.1
62.8
48.9
24.3
Source: PAHO (1976).
FIGURE 8Child malnutrition by policy period (percent of children under 5 years)
0
5
10
15
20
Perc
ent
1971 1982-85 1986-95 1996-00
Period
Source: World Bank 1993, Guyana Agency for Health Science Education and Food Policy 2001, Ministry of Finance, BudgetSpeeches (various issues)
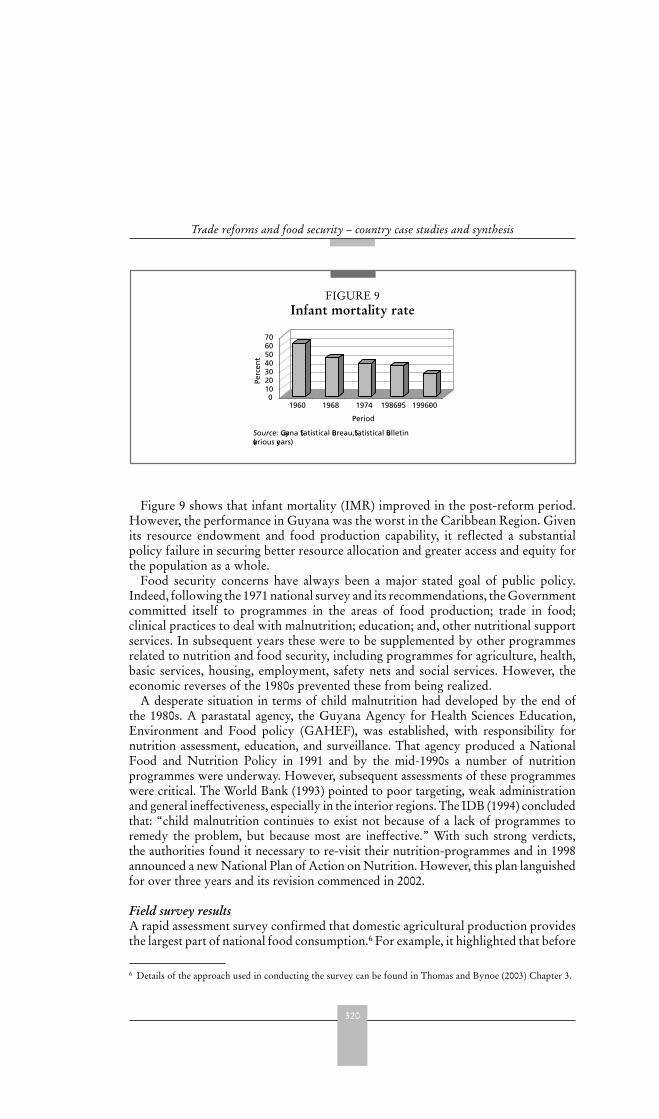
320
Trade reforms and food security – country case studies and synthesis
Figure 9 shows that infant mortality (IMR) improved in the post-reform period.However, the performance in Guyana was the worst in the Caribbean Region. Givenits resource endowment and food production capability, it reflected a substantialpolicy failure in securing better resource allocation and greater access and equity forthe population as a whole.
Food security concerns have always been a major stated goal of public policy.Indeed, following the 1971 national survey and its recommendations, the Governmentcommitted itself to programmes in the areas of food production; trade in food;clinical practices to deal with malnutrition; education; and, other nutritional supportservices. In subsequent years these were to be supplemented by other programmesrelated to nutrition and food security, including programmes for agriculture, health,basic services, housing, employment, safety nets and social services. However, theeconomic reverses of the 1980s prevented these from being realized.
A desperate situation in terms of child malnutrition had developed by the end ofthe 1980s. A parastatal agency, the Guyana Agency for Health Sciences Education,Environment and Food policy (GAHEF), was established, with responsibility fornutrition assessment, education, and surveillance. That agency produced a NationalFood and Nutrition Policy in 1991 and by the mid-1990s a number of nutritionprogrammes were underway. However, subsequent assessments of these programmeswere critical. The World Bank (1993) pointed to poor targeting, weak administrationand general ineffectiveness, especially in the interior regions. The IDB (1994) concludedthat: “child malnutrition continues to exist not because of a lack of programmes toremedy the problem, but because most are ineffective.” With such strong verdicts,the authorities found it necessary to re-visit their nutrition-programmes and in 1998announced a new National Plan of Action on Nutrition. However, this plan languishedfor over three years and its revision commenced in 2002.
Field survey resultsA rapid assessment survey confirmed that domestic agricultural production providesthe largest part of national food consumption.6 For example, it highlighted that before
6 Details of the approach used in conducting the survey can be found in Thomas and Bynoe (2003) Chapter 3.
FIGURE 9Infant mortality rate
010203040506070
Perc
ent
1960 1968 1974 1986-95 1996-00
Period
Source: Guyana Statistical Bureau, Statistical Bulletin (various years)

321
Guyana
the reform period in the late 1980s, when food shortages were severe, approximately92 percent of all surveyed producers were selling to meet local consumptiondemands. After the liberalization of the economy, this figure fell to 73 percent.
The same survey found that the mean expenditure on food of small farmerswas GYD23626 and non-food items GYD15800. The mean total expenditure wastherefore GYD39426 or the equivalent of about US$207, which was well above thenational mean. Forty percent of the respondents spent less than half this amount andone-quarter spent about 30 percent of this amount.
Before the reforms, 78 percent of the respondents consumed rice as the main foodstaple, but after the reforms this was reduced to 64 percent (Table 9). Both before andafter the reforms the only other significant food item was flour, whose share trebled,rising from 11 percent before the reforms to 32 percent after, due in large part to theliberalization of the economy and the greater influx of wheat and wheat products.
The main protein sources before the reform were meat (32 percent) poultry(28 percent) and fish (also 28 percent) (Table 10). After the reforms more meat andpoultry were consumed and less fish.
Following the liberalization of the economy in the early 1990s, there was a surgein food imports, with the value of some major categories increasing by three to sixtimes. There was a 66 percent decline in the consumption of ground provisionsas wheat flour became more readily available under the PL 480 Programme. Theconsumption of fish fell by 35 percent, as the liberalization of the economy madepoultry and other meat products more readily available, and often at competitiveprices compared to fish.
The survey also sought to establish whether farmers felt they were more foodsecure before the reforms or after. When asked whether the family enjoyed “three
TABLE 9 Main food staple consumed by the surveyed population before and after reform
Main food group Before reform After reformFrequency Percent Frequency Percent
Rice and rice products 102 77.9 84 64.1Flour and flour products 14 10.7 42 32.1Ground provisions 15 11.5 5 3.8Total 131 100 100 100
Source: Rapid Assessment Survey (2003).
TABLE 10 Main food complements before and after the reform
Main food complement Before reform After reformFrequency Percent Frequency Percent
Meats 42 32.1 51 38.9Poultry products 37 28.2 45 34.4Fish 37 28.2 24 18.3Milk 3 2.3 2 1.5Vegetables 12 9.2 9 6.9Total 131 100 131 100
Source: Rapid Assessment Survey (2003).
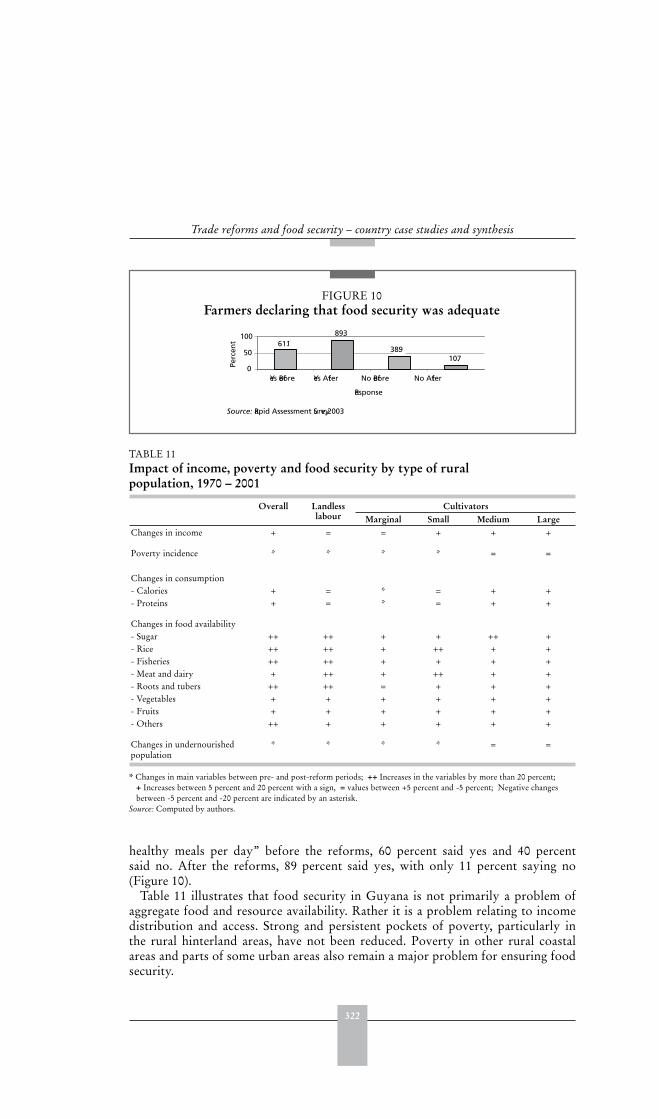
322
Trade reforms and food security – country case studies and synthesis
healthy meals per day” before the reforms, 60 percent said yes and 40 percentsaid no. After the reforms, 89 percent said yes, with only 11 percent saying no(Figure 10).
Table 11 illustrates that food security in Guyana is not primarily a problem ofaggregate food and resource availability. Rather it is a problem relating to incomedistribution and access. Strong and persistent pockets of poverty, particularly inthe rural hinterland areas, have not been reduced. Poverty in other rural coastalareas and parts of some urban areas also remain a major problem for ensuring foodsecurity.
FIGURE 10Farmers declaring that food security was adequate
61.189.3
38.910.7
0
50
100
Yes Before Yes After No Before No After
Response
Perc
ent
Source: Rapid Assessment Survey, 2003
TABLE 11 Impact of income, poverty and food security by type of rural population, 1970 – 2001
Overall Landlesslabour
CultivatorsMarginal Small Medium Large
Changes in income + = = + + +
Poverty incidence * * * * = =
Changes in consumption- Calories + = * = + +- Proteins + = * = + +
Changes in food availability- Sugar ++ ++ + + ++ +- Rice ++ ++ + ++ + +- Fisheries ++ ++ + + + +- Meat and dairy + ++ + ++ + +- Roots and tubers ++ ++ = + + +- Vegetables + + + + + +- Fruits + + + + + +- Others ++ + + + + +
Changes in undernourishedpopulation
* * * * = =
* Changes in main variables between pre- and post-reform periods; ++ Increases in the variables by more than 20 percent;+ Increases between 5 percent and 20 percent with a sign, = values between +5 percent and -5 percent; Negative changesbetween -5 percent and -20 percent are indicated by an asterisk.
Source: Computed by authors.
323
Guyana
POLICY LESSONS
By any standard the economic and trade policy reforms introduced in 1989 wereradical. In a relatively short period of time they shifted the economy away fromstate-led, inward-looking, commandist policies, to a de-regulated, liberalized, open,private sector-led, market-driven economic system. The reforms were designed tohave a calculated shock effect during the initial stabilization period, paving the wayfor subsequent far-reaching structural reforms.
The consequent improvements in agricultural performance after 1991 is largelydue to these reforms, which included eliminating price and other controls in the foodindustry sectors; the private management contract under which the state-ownedsugar industry is now operated; the unification of the exchange rate and opening upof private transactions in foreign currency; the liberalization of capital flows; betterwater resources management; and promotion of land markets. Although importedfood items (many of which were being subsidized in exporting countries) put someagricultural sub-sectors under pressure, consumers benefited through reducedprices, greater choice and better quality products.
There is to date no clear evidence that liberalization has caused export agricultureto develop at the expense of domestic food production. This could of course becomea problem at a later date. Guyana depends significantly on food imports to meet itsfood requirements. However, foreign exchange availability and highly liberalizedimport regimes should ensure food availability, if not guaranteeing food access to theneedy. In the post-reform period there have been no scarcities of foreign exchangeand therefore no pressure from this quarter on food imports.
The performance of the economy tapered off after 1996. Reasons given are: 1)the statistical illusion of rapid growth from the low base to which the economy haddeclined by 1990 2) design flaws in the original reforms 3) some reduction in thelevel of “implementation will” as political unrest and civil conflict worsened and 4)exogenous shocks.
Despite some of the reforms’ successes, there were various flaws in the approachundertaken. The currency has been allowed to appreciate again in real terms, withdeleterious consequences for the competitiveness of agriculture which, in Guyana, isparticularly exposed to international market forces.
The reform process underestimated the social consequences of the massivecompression of national expenditure and the rapid increase in the cost of living whichfollowed the currency devaluations. Measures to reduce the associated politicalconflict were insufficient. International finance institutions and donor countriesput pressure on Guyana to follow what was at the time a standard one-size-fits-allapproach to its economic recovery programme which did not take adequate accountof local conditions.
After 1996, greater attention was paid to poverty-related issues, and Guyanaqualified under the HIPC programmes, which required drawing up a plan to reducepoverty. Although the distribution of household expenditure by income groupshowed some improvement during the reform period (the share of the poorestquintile more than doubled, and also increased substantially for the second andthird quintiles), nevertheless, income inequality remains a pressing issue for Guyana.Such improvements in the poverty rate as have occurred have benefited urban areas
324
Trade reforms and food security – country case studies and synthesis
disproportionately. The overall rate is still high, and rural areas remain the worst hitby poverty. This is particularly so in the rural interior which experienced no changein the absolute poverty rate. This is also the region where most of the indigenouspopulation lives.
Safety nets provide cash, food and other benefits designed to alleviate the worsteffects of poverty, and Government expenditure on social security and welfare hasincreased. However, there appear to have been targeting problems, with the patternof expenditure not matching the distribution of regional poverty.
It is important to stress that the beneficial effects of state withdrawal fromcommercial agriculture activities should not be read as support for state withdrawalfrom the role of ensuring adequate food security, especially since the main problemof food security seems to be at the level of access, distribution, and equity. Withpersistent pockets of poverty remaining in the rural interior areas, among theAmerindian population, and in several rural coastal communities, food security isstill an important public policy issue.
Broad-based rural reform, sustained economic growth, and better targeting areessential components for any successful programme to enhance food security. Sucha programme would need to direct attention to the assets of the rural poor, includingtheir land access, land improvement, infrastructure, credit, training, technicalsupport and improved community services, as well as overall institutional supportand strengthening. The programme has also to promote linkages among sectors inthe rural areas and between the rural and urban areas. There is also a sharp dividebetween hinterland and coastal areas and here linkages also need to be promoted.
In conclusion, the reforms have impacted positively on the economy, contributingto rapid economic growth. This appears to be responsible for an improvementin household welfare. However, economic growth has slowed since 1997, raisingconcerns about the sustainability of food security improvements.
REFERENCES
FAOSTAT. 2002.IDB. 1990. Socioeconomic report – Guyana. Washington, DC.IDB. 1994. Building consensus for social and economic reconstruction. Report of the IDB Pilot
Mission or Scio-economic Reform, Guyana.IMF various years. Guyana reports statistical appendices. Washington, DC.PAHO. 1976. Food and nutrition survey, Guyana. PAHO, Washington, DC.PAHO/CFNI/MoH. 1997. Micronutrient study report in collaboration with Ministry of
Health, Guyana.PAHO/WHO. 1996. Poverty and interventions in health and education. Washington, DC.Thomas, C.Y. & Bynoe, M. 2003. Impact of agricultural, trade and related reforms on food
security, Institute of Development Studies, University of Guyana, paper prepared forFAO.
Thomas, C.Y. 1989. Foreign currency black markets: lessons from Guyanese experience.Social and Economic Studies 38(2): 137-84.
World Bank. 1993. Guyana: from economic recovery to sustained growth. World BankCountry Study, Washington, DC.
325
Guyana
FURTHER READING
Agro Dev Canada Inc. 1995. Guyana agricultural support services programme: Draft FinalReport – Volume 1.
Angel, Amy. 1996. Analysis of the effects of Guyana’s export sector: Change in international
markets. Carter Center for Sustainable Development Program, Atlanta Georgia.Baker, Judy L. 1994. Strategies for reducing poverty (Guyana). World Bank Report, Latin
America and the Caribbean.Ballayram, Lawrence, B.A. & Henry, F.J. 2002. Agriculture, food security and health in the
Caribbean: an indispensable link. Proceedings of the Caribbean Agricultural EconomicsConference (CAES). St Georges, Grenada. 8–13 July 2002.
Bank of Guyana. Various issues. Statistical Bulletin.Beveridge, M., Fried, M., Bradley, M. & Rowe, N. 2002. Guyana’s rice farmers and the myth
of the free market. Oxfam Canada.Bickel, G., Nord, M., Price, C., Hamilton, W. & Cook, J. 2000. Guide to measuring
household food security. USDA, United States.Bishop, A.R. 1996. Collaboration and consultation on land Use in Guyana: Baseline Document
on Land Use in Guyana. University of Guyana and Carter Centre.Bureau of Statistics, Government of Guyana. 1993. Household income and expenditure
survey (1992–1993).Bureau of Statistics/UNICEF. 2001. Report: multiple indicator cluster survey (Guyana)
Bureau of Statistics/UNICEF. Various issues. Statistical Bulletin.Bynoe, Mark. 1997. An outlook and situation analysis of the Guyanese agricultural sector,
1990-95. Inter-American Institute for Co-operation on Agriculture (IICA), Georgetown.Canterbury, D. et al. 1991. Guyana agricultural sector assessment. IICA Report, Guyana.Canterbury, D., Carmichael C. & Thomas, C.Y. 1994. Report on rural poverty studies in
Guyana. IDS/IICA, Georgetown Guyana.Caribbean Engineering Management Company (CEMCO)/UNICEF. 1993. Analysis of
children and women in Guyana. Georgetown, Guyana.Dangour, A. & Ismail, S. 1994. Nutritional status of Guyanese Potomonia indians. London
School of Hygiene and Tropical Medicine, London.Danns, G. K. 1996. Situation analysis of children in especially difficult circumstances.
Guyana.Deodat, Maharaj. 1997. Food security analysis of Guyana. World Food Program (WFP).Durrant, Nigel, Goodland, Andrea & De Mendonca, Arnold. 1995. Shaping food and
agricultural policies in the caribbean in the context of economic and trade liberalization.
Guyana.Durrant, Nigel. 2000. Structural effects of preferential trade agreements in the context of
economic & trade liberalization. Ministry of Agriculture, Government of Guyana.Durrant, Nigel. 2002. Guyana’s participation in the multilateral and regional trade negotiations
and the United Nations Framework Convention on Climate Change. Georgetown.Eduardo, Atalah S. 2001. Guyana: nutritional situation of the population and proposals for
intervention.
Faal, Abrima. 2003. Currency demand, the underground economy and tax evasion: the case of
Guyana. IMF Working Paper WP/03/7. Washington, DC.FAO. 1984. Agrarian reform legislation for Guyana. Rome.
326
Trade reforms and food security – country case studies and synthesis
FAO. 2000. Agriculture, trade and food security issues and options in the wto negotiations from
the perspective of developing countries. Vol. II Country case studies. Chapter 5 Guyana.FAO. 2002. Regional Programme for Food Security in Member Countries of the Caribbean
Community.
Ferro, Manuela et al. 1995. Honduras: impact of policy reforms on the incomes of the rural
poor. Report No. 14396-HO. Natural Resources and Rural Poverty Division, WorldBank.
Ford, J. R. et al. 1985. Small farmers development in Guyana. IICA, Georgetown.Fried , M. (ed). 2001. Guyana’s rice farmers and the myth of the free market. Oxfam Trade
Report Research.Ganga, Gobind. 2000. Structural adjustment programme and poverty in Guyana. Bank of
Guyana, Georgetown.Government of Guyana. 1994. National Plan of Action for Children to the Year 2000.
Georgetown.Government of Guyana. 2001. National Development Strategy (Final Draft). Georgetown.Government of Guyana. 2002. Poverty Reduction Strategy Paper. Georgetown.Government of Guyana/ODA. 1996. Guyana land administrative support programme.
Hunting Technical Services Ltd., UK.Guyana Agency for Health Science Education and Food Policy (GAHEF). 1991. GAHEF
Nutritional Reports.Guyana Rice Development Board Report. 2001-2011. Strategic plan by stakeholders in the
rice industry (Rice Committee), Georgetown.Guyana Rice Development Board. 2001. Annual Report. Georgetown.Hunte, C.K. 1993. The privatization of lands in Guyana: Some implications for agricultural
development. GAI Bank, Georgetown.Hunting Technical Services Ltd., UK. 1997. Guyana land administration support program
phase 1 (Socio-Economic Survey Report) Government of Guyana/DFID.IDB Baseline Study. 1998. Poor rural committees support services. Project Contract
Document.IDB Report. 1997. Latin America After a decade of reforms. Washington DC.IICA/IFAD. 1994. Results of socio-economic survey in coastal area of Guyana.IMF. Various issues. Country Reports.Institute of Development Studies/UG and Ministry of Agriculture. 1995. FAO Land
Tenure Survey – Household Questionnaire.Institute of Development Studies/University of Guyana. 1993. Poverty in Guyana: Finding
Solutions. Georgetown.Institute of Development Studies/University of Guyana. 2000. Poverty Profiles in Guyana,
Georgetown.International Fund for Agricultural Development. 1992. A smallholder based development
strategy for Guyana (Confidential Report No. 0398.) Report of the Country StrategyMission to Guyana.
Ismail, Suraiya. 2002. National Plan of Action on Nutrition. Georgetown.Maletta, Hector E. 1993. Guyana Rural Socio-Economic Survey. IFAD/IICA, Guyana.Ministry of Agriculture. 1992. Review of Agriculture Sector. Government of GuyanaMinistry of Agriculture. 1996. Agricultural Development Plan (1985 – 1989).Georgetown.Ministry of Agriculture/FAO. 1995. National workshop on land policy and administration in
Guyana. Workshop Proceedings and Recommendations, Guyana.

327
Guyana
Ministry of Finance, Guyana. Various years. Estimates of Public Sector: Current and CapitalRevenue and Expenditure. Georgetown.
Ministry of Finance, Guyana. Various issues. Budget Speeches. Georgetown.Odie-Ali, S. 1996. Program for the analysis of agriculture policies vis-à-vis women food
producers in the Andean Region, Women Food Producers in Guyana: Assessment Policies.
IICA/IDB, San Jose, Costa Rica.Okoth-Ogendo, Hwo. 1984. Agrarian Reform Legislation for Guyana for Government of
Guyana. FAO. Rome.Omawale, O. 2001 Mid-term Evaluation of the SIMAP Health & Nutrition Sub-Projects.
Georgetown.PAHO. 1997. Guyana HCA 1998 Report. Government of Guyana.PAHO/GAHEF. (various issues) Nutrition Surveillance Bulletins.Rawana, Dev. 1996. Land tenure survey. Institute of Development Studies/University of Guyana.Rawana, Dev. 2000. Land policy instruments. Institute of Development Studies, University of
Guyana and Ministry of Agriculture, Georgetown.Sahn, David E. & Sarris, Alexander. 1991. Structural adjustment and the welfare of rural
smallholders: a comparative analysis from Sub-Saharan Africa. World Bank Economic
Review, Vol. 1, No. 2.SIMAP. 1999. National Plan of Action on Nutrition (Guyana). Georgetown Guyana.Standing, Guy & Szal, Richard. 1979. Poverty and basic needs: evidence on Guyana and the
Philippines. ILO, Geneva.Thomas C.Y. 1991. The cambio system of an independent exchange rate float: the case of
Guyana. Social and Economic Studies, Vol. 40, No. 4.Thomas C.Y. 1995. Social development and the social summit: A Report on Guyana, Jamaica
and Trinidad & Tobago for the Economic Commission of Latin America and theCaribbean. Trinidad.
Thomas C.Y. 2000. Poverty and the 1999 Guyana Survey Living Conditions. Institute ofDevelopment Studies, University of Guyana. Georgetown.
Thomas, C.Y. 1983. State Capitalism in Guyana: an Assessment of Burnham’s co-operativesocialist republic. In F. Ambursley & R. Cohen, eds. Crisis in the Caribbean. Heinemann
Monthly Review Press, New York/London.Thomas, C.Y. 1984. Overcoming dependence (Guyana: the rise and fall of cooperative
socialism). In P. Sutton & A. Payne, eds. Dependency under challenge: the political
economy of the Commonwealth Caribbean, pp. xi and 295. Manchester University Press,Manchester and Dover, New Hampshire.
Tsang, Mun C. 1996. Financing of education In Guyana: issues and strategies. Michigan StateUniversity/IDB.
UNDP. Various years. Human Development Reports, New York.USDA (Economic Research Service). 2002. Global Food Security – Food Security Assessment
GFA-13, USA.USDA. 2002. Guide for Measuring Household Food Security (revised).World Bank. (various years) World Tables. Washington, DC.World Bank. 1996. Poverty Reduction and Human Resource Development in the Caribbean.
Washington, DC.World Bank. 1999. Recent Economic Developments in Guyana. Washington, DC.World Bank. 2002. Guyana Public Expenditure Review, Report No. 20151-GUA. Washington,
DC.

329
IndiaRamesh Chand and Praduman Kumar1
EXECUTIVE SUMMARY
Pre reformLarge-scale direct government intervention in agricultural marketing started in themid-1960s, coinciding with the introduction of high yielding varieties of wheat andrice. The adoption of new seeds and the investment by farmers in associated inputsand technologies required appropriate incentives, including a favourable priceenvironment. To achieve this, the Agricultural Prices Commission and the FoodCorporation of India were created in 1965 to set and ensure minimum support prices(MSP) for rice and wheat. MSPs for other crops were either non-existent or operatedon a small scale.
The Government also intervened in agricultural markets through the EssentialCommodities Act, licences and permits. These regulated prices and the storage,transport, distribution, disposal and acquisition of agricultural produce by privateagencies.
The 1960s and 1970s also witnessed rapid growth in public investments inagriculture, but in the 1980s and 1990s a decline set in combined with a sharp rise inthe level of input and output subsidies.
The reformsA major shift in policy was initiated in 1991 as a result of serious fiscal and balance ofpayments problems. The process of reform, particularly in trade, was further intensifiedin 1995 following the implementation of the WTO agreement on agriculture.
Two components comprised the 1991 reforms: (1) short-term stabilizationmeasures which included a reduction of the fiscal deficit, devaluation of the currency,and the dismantling of barriers to foreign capital; (2) medium-term structural changesinvolving reforms in fiscal policy, exchange rate policy, trade and industrial policy, aswell as financial sector and capital market reform. The focus shifted from the inwardlooking policy towards an outward one. Instruments used included a devaluation ofthe rupee by 23 percent against the dollar; export controls reduced to a minimumand imposed for only a few selected commodities; widening of the list of items thatcould be freely imported; reduction of canalization of exports and imports; and therupee was made partially convertible. As a result of these reforms, agricultural tradehas been largely liberalized.
1 Ramesh Chand, National Centre for Agricultural Economics and Policy Research, New Delhi; and PradumanKumar, Division of Agricultural Economics, Indian Agricultural Research Institute, New Delhi.
330
Trade reforms and food security – country case studies and synthesis
Impact on intermediate variablesThe reforms initiated in 1991 affected agricultural prices in two ways: through steepincreases in domestic support prices (particularly for rice and wheat) to reducethe gap between domestic and international prices; and through the liberalizationof trade. In the first year of economic reforms, agricultural prices increased by19 percent. Substantial changes in the terms of trade took place during the reformsas agricultural prices increased faster than the prices of goods in other sectors.
The main beneficiaries of price support have been states where the new high-yielding varieties of grain were first introduced. Government procurement wasconcentrated in these areas, although the output response to higher prices islimited because productivity is already high and has virtually reached a plateau Theremaining states have hardly benefited from government procurement of grains, eventhough these neglected regions have shown tremendous potential for generating amarketable surplus and there is still significant potential in those areas for raisingproductivity through greater investment and better prices.
The devaluation of the exchange rate in 1991 and subsequent depreciations,coupled with the lifting of some restrictions on exports, helped the country todouble its exports over the next six years. After 1996/97, as international pricesstarted falling, so did the value of exports. Imports were facilitated by the importliberalization resulting from WTO commitments and doubled over the next threeyears. Net agriculture trade earnings in the post-WTO period dropped sharply.
Impact on target variablesCereal net availability and consumption has declined over the reform period. Thishas not occurred due to a significant setback in production, but due to high pricesand the consequent accumulation of cereals in government stocks. While therewas a sharp reduction in the proportion of the population consuming less than thesuggested minimum level of calorie intake between 1983 and 1987-88, the processreversed at the beginning of economic reforms.
During the reforms per capita income among rural households has risen significantly,pointing to a reduction in poverty. However, these positive developments havenot coincided with a reduction in calorie and protein deficiency, mainly becauseof the reduction in per capita intake of cereals. There has been an increase in theconsumption of horticultural and livestock products, but in terms of calorie andprotein intake, this has not sufficiently compensated for calorie and protein lossesarising from reduced cereal consumption.
Policy lessonsPrice support for cereal production, which was earlier confined to small agriculturallyadvanced regions, has become further concentrated. In states with a large unexploitedpotential to raise cereal production, institutional and policy support has remainedweak and unreliable. Exclusive emphasis on prices during the reforms caused asetback in efforts to promote improved technology, modern inputs, and irrigation.If greater importance was accorded to the development of public infrastructure andto the spread of improved technology and institutional support for the neglectedregions, then even with lower prices, the production response to agricultural reformcould be expected to be better than that achieved.
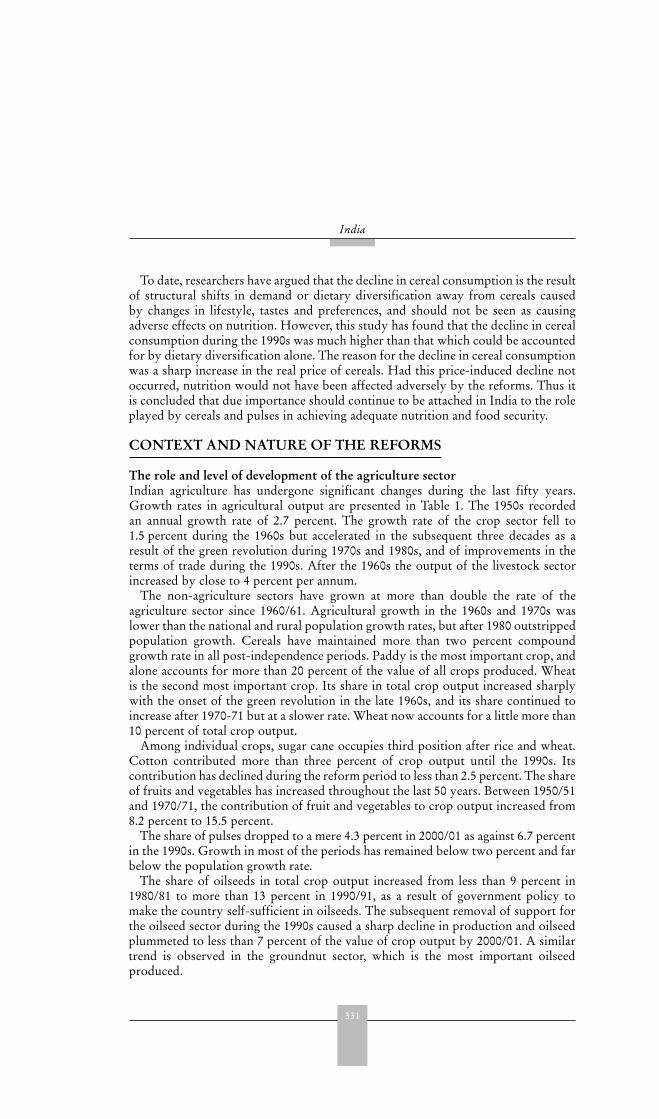
331
India
To date, researchers have argued that the decline in cereal consumption is the resultof structural shifts in demand or dietary diversification away from cereals causedby changes in lifestyle, tastes and preferences, and should not be seen as causingadverse effects on nutrition. However, this study has found that the decline in cerealconsumption during the 1990s was much higher than that which could be accountedfor by dietary diversification alone. The reason for the decline in cereal consumptionwas a sharp increase in the real price of cereals. Had this price-induced decline notoccurred, nutrition would not have been affected adversely by the reforms. Thus itis concluded that due importance should continue to be attached in India to the roleplayed by cereals and pulses in achieving adequate nutrition and food security.
CONTEXT AND NATURE OF THE REFORMS
The role and level of development of the agriculture sectorIndian agriculture has undergone significant changes during the last fifty years.Growth rates in agricultural output are presented in Table 1. The 1950s recordedan annual growth rate of 2.7 percent. The growth rate of the crop sector fell to1.5 percent during the 1960s but accelerated in the subsequent three decades as aresult of the green revolution during 1970s and 1980s, and of improvements in theterms of trade during the 1990s. After the 1960s the output of the livestock sectorincreased by close to 4 percent per annum.
The non-agriculture sectors have grown at more than double the rate of theagriculture sector since 1960/61. Agricultural growth in the 1960s and 1970s waslower than the national and rural population growth rates, but after 1980 outstrippedpopulation growth. Cereals have maintained more than two percent compoundgrowth rate in all post-independence periods. Paddy is the most important crop, andalone accounts for more than 20 percent of the value of all crops produced. Wheatis the second most important crop. Its share in total crop output increased sharplywith the onset of the green revolution in the late 1960s, and its share continued toincrease after 1970-71 but at a slower rate. Wheat now accounts for a little more than10 percent of total crop output.
Among individual crops, sugar cane occupies third position after rice and wheat.Cotton contributed more than three percent of crop output until the 1990s. Itscontribution has declined during the reform period to less than 2.5 percent. The shareof fruits and vegetables has increased throughout the last 50 years. Between 1950/51and 1970/71, the contribution of fruit and vegetables to crop output increased from8.2 percent to 15.5 percent.
The share of pulses dropped to a mere 4.3 percent in 2000/01 as against 6.7 percentin the 1990s. Growth in most of the periods has remained below two percent and farbelow the population growth rate.
The share of oilseeds in total crop output increased from less than 9 percent in1980/81 to more than 13 percent in 1990/91, as a result of government policy tomake the country self-sufficient in oilseeds. The subsequent removal of support forthe oilseed sector during the 1990s caused a sharp decline in production and oilseedplummeted to less than 7 percent of the value of crop output by 2000/01. A similartrend is observed in the groundnut sector, which is the most important oilseedproduced.
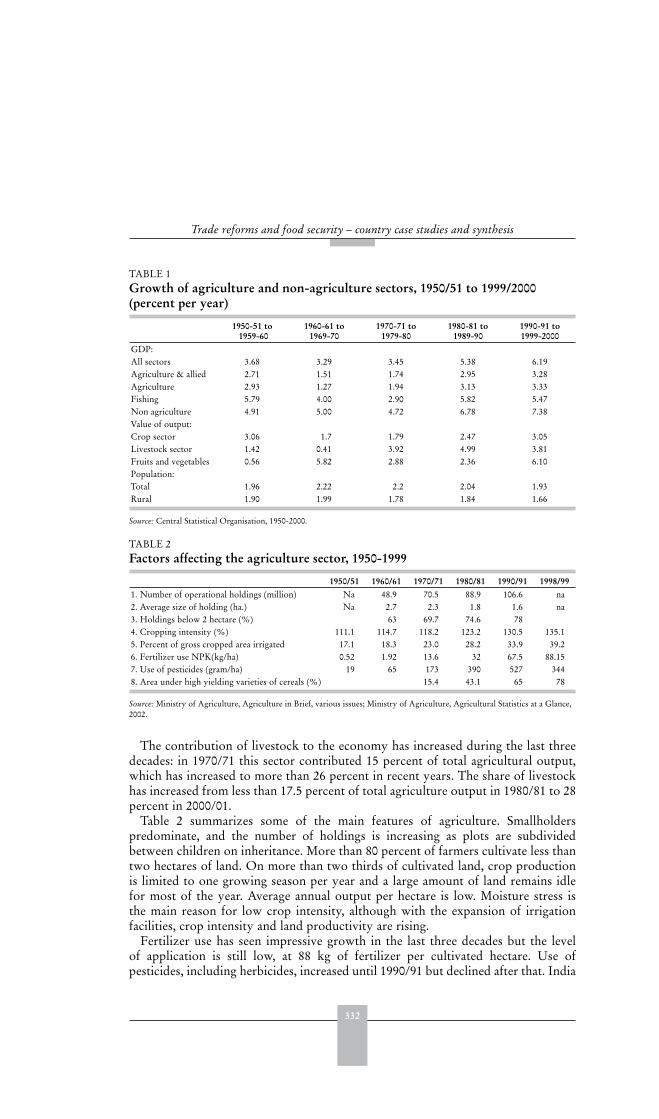
332
Trade reforms and food security – country case studies and synthesis
The contribution of livestock to the economy has increased during the last threedecades: in 1970/71 this sector contributed 15 percent of total agricultural output,which has increased to more than 26 percent in recent years. The share of livestockhas increased from less than 17.5 percent of total agriculture output in 1980/81 to 28percent in 2000/01.
Table 2 summarizes some of the main features of agriculture. Smallholderspredominate, and the number of holdings is increasing as plots are subdividedbetween children on inheritance. More than 80 percent of farmers cultivate less thantwo hectares of land. On more than two thirds of cultivated land, crop productionis limited to one growing season per year and a large amount of land remains idlefor most of the year. Average annual output per hectare is low. Moisture stress isthe main reason for low crop intensity, although with the expansion of irrigationfacilities, crop intensity and land productivity are rising.
Fertilizer use has seen impressive growth in the last three decades but the levelof application is still low, at 88 kg of fertilizer per cultivated hectare. Use ofpesticides, including herbicides, increased until 1990/91 but declined after that. India
TABLE 1 Growth of agriculture and non-agriculture sectors, 1950/51 to 1999/2000 (percent per year)
1950-51 to 1959-60
1960-61 to 1969-70
1970-71 to 1979-80
1980-81 to 1989-90
1990-91 to 1999-2000
GDP:All sectors 3.68 3.29 3.45 5.38 6.19Agriculture & allied 2.71 1.51 1.74 2.95 3.28Agriculture 2.93 1.27 1.94 3.13 3.33Fishing 5.79 4.00 2.90 5.82 5.47Non agriculture 4.91 5.00 4.72 6.78 7.38Value of output:Crop sector 3.06 1.7 1.79 2.47 3.05Livestock sector 1.42 0.41 3.92 4.99 3.81Fruits and vegetables 0.56 5.82 2.88 2.36 6.10Population:Total 1.96 2.22 2.2 2.04 1.93Rural 1.90 1.99 1.78 1.84 1.66
Source: Central Statistical Organisation, 1950-2000.
TABLE 2 Factors affecting the agriculture sector, 1950-1999
1950/51 1960/61 1970/71 1980/81 1990/91 1998/991. Number of operational holdings (million) Na 48.9 70.5 88.9 106.6 na2. Average size of holding (ha.) Na 2.7 2.3 1.8 1.6 na3. Holdings below 2 hectare (%) 63 69.7 74.6 784. Cropping intensity (%) 111.1 114.7 118.2 123.2 130.5 135.15. Percent of gross cropped area irrigated 17.1 18.3 23.0 28.2 33.9 39.26. Fertilizer use NPK(kg/ha) 0.52 1.92 13.6 32 67.5 88.157. Use of pesticides (gram/ha) 19 65 173 390 527 3448. Area under high yielding varieties of cereals (%) 15.4 43.1 65 78
Source: Ministry of Agriculture, Agriculture in Brief, various issues; Ministry of Agriculture, Agricultural Statistics at a Glance,2002.
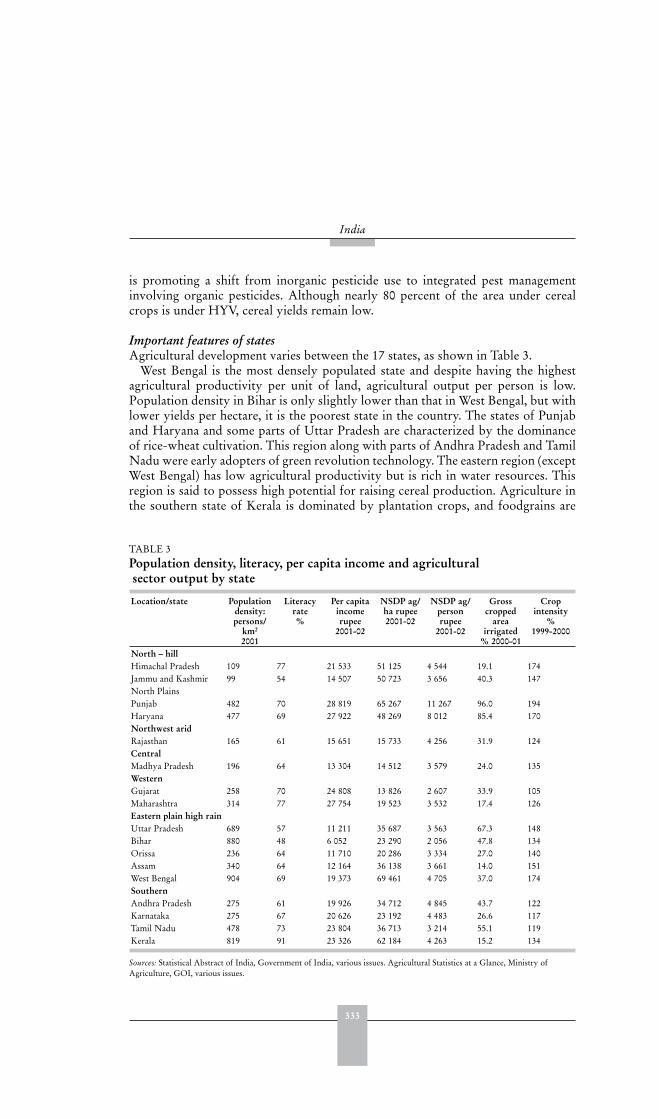
333
India
is promoting a shift from inorganic pesticide use to integrated pest managementinvolving organic pesticides. Although nearly 80 percent of the area under cerealcrops is under HYV, cereal yields remain low.
Important features of states Agricultural development varies between the 17 states, as shown in Table 3.
West Bengal is the most densely populated state and despite having the highestagricultural productivity per unit of land, agricultural output per person is low.Population density in Bihar is only slightly lower than that in West Bengal, but withlower yields per hectare, it is the poorest state in the country. The states of Punjaband Haryana and some parts of Uttar Pradesh are characterized by the dominanceof rice-wheat cultivation. This region along with parts of Andhra Pradesh and TamilNadu were early adopters of green revolution technology. The eastern region (exceptWest Bengal) has low agricultural productivity but is rich in water resources. Thisregion is said to possess high potential for raising cereal production. Agriculture inthe southern state of Kerala is dominated by plantation crops, and foodgrains are
TABLE 3 Population density, literacy, per capita income and agricultural sector output by state
Location/state Populationdensity:persons/
km2
2001
Literacyrate%
Per capitaincomerupee
2001-02
NSDP ag/ha rupee2001-02
NSDP ag/personrupee
2001-02
Grosscropped
areairrigated
% 2000-01
Cropintensity
%1999-2000
North – hillHimachal Pradesh 109 77 21 533 51 125 4 544 19.1 174Jammu and Kashmir 99 54 14 507 50 723 3 656 40.3 147North PlainsPunjab 482 70 28 819 65 267 11 267 96.0 194Haryana 477 69 27 922 48 269 8 012 85.4 170Northwest aridRajasthan 165 61 15 651 15 733 4 256 31.9 124CentralMadhya Pradesh 196 64 13 304 14 512 3 579 24.0 135WesternGujarat 258 70 24 808 13 826 2 607 33.9 105Maharashtra 314 77 27 754 19 523 3 532 17.4 126Eastern plain high rainUttar Pradesh 689 57 11 211 35 687 3 563 67.3 148Bihar 880 48 6 052 23 290 2 056 47.8 134Orissa 236 64 11 710 20 286 3 334 27.0 140Assam 340 64 12 164 36 138 3 661 14.0 151West Bengal 904 69 19 373 69 461 4 705 37.0 174SouthernAndhra Pradesh 275 61 19 926 34 712 4 845 43.7 122Karnataka 275 67 20 626 23 192 4 483 26.6 117Tamil Nadu 478 73 23 804 36 713 3 214 55.1 119Kerala 819 91 23 326 62 184 4 263 15.2 134
Sources: Statistical Abstract of India, Government of India, various issues. Agricultural Statistics at a Glance, Ministry ofAgriculture, GOI, various issues.
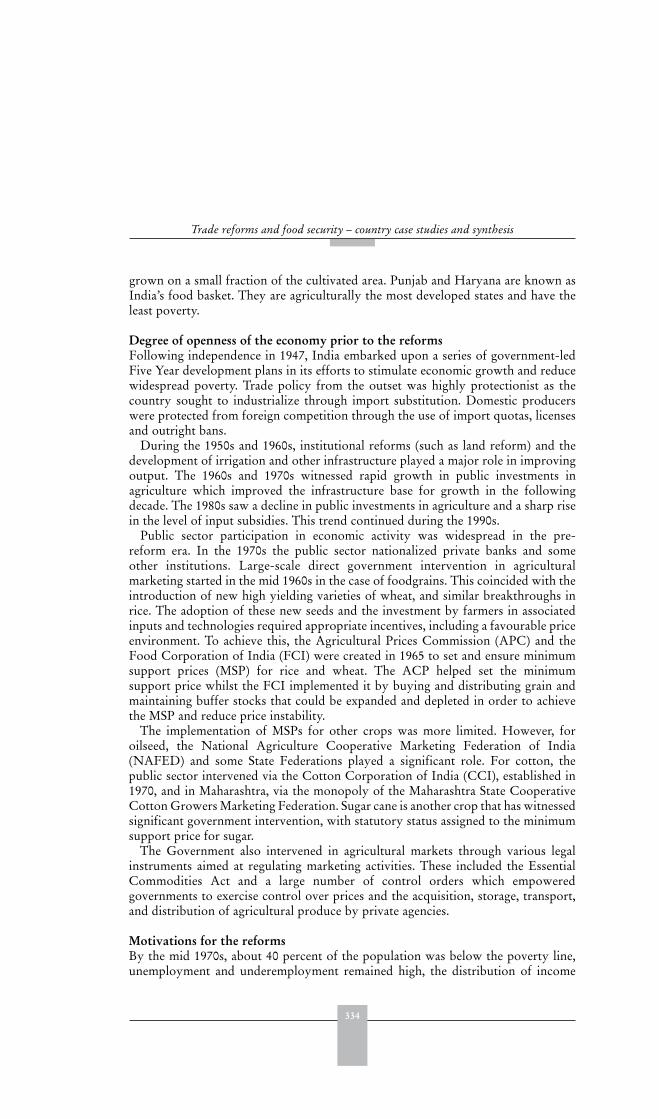
334
Trade reforms and food security – country case studies and synthesis
grown on a small fraction of the cultivated area. Punjab and Haryana are known asIndia’s food basket. They are agriculturally the most developed states and have theleast poverty.
Degree of openness of the economy prior to the reformsFollowing independence in 1947, India embarked upon a series of government-ledFive Year development plans in its efforts to stimulate economic growth and reducewidespread poverty. Trade policy from the outset was highly protectionist as thecountry sought to industrialize through import substitution. Domestic producerswere protected from foreign competition through the use of import quotas, licensesand outright bans.
During the 1950s and 1960s, institutional reforms (such as land reform) and thedevelopment of irrigation and other infrastructure played a major role in improvingoutput. The 1960s and 1970s witnessed rapid growth in public investments inagriculture which improved the infrastructure base for growth in the followingdecade. The 1980s saw a decline in public investments in agriculture and a sharp risein the level of input subsidies. This trend continued during the 1990s.
Public sector participation in economic activity was widespread in the pre-reform era. In the 1970s the public sector nationalized private banks and someother institutions. Large-scale direct government intervention in agriculturalmarketing started in the mid 1960s in the case of foodgrains. This coincided with theintroduction of new high yielding varieties of wheat, and similar breakthroughs inrice. The adoption of these new seeds and the investment by farmers in associatedinputs and technologies required appropriate incentives, including a favourable priceenvironment. To achieve this, the Agricultural Prices Commission (APC) and theFood Corporation of India (FCI) were created in 1965 to set and ensure minimumsupport prices (MSP) for rice and wheat. The ACP helped set the minimumsupport price whilst the FCI implemented it by buying and distributing grain andmaintaining buffer stocks that could be expanded and depleted in order to achievethe MSP and reduce price instability.
The implementation of MSPs for other crops was more limited. However, foroilseed, the National Agriculture Cooperative Marketing Federation of India(NAFED) and some State Federations played a significant role. For cotton, thepublic sector intervened via the Cotton Corporation of India (CCI), established in1970, and in Maharashtra, via the monopoly of the Maharashtra State CooperativeCotton Growers Marketing Federation. Sugar cane is another crop that has witnessedsignificant government intervention, with statutory status assigned to the minimumsupport price for sugar.
The Government also intervened in agricultural markets through various legalinstruments aimed at regulating marketing activities. These included the EssentialCommodities Act and a large number of control orders which empoweredgovernments to exercise control over prices and the acquisition, storage, transport,and distribution of agricultural produce by private agencies.
Motivations for the reformsBy the mid 1970s, about 40 percent of the population was below the poverty line,unemployment and underemployment remained high, the distribution of income
335
India
and wealth had worsened and there was severe inflationary pressure (Datt andSundharam 1987). Protected from foreign competition, domestic industry hadbecome inefficient and uncompetitive.
There was a perceived need to open up the economy, but it was only in 1985that India started to liberalize trade and reduce import restrictions for a variety ofdifferent goods. Moreover, major policy shifts only began in 1991 in the wake ofcompelling economic pressures, including serious fiscal deficits and a severe balanceof payments crisis in which the country had to pledge its gold reserves to assurepayment of foreign obligations.
Macro and sectoral components and the policy instruments usedThe period since 1991 has been marked by various reforms, including exchange ratereform and the liberalization of external trade. The process of reforms, particularlytrade reforms, was further intensified in 1995 following the implementation of theWTO agreement on agriculture. The reform period is therefore divided into twoparts: 1990-91 to 1995/96 and 1995/96 to 2000/01, representing sub-periods beforeand after the WTO agreement.
The New Economic Policy in 1991 consisted of two components: (1) short termstabilization measures, which included a reduction of the fiscal deficit, a 23 percentdevaluation of the currency (Rupee), and the dismantling of barriers to the free flowof foreign capital; and (2) medium term structural changes involving reforms in fiscalpolicy, exchange rate policy, trade and industrial policy, and reforms of the financialsector and capital markets.
Under trade reform, export controls were reduced to a minimum and limited toonly a few selected commodities, and the list of items that could be freely importedwas widened. The reforms also aimed at simpler and more transparent trade rules.Further action planned in the area of trade included the eventual elimination of allnon-tariff restrictions on imports; the removal of export licensing and minimumexport prices; decanalizing and allowing private participation in exporting; reducingthe role of state monopoly agencies in foreign trade; and step-by-step reductions inpeak ad valorem tariff rates.
Exchange rate devaluation was aimed at improving export incentives andinternational competitiveness. With the introduction of partial convertibility in 1992,a further boost was given to competitiveness and trade.
Reforms in agriculture sectorReforms in domestic agricultural trade and markets have been slow, despiteliberalization of external agricultural trade. Domestic trade is still regulated byprovisions that restrict the movement of goods among states and adversely affectthe efficiency of domestic markets, private trade and producers. Governmentintervention in setting prices of some commodities is discouraging private sectorinvestment and participation in agricultural trade (Chand 2002a).
Although MSPs are announced for 24 commodities they are only implementedeffectively in the case of a few commodities, notably wheat and rice. Procurementby government constituted 10 to 15 percent of total rice output and 15 to 22 percentof total wheat output during 1985/86 to 1989/90. In recent years, the procurement ofrice and wheat by government agencies has witnessed a steep rise. It reached a peak
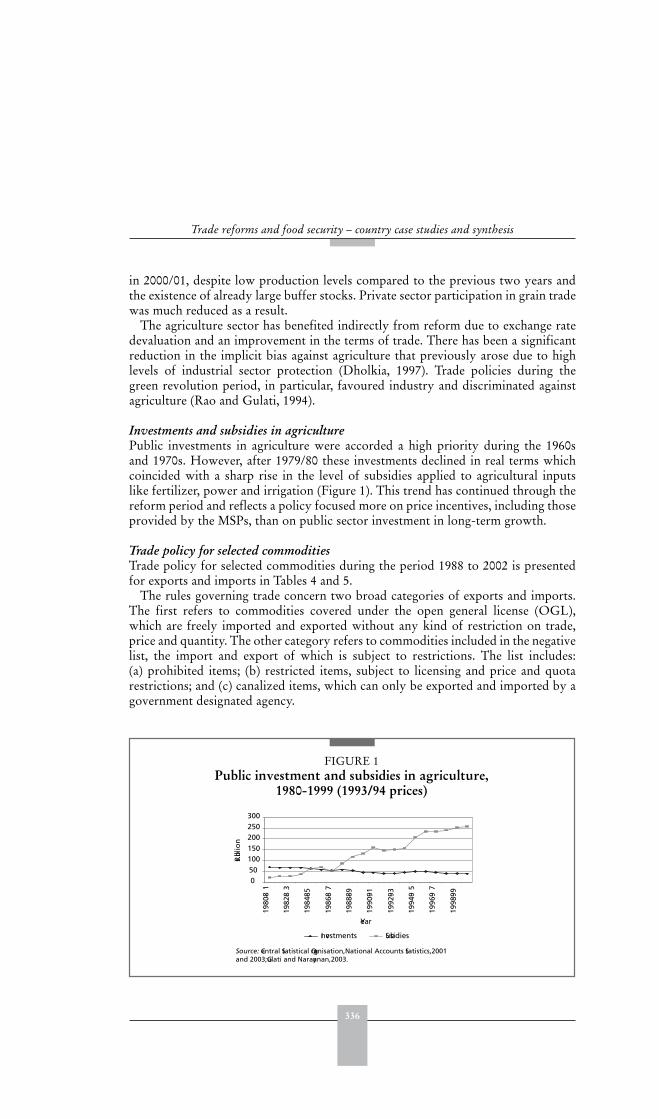
336
Trade reforms and food security – country case studies and synthesis
in 2000/01, despite low production levels compared to the previous two years andthe existence of already large buffer stocks. Private sector participation in grain tradewas much reduced as a result.
The agriculture sector has benefited indirectly from reform due to exchange ratedevaluation and an improvement in the terms of trade. There has been a significantreduction in the implicit bias against agriculture that previously arose due to highlevels of industrial sector protection (Dholkia, 1997). Trade policies during thegreen revolution period, in particular, favoured industry and discriminated againstagriculture (Rao and Gulati, 1994).
Investments and subsidies in agriculture Public investments in agriculture were accorded a high priority during the 1960sand 1970s. However, after 1979/80 these investments declined in real terms whichcoincided with a sharp rise in the level of subsidies applied to agricultural inputslike fertilizer, power and irrigation (Figure 1). This trend has continued through thereform period and reflects a policy focused more on price incentives, including thoseprovided by the MSPs, than on public sector investment in long-term growth.
Trade policy for selected commoditiesTrade policy for selected commodities during the period 1988 to 2002 is presentedfor exports and imports in Tables 4 and 5.
The rules governing trade concern two broad categories of exports and imports.The first refers to commodities covered under the open general license (OGL),which are freely imported and exported without any kind of restriction on trade,price and quantity. The other category refers to commodities included in the negativelist, the import and export of which is subject to restrictions. The list includes:(a) prohibited items; (b) restricted items, subject to licensing and price and quotarestrictions; and (c) canalized items, which can only be exported and imported by agovernment designated agency.
FIGURE 1Public investment and subsidies in agriculture,
1980-1999 (1993/94 prices)
Source: Central Statistical Organisation, National Accounts Statistics, 2001and 2003; Gulati and Narayanan, 2003.
050100150200250300
1980
-81
1982
-83
1984
-85
1986
-87
1988
-89
1990
-91
1992
-93
1994
-95
1996
-97
1998
-99
Year
Rs. bill
ion
Investments Subsidies
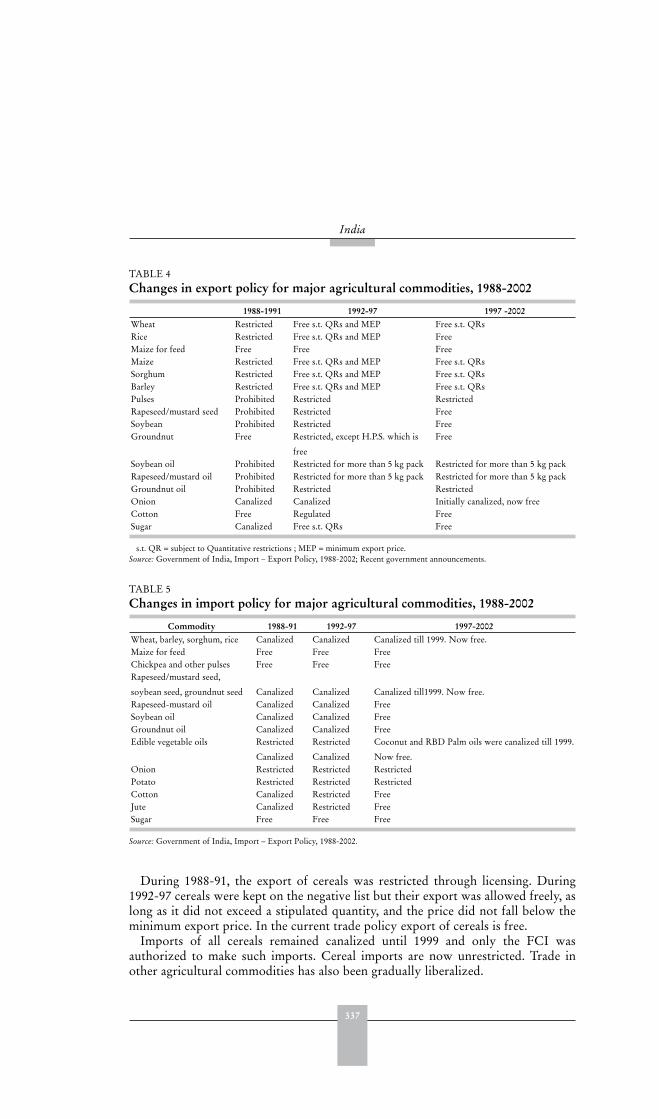
337
India
During 1988-91, the export of cereals was restricted through licensing. During1992-97 cereals were kept on the negative list but their export was allowed freely, aslong as it did not exceed a stipulated quantity, and the price did not fall below theminimum export price. In the current trade policy export of cereals is free.
Imports of all cereals remained canalized until 1999 and only the FCI wasauthorized to make such imports. Cereal imports are now unrestricted. Trade inother agricultural commodities has also been gradually liberalized.
TABLE 4 Changes in export policy for major agricultural commodities, 1988-2002
1988-1991 1992-97 1997 -2002Wheat Restricted Free s.t. QRs and MEP Free s.t. QRsRice Restricted Free s.t. QRs and MEP FreeMaize for feed Free Free FreeMaize Restricted Free s.t. QRs and MEP Free s.t. QRsSorghum Restricted Free s.t. QRs and MEP Free s.t. QRsBarley Restricted Free s.t. QRs and MEP Free s.t. QRsPulses Prohibited Restricted RestrictedRapeseed/mustard seed Prohibited Restricted FreeSoybean Prohibited Restricted FreeGroundnut Free Restricted, except H.P.S. which is
free
Free
Soybean oil Prohibited Restricted for more than 5 kg pack Restricted for more than 5 kg packRapeseed/mustard oil Prohibited Restricted for more than 5 kg pack Restricted for more than 5 kg packGroundnut oil Prohibited Restricted RestrictedOnion Canalized Canalized Initially canalized, now freeCotton Free Regulated FreeSugar Canalized Free s.t. QRs Free
s.t. QR = subject to Quantitative restrictions ; MEP = minimum export price.Source: Government of India, Import – Export Policy, 1988-2002; Recent government announcements.
TABLE 5 Changes in import policy for major agricultural commodities, 1988-2002
Commodity 1988-91 1992-97 1997-2002Wheat, barley, sorghum, rice Canalized Canalized Canalized till 1999. Now free.Maize for feed Free Free FreeChickpea and other pulses Free Free FreeRapeseed/mustard seed,
soybean seed, groundnut seed Canalized Canalized Canalized till1999. Now free.Rapeseed-mustard oil Canalized Canalized FreeSoybean oil Canalized Canalized FreeGroundnut oil Canalized Canalized FreeEdible vegetable oils Restricted
Canalized
Restricted
Canalized
Coconut and RBD Palm oils were canalized till 1999.
Now free.Onion Restricted Restricted RestrictedPotato Restricted Restricted RestrictedCotton Canalized Restricted FreeJute Canalized Restricted FreeSugar Free Free Free
Source: Government of India, Import – Export Policy, 1988-2002.
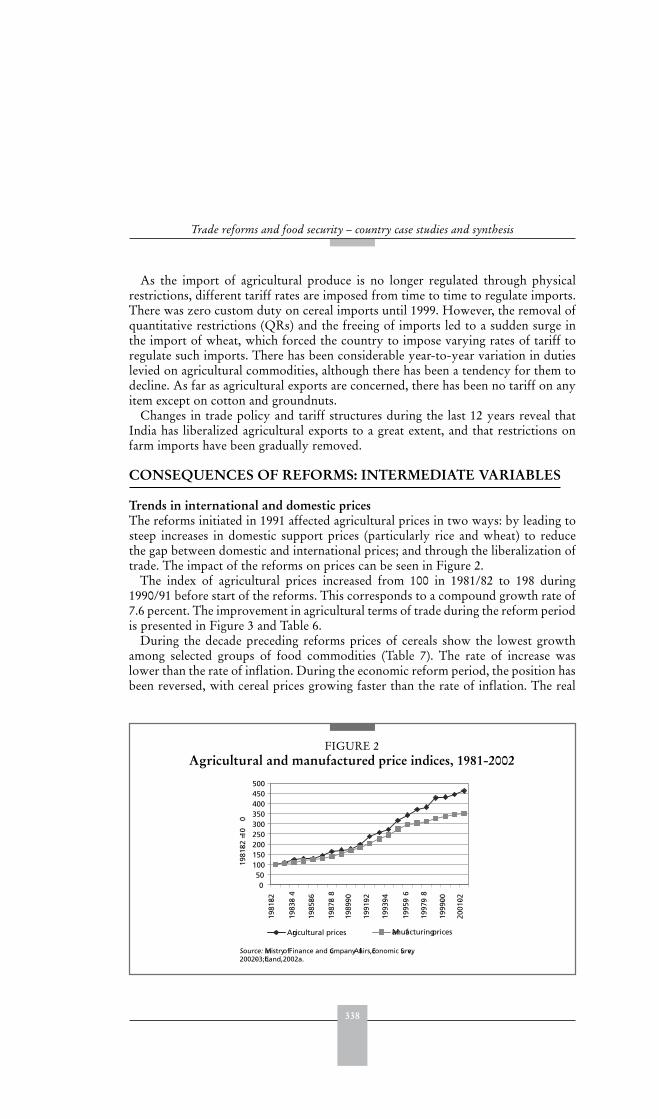
338
Trade reforms and food security – country case studies and synthesis
As the import of agricultural produce is no longer regulated through physicalrestrictions, different tariff rates are imposed from time to time to regulate imports.There was zero custom duty on cereal imports until 1999. However, the removal ofquantitative restrictions (QRs) and the freeing of imports led to a sudden surge inthe import of wheat, which forced the country to impose varying rates of tariff toregulate such imports. There has been considerable year-to-year variation in dutieslevied on agricultural commodities, although there has been a tendency for them todecline. As far as agricultural exports are concerned, there has been no tariff on anyitem except on cotton and groundnuts.
Changes in trade policy and tariff structures during the last 12 years reveal thatIndia has liberalized agricultural exports to a great extent, and that restrictions onfarm imports have been gradually removed.
CONSEQUENCES OF REFORMS: INTERMEDIATE VARIABLES
Trends in international and domestic pricesThe reforms initiated in 1991 affected agricultural prices in two ways: by leading tosteep increases in domestic support prices (particularly rice and wheat) to reducethe gap between domestic and international prices; and through the liberalization oftrade. The impact of the reforms on prices can be seen in Figure 2.
The index of agricultural prices increased from 100 in 1981/82 to 198 during1990/91 before start of the reforms. This corresponds to a compound growth rate of7.6 percent. The improvement in agricultural terms of trade during the reform periodis presented in Figure 3 and Table 6.
During the decade preceding reforms prices of cereals show the lowest growthamong selected groups of food commodities (Table 7). The rate of increase waslower than the rate of inflation. During the economic reform period, the position hasbeen reversed, with cereal prices growing faster than the rate of inflation. The real
FIGURE 2Agricultural and manufactured price indices, 1981-2002
050
100150200250300350400450500
1981
-82 = 1
00
Agricultural prices Manufacturing prices
Source: Ministry of Finance and Company Affairs, Economic Survey, 2002-03; Chand, 2002a.
1981
-82
1983
-84
1985
-86
1987
-88
1989
-90
1991
-92
1993
-94
1995
-96
1997
-98
1999
-00
2001
-02
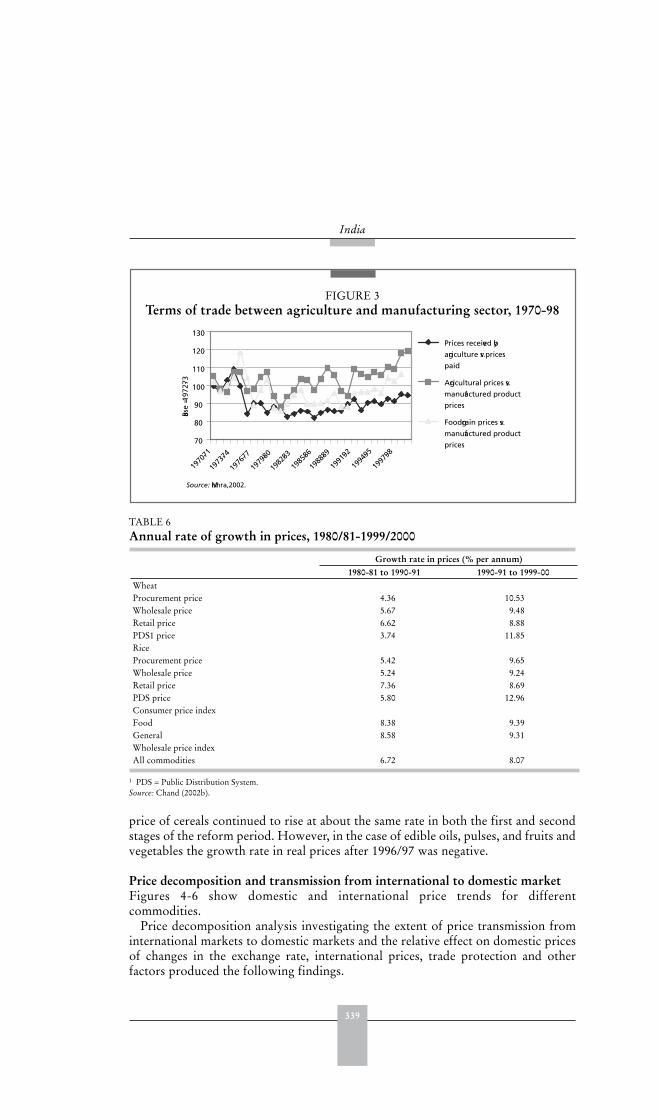
339
India
price of cereals continued to rise at about the same rate in both the first and secondstages of the reform period. However, in the case of edible oils, pulses, and fruits andvegetables the growth rate in real prices after 1996/97 was negative.
Price decomposition and transmission from international to domestic marketFigures 4-6 show domestic and international price trends for differentcommodities.
Price decomposition analysis investigating the extent of price transmission frominternational markets to domestic markets and the relative effect on domestic pricesof changes in the exchange rate, international prices, trade protection and otherfactors produced the following findings.
FIGURE 3Terms of trade between agriculture and manufacturing sector, 1970-98
70
80
90
100
110
120
130
1970
-71
Base
= 197
2-73
Prices received by
agriculture vs. prices
paid
Agricultural prices vs.
manufactured product
prices
Foodgrain prices vs.
manufactured product
prices
Source: Mishra, 2002.
1973
-74
1976
-77
1979
-80
1985
-86
1991
-92
1982
-83
1988
-89
1994
-95
1997
-98
TABLE 6 Annual rate of growth in prices, 1980/81-1999/2000
Growth rate in prices (% per annum)1980-81 to 1990-91 1990-91 to 1999-00
WheatProcurement price 4.36 10.53Wholesale price 5.67 9.48Retail price 6.62 8.88PDS1 price 3.74 11.85RiceProcurement price 5.42 9.65Wholesale price 5.24 9.24Retail price 7.36 8.69PDS price 5.80 12.96Consumer price indexFood 8.38 9.39General 8.58 9.31Wholesale price indexAll commodities 6.72 8.07
1 PDS = Public Distribution System.Source: Chand (2002b).
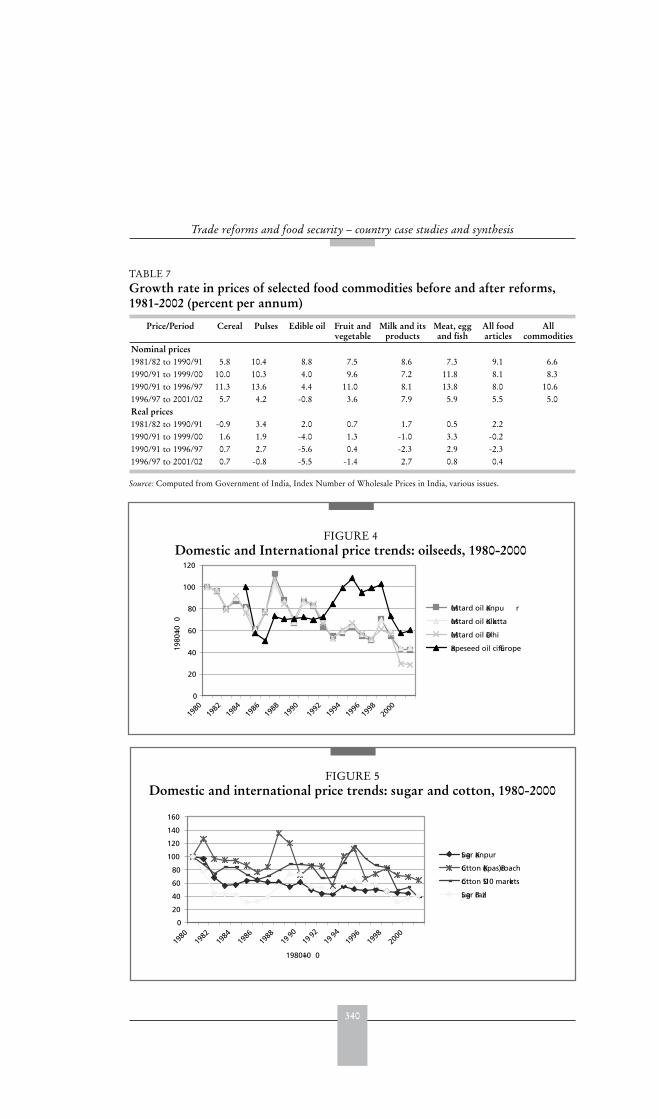
340
Trade reforms and food security – country case studies and synthesis
TABLE 7 Growth rate in prices of selected food commodities before and after reforms, 1981-2002 (percent per annum)
Price/Period Cereal Pulses Edible oil Fruit and vegetable
Milk and its products
Meat, egg and fish
All food articles
Allcommodities
Nominal prices1981/82 to 1990/91 5.8 10.4 8.8 7.5 8.6 7.3 9.1 6.61990/91 to 1999/00 10.0 10.3 4.0 9.6 7.2 11.8 8.1 8.31990/91 to 1996/97 11.3 13.6 4.4 11.0 8.1 13.8 8.0 10.61996/97 to 2001/02 5.7 4.2 -0.8 3.6 7.9 5.9 5.5 5.0Real prices1981/82 to 1990/91 -0.9 3.4 2.0 0.7 1.7 0.5 2.21990/91 to 1999/00 1.6 1.9 -4.0 1.3 -1.0 3.3 -0.21990/91 to 1996/97 0.7 2.7 -5.6 0.4 -2.3 2.9 -2.31996/97 to 2001/02 0.7 -0.8 -5.5 -1.4 2.7 0.8 0.4
Source: Computed from Government of India, Index Number of Wholesale Prices in India, various issues.
FIGURE 4Domestic and International price trends: oilseeds, 1980-2000
0
20
40
60
80
100
120
1980
1982
1984
1986
1988
1990
1992
1994
1996
1998
2000
1980
=100
Mustard oil Kanpu r
Mustard oil Kolkatta
Mustard oil Delhi
Rapeseed oil cif Europe
FIGURE 5Domestic and international price trends: sugar and cotton, 1980-2000
0
20
40
60
80
100
120
140
160
1980
1982
1984
1986
1988
1990
1992
1994
1996
1998
2000
1980=10 0
Sugar Kanpur
Cotton (Kapas) Broach
Cotton US 10 markets
Sugar Brazil
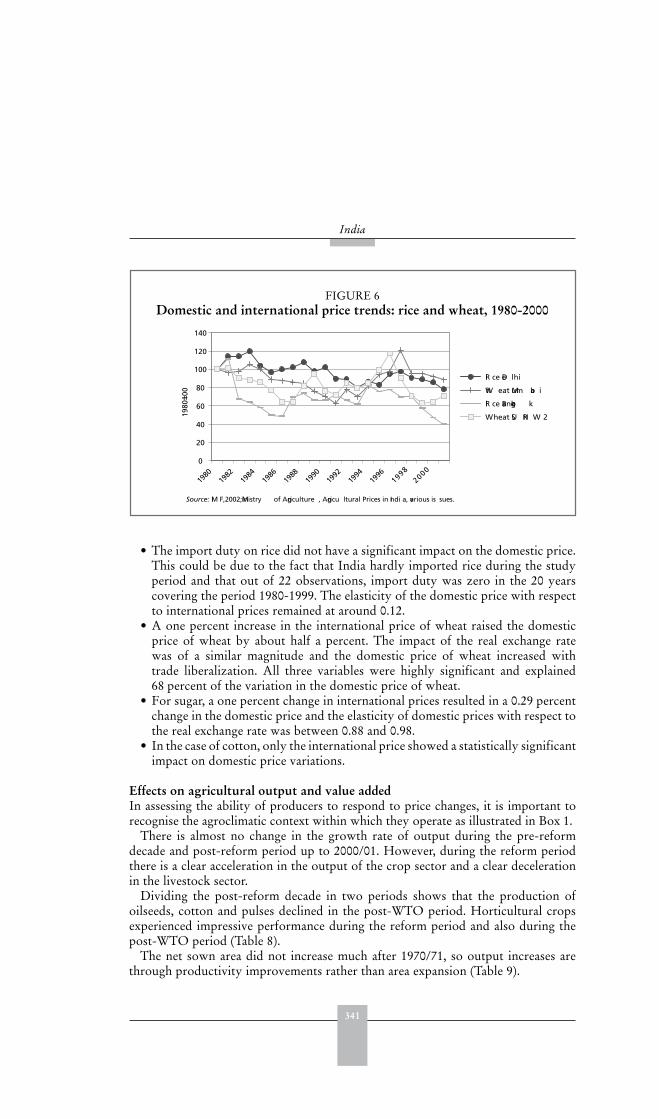
341
India
• The import duty on rice did not have a significant impact on the domestic price.This could be due to the fact that India hardly imported rice during the studyperiod and that out of 22 observations, import duty was zero in the 20 yearscovering the period 1980-1999. The elasticity of the domestic price with respectto international prices remained at around 0.12.
• A one percent increase in the international price of wheat raised the domesticprice of wheat by about half a percent. The impact of the real exchange ratewas of a similar magnitude and the domestic price of wheat increased withtrade liberalization. All three variables were highly significant and explained68 percent of the variation in the domestic price of wheat.
• For sugar, a one percent change in international prices resulted in a 0.29 percentchange in the domestic price and the elasticity of domestic prices with respect tothe real exchange rate was between 0.88 and 0.98.
• In the case of cotton, only the international price showed a statistically significantimpact on domestic price variations.
Effects on agricultural output and value addedIn assessing the ability of producers to respond to price changes, it is important torecognise the agroclimatic context within which they operate as illustrated in Box 1.
There is almost no change in the growth rate of output during the pre-reformdecade and post-reform period up to 2000/01. However, during the reform periodthere is a clear acceleration in the output of the crop sector and a clear decelerationin the livestock sector.
Dividing the post-reform decade in two periods shows that the production ofoilseeds, cotton and pulses declined in the post-WTO period. Horticultural cropsexperienced impressive performance during the reform period and also during thepost-WTO period (Table 8).
The net sown area did not increase much after 1970/71, so output increases arethrough productivity improvements rather than area expansion (Table 9).
FIGURE 6Domestic and international price trends: rice and wheat, 1980-2000
0
20
40
60
80
100
120
140
1980
1982
1984
1986
1988
1990
1992
1994
1996
19982000
1980
=100
Ri ce De lhi
Wh eat Mum ba i
Ri ce Bangko k
Wheat US HR W 2
Source: IM F, 2002; Ministry of Agriculture , Agricu ltural Prices in Indi a, various is sues.

342
Trade reforms and food security – country case studies and synthesis
To encourage productivity improvements, a four pronged strategy was followed:(a) increase in crop intensity, (b) technological improvement, (c) increased use ofproductivity-enhancing inputs, and (d) diversification in crop patterns from lowvalue to high value crops and from the crop to the livestock sector.
Three broad patterns of output response to price changes can be observed:(a) Deceleration in output growth despite prices becoming highly favourable, as
in the case of cereals.(b) Impressive increase in output with small improvement in real prices – fruits
and vegetable fall into this category.(c) Decline in real prices brings down growth in output, as has been experienced
to some extent in the case of livestock products and to a large extent withoilseeds.
Of these three patterns, cereals represent a somewhat unusual case, which is partlyexplained by regional variations in growth potential and patterns of governmentintervention. Government support for production focuses heavily on the few states(Punjab and Haryana and parts of Andhra Pradesh and Uttar Pradesh), which inthe early 1970s were the first to adopt green revolution technology and produce asurplus of rice and wheat. This support has helped these states in raising productionand farm income. Thus, government procurement activities primarily benefit thesealready developed regions. A justification given for this has been that the other statesand regions do not have a sufficient marketable surplus to require procurement byofficial agencies. Over time these states also adopted the new agricultural technology
BOX 1 Agroclimatic conditions
India’s geography provides it with diverse climatic conditions across regions andacross seasons. In summer, the temperature goes above 50 oC in the western desertswhile it drops to as low as -45 oC in some upper reaches of Himalayas. Similarvariations are observed in precipitation. The Himalayas receive snowfall and therest of the country receives annual rainfall varying from 10 cm in western desert to400 cm in north east. These climatic differences lead to considerable variations in thepattern of human settlement, vegetation and agricultural systems.
Of the total surface area (329 million hectares), 22.5 percent is under forest and46.6 percent is cultivated. Most of the area under cultivation is rainfed, but irrigationcoverage has steadily increased from 17.5 percent of net sown area in 1950/51 to40 percent during recent years. Canals and tubewells are the main source of irrigation.
Average annual rainfall for the entire country is 50 cm. However, the bulk ofrainfall is received in a brief period of three to four months. Unequal and erraticdistribution of rainfall makes the country vulnerable to droughts and floods. Indiahas made massive investments to harness its water resources for power generation andirrigation purposes.
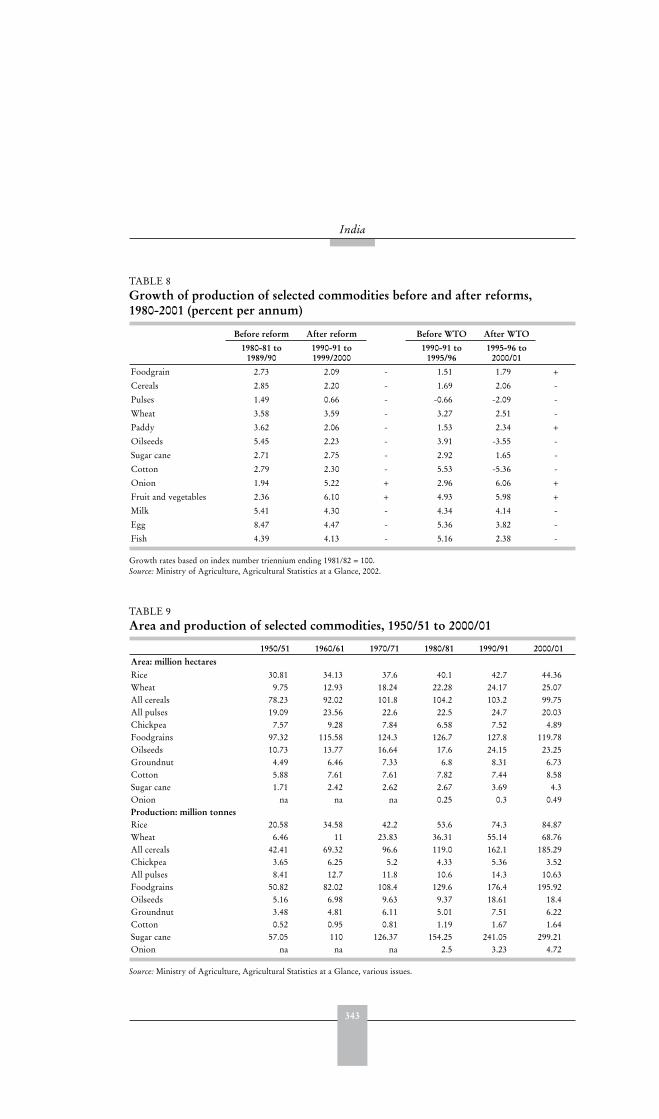
343
India
TABLE 8 Growth of production of selected commodities before and after reforms, 1980-2001 (percent per annum)
Before reform After reform Before WTO After WTO
1980-81 to 1989/90
1990-91 to 1999/2000
1990-91 to 1995/96
1995-96 to 2000/01
Foodgrain 2.73 2.09 - 1.51 1.79 +
Cereals 2.85 2.20 - 1.69 2.06 -
Pulses 1.49 0.66 - -0.66 -2.09 -
Wheat 3.58 3.59 - 3.27 2.51 -
Paddy 3.62 2.06 - 1.53 2.34 +
Oilseeds 5.45 2.23 - 3.91 -3.55 -
Sugar cane 2.71 2.75 - 2.92 1.65 -
Cotton 2.79 2.30 - 5.53 -5.36 -
Onion 1.94 5.22 + 2.96 6.06 +
Fruit and vegetables 2.36 6.10 + 4.93 5.98 +
Milk 5.41 4.30 - 4.34 4.14 -
Egg 8.47 4.47 - 5.36 3.82 -
Fish 4.39 4.13 - 5.16 2.38 -
Growth rates based on index number triennium ending 1981/82 = 100.Source: Ministry of Agriculture, Agricultural Statistics at a Glance, 2002.
TABLE 9 Area and production of selected commodities, 1950/51 to 2000/01
1950/51 1960/61 1970/71 1980/81 1990/91 2000/01Area: million hectaresRice 30.81 34.13 37.6 40.1 42.7 44.36Wheat 9.75 12.93 18.24 22.28 24.17 25.07All cereals 78.23 92.02 101.8 104.2 103.2 99.75All pulses 19.09 23.56 22.6 22.5 24.7 20.03Chickpea 7.57 9.28 7.84 6.58 7.52 4.89Foodgrains 97.32 115.58 124.3 126.7 127.8 119.78Oilseeds 10.73 13.77 16.64 17.6 24.15 23.25Groundnut 4.49 6.46 7.33 6.8 8.31 6.73Cotton 5.88 7.61 7.61 7.82 7.44 8.58Sugar cane 1.71 2.42 2.62 2.67 3.69 4.3Onion na na na 0.25 0.3 0.49Production: million tonnesRice 20.58 34.58 42.2 53.6 74.3 84.87Wheat 6.46 11 23.83 36.31 55.14 68.76All cereals 42.41 69.32 96.6 119.0 162.1 185.29Chickpea 3.65 6.25 5.2 4.33 5.36 3.52All pulses 8.41 12.7 11.8 10.6 14.3 10.63Foodgrains 50.82 82.02 108.4 129.6 176.4 195.92Oilseeds 5.16 6.98 9.63 9.37 18.61 18.4Groundnut 3.48 4.81 6.11 5.01 7.51 6.22Cotton 0.52 0.95 0.81 1.19 1.67 1.64Sugar cane 57.05 110 126.37 154.25 241.05 299.21Onion na na na 2.5 3.23 4.72
Source: Ministry of Agriculture, Agricultural Statistics at a Glance, various issues.
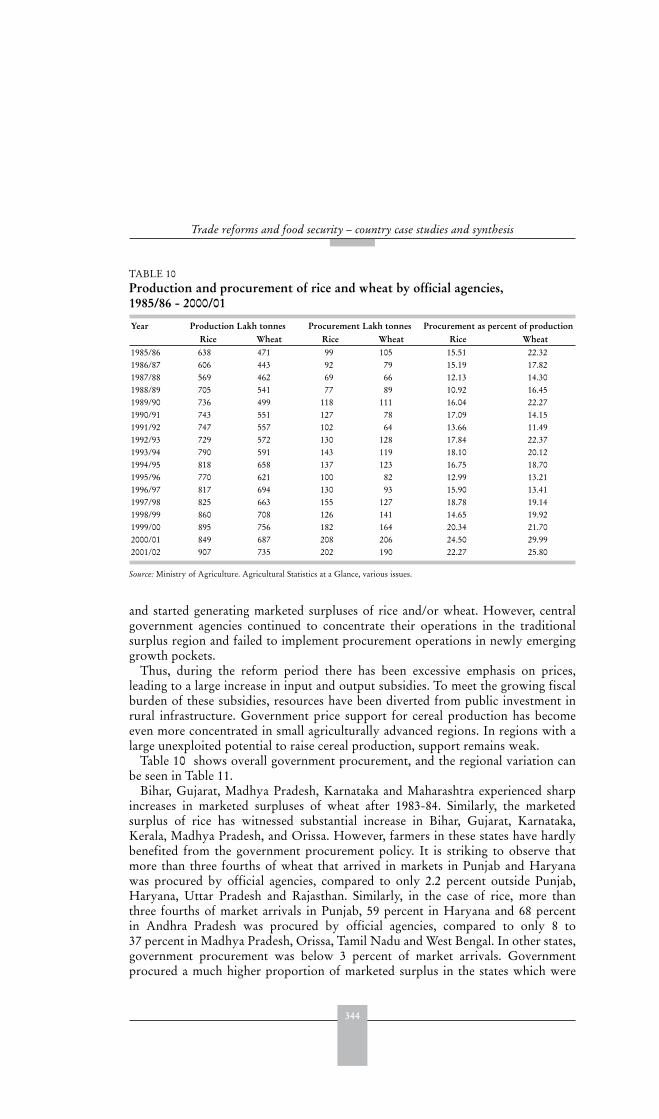
344
Trade reforms and food security – country case studies and synthesis
and started generating marketed surpluses of rice and/or wheat. However, centralgovernment agencies continued to concentrate their operations in the traditionalsurplus region and failed to implement procurement operations in newly emerginggrowth pockets.
Thus, during the reform period there has been excessive emphasis on prices,leading to a large increase in input and output subsidies. To meet the growing fiscalburden of these subsidies, resources have been diverted from public investment inrural infrastructure. Government price support for cereal production has becomeeven more concentrated in small agriculturally advanced regions. In regions with alarge unexploited potential to raise cereal production, support remains weak.
Table 10 shows overall government procurement, and the regional variation canbe seen in Table 11.
Bihar, Gujarat, Madhya Pradesh, Karnataka and Maharashtra experienced sharpincreases in marketed surpluses of wheat after 1983-84. Similarly, the marketedsurplus of rice has witnessed substantial increase in Bihar, Gujarat, Karnataka,Kerala, Madhya Pradesh, and Orissa. However, farmers in these states have hardlybenefited from the government procurement policy. It is striking to observe thatmore than three fourths of wheat that arrived in markets in Punjab and Haryanawas procured by official agencies, compared to only 2.2 percent outside Punjab,Haryana, Uttar Pradesh and Rajasthan. Similarly, in the case of rice, more thanthree fourths of market arrivals in Punjab, 59 percent in Haryana and 68 percentin Andhra Pradesh was procured by official agencies, compared to only 8 to37 percent in Madhya Pradesh, Orissa, Tamil Nadu and West Bengal. In other states,government procurement was below 3 percent of market arrivals. Governmentprocured a much higher proportion of marketed surplus in the states which were
TABLE 10 Production and procurement of rice and wheat by official agencies, 1985/86 - 2000/01
Year Production Lakh tonnes Procurement Lakh tonnes Procurement as percent of productionRice Wheat Rice Wheat Rice Wheat
1985/86 638 471 99 105 15.51 22.321986/87 606 443 92 79 15.19 17.821987/88 569 462 69 66 12.13 14.301988/89 705 541 77 89 10.92 16.451989/90 736 499 118 111 16.04 22.271990/91 743 551 127 78 17.09 14.151991/92 747 557 102 64 13.66 11.491992/93 729 572 130 128 17.84 22.371993/94 790 591 143 119 18.10 20.121994/95 818 658 137 123 16.75 18.701995/96 770 621 100 82 12.99 13.211996/97 817 694 130 93 15.90 13.411997/98 825 663 155 127 18.78 19.141998/99 860 708 126 141 14.65 19.921999/00 895 756 182 164 20.34 21.702000/01 849 687 208 206 24.50 29.992001/02 907 735 202 190 22.27 25.80
Source: Ministry of Agriculture. Agricultural Statistics at a Glance, various issues.
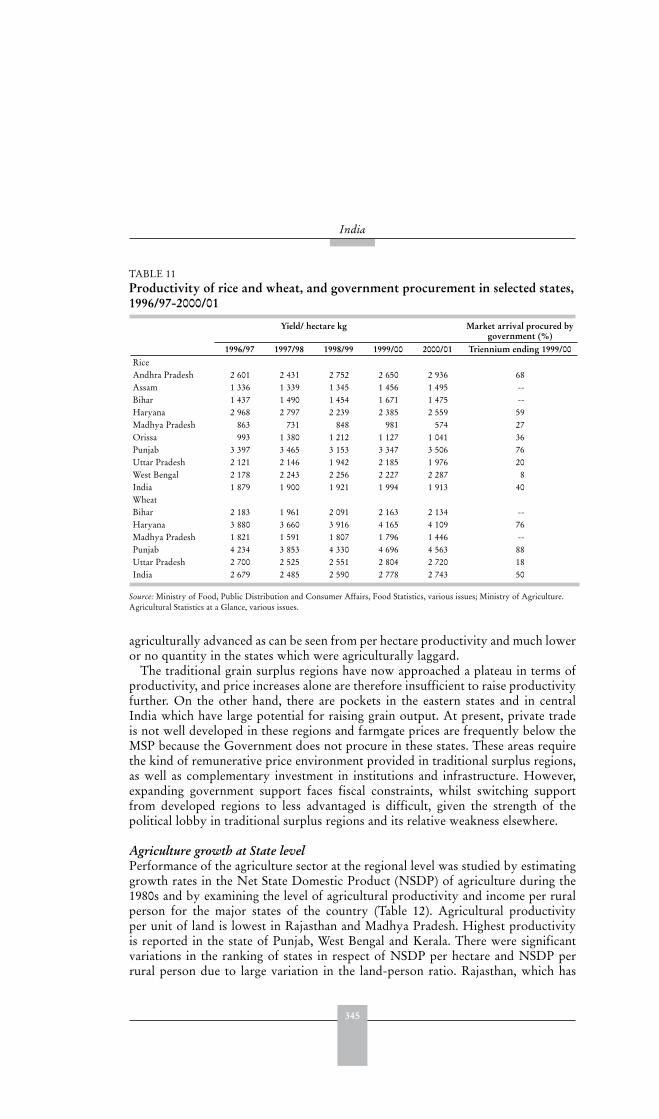
345
India
agriculturally advanced as can be seen from per hectare productivity and much loweror no quantity in the states which were agriculturally laggard.
The traditional grain surplus regions have now approached a plateau in terms ofproductivity, and price increases alone are therefore insufficient to raise productivityfurther. On the other hand, there are pockets in the eastern states and in centralIndia which have large potential for raising grain output. At present, private tradeis not well developed in these regions and farmgate prices are frequently below theMSP because the Government does not procure in these states. These areas requirethe kind of remunerative price environment provided in traditional surplus regions,as well as complementary investment in institutions and infrastructure. However,expanding government support faces fiscal constraints, whilst switching supportfrom developed regions to less advantaged is difficult, given the strength of thepolitical lobby in traditional surplus regions and its relative weakness elsewhere.
Agriculture growth at State levelPerformance of the agriculture sector at the regional level was studied by estimatinggrowth rates in the Net State Domestic Product (NSDP) of agriculture during the1980s and by examining the level of agricultural productivity and income per ruralperson for the major states of the country (Table 12). Agricultural productivityper unit of land is lowest in Rajasthan and Madhya Pradesh. Highest productivityis reported in the state of Punjab, West Bengal and Kerala. There were significantvariations in the ranking of states in respect of NSDP per hectare and NSDP perrural person due to large variation in the land-person ratio. Rajasthan, which has
TABLE 11 Productivity of rice and wheat, and government procurement in selected states, 1996/97-2000/01
Yield/ hectare kg Market arrival procured by government (%)
1996/97 1997/98 1998/99 1999/00 2000/01 Triennium ending 1999/00RiceAndhra Pradesh 2 601 2 431 2 752 2 650 2 936 68Assam 1 336 1 339 1 345 1 456 1 495 --Bihar 1 437 1 490 1 454 1 671 1 475 --Haryana 2 968 2 797 2 239 2 385 2 559 59Madhya Pradesh 863 731 848 981 574 27Orissa 993 1 380 1 212 1 127 1 041 36Punjab 3 397 3 465 3 153 3 347 3 506 76Uttar Pradesh 2 121 2 146 1 942 2 185 1 976 20West Bengal 2 178 2 243 2 256 2 227 2 287 8India 1 879 1 900 1 921 1 994 1 913 40WheatBihar 2 183 1 961 2 091 2 163 2 134 --Haryana 3 880 3 660 3 916 4 165 4 109 76Madhya Pradesh 1 821 1 591 1 807 1 796 1 446 --Punjab 4 234 3 853 4 330 4 696 4 563 88Uttar Pradesh 2 700 2 525 2 551 2 804 2 720 18India 2 679 2 485 2 590 2 778 2 743 50
Source: Ministry of Food, Public Distribution and Consumer Affairs, Food Statistics, various issues; Ministry of Agriculture.Agricultural Statistics at a Glance, various issues.
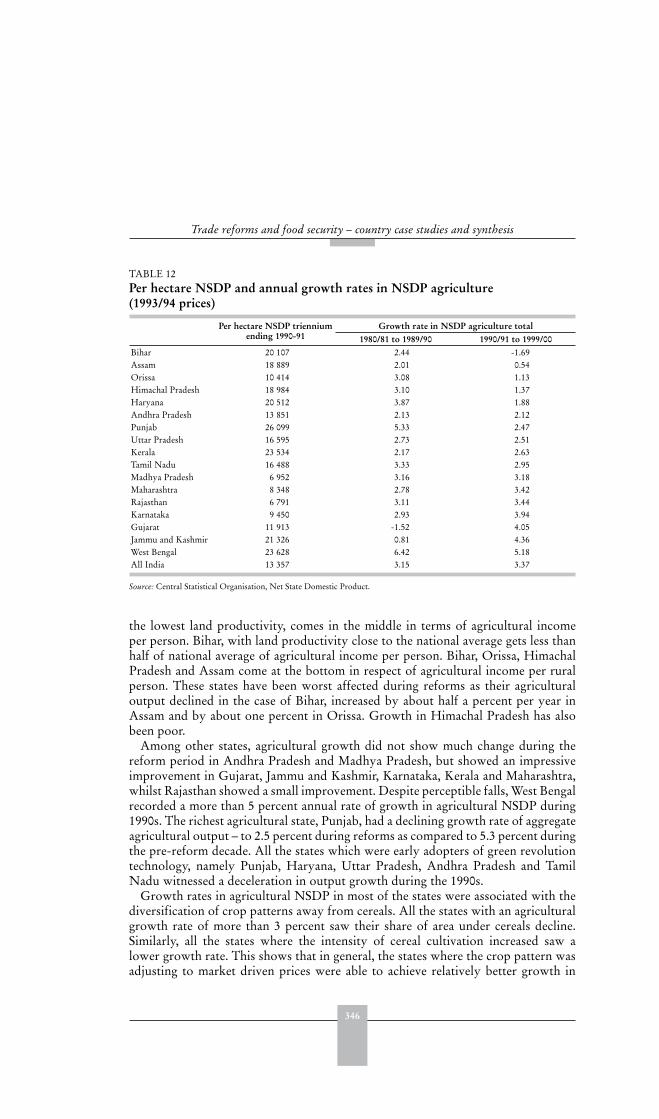
346
Trade reforms and food security – country case studies and synthesis
the lowest land productivity, comes in the middle in terms of agricultural incomeper person. Bihar, with land productivity close to the national average gets less thanhalf of national average of agricultural income per person. Bihar, Orissa, HimachalPradesh and Assam come at the bottom in respect of agricultural income per ruralperson. These states have been worst affected during reforms as their agriculturaloutput declined in the case of Bihar, increased by about half a percent per year inAssam and by about one percent in Orissa. Growth in Himachal Pradesh has alsobeen poor.
Among other states, agricultural growth did not show much change during thereform period in Andhra Pradesh and Madhya Pradesh, but showed an impressiveimprovement in Gujarat, Jammu and Kashmir, Karnataka, Kerala and Maharashtra,whilst Rajasthan showed a small improvement. Despite perceptible falls, West Bengalrecorded a more than 5 percent annual rate of growth in agricultural NSDP during1990s. The richest agricultural state, Punjab, had a declining growth rate of aggregateagricultural output – to 2.5 percent during reforms as compared to 5.3 percent duringthe pre-reform decade. All the states which were early adopters of green revolutiontechnology, namely Punjab, Haryana, Uttar Pradesh, Andhra Pradesh and TamilNadu witnessed a deceleration in output growth during the 1990s.
Growth rates in agricultural NSDP in most of the states were associated with thediversification of crop patterns away from cereals. All the states with an agriculturalgrowth rate of more than 3 percent saw their share of area under cereals decline.Similarly, all the states where the intensity of cereal cultivation increased saw alower growth rate. This shows that in general, the states where the crop pattern wasadjusting to market driven prices were able to achieve relatively better growth in
TABLE 12 Per hectare NSDP and annual growth rates in NSDP agriculture (1993/94 prices)
Per hectare NSDP triennium ending 1990-91
Growth rate in NSDP agriculture total1980/81 to 1989/90 1990/91 to 1999/00
Bihar 20 107 2.44 -1.69Assam 18 889 2.01 0.54Orissa 10 414 3.08 1.13Himachal Pradesh 18 984 3.10 1.37Haryana 20 512 3.87 1.88Andhra Pradesh 13 851 2.13 2.12Punjab 26 099 5.33 2.47Uttar Pradesh 16 595 2.73 2.51Kerala 23 534 2.17 2.63Tamil Nadu 16 488 3.33 2.95Madhya Pradesh 6 952 3.16 3.18Maharashtra 8 348 2.78 3.42Rajasthan 6 791 3.11 3.44Karnataka 9 450 2.93 3.94Gujarat 11 913 -1.52 4.05Jammu and Kashmir 21 326 0.81 4.36West Bengal 23 628 6.42 5.18All India 13 357 3.15 3.37
Source: Central Statistical Organisation, Net State Domestic Product.

347
India
output. The average rate of growth in agricultural NSDP per capita was 2.1 percentbefore the reforms and increased to 2.8 percent during the reforms. Bihar was theonly state where agricultural income per capita declined. Between the pre-and post-reform decades, the growth rate in agricultural NSDP per person turned positive inGujarat, Himachal Pradesh and Jammu and Kashmir. Out of 17 states the rate ofgrowth in agricultural NSDP per rural person accelerated in 11 states and deceleratedin 6.
Effects on imports and exportsTotal agricultural exports were US$3.4 billion in 1990/91, which corresponds to3.8 percent of agricultural sector GDP (Table 13). Devaluation of the exchangerate by 23 percent in 1991, followed by subsequent depreciations in the exchangerate coupled with the lifting of some restrictions on exports helped the country todouble its exports over the next six years. Growth in exports was much faster thangrowth in imports, raising net exports from US$2.7 billion during 1990/91 to US$4.9billion by 1996/97. The increase in exports and imports raised the ratio of trade inagricultural GDP from 4.5 percent in 1991 to 8.7 percent by 1996/97. After 1996/97,as international prices started falling, so did the value of exports. Imports, facilitatedby the liberalization under WTO commitments, doubled in the next three years. Netagriculture trade earnings in the post-WTO period dropped to a low level.
Trends in exports show that India has not been able to maintain steady exportsof commodities like non-basmati rice, wheat, cotton, and sugar. In the post-WTOperiod, exports of oil, groundnut, spices, tea and coffee have been adversely affected.In the case of high value horticultural and livestock products, exports maintained agenerally rising trend, even during the post-WTO period of depressed internationalprices. India’s agricultural exports are responsive to international prices. In the post-WTO period, price declines led to a decline in the value of exports and in turn toexport volume.
Imports of food and related items increased threefold in the first four years ofeconomic reform (Table 14). They also increased sharply during the post-WTO
TABLE 13 Agricultural trade post-reform, 1990-2002
Year Exports Imports Net exports Trade as percent of GDP agriculture$ million $ million $ million Export Import Total
1990/91 3 352 672 2 679 3.8 0.8 4.51991/92 3 203 604 2 599 4.2 0.8 5.01992/93 2 950 938 2 011 4.3 1.4 5.71993/94 4 013 742 3 271 5.2 1.0 6.21994/95 4 211 1 891 2 320 4.7 2.1 6.91995/96 6 098 1 761 4 337 6.7 1.9 8.71996/97 6 806 1 863 4 943 6.7 1.8 8.51997/98 6 685 2 364 4 321 6.4 2.3 8.71998/99 6 064 3 462 2 601 5.8 3.3 9.11999/00 5 842 3 708 2 134 5.5 3.5 9.02000/01 6 273 2 646 3 627 6.1 2.6 8.62001/02 6 183 3 408 2 775 - - -
Source: Ministry of Agriculture. Agricultural Statistics at a Glance, various issues.
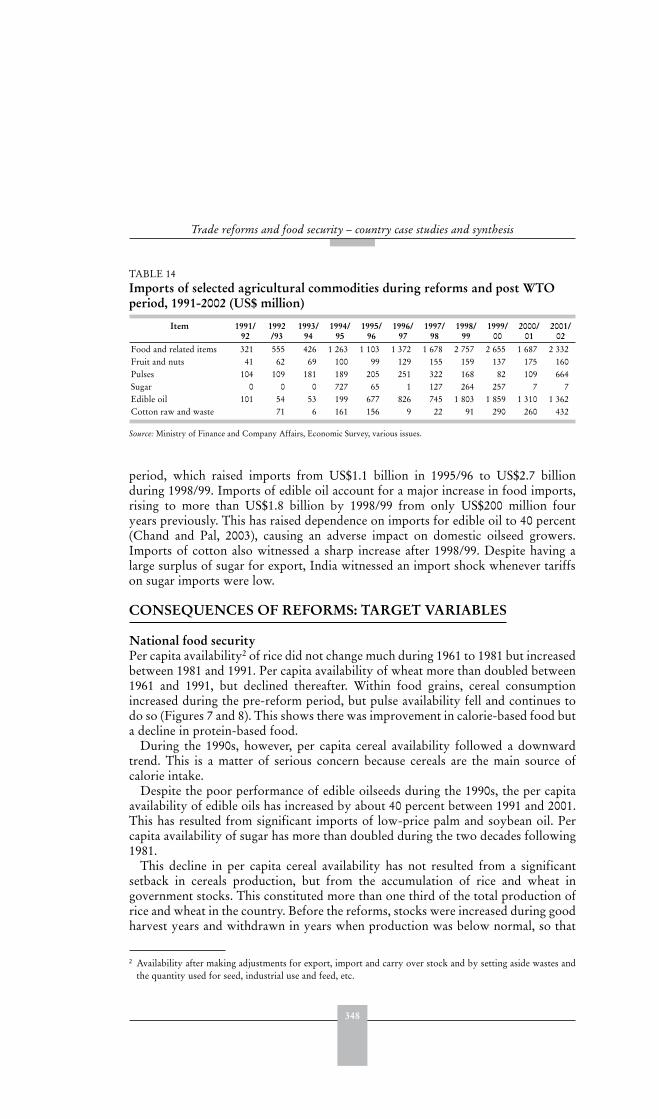
348
Trade reforms and food security – country case studies and synthesis
period, which raised imports from US$1.1 billion in 1995/96 to US$2.7 billionduring 1998/99. Imports of edible oil account for a major increase in food imports,rising to more than US$1.8 billion by 1998/99 from only US$200 million fouryears previously. This has raised dependence on imports for edible oil to 40 percent(Chand and Pal, 2003), causing an adverse impact on domestic oilseed growers.Imports of cotton also witnessed a sharp increase after 1998/99. Despite having alarge surplus of sugar for export, India witnessed an import shock whenever tariffson sugar imports were low.
CONSEQUENCES OF REFORMS: TARGET VARIABLES
National food securityPer capita availability2 of rice did not change much during 1961 to 1981 but increasedbetween 1981 and 1991. Per capita availability of wheat more than doubled between1961 and 1991, but declined thereafter. Within food grains, cereal consumptionincreased during the pre-reform period, but pulse availability fell and continues todo so (Figures 7 and 8). This shows there was improvement in calorie-based food buta decline in protein-based food.
During the 1990s, however, per capita cereal availability followed a downwardtrend. This is a matter of serious concern because cereals are the main source ofcalorie intake.
Despite the poor performance of edible oilseeds during the 1990s, the per capitaavailability of edible oils has increased by about 40 percent between 1991 and 2001.This has resulted from significant imports of low-price palm and soybean oil. Percapita availability of sugar has more than doubled during the two decades following1981.
This decline in per capita cereal availability has not resulted from a significantsetback in cereals production, but from the accumulation of rice and wheat ingovernment stocks. This constituted more than one third of the total production ofrice and wheat in the country. Before the reforms, stocks were increased during goodharvest years and withdrawn in years when production was below normal, so that
2 Availability after making adjustments for export, import and carry over stock and by setting aside wastes andthe quantity used for seed, industrial use and feed, etc.
TABLE 14 Imports of selected agricultural commodities during reforms and post WTOperiod, 1991-2002 (US$ million)
Item 1991/92
1992/93
1993/94
1994/95
1995/96
1996/97
1997/98
1998/99
1999/00
2000/01
2001/02
Food and related items 321 555 426 1 263 1 103 1 372 1 678 2 757 2 655 1 687 2 332Fruit and nuts 41 62 69 100 99 129 155 159 137 175 160Pulses 104 109 181 189 205 251 322 168 82 109 664Sugar 0 0 0 727 65 1 127 264 257 7 7Edible oil 101 54 53 199 677 826 745 1 803 1 859 1 310 1 362Cotton raw and waste 71 6 161 156 9 22 91 290 260 432
Source: Ministry of Finance and Company Affairs, Economic Survey, various issues.
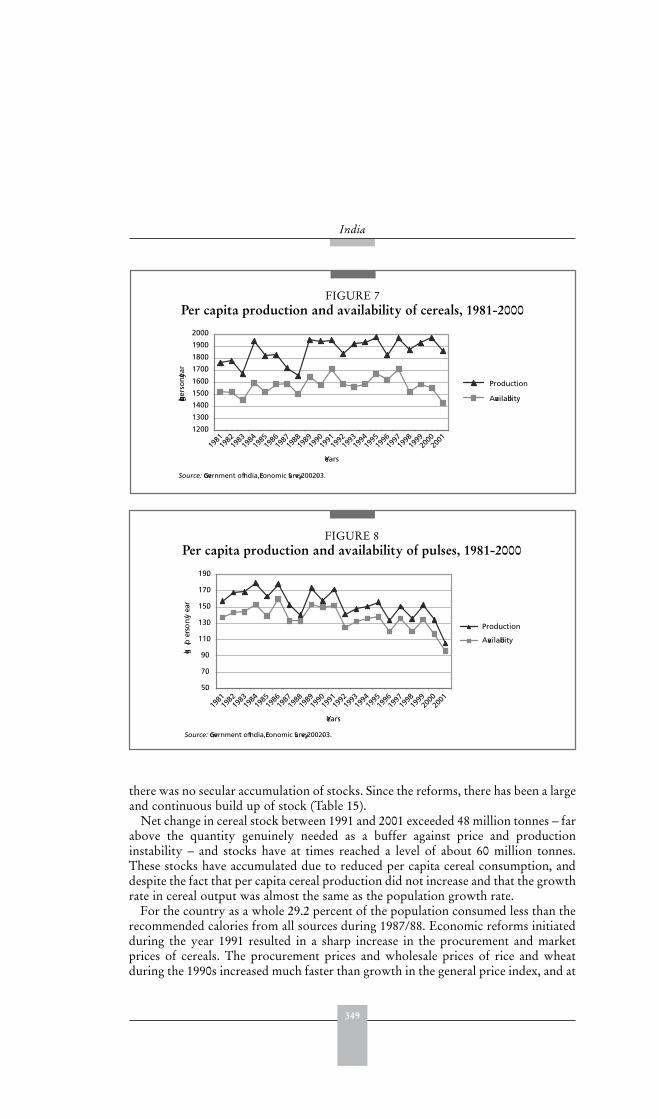
349
India
there was no secular accumulation of stocks. Since the reforms, there has been a largeand continuous build up of stock (Table 15).
Net change in cereal stock between 1991 and 2001 exceeded 48 million tonnes – farabove the quantity genuinely needed as a buffer against price and productioninstability – and stocks have at times reached a level of about 60 million tonnes.These stocks have accumulated due to reduced per capita cereal consumption, anddespite the fact that per capita cereal production did not increase and that the growthrate in cereal output was almost the same as the population growth rate.
For the country as a whole 29.2 percent of the population consumed less than therecommended calories from all sources during 1987/88. Economic reforms initiatedduring the year 1991 resulted in a sharp increase in the procurement and marketprices of cereals. The procurement prices and wholesale prices of rice and wheatduring the 1990s increased much faster than growth in the general price index, and at
FIGURE 7Per capita production and availability of cereals, 1981-2000
120.0
130.0
140.0
150.0
160.0
170.0
180.0
190.0
200.0
1981
1982
1983
1984
1985
1986
1987
1988
Years
kg/per
son
/year
Production
Availability
Source: Government of India, Economic Survey, 2002-03.
1989
1990
1993
1992
1991
1994
1995
1996
1997
1998
1999
2000
2001
FIGURE 8Per capita production and availability of pulses, 1981-2000
Source: Government of India, Economic Survey, 2002-03.
5.0
7.0
9.0
11.0
13.0
15.0
17.0
19.0
kg/p
erso
n/y
ear
Production
Availability
1981
1982
1983
1984
1985
1986
1987
1988
Years
1989
1990
1993
1992
1991
1994
1995
1996
1997
1998
1999
2000
2001
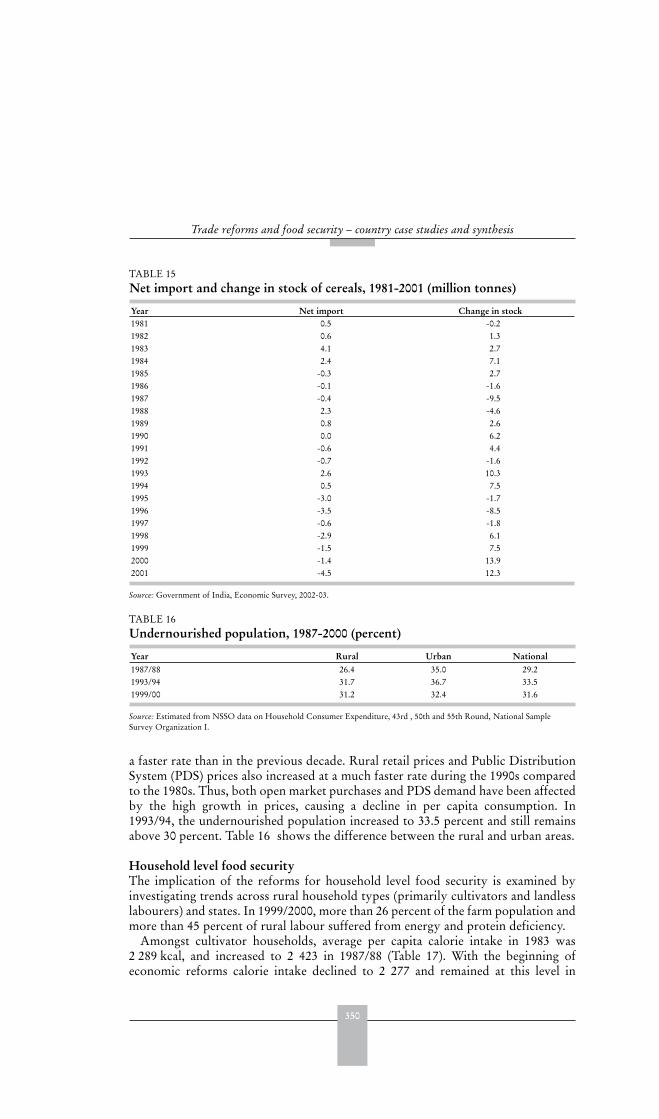
350
Trade reforms and food security – country case studies and synthesis
a faster rate than in the previous decade. Rural retail prices and Public DistributionSystem (PDS) prices also increased at a much faster rate during the 1990s comparedto the 1980s. Thus, both open market purchases and PDS demand have been affectedby the high growth in prices, causing a decline in per capita consumption. In1993/94, the undernourished population increased to 33.5 percent and still remainsabove 30 percent. Table 16 shows the difference between the rural and urban areas.
Household level food securityThe implication of the reforms for household level food security is examined byinvestigating trends across rural household types (primarily cultivators and landlesslabourers) and states. In 1999/2000, more than 26 percent of the farm population andmore than 45 percent of rural labour suffered from energy and protein deficiency.
Amongst cultivator households, average per capita calorie intake in 1983 was2 289 kcal, and increased to 2 423 in 1987/88 (Table 17). With the beginning ofeconomic reforms calorie intake declined to 2 277 and remained at this level in
TABLE 15 Net import and change in stock of cereals, 1981-2001 (million tonnes)
Year Net import Change in stock1981 0.5 -0.21982 0.6 1.31983 4.1 2.71984 2.4 7.11985 -0.3 2.71986 -0.1 -1.61987 -0.4 -9.51988 2.3 -4.61989 0.8 2.61990 0.0 6.21991 -0.6 4.41992 -0.7 -1.61993 2.6 10.31994 0.5 7.51995 -3.0 -1.71996 -3.5 -8.51997 -0.6 -1.81998 -2.9 6.11999 -1.5 7.52000 -1.4 13.92001 -4.5 12.3
Source: Government of India, Economic Survey, 2002-03.
TABLE 16 Undernourished population, 1987-2000 (percent)
Year Rural Urban National1987/88 26.4 35.0 29.21993/94 31.7 36.7 33.51999/00 31.2 32.4 31.6
Source: Estimated from NSSO data on Household Consumer Expenditure, 43rd , 50th and 55th Round, National SampleSurvey Organization I.
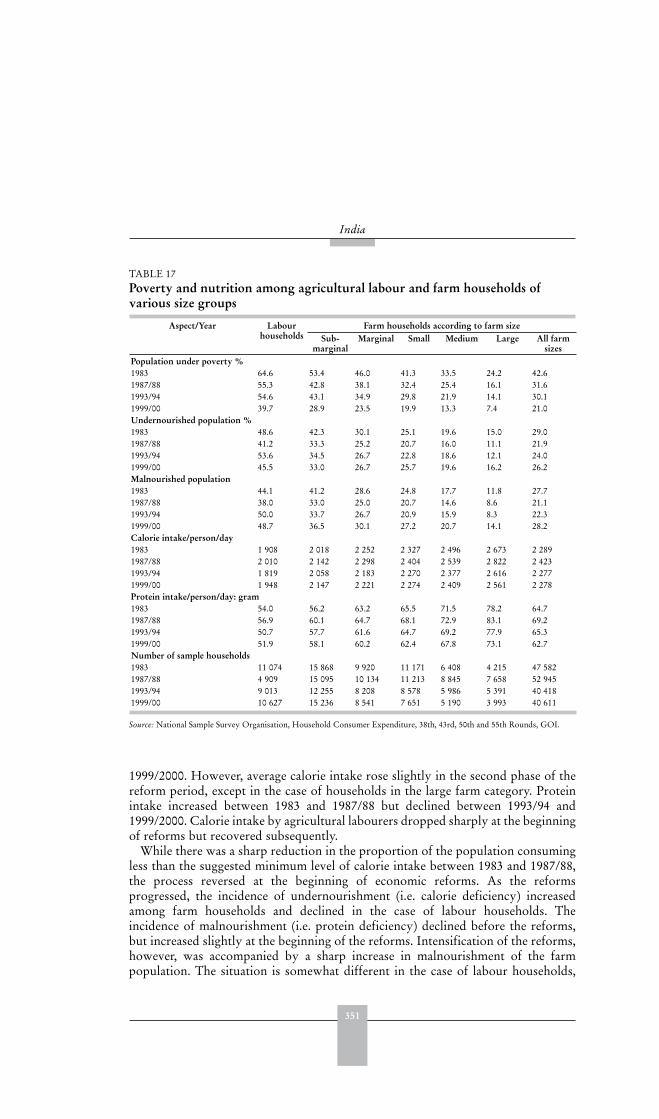
351
India
1999/2000. However, average calorie intake rose slightly in the second phase of thereform period, except in the case of households in the large farm category. Proteinintake increased between 1983 and 1987/88 but declined between 1993/94 and1999/2000. Calorie intake by agricultural labourers dropped sharply at the beginningof reforms but recovered subsequently.
While there was a sharp reduction in the proportion of the population consumingless than the suggested minimum level of calorie intake between 1983 and 1987/88,the process reversed at the beginning of economic reforms. As the reformsprogressed, the incidence of undernourishment (i.e. calorie deficiency) increasedamong farm households and declined in the case of labour households. Theincidence of malnourishment (i.e. protein deficiency) declined before the reforms,but increased slightly at the beginning of the reforms. Intensification of the reforms,however, was accompanied by a sharp increase in malnourishment of the farmpopulation. The situation is somewhat different in the case of labour households,
TABLE 17 Poverty and nutrition among agricultural labour and farm households of various size groups
Aspect/Year Labourhouseholds
Farm households according to farm sizeSub-
marginalMarginal Small Medium Large All farm
sizesPopulation under poverty %1983 64.6 53.4 46.0 41.3 33.5 24.2 42.61987/88 55.3 42.8 38.1 32.4 25.4 16.1 31.61993/94 54.6 43.1 34.9 29.8 21.9 14.1 30.11999/00 39.7 28.9 23.5 19.9 13.3 7.4 21.0Undernourished population %1983 48.6 42.3 30.1 25.1 19.6 15.0 29.01987/88 41.2 33.3 25.2 20.7 16.0 11.1 21.91993/94 53.6 34.5 26.7 22.8 18.6 12.1 24.01999/00 45.5 33.0 26.7 25.7 19.6 16.2 26.2Malnourished population1983 44.1 41.2 28.6 24.8 17.7 11.8 27.71987/88 38.0 33.0 25.0 20.7 14.6 8.6 21.11993/94 50.0 33.7 26.7 20.9 15.9 8.3 22.31999/00 48.7 36.5 30.1 27.2 20.7 14.1 28.2Calorie intake/person/day1983 1 908 2 018 2 252 2 327 2 496 2 673 2 2891987/88 2 010 2 142 2 298 2 404 2 539 2 822 2 4231993/94 1 819 2 058 2 183 2 270 2 377 2 616 2 2771999/00 1 948 2 147 2 221 2 274 2 409 2 561 2 278Protein intake/person/day: gram1983 54.0 56.2 63.2 65.5 71.5 78.2 64.71987/88 56.9 60.1 64.7 68.1 72.9 83.1 69.21993/94 50.7 57.7 61.6 64.7 69.2 77.9 65.31999/00 51.9 58.1 60.2 62.4 67.8 73.1 62.7Number of sample households1983 11 074 15 868 9 920 11 171 6 408 4 215 47 5821987/88 4 909 15 095 10 134 11 213 8 845 7 658 52 9451993/94 9 013 12 255 8 208 8 578 5 986 5 391 40 4181999/00 10 627 15 236 8 541 7 651 5 190 3 993 40 611
Source: National Sample Survey Organisation, Household Consumer Expenditure, 38th, 43rd, 50th and 55th Rounds, GOI.

352
Trade reforms and food security – country case studies and synthesis
whose protein deficit increased substantially at the beginning of reforms anddropped subsequently.
There was no significant reduction in poverty between 1987/88 and 1993/94, butbetween 1993/94 and 1999/2000 the proportion decreased significantly from 30 percentto 21 percent in farm households and from 55 to 40 percent in labour households. Thisis in contrast to the increased incidence of undernourishment in farm households.
The reason for this differential impact on labour and farm households is relatedto dietary patterns. In labour households there was a small decline in cereal intakeand a moderate to large increase in the consumption of pulses, fruits and vegetables,milk, meat etc. Thus the impact of the small decline in cereals was more than offsetby increased consumption of the other foods. Moreover, there was no decline infoodgrain (cereal plus pulses) consumption in labour households. This helped inreducing undernourishment and malnourishment among rural agricultural labour.
In contrast to this, there was a sharp drop in per capita consumption of cereals andtotal foodgrains at farm households, even after 1993/94, which was not compensatedby increased consumption of horticultural and livestock products. This caused anincrease in nutritional deficiency amongst farm households.
Household level food security across statesThe wide regional variations in income and employment opportunities affect nutritionand food security in different regions. Despite improvements at the national level,poverty remains widespread in some states. Among labour households more than twothirds of the population in Assam, about 60 percent in Bihar and Orissa, 58 percentin Madhya Pradesh, 49 percent in Uttar Pradesh. and 47 percent in West Bengal wasin poverty during 1999/2000. Among cultivator households the proportion of thepopulation in poverty was 40 percent in Orissa, 35 percent in Bihar, 31 percent inAssam, 31 percent in Madhya Pradesh, 25 percent in Uttar Pradesh and 22 percentin West Bengal. Poverty in the remaining states ranged between below 2 percent inPunjab and Haryana and 18.6 percent in Maharashtra.
In 1999/2000, the incidence of undernourishment ranges from below 8 percentin Punjab to 43.3 percent in Tamil Nadu. Despite having much higher povertycompared to southern states there is a much smaller incidence of under-nutrition inBihar, West Bengal and Orissa.
Between 1987/88 and 1993/94, the proportion of the population in rural labourhouseholds with a deficit in calories increased in all states except Jammu andKashmir, Kerala and Orissa, where there was decline during this period. Between1993/94 and 1999/2000 changes in nutritional deficiency presented a mixed picture.Calorie intake during 1999/2000 in labour households was lower than the calorieintake in 1993/94 in 12 out of 17 states. Between 1987/88 and 1999/2000, though,energy consumption by landless labourers increased in Kerala, Orissa, Tamil Nadu,West Bengal and Jammu and Kashmir. Nevertheless, more than half of labourhouseholds remain calorie-deficient in Gujarat, Karnataka, Kerala, Madhya Pradesh,Maharashtra and Tamil Nadu.
Among farm households under-nutrition worsened during the reform period inall the states except Kerala. Among cultivator households per capita calorie intakedeclined during the first and second phase of economic reforms in 9 out of 17 states.Per capita calorie intake during 1999/2000 was lower than that in 1987/88 in all the
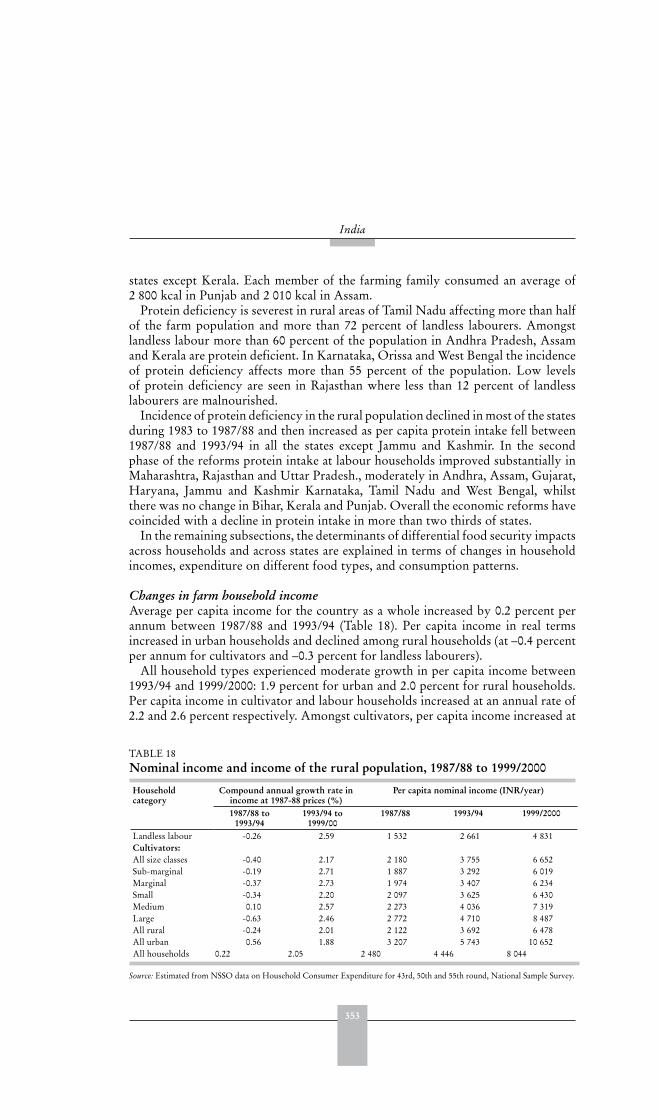
353
India
states except Kerala. Each member of the farming family consumed an average of2 800 kcal in Punjab and 2 010 kcal in Assam.
Protein deficiency is severest in rural areas of Tamil Nadu affecting more than halfof the farm population and more than 72 percent of landless labourers. Amongstlandless labour more than 60 percent of the population in Andhra Pradesh, Assamand Kerala are protein deficient. In Karnataka, Orissa and West Bengal the incidenceof protein deficiency affects more than 55 percent of the population. Low levelsof protein deficiency are seen in Rajasthan where less than 12 percent of landlesslabourers are malnourished.
Incidence of protein deficiency in the rural population declined in most of the statesduring 1983 to 1987/88 and then increased as per capita protein intake fell between1987/88 and 1993/94 in all the states except Jammu and Kashmir. In the secondphase of the reforms protein intake at labour households improved substantially inMaharashtra, Rajasthan and Uttar Pradesh., moderately in Andhra, Assam, Gujarat,Haryana, Jammu and Kashmir Karnataka, Tamil Nadu and West Bengal, whilstthere was no change in Bihar, Kerala and Punjab. Overall the economic reforms havecoincided with a decline in protein intake in more than two thirds of states.
In the remaining subsections, the determinants of differential food security impactsacross households and across states are explained in terms of changes in householdincomes, expenditure on different food types, and consumption patterns.
Changes in farm household incomeAverage per capita income for the country as a whole increased by 0.2 percent perannum between 1987/88 and 1993/94 (Table 18). Per capita income in real termsincreased in urban households and declined among rural households (at –0.4 percentper annum for cultivators and –0.3 percent for landless labourers).
All household types experienced moderate growth in per capita income between1993/94 and 1999/2000: 1.9 percent for urban and 2.0 percent for rural households.Per capita income in cultivator and labour households increased at an annual rate of2.2 and 2.6 percent respectively. Amongst cultivators, per capita income increased at
TABLE 18 Nominal income and income of the rural population, 1987/88 to 1999/2000
Householdcategory
Compound annual growth rate in income at 1987-88 prices (%)
Per capita nominal income (INR/year)
1987/88 to 1993/94
1993/94 to 1999/00
1987/88 1993/94 1999/2000
Landless labour -0.26 2.59 1 532 2 661 4 831Cultivators:All size classes -0.40 2.17 2 180 3 755 6 652Sub-marginal -0.19 2.71 1 887 3 292 6 019Marginal -0.37 2.73 1 974 3 407 6 234Small -0.34 2.20 2 097 3 625 6 430Medium 0.10 2.57 2 273 4 036 7 319Large -0.63 2.46 2 772 4 710 8 487All rural -0.24 2.01 2 122 3 692 6 478All urban 0.56 1.88 3 207 5 743 10 652All households 0.22 2.05 2 480 4 446 8 044
Source: Estimated from NSSO data on Household Consumer Expenditure for 43rd, 50th and 55th round, National Sample Survey.

354
Trade reforms and food security – country case studies and synthesis
a slightly higher rate in sub-marginal and marginal holdings compared to the otherfarm size holdings.
In 1987/88, per capita income of farm households was 88 percent of averagehousehold income. This declined to 83 percent in 1999/2000. This implies thatfarming incomes were increasing at a slower rate than the growth in national percapita income. Per capita nominal income in the sub-marginal farm size categoryremained about 25 percent higher than that of landless agricultural labourers. Thisshows that possession of land, however small, makes a difference to the economicstatus of rural households.
Per capita income of landless labourers has grown at a higher rate than farmhouseholds – real wages for agricultural labour increased in the range of 2 to8 percent per annum. The lowest growth rate was recorded in Gujarat and thehighest in West Bengal. During the post-reform period, real wages for agriculturallabour continued to rise in all states except Assam, where the real wage rate declinedat the rate of 1.6 percent per year. In more than one third of the states, real wage ratesgrew more rapidly during the reform period (Table 19).
Per capita income varies widely between states. The coefficient of variationindicates that per capita income of farm households varies more widely across statesthan is the case with labour households. It also indicates that during economicreforms, interregional differences in per capita income of farmers across states havewidened. Per capita income of farm households is highest in Punjab and Kerala, anddouble that in Orissa, Bihar, Assam and Madhya Pradesh.
Food expenditure and changes in consumptionBetween 1987/88 and 1993/94, per capita real expenditure on food declined for allcategories (Table 20). The rate of decline was higher among cultivators than landless
TABLE 19 Annual growth rate in real wage rates in major states, 1980/81 and 1990/91
Before reform After reform1980/81 to 1989/90 1990/91 to 1999/2000
Andhra Pradesh 5.67 1.87Assam 5.06 -1.60Bihar 5.29 0.28Gujarat 2.26 0.97Haryana 2.28 3.42Himachal Pradesh* 7.43 8.76Karnataka* 3.42 2.61Kerala 2.55 4.89Madhya Pradesh 5.75 4.79Maharashtra 6.45 3.58Orissa 5.48 1.69Punjab 4.35 0.41Rajasthan 3.64 4.24Tamil Nadu 2.76 8.17Uttar Pradesh 3.76 4.88West Bengal* 7.93 1.04
* Growth rate after reforms cover 1990/91 to 1997/98 only.Source: Authors’ computation from Ministry of Agriculture, Agricultural Wages in India, various issues; Government of India,Statistical Abstract of India, various Issues.

355
India
labour. The scenario changed between 1993/94 and 1999/2000 when per capitareal food expenditure increased annually by 2.4 percent in labour households and1.6 percent in cultivator households. Nominal expenditure on food, even at sub-marginal holdings, was about 20 percent higher than for labour households. Percapita expenditure on food increased with the increase in size of holding.
Among labour households, real food expenditure declined between 1987/88 and1993/94 in all states except Tamil Nadu and Jammu and Kashmir, where it increasedby 1.9 and 2.7 percent per annum; and in Gujarat and Kerala where there was asmall increase. In this period, the decline was around 3 percent in Haryana, Assam,Himachal Pradesh and Uttar Pradesh. In the second phase of reforms real foodexpenditure increased everywhere except Assam and Jammu and Kashmir.
Among cultivator households, real food expenditure at the beginning of thereforms declined in all states except Orissa, Tamil Nadu and Jammu and Kashmir.During 1993/94 to 1999/00 real expenditure on food declined in Andhra Pradesh,Karnaka, Maharashtra and Orissa. In most of the states cultivator households spentabout 25 percent more on food than labour households, except in Punjab, Keralaand Haryana where the difference was 63, 45 and 41 percent respectively. Minimumexpenditure on food occurred in Orissa for both types of households. The averagemember of a farm family in Punjab spent INR6 216 on food during 1999/00, whichwas almost double that in Orissa.
Changes in consumption patterns are shown in Table 21. Two significant changesin the food consumption basket of farm household between 1993/94 and 1999/2000are that (a) per capita edible oil consumption increased by 25 percent and (b) percapita cereal consumption declined by 6 percent. The consumption of edible oil,fruit and vegetables, and milk increased for all categories over time. Per capita cerealconsumption increases with the increase in income.
Prices of cereals increased much more than the prices of horticultural productsand milk and milk products in both the sub-periods (Table 22). From 1993/94 to1999/00, the growth rate in cereal prices was 50 percent higher than in general prices.The increase in retail prices of cereals, which account for more than one third oftotal food expenditure, definitely caused an adverse impact on their consumption.Government intervention to support rice and wheat prices during the reform period
TABLE 20 Food expenditure of rural population, 1987/88 to 1999/00
Householdcategory
Compound annual growth rate in food expenditure at 1987/88 prices (%)
Per capita nominal food expenditure INR/year
1987/88 to 1993/94 1993/94 to 1999/00 1987/88 1993/94 1999/2000Landless labour -1.2 2.4 1 078 1 777 3 214Cultivators:All size classes -1.3 1.6 1 430 2 345 4 033Sub-marginal -1.4 2.4 1 280 2 087 3 772Marginal -1.2 2.0 1 332 2 198 3 867Small -1.2 1.5 1 393 2 299 3 939Medium -1.0 1.9 1 487 2 480 4 332Large -1.2 1.3 1 708 2 814 4 759
Source: Estimated from NSSO data on Household Consumer Expenditure for 43rd, 50th and 55th Round National SampleSurvey Organisation.
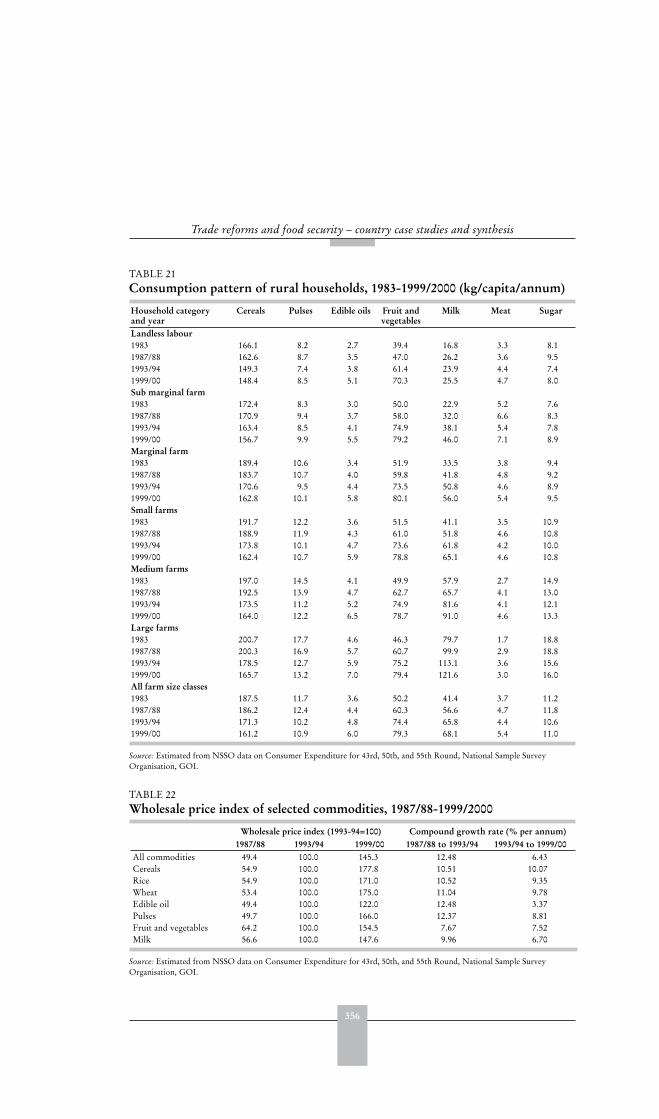
356
Trade reforms and food security – country case studies and synthesis
TABLE 21 Consumption pattern of rural households, 1983-1999/2000 (kg/capita/annum)
Household category and year
Cereals Pulses Edible oils Fruit and vegetables
Milk Meat Sugar
Landless labour1983 166.1 8.2 2.7 39.4 16.8 3.3 8.11987/88 162.6 8.7 3.5 47.0 26.2 3.6 9.51993/94 149.3 7.4 3.8 61.4 23.9 4.4 7.41999/00 148.4 8.5 5.1 70.3 25.5 4.7 8.0Sub marginal farm1983 172.4 8.3 3.0 50.0 22.9 5.2 7.61987/88 170.9 9.4 3.7 58.0 32.0 6.6 8.31993/94 163.4 8.5 4.1 74.9 38.1 5.4 7.81999/00 156.7 9.9 5.5 79.2 46.0 7.1 8.9Marginal farm1983 189.4 10.6 3.4 51.9 33.5 3.8 9.41987/88 183.7 10.7 4.0 59.8 41.8 4.8 9.21993/94 170.6 9.5 4.4 73.5 50.8 4.6 8.91999/00 162.8 10.1 5.8 80.1 56.0 5.4 9.5Small farms1983 191.7 12.2 3.6 51.5 41.1 3.5 10.91987/88 188.9 11.9 4.3 61.0 51.8 4.6 10.81993/94 173.8 10.1 4.7 73.6 61.8 4.2 10.01999/00 162.4 10.7 5.9 78.8 65.1 4.6 10.8Medium farms1983 197.0 14.5 4.1 49.9 57.9 2.7 14.91987/88 192.5 13.9 4.7 62.7 65.7 4.1 13.01993/94 173.5 11.2 5.2 74.9 81.6 4.1 12.11999/00 164.0 12.2 6.5 78.7 91.0 4.6 13.3Large farms1983 200.7 17.7 4.6 46.3 79.7 1.7 18.81987/88 200.3 16.9 5.7 60.7 99.9 2.9 18.81993/94 178.5 12.7 5.9 75.2 113.1 3.6 15.61999/00 165.7 13.2 7.0 79.4 121.6 3.0 16.0All farm size classes1983 187.5 11.7 3.6 50.2 41.4 3.7 11.21987/88 186.2 12.4 4.4 60.3 56.6 4.7 11.81993/94 171.3 10.2 4.8 74.4 65.8 4.4 10.61999/00 161.2 10.9 6.0 79.3 68.1 5.4 11.0
Source: Estimated from NSSO data on Consumer Expenditure for 43rd, 50th, and 55th Round, National Sample SurveyOrganisation, GOI.
TABLE 22 Wholesale price index of selected commodities, 1987/88-1999/2000
Wholesale price index (1993-94=100) Compound growth rate (% per annum)1987/88 1993/94 1999/00 1987/88 to 1993/94 1993/94 to 1999/00
All commodities 49.4 100.0 145.3 12.48 6.43Cereals 54.9 100.0 177.8 10.51 10.07Rice 54.9 100.0 171.0 10.52 9.35Wheat 53.4 100.0 175.0 11.04 9.78Edible oil 49.4 100.0 122.0 12.48 3.37Pulses 49.7 100.0 166.0 12.37 8.81Fruit and vegetables 64.2 100.0 154.5 7.67 7.52Milk 56.6 100.0 147.6 9.96 6.70
Source: Estimated from NSSO data on Consumer Expenditure for 43rd, 50th, and 55th Round, National Sample SurveyOrganisation, GOI.
357
India
has adversely affected their consumption, even by farm households. The implicationsfor nutrition are discussed in the section below.
In all states, per capita cereal consumption declined between 1987/88 and1999/2000. Punjab, which stood at the top in terms of per capita income ofcultivating households, was third from the bottom in cereal consumption. Keralawith the second rank in level of income of cultivating household comes at the bottomin cereal consumption. On the other hand, Orissa with lowest per capita incomeconsumed the highest quantity of cereals. Thus state level consumption data showsan inverse relation between income and consumption of cereals. Consumption ofpulses declined between 1987/88 and 1993/94 in all except two states. In the next sixyears two thirds of states increased pulse consumption. Consumption of fruits andvegetables has increased in all states during the last 12 years.
Expenditure sharesThe share of food in total expenditure has declined steadily and by 1999/2000was 66.5 percent in labour households and 60.6 percent in cultivator households(Table 23). Around half of total expenditure in 1983 was for cereals for sub-marginaland marginal farmer households and for labour households, but this fell to about37 percent in 1999/2000.
Expenditure on pulses did not decline as a percentage of total food expenditure (5-6 percent) during the reform period, despite a small decline in the quantity consumedin labour and farm households. Despite an increase in consumption of edible oil inall categories, its share in food expenditure fell steadily from 1987/88 to 1999/2000,mainly because of the decline in real prices of edible oil as a result of liberalizationof imports. In contrast to the decline in the share of cereals and edible oil, fruit andvegetables, milk and meat have increased their share in food expenditure of farmhouseholds. The increase has been impressive in the case of fruit and vegetables andmilk. Labour households also show sharp increases in the share of horticulturalproducts but no change in the share of milk.
The above discussion shows that during the reforms, poverty among cultivatorand rural labour households declined sharply due to an increase in per capita income.However, these positive developments have not helped in reducing undernutritionand malnutrition, which have actually increased. The main reason for this isthe reduction in the per capita intake of cereals which has not been sufficientlycompensated for in terms of calories and protein by increases in the consumption ofhorticultural and livestock products.
States were grouped in different categories to analyse the relation of income,poverty and cereal consumption to nutritional deficiency (Tables 24 and 25).The first category includes the states in northwest India which have the lowestnutritional deficiency. This is associated with either low poverty or high per capitacereal consumption. There is a contrast between eastern states (Uttar Pradesh, WestBengal, Bihar and Orissa) and southern states (Andhra Pradesh, Karnataka, Keralaand Tamil Nadu). The southern states have much lower poverty and higher income.However, the incidence of calorie deficiency is much higher than in the east. Thereason for this is that per capita cereal consumption in eastern states is higher than inthe south. The pattern is similar for both cultivator and labour households.

358
Trade reforms and food security – country case studies and synthesis
Because of differences in nutritive values, the decline in cereal consumption overtime has not been adequately compensated by the increase in other foodstuffs. Onekilogram of cereal contains about 3 460-3 610 kcal of energy and 64 (rice) to 116(bajra) grams of protein. Most of the leafy vegetables and fresh fruits contain lessthan 1 000 kcal and less than 60 grams of protein per kg. Similarly, one kilogram ofmilk contains less than 1 170 kcal of energy and less than 45 grams of protein. Thus,to compensate for energy lost from a one kilogram decline in cereals, intake of fruitand vegetables or milk needs to be increased by more than three kilograms. Similarly,to compensate for protein, increase in fruit/vegetables or milk needs to be muchhigher than the reduction in cereals.
TABLE 23 Food expenditure and in rural households, 1983-1999/2000 (percent)
Householdcategory and year
Share of expenditure on different commodities in total food expenditure (%) Food share in in total
expenditure (%)
Cereals Pulses Edible oil Fruitsand veg.
Milk Meat Sugar Otherfood
Landless labour1983 52.2 5.1 5.6 8.4 6.1 4.4 3.8 14.1 72.11987/88 41.4 6.1 7.4 9.8 9.0 4.6 4.7 16.6 70.41993/94 43.6 5.7 7.3 12.3 8.8 5.3 4.6 12.2 66.81999/00 38.6 6.4 6.1 12.8 9.0 5.5 3.6 17.7 66.5Sub marginal farm1983 51.1 4.5 5.4 9.7 7.4 5.5 3.1 13.2 70.91987/88 41.1 5.4 6.9 11.0 9.9 6.7 3.4 15.4 67.81993/94 41.7 5.7 6.7 12.6 12.0 6.1 4.0 11.0 63.41999/00 37.1 5.9 5.9 12.8 12.1 6.9 3.3 15.6 62.7Marginal farms1983 50.1 5.3 5.8 8.9 9.9 4.9 3.5 11.3 69.91987/88 41.0 5.8 7.3 10.1 12.1 5.9 3.6 13.9 67.01993/94 40.3 6.0 6.7 11.8 14.9 5.4 4.4 10.1 64.51999/00 36.9 6.1 6.0 12.1 14.6 6.1 3.5 14.3 62.0Small farms1983 48.6 5.7 5.8 8.6 11.6 4.7 4.0 10.9 69.51987/88 39.4 6.2 7.5 9.9 14.4 5.4 4.1 12.8 66.41993/94 38.5 6.1 6.7 11.4 17.3 5.0 4.7 9.8 63.41999/00 35.2 6.4 5.8 11.7 17.2 5.1 3.9 14.2 61.3Medium farms1983 43.7 6.2 6.0 8.0 15.8 3.8 5.0 11.1 66.31987/88 36.7 6.7 7.7 9.4 17.0 4.8 4.6 12.6 65.41993/94 34.1 6.4 6.9 11.1 21.2 4.5 5.3 9.9 61.51999/00 31.4 6.5 5.7 11.0 20.8 4.0 4.4 15.4 59.2Large farms1983 37.9 6.8 6.4 7.6 20.1 2.6 6.2 11.8 65.11987/88 30.8 7.1 8.1 8.7 22.4 3.3 6.0 12.9 61.61993/94 29.5 6.7 7.0 10.3 25.8 3.6 6.2 10.0 59.81999/00 28.5 6.5 5.6 10.6 25.1 3.2 4.9 14.7 56.1All farm size classes1983 47.3 5.5 5.8 8.7 12.0 4.5 4.1 11.7 68.81987/88 37.6 6.2 7.5 9.8 15.3 5.2 4.4 13.5 65.61993/94 36.9 6.1 6.8 11.5 18.1 4.9 4.9 10.2 62.41999/00 34.5 6.2 5.8 11.8 16.9 5.4 3.9 14.9 60.6
Source: Estimated from NSSO data on Consumer Expenditure for 43rd, 50th, and 55th Round, National Sample SurveyOrganisation, GOI.

359
India
TABLE 24 Poverty, cereal intake, income and nutrition in cultivator households, 1999/2000
State Energy deficit(percent of population)
Cereal consumption(kg per annum)
Per capita income(INR) nominal
Poverty ratio (%)
Punjab 7.4 138 11 802 1.1Haryana 11.6 141 9 677 1.7Himachal Pradesh 14.6 158 8 186 6.6Jammu & Kashmir 11.9 172 8 624 4.5Rajasthan 14.7 175 7 030 11.6Eastern statesUttar Pradesh 18.7 170 6 188 25.3West Bengal 25.3 172 6 435 22.3Orissa 26.7 187 4 951 40.4Bihar 27.0 171 5 283 35.0Southern statesAndhra Pradesh 33.6 160 6 003 9.3Karnatka 34.2 150 6 844 12.9Kerala 41.4 122 10 554 7.3Tamil Nadu 43.3 141 7 598 11.4Other statesMaharashtra 33.5 144 6 433 18.6Gujarat 33.8 129 7 347 9.2Assam 36.6 158 5 723 30.6Madhya Pradesh 32.4 163 5 478 30.1
Source: Estimated from NSSO data on Household Consumer Expenditure for 43rd, 50th, and 55th Round, National SampleSurvey Organisation.
TABLE 25 Poverty, cereal intake, income and nutrition in rural labour households, 1999/2000
State Energy deficit (percent of population)
Cereal consumption (kg per annum)
Per capita income (INR nominal)
Poverty ration (%)
Northwest statesPunjab 31.5 123.2 6 507 16.1Haryana 30.1 145.0 6 352 21.6Himachal Pradesh 39.6 135.7 6 855 17.0Jammu & Kashmir 7.9 159.7 6 539 10.9Rajasthan 19.0 172.0 6 039 24.4Eastern statesUttar Pradesh 35.7 157.1 4 607 48.6West Bengal 39.9 163.0 4 616 46.8Orissa 38.1 181.9 3 862 59.9Bihar 42.2 163.3 4 027 59.6Southern statesAndhra Pradesh 43.9 155.2 4 720 15.7Karnatka 56.3 131.4 5 096 23.9Kerala 55.6 117.0 5 997 28.6Tamil Nadu 60.6 130.8 5 594 28.5Gujarat 50.4 123.2 5 568 19.2Other statesMaharashtra 50.1 137.5 4 637 40.3Madhya Pradesh 50.9 149.0 3 920 57.8Assam 57.8 152.2 4 047 68.6
Source: Estimated from NSSO data on Consumer Expenditure for 43rd, 50th , and 55th Round, National Sample SurveyOrganisation.
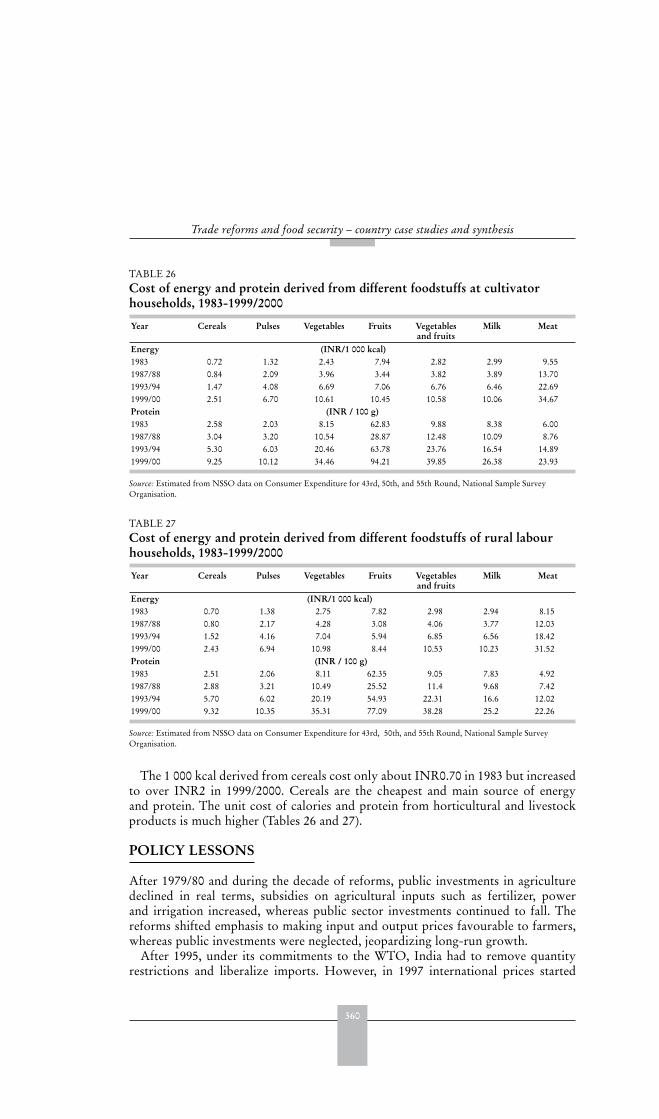
360
Trade reforms and food security – country case studies and synthesis
The 1 000 kcal derived from cereals cost only about INR0.70 in 1983 but increasedto over INR2 in 1999/2000. Cereals are the cheapest and main source of energyand protein. The unit cost of calories and protein from horticultural and livestockproducts is much higher (Tables 26 and 27).
POLICY LESSONS
After 1979/80 and during the decade of reforms, public investments in agriculturedeclined in real terms, subsidies on agricultural inputs such as fertilizer, powerand irrigation increased, whereas public sector investments continued to fall. Thereforms shifted emphasis to making input and output prices favourable to farmers,whereas public investments were neglected, jeopardizing long-run growth.
After 1995, under its commitments to the WTO, India had to remove quantityrestrictions and liberalize imports. However, in 1997 international prices started
TABLE 26 Cost of energy and protein derived from different foodstuffs at cultivator households, 1983-1999/2000
Year Cereals Pulses Vegetables Fruits Vegetables and fruits
Milk Meat
Energy (INR/1 000 kcal)1983 0.72 1.32 2.43 7.94 2.82 2.99 9.551987/88 0.84 2.09 3.96 3.44 3.82 3.89 13.701993/94 1.47 4.08 6.69 7.06 6.76 6.46 22.691999/00 2.51 6.70 10.61 10.45 10.58 10.06 34.67Protein (INR / 100 g)1983 2.58 2.03 8.15 62.83 9.88 8.38 6.001987/88 3.04 3.20 10.54 28.87 12.48 10.09 8.761993/94 5.30 6.03 20.46 63.78 23.76 16.54 14.891999/00 9.25 10.12 34.46 94.21 39.85 26.38 23.93
Source: Estimated from NSSO data on Consumer Expenditure for 43rd, 50th, and 55th Round, National Sample SurveyOrganisation.
TABLE 27 Cost of energy and protein derived from different foodstuffs of rural labour households, 1983-1999/2000
Year Cereals Pulses Vegetables Fruits Vegetables and fruits
Milk Meat
Energy (INR/1 000 kcal)1983 0.70 1.38 2.75 7.82 2.98 2.94 8.151987/88 0.80 2.17 4.28 3.08 4.06 3.77 12.031993/94 1.52 4.16 7.04 5.94 6.85 6.56 18.421999/00 2.43 6.94 10.98 8.44 10.53 10.23 31.52Protein (INR / 100 g)1983 2.51 2.06 8.11 62.35 9.05 7.83 4.921987/88 2.88 3.21 10.49 25.52 11.4 9.68 7.421993/94 5.70 6.02 20.19 54.93 22.31 16.6 12.021999/00 9.32 10.35 35.31 77.09 38.28 25.2 22.26
Source: Estimated from NSSO data on Consumer Expenditure for 43rd, 50th, and 55th Round, National Sample SurveyOrganisation.
361
India
to fall, resulting in downward pressure on the domestic prices of most agriculturalcommodities, with an adverse impact on the growth rate of agricultural output.
Stability in the import tariff regimes, important for providing clear, stableexpectations, has sometimes been an elusive goal. Customs duties on agriculturalcommodities have varied considerably in the last decade, and after the freeing upof cereal imports in 1999, a surge of wheat imports caused the Government to re-institute a variable wheat tariff for the express purpose of regulating the volume ofwheat imports.
The build-up of huge stocks of cereals has given the impression of a surplus in food.However, these surpluses are the result of reduced per capita consumption of cerealscaused by the sharp increase in prices resulting from government interventions toraise the MSP for cereals. Government pricing policy has also caused an adverseaffect on fiscal resources due to the mounting food subsidy bill.
Despite the sharp increase in grain subsidies during the last decade, per capitacereal consumption has declined. The reason why consumers have not benefitedlies in how subsidies are paid. Central government pays food subsidies to the FCIto meet (a) the difference between the economic cost of foodgrains and their salesat Central Issue Prices (CIP) fixed for welfare schemes, and (b) the carrying costof buffer stocks. During the 1990s, the Government announced hefty increases inprocurement prices and to reduce the wide gap between CIPs and the economiccost, the former were also increased sharply and frequently. Similarly, through itscontrol over a substantial part of supply, government procurement at high MSPs alsoresulted in a large increase in wholesale prices.
However, demand side factors did not justify this increase in cereal prices. Inabilityof open market and domestic consumers to absorb increases in the procurementprice caused the accumulation in government stocks and forced the government tosell produce at a heavy discount. Thus, substantial increases in the carrying cost ofbuffer stocks, and a rising difference between the price at which produce could besold and the economic cost of production resulted in the rapid growth in outputsubsidies, particularly during late 1990s. The main beneficiaries of these subsidiesare those producers who could sell their produce to government agencies. Ratherthan benefiting, consumers have been hurt by the system of administered prices inrecent years.
The main beneficiaries of price support have been states where the green revolutionstarted and where government procurement is concentrated. In these relativelydeveloped regions, the output response to higher prices is somewhat limited becauseproductivity is already high and has to some extent reached a plateau. Other stateshave hardly benefited from government procurement of grains, even though theseneglected states have shown tremendous potential for generating a marketablesurplus through greater investment and better prices. Had greater importance beenattached to improving institutions and infrastructure in these regions, the outputresponse to reforms might have been better, even if prices had been lower.
Some research concludes that the decline in cereal consumption is the result ofstructural shifts in demand or dietary diversification away from cereals caused bychanges in lifestyle, tastes and preferences and it should not be seen as causingadverse effect on nutrition. However, this study found that the decline in cerealconsumption during the 1990s was much greater than could be accounted for by

362
Trade reforms and food security – country case studies and synthesis
dietary diversification. The rate of decline in cereal consumption was small during1970s and 1980s - the period during which real prices of cereals were also falling.During the 1990s the rate of decline in cereal consumption accelerated by about 70percent. The reason for this was a sharp increase in the real price of cereals. Aboutone fifth to one third of the total decline in cereal consumption was caused by theprice rises. The study reveals that nutrition would not have been adversely affectedduring the reform period, had this price-induced decline not occurred,
Cereals continue to be the most important food for nutritional requirementsand are also the cheapest source of energy and protein. Low levels of per capitaincome prevent rural inhabitants from substituting the nutritional value of cerealswith increased consumption of fruit and vegetables, milk, meat etc. The price ofcereals plays an extremely important role in determining food security in India.Higher cereal prices might help to build up grain surpluses, but they result inreduced consumption, which is detrimental to household food security. In India, dueimportance should continue to be attached to the role played by cereals and pulsesin achieving adequate nutrition and food security.
REFERENCES
Central Statistical Organisation. Various years. National accounts statistics. Government ofIndia, Delhi.
Chand, Ramesh & Suresh, Pal. 2003. Technological and policy options to deal withimbalances in Indian agriculture. Current Science, Special Issue, February, 2003.
Chand, Ramesh. 2002a. Government intervention in foodgrain markets in the changing
context. National Centre for Agricultural Economics and Policy Research, New Delhi,Computerscript.
Chand, Ramesh. 2002b: Trade liberalisation, WTO and Indian agriculture, New Delhi.Mittal Publications.
Datt, Ruddar & Sundharam, K.P.M. 1987. Indian economy. 24th revised edition. RamNagar, New Delhi. S. Chand & Company Limited.
Dholkia, Bakul H. 1997. Impact of economic liberalisation on the growth of Indian agriculture.In Bhupat M. Desai, ed. Agricultural development paradigm for the Ninth Plan under new
economic environment. New Delhi. Oxford and IBH Publishing Co. Pvt. Ltd.Government of India. Various years. Export-import policy. New Delhi.Government of India. Various years. Index Number of Wholesale Prices in India. New
Delhi.Government of India. Various years. Statistical abstract of India. New Delhi.Gulati, Ashok & Narayanan, Sudha. 2003. The subsidy syndrome in Indian agriculture.
Oxford University Press, New Delhi.IMF, International Financial Statistics. 2002. Ministry of Agriculture. 2002. Agricultural statistics at a glance. Government of India. New
Delhi.Ministry of Agriculture. Various issues. Agricultural wages in India. Government of India.
New Delhi.Ministry of Agriculture. Various issues. Indian agriculture in brief. Government of India.
New Delhi.
363
India
Ministry of Finance and Company Affairs. 2002/03. Economic Survey. Government ofIndia. New Delhi.
Mishra V.N. 2002. Domestic terms of trade, its determinant and impact on aggregate supply:
a national and state level analysis of policy interaction and market forces in Indian
agriculture. Ministry of Agriculture, Institute of Economic Growth. New Delhi.Rao, C.H. Hanumantha & Gulati, Ashok. 1994. Indian agriculture: emerging perspective
and policy Issues. Economic and Political Weekly, 29(53): A-158 – A-170, December 31.
FURTHER READING
Agrawal, A.N. 1988. Indian economy: problem of development and planning. Delhi. WileyEastern Limited.
Bhalla G.S. 2002. Globalisation and agricultural liberalisation in India, A study sponsoredby Ministry of Agriculture, Government of India, CSRD, Jawaharlal Nehru University,New Delhi.
Bhalla G.S., Hazell, Peter & Kerr, John. 1999. Prospects for India’s Cereal supply and
Demand to 2020, Food, agriculture, and Environment Discussion Paper 29, InternationalFood Policy Research Institute, Washington
Chadha, G.K. 2002. Indian agriculture in the new millennium: human response to technological
change. Presidential Address to 62nd Annual Conference of Indian Society of AgriculturalEconomics, Indian agricultural research institute, New Delhi, Dec. 19-21.
Chand, Ramesh. 2001. Emerging trends and issues in public and private investments in Indianagriculture: A statewise analysis. Indian Journal of Agricultural Economics. April – June,Vol.56, No. 2: 161-184.
Gulati, Ashok & Seema, Bathla. 2001. Capital Formation in Indian Agriculture. Economic
and Political Weekly. Vol. 36, No. 20, May 19-25.Gulati, Ashok; & Sharma, Anil. 1994. Agricultural under GATT : What it Holds for India,
Economic and Political Weekly, 29(29):1857-1863, July 16.Kumar, P. 2002. Agricultural Performance and Productivity. In S.S. Acharya & D.P. Chaudhri
(eds.) Indian Agricultural Policy at the Crossroads. Jaipur, India. Rawat Publications.Kumar, Praduman & Mathur, V.C. 1996. Structural change in the demand for foodgrains in
India. Indian Journal of Agricultural Economics, Vol. 51 No. 4, October to December.Kumar, Praduman. 1998. Food demand and supply projections for India. Agricultural
Economics Policy Paper 98-01, Indian Agricultural Research Institute, New Delhi.Mujumdar, N. A. 2002. Rural development: new perceptions. Economic and Political Weekly,
Vol.37, No. 39, September 28.Murty, K.N. 1998. Foodgrain demand in India to 2020 – A comment. Economic and Political
Weekly, Nov.14.Rao, C.H. Hanumantha. 2000. Declining demand for foodgrains in rural India: causes and
implications. Economic and Political Weekly, Vol. 35 No. 4, Jan 22.Rao, V.M. 1994. Agriculture and liberalization: some implications for development policies,
Economic and Political Weekly, 29(16/17): 999-1004, April 16/23.Rao, V.M. 1996. Agricultural development with a human face. Economic and Political Weekly,
31(26): A-50 – A-62, June 29.Shenngen, Fan, Hazell, Peter & Haque, T. 1999. Impact of Public Investments in Agricultural
Research and Infrastructure on Growth and Poverty Reduction in Rural India. DiscussionPaper IFPRI,Washington, D-C.
364
Trade reforms and food security – country case studies and synthesis
Singh, Manmohan. 1995. Inaugural Address delivered at the 54th annual conference of theIndian society of agricultural economics. Indian Journal of Agricultural Economics, 50 (1),January – March.
365
KenyaHezron O. Nyangito, Jonathan Nzuma, Hellen Ommeh and Mary Mbithi1
EXECUTIVE SUMMARY
Pre-reformThe pre-reform period was characterized by wide-scale government interventionin the economy in general, and by strict controls over the pricing and marketingof staple food commodities and export commodities. By the mid-1980s, severestructural constraints and macro imbalances had emerged within the economy.
The reformsMarket liberalization policies were initiated in 1980 under the structural adjustmentprogrammes of the World Bank and International Monetary Fund (IMF). Reformsin macro policies involved exchange rate reform and the liberalization of interestrates. However, it was not until 1993 that the Government began implementing awide range of policy reforms.
Impact on intermediate variablesFood crop prices increased in real terms during the 1990s. Changes in cereals andexport crop prices before the reforms arose mainly from exchange rate movements.After the reforms, changes in domestic maize and wheat prices can be attributedmainly to changes in the exchange rate and the world market price, but rice priceswere affected more by other factors, such as domestic marketing margins andgovernment intervention. Coffee prices after the reforms are explained by changesin world market prices, exchange rate movements and other factors, while tea priceswere influenced more by changes in domestic price.
Production of most commodities declined, especially maize, rice, milk, cotton,sisal and coffee. Although the area under food crops (maize and wheat) and cashcrops (tea and coffee) has generally increased, it has declined for industrial crops,particularly sisal. Given these trends, the decline in production is attributed to fallingyields, although some yield increases have occurred for tea and wheat.
Agriculture’s share of export earnings has averaged 55 percent for the past tenyears. Tea, coffee, pyrethrum, and horticultural products dominate agriculturalexports. Horticultural crops overtook coffee in 1998 to become the second mostimportant agricultural export. The performance of traditional exports was poor,growing at an average of 7.4 percent compared to non-traditional exports, where
1 Hezron O. Nyangito, Jonathan Nzuma, Hellen Ommeh and Mary Mbithi, Kenya Institute for Public PolicyResearch and Analysis, Nairobi.

366
Trade reforms and food security – country case studies and synthesis
growth was estimated at 20.1 percent. Liberalization has not greatly changed thepattern of exports.
Agricultural imports are dominated by food items, particularly cereals and dairyproducts. The level of food imports for most commodities was low between 1987 and1991, but from 1992 imports have been high because of the decline in production.
Impact on target variablesThe food production index increased slowly from 1994, in contrast to the decline inmaize production, because it includes all other crops such as millet, sorghum, pulses,potatoes, etc. production of which have increased. However the low percentageincrease is an indication that the overall agricultural supply response has beenlimited. Per capita cereal supply decreased both in the pre-reform and post-reformperiods. The decline in availability is explained by the decline in maize, wheat andrice production, although other cereals (millets and sorghums) compensated to someextent. Imports have significantly increased, but the capacity to import has declinedbecause of the poor performance of exports.
The general trend for the percentage of stunted children shows a decrease between1982 and 1987 and an increase between 1987 and 1997. Between 1982 and 1987 therewas an increase in incomes and agricultural growth, while there were major declinesin 1994 to 1997. Malnutrition figures reflect these trends.
Poverty levels are highest in Coast, North Eastern and Eastern provinces and inthe highly populated regions of Western, Nyanza, Rift Valley and Central provinces.These areas have fewer agricultural opportunities due to climatic conditions or topopulation pressure.
In the average rural household, 70 percent of food is purchased and approximately30 percent is own production. Most rural households are net food purchasers.There has been a shift to greater dependence on off-farm and remittance incomes,reflecting the diminishing role of farm incomes. Farm incomes dominated in fiveregions in 1982 but declined to less than 50 percent in 1994 and 1997 for all regionsexcept in Rift Valley Province. A decline in wages during the period indicates thatthe poor performance of the agricultural sector may also have affected off-farm jobopportunities. Households headed by males had higher incomes than those headedby females in all regions except Coast Province where female headed householdshave higher off-farm incomes.
Policy lessonsThe agricultural supply response following the reforms has been weak. The linkagesbetween the performance of the agricultural sector and household incomes indicatethat when performance of the sector is poor, household incomes remain low:although the role of agriculture in its direct contribution to household incomesis diminishing, the close linkages with rural off-farm job opportunities – such asagroprocessing, manufacturing and marketing farm inputs – means that agriculturestill plays a leading role in the welfare of rural households.
While the policy reforms have helped to bring about macroeconomic stability,they have been less successful in stimulating growth in the agricultural sector.Complementary policies and proper sequencing were often missing. Kenya hasequated liberalization and privatization with an abdication of responsibility for
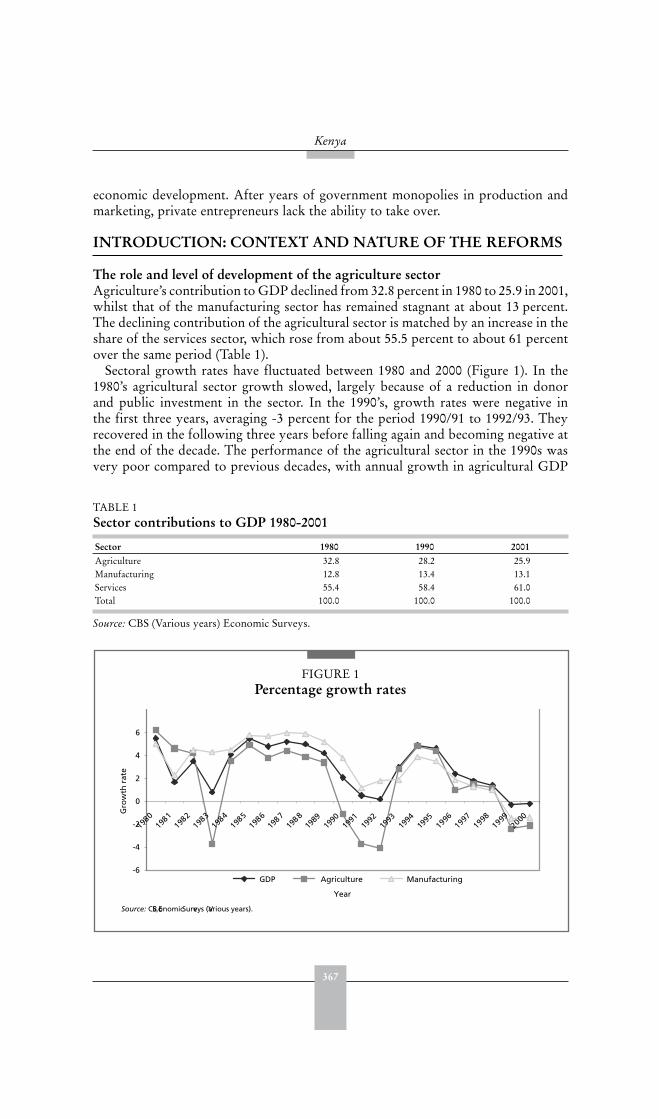
367
Kenya
economic development. After years of government monopolies in production andmarketing, private entrepreneurs lack the ability to take over.
INTRODUCTION: CONTEXT AND NATURE OF THE REFORMS
The role and level of development of the agriculture sectorAgriculture’s contribution to GDP declined from 32.8 percent in 1980 to 25.9 in 2001,whilst that of the manufacturing sector has remained stagnant at about 13 percent.The declining contribution of the agricultural sector is matched by an increase in theshare of the services sector, which rose from about 55.5 percent to about 61 percentover the same period (Table 1).
Sectoral growth rates have fluctuated between 1980 and 2000 (Figure 1). In the1980’s agricultural sector growth slowed, largely because of a reduction in donorand public investment in the sector. In the 1990’s, growth rates were negative inthe first three years, averaging -3 percent for the period 1990/91 to 1992/93. Theyrecovered in the following three years before falling again and becoming negative atthe end of the decade. The performance of the agricultural sector in the 1990s wasvery poor compared to previous decades, with annual growth in agricultural GDP
FIGURE 1Percentage growth rates
Source: CBS, Economic Surveys (Various years).
-6
-4
-2
0
2
4
6
1980
1981
1982
1983
1984
1985
1986
1987
1988
1989
1990
1991
1992
1993
1994
1995
1996
1997
1998
1999
2000
Year
Gro
wth
rat
e
GDP Agriculture Manufacturing
TABLE 1 Sector contributions to GDP 1980-2001
Sector 1980 1990 2001Agriculture 32.8 28.2 25.9Manufacturing 12.8 13.4 13.1Services 55.4 58.4 61.0Total 100.0 100.0 100.0
Source: CBS (Various years) Economic Surveys.
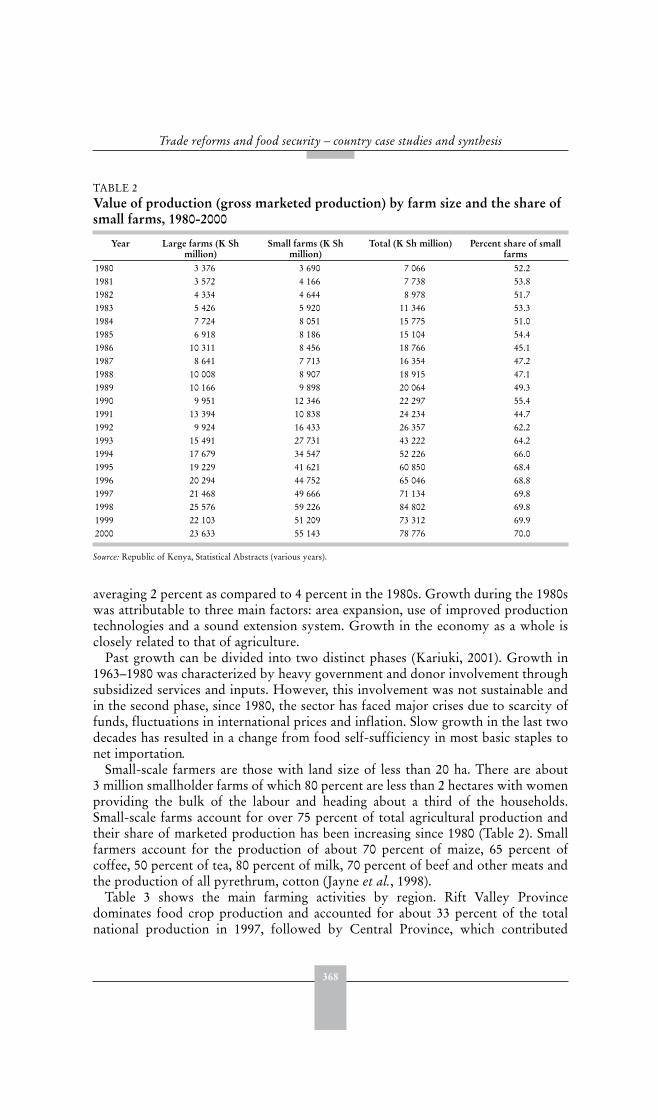
368
Trade reforms and food security – country case studies and synthesis
averaging 2 percent as compared to 4 percent in the 1980s. Growth during the 1980swas attributable to three main factors: area expansion, use of improved productiontechnologies and a sound extension system. Growth in the economy as a whole isclosely related to that of agriculture.
Past growth can be divided into two distinct phases (Kariuki, 2001). Growth in1963–1980 was characterized by heavy government and donor involvement throughsubsidized services and inputs. However, this involvement was not sustainable andin the second phase, since 1980, the sector has faced major crises due to scarcity offunds, fluctuations in international prices and inflation. Slow growth in the last twodecades has resulted in a change from food self-sufficiency in most basic staples tonet importation.
Small-scale farmers are those with land size of less than 20 ha. There are about3 million smallholder farms of which 80 percent are less than 2 hectares with womenproviding the bulk of the labour and heading about a third of the households.Small-scale farms account for over 75 percent of total agricultural production andtheir share of marketed production has been increasing since 1980 (Table 2). Smallfarmers account for the production of about 70 percent of maize, 65 percent ofcoffee, 50 percent of tea, 80 percent of milk, 70 percent of beef and other meats andthe production of all pyrethrum, cotton (Jayne et al., 1998).
Table 3 shows the main farming activities by region. Rift Valley Provincedominates food crop production and accounted for about 33 percent of the totalnational production in 1997, followed by Central Province, which contributed
TABLE 2 Value of production (gross marketed production) by farm size and the share of small farms, 1980-2000
Year Large farms (K Shmillion)
Small farms (K Shmillion)
Total (K Sh million) Percent share of small farms
1980 3 376 3 690 7 066 52.21981 3 572 4 166 7 738 53.81982 4 334 4 644 8 978 51.71983 5 426 5 920 11 346 53.31984 7 724 8 051 15 775 51.01985 6 918 8 186 15 104 54.41986 10 311 8 456 18 766 45.11987 8 641 7 713 16 354 47.21988 10 008 8 907 18 915 47.11989 10 166 9 898 20 064 49.31990 9 951 12 346 22 297 55.41991 13 394 10 838 24 234 44.71992 9 924 16 433 26 357 62.21993 15 491 27 731 43 222 64.21994 17 679 34 547 52 226 66.01995 19 229 41 621 60 850 68.41996 20 294 44 752 65 046 68.81997 21 468 49 666 71 134 69.81998 25 576 59 226 84 802 69.81999 22 103 51 209 73 312 69.92000 23 633 55 143 78 776 70.0
Source: Republic of Kenya, Statistical Abstracts (various years).
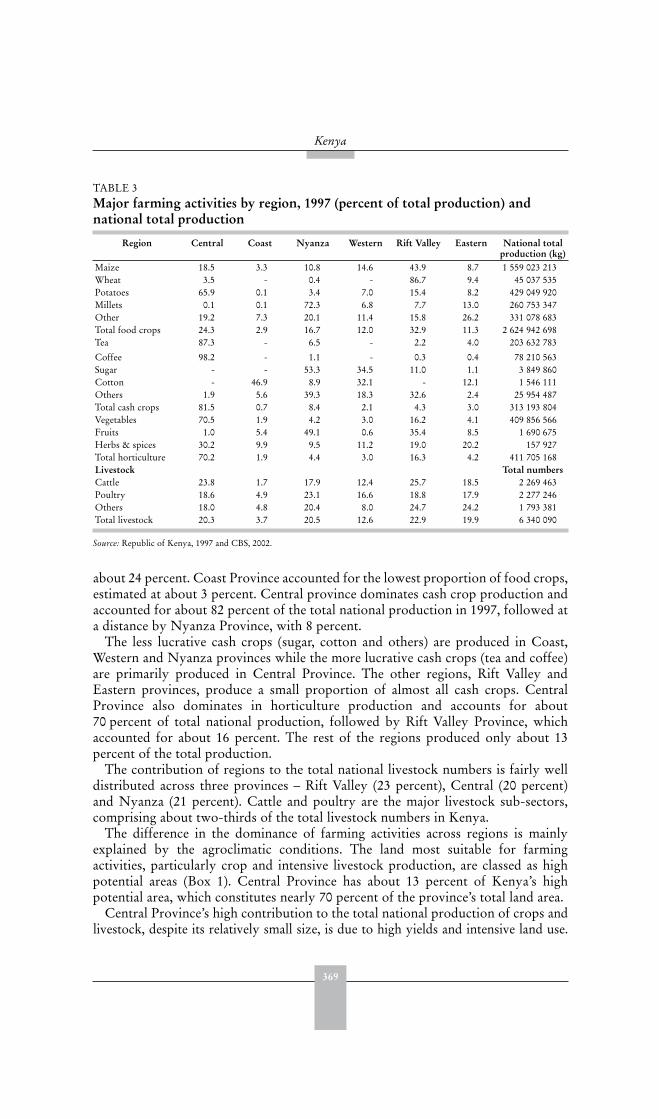
369
Kenya
about 24 percent. Coast Province accounted for the lowest proportion of food crops,estimated at about 3 percent. Central province dominates cash crop production andaccounted for about 82 percent of the total national production in 1997, followed ata distance by Nyanza Province, with 8 percent.
The less lucrative cash crops (sugar, cotton and others) are produced in Coast,Western and Nyanza provinces while the more lucrative cash crops (tea and coffee)are primarily produced in Central Province. The other regions, Rift Valley andEastern provinces, produce a small proportion of almost all cash crops. CentralProvince also dominates in horticulture production and accounts for about70 percent of total national production, followed by Rift Valley Province, whichaccounted for about 16 percent. The rest of the regions produced only about 13percent of the total production.
The contribution of regions to the total national livestock numbers is fairly welldistributed across three provinces – Rift Valley (23 percent), Central (20 percent)and Nyanza (21 percent). Cattle and poultry are the major livestock sub-sectors,comprising about two-thirds of the total livestock numbers in Kenya.
The difference in the dominance of farming activities across regions is mainlyexplained by the agroclimatic conditions. The land most suitable for farmingactivities, particularly crop and intensive livestock production, are classed as highpotential areas (Box 1). Central Province has about 13 percent of Kenya’s highpotential area, which constitutes nearly 70 percent of the province’s total land area.
Central Province’s high contribution to the total national production of crops andlivestock, despite its relatively small size, is due to high yields and intensive land use.
TABLE 3 Major farming activities by region, 1997 (percent of total production) and national total production
Region Central Coast Nyanza Western Rift Valley Eastern National total production (kg)
Maize 18.5 3.3 10.8 14.6 43.9 8.7 1 559 023 213Wheat 3.5 - 0.4 - 86.7 9.4 45 037 535Potatoes 65.9 0.1 3.4 7.0 15.4 8.2 429 049 920Millets 0.1 0.1 72.3 6.8 7.7 13.0 260 753 347Other 19.2 7.3 20.1 11.4 15.8 26.2 331 078 683Total food crops 24.3 2.9 16.7 12.0 32.9 11.3 2 624 942 698Tea 87.3 - 6.5 - 2.2 4.0 203 632 783
Coffee 98.2 - 1.1 - 0.3 0.4 78 210 563Sugar - - 53.3 34.5 11.0 1.1 3 849 860Cotton - 46.9 8.9 32.1 - 12.1 1 546 111Others 1.9 5.6 39.3 18.3 32.6 2.4 25 954 487Total cash crops 81.5 0.7 8.4 2.1 4.3 3.0 313 193 804Vegetables 70.5 1.9 4.2 3.0 16.2 4.1 409 856 566Fruits 1.0 5.4 49.1 0.6 35.4 8.5 1 690 675Herbs & spices 30.2 9.9 9.5 11.2 19.0 20.2 157 927Total horticulture 70.2 1.9 4.4 3.0 16.3 4.2 411 705 168Livestock Total numbersCattle 23.8 1.7 17.9 12.4 25.7 18.5 2 269 463Poultry 18.6 4.9 23.1 16.6 18.8 17.9 2 277 246Others 18.0 4.8 20.4 8.0 24.7 24.2 1 793 381Total livestock 20.3 3.7 20.5 12.6 22.9 19.9 6 340 090
Source: Republic of Kenya, 1997 and CBS, 2002.
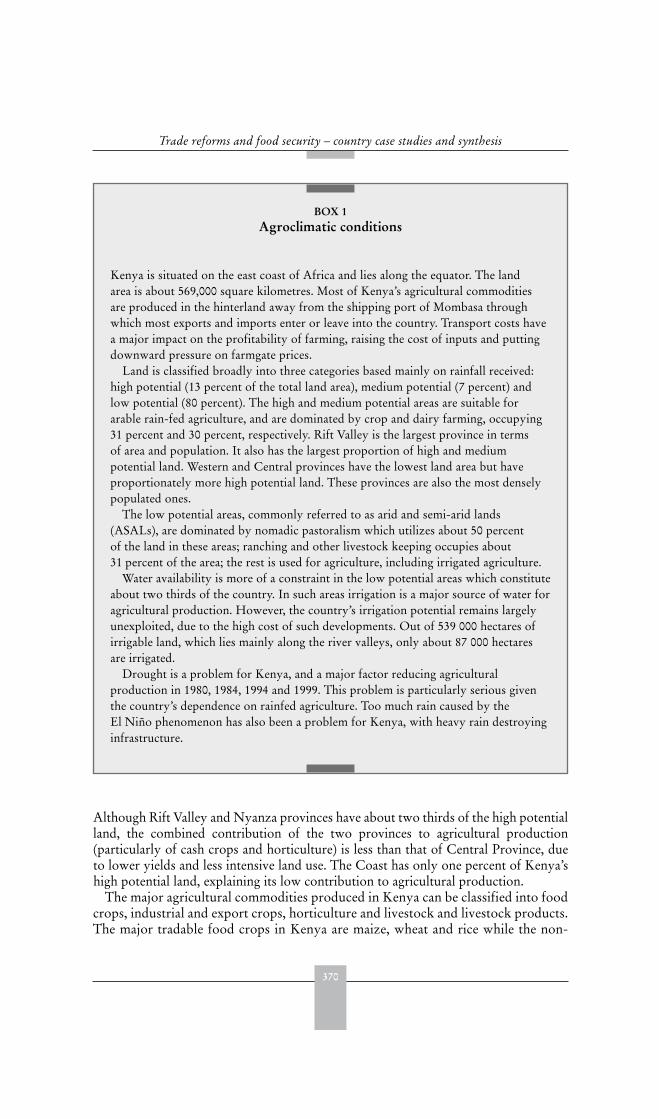
370
Trade reforms and food security – country case studies and synthesis
BOX 1 Agroclimatic conditions
Kenya is situated on the east coast of Africa and lies along the equator. The landarea is about 569,000 square kilometres. Most of Kenya’s agricultural commoditiesare produced in the hinterland away from the shipping port of Mombasa throughwhich most exports and imports enter or leave into the country. Transport costs havea major impact on the profitability of farming, raising the cost of inputs and puttingdownward pressure on farmgate prices.
Land is classified broadly into three categories based mainly on rainfall received:high potential (13 percent of the total land area), medium potential (7 percent) andlow potential (80 percent). The high and medium potential areas are suitable forarable rain-fed agriculture, and are dominated by crop and dairy farming, occupying31 percent and 30 percent, respectively. Rift Valley is the largest province in termsof area and population. It also has the largest proportion of high and mediumpotential land. Western and Central provinces have the lowest land area but haveproportionately more high potential land. These provinces are also the most denselypopulated ones.
The low potential areas, commonly referred to as arid and semi-arid lands(ASALs), are dominated by nomadic pastoralism which utilizes about 50 percentof the land in these areas; ranching and other livestock keeping occupies about31 percent of the area; the rest is used for agriculture, including irrigated agriculture.
Water availability is more of a constraint in the low potential areas which constituteabout two thirds of the country. In such areas irrigation is a major source of water foragricultural production. However, the country’s irrigation potential remains largelyunexploited, due to the high cost of such developments. Out of 539 000 hectares ofirrigable land, which lies mainly along the river valleys, only about 87 000 hectaresare irrigated.
Drought is a problem for Kenya, and a major factor reducing agriculturalproduction in 1980, 1984, 1994 and 1999. This problem is particularly serious giventhe country’s dependence on rainfed agriculture. Too much rain caused by theEl Niño phenomenon has also been a problem for Kenya, with heavy rain destroyinginfrastructure.
Although Rift Valley and Nyanza provinces have about two thirds of the high potentialland, the combined contribution of the two provinces to agricultural production(particularly of cash crops and horticulture) is less than that of Central Province, dueto lower yields and less intensive land use. The Coast has only one percent of Kenya’shigh potential land, explaining its low contribution to agricultural production.
The major agricultural commodities produced in Kenya can be classified into foodcrops, industrial and export crops, horticulture and livestock and livestock products.The major tradable food crops in Kenya are maize, wheat and rice while the non-
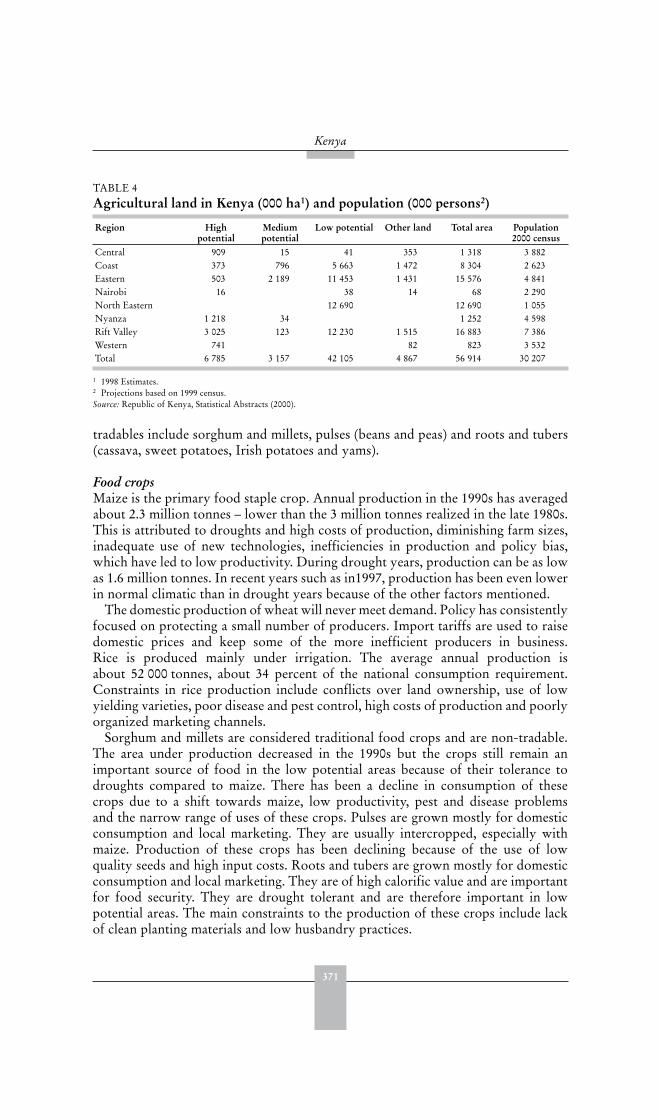
371
Kenya
tradables include sorghum and millets, pulses (beans and peas) and roots and tubers(cassava, sweet potatoes, Irish potatoes and yams).
Food cropsMaize is the primary food staple crop. Annual production in the 1990s has averagedabout 2.3 million tonnes – lower than the 3 million tonnes realized in the late 1980s.This is attributed to droughts and high costs of production, diminishing farm sizes,inadequate use of new technologies, inefficiencies in production and policy bias,which have led to low productivity. During drought years, production can be as lowas 1.6 million tonnes. In recent years such as in1997, production has been even lowerin normal climatic than in drought years because of the other factors mentioned.
The domestic production of wheat will never meet demand. Policy has consistentlyfocused on protecting a small number of producers. Import tariffs are used to raisedomestic prices and keep some of the more inefficient producers in business.Rice is produced mainly under irrigation. The average annual production isabout 52 000 tonnes, about 34 percent of the national consumption requirement.Constraints in rice production include conflicts over land ownership, use of lowyielding varieties, poor disease and pest control, high costs of production and poorlyorganized marketing channels.
Sorghum and millets are considered traditional food crops and are non-tradable.The area under production decreased in the 1990s but the crops still remain animportant source of food in the low potential areas because of their tolerance todroughts compared to maize. There has been a decline in consumption of thesecrops due to a shift towards maize, low productivity, pest and disease problemsand the narrow range of uses of these crops. Pulses are grown mostly for domesticconsumption and local marketing. They are usually intercropped, especially withmaize. Production of these crops has been declining because of the use of lowquality seeds and high input costs. Roots and tubers are grown mostly for domesticconsumption and local marketing. They are of high calorific value and are importantfor food security. They are drought tolerant and are therefore important in lowpotential areas. The main constraints to the production of these crops include lackof clean planting materials and low husbandry practices.
TABLE 4 Agricultural land in Kenya (000 ha1) and population (000 persons2)
Region Highpotential
Mediumpotential
Low potential Other land Total area Population 2000 census
Central 909 15 41 353 1 318 3 882Coast 373 796 5 663 1 472 8 304 2 623Eastern 503 2 189 11 453 1 431 15 576 4 841Nairobi 16 38 14 68 2 290North Eastern 12 690 12 690 1 055Nyanza 1 218 34 1 252 4 598Rift Valley 3 025 123 12 230 1 515 16 883 7 386Western 741 82 823 3 532Total 6 785 3 157 42 105 4 867 56 914 30 207
1 1998 Estimates.2 Projections based on 1999 census.Source: Republic of Kenya, Statistical Abstracts (2000).
372
Trade reforms and food security – country case studies and synthesis
Industrial and export cropsThe most important industrial crops are sugar cane, cotton, sisal and pyrethrum.Others are tobacco, cashew nuts, wattle trees and a wide range of oil crops. Thesecrops are produced for use in local agroprocessing and in some cases for export.Kenya consumes over 600 000 tonnes of white sugar, but produces only about400 000 tonnes in a good year. Production increased during the post-independenceperiod because of large government investments in processing between 1966 and1978. Major constraints to sugar production include high costs of production,competition with sugar imports and inefficiencies in production.
Soon after independence the Government invested in the cotton industry, whichled to massive increases in acreage and production. Free seed, inputs on creditand administered prices were the tools used in this effort. Area and productionpeaked in 1980 at 140 000 ha and 7 700 tonnes (42 000 bales), but started to declinethereafter due to reduced government intervention. Currently area under cultivationis 20 000 ha and lint production is about 2 500 tonnes. Constraints in cottonproduction include cash flow problems for farmers and ginneries, poor access toquality seed and ginning facilities.
Kenya produces over 70 percent of the world’s supply of pyrethrum. The area underproduction has consistently increased since 1998. The crop is marketed through thePyrethrum Board of Kenya, a government controlled agency. However, problemshave emerged which include delayed payments to farmers. These have led to callsfrom farmers for the liberalization of the industry. The main oil crops are sunflower,soybeans and castor. Annual production is estimated at about 2 500 tonnes comparedto an industrial sector requirement of about 50 000 tonnes. The import cost is aboutK Sh5 billion annually. The country could potentially produce 250 000 tonnes of oilcrops annually, but this potential is yet to be exploited. The main constraints includepoor plant varieties, low investments and weak marketing services.
Export crops Coffee, tea and horticultural crops jointly contribute about 34 percent of agriculturalGDP, employ over 40 percent of the agriculture labour force and jointly contributeto over 60 percent of foreign exchange earnings.
Kenya is the biggest black tea exporter in the world and is projected to account for20-23 percent of world exports in the next five years. Markets for Kenyan tea are heavilyconcentrated. Currently the United Kingdom, Pakistan and Egypt account for 83percent of Kenya’s export market. With a stagnating or declining demand in traditionalmarkets, significant increases in production might negatively affect prices. Furthermore,the tremendous increase in production has created bottlenecks in factories thus affectingprocessing efficiency. Quality of tea is being threatened by major congestion at theKenya Tea Development Agency (KTDA) run tea factories. KTDA has a monopoly inthe delivery of production, processing and marketing services to small-scale farmers.However, its role in the provision of smallholder services, including input supply, hasprovided an effective framework for supporting production.
HorticultureHorticulture is the third most important foreign exchange earner in Kenya. Thesector (fruits, vegetables, flowers, spices and herbs) has grown considerably since
373
Kenya
the 1970s mainly due to the expansion of exports. Export volumes grew from57 363 tonnes valued at K Sh2 516 million in 1992 to a total of 348 000 tonnesvalued at K Sh14.2 billion in 2000. About 2.75 million tonnes of horticulture wereconsumed in the domestic market. Smallholders constitute 80 percent of all growersand produce 60 percent of horticultural exports. The exports are dominated by cutflowers that account for 52 percent of the total value of exports. The horticulturesub-sector faces several challenges including competition from producers in othercountries, notably Morocco and Israel, who are closer to European markets.Another concern are sanitary and phytosanitary standards (SPS) which restrictKenya’s access to horticultural export markets, such as the European Union (EU)whose requirements on pesticide residues and related issues are particularly difficultfor smallholder production.
LivestockLivestock contributes about 40 percent of agricultural GDP. Red meat (beef andsmall ruminants meat) comprise about 70 percent of the meat consumed in thecountry.
Dairy production is dominated by smallholders (80 percent of total milkproduction) and uses more land than any other single agricultural enterprise,accounting for about 47 percent of the high and medium potential land. The dairyherd of about 3.2 million dairy cows gives about 60 percent of the 2.5 million litresof milk produced each year. The demand for milk continues to increase rapidly butsupply does not keep pace, especially in the dry months of the year. Milk marketingchannels are both formal and informal. The formal channels involve public-ownedcreameries and licensed private processors. The number of processors licensed bythe Kenya Dairy Board (KDB) increased to about 45 in 1998. Overall, trade in rawwhole milk has greatly increased. There are more than 1 000 traders in the industry.Although most of them are ailing, co-operative societies continue to play a key rolein milk marketing and handle about 40 percent of marketed milk.
Degree of openness of the economy prior to the reforms After Kenya achieved independence in 1963 and until 1980 when the reformprocess began, economic activity was dominated by direct government controls andparticipation, including controls on foreign exchange, investments and productionactivities.
In the pre-reform period, production and marketing for most smallholdercommodities was organized under cooperative societies whose main function wasprocurement of production inputs and marketing of outputs. In addition to thecooperatives, state-run farmer organizations were also set up to support productionand marketing of major commodities. These parastatals controlled the marketing oftheir respective commodities. They included: the Kenya Tea Development authority(KTDA) for tea, the Kenya Co-operative Creameries (KCC) for milk, the NationalCereals and Produce Board (NCPB) for cereals, the National Irrigation Board (NIB)for irrigated crops and the Horticultural Crops Development Authority (HCDA)for horticultural crops.
State boards regulated the production and marketing of all important commodities,including the Sisal Board of Kenya, the Pyrethrum Board of Kenya, the Kenya Sugar
374
Trade reforms and food security – country case studies and synthesis
Authority, the Coffee Board of Kenya (CBK), the Tea Board of Kenya, the KenyaDairy Board, the Cotton Board of Kenya and the Kenya Meat Commission. Thefarmer cooperatives, the state run farmer organizations and the boards dealingwith food crops often failed to achieve their objectives. For example, one of theresponsibilities of the NCPB was to ensure price stabilization and food security incereals. However, this objective was not always realized because of high operationalcosts and managerial problems within the boards, which led to inefficiencies inthe delivery of services to farmers, and to delayed and unreliable payments. As aresult, prices in surplus maize producing areas often fell below the government’sadministered price, whilst those in deficit areas often rose above it.
Motivation for the reformsKenya’s economy grew rapidly in the 1960s and 1970s, attaining an average annualgrowth of over 4 percent a year. However, by the mid-1980s, severe structuralconstraints and macro-economic imbalances had emerged within the economy thatprevented these growth rates from being sustained. Although indications pointed tothe oil crisis, other countries that were at the same level of economic development asKenya, and which faced similar external forces were able to emerge from the crisisunscathed, due to sound macroeconomic policy and greater structural flexibility(WTO, 2000).
Macro and sectoral components and the policy instruments used.Market liberalization policies started in 1980 under the structural adjustmentprogrammes (SAPs) of the World Bank and IMF. Macroeconomic policy reformsinvolved the removal of restrictions on the exchange rate, foreign exchange retentionand remittances, and the liberalization of interest rates. The impetus of the reformsgained momentum in 1982 as the removal of economic distortions became acondition for the disbursement of World Bank loans (Swamy, 1994) and in 1986 theGovernment committed itself to a wide-ranging reform programme. The reformsfocused on the reduction of government controls, with a shift toward increasingthe role of market forces and the private sector. However, it was not until 1993 thatrigorous implementation of reform really started, and for this reason the policyreform period considered in this study starts from 1993.
Another factor that has affected the Kenyan economy is restricted donor financingbetween 1991 and 2002. Due to the government’s failure to honour politicalgovernance and economic management pledges made to the World Bank and theIMF, these institutions suspended their support. Other donors followed suit andthe restricted lending to Kenya from 1993 affected the performance of the economy,including agriculture.
GNP per capita rose from a low of US$327 in 1980 to a high of US$389 in 1998,but this declined to US$324 in 2000 (Table 5).
GDP growth in the 1990s has been low and the public deficit has worsened(Table 6). Trade performance shows mixed results with a general increase in exportand import indices between 1995 and 1998 but a decline thereafter. The terms of tradeworsened from 1999, although international reserves have been on the increase.
The policy reforms led to export growth in 1997 and 1998 but export performancedeclined from 1999 and Kenya’s trade deficit has worsened since 1999.
375
Kenya
The 1993 reforms included monetary and fiscal policy reforms, price decontrolon all commodities, removal of import licensing and foreign exchange controls, thereplacement of import-substitution policies with outward-oriented ones, as wellas privatization of public enterprises. Several public enterprises were restructuredand the influence of most agricultural boards reduced. Kenya also dismantled itsquantitative import restrictions. The tariff structure was rationalized and tariffsbecame the main trade policy instrument.
Monetary policy reformsIn 1996 comprehensive measures were taken to improve the effectiveness ofmonetary control instruments. Strict monetary policy has affected credit availability,with most of the credit going to the government and parastatals, and only a limitedamount available for private sector development (Ndung’u, 1997).
Exchange rate reformsIn 1993, the foreign exchange system was liberalized allowing the commercial banksto effect foreign payments for their private clients without referring them to theCentral Bank of Kenya (CBK). The Kenyan Shilling was allowed to float freely andexporters were allowed to retain 100 percent of all their foreign exchange earnings.
Since independence, the nominal exchange rate has generally increased (depreciated),with the highest annual increases experienced in 1992/93 (see Table 6). However, thereal exchange rate appreciated after 1992/93 and only started depreciating again after1998. This appreciation could have contributed to the slow growth of the Kenyan
TABLE 5 GNP per capita and population growth
Year GNP (1995 =100) million US$ GNP per capita (US$) (1995 = 100) Population growth rate (%)1980 5 445 327 4.21985 6 152 309 3.51990 7 970 341 3.21995 8 686 325 2.32000 9 777 324 2.1
Source: World Bank, 2002.
TABLE 6 Selected macroeconomic indicators, 1992-2000
Indicator 1992 1994 1995 1996 1997 1998 1999 20001
Real GDP growth rate (%) 0.8 2.6 4.4 4.1 2.1 1.6 1.3 0.2Consumer prices (% change) 27.1 28.9 1.5 9.0 11.2 10.6 15.0 8.4Nominal exchange rate (US$ to K SH) 36.22 44.84 55.94 55.02 62.68 61.91 72.93 78.04Real exchange rate (%change) 0.61 0.57 0.51 0.52 0.48 0.47 0.53 0.63Public deficit (% change) 0 3.2 -6.2 -3.6 -7.5 -7.8 -5.7 -9.1International reserves (end of period)2
(million US$)68.0 148.0 408.0 433.0 497.0 557.0 564.0 746.0
Export trade indices (1995=100) 87.5 82.9 100.0 98.5 112.8 113.7 95.3 94.9Import trade indices (1995=100) 112.6 81.0 100.0 94.1 102.7 107.7 99.9 94.9Terms of trade (%) 77.7 102.4 100.0 104.6 109.8 105.6 94.5 94.5
1 Provisional 2 Excluding gold.Source: World Bank (2002), WTO (2000), CBK (2000), CBS, Economic Surveys . (Various years).
376
Trade reforms and food security – country case studies and synthesis
economy, although Ndung’u (1997) argues that the growth of the productionsectors has been contracting due to liberalization and the short-term reallocationof resources. There is need for exchange rate stability to reduce uncertainty in thesector; the floating exchange rate does not seem to be providing this.
Fiscal policiesFiscal policy reforms started during the 1980-1984 period. Combined with tightmonetary policy, they helped bring about a sharp fall in inflation by reducing thebudget deficit and cutting public expenditure. However, efforts to control the budgetdeficit have not always been successful and it has continued to grow over the years.The Government has in recent years sought to reduce the number of public sectorworkers, but servicing the public debt remains a major problem for the economy.The total debt to GDP ratio is about 80 percent. This limits the Government’scapacity to invest in productive services.
Trade policy reform Trade policies prior to the 1980s were geared towards import substitution andgovernment revenue generation, through high levels of protection. The instrumentsused to achieve these objectives included licensing, quantitative restriction, hightariffs and export/import bans. The policy reforms adopted in 1986 focusedon moving towards a more outward looking trade regime with a reduction ofrestrictive trade policies, strengthening market access for Kenyan exports and furtherintegration into the world economy.
The removal of quantitative restrictions and reduction in tariffs started in 1980,and by 1991 were only used when health and public safety was at issue. There hasbeen a policy to harmonize the structure and reduction of tariff levels. The import-weighted tariff was reduced from 30 percent (1984-1985) to 23 percent in 1991-1992and about 18 percent in 1999. Tariff dispersion has been lowered and the number oftariff bands reduced from seven in the 1980s to only three in 2001. The highest tarifflevel has decreased from above 70 percent in the 1980s to 35 percent in 1999.
On becoming a member of WTO, the country bound its tariffs at 100 percent forall agricultural products. The country also committed itself to the elimination of allnon-tariff barriers on agricultural imports. Tariff levels have since been substantiallyreduced from between 40 percent and 60 percent to below 35 percent for mostof agricultural commodities and processed products. The tariff levels have neverreached the bound ceilings, although suspended duties are sometimes used to raisethe level of protection. This has occurred for sugar whereby the tariff rate plussuspended duties were 100 percent in 2001.
Agricultural sector policy reformsIn agriculture, the focus was on removing the government monopoly in themarketing of agricultural commodities, lifting associated price controls, andending government controls on the importing, pricing, and distribution of farminputs. Implementation of reforms in the early period was reported to have beenaccompanied by considerable official ambiguity and covert and overt resistance(Ikiara et al., 1993), but reforms began to be implemented with greater commitmentin 1993. Most of the major reforms shown in Table 7 have been implemented.
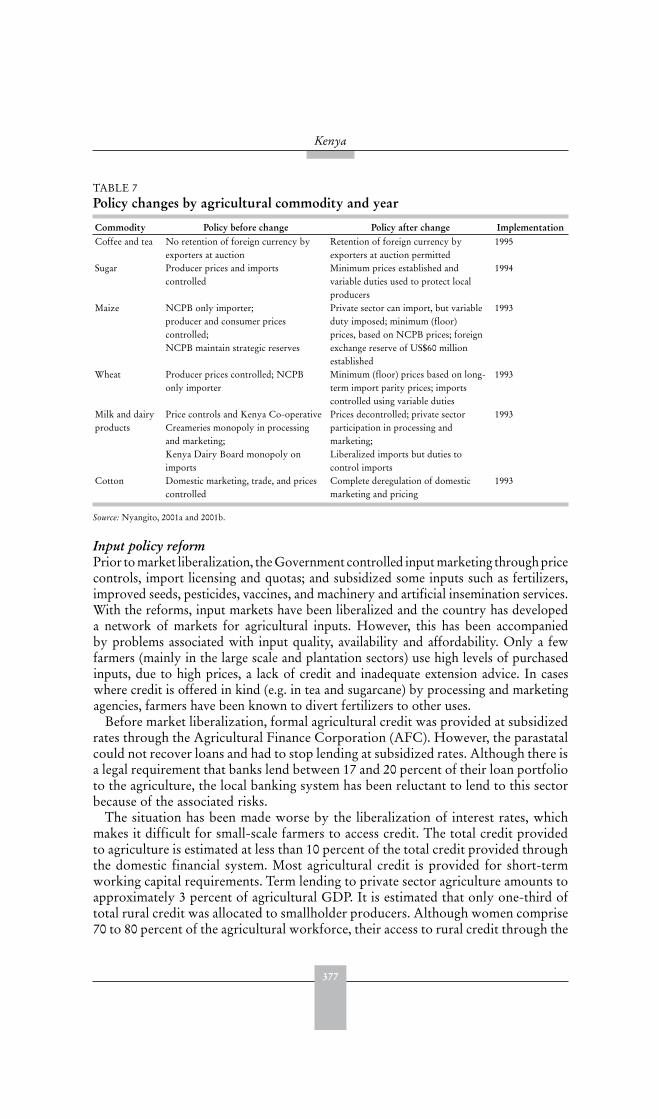
377
Kenya
Input policy reformPrior to market liberalization, the Government controlled input marketing through pricecontrols, import licensing and quotas; and subsidized some inputs such as fertilizers,improved seeds, pesticides, vaccines, and machinery and artificial insemination services.With the reforms, input markets have been liberalized and the country has developeda network of markets for agricultural inputs. However, this has been accompaniedby problems associated with input quality, availability and affordability. Only a fewfarmers (mainly in the large scale and plantation sectors) use high levels of purchasedinputs, due to high prices, a lack of credit and inadequate extension advice. In caseswhere credit is offered in kind (e.g. in tea and sugarcane) by processing and marketingagencies, farmers have been known to divert fertilizers to other uses.
Before market liberalization, formal agricultural credit was provided at subsidizedrates through the Agricultural Finance Corporation (AFC). However, the parastatalcould not recover loans and had to stop lending at subsidized rates. Although there isa legal requirement that banks lend between 17 and 20 percent of their loan portfolioto the agriculture, the local banking system has been reluctant to lend to this sectorbecause of the associated risks.
The situation has been made worse by the liberalization of interest rates, whichmakes it difficult for small-scale farmers to access credit. The total credit providedto agriculture is estimated at less than 10 percent of the total credit provided throughthe domestic financial system. Most agricultural credit is provided for short-termworking capital requirements. Term lending to private sector agriculture amounts toapproximately 3 percent of agricultural GDP. It is estimated that only one-third oftotal rural credit was allocated to smallholder producers. Although women comprise70 to 80 percent of the agricultural workforce, their access to rural credit through the
TABLE 7 Policy changes by agricultural commodity and year
Commodity Policy before change Policy after change ImplementationCoffee and tea No retention of foreign currency by
exporters at auctionRetention of foreign currency byexporters at auction permitted
1995
Sugar Producer prices and importscontrolled
Minimum prices established andvariable duties used to protect localproducers
1994
Maize NCPB only importer;producer and consumer pricescontrolled;NCPB maintain strategic reserves
Private sector can import, but variableduty imposed; minimum (floor)prices, based on NCPB prices; foreignexchange reserve of US$60 millionestablished
1993
Wheat Producer prices controlled; NCPBonly importer
Minimum (floor) prices based on long-term import parity prices; importscontrolled using variable duties
1993
Milk and dairyproducts
Price controls and Kenya Co-operativeCreameries monopoly in processingand marketing;Kenya Dairy Board monopoly onimports
Prices decontrolled; private sectorparticipation in processing andmarketing;Liberalized imports but duties tocontrol imports
1993
Cotton Domestic marketing, trade, and pricescontrolled
Complete deregulation of domesticmarketing and pricing
1993
Source: Nyangito, 2001a and 2001b.
378
Trade reforms and food security – country case studies and synthesis
financial system is negligible. For short-term borrowing, both a land certificate andevidence of a regular, non-farming source of income is required. Most rural womenhave neither. Some credit is provided to women through NGO-managed schemes,revolving credit schemes, and from friends. However, the amounts are relativelysmall compared to what could be productively absorbed by female agriculturalists.
Food security related policiesPrior to the reforms, the NCPB had the monopoly to market all cereals and toimport whenever there were deficits or export whenever there were surpluses. Theagency was mandated to maintain strategic reserves of foodstuffs, particularly maize,which would be released onto the market at time of shortage. With liberalization, theNCPB marketing monopoly has been dismantled. It now acts as buyer and seller oflast resort and otherwise acts on a commercial basis. However, it still has the functionof maintaining strategic food reserves and a foreign exchange reserve of $60 millionhas been established to allow the NCPB to purchase food when the need arises – i.e.at times of food shortages or to purchase from farmers during glut periods.
CONSEQUENCES OF REFORMS: INTERMEDIATE VARIABLES
In assessing the effects of reform on output incentives, the relationship betweenchanges in the international price and changes in the domestic price of commoditiesare investigated in relation to other possible drivers such as the real exchange rate,improvements in the efficiency of domestic marketing systems etc. It is difficultto isolate policies that have been beneficial or harmful to agricultural performancebecause many of the reforms that have been implemented simultaneously or/andsequentially are aimed at removing structural bottlenecks that impede the properfunctioning of the market mechanism.
Trends in international and domestic pricesThe trends of average real prices received by farmers for various commodities areshown in Table 8. There was greater price instability during the 1990s than in the1980s, accounted for by the liberalization of domestic markets combined with worldmarket price volatility.
The real prices of food crops have generally increased during the 1990s, possiblydue to the liberalization of domestic marketing. The price variability for industrialcrops was higher during the 1990s, possibly due to increased competition fromimports of processed commodities such as textiles and sugar.
The mixed trend for the prices of export crops may be attributed to instabilityin world market prices (Table 9). The prices for coffee show a mixed, but generallydeclining, trend, while those for tea indicate an increasing trend during the postreform era.
Decomposition of price changesThe sources of change in domestic prices for cereals (maize, wheat and rice) and forexports (coffee and tea) were decomposed into changes in world prices, exchangerates, and other sources of change (e.g. tariffs, domestic marketing margins,transport).
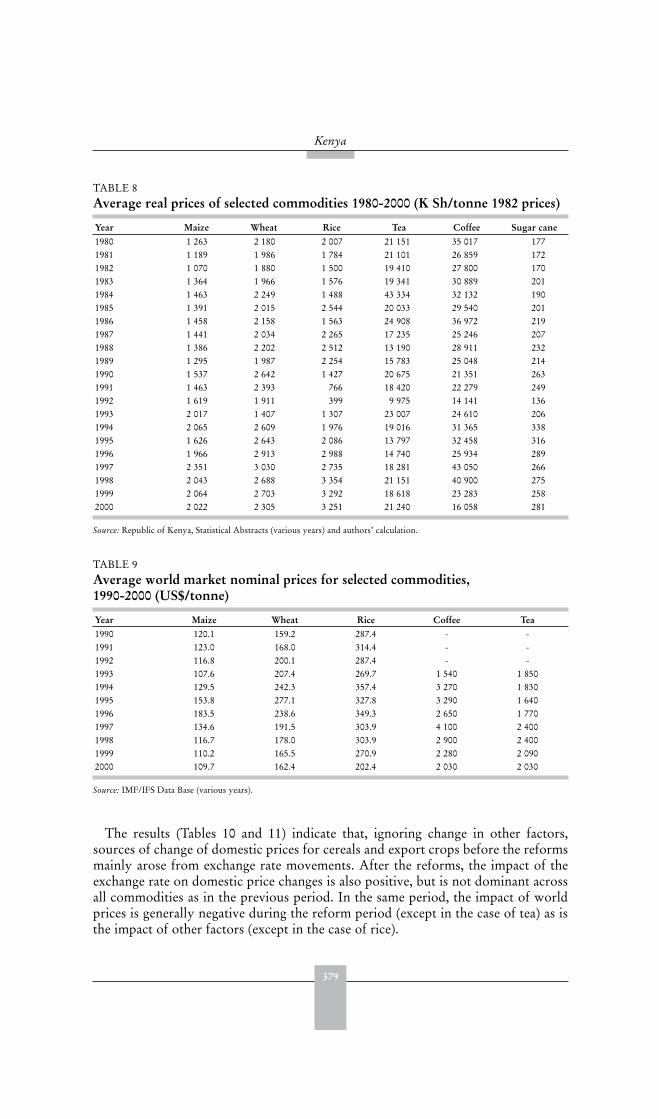
379
Kenya
The results (Tables 10 and 11) indicate that, ignoring change in other factors,sources of change of domestic prices for cereals and export crops before the reformsmainly arose from exchange rate movements. After the reforms, the impact of theexchange rate on domestic price changes is also positive, but is not dominant acrossall commodities as in the previous period. In the same period, the impact of worldprices is generally negative during the reform period (except in the case of tea) as isthe impact of other factors (except in the case of rice).
TABLE 8Average real prices of selected commodities 1980-2000 (K Sh/tonne 1982 prices)
Year Maize Wheat Rice Tea Coffee Sugar cane1980 1 263 2 180 2 007 21 151 35 017 1771981 1 189 1 986 1 784 21 101 26 859 1721982 1 070 1 880 1 500 19 410 27 800 1701983 1 364 1 966 1 576 19 341 30 889 2011984 1 463 2 249 1 488 43 334 32 132 1901985 1 391 2 015 2 544 20 033 29 540 2011986 1 458 2 158 1 563 24 908 36 972 2191987 1 441 2 034 2 265 17 235 25 246 2071988 1 386 2 202 2 512 13 190 28 911 2321989 1 295 1 987 2 254 15 783 25 048 2141990 1 537 2 642 1 427 20 675 21 351 2631991 1 463 2 393 766 18 420 22 279 2491992 1 619 1 911 399 9 975 14 141 1361993 2 017 1 407 1 307 23 007 24 610 2061994 2 065 2 609 1 976 19 016 31 365 3381995 1 626 2 643 2 086 13 797 32 458 3161996 1 966 2 913 2 988 14 740 25 934 2891997 2 351 3 030 2 735 18 281 43 050 2661998 2 043 2 688 3 354 21 151 40 900 2751999 2 064 2 703 3 292 18 618 23 283 2582000 2 022 2 305 3 251 21 240 16 058 281
Source: Republic of Kenya, Statistical Abstracts (various years) and authors’ calculation.
TABLE 9 Average world market nominal prices for selected commodities, 1990-2000 (US$/tonne)
Year Maize Wheat Rice Coffee Tea1990 120.1 159.2 287.4 - -1991 123.0 168.0 314.4 - -1992 116.8 200.1 287.4 - -1993 107.6 207.4 269.7 1 540 1 8501994 129.5 242.3 357.4 3 270 1 8301995 153.8 277.1 327.8 3 290 1 6401996 183.5 238.6 349.3 2 650 1 7701997 134.6 191.5 303.9 4 100 2 4001998 116.7 178.0 303.9 2 900 2 4001999 110.2 165.5 270.9 2 280 2 0902000 109.7 162.4 202.4 2 030 2 030
Source: IMF/IFS Data Base (various years).
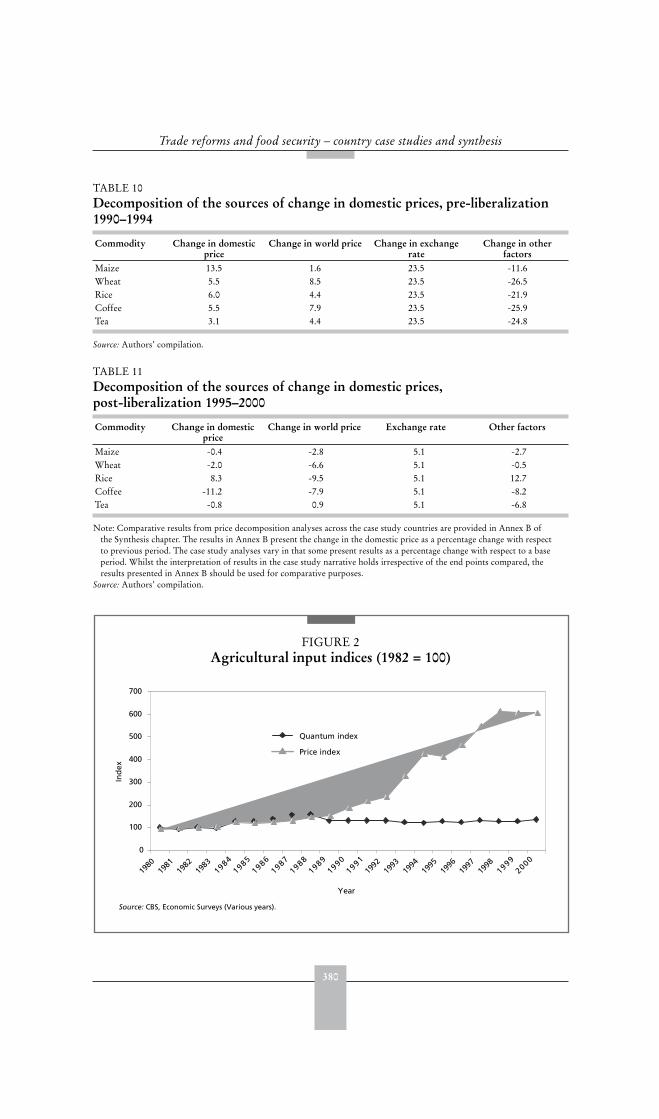
380
Trade reforms and food security – country case studies and synthesis
TABLE 10 Decomposition of the sources of change in domestic prices, pre-liberalization 1990–1994
Commodity Change in domestic price
Change in world price Change in exchange rate
Change in other factors
Maize 13.5 1.6 23.5 -11.6Wheat 5.5 8.5 23.5 -26.5Rice 6.0 4.4 23.5 -21.9Coffee 5.5 7.9 23.5 -25.9Tea 3.1 4.4 23.5 -24.8
Source: Authors’ compilation.
TABLE 11 Decomposition of the sources of change in domestic prices, post-liberalization 1995–2000
Commodity Change in domestic price
Change in world price Exchange rate Other factors
Maize -0.4 -2.8 5.1 -2.7Wheat -2.0 -6.6 5.1 -0.5Rice 8.3 -9.5 5.1 12.7Coffee -11.2 -7.9 5.1 -8.2Tea -0.8 0.9 5.1 -6.8
Note: Comparative results from price decomposition analyses across the case study countries are provided in Annex B ofthe Synthesis chapter. The results in Annex B present the change in the domestic price as a percentage change with respectto previous period. The case study analyses vary in that some present results as a percentage change with respect to a baseperiod. Whilst the interpretation of results in the case study narrative holds irrespective of the end points compared, theresults presented in Annex B should be used for comparative purposes.
Source: Authors’ compilation.
Source: CBS, Economic Surveys (Various years).
0
100
200
300
400
500
600
700
1980
1981
1982
1983
19841985
19861987
19881989
19901991
1992
1993
1994
1995
1996
1997
1998
19992000
Year
Ind
ex
Quantum index
Price index
FIGURE 2Agricultural input indices (1982 = 100)
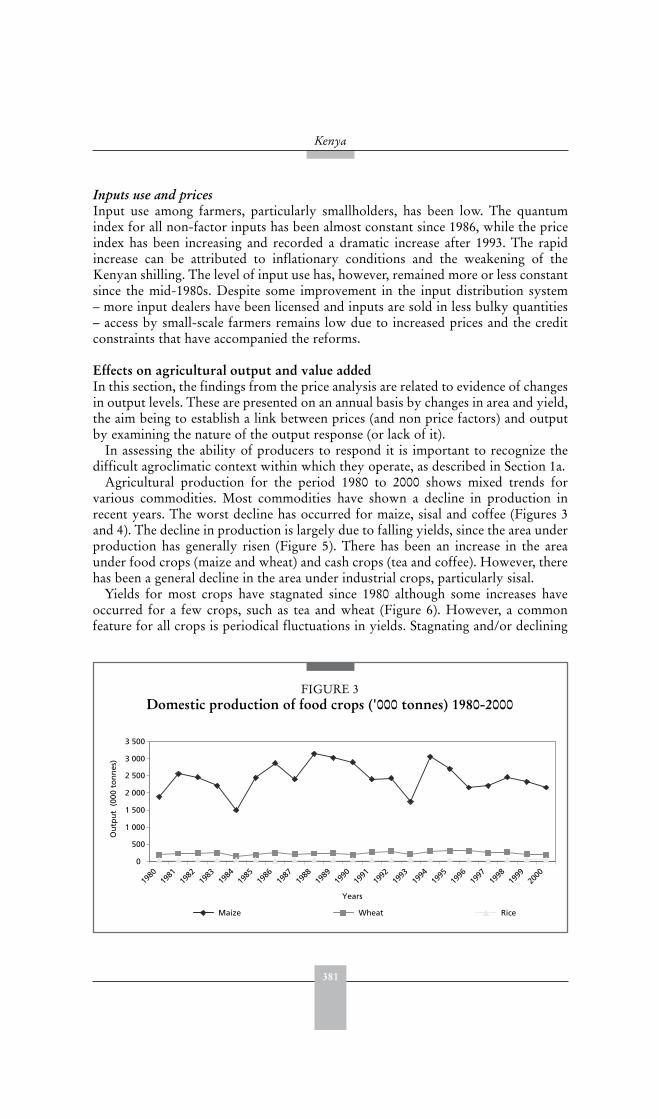
381
Kenya
Inputs use and prices Input use among farmers, particularly smallholders, has been low. The quantumindex for all non-factor inputs has been almost constant since 1986, while the priceindex has been increasing and recorded a dramatic increase after 1993. The rapidincrease can be attributed to inflationary conditions and the weakening of theKenyan shilling. The level of input use has, however, remained more or less constantsince the mid-1980s. Despite some improvement in the input distribution system– more input dealers have been licensed and inputs are sold in less bulky quantities– access by small-scale farmers remains low due to increased prices and the creditconstraints that have accompanied the reforms.
Effects on agricultural output and value added In this section, the findings from the price analysis are related to evidence of changesin output levels. These are presented on an annual basis by changes in area and yield,the aim being to establish a link between prices (and non price factors) and outputby examining the nature of the output response (or lack of it).
In assessing the ability of producers to respond it is important to recognize thedifficult agroclimatic context within which they operate, as described in Section 1a.
Agricultural production for the period 1980 to 2000 shows mixed trends forvarious commodities. Most commodities have shown a decline in production inrecent years. The worst decline has occurred for maize, sisal and coffee (Figures 3and 4). The decline in production is largely due to falling yields, since the area underproduction has generally risen (Figure 5). There has been an increase in the areaunder food crops (maize and wheat) and cash crops (tea and coffee). However, therehas been a general decline in the area under industrial crops, particularly sisal.
Yields for most crops have stagnated since 1980 although some increases haveoccurred for a few crops, such as tea and wheat (Figure 6). However, a commonfeature for all crops is periodical fluctuations in yields. Stagnating and/or declining
FIGURE 3Domestic production of food crops ('000 tonnes) 1980-2000
0
500
1 000
1 500
2 000
2 500
3 000
3 500
1980
1981
1982
1983
1984
1985
1986
1987
1988
1989
1990
1991
1992
1993
1994
1995
1996
1997
1998
1999
2000
Years
Ou
tpu
t (
000
ton
nes
)
Maize Wheat Rice
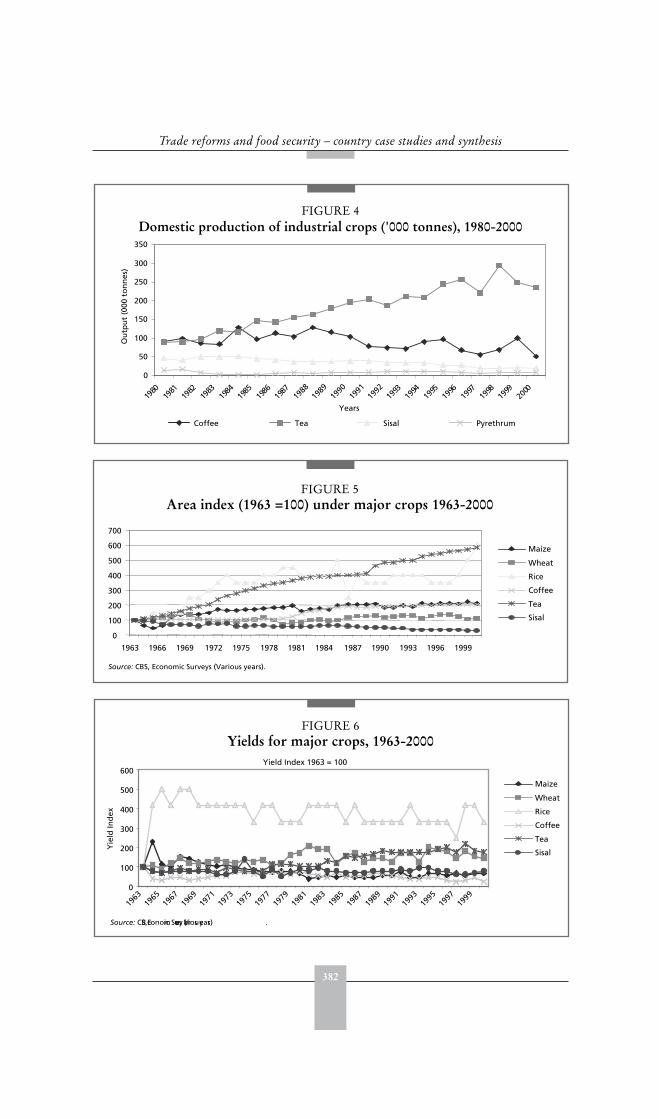
382
Trade reforms and food security – country case studies and synthesis
FIGURE 4Domestic production of industrial crops ('000 tonnes), 1980-2000
0
50
100
150
200
250
300
350
1980
1981
1982
1983
1984
1985
1986
1987
1988
1989
1990
1991
1992
1993
1994
1995
1996
1997
1998
1999
2000
Years
Ou
tpu
t (0
00 t
on
nes
)
Coffee Tea Sisal Pyrethrum
FIGURE 5Area index (1963 =100) under major crops 1963-2000
0
100
200
300
400
500
600
700
1963 1966 1969 1972 1975 1978 1981 1984 1987 1990 1993 1996 1999
Maize
Wheat
Rice
Coffee
Tea
Sisal
Source: CBS, Economic Surveys (Various years).
FIGURE 6Yields for major crops, 1963-2000
Source: CBS, Economic Surveys (Various years) .
Yield Index 1963 = 100
0
100
200
300
400
500
600
1963
1965
1967
1969
1971
1973
1975
1977
1979
1981
1983
1985
1987
1989
1991
1993
1995
1997
1999
Yie
ld In
dex
Maize
Wheat
Rice
Coffee
Tea
Sisal
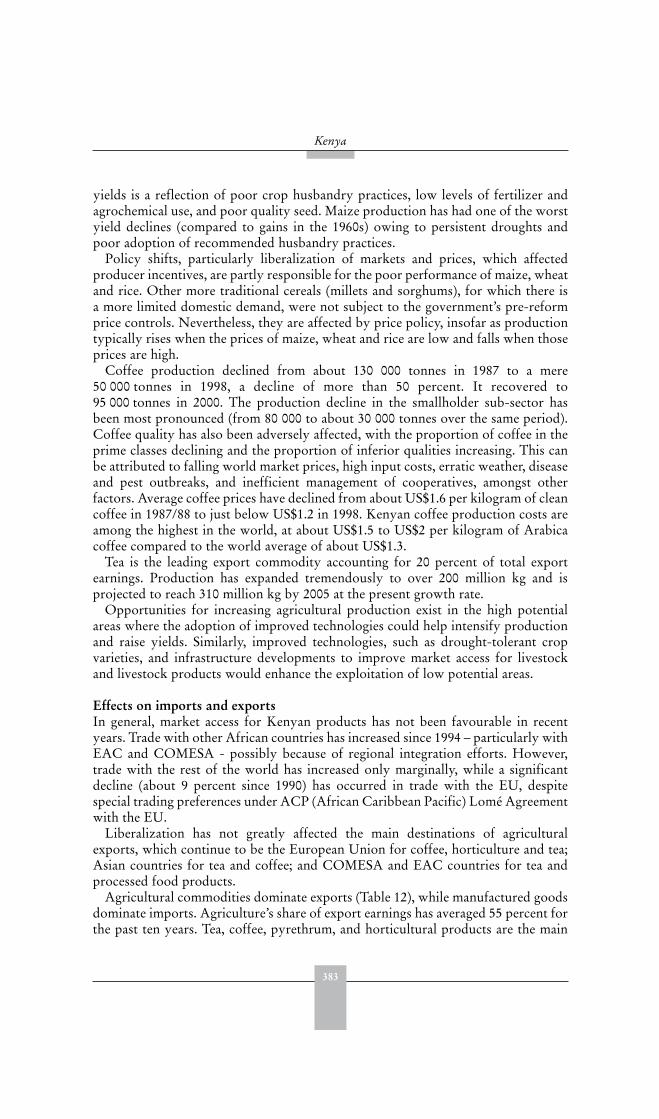
383
Kenya
yields is a reflection of poor crop husbandry practices, low levels of fertilizer andagrochemical use, and poor quality seed. Maize production has had one of the worstyield declines (compared to gains in the 1960s) owing to persistent droughts andpoor adoption of recommended husbandry practices.
Policy shifts, particularly liberalization of markets and prices, which affectedproducer incentives, are partly responsible for the poor performance of maize, wheatand rice. Other more traditional cereals (millets and sorghums), for which there isa more limited domestic demand, were not subject to the government’s pre-reformprice controls. Nevertheless, they are affected by price policy, insofar as productiontypically rises when the prices of maize, wheat and rice are low and falls when thoseprices are high.
Coffee production declined from about 130 000 tonnes in 1987 to a mere50 000 tonnes in 1998, a decline of more than 50 percent. It recovered to95 000 tonnes in 2000. The production decline in the smallholder sub-sector hasbeen most pronounced (from 80 000 to about 30 000 tonnes over the same period).Coffee quality has also been adversely affected, with the proportion of coffee in theprime classes declining and the proportion of inferior qualities increasing. This canbe attributed to falling world market prices, high input costs, erratic weather, diseaseand pest outbreaks, and inefficient management of cooperatives, amongst otherfactors. Average coffee prices have declined from about US$1.6 per kilogram of cleancoffee in 1987/88 to just below US$1.2 in 1998. Kenyan coffee production costs areamong the highest in the world, at about US$1.5 to US$2 per kilogram of Arabicacoffee compared to the world average of about US$1.3.
Tea is the leading export commodity accounting for 20 percent of total exportearnings. Production has expanded tremendously to over 200 million kg and isprojected to reach 310 million kg by 2005 at the present growth rate.
Opportunities for increasing agricultural production exist in the high potentialareas where the adoption of improved technologies could help intensify productionand raise yields. Similarly, improved technologies, such as drought-tolerant cropvarieties, and infrastructure developments to improve market access for livestockand livestock products would enhance the exploitation of low potential areas.
Effects on imports and exports In general, market access for Kenyan products has not been favourable in recentyears. Trade with other African countries has increased since 1994 – particularly withEAC and COMESA - possibly because of regional integration efforts. However,trade with the rest of the world has increased only marginally, while a significantdecline (about 9 percent since 1990) has occurred in trade with the EU, despitespecial trading preferences under ACP (African Caribbean Pacific) Lomé Agreementwith the EU.
Liberalization has not greatly affected the main destinations of agriculturalexports, which continue to be the European Union for coffee, horticulture and tea;Asian countries for tea and coffee; and COMESA and EAC countries for tea andprocessed food products.
Agricultural commodities dominate exports (Table 12), while manufactured goodsdominate imports. Agriculture’s share of export earnings has averaged 55 percent forthe past ten years. Tea, coffee, pyrethrum, and horticultural products are the main
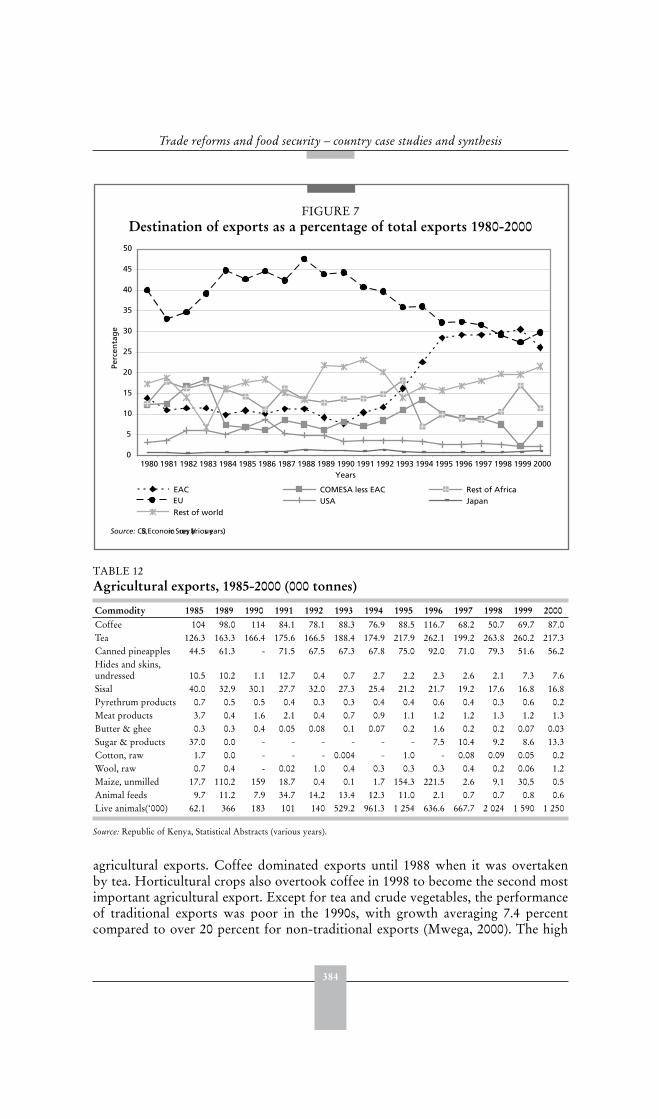
384
Trade reforms and food security – country case studies and synthesis
agricultural exports. Coffee dominated exports until 1988 when it was overtakenby tea. Horticultural crops also overtook coffee in 1998 to become the second mostimportant agricultural export. Except for tea and crude vegetables, the performanceof traditional exports was poor in the 1990s, with growth averaging 7.4 percentcompared to over 20 percent for non-traditional exports (Mwega, 2000). The high
FIGURE 7Destination of exports as a percentage of total exports 1980-2000
Source: CBS, Economic Surveys (Various years).
0
5
10
15
20
25
30
35
40
45
50
1980 1981 1982 1983 1984 1985 1986 1987 1988 1989 1990 1991 1992 1993 1994 1995 1996 1997 1998 1999 2000Years
Perc
enta
ge
EAC COMESA less EAC Rest of AfricaEU USA JapanRest of world
TABLE 12 Agricultural exports, 1985-2000 (000 tonnes)
Commodity 1985 1989 1990 1991 1992 1993 1994 1995 1996 1997 1998 1999 2000Coffee 104 98.0 114 84.1 78.1 88.3 76.9 88.5 116.7 68.2 50.7 69.7 87.0Tea 126.3 163.3 166.4 175.6 166.5 188.4 174.9 217.9 262.1 199.2 263.8 260.2 217.3Canned pineapples 44.5 61.3 - 71.5 67.5 67.3 67.8 75.0 92.0 71.0 79.3 51.6 56.2Hides and skins,undressed 10.5 10.2 1.1 12.7 0.4 0.7 2.7 2.2 2.3 2.6 2.1 7.3 7.6Sisal 40.0 32.9 30.1 27.7 32.0 27.3 25.4 21.2 21.7 19.2 17.6 16.8 16.8Pyrethrum products 0.7 0.5 0.5 0.4 0.3 0.3 0.4 0.4 0.6 0.4 0.3 0.6 0.2Meat products 3.7 0.4 1.6 2.1 0.4 0.7 0.9 1.1 1.2 1.2 1.3 1.2 1.3Butter & ghee 0.3 0.3 0.4 0.05 0.08 0.1 0.07 0.2 1.6 0.2 0.2 0.07 0.03Sugar & products 37.0 0.0 - - - - - - 7.5 10.4 9.2 8.6 13.3Cotton, raw 1.7 0.0 - - - 0.004 - 1.0 - 0.08 0.09 0.05 0.2Wool, raw 0.7 0.4 - 0.02 1.0 0.4 0.3 0.3 0.3 0.4 0.2 0.06 1.2Maize, unmilled 17.7 110.2 159 18.7 0.4 0.1 1.7 154.3 221.5 2.6 9.1 30.5 0.5Animal feeds 9.7 11.2 7.9 34.7 14.2 13.4 12.3 11.0 2.1 0.7 0.7 0.8 0.6Live animals(‘000) 62.1 366 183 101 140 529.2 961.3 1 254 636.6 667.7 2 024 1 590 1 250
Source: Republic of Kenya, Statistical Abstracts (various years).
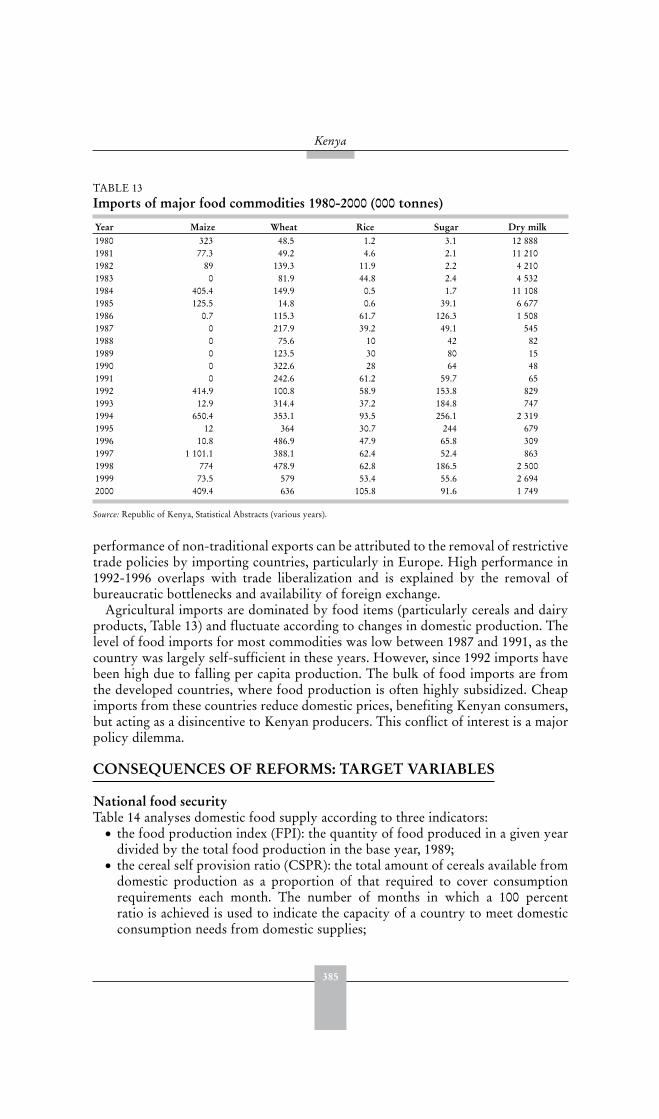
385
Kenya
performance of non-traditional exports can be attributed to the removal of restrictivetrade policies by importing countries, particularly in Europe. High performance in1992-1996 overlaps with trade liberalization and is explained by the removal ofbureaucratic bottlenecks and availability of foreign exchange.
Agricultural imports are dominated by food items (particularly cereals and dairyproducts, Table 13) and fluctuate according to changes in domestic production. Thelevel of food imports for most commodities was low between 1987 and 1991, as thecountry was largely self-sufficient in these years. However, since 1992 imports havebeen high due to falling per capita production. The bulk of food imports are fromthe developed countries, where food production is often highly subsidized. Cheapimports from these countries reduce domestic prices, benefiting Kenyan consumers,but acting as a disincentive to Kenyan producers. This conflict of interest is a majorpolicy dilemma.
CONSEQUENCES OF REFORMS: TARGET VARIABLES
National food securityTable 14 analyses domestic food supply according to three indicators:
the food production index (FPI): the quantity of food produced in a given yeardivided by the total food production in the base year, 1989;the cereal self provision ratio (CSPR): the total amount of cereals available fromdomestic production as a proportion of that required to cover consumptionrequirements each month. The number of months in which a 100 percentratio is achieved is used to indicate the capacity of a country to meet domesticconsumption needs from domestic supplies;
TABLE 13 Imports of major food commodities 1980-2000 (000 tonnes)
Year Maize Wheat Rice Sugar Dry milk1980 323 48.5 1.2 3.1 12 8881981 77.3 49.2 4.6 2.1 11 2101982 89 139.3 11.9 2.2 4 2101983 0 81.9 44.8 2.4 4 5321984 405.4 149.9 0.5 1.7 11 1081985 125.5 14.8 0.6 39.1 6 6771986 0.7 115.3 61.7 126.3 1 5081987 0 217.9 39.2 49.1 5451988 0 75.6 10 42 821989 0 123.5 30 80 151990 0 322.6 28 64 481991 0 242.6 61.2 59.7 651992 414.9 100.8 58.9 153.8 8291993 12.9 314.4 37.2 184.8 7471994 650.4 353.1 93.5 256.1 2 3191995 12 364 30.7 244 6791996 10.8 486.9 47.9 65.8 3091997 1 101.1 388.1 62.4 52.4 8631998 774 478.9 62.8 186.5 2 5001999 73.5 579 53.4 55.6 2 6942000 409.4 636 105.8 91.6 1 749
Source: Republic of Kenya, Statistical Abstracts (various years).
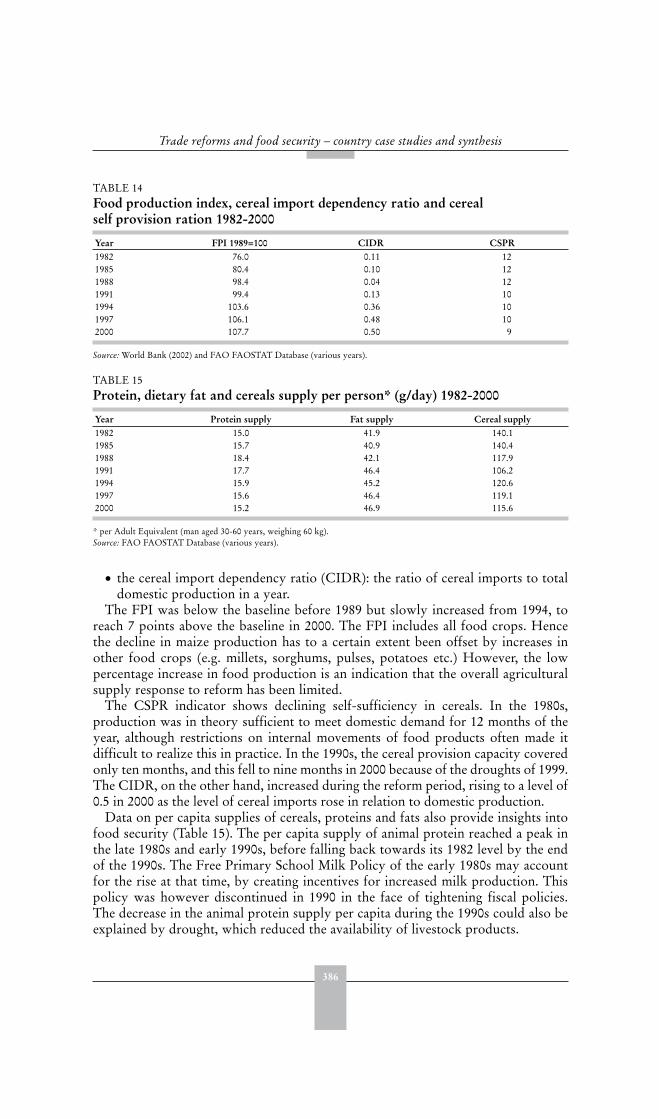
386
Trade reforms and food security – country case studies and synthesis
the cereal import dependency ratio (CIDR): the ratio of cereal imports to totaldomestic production in a year.
The FPI was below the baseline before 1989 but slowly increased from 1994, toreach 7 points above the baseline in 2000. The FPI includes all food crops. Hencethe decline in maize production has to a certain extent been offset by increases inother food crops (e.g. millets, sorghums, pulses, potatoes etc.) However, the lowpercentage increase in food production is an indication that the overall agriculturalsupply response to reform has been limited.
The CSPR indicator shows declining self-sufficiency in cereals. In the 1980s,production was in theory sufficient to meet domestic demand for 12 months of theyear, although restrictions on internal movements of food products often made itdifficult to realize this in practice. In the 1990s, the cereal provision capacity coveredonly ten months, and this fell to nine months in 2000 because of the droughts of 1999.The CIDR, on the other hand, increased during the reform period, rising to a level of0.5 in 2000 as the level of cereal imports rose in relation to domestic production.
Data on per capita supplies of cereals, proteins and fats also provide insights intofood security (Table 15). The per capita supply of animal protein reached a peak inthe late 1980s and early 1990s, before falling back towards its 1982 level by the endof the 1990s. The Free Primary School Milk Policy of the early 1980s may accountfor the rise at that time, by creating incentives for increased milk production. Thispolicy was however discontinued in 1990 in the face of tightening fiscal policies.The decrease in the animal protein supply per capita during the 1990s could also beexplained by drought, which reduced the availability of livestock products.
TABLE 14 Food production index, cereal import dependency ratio and cereal self provision ration 1982-2000
Year FPI 1989=100 CIDR CSPR1982 76.0 0.11 121985 80.4 0.10 121988 98.4 0.04 121991 99.4 0.13 101994 103.6 0.36 101997 106.1 0.48 102000 107.7 0.50 9
Source: World Bank (2002) and FAO FAOSTAT Database (various years).
TABLE 15 Protein, dietary fat and cereals supply per person* (g/day) 1982-2000
Year Protein supply Fat supply Cereal supply1982 15.0 41.9 140.11985 15.7 40.9 140.41988 18.4 42.1 117.91991 17.7 46.4 106.21994 15.9 45.2 120.61997 15.6 46.4 119.12000 15.2 46.9 115.6
* per Adult Equivalent (man aged 30-60 years, weighing 60 kg).Source: FAO FAOSTAT Database (various years).

387
Kenya
The dietary fat supply per person increased at a slow rate in both the pre-reformand post-reform periods. This increase is attributed to the consumption of fats inurban centres, with large importations meeting this demand. The percentage of totalfood expenditure spent on oils and fats is limited to 6.7 percent for the urban poorand 6.3 percent for the non-poor.
Per capita cereal supply decreased in both the pre-reform and post-reform periods.The decline in availability is partly explained by the decline in maize, wheat and riceproduction.
Food import capacityThe country depends on food imports, especially for maize, wheat, rice and sugar.It has become much less self-sufficient during the 1990s and imports have increasedsignificantly. However, the capacity to import has declined because of the poorperformance of exports. The ratios of the value of imports to the value of totalexports and to the value of agricultural exports have increased as the country hasspent an increasing proportion of its export earnings on food imports (Table 16),limiting resources available for importing goods useful for investment in long-termdevelopment.
Trends in the incidence of malnutrition The malnutrition level measured using the percentage of stunted children shows adecrease between 1982 and 1987 (except in Coast Province) and an increase between1987 and 1997 for all provinces (except for Coast and Nyanza). The stunting trend,
TABLE 16 National food security indicators, 1980-2000
Year Per capita food production (kg)
Self sufficiency ratio (%)
Ratio of value of food imports to agricultural exports
Ratio of value of food imports to total exports
1980 25.4 0.74 0.21 0.091981 25.8 1.60 0.12 0.051982 25.0 1.48 0.13 0.071983 26.2 2.13 0.09 0.061984 25.8 0.75 0.19 0.121985 25.9 1.40 0.12 0.081986 27.0 1.45 0.11 0.071987 26.2 1.77 0.12 0.071988 25.4 2.41 0.06 0.041989 25.7 1.57 0.11 0.071990 23.0 0.58 0.15 0.121991 23.4 1.17 0.09 0.061992 21.4 0.54 0.21 0.161993 21.1 0.53 0.11 0.081994 20.7 0.33 0.29 0.191995 23.6 0.97 0.09 0.061996 25.1 0.58 0.14 0.091997 19.9 0.27 0.28 0.191998 21.0 0.36 0.22 0.151999 20.4 0.41 0.15 0.112000 15.4 0.26 0.18 0.15
Source: Kenya, Statistical Abstracts (various years).
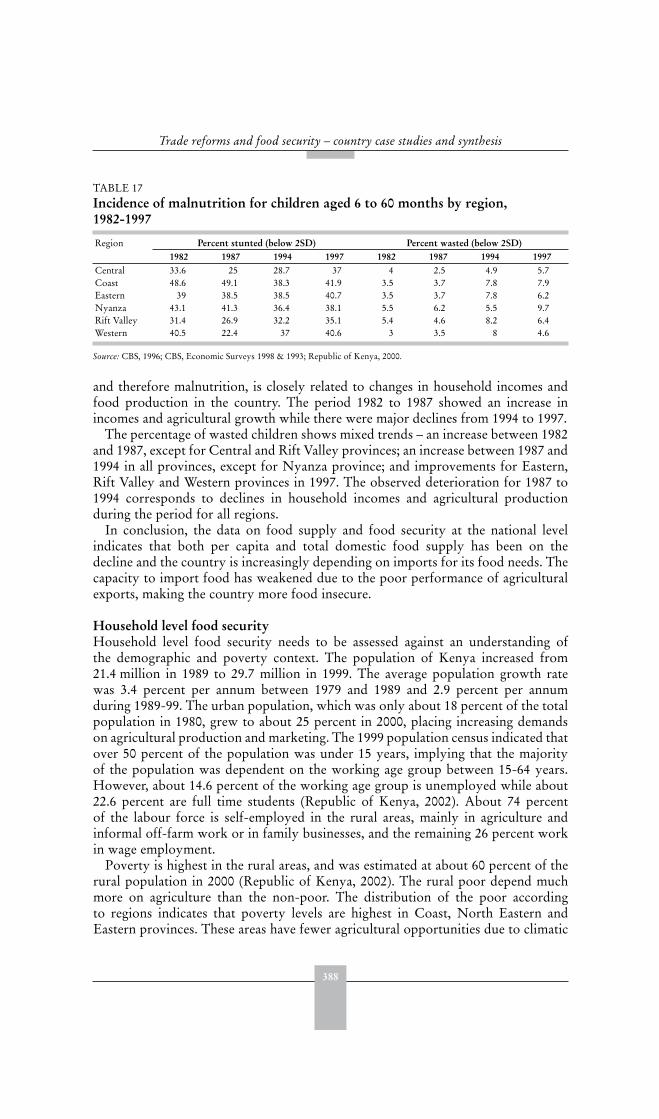
388
Trade reforms and food security – country case studies and synthesis
and therefore malnutrition, is closely related to changes in household incomes andfood production in the country. The period 1982 to 1987 showed an increase inincomes and agricultural growth while there were major declines from 1994 to 1997.
The percentage of wasted children shows mixed trends – an increase between 1982and 1987, except for Central and Rift Valley provinces; an increase between 1987 and1994 in all provinces, except for Nyanza province; and improvements for Eastern,Rift Valley and Western provinces in 1997. The observed deterioration for 1987 to1994 corresponds to declines in household incomes and agricultural productionduring the period for all regions.
In conclusion, the data on food supply and food security at the national levelindicates that both per capita and total domestic food supply has been on thedecline and the country is increasingly depending on imports for its food needs. Thecapacity to import food has weakened due to the poor performance of agriculturalexports, making the country more food insecure.
Household level food securityHousehold level food security needs to be assessed against an understanding ofthe demographic and poverty context. The population of Kenya increased from21.4 million in 1989 to 29.7 million in 1999. The average population growth ratewas 3.4 percent per annum between 1979 and 1989 and 2.9 percent per annumduring 1989-99. The urban population, which was only about 18 percent of the totalpopulation in 1980, grew to about 25 percent in 2000, placing increasing demandson agricultural production and marketing. The 1999 population census indicated thatover 50 percent of the population was under 15 years, implying that the majorityof the population was dependent on the working age group between 15-64 years.However, about 14.6 percent of the working age group is unemployed while about22.6 percent are full time students (Republic of Kenya, 2002). About 74 percentof the labour force is self-employed in the rural areas, mainly in agriculture andinformal off-farm work or in family businesses, and the remaining 26 percent workin wage employment.
Poverty is highest in the rural areas, and was estimated at about 60 percent of therural population in 2000 (Republic of Kenya, 2002). The rural poor depend muchmore on agriculture than the non-poor. The distribution of the poor accordingto regions indicates that poverty levels are highest in Coast, North Eastern andEastern provinces. These areas have fewer agricultural opportunities due to climatic
TABLE 17 Incidence of malnutrition for children aged 6 to 60 months by region, 1982-1997
Region Percent stunted (below 2SD) Percent wasted (below 2SD)1982 1987 1994 1997 1982 1987 1994 1997
Central 33.6 25 28.7 37 4 2.5 4.9 5.7Coast 48.6 49.1 38.3 41.9 3.5 3.7 7.8 7.9Eastern 39 38.5 38.5 40.7 3.5 3.7 7.8 6.2Nyanza 43.1 41.3 36.4 38.1 5.5 6.2 5.5 9.7Rift Valley 31.4 26.9 32.2 35.1 5.4 4.6 8.2 6.4Western 40.5 22.4 37 40.6 3 3.5 8 4.6
Source: CBS, 1996; CBS, Economic Surveys 1998 & 1993; Republic of Kenya, 2000.
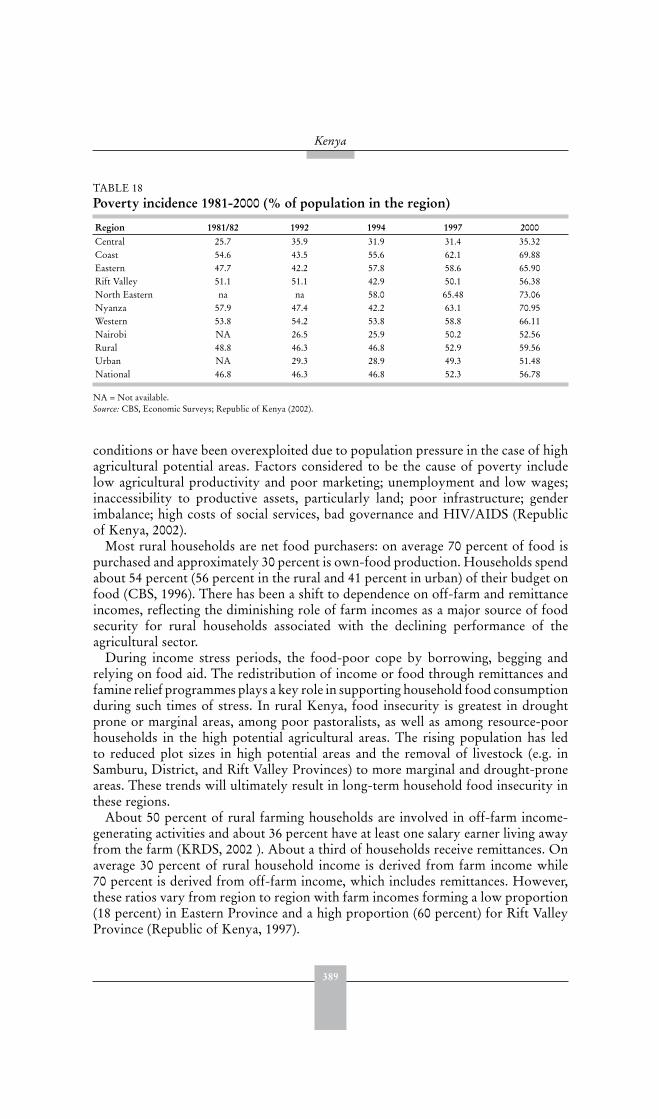
389
Kenya
conditions or have been overexploited due to population pressure in the case of highagricultural potential areas. Factors considered to be the cause of poverty includelow agricultural productivity and poor marketing; unemployment and low wages;inaccessibility to productive assets, particularly land; poor infrastructure; genderimbalance; high costs of social services, bad governance and HIV/AIDS (Republicof Kenya, 2002).
Most rural households are net food purchasers: on average 70 percent of food ispurchased and approximately 30 percent is own-food production. Households spendabout 54 percent (56 percent in the rural and 41 percent in urban) of their budget onfood (CBS, 1996). There has been a shift to dependence on off-farm and remittanceincomes, reflecting the diminishing role of farm incomes as a major source of foodsecurity for rural households associated with the declining performance of theagricultural sector.
During income stress periods, the food-poor cope by borrowing, begging andrelying on food aid. The redistribution of income or food through remittances andfamine relief programmes plays a key role in supporting household food consumptionduring such times of stress. In rural Kenya, food insecurity is greatest in droughtprone or marginal areas, among poor pastoralists, as well as among resource-poorhouseholds in the high potential agricultural areas. The rising population has ledto reduced plot sizes in high potential areas and the removal of livestock (e.g. inSamburu, District, and Rift Valley Provinces) to more marginal and drought-proneareas. These trends will ultimately result in long-term household food insecurity inthese regions.
About 50 percent of rural farming households are involved in off-farm income-generating activities and about 36 percent have at least one salary earner living awayfrom the farm (KRDS, 2002 ). About a third of households receive remittances. Onaverage 30 percent of rural household income is derived from farm income while70 percent is derived from off-farm income, which includes remittances. However,these ratios vary from region to region with farm incomes forming a low proportion(18 percent) in Eastern Province and a high proportion (60 percent) for Rift ValleyProvince (Republic of Kenya, 1997).
TABLE 18 Poverty incidence 1981-2000 (% of population in the region)
Region 1981/82 1992 1994 1997 2000Central 25.7 35.9 31.9 31.4 35.32Coast 54.6 43.5 55.6 62.1 69.88Eastern 47.7 42.2 57.8 58.6 65.90Rift Valley 51.1 51.1 42.9 50.1 56.38North Eastern na na 58.0 65.48 73.06Nyanza 57.9 47.4 42.2 63.1 70.95Western 53.8 54.2 53.8 58.8 66.11Nairobi NA 26.5 25.9 50.2 52.56Rural 48.8 46.3 46.8 52.9 59.56Urban NA 29.3 28.9 49.3 51.48National 46.8 46.3 46.8 52.3 56.78
NA = Not available.Source: CBS, Economic Surveys; Republic of Kenya (2002).
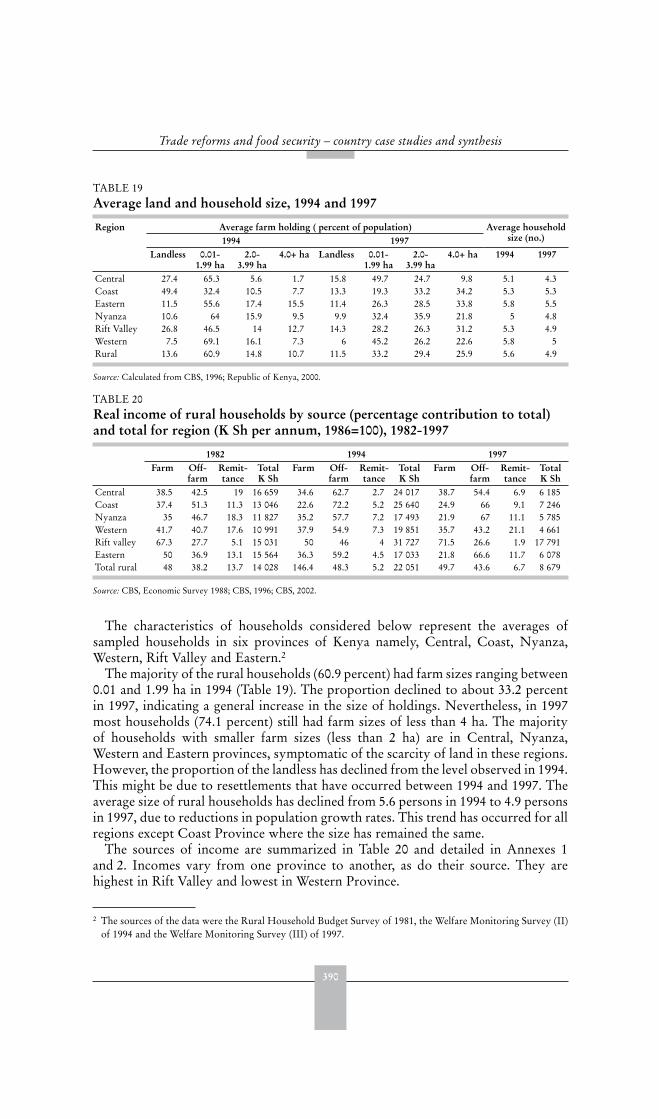
390
Trade reforms and food security – country case studies and synthesis
The characteristics of households considered below represent the averages ofsampled households in six provinces of Kenya namely, Central, Coast, Nyanza,Western, Rift Valley and Eastern.2
The majority of the rural households (60.9 percent) had farm sizes ranging between0.01 and 1.99 ha in 1994 (Table 19). The proportion declined to about 33.2 percentin 1997, indicating a general increase in the size of holdings. Nevertheless, in 1997most households (74.1 percent) still had farm sizes of less than 4 ha. The majorityof households with smaller farm sizes (less than 2 ha) are in Central, Nyanza,Western and Eastern provinces, symptomatic of the scarcity of land in these regions.However, the proportion of the landless has declined from the level observed in 1994.This might be due to resettlements that have occurred between 1994 and 1997. Theaverage size of rural households has declined from 5.6 persons in 1994 to 4.9 personsin 1997, due to reductions in population growth rates. This trend has occurred for allregions except Coast Province where the size has remained the same.
The sources of income are summarized in Table 20 and detailed in Annexes 1and 2. Incomes vary from one province to another, as do their source. They arehighest in Rift Valley and lowest in Western Province.
2 The sources of the data were the Rural Household Budget Survey of 1981, the Welfare Monitoring Survey (II)of 1994 and the Welfare Monitoring Survey (III) of 1997.
TABLE 19 Average land and household size, 1994 and 1997
Region Average farm holding ( percent of population) Average household size (no.)1994 1997
Landless 0.01-1.99 ha
2.0-3.99 ha
4.0+ ha Landless 0.01-1.99 ha
2.0-3.99 ha
4.0+ ha 1994 1997
Central 27.4 65.3 5.6 1.7 15.8 49.7 24.7 9.8 5.1 4.3Coast 49.4 32.4 10.5 7.7 13.3 19.3 33.2 34.2 5.3 5.3Eastern 11.5 55.6 17.4 15.5 11.4 26.3 28.5 33.8 5.8 5.5Nyanza 10.6 64 15.9 9.5 9.9 32.4 35.9 21.8 5 4.8Rift Valley 26.8 46.5 14 12.7 14.3 28.2 26.3 31.2 5.3 4.9Western 7.5 69.1 16.1 7.3 6 45.2 26.2 22.6 5.8 5Rural 13.6 60.9 14.8 10.7 11.5 33.2 29.4 25.9 5.6 4.9
Source: Calculated from CBS, 1996; Republic of Kenya, 2000.
TABLE 20 Real income of rural households by source (percentage contribution to total) and total for region (K Sh per annum, 1986=100), 1982-1997
1982 1994 1997Farm Off-
farmRemit-tance
TotalK Sh
Farm Off-farm
Remit-tance
TotalK Sh
Farm Off-farm
Remit-tance
TotalK Sh
Central 38.5 42.5 19 16 659 34.6 62.7 2.7 24 017 38.7 54.4 6.9 6 185Coast 37.4 51.3 11.3 13 046 22.6 72.2 5.2 25 640 24.9 66 9.1 7 246Nyanza 35 46.7 18.3 11 827 35.2 57.7 7.2 17 493 21.9 67 11.1 5 785Western 41.7 40.7 17.6 10 991 37.9 54.9 7.3 19 851 35.7 43.2 21.1 4 661Rift valley 67.3 27.7 5.1 15 031 50 46 4 31 727 71.5 26.6 1.9 17 791Eastern 50 36.9 13.1 15 564 36.3 59.2 4.5 17 033 21.8 66.6 11.7 6 078Total rural 48 38.2 13.7 14 028 146.4 48.3 5.2 22 051 49.7 43.6 6.7 8 679
Source: CBS, Economic Survey 1988; CBS, 1996; CBS, 2002.
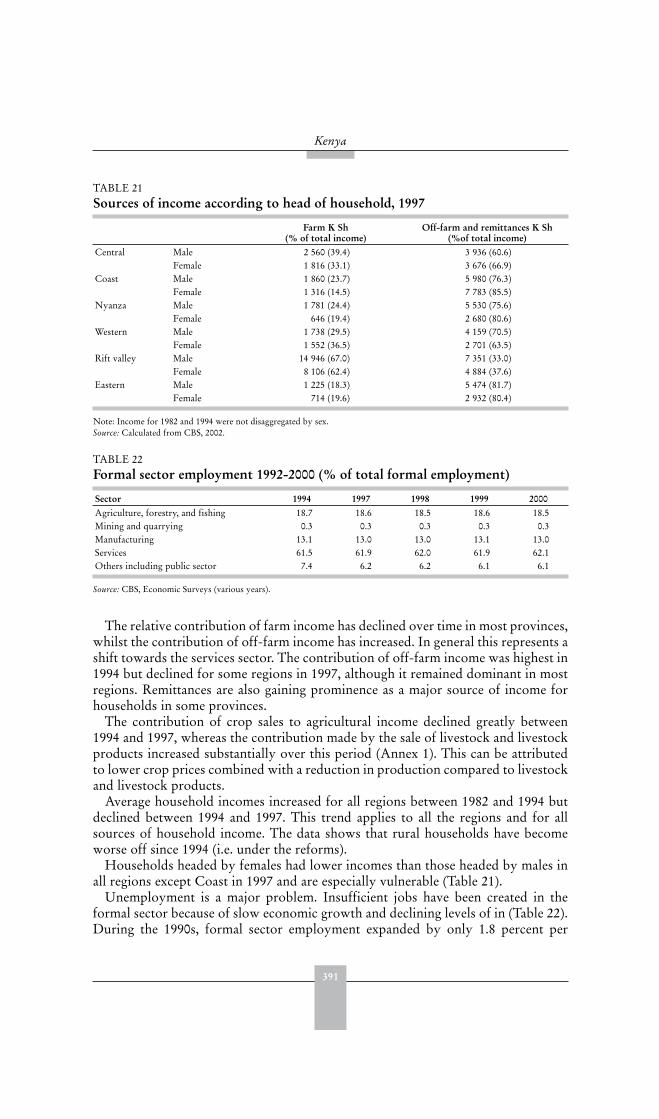
391
Kenya
The relative contribution of farm income has declined over time in most provinces,whilst the contribution of off-farm income has increased. In general this represents ashift towards the services sector. The contribution of off-farm income was highest in1994 but declined for some regions in 1997, although it remained dominant in mostregions. Remittances are also gaining prominence as a major source of income forhouseholds in some provinces.
The contribution of crop sales to agricultural income declined greatly between1994 and 1997, whereas the contribution made by the sale of livestock and livestockproducts increased substantially over this period (Annex 1). This can be attributedto lower crop prices combined with a reduction in production compared to livestockand livestock products.
Average household incomes increased for all regions between 1982 and 1994 butdeclined between 1994 and 1997. This trend applies to all the regions and for allsources of household income. The data shows that rural households have becomeworse off since 1994 (i.e. under the reforms).
Households headed by females had lower incomes than those headed by males inall regions except Coast in 1997 and are especially vulnerable (Table 21).
Unemployment is a major problem. Insufficient jobs have been created in theformal sector because of slow economic growth and declining levels of in (Table 22).During the 1990s, formal sector employment expanded by only 1.8 percent per
TABLE 21 Sources of income according to head of household, 1997
Farm K Sh(% of total income)
Off-farm and remittances K Sh(%of total income)
Central Male 2 560 (39.4) 3 936 (60.6)Female 1 816 (33.1) 3 676 (66.9)
Coast Male 1 860 (23.7) 5 980 (76.3)Female 1 316 (14.5) 7 783 (85.5)
Nyanza Male 1 781 (24.4) 5 530 (75.6)Female 646 (19.4) 2 680 (80.6)
Western Male 1 738 (29.5) 4 159 (70.5)Female 1 552 (36.5) 2 701 (63.5)
Rift valley Male 14 946 (67.0) 7 351 (33.0)Female 8 106 (62.4) 4 884 (37.6)
Eastern Male 1 225 (18.3) 5 474 (81.7)Female 714 (19.6) 2 932 (80.4)
Note: Income for 1982 and 1994 were not disaggregated by sex.Source: Calculated from CBS, 2002.
TABLE 22 Formal sector employment 1992-2000 (% of total formal employment)
Sector 1994 1997 1998 1999 2000Agriculture, forestry, and fishing 18.7 18.6 18.5 18.6 18.5Mining and quarrying 0.3 0.3 0.3 0.3 0.3Manufacturing 13.1 13.0 13.0 13.1 13.0Services 61.5 61.9 62.0 61.9 62.1Others including public sector 7.4 6.2 6.2 6.1 6.1
Source: CBS, Economic Surveys (various years).
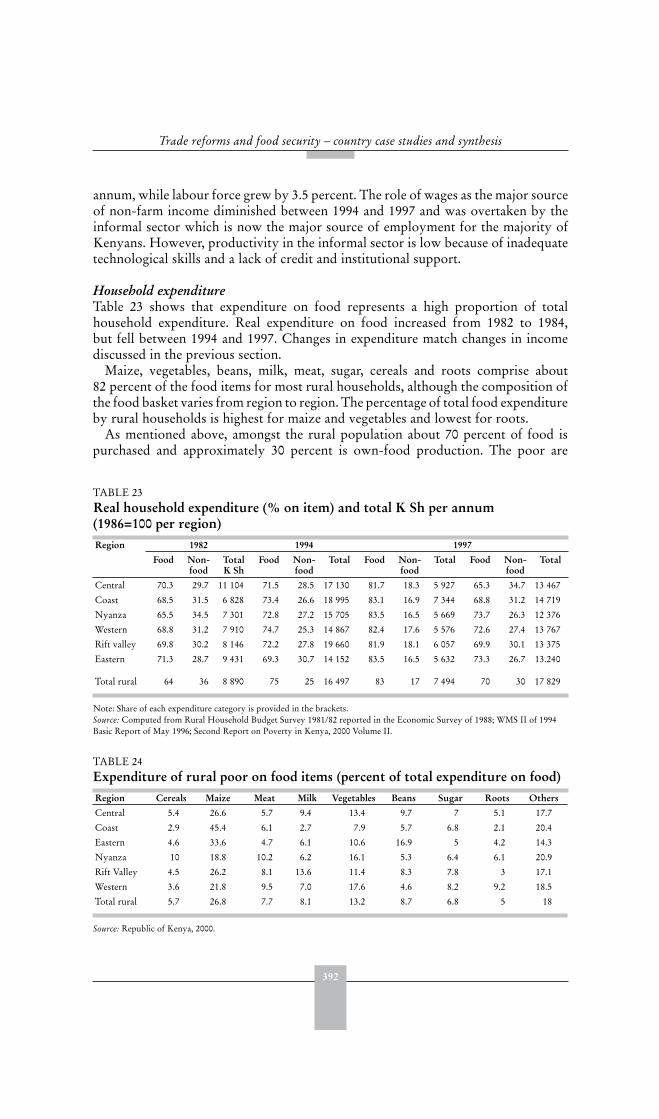
392
Trade reforms and food security – country case studies and synthesis
annum, while labour force grew by 3.5 percent. The role of wages as the major sourceof non-farm income diminished between 1994 and 1997 and was overtaken by theinformal sector which is now the major source of employment for the majority ofKenyans. However, productivity in the informal sector is low because of inadequatetechnological skills and a lack of credit and institutional support.
Household expenditureTable 23 shows that expenditure on food represents a high proportion of totalhousehold expenditure. Real expenditure on food increased from 1982 to 1984,but fell between 1994 and 1997. Changes in expenditure match changes in incomediscussed in the previous section.
Maize, vegetables, beans, milk, meat, sugar, cereals and roots comprise about82 percent of the food items for most rural households, although the composition ofthe food basket varies from region to region. The percentage of total food expenditureby rural households is highest for maize and vegetables and lowest for roots.
As mentioned above, amongst the rural population about 70 percent of food ispurchased and approximately 30 percent is own-food production. The poor are
TABLE 23 Real household expenditure (% on item) and total K Sh per annum (1986=100 per region)Region 1982 1994 1997
Food Non-food
TotalK Sh
Food Non-food
Total Food Non-food
Total Food Non-food
Total
Central 70.3 29.7 11 104 71.5 28.5 17 130 81.7 18.3 5 927 65.3 34.7 13 467
Coast 68.5 31.5 6 828 73.4 26.6 18 995 83.1 16.9 7 344 68.8 31.2 14 719
Nyanza 65.5 34.5 7 301 72.8 27.2 15 705 83.5 16.5 5 669 73.7 26.3 12 376
Western 68.8 31.2 7 910 74.7 25.3 14 867 82.4 17.6 5 576 72.6 27.4 13 767
Rift valley 69.8 30.2 8 146 72.2 27.8 19 660 81.9 18.1 6 057 69.9 30.1 13 375
Eastern 71.3 28.7 9 431 69.3 30.7 14 152 83.5 16.5 5 632 73.3 26.7 13.240
Total rural 64 36 8 890 75 25 16 497 83 17 7 494 70 30 17 829
Note: Share of each expenditure category is provided in the brackets.Source: Computed from Rural Household Budget Survey 1981/82 reported in the Economic Survey of 1988; WMS II of 1994Basic Report of May 1996; Second Report on Poverty in Kenya, 2000 Volume II.
TABLE 24 Expenditure of rural poor on food items (percent of total expenditure on food)Region Cereals Maize Meat Milk Vegetables Beans Sugar Roots Others
Central 5.4 26.6 5.7 9.4 13.4 9.7 7 5.1 17.7
Coast 2.9 45.4 6.1 2.7 7.9 5.7 6.8 2.1 20.4
Eastern 4.6 33.6 4.7 6.1 10.6 16.9 5 4.2 14.3
Nyanza 10 18.8 10.2 6.2 16.1 5.3 6.4 6.1 20.9
Rift Valley 4.5 26.2 8.1 13.6 11.4 8.3 7.8 3 17.1
Western 3.6 21.8 9.5 7.0 17.6 4.6 8.2 9.2 18.5
Total rural 5.7 26.8 7.7 8.1 13.2 8.7 6.8 5 18
Source: Republic of Kenya, 2000.
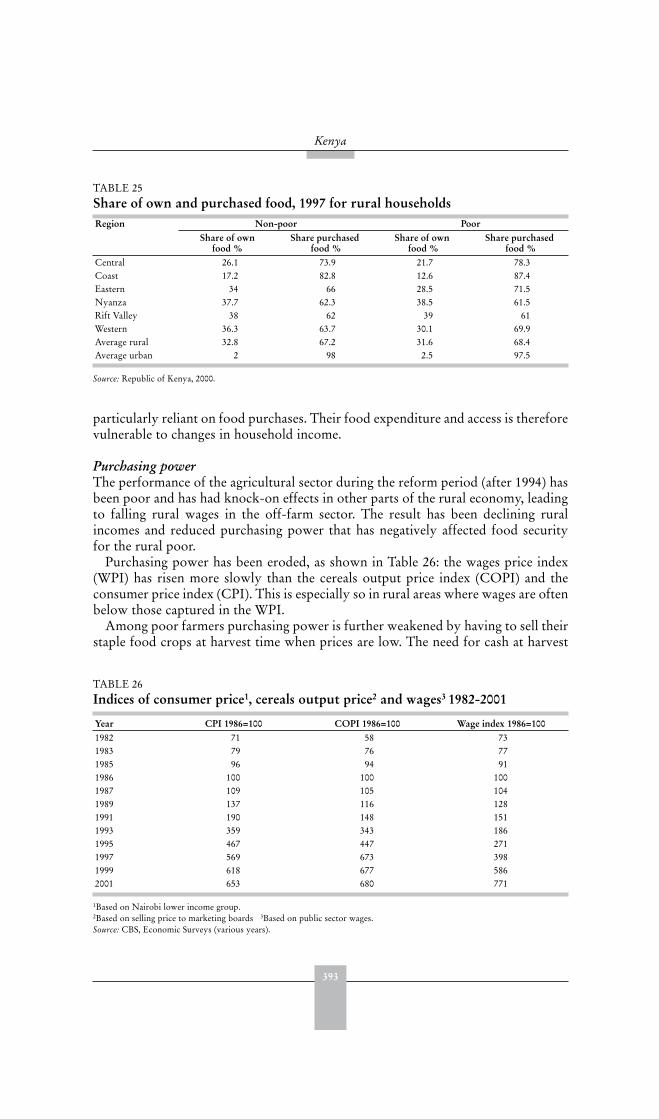
393
Kenya
particularly reliant on food purchases. Their food expenditure and access is thereforevulnerable to changes in household income.
Purchasing powerThe performance of the agricultural sector during the reform period (after 1994) hasbeen poor and has had knock-on effects in other parts of the rural economy, leadingto falling rural wages in the off-farm sector. The result has been declining ruralincomes and reduced purchasing power that has negatively affected food securityfor the rural poor.
Purchasing power has been eroded, as shown in Table 26: the wages price index(WPI) has risen more slowly than the cereals output price index (COPI) and theconsumer price index (CPI). This is especially so in rural areas where wages are oftenbelow those captured in the WPI.
Among poor farmers purchasing power is further weakened by having to sell theirstaple food crops at harvest time when prices are low. The need for cash at harvest
TABLE 25 Share of own and purchased food, 1997 for rural householdsRegion Non-poor Poor
Share of own food %
Share purchased food %
Share of own food %
Share purchased food %
Central 26.1 73.9 21.7 78.3Coast 17.2 82.8 12.6 87.4Eastern 34 66 28.5 71.5Nyanza 37.7 62.3 38.5 61.5Rift Valley 38 62 39 61Western 36.3 63.7 30.1 69.9Average rural 32.8 67.2 31.6 68.4Average urban 2 98 2.5 97.5
Source: Republic of Kenya, 2000.
TABLE 26 Indices of consumer price1, cereals output price2 and wages3 1982-2001
Year CPI 1986=100 COPI 1986=100 Wage index 1986=1001982 71 58 731983 79 76 771985 96 94 911986 100 100 1001987 109 105 1041989 137 116 1281991 190 148 1511993 359 343 1861995 467 447 2711997 569 673 3981999 618 677 5862001 653 680 771
1Based on Nairobi lower income group. 2Based on selling price to marketing boards 3Based on public sector wages.Source: CBS, Economic Surveys (various years).
394
Trade reforms and food security – country case studies and synthesis
time, a lack of storage capacity, and the small size of their harvest, means that thosesame farmers face high prices when buying food in the deficit season.
POLICY LESSONS
The major problems hampering economic growth in Kenya include an unstablemacroeconomic environment, especially with regards to inflation, exchange ratesand balance of payments; risks and inefficiencies in the financial sector; decreasingand unsustainable real wages; a lack of social safety nets and a poorly performingagricultural sector.
Macroeconomic policy needs to provide a stable economic environment to fosterprivate sector development and investment. Microeconomic policies need to focus onstimulating domestic and external trade, inducing technological change to increaseproductivity, reducing the dominant role of public corporations (parastatals) in favourof private sector enterprises, and encouraging development of strategic industries.
Policy makers need to commit themselves to reviving the fortunes of the agriculturalsector. Agriculture continues to be a major sector in terms of generating incomes andemployment for rural households and contributing to economic growth, foreignexchange earnings and industrialization. The linkages between the performance ofthe agricultural sector and household incomes indicate that when the performanceof the sector is poor, household incomes are also low. This is because, although therole of agriculture in its direct contribution to household incomes is diminishing, theclose linkages between rural off-farm job opportunities (such as in agroprocessing,farm input supply and other goods and services) and the agricultural sector ensurethat agriculture still plays a leading role in the welfare of rural households, especiallythe poor.
The poor are concentrated in both marginal and over-exploited high agriculturalpotential areas. Strategies that enhance agricultural productivity and production inboth these areas are needed to support the food security status of the rural poor. Forexample, despite some improvements in input marketing, input use by smallholdersremains low owing to high prices and a lack of credit – constraints that may havebeen worsened by reform.
Efforts have been made to improve food security by maintaining strategic foodreserves, but this has not prevented a deterioration of food security. Agriculturalexports help finance the growing need for food imports. Appropriate agriculturaltrade policy is therefore important. High dependence on a few key exportcommodities and small number of trading partners creates risks. Policy makers needto help reduce the risks by encouraging diversification, as well as promoting greaterproductivity in more traditional export sub-sectors, which have performed poorlyin recent years.
The response of agricultural production towards policy reforms has unfortunatelybeen dismal. Climatic factors and unstable world market prices have played arole, but the major problems appear to be policy related. There has been poorcoordination and sequencing of policies and a lack of commitment. Kenya hasequated liberalization and privatization with an abdication of governmentresponsibility for economic development. However, after years of governmentmonopolies in production and marketing, private entrepreneurs lack the ability
395
Kenya
to take over. These problems need to be addressed if Kenya is to benefit from thereform process.
REFERENCES
CBS (Central Bureau of Statistics). Various years. Economic Surveys. Nairobi.CBS (Central Bureau of Statistics). 1996 . Welfare Monitoring Survey II of 1994. Nairobi.CBS (Central Bureau of Statistics). 2002. Welfare Monitoring Survey III of 1997. Draft
Report of July. Unpublished.CBK (Central Bank of Kenya). 2000. Statistical Bulletin. CBK, Nairobi.FAO. Various years. FAOSTAT Database www.fao.org/faostat.Ikiara. G. K., Juma, M.A. & Amadi, J.O. 1993. Agricultural decline, politics and structural
adjustment in Kenya. In P. Gibbons, ed. Social change and Economic Reform in Africa.Nordiska Africaintitueta, Uppsala.
IMF (International Monetary Fund). IFS (International Financial Statistics). DatabaseVarious years. http//ifs.apd.net.
Jayne, T.S., Argwings-Kodhek Gem, Nyambane, Gerald & Yamano, T. 1998. Baseline
characteristics of smallholder agriculture and non-farm activity for selected districts in
Kenya. Tegemeo Institute of Agricultural Policy and Development, Egerton University.Conference on Strategies for Raising Smallholder Agricultural Productivity and Welfare.
Kariuki, J.G. 2001. Study on development strategy for the East African community.Unpublished Country Report, Kenya. Nairobi.
KRDS (Kenya Rural Development Strategy). 2002. Unpublished Report. Ministry ofAgriculture, Nairobi, Kenya.
Mwega, F.M. 2000. The GATT//WTO agreements, domestic trade policies and external
market access: the Kenyan case. Paper presented during AERC-KIPPRA Workshop onWTO Agreements, September 11-12, Nairobi.
Ndung’u, N.S. 1997. Price and exchange rate dynamics in Kenya: An empirical investigation
(1970-1999). AERC Discussion Paper 58. African Economic Research Consortium.Nairobi.
Nyangito, H.O. 2001a. Policy and legal framework for the coffee sub sector and the impact
of liberalization in Kenya. Kenya Institute for Public Policy Research and Analysis(KIPPRA). Policy Paper No. 1. Nairobi.
Nyangito, H.O. 2001b. Policy and legal framework for the tea sub sector and the impact
of liberalization in Kenya. Kenya Institute for Public Policy Research and Analysis(KIPPRA) Policy Paper No. 2. Nairobi.
Republic of Kenya. Various years. Statistical Abstracts. Nairobi.Republic of Kenya. 1997. The Second Participatory Poverty Assessment Study-Kenya -Vol.I.
Nairobi.Republic of Kenya, 2000. The Second Participatory Poverty Assessment Study-Kenya-Vol.II.
Nairobi.Republic of Kenya. 2002. Poverty Reduction Strategy paper (PRSP). NairobiSwamy, G. 1994. Kenya; patchy, intermitted commitment. In Husain, I. & Farugee, R. eds.
Adjustment in Africa Lessons from Country Case Studies. World Bank. Washington, DC.Oxford University Press.
World Bank. 2002. African Development Indicators, World Bank, Washington, DC.WTO. 2000. Trade Policy Review, Kenya 2000. WTO, Geneva.

396
Trade reforms and food security – country case studies and synthesis
ANNEX I
Average agricultural income perannum by activity (% contribution)
for region and total(K Sh 1986=100)
Region 1982 1994 1997Total
income K Sh
Totalcrop
income
Live-stocksales
Live-stockprods.
Otherincome
Ownconsump-
tion
Totalagricul-
turalincome
Totalcrop
income
Live-stocksales
Live-stockprods.
Otherincome
Totalagricul-
turalincome
Central 6 410 50 10 5 1 35 8 310 31 23 45 1 2 394.526Coast 4 876 54 12 2 1 31 5 791 16 56 12 17 1 801.053Nyanza 4 142 27 26 2 1 43 6 149 20 38 16 26 1 265.684Western 4 578 38 21 7 1 33 7 514 19 38 22 21 1 665.053Rift valley 10 112 36 18 6 1 39 15 853 3 14 82 2 1 2727.16Eastern 77 830 24 30 4 2 40 6 190 22 46 22 10 1 323.579
Own consumption: includes income forgone from crop, livestock and livestock products produced for subsistence.Other farm income includes land sales, interest, sale of home brewed beer/wine, sale of crop products like flour, fishing, etc.
The 1982 statistics did not disaggregate income into various categories.Source: Calculated from CBS, Economic Survey 1988; CBS, 1996; Republic of Kenya, 2000.
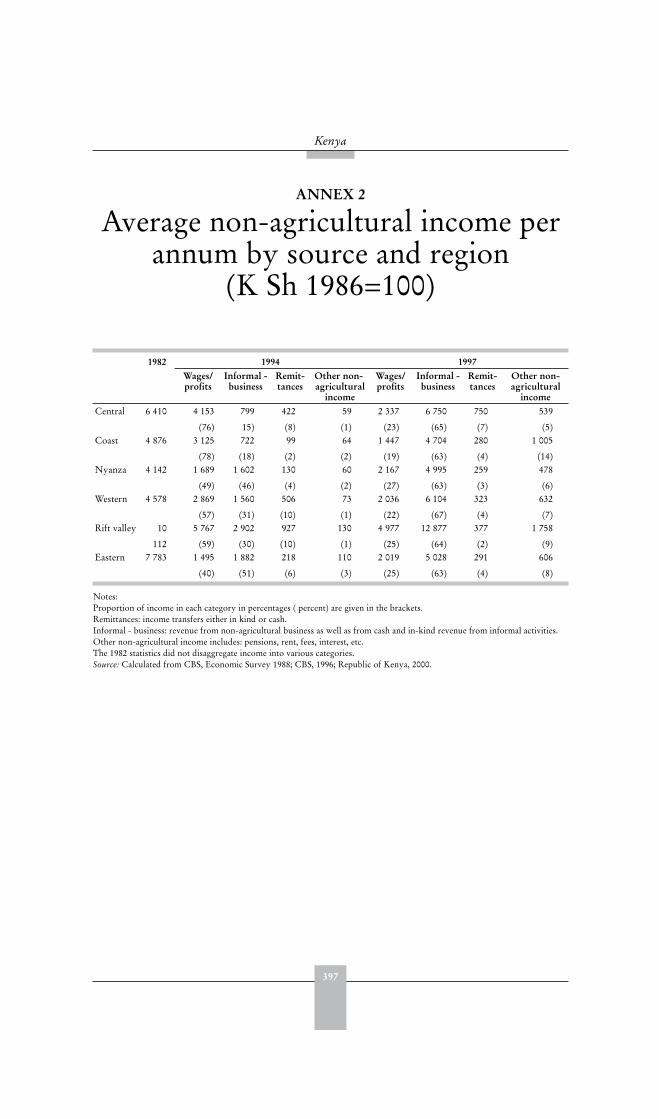
397
Kenya
ANNEX 2
Average non-agricultural income perannum by source and region
(K Sh 1986=100)
1982 1994 1997Wages/profits
Informal - business
Remit-tances
Other non- agricultural
income
Wages/profits
Informal -business
Remit-tances
Other non-agricultural
incomeCentral 6 410 4 153
(76)
799
15)
422
(8)
59
(1)
2 337
(23)
6 750
(65)
750
(7)
539
(5)Coast 4 876 3 125
(78)
722
(18)
99
(2)
64
(2)
1 447
(19)
4 704
(63)
280
(4)
1 005
(14)Nyanza 4 142 1 689
(49)
1 602
(46)
130
(4)
60
(2)
2 167
(27)
4 995
(63)
259
(3)
478
(6)Western 4 578 2 869
(57)
1 560
(31)
506
(10)
73
(1)
2 036
(22)
6 104
(67)
323
(4)
632
(7)Rift valley 10
112
5 767
(59)
2 902
(30)
927
(10)
130
(1)
4 977
(25)
12 877
(64)
377
(2)
1 758
(9)Eastern 7 783 1 495
(40)
1 882
(51)
218
(6)
110
(3)
2 019
(25)
5 028
(63)
291
(4)
606
(8)
Notes:Proportion of income in each category in percentages ( percent) are given in the brackets.Remittances: income transfers either in kind or cash.Informal - business: revenue from non-agricultural business as well as from cash and in-kind revenue from informal activities.Other non-agricultural income includes: pensions, rent, fees, interest, etc.The 1982 statistics did not disaggregate income into various categories.Source: Calculated from CBS, Economic Survey 1988; CBS, 1996; Republic of Kenya, 2000.
399
MalawiEphraim W. Chirwa and Christina Zakeyo1
EXECUTIVE SUMMARY
Pre-reformIn the 1960s and 1970s, the Malawian economy grew at an average rate of 6 percentper annum. During this period, the marketing of smallholder agricultural producewas controlled by the state marketing agency, ADMARC. Prices were pan-territorial, pan-seasonal and pre-announced. There was a network of agriculturalextension services and subsidized credit and inputs to smallholder farmers.
Negative economic growth rates in 1980 and 1981 followed a crisis triggered bythe oil shock of 1979, an international transport bottleneck due to the civil war inMozambique and the structural rigidities of the economy.
The reformsThe economic crisis resulted in the adoption of a series of structural adjustmentloans. The reforms were slow initially, involving periodic adjustment in output andinput prices. Major economic reforms took place between 1987 and 1995. Most ofthe policies targeted the agricultural sector, notably deregulation of agriculturalmarketing activities in 1987, removal of fertilizer subsidies between 1984 and 1992,deregulation of smallholder crop production by 1992, devaluation of the Malawikwacha (MK) and its eventual flotation in 1994, and the liberalization of pricesfrom 1995/96. These policies were reinforced by other economic reforms, such asremoval of trade barriers, liberalization of the financial sector and interest rates, andimplementation of trade agreements.
Impact on intermediate variablesReal prices for tradable commodities fell substantially and although changes inthe exchange rate had a positive impact on real domestic prices, these were morethan offset by the negative effects of international prices and the poor mix ofother economic policies. The degree of market integration increased, particularlyfor cash food crops in which private sector participation in marketing was high,and for commodities whose prices were completely liberalized. Improvement inthe integration of maize markets, a commodity in which price controls were stillmaintained, was marginal.
1 Ephraim W. Chirwa, University of Malawi, Chancellor College, and Christina Zakeyo, Ministry of Commerceand Industry, Malawi.
400
Trade reforms and food security – country case studies and synthesis
While both international and domestic prices have been declining, the productionof Malawi’s main crops has, surprisingly, been increasing. This may be the result ofsmallholder farmers expanding their production to maintain a target level of incomeor consumption. Smallholder farmers continue to face credit constraints, exacerbatedby the collapse of the government administered Smallholder Agricultural CreditAdministration in 1992.
The structure and composition of agricultural exports did not change. Exportearnings in dollar terms have declined and agricultural exports remain dominated bytobacco, tea and sugar.
Impact on target variablesThe analysis suggests that economic reforms have had little impact on improving thefood security of rural households. Per capita food and nutrient supply increased, butthe supply of the main staple, maize, declined. The structure of production remainsthe same; diets are still dominated by maize consumption; real expenditures, andhence real incomes, have declined; producer prices and international prices havefallen; the nutritional status of children has marginally increased, food and cash cropproduction at the household level have declined. Overall, the food security situationat the household level has worsened over time, with an increased proportion of foodinsecure households compared to five years ago.
Because of increases in input prices, and decreases in producer prices, theprofitability of major crops such as burley tobacco, cotton, paprika, cassava andgroundnuts declined substantially between 1996 and 2001.
Policy lessonsMost indicators have remained constant or declined, despite a long history ofeconomic reforms. The sequencing of some policies was poor and the highmacroeconomic instability may have offset the positive impact of some policies.
While the constraints on private sector participation have largely been eliminatedit has not responded optimally and trade is dominated by a few enterprises. Privatetrading in domestic agricultural markets remains limited and continues to faceconstraints and a high risk market environment.
Adjustment policies were implemented hastily without considering the necessaryconditions for effective reform. For example, some of the government services thatbenefited smallholder farmers, such as extension services, credit facilities and state-marketing activities were withdrawn without credible replacement. The reformprocess did not recognize the need for additional policies to complement marketliberalization and compensate for some of its more serious effects.
INTRODUCTION: CONTEXT AND NATURE OF THE REFORMS
The role and level of development of the agriculture sectorThe Malawian economy is predominantly agro-based with agriculture accountingfor more than a third of gross domestic product and more than 80 percent of foreignexchange earnings. Crop production accounts for 74 percent of all rural incomes andagriculture is the most important occupation for 71 percent of rural population. Thedominance of agriculture is conditioned by the country’s natural resources.
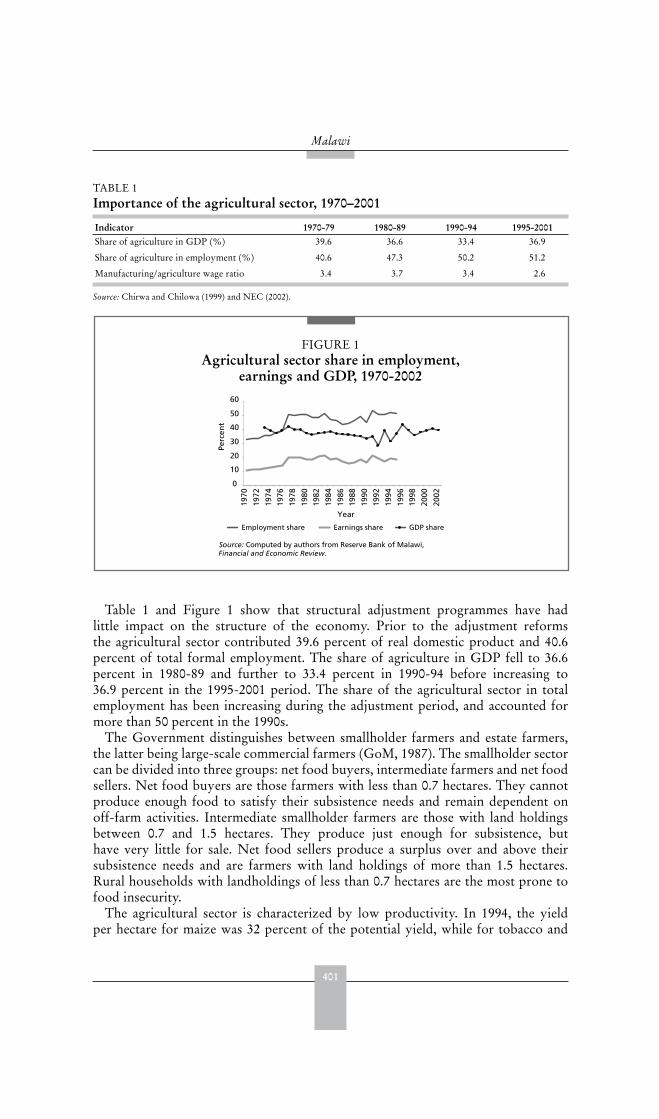
401
Malawi
Table 1 and Figure 1 show that structural adjustment programmes have hadlittle impact on the structure of the economy. Prior to the adjustment reformsthe agricultural sector contributed 39.6 percent of real domestic product and 40.6percent of total formal employment. The share of agriculture in GDP fell to 36.6percent in 1980-89 and further to 33.4 percent in 1990-94 before increasing to36.9 percent in the 1995-2001 period. The share of the agricultural sector in totalemployment has been increasing during the adjustment period, and accounted formore than 50 percent in the 1990s.
The Government distinguishes between smallholder farmers and estate farmers,the latter being large-scale commercial farmers (GoM, 1987). The smallholder sectorcan be divided into three groups: net food buyers, intermediate farmers and net foodsellers. Net food buyers are those farmers with less than 0.7 hectares. They cannotproduce enough food to satisfy their subsistence needs and remain dependent onoff-farm activities. Intermediate smallholder farmers are those with land holdingsbetween 0.7 and 1.5 hectares. They produce just enough for subsistence, buthave very little for sale. Net food sellers produce a surplus over and above theirsubsistence needs and are farmers with land holdings of more than 1.5 hectares.Rural households with landholdings of less than 0.7 hectares are the most prone tofood insecurity.
The agricultural sector is characterized by low productivity. In 1994, the yieldper hectare for maize was 32 percent of the potential yield, while for tobacco and
TABLE 1 Importance of the agricultural sector, 1970–2001
Indicator 1970-79 1980-89 1990-94 1995-2001Share of agriculture in GDP (%)
Share of agriculture in employment (%)
Manufacturing/agriculture wage ratio
39.6
40.6
3.4
36.6
47.3
3.7
33.4
50.2
3.4
36.9
51.2
2.6
Source: Chirwa and Chilowa (1999) and NEC (2002).
FIGURE 1Agricultural sector share in employment,
earnings and GDP, 1970-2002
0
10
20
30
40
50
60
1970
1972
1974
1976
1978
1980
1982
1984
1986
1988
1990
1992
1994
1996
1998
2000
2002
Year
Perc
ent
Employment share Earnings share GDP share
Source: Computed by authors from Reserve Bank of Malawi, Financial and Economic Review.
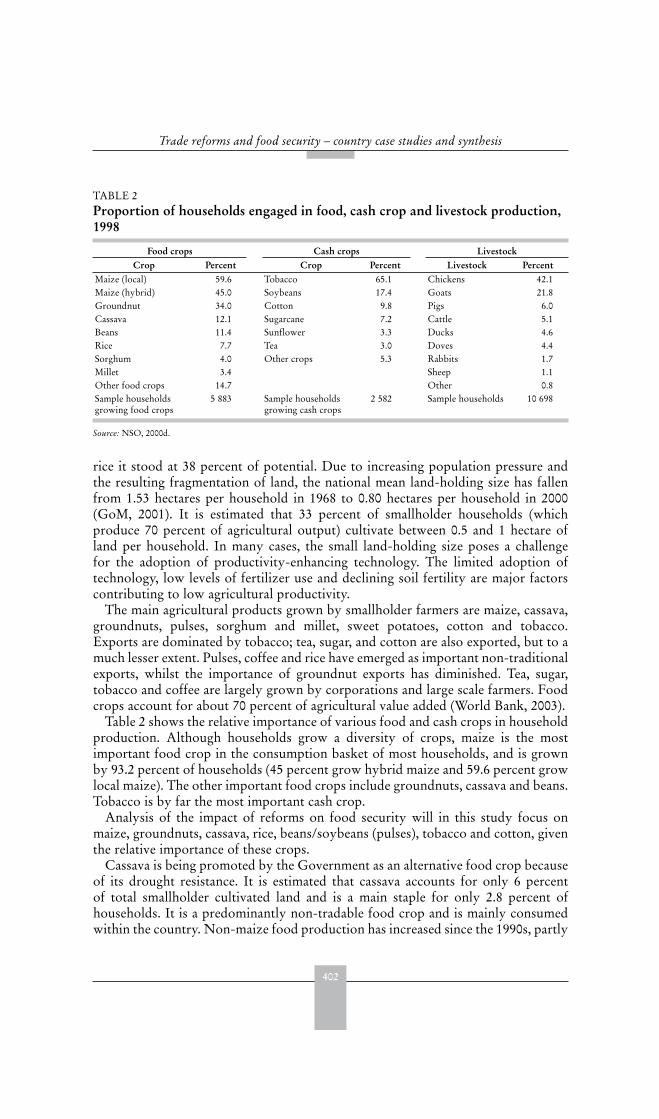
402
Trade reforms and food security – country case studies and synthesis
rice it stood at 38 percent of potential. Due to increasing population pressure andthe resulting fragmentation of land, the national mean land-holding size has fallenfrom 1.53 hectares per household in 1968 to 0.80 hectares per household in 2000(GoM, 2001). It is estimated that 33 percent of smallholder households (whichproduce 70 percent of agricultural output) cultivate between 0.5 and 1 hectare ofland per household. In many cases, the small land-holding size poses a challengefor the adoption of productivity-enhancing technology. The limited adoption oftechnology, low levels of fertilizer use and declining soil fertility are major factorscontributing to low agricultural productivity.
The main agricultural products grown by smallholder farmers are maize, cassava,groundnuts, pulses, sorghum and millet, sweet potatoes, cotton and tobacco.Exports are dominated by tobacco; tea, sugar, and cotton are also exported, but to amuch lesser extent. Pulses, coffee and rice have emerged as important non-traditionalexports, whilst the importance of groundnut exports has diminished. Tea, sugar,tobacco and coffee are largely grown by corporations and large scale farmers. Foodcrops account for about 70 percent of agricultural value added (World Bank, 2003).
Table 2 shows the relative importance of various food and cash crops in householdproduction. Although households grow a diversity of crops, maize is the mostimportant food crop in the consumption basket of most households, and is grownby 93.2 percent of households (45 percent grow hybrid maize and 59.6 percent growlocal maize). The other important food crops include groundnuts, cassava and beans.Tobacco is by far the most important cash crop.
Analysis of the impact of reforms on food security will in this study focus onmaize, groundnuts, cassava, rice, beans/soybeans (pulses), tobacco and cotton, giventhe relative importance of these crops.
Cassava is being promoted by the Government as an alternative food crop becauseof its drought resistance. It is estimated that cassava accounts for only 6 percentof total smallholder cultivated land and is a main staple for only 2.8 percent ofhouseholds. It is a predominantly non-tradable food crop and is mainly consumedwithin the country. Non-maize food production has increased since the 1990s, partly
TABLE 2 Proportion of households engaged in food, cash crop and livestock production, 1998
Food crops Cash crops LivestockCrop Percent Crop Percent Livestock Percent
Maize (local) 59.6 Tobacco 65.1 Chickens 42.1Maize (hybrid) 45.0 Soybeans 17.4 Goats 21.8Groundnut 34.0 Cotton 9.8 Pigs 6.0Cassava 12.1 Sugarcane 7.2 Cattle 5.1Beans 11.4 Sunflower 3.3 Ducks 4.6Rice 7.7 Tea 3.0 Doves 4.4Sorghum 4.0 Other crops 5.3 Rabbits 1.7Millet 3.4 Sheep 1.1Other food crops 14.7 Other 0.8Sample householdsgrowing food crops
5 883 Sample householdsgrowing cash crops
2 582 Sample households 10 698
Source: NSO, 2000d.
403
Malawi
due to strengthened root crop research and promotion of cassava and other root cropsas drought resistant crops. Rice is an alternative food crop to maize, particularly inthe urban areas. In some areas it is also a cash crop for some households. Rice ismainly grown in the lakeshore districts. Rice has also become an important exportcrop since the late 1990s.
Groundnuts are mainly grown in the central and northern regions and account forabout 5.4 percent of smallholder cultivated land. Groundnuts used to be the thirdmost important export product in the 1970s, but export earnings declined in the1980s and the export market was lost by the 1990s.
Pulses comprising pigeon peas, soybeans, beans and cow peas account for 16.8percent of smallholder cultivated land. Pulses are also emerging export cropsand an important cash crop for smallholder farmers. They are mainly grown bysmallholders.
Tobacco is the main export commodity, accounting for more than 60 percent ofexport earnings since the 1990s, 23 percent of the economy’s tax base and 10 percentof GDP (World Bank, 2003). Five main types are grown: flue-cured, fire-cured,sun/air-cured, burley and Turkish tobacco. Prior to liberalization, the Special CropsAct ensured that the production of flue-cured and burley tobacco was restrictedto estates, whilst other types of tobacco were grown by smallholders. Cotton isalso exported crop and accounts for 2.3 percent of smallholder cultivated land. It isgrown mainly by smallholders and is concentrated in central and southern Malawi.
Degree of openness of the economy prior to the reforms The performance of the economy after independence in 1964 until the late 1970s wasrelatively encouraging, with high growth rates, favourable balance of payments andimprovements in food availability and food security. The development strategy inthe1970s was based on limited industrial import-substitution and increasing the roleof the agricultural sector. The trade regime was focused on stimulating agriculturalexports; as a result, the economy was relatively open, tariffs were generally low anddirect restrictions on imports were minimal (Harrigan, 1991).
The development strategy in the post-independence period up to 1979 was basedon increased government involvement in the production process through acquisitionof agricultural land and the establishment of state holding corporations. This wasjustified by the lack of an indigenous entrepreneurial class.
National food security was at the centre of development strategies in the post-independence era when the main objective of development was “to enhance thesocial welfare and incomes of the agricultural community and the prosperity andstability of the nation as a whole by means of both improving self-sufficiency in foodproducts and expanding and diversifying export receipts from agricultural produce”(GoM, 1987, p.22).
Within this framework, the strategy has been to increase agricultural productivitywith special emphasis on the productivity of smallholder farmers with land holdingsizes of less than one hectare. More specifically, increasing maize production andpromotion of drought-resistant food crops such as cassava have been the mainstrategies in achieving self-sufficiency in food.
Policies included fostering the ownership of the estate sector by Malawians;developing the smallholder sector through investments in agricultural extension
404
Trade reforms and food security – country case studies and synthesis
services; provision of subsidies on agricultural inputs; state-led marketing ofsmallholder produce; control of agricultural produce prices; control of interestrates and the institutionalization of preferential rates to the agricultural sector;management of the exchange rate; international trade controls on agriculturalproducts; and other administrative measures.
Industrial goods and smallholder agricultural produce were subject to pricecontrols. The state marketing agency, the Agricultural Development and MarketingCorporation (ADMARC) monopolized the purchase of tobacco and cotton fromsmallholder farmers as well as the sale of subsidized agricultural inputs. ADMARCimplemented the government pricing policy on food crops through pan-territorialand pan-seasonal prices that were announced in advance of each season. TheGovernment, through the Smallholder Agricultural Credit Administration (SACA),provided agricultural credit to smallholder farmers organized into farmer clubs.
However, the economy was relatively open to trade, with only limited protectionaccorded to manufacturing through tariffs, combined with a variety of non-tarifftrade barriers such as import and export licensing. In addition, the exchange ratewas overvalued at a fixed peg, which combined with trade restrictions, providedincentives for import substituting industries and moderated the cost of agriculturalinputs.
These policies were reinforced by a stable macroeconomic environmentcharacterized by low inflation and price stability, low balance of payments pressure,low interest rates and a manageable fiscal budget deficit.
Motivations for the reformsBy 1980, however, Malawi faced an economic crisis. Real GDP growth fell from8.3 percent in 1978 to 3.9 percent in 1979, followed for the first time by negativegrowth rates of -1.1 percent in 1980 and -4.7 percent in 1981. This has beenvariously attributed to a combination of factors, including the oil-shock of 1979,an international transport bottleneck caused by the intensification of war inMozambique, adverse weather conditions, weakening internal demand and otherstructural rigidities in the economy.
The crisis drove Malawi into the adoption of World Bank structural adjustmentprogrammes and IMF stabilization measures to address the internal and externalimbalances (Harrigan, 1991; Kaluwa et al., 1992; Mhone, 1992).
Preparatory work for the first Structural Adjustment Loan (SAL) identifiedsix structural weaknesses in the economy: (i) the slow growth of smallholderexports; (ii) the narrowness of the export base and increased reliance on tobacco;(iii) dependence on imported fuel and on a declining stock of domestic fuel wood; (iv)the rapid deterioration of the finances of state owned enterprises; (v) the increasingbudget deficits of the late 1970s; and (vi) the inflexible system of government-administered prices and wages.
Macro and sectoral components and the policy instruments usedIn this study, the period before 1981 is identified as the pre-reform period, theperiod between 1981 and 1994 as the adjustment period, and the period from 1995as the post-reform period. The major policy reforms affecting agriculture directlywere implemented by 1995. These include liberalization of smallholder agricultural
405
Malawi
produce marketing in 1987, liberalization of agricultural input marketing andremoval of fertilizer subsidies in 1991, and liberalization of producer prices foragricultural crops with effect from the 1995 agricultural season.
Macroeconomic reformsSince 1981, Malawi has had eight loans to support her structural reform measures,three of which were structural adjustment programmes (SALs) and four weresectoral adjustment loans:
SAL I was implemented between 1981 and 1983 with the World Bank makingavailable US$45 million. The objectives were to diversify the export base;encourage efficient import substitution; ensure appropriate price and incomespolicy; improve the public sector's financial performance; and strengthengovernment economic planning and monitoring capabilities. SAL I was supportedby three IMF Stand-by facilities which aimed at reversing the unfavourablebalance of payments trends and reducing the fiscal imbalance.SAL II was implemented in 1984-85 with US$55 million from the World Bank. Thepolicy objectives and measures were essentially the same as in SAL I. However,under SAL II, prices for most industrial goods were decontrolled and two furtherdevaluations were pursued (15 percent in 1985 and 9.5 percent in 1986).SAL III was implemented in 1986 to 1987 with the additional objective ofexpanding the role of the private sector in the marketing of smallholder cropsand improving its financial performance and operational efficiency.
Sectoral adjustment credit facilities from the World Bank were first implementedin 1988:
The Industry and Trade Policy Adjustment Credit (ITPAC) was implementedin 1988/89 to consolidate the existing reforms. The main objective of ITPACwas to improve the policy environment for the manufacturing sector in orderto increase the efficiency of resource use (including imported resources) and toexpand exports.The Agriculture Sector Adjustment Credit (ASAC) was made available in1990 to 1991. While continuing the principles of the previous loans, the mainobjectives were to increase efficiency and improve the incomes of smallholderfarmers, increase the efficiency of land use and protect the environment, andimprove the macroeconomic environment through further import liberalizationand public expenditure restructuring.The Entrepreneurship Development and Drought Recovery Programme(EDDRP) was instituted in 1992 in response to the drought that hit southernAfrica in 1991/92, providing $210 million worth of financial resources to theMalawi Government. This was augmented by supplementary resources in 1995.The EDDRP aimed at supporting: an improved environment for entrepreneurialactivities and investment in labour intensive activities; the adoption of policiesaimed at deepening financial markets; the reorientation of fiscal and labourpolicies towards human capital development; the reduction in balance ofpayments pressure due to drought-related imports; and the alleviation of theimpact of drought.The first Fiscal Restructuring and Deregulation Programme (FRDP I)commenced in 1996. FRDP had several objectives including prioritizing,

406
Trade reforms and food security – country case studies and synthesis
protecting and expanding inter-sectoral and intra-sectoral allocations to socialsectors; accelerating the consolidation of structural measures under previousadjustment facilities, including complete removal of the remaining pricingand marketing constraints on smallholder agriculture, and removal of bindingconstraints to broad-based private sector entry and development; restructuringthe civil service to improve efficiency and control the growth of civil servicewages and salaries; development of land policy and rationalization of tariffs andsurtax. FRDP II in 1998 and FRDP III in 2000 both reinforced the objectivesand the policy reforms stipulated under FRDPI.
Most of the policies formulated in these various programmes were implemented,although there have been a few policy reversals.
Table 3 shows macroeconomic performance indicators between 1973 and 2001.Recent macroeconomic performance is characterized by slow growth compared tothe pre-reform era, large fiscal deficits and rapid growth in the money supply. Highinflation and volatile interest rates and exchange rates have resulted in uncertaintyover input and output prices.
The World Bank (2003) attributes poor growth in the economy to the Government’sfailure to implement key policies that would have reduced the risks facing economicagents. There has been substantial depreciation of the Malawi kwacha against the majorcurrencies since its floatation in 1994. The World Bank finds positive and significantrelationships between depreciation, inflation and growth in the money supply.
The policy measures here are grouped into fiscal policies, monetary policies,trade policies, institutional reforms, agriculture sector reforms, and other policymeasures.
Fiscal policiesThe implementation of economic reforms led to a reduction in the budget deficitbetween 1986 and 1993 (Figure 2). However, the deficit rose sharply again after1993 at a time when the Government introduced a cash budgeting system that wasexpected to control over-expenditure by government agencies. The deficit has sincefallen but has yet to recover its pre-1993 position.
Several key fiscal policy measures have been implemented under the adjustmentprogrammes. There have been increases in the recurrent budget allocation toagriculture and other key economic and social sectors between 1982 and 1995. UnderFRDP II, non-wage budgetary allocations to the agricultural sector increased by22 percent in 1998/99.
TABLE 3 Selected macroeconomic performance indicators, 1973-2001
Indicator 1973-1979
1980-1989
1990-1994
1995 1996 1997 1998 1999 2000 2001
GDP Growth (%) 5.9 2.0 0.6 13.8 10.4 7.0 2.2 3.6 2.0 -1.5Inflation (%) 8.4 16.6 20.0 83.5 47.8 9.2 29.7 46.0 29.5 27.2Fiscal Deficit/GDP (%) -7.16 -9.64 -7.42 -12.4 -7.2 -9.0 -11.5 -12.6 -15.0 -15.9Money Supply Growth (%) 13.3 18.3 28.5 44.0 24.0 16.7 57.4 33.2 37.2 8.9Current Account /GDP (%) -12.0 -12.0 -15.7 -10.3 -16.9 -14.2 -12.9Exchange Rate (MK/$) 0.85 1.07 2.22 15.3 15.3 21.2 43.9 46.4 80.1 65.2
Source: Chirwa and Chilowa (1999) and NEC (2002).

407
Malawi
The Government took over the financing of the strategic grain reserves fromADMARC in the 1987/88 season. Scarborough (1990) argues that the managementof the strategic grain reserves by the state marketing agency contributed to the lowoperational efficiency of ADMARC. In 1999, the National Food Reserve Agency(NFRA) was established under a Trust Deed, replacing the strategic grain reservesmanaged by ADMARC. NFRA is focused purely on emergency relief operationsthrough procurement and marketing of maize in times of drought.
Monetary policiesThe Government pursued an active exchange rate policy through periodic devaluationof the Malawi kwacha from 1982 until the end of 1993. Over the period 1983-93,the kwacha was devalued by more than 300 percent. In 1991, the system of foreignexchange allocation by the Reserve Bank was abolished and the foreign exchangemarket was therefore completely liberalized. In February 1994, the kwacha wasfloated. Figure 3 shows the continuous depreciation of the kwacha since 1981.However, this does not seem to have had a consistent impact on the movementsof the real effective exchange rate. Real depreciation occurred between 1985 and
FIGURE 2Ratio of fiscal deficit to GDP, 1970-2000 (percent)
Source: Computed by authors from Reserve Bank of Malawi, Financial and Economic Review.
-18-16-14-12-10-8-6-4-20 19
70
1972
1974
1976
1978
1980
1982
1984
1986
1988
1990
1992
1994
1996
1998
2000
Year
Perc
ent
Fiscal deficit/GDP
FIGURE 3Nominal and real effective exchange rate, 1970-2002
0
20
40
60
80
100
120
1970 1974 1978 1982 1986 1990 1994 1998 2002Year
Ind
ex (
1980
=10
0)
USD/MK REER
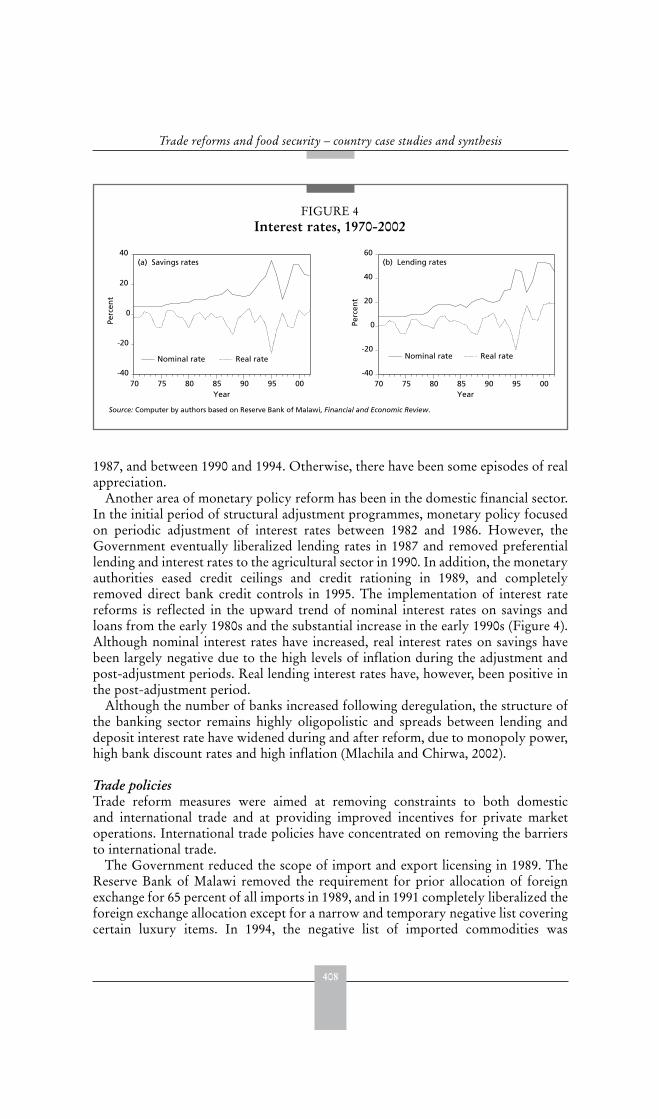
408
Trade reforms and food security – country case studies and synthesis
1987, and between 1990 and 1994. Otherwise, there have been some episodes of realappreciation.
Another area of monetary policy reform has been in the domestic financial sector.In the initial period of structural adjustment programmes, monetary policy focusedon periodic adjustment of interest rates between 1982 and 1986. However, theGovernment eventually liberalized lending rates in 1987 and removed preferentiallending and interest rates to the agricultural sector in 1990. In addition, the monetaryauthorities eased credit ceilings and credit rationing in 1989, and completelyremoved direct bank credit controls in 1995. The implementation of interest ratereforms is reflected in the upward trend of nominal interest rates on savings andloans from the early 1980s and the substantial increase in the early 1990s (Figure 4).Although nominal interest rates have increased, real interest rates on savings havebeen largely negative due to the high levels of inflation during the adjustment andpost-adjustment periods. Real lending interest rates have, however, been positive inthe post-adjustment period.
Although the number of banks increased following deregulation, the structure ofthe banking sector remains highly oligopolistic and spreads between lending anddeposit interest rate have widened during and after reform, due to monopoly power,high bank discount rates and high inflation (Mlachila and Chirwa, 2002).
Trade policiesTrade reform measures were aimed at removing constraints to both domesticand international trade and at providing improved incentives for private marketoperations. International trade policies have concentrated on removing the barriersto international trade.
The Government reduced the scope of import and export licensing in 1989. TheReserve Bank of Malawi removed the requirement for prior allocation of foreignexchange for 65 percent of all imports in 1989, and in 1991 completely liberalized theforeign exchange allocation except for a narrow and temporary negative list coveringcertain luxury items. In 1994, the negative list of imported commodities was
FIGURE 4Interest rates, 1970-2002
Source: Computer by authors based on Reserve Bank of Malawi, Financial and Economic Review.
-40
-20
0
20
40
70 75 80 85 90 95 00
Nominal rate Real rate
(a) Savings rates
Perc
ent
Year
-40
-20
0
20
40
60
70 75 80 85 90 95 00
Nominal rate Real rate
(b) Lending rates
Perc
ent
Year
409
Malawi
abolished. In addition, under the Export Incentives Act and Investment PromotionAct in 1992, the Government provided for additional tax incentives for the exportof non-traditional agricultural products. In 1997, all licensing requirements onimports and exports were abolished except for items related to health, security, andenvironmental considerations. The maximum tariff on imports was reduced from70 percent in 1988 to 25 percent in 1998. Since 1989, under ITPAC, there has been aphased reduction in tariff rates and base surtax rates.
Other major trade policy issues relate to the implementation of policies undertrade agreements since 1990. The bilateral and regional trade agreements includethe Malawi-South Africa non-reciprocal free trade agreement in 1990; the Malawi–Zimbabwe reciprocal trade agreement in 1995; the Common Market for Easternand Southern Africa (COMESA) free trade area regional agreement in 2000; andthe Southern African Development Community (SADC) Trade Protocol in 2001.These regional agreements introduced duty-free access to products on a reciprocalbasis among member states. However, the SADC protocol’s provision on protectinginfant industries allowed restrictions on imported livestock commodities such aseggs and chicken meat. Malawi also benefits from a number of non-reciprocal,preferential trade agreements such as the European Union’s African Caribbean andPacific countries (EU-ACP) agreement, the Cotonou agreement, the EuropeanUnion Everything but Arms (EBA) agreement, and the multilateral African GrowthOpportunity Act agreement with the United States of America.
Institutional reformsMost institutional reforms that have taken place since 1981 have been driven bythe desire to encourage private sector development. These include the reduction ofgovernment involvement in economic activities through privatization, abolishing orchanging legislation that impeded private sector development, and the introductionof new legislation aimed at facilitating private sector development.
The Government has implemented the privatization policy since 1984 in twophases (Chirwa, 2000). Between 1984 and 1995 the investment portfolio ofADMARC was targeted, in order to improve its operational efficiency in itsmarketing activities and to enable it to compete effectively with private traders in themarketing of agricultural produce and inputs. The second phase commenced in 1996with the enactment of the Public Enterprises (Privatization) Act and the creationof the Privatization Commission. Privatization of state enterprises has mainly beenimplemented during the post-reform period. Nonetheless, most of the privatizedenterprises are manufacturing and service industries with indirect effects on theagricultural sector.
The Government also established the Malawi Investment Promotion Agencyin 1992 as a one-stop investment centre. New investment incentives and exportincentives were introduced following the Investment Promotion Act of 1992,including the introduction of a 25 percent tax allowance on international transportcosts for non-traditional exports.
Agricultural sector reformsA summary of the reforms affecting agriculture is given in Table 4. The main area ofdomestic reform was the deregulation of agricultural produce and input marketing
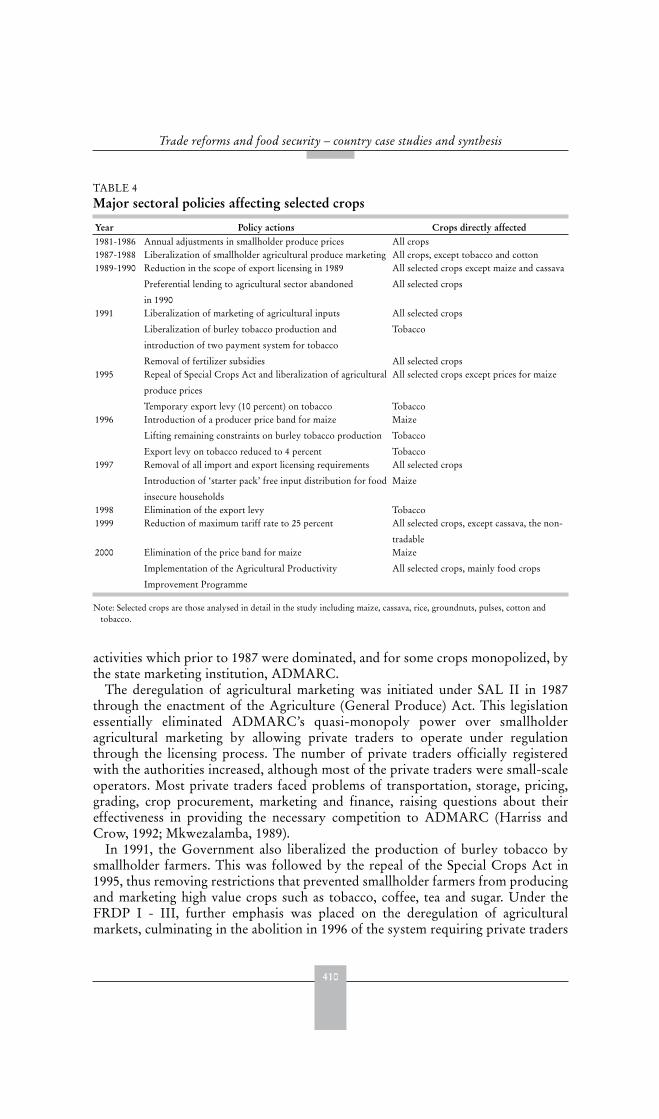
410
Trade reforms and food security – country case studies and synthesis
activities which prior to 1987 were dominated, and for some crops monopolized, bythe state marketing institution, ADMARC.
The deregulation of agricultural marketing was initiated under SAL II in 1987through the enactment of the Agriculture (General Produce) Act. This legislationessentially eliminated ADMARC’s quasi-monopoly power over smallholderagricultural marketing by allowing private traders to operate under regulationthrough the licensing process. The number of private traders officially registeredwith the authorities increased, although most of the private traders were small-scaleoperators. Most private traders faced problems of transportation, storage, pricing,grading, crop procurement, marketing and finance, raising questions about theireffectiveness in providing the necessary competition to ADMARC (Harriss andCrow, 1992; Mkwezalamba, 1989).
In 1991, the Government also liberalized the production of burley tobacco bysmallholder farmers. This was followed by the repeal of the Special Crops Act in1995, thus removing restrictions that prevented smallholder farmers from producingand marketing high value crops such as tobacco, coffee, tea and sugar. Under theFRDP I - III, further emphasis was placed on the deregulation of agriculturalmarkets, culminating in the abolition in 1996 of the system requiring private traders
TABLE 4 Major sectoral policies affecting selected crops
Year Policy actions Crops directly affected1981-1986 Annual adjustments in smallholder produce prices All crops1987-1988 Liberalization of smallholder agricultural produce marketing All crops, except tobacco and cotton1989-1990 Reduction in the scope of export licensing in 1989
Preferential lending to agricultural sector abandoned
in 1990
All selected crops except maize and cassava
All selected crops
1991 Liberalization of marketing of agricultural inputs
Liberalization of burley tobacco production and
introduction of two payment system for tobacco
Removal of fertilizer subsidies
All selected crops
Tobacco
All selected crops1995 Repeal of Special Crops Act and liberalization of agricultural
produce prices
Temporary export levy (10 percent) on tobacco
All selected crops except prices for maize
Tobacco1996 Introduction of a producer price band for maize
Lifting remaining constraints on burley tobacco production
Export levy on tobacco reduced to 4 percent
Maize
Tobacco
Tobacco1997 Removal of all import and export licensing requirements
Introduction of ‘starter pack’ free input distribution for food
insecure households
All selected crops
Maize
1998 Elimination of the export levy Tobacco1999 Reduction of maximum tariff rate to 25 percent All selected crops, except cassava, the non-
tradable2000 Elimination of the price band for maize
Implementation of the Agricultural Productivity
Improvement Programme
Maize
All selected crops, mainly food crops
Note: Selected crops are those analysed in detail in the study including maize, cassava, rice, groundnuts, pulses, cotton andtobacco.
411
Malawi
to obtain a licence to conduct trade in rural areas. Similarly, the marketing ofagricultural inputs, such as fertilizers, was liberalized from 1990 under the ASAC.In 1996, under the FRDP, the Government removed the licensing and registrationprocedures for private traders in seeds and fertilizer marketing.
Prior to these market reforms, the Government set prices for agriculturalproduce and inputs and other selected industrial commodities. The pricing reformscommenced with periodic adjustments between 1982 and 1986 of the pan-territorialand pan-seasonal prices for agricultural products, particularly maize. In 1982,the Government adopted the international trade parity pricing approach and theproducer price of maize was consequently increased by 68 percent. By 1988, pricesof most crops were liberalized, with the state marketing agency acting as a buyer oflast resort at minimum guaranteed pan-territorial and pan-seasonal prices. Privatetraders were therefore free to negotiate their own prices, and by 1995 prices of allcrops, except for maize, were fully liberalized (Chirwa, 1998).
Maize remains at the centre of food security policy. While prices of all otherproducts were liberalized, maize remained under limited pricing control. Maizeexports are still subject to licensing requirements, and maize is only imported in anational food crisis. Maize is only semi-tradable.
Maize pricing policy has historically sought to protect smallholder producers fromfalling nominal prices and to enable wage earners to purchase enough maize for acalorie-adequate diet. Harrigan (1988) and Kandoole et al. (1988) noted that the twinobjectives seriously conflicted, leading to changes in pricing policy in the reformperiod. ADMARC was free to determine the producer price of maize within a fixedband while the consumer price of maize remained pan-territorial and pan-seasonal.However, due to increased marketing of maize by private traders, it became difficultfor ADMARC to defend the price band, which was abandoned in 2000 and the priceof maize increased significantly.
In contrast to maize, rice, groundnuts and pulses have been far less regulated. Traderestrictions have been minimal and private traders have dominated the marketing ofthese crops.
The marketing of cotton prior to liberalization was governed by the Agriculturaland Livestock Marketing Act of 1964 that gave ADMARC monopsony power topurchase and sell smallholder cotton. However, the export potential for cotton hasbeen declining over time, particularly during the 1980s and early 1990s. Pan-territorialand pan-seasonal prices of cotton were adjusted annually after 1981, significantlyincreased (by 18 percent) in 1987 and were completely liberalized in 1995.
The marketing of smallholder tobacco was also an ADMARC monopoly before1991, when the Government liberalized the production of burley tobacco bysmallholder farmers. In 1996 the remaining constraints were lifted. Since then therehas been a shift from estate based flue-cured tobacco to smallholder burley tobacco.About 19 percent of smallholder households cultivate burley tobacco.
In addition to agricultural produce pricing policies, the Government implementeda phased programme of decontrolling prices for industrial commodities, includingprices of inputs to the agricultural sector. Under ASAC and beginning in 1990, theGovernment started upward adjustments in land rents for estates.
Subsidies of fertilizers were removed by phases, with an increase in the price offertilizer by 21 percent in the 1983/84 season. However, due to a reduction in the
412
Trade reforms and food security – country case studies and synthesis
application of fertilizers by smallholder farmers, the removal of subsidies in the1986/87 season was postponed to the 1989/90 season. The phased removal continuedin the 1990/91 season following the deregulation of fertilizer marketing under whichprivate traders were allowed to engage in the marketing of agricultural inputs. Since1985 the Government has also pursued a phased privatization programme thatwas supposed to reduce the pressure of state-owned enterprises on public finance(Chirwa, 2000).
The Smallholder Agriculture Credit Administration (SACA), the only supplierof agricultural input credit since independence, collapsed in 1992 and was replacedin 1995 by the Malawi Rural Finance Company (MRFC). While the drought inthe 1991/92 season had contributed to difficulties in repayment, it was the politicalchanges that were taking place during the transition period to a multiparty democracythat eventually led to the collapse of SACA (Buckley, 1996; Msukwa et al., 1994).
The number of microfinance institutions has increased. However, access to thesecredit facilities remains limited and smallholder farmers have experienced severecredit constraints since the collapse of SACA, as MRFC has not effectively replacedit. MRFC’s agricultural lending portfolio is exclusively designed for and accessed bytobacco farmers at commercial interest rates, while SACA offered credit to farmersproducing all kinds of crops at subsidized interest rates through agricultural clubsthat no longer exist. Most other microcredit institutions operate local programmesand tend to support non-farm business activities.
The 1990s also witnessed the proliferation of non-governmental organizations(NGOs) in local food security interventions. The development of farmer cooperativesstarted in 1998 through the National Association of Smallholder Farmers of Malawi(NASFAM), but membership remains limited, consisting mainly of medium scalefarmers with more than 1.5 hectare of landholdings. NASFAM is currently fundedby the United States Agency for International Development (USAID) and is theonly institution actively involved in the creation of cooperatives among smallholderfarmers.
The sequencing of agricultural policy reforms has not always been optimal. Forexample, the removal of subsidies on inputs was initiated in advance of increases inthe maize producer price. Agricultural produce price controls were still in place until1995. However, subsidies on fertilizers were completely removed in 1990, whichcoupled with exchange rate devaluation, led to a large rise in fertilizer prices.
The sequencing of other policy intervention has facilitated the development ofprivate marketing. For instance, the removal of fertilizer subsidies and decontrol ofindustrial prices in the 1980s paved the way for the liberalization of input markets;and the restructuring of ADMARC in the early 1980s preceded the deregulation ofmarketing activities so that the state marketing agency would be prepared to operatein a competitive environment with private operators.
Instability in the economy has raised the risk of business in Malawi. The volatilityof exchange rates and interest rates, and unpredictable input and output prices havenot combined to provide improved incentives to smallholder farmers.
Other reforms and programmesSince the 1990s, the Government has been implementing policies intended tominimize the impact of adjustment on poor and vulnerable groups in society. In
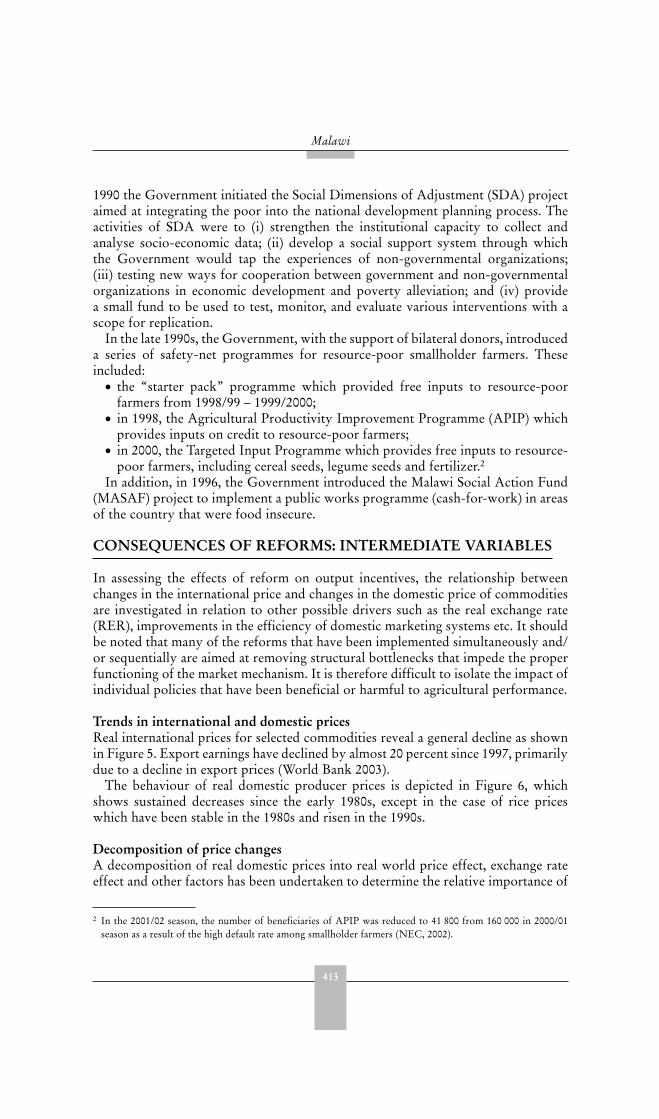
413
Malawi
1990 the Government initiated the Social Dimensions of Adjustment (SDA) projectaimed at integrating the poor into the national development planning process. Theactivities of SDA were to (i) strengthen the institutional capacity to collect andanalyse socio-economic data; (ii) develop a social support system through whichthe Government would tap the experiences of non-governmental organizations;(iii) testing new ways for cooperation between government and non-governmentalorganizations in economic development and poverty alleviation; and (iv) providea small fund to be used to test, monitor, and evaluate various interventions with ascope for replication.
In the late 1990s, the Government, with the support of bilateral donors, introduceda series of safety-net programmes for resource-poor smallholder farmers. Theseincluded:
the “starter pack” programme which provided free inputs to resource-poorfarmers from 1998/99 – 1999/2000;in 1998, the Agricultural Productivity Improvement Programme (APIP) whichprovides inputs on credit to resource-poor farmers;in 2000, the Targeted Input Programme which provides free inputs to resource-poor farmers, including cereal seeds, legume seeds and fertilizer.2
In addition, in 1996, the Government introduced the Malawi Social Action Fund(MASAF) project to implement a public works programme (cash-for-work) in areasof the country that were food insecure.
CONSEQUENCES OF REFORMS: INTERMEDIATE VARIABLES
In assessing the effects of reform on output incentives, the relationship betweenchanges in the international price and changes in the domestic price of commoditiesare investigated in relation to other possible drivers such as the real exchange rate(RER), improvements in the efficiency of domestic marketing systems etc. It shouldbe noted that many of the reforms that have been implemented simultaneously and/or sequentially are aimed at removing structural bottlenecks that impede the properfunctioning of the market mechanism. It is therefore difficult to isolate the impact ofindividual policies that have been beneficial or harmful to agricultural performance.
Trends in international and domestic pricesReal international prices for selected commodities reveal a general decline as shownin Figure 5. Export earnings have declined by almost 20 percent since 1997, primarilydue to a decline in export prices (World Bank 2003).
The behaviour of real domestic producer prices is depicted in Figure 6, whichshows sustained decreases since the early 1980s, except in the case of rice priceswhich have been stable in the 1980s and risen in the 1990s.
Decomposition of price changesA decomposition of real domestic prices into real world price effect, exchange rateeffect and other factors has been undertaken to determine the relative importance of
2 In the 2001/02 season, the number of beneficiaries of APIP was reduced to 41 800 from 160 000 in 2000/01season as a result of the high default rate among smallholder farmers (NEC, 2002).
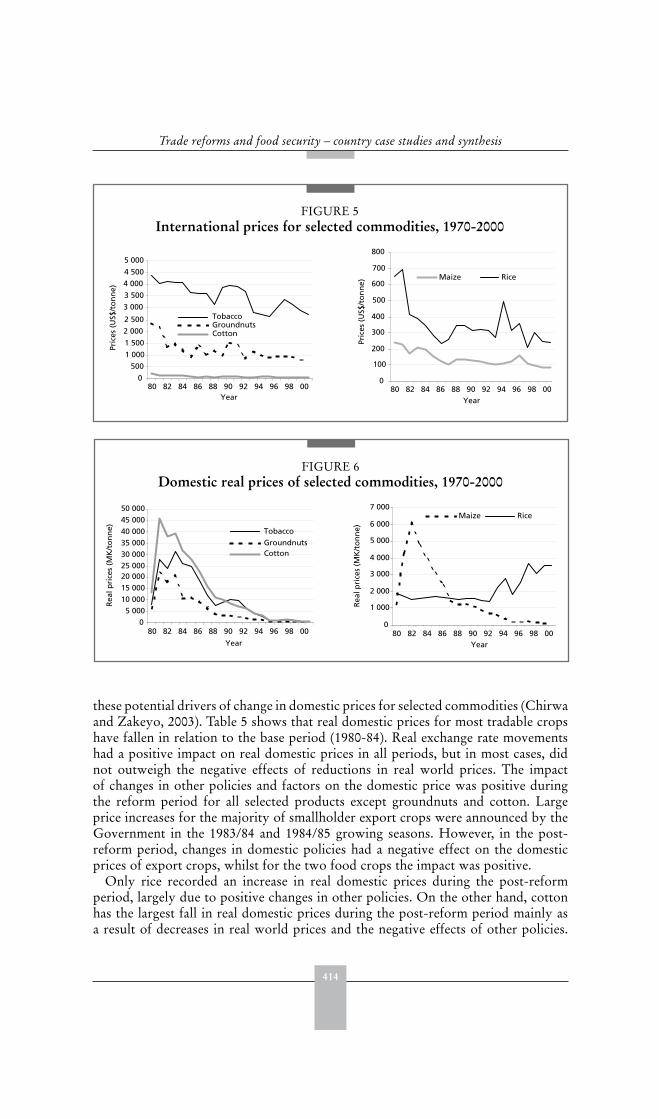
414
Trade reforms and food security – country case studies and synthesis
these potential drivers of change in domestic prices for selected commodities (Chirwaand Zakeyo, 2003). Table 5 shows that real domestic prices for most tradable cropshave fallen in relation to the base period (1980-84). Real exchange rate movementshad a positive impact on real domestic prices in all periods, but in most cases, didnot outweigh the negative effects of reductions in real world prices. The impactof changes in other policies and factors on the domestic price was positive duringthe reform period for all selected products except groundnuts and cotton. Largeprice increases for the majority of smallholder export crops were announced by theGovernment in the 1983/84 and 1984/85 growing seasons. However, in the post-reform period, changes in domestic policies had a negative effect on the domesticprices of export crops, whilst for the two food crops the impact was positive.
Only rice recorded an increase in real domestic prices during the post-reformperiod, largely due to positive changes in other policies. On the other hand, cottonhas the largest fall in real domestic prices during the post-reform period mainly asa result of decreases in real world prices and the negative effects of other policies.
FIGURE 5International prices for selected commodities, 1970-2000
0
500
1 000
1 500
2 000
2 500
3 000
3 500
4 000
4 500
5 000
80 82 84 86 88 90 92 94 96 98 00Year
Pric
es (
US$
/to
nn
e)
TobaccoGroundnutsCotton
0
100
200
300
400
500
600
700
800
80 82 84 86 88 90 92 94 96 98 00Year
Pric
es (
US$
/to
nn
e)
Maize Rice
FIGURE 6Domestic real prices of selected commodities, 1970-2000
05 000
10 00015 00020 00025 00030 00035 00040 00045 00050 000
80 82 84 86 88 90 92 94 96 98 00
Year
Rea
l pri
ces
(MK
/to
nn
e) TobaccoGroundnutsCotton
0
1 000
2 000
3 000
4 000
5 000
6 000
7 000
80 82 84 86 88 90 92 94 96 98 00Year
Rea
l pri
ces
(MK
/to
nn
e)
Maize Rice
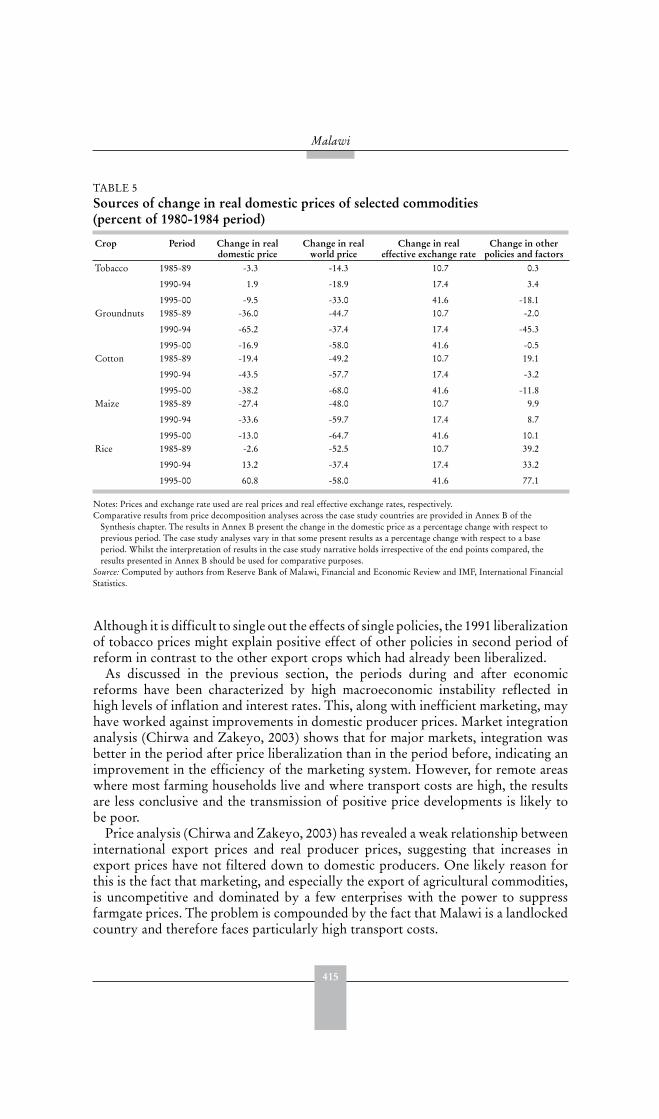
415
Malawi
Although it is difficult to single out the effects of single policies, the 1991 liberalizationof tobacco prices might explain positive effect of other policies in second period ofreform in contrast to the other export crops which had already been liberalized.
As discussed in the previous section, the periods during and after economicreforms have been characterized by high macroeconomic instability reflected inhigh levels of inflation and interest rates. This, along with inefficient marketing, mayhave worked against improvements in domestic producer prices. Market integrationanalysis (Chirwa and Zakeyo, 2003) shows that for major markets, integration wasbetter in the period after price liberalization than in the period before, indicating animprovement in the efficiency of the marketing system. However, for remote areaswhere most farming households live and where transport costs are high, the resultsare less conclusive and the transmission of positive price developments is likely tobe poor.
Price analysis (Chirwa and Zakeyo, 2003) has revealed a weak relationship betweeninternational export prices and real producer prices, suggesting that increases inexport prices have not filtered down to domestic producers. One likely reason forthis is the fact that marketing, and especially the export of agricultural commodities,is uncompetitive and dominated by a few enterprises with the power to suppressfarmgate prices. The problem is compounded by the fact that Malawi is a landlockedcountry and therefore faces particularly high transport costs.
TABLE 5 Sources of change in real domestic prices of selected commodities (percent of 1980-1984 period)
Crop Period Change in real domestic price
Change in real world price
Change in real effective exchange rate
Change in other policies and factors
Tobacco 1985-89
1990-94
1995-00
-3.3
1.9
-9.5
-14.3
-18.9
-33.0
10.7
17.4
41.6
0.3
3.4
-18.1Groundnuts 1985-89
1990-94
1995-00
-36.0
-65.2
-16.9
-44.7
-37.4
-58.0
10.7
17.4
41.6
-2.0
-45.3
-0.5Cotton 1985-89
1990-94
1995-00
-19.4
-43.5
-38.2
-49.2
-57.7
-68.0
10.7
17.4
41.6
19.1
-3.2
-11.8Maize 1985-89
1990-94
1995-00
-27.4
-33.6
-13.0
-48.0
-59.7
-64.7
10.7
17.4
41.6
9.9
8.7
10.1Rice 1985-89
1990-94
1995-00
-2.6
13.2
60.8
-52.5
-37.4
-58.0
10.7
17.4
41.6
39.2
33.2
77.1
Notes: Prices and exchange rate used are real prices and real effective exchange rates, respectively.Comparative results from price decomposition analyses across the case study countries are provided in Annex B of the
Synthesis chapter. The results in Annex B present the change in the domestic price as a percentage change with respect toprevious period. The case study analyses vary in that some present results as a percentage change with respect to a baseperiod. Whilst the interpretation of results in the case study narrative holds irrespective of the end points compared, theresults presented in Annex B should be used for comparative purposes.
Source: Computed by authors from Reserve Bank of Malawi, Financial and Economic Review and IMF, International FinancialStatistics.
416
Trade reforms and food security – country case studies and synthesis
Although prices for most food products have been liberalized, it seems there hasbeen little change in the structural constraints facing private traders. Prices in themain cities of Lilongwe and Blantyre were found to be key drivers of price movementin other markets for beans, and maize and groundnuts. For rice, Karonga, a bordertown with Tanzania and the main rice producing area, was found to be central toprice formation in other markets. The Government can therefore influence the pricesof food crops in rural markets through market operations in these three markets.Blantyre for maize and groundnuts, Blantyre and Lilongwe for beans, and Karongafor rice represent the potential focus for government price stabilization policy.
The weak integration of domestic markets can be explained by poor infrastructure,particularly in the rural areas. Mkwezalamba (1989) and Harris and Crow (1992)note that the problems of transport infrastructure, high transport costs, slow accessto information, and lack of marketing skills and finance prevented private tradersfrom effectively replacing the state marketing agency. These factors have not changedsignificantly over time and they remain the most important problems in commerceand trade (ECI and NSO, 2001). In addition, most private traders in the rural areasare small buyers operating locally and do not have the capacity to store productsto take advantage of inter-seasonal arbitrage (Fafchamps and Gabre-Madhin, 2001;Mvula et al., 2003). The oligopolistic behaviour of private traders in local markets isseen by some as disadvantageous to unorganized farmers. Similarly, the deregulationof agricultural input marketing has not led to increases in the number of privatetraders dealing in input markets. One reason for the limited response from theprivate sector in agricultural input marketing is the fact that such trade requiressubstantial capital compared with produce marketing. This limits participation tolarge firms who are usually unable to meet the needs of small farmers.
Agricultural marketing was deregulated in 1987 and the pricing reforms for allagricultural products except for maize were finalized in early 1995. Chirwa andZakeyo (2003) suggest that market integration is higher in products in which therehas been complete price liberalization (groundnuts, beans and rice), and this mayindicate that the fixed-price band that existed for maize up to 2000 could haveconstrained the activities of private traders. In rice, for example, the operation ofprivate traders has been more significant.
Effects on agricultural output and value added In this section, the findings from the price analysis are related to evidence of changesin output levels. These are presented on an annual basis by changes in area and inyield, the aim being to attempt to establish a link between prices (and non-pricefactors) and output by examining the nature of the output response (or lack of it).
In assessing the ability of producers to respond it is important to recognize theagroclimatic context within which they operate as illustrated in Box 1.
Against this background, the growth rate of aggregate agricultural output3 hasbeen erratic, particularly during the period of the reform programmes. During the
3 Agricultural production estimates tend to overstate food production and area under cultivation (World Bank, 2003).While it is recognized that land is a major constraint, the area under cultivation for all major crops has according tothe data been increasing and there appears to have been no major crop substitution. Estimates of cassava productionand potatoes are overstated since these crops are grown by only a small proportion of rural households.
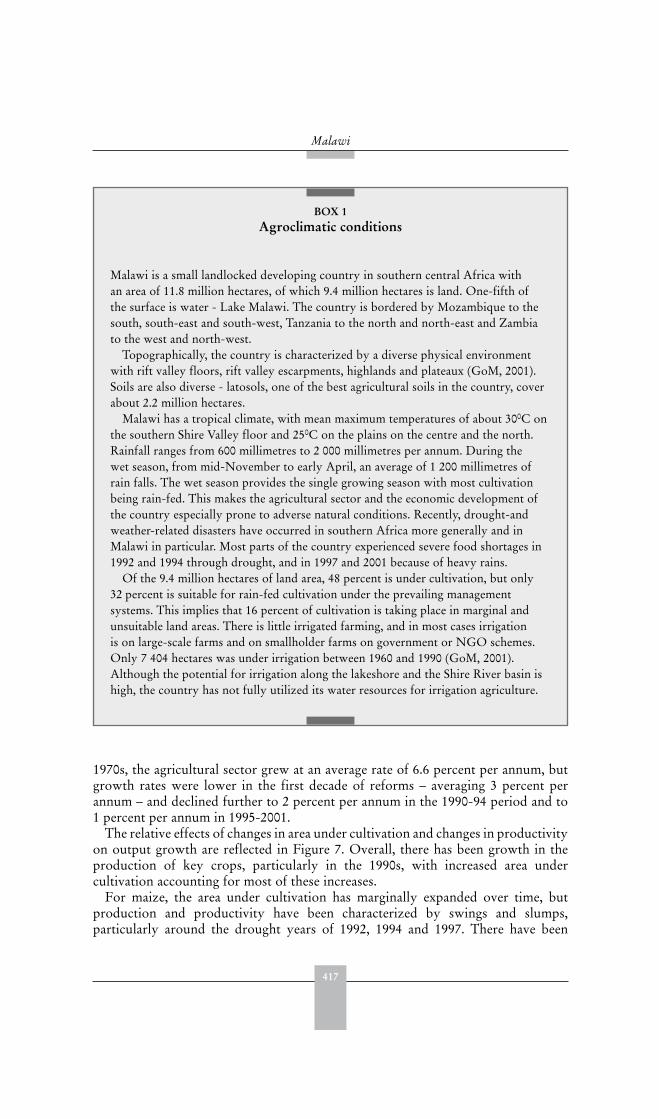
417
Malawi
BOX 1 Agroclimatic conditions
Malawi is a small landlocked developing country in southern central Africa withan area of 11.8 million hectares, of which 9.4 million hectares is land. One-fifth ofthe surface is water - Lake Malawi. The country is bordered by Mozambique to thesouth, south-east and south-west, Tanzania to the north and north-east and Zambiato the west and north-west.
Topographically, the country is characterized by a diverse physical environmentwith rift valley floors, rift valley escarpments, highlands and plateaux (GoM, 2001).Soils are also diverse - latosols, one of the best agricultural soils in the country, coverabout 2.2 million hectares.
Malawi has a tropical climate, with mean maximum temperatures of about 300C onthe southern Shire Valley floor and 250C on the plains on the centre and the north.Rainfall ranges from 600 millimetres to 2 000 millimetres per annum. During thewet season, from mid-November to early April, an average of 1 200 millimetres ofrain falls. The wet season provides the single growing season with most cultivationbeing rain-fed. This makes the agricultural sector and the economic development ofthe country especially prone to adverse natural conditions. Recently, drought-andweather-related disasters have occurred in southern Africa more generally and inMalawi in particular. Most parts of the country experienced severe food shortages in1992 and 1994 through drought, and in 1997 and 2001 because of heavy rains.
Of the 9.4 million hectares of land area, 48 percent is under cultivation, but only32 percent is suitable for rain-fed cultivation under the prevailing managementsystems. This implies that 16 percent of cultivation is taking place in marginal andunsuitable land areas. There is little irrigated farming, and in most cases irrigationis on large-scale farms and on smallholder farms on government or NGO schemes.Only 7 404 hectares was under irrigation between 1960 and 1990 (GoM, 2001).Although the potential for irrigation along the lakeshore and the Shire River basin ishigh, the country has not fully utilized its water resources for irrigation agriculture.
1970s, the agricultural sector grew at an average rate of 6.6 percent per annum, butgrowth rates were lower in the first decade of reforms – averaging 3 percent perannum – and declined further to 2 percent per annum in the 1990-94 period and to1 percent per annum in 1995-2001.
The relative effects of changes in area under cultivation and changes in productivityon output growth are reflected in Figure 7. Overall, there has been growth in theproduction of key crops, particularly in the 1990s, with increased area undercultivation accounting for most of these increases.
For maize, the area under cultivation has marginally expanded over time, butproduction and productivity have been characterized by swings and slumps,particularly around the drought years of 1992, 1994 and 1997. There have been
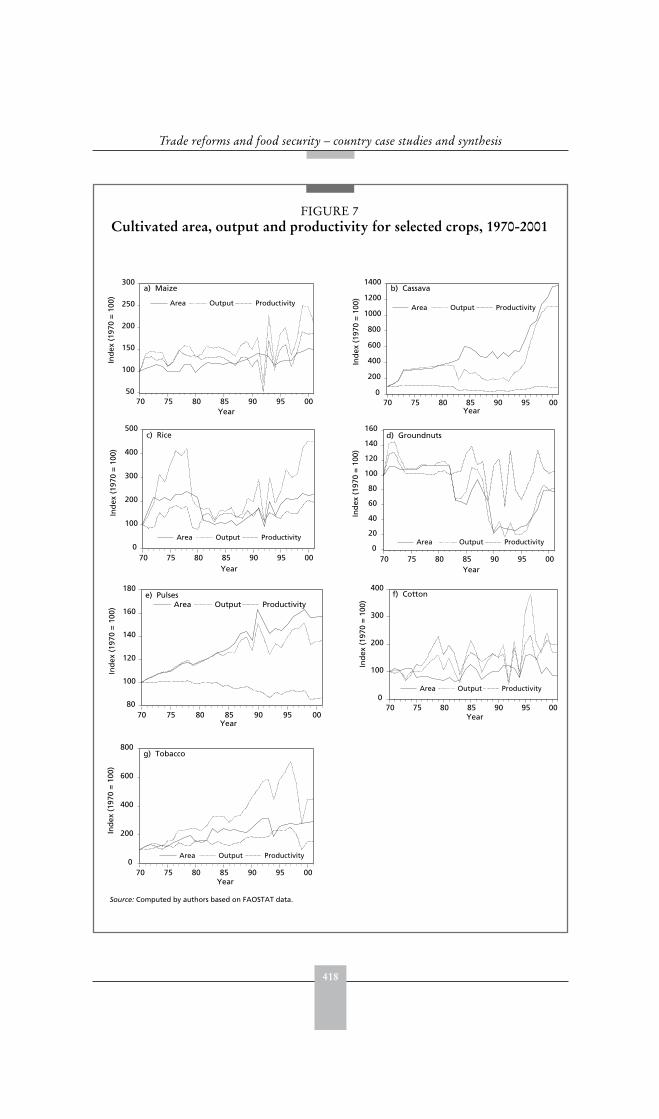
418
Trade reforms and food security – country case studies and synthesis
FIGURE 7Cultivated area, output and productivity for selected crops, 1970-2001
Source: Computed by authors based on FAOSTAT data.
0
200
400
600
800
1000
1200
1400
70 75 80 85 90 95 00
Area Output Productivity
b) Cassava
Ind
ex (
1970
= 1
00)
Year
0
100
200
300
400
500
70 75 80 85 90 95 00
Area Output Productivity
c) Rice
Ind
ex (
1970
= 1
00)
Year
50
100
150
200
250
300
70 75 80 85 90 95 00
Area Output Productivity
a) Maize
Ind
ex (
1970
= 1
00)
Year
0
20
40
60
80
100
120
140
160
70 75 80 85 90 95 00
Area Output Productivity
d) Groundnuts
Year
Ind
ex (
1970
= 1
00)
80
100
120
140
160
180
70 75 80 85 90 95 00
Area Output Productivitye) Pulses
Ind
ex (
1970
= 1
00)
Year
0
100
200
300
400
70 75 80 85 90 95 00
Area Output Productivity
f) Cotton
Year
Ind
ex (
1970
= 1
00)
0
200
400
600
800
70 75 80 85 90 95 00
Area Output Productivity
g) Tobacco
Ind
ex (
1970
= 1
00)
Year

419
Malawi
marginal increases in average yields of maize, and these small increases are attributedto increased adoption of hybrid and composite maize seeds distributed through thefree input programmes. Indeed, in years where increases in food production haveoccurred it has been largely attributed to non-price factors such as good weatherand the implementation of the agricultural safety net programmes, including the free“starter pack”, the targeted input programme, and the input credit facilities under theagricultural productivity and improvement programme and from the Malawi RuralFinance Company (World Bank, 2003).
The area under cultivation has also been the driving force for increased output ofcassava and pulses, where productivity has remained relatively stable or in the caseof pulses has declined over time.
The area under groundnuts cultivation generally fell substantially between 1980and 1996, while productivity remained relatively constant around the 1970 level.This period was also characterized by substantial reduction in the real producer pricefor groundnuts in the domestic market. For tobacco, production grew by 5.7 percentwith a productivity fall of nearly 1 percent offset by area under cultivation increaseof 6.6 percent during the 1995-2001 period.
The decrease in the yields of maize and other food crops is attributed tofragmentation of land through subdivisions within the family, poor soil fertility due tooveruse of plots, lack of inputs such as fertilizers, and increases in the prices of inputs,particularly fertilizers. Most poor households cannot afford fertilizers and used to relyon the government agricultural input credit scheme that is no longer available.
The upward trend in output for most crops is somewhat surprising, given thatreal domestic producer prices and international prices for tradable crops have beenfalling. Unless producers are expanding production to maintain their income levels,this negative relationship between prices and supply may be purely a reflection of thepoor quality of production data, as noted by World Bank (2003).
This perverse supply response is further revealed in a regression analysis ofindividual crops’ output on real prices, area under cultivation and real effectiveexchange rate (Chirwa and Zakeyo, 2003; Danielson, 2002; Lamb, 2000). Theanalysis shows a generally weak supply response, with negative supply responses intobacco and rice. Only cotton and maize reacted positively to price incentives. In allthe models, production increases primarily due to increases in area under cultivation.The real depreciation of the kwacha (an increase in REER) provided incentives forincreased production only in cotton and maize production.
Effects on imports and exportsThe balance of trade continues to be adverse. Exports and imports have beenincreasing in value at similar rates over the period, but the visible trade balance hasactually worsened. Chirwa and Chilowa (1999) note that as a proportion of GDP,imports have generally been higher than exports. The visible trade deficit in the early1990s was more than ten times the deficit recorded in the 1970s. The trend in importsand exports in Figure 8 show the impact of international trade policy reforms in the1990s. The steady increase in the volume of imports and exports from 1990, andsubstantially from 1995, indicates greater openness of the economy.
The agricultural sector contributes more than 90 percent of foreign exchangeearnings but the export basket is dominated by the traditional exports of tobacco,

420
Trade reforms and food security – country case studies and synthesis
tea and sugar (Table 6). There has been little change since the implementationof economic reforms: tobacco remains the principal export accounting for morethan half of the total export earnings and its share in exports has increased from47.7 percent in the 1970s to 62.8 percent between 1990 and 2001. Tea is the secondlargest foreign exchange earner but its significance has declined from 21.2 percent inthe 1970s to 8.6 percent in the late 1990s. Non-traditional exports that have emergedin since the late 1990s include coffee, pulses and rice, although they still contributeless than 3 percent to total exports, while groundnut exports became insignificantduring the 1990s. Although the international price for groundnuts has been stable,the export market for Malawian groundnuts collapsed. One likely reason for this isthat, prior to liberalization of agricultural marketing services, groundnuts boughtfrom smallholder farmers were being exported by ADMARC, but after liberalizationADMARC’s role has substantially diminished. Domestic trade in groundnuts isdominated by small private traders who eventually sell to domestic manufacturers.
Overall, export earnings in dollar terms have been declining since the late 1990s,due to declining international prices, declining profitability in smallholder agriculture
FIGURE 8Imports and exports, 1970–2002
Source: Computed by authors based on Reserve Bank of Malawi, Financial and Economic Review.
0
10 000
20 000
30 000
40 000
50 000
60 000
1970
1972
1974
1976
1978
1980
1982
1984
1986
1988
1990
1992
1994
1996
1998
2000
2002
Year
Mill
ion
s o
f M
alaw
i Kw
ach
a
0
50
100
150
200
250
Perc
ent
Imports Exports Import/Export ratio
TABLE 6 Composition of exports by main commodity, 1970-2001 (percent)
Commodity 1970-79 1980-89 1990-94 1995-2001Tobacco 47.7 54.0 68.7 61.4Tea 21.2 16.3 9.6 8.6Groundnuts 7.7 2.5 - -Cotton 2.9 1.0 1.0 1.3Sugar 7.2 11.7 6.5 8.3Coffee - - - 1.6Pulses - - - 0.8Rice - - - 0.4Other 13.3 14.5 14.1 17.6
Source: Chirwa and Chilowa (1999) and NEC (2002).

421
Malawi
resulting from disproportionate increases in input prices, high transport costs andthe poor macroeconomic environment (World Bank, 2003).
The analysis of production and prices has shown that economic reforms have notled to a substantial transformation of agricultural production. The price transmissionmechanism between international prices and domestic prices for agriculturaltradables is weak for most commodities, although there is evidence of improvedspatial market integration among some domestic markets.
While the policy constraints on private sector participation have largely beeneliminated, the private sector has not responded as hoped. International trade isstill dominated by a few enterprises; private traders in agricultural marketing in thedomestic market remain small and continue to face business constraints and a highrisk market environment; farmers remain unorganized and are in a weak bargainingposition in relation to traders.
CONSEQUENCES OF REFORMS: TARGET VARIABLES
National food securityNational food security is defined by the Government in terms of accessibilityto maize, the main staple food. Thus, even if total food production is above theminimum food requirement, the nation is deemed to be food insecure if maizesupply is below this requirement. Other food crops such as rice and cassava arealternatives to maize in some parts of the country, but maize has remained the mainstaple food, in spite of government policy to promote other crops, particularly thosethat are resistant to drought, such as potatoes and cassava. In a study of recipientsof free inputs in the 1999/2000 season, 96.4 percent of households reported thatmaize was the staple food, while cassava is a staple for only 2.8 percent and rice for0.5 percent of the sampled households (NSO, 2000c). Cassava is the main staple onlyin one northern district.
Measured against the minimum maize requirement, Malawi was self-sufficient inmaize production in the 1960s and 1970s. During these periods, records indicatethat no maize imports were required to augment domestic supply.4 Msukwa (1994)notes that with increases in the population since the mid-1980s, Malawi moved froma situation of national self-sufficiency in food production to recurring food deficits.The period of economic reforms has been characterized by increased imports ofmaize to satisfy domestic demand, partly due to poor weather conditions, low maizeproductivity and high population growth. According to the World Bank (2003), percapita maize production in the last decade has fluctuated between 170 and 220 kg,with sharp declines in 1992 (67 kg) and in 1994 (105 kg).
ADE (2000) estimated that imports of maize were typically between 100 000and 150 000 tonnes during the years of shortages after 1987. Taking maize as themain staple food and using a consumption of 185 kg per capita, the national foodsituation was relatively better in the 1970s compared to the situation since the late1980s. In some cases, other food crops such as cassava, pulses, rice and sorghumare substituting for maize production. Estimates of cassava production show
4 However, data from FAO indicate that Malawi has been importing maize almost every year sinceindependence.
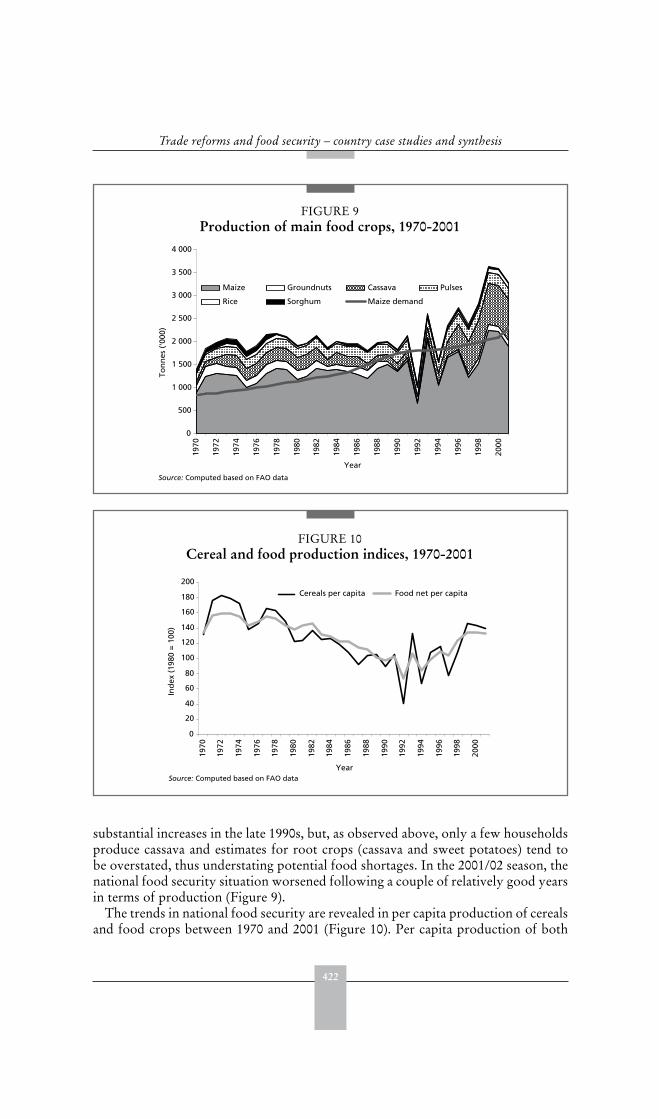
422
Trade reforms and food security – country case studies and synthesis
substantial increases in the late 1990s, but, as observed above, only a few householdsproduce cassava and estimates for root crops (cassava and sweet potatoes) tend tobe overstated, thus understating potential food shortages. In the 2001/02 season, thenational food security situation worsened following a couple of relatively good yearsin terms of production (Figure 9).
The trends in national food security are revealed in per capita production of cerealsand food crops between 1970 and 2001 (Figure 10). Per capita production of both
FIGURE 9Production of main food crops, 1970-2001
Source: Computed based on FAO data
0
500
1 000
1 500
2 000
2 500
3 000
3 500
4 000
1970
1972
1974
1976
1978
1980
1982
1984
1986
1988
1990
1992
1994
1996
1998
2000
Year
Ton
nes
('0
00)
Maize Groundnuts Cassava Pulses
Rice Sorghum Maize demand
FIGURE 10Cereal and food production indices, 1970-2001
Source: Computed based on FAO data
0
20
40
60
80
100
120
140
160
180
200
1970
1972
1974
1976
1978
1980
1982
1984
1986
1988
1990
1992
1994
1996
1998
2000
Year
Ind
ex (
1980
= 1
00)
Cereals per capita Food net per capita
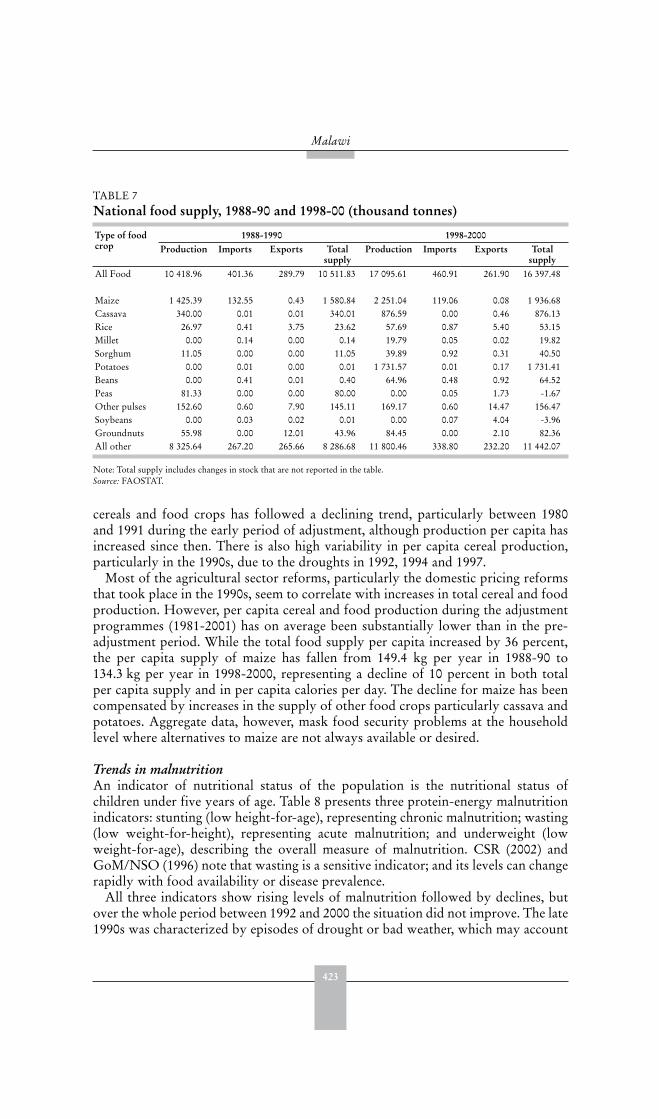
423
Malawi
cereals and food crops has followed a declining trend, particularly between 1980and 1991 during the early period of adjustment, although production per capita hasincreased since then. There is also high variability in per capita cereal production,particularly in the 1990s, due to the droughts in 1992, 1994 and 1997.
Most of the agricultural sector reforms, particularly the domestic pricing reformsthat took place in the 1990s, seem to correlate with increases in total cereal and foodproduction. However, per capita cereal and food production during the adjustmentprogrammes (1981-2001) has on average been substantially lower than in the pre-adjustment period. While the total food supply per capita increased by 36 percent,the per capita supply of maize has fallen from 149.4 kg per year in 1988-90 to134.3 kg per year in 1998-2000, representing a decline of 10 percent in both totalper capita supply and in per capita calories per day. The decline for maize has beencompensated by increases in the supply of other food crops particularly cassava andpotatoes. Aggregate data, however, mask food security problems at the householdlevel where alternatives to maize are not always available or desired.
Trends in malnutrition An indicator of nutritional status of the population is the nutritional status ofchildren under five years of age. Table 8 presents three protein-energy malnutritionindicators: stunting (low height-for-age), representing chronic malnutrition; wasting(low weight-for-height), representing acute malnutrition; and underweight (lowweight-for-age), describing the overall measure of malnutrition. CSR (2002) andGoM/NSO (1996) note that wasting is a sensitive indicator; and its levels can changerapidly with food availability or disease prevalence.
All three indicators show rising levels of malnutrition followed by declines, butover the whole period between 1992 and 2000 the situation did not improve. The late1990s was characterized by episodes of drought or bad weather, which may account
TABLE 7 National food supply, 1988-90 and 1998-00 (thousand tonnes)
Type of food crop
1988-1990 1998-2000Production Imports Exports Total
supplyProduction Imports Exports Total
supplyAll Food 10 418.96 401.36 289.79 10 511.83 17 095.61 460.91 261.90 16 397.48
Maize 1 425.39 132.55 0.43 1 580.84 2 251.04 119.06 0.08 1 936.68Cassava 340.00 0.01 0.01 340.01 876.59 0.00 0.46 876.13Rice 26.97 0.41 3.75 23.62 57.69 0.87 5.40 53.15Millet 0.00 0.14 0.00 0.14 19.79 0.05 0.02 19.82Sorghum 11.05 0.00 0.00 11.05 39.89 0.92 0.31 40.50Potatoes 0.00 0.01 0.00 0.01 1 731.57 0.01 0.17 1 731.41Beans 0.00 0.41 0.01 0.40 64.96 0.48 0.92 64.52Peas 81.33 0.00 0.00 80.00 0.00 0.05 1.73 -1.67Other pulses 152.60 0.60 7.90 145.11 169.17 0.60 14.47 156.47Soybeans 0.00 0.03 0.02 0.01 0.00 0.07 4.04 -3.96Groundnuts 55.98 0.00 12.01 43.96 84.45 0.00 2.10 82.36All other 8 325.64 267.20 265.66 8 286.68 11 800.46 338.80 232.20 11 442.07
Note: Total supply includes changes in stock that are not reported in the table.Source: FAOSTAT.
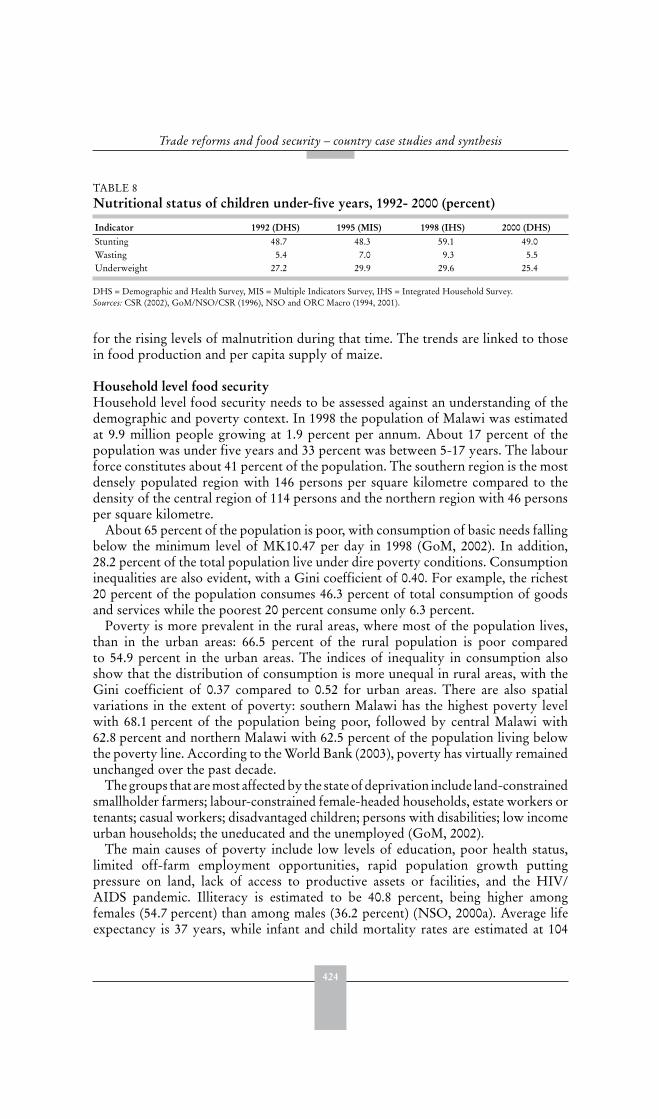
424
Trade reforms and food security – country case studies and synthesis
for the rising levels of malnutrition during that time. The trends are linked to thosein food production and per capita supply of maize.
Household level food securityHousehold level food security needs to be assessed against an understanding of thedemographic and poverty context. In 1998 the population of Malawi was estimatedat 9.9 million people growing at 1.9 percent per annum. About 17 percent of thepopulation was under five years and 33 percent was between 5-17 years. The labourforce constitutes about 41 percent of the population. The southern region is the mostdensely populated region with 146 persons per square kilometre compared to thedensity of the central region of 114 persons and the northern region with 46 personsper square kilometre.
About 65 percent of the population is poor, with consumption of basic needs fallingbelow the minimum level of MK10.47 per day in 1998 (GoM, 2002). In addition,28.2 percent of the total population live under dire poverty conditions. Consumptioninequalities are also evident, with a Gini coefficient of 0.40. For example, the richest20 percent of the population consumes 46.3 percent of total consumption of goodsand services while the poorest 20 percent consume only 6.3 percent.
Poverty is more prevalent in the rural areas, where most of the population lives,than in the urban areas: 66.5 percent of the rural population is poor comparedto 54.9 percent in the urban areas. The indices of inequality in consumption alsoshow that the distribution of consumption is more unequal in rural areas, with theGini coefficient of 0.37 compared to 0.52 for urban areas. There are also spatialvariations in the extent of poverty: southern Malawi has the highest poverty levelwith 68.1 percent of the population being poor, followed by central Malawi with62.8 percent and northern Malawi with 62.5 percent of the population living belowthe poverty line. According to the World Bank (2003), poverty has virtually remainedunchanged over the past decade.
The groups that are most affected by the state of deprivation include land-constrainedsmallholder farmers; labour-constrained female-headed households, estate workers ortenants; casual workers; disadvantaged children; persons with disabilities; low incomeurban households; the uneducated and the unemployed (GoM, 2002).
The main causes of poverty include low levels of education, poor health status,limited off-farm employment opportunities, rapid population growth puttingpressure on land, lack of access to productive assets or facilities, and the HIV/AIDS pandemic. Illiteracy is estimated to be 40.8 percent, being higher amongfemales (54.7 percent) than among males (36.2 percent) (NSO, 2000a). Average lifeexpectancy is 37 years, while infant and child mortality rates are estimated at 104
TABLE 8 Nutritional status of children under-five years, 1992- 2000 (percent)
Indicator 1992 (DHS) 1995 (MIS) 1998 (IHS) 2000 (DHS)Stunting 48.7 48.3 59.1 49.0Wasting 5.4 7.0 9.3 5.5Underweight 27.2 29.9 29.6 25.4
DHS = Demographic and Health Survey, MIS = Multiple Indicators Survey, IHS = Integrated Household Survey.Sources: CSR (2002), GoM/NSO/CSR (1996), NSO and ORC Macro (1994, 2001).
425
Malawi
and 189 per 1 000 live births, respectively. The greatest threat to the population andthe labour force is the problem of HIV/AIDS with the nation-wide prevalence rateestimated at 15 percent, and in urban areas at 23 percent.
Whilst the national aggregate data on food supplies and food security show thatfood supply has been adequate for many years, the picture at household level iscompletely different. The national food balance shows that the supply of food percapita and nutrients per capita have increased between 1990 and 2000, although thesupply for the main staple food, maize, has declined.
The trends in household food security are difficult to capture because of theabsence of periodic national level surveys. Nonetheless, the available informationindicates that most households in the rural areas rely on own food production,particularly maize. Of the incomes of the rural poor and non-poor, 63.7 percentand 59.1 percent respectively are from subsistence agriculture in the form ofown production consumption (GoM, 2002). The poor and non-poor also spend80.9 percent and 69.7 percent of the value of total consumption on food products.In urban areas the poor spend 57.5 percent of their incomes on food, comparedto 29.8 percent for the non-poor. According to NEC (1999), nearly 60 percent ofhouseholds experience food shortages, especially between the months of Decemberand February – the lean season.
On average, rural households only have enough food from their own productionfor 6 to 7 months. This implies that most rural households and urban householdshave to buy maize and other food products from the market. However, in recentyears the prices of food products have increased substantially. For instance, the foodprice index increased at the average rate of 33.3 percent per annum between 1995 and2001. This, coupled with the fact that poverty levels have remained unchanged in thepast decade, implies that most households are at risk for part of the year, althoughthe entitlement to food may vary tremendously between households.
Data from the two districts of Mulanje and Mangochi (CSR and IDS, 2003) indicatethat households describe the food security concept in terms of own food productionand ability to acquire food from the market. In many focus group discussions, a foodsecure household was defined as a household that had enough maize and other foodcrops from its own production to last up to the next harvest and/or as a householdthat is able to buy food without problems. Three categories of household weretypically defined in terms of food security: food secure, moderately food secure, andfood insecure. The food secure usually produce enough food or enough cash cropsto enable them buy food to last the household for a year. The food secure also havelivestock and operate small businesses and usually apply fertilizers to their plots. Themoderately food secure will usually harvest maize and other food crops that wouldlast for three to four months and struggle to buy food from the market after that. Themoderately food secure have little livestock and a few operate small businesses butcannot afford fertilizers. The food insecure usually either produce maize to last thehousehold for a month or eat the maize while green and rely on casual employmentto purchase food throughout the year.
Changes in food production at household levelFood crop production trends between 1998 and 2002 are presented for variouscategories of rural farming household in Table 9. The land size category of less than
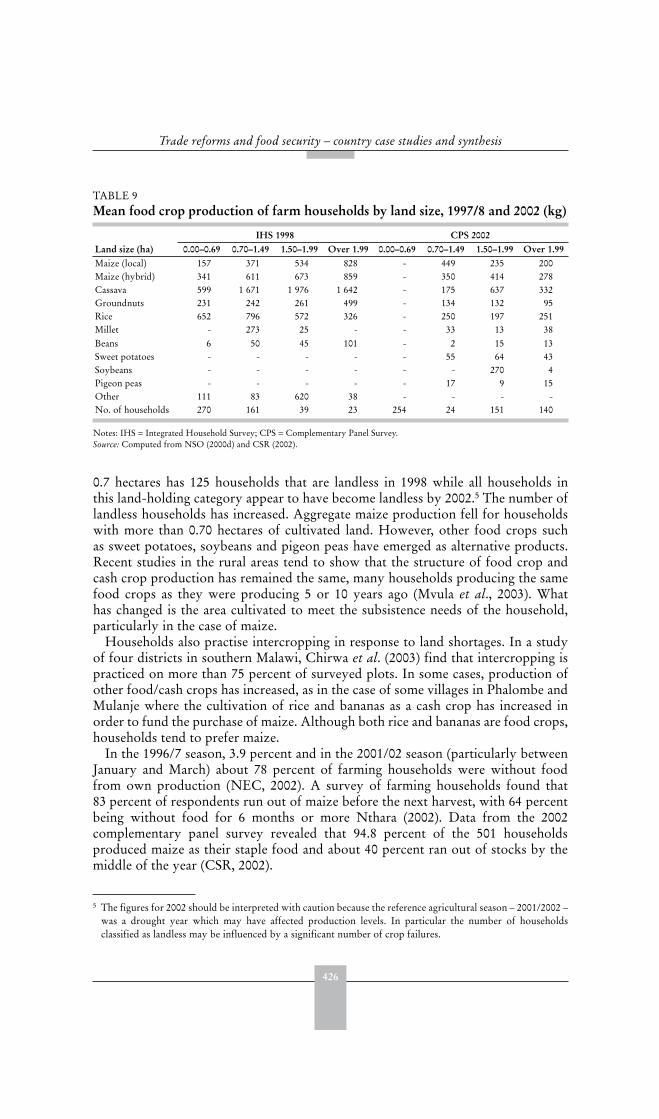
426
Trade reforms and food security – country case studies and synthesis
0.7 hectares has 125 households that are landless in 1998 while all households inthis land-holding category appear to have become landless by 2002.5 The number oflandless households has increased. Aggregate maize production fell for householdswith more than 0.70 hectares of cultivated land. However, other food crops suchas sweet potatoes, soybeans and pigeon peas have emerged as alternative products.Recent studies in the rural areas tend to show that the structure of food crop andcash crop production has remained the same, many households producing the samefood crops as they were producing 5 or 10 years ago (Mvula et al., 2003). Whathas changed is the area cultivated to meet the subsistence needs of the household,particularly in the case of maize.
Households also practise intercropping in response to land shortages. In a studyof four districts in southern Malawi, Chirwa et al. (2003) find that intercropping ispracticed on more than 75 percent of surveyed plots. In some cases, production ofother food/cash crops has increased, as in the case of some villages in Phalombe andMulanje where the cultivation of rice and bananas as a cash crop has increased inorder to fund the purchase of maize. Although both rice and bananas are food crops,households tend to prefer maize.
In the 1996/7 season, 3.9 percent and in the 2001/02 season (particularly betweenJanuary and March) about 78 percent of farming households were without foodfrom own production (NEC, 2002). A survey of farming households found that83 percent of respondents run out of maize before the next harvest, with 64 percentbeing without food for 6 months or more Nthara (2002). Data from the 2002complementary panel survey revealed that 94.8 percent of the 501 householdsproduced maize as their staple food and about 40 percent ran out of stocks by themiddle of the year (CSR, 2002).
5 The figures for 2002 should be interpreted with caution because the reference agricultural season – 2001/2002 –was a drought year which may have affected production levels. In particular the number of householdsclassified as landless may be influenced by a significant number of crop failures.
TABLE 9 Mean food crop production of farm households by land size, 1997/8 and 2002 (kg)
IHS 1998 CPS 2002Land size (ha) 0.00–0.69 0.70–1.49 1.50–1.99 Over 1.99 0.00–0.69 0.70–1.49 1.50–1.99 Over 1.99Maize (local) 157 371 534 828 - 449 235 200Maize (hybrid) 341 611 673 859 - 350 414 278Cassava 599 1 671 1 976 1 642 - 175 637 332Groundnuts 231 242 261 499 - 134 132 95Rice 652 796 572 326 - 250 197 251Millet - 273 25 - - 33 13 38Beans 6 50 45 101 - 2 15 13Sweet potatoes - - - - - 55 64 43Soybeans - - - - - - 270 4Pigeon peas - - - - - 17 9 15Other 111 83 620 38 - - - -No. of households 270 161 39 23 254 24 151 140
Notes: IHS = Integrated Household Survey; CPS = Complementary Panel Survey.Source: Computed from NSO (2000d) and CSR (2002).
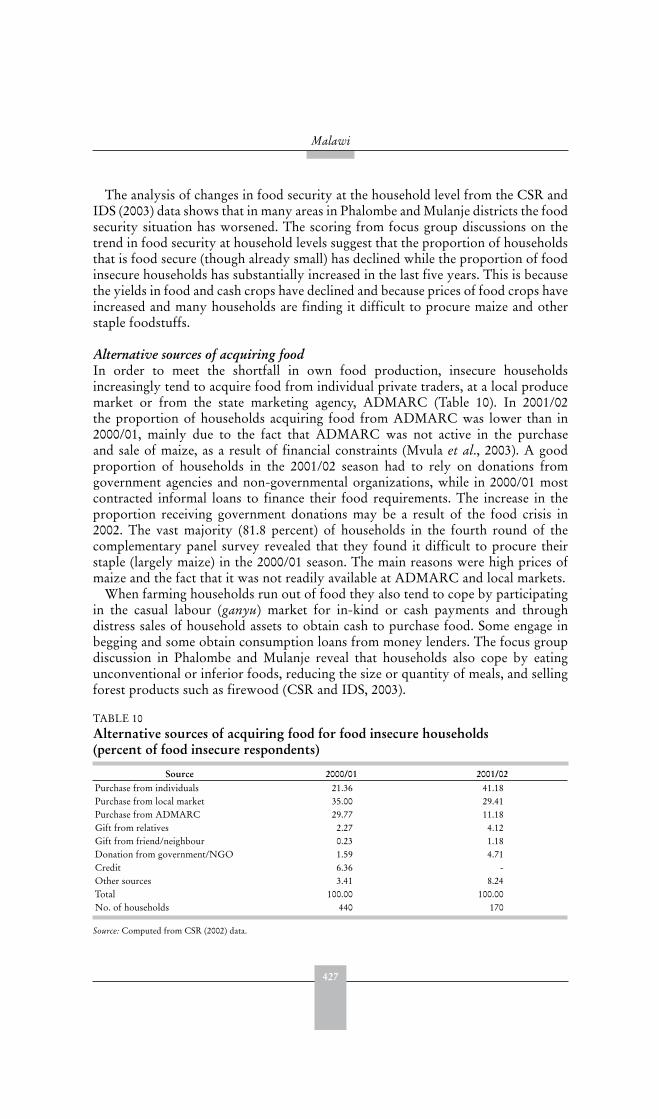
427
Malawi
The analysis of changes in food security at the household level from the CSR andIDS (2003) data shows that in many areas in Phalombe and Mulanje districts the foodsecurity situation has worsened. The scoring from focus group discussions on thetrend in food security at household levels suggest that the proportion of householdsthat is food secure (though already small) has declined while the proportion of foodinsecure households has substantially increased in the last five years. This is becausethe yields in food and cash crops have declined and because prices of food crops haveincreased and many households are finding it difficult to procure maize and otherstaple foodstuffs.
Alternative sources of acquiring foodIn order to meet the shortfall in own food production, insecure householdsincreasingly tend to acquire food from individual private traders, at a local producemarket or from the state marketing agency, ADMARC (Table 10). In 2001/02the proportion of households acquiring food from ADMARC was lower than in2000/01, mainly due to the fact that ADMARC was not active in the purchaseand sale of maize, as a result of financial constraints (Mvula et al., 2003). A goodproportion of households in the 2001/02 season had to rely on donations fromgovernment agencies and non-governmental organizations, while in 2000/01 mostcontracted informal loans to finance their food requirements. The increase in theproportion receiving government donations may be a result of the food crisis in2002. The vast majority (81.8 percent) of households in the fourth round of thecomplementary panel survey revealed that they found it difficult to procure theirstaple (largely maize) in the 2000/01 season. The main reasons were high prices ofmaize and the fact that it was not readily available at ADMARC and local markets.
When farming households run out of food they also tend to cope by participatingin the casual labour (ganyu) market for in-kind or cash payments and throughdistress sales of household assets to obtain cash to purchase food. Some engage inbegging and some obtain consumption loans from money lenders. The focus groupdiscussion in Phalombe and Mulanje reveal that households also cope by eatingunconventional or inferior foods, reducing the size or quantity of meals, and sellingforest products such as firewood (CSR and IDS, 2003).
TABLE 10 Alternative sources of acquiring food for food insecure households(percent of food insecure respondents)
Source 2000/01 2001/02Purchase from individuals 21.36 41.18Purchase from local market 35.00 29.41Purchase from ADMARC 29.77 11.18Gift from relatives 2.27 4.12Gift from friend/neighbour 0.23 1.18Donation from government/NGO 1.59 4.71Credit 6.36 -Other sources 3.41 8.24Total 100.00 100.00No. of households 440 170
Source: Computed from CSR (2002) data.
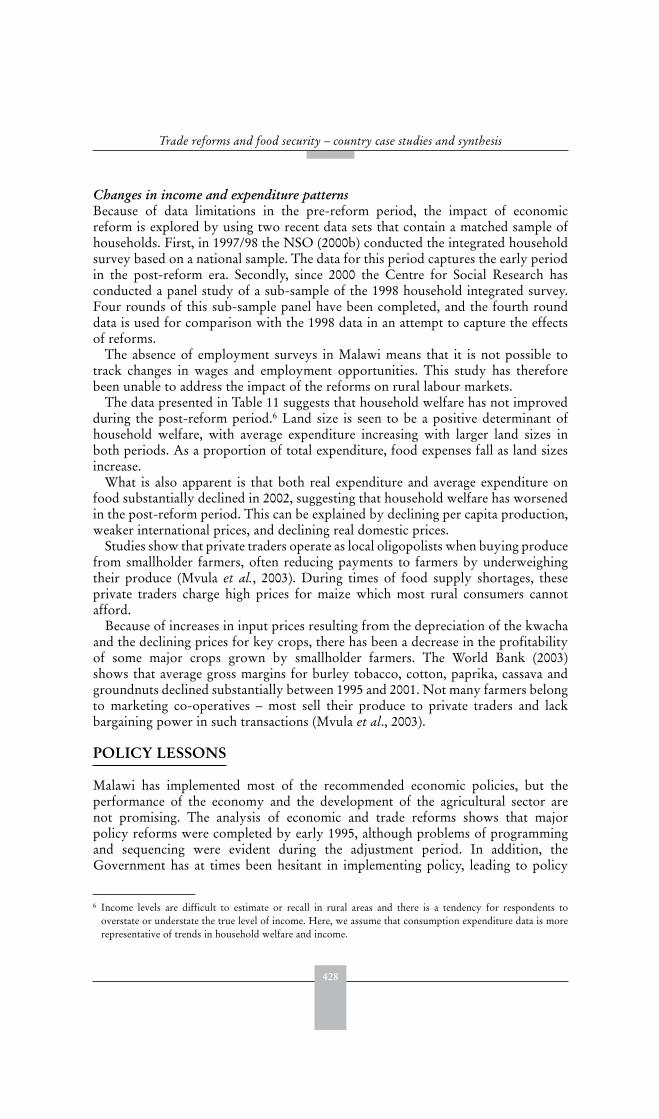
428
Trade reforms and food security – country case studies and synthesis
Changes in income and expenditure patternsBecause of data limitations in the pre-reform period, the impact of economicreform is explored by using two recent data sets that contain a matched sample ofhouseholds. First, in 1997/98 the NSO (2000b) conducted the integrated householdsurvey based on a national sample. The data for this period captures the early periodin the post-reform era. Secondly, since 2000 the Centre for Social Research hasconducted a panel study of a sub-sample of the 1998 household integrated survey.Four rounds of this sub-sample panel have been completed, and the fourth rounddata is used for comparison with the 1998 data in an attempt to capture the effectsof reforms.
The absence of employment surveys in Malawi means that it is not possible totrack changes in wages and employment opportunities. This study has thereforebeen unable to address the impact of the reforms on rural labour markets.
The data presented in Table 11 suggests that household welfare has not improvedduring the post-reform period.6 Land size is seen to be a positive determinant ofhousehold welfare, with average expenditure increasing with larger land sizes inboth periods. As a proportion of total expenditure, food expenses fall as land sizesincrease.
What is also apparent is that both real expenditure and average expenditure onfood substantially declined in 2002, suggesting that household welfare has worsenedin the post-reform period. This can be explained by declining per capita production,weaker international prices, and declining real domestic prices.
Studies show that private traders operate as local oligopolists when buying producefrom smallholder farmers, often reducing payments to farmers by underweighingtheir produce (Mvula et al., 2003). During times of food supply shortages, theseprivate traders charge high prices for maize which most rural consumers cannotafford.
Because of increases in input prices resulting from the depreciation of the kwachaand the declining prices for key crops, there has been a decrease in the profitabilityof some major crops grown by smallholder farmers. The World Bank (2003)shows that average gross margins for burley tobacco, cotton, paprika, cassava andgroundnuts declined substantially between 1995 and 2001. Not many farmers belongto marketing co-operatives – most sell their produce to private traders and lackbargaining power in such transactions (Mvula et al., 2003).
POLICY LESSONS
Malawi has implemented most of the recommended economic policies, but theperformance of the economy and the development of the agricultural sector arenot promising. The analysis of economic and trade reforms shows that majorpolicy reforms were completed by early 1995, although problems of programmingand sequencing were evident during the adjustment period. In addition, theGovernment has at times been hesitant in implementing policy, leading to policy
6 Income levels are difficult to estimate or recall in rural areas and there is a tendency for respondents tooverstate or understate the true level of income. Here, we assume that consumption expenditure data is morerepresentative of trends in household welfare and income.
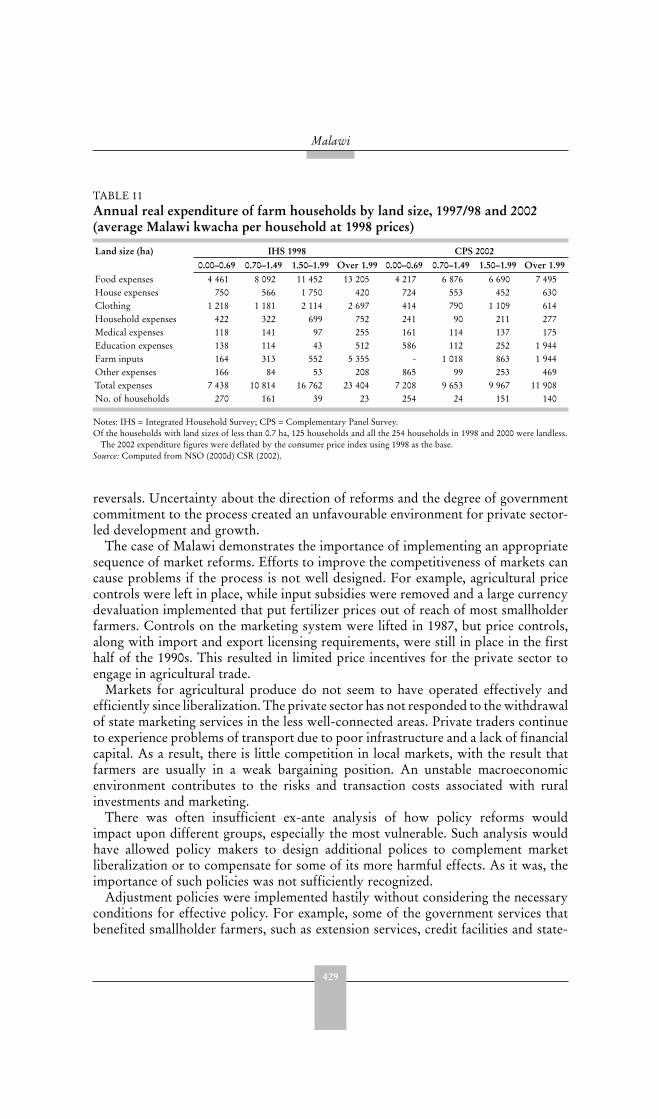
429
Malawi
reversals. Uncertainty about the direction of reforms and the degree of governmentcommitment to the process created an unfavourable environment for private sector-led development and growth.
The case of Malawi demonstrates the importance of implementing an appropriatesequence of market reforms. Efforts to improve the competitiveness of markets cancause problems if the process is not well designed. For example, agricultural pricecontrols were left in place, while input subsidies were removed and a large currencydevaluation implemented that put fertilizer prices out of reach of most smallholderfarmers. Controls on the marketing system were lifted in 1987, but price controls,along with import and export licensing requirements, were still in place in the firsthalf of the 1990s. This resulted in limited price incentives for the private sector toengage in agricultural trade.
Markets for agricultural produce do not seem to have operated effectively andefficiently since liberalization. The private sector has not responded to the withdrawalof state marketing services in the less well-connected areas. Private traders continueto experience problems of transport due to poor infrastructure and a lack of financialcapital. As a result, there is little competition in local markets, with the result thatfarmers are usually in a weak bargaining position. An unstable macroeconomicenvironment contributes to the risks and transaction costs associated with ruralinvestments and marketing.
There was often insufficient ex-ante analysis of how policy reforms wouldimpact upon different groups, especially the most vulnerable. Such analysis wouldhave allowed policy makers to design additional polices to complement marketliberalization or to compensate for some of its more harmful effects. As it was, theimportance of such policies was not sufficiently recognized.
Adjustment policies were implemented hastily without considering the necessaryconditions for effective policy. For example, some of the government services thatbenefited smallholder farmers, such as extension services, credit facilities and state-
TABLE 11 Annual real expenditure of farm households by land size, 1997/98 and 2002 (average Malawi kwacha per household at 1998 prices)
Land size (ha) IHS 1998 CPS 20020.00–0.69 0.70–1.49 1.50–1.99 Over 1.99 0.00–0.69 0.70–1.49 1.50–1.99 Over 1.99
Food expenses 4 461 8 092 11 452 13 205 4 217 6 876 6 690 7 495House expenses 750 566 1 750 420 724 553 452 630Clothing 1 218 1 181 2 114 2 697 414 790 1 109 614Household expenses 422 322 699 752 241 90 211 277Medical expenses 118 141 97 255 161 114 137 175Education expenses 138 114 43 512 586 112 252 1 944Farm inputs 164 313 552 5 355 - 1 018 863 1 944Other expenses 166 84 53 208 865 99 253 469Total expenses 7 438 10 814 16 762 23 404 7 208 9 653 9 967 11 908No. of households 270 161 39 23 254 24 151 140
Notes: IHS = Integrated Household Survey; CPS = Complementary Panel Survey.Of the households with land sizes of less than 0.7 ha, 125 households and all the 254 households in 1998 and 2000 were landless.
The 2002 expenditure figures were deflated by the consumer price index using 1998 as the base.Source: Computed from NSO (2000d) CSR (2002).
430
Trade reforms and food security – country case studies and synthesis
marketing activities, were withdrawn without credible replacement institutionsand without the creation of a conducive market environment and regulatoryframework.
Smallholder farmers continue to face credit constraints exacerbated by the collapsein 1992 of the government administered SACA which offered subsidized credit at anational level. The MRFC, which replaced SACA, offers credit on commercial termsbut agricultural credit is confined to the tobacco growers and its network is not asextensive as its predecessor’s. Although the number of microfinance institutionshas mushroomed in the past decade, they tend to specialize in financing off-farmbusiness activities, with much of the available agricultural credit confined to thetobacco sector.
The collapse of SACA was also followed by the collapse of farmers’ clubs thatwere a vehicle for the delivery of credit facilities and extension services. Manysmallholder farmers remain unorganized and very few have formed co-operatives.Although the National Smallholder Farmers’ Association of Malawi (NASFAM) isbridging the gap through the formation of marketing cooperatives, it operates in alimited area where accessibility is not a major problem. Membership is drawn mainlyfrom smallholder farmers engaged in commercial agriculture, and usually foodsecure, rather than the food insecure who would particularly benefit from betterfarming practices and higher prices.
The quality and adequacy of infrastructure such as domestic and internationalroad networks and telecommunication facilities were accorded low priorityduring the adjustment period. The poor road network poses a major challenge tothe development of the agricultural sector and without adequate infrastructurethe integration of markets and price transmission is likely to be weak, with poorimplications for the ability of the private marketing system to provide productionincentives to farmers. For example, the withdrawal from marketing by ADMARChas created problems of input supply and produce marketing in remote areas. Privatetraders engaged in agricultural input trade are located in urban areas and thoseengaged in produce marketing tend to operate in areas where accessibility is not aproblem. Given that no regulations were developed prior to the liberalization ofagricultural markets, many private traders behave as local monopsonists and tend tooffer reduced prices to farmers.
The main challenges facing Malawi today remain how to achieve sustainable growthand to reduce poverty. Since 1994, government policy has emphasized the need toreduce poverty through the development of the agricultural sector and other sectorsof the economy. Poverty reduction has been at the centre of government policy sincethe 1990s, particularly in the Poverty Alleviation Programme which emphasizedraising national productivity through sustainable, broad-based economic growthand socio-cultural development. However, safety net compensatory measures havebeen insufficient to protect the most vulnerable from food insecurity.
In 2002, Malawi formulated its poverty reduction strategy paper with the objectiveof achieving sustainable poverty reduction through empowerment of the poor(GoM, 2002). The Malawi Poverty Reduction Strategy Paper (MPRSP) proposes anumber of strategies in order to reduce poverty, including promotion of micro andsmall enterprises, provision of necessary agricultural services to smallholder farmers,improving access to credit facilities, improving rural infrastructure and provision
431
Malawi
of safety nets. The agricultural sector is identified as the main source of pro-poorgrowth in the MPRSP, as it remains the most important source of income for manyMalawians. The main strategies in the development of the agricultural sector includeexpanding and strengthening access to agricultural inputs, improving research andextension services, improving access to domestic and international markets, reducingland shortages and degradation, increasing investment in irrigation and developingfarmer co-operatives and associations.
REFERENCES
ADE. 2000. Malawi: inception technical assistance to the National Food Reserve Agency. Draftreport.
Buckley, G. 1996. Rural and agricultural credit in Malawi: A study of the Malawi Mudzi Fundand the Smallholder Agricultural Credit Administration. In D. Hulme & P. Mosley, eds.Finance against poverty, Volume 2, London and New York, Routledge.
Chirwa, E.W. 1998. Fostering private food marketing and food policies after liberalization inSub-Saharan Africa - the case of Malawi. In P. Seppala (ed.) Liberalized and Neglected?
Food Marketing Policies in Eastern Africa. World Development Studies 12. Helsinki,UNU/WIDER.
Chirwa, E.W. 2000. Privatization and economic efficiency in Malawi manufacturing: mixed
enterprises in oligopolistic industries. Unpublished PhD Thesis. University of East Anglia,United Kingdom.
Chirwa, E.W. 2001. Liberalization of food marketing and market integration in Malawi. FinalReport submitted the African Economic Research Consortium.
Chirwa, E. & Chilowa, W. 1999. Malawi: employment and labour markets during adjustment.In W. Geest & R. Hoeven (eds.). Adjustment employment and missing institutions in
Africa: Experience in Eastern and Southern Africa. Geneva and Oxford, ILO and JamesCurrey.
Chirwa, E.W., Mvula, P.M., Kadzandira, J. & Horea, L. 2003. Baseline socioeconomic survey
of the community rural land development project. Draft Report by Wadonda Consultsubmitted to Ministry of Lands, Physical Planning and Surveys.
Chirwa E W. & Zakeyo, C. 2003. Impact of economic and trade policy reforms on food security
in Malawi, paper prepared for FAO.CSR (Centre for Social Research) 2002. Complementary panel survey for poverty monitoring
(Data Set), Zomba: CSR, University of Malawi.CSR (Centre for Social Research) & IDS (Institute of Development Studies). 2003. Food
Crisis Impact Study: Focus Group Discussion Reports for Mulanje and Phalombe Districts,Zomba: Centre for Social Research.
Danielson, A. 2002 Agricultural supply response in Tanzania: Has adjustment really worked?African Development Review, 14 (1), 98-112.
ECI (Ebony Consulting International) & NSO (National Statistical Office). 2001. Malawi
national GEMENI MSE Baseline Study 2000. Final Report prepared, with the assistanceof Kadale Consultants and Wadonda Consult, for the Department for InternationalDevelopment.
Fafchamps, M. & Gabre-Madhin, E. 2001. Agricultural markets in Benin and Malawi:
Operation and performance of traders. World Bank Working Paper Series No. 2734(Washington, DC).

432
Trade reforms and food security – country case studies and synthesis
GoM (Government of Malawi). 1987. Statement of development policies, 1987-1996. Zomba:Government Printer.
GoM (Government of Malawi). 2001. State of environment report for Malawi 2001.
Lilongwe: Ministry of Natural Resources and Environmental Affairs.GoM (Government of Malawi). 2002. Malawi poverty reduction strategy. Lilongwe: Ministry
of Finance and Economic Planning.GoM (Government of Malawi), NSO (National Statistical Office) & CSR (Centre for
Social Research). 1996. Malawi social indicators survey 1995. Zomba: National StatisticalOffice and Centre for Social Research.
Harrigan, J. 1988. Malawi: the Impact of Pricing Policy on Smallholder Agriculture 1971-1988, Development Policy Review 6: 415-433.
Harrigan, J. 1991. Malawi. In P. Mosley, J. Harrigan & J. Toye (eds.). Aid and power: the
World Bank and policy-based lending, Case Studies. Volume 2, London, Routledge.Harriss, B. & Crow, B. 1992. Twentieth century free trade reform: market deregulation
in Sub-Saharan Africa and South Asia. In M. Wuyts, M. Mackintosh & T. Hewitt, eds.Development Policy and Public Action. Oxford, UK, Oxford University Press.
IMF. Various years. International Financial Statistics.Kaluwa, B. M., Silumbu, E., Ngalande Banda, E. & Chilowa, W. 1992. The Structural
adjustment programme in Malawi: A Case for Successful Adjustment? Monograph seriesNo. 3, Harare, SAPES Books.
Kandoole, B. F., Kaluwa, B. M. & Buccola, S. 1988. Market Liberalisation and Food Securityin Malawi. in M. Rukuni and R. H. Bernsten (eds.). Southern Africa: Food Security
Policy Options, proceedings of the Third Annual Conference on Food Security Research
in Southern Africa. University of Zimbabwe/Michigan State University Food SecurityResearch Project.
Lamb, R. L. 2000. Food crops, exports, and the short-run policy response of agriculture inAfrica. Agricultural Economics 22:271-298.
Mhone, G. 1992. The political economy of Malawi - An overview. In G.C.Z. Mhone, ed.Malawi at the Crossroads: The Post-Colonial Political Economy. Harare, Sapes Books.
Mkwezalamba, M.M. 1989. The Impact of liberalization on smallholder agricultural
produce pricing and marketing in Malawi. Report submitted to Ministry of Agriculture,Lilongwe.
Mlachila, M. & Chirwa, E.W. 2002. Financial reforms and interest rate spreads in the
commercial banking system in Malawi. IMF Working Paper WP/02/6.Msukwa, L.A.H. 1994. Food policy and production: towards increased household food security.
Zomba: Centre for Social Research.Msukwa, L.A.H., Chilowa, W.R., Bagazonzya, H., Mawaya, A., Nankhuni, F. & Bisika, T.J.
1994. Smallholder credit repayment study. Zomba: Centre for Social Research.Mvula, P. M., Chirwa, E. W. & Kadzandira, J. 2003. Poverty and Social Impact Assessment
in Malawi: Closure of ADMARC Markets, Draft Final Report submitted to SocialDevelopment Department, World Bank and Economic Section/PRSP Support, GTZ.
NEC (National Economic Council). 2002. Economic Report. Lilongwe: NEC.NEC (National Economic Council). 1999. Annual Report on Poverty in Malawi. Lilongwe:
NEC.NSO (National Statistical Office). 2000a. 1998 Malawi Population and Housing Census:
Report of Final Census Results, Zomba: National Statistical Office.
433
Malawi
NSO (National Statistical Office). 2000b. The Poverty analysis of the Integrated Household
Survey 1997-98 - The state of Malawi’s poor: the incidence, depth, and severity of poverty.Available at http://www.nso.malawi.net.
NSO (National Statistical Office). 2000c. Starter Park 1999/00 Agro-Economic Survey,Zomba: National Statistical Office (Draft Report).
NSO (National Statistical Office) 2000d. Malawi: Integrated Household Survey (Data Set),Zomba: National Statistical Office.
NSO (National Statistical Office) & ORC Macro 1994. Malawi: demographic and health
survey 1992, Zomba, Malawi and Calverton, Maryland, USA: National Statistical Officeand ORC Macro.
NSO (National Statistical Office) & ORC Macro. 2001. Malawi: demographic and health
survey 2000, Zomba, Malawi and Calverton, Maryland, USA: National Statistical Officeand ORC Macro.
Nthara, K. 2002. What needs to be done to improve the impact of ADMARC on the poor.Phase 2. Final Report presented to Oxfam Malawi, Blantyre.
Reserve Bank of Malawi. Various years. Financial and economic review.
Scarborough, V. 1990. Domestic food marketing liberalization in Malawi: A preliminary
assessment. ADU Occasional Paper 13. London: Wye College, University of London.World Bank. 2003. Malawi country economic memorandum: policies for accelerating growth.
Washington: World Bank.


435
MoroccoAbdelaziz Sbai, Mohamed Jaoad and Azzouz Jakhjoukhi1
EXECUTIVE SUMMARY
Pre-reformUnlike many other developing countries, Morocco’s development strategy sincethe 1960s gave priority to agriculture and to investment in large-scale irrigationinfrastructure. On average between one-third and one-quarter of public investmentand between one-half and two-thirds of agricultural investment went to irrigation.To encourage farmers, the Government provided subsidies, cheap loans, and inmany cases guaranteed outlets for production. The authorities tried to regulate stapleproduct prices of such goods as cereals, milk and certain industrial crops (sugar beet,cotton, sunflower, etc.) for the domestic market, but at the same time made a greateffort to encourage export.
The reformsThe structural adjustment policy affected agriculture directly through the 1985Medium Term Adjustment Programme for the Agriculture Sector, which aimed atliberalizing production and trade. Loans and programmes were linked to redefiningthe role of public intervention agencies and applying commercial principles to theirmanagement; removing obstacles to domestic and external trade (monopolies, quotasand other restrictive regulations on the trade in agricultural products); abolishingstate subsidies for production inputs and introducing economic pricing for inputs andoutputs; reforming agricultural credit; and privatizing some of the land and livestockthat had previously belonged to the state. However, reform was more difficult toachieve than expected, and initiatives were often delayed or only partly implemented.
Impact on intermediate variablesThe decomposition of prices indicates that there are three categories of product.For some, such as maize and barley, domestic prices can be partially explained byworld price changes; for others, such as groundnuts or sugar crops (beet and cane),domestic price changes are mainly due to changes in other factors; a third categoryconcerns products for which world price changes only had an impact on domesticprices during the latter period: soft wheat and sunflower. Exchange rate changes(devaluation) since the pre-reform period had a positive impact on the prices of allcommodities.
1 Abdelaziz Sbai, Département des Sciences Humaines, Institut Agronomique et Vétérinaire Hassan II,Mohamed Jaoad, Ministry of Agriculture and Azzouz Jakhjoukhi, Agroconcept, Morocco.
436
Trade reforms and food security – country case studies and synthesis
The cereals sub-sector was more strongly supported after adjustment than before.After a major cereal shortage between 1975 and 1985 (some 20 million quintals peryear) Morocco’s situation improved from 1985 thanks to a remarkable increase inoutput until production began to fall, from 6 700 000 tonnes (1986-90) to 4 159 000tonnes (1997-2001), entailing a fall of 40 percent in the cereal self-sufficiency rate.
The sugar crop sub-sector was originally slightly supported at a price support(PSE) level of 8 percent, and moved to widespread protection (43 percent PSE)during the adjustment period. Oilseeds are actively supported by the Government atproduction and marketing stages. The PSE averaged 71 percent in 1991-93, comparedwith average support of 29 percent in 1980-83.
The fruit and vegetable sub-sector (tomatoes and oranges) is taxed but slightlyless than before reform. (-3 percent instead of 13 percent). Vegetable farming hasdeveloped considerably. The acreage under vegetables has increased by 40 percentover 10 years
The meat sub-sector as a whole is still broadly supported, and this increased in theadjustment period to reach 58 percent for red meat and 59 percent for white meat,and is much more pronounced for meat than for milk. Red meat production hasvaried widely in line with fluctuations in rainfall. Milk production fell during the1980 droughts, then recovered in 1985 until 1992 before once again falling after thedroughts in 1992/93. In 1997-2001 it grew by 34 percent.
With regards to trade, the stability of increased export revenues is remarkablewhen one compares it to the fluctuations in production for the domestic market. Thevalue of imports tends to vary much more, reflecting the fluctuations in domesticproduction and in world prices.
Impact on target variablesDespite the higher level of instability resulting from both climatic events andreductions in border protection, the reforms coincided with greater self-sufficiencyfor a number of commodities, especially animal products and edible oils, but withthe notable exception of cereals.
The incidence of poverty fell between 1984/85 and 1990/91, but worsened duringthe 1990s. In 1998/99 over one Moroccan in five (22 percent) was below the povertythreshold, compared to just over one in ten (13 percent) in 1990/91. The incidence ofpoverty is greater in rural than in urban areas. In 1998/99 it was 29 percent comparedwith 16 percent in the urban areas. In 2000 the agriculture sector generated an annualincome per active person 30 percent below the national income per active person.
Policy lessonsThe agriculture sector has benefited from relatively high levels of support, enhancedby the devaluations during the process of reform, and the relatively slow, andresisted, implementation of price reforms. However, the high levels of protectionhave tended to serve the interests of large farmers and those in areas with a highagricultural production potential, and not the small producers in the semi-arid andarid zones who mainly farmed to meet their own subsistence requirements, and hadfew marketable surpluses.
The enduring feature in Morocco’s poverty profile is its rural dimension andthe shortcomings in rural living standards: poverty is both more frequently found
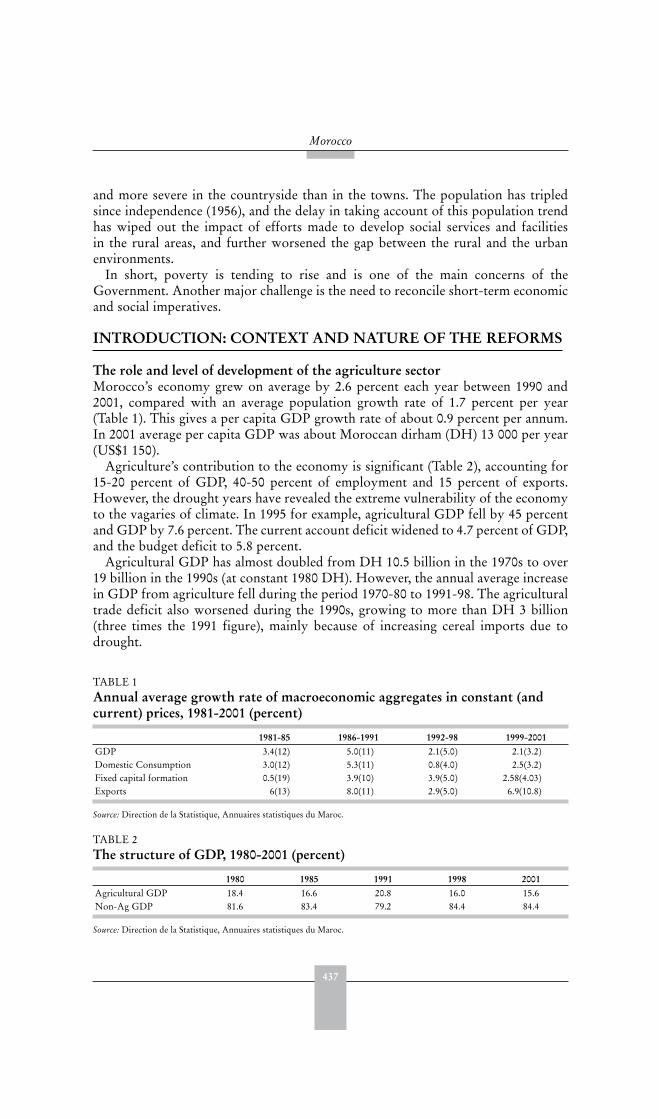
437
Morocco
and more severe in the countryside than in the towns. The population has tripledsince independence (1956), and the delay in taking account of this population trendhas wiped out the impact of efforts made to develop social services and facilitiesin the rural areas, and further worsened the gap between the rural and the urbanenvironments.
In short, poverty is tending to rise and is one of the main concerns of theGovernment. Another major challenge is the need to reconcile short-term economicand social imperatives.
INTRODUCTION: CONTEXT AND NATURE OF THE REFORMS
The role and level of development of the agriculture sectorMorocco’s economy grew on average by 2.6 percent each year between 1990 and2001, compared with an average population growth rate of 1.7 percent per year(Table 1). This gives a per capita GDP growth rate of about 0.9 percent per annum.In 2001 average per capita GDP was about Moroccan dirham (DH) 13 000 per year(US$1 150).
Agriculture’s contribution to the economy is significant (Table 2), accounting for15-20 percent of GDP, 40-50 percent of employment and 15 percent of exports.However, the drought years have revealed the extreme vulnerability of the economyto the vagaries of climate. In 1995 for example, agricultural GDP fell by 45 percentand GDP by 7.6 percent. The current account deficit widened to 4.7 percent of GDP,and the budget deficit to 5.8 percent.
Agricultural GDP has almost doubled from DH 10.5 billion in the 1970s to over19 billion in the 1990s (at constant 1980 DH). However, the annual average increasein GDP from agriculture fell during the period 1970-80 to 1991-98. The agriculturaltrade deficit also worsened during the 1990s, growing to more than DH 3 billion(three times the 1991 figure), mainly because of increasing cereal imports due todrought.
TABLE 1 Annual average growth rate of macroeconomic aggregates in constant (and current) prices, 1981-2001 (percent)
1981-85 1986-1991 1992-98 1999-2001GDP 3.4(12) 5.0(11) 2.1(5.0) 2.1(3.2)Domestic Consumption 3.0(12) 5.3(11) 0.8(4.0) 2.5(3.2)Fixed capital formation 0.5(19) 3.9(10) 3.9(5.0) 2.58(4.03)Exports 6(13) 8.0(11) 2.9(5.0) 6.9(10.8)
Source: Direction de la Statistique, Annuaires statistiques du Maroc.
TABLE 2 The structure of GDP, 1980-2001 (percent)
1980 1985 1991 1998 2001Agricultural GDP 18.4 16.6 20.8 16.0 15.6Non-Ag GDP 81.6 83.4 79.2 84.4 84.4
Source: Direction de la Statistique, Annuaires statistiques du Maroc.
438
Trade reforms and food security – country case studies and synthesis
Non-agricultural GDP has grown at an annual average rate of 3.1 percent overthe past decade. This growth was driven by energy (6.2 percent), transport andcommunications (5.6 percent), trade (2.9 percent) and manufacturing (2.8 percent).
Of the active population, 41 percent (4.4 million people) worked in agriculture in2000. In relation to agricultural GDP, this indicates low labour productivity (DH 3 500per employed person), compared with the average of DH 12 000 for all commercialactivities, and DH 26 000 per person employed in manufacturing and energy).
The vulnerability of agricultural GDP, which varies between 11 and 21 percentof GDP depending upon the year, is explained by the importance of cereals. Theseaccount for 80 percent of the value of crop output (excluding fruit and vegetables)and occupy between 50 and 60 percent of the land under crops, 70 to 75 percent ofthe rainfed area (bour land) and 30 to 40 percent of the irrigated lands. They absorbone-quarter of household food expenditure. The small cereal farmers on bour landmake up the majority of the agricultural population, and cereals are their mainsource of livelihood.
Although cereals are important everywhere, there are large regional differences in theproportion of cultivated land devoted to cereals. For example, during the 1995/1996season, the Tanger-Tétouan region devoted only 46 percent of cultivated land to cereals,in contrast to 82 percent in Marrakech-Tensift-El Haouz and Chaouia-Ouardigha.
For oilseeds, the region of Gharb-Cherarda-Beni Hssen stands out from theother regions as these crops account for 14.6 percent of the region’s area used forfarming (AUF) and account for about 74 percent of the country’s total area devotedto oilseeds.
Fodder crops are present in virtually every region. They generally cover less than2.4 percent of AUF, except Grand Casablanca, where the percentage is 11.3.
Land tenure structure is unequal: the 1996 Agriculture General Census showedthat 70 percent of the farmers worked 24 percent of the total AUF (on farms of lessthan 5 hectares) while 30 percent of the farmers worked more than 75 percent ofthe total area. Collective lands account for 18 percent of the total AUF, an area of1 544 656 hectares. State-owned land covers AUF of 270 153 hectares, or 3 percentof the total AUF.
Degree of openness of the economy prior to the reforms Unlike many other developing countries, Morocco’s development strategy sincethe 1960s has given priority to agriculture, with the objective of modernizingagricultural research and achieving self-sufficiency, while promoting exports. Basedon the need to mobilize water resources in a country where climate constraints havealways been decisive, the strategy was to develop a large scale system of dams andirrigation networks, the goal being to irrigate millions of hectares by the year 2000.On average, between one-third and one-quarter of public investment and betweenone-half and two-thirds of agriculture investment since the mid-1960s has beendevoted to agricultural water management. The Government provided subsidizedservices and loans and guaranteed outlets for farm output. Water user fees wereminimal and small and medium-sized farms were exempt. Irrigated land had to beused according to standards and rotation plans.
Agricultural pricing policy was selective. Prices of certain commodities, such ascereals, milk and some industrial crops (such as sugar beet, cotton and sunflower)

439
Morocco
were regulated. Trade instruments were used where necessary to bring pressureon price levels in the 1960s. In 1972/73 a new policy was implemented which ledto frequent producer price increases. Public subsidies were also provided in orderto cushion the impact on consumer prices. With regard to imports, world pricefluctuations were also absorbed by internal stabilization measures.
The Government’s trade policy was also selective, aiming to encourage the sale ofproducts which they hoped to develop within the framework of their dams policy.
Domestically, the marketing of industrial crops was promoted within theframework of crop contracts (mainly within the irrigated perimeters) and benefitedfrom comparatively efficient and effective organization. Milk was organized aroundcollection centres in the intensive production zones. Soft wheat was marketedby marketing cooperatives (which were managed and supported by the state).However, other domestically marketed foods, such as barley, durum wheat, fruitsand vegetables, pulses, olive oil and meats, did not benefit from any organization orsupport measures.
The Government has also made a great effort to promote exports. In 1965 it setup the Marketing and Export Office (OCE) which until 1985 monopolized exportsof the main commodities (citrus fruits, early fruit and vegetables, vegetable andlivestock products). This organization finds new foreign markets and guaranteesproducers comparatively advantageous selling conditions. In 1969, Morocco signedthe first association agreement with the EEC which was renewed and expanded in1976. Its primary concern was to seek guaranteed access by these commodities to theCommunity market.
Macro and sectoral components and the policy instruments usedThe structural adjustment policy affected agriculture directly in 1985 in the MediumTerm Adjustment Programme for the Agriculture Sector (PAMTSA) and was mainlysupported by World Bank loans and technical assistance agreements. It involvedagriculture sector adjustment programmes and loans (PASA 1 and 2), large scaleirrigation improvement schemes (PAGI 1 and 2), and agriculture investment schemes(PISA 1 and 2).
These programmes followed the general objectives of the overall adjustment policywhich were to liberalize production and trade and adapt resource allocation to themarket philosophy. However, the greatest emphasis was on improving resourceallocation, fostering increased agricultural productivity, reducing government costs,and finding ways for the state to withdraw from its high level of engagement inagriculture, especially irrigated agriculture. Loans and programmes were linkedto redefining the role of public intervention agencies and applying commercialprinciples to their management; removing obstacles to domestic and external trade(monopolies, quotas and other restrictive regulations on the trade in agriculturalproducts); abolishing state subsidies for production inputs and introducing economicpricing for inputs and outputs; reforming agricultural credit; and privatizing somepreviously state-owned land and livestock.
Macroeconomic policy Tight monetary and fiscal policy aimed at controlling inflation were a key elementof the reform process, as was exchange rate devaluation. Between 1983 and 1987 the
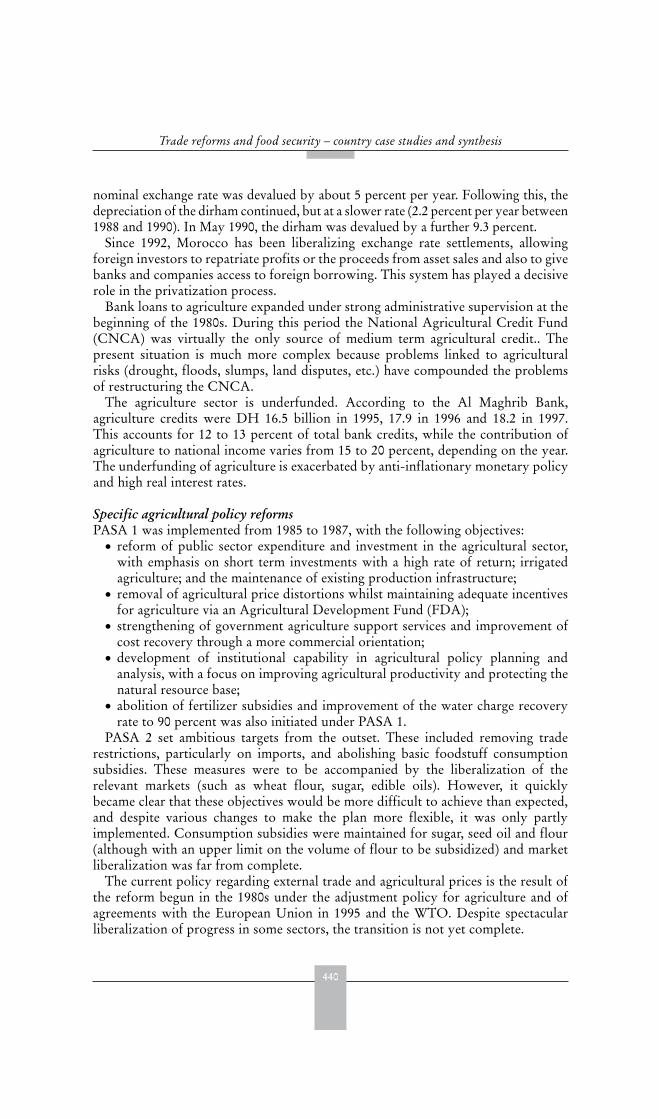
440
Trade reforms and food security – country case studies and synthesis
nominal exchange rate was devalued by about 5 percent per year. Following this, thedepreciation of the dirham continued, but at a slower rate (2.2 percent per year between1988 and 1990). In May 1990, the dirham was devalued by a further 9.3 percent.
Since 1992, Morocco has been liberalizing exchange rate settlements, allowingforeign investors to repatriate profits or the proceeds from asset sales and also to givebanks and companies access to foreign borrowing. This system has played a decisiverole in the privatization process.
Bank loans to agriculture expanded under strong administrative supervision at thebeginning of the 1980s. During this period the National Agricultural Credit Fund(CNCA) was virtually the only source of medium term agricultural credit.. Thepresent situation is much more complex because problems linked to agriculturalrisks (drought, floods, slumps, land disputes, etc.) have compounded the problemsof restructuring the CNCA.
The agriculture sector is underfunded. According to the Al Maghrib Bank,agriculture credits were DH 16.5 billion in 1995, 17.9 in 1996 and 18.2 in 1997.This accounts for 12 to 13 percent of total bank credits, while the contribution ofagriculture to national income varies from 15 to 20 percent, depending on the year.The underfunding of agriculture is exacerbated by anti-inflationary monetary policyand high real interest rates.
Specific agricultural policy reformsPASA 1 was implemented from 1985 to 1987, with the following objectives:
reform of public sector expenditure and investment in the agricultural sector,with emphasis on short term investments with a high rate of return; irrigatedagriculture; and the maintenance of existing production infrastructure;removal of agricultural price distortions whilst maintaining adequate incentivesfor agriculture via an Agricultural Development Fund (FDA);strengthening of government agriculture support services and improvement ofcost recovery through a more commercial orientation;development of institutional capability in agricultural policy planning andanalysis, with a focus on improving agricultural productivity and protecting thenatural resource base;abolition of fertilizer subsidies and improvement of the water charge recoveryrate to 90 percent was also initiated under PASA 1.
PASA 2 set ambitious targets from the outset. These included removing traderestrictions, particularly on imports, and abolishing basic foodstuff consumptionsubsidies. These measures were to be accompanied by the liberalization of therelevant markets (such as wheat flour, sugar, edible oils). However, it quicklybecame clear that these objectives would be more difficult to achieve than expected,and despite various changes to make the plan more flexible, it was only partlyimplemented. Consumption subsidies were maintained for sugar, seed oil and flour(although with an upper limit on the volume of flour to be subsidized) and marketliberalization was far from complete.
The current policy regarding external trade and agricultural prices is the result ofthe reform begun in the 1980s under the adjustment policy for agriculture and ofagreements with the European Union in 1995 and the WTO. Despite spectacularliberalization of progress in some sectors, the transition is not yet complete.
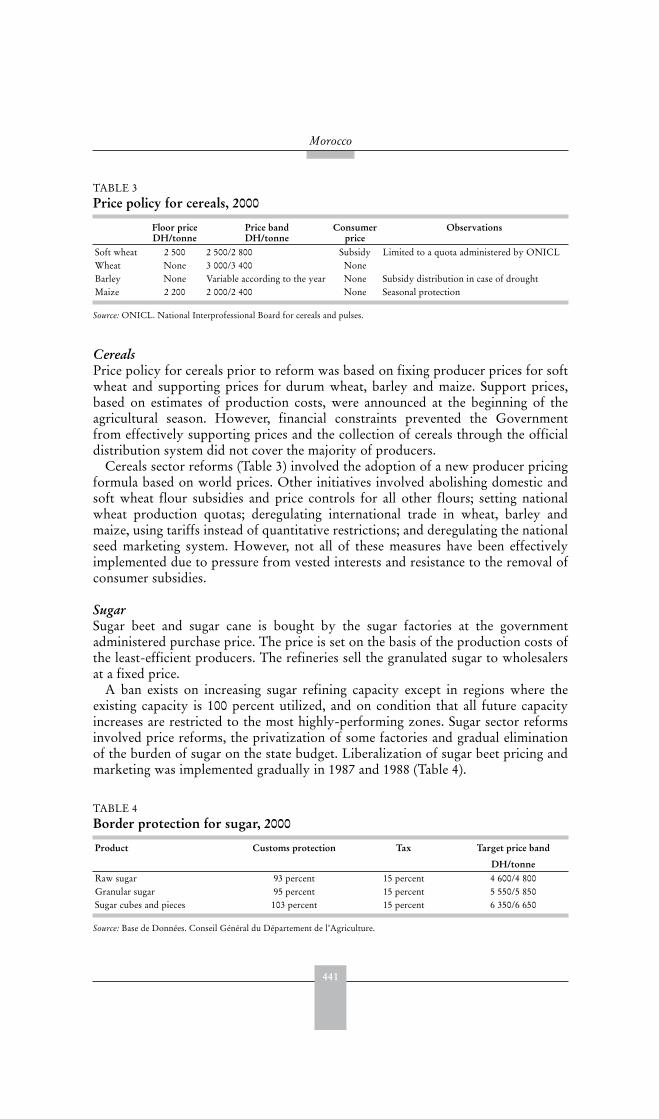
441
Morocco
CerealsPrice policy for cereals prior to reform was based on fixing producer prices for softwheat and supporting prices for durum wheat, barley and maize. Support prices,based on estimates of production costs, were announced at the beginning of theagricultural season. However, financial constraints prevented the Governmentfrom effectively supporting prices and the collection of cereals through the officialdistribution system did not cover the majority of producers.
Cereals sector reforms (Table 3) involved the adoption of a new producer pricingformula based on world prices. Other initiatives involved abolishing domestic andsoft wheat flour subsidies and price controls for all other flours; setting nationalwheat production quotas; deregulating international trade in wheat, barley andmaize, using tariffs instead of quantitative restrictions; and deregulating the nationalseed marketing system. However, not all of these measures have been effectivelyimplemented due to pressure from vested interests and resistance to the removal ofconsumer subsidies.
SugarSugar beet and sugar cane is bought by the sugar factories at the governmentadministered purchase price. The price is set on the basis of the production costs ofthe least-efficient producers. The refineries sell the granulated sugar to wholesalersat a fixed price.
A ban exists on increasing sugar refining capacity except in regions where theexisting capacity is 100 percent utilized, and on condition that all future capacityincreases are restricted to the most highly-performing zones. Sugar sector reformsinvolved price reforms, the privatization of some factories and gradual eliminationof the burden of sugar on the state budget. Liberalization of sugar beet pricing andmarketing was implemented gradually in 1987 and 1988 (Table 4).
TABLE 3 Price policy for cereals, 2000
Floor price DH/tonne
Price bandDH/tonne
Consumerprice
Observations
Soft wheat 2 500 2 500/2 800 Subsidy Limited to a quota administered by ONICLWheat None 3 000/3 400 NoneBarley None Variable according to the year None Subsidy distribution in case of droughtMaize 2 200 2 000/2 400 None Seasonal protection
Source: ONICL. National Interprofessional Board for cereals and pulses.
TABLE 4 Border protection for sugar, 2000
Product Customs protection Tax Target price band
DH/tonneRaw sugar 93 percent 15 percent 4 600/4 800Granular sugar 95 percent 15 percent 5 550/5 850Sugar cubes and pieces 103 percent 15 percent 6 350/6 650
Source: Base de Données. Conseil Général du Département de l’Agriculture.
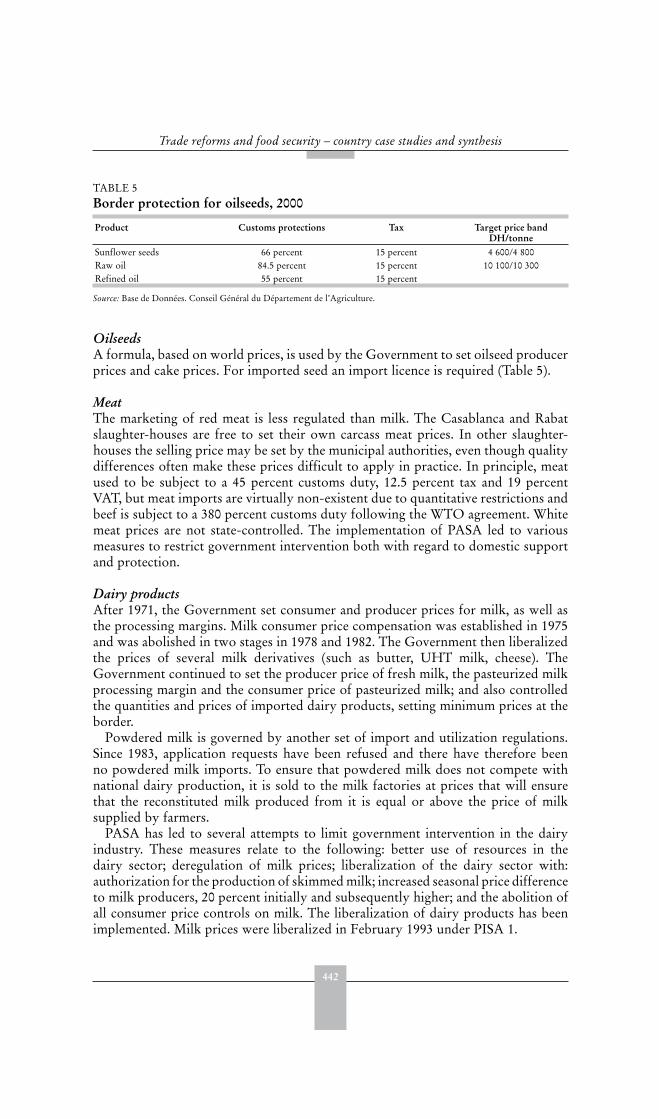
442
Trade reforms and food security – country case studies and synthesis
OilseedsA formula, based on world prices, is used by the Government to set oilseed producerprices and cake prices. For imported seed an import licence is required (Table 5).
MeatThe marketing of red meat is less regulated than milk. The Casablanca and Rabatslaughter-houses are free to set their own carcass meat prices. In other slaughter-houses the selling price may be set by the municipal authorities, even though qualitydifferences often make these prices difficult to apply in practice. In principle, meatused to be subject to a 45 percent customs duty, 12.5 percent tax and 19 percentVAT, but meat imports are virtually non-existent due to quantitative restrictions andbeef is subject to a 380 percent customs duty following the WTO agreement. Whitemeat prices are not state-controlled. The implementation of PASA led to variousmeasures to restrict government intervention both with regard to domestic supportand protection.
Dairy productsAfter 1971, the Government set consumer and producer prices for milk, as well asthe processing margins. Milk consumer price compensation was established in 1975and was abolished in two stages in 1978 and 1982. The Government then liberalizedthe prices of several milk derivatives (such as butter, UHT milk, cheese). TheGovernment continued to set the producer price of fresh milk, the pasteurized milkprocessing margin and the consumer price of pasteurized milk; and also controlledthe quantities and prices of imported dairy products, setting minimum prices at theborder.
Powdered milk is governed by another set of import and utilization regulations.Since 1983, application requests have been refused and there have therefore beenno powdered milk imports. To ensure that powdered milk does not compete withnational dairy production, it is sold to the milk factories at prices that will ensurethat the reconstituted milk produced from it is equal or above the price of milksupplied by farmers.
PASA has led to several attempts to limit government intervention in the dairyindustry. These measures relate to the following: better use of resources in thedairy sector; deregulation of milk prices; liberalization of the dairy sector with:authorization for the production of skimmed milk; increased seasonal price differenceto milk producers, 20 percent initially and subsequently higher; and the abolition ofall consumer price controls on milk. The liberalization of dairy products has beenimplemented. Milk prices were liberalized in February 1993 under PISA 1.
TABLE 5 Border protection for oilseeds, 2000
Product Customs protections Tax Target price bandDH/tonne
Sunflower seeds 66 percent 15 percent 4 600/4 800Raw oil 84.5 percent 15 percent 10 100/10 300Refined oil 55 percent 15 percent
Source: Base de Données. Conseil Général du Département de l’Agriculture.
443
Morocco
Agricultural inputsIn general, agricultural inputs are duty-free or tax-free, or subject to the minimumof 2.5 percent. This applies to fertilizers and phytosanitary products, irrigation andagricultural equipment. The exceptions relate to certain seeds (cereals and potato),veterinary products and small agricultural implements.
Customs duty on imported feeds varies from 2.5 percent (bran, sugar beet pulp,dehydrated alfalfa) to over 60 percent. Variable rates are applied between these twoextremes to cereals, cereal substitutes and oilseed cake.
Subsidies for consumable agricultural inputs have been gradually removed.Fertilizer subsidies were finally abolished completely in 1990. Subsidies for the useof selected seeds have been abolished but subsidies for producing them have not.Irrigation subsidies have fallen as water charges have risen, leading to the recoveryof a major part of the operational and maintenance costs.
CONSEQUENCES OF REFORMS: INTERMEDIATE VARIABLES
In assessing the effects of reform on output incentives, the relationship betweeninternational and domestic price changes of commodities are investigated in relationto other possible drivers, such as the RER and improvements in the efficiency ofdomestic marketing systems. It should be noted that many of the reforms thathave been implemented simultaneously or sequentially are aimed at removingstructural bottlenecks that impede the proper functioning of the market mechanism.It is therefore difficult to isolate specific policies that have positively or negativelyaffected agricultural incentives.
International and domestic pricesThe linkage between the domestic price, world price and other variables is analysedtaking two complementary approaches. The first is to decompose the changesin domestic prices into several components: world price changes, real exchangerate changes and changes due to other factors (customs, import restrictions, otherpolicies, etc.). The second approach tests the relationship between domestic prices ofagricultural products and the explanatory variables. In both cases, price indices areexpressed in real terms taking 1995 as 100. For sugar beet and sugar cane, domesticprices are related to the world price of raw sugar.
Decomposition of price changes2
The decomposition in Tables 6 and 7 are expressed first in relation to the pre-reformperiod (1980-85) and then in relation to the reform and post-reform periods. Thetables suggest that there are three categories of products:
2 In order to gauge the relative contribution of world prices, exchange rates and all other factors to changes inreal domestic prices, a simple decomposition method using the following equation was employed:
where superscripts 0 and 1 represent two time periods,dP is the real domestic price,
wP is the world price, Eis the exchange rate, t is the ad valorem tariff and c represents other transaction costs.
)c/cln()t/tln()E/Eln()P/Pln()P/Pln( wwdd0101010101
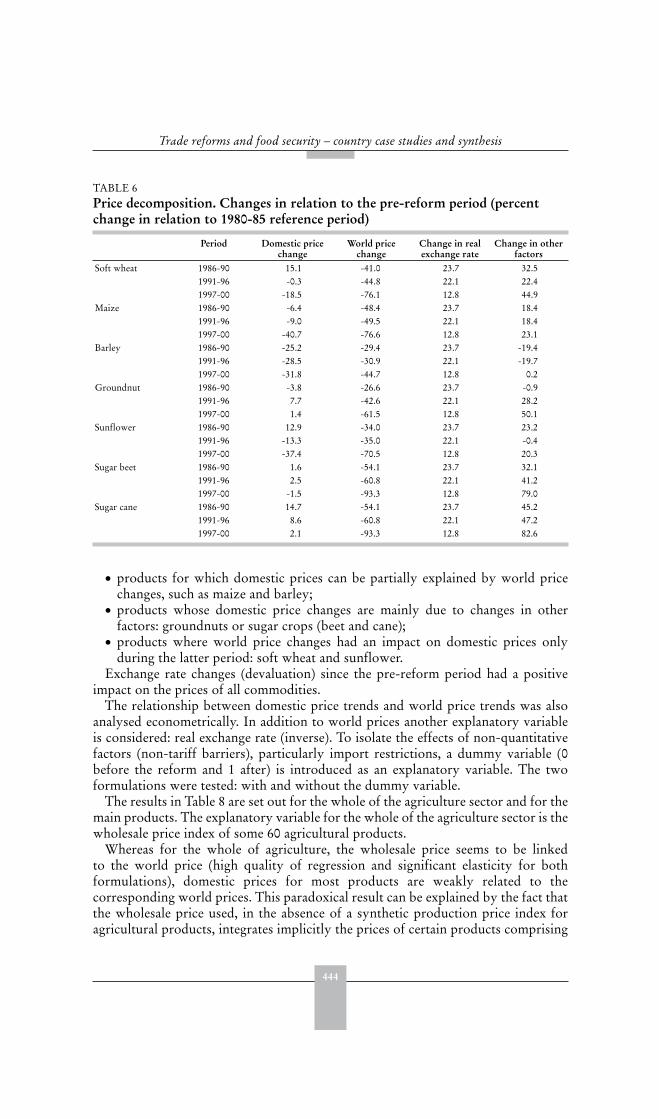
444
Trade reforms and food security – country case studies and synthesis
products for which domestic prices can be partially explained by world pricechanges, such as maize and barley;products whose domestic price changes are mainly due to changes in otherfactors: groundnuts or sugar crops (beet and cane);products where world price changes had an impact on domestic prices onlyduring the latter period: soft wheat and sunflower.
Exchange rate changes (devaluation) since the pre-reform period had a positiveimpact on the prices of all commodities.
The relationship between domestic price trends and world price trends was alsoanalysed econometrically. In addition to world prices another explanatory variableis considered: real exchange rate (inverse). To isolate the effects of non-quantitativefactors (non-tariff barriers), particularly import restrictions, a dummy variable (0before the reform and 1 after) is introduced as an explanatory variable. The twoformulations were tested: with and without the dummy variable.
The results in Table 8 are set out for the whole of the agriculture sector and for themain products. The explanatory variable for the whole of the agriculture sector is thewholesale price index of some 60 agricultural products.
Whereas for the whole of agriculture, the wholesale price seems to be linkedto the world price (high quality of regression and significant elasticity for bothformulations), domestic prices for most products are weakly related to thecorresponding world prices. This paradoxical result can be explained by the fact thatthe wholesale price used, in the absence of a synthetic production price index foragricultural products, integrates implicitly the prices of certain products comprising
TABLE 6 Price decomposition. Changes in relation to the pre-reform period (percent change in relation to 1980-85 reference period)
Period Domestic price change
World price change
Change in real exchange rate
Change in other factors
Soft wheat 1986-90 15.1 -41.0 23.7 32.51991-96 -0.3 -44.8 22.1 22.41997-00 -18.5 -76.1 12.8 44.9
Maize 1986-90 -6.4 -48.4 23.7 18.41991-96 -9.0 -49.5 22.1 18.41997-00 -40.7 -76.6 12.8 23.1
Barley 1986-90 -25.2 -29.4 23.7 -19.41991-96 -28.5 -30.9 22.1 -19.71997-00 -31.8 -44.7 12.8 0.2
Groundnut 1986-90 -3.8 -26.6 23.7 -0.91991-96 7.7 -42.6 22.1 28.21997-00 1.4 -61.5 12.8 50.1
Sunflower 1986-90 12.9 -34.0 23.7 23.21991-96 -13.3 -35.0 22.1 -0.41997-00 -37.4 -70.5 12.8 20.3
Sugar beet 1986-90 1.6 -54.1 23.7 32.11991-96 2.5 -60.8 22.1 41.21997-00 -1.5 -93.3 12.8 79.0
Sugar cane 1986-90 14.7 -54.1 23.7 45.21991-96 8.6 -60.8 22.1 47.21997-00 2.1 -93.3 12.8 82.6
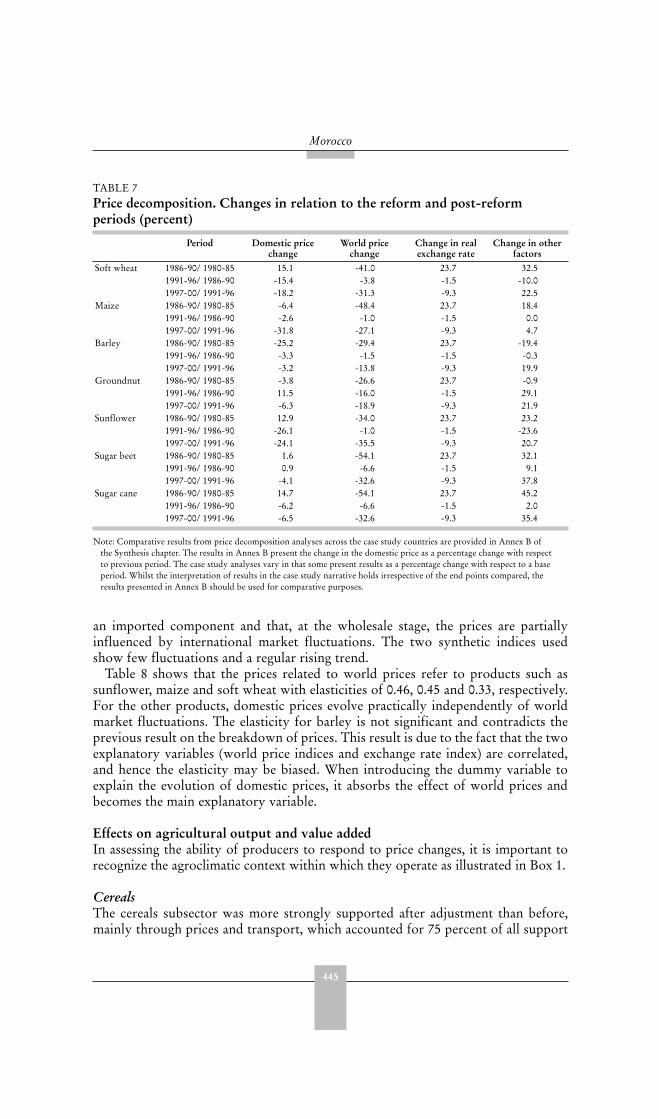
445
Morocco
TABLE 7 Price decomposition. Changes in relation to the reform and post-reform periods (percent)
Period Domestic price change
World price change
Change in real exchange rate
Change in other factors
Soft wheat 1986-90/ 1980-85 15.1 -41.0 23.7 32.51991-96/ 1986-90 -15.4 -3.8 -1.5 -10.01997-00/ 1991-96 -18.2 -31.3 -9.3 22.5
Maize 1986-90/ 1980-85 -6.4 -48.4 23.7 18.41991-96/ 1986-90 -2.6 -1.0 -1.5 0.01997-00/ 1991-96 -31.8 -27.1 -9.3 4.7
Barley 1986-90/ 1980-85 -25.2 -29.4 23.7 -19.41991-96/ 1986-90 -3.3 -1.5 -1.5 -0.31997-00/ 1991-96 -3.2 -13.8 -9.3 19.9
Groundnut 1986-90/ 1980-85 -3.8 -26.6 23.7 -0.91991-96/ 1986-90 11.5 -16.0 -1.5 29.11997-00/ 1991-96 -6.3 -18.9 -9.3 21.9
Sunflower 1986-90/ 1980-85 12.9 -34.0 23.7 23.21991-96/ 1986-90 -26.1 -1.0 -1.5 -23.61997-00/ 1991-96 -24.1 -35.5 -9.3 20.7
Sugar beet 1986-90/ 1980-85 1.6 -54.1 23.7 32.11991-96/ 1986-90 0.9 -6.6 -1.5 9.11997-00/ 1991-96 -4.1 -32.6 -9.3 37.8
Sugar cane 1986-90/ 1980-85 14.7 -54.1 23.7 45.21991-96/ 1986-90 -6.2 -6.6 -1.5 2.01997-00/ 1991-96 -6.5 -32.6 -9.3 35.4
Note: Comparative results from price decomposition analyses across the case study countries are provided in Annex B ofthe Synthesis chapter. The results in Annex B present the change in the domestic price as a percentage change with respectto previous period. The case study analyses vary in that some present results as a percentage change with respect to a baseperiod. Whilst the interpretation of results in the case study narrative holds irrespective of the end points compared, theresults presented in Annex B should be used for comparative purposes.
an imported component and that, at the wholesale stage, the prices are partiallyinfluenced by international market fluctuations. The two synthetic indices usedshow few fluctuations and a regular rising trend.
Table 8 shows that the prices related to world prices refer to products such assunflower, maize and soft wheat with elasticities of 0.46, 0.45 and 0.33, respectively.For the other products, domestic prices evolve practically independently of worldmarket fluctuations. The elasticity for barley is not significant and contradicts theprevious result on the breakdown of prices. This result is due to the fact that the twoexplanatory variables (world price indices and exchange rate index) are correlated,and hence the elasticity may be biased. When introducing the dummy variable toexplain the evolution of domestic prices, it absorbs the effect of world prices andbecomes the main explanatory variable.
Effects on agricultural output and value added In assessing the ability of producers to respond to price changes, it is important torecognize the agroclimatic context within which they operate as illustrated in Box 1.
CerealsThe cereals subsector was more strongly supported after adjustment than before,mainly through prices and transport, which accounted for 75 percent of all support
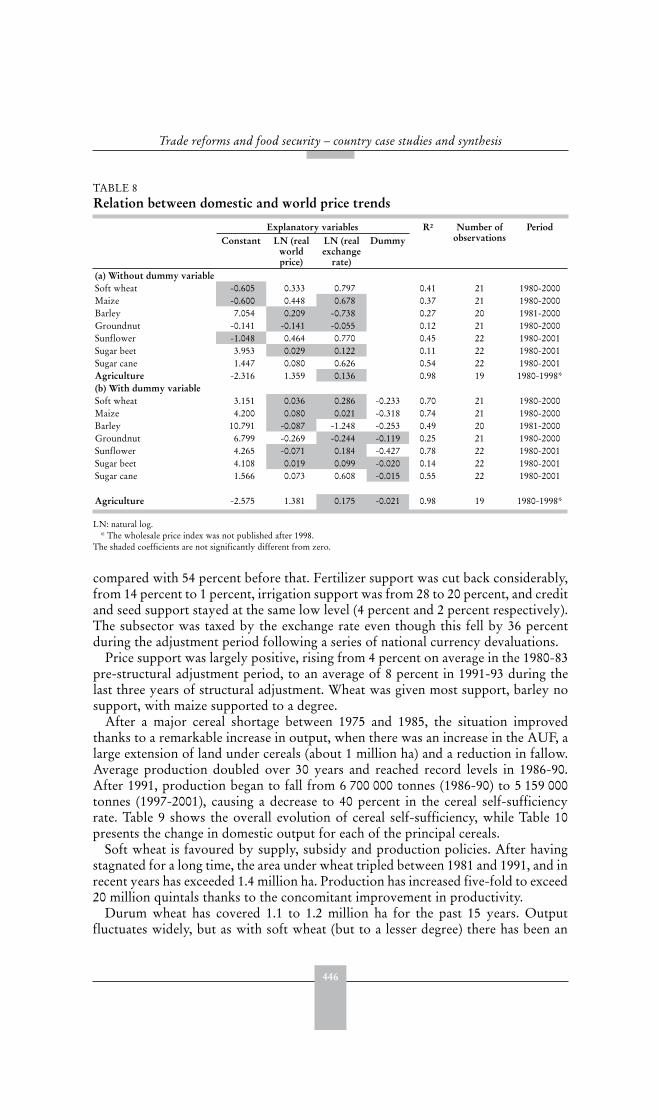
446
Trade reforms and food security – country case studies and synthesis
compared with 54 percent before that. Fertilizer support was cut back considerably,from 14 percent to 1 percent, irrigation support was from 28 to 20 percent, and creditand seed support stayed at the same low level (4 percent and 2 percent respectively).The subsector was taxed by the exchange rate even though this fell by 36 percentduring the adjustment period following a series of national currency devaluations.
Price support was largely positive, rising from 4 percent on average in the 1980-83pre-structural adjustment period, to an average of 8 percent in 1991-93 during thelast three years of structural adjustment. Wheat was given most support, barley nosupport, with maize supported to a degree.
After a major cereal shortage between 1975 and 1985, the situation improvedthanks to a remarkable increase in output, when there was an increase in the AUF, alarge extension of land under cereals (about 1 million ha) and a reduction in fallow.Average production doubled over 30 years and reached record levels in 1986-90.After 1991, production began to fall from 6 700 000 tonnes (1986-90) to 5 159 000tonnes (1997-2001), causing a decrease to 40 percent in the cereal self-sufficiencyrate. Table 9 shows the overall evolution of cereal self-sufficiency, while Table 10presents the change in domestic output for each of the principal cereals.
Soft wheat is favoured by supply, subsidy and production policies. After havingstagnated for a long time, the area under wheat tripled between 1981 and 1991, and inrecent years has exceeded 1.4 million ha. Production has increased five-fold to exceed20 million quintals thanks to the concomitant improvement in productivity.
Durum wheat has covered 1.1 to 1.2 million ha for the past 15 years. Outputfluctuates widely, but as with soft wheat (but to a lesser degree) there has been an
TABLE 8 Relation between domestic and world price trends
Explanatory variables R2 Number of observations
PeriodConstant LN (real
worldprice)
LN (real exchange
rate)
Dummy
(a) Without dummy variableSoft wheat -0.605 0.333 0.797 0.41 21 1980-2000Maize -0.600 0.448 0.678 0.37 21 1980-2000Barley 7.054 0.209 -0.738 0.27 20 1981-2000Groundnut -0.141 -0.141 -0.055 0.12 21 1980-2000Sunflower -1.048 0.464 0.770 0.45 22 1980-2001Sugar beet 3.953 0.029 0.122 0.11 22 1980-2001Sugar cane 1.447 0.080 0.626 0.54 22 1980-2001Agriculture -2.316 1.359 0.136 0.98 19 1980-1998*(b) With dummy variableSoft wheat 3.151 0.036 0.286 -0.233 0.70 21 1980-2000Maize 4.200 0.080 0.021 -0.318 0.74 21 1980-2000Barley 10.791 -0.087 -1.248 -0.253 0.49 20 1981-2000Groundnut 6.799 -0.269 -0.244 -0.119 0.25 21 1980-2000Sunflower 4.265 -0.071 0.184 -0.427 0.78 22 1980-2001Sugar beet 4.108 0.019 0.099 -0.020 0.14 22 1980-2001Sugar cane 1.566 0.073 0.608 -0.015 0.55 22 1980-2001
Agriculture -2.575 1.381 0.175 -0.021 0.98 19 1980-1998*
LN: natural log. * The wholesale price index was not published after 1998.The shaded coefficients are not significantly different from zero.
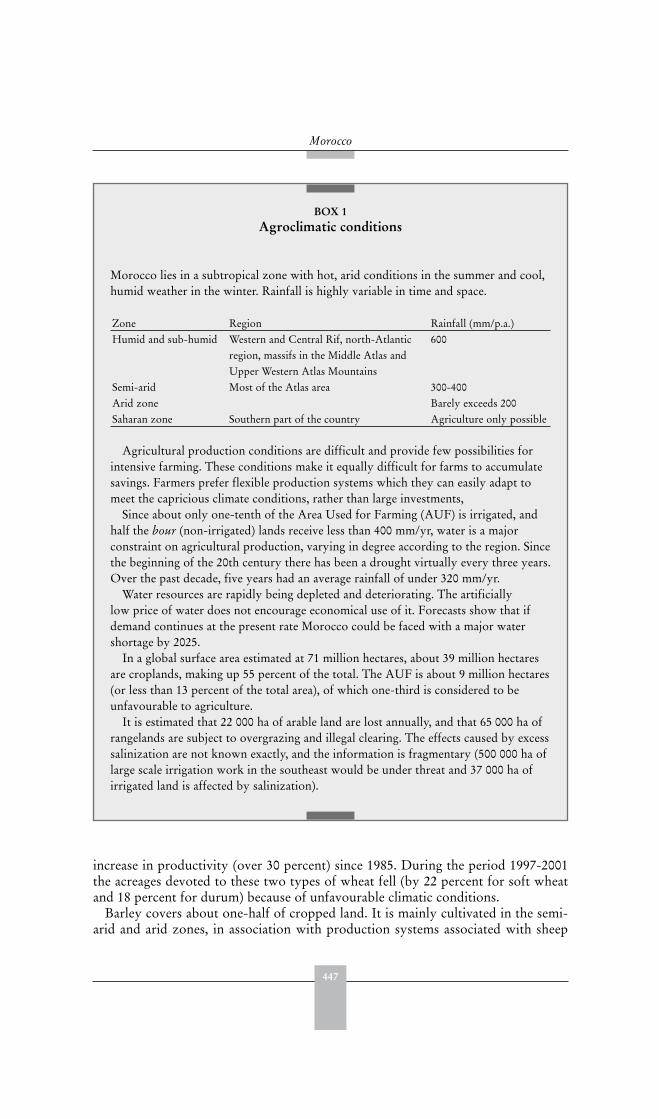
447
Morocco
BOX 1 Agroclimatic conditions
Morocco lies in a subtropical zone with hot, arid conditions in the summer and cool,humid weather in the winter. Rainfall is highly variable in time and space.
Zone Region Rainfall (mm/p.a.)Humid and sub-humid Western and Central Rif, north-Atlantic
region, massifs in the Middle Atlas andUpper Western Atlas Mountains
600
Semi-arid Most of the Atlas area 300-400Arid zone Barely exceeds 200Saharan zone Southern part of the country Agriculture only possible
Agricultural production conditions are difficult and provide few possibilities forintensive farming. These conditions make it equally difficult for farms to accumulatesavings. Farmers prefer flexible production systems which they can easily adapt tomeet the capricious climate conditions, rather than large investments,
Since about only one-tenth of the Area Used for Farming (AUF) is irrigated, andhalf the bour (non-irrigated) lands receive less than 400 mm/yr, water is a majorconstraint on agricultural production, varying in degree according to the region. Sincethe beginning of the 20th century there has been a drought virtually every three years.Over the past decade, five years had an average rainfall of under 320 mm/yr.
Water resources are rapidly being depleted and deteriorating. The artificiallylow price of water does not encourage economical use of it. Forecasts show that ifdemand continues at the present rate Morocco could be faced with a major watershortage by 2025.
In a global surface area estimated at 71 million hectares, about 39 million hectaresare croplands, making up 55 percent of the total. The AUF is about 9 million hectares(or less than 13 percent of the total area), of which one-third is considered to beunfavourable to agriculture.
It is estimated that 22 000 ha of arable land are lost annually, and that 65 000 ha ofrangelands are subject to overgrazing and illegal clearing. The effects caused by excesssalinization are not known exactly, and the information is fragmentary (500 000 ha oflarge scale irrigation work in the southeast would be under threat and 37 000 ha ofirrigated land is affected by salinization).
increase in productivity (over 30 percent) since 1985. During the period 1997-2001the acreages devoted to these two types of wheat fell (by 22 percent for soft wheatand 18 percent for durum) because of unfavourable climatic conditions.
Barley covers about one-half of cropped land. It is mainly cultivated in the semi-arid and arid zones, in association with production systems associated with sheep
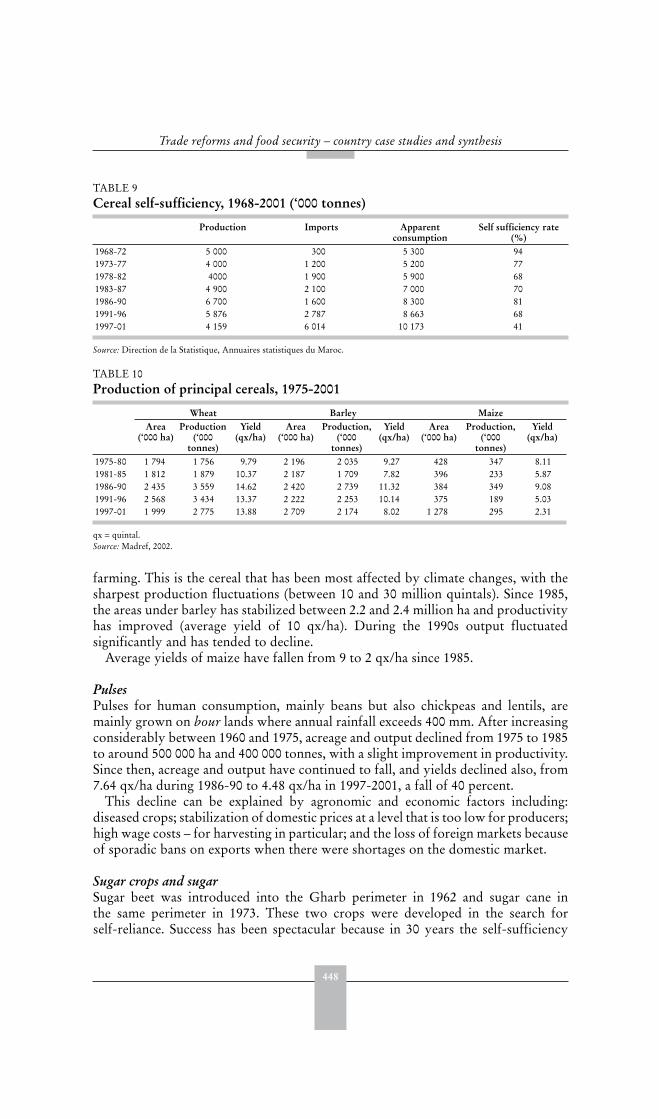
448
Trade reforms and food security – country case studies and synthesis
farming. This is the cereal that has been most affected by climate changes, with thesharpest production fluctuations (between 10 and 30 million quintals). Since 1985,the areas under barley has stabilized between 2.2 and 2.4 million ha and productivityhas improved (average yield of 10 qx/ha). During the 1990s output fluctuatedsignificantly and has tended to decline.
Average yields of maize have fallen from 9 to 2 qx/ha since 1985.
PulsesPulses for human consumption, mainly beans but also chickpeas and lentils, aremainly grown on bour lands where annual rainfall exceeds 400 mm. After increasingconsiderably between 1960 and 1975, acreage and output declined from 1975 to 1985to around 500 000 ha and 400 000 tonnes, with a slight improvement in productivity.Since then, acreage and output have continued to fall, and yields declined also, from7.64 qx/ha during 1986-90 to 4.48 qx/ha in 1997-2001, a fall of 40 percent.
This decline can be explained by agronomic and economic factors including:diseased crops; stabilization of domestic prices at a level that is too low for producers;high wage costs – for harvesting in particular; and the loss of foreign markets becauseof sporadic bans on exports when there were shortages on the domestic market.
Sugar crops and sugarSugar beet was introduced into the Gharb perimeter in 1962 and sugar cane inthe same perimeter in 1973. These two crops were developed in the search forself-reliance. Success has been spectacular because in 30 years the self-sufficiency
TABLE 9 Cereal self-sufficiency, 1968-2001 (‘000 tonnes)
Production Imports Apparentconsumption
Self sufficiency rate (%)
1968-72 5 000 300 5 300 941973-77 4 000 1 200 5 200 771978-82 4000 1 900 5 900 681983-87 4 900 2 100 7 000 701986-90 6 700 1 600 8 300 811991-96 5 876 2 787 8 663 681997-01 4 159 6 014 10 173 41
Source: Direction de la Statistique, Annuaires statistiques du Maroc.
TABLE 10 Production of principal cereals, 1975-2001
Wheat Barley MaizeArea
(‘000 ha)Production
(‘000tonnes)
Yield(qx/ha)
Area(‘000 ha)
Production,(‘000
tonnes)
Yield(qx/ha)
Area(‘000 ha)
Production,(‘000
tonnes)
Yield(qx/ha)
1975-80 1 794 1 756 9.79 2 196 2 035 9.27 428 347 8.111981-85 1 812 1 879 10.37 2 187 1 709 7.82 396 233 5.871986-90 2 435 3 559 14.62 2 420 2 739 11.32 384 349 9.081991-96 2 568 3 434 13.37 2 222 2 253 10.14 375 189 5.031997-01 1 999 2 775 13.88 2 709 2 174 8.02 1 278 295 2.31
qx = quintal.Source: Madref, 2002.
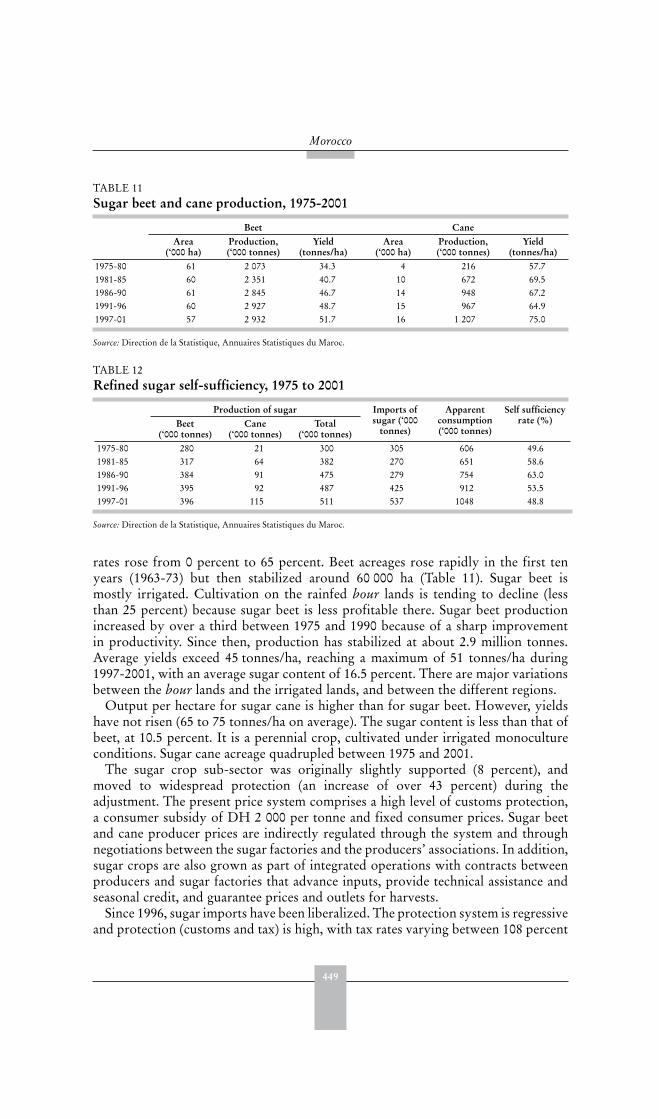
449
Morocco
rates rose from 0 percent to 65 percent. Beet acreages rose rapidly in the first tenyears (1963-73) but then stabilized around 60 000 ha (Table 11). Sugar beet ismostly irrigated. Cultivation on the rainfed bour lands is tending to decline (lessthan 25 percent) because sugar beet is less profitable there. Sugar beet productionincreased by over a third between 1975 and 1990 because of a sharp improvementin productivity. Since then, production has stabilized at about 2.9 million tonnes.Average yields exceed 45 tonnes/ha, reaching a maximum of 51 tonnes/ha during1997-2001, with an average sugar content of 16.5 percent. There are major variationsbetween the bour lands and the irrigated lands, and between the different regions.
Output per hectare for sugar cane is higher than for sugar beet. However, yieldshave not risen (65 to 75 tonnes/ha on average). The sugar content is less than that ofbeet, at 10.5 percent. It is a perennial crop, cultivated under irrigated monocultureconditions. Sugar cane acreage quadrupled between 1975 and 2001.
The sugar crop sub-sector was originally slightly supported (8 percent), andmoved to widespread protection (an increase of over 43 percent) during theadjustment. The present price system comprises a high level of customs protection,a consumer subsidy of DH 2 000 per tonne and fixed consumer prices. Sugar beetand cane producer prices are indirectly regulated through the system and throughnegotiations between the sugar factories and the producers’ associations. In addition,sugar crops are also grown as part of integrated operations with contracts betweenproducers and sugar factories that advance inputs, provide technical assistance andseasonal credit, and guarantee prices and outlets for harvests.
Since 1996, sugar imports have been liberalized. The protection system is regressiveand protection (customs and tax) is high, with tax rates varying between 108 percent
TABLE 11 Sugar beet and cane production, 1975-2001
Beet CaneArea
(‘000 ha)Production,(‘000 tonnes)
Yield(tonnes/ha)
Area(‘000 ha)
Production,(‘000 tonnes)
Yield(tonnes/ha)
1975-80 61 2 073 34.3 4 216 57.71981-85 60 2 351 40.7 10 672 69.51986-90 61 2 845 46.7 14 948 67.21991-96 60 2 927 48.7 15 967 64.91997-01 57 2 932 51.7 16 1 207 75.0
Source: Direction de la Statistique, Annuaires Statistiques du Maroc.
TABLE 12 Refined sugar self-sufficiency, 1975 to 2001
Production of sugar Imports of sugar (‘000
tonnes)
Apparentconsumption(‘000 tonnes)
Self sufficiency rate (%)Beet
(‘000 tonnes)Cane
(‘000 tonnes)Total
(‘000 tonnes)1975-80 280 21 300 305 606 49.61981-85 317 64 382 270 651 58.61986-90 384 91 475 279 754 63.01991-96 395 92 487 425 912 53.51997-01 396 115 511 537 1048 48.8
Source: Direction de la Statistique, Annuaires Statistiques du Maroc.
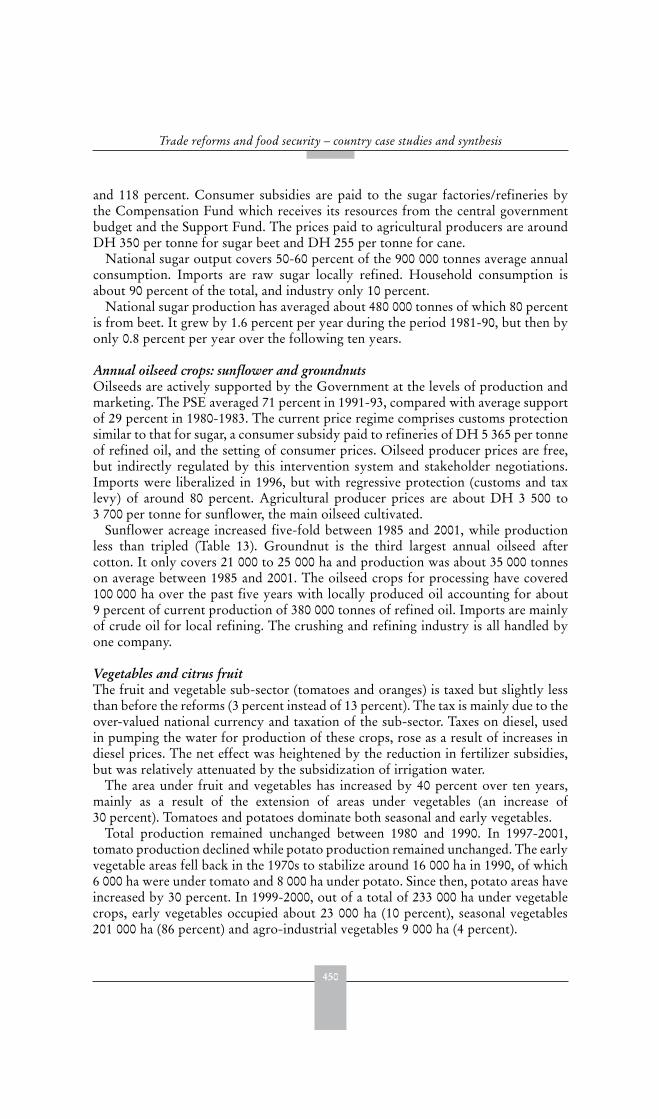
450
Trade reforms and food security – country case studies and synthesis
and 118 percent. Consumer subsidies are paid to the sugar factories/refineries bythe Compensation Fund which receives its resources from the central governmentbudget and the Support Fund. The prices paid to agricultural producers are aroundDH 350 per tonne for sugar beet and DH 255 per tonne for cane.
National sugar output covers 50-60 percent of the 900 000 tonnes average annualconsumption. Imports are raw sugar locally refined. Household consumption isabout 90 percent of the total, and industry only 10 percent.
National sugar production has averaged about 480 000 tonnes of which 80 percentis from beet. It grew by 1.6 percent per year during the period 1981-90, but then byonly 0.8 percent per year over the following ten years.
Annual oilseed crops: sunflower and groundnutsOilseeds are actively supported by the Government at the levels of production andmarketing. The PSE averaged 71 percent in 1991-93, compared with average supportof 29 percent in 1980-1983. The current price regime comprises customs protectionsimilar to that for sugar, a consumer subsidy paid to refineries of DH 5 365 per tonneof refined oil, and the setting of consumer prices. Oilseed producer prices are free,but indirectly regulated by this intervention system and stakeholder negotiations.Imports were liberalized in 1996, but with regressive protection (customs and taxlevy) of around 80 percent. Agricultural producer prices are about DH 3 500 to3 700 per tonne for sunflower, the main oilseed cultivated.
Sunflower acreage increased five-fold between 1985 and 2001, while productionless than tripled (Table 13). Groundnut is the third largest annual oilseed aftercotton. It only covers 21 000 to 25 000 ha and production was about 35 000 tonneson average between 1985 and 2001. The oilseed crops for processing have covered100 000 ha over the past five years with locally produced oil accounting for about9 percent of current production of 380 000 tonnes of refined oil. Imports are mainlyof crude oil for local refining. The crushing and refining industry is all handled byone company.
Vegetables and citrus fruitThe fruit and vegetable sub-sector (tomatoes and oranges) is taxed but slightly lessthan before the reforms (3 percent instead of 13 percent). The tax is mainly due to theover-valued national currency and taxation of the sub-sector. Taxes on diesel, usedin pumping the water for production of these crops, rose as a result of increases indiesel prices. The net effect was heightened by the reduction in fertilizer subsidies,but was relatively attenuated by the subsidization of irrigation water.
The area under fruit and vegetables has increased by 40 percent over ten years,mainly as a result of the extension of areas under vegetables (an increase of30 percent). Tomatoes and potatoes dominate both seasonal and early vegetables.
Total production remained unchanged between 1980 and 1990. In 1997-2001,tomato production declined while potato production remained unchanged. The earlyvegetable areas fell back in the 1970s to stabilize around 16 000 ha in 1990, of which6 000 ha were under tomato and 8 000 ha under potato. Since then, potato areas haveincreased by 30 percent. In 1999-2000, out of a total of 233 000 ha under vegetablecrops, early vegetables occupied about 23 000 ha (10 percent), seasonal vegetables201 000 ha (86 percent) and agro-industrial vegetables 9 000 ha (4 percent).
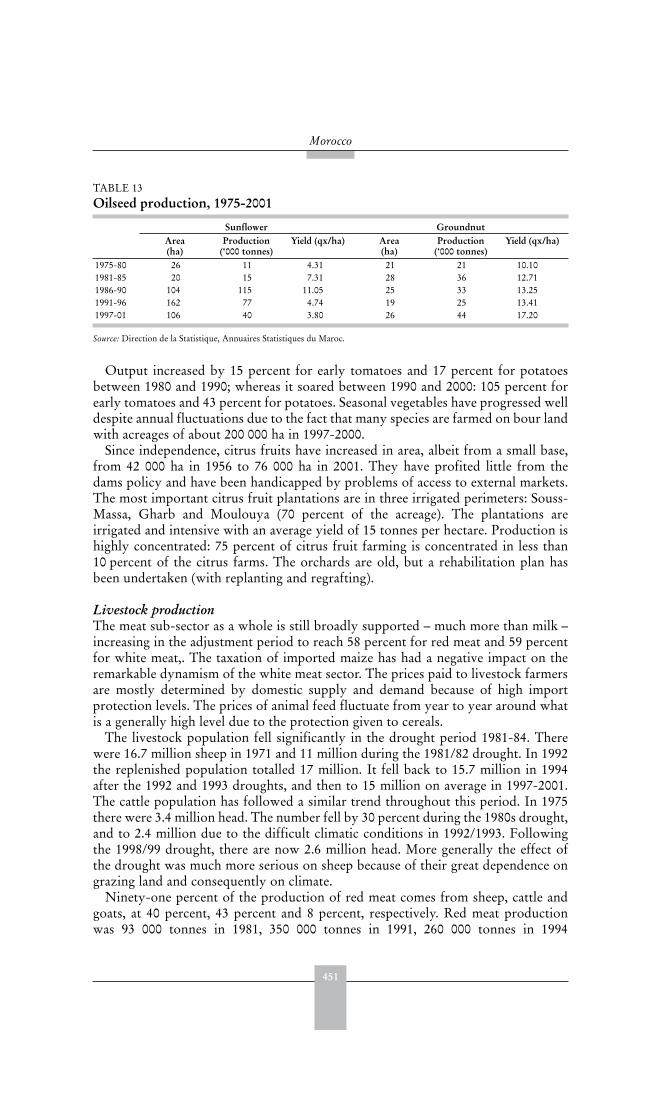
451
Morocco
Output increased by 15 percent for early tomatoes and 17 percent for potatoesbetween 1980 and 1990; whereas it soared between 1990 and 2000: 105 percent forearly tomatoes and 43 percent for potatoes. Seasonal vegetables have progressed welldespite annual fluctuations due to the fact that many species are farmed on bour landwith acreages of about 200 000 ha in 1997-2000.
Since independence, citrus fruits have increased in area, albeit from a small base,from 42 000 ha in 1956 to 76 000 ha in 2001. They have profited little from thedams policy and have been handicapped by problems of access to external markets.The most important citrus fruit plantations are in three irrigated perimeters: Souss-Massa, Gharb and Moulouya (70 percent of the acreage). The plantations areirrigated and intensive with an average yield of 15 tonnes per hectare. Production ishighly concentrated: 75 percent of citrus fruit farming is concentrated in less than10 percent of the citrus farms. The orchards are old, but a rehabilitation plan hasbeen undertaken (with replanting and regrafting).
Livestock productionThe meat sub-sector as a whole is still broadly supported – much more than milk –increasing in the adjustment period to reach 58 percent for red meat and 59 percentfor white meat,. The taxation of imported maize has had a negative impact on theremarkable dynamism of the white meat sector. The prices paid to livestock farmersare mostly determined by domestic supply and demand because of high importprotection levels. The prices of animal feed fluctuate from year to year around whatis a generally high level due to the protection given to cereals.
The livestock population fell significantly in the drought period 1981-84. Therewere 16.7 million sheep in 1971 and 11 million during the 1981/82 drought. In 1992the replenished population totalled 17 million. It fell back to 15.7 million in 1994after the 1992 and 1993 droughts, and then to 15 million on average in 1997-2001.The cattle population has followed a similar trend throughout this period. In 1975there were 3.4 million head. The number fell by 30 percent during the 1980s drought,and to 2.4 million due to the difficult climatic conditions in 1992/1993. Followingthe 1998/99 drought, there are now 2.6 million head. More generally the effect ofthe drought was much more serious on sheep because of their great dependence ongrazing land and consequently on climate.
Ninety-one percent of the production of red meat comes from sheep, cattle andgoats, at 40 percent, 43 percent and 8 percent, respectively. Red meat productionwas 93 000 tonnes in 1981, 350 000 tonnes in 1991, 260 000 tonnes in 1994
TABLE 13 Oilseed production, 1975-2001
Sunflower GroundnutArea(ha)
Production(‘000 tonnes)
Yield (qx/ha) Area(ha)
Production(‘000 tonnes)
Yield (qx/ha)
1975-80 26 11 4.31 21 21 10.101981-85 20 15 7.31 28 36 12.711986-90 104 115 11.05 25 33 13.251991-96 162 77 4.74 19 25 13.411997-01 106 40 3.80 26 44 17.20
Source: Direction de la Statistique, Annuaires Statistiques du Maroc.
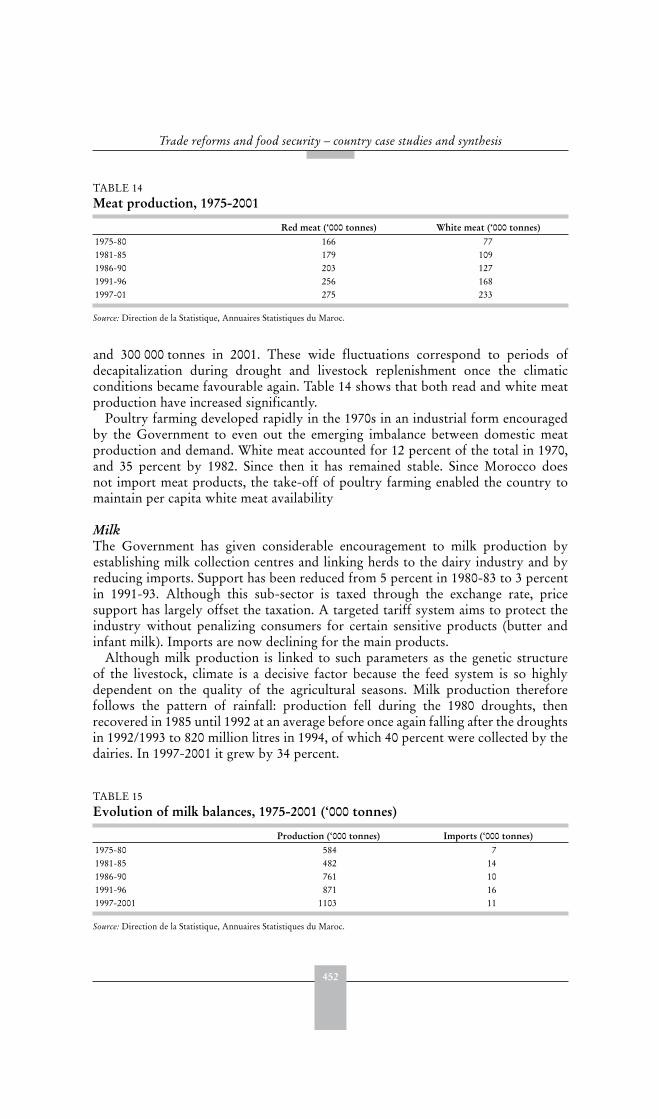
452
Trade reforms and food security – country case studies and synthesis
and 300 000 tonnes in 2001. These wide fluctuations correspond to periods ofdecapitalization during drought and livestock replenishment once the climaticconditions became favourable again. Table 14 shows that both read and white meatproduction have increased significantly.
Poultry farming developed rapidly in the 1970s in an industrial form encouragedby the Government to even out the emerging imbalance between domestic meatproduction and demand. White meat accounted for 12 percent of the total in 1970,and 35 percent by 1982. Since then it has remained stable. Since Morocco doesnot import meat products, the take-off of poultry farming enabled the country tomaintain per capita white meat availability
MilkThe Government has given considerable encouragement to milk production byestablishing milk collection centres and linking herds to the dairy industry and byreducing imports. Support has been reduced from 5 percent in 1980-83 to 3 percentin 1991-93. Although this sub-sector is taxed through the exchange rate, pricesupport has largely offset the taxation. A targeted tariff system aims to protect theindustry without penalizing consumers for certain sensitive products (butter andinfant milk). Imports are now declining for the main products.
Although milk production is linked to such parameters as the genetic structureof the livestock, climate is a decisive factor because the feed system is so highlydependent on the quality of the agricultural seasons. Milk production thereforefollows the pattern of rainfall: production fell during the 1980 droughts, thenrecovered in 1985 until 1992 at an average before once again falling after the droughtsin 1992/1993 to 820 million litres in 1994, of which 40 percent were collected by thedairies. In 1997-2001 it grew by 34 percent.
TABLE 14 Meat production, 1975-2001
Red meat (‘000 tonnes) White meat (‘000 tonnes)1975-80 166 771981-85 179 1091986-90 203 1271991-96 256 1681997-01 275 233
Source: Direction de la Statistique, Annuaires Statistiques du Maroc.
TABLE 15 Evolution of milk balances, 1975-2001 (‘000 tonnes)
Production (‘000 tonnes) Imports (‘000 tonnes)1975-80 584 71981-85 482 141986-90 761 101991-96 871 161997-2001 1103 11
Source: Direction de la Statistique, Annuaires Statistiques du Maroc.
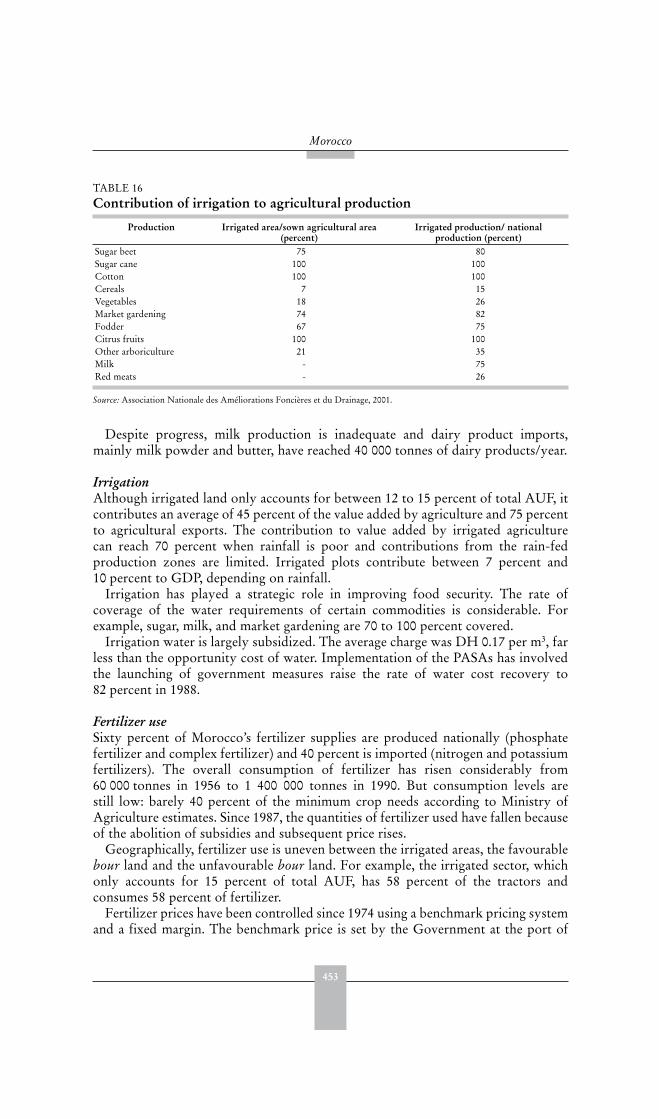
453
Morocco
Despite progress, milk production is inadequate and dairy product imports,mainly milk powder and butter, have reached 40 000 tonnes of dairy products/year.
IrrigationAlthough irrigated land only accounts for between 12 to 15 percent of total AUF, itcontributes an average of 45 percent of the value added by agriculture and 75 percentto agricultural exports. The contribution to value added by irrigated agriculturecan reach 70 percent when rainfall is poor and contributions from the rain-fedproduction zones are limited. Irrigated plots contribute between 7 percent and10 percent to GDP, depending on rainfall.
Irrigation has played a strategic role in improving food security. The rate ofcoverage of the water requirements of certain commodities is considerable. Forexample, sugar, milk, and market gardening are 70 to 100 percent covered.
Irrigation water is largely subsidized. The average charge was DH 0.17 per m3, farless than the opportunity cost of water. Implementation of the PASAs has involvedthe launching of government measures raise the rate of water cost recovery to82 percent in 1988.
Fertilizer useSixty percent of Morocco’s fertilizer supplies are produced nationally (phosphatefertilizer and complex fertilizer) and 40 percent is imported (nitrogen and potassiumfertilizers). The overall consumption of fertilizer has risen considerably from60 000 tonnes in 1956 to 1 400 000 tonnes in 1990. But consumption levels arestill low: barely 40 percent of the minimum crop needs according to Ministry ofAgriculture estimates. Since 1987, the quantities of fertilizer used have fallen becauseof the abolition of subsidies and subsequent price rises.
Geographically, fertilizer use is uneven between the irrigated areas, the favourablebour land and the unfavourable bour land. For example, the irrigated sector, whichonly accounts for 15 percent of total AUF, has 58 percent of the tractors andconsumes 58 percent of fertilizer.
Fertilizer prices have been controlled since 1974 using a benchmark pricing systemand a fixed margin. The benchmark price is set by the Government at the port of
TABLE 16 Contribution of irrigation to agricultural production
Production Irrigated area/sown agricultural area (percent)
Irrigated production/ national production (percent)
Sugar beet 75 80Sugar cane 100 100Cotton 100 100Cereals 7 15Vegetables 18 26Market gardening 74 82Fodder 67 75Citrus fruits 100 100Other arboriculture 21 35Milk - 75Red meats - 26
Source: Association Nationale des Améliorations Foncières et du Drainage, 2001.
454
Trade reforms and food security – country case studies and synthesis
entry or at the factory. The difference between these prices and the real price offertilizer is paid by the Government in the form of a subsidy.
The reaction of the agriculture sector to the structural adjustment measures: rapid appraisalThe study involved a rapid appraisal through interviews with farmers, in order toevaluate the impact of the reforms on farming structures and systems.
In the Méknès region the interviews related to the intensive farms based onhorticulture (potatoes, onions and fruit trees) and dairy cattle raising and fattening;and to less intensive farms, based on cereals, oilseeds and sheep.
The interviews brought out the following points:All farmers complained of the effect of fertilizer and livestock feed price increasesand production costs. Loss of soil fertility resulting from reduced fertilizer usewas also noted by farmers in intensive horticulture.The increase in livestock feed prices have been tempered by the liberalization ofmilk prices in the case of cattle farming. As far as sheep fattening is concerned,the negative effect was not offset by better output prices.Because of the size of the fertilizer supply network and the emergence of newdistributors, farmers do not seem to be concerned about the closure of thefertilizer retailing agency (FERTIMA) sales outlets at the Centre de Travauxagricoles (CTA) level.Liberalization of the prices of durum wheat and barley does not seem to havehad much effect - in the case of durum wheat, because market prices have alwaysbeen higher than the minimum guaranteed price. For barley the quantitiesmarketed through the official channels are rarely significant.Liberalization of crop rotation did not affect this region.
The reactions of different farms varied from merely reducing purchases ofinputs to the extreme case of disinvestment. Higher production costs and changingrelative prices have led many farmers to alter their production patterns. Somehave sought to improve the efficiency of input use, others have sought to diversifyinto crop marketing. The role of cooperatives and producer organizations wasemphasized.
In the irrigated areas, discussions were held with farmers in Béni Amir and BéniMoussa, mainly regarding the changes following the liberalization of croppingpatterns, the disengagement of the Office regional de Mise en Valeur de Tadia(ORMVAT) from associated support functions, and the introduction of attempts torecover irrigation water charges.
The interviews brought out the following points:Farmers were relieved of the obligation to comply with a fixed rotation systemwhich had included sugar beet and cotton, enabling them to develop moreprofitable crops. But it also deprived farmers of part of the irrigation water thatORMVAT was required to supply. The freedom to choose crops also increasedthe price of farmland. These changes in the cropping systems encouraged thedevelopment of dairy and fattening cattle, and exports of the alfalfa surpluses toother regions.The end of collective rotation also created difficulties in the management anddistribution of water.
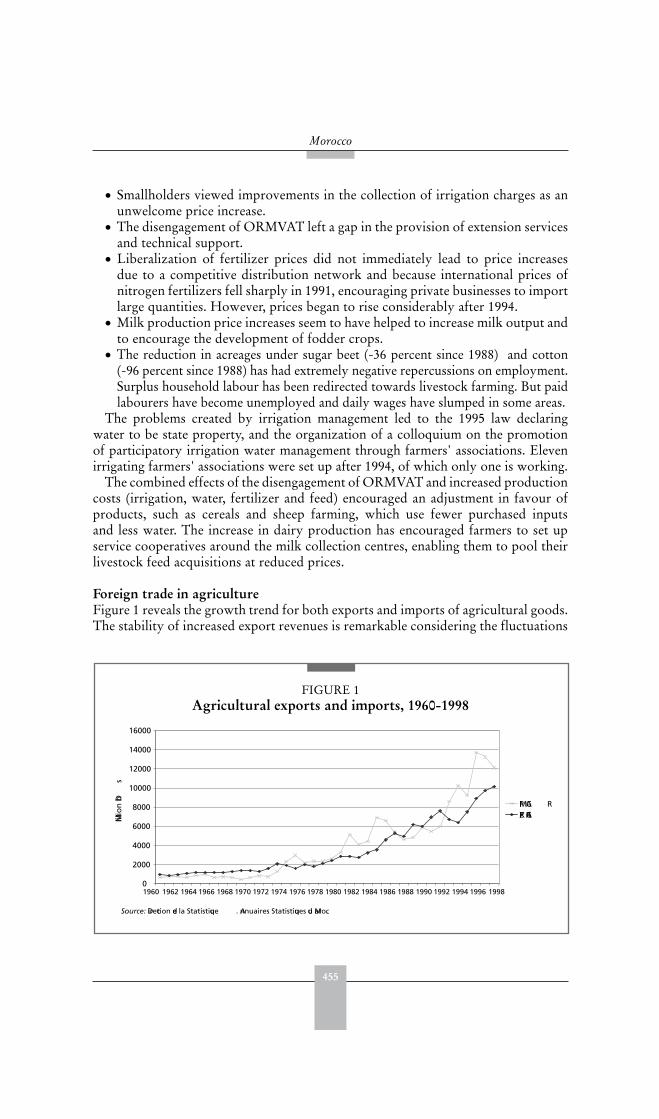
455
Morocco
Smallholders viewed improvements in the collection of irrigation charges as anunwelcome price increase.The disengagement of ORMVAT left a gap in the provision of extension servicesand technical support.Liberalization of fertilizer prices did not immediately lead to price increasesdue to a competitive distribution network and because international prices ofnitrogen fertilizers fell sharply in 1991, encouraging private businesses to importlarge quantities. However, prices began to rise considerably after 1994.Milk production price increases seem to have helped to increase milk output andto encourage the development of fodder crops.The reduction in acreages under sugar beet (-36 percent since 1988) and cotton(-96 percent since 1988) has had extremely negative repercussions on employment.Surplus household labour has been redirected towards livestock farming. But paidlabourers have become unemployed and daily wages have slumped in some areas.
The problems created by irrigation management led to the 1995 law declaringwater to be state property, and the organization of a colloquium on the promotionof participatory irrigation water management through farmers' associations. Elevenirrigating farmers' associations were set up after 1994, of which only one is working.
The combined effects of the disengagement of ORMVAT and increased productioncosts (irrigation, water, fertilizer and feed) encouraged an adjustment in favour ofproducts, such as cereals and sheep farming, which use fewer purchased inputsand less water. The increase in dairy production has encouraged farmers to set upservice cooperatives around the milk collection centres, enabling them to pool theirlivestock feed acquisitions at reduced prices.
Foreign trade in agriculture Figure 1 reveals the growth trend for both exports and imports of agricultural goods.The stability of increased export revenues is remarkable considering the fluctuations
0
2000
4000
6000
8000
10000
12000
14000
16000
1960 1962 1964 1966 1968 1970 1972 1974 1976 1978 1980 1982 1984 1986 1988 1990 1992 1994 1996
Miilio
n Dh
s
IMP AG REXP AGR
1998
Source: Direction de la Statistique . Annuaires Statistiques du Maroc.
FIGURE 1Agricultural exports and imports, 1960-1998
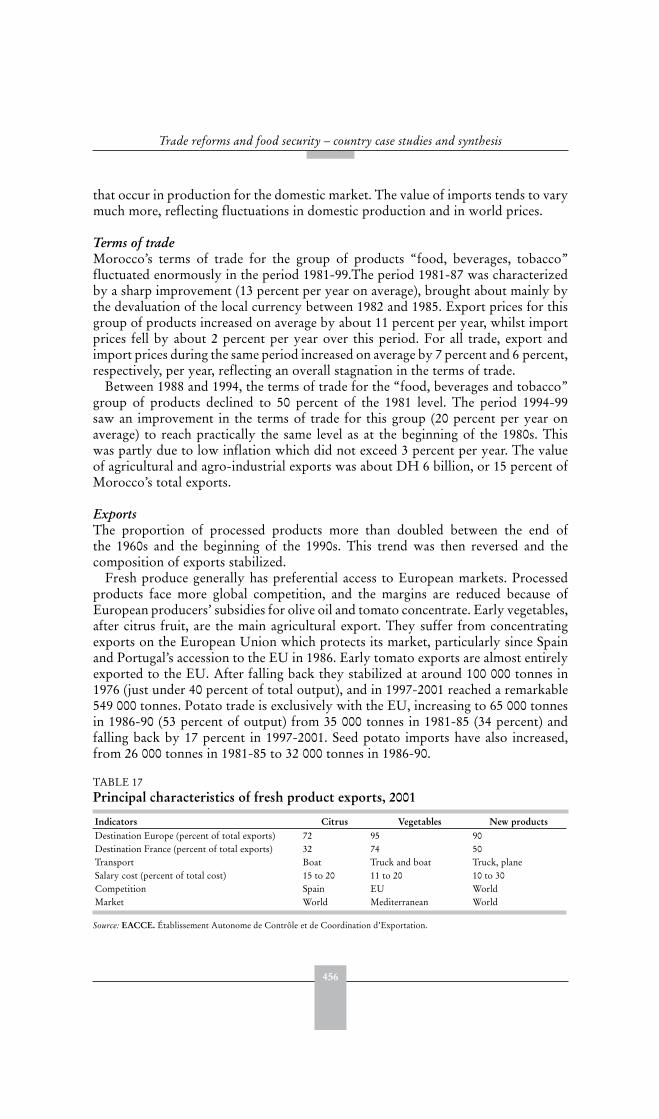
456
Trade reforms and food security – country case studies and synthesis
that occur in production for the domestic market. The value of imports tends to varymuch more, reflecting fluctuations in domestic production and in world prices.
Terms of tradeMorocco’s terms of trade for the group of products “food, beverages, tobacco”fluctuated enormously in the period 1981-99.The period 1981-87 was characterizedby a sharp improvement (13 percent per year on average), brought about mainly bythe devaluation of the local currency between 1982 and 1985. Export prices for thisgroup of products increased on average by about 11 percent per year, whilst importprices fell by about 2 percent per year over this period. For all trade, export andimport prices during the same period increased on average by 7 percent and 6 percent,respectively, per year, reflecting an overall stagnation in the terms of trade.
Between 1988 and 1994, the terms of trade for the “food, beverages and tobacco”group of products declined to 50 percent of the 1981 level. The period 1994-99saw an improvement in the terms of trade for this group (20 percent per year onaverage) to reach practically the same level as at the beginning of the 1980s. Thiswas partly due to low inflation which did not exceed 3 percent per year. The valueof agricultural and agro-industrial exports was about DH 6 billion, or 15 percent ofMorocco’s total exports.
ExportsThe proportion of processed products more than doubled between the end ofthe 1960s and the beginning of the 1990s. This trend was then reversed and thecomposition of exports stabilized.
Fresh produce generally has preferential access to European markets. Processedproducts face more global competition, and the margins are reduced because ofEuropean producers’ subsidies for olive oil and tomato concentrate. Early vegetables,after citrus fruit, are the main agricultural export. They suffer from concentratingexports on the European Union which protects its market, particularly since Spainand Portugal’s accession to the EU in 1986. Early tomato exports are almost entirelyexported to the EU. After falling back they stabilized at around 100 000 tonnes in1976 (just under 40 percent of total output), and in 1997-2001 reached a remarkable549 000 tonnes. Potato trade is exclusively with the EU, increasing to 65 000 tonnesin 1986-90 (53 percent of output) from 35 000 tonnes in 1981-85 (34 percent) andfalling back by 17 percent in 1997-2001. Seed potato imports have also increased,from 26 000 tonnes in 1981-85 to 32 000 tonnes in 1986-90.
TABLE 17 Principal characteristics of fresh product exports, 2001
Indicators Citrus Vegetables New productsDestination Europe (percent of total exports) 72 95 90Destination France (percent of total exports) 32 74 50Transport Boat Truck and boat Truck, planeSalary cost (percent of total cost) 15 to 20 11 to 20 10 to 30Competition Spain EU WorldMarket World Mediterranean World
Source: EACCE. Établissement Autonome de Contrôle et de Coordination d’Exportation.
457
Morocco
Citrus fruit has always been the main agricultural export (33 percent in of thevalue of total agricultural exports in 1982 and 20 percent in 1990) and a major sourceof foreign exchange (4 percent of total export revenues in 1982 and 1990). Exportmarkets are concentrated in the EU (over 70 percent of export value in 1990) whichis also a major producer. Exports have fallen back to 34 percent of total output in1997-2001, from 62 percent in 1980-85.
The export of fresh produce has expanded thanks to the opening up of refrigeratedroad transport when Spain joined the EU (Table 17). Access to the European marketis essential for these products. Access conditions are set out in the Euro-MoroccanAssociation Agreement of 1995. For citrus fruits, tomatoes, courgettes, cucumbersand artichokes, favourable access has been reserved for Moroccan exports atparticular times of the year and up to a maximum volume. This access is subjectto annual adjustment involving a gradual increase in import quotas combined withreductions in import fees.
The main processed exports are canned olives, apricots, green beans, gherkins,capers, frozen foods (green beans and strawberries) and orange juice. Severalproducts have virtually disappeared from the export range, particularly tomatoconcentrates, wines and olive oils, largely because of the European productionsubsidies under the CAP.
Morocco is the world’s fourth largest orange juice exporter, the world’s secondlargest for canned olives, and the leader for capers. It is also Europe’s leading supplierof apricot conserves and the second for processed green beans. A recent foreigntrade ministry study estimated that the domestic resource coefficients were 0.33 forapricot conserves, 0.49 for canned olives, 0.58 for citrus fruit concentrates, 0.75 forcitrus juice and 0.95 for tomato concentrate.
A dualism exists in the main export ranges between traditional traders andthe large integrated enterprises managed jointly with foreign investors. The firstcategory provides the semi-finished products to be processed by the Europeanindustries or to be sold on the domestic market. These operators generally do nothave the critical size needed to be competitive on the world market. The secondcategory of operators are the large-scale, vertically-integrated operations which arelinked to European or American distributors or which supply high value-addedproducts. Their strategy is to formalize the raw material collection system throughupstream integration, exclusive contracts with agricultural raw materials producers,quality control and price guarantees. These enterprises dominate the main processedfruit and vegetable production sectors.
ImportsSoft wheat imports grew rapidly in the 1970s to a maximum in 1980-85 (about2 million tonnes). Between 1986 and 1990 they fell as a result of the increase indomestic output (imports averaged 1.4 million tonnes). Since then, wheat importshave increased considerably because of the decline in national output (due to theclimate) and peaked in 2000 (3.5 million tonnes imported on average), except for1994 when imports dropped lower (an average of 1.2 million tonnes).
The maize deficit dates back to 1970 and rose considerably in the mid-1970slinked to the development of industrial poultry farming. Since 1980, the deficit
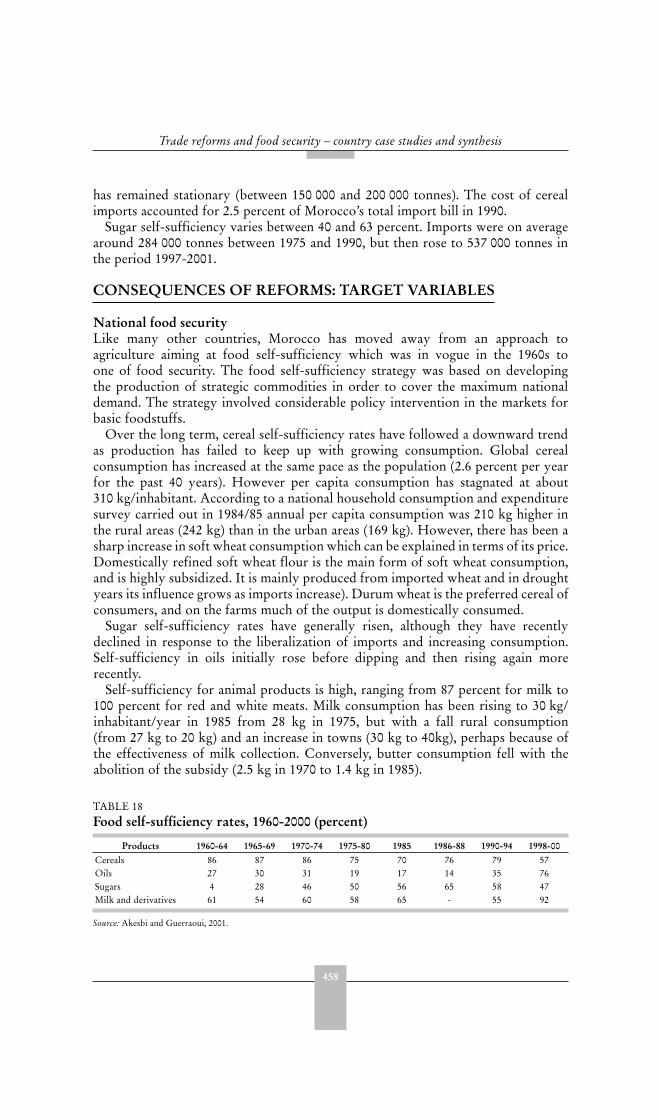
458
Trade reforms and food security – country case studies and synthesis
has remained stationary (between 150 000 and 200 000 tonnes). The cost of cerealimports accounted for 2.5 percent of Morocco’s total import bill in 1990.
Sugar self-sufficiency varies between 40 and 63 percent. Imports were on averagearound 284 000 tonnes between 1975 and 1990, but then rose to 537 000 tonnes inthe period 1997-2001.
CONSEQUENCES OF REFORMS: TARGET VARIABLES
National food securityLike many other countries, Morocco has moved away from an approach toagriculture aiming at food self-sufficiency which was in vogue in the 1960s toone of food security. The food self-sufficiency strategy was based on developingthe production of strategic commodities in order to cover the maximum nationaldemand. The strategy involved considerable policy intervention in the markets forbasic foodstuffs.
Over the long term, cereal self-sufficiency rates have followed a downward trendas production has failed to keep up with growing consumption. Global cerealconsumption has increased at the same pace as the population (2.6 percent per yearfor the past 40 years). However per capita consumption has stagnated at about310 kg/inhabitant. According to a national household consumption and expendituresurvey carried out in 1984/85 annual per capita consumption was 210 kg higher inthe rural areas (242 kg) than in the urban areas (169 kg). However, there has been asharp increase in soft wheat consumption which can be explained in terms of its price.Domestically refined soft wheat flour is the main form of soft wheat consumption,and is highly subsidized. It is mainly produced from imported wheat and in droughtyears its influence grows as imports increase). Durum wheat is the preferred cereal ofconsumers, and on the farms much of the output is domestically consumed.
Sugar self-sufficiency rates have generally risen, although they have recentlydeclined in response to the liberalization of imports and increasing consumption.Self-sufficiency in oils initially rose before dipping and then rising again morerecently.
Self-sufficiency for animal products is high, ranging from 87 percent for milk to100 percent for red and white meats. Milk consumption has been rising to 30 kg/inhabitant/year in 1985 from 28 kg in 1975, but with a fall rural consumption(from 27 kg to 20 kg) and an increase in towns (30 kg to 40kg), perhaps because ofthe effectiveness of milk collection. Conversely, butter consumption fell with theabolition of the subsidy (2.5 kg in 1970 to 1.4 kg in 1985).
TABLE 18 Food self-sufficiency rates, 1960-2000 (percent)
Products 1960-64 1965-69 1970-74 1975-80 1985 1986-88 1990-94 1998-00Cereals 86 87 86 75 70 76 79 57Oils 27 30 31 19 17 14 35 76Sugars 4 28 46 50 56 65 58 47Milk and derivatives 61 54 60 58 65 - 55 92
Source: Akesbi and Guerraoui, 2001.
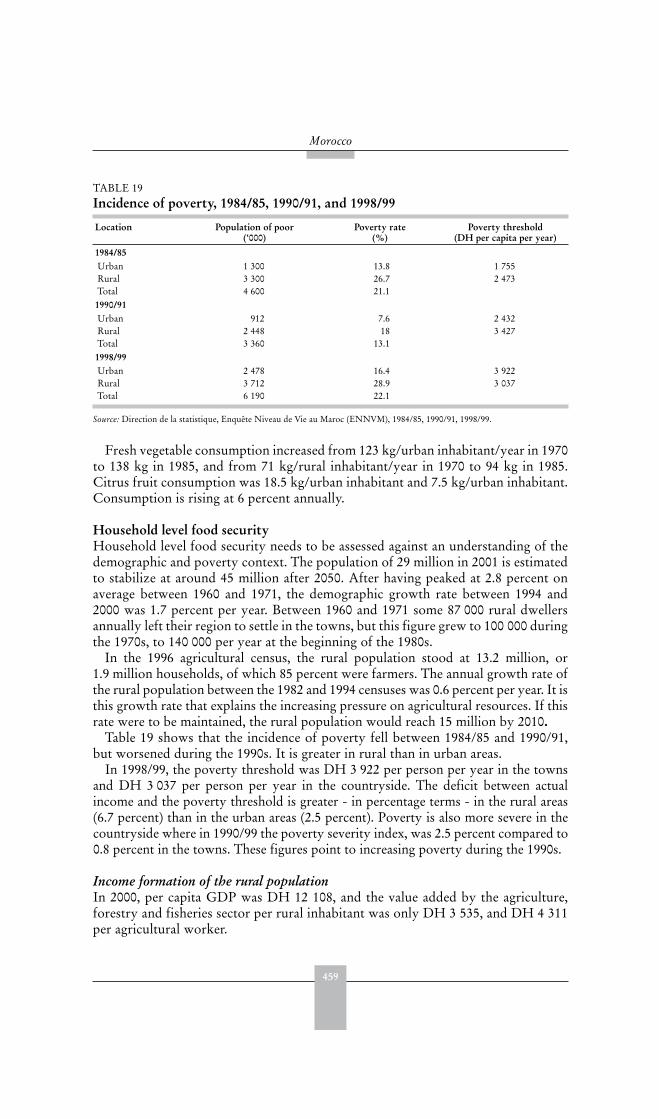
459
Morocco
Fresh vegetable consumption increased from 123 kg/urban inhabitant/year in 1970to 138 kg in 1985, and from 71 kg/rural inhabitant/year in 1970 to 94 kg in 1985.Citrus fruit consumption was 18.5 kg/urban inhabitant and 7.5 kg/urban inhabitant.Consumption is rising at 6 percent annually.
Household level food securityHousehold level food security needs to be assessed against an understanding of thedemographic and poverty context. The population of 29 million in 2001 is estimatedto stabilize at around 45 million after 2050. After having peaked at 2.8 percent onaverage between 1960 and 1971, the demographic growth rate between 1994 and2000 was 1.7 percent per year. Between 1960 and 1971 some 87 000 rural dwellersannually left their region to settle in the towns, but this figure grew to 100 000 duringthe 1970s, to 140 000 per year at the beginning of the 1980s.
In the 1996 agricultural census, the rural population stood at 13.2 million, or1.9 million households, of which 85 percent were farmers. The annual growth rate ofthe rural population between the 1982 and 1994 censuses was 0.6 percent per year. It isthis growth rate that explains the increasing pressure on agricultural resources. If thisrate were to be maintained, the rural population would reach 15 million by 2010.
Table 19 shows that the incidence of poverty fell between 1984/85 and 1990/91,but worsened during the 1990s. It is greater in rural than in urban areas.
In 1998/99, the poverty threshold was DH 3 922 per person per year in the townsand DH 3 037 per person per year in the countryside. The deficit between actualincome and the poverty threshold is greater - in percentage terms - in the rural areas(6.7 percent) than in the urban areas (2.5 percent). Poverty is also more severe in thecountryside where in 1990/99 the poverty severity index, was 2.5 percent compared to0.8 percent in the towns. These figures point to increasing poverty during the 1990s.
Income formation of the rural populationIn 2000, per capita GDP was DH 12 108, and the value added by the agriculture,forestry and fisheries sector per rural inhabitant was only DH 3 535, and DH 4 311per agricultural worker.
TABLE 19 Incidence of poverty, 1984/85, 1990/91, and 1998/99
Location Population of poor (‘000)
Poverty rate (%)
Poverty threshold(DH per capita per year)
1984/85Urban 1 300 13.8 1 755Rural 3 300 26.7 2 473Total 4 600 21.1
1990/91Urban 912 7.6 2 432Rural 2 448 18 3 427Total 3 360 13.1
1998/99Urban 2 478 16.4 3 922Rural 3 712 28.9 3 037Total 6 190 22.1
Source: Direction de la statistique, Enquête Niveau de Vie au Maroc (ENNVM), 1984/85, 1990/91, 1998/99.
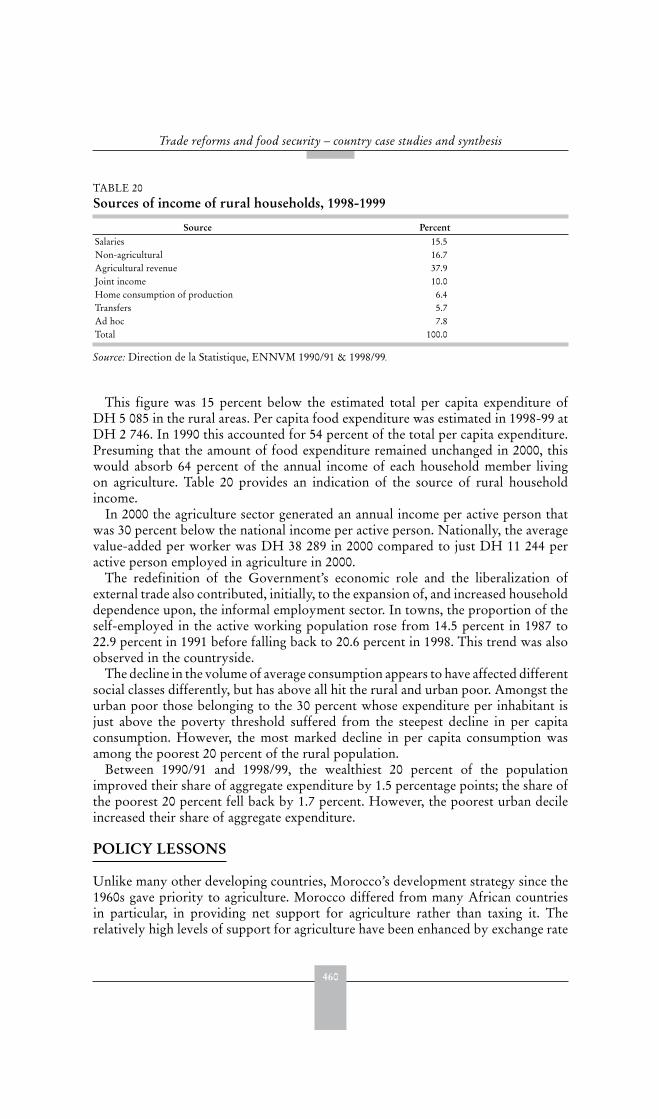
460
Trade reforms and food security – country case studies and synthesis
This figure was 15 percent below the estimated total per capita expenditure ofDH 5 085 in the rural areas. Per capita food expenditure was estimated in 1998-99 atDH 2 746. In 1990 this accounted for 54 percent of the total per capita expenditure.Presuming that the amount of food expenditure remained unchanged in 2000, thiswould absorb 64 percent of the annual income of each household member livingon agriculture. Table 20 provides an indication of the source of rural householdincome.
In 2000 the agriculture sector generated an annual income per active person thatwas 30 percent below the national income per active person. Nationally, the averagevalue-added per worker was DH 38 289 in 2000 compared to just DH 11 244 peractive person employed in agriculture in 2000.
The redefinition of the Government’s economic role and the liberalization ofexternal trade also contributed, initially, to the expansion of, and increased householddependence upon, the informal employment sector. In towns, the proportion of theself-employed in the active working population rose from 14.5 percent in 1987 to22.9 percent in 1991 before falling back to 20.6 percent in 1998. This trend was alsoobserved in the countryside.
The decline in the volume of average consumption appears to have affected differentsocial classes differently, but has above all hit the rural and urban poor. Amongst theurban poor those belonging to the 30 percent whose expenditure per inhabitant isjust above the poverty threshold suffered from the steepest decline in per capitaconsumption. However, the most marked decline in per capita consumption wasamong the poorest 20 percent of the rural population.
Between 1990/91 and 1998/99, the wealthiest 20 percent of the populationimproved their share of aggregate expenditure by 1.5 percentage points; the share ofthe poorest 20 percent fell back by 1.7 percent. However, the poorest urban decileincreased their share of aggregate expenditure.
POLICY LESSONS
Unlike many other developing countries, Morocco’s development strategy since the1960s gave priority to agriculture. Morocco differed from many African countriesin particular, in providing net support for agriculture rather than taxing it. Therelatively high levels of support for agriculture have been enhanced by exchange rate
TABLE 20 Sources of income of rural households, 1998-1999
Source PercentSalaries 15.5Non-agricultural 16.7Agricultural revenue 37.9Joint income 10.0Home consumption of production 6.4Transfers 5.7Ad hoc 7.8Total 100.0
Source: Direction de la Statistique, ENNVM 1990/91 & 1998/99.
461
Morocco
devaluations during the reform process, along with the relatively slow, and resisted,implementation of price reforms.
The high level of protection tended to serve the interests of large farmers andfarmers in areas with a high agricultural production potential. It did not benefitthe small producers in the semi-arid and arid zones, who mainly farmed to meettheir own subsistence requirements and had few marketable surpluses. These socialand regional differences have been further compounded by high domestic costs ofproduction and inefficient resource use.
Differences in the performance of different commodities during the reform periodcan be partly explained by the extent to which domestic prices were protected fromthe secular downward trend in commodity prices. For soft wheat, changes in theworld price only had an impact in the latter stages of reform. By contrast, for maizeand barley, the domestic prices can be partially explained by world price changes.For groundnuts or sugar crops (beet and cane), domestic price changes are mainlydue to changes in other factors.
Despite the rapid industrialization of the country over the past few years,Morocco’s economic growth has been largely determined by the performance of theagriculture sector, which depends heavily on climate. The great variability in climaticconditions can make it difficult to determine the relationship between policy changeand supply response, given large swings in production due to the droughts.
PASA 2 was ambitious and its objectives were more difficult to achieve thaninitially anticipated. Despite various changes to make the plan more flexible, it wasdelayed and only partly implemented. On the whole, PASA 2 was evaluated to bepositive, but some reforms were still far from having been completed. One of themain reasons for this was an underestimation of the ability of large pressure groups,particularly in the agro-industrial sectors, to organize opposition to the reforms thatthey considered to be against their own interests.
Specific problems in implementing policy include a time lag between officialpolicy decisions and policy implementation. There has also been some hesitancyand ambiguity in the liberalization of domestic agricultural marketing. For example,the law reorganizing the cereals market has been enacted, but it is facing seriousproblems and opposition and has yet to be implemented. The monopoly over theimport and marketing of tea, sugar and seed has been abolished in theory, but privateoperators do not seem to be interested and the rules are not at all clear. Conversely,fertilizer trade has been properly liberalized.
The gap between the average income per agricultural worker and the nationalaverage indicates a need for greater agricultural productivity. The delay in increasingproductivity in the agriculture sector is due to the slow pace of introducinginnovations in cropping practices (the quality of mechanical work, the quality ofseeds and plants, weed reduction, and methods of soil enrichment) and in livestocktechniques (supervising flocks, selection, reproduction methods, veterinary care,and establishing feed diets). The low level of rural education and training and highilliteracy rates hinder improved productivity by hampering information flows andthe dissemination of new technologies.
The reduction in investment programmes caused by the PASAs has restrictedthe Government’s capacity to guarantee the necessary physical infrastructure foreconomic development and at the same time placed a curb on the main source of

462
Trade reforms and food security – country case studies and synthesis
growth, namely, demand. Private investment did not compensate for the reductionin public investment and the simultaneous liberalization of domestic and foreigntrade did not give enough time for the domestic economy to prepare itself for foreigncompetition.
The policy for modernizing agriculture in Morocco has been designed to includethe construction of irrigation dams; mechanization; and intensifying productionusing selected seeds, fertilizer and phytosanitary products. Irrigation plays a strategicrole in improving Morocco’s food security. Even though mechanization, includingthe tractor stock, has considerably increased since 1975, levels are still low and thesteep devaluations of the dirham made agricultural equipment more costly duringthe 1980s. While the overall consumption of fertilizer rose from 60 000 tonnes in1956 to 1 400 000 tonnes in 1990, consumption levels are still weak. Since 1987 thequantities of fertilizer used have fallen because of the abolition of subsidies, whichhas raised its price. There is also an imbalance in the use of agricultural equipmentand other inputs between zones, crops and farms.
The reduction of poverty at the end of the 1980s was due mainly to the rapidexpansion of the informal sector and to good agricultural seasons, combined withstrong domestic demand mainly stimulated by increased wages and salaries. Since themain outlet for this sector is domestic market, the policy to restrict wages and publicexpenditure resulted in a reduction in per capita incomes of the active population,whether employed or self-employed. This reduction was not sufficiently offset bya redistribution policy for this category of the population (households working inthe informal sector). Two indicators support this observation: an increase in nationalsaving while the final per capita consumption was deteriorating, and an increasein the gap between the expenditure of the poorest and the richest groups of thepopulation.
Poverty is both more frequent and more severe in the countryside than in thetowns, and these disparities are even more marked in the regions of the south. Thepopulation has tripled since independence (1956), and the delay in taking accountof this trend has annulled efforts to develop social services and facilities in the ruralareas, and further worsened the gap between the rural and the urban environments.
In short, poverty is tending to rise and is one of the main concerns of theGovernment. Another major challenge is the need to reconcile short-term interestsmarked by economic and social imperatives and the need to protect the environment,which is more a long-term issue.
REFERENCES
Akesbi, N. & Guerraoui, D. 2001. Enjeux Agricoles.
Association Nationale des Améliorations Foncières et du Drainage. 2001. Hommes Terres
et Eau. N°120, September.Base de Données. Conseil Général du Département de l’Agriculture, Rabat.Direction de la Statistique. Various years. Annuaires Statistiques du Maroc. Ministère de la
Prévision Économique et du Plan. Rabat.Direction de la Statistique. Various years. Comptes nationaux. Ministère de la Prévision
Économique et du Plan. Rabat.
463
Morocco
Direction de la Statistique. Various years. Enquête Niveau de Vie au Maroc. Ministère de laPrévision Économique et du Plan. Rabat.
FAO. 1995. FAOSTAT database. Profil nutritionnel du Maroc.
Ministère de l’Agriculture, du Développement Rural et des Eaux et Forêts (Madref, 2002).Bilan de la campagne agricole 2000-2001. Direction de la Production Végétale, Rabat,janvier 2002.
FURTHER READING
Agrostat. Various years. Database with selected statistics on the agricultural sector. FAO,Rome, Italy
Laraki, K. 1989. Ending Food Subsidies:Nutritional Welfare and Budgetary effects. The WorldBank Economic Review,395-408,vol. 3, N°3.
MADREF (Ministère de l’Agriculture, du Développement Rural et des Eaux et Forêts)2000. Etat de l’Agriculture 1998, Base de Données. Conseil Général du Département del’Agriculture, Rabat.
MADRPM (Ministère de l’Agriculture, du Développement Rural et des Pêches Maritimes)1999c. Le programme de lutte contre les effets de la sécheresse: Revitaliser la campagne. LeTerroir, Revue du MADRPM, n°2, juillet 1999.
MADRPM (Ministère de l’Agriculture, du Développement Rural et des Pêches Maritimes)2000b. Pour une stratégie de développement à long terme de l’agriculture marocaine.Colloque National de l’Agriculture et du Développement Rural, Rabat, 19-20 juillet2000.
MADRPM (Ministère de l’Agriculture, du Développement Rural et des Pêches Maritimes)1998. Recensement général de l’agriculture, Résultats préliminaires. Direction de laprogrammation et des affaires économiques, septembre 1998.
MADRPM (Ministère de l’Agriculture, du Développement Rural et des Pêches Maritimes)1999b. Politique agricole: les nouvelles orientations. Le Terroir, Revue du MADRPM, n°1,mars 1999.
MADRPM (Ministère de l’Agriculture, du Développement Rural et des Pêches Maritimes),1999d. Flash Agri, mensuel édité par le MADRPM, n°1 et 2, mai et juin 1999.
MADRPM (Ministère de l’Agriculture, du Développement Rural et des Pêches Maritimes)2000a. L’Observatoire National de la Sécheresse: un outil de gestion prospective. Le Terroir,n°3, Rabat; janvier 2000.
MADRPM, (Ministère de l’Agriculture, du Développement Rural et des Pêches Maritimes)1999a. Stratégie 2020 de développement rural. Document de synthèse, Rabat.
MADRPM. 1999e. Ministère de l’Agriculture, du Développement Rural et des Pêches Maritimes, Programme de sécurisation de la production céréalière, 1999-2002. Dossier dePresse, octobre 1999.
MATUHE (Ministère de l’Aménagement du Territoire, de l’Urbanisme, de l’Habitat et de l’Environnement) 2001 Rapport sur l’état de l’environnement du Maroc. Département del’Environnement, Rabat, octobre 2001.
MPEP (Ministère de la Prévision Economique et du Plan) 1998. Projet de Plan de
Développement Économique et Social 1999-2003. Commission “Développement agricoleet rural”. Rabat, décembre 1998.
WTO, 2003. Trade Policy Review: Kingdom of Morocco, Report by the Secretariat. WT/TPR/S/116. 19 May 2003.

465
NigeriaT. Ademola Oyejide, E. Olawale Ogunkola and Olumuyiwa B. Alaba1
EXECUTIVE SUMMARY
Pre-reformMarketing boards had monopoly power for organizing the purchase and sale ofthe country’s export crops, they acted as fiscal agents of the Government and paidproducers prices that were well below world market prices for their crops. In thelate 1970s, most of the taxation elements had been removed. However, because of theovervaluation of the exchange rate farmers continued to be effectively taxed
The single most important event that served as the precursor of general economicpolicy reforms in Nigeria from the mid-1980s was the abrupt end of the oil exportboom in 1981. This event and the associated responses to it had a severely negativeeffect on the Nigerian economy in general and on the agricultural sector in particular.
The reformsIn April 1984 a short-term programme consisting of ad hoc measures designed toreduce the fiscal deficit and suppress import demand as a means improving the balance-of-payments position was initiated. In July 1986, a two-year structural adjustmentprogramme (SAP) was launched that included the introduction of a market-basedexchange rate system, reform to the trade regime, and monetary and fiscal restraint.Although the SAP document envisaged 18 months for its implementation, the mainelements were implemented up to the end of 1993 and beyond.
Changes in the exchange rate constituted the cornerstone of reform with asubstantial devaluation of the naira in 1986, when the exchange rate declined byover 60 percent. This change was minor compared to the magnitude of depreciationexperienced during 1986-93 (1 161 percent) and 1994-2000 (364 percent). Agriculturaltrade policy changes were not as radical and the main trade policy instrumentsremained essentially the same.
At a sectoral level, the focus was on agricultural export crops. The abolitionof commodity marketing boards in 1986 was aimed at raising incentives for theproduction of agricultural export crops. On the input side, the removal of theceilings on interest rates on rural loans and greater availability of agricultural creditthrough cooperatives were observed. Tighter controls on imports were establishedwith a view to encouraging increased domestic food production and imports ofwheat, maize, rice, vegetable oil, poultry and animal feed were banned.
1 T. Ademola Oyejide, E. Olawale Ogunkola and Olumuyiwa B. Alaba, Trade Policy Research and TrainingProgramme and Department of Economics, University of Ibadan, Nigeria.

466
Trade reforms and food security – country case studies and synthesis
Impact on intermediate variablesBoth rice and millet experienced substantial real price increases in 1986-93, but by1994-2000, much of the gain in real prices had disappeared. Average real prices ofexport crops experienced substantial increases across the three sub-periods. Changesin domestic prices of major staples and cash crops were moderately positive in thepre-reform period (1980–1985) despite a decline in world prices of these commodities(cocoa, rubber, groundnut, coffee, palm kernel and palm oil) from 1980 to 1982. Thepositive changes in the prices were the result of moderate changes in exchange rateand in other factors.
The change in domestic prices of major cash crops during 1986–88 was positiveand in most cases higher than in any other sub-periods under consideration. In mostcases developments in the exchange rate drove the significant change in the domesticprices. The period between 1992 and 1994 recorded positive changes in the domesticprices of cash crops. Developments in the exchange rate and in macroeconomic andagricultural sector specific policies accounted for the observed trend. The 1995-1997period witnessed a strong positive change in the exchange rate; however, the marginalchange in the world prices coupled with unfavourable development in other factors,limited the positive changes in domestic prices for most cash crops.
In aggregate, the agricultural sector achieved an average annual growth rate of5 percent over the period from 1980 to 2000. The average annual growth ratesover the same period were 6 percent for all crops, 7 percent for staple crops and3 percent for other crops. Agriculture’s performance was particularly poor in thefirst half of the 1980s when aggregate agriculture grew at an annual average of only2 percent. The second half of the 1980s witnessed a sharp improvement in the growthperformance of the agricultural sector. The average annual growth rate of aggregateagriculture fell to 5 percent in 1990-95 and 3 percent during 1995-2000. There wasa significant expansion in the area under cultivation suggesting that this was moreimportant than intensification. Production increases also contributed to an increasein agricultural exports.
Impact on target variablesFood import dependence fell from an average of 13 percent of total imports during1980-82 to 6 percent during 1989-91, but then rose to 12 percent in 1998-2000. Thecountry’s dependence on food imports is however minimal as significant proportionsof most food items were met through domestic food production.
The number of undernourished declined from about 25 million in 1979-80 toabout 7 million in 1998-2000. Daily calorie intake increased. There was a decline inthe proportion of undernourished from 39 percent in 1979-80 to 13 percent in 1990-92 and further to 7 percent in 1998-2000.
The share of consumption of own production hovered between 20 and 26 percentfor the period under review. The rural population’s integration with markets forproduction and consumption remains limited. Farmers remained predominantlyat a subsistence level of production and the reform did not alter this characteristicsignificantly. The real income of the average rural household rose by 60 percentbetween the pre-reform and the reform periods, and by 5 percent between thereform and post-reform periods. However, the incidence of poverty seems to beincreasing. Self-employed rural households appear to have been better off, in terms
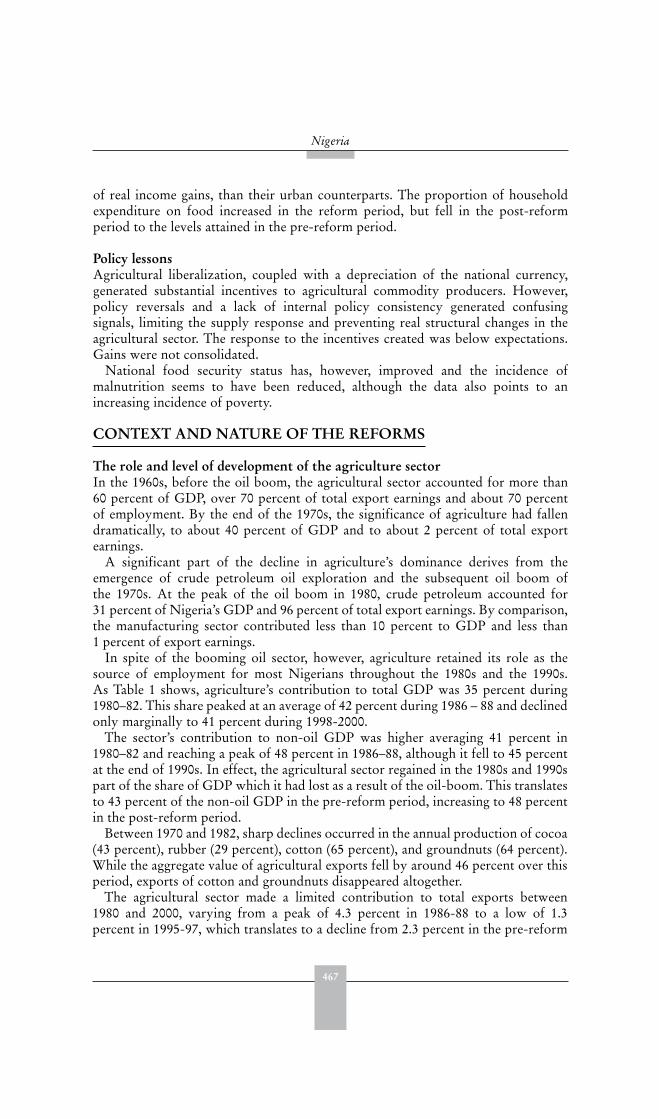
467
Nigeria
of real income gains, than their urban counterparts. The proportion of householdexpenditure on food increased in the reform period, but fell in the post-reformperiod to the levels attained in the pre-reform period.
Policy lessonsAgricultural liberalization, coupled with a depreciation of the national currency,generated substantial incentives to agricultural commodity producers. However,policy reversals and a lack of internal policy consistency generated confusingsignals, limiting the supply response and preventing real structural changes in theagricultural sector. The response to the incentives created was below expectations.Gains were not consolidated.
National food security status has, however, improved and the incidence ofmalnutrition seems to have been reduced, although the data also points to anincreasing incidence of poverty.
CONTEXT AND NATURE OF THE REFORMS
The role and level of development of the agriculture sectorIn the 1960s, before the oil boom, the agricultural sector accounted for more than60 percent of GDP, over 70 percent of total export earnings and about 70 percentof employment. By the end of the 1970s, the significance of agriculture had fallendramatically, to about 40 percent of GDP and to about 2 percent of total exportearnings.
A significant part of the decline in agriculture’s dominance derives from theemergence of crude petroleum oil exploration and the subsequent oil boom ofthe 1970s. At the peak of the oil boom in 1980, crude petroleum accounted for31 percent of Nigeria’s GDP and 96 percent of total export earnings. By comparison,the manufacturing sector contributed less than 10 percent to GDP and less than1 percent of export earnings.
In spite of the booming oil sector, however, agriculture retained its role as thesource of employment for most Nigerians throughout the 1980s and the 1990s.As Table 1 shows, agriculture’s contribution to total GDP was 35 percent during1980–82. This share peaked at an average of 42 percent during 1986 – 88 and declinedonly marginally to 41 percent during 1998-2000.
The sector’s contribution to non-oil GDP was higher averaging 41 percent in1980–82 and reaching a peak of 48 percent in 1986–88, although it fell to 45 percentat the end of 1990s. In effect, the agricultural sector regained in the 1980s and 1990spart of the share of GDP which it had lost as a result of the oil-boom. This translatesto 43 percent of the non-oil GDP in the pre-reform period, increasing to 48 percentin the post-reform period.
Between 1970 and 1982, sharp declines occurred in the annual production of cocoa(43 percent), rubber (29 percent), cotton (65 percent), and groundnuts (64 percent).While the aggregate value of agricultural exports fell by around 46 percent over thisperiod, exports of cotton and groundnuts disappeared altogether.
The agricultural sector made a limited contribution to total exports between1980 and 2000, varying from a peak of 4.3 percent in 1986-88 to a low of 1.3percent in 1995-97, which translates to a decline from 2.3 percent in the pre-reform
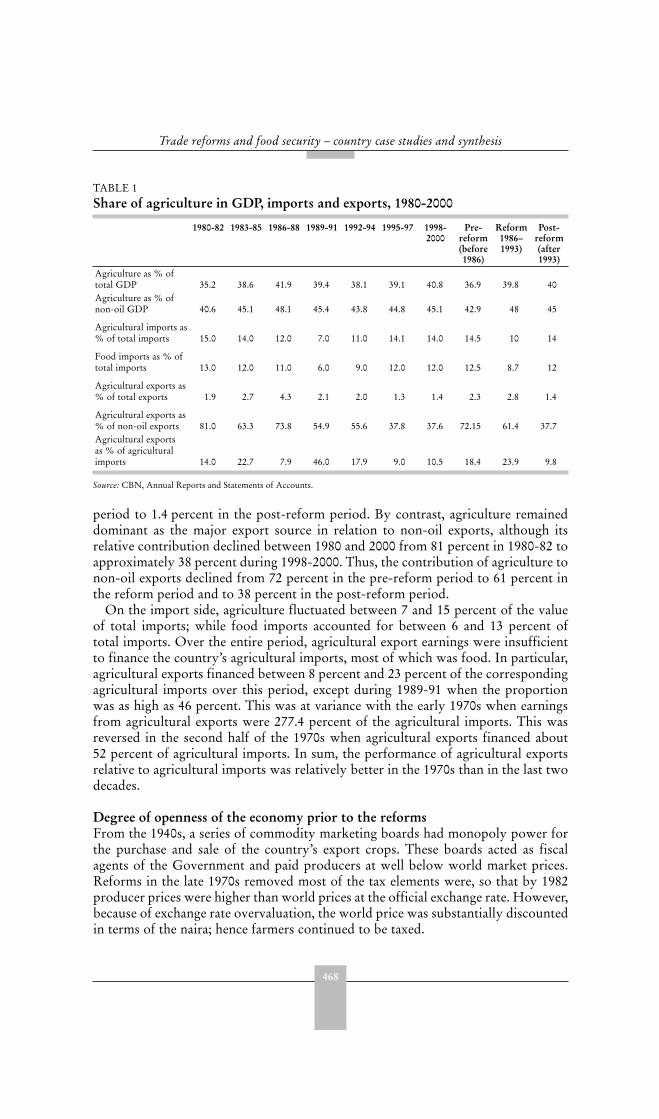
468
Trade reforms and food security – country case studies and synthesis
period to 1.4 percent in the post-reform period. By contrast, agriculture remaineddominant as the major export source in relation to non-oil exports, although itsrelative contribution declined between 1980 and 2000 from 81 percent in 1980-82 toapproximately 38 percent during 1998-2000. Thus, the contribution of agriculture tonon-oil exports declined from 72 percent in the pre-reform period to 61 percent inthe reform period and to 38 percent in the post-reform period.
On the import side, agriculture fluctuated between 7 and 15 percent of the valueof total imports; while food imports accounted for between 6 and 13 percent oftotal imports. Over the entire period, agricultural export earnings were insufficientto finance the country’s agricultural imports, most of which was food. In particular,agricultural exports financed between 8 percent and 23 percent of the correspondingagricultural imports over this period, except during 1989-91 when the proportionwas as high as 46 percent. This was at variance with the early 1970s when earningsfrom agricultural exports were 277.4 percent of the agricultural imports. This wasreversed in the second half of the 1970s when agricultural exports financed about52 percent of agricultural imports. In sum, the performance of agricultural exportsrelative to agricultural imports was relatively better in the 1970s than in the last twodecades.
Degree of openness of the economy prior to the reforms From the 1940s, a series of commodity marketing boards had monopoly power forthe purchase and sale of the country’s export crops. These boards acted as fiscalagents of the Government and paid producers at well below world market prices.Reforms in the late 1970s removed most of the tax elements were, so that by 1982producer prices were higher than world prices at the official exchange rate. However,because of exchange rate overvaluation, the world price was substantially discountedin terms of the naira; hence farmers continued to be taxed.
TABLE 1 Share of agriculture in GDP, imports and exports, 1980-2000
1980-82 1983-85 1986-88 1989-91 1992-94 1995-97 1998-2000
Pre-reform(before1986)
Reform1986–1993)
Post-reform(after1993)
Agriculture as % oftotal GDP 35.2 38.6 41.9 39.4 38.1 39.1 40.8 36.9 39.8 40Agriculture as % ofnon-oil GDP 40.6 45.1 48.1 45.4 43.8 44.8 45.1 42.9 48 45
Agricultural imports as% of total imports 15.0 14.0 12.0 7.0 11.0 14.1 14.0 14.5 10 14
Food imports as % oftotal imports 13.0 12.0 11.0 6.0 9.0 12.0 12.0 12.5 8.7 12
Agricultural exports as% of total exports 1.9 2.7 4.3 2.1 2.0 1.3 1.4 2.3 2.8 1.4
Agricultural exports as% of non-oil exports 81.0 63.3 73.8 54.9 55.6 37.8 37.6 72.15 61.4 37.7Agricultural exportsas % of agriculturalimports 14.0 22.7 7.9 46.0 17.9 9.0 10.5 18.4 23.9 9.8
Source: CBN, Annual Reports and Statements of Accounts.
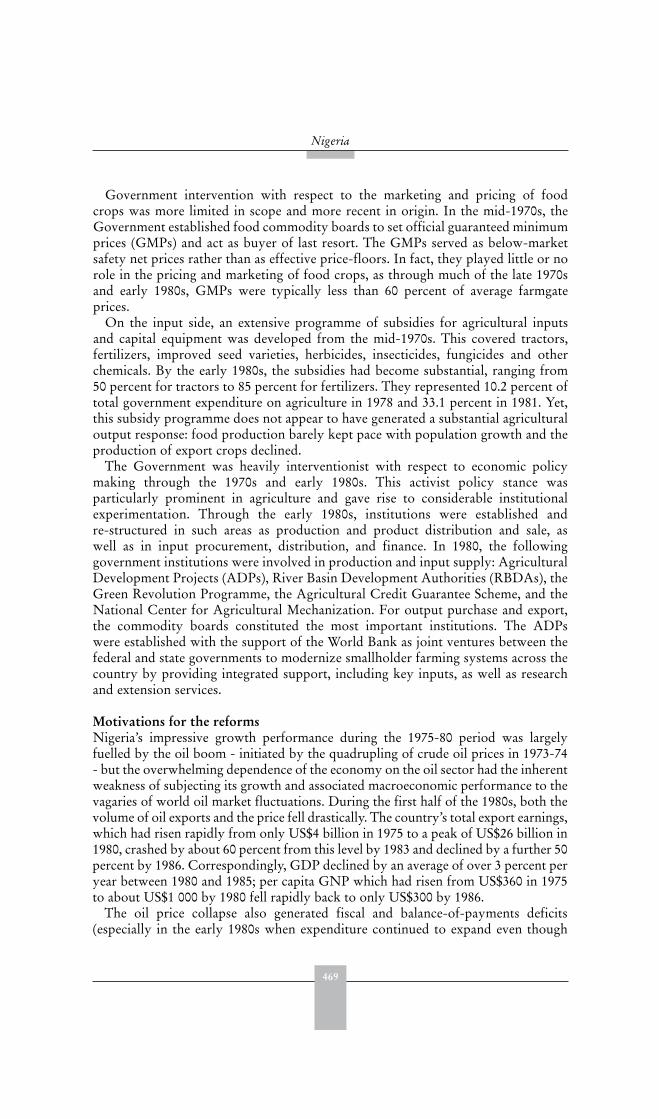
469
Nigeria
Government intervention with respect to the marketing and pricing of foodcrops was more limited in scope and more recent in origin. In the mid-1970s, theGovernment established food commodity boards to set official guaranteed minimumprices (GMPs) and act as buyer of last resort. The GMPs served as below-marketsafety net prices rather than as effective price-floors. In fact, they played little or norole in the pricing and marketing of food crops, as through much of the late 1970sand early 1980s, GMPs were typically less than 60 percent of average farmgateprices.
On the input side, an extensive programme of subsidies for agricultural inputsand capital equipment was developed from the mid-1970s. This covered tractors,fertilizers, improved seed varieties, herbicides, insecticides, fungicides and otherchemicals. By the early 1980s, the subsidies had become substantial, ranging from50 percent for tractors to 85 percent for fertilizers. They represented 10.2 percent oftotal government expenditure on agriculture in 1978 and 33.1 percent in 1981. Yet,this subsidy programme does not appear to have generated a substantial agriculturaloutput response: food production barely kept pace with population growth and theproduction of export crops declined.
The Government was heavily interventionist with respect to economic policymaking through the 1970s and early 1980s. This activist policy stance wasparticularly prominent in agriculture and gave rise to considerable institutionalexperimentation. Through the early 1980s, institutions were established andre-structured in such areas as production and product distribution and sale, aswell as in input procurement, distribution, and finance. In 1980, the followinggovernment institutions were involved in production and input supply: AgriculturalDevelopment Projects (ADPs), River Basin Development Authorities (RBDAs), theGreen Revolution Programme, the Agricultural Credit Guarantee Scheme, and theNational Center for Agricultural Mechanization. For output purchase and export,the commodity boards constituted the most important institutions. The ADPswere established with the support of the World Bank as joint ventures between thefederal and state governments to modernize smallholder farming systems across thecountry by providing integrated support, including key inputs, as well as researchand extension services.
Motivations for the reformsNigeria’s impressive growth performance during the 1975-80 period was largelyfuelled by the oil boom - initiated by the quadrupling of crude oil prices in 1973-74- but the overwhelming dependence of the economy on the oil sector had the inherentweakness of subjecting its growth and associated macroeconomic performance to thevagaries of world oil market fluctuations. During the first half of the 1980s, both thevolume of oil exports and the price fell drastically. The country’s total export earnings,which had risen rapidly from only US$4 billion in 1975 to a peak of US$26 billion in1980, crashed by about 60 percent from this level by 1983 and declined by a further 50percent by 1986. Correspondingly, GDP declined by an average of over 3 percent peryear between 1980 and 1985; per capita GNP which had risen from US$360 in 1975to about US$1 000 by 1980 fell rapidly back to only US$300 by 1986.
The oil price collapse also generated fiscal and balance-of-payments deficits(especially in the early 1980s when expenditure continued to expand even though

470
Trade reforms and food security – country case studies and synthesis
both export earnings and fiscal revenues had fallen off) and increasing inflationresulting from the way in which the rising fiscal deficit was financed. Rising externalimbalances were temporarily financed by public sector borrowing abroad. This debtrose three-fold from less than US$9 billion in 1980 to well over US$23 billion by1986 and brought along with it an unsustainable external payments obligation. Theinitial response to this problem was an austerity regime, which relied exclusively ondemand restraint measures, including expenditure reduction and import control. Asa result, both fiscal and external deficits fell sharply, particularly between 1983 and1985. In particular, the overall public sector deficit fell from 12 percent of GDP in1983 to 3 percent in 1985; the growth of net domestic credit to the economy fell froman annual average of 47 percent in 1980 to 13 percent during 1981-83 and 10 percentin 1984-85.
Coinciding with the drastic fall in export earnings, domestic agricultural productionvirtually stagnated As a result, import capacity was reduced, and the import of keyfood items was stringently compressed at the same time as purchasing power wasfalling. Consequently, food security at the national level probably worsened during1981-85.
When the oil boom came to an end in 1981, the Government did not reactimmediately, and when it eventually did, the main focus of attention was on demandmanagement measures, which were directed at restoring the balance-of-paymentsposition. In 1983, the Government took steps to limit a wide range of imports,including a number of agricultural products: import bans were imposed on productssuch as rice, maize, vegetable oils and, at a later date, wheat. Import duties on fooditems such as grains and oils, were raised to between 50 percent and 100 percentduring 1978-82. The placing of most agricultural imports under specific importlicence soon followed this. Between 1982 and 1985, about 200 commodities weresubject to quantitative import restrictions while virtually all food items were placedunder export ban. In April 1984, a new reform programme was launched; but thiswas also built around ad hoc measures designed to reduce the fiscal deficit, compressimport demand, save foreign exchange and improve the balance of payments.
This policy, driven entirely by balance-of-payments considerations, differed fromthe previous pattern. In the past, agricultural import policies fluctuated in responseto changing priorities for on the one hand increasing food supplies and limiting foodprice increases to protect consumers; and on the other, stimulating domestic foodproduction and raising rural income.
The single most important event to serve as a stimulus for general economic policyreforms from the mid-1980s was therefore the abrupt end of the oil export boom, in1981. This event and the associated management of and responses to it had a severelynegative effect on the economy in general and on the agricultural sector in particular(Table 2).
The oil-boom related “Dutch Disease”2 affected agriculture through severalchannels. The exchange rate appreciated by 80 percent in real terms between1973 and 1980 as oil revenue rose dramatically. The growing overvaluation of the
2 The deindustrialization of a nation’s economy that occurs when the discovery of a natural resource raises thevalue of the currency, making manufactured goods less competitive. The term originated in Holland after thediscovery of North Sea gas.

471
Nigeria
naira put agricultural exports in particular at a disadvantage. Further, growers ofagricultural export crops suffered from the taxes and retention charges imposed bythe commodity marketing boards and thus received only a proportion of the averageworld market prices for their crops. Even on the world market, the declining termsof trade for Nigeria’s main agricultural commodity exports (such as cocoa, palmproduce, and rubber) contributed to the decline in agricultural export earnings.
Macro and sectoral components and the policy instruments usedThe first reform attempt was launched in April 1984. This was an essentially short-term programme consisting of ad hoc measures designed primarily to reduce thefiscal deficit and compress import demand as a means of saving foreign exchange andimproving the balance-of-payments position. These measures succeeded in slashingthe fiscal deficit. External imbalances were not as easily controlled. The furtherreduction by 50 percent of world prices early in 1986 caused oil export revenues todrop to US$6 billion. This increased the urgency of reform and made it clear thatthe problem had to be approached through a longer-term structural adjustmentprogramme.
By this time, both the World Bank and the IMF had concluded that Nigeria’smacroeconomic problems arose from an over-valued domestic currency (the naira),a protectionist trade regime and an unduly regulated economic environment. Theyproposed a programme of structural reform, but this was overwhelmingly refusedin a national referendum.
In spite of this result, the Government launched a two-year structural adjustmentprogramme (SAP) in July 1986, whose main components included the introductionof a market-based exchange rate system; reform of the trade regime starting withthe elimination of the import licensing system; and monetary and fiscal restraintdesigned to moderate inflationary pressure on the real exchange rate.
One of the main aims was to control the country’s large and growing externalimbalances, so as to facilitate a re-negotiation of the external debt. More generally, theSAP sought to increase the competitiveness of the economy’s non-oil tradable sectors.In specific terms, the aims of SAP included the restructuring and diversification of
TABLE 2 Key macroeconomic changes, 1980-1985
1975-80 1981 1982 1983 1984 1985Annual Growth Rate (%) of GDP 3.5 -5.1 -4.8 -3.3 -7.7 9.5Annual Growth Rate (%) of Exports 5.5 -39.8 -14.3 -14.7 18.0 28.4Annual Growth Rate (%) of Imports 6.3 11.4 10.0 -18.6 -19.4 -2.6Resource Balance ($million) 9.36 -3.33 -5.09 -4.25 -3.39 -3.42Current Account Balance ($million) 4.31 -6.04 -7.34 -4.99 0.12 2.60Fiscal Balance as % of GDP -1.20 -10.50 -9.50 -11.20 0.23 4.45Official Exchange Rate (N/$) 0.54 0.64 0.67 0.75 0.77 0.89Parallel Market Exchange Rate(N/$) 0.9 0.9 1.1 1.8Parallel Market Premium (%) 65.8 45.2 69.9 141.5Inflation Rate (%) 10.0 20.8 7.7 23.2 39.6 5.5Agriculture (% of GDP) 26.51 26.76 30.62 32.96 49.4 40.3Petroleum (% of GDP) 24.33 20.14 16.23 13.63 25.2 15.1Manufacturing (% of GDP) 13.70 15.48 15.20 14.72 7.8 8.57
Source: CBN (various issues).
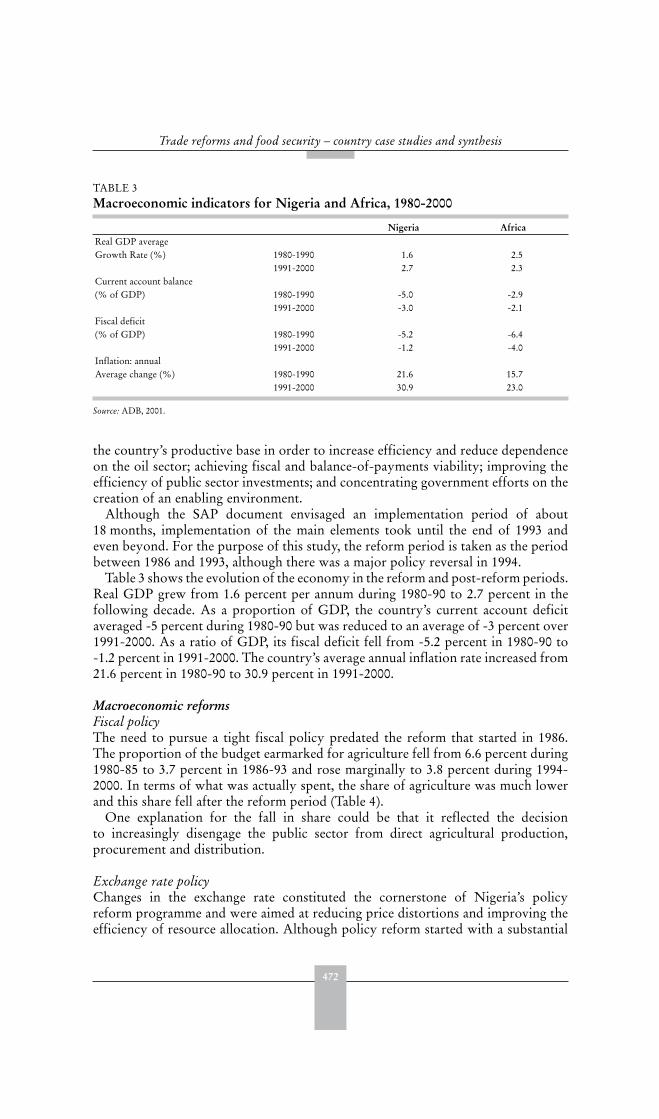
472
Trade reforms and food security – country case studies and synthesis
the country’s productive base in order to increase efficiency and reduce dependenceon the oil sector; achieving fiscal and balance-of-payments viability; improving theefficiency of public sector investments; and concentrating government efforts on thecreation of an enabling environment.
Although the SAP document envisaged an implementation period of about18 months, implementation of the main elements took until the end of 1993 andeven beyond. For the purpose of this study, the reform period is taken as the periodbetween 1986 and 1993, although there was a major policy reversal in 1994.
Table 3 shows the evolution of the economy in the reform and post-reform periods.Real GDP grew from 1.6 percent per annum during 1980-90 to 2.7 percent in thefollowing decade. As a proportion of GDP, the country’s current account deficitaveraged -5 percent during 1980-90 but was reduced to an average of -3 percent over1991-2000. As a ratio of GDP, its fiscal deficit fell from -5.2 percent in 1980-90 to-1.2 percent in 1991-2000. The country’s average annual inflation rate increased from21.6 percent in 1980-90 to 30.9 percent in 1991-2000.
Macroeconomic reformsFiscal policyThe need to pursue a tight fiscal policy predated the reform that started in 1986.The proportion of the budget earmarked for agriculture fell from 6.6 percent during1980-85 to 3.7 percent in 1986-93 and rose marginally to 3.8 percent during 1994-2000. In terms of what was actually spent, the share of agriculture was much lowerand this share fell after the reform period (Table 4).
One explanation for the fall in share could be that it reflected the decisionto increasingly disengage the public sector from direct agricultural production,procurement and distribution.
Exchange rate policyChanges in the exchange rate constituted the cornerstone of Nigeria’s policyreform programme and were aimed at reducing price distortions and improving theefficiency of resource allocation. Although policy reform started with a substantial
TABLE 3 Macroeconomic indicators for Nigeria and Africa, 1980-2000
Nigeria AfricaReal GDP averageGrowth Rate (%) 1980-1990 1.6 2.5
1991-2000 2.7 2.3Current account balance(% of GDP) 1980-1990 -5.0 -2.9
1991-2000 -3.0 -2.1Fiscal deficit(% of GDP) 1980-1990 -5.2 -6.4
1991-2000 -1.2 -4.0Inflation: annualAverage change (%) 1980-1990 21.6 15.7
1991-2000 30.9 23.0
Source: ADB, 2001.

473
Nigeria
devaluation of the currency in 1986, the exchange rate actually declined by over60 percent during the pre-reform period. However, this change was minor comparedto the magnitude of depreciation experienced during 1986-93 (1 161 percent) and1994-2000 (364 percent) (Table 5).
The changes in the real effective exchange rate (REER) were smaller but followedthe pattern depicted by the changes in the nominal exchange rate. The REERdepreciated by about 60 percent in the pre-reform period, by 118 percent in thereform period and by 113 percent in the post-reform period.
Trade policyReform of the trade regime was designed to diversify the productive and export baseand reduce import dependence. Special emphasis was laid on the development ofnon-oil exports, particularly those of agriculture and manufacturing.
Agricultural trade policy changes were not as radical as the correspondingexchange rate changes over the 1980-2000 period. Over the entire period, the maininstruments deployed remained the same, i.e. import and export duties as well asquantitative import and export restrictions. But the mix changed over time:, exportduties were already being phased out in the 1970s and had virtually disappeared by1980. In 1984, import tariffs were rationalized and reformed by reducing the rangeof import duties from 0 to 500 percent to 5 to 200 percent.
From 1986, the process of trade policy reform started with a number of interimtariff reductions, a reduction in the number of items on the import prohibition listfrom 72 to 17 broadly defined product groups, and the abolition of import andexport licensing schemes. This was followed by the introduction of a comprehensivetariff schedule for the seven-year period of 1988-94, followed by another established
TABLE 4 Agriculture in Federal Government spending, 1980-2000
1980-85 1986-93 1994–2000BudgetAgriculture as % of total 6.61 3.72 3.75Actual spendingAgriculture as % of total 3.54 2.28 1.93Actual/Budget (%) 53.6 61.3 51.5
Source: Authors’ computations from various government documents.
TABLE 5 Changes in the exchange rate (naira/US$), 1980-2000
1980-85 1986–93 1994-2000Period average 0.7038 9.373 77.7959Minimum 0.5468 1.7545 21.9960Maximum 0.8938 22.0654 102.1000Total change (%) 63.5 1 158.6 364.3Annual average change (%) 12.36 165.88 60.72Changes in real effective exchange rateTotal change (%) 60.49 118.07 113.44Annual average change (%) 10.08 13.12 16.21
Source: Authors’ computations from various government documents.
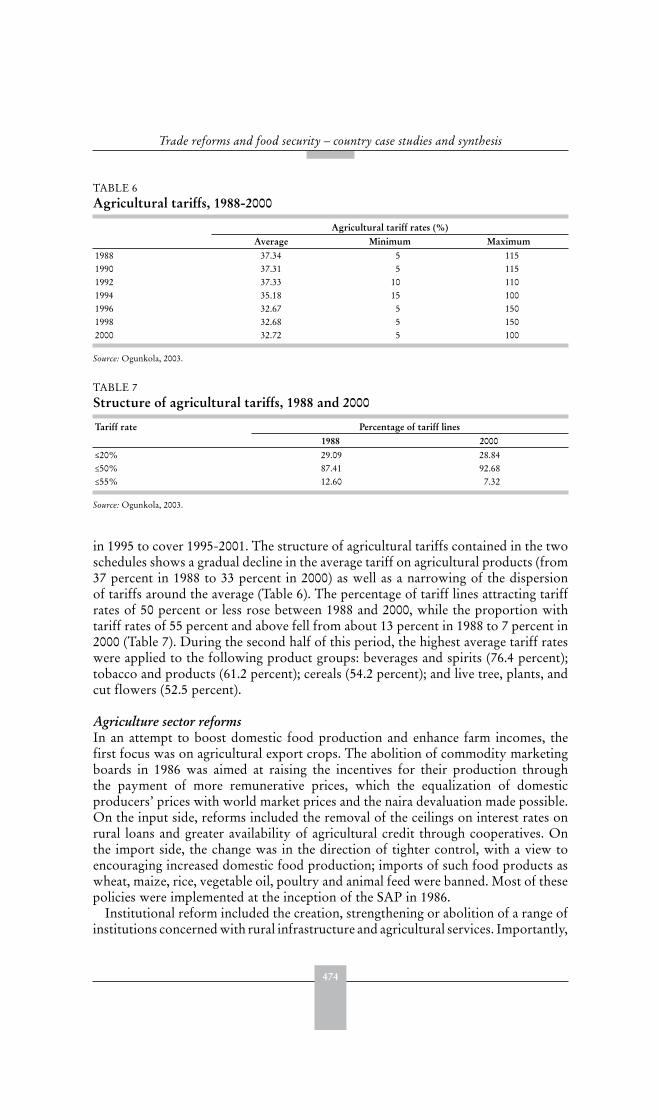
474
Trade reforms and food security – country case studies and synthesis
in 1995 to cover 1995-2001. The structure of agricultural tariffs contained in the twoschedules shows a gradual decline in the average tariff on agricultural products (from37 percent in 1988 to 33 percent in 2000) as well as a narrowing of the dispersionof tariffs around the average (Table 6). The percentage of tariff lines attracting tariffrates of 50 percent or less rose between 1988 and 2000, while the proportion withtariff rates of 55 percent and above fell from about 13 percent in 1988 to 7 percent in2000 (Table 7). During the second half of this period, the highest average tariff rateswere applied to the following product groups: beverages and spirits (76.4 percent);tobacco and products (61.2 percent); cereals (54.2 percent); and live tree, plants, andcut flowers (52.5 percent).
Agriculture sector reformsIn an attempt to boost domestic food production and enhance farm incomes, thefirst focus was on agricultural export crops. The abolition of commodity marketingboards in 1986 was aimed at raising the incentives for their production throughthe payment of more remunerative prices, which the equalization of domesticproducers’ prices with world market prices and the naira devaluation made possible.On the input side, reforms included the removal of the ceilings on interest rates onrural loans and greater availability of agricultural credit through cooperatives. Onthe import side, the change was in the direction of tighter control, with a view toencouraging increased domestic food production; imports of such food products aswheat, maize, rice, vegetable oil, poultry and animal feed were banned. Most of thesepolicies were implemented at the inception of the SAP in 1986.
Institutional reform included the creation, strengthening or abolition of a range ofinstitutions concerned with rural infrastructure and agricultural services. Importantly,
TABLE 6 Agricultural tariffs, 1988-2000
Agricultural tariff rates (%)Average Minimum Maximum
1988 37.34 5 1151990 37.31 5 1151992 37.33 10 1101994 35.18 15 1001996 32.67 5 1501998 32.68 5 1502000 32.72 5 100
Source: Ogunkola, 2003.
TABLE 7 Structure of agricultural tariffs, 1988 and 2000
Tariff rate Percentage of tariff lines1988 2000
≤20% 29.09 28.84≤50% 87.41 92.68≤55% 12.60 7.32
Source: Ogunkola, 2003.
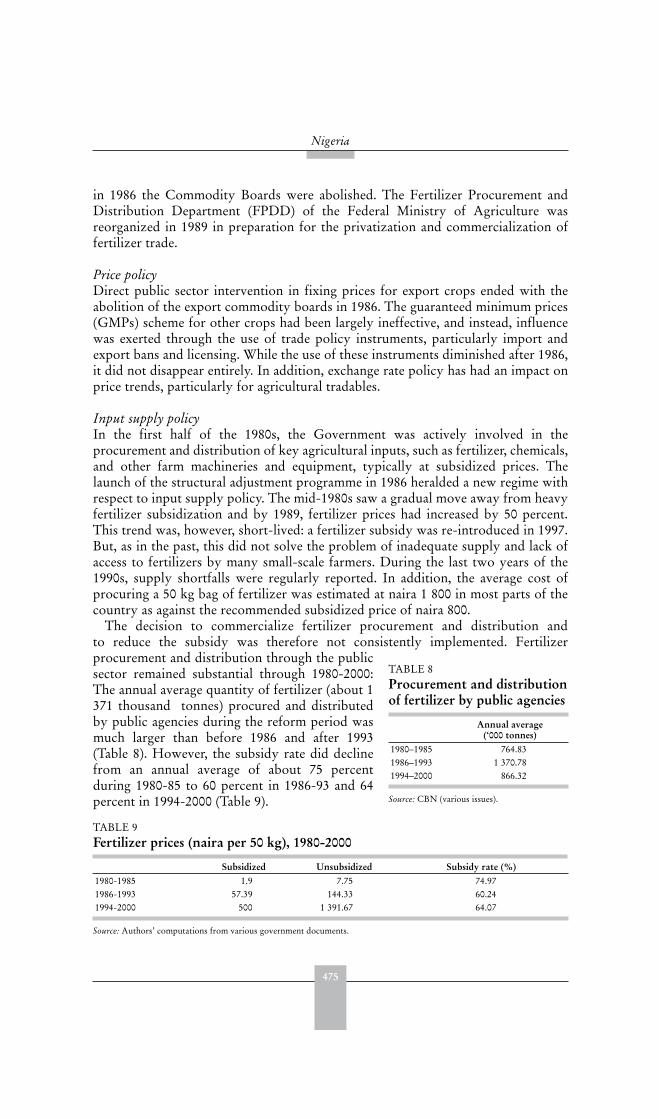
475
Nigeria
in 1986 the Commodity Boards were abolished. The Fertilizer Procurement andDistribution Department (FPDD) of the Federal Ministry of Agriculture wasreorganized in 1989 in preparation for the privatization and commercialization offertilizer trade.
Price policyDirect public sector intervention in fixing prices for export crops ended with theabolition of the export commodity boards in 1986. The guaranteed minimum prices(GMPs) scheme for other crops had been largely ineffective, and instead, influencewas exerted through the use of trade policy instruments, particularly import andexport bans and licensing. While the use of these instruments diminished after 1986,it did not disappear entirely. In addition, exchange rate policy has had an impact onprice trends, particularly for agricultural tradables.
Input supply policyIn the first half of the 1980s, the Government was actively involved in theprocurement and distribution of key agricultural inputs, such as fertilizer, chemicals,and other farm machineries and equipment, typically at subsidized prices. Thelaunch of the structural adjustment programme in 1986 heralded a new regime withrespect to input supply policy. The mid-1980s saw a gradual move away from heavyfertilizer subsidization and by 1989, fertilizer prices had increased by 50 percent.This trend was, however, short-lived: a fertilizer subsidy was re-introduced in 1997.But, as in the past, this did not solve the problem of inadequate supply and lack ofaccess to fertilizers by many small-scale farmers. During the last two years of the1990s, supply shortfalls were regularly reported. In addition, the average cost ofprocuring a 50 kg bag of fertilizer was estimated at naira 1 800 in most parts of thecountry as against the recommended subsidized price of naira 800.
The decision to commercialize fertilizer procurement and distribution andto reduce the subsidy was therefore not consistently implemented. Fertilizerprocurement and distribution through the publicsector remained substantial through 1980-2000:The annual average quantity of fertilizer (about 1371 thousand tonnes) procured and distributedby public agencies during the reform period wasmuch larger than before 1986 and after 1993(Table 8). However, the subsidy rate did declinefrom an annual average of about 75 percentduring 1980-85 to 60 percent in 1986-93 and 64percent in 1994-2000 (Table 9).
TABLE 8 Procurement and distribution of fertilizer by public agencies
Annual average (‘000 tonnes)
1980–1985 764.831986–1993 1 370.781994–2000 866.32
Source: CBN (various issues).
TABLE 9 Fertilizer prices (naira per 50 kg), 1980-2000
Subsidized Unsubsidized Subsidy rate (%)1980-1985 1.9 7.75 74.971986-1993 57.39 144.33 60.241994-2000 500 1 391.67 64.07
Source: Authors’ computations from various government documents.
476
Trade reforms and food security – country case studies and synthesis
Credit policyThe standard policy before reform had three components. One was to compeltraditional banks to set aside a certain proportion of their total credit for agriculturalloans. The second was to establish special agricultural credit institutions. Finally,a concessional interest rate was imposed on agricultural credit. The first and thirdof these mechanisms were essentially phased-out as a result of the policy reformprogramme.
Agricultural credit received periodic policy attention. In 1985, for instance,lending institutions were required by the Government to grant a moratorium on therepayment of agricultural loans. In the following year, at least 15 percent of all loansmade by commercial banks were to be allocated to agriculture, with the proviso thathalf of this should be reserved for supporting the production of grains. In an effortto further enhance the accessibility of small-scale farmers to credit, a new nationalsmall farmers’ credit programme was inaugurated in 1987. These agricultural creditinitiatives continued through the 1990s. Thus, in 1991, tax exemption was grantedwith respect to agricultural loans; while in 1994, loans for large-scale cropping,fishing and poultry farming were allowed five years of grace for repayment. Twoyears later, another initiative was launched to revitalize special banks to makefunds available for the development of agriculture and rural infrastructure. Finally,the Agricultural Credit Guarantee Scheme Fund was strengthened to increase theamount of agricultural loans covered.
The average share of agriculture in total credit during 1980-85 was actually higher(13.5 percent) than the target of 9.0 percent. The share increased to an averageof almost 22 percent during 1986-93, before falling to 12 percent in 1994-2000.Following the lifting of the cap on the interest rate on agricultural loans, the rate rosesharply from an average of 7.5 percent during 1980-85 to 22.6 percent in 1986-93before falling by three percentage points to 19.6 percent in 1994-2000.
Social safety netsNone of the policy reform programmes adopted and implemented explicitlyinclude official social safety nets. Several poverty-related government programmeswere initiated during the reform period, including programmes relating to health,transport, housing and microcredit. However, a lack of clear targeting to those whowere particularly vulnerable to the negative impact of the structural policy reformprogrammes meant that these initiatives did not provide an effective social safetynet.
Food securityIt is possible to view national food security initiatives as a distinct element ofagricultural development strategy. These include the tasking of the National GrainsBoard to build up a strategic buffer stock of not less than 50 000 tonnes in 1986; aswell as the creation the following year of a national food security and storage systemwith the capacity to hold 500 000 tonnes. In 1989, the reduction of high food priceswas added to the objectives of agricultural development. During the first half of the1990s, successive budget statements added the following objectives: reduction infood prices; accelerated production of food consumed by low and middle incomegroups; reduction in the high cost of food and fibre production; access to adequate
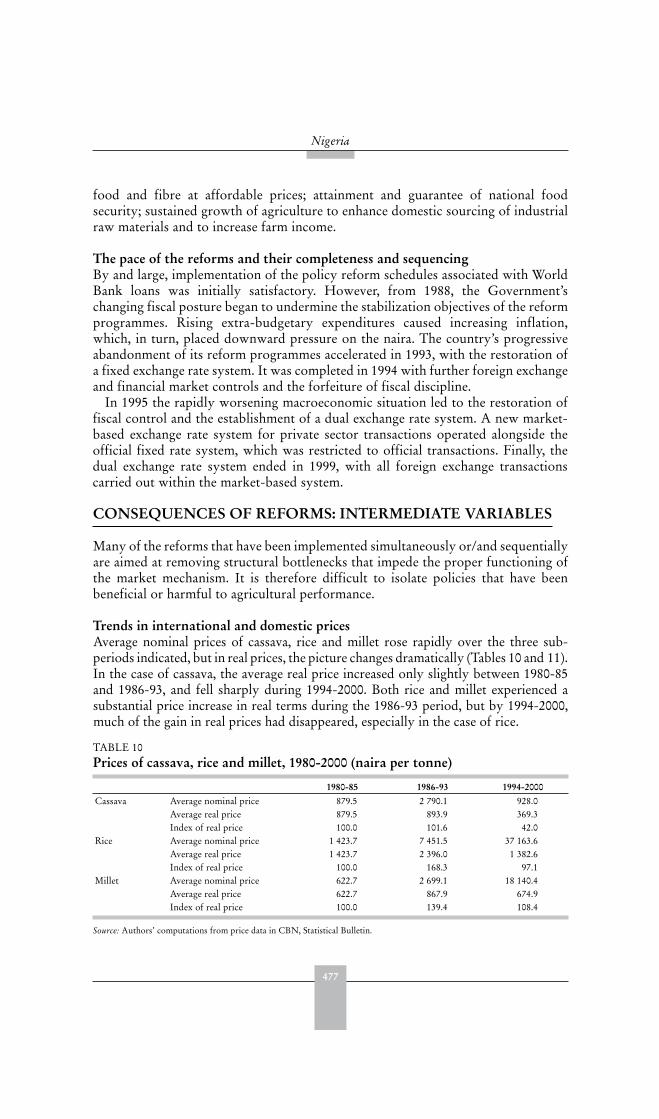
477
Nigeria
food and fibre at affordable prices; attainment and guarantee of national foodsecurity; sustained growth of agriculture to enhance domestic sourcing of industrialraw materials and to increase farm income.
The pace of the reforms and their completeness and sequencingBy and large, implementation of the policy reform schedules associated with WorldBank loans was initially satisfactory. However, from 1988, the Government’schanging fiscal posture began to undermine the stabilization objectives of the reformprogrammes. Rising extra-budgetary expenditures caused increasing inflation,which, in turn, placed downward pressure on the naira. The country’s progressiveabandonment of its reform programmes accelerated in 1993, with the restoration ofa fixed exchange rate system. It was completed in 1994 with further foreign exchangeand financial market controls and the forfeiture of fiscal discipline.
In 1995 the rapidly worsening macroeconomic situation led to the restoration offiscal control and the establishment of a dual exchange rate system. A new market-based exchange rate system for private sector transactions operated alongside theofficial fixed rate system, which was restricted to official transactions. Finally, thedual exchange rate system ended in 1999, with all foreign exchange transactionscarried out within the market-based system.
CONSEQUENCES OF REFORMS: INTERMEDIATE VARIABLES
Many of the reforms that have been implemented simultaneously or/and sequentiallyare aimed at removing structural bottlenecks that impede the proper functioning ofthe market mechanism. It is therefore difficult to isolate policies that have beenbeneficial or harmful to agricultural performance.
Trends in international and domestic prices Average nominal prices of cassava, rice and millet rose rapidly over the three sub-periods indicated, but in real prices, the picture changes dramatically (Tables 10 and 11).In the case of cassava, the average real price increased only slightly between 1980-85and 1986-93, and fell sharply during 1994-2000. Both rice and millet experienced asubstantial price increase in real terms during the 1986-93 period, but by 1994-2000,much of the gain in real prices had disappeared, especially in the case of rice.
TABLE 10 Prices of cassava, rice and millet, 1980-2000 (naira per tonne)
1980-85 1986-93 1994-2000Cassava Average nominal price 879.5 2 790.1 928.0
Average real price 879.5 893.9 369.3Index of real price 100.0 101.6 42.0
Rice Average nominal price 1 423.7 7 451.5 37 163.6Average real price 1 423.7 2 396.0 1 382.6Index of real price 100.0 168.3 97.1
Millet Average nominal price 622.7 2 699.1 18 140.4Average real price 622.7 867.9 674.9Index of real price 100.0 139.4 108.4
Source: Authors’ computations from price data in CBN, Statistical Bulletin.
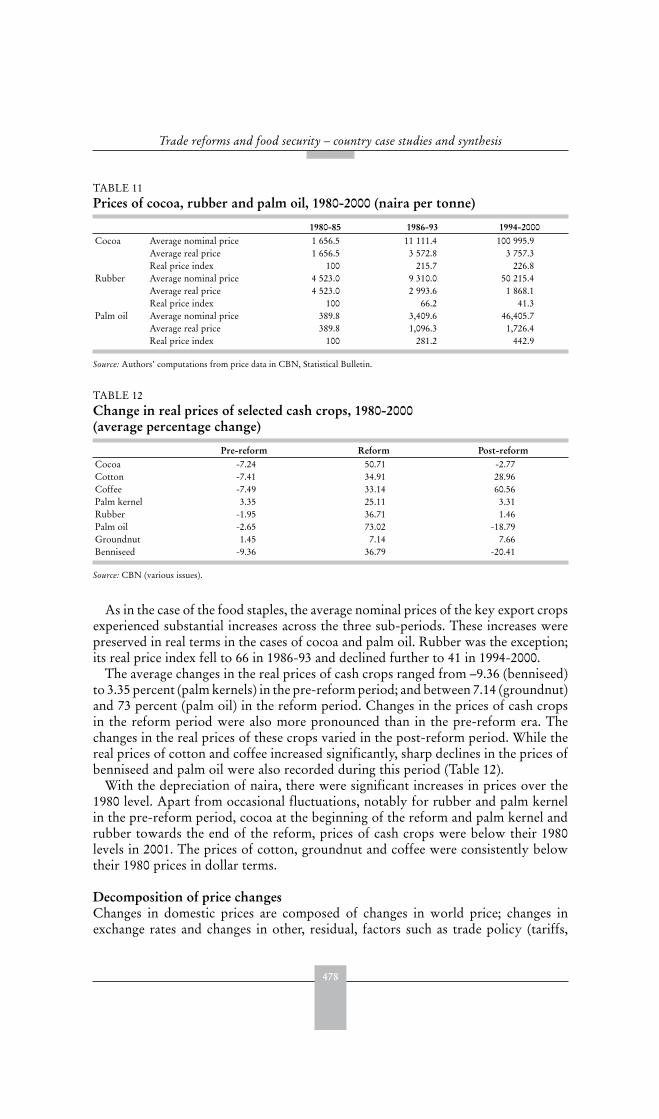
478
Trade reforms and food security – country case studies and synthesis
As in the case of the food staples, the average nominal prices of the key export cropsexperienced substantial increases across the three sub-periods. These increases werepreserved in real terms in the cases of cocoa and palm oil. Rubber was the exception;its real price index fell to 66 in 1986-93 and declined further to 41 in 1994-2000.
The average changes in the real prices of cash crops ranged from –9.36 (benniseed)to 3.35 percent (palm kernels) in the pre-reform period; and between 7.14 (groundnut)and 73 percent (palm oil) in the reform period. Changes in the prices of cash cropsin the reform period were also more pronounced than in the pre-reform era. Thechanges in the real prices of these crops varied in the post-reform period. While thereal prices of cotton and coffee increased significantly, sharp declines in the prices ofbenniseed and palm oil were also recorded during this period (Table 12).
With the depreciation of naira, there were significant increases in prices over the1980 level. Apart from occasional fluctuations, notably for rubber and palm kernelin the pre-reform period, cocoa at the beginning of the reform and palm kernel andrubber towards the end of the reform, prices of cash crops were below their 1980levels in 2001. The prices of cotton, groundnut and coffee were consistently belowtheir 1980 prices in dollar terms.
Decomposition of price changesChanges in domestic prices are composed of changes in world price; changes inexchange rates and changes in other, residual, factors such as trade policy (tariffs,
TABLE 11 Prices of cocoa, rubber and palm oil, 1980-2000 (naira per tonne)
1980-85 1986-93 1994-2000Cocoa Average nominal price 1 656.5 11 111.4 100 995.9
Average real price 1 656.5 3 572.8 3 757.3Real price index 100 215.7 226.8
Rubber Average nominal price 4 523.0 9 310.0 50 215.4Average real price 4 523.0 2 993.6 1 868.1Real price index 100 66.2 41.3
Palm oil Average nominal price 389.8 3,409.6 46,405.7Average real price 389.8 1,096.3 1,726.4Real price index 100 281.2 442.9
Source: Authors’ computations from price data in CBN, Statistical Bulletin.
TABLE 12 Change in real prices of selected cash crops, 1980-2000(average percentage change)
Pre-reform Reform Post-reformCocoa -7.24 50.71 -2.77Cotton -7.41 34.91 28.96Coffee -7.49 33.14 60.56Palm kernel 3.35 25.11 3.31Rubber -1.95 36.71 1.46Palm oil -2.65 73.02 -18.79Groundnut 1.45 7.14 7.66Benniseed -9.36 36.79 -20.41
Source: CBN (various issues).

479
Nigeria
quantitative restrictions), fiscal policy (taxes and subsidies, etc), commodity/cropspecific policies, transportation costs and marketing margins.
The results (Table 13) show that pre-reform changes in domestic prices of majorstaples and cash crops were moderately positive, despite a decline in world prices ofcocoa, rubber, groundnut, coffee, palm kernel and palm oil in the 1980–82 period.This was the result of moderate changes in the exchange rate and in other factors.An exception was the fall in the domestic price of cotton where the positive changein the exchange rate was not sufficient to offset the combined effects of the declinein the world price and unfavourable changes in other factors.
The change in domestic prices of major cash crops between 1986 and 1988 waspositive and in many cases greater than in the other sub-periods under consideration.3
For most commodities, developments in the exchange rate drove the significantchange in the domestic prices of cash crops through depreciation of the naira. Thecontribution of changes in other factors to the positive change in domestic prices,especially the abolition of marketing boards, is mixed. For cocoa, and cotton, theimpact was positive. However, for rubber, palm kernel and palm oil, the impact wasnegative. The estimates suggest that the effects of other factors outweighed that ofthe marketing and trade policy reforms.
The change in the domestic prices was positive for all products except cocoabetween 1989 and 1991, though it was generally inferior to the 1986-88 performance.Notwithstanding the relatively small change in the exchange rate, changes in worldprices and in other factors seem to have driven the overall changes in domesticprices. The period between 1992 and 1994 recorded positive changes in all thecomponents of the domestic prices of cash crops (except for a decline in the world
3 An exception was the domestic price of cocoa in the 1989-91 sub-period.
Source: Based on data from CBN (various issues)
0.00
50.0 0
100.0 0
150.0 0
200.0 0
250.0 0
198019811982 19831984 19851986 1987 19881989 19901991 19921993 1994 1995199619971998 199920002001
Year
Index
1980
$ valu
e=100
Cocoa Cotton Coffee Palm Kern Rubber Groundnut
FIGURE 1Trends in prices of selected agricultural commodities
(Index 1980 US$ value=100)
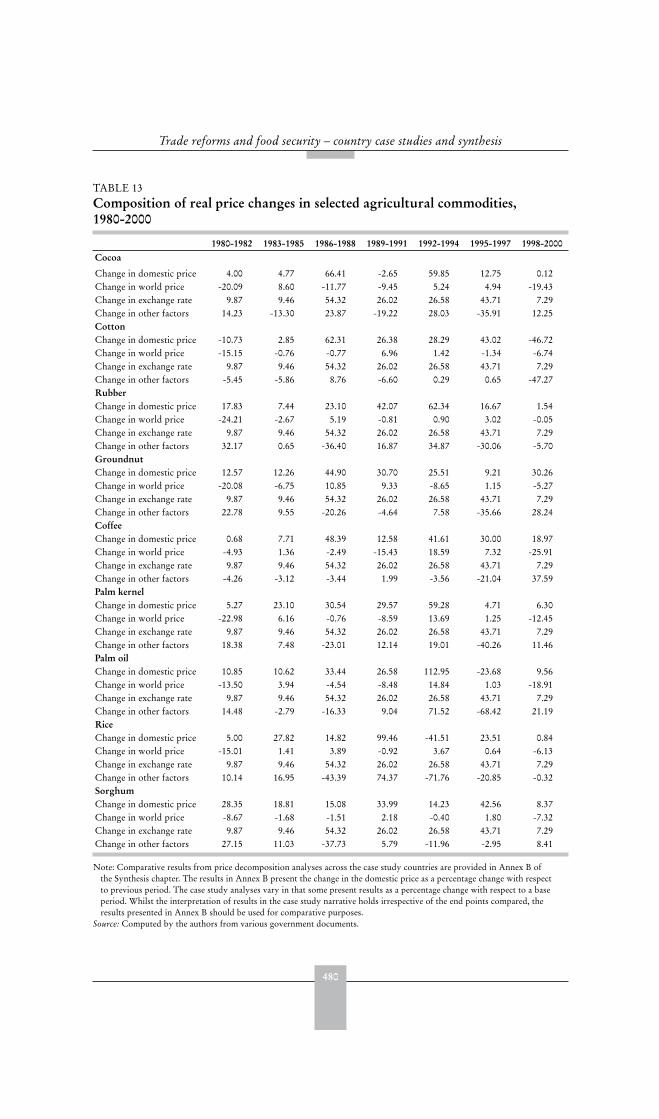
480
Trade reforms and food security – country case studies and synthesis
TABLE 13 Composition of real price changes in selected agricultural commodities, 1980-2000
1980-1982 1983-1985 1986-1988 1989-1991 1992-1994 1995-1997 1998-2000Cocoa
Change in domestic price 4.00 4.77 66.41 -2.65 59.85 12.75 0.12Change in world price -20.09 8.60 -11.77 -9.45 5.24 4.94 -19.43Change in exchange rate 9.87 9.46 54.32 26.02 26.58 43.71 7.29Change in other factors 14.23 -13.30 23.87 -19.22 28.03 -35.91 12.25CottonChange in domestic price -10.73 2.85 62.31 26.38 28.29 43.02 -46.72Change in world price -15.15 -0.76 -0.77 6.96 1.42 -1.34 -6.74Change in exchange rate 9.87 9.46 54.32 26.02 26.58 43.71 7.29Change in other factors -5.45 -5.86 8.76 -6.60 0.29 0.65 -47.27RubberChange in domestic price 17.83 7.44 23.10 42.07 62.34 16.67 1.54Change in world price -24.21 -2.67 5.19 -0.81 0.90 3.02 -0.05Change in exchange rate 9.87 9.46 54.32 26.02 26.58 43.71 7.29Change in other factors 32.17 0.65 -36.40 16.87 34.87 -30.06 -5.70GroundnutChange in domestic price 12.57 12.26 44.90 30.70 25.51 9.21 30.26Change in world price -20.08 -6.75 10.85 9.33 -8.65 1.15 -5.27Change in exchange rate 9.87 9.46 54.32 26.02 26.58 43.71 7.29Change in other factors 22.78 9.55 -20.26 -4.64 7.58 -35.66 28.24CoffeeChange in domestic price 0.68 7.71 48.39 12.58 41.61 30.00 18.97Change in world price -4.93 1.36 -2.49 -15.43 18.59 7.32 -25.91Change in exchange rate 9.87 9.46 54.32 26.02 26.58 43.71 7.29Change in other factors -4.26 -3.12 -3.44 1.99 -3.56 -21.04 37.59Palm kernelChange in domestic price 5.27 23.10 30.54 29.57 59.28 4.71 6.30Change in world price -22.98 6.16 -0.76 -8.59 13.69 1.25 -12.45Change in exchange rate 9.87 9.46 54.32 26.02 26.58 43.71 7.29Change in other factors 18.38 7.48 -23.01 12.14 19.01 -40.26 11.46Palm oilChange in domestic price 10.85 10.62 33.44 26.58 112.95 -23.68 9.56Change in world price -13.50 3.94 -4.54 -8.48 14.84 1.03 -18.91Change in exchange rate 9.87 9.46 54.32 26.02 26.58 43.71 7.29Change in other factors 14.48 -2.79 -16.33 9.04 71.52 -68.42 21.19RiceChange in domestic price 5.00 27.82 14.82 99.46 -41.51 23.51 0.84Change in world price -15.01 1.41 3.89 -0.92 3.67 0.64 -6.13Change in exchange rate 9.87 9.46 54.32 26.02 26.58 43.71 7.29Change in other factors 10.14 16.95 -43.39 74.37 -71.76 -20.85 -0.32SorghumChange in domestic price 28.35 18.81 15.08 33.99 14.23 42.56 8.37Change in world price -8.67 -1.68 -1.51 2.18 -0.40 1.80 -7.32Change in exchange rate 9.87 9.46 54.32 26.02 26.58 43.71 7.29Change in other factors 27.15 11.03 -37.73 5.79 -11.96 -2.95 8.41
Note: Comparative results from price decomposition analyses across the case study countries are provided in Annex B ofthe Synthesis chapter. The results in Annex B present the change in the domestic price as a percentage change with respectto previous period. The case study analyses vary in that some present results as a percentage change with respect to a baseperiod. Whilst the interpretation of results in the case study narrative holds irrespective of the end points compared, theresults presented in Annex B should be used for comparative purposes.
Source: Computed by the authors from various government documents.

481
Nigeria
price of groundnut and other factors for rice and sorghum). The developments in theexchange rate and various macroeconomic and agricultural sector specific policiesaccounted for the observed trend.
The 1995-1997 period witnessed a strong positive change in the exchangerate. However, the weak changes in world prices, together with unfavourabledevelopment in other factors, limited the positive changes in domestic prices formost cash crops. The negative developments in other factors were even greater thanthe positive changes in the exchange rate, hence a fall in the domestic price of palmoil. The 1998-2000 period recorded marginal changes in domestic prices of majorcash crops. Exceptions to this trend are the negative change in the domestic price ofcotton and a significant positive change in the domestic price of groundnut. Theseexceptions are explained by changes in the residual factors.
Changes in the domestic price of rice and sorghum were positive between 1980and 2000. The changes in prices of sorghum were relatively stable when comparedwith that of rice. As the changes in world prices were, at best, marginally positive,and the changes in the exchange rate consistently positive, changes in other factorsexerted a decisive impact on the domestic prices. The reform period, 1986 to 1994,was characterized by unfavourable changes in the residual factors especially between1986-88 and 1992-94. During the pre-adjustment period, the changes in the domesticprices of these food crops were positive notwithstanding the decline in world prices.Stable exchange rate and residual factors contributed to this development. Changesin the prices of rice and sorghum in the post-reform period were sustained by thedepreciation of naira and changes in the residual factors as the changes in the worldprices remained very low.
Table 14 presents a simple framework used to further investigate changesin agricultural prices as a function of real effective exchange rate (REER),international prices of agricultural products (IP), and trade policy indicators (TP).For the aggregate agricultural domestic price equation4, the exchange rate elasticityis negative and statistically insignificant. The expected relationship between currencydepreciation and domestic prices is not captured by the regression result. A possibleinterpretation is that an exchange rate-induced change in domestic prices was notsustained. The model captures medium to long-run relationships whilst the changesin domestic price as a result of exchange rate depreciation observed in the pricedecomposition was a short-run phenomenon.
As expected, the model captures a positive relationship between domestic pricesand international prices. In the aggregate agricultural price equation, the internationalprice elasticity is not only positive but also statistically significant. The fact that theelasticity is greater than unity (1.16) implies that domestic prices tend to respondmore than proportionally to changes in international prices.
The index of trade policy (published tariff rates) exhibits a positive but statisticallyinsignificant relationship to aggregate agricultural prices. Since this is an aggregationof prices, a plausible interpretation is that the reform has a mixed impact on thedifferent sectors and the negative effects tend to outweigh the positive ones. Theanalysis at sectoral level supports this observation. The coefficient of the dummy is
4 The specifications are in natural logarithm, thus the estimated coefficients are elasticities. The period for theanalysis was from 1980 to 2002.
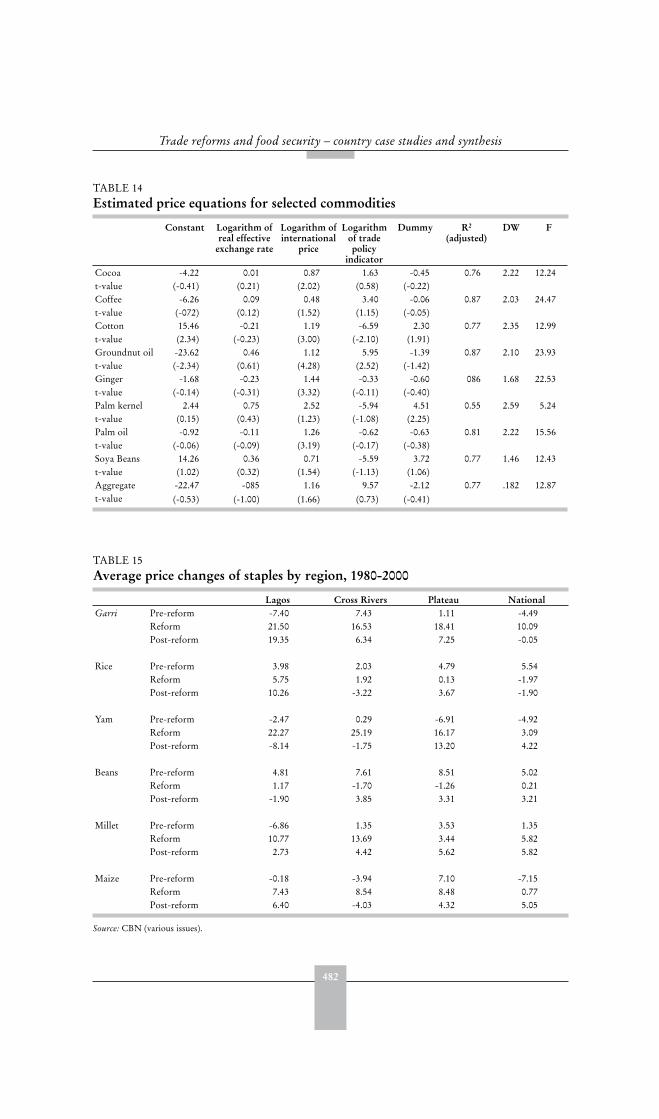
482
Trade reforms and food security – country case studies and synthesis
TABLE 14 Estimated price equations for selected commodities
Constant Logarithm of real effective
exchange rate
Logarithm of international
price
Logarithm of trade policy
indicator
Dummy R2
(adjusted)DW F
Cocoat-value
-4.22 0.01 0.87 1.63 -0.45 0.76 2.22 12.24(-0.41) (0.21) (2.02) (0.58) (-0.22)
Coffeet-value
-6.26 0.09 0.48 3.40 -0.06 0.87 2.03 24.47(-072) (0.12) (1.52) (1.15) (-0.05)
Cottont-value
15.46 -0.21 1.19 -6.59 2.30 0.77 2.35 12.99(2.34) (-0.23) (3.00) (-2.10) (1.91)
Groundnut oilt-value
-23.62 0.46 1.12 5.95 -1.39 0.87 2.10 23.93(-2.34) (0.61) (4.28) (2.52) (-1.42)
Gingert-value
-1.68 -0.23 1.44 -0.33 -0.60 086 1.68 22.53(-0.14) (-0.31) (3.32) (-0.11) (-0.40)
Palm kernelt-value
2.44 0.75 2.52 -5.94 4.51 0.55 2.59 5.24(0.15) (0.43) (1.23) (-1.08) (2.25)
Palm oilt-value
-0.92 -0.11 1.26 -0.62 -0.63 0.81 2.22 15.56(-0.06) (-0.09) (3.19) (-0.17) (-0.38)
Soya Beanst-value
14.26 0.36 0.71 -5.59 3.72 0.77 1.46 12.43(1.02) (0.32) (1.54) (-1.13) (1.06)
Aggregatet-value
-22.47 -085 1.16 9.57 -2.12 0.77 .182 12.87(-0.53) (-1.00) (1.66) (0.73) (-0.41)
TABLE 15 Average price changes of staples by region, 1980-2000
Lagos Cross Rivers Plateau NationalGarri Pre-reform -7.40 7.43 1.11 -4.49
Reform 21.50 16.53 18.41 10.09Post-reform 19.35 6.34 7.25 -0.05
Rice Pre-reform 3.98 2.03 4.79 5.54Reform 5.75 1.92 0.13 -1.97Post-reform 10.26 -3.22 3.67 -1.90
Yam Pre-reform -2.47 0.29 -6.91 -4.92Reform 22.27 25.19 16.17 3.09Post-reform -8.14 -1.75 13.20 4.22
Beans Pre-reform 4.81 7.61 8.51 5.02Reform 1.17 -1.70 -1.26 0.21Post-reform -1.90 3.85 3.31 3.21
Millet Pre-reform -6.86 1.35 3.53 1.35Reform 10.77 13.69 3.44 5.82Post-reform 2.73 4.42 5.62 5.82
Maize Pre-reform -0.18 -3.94 7.10 -7.15Reform 7.43 8.54 8.48 0.77Post-reform 6.40 -4.03 4.32 5.05
Source: CBN (various issues).
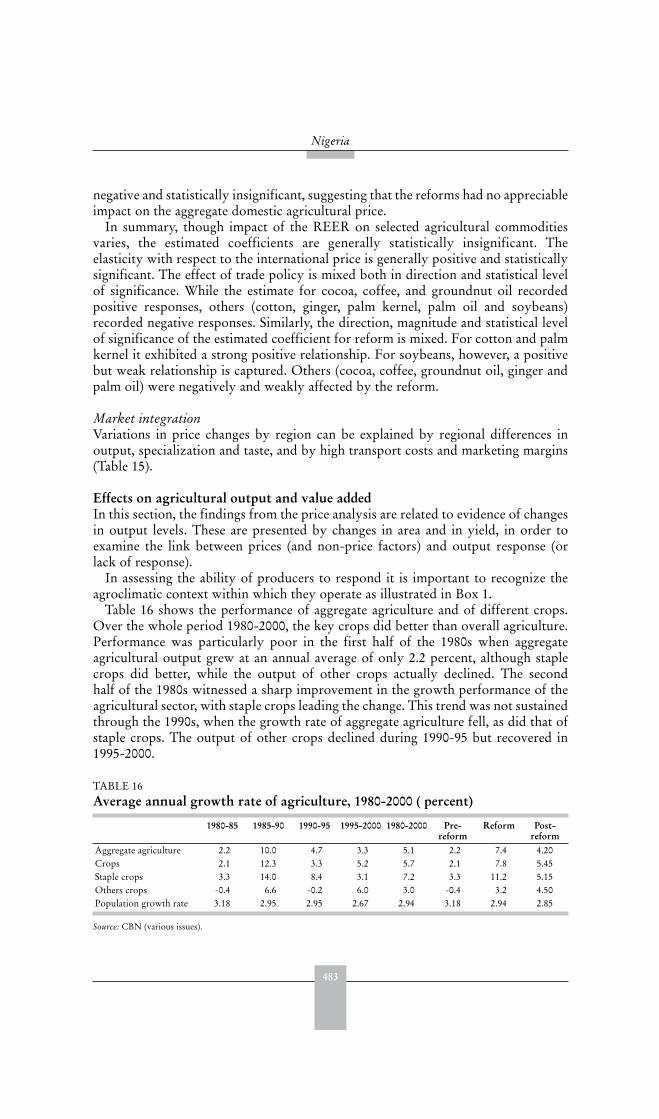
483
Nigeria
negative and statistically insignificant, suggesting that the reforms had no appreciableimpact on the aggregate domestic agricultural price.
In summary, though impact of the REER on selected agricultural commoditiesvaries, the estimated coefficients are generally statistically insignificant. Theelasticity with respect to the international price is generally positive and statisticallysignificant. The effect of trade policy is mixed both in direction and statistical levelof significance. While the estimate for cocoa, coffee, and groundnut oil recordedpositive responses, others (cotton, ginger, palm kernel, palm oil and soybeans)recorded negative responses. Similarly, the direction, magnitude and statistical levelof significance of the estimated coefficient for reform is mixed. For cotton and palmkernel it exhibited a strong positive relationship. For soybeans, however, a positivebut weak relationship is captured. Others (cocoa, coffee, groundnut oil, ginger andpalm oil) were negatively and weakly affected by the reform.
Market integrationVariations in price changes by region can be explained by regional differences inoutput, specialization and taste, and by high transport costs and marketing margins(Table 15).
Effects on agricultural output and value added In this section, the findings from the price analysis are related to evidence of changesin output levels. These are presented by changes in area and in yield, in order toexamine the link between prices (and non-price factors) and output response (orlack of response).
In assessing the ability of producers to respond it is important to recognize theagroclimatic context within which they operate as illustrated in Box 1.
Table 16 shows the performance of aggregate agriculture and of different crops.Over the whole period 1980-2000, the key crops did better than overall agriculture.Performance was particularly poor in the first half of the 1980s when aggregateagricultural output grew at an annual average of only 2.2 percent, although staplecrops did better, while the output of other crops actually declined. The secondhalf of the 1980s witnessed a sharp improvement in the growth performance of theagricultural sector, with staple crops leading the change. This trend was not sustainedthrough the 1990s, when the growth rate of aggregate agriculture fell, as did that ofstaple crops. The output of other crops declined during 1990-95 but recovered in1995-2000.
TABLE 16 Average annual growth rate of agriculture, 1980-2000 ( percent)
1980-85 1985-90 1990-95 1995-2000 1980-2000 Pre-reform
Reform Post-reform
Aggregate agriculture 2.2 10.0 4.7 3.3 5.1 2.2 7.4 4.20Crops 2.1 12.3 3.3 5.2 5.7 2.1 7.8 5.45Staple crops 3.3 14.0 8.4 3.1 7.2 3.3 11.2 5.15Others crops -0.4 6.6 -0.2 6.0 3.0 -0.4 3.2 4.50Population growth rate 3.18 2.95 2.95 2.67 2.94 3.18 2.94 2.85
Source: CBN (various issues).
484
Trade reforms and food security – country case studies and synthesis
BOX 1Agroclimatic conditions
Nigeria has a land area of 923 708 square kilometres. About 31 percent is arable landand about 15 percent is forest cover. The climate is equatorial for the most part. Thecountry has two seasons; the wet season from April to October, and the dry seasonfrom November to March. Regardless of seasonal changes, temperatures range from20oC to 30oC. The mean monthly rainfall is greater than 10 cm and humidity averagesabove 60 percent. These averages hide considerable regional variations. For instance,the wet season ranges from only three months in the far north of the country to elevenmonths in the coastal south. Similarly, mean annual rainfall ranges from a low of 50 cmin parts of the far north to as much as 400 cm in parts of the south. The northern half ofthe country is much more susceptible to drought than the south. In addition, the heavydownpours associated with tropical storms, which this region experiences in its shortwet season, often lead to severe leaching of the soils, rapid run-off and soil erosion.Only one crop per year can be grown in the northern part of the country under rain-fed agricultural production conditions. By comparison, annual rainfall in the south andmuch of the middle belt is adequate to support the planting of two crops each year.
In general, soils are highly weathered. About half of the country’s soils arevertisols, lithosols, rigosols and the semi-arid soils that are of low quality (Udo,1981). This is consistent with the finding by FAO (1966) that about 63 percent ofsoils can be rated as low or very low in productivity.
There are three main vegetation zones: the swamp, the forest and savannah zones.The swamp zones consist of fresh-water swamp and mangrove swamp. The mangroveswamp zone supports the cultivation of swamp rice; in the fresh-water swamp zone,fishing and fibre making are the main agricultural activities. The tropical high forestzone covers much of the southern half of the southeastern and southwestern regions ofNigeria. This zone accounts for most of the country’s timber requirements and forestreserves. It is also home to the main perennial crops such as cocoa, oil palm, coffee, kola,cashew, rubber, roots and tubers (i.e. yam, cassava, cocoyam, sweet potato). In addition,the zone supports the cultivation of maize, rice, groundnuts, cowpeas, and beans.
The savannah vegetation zone covers much of Nigeria. There are five sub-divisionsto this zone. Its southern-most belt is referred to as derived savannah and extendsover the northern half of the south-west and south-east of the country, just northof the tropical forest zone, and supports the production of some grains, particularlymaize, roots and tubers (cassava, yams) as well as tobacco. Immediately north of thisbelt is the southern guinea savannah sub-zone which covers the southern portion ofthe Middle Belt and produces yams, cassava, guinea corn, cotton, tobacco, soybeans,cowpeas and rice. The northern guinea savannah sub-zone supports grain and livestockproduction. The Sudan savannah sub-zone’s main agricultural activities include theproduction of cereals (millet, sorghum, maize, and rice), cotton, groundnuts, legumes,and livestock. The sahel savannah sub-zone supports limited production of millet andgroundnuts and has some potential for irrigated rice and wheat.
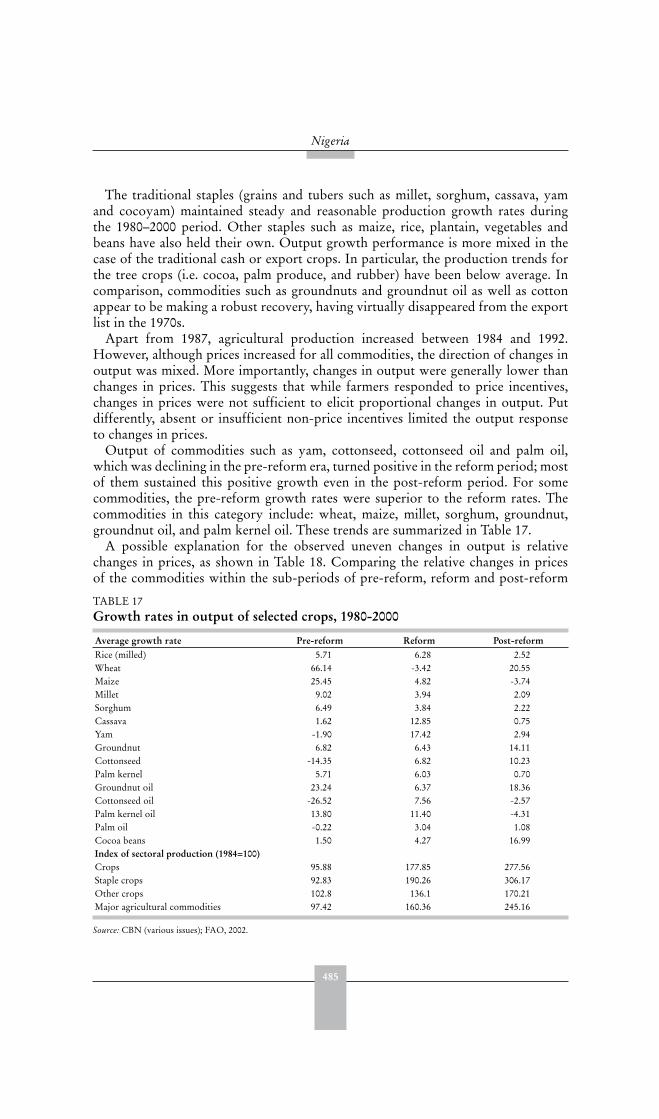
485
Nigeria
The traditional staples (grains and tubers such as millet, sorghum, cassava, yamand cocoyam) maintained steady and reasonable production growth rates duringthe 1980–2000 period. Other staples such as maize, rice, plantain, vegetables andbeans have also held their own. Output growth performance is more mixed in thecase of the traditional cash or export crops. In particular, the production trends forthe tree crops (i.e. cocoa, palm produce, and rubber) have been below average. Incomparison, commodities such as groundnuts and groundnut oil as well as cottonappear to be making a robust recovery, having virtually disappeared from the exportlist in the 1970s.
Apart from 1987, agricultural production increased between 1984 and 1992.However, although prices increased for all commodities, the direction of changes inoutput was mixed. More importantly, changes in output were generally lower thanchanges in prices. This suggests that while farmers responded to price incentives,changes in prices were not sufficient to elicit proportional changes in output. Putdifferently, absent or insufficient non-price incentives limited the output responseto changes in prices.
Output of commodities such as yam, cottonseed, cottonseed oil and palm oil,which was declining in the pre-reform era, turned positive in the reform period; mostof them sustained this positive growth even in the post-reform period. For somecommodities, the pre-reform growth rates were superior to the reform rates. Thecommodities in this category include: wheat, maize, millet, sorghum, groundnut,groundnut oil, and palm kernel oil. These trends are summarized in Table 17.
A possible explanation for the observed uneven changes in output is relativechanges in prices, as shown in Table 18. Comparing the relative changes in pricesof the commodities within the sub-periods of pre-reform, reform and post-reform
TABLE 17 Growth rates in output of selected crops, 1980-2000
Average growth rate Pre-reform Reform Post-reformRice (milled) 5.71 6.28 2.52Wheat 66.14 -3.42 20.55Maize 25.45 4.82 -3.74Millet 9.02 3.94 2.09Sorghum 6.49 3.84 2.22Cassava 1.62 12.85 0.75Yam -1.90 17.42 2.94Groundnut 6.82 6.43 14.11Cottonseed -14.35 6.82 10.23Palm kernel 5.71 6.03 0.70Groundnut oil 23.24 6.37 18.36Cottonseed oil -26.52 7.56 -2.57Palm kernel oil 13.80 11.40 -4.31Palm oil -0.22 3.04 1.08Cocoa beans 1.50 4.27 16.99Index of sectoral production (1984=100)Crops 95.88 177.85 277.56Staple crops 92.83 190.26 306.17Other crops 102.8 136.1 170.21Major agricultural commodities 97.42 160.36 245.16
Source: CBN (various issues); FAO, 2002.
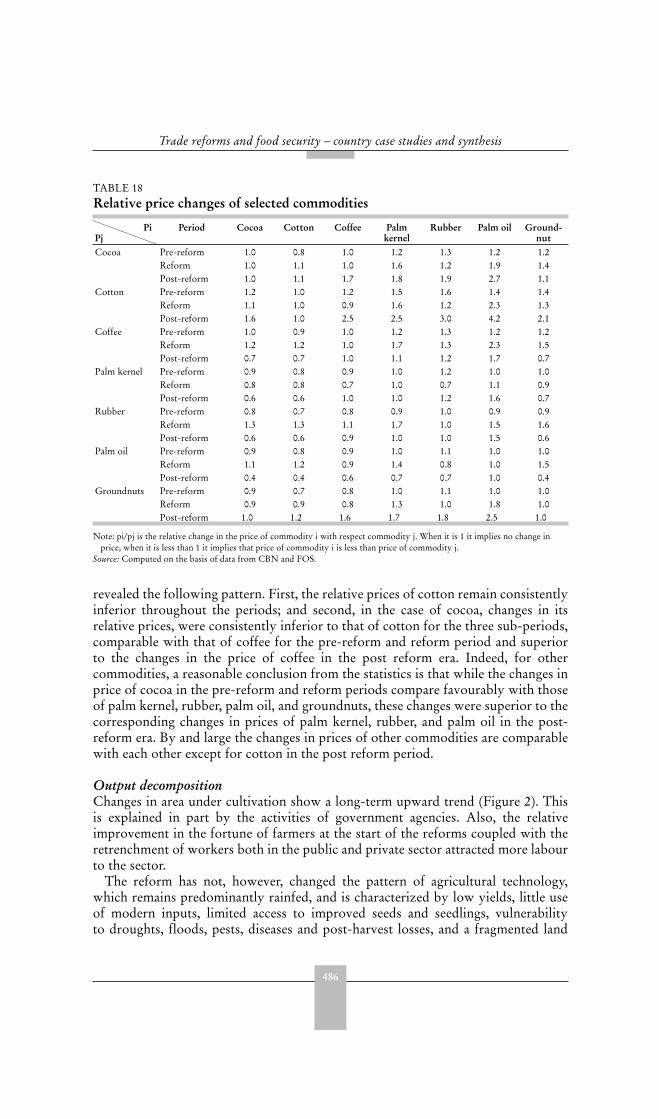
486
Trade reforms and food security – country case studies and synthesis
revealed the following pattern. First, the relative prices of cotton remain consistentlyinferior throughout the periods; and second, in the case of cocoa, changes in itsrelative prices, were consistently inferior to that of cotton for the three sub-periods,comparable with that of coffee for the pre-reform and reform period and superiorto the changes in the price of coffee in the post reform era. Indeed, for othercommodities, a reasonable conclusion from the statistics is that while the changes inprice of cocoa in the pre-reform and reform periods compare favourably with thoseof palm kernel, rubber, palm oil, and groundnuts, these changes were superior to thecorresponding changes in prices of palm kernel, rubber, and palm oil in the post-reform era. By and large the changes in prices of other commodities are comparablewith each other except for cotton in the post reform period.
Output decompositionChanges in area under cultivation show a long-term upward trend (Figure 2). Thisis explained in part by the activities of government agencies. Also, the relativeimprovement in the fortune of farmers at the start of the reforms coupled with theretrenchment of workers both in the public and private sector attracted more labourto the sector.
The reform has not, however, changed the pattern of agricultural technology,which remains predominantly rainfed, and is characterized by low yields, little useof modern inputs, limited access to improved seeds and seedlings, vulnerabilityto droughts, floods, pests, diseases and post-harvest losses, and a fragmented land
TABLE 18 Relative price changes of selected commodities
PiPj
Period Cocoa Cotton Coffee Palm kernel
Rubber Palm oil Ground-nut
Cocoa Pre-reform 1.0 0.8 1.0 1.2 1.3 1.2 1.2Reform 1.0 1.1 1.0 1.6 1.2 1.9 1.4Post-reform 1.0 1.1 1.7 1.8 1.9 2.7 1.1
Cotton Pre-reform 1.2 1.0 1.2 1.5 1.6 1.4 1.4Reform 1.1 1.0 0.9 1.6 1.2 2.3 1.3Post-reform 1.6 1.0 2.5 2.5 3.0 4.2 2.1
Coffee Pre-reform 1.0 0.9 1.0 1.2 1.3 1.2 1.2Reform 1.2 1.2 1.0 1.7 1.3 2.3 1.5Post-reform 0.7 0.7 1.0 1.1 1.2 1.7 0.7
Palm kernel Pre-reform 0.9 0.8 0.9 1.0 1.2 1.0 1.0Reform 0.8 0.8 0.7 1.0 0.7 1.1 0.9Post-reform 0.6 0.6 1.0 1.0 1.2 1.6 0.7
Rubber Pre-reform 0.8 0.7 0.8 0.9 1.0 0.9 0.9Reform 1.3 1.3 1.1 1.7 1.0 1.5 1.6Post-reform 0.6 0.6 0.9 1.0 1.0 1.5 0.6
Palm oil Pre-reform 0.9 0.8 0.9 1.0 1.1 1.0 1.0Reform 1.1 1.2 0.9 1.4 0.8 1.0 1.5Post-reform 0.4 0.4 0.6 0.7 0.7 1.0 0.4
Groundnuts Pre-reform 0.9 0.7 0.8 1.0 1.1 1.0 1.0Reform 0.9 0.9 0.8 1.3 1.0 1.8 1.0Post-reform 1.0 1.2 1.6 1.7 1.8 2.5 1.0
Note: pi/pj is the relative change in the price of commodity i with respect commodity j. When it is 1 it implies no change inprice, when it is less than 1 it implies that price of commodity i is less than price of commodity j.
Source: Computed on the basis of data from CBN and FOS.
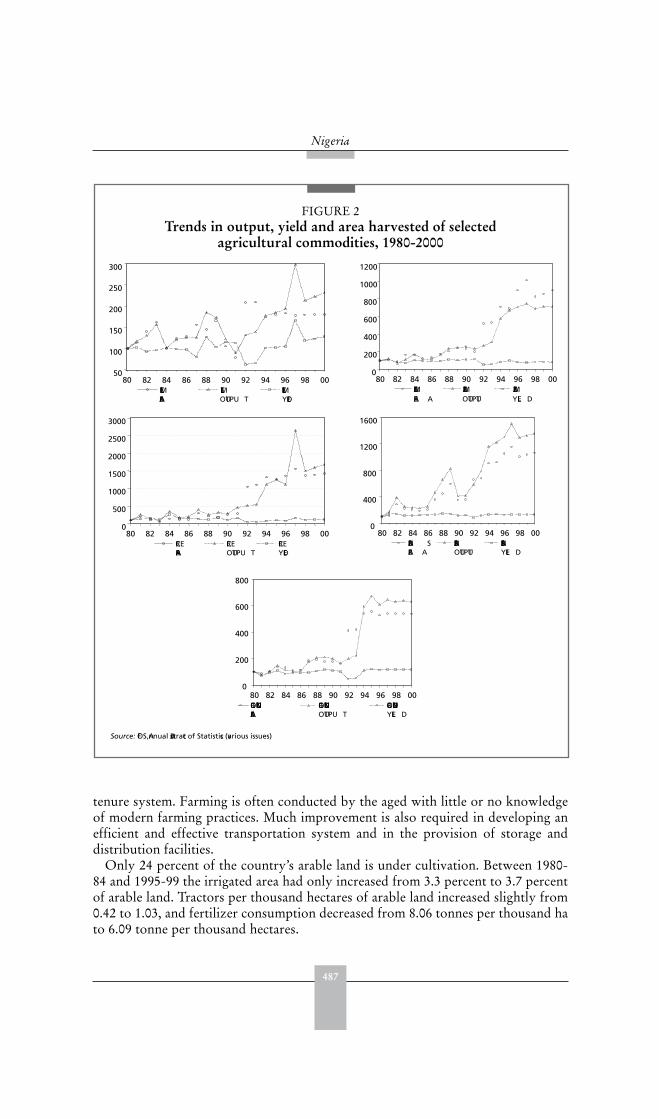
487
Nigeria
FIGURE 2Trends in output, yield and area harvested of selected
agricultural commodities, 1980-2000
Source: FOS, Annual Abstract of Statistics (various issues)
0
500
1000
1500
2000
2500
3000
80 82 84 86 88 90 92 94 96 98 00RICEAREA
RICEOUTPU T
RICEYIELD
0
200
400
600
800
1000
1200
80 82 84 86 88 90 92 94 96 98 00MAIZEARE A
MAIZEOUTPUT
MAIZEYIEL D
50
100
150
200
250
300
80 82 84 86 88 90 92 94 96 98 00MILLETAREA
MILLETOUTPU T
MILLETYIELD
0
200
400
600
800
80 82 84 86 88 90 92 94 96 98 00GROUNDNUTAREA
GROUNDNUTOUTPU T
GROUNDNUTYIEL D
0
400
800
1200
1600
80 82 84 86 88 90 92 94 96 98 00BEAN SARE A
BEANSOUTPUT
BEANSYIEL D
tenure system. Farming is often conducted by the aged with little or no knowledgeof modern farming practices. Much improvement is also required in developing anefficient and effective transportation system and in the provision of storage anddistribution facilities.
Only 24 percent of the country’s arable land is under cultivation. Between 1980-84 and 1995-99 the irrigated area had only increased from 3.3 percent to 3.7 percentof arable land. Tractors per thousand hectares of arable land increased slightly from0.42 to 1.03, and fertilizer consumption decreased from 8.06 tonnes per thousand hato 6.09 tonne per thousand hectares.
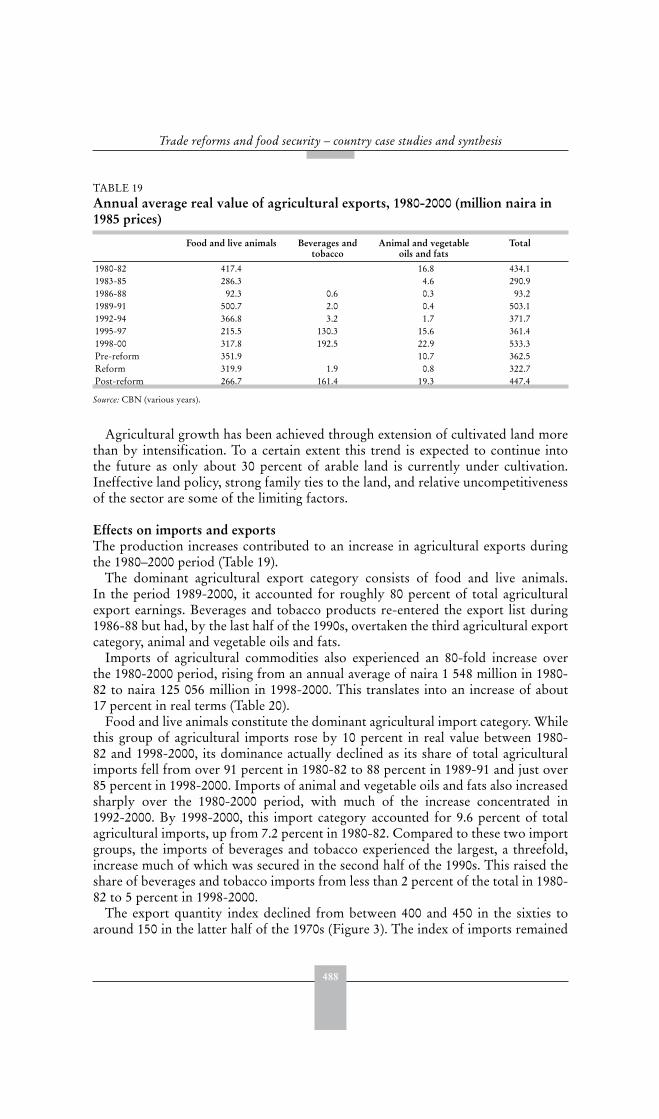
488
Trade reforms and food security – country case studies and synthesis
Agricultural growth has been achieved through extension of cultivated land morethan by intensification. To a certain extent this trend is expected to continue intothe future as only about 30 percent of arable land is currently under cultivation.Ineffective land policy, strong family ties to the land, and relative uncompetitivenessof the sector are some of the limiting factors.
Effects on imports and exports The production increases contributed to an increase in agricultural exports duringthe 1980–2000 period (Table 19).
The dominant agricultural export category consists of food and live animals.In the period 1989-2000, it accounted for roughly 80 percent of total agriculturalexport earnings. Beverages and tobacco products re-entered the export list during1986-88 but had, by the last half of the 1990s, overtaken the third agricultural exportcategory, animal and vegetable oils and fats.
Imports of agricultural commodities also experienced an 80-fold increase overthe 1980-2000 period, rising from an annual average of naira 1 548 million in 1980-82 to naira 125 056 million in 1998-2000. This translates into an increase of about17 percent in real terms (Table 20).
Food and live animals constitute the dominant agricultural import category. Whilethis group of agricultural imports rose by 10 percent in real value between 1980-82 and 1998-2000, its dominance actually declined as its share of total agriculturalimports fell from over 91 percent in 1980-82 to 88 percent in 1989-91 and just over85 percent in 1998-2000. Imports of animal and vegetable oils and fats also increasedsharply over the 1980-2000 period, with much of the increase concentrated in1992-2000. By 1998-2000, this import category accounted for 9.6 percent of totalagricultural imports, up from 7.2 percent in 1980-82. Compared to these two importgroups, the imports of beverages and tobacco experienced the largest, a threefold,increase much of which was secured in the second half of the 1990s. This raised theshare of beverages and tobacco imports from less than 2 percent of the total in 1980-82 to 5 percent in 1998-2000.
The export quantity index declined from between 400 and 450 in the sixties toaround 150 in the latter half of the 1970s (Figure 3). The index of imports remained
TABLE 19 Annual average real value of agricultural exports, 1980-2000 (million naira in 1985 prices)
Food and live animals Beverages and tobacco
Animal and vegetable oils and fats
Total
1980-82 417.4 16.8 434.11983-85 286.3 4.6 290.91986-88 92.3 0.6 0.3 93.21989-91 500.7 2.0 0.4 503.11992-94 366.8 3.2 1.7 371.71995-97 215.5 130.3 15.6 361.41998-00 317.8 192.5 22.9 533.3Pre-reform 351.9 10.7 362.5Reform 319.9 1.9 0.8 322.7Post-reform 266.7 161.4 19.3 447.4
Source: CBN (various years).
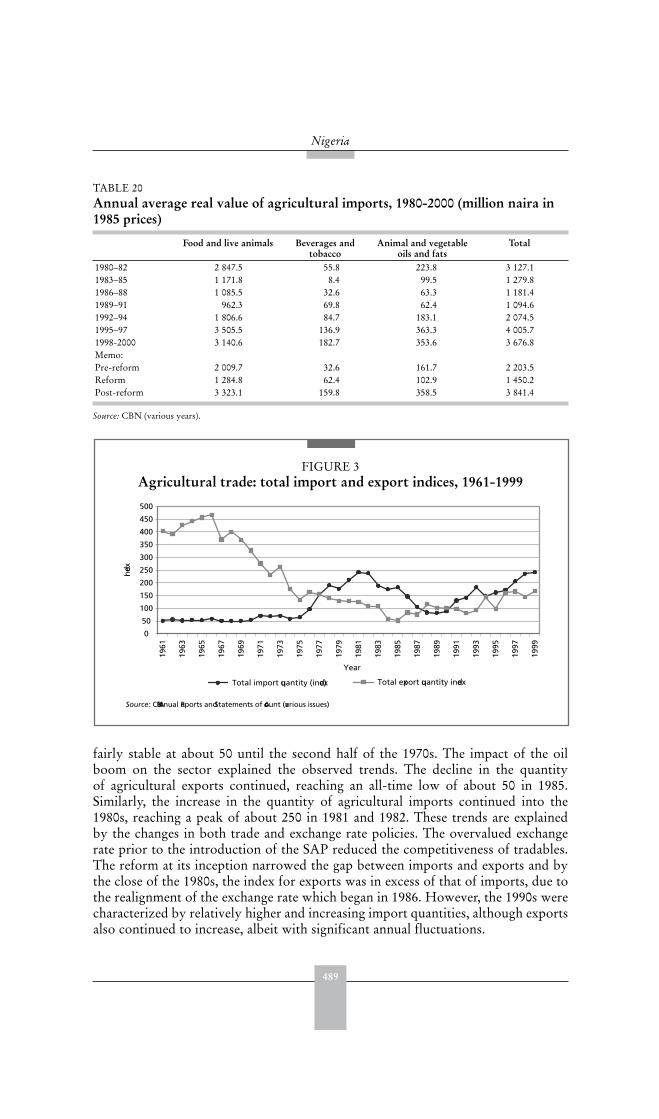
489
Nigeria
fairly stable at about 50 until the second half of the 1970s. The impact of the oilboom on the sector explained the observed trends. The decline in the quantityof agricultural exports continued, reaching an all-time low of about 50 in 1985.Similarly, the increase in the quantity of agricultural imports continued into the1980s, reaching a peak of about 250 in 1981 and 1982. These trends are explainedby the changes in both trade and exchange rate policies. The overvalued exchangerate prior to the introduction of the SAP reduced the competitiveness of tradables.The reform at its inception narrowed the gap between imports and exports and bythe close of the 1980s, the index for exports was in excess of that of imports, due tothe realignment of the exchange rate which began in 1986. However, the 1990s werecharacterized by relatively higher and increasing import quantities, although exportsalso continued to increase, albeit with significant annual fluctuations.
TABLE 20 Annual average real value of agricultural imports, 1980-2000 (million naira in 1985 prices)
Food and live animals Beverages and tobacco
Animal and vegetableoils and fats
Total
1980–82 2 847.5 55.8 223.8 3 127.11983–85 1 171.8 8.4 99.5 1 279.81986–88 1 085.5 32.6 63.3 1 181.41989–91 962.3 69.8 62.4 1 094.61992–94 1 806.6 84.7 183.1 2 074.51995–97 3 505.5 136.9 363.3 4 005.71998-2000 3 140.6 182.7 353.6 3 676.8Memo:Pre-reform 2 009.7 32.6 161.7 2 203.5Reform 1 284.8 62.4 102.9 1 450.2Post-reform 3 323.1 159.8 358.5 3 841.4
Source: CBN (various years).
FIGURE 3Agricultural trade: total import and export indices, 1961-1999
Source: CBN Annual Reports and Statements of Account (various issues)
0
50
100
150
200
250
300
350
400
450
500
1961
1963
1965
1967
1969
1971
1973
1975
1977
1979
1981
1983
1985
1987
1989
1991
1993
1995
1997
1999
Year
Index
Total import quantity (index) Total export quantity index
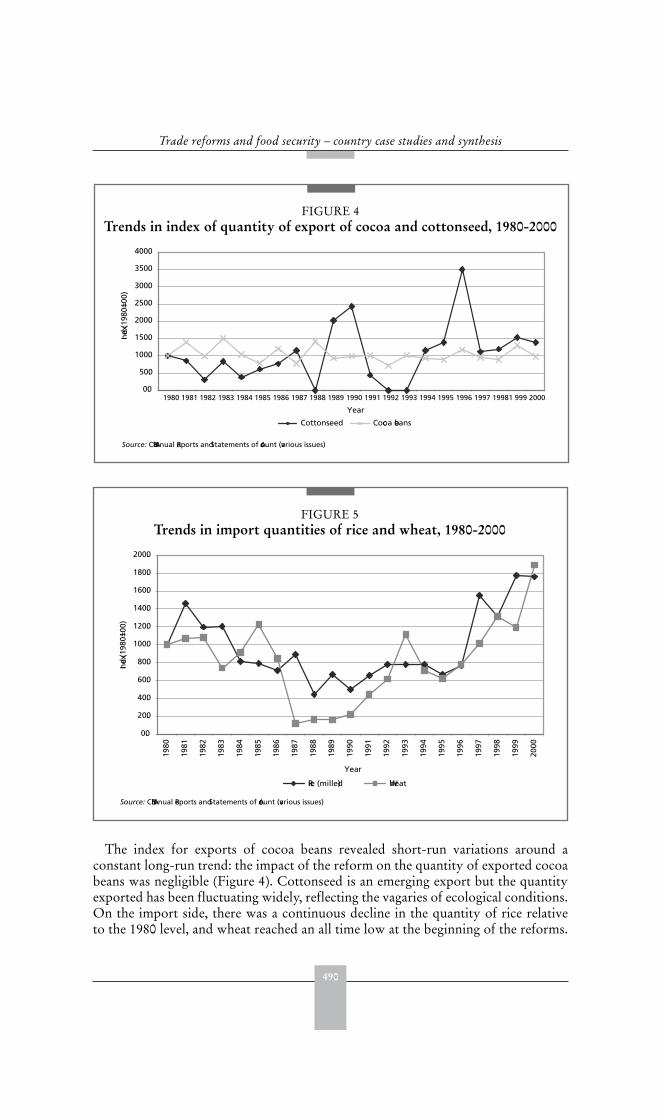
490
Trade reforms and food security – country case studies and synthesis
The index for exports of cocoa beans revealed short-run variations around aconstant long-run trend: the impact of the reform on the quantity of exported cocoabeans was negligible (Figure 4). Cottonseed is an emerging export but the quantityexported has been fluctuating widely, reflecting the vagaries of ecological conditions.On the import side, there was a continuous decline in the quantity of rice relativeto the 1980 level, and wheat reached an all time low at the beginning of the reforms.
FIGURE 4Trends in index of quantity of export of cocoa and cottonseed, 1980-2000
0.0
50.0
100.0
150.0
200.0
250.0
300.0
350.0
400.0
1980 1981 1982 1983 1984 1985 1986 1987 1988 1989 1990 1991 1992 1993 1994 1995 1996 1997 19981 999 2000
Year
Index
(198
0=100
)
Cottonseed Cocoa beans
Source: CBN Annual Reports and Statements of Account (various issues)
FIGURE 5Trends in import quantities of rice and wheat, 1980-2000
0.0
20.0
40.0
60.0
80.0
100.0
120.0
140.0
160.0
180.0
200.0
1980
1981
1982
1983
1984
1985
1986
1987
1988
1989
1990
1991
1992
1993
1994
1995
1996
1997
1998
1999
2000
Year
Index
(198
0=100
)
Rice (milled) Wheat
Source: CBN Annual Reports and Statements of Account (various issues)
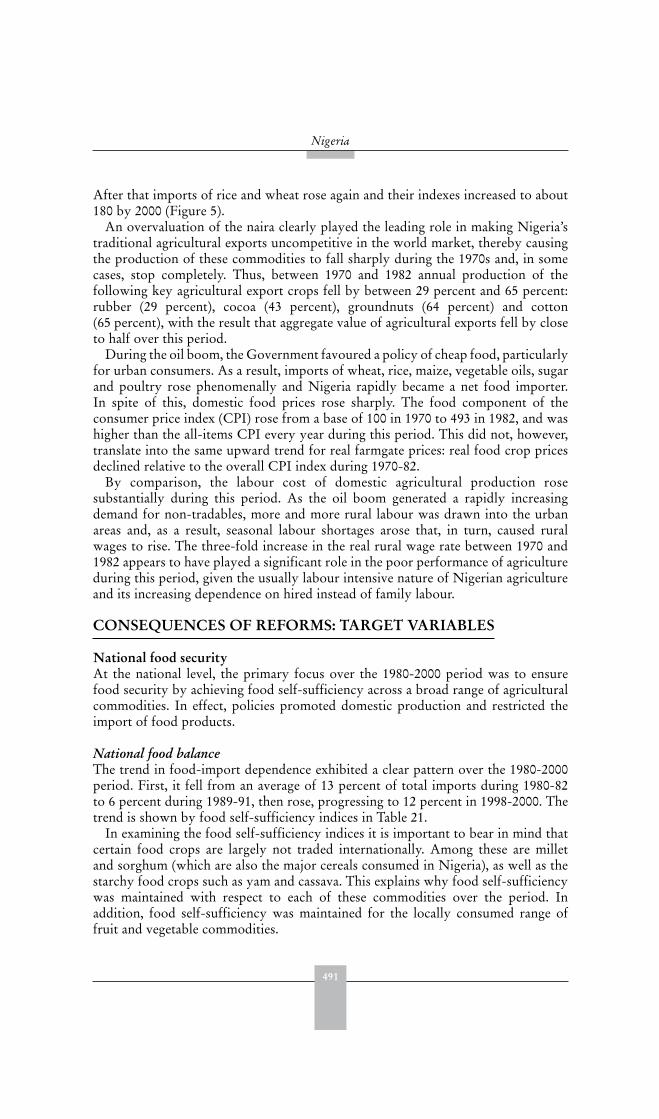
491
Nigeria
After that imports of rice and wheat rose again and their indexes increased to about180 by 2000 (Figure 5).
An overvaluation of the naira clearly played the leading role in making Nigeria’straditional agricultural exports uncompetitive in the world market, thereby causingthe production of these commodities to fall sharply during the 1970s and, in somecases, stop completely. Thus, between 1970 and 1982 annual production of thefollowing key agricultural export crops fell by between 29 percent and 65 percent:rubber (29 percent), cocoa (43 percent), groundnuts (64 percent) and cotton(65 percent), with the result that aggregate value of agricultural exports fell by closeto half over this period.
During the oil boom, the Government favoured a policy of cheap food, particularlyfor urban consumers. As a result, imports of wheat, rice, maize, vegetable oils, sugarand poultry rose phenomenally and Nigeria rapidly became a net food importer.In spite of this, domestic food prices rose sharply. The food component of theconsumer price index (CPI) rose from a base of 100 in 1970 to 493 in 1982, and washigher than the all-items CPI every year during this period. This did not, however,translate into the same upward trend for real farmgate prices: real food crop pricesdeclined relative to the overall CPI index during 1970-82.
By comparison, the labour cost of domestic agricultural production rosesubstantially during this period. As the oil boom generated a rapidly increasingdemand for non-tradables, more and more rural labour was drawn into the urbanareas and, as a result, seasonal labour shortages arose that, in turn, caused ruralwages to rise. The three-fold increase in the real rural wage rate between 1970 and1982 appears to have played a significant role in the poor performance of agricultureduring this period, given the usually labour intensive nature of Nigerian agricultureand its increasing dependence on hired instead of family labour.
CONSEQUENCES OF REFORMS: TARGET VARIABLES
National food securityAt the national level, the primary focus over the 1980-2000 period was to ensurefood security by achieving food self-sufficiency across a broad range of agriculturalcommodities. In effect, policies promoted domestic production and restricted theimport of food products.
National food balanceThe trend in food-import dependence exhibited a clear pattern over the 1980-2000period. First, it fell from an average of 13 percent of total imports during 1980-82to 6 percent during 1989-91, then rose, progressing to 12 percent in 1998-2000. Thetrend is shown by food self-sufficiency indices in Table 21.
In examining the food self-sufficiency indices it is important to bear in mind thatcertain food crops are largely not traded internationally. Among these are milletand sorghum (which are also the major cereals consumed in Nigeria), as well as thestarchy food crops such as yam and cassava. This explains why food self-sufficiencywas maintained with respect to each of these commodities over the period. Inaddition, food self-sufficiency was maintained for the locally consumed range offruit and vegetable commodities.
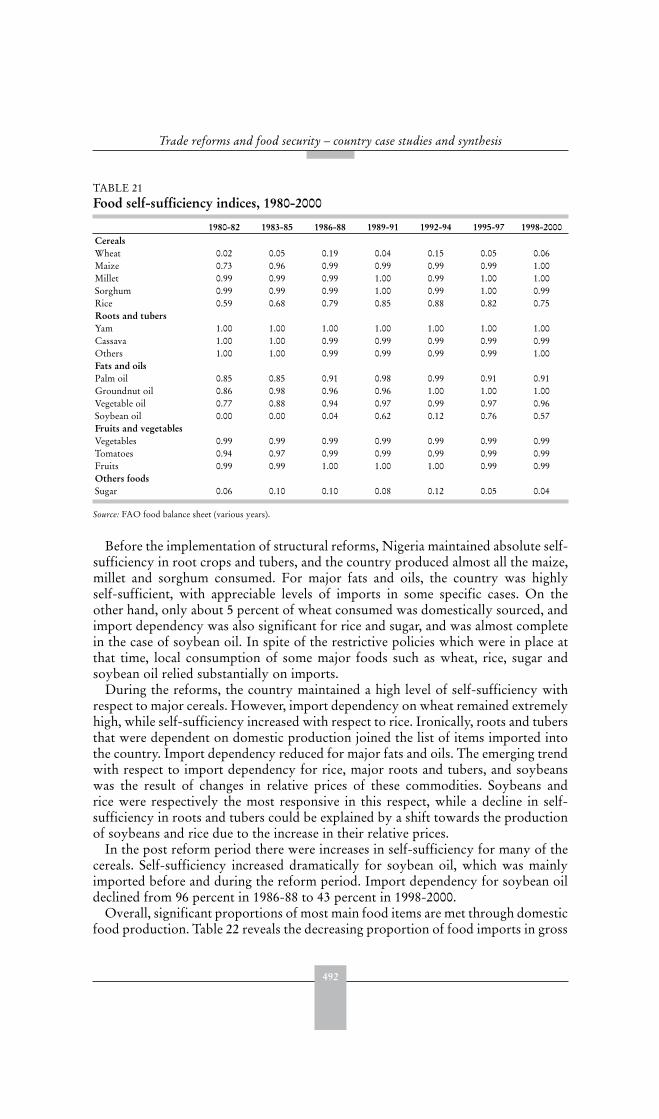
492
Trade reforms and food security – country case studies and synthesis
Before the implementation of structural reforms, Nigeria maintained absolute self-sufficiency in root crops and tubers, and the country produced almost all the maize,millet and sorghum consumed. For major fats and oils, the country was highlyself-sufficient, with appreciable levels of imports in some specific cases. On theother hand, only about 5 percent of wheat consumed was domestically sourced, andimport dependency was also significant for rice and sugar, and was almost completein the case of soybean oil. In spite of the restrictive policies which were in place atthat time, local consumption of some major foods such as wheat, rice, sugar andsoybean oil relied substantially on imports.
During the reforms, the country maintained a high level of self-sufficiency withrespect to major cereals. However, import dependency on wheat remained extremelyhigh, while self-sufficiency increased with respect to rice. Ironically, roots and tubersthat were dependent on domestic production joined the list of items imported intothe country. Import dependency reduced for major fats and oils. The emerging trendwith respect to import dependency for rice, major roots and tubers, and soybeanswas the result of changes in relative prices of these commodities. Soybeans andrice were respectively the most responsive in this respect, while a decline in self-sufficiency in roots and tubers could be explained by a shift towards the productionof soybeans and rice due to the increase in their relative prices.
In the post reform period there were increases in self-sufficiency for many of thecereals. Self-sufficiency increased dramatically for soybean oil, which was mainlyimported before and during the reform period. Import dependency for soybean oildeclined from 96 percent in 1986-88 to 43 percent in 1998-2000.
Overall, significant proportions of most main food items are met through domesticfood production. Table 22 reveals the decreasing proportion of food imports in gross
TABLE 21 Food self-sufficiency indices, 1980-2000
1980-82 1983-85 1986-88 1989-91 1992-94 1995-97 1998-2000CerealsWheat 0.02 0.05 0.19 0.04 0.15 0.05 0.06Maize 0.73 0.96 0.99 0.99 0.99 0.99 1.00Millet 0.99 0.99 0.99 1.00 0.99 1.00 1.00Sorghum 0.99 0.99 0.99 1.00 0.99 1.00 0.99Rice 0.59 0.68 0.79 0.85 0.88 0.82 0.75Roots and tubersYam 1.00 1.00 1.00 1.00 1.00 1.00 1.00Cassava 1.00 1.00 0.99 0.99 0.99 0.99 0.99Others 1.00 1.00 0.99 0.99 0.99 0.99 1.00Fats and oilsPalm oil 0.85 0.85 0.91 0.98 0.99 0.91 0.91Groundnut oil 0.86 0.98 0.96 0.96 1.00 1.00 1.00Vegetable oil 0.77 0.88 0.94 0.97 0.99 0.97 0.96Soybean oil 0.00 0.00 0.04 0.62 0.12 0.76 0.57Fruits and vegetablesVegetables 0.99 0.99 0.99 0.99 0.99 0.99 0.99Tomatoes 0.94 0.97 0.99 0.99 0.99 0.99 0.99Fruits 0.99 0.99 1.00 1.00 1.00 0.99 0.99Others foodsSugar 0.06 0.10 0.10 0.08 0.12 0.05 0.04
Source: FAO food balance sheet (various years).
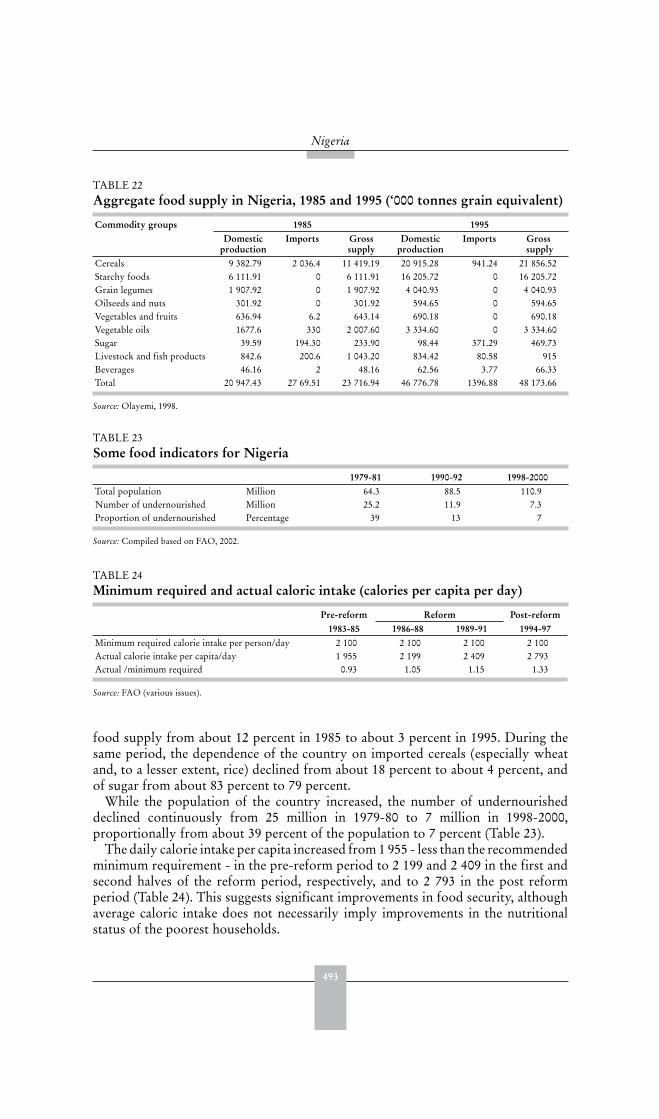
493
Nigeria
food supply from about 12 percent in 1985 to about 3 percent in 1995. During thesame period, the dependence of the country on imported cereals (especially wheatand, to a lesser extent, rice) declined from about 18 percent to about 4 percent, andof sugar from about 83 percent to 79 percent.
While the population of the country increased, the number of undernourisheddeclined continuously from 25 million in 1979-80 to 7 million in 1998-2000,proportionally from about 39 percent of the population to 7 percent (Table 23).
The daily calorie intake per capita increased from 1 955 - less than the recommendedminimum requirement - in the pre-reform period to 2 199 and 2 409 in the first andsecond halves of the reform period, respectively, and to 2 793 in the post reformperiod (Table 24). This suggests significant improvements in food security, althoughaverage caloric intake does not necessarily imply improvements in the nutritionalstatus of the poorest households.
TABLE 22 Aggregate food supply in Nigeria, 1985 and 1995 (‘000 tonnes grain equivalent)
Commodity groups 1985 1995Domestic
productionImports Gross
supplyDomestic
productionImports Gross
supplyCereals 9 382.79 2 036.4 11 419.19 20 915.28 941.24 21 856.52Starchy foods 6 111.91 0 6 111.91 16 205.72 0 16 205.72Grain legumes 1 907.92 0 1 907.92 4 040.93 0 4 040.93Oilseeds and nuts 301.92 0 301.92 594.65 0 594.65Vegetables and fruits 636.94 6.2 643.14 690.18 0 690.18Vegetable oils 1677.6 330 2 007.60 3 334.60 0 3 334.60Sugar 39.59 194.30 233.90 98.44 371.29 469.73Livestock and fish products 842.6 200.6 1 043.20 834.42 80.58 915Beverages 46.16 2 48.16 62.56 3.77 66.33Total 20 947.43 27 69.51 23 716.94 46 776.78 1396.88 48 173.66
Source: Olayemi, 1998.
TABLE 23 Some food indicators for Nigeria
1979-81 1990-92 1998-2000Total population Million 64.3 88.5 110.9Number of undernourished Million 25.2 11.9 7.3Proportion of undernourished Percentage 39 13 7
Source: Compiled based on FAO, 2002.
TABLE 24Minimum required and actual caloric intake (calories per capita per day)
Pre-reform Reform Post-reform1983-85 1986-88 1989-91 1994-97
Minimum required calorie intake per person/day 2 100 2 100 2 100 2 100Actual calorie intake per capita/day 1 955 2 199 2 409 2 793Actual /minimum required 0.93 1.05 1.15 1.33
Source: FAO (various issues).
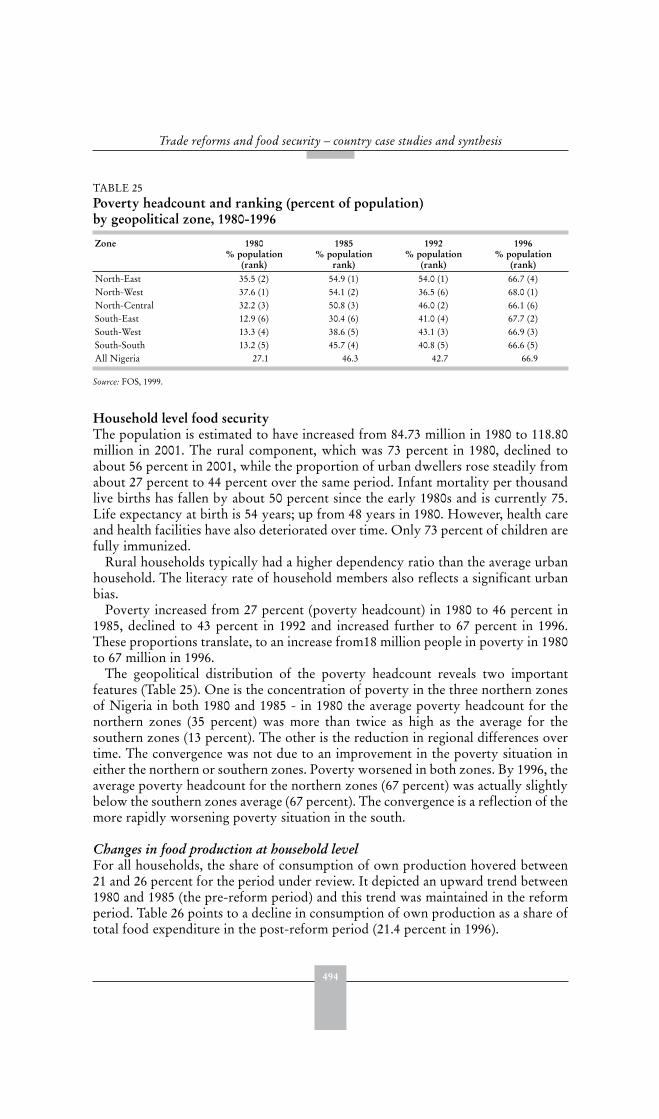
494
Trade reforms and food security – country case studies and synthesis
Household level food securityThe population is estimated to have increased from 84.73 million in 1980 to 118.80million in 2001. The rural component, which was 73 percent in 1980, declined toabout 56 percent in 2001, while the proportion of urban dwellers rose steadily fromabout 27 percent to 44 percent over the same period. Infant mortality per thousandlive births has fallen by about 50 percent since the early 1980s and is currently 75.Life expectancy at birth is 54 years; up from 48 years in 1980. However, health careand health facilities have also deteriorated over time. Only 73 percent of children arefully immunized.
Rural households typically had a higher dependency ratio than the average urbanhousehold. The literacy rate of household members also reflects a significant urbanbias.
Poverty increased from 27 percent (poverty headcount) in 1980 to 46 percent in1985, declined to 43 percent in 1992 and increased further to 67 percent in 1996.These proportions translate, to an increase from18 million people in poverty in 1980to 67 million in 1996.
The geopolitical distribution of the poverty headcount reveals two importantfeatures (Table 25). One is the concentration of poverty in the three northern zonesof Nigeria in both 1980 and 1985 - in 1980 the average poverty headcount for thenorthern zones (35 percent) was more than twice as high as the average for thesouthern zones (13 percent). The other is the reduction in regional differences overtime. The convergence was not due to an improvement in the poverty situation ineither the northern or southern zones. Poverty worsened in both zones. By 1996, theaverage poverty headcount for the northern zones (67 percent) was actually slightlybelow the southern zones average (67 percent). The convergence is a reflection of themore rapidly worsening poverty situation in the south.
Changes in food production at household levelFor all households, the share of consumption of own production hovered between21 and 26 percent for the period under review. It depicted an upward trend between1980 and 1985 (the pre-reform period) and this trend was maintained in the reformperiod. Table 26 points to a decline in consumption of own production as a share oftotal food expenditure in the post-reform period (21.4 percent in 1996).
TABLE 25 Poverty headcount and ranking (percent of population) by geopolitical zone, 1980-1996
Zone 1980% population
(rank)
1985% population
rank)
1992% population
(rank)
1996% population
(rank)North-East 35.5 (2) 54.9 (1) 54.0 (1) 66.7 (4)North-West 37.6 (1) 54.1 (2) 36.5 (6) 68.0 (1)North-Central 32.2 (3) 50.8 (3) 46.0 (2) 66.1 (6)South-East 12.9 (6) 30.4 (6) 41.0 (4) 67.7 (2)South-West 13.3 (4) 38.6 (5) 43.1 (3) 66.9 (3)South-South 13.2 (5) 45.7 (4) 40.8 (5) 66.6 (5)All Nigeria 27.1 46.3 42.7 66.9
Source: FOS, 1999.
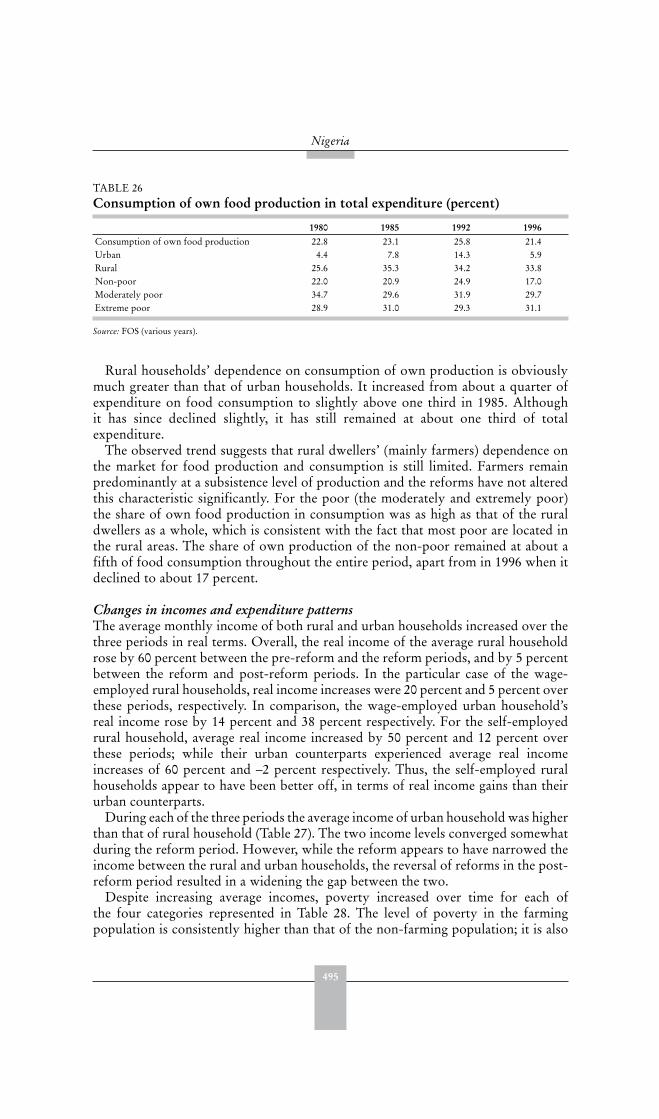
495
Nigeria
Rural households’ dependence on consumption of own production is obviouslymuch greater than that of urban households. It increased from about a quarter ofexpenditure on food consumption to slightly above one third in 1985. Althoughit has since declined slightly, it has still remained at about one third of totalexpenditure.
The observed trend suggests that rural dwellers’ (mainly farmers) dependence onthe market for food production and consumption is still limited. Farmers remainpredominantly at a subsistence level of production and the reforms have not alteredthis characteristic significantly. For the poor (the moderately and extremely poor)the share of own food production in consumption was as high as that of the ruraldwellers as a whole, which is consistent with the fact that most poor are located inthe rural areas. The share of own production of the non-poor remained at about afifth of food consumption throughout the entire period, apart from in 1996 when itdeclined to about 17 percent.
Changes in incomes and expenditure patternsThe average monthly income of both rural and urban households increased over thethree periods in real terms. Overall, the real income of the average rural householdrose by 60 percent between the pre-reform and the reform periods, and by 5 percentbetween the reform and post-reform periods. In the particular case of the wage-employed rural households, real income increases were 20 percent and 5 percent overthese periods, respectively. In comparison, the wage-employed urban household’sreal income rose by 14 percent and 38 percent respectively. For the self-employedrural household, average real income increased by 50 percent and 12 percent overthese periods; while their urban counterparts experienced average real incomeincreases of 60 percent and –2 percent respectively. Thus, the self-employed ruralhouseholds appear to have been better off, in terms of real income gains than theirurban counterparts.
During each of the three periods the average income of urban household was higherthan that of rural household (Table 27). The two income levels converged somewhatduring the reform period. However, while the reform appears to have narrowed theincome between the rural and urban households, the reversal of reforms in the post-reform period resulted in a widening the gap between the two.
Despite increasing average incomes, poverty increased over time for each ofthe four categories represented in Table 28. The level of poverty in the farmingpopulation is consistently higher than that of the non-farming population; it is also
TABLE 26Consumption of own food production in total expenditure (percent)
1980 1985 1992 1996Consumption of own food production 22.8 23.1 25.8 21.4Urban 4.4 7.8 14.3 5.9Rural 25.6 35.3 34.2 33.8Non-poor 22.0 20.9 24.9 17.0Moderately poor 34.7 29.6 31.9 29.7Extreme poor 28.9 31.0 29.3 31.1
Source: FOS (various years).
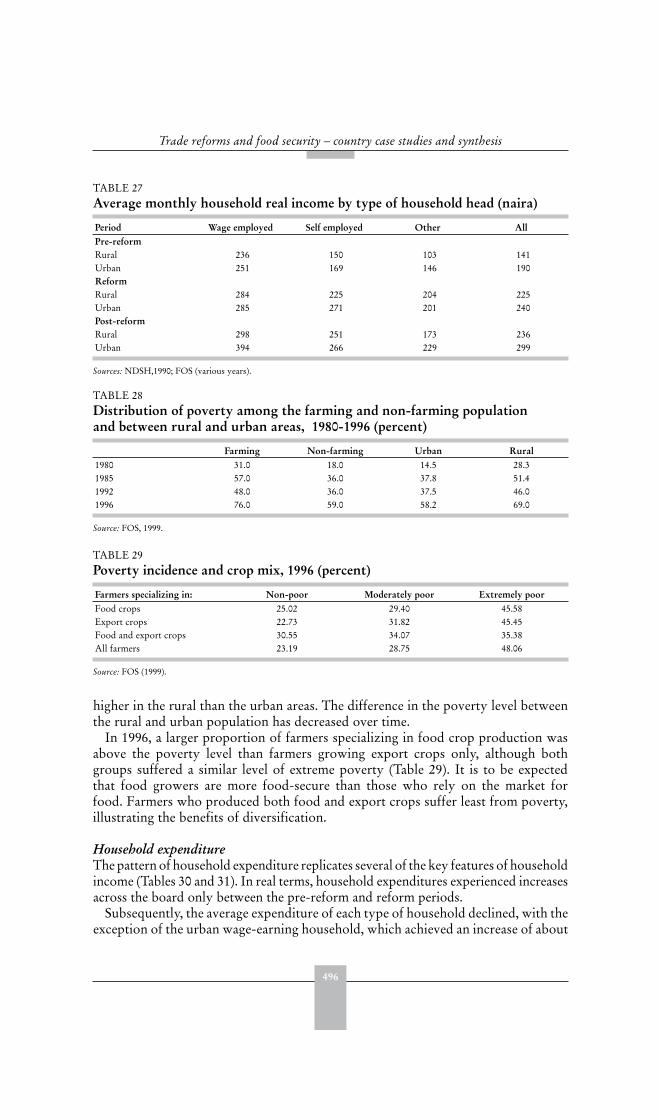
496
Trade reforms and food security – country case studies and synthesis
higher in the rural than the urban areas. The difference in the poverty level betweenthe rural and urban population has decreased over time.
In 1996, a larger proportion of farmers specializing in food crop production wasabove the poverty level than farmers growing export crops only, although bothgroups suffered a similar level of extreme poverty (Table 29). It is to be expectedthat food growers are more food-secure than those who rely on the market forfood. Farmers who produced both food and export crops suffer least from poverty,illustrating the benefits of diversification.
Household expenditure The pattern of household expenditure replicates several of the key features of householdincome (Tables 30 and 31). In real terms, household expenditures experienced increasesacross the board only between the pre-reform and reform periods.
Subsequently, the average expenditure of each type of household declined, with theexception of the urban wage-earning household, which achieved an increase of about
TABLE 27Average monthly household real income by type of household head (naira)
Period Wage employed Self employed Other AllPre-reformRural 236 150 103 141Urban 251 169 146 190ReformRural 284 225 204 225Urban 285 271 201 240Post-reformRural 298 251 173 236Urban 394 266 229 299
Sources: NDSH,1990; FOS (various years).
TABLE 28 Distribution of poverty among the farming and non-farming population and between rural and urban areas, 1980-1996 (percent)
Farming Non-farming Urban Rural1980 31.0 18.0 14.5 28.31985 57.0 36.0 37.8 51.41992 48.0 36.0 37.5 46.01996 76.0 59.0 58.2 69.0
Source: FOS, 1999.
TABLE 29 Poverty incidence and crop mix, 1996 (percent)
Farmers specializing in: Non-poor Moderately poor Extremely poor Food crops 25.02 29.40 45.58Export crops 22.73 31.82 45.45Food and export crops 30.55 34.07 35.38All farmers 23.19 28.75 48.06
Source: FOS (1999).
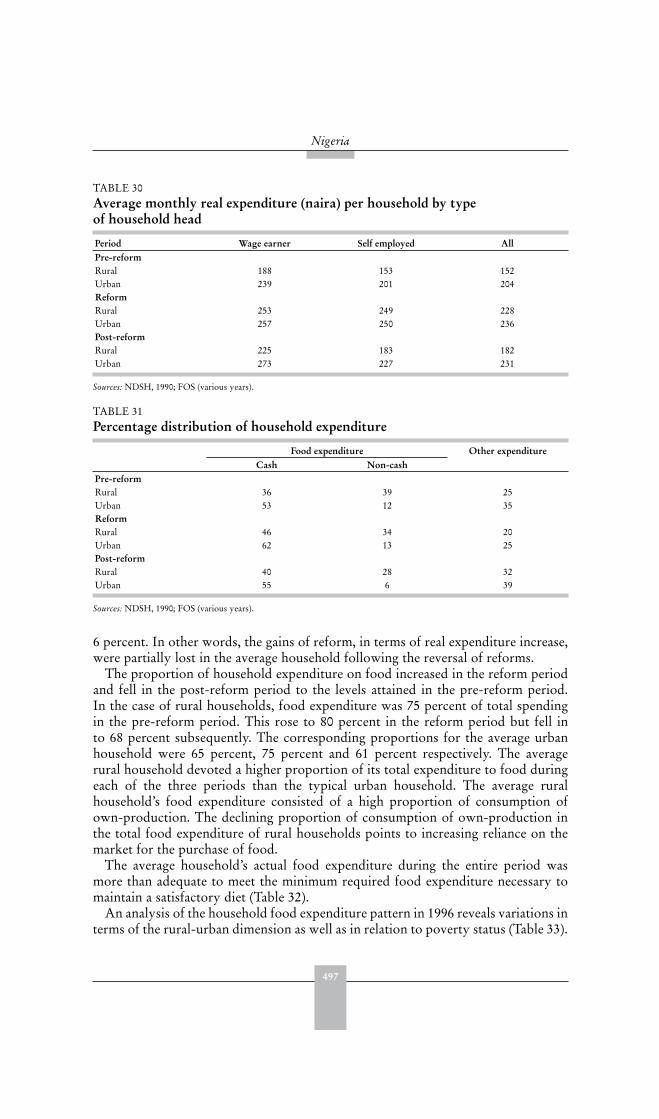
497
Nigeria
6 percent. In other words, the gains of reform, in terms of real expenditure increase,were partially lost in the average household following the reversal of reforms.
The proportion of household expenditure on food increased in the reform periodand fell in the post-reform period to the levels attained in the pre-reform period.In the case of rural households, food expenditure was 75 percent of total spendingin the pre-reform period. This rose to 80 percent in the reform period but fell into 68 percent subsequently. The corresponding proportions for the average urbanhousehold were 65 percent, 75 percent and 61 percent respectively. The averagerural household devoted a higher proportion of its total expenditure to food duringeach of the three periods than the typical urban household. The average ruralhousehold’s food expenditure consisted of a high proportion of consumption ofown-production. The declining proportion of consumption of own-production inthe total food expenditure of rural households points to increasing reliance on themarket for the purchase of food.
The average household’s actual food expenditure during the entire period wasmore than adequate to meet the minimum required food expenditure necessary tomaintain a satisfactory diet (Table 32).
An analysis of the household food expenditure pattern in 1996 reveals variations interms of the rural-urban dimension as well as in relation to poverty status (Table 33).
TABLE 30 Average monthly real expenditure (naira) per household by type of household head
Period Wage earner Self employed AllPre-reformRural 188 153 152Urban 239 201 204ReformRural 253 249 228Urban 257 250 236Post-reformRural 225 183 182Urban 273 227 231
Sources: NDSH, 1990; FOS (various years).
TABLE 31Percentage distribution of household expenditure
Food expenditure Other expenditureCash Non-cash
Pre-reformRural 36 39 25Urban 53 12 35ReformRural 46 34 20Urban 62 13 25Post-reformRural 40 28 32Urban 55 6 39
Sources: NDSH, 1990; FOS (various years).
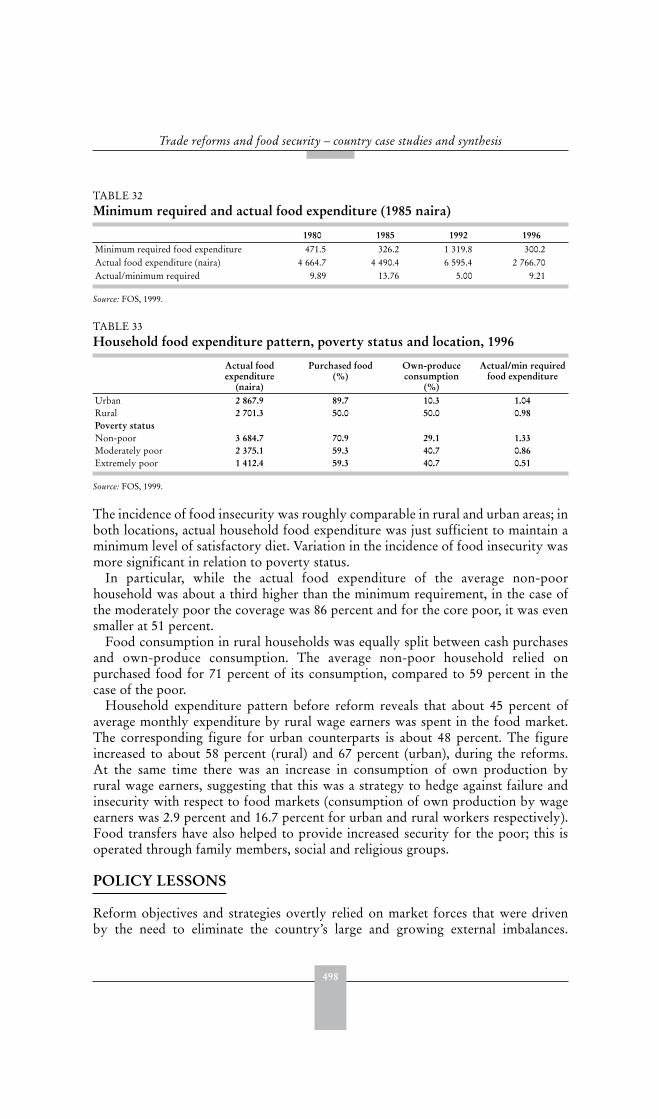
498
Trade reforms and food security – country case studies and synthesis
The incidence of food insecurity was roughly comparable in rural and urban areas; inboth locations, actual household food expenditure was just sufficient to maintain aminimum level of satisfactory diet. Variation in the incidence of food insecurity wasmore significant in relation to poverty status.
In particular, while the actual food expenditure of the average non-poorhousehold was about a third higher than the minimum requirement, in the case ofthe moderately poor the coverage was 86 percent and for the core poor, it was evensmaller at 51 percent.
Food consumption in rural households was equally split between cash purchasesand own-produce consumption. The average non-poor household relied onpurchased food for 71 percent of its consumption, compared to 59 percent in thecase of the poor.
Household expenditure pattern before reform reveals that about 45 percent ofaverage monthly expenditure by rural wage earners was spent in the food market.The corresponding figure for urban counterparts is about 48 percent. The figureincreased to about 58 percent (rural) and 67 percent (urban), during the reforms.At the same time there was an increase in consumption of own production byrural wage earners, suggesting that this was a strategy to hedge against failure andinsecurity with respect to food markets (consumption of own production by wageearners was 2.9 percent and 16.7 percent for urban and rural workers respectively).Food transfers have also helped to provide increased security for the poor; this isoperated through family members, social and religious groups.
POLICY LESSONS
Reform objectives and strategies overtly relied on market forces that were drivenby the need to eliminate the country’s large and growing external imbalances.
TABLE 32 Minimum required and actual food expenditure (1985 naira)
1980 1985 1992 1996Minimum required food expenditure 471.5 326.2 1 319.8 300.2Actual food expenditure (naira) 4 664.7 4 490.4 6 595.4 2 766.70Actual/minimum required 9.89 13.76 5.00 9.21
Source: FOS, 1999.
TABLE 33 Household food expenditure pattern, poverty status and location, 1996
Actual food expenditure
(naira)
Purchased food(%)
Own-produceconsumption
(%)
Actual/min required food expenditure
Urban 2 867.9 89.7 10.3 1.04Rural 2 701.3 50.0 50.0 0.98Poverty statusNon-poor 3 684.7 70.9 29.1 1.33Moderately poor 2 375.1 59.3 40.7 0.86Extremely poor 1 412.4 59.3 40.7 0.51
Source: FOS, 1999.
499
Nigeria
Trade, exchange rate and institutional reforms were key elements of the reformprogramme.
The liberalization of agricultural marketing coupled with currency depreciationincreased the incentives facing agricultural producers. However, the effects ofdevaluation were mixed. Devaluation helped offset the negative impact on thedomestic price of tradables of declining international commodity prices and helpedincrease the earnings of farmers. On the other hand, it also increased the cost ofinputs, such as seed, seedlings, fertilizers and chemicals increased. This rise in inputprices was exacerbated by the removal of government input subsides.
Growth in agricultural output has been more closely associated with increasesin cultivated area and labour input than with increases in yield and agriculturalintensification. At the early stage of the reform, additional labour was releasedfrom other sectors of the economy to the agricultural sector and this contributedto boosting agricultural output, primarily through increases in harvested area. Theactivities of government agencies also helped. However, the response to higherprices was below expectations. Agriculture continued to be characterized by lowyielding, rainfed production on fragmented landholdings. Failure to adopt improvedtechnologies and persistent vulnerability to the vagaries of climate remain a majorconstraint to increased agricultural productivity.
Nevertheless, national food security seems to have improved since the pre-reformperiod in terms of per capita availability of food and calorie intake.
Cropping patterns in Nigeria have always favoured food crop production. Yet,despite near self-sufficiency in a large proportion of non-tradable food staples, Nigeriacontinues to import large quantities of food (especially, wheat, sugar and rice) whichcontinues to dominate total imports. Agricultural trade, especially regional trade infood staples, appears to have increased, suggesting increased regional specializationas a result of reform. The reform period saw increased production of cash cropsbut the tempo was not sustained in the post-reform period. It is noteworthy thatfarmers relying exclusively on export crops had higher poverty rates than those whoproduced only food crops, and those that produced a combination of food and cashcrops (the latter had the lowest poverty rates).
Analysis at the household level suggests that the reforms may have narrowed theincome gap between rural and urban households. Unfortunately, the reversal ofthe reforms resulted in a widening the gap between the two. In the 1980s, povertywas significantly higher in the northern regions, but by the 1990s, the incidenceof poverty in the south had reached the same level as in the north. The incidenceof poverty at a national level increased significantly during the 1980s and 1990s,although it fell slightly during the reform period, before increasing again in the postreform period.
There has been no official social-safety net programme to ameliorate the impactof adjustment on vulnerable groups. Social programmes aimed at the poor were notwell targeted and failed to address the negative impacts of the policy reforms. Theincreasing incidence of poverty points to a need for better targeted social safety nets.
The policy environment has been unstable, with policy reversals and a lack ofinternal consistency generating confusing signals. The decision to disengage the publicsector and encourage the private sector to assume increased responsibilities in certainagricultural activities has been problematic. For example, as a result of the sudden
500
Trade reforms and food security – country case studies and synthesis
abolition of the commodity boards, farmers were exposed to sharp fluctuations inworld commodity prices and exchange rate risk without any compensatory policies.Also, without quality control services provided by the boards, there was somedeterioration in product quality that adversely effected export sales, particularly inthe case of cocoa.
The initial response of the agricultural sector was positive and significant. Thefavourable environmental conditions also helped. The gains were, however, notconsolidated. Policy reversals, especially in trade policy, as well as unfavourableinternational prices limited the supply response and prevented real structuralchanges in agricultural production taking place.
REFERENCES
ADB (African Development Bank) 2001. Africa Development Report 2001. OxfordUniversity Press.
CBN (Central Bank of Nigeria). 1998. Statistical Bulletin, CBN Lagos.CBN (Central Bank of Nigeria). Various years. Annual reports and statements of accountsFAO. 1966. Agricultural Development in Nigeria, 1965-1985. Rome.FAO. 2002. Food Balance Sheet (Rome).FOS (Federal Office Statistics). 1980; 1985; 1990; 1996; 1999. National consumer survey,
Lagos.FOS (Federal Office Statistics). 1999. Poverty profile in Nigeria. Lagos.FOS (Federal Office Statistics). Various years. Annual abstract of statistics.NDHS. 1990. National Demographic Health Survey, Nigeria.Ogunkola, E.O. 2003. Advancing Nigeria’s agricultural development through Doha
Development Round. A draft final research report submitted to the African EconomicResearch Consortium (AERC) Collaborative Research Project on African Imperatives in
the World Trade Order. April.Olayemi, J.K. 1998. Food Security in Nigeria. Development Policy Centre Research Report
Number 2. Ibadan, Nigeria.Udo, K.K. 1981. Geographical regions of Nigeria, Heinemann, Ibadan.Unklesbay, Nan. 1992. World food and you, Food Production Press N.Y.
FURTHER READING
Agboola, S.A. 1979. An agricultural atlas of Nigeria, Oxford University Press.Central Bank of Nigeria. 2002. Diversification of the Nigerian economy: Policies and
programmes for increasing agricultural output. Bullion (July/September).FOS (Federal Office Statistics). 1985; 1989; 1994; 1996. Social Statistics in Nigeria, Lagos.Herbst, J. & Olukoshi, A. 1994. Nigeria: Economic and Political Reforms and Cross
Purposes. Chapter II. In S. Haggard & S.B. Webb, eds. Voting for Reform: Democracy,
Political Liberalization, and Economic Adjustment. Oxford University Press: Oxford.Norton, R.D. 2003. Agricultural development policy: concepts and experiences. TCAS
Working Document No. 43/1, FAO Rome.Okoh, R. N. & Egbon, P. C. 2002. The integration of Nigeria’s rural and urban foodstuff
market. A Final Research Report Submitted to the African Economic ResearchConsortium (AERC), Nairobi. May.
501
Nigeria
Sharma, R. 2003. An overview of FAO studies on international trade and household food
security and methodology. Paper presented at Infosamak Expert Consultation onInternational Fish Trade and Food Security. In Cooperation with Fish Utilization andMarketing Service (FIIU), FAO, Casablanca, Morocco, 27-30: January.
UNICEF. 2002. UNICEF Statistics. Mimeo.World Bank. 2002. World development indicators. Washington, DC.

503
PeruJorge Torres Zorrilla and Julio Paz Cafferata1
EXECUTIVE SUMMARY
Pre-reformPeru was a highly distorted economy with widespread government interventionin product, service and factor markets. Most basic agricultural products hadguaranteed prices, implemented through the operation of public enterprises suchas the Enterprise for Rice Marketing which had a pan-territorial buying and sellingprice, thus benefiting producers and consumers in remote locations. The main inputswere subsidized. Average import tariffs for primary agricultural products were in therange of 50 percent to 60 percent, and non-tariff barriers were widespread.
The reformsFrom 1990 to 1993, a tough economic reform programme was implemented,consisting of trade liberalization, fiscal and monetary restraint, the introduction of afloating exchange rate, and the privatization of public enterprises. The post–reformperiod of 1993-1997 saw rapid growth in GDP, trade, and foreign investment,and improvement in social welfare indicators. However, the economy went intorecession in 1998. The institutional framework was reformed, eliminating statemarketing agencies and agricultural banks with a view to relying more on privatesector initiatives, although the private sector response was slower than expected.Input and credit subsidies were replaced by investments in rural infrastructureto reduce transaction costs to farms and non-farm activities. The experience withgovernment credit provision schemes was disappointing, with massive losses incapital reported. Most of the credit to the agricultural sector now comes fromcommercial banks and there was a dramatic reduction in the number of small farmerssupported by the formal financial system during the 1990s. At the macroeconomiclevel, exchange rate and interest rate determination were left to market forces, withoccasional government intervention.
The main objectives of the reforms were to control domestic inflation, to achieve fiscaland monetary discipline, to obtain a balance of payments equilibrium, to boost economicgrowth and to reduce unemployment. Exchange rate reform was a key element and oneof the first measures was the unification of the exchange rate system and later, in 1991,the adoption of a free-floating exchange rate policy. Tariffs were reduced to 26 percentand all non-tariff restrictions on imports were eliminated. The most important exceptionwas the price band system, applied to some sensitive products.
1 Jorge Torres Zorrilla and Julio Paz Cafferata, Departamento de Economía, Universidad Católica, Perú.
504
Trade reforms and food security – country case studies and synthesis
All price interventions in agricultural product and input markets were eliminatedand all state monopolies were abolished. Currently, agricultural support policiesamount to only 5 percent of the total value of production in the sector. Importantsafety net policies were initiated in tandem with the reform programme and tookthe form of food and health programmes for the extremely poor, with support frommultilateral financial institutions and non-governmental organizations.
Impact on intermediate variablesTrade and related reforms have substantially changed the agricultural incentiveframework and have impacted negatively on agricultural prices. There was a profounddeterioration in the terms of trade of agricultural products vis-à-vis the rest of theeconomy as a result of hyperinflation and the breakdown of the agricultural incentivesystem at the end of the pre-reform era. Despite positive world market agricultural pricetrends during the second half of the 1990s, agricultural producers faced deterioratingdomestic terms of trade. Between agricultural products there were important changesin relative prices; for example, a reduction in the relative price of cotton with respect torice and yellow maize. The most important variables in explaining changes in domesticprices were the real exchange rate and the world price index. Tariff levels were foundto be less important. Specific trade reforms do not seem to have had a significant effecton the evolution of real agricultural domestic prices.
After a short-lived production increase during the pre-reform years, agriculturalproduction gradually collapsed until reaching its lowest per capita level in 1992.Growth accelerated after 1992 despite the persistent negative price trends. Theevolution of output is explained mainly by increases in yields due to better thanexpected weather and support provided through government programmes oninfrastructure and technology, small-scale irrigation works, and measures to increasecrop and livestock productivity.
The value of agricultural trade more than doubled in the five-year period after thereforms begun. Exports grew by 13.8 percent per year, and imports increased at arate of 14.8 percent per year during the second half of the 1990s.
Impact on target variablesIn the past, food supply has often been inadequate to provide the amount of caloriesconsidered sufficient for a healthy life. However, in the second half of the 1990s,the recovery of domestic food production and increased imports allowed Peru toovercome its food availability problem. The sudden improvement in food availabilityhas made Peru stand out as one of the apparent liberalization success stories. Theproportion of undernourished decreased from 40 percent of the population in theearly nineties (1990-1992) to only 11 percent in the late nineties (1998-2000). Noother country managed to achieve this kind of improvement in nutrition indicatorsin such a short time.
However, the financial situation facing most small rural farmers deterioratedsharply during the late 1980s and did not improve with the policy reforms – aconsequence of the downward trend in the prices of the small farm productionbasket, the upward trend in agricultural input prices, combined with depressedreal wages and employment. In 1997-2000, real income obtained from one hectareplanted with main small farm products was substantially lower than in mid 1980s.
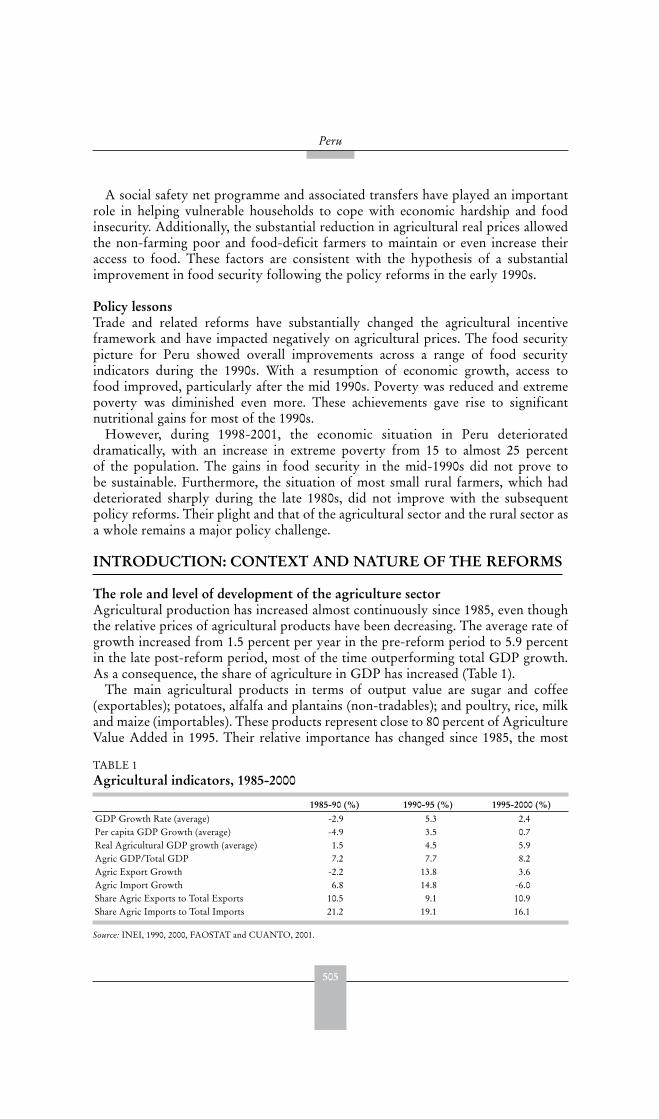
505
Peru
A social safety net programme and associated transfers have played an importantrole in helping vulnerable households to cope with economic hardship and foodinsecurity. Additionally, the substantial reduction in agricultural real prices allowedthe non-farming poor and food-deficit farmers to maintain or even increase theiraccess to food. These factors are consistent with the hypothesis of a substantialimprovement in food security following the policy reforms in the early 1990s.
Policy lessonsTrade and related reforms have substantially changed the agricultural incentiveframework and have impacted negatively on agricultural prices. The food securitypicture for Peru showed overall improvements across a range of food securityindicators during the 1990s. With a resumption of economic growth, access tofood improved, particularly after the mid 1990s. Poverty was reduced and extremepoverty was diminished even more. These achievements gave rise to significantnutritional gains for most of the 1990s.
However, during 1998-2001, the economic situation in Peru deteriorateddramatically, with an increase in extreme poverty from 15 to almost 25 percentof the population. The gains in food security in the mid-1990s did not prove tobe sustainable. Furthermore, the situation of most small rural farmers, which haddeteriorated sharply during the late 1980s, did not improve with the subsequentpolicy reforms. Their plight and that of the agricultural sector and the rural sector asa whole remains a major policy challenge.
INTRODUCTION: CONTEXT AND NATURE OF THE REFORMS
The role and level of development of the agriculture sectorAgricultural production has increased almost continuously since 1985, even thoughthe relative prices of agricultural products have been decreasing. The average rate ofgrowth increased from 1.5 percent per year in the pre-reform period to 5.9 percentin the late post-reform period, most of the time outperforming total GDP growth.As a consequence, the share of agriculture in GDP has increased (Table 1).
The main agricultural products in terms of output value are sugar and coffee(exportables); potatoes, alfalfa and plantains (non-tradables); and poultry, rice, milkand maize (importables). These products represent close to 80 percent of AgricultureValue Added in 1995. Their relative importance has changed since 1985, the most
TABLE 1 Agricultural indicators, 1985-2000
1985-90 (%) 1990-95 (%) 1995-2000 (%)GDP Growth Rate (average) -2.9 5.3 2.4Per capita GDP Growth (average) -4.9 3.5 0.7Real Agricultural GDP growth (average) 1.5 4.5 5.9Agric GDP/Total GDP 7.2 7.7 8.2Agric Export Growth -2.2 13.8 3.6Agric Import Growth 6.8 14.8 -6.0Share Agric Exports to Total Exports 10.5 9.1 10.9Share Agric Imports to Total Imports 21.2 19.1 16.1
Source: INEI, 1990, 2000, FAOSTAT and CUANTO, 2001.
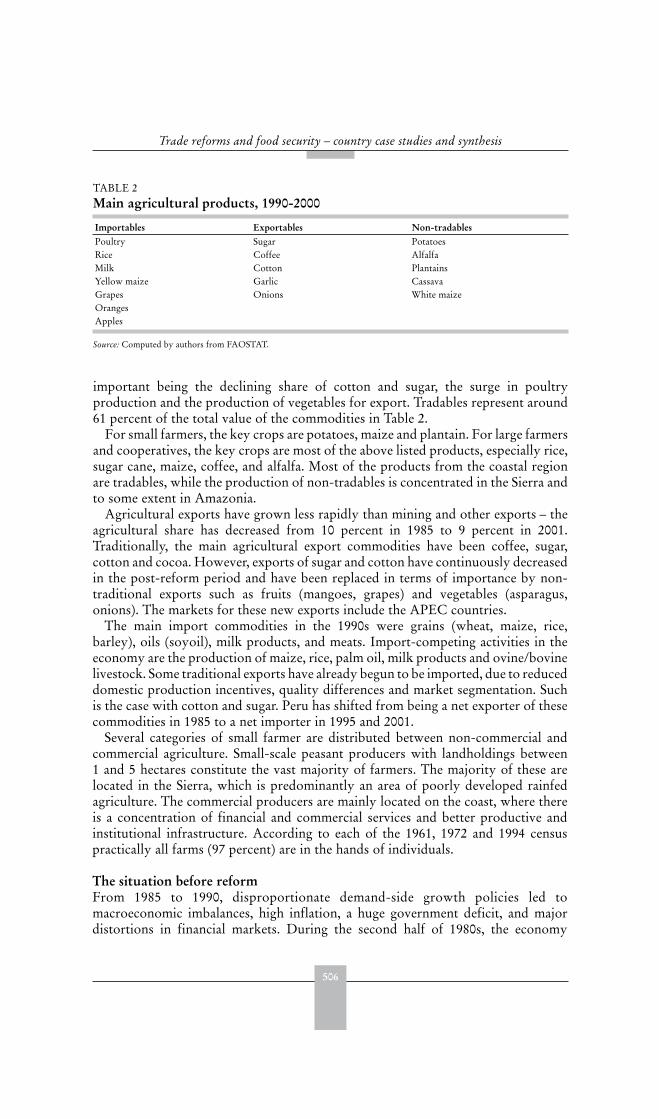
506
Trade reforms and food security – country case studies and synthesis
important being the declining share of cotton and sugar, the surge in poultryproduction and the production of vegetables for export. Tradables represent around61 percent of the total value of the commodities in Table 2.
For small farmers, the key crops are potatoes, maize and plantain. For large farmersand cooperatives, the key crops are most of the above listed products, especially rice,sugar cane, maize, coffee, and alfalfa. Most of the products from the coastal regionare tradables, while the production of non-tradables is concentrated in the Sierra andto some extent in Amazonia.
Agricultural exports have grown less rapidly than mining and other exports – theagricultural share has decreased from 10 percent in 1985 to 9 percent in 2001.Traditionally, the main agricultural export commodities have been coffee, sugar,cotton and cocoa. However, exports of sugar and cotton have continuously decreasedin the post-reform period and have been replaced in terms of importance by non-traditional exports such as fruits (mangoes, grapes) and vegetables (asparagus,onions). The markets for these new exports include the APEC countries.
The main import commodities in the 1990s were grains (wheat, maize, rice,barley), oils (soyoil), milk products, and meats. Import-competing activities in theeconomy are the production of maize, rice, palm oil, milk products and ovine/bovinelivestock. Some traditional exports have already begun to be imported, due to reduceddomestic production incentives, quality differences and market segmentation. Suchis the case with cotton and sugar. Peru has shifted from being a net exporter of thesecommodities in 1985 to a net importer in 1995 and 2001.
Several categories of small farmer are distributed between non-commercial andcommercial agriculture. Small-scale peasant producers with landholdings between1 and 5 hectares constitute the vast majority of farmers. The majority of these arelocated in the Sierra, which is predominantly an area of poorly developed rainfedagriculture. The commercial producers are mainly located on the coast, where thereis a concentration of financial and commercial services and better productive andinstitutional infrastructure. According to each of the 1961, 1972 and 1994 censuspractically all farms (97 percent) are in the hands of individuals.
The situation before reform From 1985 to 1990, disproportionate demand-side growth policies led tomacroeconomic imbalances, high inflation, a huge government deficit, and majordistortions in financial markets. During the second half of 1980s, the economy
TABLE 2 Main agricultural products, 1990-2000
Importables Exportables Non-tradablesPoultry Sugar PotatoesRice Coffee AlfalfaMilk Cotton PlantainsYellow maize Garlic CassavaGrapes Onions White maizeOrangesApples
Source: Computed by authors from FAOSTAT.
507
Peru
was highly distorted, with widespread government intervention in product, serviceand factor markets. In 1985, economic stagnation was combined with inflation, astagflation situation that prevailed in many Latin American economies after the debtcrisis of 1982. The Government’s response to this involved freezing all prices bydecree, introducing a fixed nominal exchange rate and expansionary monetary andfiscal policies. These measures were accompanied by higher import tariffs, increasedquantitative trade restrictions and wider exclusive state trading than was the caseearlier in the decade.
The increase in domestic demand, resulting from government spending, wasexpected to stimulate economic growth. The programme resulted in a short-livedeconomic boom (1986-87) that was quickly eroded by increasing inflationarypressures and decreasing foreign exchange reserves. In the case of the agriculturalsector in particular, some basic product prices were adjusted upwards before theprice freezing, so they enjoyed a temporary improvement in terms of trade withrespect to other products in the economy.2
Most basic agricultural products had guaranteed prices, implemented through theoperation of public enterprises. The Enterprise for Rice Marketing (ECASA) hadthe function of buying all paddy rice, contracting milling services, and importing,and distributing milled rice. ECASA had a pan-territorial buying and selling price,so benefiting producers and consumers of remote locations. The National Enterprisefor Input Marketing (ENCI) fulfilled similar functions with respect to other grains,oils, milk, and sugar. ENCI would buy the agricultural products from producers andwould sell them to processors or retailers at a price below what was required to coverthe procurement cost plus the marketing margin, thus implementing a consumersubsidy. Most prices at the retail level were regulated and controlled by the Ministryof Agriculture.
Fertilizer production, marketing and distribution were controlled throughFERTISA, a state enterprise. Irrigation water was priced well below its cost recoverylevel. Agricultural credit was mostly provided by the Banco Agrario, a state bank incharge of financing agricultural operations at subsidized interest rates – sometimes atzero. This loan policy within an inflationary economy combined with a high volumeof default loans eroded the capital base of the Banco Agrario.
Average import tariffs for primary agricultural products (animal and vegetableproducts and fats and oils) ranged from 50 percent to 60 percent, while foodstuffs andbeverages had an average tariff of 91 percent. However, a large number of exemptionschemes allowed duty free entry for most basic food products, especially for thoseimported by the state marketing enterprises and food aid. Non-tariff barriers werewidespread during the pre-reform period, reaching a maximum in 1987 when allproducts were affected by some kind of import restriction. The import of basicagricultural commodities was restricted to state enterprises, whilst other imports bythe private sector were subject to licensing by the Ministry of Agriculture.
One of the most discriminatory policies against agriculture was exchange ratepolicy. The multiple exchange rate system discriminated against agricultural tradablesby assigning the lowest exchange rate within the range to agricultural imports andexports. Moreover, the effort to keep artificially low nominal exchange rates together
2 See Paz and Larios, 1991; Escobal et al., 1990.
508
Trade reforms and food security – country case studies and synthesis
with expansionary monetary and fiscal policies led to a strong appreciation of thereal exchange rate throughout the pre-reform period and again in the late 1990s. Thisput downward pressure on the relative prices of tradable goods, which constitute themajority of agricultural goods.
Export subsidies were applied to all non-traditional exports as compensation fordistortions induced by high tariffs on inputs and as compensation for domesticindirect taxes.
Motivations for the reforms By late 1980s, there was a huge macroeconomic disequilibrium and a deep crisis in theagricultural sector. Total GDP decreased by over 25 percent between 1988 and 1990.There was a major balance of payments crisis, with net foreign reserves reaching-300 million dollars in 1990. The fiscal deficit was around 7.2 percent of GDP in1988/90 and the ratio of taxes/GDP fell from 14 percent to 4 percent in the 1985-90 period. Inflation reached 7 700 percent in 1990. Public and private investmenttotally dried up and agricultural GDP declined by 13 percent in 1989/1990.3 Stateintervention in agriculture led to bankrupted state enterprises, ineffective pricecontrols and consumption subsidies, and ineffective state marketing boards. Thepoor overall food situation spread nationally, with the import component of thedomestic food supply covering most of the basic urban food demand.
Macro and sectoral components and the policy instruments used The period studied can be subdivided as follows:
(a) From 1990 to 1993: a tough reform programme was implemented, consistingof trade liberalization, fiscal and monetary restraint, the introduction of afloating exchange rate, and the privatization of public enterprises.
(b) From 1993 to 1997: a post-reform period involving rapid growth in GDP,trade, and foreign investment, and improvement in social welfare indicators.
(c) From 1998 to the present: a period of economic recession.The main objectives of the reforms in the early 1990s were to control domestic
inflation, to achieve fiscal and monetary discipline, to obtain balance of paymentsequilibrium and regenerate foreign exchange reserves, and to boost economicgrowth and reduce unemployment. These objectives were to be achieved by:increasing domestic market competition through private sector development andthe privatization of state enterprises; opening up markets and encouraging greaterintegration with the international economy through freer domestic and internationaltrade; deregulating factor markets; providing macroeconomic stability; and helpingto alleviate poverty by providing a social safety net as part of the reform package.
Macroeconomic reformsFiscal reformThe new government that took office in July 1990 pursued tight fiscal and monetarycontrol in order to contain hyperinflation, stabilize the economy and create thenecessary conditions for growth. The central government deficit was gradually
3 See Boloña, 1993.
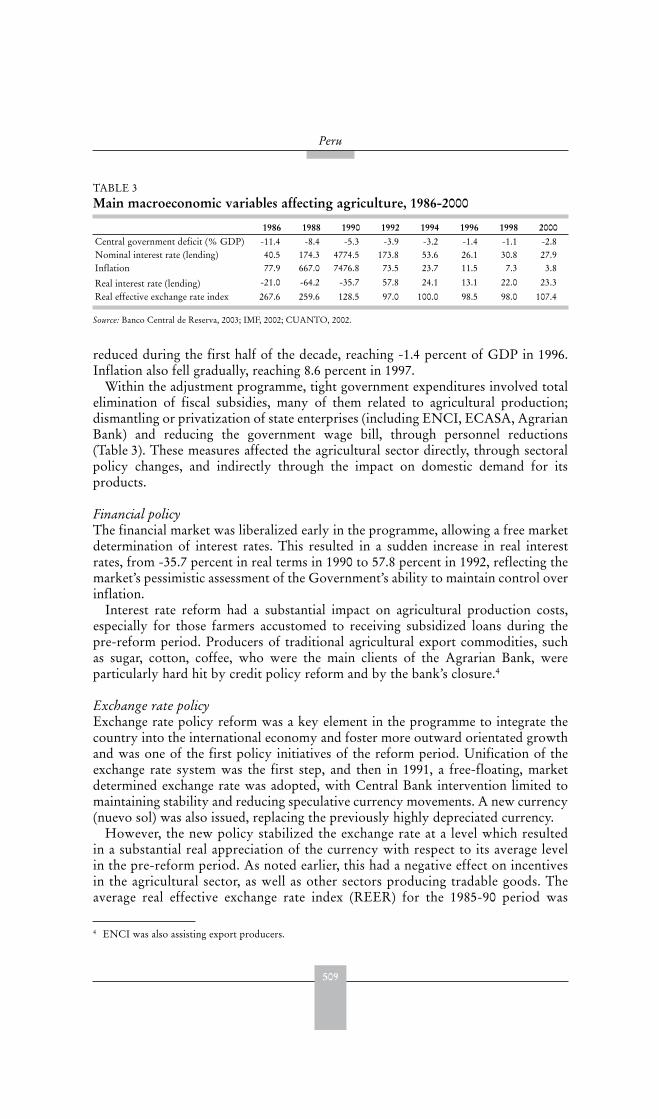
509
Peru
reduced during the first half of the decade, reaching -1.4 percent of GDP in 1996.Inflation also fell gradually, reaching 8.6 percent in 1997.
Within the adjustment programme, tight government expenditures involved totalelimination of fiscal subsidies, many of them related to agricultural production;dismantling or privatization of state enterprises (including ENCI, ECASA, AgrarianBank) and reducing the government wage bill, through personnel reductions(Table 3). These measures affected the agricultural sector directly, through sectoralpolicy changes, and indirectly through the impact on domestic demand for itsproducts.
Financial policyThe financial market was liberalized early in the programme, allowing a free marketdetermination of interest rates. This resulted in a sudden increase in real interestrates, from -35.7 percent in real terms in 1990 to 57.8 percent in 1992, reflecting themarket’s pessimistic assessment of the Government’s ability to maintain control overinflation.
Interest rate reform had a substantial impact on agricultural production costs,especially for those farmers accustomed to receiving subsidized loans during thepre-reform period. Producers of traditional agricultural export commodities, suchas sugar, cotton, coffee, who were the main clients of the Agrarian Bank, wereparticularly hard hit by credit policy reform and by the bank’s closure.4
Exchange rate policyExchange rate policy reform was a key element in the programme to integrate thecountry into the international economy and foster more outward orientated growthand was one of the first policy initiatives of the reform period. Unification of theexchange rate system was the first step, and then in 1991, a free-floating, marketdetermined exchange rate was adopted, with Central Bank intervention limited tomaintaining stability and reducing speculative currency movements. A new currency(nuevo sol) was also issued, replacing the previously highly depreciated currency.
However, the new policy stabilized the exchange rate at a level which resultedin a substantial real appreciation of the currency with respect to its average levelin the pre-reform period. As noted earlier, this had a negative effect on incentivesin the agricultural sector, as well as other sectors producing tradable goods. Theaverage real effective exchange rate index (REER) for the 1985-90 period was
4 ENCI was also assisting export producers.
TABLE 3 Main macroeconomic variables affecting agriculture, 1986-2000
1986 1988 1990 1992 1994 1996 1998 2000Central government deficit (% GDP) -11.4 -8.4 -5.3 -3.9 -3.2 -1.4 -1.1 -2.8Nominal interest rate (lending) 40.5 174.3 4774.5 173.8 53.6 26.1 30.8 27.9Inflation 77.9 667.0 7476.8 73.5 23.7 11.5 7.3 3.8
Real interest rate (lending) -21.0 -64.2 -35.7 57.8 24.1 13.1 22.0 23.3
Real effective exchange rate index 267.6 259.6 128.5 97.0 100.0 98.5 98.0 107.4
Source: Banco Central de Reserva, 2003; IMF, 2002; CUANTO, 2002.
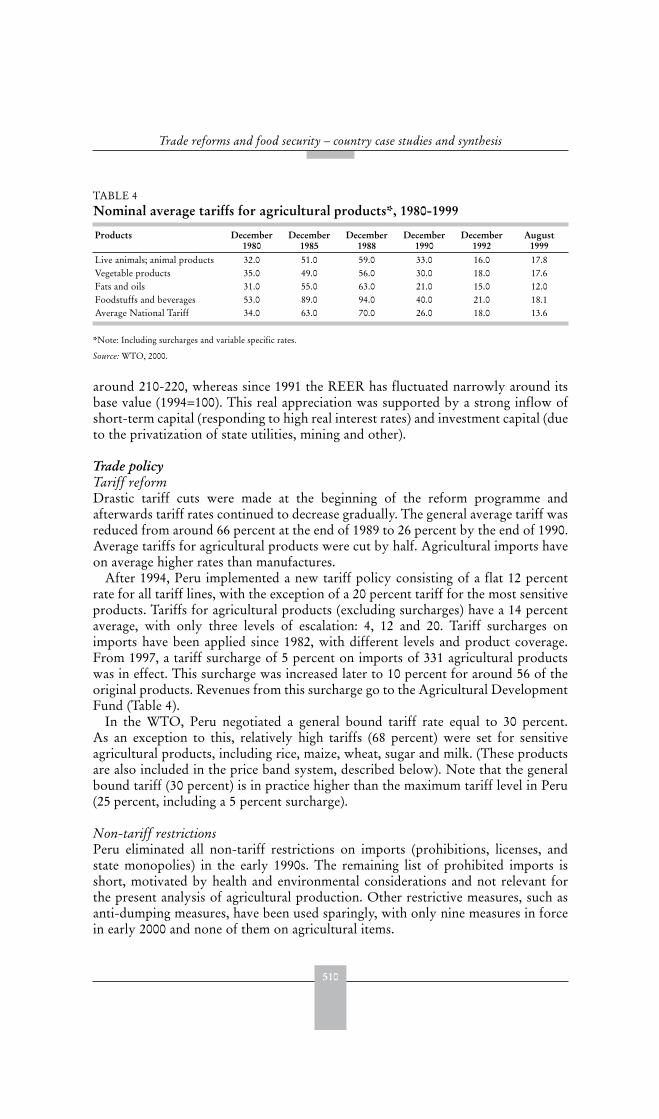
510
Trade reforms and food security – country case studies and synthesis
around 210-220, whereas since 1991 the REER has fluctuated narrowly around itsbase value (1994=100). This real appreciation was supported by a strong inflow ofshort-term capital (responding to high real interest rates) and investment capital (dueto the privatization of state utilities, mining and other).
Trade policyTariff reformDrastic tariff cuts were made at the beginning of the reform programme andafterwards tariff rates continued to decrease gradually. The general average tariff wasreduced from around 66 percent at the end of 1989 to 26 percent by the end of 1990.Average tariffs for agricultural products were cut by half. Agricultural imports haveon average higher rates than manufactures.
After 1994, Peru implemented a new tariff policy consisting of a flat 12 percentrate for all tariff lines, with the exception of a 20 percent tariff for the most sensitiveproducts. Tariffs for agricultural products (excluding surcharges) have a 14 percentaverage, with only three levels of escalation: 4, 12 and 20. Tariff surcharges onimports have been applied since 1982, with different levels and product coverage.From 1997, a tariff surcharge of 5 percent on imports of 331 agricultural productswas in effect. This surcharge was increased later to 10 percent for around 56 of theoriginal products. Revenues from this surcharge go to the Agricultural DevelopmentFund (Table 4).
In the WTO, Peru negotiated a general bound tariff rate equal to 30 percent.As an exception to this, relatively high tariffs (68 percent) were set for sensitiveagricultural products, including rice, maize, wheat, sugar and milk. (These productsare also included in the price band system, described below). Note that the generalbound tariff (30 percent) is in practice higher than the maximum tariff level in Peru(25 percent, including a 5 percent surcharge).
Non-tariff restrictionsPeru eliminated all non-tariff restrictions on imports (prohibitions, licenses, andstate monopolies) in the early 1990s. The remaining list of prohibited imports isshort, motivated by health and environmental considerations and not relevant forthe present analysis of agricultural production. Other restrictive measures, such asanti-dumping measures, have been used sparingly, with only nine measures in forcein early 2000 and none of them on agricultural items.
TABLE 4 Nominal average tariffs for agricultural products*, 1980-1999
Products December1980
December1985
December1988
December1990
December1992
August1999
Live animals; animal products 32.0 51.0 59.0 33.0 16.0 17.8Vegetable products 35.0 49.0 56.0 30.0 18.0 17.6Fats and oils 31.0 55.0 63.0 21.0 15.0 12.0Foodstuffs and beverages 53.0 89.0 94.0 40.0 21.0 18.1Average National Tariff 34.0 63.0 70.0 26.0 18.0 13.6
*Note: Including surcharges and variable specific rates.
Source: WTO, 2000.
511
Peru
Peru maintains local-content requirements in relation to various governmentnutrition programmes, as well as a trade-related investment measure in dairyproducts. A number of provisions favour domestic suppliers in governmentprocurement, which is governed by a more transparent regulatory frameworkintroduced in 1997.
Import price bandsThe most important exception to the elimination of non-tariff trade restrictions isthe price band system. This system is applied by Peru to some sensitive products.It is regarded as a complementary policy to the adjustment policies, to deal withproblems from instability in world markets prices.
The price band system is applied to 29 items which are subject to additionalduties, over and above their normal duties (tariff plus surcharges), that vary inaccordance with the difference between a commodity’s current world market priceand its estimated minimum normal world price set annually as a reference. A newprice band system was established in 2001, affecting only five product groups: milk,maize, sorghum, rice, and sugar. The system was an important stabilizer of importcosts with a neutral effect on protection.5 Peru has applied additional duties as highas 29 percent for sugar (a total tariff of 54 percent) and of 39 percent for rice import(a total of 59 percent) at certain periods, in order to stabilize domestic market pricesand provide some protection to its "sensitive" import-competing sectors. Thelegality of the price band system in relation to WTO rules has been the subject ofdebate and scrutiny.
Export subsidiesExports received very limited direct government support before or after adjustment.Moreover, in most cases traditional exports were subject to export taxes. Currently,there is a drawback regime, which refunds 5 percent of the FOB value of the goodexported regardless of the actual amount of duty paid on imported inputs.
Agricultural sector policiesDomestic support policiesAll price interventions in agricultural product and input markets were eliminatedas part of the reform programme. All prices were to be established by the marketunder free competition and all state monopolies were abolished. Most reformswere completed in the period 1990-93. ECASA and ENCI were closed by 1992.The reforms yielded substantial changes in the provision of agricultural inputs andservices, such as credit, fertilizers, and technical assistance, implying a transfer to theprivate sector of the role previously played by the Government.
Currently, agricultural support policies amount to only 5 percent of the total valueof production in the sector. Emphasis has changed from subsidies on output andinput prices to productive investment in rural areas. Outlays have been concentratedon research and development (R&D) and on infrastructure (irrigation projects, ruralroads, electrification). The sharp increase in the outlay on infrastructure, which morethan quadrupled from 1995 to 1997, was a notable change in the pattern of support.
5 JUNAC, 1995.
512
Trade reforms and food security – country case studies and synthesis
The Rural Road Rehabilitation and Maintenance Programme (PCR) has beenimplemented since 1996 and is a key component in the poverty reduction strategyfor most of the Sierra region and part of Amazonia. The impact of this programmein terms of rural household incomes, through reductions in agricultural transactioncosts and increasing employment opportunities in farm and non-farm activities, hasbeen significant.6
Other agricultural development projects are being implemented through theNational Fund for Compensation and Social Development (FONCODES) and theNational Project for Basin Management and Soil Conservation (PRONAMACHS),focusing on land rehabilitation and technological improvements in poor areas.
Agricultural credit After closing the Agrarian Bank, the Government created some ad hoc mechanismsfor specific emergencies and promoted new financial schemes (Cajas Rurales)to be developed by the private sector, farmer’s organizations, NGOs and otherstakeholders in the rural areas.
In 1992, the Government provided funds through regional financial institutions(FONDEAGROS) to peasants and small and medium farmers to finance the 1992/93planting season. Another financial scheme was the Rotating Fund programme,which was intended to offer credit in-kind to the poorest farmers at real interest ratesof between 3 and 10 percent. The experience with both schemes was disappointing.FONDEAGRO lost almost 90 percent of its capital in five years (1992-96) and theRotating Funds, which began operations in 1997, had lost around 95 percent of theircapital by 2000.
Although the amount of credit provided by formal financial intermediaries to theagricultural sector has gradually recovered and surpassed the levels of the mid- 1980s,its composition and clientele has change significantly. In the late-1980’s around85 percent of credits to the agricultural sector were provided by the Banco Agrarioand the rest by the private commercial banks; nowadays the core of financing (around86 percent of the total) to the sector is from commercial banks. The rest is dividedbetween Cajas Rurales (7.5 percent), Municipal Banks (3.5 percent) and RotatingFunds (3 percent). The number of small farmers (less than 10 ha) clients of the formalfinancial system has fallen dramatically from 184 920 in 1989 to 21 457 in 2000.7
Social welfare policyThe harsh structural adjustment programmes initiated in 1991 required a social safetynet in order to mitigate the impacts of economic policies on the poor. The safety netinitiated in the early 1990s was provided in the form of food and health programmesfor the extremely poor, with support from multilateral financial institutions. Theywere a central feature of the structural adjustment programmes.
The original goal of these programmes was only to provide a temporary floorof support for the very poor. However, funding increased substantially during the1990s. The safety net system is based on two institutions: the National Fund forCompensation and Social Development (FONCODES) and the National Food
6 Escobal and Ponce, 2002.7 See Salaverry, 2001.
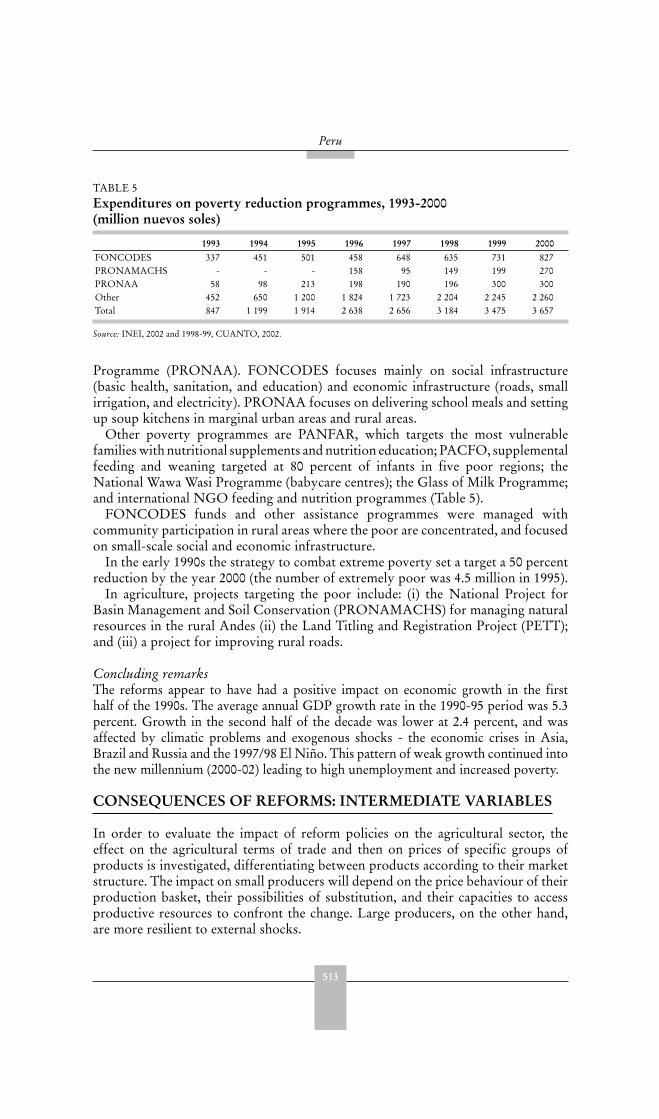
513
Peru
Programme (PRONAA). FONCODES focuses mainly on social infrastructure(basic health, sanitation, and education) and economic infrastructure (roads, smallirrigation, and electricity). PRONAA focuses on delivering school meals and settingup soup kitchens in marginal urban areas and rural areas.
Other poverty programmes are PANFAR, which targets the most vulnerablefamilies with nutritional supplements and nutrition education; PACFO, supplementalfeeding and weaning targeted at 80 percent of infants in five poor regions; theNational Wawa Wasi Programme (babycare centres); the Glass of Milk Programme;and international NGO feeding and nutrition programmes (Table 5).
FONCODES funds and other assistance programmes were managed withcommunity participation in rural areas where the poor are concentrated, and focusedon small-scale social and economic infrastructure.
In the early 1990s the strategy to combat extreme poverty set a target a 50 percentreduction by the year 2000 (the number of extremely poor was 4.5 million in 1995).
In agriculture, projects targeting the poor include: (i) the National Project forBasin Management and Soil Conservation (PRONAMACHS) for managing naturalresources in the rural Andes (ii) the Land Titling and Registration Project (PETT);and (iii) a project for improving rural roads.
Concluding remarksThe reforms appear to have had a positive impact on economic growth in the firsthalf of the 1990s. The average annual GDP growth rate in the 1990-95 period was 5.3percent. Growth in the second half of the decade was lower at 2.4 percent, and wasaffected by climatic problems and exogenous shocks - the economic crises in Asia,Brazil and Russia and the 1997/98 El Niño. This pattern of weak growth continued intothe new millennium (2000-02) leading to high unemployment and increased poverty.
CONSEQUENCES OF REFORMS: INTERMEDIATE VARIABLES
In order to evaluate the impact of reform policies on the agricultural sector, theeffect on the agricultural terms of trade and then on prices of specific groups ofproducts is investigated, differentiating between products according to their marketstructure. The impact on small producers will depend on the price behaviour of theirproduction basket, their possibilities of substitution, and their capacities to accessproductive resources to confront the change. Large producers, on the other hand,are more resilient to external shocks.
TABLE 5 Expenditures on poverty reduction programmes, 1993-2000(million nuevos soles)
1993 1994 1995 1996 1997 1998 1999 2000FONCODES 337 451 501 458 648 635 731 827PRONAMACHS - - - 158 95 149 199 270PRONAA 58 98 213 198 190 196 300 300Other 452 650 1 200 1 824 1 723 2 204 2 245 2 260Total 847 1 199 1 914 2 638 2 656 3 184 3 475 3 657
Source: INEI, 2002 and 1998-99, CUANTO, 2002.
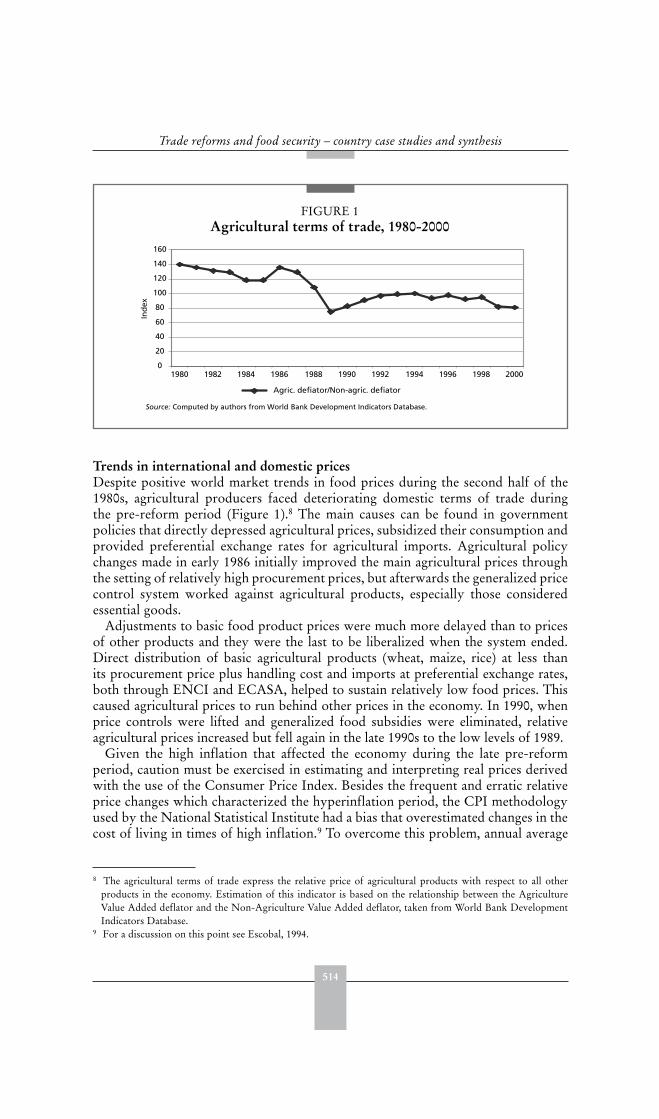
514
Trade reforms and food security – country case studies and synthesis
Trends in international and domestic prices Despite positive world market trends in food prices during the second half of the1980s, agricultural producers faced deteriorating domestic terms of trade duringthe pre-reform period (Figure 1).8 The main causes can be found in governmentpolicies that directly depressed agricultural prices, subsidized their consumption andprovided preferential exchange rates for agricultural imports. Agricultural policychanges made in early 1986 initially improved the main agricultural prices throughthe setting of relatively high procurement prices, but afterwards the generalized pricecontrol system worked against agricultural products, especially those consideredessential goods.
Adjustments to basic food product prices were much more delayed than to pricesof other products and they were the last to be liberalized when the system ended.Direct distribution of basic agricultural products (wheat, maize, rice) at less thanits procurement price plus handling cost and imports at preferential exchange rates,both through ENCI and ECASA, helped to sustain relatively low food prices. Thiscaused agricultural prices to run behind other prices in the economy. In 1990, whenprice controls were lifted and generalized food subsidies were eliminated, relativeagricultural prices increased but fell again in the late 1990s to the low levels of 1989.
Given the high inflation that affected the economy during the late pre-reformperiod, caution must be exercised in estimating and interpreting real prices derivedwith the use of the Consumer Price Index. Besides the frequent and erratic relativeprice changes which characterized the hyperinflation period, the CPI methodologyused by the National Statistical Institute had a bias that overestimated changes in thecost of living in times of high inflation.9 To overcome this problem, annual average
8 The agricultural terms of trade express the relative price of agricultural products with respect to all otherproducts in the economy. Estimation of this indicator is based on the relationship between the AgricultureValue Added deflator and the Non-Agriculture Value Added deflator, taken from World Bank DevelopmentIndicators Database.
9 For a discussion on this point see Escobal, 1994.
FIGURE 1Agricultural terms of trade, 1980-2000
Source: Computed by authors from World Bank Development Indicators Database.
0
20
40
60
80
100
120
140
160
1980 1982 1984 1986 1988 1990 1992 1994 1996 1998 2000
Ind
ex
Agric. defiator/Non-agric. defiator

515
Peru
real prices are estimated using monthly price and CPI data and weighting them bythe corresponding monthly production data.
Agricultural real prices increased with the demand boom of 1986/87, especially fornon-tradables, but fell abruptly between 1987 and 1990 before stabilizing at a verylow level (Figure 2). On average, agricultural prices fell from the base index of 100in the mid-1980s to a range of 20 to 40 in the 1990s.
After 1990, the decline in real prices slowed and in some case prices even roseagain, especially in the case of exportables which benefited from a moderate increasein world prices in the early 1990s, particularly for coffee, and from short lived realdepreciation episodes. The price of importables recovered for a while as a resultof the abrupt adjustment made at the beginning of the reform in the previouslycontrolled prices of maize, wheat and milk. Non-tradables maintained a relativelybetter price than tradable products.
Relative prices within the agricultural sectorChanges in relative prices between agricultural products affected planting decisionsat the farm level. There was a reduction in the relative price of cotton with respect torice and yellow maize between pre-reform (1985-88) and post-reform periods (1993-96). This could have been one of the causes of the shift away from planted areas ofcotton at the farm level in the northern coastal region. Changes in rice prices relativeto yellow maize and plantain could help to explain the increased share of rice areawithin the total area harvested in the Amazonian region (Table 6).
Decomposition of price changesPrice decomposition was undertaken to analyse the extent to which the main tradereforms have affected agricultural domestic prices (see Annex). The conclusion isthat the index of domestic prices is better explained by the RER variable and by realworld prices. The tariff levels are less important because tariffs became relevant only
FIGURE 2Agricultural real domestic price trends, 1980-2001
Source: Estimates by the authors from Ministry of Agriculture data
0
20
40
60
80
100
120
140
160
1985 1986 1987 1988 1989 1990 1991 1992 1993 1994 1995 1996 1997 1998 1999 2000 2001
Index
IMPORTABLES EXPORTABLES NON-TRADABLES
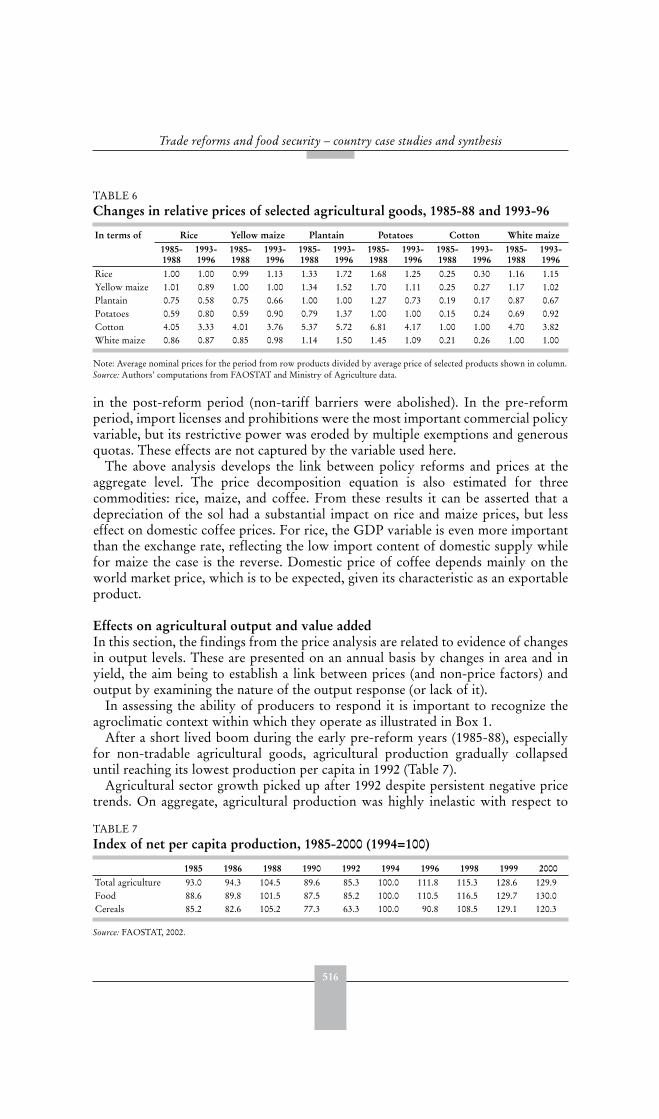
516
Trade reforms and food security – country case studies and synthesis
in the post-reform period (non-tariff barriers were abolished). In the pre-reformperiod, import licenses and prohibitions were the most important commercial policyvariable, but its restrictive power was eroded by multiple exemptions and generousquotas. These effects are not captured by the variable used here.
The above analysis develops the link between policy reforms and prices at theaggregate level. The price decomposition equation is also estimated for threecommodities: rice, maize, and coffee. From these results it can be asserted that adepreciation of the sol had a substantial impact on rice and maize prices, but lesseffect on domestic coffee prices. For rice, the GDP variable is even more importantthan the exchange rate, reflecting the low import content of domestic supply whilefor maize the case is the reverse. Domestic price of coffee depends mainly on theworld market price, which is to be expected, given its characteristic as an exportableproduct.
Effects on agricultural output and value addedIn this section, the findings from the price analysis are related to evidence of changesin output levels. These are presented on an annual basis by changes in area and inyield, the aim being to establish a link between prices (and non-price factors) andoutput by examining the nature of the output response (or lack of it).
In assessing the ability of producers to respond it is important to recognize theagroclimatic context within which they operate as illustrated in Box 1.
After a short lived boom during the early pre-reform years (1985-88), especiallyfor non-tradable agricultural goods, agricultural production gradually collapseduntil reaching its lowest production per capita in 1992 (Table 7).
Agricultural sector growth picked up after 1992 despite persistent negative pricetrends. On aggregate, agricultural production was highly inelastic with respect to
TABLE 6 Changes in relative prices of selected agricultural goods, 1985-88 and 1993-96
In terms of Rice Yellow maize Plantain Potatoes Cotton White maize1985-1988
1993-1996
1985-1988
1993-1996
1985-1988
1993-1996
1985-1988
1993-1996
1985-1988
1993-1996
1985-1988
1993-1996
Rice 1.00 1.00 0.99 1.13 1.33 1.72 1.68 1.25 0.25 0.30 1.16 1.15Yellow maize 1.01 0.89 1.00 1.00 1.34 1.52 1.70 1.11 0.25 0.27 1.17 1.02Plantain 0.75 0.58 0.75 0.66 1.00 1.00 1.27 0.73 0.19 0.17 0.87 0.67Potatoes 0.59 0.80 0.59 0.90 0.79 1.37 1.00 1.00 0.15 0.24 0.69 0.92Cotton 4.05 3.33 4.01 3.76 5.37 5.72 6.81 4.17 1.00 1.00 4.70 3.82White maize 0.86 0.87 0.85 0.98 1.14 1.50 1.45 1.09 0.21 0.26 1.00 1.00
Note: Average nominal prices for the period from row products divided by average price of selected products shown in column.Source: Authors’ computations from FAOSTAT and Ministry of Agriculture data.
TABLE 7 Index of net per capita production, 1985-2000 (1994=100)
1985 1986 1988 1990 1992 1994 1996 1998 1999 2000Total agriculture 93.0 94.3 104.5 89.6 85.3 100.0 111.8 115.3 128.6 129.9Food 88.6 89.8 101.5 87.5 85.2 100.0 110.5 116.5 129.7 130.0Cereals 85.2 82.6 105.2 77.3 63.3 100.0 90.8 108.5 129.1 120.3
Source: FAOSTAT, 2002.
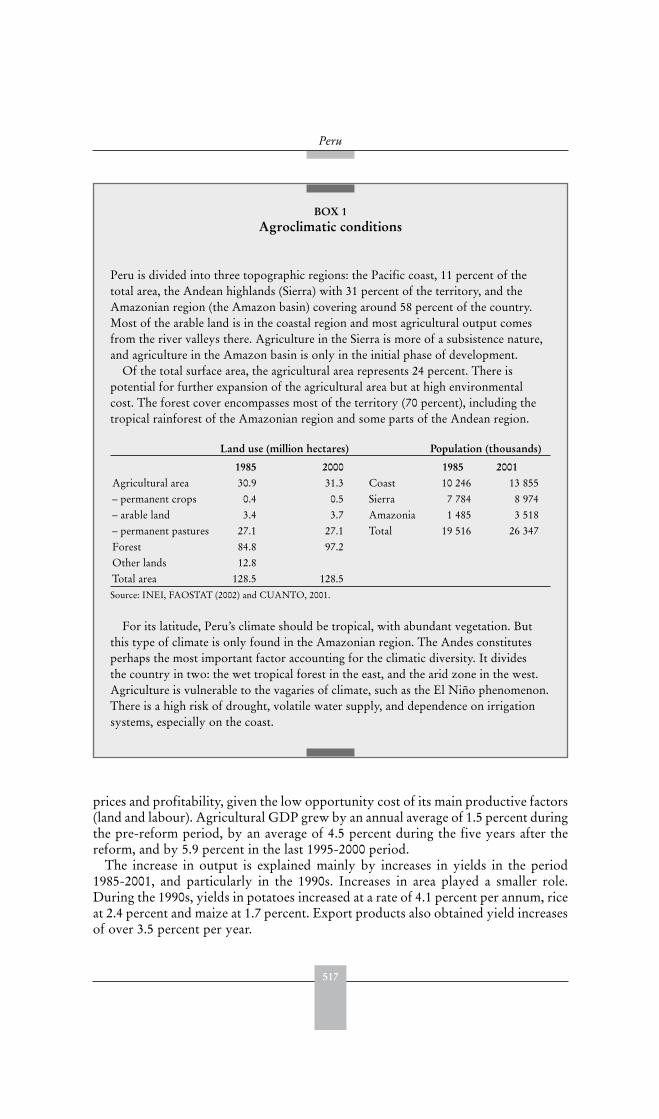
517
Peru
BOX 1Agroclimatic conditions
Peru is divided into three topographic regions: the Pacific coast, 11 percent of thetotal area, the Andean highlands (Sierra) with 31 percent of the territory, and theAmazonian region (the Amazon basin) covering around 58 percent of the country.Most of the arable land is in the coastal region and most agricultural output comesfrom the river valleys there. Agriculture in the Sierra is more of a subsistence nature,and agriculture in the Amazon basin is only in the initial phase of development.
Of the total surface area, the agricultural area represents 24 percent. There ispotential for further expansion of the agricultural area but at high environmentalcost. The forest cover encompasses most of the territory (70 percent), including thetropical rainforest of the Amazonian region and some parts of the Andean region.
Land use (million hectares) Population (thousands)
1985 2000 1985 2001Agricultural area 30.9 31.3 Coast 10 246 13 855– permanent crops 0.4 0.5 Sierra 7 784 8 974– arable land 3.4 3.7 Amazonia 1 485 3 518– permanent pastures 27.1 27.1 Total 19 516 26 347Forest 84.8 97.2Other lands 12.8Total area 128.5 128.5Source: INEI, FAOSTAT (2002) and CUANTO, 2001.
For its latitude, Peru’s climate should be tropical, with abundant vegetation. Butthis type of climate is only found in the Amazonian region. The Andes constitutesperhaps the most important factor accounting for the climatic diversity. It dividesthe country in two: the wet tropical forest in the east, and the arid zone in the west.Agriculture is vulnerable to the vagaries of climate, such as the El Niño phenomenon.There is a high risk of drought, volatile water supply, and dependence on irrigationsystems, especially on the coast.
prices and profitability, given the low opportunity cost of its main productive factors(land and labour). Agricultural GDP grew by an annual average of 1.5 percent duringthe pre-reform period, by an average of 4.5 percent during the five years after thereform, and by 5.9 percent in the last 1995-2000 period.
The increase in output is explained mainly by increases in yields in the period1985-2001, and particularly in the 1990s. Increases in area played a smaller role.During the 1990s, yields in potatoes increased at a rate of 4.1 percent per annum, riceat 2.4 percent and maize at 1.7 percent. Export products also obtained yield increasesof over 3.5 percent per year.
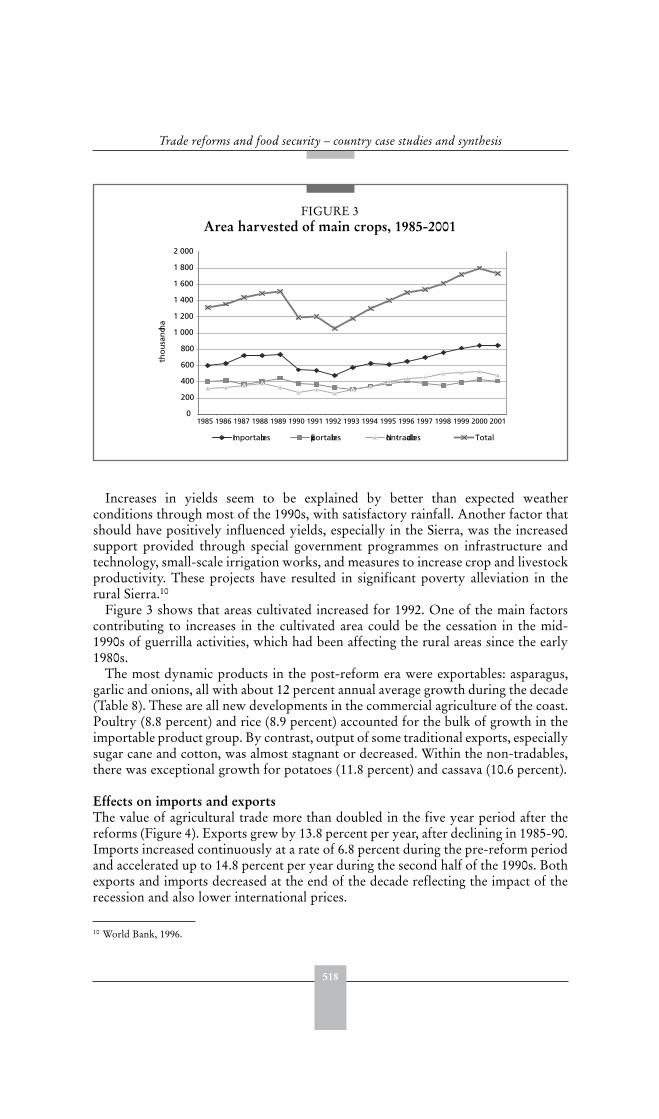
518
Trade reforms and food security – country case studies and synthesis
Increases in yields seem to be explained by better than expected weatherconditions through most of the 1990s, with satisfactory rainfall. Another factor thatshould have positively influenced yields, especially in the Sierra, was the increasedsupport provided through special government programmes on infrastructure andtechnology, small-scale irrigation works, and measures to increase crop and livestockproductivity. These projects have resulted in significant poverty alleviation in therural Sierra.10
Figure 3 shows that areas cultivated increased for 1992. One of the main factorscontributing to increases in the cultivated area could be the cessation in the mid-1990s of guerrilla activities, which had been affecting the rural areas since the early1980s.
The most dynamic products in the post-reform era were exportables: asparagus,garlic and onions, all with about 12 percent annual average growth during the decade(Table 8). These are all new developments in the commercial agriculture of the coast.Poultry (8.8 percent) and rice (8.9 percent) accounted for the bulk of growth in theimportable product group. By contrast, output of some traditional exports, especiallysugar cane and cotton, was almost stagnant or decreased. Within the non-tradables,there was exceptional growth for potatoes (11.8 percent) and cassava (10.6 percent).
Effects on imports and exportsThe value of agricultural trade more than doubled in the five year period after thereforms (Figure 4). Exports grew by 13.8 percent per year, after declining in 1985-90.Imports increased continuously at a rate of 6.8 percent during the pre-reform periodand accelerated up to 14.8 percent per year during the second half of the 1990s. Bothexports and imports decreased at the end of the decade reflecting the impact of therecession and also lower international prices.
10 World Bank, 1996.
FIGURE 3Area harvested of main crops, 1985-2001
0
200
400
600
800
1 000
1 200
1 400
1 600
1 800
2 000
1985 1986 1987 1988 1989 1990 1991 1992 1993 1994 1995 1996 1997 1998 1999 2000 2001
tho
usa
nd h
a
Importables Exportables Non-tradables Total
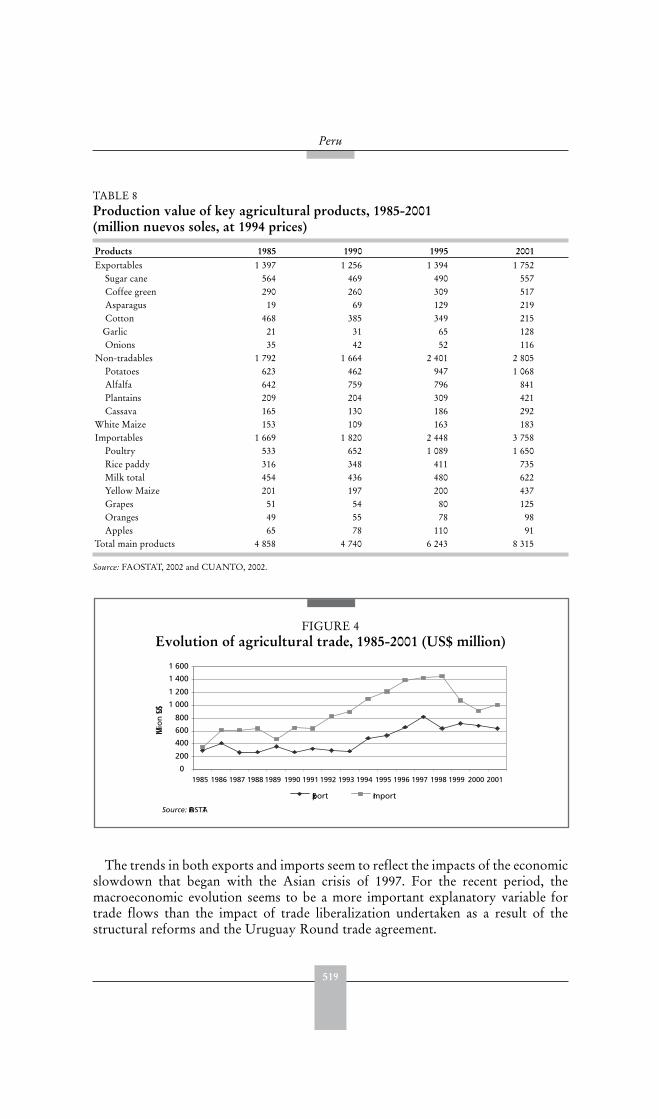
519
Peru
The trends in both exports and imports seem to reflect the impacts of the economicslowdown that began with the Asian crisis of 1997. For the recent period, themacroeconomic evolution seems to be a more important explanatory variable fortrade flows than the impact of trade liberalization undertaken as a result of thestructural reforms and the Uruguay Round trade agreement.
TABLE 8 Production value of key agricultural products, 1985-2001(million nuevos soles, at 1994 prices)
Products 1985 1990 1995 2001Exportables 1 397 1 256 1 394 1 752 Sugar cane 564 469 490 557 Coffee green 290 260 309 517 Asparagus 19 69 129 219 Cotton 468 385 349 215 Garlic 21 31 65 128 Onions 35 42 52 116Non-tradables 1 792 1 664 2 401 2 805 Potatoes 623 462 947 1 068 Alfalfa 642 759 796 841 Plantains 209 204 309 421 Cassava 165 130 186 292White Maize 153 109 163 183Importables 1 669 1 820 2 448 3 758 Poultry 533 652 1 089 1 650 Rice paddy 316 348 411 735 Milk total 454 436 480 622 Yellow Maize 201 197 200 437 Grapes 51 54 80 125 Oranges 49 55 78 98 Apples 65 78 110 91Total main products 4 858 4 740 6 243 8 315
Source: FAOSTAT, 2002 and CUANTO, 2002.
FIGURE 4Evolution of agricultural trade, 1985-2001 (US$ million)
Source: FAOSTAT
0
200
400
600
800
1 000
1 200
1 400
1 600
1985 1986 1987 1988 1989 1990 1991 1992 1993 1994 1995 1996 1997 1998 1999 2000 2001
Millio
n US
$
Export Import

520
Trade reforms and food security – country case studies and synthesis
It is noteworthy that the chronic agricultural trade deficit turns into a significantsurplus in the food trade balance if exports of fishing products are included.
Six products make up 95 percent of the food import basket: wheat, yellow maize,milk, soybean oil, rice, and sugar (Table 9). The commodities with above averageimport growth in 1985-2001 were soybean oil (8.7 percent), maize (8.0 percent), andrice (7.1 percent). Food import increases in the 1990s were a lagged response to thedecline in per capita food production from 1988 to 1992. At the start of the reformera, problems with foreign exchange availability and income contraction containedfood import demand. Dependence on donated food imports increased.11
Agricultural exports have diversified in the last fifteen years. In 1985, there wereonly 70 items in the agricultural export list. Many new products have been addedto the list including asparagus, mangoes, onions and beans. In the year 2000, therewere 180 items.
In summary, trade and related reforms have substantially changed the incentiveframework in the agricultural sector and have impacted negatively on agriculturalprices. Even though the estimates could be somewhat exaggerated, the magnitudeof the agricultural relative price decline is so large that there is no doubt about its
11 See Riordan et al., 1994.
TABLE 9 Main agricultural imports, 1985-2001 (US$ million)
Maize Milk Soybean oil Rice Sugar Wheat Total1985 36 33 26 3 0 128 2251990 72 42 29 109 61 125 4391993 75 79 52 111 91 181 5891995 139 108 60 69 91 286 7531997 153 122 97 148 102 245 8672000 97 68 52 27 47 171 4622001 98 69 80 17 56 202 523
Source: FAOSTAT; CUANTO, 2002.
TABLE 10 Main agricultural exports, 1985-2001 (US$ million)
Products 1985 1990 1995 2001Coffee green 144.7 98.2 278.4 180.1Vegetables processed 6.3 22.1 71.9 95.5Asparagus 2.3 5.1 23.9 64.1Mangoes 1.5 2.2 6.9 26.8Sugar 24.1 36.5 30.2 16.8Onions - - - 14.0Beans dry 1.5 1.0 11.9 11.0Cocoa butter 13.6 7.7 7.4 6.8White Maize 0.7 2.1 4.1 5.0Cotton lint 51.8 30.3 7.1 4.7Total sample 246.5 205.2 441.8 424.8Percentage of agricultural exports 82.4 74.6 82.6 66.
Source: FAOSTAT, 2002 and CUANTO, 2002.
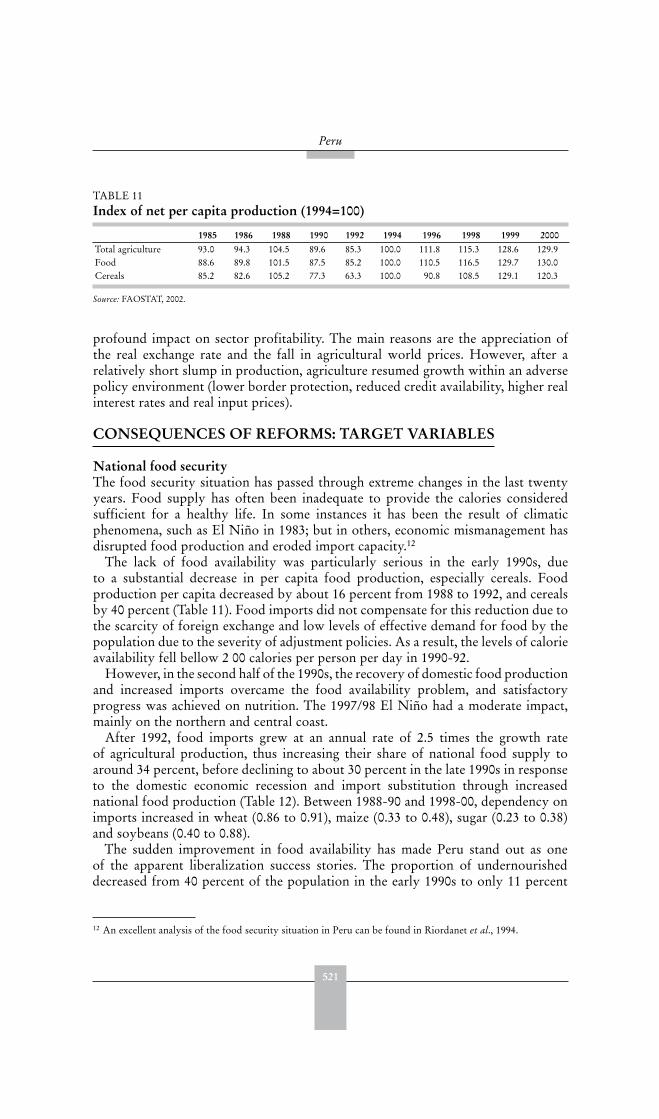
521
Peru
profound impact on sector profitability. The main reasons are the appreciation ofthe real exchange rate and the fall in agricultural world prices. However, after arelatively short slump in production, agriculture resumed growth within an adversepolicy environment (lower border protection, reduced credit availability, higher realinterest rates and real input prices).
CONSEQUENCES OF REFORMS: TARGET VARIABLES
National food securityThe food security situation has passed through extreme changes in the last twentyyears. Food supply has often been inadequate to provide the calories consideredsufficient for a healthy life. In some instances it has been the result of climaticphenomena, such as El Niño in 1983; but in others, economic mismanagement hasdisrupted food production and eroded import capacity.12
The lack of food availability was particularly serious in the early 1990s, dueto a substantial decrease in per capita food production, especially cereals. Foodproduction per capita decreased by about 16 percent from 1988 to 1992, and cerealsby 40 percent (Table 11). Food imports did not compensate for this reduction due tothe scarcity of foreign exchange and low levels of effective demand for food by thepopulation due to the severity of adjustment policies. As a result, the levels of calorieavailability fell bellow 2 00 calories per person per day in 1990-92.
However, in the second half of the 1990s, the recovery of domestic food productionand increased imports overcame the food availability problem, and satisfactoryprogress was achieved on nutrition. The 1997/98 El Niño had a moderate impact,mainly on the northern and central coast.
After 1992, food imports grew at an annual rate of 2.5 times the growth rateof agricultural production, thus increasing their share of national food supply toaround 34 percent, before declining to about 30 percent in the late 1990s in responseto the domestic economic recession and import substitution through increasednational food production (Table 12). Between 1988-90 and 1998-00, dependency onimports increased in wheat (0.86 to 0.91), maize (0.33 to 0.48), sugar (0.23 to 0.38)and soybeans (0.40 to 0.88).
The sudden improvement in food availability has made Peru stand out as oneof the apparent liberalization success stories. The proportion of undernourisheddecreased from 40 percent of the population in the early 1990s to only 11 percent
12 An excellent analysis of the food security situation in Peru can be found in Riordanet et al., 1994.
TABLE 11 Index of net per capita production (1994=100)
1985 1986 1988 1990 1992 1994 1996 1998 1999 2000Total agriculture 93.0 94.3 104.5 89.6 85.3 100.0 111.8 115.3 128.6 129.9Food 88.6 89.8 101.5 87.5 85.2 100.0 110.5 116.5 129.7 130.0Cereals 85.2 82.6 105.2 77.3 63.3 100.0 90.8 108.5 129.1 120.3
Source: FAOSTAT, 2002.
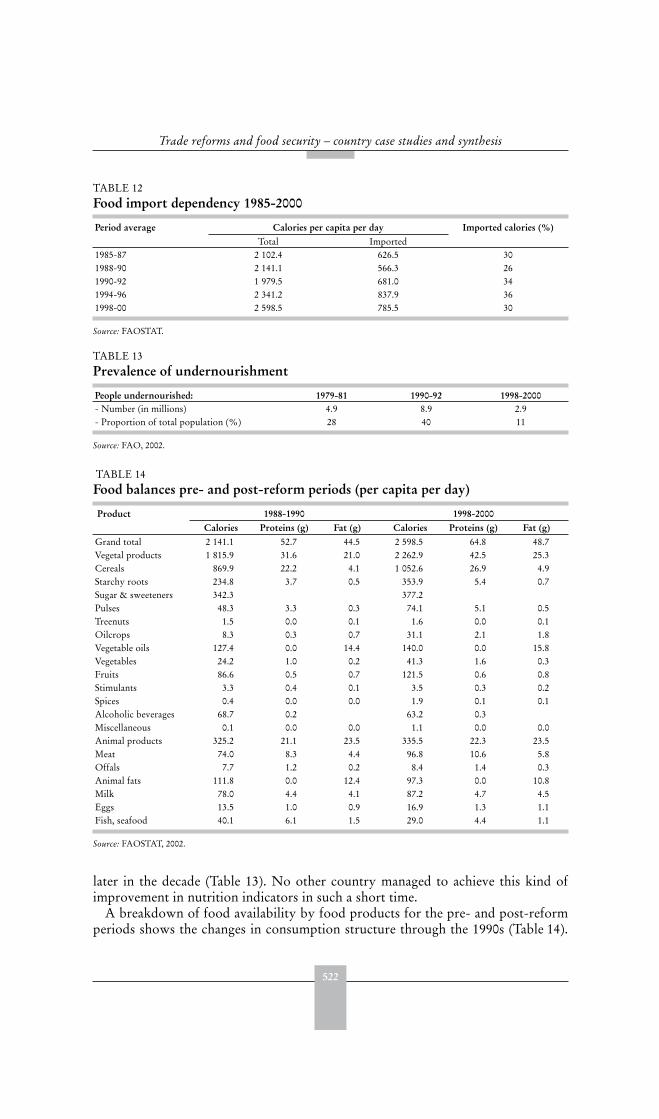
522
Trade reforms and food security – country case studies and synthesis
later in the decade (Table 13). No other country managed to achieve this kind ofimprovement in nutrition indicators in such a short time.
A breakdown of food availability by food products for the pre- and post-reformperiods shows the changes in consumption structure through the 1990s (Table 14).
TABLE 12 Food import dependency 1985-2000
Period average Calories per capita per day Imported calories (%)Total Imported
1985-87 2 102.4 626.5 301988-90 2 141.1 566.3 261990-92 1 979.5 681.0 341994-96 2 341.2 837.9 361998-00 2 598.5 785.5 30
Source: FAOSTAT.
TABLE 13 Prevalence of undernourishment
People undernourished: 1979-81 1990-92 1998-2000- Number (in millions) 4.9 8.9 2.9- Proportion of total population (%) 28 40 11
Source: FAO, 2002.
TABLE 14 Food balances pre- and post-reform periods (per capita per day)
Product 1988-1990 1998-2000Calories Proteins (g) Fat (g) Calories Proteins (g) Fat (g)
Grand total 2 141.1 52.7 44.5 2 598.5 64.8 48.7Vegetal products 1 815.9 31.6 21.0 2 262.9 42.5 25.3Cereals 869.9 22.2 4.1 1 052.6 26.9 4.9Starchy roots 234.8 3.7 0.5 353.9 5.4 0.7Sugar & sweeteners 342.3 377.2Pulses 48.3 3.3 0.3 74.1 5.1 0.5Treenuts 1.5 0.0 0.1 1.6 0.0 0.1Oilcrops 8.3 0.3 0.7 31.1 2.1 1.8Vegetable oils 127.4 0.0 14.4 140.0 0.0 15.8Vegetables 24.2 1.0 0.2 41.3 1.6 0.3Fruits 86.6 0.5 0.7 121.5 0.6 0.8Stimulants 3.3 0.4 0.1 3.5 0.3 0.2Spices 0.4 0.0 0.0 1.9 0.1 0.1Alcoholic beverages 68.7 0.2 63.2 0.3Miscellaneous 0.1 0.0 0.0 1.1 0.0 0.0Animal products 325.2 21.1 23.5 335.5 22.3 23.5Meat 74.0 8.3 4.4 96.8 10.6 5.8Offals 7.7 1.2 0.2 8.4 1.4 0.3Animal fats 111.8 0.0 12.4 97.3 0.0 10.8Milk 78.0 4.4 4.1 87.2 4.7 4.5Eggs 13.5 1.0 0.9 16.9 1.3 1.1Fish, seafood 40.1 6.1 1.5 29.0 4.4 1.1
Source: FAOSTAT, 2002.
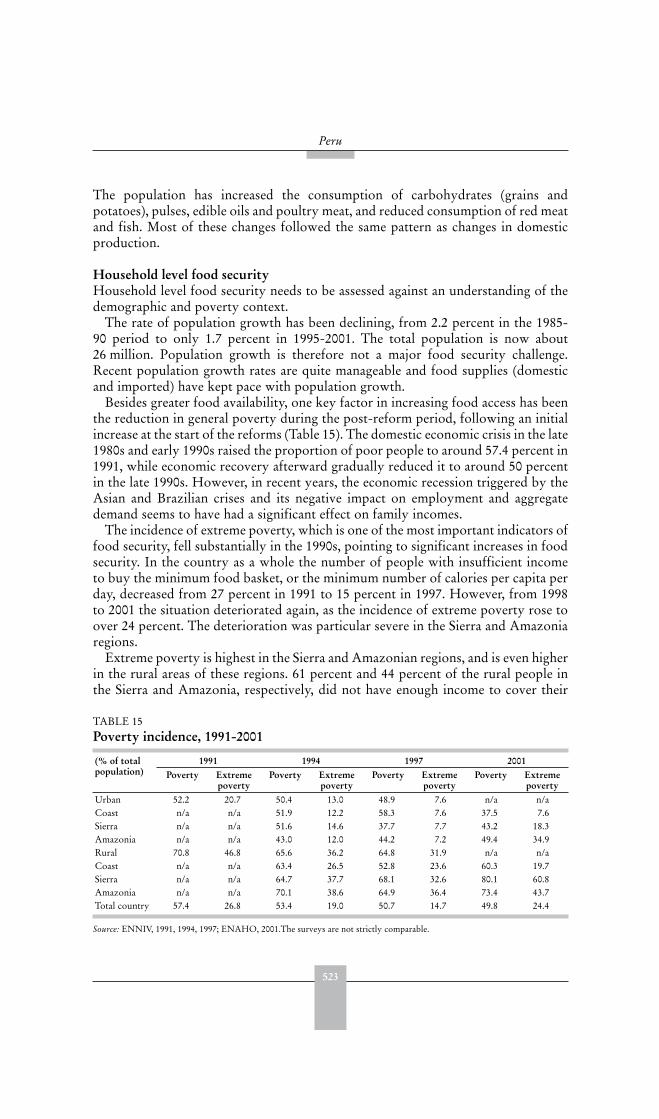
523
Peru
The population has increased the consumption of carbohydrates (grains andpotatoes), pulses, edible oils and poultry meat, and reduced consumption of red meatand fish. Most of these changes followed the same pattern as changes in domesticproduction.
Household level food securityHousehold level food security needs to be assessed against an understanding of thedemographic and poverty context.
The rate of population growth has been declining, from 2.2 percent in the 1985-90 period to only 1.7 percent in 1995-2001. The total population is now about26 million. Population growth is therefore not a major food security challenge.Recent population growth rates are quite manageable and food supplies (domesticand imported) have kept pace with population growth.
Besides greater food availability, one key factor in increasing food access has beenthe reduction in general poverty during the post-reform period, following an initialincrease at the start of the reforms (Table 15). The domestic economic crisis in the late1980s and early 1990s raised the proportion of poor people to around 57.4 percent in1991, while economic recovery afterward gradually reduced it to around 50 percentin the late 1990s. However, in recent years, the economic recession triggered by theAsian and Brazilian crises and its negative impact on employment and aggregatedemand seems to have had a significant effect on family incomes.
The incidence of extreme poverty, which is one of the most important indicators offood security, fell substantially in the 1990s, pointing to significant increases in foodsecurity. In the country as a whole the number of people with insufficient incometo buy the minimum food basket, or the minimum number of calories per capita perday, decreased from 27 percent in 1991 to 15 percent in 1997. However, from 1998to 2001 the situation deteriorated again, as the incidence of extreme poverty rose toover 24 percent. The deterioration was particular severe in the Sierra and Amazoniaregions.
Extreme poverty is highest in the Sierra and Amazonian regions, and is even higherin the rural areas of these regions. 61 percent and 44 percent of the rural people inthe Sierra and Amazonia, respectively, did not have enough income to cover their
TABLE 15 Poverty incidence, 1991-2001
(% of total population)
1991 1994 1997 2001Poverty Extreme
povertyPoverty Extreme
povertyPoverty Extreme
povertyPoverty Extreme
povertyUrban 52.2 20.7 50.4 13.0 48.9 7.6 n/a n/aCoast n/a n/a 51.9 12.2 58.3 7.6 37.5 7.6Sierra n/a n/a 51.6 14.6 37.7 7.7 43.2 18.3Amazonia n/a n/a 43.0 12.0 44.2 7.2 49.4 34.9Rural 70.8 46.8 65.6 36.2 64.8 31.9 n/a n/aCoast n/a n/a 63.4 26.5 52.8 23.6 60.3 19.7Sierra n/a n/a 64.7 37.7 68.1 32.6 80.1 60.8Amazonia n/a n/a 70.1 38.6 64.9 36.4 73.4 43.7Total country 57.4 26.8 53.4 19.0 50.7 14.7 49.8 24.4
Source: ENNIV, 1991, 1994, 1997; ENAHO, 2001.The surveys are not strictly comparable.
524
Trade reforms and food security – country case studies and synthesis
essential food needs in 2001. Loreto, Amazonas, Cajamarca, Pasco, Ucayali arethe provinces (departments) with the highest incidence of extreme poverty, whilstHuancavelica, Pasco, Puno, Ayacucho, and Loreto have the highest incidence ofgeneral poverty. Both the general poverty and the extreme poverty indices are high inthose departments in which large parts of the population speak their native languagerather than Spanish (Quechua, Aymara, and Amazonian dialects).
Poverty in rural areas has been higher than in urban areas. The percentage of poorpeople in rural areas is over 60 percent in all regions. In absolute terms, the total poorpopulation in the urban areas grew significantly over the years and exceeded that ofthe rural areas in 2000. Due to the concentration of the population in cities the actualnumber of poor people is higher in the urban areas.
Relating agricultural sector performance to household food securityReforms in the agriculture sector can be analysed in terms of how they have beentranslated into changes in the incomes of small farm households. This sectionconsiders the case of small farmers with landholdings below 5 hectares, because theyconstitute the great majority of farmers (over 70 percent of total producers), andface a higher risk of food insecurity. The data used comes mainly from three sources:(i) the Agricultural Census (INEI) of 1994; (ii) the Statistical Office of the Ministryof Agriculture; and (iii) a small farmers survey in selected regions. The Departmentsof Piura (Coast), San Martin (Amazonia), and Cusco and Puno (Sierra) were selectedas being representative of the socio-economic and geographic diversity within thesmall farm sector.
Income composition in small farm householdsChanges in the relative importance of different sources of farm household incomehave occurred since the reforms. The main activity in the rural areas and the mainsource of income for rural households is agriculture, although other sources of ruralemployment and income are growing in importance.13 The proportion of householdlabour dedicated to agricultural activities has decreased since the reforms in favour ofnon-agricultural activities within the household (textiles, handicrafts and other). Theproportion of labour allocated to wage-employment increased in 1994 but returnedto their pre-reform levels in 1997 (Table 16).
The rural household income structure derived from the labour allocation for1997, results in an even higher role for non-agricultural activities due to their highermonetary return (Table 17).
The results of a 2003 survey of small farmers produced very similar results interms of the relative importance of the various sources and their differences betweenregions. The survey also suggests that non-agricultural incomes are particularlyimportant for farmers with less than one hectare, independently of crop and region.
Although the crop portfolio has not varied much through the decade, the useof family labour (as opposed to hired labour) has intensified and the importanceof income diversification strategies has increased. This was needed in order toconfront falling agricultural prices, falling wages, and the price increases of industrialproducts.
13 Reardon et al., 1998.

525
Peru
The structural adjustment policies have not created incentives for small commercialfarmers or peasants. The economic environment generated by those policies mayhave led to increased use of family labour and/or an increase in the proportion ofoutput consumed by the farm household.
Income from agricultural outputThe reform programmes have affected farmer’s income directly though their impacton the relative prices of the products and services they sell and buy, and indirectly,through their effect on national income and aggregate demand for the products ofthe sector. The magnitude of these impacts can differ between farm householdsdepending on characteristics, such as its status as net food producer or consumer;its production mix between tradable and non-tradable products; and the specificcombination of products within the production basket.
TABLE 16 Labour allocation of rural households, 1985-1997 ( percent of households)
Year 1985-1986 1994 1997Self-employed: 90.4 87.4 90.5Agricultural activities 75.8 62.3 64.7Non-agricultural activities 14.6 25.1 25.8Wage-employed: 9.6 12.6 9.5Agricultural activities 4.3 6.2 4.8Non-agricultural activities 5.3 6.5 4.7
Source: Escobal et al., 2002.
TABLE 17 Composition of rural household income (1997)
Region Income, non- agriculture self-
employment(%)
Income, non- agriculture wage
employment(%)
Income,agriculture
on-farm(%)
Income,agriculture
off-farm(%)
Total income
Coast 14.5 6.6 67.6 11.4 100Sierra 34.8 18.3 41.6 5.3 100Amazonia 26.3 10.3 56.5 6.9 100Rural Peru 29.7 14.6 49.0 6.7 100
Source: Escobal et al., 2002.
TABLE 18 Agricultural holdings according to farm size, 1994
Category Criteria Area Agricultural unitsNumber %
Below subsistence Productive potential insufficient for foodprovision for family.
< 0.99 ha 423 263 34.5
Subsistence level Productive potential exceeds food requirements,but is insufficient to generate a revolving fund.
1 to 2.99 ha 544 287 44.3
Commercial Unit is able to generate a surplus above foodneeds and maintain working capital.
3 to 5 ha 260 790 21.2
Total 1 228 340 100.0
Source: INEI, 1994. Classification adapted from Schejtman, 1998.

526
Trade reforms and food security – country case studies and synthesis
Producers of tradable goods are much more closely linked to the world market andmore directly affected by changes in trade related policies. A combination of reducedborder protection with domestic currency appreciation should have depresseddomestic prices of tradable goods relatively to non-tradable goods. Prices of thelatter mainly depend on the dynamism of domestic demand, but could be affectedindirectly by trade measures through their impact on some tradable substitutes inproduction and consumption. Most small farmers in the Sierra region concentrate onnon-tradable products, while the coastal farmers produce mostly tradable goods.
However, given that agricultural products in the same categories described havebeen subject to different degrees of specific government interventions in the pre-reform period and that their effective implementation has varied between regions, theimpact of trade reform measures would depend greatly on the specific compositionof the production basket and the location of the small farm household.
Real prices for production baskets of selected small farm householdsTo follow the impact of the reform package on farm income, production baskets forsmall farm households in the selected regions have been identified according to theaverage product composition registered in the 1994 Agricultural Census. The fourcrops most cultivated by small farm units in each region were included in a simplifiedproduction basket.
The composition of the production basket in the Sierra differs totally from thebaskets of the Coast and Amazonian regions, which have many common items(Table 19). Three of the four main products produced by small farmers in Piura inthe Coast region (yellow maize, cotton, and rice) were tradable goods, while in theSierra in Cusco (white maize, potatoes, and lima bean) and Puno (potatoes, quinua,and lima bean) much of the production basket consists of non-tradables. In SanMartin, its main products were equally divided between tradable (yellow maize, rice)and non-tradable items (plantain and cassava).
Real price indices for small farm products in the selected regions were estimatedfor the period 1985-2000, using the production baskets and weights assigned tothem according to their relative importance in the total volume of production of thecorresponding region.
The demand-push policies plus generous price support measures for some staplesin the early pre-reform period resulted in substantial increases in average farmprices, but for a short period only. During 1985-87, real prices of the small farmer’sproduction baskets in Cusco and Puno, consisting mainly of non-tradable crops,increased by around 40 percent with respect to the initial year. Small farmers inSan Martin also enjoyed real price increases of similar magnitude, but due mainlyto an additional incentive through the pan-territorial price support setting by thestate marketing agencies: ENCI (for yellow maize) and ECASA (for rice) gave animplicit transport subsidy for Amazonian production, most of which was broughtfor processing or consumption to the coast. This explains why basic products in SanMartin had higher local price increases than the same products in Piura during thatperiod.
From 1988 to 1991, real price indices of all regional agricultural production basketsdropped abruptly relatively to all other prices in the economy. The main factorsthat help to explain this are: (i) the relaxation of general price freezing, established
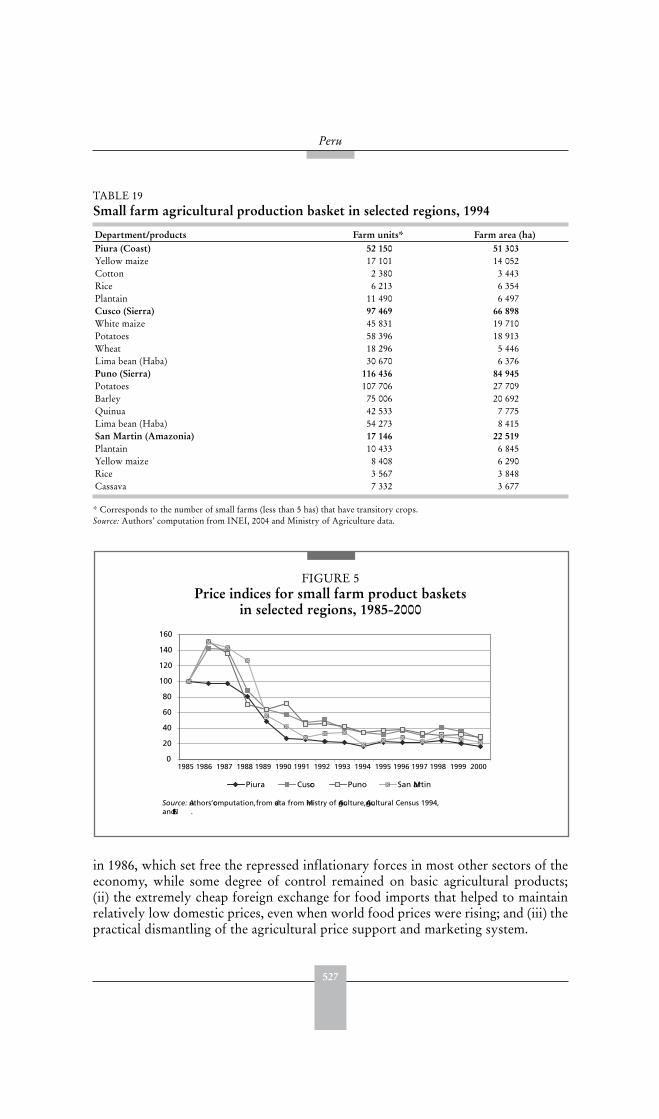
527
Peru
in 1986, which set free the repressed inflationary forces in most other sectors of theeconomy, while some degree of control remained on basic agricultural products;(ii) the extremely cheap foreign exchange for food imports that helped to maintainrelatively low domestic prices, even when world food prices were rising; and (iii) thepractical dismantling of the agricultural price support and marketing system.
TABLE 19 Small farm agricultural production basket in selected regions, 1994
Department/products Farm units* Farm area (ha)Piura (Coast) 52 150 51 303Yellow maize 17 101 14 052Cotton 2 380 3 443Rice 6 213 6 354Plantain 11 490 6 497Cusco (Sierra) 97 469 66 898White maize 45 831 19 710Potatoes 58 396 18 913Wheat 18 296 5 446Lima bean (Haba) 30 670 6 376Puno (Sierra) 116 436 84 945Potatoes 107 706 27 709Barley 75 006 20 692Quinua 42 533 7 775Lima bean (Haba) 54 273 8 415San Martin (Amazonia) 17 146 22 519Plantain 10 433 6 845Yellow maize 8 408 6 290Rice 3 567 3 848Cassava 7 332 3 677
* Corresponds to the number of small farms (less than 5 has) that have transitory crops.Source: Authors’ computation from INEI, 2004 and Ministry of Agriculture data.
FIGURE 5Price indices for small farm product baskets
in selected regions, 1985-2000
Source: Authors’ computation, from data from Ministry of Agriculture, Agricultural Census 1994, and INEI .
0
20
40
60
80
100
120
140
160
1985 1986 1987 1988 1989 1990 1991 1992 1993 1994 1995 1996 1997 1998 1999 2000
Piura Cusco Puno San Martin

528
Trade reforms and food security – country case studies and synthesis
In much of the post-reform period, with liberalized agricultural trade and reduceddirect government intervention in agriculture, regional prices have behaved mainlyas a function of domestic supply and demand and, in the case of tradable products,as a function of the real exchange rate and world prices, as shown in the sectionabove. However, some price intervention has been exercised by the Government tocope with situations of critical excess supply in potatoes and rice, through increasedpurchases by PRONAA.
In short, real prices faced by small farmers were drastically reduced by the pre-reform policies, and have not recovered since. Prices for small farmers from Cuscoand Puno were less affected than those from Piura, possibly due to the former’sgreater involvement in the production of non-tradables compared to the latter’sfocus on tradables. In between lay the San Martin prices, which grew a much morebalanced mix of tradable and non-tradable products. In addition, given the highpercentage of the production of small farmers in Puno and Cusco whose householdconsumed their own production, these price changes will have little effect on theirreal income.
Production trends for small farm products in selected regionsGrowth in the main products of the selected regions has been irregular, but with apositive trend in most during the post-reform period. This follows the general trendobserved earlier for overall agricultural production (Table 20).
There was a general increase in yields, although in some cases it was not themain factor explaining production growth. Exceptionally good weather in the mainproduction areas after 1992 and improved technical assistance from FONCODESand PRONAMACHS, as well as investment in rural roads, could have influencedthis positive trend.
Puno had an extraordinary increase in production volumes, close to a 20 percentannual average during the 1990s, especially based on increases in planted area, mainlyusing land previously under natural pasture. Improved weather conditions afterthe 1992 drought and increased use of improved varieties and cultivation practices
TABLE 20 Production, area harvested and yield indices in selected regions, 1985-2000 (index numbers)
1985 1987 1988 1990 1991 1992 1994 1995 1997 1998 2000Piura Production 100.0 80.4 115.0 127.3 89.4 79.9 97.8 100.1 98.6 52.4 104.8
Area 100.0 109.7 104.1 120.3 92.7 105.6 94.5 82.1 86.7 63.0 93.4Yields 100.0 73.3 110.5 105.9 96.5 75.6 103.4 121.8 113.7 83.2 112.1
Cusco Production 100.0 87.1 118.4 69.4 86.2 79.9 149.7 134.9 102.2 98.9 121.3Area 100.0 119.8 120.0 95.1 106.7 91.0 118.8 105.5 100.9 104.8 117.5Yields 100.0 72.8 98.7 73.1 80.8 87.8 126.0 127.9 101.3 94.3 103.2
Puno Production 100.0 55.0 97.0 23.9 71.5 31.8 148.0 117.3 135.3 158.8 201.0Area 100.0 83.8 115.4 38.2 98.2 52.2 119.9 112.8 128.4 144.3 143.7Yields 100.0 65.7 84.1 62.6 72.9 60.9 123.4 104.0 105.4 110.0 139.8
San Martin Production 100.0 110.5 124.1 83.0 77.3 62.5 79.9 72.5 124.6 159.8 160.7Area 100.0 108.0 114.9 64.1 55.9 49.7 58.4 48.1 82.3 104.5 106.5Yields 100.0 102.3 108.0 129.5 138.4 125.9 136.9 150.8 151.3 152.9 150.9
Source: Authors’ computation, from Ministry of Agriculture data.
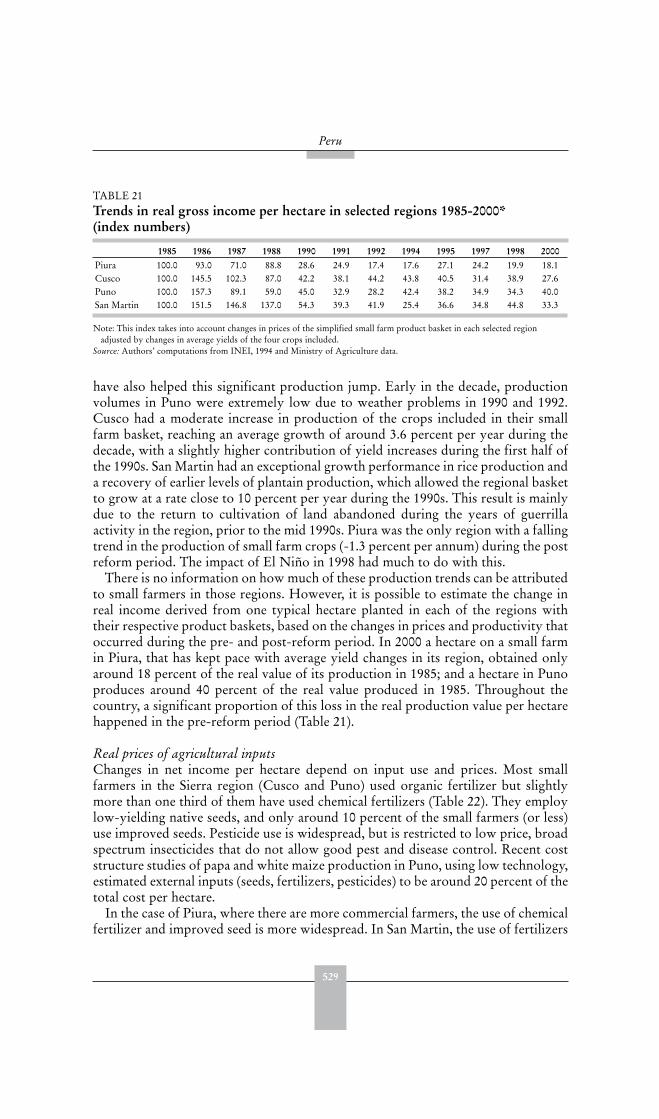
529
Peru
have also helped this significant production jump. Early in the decade, productionvolumes in Puno were extremely low due to weather problems in 1990 and 1992.Cusco had a moderate increase in production of the crops included in their smallfarm basket, reaching an average growth of around 3.6 percent per year during thedecade, with a slightly higher contribution of yield increases during the first half ofthe 1990s. San Martin had an exceptional growth performance in rice production anda recovery of earlier levels of plantain production, which allowed the regional basketto grow at a rate close to 10 percent per year during the 1990s. This result is mainlydue to the return to cultivation of land abandoned during the years of guerrillaactivity in the region, prior to the mid 1990s. Piura was the only region with a fallingtrend in the production of small farm crops (-1.3 percent per annum) during the postreform period. The impact of El Niño in 1998 had much to do with this.
There is no information on how much of these production trends can be attributedto small farmers in those regions. However, it is possible to estimate the change inreal income derived from one typical hectare planted in each of the regions withtheir respective product baskets, based on the changes in prices and productivity thatoccurred during the pre- and post-reform period. In 2000 a hectare on a small farmin Piura, that has kept pace with average yield changes in its region, obtained onlyaround 18 percent of the real value of its production in 1985; and a hectare in Punoproduces around 40 percent of the real value produced in 1985. Throughout thecountry, a significant proportion of this loss in the real production value per hectarehappened in the pre-reform period (Table 21).
Real prices of agricultural inputsChanges in net income per hectare depend on input use and prices. Most smallfarmers in the Sierra region (Cusco and Puno) used organic fertilizer but slightlymore than one third of them have used chemical fertilizers (Table 22). They employlow-yielding native seeds, and only around 10 percent of the small farmers (or less)use improved seeds. Pesticide use is widespread, but is restricted to low price, broadspectrum insecticides that do not allow good pest and disease control. Recent coststructure studies of papa and white maize production in Puno, using low technology,estimated external inputs (seeds, fertilizers, pesticides) to be around 20 percent of thetotal cost per hectare.
In the case of Piura, where there are more commercial farmers, the use of chemicalfertilizer and improved seed is more widespread. In San Martin, the use of fertilizers
TABLE 21 Trends in real gross income per hectare in selected regions 1985-2000*(index numbers)
1985 1986 1987 1988 1990 1991 1992 1994 1995 1997 1998 2000Piura 100.0 93.0 71.0 88.8 28.6 24.9 17.4 17.6 27.1 24.2 19.9 18.1Cusco 100.0 145.5 102.3 87.0 42.2 38.1 44.2 43.8 40.5 31.4 38.9 27.6Puno 100.0 157.3 89.1 59.0 45.0 32.9 28.2 42.4 38.2 34.9 34.3 40.0San Martin 100.0 151.5 146.8 137.0 54.3 39.3 41.9 25.4 36.6 34.8 44.8 33.3
Note: This index takes into account changes in prices of the simplified small farm product basket in each selected regionadjusted by changes in average yields of the four crops included.
Source: Authors’ computations from INEI, 1994 and Ministry of Agriculture data.
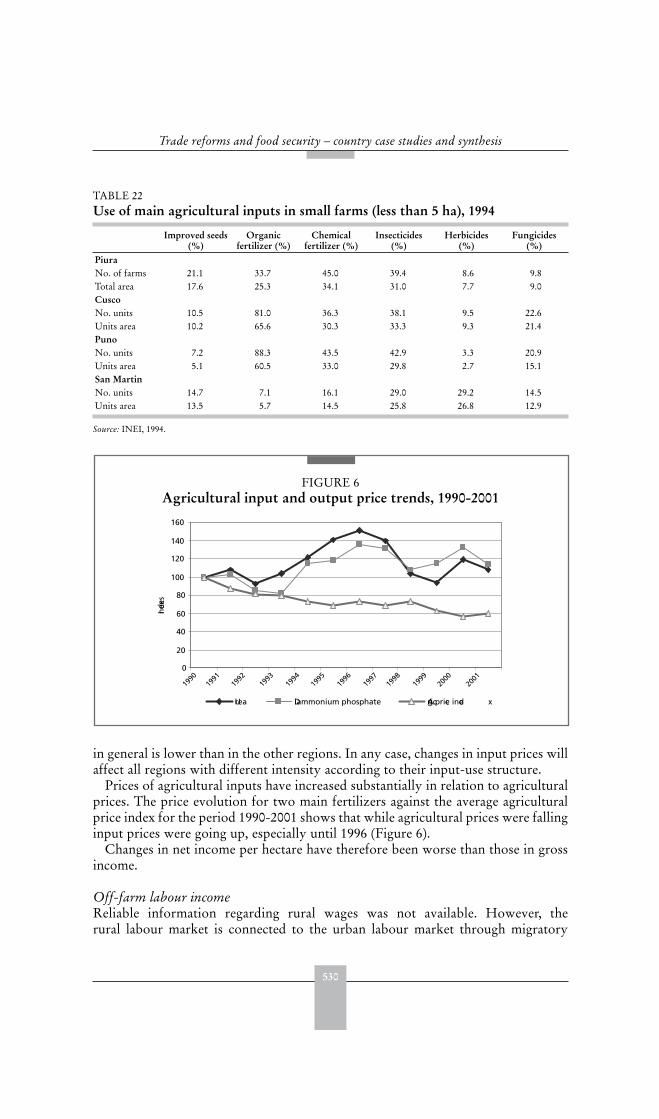
530
Trade reforms and food security – country case studies and synthesis
in general is lower than in the other regions. In any case, changes in input prices willaffect all regions with different intensity according to their input-use structure.
Prices of agricultural inputs have increased substantially in relation to agriculturalprices. The price evolution for two main fertilizers against the average agriculturalprice index for the period 1990-2001 shows that while agricultural prices were fallinginput prices were going up, especially until 1996 (Figure 6).
Changes in net income per hectare have therefore been worse than those in grossincome.
Off-farm labour incomeReliable information regarding rural wages was not available. However, therural labour market is connected to the urban labour market through migratory
TABLE 22 Use of main agricultural inputs in small farms (less than 5 ha), 1994
Improved seeds (%)
Organic fertilizer (%)
Chemicalfertilizer (%)
Insecticides(%)
Herbicides(%)
Fungicides(%)
PiuraNo. of farms 21.1 33.7 45.0 39.4 8.6 9.8Total area 17.6 25.3 34.1 31.0 7.7 9.0CuscoNo. units 10.5 81.0 36.3 38.1 9.5 22.6Units area 10.2 65.6 30.3 33.3 9.3 21.4PunoNo. units 7.2 88.3 43.5 42.9 3.3 20.9Units area 5.1 60.5 33.0 29.8 2.7 15.1San MartinNo. units 14.7 7.1 16.1 29.0 29.2 14.5Units area 13.5 5.7 14.5 25.8 26.8 12.9
Source: INEI, 1994.
FIGURE 6Agricultural input and output price trends, 1990-2001
0
20
40
60
80
100
120
140
160
1993
1994
1995
1996
1997
2001
Indexe
s
Urea Diammonium phosphate Agric. price inde x
1990
1991
1992
1998
1999
2000
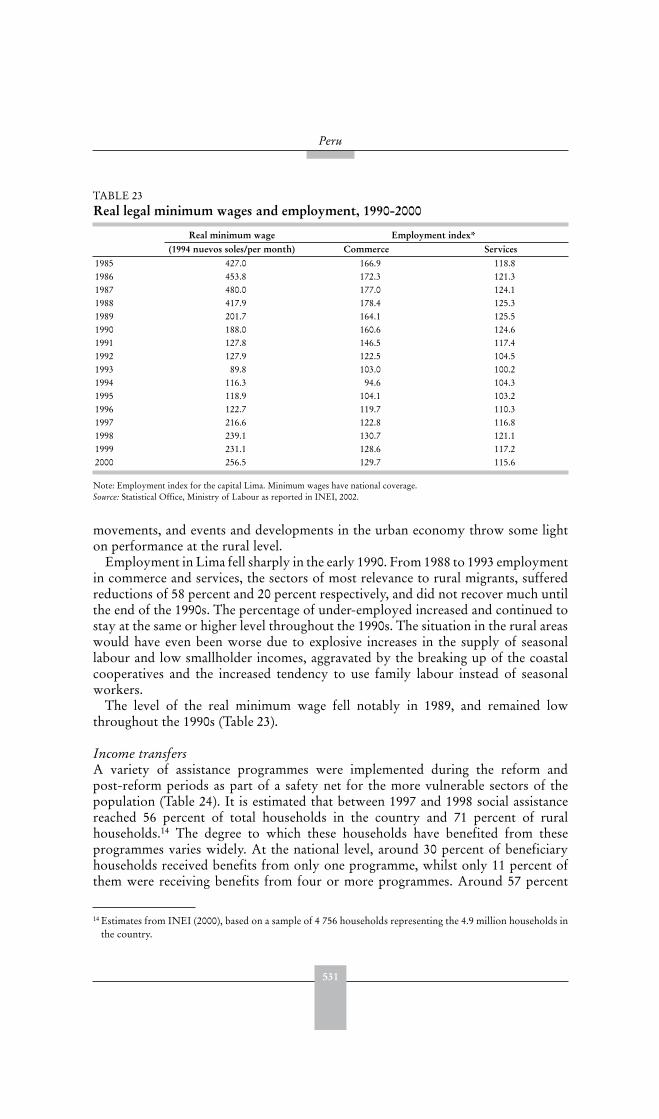
531
Peru
movements, and events and developments in the urban economy throw some lighton performance at the rural level.
Employment in Lima fell sharply in the early 1990. From 1988 to 1993 employmentin commerce and services, the sectors of most relevance to rural migrants, sufferedreductions of 58 percent and 20 percent respectively, and did not recover much untilthe end of the 1990s. The percentage of under-employed increased and continued tostay at the same or higher level throughout the 1990s. The situation in the rural areaswould have even been worse due to explosive increases in the supply of seasonallabour and low smallholder incomes, aggravated by the breaking up of the coastalcooperatives and the increased tendency to use family labour instead of seasonalworkers.
The level of the real minimum wage fell notably in 1989, and remained lowthroughout the 1990s (Table 23).
Income transfersA variety of assistance programmes were implemented during the reform andpost-reform periods as part of a safety net for the more vulnerable sectors of thepopulation (Table 24). It is estimated that between 1997 and 1998 social assistancereached 56 percent of total households in the country and 71 percent of ruralhouseholds.14 The degree to which these households have benefited from theseprogrammes varies widely. At the national level, around 30 percent of beneficiaryhouseholds received benefits from only one programme, whilst only 11 percent ofthem were receiving benefits from four or more programmes. Around 57 percent
14 Estimates from INEI (2000), based on a sample of 4 756 households representing the 4.9 million households inthe country.
TABLE 23 Real legal minimum wages and employment, 1990-2000
Real minimum wage Employment index*(1994 nuevos soles/per month) Commerce Services
1985 427.0 166.9 118.81986 453.8 172.3 121.31987 480.0 177.0 124.11988 417.9 178.4 125.31989 201.7 164.1 125.51990 188.0 160.6 124.61991 127.8 146.5 117.41992 127.9 122.5 104.51993 89.8 103.0 100.21994 116.3 94.6 104.31995 118.9 104.1 103.21996 122.7 119.7 110.31997 216.6 122.8 116.81998 239.1 130.7 121.11999 231.1 128.6 117.22000 256.5 129.7 115.6
Note: Employment index for the capital Lima. Minimum wages have national coverage.Source: Statistical Office, Ministry of Labour as reported in INEI, 2002.
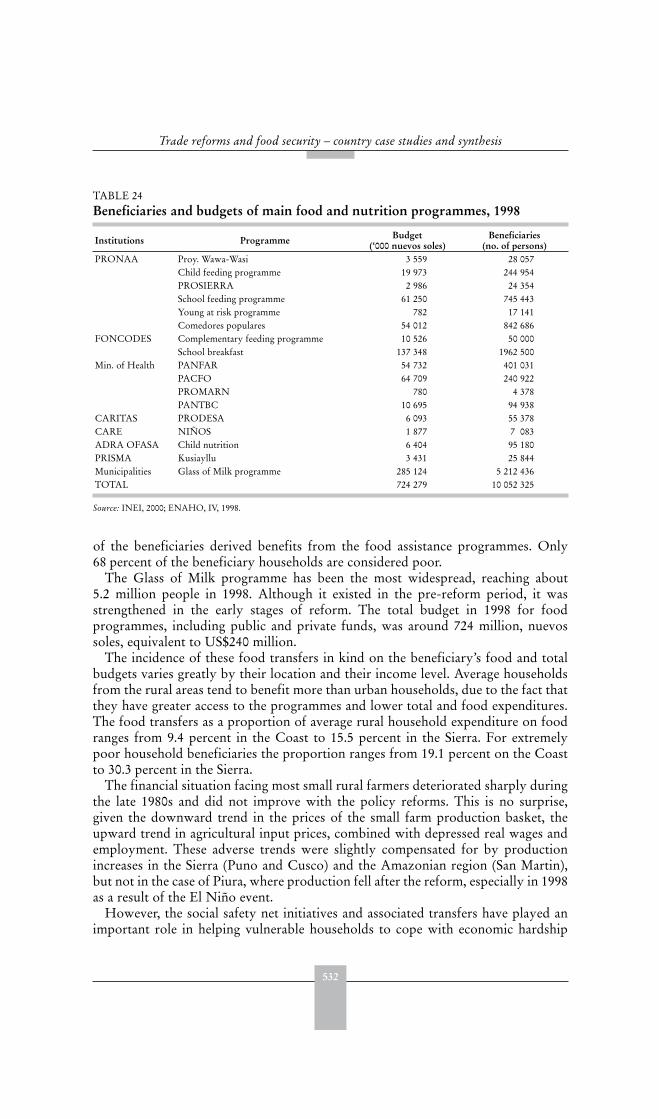
532
Trade reforms and food security – country case studies and synthesis
of the beneficiaries derived benefits from the food assistance programmes. Only68 percent of the beneficiary households are considered poor.
The Glass of Milk programme has been the most widespread, reaching about5.2 million people in 1998. Although it existed in the pre-reform period, it wasstrengthened in the early stages of reform. The total budget in 1998 for foodprogrammes, including public and private funds, was around 724 million, nuevossoles, equivalent to US$240 million.
The incidence of these food transfers in kind on the beneficiary’s food and totalbudgets varies greatly by their location and their income level. Average householdsfrom the rural areas tend to benefit more than urban households, due to the fact thatthey have greater access to the programmes and lower total and food expenditures.The food transfers as a proportion of average rural household expenditure on foodranges from 9.4 percent in the Coast to 15.5 percent in the Sierra. For extremelypoor household beneficiaries the proportion ranges from 19.1 percent on the Coastto 30.3 percent in the Sierra.
The financial situation facing most small rural farmers deteriorated sharply duringthe late 1980s and did not improve with the policy reforms. This is no surprise,given the downward trend in the prices of the small farm production basket, theupward trend in agricultural input prices, combined with depressed real wages andemployment. These adverse trends were slightly compensated for by productionincreases in the Sierra (Puno and Cusco) and the Amazonian region (San Martin),but not in the case of Piura, where production fell after the reform, especially in 1998as a result of the El Niño event.
However, the social safety net initiatives and associated transfers have played animportant role in helping vulnerable households to cope with economic hardship
TABLE 24 Beneficiaries and budgets of main food and nutrition programmes, 1998
Institutions Programme Budget(‘000 nuevos soles)
Beneficiaries(no. of persons)
PRONAA Proy. Wawa-Wasi 3 559 28 057Child feeding programme 19 973 244 954PROSIERRA 2 986 24 354School feeding programme 61 250 745 443Young at risk programme 782 17 141Comedores populares 54 012 842 686
FONCODES Complementary feeding programme 10 526 50 000School breakfast 137 348 1962 500
Min. of Health PANFAR 54 732 401 031PACFO 64 709 240 922PROMARN 780 4 378PANTBC 10 695 94 938
CARITAS PRODESA 6 093 55 378CARE NIÑOS 1 877 7 083ADRA OFASA Child nutrition 6 404 95 180PRISMA Kusiayllu 3 431 25 844Municipalities Glass of Milk programme 285 124 5 212 436TOTAL 724 279 10 052 325
Source: INEI, 2000; ENAHO, IV, 1998.
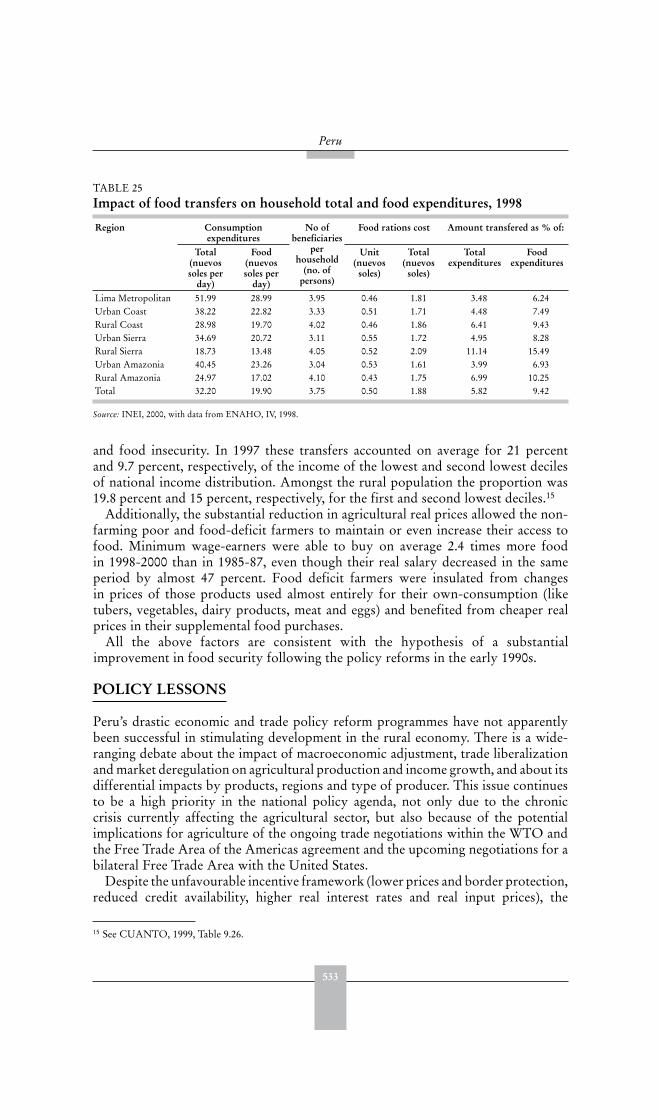
533
Peru
and food insecurity. In 1997 these transfers accounted on average for 21 percentand 9.7 percent, respectively, of the income of the lowest and second lowest decilesof national income distribution. Amongst the rural population the proportion was19.8 percent and 15 percent, respectively, for the first and second lowest deciles.15
Additionally, the substantial reduction in agricultural real prices allowed the non-farming poor and food-deficit farmers to maintain or even increase their access tofood. Minimum wage-earners were able to buy on average 2.4 times more foodin 1998-2000 than in 1985-87, even though their real salary decreased in the sameperiod by almost 47 percent. Food deficit farmers were insulated from changesin prices of those products used almost entirely for their own-consumption (liketubers, vegetables, dairy products, meat and eggs) and benefited from cheaper realprices in their supplemental food purchases.
All the above factors are consistent with the hypothesis of a substantialimprovement in food security following the policy reforms in the early 1990s.
POLICY LESSONS
Peru’s drastic economic and trade policy reform programmes have not apparentlybeen successful in stimulating development in the rural economy. There is a wide-ranging debate about the impact of macroeconomic adjustment, trade liberalizationand market deregulation on agricultural production and income growth, and about itsdifferential impacts by products, regions and type of producer. This issue continuesto be a high priority in the national policy agenda, not only due to the chroniccrisis currently affecting the agricultural sector, but also because of the potentialimplications for agriculture of the ongoing trade negotiations within the WTO andthe Free Trade Area of the Americas agreement and the upcoming negotiations for abilateral Free Trade Area with the United States.
Despite the unfavourable incentive framework (lower prices and border protection,reduced credit availability, higher real interest rates and real input prices), the
15 See CUANTO, 1999, Table 9.26.
TABLE 25 Impact of food transfers on household total and food expenditures, 1998
Region Consumptionexpenditures
No of beneficiaries
perhousehold
(no. of persons)
Food rations cost Amount transfered as % of:
Total(nuevos soles per
day)
Food(nuevos soles per
day)
Unit(nuevos
soles)
Total(nuevos
soles)
Totalexpenditures
Foodexpenditures
Lima Metropolitan 51.99 28.99 3.95 0.46 1.81 3.48 6.24Urban Coast 38.22 22.82 3.33 0.51 1.71 4.48 7.49Rural Coast 28.98 19.70 4.02 0.46 1.86 6.41 9.43Urban Sierra 34.69 20.72 3.11 0.55 1.72 4.95 8.28Rural Sierra 18.73 13.48 4.05 0.52 2.09 11.14 15.49Urban Amazonia 40.45 23.26 3.04 0.53 1.61 3.99 6.93Rural Amazonia 24.97 17.02 4.10 0.43 1.75 6.99 10.25Total 32.20 19.90 3.75 0.50 1.88 5.82 9.42
Source: INEI, 2000, with data from ENAHO, IV, 1998.
534
Trade reforms and food security – country case studies and synthesis
agricultural sector had an impressive GDP growth during the post-reform period.This reflects in part, a recovery of the early pre-reform levels of agriculturalproduction. Many factors have been mentioned to explain this sectoral recovery.Some of them are of a temporary nature (“good” weather), or a “one off” impact(increased area planting due to pacification). Others are real and sustainable growthfactors (improved seeds, exploitation of export market opportunities), but theirimpact has tended to benefit commercial farmers almost exclusively.
A very positive aspect of the reforms was the inclusion of a compensatoryprogramme to alleviate the adjustment cost on the poor, with an increasing amount offunds oriented towards these programmes. Peru followed a strategy of emphasizingthe provision of food and nutrition, as well as basic health, sanitation and educationto targeted sections of the population. It is estimated that between 1997 and 1998,social assistance programmes reached more than 56 percent of households, withparticularly strong coverage for rural households. There were some targetingproblems, however, with only about two-thirds of the beneficiary households beingconsidered poor.
Low agricultural real prices allowed non-farm poor and food-deficit farmers tomaintain or even increase their access to food. Maintaining the relatively low priceof the basic food basket for consumers has helped to reduce poverty during he post-reform period, and especially the incidence of extreme poverty, which has fallensharply.
However, during 1998-2001, the economic situation in Peru deteriorateddramatically, with an increase in extreme poverty from 15 to almost 25 percent ofthe population. In short, the gains in food security in the mid-1990s did not proveto be sustainable. Furthermore, the situation of most small rural farmers, which haddeteriorated sharply during the late 1980s, did not improve with the subsequentpolicy reforms. Their plight and that of the agricultural sector and the rural sector asa whole remains a major policy challenge.
REFERENCES
Banco Central de Reserva, 2003. Nota Semanal No 19, 23 Mayo 2003. Lima.Boloña, Carlos. 1993. Cambio de Rumbo. Instituto de Economía de Libre Mercado, Lima.CUANTO. 2001 and 2002. Perú en Números. Anuario Estadístico. Compiladores: Webb R.,
G. Fernandez-Baca, Cuánto. LimaENNIV (Encuesta Nacional por Niveles de Vida). 1991, 1994, 1997. Lima (reported in
CUANTO).ENAHO (Encuesta Nacional de Hogares). IV. 1998, 2001. Lima (reported in CUANTO).Escobal, J. 1994. Sesgos en la medición de la inflación en contextos inflacionarios: El caso
peruano. Documento de Trabajo #21, GRADE, 1994, Lima.Escobal, J. & Saavedra, J. 1990. Las variaciones del tipo de cambio real y el ingreso agricola.
Debate Agrario No.9, Lima.Escobal, J. & Torero, M. 2000. Does geography explain differences in economic growth in
Peru? Research Network Working Paper #R-104, Inter-American Development Bank,Washington, DC.
Escobal, J. & Ponce, C. 2002. El Beneficio de los Caminos Rurales: Ampliando oportunidades
de ingreso para los pobres. Documento de Trabajo #40, GRADE, Lima.
535
Peru
FAOSTAT, 2002. FAO on-line Database.INEI. 1994. National Agricultural Census. Peru.INEI. Various years. Compendio Estadistico. LimaINEI, 2000. Tabla Insumo Producto 1994 de la Economía Peruana 1994. Lima, Julio 2000.
Colección Cambio de Año Base de las Cuentas Nacionales del Perú. Documento 1.Lima.
International Monetary Fund (IMF). Various years. International Financial Statistics.Washington, DC.
JUNAC, 1995. Medición del efecto estabilización y efecto protección de las franjas de precios.Departamento Agropecuario, Lima.
Paz Cafferata, J. & Larios, F. 1991. Impacto de las políticas de ajuste macroeconómico sobreel sector agrario en el Peru. In Ajuste Economico y Sector Agropecuario en America Latina.KIFP/FS and IICA, Edit. Legasa, Buenos Aires.
Reardon, T., Taylor, J.E. & Stamoulis, K. 1998. Rural nonfarm income in developingcountries. Special Chapter in The State of Food and Agriculture (SOFA) 1998. FAO.Rome.
Riordan, J., van Haeften, R., Daly, J., Amat y Leon, C., Beltran, A., Gomez, R. & Yamada, G. 1994. Food security strategy for Peru. Report prepared for USAID/Peru.,December 1994, Lima.
Salaverry, J.A. 2001. Diagnostico sobre el crédito y financiamiento agropecuario en el Perú.
Ministerio de Agricultura, Lima.Schejtman, A. 1998. Elementos para una teoría de la economía campesina: pequeños
propietarios y campesinos de hacienda. FAO, Santiago de Chile.World Bank. 1996. Sierra - natural resource management and poverty alleviation project. Staff
Appraisal Report LAC Regional Office.WTO (World Trade Organization). 2000. Peru’s trade policy review. Report by the
Secretariat. WT/TPR/S/69, Geneva.
536
Trade reforms and food security – country case studies and synthesis
ANNEX
Method of price decomposition
This technique aims to identify the relative importance of the different variablesaffecting the domestic price of tradable goods. Its basic formulation is that in anyperiod the following identity holds:
Pd = Pw * E * (1+t) * (1+c) (1)
where Pd is the domestic price of a product, Pw its world price, t is the ad valoremimport tariff, and c represents all other costs that affect the import price. In orderto decompose the impact on the domestic price in terms of percentage contributionof each of the components in the equation (1), it is estimated taking the first-orderdifferences of logs. The variable “c” is estimated by the differences between thechanges in the domestic price and the changes in the world price, exchange rate, andimport tariff rates.
First the effects of the trade policy variables on domestic agricultural prices atthe aggregate level are estimated. The endogenous variable is the real domesticagricultural price index RDP. The explanatory variables are the index of realexchange rate (RER), a trade-weighted index of real world agricultural prices (RWP),and a time-series of trade-weighted average tariff rates for agricultural imports (T).16
In order to separate the pre-reform period a dummy variable: zero for period 1986-89 and one for 1990-2001 is included.
The results were as follows:
Log (RDP) = 0.6676* log (RER) + 0.66353* log (RWP) -0.471* log (T)- 0.124* (D)t-statistics (4.409) (3.854) (-1.677) (-0.901)R2= 0.75 DW = 1.6573 Observations=16
The most important variables are the Real Exchange Rate and the World PriceIndex; the tariff rate has a negative sign and the reform dummy variable is non-significant.
The above analysis develops the link between policy reforms and prices at theaggregate level. The price decomposition equation is also estimated for threecommodities: rice, maize, and coffee. Per caput GDP is used as a proxy variable forchanges in domestic income. The results of the regressions are:
RICELog RDPR = -12.5885 + 0.3630 *log(RWP) +1.3460 *log(RER)+2.1352*log(GDP)t-statistic (-5.04) (2.03) (12.36)R2 = 0.899 Observations= 21
16 The index of real international prices is deflated by the United States producer price index.

537
Peru
MAIZELog RDPM = -3.3316 + 0.2029 *log(MWP) +1.1951*log(RER) +0.3738*log(GDP)t-statistic (-2.85) (1.93) (13.60) (1.31)R2 = 0.926 Observations = 21
COFFEELog RDPC = -7.7964 + 0.9308 *log(CWP) +0.4481*log(RER) +1.3279*log(GDP)t-statistic (-2.31) (3.32) (2.90) (1.46)R2 = 0.785 Observations = 21
Comparative results from price decomposition analyses across the case studycountries are provided in Annex B of the Synthesis chapter. The results in Annex Bpresent the change in the domestic price as a percentage change with respect toprevious period. The case study analyses vary in that some present results as apercentage change with respect to a base period. Whilst the interpretation of resultsin the case study narrative holds irrespective of the end points compared, the resultspresented in Annex B should be used for comparative purposes.

539
SenegalAbdoulaye Diagne, François Joseph Cabral, Ben Omar Ndiaye, Mamadou Danskh
and Malick Sane1
EXECUTIVE SUMMARY
Pre-reformOn independence in 1960, Senegal inherited an economy specialized in groundnutmonoculture and the exploitation of its mining resources. This structure obligedthe country to export most of its production and to import a major part of itsconsumption needs.
Many marketing functions were subsequently nationalized. The state set pricesand the private sector was heavily regulated. The system that prevailed during thetwo first decades of independence showed signs of weakness by the end of the 1970s.The necessity of supporting parastatal organisations had a destabilizing effect onagriculture as well as on the country’s fiscal position, and drove the Government tostart reforming the economy.
The reformsReforms of the agricultural sector transferred to the private sector functionspreviously reserved for the public sector and parastatals, such as the distributionof inputs, the marketing of agricultural products and agricultural credit. It alsoentailed a reduction of input subsidies and production subsidies, reform of the pricesystem to encourage the substitution of local cereals for imported cereals, and theliberalization of agricultural markets. Structural Adjustment Programmes for theagricultural sector (PASA) were initiated in 1994 in a stabilized macroeconomicenvironment, and liberalization was reinforced by the 1994 devaluation.
Impact on intermediate variablesDuring the period 1984-92, cereals recorded an increase in the real producer price.This is more apparent for rice (6.9 percent) than for millet/sorghum (0.1 percent),and was largely attributable to policies and other effects and to small changes inthe real exchange rate. The combined effect of these factors was greater than thefall in world prices. The same trend occurred during the period 1993-2000, but theincrease in real producer price was more pronounced. A 48 percent depreciation ofthe exchange rate largely explains this improvement.
1 Abdoulaye Diagne, François Joseph Cabral, Ben Omar Ndiaye, Mamadou Danskho, Malick Sane, Consortiumpour la Recherche Economique (CREA); Ndioba Diene, Direction de l’Analyse, de la Prévision et desStatistiques (DAPS), Senegal.

540
Trade reforms and food security – country case studies and synthesis
In spite of the positive impact on the real producer price of policies and thedepreciation of the real exchange rate, there was a decrease in the real producer priceof groundnuts and cotton in 1984-92. However, in the following period, their pricesincreased. The effect of the depreciation is amplified by the accompanying policies.Together these outweigh the impact of the large fall in world prices.
The production of Senegal’s two main crops, groundnuts and millet/sorghum, fellduring 1984-92. The reforms generated failures in input distribution and agriculturalmarketing. An effective private sector able to fulfil the functions previouslyundertaken by the state did not emerge. In the subsequent period, devaluation andagricultural reforms led to improved price incentives and a growth in foreign anddomestic demand for locally produced products, explaining the positive impact onthe production of groundnuts and millet/sorghum during this period. However, thecontribution to total exports of groundnut products has fallen.
In 1994, the devaluation of the CFAF and the increase in world prices inducedan 118.6 percent increase in exports between 1993 and 1994. The evolution of theimports of cereals was strongly influenced by rice imports. The latter increased from67 percent of total food imports in 1985-93 to 69 percent in 1994-98.
Impact on target variablesAn examination of the food balance between the periods 1988-90 and 1998-2000 demonstrates a relative improvement of the situation. The daily percapita consumption of calories increased from 2 213.3 to 2 256.8, an increase of1.96 percent.
The contribution of local production to the coverage of cereal requirements hasbeen falling. Between 1980 and 1983, it was 59 percent but in 1994-2000 it fell to50 percent. The growth of supply has not kept up with growth in demand createdby population growth.
Almost 40 percent of households were unable to obtain a calorific intake of2 400 calories in 1992. In 1994/1995, the proportion of households living belowthe food security threshold was 34.3 percent. Rural households suffered more foodinsecurity than the urban population. Disparities can also be seen according to thegender of the household head. Food insecurity was lower in households headed bywomen, than in those headed by men.
Policy lessonsInitial reforms depressed agricultural supply, but the reforms brought aboutby the devaluation of the CFAF have had a positive impact on the main crops.However, while there have been some benefits from reform, the implementation ofaccompanying measures appears necessary to combat food insecurity: in particular,targeting the most affected categories of households and zones and measures toreduce agricultural supply rigidities are also needed.
INTRODUCTION: CONTEXT AND NATURE OF THE REFORMS
The role and level of development of the agriculture sectorThe performance of the Senegalese economy was comparatively weak before thedevaluation of the CFA Franc (CFAF) in 1994. The growth rate has remained below
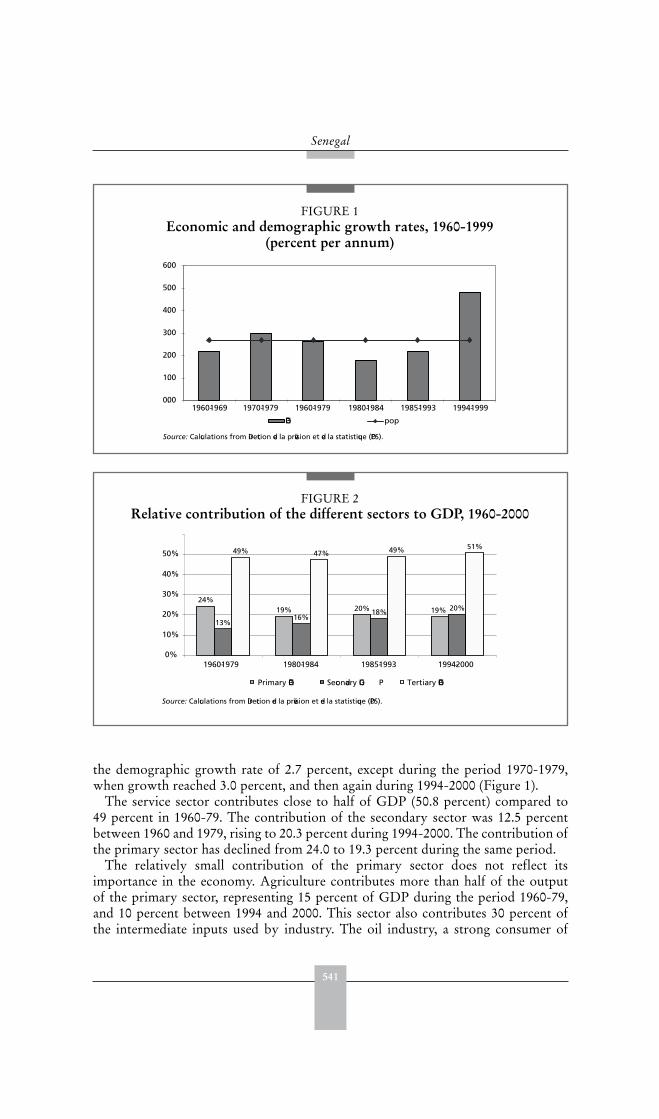
541
Senegal
the demographic growth rate of 2.7 percent, except during the period 1970-1979,when growth reached 3.0 percent, and then again during 1994-2000 (Figure 1).
The service sector contributes close to half of GDP (50.8 percent) compared to49 percent in 1960-79. The contribution of the secondary sector was 12.5 percentbetween 1960 and 1979, rising to 20.3 percent during 1994-2000. The contribution ofthe primary sector has declined from 24.0 to 19.3 percent during the same period.
The relatively small contribution of the primary sector does not reflect itsimportance in the economy. Agriculture contributes more than half of the outputof the primary sector, representing 15 percent of GDP during the period 1960-79,and 10 percent between 1994 and 2000. This sector also contributes 30 percent ofthe intermediate inputs used by industry. The oil industry, a strong consumer of
FIGURE 1Economic and demographic growth rates, 1960-1999
(percent per annum)
Source: Calculations from Direction de la prévision et de la statistique (DPS).
0.00
1.00
2.00
3.00
4.00
5.00
6.00
1960-1969 1970-1979 1960-1979 1980-1984 1985-1993 1994-1999
GDP pop
FIGURE 2Relative contribution of the different sectors to GDP, 1960-2000
24%19% 20% 19%
13%16%
18% 20%
49% 47% 49% 51%
0%
10%
20%
30%
40%
50%
Primary GDP Secondary GD P Tertiary GDP
1960-1979 1980-1984 1985-1993 1994-2000
Source: Calculations from Direction de la prévision et de la statistique (DPS).

542
Trade reforms and food security – country case studies and synthesis
groundnuts, accounts for 12 percent of the secondary sector. Agriculture employsmore than 60 percent of the population. In rural areas, 86.4 percent of the activepopulation is employed in the sector, compared with 11.3 percent in urban areas(ESAM2, 1994/1995).
Groundnuts and millet occupy 86 percent of the cultivable area. Millet covers 1 050762 hectares on average per year, followed by groundnuts at 864 524 hectares. Maize,rice and cotton are much less important at 89 047 hectares, 74 000 hectares and 37048 hectares respectively. In terms of production levels the most important cropsare groundnuts and millet with an average of 710 381 tonnes and 654 000 tonnes,respectively, in the period 1980–2000. Next is rice (153 333 tonnes), maize (98 476tonnes) and cotton (35 333 tonnes).
Agricultural imports and exports also play an important role in external trade.Groundnuts and cotton account for almost all the exports of the sub-sector whileagricultural imports are dominated by rice.
Degree of openness of the economy prior to the reformsWith independence in 1960, Senegal inherited the fragile economic structuresimplemented during the colonial period. The country specialized in groundnutmonoculture and mining (phosphates). This made it necessary for the country to exportmost of its production and to import a major part of its consumer requirements.
At independence, Senegal adopted African socialism as the model for itsdevelopment strategy. This led to intervention by the state in all economic sectors –private sector activities were heavily regulated.
In agriculture, state-controlled corporations were established to promote modernproduction methods and to diversify agricultural production. The AgriculturalMarketing Office (OCA) was set up to purchase farm output, distribute inputs, andimport rice. The Regional Development Assistance Centres (CRAD) supported thedevelopment of co-operatives and liaised between these and the OCA. The National
2 Enquete sénégalaise auprès des ménages (ESAM), Ministère de l’économie et des finances.
FIGURE 3Share of agriculture in GDP, 1960-2000
Source: Calculated from Direction de la prévision et de la statistique (DPS).
63%
54%52%
15%11% 11% 10%
0%
10%
20%
30%
40%
50%
60%
70%
Agriculture/primary ratio Agriculture/GDP ratio
52%
1960-1979 1980-1984 1985-1993 1994-2000
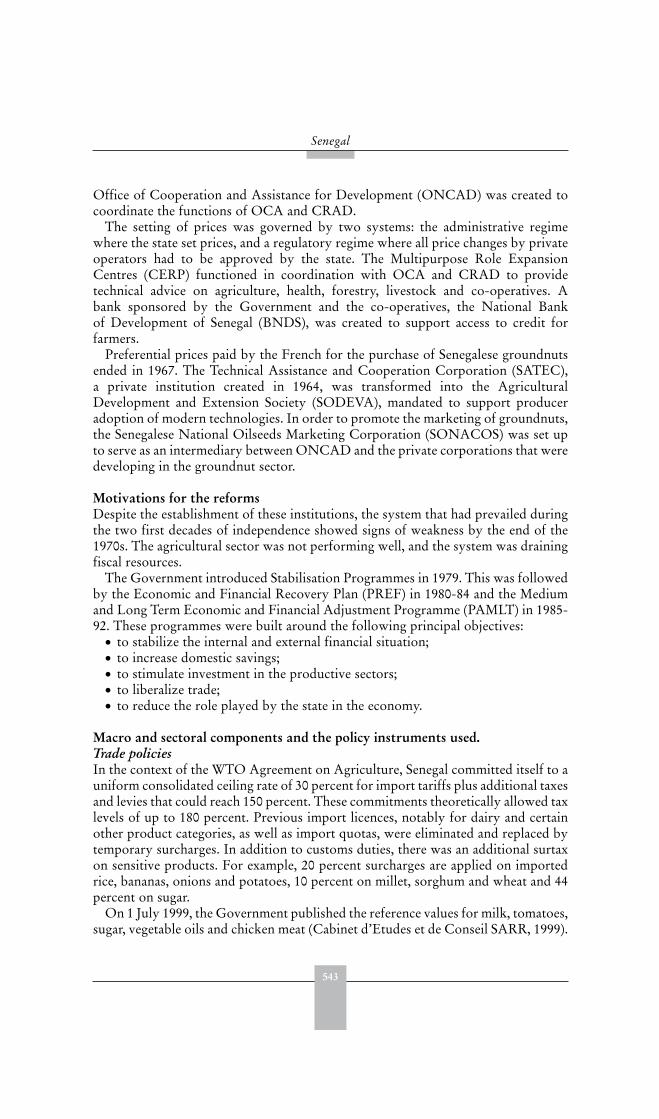
543
Senegal
Office of Cooperation and Assistance for Development (ONCAD) was created tocoordinate the functions of OCA and CRAD.
The setting of prices was governed by two systems: the administrative regimewhere the state set prices, and a regulatory regime where all price changes by privateoperators had to be approved by the state. The Multipurpose Role ExpansionCentres (CERP) functioned in coordination with OCA and CRAD to providetechnical advice on agriculture, health, forestry, livestock and co-operatives. Abank sponsored by the Government and the co-operatives, the National Bankof Development of Senegal (BNDS), was created to support access to credit forfarmers.
Preferential prices paid by the French for the purchase of Senegalese groundnutsended in 1967. The Technical Assistance and Cooperation Corporation (SATEC),a private institution created in 1964, was transformed into the AgriculturalDevelopment and Extension Society (SODEVA), mandated to support produceradoption of modern technologies. In order to promote the marketing of groundnuts,the Senegalese National Oilseeds Marketing Corporation (SONACOS) was set upto serve as an intermediary between ONCAD and the private corporations that weredeveloping in the groundnut sector.
Motivations for the reforms Despite the establishment of these institutions, the system that had prevailed duringthe two first decades of independence showed signs of weakness by the end of the1970s. The agricultural sector was not performing well, and the system was drainingfiscal resources.
The Government introduced Stabilisation Programmes in 1979. This was followedby the Economic and Financial Recovery Plan (PREF) in 1980-84 and the Mediumand Long Term Economic and Financial Adjustment Programme (PAMLT) in 1985-92. These programmes were built around the following principal objectives:
to stabilize the internal and external financial situation;to increase domestic savings;to stimulate investment in the productive sectors;to liberalize trade;to reduce the role played by the state in the economy.
Macro and sectoral components and the policy instruments used.Trade policiesIn the context of the WTO Agreement on Agriculture, Senegal committed itself to auniform consolidated ceiling rate of 30 percent for import tariffs plus additional taxesand levies that could reach 150 percent. These commitments theoretically allowed taxlevels of up to 180 percent. Previous import licences, notably for dairy and certainother product categories, as well as import quotas, were eliminated and replaced bytemporary surcharges. In addition to customs duties, there was an additional surtaxon sensitive products. For example, 20 percent surcharges are applied on importedrice, bananas, onions and potatoes, 10 percent on millet, sorghum and wheat and 44percent on sugar.
On 1 July 1999, the Government published the reference values for milk, tomatoes,sugar, vegetable oils and chicken meat (Cabinet d’Etudes et de Conseil SARR, 1999).
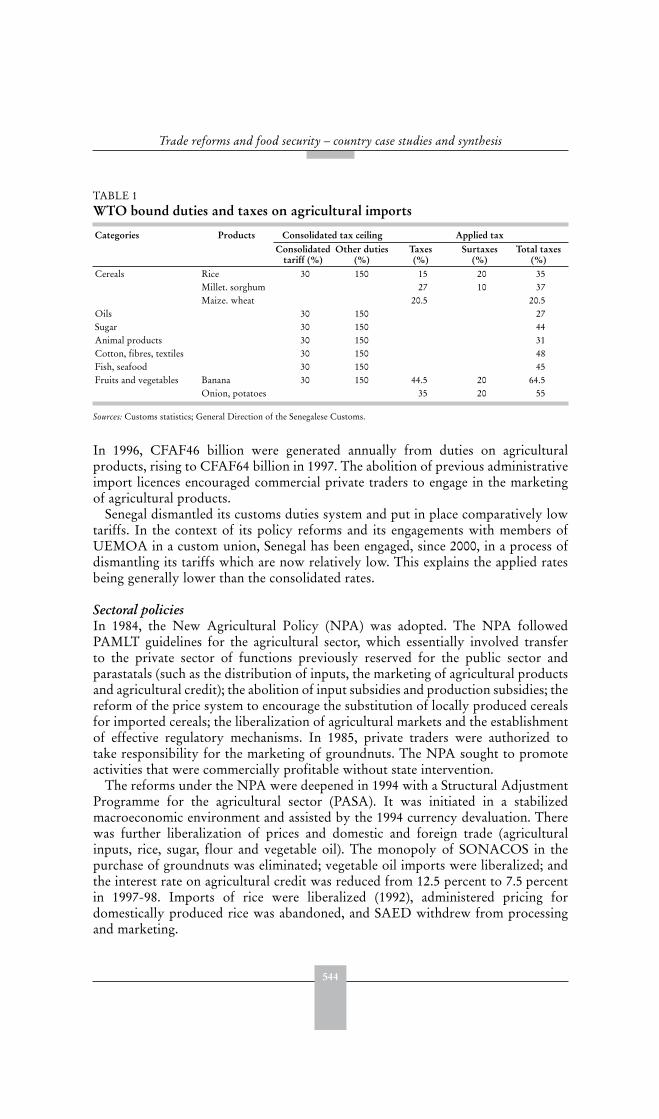
544
Trade reforms and food security – country case studies and synthesis
In 1996, CFAF46 billion were generated annually from duties on agriculturalproducts, rising to CFAF64 billion in 1997. The abolition of previous administrativeimport licences encouraged commercial private traders to engage in the marketingof agricultural products.
Senegal dismantled its customs duties system and put in place comparatively lowtariffs. In the context of its policy reforms and its engagements with members ofUEMOA in a custom union, Senegal has been engaged, since 2000, in a process ofdismantling its tariffs which are now relatively low. This explains the applied ratesbeing generally lower than the consolidated rates.
Sectoral policiesIn 1984, the New Agricultural Policy (NPA) was adopted. The NPA followedPAMLT guidelines for the agricultural sector, which essentially involved transferto the private sector of functions previously reserved for the public sector andparastatals (such as the distribution of inputs, the marketing of agricultural productsand agricultural credit); the abolition of input subsidies and production subsidies; thereform of the price system to encourage the substitution of locally produced cerealsfor imported cereals; the liberalization of agricultural markets and the establishmentof effective regulatory mechanisms. In 1985, private traders were authorized totake responsibility for the marketing of groundnuts. The NPA sought to promoteactivities that were commercially profitable without state intervention.
The reforms under the NPA were deepened in 1994 with a Structural AdjustmentProgramme for the agricultural sector (PASA). It was initiated in a stabilizedmacroeconomic environment and assisted by the 1994 currency devaluation. Therewas further liberalization of prices and domestic and foreign trade (agriculturalinputs, rice, sugar, flour and vegetable oil). The monopoly of SONACOS in thepurchase of groundnuts was eliminated; vegetable oil imports were liberalized; andthe interest rate on agricultural credit was reduced from 12.5 percent to 7.5 percentin 1997-98. Imports of rice were liberalized (1992), administered pricing fordomestically produced rice was abandoned, and SAED withdrew from processingand marketing.
TABLE 1 WTO bound duties and taxes on agricultural imports
Categories Products Consolidated tax ceiling Applied taxConsolidated
tariff (%)Other duties
(%)Taxes(%)
Surtaxes(%)
Total taxes (%)
Cereals Rice 30 150 15 20 35Millet. sorghum 27 10 37Maize. wheat 20.5 20.5
Oils 30 150 27Sugar 30 150 44Animal products 30 150 31Cotton, fibres, textiles 30 150 48Fish, seafood 30 150 45Fruits and vegetables Banana 30 150 44.5 20 64.5
Onion, potatoes 35 20 55
Sources: Customs statistics; General Direction of the Senegalese Customs.
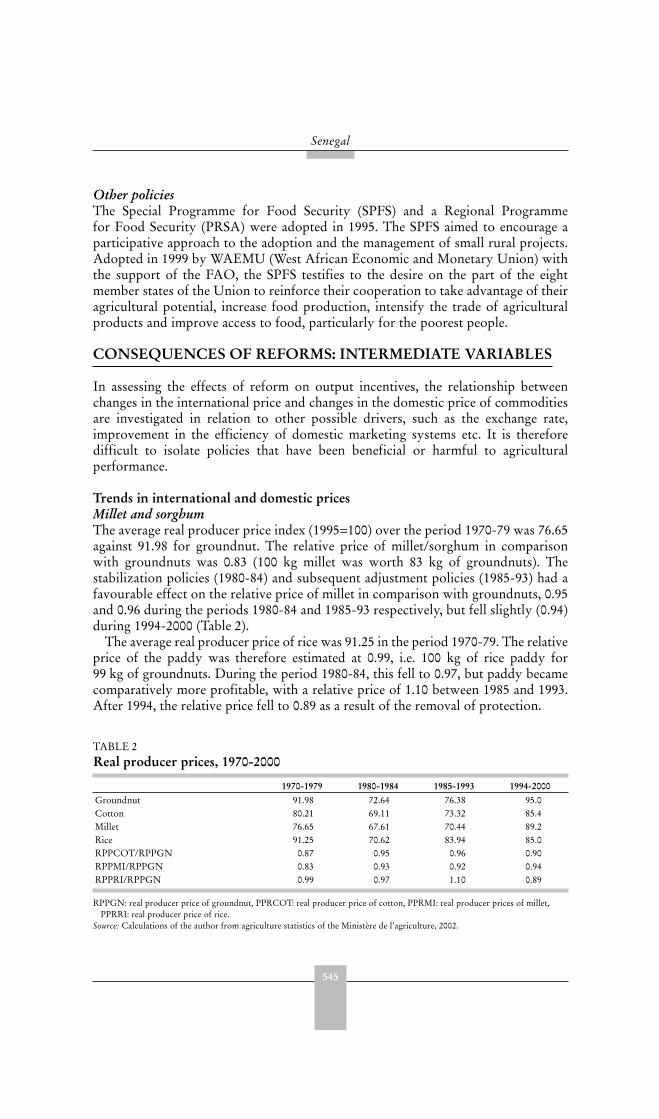
545
Senegal
Other policiesThe Special Programme for Food Security (SPFS) and a Regional Programmefor Food Security (PRSA) were adopted in 1995. The SPFS aimed to encourage aparticipative approach to the adoption and the management of small rural projects.Adopted in 1999 by WAEMU (West African Economic and Monetary Union) withthe support of the FAO, the SPFS testifies to the desire on the part of the eightmember states of the Union to reinforce their cooperation to take advantage of theiragricultural potential, increase food production, intensify the trade of agriculturalproducts and improve access to food, particularly for the poorest people.
CONSEQUENCES OF REFORMS: INTERMEDIATE VARIABLES
In assessing the effects of reform on output incentives, the relationship betweenchanges in the international price and changes in the domestic price of commoditiesare investigated in relation to other possible drivers, such as the exchange rate,improvement in the efficiency of domestic marketing systems etc. It is thereforedifficult to isolate policies that have been beneficial or harmful to agriculturalperformance.
Trends in international and domestic pricesMillet and sorghumThe average real producer price index (1995=100) over the period 1970-79 was 76.65against 91.98 for groundnut. The relative price of millet/sorghum in comparisonwith groundnuts was 0.83 (100 kg millet was worth 83 kg of groundnuts). Thestabilization policies (1980-84) and subsequent adjustment policies (1985-93) had afavourable effect on the relative price of millet in comparison with groundnuts, 0.95and 0.96 during the periods 1980-84 and 1985-93 respectively, but fell slightly (0.94)during 1994-2000 (Table 2).
The average real producer price of rice was 91.25 in the period 1970-79. The relativeprice of the paddy was therefore estimated at 0.99, i.e. 100 kg of rice paddy for99 kg of groundnuts. During the period 1980-84, this fell to 0.97, but paddy becamecomparatively more profitable, with a relative price of 1.10 between 1985 and 1993.After 1994, the relative price fell to 0.89 as a result of the removal of protection.
TABLE 2 Real producer prices, 1970-2000
1970-1979 1980-1984 1985-1993 1994-2000Groundnut 91.98 72.64 76.38 95.0Cotton 80.21 69.11 73.32 85.4Millet 76.65 67.61 70.44 89.2Rice 91.25 70.62 83.94 85.0RPPCOT/RPPGN 0.87 0.95 0.96 0.90RPPMI/RPPGN 0.83 0.93 0.92 0.94RPPRI/RPPGN 0.99 0.97 1.10 0.89
RPPGN: real producer price of groundnut, PPRCOT: real producer price of cotton, PPRMI: real producer prices of millet,PPRRI: real producer price of rice.
Source: Calculations of the author from agriculture statistics of the Ministère de l’agriculture, 2002.

546
Trade reforms and food security – country case studies and synthesis
During the period 1970-79, the relative price of cotton to groundnuts was 0.87.After a net improvement in the two following periods, this relative price fell back to0.90 in 1994-2000.
Decomposition of price changesThe analysis of variations in the domestic real producer price is based on thereference period, 1980-83 (Table 3). During the period 1984-1992, cereals recordedan increase in the real producer price. This is more apparent for rice (6.9 percent) thanfor millet/sorghum (0.1 percent). This was largely attributable to policies and othereffects and to small changes in the real exchange rate. The combined effect of thesefactors was greater than the fall in world prices. The same trend occurred during theperiod 1993-2000, but the increase in real producer price is more pronounced. A47.9 percent depreciation of the exchange rate largely explains this improvement.
In spite of the positive impact of policies and the depreciation of the real exchangerate, there was a decrease in the real producer price of groundnuts and cotton in1984-92. However, in the following period, their prices increased 18.4 percentand 18.6 percent, respectively, in relation to the reference period. The effect of thedepreciation is amplified by the accompanying policies. Together these outweigh theimpact of the large fall in world prices.
Fertilizer consumptionDuring the period 1964-1969, fertilizer consumption increased to an average of77 400 tonnes per year (Table 4). During the period 1969-1980, consumption fell to70 200 tonnes. In the early 1980s, in spite of policies to encourage the use of fertilizer,annual consumption fell to an average of 53 400 tonnes. During the period 1984-93, theadjustment policies resulted in further strong falls in fertilizer consumption. Furthermore,the PAMLT also coincided with a period of decreased rainfall. The shock of the CFAFdevaluation in 1994 depressed fertilizer consumption further, while the agriculturalreform programme in 1996-2000 coincided with even lower consumption levels.
TABLE 3 Decomposition of the variations of the domestic real producer price
Product Period Change in relation to pre-reform reference period (%):Variation of real
domestic producer price
Variation in world price
Variation in exchange rate
Changes in policies and other effects
Rice 1980-83 Reference period1984-92 6.9 -55.6 1.4 61.21993-98 37.7 -56.4 49.2 44.9
Groundnut 1980-83 Reference period1984-92 -2.3 -45.7 1.4 42.11993-00 18.4 -68.7 49.2 37.8
Millet, 1980-83 Reference periodsorghum 1984-92 0.1 -51.4 1.4 50.1
1993-00 7.0 -69.8 49.2 27.6Cotton 1980-83 Reference period
1984-92 -1.9 -49.5 1.4 46.21993-00 18.6 -71.0 49.2 40.3
Source: Calculations of the authors from agriculture statistics of the Ministère de l’agriculture, 2002.
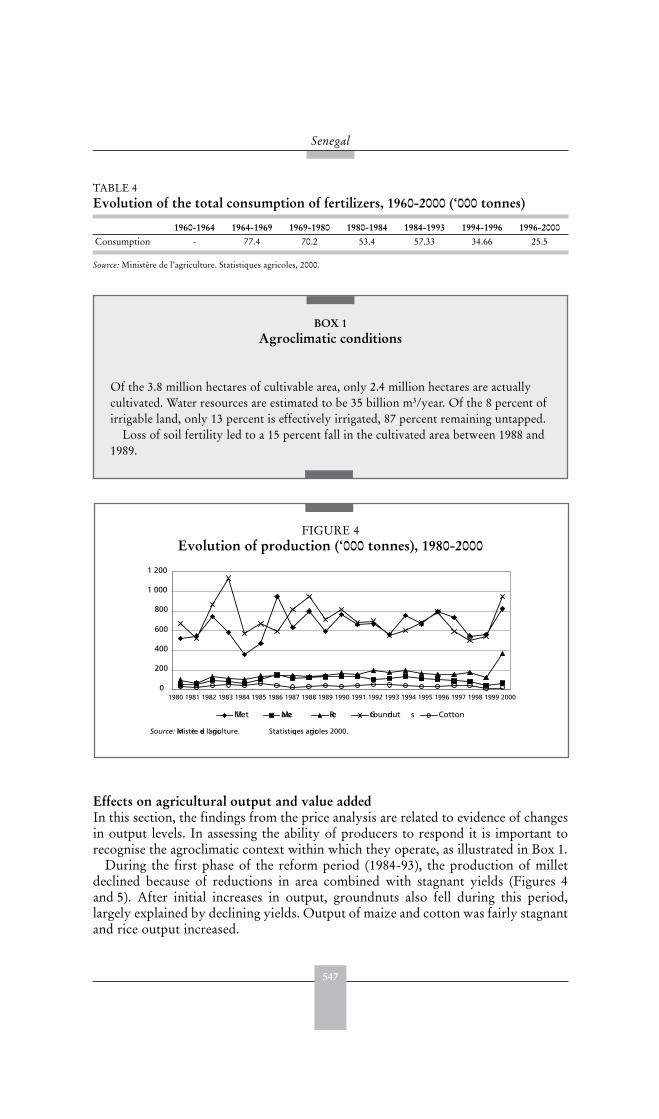
547
Senegal
Effects on agricultural output and value addedIn this section, the findings from the price analysis are related to evidence of changesin output levels. In assessing the ability of producers to respond it is important torecognise the agroclimatic context within which they operate, as illustrated in Box 1.
During the first phase of the reform period (1984-93), the production of milletdeclined because of reductions in area combined with stagnant yields (Figures 4and 5). After initial increases in output, groundnuts also fell during this period,largely explained by declining yields. Output of maize and cotton was fairly stagnantand rice output increased.
TABLE 4 Evolution of the total consumption of fertilizers, 1960-2000 (‘000 tonnes)
1960-1964 1964-1969 1969-1980 1980-1984 1984-1993 1994-1996 1996-2000Consumption - 77.4 70.2 53.4 57.33 34.66 25.5
Source: Ministère de l’agriculture. Statistiques agricoles, 2000.
BOX 1 Agroclimatic conditions
Of the 3.8 million hectares of cultivable area, only 2.4 million hectares are actuallycultivated. Water resources are estimated to be 35 billion m3/year. Of the 8 percent ofirrigable land, only 13 percent is effectively irrigated, 87 percent remaining untapped.
Loss of soil fertility led to a 15 percent fall in the cultivated area between 1988 and1989.
FIGURE 4Evolution of production (‘000 tonnes), 1980-2000
Source: Ministère de l’agriculture. Statistiques agricoles 2000.
0
200
400
600
800
1 000
1 200
1980 1981 1982 1983 1984 1985 1986 1987 1988 1989 1990 1991 1992 1993 1994 1995 1996 1997 1998 1999 2000
Millet Maize Rice Groundnut s Cotton
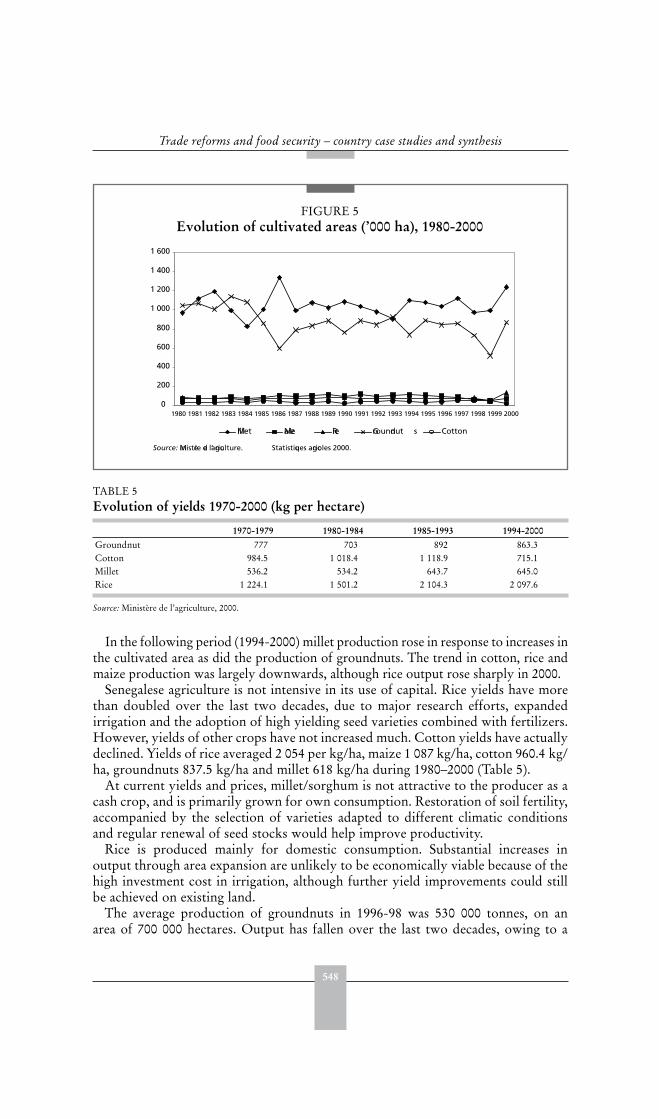
548
Trade reforms and food security – country case studies and synthesis
In the following period (1994-2000) millet production rose in response to increases inthe cultivated area as did the production of groundnuts. The trend in cotton, rice andmaize production was largely downwards, although rice output rose sharply in 2000.
Senegalese agriculture is not intensive in its use of capital. Rice yields have morethan doubled over the last two decades, due to major research efforts, expandedirrigation and the adoption of high yielding seed varieties combined with fertilizers.However, yields of other crops have not increased much. Cotton yields have actuallydeclined. Yields of rice averaged 2 054 per kg/ha, maize 1 087 kg/ha, cotton 960.4 kg/ha, groundnuts 837.5 kg/ha and millet 618 kg/ha during 1980–2000 (Table 5).
At current yields and prices, millet/sorghum is not attractive to the producer as acash crop, and is primarily grown for own consumption. Restoration of soil fertility,accompanied by the selection of varieties adapted to different climatic conditionsand regular renewal of seed stocks would help improve productivity.
Rice is produced mainly for domestic consumption. Substantial increases inoutput through area expansion are unlikely to be economically viable because of thehigh investment cost in irrigation, although further yield improvements could stillbe achieved on existing land.
The average production of groundnuts in 1996-98 was 530 000 tonnes, on anarea of 700 000 hectares. Output has fallen over the last two decades, owing to a
FIGURE 5Evolution of cultivated areas (’000 ha), 1980-2000
0
200
400
600
800
1 000
1 200
1 400
1 600
Source: Ministère de l’agriculture. Statistiques agricoles 2000.
1980 1981 1982 1983 1984 1985 1986 1987 1988 1989 1990 1991 1992 1993 1994 1995 1996 1997 1998 1999 2000
Millet Maize Rice Groundnut s Cotton
TABLE 5 Evolution of yields 1970-2000 (kg per hectare)
1970-1979 1980-1984 1985-1993 1994-2000Groundnut 777 703 892 863.3Cotton 984.5 1 018.4 1 118.9 715.1Millet 536.2 534.2 643.7 645.0Rice 1 224.1 1 501.2 2 104.3 2 097.6
Source: Ministère de l’agriculture, 2000.

549
Senegal
decrease in cultivated area (notably in the “Groundnut basin”) and lower yields. Thegroundnut market is now liberalized, but remains organized within the frameworkof an intra-industry agreement. The needs of the domestic market, estimated at about150 000 to 200 000 tonnes per year, should grow in the future at the same rate asdemographic growth.
Demand in the European export market has remained stable during recent years.A support fund was also put in place with the assistance of the Government and theEuropean Union (STABEX funds) to help stabilize prices..
Studies show that yields could be improved by about 50 percent if a seed industrywere to be established. The average production of edible groundnut in the period1996-98 rose to 45 000 tonnes on an area of 53 500 hectares, a strong increase in areaand in production in comparison with the preceding decade. Financial profitabilityfor the producer is currently very low. Edible groundnut is marketed at practicallythe same price as the oil groundnut, whilst input costs are higher.
Cotton is supervised by SODEFITEX, which provides input credits andtechnical support, and buys cottonseed at a fixed price. The international prices ofcotton are currently at an historic low, but estimates by the World Bank predictan increase in the long term. Export opportunities are therefore substantial. Atcurrent yields, the production of cotton is only slightly profitable for the producer(significantly less than for groundnut), but it is the only crop for which thereexists a guaranteed price and a supply of inputs on credit. The financial situationof SODEFITEX is however weak: the cost of the fibre has risen to CFAF750 perkg (against a projected price of CFAF650 in 2000). To this loss, must be added thepoor repayment performance of the input credit system. Cotton does, on the otherhand, have a comparative advantage, less than groundnut under current marketconditions, but practically of the same order in the long term. The profitability ofthe system requires an improvement in yields and a drastic adjustment in the coststructure of SODEFITEX.
In summary, the New Agricultural Policy (NPA) led to depressed production ofgroundnuts and of millet/sorghum. The reforms led to failures in input distributionand the marketing of agricultural products. The emergence of an effective privatesector able to fill the functions previously the responsibility of the state did notoccur. Devaluation and the measures geared towards the agricultural sector underPASA allowed an improvement of price incentives and a growth in foreign anddomestic demand for locally produced products, explaining the positive impact onthe production of groundnuts and millet/sorghum.
Effects on imports and exportsAgricultural imports represent one third of total imports, while agricultural exportsare about 80 percent of total exports. Groundnuts alone constituted 52 percent ofagricultural exports in 1998. Senegal remains a net importer of agricultural productsand this position did not improve during the reform period. The evolution of theratio of food imports to agricultural exports testifies to this. Between 1986 and 1990,the value of imports represented on average 1.7 times the value of exports. Theperiod 1991-93 is marked by an increase in this ratio to 2.7 and by 1995-98 it was4.2 (Office d’Etudes, 1999). The agricultural trade deficit increased between from 4percent of GDP in 1990-94 to 10 percent of GDP in 1995-98.
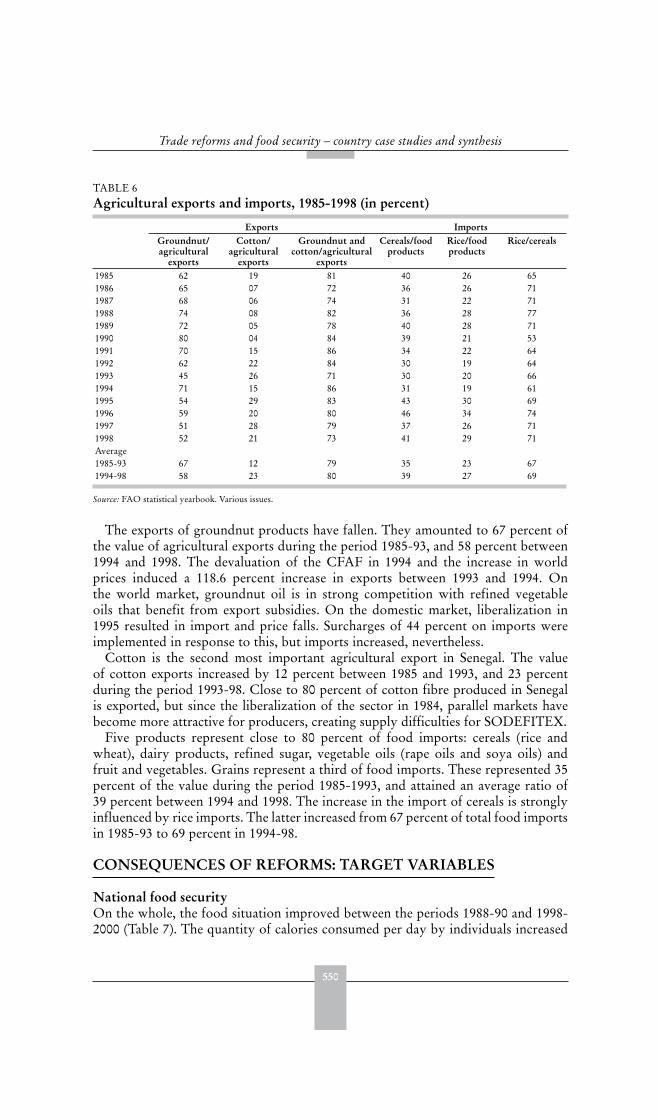
550
Trade reforms and food security – country case studies and synthesis
The exports of groundnut products have fallen. They amounted to 67 percent ofthe value of agricultural exports during the period 1985-93, and 58 percent between1994 and 1998. The devaluation of the CFAF in 1994 and the increase in worldprices induced a 118.6 percent increase in exports between 1993 and 1994. Onthe world market, groundnut oil is in strong competition with refined vegetableoils that benefit from export subsidies. On the domestic market, liberalization in1995 resulted in import and price falls. Surcharges of 44 percent on imports wereimplemented in response to this, but imports increased, nevertheless.
Cotton is the second most important agricultural export in Senegal. The valueof cotton exports increased by 12 percent between 1985 and 1993, and 23 percentduring the period 1993-98. Close to 80 percent of cotton fibre produced in Senegalis exported, but since the liberalization of the sector in 1984, parallel markets havebecome more attractive for producers, creating supply difficulties for SODEFITEX.
Five products represent close to 80 percent of food imports: cereals (rice andwheat), dairy products, refined sugar, vegetable oils (rape oils and soya oils) andfruit and vegetables. Grains represent a third of food imports. These represented 35percent of the value during the period 1985-1993, and attained an average ratio of39 percent between 1994 and 1998. The increase in the import of cereals is stronglyinfluenced by rice imports. The latter increased from 67 percent of total food importsin 1985-93 to 69 percent in 1994-98.
CONSEQUENCES OF REFORMS: TARGET VARIABLES
National food securityOn the whole, the food situation improved between the periods 1988-90 and 1998-2000 (Table 7). The quantity of calories consumed per day by individuals increased
TABLE 6 Agricultural exports and imports, 1985-1998 (in percent)
Exports ImportsGroundnut/agricultural
exports
Cotton/agricultural
exports
Groundnut and cotton/agricultural
exports
Cereals/foodproducts
Rice/foodproducts
Rice/cereals
1985 62 19 81 40 26 651986 65 07 72 36 26 711987 68 06 74 31 22 711988 74 08 82 36 28 771989 72 05 78 40 28 711990 80 04 84 39 21 531991 70 15 86 34 22 641992 62 22 84 30 19 641993 45 26 71 30 20 661994 71 15 86 31 19 611995 54 29 83 43 30 691996 59 20 80 46 34 741997 51 28 79 37 26 711998 52 21 73 41 29 71Average1985-93 67 12 79 35 23 671994-98 58 23 80 39 27 69
Source: FAO statistical yearbook. Various issues.
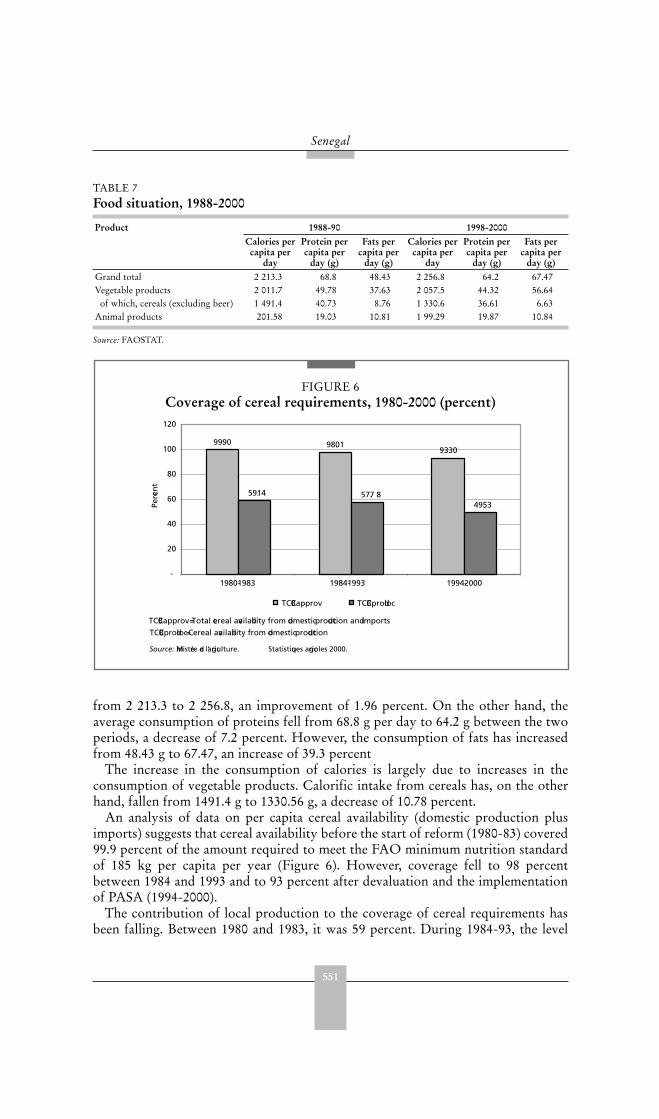
551
Senegal
from 2 213.3 to 2 256.8, an improvement of 1.96 percent. On the other hand, theaverage consumption of proteins fell from 68.8 g per day to 64.2 g between the twoperiods, a decrease of 7.2 percent. However, the consumption of fats has increasedfrom 48.43 g to 67.47, an increase of 39.3 percent
The increase in the consumption of calories is largely due to increases in theconsumption of vegetable products. Calorific intake from cereals has, on the otherhand, fallen from 1491.4 g to 1330.56 g, a decrease of 10.78 percent.
An analysis of data on per capita cereal availability (domestic production plusimports) suggests that cereal availability before the start of reform (1980-83) covered99.9 percent of the amount required to meet the FAO minimum nutrition standardof 185 kg per capita per year (Figure 6). However, coverage fell to 98 percentbetween 1984 and 1993 and to 93 percent after devaluation and the implementationof PASA (1994-2000).
The contribution of local production to the coverage of cereal requirements hasbeen falling. Between 1980 and 1983, it was 59 percent. During 1984-93, the level
TABLE 7 Food situation, 1988-2000
Product 1988-90 1998-2000Calories per capita per
day
Protein per capita per
day (g)
Fats per capita per
day (g)
Calories per capita per
day
Protein per capita per
day (g)
Fats per capita per
day (g)Grand total 2 213.3 68.8 48.43 2 256.8 64.2 67.47Vegetable products 2 011.7 49.78 37.63 2 057.5 44.32 56.64 of which, cereals (excluding beer) 1 491.4 40.73 8.76 1 330.6 36.61 6.63Animal products 201.58 19.03 10.81 1 99.29 19.87 10.84
Source: FAOSTAT.
FIGURE 6Coverage of cereal requirements, 1980-2000 (percent)
Source: Ministère de l’agriculture. Statistiques agricoles 2000.
TCBCapprov = Total cereal availability from domestic production and imports
TCBCprodloc = Cereal availability from domestic production
99.90 98.0193.30
59.14 57.7 849.53
-
20
40
60
80
100
120
TCBCapprov TCBCprodloc
Perce
nt
1980-1983 1984-1993 1994-2000
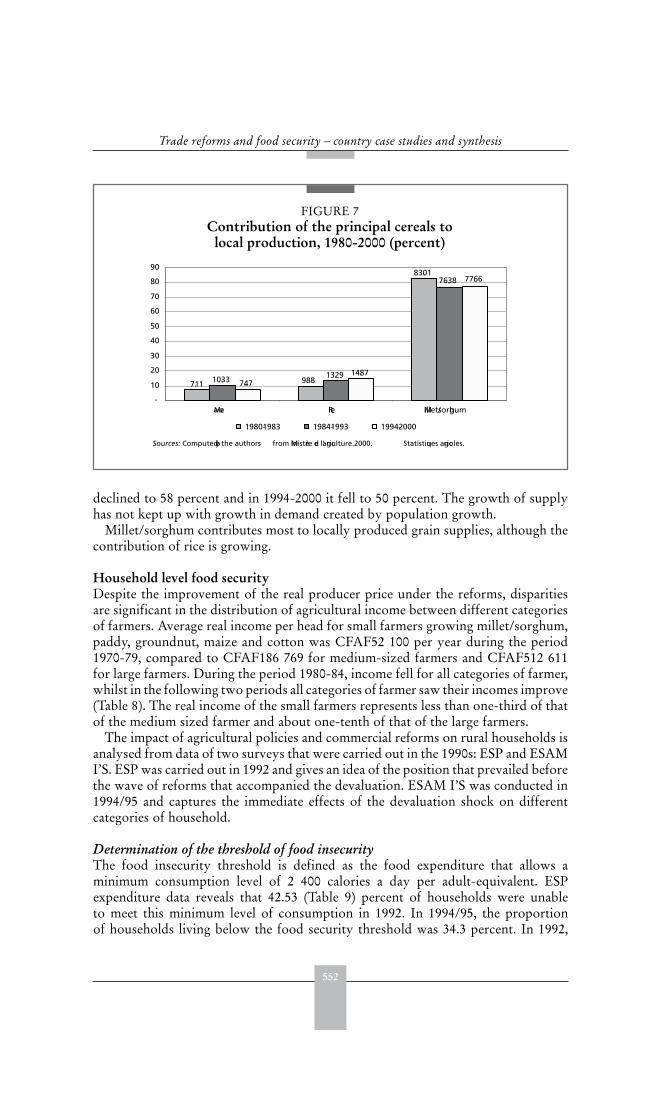
552
Trade reforms and food security – country case studies and synthesis
declined to 58 percent and in 1994-2000 it fell to 50 percent. The growth of supplyhas not kept up with growth in demand created by population growth.
Millet/sorghum contributes most to locally produced grain supplies, although thecontribution of rice is growing.
Household level food securityDespite the improvement of the real producer price under the reforms, disparitiesare significant in the distribution of agricultural income between different categoriesof farmers. Average real income per head for small farmers growing millet/sorghum,paddy, groundnut, maize and cotton was CFAF52 100 per year during the period1970-79, compared to CFAF186 769 for medium-sized farmers and CFAF512 611for large farmers. During the period 1980-84, income fell for all categories of farmer,whilst in the following two periods all categories of farmer saw their incomes improve(Table 8). The real income of the small farmers represents less than one-third of thatof the medium sized farmer and about one-tenth of that of the large farmers.
The impact of agricultural policies and commercial reforms on rural households isanalysed from data of two surveys that were carried out in the 1990s: ESP and ESAMI’S. ESP was carried out in 1992 and gives an idea of the position that prevailed beforethe wave of reforms that accompanied the devaluation. ESAM I’S was conducted in1994/95 and captures the immediate effects of the devaluation shock on differentcategories of household.
Determination of the threshold of food insecurityThe food insecurity threshold is defined as the food expenditure that allows aminimum consumption level of 2 400 calories a day per adult-equivalent. ESPexpenditure data reveals that 42.53 (Table 9) percent of households were unableto meet this minimum level of consumption in 1992. In 1994/95, the proportionof households living below the food security threshold was 34.3 percent. In 1992,
FIGURE 7Contribution of the principal cereals to
local production, 1980-2000 (percent)
Sources: Computed by the authors from Ministère de l’agriculture. 2000. Statistiques agricoles.
7.11 9.88
83.01
10.33 13.29
76.38
7.4714.87
77.66
-
10
20
30
40
50
60
70
80
90
1980-1983 1984-1993 1994-2000
Maize Rice Millet/sorghum

553
Senegal
rural households suffered most from food insecurity (57 percent in Table 9). Thisproportion was 15.09 (Table 9) percent for the urban population. During theperiod 1994/95, the proportion of households not obtaining the calorific rationwas 52.1 percent in rural locations. Amongst urban households, 11.4 percent ofhouseholds in cities other than Dakar were below the threshold, while in Dakar thisproportion was 2.5 percent.
Strong disparities in food insecurity exist between regions (Table 10). In 1992,six of the ten regions have rates above the national average. These were Kolda(78.62 percent), Fatick (70.68 percent), Kaolack (61.68 percent), Tambacounda(60.76 percent), Ziguinchor (53.11 percent), Louga (42.78 percent). In Esam I’S(1994/95), it appears that the number of regions where the rate is greater than thenational average increased to seven. The regions concerned are: Fatick (62.90 percent),Kolda (58.89 percent), Kaolack (54.76 percent), Ziguinchor (48.29 percent), Thiès(41.82 percent), Diourbel (37.99 percent), and Tambacounda (36.19 percent).
TABLE 8 Average real income of farmers, 1970-2000 (in CFAF)
1970-1979 1980-1984 1985-1993 1994-2000Small farmersMillet 20 289 17 830 22 384 28 402Maize 3 702 2 789 5 168 4 952Paddy 3 265 3 099 5 163 5 211Groundnuts 23 149 16 541 22 068 26 565Cotton 1 694 1 510 1 760 1 310Total 52 100 41 768 56 543 66 441Medium size farmers Millet 72 733 64 155 66 841 84 642Maize 13 272 9 997 18 527 17 752Paddy 11 704 11 108 18 508 18 682Groundnuts 82 986 59 296 79 111 95 231Cotton 6 074 5 413 6 310 4 697Total 186 769 149 970 189 296 221 004Large farmersMillet 208 859 183 540 230 419 292 375Maize 14 401 10 847 20 102 19 261Paddy 33 609 31 899 53 148 53 648Groundnuts 238 301 170 272 227 172 273 462Cotton 17 441 15 545 18 119 13 488Total 512 611 412 102 548 961 652 233
Sources: Computed by the authors from Ministère de l’agriculture. 2000.
TABLE 9 Incidence of food insecurity, 1992 and 1995
States ESP (1992) ESAM (1994/1995)Dakar 15.09 2.54 Other urban centres 11.36Rural 57.32 52.06Total 42.53 34.33
Sources: Computed by the authors from the data in Enquête sur les priorités (EPS), and Enquête sénégalaise auprès des ménages(ESAM).
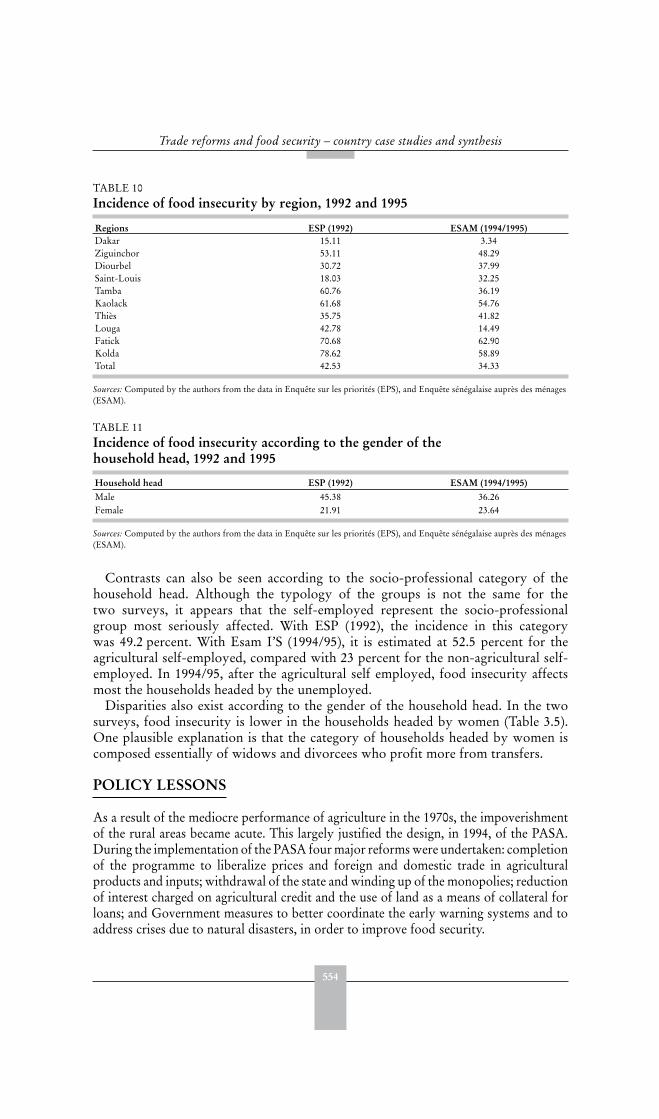
554
Trade reforms and food security – country case studies and synthesis
Contrasts can also be seen according to the socio-professional category of thehousehold head. Although the typology of the groups is not the same for thetwo surveys, it appears that the self-employed represent the socio-professionalgroup most seriously affected. With ESP (1992), the incidence in this categorywas 49.2 percent. With Esam I’S (1994/95), it is estimated at 52.5 percent for theagricultural self-employed, compared with 23 percent for the non-agricultural self-employed. In 1994/95, after the agricultural self employed, food insecurity affectsmost the households headed by the unemployed.
Disparities also exist according to the gender of the household head. In the twosurveys, food insecurity is lower in the households headed by women (Table 3.5).One plausible explanation is that the category of households headed by women iscomposed essentially of widows and divorcees who profit more from transfers.
POLICY LESSONS
As a result of the mediocre performance of agriculture in the 1970s, the impoverishmentof the rural areas became acute. This largely justified the design, in 1994, of the PASA.During the implementation of the PASA four major reforms were undertaken: completionof the programme to liberalize prices and foreign and domestic trade in agriculturalproducts and inputs; withdrawal of the state and winding up of the monopolies; reductionof interest charged on agricultural credit and the use of land as a means of collateral forloans; and Government measures to better coordinate the early warning systems and toaddress crises due to natural disasters, in order to improve food security.
TABLE 10 Incidence of food insecurity by region, 1992 and 1995
Regions ESP (1992) ESAM (1994/1995)Dakar 15.11 3.34Ziguinchor 53.11 48.29Diourbel 30.72 37.99Saint-Louis 18.03 32.25Tamba 60.76 36.19Kaolack 61.68 54.76Thiès 35.75 41.82Louga 42.78 14.49Fatick 70.68 62.90Kolda 78.62 58.89Total 42.53 34.33
Sources: Computed by the authors from the data in Enquête sur les priorités (EPS), and Enquête sénégalaise auprès des ménages(ESAM).
TABLE 11 Incidence of food insecurity according to the gender of the household head, 1992 and 1995
Household head ESP (1992) ESAM (1994/1995)Male 45.38 36.26Female 21.91 23.64
Sources: Computed by the authors from the data in Enquête sur les priorités (EPS), and Enquête sénégalaise auprès des ménages(ESAM).
555
Senegal
In spite of the positive impact of domestic policy reform, particularly changes inthe real exchange rate which offset significant falls in world commodity prices, theproduction of groundnuts, cotton and millet/sorghum fell during the early periodof reform. This occurred because the reforms generated failures in input distributionand in the marketing of agricultural products. The emergence of an effective privatesector able to fulfil the functions previously undertaken by the state did not occur.Although the NPA depressed agricultural supply, the series of reforms led by thedevaluation of the CFA franc, in particular the PASA, appear to have had a positiveimpact on the two main crops (millet/sorghum and groundnuts). In 1994, thedevaluation of the CFAF and the consecutive increase of the world prices inducedan increase of groundnut exports of 118.6 percent between 1993 and 1994, thoughthis expansion was shortlived.
One of the constraints to increased agricultural output is heavy dependence onerratic rainfall. Only 13 percent of irrigable arable land is actually irrigated; theremaining 87 percent is not farmed. There has been a decline in soil fertility on theland in which production is concentrated. The agricultural sector is confronted byseveral other constraints: demographic growth rate of 2.7 percent, greater than thatof agricultural production; absence of appropriate price incentive policies; weakmarketing and high transactions costs; high costs of inputs and constraints linked tothe availability of agricultural credit.
Between 1988-90 and 1998-2000, there was a relative improvement in the nationalfood balance. The quantity of calories consumed per day by individuals increased,but, as the contribution of domestic supply to total availability of cereals fell so thevalue of imports increased from 1.7 times the value of exports, to a ratio of 2.7. Theevolution of cereal imports was strongly influenced by the increase in rice imports.
Surveys of household supplies show that a substantial proportion of the populationare unable to meet their nutritional requirements. Food insecurity exists in theregions that are most seriously affected by poverty. While the demand for agriculturalproducts has soared, the supply has not increased significantly. Ultimately it is theincrease in food imports and aid that is helping to bridge the cereals deficit.
Rural households suffered more food insecurity than the urban population.However, the breakdown of the producer price shows that the liberalization reformsinduced by the devaluation of the CFA franc, on the whole, brought about animprovement in the producer prices of groundnut, cotton, millet/sorghum and rice.This improvement certainly led to a comparative rise in household expenditure ofrural households compared with urban households.
Disparities are significant in the distribution of agricultural income betweendifferent categories of farmers. At the level of the occupational/social categories,food insecurity is much more marked among the self-employed and among theagricultural self-employed. Differences can also be seen in the incidence of foodinsecurity by the gender of the household head, with surveys indicating that foodsecurity was better in the case of households headed by women. However, a findingof concern is that, while male-headed households improved food security over time,female-headed households experienced a worsening of food insecurity.
Empirical analysis of Senegal has provided an overall picture of some of the mostproblematic issues in terms of food security. While there have been some benefitsfrom reform, the implementation of accompanying measures appears necessary
556
Trade reforms and food security – country case studies and synthesis
to combat food insecurity. In particular, targeting the most affected categories ofhouseholds and zones would make it possible to combat food insecurity moreeffectively. Accompanying measures to reduce agricultural supply rigidities are alsoneeded.
REFERENCES
Cabinet d’Études et de Conseil SARR. 1999. Expériences sur la mise en œuvre de l’Accord
sur l’agriculture du cycle de l’Uruguay: étude de cas du Sénégal.
DPS (Direction de la prévision et de la statistique). 1999. Un profil de pauvreté au Sénégal.Ministère de l’économie et des finances.
DPS (Direction de la prévision et de la statistique). 1994/1995. Enquête sénégalaise auprès
des ménages (ESAM). Ministère de l’économie et des finances.DPS (Direction de la prévision et de la statistique). 1992. Enquête sur les priorités (EPS),
Ministère de l’économie et des finances.Ministère de l’agriculture. 2000. Statistiques agricoles, GOS/MRDH/DH.
FURTHER READING
Alderman, H. & Shiveley, G. 1991. Price movements and Economic reform in Ghana:Implications for food security. World Bank Economic Review 5(2):437 – 473.
Bale, M.D. 1986. Analyse de la politique de commercialisation agricole et de la politique
alimentaire: leçons tirées de cinq pays. In Séminaire sur la politique des prix et des produits
agricoles, IDE, World Bank.Bautista, R.M. & Valdès, A. 1993. The bias against agriculture: Trade and macroeconomic
policies in developing countries. IFPRI & ICEG. San Francisco, 338 p.Binswanger, H. 1989. The policy response of agriculture. Proceedings of the World Bank
annual conference on development economics.Bonjean, C. 1990. Elasticité-prix de l’offre des cultures d’exportations en Afrique: Quelques
résultats empiriques. Revue Canadienne d’études du développement, Vol XI, N°2.Broussard, J.M. 1992. Introduction à l’économie rurale. Collection Théorie économique,
Édition Cujas, Paris, 134 p.Cabral, F.J. 1996. Le rôle des facteurs fixes dans la réaction de l’offre agricole: une analyse par
zone agro-écologique. Mémoire de DEA, PTCI/FASEG/UCAD.Commander, S. 1989. Adjustment and Africa: Theory and practice in Africa and Latin
America, ODI by S. COMMANDER, London, 250 p.Demery, L. & Addison, T. 1987. Food insecurity and adjustment policies in Sub-saharan
Africa: A review of the evidence. Development policy review (SAGE, London, NewburyPark, Beverly Hills and New Delhi), Vol.5, 1987, pp. 177 – 196.
Diagne, A. 1998. Economic Policies and Agriculture in Senegal in Structural Adjustment and
Agriculture in West Africa, by Tshikala B. Tshibaka, CODESRIA.Duclos, J.Y., Arrar, A. & Fortin, C. 1999. DAD 4.02: Distributive analysis/Analyse
distributive. MIMAP Project, International Development Research Centre, Canada.Einarsson, P. 2001. The disagreement on agriculture. Seedling. Available at www.grain.org/
publications.mar012-en.cfm.FAO. 1996. Déclaration de Rome sur la sécurité alimentaire et Plan d’action du Sommet
mondial de l’alimentation. Rome, Sommet mondial de l’alimentation, 13-17 novembre.
557
Senegal
FAO. 1999a. Assessment of the impact of the Uruguay Round on agricultural markets and food
security. Rome, Committee on Commodity Problems, CCP 99/12 Rev.FAO. 1999b. L’application de l’Accord sur l’agriculture conclu à l’issue du Cycle d’Uruguay et
son impact sur les marchés agricoles mondiaux: Évolution des marchés agricoles mondiaux.
1995-1998. Colloque de la FAO sur l’agriculture, le commerce et la sécurité alimentaire,Genève, 23-24 septembre 1999, Document n°2.
FAO. 2000. Agriculture, Trade and Food Security: Issues and Options in he WTO negotiations
from the Perspective of Developing Countries. FAO Symposium, Geneva, 23-24 September1999, Report and Papers, Commodities and Trade Division, Rome.
FAO. 2001a. Promouvoir la volonté politique de lutter contre la faim. Rome, Comité de lasécurité alimentaire, 27ème session, 28-mai-1er juin.
FAO. 2001b. Mobiliser des ressources pour combattre la faim. Rome, Comité de la sécuritéalimentaire, 27ème session, 28-mai-1er juin.
FONGS/FAO. 1999. Manuel 3: Les accords du cycle de l’Uruguay: Contraintes et opportunités
pour l’agriculture sénégalaise, par FONGS/FAO renforcement des capacités d’analyse desorganisations paysannes (TCP/SEN/6713).
Gibbon, P., Havnevik, K. J. & Hermele, K. 1993. A Blighted Harvest: The World Bank and
African Agriculture in the 1980 s. James Currey. London, 168 p.Krueger, A.O., Schiff, A. & Valdès, A. 1991. The political economy of agricultural pricing
policy. John Hopkins University Press, Baltimore.Krueger, A.O., Schiff, A. & Valdès, A. 1988. Agricultural incentives in developing countries:
measuring the effect of sectoral and economywide policies. The World Bank Economic
Review 2 (3): 255-271.Lequesne, C. 1997. The World Trade Organization and food security, Talk to UK Food
Group, July 15.Lindland, J. & Konandreas, P. 1997. L’Accord sur l’Agriculture de l’OMC: Conséquences
pour le Sénégal, Division de Produits et du Commerce International, FAO.Mamingi, N. 1997. The Impact of Prices and Macroeconomic Policies on Agricultural Supply:
A Synthesis of Available Results.
Ministère de l’agriculture. 2001. Proposition de document de stratégie opérationnelle et plan-
cadre d’actions du secteur agricole, Rapport principal.Ministère de l’agriculture. 2000. Statistiques agricoles, GOS/MRDH/DH.Ministère du développement rural. 1986. Étude du secteur agricole, Plan Céréalier.
Ministère du développement rural. 1986. Rapport de synthèse.
Mkandawire, T. & Bourenane, N. 1987. The state and agriculture in Africa. CODESRIA,book series, London, 386 p.
Morrison, C. & Schwartz, A. 1996. State infrastructure and productive performance.American Economic Review, 86(5) 1 095-1 111.
Oyejide, T. Ademola. 1990. Supply response in the context of structural adjustment in Sub-
Saharan Africa. AERC Special Paper 1, Initiations Publishers, Nairobi.Palanivel, T. 1995. Aggregate supply response in Indian Agriculture: some empirical evidence
and policy implications. Indian-Economic-Review 30(2) 251-63.Pinckney T. 1993. Is market liberalization compatible with food security? Storage, trade &
price policies for maize in Southern Africa. Food policy, 18(4).Sadoulet, E. & De Janvry, A. 1995. Quantitative development policy analysis. Johns Hopkins,
London, 398 p.
558
Trade reforms and food security – country case studies and synthesis
Thiombiano, T. 1993. L’inadaptation des PAS à l’Afrique: cas de l’agriculture. Composantes,
stratégies et politique alimentaires au Sahel (SPAS). Centre Sahel, Université Laval, Sériesconférences N°35, Septembre 1993.
Valdès, A. 1993. The macroeconomic environment necessary for agriculture, trade and pricepolicy reforms. Food policy, 18(4).
559
United Republic of TanzaniaFlora Mndeme Musonda and Godwill George Wanga1
EXECUTIVE SUMMARY
Pre-reformIn 1967, Tanzanian development policy shifted from the goal of achieving maximumeconomic growth to the goal of equitable growth. The private sector was replaced to a largeextent by parastatals. Some agricultural estates were placed under public management,smallholder farming was collectivized, and cooperatives were given monopoly controlover marketing. For the first six years of this period the economy performed reasonablywell, but by the mid-1970s the country was experiencing serious problems.
The reformsA National Economic Survival Programme (NESP, 1981/82) and a StructuralAdjustment Programme (SAP, 1982/83 to 1984/85) were formulated in the early1980s, but only partially implemented due to an inadequacy of resources. The ERPI (1986-89), supported by the World Bank and the IMF, was successful in improvingthe economy, but there was a worsening trend in the provision of social services(education, health, water and nutrition). The ERP II (1989-92) maintained addedexplicit recognition of the social dimensions of reform and the need to addresspoverty. Sectoral reforms included liberalization of food and cash crop marketingand of agricultural input distribution; deregulation of prices; exchange rateadjustment and rationalization of the tariff structure. However, the real exchangerate began to appreciate again after 1993. A summary of the instruments of reformand their impact on food security is presented in the Annex.
Impact on intermediate variablesThe market-determined producer prices of food in the early 1990s were substantiallyhigher in real terms than the official procurement prices of the 1980s, and weresignificantly affected by the 1991/92 drought in southern Africa. However, realproducer prices of food have fallen by 40-60 percent since 1993. The reduction inproducer prices for maize, wheat, and rice has been larger (55-60 percent) than thosefor non-tradable crops (World Bank, 2001) due to appreciation of the exchange rate.Since 1993, real producer prices for all the major export crops have fallen between25 and 70 percent, in spite of some reduction in marketing margins due to privatizationand in spite of stable world prices for most crops. The main explanation for the fallingproducer prices is the appreciation of the real exchange rate since 1993.
1 Flora Mndeme Musonda, East African Community, United Republic of Tanzania, and Godwill GeorgeWanga, Daima Associates, United Republic of Tanzania.

560
Trade reforms and food security – country case studies and synthesis
The output of maize, rice and wheat appears to have stagnated in the 1990s afterexperiencing relative growth during the 1980s. This is consistent with the drought andthe fall in real prices due to the appreciating exchange rate. By contrast, the outputgrowth of non-tradable crops does not appear to have slowed noticeably during the1990s. Export crop production expanded in the late 1980s and early to mid-1990s,reflecting the higher prices achieved as a result of real exchange rate devaluation.However, in the last few years prices have plummeted for a number of crops, whichis expected to have a negative impact on production in the coming years.
Impact on target variablesDespite its potential, agricultural output has scarcely kept up with population. Fooddeficits occurred in 6 out of the last 15 years. Food production and crop productionboth increased between the periods 1980-1992 and 1993-2000, but food productionper capita decreased by 13 percent.
Between 1991/2 and 2000/01 the percentage of the population falling below thefood poverty lines fell from 22 percent to 19 percent, and in the case of the basicneeds poverty line, from 39 to 36 percent. The incidence of poverty is greater in ruralareas, but has also fallen. Nevertheless, the reduction in the incidence of poverty hasbeen small and the absolute number of people below the basic needs poverty line hasrisen from 8.8 million in 1991/92 to 12.5 million in 2000/01.
Some health and nutrition indicators have worsened between the periods beforeand after 1992. The incidence of malnutrition amongst children under five hasincreased by 4 percent and life expectancy has dropped by 8 percent. Per capita dailycalorie intake has declined from 2 146 in 1988-90 to 1 916 in 1998-2000. Per capitaconsumption of protein and fat has also declined.
Policy lessonsUnder reform the role of public institutions in the supply of inputs and themarketing of crops has been left to the private sector. However, the efficiencyand capability of the private sector to carry out such a role has been shown to below: there is no incentive to commit resources for longer term investment in suchthings as storage facilities, processing plants, quality assurance systems, marketingcapabilities and farmer support programmes. Since infrastructure difficulties lead tovery high transport costs private traders have concentrated business in areas withbetter infrastructure. Other areas have been deprived of marketing and supportservices. As a result many smallholders make only limited use of agricultural inputsand agricultural productivity remains low.
Despite liberalization, gaps in the policy, legislative, regulatory, and institutionalframework continue to exist in Tanzania. The government has yet to formulate acomprehensive agricultural marketing policy and a set of supportive strategies.
INTRODUCTION: CONTEXT AND NATURE OF THE REFORMS
The role and level of development of the agriculture sectorIt is estimated that 79 percent of the economically active population of Tanzaniais engaged in the agricultural sector and that some 60 percent of the population inrural areas fall below the poverty line. Crop production accounts for most of the
561
United Republic of Tanzania
agricultural production of rural households, with the exception of the relatively smallnomadic populations inhabiting the dryer areas. Of total production in the exportand food crops sectors, 80 percent derives from smallholder production. Annualgrowth rates of the agriculture sector increased from 3.2 percent during 1986-91 to3.8 percent during 1992-2001, but with population growth at 2.8 percent per annumin 2001, this has been insufficient to pull the majority of the rural population out ofpoverty. Production levels are far below potential and the sector’s contribution toboth GDP and export earnings has been sluggish.
In 1996/97 there were about 4.4 million smallholder households and 1 039 large andmedium-sized agricultural holdings. Most of the smallholders (in about 8 000 villages)are engaged in subsistence cultivation of food crops and in cash cropping. Eachhousehold works on an average holding of less than two hectares. Of these, 38 percentsold no product at all, consuming all output within the household (ERB, 2001).
The nature of agricultural activity varies greatly from district to district, in somecases because of ecological conditions, in others governed by differences in recenteconomic history. In some areas production is capital intensive and conducted on alarge scale, (for example, in the production of tea, sisal and sugar cane); in other areasit is still small scale and predominantly concentrated on food production. In someareas, although still small scale and labour intensive, a large proportion of activity isdirected towards producing export crops, such as coffee, cotton and cashew nuts.
The preferred staples in Tanzania are maize and rice. Maize is grown on four out ofevery ten acres of cultivated land. More than 80 percent of rural households grow maizeand of these 26 percent sell maize (ERB, 2001). Ruvuma, Iringa, Rukwa and Mbeyaregions are known as the “big four” maize producers. Use of fertilizers and improvedseed have made them leaders in both yield (average 1.96 tonnes, more than double thenational average) and output (40 percent of total production between 1985/93 and1998/99).
In all, about 60 percent of the maize produced is retained for home consumptionand only 40 percent marketed. At present, surplus production in years of good harvestis exported both officially and informally to neighbouring countries (Ackello-Ogutuand Echessah, 1997). On average, 572 000 tonnes of rice were produced yearly for theperiod covering 1981/82 to 2000/2001. Morogoro, Mbeya, Mwanza and Shinyangaaccount for 63 percent of total rice production over the same period.
Tanzania has 16.4 million cattle, 11.64 million goats, 3.5 million sheep and about47 million chickens. However, the livestock sub-sector suffers greatly from disease,which hampers efforts to revive the export of livestock and its products.
The country has a capacity to process 500 000 litres of milk per day, of whichplants of the former Tanzania Dairies Limited (TDL), which has been privatized, canprocess 309 000 litres. The estimated production capacity of milk is 900 million litres.Recent studies show that by the year 2010 the demand for milk will be 1.5 billionlitres per annum compared to the supply of only 1.33 billion litres.
Degree of openness of the economy prior to the reforms In 1967, Tanzanian development policy shifted from the goal of achieving maximumeconomic growth to the goal of equitable growth, whereby satisfying the basicneeds of all its citizens was a top priority. The objectives were based on principles ofsocialism and self-reliance, as spelt out in the Arusha Declaration of 1967.

562
Trade reforms and food security – country case studies and synthesis
Production sectors were restructured and the private sector was replaced to alarge extent by the state (parastatal) sector. From 1967 onwards, the Governmentexerted comprehensive control over the economy, nationalized the main commercialand financial businesses, placed some agricultural estates under public management,collectivized smallholder farming, and displaced private agricultural traders bygiving agricultural cooperatives monopoly control over marketing For the first sixyears of this period of government takeover, the economy performed reasonablywell on the surface. However, due to over-concentration on social investments, somesigns of economic imbalance appeared, and problems became acute in the mid-1970swhen production stagnated and earlier achievements were eroded.
In 1961, cooperatives were introduced for marketing maize and other food crops.The Government established the National Agricultural Products Board (NAPB) in1963 to control and regulate food crop; the National Milling Company (NMC) in1968 to manufacture and process agricultural products; and the General AgriculturalProducts Export (GAPEX) Company to handle major agricultural export cropsincluding cashew, coffee, cotton, pyrethrum, tea, and tobacco and livestockproducts.
The NMC expanded in 1975 to include procurement, transport, export, import,and storage of all grains and the maximum permissible grain transfer by privateindividuals was lowered to 100 kg. In 1976 cooperative unions were abolishedand their functions taken over by the NMC. Through the NMC, the Governmentmaintained a monopoly in the trade of all the main cereals, including maize, and appliedpan-territorial pricing, setting producer and consumer prices regardless of transportcosts. Consumer maize prices were subsidized and minimum producer prices wereguaranteed. The NMC was also responsible for managing emergency food reservesand exporting surplus production. Prior to the late 1980s, private sector agriculturalmarketing hardly existed, except in the case of perceived non-strategic products, suchas fruits and vegetables. The pan-territorial pricing system and transport and inputsubsidies promoted maize production and agricultural development in the southernhighlands comprised of Rukwa and Ruvuma regions, over 1 000 km from the maindomestic market of Dar es Salaam.
Severe inefficiencies in the cooperatives’ system of distributing agriculturalinputs and production were reflected in heavy operating losses. The Governmenttemporarily sustained such losses through subsidies. However, the cooperativestructure eventually collapsed, and with it many of the services that farmers tookfor granted.
Motivations for the reformsFrom the end of the mid-1970s to the early 1980s, the socialist approach engenderedmany problems that culminated in severe economic crises. The crisis can beattributed to several factors, external and internal including drought, the oil crisis,the war with Uganda and the general world recession. The productivity of publicinvestment was falling, domestic savings were eroding, the confidence of the privatesector was in decline, and with tight controls on foreign exchange, the black marketpremium on foreign exchange ballooned to more than 100 percent. Also, with fewerfunds, all forms of maintenance lapsed. Roads and other infrastructure deterioratedsubstantially.
563
United Republic of Tanzania
Macro and sectoral components and the policy instruments usedThe transition from the old to the new economic policy regime has involved effortsto move from a restrictive public sector-led economy to a liberalized, market-led andprivate sector-oriented economy.
In a period of home-grown reform, the NESP (1981/82) and the SAP (1982/83to 1984/85) were formulated but only partially implemented because of inadequateresources. Real GDP growth declined from an annual rate of 2 percent between1976 and 1980 to 1.8 percent between 1981 and1985 (Wangwe and Tsikata, 1999).The NESP and the SAP both failed to address the underlying distortions in theeconomy.
Post-1986-to present policy reform regime In the first sub-period of genuine reform (1986-1991/92), the World Bank linkedstructural adjustment loans (SALs) to a broad set of policy changes includingexchange rate reform, debt reduction, trade liberalization, subsidy reductions, andtax and institutional reform. This regime was adopted in the Economic RecoveryProgramme (ERP I, 1986/87-1988/89) and the Economic-Social Action Programme(ESAP or ERP II, 1989/90-1991/92).
While ERP I was successful in improving key economic indicators in the short-term, a worsening trend in the provision of social services (education, health, waterand nutrition) threatened longer-term growth prospects. ERP II maintained theobjectives of ERP I but added explicit recognition of the social dimensions of reformand the need to address poverty.
In the second sub-period of reforms (1993 onwards), reform efforts have focusedon restructuring the public sector to serve a private sector-led, market-orientedeconomy. Reforms affecting agriculture included liberalization of food and cash cropmarketing and of agricultural input distribution; deregulation of prices; exchangerate devaluation; trade and interest rate policy reforms. The measures were intendedto reverse tariff and trade policies that had an anti-agriculture and anti-export bias.
GDP per capita increased at a rate of 1.6 percent per annum between 1990 and2001. The rate of inflation decreased from 32 percent in 1990 to 4 percent in 2001, thebalance of payments position has been improving and foreign direct investment (FDI)inflows have been rising (Table 1). However, it is generally agreed that the privatesector response to the reform measures has been slow because of poor infrastructure,a complex and ambiguous tax regime and a poorly functioning legal framework.
Exchange rate policyThe most important reforms in terms of their immediate impact on economic activitywere the liberalization of exchange rate transactions and foreign trade. In 1994 theofficial and unofficial foreign exchange markets were unified under a flexible, marketdetermined regime. The exchange rate adjustment has been substantial, with theshilling being devalued from TSh17 to the US dollar in March 1986 to over TSh 600in October 1995 and TSh 1 040 in March 2003.
Between the 1960s and the mid-1980s the Government maintained a fixedexchange rate under which the REER gradually appreciated. The Tanzanian shillingwas consistently overvalued between 1980 and 1985, a situation that was accentuatedby the increasing strength of the US dollar.
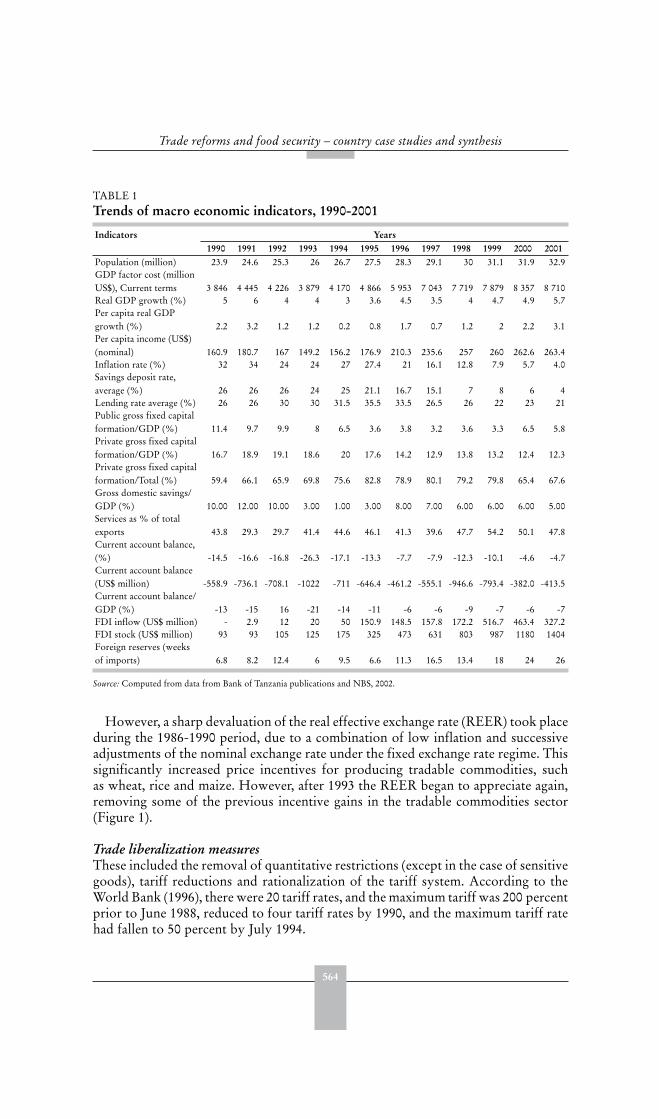
564
Trade reforms and food security – country case studies and synthesis
However, a sharp devaluation of the real effective exchange rate (REER) took placeduring the 1986-1990 period, due to a combination of low inflation and successiveadjustments of the nominal exchange rate under the fixed exchange rate regime. Thissignificantly increased price incentives for producing tradable commodities, suchas wheat, rice and maize. However, after 1993 the REER began to appreciate again,removing some of the previous incentive gains in the tradable commodities sector(Figure 1).
Trade liberalization measuresThese included the removal of quantitative restrictions (except in the case of sensitivegoods), tariff reductions and rationalization of the tariff system. According to theWorld Bank (1996), there were 20 tariff rates, and the maximum tariff was 200 percentprior to June 1988, reduced to four tariff rates by 1990, and the maximum tariff ratehad fallen to 50 percent by July 1994.
TABLE 1 Trends of macro economic indicators, 1990-2001
Indicators Years1990 1991 1992 1993 1994 1995 1996 1997 1998 1999 2000 2001
Population (million) 23.9 24.6 25.3 26 26.7 27.5 28.3 29.1 30 31.1 31.9 32.9GDP factor cost (millionUS$), Current terms 3 846 4 445 4 226 3 879 4 170 4 866 5 953 7 043 7 719 7 879 8 357 8 710Real GDP growth (%) 5 6 4 4 3 3.6 4.5 3.5 4 4.7 4.9 5.7Per capita real GDPgrowth (%) 2.2 3.2 1.2 1.2 0.2 0.8 1.7 0.7 1.2 2 2.2 3.1Per capita income (US$)(nominal) 160.9 180.7 167 149.2 156.2 176.9 210.3 235.6 257 260 262.6 263.4Inflation rate (%) 32 34 24 24 27 27.4 21 16.1 12.8 7.9 5.7 4.0Savings deposit rate,average (%) 26 26 26 24 25 21.1 16.7 15.1 7 8 6 4Lending rate average (%) 26 26 30 30 31.5 35.5 33.5 26.5 26 22 23 21Public gross fixed capitalformation/GDP (%) 11.4 9.7 9.9 8 6.5 3.6 3.8 3.2 3.6 3.3 6.5 5.8Private gross fixed capitalformation/GDP (%) 16.7 18.9 19.1 18.6 20 17.6 14.2 12.9 13.8 13.2 12.4 12.3Private gross fixed capitalformation/Total (%) 59.4 66.1 65.9 69.8 75.6 82.8 78.9 80.1 79.2 79.8 65.4 67.6Gross domestic savings/GDP (%) 10.00 12.00 10.00 3.00 1.00 3.00 8.00 7.00 6.00 6.00 6.00 5.00Services as % of totalexports 43.8 29.3 29.7 41.4 44.6 46.1 41.3 39.6 47.7 54.2 50.1 47.8Current account balance,(%) -14.5 -16.6 -16.8 -26.3 -17.1 -13.3 -7.7 -7.9 -12.3 -10.1 -4.6 -4.7Current account balance(US$ million) -558.9 -736.1 -708.1 -1022 -711 -646.4 -461.2 -555.1 -946.6 -793.4 -382.0 -413.5Current account balance/GDP (%) -13 -15 16 -21 -14 -11 -6 -6 -9 -7 -6 -7FDI inflow (US$ million) - 2.9 12 20 50 150.9 148.5 157.8 172.2 516.7 463.4 327.2FDI stock (US$ million) 93 93 105 125 175 325 473 631 803 987 1180 1404Foreign reserves (weeksof imports) 6.8 8.2 12.4 6 9.5 6.6 11.3 16.5 13.4 18 24 26
Source: Computed from data from Bank of Tanzania publications and NBS, 2002.

565
United Republic of Tanzania
Impediments to exports were removed, including abolishing the surrenderrequirements on foreign exchange receipts from non-traditional exports; eliminatingthe licensing and registration requirements for exports; reducing the number ofexport items subject to permit and allowing private participation in traditionalexports.
A duty drawback scheme was introduced in 1986, but is yet to function welldespite efforts to streamline it. An export retention scheme was introduced to allowexporters to retain varying degrees of export receipts. Export retention for traditionalexports and non-traditional exports is now 100 percent of receipts. Restrictions oncurrent accounts regarding international payments and transfers were eliminated.Export volume rose by a total of over 50 percent between 1986 and 1994, althoughthe impact of export receipts on the external accounts was offset by deterioration inthe terms of trade. The revival of traditional and non-traditional exports coincidedwith the depreciation of the exchange rate as well as with measures introduced toderegulate agricultural exports.
Agricultural sector policies and strategiesSectoral reforms took the form of liberalizing marketing, processing, external tradeand the distribution of inputs; reducing the power of agricultural marketing boards;and eliminating subsidies on transport, maize flour and fertilizers.
After March 1987, private traders were allowed to trade freely in food and in 1989the single channel marketing system through the NMC was abandoned in favour ofa liberalized food marketing system. The NMC became a buyer of last resort, beforecollapsing in the early 1990s due to mounting financial losses. In 1992, the cooperativeunions also disengaged from the marketing of staple food crops. The participation ofthe private sector in food crop trade increased rapidly. In 1990/91, the governmentstopped prescribing the farm gate prices of food crops and announced indicativeprices until 1993/94.
From 1991 to 1995, fertilizer and other input subsidies were phased out and inputmarkets were opened up to private traders. Taxes and import duties on almostall agricultural inputs (including fertilizers and agrochemicals) were removed.The budget savings associated with the elimination of input subsidies and loss-making commercial activities were not, however, redirected to public support for
FIGURE 1Real effective exchange rate, 1980-2001
Source: IMF Database, 2003.
0.00
20.0 0
40.0 0
60.0 0
80.0 0
100.0 0
120.0 0
1980 1982 1984 1986 1988 1990 1992 1994 1996 1998 2000
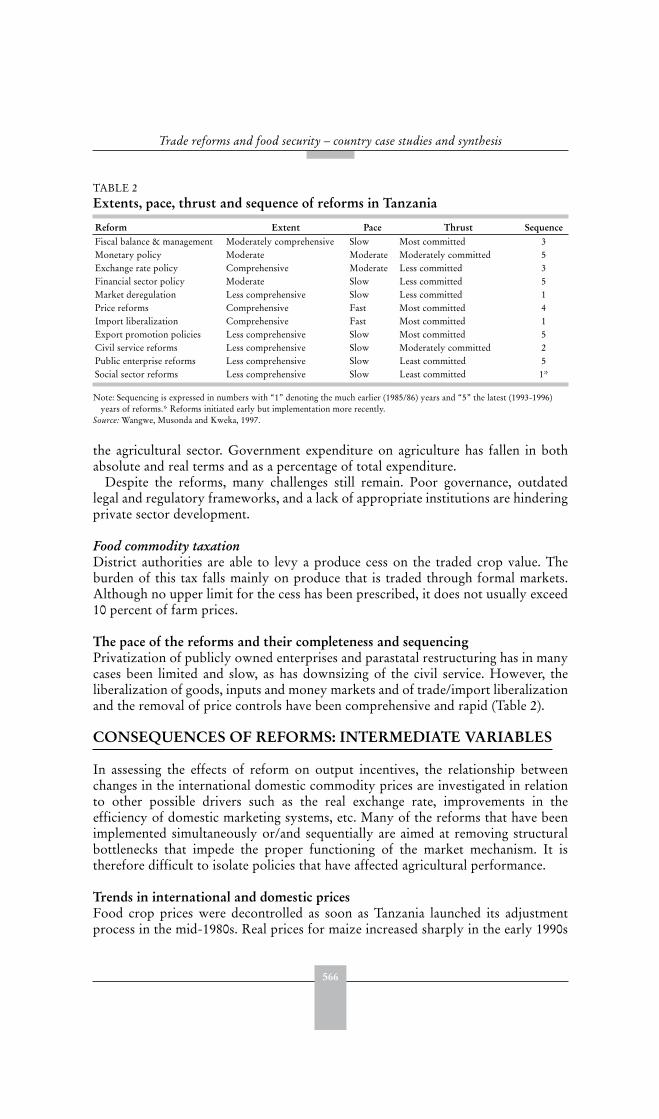
566
Trade reforms and food security – country case studies and synthesis
the agricultural sector. Government expenditure on agriculture has fallen in bothabsolute and real terms and as a percentage of total expenditure.
Despite the reforms, many challenges still remain. Poor governance, outdatedlegal and regulatory frameworks, and a lack of appropriate institutions are hinderingprivate sector development.
Food commodity taxationDistrict authorities are able to levy a produce cess on the traded crop value. Theburden of this tax falls mainly on produce that is traded through formal markets.Although no upper limit for the cess has been prescribed, it does not usually exceed10 percent of farm prices.
The pace of the reforms and their completeness and sequencingPrivatization of publicly owned enterprises and parastatal restructuring has in manycases been limited and slow, as has downsizing of the civil service. However, theliberalization of goods, inputs and money markets and of trade/import liberalizationand the removal of price controls have been comprehensive and rapid (Table 2).
CONSEQUENCES OF REFORMS: INTERMEDIATE VARIABLES
In assessing the effects of reform on output incentives, the relationship betweenchanges in the international domestic commodity prices are investigated in relationto other possible drivers such as the real exchange rate, improvements in theefficiency of domestic marketing systems, etc. Many of the reforms that have beenimplemented simultaneously or/and sequentially are aimed at removing structuralbottlenecks that impede the proper functioning of the market mechanism. It istherefore difficult to isolate policies that have affected agricultural performance.
Trends in international and domestic pricesFood crop prices were decontrolled as soon as Tanzania launched its adjustmentprocess in the mid-1980s. Real prices for maize increased sharply in the early 1990s
TABLE 2 Extents, pace, thrust and sequence of reforms in Tanzania
Reform Extent Pace Thrust SequenceFiscal balance & management Moderately comprehensive Slow Most committed 3Monetary policy Moderate Moderate Moderately committed 5Exchange rate policy Comprehensive Moderate Less committed 3Financial sector policy Moderate Slow Less committed 5Market deregulation Less comprehensive Slow Less committed 1Price reforms Comprehensive Fast Most committed 4Import liberalization Comprehensive Fast Most committed 1Export promotion policies Less comprehensive Slow Most committed 5Civil service reforms Less comprehensive Slow Moderately committed 2Public enterprise reforms Less comprehensive Slow Least committed 5Social sector reforms Less comprehensive Slow Least committed 1*
Note: Sequencing is expressed in numbers with “1” denoting the much earlier (1985/86) years and “5” the latest (1993-1996)years of reforms.* Reforms initiated early but implementation more recently.
Source: Wangwe, Musonda and Kweka, 1997.

567
United Republic of Tanzania
and peaked in 1993/94 due to a combination of severe drought and the withdrawalof the NMC and cooperatives from crop marketing, but fell again in the followingyears (Table 3). The government still intervenes to restrict movement across internaland external boundaries, especially during anticipated food shortages.
Comparing the pre- and post-reform periods (1990/92 to 1993/99), the average realproducer prices (TSh/kg) of key food crops (maize, rice and sorghum) have declinedby a weighted average of 11 percent. This is attributable to several factors, includingthe appreciation of the real exchange rate, increased supply following good weather,and export restrictions on food grains (particularly maize). On the other hand, thefarmers’ share of the consumer price for the same selected grain crops (maize, rice,and sorghum) has increased.
The real producer prices and farmers’ share of export prices of cash crops hasindicated mixed results (Table 4). One of the explanations for the improvement oftheir share in some crops (cashew nuts, tobacco, cotton, arabica coffee) is greatercompetition from the private sector against the cooperatives that still play a dominantin the marketing of some crops. The decline in the farmer’s share of the export pricefor other crops (robusta coffee, pyrethrum and tea) reflects the increased transactionscosts associated with regulation by crop marketing boards that have maintained theiractivity. For instance, the Coffee Board requires all exporters to purchase coffeefrom the coffee auctions administered by the coffee authorities.
TABLE 3 Real producer prices for maize 1990/91–1998/99 (constant market prices 1998-99 TSh/kg)
Year 1990-91 1991-92 1992-93 1993-94 1994-95 1995-96 1996-97 1997-98 1998-99Price 106 279 298 256 181 165 138 117 118
Source: Figures supplied by MAFS, 2001.
TABLE 4 Trends in selected crop prices pre-and post 1992 (1990/92 to 1993/99)
Pre-1992(Average)
Post-1992 (Average)
Change(%)
TOT index (Agri/ Industry) 1992=100 95 98 3.2Real producer prices (food) TSh/kg (weighted average of maize, rice and wheat) 36.6 32.6 -10.9Real producer prices (export) TSh/kg (weighted average of coffee, tobacco,cotton and cashew nuts)
137.3 165.7 20.7
Farmers share of consumer price (%) 43.37 75.23 73.5Maize prices 63.05 87.9 39.4Rice prices 30.8 38.4 24.7Sorghum prices 36.25 99.4 174.2Farmers’ share in export prices (%) 45.46 50.98 12.1Cashew nuts 55.7 64.7 16.2Arabica coffee 57.0 58.5 2.6Robusta coffee 53.0 45.7 13.8Tea 49.6 34.5 30.4Fire cured tobacco 49.4 74.9 51.6Flue cured tobacco 38.2 56.5 47.9Lint cotton 36.0 51.2 42.2Pyrethrum 24.75 21.8 11.9
Source: United Republic of Tanzania and World Bank, 2000; and computed from data from various government papers.
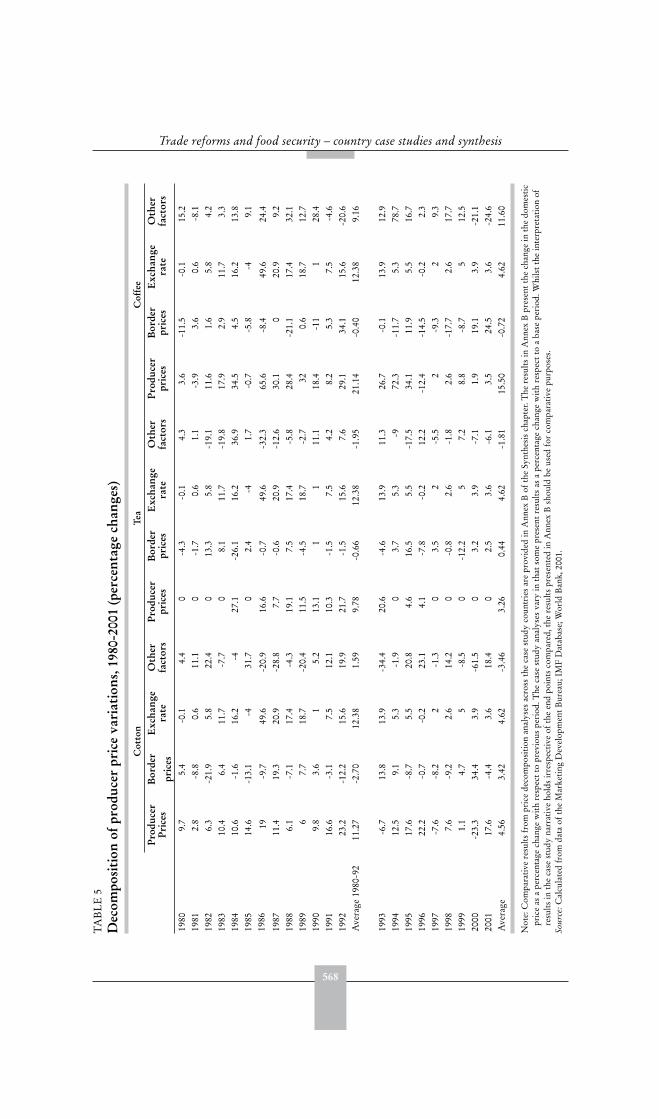
568
Trade reforms and food security – country case studies and synthesis
TA
BL
E5
D
ecom
posi
tion
of p
rodu
cer
pric
e va
riat
ions
, 198
0-20
01 (p
erce
ntag
e ch
ange
s)
Cot
ton
Tea
Cof
fee
Prod
ucer
Pric
esB
orde
r
pric
es
Exc
hang
era
teO
ther
fact
ors
Prod
ucer
pric
esB
orde
rpr
ices
Exc
hang
era
teO
ther
fact
ors
Prod
ucer
pric
esB
orde
rpr
ices
Exc
hang
era
teO
ther
fact
ors
1980
9.7
5.4
-0.1
4.4
0-4
.3-0
.14.
33.
6-1
1.5
-0.1
15.2
1981
2.8
-8.8
0.6
11.1
0-1
.70.
61.
1-3
.93.
60.
6-8
.119
826.
3-2
1.9
5.8
22.4
013
.35.
8-1
9.1
11.6
1.6
5.8
4.2
1983
10.4
6.4
11.7
-7.7
08.
111
.7-1
9.8
17.9
2.9
11.7
3.3
1984
10.6
-1.6
16.2
-427
.1-2
6.1
16.2
36.9
34.5
4.5
16.2
13.8
1985
14.6
-13.
1-4
31.7
02.
4-4
1.7
-0.7
-5.8
-49.
119
8619
-9.7
49.6
-20.
916
.6-0
.749
.6-3
2.3
65.6
-8.4
49.6
24.4
1987
11.4
19.3
20.9
-28.
87.
7-0
.620
.9-1
2.6
30.1
020
.99.
219
886.
1-7
.117
.4-4
.319
.17.
517
.4-5
.828
.4-2
1.1
17.4
32.1
1989
67.
718
.7-2
0.4
11.5
-4.5
18.7
-2.7
320.
618
.712
.719
909.
83.
61
5.2
13.1
11
11.1
18.4
-11
128
.419
9116
.6-3
.17.
512
.110
.3-1
.57.
54.
28.
25.
37.
5-4
.619
9223
.2-1
2.2
15.6
19.9
21.7
-1.5
15.6
7.6
29.1
34.1
15.6
-20.
6A
vera
ge19
80-9
211
.27
-2.7
012
.38
1.59
9.78
-0.6
612
.38
-1.9
521
.14
-0.4
012
.38
9.16
1993
-6.7
13.8
13.9
-34.
420
.6-4
.613
.911
.326
.7-0
.113
.912
.919
9412
.59.
15.
3-1
.90
3.7
5.3
-972
.3-1
1.7
5.3
78.7
1995
17.6
-8.7
5.5
20.8
4.6
16.5
5.5
-17.
534
.111
.95.
516
.719
9622
.2-0
.7-0
.223
.14.
1-7
.8-0
.212
.2-1
2.4
-14.
5-0
.22.
319
97-7
.6-8
.22
-1.3
03.
52
-5.5
2-9
.32
9.3
1998
7.6
-9.2
2.6
14.2
0-0
.82.
6-1
.82.
6-1
7.7
2.6
17.7
1999
1.1
4.7
5-8
.50
-12.
25
7.2
8.8
-8.7
512
.520
00-2
3.3
34.4
3.9
-61.
50
3.2
3.9
-7.1
1.9
19.1
3.9
-21.
120
0117
.6-4
.43.
618
.40
2.5
3.6
-6.1
3.5
24.5
3.6
-24.
6A
vera
ge4.
563.
424.
62-3
.46
3.26
0.44
4.62
-1.8
115
.50
-0.7
24.
6211
.60
Not
e:C
ompa
rati
vere
sult
sfr
ompr
ice
deco
mpo
siti
onan
alys
esac
ross
the
case
stud
yco
untr
ies
are
prov
ided
inA
nnex
Bof
the
Synt
hesi
sch
apte
r.T
here
sult
sin
Ann
exB
pres
ent
the
chan
gein
the
dom
esti
cpr
ice
asa
perc
enta
gech
ange
wit
hre
spec
tto
prev
ious
peri
od.T
heca
sest
udy
anal
yses
vary
inth
atso
me
pres
ent
resu
lts
asa
perc
enta
gech
ange
wit
hre
spec
tto
aba
sepe
riod
.Whi
lst
the
inte
rpre
tati
onof
resu
lts
inth
eca
sest
udy
narr
ativ
eho
lds
irre
spec
tive
ofth
een
dpo
ints
com
pare
d,th
ere
sult
spr
esen
ted
inA
nnex
Bsh
ould
beus
edfo
rco
mpa
rati
vepu
rpos
es.
Sou
rce:
Cal
cula
ted
from
data
ofth
eM
arke
ting
Dev
elop
men
tB
urea
u;IM
FD
atab
ase;
Wor
ldB
ank,
2001
.

569
United Republic of Tanzania
Price decomposition Prior to trade reforms there were no significant links between border prices, realproducer prices and the exchange rate. After the reforms, this link can be seen, albeitwith time lags.
The market-determined producer prices of food in the early 1990s weresubstantially higher in real terms than the official procurement prices of the 1980s.The prices were significantly affected by the 1991/92 drought in Southern Africaand associated maize exports from Tanzania. However, real producer prices of foodhave fallen by 40-60 percent since 1993. The reduction in producer prices for maize,wheat, and rice has been larger (55-60 percent) than those for non-tradable crops(World Bank, 2001) due to appreciation of the exchange rate.
Since 1993, real producer prices for all the major export crops have fallen between27 percent and 70 percent (Table 5). This has occurred in spite of some reduction inmarketing margins due to privatization and in spite of stable world prices for mostcrops. The main explanation for the falling producer prices is the appreciation of thereal exchange rate since 1993.
Market integrationA large proportion of food crops are still consumed within the household orlocality that produces them. Nevertheless, maize markets have developed rapidlysince liberalization, although they are still quite volatile. There is a reasonable levelof market integration between major rural and wholesale markets, with maizebeing readily transported from surplus to deficit areas. Dar es Salaam is the maindestination for maize, as well as rice and beans. Traders are aware of the prices indifferent wholesale markets. Although there may be a relatively small number oftraders operating in any individual wholesale market, they face competition fromtraders coming in from other regional centres and from Dar es Salaam. Marginsare generally not high and spatial marketing margins are decreasing over time forpreviously regulated tradable food crops, such as wheat, rice and maize.
However, poor communications, storage and marketing infrastructure and hightransport costs remain an obstacle to improved marketing, especially in remoterrural areas; and private traders have tended to concentrate their activities in thoseareas with better infrastructure facilities. Poor roads are probably one of the mostlimiting factors to agricultural growth. Only 5.5 percent of roads are paved. Onlyabout 14 percent of unpaved roads are in good condition, only about 25 percent arein fair condition, while the remaining 61 percent are in poor condition.
The withdrawal of the public sector and cooperatives from crop marketing hasmade it harder for some farmers to find outlets for their crops, especially in areas thatthe private sector has been reluctant to enter. A lack of price information has also putsome farmers at a disadvantage when dealing with traders.
Effects on agricultural output and value addedThe overall production trend of most of the export crops recorded positive growthduring the 1981-99 period (Table 6). For instance, cashew nuts, coffee, tea, tobaccoand sisal expanded their growth while cotton and pyrethrum registered negativegrowth. The positive growth reflected the higher prices achieved as a result of realexchange rate devaluation since the mid-1980s. However, in the last few years,
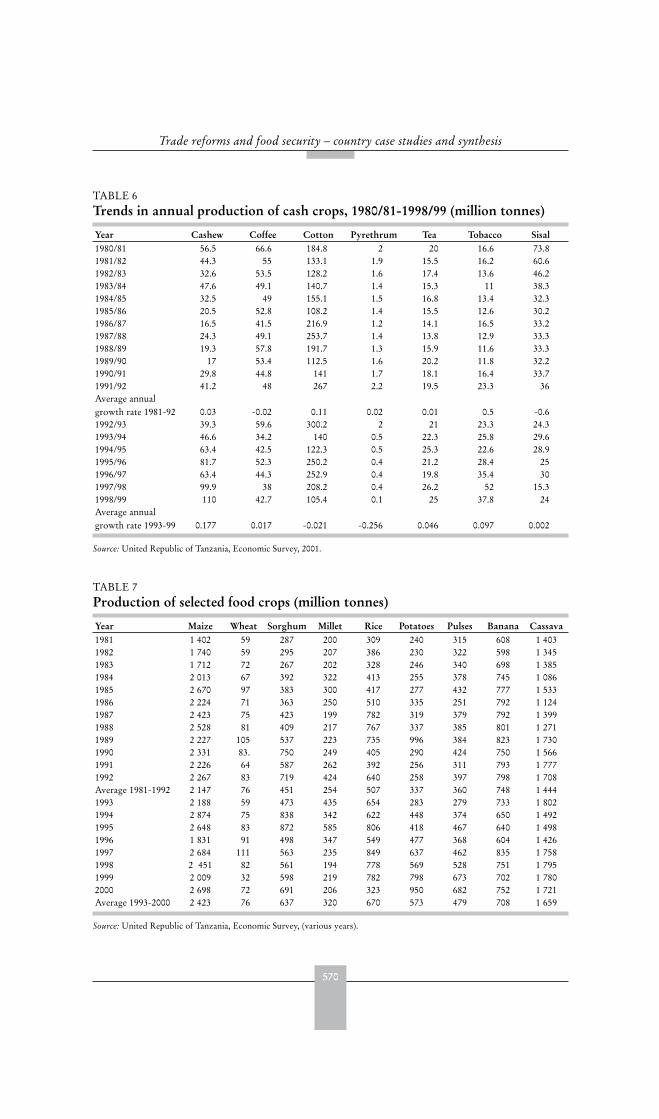
570
Trade reforms and food security – country case studies and synthesis
TABLE 6 Trends in annual production of cash crops, 1980/81-1998/99 (million tonnes)
Year Cashew Coffee Cotton Pyrethrum Tea Tobacco Sisal1980/81 56.5 66.6 184.8 2 20 16.6 73.81981/82 44.3 55 133.1 1.9 15.5 16.2 60.61982/83 32.6 53.5 128.2 1.6 17.4 13.6 46.21983/84 47.6 49.1 140.7 1.4 15.3 11 38.31984/85 32.5 49 155.1 1.5 16.8 13.4 32.31985/86 20.5 52.8 108.2 1.4 15.5 12.6 30.21986/87 16.5 41.5 216.9 1.2 14.1 16.5 33.21987/88 24.3 49.1 253.7 1.4 13.8 12.9 33.31988/89 19.3 57.8 191.7 1.3 15.9 11.6 33.31989/90 17 53.4 112.5 1.6 20.2 11.8 32.21990/91 29.8 44.8 141 1.7 18.1 16.4 33.71991/92 41.2 48 267 2.2 19.5 23.3 36Average annualgrowth rate 1981-92 0.03 -0.02 0.11 0.02 0.01 0.5 -0.61992/93 39.3 59.6 300.2 2 21 23.3 24.31993/94 46.6 34.2 140 0.5 22.3 25.8 29.61994/95 63.4 42.5 122.3 0.5 25.3 22.6 28.91995/96 81.7 52.3 250.2 0.4 21.2 28.4 251996/97 63.4 44.3 252.9 0.4 19.8 35.4 301997/98 99.9 38 208.2 0.4 26.2 52 15.31998/99 110 42.7 105.4 0.1 25 37.8 24Average annualgrowth rate 1993-99 0.177 0.017 -0.021 -0.256 0.046 0.097 0.002
Source: United Republic of Tanzania, Economic Survey, 2001.
TABLE 7 Production of selected food crops (million tonnes)
Year Maize Wheat Sorghum Millet Rice Potatoes Pulses Banana Cassava1981 1 402 59 287 200 309 240 315 608 1 4031982 1 740 59 295 207 386 230 322 598 1 3451983 1 712 72 267 202 328 246 340 698 1 3851984 2 013 67 392 322 413 255 378 745 1 0861985 2 670 97 383 300 417 277 432 777 1 5331986 2 224 71 363 250 510 335 251 792 1 1241987 2 423 75 423 199 782 319 379 792 1 3991988 2 528 81 409 217 767 337 385 801 1 2711989 2 227 105 537 223 735 996 384 823 1 7301990 2 331 83. 750 249 405 290 424 750 1 5661991 2 226 64 587 262 392 256 311 793 1 7771992 2 267 83 719 424 640 258 397 798 1 708Average 1981-1992 2 147 76 451 254 507 337 360 748 1 4441993 2 188 59 473 435 654 283 279 733 1 8021994 2 874 75 838 342 622 448 374 650 1 4921995 2 648 83 872 585 806 418 467 640 1 4981996 1 831 91 498 347 549 477 368 604 1 4261997 2 684 111 563 235 849 637 462 835 1 7581998 2 451 82 561 194 778 569 528 751 1 7951999 2 009 32 598 219 782 798 673 702 1 7802000 2 698 72 691 206 323 950 682 752 1 721Average 1993-2000 2 423 76 637 320 670 573 479 708 1 659
Source: United Republic of Tanzania, Economic Survey, (various years).
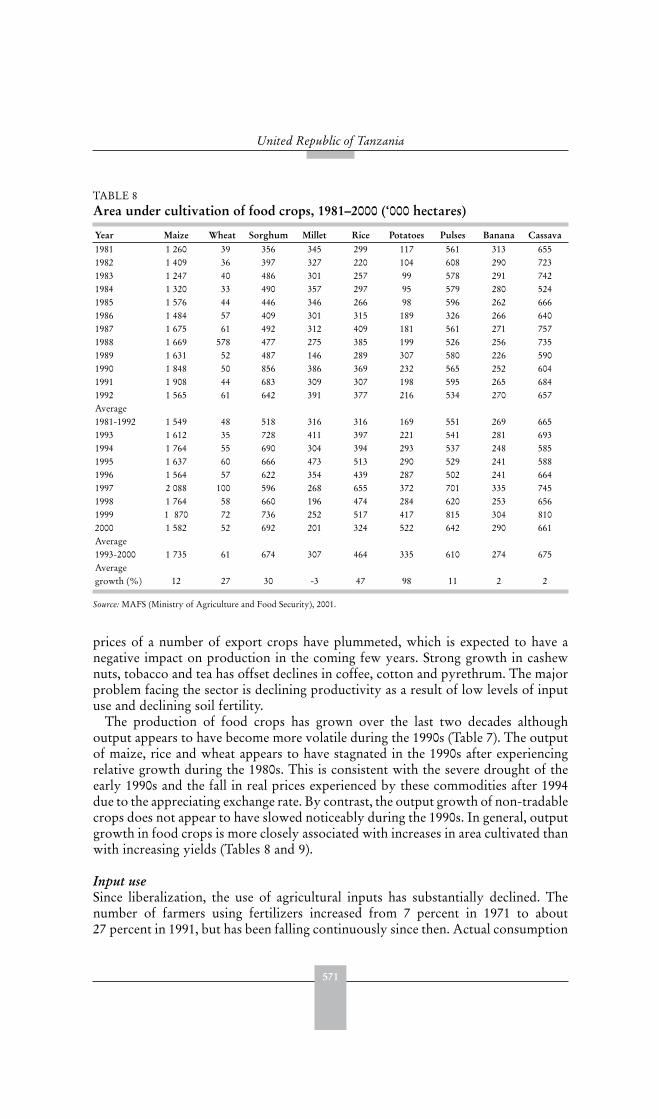
571
United Republic of Tanzania
prices of a number of export crops have plummeted, which is expected to have anegative impact on production in the coming few years. Strong growth in cashewnuts, tobacco and tea has offset declines in coffee, cotton and pyrethrum. The majorproblem facing the sector is declining productivity as a result of low levels of inputuse and declining soil fertility.
The production of food crops has grown over the last two decades althoughoutput appears to have become more volatile during the 1990s (Table 7). The outputof maize, rice and wheat appears to have stagnated in the 1990s after experiencingrelative growth during the 1980s. This is consistent with the severe drought of theearly 1990s and the fall in real prices experienced by these commodities after 1994due to the appreciating exchange rate. By contrast, the output growth of non-tradablecrops does not appear to have slowed noticeably during the 1990s. In general, outputgrowth in food crops is more closely associated with increases in area cultivated thanwith increasing yields (Tables 8 and 9).
Input useSince liberalization, the use of agricultural inputs has substantially declined. Thenumber of farmers using fertilizers increased from 7 percent in 1971 to about27 percent in 1991, but has been falling continuously since then. Actual consumption
TABLE 8 Area under cultivation of food crops, 1981–2000 (‘000 hectares)
Year Maize Wheat Sorghum Millet Rice Potatoes Pulses Banana Cassava1981 1 260 39 356 345 299 117 561 313 6551982 1 409 36 397 327 220 104 608 290 7231983 1 247 40 486 301 257 99 578 291 7421984 1 320 33 490 357 297 95 579 280 5241985 1 576 44 446 346 266 98 596 262 6661986 1 484 57 409 301 315 189 326 266 6401987 1 675 61 492 312 409 181 561 271 7571988 1 669 578 477 275 385 199 526 256 7351989 1 631 52 487 146 289 307 580 226 5901990 1 848 50 856 386 369 232 565 252 6041991 1 908 44 683 309 307 198 595 265 6841992 1 565 61 642 391 377 216 534 270 657Average1981-1992 1 549 48 518 316 316 169 551 269 6651993 1 612 35 728 411 397 221 541 281 6931994 1 764 55 690 304 394 293 537 248 5851995 1 637 60 666 473 513 290 529 241 5881996 1 564 57 622 354 439 287 502 241 6641997 2 088 100 596 268 655 372 701 335 7451998 1 764 58 660 196 474 284 620 253 6561999 1 870 72 736 252 517 417 815 304 8102000 1 582 52 692 201 324 522 642 290 661Average1993-2000 1 735 61 674 307 464 335 610 274 675Averagegrowth (%) 12 27 30 -3 47 98 11 2 2
Source: MAFS (Ministry of Agriculture and Food Security), 2001.
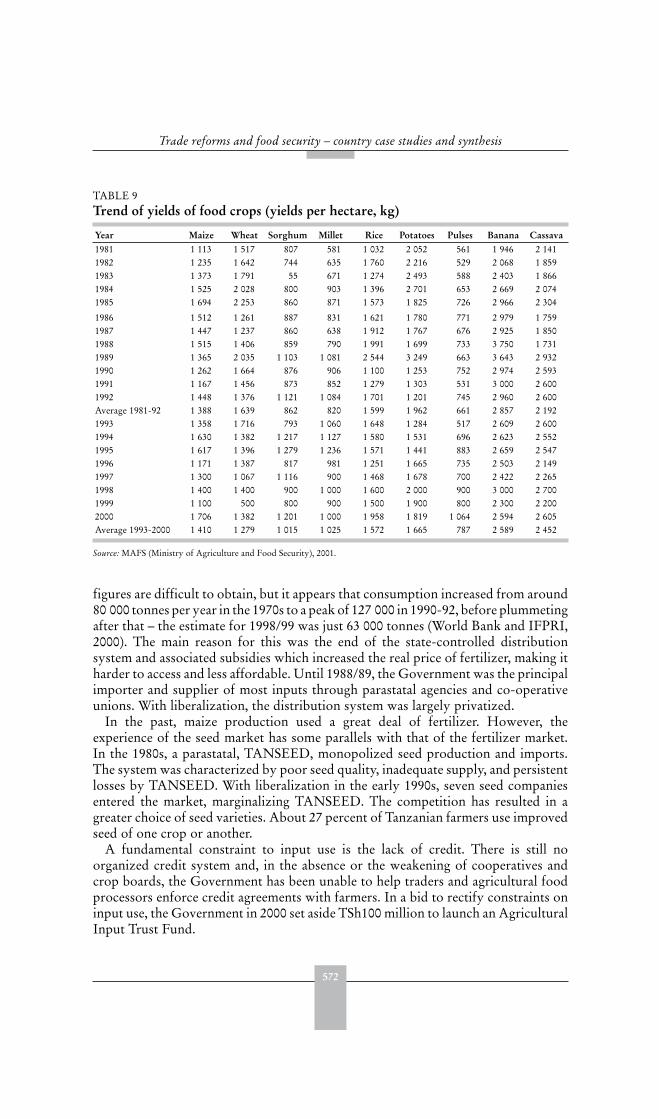
572
Trade reforms and food security – country case studies and synthesis
figures are difficult to obtain, but it appears that consumption increased from around80 000 tonnes per year in the 1970s to a peak of 127 000 in 1990-92, before plummetingafter that – the estimate for 1998/99 was just 63 000 tonnes (World Bank and IFPRI,2000). The main reason for this was the end of the state-controlled distributionsystem and associated subsidies which increased the real price of fertilizer, making itharder to access and less affordable. Until 1988/89, the Government was the principalimporter and supplier of most inputs through parastatal agencies and co-operativeunions. With liberalization, the distribution system was largely privatized.
In the past, maize production used a great deal of fertilizer. However, theexperience of the seed market has some parallels with that of the fertilizer market.In the 1980s, a parastatal, TANSEED, monopolized seed production and imports.The system was characterized by poor seed quality, inadequate supply, and persistentlosses by TANSEED. With liberalization in the early 1990s, seven seed companiesentered the market, marginalizing TANSEED. The competition has resulted in agreater choice of seed varieties. About 27 percent of Tanzanian farmers use improvedseed of one crop or another.
A fundamental constraint to input use is the lack of credit. There is still noorganized credit system and, in the absence or the weakening of cooperatives andcrop boards, the Government has been unable to help traders and agricultural foodprocessors enforce credit agreements with farmers. In a bid to rectify constraints oninput use, the Government in 2000 set aside TSh100 million to launch an AgriculturalInput Trust Fund.
TABLE 9 Trend of yields of food crops (yields per hectare, kg)
Year Maize Wheat Sorghum Millet Rice Potatoes Pulses Banana Cassava1981 1 113 1 517 807 581 1 032 2 052 561 1 946 2 1411982 1 235 1 642 744 635 1 760 2 216 529 2 068 1 8591983 1 373 1 791 55 671 1 274 2 493 588 2 403 1 8661984 1 525 2 028 800 903 1 396 2 701 653 2 669 2 0741985 1 694 2 253 860 871 1 573 1 825 726 2 966 2 304
1986 1 512 1 261 887 831 1 621 1 780 771 2 979 1 7591987 1 447 1 237 860 638 1 912 1 767 676 2 925 1 8501988 1 515 1 406 859 790 1 991 1 699 733 3 750 1 7311989 1 365 2 035 1 103 1 081 2 544 3 249 663 3 643 2 9321990 1 262 1 664 876 906 1 100 1 253 752 2 974 2 5931991 1 167 1 456 873 852 1 279 1 303 531 3 000 2 6001992 1 448 1 376 1 121 1 084 1 701 1 201 745 2 960 2 600Average 1981-92 1 388 1 639 862 820 1 599 1 962 661 2 857 2 1921993 1 358 1 716 793 1 060 1 648 1 284 517 2 609 2 6001994 1 630 1 382 1 217 1 127 1 580 1 531 696 2 623 2 5521995 1 617 1 396 1 279 1 236 1 571 1 441 883 2 659 2 5471996 1 171 1 387 817 981 1 251 1 665 735 2 503 2 1491997 1 300 1 067 1 116 900 1 468 1 678 700 2 422 2 2651998 1 400 1 400 900 1 000 1 600 2 000 900 3 000 2 7001999 1 100 500 800 900 1 500 1 900 800 2 300 2 2002000 1 706 1 382 1 201 1 000 1 958 1 819 1 064 2 594 2 605Average 1993-2000 1 410 1 279 1 015 1 025 1 572 1 665 787 2 589 2 452
Source: MAFS (Ministry of Agriculture and Food Security), 2001.

573
United Republic of Tanzania
With the removal of fertilizer subsidies and the end of fertilizer supplies on creditthrough the cooperatives, the profitability of applying fertilizer to maize and otherfood crops has been greatly reduced, especially in the Iringa, Mbeya and RukwaRegions. Interviews with farmers suggest that many producers may have switchedaway from cash crops, such as cotton, to food crops because cash crops require moreintensive use of inputs.
Effects on imports and exports Table 10 shows that while Tanzania’s exports remain dominated by seven primaryagricultural commodities (coffee, cotton, cashew nuts, cloves, tea, tobacco and sisal)which have traditionally constituted more than half of the value of total exports,non-agricultural exports have improved, especially in the mineral sub-sector and intourism. The average contribution of primary exports was 75 percent during 1984-86,before declining to 57 percent in 1996, as the share of non-traditional merchandiseexports picked up (World Bank, 2001). Tanzania’s export sector is vulnerable toclimatic changes and fluctuations in world market prices.
The value of exports increased dramatically between 1985 and 1999 in responseto better prices arising from the depreciating real exchange rate, export incentiveschemes and the emphasis given to non-traditional exports. The rise in exportscontinued even after the real exchange rate began to appreciate in 1994. However, in1996 exports peaked and then began to fall again, possibly in a delayed response tothe real exchange appreciation.
TABLE 10 Exports by major category, 1985-1999 (US$ million)
Year Coffee Cotton Sisal Tea Tobacco Cashew nuts
Cloves Totaltraditional
Totalmerchand-ise exports
Agri.% of total
exports1985 93 26 4 16 14 10 49 212 271 781986 164 31 5 14 14 13 15 256 290 881987 90 37 5 13 12 11 6 174 254 681988 71 65 4 15 13 2 8 177 270 661989 98 77 4 17 13 3 0 212 395.2 541990 82 76 17 38 13 5 0 231 407.8 571991 76 62 2 22 2 16 0 179 340 531992 58 95 1 24 2 22 0 203 370 55Average1985-92 91.5 58.625 5.25 19.875 10.375 10.25 9.75 205.5 324.75 651993 96.08 78.38 3.33 30.03 17.07 23.31 0 248 431 581994 115.36 105.12 5.12 39.52 20.56 51.16 0 337 519 651995 142.6 120.15 6.31 23.36 27.13 64 0 384 683 561996 136.11 125.33 5.32 22.42 49.24 97.77 0 436 764 571997 119.28 130.38 9.12 31.83 53.64 91.08 0 435 753 581998 108.74 47.63 6.78 30.43 55.39 107.32 0 356 589 611999 76.63 28.25 7.26 24.37 43.44 98.94 0 279 541 52Average1993-99 110.78 86.73 6.06 27.72 34.60 67.97 1.21 335.06 575.59 59Change inaverages (%) 21 48 15 39 233 563 -88 63 77 -9
Source: Bank of Tanzania (various publications and years).
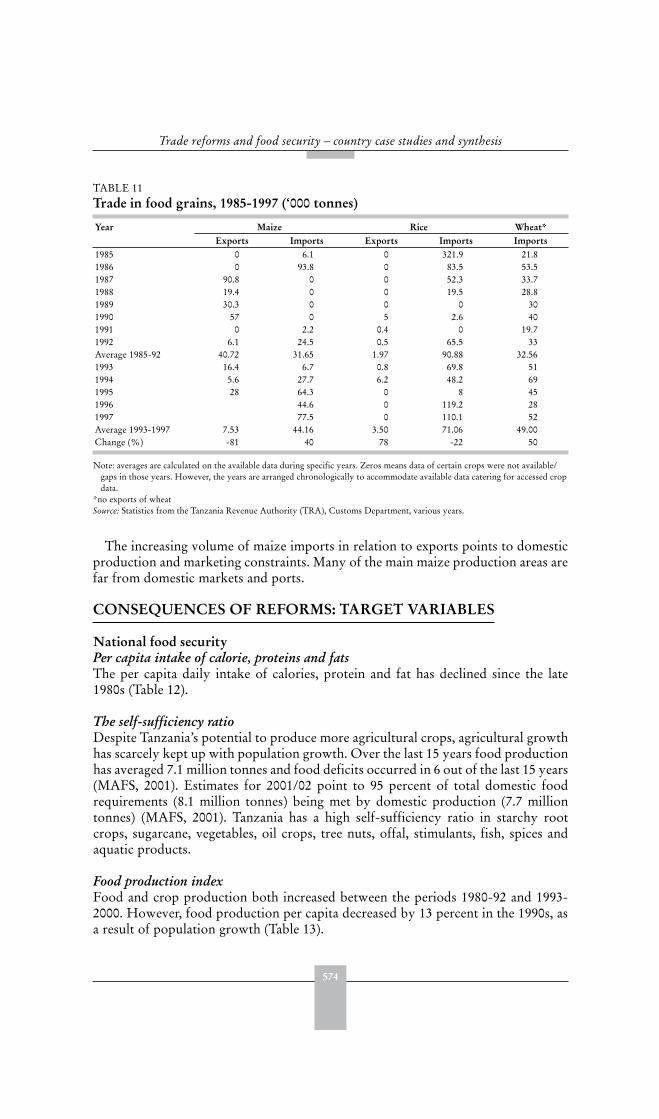
574
Trade reforms and food security – country case studies and synthesis
The increasing volume of maize imports in relation to exports points to domesticproduction and marketing constraints. Many of the main maize production areas arefar from domestic markets and ports.
CONSEQUENCES OF REFORMS: TARGET VARIABLES
National food securityPer capita intake of calorie, proteins and fatsThe per capita daily intake of calories, protein and fat has declined since the late1980s (Table 12).
The self-sufficiency ratio Despite Tanzania’s potential to produce more agricultural crops, agricultural growthhas scarcely kept up with population growth. Over the last 15 years food productionhas averaged 7.1 million tonnes and food deficits occurred in 6 out of the last 15 years(MAFS, 2001). Estimates for 2001/02 point to 95 percent of total domestic foodrequirements (8.1 million tonnes) being met by domestic production (7.7 milliontonnes) (MAFS, 2001). Tanzania has a high self-sufficiency ratio in starchy rootcrops, sugarcane, vegetables, oil crops, tree nuts, offal, stimulants, fish, spices andaquatic products.
Food production index Food and crop production both increased between the periods 1980-92 and 1993-2000. However, food production per capita decreased by 13 percent in the 1990s, asa result of population growth (Table 13).
TABLE 11 Trade in food grains, 1985-1997 (‘000 tonnes)
Year Maize Rice Wheat*Exports Imports Exports Imports Imports
1985 0 6.1 0 321.9 21.81986 0 93.8 0 83.5 53.51987 90.8 0 0 52.3 33.71988 19.4 0 0 19.5 28.81989 30.3 0 0 0 301990 57 0 5 2.6 401991 0 2.2 0.4 0 19.71992 6.1 24.5 0.5 65.5 33Average 1985-92 40.72 31.65 1.97 90.88 32.561993 16.4 6.7 0.8 69.8 511994 5.6 27.7 6.2 48.2 691995 28 64.3 0 8 451996 44.6 0 119.2 281997 77.5 0 110.1 52Average 1993-1997 7.53 44.16 3.50 71.06 49.00Change (%) -81 40 78 -22 50
Note: averages are calculated on the available data during specific years. Zeros means data of certain crops were not available/gaps in those years. However, the years are arranged chronologically to accommodate available data catering for accessed cropdata.
*no exports of wheatSource: Statistics from the Tanzania Revenue Authority (TRA), Customs Department, various years.
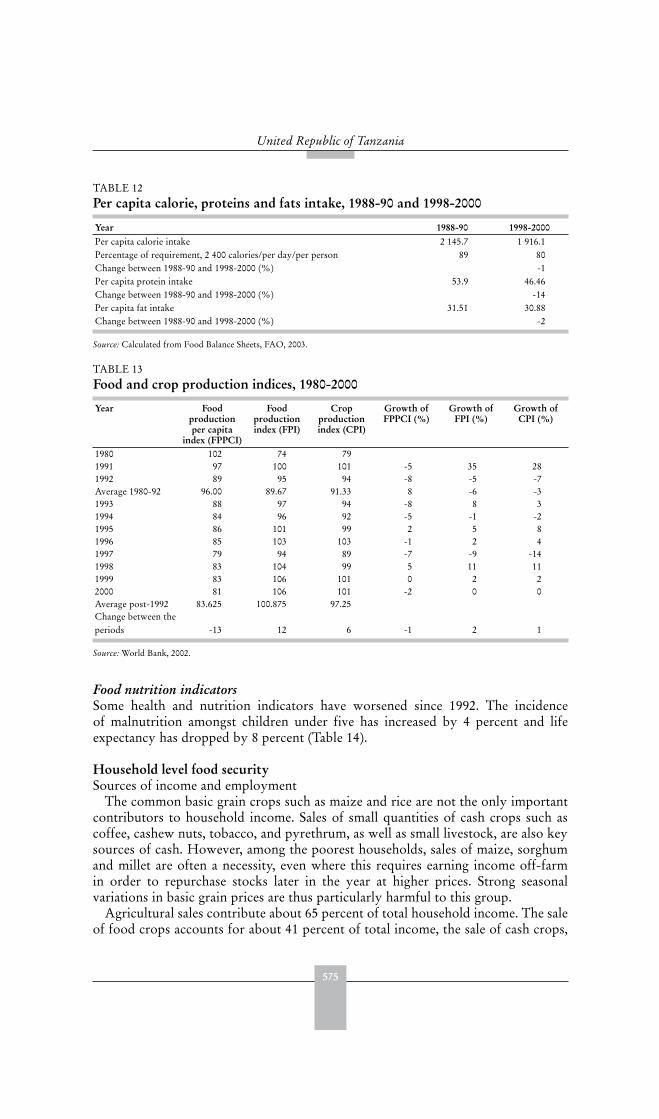
575
United Republic of Tanzania
Food nutrition indicatorsSome health and nutrition indicators have worsened since 1992. The incidenceof malnutrition amongst children under five has increased by 4 percent and lifeexpectancy has dropped by 8 percent (Table 14).
Household level food security Sources of income and employment
The common basic grain crops such as maize and rice are not the only importantcontributors to household income. Sales of small quantities of cash crops such ascoffee, cashew nuts, tobacco, and pyrethrum, as well as small livestock, are also keysources of cash. However, among the poorest households, sales of maize, sorghumand millet are often a necessity, even where this requires earning income off-farmin order to repurchase stocks later in the year at higher prices. Strong seasonalvariations in basic grain prices are thus particularly harmful to this group.
Agricultural sales contribute about 65 percent of total household income. The saleof food crops accounts for about 41 percent of total income, the sale of cash crops,
TABLE 12 Per capita calorie, proteins and fats intake, 1988-90 and 1998-2000
Year 1988-90 1998-2000Per capita calorie intake 2 145.7 1 916.1Percentage of requirement, 2 400 calories/per day/per person 89 80Change between 1988-90 and 1998-2000 (%) -1Per capita protein intake 53.9 46.46Change between 1988-90 and 1998-2000 (%) -14Per capita fat intake 31.51 30.88Change between 1988-90 and 1998-2000 (%) -2
Source: Calculated from Food Balance Sheets, FAO, 2003.
TABLE 13 Food and crop production indices, 1980-2000
Year Foodproductionper capita
index (FPPCI)
Foodproductionindex (FPI)
Cropproductionindex (CPI)
Growth of FPPCI (%)
Growth of FPI (%)
Growth of CPI (%)
1980 102 74 791991 97 100 101 -5 35 281992 89 95 94 -8 -5 -7Average 1980-92 96.00 89.67 91.33 8 -6 -31993 88 97 94 -8 8 31994 84 96 92 -5 -1 -21995 86 101 99 2 5 81996 85 103 103 -1 2 41997 79 94 89 -7 -9 -141998 83 104 99 5 11 111999 83 106 101 0 2 22000 81 106 101 -2 0 0Average post-1992 83.625 100.875 97.25Change between theperiods -13 12 6 -1 2 1
Source: World Bank, 2002.

576
Trade reforms and food security – country case studies and synthesis
TABLE 14 Health and nutrition indicators, 1980-2000
Year Safe water, rural (% of rural
populationwith
access)
Safe water, urban (% of urban
populationwith
access)
Prevalence of anaemia
amongpregnantwomen
(%)
Low-birth-weight
babies (% of births)
Malnutritionprevalence
(% of childrenunder 5)
Deathrate, crude (per 1 000
people)
Lifeexpectancy
at birth, female(years)
Lifeexpectancy
at birth, male
(years)
Lifeexpectancy
at birth, total
(years)
1980 ... ... ... ... ... 15.44 51.78 48.26 49.981982 ... ... ... ... ... 14.8 52.5 48.9 50.661985 ... ... ... 12 ... 14.2 52.62 49.2 50.871987 ... ... ... 13 ... 13.8 52.7 49.4 51.011988 ... ... ... 13 ... ... ... ... ...1990 42 80 ... ... ... 13.62 51.56 48.62 50.051991 ... ... ... 8.6 ... ... ... ... ...1992 ... ... ... 17 28.9 13.5 50.8 48.1 49.42Average1980-92 42 80 0 12.7 28.9 14.2 52.0 48.7 50.3
1994 ... ... ... ... ... ... ... ... ...1995 ... ... ... ... ... 14.76 49.78 47.32 48.521996 ... ... ... ... 30.6 ... ... ... ...1997 ... ... ... ... ... 15.6 49.1 46.8 47.921998 ... ... 59 ... ... ... ... ... ...1999 ... ... ... ... 29.4 ... 45.6 44.4 44.992000 42 80 ... ... ... 17.16 44.93 43.8 44.35Average1994-2000 42 80 59 0.0 30.0 15.8 47.4 45.6 46.4Change(%) 0 0 0 -100 4 11 -9 -8 -8
Source: World Bank Data Base, 2002.
TABLE 15 Sources of household cash income, 1991/92-2000/01 (percent)
Dar es Salaam
OtherUrban
Rural Tanzania(Mainland)
Dar es Salaam
Urban Rural Tanzania
1991/92
2000/01
1991/92
2000/01
1991/92
2000/01
1991/92
2000/01
∆ ∆ ∆ ∆
Sales of food crops 1.7 2.8 20.7 13.8 48.5 48.9 41.4 40.6 65 -33 1 -2Sales of livestock& livestockproducts
0.1 0.3 0.4 0.9 5.3 5.5 4.3 4.5 200 125 4 5
Sales of cash crops 1.2 0.6 8.3 7.4 25.6 20.5 21.6 17.2 -50 -11 -20 -20Business income 26.8 31.1 26.8 30.3 6.1 8.1 10.4 13 16 13 33 25Wages or salariesin cash
62.7 40.7 31.1 23.9 5.8 3.8 13.1 9.3 -35 -23 -34 -29
Other casual cashearnings
2.9 15.2 4.9 12 1.9 4.2 2.4 6.1 424 145 121 154
Cash remittances 1 4.8 2.1 5.4 1 3 1.1 3.5 380 157 200 218Fishing 0.7 0.6 2 0.8 1.9 2.2 1.9 1.9 -14 -60 16 0Other 3 3.9 3.7 5.3 3.9 3.6 3.8 3.9 30 43 -8 3Total 100 100 100 100 100 100 100 100 0 0 0 0
Note: = changeSource: Calculated from NBS (1991/92 and 2000/01)
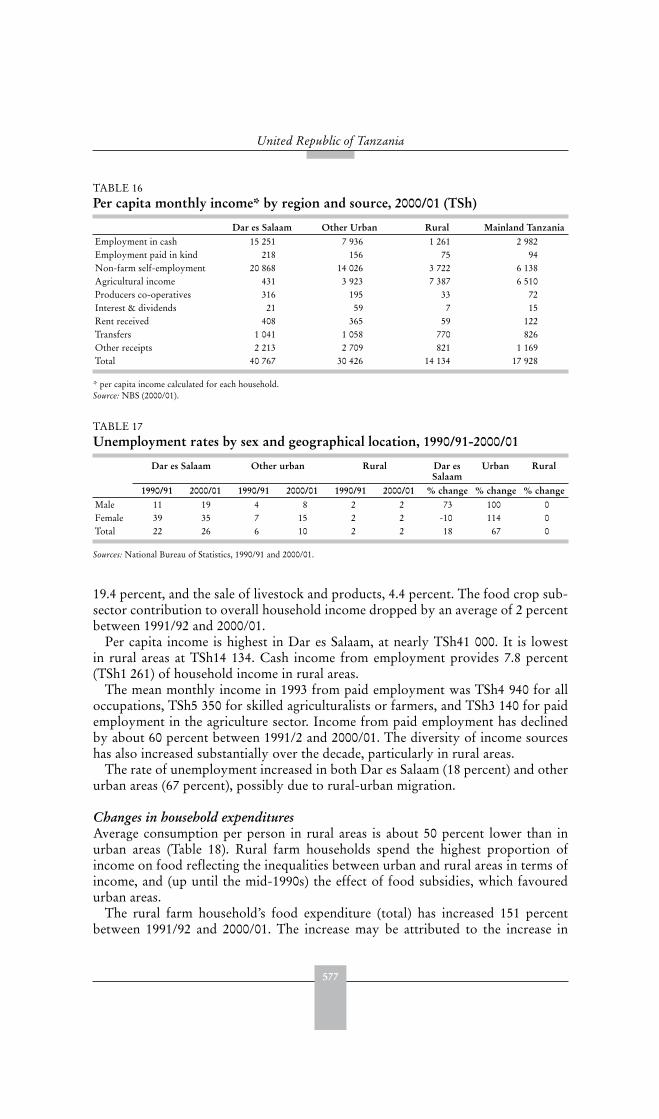
577
United Republic of Tanzania
19.4 percent, and the sale of livestock and products, 4.4 percent. The food crop sub-sector contribution to overall household income dropped by an average of 2 percentbetween 1991/92 and 2000/01.
Per capita income is highest in Dar es Salaam, at nearly TSh41 000. It is lowestin rural areas at TSh14 134. Cash income from employment provides 7.8 percent(TSh1 261) of household income in rural areas.
The mean monthly income in 1993 from paid employment was TSh4 940 for alloccupations, TSh5 350 for skilled agriculturalists or farmers, and TSh3 140 for paidemployment in the agriculture sector. Income from paid employment has declinedby about 60 percent between 1991/2 and 2000/01. The diversity of income sourceshas also increased substantially over the decade, particularly in rural areas.
The rate of unemployment increased in both Dar es Salaam (18 percent) and otherurban areas (67 percent), possibly due to rural-urban migration.
Changes in household expendituresAverage consumption per person in rural areas is about 50 percent lower than inurban areas (Table 18). Rural farm households spend the highest proportion ofincome on food reflecting the inequalities between urban and rural areas in terms ofincome, and (up until the mid-1990s) the effect of food subsidies, which favouredurban areas.
The rural farm household’s food expenditure (total) has increased 151 percentbetween 1991/92 and 2000/01. The increase may be attributed to the increase in
TABLE 16 Per capita monthly income* by region and source, 2000/01 (TSh)
Dar es Salaam Other Urban Rural Mainland TanzaniaEmployment in cash 15 251 7 936 1 261 2 982Employment paid in kind 218 156 75 94Non-farm self-employment 20 868 14 026 3 722 6 138Agricultural income 431 3 923 7 387 6 510Producers co-operatives 316 195 33 72Interest & dividends 21 59 7 15Rent received 408 365 59 122Transfers 1 041 1 058 770 826Other receipts 2 213 2 709 821 1 169Total 40 767 30 426 14 134 17 928
* per capita income calculated for each household.Source: NBS (2000/01).
TABLE 17 Unemployment rates by sex and geographical location, 1990/91-2000/01
Dar es Salaam Other urban Rural Dar es Salaam
Urban Rural
1990/91 2000/01 1990/91 2000/01 1990/91 2000/01 % change % change % changeMale 11 19 4 8 2 2 73 100 0Female 39 35 7 15 2 2 -10 114 0Total 22 26 6 10 2 2 18 67 0
Sources: National Bureau of Statistics, 1990/91 and 2000/01.
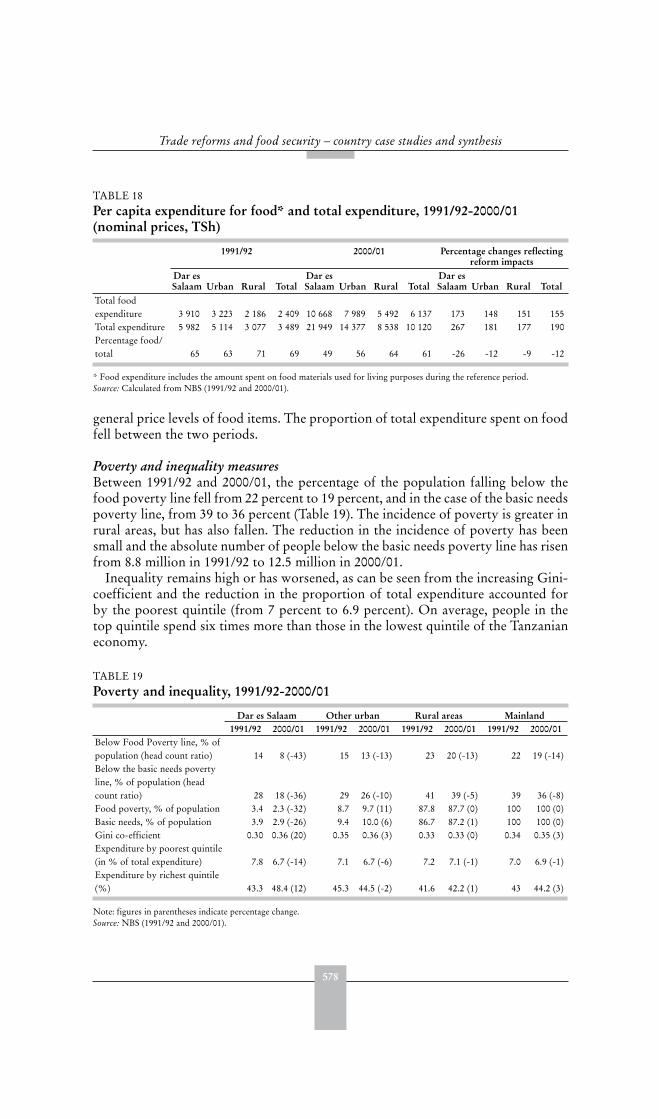
578
Trade reforms and food security – country case studies and synthesis
general price levels of food items. The proportion of total expenditure spent on foodfell between the two periods.
Poverty and inequality measuresBetween 1991/92 and 2000/01, the percentage of the population falling below thefood poverty line fell from 22 percent to 19 percent, and in the case of the basic needspoverty line, from 39 to 36 percent (Table 19). The incidence of poverty is greater inrural areas, but has also fallen. The reduction in the incidence of poverty has beensmall and the absolute number of people below the basic needs poverty line has risenfrom 8.8 million in 1991/92 to 12.5 million in 2000/01.
Inequality remains high or has worsened, as can be seen from the increasing Gini-coefficient and the reduction in the proportion of total expenditure accounted forby the poorest quintile (from 7 percent to 6.9 percent). On average, people in thetop quintile spend six times more than those in the lowest quintile of the Tanzanianeconomy.
TABLE 18 Per capita expenditure for food* and total expenditure, 1991/92-2000/01(nominal prices, TSh)
1991/92 2000/01 Percentage changes reflecting reform impacts
Dar es Salaam Urban Rural Total
Dar es Salaam Urban Rural Total
Dar es Salaam Urban Rural Total
Total foodexpenditure 3 910 3 223 2 186 2 409 10 668 7 989 5 492 6 137 173 148 151 155Total expenditure 5 982 5 114 3 077 3 489 21 949 14 377 8 538 10 120 267 181 177 190Percentage food/total 65 63 71 69 49 56 64 61 -26 -12 -9 -12
* Food expenditure includes the amount spent on food materials used for living purposes during the reference period.Source: Calculated from NBS (1991/92 and 2000/01).
TABLE 19 Poverty and inequality, 1991/92-2000/01
Dar es Salaam Other urban Rural areas Mainland1991/92 2000/01 1991/92 2000/01 1991/92 2000/01 1991/92 2000/01
Below Food Poverty line, % ofpopulation (head count ratio) 14 8 (-43) 15 13 (-13) 23 20 (-13) 22 19 (-14)Below the basic needs povertyline, % of population (headcount ratio) 28 18 (-36) 29 26 (-10) 41 39 (-5) 39 36 (-8)Food poverty, % of population 3.4 2.3 (-32) 8.7 9.7 (11) 87.8 87.7 (0) 100 100 (0)Basic needs, % of population 3.9 2.9 (-26) 9.4 10.0 (6) 86.7 87.2 (1) 100 100 (0)Gini co-efficient 0.30 0.36 (20) 0.35 0.36 (3) 0.33 0.33 (0) 0.34 0.35 (3)Expenditure by poorest quintile(in % of total expenditure) 7.8 6.7 (-14) 7.1 6.7 (-6) 7.2 7.1 (-1) 7.0 6.9 (-1)Expenditure by richest quintile(%) 43.3 48.4 (12) 45.3 44.5 (-2) 41.6 42.2 (1) 43 44.2 (3)
Note: figures in parentheses indicate percentage change.Source: NBS (1991/92 and 2000/01).
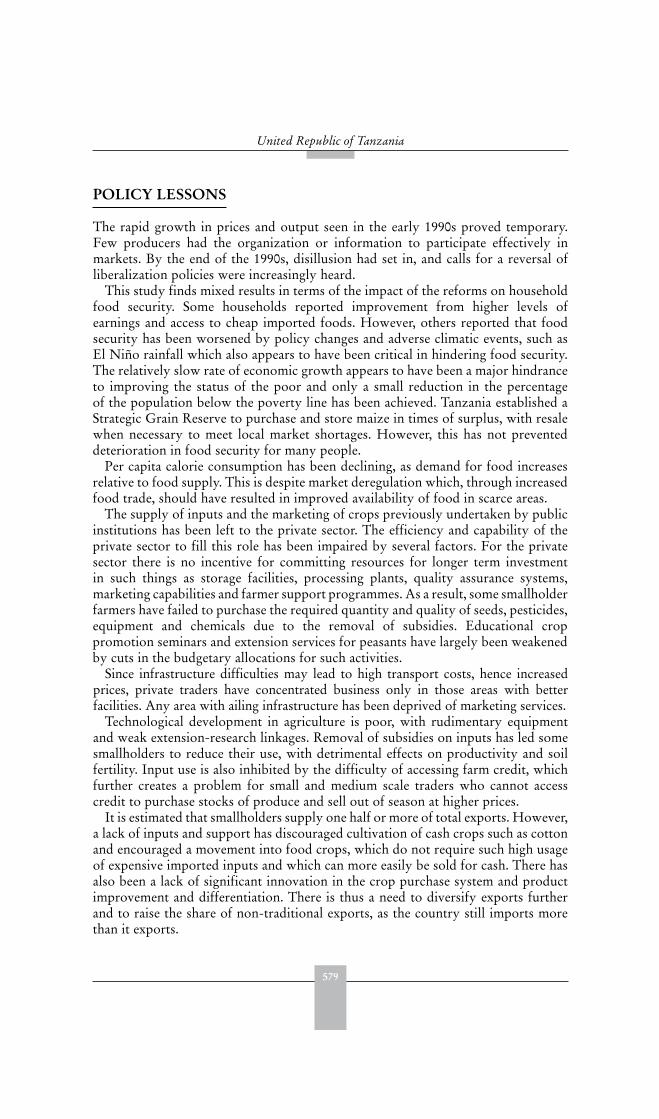
579
United Republic of Tanzania
POLICY LESSONS
The rapid growth in prices and output seen in the early 1990s proved temporary.Few producers had the organization or information to participate effectively inmarkets. By the end of the 1990s, disillusion had set in, and calls for a reversal ofliberalization policies were increasingly heard.
This study finds mixed results in terms of the impact of the reforms on householdfood security. Some households reported improvement from higher levels ofearnings and access to cheap imported foods. However, others reported that foodsecurity has been worsened by policy changes and adverse climatic events, such asEl Niño rainfall which also appears to have been critical in hindering food security.The relatively slow rate of economic growth appears to have been a major hindranceto improving the status of the poor and only a small reduction in the percentageof the population below the poverty line has been achieved. Tanzania established aStrategic Grain Reserve to purchase and store maize in times of surplus, with resalewhen necessary to meet local market shortages. However, this has not preventeddeterioration in food security for many people.
Per capita calorie consumption has been declining, as demand for food increasesrelative to food supply. This is despite market deregulation which, through increasedfood trade, should have resulted in improved availability of food in scarce areas.
The supply of inputs and the marketing of crops previously undertaken by publicinstitutions has been left to the private sector. The efficiency and capability of theprivate sector to fill this role has been impaired by several factors. For the privatesector there is no incentive for committing resources for longer term investmentin such things as storage facilities, processing plants, quality assurance systems,marketing capabilities and farmer support programmes. As a result, some smallholderfarmers have failed to purchase the required quantity and quality of seeds, pesticides,equipment and chemicals due to the removal of subsidies. Educational croppromotion seminars and extension services for peasants have largely been weakenedby cuts in the budgetary allocations for such activities.
Since infrastructure difficulties may lead to high transport costs, hence increasedprices, private traders have concentrated business only in those areas with betterfacilities. Any area with ailing infrastructure has been deprived of marketing services.
Technological development in agriculture is poor, with rudimentary equipmentand weak extension-research linkages. Removal of subsidies on inputs has led somesmallholders to reduce their use, with detrimental effects on productivity and soilfertility. Input use is also inhibited by the difficulty of accessing farm credit, whichfurther creates a problem for small and medium scale traders who cannot accesscredit to purchase stocks of produce and sell out of season at higher prices.
It is estimated that smallholders supply one half or more of total exports. However,a lack of inputs and support has discouraged cultivation of cash crops such as cottonand encouraged a movement into food crops, which do not require such high usageof expensive imported inputs and which can more easily be sold for cash. There hasalso been a lack of significant innovation in the crop purchase system and productimprovement and differentiation. There is thus a need to diversify exports furtherand to raise the share of non-traditional exports, as the country still imports morethan it exports.
580
Trade reforms and food security – country case studies and synthesis
Despite liberalization, gaps in the policy, legislative, regulatory, and institutionalframework continue to exist. The government has yet to formulate a comprehensiveagricultural marketing policy and a set of supportive strategies.
REFERENCES
Akello-Ogutu, C. & Echessah, P.N. 1997. Unrecorded cross-border trade between Tanzania
and her neighbours. Draft Report; USAID.Bank of Tanzania. Various years. Quarterly Economic Bulletin. Dar Es Salaam.ERB (Economic Research Bureau). 2001. Rural agricultural marketing services in Tanzania.
Draft Report. Dar es Salaam, March 2001.FAO. 2003. Food balance sheets.
NBS (National Bureau of Statistics and Ministry of Labour). 1993. The labour survey
1990/91. June.NBS (National Bureau of Statistics). 1990/91 and 2000/01. Integrated Labour Force Surveys
(ILFS).NBS (National Bureau of Statistics). 2002. The household budget survey 2000/01. Tanzania
and Oxford Policy Management Limited (OPML) UK.United Republic of Tanzania and World Bank. 2000. Tanzania agriculture: performance and
strategies for sustainable growth.United Republic of Tanzania. Various years. The economic survey. The President’s Office –
Planning and Privatization.Wangwe, S.M. & Tsikata, Y. 1999. Macroeconomic developments and employment in
Tanzania. ESRF Paper for ILO.World Bank & IFPRI. 2000. Agriculture in Tanzania since 1986. Follower or leader of growth.
World Bank Country Study, Washington.World Bank database. 2002. African Development Indicators 2002 drawn from World Bank
Africa Database. World Bank Publications.World Bank. 1996. Tanzania: The challenge of reforms: growth, incomes and welfare Vol. I &
II. Country Operation Division, Eastern Africa Department, Africa Region.World Bank. 2001. Tanzania at the turn of the century: from reforms to sustained growth and
poverty reduction. Washington, DC, Government of Tanzania and World Bank.World Bank. 2002. The Little Green Data Book, drawn from the World Development
Indicators. Washington DC.
FURTHER READING
African Institute for Economic and Social Development. 2001. Food Security in Africa: A
Development Challenge. Abidjan Inades-Information.Alphonce, Christian B. 1997. Practical decision support system for food security planning in
low-income food deficit developing countries. Dublin, University College Dublin-NationalUniversity of Ireland.
Bagachwa, M.S.D. 1994. Changing perceptions of poverty and the emerging research issues,
in M.S.D. Bagachwa (ed.) Poverty alleviation in Tanzania: recent research issues. Dar esSalaam. Dar es Salaam University Press.
Bryceson, D.F. 1998. Food insecurity and social division of labour in Tanzania: 1919–1985.Oxford University, St. Anthony’s College.
581
United Republic of Tanzania
Datt, G. & Ravallion, M. 1992. Growth and redistribution Components of changes inpoverty measures: a decomposition with application to Brazil and India in the 1980s.
Journal of Development Economics 38:275-295.Davis, S. 1996. Adaptable livelihoods: coping with food insecurity in the Malian Sahel.
London, Macmillan Press Ltd.Donovan, W. Graeme. 1996. Agriculture and economic reform in Sub-Saharan Africa,
Working Paper No. 18, The World Bank.Dorward, A., Kydd, J. & Poulton, C. (eds). Smallholder Cash Crop Production, New
Institutional Economics Perspective, CAB International, Wallingford. pp. 280.Ellis, Frank & Mdoe, Ntengua. 2002. Livelihoods and rural poverty reduction in Tanzania.
LADDER Working Paper No.11, February, 2002.ERB (Economic Research Bureau). 2002. Rural Agricultural Marketing Services in Tanzania,
Draft Report.ESRF. 1999. A 2025 Vision for Food and Agriculture: Tanzania.ESRF. 2002. Quarterly Economic Review – Tanzania. Volume 4 Issue 4 Oct-Dec 2001.ESRF. 2002. Quarterly Economic Review – Tanzania. Volume 5 Issue 2 April-June 2002.FAO. Assessment and issues paper. The nature of food security problems in mainland Tanzania.
Revised draft report No. 2, 1990.Federal Democratic Republic of Ethiopia. 2002. Ethiopia: Sustainable development and
poverty reduction program. Ministry of Finance and Economic Development. AddisAbaba, Ethiopia, 2002.
Garret, James L. 2000. Achieving urban food and nutrition security in the developing world.
IFPR.Grote, Ulrike & Kirchhoff, Stefanie. 2001. Environmental and food safety standards in the
context of trade liberalization: issues and options. Bonn, Germany, Centre for DevelopmentResearch (ZEF).
Hossein, Askari & Cummings, John. 1976. Agricultural supply response: a survey of the
econometric evidence. New York, Praeger.IFPRI (International Food Policy Research Institute). 2001. 2020 Vision: sustainable food
security for all by 2020. Bonn, Germany, 1990 Report.International Fund for Agricultural Development. 1992. The state of world rural poverty,
an enquiry into its causes and consequences. New York University Press.International Labour Office; Basic needs in danger: a basic needs-oriented development for
Tanzania. JASPA, Addis Ababa.Jones, J.V.S. 1998. Food security and economic development in Tanzania, Past Problems and
Proposals for a New Strategy. African Review; A Journal of African Politics, Developmentand Internal Affairs, No. 15.
Kironde, J.M.L. 1996. The Role of municipalities in dealing with urban poverty in Tanzania:
The case of the City of Dar es Salaam. Report prepared for the UNCHS Habitat on UrbanPoverty.
Lugalla, J. 1995. Crisis, urbanization and urban poverty in Tanzania: A study of urban
poverty and survival politics,. Boston, University Press of America.Lussuga Kironde, J.M. 1998. An evaluation of government’s attempts to cope with the
growing demand imposed by rapid urbanization in Tanzania. A paper presented at theWorkshop to Establish a Knowledge Base on Urban in Tanzania – September 2-3.
MAFS (Ministry of Agriculture and Food Security). 2001. Agriculture statistics (AGSTATS)
for food security. Food Security Department, MAFS, May 2001.
582
Trade reforms and food security – country case studies and synthesis
Masaiganah, Mwajuma Saiddy. 2001. Achieving food security in the urban context through
urban agriculture: an example from Tanzania.
MOAC Food Security Department. 1995 Tanzania Food Security Report: 1995. Dar esSalaam.
MOAC Food Security Department. 1996. Tanzania Food Security Report: 1996. Dar esSalaam.
MOAC Food Security Department. 1999 Tanzania Food Security Bulletin, January/February,
1999. Dar es Salaam.MOAC Food Security Department. 2002 Tanzania Food Security Report: June 14, 2002. Dar
es Salaam.Ngaga, Sudi S. 1996: Food security information systems in Tanzania: An evaluative study. Dar
es Salaam, UDSM.Ngware, Suleiman & Lussuga Kironde, J.M. 2000. Urbanizing Tanzania: issues, initiatives
and priorities. Dar es Salaam, DUP (1996) Ltd.Okpala, D.C.I. 1987. Recovered concepts and theories of African Urban studies and urban
management strategies: a critique. Urban Studies. Vol.24.Pinstrup Andersen, Per. 1989. Government policy, food security and nutrition in Sub-Saharan
Africa. New York, Cornell University.Rafiq, M. 1988. Urbanization; an on-going process. In 1978 Population Census, Vol. III.
Bureau of Statistics, Dar es Salaam.Rodrick, D. 1999. The New Global Economy and developing countries: making openness
work. Policy Essay, 24, Washington, D.C: Overseas Development Council.SADC Food Security Quarterly Bulletin. Various years. Harare, Zimbabwe.Sadoulet, Elisabeth & de Janvry, Alan. 1995. Quantitative Development Policy Analysis. The
Johns Hopkins University Press Baltimore and London.Sawio, Camillus J. 1993. Feeding the urban masses? Toward an understanding of the
dynamics of urban agriculture and land use change in Dar es Salaam, Tanzania. Worcester,Massachusetts, Faculty of Clark University.
Schuh, G. Edward. 2002. Global Food Security. University of MinnesotaSeppala, Pekka. 1998. Liberalized and neglected? food marketing policies in East Africa. The
United Nations University.Smith, A. 1997. Human rights and choice in poverty: food insecurity, dependency and human
right-based development aid for the Third World poor. Westport, Praeger.Sowa, K. & Oduro, Abena, D. 2002. Basic measurements and diagnostics course: summary
and presentations. IPAR (Nairobi), SISERA (Dakar) and WBI (Washington).Sowa, Nii K. & Oduro, Abena D.. 2002. Basic Measurements and diagnostics course: summary
and presentations, IPAR (Nairobi), SISERA (Dakar) and WBI (Washington), 2002.Sporrek, Anders. 1985. Food marketing and urban growth in Dar es Salaam. Lund-Sweden,
The Royal University of Lund.Stamoulis, Kostas G. 2001. Food, agriculture and rural development: current and emerging
issues for economic analysis and policy research. Rome, Economic and Social Department,FAO.
Stiglitz, Joseph. 1996. Some lessons from East Asia. World Bank Research Observer. (11)2:151-77.
The Economist. 2000. Guide to Econometric Indicators: Making Sense of Economics. 2000.UNCHS – Habitat, 1996. An urbanising world: a global report on human settlement. London,
Oxford University Press.
583
United Republic of Tanzania
UNFPA. 2002. State of the world population 2002: people, poverty and possibilities. UNFPA.New York, USA.
UNHSP. 2002. World Urban Forum, First Session Nairobi, 29 April – 3 May 2002.United Nations Development Programme. 2000. Human development report.United Republic of Tanzania, MOA. 1992. Comprehensive food security programme, Vol. 1.
Dar es Salaam.United Republic of Tanzania. 1984. Tanzania national food strategy: a framework for action.
Volume II. Ministry of Agriculture and Livestock Development (MOALD), Dar esSalaam.
United Republic of Tanzania. 1989. Food security bulletin for June, 1989. Ministry ofAgriculture and Livestock Development (MOALD), Dar es Salaam.
United Republic of Tanzania. 2002. The agricultural sector development strategy.Van Braun, J., McComb, J., Fred-Mensah, B.K. & Pandya-Lorch, R. 1993. Urban food
security and malnutrition in developing countries: trends, policies and research implications.Washington, DC, International Food Policy Research.
Wangwe, S.M. 1995. Exporting Africa. Technology trade and industrialization in Sub-Saharan
Africa. Routledge Publishers, New York.Wangwe, S.M., Musonda, F.M. & Kweka, J.P. 1997. An assessment of the economic and social
implication of economic reform programme in Tanzania, ESRF.World Bank. 1997. Rural development: from vision to action. environmentally and socially
sustainable development. Study Series 12. World Bank, Washington, DC.
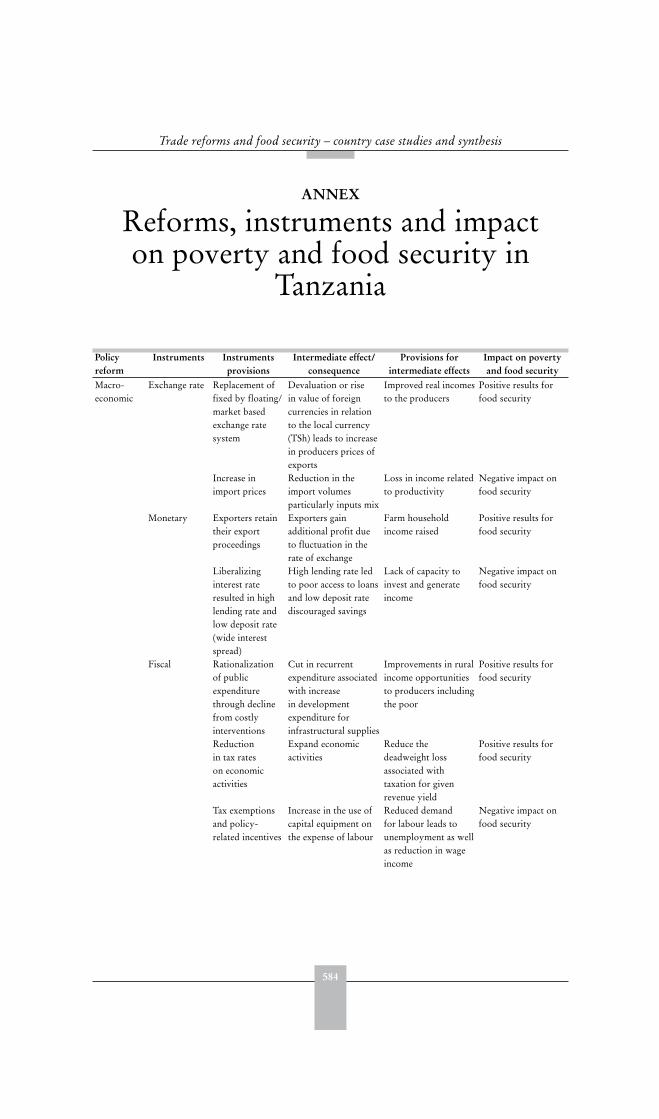
584
Trade reforms and food security – country case studies and synthesis
ANNEX
Reforms, instruments and impacton poverty and food security in
Tanzania
Policy reform
Instruments Instrumentsprovisions
Intermediate effect/ consequence
Provisions for intermediate effects
Impact on poverty and food security
Macro-economic
Exchange rate Replacement offixed by floating/market basedexchange ratesystem
Devaluation or risein value of foreigncurrencies in relationto the local currency(TSh) leads to increasein producers prices ofexports
Improved real incomesto the producers
Positive results forfood security
Increase inimport prices
Reduction in theimport volumesparticularly inputs mix
Loss in income relatedto productivity
Negative impact onfood security
Monetary Exporters retaintheir exportproceedings
Exporters gainadditional profit dueto fluctuation in therate of exchange
Farm householdincome raised
Positive results forfood security
Liberalizinginterest rateresulted in highlending rate andlow deposit rate(wide interestspread)
High lending rate ledto poor access to loansand low deposit ratediscouraged savings
Lack of capacity toinvest and generateincome
Negative impact onfood security
Fiscal Rationalizationof publicexpenditurethrough declinefrom costlyinterventions
Cut in recurrentexpenditure associatedwith increasein developmentexpenditure forinfrastructural supplies
Improvements in ruralincome opportunitiesto producers includingthe poor
Positive results forfood security
Reductionin tax rateson economicactivities
Expand economicactivities
Reduce thedeadweight lossassociated withtaxation for givenrevenue yield
Positive results forfood security
Tax exemptionsand policy-related incentives
Increase in the use ofcapital equipment onthe expense of labour
Reduced demandfor labour leads tounemployment as wellas reduction in wageincome
Negative impact onfood security

585
United Republic of Tanzania
Policy reform
Instruments Instrumentsprovisions
Intermediate effect/ consequence
Provisions for intermediate effects
Impact on poverty and food security
Trade Export andImport tariff
Commitmentto liberalizingdomestic andexternal trade
Abolition of exporttariff and narrowingof tariff dispersions /bands
Improvement intrade creation andminimization oftrade diversion forimproved socialwelfare
Positive results forfood security
Non-tariffbarriers(quotas, levies,licences)
Restrictions ofimports
Limits trade creationas well as increasingtrade diversion
Limitation of tradeincomes and socialwelfare
Negative impact onfood security
Exportsubsidies,incentives andcredit
Promotion ofexports
Expand opportunitiesfor receiving higherproducer prices fortheir products
High income earningby producers
Positive results forfood security
Agriculture Outputsubsidies
Promote marketoperationswithout controls
Elimination of pricesupports
Loss of welfare dueto increase in cost ofliving
Negative impact onfood security
Input subsidies Reduction orremoval of inputsubsidies
Low use of inputsespecially fertilizers,insecticides,pesticides and otheragrochemicals
Low yield and lowproductivity of labourresults in low incomeearnings
Negative impact onfood security
Price controls Reduceworld markettransmission ofthe instability dueto unfavourableprices or terms oftrade
Improvement inproducer pricestability andprofitability
Increase in real incomethrough favourableexternal and internalterms of trade
Positive results forfood security
Abandoning ofprice controlsin favour ofconsumersresulting inraising producerprices
Reduction in the taxburden and rise inproducer prices
Additional income andequality through fairincome distribution
Positive results forfood security
DirectPayment
Prompt paymentto farmers orcrop producers
Address of laggingreturns in agriculturalsector
Availability of incometo poor
Positive results forfood security
Research andextension
Ensure accessto reliableinformation onhigher-valuetechnologiesand markets forproducts
Improved harvests andproductivity and sale
Improved status ofincome earnings
Positive results forfood security
Institutional Statewithdrawalfromproduction,marketingand serviceprovision
Reformingthe role andreducing the sizeof public sectorand state-ownedenterprises /parastatals
Free public resourcesto provide basefor investment ininfrastructure such asroads and educationand health facilitiesand extension services
Promotion of incomeopportunities andlevels for improvedwelfare of the poor
Positive results forfood security
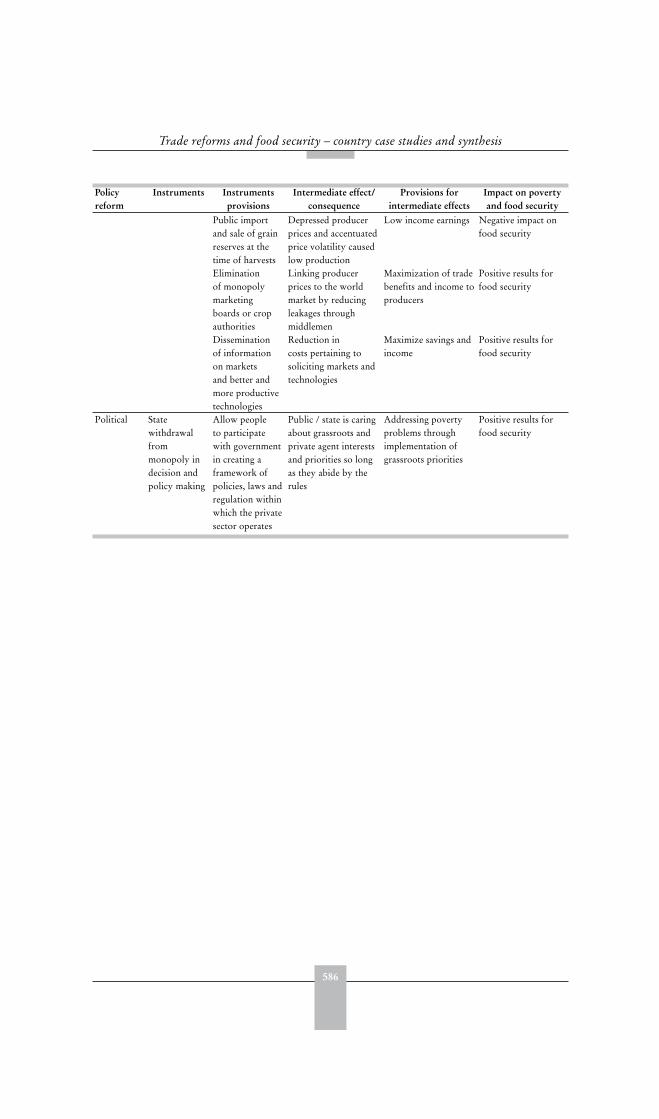
586
Trade reforms and food security – country case studies and synthesis
Policy reform
Instruments Instrumentsprovisions
Intermediate effect/ consequence
Provisions for intermediate effects
Impact on poverty and food security
Public importand sale of grainreserves at thetime of harvests
Depressed producerprices and accentuatedprice volatility causedlow production
Low income earnings Negative impact onfood security
Eliminationof monopolymarketingboards or cropauthorities
Linking producerprices to the worldmarket by reducingleakages throughmiddlemen
Maximization of tradebenefits and income toproducers
Positive results forfood security
Disseminationof informationon marketsand better andmore productivetechnologies
Reduction incosts pertaining tosoliciting markets andtechnologies
Maximize savings andincome
Positive results forfood security
Political Statewithdrawalfrommonopoly indecision andpolicy making
Allow peopleto participatewith governmentin creating aframework ofpolicies, laws andregulation withinwhich the privatesector operates
Public / state is caringabout grassroots andprivate agent interestsand priorities so longas they abide by therules
Addressing povertyproblems throughimplementation ofgrassroots priorities
Positive results forfood security

587
UgandaJacob Opolot, Augustine Wandera and Yusuf Atiku Abdalla1
EXECUTIVE SUMMARY
Pre-reformPolicy in the pre-reform era was restrictive and regulatory in nature. Policy measuresincluded export taxes, price regulation by state marketing boards, exchange ratecontrols, and the provision of subsidies and administered credit to the agriculturalsector. Agricultural marketing was almost exclusively by government marketingboards. The economy was paralyzed by a series of external shocks during the mid1970s. As a result of these shocks, GDP stagnated. The combination of decliningproduction, the diversion of sales to parallel markets and reduced levels of importand export trade, all contributed to the erosion of the government’s revenue base
The reformsThe first reforms were initiated in 1981 with the Stabilization and StructuralAdjustment Programmes (SAPs) and emphasized trade and exchange adjustmentsas well as reduced public spending and the improvement of monetary and creditpolicies. This programme collapsed in 1984 after the IMF/World Bank cut offlending following Uganda’s failure to meet the programme’s benchmarks. Theperiod was characterized by policy reversals and confusion.
The second more successful phase of reforms was launched in May 1987. Themajor reform measures with implications for the agricultural sector and food securityincluded restrictive fiscal policies, exchange rate policy, monetary and credit policiesand trade policy reform, in addition to sectoral level reforms involving institutionaland domestic market reforms, and pricing policy, which aimed to improve thecompetitiveness and efficiency of agricultural markets.
Impact on intermediate variablesThe real producer price of coffee increased by 82.5 percent between 1980 and 1984while real international prices rose by only 15.5 percent. Movements in the realexchange rate accounted for 77.5 percent of the increase. Policy interventions actedto reduce domestic prices by 10.6 percent. The real producer prices for cotton,maize, beans and tobacco also rose, in spite of a fall in their international pricesduring the same period, and largely on account of exchange rate depreciation andpolicy interventions. Further depreciation of the exchange rate contributed again to
1 Jacob Opolot, Augustine Wandera and Yusuf Atiku Abdalla, Research Department, Bank of Uganda.
588
Trade reforms and food security – country case studies and synthesis
improvement in producer prices in the 1984-87 period. In contrast to the previousperiod, world markets had a negative impact on the price of all commodities.
The negative impact on producer prices of international price movements from1987 to 1993 was outweighed by other factors, including exchange rate movements.Between 1993 and 2000, real producer prices again rose for most commodities,largely because of improved infrastructure that helped reduce operating costs andmitigated the adverse impact of a fall in the international price of export crops. Overthe period since 1981, there have been significant improvements in real domesticproducer prices.
Growth in production during 1984-87 was lower than in the preceding period.Although some recovery was registered in 1987-93, annual growth was far belowrates registered in 1980-84. The period 1993-2000 depicts mixed results, with coffeeand cotton performing relatively well compared to the preceding period, whiletobacco, tea, maize and beans registered lower growth rates compared to 1987-93.The performance of the export sector shows some improvement over the pre-reformperiod and, although it is still concentrated on a narrow range of commodities, somenew export items have been introduced.
Impact on target variablesDespite moderate improvements in agricultural sector performance, food productionis insufficient to satisfy national food requirements. Per capita food production in2000 was almost half the 1975 level. Amongst the poor, a typical consumption basketyields only 1 373 calories per day per person. The proportion of the populationreceiving less than 60 percent of required calories rose from 32.1 percent in 1992/93to 44.3 percent in 2000, and the proportion receiving less than 60 percent of therequired protein and iron also increased. Child malnutrition indicators in rural areasimproved slightly between 1995 and 2000. Stunting decreased from 40.3 percent to39.9 percent, while wasting declined from 5.4 percent to 4.2 percent. The country’sexport earnings are not sufficient to meet the ever increasing import requirements.The fragility of the export sector is exemplified by the country’s reliance on importsupport grants.
At the household level, the main source of food is own production. Income sourcesfor rural smallholder households have changed only slightly. In 1992/93, agriculturalincome accounted for 75.4 percent of total rural household income, while wages andnon-farm income sources accounted for 14.3 percent and 10.3 percent respectively.In 1999/2000, the share of agriculture in total household income declined to67.6 percent, while wages and non-farm income sources rose to 15.6 percent and16.8 percent respectively. Smallholder households have not been successful indiversifying income sources away from agriculture.
The profitability of all crops increased between 1994 and 1997. Coffee producersbenefited most, with an average increase in gross margins of over 500 percent.Households producing coffee, tobacco and tea reported increases in their incomelevels. Cotton producing rural smallholder households reported mixed results. Thefood crop producers indicated increased incomes from the sale of maize and beans.
Economic reforms appear to have resulted in some positive results for foodsecurity: there has been some improvement in per capita availability of calories, thepercentage of food secure households appears to have increased, and poverty trends
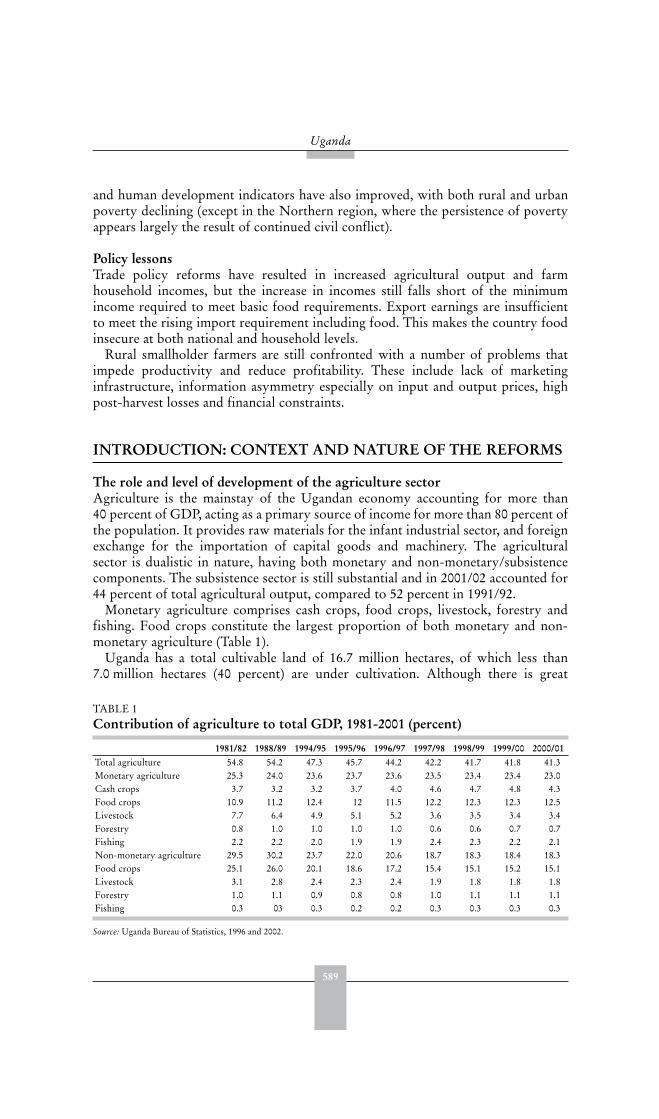
589
Uganda
and human development indicators have also improved, with both rural and urbanpoverty declining (except in the Northern region, where the persistence of povertyappears largely the result of continued civil conflict).
Policy lessonsTrade policy reforms have resulted in increased agricultural output and farmhousehold incomes, but the increase in incomes still falls short of the minimumincome required to meet basic food requirements. Export earnings are insufficientto meet the rising import requirement including food. This makes the country foodinsecure at both national and household levels.
Rural smallholder farmers are still confronted with a number of problems thatimpede productivity and reduce profitability. These include lack of marketinginfrastructure, information asymmetry especially on input and output prices, highpost-harvest losses and financial constraints.
INTRODUCTION: CONTEXT AND NATURE OF THE REFORMS
The role and level of development of the agriculture sectorAgriculture is the mainstay of the Ugandan economy accounting for more than40 percent of GDP, acting as a primary source of income for more than 80 percent ofthe population. It provides raw materials for the infant industrial sector, and foreignexchange for the importation of capital goods and machinery. The agriculturalsector is dualistic in nature, having both monetary and non-monetary/subsistencecomponents. The subsistence sector is still substantial and in 2001/02 accounted for44 percent of total agricultural output, compared to 52 percent in 1991/92.
Monetary agriculture comprises cash crops, food crops, livestock, forestry andfishing. Food crops constitute the largest proportion of both monetary and non-monetary agriculture (Table 1).
Uganda has a total cultivable land of 16.7 million hectares, of which less than7.0 million hectares (40 percent) are under cultivation. Although there is great
TABLE 1 Contribution of agriculture to total GDP, 1981-2001 (percent)
1981/82 1988/89 1994/95 1995/96 1996/97 1997/98 1998/99 1999/00 2000/01Total agriculture 54.8 54.2 47.3 45.7 44.2 42.2 41.7 41.8 41.3Monetary agriculture 25.3 24.0 23.6 23.7 23.6 23.5 23.4 23.4 23.0Cash crops 3.7 3.2 3.2 3.7 4.0 4.6 4.7 4.8 4.3Food crops 10.9 11.2 12.4 12 11.5 12.2 12.3 12.3 12.5Livestock 7.7 6.4 4.9 5.1 5.2 3.6 3.5 3.4 3.4Forestry 0.8 1.0 1.0 1.0 1.0 0.6 0.6 0.7 0.7Fishing 2.2 2.2 2.0 1.9 1.9 2.4 2.3 2.2 2.1Non-monetary agriculture 29.5 30.2 23.7 22.0 20.6 18.7 18.3 18.4 18.3Food crops 25.1 26.0 20.1 18.6 17.2 15.4 15.1 15.2 15.1Livestock 3.1 2.8 2.4 2.3 2.4 1.9 1.8 1.8 1.8Forestry 1.0 1.1 0.9 0.8 0.8 1.0 1.1 1.1 1.1Fishing 0.3 03 0.3 0.2 0.2 0.3 0.3 0.3 0.3
Source: Uganda Bureau of Statistics, 1996 and 2002.
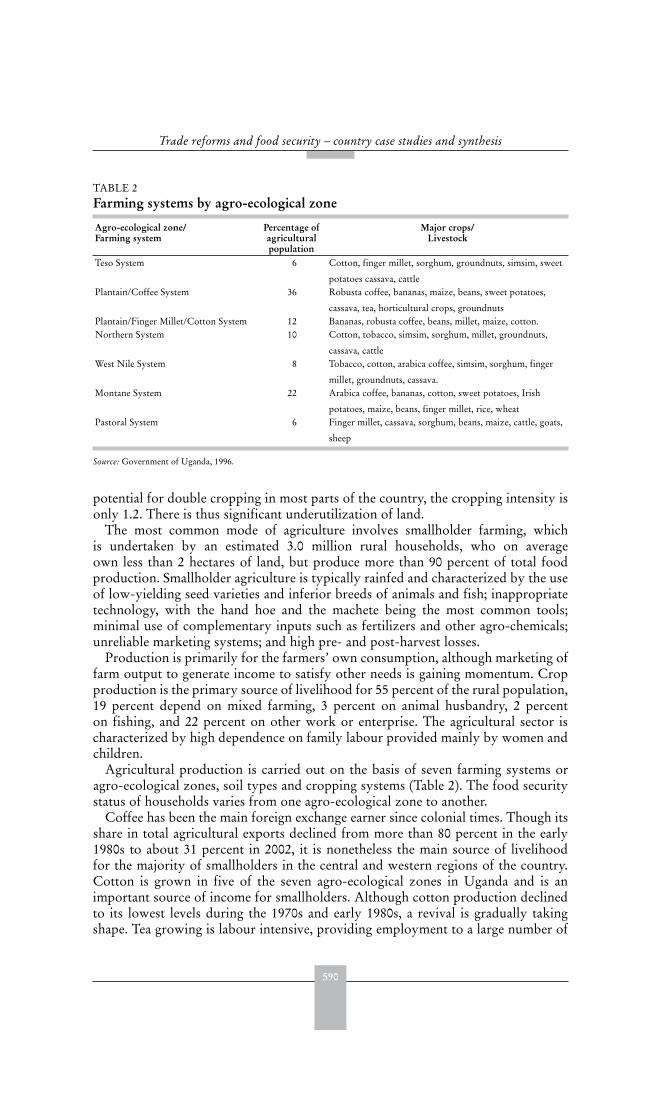
590
Trade reforms and food security – country case studies and synthesis
potential for double cropping in most parts of the country, the cropping intensity isonly 1.2. There is thus significant underutilization of land.
The most common mode of agriculture involves smallholder farming, whichis undertaken by an estimated 3.0 million rural households, who on averageown less than 2 hectares of land, but produce more than 90 percent of total foodproduction. Smallholder agriculture is typically rainfed and characterized by the useof low-yielding seed varieties and inferior breeds of animals and fish; inappropriatetechnology, with the hand hoe and the machete being the most common tools;minimal use of complementary inputs such as fertilizers and other agro-chemicals;unreliable marketing systems; and high pre- and post-harvest losses.
Production is primarily for the farmers’ own consumption, although marketing offarm output to generate income to satisfy other needs is gaining momentum. Cropproduction is the primary source of livelihood for 55 percent of the rural population,19 percent depend on mixed farming, 3 percent on animal husbandry, 2 percenton fishing, and 22 percent on other work or enterprise. The agricultural sector ischaracterized by high dependence on family labour provided mainly by women andchildren.
Agricultural production is carried out on the basis of seven farming systems oragro-ecological zones, soil types and cropping systems (Table 2). The food securitystatus of households varies from one agro-ecological zone to another.
Coffee has been the main foreign exchange earner since colonial times. Though itsshare in total agricultural exports declined from more than 80 percent in the early1980s to about 31 percent in 2002, it is nonetheless the main source of livelihoodfor the majority of smallholders in the central and western regions of the country.Cotton is grown in five of the seven agro-ecological zones in Uganda and is animportant source of income for smallholders. Although cotton production declinedto its lowest levels during the 1970s and early 1980s, a revival is gradually takingshape. Tea growing is labour intensive, providing employment to a large number of
TABLE 2 Farming systems by agro-ecological zone
Agro-ecological zone/Farming system
Percentage of agriculturalpopulation
Major crops/Livestock
Teso System 6 Cotton, finger millet, sorghum, groundnuts, simsim, sweet
potatoes cassava, cattlePlantain/Coffee System 36 Robusta coffee, bananas, maize, beans, sweet potatoes,
cassava, tea, horticultural crops, groundnutsPlantain/Finger Millet/Cotton System 12 Bananas, robusta coffee, beans, millet, maize, cotton.Northern System 10 Cotton, tobacco, simsim, sorghum, millet, groundnuts,
cassava, cattleWest Nile System 8 Tobacco, cotton, arabica coffee, simsim, sorghum, finger
millet, groundnuts, cassava.Montane System 22 Arabica coffee, bananas, cotton, sweet potatoes, Irish
potatoes, maize, beans, finger millet, rice, wheatPastoral System 6 Finger millet, cassava, sorghum, beans, maize, cattle, goats,
sheep
Source: Government of Uganda, 1996.
591
Uganda
people. Tea out-growers are playing an increasingly important role in the expansionof the industry. Tea is also an important foreign exchange earner: in 2002, exportreceipts amounted to about 8 percent of agricultural export earnings.
Maize and beans are emerging non-traditional exports in regional cross-bordertrade, accounting for about 5 percent of total agricultural exports in 2002. Thesecrops are not only a source of income for the smallholder rural farmers, but arealso part of a typical consumption basket for the poor. It is estimated that close toone million people derive their livelihood directly or indirectly from the tobaccoindustry. This includes an estimated 50 000 families who subsist exclusively on theincomes derived from its sale. Tobacco is also an important foreign exchange earner,representing 12 percent of agricultural export earnings.
Both private and public investment is low in the agricultural sector and access tocredit facilities in the formal financial market limited, since the current credit systemsfavour urban-based entrepreneurs while marginalizing the rural population. Theonly source of credit for the rural dwellers is the microfinance industry, which alsodiscriminates against agriculture.
Degree of openness of the economy prior to the reforms The policy measures deployed in the pre-reform era were restrictive, regulative andadministrative in nature: export taxes, price regulation/controls by state marketingboards, exchange controls, and the provision of subsidies and administered creditto the agricultural sector. The state intervened in almost all aspects of agriculturalproduction and marketing.
Agricultural marketing was almost exclusively by government marketing boards.The Coffee Marketing Board (CMB), Lint Marketing Board (LMB) and ProduceMarketing Board (PMB), in collaboration with co-operatives, controlled agriculturalmarketing. The system was viewed by the government as the most effective way ofcollecting tax revenues from agricultural exports (Bibangambah, 1992).
Most of the agricultural support systems were either ineffective or delivered athigh cost and were not sustainable without external support. The corruption andbureaucracy that was characteristic of the marketing boards increased overheadcosts. Consequently, marketing boards absorbed a large percentage of world marketprices, which resulted in low producer prices. At the same time, produce was oftenpurchased on credit, which acted as additional tax to the farmer’s income.
Motivation for the reformsFollowing independence in 1962, Uganda initially experienced a period of considerableeconomic progress. Between 1963 and 1973, the annual average rate of real GDPgrowth was 6 percent. The country was also able to maintain a reasonable savingsrate (averaging 13 percent of GDP) that permitted implementation of an ambitiousinvestment programme, without undue pressure on domestic prices or the balanceof payments. Although export volumes grew slowly, export earnings were morethan adequate to cover import requirements, and the country maintained a currentaccount surplus in most years.
However, during the economic and political turmoil of the 1970s and early 1980s,the economic infrastructure was almost completely destroyed. This affected bothagricultural and industrial production. The economy was also paralyzed by a series of
592
Trade reforms and food security – country case studies and synthesis
external shocks during the mid 1970s. As a result, GDP stagnated, with particularlysharp falls of value added in the industrial and monetary agricultural sectors. Theonly sector that recorded steady growth was the subsistence sector, both to provideindividual food security and to supply the thriving and lucrative parallel markets.The savings rate fell sharply and, with limited external capital inflows, investmentfell to low levels. Little effort was made to maintain the existing infrastructure andproductive assets.
The combination of declining production in the monetary economy, thediversification of sales to parallel markets and reduced levels of import and exporttrade, all contributed to the erosion of the Government’s revenue base. Revenuecollection was also affected by the impact of the over-valued exchange rate, by pricecontrols on the value of goods being taxed, by poor financial performance and taxcompliance of the parastatal sector, and by ineffective tax collection procedures.Despite these revenue problems little attempt was made to restrict the growthof government expenditure. With access to external assistance restricted, theGovernment increasingly resorted to borrowing from the central bank, which led toan uncontrollable pressure on domestic prices.
Macro and sectoral components and the policy instruments usedWith a view to raising the rate of economic growth, the broad policy objectivesof reform focused on the stabilization of the economy through the restorationof fiscal and monetary discipline (notwithstanding the demands for considerableoutlays to rehabilitate the devastated infrastructure in this post conflict economy);the liberalization of consumer and producer prices in order to improve resourceallocation and channel resources to the productive sectors of the economy; theprogressive movement towards a realistic, market determined exchange rate;the strengthening of the balance of payments and the normalization of relationswith external creditors; the removal of trade restrictions; the privatization andrationalization of state enterprises; and the liberalization of interest rates within arestructured and more efficient financial system capable of mobilizing savings andincreasing investments.
The first attempt at coordinated policy reforms was made in 1981, when theGovernment received financial and technical support from the InternationalMonetary Fund (IMF) and the World Bank. This marked the start of the Stabilizationand Structural Adjustment Programmes (SAPs) and involved the implementationof policy reforms that emphasized trade and exchange rate adjustments as wellas a reduction in public spending and the improvement of monetary and creditpolicies. This programme collapsed in 1984 after the IMF/World Bank cut offlending following policy reversals and the country’s failure to meet the programmebenchmarks.
The second and more successful phase of economic reforms was launched inMay 1987. Since then, the adjustment programmes have typically consisted of acombination of demand-reducing policies (often associated with macroeconomicstabilization), in particular restrictive fiscal and monetary policies; and supplyenhancing policies (often associated with structural adjustment), in particular tradeand exchange rate policies aimed at improving economy-wide resource allocationand exploiting more fully the gains from international trade. The second reform

593
Uganda
period is divided into two episodes: movement towards liberalization (1987–93) andthe complete liberalization of the economy (1993-2002).
Within the overall package of macroeconomic stabilization and structuraladjustment programmes, the major reform measures with implications for theagricultural sector and food security include restrictive fiscal policies, exchangerate policy, monetary and credit policies, trade policy reform, and, at the sectorallevel, market and pricing policy reforms. Agricultural policy reforms were intendedto improve the competitiveness and efficiency of agricultural markets. The basicpremise was that improving the incentive structure for smallholder farmers throughhigher prices and better functioning markets would lead to a positive supplyresponse thereby raising agricultural output, income and the food security status ofthe smallholder farmers.
The economy has enjoyed relatively buoyant growth rates over the last 20 years,averaging about 6 percent annually (Table 3).
Prudent macroeconomic management has improved stability. From the volatiletrend in consumer prices during the 1980s, which led to a headline annual inflationrate of 250 percent in 1987, inflation has declined to less than 10 percent per annum.The savings and domestic investment rates, although still low, have maintained anupward trend.
Macro-economic reformsFiscal policyThe Government has consistently pursued fiscal discipline since the inception ofthe reform programme. The overall objective has been to reduce the fiscal deficitto a sustainable level by increasing the tax base/revenue and reducing governmentspending. The expenditure cuts have reduced agriculture’s share of governmentexpenditure, which has stagnated at around 0.8 percent of total recurrent expendituresince 1997/98. The sector has also been affected by the unsystematic removal ofsubsidized inputs.
TABLE 3 GDP performance by sector, 1982-2002 (percentage growth rates)
Sector 1982/83 1987/88 1990/91 1998/99 1999/00 2000/01 2001/02Monetary 6.5 9.0 7.3 7.5 5.2 6.2 5.9Agriculture 5.0 5.7 5.6 6.6 5.3 4.3 5.5Mining and quarrying 17.1 -11.3 106.0 5.9 4.8 5.9 7.8Manufacturing 14.0 17.1 7.3 13.7 3.5 8.9 7.4Electricity and water -1.3 6.5 6.3 6.0 8.7 9.3 6.4Construction 3.1 27.0 7.3 9.4 1.4 2.9 6.6Wholesale and retail trade 9.2 12.0 7.1 9.2 1.9 6.3 6.4Hotels and restaurants 12.3 12.7 14.6 7.3 5.3 6.1 5.4Transport and communication 7.0 7.1 7.5 7.0 7.4 8.2 10.0Community services 5.2 4.5 8.8 4.5 8.6 7.5 5.9Non-monetary 5.6 5.1 0.9 5.3 6.2 5.4 4.3Agriculture 6.0 5.4 0.6 4.9 6.0 5.0 3.8Construction 2.1 6.1 3.4 2.6 2.5 2.4 2.2Owner-occupied dwellings 2.7 2.7 2.9 8.5 8.0 8.0 7.0Total GDP 6.2 7.6 5.2 7.0 5.5 6.0 5.6Per capita GDP 3.5 4.8 2.3 4.3 2.9 3.5 3.3
Source: Uganda Bureau of Statistics, 2002; Government of Uganda (2002a).
594
Trade reforms and food security – country case studies and synthesis
Exchange rate policySince 1981, exchange rate policy has focused on devaluing the real exchange rateso as to restore confidence in the shilling (U Sh), reduce price distortions, and shiftresources from speculative to productive activities such as agriculture. Devaluationhas been brought about by nominal currency devaluations combined with fiscal andmonetary policy measures aimed at curbing the resulting inflation in order to avoidreal exchange rate appreciation.
Monetary policyMonetary policy has, since 1993, moved from the use of direct to indirectinstruments.2 Financial sector liberalization began in 1992. Interest rates, theexchange rate, and flows of credit and capital are now market determined. Bankshave been privatized and barriers to new entrants reduced, thus eliminating thedirect role of Government in the allocation of commercial finance. In 1998/99 theCo-operative Bank, which was largely viewed as an agricultural bank, was closed.Microfinance institutions were expected to take over from the public sector in theprovision of financial services to the rural and urban poor. Nevertheless, credit is stillinaccessible to a large majority of rural smallholder farmers who subsist primarily onagricultural production. Financial sector reforms have led to a reduction of the flowof credit to the agricultural sector.
Trade policy reformsUganda’s commitment to trade liberalization has ensured that the export sectorremains as open as possible. The key reforms here have been easing licensingrequirements and eliminating quantitative restrictions. Trade taxes have continuedto be lowered or even eliminated, as in the case of export taxes, and their structuresimplified. Trade policy is increasingly being shifted from quantitative restrictionsand other non-tariff instruments to more transparent taxes and tariffs. Since1986 tariff reforms have sought to balance the aims of increasing fiscal revenues,improving export incentives, and protecting domestic producers. A vital goal fortrade liberalization has been to reduce the anti-export bias and ensure that noexcessive protection results from the tariff system.
Uganda has implemented the tariff reductions approved by the Common Marketfor Eastern and Southern Africa, and continues to harmonise its overall tariffstructure. The tariff structure was rationalized within the 10-50 percent range in1992, and within the 10-30 percent range in 1994.
Improvement in rural infrastructureAlthough over the last ten years, the Government has invested substantial resourcesin opening up rural areas through the construction and maintenance of ruralfeeder roads, much still remains to be done. At the moment, it is estimated that25 percent of feeder roads are impassable during the rainy season. This limits the
2 The indirect financial and monetary policy instruments used are treasury bills, Bank of Uganda bills, cashreserve requirements, bank rate, rediscount rate, repurchase agreements (REPOS) and reverse REPOS, andforeign exchange deals largely in the form of spot transactions.
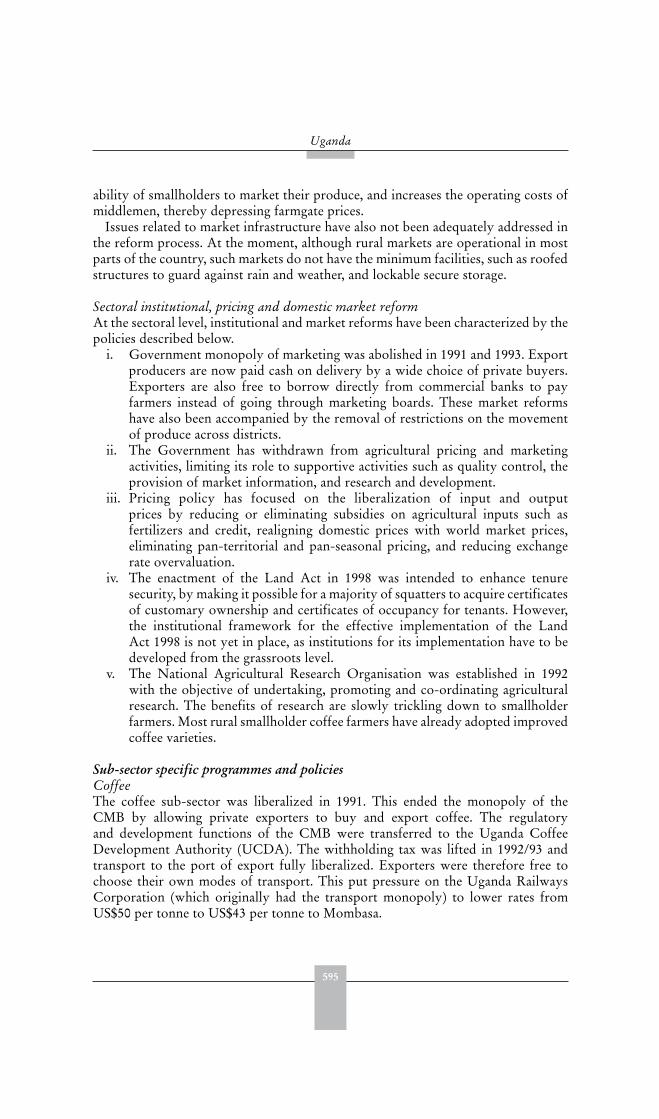
595
Uganda
ability of smallholders to market their produce, and increases the operating costs ofmiddlemen, thereby depressing farmgate prices.
Issues related to market infrastructure have also not been adequately addressed inthe reform process. At the moment, although rural markets are operational in mostparts of the country, such markets do not have the minimum facilities, such as roofedstructures to guard against rain and weather, and lockable secure storage.
Sectoral institutional, pricing and domestic market reformAt the sectoral level, institutional and market reforms have been characterized by thepolicies described below.
i. Government monopoly of marketing was abolished in 1991 and 1993. Exportproducers are now paid cash on delivery by a wide choice of private buyers.Exporters are also free to borrow directly from commercial banks to payfarmers instead of going through marketing boards. These market reformshave also been accompanied by the removal of restrictions on the movementof produce across districts.
ii. The Government has withdrawn from agricultural pricing and marketingactivities, limiting its role to supportive activities such as quality control, theprovision of market information, and research and development.
iii. Pricing policy has focused on the liberalization of input and outputprices by reducing or eliminating subsidies on agricultural inputs such asfertilizers and credit, realigning domestic prices with world market prices,eliminating pan-territorial and pan-seasonal pricing, and reducing exchangerate overvaluation.
iv. The enactment of the Land Act in 1998 was intended to enhance tenuresecurity, by making it possible for a majority of squatters to acquire certificatesof customary ownership and certificates of occupancy for tenants. However,the institutional framework for the effective implementation of the LandAct 1998 is not yet in place, as institutions for its implementation have to bedeveloped from the grassroots level.
v. The National Agricultural Research Organisation was established in 1992with the objective of undertaking, promoting and co-ordinating agriculturalresearch. The benefits of research are slowly trickling down to smallholderfarmers. Most rural smallholder coffee farmers have already adopted improvedcoffee varieties.
Sub-sector specific programmes and policiesCoffeeThe coffee sub-sector was liberalized in 1991. This ended the monopoly of theCMB by allowing private exporters to buy and export coffee. The regulatoryand development functions of the CMB were transferred to the Uganda CoffeeDevelopment Authority (UCDA). The withholding tax was lifted in 1992/93 andtransport to the port of export fully liberalized. Exporters were therefore free tochoose their own modes of transport. This put pressure on the Uganda RailwaysCorporation (which originally had the transport monopoly) to lower rates fromUS$50 per tonne to US$43 per tonne to Mombasa.
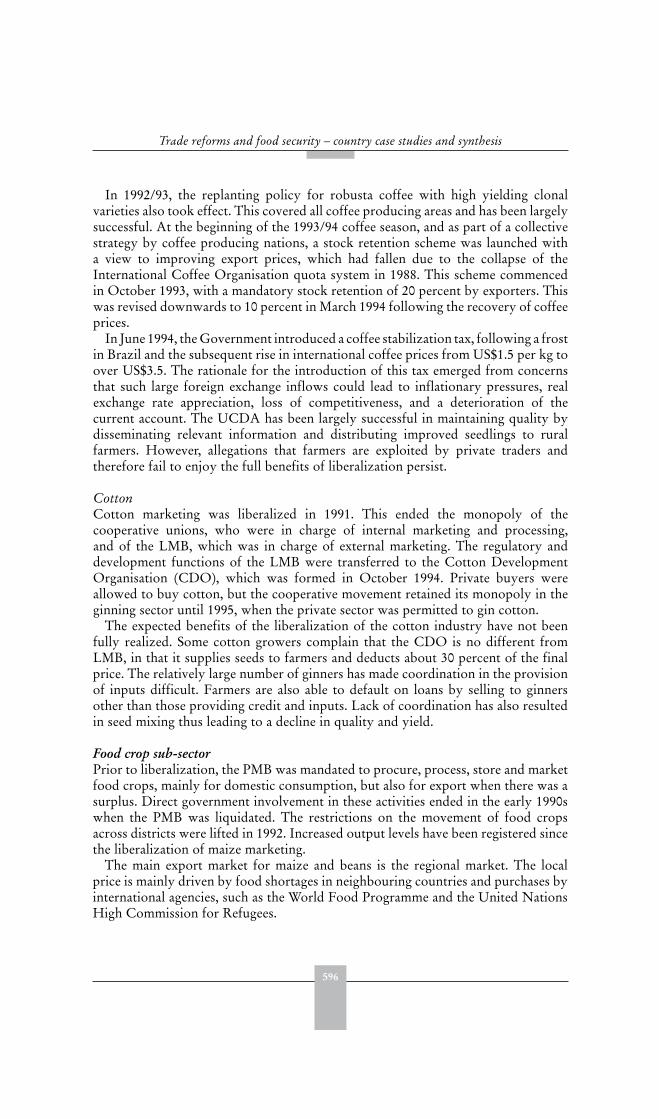
596
Trade reforms and food security – country case studies and synthesis
In 1992/93, the replanting policy for robusta coffee with high yielding clonalvarieties also took effect. This covered all coffee producing areas and has been largelysuccessful. At the beginning of the 1993/94 coffee season, and as part of a collectivestrategy by coffee producing nations, a stock retention scheme was launched witha view to improving export prices, which had fallen due to the collapse of theInternational Coffee Organisation quota system in 1988. This scheme commencedin October 1993, with a mandatory stock retention of 20 percent by exporters. Thiswas revised downwards to 10 percent in March 1994 following the recovery of coffeeprices.
In June 1994, the Government introduced a coffee stabilization tax, following a frostin Brazil and the subsequent rise in international coffee prices from US$1.5 per kg toover US$3.5. The rationale for the introduction of this tax emerged from concernsthat such large foreign exchange inflows could lead to inflationary pressures, realexchange rate appreciation, loss of competitiveness, and a deterioration of thecurrent account. The UCDA has been largely successful in maintaining quality bydisseminating relevant information and distributing improved seedlings to ruralfarmers. However, allegations that farmers are exploited by private traders andtherefore fail to enjoy the full benefits of liberalization persist.
CottonCotton marketing was liberalized in 1991. This ended the monopoly of thecooperative unions, who were in charge of internal marketing and processing,and of the LMB, which was in charge of external marketing. The regulatory anddevelopment functions of the LMB were transferred to the Cotton DevelopmentOrganisation (CDO), which was formed in October 1994. Private buyers wereallowed to buy cotton, but the cooperative movement retained its monopoly in theginning sector until 1995, when the private sector was permitted to gin cotton.
The expected benefits of the liberalization of the cotton industry have not beenfully realized. Some cotton growers complain that the CDO is no different fromLMB, in that it supplies seeds to farmers and deducts about 30 percent of the finalprice. The relatively large number of ginners has made coordination in the provisionof inputs difficult. Farmers are also able to default on loans by selling to ginnersother than those providing credit and inputs. Lack of coordination has also resultedin seed mixing thus leading to a decline in quality and yield.
Food crop sub-sectorPrior to liberalization, the PMB was mandated to procure, process, store and marketfood crops, mainly for domestic consumption, but also for export when there was asurplus. Direct government involvement in these activities ended in the early 1990swhen the PMB was liquidated. The restrictions on the movement of food cropsacross districts were lifted in 1992. Increased output levels have been registered sincethe liberalization of maize marketing.
The main export market for maize and beans is the regional market. The localprice is mainly driven by food shortages in neighbouring countries and purchases byinternational agencies, such as the World Food Programme and the United NationsHigh Commission for Refugees.
597
Uganda
TeaManagement of the tea industry was originally under the control of the Uganda TeaAssociation, a voluntary association of tea producers established in 1948. However,in 1972, the Uganda Tea Authority took control, and production collapsed. In 1983,the industry was liberalized and the Uganda Tea Association was revived. Ugandantea is marketed through the Mombasa Auction Market. Smallholder tea productionhas existed since 1966. Arrangements are under way for smallholder producers toform co-operatives to bridge the gap that will be created when the Uganda TeaGrowers Corporation is wound up. This is expected to increase the bargainingpower of smallholder producers and thus reduce their exploitation.
TobaccoTobacco is the second largest cash crop, far outstripping cotton and tea. It is grownin 16 out of 56 districts. Production peaked in the early 1970s and collapsed duringthe late 1970s when management was brought under the monopoly of the NationalTobacco Corporation. Production recovered in 1984 after the divestiture of theindustry to British American Tobacco (BAT) Uganda Limited. BAT is the mainplayer in the tobacco industry, controlling up to 93 percent of the market. Becauseof its monopoly, tobacco is the only crop produced under contract farming.
CONSEQUENCES OF REFORMS: INTERMEDIATE VARIABLES
In assessing the effects of reform on output incentives, the effects of changes ininternational and domestic commodity prices are investigated in relation to otherpossible drivers, such as the real exchange rate (RER), improvements in the efficiencyof domestic marketing systems etc. It should be noted that many of the reforms thathave been implemented simultaneously or/and sequentially are aimed at removingstructural bottlenecks that impede the proper functioning of the market mechanism.It is therefore difficult to isolate the effects of individual policies.
Trends in real producer and world pricesFor some tradable commodities, such as coffee and cotton, the real producer priceduring the reform period has followed trends in international commodity prices,reaching a peak in the mid to late 1980s, falling to a low in the early 1990s and thenrising to a peak again at the end of the 1990s before falling once more. However, somedivergences are notable. For example, the real producer price of coffee rose steadilyup to 1984as a result of Government policy to revive the coffee sector, which hadvirtually collapsed during the economic mismanagement of the 1970s (Figure 1). Thedivergence between the producer price and the world price for cotton between 1994and 1998 may be associated with the emergence of private sector marketing activityand related reductions in the quality of domestically produced cotton (Figure 2).
Maize and beans are semi tradable commodities and weak transmission ofinternational prices is not unexpected. However supply and demand conditions(including drought) in neighbouring countries can have a significant influence onUgandan prices and cross border trade. It is notable that post 1990 domestic pricestracked the international price more closely than previously. This may be a result ofthe liberalization of marketing activities in the early 1990s (Figures 3 and 4).
598
Trade reforms and food security – country case studies and synthesis
The real producer price of tobacco declined sharply up to 1983 when the NationalTobacco Corporation was privatized (Figure 5). British American Tobacco (Uganda)Limited enjoys some monopoly over the tobacco industry and engages farmers oncontract terms. This gives them power to set prices and may explain why producerprices have remained low in the face of rising international prices since 1995.
The real producer price for tea declined sharply in the first half of the 1980s andhas remained low even in the face of rising world prices (Figure 6). Tea is mostlygrown on plantations and by out-growers contracted to the plantations, which areable to maintain downward pressure on prices.
FIGURE 1Real producer and world prices of coffee, 1980-2000
FIGURE 2Real producer and world prices of cotton, 1980-2000
0.00
0.20
0.40
0.60
0.80
1.00
1.20
1.40
1.60
1.80
2.00
1980 198119821983 1984 19851986198719881989 19901991199219931994199519961997199819992000
Period
Worl
d pri
ce US
$/kg
0.00
0.05
0.10
0.15
0.20
0.25
0.30
0.35
Pro
ducer
pri
ce US
$/kg
Real world pric e Real producer pric e
Source: Computed from Bank of Uganda databank (2002) and IMF commodity prices database (2002).
0.00
0.10
0.20
0.30
0.40
0.50
0.60
0.70
0.80
0.90
198019811982198319841985 1986198719881989 19901991 1992 1993 1994 19951996 199719981999 20000.00
0.05
0.10
0.15
0.20
0.25
0.30
Real wo
rld p
ric
e
Real p
rodu
cer p
rice
(US$ p
er kg)
Real world pric e Real producer pric e
Source: Computed from Bank of Uganda databank (2002) and IMF commodity prices database (2002).
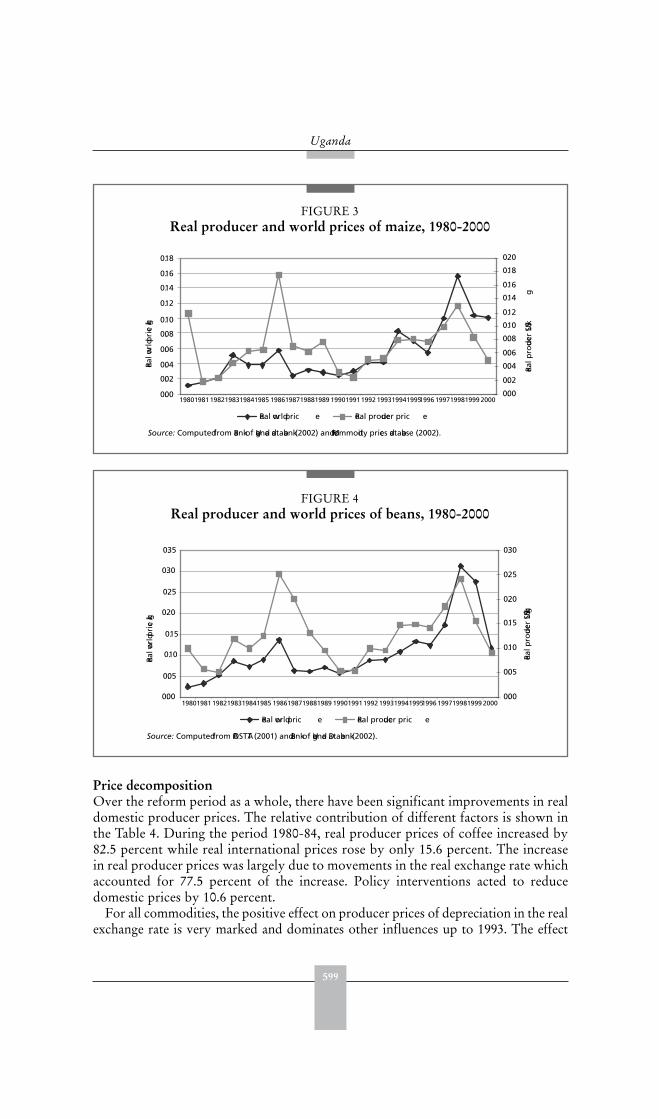
599
Uganda
Price decompositionOver the reform period as a whole, there have been significant improvements in realdomestic producer prices. The relative contribution of different factors is shown inthe Table 4. During the period 1980-84, real producer prices of coffee increased by82.5 percent while real international prices rose by only 15.6 percent. The increasein real producer prices was largely due to movements in the real exchange rate whichaccounted for 77.5 percent of the increase. Policy interventions acted to reducedomestic prices by 10.6 percent.
For all commodities, the positive effect on producer prices of depreciation in the realexchange rate is very marked and dominates other influences up to 1993. The effect
FIGURE 3Real producer and world prices of maize, 1980-2000
FIGURE 4Real producer and world prices of beans, 1980-2000
0.00
0.02
0.04
0.06
0.08
0.10
0.12
0.14
0.16
0.18
Real wo
rld p
rice
/kg
0.00
0.02
0.04
0.06
0.08
0.10
0.12
0.14
0.16
0.18
0.20
Real p
rodu
cer US
$ /kg
198019811982198319841985 1986198719881989 19901991 1992 1993 1994 19951996 199719981999 2000
Real world pric e Real producer pric e
Source: Computed from Bank of Uganda databank (2002) and IMF commodity prices database (2002).
0.00
0.05
0.10
0.15
0.20
0.25
0.30
0.35
Real wo
rld p
rice
/kg
0.00
0.05
0.10
0.15
0.20
0.25
0.30
Real p
rodu
cer US
$ /kg
Source: Computed from FAOSTAT (2001) and Bank of Uganda Databank (2002).
198019811982198319841985 1986198719881989 19901991 1992 1993 1994 19951996 199719981999 2000
Real world pric e Real producer pric e
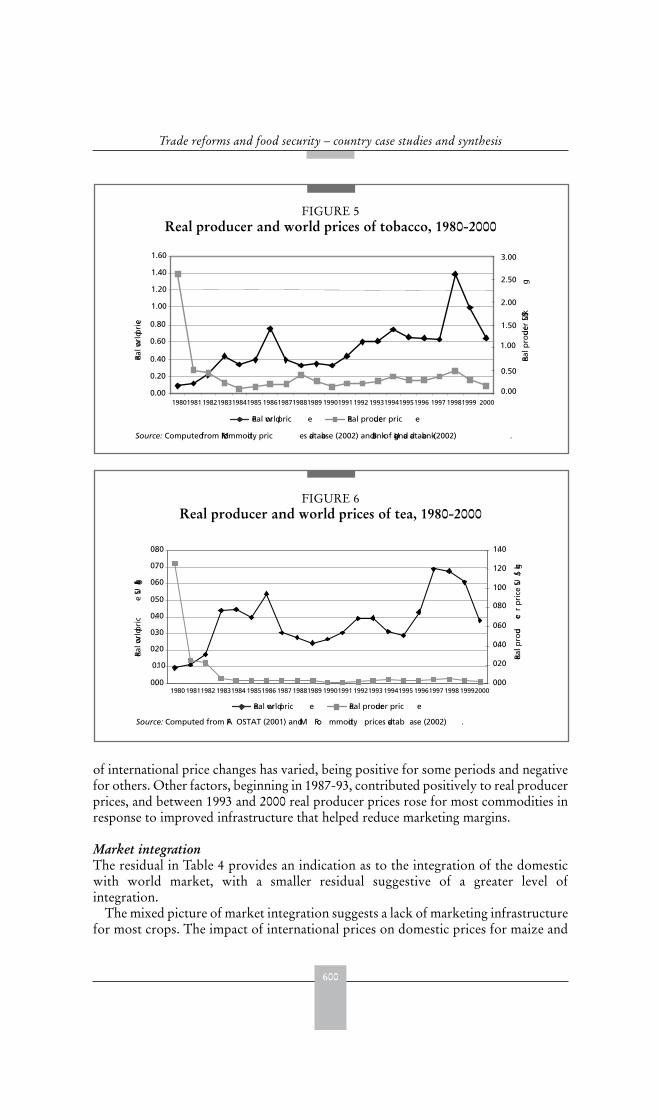
600
Trade reforms and food security – country case studies and synthesis
of international price changes has varied, being positive for some periods and negativefor others. Other factors, beginning in 1987-93, contributed positively to real producerprices, and between 1993 and 2000 real producer prices rose for most commodities inresponse to improved infrastructure that helped reduce marketing margins.
Market integrationThe residual in Table 4 provides an indication as to the integration of the domesticwith world market, with a smaller residual suggestive of a greater level ofintegration.
The mixed picture of market integration suggests a lack of marketing infrastructurefor most crops. The impact of international prices on domestic prices for maize and
FIGURE 5Real producer and world prices of tobacco, 1980-2000
FIGURE 6Real producer and world prices of tea, 1980-2000
Real wo
rld p
rice
0.00
0.20
0.40
0.60
0.80
1.00
1.20
1.40
1.60
0.00
0.50
1.00
1.50
2.00
2.50
3.00
Real p
rodu
cer US
$ /kg
198019811982198319841985 1986198719881989 19901991 1992 1993 1994 1995 1996 1997 19981999 2000
Real world pric e Real producer pric e
Source: Computed from IMF commodity pric es database (2002) and Bank of Uganda databank (2002) .
0.00
0.10
0.20
0.30
0.40
0.50
0.60
0.70
0.80
1980 19811982 19831984 19851986 1987 19881989 19901991 19921993 19941995 19961997 1998 19992000
Real wo
rld p
ric
e US
$/kg
0.00
0.20
0.40
0.60
0.80
1.00
1.20
1.40
Real p
rodu
cer
pri
ce US
$/kg
Real world pric e Real producer pric e
Source: Computed from FA OSTAT (2001) and IM F co mmodity prices datab ase (2002) .
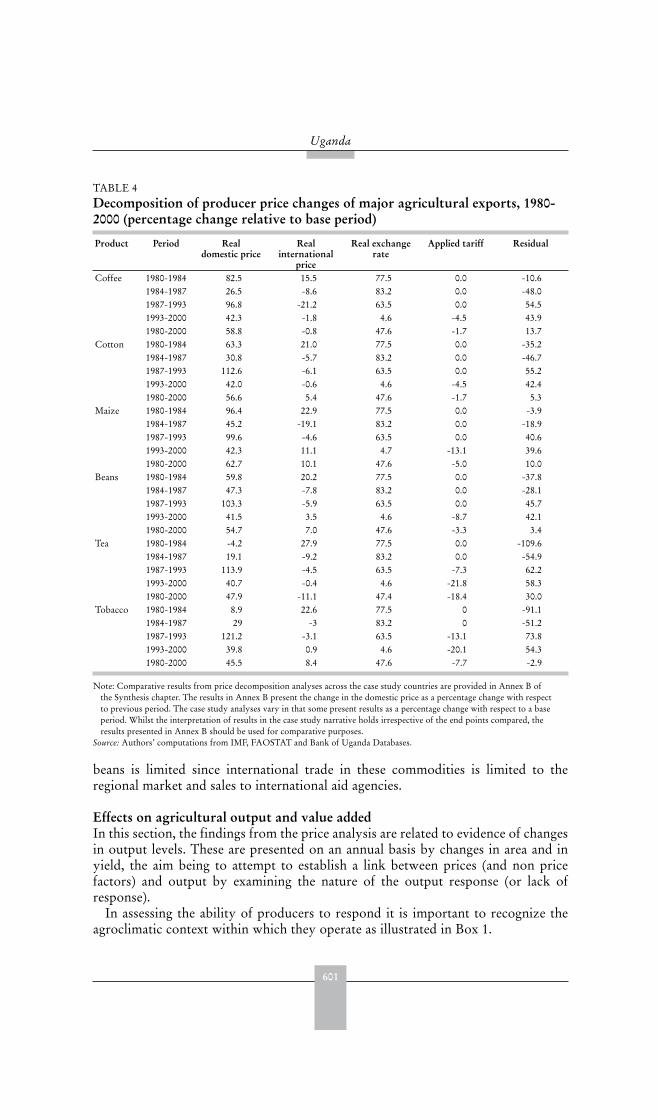
601
Uganda
beans is limited since international trade in these commodities is limited to theregional market and sales to international aid agencies.
Effects on agricultural output and value added In this section, the findings from the price analysis are related to evidence of changesin output levels. These are presented on an annual basis by changes in area and inyield, the aim being to attempt to establish a link between prices (and non pricefactors) and output by examining the nature of the output response (or lack ofresponse).
In assessing the ability of producers to respond it is important to recognize theagroclimatic context within which they operate as illustrated in Box 1.
TABLE 4 Decomposition of producer price changes of major agricultural exports, 1980-2000 (percentage change relative to base period)
Product Period Realdomestic price
Realinternational
price
Real exchange rate
Applied tariff Residual
Coffee 1980-1984 82.5 15.5 77.5 0.0 -10.61984-1987 26.5 -8.6 83.2 0.0 -48.01987-1993 96.8 -21.2 63.5 0.0 54.51993-2000 42.3 -1.8 4.6 -4.5 43.91980-2000 58.8 -0.8 47.6 -1.7 13.7
Cotton 1980-1984 63.3 21.0 77.5 0.0 -35.21984-1987 30.8 -5.7 83.2 0.0 -46.71987-1993 112.6 -6.1 63.5 0.0 55.21993-2000 42.0 -0.6 4.6 -4.5 42.41980-2000 56.6 5.4 47.6 -1.7 5.3
Maize 1980-1984 96.4 22.9 77.5 0.0 -3.91984-1987 45.2 -19.1 83.2 0.0 -18.91987-1993 99.6 -4.6 63.5 0.0 40.61993-2000 42.3 11.1 4.7 -13.1 39.61980-2000 62.7 10.1 47.6 -5.0 10.0
Beans 1980-1984 59.8 20.2 77.5 0.0 -37.81984-1987 47.3 -7.8 83.2 0.0 -28.11987-1993 103.3 -5.9 63.5 0.0 45.71993-2000 41.5 3.5 4.6 -8.7 42.11980-2000 54.7 7.0 47.6 -3.3 3.4
Tea 1980-1984 -4.2 27.9 77.5 0.0 -109.61984-1987 19.1 -9.2 83.2 0.0 -54.91987-1993 113.9 -4.5 63.5 -7.3 62.21993-2000 40.7 -0.4 4.6 -21.8 58.31980-2000 47.9 -11.1 47.4 -18.4 30.0
Tobacco 1980-1984 8.9 22.6 77.5 0 -91.11984-1987 29 -3 83.2 0 -51.21987-1993 121.2 -3.1 63.5 -13.1 73.81993-2000 39.8 0.9 4.6 -20.1 54.31980-2000 45.5 8.4 47.6 -7.7 -2.9
Note: Comparative results from price decomposition analyses across the case study countries are provided in Annex B ofthe Synthesis chapter. The results in Annex B present the change in the domestic price as a percentage change with respectto previous period. The case study analyses vary in that some present results as a percentage change with respect to a baseperiod. Whilst the interpretation of results in the case study narrative holds irrespective of the end points compared, theresults presented in Annex B should be used for comparative purposes.
Source: Authors’ computations from IMF, FAOSTAT and Bank of Uganda Databases.
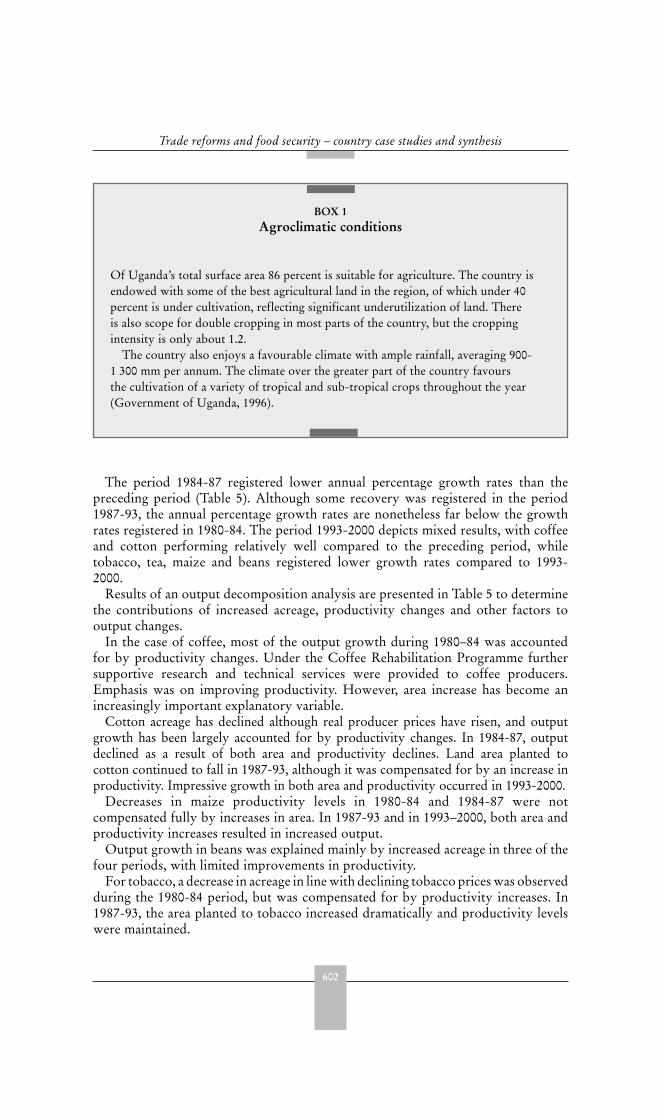
602
Trade reforms and food security – country case studies and synthesis
The period 1984-87 registered lower annual percentage growth rates than thepreceding period (Table 5). Although some recovery was registered in the period1987-93, the annual percentage growth rates are nonetheless far below the growthrates registered in 1980-84. The period 1993-2000 depicts mixed results, with coffeeand cotton performing relatively well compared to the preceding period, whiletobacco, tea, maize and beans registered lower growth rates compared to 1993-2000.
Results of an output decomposition analysis are presented in Table 5 to determinethe contributions of increased acreage, productivity changes and other factors tooutput changes.
In the case of coffee, most of the output growth during 1980–84 was accountedfor by productivity changes. Under the Coffee Rehabilitation Programme furthersupportive research and technical services were provided to coffee producers.Emphasis was on improving productivity. However, area increase has become anincreasingly important explanatory variable.
Cotton acreage has declined although real producer prices have risen, and outputgrowth has been largely accounted for by productivity changes. In 1984-87, outputdeclined as a result of both area and productivity declines. Land area planted tocotton continued to fall in 1987-93, although it was compensated for by an increase inproductivity. Impressive growth in both area and productivity occurred in 1993-2000.
Decreases in maize productivity levels in 1980-84 and 1984-87 were notcompensated fully by increases in area. In 1987-93 and in 1993–2000, both area andproductivity increases resulted in increased output.
Output growth in beans was explained mainly by increased acreage in three of thefour periods, with limited improvements in productivity.
For tobacco, a decrease in acreage in line with declining tobacco prices was observedduring the 1980-84 period, but was compensated for by productivity increases. In1987-93, the area planted to tobacco increased dramatically and productivity levelswere maintained.
BOX 1 Agroclimatic conditions
Of Uganda’s total surface area 86 percent is suitable for agriculture. The country isendowed with some of the best agricultural land in the region, of which under 40percent is under cultivation, reflecting significant underutilization of land. Thereis also scope for double cropping in most parts of the country, but the croppingintensity is only about 1.2.
The country also enjoys a favourable climate with ample rainfall, averaging 900-1 300 mm per annum. The climate over the greater part of the country favoursthe cultivation of a variety of tropical and sub-tropical crops throughout the year(Government of Uganda, 1996).
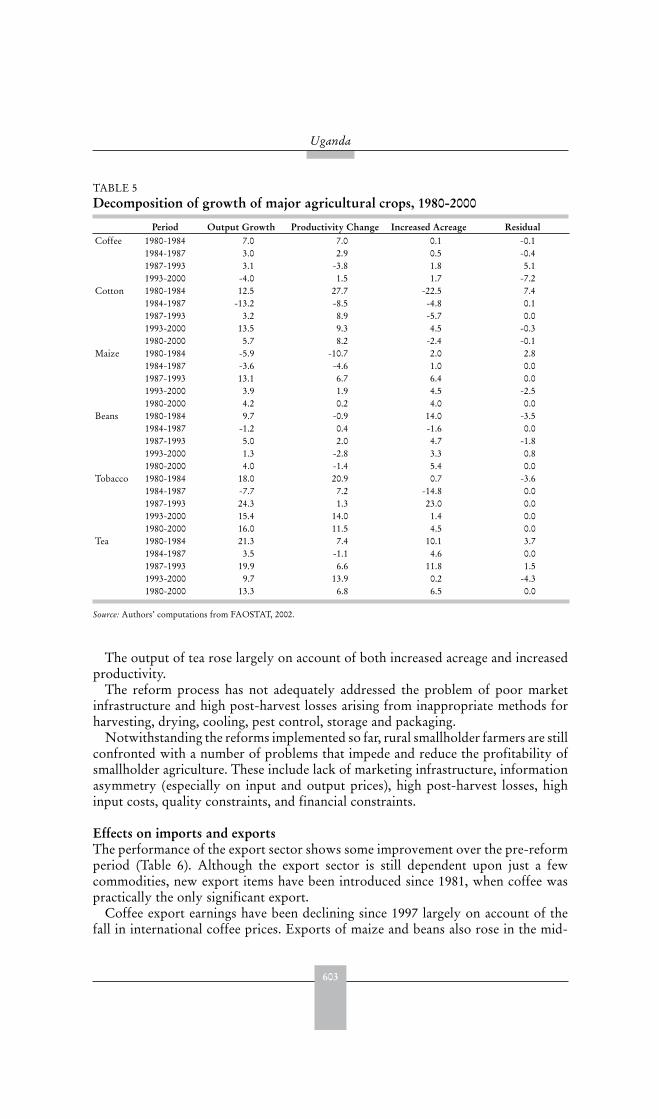
603
Uganda
The output of tea rose largely on account of both increased acreage and increasedproductivity.
The reform process has not adequately addressed the problem of poor marketinfrastructure and high post-harvest losses arising from inappropriate methods forharvesting, drying, cooling, pest control, storage and packaging.
Notwithstanding the reforms implemented so far, rural smallholder farmers are stillconfronted with a number of problems that impede and reduce the profitability ofsmallholder agriculture. These include lack of marketing infrastructure, informationasymmetry (especially on input and output prices), high post-harvest losses, highinput costs, quality constraints, and financial constraints.
Effects on imports and exports The performance of the export sector shows some improvement over the pre-reformperiod (Table 6). Although the export sector is still dependent upon just a fewcommodities, new export items have been introduced since 1981, when coffee waspractically the only significant export.
Coffee export earnings have been declining since 1997 largely on account of thefall in international coffee prices. Exports of maize and beans also rose in the mid-
TABLE 5 Decomposition of growth of major agricultural crops, 1980-2000
Period Output Growth Productivity Change Increased Acreage ResidualCoffee 1980-1984 7.0 7.0 0.1 -0.1
1984-1987 3.0 2.9 0.5 -0.41987-1993 3.1 -3.8 1.8 5.11993-2000 -4.0 1.5 1.7 -7.2
Cotton 1980-1984 12.5 27.7 -22.5 7.41984-1987 -13.2 -8.5 -4.8 0.11987-1993 3.2 8.9 -5.7 0.01993-2000 13.5 9.3 4.5 -0.31980-2000 5.7 8.2 -2.4 -0.1
Maize 1980-1984 -5.9 -10.7 2.0 2.81984-1987 -3.6 -4.6 1.0 0.01987-1993 13.1 6.7 6.4 0.01993-2000 3.9 1.9 4.5 -2.51980-2000 4.2 0.2 4.0 0.0
Beans 1980-1984 9.7 -0.9 14.0 -3.51984-1987 -1.2 0.4 -1.6 0.01987-1993 5.0 2.0 4.7 -1.81993-2000 1.3 -2.8 3.3 0.81980-2000 4.0 -1.4 5.4 0.0
Tobacco 1980-1984 18.0 20.9 0.7 -3.61984-1987 -7.7 7.2 -14.8 0.01987-1993 24.3 1.3 23.0 0.01993-2000 15.4 14.0 1.4 0.01980-2000 16.0 11.5 4.5 0.0
Tea 1980-1984 21.3 7.4 10.1 3.71984-1987 3.5 -1.1 4.6 0.01987-1993 19.9 6.6 11.8 1.51993-2000 9.7 13.9 0.2 -4.31980-2000 13.3 6.8 6.5 0.0
Source: Authors’ computations from FAOSTAT, 2002.
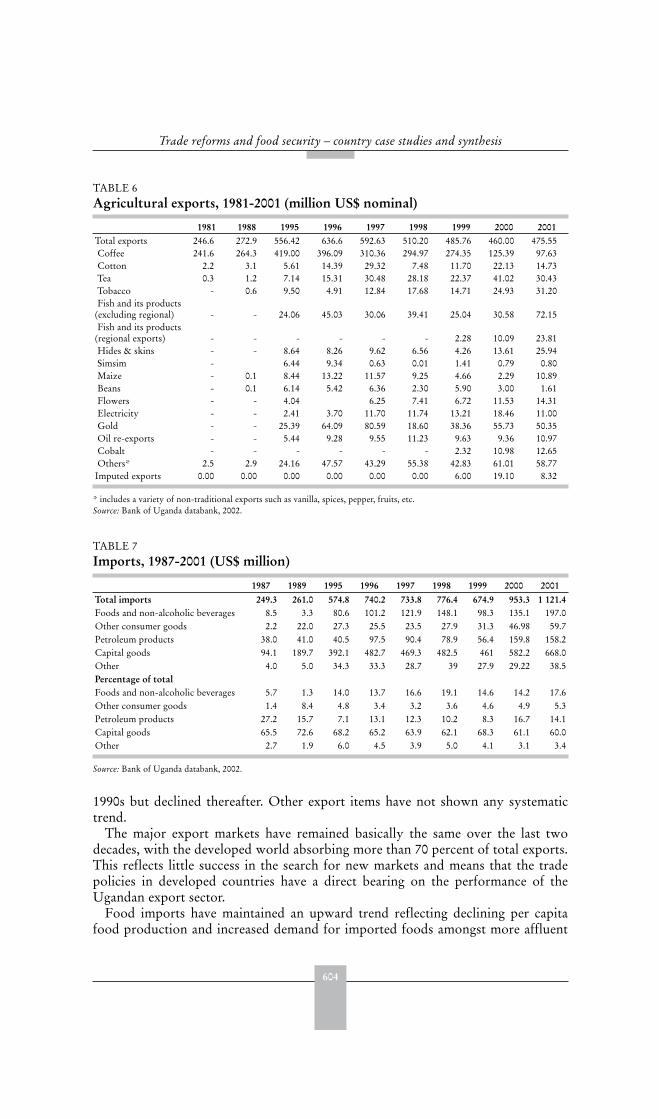
604
Trade reforms and food security – country case studies and synthesis
1990s but declined thereafter. Other export items have not shown any systematictrend.
The major export markets have remained basically the same over the last twodecades, with the developed world absorbing more than 70 percent of total exports.This reflects little success in the search for new markets and means that the tradepolicies in developed countries have a direct bearing on the performance of theUgandan export sector.
Food imports have maintained an upward trend reflecting declining per capitafood production and increased demand for imported foods amongst more affluent
TABLE 6 Agricultural exports, 1981-2001 (million US$ nominal)
1981 1988 1995 1996 1997 1998 1999 2000 2001Total exports 246.6 272.9 556.42 636.6 592.63 510.20 485.76 460.00 475.55Coffee 241.6 264.3 419.00 396.09 310.36 294.97 274.35 125.39 97.63Cotton 2.2 3.1 5.61 14.39 29.32 7.48 11.70 22.13 14.73Tea 0.3 1.2 7.14 15.31 30.48 28.18 22.37 41.02 30.43Tobacco - 0.6 9.50 4.91 12.84 17.68 14.71 24.93 31.20Fish and its products
(excluding regional) - - 24.06 45.03 30.06 39.41 25.04 30.58 72.15Fish and its products
(regional exports) - - - - - - 2.28 10.09 23.81Hides & skins - - 8.64 8.26 9.62 6.56 4.26 13.61 25.94Simsim - 6.44 9.34 0.63 0.01 1.41 0.79 0.80Maize - 0.1 8.44 13.22 11.57 9.25 4.66 2.29 10.89Beans - 0.1 6.14 5.42 6.36 2.30 5.90 3.00 1.61Flowers - - 4.04 6.25 7.41 6.72 11.53 14.31Electricity - - 2.41 3.70 11.70 11.74 13.21 18.46 11.00Gold - - 25.39 64.09 80.59 18.60 38.36 55.73 50.35Oil re-exports - - 5.44 9.28 9.55 11.23 9.63 9.36 10.97Cobalt - - - - - - 2.32 10.98 12.65Others* 2.5 2.9 24.16 47.57 43.29 55.38 42.83 61.01 58.77
Imputed exports 0.00 0.00 0.00 0.00 0.00 0.00 6.00 19.10 8.32
* includes a variety of non-traditional exports such as vanilla, spices, pepper, fruits, etc.Source: Bank of Uganda databank, 2002.
TABLE 7 Imports, 1987-2001 (US$ million)
1987 1989 1995 1996 1997 1998 1999 2000 2001Total imports 249.3 261.0 574.8 740.2 733.8 776.4 674.9 953.3 1 121.4Foods and non-alcoholic beverages 8.5 3.3 80.6 101.2 121.9 148.1 98.3 135.1 197.0Other consumer goods 2.2 22.0 27.3 25.5 23.5 27.9 31.3 46.98 59.7Petroleum products 38.0 41.0 40.5 97.5 90.4 78.9 56.4 159.8 158.2Capital goods 94.1 189.7 392.1 482.7 469.3 482.5 461 582.2 668.0Other 4.0 5.0 34.3 33.3 28.7 39 27.9 29.22 38.5Percentage of totalFoods and non-alcoholic beverages 5.7 1.3 14.0 13.7 16.6 19.1 14.6 14.2 17.6Other consumer goods 1.4 8.4 4.8 3.4 3.2 3.6 4.6 4.9 5.3Petroleum products 27.2 15.7 7.1 13.1 12.3 10.2 8.3 16.7 14.1Capital goods 65.5 72.6 68.2 65.2 63.9 62.1 68.3 61.1 60.0Other 2.7 1.9 6.0 4.5 3.9 5.0 4.1 3.1 3.4
Source: Bank of Uganda databank, 2002.
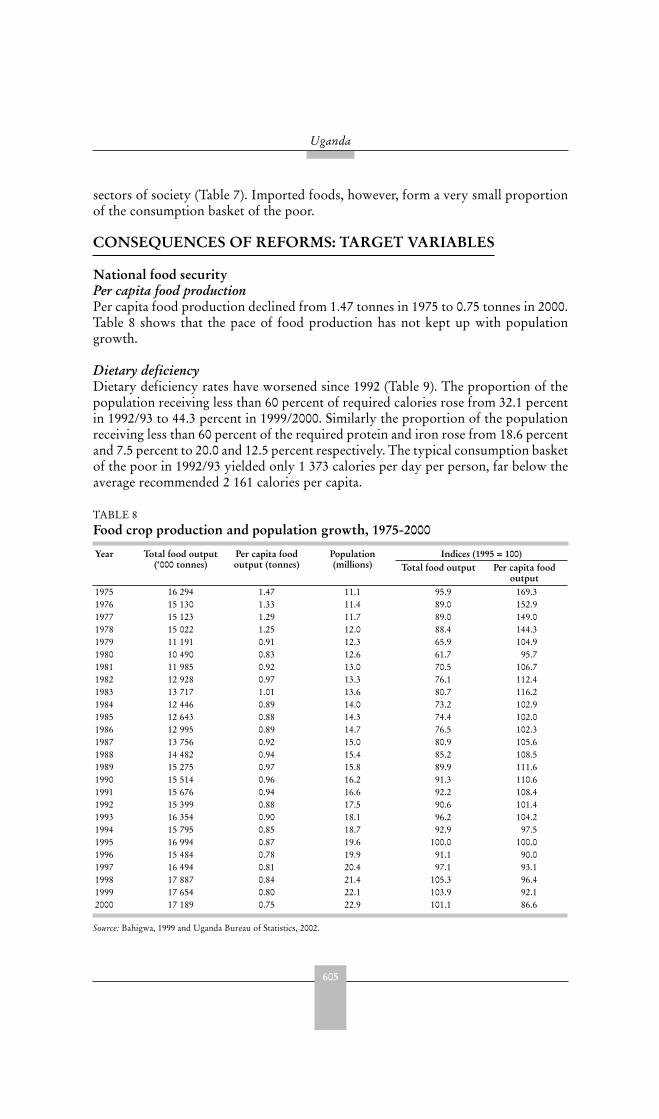
605
Uganda
sectors of society (Table 7). Imported foods, however, form a very small proportionof the consumption basket of the poor.
CONSEQUENCES OF REFORMS: TARGET VARIABLES
National food securityPer capita food productionPer capita food production declined from 1.47 tonnes in 1975 to 0.75 tonnes in 2000.Table 8 shows that the pace of food production has not kept up with populationgrowth.
Dietary deficiencyDietary deficiency rates have worsened since 1992 (Table 9). The proportion of thepopulation receiving less than 60 percent of required calories rose from 32.1 percentin 1992/93 to 44.3 percent in 1999/2000. Similarly the proportion of the populationreceiving less than 60 percent of the required protein and iron rose from 18.6 percentand 7.5 percent to 20.0 and 12.5 percent respectively. The typical consumption basketof the poor in 1992/93 yielded only 1 373 calories per day per person, far below theaverage recommended 2 161 calories per capita.
TABLE 8 Food crop production and population growth, 1975-2000
Year Total food output (‘000 tonnes)
Per capita food output (tonnes)
Population (millions)
Indices (1995 = 100)Total food output Per capita food
output1975 16 294 1.47 11.1 95.9 169.31976 15 130 1.33 11.4 89.0 152.91977 15 123 1.29 11.7 89.0 149.01978 15 022 1.25 12.0 88.4 144.31979 11 191 0.91 12.3 65.9 104.91980 10 490 0.83 12.6 61.7 95.71981 11 985 0.92 13.0 70.5 106.71982 12 928 0.97 13.3 76.1 112.41983 13 717 1.01 13.6 80.7 116.21984 12 446 0.89 14.0 73.2 102.91985 12 643 0.88 14.3 74.4 102.01986 12 995 0.89 14.7 76.5 102.31987 13 756 0.92 15.0 80.9 105.61988 14 482 0.94 15.4 85.2 108.51989 15 275 0.97 15.8 89.9 111.61990 15 514 0.96 16.2 91.3 110.61991 15 676 0.94 16.6 92.2 108.41992 15 399 0.88 17.5 90.6 101.41993 16 354 0.90 18.1 96.2 104.21994 15 795 0.85 18.7 92.9 97.51995 16 994 0.87 19.6 100.0 100.01996 15 484 0.78 19.9 91.1 90.01997 16 494 0.81 20.4 97.1 93.11998 17 887 0.84 21.4 105.3 96.41999 17 654 0.80 22.1 103.9 92.12000 17 189 0.75 22.9 101.1 86.6
Source: Bahigwa, 1999 and Uganda Bureau of Statistics, 2002.
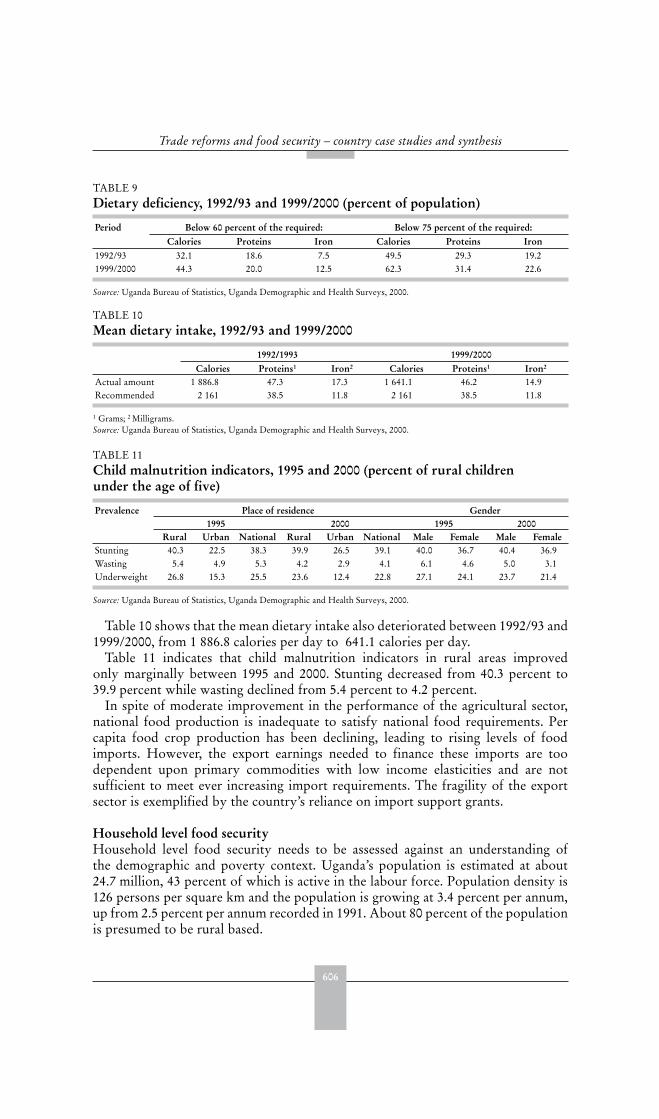
606
Trade reforms and food security – country case studies and synthesis
Table 10 shows that the mean dietary intake also deteriorated between 1992/93 and1999/2000, from 1 886.8 calories per day to 641.1 calories per day.
Table 11 indicates that child malnutrition indicators in rural areas improvedonly marginally between 1995 and 2000. Stunting decreased from 40.3 percent to39.9 percent while wasting declined from 5.4 percent to 4.2 percent.
In spite of moderate improvement in the performance of the agricultural sector,national food production is inadequate to satisfy national food requirements. Percapita food crop production has been declining, leading to rising levels of foodimports. However, the export earnings needed to finance these imports are toodependent upon primary commodities with low income elasticities and are notsufficient to meet ever increasing import requirements. The fragility of the exportsector is exemplified by the country’s reliance on import support grants.
Household level food securityHousehold level food security needs to be assessed against an understanding ofthe demographic and poverty context. Uganda’s population is estimated at about24.7 million, 43 percent of which is active in the labour force. Population density is126 persons per square km and the population is growing at 3.4 percent per annum,up from 2.5 percent per annum recorded in 1991. About 80 percent of the populationis presumed to be rural based.
TABLE 9 Dietary deficiency, 1992/93 and 1999/2000 (percent of population)
Period Below 60 percent of the required: Below 75 percent of the required:Calories Proteins Iron Calories Proteins Iron
1992/93 32.1 18.6 7.5 49.5 29.3 19.21999/2000 44.3 20.0 12.5 62.3 31.4 22.6
Source: Uganda Bureau of Statistics, Uganda Demographic and Health Surveys, 2000.
TABLE 10 Mean dietary intake, 1992/93 and 1999/2000
1992/1993 1999/2000Calories Proteins1 Iron2 Calories Proteins1 Iron2
Actual amount 1 886.8 47.3 17.3 1 641.1 46.2 14.9Recommended 2 161 38.5 11.8 2 161 38.5 11.8
1 Grams; 2 Milligrams.Source: Uganda Bureau of Statistics, Uganda Demographic and Health Surveys, 2000.
TABLE 11 Child malnutrition indicators, 1995 and 2000 (percent of rural children under the age of five)
Prevalence Place of residence Gender1995 2000 1995 2000
Rural Urban National Rural Urban National Male Female Male FemaleStunting 40.3 22.5 38.3 39.9 26.5 39.1 40.0 36.7 40.4 36.9Wasting 5.4 4.9 5.3 4.2 2.9 4.1 6.1 4.6 5.0 3.1Underweight 26.8 15.3 25.5 23.6 12.4 22.8 27.1 24.1 23.7 21.4
Source: Uganda Bureau of Statistics, Uganda Demographic and Health Surveys, 2000.

607
Uganda
Both rural and urban poverty has been declining (Table 12). At the nationallevel, the headcount ratios declined from 55.7 percent in 1992/93 to 35.1 percent in1999/00. The rural and urban headcount ratios declined from 57.9 percent and 27.8percent to 39.0 percent and 10.1 percent respectively. Poverty was reduced acrossall regions with the exception of the northern region, which has not shown anyconsistent trend. The persistence of poverty in the northern region is largely a resultof the civil conflict that has raged there for more than 16 years.
The typical diet varies from region to region due to differences in staple crops, ofwhich the most important are matooke, sweet potatoes, cassava, maize, millet andsorghum. The consumption basket also depends on culture and the type of farmingsystem.
Own production constitutes a significant portion of the consumption basket inrural areas. The purchase of food from income derived from the sale of cash crops,provision of labour services, and remittances also helps supplement own foodproduction. Households from areas with a history of insecurity reported donationfrom the government and international and non-governmental organizations asan additional source of food. Transfers from other households and donationsfrom relatives were also reported to be contributing positively to household foodsecurity.
During harvest seasons, 95 percent of the households surveyed reported that theyare food secure.3 However, due to high post-harvest losses and poor storage facilities,food security declines over the course of the year (Table 13). During drought and badharvests, the food security situation actually becomes chronic.
At the national level, food security improved by 10.9 percent (Table 14). The largestimprovement was however registered in western region, where the proportion offood secure households increased from 65.5 percent to 86.2 percent. The eastern
3 Households were asked how many meals they could afford in a day. Those that reported less than two mealsa day were categorized as food insecure.
TABLE 12 Rural poverty, 1992-2000 (headcount ratios – percent)
Location 1992/93 1993/94 1994/95 1995/96 1997/98 1999/00National 55.7 52.2 50.1 48.5 44.0 35.1Rural 57.9 56.7 54.0 53.0 48.2 39.0Urban 27.8 20.60 22.3 19.5 16.3 10.1Central 45.5 35.6 30.5 30.1 27.7 20.1Rural 52.8 43.4 35.9 37.1 34.3 25.6Urban 21.5 14.2 14.6 14.5 11.5 7.0West 52.8 53.9 50.4 46.7 42.0 28.0Rural 53.8 55.3 51.6 48.3 43.2 29.4Urban 29.7 24.7 25.4 16.2 19.9 5.6East 59.2 58.0 64.9 57.5 54.3 37.3Rural 61.1 60.2 66.8 59.4 56.8 39.2Urban 40.4 30.5 41.5 31.8 24.8 17.4North 71.3 69.3 63.5 68.0 58.8 64.8Rural 72.2 70.7 65.1 70.3 60.7 66.7Urban 52.6 46.2 39.8 39.6 32.6 30.6
Source: Appleton et al., 1999 and Appleton, 2001.
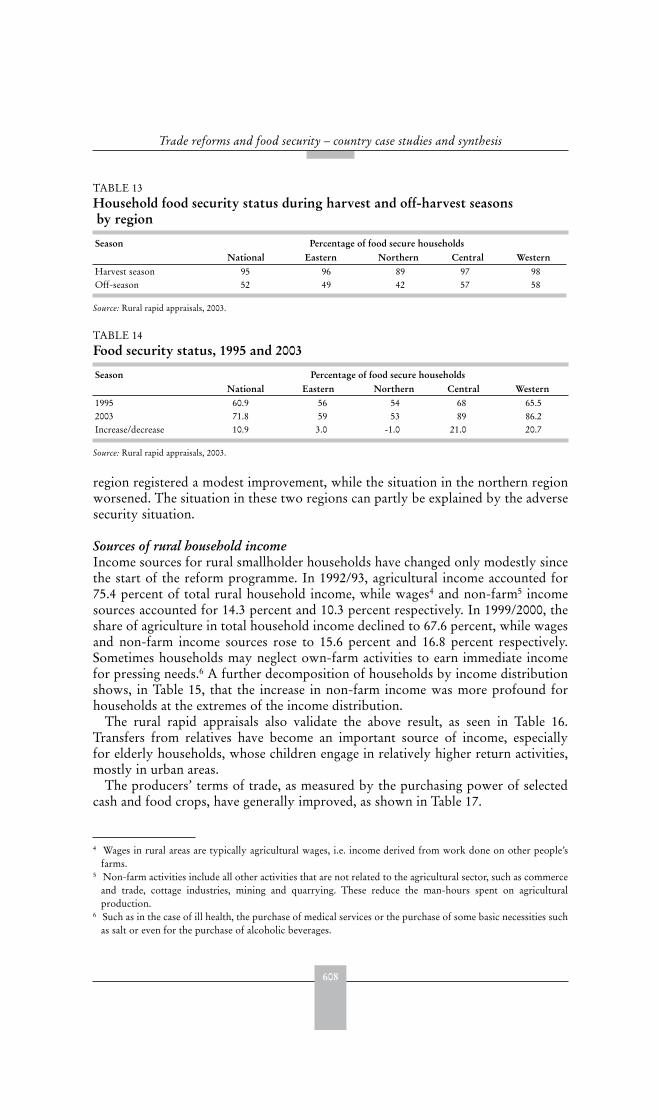
608
Trade reforms and food security – country case studies and synthesis
region registered a modest improvement, while the situation in the northern regionworsened. The situation in these two regions can partly be explained by the adversesecurity situation.
Sources of rural household incomeIncome sources for rural smallholder households have changed only modestly sincethe start of the reform programme. In 1992/93, agricultural income accounted for75.4 percent of total rural household income, while wages4 and non-farm5 incomesources accounted for 14.3 percent and 10.3 percent respectively. In 1999/2000, theshare of agriculture in total household income declined to 67.6 percent, while wagesand non-farm income sources rose to 15.6 percent and 16.8 percent respectively.Sometimes households may neglect own-farm activities to earn immediate incomefor pressing needs.6 A further decomposition of households by income distributionshows, in Table 15, that the increase in non-farm income was more profound forhouseholds at the extremes of the income distribution.
The rural rapid appraisals also validate the above result, as seen in Table 16.Transfers from relatives have become an important source of income, especiallyfor elderly households, whose children engage in relatively higher return activities,mostly in urban areas.
The producers’ terms of trade, as measured by the purchasing power of selectedcash and food crops, have generally improved, as shown in Table 17.
4 Wages in rural areas are typically agricultural wages, i.e. income derived from work done on other people’sfarms.
5 Non-farm activities include all other activities that are not related to the agricultural sector, such as commerceand trade, cottage industries, mining and quarrying. These reduce the man-hours spent on agriculturalproduction.
6 Such as in the case of ill health, the purchase of medical services or the purchase of some basic necessities suchas salt or even for the purchase of alcoholic beverages.
TABLE 13 Household food security status during harvest and off-harvest seasons by region
Season Percentage of food secure householdsNational Eastern Northern Central Western
Harvest season 95 96 89 97 98Off-season 52 49 42 57 58
Source: Rural rapid appraisals, 2003.
TABLE 14 Food security status, 1995 and 2003
Season Percentage of food secure householdsNational Eastern Northern Central Western
1995 60.9 56 54 68 65.52003 71.8 59 53 89 86.2Increase/decrease 10.9 3.0 -1.0 21.0 20.7
Source: Rural rapid appraisals, 2003.
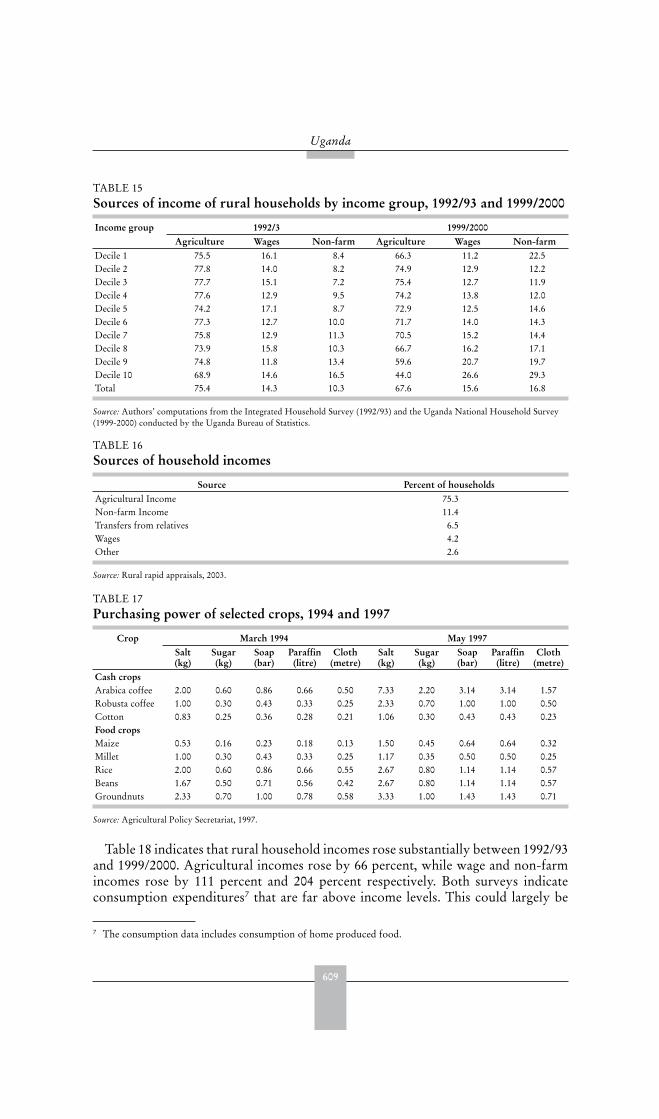
609
Uganda
Table 18 indicates that rural household incomes rose substantially between 1992/93and 1999/2000. Agricultural incomes rose by 66 percent, while wage and non-farmincomes rose by 111 percent and 204 percent respectively. Both surveys indicateconsumption expenditures7 that are far above income levels. This could largely be
7 The consumption data includes consumption of home produced food.
TABLE 15 Sources of income of rural households by income group, 1992/93 and 1999/2000
Income group 1992/3 1999/2000Agriculture Wages Non-farm Agriculture Wages Non-farm
Decile 1 75.5 16.1 8.4 66.3 11.2 22.5Decile 2 77.8 14.0 8.2 74.9 12.9 12.2Decile 3 77.7 15.1 7.2 75.4 12.7 11.9Decile 4 77.6 12.9 9.5 74.2 13.8 12.0Decile 5 74.2 17.1 8.7 72.9 12.5 14.6Decile 6 77.3 12.7 10.0 71.7 14.0 14.3Decile 7 75.8 12.9 11.3 70.5 15.2 14.4Decile 8 73.9 15.8 10.3 66.7 16.2 17.1Decile 9 74.8 11.8 13.4 59.6 20.7 19.7Decile 10 68.9 14.6 16.5 44.0 26.6 29.3Total 75.4 14.3 10.3 67.6 15.6 16.8
Source: Authors’ computations from the Integrated Household Survey (1992/93) and the Uganda National Household Survey(1999-2000) conducted by the Uganda Bureau of Statistics.
TABLE 16 Sources of household incomes
Source Percent of householdsAgricultural Income 75.3Non-farm Income 11.4Transfers from relatives 6.5Wages 4.2Other 2.6
Source: Rural rapid appraisals, 2003.
TABLE 17 Purchasing power of selected crops, 1994 and 1997
Crop March 1994 May 1997Salt(kg)
Sugar(kg)
Soap(bar)
Paraffin(litre)
Cloth(metre)
Salt(kg)
Sugar(kg)
Soap(bar)
Paraffin(litre)
Cloth(metre)
Cash cropsArabica coffee 2.00 0.60 0.86 0.66 0.50 7.33 2.20 3.14 3.14 1.57Robusta coffee 1.00 0.30 0.43 0.33 0.25 2.33 0.70 1.00 1.00 0.50Cotton 0.83 0.25 0.36 0.28 0.21 1.06 0.30 0.43 0.43 0.23Food cropsMaize 0.53 0.16 0.23 0.18 0.13 1.50 0.45 0.64 0.64 0.32Millet 1.00 0.30 0.43 0.33 0.25 1.17 0.35 0.50 0.50 0.25Rice 2.00 0.60 0.86 0.66 0.55 2.67 0.80 1.14 1.14 0.57Beans 1.67 0.50 0.71 0.56 0.42 2.67 0.80 1.14 1.14 0.57Groundnuts 2.33 0.70 1.00 0.78 0.58 3.33 1.00 1.43 1.43 0.71
Source: Agricultural Policy Secretariat, 1997.

610
Trade reforms and food security – country case studies and synthesis
TABLE 18 Average incomes and consumption expenditure of rural households 1992/93and 1999/2000 (1989 U Sh prices).
Item 1992/93 1999/2000 Percentage increaseConsumption 304 000 500 000 64.5Income 198 000 366 000 84.8Agricultural 149 000 247 000 66.0Wage 28 500 57 000 111.0Non-farm 20 400 62 000 204.0
Source: Authors’ computations from the Integrated Household Survey (1992) and Uganda National Household Survey (1999-2000).
TABLE 19 Real monthly consumption expenditure per adult equivalent by region, 1992-2000 (1989 U Sh prices)
Location 1992/93 1993/94 1994/95 1995/96 1997/98 1999/00National 6 900 7 281 7 659 7 759 8 078 9 731Rural 6 091 6 327 6 712 6 742 7 127 8 108Urban 12 608 13 885 14 342 14 273 14 264 19 986Central 8 865 9 860 10 983 10 672 10 958 13 783Rural 6 861 7 635 8 995 8 383 8 957 10 065Urban 14 564 16 044 16 815 15 731 15 874 22 563West 6 449 6 527 6 839 7 371 7 369 9 355Rural 6 223 6 307 6 563 7 066 7 079 8 703Urban 11 299 11 219 12 264 13 014 12 589 19 429East 6 115 6 085 5 681 6 463 6 739 8 356Rural 5 866 5 783 5 411 6 066 6 336 7 845Urban 8 633 9 765 8 945 11 877 11 455 13 743North 5 317 5 403 5 677 5 525 6 226 5 675Rural 5 195 5 203 5 506 5 276 5 988 5 408Urban 7 677 8 029 8 181 8 633 9 406 10 594
Source: Appleton, 2001.
due to the problem of households under-reporting income relative to consumption.Consumption expenditure is used here as a proxy for income.
Household Survey (1999-2000).Table 19 demonstrates that consumption expenditure per adult equivalent in ruralareas is about half that in urban areas, and within the rural areas the northern regionhas the lowest expenditure and central region the highest.
Poor rural smallholder households allocate a large share of expenditure to food(Table 20). In the lowest income group8 this share declined only marginally between1992/93 and 1999/00.
Food expenditure in urban areas is at least twice that in the rural areas. It hasalso risen proportionately more in urban areas compared to rural areas, and as ashare of total expenditure it has declined more in urban areas, reflecting growthin urban living standards (Table 21). In the rural north food expenditures declined
8 Those with a monthly expenditure of not more than UGX100 000 (at constant 1989 prices). More than80 percent of rural small holder households fall into this category.
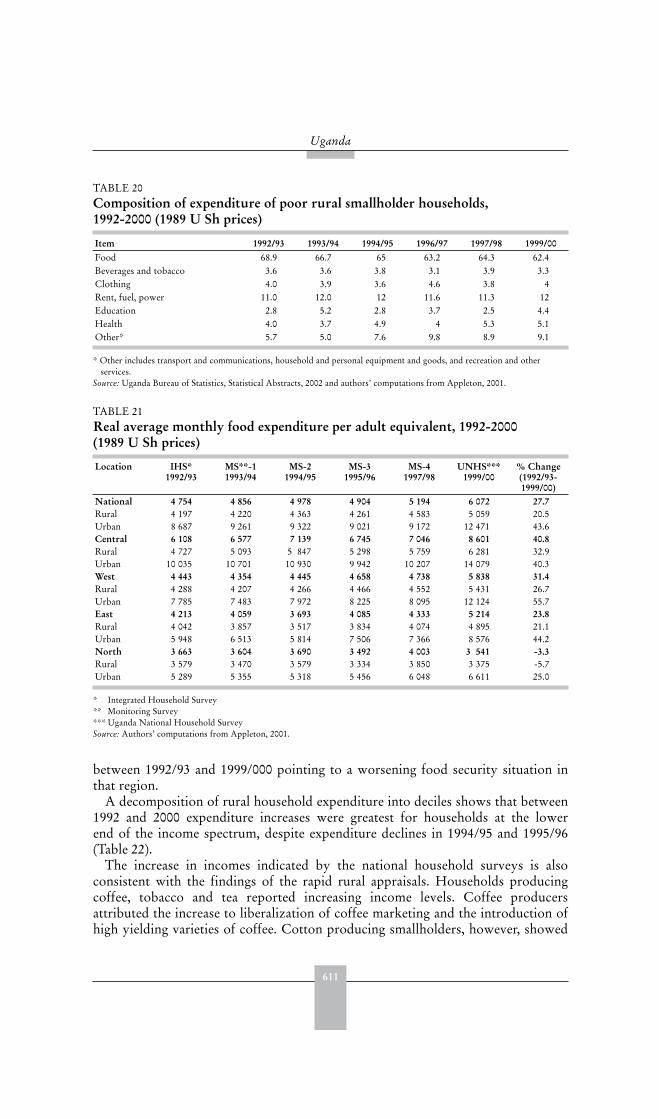
611
Uganda
between 1992/93 and 1999/000 pointing to a worsening food security situation inthat region.
A decomposition of rural household expenditure into deciles shows that between1992 and 2000 expenditure increases were greatest for households at the lowerend of the income spectrum, despite expenditure declines in 1994/95 and 1995/96(Table 22).
The increase in incomes indicated by the national household surveys is alsoconsistent with the findings of the rapid rural appraisals. Households producingcoffee, tobacco and tea reported increasing income levels. Coffee producersattributed the increase to liberalization of coffee marketing and the introduction ofhigh yielding varieties of coffee. Cotton producing smallholders, however, showed
TABLE 20 Composition of expenditure of poor rural smallholder households, 1992-2000 (1989 U Sh prices)
Item 1992/93 1993/94 1994/95 1996/97 1997/98 1999/00Food 68.9 66.7 65 63.2 64.3 62.4Beverages and tobacco 3.6 3.6 3.8 3.1 3.9 3.3Clothing 4.0 3.9 3.6 4.6 3.8 4Rent, fuel, power 11.0 12.0 12 11.6 11.3 12Education 2.8 5.2 2.8 3.7 2.5 4.4Health 4.0 3.7 4.9 4 5.3 5.1Other* 5.7 5.0 7.6 9.8 8.9 9.1
* Other includes transport and communications, household and personal equipment and goods, and recreation and otherservices.
Source: Uganda Bureau of Statistics, Statistical Abstracts, 2002 and authors’ computations from Appleton, 2001.
TABLE 21 Real average monthly food expenditure per adult equivalent, 1992-2000 (1989 U Sh prices)
Location IHS*1992/93
MS**-11993/94
MS-21994/95
MS-31995/96
MS-41997/98
UNHS***1999/00
% Change(1992/93-1999/00)
National 4 754 4 856 4 978 4 904 5 194 6 072 27.7Rural 4 197 4 220 4 363 4 261 4 583 5 059 20.5Urban 8 687 9 261 9 322 9 021 9 172 12 471 43.6Central 6 108 6 577 7 139 6 745 7 046 8 601 40.8Rural 4 727 5 093 5 847 5 298 5 759 6 281 32.9Urban 10 035 10 701 10 930 9 942 10 207 14 079 40.3West 4 443 4 354 4 445 4 658 4 738 5 838 31.4Rural 4 288 4 207 4 266 4 466 4 552 5 431 26.7Urban 7 785 7 483 7 972 8 225 8 095 12 124 55.7East 4 213 4 059 3 693 4 085 4 333 5 214 23.8Rural 4 042 3 857 3 517 3 834 4 074 4 895 21.1Urban 5 948 6 513 5 814 7 506 7 366 8 576 44.2North 3 663 3 604 3 690 3 492 4 003 3 541 -3.3Rural 3 579 3 470 3 579 3 334 3 850 3 375 -5.7Urban 5 289 5 355 5 318 5 456 6 048 6 611 25.0
* Integrated Household Survey** Monitoring Survey*** Uganda National Household SurveySource: Authors’ computations from Appleton, 2001.
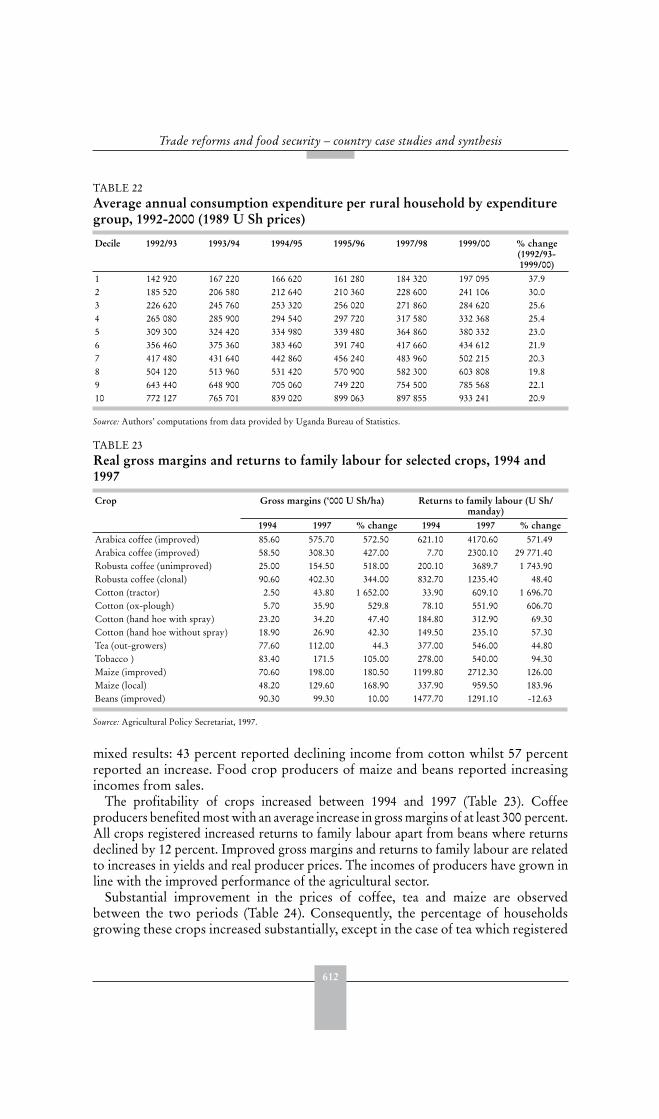
612
Trade reforms and food security – country case studies and synthesis
mixed results: 43 percent reported declining income from cotton whilst 57 percentreported an increase. Food crop producers of maize and beans reported increasingincomes from sales.
The profitability of crops increased between 1994 and 1997 (Table 23). Coffeeproducers benefited most with an average increase in gross margins of at least 300 percent.All crops registered increased returns to family labour apart from beans where returnsdeclined by 12 percent. Improved gross margins and returns to family labour are relatedto increases in yields and real producer prices. The incomes of producers have grown inline with the improved performance of the agricultural sector.
Substantial improvement in the prices of coffee, tea and maize are observedbetween the two periods (Table 24). Consequently, the percentage of householdsgrowing these crops increased substantially, except in the case of tea which registered
TABLE 22 Average annual consumption expenditure per rural household by expenditure group, 1992-2000 (1989 U Sh prices)
Decile 1992/93 1993/94 1994/95 1995/96 1997/98 1999/00 % change (1992/93-1999/00)
1 142 920 167 220 166 620 161 280 184 320 197 095 37.92 185 520 206 580 212 640 210 360 228 600 241 106 30.03 226 620 245 760 253 320 256 020 271 860 284 620 25.64 265 080 285 900 294 540 297 720 317 580 332 368 25.45 309 300 324 420 334 980 339 480 364 860 380 332 23.06 356 460 375 360 383 460 391 740 417 660 434 612 21.97 417 480 431 640 442 860 456 240 483 960 502 215 20.38 504 120 513 960 531 420 570 900 582 300 603 808 19.89 643 440 648 900 705 060 749 220 754 500 785 568 22.110 772 127 765 701 839 020 899 063 897 855 933 241 20.9
Source: Authors’ computations from data provided by Uganda Bureau of Statistics.
TABLE 23 Real gross margins and returns to family labour for selected crops, 1994 and 1997
Crop Gross margins (‘000 U Sh/ha) Returns to family labour (U Sh/manday)
1994 1997 % change 1994 1997 % changeArabica coffee (improved) 85.60 575.70 572.50 621.10 4170.60 571.49Arabica coffee (improved) 58.50 308.30 427.00 7.70 2300.10 29 771.40Robusta coffee (unimproved) 25.00 154.50 518.00 200.10 3689.7 1 743.90Robusta coffee (clonal) 90.60 402.30 344.00 832.70 1235.40 48.40Cotton (tractor) 2.50 43.80 1 652.00 33.90 609.10 1 696.70Cotton (ox-plough) 5.70 35.90 529.8 78.10 551.90 606.70Cotton (hand hoe with spray) 23.20 34.20 47.40 184.80 312.90 69.30Cotton (hand hoe without spray) 18.90 26.90 42.30 149.50 235.10 57.30Tea (out-growers) 77.60 112.00 44.3 377.00 546.00 44.80Tobacco ) 83.40 171.5 105.00 278.00 540.00 94.30Maize (improved) 70.60 198.00 180.50 1199.80 2712.30 126.00Maize (local) 48.20 129.60 168.90 337.90 959.50 183.96Beans (improved) 90.30 99.30 10.00 1477.70 1291.10 -12.63
Source: Agricultural Policy Secretariat, 1997.
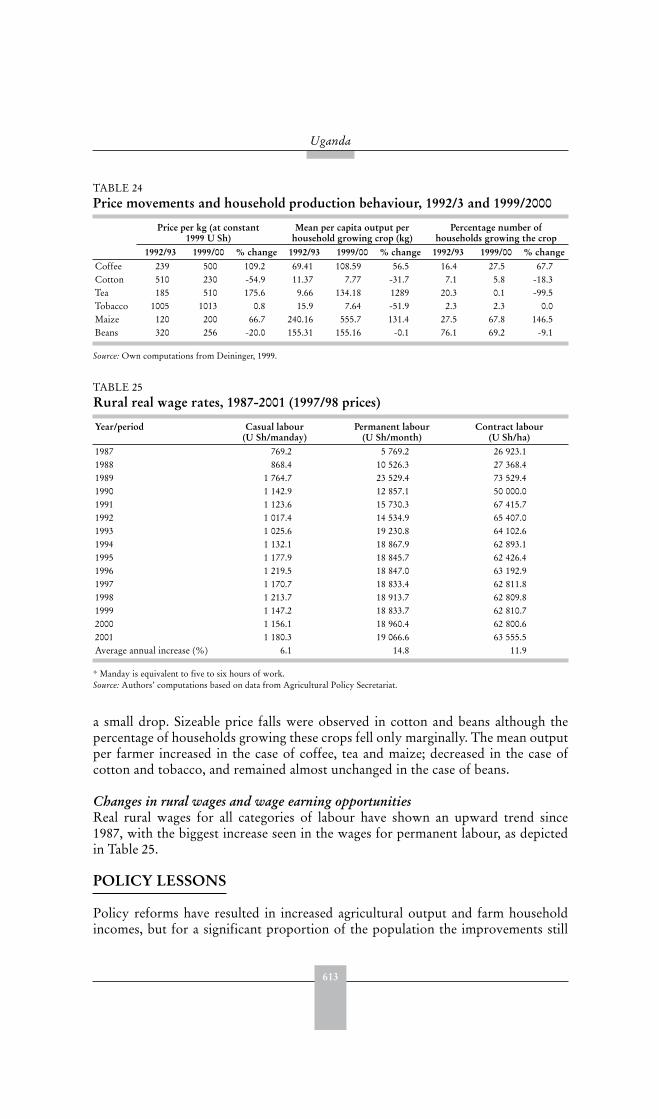
613
Uganda
a small drop. Sizeable price falls were observed in cotton and beans although thepercentage of households growing these crops fell only marginally. The mean outputper farmer increased in the case of coffee, tea and maize; decreased in the case ofcotton and tobacco, and remained almost unchanged in the case of beans.
Changes in rural wages and wage earning opportunitiesReal rural wages for all categories of labour have shown an upward trend since1987, with the biggest increase seen in the wages for permanent labour, as depictedin Table 25.
POLICY LESSONS
Policy reforms have resulted in increased agricultural output and farm householdincomes, but for a significant proportion of the population the improvements still
TABLE 24 Price movements and household production behaviour, 1992/3 and 1999/2000
Price per kg (at constant 1999 U Sh)
Mean per capita output per household growing crop (kg)
Percentage number of households growing the crop
1992/93 1999/00 % change 1992/93 1999/00 % change 1992/93 1999/00 % changeCoffee 239 500 109.2 69.41 108.59 56.5 16.4 27.5 67.7Cotton 510 230 -54.9 11.37 7.77 -31.7 7.1 5.8 -18.3Tea 185 510 175.6 9.66 134.18 1289 20.3 0.1 -99.5Tobacco 1005 1013 0.8 15.9 7.64 -51.9 2.3 2.3 0.0Maize 120 200 66.7 240.16 555.7 131.4 27.5 67.8 146.5Beans 320 256 -20.0 155.31 155.16 -0.1 76.1 69.2 -9.1
Source: Own computations from Deininger, 1999.
TABLE 25 Rural real wage rates, 1987-2001 (1997/98 prices)
Year/period Casual labour(U Sh/manday)
Permanent labour(U Sh/month)
Contract labour(U Sh/ha)
1987 769.2 5 769.2 26 923.11988 868.4 10 526.3 27 368.41989 1 764.7 23 529.4 73 529.41990 1 142.9 12 857.1 50 000.01991 1 123.6 15 730.3 67 415.71992 1 017.4 14 534.9 65 407.01993 1 025.6 19 230.8 64 102.61994 1 132.1 18 867.9 62 893.11995 1 177.9 18 845.7 62 426.41996 1 219.5 18 847.0 63 192.91997 1 170.7 18 833.4 62 811.81998 1 213.7 18 913.7 62 809.81999 1 147.2 18 833.7 62 810.72000 1 156.1 18 960.4 62 800.62001 1 180.3 19 066.6 63 555.5Average annual increase (%) 6.1 14.8 11.9
* Manday is equivalent to five to six hours of work.Source: Authors’ computations based on data from Agricultural Policy Secretariat.
614
Trade reforms and food security – country case studies and synthesis
fail to guarantee access to sufficient food and other basic needs. At a national level,export earnings are insufficient to meet rising import requirements, with potentiallyadverse implications for present and future food security.
Output increases were significantly greater than in many other countries, partlyexplained by recovery from a low pre-reform base. However, the more recentflattening off in output suggests that there are severe constraints to the expansionand modernization of agricultural production.
Rural smallholder farmers are still confronted with a number of obstacles toincreased productivity and profitability, including minimal use of fertilizers andother inputs, poor marketing infrastructure, a lack of market information, high post-harvest losses, financial constraints and land tenure problems. The 1998 Land Actintended to improve land tenure security is not yet effective.
Improvements in agricultural productivity as well as diversification to non-farmenterprises are key requirements for poverty alleviation and food security. TheNational Agricultural Research Organisation was established in 1992 to undertake,promote and co-ordinate research in various aspects of agricultural development.The benefits of this are slowly trickling to the smallholder farmers; for example,most rural smallholder coffee farmers have adopted improved coffee varieties.
The Government has invested substantial resources roads, but market infrastructureconstraints have not been adequately addressed during the reform process. Transportcosts are high because of high fuel costs, poor roads and a lack of competition. Thehigh level of other post-harvest costs, including storage, processing and handlingcosts, also affects the sector’s competitiveness. Credit is a further constraint to smallfarmers, with the only source of credit for rural dwellers being the micro financeindustry, which favours non-agricultural activities. Attempts are currently underwayto develop financial services that meet the needs of the rural population and integratethem into the national financial system.
REFERENCES
Agricultural Policy Secretariat. 1997. Economics of crop and livestock production.Appleton S. 1994. Problems of measuring changes in poverty over time: the case of Uganda,
1989-1992. CSAE.Appleton, S. 2001. Poverty in Uganda, 1999/2000: preliminary estimates from the UNHS.
University of Nottingham, UK.Appleton, S., Emwanu, T., Kagugube, J. & Muwonge, J. 1999. Changes in poverty in
Uganda, 1992-1997. CSAE WPS/99.22.Bahigwa, G. 1999. Household food security in Uganda: an empirical analysis. EPRC
Report.Bank of Uganda Databank. Various years.Bank of Uganda. Various issues. Quarterly Reports.Bibangambah, J. R. 1992. Agriculture in Uganda: current state, problems and prospects for the
future. Uganda Economics Association.Deininger, K. & Okidi, J. 2002. Growth and poverty reduction in Uganda, 1992–2000: Panel
Data Evidence. World Bank.Deininger, K. 1999. Agricultural production: the case of Uganda 1992-2000. World Bank.FAOSTAT. Various years. FAO.

615
Uganda
Government of Uganda. 1987. Background to the Budget for 1987/88. Ministry of Finance,Planning and Economic Development.
Government of Uganda. 1989. Agricultural Production Programme and Targets: 1989/90-
1991/92.
Government of Uganda. 1996. Modernization of agriculture in Uganda: the way forward.Ministry of Animal Industry and Fisheries.
Government of Uganda. 2002. Modernization of agriculture in Uganda: the way forward.
Ministry of Animal Industry and Fisheries.Government of Uganda. 2002a. Background to the Budget for 2002/03. Ministry of Finance,
Planning and economic Development.IMF Commodity Prices. 2002.Uganda Bureau of Statistics. 1995 and 2000. Uganda Demographic and Health Surveys.Uganda Bureau of Statistics. 1996 and 2002. Statistical Abstracts.