Trade Reforms and Manufacturing Industry in Chile
46
Banco Central de Chile Documentos de Trabajo Central Bank of Chile Working Papers N° 210 Mayo 2003 TRADE REFORMS AND MANUFACTURING INDUSTRY IN CHILE Roberto Alvarez Rodrigo Fuentes La serie de Documentos de Trabajo en versión PDF puede obtenerse gratis en la dirección electrónica: http://www.bcentral.cl/Estudios/DTBC/doctrab.htm. Existe la posibilidad de solicitar una copia impresa con un costo de $500 si es dentro de Chile y US$12 si es para fuera de Chile. Las solicitudes se pueden hacer por fax: (56-2) 6702231 o a través de correo electrónico: [email protected]. Working Papers in PDF format can be downloaded free of charge from: http://www.bcentral.cl/Estudios/DTBC/doctrab.htm. Printed versions can be ordered individually for US$12 per copy (for orders inside Chile the charge is Ch$500.) Orders can be placed by fax: (56-2) 6702231 or e-mail: [email protected].
-
Upload
independent -
Category
Documents
-
view
0 -
download
0
Transcript of Trade Reforms and Manufacturing Industry in Chile

Banco Central de ChileDocumentos de Trabajo
Central Bank of ChileWorking Papers
N° 210
Mayo 2003
TRADE REFORMS AND MANUFACTURINGINDUSTRY IN CHILE
Roberto Alvarez Rodrigo Fuentes
La serie de Documentos de Trabajo en versión PDF puede obtenerse gratis en la dirección electrónica:http://www.bcentral.cl/Estudios/DTBC/doctrab.htm. Existe la posibilidad de solicitar una copiaimpresa con un costo de $500 si es dentro de Chile y US$12 si es para fuera de Chile. Las solicitudes sepueden hacer por fax: (56-2) 6702231 o a través de correo electrónico: [email protected].
Working Papers in PDF format can be downloaded free of charge from: http://www.bcentral.cl/Estudios/DTBC/doctrab.htm. Printed versions can be ordered individually forUS$12 per copy (for orders inside Chile the charge is Ch$500.) Orders can be placed by fax: (56-2) 6702231or e-mail: [email protected].

BANCO CENTRAL DE CHILE
CENTRAL BANK OF CHILE
La serie Documentos de Trabajo es una publicación del Banco Central de Chile que divulgalos trabajos de investigación económica realizados por profesionales de esta institución oencargados por ella a terceros. El objetivo de la serie es aportar al debate de tópicosrelevantes y presentar nuevos enfoques en el análisis de los mismos. La difusión de losDocumentos de Trabajo sólo intenta facilitar el intercambio de ideas y dar a conocerinvestigaciones, con carácter preliminar, para su discusión y comentarios.
La publicación de los Documentos de Trabajo no está sujeta a la aprobación previa de losmiembros del Consejo del Banco Central de Chile. Tanto el contenido de los Documentosde Trabajo, como también los análisis y conclusiones que de ellos se deriven, son deexclusiva responsabilidad de su o sus autores y no reflejan necesariamente la opinión delBanco Central de Chile o de sus Consejeros.
The Working Papers series of the Central Bank of Chile disseminates economic researchconducted by Central Bank staff or third parties under the sponsorship of the Bank. Thepurpose of the series is to contribute to the discussion of relevant issues and develop newanalytical or empirical approaches in their analyses. The only aim of the Working Papers isto disseminate preliminary research for its discussion and comments.
Publication of Working Papers is not subject to previous approval by the members of theBoard of the Central Bank. The views and conclusions presented in the papers areexclusively those of the author(s) and do not necessarily reflect the position of the CentralBank of Chile or of the Board members.
Documentos de Trabajo del Banco Central de ChileWorking Papers of the Central Bank of Chile
Huérfanos 1175, primer piso.Teléfono: (56-2) 6702475; Fax: (56-2) 6702231

Documento de Trabajo Working PaperN° 210 N° 210
TRADE REFORMS AND MANUFACTURING INDUSTRYIN CHILE
Roberto Alvarez Rodrigo FuentesAnderson School of Management
UCLABanco Central de Chile
ResumenLa economía chilena experimentó un profundo cambio estructural a mediados de los setenta,debido a varias reformas económicas. De todas ellas la más profunda fue la liberalización delcomercio internacional. Este proceso causó una serie de quiebras en la industria manufacturera yuna reducción en la participación de este sector en el PIB, lo cual ha llevado a algunos autores apensar que Chile se ha convertido en un país menos industrializados. Este artículo describe losprincipales cambios de política que son relevantes para entender la evolución de la productividadusando datos a nivel de plantas. Nuestros resultados desafían la hipótesis de que la liberalizacióncomercial ahogó al sector manufacturero y que habría empujado a la economía hacia la exportaciónde materias primas. También, nuestros resultados muestran que la industria chilena, después de lasreformas económicas, llego a ser más eficiente y competitiva.
AbstractThe Chilean economy underwent a deep structural change in the mid-seventies, through severaleconomic reforms. Among these, the most impressive one was trade liberalization. This processcaused a string of bankruptcies in the manufacturing industry and a reduction in the share of thissector in GDP, which some authors have used to imply that Chile has become a less industrializedeconomy. This paper describes the main policy changes that are relevant to understand the evolutionof the manufacturing industry in Chile after the reforms, and analyzes the evolution of productivityusing plant-level data. Our findings challenge the hypothesis that trade liberalization stifled themanufacturing sector and pushed the economy toward exporting raw materials. Also, our resultsshow that the Chilean industry, after these economic reforms, became more efficient andcompetitive.
___________________Paper prepared for Structure and Structural Change in the Chilean Economy , edited by P. Aroca and G.J.D.Hewings. We are grateful for the useful discussions with Antonio Escandón, Ricardo Vicuña and theparticipants in the XXXVII Anual Meeting of the Asociación Argentina de Economía Política. The views andconclusions presented in the paper are exclusively those of the authors and do not necessarily reflect theposition of the Central Bank of Chile or of the Board members.E-mails: [email protected]; [email protected].

1
1. Introduction and motivation
The big changes in both political spectrum and economic conception experienced by the
Chilean economy in the seventies and eighties have attracted the interest of both
economists and political scientists. From the purely economic point of view, after the Great
Depression of the thirties, and following the strategy of most countries in the world, the
Chilean economy became less outward oriented implementing several barriers to
international trade. This gathered even more strength after Prebich’s ideas about economic
development and international trade in the fifties.
These policies reached their peak in the early seventies under the government of President
Salvador Allende, who was supported by a coalition of left political parties. Under his
administration from 1970 to 1973, not only did the economy become almost closed, but
also the very idea of resource allocation by the market was derided. Most private firms
were either nationalized or driven out of business, through price and interest rate controls
(see Edwards and Edwards, 1987).
After the military coup in 1973, the new team reversed several of these measures in almost
six years, introducing what may be the largest structural change in the Chilean economic
history. The actions taken by the military administration were severely criticized by
politicians and economists that opposed the new government. Criticism was based on the
idea that the new model of development would push the economy toward becoming a
primary product exporter, thus very vulnerable to international market fluctuations. Also, it

2
was argued that the new policies would undermine the industrial sector and therefore the
Chilean economy would never be able to join the group of more developed countries.
Regarding the Chilean industry, several articles1 have explored the impact of trade
liberalization on productivity growth, but methodological problems leave open the question
of whether outward orientation has a positive impact on productivity. The theoretical trade
literature provides conflicting predictions about the impact of liberalization on productivity.
Both groups, inward and outward oriented policy advocates, expected higher rates of
productivity growth in manufacturing as a result of their respective opposite policies (Pack,
1988). Much of the empirical evidence has focused on this topic for developing countries,
but the evidence is not yet conclusive.2
The purpose of this paper is to present a different look at the large structural changes to the
Chilean economy in the 70s and their effects on the manufacturing sector, from a long-term
perspective. The hypothesis is that Chile had comparative advantages in natural resource
intensive commodities and, as trade liberalization came forward, a large shift in the
resources’ allocation should take place. In this process, the share of manufacturing industry
on total GDP would decrease and therefore Chile would become less industrialized. Some
authors gave a negative connotation to this process since industrialization was used as
signal of development.3 Our approach is to analyze how the manufacturing industry
performed during and after the reforms, and what were the losses and gains of the process.
1 See Corbo and Sánchez (1985), Tybout, De Melo, and Corbo (1991), Agacino, Rivas, and Roman (1991),Marshall (1992), Fuentes (1995) and Pavcnik (2002).2 For an excelent survey of theoretical arguments and empirical evidence, see Rodrick (1995).3 See, for example, Ffrench-Davis and Saez (1995).

3
Is this a story of just losses? Do we have a weak industrial sector? Today we have a long-
run perspective that can provide additional insight on this topic.
The methodology used is the following. First, a number of articles are reviewed that
address the relationship between trade and productivity in the Chilean manufacturing
industry. Second, we provide our own estimates of technological progress and technical
efficiency indices. The difference with previous studies is that now we can assess the effect
of trade liberalization on both variables over a longer time span. Third, we analyze changes
in productivity over time and across sectors, and its link to trade liberalization.
Our main findings are that 1) Chile did not become a less industrialized economy, using the
share of manufacturing industry value added over GDP and the share of exported
manufactured products over total exports as measures of industrialization. 2) However,
accordingly with the comparative advantage hypothesis, the composition of the
manufacturing industry changed in favor of sectors more intensive in natural resources. 3)
The Chilean industrial sector showed higher overall efficiency in 1994 compared with
1979, when the trade reform was completed. Combining this finding with the increase in
the share of manufactured over total exports, we can conclude that this sector has become a
more competitive one.
The paper continues as follows. Next section describes in more detail the structural changes
concerning the trade reform in the Chilean economy during the 70s and 80s. The trade
reform and the exchange rate policy of the late seventies had the greatest impact on the
manufacturing sector. Using this as background, the third section looks at the figures of the

4
manufacturing industry to have an idea of the magnitude of these changes. The fourth
section offers a brief review of the empirical studies concerning the relationship between
trade liberalization and manufacturing industry performance. Then, the fifth section, using
plant-level data, estimates productivity changes in the post trade liberalization period. The
paper ends with concluding remarks.
2. The trade policies of the seventies and eighties
The reforms of the seventies and eighties have been the object of numerous studies. Among
the most comprehensive ones it is worth singling out Edwards and Edwards (1987) and the
book edited by Bosworth, Dornbusch and Labán (1993). These reforms were deep and
drastic. They meant a big shift in the development strategy that had prevailed in Chile since
the 1940s.
Chile did not escape the ideas of inward oriented development that were common around
the world after the Great Depression. 4 This inward oriented strategy was accompanied by
proactive industrial policies and an increasing share of the Government in the economy,
through the creation of state owned enterprises. The manufacturing industry was protected
with high tariffs, non-tariff barriers and multiple exchange rates. All this happened between
1940 and 1970, with three failed attempts to reverse this trend during the 1956-58 1959-
1961 and 1965-1970 periods. In the late 60s, the Chilean government introduced some

5
reforms to the external sector that simplified the international trade regime (Berhman,
1976), reduced some of the import substitution effect, but according to Cortés, Butelman
and Videla (1981) protectionism still survived after the reform.
In 1970, a newly elected government deepened the inward oriented policy and government
intervention. Before the military coup of 1973, the Chilean economy could be characterized
as a closed economy (high barriers to trade and capital movements)5 with strong
government intervention, price and interest rate controls, a large fiscal deficit and high
inflation. Moreover, during the 1970-1973 period the Government expropriated an
important number of private companies (Edwards and Edwards, 1987).
Among the trade protection measures, it is worth mentioning that in 1973 there was a high
dispersion in import tariffs, ranging from 0% to 750%, with an average nominal tariff equal
to 105% and a mode of 90%. Half the tariffs were above 80% and only 4% of the tariff
positions had rates below 25% (Corbo, 1985). There was also import prohibition for 187
tariff positions, a 90-day import deposit requirement of 10,000% over the CIF value, plus
some other discretionary actions that could be taken by the Central Bank.
After the military coup, Chile moved toward a market economy. The most relevant policies
were price liberalization (including interest rates), the abrupt reduction of the fiscal deficit
through reduced government spending and the privatization of state-owned enterprises.
4 It is worth noticing that Chile was one of the economies that suffered the most during the Great Depression.In fact, per capita GDP fell by 47% and exports by 79% (see Lüders, 1988). This event triggered the inwardoriented type of policies.5 Chile was one of the countries with the highest degree of trade distortions in the world. See Edwards (1994)and the references therein.

6
Among the reforms of the first ten years of the military administration it is worth
mentioning trade and financial liberalization, and the new pension fund system that is the
heart of the Chilean capital market.
Perhaps the deepest reform conducted over that period was trade liberalization. In less than
six years almost all the trade restrictions were lifted.6 By June 1979 all the non-tariff
barriers (NTBs) were eliminated and an across the board 10% tariff was imposed. The
following table shows the evolution of the effective rate of protection (ERP) during that
period.
6 See Cauas and De la Cuadra (1981) for a detailed description of the process of trade liberalization.

7
Table 2.1. Effective Rate of Protection 1974-1979
Sectors 1974 1975 1976 1977 1978 1979Food 161 105 48 28 16 12Beverages 203 119 47 32 19 13Tobacco 114 68 29 19 11 11Textile 239 138 74 49 28 14Apparel and Footwear 264 164 71 48 27 14Leather 181 98 46 36 21 13Wood Products 157 93 45 28 16 15Furniture, except Metal 95 58 28 17 11 11Paper and Pulp 184 114 62 37 22 17Printing 140 75 40 32 20 12Chemical Products 80 53 45 24 16 13Plastic 80 53 45 24 16 13Petroleum and Coal 265 101 17 0 12 13Glass, Pottery and Non Metallic Minerals 128 87 55 32 20 14Basic Metals 127 86 64 38 25 17Metallic Products 147 101 77 52 27 15Electrical and Non Electrical Machinery 96 72 58 35 19 13
Manufacturing Industry (Average ERP) 156.5 93.2 50.1 31.2 19.2 13.5Agriculture 30 27 19 11 10 10Mining 7 18 24 17 13 14Non Tradable -30 -19 -11 -7 -4 -3Source: Aedo and Lagos (1984)
Two features are worth highlighting from table 2.1. The first one is the high ERP enjoyed
by the manufacturing industry in 1974, compared to other sectors in the economy. Thus,
trade liberalization introduced a big change in relative prices in favor of agriculture, mining
and non-tradable goods. The second important characteristic concerns the high ERP
dispersion across the manufacturing sectors at the beginning of the period and the almost no
differences at the end of it. These big changes in relative prices affected the allocation of
resources within the economy.
In addition to the relative price shifts described above, the exchange rate policy played a
significant role in resource allocation. In an effort to control inflation, in June 1979 the

8
economic authority decided to peg the exchange rate, which coincided with the completion
of the first trade liberalization process. However the low speed of convergence between
domestic and international inflation rates (because of wage indexation) and capital inflows
(as a result of the external financial liberalization) the peso experienced a large real
appreciation. 7 This, combined with wage indexation based on past inflation, introduces an
even larger loss in competitiveness to the tradable sector. Corbo and Sánchez (1985) called
this episode a “second and more intensive trade liberalization.”
External and internal factors induced in 1982 the deepest recession since the Great
Depression. Among them, one can mention the lack of external funding and the low world
economic growth rates. Domestically, wage rigidities, that hindered the necessary
adjustments in the labor market to realign the real exchange rate, plus a weak banking
system, further propagated the external shocks on the economy. At last the Government
decided to devaluate the peso in 1982, after two years of fixed exchange rate. After several
devaluations and a short episode of flexible exchange rate, Chile adopted a crawling peg
system.
Given the situation at the time, the Government decided to modify the trade policy by
increasing tariffs from 10% to 20% in 1983 and to 35% in 1984 (always across the board).
Additional tariffs were imposed for electronic goods and automobiles, and a price band for
certain crops (i.e. wheat, sugar and oil seed).
7 See Edwards (1989) and Le Fort (1988) for empirical evidence on the real exchange’s rate behavior overthat period.

9
In 1985, a second trade liberalization process was implemented. Tariffs were reduced from
35% to 20% in 1986 and to 15% in 1988. In 1991 a newly elected Government reduced
tariffs further to 11% and established free trade agreements with several countries, whereby
tariff differences were again introduced according to origin and type of good, but now at a
much lower level.
3. The history of the manufacturing industry in numbers
As stated above, the large changes in relative prices introduced important shifts in resource
allocation across sectors. The share of the manufacturing industry in GDP diminished, but
less dramatically than many authors has argued.8 The base year of the national accounts
was changed in 1986, making it difficult to compare figures before and after that year, even
in current prices. For instance, in 1985 (a year that is common to both national accounts
systems) there is a difference of 5.2 percentage points between the 1977 series and the 1986
one. Figure 3.1 shows the shares of manufacturing industry over GDP using the national
accounts based on 1977 (Share 77) and 1986 prices (Share 86). To construct a more
consistent series of manufacturing valued added over GDP we extrapolated the Share 86
series using the nominal series of manufacturing value added and GDP from the national
accounts system based on 1977.9 The new series appears in Figure 3.1 as a dashed line.
8 For instance, Ffrench-Davis and Saez (1995) mentioned that the share of the manufacturing industry in 1989was way below the 1960-1969 average. This conclusion cannot be drawn from figure 3.1, below.9 We did the same exercise using the 1986 nominal series to extrapolate the Share 77, and the conclusion doesnot change. What changes is the level of the share but in all periods. We agree that this is not a first bestmethodology, but it is more accurate than compared shares in nominal terms under different national accountssystems.

10
Figure 3.1 Share of the manufacturing sector in GDP
0.0%
5.0%
10.0%
15.0%
20.0%
25.0%
30.0%
35.0%
1960 1965 1970 1975 1980 1985 1990 1995
Share 77 Share 86 Extra
Source: Central Bank of Chile; authors’ calculations
In the sixties, the average share was equal to 17.0%, while in the 1975-1985 period the
figure was only 15.4%. After 1987, the manufacturing sector increased very fast, mainly
due to a higher real exchange rate. Although the real exchange rate peaked in 1990, and
declined after that, the manufacturing sector still grew faster than the rest of the economy.
As section 5 of the paper will show, this growth was driven mainly by productivity
increases. Moreover, the 1986-1999 average is similar to the sixties’, but with a more
competitive industry and a different composition of sectors, as will be seen below.
In exports, the manufacturing sector also shows an interesting behavior. In 1970, Chile was
mainly a copper exporter, and to this day it is by far its most important exported product.
But the weight of copper in total exports has decreased, while manufacturing exports have
increased as a share of total exports. By the late nineties, the share of manufacturing in total

11
exports was almost three times as high as in 1970, and almost four times with respect to
1960 (see Figure 3.2). It is important to consider that between 1960 and 1989 total exports
went from 490 million to 8.19 billion US dollars.
Figure 3.2 Exports by sectors over total exports 1960-1989
Unfortunately, because of an export classification problem, the figures after 1990 are not
strictly comparable with those in the figure above. That comparison is shown in a different
graph below. As can be seen, the significance of the manufacturing industry increases even
further, outperforming the mining sector in 1999.
In light of the evidence presented herein, the so-called deindustrialization process is
doubtful, to say the least. However, there are still arguments in favor of the
deindustrialization process, based on the idea that the manufacturing industry is intensive in
natural resources. But, considering the standard Heckscher-Ohlin-Vaneck model of
0%
20%
40%
60%
80%
100%
1960 1970 1975 1980 1985 1989
Agricultura Minería Industria

12
international trade, a country that opens to trade would tend to specialize in those goods
that use the most abundant factor more intensively, which is the case of Chile with natural
resources.
Nevertheless, it is important to point out that the evidence concerning natural resource
abundance, as a barrier for growth is not over yet. In a seminal paper, Sachs and Warner
(1995) argue that economies with abundance of natural resources grow slower than the rest
of the world. However, Leite and Weidmann (1999) and Lederman and Maloney (2002)
have challenged this idea using different types of arguments. The former paper argues that
natural resources may be a good measure of the level of corruption; in general, economies
that are rich in natural resources tend to have property right problems and large incentives
for corruption. The latter paper criticizes the econometric methodology used by Sachs and
Warner; using GMM that deals with unobserved heterogeneity and endogenous explanatory
variables, Lederman and Maloney show that there is no such thing as a negative relation
between natural resource abundance and growth.

13
Figure 3.3 Exports by sectors over total exports 1990-1999
0%
10%
20%
30%
40%
50%
60%
70%
80%
90%
100%
1990 1995 1999
Agricultura Minería Industria Others
Table 3.2 below shows the value-added distribution across sectors of the manufacturing
industry. It clearly shows how sectors more closely associated to natural resources and
labor intensive increase their importance, in terms of total value added, in the
manufacturing industry. Conversely, those sectors more capital intensive account for one
fourth of total value added, which is lower than their share in 1974. This evidence considers
the important change in resource allocation after the trade reform. It is no surprise,
however, considering that in 1972 Chile could be classified as relatively abundant in
minerals, land and literate non professional workers, and relatively scarce in capital and
illiterate workers (Leamer, 1984). On top of this, Chile exhibited highly distorted relative
prices, as shown above.

14
Table 3.2 Value Added Distribution Across Sectors
Sectors 1974 1979 1982 1986 1990 1994Natural Resources Intensive 52.31% 49.99% 57.66% 58.60% 59.10% 56.40%
Food 11.66% 18.04% 19.66% 18.93% 18.54% 20.93%Tobacco 3.01% 3.80% 4.77% 4.32% 3.25% 3.54%Wood products 1.37% 3.68% 2.91% 2.58% 3.18% 3.82%Furniture, except metal 0.27% 0.76% 0.70% 0.58% 0.70% 1.00%Paper products 3.10% 4.54% 4.53% 6.88% 6.20% 7.49%Petroleum and coal 3.61% 4.09% 5.76% 4.06% 5.15% 6.23%Non-metallic minerals 1.31% 2.30% 2.48% 2.86% 2.53% 3.70%Non-ferrous metals 27.98% 12.79% 16.86% 18.41% 19.55% 9.68%
Capital Intensive 36.19% 31.34% 25.46% 25.97% 25.91% 25.16%
Textile 5.73% 5.39% 3.79% 4.82% 4.21% 3.19%Chemical products 3.25% 3.48% 1.90% 2.33% 3.24% 3.77%Other chemicals 4.39% 6.22% 7.77% 6.23% 6.94% 7.66%Iron and steel 8.38% 4.03% 3.96% 4.79% 3.29% 2.55%Metal products 3.85% 4.38% 3.74% 3.67% 4.46% 4.45%Non-electrical machinery 2.21% 2.18% 1.75% 1.56% 0.53% 0.63%Electrical machinery 3.58% 2.28% 1.20% 1.48% 1.45% 1.23%Transport equipment 4.80% 3.38% 1.36% 1.08% 1.80% 1.69%
Labor Intensive 11.49% 18.67% 16.88% 15.43% 14.99% 18.44%
Beverages 3.37% 5.19% 5.77% 4.26% 4.15% 5.15%Clothing and footwear 2.68% 4.42% 3.82% 3.30% 3.55% 4.19%Leather 0.75% 0.78% 0.50% 1.62% 0.52% 0.47%Printing 1.49% 3.95% 3.74% 2.49% 2.92% 3.47%Rubber products 1.31% 1.35% 0.98% 1.05% 0.86% 1.10%Plastic products 0.81% 1.70% 1.44% 1.80% 2.27% 3.16%Pottery 0.48% 0.46% 0.11% 0.21% 0.11% 0.16%Glass 0.60% 0.81% 0.52% 0.70% 0.60% 0.73%Sources: Fuentes (1995) and authors’ calculations.
4. Previous studies in productivity and efficiency in the Chilean manufacturing
industry
Several empirical studies have focused on the link between trade liberalization and
productivity growth in the Chilean economy. It has been argued that higher productivity

15
growth is expected when the economy reduces its trade barriers. Arguments have been
provided to explain this positive link between trade liberalization and productivity growth.
The first one concerns the expected increases in technical efficiency once the domestic
industry is forced to compete in the international markets. In protected sectors, the absence
of competition discourages efficient production because firms can enjoy monopolistic
power. Hence, trade liberalization is assumed to contribute to increase efficiency.
Other authors contend that in developing countries, trade liberalization would increase the
rate of technological progress mainly for two reasons. First, more integrated developing
economies have advantages to absorb technological innovations generated in the advanced
nations.10 The second reason stems from the literature on foreign exchange constraints and
focuses on the evidence that developing countries import capital and intermediate goods
that are not very substitutable by domestic ones because of embodied technological
progress. Thus, trade liberalization would allow importing these more technologically
advanced goods, increasing the technological progress embodied in imported goods. The
empirical evidence in Lee (1995) supports the idea that imported capital goods contribute
positively to economic growth, particularly in developing countries.
Corbo and Sánchez (1985) carried out one of the first empirical studies in this area, using a
special survey on manufacturing firms after trade liberalization. They found that, due to
increasing import competition, the surveyed firms closed down their inefficient plants and
reduced production lines. They also struggled to increase efficiency by expanding
investment and reducing their labor force.

16
In a more systematic approach, Tybout, De Melo and Corbo (1991) analyzed the
hypotheses related to the link between trade liberalization and efficiency. Using cross-
sectional data for the manufacturing industry, they estimated industry-specific technical
efficiency indices for 1967, when the economy was highly protected, and for 1979, when
trade had been liberalized. Their findings reveal little evidence about efficiency
improvements between pre and post liberalization years. Of the 21 sectors analyzed, only 9
showed an increment in technical efficiency, and barely 10 had improved their scale
efficiency. Although overall industry efficiency did not improve significantly between the
two periods, industries with larger reductions in protection were found to achieve the
highest increments in efficiency.
Two similar papers have studied the same issue, but over a longer time span. Marshall
(1992) estimated industry-specific efficiency indices for the 1979-1986 period. She found
that efficiency and productivity tended to increase between 1974 and 1979, but to decrease
between 1979 and 1986. This behavior would be strongly related to changes in tariffs
occurred in both periods. In fact, between 1974 and 1979 the average tariff was reduced
from 57 to 10%, but between 1979 and 1986 it was raised to 20%.11
Liu (1993) focused on plant-specific efficiency during the same period. The results in his
paper, consistent with Marshall’s (1992), suggest a negative relationship between efficiency
and protection. A distinctive feature of this article is the evidence it presents on the
10 A model based on this idea of “learning by looking” is developed by Edwards (1992).11 During this second period, the tariff reached a maximum of 35% in 1984

17
performance of different groups of firms. Liu distinguished among surviving, entering, and
exiting plants and he searched for differences in the evolution of efficiency within these
three groups. His results indicated that entrants were more efficient than exiting plants, but
less so than surviving ones. However, efficiency was almost always increasing in entrants,
but slightly decreasing in surviving plants. Then, he concluded that the competitive
pressure of trade liberalization forced less efficient producers to shut down, generating
positive effects on aggregate efficiency.
Other authors have approached this issue using a different methodology. Fuentes (1995),
applying growth accounting methodology to aggregate data at the three-digit level of ISIC,
reports changes in productivity growth after trade liberalization in manufacturing sectors.
Consistently with the hypotheses mentioned above, his results show that trade liberalization
was accompanied by huge increments in labor productivity and total factor productivity in
the 1974-1979 period, for almost every sector in the manufacturing industry.
Liu and Tybout (1996) estimate separate total factor productivity and efficiency indices for
manufacturing plants. Although their objective is to analyze the role of entry and exit on
aggregate productivity, their estimates are highly consistent with the above-cited studies.
Between 1979 and 1986, total factor productivity and efficiency were negatively correlated
with protection.
More recently, Pavcnik (2002) makes a critical review about the econometric approach
used in these studies. Her contribution, using plant-level data for the same period of the
other studies, is to correct the estimates of production function parameters by the presence

18
of selection bias and simultaneity, obtaining a more consistent measurement of total factor
productivity. After that, she carries out a regression analysis between firm productivity and
outward orientation of the industries, separating among non-tradable, exportable, and
import-competing sectors. In general, she finds that plants in the exportable and import-
competing sectors are more productive than plants in non-tradable sector. The changes over
time in productivity are not very consistent with expected results. Although the productivity
differentials between firms in the non-tradable and import-competing sectors increased
from 1981 through 1986, the same is not valid for plants in the exporting sector.
Consistently with the international experience, the evidence on Chile has not been
conclusive about the relationship between trade liberalization and productivity (see
Deraniyagala and Fine, 2001). There are several shortcomings in the cited studies. First,
more often than not, empirical works have studied a relatively short time span. Although a
great part of trade liberalization was carried out between 1974 and 1979, this was reversed
after the 1982-83 crisis. We believe that a longer time period is needed, to allow for firms
to adjust to the new economic conditions. Also, a long-run analysis is preferable, so that
our inferences are less distorted by the severe 1982-83 crisis.
Second, to our knowledge, there are no studies about productivity growth in the Chilean
manufacturing industry that jointly estimate efficiency and technological progress indices.
Past literature has either focused on total factor productivity, or estimated technical
efficiency. Theoretically, total factor productivity involves these two elements. Higher
production may be achieved by either increasing technical efficiency (reaching the

19
maximum output given the inputs) or improving the production technology (producing
more with the same inputs).
Figure 4.1 illustrates both concepts. If attention is focused only on productivity, defined as
technological progress, assuming that firms are always efficient, changes in productivity
will be equivalent to the vertical distance between two different production functions. On
the other hand, if the focus is only on technical efficiency, the correct measure is the
distance between an actual production point and the corresponding level of output in the
production frontier. Changes in efficiency over time can be seen by looking at how much
closer is the firm to the frontier in point A as compared to B. In the empirical analyses
carried out in Chile until now, there is no distinction between both elements.
Figure 4.1
Efficiency and Technological Progress
Output
Input
A*
B*
Technicalinefficiency
Technologicalprogress

20
A third shortcoming of these studies, which is also a limitation for this one, concerns the
data. Neither of them has a direct measurement of outward orientation at the plant level.
Actually, in Pavcnik (2002) the differences in international exposure are determined at the
industry level and used in the total factor productivity regressions at the plant level. For
example, if there were benefits from competing in international markets, one would expect
that in a same sector, exporting firms would be more productive than non-exporters.12
These productivity differentials have received little attention in Chile.
5. Productivity and Technical Efficiency: Evidence at the Plant Level
The empirical approach in this article contributes to the previous analysis in three ways.
First, in the next section, we estimate joint indices of technological progress and technical
efficiency. Hence, we can distinguish the effect of trade liberalization on both variables.
Second, we have used a longer time period than similar studies. Third, we analyze changes
in productivity over time and across sectors, and their link to trade liberalization. The data
is obtained on an annual basis from the nationwide survey on manufacturing establishments
(ENIA) conducted by the National Institute of Statistics (INE), for the period 1979 to 1994.
12 Many recent empirical studies document the existence of productivity differentials between exporters andnon-exporters. See Bernard and Jensen (1999) for evidence of this in the United States.

21
5.1 Methodological and Measurement Issues
Following recent developments in the measurement of productivity, a stochastic frontier
production function was estimated to decompose total factor productivity into technical
progress and changes in technical efficiency. 13 The stochastic frontiers methodology was
developed by Aigner, Lovell and Schmidt (1977) and Meeusen and Van den Broeck
(1977), and it has been used to obtain efficient production frontiers that represent the
maximum level of output that can be reached with a specified quantity of inputs. The most
efficient firms will be those that are closest to this frontier.
A stochastic frontier production function is defined by:
Y F X eit it it= ( ; )exp( )β (1)
and
e v uit it it= − (2)
where Y is the output of the ith firm (i = 1…n) in the tth period of time (t = 1…T); F is the
production frontier, and X is a vector of inputs. The error term eit is divided into two
random components: vit is the traditional error term, independent and identically distributed
as ),0( 2vN σ , and uit represents technical inefficiency, which is assumed to be independent
and identically distributed as a positive truncated normal.
13 See Kim and Han (2001) for an application of this methodology in Korea.

22
We model inefficiency as a function of the degree of protection in the economy. Our
hypothesis is that a reduction in trade barriers would be associated to an increment in firms’
efficiency. Also, if trade liberalization favors technological absorption from more advanced
economies, we expect higher technological progress through this period. The protection
level (Pt) is measured at the aggregate level and is time varying, but constant across the
different sectors. This is given by:
ttt RERaP )1( +=
where RER is the real exchange rate and a is the average tariff.
We estimate two specifications of the production function: Translog and Cobb-Douglas.14
Then we compute a likelihood ratio test to identify the most appropriate functional form.
Every specification is estimated for 21 sectors in the manufacturing industry. In general,
these sectors correspond to 3-digit ISIC industries. An exception is Food (ISIC 311). Due
to its great size, we have included five industries to 4-digit ISIC; namely sugar products
(ISIC 3113), fruits and vegetables (3114), dairy products (ISIC 3115), meat products (ISIC
3116) and bakery products (ISIC 3118).
Output is measured as value added and has been deflated using the 4-digit SIC deflators
built by Yagui (1993). These deflators were extended using the same methodology. As for
employment, the survey identifies blue-collar (U) and white-collar (S) workers. A simple

23
measurement of total employment would be to add directly both types of workers.
However, since both groups have different productivity, we express labor in units of
efficiency using the minimum wage as a common measure for low human capital (or
productivity). Thus, employment of each type is defined by:
Mint
ttt w
UwU =* and
Mint
ttt w
SwS =* (3)
where w is mean wage in every category and wMin is minimum wage. Hence, labor used in
the estimates is the sum of both categories of workers expressed in the same units.
No direct measure of capital stock for every plant is available from the survey. In addition,
investment data, which potentially could be used to estimate capital input, show a very
erratic behavior, and not all the plants report this information in the survey. Because of this,
electrical power consumption is used as a proxy for capital stock. This proxy has the
advantage that it measures the use of capital stock directly and is expected to best capture
any changes in capital utilization during business cycles.
Costello (1993) mentioned other advantages for using this variable. First, it is a perfectly
homogeneous of invariant quality, and lacks the measurement problems that are common to
other methods for measuring capital utilization. Second, because electric power cannot be
easily stored, its consumption in a productive process corresponds exactly to the quantity
used in such process. However, a disadvantage of this variable, especially in long series, is
14 Specific details about the production function are shown in the annex.

24
that changes in the relative prices of different types of energy induce changes in relative
demand by types of capital. 15 In order to incorporate these substitution possibilities, the
relative price between electric power and petroleum is incorporated into the production
function regressions.16
5.2 Estimation Results
Efficiency
If trade liberalization had some positive effect on efficiency, a higher average efficiency
would be expected in 1994 as compared to 1979. Table 5.1 shows the estimated level of
efficiency and the difference in the mean between both years. According to these results,
almost every sector in the manufacturing industry increased its technical efficiency between
1979 and 1994. The professional and scientific equipment (385), and paper and pulp (341)
sectors experienced the greatest increment in efficiency. In these sectors, efficiency
increased by approximately 20%. In some other sectors, such as meat products (3116), iron
and steel (371), electric machinery (383), chemical products (351) and bakery products
(3118), efficiency declined, although these changes are not statistically significant.
Table 5.2 summarizes these results. Out of the 21 industrial sectors analyzed, more than
70% experienced a significant increment in efficiency. In addition, for those industries that
15 For example, a rise in the cost of electrical energy may provide an incentive for replacing machines andequipment by others that use alternative energy sources, like petroleum.16 Technically, assuming a Cobb-Douglas functional form for the capital input, it can be proven that relativeprice of electricity is an independent variable in production function estimates. See the annex for the finalfunctional form estimated.

25
experienced a reduction in efficiency, the differences between the two years are not
statistically significant. From these estimates, it can be concluded that, along the path
toward a more open economy, almost every manufacturing sector has gained in efficiency,
which is consistent with the benefits associated to trade liberalization.
Table 5.1: Changes in Efficiency by Sector
ISICSector
Description Efficiency1979
Efficiency1994
Change%
t-test P-Value
3113 Sugar Products 0.56 0.62 11.0 2.69 0.008
3114 Fruits and vegetables 0.61 0.62 0.3 0.08 0.933
3115 Dairy products 0.58 0.61 6.0 0.94 0.351
3116 Meat products 0.69 0.68 -1.4 -0.52 0.604
3118 Bakery products 0.54 0.49 -8.8 -0.31 0.579
313 Beverages 0.53 0.57 8.2 1.65 0.100
321 Textiles 0.65 0.67 2.7 1.84 0.066
322 Apparel 0.67 0.70 4.5 3.40 0.000
331 Wood products 0.58 0.63 8.4 4.26 0.000
332 Furniture, except metal 0.63 0.66 4.7 1.83 0.068
341 Paper and pulp 0.58 0.69 18.7 2.25 0.028
351 Chemical products 0.66 0.63 -4.4 -1.31 0.193
352 Other chemicals 0.55 0.58 5.5 1.52 0.130
356 Plastic products 0.61 0.68 11.5 1.22 0.231
371 Iron and steel 0.65 0.64 -1.4 -0.38 0.705
372 Non-ferrous metals 0.53 0.57 7.5 0.98 0.330
381 Fabricated metal products 0.65 0.69 6.2 4.57 0.000
382 Non-electrical machinery 0.61 0.66 8.7 3.16 0.002
383 Electrical machinery 0.71 0.70 -2.3 -0.95 0.341
384 Transport equipment 0.65 0.67 4.3 1.72 0.086
385 Prof. and scientific equip’t 0.49 0.68 38.8 3.14 0.004
Table 5.2: Statistical Test Summary
H0: Equal Means Higher Efficiency Lower EfficiencySectors % Sectors %
Significant* 11 52.4 0 0.0Non-significant 5 23.8 5 23.8Total 16 76.2 5 23.8
* At 10%.

26
Convergence in Efficiency
Given the results obtained for average efficiency by sectors, we now look at the question
about convergence in efficiency. Industries closest to the efficiency frontier will expectedly
experience lower increments in efficiency than those that were less efficient at the
beginning of the period. This is similar to the concept of β-convergence in cross-country
studies about economic growth. Thus, increments in efficiency should be negatively
correlated to initial efficiency.
Our results support this idea. In figure 5.1, we plot changes in efficiency versus the initial
efficiency level for every industry in the sample, and a regression line between both
variables. The results of this exercise indicate that changes in efficiency are negatively
correlated with the initial level of efficiency, suggesting that convergence in efficiency
exist across industrial sectors.

27
Figure 5.1 Convergence in Efficiency
Another interesting analysis is to verify whether there is evidence of dispersion in
efficiency diminishing over time across manufacturing sectors (σ-convergence). Table 5.3
shows the results of a statistical test for changes in efficiency dispersion across industrial
sectors. The null hypothesis is that variance in 1979 is the same as in 1994 or, in other
words, that the variance ratio is equal to 1. It can be appreciated that in most of the
manufacturing sector (19 over 21) the efficiency variance in 1994 is smaller than in 1979,
although in only eight of these sectors, the reduction in variance is statistically significant.
An increment in variance is observed in only two sectors, but this is not significant. These
results are summarized in table 5.4.
y = -0.90x + 60.74 (-2.03) (2.14)
R2 = 0.3161
-10
0
10
20
30
40
45.00 50.00 55.00 60.00 65.00 70.00 75.00
Initial Efficiency (x)
Efic
ienc
ia C
hang
e (y
)
y = -0.90x + 60.74 (-2.03) (2.14)
R2 = 0.3161
-10
0
10
20
30
40
45.00 50.00 55.00 60.00 65.00 70.00 75.00
Initial Efficiency (x)
Eff
icie
ncy
Cha
nge
(y)

28
Table 5.3: Changes in Efficiency Variance by Sector
ISICSector
Description Variance1979(1)
Variance1994(2)
VarianceRatio(2/1)
P-Value
3113 Sugar products 0.025 0.020 0.788 0.138
3114 Fruits and vegetables 0.021 0.015 0.714 0.045
3115 Dairy products 0.039 0.031 0.791 0.199
3116 Meat products 0.019 0.013 0.683 0.036
3118 Bakery products 0.055 0.097 1.755 0.758
313 Beverages 0.044 0.039 0.888 0.270
321 Textiles 0.020 0.019 0.941 0.271
322 Apparel 0.021 0.014 0.666 0.000
331 Wood products 0.034 0.019 0.552 0.000
332 Furniture, except metal 0.025 0.019 0.766 0.004
341 Paper and pulp 0.019 0.016 0.856 0.333
351 Chemical products 0.017 0.016 0.922 0.371
352 Other chemicals 0.034 0.029 0.874 0.183
356 Plastic products 0.029 0.028 0.944 0.411
371 Iron and steel 0.015 0.012 0.790 0.229
372 Non-ferrous metals 0.022 0.032 1.431 0.842
381 Fabricated metal products 0.025 0.013 0.527 0.000
382 No-electrical machinery 0.032 0.019 0.597 0.000
383 Electrical machinery 0.011 0.010 0.873 0.287
384 Transport equipment 0.020 0.014 0.701 0.022
385 Prof. And scientific equip’t 0.039 0.027 0.695 0.231
Table 5.4: Statistical Test Summary
H0: Variances ratio = 1 Higher Variance Lower VarianceSectors % Sectors %
Significant* 0 0.0 8 38.1
Non-significant 2 9.5 11 52.4
Total 2 9.5 19 90.5
* At 10%.

29
Technological Progress
The evidence in this paper suggests that during the period when the Chilean economy
opened to international trade, the manufacturing industry also experienced increments in
technical efficiency. Here, we discuss our results about the technological progress in this
period. Table 5.5 shows the annual rates of technological progress for each sector.
The evidence is less conclusive compared to our findings for technical efficiency. The
results show that not all the sectors experienced technological progress during the period
analyzed. Technological progress growth is positive and statistically significant for only
seven sectors in the manufacturing industry.

30
Table 5.5: Technological Progress by Sector
ISIC Sector Description Annual growth rate(%
t-test
3113 Sugar products -1.9 -0.48
3114 Fruits and vegetables 5.3 1.29
3115 Dairy products 5.7 4.04*
3116 Meat products -3.6 -2.54*
3118 Bakery products 7.5 4.32*
313 Beverages -2.2 -0.63
321 Textiles 1.4 1.31
322 Apparel 3.9 16.99*
331 Wood products 2.0 0.18
332 Furniture, except metal 0.1 0.13
341 Paper and pulp -1.2 -1.02
351 Chemical products 4.9 0.78
352 Other chemicals 0.6 1.51
356 Plastic products 2.2 0.33
371 Iron and steel -0.7 -0.55
372 Non-ferrous metals 5.8 4.72*
381 Fabricated metal products 1.1 4.79*
382 Non-electrical machinery -0.5 -0.52
383 Electrical machinery 5.5 4.19*
384 Transport equipment 3.6 3.39*
385 Prof. and scientific equip’t -1.3 -1.58
* Significant at 5%
Efficiency and Trade Liberalization
One important question concerns the causality between efficiency and trade liberalization.
Although the evidence presented above supports the idea that openness has been associated
to greater efficiency, causality has not been discussed. To motivate a more formal
approach, consider figure 5.2 that plots average efficiency for the aggregate manufacturing
industry and the measurement of protection used (real exchange rate times the average
tariff rate). An inverse relation can be observed between these two variables. When

31
protection was increased in the first part of the period, efficiency tended to decrease.
During the second part of the period, reduction in protection was followed by an increment
in efficiency. 17
Figure 5.2 Efficiency and Protection
90
95
100
105
110
115
120
1979 1980 1981 1982 1983 1984 1985 1986 1987 1988 1989 1990 1991 1992 1993 1994
Efficiency RER(1+a)
Similar evidence regarding the evolution of technical efficiency by sectors is shown
in figure 5.3. In general, in almost all the sectors efficiency increased at the beginning of
the period, then declined until the mid 1980’s. From there on, efficiency grew slightly up to
the end of the period.
17 Given the huge trade liberalization between both decades, it may be surprising that “protection” is higher inthe 90’s that it is in the 70’s. But this can be because we compute a measure of protection that includes thereal exchange rate, and during this period, especially in the 80’s, the real exchange rate appreciatedenormously.

32
Figure 5.3 Evolution of Technical Efficiency Across Sectors
A more formal analysis is presented in table 5.6. As explained above, we include
protection as an explicative variable in the estimation of inefficiency from the production
frontier. The expected value of the parameter associated to protection is positive, under the
hypothesis that increases (reductions) in protection generate greater (smaller) inefficiency.
Our results show a positive and significant parameter in nine out of 21 sectors. The number
of sectors in which the relationship is negative and significant is only six. Then, from this
Food and Beverage1979=100
95,0
105,0
1979 1981 1983 1985 1987 1989 1991 1993
Textiles and Appareal1979=100
90,0
100,0
1979 1981 1983 1985 1987 1989 1991 1993
Chemical Products1979=100
95,0
105,0
115,0
125,0
135,0
1979 1981 1983 1985 1987 1989 1991 1993
Plastic Products 1979=100
95,0
105,0
1979 1981 1983 1985 1987 1989 1991 1993
Iron and Steel1979=100
75,0
85,0
95,0
105,0
115,0
1979 1981 1983 1985 1987 1989 1991 1993
Machinery and Equipment1979=100
95,0
105,0
1979 1981 1983 1985 1987 1989 1991 1993

33
evidence, we can conclude that, although there is not a general case for every
manufacturing sector, trade liberalization has had a positive impact on efficiency for an
important number of sectors in the Chilean manufacturing industry. Future research should
explore these differences in the impact of trade liberalization on technical efficiency.
Table 5.6: Efficiency and Protection by Sector
ISICSector
Description Parameter t-test
3113 Sugar Products -22.6 -7.08*
3114 Fruits and vegetables 20.1 2.35*
3115 Dairy products -10.4 -4.93*
3116 Meat products 21.3 2.84*
3118 Bakery products -0.5 -1.15
313 Beverages -23.3 -1.45
321 Textiles 4.5 6.49*
322 Apparel 16.2 3.34*
331 Wood products -18.4 -4.87*
332 Furniture, except metal -11.6 -3.36*
341 Paper and pulp 12.1 6.48*
351 Chemical products 24.1 3.17*
352 Other chemicals -9.9 -5.37*
356 Plastic products 11.9 1.63
371 Iron and steel 34.1 3.79*
372 Non-ferrous metals 5.1 1.25
381 Fabricated metal products 2.5 9.31*
382 Non-electrical machinery -12.8 -3.15*
383 Electrical machinery 13.4 5.45*
384 Transport equipment -11.0 -4.1*
385 Prof. and scientific equip’t -19.1 -1.63
* Significant at 5%

34
6. Concluding remarks
This paper has shown how the trade reforms in the seventies have affected the
manufacturing industry. We found no evidence of deindustialization in Chile after the
reforms, as defined by the share of the manufacturing industry in GDP and the export of
manufactured products. The share of manufacturing sector over GDP actually increased
during the nineties, where the average was higher than the sixties. On the other hand,
manufacturing exports surpassed mining exports in 1999.
However, a case can be made that the manufacturing sector has developed based on natural
resources, and therefore Chile is still exporting primary products. But, this is consistent
with having comparative advantage in natural resource intensive industries as predicted by
the standard Heckscher-Ohlin-Vaneck model. Nevertheless, it is important to point out that
the controversy concerning natural resource abundance, as a barrier for growth, is not over
yet. In a seminal paper Sachs and Warner (1995) argue that economies abundant in natural
resources grow slower than the rest. However, Leite and Weidmann (1999) and Lederman
and Maloney (2002) have challenged this idea using different types of arguments.
Besides the level of the manufacturing sector production, it is important to notice the
significant shifts occurred in the structure and level of productivity in the manufacturing
industry after the trade liberalization. Specifically, our findings reveal that increases in
productivity are closely associated to changes in technical efficiency for the manufacturing
industry as a whole and for most manufacturing sectors. On the other hand, we cannot find
strong evidence of technological changes in the manufacturing industry. But, given that

35
Chile has a natural advantage in mining products, the manufacturing sector has to be highly
competitive to become as important as mining in terms of exports.

36
References
Aedo, C. and L. Lagos (1984). “Protección Efectiva en el Sector Manufacturero” Working
Paper No94. Universidad Católica de Chile.
Agacino, R., G. Rivas and E. Roman (1991). “Apertura y Eficiencia Productiva: La
Experiencia Chilena 1975-89”. Working Paper No18. InterAmerican Development Bank,
Washington, D.C.
Aigner,D.J., Lovell, C.A.K. y P. Schmidt (1977). "Formulation and Estimation of Stochastic
Frontier Production Function Models", Journal of Econometrics 6(1): 21-37.
Behrman, J.R. (1976). Foreign Trade Regimes and Economic Development: Chile. New
York: Columbia University Press for NBER.
Bernard, A. and J. B. Jensen (1999). “Exceptional Exporter Performance: Cause, Effect, or
both?” Journal of International Economics 47 (1): 1-25.
Bosworth, B., R. Dornbusch and R. Labán (1994). The Chilean Economy: Policy Lessons
and Challenges. Washington D.C.: The Brookings Institution.
Cauas, J. and S. De La Cuadra (1981). “La Política Económica de la Apertura al Exterior en
Chile” Cuadernos de Economía 18(54-55): 195-230.
Corbo, V. (1985). “Chile Economic Policy and International Economic Relations Since
1970,” in The National Economic Policies of Chile edited by G.M. Walton: 107-44.
Greenwich, Conn.: JAI Press.
Corbo, V. and J.M. Sanchez (1985). “Adjustment by Industrial Firms in Chile during 1974-
1982”, in Scrambling for Survival – How Firms Adjusted to the Recent Reforms in
Argentina, Chile and Uruguay, World Bank Staff Working Papers No764.

37
Cortes, D., A. Butelmann and P. Videla (1981). “Proteccionismo en Chile: Una visión
Restrospectiva” Cuadernos de Economía, 18(54-55): 141-94.
Costello, D. (1993): “A Cross Country, Cross-Industry Comparison of Productivity Growth”,
Journal of Political Economy 101(2): 207-22.
Deraniyagala, S. and B. Fine (2001). New Trade Theory versus Old Trade Policy: A
Continuing Enigma”, Cambridge Journal of Economics 25: 809-25.
Edwards, S. (1994). “Trade and Industrial Policy Reform in Latin America”, NBER
Working Paper No4772.
Edwards, S. (1992). “Trade Orientation, Distortions and Growth in Developing Countries”,
Journal of Development-Economics 39 (1): 31-57.
Edwards, S. (1989). Real Exchange Rates, Devaluation, and Adjustment: Exchange Rate
Policy in Developing Countries. Cambridge, Mass.: MIT Press.
Edwards, A. and S. Edwards (1987). Monetarism and Liberalization: The Chilean
Experiment. Chicago: The University of Chicago Press.
Ffrench-Davis, R. and R Saez (1995). “Comercio y Desarrollo Industrial en Chile”,
Colección de Estudios de Cieplan 41: 67-96.
Fuentes, R. (1995): “Openness and Economic Efficiency: Evidence from de Chilean
Manufacturing Industry”, Estudios de Economía, Vol. 22(2): 357-87.
Kim, S. and G. Han (2001). “A Decomposition of Total Factor Productivity Growth in
Korean Manufacturing Industries: A Stochastic Frontier Approach”, Journal of
Productivity Analysis 16(3): 269-81.

38
Le Fort, G. (1988). “The Relative Price of Nontraded Goods, Absorption, and Exchange
Rate Policy in Chile”, FMI Staff Papers 35(2): 336-70.
Leamer, E.E. (1984). Source of International Comparative Advantage: Theory and
Evidence. Cambridge, Mass MIT Press.
Lederman, D. and W. Maloney (2002). “Open Questions About the Link Between Natural
Resources and Economic Growth: Sachs and Warner Revisited”, Working PaperNo141,
Central Bank of Chile.
Lee, J-W. (1995): “Capital Goods Imports and Long-Run Growth”, Journal of
Development Economics 48 (1): 91-110.
Leite, C. and J. Weidmann (1999). “Does Mother Nature Corrupt? Natural Resources,
Corruption and Economic Growth”, IMF Working Paper No99/85, International Monetary
Fund.
Liu, L. (1993). “Entry-Exit, Learning, and Productivity Exchange: Evidence from Chile”,
Journal of Development Economics 42 (2): 217-42.
Marshall, I. (1992): “Liberalización Comercial en Chile y su Impacto sobre la Eficiencia
Técnica Industrial: 1974-1986”, Colección de Estudios CIEPLAN No135: 201-45.
Meeusen W. and J. van den Broeck (1977): “Efficiency Estimation from Cobb-Douglas
Production Functions with Composed Error”, International Economic Review 18(2): 435-
44.
Pack, H. (1988): “Industralization and Trade”, Handbook of Development Economics I:
333-80.

39
Pavcnik, N. (2002). “Trade Liberalization, Exit, and Productivity Improvement: Evidence
from Chilean Plants”, Review of Economic Studies 69(1): 245-76.
Rodrik, D. (1995): “Trade and Industrial Policy Reform”, Handbook of Development
Economics 3(45): 2925-82.
Tybout. J., J. De Melo,. and V. Corbo (1991): "The Effects of Trade Reforms on Scale and
Technical Efficiency: New Evidence from Chile”, Journal of International Economics 31:
231-50.
Yagui, E. (1993): “Un Deflactor para la Encuesta Nacional Industrial Anual (Base
1989=100)”, Revista de Estadística y Economía 6: 129-63.

40
Annex
Functional Form of the Production Function
Two alternative functional forms of the production function were estimated: (1)
Translog, and (2) Cobb-Douglas. These can be expressed, respectively, as:
(1)ititititit
ititititit
KLKL
KtKLtLttY
εβββ
βββββββ
+++
+++++++=
logogl)(log)(log
logloglogloglog
92
82
7
65432
210
(2) itititit LogKLogLtY εββββ ++++= 3210log
where i represents the plant, t is time, Y is value added, L the corrected
employment, K capital services, and ε is the error term defined in equation 2, section 5.
We suppose that services of capital (K) can be approximated by a combination of
electric power consumption (E) and petroleum (M). Using a Cobb-Douglas function, we
can write an expression for capital services as:
(3) λλ −= 1MEK
The first order condition establishes that the firm will combine energy and
petroleum equating the ratio of marginal productivity with relative prices of these types of
energy.
41
(4)M
E
PP
EM
=− )1( λλ
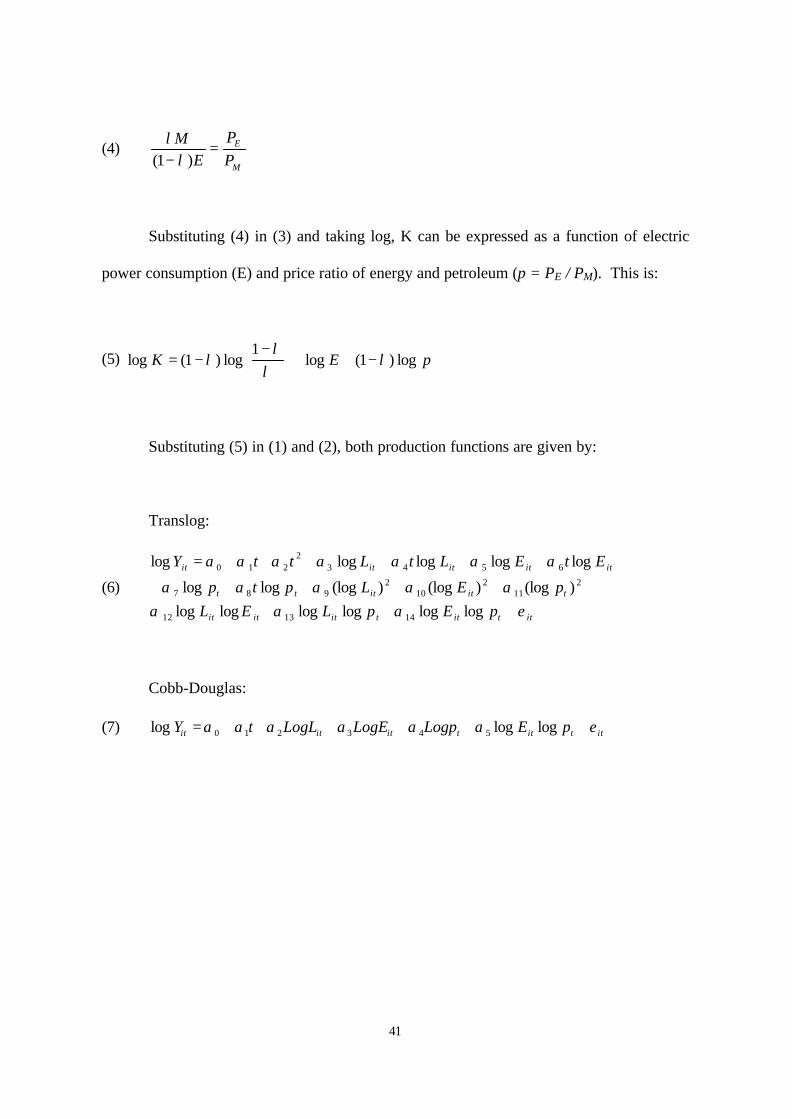
Substituting (4) in (3) and taking log, K can be expressed as a function of electric
power consumption (E) and price ratio of energy and petroleum (p = PE / PM). This is:
(5) pEK log)1(log1
log)1(log λλ
λλ −++
−
−=
Substituting (5) in (1) and (2), both production functions are given by:
Translog:
(6)
ittittititit
titittt
ititititit
pEpLELpELptp
EtELtLttY
εαααααααα
ααααααα
+++++++++
++++++=
loglogloglogloglog)(log)(log)(logloglog
logloglogloglog
141312
211
210
2987
65432
210
Cobb-Douglas:
(7) ittittititit pELogpLogELogLtY εαααααα ++++++= logloglog 543210

Documentos de TrabajoBanco Central de Chile
Working PapersCentral Bank of Chile
NÚMEROS ANTERIORES PAST ISSUES
La serie de Documentos de Trabajo en versión PDF puede obtenerse gratis en la dirección electrónica:http://www.bcentral.cl/Estudios/DTBC/doctrab.htm. Existe la posibilidad de solicitar una copiaimpresa con un costo de $500 si es dentro de Chile y US$12 si es para fuera de Chile. Las solicitudes sepueden hacer por fax: (56-2) 6702231 o a través de correo electrónico: [email protected].
Working Papers in PDF format can be downloaded free of charge from:http://www.bcentral.cl/Estudios/DTBC/doctrab.htm. Printed versions can be ordered individually forUS$12 per copy (for orders inside Chile the charge is Ch$500.) Orders can be placed by fax: (56-2) 6702231or e-mail: [email protected].
DTBC-209Corporate Governance in ChileManuel R. Agosin y Ernesto Pastén H.
Mayo 2003
DTBC-208Indicadores Líderes del IMACECLuis Firinguetti y Hernán Rubio
Abril 2003
DTBC-207El Embrague Financiero: Un Mecanismo Alternativo deAmplificación BancariaElías Albagli
Marzo 2003
DTBC-206Efectos de las Intervenciones en el Mercado Cambiario:el Caso de ChileMatías Tapia y Andrea Tokman
Marzo 2003
DTBC-205Policy Evaluation and Empirical Growth ResearchSteven N. Durlauf
Marzo 2003
DTBC-204Growth and Adjustment in Chile: A Look at the 1990sVittorio Corbo y José A. Tessada
Marzo 2003
DTBC-203Microeconomic Effects of Capital Controls: The ChileanExperience during the 1990sFrancisco A. Gallego y F. Leonardo Hernández
Febrero 2003

DTBC-202Building Confidence Intervals for the Band-Pass and Hodrick-Prescott Filters: An Application using BootstrappingFrancisco A. Gallego y Christian A. Johnson
Febrero 2003
DTBC-201Dinero e Inflación: ¿En qué Estamos?José De Gregorio
Febrero 2003
DTBC-200Exploring the Implications of Official Dollarization onMacroeconomic VolatilityRoberto Duncan
Febrero 2003
DTBC-199Errores de Proyección en PerspectivaE. Albagli, G. Contreras, P. García, I. Magendzo y R. Valdés
Enero 2003
DTBC-198Dinero e Inflación en el Marco de Metas de InflaciónPablo García S. y Rodrigo Valdés P.
Enero 2003
DTBC-197Efectos de la Nominalización de la Política Monetaria en ChileR. Fuentes, A. Jara, K. Schmidt-Hebbel, M. Tapia y E. Arraño
Enero 2003
DTBC-196The Role of Foreign Direct Investment and Natural Resourcesin Economic DevelopmentJosé De Gregorio
Enero 2003
DTBC-195Trade Intensity and Business Cycle Synchronization:Are Developing Countries any Different?César Calderón, Alberto Chong y Ernesto Stein
Enero 2003
DTBC-194Fiscal and Monetary Policy Coordination in EMUJürgen von Hagen y Susanne Mundschenk
Diciembre 2002
DTBC-193Reflections on the Optimal Currency Area (OCA) Criteriain the Light of EMUM.J. Artis
Diciembre 2002