Manufacturing and Mining
15
CHAPTER 3 Manufacturing and Mining Manufacturing plays a vital role in economic development. The contribution of Manufacturing in GDP is hovering around the 13.5-13.8 percent for almost decade, while for the current fiscal year it declined to 13.0 percent. The performance of major crops, power slippages, global commodity price shocks, and contraction in demand of domestic consumer goods hindered the growth of manufacturing sector. Large Scale Manufacturing (LSM) has 78 percent share in Manufacturing and 10.2 percent in GDP whereas Small scale manufacturing accounts for 2.0 percent in GDP. The third component of the sector is Slaughtering and account 0.9 percent in GDP. The Large Scale Manufacturing (LSM) growth during July-March FY 2019 declined to 2.93 percent as compared to 6.33 percent in the same period last year. On Year on Year (YoY), LSM growth witnessed sharp decline of 10.63 percent in March 2019 compared to increase of 4.70 percent in March 2018. The current Fiscal Year 2019 started with 7.4 percent growth mainly contributed by Electronics 95.6 percent, Non metallic minerals product 17.9 percent (Cement 18.0 percent) and Automobiles 22.1 percent (Jeeps & Cars 36.1 percent, Trucks 33.1 percent and Buses 54.3 percent). However, it declined by 2.1 percent in August 2018 on account of dismal performance witnessed in Non metallic mineral products which declined by 4.1 percent (Cement declined by 4.0 percent ), Automobiles declined by 13.9 percent (LCVs -15.9 percent, Tractors -4.8 percent and Cars -15.9 percent) and Electronics -32.5 percent. However, it marginally improved in September 2018 by 1.2 percent. This improvement was on account of Non metallic mineral products by 8.9 percent (Cement 8.4 percent). In October 2018, it reached to 6.7 percent on account of recovery witnessed in Non metallic mineral product by 22.2 percent (22.3 percent growth in Cement), Automobiles 13.8 percent (LCVs 8.7 percent, Tractors 26.6 percent and motor cycles 5.4 percent), Fertilizer 14.5 percent and Electronics 24.1 percent. In November 2018, LSM witnessed a sharp dip of 6.1 percent due to decline in Food, Beverages and Tobacco growth by -8.9 percent, Textile -0.2 percent and Paper & Board -27.0 percent. A slight recovery of 0.8 percent witnessed in December 2018. However, steep rise witnessed in January 2019 by 24.9 percent owing to phenomenal improvement of 208.1 percent in electronics, Paper & Board 23.8 percent and Food, Beverages & Tobacco 76.2 percent due to Sugar production increased by 183 percent. The impact of sugar however, moderated to 2.0 percent and -27.0 percent in February and March 2019. The graph below shows the LSM behavior on Month on Month basis. 7.4 -2.1 1.2 6.7 -6.1 0.8 24.9 -5.1 1.8 -10 -5 0 5 10 15 20 25 30 July-18 Aug-18 Sep-18 Oct-18 Nov-18 Dec-18 Jan-19 Feb-19 Mar-19 Fig-3.1: LSM growth (Month on Month) Source: Pakistan Bureau of Statistics
-
Upload
khangminh22 -
Category
Documents
-
view
1 -
download
0
Transcript of Manufacturing and Mining

CHAPTER 3
Manufacturing and Mining
Manufacturing plays a vital role in economic development. The contribution of Manufacturing in
GDP is hovering around the 13.5-13.8 percent for almost decade, while for the current fiscal year it
declined to 13.0 percent. The performance of major crops, power slippages, global commodity price
shocks, and contraction in demand of domestic consumer goods hindered the growth of
manufacturing sector.
Large Scale Manufacturing (LSM) has 78 percent share in Manufacturing and 10.2 percent in GDP
whereas Small scale manufacturing accounts for 2.0 percent in GDP. The third component of the
sector is Slaughtering and account 0.9 percent in GDP.
The Large Scale Manufacturing (LSM) growth during July-March FY 2019 declined to 2.93 percent
as compared to 6.33 percent in the same period last year. On Year on Year (YoY), LSM growth
witnessed sharp decline of 10.63 percent in March 2019 compared to increase of 4.70 percent in
March 2018.
The current Fiscal Year 2019 started with 7.4 percent growth mainly contributed by Electronics 95.6
percent, Non metallic minerals product 17.9 percent (Cement 18.0 percent) and Automobiles 22.1
percent (Jeeps & Cars 36.1 percent, Trucks 33.1 percent and Buses 54.3 percent). However, it
declined by 2.1 percent in August 2018 on account of dismal performance witnessed in Non metallic
mineral products which declined by 4.1 percent (Cement declined by 4.0 percent ), Automobiles
declined by 13.9 percent (LCVs -15.9 percent, Tractors -4.8 percent and Cars -15.9 percent) and
Electronics -32.5 percent. However, it marginally improved in September 2018 by 1.2 percent. This
improvement was on account of Non metallic mineral products by 8.9 percent (Cement 8.4 percent).
In October 2018, it reached to 6.7 percent on account of recovery witnessed in Non metallic mineral
product by 22.2 percent (22.3 percent growth in Cement), Automobiles 13.8 percent (LCVs 8.7
percent, Tractors 26.6 percent and motor cycles 5.4 percent), Fertilizer 14.5 percent and Electronics
24.1 percent. In November 2018, LSM witnessed a sharp dip of 6.1 percent due to decline in Food,
Beverages and Tobacco growth by -8.9 percent, Textile -0.2 percent and Paper & Board -27.0
percent. A slight recovery of 0.8 percent witnessed in December 2018. However, steep rise
witnessed in January 2019 by 24.9 percent owing to phenomenal improvement of 208.1 percent in
electronics, Paper & Board 23.8 percent and Food, Beverages & Tobacco 76.2 percent due to Sugar
production increased by 183 percent. The impact of sugar however, moderated to 2.0 percent and
-27.0 percent in February and March 2019. The graph below shows the LSM behavior on Month on
Month basis.
7.4
-2.1
1.26.7
-6.1
0.8
24.9
-5.1
1.8
-10
-5
0
5
10
15
20
25
30
July-18 Aug-18 Sep-18 Oct-18 Nov-18 Dec-18 Jan-19 Feb-19 Mar-19
Fig-3.1: LSM growth (Month on Month)
Source: Pakistan Bureau of Statistics
Pakistan Economic Survey 2018-19
36
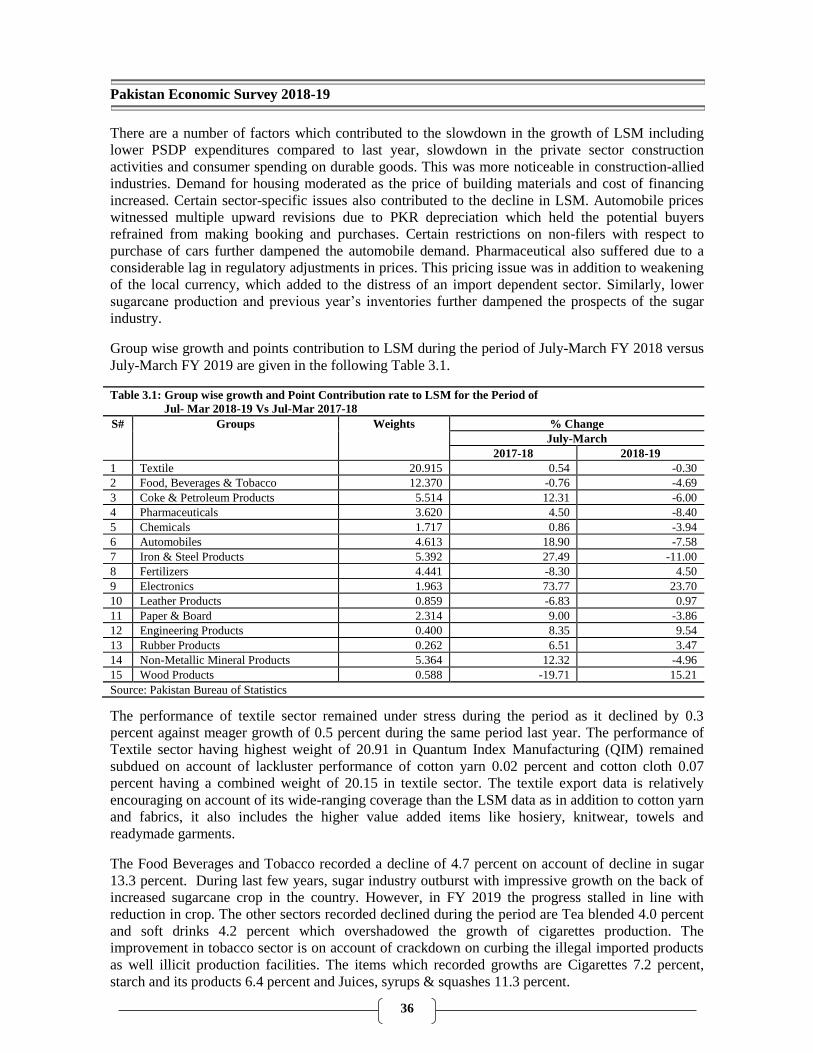
There are a number of factors which contributed to the slowdown in the growth of LSM including
lower PSDP expenditures compared to last year, slowdown in the private sector construction
activities and consumer spending on durable goods. This was more noticeable in construction-allied
industries. Demand for housing moderated as the price of building materials and cost of financing
increased. Certain sector-specific issues also contributed to the decline in LSM. Automobile prices
witnessed multiple upward revisions due to PKR depreciation which held the potential buyers
refrained from making booking and purchases. Certain restrictions on non-filers with respect to
purchase of cars further dampened the automobile demand. Pharmaceutical also suffered due to a
considerable lag in regulatory adjustments in prices. This pricing issue was in addition to weakening
of the local currency, which added to the distress of an import dependent sector. Similarly, lower
sugarcane production and previous year’s inventories further dampened the prospects of the sugar
industry.
Group wise growth and points contribution to LSM during the period of July-March FY 2018 versus
July-March FY 2019 are given in the following Table 3.1.
Table 3.1: Group wise growth and Point Contribution rate to LSM for the Period of
Jul- Mar 2018-19 Vs Jul-Mar 2017-18
S# Groups Weights % Change
July-March
2017-18 2018-19
1 Textile 20.915 0.54 -0.30
2 Food, Beverages & Tobacco 12.370 -0.76 -4.69
3 Coke & Petroleum Products 5.514 12.31 -6.00
4 Pharmaceuticals 3.620 4.50 -8.40
5 Chemicals 1.717 0.86 -3.94
6 Automobiles 4.613 18.90 -7.58
7 Iron & Steel Products 5.392 27.49 -11.00
8 Fertilizers 4.441 -8.30 4.50
9 Electronics 1.963 73.77 23.70
10 Leather Products 0.859 -6.83 0.97
11 Paper & Board 2.314 9.00 -3.86
12 Engineering Products 0.400 8.35 9.54
13 Rubber Products 0.262 6.51 3.47
14 Non-Metallic Mineral Products 5.364 12.32 -4.96
15 Wood Products 0.588 -19.71 15.21
Source: Pakistan Bureau of Statistics
The performance of textile sector remained under stress during the period as it declined by 0.3
percent against meager growth of 0.5 percent during the same period last year. The performance of
Textile sector having highest weight of 20.91 in Quantum Index Manufacturing (QIM) remained
subdued on account of lackluster performance of cotton yarn 0.02 percent and cotton cloth 0.07
percent having a combined weight of 20.15 in textile sector. The textile export data is relatively
encouraging on account of its wide-ranging coverage than the LSM data as in addition to cotton yarn
and fabrics, it also includes the higher value added items like hosiery, knitwear, towels and
readymade garments.
The Food Beverages and Tobacco recorded a decline of 4.7 percent on account of decline in sugar
13.3 percent. During last few years, sugar industry outburst with impressive growth on the back of
increased sugarcane crop in the country. However, in FY 2019 the progress stalled in line with
reduction in crop. The other sectors recorded declined during the period are Tea blended 4.0 percent
and soft drinks 4.2 percent which overshadowed the growth of cigarettes production. The
improvement in tobacco sector is on account of crackdown on curbing the illegal imported products
as well illicit production facilities. The items which recorded growths are Cigarettes 7.2 percent,
starch and its products 6.4 percent and Juices, syrups & squashes 11.3 percent.

Manufacturing and Mining
37
The petroleum products is undergoing a significant shift in the country due to the government’s
policy of reducing the reliance on electricity generated from furnace oil based power plants. Furnace
oil production sharply contracted by 11.1 percent. However, LPG recorded impressive growth of
27.7 percent, Diesel oil 32.7 percent and motor spirit 7.7 percent.
Automobile sector growth declined by 7.6 percent during July-March FY 2019. Its sub sector except
such as Buses grew by 16.9 percent while all other registered negative growth such as; Tractors 28.7
percent, Trucks 27.2 percent, LCVs 13.6 percent, Jeeps & Cars 0.1 and motor cycles 11.7 percent.
The factors which impacted this vibrant sector remained currency depreciation, policy rate hikes and
uncertainty regarding filer versus non filer issue. The assemblers passed on the impact of
depreciation to the customer. Furthermore, the increase in car prices along with higher financing
costs has also contained the demand for automobiles. However, later on government relaxed some
restrictions on non-filer and also government’s commitment to implement the vehicle import policy
in letter and spirit will spur the growth.
The production of Iron and Steel shrank due to dismal performance of billets/Ignots which grew by -
24.7 percent whereas H/C.R. Sheets/Strips/Coils/plates slightly inched up to 3.1 percent. Steel
demand contracted from decline in automobile production along with international price dynamics.
During the period global economy is currently gripped by US-China trade tensions which led to
volatility in the global steel market resulted adverse implications for domestic steel industry.
The electronics recorded a growth of 23.7 percent, mainly derived from phenomenal growth of
electrics motor which registered a growth of 37.4 percent, which is due to its wide usage in washing
machines, refrigerator, air conditioners etc. The demand for these goods rises in summer and
manufacturers build up the inventories. Improvement of electricity supplies also contributed to the
performance of this subsector.
The dismal performance of Non-metallic mineral growth is on account of cement production which
declined by 5.5 percent. The cement dispatches however, increased by 4.34 million tons in March as
against 3.35 million tons in February 2019 which augur well that demand is picking up and will be
further supplemented under government’s housing program, going forward.
Fertilizers recorded a growth of 4.5 percent on account of Nitrogenous Fertilizers which recorded a
growth of 5.7 percent. The pickup in its growth was due to provision of subsidized RLNG.
Selected items of Large Scale Manufacturing are given in Table 3.2.
Table-3.2 : Production of selected industrial items of Large Scale Manufacturing
S# Items Unit Weights July-March % Change
(Jul-Mar)
2018-19
% Point
Contribution
(Jul-Mar)
2018-19
2017-18 2018-19
1 Cotton Yarn (tones) 12.9646 2,574,215 2,574,700 0.02 0.00
2 Cotton Cloth (000 sq.m.) 7.1858 784,635 785,200 0.07 0.01
3 Sugar (tones) 3.5445 5,653,589 4,898,869 -13.35 -0.47
4 Tea Blended (tones) 0.3818 124,787 119,739 -4.05 -0.02
5 Cooking Oil (Tones) 2.2271 296,520 297,998 0.50 0.01
6 Vegetable Ghee (000 tones) 1.1444 1,022,824 1,030,533 0.75 0.01
7 Cigarettes (Million No.) 2.1252 45,627 48,931 7.24 0.15
8 Deep Freezers (Nos.) 0.1622 79,449 79,757 0.39 0.00
9 Refrigerators (Nos.) 0.2394 912,362 865,480 -5.14 -0.01
10 Phosphate Fertilizer (N tones) 0.3996 485,501 463,787 -4.47 -0.02
11 Nitrogenous Fertilizer ( N tones) 4.0411 2,085,670 2,204,632 5.70 0.23
12 Cement (000 tones) 5.299 31,228 29,527 -5.45 -0.29
13 Jeep & Cars (Nos.) 2.8183 176,007 175,863 -0.08 -0.00
14 Upper Leather (000 sq.m.) 0.3924 20,223 20,620 1.96 0.01

Pakistan Economic Survey 2018-19
38
Table-3.2 : Production of selected industrial items of Large Scale Manufacturing
S# Items Unit Weights July-March % Change
(Jul-Mar)
2018-19
% Point
Contribution
(Jul-Mar)
2018-19
2017-18 2018-19
15 Liquids/Syrups (000 Litres) 1.1361 81,036 78,661 -2.93 -0.03
16 Tablets (000 Nos.) 1.9143 21,224,146 21,119,512 -0.49 -0.01
17 Petroleum products (000 Litres) 5.4096 12,142,845 11,414,558 -6.00 -0.32
18 Billets/Ingots (Tones) 1.5234 3,973,000 2,990,954 -24.72 -0.38
19 H/C.R sheets/Strips/Coils/plate (Tones) 2.2841 3,191,550 3,291,600 3.13 0.07
Source: Pakistan Bureau of Statistics (PBS)
The government has recently announced Naya Pakistan Housing Scheme to construct houses across
the country for the uplift of the poor strata of the society and to bring them into the national
mainstream. This will jack up the construction industries specially cement and also generate
employment. In addition, SAIC motor, the largest automotive company of China already launches
HONGYAN heavy-duty trucks in Pakistan as well as Renault in partnership with Ghandara Nissan
Ltd. Kia Lucky Motors Pakistan Limited (KLM), one of the eight new prospective entrants into the
automobile sector, has announced that it will begin commercial production of vehicles by September
2019. The rapidly developing with many infrastructure projects especially under China Pakistan
Economic Corridor will helped to boost the automobile sector as well push up the construction
related allied industries.
3.2 Textile Industry
Textile is the most important manufacturing sector of Pakistan and has the longest production chain,
with inherent potential for value addition at each stage of processing, from cotton to ginning,
spinning, fabric, dyeing and finishing, made-ups and garments. The sector contributes nearly one-
fourth of industrial value-added and provides employment to about 40 percent of industrial labor
force. Barring seasonal and cyclical fluctuations, textiles products have maintained an average share
of about 59 percent in national exports. The export performance during the period under review is
given in Table 3.3.
Table 3.3: Export of Pakistan Textiles (US$ Millions)
2013-14 2014-15 2015-16 2016-17 2017-18 2018-19
(Jul-Mar)
Cotton & Cotton Textiles 13349 13139 12168 12205 13220 9771
Synthetic Textiles 383.47 330.743 287.793 187.587 309.681 220
Sub-Total Textiles 13731 13469 12455 12450 13530 9991
Wool & Woolen Textiles 125 119.448 97.68 78.506 75.852 50.688
Total Textiles 13857 13589 12553 12529 13606 10042
Pakistan`s Total Exports 25131 23885 20802 20478 23222 17083
Textile as %age of Export 55.14 56.90 60.34 61.35 58.59 58.78
Source: Ministry of Textile
3.2.1 Ancillary Textile Industry
The ancillary textile industry includes cotton spinning, cotton cloth, cotton yarn, cotton fabric, fabric
processing, home textiles, towels, hosiery and knitwear and readymade garments, these components
are being produced both in the large scale organized sector as well as in the unorganized cottage /
small and medium units. The performance of these various ancillary textile industries is illustrated as
under:-

Manufacturing and Mining
39
i. Cotton Spinning Sector
The spinning sector is the backbone in the ranking of textile production. At present, as per record of
Textiles Commissioner’s Organization (TCO), it comprises 517 textile units (40 composite units and
477 spinning units) with 13.414 million spindles and 198801 rotors installed and 11.338 million
spindles and 126583 rotors in operation with capacity utilization of 84.55 percent and 63.67 percent,
respectively.
ii. Cloth Sector
Problems of the power loom sector evolve mainly due to the poor technology and scarcity of quality
yarn. Looms installed in cotton textile mills are 9,084 and looms worked were 6,384. Moreover,
Production of cloth in mill sector is reported whereas in non-mills sector is not reported and
therefore is estimated. The production of cotton cloth has remained stagnant which slightly increased
by 0.03 percent while the exports in term of quantity increased by 18.1 percent whereas in value term
decreased by 2.09 percent.
Table 3.4: Production and export of Clothing Sector
Production July-Mar 2018-19 July-Mar 2017-18 % Change
Mill Sector (000. Sq. Mtrs.) 785200 784635 0.07
Non Mill Sector (000. Sq. Mtrs.) 6100150 6098745 0.02
Total 6885350 6883380 0.03
Cotton Cloth Exports
Quantity (M.SqMtr.) 1967.303 1666.130 18.08
Value (M.US$) 1596.271 1630.268 -2.09
Source: Ministry of Textile
iii. Textile Made-Up Sector
Being value added segment of textile industry made-up sector comprises different sub groups namely
towels, tents & canvas, cotton bags, bed-wear, hosiery, knitwear & readymade garments including
fashion apparels. Export performance of made-up sector during the period July-March FY 2019 is
presented in Table 3.5.
Table 3.5: Export of Textile Made-Ups
(July-Mar) 2018-19 (July-Mar) 2017-18 % Change
Hosiery Knitwear
Quantity (M.Doz) 89.231 77.712 14.82
Value (M.US$) 2155.039 1971.906 9.29
Readymade Garments
Quantity (M.Doz) 37.528 29.289 28.13
Value (M.US$) 1957.018 1918.313 2.02
Towels
Quantity (M.kgs) 137.318 154.237 -10.97
Value (M.US$) 587.779 598.845 -1.85
Tents/Canvas
Quantity (M.kgs) 24.093 22.871 5.34
Value (M.US$) 68.252 65.953 3.49
Bed Wears
Quantity (M.kgs) 308.150 279.460 10.27
Value (M.US$) 1719.185 1674.096 2.69
Other Made up
Value (M.US$) 519.857 513.364 1.26
Source: Ministry of Textile

Pakistan Economic Survey 2018-19
40
a) Hosiery Industry
The industry sustains directly livelihood of
210,000 skilled workers and 490,000
unskilled workers. Another 350,000 people
benefit in allied cottage industries. Thus,
the industry provides directly and indirectly
sustenance to well over a million people.
Knitwear exports consists of knitted and processed fabrics knitted garments; knitted bed sheets,
socks etc. The export performance of knitwear during the period under review is given in
Table 3.6.
b) Readymade Garment Industry
Readymade garment industry has emerged
as one of the important small scale
industries in Pakistan. Its products have
large demand both at home and abroad. The
local requirements of readymade garments
are almost fully met by this industry.
Garment industry is also a good source of
providing employment opportunities to a large number of people at a very low capital
investment. It mainly uses locally produced raw materials. Most of the machines used by this
industry are imported or locally made/assembled. Exports increased from 29.3 million dozens to
37.5 million dozen in various types of readymade garments worth US$ 1918.3 million during
Jul-Mar FY 2018 as compared to US$ 1957.0 million during Jul-Mar FY 2019, thus showing an
increase of 2.02 percent in terms of value and 28.13 percent in term of quantity.
c) Towel Industry
There are about 10,000 towel looms
including shuttle and shuttle less in the
country in both organized and unorganized
sector. This industry is dominantly export
based and its growth has all the time
depended on export outlets. The existing
towels manufacturing factories are upgraded to produce higher value towels. Export
performance of towel sector during the period is given in Table 3.8.
d) Canvas
The production capacity of this sector is
more than 100 million Sq. meters. This
sector is also known as raw cotton
consuming sector. In term of quantity
during Jul-Mar FY2019 it was recorded at
24.1 million Kgs as compared to 22.9
million Kgs during the same period last
year thus showing increase of 5.34 percent.
In value term it increased by 3.49 percent.
iv. Textile Made-Up Sector
Synthetic fibers Nylon, Polyester, Acrylic and Polyolefin dominate the market. There are currently
Table 3.6: Export of Knitwear
July-Mar
2018-19
July-Mar
2017-18
% Change
Quantity
(M.Doz) 89.231 77.712 14.82
Value
(M.US$) 2155.039 1971.906 9.29
Source: Ministry of Textile
Table 3.7: Export of Readymade Garments
July-Mar
2018-19
July-Mar
2017-18
% Change
Quantity
(M.Doz) 37.528 29.289 28.13
Value
(M.US$) 1957.018 1918.313 2.02
Source: Ministry of Textile
Table 3.8: Export performance of Towel sector
July-Mar
2018-19
July-Mar
2017-18
% Change
Quantity
(M.kgs) 137.318 154.237 -10.97
Value (M.US$) 587.779 598.845 -1.85
Source: Ministry of Textile
Table 3.9: Export performance of Tent and Canvas
Sector
July-Mar
2018-19
July-Mar
2017-18
% Change
Quantity
(M.kgs) 24.093 22.871 5.34
Value
(M.US$) 68.252 65.953 3.49
Source: Ministry of Textile

Manufacturing and Mining
41
five major producers of synthetic fibers in Pakistan, with a total capacity of 636,000 tons per annum.
Artificial silk resembles silk but costs less to produce, with capacity in country about 9000 looms.
During July-Mar FY 2019, synthetic textile
fabrics worth $ 220.45 million were exported as
compared to $ 227.77 million during the same
period which is showing a decrease of 3.21
percent as compared to last year. In Quantity
term the exports of synthetic increased by 11.95
percent.
v. Woolen Industry
The main products manufactured by the Woolen
Industry are carpets and rugs. The exports of
carpets during the period July-Mar FY 2019 is
given in the Table 3.11.
vi. Jute Industry
The main products manufactured by the Jute
Industries are Jute Sacks and Hessian cloth, which are used for packing and handling of Wheat, Rice
and Food Grains. The installed and working capacity of jute industry is given in the Table 3.12.
Table 3.12: Installed and working capacity of Jute
(July-Mar) 2018-19 (July-Mar) 2017-18 % Change
Total No. of Units 10 10 0%
Spindles Installed 24712 25208 2.00
Spindles Worked 14276 12511 -12.36
Looms Installed 1072 1106 3.17
Looms Worked 772 720 6.73
Source: Ministry of Textile
The production of the Jute goods during Jul-Mar FY2019 remained at 47,897 metric tons and last
year it was 55,734 metric tons, respectively showing a decline of 14.1 percent.
3.3 Other Industries
3.3-1 Automobile Industry
The auto sector continues to stand out as one of the best performing, amongst the large-scale
manufacturing sectors, in terms of providing jobs, revenues and in bringing technological
advancement to the country. At present , there may be transient deceleration in growth, but as the
auto policy (ADP 2016-21) is going to bear fruits, there would be paradigm shift in the industry
when many new players would soon join the market with entirely new models. Besides, the existing
players have already made huge investments and a lot more is in waiting. Despite extraneous factors
particularly in terms of tariffs and import of used vehicles, which still hold 18 percent market share,
huge expansion of industry volumes take place to enact much awaited take off stage as envisioned in
the Auto Policy 2016-21.
Automobile prices witnessed multiple upward revisions due to PKR depreciation, economic
slowdown to curtail domestic demand and price-sensitive potential buyers refrained from making
purchases. In addition, certain restrictions on non-filers with respect to purchase of cars further
dampened the automobile demand. There has been sluggishness everywhere in the local auto
industry during the current financial year; except buses where normal growth of 17 percent has taken
place, during Jul-Mar FY2019. Indeed, there is enormous potential in demand for buses, waiting to
Table 3.10: Export performance of Synthetic Textile
Fabrics
July-Mar
2018-19
July-Mar
2017-18
% Change
Quantity
(Th.Sq.Mtrs) 248.919 222.352 11.95
Value (M.US$) 220.453 227.770 -3.21
Source: Ministry of Textile
Table 3.11: Exports of Carpets and Rugs (Woolen)
July-Mar
2018-19
July-Mar
2017-18
% Change
Quantity
(Th.Sq.Mtr) 1.189 1.345 -11.60
Value (M.US$) 50.688 57.936 -12.51
Source: Ministry of Textile

Pakistan Economic Survey 2018-19
42
unleash when serious measures are taken on formulating and implementing Urban Transport
Schemes in the cities by replacing the old and dilapidated buses, presently plying on the roads of
most of metropolitan areas.
A persistent decline was in evidence, in case of Trucks, registered 27 percent loss in production. The
non-filers policy may not have impacted here; but the work at certain government projects had
halted, so are the supplies of trucks and the respective payments, resulting disruption of the chain of
events at the trucking industry.
During Jul-Mar, FY 2019, the farm tractor sector massively declined by 28.7 percent as the
production recorded at 37,457 units against 52,551 units produced, in the corresponding period of the
last year. This decline was due to massive slow down in agriculture growth, water shortages and
other issues like increase in the prices of agricultural inputs and halting of development projects
added woes of the farmers, thus badly impacted the bookings of Farm Tractors.
Passenger car sector was somewhat resistant to the general receding trend in the industry with
meager growth of 2.4 percent. The growth was impacted by repeated policy changes with regard to
non-filers like imposition ban on purchase, heavy taxation on registration by non-filers and the recent
10 percent levy of federal excise duty. The imposition of 10 percent FED on exceeding 1700cc
engine capacity has badly impacted locally produced cars, jeeps and SUBS. The LCV/pick-ups being
price sensitive also lost ground, 14 percent down in production.
The two/three wheelers sector also failed to show normal growth, it rather dropped off production by
5.8 percent during Jul-Mar FY2019. These vehicles cater to lower income group, hence, are
extremely price sensitive. Still, this sector offers most preferred and economical means of transport
and best alternative in the absence of public transport in the cities and thus holds a dependable and
continued potential for growth in the coming years.
The Table below shows previous year’s comparative position of production in auto industry (PAMA
members).
Table 3.13: Production of Automobiles
Category Installed
Capacity
No. of Units
2018-19
(Jul-Mar)
2017-18
(Jul-Mar)
% change
CAR 240,000 170,118 166,166 2.4
LCV 43,900 19,536 22,713 -14.0
JEEP 5,000 5,745 9,841 -41.6
BUS 5,000 649 555 16.9
TRUCK 28,500 5,027 6,907 -27.2
TRACTOR 100,000 37,457 52,551 -28.7
2/3 WHEELERS 2,500,000 1,342,185 1,424,379 -5.8
Source: Pakistan Automotive Manufacturer Association (PAMA)
3.3-2 Fertilizer Industry
Fertilizer industry is important for economic development and the prosperity of farming community.
The industry produces, imports and distributes fertilizer throughout the country. As fertilizer is an
important input for agriculture growth: the government’s intervention in the shape of subsidy and tax
relaxations has improved the performance of the agriculture sector. There are ten urea manufacturing
plants, one DAP, three NP, four SSP, two CAN and one plant of blended NPKs having a total
production capacity of 9218 thousand product tonnes per annum. Total production during first nine
months (July to March) of the current fiscal year was 5756 thousand tonnes which was 2.7 percent

Manufacturing and Mining
43
less as compared to the corresponding time frame of the last year. This increase in production is
attributed to the provision of LNG at subsidized rate to Fatima Fert. and Agritech plants. Urea is
main fertilizer having 70 percent share in production capacity. Although installed production
capacity of 6408 thousand tonnes per annum is enough to meet local demand but gas curtailment for
fertilizer sector and high price of LNG has resulted in production of urea at 80% of capacity.
Consequently, domestic demand has to be met through imported supplies during peak demand time
of crop growing season. About 105 thousand tonnes of urea was imported during current fiscal year.
Nutrient offtake during July 2018 to March 2019 was 3497 thousand tonnes which was 7.2 percent
less than the corresponding period of the previous year. Nitrogen and Phosphate offtake was 2551
and 900 thousand tonnes respectively, whereas Potash offtake was 46 thousand tonnes. The
recommended level of fertilizer use in Pakistan for Nitrogen (N), Phosphate (P) and Potash (K) is
2:1:0.5. Current fiscal year first nine months estimates shows that Nitrogen (N) and Phosphate
offtake has been decreased by 2.9 and 18.1 percent respectively, while Potash (K) offtake has surged
by 4.5 percent as compared to last year.
Urea and DAP offtake during first nine months of current fiscal year was 4443 thousand tonnes and
1743 thousand tonnes respectively. Urea and DAP offtake decreased by 2.2 and 17.7 percent
respectively, as compared to the same time frame of the last year.
3.3-3 Cement Industry
Pakistan's cement industry showed poor performance during the first nine months of current
financial year July -March FY 2019. Cement sector with its huge underused capacities continued to
face lack of domestic demand due to slow growth, low development spending and delayed in launch
of the government’s low-cost housing scheme.
While cement consumption is usually at its
height in March as construction activities peak
with the pleasant weather and urgency in
completing government development works
within the financial year. Total dispatches (local
and exports) in March 2019 declined by 6.7
percent to 4.34 Mt from 4.652 Mt in March
2018. The decline in domestic consumption
continued as it went down to 3.858 Mt in March
2019 from 4.26 Mt in March 2018, depicting a
decrease of 9.4 percent. Though exports
continued to increase, the growth posted in
March 2019 (23.1 percent) is the lowest export
growth in the last seven months.
Northern region
Domestic consumption in the northern part of the country continued to decline as it was only 3.071
Mt last month when compared with 3.543 Mt in the year-ago period. Exports from northern mills
also declined to 0.131 Mt in March 2019 from 0.218 Mt in March 2018.
Southern region
Domestic dispatches from mills in the southern part of the country edged up to 0.787 Mt in March
2019 as compared to 0.717 Mt in March 2018. Furthermore, exports from the region doubled from
0.173 Mt in March 2018 to 0.35 Mt in March 2019.
3.5
7
3.4
6 3.8
3
4.5
6
3.9
3
3.8
9
3.6
6
3.3
5
4.3
4
0.0
0.5
1.0
1.5
2.0
2.5
3.0
3.5
4.0
4.5
5.0
Ju
l/18
Au
g/1
8
Sep
/18
Oct
/18
Nov/1
8
Dec
/18
Jan
/19
Feb
/19
Mar/
19
Fig-3.2: Cement Dispatches (M.Tonnes)
Source: All Pakistan Cement Manufacture Association

Pakistan Economic Survey 2018-19
44
Cumulative dispatches
Total local dispatches during Jul-Mar FY 2019, fell to 29.448 Mt from 31.314 Mt, whereas exports
rose to 5.132 Mt from 3.444 Mt in FY2017-18. According to the APCMA, of particular concern is
the continued slump in the northern region where local dispatches have declined by over 10 per cent
in last nine months from 25.887 Mt in FY2017-18 to 23.199 Mt in the corresponding period of
FY2018-19.
However, local dispatches from the mills situated in southern region of the country have increased
during Jul-Mar FY2019 by 15.16 percent to 6.248 Mt from 5.426 Mt in Jul-Mar FY 2018. Exports
also rose in the south by 210 percent in the current fiscal year, from 1.013 Mt in July-Mar FY 2018
to 3.143 Mt in Jul-Mar FY2019, while in the north the exports stood at 1.988 Mt in first nine months
of this fiscal year as compared to 2.431 Mt during the same period last year, a decline of 18.2
percent.
The cement industry has been under pressure in this fiscal year as development expenditure has been
slashed, however, government announcement of program to build five million low cost houses in
next five years for the homeless will spur the growth.
Table 3.14: Cement Production Capacity & Dispatches (Million Tonnes)
Years Production
Capacity
Capacity
Utilization (%)
Local
Dispatches
Exports Total
Dispatches
2006-07 30.50 79.23 21.03 3.23 24.26
2007-08 37.68 80.14 22.58 7.72 30.30
2008-09 42.28 74.05 20.33 10.98 31.31
2009-10 45.34 75.46 23.57 10.65 34.22
2010-11 42.37 74.17 22.00 9.43 31.43
2011-12 44.64 72.83 23.95 8.57 32.52
2012-13 44.64 74.89 25.06 8.37 33.43
2013-14 44.64 76.79 26.15 8.14 34.28
2014-15 45.62 77.60 28.20 7.20 35.40
2015-16 45.62 85.21 33.00 5.87 38.87
2016-17 46.39 86.90 35.65 4.66 40.32
2017-18 53.44 85.87 41.15 4.75 45.89
July-Mar
2017-18 49.44 93.74 31.31 3.44 34.76
2018-19 57.13 80.71 29.45 5.13 34.58
Source: All Pakistan Cement Manufacturers Association (APCMA)
3.4: Small and Medium Enterprises
SMEs play a key role in shaping national growth strategies, employment generation and improving
standard of living of the vulnerable segments of the society. SMEs are the backbone of the economy
but lack resources to adopt new technologies and improve their production based on latest
development. To provide impetus to SME sector and enhances its competiveness, the present
government, is developing National SME Policy 2019, which will serve as Government of Pakistan’s
master plan for providing support to catalyze growth of the sector. The focus of the policy shall be
on job creation, export enhancement and increased contribution of SMEs in the National economy.
The policy will address core SME development issues, including access to finance, Business
Development Services (HR Development, Technology, Marketing, Market Access, Standards and
Certifications etc.), simplification & rationalization of taxation regime and reduction in cost of doing
business. A cohesive strategic framework for business facilitation across the public sector
institutional infrastructure, both federal & provincial, will be developed for implementation of policy
under the principle of ease of doing business.
Manufacturing and Mining
45
In order to formulate the Policy, a participatory process has been adopted to identify real SME
challenges, which will be coupled with a strategy to address them. In this regard, Focus Group
Discussions, Workshops and Consultative sessions were held nationwide (Lahore, Islamabad,
Multan, Peshawar, Swat, Sialkot, Gujranwala & Gujrat) during current fiscal year. Eminent
researchers, representatives of chambers of Commerce & Industry, Trade Associations and academia
are also actively involved in the policy making Committee to provide necessary guidance to the
policy formulation process. The first meeting of Steering Committee for national SME Policy was
held in December 2018. The draft Policy shall be submitted for approval to the Federal Cabinet in
2019.
i. SMEDA over the Counter (OTC) Services (July 2018-Mar 2019):
SME Facilitation 4,972
Pre-feasibility Studies Development (New & updated) 22
Investment Facilitation (PKR Million) 389.82
Business Plans 10
Training Programs 233
Cluster/District Profiles (New and Update) 13
OTC Products (Food Safety, Business Management, A2F etc) 23
Diagnostic/Value Chain Studies 8
Theme Specific Helpdesks 90
SMEDA Web Portal (Download Statistics) 69,733
SME Observer 1 issue
SMEDA Newsletter 3issues
SMEDA Research Journal Annual
v. Special Projects with International Development Partners
a. Economic Revitalization of Khyber Pakhtunkhwa and erstwhile Federally Administered
Tribal Areas (ERKF)
Economic Revitalization of Khyber Pakhtunkhwa and Federally Administered Tribal Areas
(ERKF) is a Multi Donor Trust Fund Project (MDTF). The project was initiated to provide
assistance in the economic recovery and rehabilitation of crisis affected areas of Khyber
Pakhtunkhwa and erstwhile FATA.
After the successful completion of Phase-I, MDTF extended the project to Phase-II (2017-2020).
Under Phase-II, ERKF Project is offering support to SMEs on the basis of 50% matching share
through the following types of grants;
1. Rehabilitation Grant – This grant is given to SMEs for rehabilitation of businesses affected
by crisis in Khyber Pakhtunkhwa and erstwhile FATA. The program provides the flexibility
of using these grants either for capital expenditures or for working capital.
2. Up-gradation Grant – Up-gradation grant is available to those SMEs that have an existing
business and they need support for upgrading their business processes for improving their
productivity and efficiency.
3. Cluster Grant – this type of grant is provided to groups of SMEs (at least 5 SMEs).
Preference is given to those project that benefit, not only the concerned SMEs, but the entire
cluster.
In order to raise awareness of Phase-II of the project, SMEDA arranged several awareness
sessions across the Khyber Pakhtunkhwa province for providing hands on information to SMEs,
including women entrepreneurs. Application forms of respective grants have also been provided
to all SMEs, chambers associations and other business representative bodies in the region.

Pakistan Economic Survey 2018-19
46
Under Phase-II of ERKF project (July 2018 – March 2019), a total amount of PKR 274.25
million has been approved/sanctioned to 372 SMEs in the region. The project aims to achieve its
development objective by 2020, through creation of sustainable employment opportunities and
rehabilitation of small and medium enterprises (SMEs).
b. SMEDA Industrial Support Program:
In order to provide support to the Industry, SMEDA collaborates with international development
organizations, such as; Japan International Cooperation agency (JICA), German International
Cooperation (GIZ), Training and Development Centers of the Bavarian Employers Association (bfz),
Germany and local experts. Technical assistance is provided to SMEs across a range of industries to
improve productivity, competitiveness and energy efficiency. During July 2018 to March 2019,
SMEDA provided support to Auto Parts manufacturers by conducting energy audits, improving
production efficiency, enhancing productivity, increasing capacity of local engineers and training.
vi. Cluster Development Based Mineral Transformation Plan/Vision 2025
SMEDA was awarded a contract for a project titled ‘Feasibility Research Study on Cluster
Development Based Mineral Transformation Plan/Vision 2025’ by the Planning Commission. The
project entails an extensive study of 20 mineral clusters besides improving the efficiency of existing
ones throughout the value chain i.e. supply-chain development, market intelligence, attraction of
foreign direct investment & improved processing. From July 2018 to March 2019, first draft of 20
cluster profiles was completed and submitted to the Planning Commission. Moreover, 5 value chain
studies were also developed; i) Gypsum, ii) Gemstone, iii) Coal, iv) Chromite, and v) Dimension
Stones (Marble, Granite and Onyx). In addition to this, database of 1800 SMEs has also been
developed.
3.6: Mineral Sector
The mineral potential of Pakistan is widely recognized to be excellent but this sector over the past
inadequately developed. This is evident that its contribution to industry as a sub sector 13.5 percent
and GDP remained 2.7 percent. Although efforts are underway to developed but enough remains to
be done to enhance the sector to take full advantage of its endowment. This sector is lagging behind
despite huge potential, due to interconnected and cross cutting issues like lack of infrastructure at
mines sites, low level of technology installed and semi skilled labor, low financial support and lack
of marketing.
The Mining and Quarrying sector negatively grew by 1.96 percent during Jul-Feb FY 2019 as
against 7.7 percent last year. Chromite, Magnesite, Rock salt, Barytes, Ocher and Crude oil posted a
positive growth of 228.69 percent, 159.63 percent, 12.65 percent, 22.15 percent, 19.12 percent and
0.47 percent, respectively.
However, some witnessed negative growth during the period under review such as Coal 25.42
percent, Natural gas 1.98 percent, Sulphur 40.72 percent, Calcite 91.49 percent, Soap stone 13.12
percent, Marble 4.66 percent and Bauxite 30.82 percent (Table 3.15).
Table 3.15: Extraction of Principal Minerals
Minerals Unit of
Quantity
2016-17 2017-18 2018-19 %Change
FY19/FY18
Coal M.T 3,953,992 4,477,555 3,339,582 -25.42
Natural Gas MMCFT 1,471,854 1,458,935 1,430,097 -1.98
Crude Oil JSB(000) 32,269 32,557 32,711 0.47
Chromite M.T 105,238 97,420 320,209 228.69
Magnesite M.T 19,656 23,596 61,263 159.63
Dolomite M.T 301,124 488,825 467,131 -4.44

Manufacturing and Mining
47
Table 3.15: Extraction of Principal Minerals
Minerals Unit of
Quantity
2016-17 2017-18 2018-19 %Change
FY19/FY18
Gypsum M.T 2,079,629 2,475,893 2,641,833 6.70
Lime Stone M.T 52,144,064 70,818,725 73,515,665 3.81
Rock Salt M.T 3,534,075 3,647,584 4,108,929 12.65
Sulphur M.T 23,740 22,040 13,065 -40.72
Barytes M.T 91,711 88,847 108,531 22.15
Calcite M.T 4,448 1,692 144 -91.49
Soap Stone M.T 152,279 141,504 122,938 -13.12
Marble M.T 4,904,141 8,813,025 8,402,276 -4.66
Bauxite M.T 75,375 145,189 100,439 -30.82
Quartz M.T 98,529 117,785 114,184 -3.06
Ocher M.T 86,080 75,939 90,461 19.12
Source: Pakistan Bureau of Statistics (PBS)
Punjab:
Mines and Minerals Department aims to ensure responsible mineral development that contributes the
most advantageous level of mineral revenue while respecting the principles of sustainable
development.
Following Schemes is underway to develop the
sector.
i. Resource estimation of placer gold in
river Indus flowing through District
Attock
Placer gold occurrences along the dispositional
meanders of River Indus have been of great
interest for exploration of gold resources in the
upper reaches of Chitral, Gilgit, Hunza and
adjoining areas to explore the source rocks for
gold. River Indus enters Punjab from
downstream of Tarbila dam and after passing
through areas of Ghazi, Waisa, Attock, Khurd,
Choai, Jhand, Kalabagh etc., enters into Dera
Ismael Khan, beyond the boundary of Punjab
province. The Indus river course mainly falls in
District Attock & Mianwali in Punjab.
The objective is to determine the economic
potential of the placer gold in specified areas of river Indus at different locations in District Attock.
According to the results, viable block(s)/ zone(s) can be granted of concessions under the Punjab
Mining Concession Rules 2002.
ii. Construction of drainage Nala for disposal of saline water from sandstone leases of chak
No.123 SB and 126 SB, District Sargodha
Mines & Minerals Department has 58 blocks of Sandstone in Kirana Hills of District Sargodha
in the province of Punjab and the leases of these blocks have been granted through open auction
under the provision of Punjab Mining Concession Rules 2002.
Table 3.16: Mineral Production Data
MINERALS Jul-Feb FY 2019
(M tonnes)
Arg Clay LSM 3,818,152
Bauxite 63,924
Coal 675,659
China Clay 6,796
Dolomite 2,702
Fireclay 469,351
Fuller Earth 9,460
Gypsum 914,320
Gypsum LSM 213,546
Iron Ore 337,485
Lime Stone 14,845,031
Lime Stone LSM 15,568,255
Rock Salt 1,817,855
Rock Salt LSM 835,092
Silica Sand 259,433
Silica Sand LSM 27,657

Pakistan Economic Survey 2018-19
48
As excavation of stone from these hills/ blocks is being done since long, pits have been
developed in most of the blocks having depths of 15-25 feet due to extensive working. Almost in
all the pits, water gets accumulated due to seepage and rain which causes lessees immense
difficulties during mining operations. This situation compels the lessees to dispose this saline
water from the pits on to nearby lands & pits of other vacant blocks. Due to this uncontrolled
disposal of saline water, the surrounding lands have gotten affected badly causing unrest among
the inhabitants.
Therefore, construction of drainage nala to dispose of this saline water is a basic necessity of the
stone market and the locals which on one hand will eventually make the pits workable and on the
other facilitate the local land owners and inhabitants.
Khyber Pakhtunkhwa:
The total area of Khyber Pakhtunkhwa is
74,521 Sq Km out of which 70 percent consist
of mountains and rocks. The formation of these
rocks contains huge prospects of different
metallic /non-metallic minerals and various
precious/semi-precious gemstones minerals. It
has large number of mineral resources which
have not yet been exploited at all to its full
potential. Based on the exploration done so far,
excellent prospects of other valuable deposits
exist. The production data of mineral in respect
of Khyber Pakhtunkhwa is given in the table.
Sindh:
Sindh is located in the Southern part of Pakistan. From East to West, it is comprised of three main
geological zones, namely the Thar Desert, the Indus Plain and Delta, and the Khirthar Mountains. At
present about 24 minerals are under exploitation but on small scale. Sindh government has accorded
priority to the development of mineral sector as it correlates with the development of remote areas
of province as well as alleviating poverty. Mines and Mineral development department are being
acquired by latest mineral exploration techniques for effective date geological generation and
identification of exploration targets.
Sindh produces a variety of commercial clays, including Fuller’s Earth, China Clay, Fire Clay, Ball
Clay and Bentonite. It is endowed with large and extensive deposits of Limestone. Keeping in view
the contribution of mineral sector in GDP which can also be enhanced by commercial exploitation of
granite, marble and the other minerals as well. The Directorate General of Mines & Mineral
Development, sponsored the on-going ADP-Scheme-2018-19 title “Feasibility Study of granite
Deposits in District Tharparkar Sindh” and “Exploration, evaluation and value addition of Granite
Deposits in Sindh for economical & industrial use”.The scheme will be completed in June 2020. The
Mines & Mineral Development Department, Government of Sindh has also proposed a Scheme titled
as “Sindh Mineral Policy” for the year 2019-20.
The Mines & Mineral Development Department, has already established Geo-data Centre with
official web portal which will provide all the necessary information to the General Public as well as
Investors/Stake holders. This carries with mineral based information and online granted leases
database along with provision of information regarding the granted areas in the Sindh.
Balochistan
Balochistan is the largest province (area wise) of the country constituting about 43% of the total
Table 3.17: Mineral Production Data
MINERALS Jul-March FY 2019
(M. tonnes)
Barytes 1,813
Bauxite 4,910
Coal 25,402
Dolomite 288,864
Granite 9,999,060
Gypsum 216,833
Iron ore 23,550
Lime stone 10,922,199
Marble 2,313,251
Rock salt 57,300

Manufacturing and Mining
49
National landmass. The Country, in general, and the province in particular, is endowed by the nature
with the blessing of substantial mineral wealth. Mineral industry can play an important role in
boosting up the socio-economic setup in Balochistan as agriculture in other parts of the country but
due attention could not be given to the exploration and development of mineral sector due to
financial constraints, heavy risk investment and lack of infrastructure as the deposits are located in
remote and far flung areas.
Nature has gifted Balochistan with vast natural resources. Efforts are being made for scientific
exploration and exploitation of minerals resources of the province. Major mineral potentials are
described as under:-
i. Metallic Minerals (Chromite, Iron, Copper/Gold, Lead Zinc, Titanium potential and Antimony
ii. Non-Metallic Minerals (Coal, Gypsum, Fluorite, Magnesite, Baryte, Vermiculite, Asbestos,
Dimension stone)
Currently the Government has planned projects related to management of the Mining Industry,
however, following are the potential projects for development and investment related to CPEC and
also in general for the government and private sector:
Project Location Cost
(Billion PKR)
Establishment of Mini Steel Mills Mastung and Chagai 15
Cement Manufacturing Plants Quetta, Kalat, Mastung, Loralai, Lasbella,
MBarkhan, Bolan, Sibi, Hernai and Kohlu
05
Establishment of Coal based
thermal Power Stations.
Quetta, Loralai, Sibi and Hernai. 03
Establishment of Ferro-Chrome
Plant
Muslim Bagh and Khuzdar 05
Establishment of Marble Cities. Chagai, Khuzdar and Loralai 02
Establishment of Barium Chemical
Compounds Industry
Khuzdar 02
Conclusion:
Large Scale Manufacturing (LSM) performance remains muted due to lower PSDP expenditures
compared to last year, slowdown in the private sector construction activities and consumer spending
on durable goods along with low labor productivity. Adjustments, stabilization and reform process
will continue for higher growth. The government is seriously focusing on ease of doing business by
making efforts to rebuild investors confidence and trying to remove all basic impediments that
adversely affect business environment and thus investment in the country. Going forward, some
gradual recovery in economic activity is expected on the back of improved market sentiment in the
context of the IMF supported program. The rebound in the agro based industries as well as
government incentives for export oriented industries will improve labor productivity which will help
in reviving LSM in medium term.