
WOOD PROCESSING AND FURNITURE MANUFACTURING
205
-
Upload
khangminh22 -
Category
Documents
-
view
0 -
download
0
Transcript of WOOD PROCESSING AND FURNITURE MANUFACTURING


International Association for Economics and Management in Wood Processing
and Furniture Manufacturing
WOOD PROCESSING AND FURNITURE MANUFACTURING:
present conditions, opportunities and new challenges
Proceedings
Vyhne, Slovakia, 2010

Publisher: International Association for Economics and Management in Wood Processing and Furniture Manufacturing – WoodEMA, i.a.
Editor-in-chief: assoc. prof. Hubert Palus, PhD. Copy editor: Hana Maťová, PhD. Organisation Committee:
assis.prof. Hubert Palus, PhD. – Zvolen (SVK) Jan Parobek, PhD. – Zvolen (SVK) Vladislav Kaputa, PhD. – Zvolen (SVK) Hana Matova, PhD. – Zvolen (SVK) Marek Potkany, PhD. – Zvolen (SVK)
Conference Scientific Board:
assoc.prof. Leon Oblak, PhD. – Ljubljana (SLO) assis.prof. Hubert Palus, PhD. – Zvolen (SVK) assoc.prof. Zivka Meloska, PhD. – Skopje (MK) assoc.prof. Branko Glavonjic, PhD. – Beograd (SRB) assoc.prof. Darko Motik, PhD. – Zagreb (CRO) assoc.prof. Denis Jelacic, PhD. – Zagreb (CRO) assis.prof. Josef Drabek, PhD. – Zvolen (SVK) assis.prof. Joze Kropivsek, PhD. – Ljubljana (SLO) assis.prof. Renata Novakova, PhD. – Trnava (SVK) prof. Anna Satanova, PhD. – Zvolen (SVK) prof. Mikulas Supin, PhD. – Zvolen (SVK) prof. Richard Vlosky, PhD. – Baton Rouge (USA)
Print: The Publishing institution of the Technical University in Zvolen Edition: 60 copies ISBN: 978-80-228-2160-5

PREFACE
This proceedings is a collection of papers introducing recent research results of their authors. The papers were presented at the international scientific conference “WOOD PROCESSING AND FURNITURE MANUFACTURING: present conditions, opportunities and new challenges” held in Vyhne, Slovakia on October 6th- 8th 2010. The conference was organised by WoodEMA, i.a. The main goal of the conference was to exchange and transfer knowledge of international experts and scientists and to discuss issues regarding the present conditions, opportunities and new challenges in wood processing and furniture manufacturing with a particular attention paid to organisation, economics, management, marketing, trade and environmental issues both nationally and internationally. The international scientific conference “WOOD PROCESSING AND FURNITURE MANUFACTURING: present conditions, opportunities and new challenges” was the third WoodEMA conference. The conference organisers tried to continue in the tradition started in Beograd where the first WoodEMA conference was organised in 2008 and they hope that this year’s conference enabled to exchange valuable information and knowledge among the participants and will be useful for implementation of this knowledge in the future. October 7th, 2010 For Organisation Board: assoc. prof. Hubert Palus, PhD. Department of marketing, trade and World Forestry
Technical University in Zvolen, Slovakia

CONTENTS
Trade and Marketing ...................................................................................................................... 1
Maťová H.: A New Diagnostic Method to Detect the Hidden Causes of Problems in the Enterprise ....... 3
Glavonjić B., Simikić M., Pajović L.:, Market of Elements for Wood Floorings in South East Europe –
Current Situation and Trends ........................................................................................................................... 9
Motik D., Pirc A., Kruljac A.: The Attitudes of Participants in the Chain of Wood Products Use 21
Parobek J., Paluš H.: Main Uses of Wood in The Slovak Republic .......................................................... 31
Petrović S., Sretenović P., Pajović L.: Impact of World Economic Crisis on Flooring Market
in Europe ......................................................................................................................................................... 39
Svitok R.: Wood Removals Development and Crisis Influence on Wood and Wood Products
Consumption in Slovakia. ............................................................................................................................... 51
Perić I., Grladnović T.: Satisfied Customer is a Guarantee for Sustainable Development ..................... 63
Kropivšek J., Zupaničič A., Oblak L.: Use of Crm Systems in Slovenian Wood Industry Companies 73
Kaputa V., Šupín M.: Consumer Preferences for Furniture ....................................................................... 81
Economics and Investments ...................................................................................................................... 91
Petráš R., Mecko J., Paluš H.: Production of High Quality Raw Timber Assortments for the Furniture
Production in the Forests of Slovakia ............................................................................................................ 93
Gejdoš P.: Process-Oriented Monitoring Costs in the Furniture Company ............................................. 101
Borkowski S., Stasiak-Betlejewska R.: Analysis of Bent Furniture Production Costs ......................... 109
Moro M., Šporčić M., Šegotić K., Pirc A., Ojurović R.: The Multi-Criteria Model for Optimal Selection
of Croatian Wood Industry Companies ....................................................................................................... 117
Merková M, Drábek J.: Effects and Benefits of Foreign Direct Investment for the Development of
Wood-Processing Industry ........................................................................................................................... 125
Jelačić D., Bičanić K.: Investments to Croatian Wood Processing and Furniture Manufacturing........ 135
Quality, Management and Innovation ..................................................................................................... 143
Nováková R., Kusý O.: Cost-Oriented Quality Management and its Utilisation in the Wood-Processing
Industry .......................................................................................................................................................... 145
Pirc A., Vlosky R.: A Comparison of Innovation in the Furniture Manufacturing Industries of Croatia and
the United States ........................................................................................................................................... 149
Oblak L., Jošt M., Zupančič A., Antolin D., Kropivšek J.: Development of New Furniture Program for
Kindergartens ................................................................................................................................................ 157

Ivković D., Nešić M., Glavonjić B., Nešić M.: The Improvement of Production Planning and Control for
Intermittent Processes in Serbian Wood Processing ................................................................................ 163
Potkány M.: Using of Outsourcing at Woodworking Industry in Slovakia................................................ 169
Sloboda M.: Increasing Productivity Through Internal Communication Tools ........................................ 179
Šatanová A., Krajčírová L.: Measurement, Analysis and Improvement in Wood-Processing
Companies .................................................................................................................................................... 187


WOOD PROCESSING AND FURNITURE MANUFACTURING: present conditions, opportunities and new challenges
1
CHAPTER 1
TRADE AND MARKETING

WoodEMA 2010
2

WOOD PROCESSING AND FURNITURE MANUFACTURING: present conditions, opportunities and new challenges
3
A NEW DIAGNOSTIC METHOD TO DETECT THE HIDDEN CAUSES OF PROBLEMS IN THE ENTERPRISE
Hana Maťová
ABSTRACT
A new diagnostic method applied body therapy used in human psychology. Method was originally designed for wood-processing companies to reveal their true identity (corporate identity).Using this method it is possible to detect possible causes of the existence of weaknesses and strengths of the company, which is impossible to detect using conventional methods such as SWOT analysis. Body therapy applies a holistic approach to human beings. In our proposed method, we attempted to apply a holistic approach to an enterprise, the firm is seen as a human being or as an artificial intelligence, and this means that the company is personified.
Key words: corporate identity, body therapy, holistic approach.
1 INTRODUCTION
The main aim of this paper is introduction of new diagnostic method to detect the hidden causes of problems in the enterprise. This new method is based on the “body therapy”, the method used in psychological practise as therapy or can be used as tool in psychoanalysis. The origin of the method is in bioenergetic analysis carried out by Alexander Lowen. “Bioenergetic Analysis is the milestone in the study of how the psyche and the body interact.” (6, l.2 – 3)
The main idea of this holistic approach is that the human body and mind, psyche (soul) is a single unit.
This holistic approach to human being inspired us and brought the idea to apply this holistic approach to business and we have proposed a new method for the detection of possible hidden causes of problems in the company.
The use of such methods for business requires a certain degree of abstraction, so we imagine the business as a living human being or an artificial intelligence. This "being" should have body, soul and mind. This approach to business has been presented by Balmer and Soenen in their studies on corporate identity, where identity is made up of business voice, soul and mind. Steidl and Emery noted that the company has a body.
In our work we have combined those two, and so we see the enterprise as a human being who has body, soul, mind and voice. For the personalized business we are able to apply the modified method used in human medicine.
Because in the real world it is impossible to work with the company as a living being, we have sought a way to fix this problem. We are again inspired in psychology and we used existing projective tests, such as. Draw a person test (DAP), Figure Drawing Test (FDT).
Projective tests have their origins in psychoanalytic psychology, which argues that humans have conscious and unconscious attitudes and motivations that are beyond or hidden from conscious awareness (7).

WoodEMA 2010
4
The respondent's deep-seated motivations may not be consciously recognized by the respondent or the respondent may not be able to verbally express them in the form demanded by the questioner. Advocates of projective tests stress that the ambiguity of the stimuli presented within the tests allow subjects to express thoughts that originate on a deeper level than tapped by explicit questions (7).
We decided to take advantage of projective tests and we modified them in the proposed method to detect hidden problems possibly hidden causes of problems in the company.
The aim of this methodology is to show the company, that the problem areas there are not always rational or substantive nature, but the problem could be: poor internal communication, poor identification of employees with the company etc. (soft problems, which can cause bad economic acting of the company on the market).
2 PROPOSED METHOD – DRAWING THE IDENTIKIT OF THE COMPANY
The working title of the proposed method is “Identikit of the company”. Identikit is “a picture of a person, especially one sought by the police, reconstructed from typical facial features according to witnesses' descriptions” (8). Our identikit of the company will cover the whole body and not just the face of corporate being.
3 METHODOLOGY OF DIC
It will be a creative session with company management. The main theme is: Draw the enterprise as a human being. At the beginning of this session we will describe “company being", a part of her body and functions of those parts, and also we will present the basic rules of drawing. During the session should be present external worker, who is acting as consultant in the implementation of this task.
During analyzing the identikit of the company will be used the interpretation of differences in the corporate body according to human bodytherapy. The results will be combined with secondary research materials available in the company and corporate identity. Body therapy based on the holistic approach to human being, it means that body and psyche are an inseparable whole.
In the following section we briefly interpret the individual features of the "corporate body" and their functions that we proposed. Our proposal was based on the Sedláková (2003) (4) and her interpretations in human body therapy.
Breathing – a cash flow in the company (revenues, costs and etc.). Inhale-- a revenue, exhale – an expense.
Nourishment for the company would be material (non-production material), information from the environment and energies.
Muscles – human and machine labour force. This labour force is used for production. Nervous system would represent control data (from the external and internal
environment). The flow of data in the enterprise, we can metaphorically compare to the nervous system, which gives instructions to the muscles. Nervous system is a gatherer, analyzer, inspector and evaluator. This system must deal with the information from external and also internal environment. In our proposal, the Nervous system is bidirectional.
WOOD PROCESSING AND FURNITURE MANUFACTURING: present conditions, opportunities and new challenges
5
Blood represent tangible and intangible internal flows in the company. Blood is a “carrier”, it carries the vital elements for the body and blood is responsible for receiving and dispensing elements in the whole body.
Upper limbs: Teams or departments, which are aimed at production and at the same time, provide the basis for contact with surroundings (through the products, services). Upper limbs functions are the production and communication. The communication function is understood in terms of the marketing department (f.e. communication through the products).
Lower limbs: perform the movements and also they may be involved inproduction of the products. The movements of the corporate body, in figuratively speech, we can understand as movements towards the partners of the company or towards the company sources. Lower limbs connect the company body with the ground; metaphorically, the company have to have “both feet on the ground”. The lower limbs represent functions that move the enterprise in real time. They should be pillars of the company. Lower limbs, therefore, could have logistic, marketing, supply management functions etc.
The Trunk (torso) is linked to the existence; basic body functions important for survival are taking place in the trunk. The basic corporate body functions are: accounting, personnel management, legal department and the others administrative departments. The trunk is close to the control centre (the backbone, spine).The soul resides in the corporate trunk.
The head is the part of the body, which has a public nature. It has the most visual contacts with the environment and partners of the company. The corporate mind and voice resides in corporate head. Head in conjunction with the backbone represents senior management and business owner.
Organizational structure can be seen as a skeleton. Without the skeleton, the body collapsed. The head and spine are senior management; middle management controls upper and lower limbs and lower management control hands and feet.
We expect that by using visualization methods we can reveal information which management does not want or cannot present because they need not consider these information as crucial for the company. This means that such techniques can help to detect the hidden causes of problems in the company. We recommend using these "soft" methods as secondary methods addition to primary "hard" methods such as SWOT analysis.
4 CONCLUSION
We expect that by using visualization methods we can reveal information which management does not want or cannot present because they need not consider these information as crucial for the company. This means that such techniques can help to detect the hidden causes of problems in the company. We recommend using these "soft" methods as secondary methods addition to primary "hard" methods such as SWOT analysis.

WoodEMA 2010
6
Acknowledgment The author thanks the Agency VEGA for financial support in addressing the project
1/0496/09.
REFERENCES
1. Balmer, J.M.T., Soenen, G.B. 1998. A NEW APPROACH TO CORPORATE IDENTITY MANAGEMENT. In Interational centre for corporate identity studies : Working paper, 1998/5.
2. Balmer, J.M.T., Soenen, G.B 1999. THE ACID TEST OF CORPORATE IDENTITY MANAGEMENT. In Journal of Marketing Management, Vol. 15, 1999. s. 69-92.
3. Melewar, T.C., E. Karaosmanoglu. 2006. SEVEN DIMENSIONS OF CORPORATE IDENTITY: A CATEGORISATION FROM THE PRACTITIONERS' PERSPECTIVES. In European Journal of Marketing, Vol.40, No.7/8.
4. Sedláková, Z. 2003. PRÁCE S TĚLEM V PSYCHOTERAPII : Diplomová práca. Praha : UK, 2003. 151 s.
5. Steidl, P., Emery, G. 1997. Corporate IMAGE AND IDENTITY STRATEGIES: DESIGNING THE CORPORATE FUTURE. Warriewoood : Business & Professional Publishing. 1997.
6. BIOENERGETIC ANALYSIS - ALEXANDER LOWEN. Nienteansia.it. 2010. <http://en.nienteansia.it/psychotherapies/bioenergetic-therapy-alexander-lowen.html>, accesed July 09, 2010.
7. PROJECTIVE TEST. Wikipedia. 2010. http://en.wikipedia.org/wiki/Projective_test#Theory), accesed July 09, 2010.
8. "IDENTIKIT". Oxford Dictionaries. April 2010. Oxford Dictionaries. April 2010. Oxford University Press. http://oxforddictionaries.com/definition/identikit?attempted=true (accessed July 09, 2010).
Figure 1 The skeleton of the corporate body

WOOD PROCESSING AND FURNITURE MANUFACTURING: present conditions, opportunities and new challenges
7
Authors' address:
Hana Maťová, PhD. Department of marketing, trade and world forestry Faculty of wood sciences and technology Technical University in Zvolen T.G. Masaryka 24 Zvolen, 960 53, Slovakia e-mail: [email protected]

WoodEMA 2010
8

WOOD PROCESSING AND FURNITURE MANUFACTURING: present conditions, opportunities and new challenges
9
MARKET OF ELEMENTS FOR WOOD FLOORINGS IN SOUTH EAST EUROPE – CURRENT SITUATION AND TRENDS
Branko Glavonjić, Mićo Simikić, Ljiljana Pajović
ABSTRACT
The paper1 gives the overview of the research results for current situation and trends on the market of elements for wood floorings in the region of South East Europe. Current situation on the market of wood flooring elements included the analysis of their consumption, individually by element types as well as their prices and quality class characteristics. Analysis of trends included the analysis of the participation of certain wood species from temperate and tropical zones as well as the requirements in the area of interior decoration. Key words: wood, floorings, elements, consumption, trends.
1 INTRODUCTION
Parquet is a product used as floor covering from ancient times. It is a product which will surely always have buyers and it will not be overcome with substitutes for a long time. There are various divisions of parquet according to different criteria. One of most frequently used classifications is the one according to which parquet is classified into solid and multilayer.
Main characteristics of solid parquet refer to the condition that it has to be made of a single piece of wood of the same species, presence of structural joint elements, where at assembling each individual piece represents a visible unit of surface onto which it is placed. Main types in which solid wood flooring is produced are the following: solid parquet, lamel parquet, lamparquet and ship decking (Landhaus dilen).
One of the characteristics of this parquet is the fact that during its production a large amount of relatively expensive wood species is used, such as oak, ash, maple and others. Thus, its price per unit of surface is high so that very often it is a product in the production of which a large amount of quality hardwood species is irrationally and needlessly used. At the same time, it is a product with long tradition and its usage and consumption will surely have adequate trend in the future as well in terms of both quantity and prices.
Multilayer parquet2 is parquet produced from several layers (most often three) so that the top layer is made of hard wood, while the middle layer is produced from soft wood (coniferous) or plywood. Veneer is mostly used as the lower layer.
1 The paper is financially supported by the Ministry of Science and Technological Development of the Republic of Serbia within the project: ‘’Development and application of the new visual identity for wood floorings from Serbia in the function of increasing their competitive value on the market of the European Union’’. 2 In order to call a product multilayer parquet it is necessary to have top layer of wood thick at least 2.5 mm
(according to the classification of the European Federation of Parquet Industry).

WoodEMA 2010
10
Multilayer parquet is an example of a product which emerged as a reply to the increase of demand for solid parquet and impossibility of the market to fulfill these requirements, as well as an example of a rational usage of wood of quality, expensive and precious wood species.
Multilayer parquet is most frequently classified according to the number of layers into two-layer and three-layer parquet. The next classification of multilayer parquet is according to the number of rows in upper layer on one placement unit (strips). According to this characteristic multilayer parquet is divided into multilayer parquet three strips, multilayer parquet two strips multilayer parquet one strip.
Model with the highest presence today in the production and on the markets of South East European countries is three-layer parquet three strips. One of the reasons of its dominant participation on the market is the fact that three-layer parquet as an alternative to cheap laminates as important competition to wood floorings.
Market of parquet elements involves a lot of stakeholders, most frequently producers of parquet elements (sawmills), agents in the trade of parquet elements (wood dealers), parquet producers and buyers of finished parquet.
Research results referring to the current situation on the market of elements for parquet production are presented in the continuation, with the analysis of interrelations of stakeholders, as well as the forecasted demand with proposals for meeting the needs and consumption of parquet elements in the region of South East Europe.
2 SCOPE AND OBJECTIVE OF THE PAPER
Scope of the research in this paper is the consumption of wood flooring elements in the selected South East European countries. The main reason for performing the stated researches lies in the fact that in this region in several previous years significant investments in the erection of factories for wood flooring production were realized due to which their demand started to increase rapidly. On the other hand, owing to significant capacities, the region is getting more significant position in wood flooring production in Europe.
Starting from the mentioned statements, the main objective of the paper is to observe the current situation and trends on the market of wood flooring elements in the selected countries of South East Europe, namely Croatia, Serbia, Bosnia and Herzegovina, Romania and Ukraine. The selection of these countries is conditioned with the fact that there are strong trading chains established among factories for the production of finished products and factories for the production of wood flooring elements in the stated countries and thus significant trade flow is achieved among the stated countries. Beside the abovementioned, additional reason for doing these researches is the need to view changes in the market initiated with new requirements from producers of various types of floorings in the region as well as the trends in this area.
Time period covered in the researches referred to the years 2007-2010 and as such it represents sufficiently long period for making analyses and defining adequate conclusions.
3 METHOD OF WORK
Pursuant to the defined scope of the paper and the set objectives of the research, full methodological basis has been adopted consisting of the general and specific scientific research methods.

WOOD PROCESSING AND FURNITURE MANUFACTURING: present conditions, opportunities and new challenges
11
The following general scientific methods were used: historical method, induction and deduction methods, analyses of document contents, abstractions and concretization. Among special scientific methods, method of direct interviewing the biggest flooring producers and parquet element producers in the selected South East European countries was used.
During the researches, a lot of data and information was collected based on the interviewing method, as well as from the documentation of the most significant producers of floorings and wood flooring elements which are not present in any publication, report or other displaying form. All this is accompanied with long practical experience and knowledge of one of the coauthors of this paper in the area of wood flooring elements trade. Due to all abovementioned, the analyses made and data summed give uniqueness to this paper through the overview of the current situation and conclusions and at the same time, professional and scientific public obtains a lot of useful information.
4 WOOD FLOORING ELEMENTS PRODUCED IN SOUTH EAST EUROPE-TYPES AND CHARACTERISTICS
Flooring elements are a starting form of raw material for the production of wood floorings. Depending on flooring type they are intended for, flooring elements are classified into:
Elements for solid parquet,
Elements for ship decking and,
Elements for multilayer parquet. Main characteristics of certain element types are given in the continuation with special
highlight on dimensions and quality classes.
4.1 Elements for solid parquet
Elements for solid parquet are mostly produced with the following dimensions: 25-26 mm thickness, 55-110 mm width and 250-1100 mm length (measures refer to elements in raw state and represent calculating dimensions). Dimensions with the highest presence in production and on the market of South East Europe are 25×(55/65/75)×(300/350/400/450) mm. The stated dimensions are dimensions of solid parquet.
Such elements are mostly called freezes for parquet and represent a by-product which occurs in primary wood processing (production of sawn wood). They are the product which is obtained „by fit“, i.e. as it appears and usually all qualities are mixed in one package so that sorting according to quality is done after their processing, or in the finished parquet.
If they are a subject to trade in raw state, manipulation and transport are difficult, in terms of prices it is merchandize of low value and transport of these elements over longer distances is not profitable.
4.2 ELEMENTS FOR SHIP DECKING
Elements for ship decking are more expensive segment of product assortment within sawmill wood processing. Their dimensions are most frequently 25-26 × 110-220 × 1100-2500

WoodEMA 2010
12
mm. They are often purpose made from logs of lower classes or from less valuable zones of logs, especially in rustic quality class.
These elements endure longer transport distances, they are sorted according to quality during production which they enter into individually according to quality. Sorting is very important because certain quality classes of these floorings are significantly different in terms of prices. Elements of natur quality are up to three times more expensive than elements of rustic quality of the same dimensions. This is particularly expressed in oak elements of four sides clear quality with the price of 1,000 €/m³, while the price of elements of rustic quality ranges from 300 to 400 €/m³.
Elements of the quality four sides clear and one side clear have high demand on the markets in Austria, Belgium and England especially if produced from oak3.
Certain markets reflect specificities regarding these elements, such as special requirements for the thickness of 18 mm, while the requirement for finished parquet 14 mm thick is especially expressed in Western European countries where environmental awareness of consumers is on a high level. Because of this, finished solid parquet and ship decking 14 mm thick are produced in order to preserve forest resources, and consequently sustainable development and survival of forest ecosystems.
4.3 Elements for multilayer parquet
Elements for multilayer parquet are elements with the highest demand on the market of parquet elements in South East Europe. They are classified into:
elements for multilayer parquet one strip typically with the following dimensions: 25-27 × 100 -220 × 1200 - 2500 mm
elements for multilayer parquet two strips with typical dimensions 25 - 27 × 80 - 100 × 500 -1100 mm and
elements for multilayer parquet three strips with dimensions 25-27 × 70-80 × 300-500 mm.
Most often 4 strips 3.5-4.5 mm thick are produced from these elements, while certain
producers have been lately producing five, even six strips, due to technology development. Elements for multilayer parquet have to fulfill several specific requirements, such as: precision of dimensions with small deviations in tolerances; oversize on width and thickness in the production of raw elements; oversize on length, up to 7 mm, because of fitting into matrices in multilayer parquet
two strips and three strips; no knots on lateral sides and boxed heart; in rustic quality no knots on edges (during processing they can fall out and it is not
possible to refill the hole which remains with extra work); minimum distance of the allowed knot from the edge in the stated specifications is
15 mm, and for some producers up to 25 mm. Elements for multilayer parquet three strips represent sawmill wood processing
assortment with the highest demand. They are also the most demanding concerning packaging, transport and storage, as well as drying.
3 According to the statistics of oak elements export from Croatia in 2008
WOOD PROCESSING AND FURNITURE MANUFACTURING: present conditions, opportunities and new challenges
13
In the drying process of these elements it is of special importance to avoid remaining stresses after drying, which is achieved through the selection of quality and adequate drying regime, its proper application, observance and control of all set parameters of the regime.
Certain wood species have special requirements: for oak, no yellow stain and gray stain can occur in sapwood, for ash, no olive or gray color are tolerated, and for beech, no discoloration is tolerated. Taking into consideration all abovementioned, it is very important to give precise and
clear directions and instructions to element producers (sawmills) in order to avoid misunderstandings and complaints of buyers.
5 CURRENT SITUATION ON THE MARKET OF WOOD FLOORING ELEMENTS IN SOUTH EAST EUROPE
Current situation on the market of wood flooring elements in the selected South East European countries included the analysis of their consumption and prices, as well as a short overview of the expected trends.
5.1 Consumption of wood flooring elements in the selected South East European countries
Analysis of the consumption of wood flooring elements in the selected South East European countries included consumption by types of flooring elements, consumption of elements by wood species from temperate zone and consumption of elements from tropical wood species.
Consumption of elements for parquet differs by countries and mostly depends on installed production capacities. Annually, Hungary produces all types of parquet in the amount of 2.47 million m², Croatia about 4.1 million m², Serbia about 3.1 million m² and Romania about 2.4 million m² (Source: FEP, 2008). However, the stated data are surely higher, because there is a significant number of small producers who operate in the zone of gray economy.
According to the conducted researches, participation of multilayer parquet in total wood flooring production in this region is about 5 million m², while the remaining amount includes solid parquet. This means that in this region solid parquet is primarily present, and researches show that its participation in the production is about 60% and in consumption about 70%. Such ratio is contrary to the trends in Europe as a whole, where multilayer parquet participates with over 75% in the total production and consumption of wood floorings.
Parquet elements produced in the selected countries of South East Europe are not
recorded statistically, thus it is difficult to determine exact amounts in which they are produced.
5.1.1 Consumption by types of flooring elements
Regarding the dominant participation of solid parquet in wood flooring production in South East Europe, consequently elements for solid parquet with dimensions 25 × 50-70 × 250-500 mm have the biggest consumption. Elements of the stated dimensions are mostly obtained

WoodEMA 2010
14
from extra work in the processes of sawmill wood processing, i.e. as by-products (assortments), which increases the percentage of utilization of starting raw material. On the other hand, they are often characterized by very low quality and in their processing maximum ratio of 60% of normal and 40% of out of standard quality is obtained.
These elements are characterized by the fact that they cannot be purpose made from logs of either quality class because of low price and big oversize, due to which their purpose making from logs is unprofitable. Oversizes are 18- 30 % depending on the length of elements.
If the fact that in South East Europe cca 5 million m² of solid parquet is produced as well as the relation that about 30 m² of parquet are obtained from 1 m³ are taken into consideration, the annual amount of 167,000 m³ of elements necessary for the production of this parquet is obtained in a simple calculation. Additionally, these elements cannot endure long transport distances, therefore they are not subject to trade between countries, they are mostly traded with on local markets. These elements are mostly produced in class „domestic“. This class is characterized by the mix of all qualities (extra, standard, rustic and out of standard).
According to consumption, elements with dimensions 25-27×70-80×250-500 mm follow, and they are mostly used for multilayer parquet. Those are the elements which are mostly classified into two classes according to quality, namely quality I-IV and robust. However, in recent years, many suppliers classify these elements into A, B and C quality classes.
In general, these are the elements which represent a higher segment of elements for parquet production both in terms of prices and according to quality. For that reason, demand for these elements is very high because their production is not so simple as in the example of previously stated elements. Smaller part of these elements is obtained from extra work and the biggest part is purpose made from logs of lower quality classes. Sawmills treat these elements as furniture elements, thus their availability on the market is not high. They are subject to trade and they are mostly traded in raw or airdry (transport) dry condition. Researches show that about 100,000 m³ of these elements are produced annually in the selected South East European countries, out of which 50,000-60,000 m³ are used annually for the production of multilayer parquet in South East European countries. The rest of about 40,000 m³ is exported from this region. Consumption, or demand, for these elements is constantly increasing in Europe.
Third group of parquet elements are elements with dimensions 26-30×120-200×1200-2300 mm, which are mostly produced in the quality I-III, rustic and robust. These elements are used in the production of multilayer parquet one strip and solid parquet so called landhaus dile. They are the highest and the most demanding segment of primary wood processing because they are obtained from logs of higher quality classes. Annual production of these elements in South East Europe is about 35,000 m³, 30% (cca 10.000 m³) of which is processed in South East Europe, while the rest is exported onto the markets outside this region.
Consumption, and thus demand for these elements is very high and significantly expressed especially for the quality four sides clear. As such, in terms of prices they are the most valuable segment of logs primary processing in sawmills.
5.1.2 Consumption of elements by wood species from temperate zone
Wood species with the highest demand on the market of elements for parquet production vary in consumption depending on the impact of the following factors:
Tradition in using certain wood species, Fashion trends, Availability on the market and Prices.
WOOD PROCESSING AND FURNITURE MANUFACTURING: present conditions, opportunities and new challenges
15
Due to different intensity of impacts of the stated factors, “trendy” wood species and wood species out of the trends are obtained on certain markets.
By analyzing the demand for wood flooring elements the conclusion was reached that oak is dominant wood species in Europe. The same fact refers to South East European countries as well in which oak covers about 50% of total consumption of parquet elements of all qualities and dimensions in the last ten years.
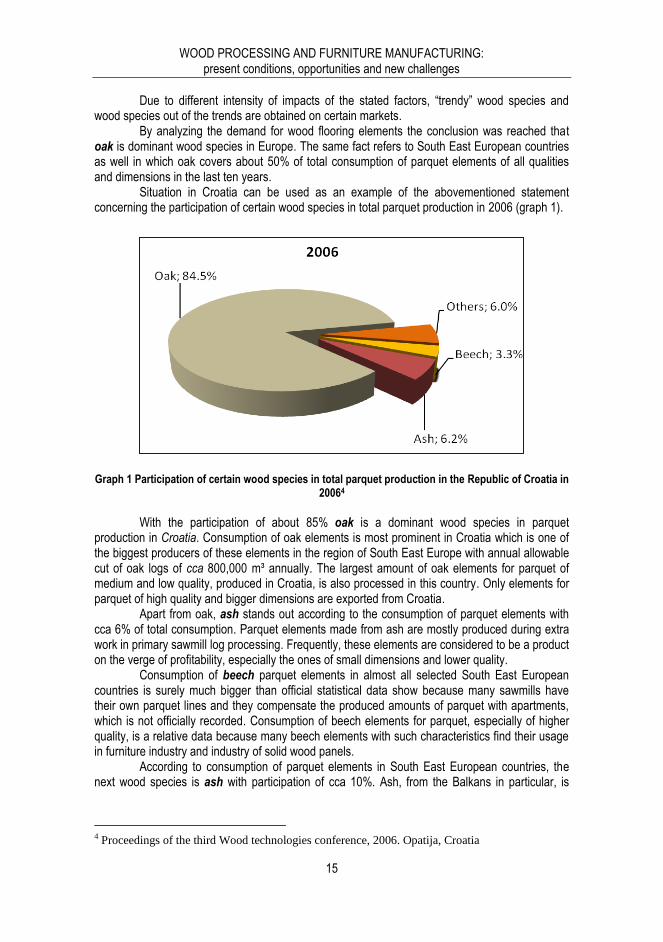
Situation in Croatia can be used as an example of the abovementioned statement concerning the participation of certain wood species in total parquet production in 2006 (graph 1).
Graph 1 Participation of certain wood species in total parquet production in the Republic of Croatia in
20064
With the participation of about 85% oak is a dominant wood species in parquet
production in Croatia. Consumption of oak elements is most prominent in Croatia which is one of the biggest producers of these elements in the region of South East Europe with annual allowable cut of oak logs of cca 800,000 m³ annually. The largest amount of oak elements for parquet of medium and low quality, produced in Croatia, is also processed in this country. Only elements for parquet of high quality and bigger dimensions are exported from Croatia.
Apart from oak, ash stands out according to the consumption of parquet elements with cca 6% of total consumption. Parquet elements made from ash are mostly produced during extra work in primary sawmill log processing. Frequently, these elements are considered to be a product on the verge of profitability, especially the ones of small dimensions and lower quality.
Consumption of beech parquet elements in almost all selected South East European countries is surely much bigger than official statistical data show because many sawmills have their own parquet lines and they compensate the produced amounts of parquet with apartments, which is not officially recorded. Consumption of beech elements for parquet, especially of higher quality, is a relative data because many beech elements with such characteristics find their usage in furniture industry and industry of solid wood panels.
According to consumption of parquet elements in South East European countries, the next wood species is ash with participation of cca 10%. Ash, from the Balkans in particular, is
4 Proceedings of the third Wood technologies conference, 2006. Opatija, Croatia

WoodEMA 2010
16
highly valuable wood species, especially during the trend of lighter wood shades. Such a trend is highly expressed on the market of Scandinavian countries.
According to the researches of the author of this paper, ash from Romania, Poland and Ukraine does not possess lighter shades like ash from Croatia and Serbia, however it has a lot of gray and olive tones. Ash from France has a large content of brown heart, the so called kern (brown color), so that it is used only when elements with brown heart are needed in the production. For that reason, most parquet producers in Europe buy elements for parquet made of ash from the Balkans.
Other wood species, especially fruit trees and tropical wood species, participate with about 15% in total consumption of parquet elements in South East Europe. Among European wood species, maple, chestnut and acacia and among fruit trees the most popular are: walnut, cherry, pear and plum.
In previous years, consumption of thermally treated wood species has been increasing, especially ash, beech, oak and hornbeam. The procedure of thermal treatment is very expensive and solid parquet hardly endures it in terms of prices. However, it is acceptable in the production of multilayer parquet and thus the consumption of elements thermally treated for multilayer parquet is constantly increasing.
Graph 3 Production of all types of parquet in Serbia in 2007
In endeavors to offer the market a wide assortment of floorings of different wood species,
big producers of floorings import relatively large amounts of certain American wood species. This refers in particular to American red oak and American walnut (lat. Juglans nigra), as well as cherry and maple. In the conditions of economic crisis in wood flooring production, elements for parquet of American red oak have been replaced with elements of European red oak in most South East European countries due to the expressed difference in prices which is in favor of almost two times lower price of European red oak. Negligible difference in the texture of these two wood species (the most significant regards the width of annual rings) makes this process even more expressed.
Multilayer parquet
1.700.000 m2,58%
Solid parquet1.100.000 m2,
38%
Ship decking 66.000 m2,
2%
Lamel parket 50.000 m2,
2%

WOOD PROCESSING AND FURNITURE MANUFACTURING: present conditions, opportunities and new challenges
17
5.1.3 Consumption of elements of tropical wood species in South East Europe
The most significant tropical wood species used for the production of wood floorings in
South East Europe are: sapeli (African mahogany), iroko, dousie, venge, merbau, jatoba, kempas and sipo. Popularity of the stated wood species is expressed depending on certain trends in furniture production and interior design.
Tropical wood species are estimated to participate with about 10% in total consumption of flooring elements in this region, primarily in the category of multilayer parquet. Their import is about 7,000-8,000 m³ annually. These are mostly elements for multilayer parquet with dimensions 30×80×300-500 mm.
Main ports for importing elements from tropical wood species are Kopar (Slovenia) and Rijeka (Croatia) on the Adriatic Sea, from where the transport of containers with goods is done by trucks and railway. Containers from ports (Kopar and Rijeka) are transported by trucks to parquet producers in Croatia, while the containers for Serbia are transported by railway from the ports to the main nodes where reload is performed and the goods is further transported by trucks. The reason for this is that none of the parquet producers in South East Europe have a railway track in their factories, so that container transport by railway to the factories is not possible. Transport of one container from the port in Kopar to Orahovica and Varaždin (Croatia) is cca 800 €, while the transport of one container from Rijeka to Bačka Palanka (Serbia), by railway and truck combined, is 1,200-1,500 €.
In recent years, there is a noticeable trend of increased consumption of elements made of tropical species for multilayer parquet three strips, i.e freezes in dimensions 27×75×300-500 mm as well as the elements for ship decking of bigger dimensions 25-27×80-150×800-2000 mm. Their consumption was expressed in particular in the last two years in Serbia where a big increase in the consumption of tropical wood species in freeze category was marked. Also, a new trend of importing logs and planks is noticeable as well as the processing and production of elements for parquet from tropical wood species. Consumption of elements from tropical wood species was about 2,000 m³ in Serbia in 2008.
Consumption of parquet elements from tropical wood species marks constant increase and the reasons are the following:
There is a general increase of demand for parquet made of tropical wood species in South East European countries;
Introduction of duty-free export of parquet from Serbia into the Russian Federation; New trends in interior design on "immature markets" of parquet, namely on the
territories of South East European countries, Russia and Ukraine. According to the estimations of certain experts and available statistical data,
consumption of parquet elements from tropical wood species in South East European countries is constantly increasing and in 2007 the consumption was about 8,000 m3 (collective for all tropical species), in order to increase to about 10.000 m3 in 20085.
5 According to the Author’s research using interviewing method

WoodEMA 2010
18
5.2 Prices of elements for wood floorings in the selected South East European countries
Prices of flooring elements depend on wood species, purpose, dimensions, quality and moisture content. Therefore, exotic species have the highest value in terms of prices, namely: venge, merbau, tik, kempas, dusie, iroko, jatobu and sapeli. These are followed by American walnut and thermally treated wood species, like ash, oak, beech and birch. Purchase prices for multilayer parquet three strips at parity DDU factory (production) are as follows: wenge cca 1,600 €/m3, merbau, kempas, doussie cca 1,000 €/m3, jotoba, sapeli 700 to 800 €/m3. Price of American walnut is cca 1,200 €/m3, while the price of thermally treated elements of ash and beech is cca 700-800 €/m3.
Among others, oak, ash and beech in their thermally untreated form stand out. In terms of prices, fruit trees are prominent as well, namely European cherry, European walnut and pear. Intensively steamed acacia can also be highlighted. Purchase price of elements for multilayer parquet three strips at parity DDU factory (production) for oak and ash is cca 400 €/m3, for beech cca 300 €/m3 and for fruit trees (walnut, pear, cherry) is 700-800 €/m3.
The price of parquet elements is also influenced by the trend in production, demand, as well as the availability of particular wood species on the market. It is frequent situation regarding trends that there is an expressed demand for one wood species of similar specification, but its availability is low due to seasonal character of loggings. At that point prices increase unrealistically, namely big oscillations of supply and demand occur on purchase market.
The relation between the rates of American dollar (US$) and Euro (€) has a big impact on the price of flooring elements, especially for American wood species. This relation is expressed in particular when deliveries of wood species with a long delivery date, e.g. 2-4 months, are negotiated. In practice, this means that prices are negotiated at one rate, while on delivery date this relation of rates is most often different. Such deliveries can be highly favorable or highly unfavorable depending on the relation of these two currencies.
Also, it is a common situation in practice that only two or three companies have concession for logging certain wood species, as in the example of African species, thus they easily maintain the level of prices which is not a market one, which enables them to gain extra profit.
Beside the abovementioned, long-term contracts, partnership relations between big suppliers and consumers as well as exclusive rights for distribution on certain markets also have a significant impact on prices. Prices are generally contracted in US dollars or in Euros for accounting dimensions and moisture content AD/KD (airdry/kilndry). The stated principle does not refer to the deliveries from Russia and Ukraine where the law states that the measures of sawing raw material are at the same time the accounting measures in wood trade.
When purchasing wood from Russia and Ukraine it is very important to include in the price the loss of oversize which appears due to wood shrinkage. This loss on elements for multilayer parquet three strips ranges from 18 to 23% per m³ depending on the length of elements (250 to 450 mm). Thus, it is easy to calculate possible losses of amount.
Prices of parquet elements mostly have increasing trend for all wood species except beech, which has had a mild drop of prices or the same level of prices for several previous years. Prices of beech elements for multilayer parquet three strips have not changed for the last four years6
6 According to the records of Coauthor of the paper

WOOD PROCESSING AND FURNITURE MANUFACTURING: present conditions, opportunities and new challenges
19
6 CONCLUSIONS
In the conditions of expressed competition accompanied by all positive and negative effects of the globalization of wood flooring market, certain number of foreign companies invested in the construction of factories for wood flooring production in South East European countries. They were joined by a certain number of national producers of wood floorings who invested in the expansion of their production capacities, which altogether had an impact on significant increase of demand for flooring elements in this region.
Simultaneously, resulting from various range of finished floorings, different requirements regarding quality classes and other characteristics of elements for wood floorings appeared, which caused the need to adjust and make changes in sawmill wood processing. Main changes on the market of flooring elements refer to dimensions and allowed flaws in certain quality classes. In both cases the criteria which producers of flooring elements have to fulfill increased, which significantly influenced on the percentage of utilization of starting raw material and the change of up-to-then model of organizing production in sawmill wood processing. Such increased requirements regarding quality of elements were also accompanied by adequate increase of their prices so that the production can remain profitable.
General conclusion concerning the situation on the market of wood flooring elements in South East Europe is that it is relatively stable with occasional oscillations in supply and demand of certain dimensions, quality classes and wood species. The position of certain producers of elements on the market as well as financial effects of business operations depend on the trends and speed at which they adjust to market trends.
REFERENCES
1. Glavonić B., Petrović S. (2006): TIMBER TRADE II., University of Belgrade Faculty of Forestry, Belgrade, Serbia
2. FEP (European Federation of Parquet Industry) 2008., Internal Report 2008, Brussels 3. Internal documentationof producers of elements for wood floorings in South East Europe 4. Simikić M. (2010): MARKET OF ELEMENTS FOR WOOD FLOORINGS IN SOUTH EAST
EUROPE, Specialistic thesis, University of Belgrade Faculty of Forestry, Belgrade 5. Statistical Yearbook of Croatia 2008., State Statistical Office, Zagreb, Croatia 6. Statistical Yearbook of Serbia 2008, State Statistical Office, Beograd, Serbia 7. Proceedings of the 3rd Wood technology conference Opatija 2006, Opatija, Croatia 8. Žarković M.(2008) WOOD FLOORINGS MARKET IN SERBIA, Specialistic thesis, University
of Belgrade Faculty of Forestry, Belgrade, Serbia

WoodEMA 2010
20
Authors’ addresses:
Branko Glavonjić, PhD, Full University Professor, University of Belgrade Faculty of Forestry, Serbia email: [email protected] Mićo Simikić, BsC, Raw Materials Buyer, Supply Chain Wood, Tarkett Eastern Europe Student of Specialistic Study of Forest Products Marketing and Trade Unviversity of Belgrade Faculty of Forestry, Serbia email: [email protected] Ljiljana Pajović, Economist, Professional Associate, University of Belgrade Faculty of Forestry, Serbia, e-mail: [email protected]

WOOD PROCESSING AND FURNITURE MANUFACTURING: present conditions, opportunities and new challenges
21
THE ATTITUDES OF PARTICIPANTS IN THE CHAIN OF WOOD PRODUCTS USE
Darko Motik, Andreja Pirc, Ariana Kruljac
ABSTRACT
Faced with increasing market globalization and liberalization, the Croatian wood processing and furniture industry is constantly seeking ways and methods to survive or improve its position. It is therefore necessary to stimulate the creation of higher use value of wood and its products as renewable and organic materials.
The objective of this paper was to examine the opinions and views of experts on the Croatian wood processing and furniture industry. The experts included architects, investors, designers, journalists and sellers. Being directly or indirectly involved in the chain of wood products use, they exert an important influence on the final result.
According to the research results and expert opinions, the Croatian wood processing and furniture industry is a promising sector that could help Croatia in the current economic crisis. However, there is insufficient investment in the development of this sector. As a result, the Croatian wood industry lags behind other global timber industries.
Key words: wood industry, wood products, expert opinion, chain of use
1 INTRODUCTION
It is an indisputable fact that many companies in different economic branches are currently at the crossroads of their life cycle. The merciless dynamics and unpredictability of business changes, competition, the unstoppable globalization trend, innovations and environmental impacts make market competition and survival increasingly more complex and demanding. Market competition, technological changes, and the necessity to satisfy market needs of buyers/consumers encourage companies, and even force them to some extent, to cooperate with experts who can contribute to creating and/or increasing the value and, consequently, the use of their products. Today, information is a resource which creates new product value.
The value chain of a company is a set of moves a company makes in order to develop the product from the idea, manufacture it, advertise it and finally distribute it on the market (Porter, 2008). According to Porter (2008), value chains within each industry vary; accordingly, in the furniture industry, important participants in the creation of product value are architects, designers, investors, the media and sellers. Participants in the formation of product value create the value of a product if they are capable of making a decision and selecting investment projects whose value is higher than the cost of realizing them (Predović and Dolly, 2007). The opinions and attitudes of these participants may represent a very important segment in the chain of product use. Compared to Finland and Austria, per capita wood consumption in the Republic of Croatia is about ten times lower, while per capita furniture consumption in 2007, for example, amounted to only 132 Euro

WoodEMA 2010
22
(Motik and Pirc, 2008). In relation to other European countries, wood and wood products use in the Republic of Croatia is still at an unacceptable level; consequently, the opinions and suggestions of experts who participate or may participate in stimulating the end user to consume wood products is exceptionally important.
The objective of this paper was to examine and establish how the previously selected participants perceive and view the Croatian wood industry.
2 MATERIAL AND METHODS
The paper analyzed the data obtained from research, which was part of the advertising campaign „Wood is First“, undertaken in cooperation with the Croatian Chamber of Economy, the Ministry of Regional Development, Forestry and Water Management and the company Hrvatske Šume. The research, lasting from July to September 2009, comprised the territory of the Republic of Croatia.
Data were collected with quantitative and qualitative data collection methods. The reason was that the integration of these two methods, wherever feasible, makes it possible to supplement the collected data with new ones and to make more extensive conclusions on the basis of previous analyses (Lobe, 2006).
Quantitative data were collected by means of questionnaires which the respondents answered by telephone, whereas qualitative data were collected by means of 'one to one' in-depth interviews, involving the interviewer and the respondent. 100 respondents (business subjects) from the fields of architecture, journalism, investments, design and sales took part in data collection via the questionnaire, while in-depth interviews comprised 10 respondents (business subjects), also from the fields of architecture, journalism, investments, design and sales.
3 RESULTS
3.1 Respondent structure and profile
Of a total of 100 respondents taking part in the questionnaire, 50 respondents (50%) were architects, 30 respondents (30%) were furniture sellers, 6 (6%) were designers, while the rest were investors (7%), and journalists (7%). 24% of respondents said they belonged to the age group up to 34 years, 28% said they were in the 35 – 44 age group, 28% said they were between 45 and 54 years of age, while the lowest number of respondents, 20%, said they were in the 46 – 64 age group. In terms of the respondents' educational structure, 85% of the total number had academic education – higher school or faculty, and 4% of the respondents were masters or doctors of science. A further 10% of the respondents had secondary school education, and only one percent did not want to reveal their educational status. Of the 100 respondents (business subjects), the majority, as many as 73%, employ fewer than 50 workers in their companies, while only 23% of the respondents stated they had more than 50 employees. Four percent did not say anything about the number of employees.
Of the 10 respondents taking part in the 'one to one' in-depth interviews, the majority were architects (30%) and furniture sellers (30%), while investors accounted for 20%, designers for 10% and journalists for 10% of the respondents. In terms of the respondents' age structure, the persons in the 31– 40, and in the 41 – 50 age groups make up the same percentage (40%). 20% of the respondents taking part in in-depth interviews were above 51 years of age. In terms of

WOOD PROCESSING AND FURNITURE MANUFACTURING: present conditions, opportunities and new challenges
23
employee structure, 60% of the respondents said they employed over 100 people in their companies, while 40% of the respondents said they had fewer than 10 employees.
3.2. Expert perception of wood industry
The attitude of experts towards wood industry in the Republic of Croatia was examined by means of 1 to 5 point Likert scale. The respondents expressed their agreement or disagreement with different statements related to wood industry, where 1 denoted the opinion „I strongly disagree“, while 5 denoted „I strongly agree“, and ‘I don’t know’ statement.
According to Figure 1, the majority of the respondents, 85 out of 100, agreed that the Croatian wood industry should not be given over to foreigners, and 70 respondents stated that the Croatian wood industry was a promising economic branch which can help Croatia it the current economic crisis. Thirty-five respondents declared they considered wood industry an important economic branch in the country, whereas most of the undecided (39%) answers related to forest management methods and to whether forests were adequately managed. On the other hand, more than half of the respondents, or 66 %, thought that not enough was invested in the development of wood industry and that the Croatian wood industry lagged behind other world industries.
Figure 1 Expert opinions about Croatian furniture industry (n=100)
76
39
43
2
5
1
1
9
27
15
12
15
9
6
9
20
25
39
19
19
16
4
4
4
20
26
33
34
1
4
12
27
35
37
43
1
6
1
0
0
1
0
0% 20% 40% 60% 80% 100%
Croatian wood industry should be given over toforeigners
Croatia invests sufficient means in its woodindustry
Croatian wood industry lags behind other worldwood industries
Croatian forests are adequately managed
Wood industry is a very important industrialbranch
Wood industry can help Croatia in currenteconomic crises and recession
Wood industry is a promising industry in Croaita
Percent of Respondents (%)
strongly disagree disagree neither agree nor disagree

WoodEMA 2010
24
In their answer to what they perceived as the biggest problems within the Croatian wood industry, where the respondents were offered the possibility of a multiple choice, the largest number of the participants, 20%, opted for inadequate production technology, while 18% of respondents thought design was the biggest problem. Other big problems of the Croatian wood industry included poor management (12% of the total number of respondents), lack of specialized personnel, exaggerated export of raw material, and a shortage of final products, quality and the absence of investments.
In the opinion of the architects, the basic problem of wood industry is the lack of professional people who will be trained to recognize and select the right project of good quality. Such a project will receive a financial incentive for further development of a product/service and its placement on the market only in the later stage. The architects also point out that the wood sector urgently requires work specialization and interest associations (clusters). From their standpoint, the basic problem entails lack of production and poor product design, which the designers also identified as the leading problem. The designers advocate the need for interest associations, and so do most of the journalists, who think that the media have no influence on the development of wood industry. Wood sellers emphasize that the companies within the Croatian wood industry have neither business strategy nor vision and mission. They further state that manufacturers should be more market oriented, should increase the production climate in the sector and should cut down on import. The investors share the opinion of the architects and designers and stress the need for finding experts who will design, develop and place a product on the market. They also believe that the wood industry in undergoing a difficult period with little possibility of recovery in the future unless a good final product with acceptable price, quality and good design is manufactured – ' We buy from the Italians, who wrap it all up more attractively!'
3.3 Expert opinions on the use of wood materials in construction and interior decorating
One of the more important pieces of information is who of the experts in the construction and furnishing process proposes which materials to use for particular interior parts. According to the results in Figure 2, it is the architects who are largely responsible for proposing the materials for floor coverings, ceramics, wood joinery, furniture and constructions. Designers are more involved in proposing the material for furniture manufacture.

WOOD PROCESSING AND FURNITURE MANUFACTURING: present conditions, opportunities and new challenges
25
Figure 2 Experts’ suggestions on the use of material for different parts of the interior (n=63)
The respondents were asked to attribute characteristics and concepts to the materials
used in construction and furnishings (massif wood, concrete, PVC, chipboard, and metal) which would best describe and suit these materials. The range of characteristics included ‘safe’, ‘natural’, ‘pleasant’, ‘ecologically acceptable’, ‘warm’, ‘traditional’, ‘timeless’, ‘reliable’, ‘old-fashioned’, ‘important in the future’, ‘attractive looking’, and ‘trendy’ (modern). Of all the offered materials, the respondents chose massif wood as the material which best integrates all the mentioned characteristics and notions. On the other hand, despite all the positive characteristics, massif wood was also largely proclaimed an old-fashioned material. All the respondents in in-depth interviews also selected wood as the best and the most acceptable material for the manufacture of furniture and interior parts and pointed out that, compared to other materials, its biggest advantage was naturalness and ecological acceptability. However, unlike other materials, it requires more frequent maintenance, which was perceived as a disadvantage. During in-depth interviews, wood sellers stressed that the price of wood was one of the important factors which affects the use of wood in construction and furnishings. This is also one of the main reasons that the demand for PVC joinery is much higher in relation to the demand for wood joinery.
The respondents were also provided with multiple choice answers and asked to give their opinions concerning the use of different materials in construction on the basis of their characteristics. These included water-resistance, renewability, good heat insulator capacity, durability, easy maintenance, competitive price, good insulator, and short construction time. Of all the proposed materials, the respondents denoted massif wood as the material with an exceptionally good heat insulator capacity, renewability, durability and short construction time. In the opinion of the respondents, the price of wood material was perceived as the least acceptable characteristic in relation to other materials.
During in-depth interviews, the sellers were asked how they made a decision on what material or parts of the interior to select for sale in their shops. They said they usually visited European fairs and followed trends in products.
The respondents were asked to indicate which of the materials they would chose for the manufacture of furniture, furniture parts, or the interior, assuming that the price of all the materials was equal. About 80% of respondents selected massif wood as the most desirable material for all
14
19
16
19
11
75
73
73
60
59
6
5
3
19
5
5
3
8
2
25
0% 20% 40% 60% 80% 100%
Floor coverings
Ceramics
Doors/Windows
Furniture
Constructions
Percent of Respondents (%)
Investors Architects

WoodEMA 2010
26
furniture or interior parts, except for shelves and kitchen elements. Of other materials, 27% of the experts pointed out MDF as a desirable material in kitchen manufacture (Figure 3).
Figure 3 Selection of materials for furniture and interior parts by experts in the situation when prices would be equal for all materials (n=63) (multiple responses possible)
Almost all of the 63 respondents (94%) suggested at least once to their clients what
material to use for certain furniture or interior parts. According to Figure 4, in all cases the main criterion for the selection of the material was quality. Quality as the main selection element was the most represented in the choice of material for doors and windows and the least represented in the choice of furniture material. Price was not perceived as an especially important factor in the choice of the material for furniture and parts of the interior.
Architects generally choose materials for certain parts of the interior to suit the concept and type of space; for example, more expensive materials, such as massif, two-layered and three-layered parquet are their preferred choice for dining rooms and living rooms. On the other hand, investors usually select the materials on the basis of end user category; the price and quality of the material are closely integrated elements, meaning that in the case of apartments in lower price classes, the selected materials will be cheaper. Designers give preference to wood over all the other materials due to its naturalness and quality, while on the other hand, sellers choose those materials which reflect the desires and needs of their customers in terms of both price and design.
92
92
89
83
83
81
81
79
63
4
5
8
14
13
17
0
19
33
2
0
2
0
3
0
13
0
3
0% 20% 40% 60% 80% 100%
Chairs
Floors
Beds
Tables
Doors
Closets
Windows
Shelves
Kitchens
Percent of Respondents (%)
Wood (massif) Plywood, MDF PVC

WOOD PROCESSING AND FURNITURE MANUFACTURING: present conditions, opportunities and new challenges
27
Figure 4 Experts' criteria for selecting materials for furniture of interior parts
With regard to the selection of manufacturers/suppliers of furniture or interior parts, the
most important criterion for the majority of the respondents (52%) is quality. This criterion features the highest in the selection of manufacturers/suppliers of doors and windows, but the lowest in the selection of furniture (Figure 5).
Figure 5 Experts' criteria for selecting producers/suppliers of material for furniture or interior parts (n=63)
4
4
11
5
8
74
71
46
81
54
9
4
0
10
5
0
0
6
4
21
39
5
15
0
0
0
9
7
0% 50% 100%
Wood constructions(n=23)
Ceramics (n=24)
Furniture (n=28)
Doors/Windows(n=21)
Floors (n=59)
Percent of Respondents (%)
Price
Quality
Experiences on materialbased on previoususageEcologically friendly
Design
10
14
13
14
13
68
64
52
70
62
8
0
2
10
11
5
5
2
2
2
6
17
28
2
5
0% 20% 40% 60% 80% 100%
Woodconstructions
Ceramics
Furniture
Doors/Windows
Floors
Percent of Respondents (%)
Price
Quality
Previous cooperation
Reference
Delivery
Source of material(domestic or foreign)
Other

WoodEMA 2010
28
During one-to-one interviews, the architects pointed out the following three criteria as the most important in selecting manufacturers/suppliers of wood products: technology, product and „expertise“, meaning professionals. They further stress that the choice of manufacturers/suppliers depends on factors such as the investor, the financial means and the location of construction. Some architects choose their suppliers themselves, while others let investors do the task. When selecting the supplier, the designers also, like architects, frequently visit the suppliers' production plants in order to verify on site the quality of the technology and the assortment of the materials. The question how often they purchased wood products from Croatian manufactures and how often from foreign manufactures elicited the following answers: 44% of the respondents noted they purchased wood products from Croatian manufactures more often than from foreign manufactures. About 30% of the respondents said they purchased wood products equally from Croatian and foreign manufacturers, while 12% of the respondents said they purchased wood products more often from foreign manufactures. Eleven percent said that they did not buy wood products at all, while 5% of the respondents did not answer this question (Figure 6).
The respondents were further asked to give reasons for purchasing either Croatian or foreign wood products. The respondents listed the following as the most common reasons for purchasing Croatian products: familiar origin of the product, its quality and price. Better design was the primary factor for purchasing from foreign producers. 98% of the respondents stated that foreign manufacturers have better product design in relation to Croatian manufactures, and that they are far more advanced in terms of professionalism (this opinion is shared by 81% of respondents)
Figure 6 Expert views on purchasing domestic or foreign wood products (n=93)
More often from Croatian
wood producers
44%
More often from foreign
wood producers
12%
Equally from Croatian and foreign wood
producers 28%
I don't know 5%
I don't buy wood products
11%

WOOD PROCESSING AND FURNITURE MANUFACTURING: present conditions, opportunities and new challenges
29
4 CONCLUSIONS
Experts perceive the Croatian wood industry as a promising branch which can help the country in the current economic situation. On the other hand, the majority of the experts share the opinion that not enough is invested in its development and that the Croatian wood industry lags behind other world industries. Technological development, the problem of design, poor business activities, excessive export of raw material and the lack of final products are considered the biggest problems of wood industry. In most cases, experts see the solution to the problem of wood industry in improved design, use of designer and architect services, and the pooling of companies into clusters.
In relation to other materials, most experts consider wood as high quality material with excellent characteristics, including in the first place renewability and durability. According to the results of both telephone surveys and in-depth interviews, the expert who generally suggests materials for different interior parts is the architect, while the investor makes the final decision which material to select, depending, naturally, on the price of the material itself. In a hypothetical case of equal prices of all the materials, the majority of the experts would opt for wood as the most suitable material for different interior parts.
Most of the respondents have on occasion proposed the material for interior parts. All of the respondents stress that the most important factor in the selection of doors and windows is the quality of the product, while in the choice of furniture, they all emphasize design. Almost one half of the respondents prefer to purchase furniture from Croatian manufactures for reasons of familiar origin and quality. The main drawback of Croatian manufactures is poor design and lack of business professionalism.
REFERENCES
1 Lobe, B. (2006): ZDRUŽIVANJE KVALITATIVNIH IN KVANTITATIVNIH METOD – STARA PRAKSA V NOVI PREOBLEKI?. Družboslovne razprave. 53:55-73.
2 Motik, D, Pirc, A. (2008): POTROŠNJA DRVA I DRVNIH PROIZVODA U REPUBLICI HRVATSKOJ – MODELI IZRAČUNA I TRENDOVI, Međunarodno savjetovanje Drvo je prvo- svojstva, tehnologija, valorizacija, primjena. 45-48.
3 Porter, M.E. (2008): KONKURENTSKA PREDNOST, Masmedia, Zagreb. 4 Predovic, Dolly. (2007): VREDNOVANJE MARKE, Mate, Zagreb. 5 *** (2009): ISTRAŽIVANJE TRŽIŠTA ZA POTREBE KAMPANJE 'DRVO JE PRVO', Hrvatska
Gospodarska Komora, Zagreb.
Authors' addresses: Assoc.Prof. Darko Motik, PhD. Andreja Pirc, B.Sc. University of Zagreb Faculty of Forestry Svetosimunska 25 HR-10000 Zagreb, Croatia e-mail: [email protected]; [email protected]

WoodEMA 2010
30

WOOD PROCESSING AND FURNITURE MANUFACTURING: present conditions, opportunities and new challenges
31
MAIN USES OF WOOD IN THE SLOVAK REPUBLIC
Jan Parobek, Hubert Palus
ABSTRACT
This paper deals with the description of the main uses of timber in the Slovak Republic. The analysis is based on the available national statistical data in order to outline the main flows of wood classified according to main ways of use. The national roundwood quality classification standards are used to define main categories of timber use for coniferous and non-coniferous timber. Elementary analytic tools are used to determine wood balance and estimate consumption of timber in different sectors of forest industry. Key words: wood uses, wood balance, consupmtion
1 INTRODUCTION
Forests cover about 42 % of territory (2 mil. ha) of Slovakia. Broadleaved forests represent 57% (beech 31% hornbeam 5.5%, oak 11%) and coniferous forests 43% (spruce 26%, pine 7.2%, fir 4.2%) with a good quality of total growing stock more than 439 million m3. The average growing stock per hectare is more than 220 m3, which highly overtops the European average. Available wood resources are important basis for timber production and consequently for wood processing industry. Territorial and commodity structure of timber flows and the main ways of timber use are determined to a great extent by general globalisation trends, free market economy and open trade possibilities. These factors also significantly influence business relations between timber sellers and buyers (Paluš, Šulek, Parobek, 2007). Wood is one of the most versatile renewable materials. Different ways of use have strong influence on wood resources and wood supply. There is a lack of information about this field in Slovakia. Present structures of production require large value of primary wood materials which are processed into products, transported, consumed and at the end discarded as waste.
2 MATERIAL FLOW ANALYSIS
Economy-wide material flow analysis (MFA) and balances and the indicators derived from them are descriptive tools aiming to provide information on the material and energy coming into and leaving a society/economy. They are conceptually based on a simple environment-economy model where the latter is embedded into the former (figure 1). The economy is connected with the surrounding environment via material and energy flows [1]

WoodEMA 2010
32
Source [1]
Figure 1 The economy/environment system
Hekkert et al. (2000) states that understanding of wood flows and material metabolism is
likely to contribute to more sustainable production and consumption. For forestry sector as well as any company it is possible to use MFA, which intends to support understanding by providing insight into the volume, the structure, and the regulating mechanisms of material flows. The analysis refers to accounts in units (usually in terms of meter cubic or ton) comprising the extraction, production, transformation, consumption, recycling and disposal of materials. Various methods exist which cover approaches such as substance flow analysis, product flow accounts, material balancing and bulk material accounts. MFA has been used for wood processing industry in different countries and is a suitable method to be used in any other industry sector.
In association with forest sector, the analysis provides relevant information about the consumption of wood as a material. Monitoring of wood use could be problematic for final productions of specific commodities, as well as, semi products as wood waste, which could be use for next processing. This is important information since final data of products and materials consumption are hard to obtain. Wood flows could be described by three dimensions. The first dimension is territorial and indicates the origin or destination of the wood and wood products flows (domestic or foreign). The second dimension is a product – chain or life cycle dimension accounting for direct (as input) and indirect wood and wood products flows. The third dimension is product dimension which describes enter of wood and wood product to any wood processing (or other) industry or not. (if wood and how much of wood is used or unused) (Parobek, Paluš, Kaputa, 2009).
The analysis of wood flow can be considered in two different ways. Firstly, the analysis can concentrate on the wood balance with the aim to determine consumption or any other category. Secondly, wood balance can be understood more complexly with concentrating on resources and sustainability.
3 METHODOLOGY
For the purposes of this paper wood balance approach with the aim to determine wood consumption in different sectors is used. The wood balance method was usually used to determine consumption as a rest calculation of more or less available statistics and for policy reasons different supply rates were calculated (e.g. to determine the dependence of imports). In the course of time special topics have been analysed (separate paper and wood balances, tropical wood balance etc.). The analysis uses information from the side of resources (production or supply) and the side of use (consumption or demand). Data on import and export are also used. The complete analysis should consider all primary and secondary fibres on the resource side (table 1).
energy energy
EEnnvviirroonnmmeenntt
SSoocciieettyy // EEccoonnoommyy
materials materials
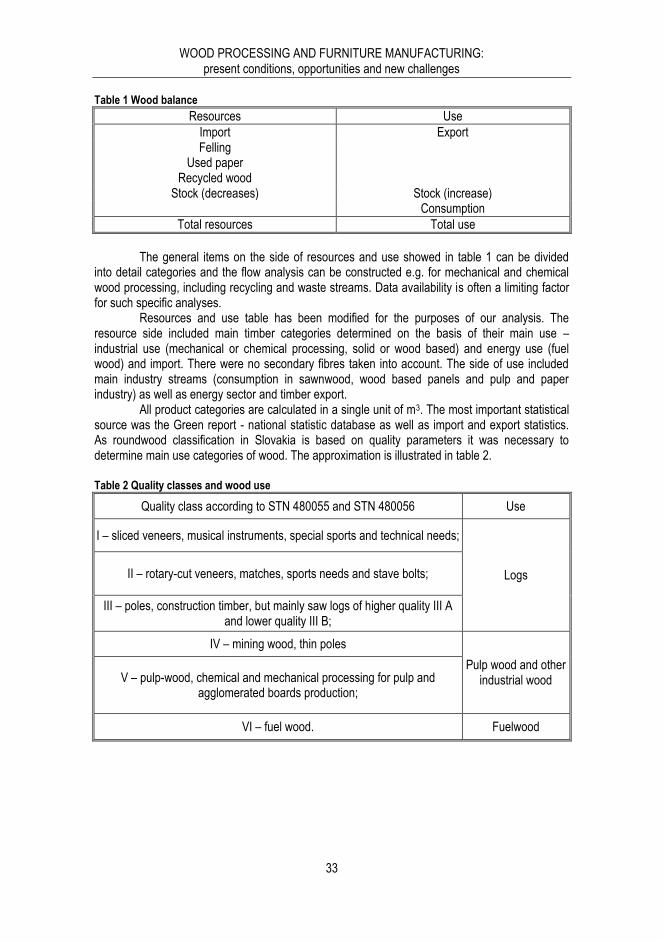
WOOD PROCESSING AND FURNITURE MANUFACTURING: present conditions, opportunities and new challenges
33
Table 1 Wood balance
Resources Use
Import Export Felling
Used paper Recycled wood
Stock (decreases) Stock (increase) Consumption
Total resources Total use
The general items on the side of resources and use showed in table 1 can be divided
into detail categories and the flow analysis can be constructed e.g. for mechanical and chemical wood processing, including recycling and waste streams. Data availability is often a limiting factor for such specific analyses.
Resources and use table has been modified for the purposes of our analysis. The resource side included main timber categories determined on the basis of their main use – industrial use (mechanical or chemical processing, solid or wood based) and energy use (fuel wood) and import. There were no secondary fibres taken into account. The side of use included main industry streams (consumption in sawnwood, wood based panels and pulp and paper industry) as well as energy sector and timber export.
All product categories are calculated in a single unit of m3. The most important statistical source was the Green report - national statistic database as well as import and export statistics. As roundwood classification in Slovakia is based on quality parameters it was necessary to determine main use categories of wood. The approximation is illustrated in table 2.
Table 2 Quality classes and wood use
Quality class according to STN 480055 and STN 480056 Use
I – sliced veneers, musical instruments, special sports and technical needs;
Logs II – rotary-cut veneers, matches, sports needs and stave bolts;
III – poles, construction timber, but mainly saw logs of higher quality III A and lower quality III B;
IV – mining wood, thin poles
Pulp wood and other industrial wood V – pulp-wood, chemical and mechanical processing for pulp and
agglomerated boards production;
VI – fuel wood. Fuelwood

WoodEMA 2010
34
All other timber quality categories included in the structure of timber deliveries (whole lengths, sold standing timber) were proportionally divided into the main use categories on the basis of average share of timber assortments on the total deliveries. When possible, for the main wood use classes the following item categories were analysed: felling (F), domestic deliveries (DD), timber producer exports (TPE), timber merchant exports (TME), total exports (TE), total imports (TI), own consumption of timber producers (OC), consumption (CO), stock (S).
The following relations apply: F = DD + TPE + S [1] TE = TPE + TME [2] CO = F + TI – TE +/- S [3]
4 RESULTS
The analysis of roundwood flows has been done according to data of 2007. This year can be considered as a standard year in timber trade in Slovakia reflecting the previous economic development on the market. The data from 2007 are not distorted by economic crisis as well as the wind storm calamity in the High Tatras region in 2004.
Figure 2 describes flows of different use categories of roundwood from the producers to the primary processing industry. This flow chart differentiates between the log and pulpwood flows as well as between coniferous and non-coniferous and presents the complete flow of roundwood from the forestry production to consumption. In Slovakia almost 92% of felling is utilised for domestic deliveries. The timber producers export about 0.29 mil. m3 of roundwood (mostly coniferous wood), but the total export is much higher (1.46 mil. m3) as a result of timber merchant exports.

WOOD PROCESSING AND FURNITURE MANUFACTURING: present conditions, opportunities and new challenges
35
Figure 2 Wood flows in the Slovak Republic 2007
There is a paradox in the Slovak wood supply concerning wood species. As mentioned
above, broadleaved forests represent 57% and coniferous forests 43% of the forest area, however due to more productive coniferous forest stands the wood supply in Slovakia is represented almost 64% of coniferous wood. This is also a reflection of strong demand for coniferous timber (especially sawlogs). On one side the demand of wood processing industry (mainly sawmilling industry) is mostly for coniferous sawlogs, on the other side the demand for non-coniferous pulpwood is dominantly created by pulp and paper industry. As for timber export, there is 0.923 mil. m3 of coniferous wood exported compared to 0.534 mil. m3 of non-coniferous. In 2007 timber import was 0.41 mil. m3 (84% non-coniferous). Even if there are sufficient resources of broadleaved species available in the forests the rate of harvest is below the annual increment. This is mainly caused by low demand for beech logs and non-existing processing capacities in domestic industry.
The gap calculated in wood balance can help to estimate wood consumption as a difference between deliveries, export, import and change of stock. For 2007 we estimated that domestic consumption of timber was about 6.65 mil. m3 and timber stock increased by 0.5 mil. m3. These results strongly depend on felling volume and foreign timber trade.
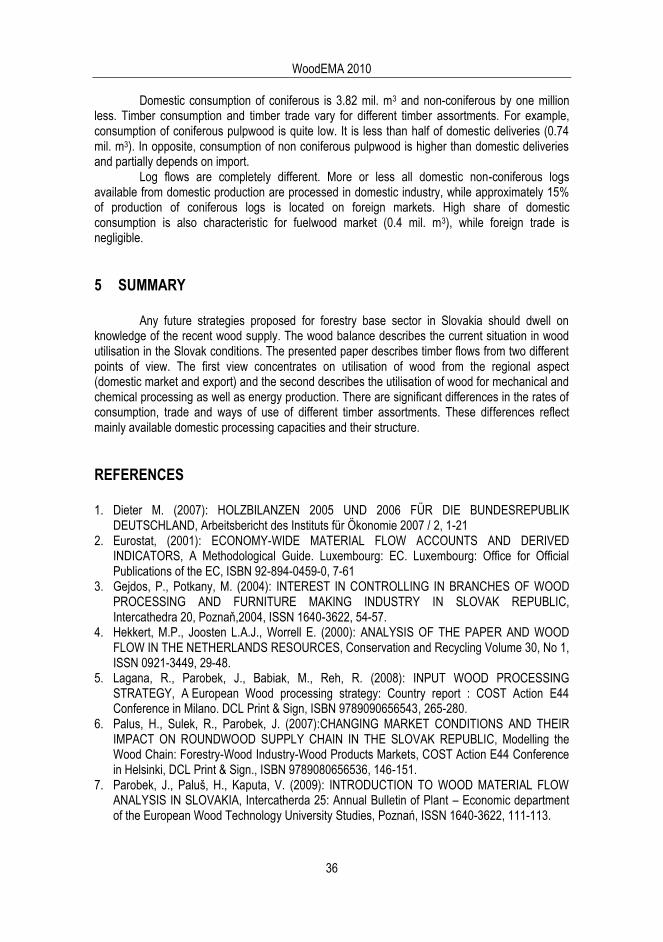
WoodEMA 2010
36
Domestic consumption of coniferous is 3.82 mil. m3 and non-coniferous by one million less. Timber consumption and timber trade vary for different timber assortments. For example, consumption of coniferous pulpwood is quite low. It is less than half of domestic deliveries (0.74 mil. m3). In opposite, consumption of non coniferous pulpwood is higher than domestic deliveries and partially depends on import.
Log flows are completely different. More or less all domestic non-coniferous logs available from domestic production are processed in domestic industry, while approximately 15% of production of coniferous logs is located on foreign markets. High share of domestic consumption is also characteristic for fuelwood market (0.4 mil. m3), while foreign trade is negligible.
5 SUMMARY
Any future strategies proposed for forestry base sector in Slovakia should dwell on knowledge of the recent wood supply. The wood balance describes the current situation in wood utilisation in the Slovak conditions. The presented paper describes timber flows from two different points of view. The first view concentrates on utilisation of wood from the regional aspect (domestic market and export) and the second describes the utilisation of wood for mechanical and chemical processing as well as energy production. There are significant differences in the rates of consumption, trade and ways of use of different timber assortments. These differences reflect mainly available domestic processing capacities and their structure.
REFERENCES
1. Dieter M. (2007): HOLZBILANZEN 2005 UND 2006 FÜR DIE BUNDESREPUBLIK DEUTSCHLAND, Arbeitsbericht des Instituts für Ökonomie 2007 / 2, 1-21
2. Eurostat, (2001): ECONOMY-WIDE MATERIAL FLOW ACCOUNTS AND DERIVED INDICATORS, A Methodological Guide. Luxembourg: EC. Luxembourg: Office for Official Publications of the EC, ISBN 92-894-0459-0, 7-61
3. Gejdos, P., Potkany, M. (2004): INTEREST IN CONTROLLING IN BRANCHES OF WOOD PROCESSING AND FURNITURE MAKING INDUSTRY IN SLOVAK REPUBLIC, Intercathedra 20, Poznaň,2004, ISSN 1640-3622, 54-57.
4. Hekkert, M.P., Joosten L.A.J., Worrell E. (2000): ANALYSIS OF THE PAPER AND WOOD FLOW IN THE NETHERLANDS RESOURCES, Conservation and Recycling Volume 30, No 1, ISSN 0921-3449, 29-48.
5. Lagana, R., Parobek, J., Babiak, M., Reh, R. (2008): INPUT WOOD PROCESSING STRATEGY, A European Wood processing strategy: Country report : COST Action E44 Conference in Milano. DCL Print & Sign, ISBN 9789090656543, 265-280.
6. Palus, H., Sulek, R., Parobek, J. (2007):CHANGING MARKET CONDITIONS AND THEIR IMPACT ON ROUNDWOOD SUPPLY CHAIN IN THE SLOVAK REPUBLIC, Modelling the Wood Chain: Forestry-Wood Industry-Wood Products Markets, COST Action E44 Conference in Helsinki, DCL Print & Sign., ISBN 9789080656536, 146-151.
7. Parobek, J., Paluš, H., Kaputa, V. (2009): INTRODUCTION TO WOOD MATERIAL FLOW ANALYSIS IN SLOVAKIA, Intercatherda 25: Annual Bulletin of Plant – Economic department of the European Wood Technology University Studies, Poznań, ISSN 1640-3622, 111-113.

WOOD PROCESSING AND FURNITURE MANUFACTURING: present conditions, opportunities and new challenges
37
Authors' addresses:
Jan Parobek, PhD. assoc. prof. Hubert Palus, PhD. Department of marketing, trade and world forestry Faculty of wood sciences and technology Technical University in Zvolen T.G. Masaryka 24 Zvolen, 960 53, Slovakia e-mail: [email protected], [email protected]

WoodEMA 2010
38

WOOD PROCESSING AND FURNITURE MANUFACTURING: present conditions, opportunities and new challenges
39
IMPACT OF WORLD ECONOMIC CRISIS ON FLOORING MARKET IN EUROPE
Slavica Petrović, Predrag Sretenović, Ljiljana Pajović
ABSTRACT
The paper7 shows research results for wood flooring markets in FEP member states in the period 2000-2009. Regarding significant changes it caused, impact of the world economic crisis on flooring production and consumption in the stated countries was separately analyzed. Analysis included wood flooring market in Serbia as well, its development and changes which occurred in the period after initial foreign investments at the end of 2005.
Key words: wood flooring, production, consumption, world economic crisis
1 INTRODUCTION
During the analyzed period, wood flooring market in Europe suffered significant changes, influenced by numerous factors. Industry and economy growth in Far East countries such as China, Indonesia and Malaysia significantly reflected on European economy. European producers were under the strong pressure of unfair competition as the products imported from these countries had significantly lower price than the ones produced in Europe. Faced with such market conditions, numerous European producers dislocated their factories into the Far East countries in order to reduce own production costs. Such business policy is one of the reasons for the change in order of the biggest flooring producers in Europe during 2008.
Except strong competition of products from Asian continent, wood flooring market in Europe has been under strong pressure of laminate flooring market for years. In the period 2000-2009, wood flooring had market share in the interval of 5-6% of total consumption of floorings in Europe. Simultaneously, share of laminate floorings in total flooring consumption was 10.6% in 2003 and 13.9% in 2008.
However, beside numerous problems which producers faced, flooring production in Europe had steadily increased until the world economic crisis came in 2008. Reduction of civil engineering activities in almost all European countries resulted in both fewer newly constructed buildings and fewer renovated buildings. Production decrease was followed by the drop in flooring consumption which was marked in 2009 in all European countries.
Flooring market in Serbia significantly changed during the analyzed period, just like the European market. Impact of the world economic crisis was felt during 2009, not earlier, which caused production decrease and direct reduction of export value. From the aspect of foreign trade
7 The paper is financially supported by the Ministry of Science and Technological Development of the Republic of Serbia within the project: Development and application of the new visual identity for wood floorings from Serbia in the function of increasing their competitive value on the market of the European Union.

WoodEMA 2010
40
balance, wood floorings are a very important group of products because significant surplus is achieved every year with their export.
2 SCOPE AND OBJECTIVE OF THE PAPER
In this paper, research of production and consumption of wood floorings in FEP member states was done, with special analysis of the biggest flooring producers and consumers. The research included wood species used for flooring production since oak has been the most present wood species for many years, while the usage of beech is constantly decreasing. Such participation of wood species in flooring production is highly unfavorable for producers from Serbia because beech is dominant in the structure of Serbian forest fund.
The main objective of the paper is analysis of wood flooring market in Serbia in order to observe the position of these products on European markets. Until 2005, solid parquet and ship decking were produced most and the most significant markets for the placement of these products were former SFRY republics. Since multilayer parquet has been dominant in the structure of flooring production since 2005, the most significant markets for the placement of this product type have changed as well.
3 METHOD OF WORK
For the purpose of research in this paper the methodology of analyzing available information and literature sources on Internet websites of European flooring producers was used as well as websites of the most important associations of producers and exporters of floorings in Europe and the world.
Research of Serbian market regarding the production of certain wood flooring types was done with surveying method, i.e. by interviewing the most significant producers. Beside analysis method, special scientific methods were used for the research as well such as synthesis and generalization method, while from general scientific methods inductive-deductive method of concluding was used.
4 PRODUCTION OF WOOD FLOORINGS IN FEP MEMBER STATES
After nine years of constant increase, production of wood floorings in FEP member states decreased by 15.6% to 84.7 million m2, influenced by the world economic crisis.8 Impact of the recession on the market of wood floorings was so strong that in all analyzed countries production drop was recorded. The biggest production drop rates were recorded in Sweden (29.4%), Netherlands (28.3%) and Slovakia (25.5%) (table 1). A lot of producers around Europe reduced the number of shifts during work days and the utilization degree of their capacities due to the new situation which arose. Also, certain producers stopped production by introducing forced vacations or prolonging legally prescribed time for religious and other holidays. In order to overcome this new situation, producers reacted by changing prices of their products, thus in
8 Collective results of production for FEP member states: Sweden, Belgium, Switzerland, the Czech Republic, Austria, Germany, Italy, Spain, France, Romania, Poland, Hungary, Netherlands, Norway, Finland, Denmark

WOOD PROCESSING AND FURNITURE MANUFACTURING: present conditions, opportunities and new challenges
41
Austria and Germany they were increased on average by 2% to 8%. Prices were increased for long strip parquet and ship decking produced from oak and tropical wood species, while the prices for parquet from light wood species, such as beech and maple, dropped. Certain number of producers kept the same prices for floorings and decided to wait for a certain time period in order to perceive the direction of further recession development.
Table 1 Increase/decrease rates for production of wood floorings in certain FEP countries in the period 2000-2009
Countries Increase/decrease rates (%)
00/01 02/01 03/02 04/03 05/04 06/05 07/06 08/07 09/08
Sweden 7.2 -10.5 8.0 30.8 -3.3 -9.2 -1.5 -29.4 - 22.5
Poland 25.8 15.9 23.8 2.3 13.6 28.3 -8.4 -22.6
Germany -11.3 -2.2 4.1 5.5 7.3 10.3 0.8 -15.1 -9.4
Spain 9.2 33.3 9.4 23.4 8.9 0.01 3.6 -18.5 -19.9
Denmark/Finland Norway
-0.8 1.9 11.6 -6.8 -21.2 -17.4 -30.3
France 0.1 5.7 2.0 1.3 21.8 -20.0 -17.0
Austria -2.2 2.7 37.0 16.7 30.7 -6.4 -4.5 -9.5 -5.0
Although forecasts for 2009 were optimistic, production in all FEP member states
decreased by 20.3% to 67.52 million m2. The biggest production drop was recorded in Hungary (-44.5%), Netherlands (-36.1%), Italy (-34.5%) and cluster of Nordic countries (-30.3%). East European Countries were also under extremely strong pressure of recession, while on the markets of Austria and Germany there was a slight recovery and reduction of decrease rates. Deepening of recession caused new problems for producers as the prices of wood and other materials (glues and means for surface coating) used in flooring production increased. Prices of softwood used for middle layer in the production of multilayer parquet increased by 5 to 13% depending on the region of their production.
Prices of freezes and strips of oak, American walnut and other tropical species also increased. Sharp decrease of the value of Euro compared to Dollar had a particular impact on the price increase of tropical species. Due to wood raw material with increasing prices, multilayer parquet will be produced with thinner upper layer in the following period.
4.1. The biggest producers of wood floorings among FEP countries
In Poland, Germany, Sweden and Austria in 2009, more than a half (56.8%) of total wood flooring production of FEP member states was produced, where Poland participated with 17.5%, Germany with 14.8%, Sweden with 13.8% and Austria with 10.7%.
World economic crisis had an impact on the order of the biggest wood flooring producers in FEP countries, apart from the impact on production drop. Although it was the leader for many years, Sweden fell to the second position of the biggest producers in 2008 and to the third position in 2009. However, flooring production in this country started its decrease in 2005, when a drop of 3.3% was recorded. The same trend continued during 2006 and 2007 when drop rates of 9.2% and 1.5% respectively were recorded (graph 1). As a result of the five-year negative trend, flooring

WoodEMA 2010
42
production in Sweden decreased by 47.3%, namely, from 19.65 million m2 (2004) to 9.3 million m2
(2009).
Unlike Sweden, production of floorings in Poland increased by almost 2.5 times in the
period 2001-2007. Since it had the lowest decrease rate compared to other big producers, Poland became the leader in flooring production in Europe in 2008. It kept the same position in 2009 as well when it realized the production of 11.81 million m2. Apart from being the biggest producer, Poland is also the biggest exported of floorings in Europe, and the most significant markets on which it places its products are Scandinavian countries, Germany, Russia, France, Spain and the USA. In production structure three-layer parquet is dominant, while solid parquet is much less present, and the production of mosaic parquet is symbolic.
With the production of 10.0 million m2 in 2009, Germany became the second most important producer in Europe. The stated production level was achieved due to the increase of production of primarily multilayer parquet which is dominant in production structure. Apart from multilayer parquet, the production of solid parquet 10 mm thick also increased, while the production of parquet 14/16 and 22 mm thick decreased.
Countries of the Nordic cluster, France and Italy had relatively stable production until 2007, while Spain had an expressed growth trend. Under the impact of recession, in 2008 production decreased in all countries except Italy, where the recession was felt in 2009. Unlike other countries, flooring production in Italy is characterized with dominant participation of two-layer parquet (60%:2008), while three-layer parquet participated with 26%, solid parquet with 12%, and mosaic with 2%.
4.2. Structure of wood flooring production
Analysis of the structure of total flooring production in FEP member states in the period 2000-2009 shows dominant participation of multilayer parquet (graph 2). In total production of 2009, multilayer parquet participated with 78%, while solid parquet participated with 16%, and mosaic and lamparquet with 3% respectively. Production of multilayer parquet increased from 48.0
Graph 1 Production of wood floorings by countries in the period 2000-2009
0
5
10
15
20
25
AT B
ECH C
Z DE
ES
FRH
U IT NL PL
RO
DK
/FIN
/NO
SE
mil
lio
n m
2
2000 2001 2002 2003 2004 2005 2006 2007 2008 2009

WOOD PROCESSING AND FURNITURE MANUFACTURING: present conditions, opportunities and new challenges
43
million m2, the figure from 2000, to the record of 77.35 million m2 in 2006. During 2007, the participation of multilayer parquet in total production decreased for the account of solid parquet, the production of which reached maximum value of 19.1 million m2. Regarding the drop of total production, during 2008 and 2009, production of multilayer parquet decreased to 65.23 million m2 and 51.23 million m2 respectively.
Except in 2002, production of lamparquet had a negative trend in all years of the analyzed period. Such a trend resulted in production drop from 6.0 million m2 in 2000 to 1.96 million m2 in 2009. Production of mosaic parquet also had a negative trend during the analyzed period so that it was only 1.97 million m2 in 2009.
4.3. Wood species used for flooring production
For many years wood floorings in Europe are mostly produced from oak. In total flooring production of FEP countries, participation of oak increased from 42.6% in 2001 to 62.8% in 2009. Increase of oak participation impacted on the decrease of other significant wood species in flooring production. With the participation of 21.7%, beech was on the second position, while tropical species took the third position with 9.2% according to their participation in flooring production. In the next four years the participation of beech fell to 9.4% while the participation of tropical species increased to 16.6%. Negative trend of beech utilization continued until 2009 when it participated with 5.9%. Among other hardwood species, ash should be mentioned, the participation of which was 6.5% in flooring production in 2009 (Source: FEP).
Participation of tropical wood species in flooring production started to drop from 2006 and in 2009 it was 10.2%. Production of floorings made of tropical species decreased in almost all FEP countries, and the biggest drop occurred in Austria, Netherlands, Italy and France (table 2).9
The main reason for decreasing the usage of tropical species is connected with the problem of regular supply of flooring producers, whose orders were defined according to the just-in-time system, which the producers of strips made of tropical wood cannot fulfill. The second
9 Data for Sweden, Denmark/Norway/Finland, Romania and Slovakia are not available.
Graph 2 Production of parquet by types in the period 2000-2009
0
20
40
60
80
100
2000 2001 2002 2003 2004 2005 2006 2007 2008 2009
mil
lio
n m
2
lam mosaic solid multilayer
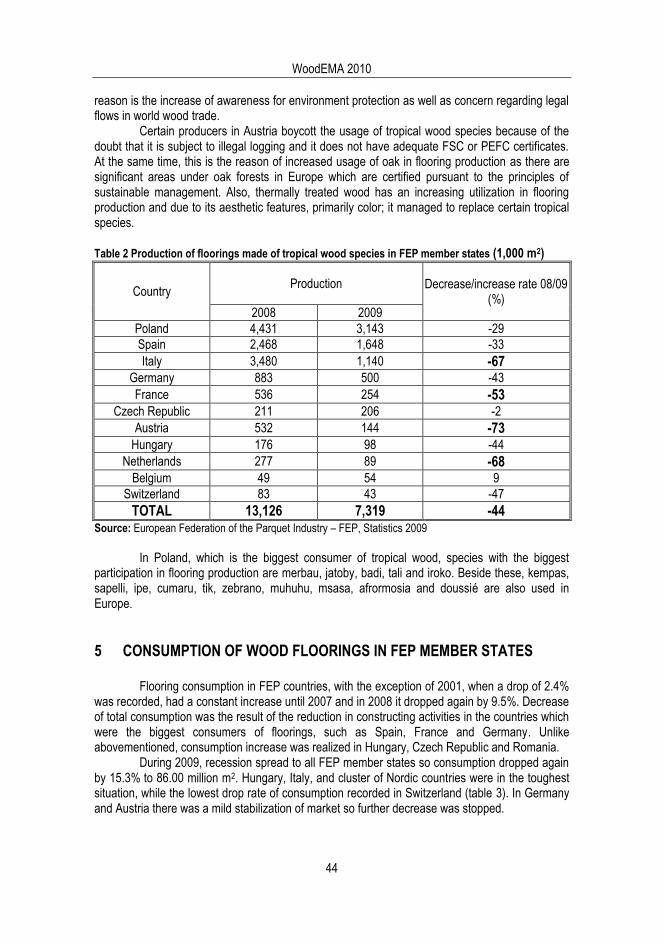
WoodEMA 2010
44
reason is the increase of awareness for environment protection as well as concern regarding legal flows in world wood trade.
Certain producers in Austria boycott the usage of tropical wood species because of the doubt that it is subject to illegal logging and it does not have adequate FSC or PEFC certificates. At the same time, this is the reason of increased usage of oak in flooring production as there are significant areas under oak forests in Europe which are certified pursuant to the principles of sustainable management. Also, thermally treated wood has an increasing utilization in flooring production and due to its aesthetic features, primarily color; it managed to replace certain tropical species.
Table 2 Production of floorings made of tropical wood species in FEP member states (1,000 m2)
Country Production Decrease/increase rate 08/09
(%) 2008 2009
Poland 4,431 3,143 -29
Spain 2,468 1,648 -33
Italy 3,480 1,140 -67 Germany 883 500 -43
France 536 254 -53 Czech Republic 211 206 -2
Austria 532 144 -73 Hungary 176 98 -44
Netherlands 277 89 -68 Belgium 49 54 9
Switzerland 83 43 -47
TOTAL 13,126 7,319 -44 Source: European Federation of the Parquet Industry – FEP, Statistics 2009
In Poland, which is the biggest consumer of tropical wood, species with the biggest
participation in flooring production are merbau, jatoby, badi, tali and iroko. Beside these, kempas, sapelli, ipe, cumaru, tik, zebrano, muhuhu, msasa, afrormosia and doussié are also used in Europe.
5 CONSUMPTION OF WOOD FLOORINGS IN FEP MEMBER STATES
Flooring consumption in FEP countries, with the exception of 2001, when a drop of 2.4% was recorded, had a constant increase until 2007 and in 2008 it dropped again by 9.5%. Decrease of total consumption was the result of the reduction in constructing activities in the countries which were the biggest consumers of floorings, such as Spain, France and Germany. Unlike abovementioned, consumption increase was realized in Hungary, Czech Republic and Romania.
During 2009, recession spread to all FEP member states so consumption dropped again by 15.3% to 86.00 million m2. Hungary, Italy, and cluster of Nordic countries were in the toughest situation, while the lowest drop rate of consumption recorded in Switzerland (table 3). In Germany and Austria there was a mild stabilization of market so further decrease was stopped.

WOOD PROCESSING AND FURNITURE MANUFACTURING: present conditions, opportunities and new challenges
45
Table 3 Decrease rates of consumption in FEP member states during 2008 and 2009
Country Increase/decrease rates
08/07 (%)
Decrease rates 09/08 (%)
Hungary 20.8 - 41.4
Italy - 7.2 -25.0
Denmark/Finland/Norway - 11.9 -25.5
Sweden - 5.5 -22.1
Spain - 21.8 -19.8
Slovakia -9.2 -24.0
Poland -0.4 -19.0
Netherlands -2.9 -14.2
Czech Republic 15.3 -13.2
Germany - 13.6 -11.4
Romania 11.1 -10.0
Belgium 0.2 -7.5
France - 15.0 -5.5
Austria - 9.5 -4.0
Switzerland 3.5 -1.8
5.1. Biggest consumers of wood floorings
Germany, Spain and Italy have been for many years three biggest consumers as well as importers of wood floorings among FEP member states. However, for several years consumption in Germany has been showing decrease tendency as it decreased from it was 24.82 million m2 in 2000 to 15.83 million m2 in 2009 (graph 3). In consumption and import structure multilayer parquet is dominant and one third of this parquet type is imported from Austria. Poland is the second country by significance for import of floorings into Germany, followed by China, Indonesia, Thailand, Switzerland and Sweden. Unlike import, European countries are the most significant for the export of parquet from Germany, namely, Austria, France, Italy and Norway.
Until recession, consumption in Spain constantly increased and in 2007 it reached the maximum level of 17.98 million m2, but in the following two years it dropped by 37.3%. Consumption trend in Italy in the same period was completely different than in Germany and Spain. In Italy the consumption was relatively stable until 2007 and in the first year of recession only a mild drop was recorded. Owing to the drop of constructing activities, when 9.2% less residential buildings, 7.3% less business and industrial buildings and 7.3% less public facilities were constructed, consumption of floorings in Italy decreased by 25.0% in 2009. Analyzing by areas, it can be concluded that consumption is the biggest in northeast and northwest part of the country (30% respectively), followed by the central part (25%), and the least is on the south of the country and on the islands (15%). During 2008, half of the total amount of parquet sold on this market is distributed through salons for selling bathroom equipment. Second most important distribution channel is companies for parquet installation and placement through which 20% was

WoodEMA 2010
46
placed, while suppliers of construction material and salons for selling chairs placed on the market 10% and 7% of the parquet respectively.
Austria had the biggest consumption of wood floorings per capita in 2009 (0.76 m2),
Switzerland was the second (0.68 m2) and Sweden was the third (0.57 m2). Consumption per capita in FEP countries fell in 2009 to 0.21 m2.
5.2. Export and import of wood floorings in FEP member states
FEP member states realized the biggest import of wood floorings in 2006 in the amount of 55 million m2. During 2007 and 2008, import decreased by 36.4% and 14.3% respectively (graph 4).10 Unlike import, export was relatively stable and ranged from 14 million m2 (2002) to the maximum of 22 million m2 (2005).
Import analysis did not include Great Britain, as it is not FEP member, but it is necessary to highlight that this country is one of the biggest importers of floorings in Europe. In favor of this is the fact that in 2007 Great Britain imported 60,000 tons of floorings from China only and thus became the third most important market for the export of floorings from China. In the same year, China realized the biggest export into the USA (100,000 tons), followed by Canada (70,000 tons). Except from China, European countries import significant amounts of floorings from other Far East countries as well, such as Indonesia, Malaysia and Vietnam.
10 As Great Britain is not a FEP member, it was not included in the analysis
Graph 3 Parquet consumption by countries in the period 2000-2009
0
5
10
15
20
25
30
SE AT B
ECH C
Z DE
ES
FR
HU IT N
L PL
RO
DK
/FIN
/NO
mil
lio
n m
2
2000 2001 2002 2003 2004 2005 2006 2007 2008 2009

WOOD PROCESSING AND FURNITURE MANUFACTURING: present conditions, opportunities and new challenges
47
Decrease of import of floorings in Europe results primarily from the reduction of import of
floorings made of tropical wood species, which is explained by the rise of value of US dollar compared to Euro. In 2008, this relation ranged from 1.0 to 1.25 US dollars for one Euro, which created the difference of ± 12.5% compared to the mean value of 1.425.
During 2009 in China domestic currency increased compared to Euro (new ratio is 9:1 instead of 10.75:1) due to which the price of wood floorings increased and their import in Europe decreased. Also, constant rise of oil price impacted on the increase of flooring prices imported from China, due to which overseas transport became more expensive. Because of all defined above, negative trend of flooring import from China it is expected to continue in the following period as well and that the import will increase from Indonesia, Brazil and similar countries where national currencies dropped.
During 2009, in Indonesia the value of one Euro ranged in the interval from 12,300 to 16,000 rupiahs, which had an influence on price drops for wood floorings. In Brazil, national currency devaluated from 2.4 to 3.4 compared to Euro from September 2008. Because of such a situation, importers from Europe asked for price reductions for the imported products, which Brazilian exporters had to accept. Here it should be mentioned that Brazil is the main exporter of floorings produced from tropical species such as ipe, jatoby, cabreuva and masaranduba.
Reduction of import from China occurred also due to the problems which wood flooring production faces in this country. After 12 years of constant increase, in 2008 production of all flooring types decreased by 4.8% (table 4). The biggest drop occurred in the production of laminate floorings which represented 57.5% of total flooring production. Because of the problems with the supply of raw material, since China imports significant amounts of wood, and due to price increase of the raw material, production of solid parquet dropped in the period 2004 – 2008 by 40%. Production decrease of solid parquet was followed by production increase of multilayer parquet, which increased by 136.4% during five years. Besides, in previous years, market of solid parquet was under the strong influence of bamboo flooring market the production of which increased 5.2 times in the same period.
Graph 4 Export and import of parquet in Europe in the period 2000 – 2008
0
10
20
30
40
50
60
2000 2001 2002 2003 2004 2005 2006 2007 2008
mil
lio
n m
2
Import Export

WoodEMA 2010
48
Table 4 Production of floorings in China in the period 2004-2008
Flooring type 2004 2005 2006 2007 2008 2008/2007
%
million m2
Laminate 150 190 200 220 198 -10.0
Multilayer parquet 33 46 60 75 78 4.0
Solid parquet 70 50 45 44 42 -4.5
Bamboo floorings 5 6 25 20 26 18.2
Total 258 292 330 361 344 -4.8
6 MARKET OF WOOD FLOORINGS IN SERBIA
Analysis of wood flooring market in Serbia needs to be done for two periods, since after the first capacities for the production of multilayer parquet were installed the situation on the market changed. Until 2005, solid parquet and ship decking were traditional wood flooring types produced in Serbia. With the construction of the first factory for the production of multilayer parquet with the capacity of 2 million m2, this type of wood flooring achieved the biggest participation in the structure of flooring production in Serbia. In 2006 in Serbia 2,361,651 m2 of wood floorings was produced, out of which 1,200,000 m2 was multilayer parquet, or 50.8%, while the production of solid parquet was 1,033,051 m2 or 43.7%, and the production of ship decking was 66,599 m2 11. During 2008 capacities for the production of multilayer parquet were increased to 3.0 million m2, which enabled new rise in production of this type of floorings.
Unlike the production of multilayer parquet, there are no big factories in Serbia with production capacities over 200,000 m2 for the production of solid parquet. Most factories have annual production up to 50,000 m2. Five medium-sized factories, with production up to 200,000 m2, produce 51% of the total annual production of solid parquet, while the rest of twenty-four factories produce 49%.
During the period 1999-2005, export value of wood floorings from Serbia was relatively low and ranged from 2.54 million US$ (1999) to 6.65 million US$ (2005). In this period, the most significant countries for exporting wood floorings from Serbia were the Republics of the former SFRY, among which Macedonia and Bosnia and Herzegovina. Also, in the same period Serbia exported solid parquet and ship decking to Great Britain, Germany and Austria. Owing to the production of multilayer parquet, export in 2006 increased by 174.6% and reached the value of 18.25 million US$ (graph 5). The same trend continued in 2007 and 2008 as well, when the export of 41.19 million US$ and 50.49 million US$ was achieved. Consequences of the world economic crisis on flooring market in Serbia were felt not earlier than 2009 when export fell by 31.33%.
11 Žarković M.(2008):Tržište podova od drveta u Srbiji-razvoj i problemi, Specialist thesis, Faculty of Forestry, Belgrade

WOOD PROCESSING AND FURNITURE MANUFACTURING: present conditions, opportunities and new challenges
49
From 2006 Russia, Sweden, Ukraine and Romania became the most significant countries for export wood floorings from Serbia. Export value in the stated four countries in 2009 was 83.3% of total realized export.
Import of wood floorings in Serbia during the period 1999-2009 was relatively low and the highest value of 6.22 million US$ was achieved in 2004. Until 2005, Serbia imported wood floorings most from Bosnia and Herzegovina and Croatia. From 2004 Serbia started importing floorings from China and the highest import value was 817,993 US$ in 2005. In the following years import from this country started decreasing and in 2009 it was 431,686 US$. Among other European countries, Croatia, Italy and Austria are significant for the import of floorings into Serbia and from 2007 Poland as well.
7 CONCLUSIONS
Although it faced certain problems, flooring production in FEP countries increased from 69.8 million m2 to 100.3 million m2 in the period 2000-2007. However, influenced by recession, production dropped by 15.6% to 84.7 million m2 in 2008. In the second year of recession, drop of total production was even more expressed and the highest drop rates were recorded in Hungary (-44.5%), Netherlands (-36.1%), Italy (-34.5%) and cluster of Nordic countries (-30.3%).
In Poland, Germany, Sweden and Austria more than a half (56.8%) of total wood flooring production of all FEP member states was produced in 2009.
During all years of the analyzed period, multilayer parquet had a dominant participation in the structure of flooring production, while the production of mosaic and lamparquet had a negative trend.
Oak is most used for the production of wood floorings in Europe. Because of supply problems and boycotts from certain European producers, tropical wood species are used less and less in flooring production.
Impacted by recession, flooring consumption in FEP countries decreased during two-year period by 23.4% to 86.0 million m2. Among FEP member states, Germany, Spain and Italy have been the biggest flooring consumers for many years.
Flooring market in Serbia significantly changed during the period 2000-2009. Owing to the production of multilayer parquet, Serbia increased export value to 18.25 million US$ in 2006. During 2008, maximum value of export was achieved amounting to 50.49 million US$, but in the following year export dropped by 31.3% under the impact of the world economic crisis.
Graph 5 Export and import of wood floorings from Serbia in the period 1999-2009
0
10
20
30
40
50
60
1999 2000 2001 2002 2003 2004 2005 2006 2007 2008 2009
mil
lio
n U
S$
Export Import

WoodEMA 2010
50
REFERENCES
1 Glavonjić, B.; Petrović, S.(2004): Timber trade II, University of Belgrade faculty of Forestry, Beograd
2 Ministry of Science and Technological Development of the Republic of Serbia within the project: Development and application of the new visual identity for wood floorings from Serbia in the function of increasing their competitive value on the market of the European Union, Beograd, 2010
3 Petrović, S.: Istraživanje elemenata konkurentnosti podova od drveta iz Srbije na tržištu Evropske unije, magistarski rad, Šumarski fakultet Univerziteta u Beogradu, Beograd, 2007
4 www.euwid-wood-products.com 5 www.parquet.net 6 www.cfgc.cn 7 www.parador.de 8 www.hardwoodflooringcompany.com 9 www.naturallywood.net 10 www.parkett.co.at
Authors' addresses:
Slavica Petrović, MSc, Assistant, University of Belgrade Faculty of Forestry, Serbia e-mail: [email protected] Predrag Sretenović, PhD student: Timber trade and Economics of Wood Processing, University of Belgrade Faculty of Forestry Ljiljana Pajović, Economist, Professional Associate, University of Belgrade Faculty of Forestry, Serbia, e-mail: [email protected]

WOOD PROCESSING AND FURNITURE MANUFACTURING: present conditions, opportunities and new challenges
51
WOOD REMOVALS DEVELOPMENT AND CRISIS INFLUENCE ON WOOD AND WOOD PRODUCTS CONSUMPTION IN SLOVAKIA.
Roman Svitok
ABSTRACT
Wood markets in Slovakia are evaluated. Analyze of wood removals since 1993. Round wood, sawlogs and veneer logs, pulpwood, other industrial roundwood, wood fuel, lumber, analyze since 1993, from viewpoint of production, consumption, imports and exports. Three periods of wood markets are identified: transition 1990 -1999, growth 2000 – 2007 and crisis since 2008. A forecast of wood removals is made for the year 2020 on the base of forest inventory, industry and economy development. Three scenarios are made for wood market development during the crisis in 2010 – 2011.
For the wood removals are recognized three different strategies of wood supply during the crisis period according to forest ownership: State forests, City forests and small ownership private forests. Key words: Wood markets, removals, wood consumption, crisis.
1 INTRODUCTION
Wood production and wood processing experienced significant changes since the beginning of 90’s. Wood producing and wood processing industry during economy transformation went two different ways. Wood processing industry was privatized and - forestry was reprivatized, in other word return of forest ownership to the original owners according to ownership before 1948. Overall 46% of forest area remains in the state ownership. Wood processing industry has been fully privatized. State forestry sector had to find a new production structure. Private sector of wood processing industry and forestry found new structure, started to build its new capacity and to seek new customer’s relations. Customer’s relation stabilization lasted until 2000, and since then we can see a significant growth of the wood industry, its wood consumption from domestic sources as well as higher production and consumption of wood industry products in the domestic market.
This positive development was interrupted by the international economic crisis at the end of 2008. Now day situation is characterized by 30% down of wood prices lower demand for wood and wood sales problems (KOVALČÍK A KOL. 2009).
2 MATERIAL AND METHODOLOGY
Statistical data on wood production, wood imports and wood exports from green reports of Slovakia, data FAO UNECE, EUROSTAT, Statistical Office as well as data from record of

WoodEMA 2010
52
Ministry of agriculture and ministry of economy were used. Data are collected for the period of 1993-2008.
Carbon volume assessment is based on the expected consumption of materials such as sawn wood, veneers, plywood, particleboards, fiberboards and others in separate categories of consumption in Slovakia in 1980-2008.
Consumption was estimated from data of EUROSTAT and FAO/UNECE as a sum of production and variance of imports and exports. Volume (m3) calculation in to weight units (metric tones) was made by use of conversion factors of EUROSTAT and UNECE.
3 WOOD PRODUCTION
Until 1999 roundwood production was at the level of 5.3-5.6 million m3 per year. Since 2000, roundwood production reaches the level of 6-7 million m3 per year. Increased production in 2005 and 2006 was caused by the windstorm in High and Low Tatra in November 2004. Coniferous and non-coniferous wood proportion remains balanced except years 2005 and 2006 due to windbreak calamity in coniferous forests.
Saw logs production has a constantly growing trend in coniferous and non-coniferous. Non- coniferous saw logs share increases significantly in four years 2005-2008 and is the best since 1990.
Since 1995 pulp wood production steadily ranges from 2 700-3 200 thousands m3 except wood from calamity in 2005-2006.
Fuel wood production share remains at relatively very low level. It is a result of the ability of the domestic wood processing industry to use wood for products as well as wood export market where industrial wood is more expensive than fuel wood. Consumption of the fuel wood gradually dropped from the beginning of 90’s until the end of 20th century, as a result of higher use of gas as relatively more comfortable energy source for households. Resulting from cancelled subsidies for heat energy and gas, people started to use more wood as a source of energy. Since the prices of the fuel wood had also increased, people started to use more wood residues for heating.
However at the time of the crisis the situation is shifting more in favor of higher consumption of wood for energy in the industry and in households.
Slovak veneer logs production continuously drops down due to the destruction of wood working capacity for veneer production. Veneer logs production, as the most valuable wood assortment, is undersized considering wood quality in Slovak forests.
Other industrial roundwood production, after decrease at the end of the century, again reaches levels from beginning of 90’s in the years 2003-2006. In the recent time other industrial roundwood production is decreasing.

WOOD PROCESSING AND FURNITURE MANUFACTURING: present conditions, opportunities and new challenges
53
Picture 1 Wood removals in Slovakia.
Source: Data of Ministry of Economy, EUROSTAT, Statistical Office of SR, Ministry of Agriculture, National Forest Centre Zvolen.
4 SHARE OF PRIVATE FOREST OWNERS IN WOOD PRODUCTION.
Forest ownership of non-state forests owners represents 54% of the forest area. The transfer of forest ownership rights has not yet finished, mainly due to problems with ownership documentation caused by the decease of the original owners during the period of 40 years of the previous regime. Part of private forest owners rented their forest out to State Forests. Therefore State Forests manage approximately 56% of the total Slovak forests.
State Forests share 57-65% of total Slovak wood removals. The large windfall that occurred in the forest area owned by state forests enterprises caused higher wood removals from State Forests during 2005-2006.
0
1000
2000
3000
4000
5000
6000
7000
8000
9000
100001
00
0 m
3
year
Sawlogs and veneer logsnon-coniferous
Sawlogs and veneer logsconiferous
Pulp wood non-coniferous
Pulp wood coniferous
Other industrialroundwood non-coniferous
Other industrialroundwood coniferous
Wood fuel non-coniferous
Wood fuel coniferous
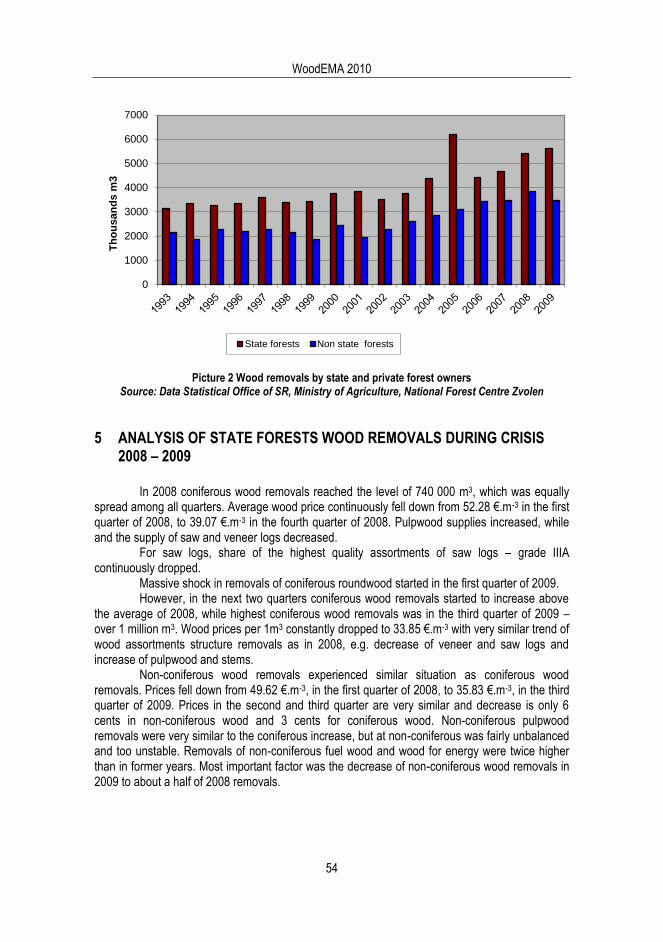
WoodEMA 2010
54
Picture 2 Wood removals by state and private forest owners
Source: Data Statistical Office of SR, Ministry of Agriculture, National Forest Centre Zvolen
5 ANALYSIS OF STATE FORESTS WOOD REMOVALS DURING CRISIS 2008 – 2009
In 2008 coniferous wood removals reached the level of 740 000 m3, which was equally spread among all quarters. Average wood price continuously fell down from 52.28 €.m-3 in the first quarter of 2008, to 39.07 €.m-3 in the fourth quarter of 2008. Pulpwood supplies increased, while and the supply of saw and veneer logs decreased.
For saw logs, share of the highest quality assortments of saw logs – grade IIIA continuously dropped.
Massive shock in removals of coniferous roundwood started in the first quarter of 2009. However, in the next two quarters coniferous wood removals started to increase above
the average of 2008, while highest coniferous wood removals was in the third quarter of 2009 – over 1 million m3. Wood prices per 1m3 constantly dropped to 33.85 €.m-3 with very similar trend of wood assortments structure removals as in 2008, e.g. decrease of veneer and saw logs and increase of pulpwood and stems.
Non-coniferous wood removals experienced similar situation as coniferous wood removals. Prices fell down from 49.62 €.m-3, in the first quarter of 2008, to 35.83 €.m-3, in the third quarter of 2009. Prices in the second and third quarter are very similar and decrease is only 6 cents in non-coniferous wood and 3 cents for coniferous wood. Non-coniferous pulpwood removals were very similar to the coniferous increase, but at non-coniferous was fairly unbalanced and too unstable. Removals of non-coniferous fuel wood and wood for energy were twice higher than in former years. Most important factor was the decrease of non-coniferous wood removals in 2009 to about a half of 2008 removals.
0
1000
2000
3000
4000
5000
6000
7000T
ho
us
an
ds
m3
State forests Non state forests

WOOD PROCESSING AND FURNITURE MANUFACTURING: present conditions, opportunities and new challenges
55
Picture 3 Coniferous wood removals in 10 000 m3 and prices in € Lesy SR 2008-9 Source: Quarterly reports on Wood supply in forestry. Les D (MP SR)
Picture 4 Non coniferous wood removals in 10 000 m3 and prices in € Lesy SR 2008-9 Source: Quarterly reports on Wood supply in forestry. Les D (MP SR)
0
20
40
60
80
100
120
10 0
00 m
3(€
/m3)
Coniferous wood removals in 10 000 m3 Coniferous wood price in €
0
10
20
30
40
50
60
70
80
90
1.Q 2008 2.Q 2008 3.Q 2008 4.Q 2008 1.Q 2009 2.Q 2009 3.Q 2009 4.Q 2009
10 0
00 m
3(€/
m3)
Non-coniferous wood removals in 10 000 m3 Non-coniferous wood price in €

WoodEMA 2010
56
6 WOOD IMPORT
Slovak roundwood and fuel wood import is very small, due to very high domestic production. During the woodworking recession time at the beginning of 90’s, wood imports were minimal, and since 2000 the level reaches 140 thousands m3.
Since 2002 in, resulting from the revival of the wood working industry, wood imports increased to the level of 350 thousands m3 per year, except year 2005 due to influence of higher domestic removals caused by the large wind break. Mainly non-coniferous saw logs and pulpwood are imported.
Wood residues, wood chips and particles, wood charcoal imports start after 1999 at very low level.
7 WOOD EXPORT
Round wood export, as sale of wood with the lowest added value, gradually increased since 1993 from 363 thousands m3 to reach its maximums of 1 828 thousands m3 in 2001 and 2 289 thousands m3 in 2008. Since 1998, export of wood residues and wood chips is higher at level of 150 thousands m3, with annually growing trend.
8 WOOD SUPPLY FORECAST TILL THE YEAR OF 2020
Wood supply was derived based on the outlook of its harvesting, decreased by the loss of manipulation, harvest residues and waste, which represents 3,5-5,5% from raw timber.
With regards to the development of wood supply, decreased supply of wood for domestic and foreign market is estimated for this and next year, even though the wood supply increased at the beginning of the economic crisis in 2008. World financial and economic crisis started to impact only in the third quarter of 2008 and therefore annual results for 2008 were still good. In 2009 however, the full impact of decreased wood supply, as well as a big price drop took place, although in last two quarters of 2009 we can see the increase of supply of coniferous wood timber as a partial effect of demand and supply.
In 2009 a significant shift in quality assortments classification occurred. Share of the most valuable assortments was decreasing – veneer logs. In the saw logs the quality class also shifted towards the worse grades. Production of saw logs of quality grade IIIA and partly IIIB decreased. Majority of the supply has shifted towards the quality grade of IIIC.
Due to its relatively good viability, the pulp and paper industry did not experience a significant drop in the pulpwood supply in 2009. Fuel wood supply experienced an increase, caused by the fact that the prices of pulpwood got near the prices of fuel wood, and as a reaction of the population to a lower disposable income in the time of the crisis people tried to eliminate the impact by lowering their expenses on heating
In 2010 a stabilization of wood supply is expected, due to the approximate one-year delay in the development tendencies of wood supply and it’s processing, comparing to the USA and EU15. Turning point is expected in the middle of 2010, with increasing wood supply afterwards. With regards to the development of harvesting technologies by the 2020, a gradual decrease of share of harvesting residues and waste that remained unused is expected. Residues should become part of the production of chips as part of the fuel wood.

WOOD PROCESSING AND FURNITURE MANUFACTURING: present conditions, opportunities and new challenges
57
From the long term perspective, an increase of roundwood supply is expected, due to the development of harvesting potential and should reach almost 8 400 thousand m3 in 2020. The difference is in the increase of soft and hard wood supply. While the supply of coniferous timber remain at level of around 4 400 thousand m3 during the whole period, the increase of total timber supply will be caused by the increase of supply of non coniferous roundwood from approximately 3 300 thousand to 3 700 thousand m3.
At the same time a change of structure of these wood assortments is expected, with gradual increase of the share of veneer assortments as well as the transfer of wood processing technologies in order to use thinner wood assortments for sawn wood. This is explained by the higher valuation of wood in final products, such as high quality furniture and by the increasing construction of houses and apartments in Slovakia after the year 2010, and by the higher frequency of furniture renewal.
Although its percentage share of the total supply will remain at the same levels during the whole period, pulp wood supply will be increasing in the absolute terms due to the overall supply increase. Increase will be caused by the hard pulpwood, to almost 2 000 thousand m3 in the year 2020. It is also expected, that the utilization of this assortment in the wood processing industry will change. Utilization of pulp in pulp-paper industry is expected at the level of 2 200 – 2 400 thousand m3 during the whole time period. The increase will be in the processing of this assortment for particleboards, which are an important element in the production of furniture and construction of wooden houses and wood-based constructions.
Production of the fuel wood from the raw timber is expected to gradually increase, while the fuel wood supply will increase only due to the total harvesting increase and its share on the total supply will slightly decrease. Fuel wood increase will be caused by the increase of the forest chips production from the residues of harvesting. Another significant part of the fuel wood supply will be the wood under 7cm diameter, which is processed for fuel wood chips.
Picture.7 Perspective of wood removals till year 2020
0
1 000
2 000
3 000
4 000
5 000
6 000
7 000
8 000
9 000
10 000
2005 2006 2007 2008 2010 R 2010 C 2015 2020
Th
ou
san
ds m
3
Sawlogs and veneer logs non-
coniferousSawlogs and veneer logs
coniferousPulp wood non-coniferous
Pulp wood coniferous
Other industrial roundwood non-
coniferousOther industrial roundwood
coniferousWood fuel non-coniferous
Wood fuel coniferous

WoodEMA 2010
58
9 WOOD PROCESSING INDUSTRY PRODUCTION
The production output of the wood processing industry, as a dominant customer of timber in Slovakia, is steadily increasing, with the exception of the fluctuations in the restructuring time in 90’s. Stabilizing element in Slovakia is the pulp and paper industry, with the exception of slight decrease of production in 2002-2003, when the restructuring also impacted this industry. In the recent period the pulp and paper industry is reaching its former levels.
Sawn wood production (hard wood and soft wood) is steadily increasing. Its maximums were reached in the recent years and indicate a viability of this segment and the ability to positively react to the increased wood production caused by the large windfall.
Wood panels production has an increasing tendency that also can be viewed positively. Wood panels however do not have the proper structure in all commodities. Only a small irrelevant amount of the most expensive assortment (veneer) is produced, and similar situation is in the production of plywood. As for the particleboards, Slovakia practically does not produce OSB boards. Production of MDF boards, required by the market is only at its starting phase. Since the year 2000 its production volume is around 25 thousand m3, all segmented.
Picture 8 Wood processing industry output
Source: Statistical Bureau, UEROSTAT, National Forestry Institute NLC Zvolen
10 WOOD CONSUMPTION
The wood produced by the forestry is consumed directly by the population only to a limited extend – fuel wood, pole timber and small pole stage. The population consumes wood mainly indirectly by the products of wood processing industry (sawn wood, furniture, paper, cardboard), partly by the energy production industry (heat, electricity). Following factors impact the consumption of wood assortments:
Income of households;
Size of households
0
1000
2000
3000
4000
5000
6000
1993
1994
1995
1996
1997
1998
1999
2000
2001
2002
2003
2004
2005
2006
2007
2008
2009
1000
m3(
mt)
Paper and
paperboard
Wood pulp
Wood based
panels
Non-coniferous
sownwood
Coniferous
sawnwood

WOOD PROCESSING AND FURNITURE MANUFACTURING: present conditions, opportunities and new challenges
59
Number and size of houses and apartments and the intensity of their renovation;
Prices of energy sources;
Movements on international wood markets;
Speed of furniture innovation;
Media used for recording, providing and storing of information
Environmental requirements of the population Wood consumption is best described by the potential of wood processing industry. Until
year 2000 the restructuring of wood processing industry caused the unstableness of the consumption. At the beginning of year 2000 a restructuring of the pulp – paper industry occurred. Last 4 – 5 years we can see the stabilization of wood consumption in wood processing industry, however at new level, higher by 1 mil. m3 comparing to the previous period.
Until year 2002 we can observe very unstable situation or even slight decrease of wood consumption. At the same time we can see a gradual increase of export of raw timber as a commodity with the lowest added value. This was caused by the restructuring of large wood processing plants and introduction of small and medium size businesses in wood processing industry. Stabilizing element was the pulp – paper industry, which was however also restructured at the end of 90’s to increase the processing of pulp hardwood, which did not have any domestic demand. Negatively impacted also unemployment rate increase, reduction of the consumption basket of the population and decrease of construction of houses and apartment blocks.
Fuel wood consumption remains a separate issue. Consumption of this wood was gradually decreasing from the 90’s until the end of the 20th century, due to the higher use of natural gas as relatively more comfortable energy source for households. Resulting from cancelled subsidies for heat energy and gas, people started to use more wood as a source of energy. Since the prices of the fuel wood had also increased, people started to use waste wood for heating.
Picture 9 Wood consumption
Source: Quarterly reports on Wood supply in forestry.Les D (MP SR), Data from Ministry of Economy, Statistical Bureau, UEROSTAT, NLC (National Forestry Institute) Zvolen
0
1 000
2 000
3 000
4 000
5 000
6 000
7 000
8 000
9 000
1993
1994
1995
1996
1997
1998
1999
2000
2001
2002
2003
2004
2005
2006
2007
2008
2009
1000
m3
Non-coniferous
industrial
roundwood
Coniferous
industrial
roundwood
Wood fuel

WoodEMA 2010
60
11 DISCUSSION AND CONCLUSION
Wood assortments production, its transport and processing in Slovakia are interconnected segments of Forestry and Wood Processing Industries. In years 2005 – 2008 consumption, production as well as foreign trade (export and import) reached their highest levels. Wood processing industry output was four times higher in 2008, when compared with year 1993, while the forestry industry had increased its roundwood production only by one third. Despite significantly positive results, domestic consumption of round timber needs to be increased to reach the levels of its potential production, while the wood processing industry production should focus more on finalization of products and reduce export of timber.
Until the middle of the year 2008, timber production and wood processing benefited from positive aspects of integration of Slovakia into the EU and world economic growth.
Although essential for small economies like Slovakia, the integration of Slovakia into the world economy also brings some risks. It may be temporary, but the world economic crisis, launched in the USA, is directly impacting Slovak forestry and wood processing chain, mainly by lower wood consumption in North America and increased export of wood processing products into Europe, with decreasing dollar exchange rate. Similar applies for ever increasing consumption of round timber in China and increasing output of its wood processing industry, which after the recession of consumption in USA will probably start to seek new markets in Europe. Due to the fact, that crises from USA usually delay before they enter the EU and last longer afterwards, next year Slovakia should expect decreased production of wood processing industry as well as decreased demand for wood assortments and wood processing products, compared to year 2008.
Separate issue will remain the impact of increase of energy prices in two aspects. First, the pressure on costs of wood harvesting in forestry as well as costs of wood processing, and second increased demand for wood as an energy source. However, at the time of crisis, due to the lower demand for oil its price is falling, which could be a signal for increased use of fuel wood, as a renewable ecologic raw material.
Despite all possible risks the wood processing industry should be viewed as a perspective production that is based on utilization of domestic renewable and ecologic source.
REFERENCES
1 COLLECTIVE, 2009: Forest products, Annual Market Review 2008-2009, Geneva Timber and Forest Study Paper 24, United Nations, New York and Geneva, ISBN 978-92-1-117007-8, 165p.
2 COLLECTIVE, 2007: Forestry statistics, 2009 edition, Eurostat EC, Belgium, ISBN 978-92-79-12111-0, 170p.
3 Kovalčík, M. a kol.. 2009: Ekonomické výsledky lesného hospodárstva Slovenskej republiky a vplyv svetovej finančnej a hospodárskej krízy. In: Kovalčík, M. (ed.): Aktuálne otázky ekonomiky lesného hospodárstva Slovenskej republiky : Recenzovaný zborník z odborného seminára, Zvolen 21. - 22. október 2009, Zvolen : Národné lesnícke centrum- Lesnícky výskumný ústav Zvolen, 2009, s. 5-25. ISBN 978-80-8093-102-5
4 SVITOK, R., TUTKA, J. 2010: Role of Slovak small- scale forestry in wood business and carbon storage. In: Small Scale Forestry in Changing World, Opportunities and Challenges and the Role of Extension and Technology Transfer, IUFRO conference, Ljubljana : Slovenian forestry institute, 2010, p. 727-745. ISBN 978-961-6425-53-7

WOOD PROCESSING AND FURNITURE MANUFACTURING: present conditions, opportunities and new challenges
61
5 SVITOK, R., KOVALČÍK, M., TUTKA, J, 2010.: Najnovšie poznatky z priebehu hospodárskej krízy v lesníctve vo svete a predpoklady jej vývoja na Slovensku a v EU. In: Tóthová, S. (ed.): Lesy pre spoločnosť 2010 : 2. medzinárodná konferencia vlastníkov a obhospodarovateľov lesov na Slovensku, Košická Belá 9. - 10. marec 2010: Zborník príspevkov. Rožňava : Gemerské regionálne združenie vlastníkov neštátnych lesov, s. 71-77.
Authors' address:
Dr. Roman Svitok National Forest Centre Forest Research Institution T.G. Masaryka, 960 92, Zvolen Slovakia e-mail: [email protected]

WoodEMA 2010
62

WOOD PROCESSING AND FURNITURE MANUFACTURING: present conditions, opportunities and new challenges
63
SATISFIED CUSTOMER IS A GUARANTEE FOR SUSTAINABLE DEVELOPMENT
Ivana Perić, Tomislav Grladnović
ABSTRACT
To find a new customer is much more difficult than to keep the old one, and today it is, agreed by many manufacturers and dealers harder than ever before. Today, but also in the past, a salesroom which largely determines the daily circulation of potential buyers is very important in sell realization. Due to the competition of the same type of salesroom that mostly offer similar goods with approximately the same rates, factors such as salesroom layout and sales staff are increasingly influencing the choice of salesroom and purchase. Expanding sales to new conditions is a very complex activity that requires a multidisciplinary approach, quite different from the traditional model of work, which is characterized by aggressive marketing. Flexibility and high levels of coordination becomes imperative in the business.
The paper presents the customers/users evaluation on furniture sale places in Zagreb. Research was conducted as questionnaire survey in four sales centers. Given data were analyzed statistically using χ² test. The results showed that customers were the most satisfied by the information about products range that they receive from the staff and selection of products in sales centers. Respondents were somewhat less satisfied with the location and appearance of the sales centers. At least respondents were satisfied with price and payment conditions of the furniture selling places. Key words: customer, mesurment of customer statification, furniture, salesroom, Zagreb area.
1 INTRODUCTION
The changing pattern of sales also changes the customers. Apart from being better informed, the customers of today are also much more critical and demanding; it is therefore very important to maintain a permanent dialogue with them. Enlarged markets, competition of selling centres which generally offer similar products at relatively similar prices, factors such as the appearance of the sales place, sales staff and product differentiation are becoming increasingly important and allow retailers to better understand consumer advantages, motives and attitudes (Mihić, 2006).
The key to overcoming competition and establishing a relationship with the customers is to offer better value to your customers and achieve higher customer satisfaction than your competition does. Customers select sellers, products and services on the basis of long-term values that these provide for them. Whether the customer will be satisfied and whether he or she will perceive the value depends on the fulfilment of their expectations (Kotler, 2001).
Traditional sales, characterized by aggressive marketing, are a thing of the past. Today, focus is on partner relationship with the consumer. The key word is long-term: a satisfied buyer best enhances sales.

WoodEMA 2010
64
According to Kotler (2001), satisfaction is a feeling of contentment or disappointment which results from balancing the expected and the realistic, i.e. the delivered product values (performances). Increasingly, a product is shaped according to the real, rather than the assumed needs of the customers.
Customer satisfaction and its fulfilment create an emotional affinity for the brand, which results in high customer loyalty. Customer expectations are determined by experiences from past purchases, advice of friends and acquaintances, and information and promises of the competition. The challenge of achieving complete customer satisfaction lies in creating a company culture in which all its members will strive to fulfil customer expectations. A satisfied customer is the best guarantee of sustainable growth, since a recommendation passed from one buyer to another, despite the constantly changing trends, is still the best advertisement.
First of all, it is very important to retain the existing customers, since the cost of attracting new customers is five times higher than the cost of maintaining the satisfaction of current buyers. It is also important to determine how many customers have been lost and for what reasons. The focus should be shifted from sales growth to building relationships by delivering high satisfaction, which also includes post-sale customer care. All this is achieved by relationship marketing strategies, which involves all the steps that a company makes in order to get to know and better serve each individual buyer (www.liederpress.hr).
The objective of this work is to examine the degree of satisfaction of furniture buyers in the area of the City of Zagreb and find out whether there are differences in the respondents' satisfaction.
2 RESEARCH METHODS
Research included four furniture stores in the Zagreb market area – A, B, C and D. Data collection involved random distribution of 200 questionnaire forms in four selected furniture stores, or 50 questionnaires in each. A part of the questionnaires was not returned, while a part was not completed correctly. Twenty-one out of 50 questionnaire forms, or 42%, were completed and returned in the sales centre A. In the sales centre B, the form was completed by 20 respondents, or 40%. In the sales centre C, the form was completed by 21 respondents, which makes 42%, while in the sales centre D, the form was completed by 26 respondents, or 52%. Out of 200 questionnaires, 88 or 44% of the forms were completed and returned.
The questionnaire form consisted of 8 statements/questions, of which two related to the sales staff, two to the sales location, and four to the product itself. Each statement/question was accompanied by marks from one to three, allowing the customers to express their degree of satisfaction or dissatisfaction. The degree of customer satisfaction was measured by means of the following elements: (a) location of the sales place, (b) appearance of the sales place, (c) information on the product provided by the salespeople, (d) salespeople’s treatment of the customers, (e) range of products, (f) product quality, (g) product price, and (h) conditions of payment.
The χ² test was used to establish whether there is considerable difference in customer satisfaction between sales centres A, B, C and D in the Zagreb market area.

WOOD PROCESSING AND FURNITURE MANUFACTURING: present conditions, opportunities and new challenges
65
3 RESEARCH RESULTS
Question 1 relating to the location of the sales centre earned an average mark of 2. The respondents in the sales centre A declared that they were satisfied with the location (average mark 2.5). Slightly less satisfaction with the location of the sales place was expressed by the respondents in the sales centres B and C (average marks 1.9 and 2.0), while the respondents in the sales place C gave the lowest marks (average mark1.6).
\,,257,
A1 = 21*1*normal(x; 2,4762; 0,6796)
B1 = 20*1*normal(x; 1,9; 0,6407)
C1 = 21*1*normal(x; 2; 0,7071)
D1 = 26*1*normal(x; 1,6538; 0,6288)
1 2 3
Ocjene / Marks
0
2
4
6
8
10
12
14
16
18
Bro
j is
pit
an
ika
/ N
um
ber
of
resp
on
den
ts
A1
B1
C1
D1
Figure 1 Customer satisfaction with the location of with sales center
Question 2 concerning the satisfaction of customers with the appearance of the sales place attracted an average mark of 2. According to Figure 2, the respondents in the sales centre A declared themselves to be very satisfied with the appearance of the sales centre (average mark 2.5), but the respondents in the sales centre B were less satisfied (average mark 2.4). The respondents in the sales centres C and D graded their satisfaction with the appearance of these centres with lower marks (average marks 1.6 and 1.5).

WoodEMA 2010
66
Figur 2 Feedback satisfaction appearance with sales center
According to Figure 3, the respondents in the sales centres A, B, C and D were equally
satisfied with the information regarding the range of products. The highest marks were given by the respondents in the sales centre C (average mark 2.2).
Figure 3 Customer satisfaction with recived information about the range of products
\,,257,
A3 = 21*1*normal(x; 2,0476; 0,8047)
B3 = 20*1*normal(x; 2,15; 0,8127)
C3 = 21*1*normal(x; 2,1905; 0,8729)
D3 = 26*1*normal(x; 2; 0,8485)
1 2 3
Ocjene / Marks
0
2
4
6
8
10
12
14
Bro
j is
pit
an
ika /
Nu
mb
er o
f re
spo
nd
ents A3
B3
C3
D3
\,,257,
A2 = 21*1*normal(x; 2,5238; 0,6796)
B2 = 20*1*normal(x; 2,4; 0,7539)
C2 = 21*1*normal(x; 1,619; 0,74)
D2 = 26*1*normal(x; 1,5; 0,5831)
1 2 3
Ocjene / Marks
0
2
4
6
8
10
12
14
16
18
Bro
j is
pit
an
ika
/ N
um
ber
of
resp
on
den
ts A2
B2
C2
D2

WOOD PROCESSING AND FURNITURE MANUFACTURING: present conditions, opportunities and new challenges
67
The average marks in Figure 4 show that the respondents expressed the highest satisfaction with the treatment they received from the salespeople in the sales centre A, where the average mark was 1.9. The largest number of the respondents (39 respondents in all the sales centres) marked the treatment by the sales staff with mark 1, as evidenced by the relatively low average marks.
\,,257,
A4 = 21*1*normal(x; 1,9048; 0,8309)
B4 = 20*1*normal(x; 1,7; 0,8013)
C4 = 21*1*normal(x; 1,7143; 0,7838)
D4 = 26*1*normal(x; 1,7692; 0,7646)
1 2 3
Ocjene / Marks
0
2
4
6
8
10
12
14
Bro
j is
pit
an
ika
/ N
um
ber
of
resp
on
den
ts A4
B4
C4
D4
Figure 4 Customer satisfaction with the treatment sales center staff
The respondents in the sales centre B declared themselves to be relatively satisfied with
the range of products offered by the sales centre (average mark 2.15), while those in the sales centres A, C, and D were equally satisfied, giving the average mark of close to 2, as seen in Figure 5.

WoodEMA 2010
68
Figure 5. Customer satisfaction with the range of products
The question relating to product quality (Figure 6) earned a similar degree of satisfaction
(average mark 1.9). The respondents in the sales centre A expressed their satisfaction with the quality of the products by awarding the lowest marks (average mark 1.7).
Figure 6 Customer satisfaction with the quality of products
The respondents in the sales centre D showed the least satisfaction with the price of the products, as evidenced by the average mark of 1.4, which is also the lowest average mark in terms of all the
\,,257,
A5 = 21*1*normal(x; 2,0476; 0,669)
B5 = 20*1*normal(x; 2,15; 0,7452)
C5 = 21*1*normal(x; 2,0476; 0,74)
D5 = 26*1*normal(x; 2,0385; 0,72)
1 2 3
Ocjene / Marks
0
2
4
6
8
10
12
14
Bro
j ispita
nik
a /
Num
ber o
f resp
on
dents
A5
B5
C5
D5
\,,257,
A6 = 21*1*normal(x; 1,6667; 0,6583)
B6 = 20*1*normal(x; 1,95; 0,7592)
C6 = 21*1*normal(x; 1,9524; 0,669)
D6 = 26*1*normal(x; 1,8462; 0,7317)
1 2 3
Ocjene / Marks
0
2
4
6
8
10
12
14
Bro
j ispita
nik
a /
Nu
mb
er of resp
on
den
ts
A6
B6
C6
D6

WOOD PROCESSING AND FURNITURE MANUFACTURING: present conditions, opportunities and new challenges
69
sales centres and all the questions from the questionnaire. The average marks in other sales centres were also relatively low, amounting to 1.6 in the sales centres A and B and to 1.9 in the sales centre C (see Figure 7).
Figure 7 Customer satisfaction with the price of products
Figure 8 Customer satisfaction with payment conditions
Figure 8 shows equal customer satisfaction with the conditions of payment in the sales
centres A and B (average mark 1.8). The customers in the sales centre D showed less satisfaction
\,,257,
A7 = 21*1*normal(x; 1,5714; 0,6761)
B7 = 20*1*normal(x; 1,6; 0,6806)
C7 = 21*1*normal(x; 1,7619; 0,7003)
D7 = 26*1*normal(x; 1,3846; 0,5711)
1 2 3
Ocjene / Marks
0
2
4
6
8
10
12
14
16
18
Bro
j ispita
nik
a /
Nu
mb
er of resp
on
den
ts
A7
B7
C7
D7
\,,257,
A8 = 21*1*normal(x; 1,8095; 0,6796)
B8 = 20*1*normal(x; 1,8; 0,6959)
C8 = 21*1*normal(x; 1,5714; 0,6761)
D8 = 26*1*normal(x; 1,7308; 0,6038)
1 2 3
Ocjene / Marks
0
2
4
6
8
10
12
14
16
18
Bro
j ispita
nik
a
/ N
um
ber o
f respo
nd
ents
A8
B8
C8
D8

WoodEMA 2010
70
with the conditions of payment (average mark 1.7), while the least satisfied were those in the sales centre D (average mark 1.6).
In order to determine considerable differences in the responses between the sales centres, we established the null hypothesis H0: There is no considerable difference in the responses among the sales centres A, B, C and D. The null hypothesis was tested at the significance level of 0.05.
The χ² test for question number one, „Are you satisfied with the location of the sales place?“ and the responses obtained from the sales centres A, B, C and D showed that there was considerable difference in customer satisfaction in terms of the location of the sales place (χ²=19,08, p = 0,004, df = 6). (Individual testing found that the said considerable difference was due to the responses from the centres A and D).
Using the X2 test for question number two, „Are you satisfied with the appearance of the sales place?“, it was found that there was considerable difference in the responses between the sales centres A, B, C and D (χ²=29,47, p = 0,00005, df = 6). Additional testing showed that the said considerable difference can be attributed to the responses from the sales centres A, B and C.
The results of the χ² test for the remaining questions (from 3 to 8) showed that there was no significant difference in the responses among the sales centres, as seen in Figure 9.
Figure 9 χ² test responses to questions from the questionnaire survey
4 CONCLUSION
High satisfaction and fulfilled expectations create an emotional affinity for the brand, which results in high customer loyalty. The end consumer is increasingly demanding: in the
χ² = 19,08, p=0,004 (usporedba odgovora na pitanje 1 / comparison responses to question 1)
χ² = 15,69, p=0,015 (usporedba odgovora na pitanje 2 / comparison responses to question 2)
χ² = 1,84, p=0,933 (usporedba odgovora na pitanje 3 / comparison responses to question 3)
χ² = 1,28, p=0,973 (usporedba odgovora na pitanje 4 / comparison responses to question 4)
χ² = 0,98, p=0,986 (usporedba odgovora na pitanje 5 / comparison responses to question 5)
χ² = 3,03, p=0,804 (usporedba odgovora na pitanje 6 / comparison responses to question 6)
χ² = 3,98, p=0,679 (usporedba odgovora na pitanje 7 / comparison responses to question 7)
χ² = 3,04, p=0,803 (usporedba odgovora na pitanje 8 / comparison responses to question 8)
0 5 10 15 20 25
X2 vrijednosti / Chi square values
0,00
0,02
0,04
0,06
0,08
0,10
0,12
0,14
0,16
Vjero
jatn
ost
/ P
robability
χ²(6)

WOOD PROCESSING AND FURNITURE MANUFACTURING: present conditions, opportunities and new challenges
71
shortage of time to form an idea in his or her mind, the customer wants to see, feel and touch the integral living space or at least a particular room which will be exhibited to him, rather than individual pieces of furniture scattered in a furniture sales area.
Furniture buyers regard the location and the appearance of the sales place as important factors which influence the build-up of satisfaction. Furniture manufacturers and sales people should focus on developing and improving the relationship with their customers and should try to understand their economic situation. Permanent development within the company is the role of marketing.
Research has shown that the customers in the Zagreb market area are the most satisfied with information provided by the staff and with the range of products in the sales centres. The customers expressed the lowest degree of satisfaction with the prices and payment conditions in all the four sales centres. Sales centres pay outstanding attention to the salespeople – customer relationship, and less attention to understanding the economic situation of their customers. Each sales centre should strive to fully meet all their customer demands. After all, only a satisfied customer will become a repeat customer.
REFERENCES
1 Burns, D.J.; Neisner, L. 2006: Customer satisfaction in a retail setting, International Journal of Retail & Distribution Management, 34(1):49-66.
2 Hensen, E.; Knowles, C.; Juslin, H. 2007: Ahead of the Pack - What Forest Industry Managers Think About Achieving and Measuring Innovation. Engineered Wood Journal, No.Spring/2007, Oregon State University
3 Kotler, P.; Wong, V.; Saunders J. 2001: Osnove marketinga, Mate, Zagreb. 4 Mihić, M. 2006: Segmentacija kupaca u supermarketima na osnovi njihova zadovoljstva
prodajnim osobljem i izgledom prodavaonice: multivarijantna analiza, Ekonomski pregled, Zagreb 57(12):919-938..
5 ***www.liederpress.hr
Authors' addresses: Ivana Perić, B.Sc. University of Zagreb, Faculty of Forestry Svetošimunska 25, HR-10 000 Zagreb, Croatia Telephone: +385 1 235 24 12 E-mail address: [email protected] Tomislav Grladnović, PhD Professor University of Zagreb, Faculty of Forestry Svetošimunska 25, HR-10 000 Zagreb, Croatia Telephone: +385 1 235 24 51 E-mail address: [email protected]

WoodEMA 2010
72

WOOD PROCESSING AND FURNITURE MANUFACTURING: present conditions, opportunities and new challenges
73
USE OF CRM SYSTEMS IN SLOVENIAN WOOD INDUSTRY COMPANIES
Jože Kropivšek, Anton Zupančič, Leon Oblak
ABSTRACT
Relationship between company and costumers is becoming the key success factor of a company. While costumer demands are changing and becoming more and more complex, their effective management is not possible without the use of modern information tools. CRM (Customer Relationship Management) systems and tools are becoming more and more popular instruments for managing relations with costumers in companies of all sizes, small and big. However, this study has shoved that only a small share of Slovenian wood-industry companies uses these tools, although they realize their benefits.
Keywords: management, marketing, selling, IT, CRM-systems
1 INTRODUCTION
Contemporary business environment requires explicit marketing oriented management focused on identifying needs of final customer. Their satisfaction leading to purchase depends on the level of satisfying customers’ needs. Companies or employees communicating with customers (usually marketing personnel, sales staff etc.) must effectively follow up on customers and build effective relationships with them. Marketing and sales activities require good knowledge of customers’ characteristics and wishes besides highly skilled personnel being very familiar with the product or service available if we want to offer highly efficient and quality service to the customer. This ensures successful and long-lasting business operation. Research indicates that in order to obtain new customers companies require five times larger investment than for exercising a sale to an old customer and a 5 % increase in the customer maintenance rate increases the profits between 20 and 125 percentage points, expressed in the net present value (Turk, 2006).
Customers’ requirements and desires keep changing and therefore their management is getting more and more complex. The use of modern computer tools and CRM tools/systems (Customer Relationship Management tools and systems – hereinafter CRM tools/systems) that ensure managing of complex relations besides being truly functional and focus on building better relationships with customers reflecting in their higher level of satisfaction (Dyche, 2001), are therefore highly recommended. CRM tools/systems have been in practise becoming even more frequent accessories for customers’ relations in case of small and big companies. The key feature of CRM concept has been to establish quality relationships with customers basing on IT and communication technology leading to mutually useful and long-lasting business cooperation. Effective use of contemporary information CRM tools/systems causes quantity and quality enlargement effective customer/client service (Kotorov, 2002), as well as extension of communication with customers capabilities through various communication media (Dussart, 2001).
The fact that costs of gaining new customers tend to be quite high compared to costs of keeping the existing ones can be easily explained through economic means. He costs of

WoodEMA 2010
74
advertising and enforcement of various forms of speedy sales, direct marketing etc. are not needed in case of existing customers making them more profitable. (Satisfied) existing buyer is more likely to buy products or service of certain providers. It often depends on psychological means because every purchase presents certain risk. That is why the customer making the first purchase tends to be very cautious and usually opts for less valuable items. Positive experiences and good relationship with seller cause customer to develop more trustful attitude and can possible decide to go for a more valuable purchase. That is why quality relations with customers can be a highly advantageous competitive characteristic of a company. If clients are satisfied with a relationship, it is very likely that they will be less susceptible for offers made by competitive companies. That is why introduction of CRM tools/systems into the companies is basically more than just needed because it offers effective help in keeping existing customers. This is proved by many authors (e.a. Kos/Zupančič, 2003). Within the framework of the above described the selection of the suitable CRM tools represents one of the most important factors influencing the introduction of the complete CRM system, however, not the only factor (Light, 2003).
We assume that Slovenian wood-industry companies do not apply CRM tools/systems on a large scale even though they are well aware of their significance. The research objective is to determine the scope of applying CRM tools/systems in wood companies and their expectations related to them. The latter, namely, widely define the final selection of the CRM tool.
2 CRM – SYSTEMS AND TOOLS
CRM tools/systems as we have known them now, have been originating in sales support tools. In early 1990-ies, when first such tools came to be, their aim was to improve sales productivity and persuade the sales teams to document all activities connected to their customers. But advantages as quality and affordable product and service have nowadays been only short-term guarantee to business success. Customer relations have become the most important »asset« company can get. One of the reasons could be the fact that today it has been easier for customers to compare prices and offers of various companies as it was 10 or 20 years ago. It has also been made simpler to change supplier. Strategy of any company must therefore include also how to win over and keep the customers, that is to manage customer relations. Optimized establishing and maintenance of quality relations with customers and clients can be ensured only by introducing CRM-systems into the company. Today’s applications have been complex enough as well as highly technologically advanced to create better relations with customers and increase their level of satisfaction. (Dyche, 2001). Basic building blocks of CRM-tools have been: collection of addresses, calendar, documents, procedures, e-mails, phone calls, opportunities, reports and analyses.
Primary aim of CRM-systems and tools is not to increase the scope of sales personnel’s and marketing team’s work but to relieve them since it has been proven that sales people have to deal with huge amounts of paper work and travelling (Dickie / Hayes, 2001) causing them to be involved in actual selling only 38 per cents of their time. Automation of administrative and similar procedures can help sales personnel to focus more on customers instead of having to deal with paper work.
These tools have been rather helpful in case of individual approach to customers’ management that has been prevailing in the last couple of years. They help salesmen to recall important facts about certain client; they help company to »remember« one in 10.000 customers that came back after being away for a year or more and was being initially dealt with by a seller that no longer work for the certain company (Pukšič, 2006). Besides these primary purposes

WOOD PROCESSING AND FURNITURE MANUFACTURING: present conditions, opportunities and new challenges
75
ensuring higher quality of service offered to the customer and integral use of customers’ data, the tools’ need to establish complex relations (such as crossway sales) with clients. When introducing CRM-systems in a company we must be aware that introduction of CRM-system does not mean only to establish certain software solution but also to change the business strategy, procedures, organisational structure and culture of a company with an aim to satisfy customers’ needs and reach higher profit.
3 METHODS
By applying the method of a classical questionnaire we have explored the wide range of using the CRM tools/systems in Slovenian wood-industry companies and their satisfaction at use. In addition to the above, we have also been determining the meaning of particular characteristics of CRM tool/system. The questionnaire was sent via e-mail to randomly selected wood-industry companies of all sizes. We received responses from 31 companies, which employ something more than 28% of all employees in wood industry in Slovenia, which represents quite a satisfactory sample. As we are able to determine from the Figure 1, the responses were sent from companies of different sizes, where are all size classes are represented almost equally. The group of large-size companies includes those companies employing more than 250 workers, medium-sized companies are companies employing between 50 and 250 workers and small companies are those particular companies employing from 10 to 50 workers and less but not the least are micro companies with less than 10 employed. The reseacrh was carried out in April 2010.
Figure 1 Classification of examined wood-industry companies with regard to their size
Big company22%
Middle sized company
29%
Small company
23%
Micro company
26%

WoodEMA 2010
76
4 RESULTS AND DISCUSION
We concluded that only 13% of companies that were included in the research apply CRM tools/systems, while other companies do not use these tools and systems. Between the latter less than one fifth of these companies plan to apply CRM tools/ systems on the short run (Figure 2).
Figure 2 Use of CRM tools/system in business operations
Among numerous characteristics and purposes of applying CRM systems/tools, which
may be found in the literature (for example Reinhold, 2004; Bull, 2003; Comport / Radcliffe, 2001; Thompson / Kirkby / Buytendijk, 2001), our research was focused on checking expectations and/ or characteristics that companies expect from introducing CRM tool or system into their business operations. We concluded that one of the main expectations »higher level of supervision of the sales process efficiency«, which indicates the orientation of companies into providing a higher level of transparency of the sales process and thus also its better efficiency (Figure 3). In addition to »shortening the response times« figure 3 also indicates that »reducing the number of non-satisfied customers« is also of great significance, because failing this they will lost for the company in the future. Companies realize that maintaining the existing customer is much cheaper than acquiring a new one and they also strongly believe that they are able to improve this by applying CRM tools /systems.
Yes13%
No70%
No, but it is a part of our short-term
plan17%

WOOD PROCESSING AND FURNITURE MANUFACTURING: present conditions, opportunities and new challenges
77
(Information box: 1 – irrelevant, 4 very relevant) Figure 3 Expectations and requirements for CRM tool/system
The examined companies have exposed the simplicity of appliance as the most
important characteristic of the CRM tool/system, which, however, do not also include the user interface in Slovenian language and web user interface, which is very interesting (Figure 4).
(Information box: 1 – irrelevant, 4 very relevant) Figure 4 Significance of the selected characteristics of CRM tool/system
In addition to the above the Figure 4 also indicates that companies evaluate certain characteristics of the CRM tools/ systems as crucial, which refers to those enabling following the sales opportunities and monitoring the consumption of resources as well as carrying out particular marketing communication actions. Companies in addition to that also wish for such CRM tool/system, which will for the purposes of sales process management enable a faster insight into the sales process operation and carrying out analyses (so-called business intelligence) and the possibility of rapid adaptations of the tool/ system to the (current and future) requirements of the
3,21
3,46
3,68
3,21
3,39
1,00 1,50 2,00 2,50 3,00 3,50 4,00
Reducing the scope of administrative work and secretarial services
Reducing the response times
Higher efficiency level of the sales process
The increase in sales
Reducing the number of non-satisfied customers
2,9
3,3
3,2
3,4
3,4
3,3
3,3
2,8
2,8
3,5
3,4
3,2
1,00 1,50 2,00 2,50 3,00 3,50 4,00
Connection of the time schedule with other time schedules (for example MS Outlook, Google)
Implementing marketing communication actions (for example research among buyers)
Project management support
Managerial insight into sales (business inteligence)
Automatic analysis and report creation
Measuring the effect and monitoring the consumption of resources (time, money, …)
Tracking sale possibilities
User interface in Slovenian language
Web user interface
Simple use
The possibility of rapid adaptation to the company needs
Favourable price

WoodEMA 2010
78
company. Nevertheless, the price is also one of the factors, which finally effects the selection of the relevant CRM tool/system.
What is also interesting here are the answers from those companies, which are already applying the CRM tools in their business operations. Everybody are certainly very pleased with their flexibility and their influence on reducing the responsiveness time, since communication is thus much faster and more transparent. They are also very pleased with the surveillance of the implementation and efficiency of the sales process. In addition, companies also evaluate that these tools and systems are very easy to operate and also strongly contribute to reducing the administrative work and secretarial services. However, on the other hand these companies believe that CRM tools failed to help in increasing the sale and reducing the number of non-satisfied customers, which is (very likely) the result of relatively adverse economic conditions that we witnessed in the recent period, and also the use of CRM tools alone does not provide a guarantee for more satisfied customers, since the latter is also dependant on numerous factors related with the organizational culture.
5 CONCLUSIONS
In the modern business environment in addition to the good quality and affordable products customer also expect particularly prompt, efficient and quality service. Since customer demands change and are becoming increasingly complex, their efficient management without applying information tools is (practically) impossible.
In our research we came to the conclusion that Slovenian wood industry companies apply these systems only on rare occasions, however, they believe that their use has a strong impact on performance and efficiency of the sales process and consequently also on the company as a whole. Those particular companies that apply CRM tools/systems confirm this, because all of them have experienced a significant shortage in response times, higher level of transparency above the sales process and a substantial reduction of administrative work and secretarial services.
The companies keep realizing that they could significantly contribute to greater level of efficiency and increase the customer satisfaction by applying the CRM tools/systems, which represents an important basis of the company's long-term success. That is why in addition to their simple use the companies also expect from CRM tools/ systems mainly their functionality in the management of the sales process, so-called business intelligence.
Introduction of CRM tools/ systems, however, in addition to their selection with regard to their characteristics and meeting the expectations also demands a strategy, which includes the comprehensive business operations of the company and shall begin on the highest organizational level, which is, however, very complex, since it requires a strong support from the management, customer oriented vision, process reengineering, change in the company culture and structure, introducing complex new technologies and systemic integration and data management.
REFERENCES
1 BULL, C. 2003: Strategic issues in customerrelationship management(CRM) implementation. Business Process Management Journal, Vol. 9 No. 5, 2003, pp. 592-602.
2 COMPORT, J. / RADCLIFFE, J., 2001. Technology Decisions Are Key to Enabling CRM Strategies. Gartner Group, Stamford (USA), Note Number: DF-14-8082.

WOOD PROCESSING AND FURNITURE MANUFACTURING: present conditions, opportunities and new challenges
79
3 DICKIE, J. / HAYES, L., 2002. The 2001 Sales Excellence Challenge – Optimizing the Way We Sell. CRM Insights, Danville (USA).
4 DUSSART, C., 2001. Transformative špwer of e-business over costumer brands. Euopean Management Juornal, Vol. 19, No. 6; 629-637.
5 DYCHE, J., 2001. The CRM Handbook: A Business Guide to Customer Relationship Management. Boston (USA): Addison-Wesley Pub Co.
6 KOS, B. / ZUPANČIČ, J. 2003. Upravljanje odnosov s strankami – stanje in usmeritve v Sloveniji. Moderna organizacija, Organizacija (3); 171 – 182.
7 KOTOROV, R.P., 2002. Ubiquitous organization: organizational design for e-CRM. Busines proces management journal, Vol. 8, No. 3; 218-232.
8 LIGHT, B., 2003. CRM packaged software: a study of organisational experiences. Business Process Management Journal Vol. 9 No. 5; 603-616.
9 PUKŠIČ, S., 2006. CRM – Nova paradigma ali obujanje davno pozabljenega. Uspešna prodaja, 2; 7–7.
10 THOMPSON, E. / KIRKBY, J. / BUYTENDIJK, F., 2001. Getting the Best Out of CRM Performance Metrics. Gartner Group, Stamford (USA), Note Number: DF-13-1433.
11 TURK, D. 2006: CRM je strategija, ne le programsko orodje; Finance 26/2006. 12 REICHOLD, A. 2006: Prozesse des Analytischen CRM - Fallstudien, Architekturvorschlag,
Methodenelemente, Universität St. Gallen, St. Gallen, 2006 (http://web.iwi.unisg.ch/org/iwi/iwi_pub.nsf/wwwPublRecentGer/C0CAE05CFB5D60F4C1257230003C79B3/$file/diss%20aCRM_arc_final.pdf).
Authors' addresses: Assist. Prof. Jože Kropivšek, PhD Anton Zupančič, B.Sci. Assoc. Prof. Leon Oblak, PhD University of Ljubljana Biotechnical Faculty Department of Wood Science and Technology Rožna dolina, C. VIII/34 1000 Ljubljana Slovenia

WoodEMA 2010
80

WOOD PROCESSING AND FURNITURE MANUFACTURING: present conditions, opportunities and new challenges
81
CONSUMER PREFERENCES FOR FURNITURE
Vladislav Kaputa, Mikuláš Šupín
ABSTRACT
The paper deals with the selected results of research aimed at the consumer’s preferences for furniture in the Slovak Republic. Questionnaire survey via e-mailing was used for data gathering. Respondents were asked about demographical data and several closed questions. Their attitudes towards specific attributes of furniture were expressed by 5-points scale. Not surprisingly, the most relevant purchase decision factors are quality, price and design of furniture. The most preferred is modern style furniture. Decision to buy certain furniture most frequently arises in a store followed by catalogue and internet and is mostly based on a compromise between men and women in the households. Key words: questionnaire survey, consumer preferences, furniture attributes, purchase decision.
1 INTRODUCTION
Consumer’s purchase behaviour is still not clear enough for marketers. It encompasses personal preferences for attributes of specific good with number of external influences. It is not possible to complete this “puzzle” in a way that product could meet requirements or demand of all consumers, but there is an opportunity to satisfy some groups of consumers.
This is the idea why we decided to research (ex ante) consumer purchase behaviour based on basic demographic criterions such as gender, age and education. In this way we could analyse how or if ever preferences differ in a subgroups of consumers. Selection of specific subgroups allows us to identify potential market segments of consumers with similar attitudes towards furniture attributes.
2 METHODS
Research of the preferences for furniture attributes among consumers in the Slovak Republic was carried out during the years 2009-2010. Nonprobability sampling, used to cover as much respondents as possible, could be precisely called purposive sampling, as Dillon et al. (1990) stated, because certain segments of the target population were intentionally overrepresented in the sample (such as age categories – any respondents under 18 years old). Direct questioning and questioning via e-mail were used to collect data. The questionnaires were distributed to the respondents. Totally, there were directly distributed as well as communicated by e-mail over 620 questionnaires in two rounds during 2 years.
The questionnaire is structured into two sections where the first part is aimed at the demographical data and the second one contains questions reviewing respondents’ attitudes towards furniture attributes. Demographic factors are as follows: gender, age and achieved

WoodEMA 2010
82
education. The answers have a form of five-point scale (1-definitely yes, 2-yes, 3-do not know, 4-no, 5-definitely no). The obtained data were transformed to the electronic form for further analyses. Owing to the use of purposive sampling the methods of descriptive statistics were applied. The frequency analysis was used for primary statistical analysis of data. Frequency tables or graphs illustrate absolute and relative occurrences. Contingency tables and graphs were used to analyse the relations within the demographic factors and the answers.
United factor (UF) originates in demographic data (Kaputa, 2008) and is used to divide the respondents according the answers specific for each subgroup. In this case the low-numerousness subgroups occurred frequently (e. g. respondents with primary school achieved education). It is necessary to consider this fact completing results of the research. Table 1 shows subgroups of respondents created from the obtained demographic data. Not only below presented triple united factor (composed of gender, age and achieved education) is used to analyse the data. Also double united factor (composes of two demographic data: gender and age) examined attitudes of (this way created) subgroups towards certain criterions.
Table 1 Subgroups of respondents divided according to the united factor (UF)
Gender Age Achieved education United factor (UF)
Men (1)
18 – 30 years (1)
primary school (1) 111
high school (2) 112
university (3) 113
31 – 50 years (2)
primary school (1) 121
high school (2) 122
university (3) 123
over 51 years (3)
primary school (1) 131
high school (2) 132
university (3) 133
Women (2)
18 – 30 years (1)
primary school (1) 211
high school (2) 212
university (3) 213
31 – 50 years (2)
primary school (1) 221
high school (2) 222
university (3) 223
over 51 years (3)
primary school (1) 231
high school (2) 231
university (3) 233
Regarding the overall analysis of acquired data we considered the answers “1-definitely
yes” and “2-yes” as positive attitudes and the answers “4-definitely no” and “5-no” as negative attitudes. Consequently, those two possibilities to answer – in a positive or in a negative way – were interpreted as one, either positive or positive, attitude. Thus, the total share of expressed attitudes (positive or negative) introduced in the results is the sum of two items. Indifferent attitudes represents answer number 3 described as “do not know”.
Almost each question of questionnaire asks to assess some more factors. Owing to use of five-points scale, as possibility to assess each examined factor (answer), we transformed and described all those answers as equal to 100 %. This approach allows to respondent express his attitude towards a factor more freely – without necessity to set an order of factors.

WOOD PROCESSING AND FURNITURE MANUFACTURING: present conditions, opportunities and new challenges
83
3 RESULTS
Response rate of the questionnaire survey (Table 2) was high (90,5 %) also due to the fact that the data were collected by students and each one student had managed to obtain only up to 20 questionnaires. Finally, 620 questionnaires were included into database.
Table 2 Response rate
Questioning Absolute number Relative number
Distributed questionnaires 685 100 %
Obtained questionnaires 620 90,5 %
Share of women participated in the survey is 54 % and the share of men is 46 %.
Concerning an achieved education our sample contains 3 % of the respondents with primary school education, 31 % with high school degree and 31 % with university degree. More than half of respondents (52 %) are 18-30 years old, the share of 31-50 years old respondents is 34 % and the group over 55 years old respondents covers 14 % of our sample (Figure 1).
Figure 1 Demographical data of respondents
It is worth to mention that the sample of respondents contains the high share (52 %) of
the youngest age category (18-30 years old consumers), so the overall evaluation of frequency analysis has to consider that fact.
3.1 Frequency analysis
Purchase decision factors Respondents were asked for assessment of factors which could influence their purchase
decision within furniture supply. As Figure 2 and Table 3 shows the most relevant factors are quality, price and design (given in order). All three factors have over 85 % of positive answers.
3%
66%
31%
Achieved education
primary school grammar/high school college/university
52%34%
14%
Age
18-30 years 31-50 years 51 and more years

WoodEMA 2010
84
Figure 2 Purchase decision factors
Further important decision making factors are “colour” and “safety” of furniture as they
achieved between 75-80 % of positive answers. On the other hand “country of origin”, “environmental attributes” and “brand” seems to be less important purchase decision factors.
Table 3 Attitudes of respondents towards specific factors
Factors Answers
Positive answers Do not know Negative answers
Price 87,1 % 8,4 % 4,5 %
Quality 94,5 % 4,4 % 1,1 %
Design 85,6 % 10,6 % 3,7 %
Environmental attributes 37,9 % 35,5 % 26,6 %
Country of origin 27,3 % 29,0 % 43,7 %
Warranty 64,5 % 24,5 % 11,0 %
Colour 79,0 % 13,2 % 7,7 %
Brand 36,8 % 27,7 % 35,5 %
Safety 75,8 % 18,1 % 6,1 %
Table 3 shows that the environmental attributes of purchased furniture are important for
38 % of respondents. Regardless the respondents care or do not care about environmental issues we asked them if they would prefer to buy furniture with environmental certificate either designated for interior or exterior use. Almost 64 % of them would prefer furniture with environmental certificate to interior. Furniture with environmental certificate designated for exterior use would prefer almost 46 % of respondents.
0% 20% 40% 60% 80% 100%
price
quality
design
environmental attributes
country of origin
warranty
colour
brand
safety
definitely yes yes do not know no definitely no
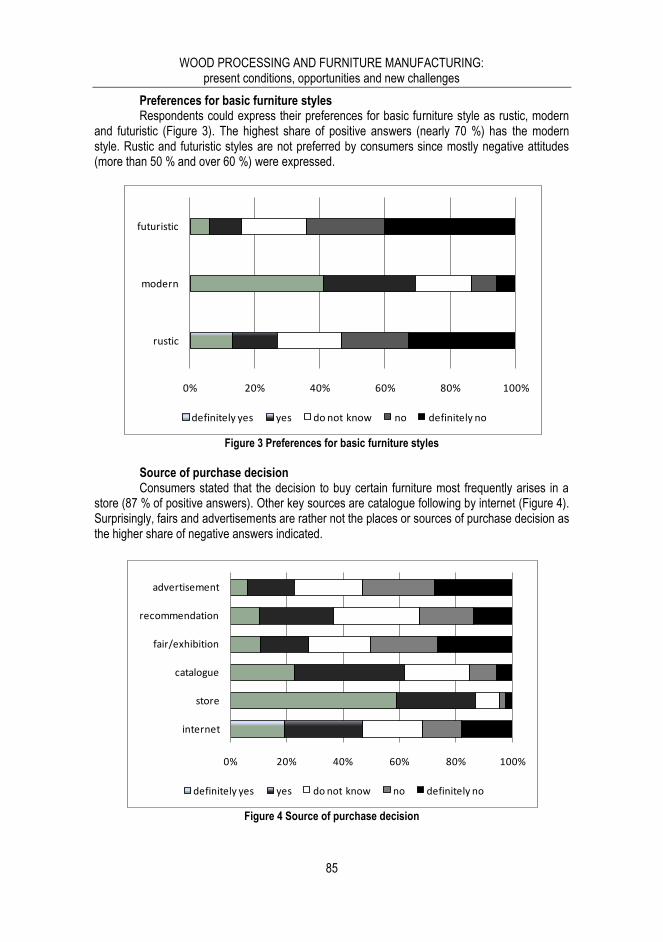
WOOD PROCESSING AND FURNITURE MANUFACTURING: present conditions, opportunities and new challenges
85
Preferences for basic furniture styles Respondents could express their preferences for basic furniture style as rustic, modern
and futuristic (Figure 3). The highest share of positive answers (nearly 70 %) has the modern style. Rustic and futuristic styles are not preferred by consumers since mostly negative attitudes (more than 50 % and over 60 %) were expressed.
Figure 3 Preferences for basic furniture styles
Source of purchase decision Consumers stated that the decision to buy certain furniture most frequently arises in a
store (87 % of positive answers). Other key sources are catalogue following by internet (Figure 4). Surprisingly, fairs and advertisements are rather not the places or sources of purchase decision as the higher share of negative answers indicated.
Figure 4 Source of purchase decision
rustic
modern
futuristic
0% 20% 40% 60% 80% 100%
definitely yes yes do not know no definitely no
0% 20% 40% 60% 80% 100%
internet
store
catalogue
fair/exhibition
recommendation
advertisement
definitely yes yes do not know no definitely no

WoodEMA 2010
86
Bearer of purchase decision in a household The aim of additional question “Who made decision to buy furniture in a household?”
was to indentify the most common bearer of purchase decision. This question has just three possibilities to answer and as Figure 5 shows, compromise of opinions between man and woman is the most frequent solution – in 59 % of cases. Meanwhile, over two times more women made final decision comparing 13 % of men decided about the purchase of furniture in households.
Figure 5 Who made decision to buy furniture in a household?
3.2 Contingency analysis
Selected results of contingency analysis are described in this subchapter. We used united factor (described in chapter 2 - Methods) applied in contingency tables and graphs to carry out deeper analysis of data. Willing to obtain more detailed results the subgroups analysis was made comparing demographic data and the answers connected to the purchase decision factors.
In relation with ascended age of men the requirements for warranty of furniture rise up (Figure 6). Almost opposite course is visible within women categories since the requirements for warranty declined from the youngest category (about 10 %) and stayed nearly stable in next two age categories.
13%
28%59%
man woman compromise

WOOD PROCESSING AND FURNITURE MANUFACTURING: present conditions, opportunities and new challenges
87
Figure 6 Significance of furniture warranty to purchase decision
Analysis showed (Figure 7) slightly declining requirements for colour appearance of
furniture related to ascending age in both gender categories. It is worth to mention that the colour have some higher significance for women comparing men.
Figure 7 Significance of furniture colour appearance to purchase decision
As frequency analysis showed, brand does not belong to the most important purchase decision factors, but contingency analysis found some consumer subgroups where relevancy of furniture brand is significantly higher comparing others (Figure 8). Fifty and more percent of positive answers have university educated men in two age categories (31-50 and over 51 years old). Higher share of respondents (fifty and more percent) considering brand of furniture in purchase decision appears within high school educated women over 51 years old and university educated 18-30 years old women. There is also subgroup of university educated, over 51 years old women,
0%
10%
20%
30%
40%
50%
60%
70%
80%
90%
100%
11 12 13 21 22 23
definitely no
no
do not know
yes
definitely yes
subgroups
5
4
3
2
1
0%
10%
20%
30%
40%
50%
60%
70%
80%
90%
100%
11 12 13 21 22 23
definitely no
no
do not know
yes
definitely yes
subgroups
5
4
3
2
1

WoodEMA 2010
88
where almost 68 % of them perceive brand as important factor, but due to its low-numerousness this finding cannot be considered as significant (needs further research).
Figure 8 Significance of furniture brand to purchase decision
4 DISCUSSION
Introduction introduces the idea that the product could not meet requirements or demand of all consumers, but there is an opportunity to satisfy some groups of consumers. Company management could set up the strategy established on consumer’s demand by permanent researching of preferences (changes in time) and markets (changes in place). Gejdoš and Potkány (2004) found out that “most of the small companies do not need to change their management style. These companies are managed more intuitively and consider it useless to implement new methods”. On the contrary, small companies are those who depend on the specific segments of consumers. They are preordained to be flexible and satisfy the needs of small groups of consumers. So, understanding who belongs to the segment of their consumers is doubtless correct way for further development.
Furniture represents a long-term consumption. Its’ characteristics are high unit price, long period of utilisation and subject to fashion trends (Parobek, 2004). According to research results price, quality and design are the most important purchase decision factors. Moreover, there are not significant differences within subgroups of consumers concerning their attitudes towards those factors. Colour appearance, safety and warranty of furniture are factors of higher importance too. Contingency analysis pointed out that the requirements for colour slightly decline in relation to ascending age of consumers (men and women), while warranty significantly rise up with ascended age of men.
0%
10%
20%
30%
40%
50%
60%
70%
80%
90%
100%
121 122 123 131 132 133 221 222 223 231 232 233
definitely no
no
do not know
yes
definitely yes
subgroups
5
4
3
2
1

WOOD PROCESSING AND FURNITURE MANUFACTURING: present conditions, opportunities and new challenges
89
According to the research of Maťová and Paluš (2009) “more than 46 % of respondents are convinced that agricultural products, wooden furniture, wooden buildings, household and sanitary paper products, and office paper are environmentally appropriate. These results indicate that respondents link wood and wood products directly to the environment.” Further, “over 70 % of respondents would buy products if they knew that these products are environmentally appropriate.” Considering our findings and the results of other studies (Anderson et al., 2005; Kaputa, 2008; Kozak et al., 2004; Ozanne and Vlosky, 2003), environmental attributes are still unknown or at least not clear issue for consumers since we noticed the highest share (35, 5 %) of the answer “do not know” by this factor.
Store is the place where originate 87 % of purchase decisions concerning furniture, so the consequences for managers to create appropriate saleable environment seems to be crucial for successful business. To complete this finding it is necessary to consider that the decision to buy furniture to the household comes from compromise between men and women in most of cases (59 %), but women opinion is still significant.
Further research should be aimed at the relevancy (mainly due to size, potential of growth and purchase power) of those demographically selected market segments.
REFERENCES
1 Anderson, R., C., Laband, D., N., Hansen, E., N., Knowles, CH., D. (2005). PRICE PREMIUMS IN THE MIST. In: Forest Products Journal. Vol. 55, No. 6. June 2005. p. 19-22. ISSN 0015-7473.
2 Dillon, W., R., Madden, T., J., Firtle, N., H. (1990). MARKETING RESEARCH IN A MARKETING ENVIRONMENT. 2nd Edition, Richard D. Irwin, Inc., 1990. ISBN 0-256-07977-3.
3 Kaputa, V. (2008). POSTOJE SPOTREBITEĽOV A FIRIEM K ENVIRONMENTÁLNYM ATRIBÚTOM VÝROBKOV Z DREVA. Dissertation thesis. TU Zvolen. 2008.
4 Gejdoš, P., Potkány, M. (2004). INTEREST IN CONTROLLING IN BRANCHES OF WOOD PROCESSING AND FURNITURE MAKING INDUSTRY IN SLOVAK REPUBLIC. In: Intercathedra No. 20, Poznań, 2004, p. 54-57. ISSN 1640-3622.
5 Parobek, J. (2004). NEW ASPECTS IN WOOD PROCESSING SECTOR IMPLICIT FROM THE GLOBALISATION PROCESS IN SLOVAKIA. In: Intercathedra No. 20, Poznań, 2004. p. 133–136. ISSN 1640-3622.
6 Paluš H., Maťová, H. (2009). END-USER AWARENESS OF ENVIRONMENTALLY APPROPRIATE WOOD PRODUCTS IN SLOVAKIA. In: Competitiveness of wood processing and furniture manufacturing: proceedings. International Association for Economics and Management in Wood Processing and Furniture Manufacturing – WoodEMA. University of Zagreb, Faculty of Forestry. p. 111-116. ISBN 978-953-192-010-9.
7 Kozak, R., Cohen, D., Lerner, J., Bull, G. (2004). WESTERN CANADIAN CONSUMER ATTITUDES TOWARDS CERTIFIED VALUE-ADDED WOOD PRODUCTS: An exploratory assessment. In: Forest Products Journal. Vol. 54, No. 9. September 2004. p. 21-24. ISSN 0015-7473.
8 Ozanne, L., K., Vlosky, R., P. (2003). CERTIFICATION FROM THE U.S. CONSUMER PERSPECTIVE: A comparison from 1995 and 2000. In: Forest Products Journal. Vol. 53, No. 3. March 2003. p. 13-21. ISSN 0015-7473.

WoodEMA 2010
90
Authors' addresses: Vladislav Kaputa, PhD. prof. h. c. prof. Ing. Mikuláš Šupín, CSc. Department of marketing, trade and world forestry Faculty of wood sciences and technology Technical University in Zvolen T.G. Masaryka 24 Zvolen, 960 53, Slovakia e-mail: [email protected], [email protected]

WOOD PROCESSING AND FURNITURE MANUFACTURING: present conditions, opportunities and new challenges
91
CHAPTER 2
ECONOMICS AND INVESTMENTS

WoodEMA 2010
92

WOOD PROCESSING AND FURNITURE MANUFACTURING: present conditions, opportunities and new challenges
93
PRODUCTION OF HIGH QUALITY RAW TIMBER ASSORTMENTS FOR THE FURNITURE PRODUCTION IN THE FORESTS OF SLOVAKIA
Rudolf Petráš, Julian Mecko, Hubert Paluš
ABSTRACT
Basic parameters of production potential of raw timber in the forests of Slovakia by the 2020 are presented in the paper. There are separately predicted volumes and structure of the highest quality assortments of raw timber for the production of furniture. The prognosis is worked out according to tree species and regions of Slovakia. For 2020 it is expected that annual allowable cut will be about 6.8 million m3, of that about 6.4 m3 for industrial processing. About 80 thousand m3 of the highest quality assortments of coniferous and 350 thousand m3 of broadleaved tree species are estimated for furniture industry. These volumes exceed markedly real consumption of the highest quality assortments in Slovakia. Key words: raw timber, assortments, production.
1 INTRODUCTION
Forest production potential can be understood as the ability of forest to primary produce timber as the basic raw material for wood as well as pulp and paper industry. Therefore, timber production is considered as the crucial management and economic activity in forestry and related industries. In the long term, forestry research in Slovakia has intentionally dealt with this issue and reached significant results. As an example, the models of volume, quality and value production of forest stands of economic important tree species (HALAJ et al. 1987, HALAJ, PETRÁŠ 1998, PETRÁŠ et al. 1996), the models of felling percents (HALAJ et al. 1986) and the models of felling maturity (HALAJ et al. 1990) can be mentioned. A detailed analysis of the actual and perspective wood production and its economic potential was carried out by PETRÁŠ, MECKO (2006a, 2006b, 2007, 2008), PETRÁŠ et al. (2009).
Forests cover approximately 2.0 million ha in Slovakia, i.e. 41% of its territory. There is a relatively good composition of tree species consisting roughly of 50% coniferous and 50% broadleaved tree species. As the result of improved methodology for forest state monitoring, standing volume of all forest categories has been more precisely determined in the last decades. According to the Green report (2009) the total growing stock is approximately 452 million m3. Its composition has shifted to the older age classes, thus strengthening the basis for greater allowable cut originating mainly from regeneration felling. A higher share of broadleaved trees species, its natural composition and especially its age structure are a priori good preconditions for higher production of high quality timber assortments. Their potential production has often been derived from the volume of actually produced and sold assortments. As their volume is not big, it has been argued that it cannot significantly influence the income of their producers. The situation in production of the highest quality assortments has significantly changed recently as the forests

WoodEMA 2010
94
are presently managed many small forest owners that are not able to produce and sale effectively this group of assortments.
The objective of this paper is to present the most significant information and knowledge on the potential possibilities of production of the highest quality timber assortments for industrial processing in the Slovak forests.
2 MATERIAL AND METHODS
The long-term production of assortments was derived from the perspective allowable cuts till the year 2020 (PETRÁŠ, MECKO 2008) and the models of assortment yield tables of tree species (PETRÁŠ et al. 1996), that indicate the proportions of log quality and diameter classes in dependence on their age and site class in the stands. Based on the external and internal wood quality, the assortment tables distinguish 6 quality classes of roundwood predominantly used for industrial processing:
I – sliced veneers, musical instruments, special sports and technical needs; II – rotary-cut veneers, matches, sports needs and stave bolts; III – poles, construction timber, but mainly saw logs of higher quality III A and lower
quality III B; IV – pulp-wood, chemical and mechanical processing for pulp and agglomerated
boards production; V – fuel wood.
In order to classify coniferous timber originating from salvage felling (dead wood and windthrown timber), adjustment of assortment structure according to PETRÁŠ et al. (1995) and HALAJ et al. (1990) was applied. Taking into account the share of salvage felling within the years 1986-2002 it can be stated that this share for coniferous tree species varied within the range of 50-80%, out of which approximately one half consisted of windthrown timber and the other half of dead wood. A share of salvage felling for broadleaved tree species was only 14-34%. The future development by the year 2020 was estimated on the basis of this range. For coniferous species the considered share of salvage timber was about 60%, out of which one half of windthrown timber and one half of dead wood. A share of 25% of salvage timber was considered for broadleaved species; however, due to unreliable background materials used for timber classification, this condition was not taken into account.
3 RESULTS AND DISCUSSION
3.1 Basic production parameters of the forests of Slovakia
The category of commercial forests, creating 81% of the planned timber felling is crucial for timber production. The category of special purpose forests counts for about 17% and protective forests for only 2%. Based on the area comparison, broadleaved species in the category of commercial forests are prevailing, covering nearly double area compared to coniferous species. The differences in distribution of the growing stock according to age classes are not so significant as it is almost symmetrically distributed around the 9th age class.
The average growing stock per hectare increases with age classes according to the typical growth “S” curve, while coniferous species reach the volume up to 500 m3 per ha in the oldest age classes. The growing stock per hectare of broadleaved species is lower by about 20-
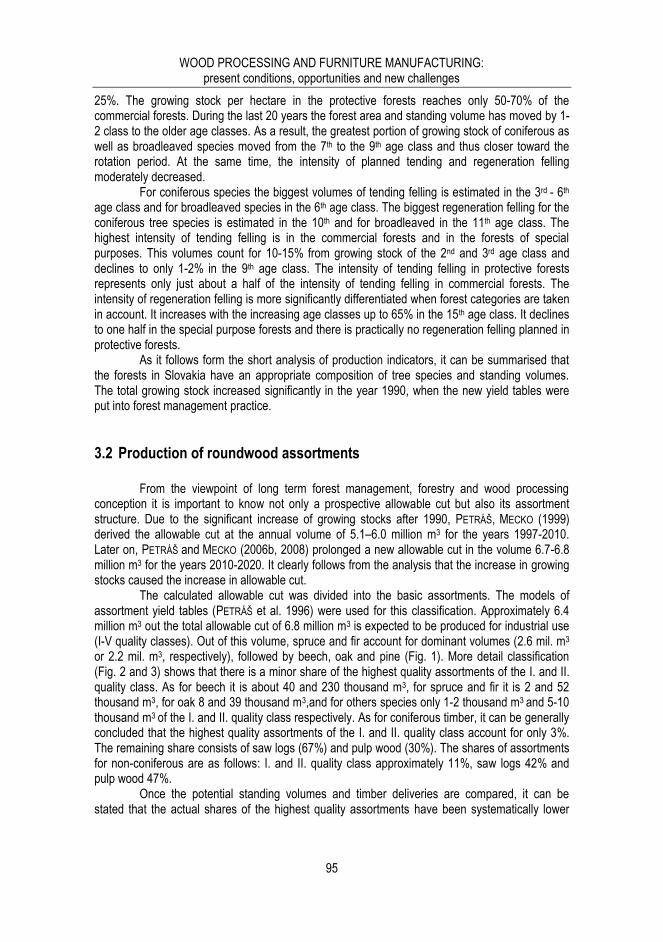
WOOD PROCESSING AND FURNITURE MANUFACTURING: present conditions, opportunities and new challenges
95
25%. The growing stock per hectare in the protective forests reaches only 50-70% of the commercial forests. During the last 20 years the forest area and standing volume has moved by 1-2 class to the older age classes. As a result, the greatest portion of growing stock of coniferous as well as broadleaved species moved from the 7th to the 9th age class and thus closer toward the rotation period. At the same time, the intensity of planned tending and regeneration felling moderately decreased.
For coniferous species the biggest volumes of tending felling is estimated in the 3rd - 6th age class and for broadleaved species in the 6th age class. The biggest regeneration felling for the coniferous tree species is estimated in the 10th and for broadleaved in the 11th age class. The highest intensity of tending felling is in the commercial forests and in the forests of special purposes. This volumes count for 10-15% from growing stock of the 2nd and 3rd age class and declines to only 1-2% in the 9th age class. The intensity of tending felling in protective forests represents only just about a half of the intensity of tending felling in commercial forests. The intensity of regeneration felling is more significantly differentiated when forest categories are taken in account. It increases with the increasing age classes up to 65% in the 15th age class. It declines to one half in the special purpose forests and there is practically no regeneration felling planned in protective forests.
As it follows form the short analysis of production indicators, it can be summarised that the forests in Slovakia have an appropriate composition of tree species and standing volumes. The total growing stock increased significantly in the year 1990, when the new yield tables were put into forest management practice.
3.2 Production of roundwood assortments
From the viewpoint of long term forest management, forestry and wood processing conception it is important to know not only a prospective allowable cut but also its assortment structure. Due to the significant increase of growing stocks after 1990, PETRÁŠ, MECKO (1999) derived the allowable cut at the annual volume of 5.1–6.0 million m3 for the years 1997-2010. Later on, PETRÁŠ and MECKO (2006b, 2008) prolonged a new allowable cut in the volume 6.7-6.8 million m3 for the years 2010-2020. It clearly follows from the analysis that the increase in growing stocks caused the increase in allowable cut.
The calculated allowable cut was divided into the basic assortments. The models of assortment yield tables (PETRÁŠ et al. 1996) were used for this classification. Approximately 6.4 million m3 out the total allowable cut of 6.8 million m3 is expected to be produced for industrial use (I-V quality classes). Out of this volume, spruce and fir account for dominant volumes (2.6 mil. m3 or 2.2 mil. m3, respectively), followed by beech, oak and pine (Fig. 1). More detail classification (Fig. 2 and 3) shows that there is a minor share of the highest quality assortments of the I. and II. quality class. As for beech it is about 40 and 230 thousand m3, for spruce and fir it is 2 and 52 thousand m3, for oak 8 and 39 thousand m3,and for others species only 1-2 thousand m3 and 5-10 thousand m3 of the I. and II. quality class respectively. As for coniferous timber, it can be generally concluded that the highest quality assortments of the I. and II. quality class account for only 3%. The remaining share consists of saw logs (67%) and pulp wood (30%). The shares of assortments for non-coniferous are as follows: I. and II. quality class approximately 11%, saw logs 42% and pulp wood 47%.
Once the potential standing volumes and timber deliveries are compared, it can be stated that the actual shares of the highest quality assortments have been systematically lower

WoodEMA 2010
96
than the potential ones during the last decade. This share accounts only for less than one percent for coniferous and for 1-2% for broadleaved species.
Figure 1 Prognosis of industrial assortments of the I.-V. quality class in Slovakia by the year 2020
Figure 2 Expected production of assortments of the I. and II. quality class for main commercial
tree species (spruce with fir and beech) in Slovakia by the year 2020
Figure 3 Expected production of assortments of I. and II. quality class for other tree species in
Slovakia by the year 2020
The distribution of the highest quality assortment volumes is very unbalanced in the
regions of the Slovak Republic (Fig. 4 and 5). Spruce and fir are dominantly present (approximately 25 thousand m3) in the regions of Žilina (ZA) and Banska Bystrica (BB) (18 thousand m3). Substantial volumes of the highest quality assortments of beech (38 - 86 thousand m3) are in the regions of Banská Bystrica (BB), Trenčín (TN), Košice (KE) and Prešov (PO). The
0
500
1 000
1 500
2 000
2 500
3 000
tho
usa
nd m
3
0
50
100
150
200
250
I II
tho
usa
nd
m3
Qality class
spruce, fir
beech
0
10
20
30
40
I II
tho
usa
nd
m3
Quality class
pinelarchoakmapleashpoplar
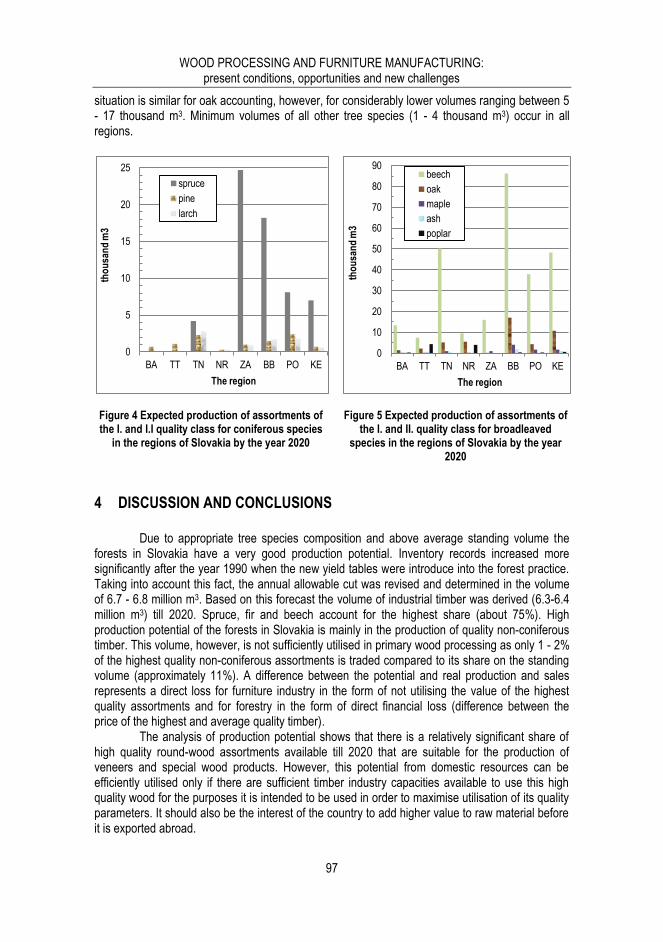
WOOD PROCESSING AND FURNITURE MANUFACTURING: present conditions, opportunities and new challenges
97
situation is similar for oak accounting, however, for considerably lower volumes ranging between 5 - 17 thousand m3. Minimum volumes of all other tree species (1 - 4 thousand m3) occur in all regions.
Figure 4 Expected production of assortments of the I. and I.I quality class for coniferous species
in the regions of Slovakia by the year 2020
Figure 5 Expected production of assortments of
the I. and II. quality class for broadleaved species in the regions of Slovakia by the year
2020
4 DISCUSSION AND CONCLUSIONS
Due to appropriate tree species composition and above average standing volume the forests in Slovakia have a very good production potential. Inventory records increased more significantly after the year 1990 when the new yield tables were introduce into the forest practice. Taking into account this fact, the annual allowable cut was revised and determined in the volume of 6.7 - 6.8 million m3. Based on this forecast the volume of industrial timber was derived (6.3-6.4 million m3) till 2020. Spruce, fir and beech account for the highest share (about 75%). High production potential of the forests in Slovakia is mainly in the production of quality non-coniferous timber. This volume, however, is not sufficiently utilised in primary wood processing as only 1 - 2% of the highest quality non-coniferous assortments is traded compared to its share on the standing volume (approximately 11%). A difference between the potential and real production and sales represents a direct loss for furniture industry in the form of not utilising the value of the highest quality assortments and for forestry in the form of direct financial loss (difference between the price of the highest and average quality timber).
The analysis of production potential shows that there is a relatively significant share of high quality round-wood assortments available till 2020 that are suitable for the production of veneers and special wood products. However, this potential from domestic resources can be efficiently utilised only if there are sufficient timber industry capacities available to use this high quality wood for the purposes it is intended to be used in order to maximise utilisation of its quality parameters. It should also be the interest of the country to add higher value to raw material before it is exported abroad.
0
5
10
15
20
25
BA TT TN NR ZA BB PO KE
tho
usa
nd
m3
The region
spruce
pine
larch
0
10
20
30
40
50
60
70
80
90
BA TT TN NR ZA BB PO KE
tho
usa
nd
m3
The region
beech
oak
maple
ash
poplar

WoodEMA 2010
98
The process of economic transition in Slovakia was characterised by the reprivatisation of forest land and privatisation of wood processing companies as well as by timber trade liberalisation. The loss of former markets and rapidly changing market conditions resulted in complete destruction of the established processing capacities that were originally designed to process the available volume of high quality assortments mainly for veneer production (PALUŠ, 2002, PALUŠ et. al, 2007). In spite of the continual potential of high quality timber from the forests the production of veneers has been declining during the last 15 years and, at the present time, there are no veneer producers in the country. Furniture makers in Slovakia source their material inputs - veneer abroad. Due to the economic crisis there has been general decline in demand for wood and wood products on the market during the last two years. Taking into account that beech is the main broadleaved species in Slovakia and the demand on the beech logs market has been declining during the last decade, this situation is even more complicated.
Timber originating from regeneration felling obviously contents a certain share of high quality assortments. Depending on the volume of timber harvested, this is sold either in tree lengths or cut to assortments. In order to obtain the best possible price, big timber producers (state forests) offer I. and II. quality class assortments at timber auctions. For a couple of years, the actions have been organised at timber yards all around the country in autumn, winter and early spring time. Timber is sold by using the silent auctions with sealed bids. The higher bidder pays the price for the individual logs the buyer submitted. The advantage of this approach is that the seller can obtain the price corresponding to the best possible use of particular log. In case the logs are not sold at the minimum expected price they are usually sold on contractual basis for the prices listed on a price list. On the other hand, small forest owners sell often their timber either standing or cut in tree lengths where the decision on producing a mixture of assortments is taken by the contractor or the buyer and this decision it is significantly influenced by the existing selling opportunities and valid contracts. In conditions where market demand for quality logs is weak these logs do not have to be necessarily used for the production of veneer or special wood products. As the share of quality logs in total timber deliveries have been declining during the last decade, it can be also assumed that a certain portion of their production have been sold to sawmills or other purposes.
REFERENCES
1 Halaj, J., Petráš, R., Sequens, J. (1986): PERCENTÁ PREBIEROK PRE HLAVNÉ DREVINY. Lesnícke štúdie, 40, 1986, 98 s.
2 Halaj, J., Grék, J., Pánek, F., Petráš, R., Řehák, J. (1987): RASTOVÉ TABUĽKY HLAVNÝCH DREVÍN ČSSR. Bratislava, Príroda 1987, 361 s.
3 Halaj, J., Bortel, J., Grék, J., Mecko, J., Midriak, R., Petráš, R.,Sobocký, E., Tutka, J., Valtýni, J. (1990): RUBNÁ ZRELOSŤ DREVÍN. Lesnícke štúdie, 48, 1990, 117 s.
4 Halaj, J., Petráš, R. (1998): Rastové tabuľky hlavných drevín. Bratislava, SAP, 1998, 325s. 5 Paluš, H. (2002): MODELOVANIE DOPYTU PO VÝROBKOCH Z DREVA NA TRHU V SR.
Vedecké štúdie, 3/2002/A. TU Zvolen, 2002, 49 s. ISBN 80-228-1153-X. 6 Paluš, H., Šulek, R., Parobek, J. (2007): CHANGING MARKET CONDITIONS AND THEIR
IMPACT ON ROUNDWOOD SUPPLY CHAIN IN THE SLOVAK REPUBLIC. In Modelling the Wood Chain : Forestry-Wood Industry-Wood Products Markets : COST Action E44 Conference in Helsinki. DCL Print & Sign, 2007. ISBN 9789080656536. p. 146-151.

WOOD PROCESSING AND FURNITURE MANUFACTURING: present conditions, opportunities and new challenges
99
7 Petráš, R., Mecko, J., Nociar, V. (1995): REDUKČNÉ KOEFICIENTY PRE SORTIMENTÁCIU SMREKOVÝCH SUCHÁROV. Lesnícky časopis, 41, 1995, 4, s. 219 - 229
8 Petráš, R., Halaj, J., Mecko, J. (1996): SORTIMENTAČNÉ RASTOVÉ TABUĽKY DREVÍN. Bratislava, SAP, 1996, 252 s.
9 Petráš, R., Mecko, J. (1999): VÝHĽADOVÉ ETÁTY ŤAŽBY DREVA V SLOVENSKEJ REPUBLIKE. Lesnícky časopis – Forestry Journal, 45, 1999, č. 4, s. 225 – 240
10 Petráš, R., Mecko, J. (2006): AKÝ JE PRODUKČNÝ POTENCIÁL LESOV SLOVENSKA? Slovenské lesokruhy/Les, 2006a, č. 9-10, s. 24-25
11 Petráš, R., Mecko, J. (2006): Aká JE PROGNÓZA VÝHĽADOVÝCH ETÁTOV ŤAŽBY DREVA NA SLOVENSKU? Les/Slovenské lesokruhy, 2006b, č. 11-12, s. 24-25
12 Petráš, R., Mecko, J. (2007): VÝHĽADOVÁ PROGNÓZA PRODUKCIE SORTIMENTOV SUROVÉHO DREVA NA SLOVENSKU. Les/Slovenské lesokruhy, 2007, č. 1-2, s. 26-27
13 Petráš, R., Mecko, J. (2008): ANALYSIS OF THE PRODUCTION POTENTIAL OF RAW WOOD IN THE FORESTS OF SLOVAKIA. Journal of Forest Science, 54, 2008 (7): 314–320
14 Petráš, R., Mecko, J., Petrášová, V.(2009): PRODUKČNÝ A EKONOMICKÝ POTENCIÁL LESOV SLOVENSKA. In: Financovanie 2009 Lesy - Drevo, LF TU vo Zvolene, Zvolen, 2009, 7 s. ISBN: 978-80-228-2052-3 (CD)
15 ZELENÁ SPRÁVA (2009): Správa o lesnom hospodárstve v Slovenskej republike 2009, Bratislava, Ministerstvo pôdohospodárstva Slovenskej republiky, 2009, 147 s.
Authors' addresses: doc. Ing. Rudolf Petráš, CSc. Ing. Julian Mecko, CSc. National Forestry Centre – Forest Research Institute Zvolen T. G. Masaryka 22 960 92 Zvolen, Slovakia assoc. prof. Hubert Paluš, PhD. Department of marketing, trade and World Forestry Technical University in Zvolen T. G. Masaryka 24 960 53 Zvolen, Slovakia

WoodEMA 2010
100

WOOD PROCESSING AND FURNITURE MANUFACTURING: present conditions, opportunities and new challenges
101
PROCESS-ORIENTED MONITORING COSTS IN THE FURNITURE COMPANY
Pavol Gejdoš
ABSTRACT
The paper deals about process management and its impact on economic performance and the results of the organization. Through process costs monitoring could be detected in organizations all non-productive cost which increases overall costs of the organization without a positive effect on creating value and satisfying customer needs.
Key words: process, quality management, costs.
1 INTRODUCTION
For most organizations, quality management has become an integral part of enterprise-wide risk management. The primary objective is to achieve the required performance, increase market value and maintain competitiveness of the latter on the market. Principles of newly applied philosophy in corporate governance have been applied simultaneously in quality management which includes both the implementation of modern quality management systems, representing a shift from a strategy of detection, particularly methods which included follow-up a strategy of prevention when the quality is already built in the design phase and ensure to account for process quality assurance life-cycle. To create and maintain an effective system of quality from the perspective of each organization must be based on pre-defined customer requirements and management is based on the principles of process approach. As management and top managers of successful companies see in a process-oriented quality management an opportunity to optimize and formalize business processes, while streamline, harmonize and streamline the flow of information going on inside the company (Gejdoš, 2008).
2 PROCESS-ORIENTED MONITORING COSTS
Model process costs (Process Costs Model) in its approach to analyze the cost of quality to the manufacturer according to their impact (effect), respectively impact of activities carried out on the final product. It is consistent with the Total Quality Management which the one of the fundamental principles is the focus on processes. The process model represents the transition from the structured breakdown of the cost of a generic process and its comparison with the traditional PAF model is a procedural expression of a higher level of monitoring costs. The current concept of incorporating the principles of Total Quality Management to ISO 9000 shall enter into a process model and its significance is an important tool in process-oriented quality management systems (Stasiak – Betlejewska, Borkowski, Maszke,2009).

WoodEMA 2010
102
Process costs in relation to quality create the total cost of organizations of conformance and non-conformance of the defined process. Creating a completely different approach to the monitoring of business costs in which they are bound by conformance or non-conformance of the process, therefore, are not associated with specific business performance. Model process costs are allocated separately the cost involved and not involved the formation and growth of the utility value for the customer. The structure of these costs (quality standard is intended for customers) consists of two groups:
Costs of Conformance - Cost of conformance is the total cost of ensuring that a product is of good Quality. It includes costs of Quality Assurance activities such as standards, training, and processes; and costs of Quality Control activities such as reviews, audits, inspections, and testing. Cost of Conformance represents an organisation's investment in the quality of its products.
Costs of Non-Conformance - includes both in-process costs generated by quality failures, particularly the cost of Rework. And post-delivery costs including further Rework, re-performance of lost work (for products used internally), possible loss of business, possible legal redress, and other potential costs.
Figure 1 The traditional and the new wiev of monitoring quality costs (Gejdoš, 2010)
3 APPLICATION OF PROCESS MANAGEMENT IN THE FURNITURE COMPANY IN SLOVAKIA
For successful application of process management in any organization is beginning to be familiar with and describe in detail the existing processes within the organization through the process maps, flow charts or other suitable instruments. Figure 3 shows the production process of the selected product, which was kitchen (figure 2).
Model
PAF
The traditional view of quality costs
The costs of prevention
The costs of
assurance
Internal and
external errors
The cost of conformance The cost of non-conformance
The new view of quality costs
Model of process oriented
costs

WOOD PROCESSING AND FURNITURE MANUFACTURING: present conditions, opportunities and new challenges
103
Figure 2 Basic model of the selected kitchen
Figure 3 The sequence of operations and production process (Štefkovič, 2010)
The importance of process management and monitoring costs organizations in terms of
its impact on the economy of the organization is very large. Every activity, every operation, every process is carried out incorrectly in the organization does the organization considerable resources for its implementation, but a desired effect and in no way increased the quality of the product. On the contrary, the money funds do not add value for customers, but increase the overall costs of the
Large store of materials
Process A
workplace SCHELLING
Process B-1
workplace LPO-FLAK
Process B-2
workplace LPO-PUKANEC
Process C
workplace WEKKE
Storage
Process D
workplace LIGMATECH
Processes Ss-1,-2,-3 workplace NARDELLO,
KAL
Main process supporting process solo machines course of main process course of machines
END
ST
AR
T

WoodEMA 2010
104
organization.(Potkány, 2006) For successful detection and identification of unproductive expenditure is necessary to know the value of the production of kitchen units, showing the internal costs (cost performance), which is specified by type of calculations and calculation formula:
1. Direct material
2. Direct wages
3. Direct costs of production
4. Production overhead costs
5. Supply overhead costs
6. Own costs of production
How to quantify the cost of non-compliance of the manufacturing process of kitchen
consisted of an initial analysis of internal company documents for quality. Damaged parts of the records for the period was the model example of calculating the cost of non-compliance of nonconforming components quantified box H 100 (recorded the highest share of disagreements, table 1), which were divided according to the date of its finding in the week (internally called "KW").
Table 1 Registration and costs for non-conformance of the individual components (Štefkovič, 2010)
January 2010 February 2010 March 2010
Box H 100 p
c
Material/
pc
Wage/
pc
Cost of
production/ pc
1. KW
(pc)
2. KW
(pc)
3. KW
(pc)
4. KW
(pc)
5. KW
(pc)
6. KW
(pc)
7. KW
(pc)
8. KW
(pc)
9. KW
(pc)
10. KW
(pc)
11. KW
(pc)
12. KW
(pc)
BOK HORNÝ 2 0,360 0,077 0,437 - - - - - - - 28 - - - -
HORNÉ DNO STROP 2 0,579 0,090 0,669 9 - - 33 1 - 2 30 - - - 9
POLICA 1 0,557 0,061 0,618 1 - - 15 - - - 21 - - - 4
CHRBÁT FALT 2 0,190 0,030 0,220 - - - - - - - - - - - -
KOVANIE-DIELEC 1 0,927 0,099 1,026 - - - - - - - - - - - -
KOVANIE-DIELEC 1 0,148 0,042 0,190 - - - - - - - - - - - -
KARTÓN 1 0,177 0,035 0,212 - - - - - - - - - - - -
TOTAL: 4,067 € 0,631
€ 4,698 € 6,639 € 0,000 € 0,000 €
31,347
€ 0,669 € 0,000 € 1,338 €
45,284
€ 0,000 € 0,000 € 0,000 € 8,493 €
Production overhead
costs: 1,262 € 1,742 € 0,000 € 0,000 € 7,770 € 0,180 € 0,000 € 0,360 €
12,274
€ 0,000 € 0,000 € 0,000 € 2,108 €
Supply overhead
costs: 0,057 € 0,078 € 0,000 € 0,000 € 0,350 € 0,008 € 0,000 € 0,016 € 0,552 € 0,000 € 0,000 € 0,000 € 0,095 €
TOTAL: 6,017 € 8,459 € 0,000 € 0,000 € 39,467
€ 0,857 € 0,000 € 1,714 €
58,110
€ 0,000 € 0,000 € 0,000 € 10,696 €
119,304 €

WOOD PROCESSING AND FURNITURE MANUFACTURING: present conditions, opportunities and new challenges
105
Table 1 captures the essential components of the calculation of selected box H 100 with the captured non-compliant components and determining their cost of production, production overhead costs and supply overhead costs. The calculation principle is used and respected in all types of boxes. Total costs of conformance and non-conformance present table 2. Table 2 Total costs of conformance and non-conformance
Type of
cabinets
Material
(€) Wage (€)
Production
overhead
costs (€)
Supply
overhead
costs (€)
Costs of non-
conformance Costs of
conformanc
e (€)
The
proportion
of
disagreement
s % (€) (%)
H 50 26,416 € 5,359 € 10,718 € 0,482 € 42,975 € 9,4% 7 405,203
€ 0,58%
H 50 Z ------no incidence of non-conformance----
---- 0,000 € 0,0% 489,971 € 0,00%
H 60 25,896 € 5,916 € 11,832 € 0,532 € 44,176 € 9,7% 1 460,726
€ 3,02%
H 60 N 15,087 € 4,540 € 9,080 € 0,409 € 29,115 € 6,4% 4 797,981
€ 0,61%
H 60 R 6,090 € 1,581 € 3,162 € 0,142 € 10,975 € 2,4% 1 107,270
€ 0,99%
H 100 81,553 € 12,217 € 24,434 € 1,100 € 119,304
€ 26,2% 872,435 € 13,67%
H 100 Z 4,016 € 0,767 € 1,534 € 0,077 € 6,394 € 1,4% 7 520,544
€ 0,09%
S 50 21,317 € 3,107 € 6,214 € 0,247 € 30,885 € 6,8% 724,436 € 4,26%
S 50 DZ 24,808 € 3,772 € 7,544 € 0,339 € 36,463 € 8,0% 15 426,935
€ 0,24%
S 60 ------no incidence of non-conformance----
---- 0,000 € 0,0%
1 474,669
€ 0,00%
S 60 DZ 0,987 € 0,194 € 0,388 € 0,017 € 1,586 € 0,3% 1 311,346
€ 0,12%
S 60 3Z ------no incidence of non-conformance----
---- 0,000 € 0,0%
2 276,420
€ 0,04%
S 60 ER 0,899 € 0,117 € 0,234 € 0,011 € 1,261 € 0,3% 1 024,373
€ 0,12%
S 100 84,582 € 8,622 € 17,244 € 0,746 € 111,194
€ 24,4%
18 654,234
€ 0,60%
S 110 R ------no incidence of non-conformance----
---- 0,000 € 0,0%
2 512,406
€ 0,00%
P 50 16,920 € 1,249 € 2,498 € 0,072 € 20,739 € 4,6% 1 858,458
€ 1,12%
CH 60 ------no incidence of non-conformance----
---- 0,000 € 0,0% 227,585 € 0,00%
P 60 ------no incidence of non-conformance----
---- 0,000 € 0,0% 19,839 € 0,00%
P 100 ------no incidence of non-conformance----
---- 0,000 € 0,0% 13,770 € 0,00%
VL 40 ------no incidence of non-conformance----
---- 0,000 € 0,0% 22,471 € 0,00%
TOTAL: 308,571 € 47,441 € 94,882 € 4,175 € 455,068
€
100,0
%
69 201,070
€ 0,66%

WoodEMA 2010
106
The level of costs for non-conformance of the manufacturing process for a given period are quantified with the current distribution of costs relating to materials, wages, production and supply overhead costs of any kitchen cabinet or component separately, while the overall production process. In some cases there was no recorded incidence of non-conformance. Total costs of non- conformance was only 455 € and amounted to 0.66% of the total costs of conformance. Nevertheless, the process management is an excellent tool for detecting the causes of problems and effective tool for performance improvement processes as well as the entire organization.
4 CONCLUSION
Process-oriented management in the following industries are characterized by specific, which is essential for its successful implementation to be accepted but also its positive effects may help to maintain or enhance the competitiveness of furniture enterprises by managing processes in enterprises will be adjusted so as to ensure their management, control, measurement and improvement at all levels. Effective process management can increase productivity and efficiency in the organization by removing non-productive costs, removing discrepancies and their causes which of course has a positive impact not only on the quality of manufactured products and services but ultimately better meet and satisfy customer requirements would be one of the fundamental objectives of each organization.
REFERENCES
1 Gejdoš, P.,2010. Procesný manažment ako nástroj zvyšovania výkonnosti organizácie. In: Zborník z medzinárodnej vedeckej konferencie Podnikanie a konkurencieschopnosť firiem 2010, Ekonomická univerzita v Bratislave, Bratislava 2010, s.549-555, ISBN 978-80-225-2978-5.
2 Gejdoš, P.2008. Process oriented quality management- effective tool of companies management In: Zborník z medzinárodnej vedeckej konferencie Wood processing and furniture production in South East and Central Europe: Innovation and competitiveness 2008, Faculty of Forestry Belgrade University, 2008, s 80-84, ISBN 978-86-7299-149-9.
3 Potkány, M. 2006. Nevýhody procesne orientovanej kalkulácie nákladov z hľadiska jej implementácie In: Ekonomika a manažment podniku 1/2006, vedecký časopis pre ekonomickú teóriu a prax, Midaprint, Žilina, 2006, s. 49-53, ISSN 1336-4103
4 Stasiak – Betlejewska R., Borkowski S., Maszke A.,2009. The process quality of metallurgical rollers’ mechanical working, w:] Toyotarity. Strategic areas – elements of Toyota house’s roof, Publisher Yurii V. Makovetsky, Dnipropetrovsk 2009.ISBN 978-966-1507-08-0.
5 Štefkovič, M., 2008. Ekonomická podstata manažérstva kvality vo vybranom podniku. Bakalárska práca. Zvolen: Technická univerzita vo Zvolene, Drevárska fakulta, 2008. 52 s.

WOOD PROCESSING AND FURNITURE MANUFACTURING: present conditions, opportunities and new challenges
107
Authors' address: Pavol Gejdoš, PhD. Department of Enterprise Management Faculty of wood sciences and technology Technical University in Zvolen T.G. Masaryka 24 Zvolen, 960 53, Slovakia e-mail: [email protected]

WoodEMA 2010
108

WOOD PROCESSING AND FURNITURE MANUFACTURING: present conditions, opportunities and new challenges
109
ANALYSIS OF BENT FURNITURE PRODUCTION COSTS
Stanisław Borkowski, Renata Stasiak-Betlejewska
ABSTRACT
One of the main problems concerning enterprises activity in wooden furniture branch is problem of costs increase. This kind of problem is connected mainly with prices of outside resources using in wood furniture production. The research object of this article is enterprise dealing with bent furniture production. Problem that was the object of analysis was high level of production costs observed in this company years 2008 – 2009, which caused increase of final products prices and finally – decrease of clients’ orders. Research findings were analyzed by chosen quality management tools applying. Improvement proposals for examined enterprise are effects of research findings analysis. Key words: costs, production, Ishikawa diagram, Pareto-Lorenz diagram
1 CHARACTERISTICS OF RESEARCH OBJECT
Research object presented in this article is company producing wooden bent furniture that characterized as a company with long production tradition in this branch. It is state company established in 1913 year which was known under many names but always connected with wooden bent furniture production. Company analyzed in the article is a production company, specializing in bentwood, skeletal furniture production - classical, carpenter's, upholstery and special furniture (unique clients’ orders). Bentwood and carpenter's furniture is main products of the enterprise, in it above all chairs and furniture from the plywood. Moreover, armchairs, tables and stools are produced in groups of bent and carpenter’s furniture (straight lines). The main product group are bent furniture (chairs) that popularized by this company. Table 1 presents incomes coming from products sale, in the division according to selected groups and percent share in the sale incomes in years 2006-2009.
Table 1 Products sale structure of enterprise X in the valuable presentation in years 2006 – 2009
2006 2007 2008 first halfyear of 2009 groups sale % sale % sale % sale % of products value value value value (tys. PLN) (tys. PLN) (tys. PLN) (tys. PLN)
bent furniture 39.807,5 49,8 47.904,0 53,3 58.344,2 55,4 34.753,6 58,8 carpenter's furniture 22.608,6 28,3 23.991,8 26,7 28.700,3 27,3 14.749,9 24,9 upholstery furniture 14.503,6 18,1 15,198,0 16,9 15.033,7 14,3 8.189,7 13,8 special furniture 418,8 0,5 382,2 0,4 9.13,1 0,8 215,0 0,4
Sum 77.338,5 96,7 87.476,0 97,3 102.991,3 97,8 57.907,2 97,9
Source: own study based on material of enterprise X.

WoodEMA 2010
110
2 ISHIKAWA DIAGRAM APPLYING FOR PRODUCTION COSTS CAUSES ANALYSIS
Correct right diagnosis is a key to achieving success in enterprise management. One of the enterprise management aspect is collecting and processing of data connected with different aspects of quality management.
Quality management tools are instruments of supervising (monitoring) and diagnosing processes of designing, the production, the control, the assembly and all different operations appearing in the cycle of the product existence [POTKÁNY, M., ŠATANOVÁ, A., GEJDOŠ, P., 2001]. Their meaning results from the fact, that without administering the honest and full information, it is difficult to say about taking effective activity in the scope of systematic improving the product quality level. Traditional tools of quality management are being ranked among others: diagram of causes and effects (Ishikawa diagram) and Pareto-Lorenz diagram. These tools let in the graphic way observe the interrelation of causes, bound problems with the definite conception of problem solving. It is the effective way of announcing coefficients influencing the for example quality and for studying organizational and technological problems.
Cause and effect diagram (knows also as Ishikawa diagram) is one of the most popular and straightest in using tools of quality management tools, which have great applying in every area of enterprise management and fulfill the series of the function, among others:
- help to notice the entire complexity of the situation, - serve as the way of ideas recording, - reveal not-revealed until now relationships between individual causes, - help to discover the problem source, - expected results of get activity direction are analyzed, - concentrate researchers’ attention on essential occurring compounds, - constitute the plan or the map of activity that can be help in improvement of enterprise
management. Establishing Ishikawa diagram can be realized in a few phases so as: 1. Determining main causes. A so-called 5M attempt is most often practiced, according
to which the most important groups of factors influencing on the process result are connected with: man, machine, method, material, environment and management (groups of factors should be every time selected to problem which is object of solving).
2. Determining secondary factors i.e. the ones which are directly connected with main factors and constitute developing them.
3. Choice of the critical factor. During choosing critical factors, most strongly influencing on the result of the examined process, it is possible to apply, e.g. Pareto-Lorenz analysis.
Elaborating diagrams (Ishikawa or Pareto-Lorenz) is result of the many workers efforts, because the failures have their usual sources of activities in various fields. Therefore, the team should consist of people with high expertise, who will also have to disclose the causes defect, including those caused by them.
Object of research analysis applying Ishikawa diagram (Fig. 1) was problem noticed in examined enterprise concerning high level of production costs. There are several factors that had influence of analyzed problem appearing (with percent share of this factors): A. Transport costs of raw materials and products (35%) 1. Transport costs of outside means of transport (20%) 2. Transport costs of own means of transport (10%) 3. Maintenance costs of own transport means (5%) B. Costs of storing (10%)

WOOD PROCESSING AND FURNITURE MANUFACTURING: present conditions, opportunities and new challenges
111
4. Costs of storehouse stequipping (3%) 5. Costs of electric energy (6%) 6. Costs of the preservation of storehouses (1%) C. Machines (20%) 7. Low efficiency (8%) 8. Great degree of machines consumption (7%) 9. Mismatching of machines number to the volume of production (5%) D. Packaging costs (10%) 10. The costs of packaging materials (4%) 11. The costs of putting the logo on products (4%) 12. Costs for packaging equipment (2%) E. Materials (25%) 13. High price of materials (15%) 14. Improper quality of materials (8%) 15. Malfunctions caused by material transport and storage (2%)
As a result of the analysis of Ishikawa diagram shown in Figure 1, it can be stated that the reasons that should be restricted, and which have a substantial impact on production costs are:
1. Costs of outside transportation modes. 2. The high prices of materials.
Figure 1 Ishikawa diagram for production cost causes in wooden bent furniture production for analyzed enterprise X.
Source: own study based on material of enterprise X.
II. A. Transport costs (35 %) B. Storing costs (10 %) C. Machines (20 %)
D. Packing costs (10 %) E. Materials (25 %)
1
1
1
1
1
2
2
2
2
2
3
3
3
3
3
HIGH PRODUCTION
COSTS

WoodEMA 2010
112
3 PARETO-LORENZ DIAGRAM IN ANALYSIS OF COSTS STRUCTURE FOR BENT FURNITURE PRODUCTION
Quality cost account allows to carry out a full analysis of the causes and consequences of improper product quality, and to demonstrate that the reasons must first be eliminated, that the losses of the deficiencies as soon as possible to reduce [POTKÁNY, M., ŠATANOVÁ, A. 2000]. For this purpose it can be use the analysis (method) V. Pareto, and provide the contribution of individual nonconformities in all nonconformities causing improper product quality or high level of production costs in the Pareto diagram or by using a Lorenz curve (Pareto-Lorenz diagram). After determining the reasons for substantial parts of nonconformities (by volume) and losses to the deficiency (in value), proceed to the analysis of specific improper product quality causes or high level of specific costs by using Ishikawa diagram, showing the causes of analyzed problem appearing [BORKOWSKI S., 2004].
Percentage and cumulative percentage of these costs in period 2007 - 2009 are presented in Table 2.
Table 2 Percentage of individual costs in the total production costs in years: 2007 – 2009.
Number
Cause symbol
Name of cause
percentage contribution of individual costs in the total
production costs [%]
2007 2008 2009
1. 2. 3. 4. 5. 6. 7. 8. 9.
10. 11. 12. 13. 14. 15.
SUM
K1 K2 K3 K4 K5 K6 K7 K8 K9
K10 K11 K12 K13 K14 K15
Transport costs of outside means of transport Transport costs of own means of transport Maintenance costs of own transport means
Costs of storehouse stequipping (3%) Costs of electric energy (6%)
Costs of the preservation of storehouses Low efficiency of machines
Great degree of machines consumption Mismatching of machines number
to the volume of production Costs of packaging materials
Costs of putting the logo on products (4%) Costs for packaging equipment (2%)
High price of materials (15%) Improper quality of materials (8%)
Malfunctions caused by material transport and storage
18 11 7 4 6
0,5 8 7 6
2 3
1,5 16 9 1
100
22 8 4 3 6
1,5 11 6 5
5 3 2
10 10 3,5
100
20 12 4 2 6 1 6 8 4
5 5
2,5 17 5,5 2
100 Source: own study based on material of enterprise X.
Then, in tables 3 and 4 ordered value of costs (from largest to smallest) and their
cumulative value of increasing production costs for bent furniture production in years in period 2008 – 2009 are shown.

WOOD PROCESSING AND FURNITURE MANUFACTURING: present conditions, opportunities and new challenges
113
Table 3 Structured value of wooden bent furniture production costs for analyzed enterprise X in 2008
Number
Cause symbol
Name of cause
percentage contribution of individual
costs [%]
Cumulated value
of production costs [%]
1. 2. 3. 4. 5. 6. 7. 8. 9.
10. 11. 12. 13. 14. 15.
SUM
K1 K7
K14 K13 K2 K5 K8
K10 K9 K3
K15 K4
K11 K12 K6
Transport costs of outside means of transport Low efficiency of machines
Improper quality of materials High price of materials
Transport costs of own means of transport Costs of electric energy
Great degree of machines consumption Costs of packaging materials
Mismatching of machines number to the volume of production
Maintenance costs of own transport means Malfunctions caused by material transport and storage
Costs of storehouse stequipping Costs of putting the logo on products
Costs for packaging equipment Costs of the preservation of storehouses
22 11 10 10 8 6 6 5 5 4
3.5 3 3 2
1.5
100
22 33 43 53 61 67 73 78 83 87
90.5 93.5 96.5 98.5 100
Source: own study based on material of enterprise X. Table 4 Structured value of wooden bent furniture production costs for analyzed enterprise X in 2009
Number
Cause symbol
Name of cause
percentage contribution of individual
costs [%]
Cumulated value
of production costs [%]
1. 2. 3. 4. 5. 6. 7. 8. 9.
10. 11. 12. 13. 14. 15.
SUM
K1 K13 K2 K8 K5 K7
K14 K11 K10 K3 K9
K12 K15 K4 K6
Transport costs of outside means of transport High price of materials
Transport costs of own means of transport Great degree of machines consumption
Costs of electric energy Low efficiency of machines Improper quality of materials
Costs of putting the logo on products Costs of packaging materials
Maintenance costs of own transport means Mismatching of machines number to the volume of
production Costs for packaging equipment
Malfunctions caused by material transport and storage
Costs of storehouse stequipping Costs of the preservation of storehouses
20 17 12 8 6 6
5.5 5 5 4 4
2.5 2 2 1
100
20 37 49 57 63 69
74.5 79.5 84.5 88.5 92.5 95 97 99
100
Source: own study based on material of enterprise X.
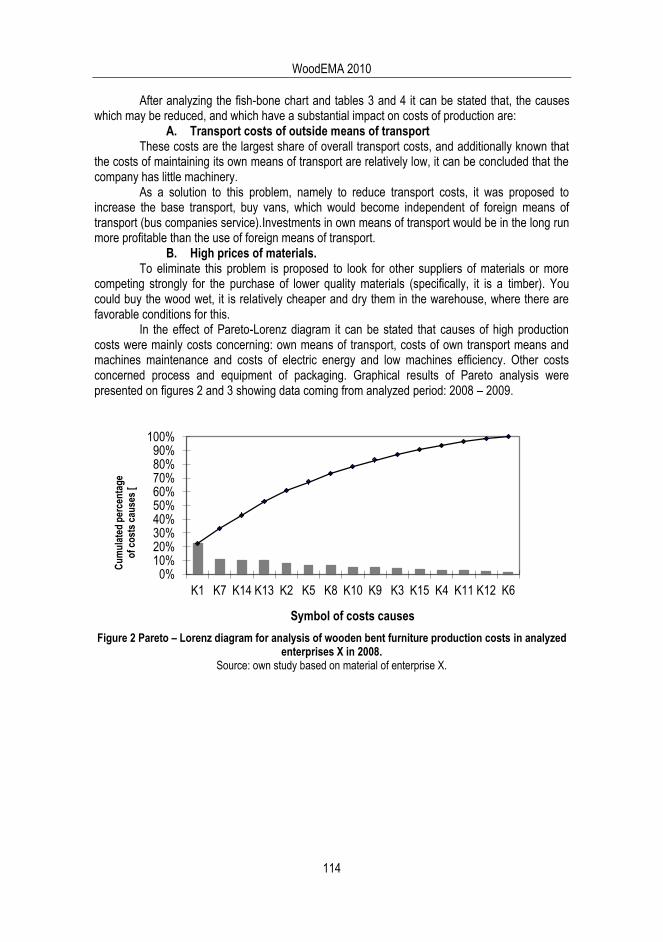
WoodEMA 2010
114
After analyzing the fish-bone chart and tables 3 and 4 it can be stated that, the causes which may be reduced, and which have a substantial impact on costs of production are:
A. Transport costs of outside means of transport These costs are the largest share of overall transport costs, and additionally known that
the costs of maintaining its own means of transport are relatively low, it can be concluded that the company has little machinery.
As a solution to this problem, namely to reduce transport costs, it was proposed to increase the base transport, buy vans, which would become independent of foreign means of transport (bus companies service).Investments in own means of transport would be in the long run more profitable than the use of foreign means of transport.
B. High prices of materials. To eliminate this problem is proposed to look for other suppliers of materials or more
competing strongly for the purchase of lower quality materials (specifically, it is a timber). You could buy the wood wet, it is relatively cheaper and dry them in the warehouse, where there are favorable conditions for this.
In the effect of Pareto-Lorenz diagram it can be stated that causes of high production costs were mainly costs concerning: own means of transport, costs of own transport means and machines maintenance and costs of electric energy and low machines efficiency. Other costs concerned process and equipment of packaging. Graphical results of Pareto analysis were presented on figures 2 and 3 showing data coming from analyzed period: 2008 – 2009.
Figure 2 Pareto – Lorenz diagram for analysis of wooden bent furniture production costs in analyzed
enterprises X in 2008. Source: own study based on material of enterprise X.
0%10%20%30%40%50%60%70%80%90%
100%
K1 K7 K14 K13 K2 K5 K8 K10 K9 K3 K15 K4 K11 K12 K6
Cu
mu
late
d p
erce
nta
ge
o
f co
sts
cau
ses
[
Symbol of costs causes

WOOD PROCESSING AND FURNITURE MANUFACTURING: present conditions, opportunities and new challenges
115
Figure 3 Pareto – Lorenz diagram for analysis of wooden bent furniture production costs in analyzed
enterprises X in 2009. Source: own study based on material of enterprise X.
An analysis of Figures 3 and 4 shows, that 20% of nonconformities cause average 44%
of effects. In addition, it can be stated that for 44% of all causes of increased costs occurring in the bent furniture production are responsible three reasons, and twelve reasons are responsible for 66% of effects. The main reasons for increasing costs were: costs of outside transport means, high price of materials and costs of machines maintenance.
Pareto – Lorenz diagram is quality management tool to not only the hierarchy of factors affecting the studied problem. Analyzing the results obtained it can be stated that the direction of corrective activity (solving and improving management problems) to eliminate or reduce the three basic production costs, which are the costs of freight transport aliens, the high price of materials and low efficiency of machines.
REFERENCES
1 BORKOWSKI S., (2004): MEASURING THE QUALITY LEVEL, WSZiM School Edition, Sosnowiec.
2 POTKÁNY, M., ŠATANOVÁ, A. (2000): MOŽNOSTI UPLATNENIE CONTROLLINGU V PODNIKU. In: Mladá veda 2000, zborník vedeckých prác, Nitra: VaES SPU v Nitre, Nitra.
3 POTKÁNY, M., ŠATANOVÁ, A., GEJDOŠ, P. (2001): QUALITY COSTS AT WOOD INDUSTRY. In: Wood-raw material for the XXI century, zborník referátov z medzinárodnej vedeckej konferencie, Druk P.P. Evan, Warszawa.
Authors' addresses: prof. n. techn. i n. ekonom. dr hab. inż. Stanisław Borkowski dr inż. Renata Stasiak-Betlejewska Institute of Production Engineering Czestochowa University of Technology, Poland
0%
20%
40%
60%
80%
100%
K1 K13 K2 K8 K5 K7 K14 K11 K10 K3 K9 K12 K15 K4 K6
Cu
mu
late
d p
erce
nta
ge
o
f co
sts
cau
ses
[
Symbol of costs causes

WoodEMA 2010
116
WOOD PROCESSING AND FURNITURE MANUFACTURING: present conditions, opportunities and new challenges
117
THE MULTI-CRITERIA MODEL FOR OPTIMAL SELECTION OF CROATIAN WOOD INDUSTRY COMPANIES
Maja Moro, Mario Šporčić, Ksenija Šegotić, Andreja Pirc, Renata Ojurović
ABSTRACT
Ministry of Regional Developement, Forestry and Water Management, Department of Wood Industry, announced a tender for assignation irrecoverable dedicated funds for stimulation and sustainability development of wood processing and furniture production in Republic of Croatia for the year 2010. Companies from industrial wood processing proposed a projects for financing and for this purpose they had to fill-in the several forms. We recognized that as a problem of multicriterial decision making for funds distribution and for this purpose a model for Optimal Selection of Croatian Wood Industry Companies was developed. The model is based on the Data Envelopment Analysis (DEA) method. The paper shows that the DEA may be useful tool at a strategic and operational level of decision making in wood industry.
Key words: wood processing, efficiency, optimal selection, DEA.
1 INTRODUCTION
Taking into consideration advantages and potentials of the wood processing and furniture production, own natural resources, long-lasting tradition, primary orientation toward export markets, high level of privatization and high-quality human resources, wood processing and furniture production have been recognized by the Government of the Republic of Croatia as strategic branches of economy and their growth and development, as well as successful business results, are of significance for the Croatian economy in whole. With an aim to utilize the above-mentioned potentials and responding to the crucial market challenges, among which competitiveness is the most pronounced one, it is of crucial importance to direct future strategic development and investments of corresponding business entities in the right way.
In order to achieve the above-mentioned goal, the Government of the Republic of Croatia has in 2006 prepared an Operative Program for the Development of Industrial Wood Processing in the Republic of Croatia 2006 - -2010, (hereinafter: Operative Program) as the instrument for the operationalization of the Development Strategy for Industrial Processing of Wood and Paper, enacted in 2004.
The Operative Program defines main, strategic goal of development of wood processing and furniture production till 2010 - increase in the value of wood raw material through products with the high level of finalization having the quality, design and recognizability features and in the end, fulfilment of the vision of the Croatian wood industry as economically successful, profitable and export-oriented with harmonized and sustainable development, following worldwide development trends.
In order to realize the main goal of the development, it is required to realize short-term goals defined in the Operative Program through implementation measures, whose realization financial support by the Government of the Republic of Croatia is required for as well. Taking the

WoodEMA 2010
118
above-mentioned into consideration, several co-financing resources for the same have been foreseen for the implementation of development programs of the business entities within the respective measures (credit line of the Croatian Bank for Reconstruction and Development via business banks, state guarantees and subventions). Past five-year period of the implementation was based on the subventions as the resource of co-financing, i.e. horizontal state support which is exclusive of the following justified production and economic business costs: research and development; marketing and promotion activities; innovations and design; personnel education; technical harmonizing; information, communication and program support; technology of wood processing and furniture production; environmental technology; energy efficiency technology and construction of business & production objects.
One of the elements that allows for reconsideration and defining of the level of competitiveness of a single business entity is export successfulness. Export as a economic activity represents one of the most complicated forms of international business and achieving of export results partially depends on the factors such as the size and years of entity's operation (Sousa, 2004) This has also been pointed out by Coskun (1996) who points out the years of entity's operation as one of the factors of export successfulness. Successfulness of business entity may be viewed through productivity as well, which may be defined as a ratio of income (output) and number of the employees (input) of the business entity (Figurić, 2003), one business branch or the economy of the state in whole.
Taking into consideration the number of the employees and years of operation as internal factors of the business entity which may influence the export and achieving income from the same, the aim of this paper was to investigate the influence of the above-mentioned factors on business success of entities within the field of wood processing and furniture production by application of the mathematical model DEA as a tool for decision making.
2 MATERIAL AND METHODS
Business entities that applied capital investments for the tender for subventions in 2010 had to also submit forms prescribed by the donor, i.e. ministry in charge of the wood industry, together with the application. After check-up on administrative compliance with the provisions of the tender which involves check-up on form correctness, 204 capital investments out of the same number of holders had been taken into further consideration out of total number of received applications. Data required for this paper had been gathered from the database of subvention donors. They include business entities, i.e. holders of capital investment who are oriented toward export and are sorted as per size (small, medium-sized and large entities) and levels of main activity (primary, semi-final and final wood processing). 31 medium-sized entities out of total number of reviewed subject oriented toward export had been selected (Table 1.), whose level of main activities is final processing. DEA method had been applied as help at decision making on how to distribute subventions per respective entity.

WOOD PROCESSING AND FURNITURE MANUFACTURING: present conditions, opportunities and new challenges
119
Table 1 Data set of results for input and output factors regarding different decision making units
DMU
Inputs Outputs
Company age (years) Number of
employees (N) Total income,
mill. euro Share of export
(%) Unscaled data, N Scaled data,
1/N x 100
1 2 3 4 5 6
3 20 5,00 124 7,34 19,56
7 16 6,25 217 9,64 86,34
14 11 9,09 156 2,57 93,41
16 4 25,00 174 7,14 93,32
17 8 12,50 87 2,71 49,77
20 18 5,56 135 3,95 27,50
23 5 20,00 168 3,49 45,60
30 14 7,14 339 8,55 80,97
34 15 6,67 392 9,94 56,33
43 16 6,25 120 3,55 21,42
60 8 12,50 117 2,42 78,58
62 18 5,56 118 4,65 77,67
64 13 7,69 56 0,89 21,68
83 15 6,67 75 2,64 29,47
100 7 14,29 100 1,06 88,27
105 19 5,26 227 3,35 51,88
107 15 6,67 70 1,54 69,71
109 15 6,67 103 1,99 84,65
123 11 9,09 128 5,07 76,94
135 8 12,50 84 2,75 65,71
136 8 12,50 76 2,50 26,66
140 17 5,88 413 11,20 92,47
141 40 2,50 101 3,98 41,78
158 62 1,61 117 4,67 29,04
165 9 11,11 132 4,58 21,66
180 62 1,61 107 3,15 75,63
196 13 7,69 123 3,29 56,51
197 16 6,25 236 7,23 44,01
199 20 5,00 334 4,66 78,71
200 17 5,88 451 6,32 68,90
201 15 6,67 341 4,92 23,18
Inputs are variables whose desirable direction is reducing and entities of longer
operation periods are more acceptable. In this way entities with longer operation periods receive lesser numeric value in inputs through data scaling and have therefore advantages in comparison with those entities that have been in the business for a shorter period of time or have been recently established.
Data Envelopment Analysis', developed by Charnes et al., 1978 is a well-known non-parametric method for the assessment of relative efficiency of comparable entities/decision making units (DMU) with different level of inputs and outputs. Efficiency is expressed as the ration

WoodEMA 2010
120
of the sum of weighted outputs of the base DMU to the sum of weighted inputs. By linear programming, DEA models determine empiric efficiency frontier (frontier of production possibilities) based on data of used inputs and achieved outputs of all decision making units. Efficiency level is calculated for each production unit, and consequently, efficient and inefficient units may be differentiated. The best practice units, those that determine the efficiency frontier, are rated '1', while the degree of technical inefficiency of other decision making units is calculated based on the difference of their input-output ratio with respect to the efficiency frontier (Cooper et al; 2003).
The analysis is focused on finding the 'best' virtual unit for each actual unit. If the virtual unit is better than the original one, either by achieving higher outputs with the same inputs or by achieving the same outputs with lower inputs than the actual unit, then it is inefficient. The basic assumption is that if a certain unit may produce y outputs with x inputs, the other units should be able to do the same if they work efficiently. While a typical statistical approach (regression analysis) is based on average values, DEA is based on extreme observations, and it compares each production unit only with the best unit. Efficiency is determined relatively with respect to other decision making units in the observed group.
In this study, two measures of efficiency are applied – technical, provided with basic CCR (proposed by Charnes, Cooper and Rhodes in 1978) and BCC (proposed by Banker, Charnes and Cooper in 1984) models and scale efficiency (SE).
Software package DEA Excel Solver had been applied for solving of CCR and BCC models, whereas the relative technical efficiency had been established separately for each business subject. Both models may be oriented by inputs or oriented by outputs. In models oriented by inputs the decision makers achieve efficiency through reducing of their inputs while retaining of the same level of output. In models oriented by outputs the efficiency is achieved by increase in the output with the same inputs. Choice of model orientation determines projection trajectory regarding efficiency level. This paper deals with output oriented models, i.e. models which are oriented toward determining of maximal outputs that may be achieved by application of the given input amount. Applied models have been used due to acceptability with regard to the process being reviewed. Namely, wood processing and furniture production cannot have reducing of the number of the employees and "short - lasting" production as their goals, but stable and long-lasting business with increase in income and export above all, i.e. improvement of total status of production and operation.
In order to determine DMU efficiency by the application of DEA models, it is necessary to define inputs and outputs, to be used as the input for the analysis. Two variables are selected for both inputs and outputs. The number of employees and the company age are entered into the model as inputs. Outputs are represented by the income per year by the share of export.
3 RESULTS AND DISCUSSION
Technical and scale efficiency were determined individually for each decision making unit. Results obtained by the application of the output-oriented DEA are given in table 2. and 3.

WOOD PROCESSING AND FURNITURE MANUFACTURING: present conditions, opportunities and new challenges
121
Table 2 Results of CCR and BCC output oriented models
CCR model BCC model Scale eff. (SE)
Number of firms (DMU) 31 31 31
Relatively efficient DMUs 5 15 7
Relatively efficient DMUs (in %)) 16,1 48,4 22,6
Average relative efficiency, E 0,741 0,866 0,854
Maximum 1,000 1,000 1,00
Minimum 0,327 0,463 0,475
Standard deviation 0,213 0,174 0,165
DMUs with efficiency lower than E 16 10 12
The average CCR efficiency of the investigated DMUs is 0.741, which means that an
average (assumed) forest office should only use 74.1% of the currently used quantity of inputs and produce the same quantity of the currently produced outputs, if it wishes to do business at the efficiency frontier. In other words, this average organisational unit, if it wishes to do business efficiently, should produce 35.0% more output with the same input level.
According to the BCC model, the average efficiency is 0.866. This means that an average forest office should only use 86.6% of the current input and produce the same quantity of output, if it wishes to be efficient. In other words, to be BCC efficient it should produce 15.5% more outputs with the same inputs.
In spite of a relatively high mean efficiency (74 or 87%) regardless of the used model (CCR or BCC), the lowest level of relative efficiency ranges between 0.327 (CCR) and 0.463 (BCC). This indicates that there are significant differences in production and business activities between the analysed units. Also, 5 DMUs are relatively efficient (16%), according to the CCR model, while a total of 15 units (48%) are rated '1.000' according to the BCC model. This can mean that the BCC model with the selected input and output variables cannot make a proper distinction between efficient and inefficient units. Such results may, however, also be useful if additional models of decision making are applied. The results of DEA analysis may then be used as the first filter of inefficient units.
Scale efficiency (SE – ratio of CCR efficiency and BCC efficiency) shows how close or far the size of the observed unit is from its optimal size. The efficiency of 100% indicates that the size and volume of activities are well balanced. The values lower than 100% mean that the level of technical efficiency is at least partly under influence of size or volume of activities of the observed unit.
The scale efficiency of 0.854 means that the analysed DMUs would increase their relative efficiency on average by 14,6% if they adapted their size or volume of activities to the optimal value. Relatively efficient are 7 (23%) units. Almost all of them (5) are also efficient according to the CCR model. DMUs that are efficient only according to the BCC model (Table 3) do not show the same efficiency level in case of determination of scale efficiency. This indicates their inadequate size or inadequate volume of activities expressed by the main parameters of their production and business performance.

WoodEMA 2010
122
Table 3 Efficiency of DMUs
DMU CCR score BCC score Scale eff.
3 1,000 1 1,000
7 0,973 1 0,973
14 0,694 1 0,694
16 0,951 1 0,951
17 0,827 0,84657763 0,977
20 0,574 0,580860084 0,989
23 0,481 0,506132606 0,951
30 0,613 0,883450366 0,694
34 0,600 0,900398972 0,667
43 0,560 0,560310032 0,999
60 0,754 0,896768542 0,841
62 1,000 1 1,000
64 0,488 1 0,488
83 0,776 1 0,776
100 0,886 1 0,886
105 0,398 0,598957259 0,664
107 1,000 1 1,000
109 0,928 1 0,928
123 0,968 0,979441723 0,988
135 0,995 1 0,995
136 0,715 0,912863475 0,783
140 0,704 1 0,704
141 0,935 1 0,935
158 1,000 1 1,000
165 0,629 0,63541602 0,989
180 1,000 1 1,000
196 0,688 0,70536165 0,975
197 0,650 0,738605565 0,880
199 0,422 0,888305719 0,475
200 0,418 0,74511877 0,561
201 0,327 0,462703095 0,706

WOOD PROCESSING AND FURNITURE MANUFACTURING: present conditions, opportunities and new challenges
123
4 CONCLUSION
This paper provides insight into additional techniques of efficiency assessment applicable in comparing companies in wood industry, where their success in not only determined based on financial profit but also based on percentage of export in total income. We have used DEA method to rank the companies, to make optimal selection of Croatian Wood industry companies. We hope that the analyses carried out in this work will be helpful in decision making in wood industry.
REFERENCES
1 Banker, R.D.,Charnes, A., Cooper, W.W. (1984): Some models for estimating technical and scale efficiencies in Data Envelopment Analysis. Management Science 30 (9): 1078-1093
2 Charnes, A., Cooper, W.W., Rhodes, E. (1978): Measuring the efficiency of decision making units. European Journal of Operational research 2, 429–444.
3 Cooper, W.W., Seiford, L.M., Tone, K. (2003): Data Envelopment Analysis – A Comprehensive Text with Models, Applications, References and DEA-Solver Software, Kluwer Academic Publishers, p. 1–318 + XXVIII.
4 Coskun, R.(1996): EXPORT PERFORMANCE OF FOREIGN AND LOCAL MANUFACTURING FIRMS IN TURKEY, Leicester University.
5 Figurić, M. (2003): MENADŽMENT TROŠKOVA U DRVNOTEHNOLOŠKIM PROCESIMA. Šumarski fakultet Sveučilišta u Zagrebu.
6 Sousa C.M.P. (2004): Export performance measurement: An evaluation of the empirical research in the literature, Academy of marketing science review, Vol. 9.
Authors' addresses: Maja Moro, prof. math. and phis. Assist.Prof.Mario Šporčić, PhD Prof. Ksenija Šegotić, PhD Andreja Pirc, B. Sc. University of Zagreb, Šumarski fakultet Svetošimunska 25, 10000 Zagreb Croatia e-mail: [email protected] Renata Ojurović, B.Sc. Ministry of Regional Development, Forestry and Water Management, Croatia

WoodEMA 2010
124

WOOD PROCESSING AND FURNITURE MANUFACTURING: present conditions, opportunities and new challenges
125
EFFECTS AND BENEFITS OF FOREIGN DIRECT INVESTMENT FOR THE DEVELOPMENT OF WOOD-PROCESSING INDUSTRY
Martina Merková, Josef Drábek
ABSTRACT
This paper deals with foreign direct investment inflows into wood-processing industry in the Slovak republic. Wood-processing sector has comparative advantages which make it possible to define the effects and benefits of foreign investment in mentioned sector. Foreign direct investment may become the basis for the modernization of production facilities, the transfer of new technologies, know-how, creating healthy competition and more efficient to integrate our economy into the international division of labor, decrease unemployment, growth of GDP as well as provide access to European and global market of products and services, respectively.
Keywords: foreign direct investment, effects of FDI, effects of investment, development of WPI.
1 INTRODUCTION
One of the limiting factors in the process of transformation in Central and Eastern Europe economies is the lack of capital resources. Economic growth in Slovakia is conditional to sufficient capital resources. Therefore, inflow of foreign capital plays a role in enhancing, growth of value added, growth of competitiveness.
However, the main task is to take into account not only the volume but also the structure of foreign investment in Slovakia, attracting them to specific regions and sectors. Taken into account should be factors such as the development of less advanced regions of Slovakia, creating equal opportunities for quality of life across our country, the development of perspective sectors that are able to create products with higher added value.
The wood-processing industry (WPI) thanks to their comparative advantage seems to be promising sector for the Slovak economy is a great opportunity. Although the sector is mentioned in Slovakia between the less important sectors in terms of GDP creation, value added and labor productivity is above average over the whole manufacturing industry.
2 FOREIGN DIRECT INVESTMENT IN THE EUROPEAN UNION
The geographical breakdown can be seen that the share of foreign direct investment (FDI) inflows in the EU as the percentage of total world (average of 37% in period 1980-2008) has a slight upward trend with fluctuating course.

WoodEMA 2010
126
Figure 2 Foreign direct investment inflow in the EU (% of global inflow)
Source: UNCTAD data
Data of United Nation Conference for Trade and Development (UNCTAD) in period 2008 present that Slovakia among the 27 EU countries has placed the highest in the indicator FDI inflows per capita – in 16th place with the value 632 USD/capita. Similar result is in the evaluation of the total FDI inflows in millions USD, as well as percentage of FDI in GDP of the country (17th place).
Figure 3 Foreign direct investment inflows per capita in the EU countries (in USD per capita)
Source: UNCTAD data
0
10
20
30
40
50
60
70
80
90
100
1980 1981 1982 1983 1984 1985 1986 1987 1988 1989 1990 1991 1992 1993 1994 1995 1996 1997 1998 1999 2000 2001 2002 2003 2004 2005 2006 2007 2008
FD
I in
flo
w in
th
e E
U a
s %
o
f to
tal w
orl
d
Year 2008
6 2665 635
4 7432 764
2 1582 001
1 8371 625
1 5771 4731 468
1 2121 040
901651632
623547
457434
331303286
631
Luxembourg Belgium Sweden Cyprus
Malta Denmark
France Austria
United Kingdom Spain
Estonia Bulgaria
Czech Republic Slovenia Hungary Slovakia
Latv ia Romania Lithuania Greece Poland
Portugal Germany
Italy Netherlands
Finland Ireland
USD per capita

WOOD PROCESSING AND FURNITURE MANUFACTURING: present conditions, opportunities and new challenges
127
3 FOREIGN DIRECT INVESTMENT IN THE SLOVAK REPUBLIC
Slovakia at the beginning of transformation had similar comparative advantages as other countries in Central and Eastern Europe, particularly qualified and cheap labor, cheap raw material and energy inputs, good location and close relations with the EU. FDI inflows until 2000 had risen, but its volume lagged behind the volume of FDI inflows in the other V4 countries.
Figure 4 Foreign direct investment in the Slovak republic (in mill. SKK) Source: NBS data
Figure 5 Inflow of foreign direct investment (equity) in the Slovak republic (in mill. SKK)
Source: NBS data
4 FOREIGN DIRECT INVESTMENT IN THE WOOD-PROCESSING INDUSTRY
FDI inflows into the wood-processing industry (WPI) in the presented period of 5 years reached the largest volume in 2005, the sum of 1.557 billion SKK, while 90% of that absorbed only the furniture industry. Other years achieve less than half this value, the second largest inflow was in 2006 what means 835 million SKK into WPI. Pulp and paper industry was dominated in 2006 and 2007 with balanced amount of 608 million SKK and 606 million SKK of FDI inflows respectively.
18 582 16 687
99 561
61 448
185 594
38 896 37 49822 182
64 287
35 52728 672
0
50 000
100 000
150 000
200 000
mill.
SK
K
1998 1999 2000 2001 2002 2003 2004 2005 2006 2007 2008*
0
100 000
200 000
300 000
400 000
500 000
600 000
700 000
800 000
900 000
1 000 000
1998 1999 2000 2001 2002 2003 2004 2005 2006 2007
mill.
SK
K
FDI stock FDI inflow

WoodEMA 2010
128
Figure 6 Inflow of FDI in sectors of wood-processing industry (in mill. SKK)
Source: NBS data
The smallest amount of foreign investment flowed into the sector of wood industry
(annually and also total) with the exception of 2004 when the wood industry recorded FDI inflows of 556 million EUR. The opposite trend as in the wood-processing industry is in the industrial production of the Slovak republic, which in the year 2005 was the lowest FDI inflows, 10.901 billion EUR.
4.1 Effects of investment and FDI in the wood-processing branch
Wood-processing industry in the Slovak economy has a specific position, it still has a comparative advantages. It is relatively little dependent on imported raw material inputs, given location of inputs is important from the perspective of regional development of small and middle business, with changes in the use of production technology and the results of innovation processes can promote employment growth. Positive development can be evaluated in labor productivity of sales, what is the most significant in the pulp and paper industry, which is recorded long-term growth above the average of industrial production. Positive development had also the furniture industry in the years 1999-2005, where the productivity growth into the level of industrial production was caused by just growing volume of investment. It appears more positive labor productivity of added value in the pulp and paper industry, especially in the years 2006-2007, when it was recorded high inflows of FDI into the mentioned sector.
0200400600800
1 0001 2001 4001 600
FD
I (
mill
. S
KK
)
2003 2004 2005 2006 2007
Wood industry Furniture industry Pulp and paper industry
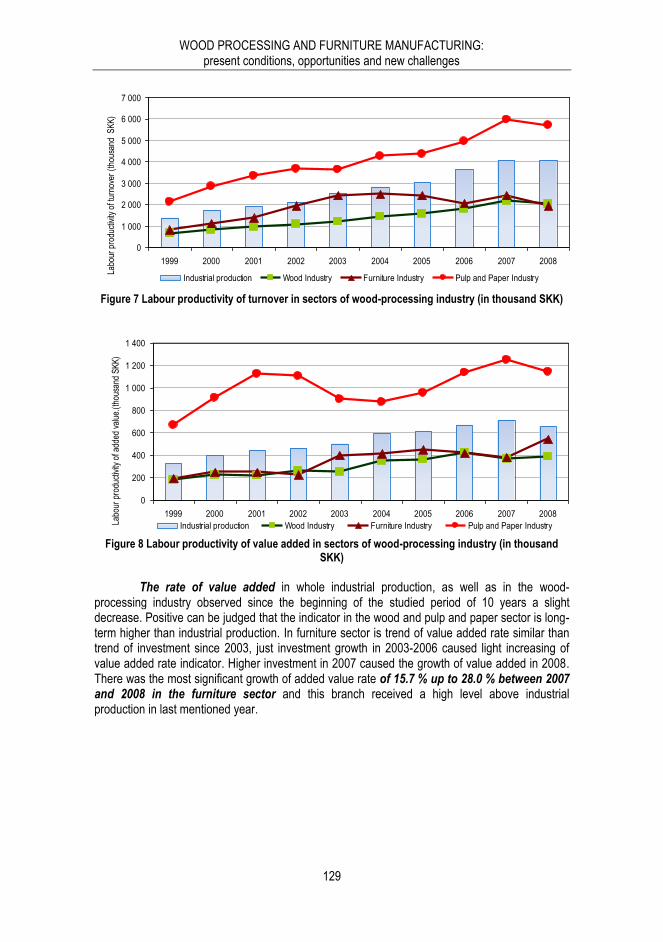
WOOD PROCESSING AND FURNITURE MANUFACTURING: present conditions, opportunities and new challenges
129
Figure 7 Labour productivity of turnover in sectors of wood-processing industry (in thousand SKK)
Figure 8 Labour productivity of value added in sectors of wood-processing industry (in thousand
SKK)
The rate of value added in whole industrial production, as well as in the wood-
processing industry observed since the beginning of the studied period of 10 years a slight decrease. Positive can be judged that the indicator in the wood and pulp and paper sector is long-term higher than industrial production. In furniture sector is trend of value added rate similar than trend of investment since 2003, just investment growth in 2003-2006 caused light increasing of value added rate indicator. Higher investment in 2007 caused the growth of value added in 2008. There was the most significant growth of added value rate of 15.7 % up to 28.0 % between 2007 and 2008 in the furniture sector and this branch received a high level above industrial production in last mentioned year.
0
1 000
2 000
3 000
4 000
5 000
6 000
7 000
1999 2000 2001 2002 2003 2004 2005 2006 2007 2008
Labo
ur p
rodu
ctiv
ity o
f tur
nove
r (t
hous
and
SK
K)
Industrial production Wood Industry Furniture Industry Pulp and Paper Industry
0
200
400
600
800
1 000
1 200
1 400
1999 2000 2001 2002 2003 2004 2005 2006 2007 2008
Labo
ur p
rodu
ctiv
ity o
f add
ed v
alue
.(th
ousa
nd S
KK
)
Industrial production Wood Industry Furniture Industry Pulp and Paper Industry

WoodEMA 2010
130
Figure 9 Rate of value added in sectors of wood-processing industry (in %)
Figure 10 Rate of value added in the wood-processing industry total (in %)
Long-term high investment rate in wood industry has made that this sector achieved the highest residual value of fixed assets (73.1% compared to 52.4% in industrial production at the end of 2008), while the long term, this indicator shows a rather significant average annual growth 1.2% versus 0.3% fall in industrial production. In the pulp and paper sector is a residual value of assets only 45.2% reported a 0.8% average annual decrease. A high residual value of assets in the wood industry, however, was caused by an unfavorable structure of capital investments, where a considerably higher share (compared with whole manufacturing) goes into building and construction, whose amortization is significantly lower than in machinery and equipment, also the benefits of building are lower than in machinery and equipment.
0
5
10
15
20
25
30
35
1999 2000 2001 2002 2003 2004 2005 2006 2007 2008
Rat
e of
val
ue a
dded
(%
)
Industrial production Wood Industry Furniture Industry Pulp and Paper Industry
0
5
10
15
20
25
30
1999 2000 2001 2002 2003 2004 2005 2006 2007 2008
Rat
e of
val
ue a
dded
(%
)
Industrial production Wood-processing Industry total

WOOD PROCESSING AND FURNITURE MANUFACTURING: present conditions, opportunities and new challenges
131
Figure 11 Investment rate in sectors of wood-processing industry (in %)
Figure 12 Investment per capita in sectors of wood-processing industry (in SKK)
Figure 13 Investment rate in the wood-processing industry total (in %)
0,0
5,0
10,0
15,0
20,0
25,0
30,0
1999 2000 2001 2002 2003 2004 2005 2006 2007 2008
Inve
stm
ent r
ate
(%)
Industrial production Wood Industry Furniture Industry Pulp and Paper Industry
0
100 000
200 000
300 000
400 000
500 000
600 000
700 000
800 000
1999 2000 2001 2002 2003 2004 2005 2006 2007 2008
Inve
stm
ent p
er c
apita
(S
KK
)
D Priemyselná výroba 20-DP 361-NP 21-CPP
0
2
4
6
8
10
12
14
16
1999 2000 2001 2002 2003 2004 2005 2006 2007 2008
Inve
stm
ent r
ate
(%)
Industrial production Wood-processing Industry total

WoodEMA 2010
132
Figure 14 Investment per capita in the wood-processing industry total (in SKK)
World economic crisis especially since the second half of 2008 caused that it is not
possible to ensure positive growth of wood-processing industry in relation to connecting this sector particularly into construction industry and other sectors of the Slovak economy. Less increasing Slovak GDP, its lower growth trend is strongly reflected in the economy of the WPI. It can be concluded that the reduction in demand, as well as one-sided orientation of most businesses in one or two customers in the EU countries are a cause of serious economic problems of enterprises. The decrease in 2008-2009 may have a serious impact on the stability of the industry, processing of available resources, as well as a significant increase in social instability in various regions of Slovakia (Drabek, Merková, 2009).
It can be stated that in the wood-processing industry no innovation development focused on increase the competitiveness of production and efficiency increasing, and without solution of the availability of financial resources needed to implement innovative plans can expect a significant decrease in the competitiveness and long-term recession. The main reason for the negative status of the WPI is long-lasting unsolved problems. Strategic and systemic measures such as more efficient use of wood as a domestic, sustainable renewable materials, support for building the processing capacities in Slovakia, programs to increase domestic consumption of timber in construction (the use of wood for public projects for new residential and nonresidential construction, reconstruction and modernization), support of domestic wood processors who manufacture products with higher added value, all these factors were underestimated in the past, and also because of this the wood sector in Slovakia found itself in a bad situation.
The reason is also unfavorable situation on the market with timber and timber products. Sales of timber significantly reduced at home and abroad. The general requirement of the WPI is currently not overproduction, but the creation of new jobs. It is necessary to develop such programs, which increase the generation of value added.
5 CONCLUSION
Foreign direct investment is considered as a resource of increasing the competitiveness of the Slovak economy through changes that direct to restructuring of enterprises and strengthening of their capital. The positions of foreign investors in the world market, their capital strength and unique knowledge improve chances to create conditions in our country for new jobs that are sustainable. The participation of foreign enterprises in the Slovak economy keeps at domestic companies to consistently and quickly change their strategy.
0
100 000
200 000
300 000
400 000
1999 2000 2001 2002 2003 2004 2005 2006 2007 2008
Inve
stm
ent p
er c
apita
(SKK
)
Industrial production Wood-processing Industry total

WOOD PROCESSING AND FURNITURE MANUFACTURING: present conditions, opportunities and new challenges
133
Foreign investment cause positive impact on the national level into GDP growth and increased competitiveness of Slovakia, at the level of wood-processing industry it is mainly the positive associated with higher value added, labor productivity and technology transfer.
Effects that bring foreign investment, considering the current situation of the WPI, may occur only after the application of targeted measures. Specific measures for job creation, the production of sophisticated products are aimed at improving the development of wood-processing industry.
REFERENCES
1 DRÁBEK, J., MERKOVÁ, M. 2009. Decreasing investment rates in the Slovak republic wood-processing industry as a result of the global economic crisis. In Competitiveness of wood processing and furniture manufacturing. Šibenik, Croatia. 2009. ISBN 978-953-192-010-9. s. 43-49.
2 DRÁBEK, J., POLÁCH, J. 2008. Reálne a finančné investovanie firiem. 1. vyd. Zvolen: Technická univerzita vo Zvolene, 2008. 271 s. ISBN 978-80-228-1934-3.
3 FIFEKOVÁ, M. 2008. Priame zahraničné investície a efekty spillovers. Občianske združenie Alternatíva Komunikácia Občania, 2008. [online] Dostupné na internete: http://alternativa.sk/uploads/tx_clanok/Fifekova_RP.pdf
4 MERKOVÁ, M.: Determinanty priamych zahraničných investícií v SR. In Priame zahraničné investície v DSP. [CD-ROM] Zvolen: 2006. ISBN 80-228-1598-5.
5 MERKOVÁ, M.: Riziká a efekty priamych zahraničných investícií. In Priame zahraničné investície v DSP. [CD-ROM] Zvolen: 2005. ISBN 80-228-1445-8.
6 MERKOVÁ, M., DRÁBEK, J.: Vývoj priamych zahraničných investícií v slovenskej republike a drevospracujúcom priemysle SR. In Intercathedra No 24. Poznan: 2008. s. 173-178. ISSN 1640-3622.
7 Informácia o stave realizácie programu Drevo – surovina 21. storočia, vrátane Programu na podporu rozvoja spracovania a využívania drevnej suroviny. Vypracovalo MH SR. Uznesenie vlády č. UV-10455/2006.
8 Koncepcia riadenia prílevu zahraničných investícií v kontexte globálnej finančnej a hospodárskej krízy. Vypracovalo MH SR v spolupráci s MZV SR. Uznesenie vlády SR č. UV-339/2009.
9 World Investment Report 2009. Ženeva: UNCTAD, 2009. [online]. [cit. 28.03.2010] Dostupné na internete: http://unctad.org/en/docs/wir2009_en.pdf
Authors' addresses: MSc. Martina Merková Assoc. Prof. Josef Drábek, PhD. Technical University in Zvolen, Faculty of Wood Sciences and Technology Department of Enterprise Management T. G. Masaryka 24, 960 53 Zvolen, Slovak Republic e-mail: [email protected], [email protected]

WoodEMA 2010
134

WOOD PROCESSING AND FURNITURE MANUFACTURING: present conditions, opportunities and new challenges
135
INVESTMENTS TO CROATIAN WOOD PROCESSING AND FURNITURE MANUFACTURING
Denis Jelačić, Kristina Bičanić
ABSTRACT
Croatian wood processing and furniture manufacturing was one of the industrial branches which nett income in foreign currency was the highest of all the industrial branches. Unfortunately, investments in Croatian wood processing and furniture manufacturing, especially foreign investments, did not follow the importance of the branche. During last several years situation was getting better, investments were increasing year after year. But, global financial crisis made an impact on Croatia also. Wood processing and furniture manufacturing was not the exception. Since textile industry and wood processing and furniture manufacturing always suffer the first, Croatian wood processing and furniture manufacturing suffered a lot and investments to the branche decreased significantly. The results are decreased production, exports, cuts on working places and fight for survival instead of fight for development and growth. Key words: investments, investments indexes, production, wood processing and furniture manufacturing.
1 INTRODUCTION
The Republic of Croatia is located in South East Europe with total area over 56 thousand km2 and population of 4.5 mil people. In Croatia wood represents a significant raw material. The share of wood processing and furniture manufacturing in Croatian GDP was about 3 % in 2007. Domestic wood consumption in Croatia is over 3.4 mil m3 annually and in the year 2007 the revenues were over 1 bil Euros with over 25 thousand employees.
Industrial production indexes show significant decrease since 2007 until 2009 with tendencies to decrease even more in year 2010. The same goes for wood processing and furniture manufacturing, since those are the first industrial branches which respond to any crisis, especially the global one. The main reason for that is the fact that wood processing and furniture manufacturing in Croatia are highly export oriented. So, any disturbances in global or European market have a significant influence on Croatian wood processing and furniture manufacturing (figure 1).
Situation in employment is almost the same. Total number of employees in wood processing and furniture manufacturing decrease from 25.000 in year 2007 (which was 9,8 % of all employees in industrial sector, and 1,67 % af all employees in Croatia) to 21.000 in year 2009 (9 % in industrial sector, i.e. 1,41 % of all employees) with the tendencies to decrease even more.

WoodEMA 2010
136
Figure 1 Industrial production indexes for wood processing and furniture manufacturing
y = -2,5571x2 + 10267x - 1E+07 R² = 0,8523
90
95
100
105
110
115
120
2005 2006 2007 2008 2009
Ind
exes
Year
wood processing
Polynomický (wood processing)
y = -6,1929x2 + 24859x - 2E+07 R² = 0,9725
90
95
100
105
110
115
120
125
130
2005 2006 2007 2008 2009
Ind
exes
Year
furniture manufacturing
Polynomický (furniture manufacturing)
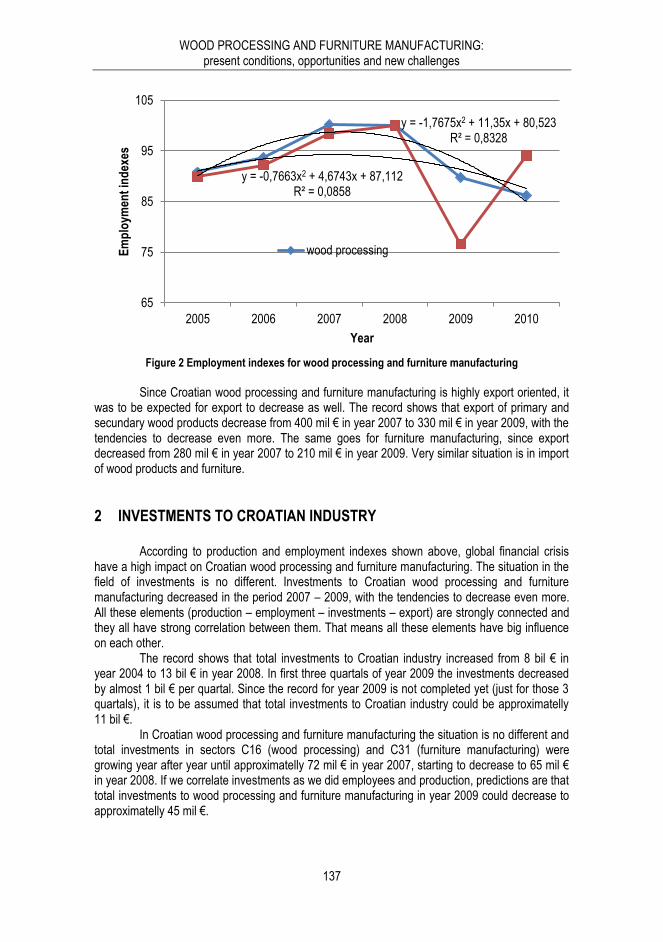
WOOD PROCESSING AND FURNITURE MANUFACTURING: present conditions, opportunities and new challenges
137
Figure 2 Employment indexes for wood processing and furniture manufacturing
Since Croatian wood processing and furniture manufacturing is highly export oriented, it
was to be expected for export to decrease as well. The record shows that export of primary and secundary wood products decrease from 400 mil € in year 2007 to 330 mil € in year 2009, with the tendencies to decrease even more. The same goes for furniture manufacturing, since export decreased from 280 mil € in year 2007 to 210 mil € in year 2009. Very similar situation is in import of wood products and furniture.
2 INVESTMENTS TO CROATIAN INDUSTRY
According to production and employment indexes shown above, global financial crisis have a high impact on Croatian wood processing and furniture manufacturing. The situation in the field of investments is no different. Investments to Croatian wood processing and furniture manufacturing decreased in the period 2007 – 2009, with the tendencies to decrease even more. All these elements (production – employment – investments – export) are strongly connected and they all have strong correlation between them. That means all these elements have big influence on each other.
The record shows that total investments to Croatian industry increased from 8 bil € in year 2004 to 13 bil € in year 2008. In first three quartals of year 2009 the investments decreased by almost 1 bil € per quartal. Since the record for year 2009 is not completed yet (just for those 3 quartals), it is to be assumed that total investments to Croatian industry could be approximatelly 11 bil €.
In Croatian wood processing and furniture manufacturing the situation is no different and total investments in sectors C16 (wood processing) and C31 (furniture manufacturing) were growing year after year until approximatelly 72 mil € in year 2007, starting to decrease to 65 mil € in year 2008. If we correlate investments as we did employees and production, predictions are that total investments to wood processing and furniture manufacturing in year 2009 could decrease to approximatelly 45 mil €.
y = -1,7675x2 + 11,35x + 80,523 R² = 0,8328
y = -0,7663x2 + 4,6743x + 87,112 R² = 0,0858
65
75
85
95
105
2005 2006 2007 2008 2009 2010
Em
plo
ymen
t in
dex
es
Year
wood processing

WoodEMA 2010
138
Figure 3 Indexes of production, employment and investments
Correlation between investments and employment, i.e. investments and production, are
high or very high (correlation indexes are between 0,78 and 0,98), which could indicate that in this stage of development of Croatian wood processing and furniture manufacturing investments are crucial. What are the main reasons for that statement?
Figure 4 Correlation between investments and production
Croatian wood processing and furniture manufacturing were depending on very few well known buyers and customers in Croatia and abroad in the past. That made a comfortable situation for companies and they were not looking far ahead. Very few of them decided to invest to new technologies. When economic transition started (beginning of 1990-ties) many companies were not prepared for that, big companies transformed to many small or medium ones, and most of them were in a lack of working capital. So, there was no money for investments.
Situation has changed over the years, but many companies are still struggeling for a chance to develop. Global financial crisis have a great impact on them since they are still depending on investments. Number of companies who have their own money to invest is not too big. And if they had that kind of financial resources, it was re-allocated, because consumption of wood products and furniture decrease, production decreased, income decreased, so money reserved for investment had to become working capital.
R² = 0,9804
0,00
20,00
40,00
60,00
80,00
100,00
120,00
95 100 105 110 115 120 125
Inve
stm
ents
Production

WOOD PROCESSING AND FURNITURE MANUFACTURING: present conditions, opportunities and new challenges
139
Croatian government is trying to help to solve the problem. Ministry of regional development, forestry and water management is investing to wood processing and furniture manufacturing companies in five year program, ending in year 2010. Ministry had an open soliciting for tenders investing 222 mil Croatian kunas (30 mil €) over 5 years.
Table 1 Investments made by Ministry of regional development, forestry and water management
in mil € 2006 2007 2008 2009 2010
foreseen by Program 18 41 55 51 36
secured by government budget 0 41 46 60 65
invested 0 41 53 63 65
In years 2008 and 2009 more money was invested then it was foreseen by Program and
Ministry had to secure some additional financial assets along with the money transfered from the year 1 of the Program (year 2006).
Croatian wood processing and furniture manufacturing was not entirelly prepared for those kind of Programs, so money foreseen in years 2006 and 2008 had to be invested in years 2009 and 2010. That brings up new additional problem of our branche – lack of good investment or development plans. In some interviews we conducted with top and midle managers in wood industry and furniture manufacturing companies, we established that many of them have no development or investment plans. So, when opportunity occures they are not prepared to take it.
3 CONCLUSION
Croatian wood processing and furniture manufacturing is highly export oriented and one of significant industrial branches in GDP and employment. Since it is strongly connected to European and world market, any disturbance on the market, never the less global financial crisis, have a strong impact on that industrial branche.
Although situation was getting better during last several years, global crisis and market problems starting 2008, and especially in 2009, created a lots of problems for Croatian wood processing and furniture manufacturing. Export decreased for 25 % for furniture and 17,5 % for primary and secondary wood products. Direct consequence of that is decrease of production and that has a direct impact on employment, which decreased for 16 % in the branche.
Some of the companies tried to solve the problem without laying the employees off. They introduced 4-days working week, which means they had working week Monday to Thursday.
Along with the global crisis, one of the main problems Croatian wood processing and furniture manufacturing companies have is not sufficiant number of good development plans and programs. Problem becomes even bigger if we consider the fact that Croatia is very close to become a European Union member. There are joining admission funds waiting for good and sustainable plans and programs created by Croatian government and companies. Without them significant financial assets will not be used for our development.
All institutions, governement, educational and scientific institutions, along with companies themselves, have to get more involved in solving the problem, creating environment for

WoodEMA 2010
140
sustainable development of Croatian wood processing and furniture manufacturing companies. Good and quality plans and programs have to be made for application to investment funds.
Government should find the way to increase the consumption of all products in Croatia, i.e. wood products and furniture. Lower standard of Croatian people had much lower consumption as a consequence. Increasing the consumption should increase production and that should help Croatian economy to survive the crisis.
Also, banks and financial institutions in Croatia have to make additional efforts to lower the interest on loans, since credits and money in Croatia are much to expensive. Economy needs a chance to apply for some lower cost money for investments and development.
REFERENCES
1 Bangs, D. H. Jr.: KAKO NAPRAVITI POSLOVNI PLAN, Jakubin i sin, Zagreb, 1998. 2 Cingula, M., Hunjak, T., Ređep, M.: POSLOVNO PLANIRANJE, RRIF, Zagreb, 2004. 3 Cingula, M.: KAKO IZRADITI POSLOVNI PLAN I INVESTICIJSKI ELABORAT, RRIF,
Zagreb, 2001. 4 Drabek, J., Jelačić, D.: INVESTMENT PROJECTS, Scientific book, TU Zvolen, Slovakia,
2007. 5 Drábek, J., Merková, M., 2009: EVALUATION OF THE REAL BENEFITS IN SUPPORT OF
INVESTMENT PROJECTS IN SMALL AND MIDDLE INTERPRISES OF EU FUNDS. In: Intercathedra No 25. Poznan: 2009.
6 Drábek, J., Merková, M., 2009: DECREASING INVESTMENT RATES IN THE SLOVAK REPUBLIC WOOD-PROCESSING INDRUSTRY AS A RESULT OF THE GLOBAL ECONOMIC CRISIS. In: Competitiveness of wood processing and furniture manufacturing. Šibenik, Croatia. 2009. S. 43-49.
7 Jelačić, D.: INVESTMENTS IN CROATIAN WOOD PROCESSING, Foreign investments to wood processing branche, TU Zvolen, str. 45-49, 2005.
8 Jelačić, D., Grladinović, T., Meloska, Ž., Oblak, L.: INVESTMENTS TO WOOD-PROCESSING INDUSTRY IN SOME SOUTHEAST EUROPEAN COUNTRIES, International scientific conference “Priame zahranične investicie v drevospracujucom preimysle”, TU Zvolen, Zvolen, Slovačka, 2006, str. 25-30.
9 Jelačić, D., Oblak, L., Sedliačikova, M., Meloska, Ž.: INVESTICIJE V PODJETJA ZA PREDELAVO LESA IN PROIZVODNJO POHIŠTVA V NEKATERIH DRŽAVAH SREDNJE IN JUGOVZAHODNE EVROPE, Les, vol 58., br. 1-2 / 2006, Ljubljana, Slovenija, 2006., str. 9-13.
10 Osmanagić Bedenik, N.: OPERATIVNO PLANIRANJE, Školska knjiga, Zagreb, 2002. 11 Sedliačikova, M.: TEORETICKÉ A PRAKTICKÉ PRÍSTUPY K FINANČNÉMU
CONTROLLINGU, Ekonomika a manažment podnikov, TU Zvolen s. 307-314, 2004. 12 ***: POSLOVNI PLAN PODUZETNIKA, Masmedia, Zagreb, 1999. 13 ***: PRIOPĆENJE HRVATSKE NARODNE BANKE, HNB, Zagreb, 2009. 14 ***: STATISTČKI LJETOPIS REPUBLIKE HRVATSKE, DZS, Zagreb, 2009.

WOOD PROCESSING AND FURNITURE MANUFACTURING: present conditions, opportunities and new challenges
141
Authors' addresses: Assoc.prof. Denis Jelačić, PhD. Kristina Bičanić, BSc. University of Zagreb Faculty of Forestry Svetošimunska 25 HR-10000 Zagreb CROATIA e-mail: [email protected] e-mail: [email protected]

WoodEMA 2010
142

WOOD PROCESSING AND FURNITURE MANUFACTURING: present conditions, opportunities and new challenges
143
CHAPTER 3
QUALITY, MANAGEMENT AND INNOVATION

WoodEMA 2010
144

WOOD PROCESSING AND FURNITURE MANUFACTURING: present conditions, opportunities and new challenges
145
COST-ORIENTED QUALITY MANAGEMENT AND ITS UTILISATION IN THE WOOD-PROCESSING INDUSTRY
Renata Nováková, Ondrej Kusý
ABSTRACT
Wood - processing industry can be divided into three areas: wood processing, cellulose and paper industry as well as furniture industry. Recent significant foreign investment into this area in the Slovak Republic has contributed to nearly 10% total industry revenues. To make this trend continue, it is necessary to produce competitive products manufactured under the customers’ quality requirements. Another prerequisite is the introduction of innovative approaches to pricing products, based on cost-oriented quality management. This contribution will analyse the current pricing and propose the pricing trend supporting the competitiveness of the wood-processing organizations.
Key words: Wood – processing, cellulose and paper industry, quality.
1 INTRODUCTION
Before we begin to address the main theme of our contribution it is necessary to point out some characteristic facts in the wood processing industry. The common feature of the wood industry, furniture and pulp and paper industry is the treatment of wood and timber products production at a different stage of finalization.
All three sectors can be characterized by: - Independent of imports of material inputs, as the SR sufficiently abundant raw material base,
although still poorly secured legislation, - Here is a very high rate of small and medium enterprises (more than 80% are Ltd.), - High export performance - that is primarily affected by the export and re-export of processed
wood, - Low purchasing power of Slovakia's population is reflected focusing on cheap products of
inferior quality imported from Central Europe, - A crucial source of jobs in some regions of Slovakia, - Low economic strength of Slovak enterprises without foreign capital and high debt, - The breakdown of traditional furniture manufacturers, - Lack of business activities being undertaken by companies in this sector and lack of
promotion of timber and timber products. Based on previous evidence, it is clear that the Slovak timber industry is relatively difficult
situation. There is a continued lack of funds for the operation, upgrading equipment and technology, resting a number in the past, significant capacity.
The current situation could only improve further inflow of foreign capital, which would certainly help to increase competitiveness in the wood industry.

WoodEMA 2010
146
Although no longer operating in Slovakia, some major foreign investors such as. Swedwood, Lind Mobler, Kronospan and so on. unable to increase share by industry specifically focused on enhancing the overall national economy indicators. If we add more impact and world crises, from available statistics, we can obtain information: - Timber trade fell in Slovakia in the first quarter of 2009 compared to the same period of 2008
to 46%. Negative developments also have the price of wood. They fell on world markets by 15-20% in Slovakia, the average price for 1 m3 of timber in the first quarter 2009 average of 24%. [2].
- Wood material and products are piled in warehouses or sold well below cost, while reducing the purchase of raw material from forest plants,
- Increased costs in the effects of rising energy prices but also prices of input materials - Has been a trend to reduce the competitiveness of export products and so on.
One way to reduce these negative impacts could be the implementation of the new
trends in pricing, which immediately follow the cost-oriented quality management.
2 PRICE VS. QUALITY
Although they already have influence on the decision of customers and other factors, the price of traditionally plays a significant role.
Price is basically the only element of the marketing mix that produces revenue and at the same time and very flexible in response to market demands and adjusting to the competitive environment.
In practice, there are several different ways, such as pricing. pricing by a price premium pricing by the target return pricing by the perceived value, or value pricing etc.
Very interesting and seem to be pricing strategies in response to product quality. Today it is a rule that supply exceeds demand usually and therefore, organizations must strive to differentiate from their competitors. One possibility is a variation and a greater emphasis on the quality of their products.
If we want to show the impact of product quality for the price, we could generate the nine possible strategies that work in their Marketing Management described the well-known marketing expert Philip Kotler.
1. The strategy to obtain the extreme price 2. The strategy of high value 3. Special high-value strategy 4. Strategy surcharge 5. Strategy mean 6. The strategy of the corresponding value 7. Strategy defraud 8. Not saving Strategy 9. Energy-saving strategy 1,5,9 Strategy, located on the diagonal, can coexist in the same market. This means that an organization can offer high quality products at high prices, another
organization offers products of average quality at average prices and in turn traded with other low-quality products at low prices.
This coexistence is possible as long if there are three groups of customers:

WOOD PROCESSING AND FURNITURE MANUFACTURING: present conditions, opportunities and new challenges
147
a) Customers interested in quality, b) Customers interested in the price c) Customer between these two aspects.[3]
In value-oriented quality management is given considerable importance to the economic aspects of quality. In organizations, however, the quality of the entire area of the economy often narrows to only one part, devoted to the costs relating to quality, which is already inadequate.
Economics of quality that actually administered a comprehensive picture of the topic should be focused on these three basic areas:
1. Monitoring and evaluating quality costs (including life-cycle cost) - advantage of this decomposition is that by the cost of quality can:
- Define the amount of loss caused by defects in ensuring product quality, - To identify any significant impacts on the quality of a corporate performance, - Eliminate the deficiencies which give rise to increased costs for quality, - Reduce overall costs to the organization.
2. Monitoring and evaluation of the effects, respectively. effectiveness of quality - an
advantage of this decomposition is that we can: - Monitor the impact of quality on economic performance organization - Quantify the benefits of high quality in production and user domain - To identify those products which, thanks to its quality become the main carriers of
economic prosperity organizations.
3. Pricing of products depending on their quality - that decomposition should be directed to: - Creating conditions for proper pricing of products so as to be equally beneficial for all
market participants, - The possibility to transform the economy into the so-called quality. "Money talk" and so
difficult to express definable activities in the area of quality management. The subject of our specification is the third area of development, which affects pricing of
products depending on their quality. It is obvious that the quality management as such, has brought new ideas and ways to
reduce costs in general economic organizations. Market-oriented production, has changed the cost approach to the creation of the unit price of the product. The emergence of so-oriented production, the unit price of the product reflect simplified as follows:
Selling price = cost + own profit
Pricing procedure was therefore concluded that, at its own cost be added a reasonable
profit and resulted in the selling price of the product. The difficulties of implementing products that are in the current crisis period demonstrate multiple, led to a fundamental starting point for determining the price became the market. This also changed the mode of calculating the unit price. We can say that the elements determining the price remained unchanged, their role has changed. The basic relationship in these conditions would then be expressed with the following:
selling price - target profit = cost
As already indicated above, in a market-oriented economy plays in determining the unit
price of the product, the primary role of the customer. Increasing the price of the product without the appropriate increase its performance and, in most cases leads to loss of customers. As a

WoodEMA 2010
148
result, the projected profit that can be achieved only if a pre-determined targets and compliance costs.
Planning and the subsequent target costs as the opposite point of view on pricing is no longer completely unknown concept. The greatest success with this way of determining the price recorded in Japan.
A characteristic feature is that pricing starts with the analysis of customer needs and perceptions of values. It means so much about the price down to match the value of the customer's viewpoint. Target value and price then lead to a decision on product design and the necessary costs.
3 CONCLUSION
For many customers, the price is determining when considering qualitative parameters, on the other hand, it is clear that customer perception of price is influenced by alternative pricing strategies. Otherwise, build the organization to determine if the price is a new product, otherwise when entering new competitive markets. Very flexible, it is necessary to respond to price fixing in various stages of product life cycle. Are the products they hold their prices, but also those which are highly sensitive to innovations and new trends. Organizations to survive in a very competitive environment must be set as the price of their products, which contribute to maximizing their profits. One of the alternative options, which gives the completely opposite view on the pricing for what we have been accustomed to and the pricing of products in response to the identification of cost. Although this information is also sound in general and are actually applicable in any sector of the economy, we believe that the wood industry can reverse the perception of pricing to bring to bear fruit and thus reduce competitive pressures in all three sectors.
REFERENCES
1 Linczényi, A.,Nováková, R.: MANAŽÉRSTVO KVALITY, STU učebnica, Bratislava, 2001 2 Novotný, J.: DOPADY SÚČASNEJ KRÍZY ZNÁSOBUJÚ DLHODOBO NERIEŠENÉ
PROBLÉMY. In: Lesmedium.sk, 2010 3 Kotler, Ph.: MARKETING MANAGEMENT, Grada Publishing. 1998 4 Zaušková, A., Horňáková, R.: VÝSLEDKY PRIESKUMU INOVAČNÉHO POTENCIÁLU
MALÝCH A STREDNÝCH PODNIKOV DREVOSPRACUJÚCEHO PRIEMYSLU BANSKOBYSTRICKÉHO KRAJA, článok k projektuVEGA 1/3396/06
Authors' addresses: doc. Ing. Renata Nováková, PhD. Ing. Ondrej Kusý Slovak University of Technology in Bratislava, Faculty of Materials Science and Technology in Trnava, Institute of Industrial Engineering, Management and Quality, Paulínska 16 917 24 Trnava, Slovakia e-mail: [email protected], [email protected]

WOOD PROCESSING AND FURNITURE MANUFACTURING: present conditions, opportunities and new challenges
149
A COMPARISON OF INNOVATION IN THE FURNITURE MANUFACTURING INDUSTRIES OF CROATIA AND THE UNITED STATES
Andreja Pirc, Richard Vlosky
ABSTRACT
In fall 2009 and in spring 2010 we conducted mail-based surveys of 430 and 409 randomly selected members of the U.S. and Croatian furniture manufacturing sectors, respectively. The primary objective of these studies was to compare manufacturing and business process innovation between these countries. Although the U.S. and Croatia have very different socioeconomic, geographic, and cultural characteristics, results indicate that over the past 5 years their furniture sectors have both lost considerable market share in the markets they serve and have experienced a decline in domestic consumption due to pressure from other furniture manufacturing countries and the global economic recession. Manufacturing facility closures, industry consolidation, and process/production innovation may be the driver to shape the future of the furniture sectors in both countries.
Key words: furniture manufacturing, innovation, USA, Croatia.
1 INTRODUCTION
Each of us has the potential to be innovative but has a different innovation style. Leaders play a vital role in providing a climate and culture that encourages individuals to contribute to organizational innovation (Tan and Kaufmann, 2008). According to Crespell and Hansen (2006) an innovative corporate culture is characterized by high levels of supervisor encouragement, team cohesion, autonomy, and openness to innovation.
The U.S. furniture industry is at a crossroads and, at the extremes, will take one of two paths in the future: continued loss of market share and competitiveness or rebuilding an industry based on innovation. Susnjara (2002) suggests that a new furniture industry paradigm involves building new relationships between furniture manufacturers, material and technology suppliers, and customers to make supply chains stronger and more competitive in the new world economy. Although the U.S. and Croatia have very different socioeconomic, geographic, and cultural characteristics their furniture industries face many of the same challenges. Furniture manufacturing has historically been a significant and profitable segment of Croatian economy. According to Motik, Pirc and Moro (2007) globalization fosters new technological and organizational efficiencies and techniques. However, the Croatian furniture industry for the most part uses outdated technology and business processes. In this paper, we develop a baseline understanding of the relationship between company characteristics and innovation adoption in the U.S. and Croatian furniture sectors.

WoodEMA 2010
150
2 MATERIALS AND METHODS
The sample frames were random samples of 430 U.S. and 409 Croatian furniture manufacturers, respectively. Mail surveys were conducted in each country. Based on research objectives, a questionnaire was developed and pre-tested with a sub-sample of selected companies. Based on pre-test input, finalized survey instruments were developed. Variables, or constructs, were measured using multiple-item scales, five-point Likert items, ranging from 1 (strongly disagree) to 5 (strongly agree) or ranging from 1 (very unimportant) to 5 (very important). In addition, multiple choice item measures and yes/no items also were used. Data collection in the U.S. started in September, 2009 and ended in November, 2009 while data collection in Croatian started in March, 2010 and ended in June, 2010. In the U.S., of the 430 surveys mailed, 115 surveys were either undeliverable or unusable. In Croatia, of the 409 surveys mailed, 91 were either undeliverable or unusable. The unusable surveys were those from firms that were no longer in the furniture business or that were not interested in survey participation. The total number of usable surveys received from U.S. companies was 74 with an adjusted response rate of 23.5%, while in Croatia there were 77 useable surveys with an adjusted response rate of 24.2%. The adjusted response rate was calculated using the following expression: Adjusted Response Rate = [Usable Surveys /Total sample – (Undeliverable + Unusable)]*100%.
Data were analyzed in MS Excel, and tests of differences between U.S. and Croatian respondents were conducted by using the Chi-Square (χ2) statistical technique. Hypothesis H0 was that there is no significant difference between the U.S. and Croatia; the coefficient of statistical dependence was p<0,05.
3 RESULTS
In general, increased sales can result from new products, as well as introducing features for existing products. In addition, customers that are attached to a company’s innovative products or new product features may be inclined to purchase other products from the company (Sponseller, 2010). Respondents in the U.S. and Croatia were asked to indicate the percentage of 2008 company revenue that came from sales of new/improved products. Responses were 35.6% for the U.S compared to only 2.8% in Croatia. Flexibility is the ability of changing in the sequence of activities and inputs to adopt new business opportunities and ability to incorporate new practices based on the improved knowledge of all members in the organization (Bhat and Deshmukh, 2005). In response to an increasingly global and competitive environment, the flexibility to adapt to changing market needs and develop innovative cross-functional processes is a foundation for success (Zhang and Cao, 2002). Respondents were asked to indicate level of in their company. As seen in Figure 1, 75% of U.S. respondents indicated that their company is somewhat flexible or very flexible, while in Croatia 95% of the respondents assessed their company as somewhat flexible or very flexible. On the other hand, 11% of U.S. respondents noted that their company is very inflexible, while in Croatia none of the respondents indicated that this was the case. In order to assess if there is a significant difference between U.S. and Croatian respondents, a Χ² test was conducted. Results indicate that significant differences exist at the α=0.05 significance level for statements ‘very flexible’ (Χ²=9.31; p-value 0.002) and ‘somewhat inflexible’ (Χ²=15.59; p-value 0.000).

WOOD PROCESSING AND FURNITURE MANUFACTURING: present conditions, opportunities and new challenges
151
Figure 1 Level of company’s flexibility* in the U.S. (n=74) and Croatia (n=77) *Flexibility is the ability to be open to change and supportive of continuous improvements
Respondents were asked to identify their company’s level of innovation in comparison to
other furniture companies in their country as well as to other industry sectors (Figure 2). Relative to other furniture industry companies, almost half (45%) of U.S. respondents indicated that they consider their company to be about on the same level of innovation relative to other furniture companies, while in Croatia, 27% of respondents felt this was the case. Forty percent of Croatian respondents feel that their companies are somewhat more innovative relative to other companies in the Croatian furniture industry, while 27% of U.S respondents said this was the case for their companies relative to other furniture manufacturers in the U.S. Both countries respondents (18% of U.S. and 22% of Croatian) considered their companies as much more innovative in comparison to other furniture industry companies. The same percent of the respondents, in both countries, indicated that their companies are less (9%) or much less innovative (1%) relative to other industries. A Χ² test indicated that there was no significant difference between U.S. and Croatian respondents on company innovation relative to other furniture industry companies.
Further, respondents were asked to indicate the level of innovation in the furniture industry relative to other industries in their respective countries. As also shown in Figure 2, 38% percent of U.S. respondents indicated that the furniture industry in their country has about the same level of innovation as other sectors while 13% of U.S. respondents felt that the furniture sector was either somewhat or much more innovative. In Croatia, 27% of the respondents believe that that furniture industry has about the same level of innovation as other sectors, while 44% of Croatian respondents considered their furniture industry either somewhat or much more innovative. A Χ² test indicated a significant difference at α=0.05 significance level for the respondents perceptions of furniture sector innovation relative to other sectors (Χ²=8.52; p-value 0.004) and ‘somewhat more innovative and very inflexible’ (Χ²=12.60; p-value 0.000).
11% 11%
43%
32%
3% 0% 1%
38%
57%
4%
0
10
20
30
40
50
60
Very inflexible Somewhat inflexible Somewhat flexible Very flexible I don't know
Per
cent
of R
espo
nden
ts
Level of flexibility
US Croatia

WoodEMA 2010
152
Figure 2 Comparison of company innovation relative to other furniture industry companies in the U.S. (n=74) and Croatia (n=77) and comparison of innovation in the furniture industry relative to other
industries in the U.S. (n=74) and Croatia (n=77) We probed the level of encouragement and reward that businesses give their employees
to suggest and implement improvements in their companies. Respondents were asked to indicate their level of agreement or disagreement on 5-point Likert scale. As shown in Figure 3, U.S. and Croatian respondents had the same level of agreement that they encourage their employees to suggest organizational improvements (mean response=3.7). A Χ² test indicated a significant difference at α=0.05 significance level between U.S. and Croatian respondents on a) rewarding employees when their organizational suggestions are implemented (Χ²=10.52; p-value 0.032) and when their technology suggestions are implemented (Χ2=11.74; p-value 0.019).
1%
9%
45%
27%
18%
19%
30%
38%
8%
5%
1%
9%
27%
40%
22%
4%
25%
27%
31%
13%
0 10 20 30 40 50
Much less innovative
Somewhat less innovative
About the same level of…
Somewhat more innovative
Much more innovative
Much less innovative
Somewhat less innovative
About the same level of…
Somewhat more innovative
Much more innovative
Percent of Respondents
Rel
ativ
e to
ofh
er f
urni
ture
com
pani
es
R
elat
ive
to o
ther
in
dust
ries.
..
Croatia US

WOOD PROCESSING AND FURNITURE MANUFACTURING: present conditions, opportunities and new challenges
153
Figure 3 Comparison of encouraging and rewarding employees for improvements in the U.S. (n=69) and Croatia (n=77)
Respondents indicated their level of agreement or disagreement on a 5-point Likert scale
of agreement regarding their company’s improvement over the last three years in a number of innovation indicator categories (Figure 4). For Croatia, mean responses for all statements were between 3.0 and 3.7, while in the U.S. mean responses were significantly lower, between 2.4 and 3.3.
Croatian respondents, with a mean response 3.9, agreed that production equipment and production software of their companies have improved over the last three years. On the other hand, in the U.S. respondents noted their disagreement that production equipment (mean response=2.9) and production software (mean response=2.5) have improved over the last three years. Χ² test results for these two statements showed a significant difference at α=0.05 significance level (production equipment has improved Χ²=25.23, p-value 0.000; production software has improved Χ²=33.80, p-value 0.000).
In addition, respondents in Croatia also somewhat agreed that their overall, their companies have become more competitive over the last three years, with mean a response 3.7. Croatian respondents also somewhat agreed that information technology has been improved in the last there years. U.S. respondents also showed, albeit with lower mean scores, somewhat of agreement with that information technology has improved (mean response=3.3) and that their companies overall have become more competitive (mean response=3.2) over the last there years. The mean responses regarding research and development investments over the past three years were 3.0 and 2.4 in Croatia and the U.S., respectively.
3.0
3.6
3.1
3.7
3.5
3.9
3.7
3.7
1 2 3 4 5
Rewards employees that suggest technologyimprovements that are implemented
Rewards employees that suggestorganizational improvements that are
implemented
Mean Response 1=strongly disagree; 5=strongly agree
My company:
Croatia US

WoodEMA 2010
154
Figure 4 Level of company improvement over the last three years in U.S. (n=72) and Croatia (n=77)
Respondents were asked how the number of manufacturing processes/operations that
they use and how the number of employees they have will change in the the next three years. As shown in Figure 5, 71% of U.S. respondents indicated that the number of manufacturing processes or operations in their company would remain the same while 15% indicated that number of manufacturing processes would increase, and 14% of respondents indicated that this would decrease over the next three years. Fifty-two percent of U.S. respondents said that the number of manufacturing employees would remain the same, 36% said this would increase, and 12% indicated that this would decrease over the next three years. For Croatian respondents, 44% indicated that the number of manufacturing processes/operation in their company and the number of manufacturing employees would remain the same in next three years. Only 4% noted that the number of manufacturing employees would increase over the next three years, while 53% percent of respondents said that the number of manufacturing employees would decrease over the same period. Sixteen percent of Croatian respondents indicated that number of manufacturing processes would decrease, while 40% of respondents indicated that number of manufacturing processes would increase over the next three years. Χ² test results indicate a significant difference at α=0.05 significance level for the respondents answers both changes over the next three years in number of manufacturing processes/operations (Χ²=13.37; p-value 0.001) and number of manufacturing employees (Χ²=41.19; p-value=0.000)
2.4
2.5
2.9
3.2
3.3
3.0
3.9
3.9
3.7
3.7
1 2 3 4 5
Research and development have investmentsincreased
Production software has improved
Production equipment has improved
We have become more competitive
Information technology has improved
Mean Response 1=strongly disagree; 5=strongly agree
Croatia US

WOOD PROCESSING AND FURNITURE MANUFACTURING: present conditions, opportunities and new challenges
155
Figure 5 Projected change in number of manufacturing processes/operations and employees in the
the next three years U.S. (n=73) and Croatia (n=77)
4 SUMMARY
In 2008, U.S. furniture company respondents achieved a much higher level of revenue from sales of new/improved products compared to Croatian respondents. This may be an indicator that U.S. furniture companies are more innovative. Conversely, a higher percent of Croatian respondents characterized their companies as “very flexible” with regard to adopting new practices compared to U.S. respondents. On the other end of the spectrum, no Croatian respondent characterized their company as “very inflexible”, while 11% of U.S respondents believe this to be the case.
Results suggest that overall becoming innovative and applying innovation are becoming more important to U.S. and Croatian furniture companies. Ninety percent of both U.S. and Croatian respondents indicated that their companies are about at the same level of innovation, more innovative or much more innovative relative to other companies in their furniture industries. In addition, respondents in both countries said their furniture industries are about at the same level of innovation or much more innovative relative to other industries.
Respondents from both countries generally encourage employees for organizational and technology improvements while Croatian respondents are more prone to reward their employees for suggesting and implementing such improvements.
With regard to improvements over time in various areas that contribute to innovation, Croatian respondents said that production equipment and production software were more improved in comparison to U.S. respondents. Improvement in information technology, research and development investments and increasing competitiveness were also made by respondents from both countries but no significant differences between two countries were found.
Finally, with a future perspective, about 80% of both U.S. and Croatian respondents believe that the number of manufacturing processes in their companies would remain the same or increase over the next three years.
14%
71%
15% 12%
52%
36%
16%
44% 40%
53%
44%
4%
0
20
40
60
80
Decrease Remain the same Increase
Per
cent
of R
espo
nden
ts
Projected change in number of manufacturing processes/operations (U.S.)Projected change in number of manufacturing employesss (U.S.)Projected change in number of manufacturing processes/operations (Croatia)Projected change in number of manufacturing employesss (Croatia)

WoodEMA 2010
156
REFERENCES
1 Bhat, J.M. and N. Deshmukh (2005): METHODS FOR MODELING FLEXIBILITY IN BUSINESS PROCESSES. Proceedings of the CaiSE’05 conference. Vol.1.13th – 14th June.Porto, Portugal.
2 Crespell, P., C. Knowles, and E. Hansen (2006): INNOVATIVENESS IN THE NORTH AMERICAN SOFTWOOD SAWMILLING INDUSTRY. Forest Science. 52(5).
3 Motik, D., A. Pirc, and M. Moro: (2007): PROBLEMS AND PERSPECTIVE OF WOOD DEVELOPMENT IN CROATIA. International Symposium, Sustainable forestry-problems and challenges perspectives and challenges in wood technology, Proceedings, 456-459. 24th – 26th October. Ohrid, Macedonia.
4 Sponseller, S. (2010): INCREASE BUSINESS REVENUE WITH AN INNOVATION STRATEGY. http://ezinearticles.com/?Increase-Business-Revenue-With-an-Innovation-Strategy&id=4146281 (Accessed 16 June, 2010).
5 Susnjara, K. (2002): THE FURNITURE NETWORK – A NEW FURNITURE INDUSTRY. Thermwood Corporation.1st Edition January 1st. Indiana. USA.
6 Tan, A. and U.H. Kaufmann. (2008): CAN OUR STAFF INNOVATIVE. Centre for Organisational Effectiveness.www.coepartners.com/Articele/Can%20Our%20Staff%.pdf. (Accessed 18 September 2009).
7 Zhang, Q. and M. Cao (2002): BUSINESS PROCESESS REENGINEERING FOR FLEXIBILITY AND INNOVATION IN MANUFACTURING. Industrial management & data Systems. 102(3):146-152.
Authors' addresses:
Andreja Pirc, B.Sc., University of Zagreb-Faculty of Forestry, Svetosimunska 25, HR-10000 Zagreb,Croatia, E-mail: [email protected] Prof. Richard Vlosky, Ph.D., Louisiana Forest Products Development Center, School of Renewable Natural Resources, Louisiana State University Agricultural Center, Baton Rouge, Louisiana, USA, E-mail:[email protected] Research funding was provided by the Unity Through Knowledge Fund and The National Foundation for Science, Higher Education, and Technological Development of the Republic of Croatia
WOOD PROCESSING AND FURNITURE MANUFACTURING: present conditions, opportunities and new challenges
157
DEVELOPMENT OF NEW FURNITURE PROGRAM FOR KINDERGARTENS
Leon Oblak, Matej Jošt, Anton Zupančič, Darja Antolin, Jože Kropivšek
ABSTRACT
There appear more and more demands for environmental protection in the world. Therefore we decided to give emphasis on the preservation of nature already in the development phase of new products. In this way, we help kindergartens and other similar facilities to give children an insight in their early life into learning and concern for the nature. In the area of manufacturing furniture for kindergartens, we have developed a new program, which includes products that are similar to the elements from the nature or from the forest.
1 INTRODUCTION
The conditions on the market are changing very fast and with it also the needs and requests of customers are changing. A product, no matter how interesting and successful, can only stay on the market for a very short time without investments and constant improvements. Each company competing in its field must be well aware of this fact. One of the most important objectives of the company is to develop new products that are interesting for the market. In this research we tried to find out how the management of kindergartens, which are also potential customers, would accept a new furniture program, which will represent element form nature – woods (a bench in the form of a trunk, open regal in the form of a tree, table in form of a stump, chairs in the form of a cut trunk etc.).
In this case it is necessary to fully adapt to children’s needs as they are the users of the product. Therefore it must be formed and implemented in the way that it will be noticeable by its form and colors and interesting, that it will contain elements that children like and be functionally adapted to their needs, and at the same time it must be made of materials that are children friendly, harmless and safe.
2 DEVELOPMENT OF THE PRODUCT
We know eight stages of development for new products. At each stage the company needs to decide whether to develop the idea further or to drop it. If the novelty successfully passes all stages, we can expect a successful product that sells well. (Potočnik, 2002)

WoodEMA 2010
158
Figure 1 Eight-stage development process for new product
Within the last couple of years environmental protection is becoming an important issue.
The education needs to starts already at a very young age, namely in kindergartens. That was the source of the idea –development of furniture program for kindergartens. The project started with a sketch on a piece of paper where the initial idea was projected.
Figure 2 Sample drawing (Antolin, 2010)
Evaluation of ideas
Studying the market possibilities
Technological development of new product
Market development of new product
Market testing of new product
Introduction of the product on the market
Commercialization
Collecting ideas for a new product

WOOD PROCESSING AND FURNITURE MANUFACTURING: present conditions, opportunities and new challenges
159
First we sketched a sample for the open-shelves regal. This is not a usual regal with straight lines and standard body with inserted shelves, but a piece with uneven lines shaped as a tree and accessible from all sides. It was followed by a bench and a seating assembly in the form of a cut-down trunk, where the three places that are cut out are intended for seating. If we have a seating assembly, we also need a table. The table would be represented by a stump. For the end we also sketched a closet that would be similar to a seating assembly only that it would be placed vertically, so it would be shaped as a trunk and had an orifice in front with visible interior containing shelves. The orifice could also be covered by closet doors. The mural element for disposing various small objects would be shaped as a tree. It would contain leaves in the form of shelves or hangers.
The forming of the new program and transformation of samples into computer drawings implied several changes. So a lot of ideas concerning the materials, the way of implementation, construction and shape of the program were changed. New products also occurred and with the help of improvements, critiques and professional opinions we established a program that is presented in figures 3-8.
Figure 3 Independent regal with open shelves
(deciduous tree, bush and conifer tree) (Antolin, 2010)
Figure 4 Seating assembly with three seats (trunk), table (stump) and independent chair (part of trunk) (Antolin, 2010)

WoodEMA 2010
160
Figure 5 Closet (vertical trunk), chair for two (part of trunk) and hanging wall (tree) (Antolin, 2010)
Figure 6 independent and mural wardrobe elements (tree with a bird house) (Antolin, 2010)
Figure 7 computer drawing of assembly of new furniture program for kindergartens (Antolin, 2010)

WOOD PROCESSING AND FURNITURE MANUFACTURING: present conditions, opportunities and new challenges
161
Figure 8 computer drawing of staff room (Antolin, 2010)
3 SURVEYS
The program was presented to the public through a survey that was sent to principals of kindergartens in Slovenia. We sent 120 questionnaires through e-mail and received 30 filled out questionnaires. The results of received questionnaires are satisfactory, as there were significantly more positive answers than negative ones.
Due to the type of presentation of the new program that was only implemented theoretically – through web media – the respondents had more difficulties imagining the product, mostly its dimensions, which can be seen in their expressed opinions. Therefore we believe that the program needs to be implemented in one sample piece of each product. Then it needs to be publically exposed, we need to inform the respondents and other potential customers, implement a sales catalogue and protect the copyrights of the product. Another important information that we received from the questionnaires is that the customers would prefer buying products individually and not buy the whole set. Bulk production would enable this.
4 CONCLUSION
More and more needs for environmental protection are occurring in the world. If we wish to educate people to be environment friendly, we need to start the education already in kindergartens. The children should learn at a very young age to connect with and care for nature.

WoodEMA 2010
162
We developed a new program in the field of development and implementation of furniture, containing products that look like forest elements. With the help of surveys implemented on the management of kindergartens we researched the market and the needs for such products. The predictions for the new furniture program were confirmed. In the next stage, the product needs to be realized and presented to potential customers.
REFERENCES
1. Antolin, D. (2010): Razvoj novega programa pohištva za vrtce. Diplomsko delo. Oddelek za lesarstvo, Biotehniška fakulteta, Ljubljana, 35 p.
2. Potočnik, V. (2002): Temelji trženja. GV Založba, Ljubljana, 531 p.
Authors' addresses:
Prof. dr. Leon Oblak, dr. Matej Jošt, Anton Zupančič, Darja Antolin, doc. dr. Jože Kropivšek University of Ljubljana, Biotechnical Faculty, Department of wood science and tecnology Rožna dolina C.VIII/34, 1000 Ljubljana, Slovenia

WOOD PROCESSING AND FURNITURE MANUFACTURING: present conditions, opportunities and new challenges
163
THE IMPROVEMENT OF PRODUCTION PLANNING AND CONTROL FOR INTERMITTENT PROCESSES IN SERBIAN WOOD PROCESSING 12
Dragoljub Ivković, Milan Nešić, Branko Glavonjić, Marija Nešić
ABSTRACT
There is not enough attention regarding production management, especially concerning intermittent processes in the most wood processing companies in Serbia. Production planning and control are mostly established on traditional and informal concepts of management. This paper gives the results of the current situation and suggests methods for the improvement of the production planning and control in wood processing companies. The research results confirm the poor state of one of the major functional areas of business. Therefore, the introduction of an appropriate system for production management is proposed. The improvement of production performances and costumer services and lowering of capital costs can be achieved through acceptance of this concept.
1 INTRODUCTION
In the most wood processing production companies in Serba, production is managed in the more or less chaotic way. The lack of production management is mostly expressed in the intermittent processes that characterize furniture and entrior equipping production. The reasone for such a state lie in the fact that the management of intermittent processes is very complex.
The concequence of the above mantioned is the greater stocks, the products are delivered after the contracted date, and there are under preasure working conditions. The question should be asked, how to improve such a situation in our production companies.
Successful companies in the world use different systems of production planning and control, with the support of computers. The implementations of these systems is one of kay elements of their success. Why do not our companies use these systems?
All abouve mantioned draws a target of this study, which is, before all, reflected in the need to set and analyse the current state of production planning in the furniture and interior equipping production companies in Serbia, the consequences of such a state on production, so as the way to overcome the unfavorable state.
12 This study was financed by TP-20109 project of Ministry of Science of Republic of Serbia.

WoodEMA 2010
164
2 MATERIAL AND METHOD OF THE STUDY
The polls and direct gathering and checkup of data in the field were used to obtain the necessary data for the analysis of the existing state in the field of intermittent production processes in the wood processing companies in Serbia. Poll provided the sufficient broadness of the research, concerning the number of companies included (10) and data. The method of data analysis and indicative method was used to make the conclusions about the existing state.
The researches were conducted in the furniture and interior equipping production companies. Observed companies belong to the group of small and medium businesses, with intermittent production process.
The broad researches of current state were conducted. 42 different indicators that concern the production management were included. Data was grouped by material, meaning by the sort of stock: raw material, unfinished production and final products. In this order only a part of the results will be presented, which clearly indicates to the unfavorable state in this field.
The proposal for improvement of the production management state in the furniture and interior equipping production companies in Serbia was given, based on consideration and analyses of gathered data.
3 RESEARCH RESULTS
The research includes ten typical companies in Serbia from the field of furniture and interior equipping production. Based on the number of employees, the companies were classified in two categories: small companies and medium companies.
Confirmed by previous researches (Nesic 1991), small companies are dominant in wood processing in Serbia. Among the observed companies, 8 were from the group of small ones, and only 2 from the group of medium companies. 20% participation of small companies in the total number of observed small and medium company does not reflect the real situation in this production field. It is significantly less and does not exceed few percent. However, it does not have greater influence on the obtained data.
All companies included in the analysis have intermittent production process. The production is performed in small series, often it is a single peace production. Table 1 shows total data that point to the general state of production management in the observed companies.

WOOD PROCESSING AND FURNITURE MANUFACTURING: present conditions, opportunities and new challenges
165
Table 1 Basic indicators of production management state.
No.
Research Elements
Results
Participation of companies in %
Remark
1. Use of any production management systems
Yes 0
No 100
2. Constructive documentation Exist 50 Incomplete
Do not exist 50
3. Component development
chart
Yes 50 Only for repeated
products
No 50
4. Planning and working
documentation
4.1 Annual total production plan Exist 100 Applied
Do not exist 0
4.2 Annual dynamic production
plan
Exist 20 Applied
Do not exist 80
4.3 Operation plan Exist 10 Applied
Do not exist 90
4.4 Forward plans Exist 20
Applied only for products, not for
operations
Do not exist 80
4.5 Monitoring of plans
execution
yes 20
no 80
5. Way of capacity planning
Planned based on experience
40
No planning 60
6. Use of input-output control yes 0
no 100
7. Costs due to the lack of
stocks – loss of reputation and profit
Significant 10 Penalties for late
delivery
insignificant 90
Concerning the pleasure of
customers with products quality
Conducted researches show that there are no production management systems in use,
in the observed companies. The production is conducted using tradition, informal concepts.

WoodEMA 2010
166
Detailed data analysis in certain production management segments, so as the analyses of preconditions for application of an existing management system additionally confirm that the production management does not get the suitable attention.
Incomplete constructive documentation, which is the planning base, is found in the half of the companies. It is indicative that there are no component development charts, which suggests that the production is improvised. Companies that make component development charts, mostly do it for repeated products. Such a state is explained by fragmented production and significant participation of individual products, which is not the justification for their omission.
Planning documentation is poor. Only total annual plans are implemented in all companies. Incomplete operation plans are implemented in two companies. Forward plans are implemented in two companies, but only for products, not for operations. The lack of operations forward planning unable proper capacity deployment and production organization.
Operation and forward planning execution is being monitored only in two companies that implement them. The execution of total annual production plans that are mainly made to satisfy the form, or on somebodies request, is usually not monitored during the year, but at the end of the planning year.
Four companies implement capacity planning. However, this planning, without suitable base, is based on the experience and practically diminishes the importance of its use.
Input-output control concepts that manage relations between inputs and outputs of working centers at intermittent production are not implemented in any company. Managers in observed companies are aware of the consequences of too small input such as: low utilization of machines and high costs by the products unit. The less understood are the consequences of over sized input. In that case, the engaged capital will increase because of the greater stocks in the production process, the average processing time for order execution will be increased since the working peaces will be spending more time waiting at the end of the line, and the system performances will decrease. Most often it is better to control input, if necessary, by delaying the orders, or rejecting the jobs, then trying to “push” more through the system.
Significant loss of reputation and profit due to the lack of stock and late deliveries is observed in only one company. This company was in situation to pay the penalties for the late deliveries. It is interesting that there are no notifications in any of the companies about late deliveries and production under high pressure for certain orders to make on time delivery. On the contrary, the production under high pressure and “pushing”the orders that are estimated as late, represent the generally accepted way of working. Even besides the occasional acceleration of flow on the described way, deliveries are often late. According to the manager of one of the observed companies, the loss of profit is avoided by the high quality of delivered products.
4 DISCUSSION
Long time accepted attitudes in the furniture and equipping production companies, that use traditional – informal production management concept are the following:
- it is impossible to make long term business estimates due to the changeable
market demands, - management systems are unnecessary for individual and small series
production, - implementation and maintenance of planning system is costly, and the benefit
uncertain.

WOOD PROCESSING AND FURNITURE MANUFACTURING: present conditions, opportunities and new challenges
167
It is a fact that, in Serbia, the production of final products is performed in small companies, and that is characterized by the often products changes, small and changeable production series, some times uniques. For this, there is an opinion that every company requires its particular system, shaped to solve particular problems. However, basically, problems of forward planning in the factory, suppliers deliveries and coordinating of marketing, engineering, production and financing activities are not much different from company to company.
The practice of developed countries show that the greatest number of production companies can gain benefits of production management system, if it is implemented and used the proper way. Because of this, every company should determine the necessary production management system volume, according to the increase of costs and benefits, with the aim of increasing the production performances.
So, the further researches should result in one unique production management system model with computerized support, which will be harmonized with specifics and necessities of companies with intermittent processing. Along with it, the implementation and maintenance costs of the projected system model should be lower, and in accordance to that this system will be more available to companies in Serbia.
For achieving this target it is necessary to determine suitable kind and type of production management system, and after that to define and model the system. The possibility of modification or adaptation of an existing system is not excluded. This study requires also precise defining of preconditions for system implementation, and based on the costs and benefits, development of the method for determination of necessary system volume.
In accordance of the above we consider that the efficient dynamic forward planning can be defined by combination of order loading with input-output control and some of the rules of emergency. The rule of order loading would enable the availability of necessary capacities in working centers. The release of orders in the production would be controlled by input-output rule, which will avoid the production overload. The emergence order rule would be used to conduct the order through production, in order to achieve desired delivery date.
5 CONCLUSION
Existing production management systems, that are implemented in the companies around the world, are not suitable in the furniture and equipping companies in Serbia. Production is managed using traditional, informal concepts, and the main reason for this is the specificity of final wood processing companies in Serbia.
Production management, on modern bases, is of no necessary significance, which is indicated by the data that only 20% of the observed companies use main forward plan, while in only 40% of companies the capacity is planed. Component development charts exist at 50% of the companies, and only for repeated products.
Production companies may achieve the increase of production performances by implementing the production management system. It is necessary for every company to determine the necessary volume of the management system, and to adequately conduct its implementation and maintenance.
Starting with the smallest system, company may upgrade the system and determine if the additional costs are justified by additional benefits. By using such an approach, every company may reach a type of system which suites best its needs.

WoodEMA 2010
168
REFERENCES
1. Krajewski L., Ritzman L.(2005): Operations Management, Pearson, New Jersey 2. Nešić M.(1991): Advancement of preparation of production in furniture industry in Serbia,
„Zbornik radova”, Forestry Faculty, Zagreb (20-30) 3. Nešić M.(2003): Strengthening of the strategic role of production in company business
activities, Wood Processing 2, Belgrade (3-4) 4. Nesic M., Milic R. (1999): Small companies in wood processing industry of Serbia. “Drvarski
glasnik” 31-32, Belgrade (25-29) 5. Reid D., Sanders N. (2005): Operations Management, Wiley, Danvers 6. Schroeder R. (1999): Production management, Mate, Zagreb 7. Suletic R. (2009): Implementation of furniture flexible production group concept. “Wood
Processing” 26/27, Belgrade (28-31)
Authors’ addresses:
Dragoljub Ivković, M.Sc., Milan Nešić, Phd, Branko Glavonjić, Phd, Marija Nešić, B.Sc. Forestry Faculty of Belgrade University Belgrade, Serbia e-mail: [email protected], [email protected]

WOOD PROCESSING AND FURNITURE MANUFACTURING: present conditions, opportunities and new challenges
169
USING OF OUTSOURCING AT WOODWORKING INDUSTRY IN SLOVAKIA
Marek Potkány
ABSTRACT
This paper present partial result of a survey about using of outsourcing at woodworking industry in Slovakia with the presentation of correlation depending on the individual responses and also with presentation of partial evaluation of methodology aimed at economic efficiency of outsourcing use.
Key words: outsourcing, processes, cost, correlation, woodworking industry
1 INTRODUCTION
External services, external supply or use of external resources are the most common use of alternative definitions of outsourcing in business practice. The outsourcing utilisation in the last years is very interesting in general business public, not only for increasing the volume of contracts in this area, but also like a role of outsourcing as a strategic management tool. Outsourcing is also a source of potential competitiveness of advantage for companies, which results in reduction of company costs, increase of quality services and orientation on core business or activities of company. According to the Outsourcing Institute these reasons are the main causes for increasing of outsourcing interest in any kind of industry13. From the year 2008 at our department we working to resolve of project VEGA 1/0360/08 “Functional and design parameters for the evaluation of economic effectiveness of outsourcing in wood working companies”.
The main aim of this paper is to present partial result of a survey about using of outsourcing at woodworking industry in Slovakia with the presentation of correlation depending on the individual responses and also with presentation of partial evaluation of methodology aimed at economic efficiency of outsourcing use.
2 OUTSOURCING AT WOODWORKING INDUSTRY
At the first stage of project analyse about the actual state of the problem in woodworking industry enterprises through a questionnaire survey and personal consultations, we focused many types of questions. We measured the interest about outsourcing, the main reasons for outsourcing utilisation (or non-use) in enterprises. In this paper are present only partial results of actual survey.
By the survey was by e-mail, telephone or personal interviews approached a total of 146 companies of woodworking industry in Slovakia. These companies are grouped in Wood Processors association. Some companies have subsequently questioned by the individual
13 http://www.outsourcing.com

WoodEMA 2010
170
contacts. Representation of various companies that provided information for the survey at the structure of company database by the region and company size present Table 1.
Table1 The structure of company database
Size / Region Micro
enterprises Small
enterprises Middle-size enterprises
Large enterprises
Together
West SVK 2 enterprises 7 enterprises 6 enterprises 1 enterprises 16 enterprises
Middle SVK 4 enterprises 10 enterprises 5 enterprises 2 enterprises 21 enterprises
East SVK 3 enterprises 5 enterprises 4 enterprises 1 enterprises 13 enterprises
Together 9 enterprises 22 enterprises 15 enterprises 4 enterprises 50 enterprises
The main reason of survey was to find interest of outsourcing services in woodworking
industry (present figure 1). However the concept of outsourcing is not commonly used business practice, the results surprisingly showed that the use of outsourcing is a relatively at high level for all types of companies, but preferably in large and medium-sized enterprises. In woodworking industry is outsourcing used mainly for many kinds of administration activities (accounting, law and economy consulting, personal administration, education...), catering but not sow often preferred area of care and maintenance of information technologies and systems. The public also often works with the outsourcing of employee evaluation14.
Figure 1 Use of outsourcing in woodworking company in Slovakia
14 Hitka, M. Aláč, P. 2005. OUTSOURCING HODNOTENIA ZAMESTNANCOV VÝROBNÝCH PODNIKOV
A SLUŽIEB. OUTSOURCING DOPRAVNĚ-LOGISTICKÝCH PROCESŮ. Univerzita Pardubice, 2005. ISBN 80-7194-818-7.
IS/I
T
Adm
inis
tration
L/E
consultin
g
Cate
ring
Education
Oth
er
No f
ield
Large enterprises
Micro enterprises
Middle-size enterprises
Small enterprises
12
11
8
1314
5
3
11
12
11
10
7
3
1
4
1
33
11
544
44
2 3

WOOD PROCESSING AND FURNITURE MANUFACTURING: present conditions, opportunities and new challenges
171
In the case of survey the main reasons for outsourcing use is confirmed the general knowledge about this problem. The main reasons are reduction of overhead company cost, orientation into core business (the main technological processes of company) and also increasing of quality for outsourcing processes (figure 2).
These main reasons by the statistical analyse of correlation reported a high linear relationship with the possibility of outsourcing use of all support and service processes, especially in large and medium-size enterprises. For small and micro enterprises as a priority reasons for outsourcing application are reduction of overhead company cost and increasing of quality for outsourcing processes.
Presented research is focusing not only on the areas and the main reasons for outsourcing utilisation in woodworking, but also about interest on this problem at the future and the methodology of calculations and allocation of overheads cost. The all results of the research can not be presented in this paper.
Figure 2 The main reasons for outsourcing use in woodworking industry in Slovakia
3 CORRELATION ANALYSES
Correlation means the linear dependence between random variables. In the case of linear dependence between the variables degree of tightness of the statistical dependence is called the correlation coefficient. Correlation coefficient of two dependent random variables x and y is the proportion of covariance and the product of standard deviations. Correlation coefficient
reduction of
costcore
businessconversion
know/howtransfer of
riskincreasing of
qualityno reason
Micro enterprises
Small enterprises
Middle-size enterprisesLarge enterprises
100% 100%
50%
25%
100%
0%
73,5%
66,6%
13,3% 6,6%
86,6%
6,6%
68,2%
63,6%
13,6% 18,2%
31,8%
13,6%
44,4%
33,3%
44,4%

WoodEMA 2010
172
takes its values from the interval <-1,1>. Interpretation of the size of the correlation coefficient is a very common problem. According to Cohen and the correlation is trivial under 0.1, from 0.1 to 0.3 is correlation small, from 0.3 to 0.5 is correlation medium and over 0.5 is correlation large. Correlation from 0.7 to 0.9 is very large and from 0.9 to 1 is almost perfect.
All of the question in questionnaire were each other through correlation analysis of pairs compared and then expressed the correlation dependence. Table 2 present the correlation matrix of the individual questions with expression of its levels depending.
Table 2. Correlation matrix of the individual questions
A B C D E F G H
A - trivial small small trivial trivial trivial trivial
B trivial - small small trivial trivial small small
C small small - large large trivial trivial trivial
D small small large - medium trivial trivial trivial
E trivial trivial large medium - trivial trivial trivial
F trivial trivial trivial trivial trivial - trivial trivial
G trivial small trivial trivial trivial trivial - very large
H trivial small trivial trivial trivial trivial very large - A Region B Size of enterprises C Outsourcing use D Reason for use outsourc. E Reason for rest outsourc F Methods of calculation G Economy efficiency before H Economy efficiency after
The statistical analyse of correlation reported a high linear relationship between the
possibility of outsourcing use of all support and service processes and main reasons for outsourcing use, but also wit the main reasons for rest of outsourcing in companies. The outsourcing is commonly used in large and medium-size of companies, when the main reasons are reduction of overhead company cost, orientation into core business and increasing of quality for outsourcing processes15 (figure 2).The use of outsourcing services absence mainly in micro and small enterprises. The basic reasons are total absence of interest about this problem, absence of information about the use in company praxis and economy and law substance.
The statistical analyse of correlation reported very large relationship between evaluating the economic efficiency of outsourcing before and after its implementation. From the point of view our research was an important question about use of preliminary analysis of final evaluation methodology of economic efficiency of outsourcing use (figure 3).
15 Gejdoš, P. 2008. PROCESS ORIENTED QUALITY MANAGEMENT EFFECTIVE TOOL OF COMPANIES MANAGEMENT. In: Wood processing and furniture production in South East and Central Europe. Faculty of Forestry Belgrade University, 2008, s 80-84, ISBN 978-86-7299-149-9.

WOOD PROCESSING AND FURNITURE MANUFACTURING: present conditions, opportunities and new challenges
173
Figure 3 Methodology for economy evaluation of outsourcing efficiency before and after implementation
The preliminary analysis of economic efficiency of outsourcing use does not even any
from interviewed companies. No company use methodical procedure suitable for economic evaluation of the advantage to replace supporting and servicing company processes by accessible forms of outsourcing. The evaluating of economic effects from the use of outsourcing after implementation makes only five companies. The basic criterion of comparison is often referred the level of basic economic indicators such as profit, productivity or sales. In the following section of paper we try to present basic methodology aimed at economic efficiency of outsourcing use with parametric indicators.
4 PARAMETRIC INDICATORS OF OUTSOURCING USE
The problem of cost determination of the same process through outsourcing and its following comparison with the level of production cost is complex process. The main problematic factor is determining the level of own production cost for supporting processes or activities. This cost is possible to determine like a level of direct cost (salaries, levies, energy, travel, depreciation, services, fuel, leasing, insurance,...), if are the all process organized at the level of organizational unit. If the department provides a number of activities and we wants to outsource only selected activities, we must to determine the partial costs of activities through the ABC costing methodology16. The total cost of outsourcing is possible to content with two separate groups:
16 Tóth, M. 2004. KALKULÁCIA NÁKLADOV PODĽA ČIASTKOVÝCH ČINNOSTÍ (Metóda Activity Based Costing). Bratislava: Ekonóm, 2004. 114 s. ISBN 80-225-1909-X.
yesno
no
answer
0
5
3027
11
9
economy efficiency before
economy efficiency after

WoodEMA 2010
174
- cost of outsourcing service in the form of payments for specific activities for provider this service. This cost are expressed in a offers sum for the account period or as a base rate per unit of service (employee, project, document, kilometre contract,...) in the monetary unit in euro
- transaction cost in the form of cooperative or additional costs, which are associated with providing of outsourcing services (administrative, labour and other own cost).
The most important information for complex form of outsourcing (use of external services for replacement all activities of organisation unit) is to determine the parametric level of cost:
Parametric cost for complex outsourcing at the account period (PCCO)
PCCO = the cost of organisation unit – transaction cost (1) The most important information for selective form of outsourcing (use of external service
only a part of a certain activities of a selected processes) is to determine the level of own cost to selected activity. In determining the own cost is necessary to proceed methodically through determining the rate of cost:
Rate = the cost of organisation unit / allocation base (2) The overhead cost of organisation unit is divided by allocation base. This allocation base
reflects the close causal relationship between the change of the cost and allocation base. In this case is ideal allocation base the labour intensive activities in terms of the amount of salary costs or fund staff time (working time fund of all organisation unit employers).
Using the rate of overhead cost and the information about the volume of allocation base in the selected sub-activity of process is possible to determine its own costs of the activity (OCA) as follows:
OCA = (rate x volume of allocation base in the activity) (3) The parametric cost of selective outsourcing is possible to determine similar way as in
the case of complex outsourcing. Parametric cost for selective outsourcing at the account period (PCSO) PCSO = the cost of organisation unit – transaction cost (4) This parametric cost is then necessary to compare with quotation of external
organisation which may provide alternative of selected activities of the organizational unit in the form of selective outsourcing.
Saving of the cost. The most important indicator for evaluation of the economic
efficiency of outsourcing is preliminary saving of the cost. This indicator is possible to determine like a different between parametric cost for selective outsourcing at the account period and price of external services for outsourcing use.
Saving of the cost = PCSO – price of external services (5) Now it is possible to transform the cost savings to the system of financial indicators for
example by Du Ponte equation or like a decomposition of EVA (economic value added) indicators. System of financial indicators - Du Ponte equation

WOOD PROCESSING AND FURNITURE MANUFACTURING: present conditions, opportunities and new challenges
175
System of financial indicators used for measuring, monitoring and benchmarking service performance in terms of profitability. In the market economy is the most important input considered total capital employed (TCE). This is the reason why many of systems of financial indicators is based from Du Ponte equation17. By Du Ponte basic equation decomposes the indicator ROA18:
ROA = Assets Total
Sales
Sales
Profitx (6)
The first fraction, the profitability of revenues expresses its appreciation consumed
production factors (profit margin). The second fraction expresses the ratio of total assets to sales. Most of the companies used foreign capital, therefore, the basic equation of Du Ponte expands on indicator ROE6:
ROE =Employed Capital Total
Assets Total
Assets Total
Sales
Sales
Profitxx (7)
Figure 4 System of financial indicators6
17 Lesáková Ľ. 2004. METÓDY HODNOTENIA VÝKONNOSTI MALÝCH A STREDNÝCH PODNIKOV. UMB
Banská Bystrica, 2004, 121 s. ISBN 80-8055-914-7. 18 Zalai, K. 2008. FINANČNO-EKONOMICKÁ ANALÝZA PODNIKU. Sprint Bratislava, 2008, 385 s. ISBN 80-8908-599-6
: :
P – net profit (profit for the accounting period after tax),
TCE – total capital employed, S – sales, TA – total assets,
PEA – profit from economic activity (after tax),
REA – return from economic activity,
FA – fixed assets, CA – current assets, OA – other assets,
FC – foreign capital, CEA – cost of economic activity,
IA – intangible assets, TFA – tangible fixed assets, LFA – longterm financial assets.
TA
TCE-1
S
LFA
S
TFA
S
IA
TA
FC
FC
TCE
REA
tax
REA
CEA-1
S
OA
S
CA
S
FA
REA
S
REA
PEA
PEA
P
TA
TCE
S
TA
S
P
TCE
P

WoodEMA 2010
176
The third part of that decomposition quantifies the capital structure (degree of financial autonomy). The complex form of financial indicators (figure 7.2.) in the form of a vertical decomposition has three branches. The first branch analyses the profitability of sales, in the second difficulty of the assets and the third structure is analyzed company financial resources. For purposes of preliminary evaluation of the economic efficiency of outsourcing is important to express the cost savings of outsourcing, through the indicator of complexity costs of economic activity (1-CEA/REA).
EVA - economic value added Economic value added is an indicator of the economic-financial business performance.
The main task of economic value added is that it measures the economic profit of the company. The company create profit only if it is paid current costs, but also cost of own and foreign capital.
The basic formula for calculating EVA is following:
EVA = NOPAT – (WACC x C) or EVA = (RONA – WACC) x C6
NOPAT – Net operating profit after taxes and interest, WACC – Weighted average cost of capital RONA – return on net assets, C – capital needed for the main business activity
Economic value added is a modern indicator that degradation of individual parameters
can predict quite correctly the financial situation before the implementation of outsourcing. The condition is correctly quantification of potential cost savings.
5 CONCLUSION
The success of every company depends on fast and precise market orientation and the ability to react to future changes a little bit sooner than the competitors. Outsourcing, respectively “selecting” additional activities for an external provider on economically more advantageous terms than it is at one’s own overhead costs, contributes to this. The main reason of outsourcing utilisation in wood working companies is to reduce the cost of company processes, which charge the capacity and don’t generate the profits. Operation of these processes by external organization is associated with a higher quality and the ability to focus on core business. Outsourcing is a way how to manage business processes more effectively.
AFFILIATION This article includes partial results of the solution project VEGA 1/0360/08. Functional
and design parameters for the evaluation of economic effectiveness of outsourcing in wood working companies.
REFERENCES
1. Gejdoš, P. 2008. PROCESS ORIENTED QUALITY MANAGEMENT EFFECTIVE TOOL OF COMPANIES MANAGEMENT. In: Wood processing and furniture production in South East and Central Europe. Faculty of Forestry Belgrade University, 2008, s 80-84, ISBN 978-86-7299-149-9.

WOOD PROCESSING AND FURNITURE MANUFACTURING: present conditions, opportunities and new challenges
177
2. Hitka, M. Aláč, P. 2005. OUTSOURCING HODNOTENIA ZAMESTNANCOV VÝROBNÝCH PODNIKOV A SLUŽIEB. OUTSOURCING DOPRAVNĚ-LOGISTICKÝCH PROCESŮ. Univerzita Pardubice, 2005. ISBN 80-7194-818-7.
3. Lesáková Ľ. 2004. METÓDY HODNOTENIA VÝKONNOSTI MALÝCH A STREDNÝCH PODNIKOV. UMB Banská Bystrica, 2004, 121 s. ISBN 80-8055-914-7.
4. Stasiak – Betlejewska R., Knop K., Jagusiak M. 2009. Chapter 12. THE APPLICATION OF ABC AND FMEA METHOD TO DEFINE CRITICAL PARTS AND SUBASSEMBLIES OF CLOSING MACHINE GOPAK, W:Production Engineering. Ed.and Scientific Elaboration Stanisław Borkowski, Robert Ulewicz, Wyd.Novosibirsk State Tech.Univ. 2009, ISBN 978-5-7782-1165-0.
5. Teplická, K. 2004. ZÁKLADNÁ CHARAKTERISTIKA PROCESOV V OBLASTI MANAŽÉRSTVA KVALITY. Q magazín- internetový časopis o jakosti. VŠB TU Ostrava, 2004, ISSN 1213-0451 (http://katedry.fmmi.vsb.cz/639/qmag/mj31-cz.htm)
6. Tóth, M. 2004. KALKULÁCIA NÁKLADOV PODĽA ČIASTKOVÝCH ČINNOSTÍ (Metóda Activity Based Costing). Bratislava: Ekonóm, 2004. 114 s. ISBN 80-225-1909-X.
7. Zalai, K a kol. 2008. FINANČNO-EKONOMICKÁ ANALÝZA PODNIKU. Sprint Bratislava, 2008, 385 s. ISBN 80-8908-599-6.
Authors' addresse: Marek Potkány, PhD. Technical University in Zvolen Faculty of Wood Sciences and Technology Department of Enterprise Management T. G. Masaryka 24, 960 53 Zvolen, Slovak Republic e-mail: [email protected]

WoodEMA 2010
178

WOOD PROCESSING AND FURNITURE MANUFACTURING: present conditions, opportunities and new challenges
179
INCREASING PRODUCTIVITY THROUGH INTERNAL COMMUNICATION TOOLS
Martin Sloboda
ABSTRACT
This contribution deals with the importance of internal company communication tools and effectiveness communication system. Internal communication plays an important role in the management of professional organizations and their achievement of success. Here we discuss the different tools and tactics that you can use to improve internal communication. Tactics can use tools that require face to face meetings, written notices and publication or information and communication technologies. We discuss the benefits of each type and elaborate on some of the different tactics that can be used.
Key words: internal company communication, internal communication tools and tactics, management
1 WHAT IS INTERNAL COMMUNICATION
Internal communications can be defined as transactions between individuals and groups in organizations at various levels and in different areas of specialization (Frank & Brownell, 1989 in Dolphin, 2005).
Kalla (2005) defines internal communications as “all formal and informal communication taking place internally at all levels of an organization” (p. 304), while Orsini (2000) defines them as “the full range of ways that people communicate with each other within the organization” (p. 31).
According to Argenti (1998), the goals of internal communications in order of their importance are (p. 201):
create the sense that employees are an important asset to the organization;
improve morale and foster goodwill between employees and management;
inform employees about internal changes;
explain compensation and benefit plans;
increase employee understanding of the organization and its products, organization, ethics, culture, and external environment;
change employee behavior toward becoming more productive, quality oriented, and entrepreneurial;
increase employee understanding of major health/social issues or trend affecting them; and
encourage employee participation in community activities. Activities or responsibilities of internal communications are many, such as: planning
and executing effective internal communications (e.g. measuring employee view and acting on such feedback, sharing information more widely and ensuring senior management visibility);

WoodEMA 2010
180
protecting and championing the desired corporate culture; ensuring a continuing supportive role by the HR department; empowering employees (e.g. encouraging self-managed teams, monitoring and continuously improving measurement assessment, reward and recognition systems); and enhancing internal relationships and learning (e.g. establishing internal support networks, encouraging employees to talk to managers and recognizing examples of successful practice) (Dalton & Croft, 2003).
Internal communication does not refer only to those few “official” channels of communication within your organisation, such as internal newsletters, notice boards or staff meetings. It is not a process that goes from the top, the Chief, to the bottom, the intern. Rather, internal communication refers to the almost constant interactions within your organisation that convey meaning. Therefore, internal communication encompasses both overt communication like meetings, memos etc, and more casual forms of communication such as gossip, pleasantries and body language.
2 MAIN PRINCIPLES OF EFFECTIVE INTERNAL COMMUNICATION
Unlike with external communication, organisations often fail to strategically plan their internal communication. In other words, internal communication is usually either arbitrary or incomplete and if planned, tends to be planned only in reaction to specific events (downsizing for example). However, effective internal communication is planned, not only to deal with specific issues, but for the long-term well-being of the organisation.
Some basic principles to keep in mind when creating your strategic internal communication plan are:
Develop a long-term focus Identify clear values for your organisation Define the specific goals for your internal communication strategy Use comprehensive, pervasive methods Be consistent in your messages
The rest of this tool kit will guide you through the step-by-step process of developing a strategic internal communication plan that is based on these principles.
3 REQUIREMENTS FOR EFFECTIVE INTERNAL COMMUNICATION
Lynn Townsend, set forth the following eight requirements for effective internal communication:
1. Internal communication must be recognized as an essential tool of management. It
is a way to achieve corporate objectives, build teamwork, and motive: It can make managers become better leaders. This requirement recognises that, employee attitudes and resulting performance are improved by effective communication.
2. Employees must be well informed concerning their mutual interests in company success. Management's position on issues needs to be known and employees should be persuaded to take actions that will best serve mutual interests and goals.
3. Individual managers must actively support the corporate communication efforts; Managers must develop teamwork among them and work cooperatively with the

WOOD PROCESSING AND FURNITURE MANUFACTURING: present conditions, opportunities and new challenges
181
corporate office. Management has responsibilities to create a climate conducive to communication and to maintain a flow through open channels.
4. Great emphasis must be placed on communication and measurement Communication cannot be left to chance. There must be a plan who communicates that how to whom, for what purpose and to what effect.
5. Top management must establish a communication climate other divisions and departments will reflect this climate.
6. A long-term investment in professional talent and communication programming must be made Programming and qualified people cost money, but it is well spent.
7. Management must recognise its responsibility 'to listen as well as to speak. If the boss is not a good listener, those who report to him will soon stop trying to communicate.
8. Management must recognise the desire of employees to help their company and the power of communication to tap this great potential. Employees are willing to help and communication can turn this desire into action.
4 INTERNAL COMMUNICATION TOOLS AND TACTICS
As mentioned above, a tool is a medium of communication, the instrument that you can use to reach your audience, while a tactic is the manner in which you use the tool. The following is an extensive, although by no means complete, list of tools and tactics you can consider using to improve the internal communication at your organisation. For each tool, we have listed its advantages and disadvantages, and then provided a number of different tactics that can be undertaken using that tool.
4.1 In-person communication
Advantages: In-person communication has the advantage that it is personal, direct and conducive to
two-way communication. In particular, face-to-face meetings allow for the discussion of sensitive issues that require more subtlety because the use of body language and other social conventions are visible. In-person communication is the ideal tool for holding discussions on important issues and getting feedback from your audience. In addition, in-person communication can also be more informal and have more social aspects then many other forms.
Disadvantages: The main disadvantage of in-person communication is that your audience must be
physically present in one location. Other disadvantages is that it can be a time-consuming form of communication, staff may not be honest in their communications because they can not be anonymous and therefore may feel ‘unsafe’ and they may not want to loose face. Office politics can also often play a large role in in-person communication and can therefore provide additional complications to tactics that use this medium.

WoodEMA 2010
182
Sample Tools and Tactics All staff meetings If your organisation is not too big, all staff meetings can be an ideal way to communicate
key information to staff. These meetings can be used to communicate updates from different programmes and departments, welcome new staff and say farewell to staff who are leaving, provide staff with an overview of the organisation’s strategic plan, and share management and board decisions. In addition, staff meetings can be the perfect place to seek feedback from staff and discuss important issues. Finally staff meetings can include team building activities and other training exercises to improve the functioning of your organisation.
Individual meetings Individual meetings are a good tool when you need to communicate sensitive issues.
Issues to do with continued employment, sub-par performance, training needs or other behavioural issues are often best dealt with on an individual basis.
Recognition programme Recognising the contribution and achievement of staff is a key part of ensuring a high
morale in the workplace. High morale translates into dedicated staff who are more efficient and effective in their work. When establishing a recognition programme, you must first consider what it is you want to recognise: length of service, success in a project, innovative ideas etc. You must also decide whether you want to give out monthly awards or have a yearly programme. In addition, will there be prizes or is it simply a certificate and a nice pat on the back? A well thought-out recognition programme can go a long way towards making your staff feel valued.
Social events Social activities can have as much impact on your organisational culture as any formal
meeting. Often, these events can build team spirit, increase morale, and deepen the connection between the staff and the organisation. Some options for you to consider are:
Birthday celebrations: Let everyone take a half hour break in the afternoon and enjoy some cake!
Shared Lunches: Each staff member brings a different dish to share at lunchtime. This can also be a good opportunity to learn about the culture of your colleagues through their different culinary dishes.
Friday afternoon social outings: Invite staff to meet for a drink and snacks at a local café or restaurant at the end of the day on Friday.
4.2 Printed Communication
Advantages: Print communication has the main advantage that it is an easy way to communicate a
large amount of information that your audience can access in their own time. It is long lasting communication that people can access whenever they are in the office. Similarly, they can be posted in strategic locations to attract the maximum of attention. Finally, using the traditional postage system, printed communication can reach around the world, even to those who do not have access to internet and email. Also of importance is the role printed communication plays in meeting legal requirements and other tasks such as contracts, invoices and accounts.

WOOD PROCESSING AND FURNITURE MANUFACTURING: present conditions, opportunities and new challenges
183
Disadvantages: Printed communication does have several disadvantages. To start, printing and
disseminating communication in print can be prohibitively costly in any large quantity. Second, your audience has the option to simply discard your communication as soon as they lose interest, if they even pick it up in the first place. In addition, preparing print material can be a lengthy process and time consuming, and is primarily conducive to one way communication. Finally, printed communication can carry more weight then more casual communication. It can have legal implications and can create issues of privacy.
Sample Tools and Tactics Internal newsletter: An internal newsletter is different from your organisation’s regular newsletter in that it
contains information that is directly relevant only to your organisation’s staff. As such, an internal newsletter can be an ideal way to communicate information such as new staff, changes in policies and procedures, programme updates and organisational developments. In addition, the newsletter could run a column from your executive director and be used to recognise staff contributions. In creating a newsletter you will need to consider the following questions:
What information will it include?
Who is responsible for writing the content?
Who is responsible for compiling and editing all the stories?
How will you disseminate it? (Put copies in the lunch room, mail it out etc – note that this could also be made into an electronic publication)
How frequently will it go out?
Who will be responsible for approving the content?
And many more… Staff handbook A staff handbook should be used as resource that staff can turn to when they have a
question about the organisation’s policies and procedures. While it is not a good place to include information that may change on a regular basis, it is a good tactic to use to ensure that staff are clear on their rights, entitlements and responsibilities, and can help ensure a smooth relationship between staff and the organisation.
Resource library Many organisations have large collection of books, journals and newsletters that they
have collected over the years. Often, however, these resources are distributed haphazardly around the organisation with one or two people using a small selection and the rest not even knowing the resources are there. To make information sharing more effective, you could consider creating a central resource library. This library would bring together the many different resources into one location and which are organised in a logical manner (by subject, alphabetically etc).
Notice board Notice boards are a simple and easy way to keep people informed of important issues.
By putting a board in a high traffic area in your office and making it visually attractive, you can grab the attention of all the staff that pass by it. This tool is most effective for conveying event announcements, brief but interesting news stories and other short items. Your notice board could also include an employee recognition section and a feedback box. Note, however, that if your

WoodEMA 2010
184
board is located somewhere where the public has access that you make sure it does not contain any confidential information.
4.3 Information Technology based Communication
Advantages: Information technology based communication has the advantage of being fast, cheap
and with a reach that stretches all the way around the world. New media make it easier than ever for organisations with sufficient technological capacity to reach a large audience with a minimum amount of resources.
Disadvantages: The major disadvantage of information technology based communication is that not
everyone has access to the necessary technology whether because of location, cost or position with an organisation or skills. In addition, information overload – meaning that many people who regularly use this form of communication receive more information then they can effectively handle – increases the chance that your communication will be missed by its intended audience.
Sample Tools and Tactics Email Email is a relatively cheap easy and quick way to send information. However, as people
become ever more inundated with information, it is important to use email strategically as well. You should consider establishing a monthly or bi-weekly e-newsletter for your staff, rather then sending out an email for each item that needs to be communicated. This will make it easy for your staff to recognise the newsletter as worthy of being read and not to relegate it to the rubbish bin, as so many others are. See the note above for some tips on developing a newsletter.
Listserves A listserve sends out an email message to everyone who is subscribed to the list. The list
can be moderated, in that one person, the moderator, controls all that goes to the list, or open, in that anyone on the list can send a message to the list. Listserves can be used to distribute messages to all staff about upcoming events, announcements, meetings etc. However, a listserve can also be used as a discussion forum with staff posting interesting resources and stories they may have found and respond to those posted by others.
Tele/video conferencing Tele/Video conferencing is the best way to simulate a face-to-face meeting when that is
not possible. Its main advantage is that it can overcome distance but has the disadvantage of requiring technology which in many areas is not very accessible. Tele/Video conferencing can be used to conduct small group discussion and get feedback from people who may work in the field or satellite offices and not be able to partake in staff meetings in the main office.
Intranet/Website An intranet site is different from a website in that it is usually protected by a password
and only accessible to the staff of an organisation. An intranet site can be used to provide access

WOOD PROCESSING AND FURNITURE MANUFACTURING: present conditions, opportunities and new challenges
185
to shared files, resources and other information to staff who are located all around the world but have access to the internet.
5 LIMITATIONS OF TOOLS AND TACTICS
Different tools and tactics, as the section above illustrates, are able to overcome a wide range of practical problems, such as distance, literacy, and the technological divide amongst others. However, tools and tactics are limited by human and social factors. Primary amongst these are the attitudes and culture of staff and management. If staff are not open to the communication being offered, whether based on past experience or the organisation’s culture, it does not particularly matter which tool or tactic is being used, it will not be effective.
Frequently, management behaviour and decisions, or more specifically, how management behaviour and decisions are perceived by staff, can have a profound effect on an organisational culture. The problem may not always be the issue of consultation and transparency in decision-making, but could relate to such problems as inconsistency of actions or treatment and appreciation of staff/volunteers amongst many others. In order to be able to address these issues, you must ‘first admit you have a problem.’ In other words, management must recognise that there is a problem with their internal communication, and must be willing to implement a strategy to improve the situation. Once the backing is there, a strategic internal communication plan can start to work to improve the organisational culture. While change and improvement may not be instantaneous, consistent implementation of your tactics, backed by consistent decisions by management, which are all in line with your key messages, will bring about long-term change.
REFERENCES
1. Argenti, P. A. (1998), STRATEGIC EMPLOYEE COMMUNICATIONS, Human Resource Management, 37 (3/4): 199-206
2. Brown, D. (August 16, 2002) INTERNAL COMMUNICATIONS SHOULD BE OF VITAL IMPORTANCE TO ANY BUSINESS. Available on: http://www.bizjournals.com/albany/stories/2002/08/19/focus7.html
3. Dalton, J., Croft, S. (2003), MANAGING CORPORATE REPUTATION, Thorogood, London 4. Dolphin, R. R. (2005), INTERNAL COMMUNICATIONS: TODAY’S STRATEGIC
IMPERATIVE, Journal of Marketing Communications, 11(3): 171-190 5. Kalla, H. K. (2005), INTEGRATED INTERNAL COMMUNICATIONS: A
MULTIDISCIPLINARY PERSPECTIVE, CorporateCommunications: An International Journal, 10(4): 302-314
6. McQuail, D. & Windahl, S. (1993) COMMUNICATION MODELS: FOR THE STUDY OF MASSCOMMUNICATION. London: Longman Group.
7. Orsini, B. (2000), IMPROVING INTERNAL COMMUNICATIONS, Internal Auditor, 57(6): 28-33
8. http://www.scribd.com/doc/8317479/Project-Report-on-Technologies-Used-for-Internal-and-External-Communication
9. http://www.civicus.org/new/media/CIVICUSInternalCommunicationToolkit.doc

WoodEMA 2010
186
Authors' address:
Ing. Mgr. Martin Sloboda The University of SS. Cyril and Methodius in Trnava Faculty of Mass media Communication Nám. Jozefa Herdu 2 917 01 Trnava Slovakia e-mail: [email protected]

WOOD PROCESSING AND FURNITURE MANUFACTURING: present conditions, opportunities and new challenges
187
MEASUREMENT, ANALYSIS AND IMPROVEMENT IN WOOD-PROCESSING COMPANIES
Anna Šatanová, Lucia Krajčírová
ABSTRACT
According to the analysis of the actual state of management in wood-processing companies and examination of classical functional approach, we propose a method of classification for the company procedures. After composing a map of processes and setting apart non-productive processes we are proposing indexes for the identified processes, which are the basis for measurement, analysis and improvement. The aim of this article is to create processes with indicators, which would point out the effectiveness compared to the original functional approach of managing company business.
Key words: indicators of process efficiency measurement, process, process efficiency measurement, process map.
1 INTRODUCTION
Nowadays the main emphasis is laid on customer. If company wants to be successful, it has to be flexible in fulfilling constantly higher requirements of its customers. Therefore it has to improve the quality of its products and services.
Traditional (functional) approach in company management is based on the decomposition of employee responsibility according to functional specialization, as Human Resources, Maintenance, Logistics... All of the activities, performed in each area of management, are based on this organization chart. The quality of outputs depends on the quality of performed activity of particular company unit.
The bold privation of traditional approach is the communication problem, which issues from long information distribution to each manager. It causes the situations, when there is no communication because of focusing on one’s own affairs, which accrue from one’s own company function or unit.
2 MATERIALS AND METHODS
Actual enterprise environment is asking for application of processional approach in management and also in quality management. One of the main reasons is the application of ISO 9001:2008 standards ideas in complex quality management.
Processional approach is primarily targeting the quality of performing processes, which are apprehended as connected complex of interacting activities. Processional approach is monitoring their flow through particular company units; together the emphasis is laid on operation performance from the view of complex value added for external and internal customer.

WoodEMA 2010
188
Basic element of processional structure is process. ISO 9001:2000 standard is defining the process as “a complex of integrated or interacting activities, which transform inputs into outputs.” Process represents a complex of interacting activities, which lead up to one aim – to make suitable results for customer. The important fact is, that all employees are participating on the process realization and they have to follow up this aim and not to focus on their own isolated tasks. All activities, which are in process progress, are not random. Their realization is integrated and organized.
Every process is characterized by its value, which it adds to final product; by informational and also physical inputs and outputs; by process owner, who is responsible to customer; by time which is needs for its realization; by its costs and also process architecture.
Processional organization brings clear and simple management, displaces duplicity and hidden wastage – reduces unnecessary costs and last but not least enables faster and more flexible reaction on customer requirements.
In order to identify particular processes and determine the relationships between them it is necessary to create so-called “Process Map” (see Figure 1).
Figure 1 Design of Company Process Map Structure (Šatanová, 2008)
Process orientated approach means not only process identification, determination and
classification between processes and their following realization and management, but also their measurement, analysis, monitoring and continual improvement.
Particular activities in progress of value creation can be divided into three groups (see Figure 2)
Figure 2 Processes of Value-creating Chain (Šatanová, 2008)
The important step to successful measurement is the identification of processes, which
do not add the value to made products and services. Together it is necessary to eliminate these activities, because they mean a loss for company. 7 types of wastage (see Figure 3), which are
PROCESSES OF VALUE-CREATING CHAIN
DIRECT ACTIVITIES - Marketing - Service and Customer services - Reasearch and Development - Construction and Technological
Preparation of Production - Production and Assembly
SUPERIOR ACTIVITIES - Human Resources - Finance - Quality Management - CompanyTop Management
ACCESORY ACTIVITIES - Technologies - Logistics
- Documentation
MANAGERIAL PROCESSES
MAIN PROCESSES
SUBSIDIARY PROCESSES
SY
ST
EM
PR
OC
ES
SE
S
Cu
sto
mer
s an
d
Oth
er In
tere
sted
Par
ties
Cu
sto
mer
s an
d
Oth
er In
tere
sted
Par
ties
Input Output
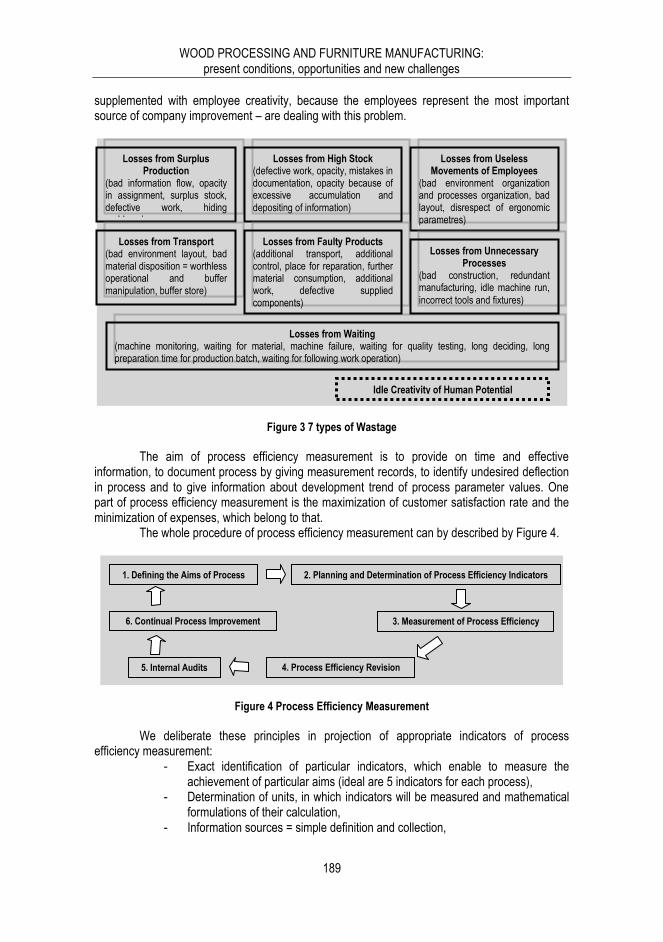
WOOD PROCESSING AND FURNITURE MANUFACTURING: present conditions, opportunities and new challenges
189
supplemented with employee creativity, because the employees represent the most important source of company improvement – are dealing with this problem.
Figure 3 7 types of Wastage
The aim of process efficiency measurement is to provide on time and effective
information, to document process by giving measurement records, to identify undesired deflection in process and to give information about development trend of process parameter values. One part of process efficiency measurement is the maximization of customer satisfaction rate and the minimization of expenses, which belong to that.
The whole procedure of process efficiency measurement can by described by Figure 4.
Figure 4 Process Efficiency Measurement
We deliberate these principles in projection of appropriate indicators of process
efficiency measurement: - Exact identification of particular indicators, which enable to measure the
achievement of particular aims (ideal are 5 indicators for each process), - Determination of units, in which indicators will be measured and mathematical
formulations of their calculation, - Information sources = simple definition and collection,
1. Defining the Aims of Process 2. Planning and Determination of Process Efficiency Indicators
3. Measurement of Process Efficiency
4. Process Efficiency Revision 5. Internal Audits
6. Continual Process Improvement
Losses from Surplus Production
(bad information flow, opacity in assignment, surplus stock, defective work, hiding problems)
Losses from High Stock (defective work, opacity, mistakes in documentation, opacity because of excessive accumulation and depositing of information)
Losses from Useless Movements of Employees
(bad environment organization and processes organization, bad layout, disrespect of ergonomic parametres)
Losses from Transport (bad environment layout, bad material disposition = worthless operational and buffer manipulation, buffer store)
Losses from Waiting (machine monitoring, waiting for material, machine failure, waiting for quality testing, long deciding, long preparation time for production batch, waiting for following work operation)
Losses from Faulty Products (additional transport, additional control, place for reparation, further material consumption, additional work, defective supplied components)
Losses from Unnecessary Processes
(bad construction, redundant manufacturing, idle machine run,
incorrect tools and fixtures)
Idle Creativity of Human Potential

WoodEMA 2010
190
- By non-financial indicators it is necessary to determine and describe the evaluative scale,
- To provide lucidity and topicality of gained data.
3 RESULTS AND DISCUSSION
By indicators selection we have to respect three basic parameters of each process, which are costs, time and quality, because these comprise the core of main indicators, which interest each process owner – continuous process time, process costs and process quality.
To gain better testifying ability of whole measurement, these indicators can be extended by determination of Sigma capability level, available capacity utilization and number of deviations appearing in process.
The indicators of process efficiency measurement can be divided into two large groups, as the discrete parameter indicators (e.g. number of faulty products, number of defects, various ratio indicators) and the continuous parameter indicators (all time and financial indicators).
The first group of indicators, which can be determined by measurement of all or most of all company processes, comprise so-called “universal indicators”, the second group so-called “special indicators” can be used in one process or several similar processes.
In Chart 1, 2, 3 and 4 we present our project of process classification in company producing chipboard. We determined indicators for managerial, system, subsidiary processes and main process, which is the chipboard production. That is divided to further subprocesses. We identified owners of particular subprocesses, inputs and aims of each of them. Together we tried to determine indicators, which give the best information about the main process efficiency – chipboard production.
Table 1 Managerial Processes of company with chipboard production
PROCESS TYPE PROCESS NAME SUBPROCESS (LEVEL 1) PROCESS OWNER
Managerial Processes
Strategic Planning
Budget Determination Financial Manager
Goal setting, Planning General Manager
Revision by Management Financial Manager
Investment Management
Planning in area of Investments
General Manager
Human Resources Management
Human Resources Planning Human Resources Manager Education and Training
Financial Management Accountancy
Financial Manager Controlling
Quality Management
Corrective and Preventive Activities
Quality Manager Faulty Products Management
Products Identification

WOOD PROCESSING AND FURNITURE MANUFACTURING: present conditions, opportunities and new challenges
191
Table 2 System Processes of company with chipboard production
PROCESS TYPE PROCESS NAME SUBPROCESS (LEVEL 1) PROCESS OWNER
System Processes
Documents Control
Control of Internal System Documents Quality Manager
Control of External Documents
Control of Internal Technical Documents
Construction and Development
Engineer
Records Management
Audits Internal Audit
Quality Manager External Audit
Table 3 Subsidiary Processes of company with chipboard production
PROCESS TYPE
PROCESS NAME SUBPROCESS (LEVEL 1) PROCESS OWNER
Subsidiary Processes
Maintenance
Machine Maintenance
Technical Manager Operation Maintenance
Service Parts Management
Work Safety and Fire Prevention
Work Safety Work Safety Technician
Fire Prevention
Property Safety
Subsidiary Processes
Maintenance
Machine Maintenance
Technical Manager Operation Maintenance
Service Parts Management
Work Safety and Fire Prevention
Work Safety Work Safety Technician
Fire Prevention
Property Safety
Power Supply
Electric Power Supply
Power Supply Controller
Heat Energy Supply (Gas, Wooden Waste)
Vapor Production
Water Supply
Waste Water Removal
Waste Management
Wooden Waste Management Production Manager
Other Waste Management Technical Manager
Waste Disposal Production Manager
Information Technologies
Hardware Management Information Technician
Software Management
IT Safety
Production Preparation
Construction Development Construction and
Development Engineer
Technological Preparation Technologist
Planning Planning of Customer Orders
Planner Planning of Marketing, Shipping,

WoodEMA 2010
192
Transport of goods
Production Assignment
Material Purchase
Order Management
Sales Manager Supplier Requirements Management
Selection, Accredition and Ranking of Suppliers
Manipulation and Storage
Manipulation and Storage of Raw Wooden Material
Logistics Manager
Manipulation and Storage during the process
Production Manager
Manipulation and Storage of Finished Products
Logistics Manager
Returnable Package Removal
Customer Requirements Management
Customer Complaints Management
Quality Manager Customer Satisfaction Measurement
Metrology
Organization
Staff Administrative Payroll Accountant
Employee Rating and Valuation Human Resources
Manager
Table 4 Main Processes of company with chipboard production
PROCESS NAME
SUBPROCESS PROCESS OWNER
INPUTS INDICATOR AIM LEVEL 1 LEVEL 2
Chipboard Production
Raw Material
Preparation
Aim – to make chips in required
quality
Storage Logistics Manager
Raw Material(Industry
Waste, Yard Wood, Recycled
Wood, Wood Chips,
Sawdust), Human Sources,
Store, Belt Carrier
Number of days in
which stock remain in
store, stock level
Chipboard Production
Raw Material
Preparation
Aim – to make chips in required
quality
Removing of dirt by
spraying, Removing of Metal Parts Chipboard
Production Manager
Metal Detector,
Jets
To remove dirt and metal parts (soil, bark)
Debarking Debarker To remove bark
Waferizing Shatter
Machine, Beater
To make chips
Dehydration Dryer Consumption
of power, To dry chips on required level of

WOOD PROCESSING AND FURNITURE MANUFACTURING: present conditions, opportunities and new challenges
193
heat, amount of emissions
humidity
Sorting, Further
Barrelling
Grader, Bolters, Beater
Rate of bolter load,
Time of Bolter
Machining
To sort out chips on three fractions (gross,
needed, dust)
Chip Storage and
Dehydration
Dry-Bulk Tank
To make
technological stock
Carpet Stratification
Batching
Spreader, Scales,
Glue, Other Additives
Glue Consumption
To stratify chip carpet in appropriate weight
Application of Glue and
Other Additives, Blending
Chip Stratification
Weight Control of
Chip Carpet
Pre-molding Pre-
molding Machine
Chip Carpet
Densification on rough thickness
Molding
Molded Carpet
Densification
Stack Molding Machine
- Molding time
(lamination length (m) /
speed of molding belts (m.s)), speed
of molding machine clamping,
electric power
consumption, heat energy
consumption, particular operating
costs (grease oil, wearing out
of steel belts)
To make product with required
characteristics
Heating
Glue Hardening
and Conglutinating
Cooling Air-
conditioning Room
Temperature and
Humidity Adjustment with External

WoodEMA 2010
194
Environment
Formatting (across and endways)
Sizing Saw To remove faulty
board sides
Quality Control Quality
Manager Laboratory
To detect mechanical and physical
characteristics of chipboard
Chipboard Production
Board Assembly
Chipboard Production Manager
Human Sources
Maturing and Air-conditioning
Palettes, Store
To achieve required
characteristics of chipboard
Levelling Edging Grinding Machine
Sorting and Control Quality
Manager Human Sources
To identify faulty
products
Shipping Logistics Manager
Control of Fuelling
Consumption
By process analysis we identified the Raw Material Storage as non-productive process. It
can be completely excluded in this company, because it is source of costs and it can be substituted by direct deliveries of raw material to manufacture (JIT).
Our main aim was to choose for each value-creating process the indicators, which best evaluate its efficiency. For the main process – production of chipboard - we projected these indicators: 1. Index of production process capability Cp and Critical Index of production process capability Cpk
(the value of both indexes should be more than 1,33) Cp= (Upper Specification Limit – Lower Specification Limit)/6σ (1) Cpk = min { CPL , CPU }= min {(µ-LSL)/3σ, (USL-µ)/3σ} (2) 2. Ratio of material costs and value of conformable outputs = input/output (3) 3. Total efficiency of machines = efficiency x efficiency rate x quality rate (4) Efficiency (Machine Productivity Index) = (operating time – sum of idle time and adjustment time)/operating time (5) Efficiency Rate (Availability Index) = amount of made production / (run time x production capacity/given time) (6) Quality Rate (Quality Index) = (number of products – faulty products – repaired products)/number of products (7) 4. Ratio of faulty products and outputs 5. Continuous Process Period

WOOD PROCESSING AND FURNITURE MANUFACTURING: present conditions, opportunities and new challenges
195
Tp = Tspr + Tov + Tman + Tk (8) Tspr – Input Process Time Tspr = Tspr1 + Topr (9) Tov – Time of examination of different activities in process
Tman – Time of manipulation in process Tk – Standstill Time (time, when products lay in store or on table without performing any activity…) Tspr1 – First Manufacture Time Topr – Manufacture Time by Repair
6. Total Process Costs Np = Nzp + Nnp (€) (10) Nzp – Process Conformity Costs
Nnp – Process Non-conformity Costs 7. Effective Cost Exploitation
100N
NV
p
zp
efn (11)
8. Value Added = Finished Products + Other Costs + Amortization + Other Value Added 9. Indicator of non-conformity number to 1 million opportunities is used in level determination of Sigma process capability (see Table 5).
Table 5 Levels of Six Sigma capability
SIGMA LEVEL
NUMBER OF NON-CONFORMITY ITEMS
TO 1 MILLION OPPORTUNITIES
% CONFORMITY PRODUCTS
(UTILIZATION) QUALITY COSTS
1 691 462 30,23 inapplicable
2 308 538 69,13 inapplicable
3 66 807 93,32 25 – 40% of sales price
4 6 210 99,379 15 – 25% of sales price
5 233 99,977 5 – 15% of sales price
6 3,4 99,99966 < 1% of sales price
The calculation can be presented by simple example: The result of production was 500 pcs of chipboard. Output quality control detected 245 conformity products. By further review of process was detected, that main causes of non-conformity appear in subprocesses Drying and Molding. Together it was identified 10 places of variability. Number of units on entry of process 500 Conformity units on exit of process 245 Utilization of inputs in process 245/500 = 0,49 x 100 = 49% Ratio of non-conformity products to inputs in process 1- 0,49 = 0,51 Number of potential causes of variability 10 Ratio of non-conformity products to 1 potential cause 0,51/10 = 0,051 Number of non-conformity output from 1 million opportunities 0,051 x 106 = 51 000 Level Determination of Sigma process capability by using Chart 3,13

WoodEMA 2010
196
4 CONCLUSION
On the basis of theoretical approaches of process management in quality management, and also on the basis of management system analysis in wood-processing company producing chipboard we projected particular efficiency indicators of managerial, system, subsidiary and main processes by designing the map. Together we determined particular subprocesses, process owners, we defined inputs and outputs and also further interaction of processes in company.
REFERENCES
1. Šatanová, A., Drábek, J., Rajnoha, R., Volčko, I., Stadtruckerová J., Potkány, M. (2008): KONTROLING. Zvolen: TU Zvolen, 2008. 133 s.
2. Šatanová, A., Gejdoš, P., Potkány, M. (2008): MANAŽÉRSTVO KVALITY. Zvolen: TU Zvolen, 2008. 353 s. ISBN 978-80-228-1928-2.
3. Kiselicová, R., Boroš, P.:PROCESNÁ ANALÝZA PROTEŽUJE PROCES PRED ZÁUJMAMI EXISTUJÚCEJ ORGANIZAČNEJ ŠTRUKTÚRY. [online]. [citované 10. júna 2010]. Dostupné na: <http://www.centire.com/aktuality/centire-news/media-archiv/procesna-analyza-protezuje-proces-pred-zaujmami-existujucej-organizacnej-struktury/>
4. Košturiak, J., Chaľ, J..: INOVÁCIE PROCESOV A KĽÚČOVÝCH SPÔSOBILOSTÍ. [online]. [citované 10. júna 2010]. Dostupné na: <http://www.ipaslovakia.sk/UserFiles/File/ZL/AI_3_ukazka.pdf>
5. Lešková, A. ANALÝZA HODNÔT ZÁKAZNÍKOV V PROCESE ZOŠTÍHLENIA PODNIKOV. [online]. [citované 10. júna 2010]. Dostupné na: http://www.sjf.tuke.sk/transferinovacii/pages/archiv/ transfer/9-2006/pdf/65-67.pdf
Authors' addresses: Prof. Ing. Anna Šatanová, CSc. Ing. Lucia Krajčírová Technical University in Zvolen, Faculty of Wood Sciences and Technology Department of Enterprise Management T. G. Masaryka 24, 960 53 Zvolen, Slovak Republic e-mail: [email protected], [email protected]

Trgovački sud u Zagrebu: MBS 2306484 Raiffeisenbank žiro-račun: 2484008 – 1104469421 Swift code: RZBHHR2X
Web site: www.woodema.org E-mail: [email protected] Phone: +385 1 235 24 83 Fax: +385 1 235 25 30
WoodEMA®, i.a. Zagreb
International Association for Economics and Management in Wood Processing and Furniture
Manufacturing
WoodEMA, i.a.
Svetosimunska 25, HR-10000 Zagreb, CROATIA
International Association for Economics and Management in Wood Processing and
Furniture Manufacturing WoodEMA, i.a. is international, non-political, non-profitable and open
Association. Association was founded in september 2007 and it was registered in december 2007.
Association's goal is to promote science and results of scientific and professional work
of its members, mutual scientific co-operation, as well as to support the science and professional
development in the Association's field of work.
To achieve these goals the Association is working on following:
Exchange of knowledge and researh results among members by organizing conferences and
publishing articles in journals and proceedings
Support mutual scientific cooperation among Association’s members through elaboration of
scientific projects
Support the development of scientific and professional organizations in Association's fields of
expertise
Scientific and professional education by organizing scientific and professional symposiums
Collecting and exchange of market, technological and technical data
Every physical and legal person who accepts the Statute and the Acting Code of the Association can become a member.
The Statute and all additional information may be found on the web site: www.woodema.org . Your questions and suggestions you may send to e-mail address of the Association secretary, Assoc.prof. Denis Jelačić, PhD.: [email protected]