Hooker Furniture - AnnualReports.com
74
Positioned for Success 2008 Annual Report
-
Upload
khangminh22 -
Category
Documents
-
view
3 -
download
0
Transcript of Hooker Furniture - AnnualReports.com

Positioned for Success2008 Annual Report

~ Company profile ~
Incorporated in 1924 and ranked among the top ten largest publicly traded furniture sources
based on 2006 shipments to U.S. retailers, Hooker Furniture is an importer of residential wood and
metal furniture and a manufacturer and importer of residential upholstered furniture based in Martinsville,
Virginia. Major wood furniture categories include home entertainment, home office, accent, dining, bedroom and
bath furniture sold under the Hooker Furniture brand, and youth furniture sold under the Opus Designs brand.
Hooker’s residential upholstered seating companies include Cherryville, North Carolina-based Bradington-Young,
a specialist in upscale motion and stationary leather furniture, and Bedford, Virginia-based Sam Moore Furniture,
specializing in upscale occasional chairs with an emphasis on cover-to-frame customization. Extensive style
selections within each of our product niches make the Company an important resource in the medium to upper-
medium price range for a broad distribution network of retailers that includes independent furniture stores,
department stores, specialty retailers, national and regional chains and catalog merchants. The Company’s stock is
listed on the Nasdaq Global Select Market under the symbol HOFT. Please visit us online at www.hookerfurniture.com,
www.bradington-young.com, www.sammoore.com and www.opusdesigns.com.
About the Cover: Hooker is widely regarded as a market, style and innovation leader in
home office furniture. Shown here is our Brookhaven group, featuring a peninsula desk
allowing for a two-person work station.
Integrity
Service
Listening
Honesty
Innovation
Citizenship
Caring
Responsibility
Hooker Furniture
To enrich the lives of the people we touch through innovative home furnishings of exceptional value.
~ mission ~

• To be a world leader in design, function, value and selection in our product categories and price points.
• To achieve best-in-class operational performance in global sourcing, logistics, warehousing, manufacturing and product delivery.
• To be an industry leader in financial performance, providing an outstanding investment for our shareholders and contributing to the well-being of all stakeholders.
• To maintain the relationship-driven, integrity-minded corporate culture that has distinguished our Company for over 80 years.
– 1 –
~ Financial HigHligHts* ~
~ strategy ~
Positioned for Success
Fifty-Three Weeks Ended
Two Months Ended Twelve Months Ended
For the:February 3,
2008January 28,
2007November 30,
2006November 30,
2005November 30,
2004November 30,
2003
Income Statement Data:Net sales $ 316,801 $ 49,061 $ 350,026 $ 341,775 $ 345,944 $ 309,005Operating income (loss) 29,697 (17,244) 22,784 21,155 31,166 25,752Net income (loss) 19,655 (18,415) 14,138 12,485 18,204 14,710Special Charges After Tax:Restructuring 190 1,843 4,266 3,255 994 911EsOp termination compensation charge 18,428Donation of two showrooms 674
Net income excluding special charges $ 20,519 $ 1,856 $ 18,404 $ 15,740 $ 19,198 $ 15,621
Per Share Data:Basic and diluted earnings (loss) per share $ 1.58 $ (1.52) $ 1.18 $ 1.06 $ 1.56 $ 1.28Restructuring 0.02 0.15 0.36 0.28 0.09 0.08EsOp termination compensation charge 1.52Donation of two showrooms 0.05
Earnings per share excluding special charges $ 1.65 $ 0.15 $ 1.54 $ 1.34 $ 1.65 $ 1.36
Weighted average shares outstanding 12,442 12,113 11,951 11,795 11,669 11,474
Cash dividends per share $ 0.40 $ 0.00 $ 0.31 $ 0.28 $ 0.24 $ 0.22
* These financial highlights should be read in conjunction with the Selected Financial Data, Consolidated Financial Statements, including the related Notes, and Management’s Discussion and Analysis of Financial Condition and Results of Operations included in the Company’s annual report on Form 10-K included in this report.
0
50000
100000
150000
200000
250000
300000
350000
400000
0
50
100
150
200
250
300
350
$400
0
5000
10000
15000
20000
25000
30000
35000
0
5
10
15
20
25
0.0
0.5
1.0
1.5
2.0
FYE: FYE: FYE: FYE:
*The Company changed its fiscal year end after 11/30/06. The above graphs exclude the transition period from 12/1/06 through 1/28/07.
11/3
0/03
11/3
0/04
11/3
0/05
11/3
0/06
2/3/
08*
Net Sales($ in millions)
11/3
0/03
11/3
0/04
11/3
0/05
11/3
0/06
2/3/
08*
Operating Income($ in millions)
11/3
0/03
11/3
0/04
11/3
0/05
11/3
0/06
2/3/
08*
0
5
10
15
20
$25
Net Income ExcludingSpecial Charges($ in millions)
11/3
0/03
11/3
0/04
11/3
0/05
11/3
0/06
2/3/
08*
0.00
0.50
1.00
1.50
$2.00
Earnings Per ShareExcluding Special Charges
0
5
10
15
20
25
30
$35

– 2 –
~ 2008 Message to our sHareHolders ~
In our past several annual reports, we have chronicled the journey of our Company from a
domestic wood furniture manufacturer to a complete wood, metal and upholstery home
furnishings resource. Our 2008 fiscal year, which ended February 3, marked the end of that
journey, and we have completed the transition from being a pure manufacturer to being a
marketing, logistics, manufacturing and distribution Company.
The road has been filled with emotion. In the early part of the decade when we began our transition, we employed
over 1,850 workers in our wood furniture plants in Virginia and North Carolina. Only 300 employees remain today in
administrative, logistics, sales and marketing roles for our wood furniture operations. Loyal, hardworking employees,
many of whom were second- and third-generation furniture workers, have moved on. With the advent of our upholstery
operations, Bradington-Young in 2003 and sam Moore this year, we have added approximately 600 new employees who,
together with the remaining wood furniture employees, make up the new face of Hooker Furniture Corporation.
We also feel very fortunate to have added three tremendously talented, very experienced individuals in key senior
executive roles: Alan Cole as Executive Vice president—Upholstery Operations; Bruce Cohenour as senior Vice president—
National Accounts and Business Development; and sekar sundararajan as Executive Vice president—Operations. With the
addition of these men, our senior management team is now complete.
You will note that the financial section of this year’s annual report has taken on a different look. After the fiscal year
that ended November 30, 2006, the Company changed its fiscal year to end on the sunday nearest to January 31. The
move was made primarily for administrative reasons and resulted in a transition period that began December 1, 2006 and
ended January 28, 2007.
That transition period, together with the first full fiscal year under the new format, which ended February 3, 2008,
are presented in this report.
Fiscal 2008 was truly a year of significant accomplishments, completing the transition of your Company to our new
model. some of the highlights of the year include:
• We opened a new customer support center in Martinsville, Virginia, providing a renewed emphasis on customer
service in parts and repairs. We believe significant improvement has already been seen in supplying retailers and consumers
with accurate and quick response to their requests for parts and service.
• We closed our last wood furniture manufacturing plant in Martinsville, Virginia, which was the oldest and largest
of our five wood manufacturing plants. While it was a sad occasion, we are gratified to report that all real and personal
property from all closed plants has been sold and eliminated from the balance sheet at year end, along with other assets we
are no longer using.
• We completed the purchase of sam Moore Furniture in April. We are excited about this further diversification of
the Company allowing us to become a more complete upholstery resource. Our position as a niche player has been enhanced
with sam Moore, a specialist in decorator chairs with an emphasis on cover-to-frame customization.
• We completed the implementation of our global sourcing purchasing system. This state-of-the-art, web-based,
interactive system allows online collaboration with vendors and provides excellent production and inventory tracking.
• We completed $36 million in stock repurchases under an authorized $40 million. Our efforts in the past few years
of streamlining inventories, reducing costs and eliminating nonessential overhead have provided us with excellent cash flow
from operations—$43.7 million in fiscal 2008—a new record. We believe that the acquisitions completed this year, along
with stock repurchases and regularly increasing cash dividends, are some of the best uses of our cash.
Hooker Furniture

– 3 –
• In December 2007, we completed the acquisition of the assets of Opus Designs Furniture LLC, a specialist in mod-
erately priced youth bedroom furniture. We believe this acquisition will provide the Company with a solid foundation to
build a strong youth bedroom program at more moderate price points with a more comprehensive product line and superior
sourcing arrangements than we previously had in this niche.
• We have embraced Lean six sigma to provide a formal framework and tools for evaluating, improving and
controlling key processes throughout the Company. Combined, Lean and six sigma are designed to improve quality, reduce
costs and speed processes. We have devoted significant resources to this project and have seen early successes. While efforts
to date have been limited to administrative areas, the plan is to permeate all aspects of our businesses with the process.
• Finally, in January of 2008, we opened a West Coast distribution center in Carson, California to better service our
westernmost retailers. We believe this center will provide faster delivery at lower costs to those customers and we believe it
will make Hooker a more valuable home furnishings resource.
The furniture industry continues to experience a long and painfully soft retail environment. Along with most of our
competitors, our top line suffered in fiscal 2008 as we dealt with a struggling economy. We are gratified, however, at the
efforts our Board of Directors, management team and employees made these last several years in repositioning the Company.
Their accomplishments have enabled us to post record net income in a year when we saw a 9.5% decline in net sales. Further,
we are confident about the prospects of continued profitability even in the face of soft market conditions. In times such as
these, it is gratifying to have the kind of people and financial resources that your Company presently possesses.
As we embark on another year, we anticipate that the business environment will continue to be difficult. A shroud
of uncertainty covers our national economy. Until we begin to see a reversal of high energy prices, a troubled housing
market, poor jobs reports and the eroding dollar, we believe business will remain at or slightly below the current levels.
The added uncertainty of an election year also contributes to the malaise of the buying public. We will continue to search
out new distribution opportunities, bring stylish, functional product to market, and look for additional ways to reduce costs.
We thank you for your support of our Company through these uncertain times and promise that we will do everything in
our power to bring you a good report in the coming year.
sincerely,
Paul B. Toms Jr.Chairman, CEO and President
E. larry rydEr
Executive Vice President,
Finance and Administration and CFO
Positioned for Success
Larry Ryder and paul Toms

– 5 –– 4 –
~ Fiscal 2008 in Review ~
During the year, we successfully executed our new home furnishings design, marketing,
global sourcing and logistics business model in an extremely difficult economy. Strong stock
performance, along with record net income and cash generation, validated our strategy as
sustainable. We are in the first chapters of a new era in our 84-year history, an era we believe is
ripe with promise as we are well-positioned for even greater success when the economy rebounds.
The timeline below highlights key events in the very eventful 2008 fiscal year.
January 2007Changed from a fiscal year ending
November 30 to one ending on the
Sunday closest to January 31 each year.
First new fiscal year calendar:
January 29, 2007–February 3, 2008.
May 2007Fully implemented Global
Sourcing Management
purchasing and sourcing system.
December 2007Company finalizes acquisition of youth
furniture specialist Opus Designs.
March 2007Closed the Martinsville, Virginia plant
after 83 years of continuous operation,
marking the Company’s complete exit from
domestic wood furniture manufacturing.
November 2007Company completes $30 mm stock repurchase
program, and in December 2007 the Board autho-
rizes an additional $10 mm for repurchases of the
Company’s common stock.
– 5 –
January 2008Hooker opens West Coast
Distribution Center in Carson,
California to better serve dealers
in Western U.S. states.
January
31
February 2007Martinsville-based customer support
center opens for parts replenishment.
December 2007The Company completes the sale of the personal and
real property located at its last wood manufacturing
facility in Martinsville, Virginia.
$40 mm
April 2007Completed purchase of Sam Moore
Furniture of Bedford, Virginia, a specialist
in custom upholstered occasional chairs.
C��������� �� 5-Y��� C��������� T���� S����������R����� ��� HOFT ��� H�������� F�������� S���� I���� (including the two-month transition period)Assumes Initial Investment of $100 and Reinvestment of Dividends
Household Furniture IndexHOFT
11/30/02
*Two-month transition period
11/30/03 11/30/04 11/30/05 11/30/06 1/28/07* 2/3/080
50
100
150
200
250
300
$350
0
50
100
150
200
250
300
350
Positioned for SuccessHooker Furniture
July 2007Launch of Lean Six Sigma Office
approach to creating value through
improved work processes.
1924–2007
open!
• In fiscal 2008, we disposed of assets no longer needed in our business. This included selling the plant and accompanying property and equipment in Martinsville, reducing our warehousing footprint and gifting of two former Bradington-Young showrooms in High Point, North Carolina to High Point University.
• Finalizing our acquisition of youth specialist Opus Designs in December 2007 created a foundation for us to build a strong youth
bedroom program with a comprehensive product line at more moderate price points, giving us a platform to add incremental sales by reaching a younger, less affluent consumer than our core demographic profile.
• The Board of Directors authorized $40 million in repurchases of the Company’s common stock in fiscal 2008, demonstrat-ing confidence in the Company’s strategy, growth opportunities and financial strength as a means to enhance shareholder value.
• In January 2008, Hooker opened a West Coast Distribution Center, with 80,000 square feet of warehouse space, stocking over 500 of the Company’s best-selling products for quick shipment to California, Arizona, New Mexico, Nevada, Oregon and Washington. We believe the center will help us shorten delivery times at reduced freight costs to West Coast retailers.
• In order to take our service-after-the-sale to the highest possible level, in February 2007 we opened a customer support center in Martinsville with a goal of shipping any replaceable parts order within 48 hours. Opening the center culminated an 18-month effort to create an inventory and database of 40,000 replacement parts to support the approximately 3,000 items in our product line. In January 2008, our catalog and advertising department moved into the facility as well.
• In March 2007, Hooker’s wood furniture manufacturing era came to an end as we
took the difficult step of closing the factory where generations of fine employees have worked since our beginnings in 1924. In making the announcement, Chief Executive Officer Paul Toms said, “While we come to the close of one era, we see a bright future as we embark on a new era in our history that we believe is in the best interests of our shareholders, customers and remaining employees.”
• With the purchase of Sam Moore Furniture completed in April, we further diversified our Company, becoming a more complete
upholstery resource, with a long-term oppor-tunity to grow revenues with the addition of the Sam Moore product line.
• The Global Sourcing Management (GSM) purchasing system and web-based sourcing program implementation was completed in May 2007 to support our new business model as a logistics and global sourcing company for wood and upholstered furni-ture. GSM enhances collaboration with our offshore vendors in order to help us enhance customer service and improve inventory availability at lower costs.
sell
38.9%38.9% Average Annual
Total Shareholder Return

– 6 –
~ growtH tHrougH strategic acquisitions and appointMents ~
The acquisitions of chair specialist sam Moore Furniture and youth bedroom specialist Opus Designs in fiscal 2008
strengthened our position as a niche powerhouse in the medium to upper-medium price range for residential furniture.
By adding a comprehensive selection of fabric upholstered chairs and youth bedroom furniture to our stable, we believe
we are now a leader in most key product categories of wood and upholstered furniture. The addition of these product lines
presents opportunities for revenue growth and positions us as a complete resource and, we believe, a preferred vendor.
In addition to strategic acquisitions, we also made strategic appointments during the year, filling selective new
executive positions with people who have the expertise to successfully execute our business model. Appointments included:
• Upholstered furniture industry veteran Alan Cole in the position of Executive Vice president—Upholstery
Operations, in which he oversees our Bradington-Young and sam Moore businesses;
• Bruce Cohenour in the position of senior Vice president—National Accounts and Business Development, to help
add incremental sales through private label programs;
• Veteran sourcing, supply chain and logistics executive sekar sundararajan in the senior management position of
Executive Vice president—Operations; and
• James Millner, a trend-setting youth bedroom merchandiser and co-founder of Opus Designs, to the position of
Vice president—Merchandising.
Hooker Furniture
“ The Opus product line is targeted to reach
a younger customer and a broader demo-
graphic income spectrum than our current
consumer base.”
—Paul Toms, Chief Executive Officer
Photos left to right, top: The Aura student desk in the Forever Young collection by Opus Designs; the Madeline bedroom in the Forever Young collection by Opus; Sam Moore’s Thomas chair with exposed wood circle design. Bottom right: Carved exposed wood chair with silk plaid cover by Sam Moore.
Opposite page, photos left to right: Leather sofa by Bradington-Young; the Fallston dining group by Hooker Furniture; the North Hampton secretary with dual function for computer and flat screen TV by Hooker; the Danforth home office by Hooker. Upper right: the Bradington-Young leather club chair.
Left to right: Bruce Cohenour, Sekar Sundararajan and James Millner

– 7 –
~ growtH tHrougH BecoMing a More valued upHolstered Furniture resource ~
Two important developments in fiscal 2008 moved Hooker closer to its goal of becoming a more complete and
important upholstered furniture resource. First, the Company acquired the assets of Bedford, Virginia-based upscale
occasional chair manufacturer sam Moore Furniture.
second, the Company appointed industry veteran Alan Cole to the new position of Executive Vice president—Upholstery
Operations, in which he oversees Hooker Furniture subsidiaries Bradington-Young and sam Moore.
Positioned for Success
~ product HigHligHts and winners ~Hooker Furniture’s time-tested collaborative approach to product development, energized by input from customers,
continued to produce winning furniture solutions in fiscal 2008. At Hooker, some of the winners included smartHutch
charging stations for portable electronic devices on many desks; the North Hampton color palette featuring a textured
black finish contrasting with soft handpainted accents on a honey maple background; furniture to provide an authentic home
theater experience and furniture converging the functions of a computer desk and flat-screen television storage in the
same piece.
At the fall High point Market, sam Moore introduced new starting price points and a custom design quick ship
program. Bradington-Young also emphasized customization with a coordinated fabric-leather combination program on
reclining chairs and sofas and novelty leather patterns.
“ We’re excited about further diversifying our Company and becoming a more complete upholstery
resource, as well as the long-term opportunity to grow revenues with the addition of Sam Moore.
We believe Hooker’s position as a niche player will be enhanced by Sam Moore, a dominant
player in decorative chairs with an emphasis on cover-to-frame customization.”
—Paul Toms, Chief Executive Officer
Left to right: Mike Moldenhauer, President, Sam Moore Furniture; Alan Cole, Executive Vice President—Upholstery Operations, Hooker Furniture; Scott Young, Senior Vice President—Merchandising and Product Development, Bradington-Young.

– 8 –
~ strengtH in ManageMent ~
Hooker Furniture Corporation Board of Directors, left to right: David Sweet, John Gregory, Henry Williamson, Paul Toms, Mark Schreiber, Christopher Beeler
Frank Richardson III
Michael Moldenhauer
Robert sherwoodKimberly shaver Dale smith
paul Toms Jr. Michael spece sekar sundararajan Raymond HarmLarry Ryder Alan Cole Henry Long Jr.
Bruce Cohenour Benjamin Causey Charlene BowlingC. scott Young Craig Young Gary Armbrister
Gary Brumfield susie Fulton Conrad Kerley Barney peachErin Dooley Roger Gossler James Millner
Hooker Furniture
oFFicers oF Hooker Furniture, Bradington-young and saM Moore

~ Directors & officers ~
– 9 –
Paul B. Toms Jr.Director, Chief Executive Officer, President and Chairman of the Board
W. Christopher Beeler Jr.Director; Chairman, President and Chief Executive Officer—Virginia Mirror Company and Virginia Glass Products
John L. Gregory IIIDirector; Shareholder, Officer and Director—Young, Haskins, Mann, Gregory, McGarry & Wall, P.C.
Mark G. SchreiberDirector; Retired President and Chief Operating Officer—Star Furniture
David G. SweetDirector; Retired Vice President— The North Face, a division of VF Corporation
Henry G. Williamson Jr.Director; Retired Chief Operating Officer—BB&T Corporation and Branch Banking and Trust Company of North Carolina, South Carolina and Virginia
E. Larry RyderExecutive Vice President— Finance and Administration and Chief Financial Officer
Michael P. SpeceExecutive Vice President— Merchandising and Design
Alan ColeExecutive Vice President— Upholstery Operations
Sekar SundararajanExecutive Vice President—Operations
Henry P. Long Jr.Senior Vice President— Merchandising and Design
Raymond T. HarmSenior Vice President—Sales
Bruce CohenourSenior Vice President—National Accounts and Business Development
C. Scott YoungSenior Vice President—Merchandising and Product Development, Bradington-Young
Benjamin S. CauseySenior Vice President—Finance and Administration, Bradington-Young
Craig S. YoungSenior Vice President—Sales, Bradington-Young
Michael C. MoldenhauerPresident, Sam Moore Furniture
R. Gary ArmbristerChief Accounting Officer
Charlene W. BowlingChief Information Officer
Gary W. BrumfieldVice President—Finance, Sam Moore Furniture
Erin M. DooleyVice President—Merchandising, Sam Moore Furniture
Susie A. FultonVice President—Human Resources, Sam Moore Furniture
Roger L. GosslerVice President—Information Technology, Sam Moore Furniture
Conrad L. KerleyVice President—Leather and Import Operations, Bradington-Young
James MillnerVice President—Merchandising
Barney PeachVice President—Quality and Process Improvement
Frank I. Richardson IIIVice President—Sales, Sam Moore Furniture
Kimberly D. ShaverVice President— Marketing Communications
Robert W. SherwoodVice President—Credit, Secretary and Treasurer
Dale C. SmithVice President—Manufacturing, Bradington-Young

F - 1
United States SECURITIES AND EXCHANGE COMMISSION
Washington, DC 20549
Form 10-K Annual Report Pursuant to Section 13 or 15(d) of the Securities Exchange Act of 1934
For the fiscal year ended February 3, 2008
Commission file number 000-25349
HOOKER FURNITURE CORPORATION (Exact name of registrant as specified in its charter)
Virginia 54-0251350 (State or other jurisdiction of incorporation or organization) (I.R.S. Employer Identification Number)
440 East Commonwealth Boulevard, Martinsville, VA 24112 (Address of principal executive offices, Zip Code)
(276) 632-0459 (Registrant’s telephone number, including area code)
Securities registered pursuant to Section 12(b) of the Act:
Name of Each Exchange Title of Each Class on Which Registered
Common Stock, no par value NASDAQ Global Select Market
Securities registered pursuant to Section 12(g) of the Act: None
Indicate by check mark if the registrant is a well-known seasoned issuer, as defined in Rule 405 of the Securities Act. Yes ( ) No (X)
Indicate by check mark if the registrant is not required to file reports pursuant to Section 13 or Section 15(d) of the Act. Yes ( ) No (X)
Indicate by check mark whether the registrant (1) has filed all reports required to be filed by Section 13 or 15(d) of the Securities Exchange Act of 1934
during the preceding 12 months (or for such shorter period that the registrant was required to file such reports), and (2) has been subject to such filing
requirements for the past 90 days. Yes (X) No ( )
Indicate by check mark if disclosure of delinquent filers pursuant to Item 405 of Regulation S-K (§229.405 of this chapter) is not contained herein, and
will not be contained, to the best of registrant’s knowledge, in definitive proxy or information statements incorporated by reference in Part III of this
Form 10-K or any amendment to this Form 10-K. ( )
Indicate by check mark whether the registrant is a large accelerated filer, an accelerated filer, a non-accelerated filer, or a smaller reporting company. See
the definitions of “large accelerated filer,” “accelerated filer” and “smaller reporting company” in Rule 12b-2 of the Exchange Act. (Check one):
Large accelerated Filer ( ) Accelerated Filer (X)
Non-accelerated Filer ( ) Smaller reporting company ( )
(Do not check if a smaller reporting company)
Indicate by check mark whether the registrant is a shell company (as defined in Rule 12b-2 of the Act). Yes ( ) No (X)
State the aggregate market value of the voting and non-voting common equity held by non-affiliates computed by reference to the price at which the
common equity was last sold, or the average bid and asked price of such common equity, as of the last business day of the registrant’s most recently
completed second fiscal quarter: $190.4 million.
Indicate the number of shares outstanding of each of the registrant’s classes of common stock as of April 14, 2008:
Common stock, no par value 11,517,737 (Class of common stock) (Number of shares)
Documents incorporated by reference: Portions of the registrant’s definitive Proxy Statement for its Annual Meeting of Shareholders scheduled to be
held June 30, 2008 are incorporated by reference into Part III.

2
Hooker Furniture Corporation
TABLE OF CONTENTS
Part I Page
Item 1. Business ...................................................................................................................................................... 3
Item 1A. Risk Factors ................................................................................................................................................ 11
Item 1B. Unresolved Staff Comments ...................................................................................................................... 13
Item 2. Properties .................................................................................................................................................... 14
Item 3. Legal Proceedings ...................................................................................................................................... 14
Item 4. Submission of Matters to a Vote of Security Holders ............................................................................... 15
Executive Officers of Hooker Furniture Corporation ............................................................................... 15
Part II
Item 5. Market for Registrant’s Common Equity, Related Shareholder Matters
and Issuer Purchases of Equity Securities ................................................................................................. 16
Item 6. Selected Financial Data .............................................................................................................................. 18
Item 7. Management’s Discussion and Analysis of Financial Condition and Results of Operations .................. 19
Item 7A. Quantitative and Qualitative Disclosures about Market Risk ................................................................... 32
Item 8. Financial Statements and Supplementary Data ......................................................................................... 33
Item 9. Changes in and Disagreements with Accountants on Accounting and
Financial Disclosure ................................................................................................................................... 33
Item 9A. Controls and Procedures............................................................................................................................. 33
Item 9B. Other Information ....................................................................................................................................... 34
Part III
Item 10. Directors, Executive Officers and Corporate Governance ....................................................................... 35
Item 11. Executive Compensation ............................................................................................................................ 35
Item 12. Security Ownership of Certain Beneficial Owners and Management and Related Shareholder Matters 35
Item 13. Certain Relationships and Related Transactions, and Director Independence ......................................... 35
Item 14. Principal Accountant Fees and Services .................................................................................................... 35
Part IV
Item 15. Exhibits and Financial Statement Schedules ............................................................................................. 36
Signatures ................................................................................................................................................................................. 38
Index to Consolidated Financial Statements ............................................................................................................................ F-1

3
Hooker Furniture Corporation Part I
ITEM 1. BUSINESS
General
Incorporated in Virginia in 1924, Hooker Furniture Corporation (“Hooker”, “Hooker Furniture” or the “Company”) is ranked in the
top 10 of the nation’s largest publicly traded furniture sources, based on 2006 shipments to U.S. retailers, according to
Furniture/Today, a leading trade publication. The 83-year old Company is a leading resource for residential wood, metal and
upholstered furniture. Major furniture categories include wall and entertainment units, and office, dining, bedroom, accent,
occasional, and leather and fabric upholstered furniture for the home. An extensive selection of designs and formats along with finish
and cover options in each of these product categories makes the Company a comprehensive resource for retailers primarily targeting
the upper-medium price range. The Company’s principal customers are retailers of residential home furnishings who are broadly
dispersed throughout North America. Customers include independent furniture stores, specialty retailers, department stores, catalog
merchants, interior designers and national and regional chains.
The Company markets wood and metal furniture under the Hooker Furniture and Opus brand names and markets upholstered furniture
under the Bradington-Young and Sam Moore brand names. Furniture is designed and marketed as stand-alone products or products
within small multi-piece groups or broader collections offering a unifying style, design theme and finish. Examples of Hooker
Furniture collections include Preston Ridge, Waverly Place and Casablanca. Products also are marketed by product category, such as
The Great Entertainers, SmartWorks Home Office and Opus Designs by Hooker. Hooker’s wood and metal furniture is typically
designed for and marketed to the upper-medium price range. Under its Bradington-Young upholstery brand, the Company offers a
broad variety of residential leather and fabric upholstered furniture and specializes in leather reclining and motion chairs, sofas, club
chairs and executive desk chairs. Under its Sam Moore upholstery brand, the Company offers upscale occasional chairs with an
emphasis on fabric-to-frame customization in the upper-medium to high-end price niches. Domestically produced upholstered
furniture is targeted at the upper and upper-medium price ranges, while imported upholstered furniture is targeted at the medium and
upper-medium price ranges. The Company is a comprehensive resource for retailers, offering furniture collections and products for
virtually every room of the home.
Transforming the Company’s Business Model
Since 2003, Hooker Furniture has transformed from a predominantly wood furniture manufacturer to a product design, global
sourcing, logistics and marketing company for residential wood and upholstered furniture. Prior to 2003 nearly 70 percent of the
Company’s net sales were derived from the sale of domestically produced wood furniture; subsequently, sales of the Company’s better
valued imported wood furniture have rapidly overtaken sales of its domestically made furniture. Hooker systematically closed its
domestic wood furniture plants as its product mix increasingly shifted toward imported wood and metal furniture. During the 2008
fiscal year the Company completed the transformation from a manufacturer to a marketer offering high-value wood, metal and
upholstered furniture sourced globally as well as domestically-produced upholstered furniture.
In March 2007, Hooker Furniture closed its Martinsville, Va. wood furniture production facility, the last of its domestic wood
furniture plants, marking the Company’s exit from domestic wood furniture manufacturing.
Also, on January 26, 2007, the Company terminated its Employee Stock Ownership Plan (“ESOP”). As of November 30, 2006, the
ESOP, in which substantially all of the Company’s employees participated, held 23.4% of Hooker Furniture’s outstanding common
stock, more than any other shareholder of the Company. The ESOP was discontinued primarily because of the fundamental change in
the Company’s business model as a rising stock price and the Company’s diminishing employee base caused the ESOP to become too
costly in this competitive industry. The annual costs of the ESOP averaged $3.4 million in the three fiscal years leading up to the
termination. As a result of the ESOP termination, the Company recorded an $18.4 million charge in the two-month transition period
ended January 28, 2007. While this non-cash, non-deductible charge to earnings was significant, management believes that
discontinuing the ESOP has better positioned the Company to compete going forward by bringing future benefit costs more in line
with the industry, the Company’s new operating model and its current workforce level.
The Company’s goal to expand its offerings to furniture retailers led to the acquisition of the assets of Bradington-Young LLC in
January 2003 and the assets of Sam Moore Furniture LLC in April 2007. These acquisitions provided Hooker’s customers with a
broad array of upholstered seating options to complement its wood and metal furniture offerings. Additionally, in December 2007, the
Company acquired certain assets of Opus Designs Furniture, LLC, a specialist in moderately-priced youth bedroom furniture. The
Opus acquisition provides the Company with expanded product offerings in a previously under-developed niche.
With the exit from domestic wood furniture manufacturing, the addition of upholstery and expanded bedroom offerings, and the
termination of the ESOP, Hooker Furniture’s transition to a design, marketing, logistics and global sourcing business model focused

4
on imported wood and metal and domestically produced and imported upholstered home furnishings is now complete. The Company
believes the costs of reorganization are behind it and that the Company has emerged financially strong and well-positioned for
continued success.
Strategy and Mission
The Company’s mission is to “enrich the lives of the people we touch through innovative home furnishings of exceptional value,”
using the following strategy:
To offer world-class style, quality and product value as a complete residential wood, metal and upholstered furniture resource
through excellence in product design, global sourcing, manufacturing, logistics, sales, marketing and customer service.
To be an industry leader in sales growth and profitability performance, providing an outstanding investment for our
shareholders and contributing to the well-being of our employees, customers, suppliers and community neighbors.
To nurture the relationship-driven, team-oriented and integrity-minded corporate culture that has distinguished our Company
for over 80 years.
The Company sells one category of products, home furnishings, which accounts for all of the Company’s net sales. The
percentages of net sales provided by each of its major product sub-categories for the 53-week fiscal year that ended February 3,
2008, the 2007 two-month transition period that ended January 28, 2007 and the twelve-month fiscal years that ended November
30, 2006 and 2005 are as follows:
(2 mos.)
2008 2007 2006 2005
Wood and metal furniture products ......................................................... 75% 80% 82% 82%
Upholstered furniture products ................................................................ 25% 20% 18% 18%
Total ......................................................................................................... 100% 100% 100% 100%
Product Design and Product Collections and Styles
The Company’s product lines cover most major style categories, including European and American traditional, transitional, urban,
country, casual and cottage designs. The Company offers furniture in a variety of materials, such as various types of wood, metal,
leather and fabric, as well as veneer and rattan, often accented with marble, stone, slate, ceramic, glass, brass and/or hand-painted
finishes. Products are designed to be attractive to consumers both as individual furniture pieces and as pieces within whole-home
collections. The Company believes its wide variety of product categories, styles and finishes enables it to anticipate and respond
quickly to changing consumer preferences. The Company offers retailers a comprehensive furniture resource principally in the upper-
medium price range and additional products within both the upscale and medium price ranges. Based on sales and market acceptance,
the Company believes its products represent good value, and the style and quality of its furniture compares favorably with more
premium-priced products.
The product life cycle for furniture continues to shorten as consumers demand innovative new features, functionality, style, finishes and
fabrics that will enhance their lifestyle while providing value and durability. The Company believes its distinctive product design,
development and market-launch process provides it with a competitive advantage. Hooker designs and develops new styles in each of its
product categories semi-annually to replace discontinued products and collections, and in some cases, to enter new product categories.
The Company’s product design process begins with the marketing team identifying customer needs and trends and conceptualizing
product ideas and features. A variety of sketches are produced, usually by independent designers, from which prototype furniture pieces
are built. The Company invites some of its independent sales representatives and a representative group of dealers to view and critique
the prototypes. Based on this input, the Company may modify the designs. Then, the Company’s engineering department, or one or
more of the Company’s off-shore suppliers, prepares a sample for full-scale production. The Company generally introduces its new
product styles at the International Home Furnishings Market held each fall and spring in High Point, North Carolina, and supports new
product launches with promotions, public relations, product brochures, websites and point-of-purchase consumer materials.
Rapid changes in consumer electronics technology prompt continual product format updates in the home entertainment and home
office furniture categories. In these two categories, Hooker strives for innovation and is recognized as an industry leader.
This was a year of transition for the Company’s entertainment furniture from domestic to total import, as well as the continued
transition to mostly console formats for flat screen televisions. While this resulted in some deflation in price points, margins increased
in this category and several new product introductions sold well at retail. With flat screen LCD and Plasma TV’s coming down in
price, consumers demanded taller consoles with more sophisticated design. These consoles also offer a smaller footprint, making them

5
more versatile in the home. The Company had success with several new formats, some of which included room for center channel
speakers. The Company also launched a line of furniture that is designed for the audio/video enthusiast, which includes extra depth for
large components, ventilated shelves and easy access for installation, in cleaner styles that appeal to this consumer.
In the home theater wall category, the Company offset price point deflation with larger wall units 94” to 104” high that are styled for
the atrium family rooms of new homes. The Company introduced several new styles, including a sophisticated look with hidden
pocket doors or lift units that accommodate 55” televisions.
With the Company well established in the large executive office category, it has focused its efforts on the growing market of younger
consumers who want smaller, more flexible office solutions. The Company developed a new format for this market, which is selling
well at a variety of dealers. The Company also developed another version of this smaller office for a national department store chain.
During the past year, the Company did not neglect its core executive business, developing a group that has the look of built in wall
cabinets that offers entertainment function, a bar unit as well as office furniture.
Bradington-Young continues to expand its distribution channels with global sourcing of leather seating in more moderate price points
than the upper-end niche occupied by its domestically produced seating. In fiscal 2008, Bradington-Young continued to expand its
imported Seven Seas Seating line, originally launched in late 2003 to round out its assortment and appeal to a broader customer base.
During fiscal 2008, Bradington-Young addressed the popular fabric/leather collage stationary seating category with numerous successful
introductions. These introductions, combined with executive seating offerings, enabled Bradington-Young to finish a very difficult year
with a slight increase in leather upholstered furniture sales. 2008 was also a difficult year for Bradington-Young’s domestic product
offerings. Its Sectional Seating by Design Program and Designer Direct Program, both introduced over the last year and a half, were
bright spots in an otherwise challenging year.
Sam Moore’s product offerings fill several niches in the occasional chair category, offering exposed wood as well as fully upholstered
seating. Sam Moore’s occasional seating covers multiple styles that include upholstered swivel rockers, club chairs, wings, chaises,
benches, ottomans, office chairs, settees, dining chairs and barstools in 18th Century, French, contemporary, shaker and mission styles.
Most chair styles are available in a choice of either fabric or leather.
Sam Moore has a modern finishing facility that offers a choice of 25 different finishes on any exposed wood chair selection. Over one-
half of the styles shipped are custom ordered with the customer’s choice of leather, fabric and finish. Options include different color and
size of nail trim, bullion, fringe or contrasting pillows. Since most orders are custom made, Sam Moore customers may provide their own
fabric (customer’s own material “COM”) to be applied to a chair. In fact, COM is the most popular fabric application choice of
customers.
Sam Moore imports three dozen seating styles from the Far East (principally China) in leather for immediate shipment in a single color
selection. In addition, Sam Moore expects to bring its customization expertise to Hooker’s line of imported decorative dining and
occasional seating. Presently, Hooker offers over three dozen decorative seating products, each in a single fabric and finish. In the near
future, Sam Moore expects to customize and expand this line by offering this seating in its wide range of fabrics and leather, as well as its
multiple finishes. It is Sam Moore’s goal to live up to its reputation as “America’s Premier Chair Specialist” by offering a quality product
from a complete selection of chairs in fresh leathers and fabrics with exceptional wood finishes.
In December 2007, the Company acquired certain assets of Opus Designs Furniture LLC, a specialist in moderately priced youth
bedroom furniture. The acquisition provides the Company with appealing designs sourced through superior offshore vendors in the
youth bedroom category.
Sourcing
Hooker Furniture has the capability, resources, longstanding business relationships and experience to efficiently and cost effectively
source its wood, metal and upholstered furniture.
Imported Products
The Company has sourced products from foreign manufacturers since 1988. In the past Hooker Furniture has imported both finished
furniture, as well as furniture that it assembles, in a variety of styles, materials and product lines. The Company believes the best way
to leverage its financial strength and differentiate its import business from the industry is through innovative and collaborative design,
outstanding products, great value, consistent quality, easy ordering, and world-class global logistics and distribution systems.
Imported wood, metal and upholstered furniture accounted for approximately 76% of net sales in fiscal 2008 and the 2007 two-month
transition period, 73% of net sales in fiscal 2006 and 62% of net sales in fiscal 2005.

6
The Company imports products primarily from China, the Philippines, Mexico, Indonesia, Vietnam, Honduras and Malaysia through
direct relationships with factories and with agents representing other factories. Because of the large number and diverse nature of the
foreign factories from which the Company sources its imported products, the Company has significant flexibility in the placement of
products in any particular factory or country. Factories located in China are an important resource for the Company. In fiscal 2008,
imported products sourced from China accounted for approximately 87% of import purchases; and the factory in China from which
the Company directly sources the most product accounted for approximately 38% of the Company’s worldwide purchases of imported
product. A sudden disruption in the Company’s supply chain from this factory, or from China in general, could significantly impact
the Company’s ability to fill customer orders for products manufactured at that factory or in that country. If such a disruption were to
occur, the Company believes that it would have sufficient inventory to adequately meet demand for approximately three months.
Also, with the broad spectrum of product the Company offers, the Company believes that, in some cases, buyers could be offered
similar product available from alternative sources. The Company believes that it could, most likely at higher cost, source most of the
products currently sourced in China from factories in other countries and could produce certain upholstered products domestically at
its own factories. However, supply disruptions and delays on selected items could occur for up to six months. If the Company were
to be unsuccessful in obtaining those products from other sources or at a comparable cost, then a sudden disruption in the Company’s
supply chain from its largest import furniture supplier, or from China in general, could have a short-term material adverse effect on the
Company’s results of operations. Given the capacity available in China and other low-cost producing countries, the Company believes
the risks from these potential supply disruptions are manageable.
The Company’s imported furniture business is subject to the usual risks inherent in importing products manufactured abroad,
including, but not limited to, supply disruptions and delays, currency exchange rate fluctuations, economic and political fluctuations
and instability, as well as the laws, policies, and actions of foreign governments and the United States affecting trade, including tariffs.
For imported products, the Company generally negotiates firm pricing with its foreign suppliers in U.S. Dollars, typically for a term of
at least one year. The Company accepts the exposure to exchange rate movements beyond these negotiated periods without using
derivative financial instruments to manage this risk. Since the Company transacts its imported product purchases in U.S. Dollars, a
relative decline in the value of the U.S. Dollar could increase the price the Company pays for imported products beyond the negotiated
periods. The Company generally expects to reflect substantially all of the effects of any price increases from suppliers in the prices it
charges for imported products. These price changes could adversely impact sales volume and profit margin during affected periods.
Conversely, a relative increase in the value of the U.S. Dollar could decrease the cost of imported products and favorably impact net
sales and profit margins during affected periods. See also “Item 7A. Quantitative and Qualitative Disclosures about Market Risk.”
Manufacturing and Raw Materials
At February 3, 2008, the Company operated approximately 639,000 square feet of manufacturing and supply plant capacity in North
Carolina and Virginia for its domestic upholstered furniture production. The Company considers its machinery and equipment
generally to be modern and well-maintained.
The Company believes there is a viable future for domestically produced upholstery, which has been less affected by import
competition over the last five years than wood furniture production. Domestic seating companies with strong niches and an upper-
medium to high-end price point have been the least impacted by lower cost imports. In addition, domestic upholstery manufacturers
have two key competitive advantages to imported upholstery manufacturers:
Offering customized cover-to-frame and fabric-to-frame combinations to the upscale consumer and interior design trade;
and
Offering quick four to six-week product delivery.
Due to these competitive advantages, the Company remains committed to maintaining domestic production of upholstered furniture.
Bradington-Young’s strategy for its two upholstered furniture production facilities and two upholstered furniture supply plants is to be
a comprehensive leather resource for retailers positioned in the upper and upper-medium price ranges. Bradington-Young offers a
comprehensive selection of approximately 250 leather covers for domestically produced upholstered furniture. The motion category
comprises approximately 44% of Bradington-Young’s domestic production. The upholstery manufacturing process begins with the
cutting of leather or fabric and the cutting and precision machining of frames. Precision frames are important for motion furniture to
operate properly and to provide durable service over the life of the products. Finally, the cut leather or fabric upholstery, frames, foam
and other materials are assembled to build reclining chairs, executive seating, stationary seating and multiple seat reclining furniture.
Sam Moore’s strategy for its upholstery production facility is to be a complete source of fashionable upholstered chairs for all rooms
of the home and other upholstered accent pieces, such as decorative upholstered headboards. Sam Moore offers a diverse range of
approximately 300 different styles of upholstered products in over 800 fabric choices and over 100 leather choices. Sam Moore
produces 95% of its products domestically at its single, large manufacturing facility in Bedford, Va.

7
Significant materials used in manufacturing upholstered furniture products include leather or fabric, foam, wooden frames and metal
mechanisms. Most of the leather is imported from Italy, South America and China. Leather is purchased as full hides, which
Bradington-Young and Sam Moore then cut and sew, and as pre-cut and sewn hides processed by the vendor to pattern specifications.
Costs for leather and leather products from Asia have increased significantly due to higher labor and freight costs, changes in foreign
tax incentives and increased costs for premium leather hides sourced from Europe. The costs for these products have also been
affected by the weaker U.S. dollar. As a result, Bradington-Young dealer prices were increased at the Fall International Furniture
Market in High Point, N.C., and will be increased again at the Spring market. These increases could affect demand, although the
Company believes the impact will be less significant for Bradington-Young, with its upper-medium price position, compared to the
more promotional end of the leather market.
The Company believes that its sources for raw materials are adequate and that it is not dependent on any one supplier. The Company’s
five largest suppliers accounted for approximately 29% of its raw materials supply purchases for its domestic upholstered furniture
manufacturing operations in fiscal 2008.
Distribution
The general marketing practice followed in the furniture industry is to exhibit products at international and regional furniture markets
attended by buyers for furniture retailers. In the spring and fall of each year, the world’s largest furniture market is held in High Point, N.
C. The Company utilizes 94,000 square feet of showroom space in High Point to introduce new products and collections; increase sales
of existing products; and design and test innovative features, products and marketing programs.
The Company sells its furniture through over 100 independent sales representatives to retailers of residential home furnishings, who are
broadly dispersed throughout North America, including:
independent furniture retailers such as Furnitureland South of Jamestown/High Point, N.C., Louis Shanks of Texas, Baer’s
Furniture of South Florida, and Berkshire Hathaway-owned companies Star Furniture, Jordan’s Furniture, Nebraska Furniture
Mart and R.C. Willey;
department stores such as Macy’s and Dillard’s;
regional chain stores such as Raymour & Flanigan, Robb & Stucky and Haverty’s;
national chain stores such as Z Gallerie; and
catalog merchandisers such as Frontgate and the Horchow Collection, a unit of Neiman Marcus.
The Company sold to over 4,900 customers during fiscal 2008. No single customer accounted for more than 3% of the Company’s net
sales in 2008. No significant part of the Company’s business is dependent upon a single customer, the loss of which would have a
material effect on the business of the Company. However, the loss of several of the Company’s major customers could have a material
impact on the business of the Company. In addition to the Company’s broad domestic customer base, approximately 3% of the
Company’s net sales in 2008 were to international customers.
The Company believes this broad network of retailers and independent sales representatives reduces its exposure to regional recessions
and allows it to capitalize on emerging trends in channels of distribution.
The Company offers tailored merchandising programs, such as its SmartLiving ShowPlace in-store galleries, Seven Seas Treasures
boutiques and home entertainment and SmartWorks Home Office galleries, to address each channel of distribution. These galleries are
currently dedicated principally to furniture groups and whole-home collections under the Hooker and Bradington-Young brands, with
plans to increase the number of galleries that carry the Company’s Sam Moore and Opus brands. These galleries typically comprise
3,500 to 8,000 square feet of retail space. The mission of the SmartLiving program is to develop progressive partnerships with retailers
by providing a merchandising and marketing plan to drive increased sales and profitability and positively impact consumers’ purchase
decisions, satisfaction and loyalty through an enhanced shopping experience.
Since 2003, an important development for imported furniture products has been the offering of the Seven Seas Treasures retail boutique
program to dealers. Currently, over 300 dealers dedicate space in their stores to display the Company’s Seven Seas Treasures line of
imported upscale and casual dining room furniture, metal beds, occasional tables and functional accents, including hand-painted furniture,
carved writing desks, tables and chests. In the home entertainment and home office categories, in which Hooker is recognized as an
industry leader, the Company has well-developed product specialty gallery programs supported by semi-annual national sales promotions,
a special Website dealer locator and point-of-purchase collateral materials. Currently, there are approximately 325 dealers that have

8
Home Entertainment by Hooker galleries and approximately 245 dealers that have SmartWorks Home Office galleries in their retail
stores. In addition, over 1,500 retailers offer Bradington-Young leather upholstery products and over 1,500 retailers offer Sam Moore
Furniture occasional seating products.
In fiscal 2008, the Company expanded its distribution channels by hiring a senior executive charged with developing a private
label/limited distribution program targeting large national retailers. The Company anticipates this program will increase sales to large
national accounts.
Warehousing, Inventory and Supply Chain Management
During fiscal year 2008, Hooker Furniture continued to refine its supply chain and sourcing operations via systems enhancements and
personnel additions both in the U.S. and China. Investments made in a new Global Purchasing System and a web-based Global
Sourcing Management System, coupled with planned upgrades to current demand and inventory planning platforms, have helped the
Company drive down inventories, reduce lead times and improve order fulfillment rates.
The Company distributes furniture to retailers from its distribution centers and warehouses in Virginia and North Carolina, as well as
directly from Asia and Latin America via its Container Direct Program. In 2004, the Company entered into a warehousing and
distribution arrangement in China with its largest supplier of imported products. The warehouse and distribution facilities are owned
by the supplier and operated by that supplier and a third party utilizing a global warehouse management system that updates daily the
Company’s central inventory management and order processing systems. Under the Container Direct Program, the Company offers
directly to retailers in the U.S. a focused mix of over 400 of its best selling items sourced from this supplier. By doing so, the
Company achieved an approximately 97% in-stock percentage at this facility during fiscal 2008. The program features an internet-
based product ordering system and a delivery notification system that is easy to use and available to the Company’s pre-registered
dealers. In addition, the Company also ships containers directly from a variety of other suppliers in Asia and Honduras. The Company
is committed to exploring ways to continually improve its distinctive, value-added Container Direct Program through additional
warehouses at key vendors, product consolidation and routing strategies aimed at shortening delivery times and providing significant
cost savings for retailers.
In January 2008, the Company opened a West Coast distribution center in Carson, California. The Company anticipates that the
80,000-square-foot warehouse, which became fully operational in February 2008, will stock 550 of the Company's best-selling
products for quick shipment to customers in California, Arizona, New Mexico, Nevada, Oregon and Washington. While delivery
times and costs will vary from customer to customer, the Company expects that, on average, it can remove approximately ten days of
delivery time and reduce inland freight costs by 6-10% for the products processed through this facility, providing 80% of the
Company’s products to its West Coast dealers more quickly and at lower inventory costs.
Seven Seas Seating, Bradington-Young’s line of imported upholstered furniture has experienced rapid growth since its introduction in
the 2003 fourth quarter. Seven Seas Seating continued to experience net sales growth in fiscal 2008, increasing by $1.1 million, or
8.6%, to $14.2 million compared to $13.1 million in fiscal 2006. Unlike domestic upholstered production, these products are
purchased based on a forecast of product demand and shipped out of inventory from 109,000 square feet of leased warehouse space in
Cherryville, N.C. Seven Seas Seating may also be purchased under the Container Direct Program, and a container order can include
any of the product produced at a given plant.
Sam Moore imports and warehouses for immediate order fulfillment thirty-four styles of leather club and desk chairs. Twenty-nine
styles come from one factory in China. Five styles come from one factory in the Philippines. For inventory, Supply Chain personnel
order mixed containers from each country based on rate of sale. Orders are shipped from Sam Moore's facility in Bedford, Va. All
styles can be ordered and shipped directly in full container quantities to any Sam Moore account.
In 2006, Hooker Furniture’s import distribution operations were certified as a full participant in the U.S. Department of Homeland
Security, Customs Trade Partnership Against Terrorism (C-TPAT) program. C-TPAT is a joint government-business initiative
designed to ensure proper security procedures are in place to protect the flow of global trade. Through C-TPAT, U.S. Customs and
Border Protection has joined with importers, carriers, brokers, warehousemen and manufacturers to provide the highest level of
security while facilitating the movement of goods entering the United States. To qualify for membership in C-TPAT, participating
companies must conduct a detailed self-assessment of supply chain security using the C-TPAT security guidelines created by Customs
and the trade community. Companies must also complete and submit a supply chain security profile questionnaire to Customs and
implement a program to enhance security throughout the supply chain in accordance with the C-TPAT guidelines. Upon C-TPAT
certification, members receive expedited handling and processing of their goods into the United States.
The Company schedules purchases of imported furniture and production of domestically manufactured upholstered furniture based
upon actual and anticipated orders and product acceptance at furniture markets. The Company strives to provide imported and
domestically produced furniture on-demand for its dealers. During fiscal year 2008, the Company shipped 75% of all wood and metal
furniture orders and 62% of all upholstery orders within 30 days of order receipt. It is the Company’s policy and industry practice to

9
allow order cancellation for wood and metal furniture up to the time of shipment; therefore, customer orders for wood and metal
furniture are not firm. However, domestically produced upholstered product orders are predominantly custom-built and shipped
within six weeks after the order is received and consequently, cannot be cancelled once the leather or fabric is cut.
The Company’s backlog of unshipped orders for all of its products amounted to $31.3 million or approximately five weeks of sales as
of February 3, 2008. For the last three years, over 92% of all orders booked were ultimately shipped. Management considers orders
and backlogs to be one helpful indicator of sales for the upcoming 30-day period, but because of the Company’s quick delivery and its
cancellation policy, management does not consider order backlogs to be a reliable indicator of expected long-term business.
Competition
The furniture industry is highly competitive and includes a large number of foreign and domestic manufacturers and importers, none of
which dominates the market. While the markets in which the Company competes include a large number of relatively small and medium-
sized manufacturers, certain competitors of the Company have substantially greater sales volumes and financial resources than the
Company. U.S. imports of furniture produced overseas, such as from China, have grown rapidly in recent years, and overseas companies
have increased both their presence through wholesale distributors based in the United States and their shipments directly to U.S. retailers
during that period.
The primary competitive factors for home furnishings in the Company’s price points include price, style, availability, service, quality and
durability. The Company believes that its design capabilities, ability to import and/or manufacture upholstered furniture, product value,
longstanding customer and supplier relationships, significant distribution and inventory capabilities, ease of ordering, financial strength,
experienced management and customer support are significant competitive advantages.
In November 2004 and January 2005, the U.S. Department of Commerce found that certain Chinese furniture manufacturers were
dumping products into the U.S. market and imposed tariffs on Chinese companies for wood bedroom products exported to the U.S. The
tariff rates were approved in a subsequent action by the International Trade Commission, based on measured damage to the U.S.
furniture manufacturing industry caused by illegal dumping. Tariffs on imported bedroom furniture have not and are not expected to have
a material adverse effect on the Company’s results of operations.
Employees
As of February 3, 2008, the Company had approximately 950 employees. None of the Company’s employees are represented by a labor
union. The Company considers its relations with its employees to be good.
Patents and Trademarks
The Hooker Furniture, Bradington-Young and Sam Moore trade names represent many years of continued business. The Company
believes these trade names are well-recognized and associated with quality and service in the furniture industry. The Company also owns
a number of patents and trademarks, none of which is considered to be material to the Company.
Hooker, the “H” logo, Bradington-Young, the “B-Y” logo, Sam Moore, Sam Moore Furniture Industries, Sam Moore Furniture, LLC,
America’s Premier Chair Specialist, Opus Designs, Furnishings by Opus Designs, Forever Young, Alexander Taylor, Belle Vista,
Casablanca, North Hampton, Summerglen, Vineyard, Chatham, Brookhaven, Belle Grove, Villa Grande, Villa Florence, Fairview,
Mirabel, Preston Ridge, Sectional Sofas by Design, Seven Seas, Seven Seas Seating, SmartKids-Youth Furniture for Life, SmartLiving
ShowPlace, SmartWorks Home Office, The Great Entertainers, Wexford Square and Waverly Place are trademarks of Hooker Furniture
Corporation.
Governmental Regulations
The Company is subject to federal, state, and local laws and regulations in the areas of safety, health, environmental pollution controls
and imports. Compliance with these laws and regulations has not in the past had any material effect on the Company’s earnings, capital
expenditures, or competitive position; however, the effect of compliance in the future cannot be predicted. Management believes that the
Company is in material compliance with applicable federal, state and local safety, health, environmental and imports regulations.
Compliance with regulations promulgated under the Sarbanes-Oxley Act of 2002 related to the documentation and testing of internal
control over financial reporting and other corporate governance matters has had a significant impact on the Company’s results of
operations in ensuing years.
10
Additional Information
You may visit the Company online at www.hookerfurniture.com, www.bradington-young.com, www.sammoore.com and
www.opusdesigns.net. The Company makes available, free of charge through its website, its annual report on Form 10-K, quarterly
reports on Form 10-Q, current reports on Form 8-K, and other documents as soon as practical after filing or furnishing the material to
the Securities and Exchange Commission. A free copy of the Company’s Form 10-K may also be obtained by contacting Robert W.
Sherwood, Vice President - Credit, Secretary and Treasurer at the corporate offices of the Company.
Forward-Looking Statements
Certain statements made in this report, including under “Item 1 - Business” and “Item 7 - Management’s Discussion and Analysis of
Financial Condition and Results of Operations,” are not based on historical facts, but are forward-looking statements. These
statements reflect the Company’s reasonable judgment with respect to future events and typically can be identified by the use of
forward-looking terminology such as “believes,” “expects,” “projects,” “intends,” “plans,” “may,” “will,” “should,” “would,” “could”
or “anticipates,” or the negative thereof, or other variations thereon, or comparable terminology, or by discussions of strategy.
Forward-looking statements are subject to risks and uncertainties that could cause actual results to differ materially from those in the
forward-looking statements. Those risks and uncertainties include but are not limited to:
general economic or business conditions, both domestically and internationally;
price competition in the furniture industry;
adverse political acts or developments in, or affecting, the international markets from which the Company imports products,
including duties or tariffs imposed on products imported by the Company;
changes in domestic and international monetary policies and fluctuations in foreign currency exchange rates affecting the
price of the Company’s imported products;
the cyclical nature of the furniture industry;
risks associated with the cost of imported goods, including fluctuation in the prices of purchased finished goods and
transportation and warehousing costs;
supply, transportation and distribution disruptions, particularly those affecting imported products;
risks associated with domestic manufacturing operations, including fluctuations in the prices of key raw materials,
transportation and warehousing costs, domestic labor costs and environmental compliance and remediation costs;
the Company’s ability to successfully implement its business plan to increase Sam Moore Furniture’s and Opus Designs’
sales and improve their financial performance;
achieving and managing growth and change, and the risks associated with acquisitions, restructurings, strategic alliances and
international operations;
higher than expected costs associated with product quality and safety, including regulatory compliance costs related to the
sale of consumer products and costs related to defective products;
risks associated with distribution through retailers, such as non-binding dealership arrangements;
capital requirements and costs;
competition from non-traditional outlets, such as catalogs, internet and home improvement centers; and
changes in consumer preferences, including increased demand for lower quality, lower priced furniture due to declines in
consumer confidence and/or discretionary income available for furniture purchases.
Any forward looking statement that the Company makes speaks only as of the date of that statement, and the Company undertakes no
obligation to update any forward-looking statements whether as a result of new information, future events, or otherwise.

11
ITEM 1A. RISK FACTORS
The Company’s business is subject to a variety of risks. The risk factors detailed below should be considered in conjunction
with the other information contained in this annual report on Form 10-K. If any of these risks actually materialize, the Company’s
business, financial condition, and future prospects could be negatively impacted. These risks are not the only ones the Company faces.
There may be additional risks that are presently unknown to the Company or that it currently believes to be immaterial that could
affect its business.
The Company may lose market share due to competition, which would decrease future sales and earnings.
The furniture industry is very competitive and fragmented. The Company competes with many domestic and foreign
manufacturers. Some competitors have greater financial resources than the Company and often offer extensively advertised, well-
recognized, branded products. Competition from foreign producers has increased dramatically in the past few years. The Company
may not be able to meet price competition or otherwise respond to competitive pressures, including increases in supplier and
production costs. Also, due to the large number of competitors and their wide range of product offerings, the Company may not be
able to continue to differentiate its products (through styling, finish and other construction techniques) from those of its competitors.
In addition, large retail furniture dealers have the ability and could at any time begin to obtain offshore sourcing on their own. As a
result, the Company is continually subject to the risk of losing market share, which may lower sales and earnings.
An economic downturn could result in a decrease in sales and earnings.
The furniture industry is subject to cyclical variations in the general economy and to uncertainty regarding future economic
prospects. Home furnishings are generally considered a postponeable purchase by most consumers. Economic downturns could affect
consumer spending habits by decreasing the overall demand for home furnishings. These events could also impact retailers, the
Company’s primary customers, possibly resulting in a decrease in the Company’s sales and earnings. Changes in interest rates,
consumer confidence, new housing starts, existing home sales, and geopolitical factors are particularly significant economic indicators
for the Company.
Failure to anticipate or timely respond to changes in fashion and consumer tastes could adversely impact the Company’s business and decrease sales and earnings.
Furniture is a styled product and is subject to rapidly changing fashion trends and consumer tastes. If the Company fails to
anticipate or timely respond to these changes it may lose market share or be faced with the decision of whether to sell excess inventory
at reduced prices. This could result in lower sales and earnings.
A loss of several large customers through business consolidations, failures or other reasons could result in a decrease in future sales and earnings.
The loss of several of the Company’s major customers through business consolidations or failures or otherwise, could
materially adversely affect the sales and earnings of the Company. Lost sales may be difficult to replace. Amounts owed to the
Company by a customer whose business fails may become uncollectible.
The Company’s ability to grow sales and earnings depends on the successful execution of its business strategies.
Since 2003, the Company has transitioned from manufacturing most of its products to sourcing most of its products from
offshore suppliers. As a result, the Company is now primarily a design, sourcing, marketing and logistics company. The Company’s
ability to maintain and grow sales and earnings depends on the continued correct selection and successful execution and refinement of
its overall business strategies and business systems for designing, marketing, sourcing, distributing and servicing its products. The
Company must also make good decisions about product mix and inventory availability targets. Since the Company has exited
domestic manufacturing of wood furniture and is now completely dependent on offshore suppliers for wood and metal furniture
products, the Company must continue to enhance relationships and business systems that allow it to continue to work more efficiently
and effectively with its global sourcing suppliers. The Company also must continue to evaluate the appropriate mix between domestic
manufacturing and foreign sourcing for upholstered products. All of these factors affect the Company’s ability to grow sales and
earnings.

12
The Company depends on suppliers in China for a high proportion of its imported furniture products, and a disruption in supply from China or from the Company’s most significant Chinese supplier could adversely affect the Company’s ability to timely fill customer orders for these products and the costs of these products to the Company.
In fiscal 2008, imported products sourced from China accounted for approximately 87% of the Company’s import purchases; and
the factory in China from which the Company directly sources the largest portion of its import products accounted for approximately 38%
of the Company’s worldwide purchases of imported products. A sudden disruption in the Company’s supply chain from this factory, or
from China in general, could significantly impact the Company’s ability to fill customer orders for products manufactured at that factory or
in that country. If such a disruption were to occur, the Company believes that it would have sufficient inventory to adequately meet
demand for approximately three months. The Company believes that it could, most likely at higher cost, source most of the products
currently sourced in China from factories in other countries and could produce certain upholstered products domestically at its own
factories. However, supply disruptions and delays on selected items could occur for up to six months before remedial measures could be
implemented. If the Company were to be unsuccessful in obtaining those products from other sources or at comparable cost, then a sudden
disruption in the Company’s supply chain from its largest import furniture supplier, or from China in general, could have a short-term
material adverse effect on the Company’s results of operations.
Changes in the value of the U.S. Dollar compared to the currencies for the countries from which the Company obtains its products could adversely affect net sales and profit margins.
For imported products, the Company generally negotiates firm pricing with its foreign suppliers in U.S. Dollars for periods
typically of at least one year. The Company accepts the exposure to exchange rate movements beyond these negotiated periods without
using derivative financial instruments to manage this risk. Since the Company transacts its imported product purchases in U.S. Dollars, a
relative decline in the value of the U.S. Dollar could increase the price the Company must pay for imported products beyond the negotiated
periods. These price changes could adversely impact net sales and profit margins during affected periods.
The Company’s dependence on offshore suppliers could, over time, adversely affect its ability to service customers, which could lower future sales and earnings.
In March 2007, the Company exited domestic wood furniture manufacturing. The Company now relies exclusively on
offshore suppliers for its wood and metal furniture products. The Company’s offshore suppliers may not supply goods that meet the
Company’s quality, design or other specifications in a timely manner and at a competitive price. If the Company’s suppliers do not
meet the Company’s specifications, the Company may need to find alternative vendors, potentially at a higher cost, or may be forced
to discontinue products. Also, delivery of goods from offshore vendors may be delayed for reasons not typically encountered for
domestically manufactured wood and metal furniture, such as shipment delays caused by customs or labor issues. The Company’s
failure to fill customer orders during an extended business interruption by a major offshore supplier could negatively impact existing
customer relationships resulting in decreased sales and earnings.
Because the Company relies on offshore sourcing for all of its wood and metal products, and for some of its upholstered products, it is subject to changes in local government regulations, which could result in a decrease in earnings.
Changes in political, economic, and social conditions, as well as laws and regulations in the foreign countries where the
Company sources its products could have adverse impacts on the Company. These changes could make it more difficult to provide
products and service to the Company’s customers. International trade policies of the United States and the countries where the
Company sources its finished products could adversely affect the Company. Imposition of trade sanctions relating to imports, taxes,
import duties and other charges on imports could increase the Company’s costs and decrease its earnings. For example in 2004, the
U.S. Department of Commerce imposed tariffs on wooden bedroom furniture coming into the United States from China. In this case,
none of the rates imposed were of sufficient magnitude to alter the Company’s import strategy in any meaningful way; however, these
tariffs are subject to review and could be increased in the future.
The Company may engage in acquisitions and investments in businesses, which could disrupt the Company’s business, dilute its earnings per share and decrease the value of its common stock.
The Company may acquire or invest in businesses that offer complementary products and that the Company believes offer
competitive advantages. However, the Company may fail to identify significant liabilities or risks that negatively affect the Company
or results in the Company paying more for the acquired company or assets than they are worth. The Company may also have
difficulty assimilating the operations and personnel of an acquired business into the Company’s current operations. Acquisitions may
disrupt the Company’s ongoing business or distract management from the Company’s ongoing business. The Company may pay for
future acquisitions using cash, stock, the assumption of debt, or a combination thereof. Future acquisitions could result in dilution to
existing shareholders and to earnings per share.

13
If demand for the Company’s domestically manufactured upholstered furniture declines and the Company responds by realigning manufacturing, the Company’s near-term earnings could decrease.
Since March 2007, the Company’s domestic manufacturing operations consist solely of upholstered furniture. A decline in
demand for the Company’s domestically produced upholstered furniture could result in the realignment of domestic manufacturing
operations and capabilities and the implementation of cost savings programs. These programs could include the consolidation and
integration of facilities, functions, systems and procedures. The Company may decide to source certain products from offshore
suppliers, instead of continuing to manufacture them domestically. These realignments and cost savings programs typically involve
initial upfront costs and could result in decreases in the Company’s near-term earnings before the expected cost reductions from
realignment are realized. The Company may not always accomplish these actions as quickly as anticipated and may not fully achieve
the expected cost reductions.
Fluctuations in the price, availability and quality of raw materials for the Company’s domestically manufactured upholstered furniture could cause manufacturing delays, adversely affect the Company’s ability to provide goods to its customers and increase costs, any of which could decrease the Company’s sales and earnings.
The Company uses various types of wood, leather, fabric, foam and other filling material, high carbon spring steel, bar and
wire stock and other raw materials in manufacturing upholstered furniture. The Company depends on outside suppliers for raw
materials and must obtain sufficient quantities of quality raw materials from these suppliers at acceptable prices and in a timely
manner. The Company does not have long-term supply contracts with its suppliers. Unfavorable fluctuations in the price, quality and
availability of required raw materials could negatively affect the Company’s ability to meet the demands of its customers. The
inability to meet customers’ demands could result in the loss of future sales. The Company may not always be able to pass along price
increases in raw materials to its customers due to competition and market pressures.
The Company may experience impairment of its long-lived assets, which would decrease earnings and net worth.
Accounting rules require that long-lived assets be tested for impairment at least annually. The Company has substantial long-
lived assets, consisting primarily of property, plant and equipment, trademarks, trade names and goodwill, which based upon the
outcome of the annual test, could result in the write-down of all or a portion of these assets. A write-down of the Company’s assets
would, in turn, reduce its earnings and net worth.
ITEM 1B. UNRESOLVED STAFF COMMENTS
None.

14
ITEM 2. PROPERTIES
Set forth below is information with respect to the Company’s principal properties. The Company believes all of these properties are
well-maintained and in good condition. The Company believes its manufacturing facilities are efficiently utilized. During fiscal
2008, the Company estimated its upholstery operations operated at approximately 69% of capacity on a one-shift basis. The Company
closed its last domestic wood manufacturing plant located in Martinsville, Va. in March 2007 and completed the sale of the real
property and equipment in December 2007. All Company production facilities are equipped with automatic sprinkler systems, except
for the Woodleaf, N.C. facility. All facilities maintain modern fire and spark detection systems, which the Company believes are
adequate. The Company has leased certain warehouse facilities for its distribution and imports operation on a short and medium-term
basis. The Company expects it will be able to renew or extend these leases or find alternative facilities to meet its warehousing and
distribution needs at a reasonable cost. All facilities set forth below are active and operational and represent approximately 2.3 million
square feet of owned or leased space.
Location Primary Use Approximate Size in Square Feet Owned or LeasedMartinsville, Va. Corporate Headquarters 43,000 Owned
Martinsville, Va. Distribution and Imports 580,000 Owned
Martinsville, Va. Distribution and Imports 150,000 Leased (1)
Martinsville, Va. Distribution 189,000 Owned
Martinsville, Va. Customer Support Center 146,000 Owned
Martinsville, Va. Distribution 300,000 Leased (2)
High Point, N.C. Showroom 94,000 Leased (3)
Cherryville, N.C. Manufacturing and Offices 144,000 Owned (4)
Cherryville, N.C. Manufacturing Supply Plant 53,000 Owned (4)
Cherryville, N.C. Distribution and Imports 74,000 Leased (4) (5)
Cherryville, N.C. Distribution and Imports 35,000 Leased (4) (6)
Hickory, N.C. Manufacturing 91,000 Owned (4)
Woodleaf, N.C. Manufacturing Supply Plant 34,000 Leased (4) (7)
Bedford, Va. Manufacturing and Offices 327,000 Owned (8)
Bedford, Va. Distribution and Imports 32,000 Leased (8) (9)
(1) Lease expires May 31, 2008
(2) Lease expires December 31, 2009
(3) Lease expires October 31, 2010
(4) Comprise the principal properties of Bradington-Young
(5) Lease expires June 30, 2009
(6) Lease expires August 31, 2008 and provides for a one year extension.
(7) Lease provides for five consecutive one year extensions and expires December 31, 2009
(8) Comprise the principal properties of Sam Moore Furniture LLC
(9) Lease may be terminated with 30 days notice.
Set forth below is information regarding principal properties utilized by the Company that are owned and operated by third parties.
Location Primary Use Approximate Size in Square FeetCarson, Ca. Distribution 80,000 (1)
Guangdong, China Distribution 210,000 (2)
(1) This property is subject to a distribution services agreement that expires on January 1, 2010.
(2) This property is subject to an operating agreement that expires on July 31, 2008 and automatically renews for one year on its
anniversary date unless notification of termination is provided 120 days prior to such anniversary.
ITEM 3. LEGAL PROCEEDINGS
In an audit of the Company’s 2003 and 2004 federal income tax returns, the IRS took the position that the timing of certain of the
Company’s tax deductions for its 401(k) retirement plan constituted a “listed transaction”, which the Company had failed to disclose
in its tax returns for those years. “Listed transactions” are transactions that are the same as, or substantially similar to, transactions that
the IRS has identified as having a tax avoidance purpose.
In preparing its federal income tax returns for each fiscal year, the Company deducted certain contributions and costs related to its
401(k) that were incurred during the one-month period falling after the close of its fiscal year, which ended November 30 in each year,
but before the end of the plan’s year, which ended December 31 of each year. Because these deductions were attributable to

15
compensation earned by plan participants during the month after the end of the Company’s taxable year, the IRS took the position that
these deductions constituted a “listed transaction”. The cumulative effect of these deductions amounted to $76,000, or $27,000 in
federal income tax through November 30, 2004.
The IRS assessed a penalty under Section 6707A(b)(2) of the Internal Revenue Code in the amount of $200,000 for failure to disclose
a listed transaction on the Company’s 2004 federal income tax return. An accuracy-related penalty under Section 6662A(c) of the
Internal Revenue Code, for an understatement with respect to a listed or reportable transaction, was also assessed for $2,606. Both
penalties were paid in full during the fiscal year ended February 3, 2008. The Company has discontinued the deductions that gave rise
to these penalties.
ITEM 4. SUBMISSION OF MATTERS TO A VOTE OF SECURITY HOLDERS
None.
EXECUTIVE OFFICERS OF HOOKER FURNITURE CORPORATION
The Company’s executive officers and their ages as of April 15, 2008 and the year each joined the Company are as follows:
Name Age Position Year Joined Company
Paul B. Toms, Jr. 53 Chairman, President and Chief Executive Officer 1983
E. Larry Ryder 60 Executive Vice President - Finance and Administration, 1977
Assistant Secretary and Assistant Treasurer
Michael P. Spece 55 Executive Vice President - Merchandising and Design 1997
Alan D. Cole 58 Executive Vice President - Upholstery 2007
Sekar Sundararajan 43 Executive Vice President - Operations 2008
Raymond T. Harm 58 Senior Vice President - Sales 1999
Paul B. Toms, Jr. has been Chairman and Chief Executive Officer since December 2000 and President since November 2006. Mr.
Toms was President and Chief Operating Officer from December 1999 to December 2000, Executive Vice President - Marketing from
1994 to December 1999, Senior Vice President - Sales and Marketing from 1993 to 1994, and Vice President - Sales from 1987 to
1993. Mr. Toms joined the Company in 1983 and has been a Director since 1993.
E. Larry Ryder has been Executive Vice President - Finance and Administration since December 2000, Assistant Treasurer since
1998, and Assistant Secretary since 1990. Mr. Ryder was Senior Vice President - Finance and Administration from December 1987 to
December 2000, Treasurer from 1989 to 1998, and Vice President - Finance and Administration from 1983 to 1987. Prior to 1983, Mr.
Ryder served in various financial management positions. Mr. Ryder joined the Company in 1977 and was a Director from 1987 until
2003.
Michael P. Spece has been Executive Vice President - Merchandising and Design since September 2004. Mr. Spece was Senior Vice
President - Import Division from December 2001 to September 2004. Mr. Spece was Vice President - Import Division from the time
he joined the Company in 1997 until December 2001.
Alan D. Cole has been Executive Vice President - Upholstery Operations since April 2007. Prior to joining the Company, Mr. Cole
was President and Chief Executive Officer of Schnadig Corporation, a manufacturer and marketer of a full line of medium-priced
home furnishings from 2004 to 2006. Mr. Cole has been President of Parkwest LLC, a real estate development firm from 2002 to the
present. Mr. Cole also served as a member of the Company’s Board of Directors in 2003.
Sekar Sundararajan has been Executive Vice President - Operations since February 2008. Prior to joining the Company, Mr.
Sundararajan was President of Libra Consulting, an operations and supply chain management consulting firm focusing on the home
furnishings and consumer goods industries from 1996 to 2008. In this capacity, he provided consulting services to the Company
beginning in April 2007.
Raymond T. Harm has been Senior Vice President - Sales since joining the Company in 1999. Prior to joining the Company, Mr.
Harm served as Vice President - Sales for The Barcalounger Company, a manufacturer of upholstered motion furniture from 1992 to
1999.

16
Hooker Furniture Corporation Part II
ITEM 5. MARKET FOR REGISTRANT’S COMMON EQUITY, RELATED SHAREHOLDER MATTERS AND ISSUER PURCHASES OF EQUITY SECURITIES
The Company’s stock is traded on the NASDAQ Global Select Market under the symbol “HOFT”. The table below sets forth the high
and low sales prices per share for the Company’s common stock and the dividends per share paid by the Company with respect to its
common stock for the periods indicated.
Sales Price Per Share DividendsHigh Low Per Share
October 29, 2007 – February 3, 2008 $22.37 $16.55 $0.10
July 30 – October 28, 2007 ...................................................... 22.36 15.52 0.10 April 30 – July 29, 2007 ........................................................... 25.10 19.39 0.10 January 29 – April 29, 2007 .................................................... 22.29 14.70 0.10
December 1, 2006 – January 28, 2007 ....................................... 15.86 14.39
September 1 – November 30, 2006 ........................................... 15.44 13.52 0.08
June 1 – August 31, 2006 .......................................................... 17.64 13.87 0.08
March 1 – May 31, 2006 ........................................................... 20.95 15.09 0.08
December 1, 2005 – February 28, 2006 ..................................... 18.45 14.44 0.07
As of February 28, 2008, the Company had approximately 1,660 beneficial shareholders and 1,104 current and former employees who
were participants in the Company’s former ESOP and are eligible to vote shares of common stock being held by the plan pending
distribution. The Company pays dividends on its common stock on or about the last day of February, May, August and November,
when declared by the Board of Directors, to shareholders of record approximately two weeks earlier. Although the Company
presently intends to continue to declare cash dividends on a quarterly basis for the foreseeable future, the determination as to the
payment and the amount of any future dividends will be made by the Board of Directors from time to time and will depend on the
Company’s then-current financial condition, capital requirements, results of operations and any other factors then deemed relevant by
the Board of Directors.
Purchases of Equity Securities by the Issuer or Affiliated Purchasers
The following table provides information about common stock purchases by or on behalf of the Company during the quarter ended
February 3, 2008:
Total Number of Maximum DollarTotal Average Shares Purchased Value of Shares That
Number of Price as Part of Publicly May Yet Be Shares Paid per Announced Purchased Under the
Purchased Share Program ProgramOctober 29, 2007 – November 25, 2007 ...................... 158,303 $20.69 158,303
November 26, 2007 – December 30, 2007 .................. 40,015 19.92 40,015 $9.2 million December 31, 2007 – February 3, 2008 ....................... 268,579 19.16 268,579 $4.1 million Total ....................................................................... 466,897 $19.74 466,897
On February 7, 2007, the Company announced that its Board of Directors had authorized the repurchase of up to $20 million of the
Company’s common stock. On June 6, 2007, the Company announced that its Board of Directors had authorized a $10 million
increase to the existing stock repurchase authorization, for an aggregate authorization of up to $30 million. The Company completed
this repurchase program in November 2007, repurchasing 1.4 million shares of Company common stock in open market transactions
under this authorization at an average price of $21.36 per share, excluding commissions.

17
On December 5, 2007, the Company announced that its Board of Directors had approved a new authorization to repurchase up to $10
million of the Company’s common stock. There is no expiration date for this authorization, but the Company expects the purchases to
be completed by the end of the 2009 fiscal year. Repurchases may be made from time-to-time in the open market, or in privately
negotiated transactions at prevailing market prices that the Company deems appropriate. The Company entered into a trading plan
under Rule 10b5-1 of the Securities Exchange Act of 1934 for effecting some or all of the purchases under this repurchase
authorization. The trading plan contains certain provisions that could restrict the amount and timing of purchases. The Company can
terminate this plan at any time. Through April 14, 2008, the Company had used $6.8 million of this authorization to purchase 351,581
shares of the Company’s common stock, with $3.2 million remaining available for future purchases.
Performance Graph
The following graph compares cumulative total shareholder return for the Company with a broad performance indicator, the
Russell 2000®
Index, and an industry index, the Household Furniture Index, for the period from November 30, 2002 to February 3,
2008. The Household Furniture Index combines wood and upholstered furniture companies.
(1) The graph shows the cumulative total return on $100 invested at the beginning of the measurement period in the Company’s
Common Stock or the specified index, including reinvestment of dividends.
(2) On August 29, 2006, the Company approved a change in its fiscal year. After the fiscal year ended November 30, 2006, the
Company’s fiscal years will end on the Sunday nearest to January 31. Information regarding the change in the Company’s fiscal
year is available in the Company’s Form 8-K filed September 1, 2006. In making the transition to a new fiscal year, the
Company completed a two-month transition period that began December 1, 2006 and ended January 28, 2007. The Company’s
fiscal year ended February 3, 2008 and the transition period are reflected in the Performance Graph.
(3) The Russell 2000® Index, prepared by Frank Russell Company, measures the performance of the 2,000 smallest companies out of
the 3,000 largest U.S. companies based on total market capitalization.
(4) The Household Furniture Index (SIC Codes 2510 and 2511) as prepared by Zack’s Investment Research. On March 1, 2008, Zacks Investment Research reported that the Household Furniture Index consisted of: Bassett Furniture Industries, Inc.,Chromcraft Revington, Inc., Ethan Allen Interiors Inc., Flexsteel Industries, Inc., Furniture Brands International, Inc., HookerFurniture Corporation, La-Z-Boy Incorporated, Natuzzi S.p.A and Stanley Furniture Company, Inc.

18
ITEM 6. SELECTED FINANCIAL DATA
On August 29, 2006, the Company approved a change in its fiscal year. After the fiscal year that ended November 30, 2006, the Company’s fiscal
years will end on the Sunday closest to January 31. The following selected financial data for each of the Company’s last five fiscal years and for the
two-month transition period ended January 28, 2007 has been derived from the Company’s audited, consolidated financial statements. The selected
financial data should be read in conjunction with the Consolidated Financial Statements, including the related Notes, and Management’s Discussion
and Analysis of Financial Condition and Results of Operations included elsewhere in this report.
For The For The Two
53 Weeks Ended Months Ended For The Twelve Months Ended
February 3, January 28, Nov. 30, Nov. 30, Nov. 30, Nov. 30,
2008 (1)(2) 2007 2006 2005 2004 2003 (3)
(In thousands, except per share data) Income Statement Data (4): Net sales ....................................................................... $316,801 $49,061 $350,026 $341,775 $345,944 $309,005 Cost of sales .................................................................. 219,555 35,446 248,812 249,873 250,467 226,880 Gross profit ................................................................... 97,246 13,615 101,214 91,902 95,477 82,125 Selling and administrative expenses ............................. 67,240 9,458 71,549 65,497 62,707 54,903 ESOP termination compensation charge (5) ................. 18,428 Restructuring and asset impairment charges (6) ........... 309 2,973 6,881 5,250 1,604 1,470 Operating income (loss) ................................................ 29,697 (17,244) 22,784 21,155 31,166 25,752 Other income (expense), net ......................................... 1,472 129 (77) (646) (1,242) (2,352) Income (loss) before income taxes ............................... 31,169 (17,115) 22,707 20,509 29,924 23,400 Income taxes ................................................................. 11,514 1,300 8,569 8,024 11,720 8,690 Net income (loss) .......................................................... 19,655 (18,415) 14,138 12,485 18,204 14,710 Per Share Data: Basic and diluted earnings per share (6) ....................... $ 1.58 $ (1.52) $ 1.18 $ 1.06 $ 1.56 $ 1.28 Cash dividends per share .............................................. 0.40 0.00 0.31 0.28 0.24 0.22 Net book value per share (7) ......................................... 12.18 12.23 13.49 12.50 11.60 10.02
Weighted average shares outstanding ........................... 12,442 12,113 11,951 11,795 11,669 11,474
Balance Sheet Data: Cash and cash equivalents ............................................ $ 33,076 $ 47,085 $ 31,864 $ 16,365 $ 9,230 $ 14,859 Trade accounts receivable ............................................. 38,229 37,744 45,444 43,993 40,960 37,601 Inventories .................................................................... 50,560 62,803 68,139 68,718 69,735 42,442 Assets held for sale (8) ................................................. 3,475 1,656 5,376 Working capital ............................................................ 102,307 127,193 124,028 110,421 97,661 75,181 Total assets ................................................................... 175,232 202,463 201,299 189,576 188,918 167,466 Long-term debt (including current maturities) .............. 7,912 10,415 11,012 13,295 23,166 30,837 Shareholders’ equity ..................................................... 140,826 162,310 162,536 148,612 136,585 116,264
(1) On April 28, 2007, the Company acquired substantially all of the assets of Bedford, Va.-based fabric upholstered seating specialist Sam Moore Furniture. Shipments of Sam Moore upholstered furniture products accounted for $20.8 million in net sales for the portion of fiscal 2008 after the acquisition.
(2) On December 14, 2007, the Company acquired the assets of Opus Designs Furniture, LLC, a specialist in imported moderately-pricedyouth bedroom furniture. Shipments of Opus youth bedroom furniture products accounted for $636,000 in net sales for the portion of fiscal 2008 after the acquisition.
(3) In 2003, the Company acquired substantially all of the assets of Cherryville, N.C. based leather seating specialist Bradington-Young LLC. Shipments of Bradington-Young upholstered furniture products accounted for net sales of $59.1 million in fiscal 2008, $9.9 million in the 2007 two-month transition period, $62.9 million in fiscal 2006, $62.5 million in fiscal 2005, $57.5 million in fiscal 2004 and $44.2 million during the eleven-month period following the acquisition in January 2003.
(4) Certain items in the financial statements for periods prior to 2008 have been reclassified to conform to the 2008 method of presentation. (5) On January 26, 2007, the Company terminated its ESOP. The termination resulted in an $18.4 million non-cash, non-tax deductible charge
to earnings in January 2007. (6) Since 2000, the Company closed facilities in order to reduce and ultimately eliminate its domestic wood furniture manufacturing capacity.
As a result, the Company has recorded restructuring charges, principally for severance and asset impairment, as follows: (a) in fiscal 2008, the Company recorded after tax charges of $190,000 ($309,000 pretax), or $0.02 per share, principally related to the
March 2007 closing and sale of its Martinsville, Va. manufacturing facility; (b) in the 2007 two-month transition period, the Company recorded after tax charges of $1.8 million ($3.0 million pretax), or $0.15 per
share, principally for severance and related benefits for salaried and hourly employees related to the planned closing of its Martinsville, Va. manufacturing facility;
(c) in fiscal 2006, the Company recorded after tax charges of $4.3 million ($6.9 million pre tax), or $0.36 per share, principally related to the planned closing of its Martinsville, Va. manufacturing facility and the closing of its Roanoke, Va. facility;
(d) in fiscal 2005, the Company recorded after tax charges of $3.3 million ($5.3 million pretax), or $0.28 per share, principally related to the closing of its Pleasant Garden, N.C. facility;
(e) in fiscal 2004, the Company recorded after tax charges of $994,000 ($1.6 million pretax), or $0.09 per share, principally related to the closing of its Maiden, N.C. facility; and

19
(f) in fiscal 2003, the Company recorded after tax charges of $911,000 ($1.5 million pretax), or $0.08 per share, related to the closing of its Kernersville, N.C. facility.
(7) Net book value per share is derived by dividing (a) “shareholders’ equity” by (b) the number of common shares issued and outstanding,excluding unearned ESOP and restricted shares, all determined as of the end of each fiscal period.
(8) In connection with the closings of the Martinsville, Va. plant in March 2007, the Roanoke, Va. plant in August 2006, the Pleasant Garden, N.C. plant in October 2005 and the Maiden, N.C. plant in October 2004, the Company reclassified substantially all of the related property, plant and equipment to “assets held for sale.” The carrying value of these assets approximated fair value less anticipated selling expenses. The Company completed the sale of the assets located in Martinsville, Va. in December 2007, the assets located in Roanoke, Va. in October 2006, the assets located in Pleasant Garden, N.C. in May 2006 and the assets located in Maiden N.C. in January 2005.
ITEM 7. MANAGEMENT’S DISCUSSION AND ANALYSIS OF FINANCIAL CONDITION AND RESULTS OF OPERATIONS
The following discussion should be read in conjunction with the Selected Financial Data and the Consolidated Financial Statements,
including the related Notes, contained elsewhere in this annual report.
On August 29, 2006, the Company approved a change in its fiscal year. After the fiscal year that ended November 30, 2006, the
Company’s fiscal years will end on the Sunday nearest to January 31. In addition, starting with the fiscal year that began January 29,
2007, the Company adopted quarterly periods based on thirteen-week “reporting periods” (which will end on a Sunday) rather than
quarterly periods consisting of three calendar months. As a result, each quarterly period generally will be thirteen weeks, or 91 days,
long. However, since the Company’s fiscal year will end on the Sunday closest to January 31, in some years (generally once every six
years) the fourth quarter will be fourteen weeks long and the fiscal year will consist of 53 weeks (e.g. the fiscal year that ended
February 3, 2008 was 53 weeks). For more information about the changes in the Company’s fiscal year and quarterly periods, please
refer to the Company’s Form 8-K filed with the Securities and Exchange Commission on September 1, 2006.
In connection with the change in its fiscal year, the Company completed a two-month transition period that began December 1, 2006
and ended January 28, 2007 and filed a transition report on Form 10-Q for that period on March 16, 2007. The financial statements
filed as part of this annual report on Form 10-K cover the fifty-three week period that began January 29, 2007 and ended on February
3, 2008. The financial statements also include the two-month transition period that began December 1, 2006 and ended January 28,
2007 and the twelve-month periods that ended November 30, 2006 and 2005. The Company did not recast the financial statements for
the twelve-month periods ended November 30, 2006 and 2005, principally because the financial reporting processes in place for those
periods included certain procedures that were completed only on a quarterly basis. Consequently, to recast those periods would have
been impractical and would not have been cost-justified.
Overview
Since 2001, the Company has operated in a sluggish economy impacted by low to moderate levels of consumer confidence and
growing consumer preference for lower-priced imported furniture products. The Company’s results of operations have been affected
in opposing ways by lower-priced imported furniture.
First, net sales of the Company’s imported wood and metal furniture as a percentage of total wood and metal net sales have
experienced significant growth during this five-year period, and Bradington-Young imported upholstered furniture net sales
have experienced significant growth since 2005. Net sales of imported products, as a percentage of total net sales have
increased to record levels every year from 2001 to 2006 and have grown as a percentage of total net sales, from 31.2% in
2001 to 76.0% in fiscal 2008.
Second, the Company’s domestic wood furniture manufacturing operations suffered from lower demand and significant
declines in volume for bedroom, home office, home entertainment and other products. These declines led to the decision to
close the Company’s last domestic wood manufacturing plant, located in Martinsville, Va. in March 2007, which marked the
Company’s exit from domestic wood furniture manufacturing. Prior to this, the Company had closed its Roanoke, Va.
facility in August 2006, Pleasant Garden, N.C. facility in 2005, Maiden, N.C. facility in 2004 and Kernersville, N.C. facility
in 2003. The Company also reduced its workforce at the Martinsville, Va. facility in 2001 and operated on reduced work
schedules at the Company’s wood furniture manufacturing facilities over most of the period since 2001. The Company’s
domestic upholstered furniture manufacturing operations at Bradington-Young experienced declining year-over-year
shipments in fiscal 2008, fiscal 2006 and in the fiscal 2005 third and fourth quarters, and reduced work schedules since the
fiscal 2005 fourth quarter.
Results of operations for the fifty-three weeks ended February 3, 2008 reflect the Company’s transformation into a home furnishings
design, marketing and logistics company with world-wide sourcing capabilities. With the closing of its last domestic wood furniture

20
plant during the fiscal 2008 first quarter, the Company is now focused on imported wood and metal and domestically produced and
imported upholstered home furnishings. On April 28, 2007, the Company completed the acquisition of substantially all of the assets
of Sam Moore Furniture Industries, Inc., a Bedford, Virginia manufacturer of upscale occasional chairs with an emphasis on fabric-to-
frame customization in the upper-medium to high-end price niches. The Company began operating the business as Sam Moore
Furniture LLC during the fiscal 2008 second quarter. On December 14, 2007, the Company completed its acquisition of certain assets
of Opus Designs Furniture, LLC, a specialist in moderately-priced imported youth bedroom furniture. The Company has integrated
this business with its existing imported wood and metal furniture business and now offers this brand to customers as Opus Designs by
Hooker.
Because fiscal 2008 included three more shipping days than fiscal 2006, due to the change in the fiscal year format, management’s
discussion of results of operations includes information regarding profitability performance as a percentage of net sales and daily
average sales rates.
Following are the principal factors that impacted the Company’s results of operations during the 53-week period ended February 3,
2008:
Based on actual shipping days in each period, average daily net sales declined 10.6% during the 255-day 2008 fiscal year
compared to the 252-day 2006 fiscal year. The decline in average daily net sales continues to mirror the year-over-year
decline in incoming order rates the Company has experienced since the fiscal 2006 third quarter resulting from the industry-
wide slow down in business at retail.
Operating margin during the 2008 fiscal year compared with the 2006 fiscal year was favorably impacted by:
a $6.6 million, or 95.5%, decline in restructuring and asset impairment related charges;
an improvement in gross profit margin to 30.7% of net sales compared with 28.9% in the prior fiscal year,
principally as a result of the higher proportion of imported wood and metal products sold and lower delivered cost of
those imported products (primarily lower inbound freight and delivery costs) as a percentage of net sales; partially
offset by
an increase in selling and administrative costs as a percentage of net sales, due to the decline in net sales. These
expenses actually declined by $4.3 million, or 6.0%, driven primarily by:
reductions in temporary warehousing and storage costs for imported wood and metal furniture products;
lower early retirement and non-cash employee stock ownership plan (“ESOP”) costs (the ESOP was
terminated in January 2007);
lower selling expenses; and
a gain on the settlement of a corporate-owned life insurance policy in connection with the death of a
former executive of the company; partially offset by
the selling and administrative expenses incurred by Sam Moore and the donation of two showrooms,
located in High Point, N.C. formerly operated by Bradington-Young to a local university, in December
2007; and
The inclusion of the operations of Sam Moore Furniture in the Company’s results of operations as of the beginning of the
fiscal 2008 second quarter.

21
Results of Operations
The following table sets forth the percentage relationship to net sales of certain items for the annual periods included in the
consolidated statements of income:
Fifty-Three Weeks Ended Twelve Months Ended
February 3, November 30, November 30,
2008 2006 2005
Net sales..................................................................................... 100.0% 100.0% 100.0%
Cost of sales ............................................................................... 69.3 71.1 73.1
Gross profit ................................................................................ 30.7 28.9 26.9
Selling and administrative expenses .......................................... 21.2 20.4 19.2
Restructuring and asset impairment charges.............................. 0.1 2.0 1.5
Operating income ..................................................................... 9.4 6.5 6.2
Other income (expense), net ...................................................... 0.5 (0.2)
Income before income taxes ...................................................... 9.8 6.5 6.0
Income taxes .............................................................................. 3.6 2.5 2.3
Net income ................................................................................. 6.2 4.0 3.7
Fiscal 2008 Compared to Fiscal 2006
For fiscal 2008, the Company reported net sales of $316.8 million, a decrease of $33.2 million, or 9.5%, compared to $350.0 million
in fiscal 2006. Net sales of Hooker’s wood and metal furniture decreased $50.2 million, or 17.5%, to $236.9 million during fiscal
2008 compared to net sales of $287.1 million in fiscal 2006, principally due to lower unit volume. The decline in unit volume was
attributed to a sharp decline in domestically produced wood furniture sales as a result of exiting domestic wood manufacturing in
March 2007 and the industry-wide slow down in business at retail. Based on actual shipping days in each period, average daily net
sales declined 10.6% to $1.2 million per day during the 255-day 2008 fiscal year compared to $1.4 million per day during the 252-day
2006 fiscal year. The Company experienced lower average daily unit volume shipments overall and in every product category except
Bradington-Young imported leather upholstery, which experienced a slight increase, comparing fiscal 2008 to fiscal 2006. Sam
Moore fabric upholstery sales amounted to $20.8 million for the three quarters since it was acquired at the beginning of the fiscal 2008
second quarter.
Overall, average selling prices declined slightly. The primary contributor to the overall decline was the sharp decline in domestically
produced wood furniture average selling prices, principally due to sharp discounting offered on these discontinued products. The
Company experienced slight increases in average selling prices for imported wood and metal and Bradington-Young imported and
domestically produced leather upholstered furniture. Average selling prices for imported wood and metal furniture during fiscal year
2008 increased in part due to the mix of products shipped and lower discounting, compared to fiscal year 2006. While average selling
prices per unit for both Bradington-Young domestically produced and imported leather upholstered furniture increased, Bradington
Young’s overall per unit average selling price declined slightly, due to the higher proportion of imported products shipped.
Gross profit margin for fiscal 2008 increased to 30.7% of net sales compared to 28.9% in fiscal 2006, principally due to the larger
proportion of sales of higher margin imported products and the lower delivered cost of those products (primarily lower inbound freight
and delivery costs) as a percentage of net sales.
For fiscal 2008, selling and administrative expenses decreased $4.3 million, or 6.0%, to $67.2 million compared with $71.5 million in
2006. The decline is principally due to reductions in temporary warehousing and storage costs for imported wood furniture products,
lower early retirement and non-cash ESOP costs, lower selling expenses and a gain on the settlement of a corporate-owned life
insurance policy in connection with the death of a former executive of the Company, partially offset by the selling and administrative
expenses incurred by Sam Moore and a $1.1 million charitable contribution for the donation of two former Bradington-Young
showrooms to a local university. As a percentage of net sales, selling and administrative expenses increased to 21.2% in fiscal 2008
from 20.4% in fiscal 2006, due to lower net sales in the current year.
During fiscal 2008, the Company recorded $309,000 ($190,000 after tax, or $0.02 per share) in restructuring and asset impairment
charges (net of restructuring credits), principally related to:
$553,000 for additional asset impairment, disassembly and exit costs associated with the closing of the Martinsville, Va. domestic
wood manufacturing facility in March 2007; net of

22
a restructuring credit of $244,000, principally for previously accrued health care benefits for terminated employees at the former
Pleasant Garden, N.C., Martinsville, Va. and Roanoke, Va. facilities that are not expected to be paid.
During fiscal 2006, the Company recorded $6.9 million ($4.3 million after tax, or $0.36 per share) in restructuring and asset
impairment charges (net of restructuring credits).
The Company’s operating income margin for fiscal 2008 increased to 9.4% of net sales, compared to operating income margin of 6.5% of
net sales for fiscal 2006, principally due to:
the $6.6 million, or 95.5%, decrease in restructuring and asset impairment costs;
the increase in gross profit margin to 30.7% from 28.9%; partially offset by
the increase in selling and administrative expenses as a percentage of net sales to 21.2% in 2008 compared to 20.4% in fiscal
2006, due to the decline in sales (although these costs decreased $4.3 million or 6.0%).
Excluding the effect of restructuring and asset impairment charges and the December 2007 donation of the two former Bradington-
Young showrooms, operating profitability in fiscal 2008 improved year over year compared to fiscal 2006, principally as a result of
higher gross profit margins on the Company’s imported wood and metal furniture. The following table reconciles operating income as
a percentage of net sales ("operating margin") to operating margin excluding these charges (“restructuring and special charges”) as a
percentage of net sales for each period:
Fifty-Three Twelve Months
Weeks Ended Ended
February 3, November 30,
2008 2006
Operating margin, including restructuring and special
charges .................................................................................... 9.4% 6.5%
Donation of two showrooms ...................................................... 0.3% Restructuring charges ................................................................ 0.1% 2.0%
Operating margin, excluding restructuring and special
charges .................................................................................... 9.8% 8.5%
The operating margin excluding the impact of restructuring charges and the showrooms donation is a “non-GAAP” financial measure.
The Company provides this information because management believes it is useful to investors in evaluating the Company’s ongoing
operations.
Other income, net was $1.5 million, or 0.5% of net sales, for fiscal 2008 compared to other expense, net of $77,000 for fiscal 2006. This
improvement was the result of an increase in interest income earned on higher cash and cash equivalent balances and a decrease in interest
expense on lower debt levels.
The Company’s effective tax rate decreased to 36.9% for fiscal 2008 compared to 37.7% for fiscal 2006. The effective rate declined
in fiscal 2008 principally due to the tax effect of the ESOP. In fiscal 2008, the Company reversed previously recorded income tax
expense related to its ESOP in connection with the settlement of an IRS audit. In addition, the Company recorded no ESOP
compensation cost during the current year period after the termination of that plan in January 2007. The effective rate also declined
during the current year period due to the non-taxable gain recorded on the settlement of a corporate owned life insurance policy
discussed previously, and lower assessments under the Company’s captive insurance arrangement compared to fiscal 2006. These
declines were partially offset by an increase in the Company’s effective state income tax rate, principally attributed to California state
income taxes incurred as a result of opening the new West Coast distribution center.
Net income for fiscal 2008 rose by 39.0%, or $5.5 million, to $19.7 million, or $1.58 per share, from $14.1 million, or $1.18 per share,
for fiscal 2006. As a percent of net sales, net income increased to 6.2% in fiscal 2008 compared to 4.0% for fiscal 2006.
Fiscal 2006 Compared to Fiscal 2005
For fiscal 2006, the Company reported net sales of $350.0 million, an increase of $8.3 million, or 2.4%, compared to $341.8 million in
fiscal 2005. Net sales of Hooker’s wood and metal furniture increased $7.8 million, or 2.8%, to $287.1 million during fiscal 2006
compared to net sales of $279.2 million in fiscal 2005. Higher unit volume for imported wood and metal furniture was partially offset
by lower unit volume for domestically produced wood furniture. Average selling prices increased slightly for imported wood and
metal products but declined for domestically manufactured wood products, principally due to the mix of products shipped and higher

23
sales discounting offered on overstocked and discontinued products.
Net sales of Bradington-Young upholstered furniture increased by $0.4 million, or 0.7%, to $62.9 million during fiscal 2006 compared
to $62.5 million during the prior fiscal year period, due to an increase in unit shipments of imported upholstered furniture, offset by
lower unit sales of domestically produced upholstered furniture. Average selling prices increased during fiscal 2006 compared to the
fiscal 2005 period for both imported and domestically produced upholstered furniture products.
Overall, unit volume increased in fiscal 2006 compared to fiscal 2005, principally due to the higher volume of imported wood, metal
and upholstered units shipped. Average selling prices declined in fiscal 2006 compared to fiscal 2005 due to the mix of products
shipped (principally the larger proportion of lower priced imported furniture) and as a result of larger discounts offered on overstocked
and discontinued products and the increased volume of imported wood and metal furniture shipped via the Company’s Container
Direct Program.
Gross profit margin for fiscal 2006 increased to 28.9% of net sales compared to 26.9% in fiscal 2005, principally due to the larger
proportion of sales of higher margin imported products.
For fiscal 2006, selling and administrative expenses increased $6.1 million, or 9.2%, to $71.5 million compared with $65.5 million in
fiscal 2005. As a percentage of net sales, selling and administrative expenses increased to 20.4% in fiscal 2006 from 19.2% in fiscal
2005. Higher warehousing and distribution costs to support increased imported furniture demand and supply chain initiatives, early
retirement benefits, principally for a key executive of the Company, and an increase in bad debt expense account for this increase in
expenses. These cost increases were partially offset by lower selling expenses, principally advertising, sample costs and depreciation.
For fiscal 2006, ESOP cost decreased $653,000 to $2.7 million compared to $3.4 million in fiscal 2005, principally due to a decline in
the average market price of the Company’s common stock. The Company recorded non-cash ESOP cost for the number of shares that
it committed to release to eligible employees at the average market price of the Company’s common stock during each respective
period based on the amount of the annual principal and interest payments made on the ESOP Loan. The Company committed to
release approximately 164,000 shares during fiscal 2006, having an average closing market price of $16.11 per share, and
approximately 171,000 shares during fiscal 2005, having an average closing market price of $18.90 per share. The ESOP shares had
a cost basis of $6.25 per share. Prior to its termination in January 2007, the cost of the plan was allocated between cost of goods sold
and selling and administrative expenses based on employee compensation.
The Company terminated its ESOP effective January 26, 2007. See “Note 10 – Employee Benefit Plans” to the Consolidated
Financial Statements included in this report for more information regarding the ESOP termination.
During fiscal 2006, the Company recorded $6.9 million ($4.3 million after tax, or $0.36 per share) in restructuring and asset
impairment charges (net of restructuring credits), principally related to:
the write-down of real and personal property at the Martinsville, Va. plant to estimated fair value in connection with the
planned closing announced January 17, 2007 ($4.2 million);
the August 2006 closing of the Roanoke, Va. manufacturing facility ($2.7 million), which included $1.6 million in
severance and related benefits for approximately 260 terminated hourly and salaried employees and $1.1 million in asset
impairment charges;
the final sale of the Pleasant Garden, N.C. wood furniture plant and the related closing of the Martinsville, Va. plywood
plant ($161,000); and
the planned sale of two showrooms in High Point, N.C. formerly operated by Bradington-Young ($140,000); net of
a restructuring credit for previously accrued health care benefits for terminated employees at the former Pleasant Garden
and Kernersville, N.C. facilities that were not expected to be paid ($295,000).
In October 2006, the Company completed the sale of the Roanoke, Va. plant for $2.2 million, net of selling costs.
In May 2006, the Company completed the sale of the Pleasant Garden facility. Aggregate proceeds from that sale, including proceeds
from equipment auctions at both the Pleasant Garden and plywood facilities held in December 2005, amounted to $1.5 million ($1.1
million in cash and a note receivable for $400,000), net of selling expenses.

24
Prior to the spring 2006 International Home Furnishings Market, the Company moved its Bradington-Young showroom to leased
space proximate to the Company’s wood furniture showroom in High Point, N.C. In connection with the relocation, the Company
decided to sell two showrooms formerly operated by Bradington-Young in High Point, N.C. and recorded an asset impairment charge
of $140,000 to write-down one of these showrooms to estimated market value less cost to sell.
During fiscal 2005, the Company recorded aggregate restructuring and asset impairment charges of $5.3 million ($3.3 million after
tax, or $0.28 per share) principally related to:
the closing of its Pleasant Garden, N.C. manufacturing facility ($4.3 million);
consolidation of plywood production at its Martinsville, Va. manufacturing facility ($406,000); and
additional factory disassembly costs, health care benefits for terminated employees, environmental monitoring, and asset
impairment charges of $586,000 related to the closing and sale of its Maiden, N.C. manufacturing facility (which closed in 2004)
and its Kernersville, N.C. facility (which closed in 2003).
Operating income in fiscal 2006 increased 7.7%, to $22.8 million from $21.2 million in fiscal 2005. As a percentage of net sales,
operating income increased to 6.5% in fiscal 2006, compared to 6.2% for fiscal 2005. The improvement in operating income
principally resulted from higher net sales and gross profit. These factors were partially offset by an increase in selling and
administrative expenses and higher restructuring charges.
Excluding the effect of restructuring and asset impairment charges, operating profitability in 2006 improved year over year compared
to fiscal 2005, principally as a result of increased net sales volume and improved gross profit margins on the Company's imported
wood and upholstered furniture. The following table reconciles operating income as a percentage of net sales ("operating margin") to
operating margin excluding restructuring and asset impairment charges ("restructuring charges") as a percentage of net sales for each
period:
For the Fiscal Years
Ended November 30,
2006 2005
Operating margin, including restructuring charges ................................. 6.5% 6.2%
Restructuring charges .............................................................................. 2.0% 1.5%
Operating margin, excluding restructuring charges ................................. 8.5% 7.7%
Other expense, net decreased to $77,000 in fiscal 2006 from $646,000 in fiscal 2005 principally as a result of increased interest
income from higher cash balances compared to the prior year, as well as a decline in interest expense, due to lower debt levels
resulting from principal repayments, partially offset by higher weighted average interest rates on outstanding borrowings
The Company’s effective tax rate decreased to 37.7% for 2006 compared to 39.1% for 2005. The decrease was principally attributed
to lower non-cash ESOP cost.
Net income for fiscal 2006 increased by 13.2%, or $1.7 million, to $14.1 million, or $1.18 per share, from $12.5 million, or $1.06 per
share, for fiscal 2005. As a percent of net sales, net income increased to 4.0% in fiscal 2006 compared to 3.7% for fiscal 2005.

25
Fiscal 2007 Two-Month Transition Period Compared to Fiscal 2006 First Quarter
The following table sets forth the percentage relationship to net sales of certain items included in the consolidated statements of
operations.
Two Months Three Months
Ended Ended
January 28, February 28,
2007 2006
Net sales................................................................................................... 100.0% 100.0%
Cost of sales ............................................................................................. 72.2 73.1
Gross profit .............................................................................................. 27.8 26.9
Selling and administrative expenses ........................................................ 19.3 19.9
ESOP termination compensation charge ................................................. 37.6
Restructuring and related asset impairment charges ................................ 6.1 0.2
Operating (loss) income ........................................................................... (35.1) 6.8
Other income, net .................................................................................... 0.3
(Loss) income before income taxes ......................................................... (34.9) 6.8
Income taxes ............................................................................................ 2.7 2.6
Net (loss) income ..................................................................................... (37.5) 4.2
Net sales for the 2007 two-month transition period ended January 28, 2007 were $49.1 million and were $85.3 million for the fiscal
2006 three-month period. Based on actual shipping days in each period, average daily net sales declined 5.8% to $1,258,000 per day
during the 39-day fiscal 2007 transition period compared to $1,335,400 per day during the 42-day operating period from December 1,
2005 through January 31, 2006 and 8.6% from $1,376,400 per day during the 62-day fiscal 2006 first quarter.
Average daily net sales increased for imported wood, metal and upholstered furniture for the 2007 transition period compared to the fiscal
2006 first quarter, principally due to slightly higher unit volume. This increase was offset by a continued decline in average daily net sales
rates for domestically manufactured wood furniture and a moderate decline in average daily net sales rates for domestically produced
upholstered furniture.
Overall average selling prices decreased slightly for wood, metal and upholstered furniture during the 2007 two-month transition
period compared with the fiscal 2006 first quarter, principally due to higher sales discounting offered on overstocked and discontinued
domestically produced wood furniture products, as well as a minimal decline in domestic upholstered furniture selling prices, partially
offset by increases in imported wood and upholstered average selling prices. Average number of units sold per day declined during
the 2007 two-month transition period compared to the fiscal 2006 first quarter. Average per-day unit sales for imported wood and
metal and upholstered furniture increased slightly, while average daily per unit sales for upholstered furniture declined moderately and
domestic wood and metal furniture average per-day unit sales declined sharply.
Gross profit margin increased to 27.8% of net sales in the 2007 two-month transition period compared to 26.9% in the fiscal 2006 first
quarter. This improvement was the result of an increase in the gross profit margin for wood and metal furniture, partially offset by a
decline in the gross profit margin for upholstered furniture. The increase in gross profit margin on wood and metal furniture was
principally due to an increased proportion of sales of imported wood, metal and upholstered furniture and was partially offset by a
significantly lower gross profit margin on domestically produced wood furniture. Gross profit margin on domestically produced wood
furniture declined as production costs as a percentage of net sales increased in the 2007 two-month transition period compared to the
fiscal 2006 first quarter, principally due to lower production levels.
Bradington-Young’s gross profit margin decline for the 2007 two-month transition period versus the fiscal 2006 first quarter was
principally due to lower production levels.
Selling and administrative expenses, as a percentage of net sales, decreased to 19.3% in the 2007 two-month transition period from
19.9% in the fiscal 2006 first quarter principally due to lower port storage and temporary warehousing costs for imported wood
furniture purchases.
On January 29, 2007, the Company announced that it had terminated its ESOP, effective January 26, 2007. The termination resulted
in an $18.4 million, non-cash, non-tax deductible charge to earnings in January 2007 with an offsetting increase in shareholders’
equity. As a result of the ESOP termination, approximately 1.2 million shares of previously unallocated shares of Company common
stock held by the ESOP were allocated to eligible employees, resulting in the $18.4 million charge to operating income. To effect the
termination of the ESOP, the Company redeemed and retired approximately 1.2 million of the shares of Company common stock held

26
by the ESOP, with proceeds to the ESOP of $17.2 million (or $15.01 per share). The ESOP used the proceeds to repay the outstanding
balance on the ESOP loan.
Through November 30, 2006, the Company recorded non-cash ESOP cost for the number of shares that it committed to release to
eligible employees at the average closing market price of the Company’s common stock during the period. During the 2007 two-
month transition period, except for the effect of the ESOP termination discussed above, no shares were committed to be released. As
a result, no non-cash ESOP cost was recorded during the 2007 two-month transition period. The Company recorded $636,000 in non-
cash ESOP cost during the 2006 first quarter. The cost of the plan was allocated to cost of goods sold and selling and administrative
expenses based on employee compensation.
During the 2007 two-month transition period, the Company recorded aggregate restructuring and asset impairment charges of $3.0 million
($1.8 million after tax, or $0.15 per share), principally for severance and related benefits for approximately 280 hourly and salaried
employees that were terminated ($2.3 million) and additional asset impairment charges for the expected costs to sell the real and personal
property of the Martinsville, Va. manufacturing facility ($655,000).
In the 2006 first quarter, the Company recorded restructuring charges of $188,000 ($117,000 after tax, or $0.01 per share) to prepare the
Pleasant Garden, N.C. manufacturing facility for sale and for additional asset impairment related to the closing of this facility.
Principally due to the ESOP termination and restructuring and asset impairment charges, the Company incurred an operating loss for the
2007 two-month transition period of $17.2 million, or 35.1% of net sales, compared to operating income of $5.8 million, or 6.8% of net
sales in the 2006 first quarter.
Excluding the effect of the ESOP termination and restructuring and asset impairment charges, operating profitability as a percentage
of net sales during the transition period improved when compared to the three month first quarter of fiscal 2006. The following table
reconciles operating results as a percentage of net sales (“operating margin”) to operating margin excluding ESOP termination charges
and restructuring and asset impairment charges (“restructuring charges”) as a percentage of net sales for each period:
Two Months Three Months
Ended January 28, Ended February 28,
2007 2006
Operating (loss) income margin, including ESOP termination
and restructuring charges ................................................................... (35.1)% 6.8%
ESOP termination charges ....................................................................... 37.5
Restructuring charges .............................................................................. 6.1 0.2
Operating margin, excluding ESOP termination and
restructuring charges .......................................................................... 8.5% 7.0%
Operating margin excluding the impact of the ESOP termination and restructuring charges is a “non-GAAP” financial measure. The
Company provides this information because management believes it is useful to investors in evaluating the Company’s ongoing operations.
Other income, net increased to $129,000 in the 2007 two-month transition period from $13,000 in the 2006 first quarter. This improvement
was the result of an increase in interest income earned on higher cash and cash equivalent balances and a decrease in interest expense, due
to one less month of interest expense in the 2007 two-month transition period compared to the three-month 2006 first quarter.
The Company recorded income tax expense of $1.3 million for the 2007 two-month transition period and $2.2 million for the 2006 first
quarter. Despite the net loss for the 2007 transition period, the Company incurred income tax expense in the transition period because the
$18.4 million non-cash ESOP termination charge was not tax deductible. In connection with the ESOP termination, the Company wrote-
off the related deferred tax asset in the amount of $855,000.
The Company incurred a net loss of $18.4 million, or $1.52 per share, for the 2007 two-month transition period and net income of $3.6
million, or $0.30 per share, in the 2006 first quarter.
Financial Condition, Liquidity and Capital Resources
Balance Sheet and Working Capital
Total assets decreased $27.2 million to $175.2 million at February 3, 2008 from $202.5 million at January 28, 2007, principally as a
result of a $14.0 million decrease in cash and cash equivalents, a $12.2 million decrease in inventories, a $3.5 million decline in assets
held for sale and a $2.3 million decrease in other long-term assets (primarily non-current deferred tax assets). These decreases were
partially offset by a $2.9 million increase in goodwill and intangible assets from acquisitions, a $667,000 increase in the cash

27
surrender value of life insurance policies, a $514,000 increase in property, plant and equipment, net, a $485,000 increase in trade
accounts receivable and a $298,000 increase in prepaid expenses and other current assets.
Working capital decreased by $24.9 million to $102.3 million as of February 3, 2008, from $127.2 million at January 28, 2007,
principally as a result of decreases in cash and cash equivalents, inventories and assets held for sale, offset by increases in trade
accounts receivable and prepaid expenses and other current assets, and a decrease in current liabilities. Current liabilities decreased to
$23.1 million at February 3, 2008, from $27.2 million at January 28, 2007. The Company’s long-term debt, including current
maturities, decreased $2.5 million to $7.9 million on February 3, 2008, compared to $10.4 million on January 28, 2007 as a result of
scheduled debt payments. Shareholders’ equity at February 3, 2008 decreased $21.5 million to $140.8 million compared to $162.3
million on January 28, 2007, principally as a result of the repurchase of 1.7 million shares of the Company’s common stock during the
2008 fiscal year.
Summary Cash Flow Information – Operating, Investing and Financing Activities
Fifty-Three Two Months
Weeks Ended Ended Twelve Months Ended February 3, January 28, November 30, November 30, 2008 2007 2006 2005 Net cash provided by operating activities ....................................... $ 43,658 $16,215 $22,328 $19,624 Net cash (used in) provided by investing activities ......................... (14,100) (397) (859) 1,636 Net cash used in financing activities ............................................... (43,567) (597) (5,970) (14,125)
Net (decrease) increase in cash and cash equivalents............ $(14,009) $15,221 $15,499 $ 7,135
During fiscal year 2008, cash generated from operations ($43.7 million), a decrease in cash and cash equivalents ($14.0 million) and
proceeds from the sale of property, plant and equipment ($3.7 million, principally from the sale of the Martinsville, Va. facility)
funded purchases of the Company’s common stock ($36.0 million), acquisitions ($15.8 million), cash dividends ($5.0 million),
payments on long-term debt ($2.5 million) and capital expenditures ($1.9 million).
During the 2007 two-month transition period ended January 28, 2007, cash generated from operations ($16.2 million) funded a net
increase in cash and cash equivalents ($15.2 million), payments on long-term debt ($597,000), and the purchase of property, plant and
equipment ($397,000, net).
During fiscal year 2006, cash generated from operations ($22.3 million) and proceeds from the sale of property, plant and equipment
($3.4 million principally from the sale of the Roanoke, Va. and Pleasant Garden, N.C. facilities) funded an increase in cash and cash
equivalents ($15.5 million), capital expenditures ($4.3 million), cash dividends ($3.7 million) and payments on long-term debt ($2.3
million).
During fiscal 2005, cash generated from operations ($19.6 million) and proceeds from the sale of property, plant and equipment ($5.2
million, principally from the sale of the Maiden, N.C. facility) funded payments on long-term debt and the termination of an interest
rate swap agreement ($9.9 million), an increase in cash and cash equivalents ($7.1 million), capital expenditures ($3.6 million), cash
dividends ($3.3 million), and the purchase and retirement of common stock ($930,000).
In fiscal year 2008, cash generated from operations of $43.7 million increased $21.3 million from $22.3 million in fiscal 2006. The
increase was due to a $51.9 million decline in payments to suppliers and employees (principally due to a decline in the purchase of
imported products) and a $1.3 million decrease in interest paid, net due to an increase interest income and a decline in interest
expense. The increase was partially offset by a $27.9 million decrease in cash received from customers and a $4.0 million increase in
income taxes paid, principally due to increased taxable income.
Cash generated from operations during the 2007 two-month transition period of $16.2 million increased 39.9%, or $4.6 million, from
$11.6 million in the fiscal 2006 first quarter. The increase was due to lower payments made to suppliers and employees and reduced
interest payments, offset by a decrease in cash received from customers and increased income tax payments. Payments to suppliers
and employees and cash received from customers reflect two months of activity and lower employee headcount in the 2007 transition
period compared to the three month fiscal 2006 first quarter. Interest payments declined $129,000 as a result of the shorter transition
period and lower outstanding debt levels compared to the prior year period.
In fiscal 2006, cash generated from operations of $22.3 million increased $2.7 million from $19.6 million in fiscal 2005. The increase
was due to a $10.0 million increase in cash received from customers, an $873,000 decline in income taxes paid (principally net
overpayments from 2005 that were recovered in 2006) and a $735,000 decrease in interest payments due to the $2.3 million decline in
long-term debt. The increase was partially offset by an $8.9 million increase in payments to suppliers and employees (principally due
to an increase in purchases of imported products).
28
Investing activities consumed $14.1 million in fiscal year 2008 compared to consuming $397,000 in the 2007 two-month transition
period, $859,000 in fiscal 2006 and generating $1.6 million in fiscal 2005. In fiscal year 2008, the investments of $10.6 million to
acquire Sam Moore, $5.3 million to acquire Opus Designs and the $1.9 million investments in property, plant and equipment exceeded
the $3.7 million in proceeds from the sale of property, plant and equipment (principally from the sale of the Martinsville, Va. facility).
The Company invested $419,000 in the 2007 transition period for the purchase of equipment and other assets to maintain and enhance
the Company’s business operating systems and facilities, offset by proceeds of $22,000 received from the sale property, plant and
equipment.
In fiscal 2006, the investment of $4.3 million in property, plant and equipment exceeded the $3.4 million in proceeds from the sale of
property, plant and equipment (principally from the sale of the Roanoke, Va. and Pleasant Garden, N.C. facilities). In fiscal 2005,
$5.2 million in proceeds from the sale of property, plant and equipment (principally from the sale of the Maiden, N.C. facility),
exceeded a $3.6 million investment in property, plant and equipment. As the number of domestic manufacturing plants has fallen
from nine to five, investments in new property, plant and equipment for manufacturing operations has declined but has increased for
supply chain management, distribution, warehousing, imports, the Company’s Container Direct Program and related computer
systems.
Financing activities consumed cash of $43.6 million in fiscal year 2008, $597,000 in the 2007 two-month transition period, $6.0
million in fiscal 2006 and $14.1 million in fiscal 2005. During fiscal year 2008, the Company expended cash of $36.0 million for the
repurchase of 1.7 million shares of Company common stock, cash dividends of $5.0 million and $2.5 million for scheduled debt
payments. During the 2007 transition period, the Company made a scheduled principal repayment of $597,000 on the Company’s
term loan. During fiscal 2006, the Company expended $2.3 million in cash for scheduled debt payments and cash dividends of $3.7
million. During fiscal 2005, the Company expended $4.6 million in cash for early redemption of industrial revenue bonds, paid $5.3
million in other scheduled debt payments, paid cash dividends of $3.3 million and redeemed 50,000 shares of Company common
stock for $930,000 under the Company’s stock repurchase authorization.
Swap Agreements
The Company is party to an interest rate swap agreement that in effect provides for a fixed interest rate of 4.1% through 2010 on its
term loan. In 2003, the Company terminated a similar swap agreement, which in effect provided a fixed interest rate of approximately
7.4% on that term loan. The Company’s $3.0 million payment to terminate the former swap agreement is being amortized over the
remaining payment period of the loan, resulting in an effective fixed interest rate of approximately 7.4% on the term loan. The
Company is accounting for the interest rate swap agreement as a cash flow hedge.
The aggregate fair market value of the Company’s swap agreement decreases when interest rates decline and increases when interest
rates rise. Overall, interest rates have declined since the inception of the Company’s swap agreement. The aggregate decrease in the
fair market value of the effective portion of the agreement of $191,000 ($311,000 pretax) as of February 3, 2008 and $69,000
($111,000 pretax) as of January 28, 2007 is reflected under the caption “accumulated other comprehensive loss” in the consolidated
balance sheets. See “Note 9 – Other Comprehensive Income (Loss)” to the Consolidated Financial Statements included in this report.
Substantially all of the aggregate pre-tax decrease in fair market value of the agreement is expected to be reclassified into interest
expense during the next twelve months.
Debt Covenant Compliance
The credit agreement for the Company’s revolving credit facility and outstanding term loan contains, among other things, financial
covenants as to minimum tangible net worth, debt service coverage, the ratio of funded debt to earnings before interest, taxes,
depreciation, amortization and maximum capital expenditures. The Company was in compliance with these covenants as of February
3, 2008.
Liquidity, Financial Resources and Capital Expenditures
As of February 3, 2008, the Company had an aggregate $13.6 million available under its revolving credit facility to fund working
capital needs. Standby letters of credit in the aggregate amount of $1.4 million, used to collateralize certain insurance arrangements
and for imported product purchases, were outstanding under the Company’s revolving credit facility as of February 3, 2008. There
were no additional borrowings outstanding under the revolving credit line on February 3, 2008. Any principal outstanding under the
credit line is due March 1, 2011.
The Company believes that it has the financial resources (including available cash and cash equivalents, expected cash flow from
operations, and lines of credit) needed to meet business requirements for the foreseeable future, including capital expenditures,
working capital, dividends on the Company’s common stock, repurchases of common stock under the Company’s stock repurchase
program and repayments of outstanding debt. Cash flow from operations is highly dependent on incoming order rates and the
29
Company’s operating performance. The Company expects to spend $4 to $6 million in capital expenditures during fiscal year 2009 to
maintain and enhance its operating systems and facilities.
Common Stock and Dividends
On February 7, 2007, the Company announced that its Board of Directors had authorized the repurchase of up to $20 million of the
Company’s common stock. On June 6, 2007, the Company announced that its Board of Directors increased this stock repurchase
authorization by $10 million to $30 million. This authorization had no expiration date, but the Company completed the repurchase
program in November 2007. The Company repurchased in open market transactions 1.4 million shares of Company common stock
under this authorization at an average price of $21.36 per share, excluding commissions.
On December 5, 2007, the Company announced that its Board of Directors had approved a new authorization to repurchase up to $10
million of the Company’s common stock. There is no expiration date for this authorization, but the Company expects the purchases to
be completed by the end of the 2009 fiscal year. Repurchases may be made from time-to-time in the open market, or in privately
negotiated transactions at prevailing market prices that the Company deems appropriate. The Company entered into a trading plan
under Rule 10b5-1 of the Securities Exchange Act of 1934 for effecting some or all of the purchases under this repurchase
authorization. The trading plan contains certain provisions that could restrict the amount and timing of purchases. The Company can
terminate this plan at any time. Through April 14, 2008, the Company had used $6.8 million of this authorization to purchase 351,581
shares of the Company’s common stock, with $3.2 million remaining available for future purchases.
On January 15, 2008, awards totaling 4,335 shares of restricted common stock were granted to five non-employee members of the
Board of Directors. Each award is subject to vesting requirements and other limitations in accordance with the Hooker Furniture 2005
Stock Incentive Plan.
On April 1, 2008, the Company’s Board of Directors declared a quarterly cash dividend of $0.10 per share, payable on May 30, 2008,
to shareholders of record May 16, 2008.
Commitments and Contractual Obligations
As of February 3, 2008, the Company’s commitments and contractual obligations were as follows:
Payments Due by Period (In thousands)
Less than More than
1 Year 1-3 Years 3-5 Years 5 Years Total
Long-term debt (a) ......................................... $2,926 $ 5,367 $ 8,293
Operating leases and agreements ................... 4,094 4,205 $ 162 $ 6 8,467
Other long-term liabilities (b) ........................ 331 744 1,088 15,951 18,114
Total contractual cash obligations ................. $7,351 $10,316 $1,250 $15,957 $34,874
(a) Represents principal and estimated interest payments under the Company’s term loan.
(b) Represents estimated payments to be made under deferred compensation arrangements.
Standby letters of credit in the aggregate amount of $1.4 million, used to collateralize certain insurance arrangements and for imported
product purchases, were outstanding under the Company’s revolving credit facility as of February 3, 2008. There were no additional
borrowings outstanding under the revolving credit line on February 3, 2008.
Strategy and Outlook
During fiscal 2008, Hooker Furniture continued to make significant progress toward its strategic goal of transforming itself into a
home furnishings design, marketing and logistics company with world-wide sourcing capabilities including:
completing the exit from domestic wood furniture manufacturing to concentrate on imported wood and metal and
domestically produced and imported upholstered home furnishings;
completing the purchase of the assets of Sam Moore Furniture LLC, a manufacturer of fabric-covered upscale occasional
chairs;
completing the purchase of certain of the assets of Opus Designs LLC, a youth bedroom furniture specialist, to expand the
Company’s youth bedroom furniture offerings and, long-term, to begin introducing more products, at a more moderate price
point, which appeal to a younger demographic;

30
completing the sale of the Company’s last domestic wood furniture plant and equipment and donating two former
Bradington-Young showrooms, thus eliminating the carrying costs and related operating and maintenance costs for those
facilities;
continuing to improve and expand the Company’s supply chain capabilities, with further improvements in forecasting and
demand-planning software and SKU count reduction, resulting in the reduction of inventories to optimal levels, while
maintaining flow of product to customers;
filling key leadership positions with people who have the skill sets and experience needed under the Company’s new business
model; and
opening a distribution facility located in the port area of Southern California to improve the Company’s service, and further
reduce inbound and outbound freight cost, to its dealers principally located on the U.S. West Coast, for certain imported
wood, metal and upholstered furniture products.
The Company anticipates that these changes will result in:
slightly improved operating margins,
increased sales, due to expanded product offerings,
reduced site operation and occupancy costs, and
lower inventory carrying costs.
During the year, Bradington-Young and Sam Moore launched a number of new domestic and imported products. Going forward, the
Company expects that Bradington-Young and Sam Moore will retain their business for domestically produced goods and expand sales
of their imported products. Following its acquisition, Sam Moore’s product distribution was expanded through Hooker’s independent
sales representatives. While Sam Moore operated at a loss in fiscal 2008, the Company believes that this improved market penetration
will result in increased sales once economic conditions improve and marginal profitability for Sam Moore in fiscal year 2009.
Hooker continues to offer its “store within a store” displays with the Company’s existing dealers through “SmartLiving ShowPlace”
galleries dedicated exclusively to multi-category and whole-home collections under the Hooker and Bradington-Young brands. The
mission of the SmartLiving program is to develop progressive partnerships with retailers consisting of a merchandising and marketing
plan to drive increased sales and profitability and positively impact consumers’ purchase decisions, satisfaction and loyalty through an
enhanced shopping experience.
The Company expects business conditions will remain challenging well into fiscal 2009 based on industry forecasts for a lower
growth rate in furniture shipments and a decline in the Company’s incoming orders since the 2006 fourth quarter. Although net sales
growth will continue to be challenging, the Company expects improved profitability because of the steps it has taken to reduce costs
and expand the Company’s product offerings.
Environmental Matters
Hooker Furniture is committed to protecting the environment. As a part of its business operations, the Company’s manufacturing sites
generate non-hazardous and hazardous wastes, the treatment, storage, transportation and disposal of which are subject to various local,
state and national laws relating to protecting the environment. The Company is in various stages of investigation, remediation or
monitoring of alleged or acknowledged contamination at current or former manufacturing sites for soil and groundwater
contamination and visible air emissions, none of which the Company believes is material to its results of operations or financial
position. The Company’s policy is to record monitoring commitments and environmental liabilities when expenses are probable and
can be reasonably estimated. The costs associated with the Company’s environmental responsibilities, compliance with federal, state
and local laws regulating the discharge of materials into the environment, or costs otherwise relating to the protection of the
environment, have not had and are not expected to have a material effect on the Company’s financial position, results of operations,
capital expenditures or competitive position.
Critical Accounting Policies and Estimates
The Company’s significant accounting policies are described in “Note 1 – Summary of Significant Accounting Policies” to the
consolidated financial statements beginning at page F-1 in this report. The preparation of financial statements in conformity with
U.S. generally accepted accounting principles requires management to make estimates and assumptions in certain circumstances that
affect amounts reported in the accompanying financial statements and related notes. In preparing these financial statements,
management has made its best estimates and judgments of certain amounts included in the financial statements, giving due
consideration to materiality. The Company does not believe that actual results will deviate materially from its estimates related to the
Company’s accounting policies described below. However, because application of these accounting policies involves the exercise of
judgment and the use of assumptions as to future uncertainties, actual results could differ materially from these estimates.

31
Allowance for Doubtful Accounts. The Company evaluates the adequacy of its allowance for doubtful accounts at the end of each
quarter. In performing this evaluation, the Company analyzes the payment history of its significant past due accounts, subsequent
cash collections on these accounts and comparative accounts receivable aging statistics. Based on this information, along with
consideration of the general strength of the economy, the Company develops what it considers to be a reasonable estimate of the
uncollectible amounts included in accounts receivable. This estimate involves significant judgment by management of the Company
and actual uncollectible amounts may differ materially from the Company’s estimate.
Valuation of Inventories. The Company values all of its inventories at the lower of cost (using the last-in, first-out (“LIFO”)
method) or market. LIFO cost for all of the Company’s inventories is determined using the dollar-value, link-chain method. This
method allows for the more current cost of inventories to be reported in cost of goods sold, while the inventories reported on the
balance sheet consist of the costs of inventories acquired earlier, subject to adjustment to the lower of cost or market. Hence, if prices
are rising, the LIFO method will generally lead to higher cost of goods sold and lower profitability as compared to the FIFO method.
The Company evaluates its inventory for excess or slow moving items based on recent and projected sales and order patterns. The
Company establishes an allowance for those items when the estimated market or net sales value is lower than their recorded cost. This
estimate involves significant judgment by management and actual values may differ materially from the Company’s estimate.
Impairment of Long-Lived Assets. Long-lived assets, such as property, plant and equipment, are evaluated for impairment when
events or changes in circumstances indicate that the carrying amount of the assets may not be recoverable through the estimated
undiscounted future cash flows from the use of those assets. When any such impairment exists, the related assets are written down to
fair value. Long-lived assets to be disposed of by sale are measured at the lower of their carrying amount or fair value less cost to sell,
are no longer depreciated, and are reported separately as “assets held for sale” in the consolidated balance sheets.
The Company’s domestic wood furniture manufacturing operations have suffered from lower demand and significant declines in
volume for its bedroom, home office and home entertainment products, principally due to competition from lower-priced imported
furniture products. These declines led to the Company’s exit from domestic wood manufacturing with the closing of the Company’s
Martinsville, Va. facility in March 2007, Roanoke, Va. facility in August 2006, Pleasant Garden, N.C. facility in October 2005,
Maiden, N.C. facility in October 2004 and Kernersville, N.C. facility in August 2003.
As a result of these plant closings, the Company recorded asset impairment charges to write down the carrying value of the related
assets to fair market value. The costs to dispose of these assets are recognized when management commits to a plan of disposal.
Severance and related benefits paid to terminated employees affected by the closings are recorded in the period when management
commits to a plan of termination. The Company recognizes liabilities for these exit and disposal activities at fair value in the period in
which the liability is incurred. Asset impairment charges related to the closure of manufacturing facilities are based on the Company’s
best estimate of expected sales prices, less related selling expenses for assets to be sold. The recognition of asset impairment and
restructuring charges for exit and disposal activities requires significant judgment and estimates by management. Management
reassesses its accrual of restructuring and asset impairment charges each reporting period. Any change in estimated restructuring and
related asset impairment charges is recognized in the period during which the change occurs.
Accounting Pronouncements
In March 2008, the Financial Accounting Standards Board (“FASB”) issued Statement of Financial Accounting Standard (“SFAS”)
No. 161, “Disclosures about Derivative Instruments and Hedging Activities – an amendment of FASB Statement No. 133.” The
objective of this statement is to require enhanced disclosures about an entity’s derivative and hedging activities and to improve the
transparency of financial reporting. This statement changes the disclosure requirements for derivative instruments and hedging
activities. Entities are required to provide enhanced disclosures about (a) how and why an entity uses derivative instruments, (b) how
derivative instruments and related hedged items are accounted for under Statement 133 and its related interpretations, and (c) how
derivative instruments and related hedged items affect an entity’s financial position, financial performance, and cash flows. This
statement is effective for financial statements issued for fiscal years and interim periods beginning after November 15, 2008, with
early application encouraged. This statement encourages, but does not require, comparative disclosures for earlier periods at initial
adoption. The Company expects to adopt the standard in its fiscal year 2010 first quarter, which will begin February 2, 2009. The
adoption of SFAS 161 is not expected to have a material impact on the Company’s financial position or results of operations.
In December 2007, the FASB issued a revision to SFAS No. 141R, “Business Combinations”. The objective of this Statement is to
improve the relevance, representational faithfulness, and comparability of the information that a reporting entity provides in its
financial reports about a business combination and its effects. To accomplish that, this statement establishes principles and
requirements for how the acquirer: a) recognizes and measures in its financial statements the identifiable assets acquired, the
liabilities assumed, and any noncontrolling interest in the acquiree; b) recognizes and measures the goodwill acquired in the business
combination or a gain from a bargain purchase; and c) determines what information to disclose to enable users of the financial

32
statements to evaluate the nature and financial effects of the business combination. This statement applies prospectively to business
combinations for which the acquisition date is on or after the beginning of the first annual reporting period beginning on or after
December 15, 2008. Early adoption of this standard is not permitted. Consequently, the Company expects to adopt the standard in its
fiscal year 2010 first quarter, which will begin February 2, 2009. The adoption of SFAS 141R is not expected to have a material
impact on the Company’s financial position or results of operations.
In March 2007, the Emerging Issues Task Force (“EITF”) reached a consensus on EITF No. 06-10 “Accounting for Collateral
Assignment Split-Dollar Life Insurance Arrangements”. The task force reached a consensus that requires an employer to measure the
asset associated with collateral-assignment split-dollar life insurance based on the arrangement’s terms. Under the consensus, an
employer would record a liability for a postretirement benefit only if the employer has agreed to maintain the life insurance policy
during the employee’s retirement or provide the employee with a death benefit. The consensus is effective for fiscal years beginning
after December 15, 2007. Consequently, the Company will adopt the EITF No. 06-10 in its fiscal year 2009 first quarter, which began
February 4, 2008. The adoption of EITF No. 06-10 is not expected to have a material impact on the Company’s financial position or
results of operations.
In February 2007, the FASB issued SFAS No. 159, “The Fair Value Option for Financial Assets and Financial Liabilities – Including
an Amendment of FASB Statement No. 115”. This statement permits entities to choose to measure many financial instruments and
certain other items at fair value. The objective is to improve financial reporting by providing entities with the opportunity to mitigate
volatility in reported earnings caused by measuring related assets and liabilities differently without having to apply complex hedge
accounting provisions. This statement is expected to expand the use of fair value measurement, which is consistent with FASB’s long-
term measurement objectives for accounting for financial instruments. This statement is effective as of the beginning of an entity’s
first fiscal year that begins after November 15, 2007. Early adoption is permitted as of the beginning of a fiscal year that begins on or
before November 15, 2007, provided the entity also elects to apply the provisions of FASB Statement No. 157, Fair Value
Measurements. Consequently, the Company will adopt the standard in its fiscal year 2009 first quarter, which began February 4,
2008. The adoption of SFAS 159 is not expected to have a material impact on the Company’s financial position or results of
operations.
In September 2006, the FASB issued SFAS No. 157, “Fair Value Measurements”. This statement defines fair value, establishes a
framework for measuring fair value under U.S. generally accepted accounting principles, and expands disclosures about fair value
measurements. This statement applies under other accounting pronouncements that require or permit fair value measurements, FASB
having previously concluded in those accounting pronouncements that fair value is the relevant measurement attribute. Accordingly,
this statement does not require any new fair value measurements. However, for some entities, the application of this statement will
change current practice. This statement is effective for financial statements issued for fiscal years beginning after November 15, 2007,
and interim periods within those fiscal years. Consequently, the Company will adopt the standard in its fiscal year 2009 first quarter,
which began February 4, 2008. The adoption of SFAS 157 is not expected to have a material impact on the Company’s financial
position or results of operations.
In September 2006, the EITF reached a consensus on EITF No. 06-5 “Accounting for Purchase of Life Insurance – Determining the
Amount That Could Be Realized in Accordance with FASB Technical Bulletin No. 85-4” . The task force reached a consensus on a
number of issues related to the purchase and surrender of life insurance contracts. The consensus is effective for fiscal years
beginning after December 15, 2006. Consequently, the Company adopted EITF No. 06-5 in its fiscal year 2008 first quarter, which
began on January 29, 2007. The adoption of EITF No. 06-5 did not have a material impact on the Company’s financial position or
results of operations.
ITEM 7A. QUANTITATIVE AND QUALITATIVE DISCLOSURES ABOUT MARKET RISK
The Company is exposed to market risk from changes in interest rates and foreign currency exchange rates, which could impact its
results of operations and financial condition. The Company manages its exposure to these risks through its normal operating and
financing activities and through the use of interest rate swap agreements with respect to interest rates.
The Company’s obligations under its lines of credit and term loan bear interest at variable rates. The outstanding balance under the
Company’s term loan amounted to $7.9 million as of February 3, 2008. The Company has entered into an interest rate swap
agreement that, in effect, fixes the rate of interest on its term loan at 4.1% through 2010. The notional principal value of the swap
agreement is substantially equal to the outstanding principal balance of the term loan. A fluctuation in market interest rates of one
percentage point (or 100 basis points) would not have a material impact on the Company’s results of operations or financial condition.

33
For imported products, the Company generally negotiates firm pricing denominated in U.S. Dollars with its foreign suppliers, for
periods typically of at least one year. The Company accepts the exposure to exchange rate movements beyond these negotiated
periods without using derivative financial instruments to manage this risk. Most of the Company’s imports are purchased from China.
The Chinese currency, formerly pegged to the U.S. Dollar, now floats within a limited range in relation to the U.S. Dollar, resulting in
additional exposure to foreign currency exchange rate fluctuations.
Since the Company transacts its imported product purchases in U.S. Dollars, a relative decline in the value of the U.S. Dollar could
increase the price the Company pays for imported products beyond the negotiated periods. The Company generally expects to reflect
substantially all of the effect of any price increases from suppliers in the prices it charges for imported products. However, these
changes could adversely impact sales volume and profit margin during affected periods.
ITEM 8. FINANCIAL STATEMENTS AND SUPPLEMENTARY DATA
The financial statements listed in Item 15(a), and which begin on page F-1, of this report are incorporated herein by reference and are
filed as a part of this report.
Certain Non-GAAP Financial Measures
The Company, in its Annual Report to Shareholders (of which this annual report on Form 10-K is a part), under the heading “Financial
Highlights,” has reported net income and earnings per share both including and excluding the impact of restructuring and asset
impairment charges, the January 2007 ESOP termination charge and the December 2007 charge related to the donation of two former
Bradington-Young showrooms. In this Form 10-K, under the headings “Results of Operations Fiscal 2008 Compared to Fiscal 2006,”
“Results of Operations Fiscal 2007 Two-Month Transition Period Compared to Fiscal 2006 First Quarter” and “Results of Operations
– Fiscal 2006 Compared to Fiscal 2005,” the Company has reported operating income margin both including and excluding the
impact of restructuring and asset impairment charges, the January 2007 ESOP termination charge and the December 2007 charge
related to the donation of two former Bradington-Young showrooms. The net income, earnings per share and operating income
margins figures excluding the impact of the items specified above are “non-GAAP” financial measures. The Company provides this
information because management believes it is useful to investors in evaluating the Company’s ongoing operations.
ITEM 9. CHANGES IN AND DISAGREEMENTS WITH ACCOUNTANTS ON ACCOUNTING AND FINANCIAL DISCLOSURE
None.
ITEM 9A. CONTROLS AND PROCEDURES
Evaluation of Disclosure Controls and Procedures
Based on their most recent review, which was made as of the end of the Company’s fourth quarter ended February 3, 2008, the
Company’s principal executive officer and principal financial officer have concluded that the Company’s disclosure controls and
procedures are effective to provide reasonable assurance that information required to be disclosed by the Company in the reports that
it files or submits under the Securities Exchange Act of 1934, as amended, is accumulated and communicated to the Company’s
management, including its principal executive officer and principal financial officer, as appropriate to allow timely decisions
regarding required disclosure and are effective to provide reasonable assurance that such information is recorded, processed,
summarized and reported within the time periods specified in the Securities and Exchange Commission (“SEC”) rules and forms.
Management’s Annual Report on Internal Control over Financial Reporting
In accordance with Section 404 of the Sarbanes-Oxley Act and SEC rules thereunder, management has conducted an assessment of the
Company’s internal control over financial reporting as of February 3, 2008. Management’s report regarding that assessment is
included with the financial statements on page F-2 of this report and is incorporated herein by reference.
Report of Registered Public Accounting Firm
The Company’s independent registered public accounting firm, KPMG LLP, audited the consolidated financial statements included inthis annual report on Form 10-K and have issued an audit report on the effectiveness of the Company’s internal control over financial reporting. Their report is included with the financial statements on page F-4 of this report and is incorporated herein by reference.

34
Changes in Internal Control over Financial Reporting
There have been no changes in the Company’s internal control over financial reporting for the Company’s fourth quarter ended
February 3, 2008, that have materially affected, or are reasonably likely to materially affect, the Company’s internal control over
financial reporting.
ITEM 9B. OTHER INFORMATION
On February 27, 2008, the Company renewed the $15 million revolving credit line under its credit facility with Bank of America, N.A.
The new maturity date for the revolving credit line is March 1, 2011. The other terms and conditions applicable to the revolving credit
line, including the financial covenants regarding minimum tangible net worth, debt service coverage, the ratio of funded debt to
earnings before interest, taxes, depreciation, amortization, and maximum capital expenditures, remain unchanged.

35
Hooker Furniture Corporation Part III
In accordance with General Instruction G (3) of Form 10-K, the information called for by Items 10, 11, 12, 13 and 14 of Part III is
incorporated by reference to the Company’s definitive Proxy Statement for its Annual Meeting of Shareholders scheduled to be held
June 30, 2008 (the “2008 Proxy Statement”), as set forth below:
ITEM 10. DIRECTORS, EXECUTIVE OFFICERS AND CORPORATE GOVERNANCE
Information related to the Company’s directors is set forth under the caption “Election of Directors” in the 2008 Proxy Statement and
is incorporated herein by reference.
Information relating to compliance with Section 16(a) of the Exchange Act is set forth under the caption “Section 16(a) Beneficial
Ownership Reporting Compliance” in the 2008 Proxy Statement and is incorporated herein by reference.
Information regarding material changes, if any, in the procedures by which shareholders may recommend nominees to the Company’s
Board of Directors will be set forth under the caption “Procedures for Shareholder Recommendations of Director Nominees” in the
2008 Proxy Statement and is incorporated herein by reference.
Information relating to the Audit Committee of the Company’s Board of Directors, including the composition of the Audit Committee
and the Board’s determinations concerning whether certain members of the Audit Committee are “financial experts” as that term is
defined under Item 407(d)(5) of Regulation S-K is set forth under the captions “Board and Board Committee Information” and “Audit
Committee” in the 2008 Proxy Statement and is incorporated herein by reference.
Information concerning the executive officers of the Company is included in Part I of this report under the caption “Executive Officers
of Hooker Furniture Corporation.”
The Company has adopted a Code of Business Conduct and Ethics, which applies to all of the Company’s employees and directors,
including the Company’s principal executive officer, principal financial officer and principal accounting officer. A copy of the
Company’s Code of Business Conduct and Ethics is available on the Company’s website at www.hookerfurniture.com. Amendments
of and waivers from the Company’s Code of Business Conduct and Ethics will be posted to the Company’s website when permitted
by applicable SEC and NASDAQ rules and regulations.
ITEM 11. EXECUTIVE COMPENSATION
Information relating to this item is set forth under the captions “Executive Compensation” and “Director Compensation” in the 2008
Proxy Statement and is incorporated herein by reference.
ITEM 12. SECURITY OWNERSHIP OF CERTAIN BENEFICIAL OWNERS AND MANAGEMENT AND RELATED SHAREHOLDER MATTERS
Information relating to this item is set forth under the captions “Equity Compensation Plan Information” and “Security Ownership of
Certain Beneficial Owners and Management” in the 2008 Proxy Statement and is incorporated herein by reference.
ITEM 13. CERTAIN RELATIONSHIPS AND RELATED TRANSACTIONS, AND DIRECTOR INDEPENDENCE
Information relating to this item is set forth under the captions “Certain Relationships and Related Transactions” and “Board and
Board Committee Information” in the 2008 Proxy Statement and is incorporated herein by reference.
ITEM 14. PRINCIPAL ACCOUNTANT FEES AND SERVICES
Information relating to this item is set forth under the caption “Ratification of Selection of Independent Registered Public Accounting
Firm” in the 2008 Proxy Statement and is incorporated herein by reference.

36
Hooker Furniture Corporation Part IV
ITEM 15. EXHIBITS AND FINANCIAL STATEMENT SCHEDULES
(a) Documents filed as part of this report on Form 10-K:
(1) The following financial statements are included in this report on Form 10-K:
Report of Independent Registered Public Accounting Firm
Consolidated Balance Sheets as of February 3, 2008 and January 28, 2007
Consolidated Statements of Operations for the fifty-three weeks ended February 3, 2008, the two-month transition period ended January 28, 2007 and the twelve months ended November 30, 2006 and 2005
Consolidated Statements of Cash Flows for the fifty-three weeks ended February 3, 2008, the two-month transition period ended January 28, 2007 and the twelve months ended November 30, 2006 and 2005
Consolidated Statements of Shareholders’ Equity for the twelve months ended November 30, 2006 and 2005, the two-month transition period ended January 28, 2007 and the fifty-three weeks ended February 3, 2008
Notes to Consolidated Financial Statements
(2) Financial Statement Schedules:
Financial Statement Schedules have been omitted because the information required has been separately disclosed in the consolidated financial statements or related notes.
(b) Exhibits:
3.1 Amended and Restated Articles of Incorporation of the Company, as amended March 28, 2003 (incorporated by reference to Exhibit 3.1 of the Company’s Form 10-Q (SEC File No. 000-25349) for the quarter ended February 28, 2003)
3.2 Amended and Restated Bylaws of the Company (incorporated by reference to Exhibit 3.2 to the Company’s Form 10-Q ((SEC File No. 000-25349) for the quarter ended August 31, 2006)
4.1 Amended and Restated Articles of Incorporation of the Company (See Exhibit 3.1)
4.2 Amended and Restated Bylaws of the Company (See Exhibit 3.2)
4.3(a) Credit Agreement, dated April 30, 2003, between Bank of America, N.A., and the Company (incorporated by reference to Exhibit 4.1 of the Company’s Form 10-Q (SEC File No. 000-25349) for the quarter ending May 31, 2003)
4.3(b) First Amendment to Credit Agreement, dated as of February 18, 2005, among the Company, the Lenders party thereto, and Bank of America, N.A., as agent (incorporated by reference to Exhibit 10.2 of the Company’s Form 10-Q (SEC File No. 000-25349) for the quarter ending February 28, 2005)
4.3(c) Second Amendment to Credit Agreement dated as of February 27, 2008, among the Company and Bank of America, N.A. as lender and agent (filed herewith)
Pursuant to Regulation S-K, Item 601(b)(4)(iii), instruments evidencing long-term debt not exceeding 10% of the Company’s total assets have been omitted and will be furnished to the Securities and Exchange Commission upon request.
10.1(a) Form of Executive Life Insurance Agreement dated December 31, 2003, between the Company and certain of its executive officers (incorporated by reference to Exhibit 10.1 of the Company’s Form 10-Q (SEC File No. 000-25349) for the quarter ended February 29, 2004)*
10.1(b)(i) Supplemental Retirement Income Plan effective as of December 1, 2003 (incorporated by reference to Exhibit 10.3 of the Company’s Form 10-Q (SEC File No. 000-25349) for the quarter ended February 29, 2004)*
10.1(b)(ii) First Amendment to the Supplemental Retirement Income Plan, dated as of May 24, 2007 (filed herewith)*
10.1(c) Summary of Compensation for Named Executive Officers (filed herewith)*

37
10.1(d) Summary of Director Compensation (filed herewith)*
10.1(e) Hooker Furniture Corporation 2005 Stock Incentive Plan (incorporated by reference to Appendix B of the Company’s
Definitive Proxy Statement dated March 1, 2005 (SEC File No. 000-25349))*
10.1(f) Form of Outside Director Restricted Stock Agreement (incorporated by reference to Exhibit 99.1 of the Company’s
Current Report on Form 8-K (SEC File No. 000-25349) filed January 17, 2006)*
10.1(g) Retirement Agreement, dated October 26, 2006, between Douglas C. Williams and the Company (incorporated by
reference to Exhibit 10.1(g) of the Company’s Annual Report on Form 10-K (SEC File No. 000-25349) filed February 28,
2007)*
10.1(h) Employment Agreement, dated June 15, 2007, between Alan D. Cole and the Company (filed herewith)*
10.2(a) Credit Agreement, dated April 30, 2003, between Bank of America, N.A., and the Company (See Exhibit 4.3(a))
10.2(b) First Amendment to Credit Agreement, dated as of February 18, 2005, among the Company, the Lenders party thereto, and
Bank of America, N.A., as agent (See Exhibit 4.3(b))
10.2(c) Second Amendment to Credit Agreement, dated as of February 27, 2008, among the Company and Bank of America, N.A.,
as lender and agent (See Exhibit 4.3(c))
21 List of Subsidiaries:
Bradington-Young LLC, a Virginia limited liability company Sam Moore Furniture LLC, a Virginia limited liability company
23 Consent of Independent Registered Public Accounting Firm (filed herewith)
31.1 Rule 13a-14(a) Certification of the Company’s principal executive officer (filed herewith)
31.2 Rule 13a-14(a) Certification of the Company’s principal financial officer (filed herewith)
32.1 Rule 13a-14(b) Certification of the Company’s principal executive officer pursuant to 18 U.S.C. Section 1350 as adopted pursuant to Section 906 of the Sarbanes-Oxley Act of 2002 (filed herewith)
32.2 Rule 13a-14(b) Certification of the Company’s principal financial officer pursuant to 18 U.S.C. Section 1350 as adopted pursuant to Section 906 of the Sarbanes-Oxley Act of 2002 (filed herewith)
*Management contract or compensatory plan

38
SIGNATURES
Pursuant to the requirements of Section 13 or 15(d) of the Securities Exchange Act of 1934, the registrant has duly caused this report
to be signed on its behalf by the undersigned, thereunto duly authorized.
HOOKER FURNITURE CORPORATION
April 16, 2008 /s/ Paul B. Toms, Jr.
Paul B. Toms, Jr.
Chairman, President and Chief Executive Officer
Pursuant to the requirements of the Securities Exchange Act of 1934, this report has been signed below by the following persons on
behalf of the registrant and in the capacities and on the dates indicated.
Signature Title Date
/s/ Paul B. Toms, Jr. Chairman, President, Chief Executive Officer and April 16, 2008
Paul B. Toms, Jr. Director (Principal Executive Officer)
/s/ E. Larry Ryder Executive Vice President - Finance and April 16, 2008
E. Larry Ryder Administration (Principal Financial Officer)
/s/ R. Gary Armbrister Chief Accounting Officer April 16, 2008
R. Gary Armbrister (Principal Accounting Officer)
/s/ W. Christopher Beeler, Jr. Director April 16, 2008
W. Christopher Beeler, Jr.
/s/ John L. Gregory, III Director April 16, 2008
John L. Gregory, III
/s/ Mark F. Schreiber Director April 16, 2008
Mark F. Schreiber
/s/ David G. Sweet Director April 16, 2008
David G. Sweet
/s/ Henry G. Williamson, Jr. Director April 16, 2008
Henry G. Williamson, Jr.

F-1
HOOKER FURNITURE CORPORATION AND SUBSIDIARIES INDEX TO CONSOLIDATED FINANCIAL STATEMENTS
Page
Management’s Report on Internal Control Over Financial Reporting ................................................... F-2
Report of Independent Registered Public Accounting Firm ................................................................... F-3
Consolidated Balance Sheets as of February 3, 2008 and January 28, 2007 ......................................... F-5
Consolidated Statements of Operations for the fifty-three weeks ended February 3, 2008, the two-month transition period ended January 28, 2007 and the twelve months ended November 30, 2006 and 2005 ................................................................................................................ F-6
Consolidated Statements of Cash Flows for the fifty-three weeks ended February 3, 2008, the two-month transition period ended January 28, 2007 and the twelve months ended November 30, 2006 and 2005 ................................................................................................................ F-7
Consolidated Statements of Shareholders’ Equity for the twelve months ended November 30, 2006 and 2005, the two-month transition period ended January 28, 2007 and the fifty-three weeks ended February 3, 2008 .............................................................................................................. F-8
Notes to Consolidated Financial Statements .......................................................................................... F-9

F-2
MANAGEMENT’S REPORT ON INTERNAL CONTROL OVER FINANCIAL REPORTING
To the Shareholders of Hooker Furniture Corporation Martinsville, Virginia
Management is responsible for establishing and maintaining adequate internal control over financial reporting, as defined in Exchange Act
Rule 13a-15(f). Under the supervision and with the participation of management, including the principal executive officer and principal
financial officer, the Company conducted an evaluation of the effectiveness of its internal control over financial reporting based on the
framework in Internal Control—Integrated Framework issued by the Committee of Sponsoring Organizations of the Treadway Commission
(COSO). Based on the Company’s evaluation under that framework, management concluded that the Company’s internal control over
financial reporting was effective as of February 3, 2008. The effectiveness of the Company’s internal control over financial reporting as of
February 3, 2008 has been audited by KPMG LLP, the Company’s independent registered public accounting firm, as stated in their report
which is included herein.
The Company acquired substantially all of the assets of Sam Moore Furniture Industries, Inc. on April 28, 2007. The Company operates the
Sam Moore business through a wholly owned subsidiary named Sam Moore Furniture LLC. Management did not include the Sam Moore
business in its evaluation of internal control over financial reporting as of February 3, 2008. The Sam Moore business constituted $11.3
million, or 6.4% of consolidated total assets and $20.8 million, or 6.6% of consolidated net sales of Hooker Furniture Corporation as of and
for the year ended February 3, 2008. Additional discussion regarding the Sam Moore acquisition and its impact on the Company’s financial
statements can be found in Note 4 of the Company’s consolidated financial statements.
Paul B. Toms, Jr.
Chairman, President and Chief Executive Officer
(Principal Executive Officer)
April 15, 2008
E. Larry Ryder
Executive Vice President – Finance and Administration
and Chief Financial Officer
(Principal Financial Officer)
April 15, 2008

F-3
REPORT OF INDEPENDENT REGISTERED PUBLIC ACCOUNTING FIRM
The Board of Directors and Shareholders Hooker Furniture Corporation:
We have audited the accompanying consolidated balance sheets of Hooker Furniture Corporation and subsidiaries as of February 3, 2008 and January 28, 2007 and the related consolidated statements of operations, cash flows and shareholders’ equity for each of: the fifty-three week period ended February 3, 2008; the two-month transition period ended January 28, 2007; and the twelve-month periods ended November 30, 2006 and 2005. These consolidated financial statements are the responsibility of the Company’s management. Our responsibility is to express an opinion on these consolidated financial statements based on our audits.
We conducted our audits in accordance with the standards of the Public Company Accounting Oversight Board (United States). Those standards require that we plan and perform the audit to obtain reasonable assurance about whether the financial statements are free of material misstatement. An audit includes examining, on a test basis, evidence supporting the amounts and disclosures in the financial statements. An audit also includes assessing the accounting principles used and significant estimates made by management, as well as evaluating the overall financial statement presentation. We believe that our audits provide a reasonable basis for our opinion.
In our opinion, the consolidated financial statements referred to above present fairly, in all material respects, the financial position of Hooker Furniture Corporation and subsidiaries as of February 3, 2008 and January 28, 2007, and the results of their operations and their cash flows for each of: the fifty-three week period ended February 3, 2008; the two-month transition period ended January 28, 2007; and the twelve-month periods ended November 30, 2006 and 2005 in conformity with U.S. generally accepted accounting principles.
As discussed in Note 13 to the consolidated financial statements, effective January 29, 2007, the Company adopted the provisions of
Financial Accounting Standards Board Interpretation No. 48, Accounting for Uncertainty in Income Taxes.
We also have audited, in accordance with the standards of the Public Company Accounting Oversight Board (United States), Hooker Furniture Corporation’s internal control over financial reporting as of February 3, 2008 based on criteria established in Internal Control—Integrated Framework issued by the Committee of Sponsoring Organizations of the Treadway Commission (COSO), and our report dated April 15, 2008 expressed an unqualified opinion on the effectiveness of the Company’s internal control over financial reporting.
Greensboro, North Carolina April 15, 2008

F-4
Report of Independent Registered Public Accounting Firm
The Board of Directors and Shareholders
Hooker Furniture Corporation:
We have audited Hooker Furniture Corporation’s internal control over financial reporting as of February 3, 2008, based on criteria established in
Internal Control – Integrated Framework issued by the Committee of Sponsoring Organizations of the Treadway Commission (COSO). Hooker
Furniture Corporation’s management is responsible for maintaining effective internal control over financial reporting and for its assessment of the
effectiveness of internal control over financial reporting, included in the accompanying Management’s Report On Internal Control Over Financial
Reporting. Our responsibility is to express an opinion on the Company’s internal control over financial reporting based on our audit.
We conducted our audit in accordance with the standards of the Public Company Accounting Oversight Board (United States). Those standards
require that we plan and perform the audit to obtain reasonable assurance about whether effective internal control over financial reporting was
maintained in all material respects. Our audit included obtaining an understanding of internal control over financial reporting, assessing the risk that a
material weakness exists, and testing and evaluating the design and operating effectiveness of internal control based on the assessed risk. Our audit
also included performing such other procedures as we considered necessary in the circumstances. We believe that our audit provides a reasonable
basis for our opinion.
A company’s internal control over financial reporting is a process designed to provide reasonable assurance regarding the reliability of financial
reporting and the preparation of financial statements for external purposes in accordance with generally accepted accounting principles. A company’s
internal control over financial reporting includes those policies and procedures that (1) pertain to the maintenance of records that, in reasonable
detail, accurately and fairly reflect the transactions and dispositions of the assets of the company; (2) provide reasonable assurance that transactions
are recorded as necessary to permit preparation of financial statements in accordance with generally accepted accounting principles, and that receipts
and expenditures of the company are being made only in accordance with authorizations of management and directors of the company; and
(3) provide reasonable assurance regarding prevention or timely detection of unauthorized acquisition, use, or disposition of the company’s assets
that could have a material effect on the financial statements.
Because of its inherent limitations, internal control over financial reporting may not prevent or detect misstatements. Also, projections of any
evaluation of effectiveness to future periods are subject to the risk that controls may become inadequate because of changes in conditions, or that the
degree of compliance with the policies or procedures may deteriorate.
In our opinion, Hooker Furniture Corporation maintained, in all material respects, effective internal control over financial reporting as of February 3,
2008, based on criteria established in Internal Control – Integrated Framework issued by the Committee of Sponsoring Organizations of the
Treadway Commission.
Hooker Furniture Corporation acquired substantially all of the assets of Sam Moore Furniture Industries, Inc. during 2008, and management excluded
from its assessment of the effectiveness of Hooker Furniture Corporation’s internal control over financial reporting as of February 3, 2008, the Sam
Moore Furniture business’s internal control over financial reporting associated with total assets of $11.3 million, or 6.4% of consolidated total assets
and net sales of $20.8 million, or 6.6% of consolidated net sales included in the consolidated financial statements of Hooker Furniture Corporation
and subsidiaries as of and for the year ended February 3, 2008. Our audit of internal control over financial reporting of Hooker Furniture Corporation
also excluded an evaluation of the internal control over financial reporting of the Sam Moore Furniture business.
We also have audited, in accordance with the standards of the Public Company Accounting Oversight Board (United States), the consolidated
balance sheets of Hooker Furniture Corporation and subsidiaries as of February 3, 2008 and January 28, 2007, and the related consolidated
statements of operations, cash flows and shareholders’ equity for each of: the fifty-three week period ended February 3, 2008; the two-month
transition period ended January 28, 2007; and the twelve-month periods ended November 30, 2006 and 2005, and our report dated April 15, 2008
expressed an unqualified opinion on those consolidated financial statements.
Greensboro, North Carolina April 15, 2008

F-5
HOOKER FURNITURE CORPORATION AND SUBSIDIARIES CONSOLIDATED BALANCE SHEETS
(In thousands)
As of February 3, January 28,
2008 2007
Assets Current assets
Cash and cash equivalents ............................................................................ $ 33,076 $ 47,085
Trade accounts receivable, less allowance for doubtful accounts
of $1,750 and $1,436 on each date ........................................................... 38,229 37,744
Inventories .................................................................................................... 50,560 62,803
Prepaid expenses and other current assets.................................................... 3,552 3,254
Assets held for sale ...................................................................................... 3,475
Total current assets .................................................................................. 125,417 154,361
Property, plant and equipment, net ................................................................... 25,353 24,839
Goodwill ........................................................................................................... 3,774 2,396
Intangible assets ................................................................................................ 5,892 4,400
Cash surrender value of life insurance policies ................................................. 12,173 11,506
Other assets ....................................................................................................... 2,623 4,961
Total assets .......................................................................................... $175,232 $202,463
Liabilities and Shareholders’ Equity
Current liabilities
Trade accounts payable ................................................................................ $ 13,025 $ 10,071
Accrued salaries, wages and benefits ........................................................... 3,838 6,918
Other accrued expenses ................................................................................ 3,553 7,676
Current maturities of long-term debt ............................................................ 2,694 2,503
Total current liabilities .............................................................................. 23,110 27,168
Long-term debt, excluding current maturities ................................................... 5,218 7,912
Deferred compensation ..................................................................................... 5,369 3,919
Other long-term liabilities ................................................................................. 709 1,154
Total liabilities ........................................................................................ 34,406 40,153
Shareholders’ equity
Common stock, no par value, 20,000 shares authorized,
11,561 and 13,269 shares issued and outstanding on each date ............... 18,182 20,840
Retained earnings ........................................................................................ 122,835 141,539
Accumulated other comprehensive loss ...................................................... (191) (69)
Total shareholders’ equity ....................................................................... 140,826 162,310
Total liabilities and shareholders’ equity ......................................... $175,232 $202,463
See accompanying Notes to Consolidated Financial Statements.

F-6
HOOKER FURNITURE CORPORATION AND SUBSIDIARIES CONSOLIDATED STATEMENTS OF OPERATIONS
(In thousands, except per share data)
For The Fifty-Three Two Months
Weeks Ended Ended Twelve Months Ended
February 3, January 28, November 30, November 30,
2008 2007 2006 2005
Net sales ..................................................................................... $316,801 $ 49,061 $350,026 $341,775
Cost of sales ............................................................................... 219,555 35,446 248,812 249,873
Gross profit ......................................................................... 97,246 13,615 101,214 91,902
Selling and administrative expenses .......................................... 67,240 9,458 71,549 65,497
ESOP termination compensation charge .................................... 18,428
Restructuring and asset impairment charges .............................. 309 2,973 6,881 5,250
Operating income (loss) ...................................................... 29,697 (17,244) 22,784 21,155
Other income (expense), net ...................................................... 1,472 129 ( 77) (646)
Income (loss) before income taxes ..................................... 31,169 (17,115) 22,707 20,509
Income taxes .............................................................................. 11,514 1,300 8,569 8,024
Net income (loss) ................................................................ $ 19,655 $(18,415) $ 14,138 $ 12,485
Earnings (loss) per share:
Basic and diluted ................................................................. $ 1.58 $ (1.52) $ 1.18 $ 1.06
Weighted average shares outstanding:
Basic ................................................................................... 12,442 12,113 11,951 11,795
Diluted ................................................................................ 12,446 12,113 11,953 11,795
Cash dividends declared per share ............................................. $ 0.40 $ $ 0.31 $ 0.28
See accompanying Notes to Consolidated Financial Statements.

F - 7
HOOKER FURNITURE CORPORATION AND SUBSIDIARIES CONSOLIDATED STATEMENTS OF CASH FLOWS
(In thousands)
For The Fifty-Three Two Months
Weeks Ended Ended Twelve Months Ended
February 3, January 28, November 30, November 30,
2008 2007 2006 2005
Cash flows from operating activities Cash received from customers .............................................. $321,189 $56,869 $349,075 $339,041
Cash paid to suppliers and employees .................................. (266,009) (40,202) (317,895) (308,957)
Income taxes paid, net .......................................................... (12,717) (480) (8,741) (9,614)
Interest received (paid), net .................................................. 1,195 28 (111) (846)
Net cash provided by operating activities ......................... 43,658 16,215 22,328 19,624
Cash flows from investing activities Acquisitions, net of cash required ........................................ (15,826) Purchase of property, plant and equipment .......................... (1,942) (419) (4,268) (3,590)
Proceeds from the sale of property and equipment ............... 3,668 22 3,409 5,226
Net cash (used in) provided by investing activities ........... (14,100) (397) (859) 1,636
Cash flows from financing activities Purchase and retirement of common stock ........................... (36,028) (930)
Cash dividends paid .............................................................. (5,036) (3,687) (3,286)
Payments on long-term debt ................................................. (2,503) (597) (2,283) (9,871)
Payment to terminate interest rate swap agreement .............. (38)
Net cash used in financing activities ................................. (43,567) (597) ( 5,970) ( 14,125)
Net (decrease) increase in cash and cash equivalents ........... (14,009) 15,221 15,499 7,135
Cash and cash equivalents at beginning of year .................... 47,085 31,864 16,365 9,230
Cash and cash equivalents at end of year .............................. $ 33,076 $47,085 $ 31,864 $ 16,365
Reconciliation of net income (loss) to net cash provided by operating activities Net income (loss) ....................................................................... $ 19,655 $ (18,415) $ 14,138 $ 12,485
Depreciation and amortization .............................................. 3,352 681 4,645 6,296
Non-cash ESOP cost ............................................................. 18,149 2,646 3,217
Restricted stock compensation cost ...................................... 47 18 8
Restructuring and related asset impairment charges ............. 309 2,973 6,881 5,250
(Loss) gain on disposal of property ...................................... (100) 2 (10)
Donation of showroom facilities .......................................... 1,082 Provision (credit) for doubtful accounts ............................... 1,313 (182) 1,920 569
Deferred income tax expense (benefit) ................................. 2,624 (787) (3,273) (1,479)
Changes in assets and liabilities, net of effect from acquisitions:
Trade accounts receivable ............................................. 2,972 7,882 (3,371) (3,602)
Inventories ..................................................................... 18,757 5,336 579 992
Prepaid expenses and other assets ................................. (1,141) 844 (1,224) (2,550)
Trade accounts payable ................................................. 2,063 (1,180) (2,621) (1,058)
Accrued salaries, wages and benefits ............................ (3,256) (1,589) (1,340) (2,440)
Accrued income taxes ................................................... (3,826) 1,607 2,489
Other accrued expenses ................................................. (1,198) 255 313 300
Other long-term liabilities ............................................. 1,005 641 526 1,646
Net cash provided by operating activities .................. $ 43,658 $ 16,215 $ 22,328 $ 19,624
See accompanying Notes to Consolidated Financial Statements.

F-8
HOOKER FURNITURE CORPORATION AND SUBSIDIARIES CONSOLIDATED STATEMENTS OF SHAREHOLDERS’ EQUITY
(In thousands, except per share data)
For The Twelve Month Periods Ended November 30, 2005 and November 30, 2006; The Two-Month Transition Period Ended January 28, 2007 and the Fifty-Three Week Period Ended February 3, 2008
Accumulated
Unearned Other Total
Common Stock ESOP Retained Comprehensive Shareholders’
Shares Amount Shares Earnings Loss Equity
Balance at November 30, 2004 ......................................... 14,475 $ 7,385 $(16,927) $146,886 $(759) $136,585
Net income ....................................................................... 12,485 12,485
Unrealized gain on interest rate swap ............................... 533 533
Total comprehensive income ............................................ 13,018
Cash dividends ($0.28 per share) ...................................... (3,286) (3,286)
Purchase and retirement of common stock ....................... (50) (28) (902) (930)
ESOP cost ......................................................................... 2,159 1,066 3,225
Balance at November 30, 2005 ..................................... 14,425 9,516 (15,861) 155,183 (226) 148,612
Cumulative effect adjustment as a result of the
implementation of SEC Staff Accounting Bulletin
No. 108 .......................................................................... 692 692
Balance at December 1, 2005 ..................................... 14,425 9,516 (15,861) 155,875 (226) 149,304
Net income ....................................................................... 14,138 14,138
Unrealized gain on interest rate swap ............................... 117 117
Total comprehensive income ............................................ 14,255
Cash dividends ($0.31 per share) ...................................... (3,687) (3,687)
Restricted stock grants, net of forfeitures ......................... 4
Restricted stock compensation cost .................................. 18 18
ESOP cost ........................................................................ 1,620 1,026 2,646
Balance at November 30, 2006 ....................................... 14,429 11,154 (14,835) 166,326 ( 109) 162,536
Net loss ............................................................................. (18,415) (18,415)
Unrealized gain on interest rate swap ............................... 40 40
Total comprehensive loss ................................................. (18,375)
Restricted stock grants ...................................................... 5
Restricted stock compensation cost .................................. 8 8
ESOP termination ............................................................. (1,165) 9,678 14,835 (6,372) 18,141
Balance at January 28, 2007 ......................................... 13,269 20,840 141,539 ( 69) 162,310
Net income ....................................................................... 19,655 19,655Unrealized loss on interest rate swap ................................ (122) (122)Total comprehensive income ............................................ 19,533Cash dividends ($0.40 per share) ...................................... (5,036) (5,036)Restricted stock grants, net of forfeitures ......................... 4
Restricted stock compensation cost .................................. 47 47Purchase and retirement of common stock ....................... (1,712) (2,705) (33,323) (36,028)
Balance at February 3, 2008 ..................................... 11,561 $18,182 $ $122,835 $(191) $140,826
See accompanying Notes to Consolidated Financial Statements.

F-9
NOTE 1 – SUMMARY OF SIGNIFICANT ACCOUNTING POLICIES
Nature of Business
Hooker Furniture Corporation and subsidiaries (the “Company”) design, import, manufacture and market residential household furniture for sale to wholesale and retail merchandisers located principally in North America.
Consolidation
The consolidated financial statements include the accounts of Hooker Furniture Corporation and its wholly owned subsidiaries. Allmaterial intercompany accounts and transactions have been eliminated in consolidation.
Certain items in the consolidated financial statements and the notes to the consolidated financial statements for the periods prior to fiscal year 2008 have been reclassified to conform to the fiscal year 2008 method of presentation.
Change in Fiscal Year
On August 29, 2006, the Company approved a change in its fiscal year. After the fiscal year that ended November 30, 2006, the
Company’s fiscal years will end on the Sunday nearest to January 31. In addition, starting with the fiscal year that began January 29,
2007, the Company adopted quarterly periods based on thirteen-week “reporting periods” (which will end on a Sunday) rather than
quarterly periods consisting of three calendar months. As a result, each quarterly period generally will be thirteen weeks, or 91 days,
long. However, since the Company’s fiscal year will end on the Sunday closest to January 31, in some years (generally once every six
years) the fourth quarter will be fourteen weeks long and the fiscal year will consist of 53 weeks (for example, the fiscal year that
ended February 3, 2008 was 53 weeks).
The Company completed a two-month transition period that began December 1, 2006 and ended January 28, 2007 and filed a
transition report on Form 10-Q for that period on March 16, 2007. These financial statements are being filed as part of an annual
report on Form 10-K covering the fifty-three week period that began January 29, 2007 and ended February 3, 2008. These financial
statements also include the two-month transition period that began December 1, 2006 and ended January 28, 2007 and the twelve-
month periods that ended November 30, 2006 and 2005. The Company did not recast the financial statements for the twelve-month
periods ended November 30, 2006 and 2005 principally because the financial reporting processes in place for those periods included
certain procedures that were completed only on a quarterly basis. Consequently, to recast those periods would have been impractical
and would not have been cost-justified.
References to the 2008 fiscal year and comparable terminology in the notes to the consolidated financial statements mean the fiscal
year that began January 29, 2007 and ended February 3, 2008. References to the 2007 two-month transition period and comparable
terminology in the notes to the consolidated financial statements refers to the period that began December 1, 2006 and ended January
28, 2007. References to the 2006 and 2005 fiscal years and comparable terminology in the notes to the consolidated financial
statements refers to the fiscal years that began December 1, 2006 and 2005 and ended November 30, 2006 and 2005, respectively.
Cash and Cash Equivalents
The Company temporarily invests its unused cash balances in a high quality, diversified money market fund that provides for daily liquidity and pays dividends monthly. Cash and cash equivalents invested in short-term liquid investments amounted to $23.5 million at February 3, 2008 and $37.7 million at January 28, 2007. Cash equivalents are stated at cost plus accrued interest, which approximates market.
Trade Accounts Receivable
Substantially all of the Company’s trade accounts receivable are due from retailers and dealers that sell residential home furnishings, which consist of a large number of entities with a broad geographical dispersion. The Company continually performs credit evaluations of its customers and generally does not require collateral. The Company’s upholstered furniture subsidiaries factorsubstantially all of their receivables on a non-recourse basis. Accounts receivable are reported net of allowance for doubtful accounts.

F-10
The activity in the allowance for doubtful accounts was:
Fifty-Three Two-Months
Weeks Ended Ended Twelve Months Ended
February 3, January 28, November 30, November 30,
2008 2007 2006 2005
Balance at beginning of year ............................................................ $1,436 $1,807 $1,352 $1,341
Non-cash charges to cost and expenses ......................................... 1,313 (182) 1,920 569
Allowance for doubtful accounts acquired in acquisitions ........... 257 Less uncollectible receivables written off, net of recoveries ............ (1,256) (189) (1,465) (558)
Balance at end of year ................................................................... $1,750 $1,436 $1,807 $1,352
Fair Value of Financial Instruments
The carrying value for each of the Company’s financial instruments (consisting of cash and cash equivalents, trade accounts
receivable and payable, and accrued liabilities) approximates fair value because of the short-term nature of those instruments. The fair
value of the Company’s term loan is estimated based on the quoted market rates for similar debt with a similar remaining maturity.
On February 3, 2008 and January 28, 2007, the carrying value of the term loan approximated fair value. The fair value of the
Company’s interest rate swap agreement is based on values provided by the issuer.
Inventories
All inventories are stated at the lower of cost, using the last-in, first-out (LIFO) method, or market.
Property, Plant and Equipment
Property, plant and equipment is stated at cost, less allowances for depreciation. Provision for depreciation has been computed
(generally by the declining balance method) at annual rates that will amortize the cost of the depreciable assets over their estimated
useful lives.
Impairment of Long-Lived Assets
Long-lived assets, such as property, plant and equipment, are evaluated for impairment when events or changes in circumstances
indicate that the carrying amount of the assets may not be recoverable through the estimated undiscounted future cash flows from the
use of those assets. When any such impairment exists, the related assets are written down to fair value. Long-lived assets to be
disposed of by sale are measured at the lower of their carrying amount or fair value less cost to sell, are no longer depreciated, and are
reported separately as “assets held for sale” in the consolidated balance sheets.
Capitalized Software Costs
Certain costs incurred in connection with developing or obtaining computer software for internal use that has a useful life of three or
more years are capitalized. These costs are amortized over five years or less, and generally over five years. The activity in capitalized
software costs was:
Fifty-Three Two-Months
Weeks Ended Ended Twelve Months Ended
February 3, January 28, November 30, November 30,
2008 2007 2006 2005
Balance beginning of year ..................................................................... $1,847 $1,576 $2,961 $4,366
Software acquired in the acquisition of Sam Moore ......................... 458 Purchases .......................................................................................... 2,176 540 166 607
Amortization expense ....................................................................... (1,142) (269) (1,407) (1,906)
Disposals ........................................................................................... (46) (144) (106)
Balance end of year ....................................................................... $3,293 $1,847 $1,576 $2,961

F-11
Goodwill and Intangible Assets
The Company owns certain amortizable and indefinite-lived intangible assets and goodwill related to Bradington-Young, Sam Moore
and Opus Designs. The principal amortizable intangible assets are non-compete agreements and furniture designs, which are
amortized over their estimated useful lives. The principal indefinite-lived intangible assets are trademarks and trade names.
Goodwill, trademarks and trade names have indefinite lives and are not amortized but are tested for impairment annually or more
frequently if events or circumstances indicate that the asset might be impaired.
The fair value of the indefinite-lived intangible assets is determined based on the estimated earnings and cash flow capacity of those
assets. The impairment test consists of a comparison of the fair value of the indefinite-lived intangible assets with their carrying
amount. If the carrying value of the indefinite-lived intangible assets exceeds their fair value, an impairment loss is recognized in an
amount equal to that excess.
Goodwill is tested for impairment by the Company at the reporting unit level and involves two steps. First, the Company determines
the fair value of the reporting unit and compares it to the reporting unit’s carrying amount including goodwill. Second, if the carrying
amount of the reporting unit exceeds its fair value, an impairment loss is recognized to the extent the carrying amount of the reporting
unit’s goodwill exceeds the implied fair value of that goodwill. The implied fair value of goodwill is determined by allocating the fair
value of the reporting unit to its assets in a manner similar to a purchase price allocation. The residual fair value resulting from this
allocation is the implied fair value of the reporting unit goodwill.
No impairment losses have been recorded for goodwill or intangible assets through February 3, 2008.
Cash Surrender Value of Life Insurance Policies
The Company owns key-man life insurance policies on certain executives and other key employees and also maintains a collateral
interest to the extent of premiums paid by the Company with respect to split-dollar life insurance policies on certain executives.
Proceeds of the policies are used to fund certain executive life insurance benefits and for other general corporate purposes. The
Company accounts for life insurance as a component of its employee benefits cost. Consequently the cost of the coverage and any
resulting gains or losses related to those insurance policies are recorded as a decrease or increase to operating income. The cash
surrender value of those life insurance policies amounted to $12.2 million as of February 3, 2008 and $11.5 million as of January 28,
2007.
Derivative Instruments and Hedging Activities
The Company uses interest rate swap agreements to manage variable interest rate exposure on the majority of its long-term debt. The
Company’s objective for holding these derivatives is to decrease the volatility of future cash flows associated with interest payments
on its variable rate debt. The Company does not issue derivative instruments for trading purposes. The Company accounts for its
interest rate swap agreements as cash flow hedges. For derivatives designated as cash flow hedges, the effective portion of changes in
the fair value of the derivative is initially reported in “accumulated other comprehensive income or loss” on the consolidated balance
sheets and subsequently reclassified to interest expense when the hedged exposure affects income (i.e. as interest expense accrues on
the related outstanding debt). Differences between the amounts paid and amounts received under the swap agreements are recognized
in interest expense.
In some cases, such as upon the early repayment of a debt instrument, the Company may continue to hold an interest rate swap for a
period of time after the related principal has been paid rendering the hedge ineffective. Changes in the ineffective portion of the fair
value of the derivative are accounted for through interest expense. The notional principal value of the Company’s swap agreement
outstanding as of February 3, 2008 was equal to the outstanding principal balance of the corresponding debt instrument.
Revenue Recognition
The Company recognizes sales revenue when title and the risk of loss pass to the customer, which occurs at the time of shipment.
Sales are recorded net of allowances for trade promotions, estimated product returns, rebate advertising programs and other discounts.

F-12
Advertising
The Company has advertising programs under which it may provide signage, catalogs and other marketing support to its customers
and may reimburse advertising and other costs incurred by its customers in connection with promoting the Company’s products. The
cost of these programs does not exceed the fair value of the benefit received. The Company charges the cost of point-of-purchase
materials (including signage and catalogs) to selling and administrative expense as incurred, which amounted to $3.0 million in fiscal
2008, $288,000 in the 2007 two-month transition period, $2.8 million in fiscal 2006 and $3.8 million in fiscal 2005. The cost for the
Company’s other advertising programs is charged against net sales.
Shipping and Handling Costs
Amounts billed to customers that represent shipping and handling are reported as net sales. The Company’s shipping and handling
costs, which include all costs to warehouse and distribute goods to customers, are classified in selling and administrative expenses and
amounted to $15.3 million in fiscal 2008, $2.4 million in the 2007 two-month transition period, $20.9 million in fiscal 2006 and $15.2
million in fiscal 2005.
Income Taxes
Income taxes are accounted for under the asset and liability method. Deferred income taxes reflect the expected future tax
consequences of differences between the book and income tax bases of assets and liabilities using enacted tax rates in effect in the
years in which those differences are expected to reverse.
Earnings Per Share
Basic earnings per share is computed by dividing income available to common shareholders by the weighted average number of
common shares outstanding for the period. Unearned ESOP shares (2.4 million shares at November 30, 2006 and 2.5 million shares at
November 30, 2005) were not considered outstanding for purposes of calculating basic or diluted earnings per share. Diluted earnings
per share reflects the potential dilutive effect of securities that could share in the earnings of the Company. The Company has issued
restricted stock awards to non-employee members of the board of directors under the Company’s 2005 Stock Incentive Plan, and
expects to continue to grant these awards to non-employee board members in the future. As of February 3, 2008, there were 13,130
shares and as of January 28, 2007 there were 8,795 shares of restricted stock outstanding, net of forfeitures and vested shares.
Restricted shares awarded that have not yet vested are considered when computing diluted earnings per share.
Concentrations of Sourcing Risk
The Company sources its imported products through over 30 different vendors, from 59 separate factories, located in seven countries.
Because of the large number and diverse nature of the foreign factories from which the Company can source its imported products, the
Company has some flexibility in the placement of products in any particular factory or country. As of February 3, 2008, the Company
held $7.9 million in inventory (4.5% of total assets) outside of the United States, in China.
Factories located in China have become an important resource for the Company. In fiscal year 2008, imported products sourced from
China accounted for approximately 87% of import purchases, and the factory in China from which the Company directly sources the
most product accounted for approximately 38% of the Company’s worldwide purchases of imported product. A sudden disruption in
the Company’s supply chain from this factory, or from China in general, could significantly impact the Company’s ability to fill
customer orders for products manufactured at that factory or in that country. If such a disruption were to occur, the Company believes
that it would have sufficient inventory to adequately meet demand for approximately three months. Also, with the broad spectrum of
product the Company offers, the Company believes that, in some cases, buyers could be offered similar product available from
alternative sources. The Company believes that it could, most likely at higher cost, source most of the products currently sourced in
China from factories in other countries and could produce certain upholstered products domestically at its own factories. However,
supply disruptions and delays on selected items could occur for approximately six months. If the Company were to be unsuccessful in
obtaining those products from other sources, or at comparable cost, then a sudden disruption in the Company’s supply chain from its
largest import furniture supplier, or from China in general, could have a short-term material adverse effect on the Company’s results
of operations. Given the capacity available in China and other low-cost producing countries, the Company believes the risks from
these potential supply disruptions are manageable.

F-13
Use of Estimates
The preparation of financial statements in conformity with U.S. generally accepted accounting principles requires management to
make estimates and assumptions that affect the reported amounts of assets and liabilities, as well as disclosures regarding contingent
assets and liabilities at the date of the financial statements; and the reported amounts of revenue and expenses during the reported
periods. Actual results could differ from those estimates.
Accounting Pronouncements
In March 2008, the Financial Accounting Standards Board (“FASB”) issued Statement of Financial Accounting Standard (“SFAS”)
No. 161, “Disclosures about Derivative Instruments and Hedging Activities – an amendment of FASB Statement No. 133.” The
objective of this statement is to require enhanced disclosures about an entity’s derivative and hedging activities and to improve the
transparency of financial reporting. This statement changes the disclosure requirements for derivative instruments and hedging
activities. Entities are required to provide enhanced disclosures about (a) how and why an entity uses derivative instruments, (b) how
derivative instruments and related hedged items are accounted for under Statement 133 and its related interpretations, and (c) how
derivative instruments and related hedged items affect an entity’s financial position, financial performance, and cash flows. This
statement is effective for financial statements issued for fiscal years and interim periods beginning after November 15, 2008, with
early application encouraged. This statement encourages, but does not require, comparative disclosures for earlier periods at initial
adoption. The Company expects to adopt the standard in its fiscal year 2010 first quarter, which will begin February 2, 2009. The
adoption of SFAS 161 is not expected to have a material impact on the Company’s financial position or results of operations.
In December 2007, the FASB issued a revision to SFAS No. 141R, “Business Combinations”. The objective of this Statement is to
improve the relevance, representational faithfulness, and comparability of the information that a reporting entity provides in its
financial reports about a business combination and its effects. To accomplish that, this statement establishes principles and
requirements for how the acquirer: a) recognizes and measures in its financial statements the identifiable assets acquired, the
liabilities assumed, and any noncontrolling interest in the acquiree; b) recognizes and measures the goodwill acquired in the business
combination or a gain from a bargain purchase; and c) determines what information to disclose to enable users of the financial
statements to evaluate the nature and financial effects of the business combination. This statement applies prospectively to business
combinations for which the acquisition date is on or after the beginning of the first annual reporting period beginning on or after
December 15, 2008. Early adoption of this standard is not permitted. Consequently, the Company expects to adopt the standard in its
fiscal year 2010 first quarter, which will begin February 2, 2009. The adoption of SFAS 141R is not expected to have a material
impact on the Company’s financial position or results of operations.
In March 2007, the Emerging Issues Task Force (“EITF”) reached a consensus on EITF No. 06-10 “Accounting for Collateral
Assignment Split-Dollar Life Insurance Arrangements”. The task force reached a consensus that requires an employer to measure the
asset associated with collateral-assignment split-dollar life insurance based on the arrangement’s terms. Under the consensus, an
employer would record a liability for a postretirement benefit only if the employer has agreed to maintain the life insurance policy
during the employee’s retirement or provide the employee with a death benefit. The consensus is effective for fiscal years beginning
after December 15, 2007. Consequently, the Company will adopt the EITF No. 06-10 in its fiscal year 2009 first quarter, which began
February 4, 2008. The adoption of EITF No. 06-10 is not expected to have a material impact on the Company’s financial position or
results of operations.
In February 2007, the FASB issued SFAS No. 159, “The Fair Value Option for Financial Assets and Financial Liabilities – Including
an Amendment of FASB Statement No. 115”. This statement permits entities to choose to measure many financial instruments and
certain other items at fair value. The objective is to improve financial reporting by providing entities with the opportunity to mitigate
volatility in reported earnings caused by measuring related assets and liabilities differently without having to apply complex hedge
accounting provisions. This statement is expected to expand the use of fair value measurement, which is consistent with FASB’s long-
term measurement objectives for accounting for financial instruments. This statement is effective as of the beginning of an entity’s
first fiscal year that begins after November 15, 2007. Early adoption is permitted as of the beginning of a fiscal year that begins on or
before November 15, 2007, provided the entity also elects to apply the provisions of FASB Statement No. 157, Fair Value
Measurements. Consequently, the Company will adopt the standard in its fiscal year 2009 first quarter, which began February 4,
2008. The adoption of SFAS 159 is not expected to have a material impact on the Company’s financial position or results of
operations.
In September 2006, the FASB issued SFAS No. 157, “Fair Value Measurements”. This statement defines fair value, establishes a
framework for measuring fair value under U.S. generally accepted accounting principles, and expands disclosures about fair value

F-14
measurements. This statement applies under other accounting pronouncements that require or permit fair value measurements, FASB
having previously concluded in those accounting pronouncements that fair value is the relevant measurement attribute. Accordingly,
this statement does not require any new fair value measurements. However, for some entities, the application of this statement will
change current practice. This statement is effective for financial statements issued for fiscal years beginning after November 15, 2007,
and interim periods within those fiscal years. Consequently, the Company will adopt the standard in its fiscal year 2009 first quarter,
which began February 4, 2008. The adoption of SFAS 157 is not expected to have a material impact on the Company’s financial
position or results of operations.
In September 2006, the EITF reached a consensus on EITF No. 06-5 “Accounting for Purchase of Life Insurance – Determining the
Amount That Could Be Realized in Accordance with FASB Technical Bulletin No. 85-4” . The task force reached a consensus on a
number of issues related to the purchase and surrender of life insurance contracts. The consensus is effective for fiscal years
beginning after December 15, 2006. Consequently, the Company adopted EITF No. 06-5 in its fiscal year 2008 first quarter, which
began on January 29, 2007. The adoption of EITF No. 06-5 did not have a material impact on the Company’s financial position or
results of operations.
NOTE 2 – INVENTORIES February 3, January 28,
2008 2007
Finished furniture ........................................................................... $52,602 $64,536
Furniture in process ....................................................................... 1,217 1,514
Materials and supplies .................................................................... 7,814 7,952
Inventories at FIFO ..................................................................... 61,633 74,002
Reduction to LIFO basis ................................................................ 11,073 11,199
Inventories ................................................................................... $50,560 $62,803
If the first-in, first-out (FIFO) method had been used in valuing all inventories, net income (loss) would have been $19.5 million in
fiscal 2008, $(18.3) million in the 2007 two-month transition period, $13.7 million in fiscal 2006 and $12.7 million in fiscal 2005.
NOTE 3 – PROPERTY, PLANT AND EQUIPMENT
Depreciable Lives February 3, January 28,
(In years) 2008 2007
Buildings and land improvements .............................................. 15 – 30 $23,076 $22,976
Machinery and equipment .......................................................... 10 3,425 2,097
Furniture and fixtures ................................................................. 3 - 8 27,516 23,066
Other .......................................................................................... 5 3,740 3,042
Total depreciable property at cost ............................................ 57,757 51,181
Less accumulated depreciation .................................................. 34,558 29,907
Total depreciable property, net ................................................. 23,199 21,274
Land ........................................................................................... 1,387 1,472
Construction in progress ............................................................ 767 2,093
Property, plant and equipment, net ........................................... $25,353 $24,839

F-15
NOTE 4 – GOODWILL AND INTANGIBLE ASSETS Useful Lives February 3, January 28,
(In years) 2008 2007
Goodwill .................................................................................... $3,774 $2,396
Non-amortizable Intangible Assets Trademarks and trade names ...................................................... $5,796 $4,400
Amortizable Intangible Assets Non-compete agreements ........................................................... 4 700 700 Furniture designs ........................................................................ 3 100 Total amortizable intangible assets ............................................ 800 700 Less accumulated amortization .................................................. 704 700 Net carrying value .................................................................... 96
Intangible assets ....................................................................... $5,892 $4,400
The Company has recorded goodwill and certain intangible assets related to Bradington-Young, Sam Moore and Opus Designs (see
“Note 5 – Acquisition”). The goodwill, trademarks and trade names have indefinite useful lives and consequently are not subject to
amortization for financial reporting purposes but are tested for impairment annually or more frequently if events or circumstances
indicate that the asset might be impaired. See “Note 1 – Summary of Significant Accounting Policies: Goodwill and Intangible
Assets.” For tax reporting purposes the goodwill and intangible assets are being amortized over 15 years on a straight line basis.
NOTE 5 – ACQUISITIONS
On April 28, 2007, the Company completed its acquisition of substantially all of the assets of Bedford, Virginia-based Sam Moore
Furniture Industries, Inc., a manufacturer of upscale occasional chairs with an emphasis on fabric-to-frame customization in the upper-
medium to high-end price niches. The Company operates the business as Sam Moore Furniture LLC. The Company acquired the
Sam Moore operation for an aggregate purchase price of $12.1 million, consisting of $10.3 million in cash (net of cash acquired), $1.5
million in assumed liabilities and acquisition-related fees of $333,000.
Based on an appraisal of the assets of Sam Moore, the fair value of those assets exceeded the Company’s purchase price paid. This
$3.6 million excess over purchase price paid was allocated as a reduction to the fair value of property, plant and equipment and
intangible assets in determining their recorded values.
The recorded values of the assets acquired and liabilities assumed were: April 28, 2007
Current assets ....................................................................................................................... $ 8,668 Property, plant and equipment ............................................................................................. 3,076 Intangible assets ................................................................................................................... 396 Total assets acquired ......................................................................................................... 12,140 Current liabilities assumed ................................................................................................... 1,487 Net assets acquired .......................................................................................................... $10,653
On December 14, 2007, the Company completed its acquisition of certain assets of Opus Designs Furniture LLC, a specialist in
imported moderately-priced youth bedroom furniture. The Company has integrated this business with its existing imported wood and
metal furniture business and will offer this brand to customers as Opus Designs by Hooker. The Company acquired the accounts
receivable, inventory, intangible assets and goodwill of Opus Designs Furniture LLC for an aggregate purchase price of $5.3 million,
consisting of $5.2 million in cash and acquisition-related fees of $54,000.
The recorded values of the assets acquired and liabilities assumed were: December 14, 2007
Current assets ....................................................................................................................... $2,773 Goodwill and intangible assets ............................................................................................. 2,479 Total assets acquired ......................................................................................................... $5,252

F-16
NOTE 6 – SUPPLEMENTAL SCHEDULE OF NON-CASH INVESTING AND FINANCING ACTIVITIES
For The Year Ended February 3, 2008
Donation of showroom facilities located in High Point, N.C. ................................................... $1,082
For The Year Ended November 30, 2006
Note received in connection with the sale of the Pleasant Garden, N.C. facility ..................... $400
NOTE 7 – LONG-TERM DEBT February 3, January 28,
2008 2007
Term loan ............................................................................................................................. $7,912 $10,415
Less current maturities ......................................................................................................... 2,694 2,503
Long-term debt, less current maturities ............................................................................ $5,218 $ 7,912
The Company’s term loan bears interest at a variable rate, 5.3% on February 3, 2008 and 6.0% on January 28, 2007 and is unsecured.
Principal and interest payments are due quarterly through September 1, 2010. The Company has entered into an interest rate swap
agreement that in effect provides for a fixed rate of interest of 4.1% on its term loan. See “Note 8 – Derivatives.”
The Company also has a revolving credit facility that is unsecured and provides for borrowings of up to $15.0 million at variable
interest rates, 5.3% on February 3, 2008 and 6.0% on January 28, 2007. Up to $3.0 million of the revolving credit line may be used
for the issuance of letters of credit. Interest is payable monthly. No borrowings were outstanding under the revolving credit line as of
February 3, 2008 or January 28, 2007. As of February 3, 2008, the Company had an aggregate $13.6 million available under its
revolving credit facility to fund working capital needs. Outstanding letters of credit under that line which is used to collateralize
certain insurance arrangements and for imported product purchases, amounted to $1.4 million as of February 3, 2008 and $1.3 million
as of January 28, 2007. On February 27, 2008, the Company renewed the $15 million revolving credit line. The new maturity date
for the revolving credit line is March 1, 2011. The other terms and conditions, including financial covenants applicable to the
revolving credit line remain unchanged.
The credit agreement for the term loan and the revolving credit facility contains customary representations and warranties, covenants
and events of default, including financial covenants as to minimum tangible net worth, debt service coverage, the ratio of funded debt
to earnings before interest, taxes, depreciation and amortization, and maximum capital expenditures. The Company was in
compliance with these covenants as of February 3, 2008.
As of February 3, 2008, aggregate future maturities for the Company’s long-term debt were $2.7 million in fiscal 2009, $2.9 million in
fiscal 2010 and $2.3 million in fiscal 2011.
NOTE 8 – DERIVATIVES
The Company has used interest rate swap agreements to manage variable interest rate exposures on the majority of its long-term debt.
The notional principal value of the Company’s outstanding swap agreement is substantially equal to the outstanding principal balance
of the corresponding debt instrument. The Company believes that its swap agreement is highly effective in managing the volatility of
future cash flows associated with interest payments on its variable rate debt. The Company accounts for its interest rate swap
agreements as cash flow hedges.
In February 2003, the Company, in connection with the refinancing of its bank debt, terminated an interest rate swap agreement that in
effect provided a fixed interest rate of 7.4% on its term loan and entered into a new interest rate swap agreement. The new swap
agreement is on substantially the same terms as the terminated agreement, except that it provides for a fixed interest rate of 4.1%
through 2010 on the term loan. The Company’s $3.0 million payment to terminate the former swap agreement is being amortized as
interest expense over the remaining repayment period for the related term loan, resulting in an effective fixed interest rate of
approximately 7.4% on the term loan.

F-17
The aggregate fair market value of the Company’s swap agreement decreases when interest rates decline and increases when interest
rates rise. Overall, interest rates have declined since the inception of the Company’s swap agreement. The aggregate decrease in the
fair market value of the effective portion of the agreement of $191,000 ($311,000 pretax) as of February 3, 2008 and $69,000
($111,000 pre-tax) as of January 28, 2007 is reflected under the caption “accumulated other comprehensive loss” in the consolidated
balance sheets. See “Note 9 – Other Comprehensive Income (Loss).”
NOTE 9 – OTHER COMPREHENSIVE INCOME (LOSS) Fifty- Three Two-Months
Weeks Ended Ended Twelve Months Ended
February 3, January 28, November 30, November 30,
2008 2007 2006 2005
Net income (loss) ................................................................... $19,655 $(18,415) $14,138 $12,485
(Loss) gain on interest rate swaps .......................................... (256) 56 88 321
Less amount of swaps’ fair value reclassified to
interest expense .................................................................. 58 9 101 539
Other comprehensive (loss) income before tax ...................... (198) 65 189 860
Income tax (benefit) expense ................................................. (76) 25 72 327
Other comprehensive (loss) income, net of tax ...................... (122) 40 117 533
Comprehensive income (loss) ................................................ $19,533 $(18,375) $14,255 $13,018
NOTE 10 – EMPLOYEE BENEFIT PLANS
Employee Stock Ownership Plan
In January 2007, the Company terminated its employee stock ownership plan (the “ESOP”). Through January 2007, the Company had
sponsored the leveraged ESOP to provide retirement benefits for substantially all employees. As a result of the ESOP termination,
approximately 1.2 million shares of previously unallocated shares of Company common stock held by the ESOP were allocated to
eligible employees, resulting in an $18.4 million, non-cash, non-tax deductible charge to earnings in January 2007 with a
corresponding increase in shareholders’ equity. To effect the termination of the ESOP, the Company redeemed and retired
approximately 1.2 million of the shares of Company common stock held by the ESOP, with proceeds to the ESOP of $17.2 million (or
$15.01 per share). The ESOP used the proceeds to repay the outstanding balance on the ESOP loan.
Prior to the termination, the Company recorded non-cash ESOP cost for the number of shares that it committed to release to eligible
employees at the average closing market price of the Company’s common stock during each period. Those shares were treated as
outstanding for computing earnings per share. “Unearned ESOP shares” in shareholders’ equity was reduced by the Company’s
aggregate cost basis in the shares that were committed to be released. Those shares had a cost basis of $6.25 per share. “Common
stock” was increased by the aggregate average market price in excess of the cost basis of those shares.
Dividends paid on allocated shares held by the ESOP were charged against retained earnings in the consolidated balance sheets.
Dividends paid on unallocated shares were in effect recorded as a reduction of principal and interest on the ESOP Loan. The cost of
the ESOP amounted to:
Fifty-Three Two-Months
Weeks Ended Ended Twelve Months Ended
February 3, January 28, November 30, November 30,
2008 2007 2006 2005
Average fair market value per share .............................................. $15.24 $ 16.12 $ 18.90
Number of shares committed to be released (in whole shares) ..... 164,156 170,628
Non-cash ESOP cost ..................................................................... 2,646 3,225
Administrative cost ....................................................................... $49 11 86 159
Total ESOP cost ........................................................................ $49 $11 $ 2,732 $ 3,384
Allocated shares held by the ESOP pending distribution to employees were 1.7 million as of February 3, 2008 and 2.2 million as of
January 28, 2007.

F-18
Employee Savings Plans
The Company sponsors a tax-qualified 401(k) plan covering substantially all employees. This plan assists employees in meeting their
savings and retirement planning goals through employee salary deferrals and discretionary matching contributions made by the
Company. The Company made contributions to the plan amounting to $574,000 in fiscal 2008, $112,000 in the 2007 two-month
transition period, $489,000 in fiscal 2006 and $555,000 in fiscal 2005.
Executive Benefits
The Company maintains a salary continuation program for certain management employees. The program consists of individual
agreements with participants that specify the amount of benefits to be paid upon retirement, death or disability. These agreements are
unfunded. All benefits are paid solely from the general assets of the Company. The total accrued liabilities relating to this program
approximated $1.8 million as of February 3, 2008 and $2.1 million as of January 28, 2007. These amounts are included in “accrued
salaries, wages and benefits” and “other long-term liabilities” in the consolidated balance sheets. The cost of the program amounted to
$188,000 in fiscal 2008, $192,000 in the 2007 two-month transition period, $276,000 in fiscal 2006 and $262,000 in fiscal 2005.
The Company also provides certain eligible executives with life insurance benefits during their working life and paid up insurance at
their retirement through split dollar life insurance policies. The Company retains a collateral interest in each of these policies to the
extent of premiums paid by the Company.
The Company also has a life insurance program and a supplemental executive retirement plan for certain executives. The life
insurance program provides death benefit protection for these executives during employment. Coverage under the program
automatically terminates when the executive terminates employment with the Company for any reason, other than death, or when the
executive attains age 65, whichever occurs first. The life insurance policies funding this program are owned by the Company.
The supplemental executive retirement plan provides a monthly supplemental retirement benefit based on the executive’s final average
monthly compensation as defined in the plan. The benefit is payable for a 15-year period following the executive’s termination of
employment, subject to a vesting schedule that may vary for each executive. In addition, the monthly retirement benefit for each
executive, regardless of age, becomes fully vested and the present value of all plan benefits is paid to participants in a lump sum upon
a change in control of the Company (as defined in the plan). Benefits are payable from the general assets of the Company. The
Company accounts for its obligation to each participant on the accrual basis. The aggregate liability for all participants under the
supplemental executive retirement plan amounted to $3.8 million as of both February 3, 2008 and January 28, 2007. The cost of the
program amounted to $1.8 million in fiscal 2008, $150,000 in the 2007 two-month transition period, $2.4 million in fiscal 2006 and
$684,000 in fiscal 2005.
Mr. Douglas C. Williams, the Company’s President and Chief Operating Officer retired effective October 31, 2006. Mr. Williams was
offered an early retirement arrangement in late August 2006. Consequently, the Company recorded $1.4 million in compensation
expense for benefits under the supplemental retirement plan and other early retirement benefits in the 2006 third quarter related to Mr.
Williams early retirement arrangement. Substantially all of Mr. Williams’s retirement benefits were paid during fiscal 2008.
NOTE 11 – SHARE-BASED COMPENSATION
The Hooker Furniture Corporation 2005 Stock Incentive Plan (“Stock Plan”) permits incentive awards of restricted stock, restricted
stock units, stock appreciation rights and performance grants to key employees and non-employee directors. A maximum of 750,000
shares of the Company’s common stock was approved for issuance under the Stock Plan. The Company expects to issue restricted
stock or other forms of stock-based compensation awards to eligible directors and employees under the plan. The Company issued
restricted stock awards to each non-employee member of the board of directors in January 2006, 2007 and 2008. These shares will
vest if the director remains on the board through a 36-month service period or may vest earlier in accordance with terms specified in
the Stock Plan. During fiscal 2006, 784 of these shares were forfeited and 147 shares vested. The grant-date fair value of stock awards
issued during the fiscal 2008 fourth quarter was $19.61 per share, $15.23 per share for stock awards issued during the 2007 two-month
transition period and $15.31 for stock awards issued during the fiscal 2006 first quarter.

F-19
The Company accounts for these awards as “non-vested equity shares.” These shares have an aggregate grant-date fair value of
$219,000, after taking vested shares and forfeitures into account. As of February 3, 2008, the Company recognized non-cash
compensation expense of approximately $71,000 related to these non-vested awards and $2,000 for shares that have vested. The
remaining $148,000 of grant-date fair value will be recognized over the remaining months of the vesting periods for these awards.
For each restricted common stock issuance, the following table summarizes the actual number of shares that have been
issued/vested/forfeited, the weighted average issue price of those shares on the grant date, the fair value of each grant on the grant
date, compensation expense recognized for the non-vested shares of each grant and the remaining fair value of the non-vested shares
of each grant as of February 3, 2008:
Whole Grant-Date Aggregate Compensation Grant-Date Fair Value
Number of Fair Value Grant-Date Expense Unrecognized At
Shares Per Share Fair Value Recognized February 3, 2008
Shared Issued on January 16, 2006
Issued .................................................. 4,851 $15.31 $74
Forfeited .............................................. (784) 15.31 (12)
Vested ................................................. (147) 15.31 (2)
3,920 60 $42 $18
Shares Issued on January 15, 2007
Issued .................................................. 4,875 $15.23 74 27 47
Shares Issued on January 15, 2008
Issued .................................................. 4,335 $19.61 85 2 83Awards outstanding at February 3, 2008: 13,130 $219 $71 $148
NOTE 12 – EARNINGS (LOSS) PER SHARE
Basic earnings per share is computed by dividing income available to common shareholders by the weighted average number of
common shares outstanding for the period. Unearned ESOP shares are not considered outstanding for purposes of calculating basic or
diluted earnings per share. Diluted earnings per share reflects the potential dilutive effect of securities that could share in the earnings
of the Company. In January 2006, 2007 and 2008, the Company issued restricted stock awards to non-employee members of the
board of directors under the Stock Plan, and expects to continue to grant these awards to non-employee board members in the future.
As of February 3, 2008, January 28, 2007, November 30, 2006 and November 30, 2005 there were 13,130, 8,795, 3,920 and 0 shares,
respectively, of restricted stock outstanding, net of forfeitures and vested shares on each date. Restricted shares awarded that have not
yet vested are considered when computing diluted earnings per share.
Fifty- Three Two-Months
Weeks Ended Ended Twelve Months Ended
February 3, January 28, November 30, November 30,
2008 2007 2006 2005
Net income ................................................................................. $19,655 $(18,415) $14,138 $12,485
Weighted average shares outstanding for basic
earnings per share ............................................................... 12,442 12,113 11,951 11,795
Dilutive effect of restricted stock awards .................................. 4 2
Weighted average shares outstanding for diluted
earnings per share............................................................ 12,446 12,113 11,953 11,795
Basic earnings per share ............................................................ $ 1.58 $ (1.52) $ 1.18 $ 1.06
Diluted earnings per share ......................................................... $ 1.58 $ (1.52) $ 1.18 $ 1.06

F-20
NOTE 13 – INCOME TAXES
The provision for income taxes: Fifty- Three Two-Months
Weeks Ended Ended Twelve Months Ended
February 3, January 28, November 30, November 30,
2008 2007 2006 2005
Current expense
Federal .............................................................................................. $ 7,937 $2,000 $10,792 $8,829
State .................................................................................................. 953 362 1,050 674
Total current expense ............................................................................... 8,890 2,362 11,842 9,503
Deferred (benefit) expense
Federal .............................................................................................. 2,609 (519) (2,833) (1,303)
State .................................................................................................. 15 (543) (440) (176)
Total deferred (benefit) expense .............................................................. 2,624 (1,062) (3,273) (1,479)
Income tax expense .................................................................................. $11,514 $1,300 $8,569 $8,024
In connection with the termination of its ESOP, the Company wrote off the related deferred tax asset in the amount of $855,000 in
January 2007. The effective income tax rate differed from the federal statutory tax rate as follows:
Fifty- Three Two-Months
Weeks Ended Ended Twelve Months Ended
February 3, January 28, November30, November 30,
2008 2007 2006 2005
Income taxes at statutory rate................................................................... 35.0% 35.0% 35.0% 35.0%
Increase (decrease) in tax rate resulting from:
State taxes, net of federal benefit ........................................................ 2.0 (0.7) 1.7 1.6
Employee stock ownership plan ........................................................ (0.7) (42.0) 0.3 2.1
Captive insurance assessments .......................................................... 0.3 0.7 0.9
Officer’s life insurance ...................................................................... (0.9) (0.2) (0.4) 0.2
Other ................................................................................................. 1.2 0.3 0.4 (0.7)
Effective income tax rate ................................................................ 36.9% ( 7.6)% 37.7% 39.1%
The tax effects of temporary differences that give rise to significant portions of the deferred tax assets and liabilities were:
February 3, January 28,
2008 2007
Assets
Deferred compensation ....................................................................... $2,156 $2,420
Interest rate swaps .............................................................................. 117 157
Allowance for bad debts ..................................................................... 674 546
State income taxes .............................................................................. 780 752
Restructuring ...................................................................................... 393 1,459
Property, plant and equipment ............................................................ 107 1,791
Other ................................................................................................... 89 70
Total deferred tax assets ..................................................................... 4,316 7,195
Liabilities
Inventories .......................................................................................... 328 1,217
Intangible assets .................................................................................. 971 503
Employee benefits .............................................................................. 359 355
Other ................................................................................................... 87 _____
Total deferred tax liabilities ................................................................ 1,745 2,075
Net deferred tax asset ................................................................. $2,571 $5,120
As of February 3, 2008, $2.3 million of deferred income taxes was classified as “other long-term assets” and $312,000 was classified
as “other current assets” in the consolidated balance sheets. As of January 28, 2007, $4.3 million of the deferred income taxes was

F-21
classified as “other long-term assets” and $781,000 was classified as “other current assets” in the consolidated balance sheets. The
Company expects to fully utilize its deferred tax assets in future periods when the amounts become deductible, consequently no
valuation allowance was recorded as of February 3, 2008 or January 28, 2007.
A portion of the change in the net deferred income tax asset (liability) relates to unrealized gains and losses on interest rate swaps that
are included in shareholders’ equity. The related deferred tax expense amounted to $76,000 in fiscal 2008, $25,000 in the 2007 two-
month transition period, $72,000 in fiscal 2006, and $327,000 in fiscal 2005 and was recorded directly to shareholders’ equity as a
component of “accumulated other comprehensive loss”.
On January 29, 2007, the Company adopted Financial Accounting Standards Interpretation No. 48, Accounting for Uncertainty in
Income Taxes, or FIN 48. FIN 48 clarifies the accounting for uncertainty in income taxes recognized in an enterprise’s financial
statements in accordance with SFAS 109, Accounting for Income Taxes. FIN 48 prescribes a recognition threshold and measurement
attribute for the financial statement recognition and measurement of a tax position taken or expected to be taken in a tax return. FIN 48
also provides guidance on de-recognition, classification, interest and penalties, accounting in interim periods, disclosures and
transition.
A reconciliation of beginning and ending unrecognized tax benefits is as follows:
Balance at January 29, 2007 (net of interest)......................................... $845,000 Increase due to positions taken during prior period ............................... 45,000 Settlements ............................................................................................ (890,000) Balance at February 3, 2008 ............................................................. $
In connection with the settlement of an IRS examination issue related to its ESOP, the Company recognized $215,000 of these
previously unrecognized tax positions as a reduction in income tax expense during fiscal 2008.
The Company elected upon adoption of FIN 48 to classify interest and penalties recognized in accordance with FIN 48 as income tax
expense. Interest and penalties charged to tax expense during fiscal 2008 were $24,000. Accrued interest and penalties in addition to
these unrecognized tax benefits amounted to $87,000 as of January 29, 2007. No interest or penalties were accrued as of February 3,
2008.
The Company believes that the statute of limitations for all major jurisdictions has expired for tax periods ending on or before
November 30, 2003.
NOTE 14 – RESTRUCTURING CHARGES AND ASSETS HELD FOR SALE
The Company incurred significant restructuring and asset impairment charges in connection with the closing of wood furniture
manufacturing plants in each of the past three full fiscal years and in the 2007 two-month transition period. These charges included
severance and related benefits for terminated employees, asset impairment charges to write down real and personal property to fair
market value (as determined based on market prices for similar assets in similar condition) less selling costs, and factory disassembly
and other related costs to prepare each facility for sale.
Pretax restructuring and asset impairment charges reduced operating income by 0.1% of net sales in fiscal 2008, 6.1% of net sales in
the 2007 two-month transition period, 2.0% of net sales in fiscal 2006 and by 1.5% of net sales in fiscal 2005.
During fiscal 2008 the Company recorded aggregate restructuring and asset impairment charges of $309,000 ($190,000 after tax, or
$0.02 per share) principally related to:
additional asset impairment, disassembly and exit costs associated with the March 2007 closing of the Martinsville, Va. domestic
wood manufacturing facility ($553,000); net of
a restructuring credit of $244,000, principally for previously accrued health care benefits for the Pleasant Garden, N.C.,
Martinsville, Va. and Roanoke, Va. facilities that are not expected to be paid.
During the 2007 two-month transition period, the Company recorded aggregate restructuring and asset impairment charges of $3.0 million
($1.8 million after tax, or $0.15 per share) principally related to:

F-22
severance and related benefits for approximately 280 hourly and salaried employees at the Martinsville, Va. manufacturing facility
who were terminated ($2.3 million) and additional asset impairment charges for the estimated costs to sell the Martinsville, Va.
facility ($655,000).
The real and personal property at the Martinsville facility were included in “assets held for sale” on the consolidated balance sheet as
of January 28, 2007. That property was sold during the fiscal year 2008 third and fourth quarters for an aggregate $3.5 million in
cash, net of selling expenses.
In December 2007, the Company donated two showrooms formerly operated by Bradington-Young, located in High Point, N.C.,
which had a carrying value of $1.1 million to a local university.
During fiscal 2006 the Company recorded aggregate restructuring and asset impairment charges of $6.9 million ($4.3 million after tax,
or $0.36 per share) principally related to:
the write down of real and personal property at the Martinsville, Va. plant to estimated fair value in connection with the
planned closing announced January 17, 2007 ($4.2 million);
the August 2006 closing of the Roanoke, Va. manufacturing facility ($2.7 million), which included $1.6 million in severance
and related benefits for approximately 260 terminated hourly and salaried employees and $1.1 million in asset impairment
charges;
the final sale of the Pleasant Garden, N.C. wood furniture plant and the related closing of the Martinsville, Va. plywood plant
($161,000); and
the planned disposition of the two Bradington-Young showrooms located in High Point, N.C. ($140,000); net of
a restructuring credit for previously accrued health care benefits for terminated employees at the former Pleasant Garden and
Kernersville, N.C. facilities that are not expected to be paid ($295,000).
In October 2006, the Company completed the sale of the Roanoke, Va. plant for $2.2 million, net of selling costs.
In May 2006, the Company completed the sale of the Pleasant Garden facility. Aggregate proceeds from that sale, including proceeds
from equipment auctions at both the Pleasant Garden facility and Martinsville plywood facility held in December 2005, amounted to
$1.5 million ($1.1 million in cash and a note receivable for $400,000), net of selling expenses.
During fiscal 2005, the Company recorded aggregate restructuring charges of $5.3 million ($3.3 million after tax, or $0.28 per share)
principally related to:
the October 2005 closing of its Pleasant Garden, N.C. plant ($4.3 million) and the September 2005 consolidation of related
plywood production at its Martinsville, Va. manufacturing facility ($406,000), which included $1.5 million in severance and
related benefits for approximately 300 hourly and salaried employees, $2.9 million in related asset impairment charges and
$258,000 for other costs to prepare the Pleasant Garden property for sale;
additional costs of $586,000 related to its Maiden, N.C. facility (which closed in 2004) and its Kernersville, N.C. facility
(which closed in 2003), consisting of :
o $322,000 principally for additional asset impairment and health care expenses incurred in connection with the sale
of the Maiden real property; and
o $264,000 of additional costs principally for environmental monitoring related to the closing of the Kernersville
facility.
In connection with the closing of the Pleasant Garden facility, the Company transferred related plywood production from a facility
located in Martinsville, Va. to its main Martinsville manufacturing facility. The Company completed this transfer in the 2005 fourth
quarter and completed the conversion of this separate facility into a finished goods warehouse during the 2006 first quarter.

F-23
The real and personal property at the Pleasant Garden facility and certain plywood production equipment located at the Martinsville
plywood facility, with an aggregate carrying value of $1.7 million net of anticipated selling expenses, were included in “assets held for
sale” on the consolidated balance sheet as of November 30, 2005.
The following table sets forth the significant components of and activity related to the accrued restructuring and asset impairment
charges for fiscal years 2005 and 2006, the 2007 two-month transition period and fiscal year 2008. Accrued restructuring charges are
included in “accrued salaries, wages and benefits,” “other accrued expenses” and “other long-term liabilities” in the consolidated
balance sheets. The expenses are included in “restructuring and asset impairment charges” in the consolidated statements of income:
Severance and Asset Pretax After-Tax
Related Benefits Impairment Other Amount Amount
Accrued balance at December 1, 2005 ............................... $ 368 $225 $ 593
Restructuring charges accrued during fiscal 2005 for the: Pleasant Garden, N.C. and Martinsville, Va. plywood facilities ..................................................................... 1,464 $ 2,942 258 4,664 Maiden and Kernersville, N.C. facilities ......................... 158 180 248 586 Total .......................................................................... 1,622 3,122 506 5,250 $3,255 Non-cash charges ................................................................ (3,122) (3,122) Cash payments .................................................................... (1,201) (513) (1,714) Accrued balance at November 30, 2005 ......................... 789 218 1,007
Restructuring charges accrued during fiscal 2006 for the:
Pleasant Garden and Kernersville, N.C. manufacturing
and Martinsville, Va. plywood facilities ..................... (295) 60 101 (134)
High Point, N.C. showrooms .......................................... 140 140
Roanoke, Va. facility ....................................................... 1,552 1,139 2,691
Martinsville, Va. facility ................................................. 4,184 4,184 Total .......................................................................... 1,257 5,523 101 6,881 $4,266
Non-cash charges ................................................................ (5,523) (5,523)
Cash payments .................................................................... (1,364) (116) (1,480)
Accrued balance at November 30, 2006.......................... 682 203 885
Restructuring charges accrued during the 2007 two-month
transition period for the Martinsville, Va. facility ........... 2,318 655 2,973 $1,843
Non-cash charges ................................................................ (655) (655)
Cash payments .................................................................... (17) (3) (20)
Accrued balance at January 28, 2007 .............................. 2,983 200 3,183
Restructuring charges accrued during fiscal 2008 for the: Pleasant Garden, N.C., Roanoke, Va. and Maiden,
N.C. facilities .................................................................. (182) (182) Martinsville, Va. facility ................................................. (62) 25 528 491 Total .......................................................................... (244) 25 528 309 $ 190 Non-cash charges ................................................................ (25) (25) Cash payments .................................................................... (1,910) (535) (2,445) Accrued balance at February 3, 2008 ............................ $ 829 $ $193 $1,022
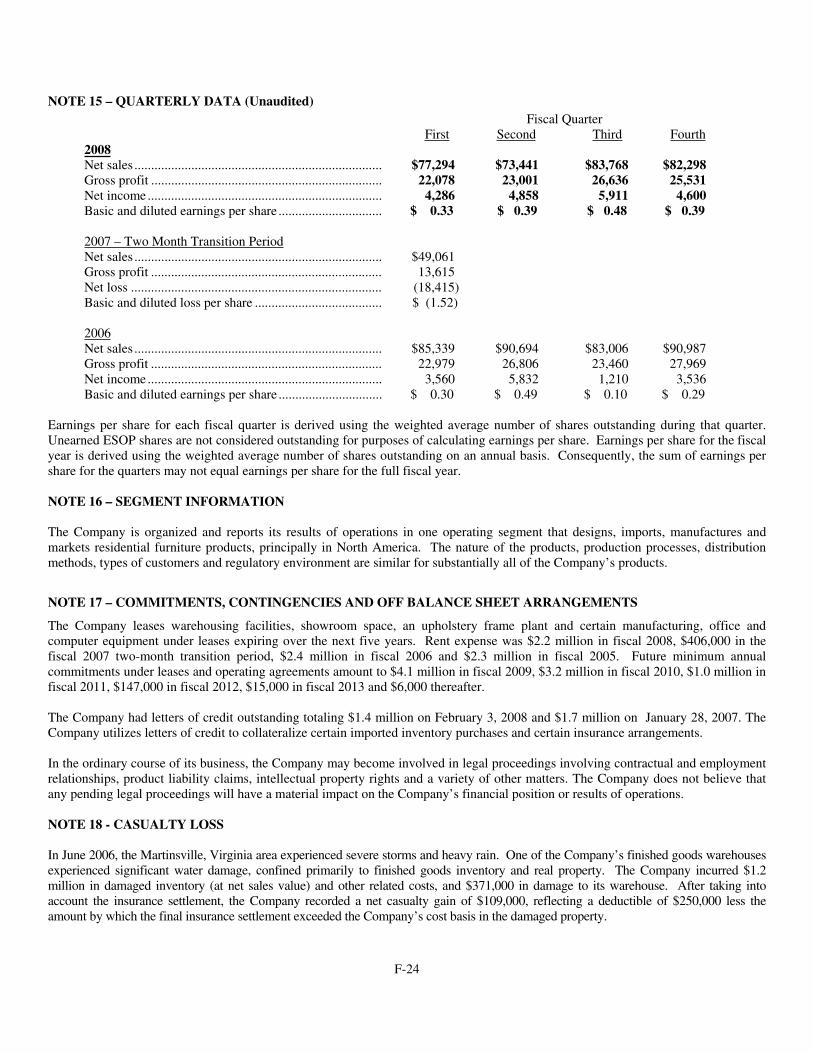
F-24
NOTE 15 – QUARTERLY DATA (Unaudited)Fiscal Quarter
First Second Third Fourth
2008 Net sales .......................................................................... $77,294 $73,441 $83,768 $82,298 Gross profit ..................................................................... 22,078 23,001 26,636 25,531 Net income ...................................................................... 4,286 4,858 5,911 4,600 Basic and diluted earnings per share ............................... $ 0.33 $ 0.39 $ 0.48 $ 0.39
2007 – Two Month Transition Period
Net sales .......................................................................... $49,061
Gross profit ..................................................................... 13,615
Net loss ........................................................................... (18,415)
Basic and diluted loss per share ...................................... $ (1.52)
2006
Net sales .......................................................................... $85,339 $90,694 $83,006 $90,987
Gross profit ..................................................................... 22,979 26,806 23,460 27,969
Net income ...................................................................... 3,560 5,832 1,210 3,536
Basic and diluted earnings per share ............................... $ 0.30 $ 0.49 $ 0.10 $ 0.29
Earnings per share for each fiscal quarter is derived using the weighted average number of shares outstanding during that quarter.
Unearned ESOP shares are not considered outstanding for purposes of calculating earnings per share. Earnings per share for the fiscal
year is derived using the weighted average number of shares outstanding on an annual basis. Consequently, the sum of earnings per
share for the quarters may not equal earnings per share for the full fiscal year.
NOTE 16 – SEGMENT INFORMATION
The Company is organized and reports its results of operations in one operating segment that designs, imports, manufactures and
markets residential furniture products, principally in North America. The nature of the products, production processes, distribution
methods, types of customers and regulatory environment are similar for substantially all of the Company’s products.
NOTE 17 – COMMITMENTS, CONTINGENCIES AND OFF BALANCE SHEET ARRANGEMENTS
The Company leases warehousing facilities, showroom space, an upholstery frame plant and certain manufacturing, office and
computer equipment under leases expiring over the next five years. Rent expense was $2.2 million in fiscal 2008, $406,000 in the
fiscal 2007 two-month transition period, $2.4 million in fiscal 2006 and $2.3 million in fiscal 2005. Future minimum annual
commitments under leases and operating agreements amount to $4.1 million in fiscal 2009, $3.2 million in fiscal 2010, $1.0 million in
fiscal 2011, $147,000 in fiscal 2012, $15,000 in fiscal 2013 and $6,000 thereafter.
The Company had letters of credit outstanding totaling $1.4 million on February 3, 2008 and $1.7 million on January 28, 2007. The
Company utilizes letters of credit to collateralize certain imported inventory purchases and certain insurance arrangements.
In the ordinary course of its business, the Company may become involved in legal proceedings involving contractual and employment
relationships, product liability claims, intellectual property rights and a variety of other matters. The Company does not believe that
any pending legal proceedings will have a material impact on the Company’s financial position or results of operations.
NOTE 18 - CASUALTY LOSS
In June 2006, the Martinsville, Virginia area experienced severe storms and heavy rain. One of the Company’s finished goods warehouses
experienced significant water damage, confined primarily to finished goods inventory and real property. The Company incurred $1.2
million in damaged inventory (at net sales value) and other related costs, and $371,000 in damage to its warehouse. After taking into
account the insurance settlement, the Company recorded a net casualty gain of $109,000, reflecting a deductible of $250,000 less the
amount by which the final insurance settlement exceeded the Company’s cost basis in the damaged property.

~ Corporate Data ~Corporate Offices
Hooker Furniture Corporation
440 East Commonwealth Boulevard
Martinsville, VA 24112 or
P.O. Box 4708
Martinsville, VA 24115
(276) 632-0459
Stock Transfer Agent and
Dividend Disbursing Agent
American Stock Transfer &
Trust Company
59 Maiden Lane
Plaza Level
New York, NY 10038
(800) 937-5449
www.amstock.com
Legal Counsel
McGuireWoods LLP
One James Center
901 East Cary Street
Richmond, VA 23219
Independent Registered Public
Accounting Firm
KPMG LLP
300 North Greene Street, Suite 400
Greensboro, NC 27401
Annual Meeting
The Annual Meeting of Shareholders
of Hooker Furniture Corporation will
be held on Monday, June 30, 2008
at 2:00 p.m. at the Hooker Furniture
Corporation’s Corporate Offices,
440 East Commonwealth Boulevard,
Martinsville, VA.
Annual Report on Form 10-K
Hooker Furniture Corporation’s
Annual Report on Form 10-K,
included herein, is also available on
our website at www.hookerfurniture.
com. A free copy of our Form 10-K
may also be obtained by contacting
Robert W. Sherwood, Vice President—
Credit, Secretary and Treasurer at the
corporate offices of the Company.
Quarterly Financial Information
Quarterly financial results are
announced by press releases that are
available at www.hookerfurniture.com
in the “Investor Relations” section.
The Company’s quarterly reports
on Form 10-Q are also available at
www.hookerfurniture.com.
At the October 2007 market, Sam
Moore entered the new category
of custom upholstered headboards,
leveraging its expertise in cover-to-
frame customization, and establishing
an incremental sales opportunity for
the Company and its retail partners.
Designed by Curran & Connors, Inc. / www.curran-connors.com

Hook er Fur nitur e Corpor at ion
440 East Commonwealth BoulevardMartinsville, VA 24112 or
P.O. Box 4708Martinsville, VA 24115
276.632.0459
www.sammoore.com www.opusdesigns.com www.hookerfurniture.com www.bradington-young.com