MINING SECTOR
12
CHILE GDP: 240.22$BN POPULATION: 17.37M TOTAL MINING INVESTMENTS (2016-2025): 49.20 $BN EXPORTS IN MINING: 30.3 $BN NUMBER 1 COPPER PRODUCTION: 5761,1 30% WORLD PRODUCTION NUMBER 2 LITHIUM PRODUCER: HAVING 54% WORLD RESERVES. AMONG TOP 50 MINING COMPANIES IN THE WORLD: CODELCO RANK 25 SQM RANK 36 MINING SECTOR Mining Overview Chile is a mining country by excellence, representing 49% of all exports of goods in the country. Over the next three or four years, mining projects in Chile will be worth over US$104,000 million or, in other words, more or less 70% of total mining investment in Latin America. The National Mining Society (Sonami) mentioned that copper prices this year will be at a level higher than 2016, the red metal is this December 2017 reaching prices of U.S. $ 3.1 a pound. Chile is a key global player in the production of metallic minerals. In 2016, the country was the world’s largest copper mine producer, with a 29.9% share in global output, the second biggest molybdenum mine producer (18.2% share) and the fourth largest producer of silver (5.5%). In terms of non-metallic minerals, the country ranked first in production of iodine (a 66% share), second in lithium compounds (36%) and eighth in potassium compounds (3.1%). In 2015, mining was the fourth largest economic sector of Chile, accounting for 9.9% of the country’s GDP, for 2.9% of total employment and for 53.6% of national exports. Yet, over the period 2010-2015, mining
-
Upload
khangminh22 -
Category
Documents
-
view
0 -
download
0
Transcript of MINING SECTOR

CHILE GDP: 240.22$BN
POPULATION: 17.37M
TOTAL MINING INVESTMENTS (2016-2025): 49.20 $BN
EXPORTS IN MINING: 30.3 $BN
NUMBER 1 COPPER PRODUCTION: 5761,1 30% WORLD PRODUCTION
NUMBER 2 LITHIUM PRODUCER: HAVING 54% WORLD RESERVES.
AMONG TOP 50 MINING COMPANIES IN THE WORLD: CODELCO RANK 25 SQM RANK 36
MINING SECTOR
Mining Overview
Chile is a mining country by excellence, representing 49% of all exports of goods in the country.
Over the next three or four years, mining projects in Chile will be worth over US$104,000
million or, in other words, more or less 70% of total mining investment in Latin America. The
National Mining Society (Sonami) mentioned that copper prices this year will be at a level
higher than 2016, the red metal is this December 2017 reaching prices of U.S. $ 3.1 a pound.
Chile is a key
global player in
the production of
metallic
minerals. In
2016, the
country was the
world’s largest
copper mine
producer, with a
29.9% share in
global output, the second biggest molybdenum mine producer (18.2% share) and the fourth largest
producer of silver (5.5%). In terms of non-metallic minerals, the country ranked first in production of
iodine (a 66% share), second in lithium compounds (36%) and eighth in potassium compounds (3.1%). In
2015, mining was the fourth largest economic sector of Chile, accounting for 9.9% of the country’s GDP,
for 2.9% of total employment and for 53.6% of national exports. Yet, over the period 2010-2015, mining

exports’ value declined by an average 5.1%, as a result of the dropping international metal commodity
prices. In the same period, exports rose significantly in volume terms by a cumulative 38.5%, resulting in
a moderate expansion of domestic production at a CAGR of 5.2%. Prices in the last few months are raising
up to level not projected during the middle of 2017 growing substantially
MINING
Sector Snapshot

OPERATIVES MINING PROJECTS IN CHILE
1. Cerro Colorado: COPPER
2. Quebrada Blanca: COPPER
3. Collahuasi: COPPER
4. El Abra: COPPER
5. Radomiro Tomic: COPPER
6. Chuquicamata: COPPER
7. Gaby: COPPER
8. Michilla-Lince: COPPER
9. Mantos Blancos: COPPER
10. Lomas Bayas: COPPER
11. Spence: COPPER
12. El Tesoro: COPPER
13. Escondida: COPPER
14. Zaldívar: COPPER
15. El Salvador: COPPER
16. Manto Verde: COPPER
17. La Candelaria: COPPER
18. Cerro Casale: GOLD
19. Andacollo: COPPER
20. Los Pelambres: COPPER
21. El Soldado: COPPER
22. Andina: COPPER
23. Los Bronces: COPPER
24. El Teniente: COPPER
New Operative Mine: Esperanza: Copper
Upcoming Projects: Pascua Lama: Gold-Silver
/ Caserones: Copper/ Ministro Hales: Copper
Medium new Projects: Franke , Antucoya,

NEW MINING PROJECTS CHILE 2017-2025
2
OPPORTUNITIES FOR ISRAELI COMPANIES
IN MINING INDUSTRY.
Israel has many opportunities with the mining sector in Chile. Innumerous technologies in several areas
that can be used in this industry; almost all the Chilean mining projects are located in deserted, dried
and inhospitable places. Israel can be a technology provider to the Mining industry with solutions in
Robotics, Software, Optimization, R&D, Turnkey projects, Water, Energy, Textiles, Plastics among many
industries for the Chilean mining Industry.
Segment Opportunities Chile has competitive advantages in the production of several non-metallic minerals in high demand such
as lithium, iodine and potassium compounds. In 2015, the country had the world’s largest lithium reserves
(a total of 7.5mn tonnes, equivalent to 53.5% of global reserves), the second biggest iodine reserves
(1.8mn tonnes or 24% of global reserves), and the seventh largest potassium reserves (150mn tonnes or
a share of 4.05%). Chile is also well positioned in the molybdenum sub-segment, as the country has
become a key supplier to the South Korean and Japanese automotive industries.
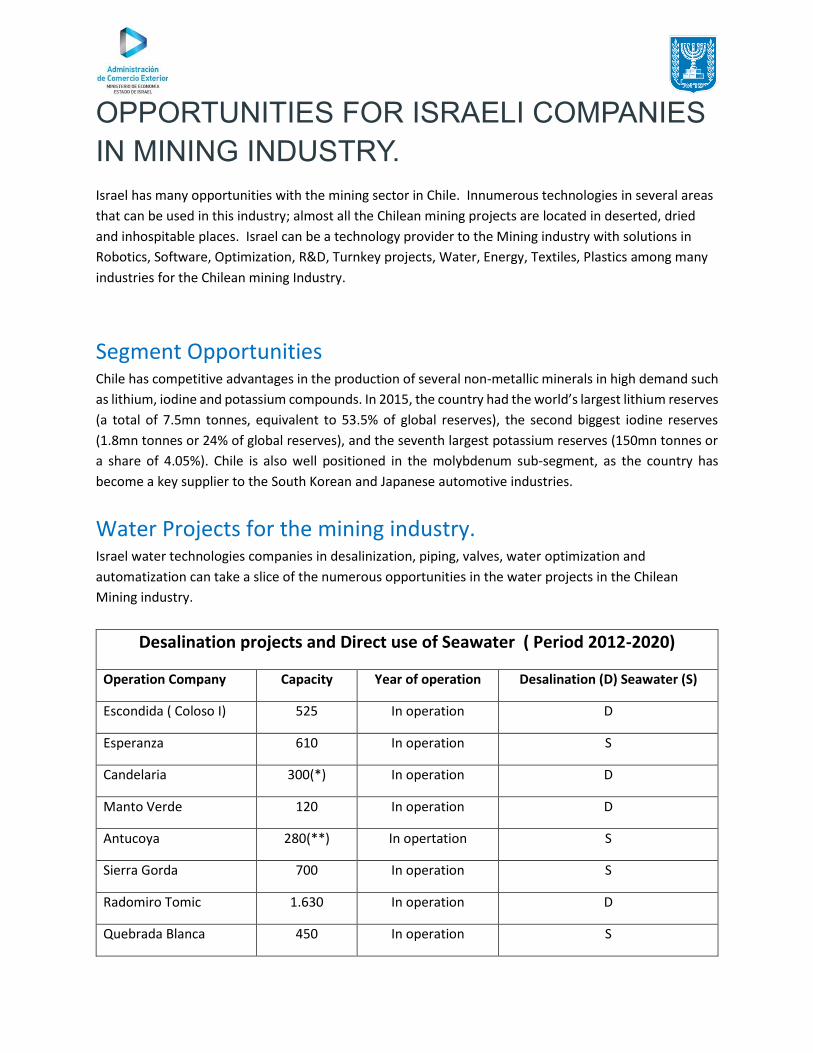
Water Projects for the mining industry. Israel water technologies companies in desalinization, piping, valves, water optimization and
automatization can take a slice of the numerous opportunities in the water projects in the Chilean
Mining industry.
Desalination projects and Direct use of Seawater ( Period 2012-2020)
Operation Company Capacity Year of operation Desalination (D) Seawater (S)
Escondida ( Coloso I) 525 In operation D
Esperanza 610 In operation S
Candelaria 300(*) In operation D
Manto Verde 120 In operation D
Antucoya 280(**) In opertation S
Sierra Gorda 700 In operation S
Radomiro Tomic 1.630 In operation D
Quebrada Blanca 450 In operation S

Collahuasi 1.500 2018 D
Escondida (Coloso II) 3.200 2018 D
El Morro 740 2019 D
Centinela 400 2019 D
Dominga 400 2019 D
Pelambres 400 2019 S
Relincho 700 2020 S
Spence 250 2020 D
TOP 10 COPPER MINING COMPANIES
PRODUCERS IN 2016-2017 / CHILE

BUSINESS PROFILE MINING COMPANIES
1. CODELCO Chilean state-owned miner Codelco holds first place
worldwide in terms of attributable copper mine
output with preliminary estimates of 1,827 kt of
copper produced in 2016, including Codelco's stake
in Minera el Abra and Anglo American Sur S.A, – an
approximate 3% decline on 2015 (1,891 kt).This drop
was mainly due to lower production coming from El
Abra, Anglo American Sur and
. Andina division, partially offset by higher production in Salvador (on the picture), El
Teniente and Radomiro Tomic divisions.
During 2016, Codelco’s cash cost was $1.26 per pound, compared to $1.39 per pound in
2015. A decrease of 9% primarily attributable to lower operational costs and favorable
exchange rate movements
2. FREEPORT
Headquartered in Phoenix, Ariz., Freeport-McMoRan Copper & Gold Inc. ranks second in global copper
competition. It produced about 1,696 kt of copper in 2016 (based on net equity ownership, including
discontinued operations), or about 12% higher
compared to 2015 (1,514 kt).
This significant growth was achieved because of the Cerro Verde expansion project that achieved capacity operating rates during first-quarter 2016, as well as copper production increase at Grasberg operations currently mining the final phase of the Grasberg open pit, which contains high copper and gold ore grades.
Consolidated average unit net cash costs (net of by-product credits) for FCX’s copper mines (including
Tenke) of $1.26 per pound of copper in 2016 were 18% lower than unit net cash costs of $1.53 per
pound in 2015, primarily reflecting higher by-product credits and higher sales volumes from Cerro Verde
and Grasberg.

3. GLENCORE
In third place, Swiss-based Glencore International plc
with copper production from its own sources of ~1,288
kt (approximate number; efforts were made to
calculate attributable Glencore’s total mined copper
originated from Copper, Zinc and Nickel Operating
Divisions, but due to a complex nature of the
company’s assets, the exact figure might be slightly
different), which is 2% lower than in 2015 (~1,311 kt),
reflecting the production suspensions at African
Copper, partly offset by improved grades and volumes
at the South American assets.
Glencore’s copper unit production costs 0.87 per pound in 2016
4. BHP BILLITON
Ranking fourth, Anglo-Australian BHP Billiton reduced its copper output by 6%, from 1,179 kt in 2015 to 1,113 kt in 2016 calendar year.This decrease was due to reduced volumes at Olympic Dam, maintenance at Pampa Norte and lower copper grades, as planned, at Antamina.
Significant reduction in C1 cash cost during half-year
ended December 31, 2016 was mainly related to the
increase in estimated recoverable copper contained in
the Escondida sulphide leach pad following
commissioning of the Escondida Bioleach Pad Extension project and a US$120 million planned build of
mined ore ahead of the commissioning of the LCE project ( Above escondida Copper Mine in Chile)

5. SOUTHERN COPPER
Holding fifth place, Southern Copper Corporation, a subsidiary of Grupo México, increased its copper production by record 21%, from 743 kt in 2015 to 900 kt in 2016.
This increase was driven by the expansion of the Buenavista mine, which increased its production by + 57%.
Southern Copper’s cash cost per pound for 2016 when
calculated with by-product revenues was $0.95 per
pound, compared to $1.11 per pound in 2015, a decrease of 14.4%. ( on picture: Toquepala copper
mine, Peru. Image: Southern Copper)
6. KGHM
Sixth-ranked Poland-based KGHM Polska Miedź Group produced 677 kt of payable copper in 2016,
which is 6% lower than in 2015 (718 kt).
The decrease in production of payable copper in 2016 as compared to 2015 was due to the lower production of cathodes by KGHM Polska Miedź S.A. and lower production in KGHM International Ltd. mainly due to lower processing of ore by the Robinson mine.
C1 cost of producing copper in concentrate reduced
by 11%, which was impacted by a weakening in the PLN and savings initiatives undertaken by KGHM.
7. RIO TINTO
British-Australian Rio Tinto (LSE:RIO, ASX:RIO) sits in seventh place and increased its attributable mined copper output by 4%, from 504 kt in 2015 to 523 kt in 2016.
Production increased at Bingham Canyon, but declined
at Escondida. The Grasberg mine put out zero tonnes
of copper for Rio Tinto last year.

8. FIRST QUANTUM
First Quantum’s record copper production driven by ramp-up of Sentinel, higher Kansanshi volumes
with record annual production at Las Cruces, allowed this ambitious company to break into the Top 10
copper producers list. First Quantum landed eighth in
2016.
Attributable copper production of 494 kt (including discontinued as of June 2016 Kevitsa mine production) was higher than 2015 by 29% (383 kt).
The average copper production C1 cash cost of $1.06 per
lb (including Sentinel) was significantly lower than C1
cash cost of $1.21 per lb in 2015, reflecting impact of
acid consumed from the smelter, lower fuel costs, lower
treatment charges associated with external smelters, reduced freight charges at Kansanshi and
improvement in operating costs from cost savings initiatives implemented at all operations.
9. ANTOFAGASTA
Attributable copper production for ninth-place Chilean-based Antofagasta plc in 2016 was 477 kt, a 15%
increase compared with 415 kt in 2015.
This increase in production was because of the successful integration of Zaldívar and the ramp-up of Antucoya – alongside the completion of the expansion of Centinela Concentrates.
Group net cash costs were $1.20/lb or 20% lower
than in 2015. This reflected the lower cash costs
before by-product credits, higher gold production
and higher realised prices for gold and
molybdenum, partly offset by lower molybdenum
production. Zaldivar copper mine, Chile.

10. VALE
Brazilian Vale is no.10 in the Top 10 list and produced 453 kt of copper in 2016, or 7% more than in 2015 (424 kt).
The strong production performance was a result of the record production in both the Sudbury and
Salobo operations.
RELEVANT MINING ORGANIZATIONS
SONAMI: The National Mining Society (SONAMI) is the trade
association that groups and represents in Chile the mining activity of large, medium and small scale, metallic and non-metallic.
Corporate Structure:
http://www.sonami.cl/site/acerca-de-sonami/estructura-corporativa-2/
ENAMI: Organization dealing with small and Medium-sized Mining to
incentive the development and fare play of companies in the industry (PYMMI) created by the State of Chile, which corrects failures of financial markets and technical assistance through effective instruments, through metallurgical processing operations and commercial activities.
Corporate Structure:
http://www.enami.cl/acerca-de-enami/directorio/directorio.html

COCHILCO: Chilean Copper Commission (COCHILCO) was created
on April 1, 1976, by Decree Law No. 1,349, is a technical and specialized agency of the State, which acts as an advisor, and depends, of the Ministry of Mining.
Its objective is to protect the interests of the Chilean State: in matters related to copper and its by-products and all metallic and non-metallic mineral substances, with the exception of coal and hydrocarbons, and perform the supervisory and other functions indicated by the present decree law (Article 1, DFL N ° 1 of 1981).
Corporate Structure:
https://www.cochilco.cl/Paginas/Quienes-Somos/Organigrama.aspx
Regarding any questions to sector please contact the trade officer manager.
Gerardo Galaz
Commercial Delegate Santiago | Gerente Desarrollo Nuevos Negocios
Economic Mission to Chile | Foreign Trade Administration Israel
Tel: +562-2381 1981
Cel: +569-7379 -8003
Email [email protected]