Aid, Dutch disease, and manufacturing growth
13
Aid, Dutch disease, and manufacturing growth Raghuram G. Rajan a , Arvind Subramanian b, ⁎ a University of Chicago, Booth Graduate School of Business, United States b Peterson Institute for International Economics, Center for Global Development, and Johns Hopkins University, United States abstract article info Article history: Received 23 August 2007 Received in revised form 8 December 2009 Accepted 14 December 2009 JEL classification: O4 O14 F35 Keywords: Aid Dutch disease Exports Manufacturing Exchange rate We examine the effects of aid on the growth of manufacturing, using a methodology that exploits the variation within countries and across manufacturing sectors, and corrects for possible reverse causality. We find that aid inflows have systematic adverse effects on a country's competitiveness, as reflected in the lower relative growth rate of exportable industries. We provide some evidence suggesting that the channel for these effects is the real exchange rate appreciation caused by aid inflows. We conjecture that this may explain, in part, why it is hard to find robust evidence that foreign aid helps countries grow. © 2009 Elsevier B.V. All rights reserved. 1. Introduction There is a voluminous literature on the effect of foreign aid on economic growth. 1 A fair summary would be that this literature does not provide robust evidence of either a positive or negative correlation between foreign aid inflows and the economic growth of poor countries. The absence of a robust positive correlation is particularly surprising since the primary purpose of most aid flows is to further the economic development of the recipient. What might explain the paucity of evi- dence for foreign aid propelling economic growth? One possible answer may be that there are costs emanating from aid that offsets the benefits—which include higher levels of physical investment, better education, and health, all paid for by the resource transfer. The classic analysis of these costs goes back to the Keynes– Ohlin debates on the effects of foreign transfers (such as aid) on the real exchange rate. For the case of foreign aid, the seminal work is van Wijnbergen (1985, 1986) building on the work of Corden and Neary (1982) in the context of natural resource discoveries. In a simple two-good model, increased aid will have two effects. First, aid could disproportionately be targeted at expanding non-tradable services such as construction, health care, and education for which there is substantial unmet demand. This will increase wages in that sector (given a fixed supply of skilled labor in the short run), will draw skilled labor into the non-tradable sector, and will increase wages overall. Given that the international price of traded goods is fixed, the higher wage in terms of traded goods will reduce traded sector profitability, compet- itiveness, and lead to a decline in exports. In Corden and Neary (1982)'s terminology, this is the resource movement effect. In addition, the higher wages will be spent, raising the price of non-traded goods relative to traded goods (the real exchange rate) and further hurting traded sector competitiveness. Corden and Neary (1982) would term this the spending effect. These are short run effects. But, in principle, in the medium run, aid could simultaneously also increase the productivity and supply of non-traded goods (for example, if the aid is spent on imparting skills and expanding the availability of skilled labor), offsetting the initial spending and resource movement impacts on relative prices. The overall impact, at least in the medium run—which is the focus of this paper—cannot be predicted a priori (also see Torvik (2001)). The more aid is spent on traded goods or factors (imported capital goods and foreign consultants) and on factors that are not in limited supply (unskilled labor), the more the supply of factors and non-traded Journal of Development Economics 94 (2011) 106–118 ⁎ Corresponding author. Room 322, Peterson Institute for International Economics, 1750 Massachusetts Avenue, Washington D.C. 20036, United States. E-mail address: [email protected] (A. Subramanian). 1 Important work includes Boone (1996), Alesina and Weder (2002), Bauer (1971), Burnside and Dollar (2000), Clemens, Radelet, and Bhavnani (2004), Collier and Dollar (2002), Dalgaard, Hansen, and Tarp (2004), Easterly (2003), Easterly, Levine, and Roodman (2004), Friedman (1958), Hansen and Tarp (2001), Rajan and Subramanian (2008), Roodman (2004), Svensson (2003), and World Bank (1998). 0304-3878/$ – see front matter © 2009 Elsevier B.V. All rights reserved. doi:10.1016/j.jdeveco.2009.12.004 Contents lists available at ScienceDirect Journal of Development Economics journal homepage: www.elsevier.com/locate/devec
-
Upload
khangminh22 -
Category
Documents
-
view
6 -
download
0
Transcript of Aid, Dutch disease, and manufacturing growth

Journal of Development Economics 94 (2011) 106–118
Contents lists available at ScienceDirect
Journal of Development Economics
j ourna l homepage: www.e lsev ie r.com/ locate /devec
Aid, Dutch disease, and manufacturing growth
Raghuram G. Rajan a, Arvind Subramanian b,⁎a University of Chicago, Booth Graduate School of Business, United Statesb Peterson Institute for International Economics, Center for Global Development, and Johns Hopkins University, United States
⁎ Corresponding author. Room 322, Peterson Institut1750 Massachusetts Avenue, Washington D.C. 20036, U
E-mail address: [email protected] (A. Subram1 Important work includes Boone (1996), Alesina and
Burnside and Dollar (2000), Clemens, Radelet, and Bhav(2002), Dalgaard, Hansen, and Tarp (2004), EasterlyRoodman (2004), Friedman (1958), Hansen and Tarp (2(2008), Roodman (2004), Svensson (2003), and World
0304-3878/$ – see front matter © 2009 Elsevier B.V. Adoi:10.1016/j.jdeveco.2009.12.004
a b s t r a c t
a r t i c l e i n f oArticle history:Received 23 August 2007Received in revised form 8 December 2009Accepted 14 December 2009
JEL classification:O4O14F35
Keywords:AidDutch diseaseExportsManufacturingExchange rate
We examine the effects of aid on the growth of manufacturing, using a methodology that exploits thevariation within countries and across manufacturing sectors, and corrects for possible reverse causality.We find that aid inflows have systematic adverse effects on a country's competitiveness, as reflected in thelower relative growth rate of exportable industries. We provide some evidence suggesting that the channelfor these effects is the real exchange rate appreciation caused by aid inflows. We conjecture that this mayexplain, in part, why it is hard to find robust evidence that foreign aid helps countries grow.
e for International Economics,nited States.anian).Weder (2002), Bauer (1971),nani (2004), Collier and Dollar(2003), Easterly, Levine, and001), Rajan and SubramanianBank (1998).
ll rights reserved.
© 2009 Elsevier B.V. All rights reserved.
1. Introduction
There is a voluminous literature on the effect of foreign aid oneconomic growth.1 A fair summary would be that this literature doesnot provide robust evidence of either a positive or negative correlationbetween foreign aid inflows and the economic growthof poor countries.The absence of a robust positive correlation is particularly surprisingsince the primary purpose of most aid flows is to further the economicdevelopment of the recipient. What might explain the paucity of evi-dence for foreign aid propelling economic growth?
One possible answer may be that there are costs emanating fromaid that offsets the benefits—which include higher levels of physicalinvestment, better education, and health, all paid for by the resourcetransfer. The classic analysis of these costs goes back to the Keynes–Ohlin debates on the effects of foreign transfers (such as aid) on thereal exchange rate. For the case of foreign aid, the seminal work is van
Wijnbergen (1985, 1986) building on the work of Corden and Neary(1982) in the context of natural resource discoveries.
In a simple two-goodmodel, increasedaidwill have twoeffects. First,aid could disproportionately be targeted at expanding non-tradableservices such as construction, health care, and education forwhich thereis substantial unmet demand. This will increase wages in that sector(given a fixed supply of skilled labor in the short run), will draw skilledlabor into thenon-tradable sector, andwill increasewages overall. Giventhat the international price of traded goods is fixed, the higher wage interms of traded goods will reduce traded sector profitability, compet-itiveness, and lead to a decline in exports. In Corden and Neary (1982)'sterminology, this is the resource movement effect.
In addition, the higher wages will be spent, raising the price ofnon-traded goods relative to traded goods (the real exchange rate)and further hurting traded sector competitiveness. Corden and Neary(1982) would term this the spending effect.
These are short run effects. But, in principle, in themedium run, aidcould simultaneously also increase the productivity and supply ofnon-traded goods (for example, if the aid is spent on imparting skillsand expanding the availability of skilled labor), offsetting the initialspending and resource movement impacts on relative prices. Theoverall impact, at least in the medium run—which is the focus of thispaper—cannot be predicted a priori (also see Torvik (2001)). Themore aid is spent on traded goods or factors (imported capital goodsand foreign consultants) and on factors that are not in limited supply(unskilled labor), the more the supply of factors and non-traded

Fig. 1.Manufacturing and aid between 1980 and 2000. This plot is based on running a panel regressionwhere the dependent variable is the log of the ratio of the share of value addedin manufacturing to GDP for a country (at two dates, the late 1990s and the early 1980s), and the explanatory variables are the country's per capita PPP GDP, per capita PPP GDPsquared, and fixed effects for the country and the time period. It can be interpreted as representing the conditional relationship between the change in the size of the manufacturingsector between 1980 and 2000 in a country and the change in aid over the same period. All variables are averages for the period 1980–85 and 1995–2000, respectively. To facilitatecomparability with the core results in the paper, the sample was chosen according to the same criteria as in the core sample of the paper, namely to include countries that had an aid-to-GDP ratio greater than 1% or are low-income countries. Data on manufacturing are from the World Bank's World Development Indicators.
107R.G. Rajan, A. Subramanian / Journal of Development Economics 94 (2011) 106–118
goods respond to aid inflows, and the more domestic fiscalcontraction takes place, the less likely will wages and prices be bidup to an excessive degree and the less likely will the real exchangerate appreciate (see Berg et al. (2005)). Thus whether aid reducescompetitiveness and shrinks the tradable goods sector by pushing upthe real exchange rate is ultimately an empirical question.
A hint that aid may have costs via its impact on the tradable sectoris provided in Fig. 1, where we plot the log of the value added inmanufacturing toGDP ratio in a country against the log of the ratio of aidreceived to GDP for that country for two separate dates (the late 1990sand the early 1980s, separated by about 15 years), after correcting forthe country's per capita PPP GDP, per capita PPP GDP squared, andcountry and time fixed effects.2 As the figure suggests, the more aida country has received, the smaller its share of manufacturing. Thecoefficient estimate suggests that a 1 percentage point increase in theratio of aid-to-GDP is associated with a reduced share of manufacturingin total GDP of about 0.2–0.3 percentage points.3
In Fig. 2 we obtain a similar negative relationshipwhenwe plot thelog of the ratio of manufacturing share to the share of services againstthe log of aid-to-GDP after similar corrections. So the inflow of aid iscorrelated with slower manufacturing growth, and the slower growthof manufacturing relative to services.
2 The residuals are obtained in a panel regression where the dependent variable islog of the ratio of the share of value added in manufacturing to GDP for a country (attwo dates, the late 1990s and the early 1980s, separated by about 15 years), and theexplanatory variables are the country's per capita GDP, per capita GDP squared (toallow for the U-shaped relationship postulated by Kuznets), and fixed effects for thecountry and the time period. All variables are averages for the period 1980–85 and1995–2000, respectively. We focus on the period after 1980 because the coverage ofthe World Bank data on sectoral output increases substantially and also because thecore analysis in the paper below is on the 1980s and 1990s. The sample comprisescountries that had an aid received to GDP ratio greater than 1% or are low incomecountries. The relationship depicted in the graph is robust to additional controls suchas the terms of trade.
3 Because we include fixed effects, the association between aid and manufacturingdepicted in the chart is a temporal one, that is, within countries over time rather thanone between countries.
What might explain this pattern? Assuming that services are lesstradable than manufacturing (at least for the period covered by ouranalysis), the figures suggest that aid and the relative size of tradablesectors in an economy are negatively correlated. The focus of ourpaper is then on providing more persuasive evidence for the channelthrough which this correlation emerges; that the inflow of aid leadsto a relative shrinkage of the tradable manufacturing sectors of theeconomy and that this shrinkage occurs through the appreciation ofthe recipient country's real exchange rate.
Why might this matter? For instance, a number of studies (Jonesand Olken (2005) and Rodrik (2007)) have argued that the tradedgoods sector is the channel through which an economy absorbsbest practices from abroad. The absence of these learning-by-doingspillovers, which may be critical to long-run productivity growth,could be one constraint on growth. Indeed, Jones and Olken (2005)and Johnson, Ostry, and Subramanian (forthcoming) point out thatvirtually all countries that have had a sustained period of growth inthe post-war period have seen a large increase in their share ofmanufacturing and manufacturing exports.
While these studies do not establish beyond doubt that there is aline of causation from manufacturing exports to overall growth—andthis paper does not address this question—the existence of such a linewould explain why the positive effects of aid are so hard to discern—aid leads to a shrinkage of the tradable manufacturing sector, whichhas adverse effects on overall growth.
There are three notable differences between our approach and thatof prior empiricalwork. First, thepapers in the literature on the effects ofaid on growthofmanufacturingor ofmanufacturing exports employ thestandard cross-country methodology.4 The key innovation in our paperis to identify the effect of aid on manufacturing growth in a within-
4 The empirical literature on aid, exchange rates, and manufacturing includes Adam(2005), Arellano et al. (2005), Atingi-Ego and Sebudde (2000), Bulir and Lane (2002),Elbadawi (1999), Nyoni (1998), Prati and Tressel (2006), Vos (1998), Yano andNugent (1999) and Younger (1992) but none of them exploits within-sector variation.A fuller description of this literature is in the online version of this paper.

Fig. 2. Share of manufacturing relative to services and aid between 1980 and 2000. This plot represents the conditional relationship between the change in the size of themanufacturing sector relative to the size of the service sector between 1980 and 2000 in a country and the change in aid over the same period. The share of the service sector isobtained as 1-(share of agriculture+share of industry). It is based on running a panel regression where the dependent variable is the log of the ratio of the share of value added inmanufacturing to GDP for a country (at two dates, the late 1990s and the early 1980s), and the explanatory variables are the country's per capita PPP GDP, per capita PPP GDPsquared, and fixed effects for the country and the time period. All variables are averages for the period 1980–85 and 1995–2000, respectively. To facilitate comparability with the coreresults in the paper, the sample was chosen according to the same criteria as in the core sample of the paper, namely, to include countries that had an aid-to-GDP ratio greater than 1%or are low-income countries. Data on manufacturing and services are from the World Bank's World Development Indicators.
108 R.G. Rajan, A. Subramanian / Journal of Development Economics 94 (2011) 106–118
country cross-industry context, using the methodology in Rajan andZingales (1998). By absorbing country-specific variation in countryindicators, and exploiting only the within-country across-industryvariation, we go some way in addressing the specification problemthat plague standard cross-country regressions—that some omittedcountry-specific variable might explain the observed correlation.
Second, the core of the paper aims to establish the effect of aid onthe relative share of exportable sectors, and to provide evidence onthe channel through which aid might have such effects. Specifically,we show that the effects of aid on relative industry growth rates seemto flow largely through the real exchange rates. In other words, weseek to establish that aid is the deep determinant, while exchangerates are the proximate transmission mechanism.
Third, countries may get more aid if they perform particularlybadly so aid is clearly endogenous to growth (though less clearlylinked to relative industry growth rates). We address the issue ofendogeneity by using plausibly exogenous instruments for aid.
To preview our results, we find strong evidence that aid under-mines the competitiveness of the exportable sectors. In particular,in countries that receive more aid, manufacturing industries thattypically export more, and thus are more likely to be adversely af-fected by an appreciating real exchange rate, grow slower thanmanufacturing industries that typically export less.
If indeed thechannel is throughaid's effect on real exchange rates,weshould see that: (1) aid inflows do affect exchange rates and lead toexchange rate appreciation in our sample; (2) in countrieswith a greaterappreciation of the real exchange rate (or, more precisely, with a greateraid-induced appreciation) more exportable industries grow relativelymore slowly; and (3) the independent effect of aid is somewhatattenuated when we include the extent to which the exchange rate hasappreciated above the norm. We do see all these effects.
This paper is structured as follows. In Section 2, we outline ourempirical strategy. In Section 3, we present our main results on theeffect of aid on the relative growth of sectors whose competitiveness
is most likely to be adversely hit, and establish its robustness. InSection 4, we provide evidence that exchange rate overvaluation (andnot other policies or institutions) is the proximate channel throughwhich aid has an effect, and Section 5 provides a conclusion.
2. Aid and growth: empirical strategy
The following is a schematic representation of the effects of aid onprices and quantities.
Simply put, we hypothesize a relationship from aid to the growthof the tradable sector (channel A). Channel A can in turn be brokendown to two mediating channels: from aid to real exchange rates (B)and from real exchange rates to the growth of the tradable sector (C).We do not have a fully elaborated structural model that can testall these effects simultaneously so we will test for these individualrelationships in the data.
We use the methodology in Rajan and Zingales (1998) to test thehypothesis that aid inflows might reduce the competitiveness of thetraded goods sector. They suggest that one way to check whether achannel is at work is to see whether industries that might be mostaffected by a channel grow differentially (faster or slower depending

Table 1Summary statistics.
Variables Period Mean Median Standarddeviation
Minimum Maximum Number ofobservations
A. Across countries and industries in the base sampleGrowth rate of value added ij 1980s 0.018 0.017 0.121 −0.457 0.754 684
1990s 0.030 0.037 0.108 −0.530 0.337 357Initial industry share ij 1980s 0.045 0.022 0.068 0.000 0.562 684
1990s 0.041 0.020 0.064 0.000 0.525 357
B. Across industries in the base sampleExportability1 index i 1980s, 1990s 0.5 0 0.500 0 1 28Exportability2 index i 1980s, 1990s 0.14 0 0.354 0 1 28Financial dependence i 1980s 0.233 0.219 0.322 −0.451 1.140 27
C. Across countries in the base sampleAid to GDP j 1980s 0.053 0.036 0.039 0.008 0.176 32
1990s 0.047 0.036 0.040 0.006 0.139 15Average real exchange rate overvaluation j 1980s −0.077 −0.153 0.355 −0.667 0.664 31
1990s −0.133 −0.011 0.368 −0.721 0.821 15Policy (Sachs–Warner) index j 1980s 0.279 0.000 0.378 0.000 1.000 32
1990s 0.775 1.000 0.335 0.000 1.000 15Black market premium j 1980s 0.698 0.174 1.242 −0.008 5.936 30
1990s 0.142 0.054 0.288 0.017 1.247 15Initial per capita Income j (in log) 1980s 7.639 7.732 0.609 6.406 8.659 31
1990s 7.750 7.830 0.708 6.202 9.106 15Life expectancy j 1980s 56.53 54.83 7.04 44.21 72.70 32
1990s 60.95 61.71 7.56 45.00 70.31 15Geography j 1980s −0.709 −1.015 0.552 −1.040 0.724 32
1990s −0.641 −1.014 0.604 −1.040 0.724 15Institutional quality (ICRG) index j 1980s 0.409 0.399 0.127 0.183 0.723 28
1990s 0.528 0.526 0.054 0.405 0.610 14Average level of tariffs j 1980s 33.279 29.000 22.047 4.000 97.000 32
1990s 23.277 24.000 8.291 10.000 45.000 15Standard deviation of inflation j 1980s 153.021 6.348 712.080 2.053 3662.771 32
1990s 6.553 4.691 4.043 1.631 15.855 15
Table 2Impact of aid on sectoral growth: core specification.
Dependent variable is annual average rate of growth of value added in industry i incountry j.
OLS; 1980s OLS; 1980s OLS; 1990s OLS; 1990s(1) (2) (3) (4)
Initial industry share(ij) −0.390*** −0.412*** −0.231** −0.219***
[0.084] [0.082] [0.089] [0.080]Aid/GDP(j)⁎exportability1index(i)
−0.506** −0.728**
[0.207] [0.304]Aid/GDP(j)⁎exportability2index(i)
−1.042*** −1.258***
[0.311] [0.485]Observations 684 684 357 357R-squared 0.415 0.424 0.328 0.335
Estimates are based on the OLS procedure. All standard errors, reported below thecoefficient estimates, are robust. ***, **, and * denote significance at 1, 5, and 10%,respectively. All equations include country and industry fixed effects. Initial industryshare (ij) refers to the share of industry i in country j as a share of total manufacturingsector value added in country j. Aid/GDP (j) refers to the share of aid to GDP in country javeraged over the period. Exportability1 index is a dummy that takes on a value of 1 ifan industry's ratio of exports to value added is greater than the median value, and 0otherwise. Exportability2 index is a dummy that takes on a value of 1 for ISIC sectors321–324, and 0 otherwise.
109R.G. Rajan, A. Subramanian / Journal of Development Economics 94 (2011) 106–118
on the nature of the effect) in countries where that channel is likelyto be more operative. The industry characteristic we are interested inis the degree to which an industry's competitive position is affectedby exchange rate appreciation, the channel is real exchange rateappreciation, and countries that get more aid are likely to be the oneswhere the channel is most operative. The estimation strategy is thento run regressions of the form:
Growthij = Constant + ζ1:::::m*Country Indicators
+ ζm + 1::::n*Industry Indicators + ζn + 1*ðIndustry i’s shareof manufacturing in country j in the initial periodÞ
+ αðAid to country j*Sensitivity of industry i to exchange
rate appreciationÞ + εij ð1Þ
where Growthij is the annual average rate of growth of value added ofindustry i in country j over a ten-year period, obtained by normalizingthe growth in nominal value added by the GDP deflator; ζ1.....m are thecoefficients of the country fixed effects; ζm+1....n are the coefficients ofthe industry fixed effects; ζn+1 is the coefficient of the initial periodshare of industry i in total value added in country j (which controls forconvergence-type effects); Aid to country j is the average aid-to-GDPratio for that country over the sample period. The coefficient of interestfor us is α. It captures an interaction between a country-specific aidvariable and an industry's sensitivity to the exchange rate effectsinduced by foreign aid. We posit that countries that receive more aidshould see a more negative impact in industrial sectors that are moresensitive, so that we would expect the coefficient α to be negative.
The chief advantage of this strategy is that by controlling forcountry and industry fixed effects, the problem of omitted variablebias or model specification, which seriously afflicts cross-countryregressions, is diminished. Essentially, we are making predictionsabout within-country differences between industries based on an
interaction between a country and industry characteristic. Moreover,because we focus on differences between manufacturing industries(rather than between, say, manufacturing and services industries), wecan rule out factors that would keep manufacturing underdevelopedas explanations of our results—for these factors should not affect thedifferences between manufacturing industries.
2.1. Implementing the strategy
However, this focus on manufacturing only (driven also by dataavailability) comes at a cost. Themanufacturing sector, by and large, is

Fig. 3. Non-parametric depiction of core results. We divide the industries into two groups—exportable and others. In panel A, the exportable industries are as defined by theexportability1 index, and in panel B as defined by the exportabillity2 index. Next we estimate for each country the difference in average growth in value added between theexportable and other industries. The y-axis measures this difference, which is plotted against the aid-to-GDP received by each country (x-axis).
110 R.G. Rajan, A. Subramanian / Journal of Development Economics 94 (2011) 106–118
tradable. So how do we develop a proxy for the sensitivity, or relativesensitivity, of an industry to the competitiveness effects of aid?
One approach is to recognize that in a poor developing country, thelack of competitiveness is likely to show up to a greater extent inexports, than in import-competing industries. This is in part because,during the time period under study, in a poor country with anovervalued exchange rate, government actions to support import-competing industries (for example, through import tariffs and non-tariff barriers) were easier than actions to support exportingindustries (for example, through cash or tax subsidies). Our proxyfor exportability is an indicator variable for each industry, which takesthe value 1 if the industry has a ratio of exports to value added(averaged across all countries in the sample) greater than the medianacross industries.5 The indicator takes the value zero otherwise. We
5 We obtained these data from Nicita and Olarreaga (2001).
call this indicator “exportability1.”6 We use another measure ofexportability, which is simply a dummy equal to one for the fourindustries that have been most closely associated with the growth ofdeveloping countries as they have moved out of agriculture: textiles,clothing, leather, and footwear.Of course, not all exports are likelyto be subject to adverse effects from aid. In particular, exports ofextractable resources where labor intensity is low are unlikely to beaffected by an overvalued real exchange rate. Fortunately, by focusingon manufacturing, we largely exclude such industries.
Because we examine growth differentials between industrieswithin countries, the results are less sensitive to the rationale forwhy aid is given. For example, even if aid is given only to countries
6 By discretizing our index we lose some information, but we also eliminate noise inclassification. We also stay closer to the notion that either a product is exportable or itis not.

111R.G. Rajan, A. Subramanian / Journal of Development Economics 94 (2011) 106–118
that display poor growth, inter-industry growth differentials shouldnot be seriously affected. So, in our core specification, we will reportour results using a simple OLS estimation strategy. However, there canbe a potential, if indirect, problem of reverse causality. Suppose lowgrowth is primarily because countries have overvalued exchangerates, and aid is systematically given to countries that have moreovervalued exchange rates. In this case, we might be attributing to aidwhat is actually driven by trade and exchange rate policies. One wayto address this is to correct directly for policies, which we attempt todo. Another is through instrumentation, which allows us todisentangle the direction of causality. We will, therefore, also showthat our results are robust to instrumentation. Our instrumentationstrategy, which draws directly from Rajan and Subramanian (2008), isdescribed in the Appendix.
2.2. Data and their sources
The data and sources are described in detail in Appendix A. Thedata for industry value added growth come from the IndustrialStatistics Database (2003) of the United Nations Industrial Develop-ment Organization (UNIDO). The data are at the 3-digit level of theInternational Standard Industrial Classification of All EconomicActivities (ISIC, Revision 2) and are available for the 1980s and 1990s.
In order to keep the sample as large as possible without com-promising our focus on long-term growth, we include all those industryobservations where the average growth rate can be computed over atleast a seven-year period in the decade. On this criterion, the UNIDOdatabase has data for 47 developing countries for the 1980s and 31countries for the 1990s.
But our methodology is most applicable when we include broadlysimilar countries with roughly similar levels of technological endow-ments. At the same time, we do not want to exclude recipients ofsignificant aid. Our final sample therefore comprises countries thatreceive aidgreater than1%ofGDPor are low-incomecountries accordingto World Bank definitions in the initial year of the sample. Our samplethen has 32 countries for the 1980s and 15 countries for the 1990s. TheUNIDO database contains data on 28 industries in these countries.7
In Table 1, we presentmeans, medians, and standard deviations forthe key variables in the analysis. The median growth rate of valueadded for industries is 1.7% for the decade 1980–90 and 3.7% for1990–2000. The average aid inflow into the 32 countries in the 1980–1990 sample is 5.3% of GDP and the average aid inflow into the 15countries in the 1990–2000 sample is 4.7% of GDP. In much of thepaper we will focus on the results for the 1980s because our sample istwice as large (32 countries and 684 observations) as it is for the1990s (15 countries and 357 observations). We will only presentsome key results for the 1990s, and refer the reader to the workingpaper version for robustness checks.
Some additional concerns need to be discussed. First, given that anumber of countries are not covered by the UNIDO database, theconcern arises whether the countries in our sample differ from thetypical aid recipient. Comparing the core 1980s sample that we use inthis paper with a larger sample (comprising all countries selected onthe same criteria as in this paper and for which manufacturing dataare available in the World Bank's World Development Indicators), wefind countries in our sample receive moderately less aid (5.6% relativeto 7.0%) and grow somewhat faster (GDP growth 1.0% vs 0.7%,manufacturing growth 4.8% vs 3.6%). Countries in our sample areneither considerably worse in performance, nor indeed very differentfrom the larger sample. The variation in our sample on these in-dicators is also not very different (see Appendix Table 1D). Primafacie, there is no clear evidence that our sample is “special.”
7 Appendix A lists all countries for which data were available as well as thosecountries that were included in the econometric analysis.
A second potential concern, related to the above, is that only afew countries in our sample have significant manufacturing sectors,limiting the relevance of our analysis. On this, it is worth pointingout that the share of manufacturing in GDP in our sample is not verydifferent from the larger set of developing countries that receive aidgreater than 1% of GDP (see row 3 in Appendix Table 1D). In otherwords, it is possible that, and indeed this is what our core resultspurport to establish, this low share is a consequence of aid. Thus, lowmanufacturing share is not in itself a reason not to explore the impactof aid, although it is clearly relevant when evaluating claims aboutthe overall growth impact of aid. We will, however, undertake somerobustness tests to address this concern.
3. Aid and sensitivity to exchange rate appreciation
3.1. The core specification
We present our core specifications in Table 2 for the 1980s and1990s corresponding to the relationship depicted as channel A in theschema in Section 2.1. The dependent variable is the annual averagegrowth in value added in industry i in country j. We estimate thecoefficient of the interaction between exportability and aid. The fourcolumns correspond to our two measures of exportability for the1980s and 1990s sample. In all four cases, the interaction term isnegative and statistically significant at the 5% confidence level orabove. Value added in exportable industries grows relatively moreslowly than for other industries in countries that receive more aid.
What can we say about magnitudes? The estimate in columnsuggests that in countries that receive an extra 1 percentage point ofaid, exportable industries (as defined by the exportability1 index)grow slower by about 0.5 percentage point per annum relative to non-exportable industries. The estimate in column 2 suggests that clothingand footwear sectors grow slower by about 1 percentage point a yearrelative to other industries in countries that receive 1 percentagepoint of GDP more in aid. This is quite substantial when comparedwith the average growth rate in the sample of 1.8%. The estimatedmagnitudes are slightly larger for the 1990s.
We depict this core result for the 1980s in a non-parametric formin Fig. 3. We divide the industries into two groups (above- and below-median) depending on their exportability. Next we estimate for eachcountry the difference in average growth in annual value addedbetween above-median and below-median exportable industries. Weplot this difference against the aid-to-GDP received by each country.Fig. 3 shows that the difference in growth is negatively related to theaid received by a country, and no single country drives it.
3.2. Robustness to instrumentation
As we said earlier, there is no obvious reason to expect growthin particular industries to drive aid or to determine the inherentexportability of industries. However, there can be a potential, if in-direct, problem of reverse causality. Suppose low growth is primarilybecause countries have overvalued exchange rates, and aid is sys-tematically given to countries that have more overvalued exchangerates. In this case, we might be attributing to aid what is actuallydriven by trade and exchange rate policies. So, we check if our resultsare robust to instrumentation, using the instrument we developed inRajan and Subramanian (2008).
The key idea for instrumentation in Rajan and Subramanian(2008) is to model the supply of aid based on donor-related ratherthan recipient-specific characteristics. In other words, we base ourinstrument on considerations that drive individual donors to give aidto a country other than those related to a country's level of income orgrowth. So, our construction of instruments starts from the bilateraldonor–recipient relationship—including measures like colonial ties,common language, and relative size to predict bilateral aid flows—and

Table 3Impact of aid on sectoral growth: robustness to instrumentation.
Manufacturing >15%
(1) (2) (3) (4) (5) (6)
Panel A: Dependent variable is annual average rate of growth of value added in industry i in country jAid/GDP(j)⁎Exportability1 index(i) −1.913*** −1.228** −1.561***
[0.644] [0.543] [0.543]Aid/GDP(j)⁎exportability2 index(i) −3.718*** −1.381** −4.136***
[1.180] [0.693] [1.094]Institutional quality⁎exportability1 index(i) −0.053
[0.074]Institutional quality⁎exportability2 index(i) −0.050
[0.128]Observations 684 684 350 350 622 622R-squared 0.365 0.321 0.372 0.384 0.397 0.306
Panel B: First stage for IV in columns 1–6 of Panel A aboveDependent variable is Aid/GDP(j)⁎exportability1 and Aid/GDP(j)⁎exportability2, respectivelyFitted aid/GDP(j)⁎exportability1 index(i) 0.230*** 0.298*** 0.292***
[0.032] [0.037] [0.034]Fitted Aid/GDP(j)⁎exportability2 index(i) 0.271*** 0.302*** 0.299***
[0.035] [0.039] [0.036]Institutional quality⁎exportability1 index(i) 0.004
[0.012]Institutional quality⁎exportability2 index(i) 0.015
[0.012]Observations 684 684 350 350 622 622R-squared 0.764 0.718 0.750 0.674 0.773 0.725
Estimates in this table use an instrumental variable (IV) procedure. Unless otherwise noted, all specifications are for the 1980s. All standard errors, reported below the coefficientestimates, are robust. ***, **, and * denote significance at 1, 5, and 10%, respectively. Standard errors are corrected, using the procedure in Frankel and Romer (1999), to allow for thefact that the instruments are estimated. All equations include country and industry fixed effects. Initial industry share (ij) refers to the share of industry i in country j as a share oftotal manufacturing sector value added in country j. Aid/GDP (j) refers to the share of aid to GDP in country j averaged over the period. Exportability1 index is a dummy that takes ona value of 1 if an industry's ratio of exports to value added is greater than themedian value, and 0 otherwise. Exportability2 index is a dummy that takes on a value of 1 for ISIC sectors321–324, and 0 otherwise. The specifications in columns 1, 2, 5 and 6 are based on the core sample, while those in columns 3 and 4 are based on a sample of countries whosemanufacturing to GDP ratio exceeds 15%. In Panel B, the dependent variable (which is the endogenous regressor in Panel A) is the product of aid/GDP in country j times the relevantexportability index (i). Fitted aid is obtained from estimating a gravity-type model of bilateral aid flows as described in the Appendix. The institutional quality variable is from ICRGE(International Country Risk Guide) and is a measure of the quality of government institutions that affect property rights or the ability to conduct business. It is published by a privatefirm that provides consulting services to international investors.
112 R.G. Rajan, A. Subramanian / Journal of Development Economics 94 (2011) 106–118
this is then aggregated up to calculate predicted aid (as Frankel andRomer (1999) have done in the trade literature). This is in contrastto the literature that picks instruments directly at the level of therecipient country.
The results are presented in Table 3, columns 1 and 2. The second-stage results for the interaction terms are in Panel A, with thecorresponding first stage in Panel B.8 The coefficient on the interac-tion term continues to be significant, and the magnitudes of thesecoefficients are greater than the OLS estimates. The results in Panel Bshow that there is no problem of weak instrumentation because theF-value for the instrument is above 50 in all columns, which com-fortably exceeds the Staiger and Stock (1997) threshold of 10 forstrong instruments.9
One concern might be that the countries in our base regressioninclude ones with tiny manufacturing sectors, which may skew theresults. As a check that this does not drive our results, we includeonly countries that had a manufacturing to GDP share greater than15%. In Table 3, columns 3 and 4, we find the coefficient estimatesfor this narrower sample to also be statistically and economicallysignificant.
Another concern is that the historical and colonial ties in ourinstrument might proxy for the quality of a country's institutions.From ICRGE (International Country Risk Guide), we obtain a measureof the quality of government institutions that affect property rights or
8 In this table, the standard errors in the second-stage regressions are corrected totake account of the fact that the instrument used in the first stage is estimated. Weused the procedure in Frankel and Romer (1999) to do this correction.
9 With one endogenous variable, the F-value for the strength of the instrument issimply the square of the t-statistic associated with its coefficient.
the ability to conduct business. We then control for institutionalquality (interacted with the exportability indicators to capture thefact that exportables may be more institution-intensive) in columns 5and 6. The core interaction coefficient between aid and exportabilityremains qualitatively similar in magnitude and significance.10
4. The transmission mechanism from aid to sectoral growth
To summarize the results thus far, we have shown the link betweenaid and the relative growth of exportable industries. The theory wehave laid out suggests this is because of the effect of aid on the realexchange rate, which in turn adversely affects the labor-intensive andexportable industries. This then leads to the natural question: how canwe be sure that our core result does indeed reflect such an effect andwhat is the connection between aid and real appreciation? To answerthese questions we can bring to bear more evidence, direct andindirect, relating to real exchange rate appreciation.
4.1. Does aid “cause” excess appreciation?
Before we elaborate on our results, we need to clarify the term“excess appreciation”. Strictly speaking aid, via its spending effect,causes a currency appreciationwhich leads to a decline in exports. Theproblem, however, is that currency appreciation could also be a trendphenomenon associated with rising trade and incomes (the Balassa–Samuelson effect). Therefore, we want to pick up the measure of real
10 In a longer version of this paper that is available online, we show that our resultsare robust to alternative samples, notably the exclusion of outliers, to clustering ofstandard errors, to alternative measures of value added growth, and to alternativemeasures and types of aid.

Table 4Impact of aid on sectoral growth: is real exchange rate the channel?
Dependent variable is excess appreciation(j) Dependent variable is annual average rate of growth of value added in industry i in country j
(1) (2) (3) (4) (5) (6) (7)
Aid/GDP(j) 1980s 3.175***[0.280]
Excess appreciation(j)⁎exportability1 index(i) −0.069*** −0.058** -0.190***[0.023] [0.025] [0.072]
Excess appreciation(j)⁎exportability2 index(i) −0.199*** −0.179*** -0.510***[0.030] [0.031] [0.149]
Aid/GDP(j)⁎ Exportability1 index(i) −0.289[0.223]
Aid/GDP(j)⁎exportability2 index (i) −0.471[0.313]
Observations 674 674 674 674 674 674 674R-squared 0.126 0.428 0.462 0.430 0.465 0.397 0.354
Panel B: First stage for IV in Columns 6–7 of Panel A aboveDependent variable is excess appreciation(j)⁎exportability1 and exportability2 respectivelyInitial industry share(ij) 0.034 0.032
[0.146] [0.106]Fitted aid/GDP(j)⁎exportability1 index(i) 1.972***
[0.300]Fitted Aid/GDP(j)⁎exportability2 index(i) 2.158***
[0.318]Observations 674 674R-squared 0.538 0.239
Estimates are based on the OLS procedure, except for those in columns 6 and 7. All standard errors, reported below the coefficient estimates, are robust. ***, **, and * denotesignificance at 1, 5, and 10%, respectively. All estimations except for column (1) include country and industry fixed effects and initial industry share (ij) of industry i in country j as ashare of total manufacturing sector value added in country j. Aid/GDP (j) refers to the share of aid to GDP in country j averaged over the period. Exportability1 index is a dummy thattakes on a value of 1 if an industry's ratio of exports to value added is greater than the median value and 0 otherwise. Exportability2 index is a dummy that takes on a value of 1 forISIC sectors 321–324, and 0 otherwise. The excess appreciation variable is from Johnson, Ostry and Subramanian (forthcoming). Note that the sample size is smaller than in the corespecification because data on excess appreciation are not available for one country in the core specification. In columns 6 and 7, the instruments for excess appreciation are the sameas those used for aid in Table 3.
113R.G. Rajan, A. Subramanian / Journal of Development Economics 94 (2011) 106–118
appreciation that is over and above that suggested by the Balassa–Samuelson effect—that real exchange rates increase with realincomes. We follow Johnson, Ostry and Subramanian (forthcoming)(and implicitly, Dollar (1992), Easterly and Levine (2003), and Rodrik(2007)) in measuring excess appreciation or overvaluation.11
In Table 4, we provide evidence that excess appreciation is thechannel through which aid affects exports. In column 1, we show thesimple correlation between excess appreciation and aid inflowswhichis statistically significant at the 1% level. If real appreciation is thechannel, then like aid, it should particularly affect exportable sectors.In other words, in countries with more appreciated exchange rates,exportable and labor-intensive sectors should grow relatively slowerthan other sectors. We therefore estimate model (1) above with thedifference that we replace the aid variable with our measure of excessappreciation. The results in columns 2 and 3 in Table 4 show that theinteraction term between excess appreciation and either of ourexportability measures is negative and significant. The coefficientestimates suggest that a one percentage point excess appreciationreduces the annual average growth of the exportable sectors by 0.07and 0.2%, respectively, for the twomeasures of exportability. We havechecked these results are robust to replacing our measure of excessappreciation with other measures of exchange rate overvaluation,including the recent work of Rodrik (2007) and Easterly and Levine(2003) and find that the results described here hold for thosemeasures too (available from the authors upon request).
11 The measure of excess appreciation is based on departures from long-run PPP. Forevery year in the sample period,we regress over the cross-section of countries, a country'sprice level of GDP from the Penn World Tables (6.1) on its real GDP per capita (in PPPterms). Thedeviationof the actual price level fromtheestimatedprice level is ameasure ofthe country's excess appreciation. We averaged the annual values over the 1980s and1990s respectively to obtain the final measure of excess appreciation.
We have just established that excess exchange rate appreciationhas a similar effect as aid on the growth in value added of exportableindustries. Another way to check this is to introduce both the aidand excess appreciation interactions in the same regression, whichwe do in columns 4 and 5 of Table 4. If aid is indeed the deep causaldeterminant, and excess appreciation themainmediating channel, weshould find that the direct effect of the aid interaction should be highlyattenuated in the presence of the excess appreciation exportabilityinteraction. Indeed, this is what we find. In both cases, the coefficientestimate of the excess appreciation interaction remains significant,while that for the aid interaction shrinks in both magnitude andstatistical significance. This suggests that excess appreciation mayrepresent the channel through which aid has influence.12
We offer one final piece of evidence in favor of excess appreciation asthe channel, using our instrument for aid (interactedwith exportability)in explaining the degree of excess appreciation (interacted withexportability) in the first stage, and use the predicted excess appreci-ation interaction in the second stage. The IV results for the second stage(columns 6 and 7, Panel A) suggest that the component of overvaluationcaused by exogenous aid inflows does hurt competitiveness.
4.2. Is the excess appreciation a reflection of other policies rather than aid?
Is the observed significant estimate for the exportability-aidintensity interaction a proxy for other policies than aid? Considertrade reform. It is well-known that trade reform alleviates the anti-export bias of a regime. Is it possible that countries are poor becausethey have bad trade policies, and this, not aid, is responsible for thepattern of industry growthwe observe? Indeed, could restrictive trade
12 We obtained very similar results when we used the Easterly and Levine (2003)measure of overvaluation.
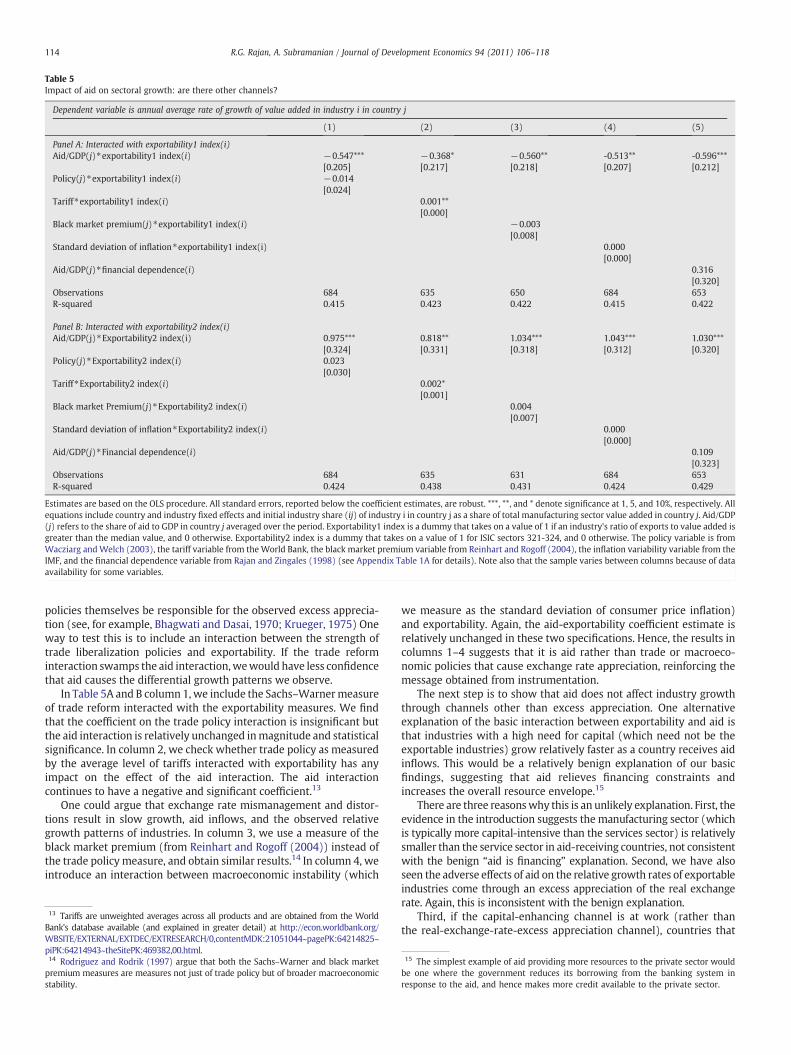
Table 5Impact of aid on sectoral growth: are there other channels?
Dependent variable is annual average rate of growth of value added in industry i in country j
(1) (2) (3) (4) (5)
Panel A: Interacted with exportability1 index(i)Aid/GDP(j)⁎exportability1 index(i) −0.547*** −0.368* −0.560** -0.513** -0.596***
[0.205] [0.217] [0.218] [0.207] [0.212]Policy(j)⁎exportability1 index(i) −0.014
[0.024]Tariff⁎exportability1 index(i) 0.001**
[0.000]Black market premium(j)⁎exportability1 index(i) −0.003
[0.008]Standard deviation of inflation⁎exportability1 index(i) 0.000
[0.000]Aid/GDP(j)⁎financial dependence(i) 0.316
[0.320]Observations 684 635 650 684 653R-squared 0.415 0.423 0.422 0.415 0.422
Panel B: Interacted with exportability2 index(i)Aid/GDP(j)⁎Exportability2 index(i) 0.975*** 0.818** 1.034*** 1.043*** 1.030***
[0.324] [0.331] [0.318] [0.312] [0.320]Policy(j)⁎Exportability2 index(i) 0.023
[0.030]Tariff⁎Exportability2 index(i) 0.002*
[0.001]Black market Premium(j)⁎Exportability2 index(i) 0.004
[0.007]Standard deviation of inflation⁎Exportability2 index(i) 0.000
[0.000]Aid/GDP(j)⁎Financial dependence(i) 0.109
[0.323]Observations 684 635 631 684 653R-squared 0.424 0.438 0.431 0.424 0.429
Estimates are based on the OLS procedure. All standard errors, reported below the coefficient estimates, are robust. ***, **, and * denote significance at 1, 5, and 10%, respectively. Allequations include country and industry fixed effects and initial industry share (ij) of industry i in country j as a share of total manufacturing sector value added in country j. Aid/GDP(j) refers to the share of aid to GDP in country j averaged over the period. Exportability1 index is a dummy that takes on a value of 1 if an industry's ratio of exports to value added isgreater than the median value, and 0 otherwise. Exportability2 index is a dummy that takes on a value of 1 for ISIC sectors 321-324, and 0 otherwise. The policy variable is fromWacziarg andWelch (2003), the tariff variable from theWorld Bank, the black market premium variable from Reinhart and Rogoff (2004), the inflation variability variable from theIMF, and the financial dependence variable from Rajan and Zingales (1998) (see Appendix Table 1A for details). Note also that the sample varies between columns because of dataavailability for some variables.
114 R.G. Rajan, A. Subramanian / Journal of Development Economics 94 (2011) 106–118
policies themselves be responsible for the observed excess apprecia-tion (see, for example, Bhagwati and Dasai, 1970; Krueger, 1975) Oneway to test this is to include an interaction between the strength oftrade liberalization policies and exportability. If the trade reforminteraction swamps the aid interaction,wewould have less confidencethat aid causes the differential growth patterns we observe.
In Table 5A and B column 1, we include the Sachs–Warnermeasureof trade reform interacted with the exportability measures. We findthat the coefficient on the trade policy interaction is insignificant butthe aid interaction is relatively unchanged inmagnitude and statisticalsignificance. In column 2, we check whether trade policy as measuredby the average level of tariffs interacted with exportability has anyimpact on the effect of the aid interaction. The aid interactioncontinues to have a negative and significant coefficient.13
One could argue that exchange rate mismanagement and distor-tions result in slow growth, aid inflows, and the observed relativegrowth patterns of industries. In column 3, we use a measure of theblack market premium (from Reinhart and Rogoff (2004)) instead ofthe trade policy measure, and obtain similar results.14 In column 4, weintroduce an interaction between macroeconomic instability (which
13 Tariffs are unweighted averages across all products and are obtained from the WorldBank's database available (and explained in greater detail) at http://econ.worldbank.org/WBSITE/EXTERNAL/EXTDEC/EXTRESEARCH/0,contentMDK:21051044~pagePK:64214825~piPK:64214943~theSitePK:469382,00.html.14 Rodriguez and Rodrik (1997) argue that both the Sachs–Warner and black marketpremium measures are measures not just of trade policy but of broader macroeconomicstability.
we measure as the standard deviation of consumer price inflation)and exportability. Again, the aid-exportability coefficient estimate isrelatively unchanged in these two specifications. Hence, the results incolumns 1–4 suggests that it is aid rather than trade or macroeco-nomic policies that cause exchange rate appreciation, reinforcing themessage obtained from instrumentation.
The next step is to show that aid does not affect industry growththrough channels other than excess appreciation. One alternativeexplanation of the basic interaction between exportability and aid isthat industries with a high need for capital (which need not be theexportable industries) grow relatively faster as a country receives aidinflows. This would be a relatively benign explanation of our basicfindings, suggesting that aid relieves financing constraints andincreases the overall resource envelope.15
There are three reasonswhy this is an unlikely explanation. First, theevidence in the introduction suggests the manufacturing sector (whichis typically more capital-intensive than the services sector) is relativelysmaller than the service sector in aid-receiving countries, not consistentwith the benign “aid is financing” explanation. Second, we have alsoseen the adverse effects of aid on the relative growth rates of exportableindustries come through an excess appreciation of the real exchangerate. Again, this is inconsistent with the benign explanation.
Third, if the capital-enhancing channel is at work (rather thanthe real-exchange-rate-excess appreciation channel), countries that
15 The simplest example of aid providing more resources to the private sector wouldbe one where the government reduces its borrowing from the banking system inresponse to the aid, and hence makes more credit available to the private sector.
16 Since local PPI was not available for all developing countries in IFS, alternativedeflators needed to be used to construct the measure of real value added in localcurrency. Accordingly, whenever PPI was not available, we used the effective deflatorconstructed with the index of industrial production as in Rajan and Zingales (1998).This deflator is the ratio of the growth rate of nominal value added in the entiremanufacturing sector (from the UNIDO database) to the growth rate of the index ofindustrial production (from IFS). Alternatively, a GDP deflator was used wheneverthese two series were not available.
115R.G. Rajan, A. Subramanian / Journal of Development Economics 94 (2011) 106–118
receive more aid should see an increase in the output of industriesthat are more dependent on external financial resources. To con-trol for any possible effect of aid in alleviating financing constraints,we include the interaction of aid inflows with the Rajan and Zingales(1998) variable that measures the dependence of a particular indus-try on external resources to finance investment. Thus, if aid increasesthe resource envelope available to the industrial sector, we shouldexpect the coefficient of this interaction term to be positive. More-over, if the availability of capital rather than exportability is whatmatters, the coefficient on the aid-exportability interaction termshould fall in magnitude when we include the aid-financial depen-dence interaction.
In Table 5A and B, column 5, we add another term, which is theinteraction of aid and financial dependence of an industry. Only theaid-exportability interaction is statistically significant (and negative).The aid-financial dependence interaction is not statistically signifi-cant. Therefore, it does not appear that the channel through whichthe relative growth rates are affected by aid is via capital-intensivesectors getting increased access to resources. The magnitudes of theaid-exportability interaction coefficient are broadly similar to thatestimated in columns 1 and 2 of Table 2, suggesting that exportabilityis not an indirect proxy for resource intensity.
5. Concluding remarks
Taken together, our results suggest there may indeed be anadverse impact of aid on the relative growth of exportable sectors, andthat the channel through which these effects are felt is the exchangerate overvaluation induced by aid.
Despite the fact that for many aid-receiving countries, themanufacturing sector might be less important currently than agri-culture, it is worth remembering that that was also true for many ofthe fast-growing countries when they first embarked upon develop-ment. Manufacturing exports provided the vehicle for their growthtake-off, so any adverse effects on such exports should prima facie bea cause for concern about the effects of aid on growth.
The message from our work is that countries should avoid creatingthe conditions that generate uncompetitive exchange rates. To theextent that aid inflows are responsible, it would suggest a focus onthe part of both donors and recipients on tailoring aid flows to theabsorptive capacity for aid in the economy.
More generally, the theory does not suggest that the adverseeffects of aid on competitiveness are inevitable, but our evidenceindicates that the historical experience has not been positive. From aresearch perspective, it is perhaps more fruitful now to move beyondthe inconclusive debate of whether aid is effective, and focus onspecific ways it can be made to work better, by better understandingthe reasons that might impair or enhance its effectiveness.
Acknowledgments
We are grateful for the helpful comments from Chris Adam, AndyBerg, Jagdish Bhagwati, Abdoulaye Bio-Tchané, Aleš Bulíř, NancyBirdsall, Francois Bourguignon, Ajay Chhibber, Michael Clemens, TitoCordella, Shanta Devarajan, Alan Gelb, Ed Glaeser, Tim Harford, JohnHicklin, Nurul Islam, Simon Johnson, Aart Kraay, Pravin Krishna, AnneKrueger, Ted Miguel, Michael Nowak, Jonathan Ostry, Rohini Pandey,Alessandro Prati, Lant Pritchett, Rodney Ramcharan, Dani Rodrik,David Roodman, Shankar Satyanath, T.N. Srinivasan, Quy Toan-Do,Thierry Tressel, AlanWinters, and participants at the Center for GlobalDevelopment Seminar in Washington D.C., and at seminars at theInternational Monetary Fund, Harvard, and George Mason Universi-ties, and the University of California at Berkeley. Wewould also like tothank Gordon Hanson and four anonymous referees for the extremelyhelpful suggestions. Manzoor Gill, Naomi Griffin, Marko Klasnja, andIoannis Tokatlidis provided superb research assistance.
Appendix A. Main data sources and description
▪ Industrial Statistics Database (2003) of the United NationsIndustrial Development Organization (UNIDO) for data on valueadded and labor share. Data are at 3-digit level of the InternationalStandard Industrial Classification of All Economic Activities (ISIC,Revision 2). [UNIDO database].
▪ World Development Indicators (World Bank) for the data on theshare of manufacturing and services in GDP.
▪ WITS (World Integrated Trade Solution) data (World Bank) forexportability index.
▪ OECD's Development Assistance Committee (DAC) for data on aid.
A.1. Growth rate of real value added
The UNIDO dataset provides nominal value added both in terms ofUS dollars and local currency. The value added figure in US dollars isused for all regression analysis. The nominal value added (in currentUS dollars) was changed to a real value added (in constant Year2000 US dollars), using the U.S. Producer Production Index providedby the International Monetary Fund's International Financial Statistics(IFS). This measure was, in turn, compared with the real value addedin local currency to ascertain its reliability.16 More specifically, werequired the correlation between the two be higher than 0.75 to beincluded in our base sample.
We then calculated the average annual growth rate of real valueadded for industry i in country j, for the 1980s and 1990s. Wecalculated this wherever data existed for at least a seven-year period.
Countries with aid less than 1% of GDP are not included in theregression analysis because they included a number of emergingmarket and other countries such as Malta, Cyprus, and Kuwait thatcannot be considered meaningful aid recipients. Peru is dropped fromthe base sample due to its unusually high level of growth rates in allindustries in the UNIDO database (i.e. exceeds 100% in all sectors).Niger is dropped from the 1990 sample as the data contained anobservation where the ratio of wages to value added exceeded 17. Wealso dropped observations when this ratio exceeded one (this resultedin 10 and 12 observations being dropped respectively from the samplefor the 1980s and 1990s).
Appendix B. Instrumentation strategy
Our instruments for aid are based on Rajan and Subramanian(2008). The key idea there is to model the supply of aid based ondonor and donor–recipient relationships rather than on recipient-specific characteristics. In other words, we base our instrument onconsiderations that drive individual donors to give aid to a countryother than those related to a country's level of income or growth. So,our construction of instruments starts from the bilateral (donor–recipient) relationship and aggregates up (as Frankel and Romer(1999) have done in the trade literature).
We posit that donors lend for reasons of history and in order tohave influence. The greater the extent of historic relationshipsbetween a donor and a recipient the more likely that a donor willwant to give aid. We capture historic relationships through coloniallinks and commonality of language.
Oneway to proxy for influence is through the relative size of donorand recipient. The bigger the donor is relative to the recipient, the
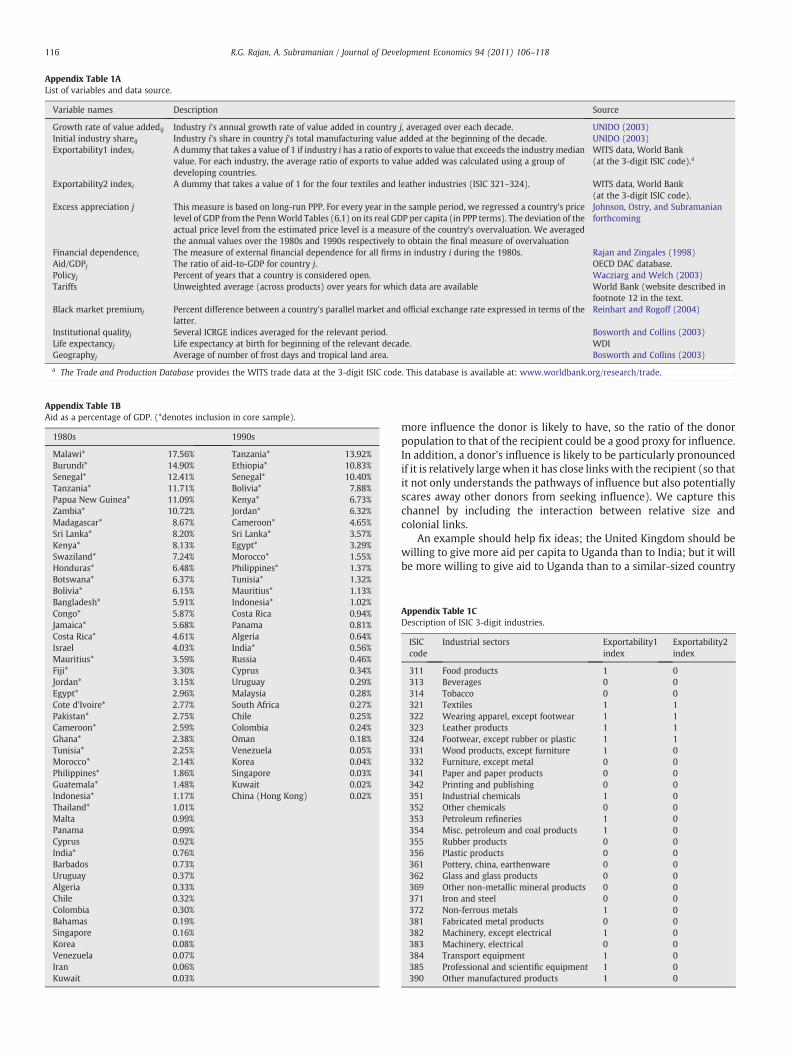
Appendix Table 1BAid as a percentage of GDP. (*denotes inclusion in core sample).
1980s 1990s
Malawi* 17.56% Tanzania* 13.92%Burundi* 14.90% Ethiopia* 10.83%Senegal* 12.41% Senegal* 10.40%Tanzania* 11.71% Bolivia* 7.88%Papua New Guinea* 11.09% Kenya* 6.73%Zambia* 10.72% Jordan* 6.32%Madagascar* 8.67% Cameroon* 4.65%Sri Lanka* 8.20% Sri Lanka* 3.57%Kenya* 8.13% Egypt* 3.29%Swaziland* 7.24% Morocco* 1.55%Honduras* 6.48% Philippines* 1.37%Botswana* 6.37% Tunisia* 1.32%Bolivia* 6.15% Mauritius* 1.13%Bangladesh* 5.91% Indonesia* 1.02%Congo* 5.87% Costa Rica 0.94%Jamaica* 5.68% Panama 0.81%Costa Rica* 4.61% Algeria 0.64%Israel 4.03% India* 0.56%Mauritius* 3.59% Russia 0.46%Fiji* 3.30% Cyprus 0.34%Jordan* 3.15% Uruguay 0.29%Egypt* 2.96% Malaysia 0.28%Cote d'Ivoire* 2.77% South Africa 0.27%Pakistan* 2.75% Chile 0.25%Cameroon* 2.59% Colombia 0.24%Ghana* 2.38% Oman 0.18%Tunisia* 2.25% Venezuela 0.05%Morocco* 2.14% Korea 0.04%Philippines* 1.86% Singapore 0.03%Guatemala* 1.48% Kuwait 0.02%Indonesia* 1.17% China (Hong Kong) 0.02%Thailand* 1.01%Malta 0.99%Panama 0.99%Cyprus 0.92%India* 0.76%Barbados 0.73%Uruguay 0.37%Algeria 0.33%Chile 0.32%Colombia 0.30%Bahamas 0.19%Singapore 0.16%Korea 0.08%Venezuela 0.07%Iran 0.06%Kuwait 0.03%
Appendix Table 1AList of variables and data source.
Variable names Description Source
Growth rate of value addedij Industry i's annual growth rate of value added in country j, averaged over each decade. UNIDO (2003)Initial industry shareij Industry i's share in country j's total manufacturing value added at the beginning of the decade. UNIDO (2003)Exportability1 indexi A dummy that takes a value of 1 if industry i has a ratio of exports to value that exceeds the industry median
value. For each industry, the average ratio of exports to value added was calculated using a group ofdeveloping countries.
WITS data, World Bank(at the 3-digit ISIC code).a
Exportability2 indexi A dummy that takes a value of 1 for the four textiles and leather industries (ISIC 321–324). WITS data, World Bank(at the 3-digit ISIC code).
Excess appreciation j This measure is based on long-run PPP. For every year in the sample period, we regressed a country's pricelevel of GDP from the PennWorld Tables (6.1) on its real GDP per capita (in PPP terms). The deviation of theactual price level from the estimated price level is a measure of the country's overvaluation. We averagedthe annual values over the 1980s and 1990s respectively to obtain the final measure of overvaluation
Johnson, Ostry, and Subramanianforthcoming
Financial dependencei The measure of external financial dependence for all firms in industry i during the 1980s. Rajan and Zingales (1998)Aid/GDPj The ratio of aid-to-GDP for country j. OECD DAC database.Policyj Percent of years that a country is considered open. Wacziarg and Welch (2003)Tariffs Unweighted average (across products) over years for which data are available World Bank (website described in
footnote 12 in the text.Black market premiumj Percent difference between a country's parallel market and official exchange rate expressed in terms of the
latter.Reinhart and Rogoff (2004)
Institutional qualityj Several ICRGE indices averaged for the relevant period. Bosworth and Collins (2003)Life expectancyj Life expectancy at birth for beginning of the relevant decade. WDIGeographyj Average of number of frost days and tropical land area. Bosworth and Collins (2003)
a The Trade and Production Database provides the WITS trade data at the 3-digit ISIC code. This database is available at: www.worldbank.org/research/trade.
116 R.G. Rajan, A. Subramanian / Journal of Development Economics 94 (2011) 106–118
more influence the donor is likely to have, so the ratio of the donorpopulation to that of the recipient could be a good proxy for influence.In addition, a donor's influence is likely to be particularly pronouncedif it is relatively largewhen it has close links with the recipient (so thatit not only understands the pathways of influence but also potentiallyscares away other donors from seeking influence). We capture thischannel by including the interaction between relative size andcolonial links.
An example should help fix ideas; the United Kingdom should bewilling to give more aid per capita to Uganda than to India; but it willbe more willing to give aid to Uganda than to a similar-sized country
Appendix Table 1CDescription of ISIC 3-digit industries.
ISIC Industrial sectors Exportability1index
Exportability2indexcode
311 Food products 1 0313 Beverages 0 0314 Tobacco 0 0321 Textiles 1 1322 Wearing apparel, except footwear 1 1323 Leather products 1 1324 Footwear, except rubber or plastic 1 1331 Wood products, except furniture 1 0332 Furniture, except metal 0 0341 Paper and paper products 0 0342 Printing and publishing 0 0351 Industrial chemicals 1 0352 Other chemicals 0 0353 Petroleum refineries 1 0354 Misc. petroleum and coal products 1 0355 Rubber products 0 0356 Plastic products 0 0361 Pottery, china, earthenware 0 0362 Glass and glass products 0 0369 Other non-metallic mineral products 0 0371 Iron and steel 0 0372 Non-ferrous metals 1 0381 Fabricated metal products 0 0382 Machinery, except electrical 1 0383 Machinery, electrical 0 0384 Transport equipment 1 0385 Professional and scientific equipment 1 0390 Other manufactured products 1 0

Appendix Table 1DIs the Core Sample Representative?
Variable Sample in this paper Larger sample
Aid to GDPMean 5.3% 7.0%Standard deviation 3.9% 5.6%
Real GDP growthMean 1.0% 0.7%Standard deviation 2.3% 2.1%
Real value added growth in manufacturingMean 4.8% 3.6%Standard deviation 3.5% 3.6%
Core sample comprises the 32 countries for which UNIDO's disaggregate manufacturingdata are available and that have aid to GDP less than 1% or fall in the category of low-income countries. Larger sample includes countries that satisfy the same criteria but forwhich data on aggregate manufacturing is available in the World Bank's WorldDevelopment Indicators (it excludes 3 countrieswith an aid-to-GDP ratio exceeding 30%).
117R.G. Rajan, A. Subramanian / Journal of Development Economics 94 (2011) 106–118
in Africa, say Senegal, because France is likely to have a significant aidpresence in the latter, thus diluting any possibility of British influence.
The aid supply decision from a donor (d) to a recipient (r) can beexpressed by the following model:
Adrt =GDPrt = β10Ydrt + υdrt
= β0 + β1COMLANGdr + β2CURCOLdr + β3COMCOLdr
+ β4COMCOLUKdr + β5COMCOLFRAdr + β6COMCOLSPAdr
+ β7COMCOLPORdr + β8 logðPOPd = POPrÞ+ β9 logðPOPd = POPrÞ*COMCOLdr
+ β10 logðPOPd = POPrÞ*COMCOLUKdr
+ β11 logðPOPd = POPrÞ*COMCOLFRAdr
+ β12 logðPOPd = POPrÞ*COMCOLSPAdr
+ β13 logðPOPd = POPrÞ*COMCOLPORdr + υdrt
ð1Þ
where Adrt is the aid given by donor d to recipient r in time period t.GDPrt is the recipient country's GDP. The first three RHS variablescapture historic factors: COMLANG is a dummy that takes a value ofone if the donor and recipient share a common language; CURCOL isa dummy that takes a value of one if the recipient is currently a colonyof the donor. COMCOL is a dummy that takes a value of one if therecipient was ever a colony of the donor. The next four variablessimply disaggregate the colonial variable to capture difference acrossdonors in the susceptibility of their giving to colonial ties (COMCOLUK,COMCOLFRA, COMCOLSPA, and COMCOLPOR refer in turn to colonialrelationships involving respectively France, Portugal, Spain, and theUnited Kingdom).
The next set of variables relate to relative size. Donor size relativeto the recipient is measured by the ratio of the logarithm of thepopulations of donor and recipient (log(POPd/POPr)).17 Donor influ-ence relative to other donors is additionally measured by theinteraction of the relative population size and the colonial dummy(log(POPd/POPr)⁎COMCOLdr).
The estimated equation is then aggregated across donors to yielda level of the fitted value of aid-to-GDP for the recipient for thatperiod.
Art.GDPrt
� �= ∑
dβ01Ydrt ð2Þ
In Rajan and Subramanian (2008), we present estimates for themodel in (1) and show that they yield meaningful results. In Table 3 ofRajan and Subramanian (2008), we present estimates for the model
17 To minimize endogeneity-related problems, we use the initial rather than thecontemporaneous value of population.
in (1). Virtually all the instrumenting variables are significant for allthe time horizons, and between them the variables account for areasonable share (between 33 and 42%) of the variation in the donorallocation decision. All the colonial relationships are significant as arethe two measures of influence. The larger the donor relative to therecipient, the greater the aid given; and this effect is magnified, asconjectured, in cases where the donor had a colonial relationship withthe recipient. For example, for the period 1960–00, a 1% increase inthe ratio of donor size relative to recipient is associated with a 0.1%increase in the ratio of aid to GDP given by the average donor, anamount which is increased by 0.2% for a U.K. colony (which is the sumof 0.6% for the average colonyminus 0.4% for the U.K. colony dummy),1% for a Spanish colony; 1.9% for a French colony and 3.3% for aPortuguese colony. Thus, influence seems to matter a lot for donors,especially for Portugal and France.
A few caveats are worth noting about this instrumentationstrategy which is not perfect. It is possible that Eq. (1) does notapply equally to all donor–recipient pairs. Our claim here is not toexplain fully the aid allocation decision but to extract some (hopefullyexogenous) information from that decision that would be reasonablefor instrumentation. We would note that since our regressions are allcross-sectional, additional complications from the time series aspectsof aid are not introduced. Finally, it should be noted that we do use acountry-specific variable—namely population size—for instrumenta-tion that might raise questions in terms of satisfying the exclusionrestriction.
References
Adam, Christopher, 2005. Exogenous inflows and real exchange rates: theoretical quirk orempirical reality? In: Isard, Peter, Lipschitz, Leslie,Mourmouras, Alexandros, Yontcheva,Boriana (Eds.), The Macroeconomic Management of Foreign Aid. InternationalMonetary Fund, Washington.
Alesina, Alberto, Weder, Beatrice, 2002. Do corrupt governments receive less foreignaid? American Economic Review 92 (4), 1126–1137.
Arellano, C., Bulir, A., Lane, T., Lipschitz, L., 2005. Thedynamic implications of foreign aid andits variability. IMF Working Paper 05/119. International Monetary Fund, Washington.
Atingi-Ego, Michael, Sebudde, Rachel, 2000. Uganda's equilibrium real exchange rateand its implications for non-traditional export performance. Bank of Uganda StaffPapers 2 (1), 1–43.
Bauer, P.T., 1971. Dissent on Development: Studies and Debates in DevelopmentEconomics. Weidenfeld & Nicholson, London.
Berg, A., Hussain, M., Aiyar, S., Roache, S., Mahone, A., 2005. The Macroeconomics ofManaging Increased Aid Inflows: Experiences of Low-Income Countries and PolicyImplications. International Monetary Fund, Washington.
Bhagwati, Jagdish, Dasai, Padma, 1970. Planning for Industrialization. Oxford UniversityPress, London.
Boone, Peter, 1996. Politics and the effectiveness of foreign aid. European EconomicReview 40 (2), 289–329.
Bosworth, Barry, Collins, Susan, 2003. The empirics of growth: an update. BrookingsPapers on Economic Activity 4, 136–147 (Fall).
Bulir, A., Lane, T., 2002. Aid and Fiscal Management. IMF Working Paper 02/112.Burnside, Craig, Dollar, David, 2000. Aid, policies, and growth. American Economic
Review 4 (90), 847–868.Clemens, Michael A., Radelet, Steven, Bhavnani, Rikhil, 2004. Counting Chickens When
They Hatch: the Short Term Effect of Aid on Growth. Working Paper No. 44. Centerfor Global Development.
Collier, Paul, Dollar, David, 2002. Aid allocation and poverty reduction. EuropeanEconomic Review 46 (8), 1475–1500.
Corden, Neary, 1982. Booming sector and de-industrialization in a small open economy.Economic Journal 92 (368), 825–848 December.
Dalgaard, Carl-Johan, Hansen, Henrik, Tarp, Finn, 2004. On the empirics of foreign aidand growth. Economic Journal 114 (496), 191–216.
Dollar, D., 1992. Outward-oriented developing economies really do grow more rapidly:evidence from 95 LCDs, 1976–1985. Economic Development and Cultural Change40, 523–544.
Easterly, William, 2003. Can foreign aid buy growth? Journal of Economic Perspectives17 (3), 23–48.
Easterly, William, Levine, Ross, 2003. Tropics, germs, and crops: how endowmentsinfluence economic development. Journal of Monetary Economics 50 (1), 3–39.
Easterly, William, Levine, Ross and Roodman, David, 2004, New data, new doubts: acomment on burnside and dollar's aid, policies, and growth. American EconomicReview, forthcoming.
Elbadawi, I.A., 1999. External aid: help or hindrance to export orientation in Africa?Journal of African Economics 8, 578–616 December.
Frankel, Jeffery, Romer, David, 1999. Does trade cause growth? American EconomicReview 89 (3), 379–399.

118 R.G. Rajan, A. Subramanian / Journal of Development Economics 94 (2011) 106–118
Friedman, Milton, 1958. Foreign economic aid. Yale Review 47 (4), 501–516.Hansen, Henrik, Tarp, Finn, 2001. Aid and growth regressions. Journal of Development
Economics 64, 547–570.Johnson, Simon, Ostry, Jonathan, Subramanian, Arvind, forthcoming. Prospects for
Africa: Benchmarking the Contsraints. International Monetary Fund Staff Papers;Washington D.C.
Jones, Benjamin, Olken, Benjamin, 2005. The Anatomy of Start-Stop Growth. NBERWorking paper, No. 11528.
Krueger, A.O., 1975. The Benefits and Costs of Import Substitution in India: aMicroeconomic Study. University of Minnesota Press, Minneapolis.
Nicita, Alessandro, Olarreaga, Marcelo, 2001. Trade and Production, 1976–99. PolicyResearch Working Paper Series 2701. The World Bank, Washington.
Nyoni, Timothy, 1998. Foreign aid and economic performance in Tanzania. WorldDevelopment 26 (7), 1235–1240.
Prati, Alessandro, and Tressel, Thiessy, 2006. “Aid volatility and Dutch disease. Is therea role for macroeconomic policies?”mimeo, (Washington: International MonetaryFund).
Rajan, Raghuram, Subramanian, Arvind, 2008. Aid and growth: what does the cross-country evidence really show? Review of Economics and Statistics 90 (4), 643–665.
Rajan, Raghuram, Zingales, Luigi, 1998. Financial dependence and growth. AmericanEconomic Review 88 (3), 559–586.
Reinhart, Carmen, Rogoff, Kenneth, 2004. The modern history of exchange rate arrange-ments: a re-interpretation. Quarterly Journal of Economics 119 (1), 1–48.
Rodriguez, Francisco, Rodrik, Dani, 1997. Trade policy and economic growth: a skeptic'sguide to the cross-national evidence. In: Bernanke, Ben, Rogoff, Kenneth (Eds.),NBER Macroeconomics Manual, 2000.
Rodrik, Dani, 2007. The Real Exchange Rate and Economic Growth: Theory andEvidence. Kennedy School of Government manuscript.
Roodman, David, 2004. The Anarchy of Numbers: Aid, Development, and Cross-countryEmpirics. Center for Global Development, Washington.
Staiger, Douglas, Stock, James, 1997. Instrumental variables regression with weakinstruments. Econometrica 3 (65), 557–586.
Svensson, Jakob, 2003. Why conditional aid doesn't work and what can be done aboutit? Journal of Development Economics 70 (2), 381–402.
Torvik, Ragnar, 2001. Learning by doing and the Dutch disease. European EconomicReview 45 (2), 285–306.
United Nations Industrial Development Organization, 2003. Database on IndustrialStatistics. United Nations, Vienna.
Van Wijnbergen, Sweder, 1985. Aid, Export promotion and the Real Exchange Rate: anAfrican Dilemma? Center for Economic Policy Research Paper No. 88.
VanWijnbergen, Sweder, 1986. Macroeconomic aspects of the effectiveness of aid: on thetwo-gap model, home goods disequilibrium, and real exchange rate misalignment.Journal of International Economics 21 (1–2), 123–136.
Vos, Rob, 1998. Aid flows and dutch disease in a general equilibrium framework forPakistan. Journal of Policy Modelling 20 (1), 77–109.
Wacziarg, Romain, Welch, Karen Horn, 2003. Trade Liberalization and Growth: NewEvidence. Mimeo, Standford University.
World Bank, 1998. Knowledge for Development. World Development Report.Yano, Makoto, Nugent, Jeffrey B., 1999. Aid, nontraded goods, and the transfer paradox
in small countries. American Economic Review 89 (3), 431–449.Younger, Stephen, 1992. Aid and Dutch disease: macroeconomic management when
everybody loves you. World Development 20 (11), 1587–1597.