Advanced Design and Manufacturing Technology I
308
-
Upload
khangminh22 -
Category
Documents
-
view
3 -
download
0
Transcript of Advanced Design and Manufacturing Technology I


Advanced Design and
Manufacturing Technology I
Edited by Hun Guo
Zuo Dunwen Tang Guoxing

Advanced Design and Manufacturing Technology I
Special topic volume with invited peer reviewed papers only.
Edited by
Hun Guo Zuo Dunwen
Tang Guoxing
TRANS TECH PUBLICATIONS LTD Switzerland • UK • USA

Copyright 2011 Trans Tech Publications Ltd, Switzerland
All rights reserved. No part of the contents of this publication may be reproduced or transmitted in any form or by any means without the written permission of the publisher.
Trans Tech Publications Ltd Laubisrutistr. 24 CH-8712 Stafa-Zurich Switzerland http://www.ttp.net
Volume 142 of Advanced Materials Research ISSN 1022-6680
Full text available online at http://www.scientific.net
Distributed worldwide by and in the Americas by
Trans Tech Publications Ltd Trans Tech Publications Inc. Laubisrutistr. 24 PO Box 699, May Street CH-8712 Stafa-Zurich Enfield, NH 03748 Switzerland USA
Phone: +1 (603) 632-7377 Fax: +41 (44) 922 10 33 Fax: +1 (603) 632-5611 e-mail: [email protected] e-mail: [email protected]

PREFACE
The special volumes are to communicate the latest progress and research results
of new theory, new technology, method, equipment and so on in Engineering
Technology, and to grasp the updated technological and research trends in
international, which will drive international communication and cooperation of
production, education and research in this field.
The major topics covered by the special volumes include
manufacture and production, engineering materials, CAD/CAM/CAE, robotics,
automation and control, environment-friendly design and manufacture, web/internet
technologies, artificial intelligence and smart computing in design and manufacture,
enterprise, management, and other related topics and so on.
Table of Contents
Preface
Technology and Characteristic of Wool Ring Spun Compound YarnB. Zhao 1
A Co-Evolutionary Contract Net-Based Framework for Distributed ManufacturingExecution SystemsR. Wang 6
The Research on Cutting Force in High-Speed Milling Process of Aluminum Alloy ImpellerY.B. Liu, C. Zhao, X. Ji and P. Zhou 11
Research of Asynchronous Multi-Type Sensors Data FusionY. Qin, X.H. Wang, M.J. Feng, Z. Zhou and L.J. Wang 16
Researcher of Region Growing Medical Image Segmentation Based on Adaboost AlgorithmP. Wang, X.F. Ye, S.W. Yin, S.C. Kang and J.L. Xin 21
Trail Investigation on Chip of High-Speed and Dry Cutting on Hardened Steel with PCBNToolZ.H. Qing, D.W. Zuo, F. Xie and C.G. Zhang 26
Simulate Measure for Spring Back of Autobody Panel's EdgeB. Liu, M.J. Liu, J.X. Jiang and Y.Q. Zhou 31
Reconfigurable Clamping Device Based on Memory Alloy, Orientation Disc, MajorityColumn and Telescopic PoleZ. Chen and M.D. Wang 35
Analysis of Mechanical Characteristics and Structural Options of Micro-Milling CutterL.J. Zhu, W.Z. Lu, D.W. Zuo and F. Xu 40
Study on Predictive Control of Ship Steering Gear SystemG.X. Yang and S.X. Yu 45
Research of Hydroforming Technology for Special-Shaped Cross-Section PipeS.G. Hu 51
Design of CNC Grinding Machine Especially for C.V Joint Inner Race Spherical RacewayProcessingL. Liu 55
Passivation of the Fe-Based Bulk Amorphous Alloy in HCl SolutionH.X. Xiao and J.P. Zhang 59
Simulation of Temperature Field during 7022 Al Alloy Friction Stir Welding process Basedon Dual-SourceD.L. Shao, W.Z. Lu, D.Z. Wen, H.F. Wang and M.M. Huang 63
Study on Al-4.5Cu-3Ce Alloy Semi-Solid Slurry Prepared by Slope Vibration CastingR.X. Yi, S.K. Xie, X.Q. Zheng, Z. Gao, X.Y. Guo and X.L. Pan 68
Precision Control Research on DACS-Based Modern Digital Shipbuilding TechnologyG.X. Liu 72
Contact Stress Analysis of NCD Coating on Roll Ball of Ball BearingJ.J. Yuan, W.Z. Lu, L.J. Ma, D.W. Zuo and F. Xu 77
Low Cycling Thermal Fatigue of Large-Scale Marine Diesel Engine PistonR. Xie 82
Study on Remote Monitoring and Control System for Construction VehicleS.L. Song, S.J. Huang, F.T. Su, Q. Zhang and R. He 87
Research on New Structural Quay Container CraneS.P. Liu 91
Study on the Microstructure and Properties of Suspensory Wire in DVD CD-ROM HeadL.Y. Wu, Y.L. Wang and J. Deng 95
Investigation of the Precipitation in Mg-Zr AlloysG.B. Lin, Z.D. Wang, Z. Zheng and L.F. Liu 99
The Optimization of Cutting Parameter of Machining the Small Diameter Deep Hole onAustenitic Stainless SteelZ.R. Huang 103
b Advanced Design and Manufacturing Technology I
An Analysis of Drawing Process in Stamping Die Design for the Wheel HubB. Liu 107
Effects of Residual Stress on Interfacial Bonding Strength of Zinc-Plated FilmX.F. Wang 112
Friction and Wear of Polished Single Crystal Silicon at Different AreaS.X. Yu, D.W. Zou, X.L. Zhu, Y.L. Sun and L. Zhou 117
Numerical Simulation of the Machining Distortion of Aircraft Aluminum Part Caused byRedistribution of Residual StressY.W. Liu 122
Study on Fuzzy D-S Evidence Theory Mathematics Foundation Based on the FormPrototypeZ. Gao and X.M. Ji 126
Study on the Influence of Internal Flow Field in Pipeline Elbow by the Guide PlateL.Y. Wu, Y.L. Wang, Z.D. Wang and M.W. Chen 130
Research on Electrical Resistively of Wood DustH.D. Zhou, Z.N. Liu and X.B. Lei 134
Primary Research of Bionic Design on Tools with Mouthpart of Larvae Long HornedBeetlesK. Zhang, B.Z. Ji, S.W. Liu and Z.H. Qing 139
Adsorption Analysis of Cr(VI) by Fly Ash Composite Material in Aqueous MediumH.Q. Xue, Z.Q. Jing and Z. Wang 143
Research of Controlling Heat Treatment Deformation for Powder Metallurgy MechanicalStructural PartsY.B. Yan, X.P. Shen, D. Zhang and M.W. Li 148
Influence of Vacuum Heat Treatment on Sintered W-Cu Alloy PerformancesY.B. Yan, X.P. Shen, M.W. Li and D. Zhang 153
Design on Numerical Control System of Glass Cutting Machine Based on PCW. Wang 157
Fast Frequency Hopping Signal Generator Based on DDSY.H. Du and Q.R. Ouyang 162
The Optimization of Material Thickness for Neutron Shielding with Monte Carlo MethodC. Chen and M. Wang 166
A Method to Measure Rotary Speed and Torque Using JC SensorsQ. Wang, S.L. Song and W. Zhao 170
Different Evaluation Approaches of Confusion Network in Chinese Spoken ClassificationL. Zhang, J.X. Chang and X.Z. Xiang 174
Study on Mine-Used Battery Locomotive Charging SystemL.P. Xuan 180
Steel Wire Rope Section Damage Detection System Based on Wavelet Multi-ResolutionAnalysisL.P. Xuan 184
Three-Level SVPWM Controller Design Based on FPGAG.X. Chang, W. Li and X.L. Liu 188
Phase Error Immunity Optical Measurement SystemW.T. He, X.L. Meng and C. Zhao 194
A Stable Least Squares Ellipses Fitting Algorithm Based on Zernike MomentsX.L. Meng, W.T. He and C. Zhao 199
Accuracy Verification Method about Optical Three-Dimensional Measuring InstrumentW.L. Zhao, C. Zhao, J.T. Cheng and H.Y. Yue 204
Contrast Research on Cutting Forces in 4-Axis and 5-Axis Blade Machining ProcessT. Wu, C. Zhao, G.B. Bu and D.W. Zuo 209
A Method to Center Extraction of Reference Point Algorithm in Reverse EngineeringX.Q. Che, J.T. Cheng, S.B. Xiao and J.J. Ma 214
Optimal Design of Flexible Manufacturing System Based on Optical Measurement PrincipleS.S. Wang, W.T. He, R.B. Liu and J.T. Cheng 219
Material Removal for Modal Effect on Impeller Blades by Finite Element AnalysisW.H. Wu, C. Zhao and G.B. Bu 223
Hun Guo, Zuo Dunwen, Tang Guoxing c
Rotation Inertia Measurement Device Design of Winged Rigid Body Based on TRIZConflict Resolving MatrixH.Y. Chi and H. Cao 228
Development of NC System of the 3-PUU Parallel Machine Tool Based on PMACH.P. Lin and Y.M. Xu 233
Finite Element Analysis and Dynamic Testing for Hard Gear Cutting by Gear HobbingMachineM.H. Liu and X.L. Liu 238
Design and Stimulation of Hydraulic Servo System for Vehicle Test Equipment for RubberShock AbsorberC.L. Zhu, W.Z. Jin and W.S. Gui 243
Research on Chip Breaking Mechanism of High-Temperature and High-Strength Steel2.25Cr-1Mo-0.25VE.L. Liu, Y.F. Li, X.Z. Wang, F. Xiao and X.L. Liu 248
Research on the Machinability of Hydrogenated Cylindrical Shell Materials (2.25 Cr-1Mo-0.25V Steel)H.P. Zhang, F.G. Yan, Y.X. Wang, Y.S. Zhai and X.L. Liu 253
Applied Research of the Electric Spindle Technology on Sub-Nanometer Crusher withCellulosineL.Y. Yang 258
High-Speed Milling Toolpath Planning for Aviation Engines Impeller Using POWERMILLSoftwareX.F. Wang, C.T. Sun and H.J. Sun 262
Finite Element Analysis of Cold Extrusion Combination Mold Interference FitY. Zhang and Q.G. Huang 266
Coagulant Prepared by Gangue and its Application in Treatment of Coal WashingWastewaterK.J. Luo and G.M. Ren 270
Development and Oxidation of RexOy-Modified Aluminide CoatingJ.C. Zhang and Y.B. Zhou 274
Design and Research on Two-Degree of Freedom Spherical GearC.S. Yang, S.Y. Zhao and S.W. Song 279
An Algorithm for Computation of Radial-Harmonic-Fourier MomentsY.J. Jiang and Z.L. Ping 284
Applied Research on Synesthesia Theory in Industrial DesignW. Wang and D. Su 289
Technology and Characteristic of Wool Ring Spun Compound Yarn
B. Zhao1, a 1College of Textiles, Zhongyuan University of Technology, Henan, Zhengzhou 450007, China
Keywords: spinning technology, performance, features, application.
Abstract. The article introduced the mechanisms and characteristics of spinning system such as solo
spinning, sirofil spinning, siro spinning and so on. New composite spinning technology can develop a
composite yarn, thread and fabrics with different characteristics. Composite spinning technology is a
new breakthrough in technology of ring-spun wool spinning. It makes a remarkable improvement in
the quality of spinning. It improves the external quality of yarn. Through comparing and analyzing,
the new technologies enable a great structural change and unique performance of the yarn. This new
spinning technology has broad prospects for development applications.
Introduction
Since china’s accession to WTO, the textile industry of china has been making great efforts to
improve the grade and quality of the products, the principal precondition of which is to implement
quick response strategy. It’s well known that spinning techniques influence directly on yarn
properties. With the science and technology unceasing development, siro spinning and solo spinning
which the technical aspect develops to reel thread were called (drawn) attention for people because of
its good economic efficiency and the unique yarn performance. This technology can improve the yarn
quality and reduce the production cost, which opened the new way for single yarn gauge weaves of
the wool spinning and also simultaneously provided the advantageous condition for the development
of the high fine count and lightweight (frivolous) wool spinning products. Therefore, its further
research had a good development prospect.Technology and Equipment of Solospun.
Several Different Types of New-type Spinning Technology
At present, there are mainly three different structures of new-type ring wool technology which are
siro, sirofil and solo spinning technology and so on. They are different in a spinning mechanisms on
the structure and performance vary.
Siro Spinning Principles and Yarn Structure Performance. Siro Spinning technology [1] that
was spinning out direct in ring spinning yarn machine are similar to the ply yarn structure of a
spinning yarn technology. It adopted two raving and maintains a certain distance parallel in feeding
single machine. The beard was feed to the yarn machine, leading the yarn machine to keep two yarns
certain separation of state. Then it had been lead long to stretch from the front roller pull to output
certain length to combine behind. Because of the twisting degree deliver, two single yarns take little
twisting degree. After the same spindle of adding twisting again, the bread was assembling and
twisted to have a ply yarn structure characteristic further. The chart is shown in Fig.1 and Fig. 2.
Siro spinning yarns were to single yarn and ply yarn with the twisting in ring spun yarn spinning
machine. The twirl is different from two-fold (double-ply) yarns, and its processing course was two
of the former roller synchronous output after the fusion, in its merger was the former section twisting
region of single yarn and formed single yarn structure. In this structure, the fiber almost was of a cone
helix configuration. Because twisting regional of the single yarn was short and twisted less, the
helical angle of the fiber in single yarn was smaller and had less fiber ends, and the surface of single
yarn was glossy. Joint stock after the twirl of the original yarn twist continue to increase, and leading
to the ply yarns and fiber helix yarn more evident and more decline of the fiber, and leading to a
circular cross-section of the ply yarn structure. In the spinning process fusion (doubling point) is
© (2011) Trans Tech Publications, Switzerlanddoi:10.4028/www.scientific.net/AMR.142.1

constantly changing, and make the horizontal movement and vertical movement so that the two units
exist twist in the yarn. Two units are exported to the fusion of the former roller nip (bite) point.
Because of the section of the separation distance and the two weakening of the unit to twisting, fiber
fusion mutual transfer, and the role of twist in the mutual twisting together, and forming a bit of spiral
space structure. Therefore, siro spinning yarns structure type is similar to the ply yarn structure.
Fig.1 Schematic of sirospun principle Fig.2 Schematic of sirospun twist triangular
space
Its structure is different from the appearance of the structure of the single yarn (strand) and ply
yarn. Two fiber beam units of siro yarn are mutual twirl together, and they are more clearly between
and aren’t been mixed. Such structures are different from single yarn and ply yarns. The twisting
direction of the two beams and the yarns is the same. The surface of fibers and yarn axis show the
largest and the ply yarn of the fiber and thread axle line show the smallest, and ply yarn twirl to single
yarn are usually opposite.
The cross-section of siro yarn is similar to circular graphics, the single yarn of ply yarn after the
fiber twirl difficult to the full mobile and has two distribution centers. The siro spinning yarn fabric is
relatively more smooth and soft than ply yarn fabrics. The siro spinning yarn has a larger extension,
less hairiness, glossy surface, the structure closely, luster strong, good resistance to abrasion,
processed fabrics look bright and clean, feel soft, flexible and permeability, and has become a
high-grade lightweight preferred fabric gauze. Currently known by people of spinning yarn fabrics
increasingly good graces (favour).
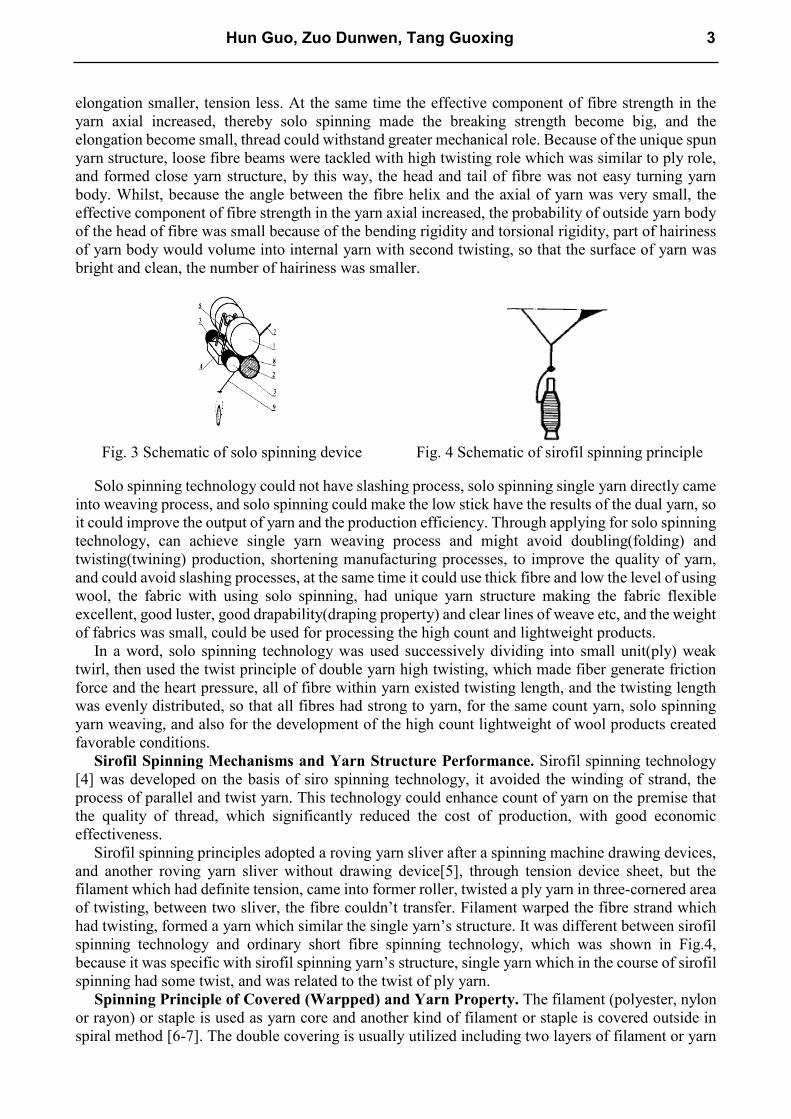
Solo Spinning Principle and Yarn Structure Performance. Solo spinning techniques [2] does
not need the sizing process. It enables fiber to reduce injuries and avoid ply yarn manufacturing
processes, so that yarn count markedly improved, lower production costs and improve yarn quality.
Solo spinning processes equipped with a simple solospun devices[3] in the traditional ring spinning
fine yarn machine, it took a stand in the trench rubber-covered roller and spring-loaded, the stand was
held in spun yarn machine cradle rubber-covered roller in the spinning, and when cradle was asided
and pressurized lock, through the operation of pressure with spring-loaded pressure spacer, trench
roller pressed forward direction, began to effect the exported strand, there are many equidistance and
continuous trench along the circumference direction of a total of four prominent corner in the trench
roller. It is based on these trench and corner, which hampered the access of strand of being drawn.
When strand passed the rubber-covered roller of the solo spinning devices, the trench on
rubber-covered roller divided the drawing strand into many small beams sliver, clamped these small
fibre beam through the former roller, and through the discontinuous blocking twirl role with roller,
small beams were twirled with varying degrees, with a different perspective; proportion and different
speed, they converged together, through twisting generated solo yarn, Figure3 illustrated the spinning
devices.
With the experiment, it is found that solo spinning yarn appearance was sleek, hairiness less, good
luster and yarn structure close, fibre twisted meticulous, high strength, good resistance to abrasion,
color and because the twisting, each fibre was constrained by adjacent fibre small beams, which made
the effort and friction of yarn increase, resulting in yarn powerful high, hairiness less. In the twisting
process, the fiber of solo spinning was chapped into many small beams, each small beam by slightly
twisting and twisted again, causing fibre-ranked close, increasing effort and friction force, and fibre
can’t slip, after twisting, yarn surface layer fibre helix short and helical angle small, which make fibre
2 Advanced Design and Manufacturing Technology I
elongation smaller, tension less. At the same time the effective component of fibre strength in the
yarn axial increased, thereby solo spinning made the breaking strength become big, and the
elongation become small, thread could withstand greater mechanical role. Because of the unique spun
yarn structure, loose fibre beams were tackled with high twisting role which was similar to ply role,
and formed close yarn structure, by this way, the head and tail of fibre was not easy turning yarn
body. Whilst, because the angle between the fibre helix and the axial of yarn was very small, the
effective component of fibre strength in the yarn axial increased, the probability of outside yarn body
of the head of fibre was small because of the bending rigidity and torsional rigidity, part of hairiness
of yarn body would volume into internal yarn with second twisting, so that the surface of yarn was
bright and clean, the number of hairiness was smaller.
Fig. 3 Schematic of solo spinning device Fig. 4 Schematic of sirofil spinning principle
Solo spinning technology could not have slashing process, solo spinning single yarn directly came
into weaving process, and solo spinning could make the low stick have the results of the dual yarn, so
it could improve the output of yarn and the production efficiency. Through applying for solo spinning
technology, can achieve single yarn weaving process and might avoid doubling(folding) and
twisting(twining) production, shortening manufacturing processes, to improve the quality of yarn,
and could avoid slashing processes, at the same time it could use thick fibre and low the level of using
wool, the fabric with using solo spinning, had unique yarn structure making the fabric flexible
excellent, good luster, good drapability(draping property) and clear lines of weave etc, and the weight
of fabrics was small, could be used for processing the high count and lightweight products.
In a word, solo spinning technology was used successively dividing into small unit(ply) weak
twirl, then used the twist principle of double yarn high twisting, which made fiber generate friction
force and the heart pressure, all of fibre within yarn existed twisting length, and the twisting length
was evenly distributed, so that all fibres had strong to yarn, for the same count yarn, solo spinning
yarn weaving, and also for the development of the high count lightweight of wool products created
favorable conditions.
Sirofil Spinning Mechanisms and Yarn Structure Performance. Sirofil spinning technology
[4] was developed on the basis of siro spinning technology, it avoided the winding of strand, the
process of parallel and twist yarn. This technology could enhance count of yarn on the premise that
the quality of thread, which significantly reduced the cost of production, with good economic
effectiveness.
Sirofil spinning principles adopted a roving yarn sliver after a spinning machine drawing devices,
and another roving yarn sliver without drawing device[5], through tension device sheet, but the
filament which had definite tension, came into former roller, twisted a ply yarn in three-cornered area
of twisting, between two sliver, the fibre couldn’t transfer. Filament warped the fibre strand which
had twisting, formed a yarn which similar the single yarn’s structure. It was different between sirofil
spinning technology and ordinary short fibre spinning technology, which was shown in Fig.4,
because it was specific with sirofil spinning yarn’s structure, single yarn which in the course of sirofil
spinning had some twist, and was related to the twist of ply yarn.
Spinning Principle of Covered (Warpped) and Yarn Property. The filament (polyester, nylon
or rayon) or staple is used as yarn core and another kind of filament or staple is covered outside in
spiral method [6-7]. The double covering is usually utilized including two layers of filament or yarn
Hun Guo, Zuo Dunwen, Tang Guoxing 3
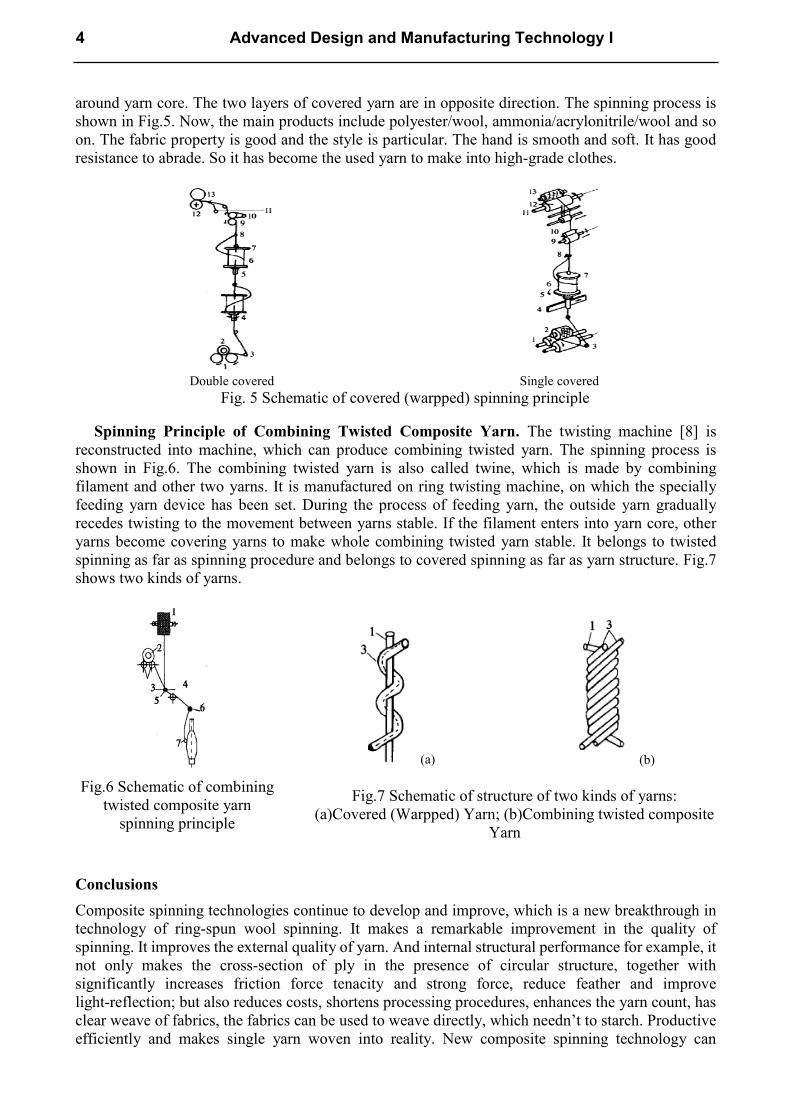
around yarn core. The two layers of covered yarn are in opposite direction. The spinning process is
shown in Fig.5. Now, the main products include polyester/wool, ammonia/acrylonitrile/wool and so
on. The fabric property is good and the style is particular. The hand is smooth and soft. It has good
resistance to abrade. So it has become the used yarn to make into high-grade clothes.
Double covered Single covered
Fig. 5 Schematic of covered (warpped) spinning principle Spinning Principle of Combining Twisted Composite Yarn. The twisting machine [8] is
reconstructed into machine, which can produce combining twisted yarn. The spinning process is
shown in Fig.6. The combining twisted yarn is also called twine, which is made by combining
filament and other two yarns. It is manufactured on ring twisting machine, on which the specially
feeding yarn device has been set. During the process of feeding yarn, the outside yarn gradually
recedes twisting to the movement between yarns stable. If the filament enters into yarn core, other
yarns become covering yarns to make whole combining twisted yarn stable. It belongs to twisted
spinning as far as spinning procedure and belongs to covered spinning as far as yarn structure. Fig.7
shows two kinds of yarns.
(a) (b)
Fig.6 Schematic of combining
twisted composite yarn
spinning principle
Fig.7 Schematic of structure of two kinds of yarns:
(a)Covered (Warpped) Yarn; (b)Combining twisted composite
Yarn
Conclusions
Composite spinning technologies continue to develop and improve, which is a new breakthrough in
technology of ring-spun wool spinning. It makes a remarkable improvement in the quality of
spinning. It improves the external quality of yarn. And internal structural performance for example, it
not only makes the cross-section of ply in the presence of circular structure, together with
significantly increases friction force tenacity and strong force, reduce feather and improve
light-reflection; but also reduces costs, shortens processing procedures, enhances the yarn count, has
clear weave of fabrics, the fabrics can be used to weave directly, which needn’t to starch. Productive
efficiently and makes single yarn woven into reality. New composite spinning technology can
4 Advanced Design and Manufacturing Technology I

develop a composite yarn, thread and fabrics with different characteristics. But this technology is still
needs further improvement to achieve a higher lever of technology. I believe this new technology will
have a composite spinning broader development and application prospects.
Reference
[1] M. Li: Shan Dong Textile Science & Technology Vol.44 (2003) No. 2, p.22-25.
[2] W. H. Zhou: Textile Technology Overseas Vol. 4 (2002) No.12, p.20-23.
[3] X. Zhang: Cotton Textile Technology Vol. 33 (2005) No. 4, p.12-17.
[4] H. Huang: International Textile Leader Vol. 20 (1998) No. 3, p.21-29.
[5] J. Chen: Journal of Zhongyuan University of Technology Vol.41 (2004) No. 5, p.32-38.
[6] Y. J.Chang: International Textile Leader Vol. 35 (1999) No. 1, p.2-7.
[7] L. M. Zang: Beijing Textile Journal Vol. 16 (2004) No. 2, p.17-24.
[8] W. G. Dong: Wool Textile Journal Vol. 44 (2000) No. 4, p.12-19.
Hun Guo, Zuo Dunwen, Tang Guoxing 5
A Co-evolutionary Contract Net-Based Framework for Distributed
Manufacturing Execution Systems
R. Wanga
School of Information Management, Shandong Economic University, Jinan 250014, China
akingkeen@126com
Keywords: Multi-agent, Manufacturing execution system, Workflow, Contract-Net
Abstract. A manufacturing execution system (MES) is the information system of a process which
actively collects processes and analyses the materials, semi-finished goods, finished goods, machine
time, cost etc. on the production site in real time and monitors work in progress (WIP). In this work
we present a service recommender system for active services according to service requestors’ goal in
manufacturing execution system -workflows. The system is modeled as a multi-agent environment
where clients and service agents negotiate using a Co-evolutionary Contract-Net (CeCN).It will
improve the MES performance and capability and operating costs significantly.
Introduction
Currently, manufacturing execution systems (MESs) are widely used in the aerospace, automotive,
semiconductor, optoelectronic, pharmaceutical and petrochemical industries, as well as other
sectors[1, 2]. A major problem facing manufacturing organizations is how to provide efficient and
cost-effective responses to the unpredictable changes taking place in a global market. Workflow is
defined as "systems that help organizations to specify, execute, monitor, and coordinate the flow of
work items within a distributed of- rice environment" [3]. We develop distributed manufacturing
execution system from a workflow perspective. The mobile computing system has been expanded as
an alternative solution and the area of mobile agent systems has achieved steadily growing interest in
the past decade [4].Contract Net Protocol (CNP) is a useful method of the task negotiation among
heterogeneous multiple agents. Although the communication efficiency has been improved in the
latest contract net theory [5, 6], they can not solve the problem of the cooperation process evolution.
In this sense, we propose a service recommender system in which service organizations
co-evolutionary process has been added to the contract-net in order to improve the results in the
heterogeneous, distributed and dynamic environment. To evaluate this service recommendation we
use F1, which is a well-known performance measure for the recommender system.
The Co-evolutionary Contract-Net
As mentioned earlier, we propose a Co-evolutionary Contract-Net (CeCN), which corresponds to a
simple and practical modification to the way in which the different actors (manager/contractor)
interact in the original Contract-Net Protocol (CNP).
Contract Net Protocol (CNP) is a useful method of the task negotiation among heterogeneous
multiple agents, which was originally proposed by Davis and Smith [7]. As Fig.1 a) shows, in the
original approach, when a task distributor called manager agent wants to allocate a task, the manager
generates and broadcasts task announcement message for the task. The potential contractor agent
receives the message, evaluates it and submits proposals before a deadline. The manager selects the
bid with the best performance and declares the winner.
As Fig.1b shows, an active service agent is introduced between the manager and potential
contractors. The recommendation of potential contractors is forwarded to the manager by the active
service agent. Then the recommended contractor submits the received bid of the service alliance
according to the manager notification. The active service agent’s role is to contribute with a more
global vision of the underlying service provision problem.
© (2011) Trans Tech Publications, Switzerlanddoi:10.4028/www.scientific.net/AMR.142.6
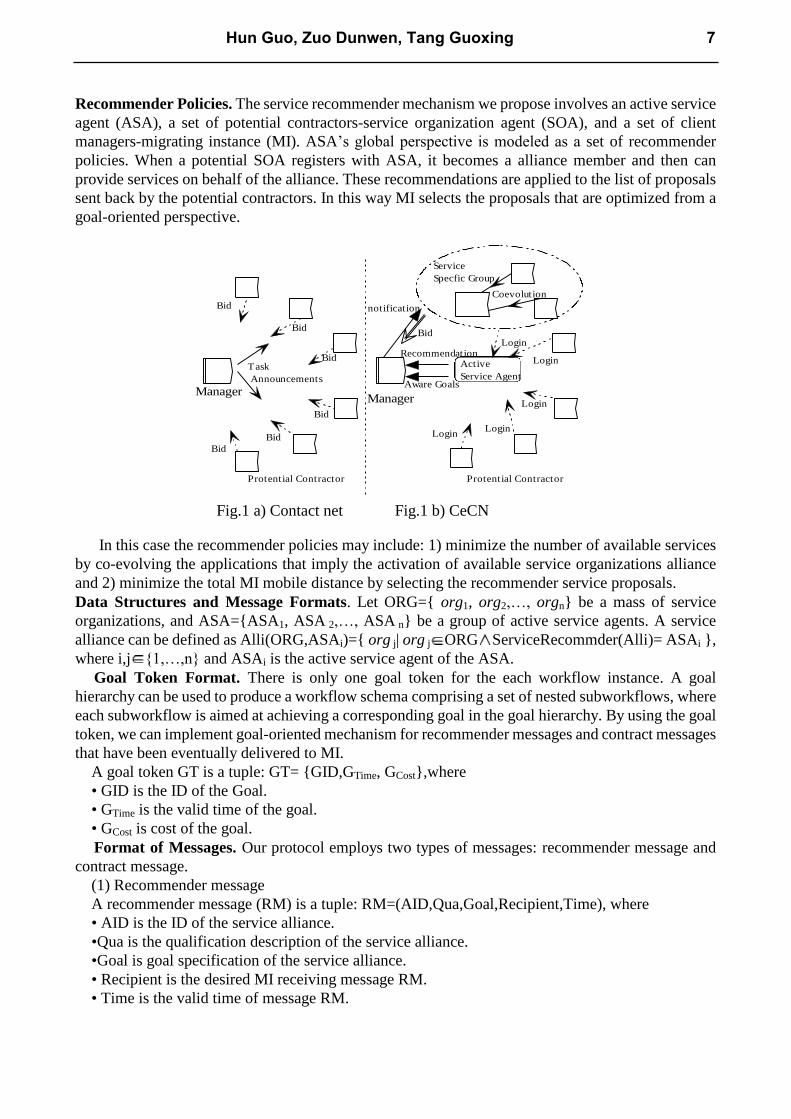
Recommender Policies. The service recommender mechanism we propose involves an active service
agent (ASA), a set of potential contractors-service organization agent (SOA), and a set of client
managers-migrating instance (MI). ASA’s global perspective is modeled as a set of recommender
policies. When a potential SOA registers with ASA, it becomes a alliance member and then can
provide services on behalf of the alliance. These recommendations are applied to the list of proposals
sent back by the potential contractors. In this way MI selects the proposals that are optimized from a
goal-oriented perspective.
Manager
Task
Announcements
Bid
Bid
Bid
Bid
Bid
Bid
Manager
Protential Contractor Protential Contractor
Active
Service AgentAware Goals
Recommendation
notification
Service
Specfic Group
Bid
Login
LoginLogin
Login
Login
Coevolution
Fig.1 a) Contact net Fig.1 b) CeCN
In this case the recommender policies may include: 1) minimize the number of available services
by co-evolving the applications that imply the activation of available service organizations alliance
and 2) minimize the total MI mobile distance by selecting the recommender service proposals.
Data Structures and Message Formats. Let ORG={ org1, org2,…, orgn} be a mass of service
organizations, and ASA={ASA1, ASA 2,…, ASA n} be a group of active service agents. A service
alliance can be defined as Alli(ORG,ASAi)={ org j| org j ORG ServiceRecommder(Alli)= ASAi },
where i,j {1,…,n} and ASAi is the active service agent of the ASA.
Goal Token Format. There is only one goal token for the each workflow instance. A goal
hierarchy can be used to produce a workflow schema comprising a set of nested subworkflows, where
each subworkflow is aimed at achieving a corresponding goal in the goal hierarchy. By using the goal
token, we can implement goal-oriented mechanism for recommender messages and contract messages
that have been eventually delivered to MI.
A goal token GT is a tuple: GT= {GID,GTime, GCost},where
• GID is the ID of the Goal.
• GTime is the valid time of the goal.
• GCost is cost of the goal.
Format of Messages. Our protocol employs two types of messages: recommender message and
contract message.
(1) Recommender message
A recommender message (RM) is a tuple: RM=(AID,Qua,Goal,Recipient,Time), where
• AID is the ID of the service alliance.
•Qua is the qualification description of the service alliance.
•Goal is goal specification of the service alliance.
• Recipient is the desired MI receiving message RM.
• Time is the valid time of message RM.
Hun Guo, Zuo Dunwen, Tang Guoxing 7
(2) Contract message
Contract messages are used for confirming the competency to acquire service when MIs are
moving between service alliance. A contract message (CM) is a tuple: CM=( CID, Task, Time),where
•CID is the ID of the CM.
•Task is the description of the task to be executed.
• Time is the expiration time of CM.
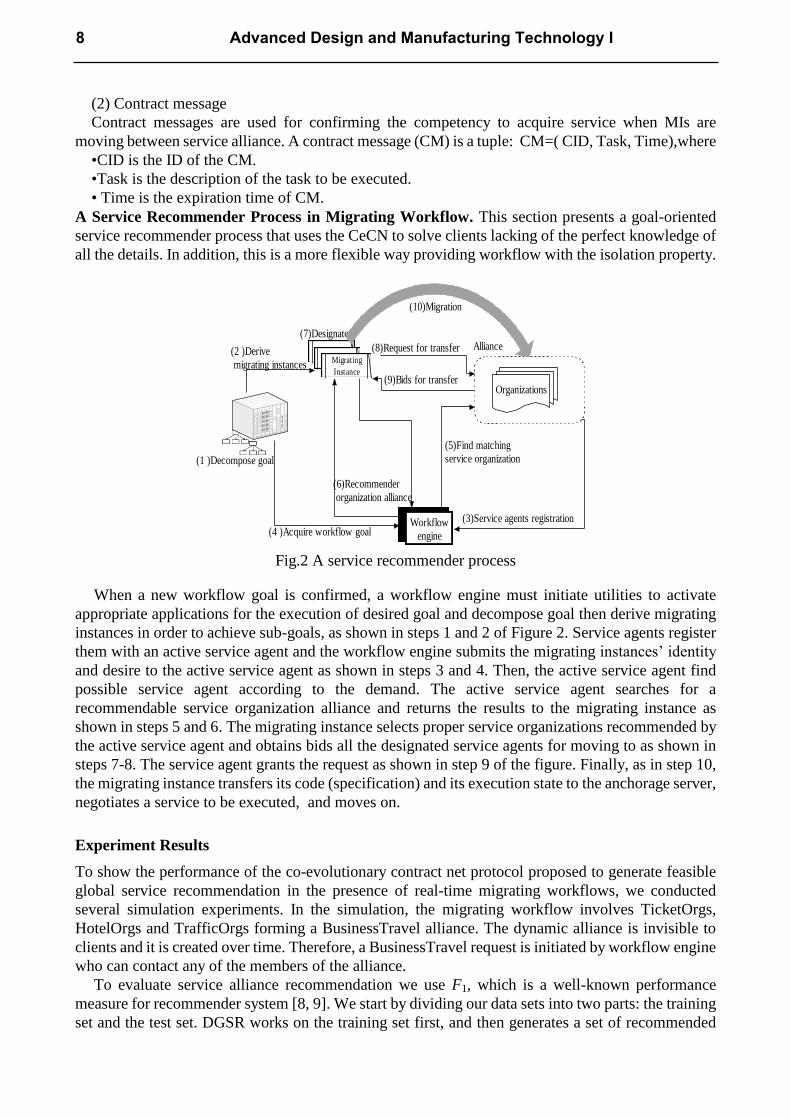
A Service Recommender Process in Migrating Workflow. This section presents a goal-oriented
service recommender process that uses the CeCN to solve clients lacking of the perfect knowledge of
all the details. In addition, this is a more flexible way providing workflow with the isolation property.
Organizations
Alliance
Workflow
engine
Migrating
Instance
(2 )Derive
migrating instances
(1 )Decompose goal
(4 )Acquire workflow goal
(3)Service agents registration
(5)Find matching
service organization
(6)Recommender
organization alliance
(8)Request for transfer
(7)Designate
(9)Bids for transfer
(10)Migration
Fig.2 A service recommender process
When a new workflow goal is confirmed, a workflow engine must initiate utilities to activate
appropriate applications for the execution of desired goal and decompose goal then derive migrating
instances in order to achieve sub-goals, as shown in steps 1 and 2 of Figure 2. Service agents register
them with an active service agent and the workflow engine submits the migrating instances’ identity
and desire to the active service agent as shown in steps 3 and 4. Then, the active service agent find
possible service agent according to the demand. The active service agent searches for a
recommendable service organization alliance and returns the results to the migrating instance as
shown in steps 5 and 6. The migrating instance selects proper service organizations recommended by
the active service agent and obtains bids all the designated service agents for moving to as shown in
steps 7-8. The service agent grants the request as shown in step 9 of the figure. Finally, as in step 10,
the migrating instance transfers its code (specification) and its execution state to the anchorage server,
negotiates a service to be executed, and moves on.
Experiment Results
To show the performance of the co-evolutionary contract net protocol proposed to generate feasible
global service recommendation in the presence of real-time migrating workflows, we conducted
several simulation experiments. In the simulation, the migrating workflow involves TicketOrgs,
HotelOrgs and TrafficOrgs forming a BusinessTravel alliance. The dynamic alliance is invisible to
clients and it is created over time. Therefore, a BusinessTravel request is initiated by workflow engine
who can contact any of the members of the alliance.
To evaluate service alliance recommendation we use F1, which is a well-known performance
measure for recommender system [8, 9]. We start by dividing our data sets into two parts: the training
set and the test set. DGSR works on the training set first, and then generates a set of recommended
8 Advanced Design and Manufacturing Technology I
services, called service alliance recommendation set. F1 integrates recall and precision and is given
by:
1
2=
+
rpF
r p
where r is recall, counting the ratio of the number of services correctly assigned to the test set t to the
total number of services belonging to the test set t; and p is precision, counting the percentage that
services assigned to the test set t actually belong to the alliance service recommendation set g. For
recall and precision, there exists contradiction between them. Emphasizing one side alone will lead to
unacceptable low value in the other side. So F1 metric is widely used as an optimization criterion for
binary decisions. For a good service recommendation, the F1 value should be high.
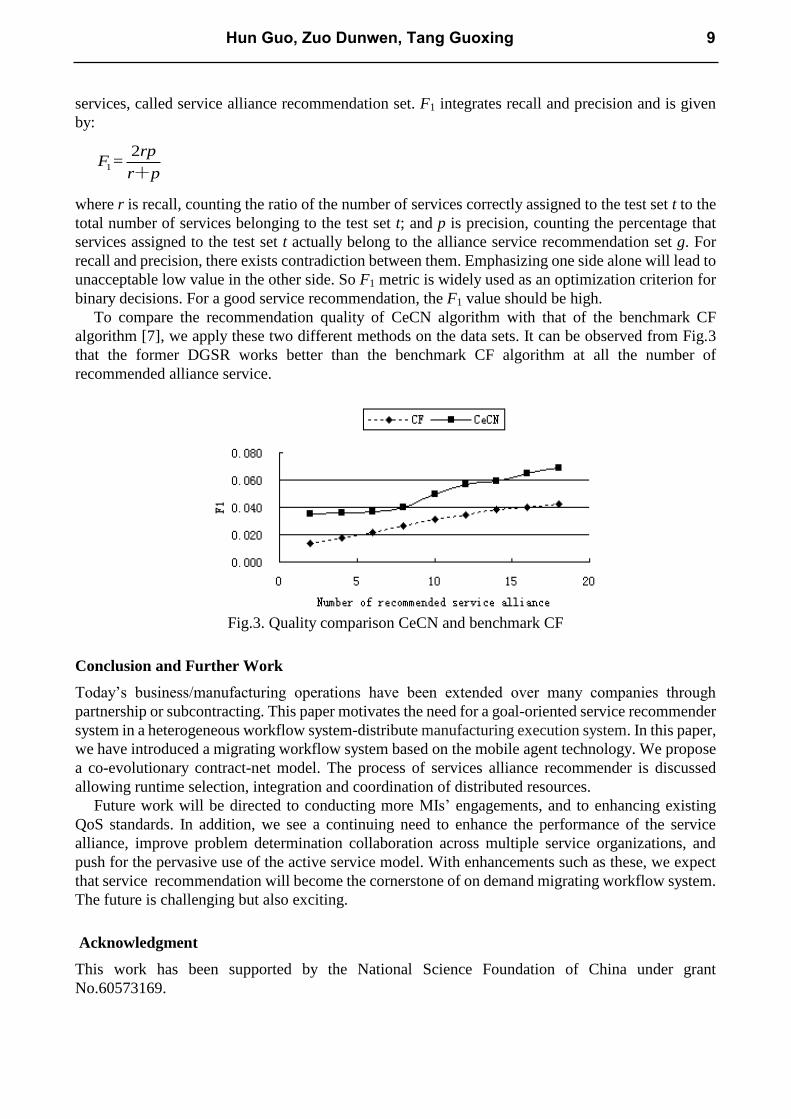
To compare the recommendation quality of CeCN algorithm with that of the benchmark CF
algorithm [7], we apply these two different methods on the data sets. It can be observed from Fig.3
that the former DGSR works better than the benchmark CF algorithm at all the number of
recommended alliance service.
Fig.3. Quality comparison CeCN and benchmark CF
Conclusion and Further Work
Today’s business/manufacturing operations have been extended over many companies through
partnership or subcontracting. This paper motivates the need for a goal-oriented service recommender
system in a heterogeneous workflow system-distribute manufacturing execution system. In this paper,
we have introduced a migrating workflow system based on the mobile agent technology. We propose
a co-evolutionary contract-net model. The process of services alliance recommender is discussed
allowing runtime selection, integration and coordination of distributed resources.
Future work will be directed to conducting more MIs’ engagements, and to enhancing existing
QoS standards. In addition, we see a continuing need to enhance the performance of the service
alliance, improve problem determination collaboration across multiple service organizations, and
push for the pervasive use of the active service model. With enhancements such as these, we expect
that service recommendation will become the cornerstone of on demand migrating workflow system.
The future is challenging but also exciting.
Acknowledgment
This work has been supported by the National Science Foundation of China under grant
No.60573169.
Hun Guo, Zuo Dunwen, Tang Guoxing 9

References
[1] C.Y. Huang: J Intell Manuf. Vol.13 (2002), p.485.
[2] J.M. Sim, P.C. Stadzisz and G. Morel: J Mater Process Tech Vol.179 (2006), p.268.
[3] S.W. Loke and A. Zaslavsky: E-Commerce Agents, Marketplace Solutions, Security Issues, and
Supply and Demand Vol.2033 (2001), p.283.
[4] R.S. Gray: Proceedings of the 1996 Tcl/Tk Workshop (1996), p.9–23.
[5] F.S. Hsieh: Automatica Vol.42 (2006), p.733.
[6] S. Paurobally, J. Cunningham and N.R. Jennings: Proceeding 2nd International Workshop on
Logic and Communication in Multi-Agent Systems (2004).
[7] R. Davis and R.G. Smith: Artif Intell Vol.20 (1983), p.63.
[8] J.S. Breese, D. Heckerman and C. Kadie: Proceedings of the Fourteenth Conference on
Uncertainty in Artificial Intelligence Vol.461 (1998).
[9] B. Sarwar, G. Karypis, J. Konstan and J. Reidl: Proceedings of the 10th international conference
on World Wide Web (2001), p.285.
10 Advanced Design and Manufacturing Technology I
The Research on Cutting Force in High-Speed Milling Process of Aluminum Alloy Impeller
Y.B Liua, C. Zhao, X. Ji and P. Zhou
Mechanical Engineering Department, Heilongjiang Institute of Science and Technology, Harbin, 150027 China
Keywords: Milling force, High-speed machining, Cutting parameters
Abstract. High-speed cutting process of cutting force influence variables and variation and ordinary
speed cutting are obviously different, in order to study the high-speed cutting process of different
parameters on the effect of cutting force, based on five axis high-speed NC machining center, using
multi-factor orthogonal test method for high speed milling of aluminum alloy impeller conducted
experiments. It was analyzed that cutting force influence factors of 5-axises blade machining process.
A private clamp was designed and produced, to measure the cutting force of machining process. It
was observe that distribution of 3-dimension cutting forces in cutting path. It was found that the
distribution rule of cutting force. With the experiment study on cutting force when high speed cutting
aluminum cuprum, the influence disciplinarian of each cutting parameter on cutting force was
obtained.
Introduction
High-speed machining (HSM) technology, with high cutting velocity, high feed rate and perfect
surface quality, is one of the most advanced technologies developed promptly in the last 20 years.
HSM is the direction of advanced manufacturing technologies, and is one of the domains that have
been studied most in the science and technology and industry fields [1].
Research data shows that cutting process stability, the processing quality and vibration in the
machine to the extent of the cutting force, and the size of the cutting force analysis, calculation of
cutting machine, the power of tools and fixture design, calculation, and the optimization of cutting
dosages are very important significance. Cutting force signal processing, with direct reflects the
continuous development of automation system, the functions of cutting condition monitoring, thus
increasing requirements of cutting force research becomes even more important.
Impeller is a typical five-axis NC-axes machining parts, the ball milling in the five-coordinate state
of the cutting force will be under the knife with the deflection axis of change, resulting in their
response to the entire technology system change, and therefore the study five-axis machining ball
milling the cutting force model is to examine the dynamic characteristics of high-speed machining
systems an important basis for.
In this paper, cutting through the high-speed milling aluminum alloy impeller test study on the
choice of the cutting parameters on cutting force of the impact of laws and arrangements for the use of
high-speed milling Orthogonal pilot program, through visual analysis of test results, verify the choice
of cutting parameters the impact of cutting force, high-speed milling process for the optimization of
cutting parameters in a pilot to provide the basis for the actual production to be widely applied.
Experiment Scheme Design
Experiment conditions. The experiment is done in the HSM600 CNC five-axis high-speed
machining center made in Swizerland Mikron, CNC system is Heidenhain ITNC530. Machining
parts for the impeller blades, spindle up to 42000r/min, the feed rate 40m/min, positioning accuracy
0.008mm, repeat positioning accuracy 0.005mm.
© (2011) Trans Tech Publications, Switzerlanddoi:10.4028/www.scientific.net/AMR.142.11
Experiment material for aluminum alloy (2A70), the cutting tools use of ball- cutter ground by
carbide alloy rod 30F, blade length 13mm, cutter length 32mm, the number of blade 4, radius of 4mm,
total length 114.6mm. Choose tool material strength and toughness, and thermal shock performance,
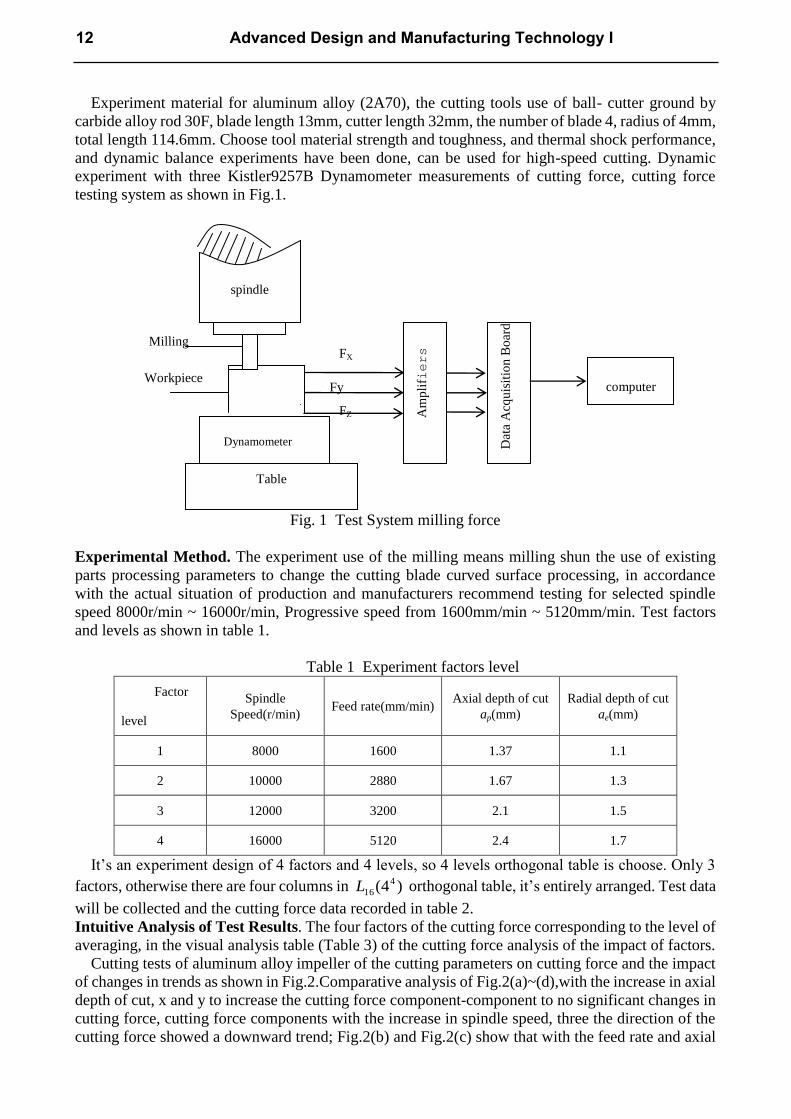
and dynamic balance experiments have been done, can be used for high-speed cutting. Dynamic
experiment with three Kistler9257B Dynamometer measurements of cutting force, cutting force
testing system as shown in Fig.1.
Fig. 1 Test System milling force
Experimental Method. The experiment use of the milling means milling shun the use of existing
parts processing parameters to change the cutting blade curved surface processing, in accordance
with the actual situation of production and manufacturers recommend testing for selected spindle
speed 8000r/min ~ 16000r/min, Progressive speed from 1600mm/min ~ 5120mm/min. Test factors
and levels as shown in table 1.
Table 1 Experiment factors level
Factor
level
Spindle
Speed(r/min)
Feed rate(mm/min) Axial depth of cut
ap(mm)
Radial depth of cut
ae(mm)
1 8000 1600 1.37 1.1
2 10000 2880 1.67 1.3
3 12000 3200 2.1 1.5
4 16000 5120 2.4 1.7
It’s an experiment design of 4 factors and 4 levels, so 4 levels orthogonal table is choose. Only 3
factors, otherwise there are four columns in )4( 4
16L orthogonal table, it’s entirely arranged. Test data
will be collected and the cutting force data recorded in table 2.
Intuitive Analysis of Test Results. The four factors of the cutting force corresponding to the level of
averaging, in the visual analysis table (Table 3) of the cutting force analysis of the impact of factors.
Cutting tests of aluminum alloy impeller of the cutting parameters on cutting force and the impact
of changes in trends as shown in Fig.2.Comparative analysis of Fig.2(a)~(d),with the increase in axial
depth of cut, x and y to increase the cutting force component-component to no significant changes in
cutting force, cutting force components with the increase in spindle speed, three the direction of the
cutting force showed a downward trend; Fig.2(b) and Fig.2(c) show that with the feed rate and axial
FZ
Fy
FX
Milling
Dynamometer
Table
Dat
a A
cqu
isit
ion
Bo
ard
computer
Am
pli
fiers
spindle
Workpiece
12 Advanced Design and Manufacturing Technology I
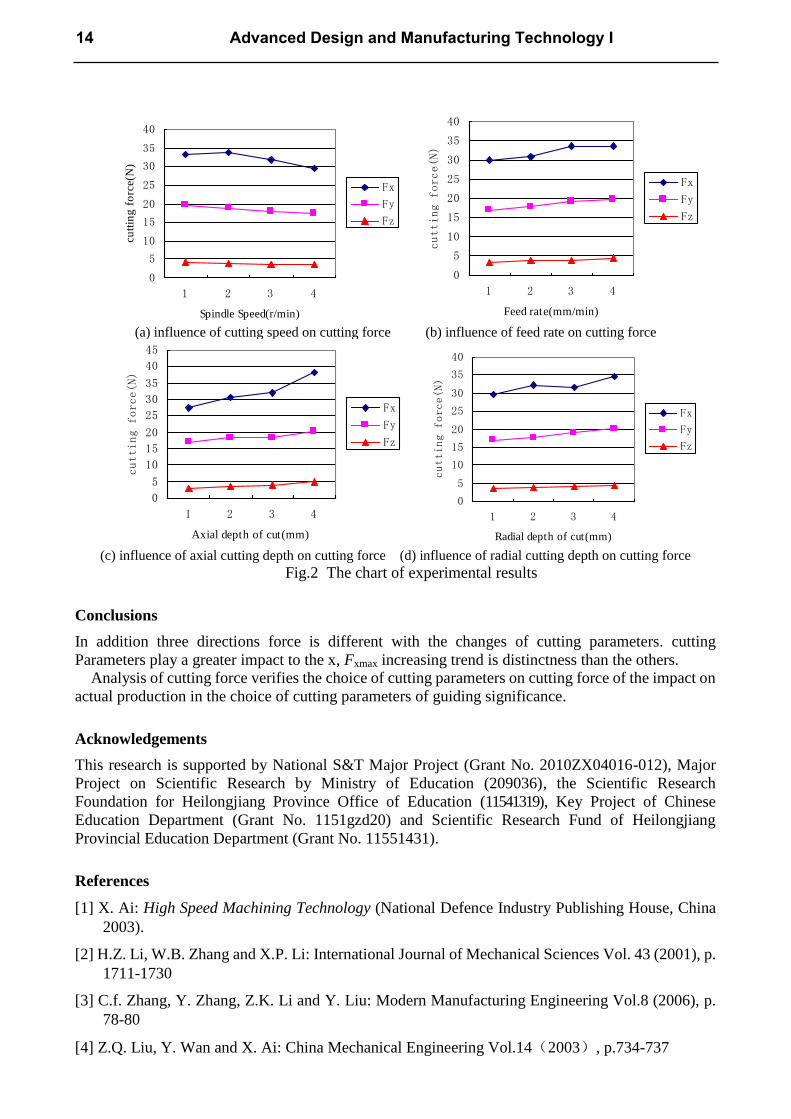
depth of cut increases, cutting force will increase, because they will increase so that the cutting area;
Fig.2(d) shows trails to the increase in radial cutting depth also caused the increase of cutting force,
the x direction of cutting force Fx as wave increases and decreases-style changes, it is little compared
with the Fig.2(c),the axial cutting depth on cutting force component the impact of Fx is much larger
than the radial cutting depth.
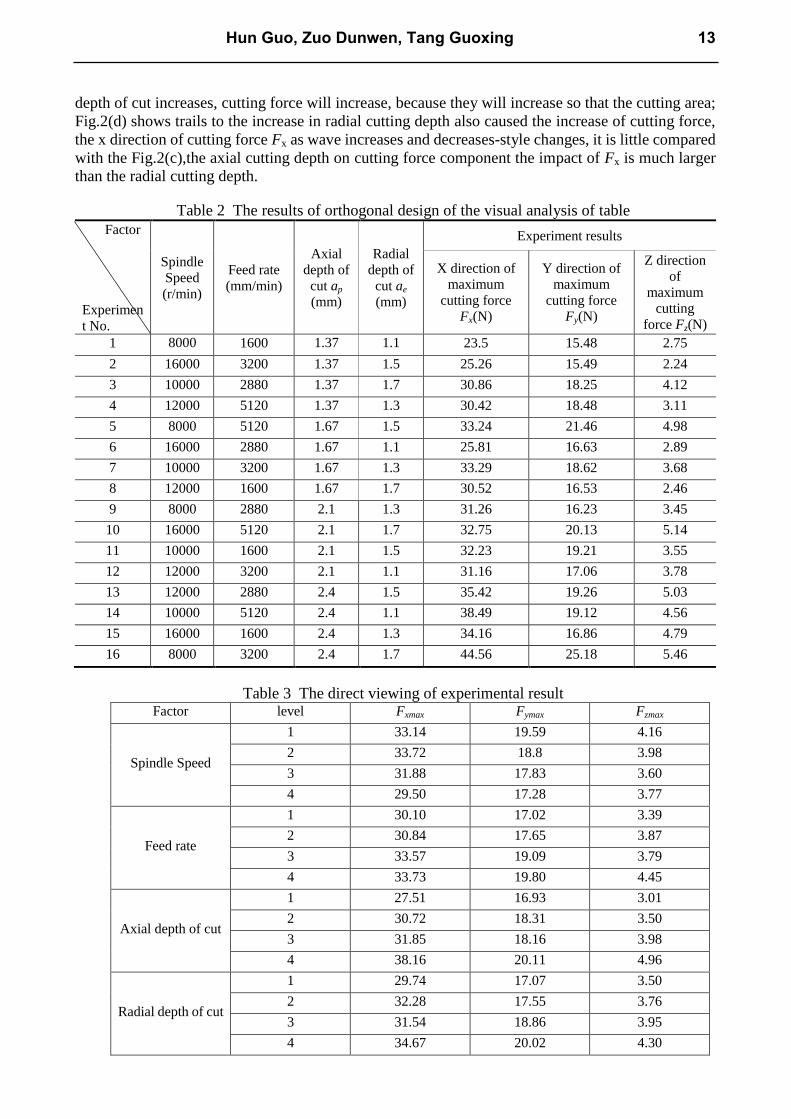
Table 2 The results of orthogonal design of the visual analysis of table
Factor
Experimen
t No.
Spindle
Speed
(r/min)
Feed rate
(mm/min)
Axial
depth of
cut ap
(mm)
Radial
depth of
cut ae
(mm)
Experiment results
X direction of
maximum
cutting force
Fx(N)
Y direction of
maximum
cutting force Fy(N)
Z direction
of
maximum
cutting
force Fz(N)
1 8000 1600 1.37 1.1 23.5 15.48 2.75
2 16000 3200 1.37 1.5 25.26 15.49 2.24
3 10000 2880 1.37 1.7 30.86 18.25 4.12
4 12000 5120 1.37 1.3 30.42 18.48 3.11
5 8000 5120 1.67 1.5 33.24 21.46 4.98
6 16000 2880 1.67 1.1 25.81 16.63 2.89
7 10000 3200 1.67 1.3 33.29 18.62 3.68
8 12000 1600 1.67 1.7 30.52 16.53 2.46
9 8000 2880 2.1 1.3 31.26 16.23 3.45
10 16000 5120 2.1 1.7 32.75 20.13 5.14
11 10000 1600 2.1 1.5 32.23 19.21 3.55
12 12000 3200 2.1 1.1 31.16 17.06 3.78
13 12000 2880 2.4 1.5 35.42 19.26 5.03
14 10000 5120 2.4 1.1 38.49 19.12 4.56
15 16000 1600 2.4 1.3 34.16 16.86 4.79
16 8000 3200 2.4 1.7 44.56 25.18 5.46
Table 3 The direct viewing of experimental result Factor level Fxmax Fymax Fzmax
Spindle Speed
1 33.14 19.59 4.16
2 33.72 18.8 3.98
3 31.88 17.83 3.60
4 29.50 17.28 3.77
Feed rate
1 30.10 17.02 3.39
2 30.84 17.65 3.87
3 33.57 19.09 3.79
4 33.73 19.80 4.45
Axial depth of cut
1 27.51 16.93 3.01
2 30.72 18.31 3.50
3 31.85 18.16 3.98
4 38.16 20.11 4.96
Radial depth of cut
1 29.74 17.07 3.50
2 32.28 17.55 3.76
3 31.54 18.86 3.95
4 34.67 20.02 4.30
Hun Guo, Zuo Dunwen, Tang Guoxing 13
0
5
10
15
20
25
30
35
40
1 2 3 4
Spindle Speed(r/min)
cutt
ing
fo
rce(
N)
Fx
Fy
Fz
0
5
10
15
20
25
30
35
40
1 2 3 4
Feed rate(mm/min)
cutting force(N)
Fx
Fy
Fz
(a) influence of cutting speed on cutting force (b) influence of feed rate on cutting force
0
5
10
15
20
25
30
35
40
45
1 2 3 4
Axial depth of cut(mm)
cutting force(N)
Fx
Fy
Fz
0
5
10
15
20
25
30
35
40
1 2 3 4
Radial depth of cut(mm)
cutting force(N)
Fx
Fy
Fz
(c) influence of axial cutting depth on cutting force (d) influence of radial cutting depth on cutting force
Fig.2 The chart of experimental results
Conclusions
In addition three directions force is different with the changes of cutting parameters. cutting
Parameters play a greater impact to the x, Fxmax increasing trend is distinctness than the others. Analysis of cutting force verifies the choice of cutting parameters on cutting force of the impact on
actual production in the choice of cutting parameters of guiding significance.
Acknowledgements
This research is supported by National S&T Major Project (Grant No. 2010ZX04016-012), Major
Project on Scientific Research by Ministry of Education (209036), the Scientific Research
Foundation for Heilongjiang Province Office of Education (11541319), Key Project of Chinese
Education Department (Grant No. 1151gzd20) and Scientific Research Fund of Heilongjiang
Provincial Education Department (Grant No. 11551431).
References
[1] X. Ai: High Speed Machining Technology (National Defence Industry Publishing House, China
2003).
[2] H.Z. Li, W.B. Zhang and X.P. Li: International Journal of Mechanical Sciences Vol. 43 (2001), p.
1711-1730
[3] C.f. Zhang, Y. Zhang, Z.K. Li and Y. Liu: Modern Manufacturing Engineering Vol.8 (2006), p.
78-80
[4] Z.Q. Liu, Y. Wan and X. Ai: China Mechanical Engineering Vol.14(2003), p.734-737
14 Advanced Design and Manufacturing Technology I

[5] G. Sutter, A. Molinari: Journal of Manufacturing Science and EngineeringVol.127 (2005),
p.245-250
[6] L.N. Lopez, D. Lacalle and J. Perez: Journal of Materials Processing Technology Vol.100 (2000),
p.1-11
[7] S.Anil and W.G. Yang: Journal of Materials Processing TechnologyVol.6 (2002), p.1-8
[8] M. Wan, W.H. Zhang and K.P. Qiu: Transactions of the ASME Journal of Manufacturing Science
and Engineering Vol. 127 (2005), p.13-22
Hun Guo, Zuo Dunwen, Tang Guoxing 15

Research of Asynchronous Multi-type Sensors Data Fusion
Y. Qin1, 2, a, X.H. Wang3, b, M.J. Feng3, c, Z. Zhou1, 2 and L.J. Wang1, 2 1 School of Measure-Control Technology and Communication Engineering, Harbin University of
Science and Technology, Harbin 154001, China
2 The higher educational key laboratory for Measuring & Control Technology and Instrumentations of Heilongjiang Province (Harbin University of Science and Technology, Harbin 154001, China
3 Heilongjiang Institute of Science & Technology, Harbin 154001, China)
[email protected], b [email protected], [email protected]
Keywords: Distributed information fusion, Multi-sensor, data fusion, Asynchronous data fusion
Abstract. A data fusion algorithm was established for estimating the state of target tracking system
with multi-type sensor. Through Kalman filter regarding the multi-sensors to computer goal
estimated value, it can obtain estimation value of goal at moment. And mean square deviation of
fusion estimation value was smaller than single sensor's mean square deviation. The simulation
results indicated that synchronisms data fusion method was effective to the multi-target tracking
problem. Asynchronous multi-sensor fusion process can obtain good control effect in the practice control process.
Introduction
Recently, the multi-sensor data fusion technique has gradually got worldwide attention and extensive
applications in all kinds of research fields. Many advanced systems now make use of a large number
of sensors in practical applications ranging from aerospace, robotics and automation systems, to
monitor and control process generation plants. But this research about the multi-sensors data fusion
focuses on the synchronization data fusion. However, due to the reasons of sensors in itself and the
communication delays, the research of the asynchronous multi-sensor data fusion problem was more
practical than that of synchronous sensors. There are many researches about asynchronous data
fusion.[1-4] In this paper, synchronous multi-sensor fusion was carried on through a multi-sensor
Kalman filter. The simulated result indicates that it increases the precision of data fusion.
Establishment of Multi-Sensors System Model
For linear Gaussian case, the evolution of the target state was described by the following linear
model:
X k k-1 X k-1 G k-1 W k-1 (1)
where kX is the state vector , kW is a white Gaussian vector noise with variance matrix kQ ,
and k is the state transition matrix and kG is system noise transition matrices.
The N-sensor distributed dynamic system can be given by
1-kW1-kG1-kX1-kkX iiiii i=0,1,2,…… (2)
kVkXkHkZj
i
j
i
j
i
j
i (3)
where N is the number of the local sensors, kZ i is the measurement vector of sensor i, kVi is a
zero-mean white Gaussian vector noise with variance matrix kRi , and kH i , is a measurement
matrix of sensor i.
© (2011) Trans Tech Publications, Switzerlanddoi:10.4028/www.scientific.net/AMR.142.16
The process noise kVi and measurement noise kWi are both zero-mean white sequences
uncorrelated with each other; j is measurement time.
Distributed Data Fusion
Local system firstly carries on preliminary analysis processing to the primitive observation data of
various sensors. Then these local decisions and other related information which were analysis and
were recognized but incompletely reliable submit to the fusion center. This was the distributional
information fusion. The center information fusion was that observation data of all various sensors
were transmitted to the identical fusion center and these information will be carried on the data fusion
in the center. So the center information fusion need more power in information process and
transmittability. The distributional information fusion needed comparatively fewer computation
quantity and transmission quantity than the center information fusion. Because local system firstly
process sensors measurement, and send useful date to the center where data fusion were completed.
This is to say, the distributional information fusion has strengthened the systematic survivability by
loss the integrality of information.
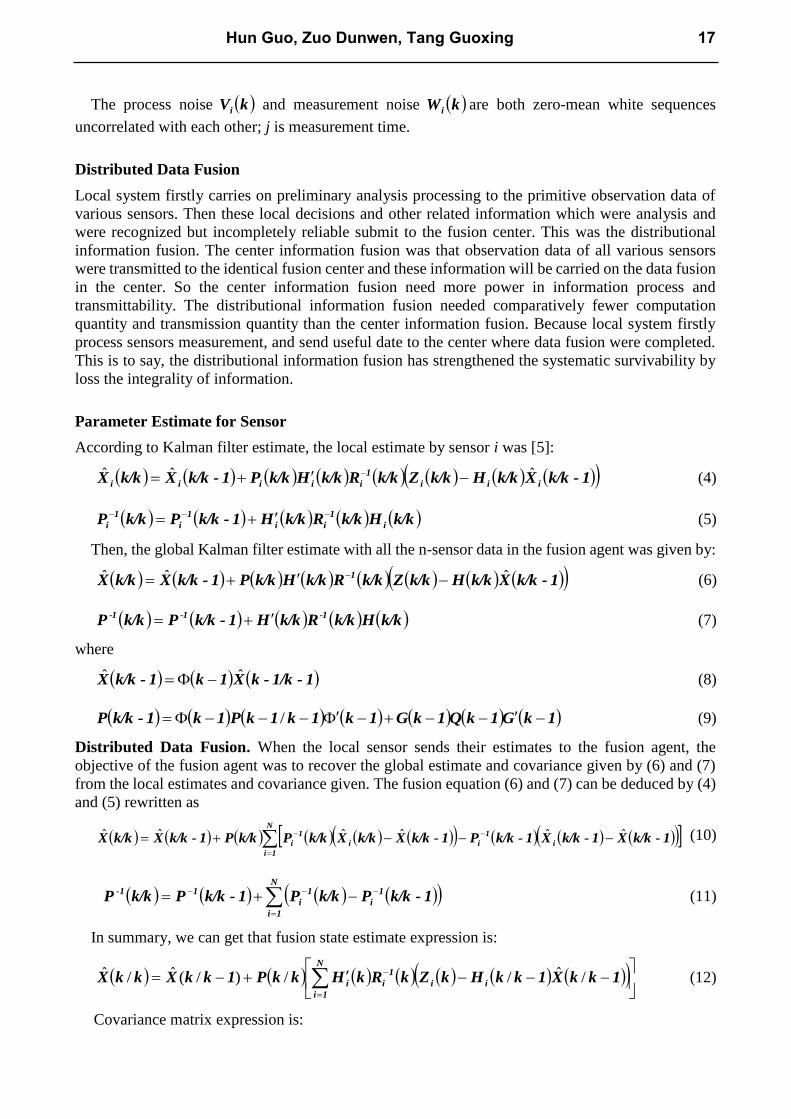
Parameter Estimate for Sensor
According to Kalman filter estimate, the local estimate by sensor i was [5]:
1-k/kXk/kHk/kZk/kRk/kHk/kP1-k/kXk/kX iii
1
iiiiiˆˆˆ (4)
k/kHk/kRk/kH1-k/kPk/kP i
1
ii
1
i
1
i
(5)
Then, the global Kalman filter estimate with all the n-sensor data in the fusion agent was given by:
1-k/kXk/kHk/kZk/kRk/kHk/kP1-k/kXk/kX1 ˆˆˆ (6)
k/kHk/kRk/kH1-k/kPk/kP-1-1-1 (7)
where
1-1/k-kX1k1-k/kX ˆˆ (8)
1kG1kQ1kG1k1k1kP1k1-k/kP / (9)
Distributed Data Fusion. When the local sensor sends their estimates to the fusion agent, the
objective of the fusion agent was to recover the global estimate and covariance given by (6) and (7)
from the local estimates and covariance given. The fusion equation (6) and (7) can be deduced by (4)
and (5) rewritten as
N
1i
i
1
ii
1
i 1-k/kX1-k/kX1-k/kP1-k/kXk/kXk/kPk/kP1-k/kXk/kX ˆˆˆˆˆˆ (10)
N
1i
1
i
1
i
11-1-k/kPk/kP1-k/kPk/kP (11)
In summary, we can get that fusion state estimate expression is:
N
1i
ii
1
ii 1kkX1kkHkZkRkHkkP1kkXkkX /ˆ//)/(ˆ/ˆ (12)
Covariance matrix expression is:
Hun Guo, Zuo Dunwen, Tang Guoxing 17
N
1i
i
1
ii
11kHkRkH1kkPkkP // (13)
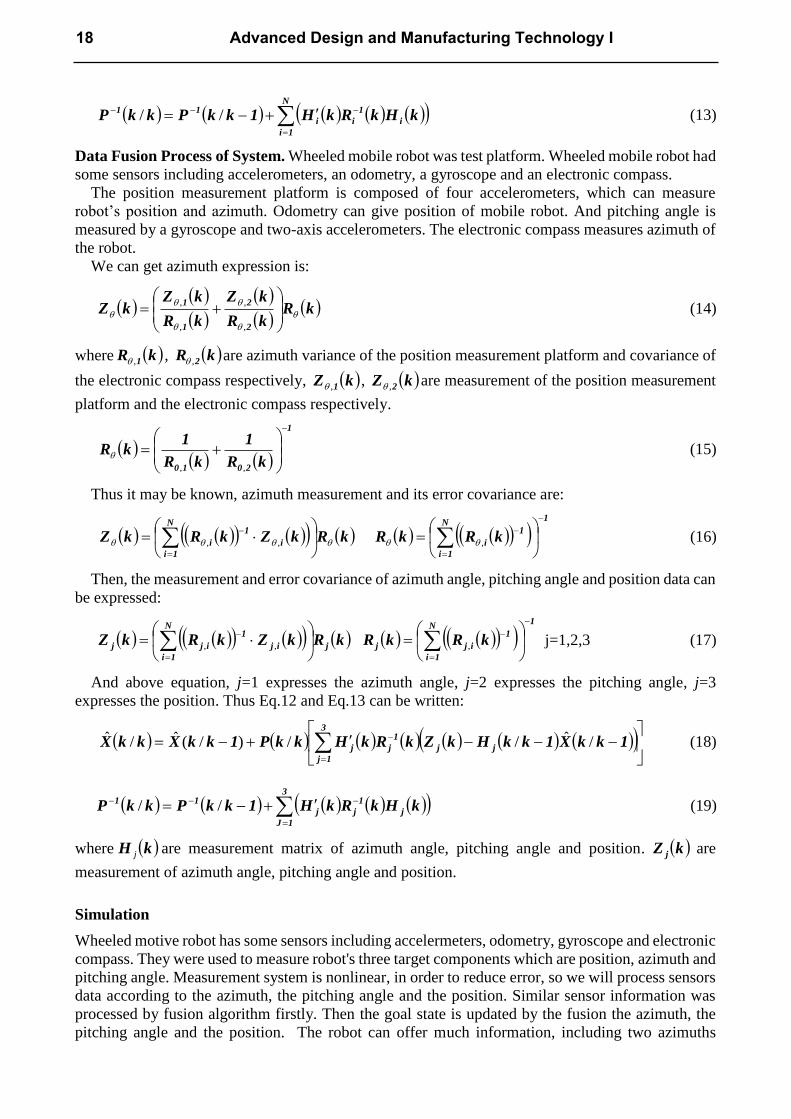
Data Fusion Process of System. Wheeled mobile robot was test platform. Wheeled mobile robot had
some sensors including accelerometers, an odometry, a gyroscope and an electronic compass.
The position measurement platform is composed of four accelerometers, which can measure
robot’s position and azimuth. Odometry can give position of mobile robot. And pitching angle is
measured by a gyroscope and two-axis accelerometers. The electronic compass measures azimuth of
the robot.
We can get azimuth expression is:
kR
kR
kZ
kR
kZkZ
2
2
1
1
,
,
,
, (14)
where kR 1, , kR 2, are azimuth variance of the position measurement platform and covariance of
the electronic compass respectively, kZ 1, , kZ 2, are measurement of the position measurement
platform and the electronic compass respectively.
1
2010 kR
1
kR
1kR
,,
(15)
Thus it may be known, azimuth measurement and its error covariance are:
kRkZkRkZN
1i
i
1
i
,, 1
N
1i
1
i kRkR
, (16)
Then, the measurement and error covariance of azimuth angle, pitching angle and position data can
be expressed:
kRkZkRkZ j
N
1i
ij
1
ijj
,, 1
N
1i
1
ijj kRkR
, j=1,2,3 (17)
And above equation, j=1 expresses the azimuth angle, j=2 expresses the pitching angle, j=3
expresses the position. Thus Eq.12 and Eq.13 can be written:
3
1j
jj
1
jj 1kkX1kkHkZkRkHkkP1kkXkkX /ˆ//)/(ˆ/ˆ (18)
3
1J
j
1
jj
11kHkRkH1kkPkkP // (19)
where kH j are measurement matrix of azimuth angle, pitching angle and position. kZ j are
measurement of azimuth angle, pitching angle and position.
Simulation
Wheeled motive robot has some sensors including accelermeters, odometry, gyroscope and electronic
compass. They were used to measure robot's three target components which are position, azimuth and
pitching angle. Measurement system is nonlinear, in order to reduce error, so we will process sensors
data according to the azimuth, the pitching angle and the position. Similar sensor information was
processed by fusion algorithm firstly. Then the goal state is updated by the fusion the azimuth, the
pitching angle and the position. The robot can offer much information, including two azimuths
18 Advanced Design and Manufacturing Technology I
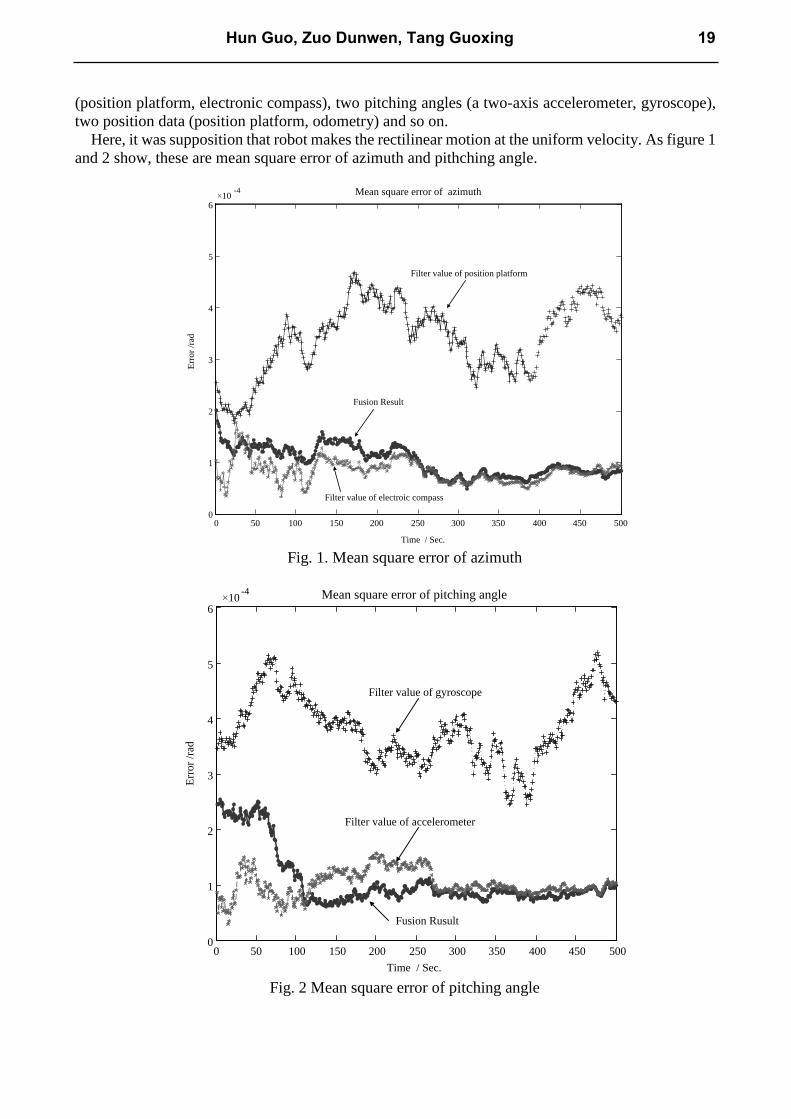
(position platform, electronic compass), two pitching angles (a two-axis accelerometer, gyroscope),
two position data (position platform, odometry) and so on.
Here, it was supposition that robot makes the rectilinear motion at the uniform velocity. As figure 1
and 2 show, these are mean square error of azimuth and pithching angle.
0 50 100 150 200 250 300 350 400 450 5000
1
2
3
4
5
6
-4 Mean square error of azimuth
Time / Sec.
Err
or
/rad
Filter value of position platform
Fusion Result
Filter value of electroic compass
×10
Fig. 1. Mean square error of azimuth
0 50 100 150 200 250 300 350 400 450 5000
1
2
3
4
5
6
-4 Mean square error of pitching angle
Filter value of gyroscope
Filter value of accelerometer
Fusion Rusult
Time / Sec.
Err
or
/rad
×10
Fig. 2 Mean square error of pitching angle
Hun Guo, Zuo Dunwen, Tang Guoxing 19
Conclusion
Aim at the wheeled motion robot sensor fusion system, an algorithm was established to realize the
asynchrononous date based on the distributed information fusion. The algorithm firstly realized
synchronization to asynchronous data in time. Then through Kalman filter algorithm,this algorithm
has reduced the computation complexity of the data fusion, strengthened the fusion algorithm
adaptability. Regarding multi-sensors data fusion of robots and other intelligent equipment, this
article will contribute stronger reference value to that field.
Acknowledgement
The Project of Science and Technology Innovation Research Project of Harbin for Young Scholar
under Grant No.2009RFQXG209, the Natural Science Foundation of Heilongjiang Province of China
under Grant No.F200804 and Scientific Research Fund of Heilongjiang Provincial Education
Department NO: 11531056
Reference
[1] T. Alouani, T. R. Rice: Optical Engineering, Vol. 37(1998), p. 427-433.
[2] Wang Jie, Han Chong-zhao, Li xiao-rong: Control and Decision, Vol. 17(2001), p. 874-880
[3] Gao Lan, Tian Kang-sheng: Journal of Air Force Radar Academy. Vol. 20(2006), p. 250-253
[4] Wang Hang-yu,Liu Miao-sen, Zhou Ying: Electronics Optics & Control, Vol. 10(2003), p. 24-27
[5] J. Ali, Fang Jiancheng: IEEE International Conference on Industrial Technology (ICIT) (Trans
Tech Publications, BeiJing of China 2005)
20 Advanced Design and Manufacturing Technology I

Researcher of Region Growing Medical Image Segmentation Based on
Adaboost Algorithm
P. Wang 1, 2, a, X.F. Ye 2, b, S.W. Yin 3, S.C. Kang 1 and J.L. Xin1
1Department of Mechanical & Power Engineering, Harbin Univ. of Sci and Tech, Harbin 150080,
China
2College of Automation, Harbin Engineering University Harbin 150001, China
3Harbin ZhongQing Gas Lo.,Ltd, Harbin 150001, China
Keywords: Image segmentation, Region growing, Adaboost algorithm, medical image
Abstract. To obtain better region extraction results of medical image, a new segmentation algorithm
is proposed based on improved Adaboost algorithm. The seed pixel is selected with background
subtraction. The neighborhood point is judged. The primary selected seed is calibrated with label, and
then the range of seed is reduced through growing label and the maximal saliency. The optimized
Adaboost algorithm is taken as growing criterion to optimally combine the scrappy region when the
region growing is over. The experiment result shows that the accuracy and robustness of the algorithm
both meet the actual application required.
Introduction
In the medical image, the Regions of Interest (ROI), namely the most primal regions of target
information in the image, which can show the image content comprehensively [1]
, we can improve the
efficiency and accuracy of the image processing and analysis only if these regions have been
extracted. Nowadays, ROI extracting technology has been effectively applied in many fields, such as
the obstacle identified of mobile vision robot, the target region orientated and identified of robot
vision, the subtitles and identification of video information automatically extracted and identified, the
region of license plate automatically extracted and identified in the intelligent transportation system,
medical image analyzing, and etc[2].
ROI extracting technology has important research significance
and vast market potential. In this paper, we extract specific ROI with region growing method
combined with Adaboost algorithm.
Description of Region Growing Algorithm
The basic thought of region growing is gathering the pixels with similar property to form region. The
realizing process is that, taking a seed pixel as starting point for each division region, and then
merging the same or similar pixels (judged by the certain growing or similar standard determined in
advance) around the field of seed pixel into the seed pixel region. Taking these new pixels as new seed
pixels to repeat the process above until all the pixels satisfied the condition have been merged. At that
time, one region is grown. To test the image, after all of the regions formed, calculating the area of all
the connected regions, and taking the region with the largest area as the target region. When the region
growing method is used in the actual, there are three questions needed to be solved.
(1) Selecting or determining a group of seed pixels which can represent the needed region
correctly;
(2) Determining the standard of merging the adjacent pixel during the growing process;
(3) Making the condition or the rule which can stop the growing process.
Selecting of ROI Seed Point. (1) Primarily selecting the seed pixel with background subtraction. The
seed pixel can always be selected with the characteristic of specific problem. In this paper, two arrays
are estimated base on the background subtraction. Array1 is used to save the coordinate value of
© (2011) Trans Tech Publications, Switzerlanddoi:10.4028/www.scientific.net/AMR.142.21
different pixels of current frame and background, while, Array2 is used to save the lightness value of
different pixels. They are sequential storages, the coordinate and the lightness values are
corresponding to the same bright point peak.
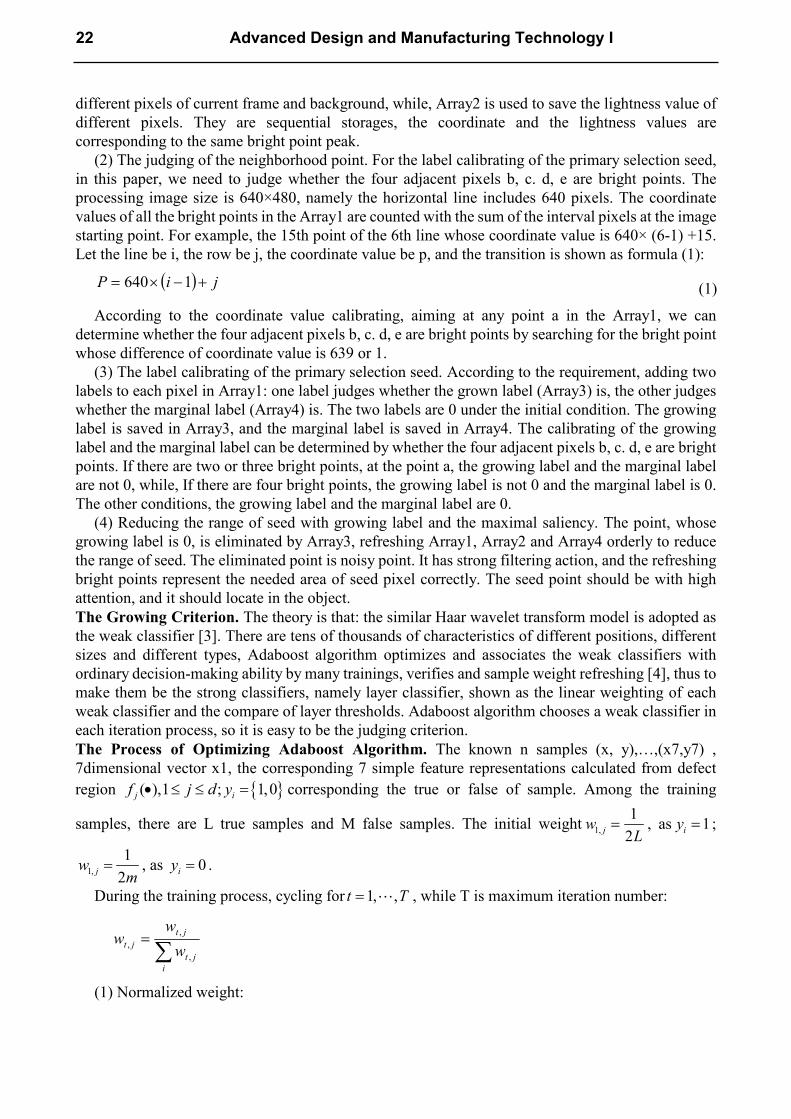
(2) The judging of the neighborhood point. For the label calibrating of the primary selection seed,
in this paper, we need to judge whether the four adjacent pixels b, c. d, e are bright points. The
processing image size is 640×480, namely the horizontal line includes 640 pixels. The coordinate
values of all the bright points in the Array1 are counted with the sum of the interval pixels at the image
starting point. For example, the 15th point of the 6th line whose coordinate value is 640× (6-1) +15.
Let the line be i, the row be j, the coordinate value be p, and the transition is shown as formula (1):
( ) jiP +−×= 1640 (1)
According to the coordinate value calibrating, aiming at any point a in the Array1, we can
determine whether the four adjacent pixels b, c. d, e are bright points by searching for the bright point
whose difference of coordinate value is 639 or 1.
(3) The label calibrating of the primary selection seed. According to the requirement, adding two
labels to each pixel in Array1: one label judges whether the grown label (Array3) is, the other judges
whether the marginal label (Array4) is. The two labels are 0 under the initial condition. The growing
label is saved in Array3, and the marginal label is saved in Array4. The calibrating of the growing
label and the marginal label can be determined by whether the four adjacent pixels b, c. d, e are bright
points. If there are two or three bright points, at the point a, the growing label and the marginal label
are not 0, while, If there are four bright points, the growing label is not 0 and the marginal label is 0.
The other conditions, the growing label and the marginal label are 0.
(4) Reducing the range of seed with growing label and the maximal saliency. The point, whose
growing label is 0, is eliminated by Array3, refreshing Array1, Array2 and Array4 orderly to reduce
the range of seed. The eliminated point is noisy point. It has strong filtering action, and the refreshing
bright points represent the needed area of seed pixel correctly. The seed point should be with high
attention, and it should locate in the object.
The Growing Criterion. The theory is that: the similar Haar wavelet transform model is adopted as
the weak classifier [3]. There are tens of thousands of characteristics of different positions, different
sizes and different types, Adaboost algorithm optimizes and associates the weak classifiers with
ordinary decision-making ability by many trainings, verifies and sample weight refreshing [4], thus to
make them be the strong classifiers, namely layer classifier, shown as the linear weighting of each
weak classifier and the compare of layer thresholds. Adaboost algorithm chooses a weak classifier in
each iteration process, so it is easy to be the judging criterion.
The Process of Optimizing Adaboost Algorithm. The known n samples (x, y),…,(x7,y7) ,
7dimensional vector x1, the corresponding 7 simple feature representations calculated from defect
region { }( ),1 ; 1,0j if j d y• ≤ ≤ = corresponding the true or false of sample. Among the training
samples, there are L true samples and M false samples. The initial weight1,
1
2jw
L= , as 1iy = ;
1,
1
2jw
m= , as 0iy = .
During the training process, cycling for 1, ,t T= � , while T is maximum iteration number:
∑=
i
jt
jt
jtw
ww
,
,
,
(1) Normalized weight:
22 Advanced Design and Manufacturing Technology I

(2) For each feature ( )jf • , only one classifier ( )jh • is used in the training, its weighting error is
defined as ( )ti j i i
i
w h x yε∗
= −∑ .
(3) Select the classifier ( )jh • of the minimum weighting error.
(4) The refreshing weight1
1, ,ie
t j t j tw w β −+ = , when ix is classified correctly, 0ie = ; when ix is
classified wrong, 1ie =1
tt
t
εβ
ε=
−.
(5) Then obtain the classifier:
( ) ( )
≥= ∑ ∑
= =
otherwise
axhaxh
T
t
T
t
ttt
02
11
1 1
Where 1
logt
t
aβ
=
(6) The sample throughth , obtained
1
[ ] ( )T
t
t
res i h x=
=∑ .
(7) Sort the factors of res array from low to high.
(8) Get the best threshold from [ ]res i , give up the fail samples.
(9) Record the number of the passing samples.
(10) Judge whether the classifier function reaches the index or not, if it reach the index, transfer to
(11), or else begin a new weak classify training.
(11) The training is over, refresh the verification set.
Stop of the Growing Process and the Post-processing. We adopt scanning line seed filling
algorithm to stop and post process the region filling. The test object is each pixel segment which is the
horizontal direction combination of the adjacent pixels in the region. It takes the boundary value pixel
as boundary at the two ends, not including the new pixel. When point (x, y) is given, firstly filling a
segment located in the given region on the scanning line where the seed point is, and then determining
a segment, which is connected with the segment above, located in the given region, between the upper
and lower scanning lines, and saving them orderly. Repeat the process above until the scanning lines
contain all the boundary pixels. If the scanning lines neither contain the boundary pixels nor the filled
pixels, taking the extremely right pixel as seed pixel, pressing it in the stack and stopping the
post-processing when the stack is empty.
Experiment and Analysis
The experiment result is shown as Fig.1, 2, 3, 4, 5. The advantage of the Adaboost algorithm
combined with region growing detecting method is that, target dividing, filtering and edge detecting
can be carried on at the same time. What’s more, it can divide the target precisely to calibrate the
centroid coordinate of moving target correctly.
Fig. 1. The original picture of cell
Hun Guo, Zuo Dunwen, Tang Guoxing 23
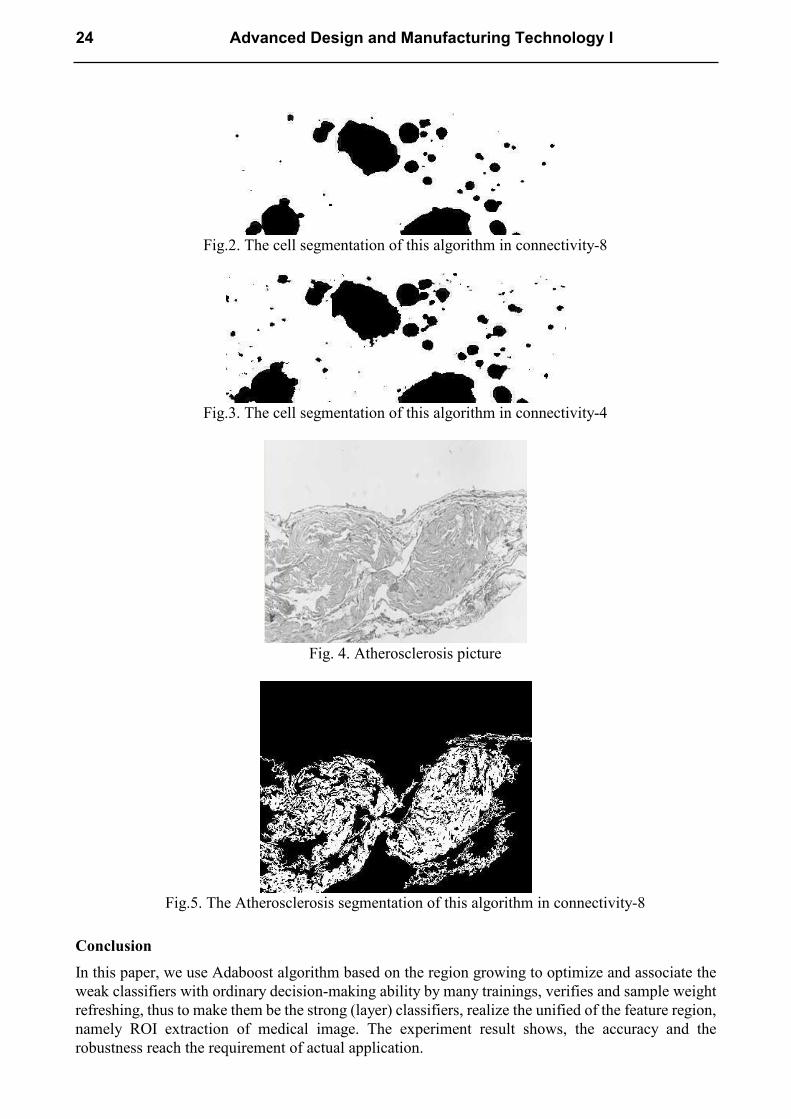
Fig.2. The cell segmentation of this algorithm in connectivity-8
Fig.3. The cell segmentation of this algorithm in connectivity-4
Fig. 4. Atherosclerosis picture
Fig.5. The Atherosclerosis segmentation of this algorithm in connectivity-8
Conclusion
In this paper, we use Adaboost algorithm based on the region growing to optimize and associate the
weak classifiers with ordinary decision-making ability by many trainings, verifies and sample weight
refreshing, thus to make them be the strong (layer) classifiers, realize the unified of the feature region,
namely ROI extraction of medical image. The experiment result shows, the accuracy and the
robustness reach the requirement of actual application.
24 Advanced Design and Manufacturing Technology I

Acknowledgment
This project is supported by post-doctoral Foundation of Heilongjiang Province (LRB09 -079). The
authors would like to thank the Harbin Engineering University and Harbin University of Science and
Technology for supporting this work. The authors would also like to thank the editors and reviewers
for their valuable comments and for making the paper more readable.
References
[1] S. Bernt and L. James: In International Journal of Computer Vision. Vol. 36 (2003), p. 31
[2] D.S.Lee and B. Erol: The Proc.of IEEE International Confererence on Image Processing Vol. 3
(2003), p. 973
[3] Y. Freund and R.E. Schapire: Journal of Computer and System Sciences. Vol. 55 (1997), p. 119
[4] P. Viola and M. Jones: Proceedings of IEEF Conference on Computer Vision and Pattern
Recognition. (2001), p. 342
Hun Guo, Zuo Dunwen, Tang Guoxing 25
Trail Investigation on Chip of High-speed and Dry Cutting on Hardened
Steel with PCBN Tool
Zhenhua Qing1, a, Dunwen Zuo1, a,Feng Xie2, band Chonggao Zhang2, b 1College of mechanical engineering and electronics, Nanjing University of aeronautics and
astronautics, Nanjing, Jiangsu 210016, P.R.China
2School of mechanical and automobile engineering, Hefei University of Technology, Hefei, Anhui
230009, P.R.China
Keywords: PCBN cutter; High-speed Hard and Dry Cutting; Chip configuration; Cutting temperature
Abstract: The high-speed hard and dry cutting chips of hardened alloy-steel with PCBN tool is
presented in this paper: After the work piece temperature measured by ThermaVision infrared
thermometer, it is proved that the heat generated by cutting is carried out by chips; After SEM
analyzed chip it is proved that the cutting temperature is increased and then fallen and the PCBN tool
suitable for high-speed hard and dry cutting. It is suitable for PCBN tool cutting hardened alloy-steel
42CrMo instead of grinding.
Introduction
Various high hardness materials such as hardened high-speed steel, die steel, bearing steel, alloyed
steel, surface-hardened steel, hard iron and alloyed iron etc. are widely used in modern industry. The
hardness is 50-70HRC. Hardened steel machining means cutting on wear part or die steel which have
martensitic structures after quenching. The hardness of the workpiece is over 50HRC.Generally,the
final size precision and surface roughness of these materials are obtained by grinding. Comparing
with machining, grinding has a characteristic of low efficiency and high cost [1].
CBN has some good properties such as high micro-hardness up to 8000-9000HV, high wearing
resistance and thermo stability, high chemical inertness, low abilities of reacting with iron family
elements in 1200-1300℃,good thermal conductivities and low friction factors. The CBN is one of the
best cutting tool materials used to machining high hardness materials [2]. In recent dry cutting
researches, the researches of PCBN cutters are insufficiency. Therefore, it is especially important to
research mechanisms of dry cutting to guide the choices of cutting quantities and cutter geometrical
parameters. This paper illustrates the experimental research for cutting chips on hardened alloy steel
42CrMo.
Characteristics of Experiment Hardened Alloy Steel and Main Properties of PCBN Cutter
Trial material of workpiece is general alloy steel 42CrMo.The hardness is 52HRC.(20℃). 42CrMo
has high strength; good harden ability, good toughness, small deformations in hardening, high creep
strength and creep rupture strength in high temperature. It is used to manufacture forge pieces with
high strength and big modified treatment sections such as big gears used in locomotive, gears used in
intensifier driver, rear axles, link rods and alligator clips bearing great loads. It is also used to
manufacture oil drilling rod joints and finger grips and so on. The chemical elements of workpiece
material are shown as table 1 [3] (Cited from GB/T3077-1999).
The cutter BN100 chosen for the experiment contains high volume of CBN(tool geometry see in
table3, tool micro-structure see on fig.1). In figure 1, the black particle is CBN grain and the grey
particle is TiN binder. Tool grade BN100 possesses larger grain size lower percentage of binder
amount of larger pores, comparing with BN250, BN300. In high speed cutting, chips are discharged
carrying a big amount of cutting heat, thus the heat transferred to cutter and workpiece is reduced
© (2011) Trans Tech Publications, Switzerlanddoi:10.4028/www.scientific.net/AMR.142.26
largely. Because of the high temperature in cutting areas, the cutting shear zone is softened. Therefore,
the cutter BN100 is adapt to be applied in high speed dry cutting of hardened steel, meaning PCBN
cutter can be used in high speed dry cutting of hardened steel.
Table 1 Elements content of 42CrMo steel (wt %)
Element C Si Mn S P Cr Ni Mo
% 0.38-0.45 0.20-0.40 0.50-0.80 ≤0.040 ≤0.040 0.90-1.20 ≤0.35 0.15-0.25
Table 2 PCBN cutters used in
experiment
Model CBN volume
BN100 85%
Graininess Main binder
3μm TiN
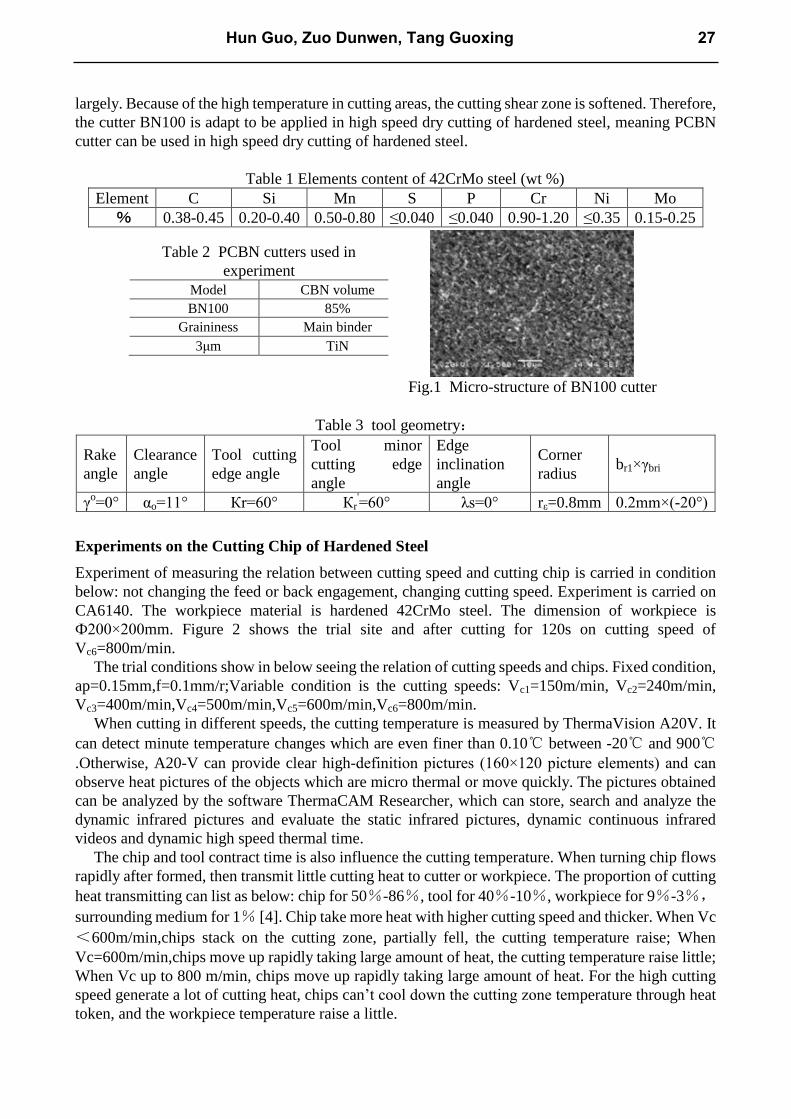
Fig.1 Micro-structure of BN100 cutter
Table 3 tool geometry:
Rake
angle
Clearance
angle
Tool cutting
edge angle
Tool minor
cutting edge
angle
Edge
inclination
angle
Corner
radius br1×γbri
γo=0° αo=11° Кr=60° Кr
'=60° λs=0° rε=0.8mm 0.2mm×(-20°)
Experiments on the Cutting Chip of Hardened Steel
Experiment of measuring the relation between cutting speed and cutting chip is carried in condition
below: not changing the feed or back engagement, changing cutting speed. Experiment is carried on
CA6140. The workpiece material is hardened 42CrMo steel. The dimension of workpiece is
Ф200×200mm. Figure 2 shows the trial site and after cutting for 120s on cutting speed of
Vc6=800m/min.
The trial conditions show in below seeing the relation of cutting speeds and chips. Fixed condition,
ap=0.15mm,f=0.1mm/r;Variable condition is the cutting speeds: Vc1=150m/min, Vc2=240m/min,
Vc3=400m/min,Vc4=500m/min,Vc5=600m/min,Vc6=800m/min.
When cutting in different speeds, the cutting temperature is measured by ThermaVision A20V. It
can detect minute temperature changes which are even finer than 0.10℃ between -20℃ and 900℃.Otherwise, A20-V can provide clear high-definition pictures (160×120 picture elements) and can
observe heat pictures of the objects which are micro thermal or move quickly. The pictures obtained
can be analyzed by the software ThermaCAM Researcher, which can store, search and analyze the
dynamic infrared pictures and evaluate the static infrared pictures, dynamic continuous infrared
videos and dynamic high speed thermal time.
The chip and tool contract time is also influence the cutting temperature. When turning chip flows
rapidly after formed, then transmit little cutting heat to cutter or workpiece. The proportion of cutting
heat transmitting can list as below: chip for 50%-86%, tool for 40%-10%, workpiece for 9%-3%,
surrounding medium for 1% [4]. Chip take more heat with higher cutting speed and thicker. When Vc
<600m/min,chips stack on the cutting zone, partially fell, the cutting temperature raise; When
Vc=600m/min,chips move up rapidly taking large amount of heat, the cutting temperature raise little;
When Vc up to 800 m/min, chips move up rapidly taking large amount of heat. For the high cutting
speed generate a lot of cutting heat, chips can’t cool down the cutting zone temperature through heat
token, and the workpiece temperature raise a little.
Hun Guo, Zuo Dunwen, Tang Guoxing 27
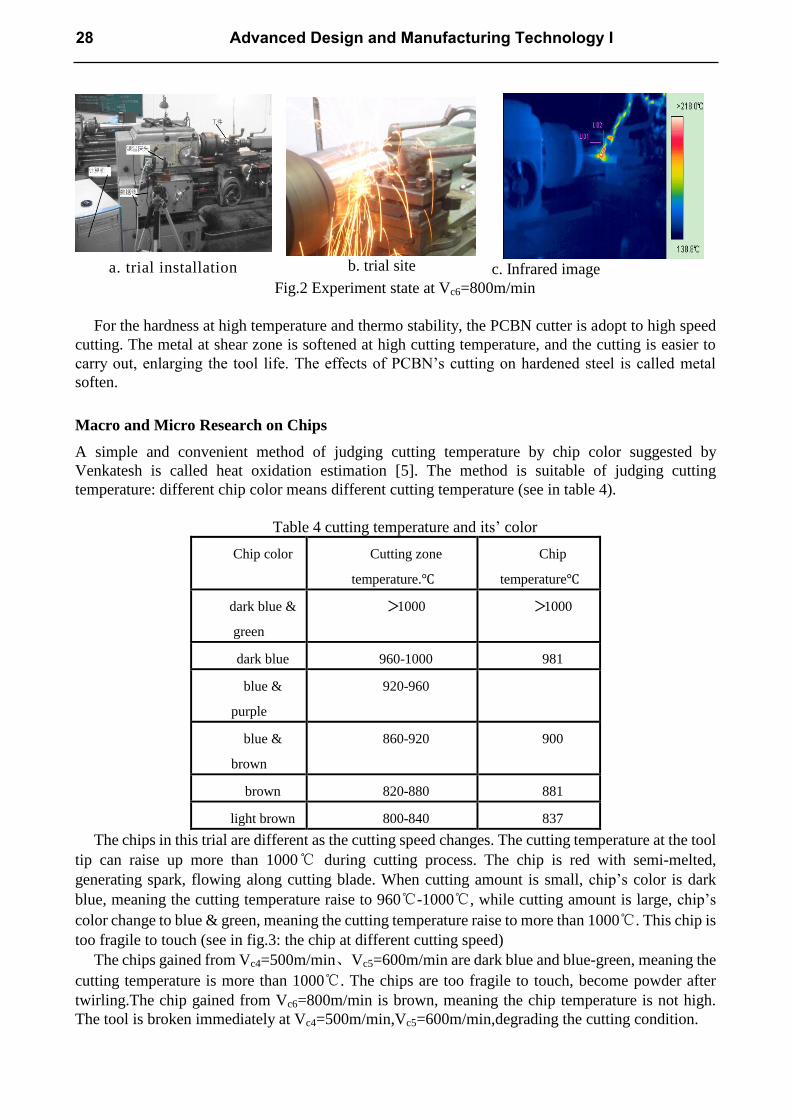
a. trial installation
b. trial site
c. Infrared image
Fig.2 Experiment state at Vc6=800m/min
For the hardness at high temperature and thermo stability, the PCBN cutter is adopt to high speed
cutting. The metal at shear zone is softened at high cutting temperature, and the cutting is easier to
carry out, enlarging the tool life. The effects of PCBN’s cutting on hardened steel is called metal
soften.
Macro and Micro Research on Chips
A simple and convenient method of judging cutting temperature by chip color suggested by
Venkatesh is called heat oxidation estimation [5]. The method is suitable of judging cutting
temperature: different chip color means different cutting temperature (see in table 4).
Table 4 cutting temperature and its’ color
Chip color Cutting zone
temperature.℃
Chip
temperature℃
dark blue &
green
>1000 >1000
dark blue 960-1000 981
blue &
purple
920-960
blue &
brown
860-920 900
brown 820-880 881
light brown 800-840 837
The chips in this trial are different as the cutting speed changes. The cutting temperature at the tool
tip can raise up more than 1000℃ during cutting process. The chip is red with semi-melted,
generating spark, flowing along cutting blade. When cutting amount is small, chip’s color is dark
blue, meaning the cutting temperature raise to 960℃-1000℃, while cutting amount is large, chip’s
color change to blue & green, meaning the cutting temperature raise to more than 1000℃. This chip is
too fragile to touch (see in fig.3: the chip at different cutting speed)
The chips gained from Vc4=500m/min、Vc5=600m/min are dark blue and blue-green, meaning the
cutting temperature is more than 1000℃. The chips are too fragile to touch, become powder after
twirling.The chip gained from Vc6=800m/min is brown, meaning the chip temperature is not high.
The tool is broken immediately at Vc4=500m/min,Vc5=600m/min,degrading the cutting condition.
28 Advanced Design and Manufacturing Technology I
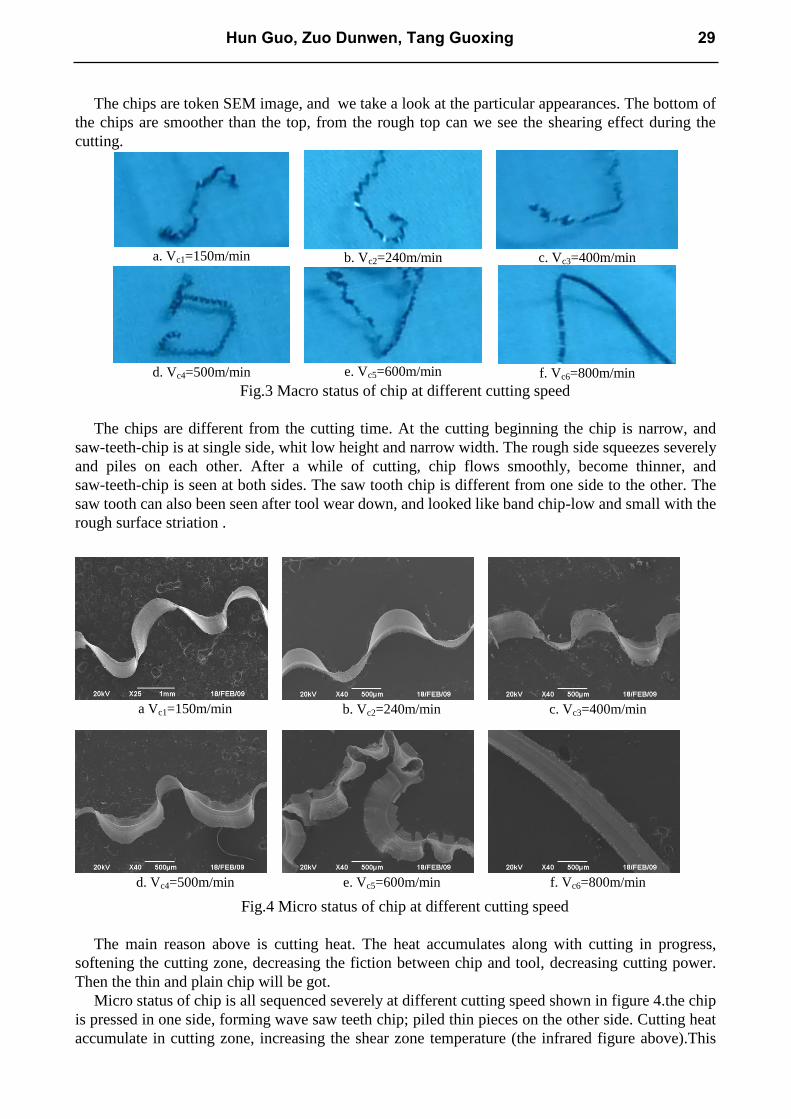
The chips are token SEM image, and we take a look at the particular appearances. The bottom of
the chips are smoother than the top, from the rough top can we see the shearing effect during the
cutting.
a. Vc1=150m/min
b. Vc2=240m/min
c. Vc3=400m/min
d. Vc4=500m/min
e. Vc5=600m/min
f. Vc6=800m/min
Fig.3 Macro status of chip at different cutting speed
The chips are different from the cutting time. At the cutting beginning the chip is narrow, and
saw-teeth-chip is at single side, whit low height and narrow width. The rough side squeezes severely
and piles on each other. After a while of cutting, chip flows smoothly, become thinner, and
saw-teeth-chip is seen at both sides. The saw tooth chip is different from one side to the other. The
saw tooth can also been seen after tool wear down, and looked like band chip-low and small with the
rough surface striation .
a Vc1=150m/min
b. Vc2=240m/min
c. Vc3=400m/min
d. Vc4=500m/min
e. Vc5=600m/min
f. Vc6=800m/min
Fig.4 Micro status of chip at different cutting speed
The main reason above is cutting heat. The heat accumulates along with cutting in progress,
softening the cutting zone, decreasing the fiction between chip and tool, decreasing cutting power.
Then the thin and plain chip will be got.
Micro status of chip is all sequenced severely at different cutting speed shown in figure 4.the chip
is pressed in one side, forming wave saw teeth chip; piled thin pieces on the other side. Cutting heat
accumulate in cutting zone, increasing the shear zone temperature (the infrared figure above).This
Hun Guo, Zuo Dunwen, Tang Guoxing 29
cutting temperature changes the chip’s crystal construction. Oxidizing reaction is more easily to
happen because of the high cutting temperature. The chip got at Vc4=500m/min,Vc5=600m/min
cutting speed are thinner and more brittle, meaning of higher cutting temperature and Oxidizing
reaction on the chip.
Conclusions
The infrared figure of the trail shows the cutting on 42CrMo steel by PCBN tool generate a lot of
cutting heat and most of the heat carried by chip flow. Along with the cutting speed increasing, the
temperature in shear zone increase and then decrease. The cutter are more likely to abrasive at
Vc4=500m/min, Vc5=600m/min cutting speed. When cutting speed increase to high as
Vc6=800m/min, a lot of cutting heat is carried out by chip, and the temperature changes little. The
cutting temperature is lower than it at Vc4=500m/min,Vc5=600m/min cutting speed. The cutting
process progresses smoothly. It suitable for PCBN cutter machining on 42CrMo hardened steel at
high speed without cutting fluid.
References
[1] R.D.Han: Cutting with hard machining material(Beijing: China machine press, 1996).
[2] R.Y.Chen:Theory of metal cutting (2nd edition) (Beijing: China machine press, 2002).
[3] Compile committee of machine design handbook. Machine Design Handbook (3rd edition, vol.
1). (Beijing: China machine press, 2004).
[4] J.Z.LU, J.N.SUN: Theory and tool of metal cutting(4th edition)(Beijing: China machine press,
2005).
[5] W.Y.H. Liew, B.K.A. Ngoi and Y.G. Lu: WEAR Vol.254(2003), p.265-277.
[6] Y. Ning, Rahman M and Wong YS: Elesevier Journal of Material Processing Technology
Vol.113(2001), p.360-367.
30 Advanced Design and Manufacturing Technology I

Simulate Measure for Spring Back of Autobody Panel's Edge
Liu bai1, a, Liu Mingjun1, b, Jiang Junxia1, c and Zhou Yongquan1, d 1Department of Information Control and Manufacturing, Shenzhen Institute of Information
Technology, Shenzhen 518029, China
[email protected], [email protected], [email protected]
Keywords: Spring back, numerical simulation, autobody panel’s edge, drawing
Abstract. With the higher quality requirement of automotive assembly, the demand for forming
precision of the stamping part gets higher. The simulation of resilience around the edge of drawn
parts of autobody panels has become a hot spot of automotive field. Currently, the study on resilience
mainly focused on the principle of resilience of bent parts and its relative control whereas the
investigation on resilience of drawing process is quite less. This paper has studied the object of
automobile cover panel through comparison of captured contour to calculate the resilience of edges of
part, resolve the resilience problems of drawn part, for which the traditional calculation method and
CAE software, focusing on bending resilience issues, couldn’t provide their solution.
Introduction
The formation of drawn automobile cover panel is a type of thin metal sheet forming with multiply
non-linear complex processes of mechanics, such as non-linear geometry, non-linear material,
non-linear boundary etc. The formability of such metal sheet is hard to be predicted due to the
complicated geometry of part. With the higher quality requirement of automotive assembly, assembly
error should be controlled under very limited tolerance, which makes stamping accuracy higher
consequently. With the huge demand of both high strength thin metal sheet and aluminum alloy in
recent years, resilience has become critical issue in automobile’s field.
The final shape of elastic resilience of part is an accumulation of total stamping processes, which is
related to many factors such as die geometry, material feature, friction touch etc. Resilience occurs in
bending and drawing processes more seriously, affecting part’s dimension accuracy as well as
productivity. During half century, many scholars in the world have studied resilience issues from
simple bent part to complicated drawn part [1-5], from theoretical analysis to numerical simulation,
focusing on two aspects, resilience prediction and resilience control. According to information index
[6-9], the change principle and control of bending resilience have been deeply studied, but the study of
drawing resilience has rarely made. Numerical simulation of FEA has been often used for bending
resilience automatic compensation instead of edge resilience of drawn part.
This paper has studied the object of automobile cover panel through comparison of captured
contour by the analysis of PAM-STAM software. From captured line of contour of relative position
of part, contour geometry obtained by calculation of part resilience, can be compared with designed
geometry, to judge whether the error between both geometries meets the design need.
Formation of Warping and Resilience
Drawing easily leads to the non-uniform residual stress in a sheet. When the residual stress is less than
a certain critical value, the sheet will stick to its normal deformation form; when residual stress is
greater than the critical value, the deformation of plate suddenly entered a new form of the
deformation. That is Instability. The new deformation offset a part of the original residual stress, so
that the potential energy minimum. Although this deformation can keep sheet stable, but the sheet
changed into the surface. And there is not only the axial stress but also torque in the sheet.
In less deformation areas, the residual stress increases with increasing of the forming height. And
distortion is becoming obvious. If drawn depth continue to increase, rigidity of distortion will be
increased and distortion to be curtailed. When Width of sheet exceeds a certain value, distortion will
© (2011) Trans Tech Publications, Switzerlanddoi:10.4028/www.scientific.net/AMR.142.31
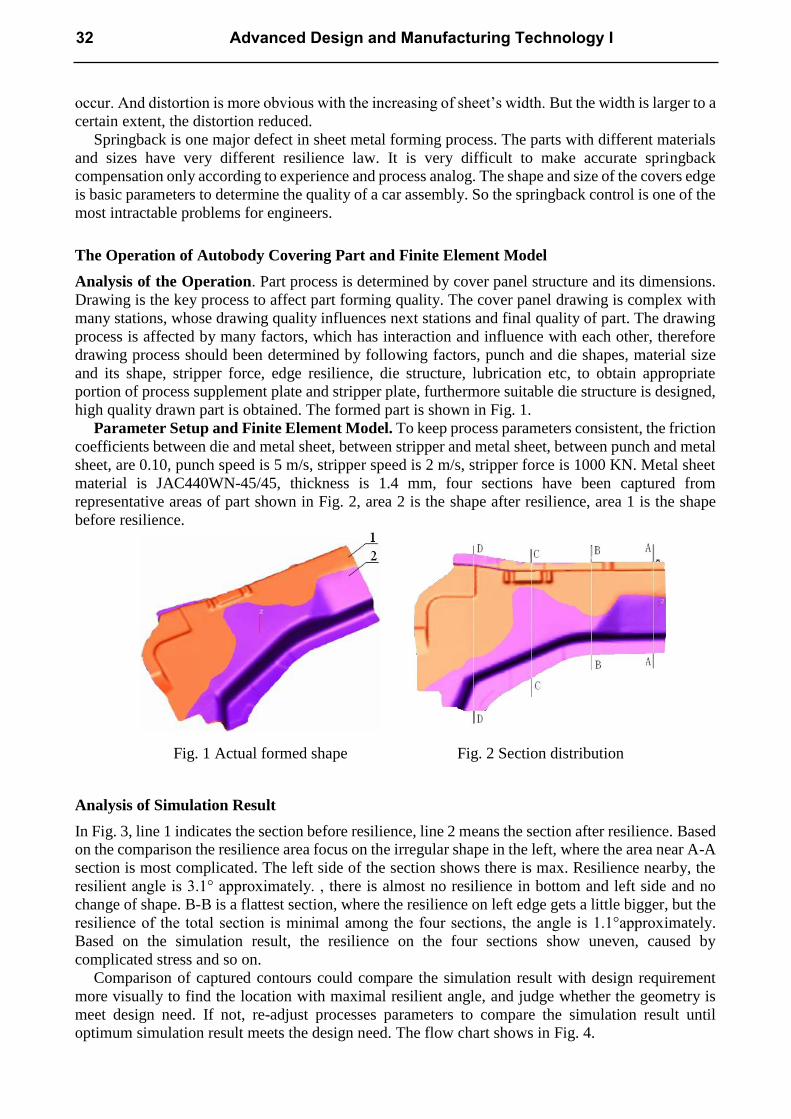
occur. And distortion is more obvious with the increasing of sheet’s width. But the width is larger to a
certain extent, the distortion reduced.
Springback is one major defect in sheet metal forming process. The parts with different materials
and sizes have very different resilience law. It is very difficult to make accurate springback
compensation only according to experience and process analog. The shape and size of the covers edge
is basic parameters to determine the quality of a car assembly. So the springback control is one of the
most intractable problems for engineers.
The Operation of Autobody Covering Part and Finite Element Model
Analysis of the Operation. Part process is determined by cover panel structure and its dimensions.
Drawing is the key process to affect part forming quality. The cover panel drawing is complex with
many stations, whose drawing quality influences next stations and final quality of part. The drawing
process is affected by many factors, which has interaction and influence with each other, therefore
drawing process should been determined by following factors, punch and die shapes, material size
and its shape, stripper force, edge resilience, die structure, lubrication etc, to obtain appropriate
portion of process supplement plate and stripper plate, furthermore suitable die structure is designed,
high quality drawn part is obtained. The formed part is shown in Fig. 1.
Parameter Setup and Finite Element Model. To keep process parameters consistent, the friction
coefficients between die and metal sheet, between stripper and metal sheet, between punch and metal
sheet, are 0.10, punch speed is 5 m/s, stripper speed is 2 m/s, stripper force is 1000 KN. Metal sheet
material is JAC440WN-45/45, thickness is 1.4 mm, four sections have been captured from
representative areas of part shown in Fig. 2, area 2 is the shape after resilience, area 1 is the shape
before resilience.
Fig. 1 Actual formed shape Fig. 2 Section distribution
Analysis of Simulation Result
In Fig. 3, line 1 indicates the section before resilience, line 2 means the section after resilience. Based on the comparison the resilience area focus on the irregular shape in the left, where the area near A-A
section is most complicated. The left side of the section shows there is max. Resilience nearby, the
resilient angle is 3.1° approximately. , there is almost no resilience in bottom and left side and no
change of shape. B-B is a flattest section, where the resilience on left edge gets a little bigger, but the
resilience of the total section is minimal among the four sections, the angle is 1.1°approximately.
Based on the simulation result, the resilience on the four sections show uneven, caused by
complicated stress and so on.
Comparison of captured contours could compare the simulation result with design requirement
more visually to find the location with maximal resilient angle, and judge whether the geometry is
meet design need. If not, re-adjust processes parameters to compare the simulation result until
optimum simulation result meets the design need. The flow chart shows in Fig. 4.
32 Advanced Design and Manufacturing Technology I
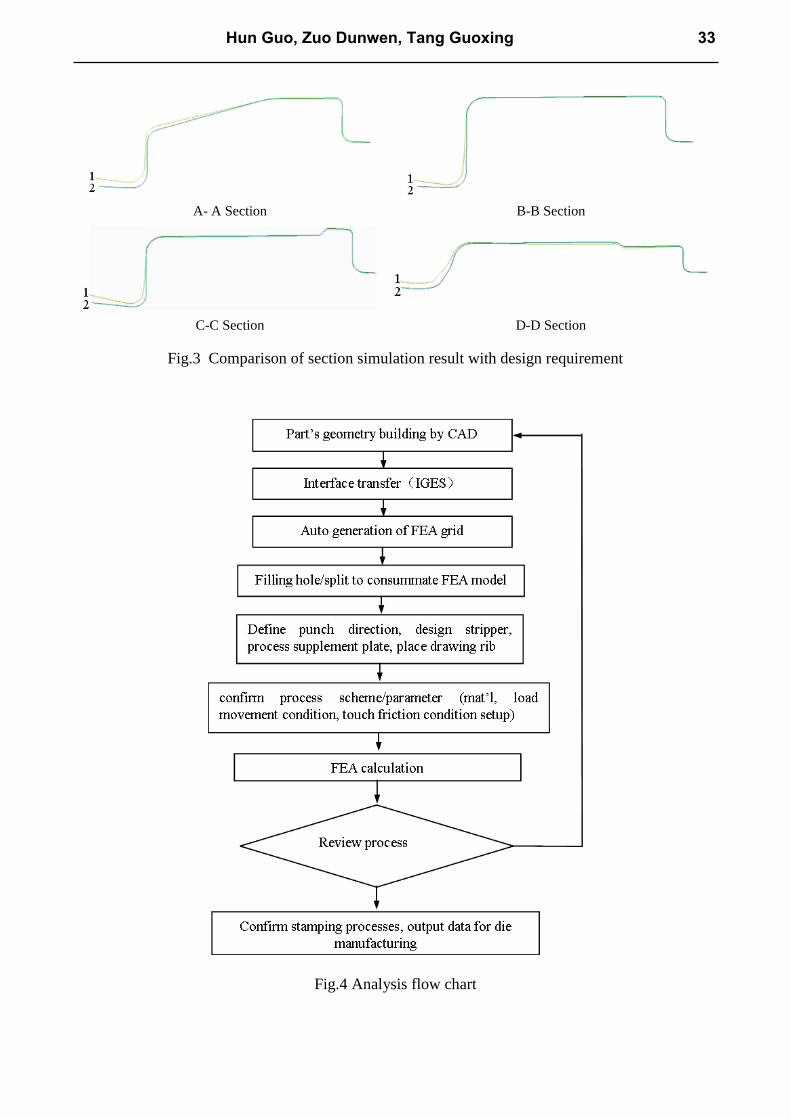
A- A Section B-B Section
C-C Section D-D Section
Fig.3 Comparison of section simulation result with design requirement
Fig.4 Analysis flow chart
Hun Guo, Zuo Dunwen, Tang Guoxing 33
Summary
Comparison of captured contour, the new method of calculating resilience of the edge of drawn part,
has been demonstrated to resolve the resilience issues of drawn part, for which the traditional
calculation method and CAE software, focusing on bending resilience issues, couldn’t provide their
solution. The calculation of resilience of the edges of drawn parts is helpful to insure and improve the
shape and dimension accuracy of drawn parts.
Acknowledgements
The financial Support of the project by Natural Science Foundation of Guangdong Province
(No.8151802904000001) and Shenzhen Plan for Science & Technology (No.JC200903180641A) are
acknowledged.
References
[1] G.D. Yuan, C.M. Yu: Mold Industry Vol. 33-4 (2007), p. 16-19
[2] J.Z. Fang: Docteral Theses, Jiangsu University, 2002
[3] Y. Tong, J.C. Zhang and L. Ying: Hot Working Technology Vol. 37-15 (2008), p. 80-82
[4] J. Zhou, J.J. Hu and Y. Zhang: Chinese Mechanical Engineering, Vol. 14-1 (2003), p. 20-22
[5] D.K. Leu: Journal of Materials Processing Technology Vol. 66 (1997), p. 9-17
[6] L.C. Zhang: J. Mater. Process. Technol. Vol. 53 (1995), p. 798-810
[7] V. Vikram, K. Brad and C. Jian: J. Eng. Mater. Technol. Vol. 125 (2003), p.125-131
[8] Z.H. Gong, Z.H. Zhong and X.J. Yang: Automotive Engineering, Vol. 29-4 (2007), p.351-354
[9] F.K. Chen, Y.C. Liao: Int. J. Adv. Manuf. Technol. Vol. 19-4 (2002), p.253–259.
34 Advanced Design and Manufacturing Technology I

Reconfigurable Clamping Device Based on Memory Alloy, Orientation
Disc, Majority Column and Telescopic Pole
Chen Zhenga, Wang Mingdib
School of Mechanical and Electric Engineering, Soochow University, Suzhou 215123, China [email protected], b [email protected]
Keywords: Reconfigurable design, Memory alloy, Telescopic poles, Majority column
Abstract. A new design on reconfigurable clamping device based on memory alloy, orientation
disc, majority column and telescopic pole is introduced, its working principle and performance
characters is discussed, then the relative formulas and illustrations are given out. This device is
based on memory alloy, common poles. Through combinations of the poles and orienting the disc,
it can meet requirements of clamping the workpieces at different positions and for different sizes
rapidly. In addition, due to adopting the majority column as clamping parts, which can hold the
workpieces with the different surfaces. Above all, it has a high capability in reconfiguration.
Introduction
Nowadays, the clamping devices used wildly in manufacturing are the special clamping devices. In
some conditions, enterprises need much money to design those special devices. However, these
special devices always become useless with some small changes in workpieces such as shapes or
sizes. This is definitely a waste of resources.
In order to solve the above problems, a new design on reconfigurable clamping device based on
memory alloy, orientation disk, majority column and telescopic pole is introduced, which is listed
as follows:
(1) Through combinations the simple common poles, it can reduce the manufacturing cost in a
large range;
(2) Through the orientation disk and telescopic poles, it can meet requirements at different
positions and for different sizes.
(3) With the majority column, it can clamp the workpieces with the different surfaces.
Working Principle and Pole Structures
Driving part based on memory alloy. The shape memory alloy (SMA) is a new kind of materials
with shape memory efficacy (SME), which is including the ability to drive, feel and act. It can work
simply when inputting the calories, and it is more and more popular in these years. The SME means
that when giving a slight distortion to SMA material in advance, and then heating the material to a
given temperature, the material will conquer the distortion back to the original shape due to the
crystal structure changes inside the material. In this paper, when using the hot end of the
semiconductor heat pump to heat the SMA spring, the sprin g will shrink, which will give out a
great force due to interior crystal structure changes to drive cylindrical the slide. When the SMA
spring shrinks, the slide will be driven to go right. The slide will be designed as in Fig.1 (a) and (b).
In Fig.1(a), two small rectangular planes are cutted out at the edge of the slide and the positioning
holes are marked, the simple poles can be fixed on the slide on both sides with a symmetrical
distribution. In the Fig.1(b), a slot is to processed in the central slide, the pin is fixed at one side of
© (2011) Trans Tech Publications, Switzerlanddoi:10.4028/www.scientific.net/AMR.142.35

the slide. Power output to achieve symmetry. In two desigs, when slides move to the right, it will
produce symmetrical output force.
(a) four poles to output the force (b) two poles to output the force
Fig.1 The different designs to output force with the slide driven by SMA spring
Force Transferring. Pole1 shown in Fig.1 is connected with pole 2 with a gemel(shown in
Fig.2) to transfer the force. As we can see in Fig.2, pole 2 is composed of a rectangle bar and a disc
with several postioning holes which are used to orientate. In order to reduce cost, they are
connected with weding. Pole 2 is used as a lever and the fixed hole is shown, so the pole 2 can’t be
rotational.
Fig.2 The Pole 2 with orientation disc Fig.3 The Pole 3 with orientation disc in “Z” shape
Pole 3 is connected to pole 2 through the left disc which is rotational, which is shown in Fig.3.
When pole 3 reaches the given angle, it can be fixed with pole 2 through the several hinges. A “Z”
shape pole is welded with the disc. At the right part of the “Z” shape pole, it is empty to hold the
telescopic pole. The telescopic pole can move back and forward in the “Z” pole and orientated by
the adjusting the hinges.
When adopting the drive part as Fig.1(a), Pole 4 is designed as Fig 4(a). Insert the left end of
Pole 4 to the telescopic cavity of Pole 3, which can be fixed with the pole 3 through the telescopic
rod hole. The right end is connected with the chuck blocks. To assemble easily, the alignment holes
are aligned.
36 Advanced Design and Manufacturing Technology I
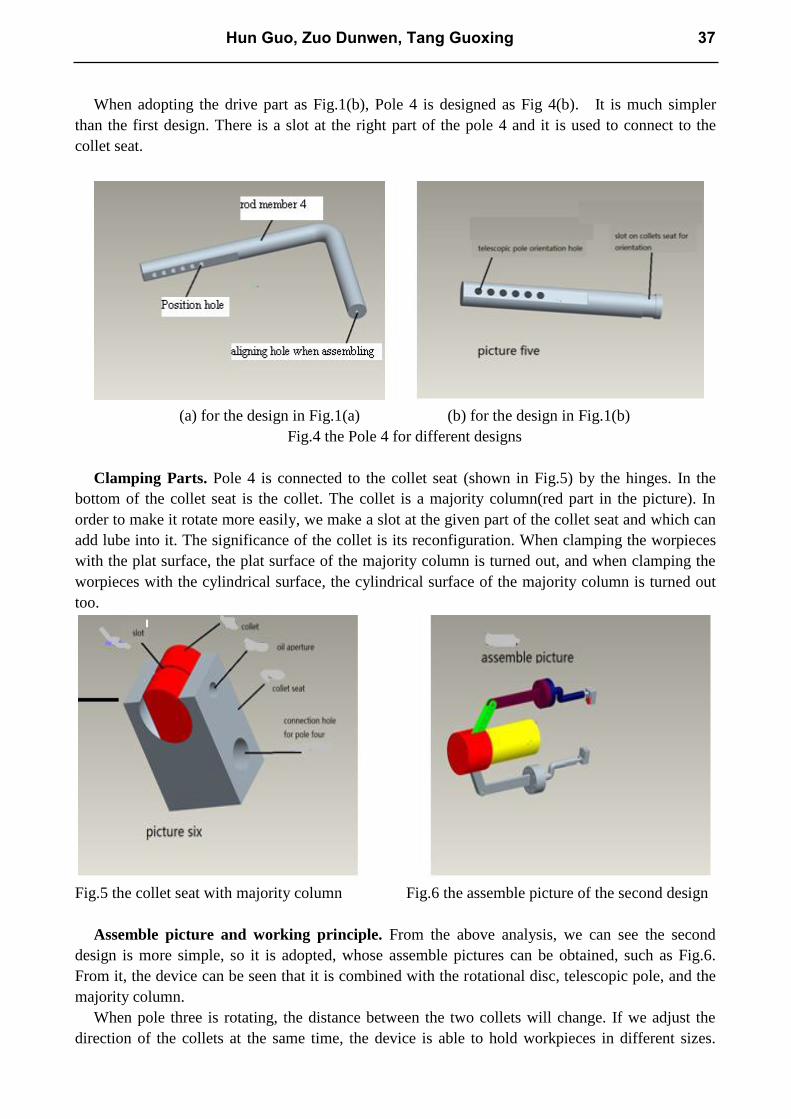
When adopting the drive part as Fig.1(b), Pole 4 is designed as Fig 4(b). It is much simpler
than the first design. There is a slot at the right part of the pole 4 and it is used to connect to the
collet seat.
(a) for the design in Fig.1(a) (b) for the design in Fig.1(b)
Fig.4 the Pole 4 for different designs
Clamping Parts. Pole 4 is connected to the collet seat (shown in Fig.5) by the hinges. In the
bottom of the collet seat is the collet. The collet is a majority column(red part in the picture). In
order to make it rotate more easily, we make a slot at the given part of the collet seat and which can
add lube into it. The significance of the collet is its reconfiguration. When clamping the worpieces
with the plat surface, the plat surface of the majority column is turned out, and when clamping the
worpieces with the cylindrical surface, the cylindrical surface of the majority column is turned out
too.
Fig.5 the collet seat with majority column Fig.6 the assemble picture of the second design
Assemble picture and working principle. From the above analysis, we can see the second
design is more simple, so it is adopted, whose assemble pictures can be obtained, such as Fig.6.
From it, the device can be seen that it is combined with the rotational disc, telescopic pole, and the
majority column.
When pole three is rotating, the distance between the two collets will change. If we adjust the
direction of the collets at the same time, the device is able to hold workpieces in different sizes.
Hun Guo, Zuo Dunwen, Tang Guoxing 37
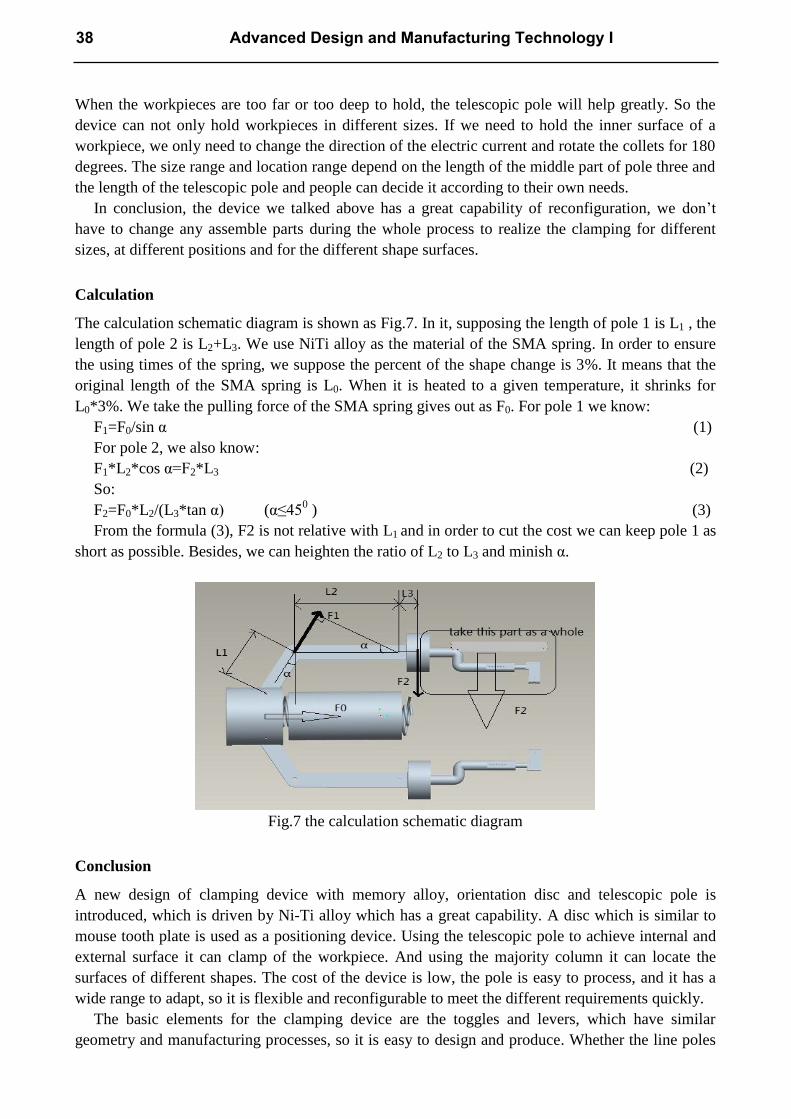
When the workpieces are too far or too deep to hold, the telescopic pole will help greatly. So the
device can not only hold workpieces in different sizes. If we need to hold the inner surface of a
workpiece, we only need to change the direction of the electric current and rotate the collets for 180
degrees. The size range and location range depend on the length of the middle part of pole three and
the length of the telescopic pole and people can decide it according to their own needs.
In conclusion, the device we talked above has a great capability of reconfiguration, we don’t
have to change any assemble parts during the whole process to realize the clamping for different
sizes, at different positions and for the different shape surfaces.
Calculation
The calculation schematic diagram is shown as Fig.7. In it, supposing the length of pole 1 is L1 , the
length of pole 2 is L2+L3. We use NiTi alloy as the material of the SMA spring. In order to ensure
the using times of the spring, we suppose the percent of the shape change is 3%. It means that the
original length of the SMA spring is L0. When it is heated to a given temperature, it shrinks for
L0*3%. We take the pulling force of the SMA spring gives out as F0. For pole 1 we know:
F1=F0/sin α (1)
For pole 2, we also know:
F1*L2*cos α=F2*L3 (2)
So:
F2=F0*L2/(L3*tan α) (α≤450 ) (3)
From the formula (3), F2 is not relative with L1 and in order to cut the cost we can keep pole 1 as
short as possible. Besides, we can heighten the ratio of L2 to L3 and minish α.
Fig.7 the calculation schematic diagram
Conclusion
A new design of clamping device with memory alloy, orientation disc and telescopic pole is
introduced, which is driven by Ni-Ti alloy which has a great capability. A disc which is similar to
mouse tooth plate is used as a positioning device. Using the telescopic pole to achieve internal and
external surface it can clamp of the workpiece. And using the majority column it can locate the
surfaces of different shapes. The cost of the device is low, the pole is easy to process, and it has a
wide range to adapt, so it is flexible and reconfigurable to meet the different requirements quickly.
The basic elements for the clamping device are the toggles and levers, which have similar
geometry and manufacturing processes, so it is easy to design and produce. Whether the line poles
38 Advanced Design and Manufacturing Technology I
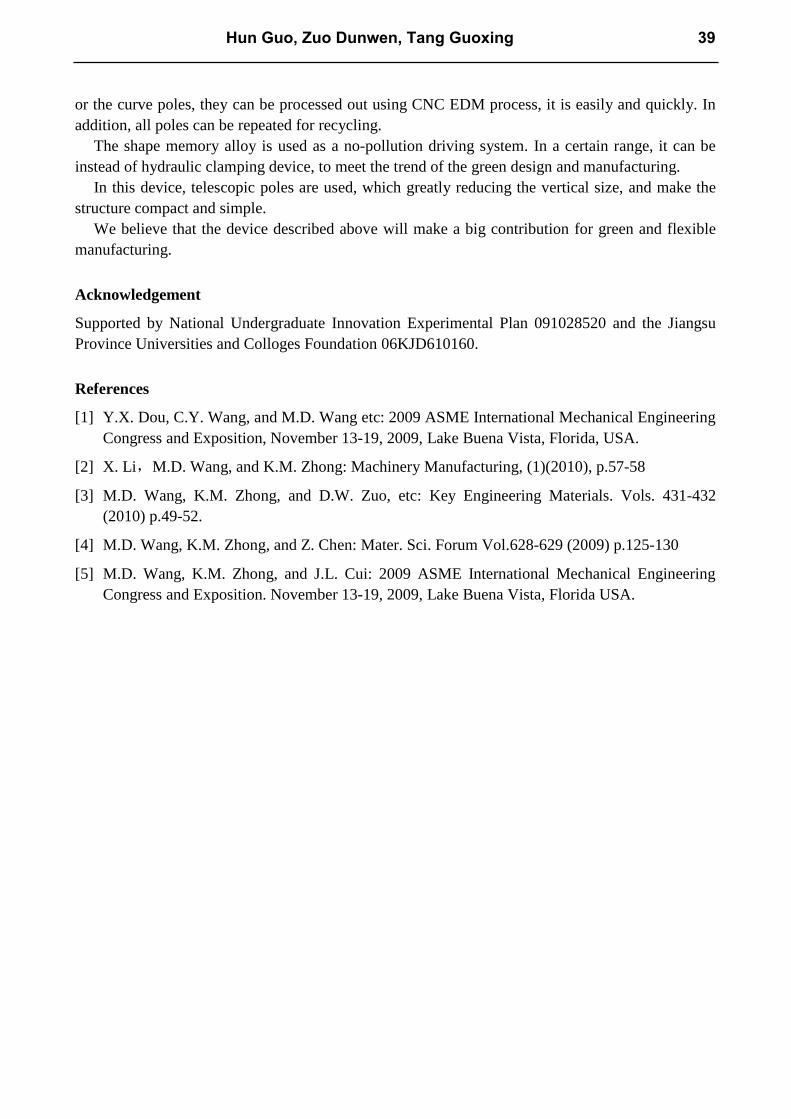
or the curve poles, they can be processed out using CNC EDM process, it is easily and quickly. In
addition, all poles can be repeated for recycling.
The shape memory alloy is used as a no-pollution driving system. In a certain range, it can be
instead of hydraulic clamping device, to meet the trend of the green design and manufacturing.
In this device, telescopic poles are used, which greatly reducing the vertical size, and make the
structure compact and simple.
We believe that the device described above will make a big contribution for green and flexible
manufacturing.
Acknowledgement
Supported by National Undergraduate Innovation Experimental Plan 091028520 and the Jiangsu
Province Universities and Colloges Foundation 06KJD610160.
References
[1] Y.X. Dou, C.Y. Wang, and M.D. Wang etc: 2009 ASME International Mechanical Engineering
Congress and Exposition, November 13-19, 2009, Lake Buena Vista, Florida, USA.
[2] X. Li,M.D. Wang, and K.M. Zhong: Machinery Manufacturing, (1)(2010), p.57-58
[3] M.D. Wang, K.M. Zhong, and D.W. Zuo, etc: Key Engineering Materials. Vols. 431-432
(2010) p.49-52.
[4] M.D. Wang, K.M. Zhong, and Z. Chen: Mater. Sci. Forum Vol.628-629 (2009) p.125-130
[5] M.D. Wang, K.M. Zhong, and J.L. Cui: 2009 ASME International Mechanical Engineering
Congress and Exposition. November 13-19, 2009, Lake Buena Vista, Florida USA.
Hun Guo, Zuo Dunwen, Tang Guoxing 39
Analysis of Mechanical Characteristics and Structural Options of
Micro-Milling Cutter
Zhu Liangjie1, a, LU Wenzhuang1, b, Zuo Dunwen1, c and Xu Feng1, d
1College of Mechanical & Electrical Engineering, Nanjing University of Aeronautics & Astronautics,
Nanjing, China, 210016
[email protected], [email protected], [email protected], [email protected]
Keywords: Micro-milling tool; Mode analysis; Static analysis; Finite element method
Abstract. The size and accuracy of the micro-structure is determined by the performance of
micro-milling tool. To reduce the tool vibration and improve the machining quality, research on the
mechanical characteristics of micro-milling tool is necessary. Finite element method was used to
research the mechanical characteristics of micro-milling in this paper. By Mode and Static Analysis,
the natural frequencies and mode shapes of various structure of micro-milling cutter was studied.
The stress and deformation characteristic, including the influence, was also studied. Finally, the
suggestion of optimal structure was supplied.
Introduction
At present, micro-cutting has become the key technology to overcome the limitations of MEMS [1].
The micro-milling technology is efficient, flexible, and can machine complex 3D shapes. It has
become a very active research focus [2]. The size and accuracy of the micro-structure that can be
machined is determined by the precision of micro-cutting tools in a large extent [3]. The
micro-tool’s overall dimensions and the local feature size should be small. The cutting-edge must
be sharp. The tool surface quality and strength must be high. Besides, the capability of anti-impact
and anti-deformation should be ensured too [4].
Micro-milling is a highly dynamic processing. The small diameter and large aspect ratio of
micro- milling tool enables it to be the main factors of system dynamic characteristics. The surface
quality may be deteriorative or the tool will even fail because of the tool’s severe vibration [5]. The
modal characteristic deformation of the tool has great effects on stability, wear and breakage during
machining. Further more, the phenomena of tipping and fracturing of micro-milling tool is obvious.
So study of the mechanical characteristics of micro-milling tool has really counts for reducing the
tool vibration and improving the machining quality [6].
Analysis of Mechanical Characteristics of Micro-Milling Tool
Finite Element Model. The structure of micro-milling tool is shown in figure 1. The main
geometric parameters are listed in Table 1 and the material properties are shown in Table 2.
As there are many curved surfaces in micro-milling tools, the software Pro-E was used to
establish the entity model, and then it was imported in ABAQUS through the data interface.
The upper surface of handle will be completely bound during FEM. To the regular shape in tool
handle and collum, sweep meshing is used during mesh generation. The elements are hexahedral.
For the cutting-edge with complex shape and many curved surfaces, free meshing is used during
© (2011) Trans Tech Publications, Switzerlanddoi:10.4028/www.scientific.net/AMR.142.40
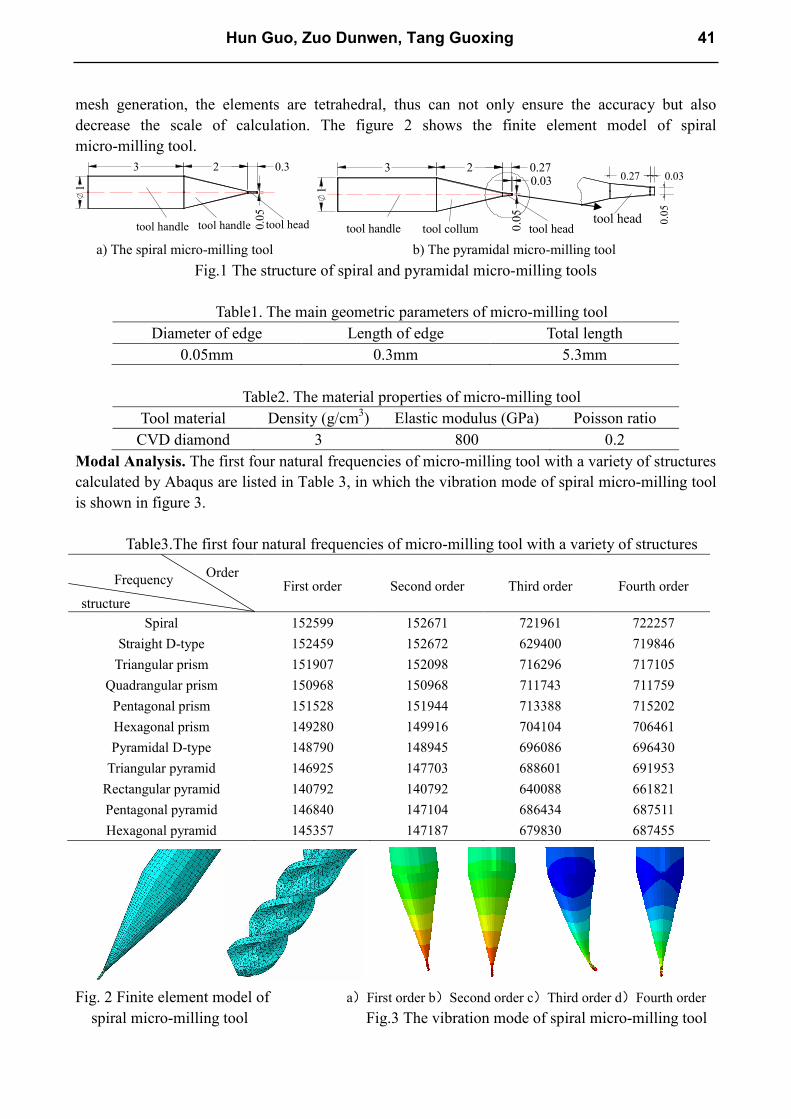
mesh generation, the elements are tetrahedral, thus can not only ensure the accuracy but also
decrease the scale of calculation. The figure 2 shows the finite element model of spiral
micro-milling tool.
3 2
1
0.3
0.05
tool handle tool handle tool head
3 2 0.270.03
1
0.05
tool handle tool collum tool headtool head
0.27 0.03
0.05
a) The spiral micro-milling tool b) The pyramidal micro-milling tool
Fig.1 The structure of spiral and pyramidal micro-milling tools
Table1. The main geometric parameters of micro-milling tool
Diameter of edge Length of edge Total length
0.05mm 0.3mm 5.3mm
Table2. The material properties of micro-milling tool
Tool material Density (g/cm3) Elastic modulus (GPa) Poisson ratio
CVD diamond 3 800 0.2
Modal Analysis. The first four natural frequencies of micro-milling tool with a variety of structures
calculated by Abaqus are listed in Table 3, in which the vibration mode of spiral micro-milling tool
is shown in figure 3.
Table3.The first four natural frequencies of micro-milling tool with a variety of structures
First order
Second order
Third order
Fourth order
Spiral 152599 152671 721961 722257
Straight D-type 152459 152672 629400 719846
Triangular prism 151907 152098 716296 717105
Quadrangular prism 150968 150968 711743 711759
Pentagonal prism 151528 151944 713388 715202
Hexagonal prism 149280 149916 704104 706461
Pyramidal D-type 148790 148945 696086 696430
Triangular pyramid 146925 147703 688601 691953
Rectangular pyramid 140792 140792 640088 661821
Pentagonal pyramid 146840 147104 686434 687511
Hexagonal pyramid 145357 147187 679830 687455
Fig. 2 Finite element model of a)First order b)Second order c)Third order d)Fourth order
spiral micro-milling tool Fig.3 The vibration mode of spiral micro-milling tool
Order Frequency
structure
Hun Guo, Zuo Dunwen, Tang Guoxing 41
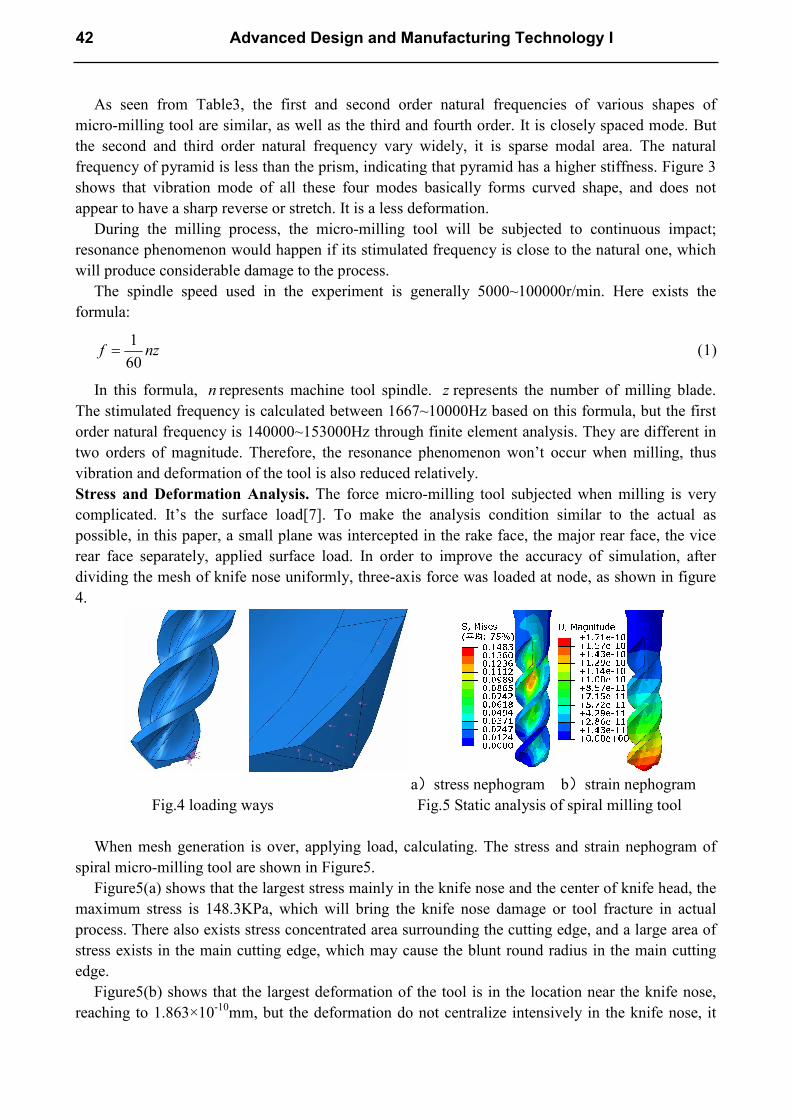
As seen from Table3, the first and second order natural frequencies of various shapes of
micro-milling tool are similar, as well as the third and fourth order. It is closely spaced mode. But
the second and third order natural frequency vary widely, it is sparse modal area. The natural
frequency of pyramid is less than the prism, indicating that pyramid has a higher stiffness. Figure 3
shows that vibration mode of all these four modes basically forms curved shape, and does not
appear to have a sharp reverse or stretch. It is a less deformation.
During the milling process, the micro-milling tool will be subjected to continuous impact;
resonance phenomenon would happen if its stimulated frequency is close to the natural one, which
will produce considerable damage to the process.
The spindle speed used in the experiment is generally 5000~100000r/min. Here exists the
formula:
nzf60
1= (1)
In this formula, n represents machine tool spindle. z represents the number of milling blade.
The stimulated frequency is calculated between 1667~10000Hz based on this formula, but the first
order natural frequency is 140000~153000Hz through finite element analysis. They are different in
two orders of magnitude. Therefore, the resonance phenomenon won’t occur when milling, thus
vibration and deformation of the tool is also reduced relatively.
Stress and Deformation Analysis. The force micro-milling tool subjected when milling is very
complicated. It’s the surface load[7]. To make the analysis condition similar to the actual as
possible, in this paper, a small plane was intercepted in the rake face, the major rear face, the vice
rear face separately, applied surface load. In order to improve the accuracy of simulation, after
dividing the mesh of knife nose uniformly, three-axis force was loaded at node, as shown in figure
4.
a)stress nephogram b)strain nephogram
Fig.4 loading ways Fig.5 Static analysis of spiral milling tool
When mesh generation is over, applying load, calculating. The stress and strain nephogram of
spiral micro-milling tool are shown in Figure5.
Figure5(a) shows that the largest stress mainly in the knife nose and the center of knife head, the
maximum stress is 148.3KPa, which will bring the knife nose damage or tool fracture in actual
process. There also exists stress concentrated area surrounding the cutting edge, and a large area of
stress exists in the main cutting edge, which may cause the blunt round radius in the main cutting
edge.
Figure5(b) shows that the largest deformation of the tool is in the location near the knife nose,
reaching to 1.863×10⁻¹⁰mm, but the deformation do not centralize intensively in the knife nose, it
42 Advanced Design and Manufacturing Technology I
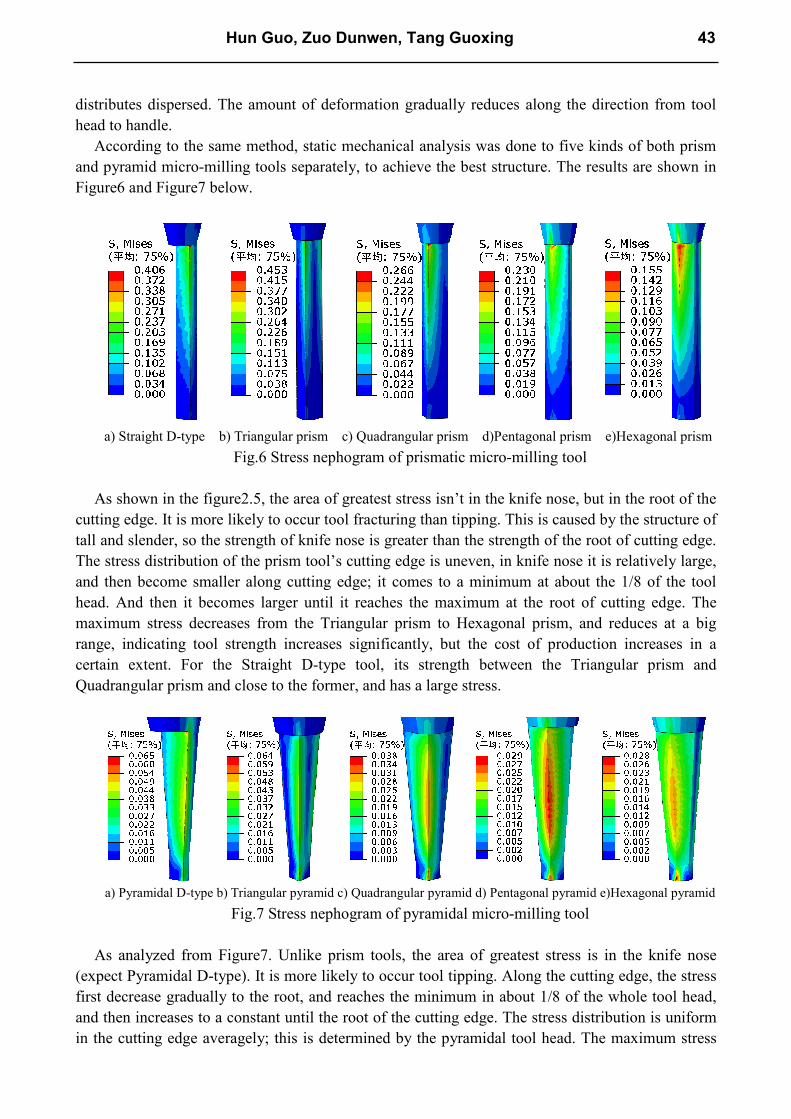
distributes dispersed. The amount of deformation gradually reduces along the direction from tool
head to handle.
According to the same method, static mechanical analysis was done to five kinds of both prism
and pyramid micro-milling tools separately, to achieve the best structure. The results are shown in
Figure6 and Figure7 below.
a) Straight D-type b) Triangular prism c) Quadrangular prism d)Pentagonal prism e)Hexagonal prism
Fig.6 Stress nephogram of prismatic micro-milling tool
As shown in the figure2.5, the area of greatest stress isn’t in the knife nose, but in the root of the
cutting edge. It is more likely to occur tool fracturing than tipping. This is caused by the structure of
tall and slender, so the strength of knife nose is greater than the strength of the root of cutting edge.
The stress distribution of the prism tool’s cutting edge is uneven, in knife nose it is relatively large,
and then become smaller along cutting edge; it comes to a minimum at about the 1/8 of the tool
head. And then it becomes larger until it reaches the maximum at the root of cutting edge. The
maximum stress decreases from the Triangular prism to Hexagonal prism, and reduces at a big
range, indicating tool strength increases significantly, but the cost of production increases in a
certain extent. For the Straight D-type tool, its strength between the Triangular prism and
Quadrangular prism and close to the former, and has a large stress.
a) Pyramidal D-type b) Triangular pyramid c) Quadrangular pyramid d) Pentagonal pyramid e)Hexagonal pyramid
Fig.7 Stress nephogram of pyramidal micro-milling tool
As analyzed from Figure7. Unlike prism tools, the area of greatest stress is in the knife nose
(expect Pyramidal D-type). It is more likely to occur tool tipping. Along the cutting edge, the stress
first decrease gradually to the root, and reaches the minimum in about 1/8 of the whole tool head,
and then increases to a constant until the root of the cutting edge. The stress distribution is uniform
in the cutting edge averagely; this is determined by the pyramidal tool head. The maximum stress
Hun Guo, Zuo Dunwen, Tang Guoxing 43
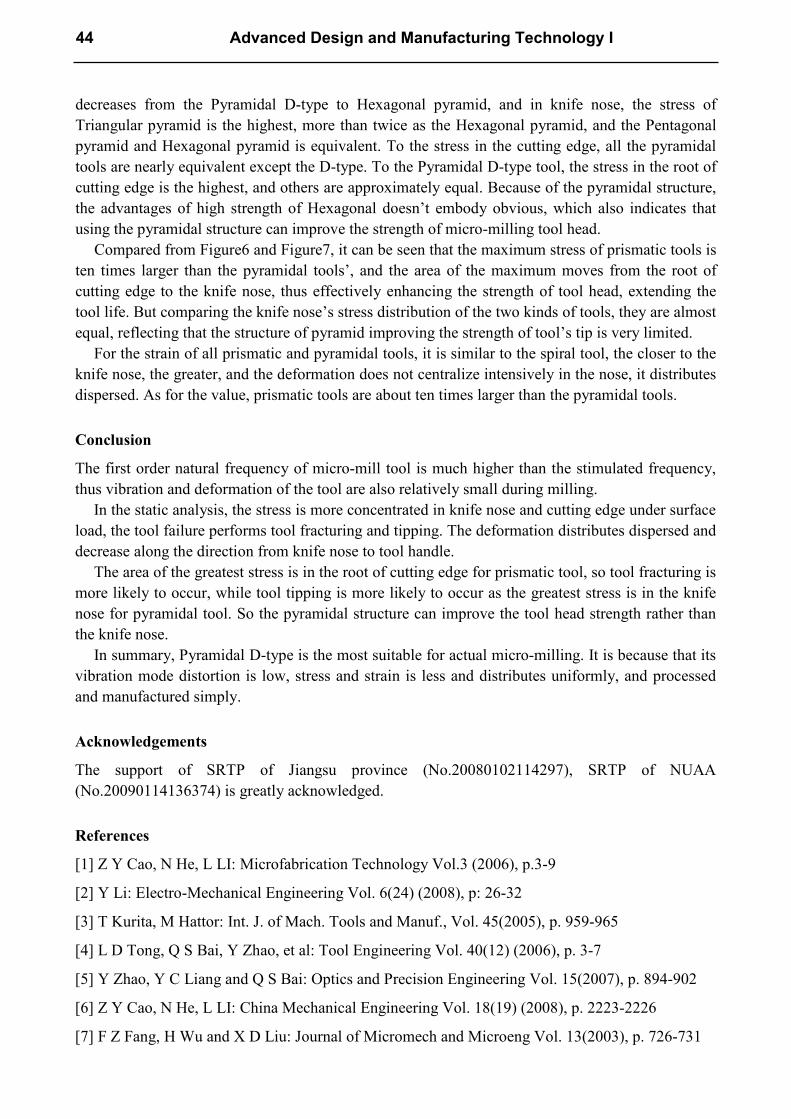
decreases from the Pyramidal D-type to Hexagonal pyramid, and in knife nose, the stress of
Triangular pyramid is the highest, more than twice as the Hexagonal pyramid, and the Pentagonal
pyramid and Hexagonal pyramid is equivalent. To the stress in the cutting edge, all the pyramidal
tools are nearly equivalent except the D-type. To the Pyramidal D-type tool, the stress in the root of
cutting edge is the highest, and others are approximately equal. Because of the pyramidal structure,
the advantages of high strength of Hexagonal doesn’t embody obvious, which also indicates that
using the pyramidal structure can improve the strength of micro-milling tool head.
Compared from Figure6 and Figure7, it can be seen that the maximum stress of prismatic tools is
ten times larger than the pyramidal tools’, and the area of the maximum moves from the root of
cutting edge to the knife nose, thus effectively enhancing the strength of tool head, extending the
tool life. But comparing the knife nose’s stress distribution of the two kinds of tools, they are almost
equal, reflecting that the structure of pyramid improving the strength of tool’s tip is very limited.
For the strain of all prismatic and pyramidal tools, it is similar to the spiral tool, the closer to the
knife nose, the greater, and the deformation does not centralize intensively in the nose, it distributes
dispersed. As for the value, prismatic tools are about ten times larger than the pyramidal tools.
Conclusion
The first order natural frequency of micro-mill tool is much higher than the stimulated frequency,
thus vibration and deformation of the tool are also relatively small during milling.
In the static analysis, the stress is more concentrated in knife nose and cutting edge under surface
load, the tool failure performs tool fracturing and tipping. The deformation distributes dispersed and
decrease along the direction from knife nose to tool handle.
The area of the greatest stress is in the root of cutting edge for prismatic tool, so tool fracturing is
more likely to occur, while tool tipping is more likely to occur as the greatest stress is in the knife
nose for pyramidal tool. So the pyramidal structure can improve the tool head strength rather than
the knife nose.
In summary, Pyramidal D-type is the most suitable for actual micro-milling. It is because that its
vibration mode distortion is low, stress and strain is less and distributes uniformly, and processed
and manufactured simply.
Acknowledgements
The support of SRTP of Jiangsu province (No.20080102114297), SRTP of NUAA
(No.20090114136374) is greatly acknowledged.
References
[1] Z Y Cao, N He, L LI: Microfabrication Technology Vol.3 (2006), p.3-9
[2] Y Li: Electro-Mechanical Engineering Vol. 6(24) (2008), p: 26-32
[3] T Kurita, M Hattor: Int. J. of Mach. Tools and Manuf., Vol. 45(2005), p. 959-965
[4] L D Tong, Q S Bai, Y Zhao, et al: Tool Engineering Vol. 40(12) (2006), p. 3-7
[5] Y Zhao, Y C Liang and Q S Bai: Optics and Precision Engineering Vol. 15(2007), p. 894-902
[6] Z Y Cao, N He, L LI: China Mechanical Engineering Vol. 18(19) (2008), p. 2223-2226
[7] F Z Fang, H Wu and X D Liu: Journal of Micromech and Microeng Vol. 13(2003), p. 726-731
44 Advanced Design and Manufacturing Technology I
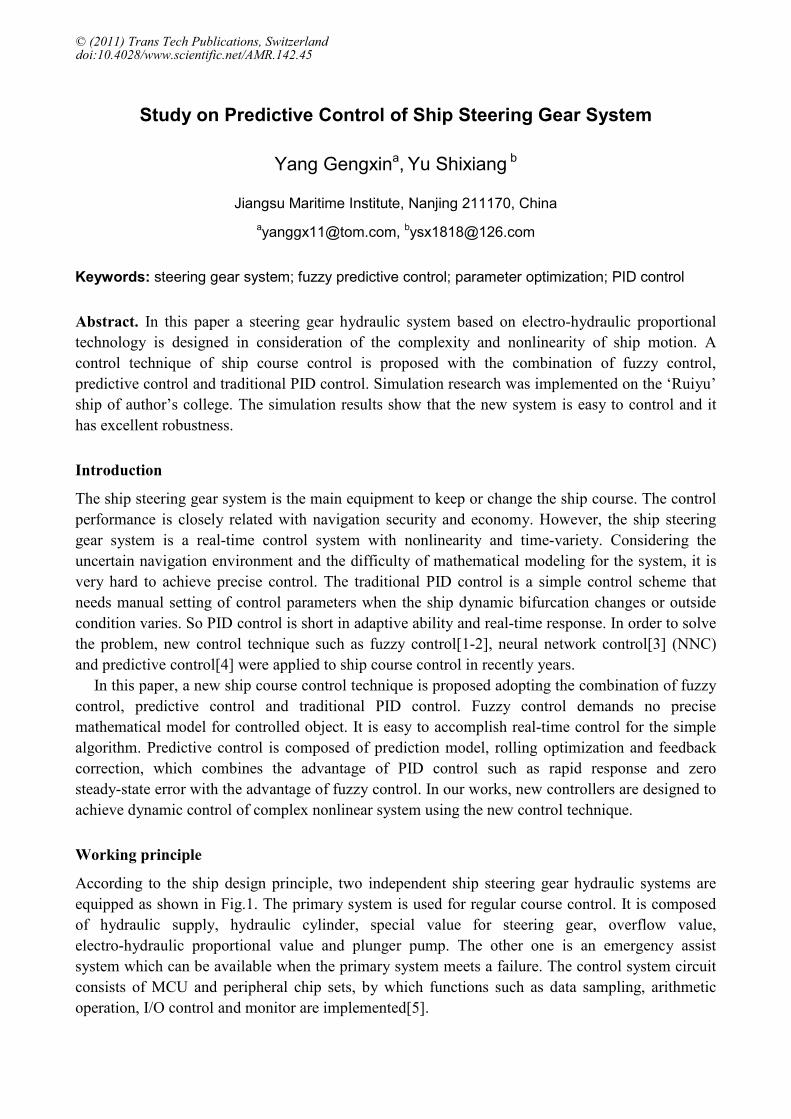
Study on Predictive Control of Ship Steering Gear System
Yang Gengxina, Yu Shixiang b
Jiangsu Maritime Institute, Nanjing 211170, China
[email protected], [email protected]
Keywords: steering gear system; fuzzy predictive control; parameter optimization; PID control
Abstract. In this paper a steering gear hydraulic system based on electro-hydraulic proportional
technology is designed in consideration of the complexity and nonlinearity of ship motion. A
control technique of ship course control is proposed with the combination of fuzzy control,
predictive control and traditional PID control. Simulation research was implemented on the ‘Ruiyu’
ship of author’s college. The simulation results show that the new system is easy to control and it
has excellent robustness.
Introduction
The ship steering gear system is the main equipment to keep or change the ship course. The control
performance is closely related with navigation security and economy. However, the ship steering
gear system is a real-time control system with nonlinearity and time-variety. Considering the
uncertain navigation environment and the difficulty of mathematical modeling for the system, it is
very hard to achieve precise control. The traditional PID control is a simple control scheme that
needs manual setting of control parameters when the ship dynamic bifurcation changes or outside
condition varies. So PID control is short in adaptive ability and real-time response. In order to solve
the problem, new control technique such as fuzzy control[1-2], neural network control[3] (NNC)
and predictive control[4] were applied to ship course control in recently years.
In this paper, a new ship course control technique is proposed adopting the combination of fuzzy
control, predictive control and traditional PID control. Fuzzy control demands no precise
mathematical model for controlled object. It is easy to accomplish real-time control for the simple
algorithm. Predictive control is composed of prediction model, rolling optimization and feedback
correction, which combines the advantage of PID control such as rapid response and zero
steady-state error with the advantage of fuzzy control. In our works, new controllers are designed to
achieve dynamic control of complex nonlinear system using the new control technique.
Working principle
According to the ship design principle, two independent ship steering gear hydraulic systems are
equipped as shown in Fig.1. The primary system is used for regular course control. It is composed
of hydraulic supply, hydraulic cylinder, special value for steering gear, overflow value,
electro-hydraulic proportional value and plunger pump. The other one is an emergency assist
system which can be available when the primary system meets a failure. The control system circuit
consists of MCU and peripheral chip sets, by which functions such as data sampling, arithmetic
operation, I/O control and monitor are implemented[5].
© (2011) Trans Tech Publications, Switzerlanddoi:10.4028/www.scientific.net/AMR.142.45
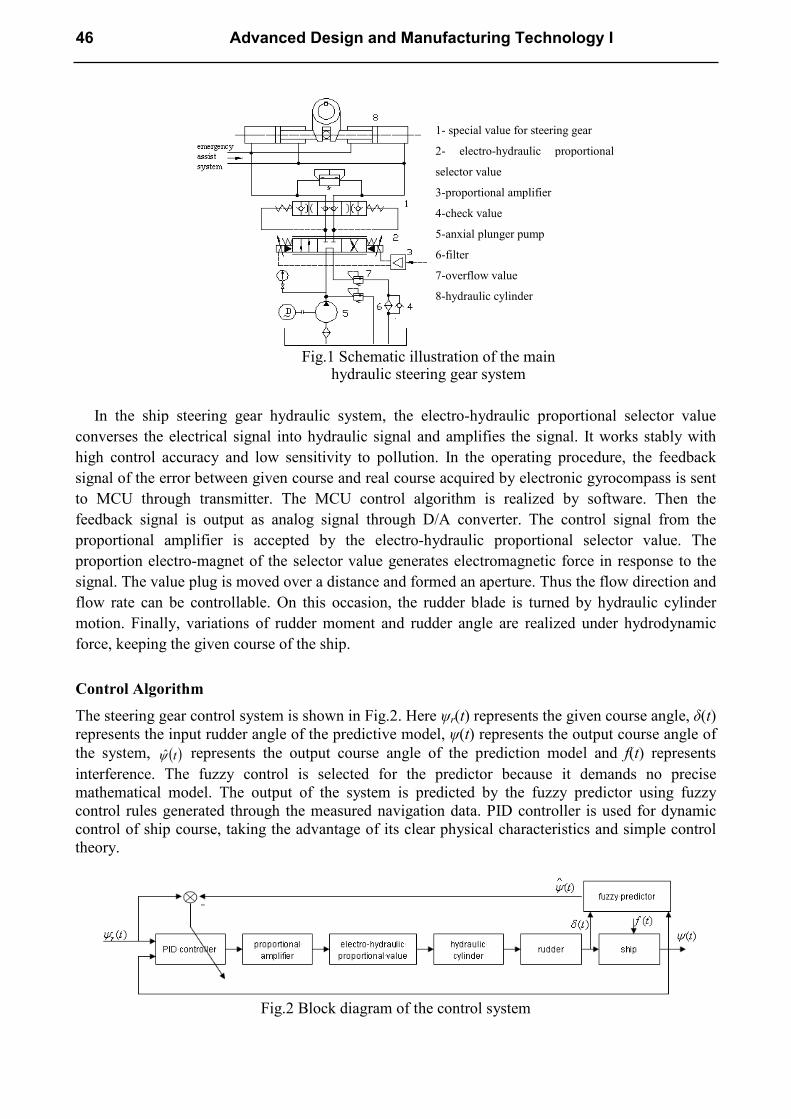
In the ship steering gear hydraulic system, the electro-hydraulic proportional selector value
converses the electrical signal into hydraulic signal and amplifies the signal. It works stably with
high control accuracy and low sensitivity to pollution. In the operating procedure, the feedback
signal of the error between given course and real course acquired by electronic gyrocompass is sent
to MCU through transmitter. The MCU control algorithm is realized by software. Then the
feedback signal is output as analog signal through D/A converter. The control signal from the
proportional amplifier is accepted by the electro-hydraulic proportional selector value. The
proportion electro-magnet of the selector value generates electromagnetic force in response to the
signal. The value plug is moved over a distance and formed an aperture. Thus the flow direction and
flow rate can be controllable. On this occasion, the rudder blade is turned by hydraulic cylinder
motion. Finally, variations of rudder moment and rudder angle are realized under hydrodynamic
force, keeping the given course of the ship.
Control Algorithm
The steering gear control system is shown in Fig.2. Here ψr(t) represents the given course angle, δ(t)
represents the input rudder angle of the predictive model, ψ(t) represents the output course angle of
the system, ( )tψ̂ represents the output course angle of the prediction model and f(t) represents
interference. The fuzzy control is selected for the predictor because it demands no precise
mathematical model. The output of the system is predicted by the fuzzy predictor using fuzzy
control rules generated through the measured navigation data. PID controller is used for dynamic
control of ship course, taking the advantage of its clear physical characteristics and simple control
theory.
Fig.2 Block diagram of the control system
1- special value for steering gear
2- electro-hydraulic proportional
selector value
3-proportional amplifier
4-check value
5-anxial plunger pump
6-filter
7-overflow value
8-hydraulic cylinder
Fig.1 Schematic illustration of the main hydraulic steering gear system
46 Advanced Design and Manufacturing Technology I

Mathematical Model of Ship Course Motion. Considering the complexity and nonlinearity of
ship motion, CARIMA model is selected for ship course control system in the design of ship course
proper-motion rudder.
( ) ( ) ( ) ( ) ( ) ( ) dtzCtzBtzA ++= −−− ξδψ 111 (1)
Where ( ) 2
2
1
1
1 1 −−− ++= zazazA , ( ) 1
10
1 −− += zbbzB ( 00 ≠b ), ( ) 1
1
1 1 −− += zczC , ψ represents
the course angle, δ represents the rudder angle, ξ(t) represents a zero-mean-value white noise with a
variance of σ2 and d represents constant interference.
Fuzzy predictor. (1)Fuzzy prediction model. Suppose that the ship motion object is expressed as
follows:
( ) ( ) ( ) ( ) ( )( )1,;1,1 +−+−=+ mttnttft δδψψψ �� (2)
Where δ and ψ represent the input and output of the ship motion respectively, thus the object can be
expressed by No.L fuzzy rules. The No.l fuzzy rule is written as the following form:
lR :IF 1x (t) islA1,
2x (t) islA2…, mnx + (t )is
l
mnA + , THEN
∧
ψ (t+1) = lψ (3)
Where l
iA represents fuzzy subset, 1x (t) … mnx + (t) represent linguistic variables, lψ represents
real value and l=1, 2…L. For l
iA the following Gaussian function is selected:
Aµ ( ix )=exp[-(σ
cxi − )2] (4)
Where c and σ represent the center and the width of the Gaussian function respectively. System
output can be calculated by weighted average method;
∧
ψ (t+1)=∑=
L
i
lZ1
(t) lψ (t)/∑=
L
l
lz1
(t) (5)
In Eq.5: ∏+
=
=mn
i
lz1
exp( ) ( )
−−
2
σtctxi
As state previously, multi-step output prediction can be carried out in the following way:
∧
ψ ( t+j)= ( ) ( ) ( )∑∑==
−+−+L
l
l
l
L
l
ljtztjtz
11
1/1ψ , j=1,2,…,N (6)
In Eq.6: ( ) ∏+
=
=++mn
i
l jtz1
1 exp( ) ( )
−−+−
21
σtcjtxi
(2) Parameters optimization. For the Gaussian function, mean square error (MSE) is defined as
cost function PIP :
( )2
1
1∑=
−=N
K
KKPIN
P γχ K =1,2,…N (7)
Hun Guo, Zuo Dunwen, Tang Guoxing 47
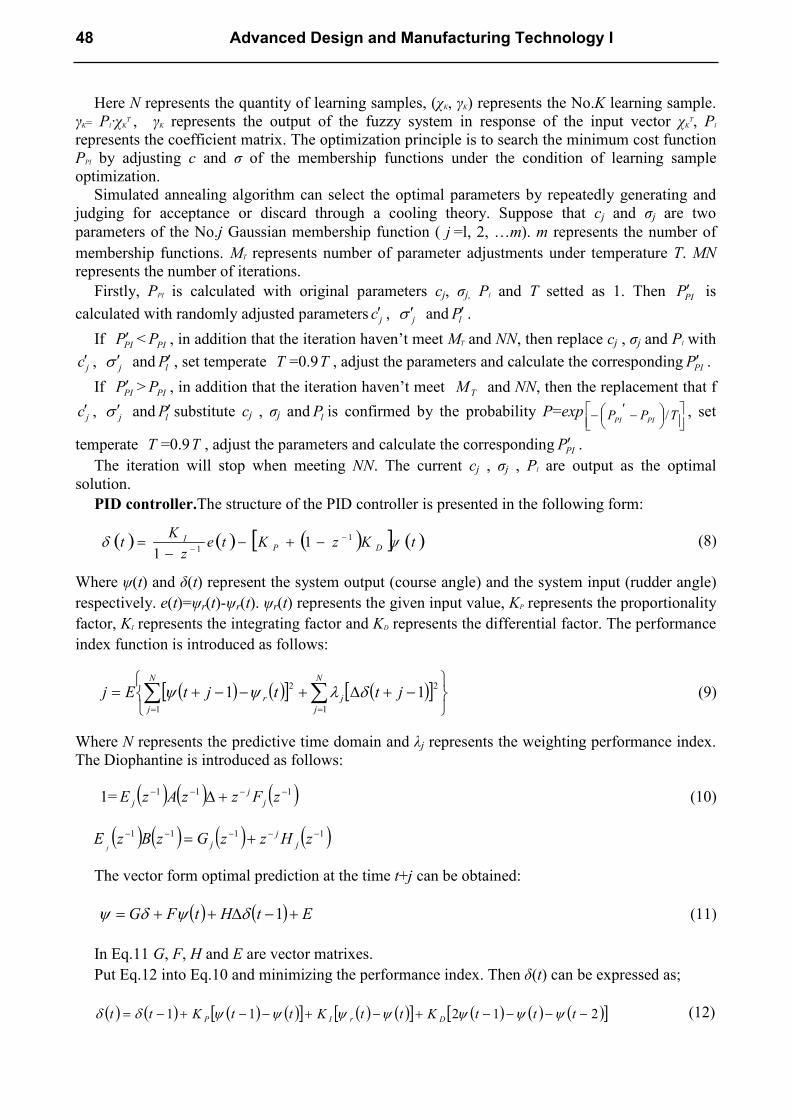
Here N represents the quantity of learning samples, (χK, γK) represents the No.K learning sample.
γK= Pl·χKT , γK represents the output of the fuzzy system in response of the input vector χK
T, Pl
represents the coefficient matrix. The optimization principle is to search the minimum cost function
PPI by adjusting c and σ of the membership functions under the condition of learning sample
optimization.
Simulated annealing algorithm can select the optimal parameters by repeatedly generating and
judging for acceptance or discard through a cooling theory. Suppose that cj and σj are two
parameters of the No.j Gaussian membership function ( j =l, 2, …m). m represents the number of
membership functions. MT represents number of parameter adjustments under temperature T. MN
represents the number of iterations.
Firstly, PPI is calculated with original parameters cj, σj, Pl and T setted as 1. Then PIP′ is calculated with randomly adjusted parameters jc′ , jσ ′ and lP′ .
If PIP′ < PIP , in addition that the iteration haven’t meet MT and NN, then replace cj , σj and Pl with
jc′ , jσ ′ and lP′ , set temperate T =0.9T , adjust the parameters and calculate the corresponding PIP′ .
If PIP′ > PIP , in addition that the iteration haven’t meet TM and NN, then the replacement that f
jc′ , jσ ′ and lP′ substitute cj , σj and lP is confirmed by the probability P=exp
−′− TPP PIPI / , set
temperate T =0.9T , adjust the parameters and calculate the corresponding PIP′ . The iteration will stop when meeting NN. The current cj , σj , Pl are output as the optimal
solution.
PID controller.The structure of the PID controller is presented in the following form:
( ) ( ) ( )[ ] ( )tKzKtez
Kt DP
I ψδ 1
11
1
−−
−+−−
= (8)
Where ψ(t) and δ(t) represent the system output (course angle) and the system input (rudder angle)
respectively. e(t)=ψr(t)-ψr(t). ψr(t) represents the given input value, KP represents the proportionality
factor, KI represents the integrating factor and KD represents the differential factor. The performance
index function is introduced as follows:
( ) ( )[ ] ( )[ ]
−+∆+−−+= ∑ ∑= =
N
j
N
j
jr jttjtEj1 1
2211 δλψψ (9)
Where N represents the predictive time domain and λj represents the weighting performance index.
The Diophantine is introduced as follows:
1= ( ) ( ) ( )111 −−−− +∆ zFzzAzE j
j
j (10)
( ) ( ) ( ) ( )1111 −−−−− += zHzzGzBzE j
j
jj
The vector form optimal prediction at the time t+j can be obtained:
( ) ( ) EtHtFG +−∆++= 1δψδψ (11)
In Eq.11 G, F, H and E are vector matrixes.
Put Eq.12 into Eq.10 and minimizing the performance index. Then δ(t) can be expressed as;
( ) ( ) ( ) ( )[ ] ( ) ( )[ ] ( ) ( ) ( )[ ]21211 −−−−+−+−−+−= tttKttKttKtt DrIP ψψψψψψψδδ (12)
48 Advanced Design and Manufacturing Technology I
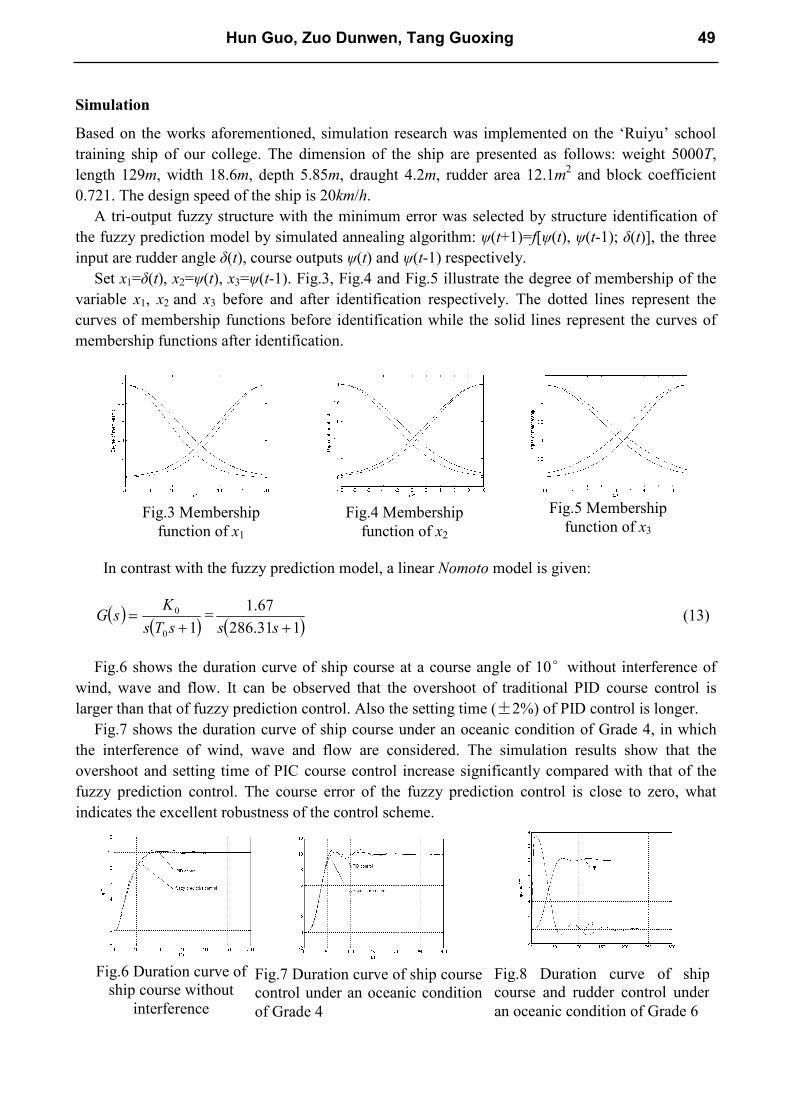
Simulation
Based on the works aforementioned, simulation research was implemented on the ‘Ruiyu’ school
training ship of our college. The dimension of the ship are presented as follows: weight 5000T,
length 129m, width 18.6m, depth 5.85m, draught 4.2m, rudder area 12.1m2 and block coefficient
0.721. The design speed of the ship is 20km/h.
A tri-output fuzzy structure with the minimum error was selected by structure identification of
the fuzzy prediction model by simulated annealing algorithm: ψ(t+1)=f[ψ(t), ψ(t-1); δ(t)], the three
input are rudder angle δ(t), course outputs ψ(t) and ψ(t-1) respectively.
Set x1=δ(t), x2=ψ(t), x3=ψ(t-1). Fig.3, Fig.4 and Fig.5 illustrate the degree of membership of the
variable x1, x2 and x3 before and after identification respectively. The dotted lines represent the
curves of membership functions before identification while the solid lines represent the curves of
membership functions after identification.
In contrast with the fuzzy prediction model, a linear Nomoto model is given:
( )( )10
0
+=
sTs
KsG =
( )131.286
67.1
+ss (13)
Fig.6 shows the duration curve of ship course at a course angle of 10°without interference of
wind, wave and flow. It can be observed that the overshoot of traditional PID course control is
larger than that of fuzzy prediction control. Also the setting time (±2%) of PID control is longer.
Fig.7 shows the duration curve of ship course under an oceanic condition of Grade 4, in which
the interference of wind, wave and flow are considered. The simulation results show that the
overshoot and setting time of PIC course control increase significantly compared with that of the
fuzzy prediction control. The course error of the fuzzy prediction control is close to zero, what
indicates the excellent robustness of the control scheme.
Fig.7 Duration curve of ship course
control under an oceanic condition
of Grade 4
Fig.8 Duration curve of ship
course and rudder control under
an oceanic condition of Grade 6
Fig.3 Membership
function of x1
Fig.4 Membership
function of x2
Fig.5 Membership
function of x3
Fig.6 Duration curve of
ship course without
interference
Hun Guo, Zuo Dunwen, Tang Guoxing 49
Fig.8 shows the duration curve of ship course and rudder angle controlled by fuzzy predication
model under an oceanic condition of Grade 6. In Fig.8 we can find that the course error and rudder
angle error is close to zero. Moreover, the steering frequency is low. Results show that the system is
easy to control.
Conclusion
Considering the disadvantage of traditional ship steering gear system in controlling the complex
nonlinear ship motion, we design a new hydraulic steering gear system based on electro-hydraulic
proportional technology. A control scheme in application of ship course control is proposed, which
adopts the combination of fuzzy control, predictive control and traditional PID control. Simulation
results show that the new system is easy to control and it has excellent robustness. The new steering
gear system is easy to realize, what shows the value of application in navigation.
Reference
[1] Amerongen J.V. in: Proc. IFAC Conference on Digital Computer Applications to Process
Control, The hague, USA(1997), p.101-106
[2] Zhang S.T, Bai S Z.: Journal of System Simulation Vol.21(2009), p.2574-2577
[3] L. Moreira, C. Guedes Soares: Ocean Engineering Vol.30(2003), p.1669-1697
[4] Hu Y.H, Jiang D.D, Jia X.L.: Control and Decision Vol.13(1998), p.156-159
[5] Zang C.D.: Study on intelligent predictive control for ship autopilots (Harbin Engineering
University, 2002)
50 Advanced Design and Manufacturing Technology I
Research of Hydroforming Technology for Special-Shaped Cross-Section Pipe
Hu ShaoGanga
Changzhou Institute of Technology, Changzhou, Jiangsu 213002, China
Keywords: Hydroforming; Special-shaped cross-section pipe; Characteristic analysis; Key technologies
Abstract. The special-shaped cross-section pipe hydroforming technology is a new combinated
technology of hydraulic transmission and material forming, the technology is gradually becoming
a new type advanced manufacturing technology, which can develop lightweight structural parts and
has broad prospects for development. In this paper, hydroforming principle of special-shaped
cross-section pipe, forming characteristic analysis, and forming key equipment design features are
discussed to promote the development of hydroforming technology.
Introduction
Pipe material have a wide range of applications in aviation, aerospace, automotive, and other fields ,
Its forming technology is an important part of manufacturing industry,which plays a vital role for
the development of national economy. With the rapid industrial development, pipe material forming
is demanded towards the more sophisticated, lightweight, integrated and diversified .pipe
hydroforming technology is gradually becoming the new advanced manufacturing technology,
which can develop weight loss, conservation materials, and energy-efficient lightweight structural
parts. Compared to traditional pipe materials forging, casting, stamping and welding of the main
processing technology, which can reduce the tooling cost, shorten production preparation period.
And the special-shaped cross-section pipe hydroforming technology is a new combinated
technology of hydraulic transmission and material forming, currently at the exploratory stage in the
country, the technology has unique advantages and widespread attention because of combinating
two different disciplines’ characteristics of the material forming and the hydraulic transmission.
Hydroforming is a suitable method for small quantity and variety of complex workpieces
forming, which enable the complex structural parts along the axis cross-section changing
components make an overall shape, which use liquid to replace the traditional rigid die or punch,
make pipe hydroform laminating surface of the die or punch under high pressure liquid acting. The
technology uses a liquid medium to replace the die or punch to deliver loader, in order to achieve pipe special
shaped cross-section shape, which not only reduces the mold cost and shorten production
preparation cycle; in the high pressure liquid acting, pipe only happen a non-cutting metal volume
plastic transfer, significantly reducing the consumption of raw materials; in hydraulic forming,
metal materials more dense grain structure, the metal flow line will not be cut off. Due to the
work-hardening characteristics of cold deformation of metal materials, pipe hydroforming greatly
enhanced strength; Hydro-forming can form thin-walled tubes of complex shaped cross-section,
reduce the intermediate processes, which is particularly suitable for an angioplasty procedure with complex
special-shaped cross-section pipe parts, and even the pipe can not be formed by traditional
manufacturing process; through controlling the liquid medium of the hydraulic drive system , it is
easy to implement the forming process requirements of parts performance ; mold has a universal,
different materials and different pipe wall thickness, can be a mold-forming. To sum up, pipe
hydroforming technology shaped cross section forming technology have other irreplaceable and unique
advantages and broad prospects for development ,which can be applied for aviation, aerospace, construction,
transportation, communications and other fields.
© (2011) Trans Tech Publications, Switzerlanddoi:10.4028/www.scientific.net/AMR.142.51
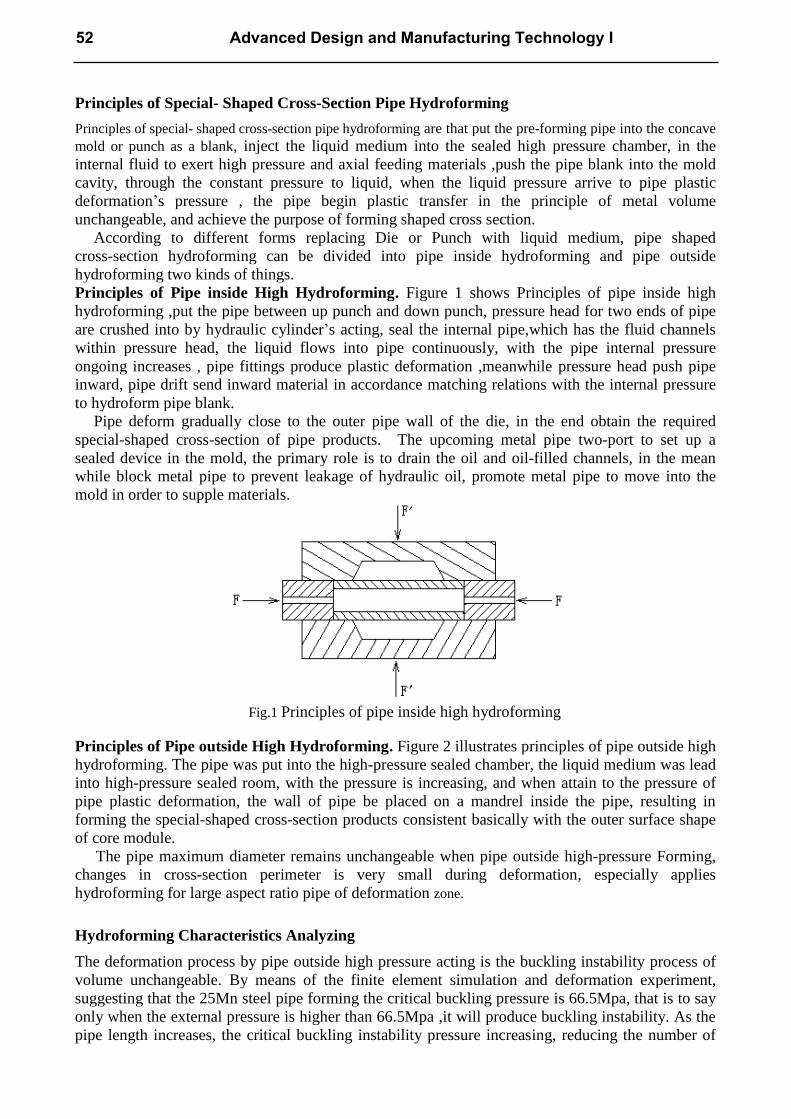
Principles of Special- Shaped Cross-Section Pipe Hydroforming
Principles of special- shaped cross-section pipe hydroforming are that put the pre-forming pipe into the concave
mold or punch as a blank, inject the liquid medium into the sealed high pressure chamber, in the
internal fluid to exert high pressure and axial feeding materials ,push the pipe blank into the mold
cavity, through the constant pressure to liquid, when the liquid pressure arrive to pipe plastic
deformation’s pressure , the pipe begin plastic transfer in the principle of metal volume
unchangeable, and achieve the purpose of forming shaped cross section.
According to different forms replacing Die or Punch with liquid medium, pipe shaped
cross-section hydroforming can be divided into pipe inside hydroforming and pipe outside
hydroforming two kinds of things.
Principles of Pipe inside High Hydroforming. Figure 1 shows Principles of pipe inside high
hydroforming ,put the pipe between up punch and down punch, pressure head for two ends of pipe
are crushed into by hydraulic cylinder’s acting, seal the internal pipe,which has the fluid channels
within pressure head, the liquid flows into pipe continuously, with the pipe internal pressure
ongoing increases , pipe fittings produce plastic deformation ,meanwhile pressure head push pipe
inward, pipe drift send inward material in accordance matching relations with the internal pressure
to hydroform pipe blank.
Pipe deform gradually close to the outer pipe wall of the die, in the end obtain the required
special-shaped cross-section of pipe products. The upcoming metal pipe two-port to set up a
sealed device in the mold, the primary role is to drain the oil and oil-filled channels, in the mean
while block metal pipe to prevent leakage of hydraulic oil, promote metal pipe to move into the
mold in order to supple materials.
Fig.1 Principles of pipe inside high hydroforming
Principles of Pipe outside High Hydroforming. Figure 2 illustrates principles of pipe outside high
hydroforming. The pipe was put into the high-pressure sealed chamber, the liquid medium was lead
into high-pressure sealed room, with the pressure is increasing, and when attain to the pressure of
pipe plastic deformation, the wall of pipe be placed on a mandrel inside the pipe, resulting in
forming the special-shaped cross-section products consistent basically with the outer surface shape
of core module.
The pipe maximum diameter remains unchangeable when pipe outside high-pressure Forming,
changes in cross-section perimeter is very small during deformation, especially applies
hydroforming for large aspect ratio pipe of deformation zone.
Hydroforming Characteristics Analyzing
The deformation process by pipe outside high pressure acting is the buckling instability process of
volume unchangeable. By means of the finite element simulation and deformation experiment,
suggesting that the 25Mn steel pipe forming the critical buckling pressure is 66.5Mpa, that is to say
only when the external pressure is higher than 66.5Mpa ,it will produce buckling instability. As the
pipe length increases, the critical buckling instability pressure increasing, reducing the number of
52 Advanced Design and Manufacturing Technology I
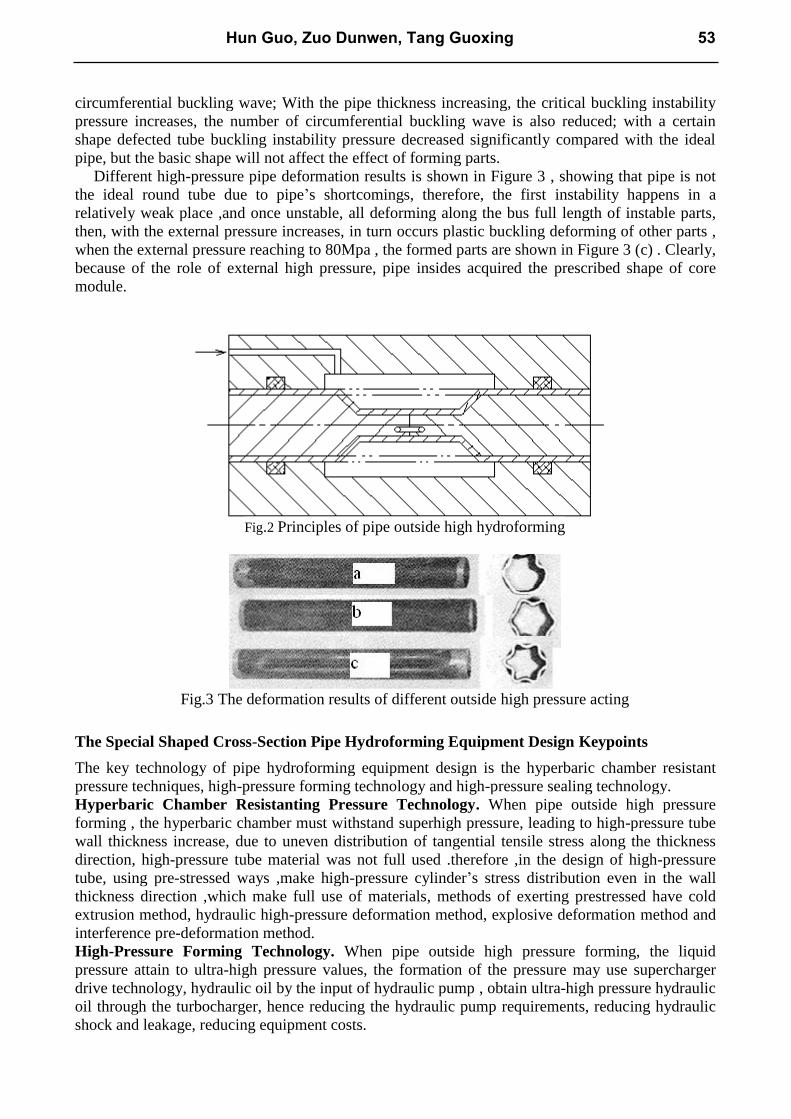
circumferential buckling wave; With the pipe thickness increasing, the critical buckling instability
pressure increases, the number of circumferential buckling wave is also reduced; with a certain
shape defected tube buckling instability pressure decreased significantly compared with the ideal
pipe, but the basic shape will not affect the effect of forming parts.
Different high-pressure pipe deformation results is shown in Figure 3 , showing that pipe is not
the ideal round tube due to pipe’s shortcomings, therefore, the first instability happens in a
relatively weak place ,and once unstable, all deforming along the bus full length of instable parts,
then, with the external pressure increases, in turn occurs plastic buckling deforming of other parts ,
when the external pressure reaching to 80Mpa , the formed parts are shown in Figure 3 (c) . Clearly,
because of the role of external high pressure, pipe insides acquired the prescribed shape of core
module.
Fig.2 Principles of pipe outside high hydroforming
Fig.3 The deformation results of different outside high pressure acting
The Special Shaped Cross-Section Pipe Hydroforming Equipment Design Keypoints
The key technology of pipe hydroforming equipment design is the hyperbaric chamber resistant
pressure techniques, high-pressure forming technology and high-pressure sealing technology.
Hyperbaric Chamber Resistanting Pressure Technology. When pipe outside high pressure
forming , the hyperbaric chamber must withstand superhigh pressure, leading to high-pressure tube
wall thickness increase, due to uneven distribution of tangential tensile stress along the thickness
direction, high-pressure tube material was not full used .therefore ,in the design of high-pressure
tube, using pre-stressed ways ,make high-pressure cylinder’s stress distribution even in the wall
thickness direction ,which make full use of materials, methods of exerting prestressed have cold
extrusion method, hydraulic high-pressure deformation method, explosive deformation method and
interference pre-deformation method.
High-Pressure Forming Technology. When pipe outside high pressure forming, the liquid
pressure attain to ultra-high pressure values, the formation of the pressure may use supercharger
drive technology, hydraulic oil by the input of hydraulic pump , obtain ultra-high pressure hydraulic
oil through the turbocharger, hence reducing the hydraulic pump requirements, reducing hydraulic
shock and leakage, reducing equipment costs.
Hun Guo, Zuo Dunwen, Tang Guoxing 53
High Pressure Sealing Technology. Forming outside high-pressure pipe is conducted in a sealed
high-pressure chamber; sealing for high-pressure chamber is the key points of forming ability.
Applies double O-ring and collar sealing in the place where guide sleeve and a high-pressure
chamber contacts, while the guide sleeve and the pipe outside contact surface using dust ring,
U-ring, plus circlips and stepseal modular seal. Through experiment the good results have been
achieved.
Conclusion
Hydroforming is a relatively new process, using high pressure oil to make sheet metal pipe
materials yield complex geometric deformation, which can replace the traditional stamping and
welding processes, pipe shaped cross-section is a new development of material hydroforming
technology, hydroforming have a mold simple, short cycle, low cost, product quality good, shape,
size precision high features, with broad prospects for development. In the process of pipe
hydroforming, the perimeter changes in cross-section is very small, especially applies for large
aspect ratio hollow pieces of deformation zone. The pipe under high pressure acting, there is a
critical buckling pressure, once the external pressure slightly higher than the critical buckling
pressure, deformation start from a pipe somewhere weaker, and as the pressure increases, and
gradually develope down to next place, ultimately obtains shaped cross-section pipe. The thickness
distribution of formed parts is more uniform, according to testing; the maximum ring amount of
thinning is only 5.9%, the vertical thickness distribution uniform, so no obvious thickening and
thinning. In the special-shaped cross section tube hydroforming equipment designing, it should
handle three key technical problems of the high-pressure chamber resistance pressure,
hydroforming and high pressure sealing.
References
[1] Lin Junfeng, etc: Machine Tool & Hydraulics (2009) No.3.
[2] Liu Gang: Journal of Harbin Institute of Technology Vol. 38 (2006) No.2.
[3] Wu Xiao Yu: Manufacturing Engineering Design (2008) No.1.
[4] Zhang Hainan, etc: Hydraulic and Pneumatic (1999) No.3.
54 Advanced Design and Manufacturing Technology I
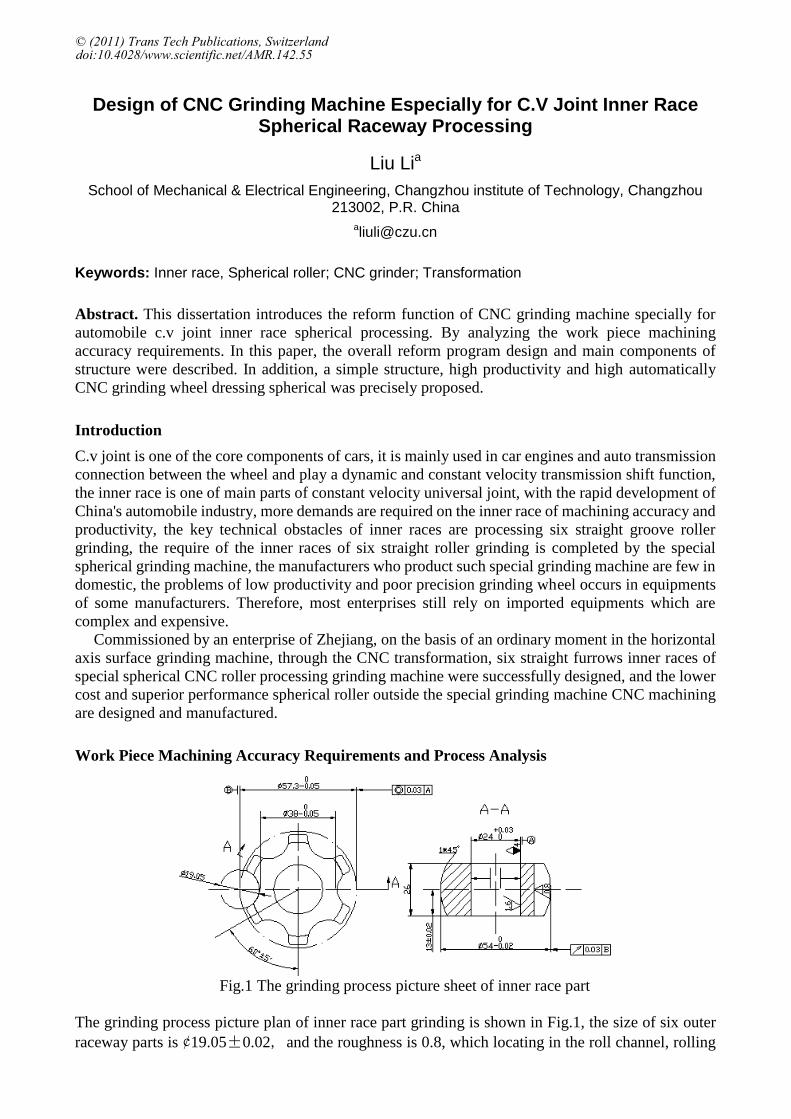
Design of CNC Grinding Machine Especially for C.V Joint Inner Race Spherical Raceway Processing
Liu Lia
School of Mechanical & Electrical Engineering, Changzhou institute of Technology, Changzhou 213002, P.R. China
Keywords: Inner race, Spherical roller; CNC grinder; Transformation
Abstract. This dissertation introduces the reform function of CNC grinding machine specially for
automobile c.v joint inner race spherical processing. By analyzing the work piece machining
accuracy requirements. In this paper, the overall reform program design and main components of
structure were described. In addition, a simple structure, high productivity and high automatically
CNC grinding wheel dressing spherical was precisely proposed.
Introduction
C.v joint is one of the core components of cars, it is mainly used in car engines and auto transmission
connection between the wheel and play a dynamic and constant velocity transmission shift function,
the inner race is one of main parts of constant velocity universal joint, with the rapid development of
China's automobile industry, more demands are required on the inner race of machining accuracy and
productivity, the key technical obstacles of inner races are processing six straight groove roller
grinding, the require of the inner races of six straight roller grinding is completed by the special
spherical grinding machine, the manufacturers who product such special grinding machine are few in
domestic, the problems of low productivity and poor precision grinding wheel occurs in equipments
of some manufacturers. Therefore, most enterprises still rely on imported equipments which are
complex and expensive.
Commissioned by an enterprise of Zhejiang, on the basis of an ordinary moment in the horizontal
axis surface grinding machine, through the CNC transformation, six straight furrows inner races of
special spherical CNC roller processing grinding machine were successfully designed, and the lower
cost and superior performance spherical roller outside the special grinding machine CNC machining
are designed and manufactured.
Work Piece Machining Accuracy Requirements and Process Analysis
Fig.1 The grinding process picture sheet of inner race part
The grinding process picture plan of inner race part grinding is shown in Fig.1, the size of six outer
raceway parts is ¢19.05±0.02, and the roughness is 0.8, which locating in the roll channel, rolling
© (2011) Trans Tech Publications, Switzerlanddoi:10.4028/www.scientific.net/AMR.142.55
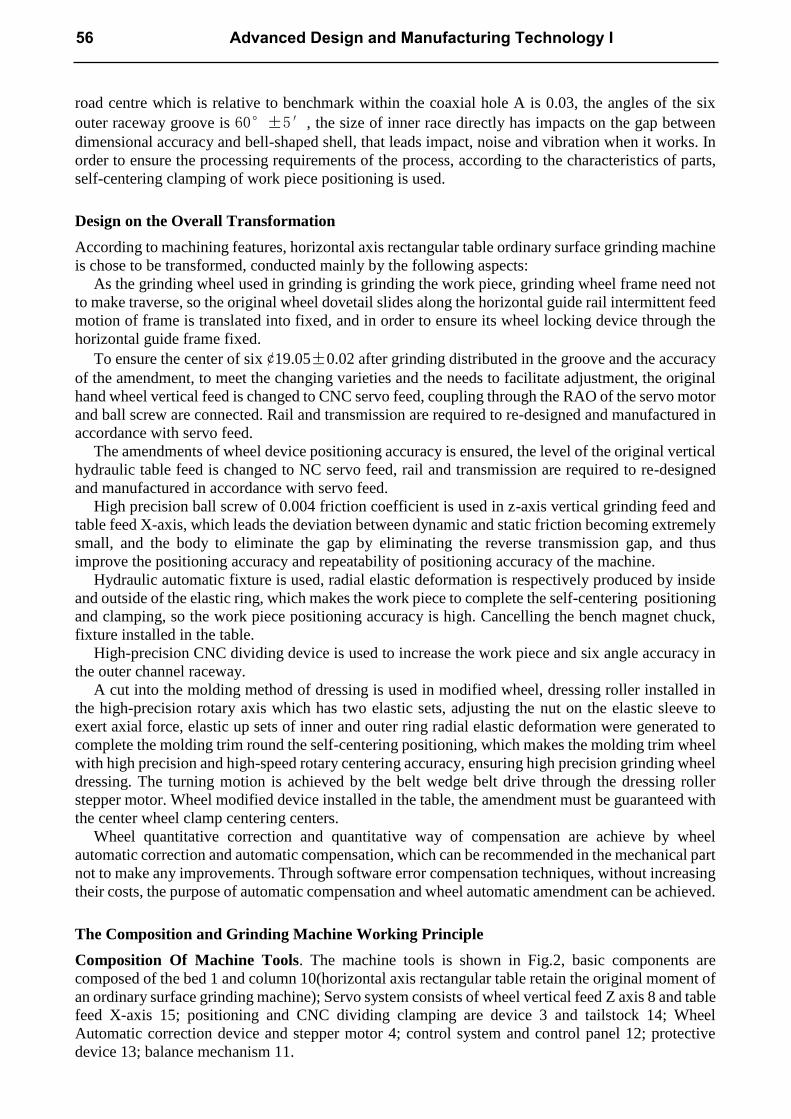
road centre which is relative to benchmark within the coaxial hole A is 0.03, the angles of the six
outer raceway groove is 60°±5′, the size of inner race directly has impacts on the gap between
dimensional accuracy and bell-shaped shell, that leads impact, noise and vibration when it works. In
order to ensure the processing requirements of the process, according to the characteristics of parts,
self-centering clamping of work piece positioning is used.
Design on the Overall Transformation
According to machining features, horizontal axis rectangular table ordinary surface grinding machine
is chose to be transformed, conducted mainly by the following aspects:
As the grinding wheel used in grinding is grinding the work piece, grinding wheel frame need not
to make traverse, so the original wheel dovetail slides along the horizontal guide rail intermittent feed
motion of frame is translated into fixed, and in order to ensure its wheel locking device through the
horizontal guide frame fixed.
To ensure the center of six ¢19.05±0.02 after grinding distributed in the groove and the accuracy
of the amendment, to meet the changing varieties and the needs to facilitate adjustment, the original
hand wheel vertical feed is changed to CNC servo feed, coupling through the RAO of the servo motor
and ball screw are connected. Rail and transmission are required to re-designed and manufactured in
accordance with servo feed.
The amendments of wheel device positioning accuracy is ensured, the level of the original vertical
hydraulic table feed is changed to NC servo feed, rail and transmission are required to re-designed
and manufactured in accordance with servo feed.
High precision ball screw of 0.004 friction coefficient is used in z-axis vertical grinding feed and
table feed X-axis, which leads the deviation between dynamic and static friction becoming extremely
small, and the body to eliminate the gap by eliminating the reverse transmission gap, and thus
improve the positioning accuracy and repeatability of positioning accuracy of the machine.
Hydraulic automatic fixture is used, radial elastic deformation is respectively produced by inside
and outside of the elastic ring, which makes the work piece to complete the self-centering positioning
and clamping, so the work piece positioning accuracy is high. Cancelling the bench magnet chuck,
fixture installed in the table.
High-precision CNC dividing device is used to increase the work piece and six angle accuracy in
the outer channel raceway.
A cut into the molding method of dressing is used in modified wheel, dressing roller installed in
the high-precision rotary axis which has two elastic sets, adjusting the nut on the elastic sleeve to
exert axial force, elastic up sets of inner and outer ring radial elastic deformation were generated to
complete the molding trim round the self-centering positioning, which makes the molding trim wheel
with high precision and high-speed rotary centering accuracy, ensuring high precision grinding wheel
dressing. The turning motion is achieved by the belt wedge belt drive through the dressing roller
stepper motor. Wheel modified device installed in the table, the amendment must be guaranteed with
the center wheel clamp centering centers.
Wheel quantitative correction and quantitative way of compensation are achieve by wheel
automatic correction and automatic compensation, which can be recommended in the mechanical part
not to make any improvements. Through software error compensation techniques, without increasing
their costs, the purpose of automatic compensation and wheel automatic amendment can be achieved.
The Composition and Grinding Machine Working Principle
Composition Of Machine Tools. The machine tools is shown in Fig.2, basic components are
composed of the bed 1 and column 10(horizontal axis rectangular table retain the original moment of
an ordinary surface grinding machine); Servo system consists of wheel vertical feed Z axis 8 and table
feed X-axis 15; positioning and CNC dividing clamping are device 3 and tailstock 14; Wheel
Automatic correction device and stepper motor 4; control system and control panel 12; protective
device 13; balance mechanism 11.
56 Advanced Design and Manufacturing Technology I
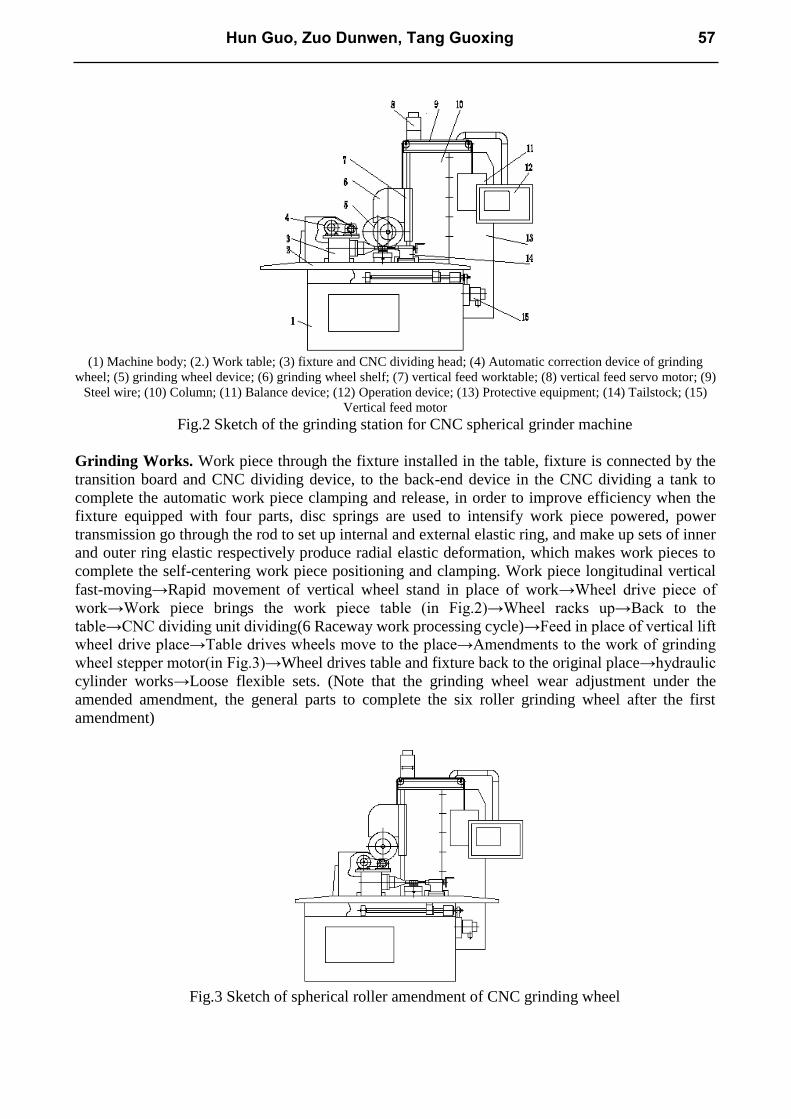
(1) Machine body; (2.) Work table; (3) fixture and CNC dividing head; (4) Automatic correction device of grinding
wheel; (5) grinding wheel device; (6) grinding wheel shelf; (7) vertical feed worktable; (8) vertical feed servo motor; (9)
Steel wire; (10) Column; (11) Balance device; (12) Operation device; (13) Protective equipment; (14) Tailstock; (15)
Vertical feed motor
Fig.2 Sketch of the grinding station for CNC spherical grinder machine
Grinding Works. Work piece through the fixture installed in the table, fixture is connected by the
transition board and CNC dividing device, to the back-end device in the CNC dividing a tank to
complete the automatic work piece clamping and release, in order to improve efficiency when the
fixture equipped with four parts, disc springs are used to intensify work piece powered, power
transmission go through the rod to set up internal and external elastic ring, and make up sets of inner
and outer ring elastic respectively produce radial elastic deformation, which makes work pieces to
complete the self-centering work piece positioning and clamping. Work piece longitudinal vertical
fast-moving→Rapid movement of vertical wheel stand in place of work→Wheel drive piece of
work→Work piece brings the work piece table (in Fig.2)→Wheel racks up→Back to the
table→CNC dividing unit dividing(6 Raceway work processing cycle)→Feed in place of vertical lift wheel drive place→Table drives wheels move to the place→Amendments to the work of grinding
wheel stepper motor(in Fig.3)→Wheel drives table and fixture back to the original place→hydraulic
cylinder works→Loose flexible sets. (Note that the grinding wheel wear adjustment under the
amended amendment, the general parts to complete the six roller grinding wheel after the first
amendment)
Fig.3 Sketch of spherical roller amendment of CNC grinding wheel
Hun Guo, Zuo Dunwen, Tang Guoxing 57
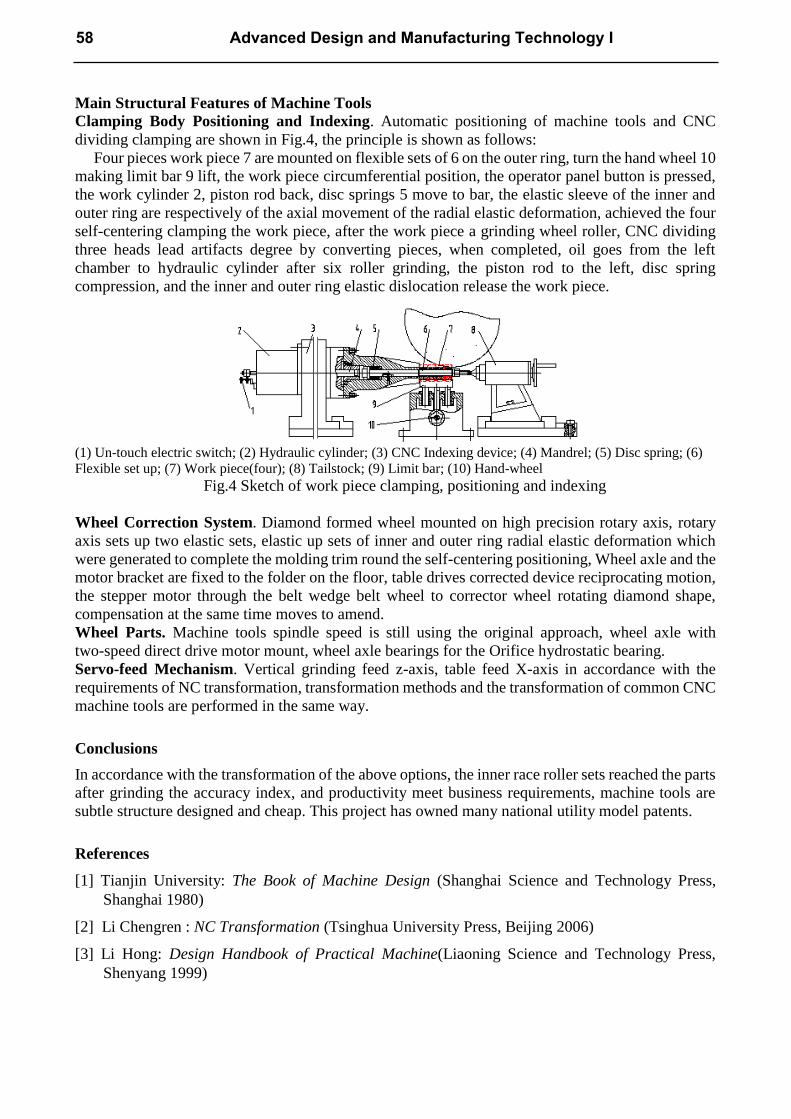
Main Structural Features of Machine Tools
Clamping Body Positioning and Indexing. Automatic positioning of machine tools and CNC
dividing clamping are shown in Fig.4, the principle is shown as follows:
Four pieces work piece 7 are mounted on flexible sets of 6 on the outer ring, turn the hand wheel 10
making limit bar 9 lift, the work piece circumferential position, the operator panel button is pressed,
the work cylinder 2, piston rod back, disc springs 5 move to bar, the elastic sleeve of the inner and
outer ring are respectively of the axial movement of the radial elastic deformation, achieved the four
self-centering clamping the work piece, after the work piece a grinding wheel roller, CNC dividing
three heads lead artifacts degree by converting pieces, when completed, oil goes from the left
chamber to hydraulic cylinder after six roller grinding, the piston rod to the left, disc spring
compression, and the inner and outer ring elastic dislocation release the work piece.
(1) Un-touch electric switch; (2) Hydraulic cylinder; (3) CNC Indexing device; (4) Mandrel; (5) Disc spring; (6)
Flexible set up; (7) Work piece(four); (8) Tailstock; (9) Limit bar; (10) Hand-wheel
Fig.4 Sketch of work piece clamping, positioning and indexing
Wheel Correction System. Diamond formed wheel mounted on high precision rotary axis, rotary
axis sets up two elastic sets, elastic up sets of inner and outer ring radial elastic deformation which
were generated to complete the molding trim round the self-centering positioning, Wheel axle and the
motor bracket are fixed to the folder on the floor, table drives corrected device reciprocating motion,
the stepper motor through the belt wedge belt wheel to corrector wheel rotating diamond shape,
compensation at the same time moves to amend.
Wheel Parts. Machine tools spindle speed is still using the original approach, wheel axle with
two-speed direct drive motor mount, wheel axle bearings for the Orifice hydrostatic bearing.
Servo-feed Mechanism. Vertical grinding feed z-axis, table feed X-axis in accordance with the
requirements of NC transformation, transformation methods and the transformation of common CNC
machine tools are performed in the same way.
Conclusions
In accordance with the transformation of the above options, the inner race roller sets reached the parts
after grinding the accuracy index, and productivity meet business requirements, machine tools are
subtle structure designed and cheap. This project has owned many national utility model patents.
References
[1] Tianjin University: The Book of Machine Design (Shanghai Science and Technology Press,
Shanghai 1980)
[2] Li Chengren : NC Transformation (Tsinghua University Press, Beijing 2006)
[3] Li Hong: Design Handbook of Practical Machine(Liaoning Science and Technology Press,
Shenyang 1999)
58 Advanced Design and Manufacturing Technology I

Passivation of the Fe-Based Bulk Amorphous Alloy in Hcl Solution
H.X. Xiao1, a, J. P. Zhang2, b
1School of Mechanical & Elec. Eng., Changzhou Institute of Technology, Changzhou 213002, China
2Harbin Boiler and Pressure Vessel Inspection and Research Institute, Harbin 150076, China
[email protected], [email protected]
Keywords: Fe-based bulk amorphous alloy; HCl solution; Full immersion test; Passivation
Abstract. The corrosion behavior of the Fe60Co8Zr10Mo5W2B15 bulk amorphous alloy in 2 mol·L-1
HCl solution was investigated using full immersion test. The results indicated that the
Fe60Co8Zr10Mo5W2B15 bulk amorphous alloy was at the passivation condition in the 2 mol·L-1
HCl
solution, which had the strong anticorrosive ability. X-Ray Photoelectron Spectroscopy (XPS)
spectrum of the composition and structural feature of the test sample surface film after passivation
indicated finally, that the passivation of the bulk amorphous alloy is primary due to the oxide
compounds such as ZrO2 and so on formed on the bulk amorphous alloy surface in the HCl solution.
Introduction
It is reported [1], the first discovered amorphous alloy which has anti-corrosive, can form the surface
passivation film is the Fe-Cr-P-C, i.e. the Fe-based amorphous alloy. The XPS examination indicated
that main composition of the surface passivation film was made up of water and chromic hydroxide
[CrOX(OH)3-2X, n·H2O], it basically accorded with the Cr crystalline state alloy. Later research
further indicated that Cr is the most effective added element that can improve the anticorrosion
performance of the amorphous alloy. It is even thought that the Fe-based amorphous alloy must be
added Cr in order to hold high anticorrosion ability [2, 3]. In view of such learning process, foretime, the investigation of anticorrosion performance was carried on the amorphous alloy that included the
Cr element whether the Fe-based amorphous alloy ribbon, amorphous thin film or the Fe-based bulk
amorphous alloy [4-8]. In this study, using full immersion test, the corrosion behavior of
Fe-Co-Zr-Mo-W-B, one of the Fe-based bulk amorphous alloy which has the greatly amorphous
forms ability and the good mechanical properties, and is not including Cr element is investigated in
HCl solution. The anticorrosion mechanism of this Fe-based bulk amorphous alloy in the
hydrochloric acid solution is analyzed.
Testing Method and Sample
Using full immersion test, the anticorrosion performance of the experimental material was weighed
up the unit area's weightlessness. The composition and structure of the test amorphous sample surface
film were identified and characterized by PHI-5702 X-Ray Photoelectron Spectroscopy (XPS) (the
test condition: Al target, power 250 W, voltage 14 KV, the electron energy 29.35 eV, vacuum degree
1.0×10⁻⁹
torr). The experimental material are the industrial pure raw materials Fe60Co8Zr10Mo5W2B15
(atomic fraction) Fe-based bulk amorphous alloys were fabrication by means of inductive melting
and copper mold suction casting as described in literature [9] and 2 mol·L-1
HCl solution prepared
distilled water. The longest immersion time of the test specimen is actually 240 h, and the experiment
temperature is 8 ℃.
Test Results
Figure 1 is the unit area’s weightlessness and the immersion time relational curve of the
Fe60Co8Zr10Mo5W2B15 bulk amorphous alloy sample marinated in the 2 mol·L-1
HCl solution. The
figure shows, in the beginning of the experiment when the corrosion of the bulk amorphous alloy
© (2011) Trans Tech Publications, Switzerlanddoi:10.4028/www.scientific.net/AMR.142.59
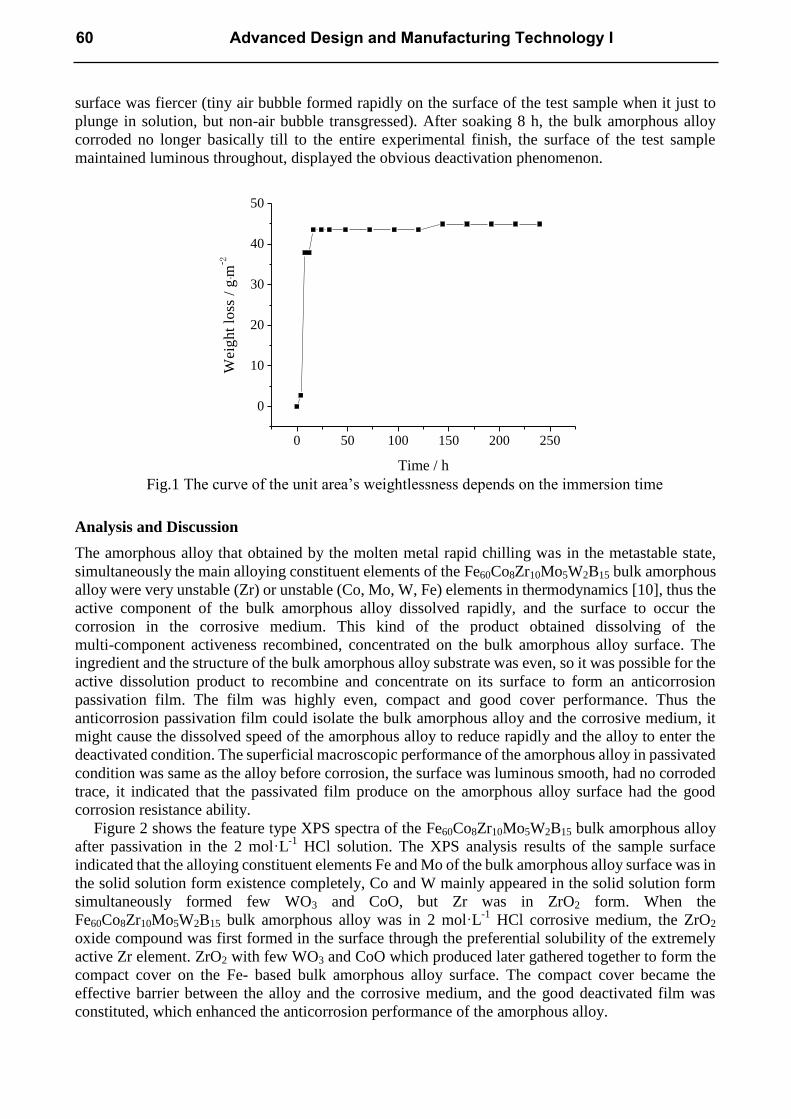
surface was fiercer (tiny air bubble formed rapidly on the surface of the test sample when it just to
plunge in solution, but non-air bubble transgressed). After soaking 8 h, the bulk amorphous alloy
corroded no longer basically till to the entire experimental finish, the surface of the test sample
maintained luminous throughout, displayed the obvious deactivation phenomenon.
0 50 100 150 200 250
0
10
20
30
40
50
Weig
ht
loss
/ g
·m- 2
Time / h Fig.1 The curve of the unit area’s weightlessness depends on the immersion time
Analysis and Discussion
The amorphous alloy that obtained by the molten metal rapid chilling was in the metastable state,
simultaneously the main alloying constituent elements of the Fe60Co8Zr10Mo5W2B15 bulk amorphous
alloy were very unstable (Zr) or unstable (Co, Mo, W, Fe) elements in thermodynamics [10], thus the
active component of the bulk amorphous alloy dissolved rapidly, and the surface to occur the
corrosion in the corrosive medium. This kind of the product obtained dissolving of the
multi-component activeness recombined, concentrated on the bulk amorphous alloy surface. The ingredient and the structure of the bulk amorphous alloy substrate was even, so it was possible for the
active dissolution product to recombine and concentrate on its surface to form an anticorrosion
passivation film. The film was highly even, compact and good cover performance. Thus the
anticorrosion passivation film could isolate the bulk amorphous alloy and the corrosive medium, it
might cause the dissolved speed of the amorphous alloy to reduce rapidly and the alloy to enter the
deactivated condition. The superficial macroscopic performance of the amorphous alloy in passivated
condition was same as the alloy before corrosion, the surface was luminous smooth, had no corroded
trace, it indicated that the passivated film produce on the amorphous alloy surface had the good
corrosion resistance ability.
Figure 2 shows the feature type XPS spectra of the Fe60Co8Zr10Mo5W2B15 bulk amorphous alloy
after passivation in the 2 mol·L-1
HCl solution. The XPS analysis results of the sample surface
indicated that the alloying constituent elements Fe and Mo of the bulk amorphous alloy surface was in
the solid solution form existence completely, Co and W mainly appeared in the solid solution form
simultaneously formed few WO3 and CoO, but Zr was in ZrO2 form. When the
Fe60Co8Zr10Mo5W2B15 bulk amorphous alloy was in 2 mol·L-1
HCl corrosive medium, the ZrO2
oxide compound was first formed in the surface through the preferential solubility of the extremely
active Zr element. ZrO2 with few WO3 and CoO which produced later gathered together to form the
compact cover on the Fe- based bulk amorphous alloy surface. The compact cover became the
effective barrier between the alloy and the corrosive medium, and the good deactivated film was
constituted, which enhanced the anticorrosion performance of the amorphous alloy.
60 Advanced Design and Manufacturing Technology I
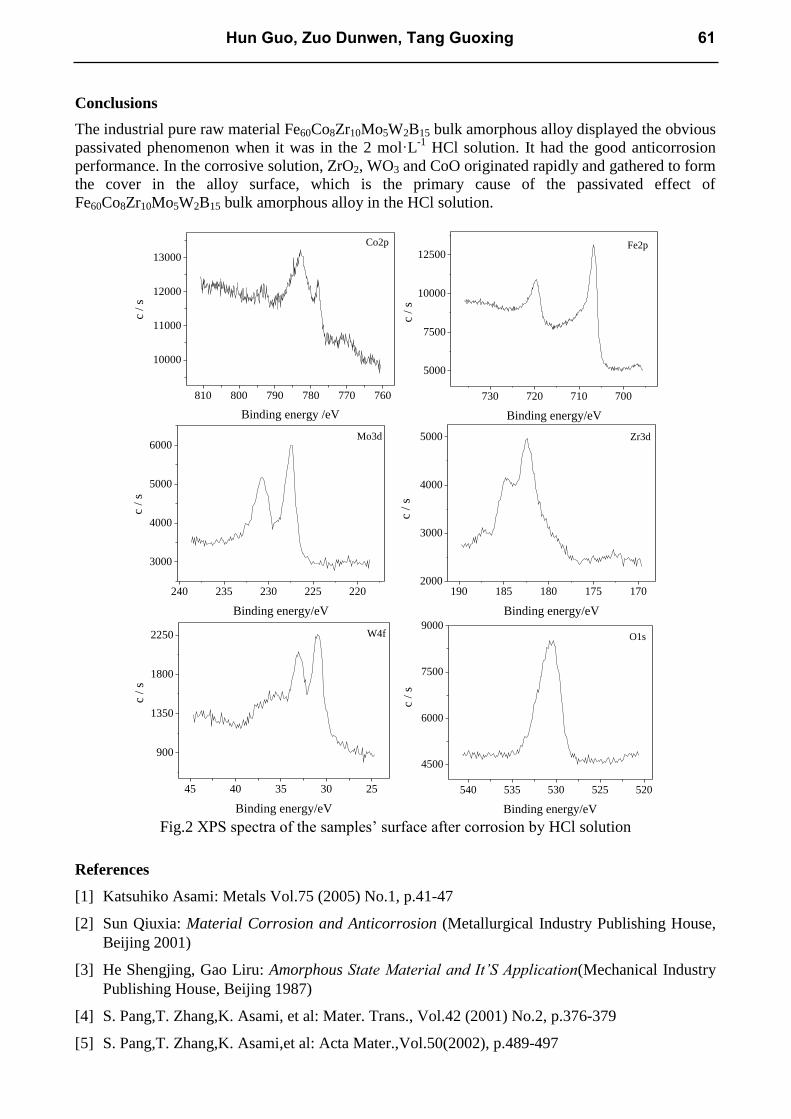
Conclusions
The industrial pure raw material Fe60Co8Zr10Mo5W2B15 bulk amorphous alloy displayed the obvious
passivated phenomenon when it was in the 2 mol·L-1
HCl solution. It had the good anticorrosion
performance. In the corrosive solution, ZrO2, WO3 and CoO originated rapidly and gathered to form
the cover in the alloy surface, which is the primary cause of the passivated effect of
Fe60Co8Zr10Mo5W2B15 bulk amorphous alloy in the HCl solution.
810 800 790 780 770 760
10000
11000
12000
13000
Co2p
c /
s
Binding energy /eV
730 720 710 700
5000
7500
10000
12500Fe2p
c /
sBinding energy/eV
240 235 230 225 220
3000
4000
5000
6000Mo3d
c /
s
Binding energy/eV
190 185 180 175 1702000
3000
4000
5000
Zr3d
c /
s
Binding energy/eV
45 40 35 30 25
900
1350
1800
2250
W4f
c /
s
Binding energy/eV
540 535 530 525 520
4500
6000
7500
9000
O1s
c /
s
Binding energy/eV Fig.2 XPS spectra of the samples’ surface after corrosion by HCl solution
References
[1] Katsuhiko Asami: Metals Vol.75 (2005) No.1, p.41-47
[2] Sun Qiuxia: Material Corrosion and Anticorrosion (Metallurgical Industry Publishing House,
Beijing 2001)
[3] He Shengjing, Gao Liru: Amorphous State Material and It’S Application(Mechanical Industry
Publishing House, Beijing 1987)
[4] S. Pang,T. Zhang,K. Asami, et al: Mater. Trans., Vol.42 (2001) No.2, p.376-379
[5] S. Pang,T. Zhang,K. Asami,et al: Acta Mater.,Vol.50(2002), p.489-497
Hun Guo, Zuo Dunwen, Tang Guoxing 61

[6] M. Hagiwara,A. Inoue and T. Masumoto: MRS International Meeting on Advanced Materials
Vol.3 (1989), p.461-465
[7] Translated by Wang Caifeng: Overseas Metallic Material Vol.5 (1991), p.13-16
[8] S. Pang,T. Zhang,K. Asami,et al: Mater. Trans., Vol.43(2002) No.8, p.2137-2142
[9] H. X. Xiao, G. Chen and Q. J. Sun: Hot Working Technology Vol.2(2004), p.18-19,22
[10] Wu Minda, Zhao Yuan: Mechanical Engineering Material Test Handbook (Liaoning Science
And Technology Publishing House, Liaoning 2002)
62 Advanced Design and Manufacturing Technology I
Simulation of Temperature Field during 7022 Al Alloy Friction Stir
Welding process Based on Dual-source
D.L. Shaoa, W.Z. Lub, D.Z. Wenc, H.F. Wang and M.M. Huang
College of Mechanical and Electrial Engeering, Nanjing University of Aeronautics and Astronautics,
China
[email protected], [email protected], [email protected]
Keywords: 7022 aluminum alloy, FSW, dual-source model, temperature field simulation
Abstract. Numerical simulation of temperature field on friction stir welded 7022 aluminum alloy
was studied in this paper. A new dual-source model has been designed and applied to investigate
the variation of temperature field over time. Result shows that temperature of the nodes along the
welding line increased at first and then decreased, the highest nodal temperature of 524℃ presents
at the ending position. Temperature of the nodes perpendicular to the welding line rises rapidly
when the source arrived and falls rapidly when it left, and then cools to room temperature linearly
when the source is removed. Simulative result predicts large temperature difference on the plates,
and thermal pretreatment should be conducted before welding.
Introduction
Friction stir welding (FSW), as a relatively new solid-state joining process, is a technology about
joining the plates via the frictional heat between high speed rotating pin tool and welding material.
It has been especially employed in the unweldable aluminum alloy such as 2XXX (Al-Cu) and
7XXX (Al-Mg-Zn) in the aerospace field for its advantages of pollution-free, few flaws and low
cost [1]. It is widely studied in engineering field by welding experiments and simulations because
its tensile strength, yield strength, anti-bend performance and fatigue resistance after welding are
much better than fusion welding. Like conventional fusion welding, welding residual stress and
distortion unavoidably exist in FSW due to nonuniform heating and cooling. Currently, most of the
studies of FSW focus on the mechanical property, microstructure, corrosivity and heat treatment of
the welding joints [2-3]. Most of samples employed in these studies are in small size (no longer
than 200mm), which leads to small distortion after welding. With the development of aerospace
industry and other engineering field, welding distortion and hot-cracking propagation of the large
size aluminum sheets have severely affected the dimensional accuracy; assemble accuracy and
service life, which result in inconvenient assembling and terrible service performance. All of these
defects are directly influenced by temperature field. As stated previously, research on the variation
laws of FSW temperature field is vitally significant.
Numerical simulation technology is an effective way to study FSW process. By simulating the
real working condition, transient temperature field, stress field and strain field can be analyzed not
only during the FSW process but also after it. In this paper, a new dual-source model has been
designed and applied into the simulation. The variation laws of the FSW temperature field on large
size aluminum alloy has been achieved during the whole simulation process, which would provide
theoretical basis for further research on stress, fatigue and engineering application.
© (2011) Trans Tech Publications, Switzerlanddoi:10.4028/www.scientific.net/AMR.142.63
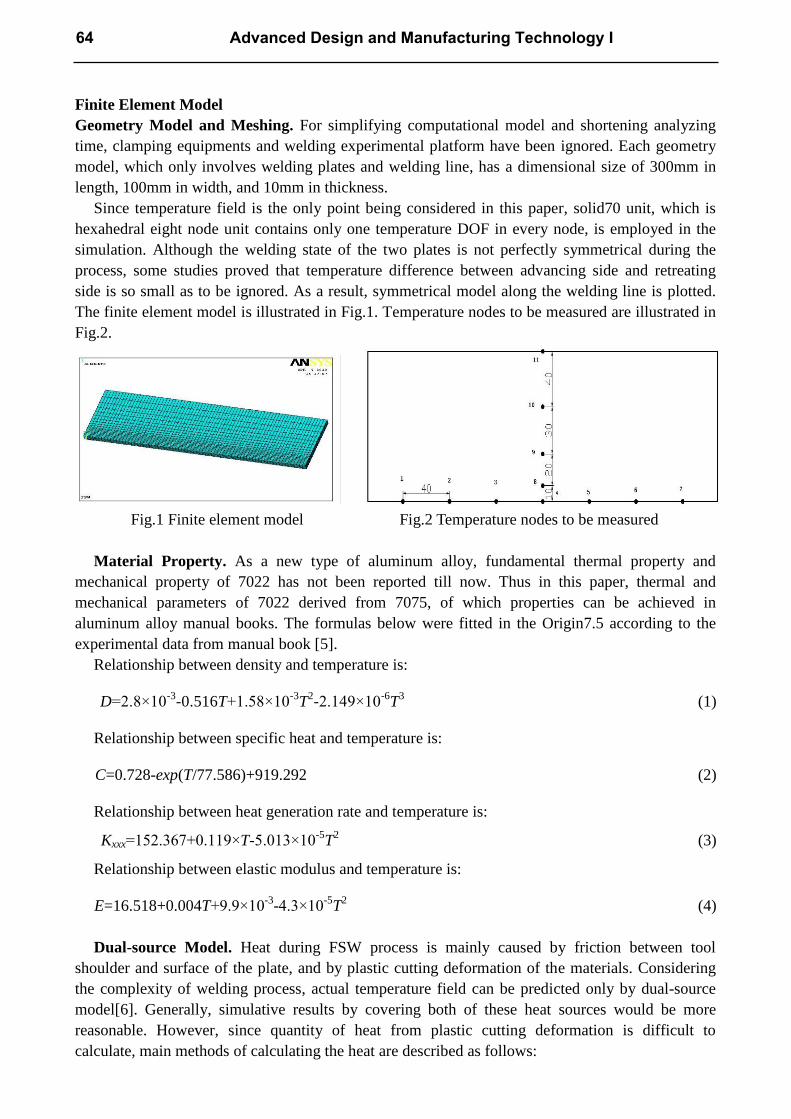
Finite Element Model
Geometry Model and Meshing. For simplifying computational model and shortening analyzing
time, clamping equipments and welding experimental platform have been ignored. Each geometry
model, which only involves welding plates and welding line, has a dimensional size of 300mm in
length, 100mm in width, and 10mm in thickness.
Since temperature field is the only point being considered in this paper, solid70 unit, which is
hexahedral eight node unit contains only one temperature DOF in every node, is employed in the
simulation. Although the welding state of the two plates is not perfectly symmetrical during the
process, some studies proved that temperature difference between advancing side and retreating
side is so small as to be ignored. As a result, symmetrical model along the welding line is plotted.
The finite element model is illustrated in Fig.1. Temperature nodes to be measured are illustrated in
Fig.2.
Fig.1 Finite element model Fig.2 Temperature nodes to be measured
Material Property. As a new type of aluminum alloy, fundamental thermal property and
mechanical property of 7022 has not been reported till now. Thus in this paper, thermal and
mechanical parameters of 7022 derived from 7075, of which properties can be achieved in
aluminum alloy manual books. The formulas below were fitted in the Origin7.5 according to the
experimental data from manual book [5].
Relationship between density and temperature is:
D=2.8×10⁻³
-0.516T+1.58×10⁻³
T2-2.149×10
-6T
3 (1)
Relationship between specific heat and temperature is:
C=0.728-exp(T/77.586)+919.292 (2)
Relationship between heat generation rate and temperature is:
Kxxx=152.367+0.119×T-5.013×10⁻⁵
T2 (3)
Relationship between elastic modulus and temperature is:
E=16.518+0.004T+9.9×10⁻³
-4.3×10⁻⁵
T2 (4)
Dual-source Model. Heat during FSW process is mainly caused by friction between tool
shoulder and surface of the plate, and by plastic cutting deformation of the materials. Considering
the complexity of welding process, actual temperature field can be predicted only by dual-source
model[6]. Generally, simulative results by covering both of these heat sources would be more
reasonable. However, since quantity of heat from plastic cutting deformation is difficult to
calculate, main methods of calculating the heat are described as follows:
64 Advanced Design and Manufacturing Technology I
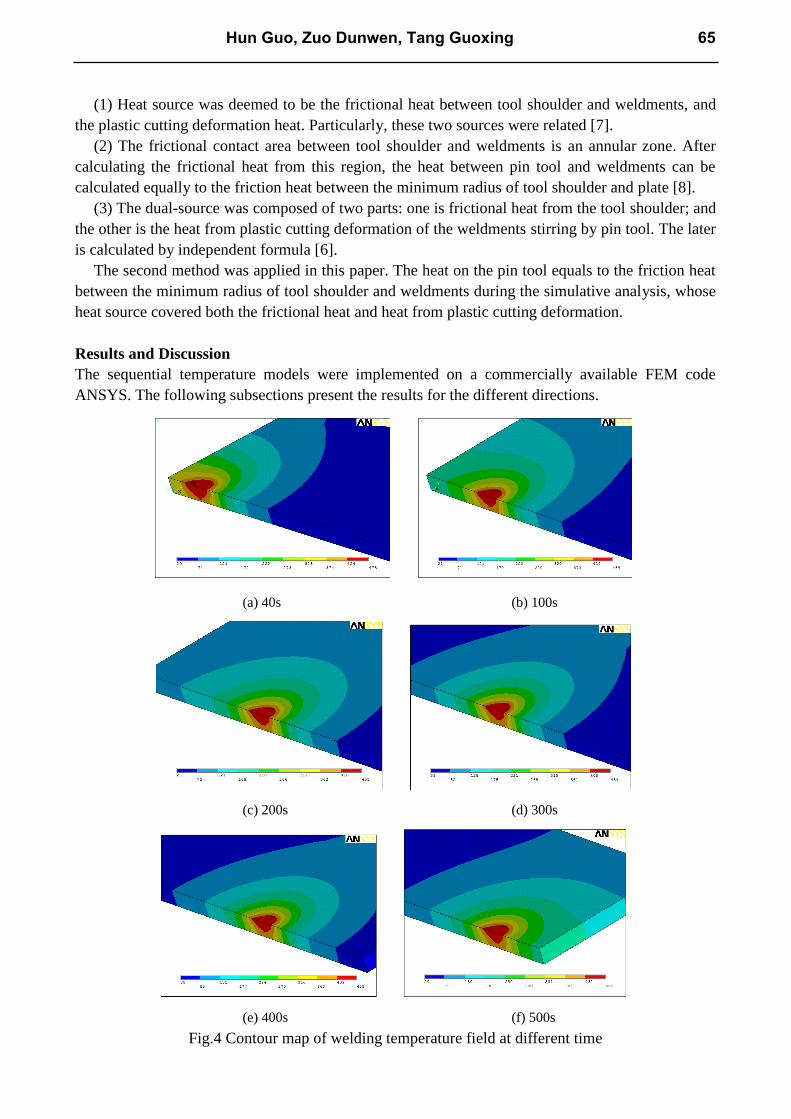
(1) Heat source was deemed to be the frictional heat between tool shoulder and weldments, and
the plastic cutting deformation heat. Particularly, these two sources were related [7].
(2) The frictional contact area between tool shoulder and weldments is an annular zone. After
calculating the frictional heat from this region, the heat between pin tool and weldments can be
calculated equally to the friction heat between the minimum radius of tool shoulder and plate [8].
(3) The dual-source was composed of two parts: one is frictional heat from the tool shoulder; and
the other is the heat from plastic cutting deformation of the weldments stirring by pin tool. The later
is calculated by independent formula [6].
The second method was applied in this paper. The heat on the pin tool equals to the friction heat
between the minimum radius of tool shoulder and weldments during the simulative analysis, whose
heat source covered both the frictional heat and heat from plastic cutting deformation.
Results and Discussion
The sequential temperature models were implemented on a commercially available FEM code
ANSYS. The following subsections present the results for the different directions.
(a) 40s (b) 100s
(c) 200s (d) 300s
(e) 400s (f) 500s
Fig.4 Contour map of welding temperature field at different time
Hun Guo, Zuo Dunwen, Tang Guoxing 65
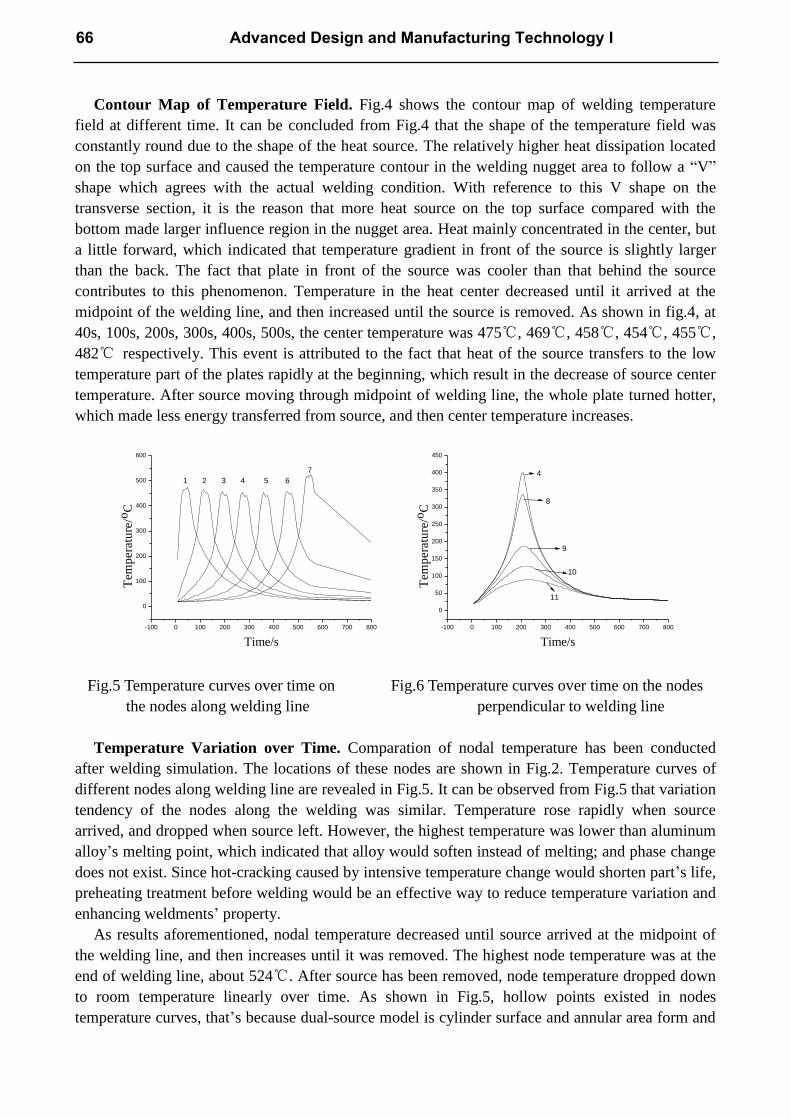
Contour Map of Temperature Field. Fig.4 shows the contour map of welding temperature
field at different time. It can be concluded from Fig.4 that the shape of the temperature field was
constantly round due to the shape of the heat source. The relatively higher heat dissipation located
on the top surface and caused the temperature contour in the welding nugget area to follow a “V”
shape which agrees with the actual welding condition. With reference to this V shape on the
transverse section, it is the reason that more heat source on the top surface compared with the
bottom made larger influence region in the nugget area. Heat mainly concentrated in the center, but
a little forward, which indicated that temperature gradient in front of the source is slightly larger
than the back. The fact that plate in front of the source was cooler than that behind the source
contributes to this phenomenon. Temperature in the heat center decreased until it arrived at the
midpoint of the welding line, and then increased until the source is removed. As shown in fig.4, at
40s, 100s, 200s, 300s, 400s, 500s, the center temperature was 475℃, 469℃, 458℃, 454℃, 455℃,
482℃ respectively. This event is attributed to the fact that heat of the source transfers to the low
temperature part of the plates rapidly at the beginning, which result in the decrease of source center
temperature. After source moving through midpoint of welding line, the whole plate turned hotter,
which made less energy transferred from source, and then center temperature increases.
-100 0 100 200 300 400 500 600 700 800
0
100
200
300
400
500
600
Tem
per
ature
/oC
Time/s
1 2 3 4 5 6
7
-100 0 100 200 300 400 500 600 700 800
0
50
100
150
200
250
300
350
400
450
Tem
per
ature
/oC
Time/s
4
8
9
11
10
Fig.5 Temperature curves over time on Fig.6 Temperature curves over time on the nodes
the nodes along welding line perpendicular to welding line
Temperature Variation over Time. Comparation of nodal temperature has been conducted
after welding simulation. The locations of these nodes are shown in Fig.2. Temperature curves of
different nodes along welding line are revealed in Fig.5. It can be observed from Fig.5 that variation
tendency of the nodes along the welding was similar. Temperature rose rapidly when source
arrived, and dropped when source left. However, the highest temperature was lower than aluminum
alloy’s melting point, which indicated that alloy would soften instead of melting; and phase change
does not exist. Since hot-cracking caused by intensive temperature change would shorten part’s life,
preheating treatment before welding would be an effective way to reduce temperature variation and
enhancing weldments’ property.
As results aforementioned, nodal temperature decreased until source arrived at the midpoint of
the welding line, and then increases until it was removed. The highest node temperature was at the
end of welding line, about 524℃. After source has been removed, node temperature dropped down
to room temperature linearly over time. As shown in Fig.5, hollow points existed in nodes
temperature curves, that’s because dual-source model is cylinder surface and annular area form and
66 Advanced Design and Manufacturing Technology I
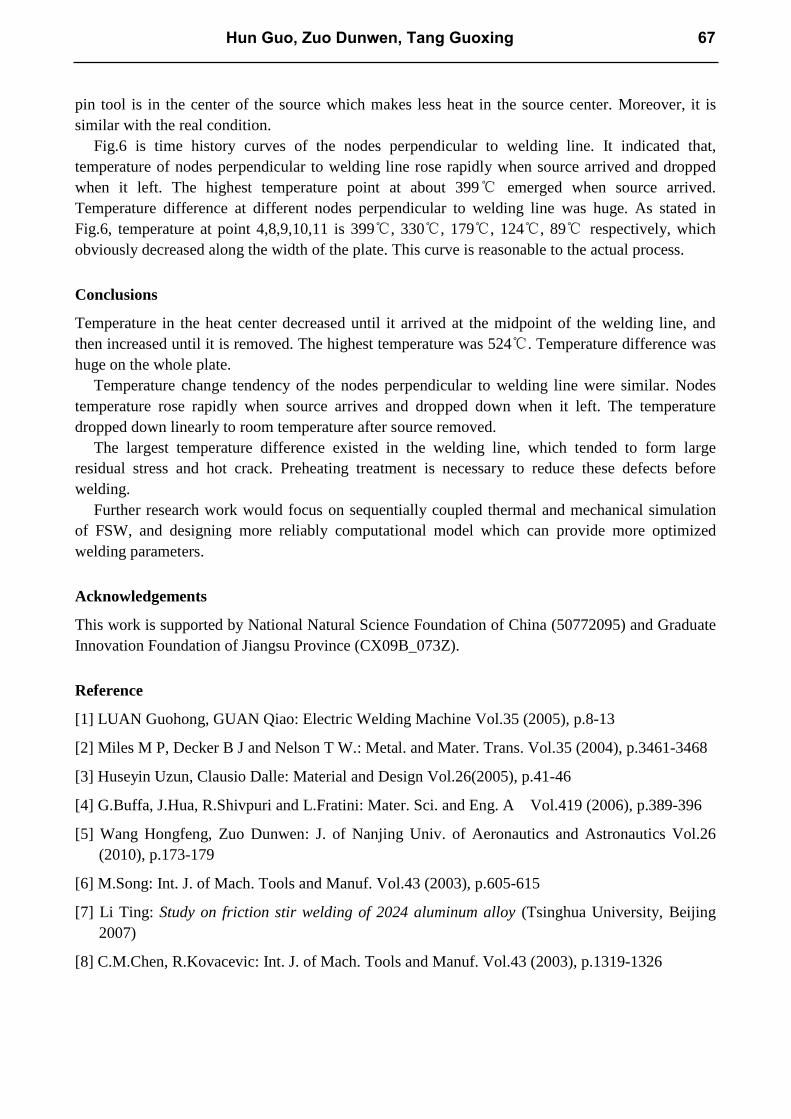
pin tool is in the center of the source which makes less heat in the source center. Moreover, it is
similar with the real condition.
Fig.6 is time history curves of the nodes perpendicular to welding line. It indicated that,
temperature of nodes perpendicular to welding line rose rapidly when source arrived and dropped
when it left. The highest temperature point at about 399℃ emerged when source arrived.
Temperature difference at different nodes perpendicular to welding line was huge. As stated in
Fig.6, temperature at point 4,8,9,10,11 is 399℃, 330℃, 179℃, 124℃, 89℃ respectively, which
obviously decreased along the width of the plate. This curve is reasonable to the actual process.
Conclusions
Temperature in the heat center decreased until it arrived at the midpoint of the welding line, and
then increased until it is removed. The highest temperature was 524℃. Temperature difference was
huge on the whole plate.
Temperature change tendency of the nodes perpendicular to welding line were similar. Nodes
temperature rose rapidly when source arrives and dropped down when it left. The temperature
dropped down linearly to room temperature after source removed.
The largest temperature difference existed in the welding line, which tended to form large
residual stress and hot crack. Preheating treatment is necessary to reduce these defects before
welding.
Further research work would focus on sequentially coupled thermal and mechanical simulation
of FSW, and designing more reliably computational model which can provide more optimized
welding parameters.
Acknowledgements
This work is supported by National Natural Science Foundation of China (50772095) and Graduate
Innovation Foundation of Jiangsu Province (CX09B_073Z).
Reference
[1] LUAN Guohong, GUAN Qiao: Electric Welding Machine Vol.35 (2005), p.8-13
[2] Miles M P, Decker B J and Nelson T W.: Metal. and Mater. Trans. Vol.35 (2004), p.3461-3468
[3] Huseyin Uzun, Clausio Dalle: Material and Design Vol.26(2005), p.41-46
[4] G.Buffa, J.Hua, R.Shivpuri and L.Fratini: Mater. Sci. and Eng. A Vol.419 (2006), p.389-396
[5] Wang Hongfeng, Zuo Dunwen: J. of Nanjing Univ. of Aeronautics and Astronautics Vol.26
(2010), p.173-179
[6] M.Song: Int. J. of Mach. Tools and Manuf. Vol.43 (2003), p.605-615
[7] Li Ting: Study on friction stir welding of 2024 aluminum alloy (Tsinghua University, Beijing
2007)
[8] C.M.Chen, R.Kovacevic: Int. J. of Mach. Tools and Manuf. Vol.43 (2003), p.1319-1326
Hun Guo, Zuo Dunwen, Tang Guoxing 67
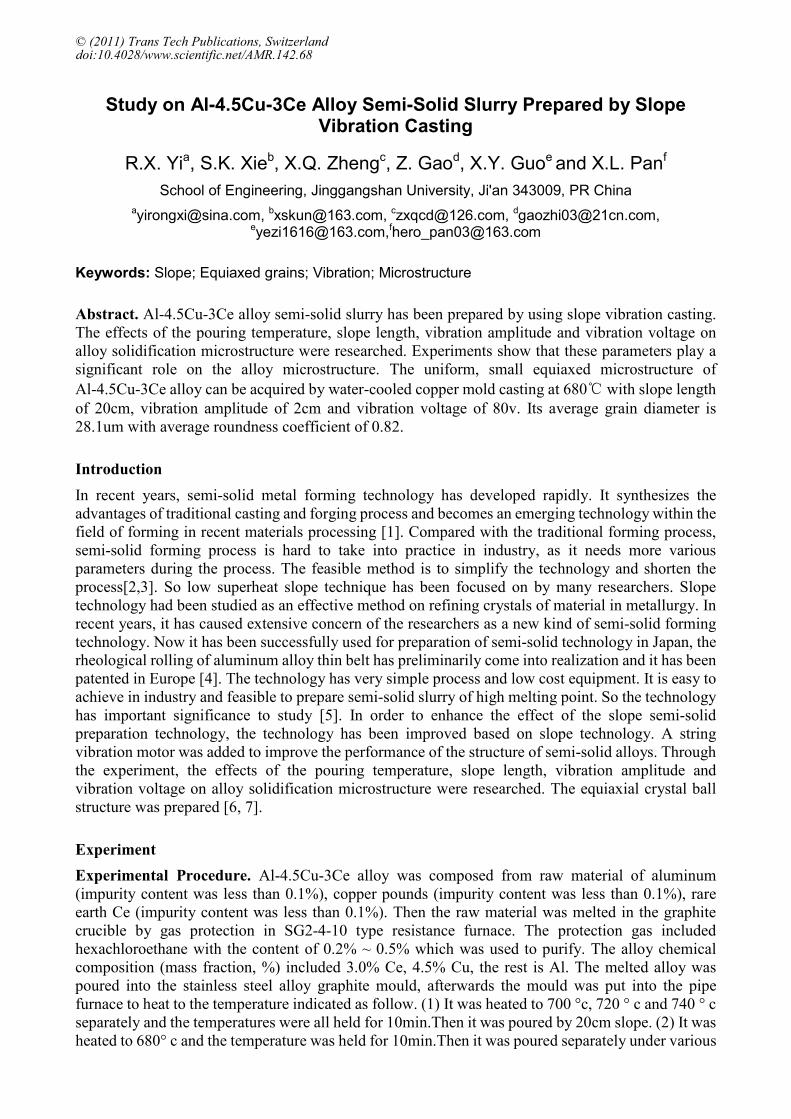
Study on Al-4.5Cu-3Ce Alloy Semi-Solid Slurry Prepared by Slope Vibration Casting
R.X. Yia, S.K. Xieb, X.Q. Zhengc, Z. Gaod, X.Y. Guoe and X.L. Panf
School of Engineering, Jinggangshan University, Ji'an 343009, PR China
[email protected], [email protected], [email protected], [email protected], [email protected],[email protected]
Keywords: Slope; Equiaxed grains; Vibration; Microstructure
Abstract. Al-4.5Cu-3Ce alloy semi-solid slurry has been prepared by using slope vibration casting.
The effects of the pouring temperature, slope length, vibration amplitude and vibration voltage on
alloy solidification microstructure were researched. Experiments show that these parameters play a
significant role on the alloy microstructure. The uniform, small equiaxed microstructure of
Al-4.5Cu-3Ce alloy can be acquired by water-cooled copper mold casting at 680℃ with slope length
of 20cm, vibration amplitude of 2cm and vibration voltage of 80v. Its average grain diameter is
28.1um with average roundness coefficient of 0.82.
Introduction
In recent years, semi-solid metal forming technology has developed rapidly. It synthesizes the
advantages of traditional casting and forging process and becomes an emerging technology within the
field of forming in recent materials processing [1]. Compared with the traditional forming process,
semi-solid forming process is hard to take into practice in industry, as it needs more various
parameters during the process. The feasible method is to simplify the technology and shorten the
process[2,3]. So low superheat slope technique has been focused on by many researchers. Slope
technology had been studied as an effective method on refining crystals of material in metallurgy. In
recent years, it has caused extensive concern of the researchers as a new kind of semi-solid forming
technology. Now it has been successfully used for preparation of semi-solid technology in Japan, the
rheological rolling of aluminum alloy thin belt has preliminarily come into realization and it has been
patented in Europe [4]. The technology has very simple process and low cost equipment. It is easy to
achieve in industry and feasible to prepare semi-solid slurry of high melting point. So the technology
has important significance to study [5]. In order to enhance the effect of the slope semi-solid
preparation technology, the technology has been improved based on slope technology. A string
vibration motor was added to improve the performance of the structure of semi-solid alloys. Through
the experiment, the effects of the pouring temperature, slope length, vibration amplitude and
vibration voltage on alloy solidification microstructure were researched. The equiaxial crystal ball
structure was prepared [6, 7].
Experiment
Experimental Procedure. Al-4.5Cu-3Ce alloy was composed from raw material of aluminum
(impurity content was less than 0.1%), copper pounds (impurity content was less than 0.1%), rare
earth Ce (impurity content was less than 0.1%). Then the raw material was melted in the graphite
crucible by gas protection in SG2-4-10 type resistance furnace. The protection gas included
hexachloroethane with the content of 0.2% ~ 0.5% which was used to purify. The alloy chemical
composition (mass fraction, %) included 3.0% Ce, 4.5% Cu, the rest is Al. The melted alloy was
poured into the stainless steel alloy graphite mould, afterwards the mould was put into the pipe
furnace to heat to the temperature indicated as follow. (1) It was heated to 700 °c, 720 ° c and 740 ° c
separately and the temperatures were all held for 10min.Then it was poured by 20cm slope. (2) It was
heated to 680° c and the temperature was held for 10min.Then it was poured separately under various
© (2011) Trans Tech Publications, Switzerlanddoi:10.4028/www.scientific.net/AMR.142.68

parameters such as different slope length (10cm,20cm,30cm) ,different vibration amplitude (1cm
2cm, 3cm) and different vibration voltage (40v, 60v,80v,100v).Slope surface was coated with zinc
oxide and not preheated before pouring. When alloy cooled to room temperature, it was splited into
the same scale specimen and the scale was ø12 x 10mm2. The good samples were taken out and
grinded separately with silicon carbide paper of 600 #, 1000 #, 1500 # and 2000#. Then the samples
were polished with Cr2O3 polishing powder. After that, they were corroded with hydrofluoric acid
that its concentration is 0.5% for 5min corrosion. The microstructure of the prepared metallographic
samples was observed by optical microscope. The alloy liquid line temperature is 640° c and solid
line temperature is 604° c.
Experiment Equipment. (1) Furnace: graphite crucibles and well resistor-stove were used in the
experiment. The resistor-stove type is SG2-4-10.
(2) KSW-8D-13 temperature controllers with K series 101 type thermocouples was used for electric
resistance furnace. The range of the temperature controller is from 0℃ to 1200 ℃.
(3) Thermo detector: YANHUA data acquisition modules controlled and collected the data, it makes
use of K series of thermocouples and the temperature range is from 0℃ to 1100℃ .The
temperature-control accuracy is ±0.3℃.
(4) PX-D2 string vibration motor was used in this experiment.
(5) Casting system included stainless steel alloy graphite mould and copper mould.It included
stainless slope coated with zinc oxide as well.
Results and Discussion
Effect of Casting Temperature on the Microstructure of the Alloy. The melting alloy with
different temperatures at 680℃, 700℃, 720℃, 740℃ were separately poured into the water-cooled
copper mold and their ingot microstructure are respectively shown as Fig.1a),b) c) and d). The white
phase is α-phase and the black phase is eutectic crystal structure. The crystal is refined as the casting
temperature reduces. The larger number of crystal nuclear are formed and the even shape and size
grains are obtained. Fig.1 d) shows the microstructure casted at 740℃which are comprised with
coarse and irregular shape grains.Fig.1a) shows the microstructure casted at 680℃.There are more
initial α-Al phase. The crystal is obviously refined and regular. The roses shape microstructure is
presented which is dendrite crystal. It can be concluded from Fig.1 that casting temperature has
significant effect on the grain number and shape of the alloy microstructure. On the premise of the
fluidity of the alloy, the lower the casting temperature is, the better the microstructure will.
Fig.1 Al-4.5Cu-3Ce alloy microstructure at different pouring temperature
Effect of the Length of the Slope on the Microstructure of the Alloy. The melting alloy at 680℃
were separately poured into the water-cooled copper mold with different length slopes which were
respectively 0cm, 10cm, 20cm and 30cm and their ingot microstructure are shown as Fig.2. Fig.2 a)
shows that the microstructure is comprised with coarse dendrites and irregular shape grains. By
comparing with Fig.2 b),c),d), it can be obviously observed that crystal structure grows more even
and regular and the number of grain grows more and the grain is refined. It can be concluded from
Fig.2 that slope length has significant effect on the grain number and shape of the alloy
microstructure. On the premise of the fluidity of the alloy, the longer of slope length is, the better the
microstructure will. However, the fluidity of the alloy become worse when the length of the slope is
50um
a) 680℃
50um 50um 50um
b) 700℃ c) 720℃ d) 740℃
Hun Guo, Zuo Dunwen, Tang Guoxing 69
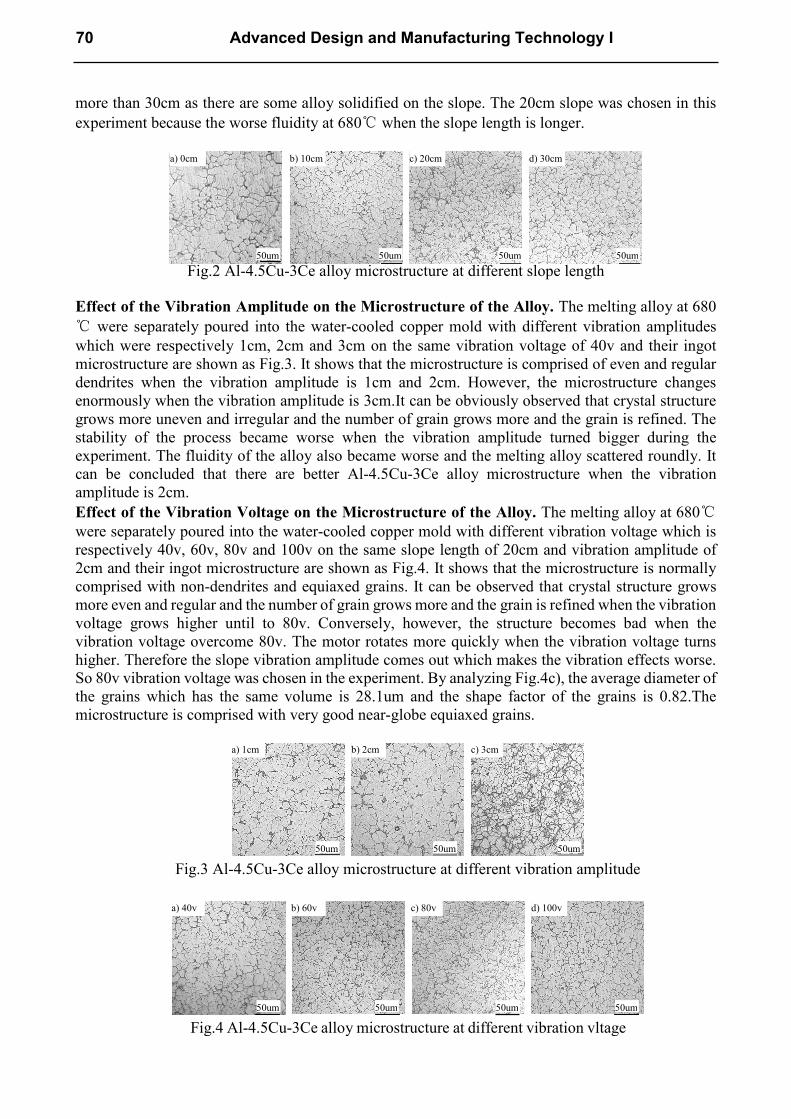
more than 30cm as there are some alloy solidified on the slope. The 20cm slope was chosen in this
experiment because the worse fluidity at 680℃ when the slope length is longer.
Fig.2 Al-4.5Cu-3Ce alloy microstructure at different slope length
Effect of the Vibration Amplitude on the Microstructure of the Alloy. The melting alloy at 680
℃ were separately poured into the water-cooled copper mold with different vibration amplitudes
which were respectively 1cm, 2cm and 3cm on the same vibration voltage of 40v and their ingot
microstructure are shown as Fig.3. It shows that the microstructure is comprised of even and regular
dendrites when the vibration amplitude is 1cm and 2cm. However, the microstructure changes
enormously when the vibration amplitude is 3cm.It can be obviously observed that crystal structure
grows more uneven and irregular and the number of grain grows more and the grain is refined. The
stability of the process became worse when the vibration amplitude turned bigger during the
experiment. The fluidity of the alloy also became worse and the melting alloy scattered roundly. It
can be concluded that there are better Al-4.5Cu-3Ce alloy microstructure when the vibration
amplitude is 2cm.
Effect of the Vibration Voltage on the Microstructure of the Alloy. The melting alloy at 680℃
were separately poured into the water-cooled copper mold with different vibration voltage which is
respectively 40v, 60v, 80v and 100v on the same slope length of 20cm and vibration amplitude of
2cm and their ingot microstructure are shown as Fig.4. It shows that the microstructure is normally
comprised with non-dendrites and equiaxed grains. It can be observed that crystal structure grows
more even and regular and the number of grain grows more and the grain is refined when the vibration
voltage grows higher until to 80v. Conversely, however, the structure becomes bad when the
vibration voltage overcome 80v. The motor rotates more quickly when the vibration voltage turns
higher. Therefore the slope vibration amplitude comes out which makes the vibration effects worse.
So 80v vibration voltage was chosen in the experiment. By analyzing Fig.4c), the average diameter of
the grains which has the same volume is 28.1um and the shape factor of the grains is 0.82.The
microstructure is comprised with very good near-globe equiaxed grains.
Fig.4 Al-4.5Cu-3Ce alloy microstructure at different vibration vltage
50um 50um 50um 50um
a) 40v b) 60v c) 80v d) 100v
a) 1cm
50um 50um 50um
b) 2cm c) 3cm
Fig.3 Al-4.5Cu-3Ce alloy microstructure at different vibration amplitude
a) 0cm
50um 50um 50um 50um
b) 10cm c) 20cm d) 30cm
70 Advanced Design and Manufacturing Technology I
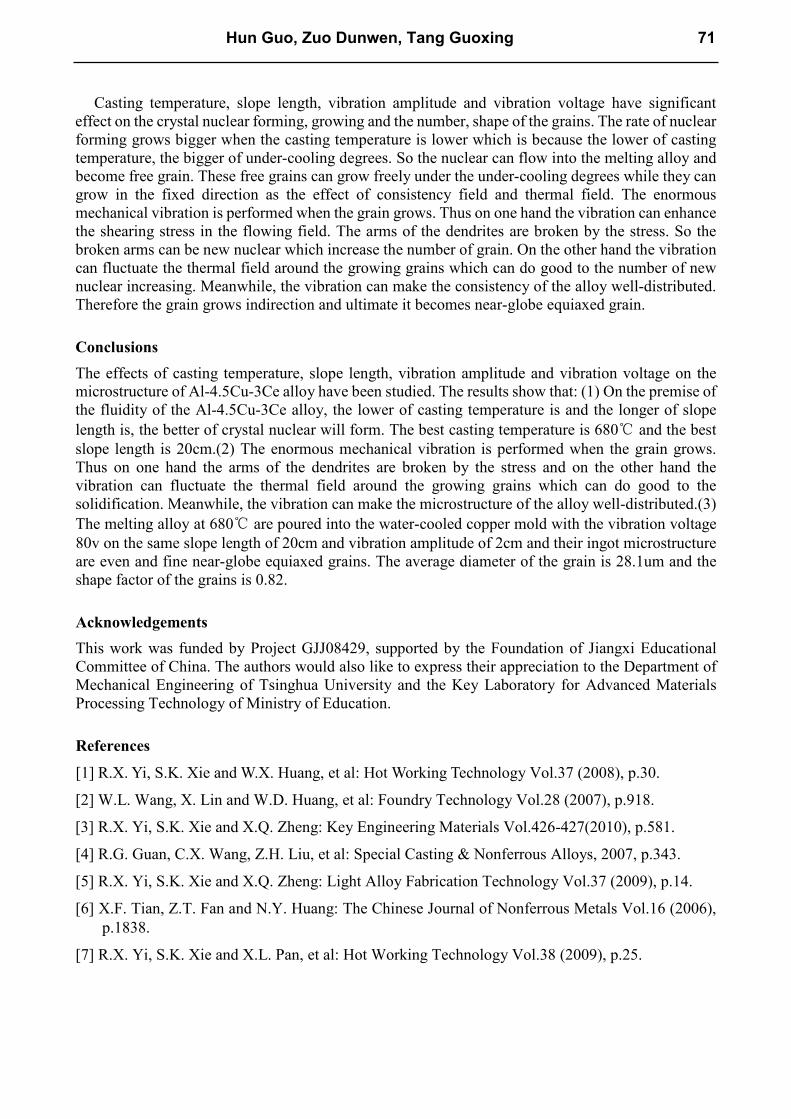
Casting temperature, slope length, vibration amplitude and vibration voltage have significant
effect on the crystal nuclear forming, growing and the number, shape of the grains. The rate of nuclear
forming grows bigger when the casting temperature is lower which is because the lower of casting
temperature, the bigger of under-cooling degrees. So the nuclear can flow into the melting alloy and
become free grain. These free grains can grow freely under the under-cooling degrees while they can
grow in the fixed direction as the effect of consistency field and thermal field. The enormous
mechanical vibration is performed when the grain grows. Thus on one hand the vibration can enhance
the shearing stress in the flowing field. The arms of the dendrites are broken by the stress. So the
broken arms can be new nuclear which increase the number of grain. On the other hand the vibration
can fluctuate the thermal field around the growing grains which can do good to the number of new
nuclear increasing. Meanwhile, the vibration can make the consistency of the alloy well-distributed.
Therefore the grain grows indirection and ultimate it becomes near-globe equiaxed grain.
Conclusions
The effects of casting temperature, slope length, vibration amplitude and vibration voltage on the
microstructure of Al-4.5Cu-3Ce alloy have been studied. The results show that: (1) On the premise of
the fluidity of the Al-4.5Cu-3Ce alloy, the lower of casting temperature is and the longer of slope
length is, the better of crystal nuclear will form. The best casting temperature is 680℃ and the best
slope length is 20cm.(2) The enormous mechanical vibration is performed when the grain grows.
Thus on one hand the arms of the dendrites are broken by the stress and on the other hand the
vibration can fluctuate the thermal field around the growing grains which can do good to the
solidification. Meanwhile, the vibration can make the microstructure of the alloy well-distributed.(3)
The melting alloy at 680℃ are poured into the water-cooled copper mold with the vibration voltage
80v on the same slope length of 20cm and vibration amplitude of 2cm and their ingot microstructure
are even and fine near-globe equiaxed grains. The average diameter of the grain is 28.1um and the
shape factor of the grains is 0.82.
Acknowledgements
This work was funded by Project GJJ08429, supported by the Foundation of Jiangxi Educational
Committee of China. The authors would also like to express their appreciation to the Department of
Mechanical Engineering of Tsinghua University and the Key Laboratory for Advanced Materials
Processing Technology of Ministry of Education.
References
[1] R.X. Yi, S.K. Xie and W.X. Huang, et al: Hot Working Technology Vol.37 (2008), p.30.
[2] W.L. Wang, X. Lin and W.D. Huang, et al: Foundry Technology Vol.28 (2007), p.918.
[3] R.X. Yi, S.K. Xie and X.Q. Zheng: Key Engineering Materials Vol.426-427(2010), p.581.
[4] R.G. Guan, C.X. Wang, Z.H. Liu, et al: Special Casting & Nonferrous Alloys, 2007, p.343.
[5] R.X. Yi, S.K. Xie and X.Q. Zheng: Light Alloy Fabrication Technology Vol.37 (2009), p.14.
[6] X.F. Tian, Z.T. Fan and N.Y. Huang: The Chinese Journal of Nonferrous Metals Vol.16 (2006),
p.1838.
[7] R.X. Yi, S.K. Xie and X.L. Pan, et al: Hot Working Technology Vol.38 (2009), p.25.
Hun Guo, Zuo Dunwen, Tang Guoxing 71

Precision Control Research on DACS-Based Modern Digital Shipbuilding Technology
G.X. Liu1, a
1Jiangsu Maritime Institute, Jiangsu, Nanjing 211170, China
Keywords: Digital Shipbuilding, Precision control, DACS system
Abstract. At present the developed shipbuilding in Japan and Korea, has entered the era of precision
control shipbuilding, our country's shipbuilding industry is during the transition from the margin
shipbuilding to no margin, and try hard to achieve precision shipbuilding, but it needs a very long
time. One of way to achieve target is the full use of modern digital precision control equipment and
software of shipbuilding. The paper is based on DACS precision control system, and deeply analysis
of modern digital control technology shipbuilding is given.
Introduction
In modern shipbuilding, the effective precision control can ensure every technical performance of
ship. Traditional shipbuilding techniques are undeveloped; obviously not meet the requirement of
time and accuracy of modern shipbuilding. Shipbuilding precision control technology is the basis of
conversion mode and integration of manufacture and outfitting. Only the application of precision
control technology can guarantee the implementation of the related technologies. And it could also
shorten the shipbuilding cycle, improve quality, reduce costs, increase Chinese shipbuilding industry
competitiveness in the international shipping market and help to broaden the ship market. China now
can build very large crude carrier (VLCC), very large ore carrier (VLOC), very large container ship,
LNG, LPG by herself. Because of the precision control technology gap with advanced countries,
many projects can't achieve the level of design requirement. It may lead to delays the time of the
construction, lower quality and loss of market competitiveness. Therefore, precision control
technology research of ship is a long-term and long-lasting mission in the shipbuilding technology.
Problems of Precision Control in Traditional Shipbuilding
In the beginnings of 70's of the early 20th century, China has begun the research and practice of hull
precision control technology, large-sized and medium-sized shipyards have made some achievements
and experience. During the conversion of shipbuilding mode, from "block shipbuilding" to
"integration of manufacture and outfitting", the applications of new precision control of hull
construction techniques become more and more important. The development of new shipbuilding
mode must be compatible with the new shipbuilding technology. Otherwise the new ship mode will
be difficult to play out its advantages. One of most important in the new shipbuilding technology is
the precision control of hull construction technology, and traditional hull precision control has the
following problems.
The Section Construction.
Non-Digital Measurement Use Manually Record. It's not easy to combine with modern
shipbuilding design software and data process and analysis technology, and not convenient to the
formation of an effective database;
The measurement of Steel ruler is less of accuracy, instability. It's also very inconvenient. And
for large structural parts of vessels, steel rule can not give an accurate measurement; Data collection
needs many staff, so the working efficiency is very low.
The Section and Block. (1) section must be placed in specific requirements to better measurement;
© (2011) Trans Tech Publications, Switzerlanddoi:10.4028/www.scientific.net/AMR.142.72

(2) need to manually calculate the data reports, not convenient for direct comparison with the
design data;
(3) Low efficiency, error-prone to result in schedule delays;
(4) The undeveloped of measurement and data processing methods can not arrive an effective
management mechanism and the cycle of precision data.
The Hull Closure. (1) Low efficiency of traditional measurement methods will result in longer
occupation of crane;
(2) Margin will be cut at job site and requirement of reduction;
(3) Requirement of secondary position will influence berth period;
(4) Traditional measurement is hard to count changes of block during the process in forming of
hull. So it can not provide data support to anti-deformation and no margin shipbuilding.
Reasons analysis
Ship building, is a series of processes including setting out of the lines plan, marking materials,
manufacturing, assembling and welding and etc. In the ship building, the steel material is pretreated,
then processed into elements, then assembled into components, then formed into blocks. All the
blocks (flat, curve, semi tri-dimension) are assembled and welded on the shipyard to form the whole
ship. Ship building is different from machinery manufacturing; first of all, the ship building has
longer construction cycle, more processes, and greater accumulated errors. The ship components are
usually big, the absolute error of their size and shape is greater than the error of the machinery
manufacturing workpiece, but the relative error is less. Secondly, the deformation of the ship during
the building process is much more complex than the machinery manufacturing; it is difficult to
control the plastic and thermoplastic deformation caused by cutting, hot and cold processing,
welding, lifting and other orthopedic. Third, the jobs in the ship building are much more manual than
machine, and a considerable portion of the process is in the high altitude, outdoor environment, hot
and cold processing, and other various processes environments, so it is hard to control the total error
of the ship component.
Construction characteristics of the ship building show, it is of great complexity to control the
components shape, size and location during the ship building. Therefore, production practice, need
precision control technology, or will result in duplication of work for carrying, finishing the increased
workload, increased crane time, dock on the increase, time delay, so that the ship's final delivery.
The Features of DACS
DACS can measure the angle and distance simultaneously, and the accuracy is high. The angular
accuracy of Total Station used in shipbuilding can reach 0.5 seconds, and the ranging accuracy is up
to 1mm +1 ppm, which is the most accurate total station all over the world, and can automatically
display and record without manual reading and recording.
The system is non-contact measurement and can test anywhere you want to, making the surveyors
easier and safer. The laser ranging technology of Total Station can measure surface of 200-500 m, and
the patented technology can accurately measure the hull of the edge, the corner and some places
difficult to reach.
This system is professional measuring software, for the shipbuilding and the data measurement is
very simple and quick. Professional measuring software with the use of the Total Station in the field,
what we need to do is to leveling the devices, targeting and do some simple operations, leaving the
remaining operations to be completed by the software. The software operating is very simple,
consistent with shipbuilding operate.
The three-dimensional accuracy management software cans automatically control and analysis the
precision of the blocks. After finishing data collection, you can import the data into sub-computer for
the simulation and carrying of the hull blocks, checking the CUT / WELD value of the blocks and
forming the precision-check tables. We should strictly control the accuracy of the segmentation,
Hun Guo, Zuo Dunwen, Tang Guoxing 73

compare them with the design data accurately and visually, and output statements according to the
requirement.
The three-dimensional simulation and carrying software for hull can do the block simulations and
carrying in the computer. Before carrying the hull onto the dock, we can do some simulation fold and
carrying with the computer, making sure that the hull can be a closure at the fist time, avoiding
staying in the dock for long and reworking.
The whole operating system is used in Chinese, which is convenient for any people who know a
little knowledge of computer operating. The measurement equipment use in the field, the
measurement software, and the post-processing software indoor, are all used in Chinese, which is
easy to use, and is highly automated, very easy to use.
Precision Management by Application of DACS
Design model. From the three-dimensional software (Figure 1), export section model for the 3D
DXF format (Figure 2).
Fig.1 three-dimensional software Fig.2 export section model for the 3D DXF format
Generate Accuracy Management Point. Generated various management point by capture tool,
establish the design coordinate file, shown in Figure 3 and Figure 4.
Site Measurement and Analysis. Using the PDA to connect all measure the block in the work site.
Setting base plane to display length and breadth, flatness, direct point of view, degree of alignment of
the measured block immediately (Fig.5).
Analysis of Computer Section Model. The block data measured by PDA is import into the software
of block precision management --DACS-OFFICE, to get automatic fit of the measured data and
design data. Accuracy analysis in the section management software DACS-OFFICE is to determine
the error of block, and generates an intuitive graphics and data table which is easy to understand
(Figure 6), provide guidance to site repair. The maximum extents possible reduce the amount to fix
up.
Fig.3 Generated various
management point by capture tool
Fig.4 establishment of the
design coordinate file
74 Advanced Design and Manufacturing Technology I
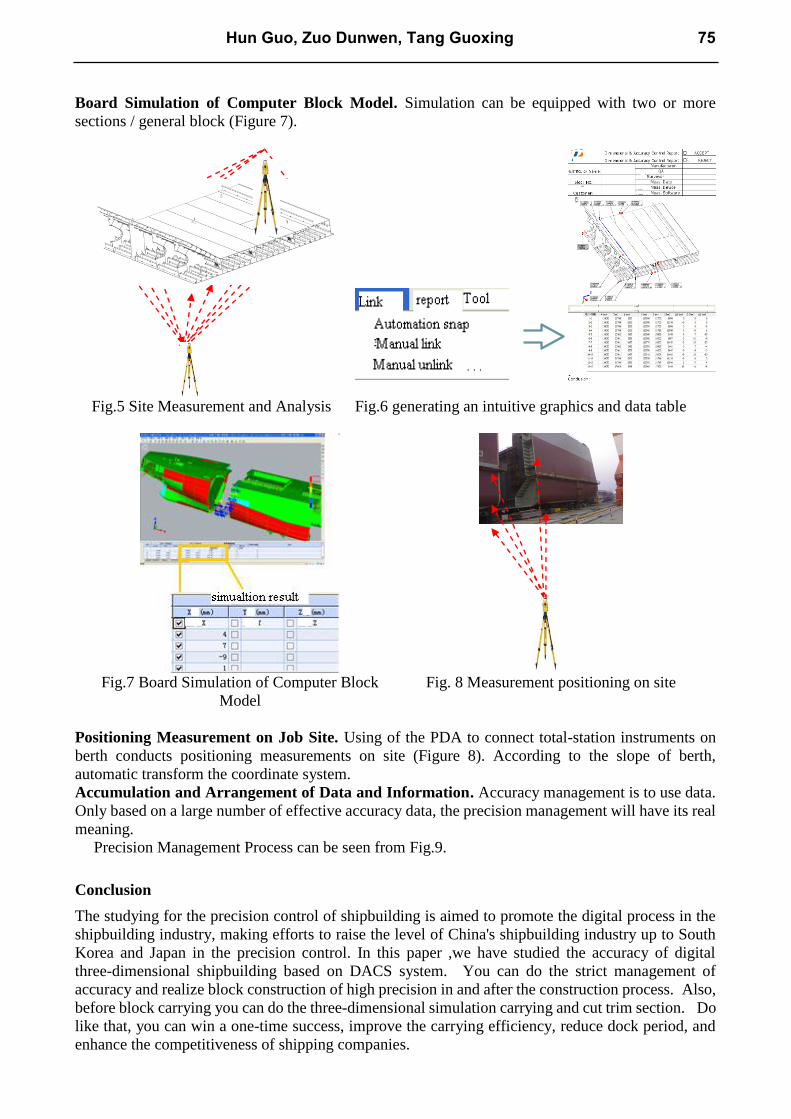
Board Simulation of Computer Block Model. Simulation can be equipped with two or more
sections / general block (Figure 7).
Fig.5 Site Measurement and Analysis Fig.6 generating an intuitive graphics and data table
Fig.7 Board Simulation of Computer Block
Model
Fig. 8 Measurement positioning on site
Positioning Measurement on Job Site. Using of the PDA to connect total-station instruments on
berth conducts positioning measurements on site (Figure 8). According to the slope of berth,
automatic transform the coordinate system.
Accumulation and Arrangement of Data and Information. Accuracy management is to use data.
Only based on a large number of effective accuracy data, the precision management will have its real
meaning.
Precision Management Process can be seen from Fig.9.
Conclusion
The studying for the precision control of shipbuilding is aimed to promote the digital process in the
shipbuilding industry, making efforts to raise the level of China's shipbuilding industry up to South
Korea and Japan in the precision control. In this paper ,we have studied the accuracy of digital
three-dimensional shipbuilding based on DACS system. You can do the strict management of
accuracy and realize block construction of high precision in and after the construction process. Also,
before block carrying you can do the three-dimensional simulation carrying and cut trim section. Do
like that, you can win a one-time success, improve the carrying efficiency, reduce dock period, and
enhance the competitiveness of shipping companies.
Hun Guo, Zuo Dunwen, Tang Guoxing 75
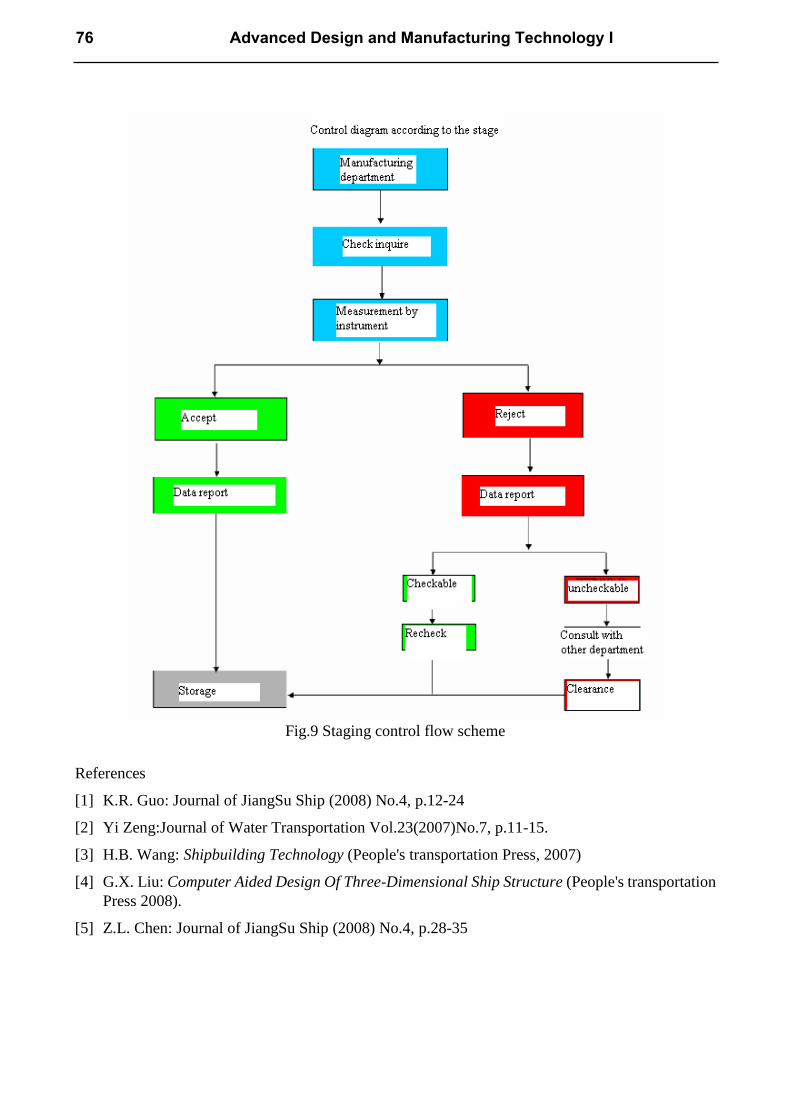
Fig.9 Staging control flow scheme
References
[1] K.R. Guo: Journal of JiangSu Ship (2008) No.4, p.12-24
[2] Yi Zeng:Journal of Water Transportation Vol.23(2007)No.7, p.11-15.
[3] H.B. Wang: Shipbuilding Technology (People's transportation Press, 2007)
[4] G.X. Liu: Computer Aided Design Of Three-Dimensional Ship Structure (People's transportation
Press 2008).
[5] Z.L. Chen: Journal of JiangSu Ship (2008) No.4, p.28-35
76 Advanced Design and Manufacturing Technology I

Contact Stress Analysis of NCD Coating on Roll Ball of Ball Bearing
J.J. Yuan1, a, W.Z. Lu1, b, L.J. Ma2, a, D.W. Zuo1.c and F. Xu1, d
1College of Mechanical & Electrical Engineering, Nanjing University of Aeronautics & Astronautics, Nanjing, 210016
28511 Institution of Nanjing, Nanjing 210016, China
1,[email protected], 1,[email protected], 2,[email protected]
Keywords: NCD, Contact analysis, Ball bearing, FEM
Abstract. Chemical vapor deposition nanocrystalline diamond (NCD) film has numerous
unsurpassed properties, among them, bulk modulus, hardness; abrasion resistance and thermal
conductivity are notable ones like polycrystalline CVD diamond film. The super mechanical
properties have made NCD film to be an effective way to improve the resistance performance of the
ceramic bearing and extended its life. The contact stress of bearing ball with NCD coating in elastic
contact was analyzed. Factors such as substrate material, thickness of NCD coating, load and
interlayer material which affect the shear stress distribution of NCD coating on bearing ball were
investigated. The results show that substrate with low elastic modulus and heavy load will enlarge
the difference of equivalent stress value at NCD/substrate interface. Thick film will make the stress
distribution at the interface uniform. Soft interlayer should be inhibited to avoid extra stress in
contact status.
Introduction
NCD film has wide application prospects in industry field because of its extremely high hardness,
excellent wear resistance and other superior performance [1-2]. As a fiction coating for rolling
contact bearing, NCD film will reduce the friction coefficient and enhance the surface hardness of
bearing parts. Deposition a NCD coating on ceramic bearing will improve the working behavior of
the bearing [3-6]. However, most of the research has focus on the process and properties of ultra
hard coating on bearing rings. Considering the wear and deformation of the roller is also a reason of
bearing failure, it is important to improve the fiction behavior of the roller using NCD coating as
well as the bearing rings.
Fatigue failure under the action of contact stress is one of the main failure forms of brittleness
material. For a NCD coating on spherical surface, the stress state in contact status is more complex
than the situation of coated plate. Therefore, investigation on contact stress distribution is important
to comprehend the fatigue failure mechanism of the NCD coating on the roll ball. In this paper,
factors such as substrate material, thickness of NCD coating, load and interlayer material which
may affect the distribution of the contact stress were investigated, with a view to search the
optimized assembly for NCD coated roll ball.
Model Description
Considering the thickness of NCD coating on the roll ball was rather tiny in contrast with the scale
of the ball bearing, a 2D FEM model of the radial section was selected, which was composed of a
roll ball with a diameter of 4.8mm and a couple of bearing rings with width of 8mm and thickness of
2.3mm. The software ANSYS was used to deal with the models, and the mesh was presented in
Fig.1. As Fig.1b shows, the coating on the roll ball consisted of the NCD layer and the interlayer (in
some of the models). The thicknesses were expressed as tf (varied from 2μm to 10μm) and ti (varied
from 0.5μm to 1μm) respectively. The mechanical properties of the models were presented in
Table.1. Three different materials of the ball bearing and two different materials of the interlayer
were investigated.
© (2011) Trans Tech Publications, Switzerlanddoi:10.4028/www.scientific.net/AMR.142.77

Fig.1 Finite element model: (a) holistic mesh and (b) mesh of the coating-substrate.
Table.1 Mechanical properties of the material in the model
Part Material Elastic Modulus (GPa) Poisson Ratio
Substrate
GCr15 208 0.22
SiC 450 0.22
YG8 600 0.22
Coating NCD 1050 0.07
Interlayer Graphite 8 0.28
Amorphous Carbon 80 0.28
The static contact stress of the NCD coated ball was caused by a radial load of 50N to 500N
which was gradually applied on the inside of the inner ring by automatic load steps, as indicated in
Fig.1. The NCD film was assumed to be elastic in all cases, and the residual stress was ignored.
Results and Discussion
Stresses distribution in NCD coated ball. The contact stresses distribution in a 10m thick NCD coated SiC roll ball under a radial load of 200N is shown in Fig.2. A typical Hertzian contact
distribution of radial stress (y) can be observed in Fig.2a, with the maximum compressive stress
presenting at the top of the ball. Fig.2b shows a high axial stress (x) distribution in NCD film cause
of large film bending. High shear stress areas are presented on both side of the central axis, about
50m below the surface as Fig.2c shows. Compared with normal stresses present in Fig.2a and 2b,
shear stress in NCD film is much lower. As a result of the three stress distributions aforementioned,
high equivalent stresses (eqv, von mises stress, shown in Fig.2d ) present in NCD film.
a b
-1029MPa
a
-1591MPa
b
78 Advanced Design and Manufacturing Technology I
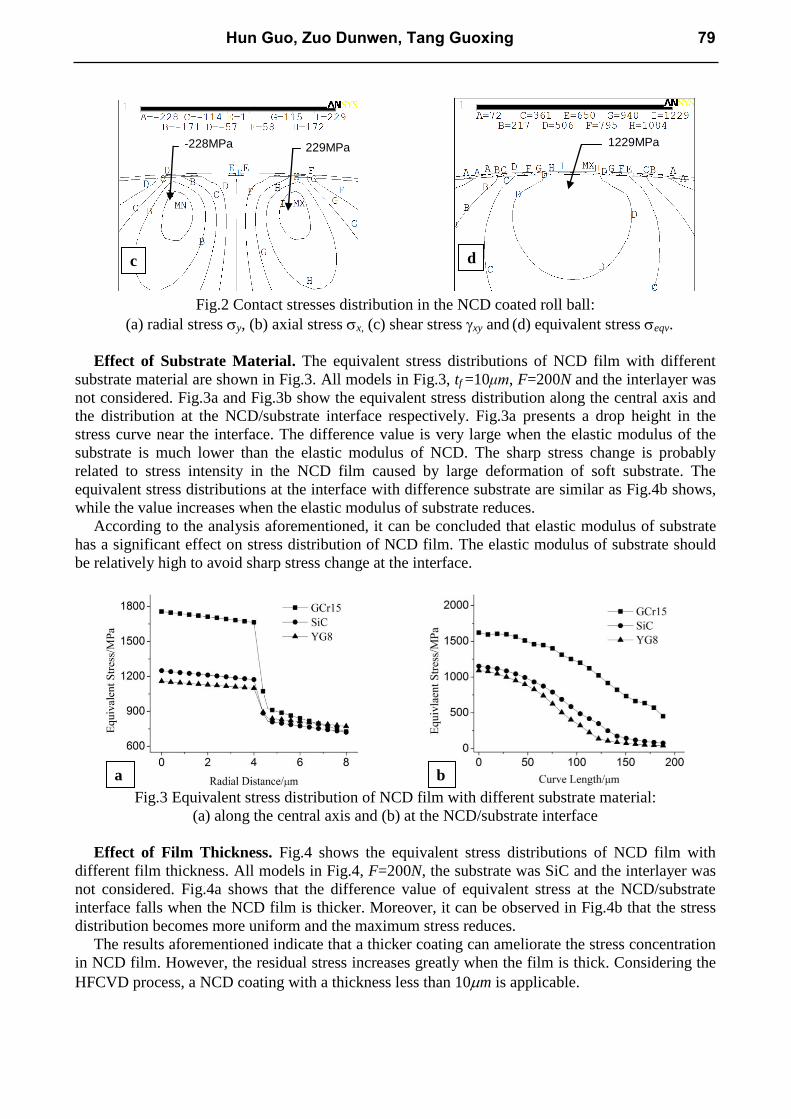
Fig.2 Contact stresses distribution in the NCD coated roll ball:
(a) radial stress y, (b) axial stress x, (c) shear stress xy and (d) equivalent stress eqv.
Effect of Substrate Material. The equivalent stress distributions of NCD film with different
substrate material are shown in Fig.3. All models in Fig.3, tf =10μm, F=200N and the interlayer was
not considered. Fig.3a and Fig.3b show the equivalent stress distribution along the central axis and
the distribution at the NCD/substrate interface respectively. Fig.3a presents a drop height in the
stress curve near the interface. The difference value is very large when the elastic modulus of the
substrate is much lower than the elastic modulus of NCD. The sharp stress change is probably
related to stress intensity in the NCD film caused by large deformation of soft substrate. The
equivalent stress distributions at the interface with difference substrate are similar as Fig.4b shows,
while the value increases when the elastic modulus of substrate reduces.
According to the analysis aforementioned, it can be concluded that elastic modulus of substrate
has a significant effect on stress distribution of NCD film. The elastic modulus of substrate should
be relatively high to avoid sharp stress change at the interface.
Fig.3 Equivalent stress distribution of NCD film with different substrate material:
(a) along the central axis and (b) at the NCD/substrate interface
Effect of Film Thickness. Fig.4 shows the equivalent stress distributions of NCD film with
different film thickness. All models in Fig.4, F=200N, the substrate was SiC and the interlayer was
not considered. Fig.4a shows that the difference value of equivalent stress at the NCD/substrate
interface falls when the NCD film is thicker. Moreover, it can be observed in Fig.4b that the stress
distribution becomes more uniform and the maximum stress reduces.
The results aforementioned indicate that a thicker coating can ameliorate the stress concentration
in NCD film. However, the residual stress increases greatly when the film is thick. Considering the
HFCVD process, a NCD coating with a thickness less than 10m is applicable.
229MPa -228MPa
c
1229MPa
d
a b
Hun Guo, Zuo Dunwen, Tang Guoxing 79
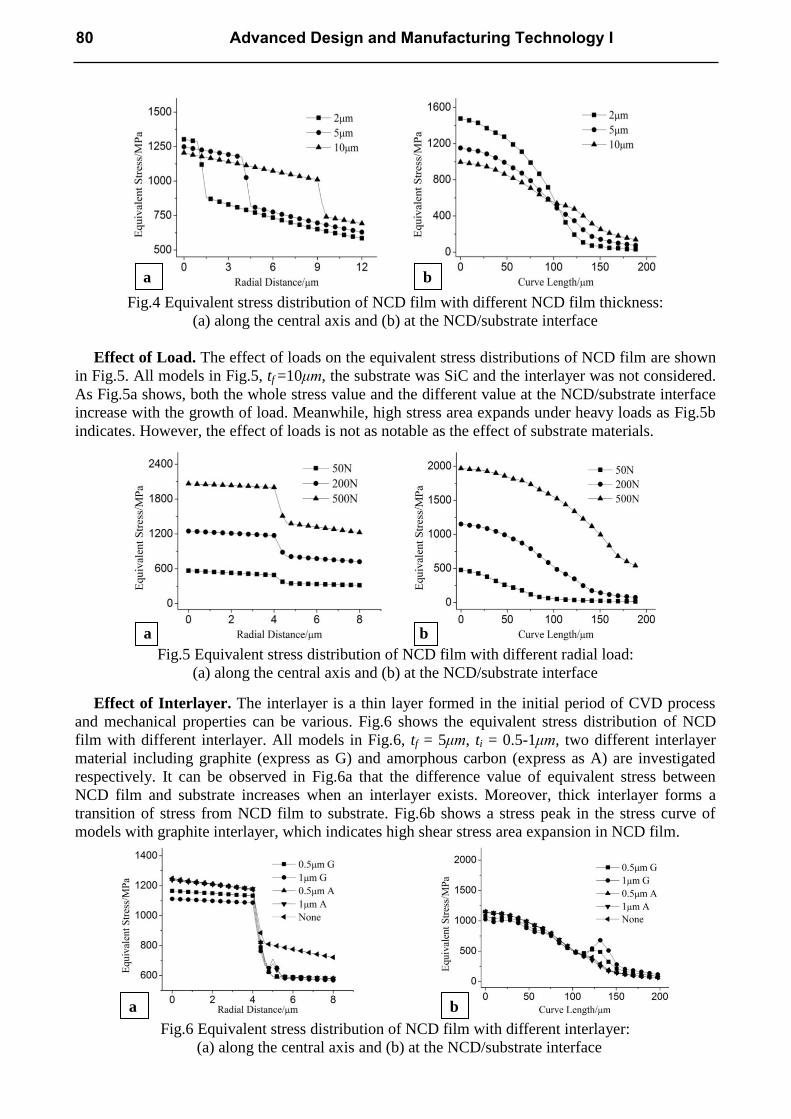
Fig.4 Equivalent stress distribution of NCD film with different NCD film thickness:
(a) along the central axis and (b) at the NCD/substrate interface
Effect of Load. The effect of loads on the equivalent stress distributions of NCD film are shown
in Fig.5. All models in Fig.5, tf =10μm, the substrate was SiC and the interlayer was not considered.
As Fig.5a shows, both the whole stress value and the different value at the NCD/substrate interface
increase with the growth of load. Meanwhile, high stress area expands under heavy loads as Fig.5b
indicates. However, the effect of loads is not as notable as the effect of substrate materials.
Fig.5 Equivalent stress distribution of NCD film with different radial load:
(a) along the central axis and (b) at the NCD/substrate interface
Effect of Interlayer. The interlayer is a thin layer formed in the initial period of CVD process
and mechanical properties can be various. Fig.6 shows the equivalent stress distribution of NCD
film with different interlayer. All models in Fig.6, tf = 5μm, ti = 0.5-1μm, two different interlayer
material including graphite (express as G) and amorphous carbon (express as A) are investigated
respectively. It can be observed in Fig.6a that the difference value of equivalent stress between
NCD film and substrate increases when an interlayer exists. Moreover, thick interlayer forms a
transition of stress from NCD film to substrate. Fig.6b shows a stress peak in the stress curve of
models with graphite interlayer, which indicates high shear stress area expansion in NCD film.
Fig.6 Equivalent stress distribution of NCD film with different interlayer:
(a) along the central axis and (b) at the NCD/substrate interface
a b
a b
a b
80 Advanced Design and Manufacturing Technology I
Generally, the toughness and fatigue strength of the interlayer materials are not as well as that of
substrate material and coating material. Considering the analysis above, soft interlayer such as
graphite should be inhibited in CVD process.
Conclusion
The FEA results present a stress concentration in NCD film of the NCD coated roll ball under the
action of radial force. Substrate with low elastic modulus and heavy load will enlarge the difference
of equivalent stress value at NCD/substrate interface. Thick film will make the stress distribution at
the interface uniform. Soft interlayer should be inhibited to avoid extra stress in contact status.
Acknowledgements
The supports of NNSF of China (No. No.50605032), NNSF of Jiangsu province (No. No:BK2008382)
are greatly acknowledged.
References
[1] W.Z. Lu, D. Zuo, W. Min, et al: Mechanical Engineering, Vol. 146(8) (2003), p.7-9
[2] F. Xu, D. Zuo, W.Z. Lu, et al: Acta Metallurgica Sinica, Vol. 44 (1) (2008), p.74-78
[3] M. Amaral, F.J. Oliveira, M. Belmonte: Diamond and Related Materials, Vol. 13(2004), p.643-647
[4] A. Erdemir, G.R. Fenske, A.R. Krauss, et al: Surface and Coatings Technology, vol.
120-121(1999), p.565-572.
[5] W.Z.Lu, D.W.Zuo, F.Xu, et al. : Bulletin of the Chinese ceramic society, Vol.27(2008),p1010
[6] M.M. Dezzani, P.K. Pearson: Journal of Engineering for Gas Turbines and Power, Vol. 118
(1996), p.449-452.
Hun Guo, Zuo Dunwen, Tang Guoxing 81

Low Cycling Thermal Fatigue of Large-Scale Marine Diesel Engine Piston
Xie Ronga
Jiangsu Maritime Institute, Nanjing 210016, China
Keywords: marine diesel engine, piston, fatigue, growth rate, intensity factor.
Abstract. According to the fatigue and fracture reliability theory, the criterion of piston fatigue
crack growth rate /da dN is induced using set-value theory of fatigue and fracture mechanics on the
basis of actual safety and life of the marine diesel engine piston. Life analysis and security
evaluation of large marine diesel engine piston was implemented with this criterion, which affords
an important reference for the application of large marine diesel engine.
Introduction
With the growing scale and developing automation of the ships, it is necessary for the marine diesel
engine piston to work under low-speed, high-power load case intelligently. Thus, the components in
the combustion chamber will be in worse condition. Surface damage and fatigue crack tend to occur
for the piston as it always operate with high mechanical load, high heat load and violent friction. In
some cases the fatigue of piston reduces the reliability of diesel engine. The prediction of thermal
fatigue life of the piston for large marine diesel engine under low cycle was investigated in this
paper, considering the instability condition of navigation.
Many attentions have been focused on the thermal fatigue research of the piston for large marine
diesel engine under low cycle in recently years. The first reasons is, as one of the moving parts, the
cooling and heat emission condition of the piston is relatively bad; Secondly, thermal fatigue under
low cycle (<105cycles) is more likely to cause components failure in the combustion chamber than
that under high cycle one (>105cycles); Thirdly, most of the piston fatigue are caused by low
thermal cycle, which is believed to form in the start/stop process of diesel engine. According the
piston’s anti-fatigue life, an allowable number start/stop count can be defined. The international
allowable start/stop count of diesel engine has been set. However, for large marine diesel engine,
the influence of practical navigation conditions should be considered.
Suppose that a ship encounters the “runaway” phenomenon under heavy sea condition, which
means the engines rotate speed increases cause by propeller emergence and load decrease of the
propeller shaft. On this occasion, the throttle flow of the diesel engine will be reduced quickly by
the steady speed device (even to 0) in order to keep the speed steady. When the propeller submerges
again, the shaft load rises, thus throttle flow will be brought up to adapt the change of load. Actually
the process aforementioned is a thermal cycle. When the ship arrives the port, fatigue crack are
found in two of six cylinders of the diesel engine, among which presents a through crack.
Thermal Fatigue Crack Analysis
The crack of large marine diesel engine piston always appears in piston crown, ring groove, cooling
side, and keyway, as shown in Fig.1, which is mainly caused by thermal stress (particularly under
strong load). When the engine is running, high temperature fatigue, creep and thermal fatigue may
appear on the top surface of the piston. Fatigue failure may happen when the working condition is
worse. The top surface, which touches fire, subjects periodically high temperature and pressure.
Generally, the temperature on the top surface can reach 400℃~500℃. The temperature difference
between the top surface and cooling surface may reach 300℃~400℃. Compressive stress and
tensile stress generate on the two surfaces separately. The compressive stress on the top surface may
© (2011) Trans Tech Publications, Switzerlanddoi:10.4028/www.scientific.net/AMR.142.82
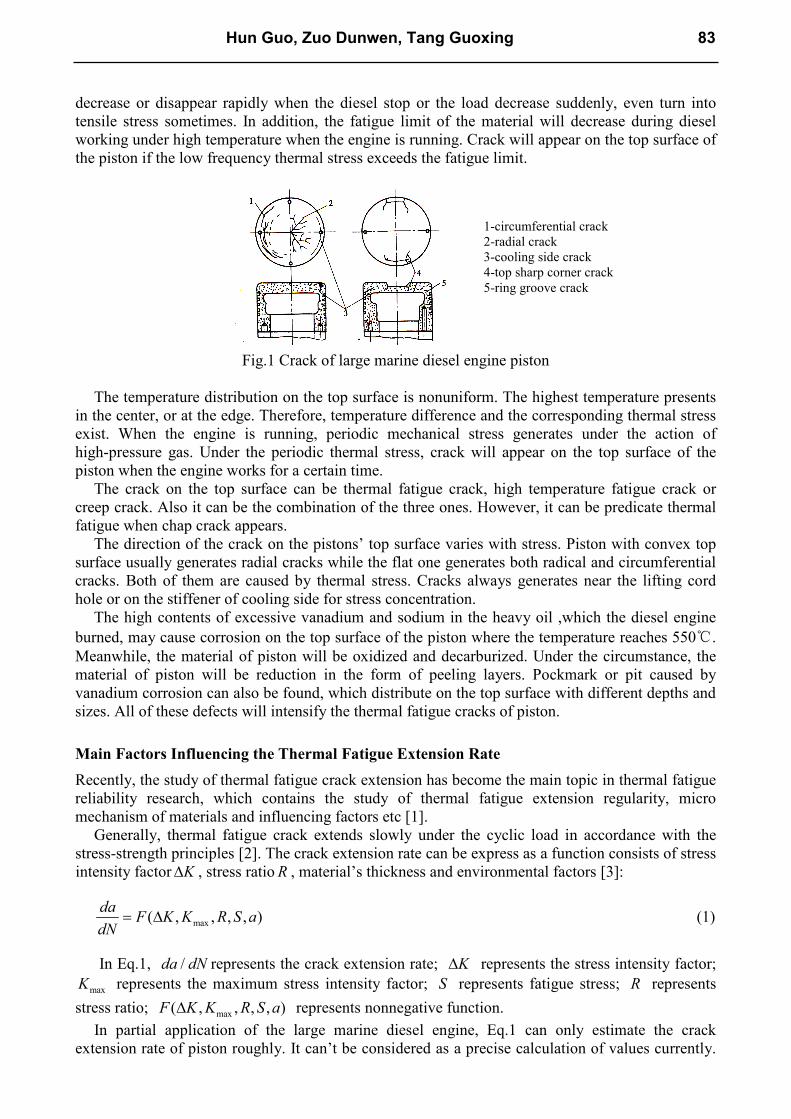
decrease or disappear rapidly when the diesel stop or the load decrease suddenly, even turn into
tensile stress sometimes. In addition, the fatigue limit of the material will decrease during diesel
working under high temperature when the engine is running. Crack will appear on the top surface of
the piston if the low frequency thermal stress exceeds the fatigue limit.
Fig.1 Crack of large marine diesel engine piston
The temperature distribution on the top surface is nonuniform. The highest temperature presents
in the center, or at the edge. Therefore, temperature difference and the corresponding thermal stress
exist. When the engine is running, periodic mechanical stress generates under the action of
high-pressure gas. Under the periodic thermal stress, crack will appear on the top surface of the
piston when the engine works for a certain time.
The crack on the top surface can be thermal fatigue crack, high temperature fatigue crack or
creep crack. Also it can be the combination of the three ones. However, it can be predicate thermal
fatigue when chap crack appears.
The direction of the crack on the pistons’ top surface varies with stress. Piston with convex top
surface usually generates radial cracks while the flat one generates both radical and circumferential
cracks. Both of them are caused by thermal stress. Cracks always generates near the lifting cord
hole or on the stiffener of cooling side for stress concentration.
The high contents of excessive vanadium and sodium in the heavy oil ,which the diesel engine
burned, may cause corrosion on the top surface of the piston where the temperature reaches 550℃.
Meanwhile, the material of piston will be oxidized and decarburized. Under the circumstance, the
material of piston will be reduction in the form of peeling layers. Pockmark or pit caused by
vanadium corrosion can also be found, which distribute on the top surface with different depths and
sizes. All of these defects will intensify the thermal fatigue cracks of piston.
Main Factors Influencing the Thermal Fatigue Extension Rate
Recently, the study of thermal fatigue crack extension has become the main topic in thermal fatigue
reliability research, which contains the study of thermal fatigue extension regularity, micro
mechanism of materials and influencing factors etc [1].
Generally, thermal fatigue crack extends slowly under the cyclic load in accordance with the
stress-strength principles [2]. The crack extension rate can be express as a function consists of stress
intensity factor K∆ , stress ratio R , material’s thickness and environmental factors [3]:
max( , , , , )da
F K K R S adN
= ∆ (1)
In Eq.1, /da dN represents the crack extension rate; K∆ represents the stress intensity factor;
maxK represents the maximum stress intensity factor; S represents fatigue stress; R represents
stress ratio; max( , , , , )F K K R S a∆ represents nonnegative function.
In partial application of the large marine diesel engine, Eq.1 can only estimate the crack
extension rate of piston roughly. It can’t be considered as a precise calculation of values currently.
1-circumferential crack
2-radial crack
3-cooling side crack
4-top sharp corner crack
5-ring groove crack
Hun Guo, Zuo Dunwen, Tang Guoxing 83
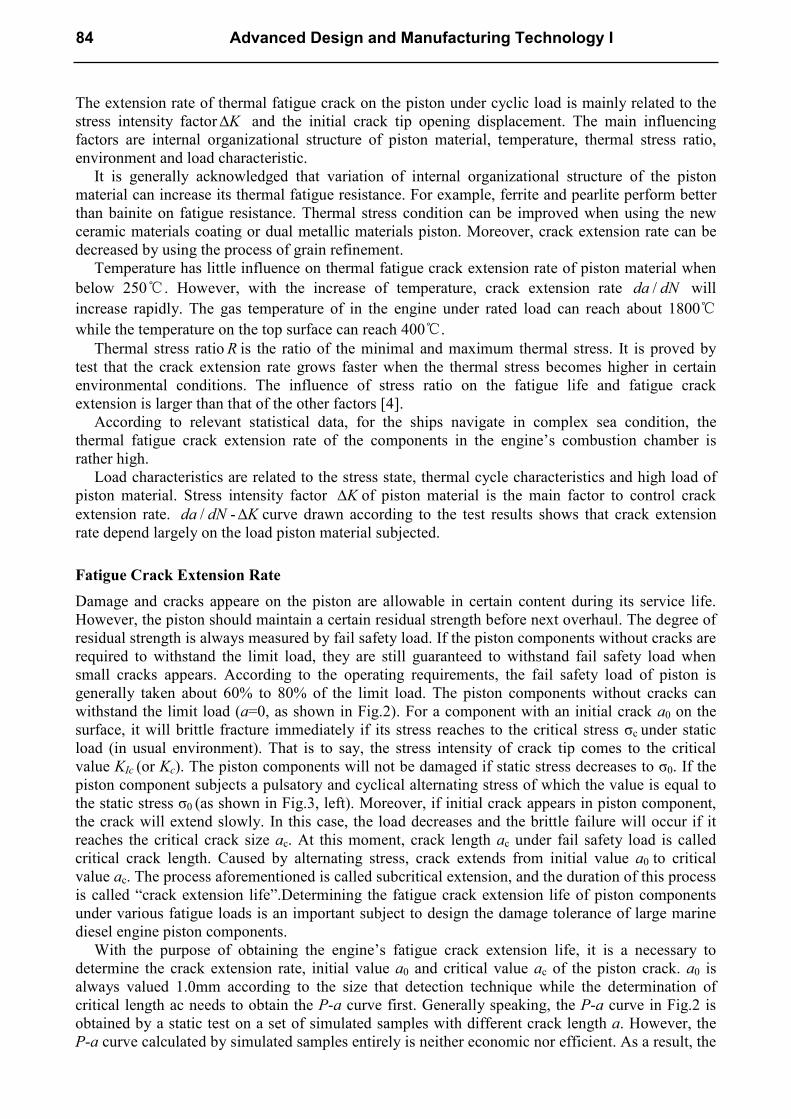
The extension rate of thermal fatigue crack on the piston under cyclic load is mainly related to the
stress intensity factor K∆ and the initial crack tip opening displacement. The main influencing
factors are internal organizational structure of piston material, temperature, thermal stress ratio,
environment and load characteristic.
It is generally acknowledged that variation of internal organizational structure of the piston
material can increase its thermal fatigue resistance. For example, ferrite and pearlite perform better
than bainite on fatigue resistance. Thermal stress condition can be improved when using the new
ceramic materials coating or dual metallic materials piston. Moreover, crack extension rate can be
decreased by using the process of grain refinement.
Temperature has little influence on thermal fatigue crack extension rate of piston material when
below 250℃. However, with the increase of temperature, crack extension rate /da dN will
increase rapidly. The gas temperature of in the engine under rated load can reach about 1800℃
while the temperature on the top surface can reach 400℃.
Thermal stress ratio R is the ratio of the minimal and maximum thermal stress. It is proved by
test that the crack extension rate grows faster when the thermal stress becomes higher in certain
environmental conditions. The influence of stress ratio on the fatigue life and fatigue crack
extension is larger than that of the other factors [4].
According to relevant statistical data, for the ships navigate in complex sea condition, the
thermal fatigue crack extension rate of the components in the engine’s combustion chamber is
rather high.
Load characteristics are related to the stress state, thermal cycle characteristics and high load of
piston material. Stress intensity factor K∆ of piston material is the main factor to control crack
extension rate. /da dN - K∆ curve drawn according to the test results shows that crack extension
rate depend largely on the load piston material subjected.
Fatigue Crack Extension Rate
Damage and cracks appeare on the piston are allowable in certain content during its service life.
However, the piston should maintain a certain residual strength before next overhaul. The degree of
residual strength is always measured by fail safety load. If the piston components without cracks are
required to withstand the limit load, they are still guaranteed to withstand fail safety load when
small cracks appears. According to the operating requirements, the fail safety load of piston is
generally taken about 60% to 80% of the limit load. The piston components without cracks can
withstand the limit load (a=0, as shown in Fig.2). For a component with an initial crack a0 on the
surface, it will brittle fracture immediately if its stress reaches to the critical stress σc under static
load (in usual environment). That is to say, the stress intensity of crack tip comes to the critical
value KIc (or Kc). The piston components will not be damaged if static stress decreases to σ0. If the
piston component subjects a pulsatory and cyclical alternating stress of which the value is equal to
the static stress σ0 (as shown in Fig.3, left). Moreover, if initial crack appears in piston component,
the crack will extend slowly. In this case, the load decreases and the brittle failure will occur if it
reaches the critical crack size ac. At this moment, crack length ac under fail safety load is called
critical crack length. Caused by alternating stress, crack extends from initial value a0 to critical
value ac. The process aforementioned is called subcritical extension, and the duration of this process
is called “crack extension life”.Determining the fatigue crack extension life of piston components
under various fatigue loads is an important subject to design the damage tolerance of large marine
diesel engine piston components.
With the purpose of obtaining the engine’s fatigue crack extension life, it is a necessary to
determine the crack extension rate, initial value a0 and critical value ac of the piston crack. a0 is
always valued 1.0mm according to the size that detection technique while the determination of
critical length ac needs to obtain the P-a curve first. Generally speaking, the P-a curve in Fig.2 is
obtained by a static test on a set of simulated samples with different crack length a. However, the
P-a curve calculated by simulated samples entirely is neither economic nor efficient. As a result, the
84 Advanced Design and Manufacturing Technology I
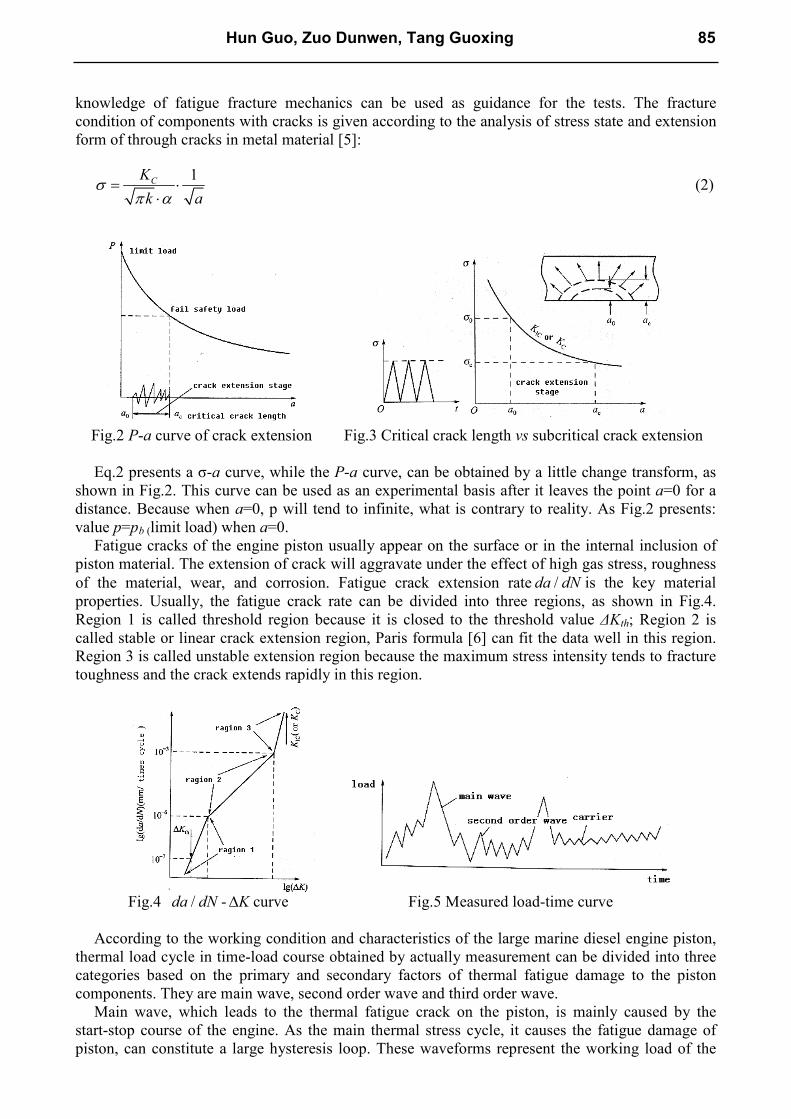
knowledge of fatigue fracture mechanics can be used as guidance for the tests. The fracture
condition of components with cracks is given according to the analysis of stress state and extension
form of through cracks in metal material [5]:
1CK
k aσ
π α= ⋅
⋅ (2)
Fig.2 P-a curve of crack extension Fig.3 Critical crack length vs subcritical crack extension
Eq.2 presents a σ-a curve, while the P-a curve, can be obtained by a little change transform, as
shown in Fig.2. This curve can be used as an experimental basis after it leaves the point a=0 for a
distance. Because when a=0, p will tend to infinite, what is contrary to reality. As Fig.2 presents:
value p=pb (limit load) when a=0.
Fatigue cracks of the engine piston usually appear on the surface or in the internal inclusion of
piston material. The extension of crack will aggravate under the effect of high gas stress, roughness
of the material, wear, and corrosion. Fatigue crack extension rate /da dN is the key material
properties. Usually, the fatigue crack rate can be divided into three regions, as shown in Fig.4.
Region 1 is called threshold region because it is closed to the threshold value ∆Kth; Region 2 is
called stable or linear crack extension region, Paris formula [6] can fit the data well in this region.
Region 3 is called unstable extension region because the maximum stress intensity tends to fracture
toughness and the crack extends rapidly in this region.
Fig.4 /da dN - K∆ curve Fig.5 Measured load-time curve
According to the working condition and characteristics of the large marine diesel engine piston,
thermal load cycle in time-load course obtained by actually measurement can be divided into three
categories based on the primary and secondary factors of thermal fatigue damage to the piston
components. They are main wave, second order wave and third order wave.
Main wave, which leads to the thermal fatigue crack on the piston, is mainly caused by the
start-stop course of the engine. As the main thermal stress cycle, it causes the fatigue damage of
piston, can constitute a large hysteresis loop. These waveforms represent the working load of the
Hun Guo, Zuo Dunwen, Tang Guoxing 85

piston in heat condition. Although the large marine diesel engine rarely starts and stops frequency
and the content of the main wave in the load spectrum are little, each cycle causes a considerable
damage to the piston. Plastic deformation always happens in the stress concentration area of the
piston under the effect of this stress. Considering that the load cycle has a very complex interaction,
it is always keeps the natural form of load changing though time in experiments.
Besides the main thermal load, piston often subjects some secondary thermal loads caused by
starting-stopping during working. These secondary thermal loads manifested as second order wave,
which constituting a smaller hysteresis loop. The second wave generates in the cases such as the
course of increase or reduce throttle suddenly during the marine diesel engine occurs the “runaway
phenomenon” that aforementioned. The second wave always accompany the overload thermal cycle
(main wave) during speed-change processes in mobile navigation. According to the rain flow-loop
counting method, the second order wave can be easily distinguished from main wave. Multiple
small second order waves can be converted a larger one in experimental spectrum.
By the damage equivalent principle, a large and a small cycle can be converted a larger thermal
load cycle. A large difference with actual piston thermal fatigue life will occur if the start/stop count
is considered as the primary data in the thermal fatigue life analysis of the large marine diesel
engine piston. Thus, proper correction is necessary in consideration of the actual working condition.
Third order waves are higher order and microdose cycle carrier which will not cause damage.
The quantity of the third waves is large. Such waveforms are slightly jagged in experimental record.
They can be filtered out by setting “threshold value” in data preprocessing.
Conclusion
Security evaluation of the thermal fatigue crack on the piston of large marine diesel engine is very
complex. Based on the integration of the fatigue crack extension rate formula and quantization
criterion of fatigue stress cycle classification, thermal fatigue crack extension rate is analyzed using
the set-value theory of fatigue and fracture mechanics. Results show that the calculated value are
consistent with actual results, what indicates important engineering application value of the method.
The thermal stress of large marine diesel engine is rather large. The calculation of the start/stop
count on the basis of the evaluation of thermal fatigue life by integrating the main wave causing
thermal fatigue and navigational conditions of ships is significant.
Essentially, the influencing factors of thermal fatigue extension rate of piston are numerous and
stochastic. For thermal fatigue crack extension rate of large marine piston, it is vital to analyze the
thermal fatigue resistance of piston and apply set-value theory rationally to describe random
variable in actual working of large marine diesel engine by using the reliability theory accurately.
References
[1] C.L.Xu, et al: Vehicle Engine Vol.4(2002), p.27-29
[2] Q.Z.Wang: Fuzhou Science and Technology Press.1985, p.213-242
[3] M.SMiller, G.P.Gallagher: ASTM STP 738, 1981, p.205-251
[4] J.W.Provan: Aviation Industry Press, 1989, p.49-64
[5] J.J.Xiong: National Defence Industry Press (2008), p.12-22
[6] P.C.Paris, F.Erdogan: Transaction ASME (Sereis d) Vol.85 (1963), p.528-534
86 Advanced Design and Manufacturing Technology I

Study on Remote Monitoring and Control System for Construction Vehicle
Shengli Song1, a, Shuijun Huang1, Fantun Su1, Qi Zhang1 and Ren He2 1Engineering Institute of Corps of Engineers, PLA University of Sci. & Tech, China
2School of Automobile and Traffic Engineering, Jiangsu University, China
Keywords: remote monitoring, construction vehicle, Embedded System, OPC, mobile communication
Abstract. This paper is aimed to constitute a distributed system for remote monitoring and control of
construction vehicle. And this system is mainly divided into three parts: intelligent vehicle
monitoring terminal, remote monitoring center and communication system. The functions and
architectures of each part are discussed respectively in detail. The critical technologies of
implementing the system are also deeply studied, which include CAN bus technology, the embedded
system technology, mobile communication technology, database technology and so on. It is indicated
that this system will meet the requirements of all the users and clients, including the field operators,
construction managers, manufacturers, etc.
Introduction
It is difficult for people to acquire the real-time state information of the construction vehicle and
control the equipment timely, due to the complex structure, wide distribution and terrible working
conditions. As a result, the construction vehicle cannot behave as people expected. With the upgrade
of technology and development of large-scale production, domestic and international engineers and
manufacturers pay more and more attention to the online condition monitoring for modern
equipment. Nowadays, the competition between products not only focuses on outstanding quality, but
also requires quick service without any delay. Therefore, it is necessary to accomplish real-time
monitoring, fault diagnosis and remote information exchange for construction vehicle with the
application of information technology.
Based on the theories of Embedded System, Fieldbus technology, mobile communication
technology, network technology and database technology etc, we build up the architecture of the
Remote Monitoring and Control System for Construction Vehicle according to modular design in this
paper. The Remote Monitoring and Control System for Construction Vehicle is divided into three
main parts: intelligent vehicle monitoring terminal, remote monitoring center and communication
system. The system is opening and extensible, which is convenient to expand and upgrade. As a
result, it will act as an effective role that meets the customers’ requirements.
The Intelligent Vehicle Monitoring Terminal Based on Embedded System and CAN Fieldbus
The embedded computer communicates with intelligent sensors and controller via CAN fieldbus;
GPS module is used for acquiring the real-time position information, and wireless communication
module is aimed to establish communication with the remote monitoring center. The structure of the
intelligent vehicle monitoring terminal is shown in Fig.1, and the key technologies of accomplishing
this system include embedded system and fieldbus technology [1, 2]
.
Embedded System. An embedded system is a computer system designed to perform one or a few
dedicated functions with real-time computing constraints, which is embedded as part of a complete
device often including hardware and mechanical parts. Generally, it is designed according to the
system's actual needs, and strived to use the smallest size, lowest cost to accomplish the function of
the system. The embedded processor usually divided into four main categories: MCU (Micro Control
Unit), MPU (Micro Process Unit), DSP (Digital Signal Processor) and SOC (System on Chip).
© (2011) Trans Tech Publications, Switzerlanddoi:10.4028/www.scientific.net/AMR.142.87
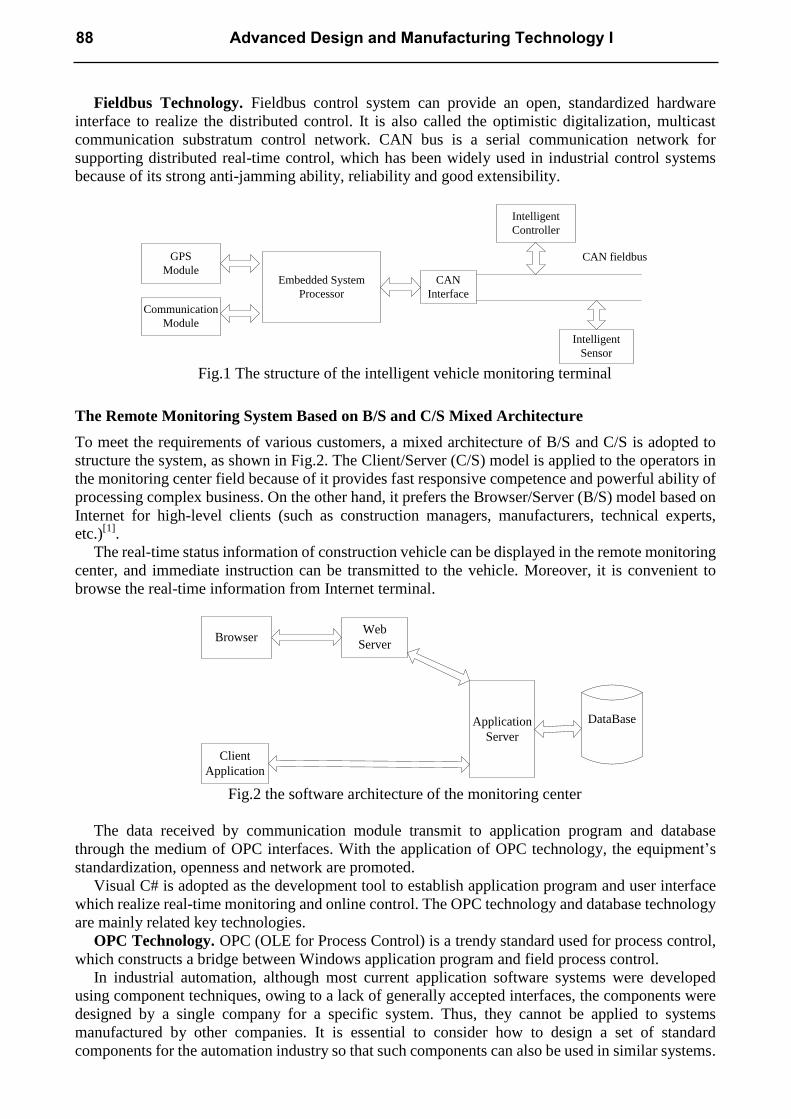
Fieldbus Technology. Fieldbus control system can provide an open, standardized hardware
interface to realize the distributed control. It is also called the optimistic digitalization, multicast
communication substratum control network. CAN bus is a serial communication network for
supporting distributed real-time control, which has been widely used in industrial control systems
because of its strong anti-jamming ability, reliability and good extensibility.
Embedded System
Processor
CAN
Interface
GPS
Module
Communication
Module
Intelligent
Controller
Intelligent
Sensor
CAN fieldbus
Fig.1 The structure of the intelligent vehicle monitoring terminal
The Remote Monitoring System Based on B/S and C/S Mixed Architecture
To meet the requirements of various customers, a mixed architecture of B/S and C/S is adopted to
structure the system, as shown in Fig.2. The Client/Server (C/S) model is applied to the operators in
the monitoring center field because of it provides fast responsive competence and powerful ability of
processing complex business. On the other hand, it prefers the Browser/Server (B/S) model based on
Internet for high-level clients (such as construction managers, manufacturers, technical experts, etc.)
[1].
The real-time status information of construction vehicle can be displayed in the remote monitoring
center, and immediate instruction can be transmitted to the vehicle. Moreover, it is convenient to
browse the real-time information from Internet terminal.
Client
Application
BrowserWeb
Server
Application
Server
DataBase
Fig.2 the software architecture of the monitoring center
The data received by communication module transmit to application program and database
through the medium of OPC interfaces. With the application of OPC technology, the equipment’s
standardization, openness and network are promoted.
Visual C# is adopted as the development tool to establish application program and user interface
which realize real-time monitoring and online control. The OPC technology and database technology
are mainly related key technologies.
OPC Technology. OPC (OLE for Process Control) is a trendy standard used for process control,
which constructs a bridge between Windows application program and field process control.
In industrial automation, although most current application software systems were developed
using component techniques, owing to a lack of generally accepted interfaces, the components were
designed by a single company for a specific system. Thus, they cannot be applied to systems
manufactured by other companies. It is essential to consider how to design a set of standard
components for the automation industry so that such components can also be used in similar systems.
88 Advanced Design and Manufacturing Technology I

The OPC standard discriminates between hardware providers and software developers. It provides
a means to gather data from a data source and communicate the data to any client application using a
standard method. The OPC server enables direct communication between the devices used in the
system and software applications. Furthermore, the OPC server also has the potential to communicate
with software applications used in the system. It enables companies to produce various properties
such as forming visual interface, storing data by using third-party software [5]
.
Monitoring Center
Communication
Server Embedded System Process
Socket
Application
Program
OPC
DataBase
Fig.3 data exchange flow
Database Technology. Database is the center of the monitoring system, which guarantees the
real-time data exchange and storage. And the database system must support TCP/IP protocol to make
sure that it allows users’ remote data visit through the Internet. The SQL server is adopted to support
database exploitation in this system.
Communication System Based on Mobile Communication Network
The communication system is the information bridge that connecting the monitoring center and the
construction vehicle.
Usually, construction vehicle information includes status information and GPS position
information, video information may be required in some special circumstance as well. Currently,
GSM/GPRS mode is applied in most construction vehicle for transmitting information, but when it
deals with some information of large data and real-time demanding (such as video information),
GPRS can not meet the requirement. With 3G technology's commercial application in China, 3G
networks will be widely covering and construction vehicles will get a promotion with the supporting
of 3G technology.
By integrated GPRS/3G DTU (Data Terminal Unit), Vehicle monitoring system can communicate
with the monitoring center. It is flexible to choose one of the two mobile networks as the
communication platform according to local network condition and application requirement.
In order to achieve data communication via Internet, GPRS/3G DTU support TCP/IP protocol.
And in the link layer, by adopting PPP protocol, GPRS/3G networks allow each node’s dynamic
login, which look exactly like PC login through cable modem. In the application layer, the vehicle
embedded system process and communication program of remote monitoring center exchange data
through Socket Interface (as shown in Fig.3).
Socket Technology. Socket, which is used to describe the IP address and port, is the cornerstone
of communication through networks. It can establish connection and transmission for an appointed
protocol (such as TCP, UDP), and can be used for most major operating systems (Windows, DOS,
UNIX, etc).
3G Technology. 3G (3rd Generation) referring to the third generation of mobile telephony
technology, is the cellular mobile communications technology which support high-speed data
transmission. Its main feature is to provide high-speed data transmission services, which preferably
meet the requirements of the image, music, video and other multimedia information’s transmission.
Currently, there are three commercial running technical standards in China: WCDMA, TD-SCDMA,
and CDMA2000.
Hun Guo, Zuo Dunwen, Tang Guoxing 89
Conclusion
This paper has presented a distributed system for remote monitoring and control of construction
vehicle, which is composed of three major parts: the intelligent vehicle monitoring terminal, remote
monitoring center and communication system. Then, the functions and architectures of each part are
discussed respectively in detail. With deeply studying on the key technologies, the system’s real-time
monitor ability and reliability will be effectively enhanced and promoted. Especially, the system is
opening and extensible, which is convenient to expand and upgrade. As a result, it will meet the
requirements of the customers and clients.
Acknowledgment
This work was supported by Automobile project priority laboratory open Funds of Jiangsu
(QC200701).
References
[1] L.Q. Liang: Construction Machinery and Equipment, Vol.38 (2007) No.6, p.5-9
[2] Y. Liu, G.R. Zhou, L.S. Xu: Industrial Control Computer, Vol.21 (2008) No.8, p.34-36
[3] S.A. Deloach, M.F. Wood: International Journal of Software Engineering and Knowledge
Engineering, Vol.11 (2001) No.3, p.231-258.
[4] M.A. Timusk, M.G. Lipsett, J. McBain, C.K. Mechefske: Journal of Vibration and Acoustics,
Vol.131 (August, 2009)
[5] C. Sahin, E.D. Bolat: Computer Standard & Interface, Vol.31 (2009), p.984-993
[6] Y.D. Guan: Electron Technology Application, (2003) No.2, p.18-21
[7] C.G. Wang, C.G. Chub, C.W. Yina: Computers in Industry, Vol.45 (2001), p.215-229
[8] S. Leng, L. Li: Industrial Control Computer, Vol.13 (2000) No.1, p.7-10
[9] W.Y. Ling, M.P. Jia, F.Y. Xu: Manufacturing Automation, Vol.24 (2000) No.7, p.26-29
[10] J.X. Feng, G.X. Wang, D.B. Zhang: Journal of Northeastern University, Vol.23 (2002),
p.617-620.
90 Advanced Design and Manufacturing Technology I

Research on New Structural Quay Container Crane
Liu Shanpinga
Jiangsu Maritime Institute, Nanjing 210016, China
Keywords: Quay Container Crane; high efficient; liftable bridge support type; high support based type; dual-lifting type; dual-jacklift type; elevator type
Abstract. The method to improve the loading and unloading efficiency of container ships was
elaborated in this paper. New structure of bridge support liftable quay container crane, dual-jacklift
quay container crane, dual-lifting quay container crane, high support base quay container crane and
elevator quay container crane was applied to promote the performance of quay container crane. The
working principle and characteristic of those new quay container cranes were analyzed in details.
Introduction
Quay container crane is an exclusive crane for loading and unloading containers between container
ship and storage yard. It has even been employed in the operation by the advantages of long span and
large radius in or out crane at some special docks [1].
Fig.1 Illustration of conventional quay container crane
As illustrated in Fig.1, the quay container crane mainly includes steel structure (e.g., bridge frame,
bridge support, draw bar), elevating mechanism, pitching mechanism, tilting mechanism, travalling
mechanism for large mobiles and small mobiles, driving mechanism, machine room, lifting appliance
of containers, electrical devices and other safe and assistant devices [2].
Working efficiency is directly determined by cargo handling productivity and velocity of the quay
container crane. In order to obtain further advanced loading and unloading efficiency of container
ships, main parameters such as load rated, lifting height, working speed of conventional quay
container crane should be expanded [3]. However, improvement of main parameters of cranes is not
only confined by safty requiments and operating skill, but also increasing the weight of crane, which
would exceed carrying capacity of the dock. As a result, expanding parameters of crane to cope with
macro-scale operation is greatly limited.
In recent years, some valuable assumation in structual style has been promoted to improve the
performance of quay container crane. Some of these technology has been significantly affected the
development of crane, and a few technology has been successfully applied in the loading and
unloading operation. The innovated structure of crane mainly includes bridge support liftable quay
container crane, dual-jacklift quay container crane, dual-lifting quay container crane, high support
base quay container crane, elevator quay container crane, etc.
© (2011) Trans Tech Publications, Switzerlanddoi:10.4028/www.scientific.net/AMR.142.91

Liftable Bridge Support Quay Container Crane
Fig.2 shows the liftable bridge support quay container crane. The characteristic of this crane is the
lifting bridge support mechanism which can be adapted to carry various container. The height of
bridge support can be adjusted according to the form of quay container crane. The illustrated liftable
bridge support quay container crane, designed and produced by Shanghai Zhenhua Port Machinery
Co.Ltd, China, has a total lifting bridge support height of 20 meters, a distance of 5 meters with each
stop position. The whole stop position is 5. One-time fixed position method is applied to aimed at
different scale container for different ships.
Liftable bridge support structure can improve the productivity because of its avoiding exceeded
hoist distance, reducing vibrational angle, shortening operation time and enlarging the sighting
distance. Liftable bridge support quay container crane is applicable for dock of different size
container ships, but limited for its high manufacturing cost, complex mechanism. The over weight of
the whole machine is about 1000t.
Fig.2 Liftable bridge support quay
container crane
Fig.3 Dual-jacklift quay container crane
Dual-jacklift quay container crane
Fig.3 shows the dual-jacklift quay container crane. Based on liftable bridge support quay container
crane, a relay platform and an additional jacklift are added into the system. It divides the whole
operation process into several links, which can work concurrently and shortening the duty time.
Dual-jacklift quay container crane equips with two self-propelled jacklift, different with height.
The higher one, which can be lift about 40 meters, is paved on the rail of girder. The lower one, which
can be lift about 15 meters, is paved on the connecting beam of the frame. The equipmet is used as a
relay platform to re-load and re-unload the container from the container truck or AGV system. These
two jacklifts can be operated independently. The “relay” operation could be executed on the platform
between higher and lower jacklift. When unloading containers, higher jacklift transports containers
onto the relay platform, and then lower jacklift transports them downwards to container carrier
vehicles aground; and vice verse. This “relay” can deal with problems of lifting height over 40 meters
on the ship and lifting height below 1.3 meters on the carrier vehicle. The successful application of
dual-40 foot jacklift quay container crane on dock has promoted the loading and unloading effiency
and reduced labor intensity.
Compared with conventional crane, the advantages of dual-jacklift quay container crane are as
follows:
1. The overhigh jacklift and overlong bracket difficulties in Panama period can be settled by
dual-40foot jacklift quay container crane. The independent operation of higher and lower jacklift has
greatly optimized the working path and easily fixed the hand over and take over position, thus
promoting the transporting efficiency.
2. The productivity of dual-jacklift quay container crane is more than 1.5 times compared with
traditional crane under the same working condition.
relay platform
higher jacklift
lower jacklift
92 Advanced Design and Manufacturing Technology I

3. Three dual-jacklift cranes would replace four or five conventional cranes with the same
transportion capacity, which makes larger working space on the front edge of dock.
Lifting equipment in higher jacklift container crane is either a single or twin lifting appliance. The
lower jacklift container crane is a standard one, which makes single and twin operation possible. The
dual-40 foot jacklift quay container crane has been widly employed in major container transporting
harbor, and significantly affected the whole industry. With the development of dual jacklift quay
container crane, this technology will be improved and completed. It can be estimated that higher
efficiency will be achieved if tri-lifting appliance was equipped both in higher and lower jacklift.
Dual-Lifting Quay Container Crane
Fig.4 shows the mobile transitive basket dual-lifting quay container crane. Two sets of mobile trolly
system, two sets of lifting facility and a center trolly moving along the bridge rail which used for
transfering containers between two sets of trolly system are embed in this dual-lifting quay container
crane.
Fig.4 Dual-lifting quay container crane
The whole transporting process of container includes elevating one of the mobile trolly system,
translating center trolly, and elevatiing the other trolly system. Elevation of containers is executed
only by mobile trolly system, and translation of containers is executed by center trolly. Minimum
height of the loaded mobile trolly is used as reference height of center trolly when containers are
lifted. When every mobile trolly system is in elevating situation or preparing situation for lifting the
next container, the center trolly will carry containers so as to speed up loading and unloading
procedure.
Simulative investigated by Paceco Co. Ltd, America, showed that the loading and unloading rate
of every single crane is 93 TEU/h in the situation of arraying 13 void compartment and cover board
container ships on the loading dock. In front of dock the transporting process in rear woking place is
methodizing with less dual-lifting quay container crane used for laoding and unloading operation.
Because of the advantage of simple loading and unloading mechanism and it’s easily automatic
control, HITACHI LTD (JP) STK, Japan, had applied for a patent of this kind of crane (patent number
JP10-324493).
High Support Base Quay Container Crane
This kind of crane constructs a firm structure as the support base of conventional container loading
bridge, and arrays lots of quay container cranes with low portal. Inside the support base, there are
intermediate platforms and mobiling trollies. During the loading and unloading operation process,
containers are carried onto the intermediate platform from the ship by crane trolly and then moved
away by the trolly to the platform inside the support base.
Owing to the high support base, the portal height and width of quay container crane is decreasd,
leading to lighter working mechanism, lower wheel-pressure, less cost of this crane compared with
the traditional one. With the high support base linked mutiple quay container cranes, high loading and
Hun Guo, Zuo Dunwen, Tang Guoxing 93
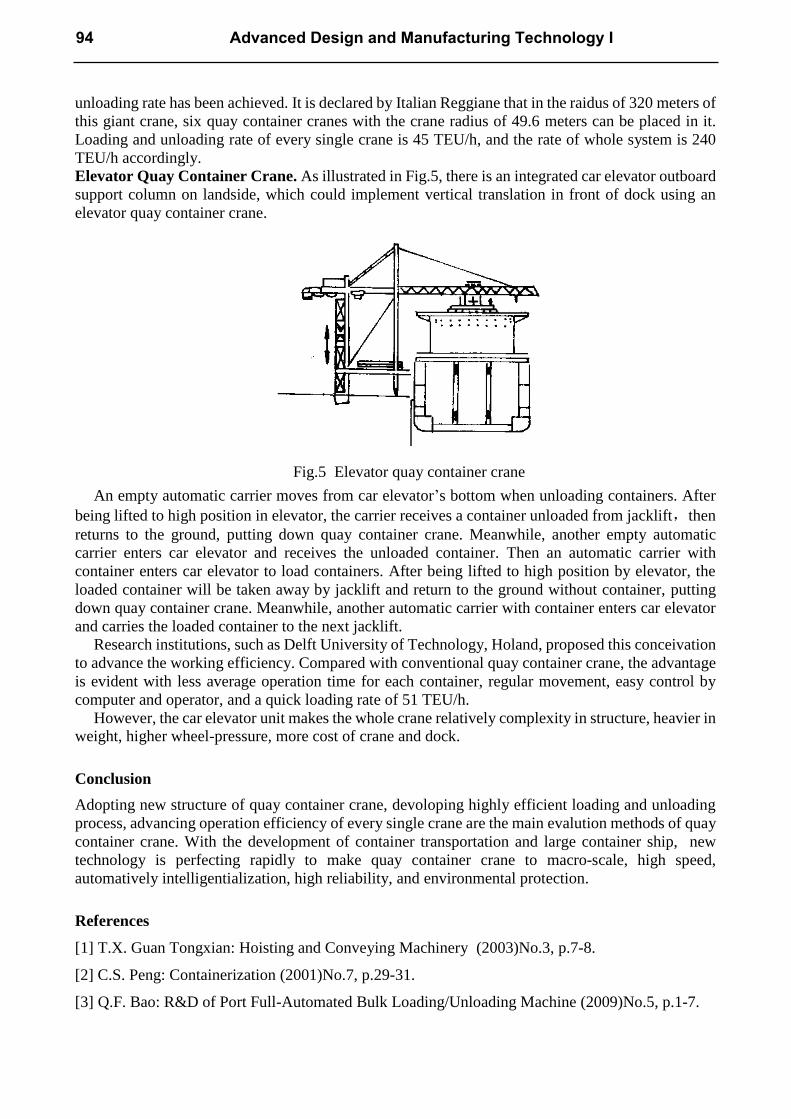
unloading rate has been achieved. It is declared by Italian Reggiane that in the raidus of 320 meters of
this giant crane, six quay container cranes with the crane radius of 49.6 meters can be placed in it.
Loading and unloading rate of every single crane is 45 TEU/h, and the rate of whole system is 240
TEU/h accordingly.
Elevator Quay Container Crane. As illustrated in Fig.5, there is an integrated car elevator outboard
support column on landside, which could implement vertical translation in front of dock using an
elevator quay container crane.
An empty automatic carrier moves from car elevator’s bottom when unloading containers. After
being lifted to high position in elevator, the carrier receives a container unloaded from jacklift,then
returns to the ground, putting down quay container crane. Meanwhile, another empty automatic
carrier enters car elevator and receives the unloaded container. Then an automatic carrier with
container enters car elevator to load containers. After being lifted to high position by elevator, the
loaded container will be taken away by jacklift and return to the ground without container, putting
down quay container crane. Meanwhile, another automatic carrier with container enters car elevator
and carries the loaded container to the next jacklift.
Research institutions, such as Delft University of Technology, Holand, proposed this conceivation
to advance the working efficiency. Compared with conventional quay container crane, the advantage
is evident with less average operation time for each container, regular movement, easy control by
computer and operator, and a quick loading rate of 51 TEU/h.
However, the car elevator unit makes the whole crane relatively complexity in structure, heavier in weight, higher wheel-pressure, more cost of crane and dock.
Conclusion
Adopting new structure of quay container crane, devoloping highly efficient loading and unloading
process, advancing operation efficiency of every single crane are the main evalution methods of quay
container crane. With the development of container transportation and large container ship, new
technology is perfecting rapidly to make quay container crane to macro-scale, high speed,
automatively intelligentialization, high reliability, and environmental protection.
References
[1] T.X. Guan Tongxian: Hoisting and Conveying Machinery (2003)No.3, p.7-8.
[2] C.S. Peng: Containerization (2001)No.7, p.29-31.
[3] Q.F. Bao: R&D of Port Full-Automated Bulk Loading/Unloading Machine (2009)No.5, p.1-7.
Fig.5 Elevator quay container crane
94 Advanced Design and Manufacturing Technology I
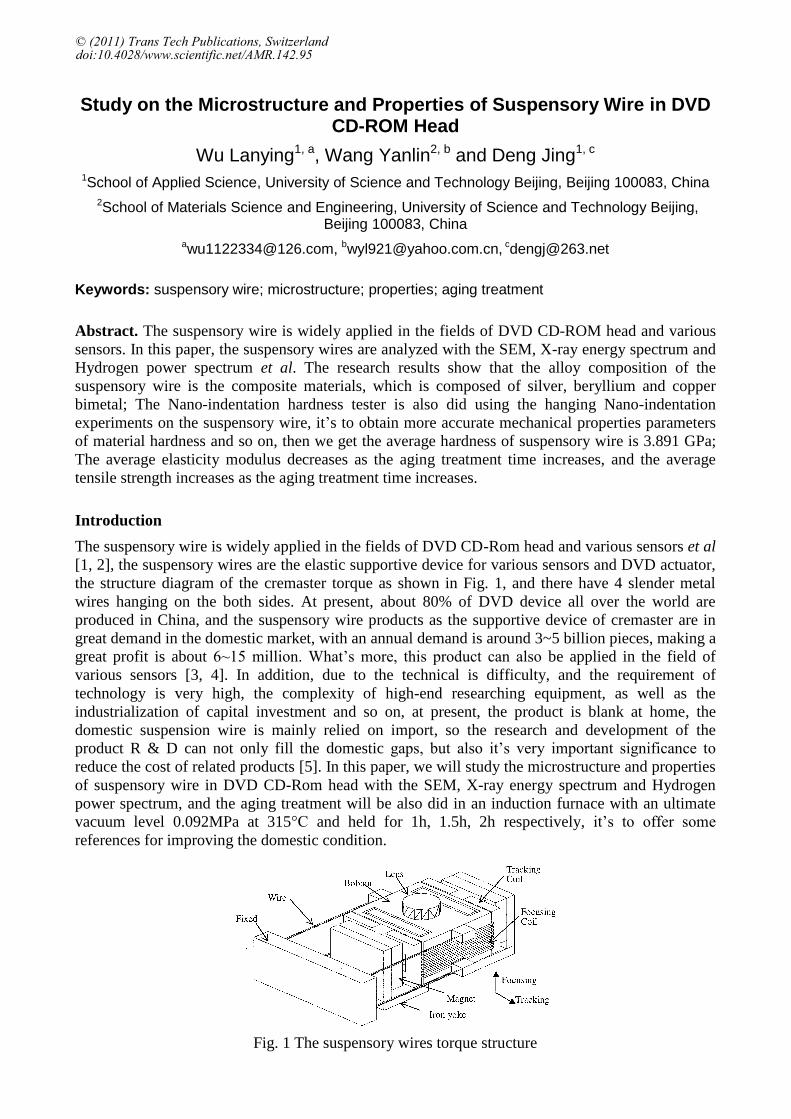
Study on the Microstructure and Properties of Suspensory Wire in DVD CD-ROM Head
Wu Lanying1, a, Wang Yanlin2, b and Deng Jing1, c 1School of Applied Science, University of Science and Technology Beijing, Beijing 100083, China
2School of Materials Science and Engineering, University of Science and Technology Beijing, Beijing 100083, China
[email protected], [email protected], [email protected]
Keywords: suspensory wire; microstructure; properties; aging treatment
Abstract. The suspensory wire is widely applied in the fields of DVD CD-ROM head and various
sensors. In this paper, the suspensory wires are analyzed with the SEM, X-ray energy spectrum and
Hydrogen power spectrum et al. The research results show that the alloy composition of the
suspensory wire is the composite materials, which is composed of silver, beryllium and copper
bimetal; The Nano-indentation hardness tester is also did using the hanging Nano-indentation
experiments on the suspensory wire, it’s to obtain more accurate mechanical properties parameters
of material hardness and so on, then we get the average hardness of suspensory wire is 3.891 GPa;
The average elasticity modulus decreases as the aging treatment time increases, and the average
tensile strength increases as the aging treatment time increases.
Introduction
The suspensory wire is widely applied in the fields of DVD CD-Rom head and various sensors et al
[1, 2], the suspensory wires are the elastic supportive device for various sensors and DVD actuator,
the structure diagram of the cremaster torque as shown in Fig. 1, and there have 4 slender metal
wires hanging on the both sides. At present, about 80% of DVD device all over the world are
produced in China, and the suspensory wire products as the supportive device of cremaster are in
great demand in the domestic market, with an annual demand is around 3~5 billion pieces, making a
great profit is about 6~15 million. What’s more, this product can also be applied in the field of
various sensors [3, 4]. In addition, due to the technical is difficulty, and the requirement of
technology is very high, the complexity of high-end researching equipment, as well as the
industrialization of capital investment and so on, at present, the product is blank at home, the
domestic suspension wire is mainly relied on import, so the research and development of the
product R & D can not only fill the domestic gaps, but also it’s very important significance to
reduce the cost of related products [5]. In this paper, we will study the microstructure and properties
of suspensory wire in DVD CD-Rom head with the SEM, X-ray energy spectrum and Hydrogen
power spectrum, and the aging treatment will be also did in an induction furnace with an ultimate
vacuum level 0.092MPa at 315°C and held for 1h, 1.5h, 2h respectively, it’s to offer some
references for improving the domestic condition.
Fig. 1 The suspensory wires torque structure
© (2011) Trans Tech Publications, Switzerlanddoi:10.4028/www.scientific.net/AMR.142.95
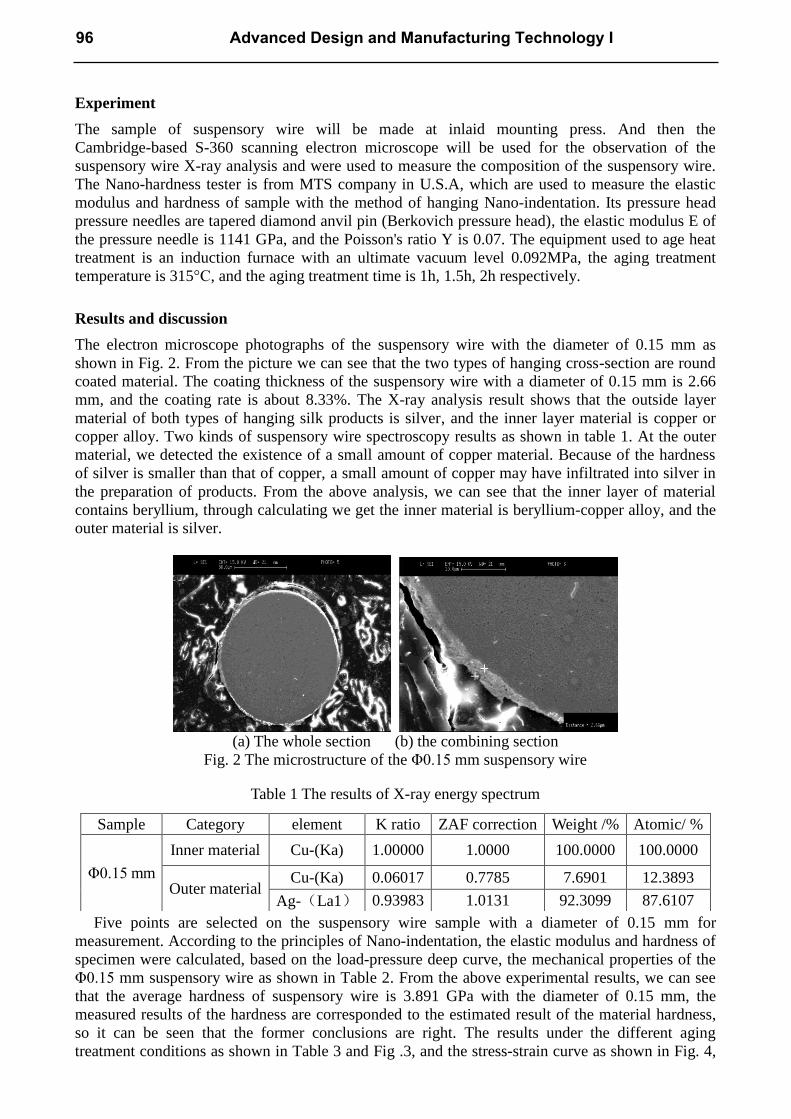
Experiment
The sample of suspensory wire will be made at inlaid mounting press. And then the
Cambridge-based S-360 scanning electron microscope will be used for the observation of the
suspensory wire X-ray analysis and were used to measure the composition of the suspensory wire.
The Nano-hardness tester is from MTS company in U.S.A, which are used to measure the elastic
modulus and hardness of sample with the method of hanging Nano-indentation. Its pressure head
pressure needles are tapered diamond anvil pin (Berkovich pressure head), the elastic modulus E of
the pressure needle is 1141 GPa, and the Poisson's ratio Y is 0.07. The equipment used to age heat
treatment is an induction furnace with an ultimate vacuum level 0.092MPa, the aging treatment
temperature is 315°C, and the aging treatment time is 1h, 1.5h, 2h respectively.
Results and discussion
The electron microscope photographs of the suspensory wire with the diameter of 0.15 mm as
shown in Fig. 2. From the picture we can see that the two types of hanging cross-section are round
coated material. The coating thickness of the suspensory wire with a diameter of 0.15 mm is 2.66
mm, and the coating rate is about 8.33%. The X-ray analysis result shows that the outside layer
material of both types of hanging silk products is silver, and the inner layer material is copper or
copper alloy. Two kinds of suspensory wire spectroscopy results as shown in table 1. At the outer
material, we detected the existence of a small amount of copper material. Because of the hardness
of silver is smaller than that of copper, a small amount of copper may have infiltrated into silver in
the preparation of products. From the above analysis, we can see that the inner layer of material
contains beryllium, through calculating we get the inner material is beryllium-copper alloy, and the
outer material is silver.
(a) The whole section (b) the combining section
Fig. 2 The microstructure of the Φ0.15 mm suspensory wire
Table 1 The results of X-ray energy spectrum
Five points are selected on the suspensory wire sample with a diameter of 0.15 mm for
measurement. According to the principles of Nano-indentation, the elastic modulus and hardness of
specimen were calculated, based on the load-pressure deep curve, the mechanical properties of the
Φ0.15 mm suspensory wire as shown in Table 2. From the above experimental results, we can see
that the average hardness of suspensory wire is 3.891 GPa with the diameter of 0.15 mm, the
measured results of the hardness are corresponded to the estimated result of the material hardness,
so it can be seen that the former conclusions are right. The results under the different aging
treatment conditions as shown in Table 3 and Fig .3, and the stress-strain curve as shown in Fig. 4,
Sample Category element K ratio ZAF correction Weight /% Atomic/ %
Φ0.15 mm
Inner material Cu-(Ka) 1.00000 1.0000 100.0000 100.0000
Outer material Cu-(Ka) 0.06017 0.7785 7.6901 12.3893
Ag-(La1) 0.93983 1.0131 92.3099 87.6107
96 Advanced Design and Manufacturing Technology I
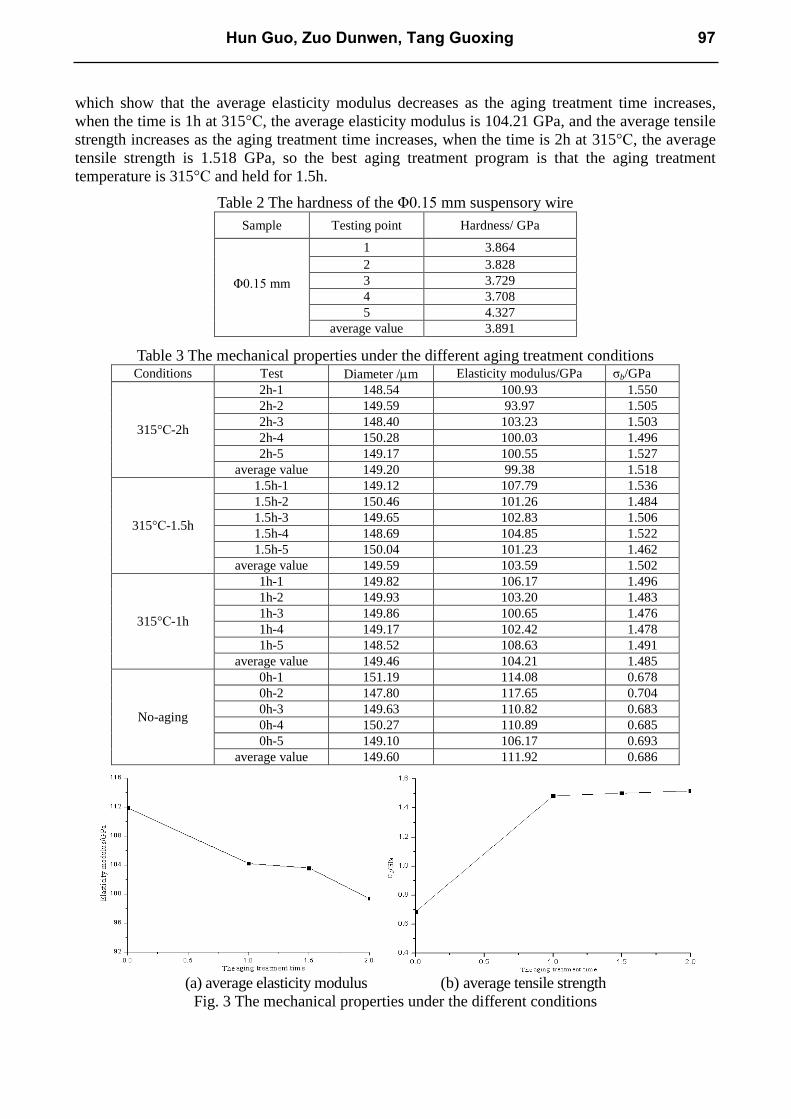
which show that the average elasticity modulus decreases as the aging treatment time increases,
when the time is 1h at 315°C, the average elasticity modulus is 104.21 GPa, and the average tensile
strength increases as the aging treatment time increases, when the time is 2h at 315°C, the average
tensile strength is 1.518 GPa, so the best aging treatment program is that the aging treatment
temperature is 315°C and held for 1.5h.
Table 2 The hardness of the Φ0.15 mm suspensory wire
Sample Testing point Hardness/ GPa
Φ0.15 mm
1 3.864
2 3.828
3 3.729
4 3.708
5 4.327
average value 3.891
Table 3 The mechanical properties under the different aging treatment conditions Conditions Test Diameter /m Elasticity modulus/GPa σb/GPa
315°C-2h
2h-1 148.54 100.93 1.550
2h-2 149.59 93.97 1.505
2h-3 148.40 103.23 1.503
2h-4 150.28 100.03 1.496
2h-5 149.17 100.55 1.527
average value 149.20 99.38 1.518
315°C-1.5h
1.5h-1 149.12 107.79 1.536
1.5h-2 150.46 101.26 1.484
1.5h-3 149.65 102.83 1.506
1.5h-4 148.69 104.85 1.522
1.5h-5 150.04 101.23 1.462
average value 149.59 103.59 1.502
315°C-1h
1h-1 149.82 106.17 1.496
1h-2 149.93 103.20 1.483
1h-3 149.86 100.65 1.476
1h-4 149.17 102.42 1.478
1h-5 148.52 108.63 1.491
average value 149.46 104.21 1.485
No-aging
0h-1 151.19 114.08 0.678
0h-2 147.80 117.65 0.704
0h-3 149.63 110.82 0.683
0h-4 150.27 110.89 0.685
0h-5 149.10 106.17 0.693
average value 149.60 111.92 0.686
(a) average elasticity modulus (b) average tensile strength
Fig. 3 The mechanical properties under the different conditions
Hun Guo, Zuo Dunwen, Tang Guoxing 97
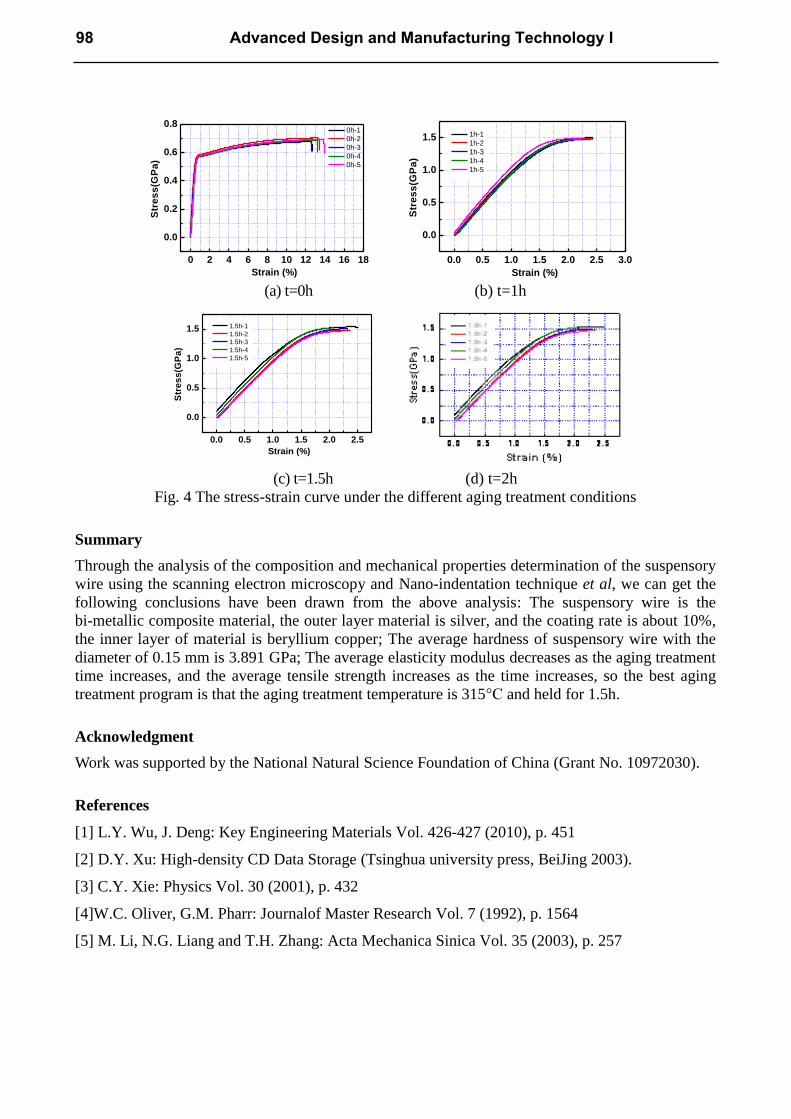
0 2 4 6 8 10 12 14 16 18
0.0
0.2
0.4
0.6
0.8 0h-1
0h-2
0h-3
0h-4
0h-5
Str
es
s(G
Pa
)
Strain (%)
0.0 0.5 1.0 1.5 2.0 2.5 3.0
0.0
0.5
1.0
1.5 1h-1
1h-2
1h-3
1h-4
1h-5
Str
es
s(G
Pa
)
Strain (%) (a) t=0h (b) t=1h
0.0 0.5 1.0 1.5 2.0 2.5
0.0
0.5
1.0
1.5 1.5h-1
1.5h-2
1.5h-3
1.5h-4
1.5h-5
Str
es
s(G
Pa
)
Strain (%)
(c) t=1.5h (d) t=2h
Fig. 4 The stress-strain curve under the different aging treatment conditions
Summary
Through the analysis of the composition and mechanical properties determination of the suspensory
wire using the scanning electron microscopy and Nano-indentation technique et al, we can get the
following conclusions have been drawn from the above analysis: The suspensory wire is the
bi-metallic composite material, the outer layer material is silver, and the coating rate is about 10%,
the inner layer of material is beryllium copper; The average hardness of suspensory wire with the
diameter of 0.15 mm is 3.891 GPa; The average elasticity modulus decreases as the aging treatment
time increases, and the average tensile strength increases as the time increases, so the best aging
treatment program is that the aging treatment temperature is 315°C and held for 1.5h.
Acknowledgment
Work was supported by the National Natural Science Foundation of China (Grant No. 10972030).
References
[1] L.Y. Wu, J. Deng: Key Engineering Materials Vol. 426-427 (2010), p. 451
[2] D.Y. Xu: High-density CD Data Storage (Tsinghua university press, BeiJing 2003).
[3] C.Y. Xie: Physics Vol. 30 (2001), p. 432
[4]W.C. Oliver, G.M. Pharr: Journalof Master Research Vol. 7 (1992), p. 1564
[5] M. Li, N.G. Liang and T.H. Zhang: Acta Mechanica Sinica Vol. 35 (2003), p. 257
98 Advanced Design and Manufacturing Technology I
Investigation of the Precipitation in Mg-Zr alloys
Lin Guobiaoa, Wang Zidongb, Zheng Zhongc and Liu Laifengd
School of Materials Science and Engineering, University of Science and Technology Beijing, Beijing 100083, China
[email protected], [email protected], [email protected], [email protected]
Keywords: Mg-Zr alloy; nano-size particles; dispersed precipitates; coherent lattice
Abstract. The Mg-Zr alloys with the Zr contents of 0.2%, 0.4%, 0.6% and 0.8% were prepared
using induction melting, metal mold centrifugal casting process. The microstructures of the alloys
were analyzed by scanning electron microscope, energy spectrum analysis, transmission electron
microscope and their mechanical properties were also measured with tensile test. The results show
that there are many micro- and nano-sized Zr-rich or Zr particles dispersed in Mg-Zr alloys. The
nano-sized Zr-rich particle consists of a rectangle shaped Zr core and its surrounding Mg (Zr) solid
solution shell with round exterior; a single Zr particle appears a coherent lattice relationship with
matrix.
Introduction
The in situ generation of nano-sized particles in a metal matrix offers a route to increase material
strengths combining not decrease in its primary elongation [1]. The melting point of Zr is much
higher than that of Mg, some Zr may dissolve in Mg to form Mg solid solution, in which solubility
of Zr decrease with the temperature. Qian [2] observed zirconium-rich cores with the white and
round clouds in an Mg–0.56%Zr alloy by the backscattered electron mode of SEM. The Zr-rich
cores also were found to be formed in the Mg–6% Zn–0.5% Zr [3] , Mg–10Gd –Zr [4],
Mg–10Gd–3Y [5], Mg–5Y–3Nd–0.6Zr–xGd (x = 0, 2 and 4 wt.%) [6]. The Zr-rich cores were
believed to play an important role in grain refinement. It was reported that the addition of 0.93% Zr
in Mg–10Gd–3Y alloy could improve the ultimate tensile strength of the as-cast alloy from 112.5 to
238.3MPa [6].The conclusion of Fanga [4] investigation is that the addition of Zr results in a
significant grain refinement of as-cast Mg–10Gd alloy by generating nucleants. However, it cannot
restrict grain growth during homogenization treatment at 520 ℃, and completely loss the grain
refining effect for extruded alloy sample. So far, less report is relevant to whether there are
nano-sized Zr particles in the magnesium alloy containing Zr. It would be desirable to have large
density of dispersed nano-particles in alloying liquids without aggregation and growth during the
solidification, which would be in favor of grain refinement and bring about dispersion strengthening
effects. According to our previous research [1], the convection produced under centrifugal casting
conditions will retard the growth rate of the nano-particles in situ generated in alloying liquids
during solidification. In the present investigation, we apply centrifugal casting technique to prepare
the Mg-Zr alloy and analyze precipitates by means of SEM, TEM and HRTEM.
Experiments
In this study, a magnesium block with purity of 99.99% and an intermediate alloy of Mg-30 wt.%
Zr were chosen as raw materials for fabrication of Mg-Zr alloy with the Zr contents of 0.2 wt.%, 0.4
wt.%, 0.6 wt.% and 0.8 wt.%. They were cleaned with silicon carbide papers before used. Rod
samples of Mg-Zr alloy with different Zr contents were prepared by melting the raw materials in a
vacuum induction furnace using a graphite crucible and metal mould centrifugal casting process.
During melting, RJ-5 covering agent and argon gas were used. When the temperature reached 350 ~
370 ℃, the covering agent on the raw materials in the crucible was molten and the furnace was
pumped down to a vacuum of 5 Pa before backfilled with Ar to approximately 0.07MPa. The
© (2011) Trans Tech Publications, Switzerlanddoi:10.4028/www.scientific.net/AMR.142.99
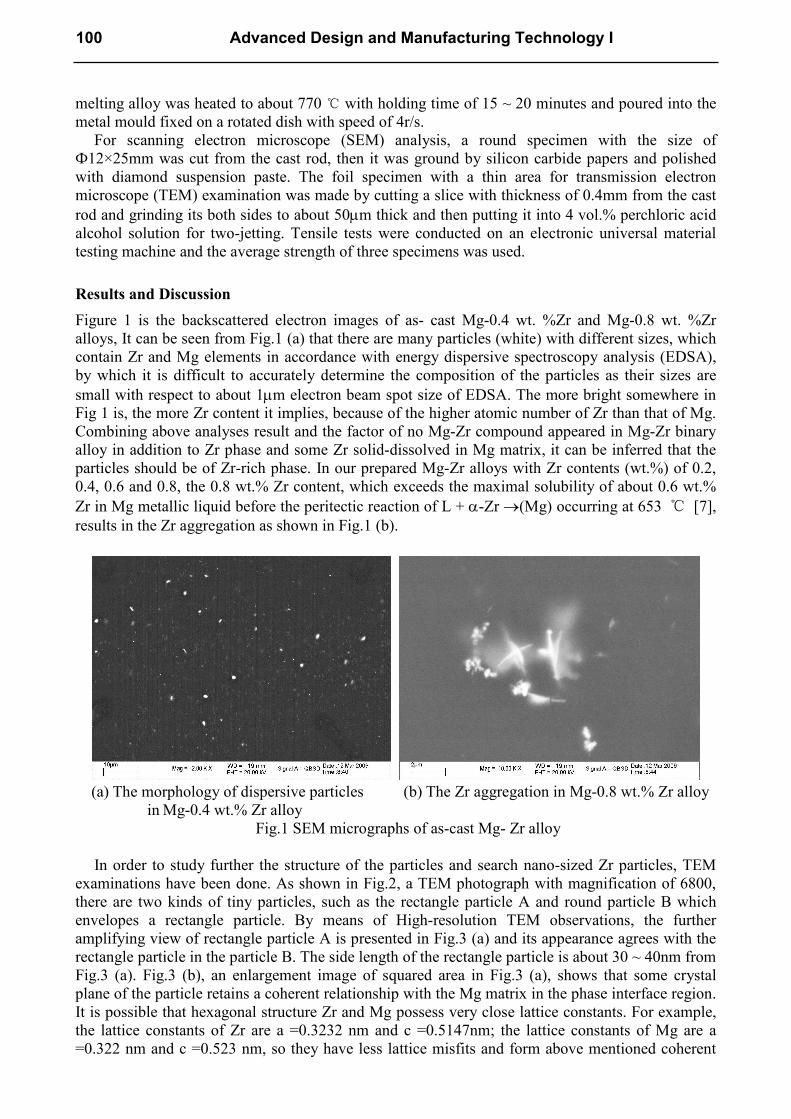
melting alloy was heated to about 770 ℃ with holding time of 15 ~ 20 minutes and poured into the
metal mould fixed on a rotated dish with speed of 4r/s.
For scanning electron microscope (SEM) analysis, a round specimen with the size of
Ф12×25mm was cut from the cast rod, then it was ground by silicon carbide papers and polished
with diamond suspension paste. The foil specimen with a thin area for transmission electron
microscope (TEM) examination was made by cutting a slice with thickness of 0.4mm from the cast
rod and grinding its both sides to about 50µm thick and then putting it into 4 vol.% perchloric acid
alcohol solution for two-jetting. Tensile tests were conducted on an electronic universal material
testing machine and the average strength of three specimens was used.
Results and Discussion
Figure 1 is the backscattered electron images of as- cast Mg-0.4 wt. %Zr and Mg-0.8 wt. %Zr
alloys, It can be seen from Fig.1 (a) that there are many particles (white) with different sizes, which
contain Zr and Mg elements in accordance with energy dispersive spectroscopy analysis (EDSA),
by which it is difficult to accurately determine the composition of the particles as their sizes are
small with respect to about 1µm electron beam spot size of EDSA. The more bright somewhere in
Fig 1 is, the more Zr content it implies, because of the higher atomic number of Zr than that of Mg.
Combining above analyses result and the factor of no Mg-Zr compound appeared in Mg-Zr binary
alloy in addition to Zr phase and some Zr solid-dissolved in Mg matrix, it can be inferred that the
particles should be of Zr-rich phase. In our prepared Mg-Zr alloys with Zr contents (wt.%) of 0.2,
0.4, 0.6 and 0.8, the 0.8 wt.% Zr content, which exceeds the maximal solubility of about 0.6 wt.%
Zr in Mg metallic liquid before the peritectic reaction of L + α-Zr →(Mg) occurring at 653 ℃ [7],
results in the Zr aggregation as shown in Fig.1 (b).
(a) The morphology of dispersive particles (b) The Zr aggregation in Mg-0.8 wt.% Zr alloy
in Mg-0.4 wt.% Zr alloy
Fig.1 SEM micrographs of as-cast Mg- Zr alloy
In order to study further the structure of the particles and search nano-sized Zr particles, TEM
examinations have been done. As shown in Fig.2, a TEM photograph with magnification of 6800,
there are two kinds of tiny particles, such as the rectangle particle A and round particle B which
envelopes a rectangle particle. By means of High-resolution TEM observations, the further
amplifying view of rectangle particle A is presented in Fig.3 (a) and its appearance agrees with the
rectangle particle in the particle B. The side length of the rectangle particle is about 30 ~ 40nm from
Fig.3 (a). Fig.3 (b), an enlargement image of squared area in Fig.3 (a), shows that some crystal
plane of the particle retains a coherent relationship with the Mg matrix in the phase interface region.
It is possible that hexagonal structure Zr and Mg possess very close lattice constants. For example,
the lattice constants of Zr are a =0.3232 nm and c =0.5147nm; the lattice constants of Mg are a
=0.322 nm and c =0.523 nm, so they have less lattice misfits and form above mentioned coherent
100 Advanced Design and Manufacturing Technology I
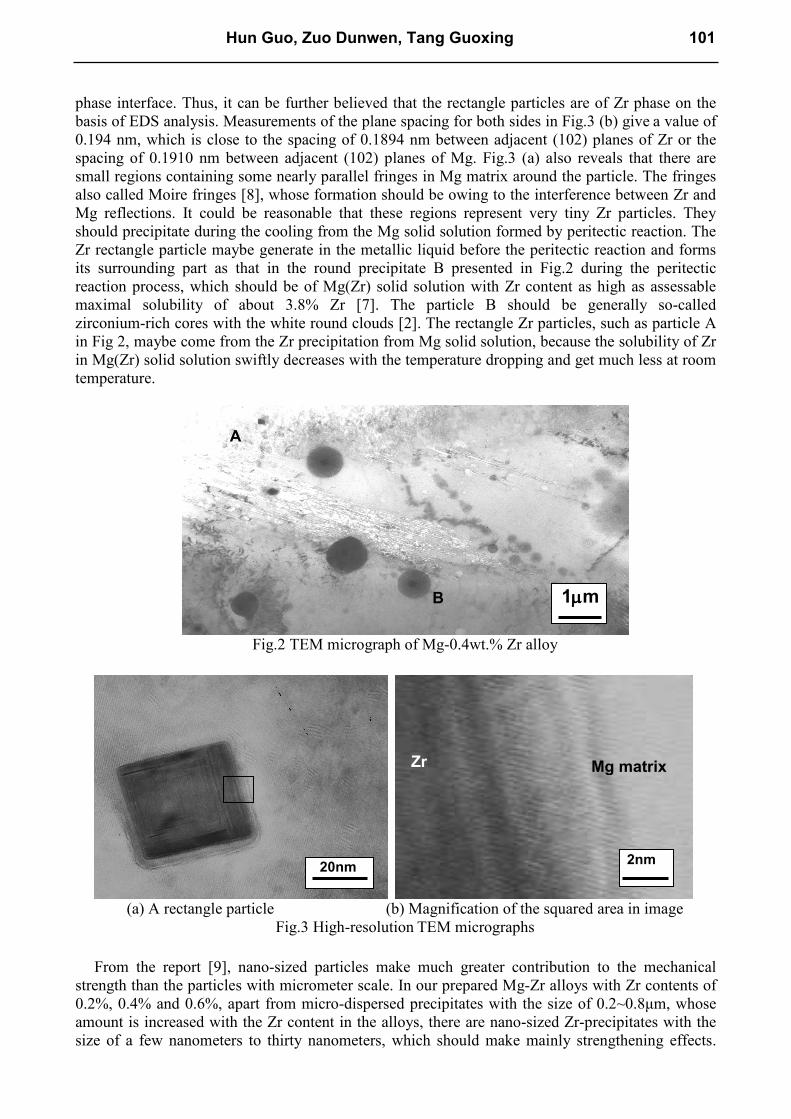
phase interface. Thus, it can be further believed that the rectangle particles are of Zr phase on the
basis of EDS analysis. Measurements of the plane spacing for both sides in Fig.3 (b) give a value of
0.194 nm, which is close to the spacing of 0.1894 nm between adjacent (102) planes of Zr or the
spacing of 0.1910 nm between adjacent (102) planes of Mg. Fig.3 (a) also reveals that there are
small regions containing some nearly parallel fringes in Mg matrix around the particle. The fringes
also called Moire fringes [8], whose formation should be owing to the interference between Zr and
Mg reflections. It could be reasonable that these regions represent very tiny Zr particles. They
should precipitate during the cooling from the Mg solid solution formed by peritectic reaction. The
Zr rectangle particle maybe generate in the metallic liquid before the peritectic reaction and forms
its surrounding part as that in the round precipitate B presented in Fig.2 during the peritectic
reaction process, which should be of Mg(Zr) solid solution with Zr content as high as assessable
maximal solubility of about 3.8% Zr [7]. The particle B should be generally so-called
zirconium-rich cores with the white round clouds [2]. The rectangle Zr particles, such as particle A
in Fig 2, maybe come from the Zr precipitation from Mg solid solution, because the solubility of Zr
in Mg(Zr) solid solution swiftly decreases with the temperature dropping and get much less at room
temperature.
Fig.2 TEM micrograph of Mg-0.4wt.% Zr alloy
(a) A rectangle particle (b) Magnification of the squared area in image
Fig.3 High-resolution TEM micrographs
From the report [9], nano-sized particles make much greater contribution to the mechanical
strength than the particles with micrometer scale. In our prepared Mg-Zr alloys with Zr contents of
0.2%, 0.4% and 0.6%, apart from micro-dispersed precipitates with the size of 0.2~0.8µm, whose
amount is increased with the Zr content in the alloys, there are nano-sized Zr-precipitates with the
size of a few nanometers to thirty nanometers, which should make mainly strengthening effects.
2nm
Zr Mg matrix
1µµµµm
20nm
A
B
Hun Guo, Zuo Dunwen, Tang Guoxing 101
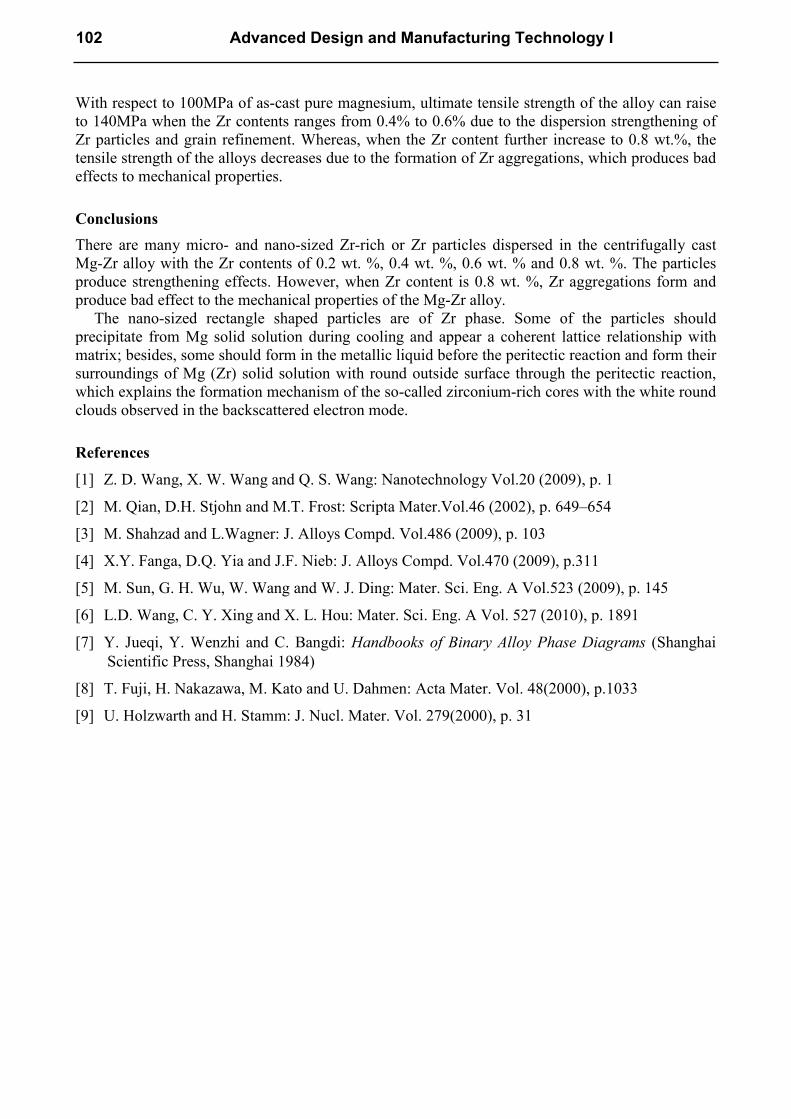
With respect to 100MPa of as-cast pure magnesium, ultimate tensile strength of the alloy can raise
to 140MPa when the Zr contents ranges from 0.4% to 0.6% due to the dispersion strengthening of
Zr particles and grain refinement. Whereas, when the Zr content further increase to 0.8 wt.%, the
tensile strength of the alloys decreases due to the formation of Zr aggregations, which produces bad
effects to mechanical properties.
Conclusions
There are many micro- and nano-sized Zr-rich or Zr particles dispersed in the centrifugally cast
Mg-Zr alloy with the Zr contents of 0.2 wt. %, 0.4 wt. %, 0.6 wt. % and 0.8 wt. %. The particles
produce strengthening effects. However, when Zr content is 0.8 wt. %, Zr aggregations form and
produce bad effect to the mechanical properties of the Mg-Zr alloy.
The nano-sized rectangle shaped particles are of Zr phase. Some of the particles should
precipitate from Mg solid solution during cooling and appear a coherent lattice relationship with
matrix; besides, some should form in the metallic liquid before the peritectic reaction and form their
surroundings of Mg (Zr) solid solution with round outside surface through the peritectic reaction,
which explains the formation mechanism of the so-called zirconium-rich cores with the white round
clouds observed in the backscattered electron mode.
References
[1] Z. D. Wang, X. W. Wang and Q. S. Wang: Nanotechnology Vol.20 (2009), p. 1
[2] M. Qian, D.H. Stjohn and M.T. Frost: Scripta Mater.Vol.46 (2002), p. 649–654
[3] M. Shahzad and L.Wagner: J. Alloys Compd. Vol.486 (2009), p. 103
[4] X.Y. Fanga, D.Q. Yia and J.F. Nieb: J. Alloys Compd. Vol.470 (2009), p.311
[5] M. Sun, G. H. Wu, W. Wang and W. J. Ding: Mater. Sci. Eng. A Vol.523 (2009), p. 145
[6] L.D. Wang, C. Y. Xing and X. L. Hou: Mater. Sci. Eng. A Vol. 527 (2010), p. 1891
[7] Y. Jueqi, Y. Wenzhi and C. Bangdi: Handbooks of Binary Alloy Phase Diagrams (Shanghai
Scientific Press, Shanghai 1984)
[8] T. Fuji, H. Nakazawa, M. Kato and U. Dahmen: Acta Mater. Vol. 48(2000), p.1033
[9] U. Holzwarth and H. Stamm: J. Nucl. Mater. Vol. 279(2000), p. 31
102 Advanced Design and Manufacturing Technology I
The Optimization of Cutting Parameter of Machining the Small Diameter Deep Hole on Austenitic Stainless Steel
Huang Zhironga
School of Mechanical Engineering, Changzhou Institute of Technology, Jiangsu, 213002, China
Keywords: small diameter deep hole, cutting parameter, austenitic stainless steel, twist drill
Abstract. In this paper, objective function for the highest productivity and longer life of the twist drill
is built. Though using Materlab software to draw the curves of the changes of feed, spindle speed, tool
life and productivity, a way to find the better cutting parameters of machining the small diameter deep
hole on the SUS316 austenitic stainless steel with the twist drill is introduced. The better cutting
parameters are obtained.
Introduction
For a long time, cutting parameters in machining are gotten from experience and manuals. But in
practical machining, it is hard to get the parameters by this way because of the different machine
tools, different cutting tool and different materials. So doing tests to get the optimized cutting
parameters is greatly necessary. The following optimization will be taken as an example to get the
suitable cutting parameters. The small diameter deep holes on the SUS316 austenitic stainless steel
were machined withφ2mm twist drill with machine center. The depth is 20mm.
Setting Target Function
On the premise of using machine center, the optimized target is max productivity. The independent
variables are cutting speed and feed. Middle control factor is the life of the twist drill.
Life of Drill. The empirical formula of the life of the drill [1]
:
vymm
z
v
c KfT
dCV
160 (m/s) (1)
Where, Cv ——coefficient (which is related with drilling materials and feed ); T——life of drill(s);
z, m, y——Index(which is the influence of d, T, f );
Kv——correction factor of cutting speed.
For austenitic stainless steel, Cv, z, m, y respectively is 3.57, 0.5, 0.12, 0.45[1]
;Kv is 0.5 to 0.7.Here
0.5 is selected[2]
.
For φ2 mm drill, substituting the values of the index may be
0.12 0.45
656.6765n
T f (r/min) (2)
The conversion is
23
8.3 3.8
3 10T
n f
(3)
© (2011) Trans Tech Publications, Switzerlanddoi:10.4028/www.scientific.net/AMR.142.103

The Objective Function Of The Highest Productivity [3]
)/(21 Tttttt mmw (min) (4)
Where, tw—— total processing time for single hole;
tm——processing time for single hole;
t1——preparation time, including loading and unloading the workpiece, feed, retracting time;
t2——time of changing tool, including the unloading abrasion tool and putting the new one,
according to the actual situation, the general tool change time is 1.5minutes.
In actual rough machining, increasing the efficiency is the basic target. The goal is usually
measured by unit processing time or the removed volume of metal per unit time. The rough drilling
which is as an example is introduced.
The processing time for single hole(tm ) can beget from Fig.1
nf
dctgB
nf
Ltm
2
1
(min) (5)
Where, L——the distance of drilling (mm);
B——hole depth (mm);
Δ——the of advance for drilling(mm),here1mm is selected;
n——speed(r/min);
f——feed(mm/r);
Fig.1 cutting parameters and drilling layer
Putting Eq.5 and Eq.3 into Eq.4 can be (min) (6)
In the equation:
1
1
2k B dctg (7)
1
1
2k B dctg
23
212
103
tkk (8)
Constraint Conditions of the Objective Function. When getting the optimum parameters, all
the constraint factors should also be taken into consideration, such as machine tool, drill and
qualification. According to characteristic of machine tool, the test after getting the optimized
parameters will be done. This is better than emphasizing these constraint conditions in the process.
Constraint Conditions of Power. Actual cutting power ≤ efficiency of machine tool
Actual cutting power: (9)
Constraint conditions of drilling force and torque. The max axial force of the drill Fz ≤ the max
force of the drill Fmax, the same argument: M ≤ Mmax
Constraint conditions of the feed and speed of the machine tool. nmin ≤n≤ nmax, fmin ≤f≤ fmax
310 czm VFP
8.23.7
211 fnkt
nf
ktw
104 Advanced Design and Manufacturing Technology I
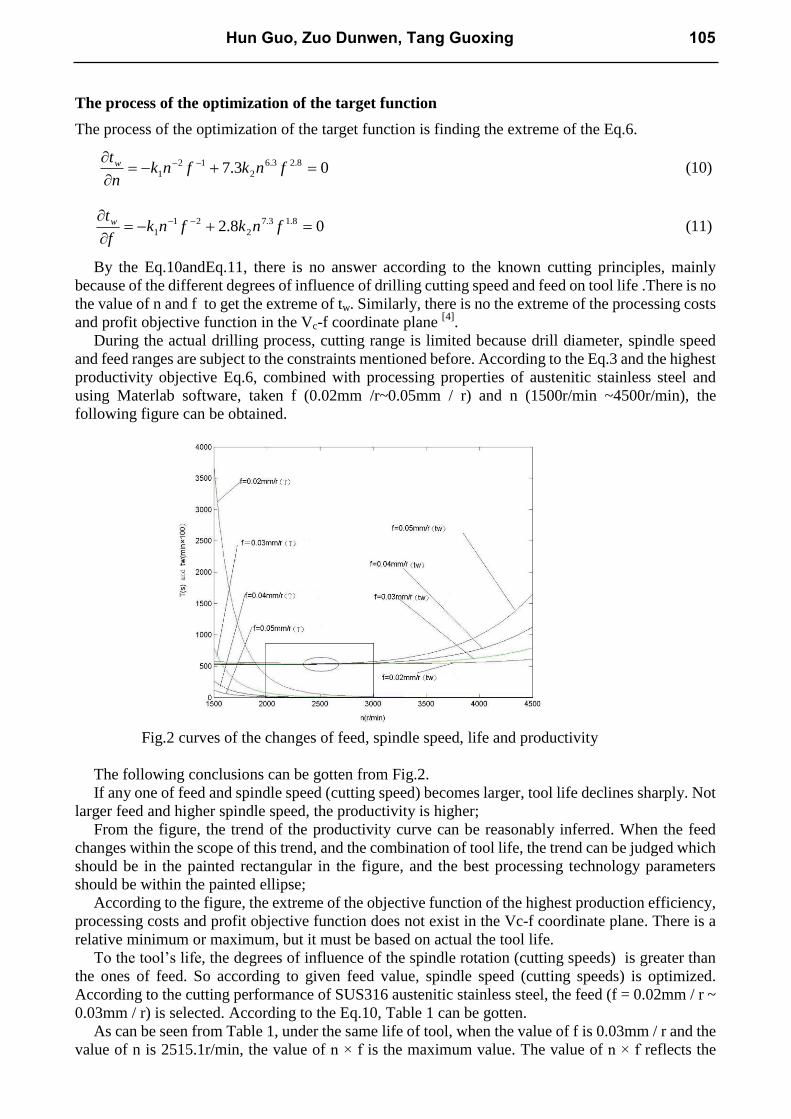
The process of the optimization of the target function
The process of the optimization of the target function is finding the extreme of the Eq.6.
03.7 8.23.6
2
12
1
fnkfnkn
tw (10)
08.2 8.13.7
2
21
1
fnkfnkf
tw (11)
By the Eq.10andEq.11, there is no answer according to the known cutting principles, mainly
because of the different degrees of influence of drilling cutting speed and feed on tool life .There is no
the value of n and f to get the extreme of tw. Similarly, there is no the extreme of the processing costs
and profit objective function in the Vc-f coordinate plane [4]
.
During the actual drilling process, cutting range is limited because drill diameter, spindle speed
and feed ranges are subject to the constraints mentioned before. According to the Eq.3 and the highest
productivity objective Eq.6, combined with processing properties of austenitic stainless steel and
using Materlab software, taken f (0.02mm /r~0.05mm / r) and n (1500r/min ~4500r/min), the
following figure can be obtained.
Fig.2 curves of the changes of feed, spindle speed, life and productivity
The following conclusions can be gotten from Fig.2.
If any one of feed and spindle speed (cutting speed) becomes larger, tool life declines sharply. Not
larger feed and higher spindle speed, the productivity is higher;
From the figure, the trend of the productivity curve can be reasonably inferred. When the feed
changes within the scope of this trend, and the combination of tool life, the trend can be judged which
should be in the painted rectangular in the figure, and the best processing technology parameters
should be within the painted ellipse;
According to the figure, the extreme of the objective function of the highest production efficiency,
processing costs and profit objective function does not exist in the Vc-f coordinate plane. There is a
relative minimum or maximum, but it must be based on actual the tool life.
To the tool’s life, the degrees of influence of the spindle rotation (cutting speeds) is greater than
the ones of feed. So according to given feed value, spindle speed (cutting speeds) is optimized.
According to the cutting performance of SUS316 austenitic stainless steel, the feed (f = 0.02mm / r ~
0.03mm / r) is selected. According to the Eq.10, Table 1 can be gotten.
As can be seen from Table 1, under the same life of tool, when the value of f is 0.03mm / r and the
value of n is 2515.1r/min, the value of n × f is the maximum value. The value of n × f reflects the
Hun Guo, Zuo Dunwen, Tang Guoxing 105
removal volume of the metal per unit time. The larger value is the higher processing efficiency. The
optimized value of f is 0.03mm / r, and the optimized value of n is 2515.1r/min.
If the value of f is 0.03mm / r and the value of n is 2515r/min, according to the empirical formula,
drilling the SUS316 austenitic stainless steel with the φ2mm high-speed steel drill, the value of the
drilling force is125.8721N and the value of the torque is 0.0714Nm. These values meet the standards
of the machine loads, and also consistent with stiffness and strength requirements of the drill.
Table 1 the value of n, n × f and T(f is 0.02mm / r to 0.03mm / r)
f (mm/r) n(r/min) n×f T(min)
0.02 3028.2 60.5634 10.95
0.021 2961.3 62.1868 10.95
0.022 2898.9 63.7752 10.95
0.023 2840.5 65.3309 10.95
0.024 2785.7 66.8559 10.95
0.025 2734.1 68.3520 10.95
0.026 2685.4 69.8211 10.95
0.027 2639.4 71.2644 10.95
0.028 2595.8 72.6835 10.95
0.029 2554.5 74.0796 10.95
0.030 2515.1 75.4538 10.95
Conclusion
In summary, if drilling the SUS316 austenitic stainless steel with theφ2mm high-speed steel twist
drill, the best combination of the speed and feed is this. The value of n is 2515r/min (Vc = 15.8m/min)
and the value of f is 0.03mm / r.
In practical machining, the method of the drilling is peck drill. According to the experimental
optimization, the cutting parameter will be more correct. The value of n is 2500r/min and the value of
f is 0.03mm / r. The drilling distance one time is 1mm. The twist drill is manufactured in Germany
TITEX.
References
[1] Nanjing Institute of Technology, Wuxi Institute of Light Industry: Metal Cutting Principles
(Fujian Science and Technology Press, Fuzhou,1984), p.188
[2] Shanghai Association of Metal Cutting Technology: Metal Cutting Manual (Second Edition)
(Shanghai Science and Technology Press, Shanghai 1984), p.722
[3] Gu Lizhi, Zhang Huili and Yuan Zhejun: Journal of Harbin University of Science and
Technology Vol.5(2000), No. 2, p.61
[4] Zhang Youzhen: Theory of Metal Cutting (Aviation Industry Press, Beijing 1988), p. 317
106 Advanced Design and Manufacturing Technology I
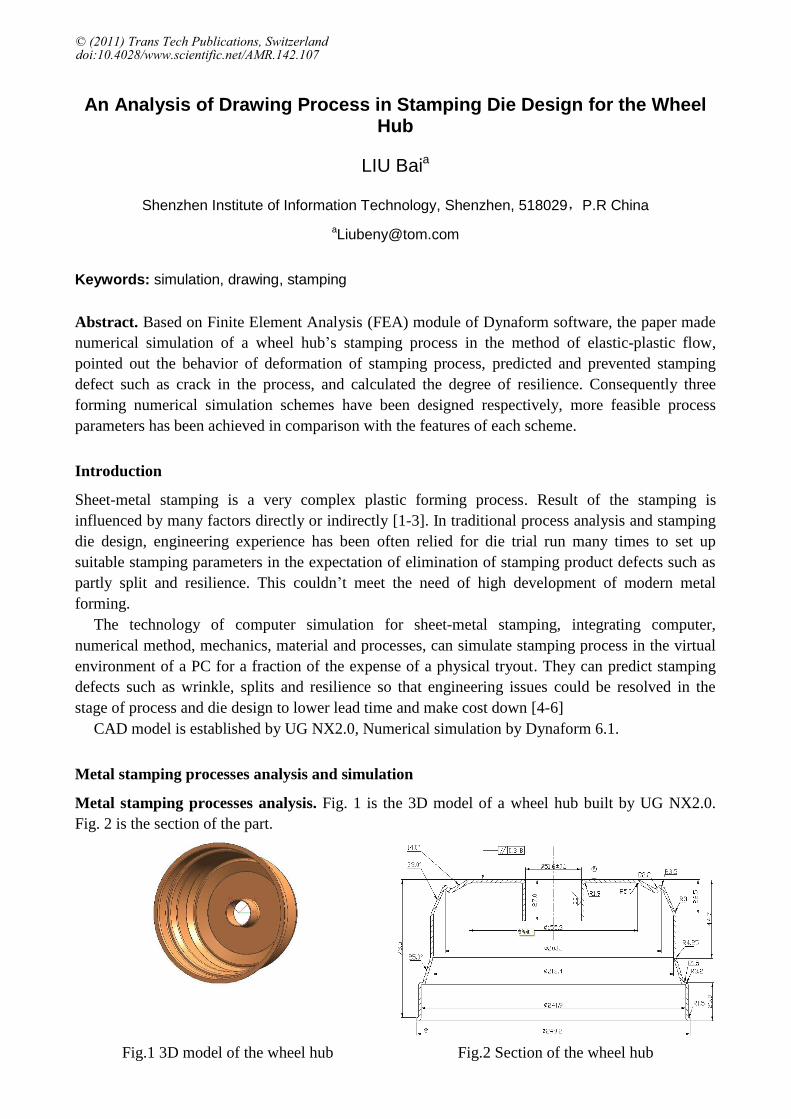
An Analysis of Drawing Process in Stamping Die Design for the Wheel Hub
LIU Baia
Shenzhen Institute of Information Technology, Shenzhen, 518029,P.R China
Keywords: simulation, drawing, stamping
Abstract. Based on Finite Element Analysis (FEA) module of Dynaform software, the paper made
numerical simulation of a wheel hub’s stamping process in the method of elastic-plastic flow,
pointed out the behavior of deformation of stamping process, predicted and prevented stamping
defect such as crack in the process, and calculated the degree of resilience. Consequently three
forming numerical simulation schemes have been designed respectively, more feasible process
parameters has been achieved in comparison with the features of each scheme.
Introduction
Sheet-metal stamping is a very complex plastic forming process. Result of the stamping is
influenced by many factors directly or indirectly [1-3]. In traditional process analysis and stamping
die design, engineering experience has been often relied for die trial run many times to set up
suitable stamping parameters in the expectation of elimination of stamping product defects such as
partly split and resilience. This couldn’t meet the need of high development of modern metal
forming.
The technology of computer simulation for sheet-metal stamping, integrating computer,
numerical method, mechanics, material and processes, can simulate stamping process in the virtual
environment of a PC for a fraction of the expense of a physical tryout. They can predict stamping
defects such as wrinkle, splits and resilience so that engineering issues could be resolved in the
stage of process and die design to lower lead time and make cost down [4-6]
CAD model is established by UG NX2.0, Numerical simulation by Dynaform 6.1.
Metal stamping processes analysis and simulation
Metal stamping processes analysis. Fig. 1 is the 3D model of a wheel hub built by UG NX2.0.
Fig. 2 is the section of the part.
Fig.1 3D model of the wheel hub Fig.2 Section of the wheel hub
© (2011) Trans Tech Publications, Switzerlanddoi:10.4028/www.scientific.net/AMR.142.107
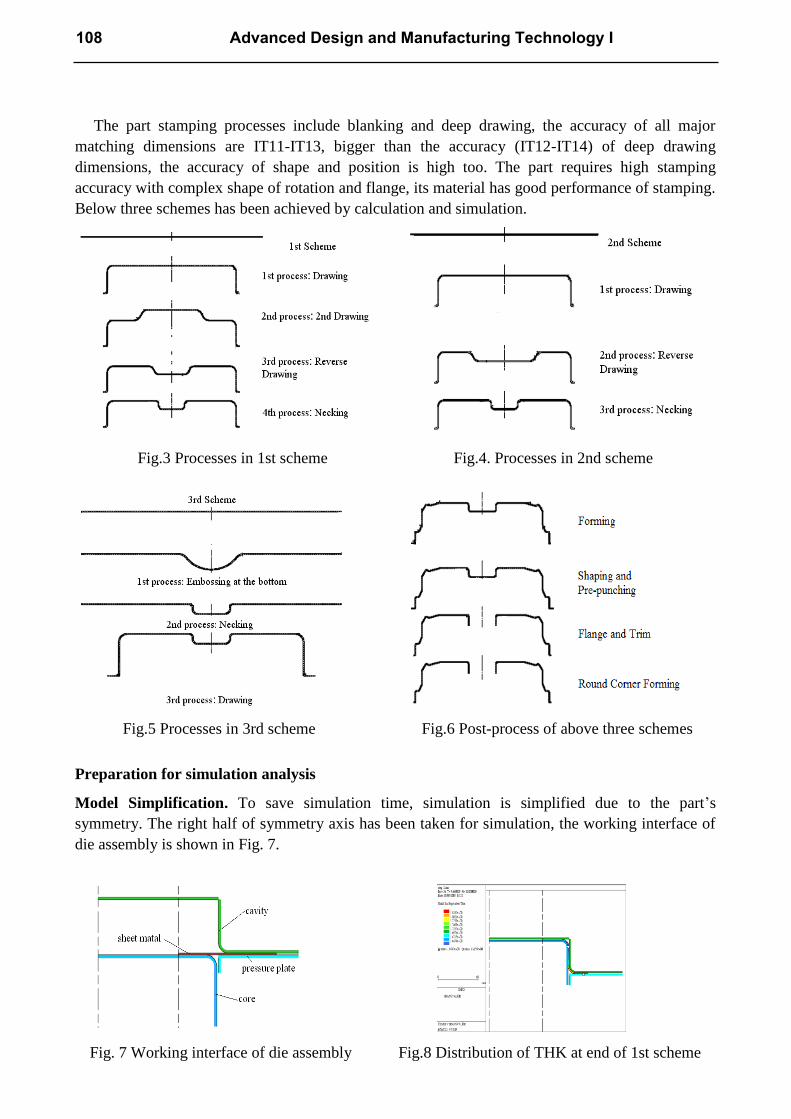
The part stamping processes include blanking and deep drawing, the accuracy of all major
matching dimensions are IT11-IT13, bigger than the accuracy (IT12-IT14) of deep drawing
dimensions, the accuracy of shape and position is high too. The part requires high stamping
accuracy with complex shape of rotation and flange, its material has good performance of stamping.
Below three schemes has been achieved by calculation and simulation.
Fig.3 Processes in 1st scheme Fig.4. Processes in 2nd scheme
Fig.5 Processes in 3rd scheme Fig.6 Post-process of above three schemes
Preparation for simulation analysis
Model Simplification. To save simulation time, simulation is simplified due to the part’s
symmetry. The right half of symmetry axis has been taken for simulation, the working interface of
die assembly is shown in Fig. 7.
Fig. 7 Working interface of die assembly Fig.8 Distribution of THK at end of 1st scheme
108 Advanced Design and Manufacturing Technology I
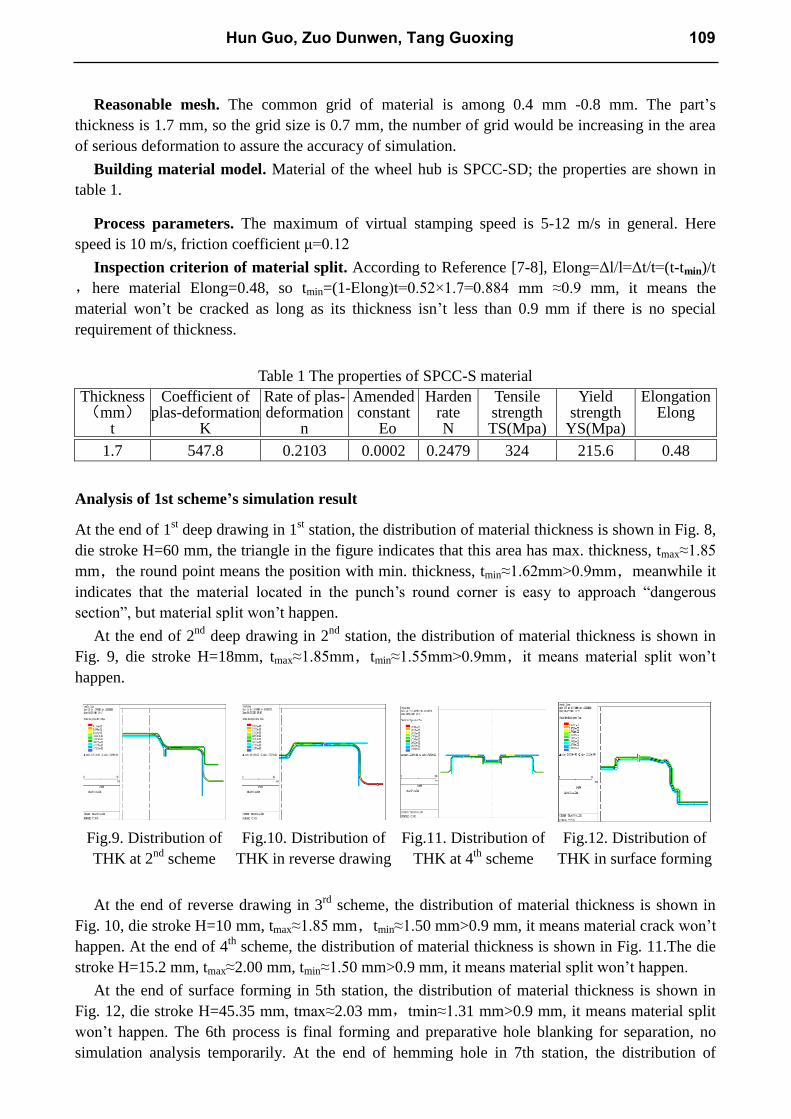
Reasonable mesh. The common grid of material is among 0.4 mm -0.8 mm. The part’s
thickness is 1.7 mm, so the grid size is 0.7 mm, the number of grid would be increasing in the area
of serious deformation to assure the accuracy of simulation.
Building material model. Material of the wheel hub is SPCC-SD; the properties are shown in
table 1.
Process parameters. The maximum of virtual stamping speed is 5-12 m/s in general. Here
speed is 10 m/s, friction coefficient μ=0.12
Inspection criterion of material split. According to Reference [7-8], Elong=Δl/l=Δt/t=(t-tmin)/t
,here material Elong=0.48, so tmin=(1-Elong)t=0.52×1.7=0.884 mm ≈0.9 mm, it means the
material won’t be cracked as long as its thickness isn’t less than 0.9 mm if there is no special
requirement of thickness.
Table 1 The properties of SPCC-S material
Thickness (mm)
t
Coefficient of plas-deformation
K
Rate of plas- deformation
n
Amended constant
Eo
Harden rate N
Tensile strength TS(Mpa)
Yield strength
YS(Mpa)
Elongation Elong
1.7 547.8 0.2103 0.0002 0.2479 324 215.6 0.48
Analysis of 1st scheme’s simulation result
At the end of 1st deep drawing in 1
st station, the distribution of material thickness is shown in Fig. 8,
die stroke H=60 mm, the triangle in the figure indicates that this area has max. thickness, tmax≈1.85
mm,the round point means the position with min. thickness, tmin≈1.62mm>0.9mm,meanwhile it
indicates that the material located in the punch’s round corner is easy to approach “dangerous
section”, but material split won’t happen.
At the end of 2nd
deep drawing in 2nd
station, the distribution of material thickness is shown in
Fig. 9, die stroke H=18mm, tmax≈1.85mm,tmin≈1.55mm>0.9mm,it means material split won’t
happen.
Fig.9. Distribution of
THK at 2nd
scheme
Fig.10. Distribution of
THK in reverse drawing
Fig.11. Distribution of
THK at 4th
scheme
Fig.12. Distribution of
THK in surface forming
At the end of reverse drawing in 3rd
scheme, the distribution of material thickness is shown in
Fig. 10, die stroke H=10 mm, tmax≈1.85 mm,tmin≈1.50 mm>0.9 mm, it means material crack won’t
happen. At the end of 4th
scheme, the distribution of material thickness is shown in Fig. 11.The die
stroke H=15.2 mm, tmax≈2.00 mm, tmin≈1.50 mm>0.9 mm, it means material split won’t happen.
At the end of surface forming in 5th station, the distribution of material thickness is shown in
Fig. 12, die stroke H=45.35 mm, tmax≈2.03 mm,tmin≈1.31 mm>0.9 mm, it means material split
won’t happen. The 6th process is final forming and preparative hole blanking for separation, no
simulation analysis temporarily. At the end of hemming hole in 7th station, the distribution of
Hun Guo, Zuo Dunwen, Tang Guoxing 109
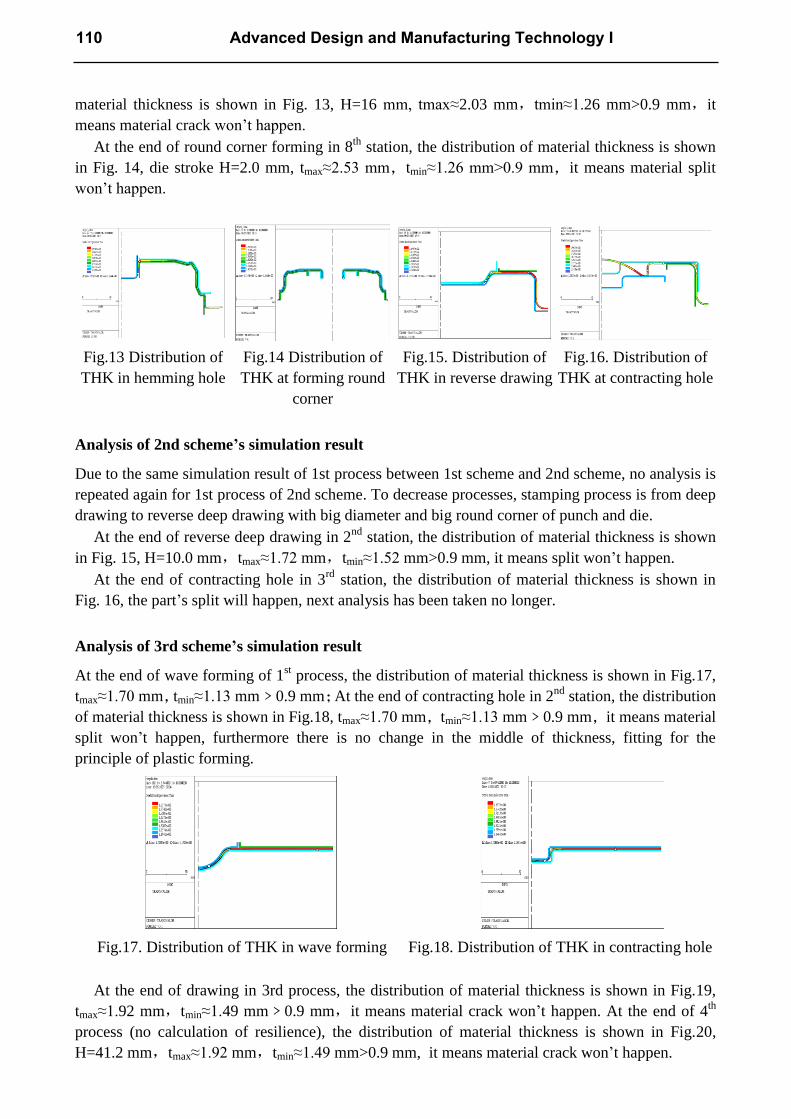
material thickness is shown in Fig. 13, H=16 mm, tmax≈2.03 mm,tmin≈1.26 mm>0.9 mm,it
means material crack won’t happen.
At the end of round corner forming in 8th
station, the distribution of material thickness is shown
in Fig. 14, die stroke H=2.0 mm, tmax≈2.53 mm,tmin≈1.26 mm>0.9 mm,it means material split
won’t happen.
Fig.13 Distribution of
THK in hemming hole
Fig.14 Distribution of
THK at forming round
corner
Fig.15. Distribution of
THK in reverse drawing
Fig.16. Distribution of
THK at contracting hole
Analysis of 2nd scheme’s simulation result
Due to the same simulation result of 1st process between 1st scheme and 2nd scheme, no analysis is
repeated again for 1st process of 2nd scheme. To decrease processes, stamping process is from deep
drawing to reverse deep drawing with big diameter and big round corner of punch and die.
At the end of reverse deep drawing in 2nd
station, the distribution of material thickness is shown
in Fig. 15, H=10.0 mm,tmax≈1.72 mm,tmin≈1.52 mm>0.9 mm, it means split won’t happen.
At the end of contracting hole in 3rd
station, the distribution of material thickness is shown in
Fig. 16, the part’s split will happen, next analysis has been taken no longer.
Analysis of 3rd scheme’s simulation result
At the end of wave forming of 1st process, the distribution of material thickness is shown in Fig.17,
tmax≈1.70 mm,tmin≈1.13 mm﹥0.9 mm;At the end of contracting hole in 2nd
station, the distribution
of material thickness is shown in Fig.18, tmax≈1.70 mm,tmin≈1.13 mm﹥0.9 mm,it means material
split won’t happen, furthermore there is no change in the middle of thickness, fitting for the
principle of plastic forming.
Fig.17. Distribution of THK in wave forming Fig.18. Distribution of THK in contracting hole
At the end of drawing in 3rd process, the distribution of material thickness is shown in Fig.19,
tmax≈1.92 mm,tmin≈1.49 mm﹥0.9 mm,it means material crack won’t happen. At the end of 4th
process (no calculation of resilience), the distribution of material thickness is shown in Fig.20,
H=41.2 mm,tmax≈1.92 mm,tmin≈1.49 mm>0.9 mm, it means material crack won’t happen.
110 Advanced Design and Manufacturing Technology I
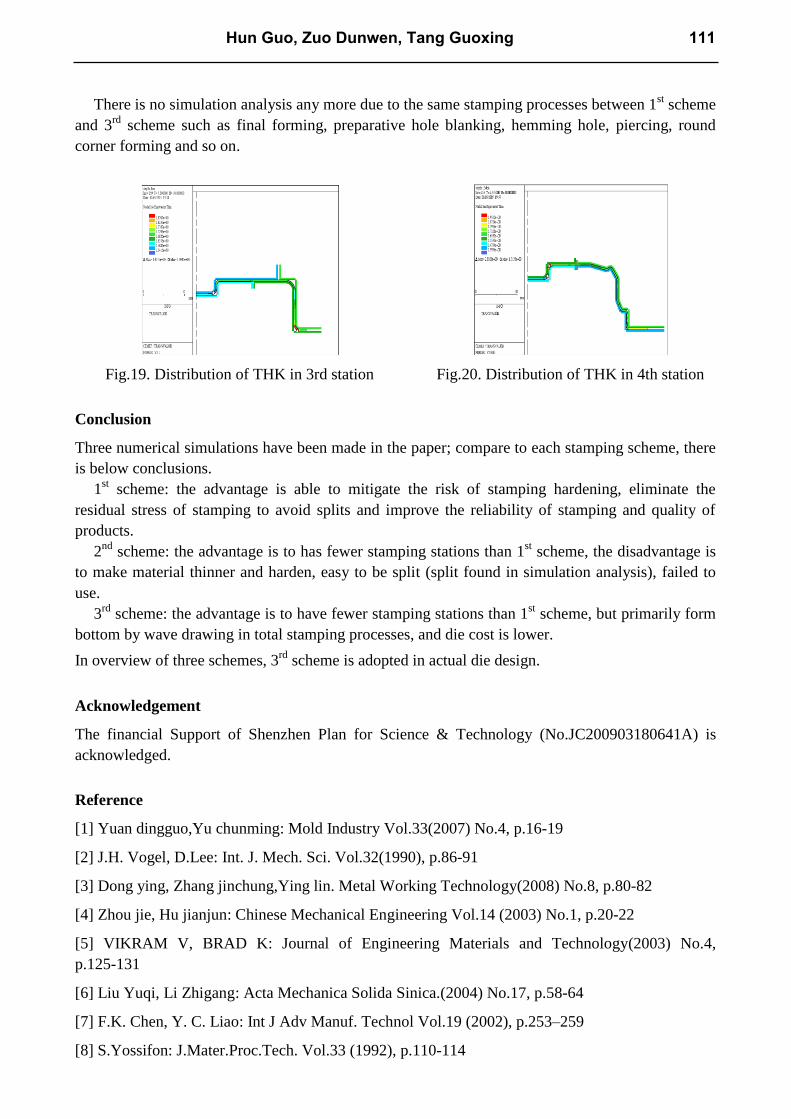
There is no simulation analysis any more due to the same stamping processes between 1st scheme
and 3rd
scheme such as final forming, preparative hole blanking, hemming hole, piercing, round
corner forming and so on.
Fig.19. Distribution of THK in 3rd station Fig.20. Distribution of THK in 4th station
Conclusion
Three numerical simulations have been made in the paper; compare to each stamping scheme, there
is below conclusions.
1st scheme: the advantage is able to mitigate the risk of stamping hardening, eliminate the
residual stress of stamping to avoid splits and improve the reliability of stamping and quality of
products.
2nd
scheme: the advantage is to has fewer stamping stations than 1st scheme, the disadvantage is
to make material thinner and harden, easy to be split (split found in simulation analysis), failed to
use.
3rd
scheme: the advantage is to have fewer stamping stations than 1st scheme, but primarily form
bottom by wave drawing in total stamping processes, and die cost is lower.
In overview of three schemes, 3rd
scheme is adopted in actual die design.
Acknowledgement
The financial Support of Shenzhen Plan for Science & Technology (No.JC200903180641A) is
acknowledged.
Reference
[1] Yuan dingguo,Yu chunming: Mold Industry Vol.33(2007) No.4, p.16-19
[2] J.H. Vogel, D.Lee: Int. J. Mech. Sci. Vol.32(1990), p.86-91
[3] Dong ying, Zhang jinchung,Ying lin. Metal Working Technology(2008) No.8, p.80-82
[4] Zhou jie, Hu jianjun: Chinese Mechanical Engineering Vol.14 (2003) No.1, p.20-22
[5] VIKRAM V, BRAD K: Journal of Engineering Materials and Technology(2003) No.4,
p.125-131
[6] Liu Yuqi, Li Zhigang: Acta Mechanica Solida Sinica.(2004) No.17, p.58-64
[7] F.K. Chen, Y. C. Liao: Int J Adv Manuf. Technol Vol.19 (2002), p.253–259
[8] S.Yossifon: J.Mater.Proc.Tech. Vol.33 (1992), p.110-114
Hun Guo, Zuo Dunwen, Tang Guoxing 111

Effects of Residual Stress on Interfacial Bonding Strength of Zinc-Plated
Film
Wang Xingfanga
Department of mechanical engineering, Changzhou Institute of Light Industry Technology, Changzhou
213164, P.R. China [email protected]
Keywords: zinc-plated film; residual stress; X-ray diffraction; bonding strength
Abstract. The distributions of residual stresses for zinc-plated film were measured quantitatively by
X-ray diffraction (XRD), its interfacial structures were observed with scanning electron microscope
(SEM). The effects of residual stress on bonding strength of zinc-plated film were investigated, and its
influence mechanism was discussed. The experimental results show that residual stresses of zinc-plated
film are behaved as tensile stress, which increase with its thickness, bonding strength of zinc-plated
film is inverse ratio with residual stresses; the effects of residual stress on film crack are obvious,
tensile stress speeds film cracking, which decrease its bonding strength; bonding strength of zinc-plated
film is increased by improving its residual stress distribution.
Introduction
Galvanizing process is used in atmospheric pressure at room temperature deposition of chemical
adsorption and mechanical collision zinc metal film formed on the surface of the work piece has been
widespread application, the process prone to zinc film and the substrate binding poor [1-3]. As the
reasons of the technology, the existence of galvanized layer of residual stress is inevitable, generally
there is a big residual tensile stress, and therefore, residual stress analysis is a study of quality control
of zinc film [4-5]. The current method of measuring a lot of residual stress, with the exception of a
cantilever beam method, there are bending plate method, changes in laws such as the length of the
cathode [6-10], but the zinc film on the study of residual stress distribution has not been reported. In
order to control the zinc film in the distribution of residual stress, using X-ray diffraction method of
stress characteristics of zinc film in a study by scanning electron microscopy combined with state of the
interface to its discussion and analysis of residual stress on the zinc film - matrix the effects of interface
strength, having a practical significance to improve the strength of combined with zinc film.
45 galvanized steel is the substrate, the solution for the 320 heads of granular materials zinc, 4%
alcohol solution of nitric acid, chemical pure copper sulfate crystals, such as cupric hydroxide. Test the
use of self-processing rotating disk electrode system: the cathode to be rotary motor drive low-carbon
steel, pewter round anode, cathode and anode spacing of 6 ~ 8mm. Bath system: sulfate system, ZnSO4
+ H2SO4. Bath parameters: Zn2 + concentration of 100g / L, temperature 58 ℃, pH value of 1.2.
Galvanizing process: heating the specimen machining skim → pickling derusting adjust pH value of
feed → to join the establishment of grass-roots preservation film thickening activator → the
polishing water → 100 ℃ drying material. These processes need to rinse. Current density 1A/dm2,
plating time is 40 ~ 120min, respectively, for the preparation of the thickness of 100μm ~ 600μm film
for X-ray diffraction and tensile bond strength test specimen.
© (2011) Trans Tech Publications, Switzerlanddoi:10.4028/www.scientific.net/AMR.142.112
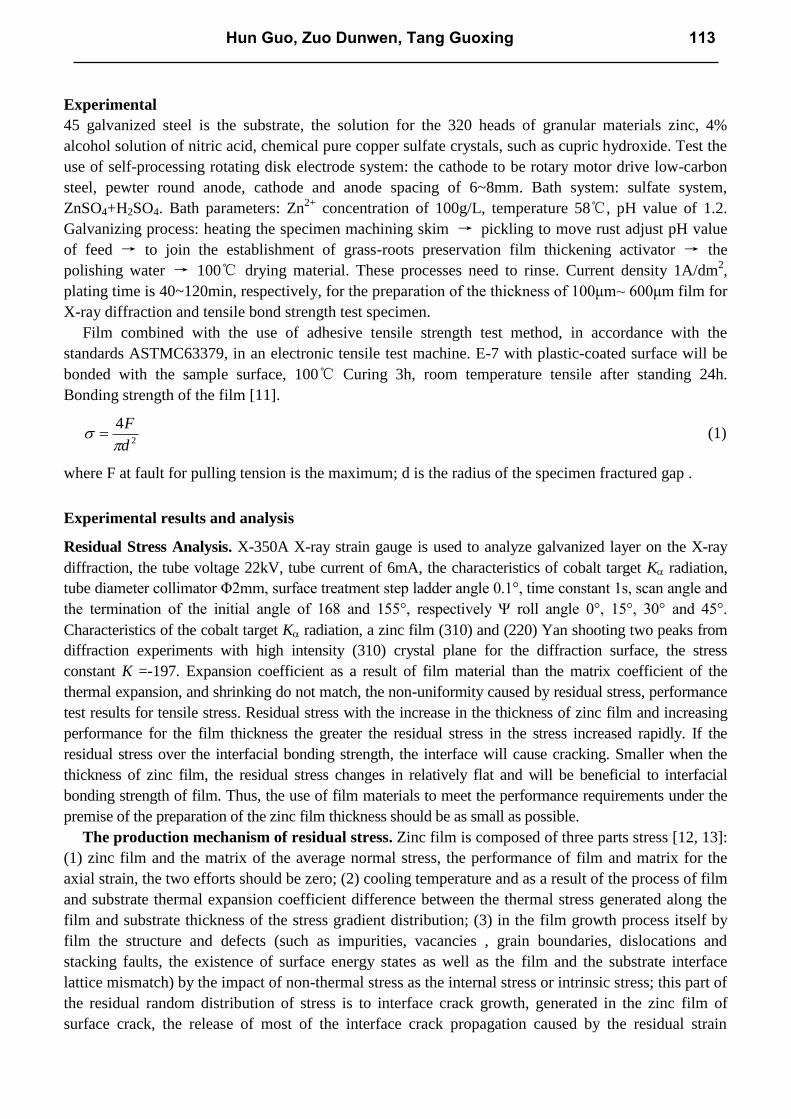
Experimental
45 galvanized steel is the substrate, the solution for the 320 heads of granular materials zinc, 4%
alcohol solution of nitric acid, chemical pure copper sulfate crystals, such as cupric hydroxide. Test the
use of self-processing rotating disk electrode system: the cathode to be rotary motor drive low-carbon
steel, pewter round anode, cathode and anode spacing of 6~8mm. Bath system: sulfate system,
ZnSO4+H2SO4. Bath parameters: Zn2+
concentration of 100g/L, temperature 58℃, pH value of 1.2.
Galvanizing process: heating the specimen machining skim → pickling to move rust adjust pH value
of feed → to join the establishment of grass-roots preservation film thickening activator → the
polishing water → 100℃ drying material. These processes need to rinse. Current density 1A/dm2,
plating time is 40~120min, respectively, for the preparation of the thickness of 100μm~ 600μm film for
X-ray diffraction and tensile bond strength test specimen.
Film combined with the use of adhesive tensile strength test method, in accordance with the
standards ASTMC63379, in an electronic tensile test machine. E-7 with plastic-coated surface will be
bonded with the sample surface, 100℃ Curing 3h, room temperature tensile after standing 24h.
Bonding strength of the film [11].
2
4
d
F
(1)
where F at fault for pulling tension is the maximum; d is the radius of the specimen fractured gap .
Experimental results and analysis
Residual Stress Analysis. X-350A X-ray strain gauge is used to analyze galvanized layer on the X-ray
diffraction, the tube voltage 22kV, tube current of 6mA, the characteristics of cobalt target K radiation,
tube diameter collimator Φ2mm, surface treatment step ladder angle 0.1°, time constant 1s, scan angle and
the termination of the initial angle of 168 and 155°, respectively Ψ roll angle 0°, 15°, 30° and 45°.
Characteristics of the cobalt target K radiation, a zinc film (310) and (220) Yan shooting two peaks from
diffraction experiments with high intensity (310) crystal plane for the diffraction surface, the stress
constant K =-197. Expansion coefficient as a result of film material than the matrix coefficient of the
thermal expansion, and shrinking do not match, the non-uniformity caused by residual stress, performance
test results for tensile stress. Residual stress with the increase in the thickness of zinc film and increasing
performance for the film thickness the greater the residual stress in the stress increased rapidly. If the
residual stress over the interfacial bonding strength, the interface will cause cracking. Smaller when the
thickness of zinc film, the residual stress changes in relatively flat and will be beneficial to interfacial
bonding strength of film. Thus, the use of film materials to meet the performance requirements under the
premise of the preparation of the zinc film thickness should be as small as possible.
The production mechanism of residual stress. Zinc film is composed of three parts stress [12, 13]:
(1) zinc film and the matrix of the average normal stress, the performance of film and matrix for the
axial strain, the two efforts should be zero; (2) cooling temperature and as a result of the process of film
and substrate thermal expansion coefficient difference between the thermal stress generated along the
film and substrate thickness of the stress gradient distribution; (3) in the film growth process itself by
film the structure and defects (such as impurities, vacancies , grain boundaries, dislocations and
stacking faults, the existence of surface energy states as well as the film and the substrate interface
lattice mismatch) by the impact of non-thermal stress as the internal stress or intrinsic stress; this part of
the residual random distribution of stress is to interface crack growth, generated in the zinc film of
surface crack, the release of most of the interface crack propagation caused by the residual strain
Hun Guo, Zuo Dunwen, Tang Guoxing 113
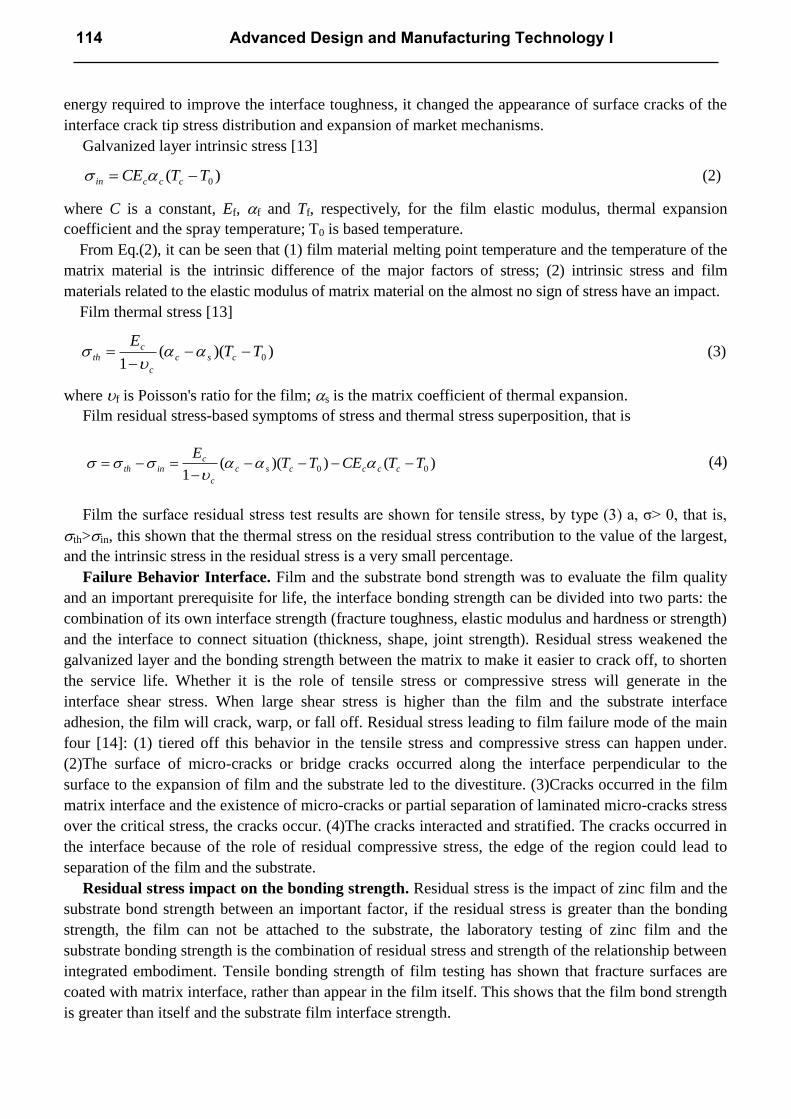
energy required to improve the interface toughness, it changed the appearance of surface cracks of the
interface crack tip stress distribution and expansion of market mechanisms.
Galvanized layer intrinsic stress [13]
)( 0TTCE cccin (2)
where C is a constant, Ef, f and Tf, respectively, for the film elastic modulus, thermal expansion
coefficient and the spray temperature; T0 is based temperature.
From Eq.(2), it can be seen that (1) film material melting point temperature and the temperature of the
matrix material is the intrinsic difference of the major factors of stress; (2) intrinsic stress and film
materials related to the elastic modulus of matrix material on the almost no sign of stress have an impact.
Film thermal stress [13]
))((1
0TTE
csc
c
c
th
(3)
where f is Poisson's ratio for the film; s is the matrix coefficient of thermal expansion.
Film residual stress-based symptoms of stress and thermal stress superposition, that is
)())((1
00 TTCETTE
ccccsc
c
c
inth
(4)
Film the surface residual stress test results are shown for tensile stress, by type (3) a, σ> 0, that is,
th>in, this shown that the thermal stress on the residual stress contribution to the value of the largest,
and the intrinsic stress in the residual stress is a very small percentage.
Failure Behavior Interface. Film and the substrate bond strength was to evaluate the film quality
and an important prerequisite for life, the interface bonding strength can be divided into two parts: the
combination of its own interface strength (fracture toughness, elastic modulus and hardness or strength)
and the interface to connect situation (thickness, shape, joint strength). Residual stress weakened the
galvanized layer and the bonding strength between the matrix to make it easier to crack off, to shorten
the service life. Whether it is the role of tensile stress or compressive stress will generate in the
interface shear stress. When large shear stress is higher than the film and the substrate interface
adhesion, the film will crack, warp, or fall off. Residual stress leading to film failure mode of the main
four [14]: (1) tiered off this behavior in the tensile stress and compressive stress can happen under.
(2)The surface of micro-cracks or bridge cracks occurred along the interface perpendicular to the
surface to the expansion of film and the substrate led to the divestiture. (3)Cracks occurred in the film
matrix interface and the existence of micro-cracks or partial separation of laminated micro-cracks stress
over the critical stress, the cracks occur. (4)The cracks interacted and stratified. The cracks occurred in
the interface because of the role of residual compressive stress, the edge of the region could lead to
separation of the film and the substrate.
Residual stress impact on the bonding strength. Residual stress is the impact of zinc film and the
substrate bond strength between an important factor, if the residual stress is greater than the bonding
strength, the film can not be attached to the substrate, the laboratory testing of zinc film and the
substrate bonding strength is the combination of residual stress and strength of the relationship between
integrated embodiment. Tensile bonding strength of film testing has shown that fracture surfaces are
coated with matrix interface, rather than appear in the film itself. This shows that the film bond strength
is greater than itself and the substrate film interface strength.
114 Advanced Design and Manufacturing Technology I
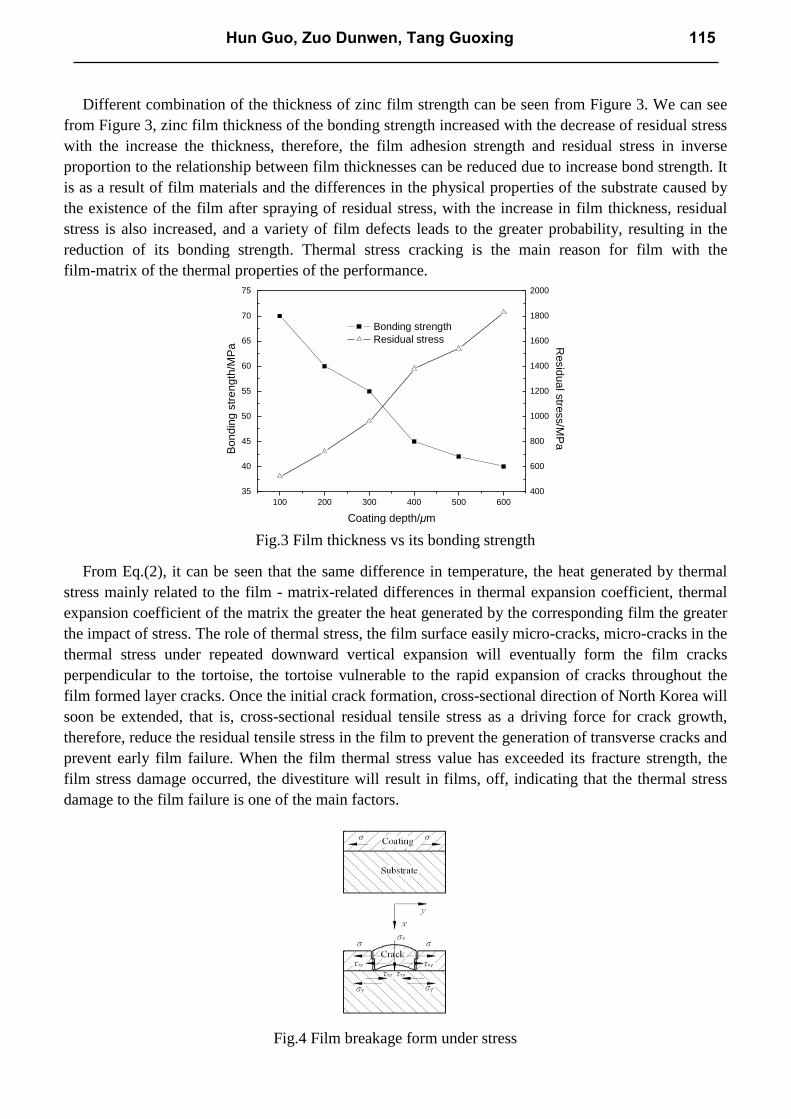
Different combination of the thickness of zinc film strength can be seen from Figure 3. We can see
from Figure 3, zinc film thickness of the bonding strength increased with the decrease of residual stress
with the increase the thickness, therefore, the film adhesion strength and residual stress in inverse
proportion to the relationship between film thicknesses can be reduced due to increase bond strength. It
is as a result of film materials and the differences in the physical properties of the substrate caused by
the existence of the film after spraying of residual stress, with the increase in film thickness, residual
stress is also increased, and a variety of film defects leads to the greater probability, resulting in the
reduction of its bonding strength. Thermal stress cracking is the main reason for film with the
film-matrix of the thermal properties of the performance.
100 200 300 400 500 600
35
40
45
50
55
60
65
70
75
Bonding strength
Residual stress
Coating depth/μm
Bondin
g s
trength
/MP
a
400
600
800
1000
1200
1400
1600
1800
2000
Resid
ual s
tress/M
Pa
Fig.3 Film thickness vs its bonding strength
From Eq.(2), it can be seen that the same difference in temperature, the heat generated by thermal
stress mainly related to the film - matrix-related differences in thermal expansion coefficient, thermal
expansion coefficient of the matrix the greater the heat generated by the corresponding film the greater
the impact of stress. The role of thermal stress, the film surface easily micro-cracks, micro-cracks in the
thermal stress under repeated downward vertical expansion will eventually form the film cracks
perpendicular to the tortoise, the tortoise vulnerable to the rapid expansion of cracks throughout the
film formed layer cracks. Once the initial crack formation, cross-sectional direction of North Korea will
soon be extended, that is, cross-sectional residual tensile stress as a driving force for crack growth,
therefore, reduce the residual tensile stress in the film to prevent the generation of transverse cracks and
prevent early film failure. When the film thermal stress value has exceeded its fracture strength, the
film stress damage occurred, the divestiture will result in films, off, indicating that the thermal stress
damage to the film failure is one of the main factors.
Fig.4 Film breakage form under stress
Hun Guo, Zuo Dunwen, Tang Guoxing 115

Film under tensile stress, fracture strain as a result of the film fracture strain than the matrix, film
cracks will occur before the destruction shown in Figure 4. Griffith can be coated by the occurrence of
damage to the relationship between the critical stresses [15]
a
EG
F
cc
c
c
1
(5)
where Ff is the geometric parameters for the film; Gf is the energy release rate for the film; Ef is the
elastic modulus of zinc film; a half for the crack length.
Cracks along the system, the fastest reduction in the direction of the energy expansion, galvanized layer
interface crack along the first expansion, will have the following two types of damage to the way [16]:
(1) When y≤if, x≥ti, tensile failure occurred in the film;
(2) When y≤tf, xy≥ti, shear failure occurred in the film.
where x (y) of parallel to crack front-end (vertical) plane tensile cracks, tf (ti) as matrix (the
interface) the theoretical tensile strength, ti theory is the interface shear strength, xy is horizontal shear
strength of crack front.
Conclusions
Residual stresses of zinc-plated film are shown as tensile stress, as its thickness increases.
Bonding strength of zinc-plated film is inversely proportional to its residual stress, as its thickness
increases.
Residual stress of zinc-plated film effects its cracking, tensile stress accelerates its cracking
propagation, which results in stripping, falling, and failure of zinc-plated film.
References
[1] Guan YJ, Xia Y: Advances In Mechanics Vol. 34 (20042), p. 237
[2] Yoshiyuki N, Kazukiyo U, Manabu S: Journal of Nuclear Materials Vol. 258-263 (1998), p.1517
[3] Wang SM, He MY, Liu L and et al: Heat Treatment of Metals Vol. 29 (2004), p. 28
[4] Ma BX, Yao N, Jia Y, et al: Acta Physica Sinica Vol. 54 (2005), p. 2853
[5] Feng WR, Yan DR He JN: Acta Physica Sinica Vol. 54 (2005), p. 2399
[6] Li N, WuG, Li DY: Material Science and Technology Vol.9 (2001) No.4, p. 420
[7] Hiroshi H, Ken G, Shinya I: Journal of the European Ceramic Society Vol. 25 (2005), p. 535
[8] Yang YC: Surface and Films Technology Vol.201 (2007), p. 7187
[9] Shao SY, Fan ZX, Shao JD: Acta Physica Sinica Vol. 54 (2005), p. 3312
[10] Masashi K, Hiroshi H Hiroshi F: Carbon Vol. 43 (2005), p. 171
[11] Wang SM, Liu L, Zhao XJ: Materials Protection Vol. 36 (2003), p. 24
[12] Wang SM, He MY, Liu L: Heat Treatment of Metals Vol. 31 (2006), p. 71
[13] Kong DJ, Zhang YK, Chen ZG: Acta Physica Sinica Vol. 56 (2007), p. 4056
[14] Zhang XC, Xu BS, Wang HD: Chinese Journal of Mechanical Engineering Vol. 42 (2006), p. 13
[15] Chu S J. Journal of Applied Sciences Vol. 13 (1995), p.74
[16] Kong DJ, Zhang YK, Lu JZ: Chinese Journal of Materials Research Vol. 21 (2007), p. 92
116 Advanced Design and Manufacturing Technology I
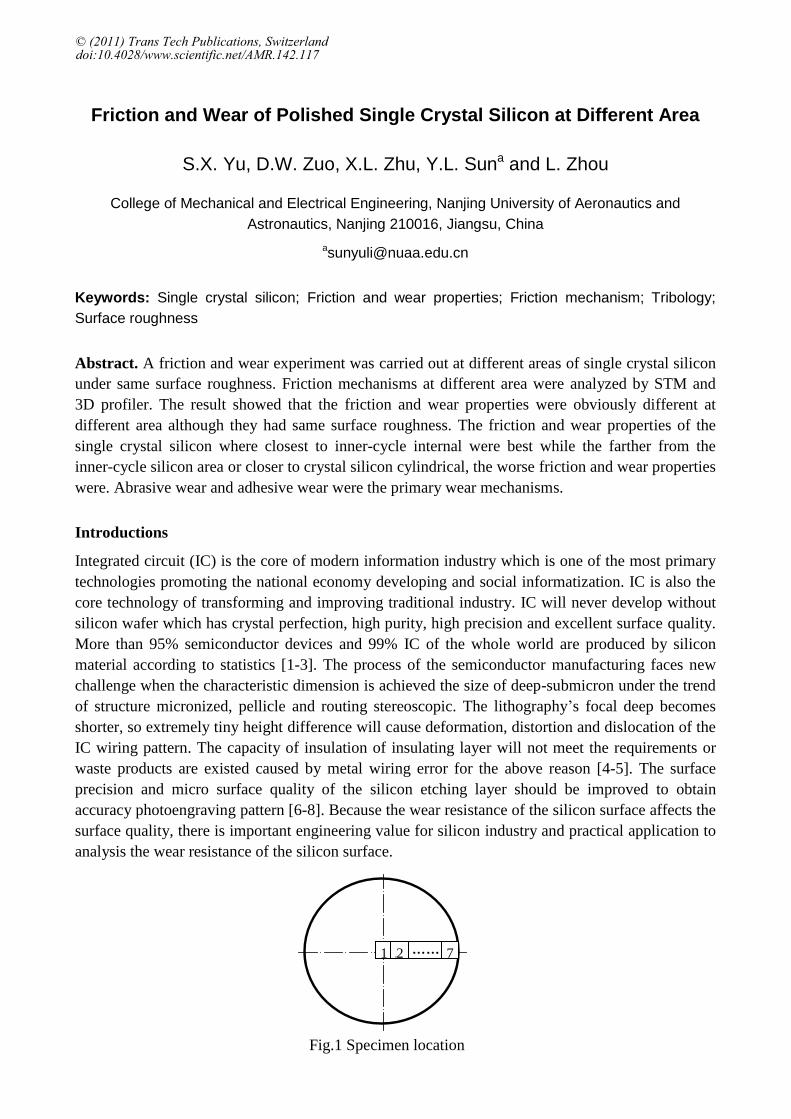
Friction and Wear of Polished Single Crystal Silicon at Different Area
S.X. Yu, D.W. Zuo, X.L. Zhu, Y.L. Suna and L. Zhou
College of Mechanical and Electrical Engineering, Nanjing University of Aeronautics and
Astronautics, Nanjing 210016, Jiangsu, China
Keywords: Single crystal silicon; Friction and wear properties; Friction mechanism; Tribology;
Surface roughness
Abstract. A friction and wear experiment was carried out at different areas of single crystal silicon
under same surface roughness. Friction mechanisms at different area were analyzed by STM and
3D profiler. The result showed that the friction and wear properties were obviously different at
different area although they had same surface roughness. The friction and wear properties of the
single crystal silicon where closest to inner-cycle internal were best while the farther from the
inner-cycle silicon area or closer to crystal silicon cylindrical, the worse friction and wear properties
were. Abrasive wear and adhesive wear were the primary wear mechanisms.
Introductions
Integrated circuit (IC) is the core of modern information industry which is one of the most primary
technologies promoting the national economy developing and social informatization. IC is also the
core technology of transforming and improving traditional industry. IC will never develop without
silicon wafer which has crystal perfection, high purity, high precision and excellent surface quality.
More than 95% semiconductor devices and 99% IC of the whole world are produced by silicon
material according to statistics [1-3]. The process of the semiconductor manufacturing faces new
challenge when the characteristic dimension is achieved the size of deep-submicron under the trend
of structure micronized, pellicle and routing stereoscopic. The lithography’s focal deep becomes
shorter, so extremely tiny height difference will cause deformation, distortion and dislocation of the
IC wiring pattern. The capacity of insulation of insulating layer will not meet the requirements or
waste products are existed caused by metal wiring error for the above reason [4-5]. The surface
precision and micro surface quality of the silicon etching layer should be improved to obtain
accuracy photoengraving pattern [6-8]. Because the wear resistance of the silicon surface affects the
surface quality, there is important engineering value for silicon industry and practical application to
analysis the wear resistance of the silicon surface.
1 2 …… 7
Fig.1 Specimen location
© (2011) Trans Tech Publications, Switzerlanddoi:10.4028/www.scientific.net/AMR.142.117
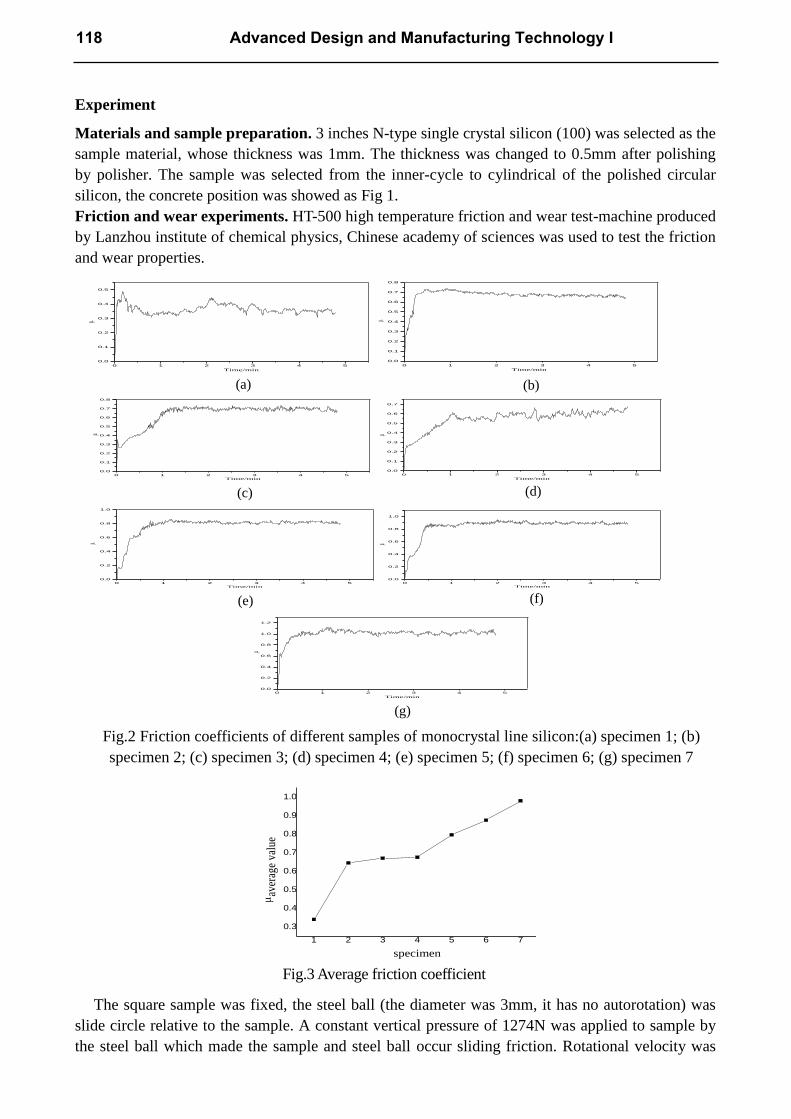
Experiment
Materials and sample preparation. 3 inches N-type single crystal silicon (100) was selected as the
sample material, whose thickness was 1mm. The thickness was changed to 0.5mm after polishing
by polisher. The sample was selected from the inner-cycle to cylindrical of the polished circular
silicon, the concrete position was showed as Fig 1.
Friction and wear experiments. HT-500 high temperature friction and wear test-machine produced
by Lanzhou institute of chemical physics, Chinese academy of sciences was used to test the friction
and wear properties.
The square sample was fixed, the steel ball (the diameter was 3mm, it has no autorotation) was
slide circle relative to the sample. A constant vertical pressure of 1274N was applied to sample by
the steel ball which made the sample and steel ball occur sliding friction. Rotational velocity was
Fig.3 Average friction coefficient
1 2 3 4 5 6 7
0.3
0.4
0.5
0.6
0.7
0.8
0.9
1.0
av
erag
e va
lue
specimen
0 1 2 3 4 5
0.0
0.1
0.2
0.3
0.4
0.5
Time/min
0 1 2 3 4 5
0.0
0.1
0.2
0.3
0.4
0.5
0.6
0.7
0.8
Time/min
0 1 2 3 4 5
0.0
0.1
0.2
0.3
0.4
0.5
0.6
0.7
0.8
Time/min
0 1 2 3 4 5
0.0
0.1
0.2
0.3
0.4
0.5
0.6
0.7
Time/min
0 1 2 3 4 5
0.0
0.2
0.4
0.6
0.8
1.0
Time/min
0 1 2 3 4 5
0.0
0.2
0.4
0.6
0.8
1.0
Time/min
0 1 2 3 4 5
0.0
0.2
0.4
0.6
0.8
1.0
1.2
Time/min
(a) (b)
(c) (d)
(e) (f)
(g)
Fig.2 Friction coefficients of different samples of monocrystal line silicon:(a) specimen 1; (b)
specimen 2; (c) specimen 3; (d) specimen 4; (e) specimen 5; (f) specimen 6; (g) specimen 7
118 Advanced Design and Manufacturing Technology I
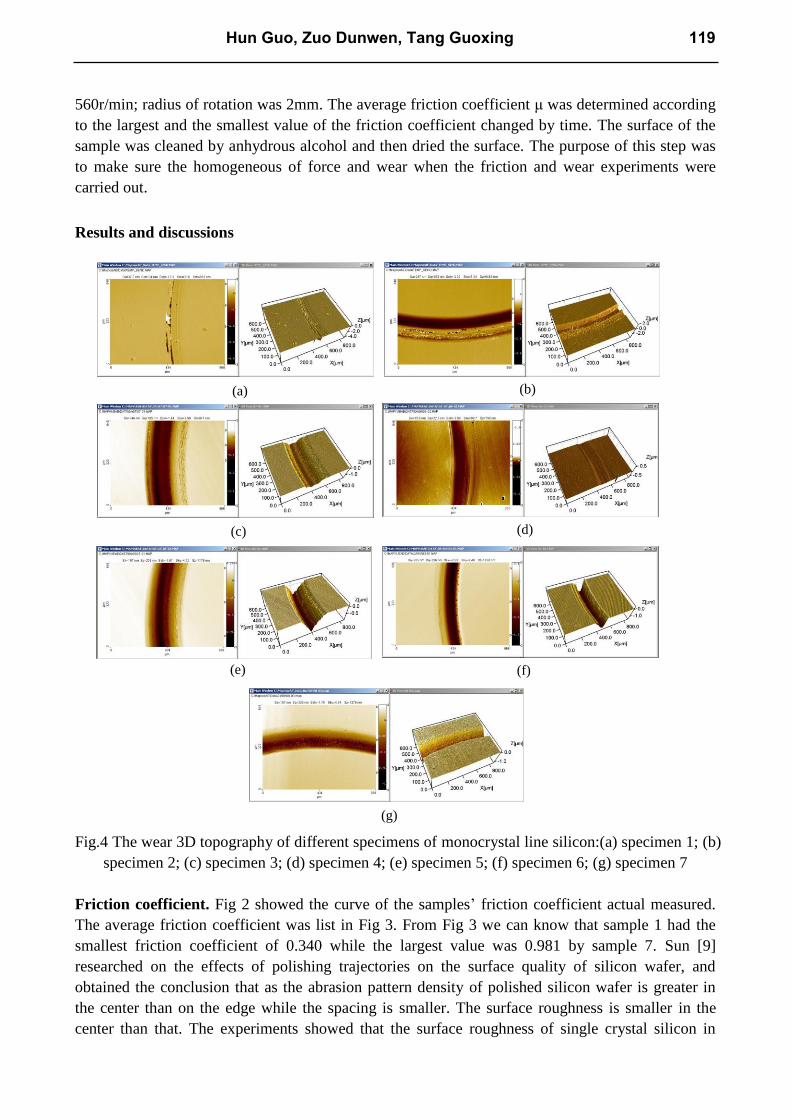
560r/min; radius of rotation was 2mm. The average friction coefficient μ was determined according
to the largest and the smallest value of the friction coefficient changed by time. The surface of the
sample was cleaned by anhydrous alcohol and then dried the surface. The purpose of this step was
to make sure the homogeneous of force and wear when the friction and wear experiments were
carried out.
Results and discussions
Fig.4 The wear 3D topography of different specimens of monocrystal line silicon:(a) specimen 1; (b)
specimen 2; (c) specimen 3; (d) specimen 4; (e) specimen 5; (f) specimen 6; (g) specimen 7
Friction coefficient. Fig 2 showed the curve of the samples’ friction coefficient actual measured.
The average friction coefficient was list in Fig 3. From Fig 3 we can know that sample 1 had the
smallest friction coefficient of 0.340 while the largest value was 0.981 by sample 7. Sun [9]
researched on the effects of polishing trajectories on the surface quality of silicon wafer, and
obtained the conclusion that as the abrasion pattern density of polished silicon wafer is greater in
the center than on the edge while the spacing is smaller. The surface roughness is smaller in the
center than that. The experiments showed that the surface roughness of single crystal silicon in
(a) (b)
(c) (d)
(e) (f)
(g)
Hun Guo, Zuo Dunwen, Tang Guoxing 119
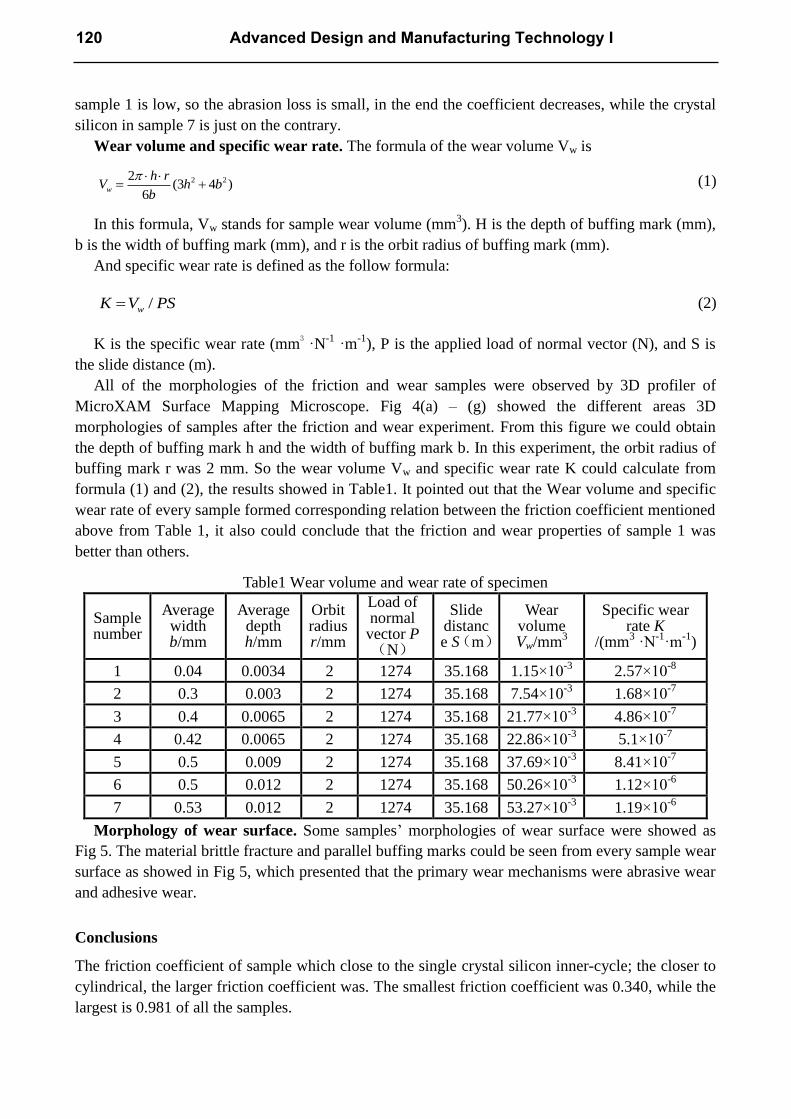
sample 1 is low, so the abrasion loss is small, in the end the coefficient decreases, while the crystal
silicon in sample 7 is just on the contrary.
Wear volume and specific wear rate. The formula of the wear volume Vw is
2 22(3 4 )
6w
h rV h b
b
(1)
In this formula, Vw stands for sample wear volume (mm3). H is the depth of buffing mark (mm),
b is the width of buffing mark (mm), and r is the orbit radius of buffing mark (mm).
And specific wear rate is defined as the follow formula:
/wK V PS (2)
K is the specific wear rate (mm3 ·N
-1 ·m
-1), P is the applied load of normal vector (N), and S is
the slide distance (m).
All of the morphologies of the friction and wear samples were observed by 3D profiler of
MicroXAM Surface Mapping Microscope. Fig 4(a) – (g) showed the different areas 3D
morphologies of samples after the friction and wear experiment. From this figure we could obtain
the depth of buffing mark h and the width of buffing mark b. In this experiment, the orbit radius of
buffing mark r was 2 mm. So the wear volume Vw and specific wear rate K could calculate from
formula (1) and (2), the results showed in Table1. It pointed out that the Wear volume and specific
wear rate of every sample formed corresponding relation between the friction coefficient mentioned
above from Table 1, it also could conclude that the friction and wear properties of sample 1 was
better than others.
Table1 Wear volume and wear rate of specimen
Sample number
Average width b/mm
Average depth h/mm
Orbit radius r/mm
Load of normal
vector P(N)
Slide distance S(m)
Wear volume Vw/mm
3
Specific wear rate K
/(mm3 ·N
-1·m
-1)
1 0.04 0.0034 2 1274 35.168 1.15×10⁻³
2.57×10⁻⁸
2 0.3 0.003 2 1274 35.168 7.54×10⁻³
1.68×10⁻⁷
3 0.4 0.0065 2 1274 35.168 21.77×10⁻³
4.86×10⁻⁷
4 0.42 0.0065 2 1274 35.168 22.86×10⁻³
5.1×10⁻⁷
5 0.5 0.009 2 1274 35.168 37.69×10⁻³
8.41×10⁻⁷
6 0.5 0.012 2 1274 35.168 50.26×10⁻³
1.12×10⁻⁶
7 0.53 0.012 2 1274 35.168 53.27×10⁻³
1.19×10⁻⁶
Morphology of wear surface. Some samples’ morphologies of wear surface were showed as
Fig 5. The material brittle fracture and parallel buffing marks could be seen from every sample wear
surface as showed in Fig 5, which presented that the primary wear mechanisms were abrasive wear
and adhesive wear.
Conclusions
The friction coefficient of sample which close to the single crystal silicon inner-cycle; the closer to
cylindrical, the larger friction coefficient was. The smallest friction coefficient was 0.340, while the
largest is 0.981 of all the samples.
120 Advanced Design and Manufacturing Technology I
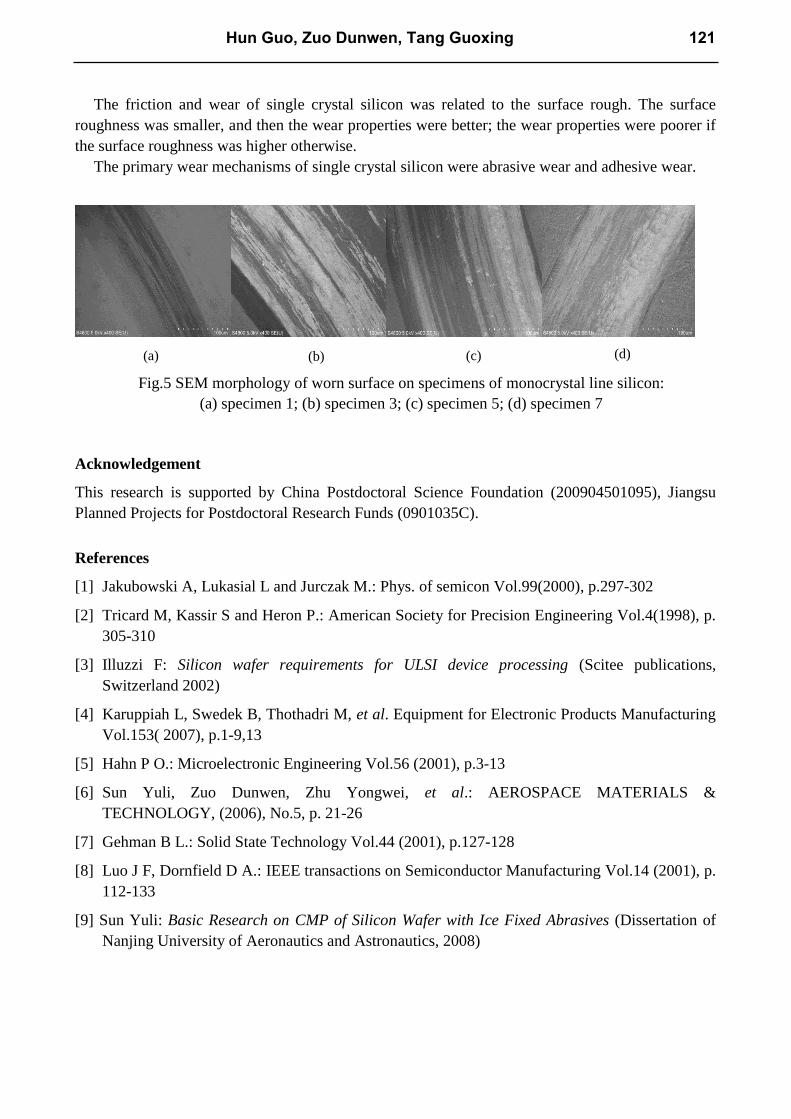
The friction and wear of single crystal silicon was related to the surface rough. The surface
roughness was smaller, and then the wear properties were better; the wear properties were poorer if
the surface roughness was higher otherwise.
The primary wear mechanisms of single crystal silicon were abrasive wear and adhesive wear.
Acknowledgement
This research is supported by China Postdoctoral Science Foundation (200904501095), Jiangsu
Planned Projects for Postdoctoral Research Funds (0901035C).
References
[1] Jakubowski A, Lukasial L and Jurczak M.: Phys. of semicon Vol.99(2000), p.297-302
[2] Tricard M, Kassir S and Heron P.: American Society for Precision Engineering Vol.4(1998), p.
305-310
[3] Illuzzi F: Silicon wafer requirements for ULSI device processing (Scitee publications,
Switzerland 2002)
[4] Karuppiah L, Swedek B, Thothadri M, et al. Equipment for Electronic Products Manufacturing
Vol.153( 2007), p.1-9,13
[5] Hahn P O.: Microelectronic Engineering Vol.56 (2001), p.3-13
[6] Sun Yuli, Zuo Dunwen, Zhu Yongwei, et al.: AEROSPACE MATERIALS &
TECHNOLOGY, (2006), No.5, p. 21-26
[7] Gehman B L.: Solid State Technology Vol.44 (2001), p.127-128
[8] Luo J F, Dornfield D A.: IEEE transactions on Semiconductor Manufacturing Vol.14 (2001), p.
112-133
[9] Sun Yuli: Basic Research on CMP of Silicon Wafer with Ice Fixed Abrasives (Dissertation of
Nanjing University of Aeronautics and Astronautics, 2008)
(a) (b) (c) (d)
Fig.5 SEM morphology of worn surface on specimens of monocrystal line silicon:
(a) specimen 1; (b) specimen 3; (c) specimen 5; (d) specimen 7
Hun Guo, Zuo Dunwen, Tang Guoxing 121
Numerical Simulation of The Machining Distortion of Aircraft Aluminum Part Caused by Redistribution of Residual Stress
Liu Yuanweia
Digital Manufacturing Technology Lab of Jiangsu province, Huaiyin Institute of Technology, HuaiAn 223001, China
Keyword: residual stress; distortion; numerical simulation
Abstract. In order to reduce the weight of airplane and increase its mechanical behaviors, more and
larger integrated parts are applied in modern aviation industry. When machining multi-frame
aeroplane parts, more than 90% of the materials would be removed, resulting in severe distortion of
the parts due to the weakened rigidity and the release of residual stress. This might also lead to stress
concentration and damage of the parts. The effect of material removal from residually stressed billet
is simulated using FEA software ANSYS, and the causations of distortion is analyzed. To verify the
finite element simulation, a high speed milling test on aluminum alloy 7050T7351 is carried out. The
results show that the simulation result is consistent with the experimental one. It included that the
original residual stress in the blocks of aero-aluminum component is one of key factors to cause
machining distortion.
Introduction
In the aviation industry, the large-scaled parts are widely used to satisfy the demands of high speed
and high mobility, such as the integrated construction panel, the integrated beam and the partition,
etc. Due to its low rigidity and the release of residual stress after more than 90% of the materials are
removed, the large-scaled parts easily deform during the cutting process. Severe distortion is often
observed on the parts, this makes the precision difficult to master [1-5]. It is assumed that the release and the redistribution of the residual stresses in the billet are the
major reasons of the distortions. The residual stress comes mainly from the rolling process of the
billets and is also influenced, though less significantly, by cutting force, fastening force, cutting
temperature, etc. Many methods to eliminate residual stress have been adopted. After a rolled
aluminum blank is stretched along rolling direction to produce 2.5% permanent distortion, its residual
stress magnitude may drop 90% [3].
In this paper, without regard to the influence of the cutting force and cutting heat, numerical
simulation method is used to simulate the milling deformation of the complex structure part due to the
redistribution of residual stress, and established the mechanical model and solution method of the
aero aluminum alloy plate caused by the redistribution of residual stress, and the relation between
residual stress and machining deformation is discussed.
Modeling and Simulation
With the removal of the residually stressed material, the remaining stresses in the workpiece
redistribute to reach new equilibrium. For pre-stretched aluminum billets, the surface is more likely to
exhibit tensile stress. The inner part of the piece is therefore stressed compressively. That is, the stress
changes from the top surface to the bottom in a tensile-compressive-tensile manner.
Without considering cutting force and cutting heat, material removal procedure can be carried out
through the use of finite element technology, the structural part is gridded, and the material removal
process is the process in which the appropriate unit will be removed. If the initial value of each
element stress is its initial residual stress, at this time, the relationship between the stress vector of the
© (2011) Trans Tech Publications, Switzerlanddoi:10.4028/www.scientific.net/AMR.142.122
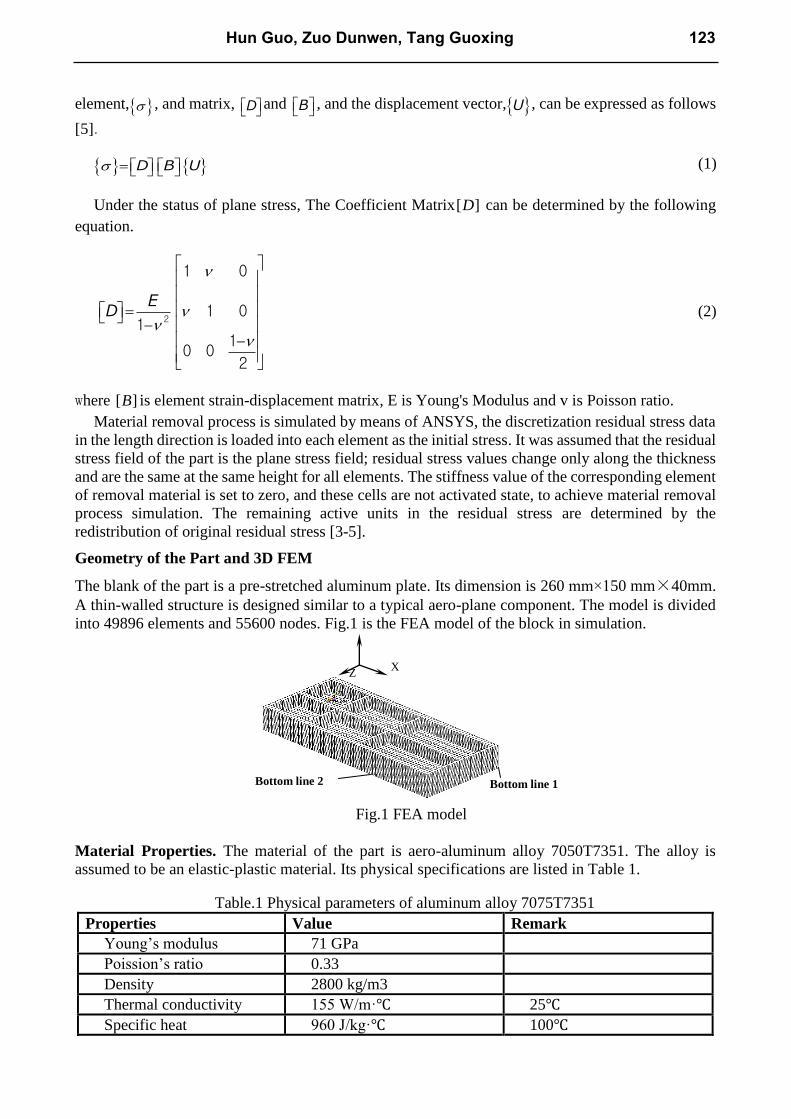
element, , and matrix, D and B , and the displacement vector, U , can be expressed as follows
[5].
D B U (1)
Under the status of plane stress, The Coefficient Matrix[ ]D can be determined by the following
equation.
2
1 0
1 01
10 0
2
ED (2)
where [ ]B is element strain-displacement matrix, E is Young's Modulus and v is Poisson ratio.
Material removal process is simulated by means of ANSYS, the discretization residual stress data
in the length direction is loaded into each element as the initial stress. It was assumed that the residual
stress field of the part is the plane stress field; residual stress values change only along the thickness
and are the same at the same height for all elements. The stiffness value of the corresponding element
of removal material is set to zero, and these cells are not activated state, to achieve material removal
process simulation. The remaining active units in the residual stress are determined by the
redistribution of original residual stress [3-5].
Geometry of the Part and 3D FEM
The blank of the part is a pre-stretched aluminum plate. Its dimension is 260 mm×150 mm×40mm.
A thin-walled structure is designed similar to a typical aero-plane component. The model is divided
into 49896 elements and 55600 nodes. Fig.1 is the FEA model of the block in simulation.
Fig.1 FEA model
Material Properties. The material of the part is aero-aluminum alloy 7050T7351. The alloy is
assumed to be an elastic-plastic material. Its physical specifications are listed in Table 1.
Table.1 Physical parameters of aluminum alloy 7075T7351
Properties Value Remark
Young’s modulus 71 GPa
Poission’s ratio 0.33
Density 2800 kg/m3
Thermal conductivity 155 W/m·℃ 25℃
Specific heat 960 J/kg·℃ 100℃
Bottom line 2
X Z
Bottom line 1
Hun Guo, Zuo Dunwen, Tang Guoxing 123
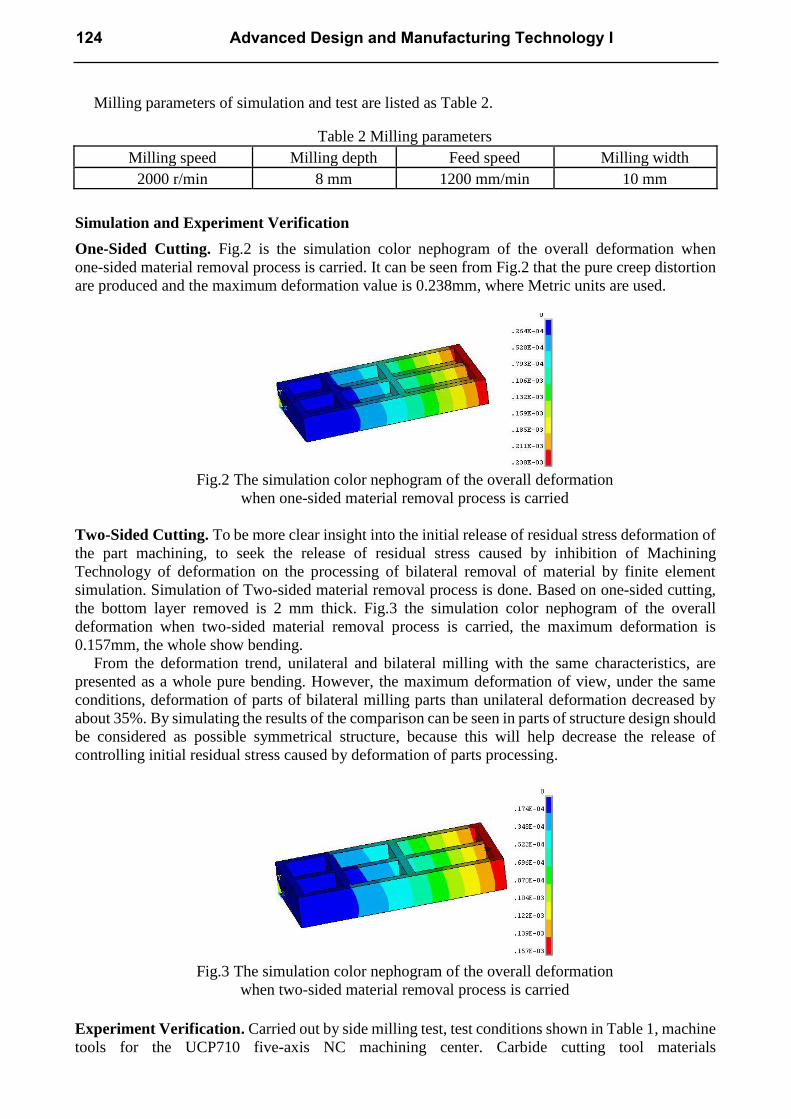
Milling parameters of simulation and test are listed as Table 2.
Table 2 Milling parameters
Milling speed Milling depth Feed speed Milling width
2000 r/min 8 mm 1200 mm/min 10 mm
Simulation and Experiment Verification
One-Sided Cutting. Fig.2 is the simulation color nephogram of the overall deformation when
one-sided material removal process is carried. It can be seen from Fig.2 that the pure creep distortion
are produced and the maximum deformation value is 0.238mm, where Metric units are used.
Fig.2 The simulation color nephogram of the overall deformation
when one-sided material removal process is carried
Two-Sided Cutting. To be more clear insight into the initial release of residual stress deformation of
the part machining, to seek the release of residual stress caused by inhibition of Machining
Technology of deformation on the processing of bilateral removal of material by finite element
simulation. Simulation of Two-sided material removal process is done. Based on one-sided cutting,
the bottom layer removed is 2 mm thick. Fig.3 the simulation color nephogram of the overall
deformation when two-sided material removal process is carried, the maximum deformation is
0.157mm, the whole show bending.
From the deformation trend, unilateral and bilateral milling with the same characteristics, are
presented as a whole pure bending. However, the maximum deformation of view, under the same
conditions, deformation of parts of bilateral milling parts than unilateral deformation decreased by
about 35%. By simulating the results of the comparison can be seen in parts of structure design should
be considered as possible symmetrical structure, because this will help decrease the release of
controlling initial residual stress caused by deformation of parts processing.
Fig.3 The simulation color nephogram of the overall deformation
when two-sided material removal process is carried
Experiment Verification. Carried out by side milling test, test conditions shown in Table 1, machine
tools for the UCP710 five-axis NC machining center. Carbide cutting tool materials
124 Advanced Design and Manufacturing Technology I
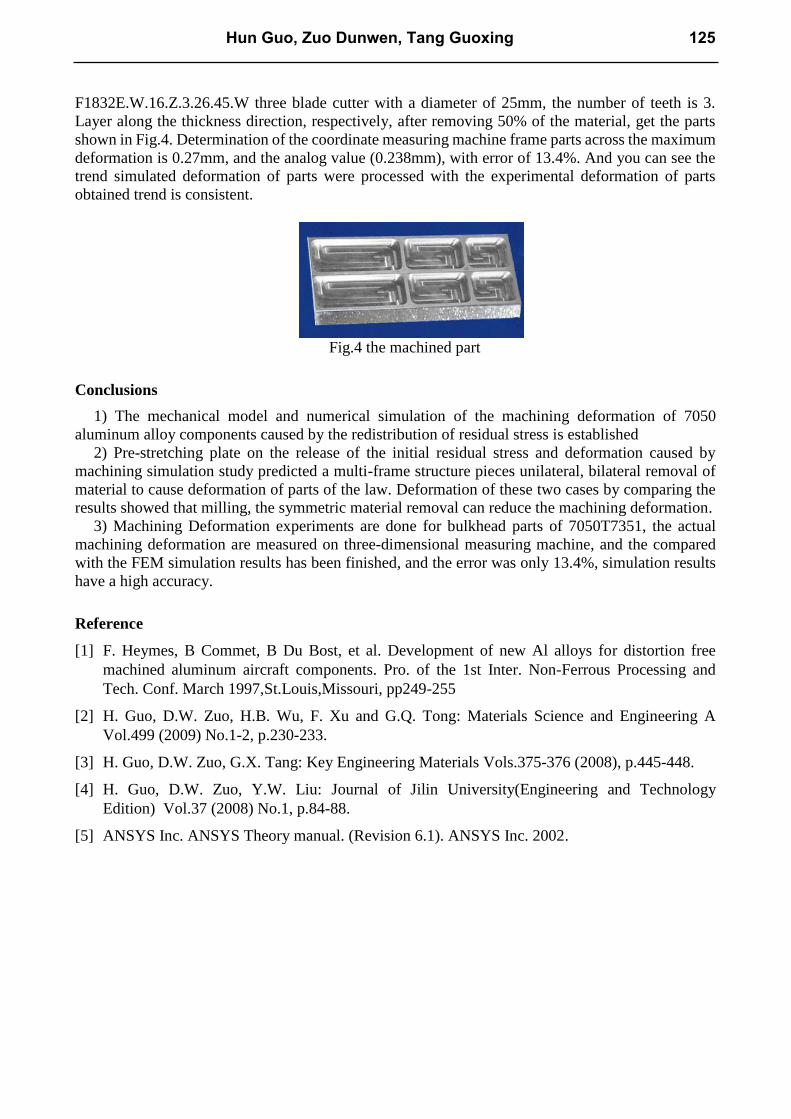
F1832E.W.16.Z.3.26.45.W three blade cutter with a diameter of 25mm, the number of teeth is 3.
Layer along the thickness direction, respectively, after removing 50% of the material, get the parts
shown in Fig.4. Determination of the coordinate measuring machine frame parts across the maximum
deformation is 0.27mm, and the analog value (0.238mm), with error of 13.4%. And you can see the
trend simulated deformation of parts were processed with the experimental deformation of parts
obtained trend is consistent.
Fig.4 the machined part
Conclusions
1) The mechanical model and numerical simulation of the machining deformation of 7050
aluminum alloy components caused by the redistribution of residual stress is established
2) Pre-stretching plate on the release of the initial residual stress and deformation caused by
machining simulation study predicted a multi-frame structure pieces unilateral, bilateral removal of
material to cause deformation of parts of the law. Deformation of these two cases by comparing the
results showed that milling, the symmetric material removal can reduce the machining deformation.
3) Machining Deformation experiments are done for bulkhead parts of 7050T7351, the actual
machining deformation are measured on three-dimensional measuring machine, and the compared
with the FEM simulation results has been finished, and the error was only 13.4%, simulation results
have a high accuracy.
Reference
[1] F. Heymes, B Commet, B Du Bost, et al. Development of new Al alloys for distortion free
machined aluminum aircraft components. Pro. of the 1st Inter. Non-Ferrous Processing and
Tech. Conf. March 1997,St.Louis,Missouri, pp249-255
[2] H. Guo, D.W. Zuo, H.B. Wu, F. Xu and G.Q. Tong: Materials Science and Engineering A
Vol.499 (2009) No.1-2, p.230-233.
[3] H. Guo, D.W. Zuo, G.X. Tang: Key Engineering Materials Vols.375-376 (2008), p.445-448.
[4] H. Guo, D.W. Zuo, Y.W. Liu: Journal of Jilin University(Engineering and Technology
Edition) Vol.37 (2008) No.1, p.84-88.
[5] ANSYS Inc. ANSYS Theory manual. (Revision 6.1). ANSYS Inc. 2002.
Hun Guo, Zuo Dunwen, Tang Guoxing 125
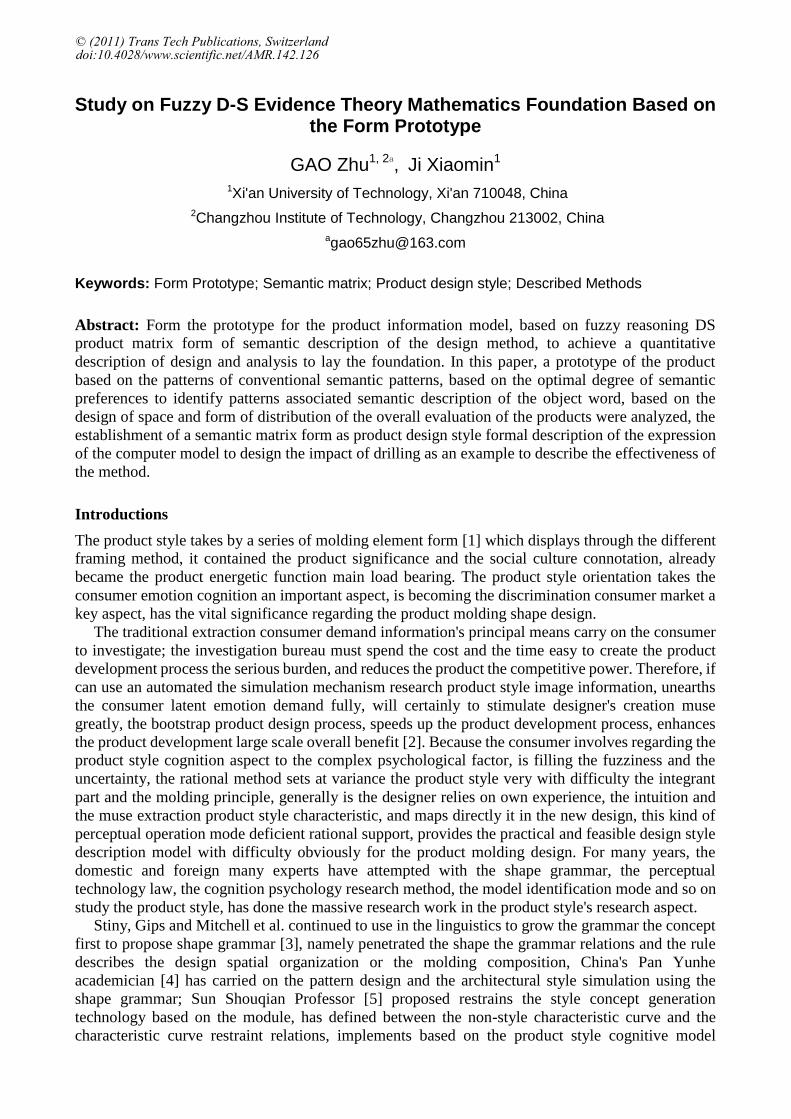
Study on Fuzzy D-S Evidence Theory Mathematics Foundation Based on the Form Prototype
GAO Zhu1, 2a, Ji Xiaomin1
1Xi'an University of Technology, Xi'an 710048, China
2Changzhou Institute of Technology, Changzhou 213002, China
Keywords: Form Prototype; Semantic matrix; Product design style; Described Methods
Abstract: Form the prototype for the product information model, based on fuzzy reasoning DS product matrix form of semantic description of the design method, to achieve a quantitative
description of design and analysis to lay the foundation. In this paper, a prototype of the product
based on the patterns of conventional semantic patterns, based on the optimal degree of semantic
preferences to identify patterns associated semantic description of the object word, based on the
design of space and form of distribution of the overall evaluation of the products were analyzed, the
establishment of a semantic matrix form as product design style formal description of the expression
of the computer model to design the impact of drilling as an example to describe the effectiveness of
the method.
Introductions
The product style takes by a series of molding element form [1] which displays through the different framing method, it contained the product significance and the social culture connotation, already
became the product energetic function main load bearing. The product style orientation takes the
consumer emotion cognition an important aspect, is becoming the discrimination consumer market a
key aspect, has the vital significance regarding the product molding shape design.
The traditional extraction consumer demand information's principal means carry on the consumer
to investigate; the investigation bureau must spend the cost and the time easy to create the product
development process the serious burden, and reduces the product the competitive power. Therefore, if
can use an automated the simulation mechanism research product style image information, unearths
the consumer latent emotion demand fully, will certainly to stimulate designer's creation muse
greatly, the bootstrap product design process, speeds up the product development process, enhances
the product development large scale overall benefit [2]. Because the consumer involves regarding the
product style cognition aspect to the complex psychological factor, is filling the fuzziness and the
uncertainty, the rational method sets at variance the product style very with difficulty the integrant
part and the molding principle, generally is the designer relies on own experience, the intuition and
the muse extraction product style characteristic, and maps directly it in the new design, this kind of
perceptual operation mode deficient rational support, provides the practical and feasible design style
description model with difficulty obviously for the product molding design. For many years, the
domestic and foreign many experts have attempted with the shape grammar, the perceptual
technology law, the cognition psychology research method, the model identification mode and so on
study the product style, has done the massive research work in the product style's research aspect.
Stiny, Gips and Mitchell et al. continued to use in the linguistics to grow the grammar the concept
first to propose shape grammar [3], namely penetrated the shape the grammar relations and the rule
describes the design spatial organization or the molding composition, China's Pan Yunhe
academician [4] has carried on the pattern design and the architectural style simulation using the
shape grammar; Sun Shouqian Professor [5] proposed restrains the style concept generation
technology based on the module, has defined between the non-style characteristic curve and the
characteristic curve restraint relations, implements based on the product style cognitive model
© (2011) Trans Tech Publications, Switzerlanddoi:10.4028/www.scientific.net/AMR.142.126
computer auxiliary conceptual design prototype system. Taiwan's Chien- Cheng Chang [6] take 32
kind of different handsets as the sample, the use grouping cognition experiment, summarized the
influence handset contour similar two big primary factors: The population impression and the local
characteristic, and analyzed these two big factors to differentiate the handset molding similar
influence, then has carried on the classification with the bunch of analysis method to 32 section of
handsets. Yellow fine jade [7] uses the MDS method extracting product style characteristic,
according to characteristic recognition algorithm and similar algorithm retrieval and match product
style [8] and so on Chen Guoxiang apply the compound expression perceptual technology
conformability of research in the product development, extracted between the product style and the
molding essential factor relations with the aid of each kind of investigation technology and the
analysis method, according to the style description establishment qualitative information to the
geometry modelling's between mapping rule, proposed the application basic physique and the whole
processing method configures and the style connection product shape modelling foundation structure,
implemented initially has designed the product molding according to the style description. Taiwan
retires from office [9] and so on peak also take the handset as an example, has discussed the humanity
to the three-dimensional shape characteristic psychological cognition process, attempts to establish
the consumer and the designer regarding between the product molding characteristic and the style
cognition relations.
Looking from above product design style's research, the majority methods pauses only in product
subject molding characteristic hold with the innovation and in the computer auxiliary molding design
system's development research, in the design style's qualitative description aspect, the research
basically belongs to the heuristic qualitative analysis, has not carried on the meaning connection
based on the product shape's three-dimensional framing, analyzes and expresses the product the
design style, to develops appears the theory basis insufficiency based on the design style CAID
system. This article based on the product shape prototype, proposed one kind solves the above
problem based on the fuzzy D-S inference establishment product shape meaning matrix's design style
description method, May the quantification and the system development lays the foundation for the
product style.
Research Frame
First establishes the product the shape prototype, and constructs the shape prototype the mathematical
model, definite shape meaning description object; Through elects by ballot the mode from the
product meaning base to determine that the product convention shape meaning set, based on the most
superior fondness's meaning connection determination description object's common shape meaning
word, corresponds based on the fuzzy D-S inference theory to the description object establishment
product shape most superior meaning matrix; Finally by the shape localization carries on the product
design style based on the shape whole appraisal distribution list and in the design style space the
analysis, carries on the computer formalization using the shape meaning matrix to the product design
style description model to express, specific frame as shown in Fig.1.
Fuzzy D-S Evidence Theory Mathematics Foundation
The D-S theory first proposed by Dempster that and one kind of uncertainty inference theory which
forms after the Shafer development. Its principle is sets the proposition with a type probability mode
the confidence level, penetrates the inquisition knowledge through the solution proposition credible
upper limit and the lower limit the uncertainty, has the big flexibility. In 1965, Zadeh first proposed
the fuzzy set concept, namely has the different degree of membership element set, uses in portraying
the knowledge the uncertainty. Hereafter, the numerous scholars unify the fuzzy set and the D-S
evidence theory, cause the D-S evidence theory the application domain to be day by day broad, main
applied research aspect in perceptual technology and product design, and between D-S evidence
theory and connection principle, neural network and conditional probability relational [10-12].
[Defines 1] supposing D is a finite set, indicated that the domain space's hypothesis or basic event.
Hun Guo, Zuo Dunwen, Tang Guoxing 127
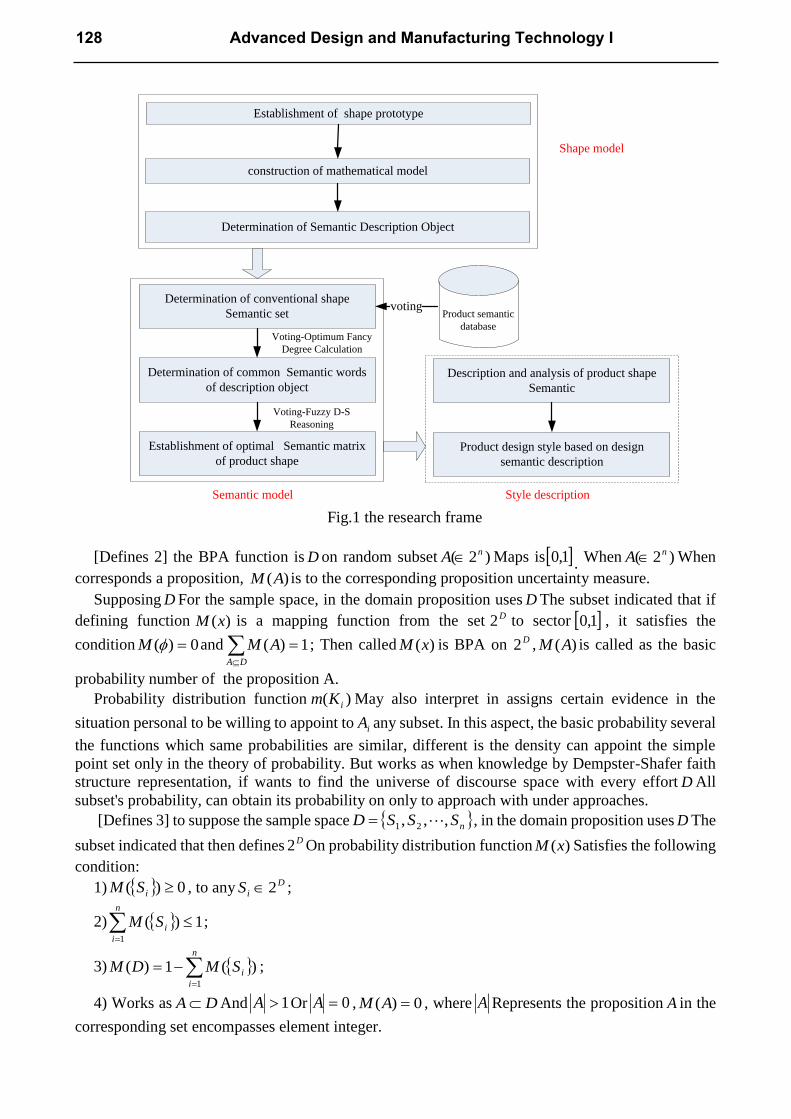
Establishment of shape prototype
construction of mathematical model
Determination of Semantic Description Object
Determination of conventional shape
Semantic set
Determination of common Semantic words
of description object
Establishment of optimal Semantic matrix
of product shape
Description and analysis of product shape
Semantic
Product design style based on design
semantic description
Product semantic
database
voting
Voting-Optimum Fancy
Degree Calculation
Voting-Fuzzy D-S
Reasoning
Shape model
Semantic model Style description
Fig.1 the research frame
[Defines 2] the BPA function is D on random subset )2( nA Maps is 1,0 . When )2( nA When
corresponds a proposition, )(AM is to the corresponding proposition uncertainty measure.
Supposing D For the sample space, in the domain proposition uses D The subset indicated that if
defining function )(xM is a mapping function from the set D2 to sector 1,0 , it satisfies the
condition 0)( M and 1)( DA
AM ; Then called )(xM is BPA on D2 , )(AM is called as the basic
probability number of the proposition A.
Probability distribution function )( iKm May also interpret in assigns certain evidence in the
situation personal to be willing to appoint to iA any subset. In this aspect, the basic probability several
the functions which same probabilities are similar, different is the density can appoint the simple
point set only in the theory of probability. But works as when knowledge by Dempster-Shafer faith
structure representation, if wants to find the universe of discourse space with every effort D All
subset's probability, can obtain its probability on only to approach with under approaches.
[Defines 3] to suppose the sample space nSSSD ,,, 21 , in the domain proposition uses D The
subset indicated that then defines D2 On probability distribution function )(xM Satisfies the following
condition:
1) 0)( iSM , to any D
iS 2 ;
2) 1)(1
n
i
iSM ;
3)
n
i
iSMDM1
)(1)( ;
4) Works as DA And 1A Or 0A , 0)( AM , where A Represents the proposition A in the
corresponding set encompasses element integer.
128 Advanced Design and Manufacturing Technology I

Conclusions
Optimal semantic matrix gives a clear direction for the product molding's improvement design.
Overall evaluation of optimal semantic level of the matrix description object is propitious to the
qualitative description of product design style, and achieves the formal and digital expression of
physical characteristics of the product structure, has built the foundation for the product design style
formal description technique as well as the sequencing.
References
[1] K.S. Chen, M.Q. He, W.S. Guan, et al: Industrial Design Vol.32 (2004) No.2, p.108-117
[2] Q. Huang, S.Q. Sun: Computer-Aided Design and Graphics Journal Vol.18 (2006) No.2,
p.1629-1635
[3] G. Stiny: Environment and Planning B: Planning and Design Vol.7 (1980) No.3, p.343-351
[4] Y.H. Pan: Intelligent CAD method and model (Scientific Publishing house, Beijing 1997)
[5] C.C. Chang, J.C. Wu: International Journal of Industrial Ergonomics Vol.xxx (2009), p.1-14.
[6] Q. Huang, S.Q. Sun: Chinese Mechanical Engineering Vol.14 (2003) No.21, p.1836-1838.
[7] K.S. Chen, M.Q. He, W.S. Guan, et al: Industrial Design Vol.32 (2004) No.2, p.108-117
[8] Z.F. Xie, W.F. Zhang: Industrial Design Vol.30 (2002) No.2, p.216-221.
[9] F.G. Shi, S.Q. Sun: Journal of Computer-aided Design and Graphics Vol.20 (2008) No.3,
p.361-365
[10] T. K. KUR: Principles of Gestalt psychology (Harcourt, New York 1967:221-290)
[11] Y.H. Zhang, Y.Yang, M.J. Wei: Computer integration manufacture system Vol.14 (2008) No.6,
p.1063 - 1069
[12] Q. Huang, S.Q. Sun: Chinese Mechanical Engineering Vol.14 (2003) No.21, p.1836-1838.
Hun Guo, Zuo Dunwen, Tang Guoxing 129
Study on the Influence of Internal Flow Field in Pipeline Elbow by the Guide Plate
Wu Lanying1, a, Wang Yanlin2, b, Wang Zidong2, c and Chen Mingwen1, d 1School of Applied Science, University of Science and Technology, Beijing 100083, China
2School of Materials Science and Engineering, University of Science and Technology, Beijing 100083, China
[email protected], [email protected], [email protected], [email protected]
Keywords: guide plate; pipeline elbow; internal flow field; guide characteristics
Abstract. The liquid-conveying elbow is an very important part in the piping system, in this paper,
the internal flow field in the pipeline elbow is studied, its structure is optimized, and the guide
characteristic is improved. The results show that the internal total pressure difference in the original
elbow is 29506.27 Pa, the Max-velocity is 7.12 m/s, and the internal flow field is very uneven;The
internal total pressure difference can be greatly reduced through setting up the guide plates
appropriately, its internal total pressure difference decreases as the number of guide plates
increases, the Max-velocity decreases first and then increases as the number increases; When the
number is a constant, the optimal result of guide plate according to the gold ratio arrangement is
superior to the equidistance ratio arrangement; When the export length of guide plate is 50 mm, the
total pressure difference is 14942 Pa in the elbow, comparing it to the result of the original elbow, it
decreases 49.26%, the optimal design has an very obvious effect.
Introduction
The pipeline elbow is an very important part in the liquid-conveying piping system[1, 2], these
years, people have studied the secondary flow and separated flow with the numerical calculation
method, there are many further researches are done for the turbulence modeling and cross-section
shape etc[3, 4], but the research for the internal structure of elbow is relatively few, some
researchers have analyzed the internal flow field in elbow including guide plates[5,6], but they only
got the guide plate can improve the internal fluid liquidity, the detailed information of the guide
plate wasn’t studied. In this paper, we will improve the guide characteristics through choosing the
number, arrangement and length of the guide plates based on the analysis of the internal flow field
in the pipeline elbow, and compare the results of the fluid liquidity, flow field pressure and
eliminating vortex, which are influenced by the different optimized guide plate, then to reduce the
internal total pressure difference in the elbow and improve the guide characteristics, it’s very
important significance to control the fluid pulse noise of the liquid-conveying elbow.
The numerical analysis of internal flow field in pipeline elbow
The original right elbow structure as shown in Fig. 1, it shows that when the liquid transportation to
the elbow, the fluid flow direction is forced to change, and there are no pipe walls to guide for the
inside fluid, the liquid flow will impact the lateral fluid and wall directly, so the fluid pressure will
be mutated in the exit of elbow, then the backflow and turbulence phenomenon will be generated,
which will cause the fluid pulsation noise, so the basic standard quality of the guide characteristics
is the internal pressure difference and the Max-velocity for the elbow. There are many elbows
extensively applied in the some equipment, if every slightly fluid noise of elbow can’t be
controlled, which will greatly affect the vibration noise performance. The inlet velocity is 5 m/s, the
outlet pressure is 0 Pa, and the working pressure is 3 MPa.
© (2011) Trans Tech Publications, Switzerlanddoi:10.4028/www.scientific.net/AMR.142.130
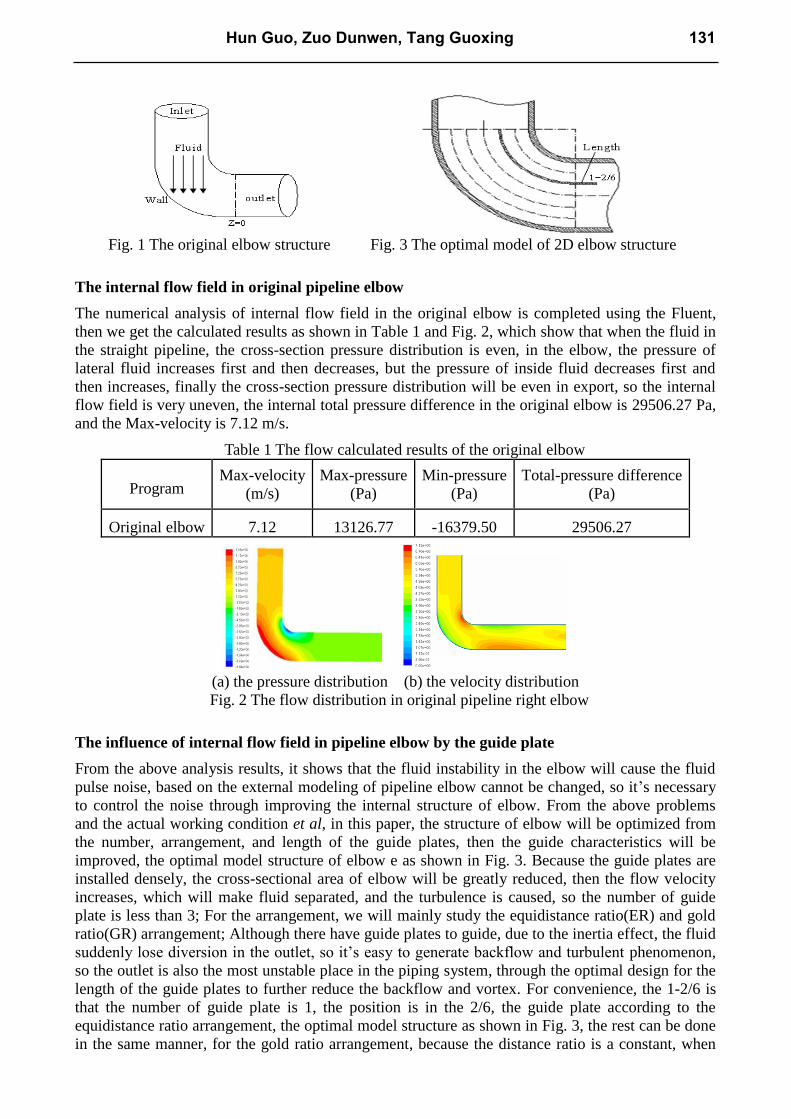
Fig. 1 The original elbow structure Fig. 3 The optimal model of 2D elbow structure
The internal flow field in original pipeline elbow
The numerical analysis of internal flow field in the original elbow is completed using the Fluent,
then we get the calculated results as shown in Table 1 and Fig. 2, which show that when the fluid in
the straight pipeline, the cross-section pressure distribution is even, in the elbow, the pressure of
lateral fluid increases first and then decreases, but the pressure of inside fluid decreases first and
then increases, finally the cross-section pressure distribution will be even in export, so the internal
flow field is very uneven, the internal total pressure difference in the original elbow is 29506.27 Pa,
and the Max-velocity is 7.12 m/s.
Table 1 The flow calculated results of the original elbow
Program Max-velocity
(m/s)
Max-pressure
(Pa)
Min-pressure
(Pa)
Total-pressure difference
(Pa)
Original elbow 7.12 13126.77 -16379.50 29506.27
(a) the pressure distribution (b) the velocity distribution
Fig. 2 The flow distribution in original pipeline right elbow
The influence of internal flow field in pipeline elbow by the guide plate
From the above analysis results, it shows that the fluid instability in the elbow will cause the fluid
pulse noise, based on the external modeling of pipeline elbow cannot be changed, so it’s necessary
to control the noise through improving the internal structure of elbow. From the above problems
and the actual working condition et al, in this paper, the structure of elbow will be optimized from
the number, arrangement, and length of the guide plates, then the guide characteristics will be
improved, the optimal model structure of elbow e as shown in Fig. 3. Because the guide plates are
installed densely, the cross-sectional area of elbow will be greatly reduced, then the flow velocity
increases, which will make fluid separated, and the turbulence is caused, so the number of guide
plate is less than 3; For the arrangement, we will mainly study the equidistance ratio(ER) and gold
ratio(GR) arrangement; Although there have guide plates to guide, due to the inertia effect, the fluid
suddenly lose diversion in the outlet, so it’s easy to generate backflow and turbulent phenomenon,
so the outlet is also the most unstable place in the piping system, through the optimal design for the
length of the guide plates to further reduce the backflow and vortex. For convenience, the 1-2/6 is
that the number of guide plate is 1, the position is in the 2/6, the guide plate according to the
equidistance ratio arrangement, the optimal model structure as shown in Fig. 3, the rest can be done
in the same manner, for the gold ratio arrangement, because the distance ratio is a constant, when
Hun Guo, Zuo Dunwen, Tang Guoxing 131
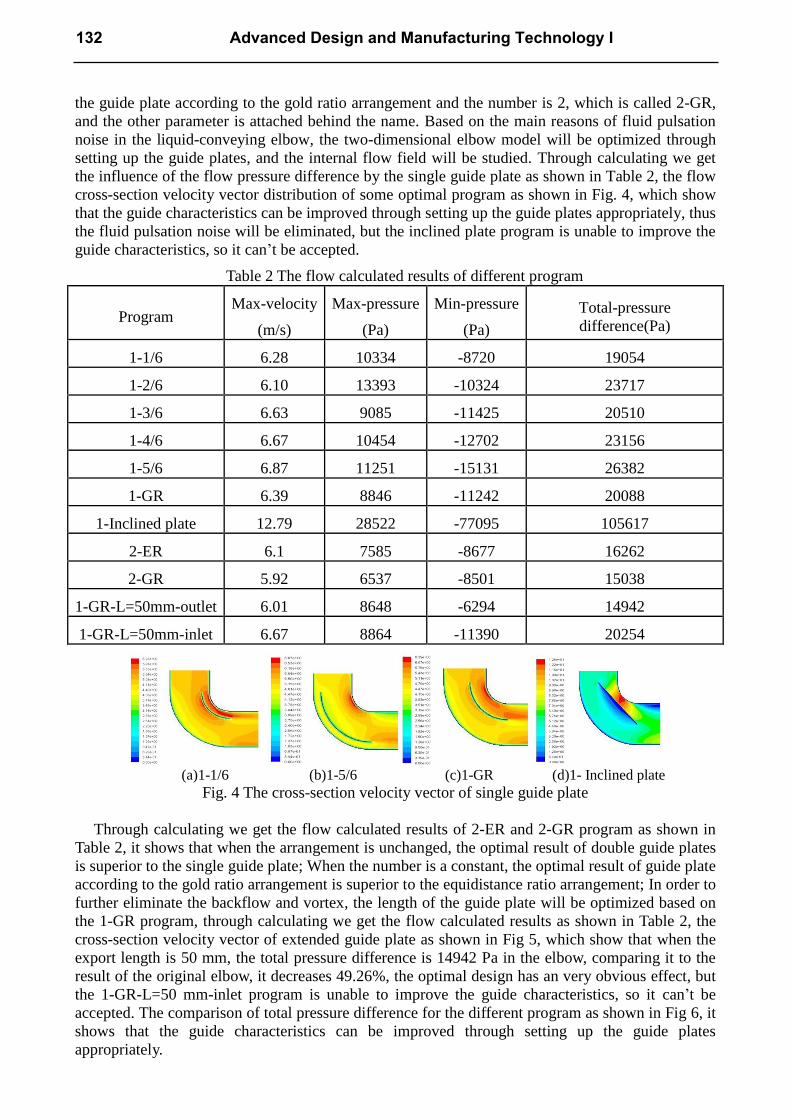
the guide plate according to the gold ratio arrangement and the number is 2, which is called 2-GR,
and the other parameter is attached behind the name. Based on the main reasons of fluid pulsation
noise in the liquid-conveying elbow, the two-dimensional elbow model will be optimized through
setting up the guide plates, and the internal flow field will be studied. Through calculating we get
the influence of the flow pressure difference by the single guide plate as shown in Table 2, the flow
cross-section velocity vector distribution of some optimal program as shown in Fig. 4, which show
that the guide characteristics can be improved through setting up the guide plates appropriately, thus
the fluid pulsation noise will be eliminated, but the inclined plate program is unable to improve the
guide characteristics, so it can’t be accepted.
Table 2 The flow calculated results of different program
Program Max-velocity
(m/s)
Max-pressure
(Pa)
Min-pressure
(Pa)
Total-pressure
difference(Pa)
1-1/6 6.28 10334 -8720 19054
1-2/6 6.10 13393 -10324 23717
1-3/6 6.63 9085 -11425 20510
1-4/6 6.67 10454 -12702 23156
1-5/6 6.87 11251 -15131 26382
1-GR 6.39 8846 -11242 20088
1-Inclined plate 12.79 28522 -77095 105617
2-ER 6.1 7585 -8677 16262
2-GR 5.92 6537 -8501 15038
1-GR-L=50mm-outlet 6.01 8648 -6294 14942
1-GR-L=50mm-inlet 6.67 8864 -11390 20254
(a)1-1/6 (b)1-5/6 (c)1-GR (d)1- Inclined plate
Fig. 4 The cross-section velocity vector of single guide plate
Through calculating we get the flow calculated results of 2-ER and 2-GR program as shown in
Table 2, it shows that when the arrangement is unchanged, the optimal result of double guide plates
is superior to the single guide plate; When the number is a constant, the optimal result of guide plate
according to the gold ratio arrangement is superior to the equidistance ratio arrangement; In order to
further eliminate the backflow and vortex, the length of the guide plate will be optimized based on
the 1-GR program, through calculating we get the flow calculated results as shown in Table 2, the
cross-section velocity vector of extended guide plate as shown in Fig 5, which show that when the
export length is 50 mm, the total pressure difference is 14942 Pa in the elbow, comparing it to the
result of the original elbow, it decreases 49.26%, the optimal design has an very obvious effect, but
the 1-GR-L=50 mm-inlet program is unable to improve the guide characteristics, so it can’t be
accepted. The comparison of total pressure difference for the different program as shown in Fig 6, it
shows that the guide characteristics can be improved through setting up the guide plates
appropriately.
132 Advanced Design and Manufacturing Technology I
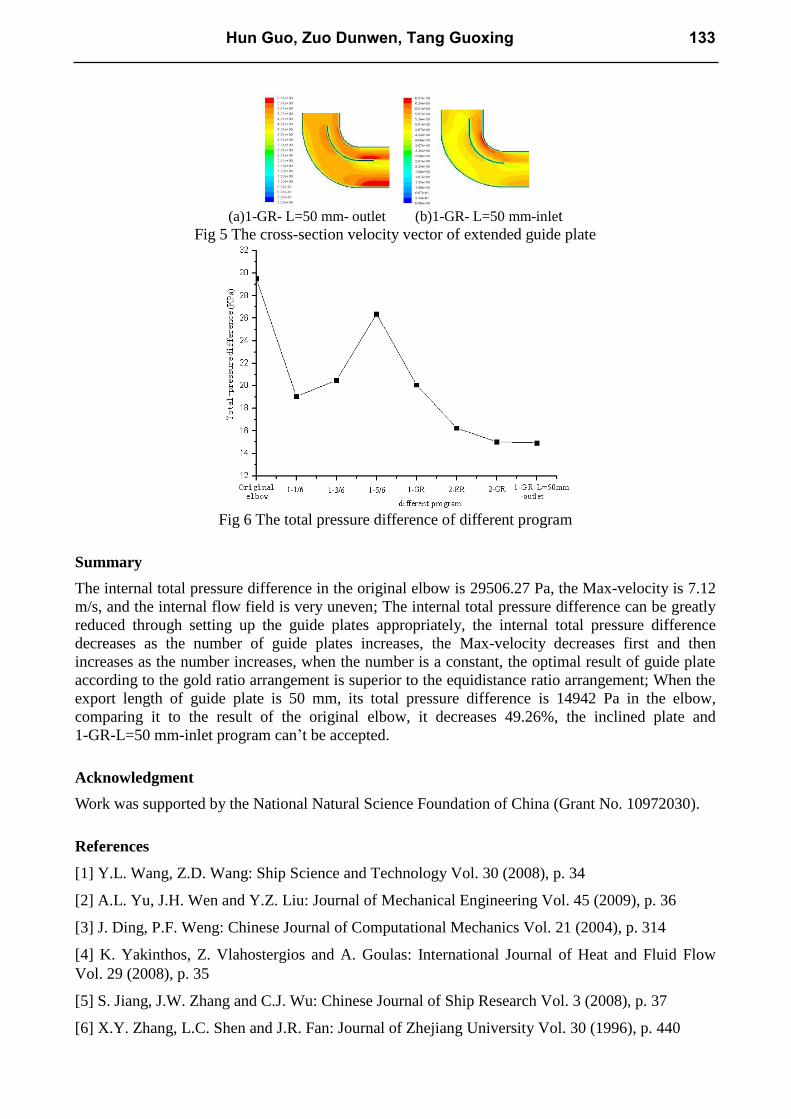
(a)1-GR- L=50 mm- outlet (b)1-GR- L=50 mm-inlet
Fig 5 The cross-section velocity vector of extended guide plate
Fig 6 The total pressure difference of different program
Summary
The internal total pressure difference in the original elbow is 29506.27 Pa, the Max-velocity is 7.12
m/s, and the internal flow field is very uneven; The internal total pressure difference can be greatly
reduced through setting up the guide plates appropriately, the internal total pressure difference
decreases as the number of guide plates increases, the Max-velocity decreases first and then
increases as the number increases, when the number is a constant, the optimal result of guide plate
according to the gold ratio arrangement is superior to the equidistance ratio arrangement; When the
export length of guide plate is 50 mm, its total pressure difference is 14942 Pa in the elbow,
comparing it to the result of the original elbow, it decreases 49.26%, the inclined plate and
1-GR-L=50 mm-inlet program can’t be accepted.
Acknowledgment
Work was supported by the National Natural Science Foundation of China (Grant No. 10972030).
References
[1] Y.L. Wang, Z.D. Wang: Ship Science and Technology Vol. 30 (2008), p. 34
[2] A.L. Yu, J.H. Wen and Y.Z. Liu: Journal of Mechanical Engineering Vol. 45 (2009), p. 36
[3] J. Ding, P.F. Weng: Chinese Journal of Computational Mechanics Vol. 21 (2004), p. 314
[4] K. Yakinthos, Z. Vlahostergios and A. Goulas: International Journal of Heat and Fluid Flow
Vol. 29 (2008), p. 35
[5] S. Jiang, J.W. Zhang and C.J. Wu: Chinese Journal of Ship Research Vol. 3 (2008), p. 37
[6] X.Y. Zhang, L.C. Shen and J.R. Fan: Journal of Zhejiang University Vol. 30 (1996), p. 440
Hun Guo, Zuo Dunwen, Tang Guoxing 133
Research on Electrical Resistively Of Wood Dust
Handong Zhou1, a, Zhenning Liu1 and Xiaobao Lei2, b
1College of Wood Science and Technology, Nanjing Forestry University, Nanjing, 210037,
P.R.China
2 College of mechanical engineering and electronics, Nanjing University of aeronautics and
astronautics, Nanjing, Jiangsu, 210016, P.R.China
[email protected], b [email protected]
Keyword: wood industry; electrical resistively of dust; ESP
Abstract. In order to design an ESP (electrostatic precipitator) used for the domain of wood
processing, electrical resistively of Wood dust should be understand clearly. The ESP could be
applied to the dust of which the specific resistance was 104~1011Ω·cm. Dust specific resistance
was related with temperature, humidity, the ingredients of dust and so on. Therefore it must be
firstly that the specific resistance of wood dust was researched to decide whether the electrostatic
dust separator was applied in wood industry.
Introductions
As the development of wood industry, the problem of wood industry dust pollution has increasingly
become severer to people, and to some extent, has become the primary factor of restricting the
development of our country wood industry. Most of the medium and small scaled woodworking
enterprises were not adopt any dust control measure. And the productive dust was vented in control.
In the existing furniture enterprises which adopted pneumatic dust collection systems, many dust
collection systems didn’t have perfect effect [1-5].
Because the dust in wood industry was lighter than in mining, cement and other industries, the
dust in wood industry was difficultly extracted, and the dust separator should have high separation
efficiency. For reaching the standard for national industrial exhaust gas (GB16297-1996), domestic
woodworking enterprises adopted increasingly bag hose precipitator to extract micro-dust, such as
wood dust. At present, wood industry has not adopted ESP (electrostatic precipitator). Compared to
other separators, ESP had many advantages. Therefore it was significant that wood industry adopted
electrostatic dust separator. The electrical resistively of dust was the important basis of electrostatic
dust separator designing. The electrostatic precipitator could be applied to the dust of which the
specific resistance was 104~10
11Ω·cm. Dust specific resistance was related with temperature,
humidity, the ingredients of dust and so on. Therefore it must be firstly that the specific resistance
of wood dust was researched to decide whether the electrostatic dust separator was applied in wood
industry [6-10].
The objects of researches were four kinds of dust came from three typical woodworking
enterprises. It was researched that how dust diameter, moisture content and temperature affected the
specific resistance. And it was discussed that if electrostatic dust separator could be used for wood
dust and when electrostatic dust separator could be used for wood dust.
© (2011) Trans Tech Publications, Switzerlanddoi:10.4028/www.scientific.net/AMR.142.134
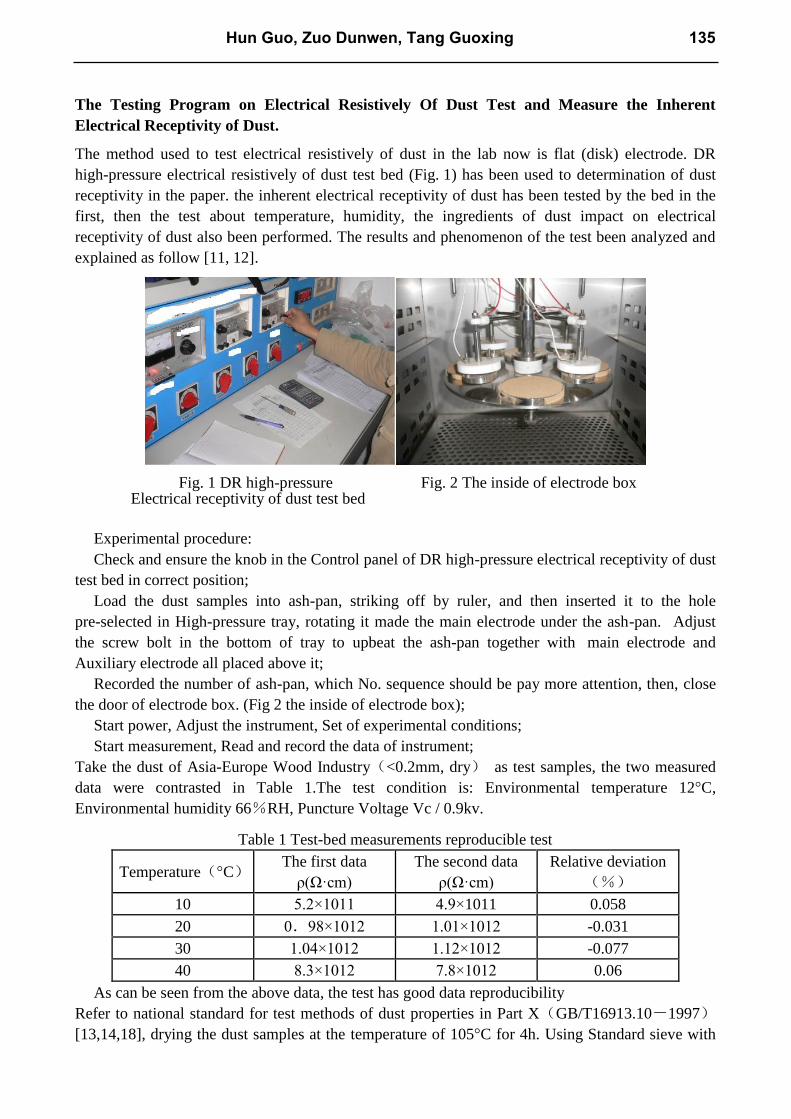
The Testing Program on Electrical Resistively Of Dust Test and Measure the Inherent
Electrical Receptivity of Dust.
The method used to test electrical resistively of dust in the lab now is flat (disk) electrode. DR
high-pressure electrical resistively of dust test bed (Fig. 1) has been used to determination of dust
receptivity in the paper. the inherent electrical receptivity of dust has been tested by the bed in the
first, then the test about temperature, humidity, the ingredients of dust impact on electrical
receptivity of dust also been performed. The results and phenomenon of the test been analyzed and
explained as follow [11, 12].
Fig. 1 DR high-pressure Fig. 2 The inside of electrode box Electrical receptivity of dust test bed
Experimental procedure:
Check and ensure the knob in the Control panel of DR high-pressure electrical receptivity of dust
test bed in correct position;
Load the dust samples into ash-pan, striking off by ruler, and then inserted it to the hole
pre-selected in High-pressure tray, rotating it made the main electrode under the ash-pan. Adjust
the screw bolt in the bottom of tray to upbeat the ash-pan together with main electrode and
Auxiliary electrode all placed above it;
Recorded the number of ash-pan, which No. sequence should be pay more attention, then, close
the door of electrode box. (Fig 2 the inside of electrode box);
Start power, Adjust the instrument, Set of experimental conditions;
Start measurement, Read and record the data of instrument;
Take the dust of Asia-Europe Wood Industry(<0.2mm, dry) as test samples, the two measured
data were contrasted in Table 1.The test condition is: Environmental temperature 12°C,
Environmental humidity 66%RH, Puncture Voltage Vc / 0.9kv.
Table 1 Test-bed measurements reproducible test
Temperature(°C) The first data
ρ(Ω·cm)
The second data
ρ(Ω·cm)
Relative deviation
(%)
10 5.2×10¹¹ 4.9×10¹¹ 0.058
20 0.98×10¹² 1.01×10¹² -0.031
30 1.04×10¹² 1.12×10¹² -0.077
40 8.3×10¹² 7.8×10¹² 0.06
As can be seen from the above data, the test has good data reproducibility
Refer to national standard for test methods of dust properties in Part X(GB/T16913.10-1997)
[13,14,18], drying the dust samples at the temperature of 105°C for 4h. Using Standard sieve with
Hun Guo, Zuo Dunwen, Tang Guoxing 135
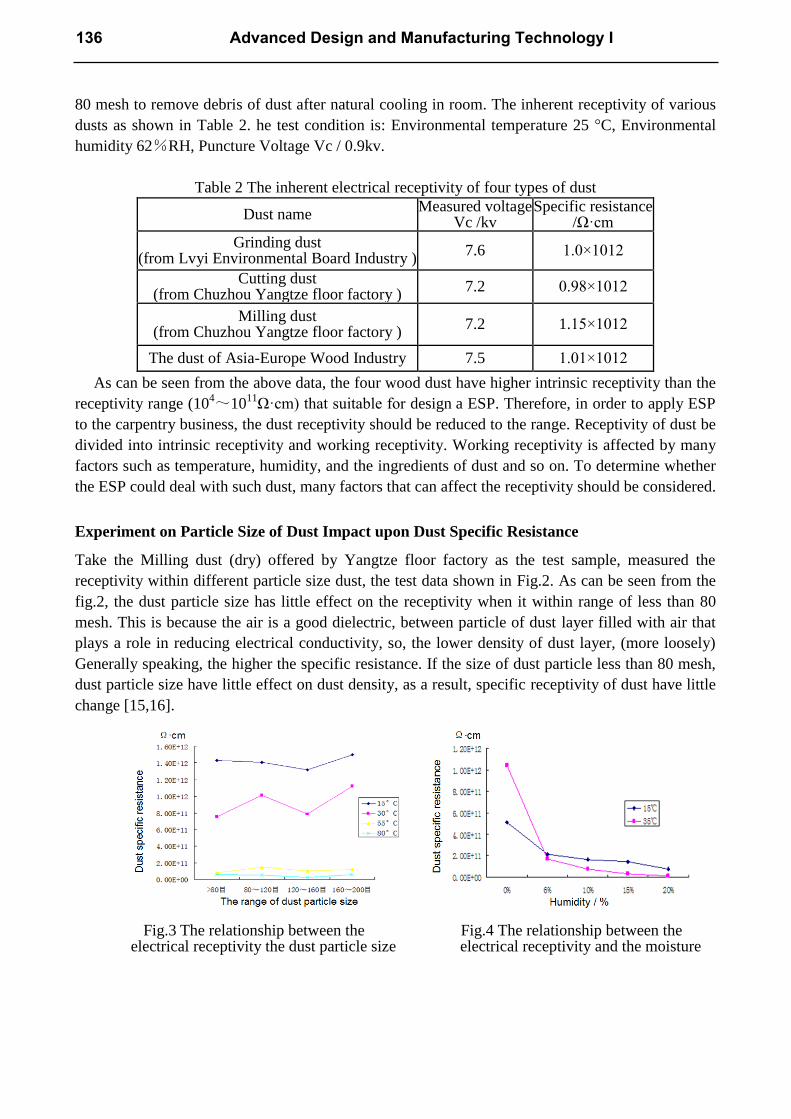
80 mesh to remove debris of dust after natural cooling in room. The inherent receptivity of various
dusts as shown in Table 2. he test condition is: Environmental temperature 25 °C, Environmental
humidity 62%RH, Puncture Voltage Vc / 0.9kv.
Table 2 The inherent electrical receptivity of four types of dust
Dust name Measured voltage
Vc /kv Specific resistance
/Ω·cm
Grinding dust (from Lvyi Environmental Board Industry )
7.6 1.0×10¹²
Cutting dust (from Chuzhou Yangtze floor factory )
7.2 0.98×10¹²
Milling dust (from Chuzhou Yangtze floor factory )
7.2 1.15×10¹²
The dust of Asia-Europe Wood Industry 7.5 1.01×10¹²
As can be seen from the above data, the four wood dust have higher intrinsic receptivity than the
receptivity range (104~10
11Ω·cm) that suitable for design a ESP. Therefore, in order to apply ESP
to the carpentry business, the dust receptivity should be reduced to the range. Receptivity of dust be
divided into intrinsic receptivity and working receptivity. Working receptivity is affected by many
factors such as temperature, humidity, and the ingredients of dust and so on. To determine whether
the ESP could deal with such dust, many factors that can affect the receptivity should be considered.
Experiment on Particle Size of Dust Impact upon Dust Specific Resistance
Take the Milling dust (dry) offered by Yangtze floor factory as the test sample, measured the
receptivity within different particle size dust, the test data shown in Fig.2. As can be seen from the
fig.2, the dust particle size has little effect on the receptivity when it within range of less than 80
mesh. This is because the air is a good dielectric, between particle of dust layer filled with air that
plays a role in reducing electrical conductivity, so, the lower density of dust layer, (more loosely)
Generally speaking, the higher the specific resistance. If the size of dust particle less than 80 mesh,
dust particle size have little effect on dust density, as a result, specific receptivity of dust have little
change [15,16].
Fig.3 The relationship between the Fig.4 The relationship between the electrical receptivity the dust particle size electrical receptivity and the moisture
136 Advanced Design and Manufacturing Technology I
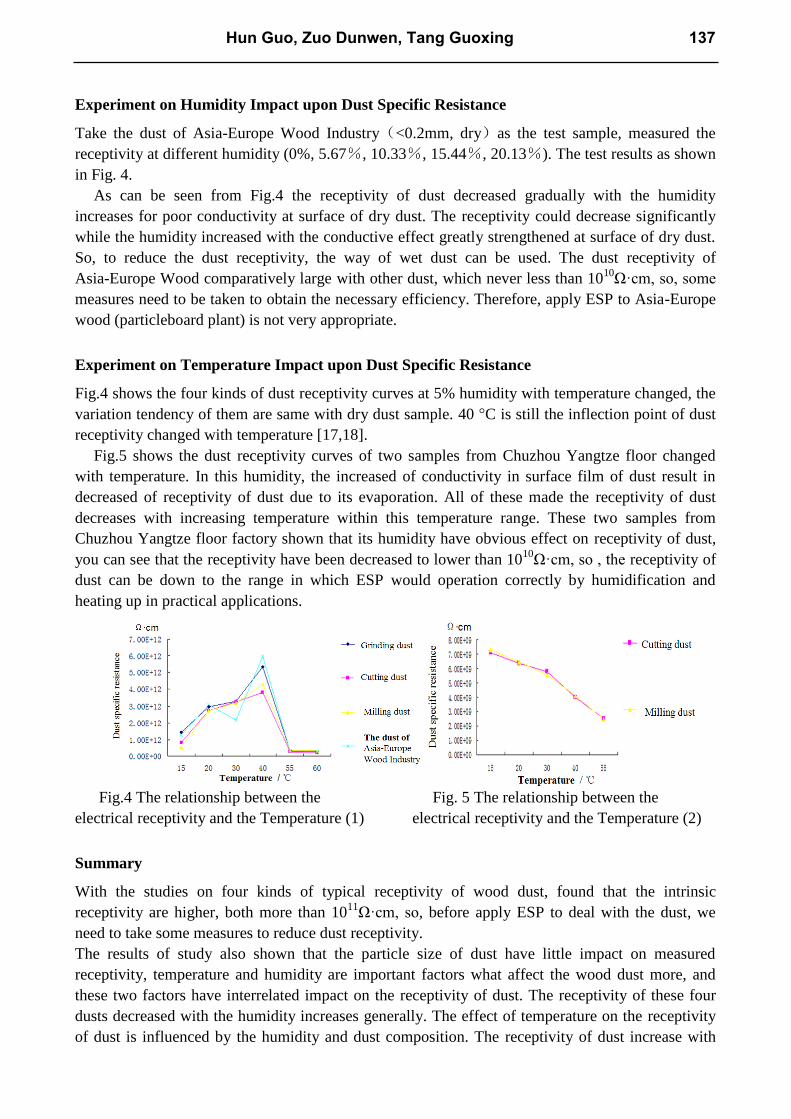
Experiment on Humidity Impact upon Dust Specific Resistance
Take the dust of Asia-Europe Wood Industry(<0.2mm, dry)as the test sample, measured the
receptivity at different humidity (0%, 5.67%, 10.33%, 15.44%, 20.13%). The test results as shown
in Fig. 4.
As can be seen from Fig.4 the receptivity of dust decreased gradually with the humidity
increases for poor conductivity at surface of dry dust. The receptivity could decrease significantly
while the humidity increased with the conductive effect greatly strengthened at surface of dry dust.
So, to reduce the dust receptivity, the way of wet dust can be used. The dust receptivity of
Asia-Europe Wood comparatively large with other dust, which never less than 1010
Ω·cm, so, some
measures need to be taken to obtain the necessary efficiency. Therefore, apply ESP to Asia-Europe
wood (particleboard plant) is not very appropriate.
Experiment on Temperature Impact upon Dust Specific Resistance
Fig.4 shows the four kinds of dust receptivity curves at 5% humidity with temperature changed, the
variation tendency of them are same with dry dust sample. 40 °C is still the inflection point of dust
receptivity changed with temperature [17,18].
Fig.5 shows the dust receptivity curves of two samples from Chuzhou Yangtze floor changed
with temperature. In this humidity, the increased of conductivity in surface film of dust result in
decreased of receptivity of dust due to its evaporation. All of these made the receptivity of dust
decreases with increasing temperature within this temperature range. These two samples from
Chuzhou Yangtze floor factory shown that its humidity have obvious effect on receptivity of dust,
you can see that the receptivity have been decreased to lower than 1010
Ω·cm, so , the receptivity of
dust can be down to the range in which ESP would operation correctly by humidification and
heating up in practical applications.
Fig.4 The relationship between the Fig. 5 The relationship between the
electrical receptivity and the Temperature (1) electrical receptivity and the Temperature (2)
Summary
With the studies on four kinds of typical receptivity of wood dust, found that the intrinsic
receptivity are higher, both more than 1011
Ω·cm, so, before apply ESP to deal with the dust, we
need to take some measures to reduce dust receptivity.
The results of study also shown that the particle size of dust have little impact on measured
receptivity, temperature and humidity are important factors what affect the wood dust more, and
these two factors have interrelated impact on the receptivity of dust. The receptivity of these four
dusts decreased with the humidity increases generally. The effect of temperature on the receptivity
of dust is influenced by the humidity and dust composition. The receptivity of dust increase with
Hun Guo, Zuo Dunwen, Tang Guoxing 137

increase temperature within range of temperature less than 40℃ and humidity less than 10%. But,
the receptivity of dust decrease with increase temperature when temperature is more than 40℃.
With the applied of DR high-pressure electrical receptivity of dust test bed, the test data showed
that the bed has good reproducibility; drawback is that temperature control should take some time.
Acknowledgment
This study was supported by National forestry and public service research specific major projects:
the key upgrade technology of wood industry (grant number 201004006).
References
[1] LIU Lei, XU Wen-xing: Journal of Environmental Science and Management Vol.30 (2005),
No.6: p.36
[2] WANG Hai-ming1, MA Hong:. Journal of Wood Processing Machinery (2003) No.2, p.2:24
[3] HUANG San-ming: Journal of Environmental Protection (2005) No.7, p.7
[4] Mirostaw Dors, jerzy Mizeracayk: Journal of Electrostatics Vol.45 (1998), p.25-36
[5] G.Mainelis, S.A. Grinshpun: Aerosol Scienceand Technogy Vol.30 (1999), No.2, p.127-144
[6] Huang Sanming: An Approach to the Precharge Technology Used for Electrostatic
Procipitators (Proceedings of The 4th International Conference On Electrostatic Precipitator,
1990)
[7] Toshiaki Misake,Akio Akasaka:Recent Applidcations of Moving Electode Type Electrostatic
Precipitator(Proceedings of The 7th international conference on Electrostatic
Precipitator,1998)
[8] Lami E, Mattachin F, Sala, R.Vigl.H.A: Journal of Electrostatics Vol.10 (1997) No.3, p.7-14
[9] ZHOU Jingwei, WANG Li, SONG Cunyi: Journal of Industrial Safety and Environmental
Protection (2006) No.6, p.3
[10] Victor Reyes,carsten R.lund: Full scale Test with switch Mode Power Supplies on Electrostatic
Precipitation(Proceedings of the 8th international conference on Electostatic Precipitation,
2001).
[11] Lili Guan: Dust Flow-Separator Type Electrostatic Precipitator for Fine Particle Control from
Nattural Gas Combustion Exhausts (NSERC Strategic Meeting, 2004)
[12] S.A.Shedd, in: Air Pollution Engineering Manual (Van Nostrand Reinhold, New York, 2001)
[13] Wang Liping, Zhou Min, Zhang Hongmei: Journal of Environmental Pollution & Control.
Vol.26(2004) No.1, p.75-77
138 Advanced Design and Manufacturing Technology I

Primary Research of Bionic Design on Tools with Mouthpart of Larvae
Long Horned Beetles
Kai Zhang1, a, Baozhong Ji1, b, Shuwen Liu2, b and Zhenhua Qing3, c
1 College of Forest Resources and Environment, Nanjing Forestry University, Jiangsu, 210037,
P.R.China
2Management Bureau of Dr. Sun Yat-sen Mausoleum—National Park, Jiangsu, 210014, China 3College of mechanical engineering and electronics, Nanjing University of Aeronautics and
Astronautics, Nanjing, Jiangsu, 210016, P.R.China
[email protected], [email protected], [email protected]
Key words: Aphrodisium sauteri (Matsushita); bionic design; tool design;
Abstract. Bionic design is a new method in engineering design. The mouthpart of the larva long
horned beetle and its tunnel in wood are discussed in this article. To improve the cutting properties
and tool life are always the main aim of cutting tool design. The foreground of cutting tool design
using the larva long horned beetle is discussed on the bases of the mouthpart maxillae of
Aphrodisium sauteri (Matsushita) and the tunnel in Quercus myrsinaefolia. The research can also
make direction at new tool material and tool geometry parameter design.
Introduction
From the very beginning, the natural world is the headspring to the human being learned and
imitated from. To research on the relationships among geometrical, physical, chemical material
behavior, structure and mechanism of creature and its` system is called bionics. The bionics
discipline includes bionic machine and mechanism, bionic manufacturing, bionic function surface,
bionic contact mechanism, and bionic tribology and etc [1].
Fig.1 tunnel in Quercus myrsinaefolia
The family Cerambycidae (“long horned beetle” as below) consists of a group of phytophagous
Coleoptera; the adult is commonly referred to as long-horned or longicorn beetles, the larvae as
round-headed borers. Seven subfamilies are currently recognized and over 25000 species have been
recorded in the world while about 2290 species recorded in china [2]. The lifespan of long horned
© (2011) Trans Tech Publications, Switzerlanddoi:10.4028/www.scientific.net/AMR.142.139

beetle is very long, and the larvae time can last for 1 to 3 years. The larvae are xylophagous
wood-borers, with light yellow or white body, very soft body wall and well developed chewing
mouthpart especially for the hard maxilla. The powerful mouthpart make them tunnel various
tissues of healthy, dead or decaying woody plants, feed on themselves during the long-term
lifecycle. The bored trunks provide covert and safe places for larvae to live. The tunnel behavior
can usually cause host plants wilted to died, be indirectly as vectors of fungi and also can reduce the
utilization of wood, resulting in heavy economic lost. Owing to their hidden habits, it is also
difficult for us to give artificial control.
Bionic tool researches in and abroad
Insect spread all over the word,taking account for more than 75% percent of the living species,
with small body, large amount and various kinds. The accomplishment of bionics comes from
understanding and utilization of certain properties of creatures in the natural world. With the rising
of bionics and development of research, the knowledge of insect properties accumulated. The
researches mainly focus on bio-tribology in the bionic branches; almost cover all over the biology
world. The aim is not only recovering the excellent biological structure itself, but also on the using
in the results on MEMS. There are a lot of fruits on this subject. The mini tribology becomes one of
the most key problems to the MEMS [3].
The bionic research on cutting tools has been stated. Xie Diwu and Zhou zhijiang at Nanjing
University of Forestry choose Aletai Sinkiang Beaver as the bionic object, researching the
self-shaping wood cutter at high speed in 1997 [4]. Xie Feng, Qing Zhenhua and Liu Guolin at
Hefei University of Technology choose beaver as the bionic object, researching the metal working
tool, founding the model [5].
A one year period project “Self-shaping mill Tool Research Based on Rodentia” was taken by
Witten/Herdecke University and Fraunhofer Institute at Germany in 2004. They studied the
principle Rodentia biting, the tooth geometry, hardness and structure. They finally bring forward the
general principles to improve tool (mainly for the mill) self-shaping properties.
Long horned beetle grow, developed in the bulk. The mouthpart structure, properties, surface
tribology and the digestive juice effects on wood are await for studied on. The results can help on
cutting tool design, cutting performance improvement, deep hole machining, material truncation,
tunneling and etc.
The surface structure of biology consists of nano-micron-mini scale, and the fractal properties
are waited for recovering. The coefficient of structure to environment will come true only through
the cooperation between biologist’s investment and manufacturer’s development. The biology
functional surface and growth offers references to mankind. To realize the bionic surface with the
advanced manufacturing technology is the most important to bionics.
Observe on mouthpart of long horned beetle and its tunnel in Quercus Myrsinaefolia
Highly developed chewing mouthpart which Consists of labrum, mandibles, maxillae, labium,
hypopharynx and etc. is one of the most important apparatus for larval long horned beetle. The
labium combines closely with the basal part of maxillae that constitute the labiomaxillary complex.
The mandible is large and hardened, shaped like pinchers, with various shape, size and length in
different species. They are divided by the middle Depression into two parts: the distal and the
basally one. The basally usually is simply with 2 lateral setae. The end of maxilla is with various
kinds of different species. For example, in the subfamily long horned beetle, the distal portion of
140 Advanced Design and Manufacturing Technology I
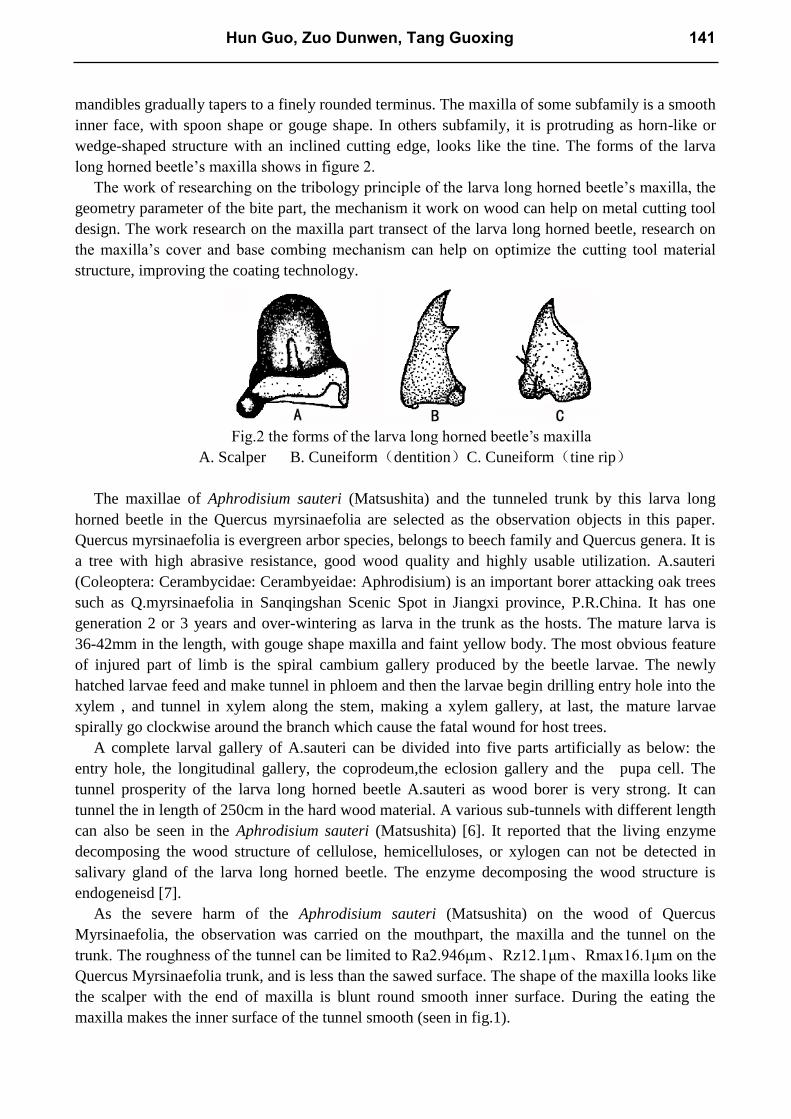
mandibles gradually tapers to a finely rounded terminus. The maxilla of some subfamily is a smooth
inner face, with spoon shape or gouge shape. In others subfamily, it is protruding as horn-like or
wedge-shaped structure with an inclined cutting edge, looks like the tine. The forms of the larva
long horned beetle’s maxilla shows in figure 2.
The work of researching on the tribology principle of the larva long horned beetle’s maxilla, the
geometry parameter of the bite part, the mechanism it work on wood can help on metal cutting tool
design. The work research on the maxilla part transect of the larva long horned beetle, research on
the maxilla’s cover and base combing mechanism can help on optimize the cutting tool material
structure, improving the coating technology.
Fig.2 the forms of the larva long horned beetle’s maxilla
A. Scalper B. Cuneiform(dentition)C. Cuneiform(tine rip)
The maxillae of Aphrodisium sauteri (Matsushita) and the tunneled trunk by this larva long
horned beetle in the Quercus myrsinaefolia are selected as the observation objects in this paper.
Quercus myrsinaefolia is evergreen arbor species, belongs to beech family and Quercus genera. It is
a tree with high abrasive resistance, good wood quality and highly usable utilization. A.sauteri
(Coleoptera: Cerambycidae: Cerambyeidae: Aphrodisium) is an important borer attacking oak trees
such as Q.myrsinaefolia in Sanqingshan Scenic Spot in Jiangxi province, P.R.China. It has one
generation 2 or 3 years and over-wintering as larva in the trunk as the hosts. The mature larva is
36-42mm in the length, with gouge shape maxilla and faint yellow body. The most obvious feature
of injured part of limb is the spiral cambium gallery produced by the beetle larvae. The newly
hatched larvae feed and make tunnel in phloem and then the larvae begin drilling entry hole into the
xylem , and tunnel in xylem along the stem, making a xylem gallery, at last, the mature larvae
spirally go clockwise around the branch which cause the fatal wound for host trees.
A complete larval gallery of A.sauteri can be divided into five parts artificially as below: the
entry hole, the longitudinal gallery, the coprodeum,the eclosion gallery and the pupa cell. The
tunnel prosperity of the larva long horned beetle A.sauteri as wood borer is very strong. It can
tunnel the in length of 250cm in the hard wood material. A various sub-tunnels with different length
can also be seen in the Aphrodisium sauteri (Matsushita) [6]. It reported that the living enzyme
decomposing the wood structure of cellulose, hemicelluloses, or xylogen can not be detected in
salivary gland of the larva long horned beetle. The enzyme decomposing the wood structure is
endogeneisd [7].
As the severe harm of the Aphrodisium sauteri (Matsushita) on the wood of Quercus
Myrsinaefolia, the observation was carried on the mouthpart, the maxilla and the tunnel on the
trunk. The roughness of the tunnel can be limited to Ra2.946μm、Rz12.1μm、Rmax16.1μm on the
Quercus Myrsinaefolia trunk, and is less than the sawed surface. The shape of the maxilla looks like
the scalper with the end of maxilla is blunt round smooth inner surface. During the eating the
maxilla makes the inner surface of the tunnel smooth (seen in fig.1).
Hun Guo, Zuo Dunwen, Tang Guoxing 141

Fig.3 The maxillae of Aphrodisium sauteri (Matsushita)
Fig.4 Maxillae shaped like tool
Conclusion
The bionic research on tool design is barely at beginning. It is highly valuable to use the bionic
method to design metal cutting tool on the material structure and parameters.
(1) For bionic design is very new in metal cutting design, few research do any work in this field.
Collecting data on bio-tribology, bionic design, self-shaping tool, tribology, wear of tool and finite
element method and etc. is very critical. On this base can the research worked.
(2) Using Electron Microscope, Scanning Electron Microscope, Sclerometer and etc. to analyze
the mouthpart of the larval long horned beetle. The result helps to realize the bionic metal cutting
tool design on cutting tool material structure.
(3) Using the bionic design method to analyzes different parts of the mouthpart on the metal
cutting tool design; evaluate the cutting properties of the creature. The result helps to realize the
bionic metal cutting tool design on cutting tool parameter design.
Reference:
[1] National Natural Science Foundation Engineering and Materials Science Division: Scientific
disciplines of Mechanical and Manufacturing Development Strategy Study(2006-2010)(Beijing: Science press,2005)
[2] Cheng Fei, Huang Hairong: Hubei Plant Conservation (2009) No.6, p.14-18
[3] Scherge Matthias, Gorb Stanislav S.: Biological Micro-and Nanotribology: Nature's Solutions
(Beijing: Machinery Press,2004)
[4] Xie Diwu: Spark strengthening coating from the sharpening of woodworking tools (Master
Degree Dissertation, Nanjing Forestry University, 1997)
[5] Qing Zhenhua: Tool Technology Vol.(2008) No.9, p.4-8
[6] Yu Yunxiang, Huang Suhong : Journal of Jiangxi Forestry technology(2007) No.1, p.38-40
[7] Yin Youping, Cao Yueqing: Science of Forestry Vol.36 (2000) No.6, p.33-38
142 Advanced Design and Manufacturing Technology I
Adsorption Analysis of Cr(VI) By Fly Ash Composite Material in Aqueous Medium
XUE Hongqina, JING Zhaoqian and WANG Zheng
School of Civil Engineering, Nanjing Forestry University, Nanjing 210037, China
Key words: Cr(VI); composite material; batch adsorption process; fly ash
Abstract. The adsorption technique using fly ash composite material has been applied for the removal
of Cr(VI) from aqueous samples. Batch experiments have been carried out for the adsorption of Cr(VI)
onto fly ash composite material. The effects of various process parameters, namely, pH, adsorbent
dosage, initial Cr(VI) concentration and contact time has been studied in batch systems. Maximum
metal removal ratio was observed at pH 5.0~5.5, and the sorption reaction was an endothermic process.
The results revealed that the hexavalent chromium is considerably adsorbed on this adsorbent and it
could be an economical method for the removal of hexavalent chromium from aqueous systems.
Introduction
Disposal of effluents containing heavy metals, produced by process industries, is a challenging task for
environmental engineers due to their persistant and non-degradable nature. Chromium is used in a
variety of industrial applications,such as steel fabrication, electroplating, paints and pigments, mining,
leather tanning, aluminum conversion coating operations and wood treatment units [1]; hence, large
quantities of chromium are discharged into the environment.
Chromium exists mainly in two oxidation states in nature, +3 and +6. It is bio-element in +3
oxidation state but mutagenic in +6 oxidation state. The hydrolysis behavior of Cr(III) is complicated
and it produces mononuclear species Cr(OH)2+, Cr(OH)4
−, neutral species Cr(OH)3, and polynuclear
species Cr2(OH)2 and Cr3(OH)45+
. Hexavalent form is more toxic than trivalent and Cr(VI) is of great
concern because of its toxicity. Cr(VI) has been reported to be a primary contaminant to humans,
plants, animals and microorganisms and it is known to be carcinogenic [2,3,4]. Due to environmental
concern, discharge limits of both Cr(III) and Cr(VI) have been instituted by most industrial countries.
Numerous treatment methods such as chemical reduction[5], ion exchange [6], membrane
separations [7,8], chemical precipitation [9], photo-catalytic reduction [10], electrochemical
precipitation [11], biosorption [12], and adsorption [13,14,15] have been tested for chromium laden
wastewater remediation in recent years. Among which adsorption is by far most versatile, simple and
effective method for removing contaminants like heavy metal, especially, if combined with appropriate
regeneration steps. However, the costliness of conventional adsorbents such as activated carbon has
prevented their wide usage. Therefore, the use of low-cost adsorbent is potential and expectable.
In this study, a kind of composite filter material made of fly ash was used as adsorbent to remove
Cr(VI) from aqueous solution. The main purposes are to investigate the sorption behavior of Cr(VI) on
this adsorbent and to study the influence of adsorbent concentration, initial Cr(VI) concentration, initial
pH, contact time and temperature on the Cr(VI) sorption process.
Experimental Methods
Materials and Instruments. All the chemical used to prepare reagent solutions were of analytical
reagent grade supplied by Nanjing Chemical Industries Ltd.(China). The stock solution of Cr(VI) was
prepared by dissolving K2Cr2O7 in deionised water. A stock solution of 100 mg/L of Cr(VI) was
© (2011) Trans Tech Publications, Switzerlanddoi:10.4028/www.scientific.net/AMR.142.143
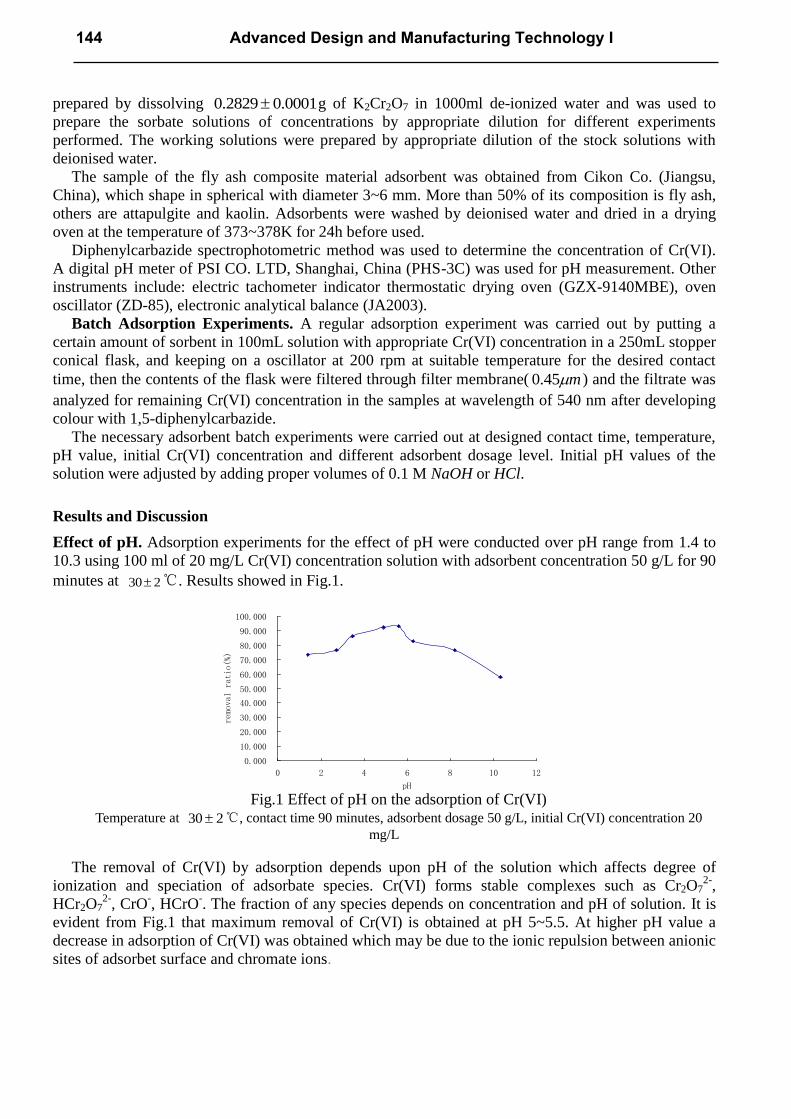
prepared by dissolving 0001.02829.0 g of K2Cr2O7 in 1000ml de-ionized water and was used to
prepare the sorbate solutions of concentrations by appropriate dilution for different experiments
performed. The working solutions were prepared by appropriate dilution of the stock solutions with
deionised water.
The sample of the fly ash composite material adsorbent was obtained from Cikon Co. (Jiangsu,
China), which shape in spherical with diameter 3~6 mm. More than 50% of its composition is fly ash,
others are attapulgite and kaolin. Adsorbents were washed by deionised water and dried in a drying
oven at the temperature of 373~378K for 24h before used.
Diphenylcarbazide spectrophotometric method was used to determine the concentration of Cr(VI).
A digital pH meter of PSI CO. LTD, Shanghai, China (PHS-3C) was used for pH measurement. Other
instruments include: electric tachometer indicator thermostatic drying oven (GZX-9140MBE), oven
oscillator (ZD-85), electronic analytical balance (JA2003).
Batch Adsorption Experiments. A regular adsorption experiment was carried out by putting a
certain amount of sorbent in 100mL solution with appropriate Cr(VI) concentration in a 250mL stopper
conical flask, and keeping on a oscillator at 200 rpm at suitable temperature for the desired contact
time, then the contents of the flask were filtered through filter membrane( m45.0 ) and the filtrate was
analyzed for remaining Cr(VI) concentration in the samples at wavelength of 540 nm after developing
colour with 1,5-diphenylcarbazide.
The necessary adsorbent batch experiments were carried out at designed contact time, temperature,
pH value, initial Cr(VI) concentration and different adsorbent dosage level. Initial pH values of the
solution were adjusted by adding proper volumes of 0.1 M NaOH or HCl.
Results and Discussion
Effect of pH. Adsorption experiments for the effect of pH were conducted over pH range from 1.4 to
10.3 using 100 ml of 20 mg/L Cr(VI) concentration solution with adsorbent concentration 50 g/L for 90
minutes at 230 ℃. Results showed in Fig.1.
0.000
10.000
20.000
30.000
40.000
50.000
60.000
70.000
80.000
90.000
100.000
0 2 4 6 8 10 12
pH
removal ratio(%)
系列1
Fig.1 Effect of pH on the adsorption of Cr(VI)
Temperature at 230 ℃, contact time 90 minutes, adsorbent dosage 50 g/L, initial Cr(VI) concentration 20
mg/L
The removal of Cr(VI) by adsorption depends upon pH of the solution which affects degree of
ionization and speciation of adsorbate species. Cr(VI) forms stable complexes such as Cr2O72-
,
HCr2O72-
, CrO-, HCrO
-. The fraction of any species depends on concentration and pH of solution. It is
evident from Fig.1 that maximum removal of Cr(VI) is obtained at pH 5~5.5. At higher pH value a
decrease in adsorption of Cr(VI) was obtained which may be due to the ionic repulsion between anionic
sites of adsorbet surface and chromate ions.
144 Advanced Design and Manufacturing Technology I
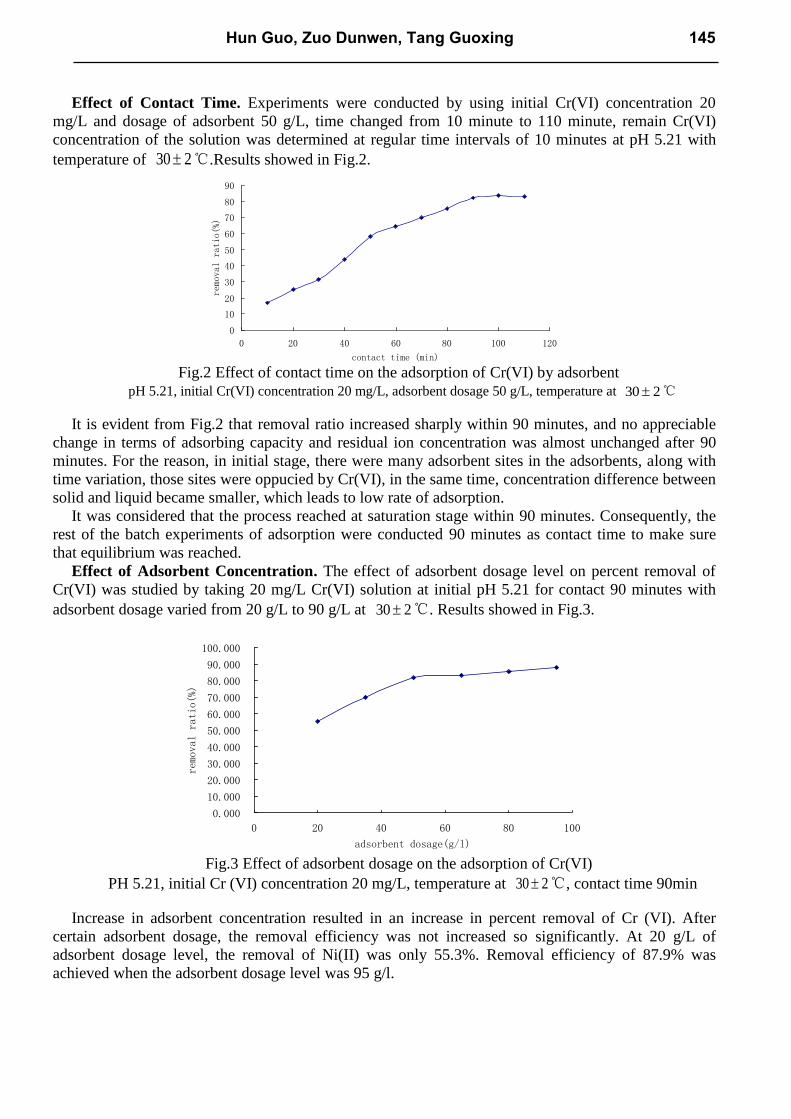
Effect of Contact Time. Experiments were conducted by using initial Cr(VI) concentration 20
mg/L and dosage of adsorbent 50 g/L, time changed from 10 minute to 110 minute, remain Cr(VI)
concentration of the solution was determined at regular time intervals of 10 minutes at pH 5.21 with
temperature of 230 ℃.Results showed in Fig.2.
0
10
20
30
40
50
60
70
80
90
0 20 40 60 80 100 120
contact time (min)
removal ratio(%)
系列1
Fig.2 Effect of contact time on the adsorption of Cr(VI) by adsorbent
pH 5.21, initial Cr(VI) concentration 20 mg/L, adsorbent dosage 50 g/L, temperature at 230 ℃
It is evident from Fig.2 that removal ratio increased sharply within 90 minutes, and no appreciable
change in terms of adsorbing capacity and residual ion concentration was almost unchanged after 90
minutes. For the reason, in initial stage, there were many adsorbent sites in the adsorbents, along with
time variation, those sites were oppucied by Cr(VI), in the same time, concentration difference between
solid and liquid became smaller, which leads to low rate of adsorption.
It was considered that the process reached at saturation stage within 90 minutes. Consequently, the
rest of the batch experiments of adsorption were conducted 90 minutes as contact time to make sure
that equilibrium was reached.
Effect of Adsorbent Concentration. The effect of adsorbent dosage level on percent removal of
Cr(VI) was studied by taking 20 mg/L Cr(VI) solution at initial pH 5.21 for contact 90 minutes with
adsorbent dosage varied from 20 g/L to 90 g/L at 230 ℃. Results showed in Fig.3.
0.000
10.000
20.000
30.000
40.000
50.000
60.000
70.000
80.000
90.000
100.000
0 20 40 60 80 100
adsorbent dosage(g/l)
removal ratio(%)
系列1
Fig.3 Effect of adsorbent dosage on the adsorption of Cr(VI)
PH 5.21, initial Cr (VI) concentration 20 mg/L, temperature at 230 ℃, contact time 90min
Increase in adsorbent concentration resulted in an increase in percent removal of Cr (VI). After
certain adsorbent dosage, the removal efficiency was not increased so significantly. At 20 g/L of
adsorbent dosage level, the removal of Ni(II) was only 55.3%. Removal efficiency of 87.9% was
achieved when the adsorbent dosage level was 95 g/l.
Hun Guo, Zuo Dunwen, Tang Guoxing 145
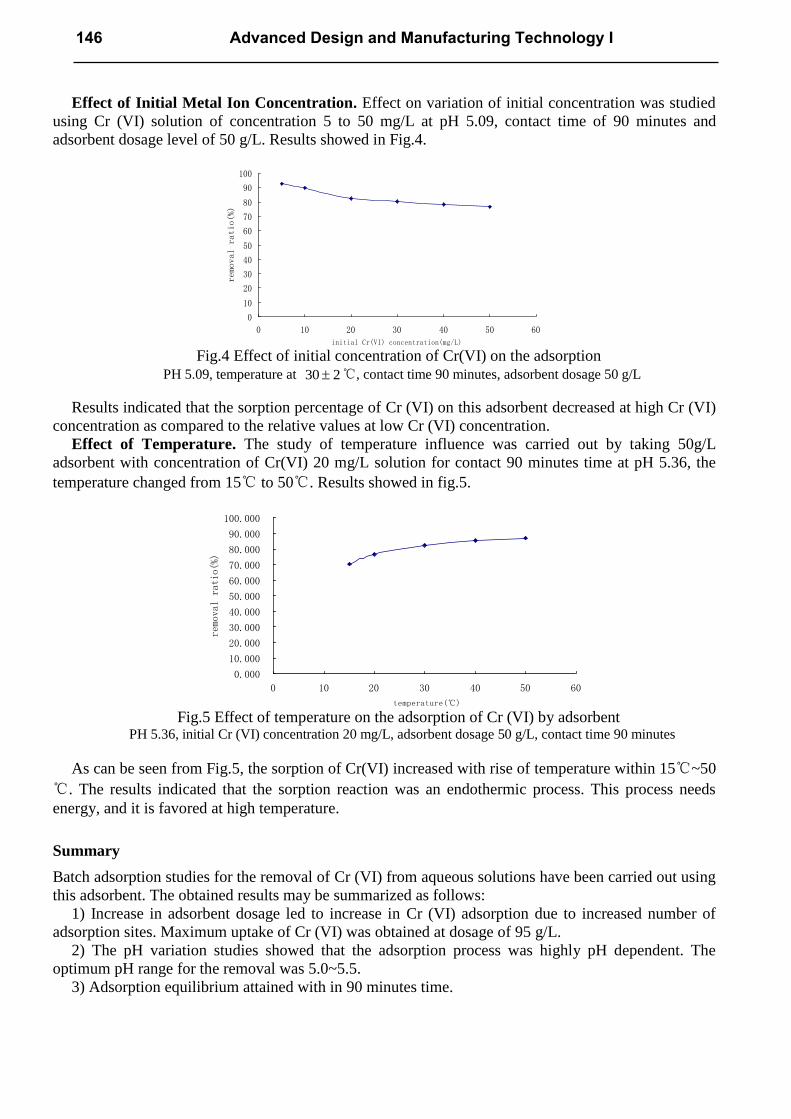
Effect of Initial Metal Ion Concentration. Effect on variation of initial concentration was studied
using Cr (VI) solution of concentration 5 to 50 mg/L at pH 5.09, contact time of 90 minutes and
adsorbent dosage level of 50 g/L. Results showed in Fig.4.
0
10
20
30
40
50
60
70
80
90
100
0 10 20 30 40 50 60
initial Cr(VI) concentration(mg/L)
removal ratio(%)
系列1
Fig.4 Effect of initial concentration of Cr(VI) on the adsorption
PH 5.09, temperature at 230 ℃, contact time 90 minutes, adsorbent dosage 50 g/L
Results indicated that the sorption percentage of Cr (VI) on this adsorbent decreased at high Cr (VI)
concentration as compared to the relative values at low Cr (VI) concentration.
Effect of Temperature. The study of temperature influence was carried out by taking 50g/L
adsorbent with concentration of Cr(VI) 20 mg/L solution for contact 90 minutes time at pH 5.36, the
temperature changed from 15℃ to 50℃. Results showed in fig.5.
0.000
10.000
20.000
30.000
40.000
50.000
60.000
70.000
80.000
90.000
100.000
0 10 20 30 40 50 60
temperature(℃)
removal ratio(%)
系列1
Fig.5 Effect of temperature on the adsorption of Cr (VI) by adsorbent
PH 5.36, initial Cr (VI) concentration 20 mg/L, adsorbent dosage 50 g/L, contact time 90 minutes
As can be seen from Fig.5, the sorption of Cr(VI) increased with rise of temperature within 15℃~50
℃. The results indicated that the sorption reaction was an endothermic process. This process needs
energy, and it is favored at high temperature.
Summary
Batch adsorption studies for the removal of Cr (VI) from aqueous solutions have been carried out using
this adsorbent. The obtained results may be summarized as follows:
1) Increase in adsorbent dosage led to increase in Cr (VI) adsorption due to increased number of
adsorption sites. Maximum uptake of Cr (VI) was obtained at dosage of 95 g/L.
2) The pH variation studies showed that the adsorption process was highly pH dependent. The
optimum pH range for the removal was 5.0~5.5.
3) Adsorption equilibrium attained with in 90 minutes time.
146 Advanced Design and Manufacturing Technology I

4) The sorption of Cr (VI) increases with rise of temperature, showing endothermic nature of the
adsorption process.
References
[1] J.O. Nriagu, E. Nieboer: Chromium in the Natural and Human Environment (Wiley, New York,
1988)
[2] US Department of Health and Human Services: Toxicological Profile for Chromium, Public Health
Services Agency for Toxic Substances and Diseases Registry (Washington, DC, 1991)
[3] M. Cieslak-Golonka: Polyhedron Vol.15 (1995), p.3667–3689
[4] C. Raji, T.S. Anirudhan: Water Res. Vol.32 (1998), p.3772–3780
[5] J.C. Seaman, P.M. Bertsch, L. Schwallie: Environ. Sci. Technol. Vol.33 (1999), p.938–944
[6] D. Petruzzelli, R. Passino, G. Tiravanti: Ind. Eng. Chem. Res. Vol.34 (1995), p.2612–2617
[7] C.A. Kozlowski,W. Walkowiak: Water Res. Vol.36 (2002), p. 4870–4876
[8] H. Shaalan, M. Sorour, S. Tewfik: Desalination Vol.14 (2001), p.315–324
[9] X. Zhou, T. Korenaga, T. Takahashi: Water Res. Vol.27 (1993), p.1049–1054
[10] J.J. Testa, M.A. Grela: Environ. Sci. Technol. Vol.38 (2004), p.1589–1594
[11] N.Kongsricharoern, C. Polprasert: Water Sci. Technol. Vol.34 (1996), p.109–116
[12] R. Arvindhan, B. Madhan: Environ. Sci. Technol. Vol.38 (2004), p. 300–306
[13] S.K. Srivastava, V.K. Gupta, D. Mohan, Environ. Model. Assess. Vol.1(1997), p. 281–290
[14] V.K. Gupta, K.T. Park, S. Sharma, et al: The Environmentalist Vol.19 (1999), p.129–136
[15] S.K. Srivastava, V.K. Gupta, D. Mohan: J. Environ. Eng. (ASCE) Vol.123 (1997), p. 461–468
Hun Guo, Zuo Dunwen, Tang Guoxing 147
Research of Controlling Heat Treatment Deformation for Powder
Metallurgy Mechanical Structural Parts
Yan Yinbiaoa, Shen Xiaoping, Zhang Di and Li Mingwei
Department of Material Science and Engineering, Nanjing University of Science & Technology,
Nanjing 210094 , PR China
Keywords: Powder metallurgy mechanical structural parts; Heat treatment deformation; Deformation control
Abstract. The paper is based on actual production condition, by taking relevant measures; we can
effectively control heat treatment deformation, and attain the accuracy as well as performance
requirements of powder metallurgy mechanical structural parts.
Introduction
Powder metallurgy is an important process method with metal powder as its raw material, through
mixing, forming, sintering and necessary subsequent treatment, to manufacture different kinds of
mechanical structure parts. So-called mechanical structure parts are parts that have quite strict
dimension precision, participating in mechanical motion, and have frictional contact with other
parts, they should also sustain load such as tensile, compression or distortion and some degree of
impact. Thus most of the mechanical structure parts out of powder metallurgy use heat treatment to
improve performance and prolong service life. And after heat treatment deformation there are
usually a large deformation, for iron base products the deformation is up to ± 0.038 mm [1]; while
for complex shape or not well-controlled powder metallurgy products the deformation is even
greater, so that the precision cannot meet the demands, which restricts the widespread use of the
powder metallurgy mechanical structure parts. Based on the analysis of the causes of heat treatment
deformation, the influencing factors of heat treatment deformation and the characteristics of the heat
treatment method for powder metallurgy sintering steel, we did selections on heat treatment
methods and proper heat treatment deformation control measures, to meet the requirements of
different parts.
Causes for heat treatment deformation of powder metallurgy mechanical structural parts and
influence factors
Causes for heat treatment deformation. Within heat treatment process, a certain degree of
deformation is inevitable. The deformation is mainly caused by the stress of the cooling process in
heat treatment. For one thing, it is due to the different cooling speed between surface and center of
the parts, which caused temperature difference and then different volume shrinkage in the surface
and the center. The internal stress caused by the non-simultaneity of volume shrinkage at the
surface and the center is called thermal stress. For another, the specific heat capacity of steel
changes as a result of microstructure changes, such as it increases when the austenite transforms
into the martensite. The transition differs in the cross section of the parts, and the inner stress
caused by non-simultaneity of microstructure transformation and the different volume changes is
defined as microstructure stress. Heat-treatment deformation is then a comprehensive effect by
© (2011) Trans Tech Publications, Switzerlanddoi:10.4028/www.scientific.net/AMR.142.148
thermal stress and microstructure stress. When the stress is beyond the yield limit, it will cause parts
of distortion, while the stress is over the ultimate strength of material, it will make parts crack.
Influence factors of heat treatment deformation. Compared with the dense steel, the
microstructure of sintered steel made from powder metallurgy has two such features: one is the
imbalance of microstructures; the other is containing pores of different shapes, sizes and certain
volume ratios. Therefore, the influence factors of heat treatment deformation contain microstructure
characteristics of dense steel as well as the chemical composition, hardening layer depth, quenching
medium and quenching temperature. The microstructure characteristics of dense steel depend on
powder metallurgical raw materials and craft manufacture methods. Such as composition of powder
particle sizes, uniformity of mixing the powders, porosity and pore distribution and sintering
process. So the deformation of steel and sintering is largely depends on its manufacturing process.
Raw materials preparation. Carbon and alloy element content increases within limits, so does
the deformation of parts after quenching. When it is over the limits, the amount of retained
austenite increases, and as a result, the effect of volume increase will be compensated, size change
trends to be smoothly.
The preparation of powder metallurgy materials is usually through element methods, and then
mixes the materials together. There definitely exists ingredients segregation, seriously when it can
be up to 0.15% (weight percentage) or even higher. And it will cause the imbalance of sintered
microstructures, adding to heat treatment distortion.
Porosity and pore distribution. The thermal conductivity of the sintered steel is influenced by
the porosity to a large degree. The pores block the thermal transmission; therefore the
quench-hardening ability of sintered steel plummeted with the increase of porosity [2]. Powder
metallurgy often adopts uniaxial compressive modulus forming method. During the pressing
process, powder bears inhomogeneous stress, and the pore distribution is inhomogeneous. For those
complex parts, the non-uniform of pore distribution tends to be more serious. This makes the heat
conduction inhomogeneous in heat treatment, and results in a relatively large heat deformation
Sintering process. Powder metallurgy sintering is a high temperature process at a temperature
below the melting point of main compositions. The higher sintering temperature and longer
period result in better alloying effects and higher density level of the alloy, which can ensure
excellent mechanical properties after treatment. Meanwhile, because of the uniformity of the
compositions and microstructures, we can improve the deformation uniformity of heat treatment.
Heat treatment process. Different heat treatment processes produce different deformations. As
for the same parts, through-hardening has the greatest deformation, high-frequency quenching takes
the second place, and nitriding process the minimum. While for the same kind of heat treatment
method, when adopting different process parameters, the deformation degree is different. If we
improve quenching temperature, the deformation increases, and if we choose strong-cooling ability
medium, increasing the cooling speed, it can also exacerbate the deformation of the parts.
In addition to the factors above, the shape of parts is also an important influencing factor of
deformation. The parts tend to be deformed when the shape is complex.
Characteristics of heat treatment on powder metallurgy parts
There are many ways to heat treatment process, such as ordinary quenching-tempering,
high-frequency surface hardening and chemical treatment, etc. But because of the existence of pores
in sintered steel in heat treatment, there are some characteristics compared with dense steel [3]:
Hun Guo, Zuo Dunwen, Tang Guoxing 149
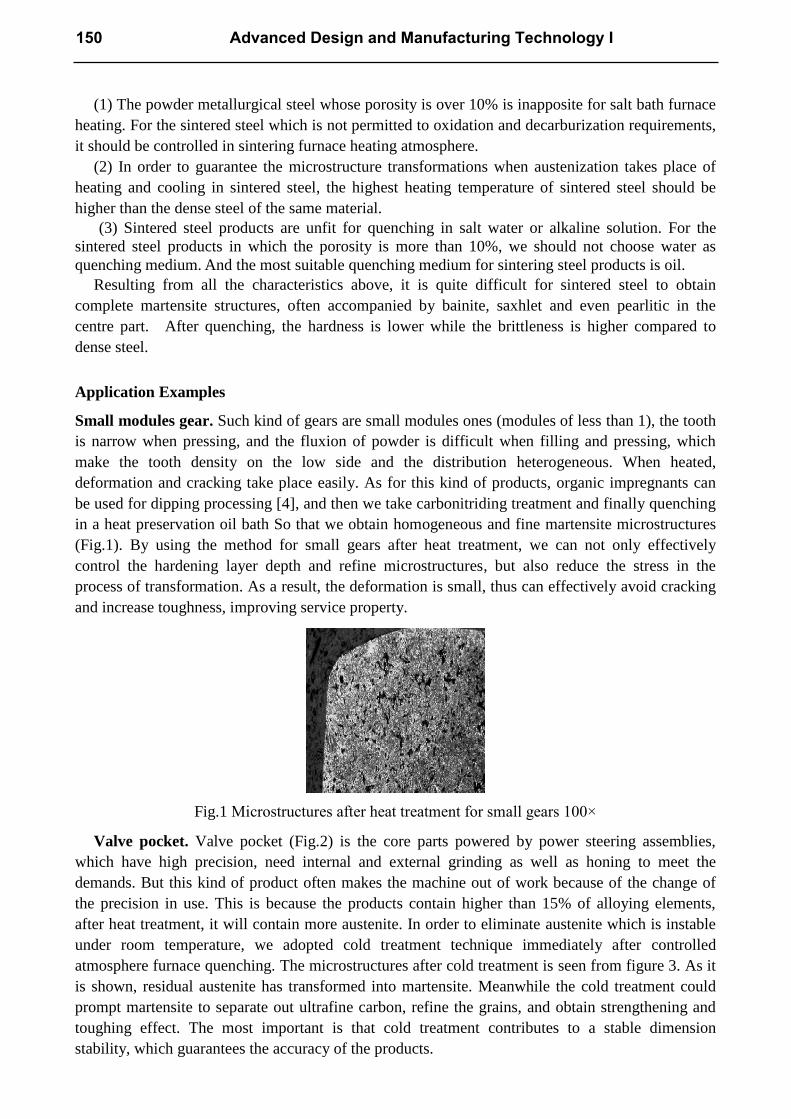
(1) The powder metallurgical steel whose porosity is over 10% is inapposite for salt bath furnace
heating. For the sintered steel which is not permitted to oxidation and decarburization requirements,
it should be controlled in sintering furnace heating atmosphere.
(2) In order to guarantee the microstructure transformations when austenization takes place of
heating and cooling in sintered steel, the highest heating temperature of sintered steel should be
higher than the dense steel of the same material.
(3) Sintered steel products are unfit for quenching in salt water or alkaline solution. For the
sintered steel products in which the porosity is more than 10%, we should not choose water as
quenching medium. And the most suitable quenching medium for sintering steel products is oil.
Resulting from all the characteristics above, it is quite difficult for sintered steel to obtain
complete martensite structures, often accompanied by bainite, saxhlet and even pearlitic in the
centre part. After quenching, the hardness is lower while the brittleness is higher compared to
dense steel.
Application Examples
Small modules gear. Such kind of gears are small modules ones (modules of less than 1), the tooth
is narrow when pressing, and the fluxion of powder is difficult when filling and pressing, which
make the tooth density on the low side and the distribution heterogeneous. When heated,
deformation and cracking take place easily. As for this kind of products, organic impregnants can
be used for dipping processing [4], and then we take carbonitriding treatment and finally quenching
in a heat preservation oil bath So that we obtain homogeneous and fine martensite microstructures
(Fig.1). By using the method for small gears after heat treatment, we can not only effectively
control the hardening layer depth and refine microstructures, but also reduce the stress in the
process of transformation. As a result, the deformation is small, thus can effectively avoid cracking
and increase toughness, improving service property.
Fig.1 Microstructures after heat treatment for small gears 100×
Valve pocket. Valve pocket (Fig.2) is the core parts powered by power steering assemblies,
which have high precision, need internal and external grinding as well as honing to meet the
demands. But this kind of product often makes the machine out of work because of the change of
the precision in use. This is because the products contain higher than 15% of alloying elements,
after heat treatment, it will contain more austenite. In order to eliminate austenite which is instable
under room temperature, we adopted cold treatment technique immediately after controlled
atmosphere furnace quenching. The microstructures after cold treatment is seen from figure 3. As it
is shown, residual austenite has transformed into martensite. Meanwhile the cold treatment could
prompt martensite to separate out ultrafine carbon, refine the grains, and obtain strengthening and
toughing effect. The most important is that cold treatment contributes to a stable dimension
stability, which guarantees the accuracy of the products.
150 Advanced Design and Manufacturing Technology I
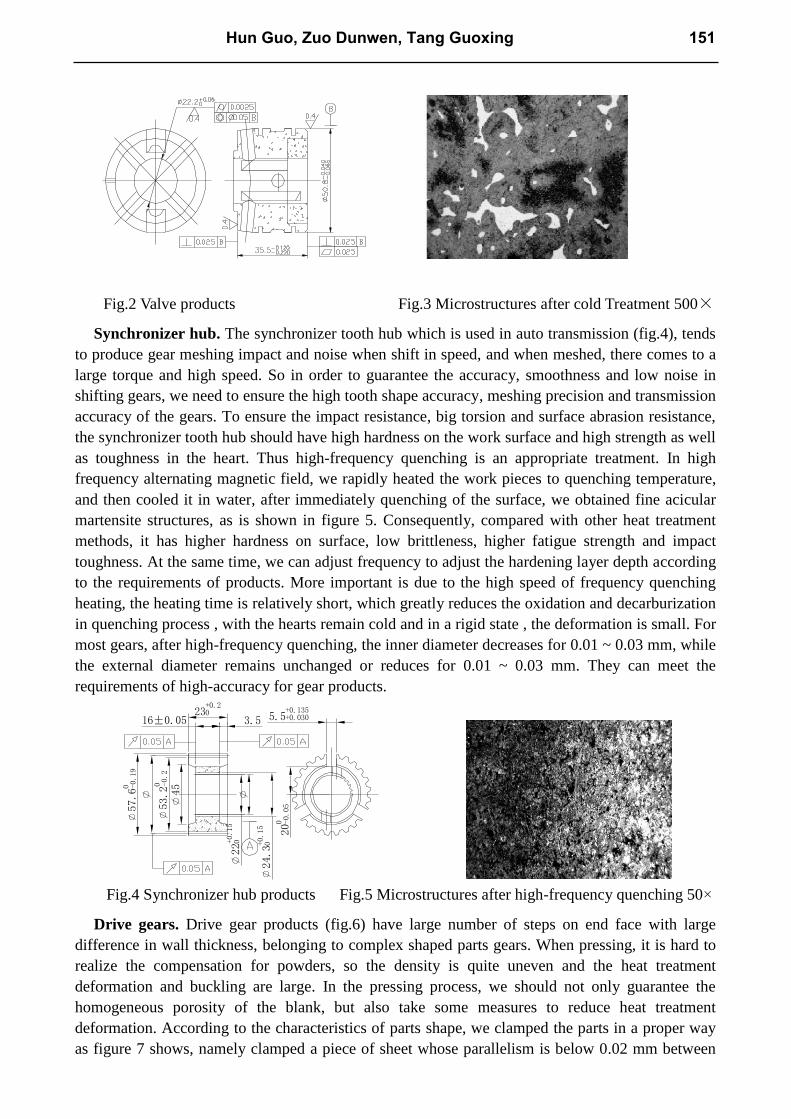
Fig.2 Valve products Fig.3 Microstructures after cold Treatment 500×
Synchronizer hub. The synchronizer tooth hub which is used in auto transmission (fig.4), tends
to produce gear meshing impact and noise when shift in speed, and when meshed, there comes to a
large torque and high speed. So in order to guarantee the accuracy, smoothness and low noise in
shifting gears, we need to ensure the high tooth shape accuracy, meshing precision and transmission
accuracy of the gears. To ensure the impact resistance, big torsion and surface abrasion resistance,
the synchronizer tooth hub should have high hardness on the work surface and high strength as well
as toughness in the heart. Thus high-frequency quenching is an appropriate treatment. In high
frequency alternating magnetic field, we rapidly heated the work pieces to quenching temperature,
and then cooled it in water, after immediately quenching of the surface, we obtained fine acicular
martensite structures, as is shown in figure 5. Consequently, compared with other heat treatment
methods, it has higher hardness on surface, low brittleness, higher fatigue strength and impact
toughness. At the same time, we can adjust frequency to adjust the hardening layer depth according
to the requirements of products. More important is due to the high speed of frequency quenching
heating, the heating time is relatively short, which greatly reduces the oxidation and decarburization
in quenching process , with the hearts remain cold and in a rigid state , the deformation is small. For
most gears, after high-frequency quenching, the inner diameter decreases for 0.01 ~ 0.03 mm, while
the external diameter remains unchanged or reduces for 0.01 ~ 0.03 mm. They can meet the
requirements of high-accuracy for gear products.
45
200 -0.05
23+0.20
16±0.05 3.5 5.5+0.135+0.030
22+0.15
0
24.3+0.15
0
57.60 -0.19
53.20 -0.2
Fig.4 Synchronizer hub products Fig.5 Microstructures after high-frequency quenching 50×
Drive gears. Drive gear products (fig.6) have large number of steps on end face with large
difference in wall thickness, belonging to complex shaped parts gears. When pressing, it is hard to
realize the compensation for powders, so the density is quite uneven and the heat treatment
deformation and buckling are large. In the pressing process, we should not only guarantee the
homogeneous porosity of the blank, but also take some measures to reduce heat treatment
deformation. According to the characteristics of parts shape, we clamped the parts in a proper way
as figure 7 shows, namely clamped a piece of sheet whose parallelism is below 0.02 mm between
Hun Guo, Zuo Dunwen, Tang Guoxing 151
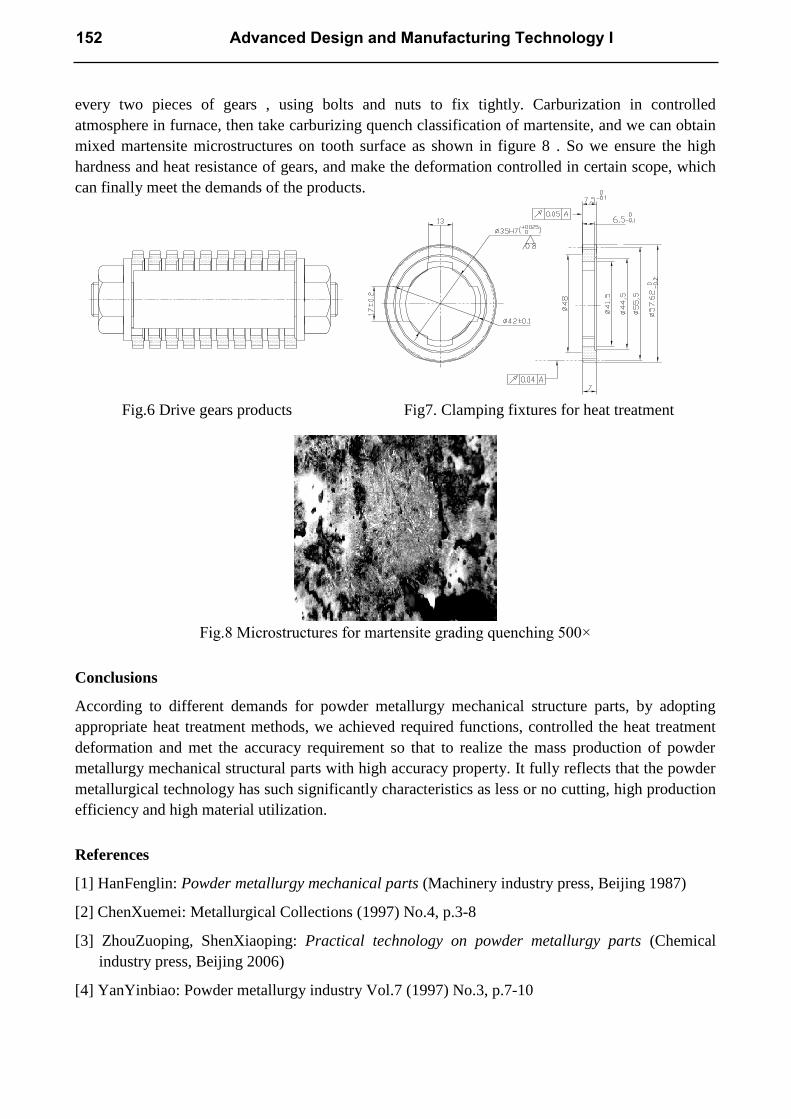
every two pieces of gears , using bolts and nuts to fix tightly. Carburization in controlled
atmosphere in furnace, then take carburizing quench classification of martensite, and we can obtain
mixed martensite microstructures on tooth surface as shown in figure 8 . So we ensure the high
hardness and heat resistance of gears, and make the deformation controlled in certain scope, which
can finally meet the demands of the products.
Fig.6 Drive gears products Fig7. Clamping fixtures for heat treatment
Fig.8 Microstructures for martensite grading quenching 500×
Conclusions
According to different demands for powder metallurgy mechanical structure parts, by adopting
appropriate heat treatment methods, we achieved required functions, controlled the heat treatment
deformation and met the accuracy requirement so that to realize the mass production of powder
metallurgy mechanical structural parts with high accuracy property. It fully reflects that the powder
metallurgical technology has such significantly characteristics as less or no cutting, high production
efficiency and high material utilization.
References
[1] HanFenglin: Powder metallurgy mechanical parts (Machinery industry press, Beijing 1987)
[2] ChenXuemei: Metallurgical Collections (1997) No.4, p.3-8
[3] ZhouZuoping, ShenXiaoping: Practical technology on powder metallurgy parts (Chemical
industry press, Beijing 2006)
[4] YanYinbiao: Powder metallurgy industry Vol.7 (1997) No.3, p.7-10
152 Advanced Design and Manufacturing Technology I
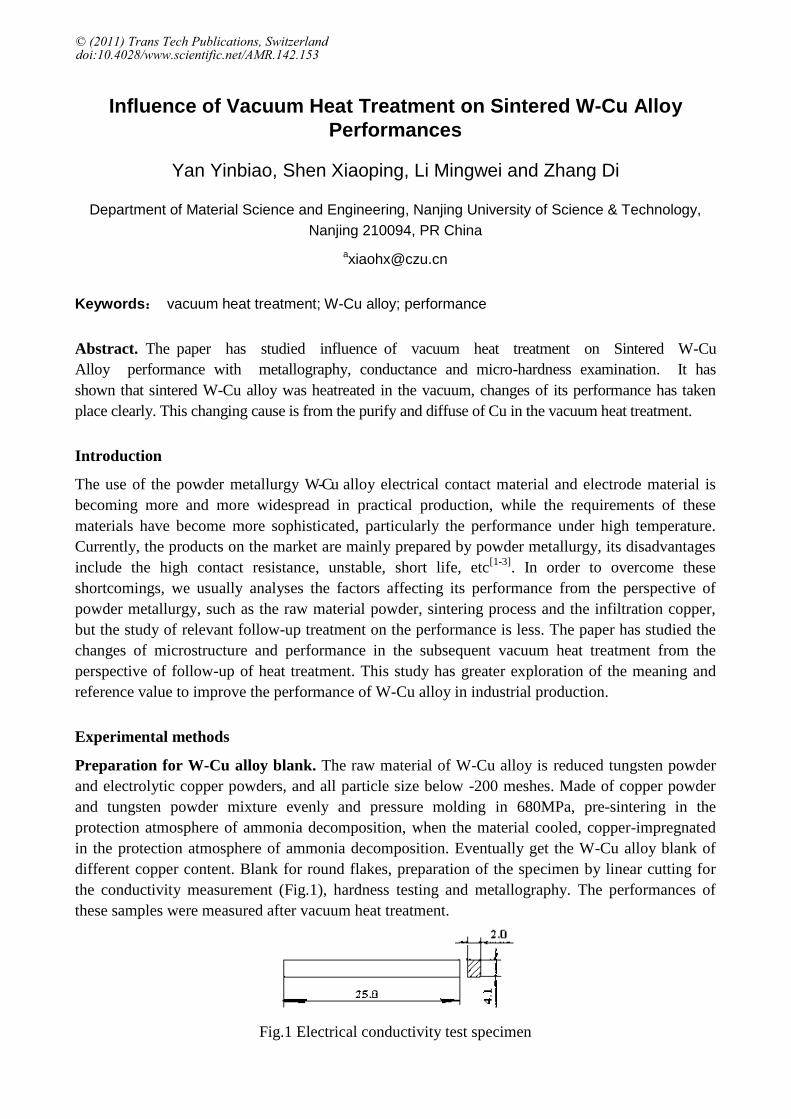
Influence of Vacuum Heat Treatment on Sintered W-Cu Alloy
Performances
Yan Yinbiao, Shen Xiaoping, Li Mingwei and Zhang Di
Department of Material Science and Engineering, Nanjing University of Science & Technology,
Nanjing 210094, PR China
Keywords: vacuum heat treatment; W-Cu alloy; performance
Abstract. The paper has studied influence of vacuum heat treatment on Sintered W-Cu
Alloy performance with metallography, conductance and micro-hardness examination. It has
shown that sintered W-Cu alloy was heatreated in the vacuum, changes of its performance has taken
place clearly. This changing cause is from the purify and diffuse of Cu in the vacuum heat treatment.
Introduction
The use of the powder metallurgy W-Cu alloy electrical contact material and electrode material is
becoming more and more widespread in practical production, while the requirements of these
materials have become more sophisticated, particularly the performance under high temperature.
Currently, the products on the market are mainly prepared by powder metallurgy, its disadvantages
include the high contact resistance, unstable, short life, etc[1-3]
. In order to overcome these
shortcomings, we usually analyses the factors affecting its performance from the perspective of
powder metallurgy, such as the raw material powder, sintering process and the infiltration copper,
but the study of relevant follow-up treatment on the performance is less. The paper has studied the
changes of microstructure and performance in the subsequent vacuum heat treatment from the
perspective of follow-up of heat treatment. This study has greater exploration of the meaning and
reference value to improve the performance of W-Cu alloy in industrial production.
Experimental methods
Preparation for W-Cu alloy blank. The raw material of W-Cu alloy is reduced tungsten powder
and electrolytic copper powders, and all particle size below -200 meshes. Made of copper powder
and tungsten powder mixture evenly and pressure molding in 680MPa, pre-sintering in the
protection atmosphere of ammonia decomposition, when the material cooled, copper-impregnated
in the protection atmosphere of ammonia decomposition. Eventually get the W-Cu alloy blank of
different copper content. Blank for round flakes, preparation of the specimen by linear cutting for
the conductivity measurement (Fig.1), hardness testing and metallography. The performances of
these samples were measured after vacuum heat treatment.
Fig.1 Electrical conductivity test specimen
© (2011) Trans Tech Publications, Switzerlanddoi:10.4028/www.scientific.net/AMR.142.153
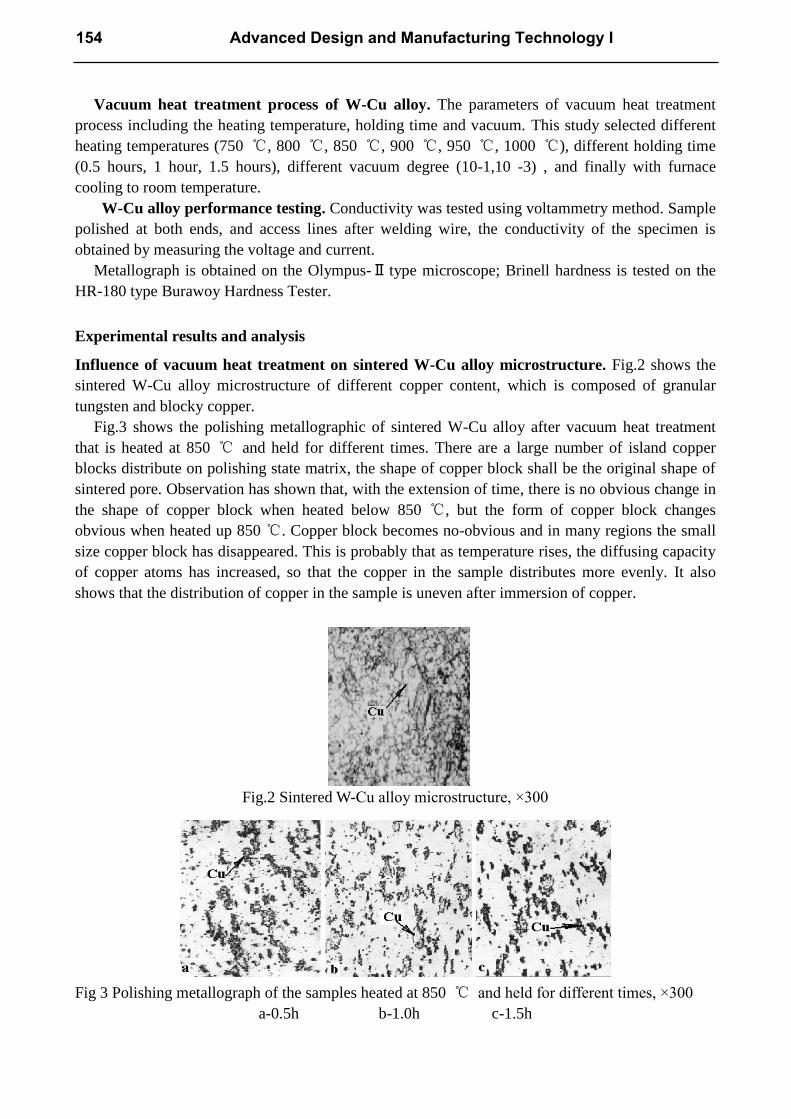
Vacuum heat treatment process of W-Cu alloy. The parameters of vacuum heat treatment
process including the heating temperature, holding time and vacuum. This study selected different
heating temperatures (750 ℃, 800 ℃, 850 ℃, 900 ℃, 950 ℃, 1000 ℃), different holding time
(0.5 hours, 1 hour, 1.5 hours), different vacuum degree (10-1,10 -3) , and finally with furnace
cooling to room temperature.
W-Cu alloy performance testing. Conductivity was tested using voltammetry method. Sample
polished at both ends, and access lines after welding wire, the conductivity of the specimen is
obtained by measuring the voltage and current.
Metallograph is obtained on the Olympus-Ⅱ type microscope; Brinell hardness is tested on the
HR-180 type Burawoy Hardness Tester.
Experimental results and analysis
Influence of vacuum heat treatment on sintered W-Cu alloy microstructure. Fig.2 shows the
sintered W-Cu alloy microstructure of different copper content, which is composed of granular
tungsten and blocky copper.
Fig.3 shows the polishing metallographic of sintered W-Cu alloy after vacuum heat treatment
that is heated at 850 ℃ and held for different times. There are a large number of island copper
blocks distribute on polishing state matrix, the shape of copper block shall be the original shape of
sintered pore. Observation has shown that, with the extension of time, there is no obvious change in
the shape of copper block when heated below 850 ℃, but the form of copper block changes
obvious when heated up 850 ℃. Copper block becomes no-obvious and in many regions the small
size copper block has disappeared. This is probably that as temperature rises, the diffusing capacity
of copper atoms has increased, so that the copper in the sample distributes more evenly. It also
shows that the distribution of copper in the sample is uneven after immersion of copper.
Fig.2 Sintered W-Cu alloy microstructure, ×300
Fig 3 Polishing metallograph of the samples heated at 850 ℃ and held for different times, ×300
a-0.5h b-1.0h c-1.5h
154 Advanced Design and Manufacturing Technology I
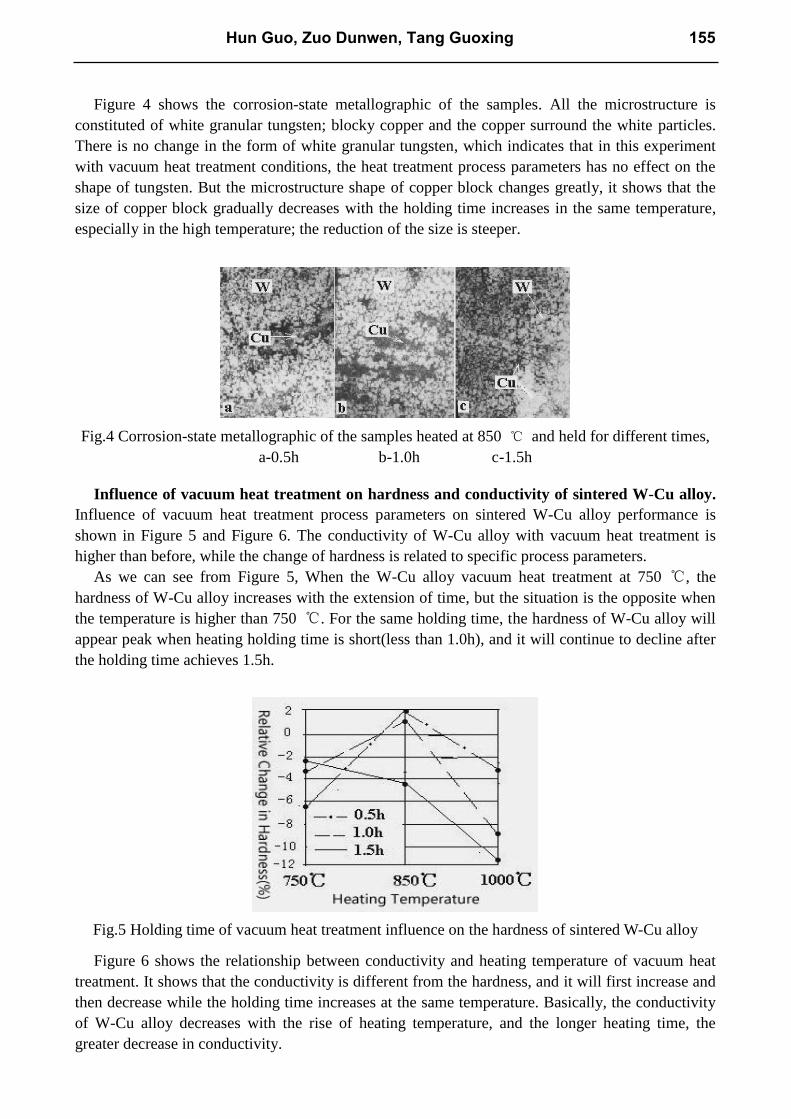
Figure 4 shows the corrosion-state metallographic of the samples. All the microstructure is
constituted of white granular tungsten; blocky copper and the copper surround the white particles.
There is no change in the form of white granular tungsten, which indicates that in this experiment
with vacuum heat treatment conditions, the heat treatment process parameters has no effect on the
shape of tungsten. But the microstructure shape of copper block changes greatly, it shows that the
size of copper block gradually decreases with the holding time increases in the same temperature,
especially in the high temperature; the reduction of the size is steeper.
Fig.4 Corrosion-state metallographic of the samples heated at 850 ℃ and held for different times,
a-0.5h b-1.0h c-1.5h
Influence of vacuum heat treatment on hardness and conductivity of sintered W-Cu alloy.
Influence of vacuum heat treatment process parameters on sintered W-Cu alloy performance is
shown in Figure 5 and Figure 6. The conductivity of W-Cu alloy with vacuum heat treatment is
higher than before, while the change of hardness is related to specific process parameters.
As we can see from Figure 5, When the W-Cu alloy vacuum heat treatment at 750 ℃, the
hardness of W-Cu alloy increases with the extension of time, but the situation is the opposite when
the temperature is higher than 750 ℃. For the same holding time, the hardness of W-Cu alloy will
appear peak when heating holding time is short(less than 1.0h), and it will continue to decline after
the holding time achieves 1.5h.
Fig.5 Holding time of vacuum heat treatment influence on the hardness of sintered W-Cu alloy
Figure 6 shows the relationship between conductivity and heating temperature of vacuum heat
treatment. It shows that the conductivity is different from the hardness, and it will first increase and
then decrease while the holding time increases at the same temperature. Basically, the conductivity
of W-Cu alloy decreases with the rise of heating temperature, and the longer heating time, the
greater decrease in conductivity.
Hun Guo, Zuo Dunwen, Tang Guoxing 155
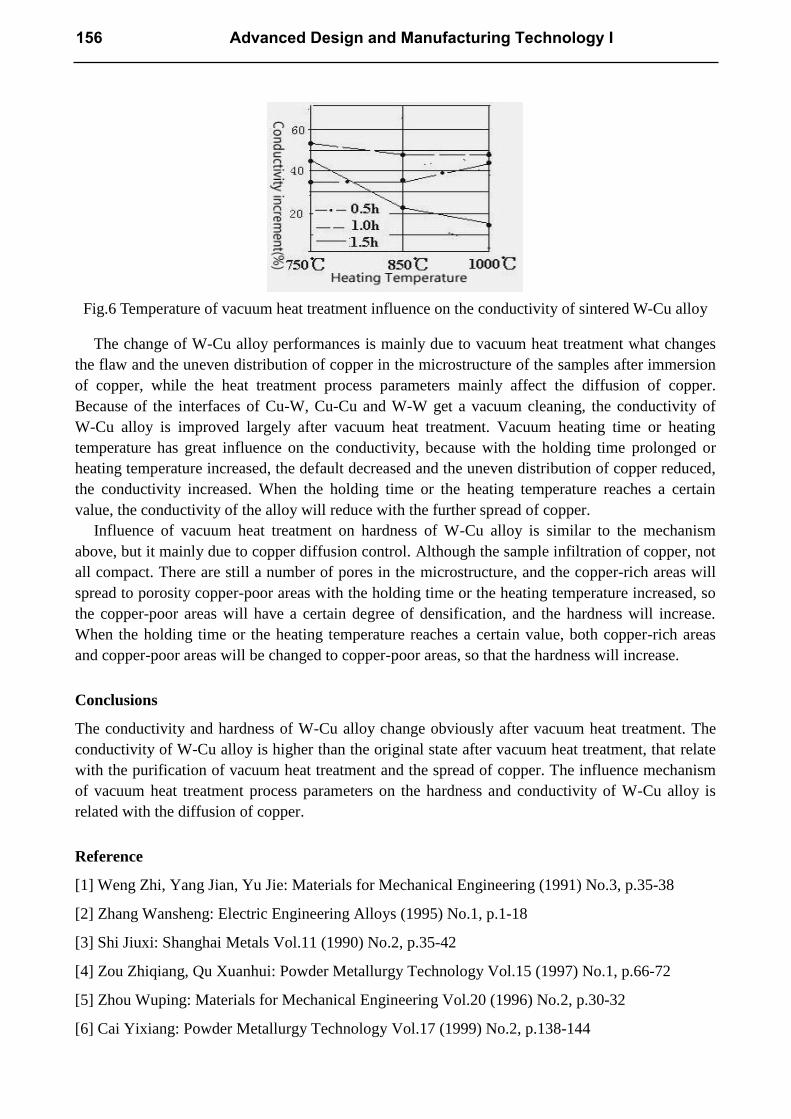
Fig.6 Temperature of vacuum heat treatment influence on the conductivity of sintered W-Cu alloy
The change of W-Cu alloy performances is mainly due to vacuum heat treatment what changes
the flaw and the uneven distribution of copper in the microstructure of the samples after immersion
of copper, while the heat treatment process parameters mainly affect the diffusion of copper.
Because of the interfaces of Cu-W, Cu-Cu and W-W get a vacuum cleaning, the conductivity of
W-Cu alloy is improved largely after vacuum heat treatment. Vacuum heating time or heating
temperature has great influence on the conductivity, because with the holding time prolonged or
heating temperature increased, the default decreased and the uneven distribution of copper reduced,
the conductivity increased. When the holding time or the heating temperature reaches a certain
value, the conductivity of the alloy will reduce with the further spread of copper.
Influence of vacuum heat treatment on hardness of W-Cu alloy is similar to the mechanism
above, but it mainly due to copper diffusion control. Although the sample infiltration of copper, not
all compact. There are still a number of pores in the microstructure, and the copper-rich areas will
spread to porosity copper-poor areas with the holding time or the heating temperature increased, so
the copper-poor areas will have a certain degree of densification, and the hardness will increase.
When the holding time or the heating temperature reaches a certain value, both copper-rich areas
and copper-poor areas will be changed to copper-poor areas, so that the hardness will increase.
Conclusions
The conductivity and hardness of W-Cu alloy change obviously after vacuum heat treatment. The
conductivity of W-Cu alloy is higher than the original state after vacuum heat treatment, that relate
with the purification of vacuum heat treatment and the spread of copper. The influence mechanism
of vacuum heat treatment process parameters on the hardness and conductivity of W-Cu alloy is
related with the diffusion of copper.
Reference
[1] Weng Zhi, Yang Jian, Yu Jie: Materials for Mechanical Engineering (1991) No.3, p.35-38
[2] Zhang Wansheng: Electric Engineering Alloys (1995) No.1, p.1-18
[3] Shi Jiuxi: Shanghai Metals Vol.11 (1990) No.2, p.35-42
[4] Zou Zhiqiang, Qu Xuanhui: Powder Metallurgy Technology Vol.15 (1997) No.1, p.66-72
[5] Zhou Wuping: Materials for Mechanical Engineering Vol.20 (1996) No.2, p.30-32
[6] Cai Yixiang: Powder Metallurgy Technology Vol.17 (1999) No.2, p.138-144
156 Advanced Design and Manufacturing Technology I

Design on Numerical Control System of Glass Cutting Machine based on PC
W. Wanga
School of Electronic Information & Electric Engineering, Changzhou Institute of Technology, Changzhou 213002, China
Keywords: Glass Cutting Machine, Numerical Control System, PC
Abstract. Based on introducing the overall structure of numerical control system of glass cutting
machine, this paper describes the software framework of the system, and gives the design idea of the
various modules, then introduces a system application example.
Introduction
Glass is one of the major materials in modern building. Glass cutting is the former working produce
of glass processing, including original glass loading, glass transmission, original glass cutting and so
on. It also needs to achieve management of raw materials, orders, processing data and graphics,
besides finishes a series of functions such as glass layout optimization.
Now most automatic glass cutting systems are from a number of large multinational companies
abroad. Although it has an advantage in performance, but hardware and software design is close, and
it can not be modified or extended according to different user needs, moreover it has high
maintenance costs and long cycle.
According to performance requirements of glass cutting machine, this paper proposes an open
CNC system that is a NC embedded PC structure; designs glass cutting machine and motion control
software, and achieves the movement control of glass cutting machine.
System Design
Overall Design. Open glass cutting machine control system is embedded PC structure, whose
hardware structure is shown in figure 1.The hardware of the system consists of industrial computer,
motion controller, I / O module circuit, servo motor drivers, servo motors and other components.
PC provides a software development platform. Under the windows operating system support, open
CNC system is developed with a dynamic link library interface function that is provided by motion
control card manufacturers. As the input and output signals are dispersion, I / O ports providing by
motion controller can not meet the needs, so it needs to expand I / O modules. One is in the main
control cabinet, another is in the vice control cabinet, and the third one is on the cutting bridge.
Through the CAN bus these I / O signals can be connected to the motion controller, finally these
signals can be delivered to the PC.
Motion controller controls the movement axis, achieves multi-axis control of continuous path
motion, and completes lines and arcs interpolation.
Servo System Control. According to the different ways of CNC servo drive control mode, CNC
machine can be divided into open-loop control, closed loop control and semi-closed loop control.
Combining with the actual situation of glass cutting machine, semi-closed loop control system is the
most ideal way. The block diagram is shown in figure 2.
Hardware System Selections
PC Selection. PC offers the user functions such as writing graphics online, setting the relevant
performance parameters and fault diagnosis functions. Taking out the processor speed, reliability and
performance, the system choose YanHua PC.
© (2011) Trans Tech Publications, Switzerlanddoi:10.4028/www.scientific.net/AMR.142.157
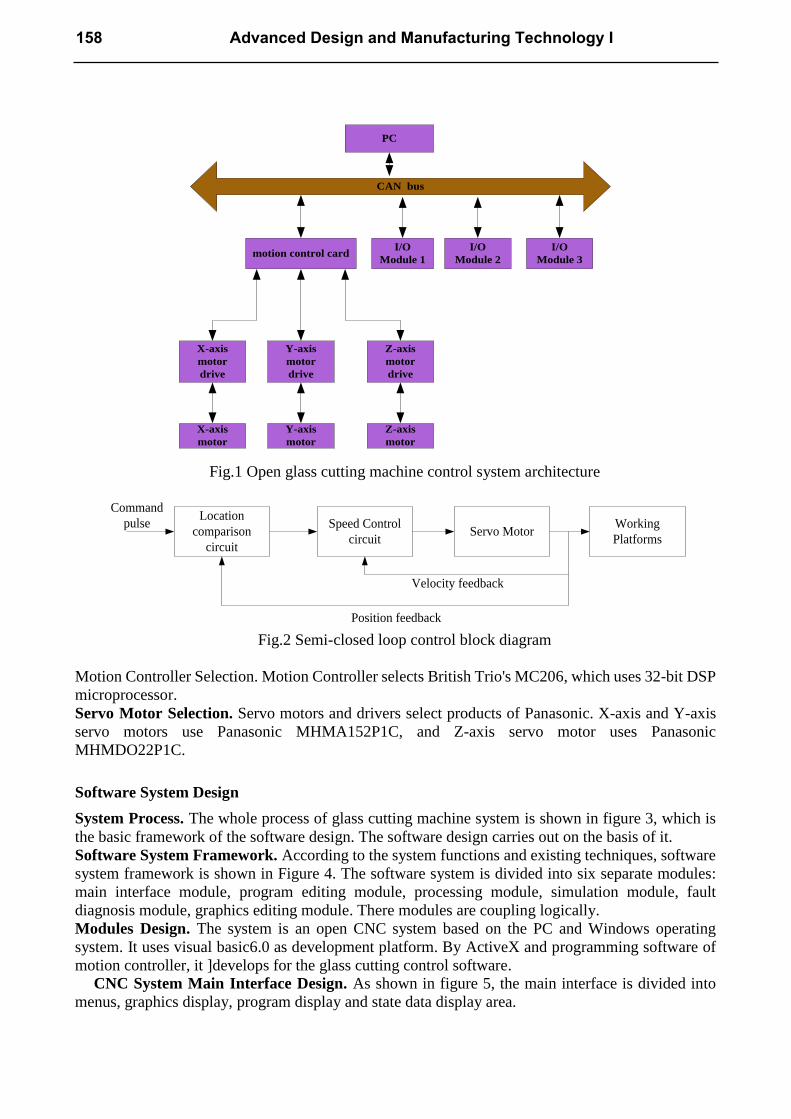
PC
CAN bus
motion control card
Y-axis
motor
drive
X-axis
motor
drive
Z-axis
motor
drive
I/O
Module 1
I/O
Module 2
I/O
Module 3
X-axis
motor
Y-axis
motor
Z-axis
motor
Fig.1 Open glass cutting machine control system architecture
Location
comparison
circuit
Command
pulse Speed Control
circuitServo Motor
Working
Platforms
Velocity feedback
Position feedback
Fig.2 Semi-closed loop control block diagram
Motion Controller Selection. Motion Controller selects British Trio's MC206, which uses 32-bit DSP
microprocessor.
Servo Motor Selection. Servo motors and drivers select products of Panasonic. X-axis and Y-axis
servo motors use Panasonic MHMA152P1C, and Z-axis servo motor uses Panasonic
MHMDO22P1C.
Software System Design
System Process. The whole process of glass cutting machine system is shown in figure 3, which is
the basic framework of the software design. The software design carries out on the basis of it.
Software System Framework. According to the system functions and existing techniques, software
system framework is shown in Figure 4. The software system is divided into six separate modules:
main interface module, program editing module, processing module, simulation module, fault
diagnosis module, graphics editing module. There modules are coupling logically.
Modules Design. The system is an open CNC system based on the PC and Windows operating
system. It uses visual basic6.0 as development platform. By ActiveX and programming software of
motion controller, it ]develops for the glass cutting control software.
CNC System Main Interface Design. As shown in figure 5, the main interface is divided into
menus, graphics display, program display and state data display area.
158 Advanced Design and Manufacturing Technology I
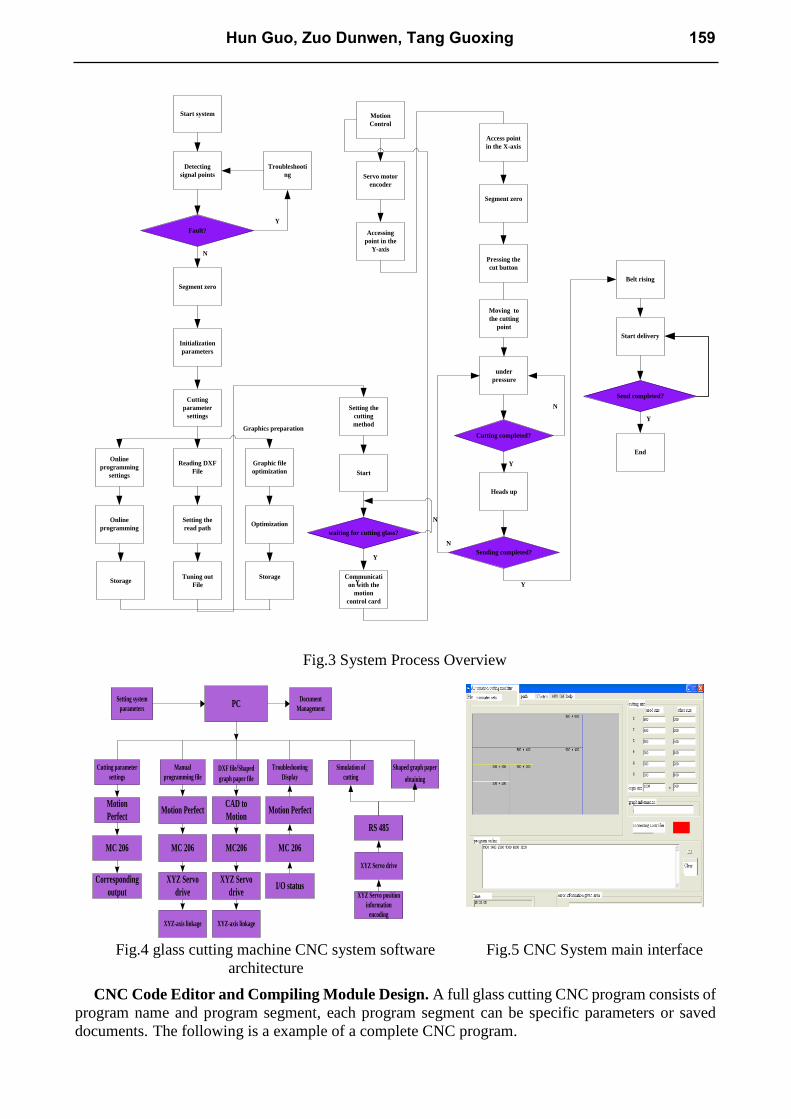
Start system
Detecting
signal points
Fault?
Troubleshooti
ng
Segment zero
Initialization
parameters
Cutting
parameter
settings
Online
programming
settings
Reading DXF
File
Graphic file
optimization
Online
programming
Setting the
read pathOptimization
StorageTuning out
File
Storage
Setting the
cutting
method
Start
waiting for cutting glass?
Communicati
on with the
motion
control card
Motion
Control
Servo motor
encoder
Accessing
point in the
Y-axis
Access point
in the X-axis
Segment zero
Pressing the
cut button
Moving to
the cutting
point
under
pressure
Cutting completed?
Heads up
Sending completed?
Belt rising
Start delivery
Send completed?
End
Y
Graphics preparation
N
Y
Y
N
Y
Y
Y
N
N
Fig.3 System Process Overview
PC
Cutting parameter
settings
Manual
programming fileDXF file/Shaped
graph paper file
Troubleshooting
Display
Simulation of
cutting
Motion
Perfect
MC 206
Corresponding
output
Motion Perfect
MC 206
XYZ-axis linkage
XYZ Servo
drive
CAD to
Motion
MC206
XYZ Servo
drive
XYZ-axis linkage
Motion Perfect
MC 206
I/O status
RS 485
XYZ Servo position
information
encoding
XYZ Servo drive
Setting system
parameters
Document
Management
Shaped graph paper
obtaining
Fig.4 glass cutting machine CNC system software
architecture
Fig.5 CNC System main interface
CNC Code Editor and Compiling Module Design. A full glass cutting CNC program consists of
program name and program segment, each program segment can be specific parameters or saved
documents. The following is a example of a complete CNC program.
Hun Guo, Zuo Dunwen, Tang Guoxing 159
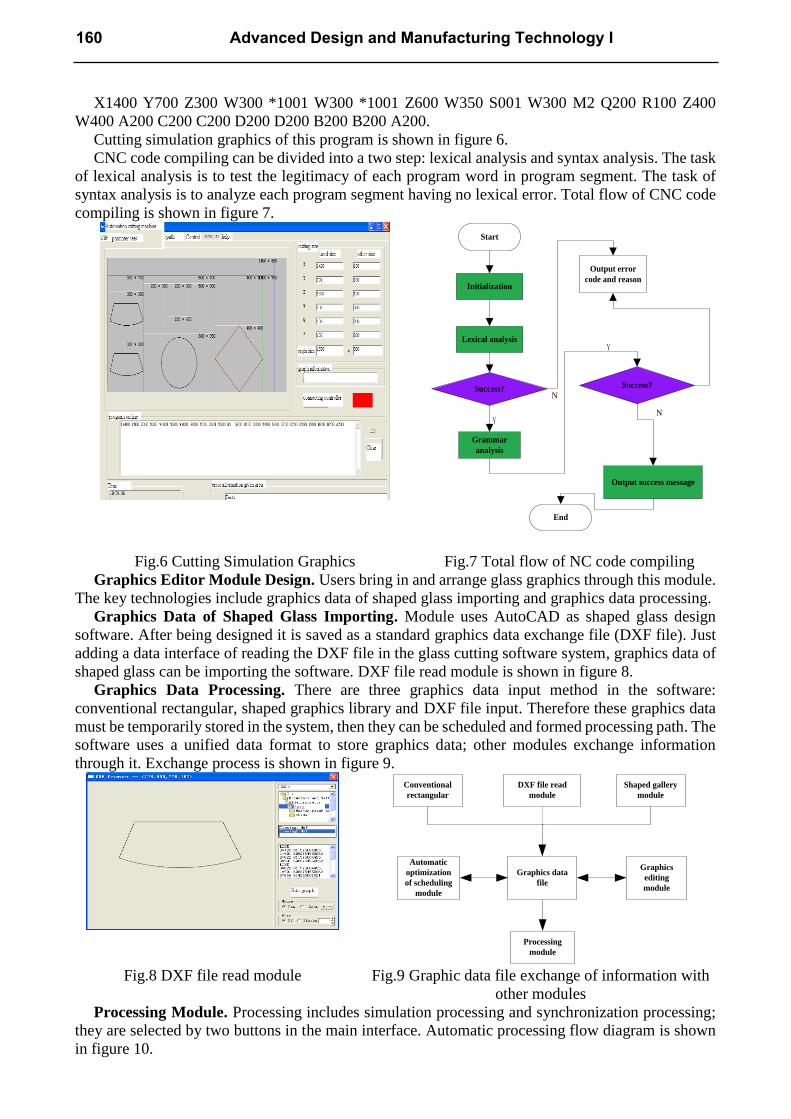
X1400 Y700 Z300 W300 *1001 W300 *1001 Z600 W350 S001 W300 M2 Q200 R100 Z400
W400 A200 C200 C200 D200 D200 B200 B200 A200.
Cutting simulation graphics of this program is shown in figure 6.
CNC code compiling can be divided into a two step: lexical analysis and syntax analysis. The task
of lexical analysis is to test the legitimacy of each program word in program segment. The task of
syntax analysis is to analyze each program segment having no lexical error. Total flow of CNC code
compiling is shown in figure 7.
Initialization
Lexical analysis
Success? Success?
Output success message
Grammar
analysis
Y
Y
N
N
Output error
code and reason
Start
End
Fig.6 Cutting Simulation Graphics Fig.7 Total flow of NC code compiling
Graphics Editor Module Design. Users bring in and arrange glass graphics through this module.
The key technologies include graphics data of shaped glass importing and graphics data processing.
Graphics Data of Shaped Glass Importing. Module uses AutoCAD as shaped glass design
software. After being designed it is saved as a standard graphics data exchange file (DXF file). Just
adding a data interface of reading the DXF file in the glass cutting software system, graphics data of
shaped glass can be importing the software. DXF file read module is shown in figure 8.
Graphics Data Processing. There are three graphics data input method in the software:
conventional rectangular, shaped graphics library and DXF file input. Therefore these graphics data
must be temporarily stored in the system, then they can be scheduled and formed processing path. The
software uses a unified data format to store graphics data; other modules exchange information
through it. Exchange process is shown in figure 9.
Graphics data
file
Processing
module
Shaped gallery
module
Conventional
rectangular
DXF file read
module
Automatic
optimization
of scheduling
module
Graphics
editing
module
Fig.8 DXF file read module Fig.9 Graphic data file exchange of information with
other modules
Processing Module. Processing includes simulation processing and synchronization processing;
they are selected by two buttons in the main interface. Automatic processing flow diagram is shown
in figure 10.
160 Advanced Design and Manufacturing Technology I
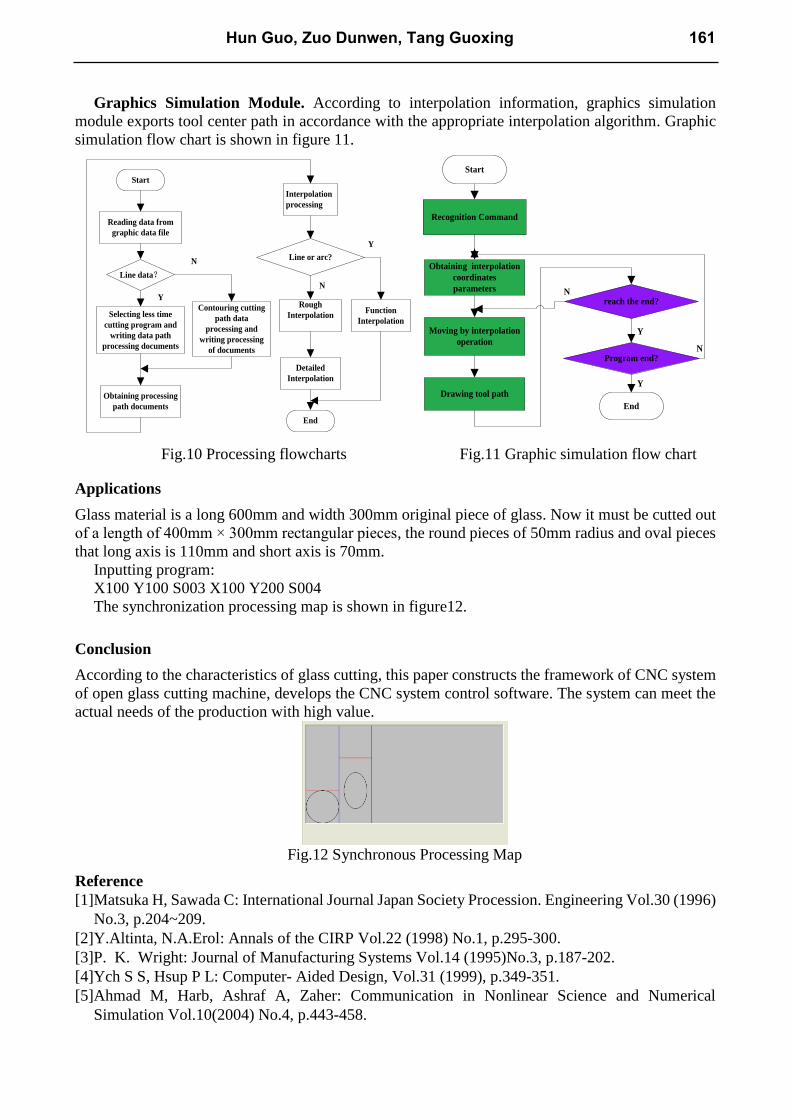
Graphics Simulation Module. According to interpolation information, graphics simulation
module exports tool center path in accordance with the appropriate interpolation algorithm. Graphic
simulation flow chart is shown in figure 11.
Start
Reading data from
graphic data file
Selecting less time
cutting program and
writing data path
processing documents
Line data?
Obtaining processing
path documents
Interpolation
processing
Line or arc?
Function
Interpolation
Rough
Interpolation
Detailed
Interpolation
Contouring cutting
path data
processing and
writing processing
of documents
End
Y
N
Y
N
Recognition Command
Obtaining interpolation
coordinates
parameters
Program end?
Moving by interpolation
operation
reach the end?
Drawing tool path
N
Y
Y
N
Start
End
Fig.10 Processing flowcharts Fig.11 Graphic simulation flow chart
Applications
Glass material is a long 600mm and width 300mm original piece of glass. Now it must be cutted out
of a length of 400mm × 300mm rectangular pieces, the round pieces of 50mm radius and oval pieces
that long axis is 110mm and short axis is 70mm.
Inputting program:
X100 Y100 S003 X100 Y200 S004
The synchronization processing map is shown in figure12.
Conclusion
According to the characteristics of glass cutting, this paper constructs the framework of CNC system
of open glass cutting machine, develops the CNC system control software. The system can meet the
actual needs of the production with high value.
Fig.12 Synchronous Processing Map
Reference
[1]Matsuka H, Sawada C: International Journal Japan Society Procession. Engineering Vol.30 (1996)
No.3, p.204~209.
[2]Y.Altinta, N.A.Erol: Annals of the CIRP Vol.22 (1998) No.1, p.295-300.
[3]P. K. Wright: Journal of Manufacturing Systems Vol.14 (1995)No.3, p.187-202.
[4]Ych S S, Hsup P L: Computer- Aided Design, Vol.31 (1999), p.349-351.
[5]Ahmad M, Harb, Ashraf A, Zaher: Communication in Nonlinear Science and Numerical
Simulation Vol.10(2004) No.4, p.443-458.
Hun Guo, Zuo Dunwen, Tang Guoxing 161

Fast Frequency Hopping Signal Generator based on DDS
Y.H. Du1, a, Q.R. Ouyang2
1School of Electronic Information & Electric Engineering, Changzhou Institute of Technology, Changzhou 213002, China
2Kunshan Jiuhua Electronic Facilities Factory, Kunshan 215300, China
Keywords: Frequency hopping (FH), DDS, AD9910
Abstract. Frequency hopping has been the most popularly considered approach for alleviating the
effects of jamming attacks. In this paper, the features and application of frequency hopping
communication technology are introduced briefly, also a solution of fast frequency hopping using
AD9910 is proposed. The design principle and feasibility of implementation are analyzed and
described in detail. It can improve the speed of frequency hopping tremendously.
Introduction
Over the past decades, there has been unprecedented growth in wireless communications. The
advancements in the field of wireless communications have led to more innovative consumer
applications. These wireless applications have evolved to cater to the needs of the commercial
industry, defense, private home users and educational institutions. Communication security becomes
more and more important with the development of wireless communication.
The need for secure communications dates back to the Second World War. Lots of theory and
method for military secure communications are proposed in decades after the Second World War.
The spread spectrum technology is one of these theories. Applications in wireless communications
started to appear after Shannon's classic theory of statistical communication (Shannon, 1948). It was
initially researched and developed with military applications in mind. This is because it offers a
number of attractive advantages, such as a wireless communication means that is resilient to
narrow-band jamming and difficult to intercept. As one of spread spectrum technology, frequency
hopping changes his carrier frequency periodically according to some pre-designated (but apparently
random to a third party observer) code (a pseudo-random sequence). The advantage of a frequency
hopping signal is that it is relatively jam and intercept resistant. This feature is used widely in military
communications where the risk of either enemy jamming or intercept is great. It is also used in the
mobile communication industry as a multiple access technique where systems are required to handle
high capacity data reliably in an urban setting. Frequency hopping (FH) communication systems have
become an important component of military communications strategy. FH systems offer an
improvement in performance when the communication system is attacked by hostile interference. FH
systems also reduce the ability of a hostile observer to receive and demodulate the communications
signal. FH systems are susceptible to a number of jamming threats, such as noise jammers and
narrowband, single or multi-tone jammers.
Frequency hopping signal is difficult to receive, demodulate and interfere, but it is not impossible.
A slow frequency hopping signal is easier to receive, demodulate and interfere as to a fast frequency
hopping signal. Thus the frequency hopping signal has the trend toward fast hopping in recent years.
Implementations of Frequency Hopping Technology
Frequency hopping used in HF(High Frequency) and VHF(Very High Frequency) mainly is slow
frequency hopping now, their hop rate is about from few hundreds hops/sec to few thousands
hops/sec. With the development of technology of modern electronics and birth of new products,
especially birth of DDS working with higher clock frequency (AD9858 and AD9910 with 1GHz),
© (2011) Trans Tech Publications, Switzerlanddoi:10.4028/www.scientific.net/AMR.142.162
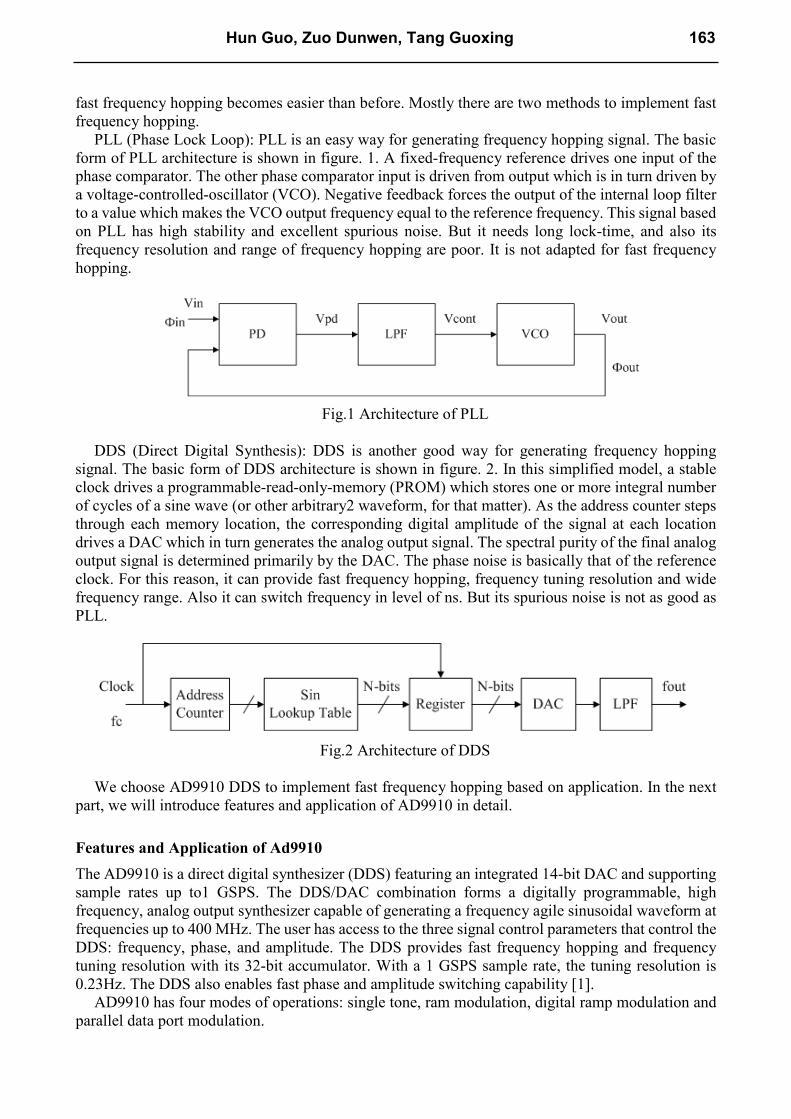
fast frequency hopping becomes easier than before. Mostly there are two methods to implement fast
frequency hopping.
PLL (Phase Lock Loop): PLL is an easy way for generating frequency hopping signal. The basic
form of PLL architecture is shown in figure. 1. A fixed-frequency reference drives one input of the
phase comparator. The other phase comparator input is driven from output which is in turn driven by
a voltage-controlled-oscillator (VCO). Negative feedback forces the output of the internal loop filter
to a value which makes the VCO output frequency equal to the reference frequency. This signal based
on PLL has high stability and excellent spurious noise. But it needs long lock-time, and also its
frequency resolution and range of frequency hopping are poor. It is not adapted for fast frequency
hopping.
Fig.1 Architecture of PLL
DDS (Direct Digital Synthesis): DDS is another good way for generating frequency hopping
signal. The basic form of DDS architecture is shown in figure. 2. In this simplified model, a stable
clock drives a programmable-read-only-memory (PROM) which stores one or more integral number
of cycles of a sine wave (or other arbitrary2 waveform, for that matter). As the address counter steps
through each memory location, the corresponding digital amplitude of the signal at each location
drives a DAC which in turn generates the analog output signal. The spectral purity of the final analog
output signal is determined primarily by the DAC. The phase noise is basically that of the reference
clock. For this reason, it can provide fast frequency hopping, frequency tuning resolution and wide
frequency range. Also it can switch frequency in level of ns. But its spurious noise is not as good as
PLL.
Fig.2 Architecture of DDS
We choose AD9910 DDS to implement fast frequency hopping based on application. In the next
part, we will introduce features and application of AD9910 in detail.
Features and Application of Ad9910
The AD9910 is a direct digital synthesizer (DDS) featuring an integrated 14-bit DAC and supporting
sample rates up to1 GSPS. The DDS/DAC combination forms a digitally programmable, high
frequency, analog output synthesizer capable of generating a frequency agile sinusoidal waveform at
frequencies up to 400 MHz. The user has access to the three signal control parameters that control the
DDS: frequency, phase, and amplitude. The DDS provides fast frequency hopping and frequency
tuning resolution with its 32-bit accumulator. With a 1 GSPS sample rate, the tuning resolution is
0.23Hz. The DDS also enables fast phase and amplitude switching capability [1].
AD9910 has four modes of operations: single tone, ram modulation, digital ramp modulation and
parallel data port modulation.
Hun Guo, Zuo Dunwen, Tang Guoxing 163
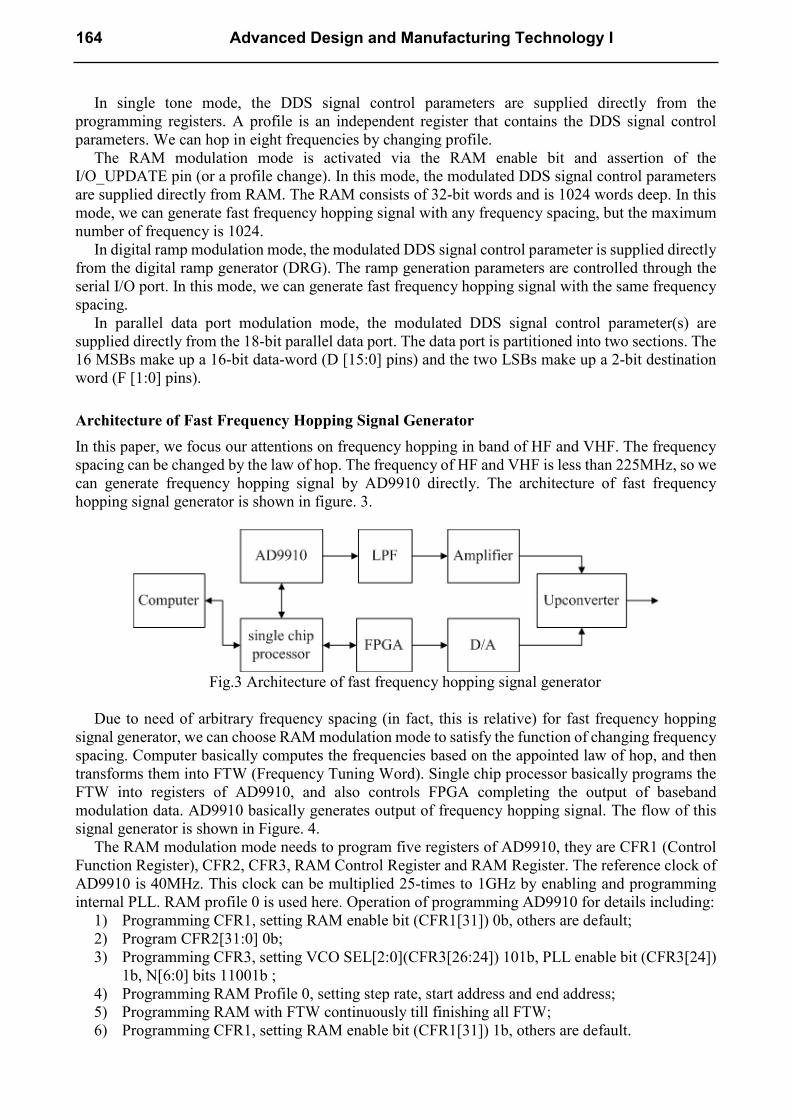
In single tone mode, the DDS signal control parameters are supplied directly from the
programming registers. A profile is an independent register that contains the DDS signal control
parameters. We can hop in eight frequencies by changing profile.
The RAM modulation mode is activated via the RAM enable bit and assertion of the
I/O_UPDATE pin (or a profile change). In this mode, the modulated DDS signal control parameters
are supplied directly from RAM. The RAM consists of 32-bit words and is 1024 words deep. In this
mode, we can generate fast frequency hopping signal with any frequency spacing, but the maximum
number of frequency is 1024.
In digital ramp modulation mode, the modulated DDS signal control parameter is supplied directly
from the digital ramp generator (DRG). The ramp generation parameters are controlled through the
serial I/O port. In this mode, we can generate fast frequency hopping signal with the same frequency
spacing.
In parallel data port modulation mode, the modulated DDS signal control parameter(s) are
supplied directly from the 18-bit parallel data port. The data port is partitioned into two sections. The
16 MSBs make up a 16-bit data-word (D [15:0] pins) and the two LSBs make up a 2-bit destination
word (F [1:0] pins).
Architecture of Fast Frequency Hopping Signal Generator
In this paper, we focus our attentions on frequency hopping in band of HF and VHF. The frequency
spacing can be changed by the law of hop. The frequency of HF and VHF is less than 225MHz, so we
can generate frequency hopping signal by AD9910 directly. The architecture of fast frequency
hopping signal generator is shown in figure. 3.
Fig.3 Architecture of fast frequency hopping signal generator
Due to need of arbitrary frequency spacing (in fact, this is relative) for fast frequency hopping
signal generator, we can choose RAM modulation mode to satisfy the function of changing frequency
spacing. Computer basically computes the frequencies based on the appointed law of hop, and then
transforms them into FTW (Frequency Tuning Word). Single chip processor basically programs the
FTW into registers of AD9910, and also controls FPGA completing the output of baseband
modulation data. AD9910 basically generates output of frequency hopping signal. The flow of this
signal generator is shown in Figure. 4.
The RAM modulation mode needs to program five registers of AD9910, they are CFR1 (Control
Function Register), CFR2, CFR3, RAM Control Register and RAM Register. The reference clock of
AD9910 is 40MHz. This clock can be multiplied 25-times to 1GHz by enabling and programming
internal PLL. RAM profile 0 is used here. Operation of programming AD9910 for details including:
1) Programming CFR1, setting RAM enable bit (CFR1[31]) 0b, others are default;
2) Program CFR2[31:0] 0b;
3) Programming CFR3, setting VCO SEL[2:0](CFR3[26:24]) 101b, PLL enable bit (CFR3[24])
1b, N[6:0] bits 11001b ;
4) Programming RAM Profile 0, setting step rate, start address and end address;
5) Programming RAM with FTW continuously till finishing all FTW;
6) Programming CFR1, setting RAM enable bit (CFR1[31]) 1b, others are default.
164 Advanced Design and Manufacturing Technology I
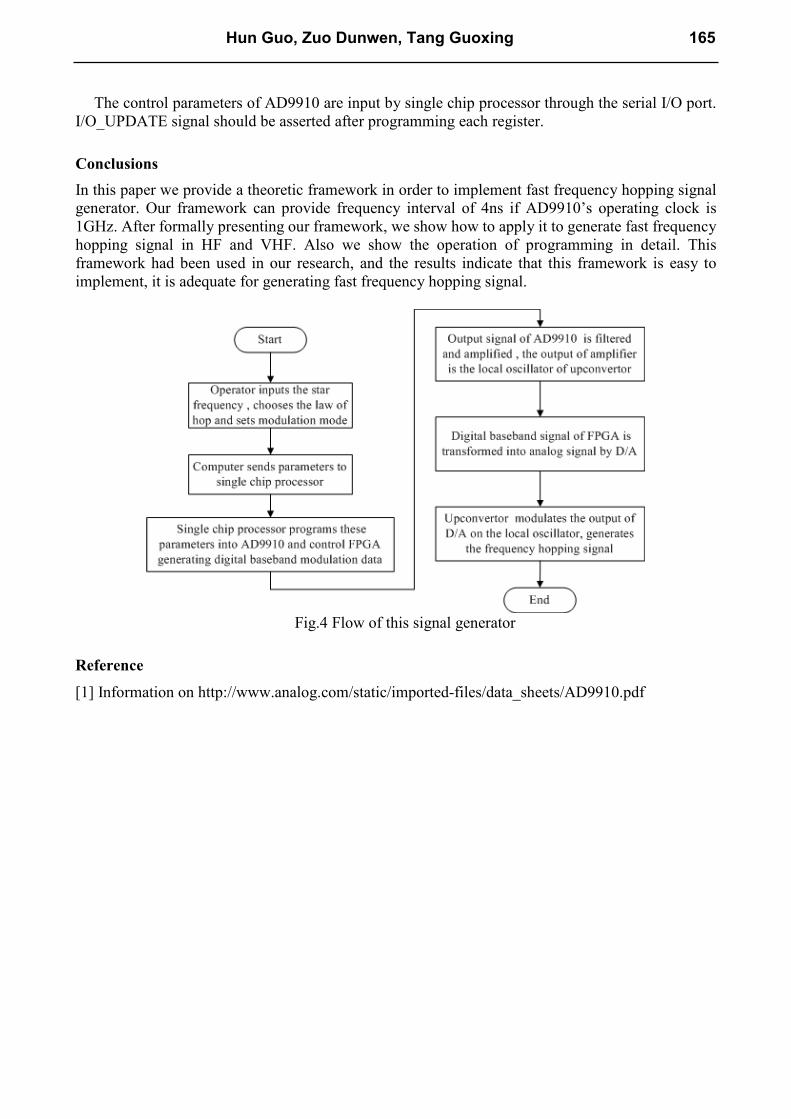
The control parameters of AD9910 are input by single chip processor through the serial I/O port.
I/O_UPDATE signal should be asserted after programming each register.
Conclusions
In this paper we provide a theoretic framework in order to implement fast frequency hopping signal
generator. Our framework can provide frequency interval of 4ns if AD9910’s operating clock is
1GHz. After formally presenting our framework, we show how to apply it to generate fast frequency
hopping signal in HF and VHF. Also we show the operation of programming in detail. This
framework had been used in our research, and the results indicate that this framework is easy to
implement, it is adequate for generating fast frequency hopping signal.
Fig.4 Flow of this signal generator
Reference
[1] Information on http://www.analog.com/static/imported-files/data_sheets/AD9910.pdf
Hun Guo, Zuo Dunwen, Tang Guoxing 165
The Optimization of Material Thickness for Neutron Shielding With Monte Carlo Method
C.Chen1, a, M.Wang1, b
1China Institute of Atomic Energy, Beijing 102413, China
[email protected], [email protected]
Keywords: Neutron Radiation, Shielding Material, Monte Carlo Method
Abstract. Some materials are selected for shielding neutron radiation in this paper. The thickness of
shielding materials is optimized with Monte Carlo method. The materials and optimizational
thickness are: Tungsten 6cm, Polythene 8cm, Cadmium 1cm and Stainless Steel 1cm.
Introduction
It is very important to shield ionizing radiation in nuclear technology application. Some materials are
selected as shielding ones because of their property. Ionizing radiation is referred to the radiation
which can ionize the medium atoms, including neutron, γ ray, α ray, and so on. This paper will discuss
the protection of neutron radiation. Because of no charged neutron can penetrate material more easily
than some other charged particles. Meanwhile, neutron radiation can be used in many agricultural and
medical fields. The usual neutron sources are d-D and d-T ones. Both kinds of neutron sources are
challengeable to meet the protection requirement, personnel health and low cost.
Generally, the neutron source generates fast neutrons. In order to shield the fast neutrons, two steps
are necessary: moderating fast neutron to thermal neutron and absorbing thermal neutron. There are
two kinds of materials which can moderate fast neutron. One kind of material with light nuclei, such
as water, polythene and paraffin, which can moderate fast neutron with better efficiency by elastic
scattering; The other kind of material with heavy nuclei, such as tungsten and lead, which can
moderate fast neutron with poor efficiency by inelastic scattering. The material which can absorb
neutron is mainly cadmium (Cd) and gadolinium (Gd).
The selection of shielding material has to be processed easily besides shielding ability. It is
necessary to select material with heavy nuclei to moderate fast neutron primarily close to the neutron
source. Lead is not processed as easily as tungsten. So tungsten is selected as the first layer for
shielding. The second layer material is selected as polythene, for it is cheap and easily processed. This
layer can moderate fast neutron more efficiently. The third layer is cadmium, which is most widely
used to absorb neutron. The fourth layer is the last one, with material of stainless steel for supporting
the shielding body and being waterproof. Table 1 shows the parameters of these materials.
Table 1 The parameters of shielding material
Material Density
[g/(cm3)]
Component Function
Tungsten 19.35 W(100%) Moderat neutron by
inelastic scattering
Polythene 0.92 -(CH2)n-
C:85.6%, H: 14.4%
Moderate neutron by elastic
scattering
Cadmium 8.65 Cd (100%) Absorbing thermal neutron
Stainless
Steel
0.80 Fe(72%), Mn(7%), Cr(16%), Ni(4%),
Si(0.7%), C(0.03%)
Waterproof and support
After selecting the shielding material, it is necessary to fix the thickness of material. For the
convenience of calculation, every layer of material is placed as sphere-shell. A neutron source is at
the center of sphere. The Monte Carlo method (also called computer random sampling method) is
adopted to simulate the effect of shielding neutron source in this study. The Monte Carlo method can
© (2011) Trans Tech Publications, Switzerlanddoi:10.4028/www.scientific.net/AMR.142.166

simulate the shielding of radiation with high reality, simple program structure and few geometry
influences [1-3]. Some national laboratories, for example Los Alamos in USA, have developed
reliable programs for Monte Carlo Calculation [4].
Monte Carlo Method
In this paper, a d-D neutron source is placed at the sphere center. The energy spectrum of d-D neutron
source can be expressed as:
P(E)=Cexp[-((E-b)/a)2] (1)
As in Refer. [1], the following parameters are selected: a=2.475MeV, b=0.1574MeV, while C is
the normalization factor. The calculation process is as the following.
1. Increasing the thickness of tungsten gradually, the neutron fluence rate is examined and the
optimized thickness of tungsten is selected.
2. With the optimized thickness of tungsten, the thickness of polythene is gradually increased. The
neutron fluence rate is examined and the best thickness of polythene is selected.
3. With the optimized thickness of tungsten and polythene, the thickness of cadmium is gradually
increased. The neutron fluence rate is examined and the best thickness of cadmium is selected.
4. With the optimized thickness of tungsten, polythene and cadmium, the thickness of stainless
steel is gradually increased. The neutron fluence rate is examined and the best thickness of stainless
steel is selected.
The number of neutron for every simulation is 1.6×10⁷. Most of the calculation errors in Monte
Carlo Simulation are less than 1% except only a little exception. Because of being moderated, the
energy of neutron is distributed from 0.02eV to 20MeV. So the energy is divided into six regions, as
listed in Table 2.
Table 2 Neutron Energy Regions
Energy Range Region Name
0-0.05eV thermal neutron
0.05eV-0.5eV epithermal neutron
0.5eV-5KeV resonance neutron
5KeV-0.5MeV slow neutron
0.5MeV-3MeV intermediate neutron
3MeV-20MeV fast neutron
Computation Results
Because of the less moderation of fast neutron, the thermal neutron fluence rate is 0. The fluence rates of other energy regions and corresponding tungsten thickness are shown in Fig. 1.
In Fig.1, slow neutron fluence rate increases and epithermal neutron fluence rate decreases when
tungsten thickness increases. Resonance neutron fluence rate gets its maximum at the tungsten
thickness of 6 cm. So the optimized thickness of tungsten is selected as 6 cm.
With the tungsten thickness of 6 cm, the neutron fluence rates with polythene thickness are shown
in Fig.2. The thermal neutron, epithermal neutron and resonance neutron fluence rates can be clearly
seen in Fig.2. Resonance neutron fluence rate gets its maximum at 3 cm while thermal and epithermal
neutron fluence rates get maximum at 8 cm. The purpose of this layer is to moderate fast neutrons to
thermal and epithermal neutrons as much as possible. So the thickness of polythene is selected to 8
cm with which the thermal and epithermal neutron fluence rates are the maximum values.
Cadmium can absorb thermal neutron and epithermal neutron very well. With tungsten thickness
of 6 cm and polythene thickness of 8 cm, the neutron fluence rates with polythene thickness are
shown in Fig.3. Because of the strong absorption, thermal neutron fluence rate is 0 when the cadmium
thickness is bigger than 0.1 cm. So thermal neutron is not shown in Fig.3.
Hun Guo, Zuo Dunwen, Tang Guoxing 167
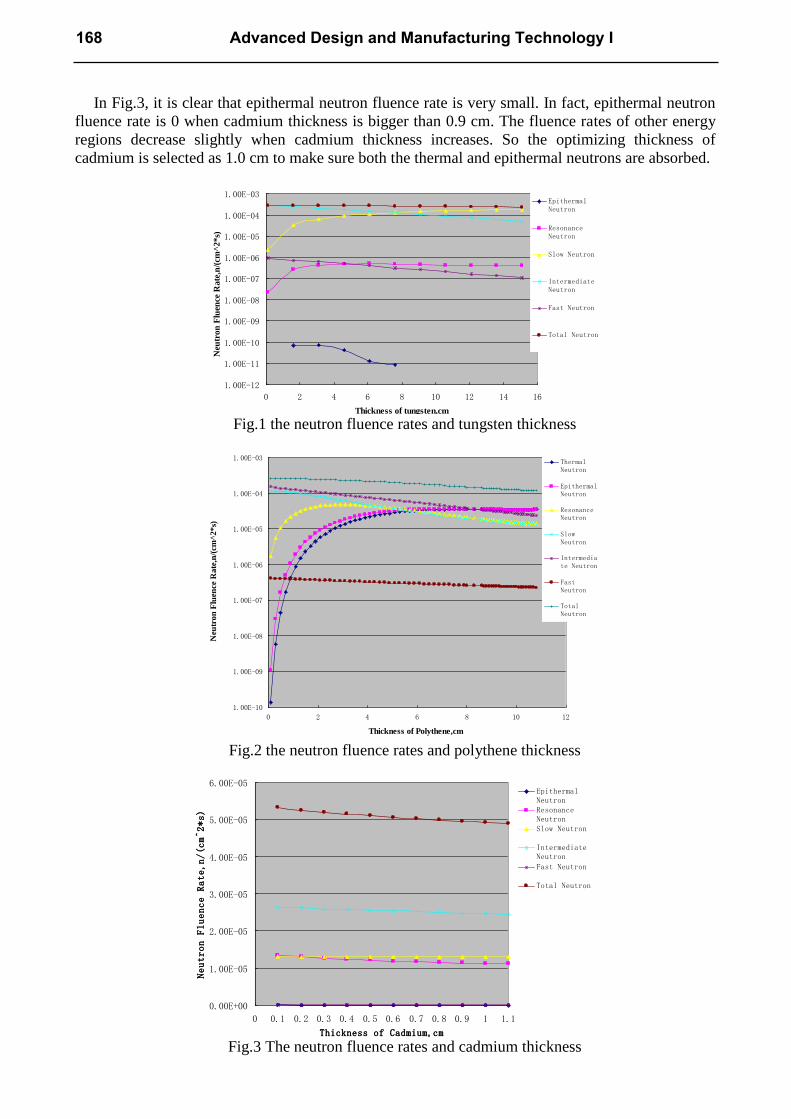
In Fig.3, it is clear that epithermal neutron fluence rate is very small. In fact, epithermal neutron
fluence rate is 0 when cadmium thickness is bigger than 0.9 cm. The fluence rates of other energy
regions decrease slightly when cadmium thickness increases. So the optimizing thickness of
cadmium is selected as 1.0 cm to make sure both the thermal and epithermal neutrons are absorbed.
1.00E-12
1.00E-11
1.00E-10
1.00E-09
1.00E-08
1.00E-07
1.00E-06
1.00E-05
1.00E-04
1.00E-03
0 2 4 6 8 10 12 14 16
Thickness of tungsten,cm
Neu
tron
Flu
ence
Rate
,n/(
cm^
2*s)
EpithermalNeutron
ResonanceNeutron
Slow Neutron
IntermediateNeutron
Fast Neutron
Total Neutron
Fig.1 the neutron fluence rates and tungsten thickness
1.00E-10
1.00E-09
1.00E-08
1.00E-07
1.00E-06
1.00E-05
1.00E-04
1.00E-03
0 2 4 6 8 10 12
Thickness of Polythene,cm
Neu
tro
n F
luen
ce R
ate
,n/(
cm^
2*
s)
ThermalNeutron
EpithermalNeutron
ResonanceNeutron
SlowNeutron
Intermediate Neutron
FastNeutron
TotalNeutron
Fig.2 the neutron fluence rates and polythene thickness
0.00E+00
1.00E-05
2.00E-05
3.00E-05
4.00E-05
5.00E-05
6.00E-05
0 0.1 0.2 0.3 0.4 0.5 0.6 0.7 0.8 0.9 1 1.1
Thickness of Cadmium,cm
Neutron Fluence Rate,n/(cm^2*s)
EpithermalNeutronResonanceNeutronSlow Neutron
IntermediateNeutron
Fast Neutron
Total Neutron
Fig.3 The neutron fluence rates and cadmium thickness
168 Advanced Design and Manufacturing Technology I
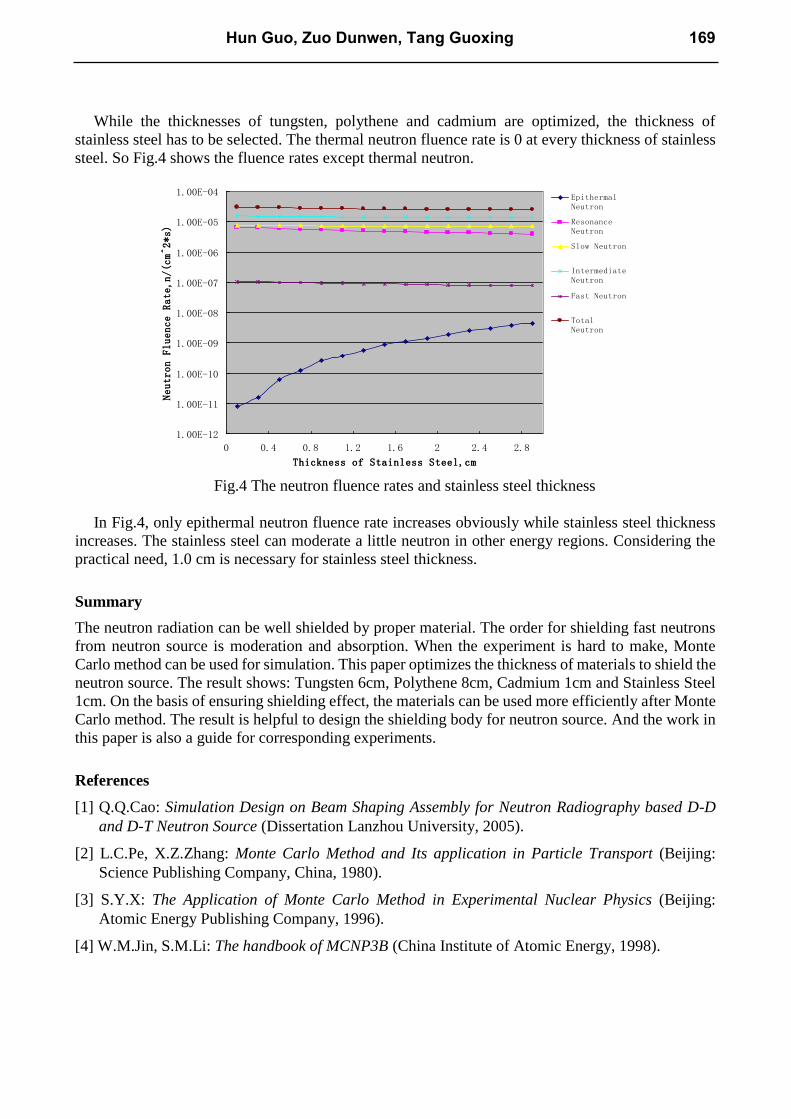
While the thicknesses of tungsten, polythene and cadmium are optimized, the thickness of
stainless steel has to be selected. The thermal neutron fluence rate is 0 at every thickness of stainless
steel. So Fig.4 shows the fluence rates except thermal neutron.
1.00E-12
1.00E-11
1.00E-10
1.00E-09
1.00E-08
1.00E-07
1.00E-06
1.00E-05
1.00E-04
0 0.4 0.8 1.2 1.6 2 2.4 2.8
Thickness of Stainless Steel,cm
Neutron Fluence Rate,n/(cm^2*s)
EpithermalNeutron
ResonanceNeutron
Slow Neutron
IntermediateNeutron
Fast Neutron
TotalNeutron
Fig.4 The neutron fluence rates and stainless steel thickness
In Fig.4, only epithermal neutron fluence rate increases obviously while stainless steel thickness
increases. The stainless steel can moderate a little neutron in other energy regions. Considering the
practical need, 1.0 cm is necessary for stainless steel thickness.
Summary
The neutron radiation can be well shielded by proper material. The order for shielding fast neutrons
from neutron source is moderation and absorption. When the experiment is hard to make, Monte
Carlo method can be used for simulation. This paper optimizes the thickness of materials to shield the
neutron source. The result shows: Tungsten 6cm, Polythene 8cm, Cadmium 1cm and Stainless Steel
1cm. On the basis of ensuring shielding effect, the materials can be used more efficiently after Monte
Carlo method. The result is helpful to design the shielding body for neutron source. And the work in
this paper is also a guide for corresponding experiments.
References
[1] Q.Q.Cao: Simulation Design on Beam Shaping Assembly for Neutron Radiography based D-D
and D-T Neutron Source (Dissertation Lanzhou University, 2005).
[2] L.C.Pe, X.Z.Zhang: Monte Carlo Method and Its application in Particle Transport (Beijing:
Science Publishing Company, China, 1980).
[3] S.Y.X: The Application of Monte Carlo Method in Experimental Nuclear Physics (Beijing:
Atomic Energy Publishing Company, 1996).
[4] W.M.Jin, S.M.Li: The handbook of MCNP3B (China Institute of Atomic Energy, 1998).
Hun Guo, Zuo Dunwen, Tang Guoxing 169

A Method to Measure Rotary Speed and Torque Using JC Sensors
WANG Qiang, SONG Shenglia and ZHAO Wei
Engineering Institute of Corps of Engineer, PLA Univ. of Sci. & Tech., Nanjing 210007, China
Key words: Torque; Rotary Speed; Phasic Difference Checking Circuit; Sensor
Abstract. A method for rotary speed and torque measuring using JC sensors was introduced in the
paper. The approximate sine signals output by JC sensors are transformed into rectangular signals by
the transform circuit. The checking circuit consists of an 8031 singlechip, it determines the rotary
speed by measuring the frequency of the rectangular signals, and determines torque by measuring
their pulse width.
Introduction
The power of an engineering machinery is usually supplyed by a diesel.The rotary speed and torque
output by the diesel are important parameters to represent the power characteristic of the machinery,
so the the maesuring of them is very important.
Along with the wide application of computer technology, the rotary speed and torque can be
quickly and exactly measured by use of computer checking technologies. In this paper, a quick
measuring method for rotary speed and torque using JC sensors was put forward.
Measuring Principle
The JC sensor used in this project is a kind of rotary speed and torque sensors. It consists of a tarsional
shaft, two signal-gears, and two pairs of magnetoelectric signal generators. The basic working
principle can be shown as in Fig 1. The signal-gears are fixed on the tarsional shaft, and turn with the
tarsional shaft. The teeth of signal-gears sweep the bottom of the alnicos periodically, and the
periodical change of the clearance makes magnetic flux in the alnicos be changed periodically, so
alternating current signals are generated in the wire coils. The frequencies of the two alternating
current signals are equal and directly proportional to the rotary speed of the tarsional shaft, they can
be used to measure the rotate speed. The phasic difference between the two alternating current signals
will be changed depending on the shaft being loaded or not, and the change magnitude is directly
proportional to the load. Therefor the torque transmited by the shaft can be measured by processing
the two alternating current signals.
Fig.1 Basic working principle of the JC sensor
© (2011) Trans Tech Publications, Switzerlanddoi:10.4028/www.scientific.net/AMR.142.170
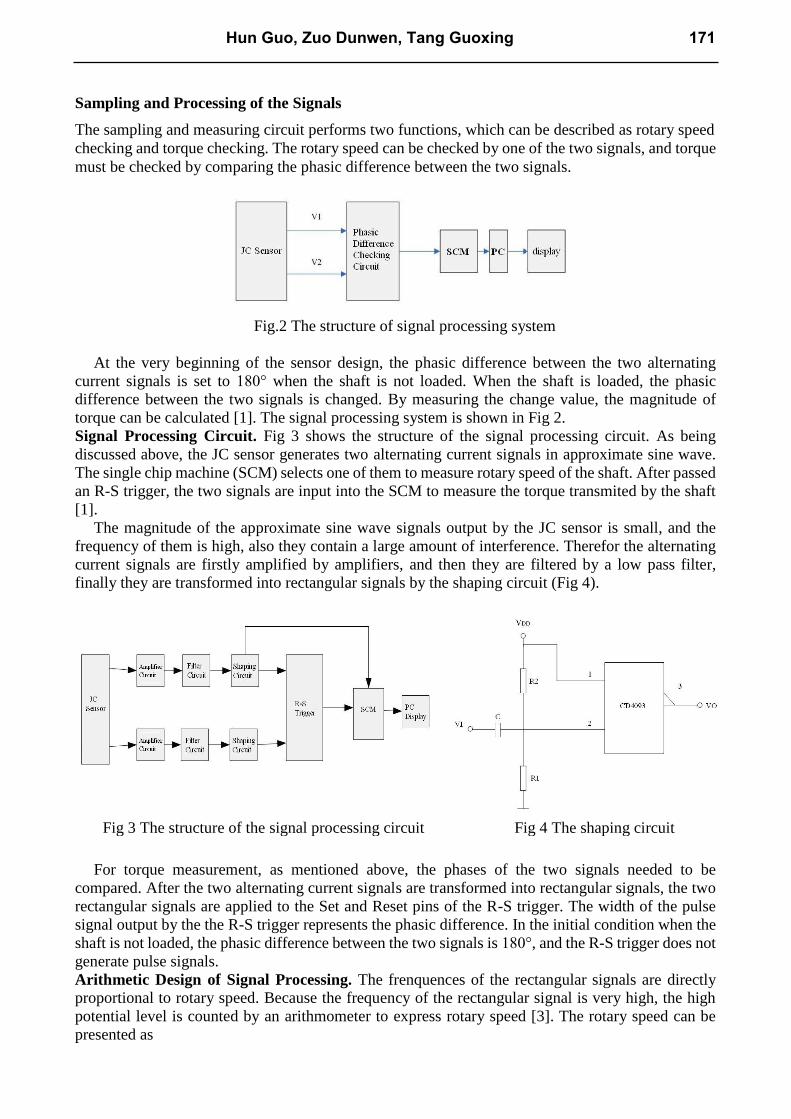
Sampling and Processing of the Signals
The sampling and measuring circuit performs two functions, which can be described as rotary speed
checking and torque checking. The rotary speed can be checked by one of the two signals, and torque
must be checked by comparing the phasic difference between the two signals.
Fig.2 The structure of signal processing system
At the very beginning of the sensor design, the phasic difference between the two alternating
current signals is set to 180° when the shaft is not loaded. When the shaft is loaded, the phasic
difference between the two signals is changed. By measuring the change value, the magnitude of
torque can be calculated [1]. The signal processing system is shown in Fig 2.
Signal Processing Circuit. Fig 3 shows the structure of the signal processing circuit. As being
discussed above, the JC sensor generates two alternating current signals in approximate sine wave.
The single chip machine (SCM) selects one of them to measure rotary speed of the shaft. After passed
an R-S trigger, the two signals are input into the SCM to measure the torque transmited by the shaft
[1].
The magnitude of the approximate sine wave signals output by the JC sensor is small, and the
frequency of them is high, also they contain a large amount of interference. Therefor the alternating
current signals are firstly amplified by amplifiers, and then they are filtered by a low pass filter,
finally they are transformed into rectangular signals by the shaping circuit (Fig 4).
Fig 3 The structure of the signal processing circuit Fig 4 The shaping circuit
For torque measurement, as mentioned above, the phases of the two signals needed to be
compared. After the two alternating current signals are transformed into rectangular signals, the two
rectangular signals are applied to the Set and Reset pins of the R-S trigger. The width of the pulse
signal output by the the R-S trigger represents the phasic difference. In the initial condition when the
shaft is not loaded, the phasic difference between the two signals is 180°, and the R-S trigger does not
generate pulse signals.
Arithmetic Design of Signal Processing. The frenquences of the rectangular signals are directly
proportional to rotary speed. Because the frequency of the rectangular signal is very high, the high
potential level is counted by an arithmometer to express rotary speed [3]. The rotary speed can be
presented as
Hun Guo, Zuo Dunwen, Tang Guoxing 171

PTmn 60 (1)
Where, m - the amount of high potential level during period T. T - the sampling period. P - the amount
of high potential level during one circle, it is determined by the number of gear teeth in the JC sensor.
Fig.5 The frequency measurement circuit
A singlechipis used to measure the frequency of the rectangular signal (Fig 5). The rectangular
signals are input to the 8031TI port. The T/C0 of singlechip 8031 is taken as timer, and T/C1 as
calculagraph. During T/C0, the numerical value taken by T/C1 is the amount of high potential level,
or m [4], the frequency of the rectangular signal is measured.
Fig.6 The R-S trigger output Fig.7 The JC sensor
The rectangular signals generated by the R-S trigger are shown in Fig 6. If the torque increases, T1 becomes large. Because the shaft rotary speed often keeps stable in a certain period, or the rectangular
signal frequency and periods keep fixed, so T=T1+T2 is not changeable. Measuring the width of T1
with a singlechip can get the value of the torque.
The proportion of high level width to the whole period is T1/T. So the phasic difference between
the two alternating current signals ouput by the JC sensor is
TT160 (2)
In a count period, the phasic difference is
TT1360 (3)
If the distance between two signal gears on the tarsional shaft is L, the shear modulus of the shaft is G, and the sectional inertia moment of the shaft is I, then the torque transmitted by the shaft is
LGIM (4)
172 Advanced Design and Manufacturing Technology I

Conclusion
An actual JC sensor is used in a tyred machinery chassis detection line (Fig.7). In the practice of
experimenting, It is found that the sonser and electronic circuits are very reliable and convenient. The
experimental data are reliable and of good repetition.
References
[1] X. Z Liao, W. L. Du: Instrument Technology (2000) No.3, p.61-63
[2] J. Wang, Q. C. Lu: Vehicle Engines Vol.4 (2001) No.2, p.29-31
[3] B. Xu: Control Engineering Vol.10 (2001) No.2, p.186-189.
[4] Z. M. Ma, Y. Ma: Program Design of C Language Application for SCM (Beijing University of
Aeronautics & Astronautics Press, 2003)
Hun Guo, Zuo Dunwen, Tang Guoxing 173

Different Evaluation Approaches of Confusion Network in Chinese Spoken Classification
Zhang Leia, Chang Jingxin and Xiang Xuezhib
Department of communication and information, Harbin Engineering University, Harbin 150001, Heilongjiang Province, China
[email protected], [email protected]
Keywords: Lattice, Confusion network, Accuracy, Complexity, Disrortion, Spoken document
classification.
Abstract. As kind of multiple results in speech recognition system, lattice and confusion network are
widely applied in spoken document classification and spoken document retrieval. In this paper, the
relation between lattice and confusion network is analyzed firstly. Then based on the confusion
network by clustering algorithm, different evaluation approaches are applied here to test the
performance of confusion network, which include accuracy, complexity and distortion of confusion
network. For the experiments on speech recognition system, it can be drawn that compared with
1-best result, confusion network can have higher words accuracy.
Introduction
The decoding approach based on maximum a posterior (MAP) probability of sentence in speech
recognition will output the hypotheses path with highest posterior probability given language and
acoustic model. This path named 1-best result is with minimum the sentence error rate. Now in most
speech recognition system, the performance criterion is not sentence error rate but word error rate. It
means that it may be not the best result for word error rate even the result is the proper one under
MAP criterion.
To solve above problem, Mangu [1] proposed the minimum risk bayes decision to get the
minimum word error rates. It can be applied in N-best results and further be combined with Chinese
spoken document classification system [2]. Also, it can be used based on lattice. Mangu proposed the
aligning approach among words, instead of the alignment between sentences. Confusion network
(CN) [3] is the final result to apply this kind of alignment on lattice. In Mangu’s approach, the
confusion network is generated by clustering algorithm.
Although CN is widely used in spoken retrieval and classification system [4, 5], and some
approximate confusion network generation algorithms are researched, still little attention is paid on
the evaluation of confusion network.
In this paper, based on the CN by clustering algorithm, the evaluation approaches are studied here.
Not only from the structure and complexity of CN, but also from the recognition rate and spoken
document classification rate.
The remainder of the paper is structured as follows: section II introduces the relation between
lattice and CN, and section III describes clustering algorithm, the evaluation system is analyzed in
section IV. At last, experiments are discussed in section V.
Relation between Lattice and Confusion Networks
Lattice is kind of middle result with multi-path during speech recognition. It is indeed a directed
acyclic graph, which includes a lot of words candidates.
As shown in Fig.1, lattice is composed by arcs and nodes. Some information such as start node,
end node, corresponding label ( )label e , acoustic probability ap , language probability lp is listed for
each arc e. For node n, there is the time information. From start node to end node, there are many
paths, and each one corresponds with one recognition result. In the traditional approach, the best path
© (2011) Trans Tech Publications, Switzerlanddoi:10.4028/www.scientific.net/AMR.142.174

is selected with the largest whole sentence posterior probability. In many applications as spoken
document classification, the main focus is on the word error rate because of word instead of sentence
is the basic unit to process in classification system.
sil
sil
shen2
ren2
ri4
fa3
fang2
fa3
da3 yue1
yuan4
yuan3
yuan2
sil
sil
min2
min2
mi2
Fig.1 Structure of lattice ‘ren2min2fa3yuan4’
In MAP, there is only one competition point at the end node. There are many paths to arrive at that
node, and the criterion of selection can only be on the whole path probability.
To deal with the problem, in confusion network, the competition point is split into many time
points. That is, for each time point in Fig. 1, there are many competitors, if these competitors are
combined in some way; the lattice is turned into confusion network, as shown in Fig. 2. Each arc
subset between two nodes is defined here as confusion set.
sil sil ren2/-67.2
shen2/-10.5
ri4/-209.9
mi4/-0.2 fa3/-0.1 yuan4/-1.7
min2/-30.2 da3/-55.6
fang1/-119.1
-119.1
yuan3/-54.3
-54.3 yue1/-59.6
yuan2/-0.2
Fig.2 structure of confusion network ‘ren2min2 fa3yuan4’
The Clustering Algorithm
Through the clustering algorithm, the arcs in lattice can be combined into confusion set. And the
partial order between arcs keeps the same as that in lattice. In clustering process, there conditions must be considered in turn. The first one is the arcs with the
same start time, end time and the word label, which should be combined in the same confusion set
unconditionally. For the second one, the arcs are with the same word label as that but different start
and end time. In order to combine these arcs, some constraints must be applied to keep the partial
order of confusion set consistent with that of lattice. In the second class cluster, since the word label is
the same, overlap of arcs and the probability of arcs are mainly considered. In the third step, those
arcs that with different labels are considered. In this processing, whether combining one arc into the
existed confusion set mostly depends on the edit distance. The detail of the last two steps is described
below.
A. Some Definition
1. )(eP - the posterior probability of arc e
)(eP is the sum of posterior probability of all paths through arc e. here, it can be computed as:
( [ ]) ( [ ]) [ ]( )
( [ ]) ( [ ]) [ ]e E
f s e b e e w eP e
f s e b e e w e
(1)
The denominator part of the above formula can be seen as a constant. And ][s and ][e are the start
node and end node of arc. ][ew is the weight of arc e, which is depend on the acoustic and language
probability as in Eq. 2.
ls
l
as
a epepew /1/1 )()(][ (2)
Hun Guo, Zuo Dunwen, Tang Guoxing 175

As and ls mean scale factor of acoustic and language model. In our experiments, the ls are selected
10 times as according to experience.
)(f and )(b mean the forward probability and backward probability of node [6, 7]. The iterate
equations are below.
neee
ewesfnf][:
][])[()( (3)
nese
eweebnb][:
][])[()( (4)
In Eq. 3 and Eq. 4, the forward probability of node n is the sum of all arcs which ends in node n.
Instead, backward probability of node n is the sum of all arcs which starts with node n.
2. )(EWords - the words set of E
Here, all the words appearing in confusion set is defined as words set. It is as
})(:|{)( welabelEewEWords (5)
3. )(wPE -probability of word w appearing in set E
))(:()( welabelEePwPE (6)
It represents the probability of label w in the arc set E.
B. Intra-word clustering
The clustering algorithm can be divided into three steps. Initialization can get the initial confusion
set with the same start and end time, the same label. Then the arcs with the same label but having
overlap on time can be combined with the initial confusion set. This step is also called intra-word
clustering. In this step, the initial confusion sets need to be further combined. For the confusion sets
with the same label and overlapped each other, we select the most similar two sets to merge. This
combination is repeated until all confusion sets with the same label are temporal ordered. The
similarity between confusion sets is defined as:
)()(),(max),( 2121;
212211
ePePeeoverlapEEsimEeEe
(7)
Here, ),( 21 eeoverlap [8] is the time overlap between the two arcs, it is normalized by the sum of
their length. The temporal overlap is weighted by the posterior probability of the arcs so as to make
the measure less sensitive to unlikely word hypotheses. In order to compute the similarity between
two confusion set, all arcs in each confusion set should be traversed to find the maximum distance,
which is the confusion set distance.
C. Inter-word clustering
For some confusion set, they are very similar with each other, but the labels may be a little
different. These confusion sets should be combined too. It is the last step of the clustering algorithm,
here, the cost function used for inter-word clustering is:
)()(),(),( 2121
)();(
21 21
22
11
wPwPeesavgEESIM EE
EWordswEWordsw
(8)
Unlike the Eq. 7, in which the maximum function is applied, in Eq. 8, average function is adopted
to represent the confusion set corresponding to different words. From the different words, we want to
find out the similar ones to group together, so the ),( 21 ees is adopted here to represent the syllable
similarity of two labels, here, we define it to be 1 minus the edit distance [9] of the two words.
Further, the edit distance is normalized by the sum of their lengths.
In the process of inter-word clustering, it may happen that there is no word in original lattice
corresponding with the confusion set. Under this condition, a ‘null link’ is added in this confusion set
176 Advanced Design and Manufacturing Technology I

to keep consistent with lattice. Since the sum of the posterior probability of the arcs in a confusion set
is strictly less than 1, this ‘null link’ can fill the miss of the posterior probability, its value is 1 minus
the sum of the posterior probability of all the links that are not null.
Confusion Network Quality Evaluation
The best confusion network not only has the most simple network structure, but also includes the
correct result as much as possible [10]. So according to this standard, we select three parameters [11]
to evaluate the quality of confusion network. Factors affecting the quality of confusion networks
include pruning threshold and score scaling. Next, we will show you the results of the experiments
under different circumstances when these two factors are different.
A. Accuracy of Confusion Network
This parameter is used to describe the size of the word error rate and be compared with 1-best
result. It is the direct reflection of the confusion network decoding performance. There is an upper
bound of decoding performance what we called oracle recognition rate, it is the most similar result to
the annotation file, and it is up to the original lattice. Here, we select the candidate which has the
largest posterior probability in its own confusion set. We call it consensus recognition rate. In next
chapter, when we mention accuracy that means consensus recognition rate.
B. Complexity of Confusion Network
The average number of arcs in confusion network is defined as the complexity of confusion
network; it is closely related with the threshold of the pruning step. In this paper, we
define prothreshold w avg , w is the weight of threshold and proavg is the average of the sum of all
arc’s posterior probability. Its value must be moderate, if it is too low, there will be too many arcs in
confusion set, but if it is too high the correct candidate may not be in the set.
We use this function to computer complexity of CN:
1
1
1
NCN
n
nCN
S
CN
(9)
Where, CNC is the complexity of confusion network, CN
nS represent the confusion set which its
number is n, then CN
nS represent the number of the confusion set, N is the number of the node, N-1
is the number of the confusion set. With the change of pruning threshold, the value of complexity will
change accordingly; we will analyze the result in detail in next chapter.
C. Distortion of Confusion Network
The distortion of the confusion network represents the average of the similarity of all the
competing candidates in a confusion set, it is the most objectively parameter which reflects the
quality of confusion network, it considers whether the arc should merge into a confusion set or not,
from a practical point of view rather than from the perspective of computer. Before defining the
distortion of the confusion network, we define the distortion in one confusion set:
, ,
1( , ) 1
( 1)( )
1 1
i jcn
i j n
cn
e e ncn cncn e e Sn nn i j
cn
n
sim w w SS S
D S
S
(10)
Where, the definition of cn
nS is same as the description above, ( , ) 0,1i je esim w w is the phonetic
similarity of the word string ie
w on arc ie and word string jew on arc je . When computing the
Hun Guo, Zuo Dunwen, Tang Guoxing 177

similarity ,it is necessary to compute the similarity between null link and any other links, its
definition is ( , ) 1i je esim w w .
Now we can define the distortion of a whole confusion network:
1
1
(1 ( ))N
cn cn
n
n
D D S
(11)
For the confusion network, the value is smaller, it is closer to the actual situation and the quality of
the confusion network is higher.
Experimental Results and Analysis
The corpus used in the experiment is from the Central People's Radio which has 8703 spoken
documents, and it can be divided into 6 categories. As mentioned above, we do experiments
according to the different threshold and score scaling. Here, we just need to adjust w, ls and as.
Firstly, We just do experiments based on category one, when we find the ls, as and w which make
the CN have a better performance, then the experiment will be extended to other five categories.
Now, we set w to 1.0, and adjust ls and as, the result is shown in table 1.
As we see in Table 1, these three parameters change little during the changing of ls and as, it imply
that quality of confusion network is not so sensitive to the changing of ls and as. Here, ls is selected 10
times as according to experience. When ls=2.0 and as=0.2 we get better performance than other
situations, other experiments is based on these parameters. Table 2 show the results according to
different w with the same ls=2.0 and as=0.2.
Table 1 selection of ls and as when w=1.0
ls as accuracy complexity distortion
0.1 0.01 60.31% 5.753429 18.952991
1.0 0.1 64.77% 5.866382 18.185980
2.0 0.2 64.84% 5.892571 18.102238
5.0 0.5 64.59% 5.848110 18.252647
10.0 1.0 64.74% 5.831824 18.320894
Table 2 selection of w when ls=2.0 and as=0.2
w accuracy complexity distortion
0.2 62.32% 3.094638 11.023515
0.5 63.79% 4.667844 14.133984
0.8 64.57% 5.541217 16.914049
1.0 64.84% 5.892571 18.102238
1.2 64.75% 6.016574 20.345112
Form Table 2, it can be seen that not only the accuracy but also the complexity and distortion also
change greatly. The reason may be that the value of threshold w determines the pruning effect, which
will greatly affect the quality of CN. With the decreasing of w, the complexity and distortion are both
decrease too. That means more paths are cut off during pruning, so the accuracy is also decreasing.
Form complexity, distortion and accuracy, the w can be selected as 0.8 or 1.0. Here, in order to
compare 1-best result and CN result, the parameter with the highest accuracy is selected.
After groups of experiments, the parameter with ls=2.0, as=0.2 and w=1.0 can achieve the best
accuracy of the confusion network. Another five categories are also tested under this condition in
Table 3, and to compare the performance of CN, here, the results of 1-best is also listed in Table 4.
From Table 3 and Table 4, it can be seen that for the six categories, all the accuracy can be
enhanced. The highest improvement is about 5.6% for category five, and the average improvement is
178 Advanced Design and Manufacturing Technology I

about 5%, which is a quite higher improvement for conversation spoken document in large
vocabulary speech recognition system.
Table 3 accuracy of CN when ls=2,as=0.2,w=1.0(%)
categorization 1 2 3 4 5 6
accuracy 64.8 61.9 60.1 68.5 59.3 67.1
Table 4. accuracy of 1-best (%)
categorization 1 2 3 4 5 6
accuracy 60.1 57.5 54.8 63.7 53.7 61.9
All in all, from the experiments above, it can be concluded that CN is more sensitive to the change
of pruning threshold. If we want to reduce the complexity and distortion, the w can be selected
smaller. But with the pruning paths increase, the accuracy is also reduced.
Although ls and as have little effect on complexity and distortion, accuracy will be affected by
different ls and as. With proper parameters of ls, as and w, CN can get better performance that 1-best.
Acknowledgement
This paper is supported by the National Science Foundation and Fundamental Research Funds for the
Central Universities.
References
[1] Mangu L, Brill E, Stolcke A: Computer Speech and Language Vol.14 (2000) No.4, p.373-400.
[2] Zhang L, Chang J X, Xiang X Z: Topic Indexing of Spoken Documents Based on Optimized
N-Best Approach, Proceedings of ICIS, China 2009.
[3] Xue J, Zhao Y X: Improved confusion network algorithm and shortest path search from word
lattice, Proceedings of ICASSP, Philadelphia, PA 2005, p.353-356.
[4] Tur G., Wright J, and Gorin A, et al: Improving spoken language understanding using word
confusion networks, Proceedings of ICSLP, Denver, Colorado, 2002, p.1137-1140.
[5] Xue J and Zhao Y X: Random forests-based confidence annotation using novel feature from
confusion network, Proceedings of ICASSPJ, Toulouse, France 2006, p.1149-1152.
[6] Bertoldi N and Federico M: A new decoder for spoken language translation based on confusion
networks, IEEE ASRU Workshop, Cancun, Mexico,2005, p.134-140.
[7] Hillard D and Ostendorf M: Compensation forward posterior estimation bias in confusion
networks, Proceedings of ICASSP Toulouse, France, 2006, p.1153-1156.
[8] Tur G, Hakkani D and Riccardi G: Extending boosting for call classification using word confusion
networks, Proceedings of IEEE International conference on acoustic, Speech, and signal
Processing, 2004, p.1520-6149
[9] Stolcke A, Konig Y, Weintraub M, Explicit word error minimization in N-best list rescoring,
Proceedings of EUROSPEECH, 1997, p.163-166.
[10] Wu B, Liu G, Guo J: Research on confusion network algorithm for mandarin large vocabulary
continuous speech recognition, Proceedings of ICWAPR, China, 2007:145-155.
[11] Wang H L, Han J Q, Zheng T R: Quality evaluation and optimization of confusion network,
Proceedings of ICMIP, 2005.
Hun Guo, Zuo Dunwen, Tang Guoxing 179

Study on Mine-Used Battery Locomotive Charging System
Xuan Lipinga
College of Electrical and Information Engineering,Heilongjiang Institute of Science and Technology,Harbin ,China
Keywords: charging; SPWM; DSP
Abstract: According to the insufficiency of large volume, high cost and poor dynamic response in
the traditional mine-used battery locomotive charging system. This paper presents a design scheme
on this system based on DSP TMS320F2801 which directly using SPWM conversion control
technology, generating the SPWM wave through DSP control chip and convert the alternating current
under the mine into the corresponding pulse charging current. The results show that the system can achieve the goal that well system stability, good dynamic performance, control circuit simplified,
high charge efficiency and low cost.
Introduction
At present most lead-acid battery charging equipment of coal mine locomotive in our country adopted
controlled silicon SCR and low capacity GTO, GTR switch power device and realized with phased
technology. In this way, 660V A.C. first can be reduced by step-down transformer, and then
converted into D.C. voltage by the rectifier and the filter. The output voltage can be controlled by
changing the conduction angles of SCR. This method has the disadvantages such as: inefficiency,
higher power dissipation and cost, heavy volume, slow dynamic respond, low reliability and often
overcharged which seriously affect the battery’s life. With the development of the modern sciences
and technologies especially the power electronics, microcomputer application and automatic control
theory development which provide solid theoretical foundation for the charging system. According to
the current deficiency in SCR phase control mine-used charging power. This paper presents a design
method based on DSP mine-used inverter type charging power supply using high frequency
switching power technology and IGBT switch element, this scheme has the advantages in small
volume, high efficiency, low cost, etc.
The Charging Theory and Mode of the lead-acid battery
In 1974, American scientist J.A.MAS puts forward battery acceptable maximum charging current and
its corresponding curve ( MAS curve) based on the battery charging minimum condensate gas rate as
shown in Fig 1.
The acceptable charging current at any time can be written as
0
atI I e (1)
Where 0I is the maximum charging current at time t=0, a is battery charging current acceptable
ratio( a = 0I / c )and c is the maximum capacity.
Fig.1 MAS curve
© (2011) Trans Tech Publications, Switzerlanddoi:10.4028/www.scientific.net/AMR.142.180
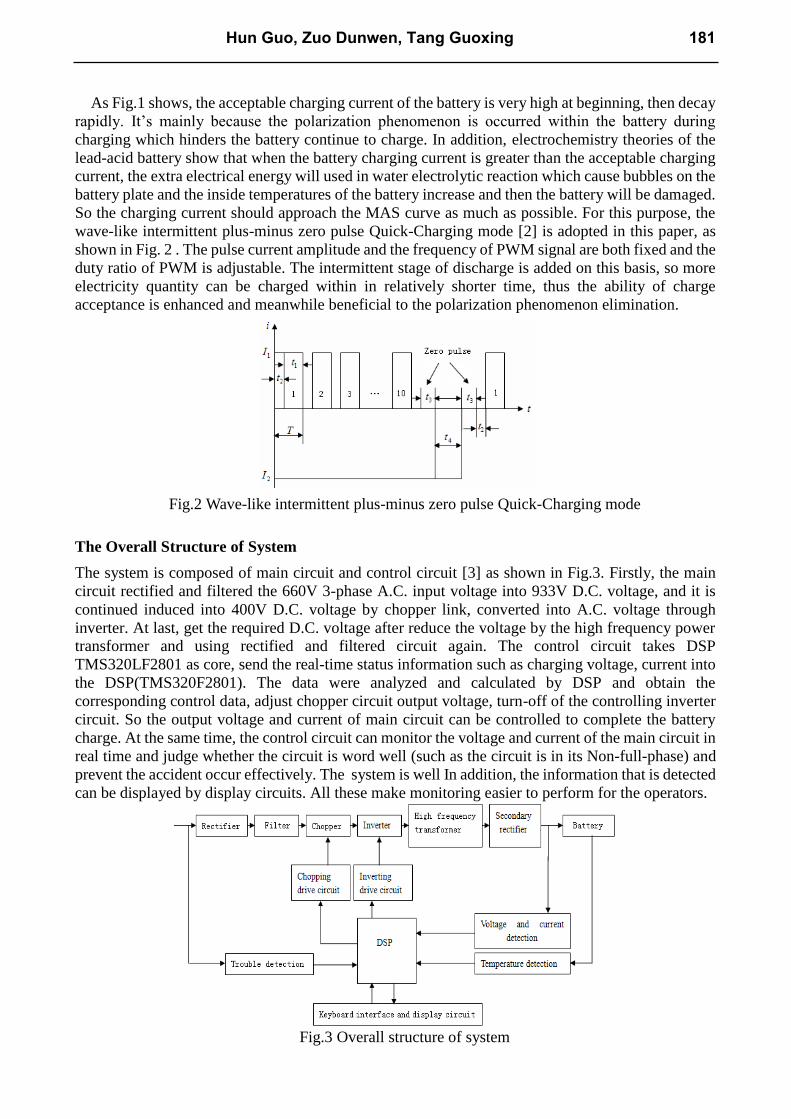
As Fig.1 shows, the acceptable charging current of the battery is very high at beginning, then decay
rapidly. It’s mainly because the polarization phenomenon is occurred within the battery during
charging which hinders the battery continue to charge. In addition, electrochemistry theories of the
lead-acid battery show that when the battery charging current is greater than the acceptable charging
current, the extra electrical energy will used in water electrolytic reaction which cause bubbles on the
battery plate and the inside temperatures of the battery increase and then the battery will be damaged.
So the charging current should approach the MAS curve as much as possible. For this purpose, the
wave-like intermittent plus-minus zero pulse Quick-Charging mode [2] is adopted in this paper, as
shown in Fig. 2 . The pulse current amplitude and the frequency of PWM signal are both fixed and the
duty ratio of PWM is adjustable. The intermittent stage of discharge is added on this basis, so more
electricity quantity can be charged within in relatively shorter time, thus the ability of charge
acceptance is enhanced and meanwhile beneficial to the polarization phenomenon elimination.
Fig.2 Wave-like intermittent plus-minus zero pulse Quick-Charging mode
The Overall Structure of System
The system is composed of main circuit and control circuit [3] as shown in Fig.3. Firstly, the main
circuit rectified and filtered the 660V 3-phase A.C. input voltage into 933V D.C. voltage, and it is
continued induced into 400V D.C. voltage by chopper link, converted into A.C. voltage through
inverter. At last, get the required D.C. voltage after reduce the voltage by the high frequency power transformer and using rectified and filtered circuit again. The control circuit takes DSP
TMS320LF2801 as core, send the real-time status information such as charging voltage, current into
the DSP(TMS320F2801). The data were analyzed and calculated by DSP and obtain the
corresponding control data, adjust chopper circuit output voltage, turn-off of the controlling inverter
circuit. So the output voltage and current of main circuit can be controlled to complete the battery
charge. At the same time, the control circuit can monitor the voltage and current of the main circuit in
real time and judge whether the circuit is word well (such as the circuit is in its Non-full-phase) and
prevent the accident occur effectively. The system is well In addition, the information that is detected
can be displayed by display circuits. All these make monitoring easier to perform for the operators.
Fig.3 Overall structure of system
Hun Guo, Zuo Dunwen, Tang Guoxing 181
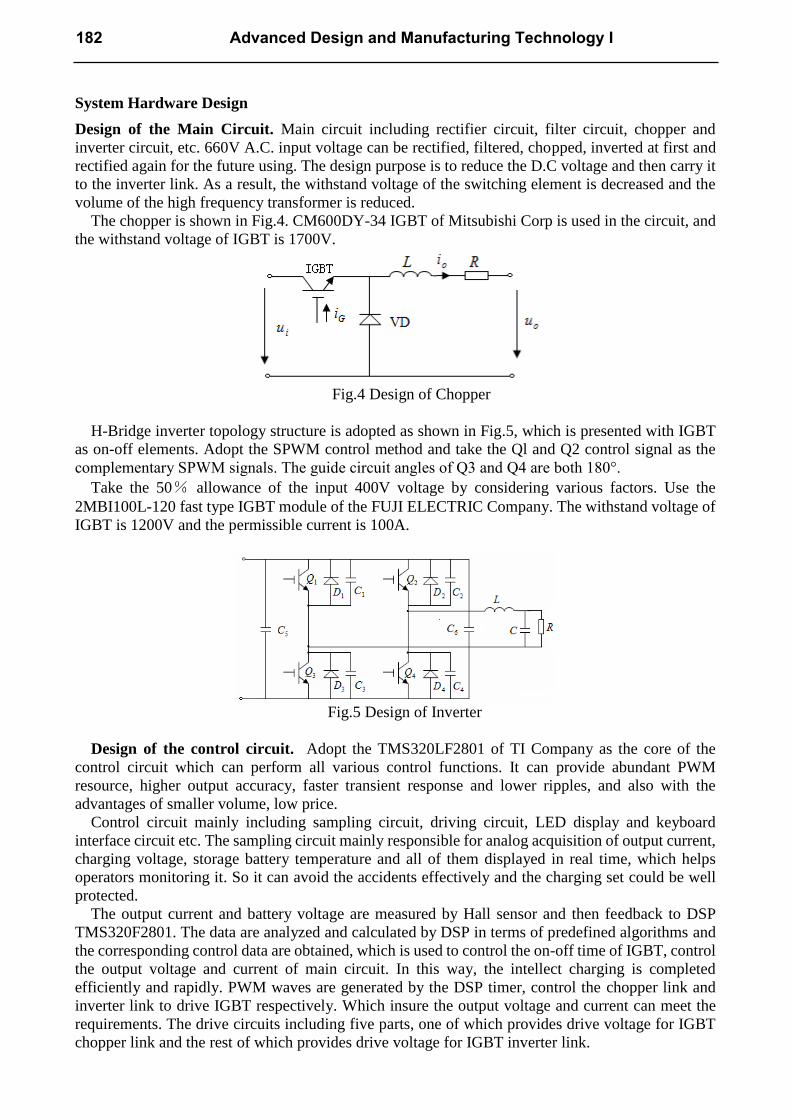
System Hardware Design
Design of the Main Circuit. Main circuit including rectifier circuit, filter circuit, chopper and
inverter circuit, etc. 660V A.C. input voltage can be rectified, filtered, chopped, inverted at first and
rectified again for the future using. The design purpose is to reduce the D.C voltage and then carry it
to the inverter link. As a result, the withstand voltage of the switching element is decreased and the
volume of the high frequency transformer is reduced.
The chopper is shown in Fig.4. CM600DY-34 IGBT of Mitsubishi Corp is used in the circuit, and
the withstand voltage of IGBT is 1700V.
Fig.4 Design of Chopper
H-Bridge inverter topology structure is adopted as shown in Fig.5, which is presented with IGBT
as on-off elements. Adopt the SPWM control method and take the Ql and Q2 control signal as the
complementary SPWM signals. The guide circuit angles of Q3 and Q4 are both 180°.
Take the 50% allowance of the input 400V voltage by considering various factors. Use the
2MBI100L-120 fast type IGBT module of the FUJI ELECTRIC Company. The withstand voltage of
IGBT is 1200V and the permissible current is 100A.
Fig.5 Design of Inverter
Design of the control circuit. Adopt the TMS320LF2801 of TI Company as the core of the
control circuit which can perform all various control functions. It can provide abundant PWM
resource, higher output accuracy, faster transient response and lower ripples, and also with the
advantages of smaller volume, low price.
Control circuit mainly including sampling circuit, driving circuit, LED display and keyboard
interface circuit etc. The sampling circuit mainly responsible for analog acquisition of output current,
charging voltage, storage battery temperature and all of them displayed in real time, which helps
operators monitoring it. So it can avoid the accidents effectively and the charging set could be well
protected.
The output current and battery voltage are measured by Hall sensor and then feedback to DSP
TMS320F2801. The data are analyzed and calculated by DSP in terms of predefined algorithms and
the corresponding control data are obtained, which is used to control the on-off time of IGBT, control
the output voltage and current of main circuit. In this way, the intellect charging is completed
efficiently and rapidly. PWM waves are generated by the DSP timer, control the chopper link and
inverter link to drive IGBT respectively. Which insure the output voltage and current can meet the
requirements. The drive circuits including five parts, one of which provides drive voltage for IGBT
chopper link and the rest of which provides drive voltage for IGBT inverter link.
182 Advanced Design and Manufacturing Technology I
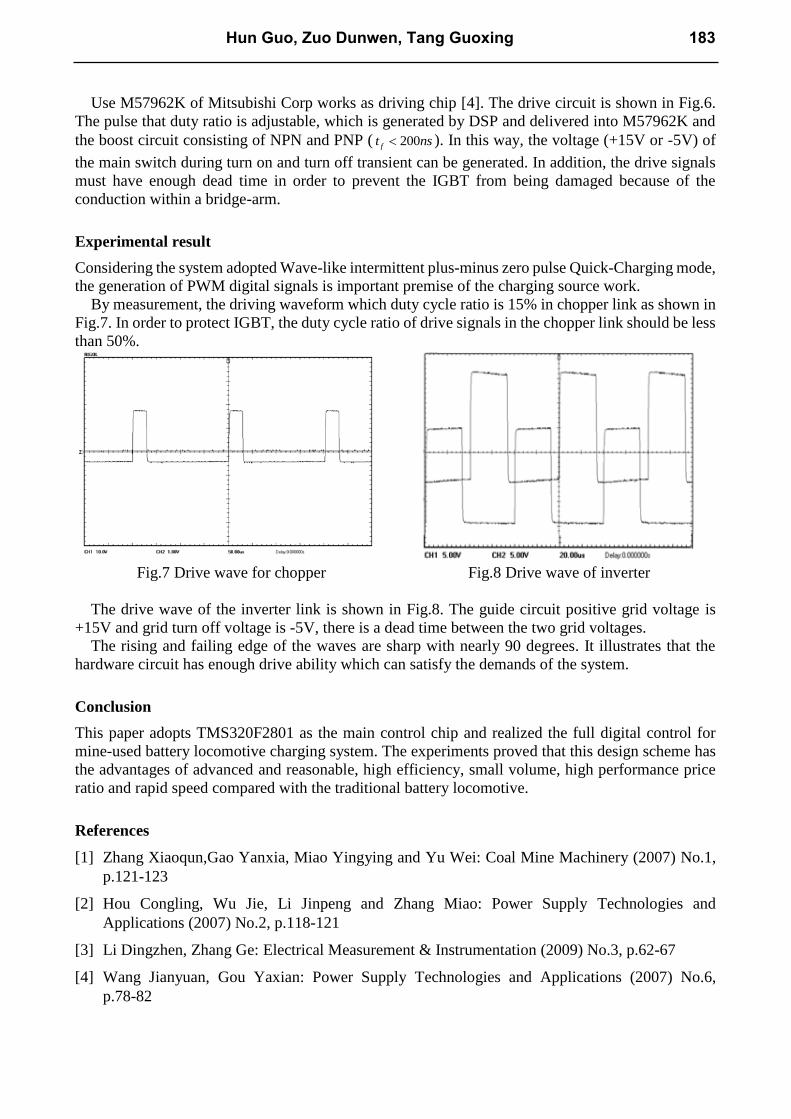
Use M57962K of Mitsubishi Corp works as driving chip [4]. The drive circuit is shown in Fig.6.
The pulse that duty ratio is adjustable, which is generated by DSP and delivered into M57962K and
the boost circuit consisting of NPN and PNP ( 200ft ns ). In this way, the voltage (+15V or -5V) of
the main switch during turn on and turn off transient can be generated. In addition, the drive signals
must have enough dead time in order to prevent the IGBT from being damaged because of the
conduction within a bridge-arm.
Experimental result
Considering the system adopted Wave-like intermittent plus-minus zero pulse Quick-Charging mode,
the generation of PWM digital signals is important premise of the charging source work.
By measurement, the driving waveform which duty cycle ratio is 15% in chopper link as shown in
Fig.7. In order to protect IGBT, the duty cycle ratio of drive signals in the chopper link should be less
than 50%.
Fig.7 Drive wave for chopper Fig.8 Drive wave of inverter
The drive wave of the inverter link is shown in Fig.8. The guide circuit positive grid voltage is
+15V and grid turn off voltage is -5V, there is a dead time between the two grid voltages.
The rising and failing edge of the waves are sharp with nearly 90 degrees. It illustrates that the
hardware circuit has enough drive ability which can satisfy the demands of the system.
Conclusion
This paper adopts TMS320F2801 as the main control chip and realized the full digital control for
mine-used battery locomotive charging system. The experiments proved that this design scheme has
the advantages of advanced and reasonable, high efficiency, small volume, high performance price
ratio and rapid speed compared with the traditional battery locomotive.
References
[1] Zhang Xiaoqun,Gao Yanxia, Miao Yingying and Yu Wei: Coal Mine Machinery (2007) No.1,
p.121-123
[2] Hou Congling, Wu Jie, Li Jinpeng and Zhang Miao: Power Supply Technologies and
Applications (2007) No.2, p.118-121
[3] Li Dingzhen, Zhang Ge: Electrical Measurement & Instrumentation (2009) No.3, p.62-67
[4] Wang Jianyuan, Gou Yaxian: Power Supply Technologies and Applications (2007) No.6,
p.78-82
Hun Guo, Zuo Dunwen, Tang Guoxing 183

Steel Wire Rope Section Damage Detection System Based on Wavelet Multi-Resolution Analysis
Xuan Lipinga
College of Electrical and Information Engineering, Heilongjiang Institute of Science and Technology, Harbin, China
Keywords: steel wire rope; section damage; wavelet analysis; multi-resolution analysis
Abstract: According to the characteristic of the steel wire rope section damage, eliminate the steel
wire rope damage signal noise by using Wavelet Multi-Resolution Analysis and the steel wire rope
damage characteristic parameters were extracted. Adopting the voltage amplitude calibration
technology recognize the steel wire rope damages. The results show that the proposed system can
identify the steel wire damage degree effectively and achieve the goal in steel wire rope safety use.
Introduction
Steel Wire rope has been widely used in mineral, metallurgy, transportation and construction industry
etc. Some phenomena such as fatigue, corrosion, wear and even fracture occurred easily. Its damage
situation and bearing capacity directly related to the safety of equipment and person. Because most of
the steel wire ropes were made of better magneto-conductivity high carbon steel, so the magnetic
detection method have certain superiority compared with other methods. The frequency components
of the detection signals are very complex which including lots of spikes and mutation, so it is
necessary filtering the noise from multi-frequencies. Lay a good foundation for steel wire rope
recognition by extracting the useful characteristic signal.
The traditional fourier transform mostly analyze the signals in frequency domain and can not give
the change situation at a certain time, so there will be no solving method to the damage signal if exists
any mutation of the signal in the time axis will effect the total spectra of the signal. We can judge out
the defect’s type and position by using WINTROS analysis software to analyze the gathering signal.
Wavelet Transform has the advantage in translation, expansion and also has better localization
characteristic in time and frequency domain.
This paper adopts wavelet multi-scale resolution analysis methods according to the characteristics
of the steel wire rope which can distinguish noise signal and high frequency mutational signal from
the damage signals. This method can realized the steel wire rope damage signal characteristic value
extracting and noise filtering, meanwhile, improved the accuracy of the analyzed signal.
Fundamentals of Section Damage Identification
The section damage, as in [2, 3 ,4] means the reduction of the cross-sectional area because of fatigue,
abrasion, corrosion, extrusion, scratch etc. This will bring the decrease of the bearing capacity and
fracture. Further, this will induce accident easily. So the section damage is one of the important
research contents on the nondestructive testing technique for steel wire.
The main feature of the section damage of wire rope is the distribution area mainly in the axial
direction of wire rope. The impact on main magnetic path is far greater than the wire breakage. Since
the magnetic induction lines are continuous, they will distort and be leaked in the cross-sectional area
decreased department. The local leakage is produced. Magnetic concentrator can be used to collect
the leakage magnetic along the axial direction of the steel wire rope [1].Then the leakage magnetic
signal can be transformed into electrical signal using Hall sensor. From reference [5],there is a
linear relationship between the voltage measured by Hall sensor and the cross-sectional area of wire
rope. The method of voltage standard calibration is used to calibrate to analyze the signals and
© (2011) Trans Tech Publications, Switzerlanddoi:10.4028/www.scientific.net/AMR.142.184
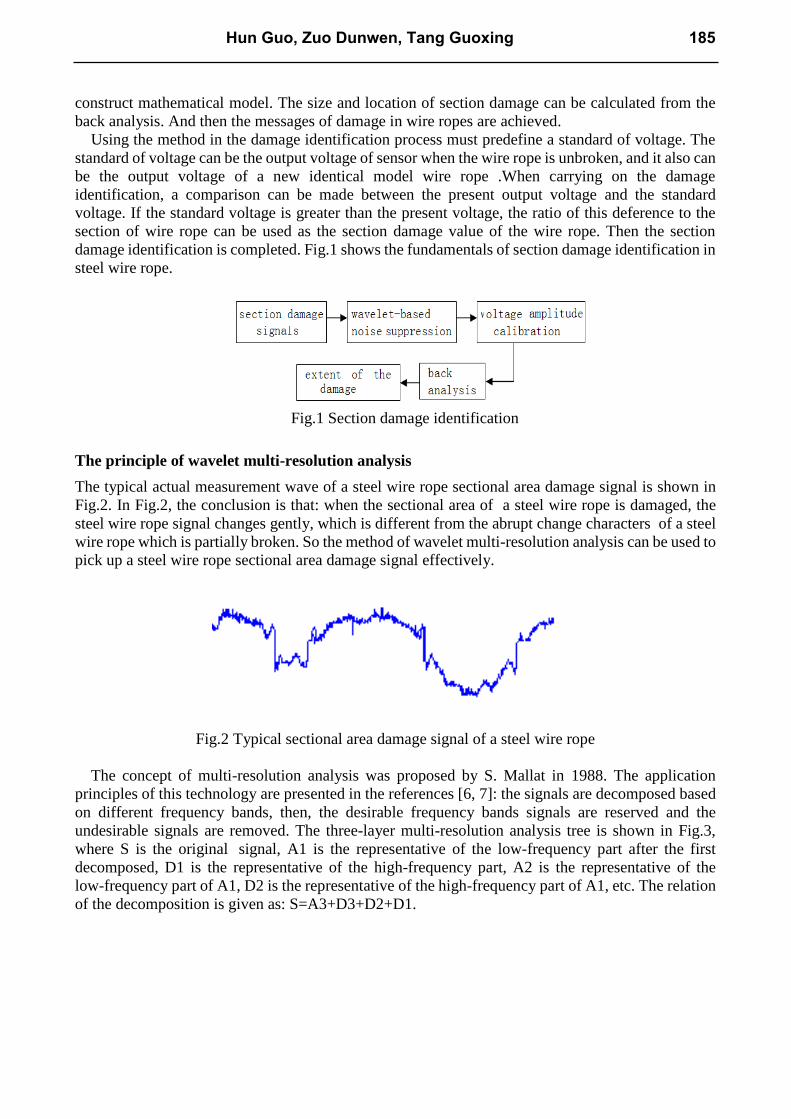
construct mathematical model. The size and location of section damage can be calculated from the
back analysis. And then the messages of damage in wire ropes are achieved.
Using the method in the damage identification process must predefine a standard of voltage. The
standard of voltage can be the output voltage of sensor when the wire rope is unbroken, and it also can
be the output voltage of a new identical model wire rope .When carrying on the damage
identification, a comparison can be made between the present output voltage and the standard
voltage. If the standard voltage is greater than the present voltage, the ratio of this deference to the
section of wire rope can be used as the section damage value of the wire rope. Then the section
damage identification is completed. Fig.1 shows the fundamentals of section damage identification in
steel wire rope.
Fig.1 Section damage identification
The principle of wavelet multi-resolution analysis
The typical actual measurement wave of a steel wire rope sectional area damage signal is shown in
Fig.2. In Fig.2, the conclusion is that: when the sectional area of a steel wire rope is damaged, the
steel wire rope signal changes gently, which is different from the abrupt change characters of a steel
wire rope which is partially broken. So the method of wavelet multi-resolution analysis can be used to
pick up a steel wire rope sectional area damage signal effectively.
Fig.2 Typical sectional area damage signal of a steel wire rope
The concept of multi-resolution analysis was proposed by S. Mallat in 1988. The application
principles of this technology are presented in the references [6, 7]: the signals are decomposed based
on different frequency bands, then, the desirable frequency bands signals are reserved and the
undesirable signals are removed. The three-layer multi-resolution analysis tree is shown in Fig.3,
where S is the original signal, A1 is the representative of the low-frequency part after the first
decomposed, D1 is the representative of the high-frequency part, A2 is the representative of the
low-frequency part of A1, D2 is the representative of the high-frequency part of A1, etc. The relation
of the decomposition is given as: S=A3+D3+D2+D1.
Hun Guo, Zuo Dunwen, Tang Guoxing 185

Fig.3 The structure of three-layer multi-resolution analysis tree
As the signals can be expanded on different frequency bands by multi-resolution analysis, so the
damage signals of a steel rope can be separated on different frequency bands. Firstly, the damage
signals of a steel rope is decomposed on different frequency bands, then, the desirable frequency
bands or the details which indicate the characteristics of the damage signals of a steel rope are
selected and reconstructed. The reconstructed signals contain the desirable frequency bands
information.
Multi-Resolution Analysis on the Section Damage
The 6 ×19S+FC type steel wire rope was chosen for the experiment test. The wire rope diameter is
13mm. The sectional area can be derived by the diameter which is about 133mm2. Using wavelet
decomposition which in 5 level on the steel wire rope, the decomposed result is shown in Fig.4.
Fig.4 Wavelet transformation for the steel wire rope section damage signals
The wavelet analysis results show that there are the section damages along the role axis direction,
the range is between 100mm ~200mm, 600mm ~800mm and 1000mm ~1200mm and there are wear
degree distinguishes among different levels. The low-frequency part of A5 reserves the section
damage signals and we can extract the damage signals by using wavelet analysis.
Conclusion
The simulation results show that the nose interference of the steel wire rope damage signals can be
eliminated effectively by using wavelet multi-resolution analysis and voltage amplitude calibration
186 Advanced Design and Manufacturing Technology I
technology, meanwhile, the characteristic parameters can be extracted and the rope damage can be
recognized.
Reference:
[1] Qiu Faju, Cao Guangmin:Hoisting and Conveying Machinery (2009) No.4, p. 89-91
[2] Chen Hui, Wang Xinhu, Feng Yaorong and Wang Lei.: Petroleum Engineering Construction
Vol.32 (2006) No.1, p.62-64
[3] Weischedel H R: Wire Rope News& Sling Technology (1993) No.12, p.14-17
[4] Dou Yutang,Guo Baozhong: Coal Mine Machinery (2001) No.8, p.37-39
[5] Lu Tian, Hu Qiang: Colliery Mechanical & Electrical Technology (2003) No.4, p.42-43
[6] Cheng Zhenxing: Algorithm and Application of Wavelet Analysis (Xi'an Jiaotong University
Press, 2002)
[7] Xu Jing, Han Lei: Chinese Journal of Sensors and Actuators (1999) No.3, p.189-194
Hun Guo, Zuo Dunwen, Tang Guoxing 187

Three- Level SVPWM Controller Design Based on FPGA
Chang Guoxianga, Li Wen and Liu Xiuling
Heilongjiang Science and Technology University, Heilongjiang, Harbin 150027, China
Key words: Three-level, SVPWN, inverter, FPGA
Abstract: Compared with traditional two-level inverter, the multilevel inverter has many advantages
such as large output power and small output harmonic. And also it is one of the hot research subjects
in recent years. Although SVPWM control is an excellent control method, its space vectors is
exponential with the increase of the number of output levels of the multilevel inverters. If the
SVPWM is controlled by DSP, a lot of components can be used. So this paper puts forward a new
method which SVPWM signals generate by PGFA directly. The fact has proved that pure hardware
design is feasible and has rapid response rate, facile programming and online configuration.
Introduction
Due to the large output current, high voltage sustainability and small output current harmonic ,
multilevel technique is one of the latest developments, which widely applied to VVVF system,
DC-AC energy conversion system, power quality optimization and so on[1-3]. SVPWM, regarding
the converts and motors as a whole, is an excellent modulator approach and convenient for real-time
control and has low torque ripple, low noise and high voltage utilization. Therefore, in high-voltage
and high-power AC motor speed regulation, multi-level of the SVPWM control became a necessity.
With the level number growth, the exponential increases in space vector. The formula is n3 that n is
the number of levels. Such as two-level, there are eight space vectors, for three-level space vector is
27, if 5, there are 125 level space vectors. However, the more the level numbers are, the more difficult
to achieve SVPWM control [4-6]. Generally, below 5-level, most systems adopt 3-level control.
However, using DSP or DSP and FPGA co-generate SVPWM signal not only need occupy a large
number of DSP resources, but also difficult to guarantee real time, this paper presents a SVPWM
method generated by FPGA directly, which using pure hardware means to obtain the SVPWM signal.
And it is convenient for programming and has rapid response time. Simulation results reflect the
superiority of the method.
Three-Level Converter
V1 V3 V5
V4 V6 V2
Vdc/2
C1
C2
Vdc/2
VT1
VT2
VT3
VT4
VT5
VT6
VT7
VT8
VT9
VT10
VT11
VT12
D1
D2
D3
D4
D5
D6
A B C
Fig. 1 The main circuit of three-level converter
© (2011) Trans Tech Publications, Switzerlanddoi:10.4028/www.scientific.net/AMR.142.188

Figure 1 shows the structure of three-level converter main circuit based on full-bridge Neutral Point
Clamped. And capacitors C1 and C2 provide the same DC voltage level for the converter and the
diodes clamp the voltage level. In the figure, while VT1 and VT2 are on and VT3 and VT4 are off, the
inverter circuit outputs a positively level; VT2 and VT3 are on and VT1 and VT4 are off, the output
voltage is 0; also turn VT3 and VT4 off and shutdown VT1 and VT2, the output is a negative level.
As can be seen from the circuit, the zero level is determined by VT2, VT3 and diodes simultaneously.
By controlling the switching devices VT1-VT4, the 3-level waveform can be synthesized in the
output terminal.
SVPWM Modulations
SVPWM method, for the motor, focuses on how to obtain a constant circular magnetic field, i.e.
sinusoidal flux. Basing on the ideal motor flux round of three phase sine wave voltage AC power, the
system form the PWM waveform with different switch modes to approximate the baseline round flux
and to determine the inverter switching states according to results of the comparison.
100
211
020 120 220
210
200
201
202102002
012
022
021
010
121110
221
101
212001
112
011
122
222
111
000
Fig.2 Space vector distribution of three-level converter
Given: three-phase sinusoidal voltage transient expression is:
sin( )
2sin( )
3
2sin( )
3
a m
b m
c m
v V t
v V t
v V t
(1)
Then the synthesis voltage space vector correspondingly is:
22( )
3a b cv v v a v ( 2 / 3ja e ) (2)
For the three-level converter, there are 27 space vectors, voltage space vector expression is:
2( )3
dc
a b c
UV S aS a S
( 2 / 3ja e ) (3)
Where, Udc is the DC bus voltage of converter; Sa, Sa and Sc are U, V and W three-phase state
operators respectively (Sa, Sb, Sc = 2,1 or 0). From formula (3) can get the sizes and direction of the
space vectors. For example, 2
200 ( / 3)(2 0 0) 2( / 3)dc dcV U a a U
by calculating three-level
inverter can output 27 basic space voltage vectors. Among those, the vectors are divided into 4
groups, 3 zero vectors (222,111,000), 12 small vectors
(100,211,110,221,010,121,011,122,001,112,101,212), 6 moderate vectors
(210,120,021,012,102,201) and 6 large vectors (200,220,020,022,002,202). Those are show in Fig. 2.
Hun Guo, Zuo Dunwen, Tang Guoxing 189

The modulation theory between three-level and two-level SVPWM is the same. But due to the
growth of the basic space vectors, the calculation complexity is marked difference and the calculation
process is given below.
(1) Firstly, to determine the reference voltage vector in that sector. 360 ° space is divided into 6
major sectors from I ~ Ⅵ, each sector is 60 degrees. That shows in Fig.3. Conditions are:
1 2 3
1 1, ,
3 3ref ref a ref aV V V V V V V V
Supposing 1 2 3
1 1, ,
3 3ref ref a ref aV V V V V V V V
if 1 0,refV then A=1, otherwise A=0;
If 2 0,refV then B=1, otherwise B=0;
If 3 0,refV then C=1, otherwise C=0.
Thus the location of reference vector is:
S = A +2 B +4 C
(2) Secondly, to judge the region where the reference vector is. Because the basic space vectors are
more, each sector is divided into six regions, different areas will choose a different space vector
group. In the first sector, for example, select the following principles:
α
jβ
V1
1
3
5
24 6
Va
Vref
I19
θ
VB
200
210
220
100
110
Fig. 3 The regional distribution chart of the first sector supposing
1
2 1
3 1
3 / 3,
3 2 ,
3 2
dc
a
a
V vV
V V V V
V V V V
If / 6 and 1V V , then n = 5, if 2 0V , then n = 1, otherwise n = 3.
If / 6 and 2 0V , then n = 2, if 3 0V , then n = 6, or n = 4.
(3) To determine the vector sequence. In each cycle, the different segmentation methods of
zero-vectors and the selection of non-zero vectors will produce a wide range of voltage space vector
PWM waves. We use seven-segment voltage space vector PWM waveform arrangement, that is, zero,
small, large, zero, large, small and zero vectors.
(4) To calculate the vector function of time. The zero vector, small vector, large vector are V0, V1,
V2 and the role times are T0、T1、T2 correspondingly and the sampling cycle is Ts, then on the basis
of the principle of output power conservation for the first sector, it can conclude that:
0 10 1 2 2 ref sT V TV T V V T
190 Advanced Design and Manufacturing Technology I
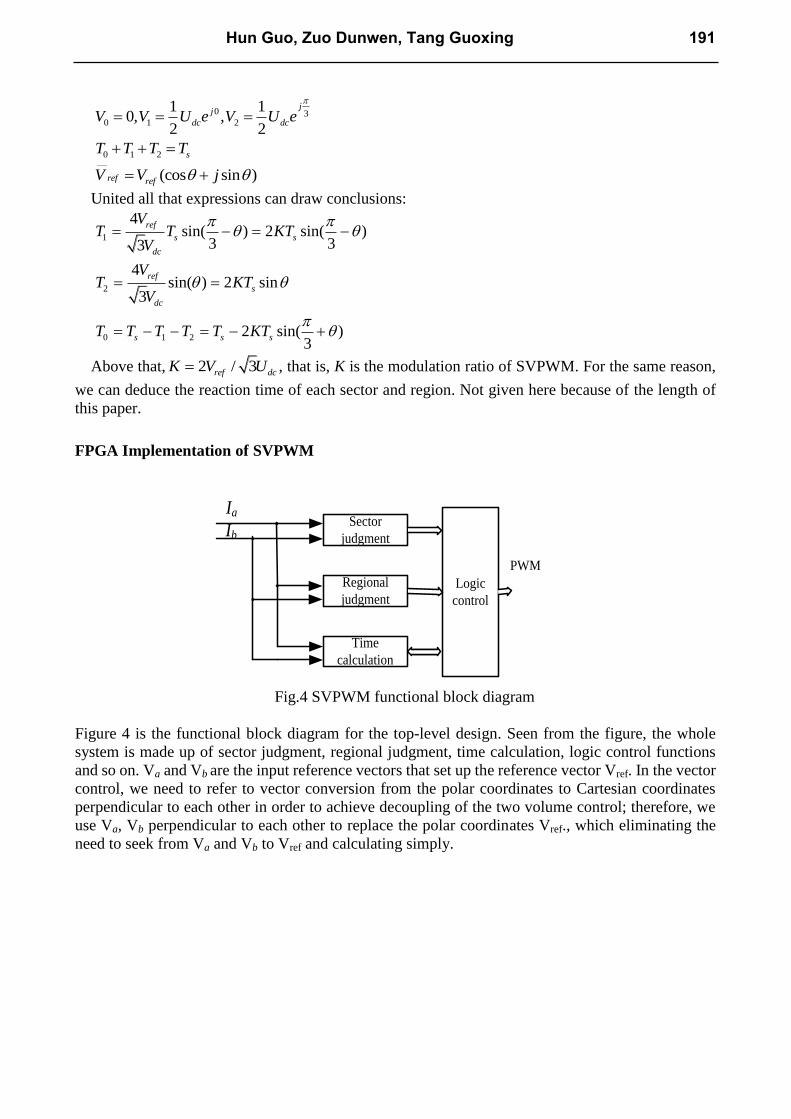
0 30 1 2
1 10, ,
2 2
jj
dc dcV V U e V U e
0 1 2 sT T T T
(cos sin )ref refV V j
United all that expressions can draw conclusions:
1
2
0 1 2
4sin( ) 2 sin( )
3 33
4sin( ) 2 sin
3
2 sin( )3
ref
s s
dc
ref
s
dc
s s s
VT T KT
V
VT KT
V
T T T T T KT
Above that, 2 / 3ref dcK V U , that is, K is the modulation ratio of SVPWM. For the same reason,
we can deduce the reaction time of each sector and region. Not given here because of the length of
this paper.
FPGA Implementation of SVPWM
Sector
judgment
Regional
judgment Logic
control
Time
calculation
Ib
Ia
PWM
Fig.4 SVPWM functional block diagram
Figure 4 is the functional block diagram for the top-level design. Seen from the figure, the whole
system is made up of sector judgment, regional judgment, time calculation, logic control functions
and so on. Va and Vb are the input reference vectors that set up the reference vector Vref. In the vector
control, we need to refer to vector conversion from the polar coordinates to Cartesian coordinates
perpendicular to each other in order to achieve decoupling of the two volume control; therefore, we
use Va, Vb perpendicular to each other to replace the polar coordinates Vref., which eliminating the
need to seek from Va and Vb to Vref and calculating simply.
Hun Guo, Zuo Dunwen, Tang Guoxing 191
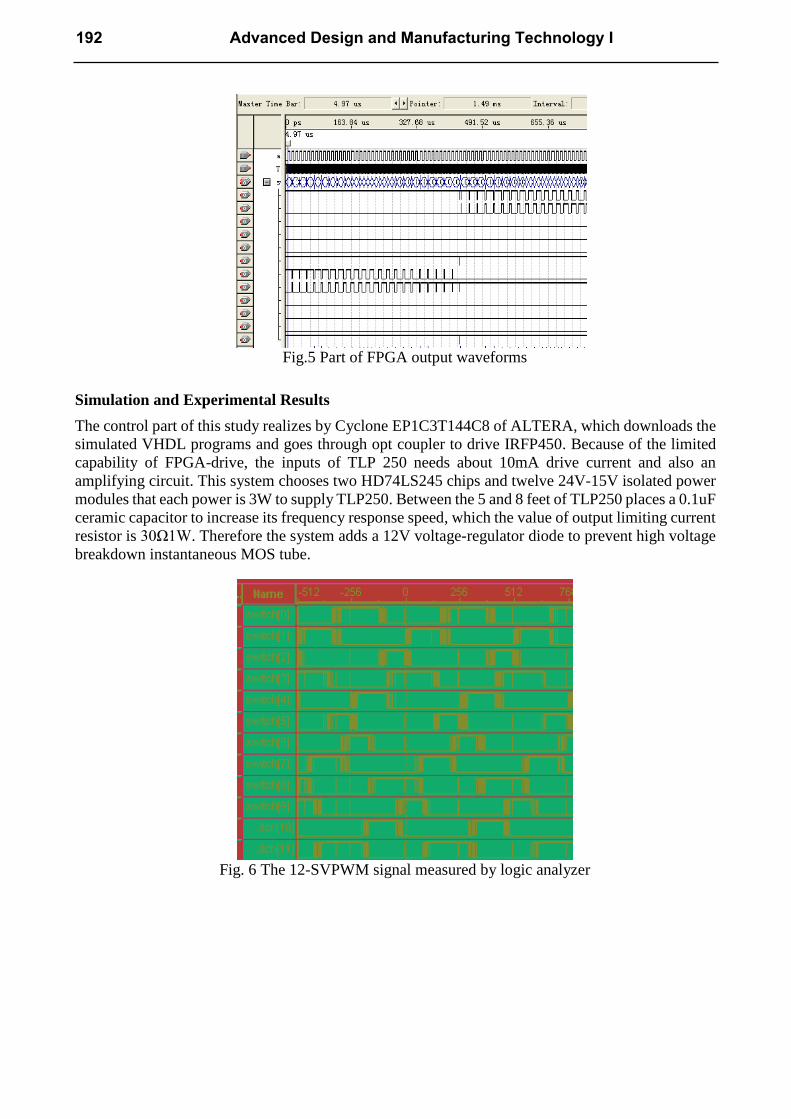
Fig.5 Part of FPGA output waveforms
Simulation and Experimental Results
The control part of this study realizes by Cyclone EP1C3T144C8 of ALTERA, which downloads the
simulated VHDL programs and goes through opt coupler to drive IRFP450. Because of the limited
capability of FPGA-drive, the inputs of TLP 250 needs about 10mA drive current and also an
amplifying circuit. This system chooses two HD74LS245 chips and twelve 24V-15V isolated power modules that each power is 3W to supply TLP250. Between the 5 and 8 feet of TLP250 places a 0.1uF
ceramic capacitor to increase its frequency response speed, which the value of output limiting current
resistor is 30Ω1W. Therefore the system adds a 12V voltage-regulator diode to prevent high voltage
breakdown instantaneous MOS tube.
Fig. 6 The 12-SVPWM signal measured by logic analyzer
192 Advanced Design and Manufacturing Technology I
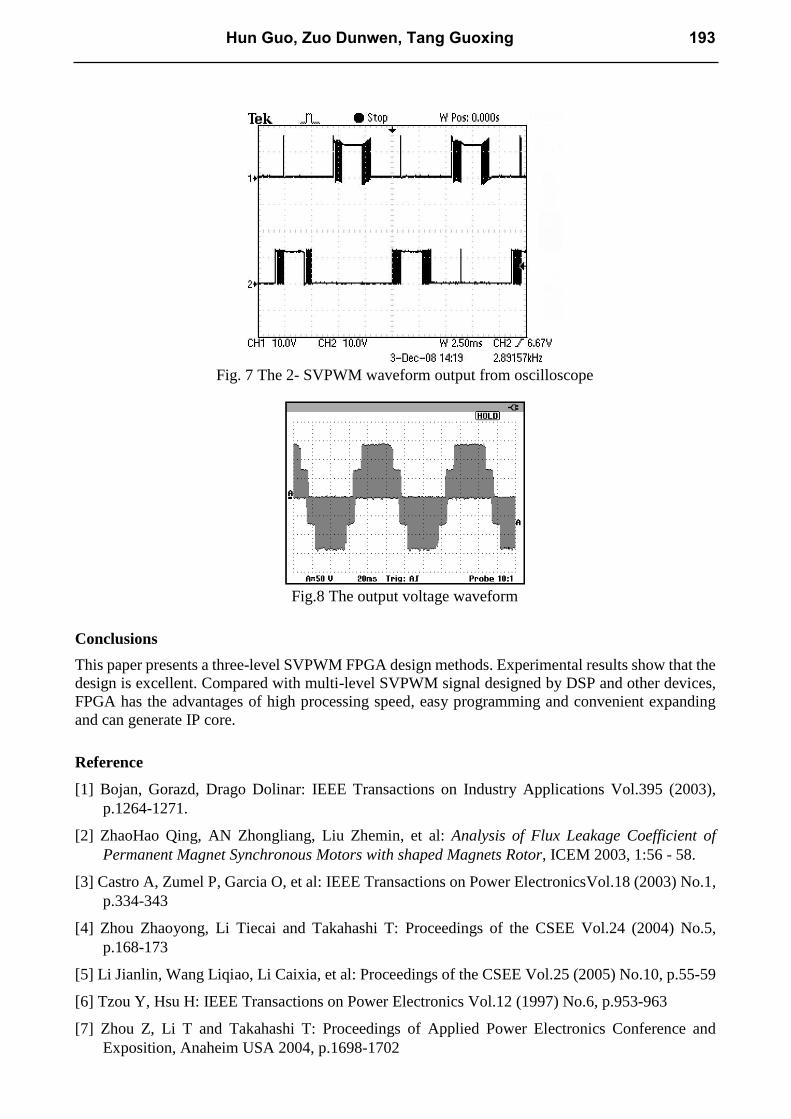
Fig. 7 The 2- SVPWM waveform output from oscilloscope
Fig.8 The output voltage waveform
Conclusions
This paper presents a three-level SVPWM FPGA design methods. Experimental results show that the
design is excellent. Compared with multi-level SVPWM signal designed by DSP and other devices,
FPGA has the advantages of high processing speed, easy programming and convenient expanding
and can generate IP core.
Reference
[1] Bojan, Gorazd, Drago Dolinar: IEEE Transactions on Industry Applications Vol.395 (2003),
p.1264-1271.
[2] ZhaoHao Qing, AN Zhongliang, Liu Zhemin, et al: Analysis of Flux Leakage Coefficient of
Permanent Magnet Synchronous Motors with shaped Magnets Rotor, ICEM 2003, 1:56 - 58.
[3] Castro A, Zumel P, Garcia O, et al: IEEE Transactions on Power ElectronicsVol.18 (2003) No.1,
p.334-343
[4] Zhou Zhaoyong, Li Tiecai and Takahashi T: Proceedings of the CSEE Vol.24 (2004) No.5,
p.168-173
[5] Li Jianlin, Wang Liqiao, Li Caixia, et al: Proceedings of the CSEE Vol.25 (2005) No.10, p.55-59
[6] Tzou Y, Hsu H: IEEE Transactions on Power Electronics Vol.12 (1997) No.6, p.953-963
[7] Zhou Z, Li T and Takahashi T: Proceedings of Applied Power Electronics Conference and
Exposition, Anaheim USA 2004, p.1698-1702
Hun Guo, Zuo Dunwen, Tang Guoxing 193
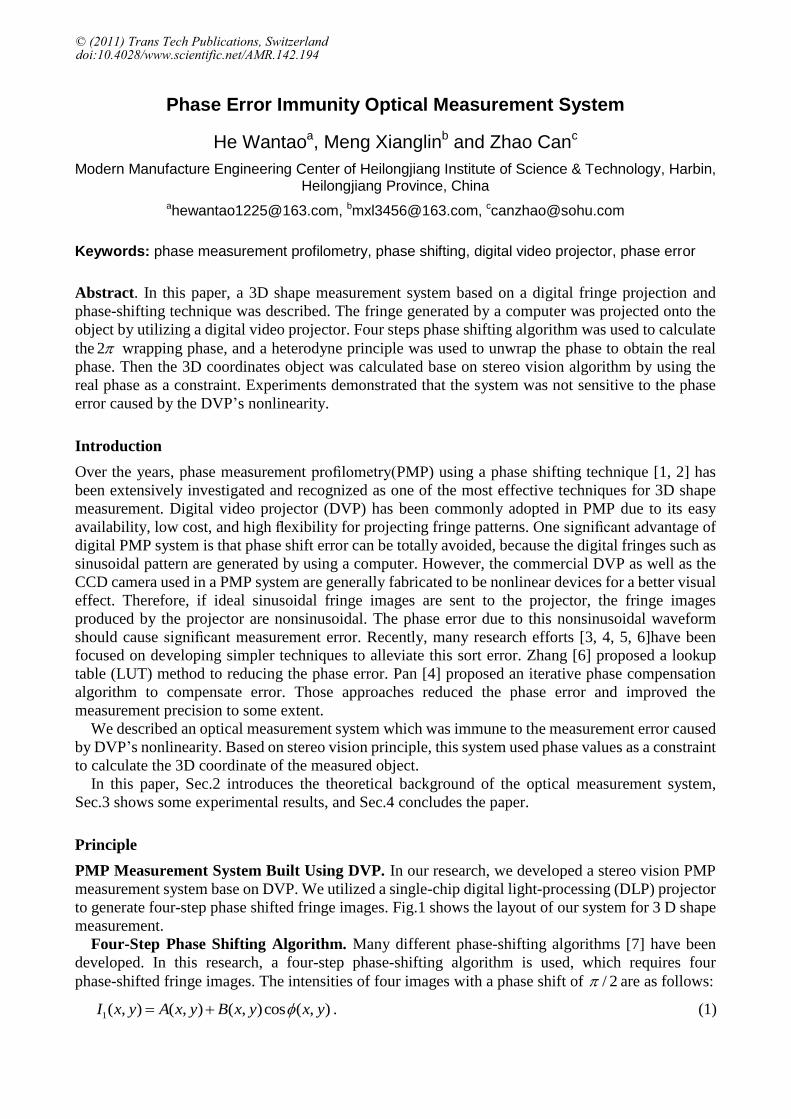
Phase Error Immunity Optical Measurement System
He Wantaoa, Meng Xianglinb and Zhao Canc
Modern Manufacture Engineering Center of Heilongjiang Institute of Science & Technology, Harbin, Heilongjiang Province, China
[email protected], [email protected], [email protected]
Keywords: phase measurement profilometry, phase shifting, digital video projector, phase error
Abstract. In this paper, a 3D shape measurement system based on a digital fringe projection and
phase-shifting technique was described. The fringe generated by a computer was projected onto the
object by utilizing a digital video projector. Four steps phase shifting algorithm was used to calculate
the 2 wrapping phase, and a heterodyne principle was used to unwrap the phase to obtain the real
phase. Then the 3D coordinates object was calculated base on stereo vision algorithm by using the
real phase as a constraint. Experiments demonstrated that the system was not sensitive to the phase
error caused by the DVP’s nonlinearity.
Introduction
Over the years, phase measurement profilometry(PMP) using a phase shifting technique [1, 2] has
been extensively investigated and recognized as one of the most effective techniques for 3D shape
measurement. Digital video projector (DVP) has been commonly adopted in PMP due to its easy
availability, low cost, and high flexibility for projecting fringe patterns. One significant advantage of
digital PMP system is that phase shift error can be totally avoided, because the digital fringes such as
sinusoidal pattern are generated by using a computer. However, the commercial DVP as well as the
CCD camera used in a PMP system are generally fabricated to be nonlinear devices for a better visual
effect. Therefore, if ideal sinusoidal fringe images are sent to the projector, the fringe images
produced by the projector are nonsinusoidal. The phase error due to this nonsinusoidal waveform
should cause significant measurement error. Recently, many research efforts [3, 4, 5, 6]have been
focused on developing simpler techniques to alleviate this sort error. Zhang [6] proposed a lookup
table (LUT) method to reducing the phase error. Pan [4] proposed an iterative phase compensation
algorithm to compensate error. Those approaches reduced the phase error and improved the
measurement precision to some extent.
We described an optical measurement system which was immune to the measurement error caused
by DVP’s nonlinearity. Based on stereo vision principle, this system used phase values as a constraint
to calculate the 3D coordinate of the measured object.
In this paper, Sec.2 introduces the theoretical background of the optical measurement system,
Sec.3 shows some experimental results, and Sec.4 concludes the paper.
Principle
PMP Measurement System Built Using DVP. In our research, we developed a stereo vision PMP
measurement system base on DVP. We utilized a single-chip digital light-processing (DLP) projector
to generate four-step phase shifted fringe images. Fig.1 shows the layout of our system for 3 D shape
measurement.
Four-Step Phase Shifting Algorithm. Many different phase-shifting algorithms [7] have been
developed. In this research, a four-step phase-shifting algorithm is used, which requires four
phase-shifted fringe images. The intensities of four images with a phase shift of / 2 are as follows:
1( , ) ( , ) ( , )cos ( , )I x y A x y B x y x y . (1)
© (2011) Trans Tech Publications, Switzerlanddoi:10.4028/www.scientific.net/AMR.142.194
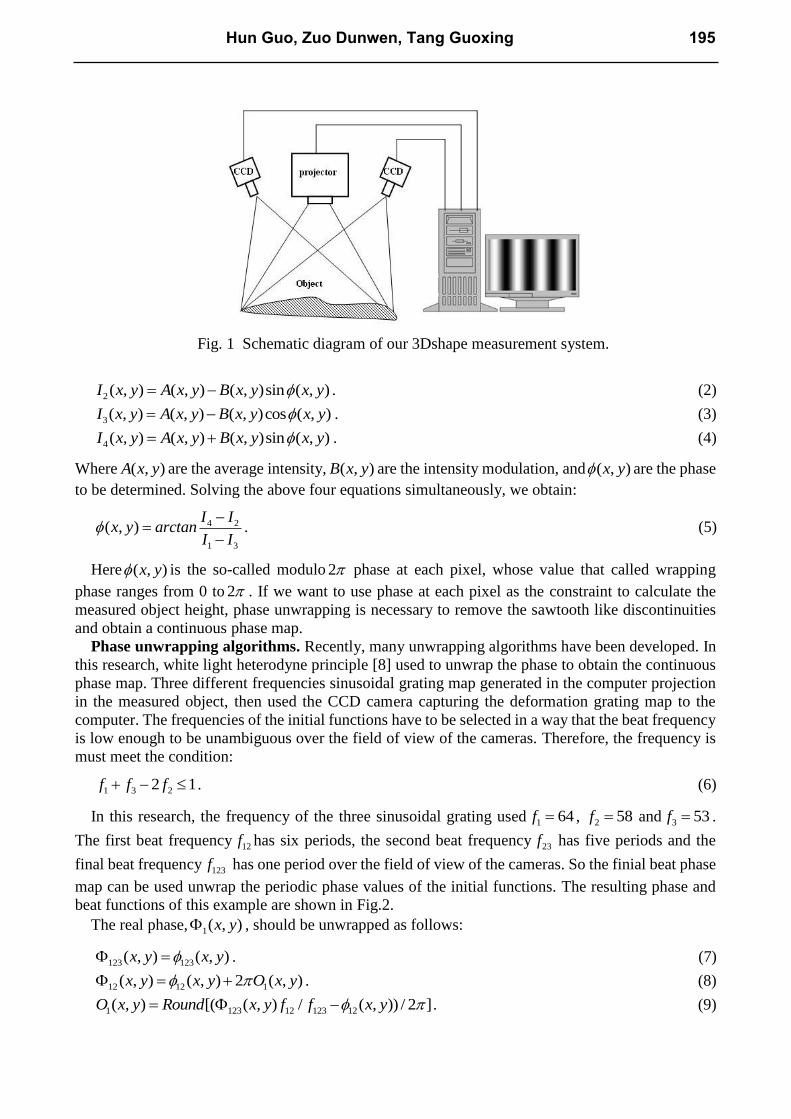
Fig. 1 Schematic diagram of our 3Dshape measurement system.
2( , ) ( , ) ( , )sin ( , )I x y A x y B x y x y . (2)
3( , ) ( , ) ( , )cos ( , )I x y A x y B x y x y . (3)
4( , ) ( , ) ( , )sin ( , )I x y A x y B x y x y . (4)
Where ( , )A x y are the average intensity, ( , )B x y are the intensity modulation, and ( , )x y are the phase
to be determined. Solving the above four equations simultaneously, we obtain:
4 2
1 3
( , )I I
x y arctanI I
. (5)
Here ( , )x y is the so-called modulo 2 phase at each pixel, whose value that called wrapping
phase ranges from 0 to 2 . If we want to use phase at each pixel as the constraint to calculate the
measured object height, phase unwrapping is necessary to remove the sawtooth like discontinuities
and obtain a continuous phase map.
Phase unwrapping algorithms. Recently, many unwrapping algorithms have been developed. In
this research, white light heterodyne principle [8] used to unwrap the phase to obtain the continuous
phase map. Three different frequencies sinusoidal grating map generated in the computer projection
in the measured object, then used the CCD camera capturing the deformation grating map to the
computer. The frequencies of the initial functions have to be selected in a way that the beat frequency
is low enough to be unambiguous over the field of view of the cameras. Therefore, the frequency is
must meet the condition:
1 3 22 1f f f . (6)
In this research, the frequency of the three sinusoidal grating used 1 64f , 2 58f and 3 53f .
The first beat frequency 12f has six periods, the second beat frequency 23f has five periods and the
final beat frequency 123f has one period over the field of view of the cameras. So the finial beat phase
map can be used unwrap the periodic phase values of the initial functions. The resulting phase and
beat functions of this example are shown in Fig.2.
The real phase, 1( , )x y , should be unwrapped as follows:
123 123( , ) ( , )x y x y . (7)
12 12 1( , ) ( , ) 2 ( , )x y x y O x y . (8)
1 123 12 123 12( , ) [( ( , ) / ( , )) / 2 ]O x y Round x y f f x y . (9)
Hun Guo, Zuo Dunwen, Tang Guoxing 195
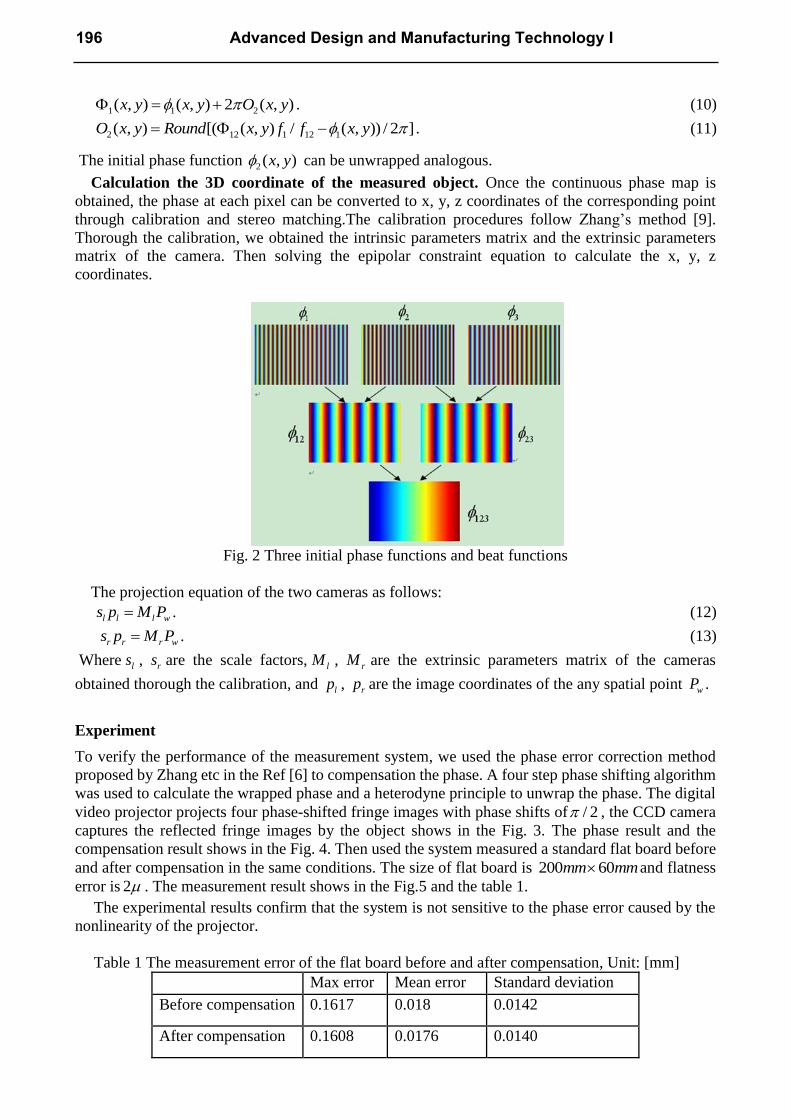
1 1 2( , ) ( , ) 2 ( , )x y x y O x y . (10)
2 12 1 12 1( , ) [( ( , ) / ( , )) / 2 ]O x y Round x y f f x y . (11)
The initial phase function 2 ( , )x y can be unwrapped analogous.
Calculation the 3D coordinate of the measured object. Once the continuous phase map is
obtained, the phase at each pixel can be converted to x, y, z coordinates of the corresponding point
through calibration and stereo matching.The calibration procedures follow Zhang’s method [9].
Thorough the calibration, we obtained the intrinsic parameters matrix and the extrinsic parameters
matrix of the camera. Then solving the epipolar constraint equation to calculate the x, y, z
coordinates.
Fig. 2 Three initial phase functions and beat functions
The projection equation of the two cameras as follows:
l l l ws p M P . (12)
r r r ws p M P . (13)
Where ls , rs are the scale factors, lM , rM are the extrinsic parameters matrix of the cameras
obtained thorough the calibration, and lp , rp are the image coordinates of the any spatial point wP .
Experiment
To verify the performance of the measurement system, we used the phase error correction method
proposed by Zhang etc in the Ref [6] to compensation the phase. A four step phase shifting algorithm
was used to calculate the wrapped phase and a heterodyne principle to unwrap the phase. The digital
video projector projects four phase-shifted fringe images with phase shifts of / 2 , the CCD camera
captures the reflected fringe images by the object shows in the Fig. 3. The phase result and the
compensation result shows in the Fig. 4. Then used the system measured a standard flat board before
and after compensation in the same conditions. The size of flat board is 200 60mm mm and flatness
error is 2 . The measurement result shows in the Fig.5 and the table 1.
The experimental results confirm that the system is not sensitive to the phase error caused by the
nonlinearity of the projector.
Table 1 The measurement error of the flat board before and after compensation, Unit: [mm]
Max error Mean error Standard deviation
Before compensation 0.1617 0.018 0.0142
After compensation 0.1608 0.0176 0.0140
196 Advanced Design and Manufacturing Technology I
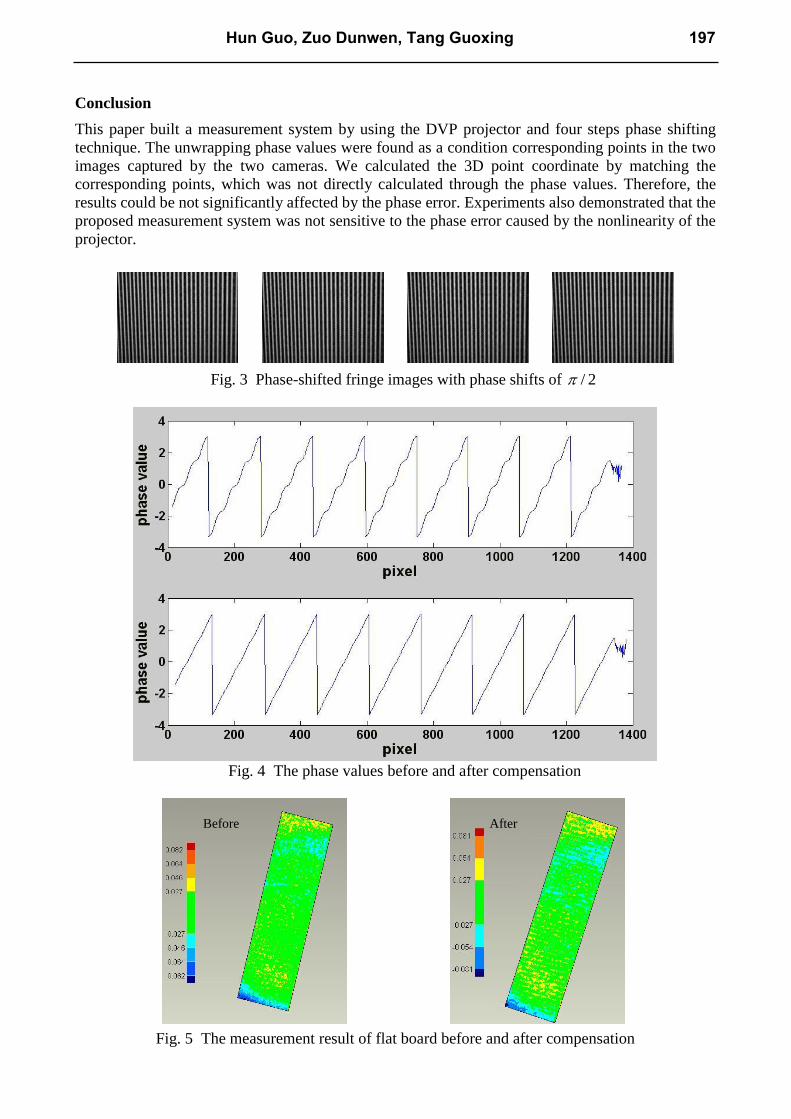
Conclusion
This paper built a measurement system by using the DVP projector and four steps phase shifting
technique. The unwrapping phase values were found as a condition corresponding points in the two
images captured by the two cameras. We calculated the 3D point coordinate by matching the
corresponding points, which was not directly calculated through the phase values. Therefore, the
results could be not significantly affected by the phase error. Experiments also demonstrated that the
proposed measurement system was not sensitive to the phase error caused by the nonlinearity of the
projector.
Fig. 3 Phase-shifted fringe images with phase shifts of / 2
Fig. 4 The phase values before and after compensation
Fig. 5 The measurement result of flat board before and after compensation
Before
After
Hun Guo, Zuo Dunwen, Tang Guoxing 197

Acknowledgement
This research was supported by Natural Science Foundation of Heilongjiang Province of China
(Grant No. ZJG0607-01).
References
[1] P.S. Huang and F. Chiang: Optical Diagnostics for Fluids, Heat, Combustion and Photomechanics
for Solids. (Denver, CO, USA ,Wednesday 21 July 1999 ).
[2] M. Tsai, and C. Hung: Measurement, Vol. 38(2005), p. 236-247.
[3] P. S. Huang, Q. Hu, and F.P. Chiang: Optical Engineering, Vol. 42(2003), p. 482-486.
[4] B. Pan, K. M. Qian and H. Lei: Optics Letters, Vol.34 No.4 (2009), p. 416-418.
[5] S. Zhang, and P.S. Huang: Boston, MA. (2005),
[6] S. Zhang, and S.T. Yau: Applied Optics, Vol. 46 No.1 (2007), p. 36-43.
[7] P. Jia, J. Kofman and C. English: Optomechatronic Sensors, Instrumentation, and
Computer-Vision Systems (Boston, MA, USA, Tuesday 3 October 2006).
[8] C. Reich, R. Ritter, and J. Thesing: Sensors, Sensor Systems, and Sensor Data
Processing(Munich, Germany, Monday 16 June 1997).
[9] Z.Y. Zhang: IEEE Transactions on Pattern Analysis and Machine Intelligence, Vol. 22 No.11
(2000), p. 1330-1334.
198 Advanced Design and Manufacturing Technology I

A Stable Least Squares Ellipses Fitting Algorithm Based on Zernike Moments
Meng Xianglina, He Wantaob and Zhao Canc
Harbin, Heilongjiang Province, China
[email protected], [email protected], [email protected]
Keywords: edge detection, Zernike moments, ellipses fitting, least squares
Abstract. This paper presents a stable least squares ellipses fitting algorithm based on Zernike
orthogonal moments. The algorithm uses Zernike orthogonal moments for sub-pixel edge detection,
and a mask of seven multiply seven was derived in the meantime. The optimal ellipse parameters
were computed according to the data points extracted previously. This stable, robust and non-iterative
algorithm can be easily implemented. The experiment results show that the proposed algorithm is
effective in various situations.
Introduction
Ellipse is a very important primitive in pattern recognition and machine vision. Therefore, various
algorithms have been developed for ellipses extraction.
The Hough transform [1, 2] and least squares [3] are best known algorithms. The Hough transform
algorithm is not sensitive to outliers, and it can detect multiple primitives at once. However, there are
problems with this algorithm such as the choices of thresholds, finding peaks, require large memory
and the accuracy is low. Other algorithms like least squares concerned iterative fitting and minimizes
the error between data points and estimated arc. The algorithm is fast and accuracy, but sensitivity to
outliers. This often leads to non-optimal results or even fails.
Considering to the problems of existing algorithms, a robust, fast and effective algorithm for
ellipses extraction was proposed in this paper. First, the edge of the ellipses was detected using
Zernike moments [4, 5]. Then, an improved fitting method is proposed based on a block
decomposition [6] of matrices.
Sub-pixel Edge Detection
Zernike moments are important digital image descriptors used in various applications such as pattern
recognition and machine vision. Teague first introduced the use of Zernike moments to overcome the
shortcomings of information redundancy present in the popular geometric moments. Zernike
moments are a class of orthogonal moments and have been shown effective in terms of image
representation. Zernike moments are rotation invariant and can be easily constructed to an arbitrary
order.
The Zernike polynomials are a set of complex, orthogonal polynomials defined over the interior of
a unit circle [7], Zernike n-order polynomial is defined as follow:
( , ) ( ) jm
nm nmV R e (1)
Polynomial Rnm is given by the following formula:
22
0
( )!( ) ( 1)
!( )!( )!2 2
n m
s n s
nm
s
n sR
n m n ms s s
(2)
Where n is a non-negative integer, m is an integer, n–|m| is even and |m| n, and 1j ,
1tan ( )y
x , 2 2x y .
© (2011) Trans Tech Publications, Switzerlanddoi:10.4028/www.scientific.net/AMR.142.199

The Zernike moment of n-order is defined as follow:
2 2 1
1( , ) ( , )nm nm
x y
nA f x y V dxdy
(3)
The Zernike moment is the convolution of ( , )f x y and ( , )nmV when ( , )f x y is discrete,
1( , ) ( , )nm nm
x y
nA f x y V
(4)
Where ( , )f x y represents the gray distribution of image, and 2 2 1x y .
Fig. 1 shows a mask of seven multiply seven. The size of each square can be calculated according
to Eq.3.
Fig. 2 is an ideal model of the sub-pixel edge detection. In a unit circle, L is the ideal edge, h and
h+k are the gray distribution , l is the distance between point o and line L, and φis Rotation angle.
Here are the results of Zernike moment from order 0 to 4:
1 2
00 sin ( ) 12
kA h k l kl l
(5)
2 3/2
11
2 (1 )
3
k lA
(6)
2 3/2
20
2 (1 )
3
kl lA
(7)
2 2 3/2
31
4 2( )(1 )5 15
A k l l (8)
2 2 3/2
40
2 8( 1)(1 )
5 3
klA l l (9)
The approach of edge detection is:
(a). Compute the Zernike moment Anm according to formula (5) ~ (9).
(b). compute l1, l2, h, k, andφ from formula (5) ~ (9).
40 201
20
5 3
8
A Al
A
(10)
31 112
11
5
6
A Al
A
(11)
11
2 3/2
2
3
2(1 )
Ak
l
(12)
1 2
00 2 2/ 2 sin ( ) 1A k k l kl lh
(13)
1 31
31
Im[ ]tan
Re[ ]
A
A
(14)
y
x
o φ
l1
L
l2
l
h+k
h
x o
unit circle
y
Fig.1 The 7×7 mask Fig.2 The ideal model
200 Advanced Design and Manufacturing Technology I

Where Im[A31] and Re[A31] are the complex part and the real part of A31 before rotate.
(c). compute the edge with edge detection formula considering Amplification of N×N mask.
cos( )sin( )2
s
s
Nlx xy y
(15)
Where l = (l1+l2) / 2.
Fitting of Ellipses
The least squares algorithm is widely used to fit an ellipse through a set of points (xi, yi), i=1, 2, … N.
An ellipse is a special case of a general conic which can be described by an implicit second order
polynomiall[8] , 2 2( , ) 0F x y ax bxy cy dx ey f x a (16)
With an ellipse-specific constraint b2-4ac < 0, and x=(x
2, xy, y
2, x, y, 1)
T, a= (a, b, c, d, e, f)
T.
Under a proper scaling, the inequality constraint can be changed into an equality constraint [3], 2 4 0b ac (17)
The fitting process is to minimize the sum of squared algebraic distances of the points to the conic
which is represented by coefficients a: 2
mina
Da subject to T =1a Ca (18)
Where matrix D of the size N×6, 2 2
1 1 1 1 1 1
2 2
2 2
1
1
1
i i i i i i
N N N N N N
x x y y x y
x x y y x y
x x y y x y
D (19)
The constraint matrix C of the size 6×6,
0 0 2 0 0 00 -1 0 0 0 02 0 0 0 0 00 0 0 0 0 00 0 0 0 0 00 0 0 0 0 0
C (20)
In order to get a optimal solution a, the following formula can be acquired by applying Lagrange
multipliers
T
λ1
Sa Ca
a Ca (21)
Where scatter matrix S of the size 6×6,
4 3 2 2 3 2 2
3 2 2 3 2 2
2 2 3 4 2 3 2
3 2 2 2
2 2 3 2
2 2
T
1
= =
x x y x y x x y x
xyx y x y xy x y xy
x y xy y xy y y
xy xx x y xy x
xy yx y xy y y
xy x yx y
S S S S S S
S S S S S S
S S S S S S
S S S S S S
S S S S S S
S S S S S S
S D D
, with 1
a b
Na b
i i
ix y
S x y
(22)
However, the constraint matrix C is singular and the scatter matrix S is nearly singular, this leads
to an unstable or even wrong results. The block decomposition of matrices technology is used to
overcome the drawbacks of this original least squares algorithm. The matrix D the constraint matrix C
and the scatter matrix S can be decomposed as the following form,
1 2( )D D D (23)
Where D1 is the quadratic part, D2 is the linear part of D.
Hun Guo, Zuo Dunwen, Tang Guoxing 201

1
C 0
C0 0
, with 1
0 0 20 -1 00 0 0
C (24)
1 2
T
2 3
S SS
S S
, where T
1 1 1S D D , T
2 1 2S D D , T
3 2 2S D D (25)
Then Eq.21 can be expressed as
1 2 1 1 1
T2 22 3
T
1 1 1
λ
1
S S a C 0 a
a 0 0 aS S
a C a (26)
Where a1= (a, b, c) T, a2= (d, e, f)
T and 1
2
aa
a.
Eq.26 is a constrained minimization problem whose optimal solution corresponds to the
eigenvector a of Eq.21 which yields a minimal non-negative value.
Experimental Results
The ellipses extraction algorithm presented in previous section is tested on images that are shown in
fig. 3. Fig. 3(a) is a CCD image of flat board with thirty-five circles on it. Fig. 3(b) and Fig. 3(c) are acquired from the same CCD camera with different brightness. The results are shown in Fig. 4 and
Table 1.
As we can see from Fig. 4 (a) and (b) that all circles are correct. For the last image, there are 19
incorrect circles and 35 correct circles, and all the incorrect circles are Located in the upper left corner
of the image, it is due to a high electronic noise level when the image is too bright. The center of the
correct circles is marked with a red “·”. The test result shows the accuracy and robustness of the
algorithm presented in this paper. The algorithm is very flexible for images with different noise level.
(a) (b) (c)
Fig.3 test images with different brightness
(a) (b) (c)
Fig.4 results
202 Advanced Design and Manufacturing Technology I

Conclusions
This paper has presented a Zernike-moments-based and least-squares-based circle extraction
algorithm. The algorithm is stable and non-iterative for circle extracted with high accuracy, speed
robustness. The Zernike-moments-based sub-pixel edge detection algorithm can be used in any other
shapes besides the ellipse and circle.
Acknowledgement
This research was supported by the financial support by the Key Project of Chinese Ministry of
Education (No.210065) and Natural Science Foundation of Heilongjiang Province of China(Grant
No. ZJG0607-01) and Startup Fund for Distinguished Scholars of Heilongjiang University of Science
& Technology (05-26).
References
[1] S. Tsuji, F. Matsumoto: IEEE Transactions on Computers, vol. 27 (1978), p. 777-781
[2] D.H. Ballard: Pattern Recognition, vol.13 (1981), p.111-122
[3] Andrew Fitzgibbon, Maurizio Pilu, Robert B. Fisher: IEEE Transactions on Pattern Analysis
and Machine Intelligence, vol. 21 (1999), p. 476-480
[4] M.R. Teague: J. Opt. Soc. Amer, vol.70 (1980), p.920-930
[5] Simon. X, Liao: Electrical and Computer Engineering, IEEE Canadian Conference on 2 (1997),
p.700-703
[6] I.S. Duff, A.M. Erisman and J.K. Reid: Direct Methods for Sparse Matrices, Oxford University
Press (1986)
[7] A. Khotanzad, Y.H. Hong: Pattern Analysis and Machine Intelligence, IEEE Transactions on,
Vol.12 (1990), p.489-497
[8] Information on http://mathworld.wolfram.com
Hun Guo, Zuo Dunwen, Tang Guoxing 203
Accuracy Verification Method about Optical Three-Dimensional Measuring Instrument
Weiling Zhao1, a, Can Zhao1, Junting Cheng1 and Haiyan Yue2 1Modern manufacture engineering center, Heilongjiang University of Science & Technology, Harbin
150027, China
2China south fire control center, Chengdu 611731, China
Keywords: optical measurement; accuracy assessment; test standards; error
Abstract. Three-dimensional measuring instrument has high precision, high efficiency, convenience,
and the stability characteristics, and is widely used in many manufacturing industries. In the process
of equipment purchases and transportation, there is the need for precision test equipment. Reference
to the VDI/VDE 2634 standard developed by German and equipments of other manufacturers, make
reasonable accuracy test method, according to measurement data maximum error, minimum error,
average error, standard deviation concept, calculate the measurement comprehensive system error,
and calculate its accuracy for foreign equipment.
Introduction
Coordinate measuring device can measure various parameters of the shape of the workpiece, with
flexibility, stability and repeatable measurement results, etc., and are more widely used. However,
some common high-precision measuring equipment have some disadvantages, such as non-contact
coordinate measuring machines are very expensive and can only measure small size of workpiece, if
large size measurement is very cumbersome.
Optical three-dimensional measuring instrument can measure large and small-scale and complex
surface workpiece, because the device has fully automated, high precision, high efficiency,
convenience, stability characteristics. With the rapid development of Chinese manufacture, it is
widely used in mechanical manufacturing, electronics, automotive and aerospace industries. This
device is complex, and its complexity lies not only in how to create a highly accurate device, but also
in how to evaluate the reliability of measurement results. After the process of equipment purchases
and transportation is the need for precision test equipment.
Now some companies and schools in China study or produce some devices, because there is not the
accuracy testing standard of the non-contact optical 3D scanner in China, and manufacturers are very
confused on the accuracy of the description. In Germany, the relevant authorities [1-3] of the
three-dimensional scanner proposed the accuracy standards, we refer to VDI/VDE 2634 standard [4]
and some equipment from domestic manufacturers, and set reasonable accuracy methods.
The Measurement Index of Equipment Precision from German Standard
VDI/VDE 2634 is the detected standards about Optical measurement system which was drafted by
Association of German Engineers, part 1 is Optical 3D measuring systems imaging systems with
point-by-point probing, part 2 is Optical 3-D measuring systems Optical systems based on area
scanning, and part 3 is Optical 3D-measuring systems-multiple view systems based on area scanning.
It calculated the measurement error mainly from the probing error, the sphere spacing error, the
length measurement error, and the flatness measurement error.
The Size Basis for Measuring Tool. We calculate body diagonal according to the length, width,
height from the measurement scope. The dimensions of the artifact result from following
requirements, shown as Fig. 1 and Eq. 1, where Lp is the ball pitch of dumbbell ball, Dp is the
diameter of dumbbell ball, L0 is body diagonal of the smallest rectangular parallelepiped enclosing
© (2011) Trans Tech Publications, Switzerlanddoi:10.4028/www.scientific.net/AMR.142.204
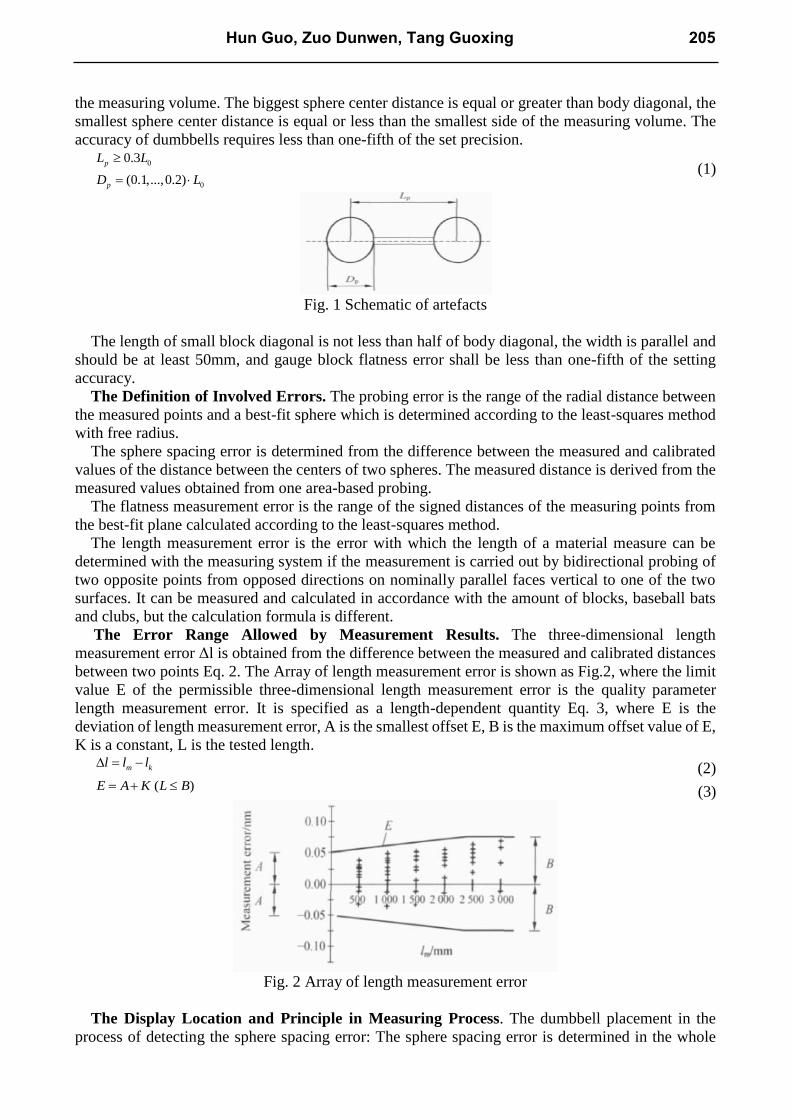
the measuring volume. The biggest sphere center distance is equal or greater than body diagonal, the
smallest sphere center distance is equal or less than the smallest side of the measuring volume. The
accuracy of dumbbells requires less than one-fifth of the set precision.
0
0
0.3
(0.1,...,0.2)
p
p
L L
D L
(1)
Fig. 1 Schematic of artefacts
The length of small block diagonal is not less than half of body diagonal, the width is parallel and
should be at least 50mm, and gauge block flatness error shall be less than one-fifth of the setting
accuracy.
The Definition of Involved Errors. The probing error is the range of the radial distance between
the measured points and a best-fit sphere which is determined according to the least-squares method
with free radius.
The sphere spacing error is determined from the difference between the measured and calibrated
values of the distance between the centers of two spheres. The measured distance is derived from the
measured values obtained from one area-based probing.
The flatness measurement error is the range of the signed distances of the measuring points from
the best-fit plane calculated according to the least-squares method.
The length measurement error is the error with which the length of a material measure can be
determined with the measuring system if the measurement is carried out by bidirectional probing of
two opposite points from opposed directions on nominally parallel faces vertical to one of the two
surfaces. It can be measured and calculated in accordance with the amount of blocks, baseball bats
and clubs, but the calculation formula is different.
The Error Range Allowed by Measurement Results. The three-dimensional length
measurement error Δl is obtained from the difference between the measured and calibrated distances
between two points Eq. 2. The Array of length measurement error is shown as Fig.2, where the limit
value E of the permissible three-dimensional length measurement error is the quality parameter
length measurement error. It is specified as a length-dependent quantity Eq. 3, where E is the
deviation of length measurement error, A is the smallest offset E, B is the maximum offset value of E,
K is a constant, L is the tested length.
m kl l l (2) ( )E A K L B (3)
Fig. 2 Array of length measurement error
The Display Location and Principle in Measuring Process. The dumbbell placement in the
process of detecting the sphere spacing error: The sphere spacing error is determined in the whole
Hun Guo, Zuo Dunwen, Tang Guoxing 205
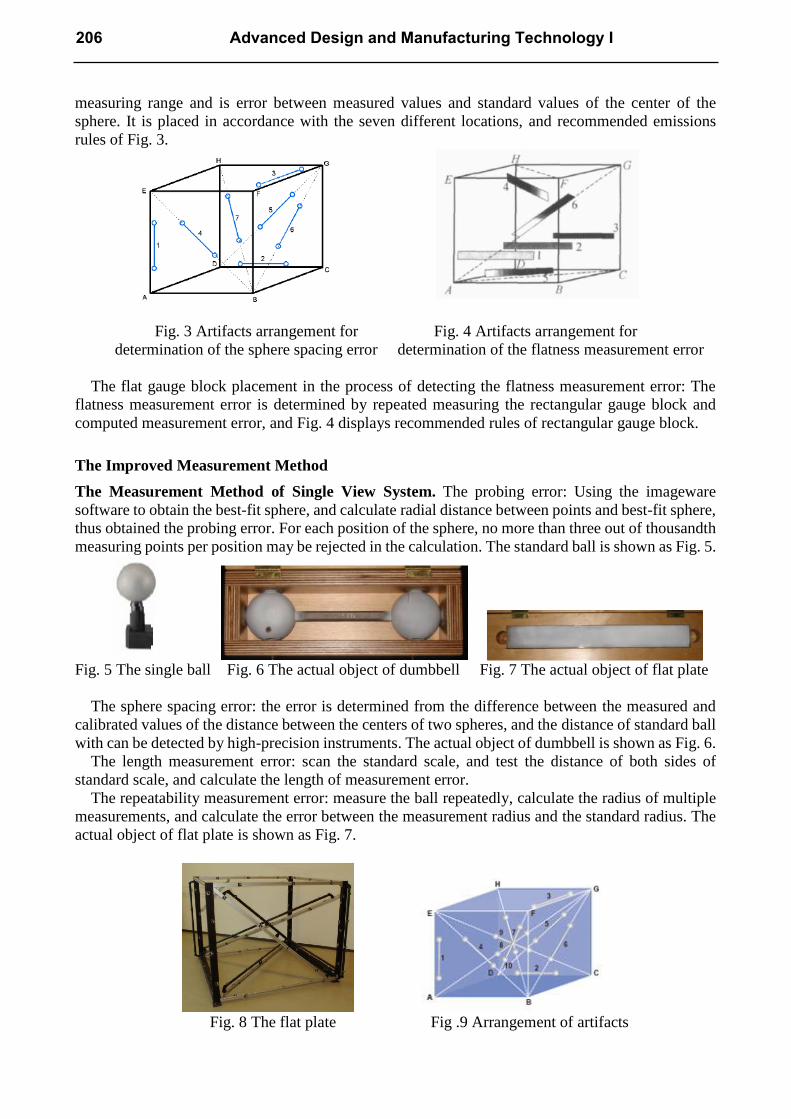
measuring range and is error between measured values and standard values of the center of the
sphere. It is placed in accordance with the seven different locations, and recommended emissions
rules of Fig. 3.
Fig. 3 Artifacts arrangement for Fig. 4 Artifacts arrangement for
determination of the sphere spacing error determination of the flatness measurement error
The flat gauge block placement in the process of detecting the flatness measurement error: The
flatness measurement error is determined by repeated measuring the rectangular gauge block and
computed measurement error, and Fig. 4 displays recommended rules of rectangular gauge block.
The Improved Measurement Method
The Measurement Method of Single View System. The probing error: Using the imageware
software to obtain the best-fit sphere, and calculate radial distance between points and best-fit sphere,
thus obtained the probing error. For each position of the sphere, no more than three out of thousandth
measuring points per position may be rejected in the calculation. The standard ball is shown as Fig. 5.
Fig. 5 The single ball Fig. 6 The actual object of dumbbell Fig. 7 The actual object of flat plate
The sphere spacing error: the error is determined from the difference between the measured and
calibrated values of the distance between the centers of two spheres, and the distance of standard ball
with can be detected by high-precision instruments. The actual object of dumbbell is shown as Fig. 6.
The length measurement error: scan the standard scale, and test the distance of both sides of
standard scale, and calculate the length of measurement error.
The repeatability measurement error: measure the ball repeatedly, calculate the radius of multiple
measurements, and calculate the error between the measurement radius and the standard radius. The
actual object of flat plate is shown as Fig. 7.
Fig. 8 The flat plate Fig .9 Arrangement of artifacts
206 Advanced Design and Manufacturing Technology I
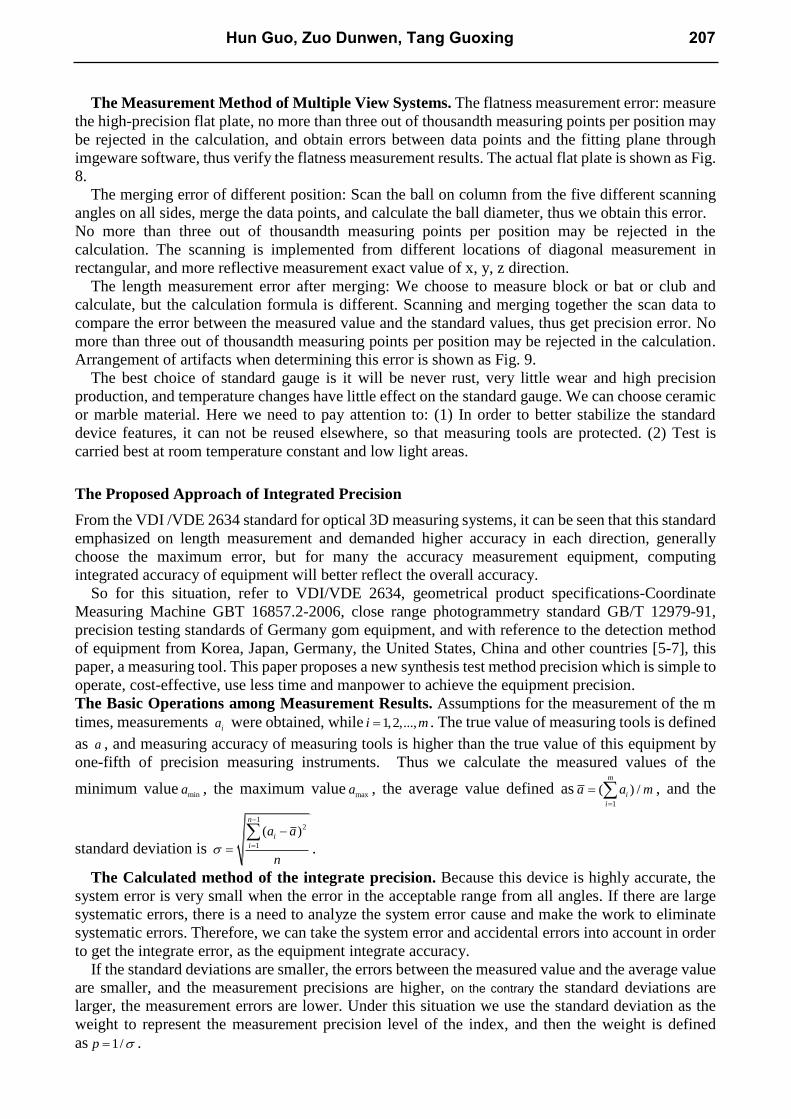
The Measurement Method of Multiple View Systems. The flatness measurement error: measure
the high-precision flat plate, no more than three out of thousandth measuring points per position may
be rejected in the calculation, and obtain errors between data points and the fitting plane through
imgeware software, thus verify the flatness measurement results. The actual flat plate is shown as Fig.
8.
The merging error of different position: Scan the ball on column from the five different scanning
angles on all sides, merge the data points, and calculate the ball diameter, thus we obtain this error.
No more than three out of thousandth measuring points per position may be rejected in the
calculation. The scanning is implemented from different locations of diagonal measurement in
rectangular, and more reflective measurement exact value of x, y, z direction.
The length measurement error after merging: We choose to measure block or bat or club and
calculate, but the calculation formula is different. Scanning and merging together the scan data to
compare the error between the measured value and the standard values, thus get precision error. No
more than three out of thousandth measuring points per position may be rejected in the calculation.
Arrangement of artifacts when determining this error is shown as Fig. 9.
The best choice of standard gauge is it will be never rust, very little wear and high precision
production, and temperature changes have little effect on the standard gauge. We can choose ceramic
or marble material. Here we need to pay attention to: (1) In order to better stabilize the standard
device features, it can not be reused elsewhere, so that measuring tools are protected. (2) Test is
carried best at room temperature constant and low light areas.
The Proposed Approach of Integrated Precision
From the VDI /VDE 2634 standard for optical 3D measuring systems, it can be seen that this standard
emphasized on length measurement and demanded higher accuracy in each direction, generally
choose the maximum error, but for many the accuracy measurement equipment, computing
integrated accuracy of equipment will better reflect the overall accuracy.
So for this situation, refer to VDI/VDE 2634, geometrical product specifications-Coordinate
Measuring Machine GBT 16857.2-2006, close range photogrammetry standard GB/T 12979-91,
precision testing standards of Germany gom equipment, and with reference to the detection method
of equipment from Korea, Japan, Germany, the United States, China and other countries [5-7], this
paper, a measuring tool. This paper proposes a new synthesis test method precision which is simple to
operate, cost-effective, use less time and manpower to achieve the equipment precision.
The Basic Operations among Measurement Results. Assumptions for the measurement of the m
times, measurements ia were obtained, while 1,2,...,i m . The true value of measuring tools is defined
as a , and measuring accuracy of measuring tools is higher than the true value of this equipment by
one-fifth of precision measuring instruments. Thus we calculate the measured values of the
minimum value mina , the maximum value maxa , the average value defined as1
( ) /m
i
i
a a m
, and the
standard deviation is
12
1
( )n
i
i
a a
n
.
The Calculated method of the integrate precision. Because this device is highly accurate, the
system error is very small when the error in the acceptable range from all angles. If there are large
systematic errors, there is a need to analyze the system error cause and make the work to eliminate
systematic errors. Therefore, we can take the system error and accidental errors into account in order
to get the integrate error, as the equipment integrate accuracy.
If the standard deviations are smaller, the errors between the measured value and the average value
are smaller, and the measurement precisions are higher, on the contrary the standard deviations are
larger, the measurement errors are lower. Under this situation we use the standard deviation as the
weight to represent the measurement precision level of the index, and then the weight is defined
as 1/p .
Hun Guo, Zuo Dunwen, Tang Guoxing 207
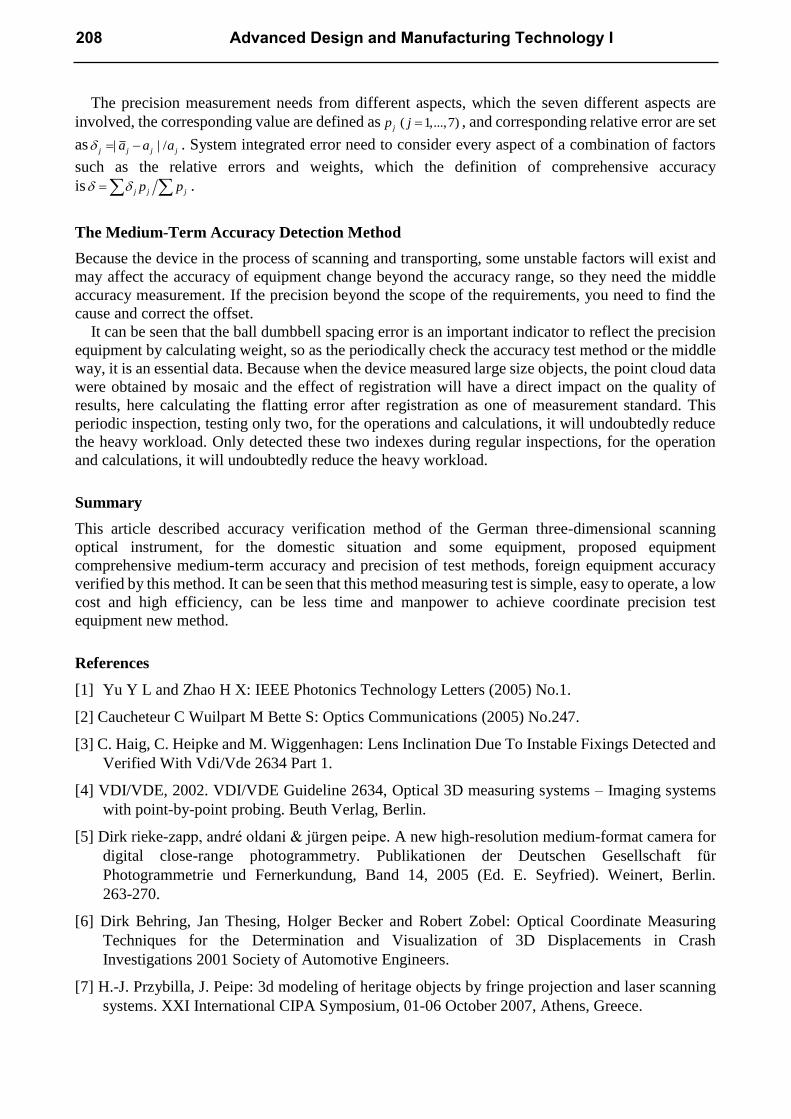
The precision measurement needs from different aspects, which the seven different aspects are
involved, the corresponding value are defined as ( 1,...,7)jp j , and corresponding relative error are set
as | | /j j j ja a a . System integrated error need to consider every aspect of a combination of factors
such as the relative errors and weights, which the definition of comprehensive accuracy
is j j jp p .
The Medium-Term Accuracy Detection Method
Because the device in the process of scanning and transporting, some unstable factors will exist and
may affect the accuracy of equipment change beyond the accuracy range, so they need the middle
accuracy measurement. If the precision beyond the scope of the requirements, you need to find the
cause and correct the offset.
It can be seen that the ball dumbbell spacing error is an important indicator to reflect the precision
equipment by calculating weight, so as the periodically check the accuracy test method or the middle
way, it is an essential data. Because when the device measured large size objects, the point cloud data
were obtained by mosaic and the effect of registration will have a direct impact on the quality of
results, here calculating the flatting error after registration as one of measurement standard. This
periodic inspection, testing only two, for the operations and calculations, it will undoubtedly reduce
the heavy workload. Only detected these two indexes during regular inspections, for the operation
and calculations, it will undoubtedly reduce the heavy workload.
Summary
This article described accuracy verification method of the German three-dimensional scanning
optical instrument, for the domestic situation and some equipment, proposed equipment
comprehensive medium-term accuracy and precision of test methods, foreign equipment accuracy
verified by this method. It can be seen that this method measuring test is simple, easy to operate, a low
cost and high efficiency, can be less time and manpower to achieve coordinate precision test
equipment new method.
References
[1] Yu Y L and Zhao H X: IEEE Photonics Technology Letters (2005) No.1.
[2] Caucheteur C Wuilpart M Bette S: Optics Communications (2005) No.247.
[3] C. Haig, C. Heipke and M. Wiggenhagen: Lens Inclination Due To Instable Fixings Detected and
Verified With Vdi/Vde 2634 Part 1.
[4] VDI/VDE, 2002. VDI/VDE Guideline 2634, Optical 3D measuring systems – Imaging systems
with point-by-point probing. Beuth Verlag, Berlin.
[5] Dirk rieke-zapp, andré oldani & jürgen peipe. A new high-resolution medium-format camera for
digital close-range photogrammetry. Publikationen der Deutschen Gesellschaft für
Photogrammetrie und Fernerkundung, Band 14, 2005 (Ed. E. Seyfried). Weinert, Berlin.
263-270.
[6] Dirk Behring, Jan Thesing, Holger Becker and Robert Zobel: Optical Coordinate Measuring
Techniques for the Determination and Visualization of 3D Displacements in Crash
Investigations 2001 Society of Automotive Engineers.
[7] H.-J. Przybilla, J. Peipe: 3d modeling of heritage objects by fringe projection and laser scanning
systems. XXI International CIPA Symposium, 01-06 October 2007, Athens, Greece.
208 Advanced Design and Manufacturing Technology I
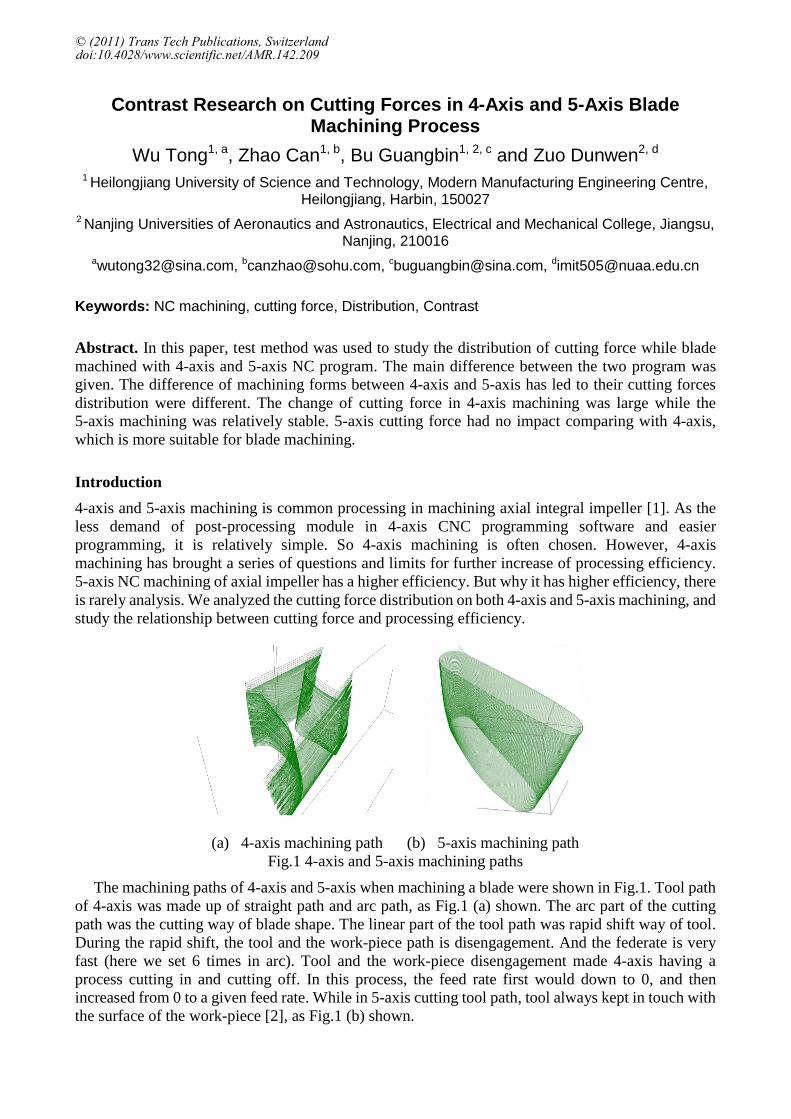
Contrast Research on Cutting Forces in 4-Axis and 5-Axis Blade Machining Process
Wu Tong1, a, Zhao Can1, b, Bu Guangbin1, 2, c and Zuo Dunwen2, d 1 Heilongjiang University of Science and Technology, Modern Manufacturing Engineering Centre,
Heilongjiang, Harbin, 150027
2 Nanjing Universities of Aeronautics and Astronautics, Electrical and Mechanical College, Jiangsu, Nanjing, 210016
[email protected], [email protected], [email protected], [email protected]
Keywords: NC machining, cutting force, Distribution, Contrast
Abstract. In this paper, test method was used to study the distribution of cutting force while blade
machined with 4-axis and 5-axis NC program. The main difference between the two program was
given. The difference of machining forms between 4-axis and 5-axis has led to their cutting forces
distribution were different. The change of cutting force in 4-axis machining was large while the 5-axis machining was relatively stable. 5-axis cutting force had no impact comparing with 4-axis,
which is more suitable for blade machining.
Introduction
4-axis and 5-axis machining is common processing in machining axial integral impeller [1]. As the
less demand of post-processing module in 4-axis CNC programming software and easier
programming, it is relatively simple. So 4-axis machining is often chosen. However, 4-axis
machining has brought a series of questions and limits for further increase of processing efficiency.
5-axis NC machining of axial impeller has a higher efficiency. But why it has higher efficiency, there
is rarely analysis. We analyzed the cutting force distribution on both 4-axis and 5-axis machining, and
study the relationship between cutting force and processing efficiency.
(a) 4-axis machining path (b) 5-axis machining path
Fig.1 4-axis and 5-axis machining paths
The machining paths of 4-axis and 5-axis when machining a blade were shown in Fig.1. Tool path
of 4-axis was made up of straight path and arc path, as Fig.1 (a) shown. The arc part of the cutting
path was the cutting way of blade shape. The linear part of the tool path was rapid shift way of tool.
During the rapid shift, the tool and the work-piece path is disengagement. And the federate is very
fast (here we set 6 times in arc). Tool and the work-piece disengagement made 4-axis having a
process cutting in and cutting off. In this process, the feed rate first would down to 0, and then
increased from 0 to a given feed rate. While in 5-axis cutting tool path, tool always kept in touch with
the surface of the work-piece [2], as Fig.1 (b) shown.
© (2011) Trans Tech Publications, Switzerlanddoi:10.4028/www.scientific.net/AMR.142.209
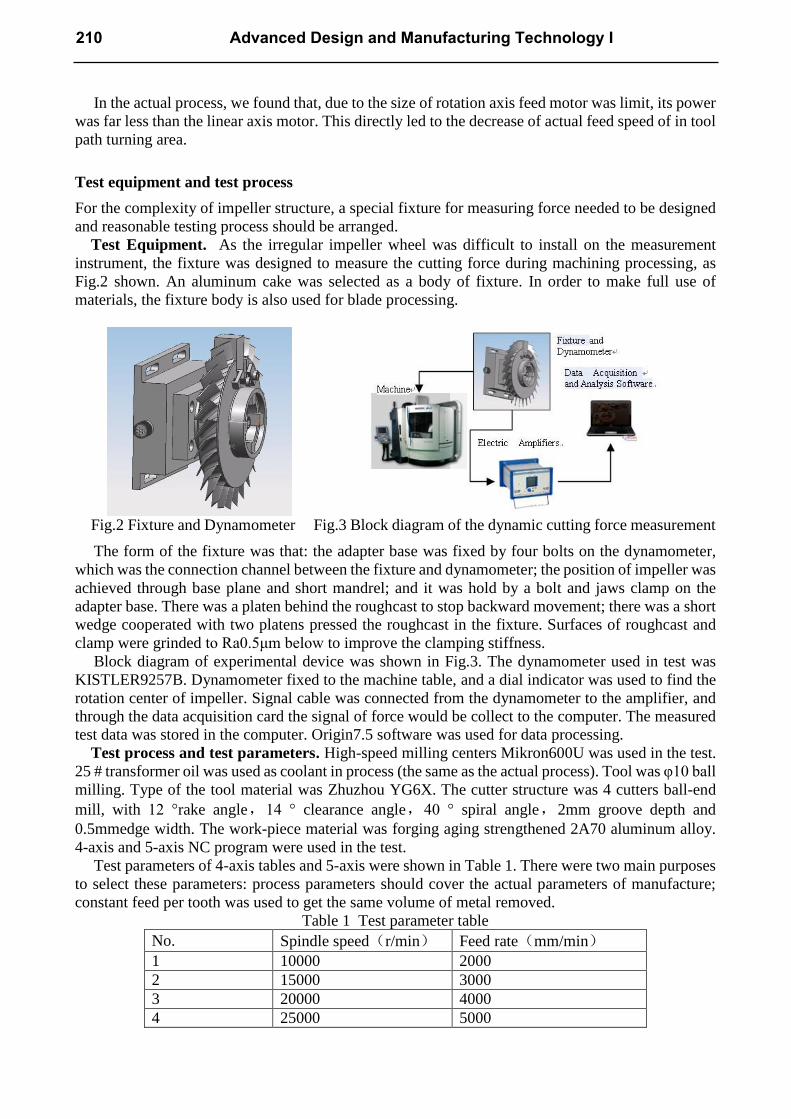
In the actual process, we found that, due to the size of rotation axis feed motor was limit, its power
was far less than the linear axis motor. This directly led to the decrease of actual feed speed of in tool
path turning area.
Test equipment and test process
For the complexity of impeller structure, a special fixture for measuring force needed to be designed
and reasonable testing process should be arranged.
Test Equipment. As the irregular impeller wheel was difficult to install on the measurement
instrument, the fixture was designed to measure the cutting force during machining processing, as
Fig.2 shown. An aluminum cake was selected as a body of fixture. In order to make full use of
materials, the fixture body is also used for blade processing.
Fig.2 Fixture and Dynamometer Fig.3 Block diagram of the dynamic cutting force measurement
The form of the fixture was that: the adapter base was fixed by four bolts on the dynamometer,
which was the connection channel between the fixture and dynamometer; the position of impeller was
achieved through base plane and short mandrel; and it was hold by a bolt and jaws clamp on the
adapter base. There was a platen behind the roughcast to stop backward movement; there was a short
wedge cooperated with two platens pressed the roughcast in the fixture. Surfaces of roughcast and
clamp were grinded to Ra0.5μm below to improve the clamping stiffness.
Block diagram of experimental device was shown in Fig.3. The dynamometer used in test was
KISTLER9257B. Dynamometer fixed to the machine table, and a dial indicator was used to find the
rotation center of impeller. Signal cable was connected from the dynamometer to the amplifier, and
through the data acquisition card the signal of force would be collect to the computer. The measured
test data was stored in the computer. Origin7.5 software was used for data processing.
Test process and test parameters. High-speed milling centers Mikron600U was used in the test.
25 # transformer oil was used as coolant in process (the same as the actual process). Tool was φ10 ball
milling. Type of the tool material was Zhuzhou YG6X. The cutter structure was 4 cutters ball-end
mill, with 12 °rake angle,14 ° clearance angle,40 ° spiral angle,2mm groove depth and
0.5mmedge width. The work-piece material was forging aging strengthened 2A70 aluminum alloy.
4-axis and 5-axis NC program were used in the test.
Test parameters of 4-axis tables and 5-axis were shown in Table 1. There were two main purposes
to select these parameters: process parameters should cover the actual parameters of manufacture;
constant feed per tooth was used to get the same volume of metal removed.
Table 1 Test parameter table
No. Spindle speed(r/min) Feed rate(mm/min)
1 10000 2000
2 15000 3000
3 20000 4000
4 25000 5000
210 Advanced Design and Manufacturing Technology I
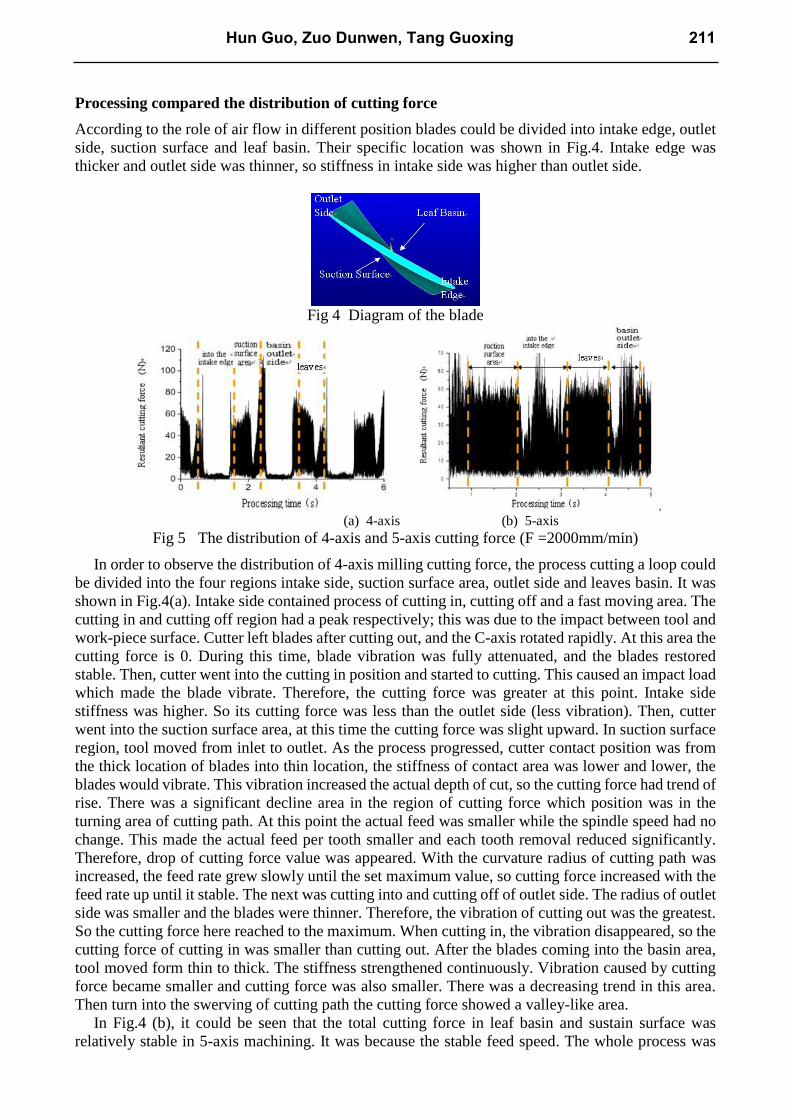
Processing compared the distribution of cutting force
According to the role of air flow in different position blades could be divided into intake edge, outlet
side, suction surface and leaf basin. Their specific location was shown in Fig.4. Intake edge was
thicker and outlet side was thinner, so stiffness in intake side was higher than outlet side.
Fig 4 Diagram of the blade
(a) 4-axis (b) 5-axis
Fig 5 The distribution of 4-axis and 5-axis cutting force (F =2000mm/min)
In order to observe the distribution of 4-axis milling cutting force, the process cutting a loop could
be divided into the four regions intake side, suction surface area, outlet side and leaves basin. It was
shown in Fig.4(a). Intake side contained process of cutting in, cutting off and a fast moving area. The
cutting in and cutting off region had a peak respectively; this was due to the impact between tool and
work-piece surface. Cutter left blades after cutting out, and the C-axis rotated rapidly. At this area the
cutting force is 0. During this time, blade vibration was fully attenuated, and the blades restored
stable. Then, cutter went into the cutting in position and started to cutting. This caused an impact load
which made the blade vibrate. Therefore, the cutting force was greater at this point. Intake side
stiffness was higher. So its cutting force was less than the outlet side (less vibration). Then, cutter
went into the suction surface area, at this time the cutting force was slight upward. In suction surface
region, tool moved from inlet to outlet. As the process progressed, cutter contact position was from
the thick location of blades into thin location, the stiffness of contact area was lower and lower, the
blades would vibrate. This vibration increased the actual depth of cut, so the cutting force had trend of
rise. There was a significant decline area in the region of cutting force which position was in the
turning area of cutting path. At this point the actual feed was smaller while the spindle speed had no
change. This made the actual feed per tooth smaller and each tooth removal reduced significantly.
Therefore, drop of cutting force value was appeared. With the curvature radius of cutting path was
increased, the feed rate grew slowly until the set maximum value, so cutting force increased with the
feed rate up until it stable. The next was cutting into and cutting off of outlet side. The radius of outlet
side was smaller and the blades were thinner. Therefore, the vibration of cutting out was the greatest.
So the cutting force here reached to the maximum. When cutting in, the vibration disappeared, so the
cutting force of cutting in was smaller than cutting out. After the blades coming into the basin area,
tool moved form thin to thick. The stiffness strengthened continuously. Vibration caused by cutting
force became smaller and cutting force was also smaller. There was a decreasing trend in this area.
Then turn into the swerving of cutting path the cutting force showed a valley-like area.
In Fig.4 (b), it could be seen that the total cutting force in leaf basin and sustain surface was
relatively stable in 5-axis machining. It was because the stable feed speed. The whole process was
Hun Guo, Zuo Dunwen, Tang Guoxing 211
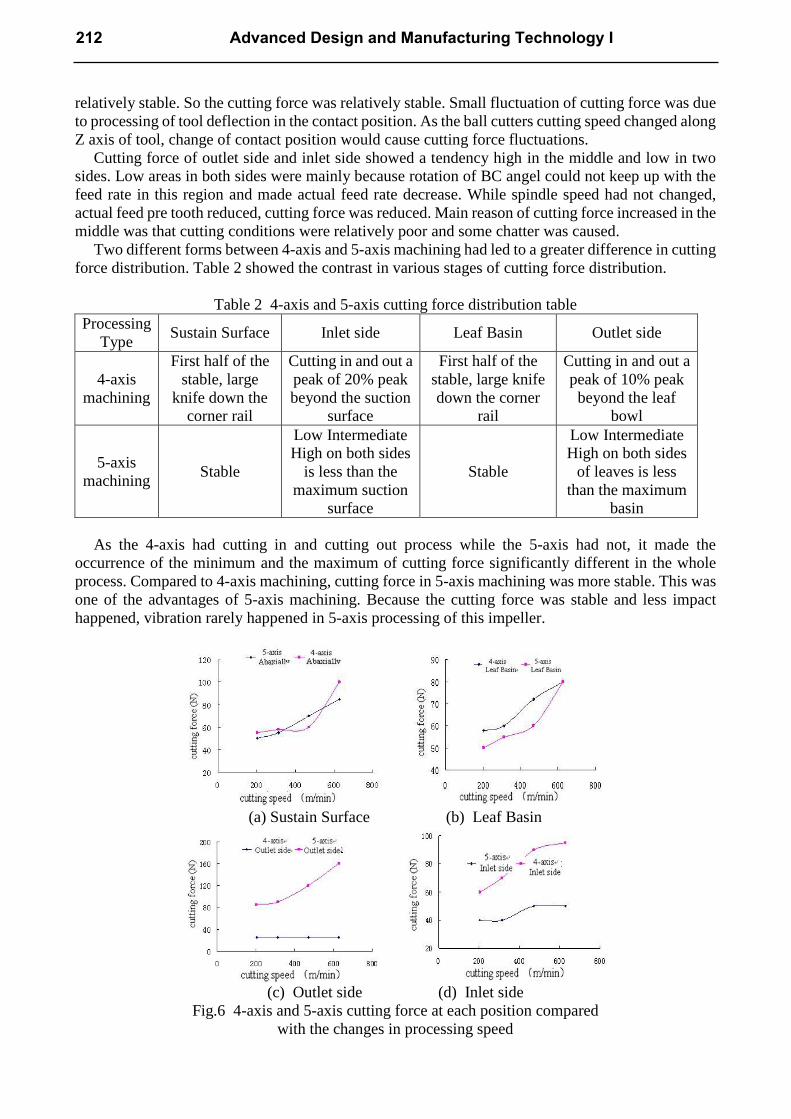
relatively stable. So the cutting force was relatively stable. Small fluctuation of cutting force was due
to processing of tool deflection in the contact position. As the ball cutters cutting speed changed along
Z axis of tool, change of contact position would cause cutting force fluctuations.
Cutting force of outlet side and inlet side showed a tendency high in the middle and low in two
sides. Low areas in both sides were mainly because rotation of BC angel could not keep up with the
feed rate in this region and made actual feed rate decrease. While spindle speed had not changed,
actual feed pre tooth reduced, cutting force was reduced. Main reason of cutting force increased in the
middle was that cutting conditions were relatively poor and some chatter was caused.
Two different forms between 4-axis and 5-axis machining had led to a greater difference in cutting
force distribution. Table 2 showed the contrast in various stages of cutting force distribution.
Table 2 4-axis and 5-axis cutting force distribution table
Processing
Type Sustain Surface Inlet side Leaf Basin Outlet side
4-axis
machining
First half of the
stable, large
knife down the
corner rail
Cutting in and out a
peak of 20% peak
beyond the suction
surface
First half of the
stable, large knife
down the corner
rail
Cutting in and out a
peak of 10% peak
beyond the leaf
bowl
5-axis
machining Stable
Low Intermediate High on both sides
is less than the
maximum suction
surface
Stable
Low Intermediate High on both sides
of leaves is less
than the maximum
basin
As the 4-axis had cutting in and cutting out process while the 5-axis had not, it made the
occurrence of the minimum and the maximum of cutting force significantly different in the whole
process. Compared to 4-axis machining, cutting force in 5-axis machining was more stable. This was
one of the advantages of 5-axis machining. Because the cutting force was stable and less impact
happened, vibration rarely happened in 5-axis processing of this impeller.
(a) Sustain Surface (b) Leaf Basin
(c) Outlet side (d) Inlet side
Fig.6 4-axis and 5-axis cutting force at each position compared
with the changes in processing speed
212 Advanced Design and Manufacturing Technology I
Comparison of changed cutting force with feed rate in different regions
Change of cutting force in every area with speed increased was shown in Fig.6. Cutting force in
suction surface and basin region of blade, 4-axis was no obvious different with 5-axis. But with the
increasing of cutting speed, 4-axis machining in the suction surface and basin region had faster rise.
In the blade edge region, whether in intake side or in outlet side, cutting force of 4-axis was greater
than that in 5-axis. It was because in the process of cutting in and cutting out, there was an impact. So
the cutting force in 4-axis increased significantly. The impact increased with speed increased.
By vibration analysis we found that in 400m/min-650m/min area the processing parameters were
used in this experiment which was the critical region of the vibration. It caused cutting force risen in
both blade basin and suction surface area [3].
5-axis cutting force of blade edges did not change. Because tool path in the blade side were the
turning regions, the actual feed rate in this area would be lower with the limitation of rotation axis
speed. These phenomena would not change with feed rate increased.
Conclusion
Two different forms between 4-axis and 5-axis machining had led to their cutting forces were quite
different. In 4-axis machining process, the fluctuations of cutting force were larger. That’s because
the tool path turn made the feed speed lower and cutting in and cutting off during 4-axis machining.
These changes of cutting force could cause instability. In 5-axis machining process, the cutting force
was relatively stable, especially in the suction surface and blade basin area. While in leaf edge region,
the cutting force had a greater change. It was mainly due to the changed feed rate. In leaf and suction
surface area, the cutting force increased with the cutting speed. While in the leaf edge because of
capacity constraints, the cutting force increased smaller with cutting speed.
Compared to 4-axis, the cutting force of 5-axis was much more smooth. There was no impact of
cutting force in 5-axis machining, so it was much more suitable for blade processing.
Acknowledgment
This research is supported by National S&T Major Project (Grant No. 2010ZX04016-012), Key (Key
grant) Project of Chinese Ministry of Education (Grant No. 209036), Key Project of Chinese
Education Department (Grant No. 1151gzd20) and Scientific Research Fund of Heilongjiang
Provincial Education Department (Grant No. 11551431).
References
[1] Duc E, Lartigue C, Laporte S.Assessment of the description format of tool trajectories in 3-axis
HSM of sculptured surfaces. Third International German and French Conference on High Speed
Machining, Metz (France), 27-29 June, 2001.
[2] C. Lartigue, E.Duc, A. Affouard: Computer-Aided Design Vol.35 (2003), p.375-382.
[3] Fleisig RV, Spence AD: Compute-Aided Des Vol.33 (2001), p.1-15.
Hun Guo, Zuo Dunwen, Tang Guoxing 213
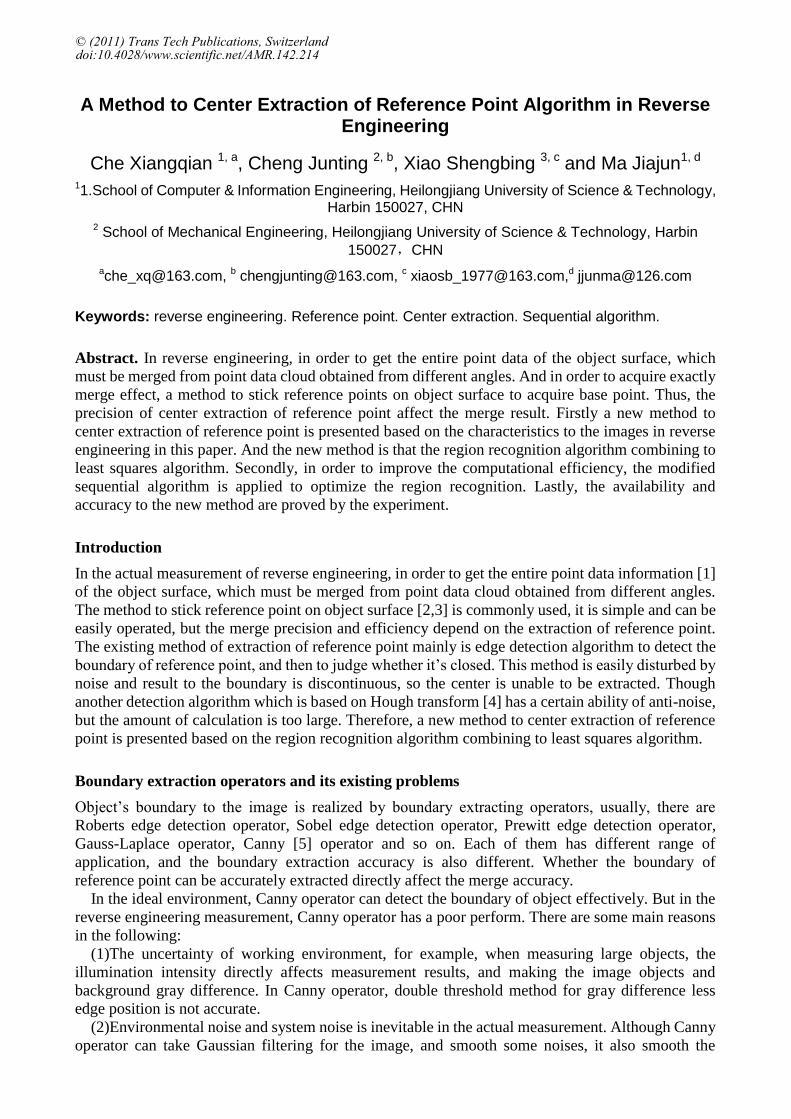
A Method to Center Extraction of Reference Point Algorithm in Reverse Engineering
Che Xiangqian 1, a, Cheng Junting 2, b, Xiao Shengbing 3, c and Ma Jiajun1, d
11.School of Computer & Information Engineering, Heilongjiang University of Science & Technology, Harbin 150027, CHN
2 School of Mechanical Engineering, Heilongjiang University of Science & Technology, Harbin
150027,CHN
[email protected], b [email protected], c [email protected],d [email protected]
Keywords: reverse engineering. Reference point. Center extraction. Sequential algorithm.
Abstract. In reverse engineering, in order to get the entire point data of the object surface, which
must be merged from point data cloud obtained from different angles. And in order to acquire exactly
merge effect, a method to stick reference points on object surface to acquire base point. Thus, the
precision of center extraction of reference point affect the merge result. Firstly a new method to
center extraction of reference point is presented based on the characteristics to the images in reverse
engineering in this paper. And the new method is that the region recognition algorithm combining to
least squares algorithm. Secondly, in order to improve the computational efficiency, the modified
sequential algorithm is applied to optimize the region recognition. Lastly, the availability and
accuracy to the new method are proved by the experiment.
Introduction
In the actual measurement of reverse engineering, in order to get the entire point data information [1]
of the object surface, which must be merged from point data cloud obtained from different angles.
The method to stick reference point on object surface [2,3] is commonly used, it is simple and can be
easily operated, but the merge precision and efficiency depend on the extraction of reference point.
The existing method of extraction of reference point mainly is edge detection algorithm to detect the
boundary of reference point, and then to judge whether it’s closed. This method is easily disturbed by
noise and result to the boundary is discontinuous, so the center is unable to be extracted. Though
another detection algorithm which is based on Hough transform [4] has a certain ability of anti-noise,
but the amount of calculation is too large. Therefore, a new method to center extraction of reference
point is presented based on the region recognition algorithm combining to least squares algorithm.
Boundary extraction operators and its existing problems
Object’s boundary to the image is realized by boundary extracting operators, usually, there are
Roberts edge detection operator, Sobel edge detection operator, Prewitt edge detection operator,
Gauss-Laplace operator, Canny [5] operator and so on. Each of them has different range of
application, and the boundary extraction accuracy is also different. Whether the boundary of
reference point can be accurately extracted directly affect the merge accuracy.
In the ideal environment, Canny operator can detect the boundary of object effectively. But in the
reverse engineering measurement, Canny operator has a poor perform. There are some main reasons
in the following:
(1)The uncertainty of working environment, for example, when measuring large objects, the
illumination intensity directly affects measurement results, and making the image objects and
background gray difference. In Canny operator, double threshold method for gray difference less
edge position is not accurate.
(2)Environmental noise and system noise is inevitable in the actual measurement. Although Canny
operator can take Gaussian filtering for the image, and smooth some noises, it also smooth the
© (2011) Trans Tech Publications, Switzerlanddoi:10.4028/www.scientific.net/AMR.142.214
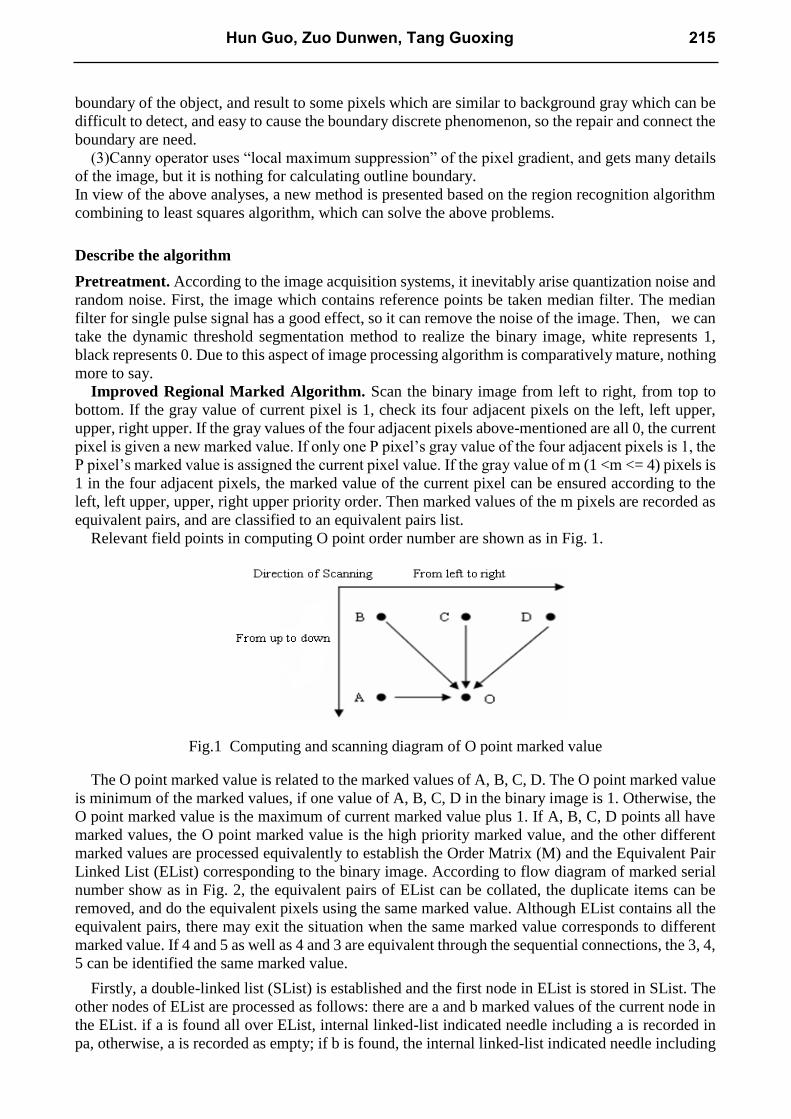
boundary of the object, and result to some pixels which are similar to background gray which can be
difficult to detect, and easy to cause the boundary discrete phenomenon, so the repair and connect the
boundary are need.
(3)Canny operator uses “local maximum suppression” of the pixel gradient, and gets many details
of the image, but it is nothing for calculating outline boundary.
In view of the above analyses, a new method is presented based on the region recognition algorithm
combining to least squares algorithm, which can solve the above problems.
Describe the algorithm
Pretreatment. According to the image acquisition systems, it inevitably arise quantization noise and
random noise. First, the image which contains reference points be taken median filter. The median
filter for single pulse signal has a good effect, so it can remove the noise of the image. Then, we can
take the dynamic threshold segmentation method to realize the binary image, white represents 1,
black represents 0. Due to this aspect of image processing algorithm is comparatively mature, nothing
more to say.
Improved Regional Marked Algorithm. Scan the binary image from left to right, from top to
bottom. If the gray value of current pixel is 1, check its four adjacent pixels on the left, left upper,
upper, right upper. If the gray values of the four adjacent pixels above-mentioned are all 0, the current
pixel is given a new marked value. If only one P pixel’s gray value of the four adjacent pixels is 1, the
P pixel’s marked value is assigned the current pixel value. If the gray value of m (1 <m <= 4) pixels is
1 in the four adjacent pixels, the marked value of the current pixel can be ensured according to the
left, left upper, upper, right upper priority order. Then marked values of the m pixels are recorded as
equivalent pairs, and are classified to an equivalent pairs list.
Relevant field points in computing O point order number are shown as in Fig. 1.
Fig.1 Computing and scanning diagram of O point marked value
The O point marked value is related to the marked values of A, B, C, D. The O point marked value
is minimum of the marked values, if one value of A, B, C, D in the binary image is 1. Otherwise, the
O point marked value is the maximum of current marked value plus 1. If A, B, C, D points all have
marked values, the O point marked value is the high priority marked value, and the other different
marked values are processed equivalently to establish the Order Matrix (M) and the Equivalent Pair
Linked List (EList) corresponding to the binary image. According to flow diagram of marked serial
number show as in Fig. 2, the equivalent pairs of EList can be collated, the duplicate items can be
removed, and do the equivalent pixels using the same marked value. Although EList contains all the
equivalent pairs, there may exit the situation when the same marked value corresponds to different
marked value. If 4 and 5 as well as 4 and 3 are equivalent through the sequential connections, the 3, 4,
5 can be identified the same marked value.
Firstly, a double-linked list (SList) is established and the first node in EList is stored in SList. The
other nodes of EList are processed as follows: there are a and b marked values of the current node in
the EList. if a is found all over EList, internal linked-list indicated needle including a is recorded in
pa, otherwise, a is recorded as empty; if b is found, the internal linked-list indicated needle including
Hun Guo, Zuo Dunwen, Tang Guoxing 215
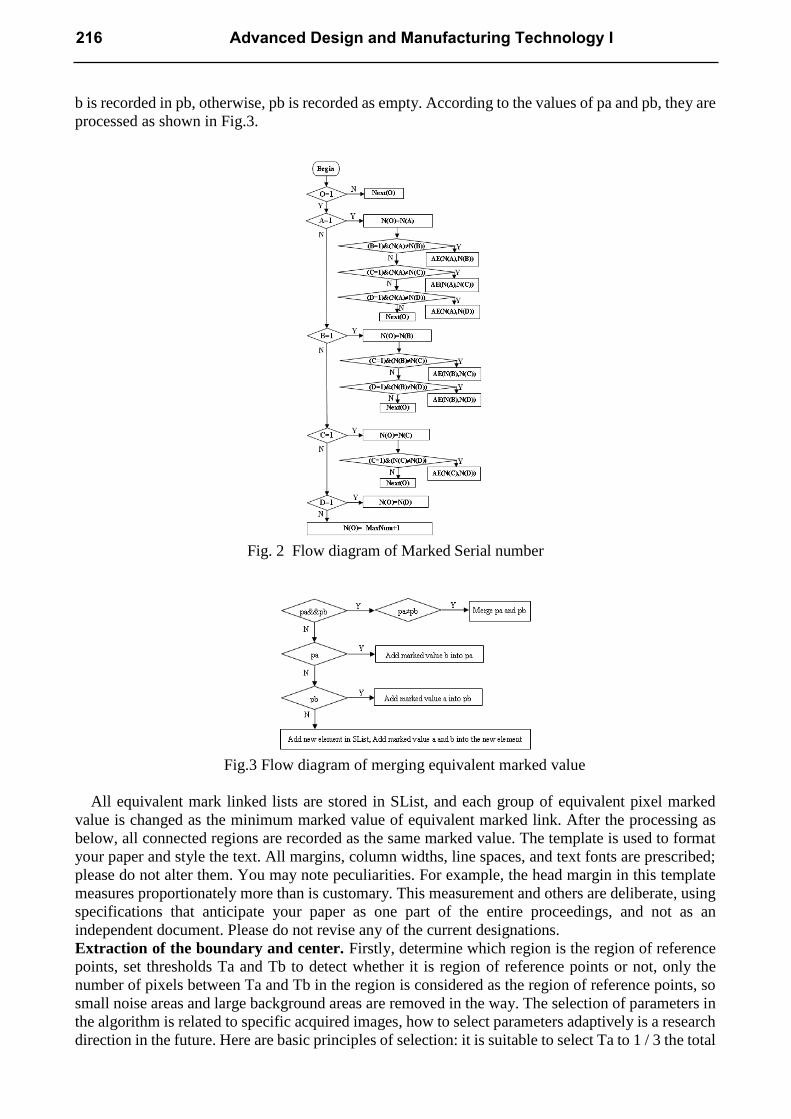
b is recorded in pb, otherwise, pb is recorded as empty. According to the values of pa and pb, they are
processed as shown in Fig.3.
Fig. 2 Flow diagram of Marked Serial number
Fig.3 Flow diagram of merging equivalent marked value
All equivalent mark linked lists are stored in SList, and each group of equivalent pixel marked
value is changed as the minimum marked value of equivalent marked link. After the processing as
below, all connected regions are recorded as the same marked value. The template is used to format
your paper and style the text. All margins, column widths, line spaces, and text fonts are prescribed;
please do not alter them. You may note peculiarities. For example, the head margin in this template
measures proportionately more than is customary. This measurement and others are deliberate, using
specifications that anticipate your paper as one part of the entire proceedings, and not as an
independent document. Please do not revise any of the current designations.
Extraction of the boundary and center. Firstly, determine which region is the region of reference
points, set thresholds Ta and Tb to detect whether it is region of reference points or not, only the
number of pixels between Ta and Tb in the region is considered as the region of reference points, so
small noise areas and large background areas are removed in the way. The selection of parameters in
the algorithm is related to specific acquired images, how to select parameters adaptively is a research
direction in the future. Here are basic principles of selection: it is suitable to select Ta to 1 / 3 the total
216 Advanced Design and Manufacturing Technology I
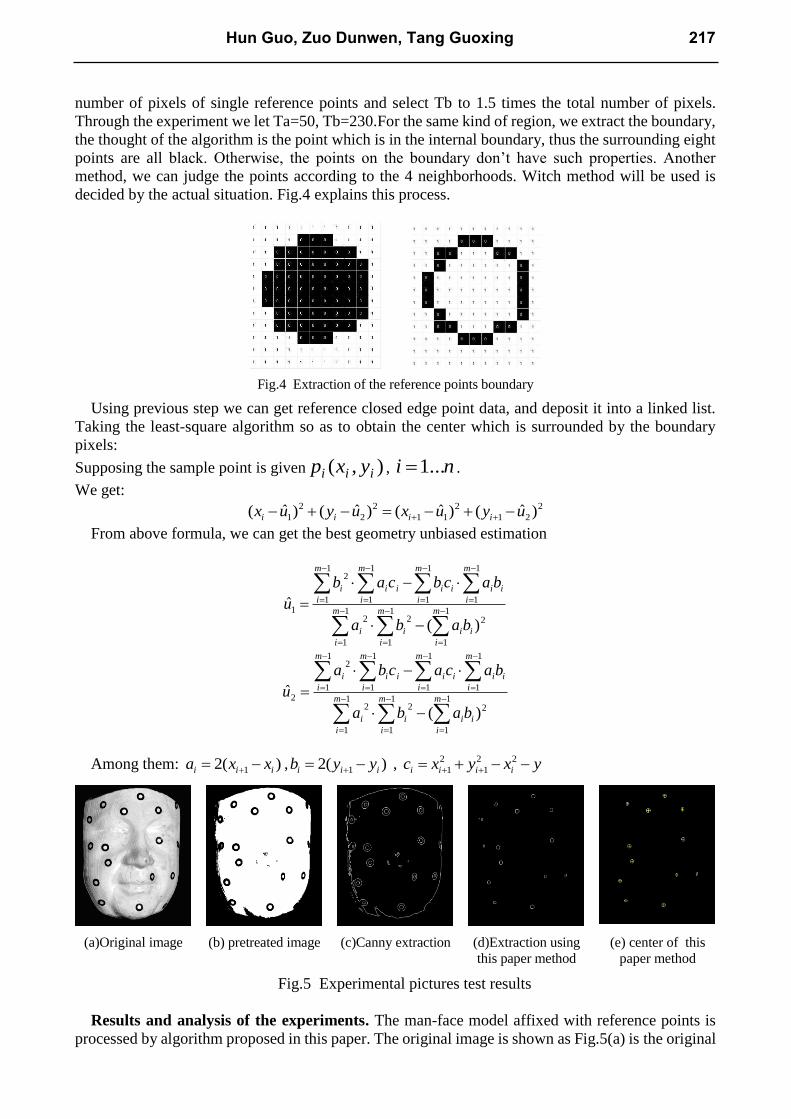
number of pixels of single reference points and select Tb to 1.5 times the total number of pixels.
Through the experiment we let Ta=50, Tb=230.For the same kind of region, we extract the boundary,
the thought of the algorithm is the point which is in the internal boundary, thus the surrounding eight
points are all black. Otherwise, the points on the boundary don’t have such properties. Another
method, we can judge the points according to the 4 neighborhoods. Witch method will be used is
decided by the actual situation. Fig.4 explains this process.
Fig.4 Extraction of the reference points boundary
Using previous step we can get reference closed edge point data, and deposit it into a linked list.
Taking the least-square algorithm so as to obtain the center which is surrounded by the boundary
pixels:
Supposing the sample point is given ),( iii yxp , ni ...1 .
We get: 2
21
2
11
2
2
2
1 )ˆ()ˆ()ˆ()ˆ( uyuxuyux iiii
From above formula, we can get the best geometry unbiased estimation
1
1
21
1
21
1
2
1
1
1
1
1
1
1
1
2
1
)(
ˆm
i
ii
m
i
i
m
i
i
m
i
m
i
iiii
m
i
ii
m
i
i
baba
bacbcab
u
1
1
21
1
21
1
2
1
1
1
1
1
1
1
1
2
2
)(
ˆm
i
ii
m
i
i
m
i
i
m
i
m
i
iiii
m
i
ii
m
i
i
baba
bacacba
u
Among them: )(2 1 iii xxa , )(2 1 iii yyb , yxyxc iiii
22
1
2
1
(a)Original image (b) pretreated image (c)Canny extraction (d)Extraction using
this paper method (e) center of this
paper method
Fig.5 Experimental pictures test results
Results and analysis of the experiments. The man-face model affixed with reference points is
processed by algorithm proposed in this paper. The original image is shown as Fig.5(a) is the original
Hun Guo, Zuo Dunwen, Tang Guoxing 217

image, Fig.5(b) is the image after pretreatment, Fig.5(c) is the image after extraction of Canny
boundary, as can be seen from the Fig., in some individual rounds, there are existing virtual connect
and boundary faults. As shown in the bottom of Fig. 5(c), there are two reference points, and the
reference points on the edge of the tested object do not extract the closed circle. With the method of
this paper, the obtained boundary is shown as Fig. 5(d), from the experiment result, even if a part of
the reference points are light upon, it also can be measured. As seen from Fig. 5(d), the upright and
the bottom reference points are not completely collected because of in the boundary of the tested
object, the points as like above are easily become public reference points when transforming the
analyze. If they were lost, it will influence the merging result. Compared with the Canny boundary
extraction algorithm, the reference point boundary detected by this algorithm do not have breakpoint,
and because it doesn’t produce double circle and more easily. Fig.5 (e) shows the result using the
method of this paper.
Summary
In this paper, a new method to center extraction of reference point is given based on the region
recognition algorithm combining to least squares algorithm. This algorithm gives a very good
solution to center extraction of reference point in reverse engineering, making the point cloud merge
more accurate. In addition, this algorithm ensures the accuracy of the center extraction, and achieves
the desired results. Experiments have proved that this algorithm can measure all the reference points,
and this algorithm is efficient and accurate, also, it meets the needs of merging in reverse engineering.
Acknowledgment
The authors are grateful for the financial support by the Key Project of Chinese Ministry of Education (No.210065) and Startup Fund for Distinguished Scholars of Heilongjiang University of Science &
Technology (05-26) and Science and Technology Innovation Talents of Harbin (NO.
2008RFQXG110)
References
[1] Chitra Dorai,Member. Pattern Analysis and Machine Intelligence, Vol. 20(1998) No.1, pp: 83-89
[2] Richard P. IEEE Trans on Image Processing, Vol. 4(1995) No.3, pp: 554-568
[3] Jodoin M, Mignotte M. Proc of the 11th IEEE International Conference on Image Processing.
Singapore, ingapore, (2004), pp: 2591-2594
[4] Cooper, G.R.J. Computers & Geosciensces, Vol. 32 (2006) No.10, pp: 1592-1599
[5] Canny J. IEEE Trans on Pattern Analysis and Machine Inteligence, Vol.8 (1986) No.6, pp:
679-698
218 Advanced Design and Manufacturing Technology I

Optimal Design of Flexible Manufacturing System based on Optical Measurement Principle
Wang Shaosheng a, He Wantaob, Liu Rongbinc and Cheng Juntingd
Modern Manufacture Engineering Center of Heilongjiang Institute of Science & Technology, Harbin, Heilongjiang Province, China
[email protected], [email protected], [email protected], [email protected]
Keywords: FMS, material recognition, grating, three-dimensional measuring.
Abstract. The material recognition and size measuring cell is very important for the development and
practicability of flexible manufacturing system (FMS). However, the existing FMS mostly recognize
the two-dimensional shape of the workpiece, measure the one- dimensional shape of the finishing
product. This greatly limits the performance of FMS. In this paper, these cells have been optimally
designed to identify and measure the three-dimensional shape of the workpiece based on the optical
measurement principle. The method has the advantage at robust recognition rate and high recognition
quality.
Introduction
With economic integration, global competition and demand diversification, the traditional
manufacturing system can not meet the market demand for more variety and small batch production
[1-2]. The traditional mass production way was changed. The era of mass production is gradually
replaced by manufacture system that adapt to changing market dynamics. Therefore, flexible
manufacturing system is become more and more important in recently. Based on the development
prospect of the flexible manufacture system, many universities as for culture engineer for the society
have been have the systems for teaching demonstration. Those systems mainly consist by CNC
machining equipment, material storage, material identification and corresponding computer control
system including lathe, vertical milling machining center, warehouse, 3-AXIS two-finger robot, no
rail transport car and transport systems.
At present, the material identification and measuring module of FMS development for teaching can
only identify the two-dimensional shape and measuring the one-dimensional size of final and
semifinished products. This will hinder the advantages of flexible manufacturing systems. Based on
the above situation, this paper presents an optimal design method for a teaching flexible
manufacturing system that was made by Germany. This method is based on the principle of grating
projection measurement. The optimal designed system can recognize the three-dimensional shape of
objects and measure the three-dimension size non-contact the parts.
The system hardware transformation The flexible manufacturing systems of material
identification testing devices have a CCD camera, so we use original CCD camera, using structure
grating projection principle to optimize transformation, which can identify and 3D object detection.
Basic principle. The principle of grating projection measuring technology is to project the
sinusoidal fringe pattern on the measured object, then to grab the fringe pattern which is distorted by
the measured object through the CCD camera. Through analysis the distorted fringe pattern to
calculate the wrapping phase, then unwrapping the phase and calibration the system to obtain the 3D
geometry information [3-5].
The hardware of optimized system. The optimized system is increased a digital projection video
to project the sinusoidal fringe pattern on the measured object. The increased projection video and the
CCD camera of the system having are made up of the material identification and measuring module
teaching FMS which can recognize 3D shape and measure the 3D geometry size. The block diagram
of the optimized system is shown in Fig.1.
© (2011) Trans Tech Publications, Switzerlanddoi:10.4028/www.scientific.net/AMR.142.219
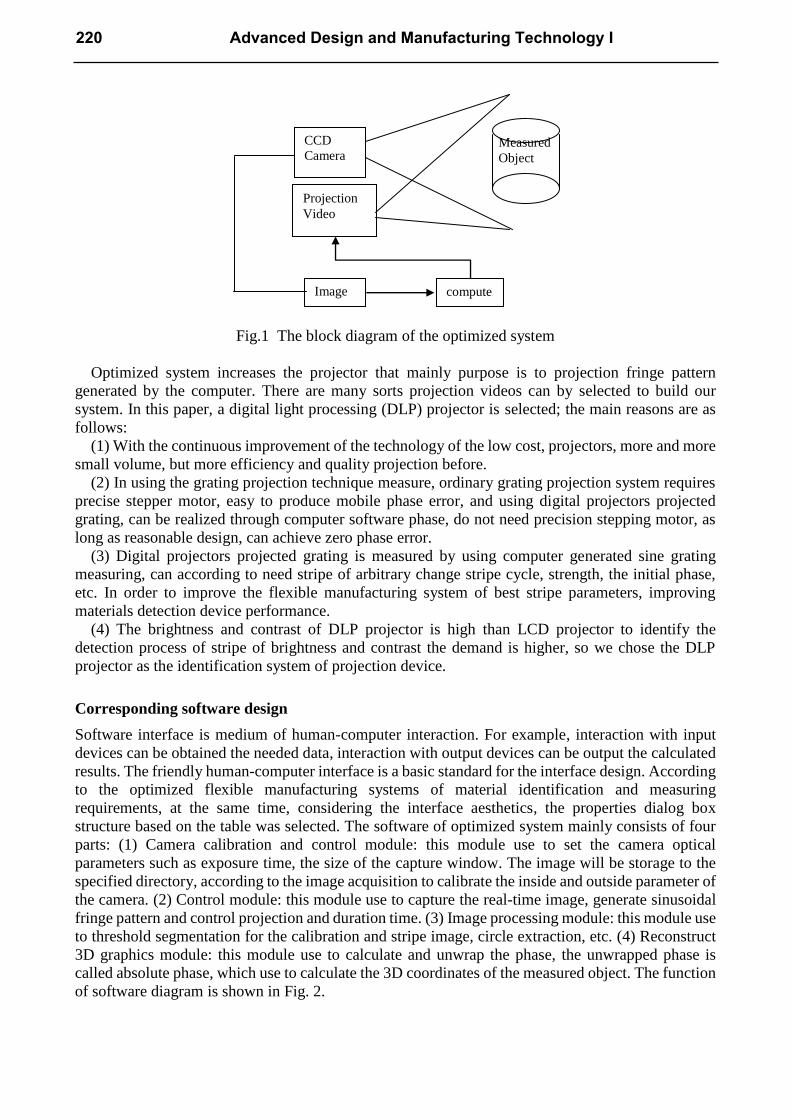
Fig.1 The block diagram of the optimized system
Optimized system increases the projector that mainly purpose is to projection fringe pattern
generated by the computer. There are many sorts projection videos can by selected to build our
system. In this paper, a digital light processing (DLP) projector is selected; the main reasons are as
follows:
(1) With the continuous improvement of the technology of the low cost, projectors, more and more
small volume, but more efficiency and quality projection before.
(2) In using the grating projection technique measure, ordinary grating projection system requires
precise stepper motor, easy to produce mobile phase error, and using digital projectors projected
grating, can be realized through computer software phase, do not need precision stepping motor, as
long as reasonable design, can achieve zero phase error.
(3) Digital projectors projected grating is measured by using computer generated sine grating
measuring, can according to need stripe of arbitrary change stripe cycle, strength, the initial phase,
etc. In order to improve the flexible manufacturing system of best stripe parameters, improving
materials detection device performance.
(4) The brightness and contrast of DLP projector is high than LCD projector to identify the
detection process of stripe of brightness and contrast the demand is higher, so we chose the DLP
projector as the identification system of projection device.
Corresponding software design
Software interface is medium of human-computer interaction. For example, interaction with input
devices can be obtained the needed data, interaction with output devices can be output the calculated
results. The friendly human-computer interface is a basic standard for the interface design. According
to the optimized flexible manufacturing systems of material identification and measuring
requirements, at the same time, considering the interface aesthetics, the properties dialog box
structure based on the table was selected. The software of optimized system mainly consists of four
parts: (1) Camera calibration and control module: this module use to set the camera optical
parameters such as exposure time, the size of the capture window. The image will be storage to the
specified directory, according to the image acquisition to calibrate the inside and outside parameter of
the camera. (2) Control module: this module use to capture the real-time image, generate sinusoidal
fringe pattern and control projection and duration time. (3) Image processing module: this module use
to threshold segmentation for the calibration and stripe image, circle extraction, etc. (4) Reconstruct
3D graphics module: this module use to calculate and unwrap the phase, the unwrapped phase is
called absolute phase, which use to calculate the 3D coordinates of the measured object. The function
of software diagram is shown in Fig. 2.
Measured
Object
CCD
Camera
Projection
Video
Image
acquisit
ion图
象采集
compute
r计算机
220 Advanced Design and Manufacturing Technology I
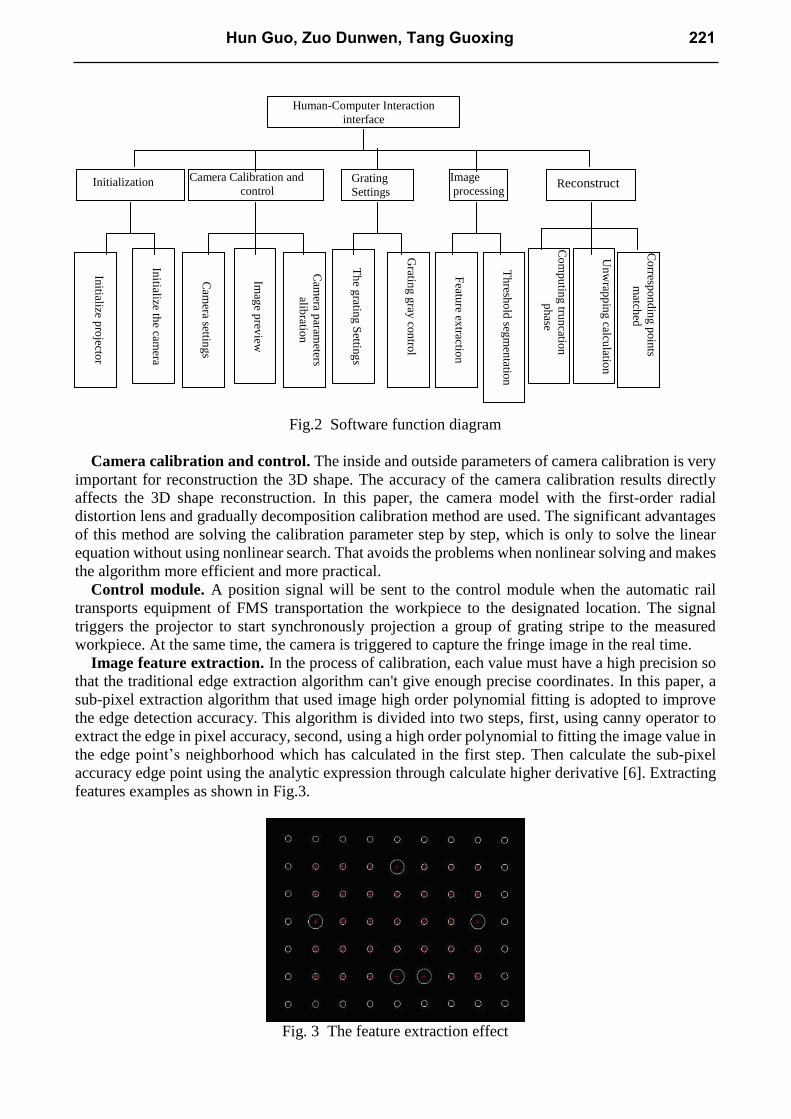
Fig.2 Software function diagram
Camera calibration and control. The inside and outside parameters of camera calibration is very
important for reconstruction the 3D shape. The accuracy of the camera calibration results directly affects the 3D shape reconstruction. In this paper, the camera model with the first-order radial
distortion lens and gradually decomposition calibration method are used. The significant advantages
of this method are solving the calibration parameter step by step, which is only to solve the linear
equation without using nonlinear search. That avoids the problems when nonlinear solving and makes
the algorithm more efficient and more practical.
Control module. A position signal will be sent to the control module when the automatic rail
transports equipment of FMS transportation the workpiece to the designated location. The signal
triggers the projector to start synchronously projection a group of grating stripe to the measured
workpiece. At the same time, the camera is triggered to capture the fringe image in the real time.
Image feature extraction. In the process of calibration, each value must have a high precision so
that the traditional edge extraction algorithm can't give enough precise coordinates. In this paper, a
sub-pixel extraction algorithm that used image high order polynomial fitting is adopted to improve
the edge detection accuracy. This algorithm is divided into two steps, first, using canny operator to
extract the edge in pixel accuracy, second, using a high order polynomial to fitting the image value in
the edge point’s neighborhood which has calculated in the first step. Then calculate the sub-pixel
accuracy edge point using the analytic expression through calculate higher derivative [6]. Extracting
features examples as shown in Fig.3.
Fig. 3 The feature extraction effect
Initialize th
e camera
Imag
e prev
iew
Th
e gratin
g S
etting
s
Co
mp
utin
g tru
ncatio
n
ph
ase
Un
wrap
pin
g calcu
lation
Human-Computer Interaction
interface
Initialization Camera Calibration and
control Grating
Settings
Image
processing Reconstruct
Initialize p
rojecto
r
Cam
era setting
s
Cam
era param
eters
alibratio
n
Gratin
g g
ray co
ntro
l
Featu
re extractio
n
Th
resho
ld seg
men
tation
Co
rrespon
din
g p
oin
ts
match
ed
Hun Guo, Zuo Dunwen, Tang Guoxing 221
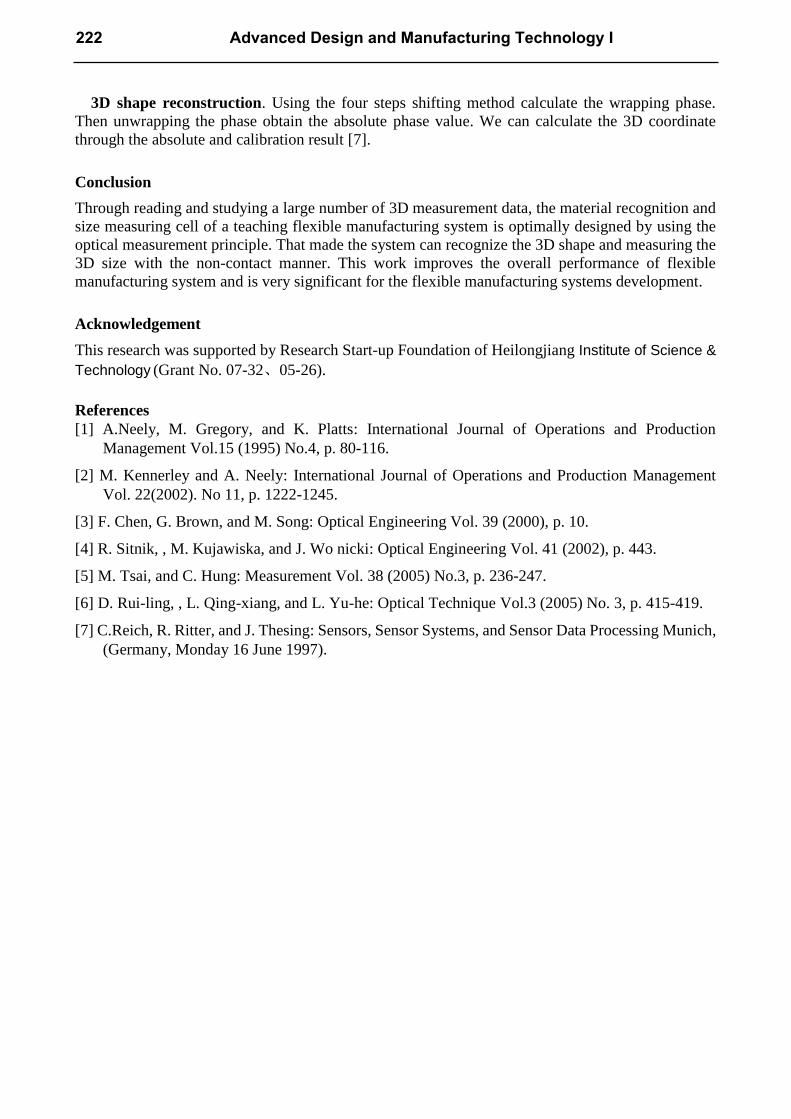
3D shape reconstruction. Using the four steps shifting method calculate the wrapping phase.
Then unwrapping the phase obtain the absolute phase value. We can calculate the 3D coordinate
through the absolute and calibration result [7].
Conclusion
Through reading and studying a large number of 3D measurement data, the material recognition and
size measuring cell of a teaching flexible manufacturing system is optimally designed by using the
optical measurement principle. That made the system can recognize the 3D shape and measuring the
3D size with the non-contact manner. This work improves the overall performance of flexible
manufacturing system and is very significant for the flexible manufacturing systems development.
Acknowledgement
This research was supported by Research Start-up Foundation of Heilongjiang Institute of Science &
Technology (Grant No. 07-32、05-26).
References
[1] A.Neely, M. Gregory, and K. Platts: International Journal of Operations and Production
Management Vol.15 (1995) No.4, p. 80-116.
[2] M. Kennerley and A. Neely: International Journal of Operations and Production Management
Vol. 22(2002). No 11, p. 1222-1245.
[3] F. Chen, G. Brown, and M. Song: Optical Engineering Vol. 39 (2000), p. 10.
[4] R. Sitnik, , M. Kujawiska, and J. Wo nicki: Optical Engineering Vol. 41 (2002), p. 443.
[5] M. Tsai, and C. Hung: Measurement Vol. 38 (2005) No.3, p. 236-247.
[6] D. Rui-ling, , L. Qing-xiang, and L. Yu-he: Optical Technique Vol.3 (2005) No. 3, p. 415-419.
[7] C.Reich, R. Ritter, and J. Thesing: Sensors, Sensor Systems, and Sensor Data Processing Munich,
(Germany, Monday 16 June 1997).
222 Advanced Design and Manufacturing Technology I
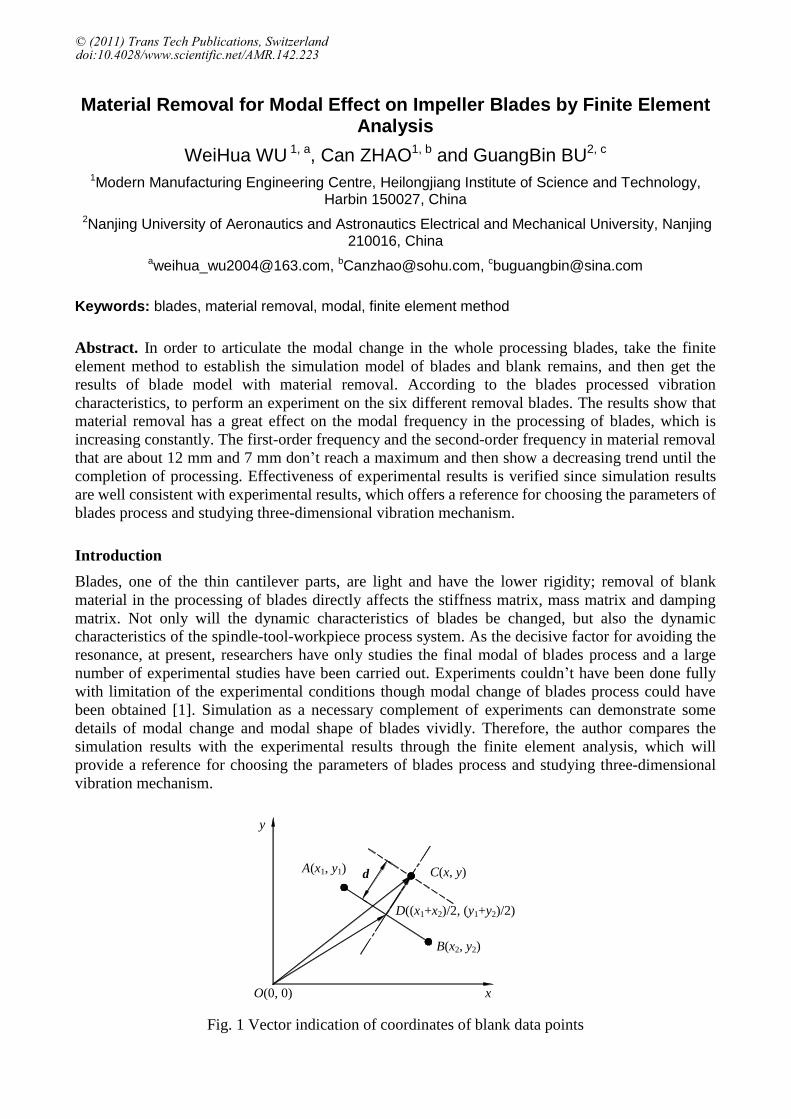
Material Removal for Modal Effect on Impeller Blades by Finite Element Analysis
WeiHua WU 1, a, Can ZHAO1, b and GuangBin BU2, c 1Modern Manufacturing Engineering Centre, Heilongjiang Institute of Science and Technology,
Harbin 150027, China
2Nanjing University of Aeronautics and Astronautics Electrical and Mechanical University, Nanjing 210016, China
[email protected], [email protected], [email protected]
Keywords: blades, material removal, modal, finite element method
Abstract. In order to articulate the modal change in the whole processing blades, take the finite
element method to establish the simulation model of blades and blank remains, and then get the
results of blade model with material removal. According to the blades processed vibration
characteristics, to perform an experiment on the six different removal blades. The results show that material removal has a great effect on the modal frequency in the processing of blades, which is
increasing constantly. The first-order frequency and the second-order frequency in material removal
that are about 12 mm and 7 mm don’t reach a maximum and then show a decreasing trend until the
completion of processing. Effectiveness of experimental results is verified since simulation results
are well consistent with experimental results, which offers a reference for choosing the parameters of
blades process and studying three-dimensional vibration mechanism.
Introduction
Blades, one of the thin cantilever parts, are light and have the lower rigidity; removal of blank
material in the processing of blades directly affects the stiffness matrix, mass matrix and damping
matrix. Not only will the dynamic characteristics of blades be changed, but also the dynamic characteristics of the spindle-tool-workpiece process system. As the decisive factor for avoiding the
resonance, at present, researchers have only studies the final modal of blades process and a large
number of experimental studies have been carried out. Experiments couldn’t have been done fully
with limitation of the experimental conditions though modal change of blades process could have
been obtained [1]. Simulation as a necessary complement of experiments can demonstrate some
details of modal change and modal shape of blades vividly. Therefore, the author compares the
simulation results with the experimental results through the finite element analysis, which will
provide a reference for choosing the parameters of blades process and studying three-dimensional
vibration mechanism.
x
C(x, y)
y
O(0, 0)
A(x1, y1)
B(x2, y2)
d
D((x1+x2)/2, (y1+y2)/2)
Fig. 1 Vector indication of coordinates of blank data points
© (2011) Trans Tech Publications, Switzerlanddoi:10.4028/www.scientific.net/AMR.142.223

Foundation of finite element modal
Algorithm calculating rough points. Taking into account of the dense blade data, the distance of
two points in the vertical line is taken as data points of blank remains, and it is available to obtain
coordinates of blank data points by vector, such as the known point A and point B, then to get the
coordinates of point C, as shown Fig. 1.
The z value of data points in the same plane is not different without considering its calculation, so
the real problem is the two-dimensional plane. The midpoint of AB is D point, length of CD is blank
remain d. It can be known from Fig. 1 that vector can be taken as a unit vector and vector-length
product, vector OD and DC is vectors OC, vector DC is perpendicular to vector AB, the vector OD is
OD=
2,
2
2121 yyxx, (1)
A Vector which parallels with vector DC is perpendicular to vector AB, so the slope of vector AB is
K = (y2-y1) / (x2-x1), (2)
The slope perpendicular to it is K ', K * K' =- 1, so:
K '= (x1-x2) / (y2-y1), (3)
Vector a that consists of original point O and point (y2-y1, x1-x2) parallel with vector DC, the
diameter of vector a is,
221
2
12 xxyyR , (4)
Vector a standardizes vector b:
R
xx
R
yy 2112 ,b , (5)
Vector DC can be expressed as the product of the standard vector b and d, and the point may be above
or below the line, so
DC=±d*b=±d*
R
xx
R
yy 2112 , =±
R
xx
R
yy 2112 *,* dd , (6)
Vector OC and vector DC is vector OD:
OC=OD+DC=
2,
2
2121 yyxx±
R
xx
R
yy 2112 *,* dd =
R
xxyy
R
yyxx 21211221 *2
,*2
dd . (7)
Therefore, to select a minus according to the actual situation, coordinate of D point is x and y:
Fig. 2 Blades and blank modal Fig. 3 Mesh
Reading data
files
Removing blank
remains gradually
Obtaining Vibration
frequencies and shapes
Founding blades and
blank modals
Fig. 4 Finite element analysis
224 Advanced Design and Manufacturing Technology I
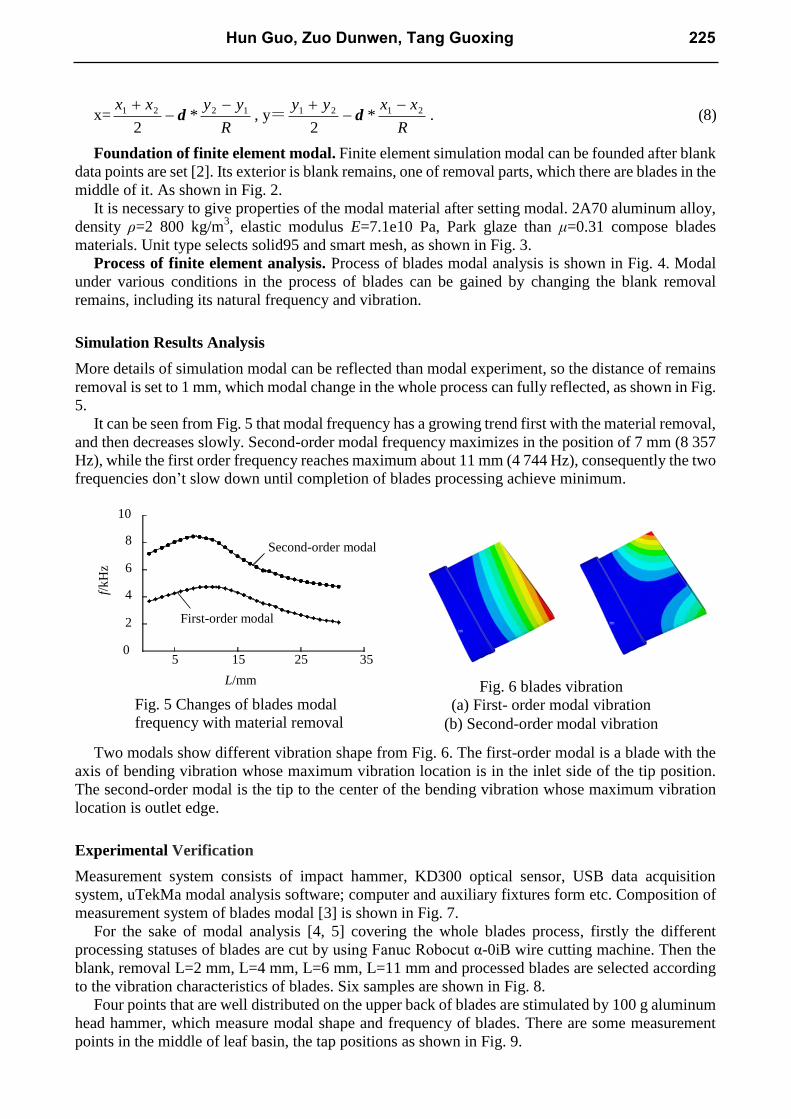
x=R
yyxx 1221 *2
d , y=
R
xxyy 2121 *2
d . (8)
Foundation of finite element modal. Finite element simulation modal can be founded after blank
data points are set [2]. Its exterior is blank remains, one of removal parts, which there are blades in the
middle of it. As shown in Fig. 2.
It is necessary to give properties of the modal material after setting modal. 2A70 aluminum alloy,
density ρ=2 800 kg/m3, elastic modulus E=7.1e10 Pa, Park glaze than μ=0.31 compose blades
materials. Unit type selects solid95 and smart mesh, as shown in Fig. 3.
Process of finite element analysis. Process of blades modal analysis is shown in Fig. 4. Modal
under various conditions in the process of blades can be gained by changing the blank removal
remains, including its natural frequency and vibration.
Simulation Results Analysis
More details of simulation modal can be reflected than modal experiment, so the distance of remains
removal is set to 1 mm, which modal change in the whole process can fully reflected, as shown in Fig.
5.
It can be seen from Fig. 5 that modal frequency has a growing trend first with the material removal,
and then decreases slowly. Second-order modal frequency maximizes in the position of 7 mm (8 357
Hz), while the first order frequency reaches maximum about 11 mm (4 744 Hz), consequently the two
frequencies don’t slow down until completion of blades processing achieve minimum.
Two modals show different vibration shape from Fig. 6. The first-order modal is a blade with the
axis of bending vibration whose maximum vibration location is in the inlet side of the tip position.
The second-order modal is the tip to the center of the bending vibration whose maximum vibration
location is outlet edge.
Experimental Verification
Measurement system consists of impact hammer, KD300 optical sensor, USB data acquisition
system, uTekMa modal analysis software; computer and auxiliary fixtures form etc. Composition of
measurement system of blades modal [3] is shown in Fig. 7.
For the sake of modal analysis [4, 5] covering the whole blades process, firstly the different
processing statuses of blades are cut by using Fanuc Robocut α-0iB wire cutting machine. Then the
blank, removal L=2 mm, L=4 mm, L=6 mm, L=11 mm and processed blades are selected according
to the vibration characteristics of blades. Six samples are shown in Fig. 8.
Four points that are well distributed on the upper back of blades are stimulated by 100 g aluminum
head hammer, which measure modal shape and frequency of blades. There are some measurement
points in the middle of leaf basin, the tap positions as shown in Fig. 9.
Second-order modal
0 5 15 25 35
2
4
6
8
10
First-order modal
L/mm
f/k
Hz
Fig. 6 blades vibration
(a) First- order modal vibration
(b) Second-order modal vibration
Fig. 5 Changes of blades modal
frequency with material removal
Hun Guo, Zuo Dunwen, Tang Guoxing 225
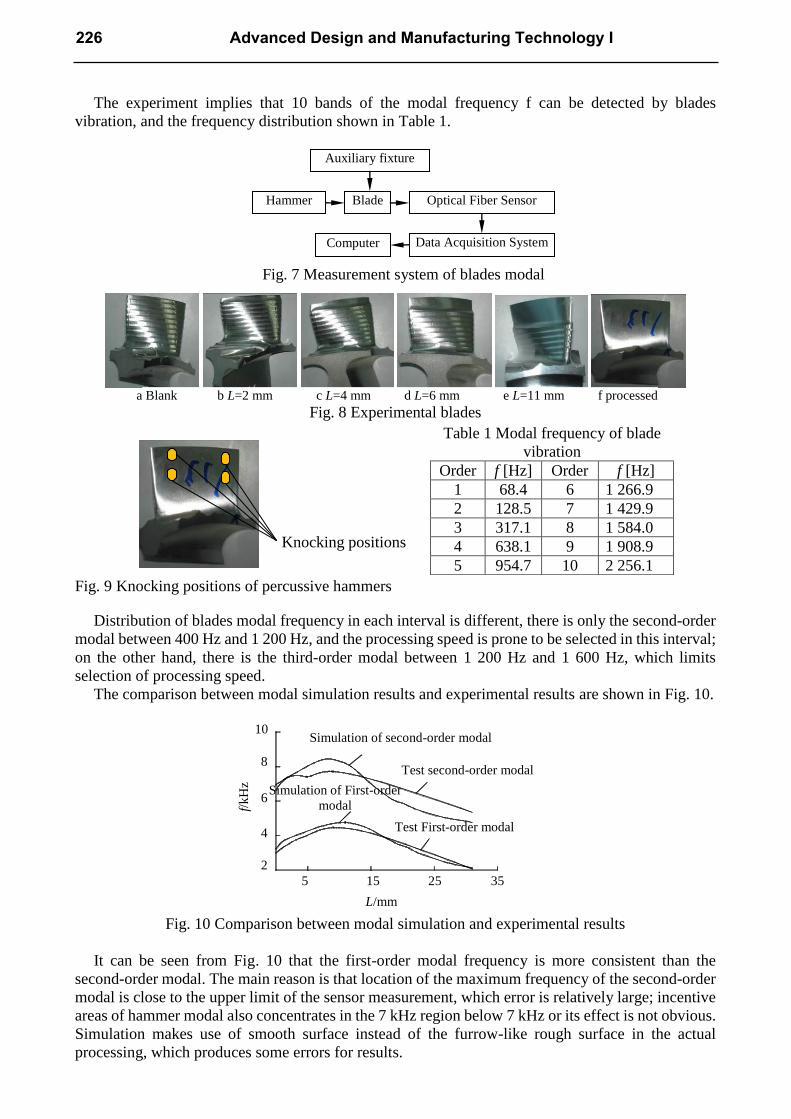
The experiment implies that 10 bands of the modal frequency f can be detected by blades
vibration, and the frequency distribution shown in Table 1.
a Blank b L=2 mm c L=4 mm d L=6 mm e L=11 mm f processed
Fig. 8 Experimental blades
Distribution of blades modal frequency in each interval is different, there is only the second-order
modal between 400 Hz and 1 200 Hz, and the processing speed is prone to be selected in this interval;
on the other hand, there is the third-order modal between 1 200 Hz and 1 600 Hz, which limits
selection of processing speed.
The comparison between modal simulation results and experimental results are shown in Fig. 10.
Fig. 10 Comparison between modal simulation and experimental results
It can be seen from Fig. 10 that the first-order modal frequency is more consistent than the
second-order modal. The main reason is that location of the maximum frequency of the second-order
modal is close to the upper limit of the sensor measurement, which error is relatively large; incentive
areas of hammer modal also concentrates in the 7 kHz region below 7 kHz or its effect is not obvious.
Simulation makes use of smooth surface instead of the furrow-like rough surface in the actual
processing, which produces some errors for results.
Table 1 Modal frequency of blade
vibration
Order f [Hz] Order f [Hz]
1 68.4 6 1 266.9
2 128.5 7 1 429.9
3 317.1 8 1 584.0
4 638.1 9 1 908.9
5 954.7 10 2 256.1
f/k
Hz
L/mm
5 15 25 35
2
4
6
8
10 Simulation of second-order modal
Test First-order modal
Simulation of First-order
modal
Test second-order modal
Knocking positions
Fig. 9 Knocking positions of percussive hammers
Optical Fiber Sensor
Data Acquisition System Computer
Blade Hammer
Auxiliary fixture
Fig. 7 Measurement system of blades modal
226 Advanced Design and Manufacturing Technology I
Conclusions
(1) The material removal process on the blades of the modal frequency has a great influence. Early as
in the processing of materials removed, each order modal of blades are increased.
(2) The material removals of second-order frequency that are about 7 mm achieve the maximum,
and then are decreasing until the process is completed. The first-order frequency is about 12 mm,
which get the maximum, and then is decreasing until the process is completed.
(3) The simulation results are identical with the experimental results, second-order modal
frequency in the position of maximum 7 mm (8 357 Hz), the first-order frequency of 11 mm reach
maximum (4 744 Hz), then the two frequencies are decreasing slowly until the completion of blades
processing to a minimum.
Acknowledgment
This research is supported by National S&T Major Project (Grant No. 2010ZX04016-012), Key (Key
grant) Project of Chinese Ministry of Education (Grant No. 209036), Key Project of Chinese
Education Department (Grant No.1151gzd20) and Scientific Research Fund of Heilongjiang
Provincial Education Department (Grant No. 11551431 and Grant No. 11541305)
References
[1] Z. Q. Wang, X. X. Meng, J. X. Ren, et al: Machine Tools and Hydraulic (2006) No.4, p. 61-63.
[2] Y. Q. Shao: ANSYS8.0 Finite Element Analysis Example Navigation (China Railway Press,
Beijing 2004).
[3] T. Chen, C. Zhao, G. B. Bu, et al: Tool Technology Vol. 43(2009) No.1, p.29-31.
[4] J. Z. Guo: Theoretical and Experimental Modal Analysis (Beijing Institute of Technology Press,
Beijing 2001).
[5] J. Zhang, X. P. Liu: Turbo Machinery Vibration Modal Analysis Theory and Numerical Methods
(National Defence Industry Press, Beijing 2001).
Hun Guo, Zuo Dunwen, Tang Guoxing 227

Rotation Inertia Measurement Device Design of Winged Rigid Body Based on TRIZ Conflict Resolving Matrix
Chi Hongyan1, a, Cao He2, b 1 Basic Experiment and Engineering Training Center, Heilongjiang Institute of Science and
Technology, Harbin 150027, China
2 Mechanical Engineering College, Heilongjiang Institute of Science and Technology, Harbin
150027, China
[email protected], [email protected]
Keywords: TRIZ; conflict resolving matrix; rotation inertia; winged rigid body
Abstract: In this paper TRIZ(Theory of Inventive Problem Solving) conflict and its resolving
theories are introduced. Then the technology conflict of winged rigid body rotation inertia
measurement is analyzed and based on the conflict resolving matrix and innovative principles
synthesis application, the winged rigid body rotation inertia measurement solution is created. It is
beneficial for rotation inertia measurement device design.
Introduction
Rotation inertia is a measure of inertia when rigid body rotating, which is a rigid physical
characteristics. The rotation inertia of rigid body is not only relative to the quality of the objects, but
also to the rotor position and mass distribution (i.e. shape, size and density distribution). If the rigid
body shape is simple and uniform, the rotation inertia rotating a specific axis can be calculated
directly. For complex shape, uneven mass distribution rigid body with wings, rudder, solar panels and
other structures, rotation inertia calculation is extremely complex, and is usually determined by
experiment. In this paper, the rotation inertia measure device of winged rigid body is designed by
TRIZ conflict resolving matrix.
Basic theory
Either new design or improvement of existing products design, designers must first ensure or improve
the internal performance of certain product during the design process, which often leads to other
internal performance reduction, that is, the design is often in conflict. According to compromise
method in traditional design, the conflict is not completely resolved, but the two sides have reached a
compromise in the conflict, or reduce the extent of the conflict. TRIZ theory considers that the
symbol of product innovation is to solve the design conflicts, and create new competitive solution [1].
G. S. Altshuller has divided conflicts into three types, management conflict, physical conflict and
technology conflict, the latter is common in design. Technical conflict is that an effect leads to two
results, useful and harmful, it can also mean the introduction of a useful effect or the elimination of
harmful effect leads one or more subsystems or system deterioration.
39 feature parameters. In order to better describe the conflict, after comparative study of a large
number of technical conflicts, Altshuller brought forward 39 feature parameters of conflicts. They
are: 1.weight of moving objects, 2.weight of stationary object, 3.length of moving objects, 4.length of
stationary object, 5.area of moving objects, 6.area of stationary object, 7.volume of moving objects,
8.volume of stationary objects, 9.speed, 10.force, 11.stress or pressure, 12.shape, 13.structural
stability, 14.strength, 15. action time of moving objects, 16.action time of stationary objects,
17.temperature, 18.illumination, 19.energy of moving objects, 20.energy of stationary objects,
21.power, 22. energy loss, 23.material damage, 24.information loss, 25.loss of time, 26.number of
substances or things, 27.reliability, 28.test accuracy, 29.manufacturing precision, 30.sensitivity of
harmful factors of external objects, 31.harmful factors generated from objects, 32.manufacturability,
© (2011) Trans Tech Publications, Switzerlanddoi:10.4028/www.scientific.net/AMR.142.228

33.operability, 34.maintainability, 35.adaptability and versatility, 36.device complexity, 37.difficulty
of monitoring and testing, 38.automation, 39.productivity. In practice, first of all the two parties of
the conflict should be represented by two of 39 feature parameters.
40 inventive principles. Based on the analysis and study of patents in the world, Altshuller put
forward 40 inventive principles, practices have proved that these principles have an important role for
guiding the design staff in invention. The 40 inventive principles are: 1.segmentation, 2.taking out,
3.local quality, 4.asymmetry, 5.merging, 6.universality, 7.nesting, 8.anti-weight, 9.preliminary
anti-action, 10.preliminary action, 11.beforehand cushioning, 12.equipotentiality, 13.inverse,
14.spheroidality, 15.dynamics, 16.partial or excessive actions, 17.another dimension, 18.vibration,
19.periodic action, 20.continuity of useful action, 21.skipping, 22.convert a harm into a benefit,
23.feedback, 24.mediator, 25.self-service, 26.copying, 27.cheap short-living objects, 28.replacement
of mechanical system, 29.pneumatics or hydraulic construction, 30.flexible “shells” or thin films,
31.porous materials, 32.color changes, 33.homogeneity, 34.discarding and recovering, 35.parameter
changes, 36.phase transformation, 37.thermal expansion, 38.strengthen oxidation, 39.inert
environment, 40.composite materials.
Technology conflict resolving matrix. Inventive principles play a role of tools, selecting
principles from the tool can give the idea to solve the question, but this method is inefficient. Through
years of research, analysis and comparison, Altshuller proposed conflict matrix, which establishes a
correspondence between the 39 engineering parameters and 40 inventive principles, so as to solve the
difficult problem of selecting principles of the invention.
Conflict resolving matrix is a matrix of 40 rows and 40 columns, line 1 or column 1 are the 39
engineering parameters describing the conflicts in sequence. In matrix, rows describe deterioration
parameters of the conflict, while columns describe improving parameters. Besides line 1 and column
1, the remaining 39 rows and 39 columns form a matrix whose elements are empty or several
numbers, these numbers indicate the recommended inventive principles number.
The principles provided by technology conflict resolving matrix often can not directly resolve the
issue, only provide a direction most likely to solve the problem. In practice, specific methods should
be given according to the principles provided and the specific conditions [2].
The rotation inertia measurement device design of torsion pendulum method
The torsion pendulum structure is shown in Fig.1 [3]. A thin coil spring 2 is installed on the vertical
axis, to generate restoring moment, the upside loading platform 1 can place test objects. 3 is the level
meter, used to adjust the system balance. After the object turned an angle in the horizontal plane,
under the action of restoring moment in the spring, the object begins to rotate around the vertical axis
to and fro.
1
3
2
4
1. loading platform 2. spring 3. level meter 4. base
Fig.1 Schematic diagram of torsion pendulum structure
From theory analysis [3], there is
Hun Guo, Zuo Dunwen, Tang Guoxing 229
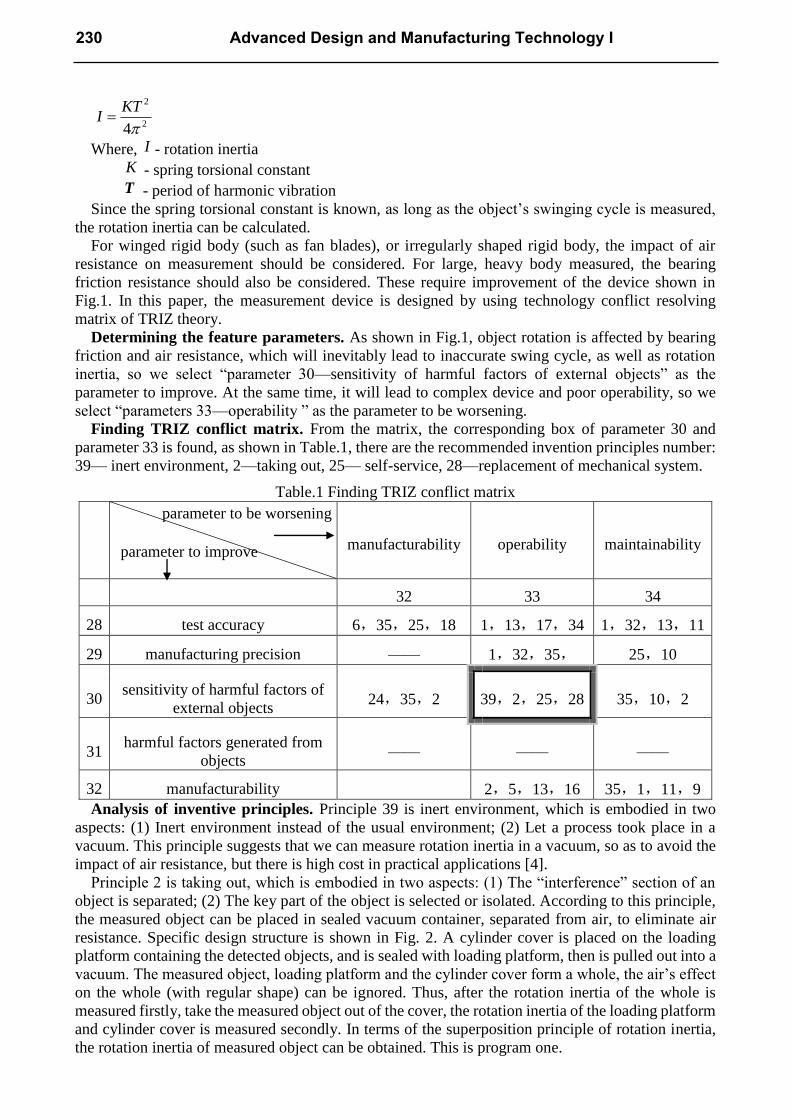
2
2
4
KTI
Where, I - rotation inertia
K - spring torsional constant T - period of harmonic vibration
Since the spring torsional constant is known, as long as the object’s swinging cycle is measured,
the rotation inertia can be calculated.
For winged rigid body (such as fan blades), or irregularly shaped rigid body, the impact of air
resistance on measurement should be considered. For large, heavy body measured, the bearing
friction resistance should also be considered. These require improvement of the device shown in
Fig.1. In this paper, the measurement device is designed by using technology conflict resolving
matrix of TRIZ theory.
Determining the feature parameters. As shown in Fig.1, object rotation is affected by bearing
friction and air resistance, which will inevitably lead to inaccurate swing cycle, as well as rotation
inertia, so we select “parameter 30—sensitivity of harmful factors of external objects” as the
parameter to improve. At the same time, it will lead to complex device and poor operability, so we
select “parameters 33—operability ” as the parameter to be worsening.
Finding TRIZ conflict matrix. From the matrix, the corresponding box of parameter 30 and
parameter 33 is found, as shown in Table.1, there are the recommended invention principles number:
39— inert environment, 2—taking out, 25— self-service, 28—replacement of mechanical system.
Table.1 Finding TRIZ conflict matrix
manufacturability operability maintainability
32 33 34
28 test accuracy 6,35,25,18 1,13,17,34 1,32,13,11
29 manufacturing precision —— 1,32,35, 25,10
30 sensitivity of harmful factors of
external objects 24,35,2 39,2,25,28 35,10,2
31 harmful factors generated from
objects —— —— ——
32 manufacturability 2,5,13,16 35,1,11,9
Analysis of inventive principles. Principle 39 is inert environment, which is embodied in two
aspects: (1) Inert environment instead of the usual environment; (2) Let a process took place in a
vacuum. This principle suggests that we can measure rotation inertia in a vacuum, so as to avoid the
impact of air resistance, but there is high cost in practical applications [4].
Principle 2 is taking out, which is embodied in two aspects: (1) The “interference” section of an
object is separated; (2) The key part of the object is selected or isolated. According to this principle,
the measured object can be placed in sealed vacuum container, separated from air, to eliminate air
resistance. Specific design structure is shown in Fig. 2. A cylinder cover is placed on the loading
platform containing the detected objects, and is sealed with loading platform, then is pulled out into a
vacuum. The measured object, loading platform and the cylinder cover form a whole, the air’s effect
on the whole (with regular shape) can be ignored. Thus, after the rotation inertia of the whole is
measured firstly, take the measured object out of the cover, the rotation inertia of the loading platform
and cylinder cover is measured secondly. In terms of the superposition principle of rotation inertia,
the rotation inertia of measured object can be obtained. This is program one.
parameter to be worsening
parameter to improve
230 Advanced Design and Manufacturing Technology I
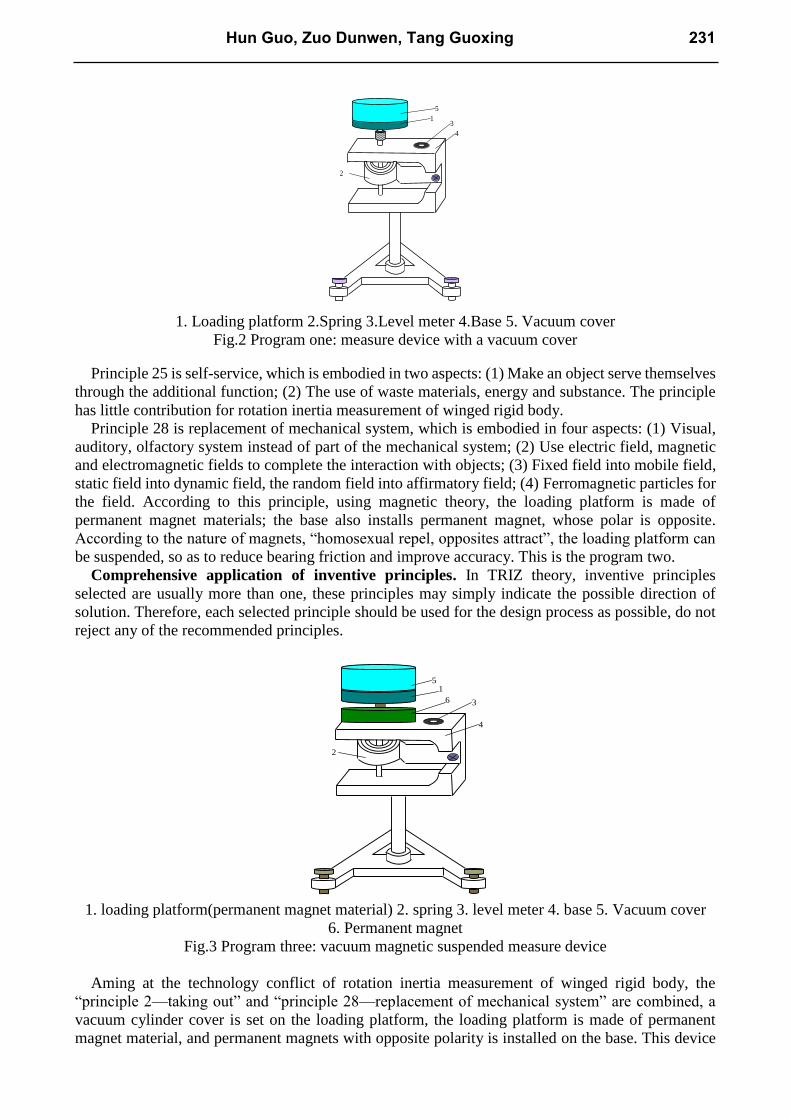
1 3
2
4
5
1. Loading platform 2.Spring 3.Level meter 4.Base 5. Vacuum cover
Fig.2 Program one: measure device with a vacuum cover
Principle 25 is self-service, which is embodied in two aspects: (1) Make an object serve themselves
through the additional function; (2) The use of waste materials, energy and substance. The principle
has little contribution for rotation inertia measurement of winged rigid body.
Principle 28 is replacement of mechanical system, which is embodied in four aspects: (1) Visual,
auditory, olfactory system instead of part of the mechanical system; (2) Use electric field, magnetic
and electromagnetic fields to complete the interaction with objects; (3) Fixed field into mobile field,
static field into dynamic field, the random field into affirmatory field; (4) Ferromagnetic particles for
the field. According to this principle, using magnetic theory, the loading platform is made of
permanent magnet materials; the base also installs permanent magnet, whose polar is opposite.
According to the nature of magnets, “homosexual repel, opposites attract”, the loading platform can
be suspended, so as to reduce bearing friction and improve accuracy. This is the program two.
Comprehensive application of inventive principles. In TRIZ theory, inventive principles
selected are usually more than one, these principles may simply indicate the possible direction of
solution. Therefore, each selected principle should be used for the design process as possible, do not
reject any of the recommended principles.
5 1
6 3
4
2
1. loading platform(permanent magnet material) 2. spring 3. level meter 4. base 5. Vacuum cover
6. Permanent magnet
Fig.3 Program three: vacuum magnetic suspended measure device
Aming at the technology conflict of rotation inertia measurement of winged rigid body, the
“principle 2—taking out” and “principle 28—replacement of mechanical system” are combined, a
vacuum cylinder cover is set on the loading platform, the loading platform is made of permanent
magnet material, and permanent magnets with opposite polarity is installed on the base. This device
Hun Guo, Zuo Dunwen, Tang Guoxing 231

can not only eliminate air resistance effect, but also reduce the bearing friction, which can greatly
improve measure accuracy. this is program three, shown in Fig.3.
Conclusions
TRIZ conflict resolving principles provide a series of innovative design principles and methods to
resolve the conflict, which provide an important way in rotation inertia measurement device design of
winged rigid body. In this paper, by rotation inertia measurement analysis of winged rigid body, the
technology conflict is abstracted, based on TRIZ technology conflict resolving matrix and
comprehensive application of innovation principles, the program of the rotation inertia measurement
device of a winged rigid body is designed, which provides a new direction for the rotation inertia
measurement device design.
References:
[1] Runhua Tan: Innovative design-TRIZ: Theory of Inventive Problem Solving (Mechanical Industry
Press, China, 2002), p129-130.
[2] Cao He, Chi Hongyan, Guo Jingnan: Chinese Manufacturing Informalization Vol.39 (2010) No.9,
p37-39.
[3] Zhang Jingmin, Chi Hongyan, LI Qicheng: Physics experiment (Science and Technology Press,
China, 2008), p57-62.
[4] Hou Wen: Journal of North University of China (Natural Science Edition) Vol.29 (2008) No.6,
p505- 508.
232 Advanced Design and Manufacturing Technology I
Development of NC System of the 3-PUU Parallel Machine Tool Based on PMAC
HaiPeng LIN1,a, YiMin Xu2 1 Mechanical Engineering Department , Heilongjiang Institute of Science and Technology, Harbin
150027, China
2 Telecom Engineering Department , Heilongjiang Institute of Science and Technology, Harbin 150027, China
Keywords: programmable multi-axis controller, parallel machine tool, open style, NC system
Abstract. In this paper, a PUU parallel machine tool with three translational degrees of freedom
(DOF) is designed which is usually used in the complex grain machining of the solid rocket engine.
,and its numerical control system is described in detail. The so-called “PC+PMAC” is used as the
hardware platform, and Windows as the software one, the parallel machine tool NC system is built.
The features, such as multi-axis motion control and fast real time communication of PMAC, software
resources and efficient data processing of PC are utilized such that Man Machine Interface, position
servo control, real time measurement of cutter configuration and closed loop control of the parallel
machine tool are realized.
Introduction
The numerical control system (NC System) is the kernel of the numerical control machine tool. NC
System can accept the carrier's machining information transmission, and after information
calculating, information judgment and information processing, it can give a control law to the
machine tool. Numerical control machine tools can conveniently manufacture the parts with a variety
of forms, such as symmetric, asymmetric, non-spherical surfaces, and those complex special-shaped
surfaces. The processing technology of numerical control has been widely used in various fields of
engineering. The numerical control machining technology is a key factor in the process of
manufacturing complex special-shaped, high-precision surface, and the open architecture NC System
with PC has become the development trend of NC technology. Three kinds of forms is adopted, that
is, PC + NC special modules, PC + programmable multi-axes controller (PMAC) and standalone PC.
The paper adopts the parallel machine tool NC system of special-shaped solid rocket motor grain
shaping that is, PC + PMAC systems [1].
3-PUU parallel machine tool introduction
The structure of the parallel machine tool in the form of 3-PUU is shown in Figure 1.The tool is made
up of moving platform, three pairs of stand columns, sliding saddle and branch chains, and the bar of
each branch chain is fixed. One side of the bar is connected with the sliding saddle, and the other is connected with the moving platform and through the Hooke joint. The sliding saddle can be driven up
and down along the rolling track which is fixed on the stand column by the servo motor and ball screw
nut, and then the moving platform can move in the three directions of Cartesian coordinate system,
which is to meet the requirement plastic cavity cross-section. In addition, the structure is hybrid due
to the space limitations. A ball screw is added which is driven by the AC servo motor on one end, and
the other end is connected with the cutting tool through universal joints, which aims to change the
angle of tool with the space limitation. This parallel transmission structure can effectively suppress
the vibration of the cutting tool.
© (2011) Trans Tech Publications, Switzerlanddoi:10.4028/www.scientific.net/AMR.142.233
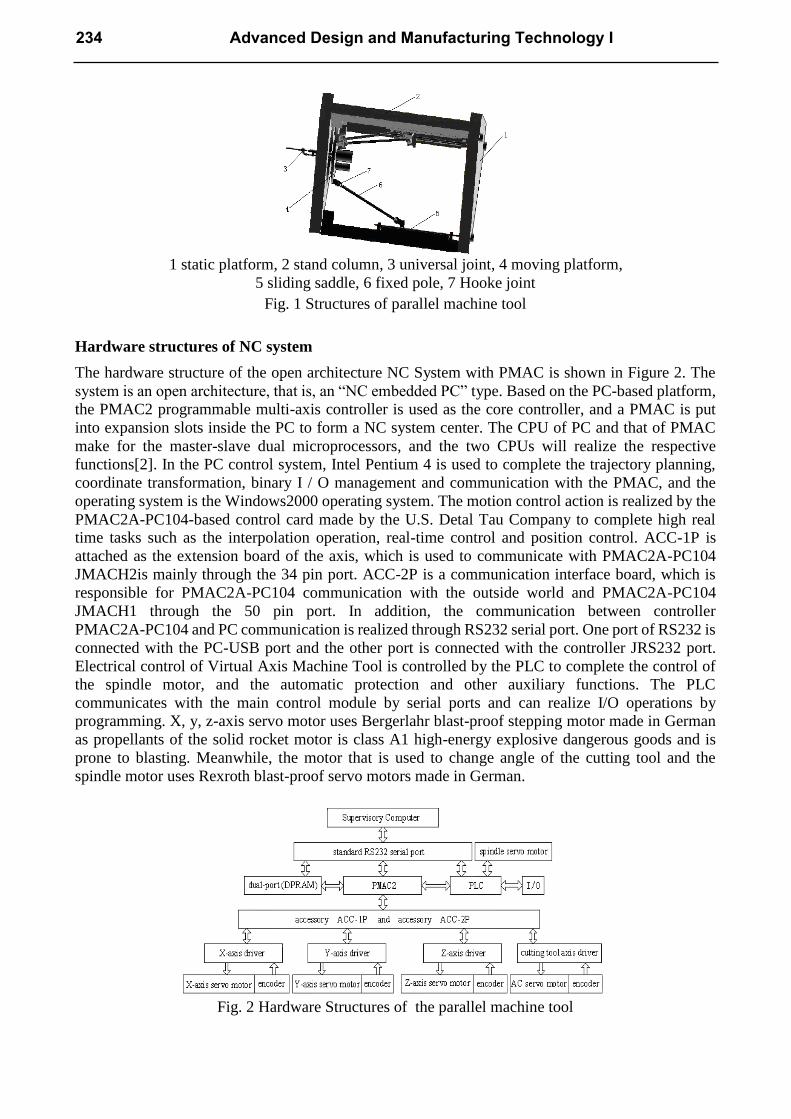
1 static platform, 2 stand column, 3 universal joint, 4 moving platform,
5 sliding saddle, 6 fixed pole, 7 Hooke joint
Fig. 1 Structures of parallel machine tool
Hardware structures of NC system
The hardware structure of the open architecture NC System with PMAC is shown in Figure 2. The
system is an open architecture, that is, an “NC embedded PC” type. Based on the PC-based platform,
the PMAC2 programmable multi-axis controller is used as the core controller, and a PMAC is put
into expansion slots inside the PC to form a NC system center. The CPU of PC and that of PMAC
make for the master-slave dual microprocessors, and the two CPUs will realize the respective
functions[2]. In the PC control system, Intel Pentium 4 is used to complete the trajectory planning,
coordinate transformation, binary I / O management and communication with the PMAC, and the
operating system is the Windows2000 operating system. The motion control action is realized by the
PMAC2A-PC104-based control card made by the U.S. Detal Tau Company to complete high real time tasks such as the interpolation operation, real-time control and position control. ACC-1P is
attached as the extension board of the axis, which is used to communicate with PMAC2A-PC104
JMACH2is mainly through the 34 pin port. ACC-2P is a communication interface board, which is
responsible for PMAC2A-PC104 communication with the outside world and PMAC2A-PC104
JMACH1 through the 50 pin port. In addition, the communication between controller
PMAC2A-PC104 and PC communication is realized through RS232 serial port. One port of RS232 is
connected with the PC-USB port and the other port is connected with the controller JRS232 port.
Electrical control of Virtual Axis Machine Tool is controlled by the PLC to complete the control of
the spindle motor, and the automatic protection and other auxiliary functions. The PLC
communicates with the main control module by serial ports and can realize I/O operations by
programming. X, y, z-axis servo motor uses Bergerlahr blast-proof stepping motor made in German
as propellants of the solid rocket motor is class A1 high-energy explosive dangerous goods and is
prone to blasting. Meanwhile, the motor that is used to change angle of the cutting tool and the
spindle motor uses Rexroth blast-proof servo motors made in German.
Fig. 2 Hardware Structures of the parallel machine tool
234 Advanced Design and Manufacturing Technology I

In the process of manufacturing of the machine tool, on one hand, plenty of information is needed
in real-time communication between PC and PMAC. The position detector of closed-loop servo
system feedbacks signals to PMAC, PMAC will constantly delivery information such as the servo
motor position, velocity and followed Errors to the host computer so as to management and
monitoring. On the other hand, PC machine passes the next trajectory segment rough interpolation
parameters and speed control parameters to PMAC instantly, and the parameters will be sent to the
servo drive after PMAC precise interpolation, and thus complete the control servo motor.. Therefore,
the communication speed between the host computer and PMAC must be very high. The hardware on
a dual-port RAM (DPRAM) is needed in order to achieve high-speed transfer of data and control
signals. DPRAM has two access ports, which has two sets of main memory address register, address
decoder, main memory data registers and two sets of read and write circuits , the two ports connect
with separate bus, which can accept the PCand PMAC2 card access memory request simultaneously,
so that DPRAM works in parallel way. Meanwhile, it does not need to send commands and wait for
the response when making data access through the communication port, which improves the speed of
data transfer greatly and solves the communication bottleneck problem between PMAC2 card and
PC. The high-speed data communication is achieved and the repeat the handshake with each other is
avoided.
Table 1 Hardware connections of PMAC2-PC104 and servo motor
#1 Motor #2 Motor #3 Motor #4 Motor Explain Description
13 14 27 28 Pulse
ACC-2P 3 4 3 4 GND
15 16 29 30 Direction
3 4 4 4 GND
5 6 17 18 CHA
ACC-1P
7 8 19 20 CHA/
9 10 21 22 CHB
11 12 23 24 CHB/
13 14 25 26 CHC
15 16 27 28 CHC/
The System adopts pulse and direction of position control mode [3] , and the hardware connection
of servo motor drive with multi-axis controller are shown in Table 1. The Encoder cable of each
motor is connected to the N SIG interface of the appropriate drive. CN 1 / F port is connected to the
ACC-1P and ACC-2P corresponding terminal rafts of PMAC controller, and ACC-1P and ACC-2P
are the expansion interface board of axis and the communication interface board, respectively.
Software design of NC system
The structure of software system. The basic requirement for NC system of the parallel machine tool and processing flow are depicted in Fig. 3. The software of NC system mainly includs the
human-machine interface module, data preprocessing module, track interpolation module,
virtual-real conversion module, axis servo control module and other auxiliary function module. Fig. 4
shows the software function module of NC system, including the center control module and other
function modules. The center control module provides a friendly human-machine interface, which
make various function modules be realized by utilization of menus. The human-machine interface
module mainly complet the setting and modification of system parameters, such as the work mode
(automatic, manual, or inching), graphic display, system initialization setting, coordinate bias setting
and dynamic display. The data preprocessing module work the function of obtaining G-codes and
decoding, which can be accomplished by PMAC. The track interpolation module is responsible for
the velocity of motor, interpolation and terminal discrimination, calculating and outputting the feed
rate to position controller, for linear interpolation, circular interpolation and spline interpolation. The
Hun Guo, Zuo Dunwen, Tang Guoxing 235
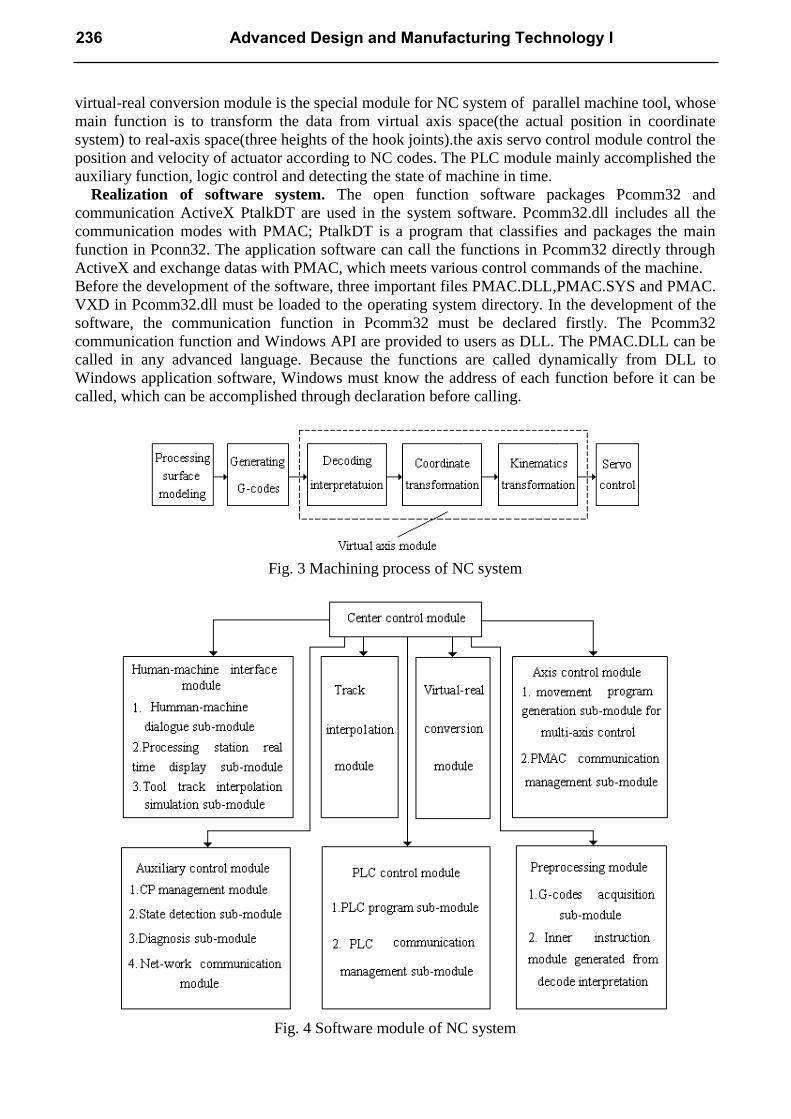
virtual-real conversion module is the special module for NC system of parallel machine tool, whose
main function is to transform the data from virtual axis space(the actual position in coordinate
system) to real-axis space(three heights of the hook joints).the axis servo control module control the
position and velocity of actuator according to NC codes. The PLC module mainly accomplished the
auxiliary function, logic control and detecting the state of machine in time.
Realization of software system. The open function software packages Pcomm32 and
communication ActiveX PtalkDT are used in the system software. Pcomm32.dll includes all the
communication modes with PMAC; PtalkDT is a program that classifies and packages the main
function in Pconn32. The application software can call the functions in Pcomm32 directly through
ActiveX and exchange datas with PMAC, which meets various control commands of the machine.
Before the development of the software, three important files PMAC.DLL,PMAC.SYS and PMAC.
VXD in Pcomm32.dll must be loaded to the operating system directory. In the development of the
software, the communication function in Pcomm32 must be declared firstly. The Pcomm32
communication function and Windows API are provided to users as DLL. The PMAC.DLL can be
called in any advanced language. Because the functions are called dynamically from DLL to
Windows application software, Windows must know the address of each function before it can be
called, which can be accomplished through declaration before calling.
Fig. 3 Machining process of NC system
Fig. 4 Software module of NC system
236 Advanced Design and Manufacturing Technology I
Conclusions
An open NC system structure is designed based on “PC+PMAC”„s development for a 3-PUU parallel
machine tool. The aim in this work is focused on the design of virtual axis module and kinematic
simulation module for 3-chain translational parallel machine tool. The designed NC systems
succeeded the manner and characters of traditional NC system and the software was modularly
designed, with convenience for transplantation, propagation and abundant usage of Windows
software platform. By utilizing object-oriented methods, a friendly operation interface was developed
and a modular programming and management software was also been realized.
References
[1] WangYang, YangBing Ni, Huang Tian, e.g: Journal of Machine Design (2001), p.15-18
[2] HengJuan Liu: Modular Machine Tool & Automatic Manufacturing Technique (2004), p.84-86
[3] KuiJing Zheng, YongSheng Zhao: Machine Tool & Hydraulics (2004) p.36-39
[4] Wang Chun,Wen Sheng and HuiZhen Guang: Manufaturing Technology & Machine Tool (
2001), p.15-17
[5] Li Bo, GuangQi Cai and TianHui Gao: Modular Machine Tool & Automatic Manufacturing
Technique (1998), p.36-38,
Hun Guo, Zuo Dunwen, Tang Guoxing 237
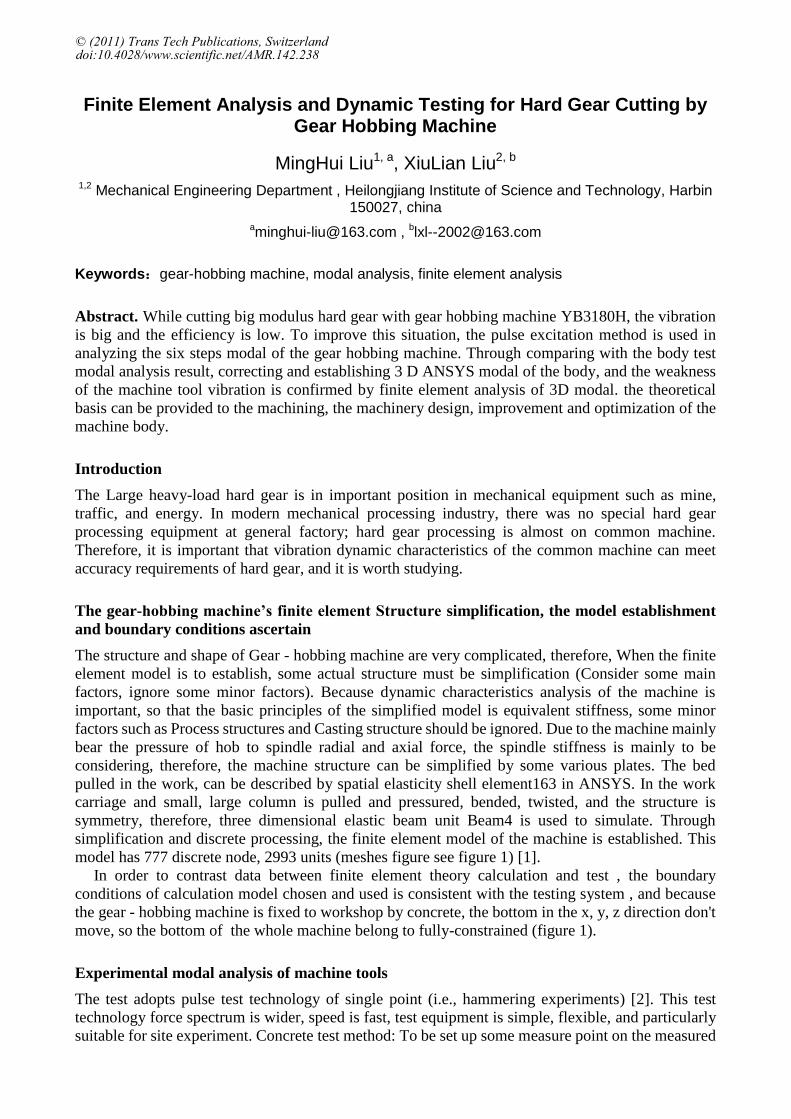
Finite Element Analysis and Dynamic Testing for Hard Gear Cutting by Gear Hobbing Machine
MingHui Liu1, a, XiuLian Liu2, b 1,2 Mechanical Engineering Department , Heilongjiang Institute of Science and Technology, Harbin
150027, china
[email protected] , [email protected]
Keywords:gear-hobbing machine, modal analysis, finite element analysis
Abstract. While cutting big modulus hard gear with gear hobbing machine YB3180H, the vibration
is big and the efficiency is low. To improve this situation, the pulse excitation method is used in
analyzing the six steps modal of the gear hobbing machine. Through comparing with the body test
modal analysis result, correcting and establishing 3 D ANSYS modal of the body, and the weakness
of the machine tool vibration is confirmed by finite element analysis of 3D modal. the theoretical
basis can be provided to the machining, the machinery design, improvement and optimization of the
machine body.
Introduction
The Large heavy-load hard gear is in important position in mechanical equipment such as mine,
traffic, and energy. In modern mechanical processing industry, there was no special hard gear
processing equipment at general factory; hard gear processing is almost on common machine.
Therefore, it is important that vibration dynamic characteristics of the common machine can meet
accuracy requirements of hard gear, and it is worth studying.
The gear-hobbing machine’s finite element Structure simplification, the model establishment
and boundary conditions ascertain
The structure and shape of Gear - hobbing machine are very complicated, therefore, When the finite
element model is to establish, some actual structure must be simplification (Consider some main
factors, ignore some minor factors). Because dynamic characteristics analysis of the machine is
important, so that the basic principles of the simplified model is equivalent stiffness, some minor
factors such as Process structures and Casting structure should be ignored. Due to the machine mainly
bear the pressure of hob to spindle radial and axial force, the spindle stiffness is mainly to be
considering, therefore, the machine structure can be simplified by some various plates. The bed
pulled in the work, can be described by spatial elasticity shell element163 in ANSYS. In the work
carriage and small, large column is pulled and pressured, bended, twisted, and the structure is
symmetry, therefore, three dimensional elastic beam unit Beam4 is used to simulate. Through
simplification and discrete processing, the finite element model of the machine is established. This
model has 777 discrete node, 2993 units (meshes figure see figure 1) [1].
In order to contrast data between finite element theory calculation and test , the boundary
conditions of calculation model chosen and used is consistent with the testing system , and because
the gear - hobbing machine is fixed to workshop by concrete, the bottom in the x, y, z direction don't
move, so the bottom of the whole machine belong to fully-constrained (figure 1).
Experimental modal analysis of machine tools
The test adopts pulse test technology of single point (i.e., hammering experiments) [2]. This test
technology force spectrum is wider, speed is fast, test equipment is simple, flexible, and particularly
suitable for site experiment. Concrete test method: To be set up some measure point on the measured
© (2011) Trans Tech Publications, Switzerlanddoi:10.4028/www.scientific.net/AMR.142.238
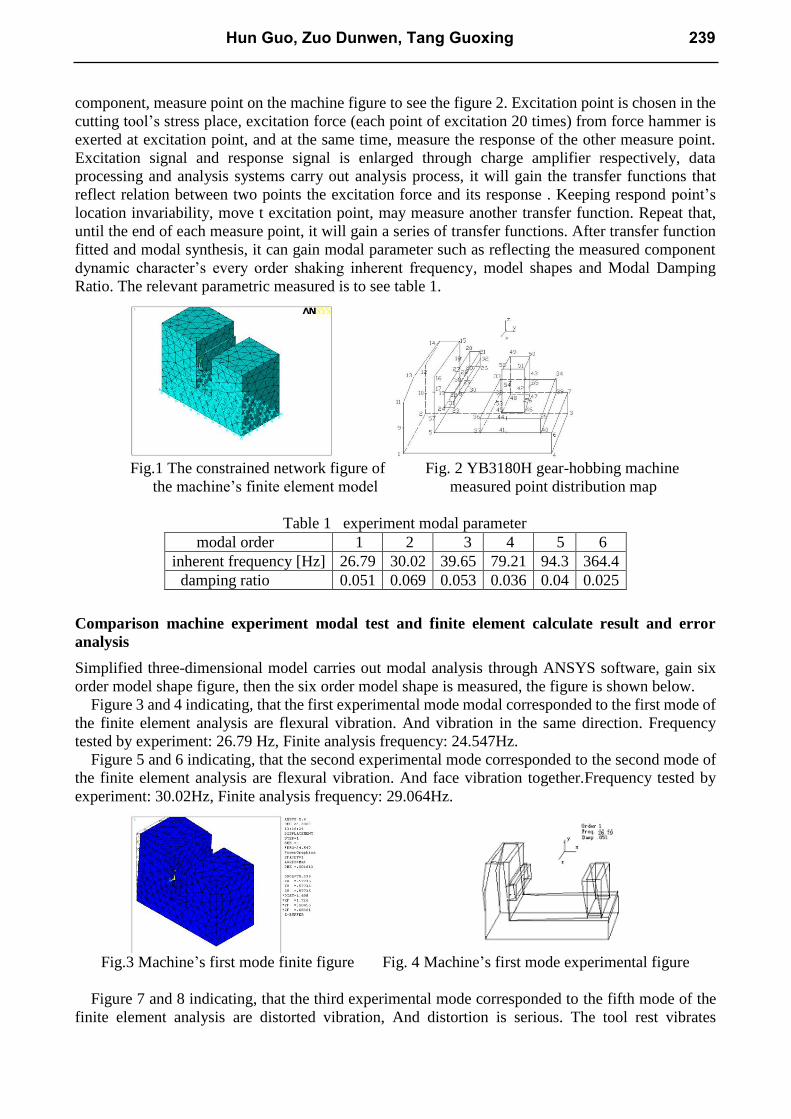
component, measure point on the machine figure to see the figure 2. Excitation point is chosen in the
cutting tool’s stress place, excitation force (each point of excitation 20 times) from force hammer is
exerted at excitation point, and at the same time, measure the response of the other measure point.
Excitation signal and response signal is enlarged through charge amplifier respectively, data
processing and analysis systems carry out analysis process, it will gain the transfer functions that
reflect relation between two points the excitation force and its response . Keeping respond point’s
location invariability, move t excitation point, may measure another transfer function. Repeat that,
until the end of each measure point, it will gain a series of transfer functions. After transfer function
fitted and modal synthesis, it can gain modal parameter such as reflecting the measured component
dynamic character’s every order shaking inherent frequency, model shapes and Modal Damping
Ratio. The relevant parametric measured is to see table 1.
Fig.1 The constrained network figure of Fig. 2 YB3180H gear-hobbing machine
the machine’s finite element model measured point distribution map
Table 1 experiment modal parameter
modal order 1 2 3 4 5 6
inherent frequency [Hz] 26.79 30.02 39.65 79.21 94.3 364.4
damping ratio 0.051 0.069 0.053 0.036 0.04 0.025
Comparison machine experiment modal test and finite element calculate result and error
analysis
Simplified three-dimensional model carries out modal analysis through ANSYS software, gain six
order model shape figure, then the six order model shape is measured, the figure is shown below.
Figure 3 and 4 indicating, that the first experimental mode modal corresponded to the first mode of
the finite element analysis are flexural vibration. And vibration in the same direction. Frequency
tested by experiment: 26.79 Hz, Finite analysis frequency: 24.547Hz.
Figure 5 and 6 indicating, that the second experimental mode corresponded to the second mode of
the finite element analysis are flexural vibration. And face vibration together.Frequency tested by
experiment: 30.02Hz, Finite analysis frequency: 29.064Hz.
Fig.3 Machine’s first mode finite figure Fig. 4 Machine’s first mode experimental figure
Figure 7 and 8 indicating, that the third experimental mode corresponded to the fifth mode of the
finite element analysis are distorted vibration, And distortion is serious. The tool rest vibrates
Hun Guo, Zuo Dunwen, Tang Guoxing 239
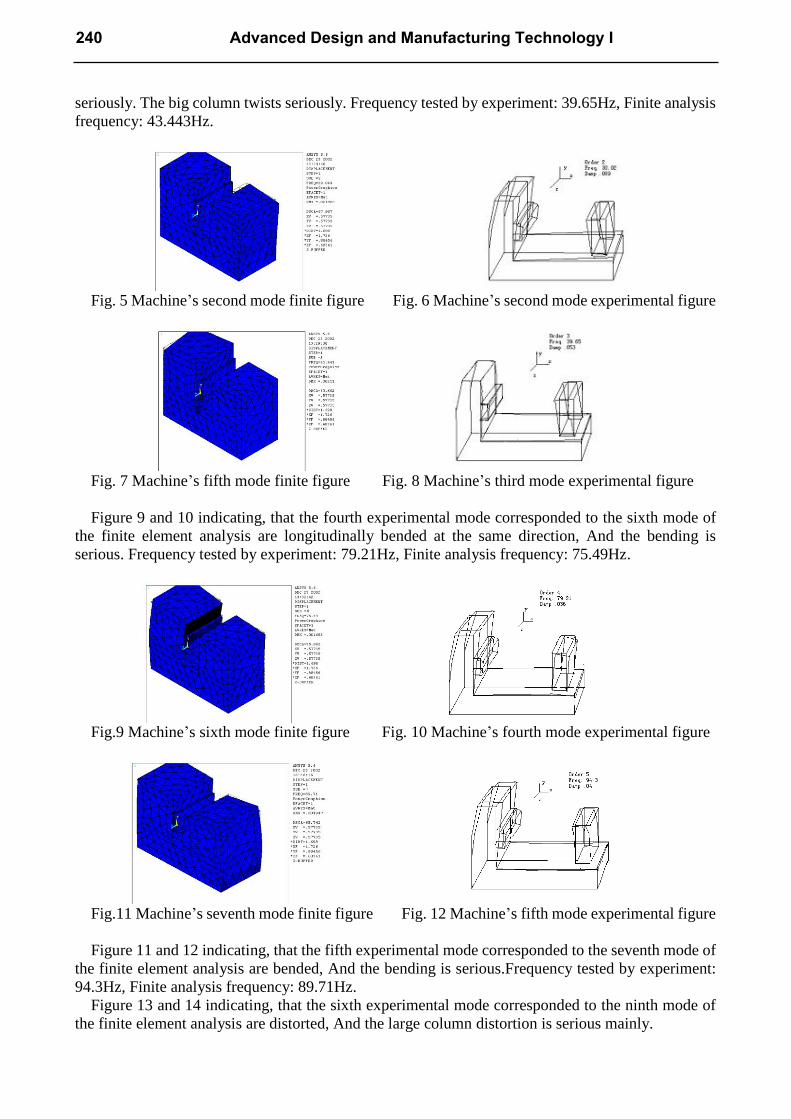
seriously. The big column twists seriously. Frequency tested by experiment: 39.65Hz, Finite analysis
frequency: 43.443Hz.
Fig. 5 Machine’s second mode finite figure Fig. 6 Machine’s second mode experimental figure
Fig. 7 Machine’s fifth mode finite figure Fig. 8 Machine’s third mode experimental figure
Figure 9 and 10 indicating, that the fourth experimental mode corresponded to the sixth mode of
the finite element analysis are longitudinally bended at the same direction, And the bending is
serious. Frequency tested by experiment: 79.21Hz, Finite analysis frequency: 75.49Hz.
Fig.9 Machine’s sixth mode finite figure Fig. 10 Machine’s fourth mode experimental figure
Fig.11 Machine’s seventh mode finite figure Fig. 12 Machine’s fifth mode experimental figure
Figure 11 and 12 indicating, that the fifth experimental mode corresponded to the seventh mode of
the finite element analysis are bended, And the bending is serious.Frequency tested by experiment:
94.3Hz, Finite analysis frequency: 89.71Hz.
Figure 13 and 14 indicating, that the sixth experimental mode corresponded to the ninth mode of
the finite element analysis are distorted, And the large column distortion is serious mainly.
240 Advanced Design and Manufacturing Technology I
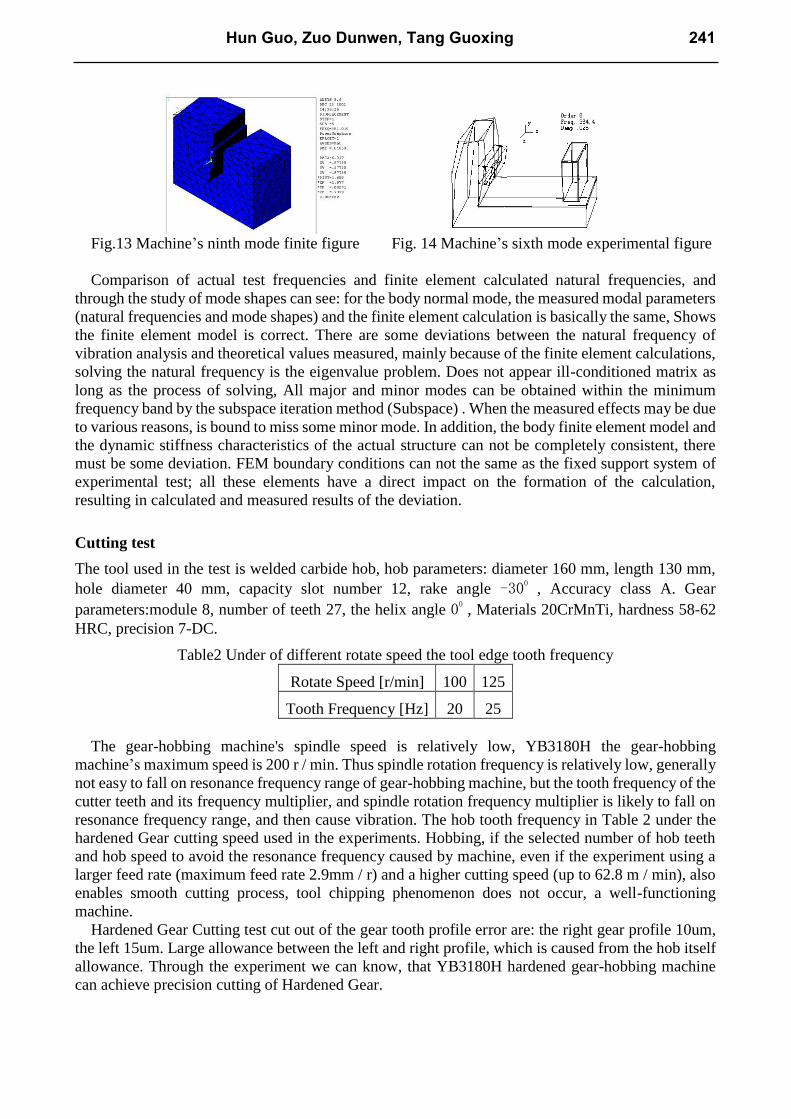
Fig.13 Machine’s ninth mode finite figure Fig. 14 Machine’s sixth mode experimental figure
Comparison of actual test frequencies and finite element calculated natural frequencies, and
through the study of mode shapes can see: for the body normal mode, the measured modal parameters
(natural frequencies and mode shapes) and the finite element calculation is basically the same, Shows
the finite element model is correct. There are some deviations between the natural frequency of
vibration analysis and theoretical values measured, mainly because of the finite element calculations,
solving the natural frequency is the eigenvalue problem. Does not appear ill-conditioned matrix as
long as the process of solving, All major and minor modes can be obtained within the minimum
frequency band by the subspace iteration method (Subspace) . When the measured effects may be due
to various reasons, is bound to miss some minor mode. In addition, the body finite element model and
the dynamic stiffness characteristics of the actual structure can not be completely consistent, there
must be some deviation. FEM boundary conditions can not the same as the fixed support system of
experimental test; all these elements have a direct impact on the formation of the calculation,
resulting in calculated and measured results of the deviation.
Cutting test
The tool used in the test is welded carbide hob, hob parameters: diameter 160 mm, length 130 mm,
hole diameter 40 mm, capacity slot number 12, rake angle -300 , Accuracy class A. Gear
parameters:module 8, number of teeth 27, the helix angle 00 , Materials 20CrMnTi, hardness 58-62
HRC, precision 7-DC.
Table2 Under of different rotate speed the tool edge tooth frequency
Rotate Speed [r/min] 100 125
Tooth Frequency [Hz] 20 25
The gear-hobbing machine's spindle speed is relatively low, YB3180H the gear-hobbing
machine’s maximum speed is 200 r / min. Thus spindle rotation frequency is relatively low, generally
not easy to fall on resonance frequency range of gear-hobbing machine, but the tooth frequency of the
cutter teeth and its frequency multiplier, and spindle rotation frequency multiplier is likely to fall on
resonance frequency range, and then cause vibration. The hob tooth frequency in Table 2 under the
hardened Gear cutting speed used in the experiments. Hobbing, if the selected number of hob teeth
and hob speed to avoid the resonance frequency caused by machine, even if the experiment using a
larger feed rate (maximum feed rate 2.9mm / r) and a higher cutting speed (up to 62.8 m / min), also
enables smooth cutting process, tool chipping phenomenon does not occur, a well-functioning
machine.
Hardened Gear Cutting test cut out of the gear tooth profile error are: the right gear profile 10um,
the left 15um. Large allowance between the left and right profile, which is caused from the hob itself
allowance. Through the experiment we can know, that YB3180H hardened gear-hobbing machine
can achieve precision cutting of Hardened Gear.
Hun Guo, Zuo Dunwen, Tang Guoxing 241

Conclusions
(1) In this paper, a finite element model of the gear-hobbing machine was built. By comparison
with the experimental modal analysis, the conclusion that this model is correct, and it provided a
reliable basis for the subsequent theoretical analysis and research.
(2) It was known various vibration conditions of machine major modal frequency by modal tests.
Therefore, when in reality selects the cutting specifications and the cutting tool parameter, should
cause the base frequency and the frequency multiplication of the cutting force component to avoid it,
in order to avoid resonates. Specially must avoid the mode of vibration most disadvantageous mode
of vibration frequency.
(3) YB3180H gear-hobbing machine can be precision on cutting hardened gears.
References
[1].JaMu studio: ANSYS5.7 Finite Element Analysis Tutorial (Mechanical Industry Publishing
Society, China 2002).
[2] DiHua Guan: Modal analysis techniques (Tsinghua University Press, China 1996).
242 Advanced Design and Manufacturing Technology I
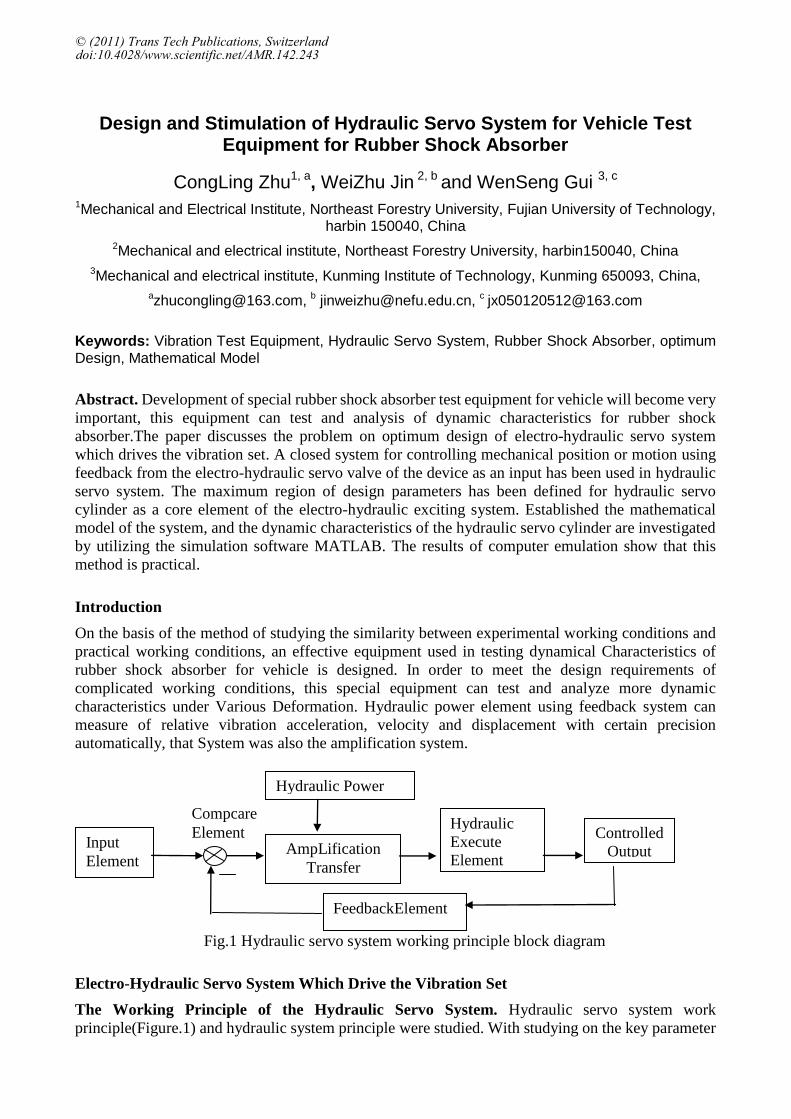
Design and Stimulation of Hydraulic Servo System for Vehicle Test Equipment for Rubber Shock Absorber
CongLing Zhu1, a, WeiZhu Jin 2, b and WenSeng Gui 3, c 1Mechanical and Electrical Institute, Northeast Forestry University, Fujian University of Technology,
harbin 150040, China
2Mechanical and electrical institute, Northeast Forestry University, harbin150040, China
3Mechanical and electrical institute, Kunming Institute of Technology, Kunming 650093, China,
[email protected], b [email protected], c [email protected]
Keywords: Vibration Test Equipment, Hydraulic Servo System, Rubber Shock Absorber, optimum Design, Mathematical Model
Abstract. Development of special rubber shock absorber test equipment for vehicle will become very
important, this equipment can test and analysis of dynamic characteristics for rubber shock
absorber.The paper discusses the problem on optimum design of electro-hydraulic servo system
which drives the vibration set. A closed system for controlling mechanical position or motion using
feedback from the electro-hydraulic servo valve of the device as an input has been used in hydraulic
servo system. The maximum region of design parameters has been defined for hydraulic servo
cylinder as a core element of the electro-hydraulic exciting system. Established the mathematical
model of the system, and the dynamic characteristics of the hydraulic servo cylinder are investigated
by utilizing the simulation software MATLAB. The results of computer emulation show that this
method is practical.
Introduction
On the basis of the method of studying the similarity between experimental working conditions and
practical working conditions, an effective equipment used in testing dynamical Characteristics of
rubber shock absorber for vehicle is designed. In order to meet the design requirements of
complicated working conditions, this special equipment can test and analyze more dynamic
characteristics under Various Deformation. Hydraulic power element using feedback system can
measure of relative vibration acceleration, velocity and displacement with certain precision
automatically, that System was also the amplification system.
Fig.1 Hydraulic servo system working principle block diagram
Electro-Hydraulic Servo System Which Drive the Vibration Set
The Working Principle of the Hydraulic Servo System. Hydraulic servo system work
principle(Figure.1) and hydraulic system principle were studied. With studying on the key parameter
Compcare
Element Input
Element AmpLification
Transfer
Hydraulic
Execute
Element
Controlled
Output
FeedbackElement
Hydraulic Power
© (2011) Trans Tech Publications, Switzerlanddoi:10.4028/www.scientific.net/AMR.142.243

of system, equipment parameters of the hydraulic servo system (Table 1) were calculated and
determined according to the similarity working conditions of rubber shock absorber for vehicle.
Piston rod displacement 20sin(60 )x t , Piston rod velocity 1200 cos(60 )dx
v tdt
,
max 1200 / 3.77 /v mm s m s , 2max30.00107
2
Lp
s
FA m
P ,
max3 1.732 0.00115 3.77 1000 60 450 / minQ Av L
Table 1 The Design Parameter of Hydraulic Servo System
Parameter
System
1
Maximum
amplitude
2
Frequency range
3
Maximum
exciting force
4
Maximum
velocity
20mm 10 30Hz 15KN 3.77 /m s
Hydraulic
cylinder
Cylinder
diameter
Piston rod
diameter
Piston effective
area
Supply
pressure
63mm 50mm 20.00115m 21MPa
Hydraulic
servo valve
Rated flow Rated current Rated supply
pressure
400 / minL 40mA 21MPa
Mathematical Model of the Electro-Hydraulic Servo System
Mathematical Model of Dynamic Characteristics of the Hydraulic Servo Cylinder. For
description dynamic characteristics of hydraulic cylinder being controlled by servo valve completely,
this paper lists out 3 Basic Equations (Eq. 1, Eq. 2, Eq. 3,).
L q V c LQ K x K P . (1)
4
p t LL p tp L
e
dx V dPQ A C P
dt dt (2)
2
2
p p
p L t p p LL
d x dxA P m B Kx F
dt dt (3)
2
3 2
2 2 2 2 2 2
(1 )4
( ) (1 )4 4 4
q ce tv L
p p e ce
pp t p cet t t ce t ce
e p p e p p p p
K K Vx s F
A A Kx
B V B KmV m K KV KKs s s
A A A A A A
(4)
2
0
2
0 0
1(1 )
4
2(1 )( 1)
ps p tv L
e cep
r
K A Vx s F
K K Kx
s ss
(5)
244 Advanced Design and Manufacturing Technology I

The Transfer Function of the Electro-Hydraulic Servo Valve. (Eq. 6)
0
2
2
( )
2 1
svsv sv
sv
sv sv
Q KK G s
sIs
(6)
The Transfer Functions of the System.
Fig.2 A closed system for Valve-Controlled Hydraulic System
using feedback from servo valve
The open-loop transfer function of the system are tabulated in Eq. 7.
0
2 2
0
2 2
0 0
( ) ( )2 2
( 1)( 1)( 1)sv
sv sv r
KG s H s
s s ss s
(7)
Where
0
p
a sv f
ce
AK K K K
K K (8)
Dynamic Characteristics Analysis of Computer Emulation for the System
Taking the electro-hydraulic servo system, as its primary object of study,the paper established the mathematical model using the transfer function of the system of the electro-hydraulic servo system
as shown by Eg. 8 in the full paper,and made its dynamic and numerical simulation using the
MATLAB language,thus working out the interrelationship among the parameters of the power
matching control system and their dynamic results.
if 200tm kg , 700e MPa , 5 3* 4.6 10t pV A L m ,
2
64
80.5 10e p
h
t
AK
V
N/m,
24634 /
e p hh
t t t
A krad s
V m m
,
65 10 /K N m , hK K , 0 1 650 /h
h
Krad s
K ,
212 32.75 10 ( / )
32
cce
WrK m s Pa
, 0.05ce e th
p t
K m
A V
, 0.2h , 0 0.2 ,
2
9.8 /1 1
( )
cer
p
h
Krad s
AK K
(9)
0.002 /a
IK A V
u
,
100 /f
p
uK V m
x
Hun Guo, Zuo Dunwen, Tang Guoxing 245
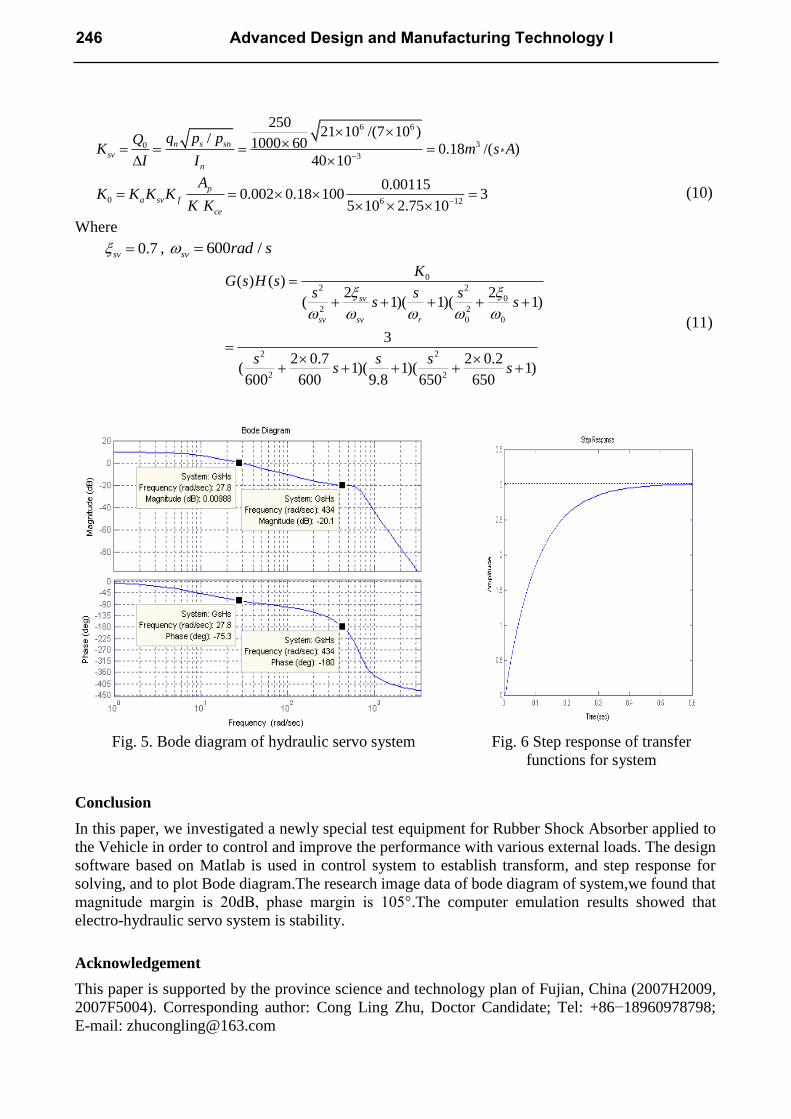
6 6
30
3
25021 10 /(7 10 )/ 1000 60 0.18 /( )
40 10
n s sn
sv
n
q p pQK m s A
I I
0 6 12
0.001150.002 0.18 100 3
5 10 2.75 10
p
a sv f
ce
AK K K K
K K
(10)
Where
0.7sv , 600 /sv rad s
0
2 2
0
2 2
0 0
2 2
2 2
( ) ( )2 2
( 1)( 1)( 1)
3
2 0.7 2 0.2( 1)( 1)( 1)600 600 9.8 650 650
sv
sv sv r
KG s H s
s s ss s
s s ss s
(11)
Fig. 5. Bode diagram of hydraulic servo system Fig. 6 Step response of transfer
functions for system
Conclusion
In this paper, we investigated a newly special test equipment for Rubber Shock Absorber applied to
the Vehicle in order to control and improve the performance with various external loads. The design
software based on Matlab is used in control system to establish transform, and step response for
solving, and to plot Bode diagram.The research image data of bode diagram of system,we found that
magnitude margin is 20dB, phase margin is 105°.The computer emulation results showed that
electro-hydraulic servo system is stability.
Acknowledgement
This paper is supported by the province science and technology plan of Fujian, China (2007H2009,
2007F5004). Corresponding author: Cong Ling Zhu, Doctor Candidate; Tel: +86−18960978798;
E-mail: [email protected]
246 Advanced Design and Manufacturing Technology I

References
[1] J.Sun, G. P.Liu: Nonlinear Analysis Vol 67(2003).No.5, p.1623-1636.
[2] A.Dall’Asta, et al: Engineering Structures Vol 28(2006), p.1874- 1884.
[3] G.Ramorino,et al: Polymer Testing Vol 22(2003), p.681- 687.
[4] J.O.Palmberg: Simulation as a Key Tool Improve the Fluid Power Systems Design Process.The
Fifth International Conference on Fluid Power Transmission and Control, (China, 2001),
p.25~37
[5] Steinel K: SAE Paper (2006) No.1, p.3292.
[6] Benjamin C Kuo, Duane C.Hanselman: Matlab Tools for Control System Analysis and Design
(Prentice Hall, 1994), p157-168
[7] Dai J, Lai J C S, and Williamson H M, and Li Y J: Journal of Sound and Vibration Vol 228
(1999).No.5, p. 831-44.
Hun Guo, Zuo Dunwen, Tang Guoxing 247
Research on Chip Breaking Mechanism of High-temperature and High-strength Steel 2.25Cr-1Mo-0.25V
E. L. Liua, Y. F. Li, X. Z. Wang, F. Xiao and X. L. Liu b
The key Lab of Advanced Manufacturing Tech. & Cutting Tools, Harbin Univ. of Sci. and Tech, Harbin, 150080, PR China
[email protected], [email protected]
Keywords: high-temperature and high-strength steel; complicated groove insert; chip curl; chip breaking
Abstract. In the process of turning high-temperature and high-strength steel, it is an effective method
for chip breaking with complicated groove insert. In this paper, chip breaking mechanism is analyzed
using the coated complicate groove insert for cutting high-temperature and high-strength steel. The
model of chip curl radios is constructed though analyzing the effect of complicated groove insert on
chip formation. The mathematical formulation of chip section profile coefficient is built through
analyzing influential effect of complicated groove on chip section profile. The chip breaking model is
developed according to chip-breaking criterion. Finally, a full experimental validation of the model is
presented for chip breaking when the workpiece is high-temperature and high-strength steel,
2.25Cr-1Mo-0.25V. The tested results show the chip breaking model is reasonable, and the
optimization cutting parameters are obtained.
Introduction
Chip breaking during the cutting process is the key technical issues: uncontrolled chips are apt to
cause poor surface quality, damage cutting tools and workpieces, and in serious cases, harm operators
owing to tangled chips [1, 2]. Because high-temperature and high-strength steel have viscosity and
toughness, it is prone to stick on cutting tool when turning it. So chip is not easily broken. Therefore,
breaking chips into suitable lengths in the continuous machining has been an important subject in
manufacturing. In recent years, with the rapid development of manufacturing processes,
chip-breaking capability of complicated groove insert is considered increasingly important.
However, chip-breaking mechanism has still not been studied because of complex chip-breaking
behavior with coated complicated groove insert [3, 4]. In this paper, the model of chip curl radios is
constructed though analyzing the effect of complicated groove insert on chip formation. The
formulation of chip section profile coefficient is built through analyzing influential effect of
complicated groove on chip section profile. The chip breaking model is developed according to chip
breaking criterion. Finally, to verify the chip breaking model, cutting experiments are performed
using coated complicated groove insert.
Chip Breaking Model
Model ofchip flow angle. Because the exact pridiction of chip flow angle is very important, there
have been many papers which calculate chip flow angle from various viewpoints since 1950s. Here,
the model of Colwell is employed because of its simplest and most appropriate[5]. The equations are
as follow.
p
pp
a
faar
22
tan
2
1
rcos1
r
a p (1)
© (2011) Trans Tech Publications, Switzerlanddoi:10.4028/www.scientific.net/AMR.142.248
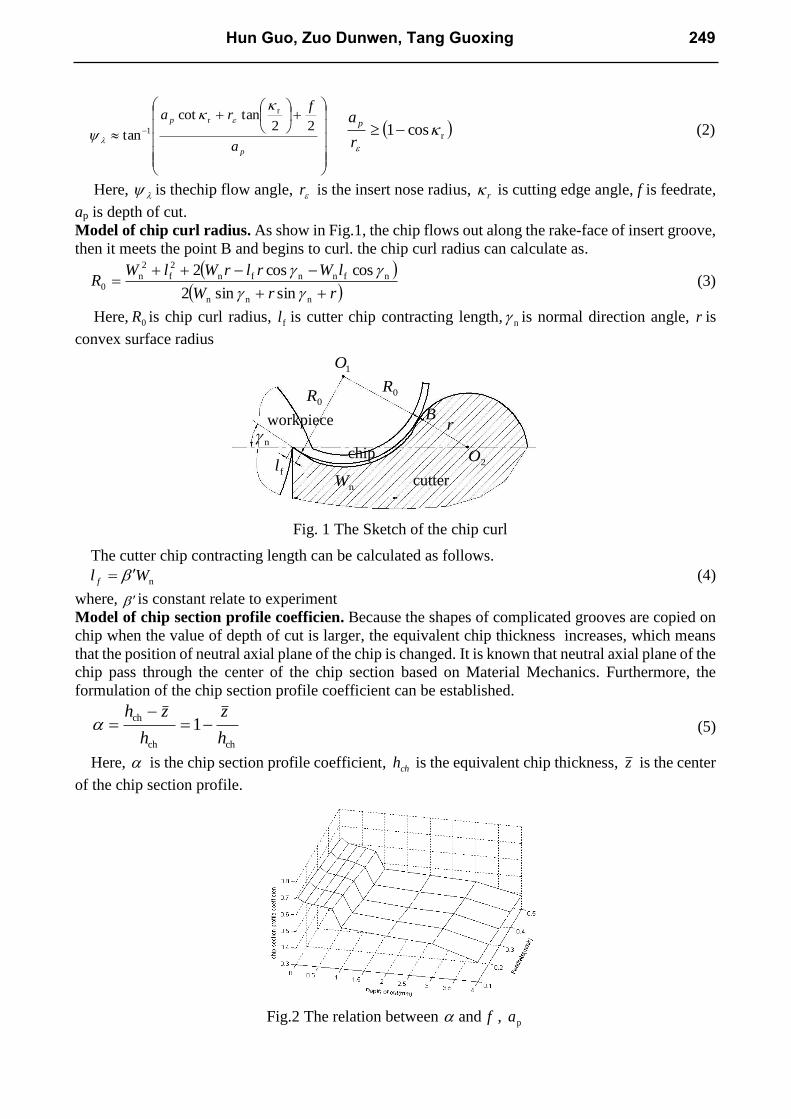
p
p
a
fra
22tancot
tan
r
r
1
rcos1
r
a p (2)
Here, is thechip flow angle, r is the insert nose radius, r is cutting edge angle, f is feedrate,
ap is depth of cut.
Model of chip curl radius. As show in Fig.1, the chip flows out along the rake-face of insert groove,
then it meets the point B and begins to curl. the chip curl radius can calculate as.
rrW
lWrlrWlWR
nnn
nfnnfn
2
f
2
n0
sinsin2
coscos2
(3)
Here, 0R is chip curl radius, fl is cutter chip contracting length, n is normal direction angle, r is
convex surface radius
The cutter chip contracting length can be calculated as follows.
nWl f (4)
where, is constant relate to experiment
Model of chip section profile coefficien. Because the shapes of complicated grooves are copied on
chip when the value of depth of cut is larger, the equivalent chip thickness increases, which means
that the position of neutral axial plane of the chip is changed. It is known that neutral axial plane of the
chip pass through the center of the chip section based on Material Mechanics. Furthermore, the
formulation of the chip section profile coefficient can be established.
chch
ch1
h
z
h
zh
(5)
Here, is the chip section profile coefficient, chh is the equivalent chip thickness, z is the center
of the chip section profile.
Fig.2 The relation between and f , pa
cutter
chip
1O
2O
nW
0R0R
fl
workpiece
n
Br
Fig. 1 The Sketch of the chip curl
Hun Guo, Zuo Dunwen, Tang Guoxing 249
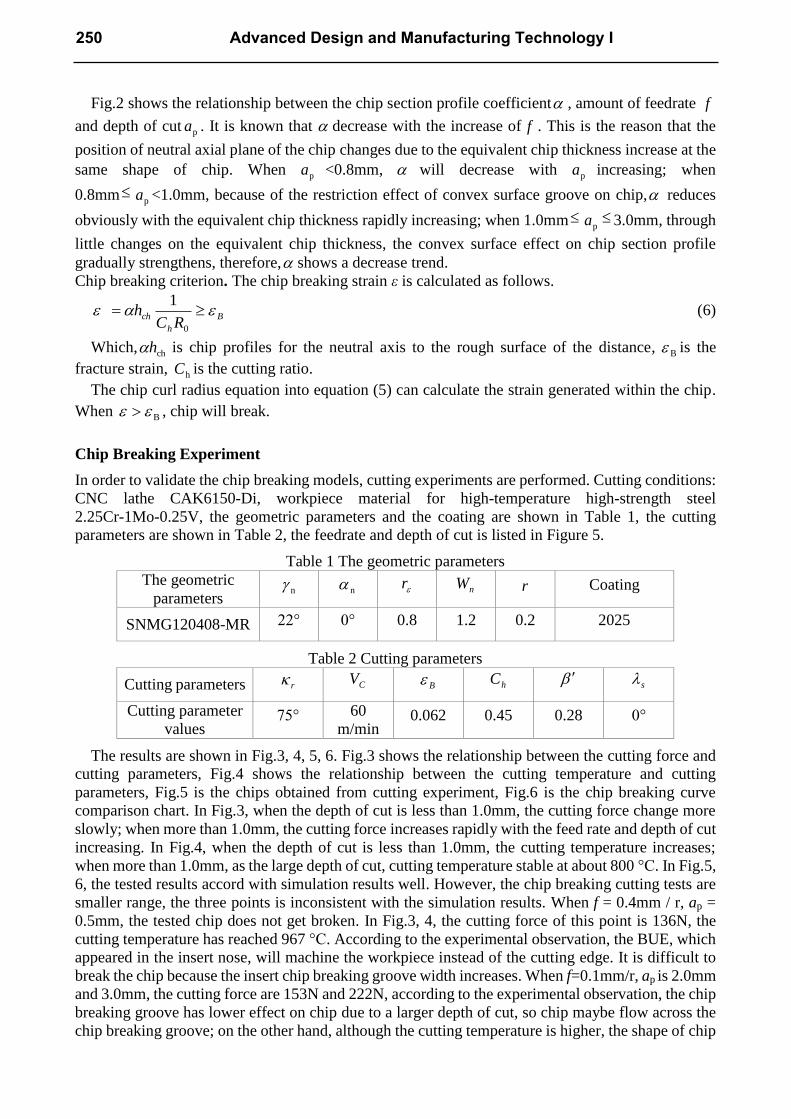
Fig.2 shows the relationship between the chip section profile coefficient , amount of feedrate f
and depth of cut pa . It is known that decrease with the increase of f . This is the reason that the
position of neutral axial plane of the chip changes due to the equivalent chip thickness increase at the
same shape of chip. When pa <0.8mm, will decrease with pa increasing; when
0.8mmpa <1.0mm, because of the restriction effect of convex surface groove on chip, reduces
obviously with the equivalent chip thickness rapidly increasing; when 1.0mmpa 3.0mm, through
little changes on the equivalent chip thickness, the convex surface effect on chip section profile
gradually strengthens, therefore, shows a decrease trend.
Chip breaking criterion. The chip breaking strain ε is calculated as follows.
B
h
chRC
h 0
1 (6)
Which, chh is chip profiles for the neutral axis to the rough surface of the distance, B is the
fracture strain, hC is the cutting ratio.
The chip curl radius equation into equation (5) can calculate the strain generated within the chip.
When B , chip will break.
Chip Breaking Experiment
In order to validate the chip breaking models, cutting experiments are performed. Cutting conditions:
CNC lathe CAK6150-Di, workpiece material for high-temperature high-strength steel
2.25Cr-1Mo-0.25V, the geometric parameters and the coating are shown in Table 1, the cutting
parameters are shown in Table 2, the feedrate and depth of cut is listed in Figure 5.
Table 1 The geometric parameters
The geometric
parameters n n r nW r Coating
SNMG120408-MR 22° 0° 0.8 1.2 0.2 2025
Table 2 Cutting parameters
Cutting parameters r CV B hC s
Cutting parameter
values 75° 60
m/min 0.062 0.45 0.28 0°
The results are shown in Fig.3, 4, 5, 6. Fig.3 shows the relationship between the cutting force and cutting parameters, Fig.4 shows the relationship between the cutting temperature and cutting
parameters, Fig.5 is the chips obtained from cutting experiment, Fig.6 is the chip breaking curve
comparison chart. In Fig.3, when the depth of cut is less than 1.0mm, the cutting force change more
slowly; when more than 1.0mm, the cutting force increases rapidly with the feed rate and depth of cut
increasing. In Fig.4, when the depth of cut is less than 1.0mm, the cutting temperature increases;
when more than 1.0mm, as the large depth of cut, cutting temperature stable at about 800 °C. In Fig.5,
6, the tested results accord with simulation results well. However, the chip breaking cutting tests are
smaller range, the three points is inconsistent with the simulation results. When f = 0.4mm / r, ap =
0.5mm, the tested chip does not get broken. In Fig.3, 4, the cutting force of this point is 136N, the
cutting temperature has reached 967 °C. According to the experimental observation, the BUE, which
appeared in the insert nose, will machine the workpiece instead of the cutting edge. It is difficult to
break the chip because the insert chip breaking groove width increases. When f=0.1mm/r, ap is 2.0mm
and 3.0mm, the cutting force are 153N and 222N, according to the experimental observation, the chip
breaking groove has lower effect on chip due to a larger depth of cut, so chip maybe flow across the
chip breaking groove; on the other hand, although the cutting temperature is higher, the shape of chip
250 Advanced Design and Manufacturing Technology I
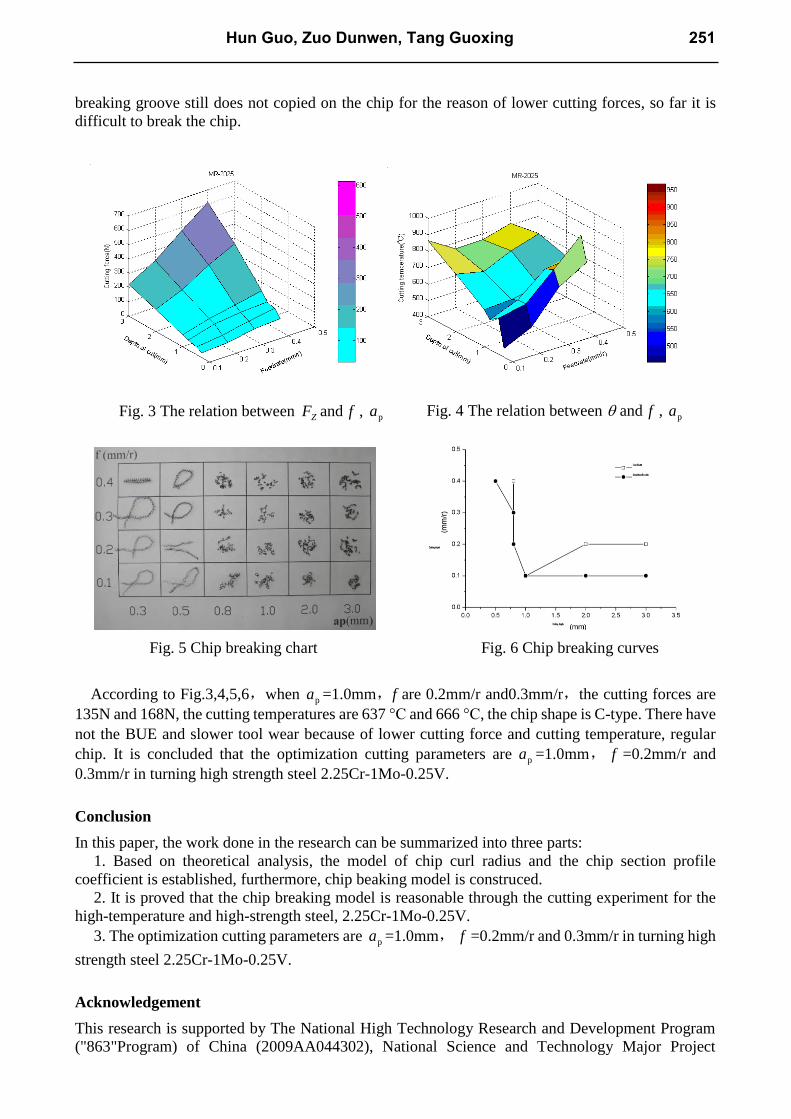
breaking groove still does not copied on the chip for the reason of lower cutting forces, so far it is
difficult to break the chip.
Fig. 5 Chip breaking chart Fig. 6 Chip breaking curves
According to Fig.3,4,5,6,when pa =1.0mm,f are 0.2mm/r and0.3mm/r,the cutting forces are
135N and 168N, the cutting temperatures are 637 °C and 666 °C, the chip shape is C-type. There have
not the BUE and slower tool wear because of lower cutting force and cutting temperature, regular
chip. It is concluded that the optimization cutting parameters are pa =1.0mm, f =0.2mm/r and
0.3mm/r in turning high strength steel 2.25Cr-1Mo-0.25V.
Conclusion
In this paper, the work done in the research can be summarized into three parts:
1. Based on theoretical analysis, the model of chip curl radius and the chip section profile
coefficient is established, furthermore, chip beaking model is construced.
2. It is proved that the chip breaking model is reasonable through the cutting experiment for the
high-temperature and high-strength steel, 2.25Cr-1Mo-0.25V.
3. The optimization cutting parameters are pa =1.0mm, f =0.2mm/r and 0.3mm/r in turning high
strength steel 2.25Cr-1Mo-0.25V.
Acknowledgement
This research is supported by The National High Technology Research and Development Program
("863"Program) of China (2009AA044302), National Science and Technology Major Project
Fig. 3 The relation between ZF and f , pa Fig. 4 The relation between and f , pa
Hun Guo, Zuo Dunwen, Tang Guoxing 251

(2009ZX04014-066-03), Youth science and technology special fundation of Heilongjiang
Province(QC08C54) and youth scientific research fundation of Harbin (2008RFQXG064).
References
[1] Z. Li: Machining Chip breaking Process Analysis (Mechanical Industry Press, Beijing 1996)
[2] Z. Li and Y. Rong: Journal of Machining Science and Technology Vol. 3(1999), p. 25~48.
[3] C. Nedeβ, W. Hintze: Annals CIRP, Vol. 38(1989), p. 75~79.
[4] C. Spaans: The Fundamentals Of Three-Dimensional Chip Curl, Chip Breaking And Chip
Control (PhD Paper, TH Delft, 1971).
[5] I.S. Jawahir and X. D. Fang: International Journal of Advanced Manufacturing Technology
Vol.10,(1995), pp. 225~239.
[6] LIU Erliang, ZHANG Chao, ZHANG Huiping: Key Engineering Materials Vols.407-408 (2009),
p.778~782.
252 Advanced Design and Manufacturing Technology I
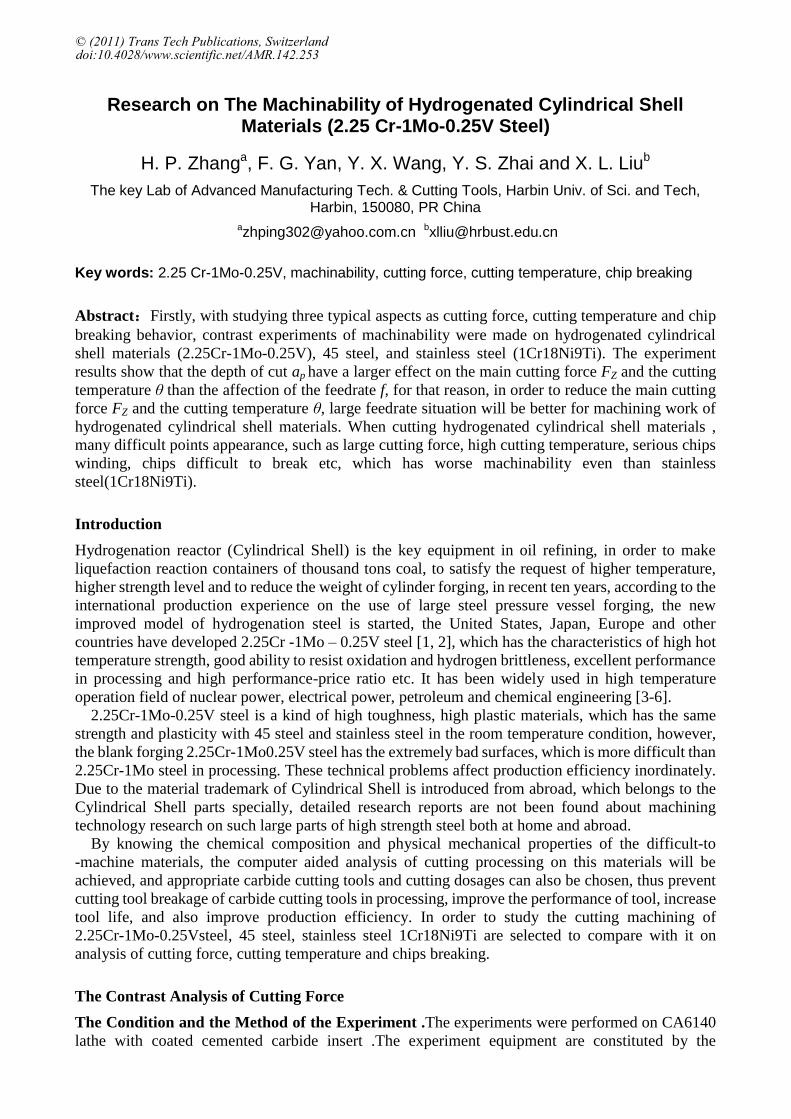
Research on The Machinability of Hydrogenated Cylindrical Shell Materials (2.25 Cr-1Mo-0.25V Steel)
H. P. Zhanga, F. G. Yan, Y. X. Wang, Y. S. Zhai and X. L. Liub
The key Lab of Advanced Manufacturing Tech. & Cutting Tools, Harbin Univ. of Sci. and Tech, Harbin, 150080, PR China
[email protected] [email protected]
Key words: 2.25 Cr-1Mo-0.25V, machinability, cutting force, cutting temperature, chip breaking
Abstract:Firstly, with studying three typical aspects as cutting force, cutting temperature and chip
breaking behavior, contrast experiments of machinability were made on hydrogenated cylindrical
shell materials (2.25Cr-1Mo-0.25V), 45 steel, and stainless steel (1Cr18Ni9Ti). The experiment
results show that the depth of cut ap have a larger effect on the main cutting force FZ and the cutting
temperature θ than the affection of the feedrate f, for that reason, in order to reduce the main cutting
force FZ and the cutting temperature θ, large feedrate situation will be better for machining work of
hydrogenated cylindrical shell materials. When cutting hydrogenated cylindrical shell materials ,
many difficult points appearance, such as large cutting force, high cutting temperature, serious chips
winding, chips difficult to break etc, which has worse machinability even than stainless
steel(1Cr18Ni9Ti).
Introduction
Hydrogenation reactor (Cylindrical Shell) is the key equipment in oil refining, in order to make
liquefaction reaction containers of thousand tons coal, to satisfy the request of higher temperature,
higher strength level and to reduce the weight of cylinder forging, in recent ten years, according to the
international production experience on the use of large steel pressure vessel forging, the new
improved model of hydrogenation steel is started, the United States, Japan, Europe and other
countries have developed 2.25Cr -1Mo – 0.25V steel [1, 2], which has the characteristics of high hot
temperature strength, good ability to resist oxidation and hydrogen brittleness, excellent performance
in processing and high performance-price ratio etc. It has been widely used in high temperature
operation field of nuclear power, electrical power, petroleum and chemical engineering [3-6].
2.25Cr-1Mo-0.25V steel is a kind of high toughness, high plastic materials, which has the same
strength and plasticity with 45 steel and stainless steel in the room temperature condition, however,
the blank forging 2.25Cr-1Mo0.25V steel has the extremely bad surfaces, which is more difficult than
2.25Cr-1Mo steel in processing. These technical problems affect production efficiency inordinately.
Due to the material trademark of Cylindrical Shell is introduced from abroad, which belongs to the
Cylindrical Shell parts specially, detailed research reports are not been found about machining
technology research on such large parts of high strength steel both at home and abroad.
By knowing the chemical composition and physical mechanical properties of the difficult-to
-machine materials, the computer aided analysis of cutting processing on this materials will be
achieved, and appropriate carbide cutting tools and cutting dosages can also be chosen, thus prevent
cutting tool breakage of carbide cutting tools in processing, improve the performance of tool, increase
tool life, and also improve production efficiency. In order to study the cutting machining of
2.25Cr-1Mo-0.25Vsteel, 45 steel, stainless steel 1Cr18Ni9Ti are selected to compare with it on
analysis of cutting force, cutting temperature and chips breaking.
The Contrast Analysis of Cutting Force
The Condition and the Method of the Experiment .The experiments were performed on CA6140
lathe with coated cemented carbide insert .The experiment equipment are constituted by the
© (2011) Trans Tech Publications, Switzerlanddoi:10.4028/www.scientific.net/AMR.142.253
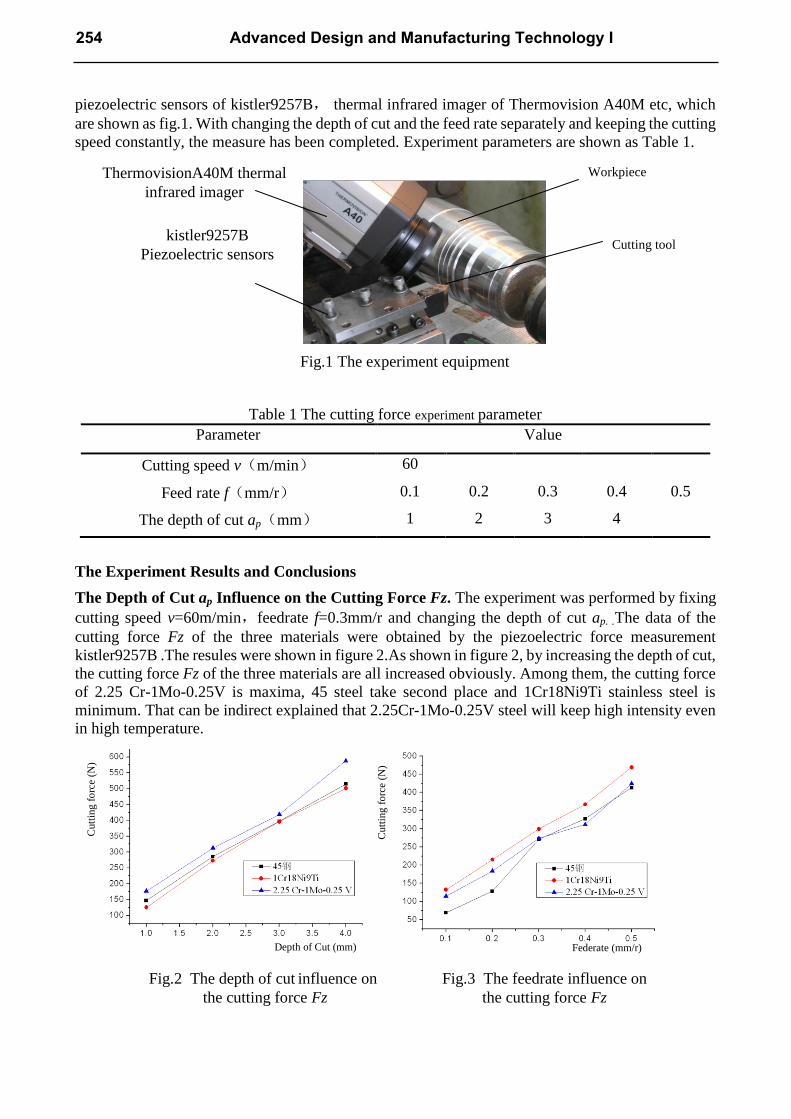
piezoelectric sensors of kistler9257B, thermal infrared imager of Thermovision A40M etc, which
are shown as fig.1. With changing the depth of cut and the feed rate separately and keeping the cutting
speed constantly, the measure has been completed. Experiment parameters are shown as Table 1.
Fig.1 The experiment equipment
Table 1 The cutting force experiment parameter
The Experiment Results and Conclusions
The Depth of Cut ap Influence on the Cutting Force Fz. The experiment was performed by fixing
cutting speed v=60m/min,feedrate f=0.3mm/r and changing the depth of cut ap. .The data of the
cutting force Fz of the three materials were obtained by the piezoelectric force measurement
kistler9257B .The resules were shown in figure 2.As shown in figure 2, by increasing the depth of cut,
the cutting force Fz of the three materials are all increased obviously. Among them, the cutting force
of 2.25 Cr-1Mo-0.25V is maxima, 45 steel take second place and 1Cr18Ni9Ti stainless steel is
minimum. That can be indirect explained that 2.25Cr-1Mo-0.25V steel will keep high intensity even in high temperature.
Parameter Value
Cutting speed v(m/min) 60
Feed rate f(mm/r) 0.1 0.2 0.3 0.4 0.5
The depth of cut ap(mm) 1 2 3 4
Fig.3 The feedrate influence on
the cutting force Fz
ThermovisionA40M thermal
infrared imager
kistler9257B
Piezoelectric sensors
Workpiece
Cutting tool
Cutt
ing
fo
rce
(N)
Depth of Cut (mm)
Federate (mm/r)
Cutt
ing
fo
rce
(N)
Fig.2 The depth of cut influence on
the cutting force Fz
254 Advanced Design and Manufacturing Technology I

The Feedrate Influence on the Cutting Force Fz .The experiment was performed by fixing
cutting speed v=60m/min,the depth of cut ap=2mm and Changing the feedrate f. The data of the
cutting force Fz of the three materials were obtained by the piezoelectric force measurement
kistler9257B .The results were shown in figure 3.As shown in figure 3, by increasing the feedrate, the
cutting force Fz of the three materials are all increased obviously. Among them, the cutting force of
2.25 Cr-1Mo-0.25V is maxima, 1Cr18Ni9Ti stainless steel take second place and 45 steel is
minimum.
The Experiment Conclusions. The experiment results from the above are that when machining
2.25Cr-1Mo-0.25V, the depth of cut effects on the cutting force more than feedrate, therefore, in
order to reducing cutting force,we should choose large feedrate than large depth of cut. Because
2.25Cr-1Mo-0.25V is able to maintain high temperature strength and hardness, so its machinability is
worse than the other two materials.
The Contrast Analysis on the Cutting Temperature θ
In the processing of hydrogenated cylindrical shell materials 2.25Cr-1Mo0.25, the insert damage is
grave. The reason that causes the damage is bonding between the insert and the workpiece. In order to
study the problem, we have used two other materials which are stainless steel (1Cr18Ni9Ti) and 45
steel to carry out the cutting temperature contrast experiment.
The Condition and the Method of the Experiment.The experiment equipment are shown as
fig.1. The cutting temperature is measured by the thermovisionA40M infrared thermal imaging
system. Experiment parameters are shown as Table 2.
Table 2 The cutting temperature experiment parameters
Parameter Value
Cutting speed v(m/min) 20 40 60 80 100
Feed rate f(mm/r) 0.1 0.2 0.3 0.4 0.5
The depth of cut ap(mm) 1 2 3 4
The Experiment Results and Conclusions
The Depth of Cut ap Influence on the Cutting Temperature θ. When cutting speed v is 60m/min,
feed rate f is 0.3mm / r constantly, we change the depth of cut ap and do the experiment. Record the
measured results and draw the experiment data on the coordinate diagram (shown in Figure 4).
The Feedrate f Influence on the Cutting Temperature θ. When cutting speed v is 60m/min,
cutting depth ap is 2mm constantly, we change feed rate f and do the experiment. Record the
measured results and draw the experiment data on the coordinate diagram (shown in Figure 5).
The Cutting Speed v Influence on Cutting Temperature.When the feed rate f is 0.3mm/r, the
depth of cut ap is 2(mm) constantly, we change cutting speed and do the experiment. Record the
measured results and draw the test data on the coordinate diagram (shown in Figure 6).
Experiment Conclusions.From figure 4, 5, 6, we can draw the conclusion that cutting temperature
of 2.25Cr-1Mo-0.25Vis highest that of 1Cr18Ni9Ti is second,45 steel is lowest. Further conclusion
is that the machinability of 2.25Cr-1Mo0.25V steel is worst, that is to say, the material has a more
obvious feature of adhesion, bonding because of the high cutting temperature. On processing of
2.25Cr-1Mo-0.25V, the effect of cutting depth ap on cutting temperature is greater than that of
feedrate, so from the perspective of reducing the cutting temperature, the choice of larger feedrate is
more beneficial than the choice of a larger depth of cut when processing 2.25Cr-1Mo-0.25V.
Hun Guo, Zuo Dunwen, Tang Guoxing 255
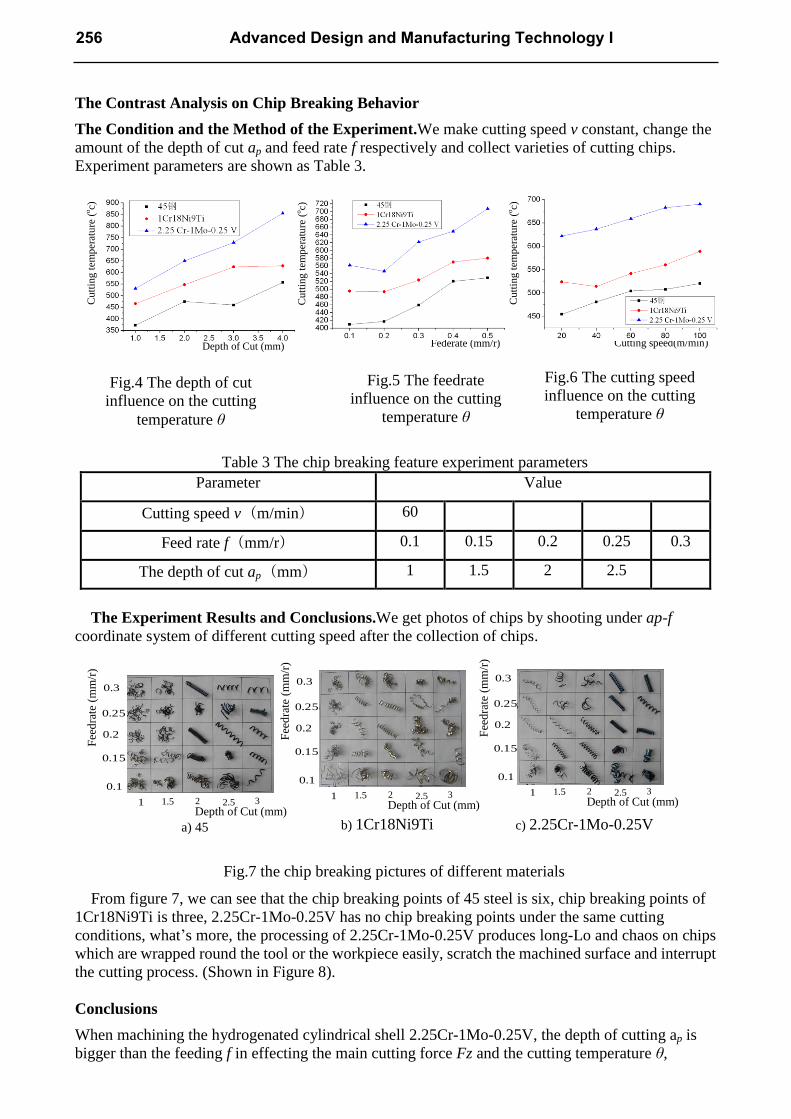
The Contrast Analysis on Chip Breaking Behavior
The Condition and the Method of the Experiment.We make cutting speed v constant, change the
amount of the depth of cut ap and feed rate f respectively and collect varieties of cutting chips.
Experiment parameters are shown as Table 3.
Table 3 The chip breaking feature experiment parameters
The Experiment Results and Conclusions.We get photos of chips by shooting under ap-f
coordinate system of different cutting speed after the collection of chips.
From figure 7, we can see that the chip breaking points of 45 steel is six, chip breaking points of
1Cr18Ni9Ti is three, 2.25Cr-1Mo-0.25V has no chip breaking points under the same cutting
conditions, what’s more, the processing of 2.25Cr-1Mo-0.25V produces long-Lo and chaos on chips
which are wrapped round the tool or the workpiece easily, scratch the machined surface and interrupt
the cutting process. (Shown in Figure 8).
Conclusions
When machining the hydrogenated cylindrical shell 2.25Cr-1Mo-0.25V, the depth of cutting ap is
bigger than the feeding f in effecting the main cutting force Fz and the cutting temperature θ,
Parameter Value
Cutting speed v(m/min) 60
Feed rate f(mm/r) 0.1 0.15 0.2 0.25 0.3
The depth of cut ap(mm) 1 1.5 2 2.5
1 5.1 2 5.2 3
1.0
15.0
2.0
25.0
3.0
Depth of Cut (mm)
Fee
dra
te (
mm
/r)
1 5.1 2 5.2 3
1.0
15.0
2.0
25.0
3.0
Depth of Cut (mm)
Fee
dra
te (
mm
/r)
1 5.1 2 5.2 3
1.0
15.0
2.0
25.0
3.0
Depth of Cut (mm)
Fee
dra
te (
mm
/r)
a) 45 b) 1Cr18Ni9Ti c) 2.25Cr-1Mo-0.25V
Cutt
ing
tem
per
atu
re (
oc)
Depth of Cut (mm)
Federate (mm/r)
Cutt
ing
tem
per
atu
re (
oc)
Cutting speed(m/min)
Cutt
ing
tem
per
atu
re (
oc)
Fig.7 the chip breaking pictures of different materials
Fig.4 The depth of cut influence on the cutting
temperature θ
Fig.5 The feedrate
influence on the cutting
temperature θ
Fig.6 The cutting speed
influence on the cutting
temperature θ
256 Advanced Design and Manufacturing Technology I
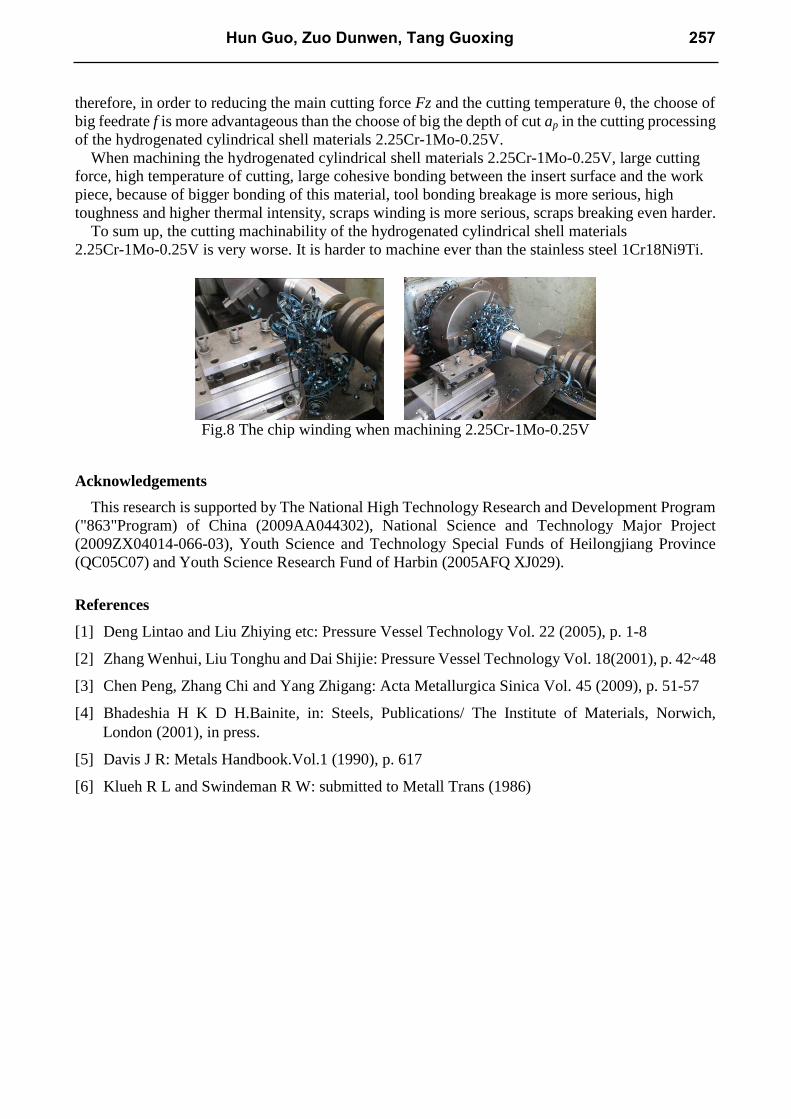
therefore, in order to reducing the main cutting force Fz and the cutting temperature θ, the choose of
big feedrate f is more advantageous than the choose of big the depth of cut ap in the cutting processing
of the hydrogenated cylindrical shell materials 2.25Cr-1Mo-0.25V.
When machining the hydrogenated cylindrical shell materials 2.25Cr-1Mo-0.25V, large cutting
force, high temperature of cutting, large cohesive bonding between the insert surface and the work
piece, because of bigger bonding of this material, tool bonding breakage is more serious, high
toughness and higher thermal intensity, scraps winding is more serious, scraps breaking even harder.
To sum up, the cutting machinability of the hydrogenated cylindrical shell materials
2.25Cr-1Mo-0.25V is very worse. It is harder to machine ever than the stainless steel 1Cr18Ni9Ti.
Fig.8 The chip winding when machining 2.25Cr-1Mo-0.25V
Acknowledgements
This research is supported by The National High Technology Research and Development Program
("863"Program) of China (2009AA044302), National Science and Technology Major Project
(2009ZX04014-066-03), Youth Science and Technology Special Funds of Heilongjiang Province
(QC05C07) and Youth Science Research Fund of Harbin (2005AFQ XJ029).
References
[1] Deng Lintao and Liu Zhiying etc: Pressure Vessel Technology Vol. 22 (2005), p. 1-8
[2] Zhang Wenhui, Liu Tonghu and Dai Shijie: Pressure Vessel Technology Vol. 18(2001), p. 42~48
[3] Chen Peng, Zhang Chi and Yang Zhigang: Acta Metallurgica Sinica Vol. 45 (2009), p. 51-57
[4] Bhadeshia H K D H.Bainite, in: Steels, Publications/ The Institute of Materials, Norwich,
London (2001), in press.
[5] Davis J R: Metals Handbook.Vol.1 (1990), p. 617
[6] Klueh R L and Swindeman R W: submitted to Metall Trans (1986)
Hun Guo, Zuo Dunwen, Tang Guoxing 257

Applied Research of the Electric Spindle Technology on Sub-nanometer Crusher with Cellulosine
Lanyu Yanga
College of Mechanical Engineering, Changshu Institute of Technology, No.99,South 3th Road,Changshu, 215500,China
Keywords : Electric spindle,superfine cellulosine with sub-nanometer, static and dynamic
equilibrium, dynamic pressure effect
Abstract. Application prospect of the superfine cellulosine with sub-nanometer was analyzed;
technology of the electric spindle was applied into the schizolysis crusher machine. One schizolysis
crusher that could manufacture the superfine cellulosine with sub-nanometer relying on wedge
structure constituted the special structure to form dynamic pressure effect with high pressure using
shearing action between milling cutter with high-speed and stationary cutter. The experimental
results showed that size of the cellulosine formed by the schizolysis cruser has reached 2400 items,
thus, a new manufacturing method on superfine cellulosine with sub-nanometer dimension was
obtained, which provided the practical basis for development and application of manufacturing
technology with the superfine cellulosine with sub-nanometer in our country.
Introduction
Machining techniques for sub-nanometer of the lumber were one new domain for development of the
wood industry to the humanity [1, 2]. Processing methods for the cellulosine with sub-nanometer
were primary coverage technical research of the tackle hard-nut problems in science and technology
to nanofabrication industry for the lumber for in the future, which would bring about huge economic
efficiency during production for the wood industry, looked from its future trend of development. The
electric spindle connected rotor of the asynchronous motor with main spindle of the grinder by
interference fit directly, thus all driving mediums between the main motor and the main spindle were
cancelled, integration for both the main motor and main spindle of the grinder were realized,
so-called “zero transmission”, which had many characteristics such as compact structure, high
mechanical efficiency, low noise, small vibration and higher precision, it had widespread application
in cutting machine with super speed. Many countries such as the United States, Japan, Switzerland
and Italy have used structure of the electric spindle on NC machine with high speed [3, 4].
Operating principle for the electric spindle
The electric spindle may be understood as “motor + spindle”, which may also be said that it was one
high-end electric motor. Phase position of motor’s winding for the electric spindle was mutual
deviation as 120º , the three-phase winding formed one magnetic field which was sinusoidal
alternating after passed the three-phase AC, whose rotational speed for the magnetic field was
synchronous speed of the electric spindle. Both electric current and frequency’s conversion for the
input motor stator winding and excitation voltage were adopted by the electric spindle to obtain
various kinds of rotational speed. Phase sequence of the input stator three-phase AC was decide
direction of the rotary magnetic field’s altering during acceleration and brake process, therefore, if
phase sequence of the electric spindle’s input current changed , rotational speed of the electric spindle
could be transformed.
Design on sub-nanometer crusher with the electric spindle’s structure
Raw materials that were used most were the sawdust and the broken fiber during production process
for the superfine cellulosine with sub-nanometer. Power of the electric spindle that was selected in
© (2011) Trans Tech Publications, Switzerlanddoi:10.4028/www.scientific.net/AMR.142.258
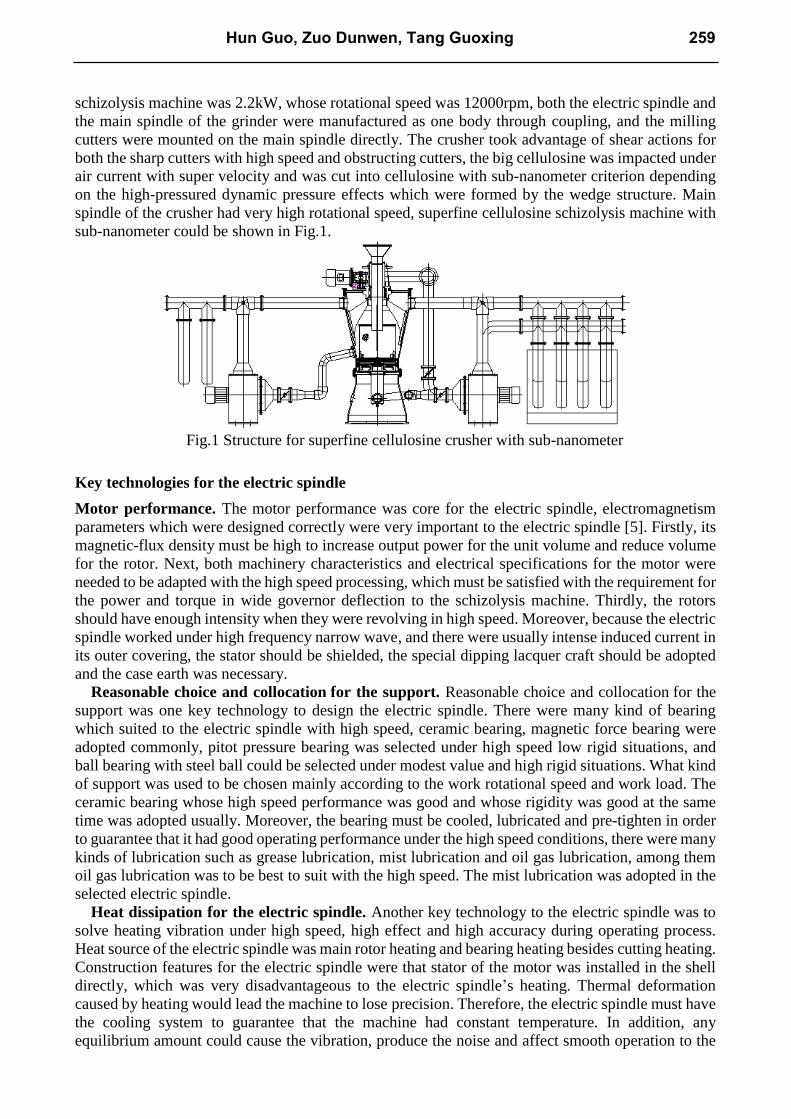
schizolysis machine was 2.2kW, whose rotational speed was 12000rpm, both the electric spindle and
the main spindle of the grinder were manufactured as one body through coupling, and the milling
cutters were mounted on the main spindle directly. The crusher took advantage of shear actions for
both the sharp cutters with high speed and obstructing cutters, the big cellulosine was impacted under
air current with super velocity and was cut into cellulosine with sub-nanometer criterion depending
on the high-pressured dynamic pressure effects which were formed by the wedge structure. Main
spindle of the crusher had very high rotational speed, superfine cellulosine schizolysis machine with
sub-nanometer could be shown in Fig.1.
Fig.1 Structure for superfine cellulosine crusher with sub-nanometer
Key technologies for the electric spindle
Motor performance. The motor performance was core for the electric spindle, electromagnetism
parameters which were designed correctly were very important to the electric spindle [5]. Firstly, its
magnetic-flux density must be high to increase output power for the unit volume and reduce volume
for the rotor. Next, both machinery characteristics and electrical specifications for the motor were
needed to be adapted with the high speed processing, which must be satisfied with the requirement for
the power and torque in wide governor deflection to the schizolysis machine. Thirdly, the rotors
should have enough intensity when they were revolving in high speed. Moreover, because the electric
spindle worked under high frequency narrow wave, and there were usually intense induced current in
its outer covering, the stator should be shielded, the special dipping lacquer craft should be adopted
and the case earth was necessary.
Reasonable choice and collocation for the support. Reasonable choice and collocation for the
support was one key technology to design the electric spindle. There were many kind of bearing
which suited to the electric spindle with high speed, ceramic bearing, magnetic force bearing were
adopted commonly, pitot pressure bearing was selected under high speed low rigid situations, and
ball bearing with steel ball could be selected under modest value and high rigid situations. What kind
of support was used to be chosen mainly according to the work rotational speed and work load. The
ceramic bearing whose high speed performance was good and whose rigidity was good at the same
time was adopted usually. Moreover, the bearing must be cooled, lubricated and pre-tighten in order
to guarantee that it had good operating performance under the high speed conditions, there were many
kinds of lubrication such as grease lubrication, mist lubrication and oil gas lubrication, among them
oil gas lubrication was to be best to suit with the high speed. The mist lubrication was adopted in the
selected electric spindle.
Heat dissipation for the electric spindle. Another key technology to the electric spindle was to
solve heating vibration under high speed, high effect and high accuracy during operating process.
Heat source of the electric spindle was main rotor heating and bearing heating besides cutting heating.
Construction features for the electric spindle were that stator of the motor was installed in the shell
directly, which was very disadvantageous to the electric spindle’s heating. Thermal deformation
caused by heating would lead the machine to lose precision. Therefore, the electric spindle must have
the cooling system to guarantee that the machine had constant temperature. In addition, any
equilibrium amount could cause the vibration, produce the noise and affect smooth operation to the
Hun Guo, Zuo Dunwen, Tang Guoxing 259
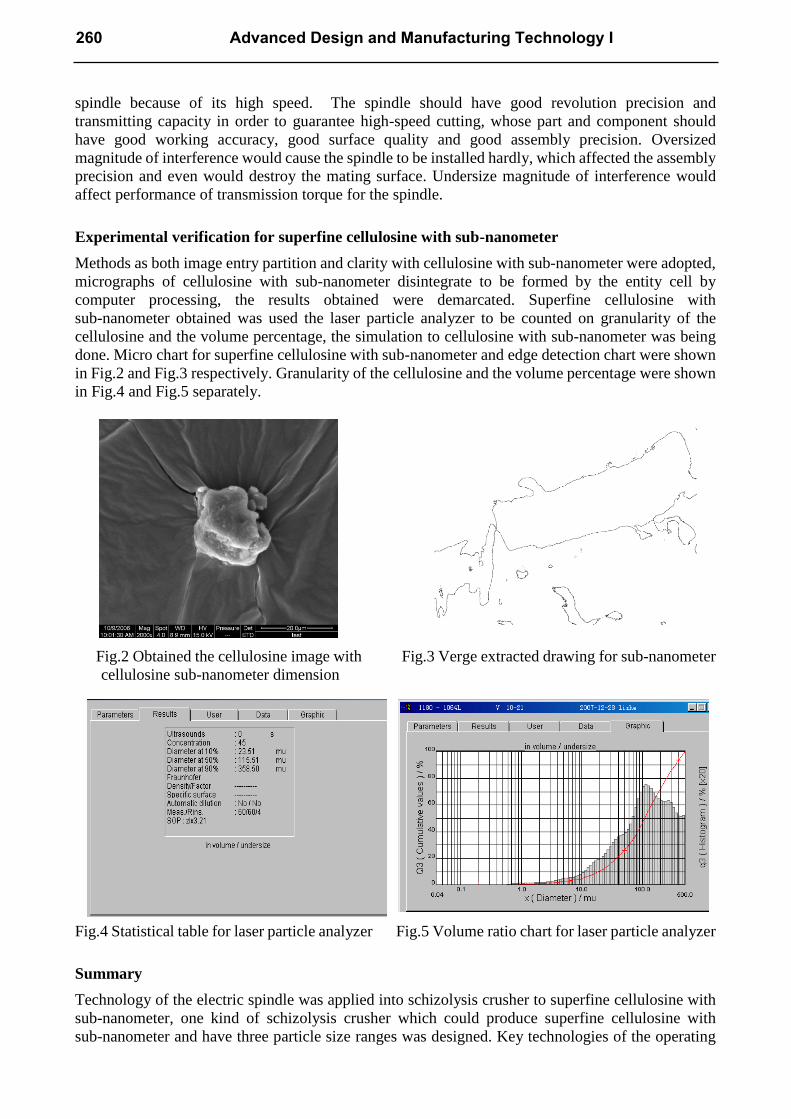
spindle because of its high speed. The spindle should have good revolution precision and
transmitting capacity in order to guarantee high-speed cutting, whose part and component should
have good working accuracy, good surface quality and good assembly precision. Oversized
magnitude of interference would cause the spindle to be installed hardly, which affected the assembly
precision and even would destroy the mating surface. Undersize magnitude of interference would
affect performance of transmission torque for the spindle.
Experimental verification for superfine cellulosine with sub-nanometer
Methods as both image entry partition and clarity with cellulosine with sub-nanometer were adopted,
micrographs of cellulosine with sub-nanometer disintegrate to be formed by the entity cell by
computer processing, the results obtained were demarcated. Superfine cellulosine with
sub-nanometer obtained was used the laser particle analyzer to be counted on granularity of the
cellulosine and the volume percentage, the simulation to cellulosine with sub-nanometer was being
done. Micro chart for superfine cellulosine with sub-nanometer and edge detection chart were shown
in Fig.2 and Fig.3 respectively. Granularity of the cellulosine and the volume percentage were shown
in Fig.4 and Fig.5 separately.
Fig.2 Obtained the cellulosine image with Fig.3 Verge extracted drawing for sub-nanometer
cellulosine sub-nanometer dimension
Fig.4 Statistical table for laser particle analyzer Fig.5 Volume ratio chart for laser particle analyzer
Summary
Technology of the electric spindle was applied into schizolysis crusher to superfine cellulosine with
sub-nanometer, one kind of schizolysis crusher which could produce superfine cellulosine with
sub-nanometer and have three particle size ranges was designed. Key technologies of the operating
260 Advanced Design and Manufacturing Technology I

performance which could influence the main spindle were studied with emphasis, many technologies
such as performance for the motor, reasonable choice and collocation for the support, heat dissipation
for the electric spindle and static and dynamic equilibrium for the spindle were discussed and
analyzed, thus one new kind of method that could produce superfine cellulosine with sub-nanometer
was obtained. The test results indicated that granularity of the superfine cellulosine formed by this
machine had already achieved 2400 items, which had provided the actual basis on both development
and application for superfine cellulosine with sub-nanometer in China.
References
[1] Chunmei Yang, Yingjie Qi and Yonghua Sun: Northeast forestry university journals Vol.36
(2008) No.10, p.45-47.
[2] Chunmei Yang and Yingjie Qi: Forestry Science & Technology Vol.33 (2008) No. 5, p.45-47.
[3] Kaizi Chu: Machine Tool & Hydraulics (2006) No.10, p.228-230.
[4] Hua Yao: Machine Tool & Hydraulics (2004) No.2, p.5-6.
[5] Linbo Zhang, Hongmei Xia and Xiaoming Huang: Manufacturing Technology & Machine Tool
(2001) No.7, p.12-14.
Hun Guo, Zuo Dunwen, Tang Guoxing 261
High-speed Milling Toolpath Planning for Aviation Engines Impeller Using POWERMILL Software
Wang Xufeng1,a, Sun Chuantong 1,b and Sun Hong-jiang2,c 1Modern Manufacture Engineering Center of Heilongjiang University of Science & Technology,
Harbin, Heilongjiang Province, China
2Institute of Mechanical Engineering of Heilongjiang University of Science & Technology, Harbin, Heilongjiang Province, China
[email protected], [email protected], [email protected]
Keyword: high-speed milling, toolpath, impeller, machining process.
Abstract. In this paper, the machining process of integrated impeller is customized basing on the
geometry feature, function characteristics and the processing difficulties. Considering the working
performance and machining rigidity, the rough machining and finish machining toolpath of the hub
are generated in surface projection manner and the finish milling toolpath of blade is created in driver
surface manner providing by the POWERMILL software. After simulating the machining toolpath,
an integrated impeller is machined by 5-axis machining center of HSM 600U.
Introduction
Impeller is the core components of aviation engine which processing technology is widely researched
over the years [1]. There are many constraints when planning the machining tool path and easy to
interfere when machining because the geometry structure very complex. It is very hard to generation
of interference-free machining tool path automatically [2]. In addition, Impeller blades have a high
aerodynamic performance and mechanical efficiency requirements. Chatter is easily happened when
machining the impeller blades because the blades are thin and serious distortion. Therefore, it is very
important for selecting reasonable cutting parameters, cutting point planning and tool axis control
mode to complete the tool path planning [3]. Recently, many companies are usually using universal
software such as UG NX, CATIA, POWERMILL. In this paper, the 5-axis machining tool path is
generated based on the geometry feature using the POWERMILL software and the generated tool
path is optimized through the point distribution function provided by the software. Finally, the
integrated impeller was machined in high-quality and high efficiency.
5- Axis NC Machining Process of Impeller Analysis
According the feature of multi-axis CNC machining, the CAM programming of integrated impeller
when using the POWERMILL is usually follows the process that shown in the Fig.1
Analysis of Impeller Geometric Modal. The characteristic parameters of blades, hub and the root
are obtained through analyzing the impeller geometric modal. The key part of the impeller is blade.
The type of blade surface can be divided into ruled surfaces and freeform surfaces and the ruled
surface can also be divided into developable ruled surface and non-developable ruled surface. The
different machining manner will be used according the sort of the blade surface. In addition, the
parameters of the inlet and outlet flow passage width must be determined in order to select tool and
generate the toolpath reasonably.
The Difficulties of Impeller Processing. The geometry structure of integrated impeller shown in
Fig.2 is very complex, such as processing channel narrow and blades twisted seriously. So it is easy to
interfere and hit tools in the machining process. Chatter and deformation are also easily to happen
when machining the impeller blades because the blades are thin. The tool axis need around
approximate 180 degrees in machining the leading and trailing edge because the curvature changing
dramatically in that part. The tool axis swing error increases between the two adjacent cutter points
© (2011) Trans Tech Publications, Switzerlanddoi:10.4028/www.scientific.net/AMR.142.262
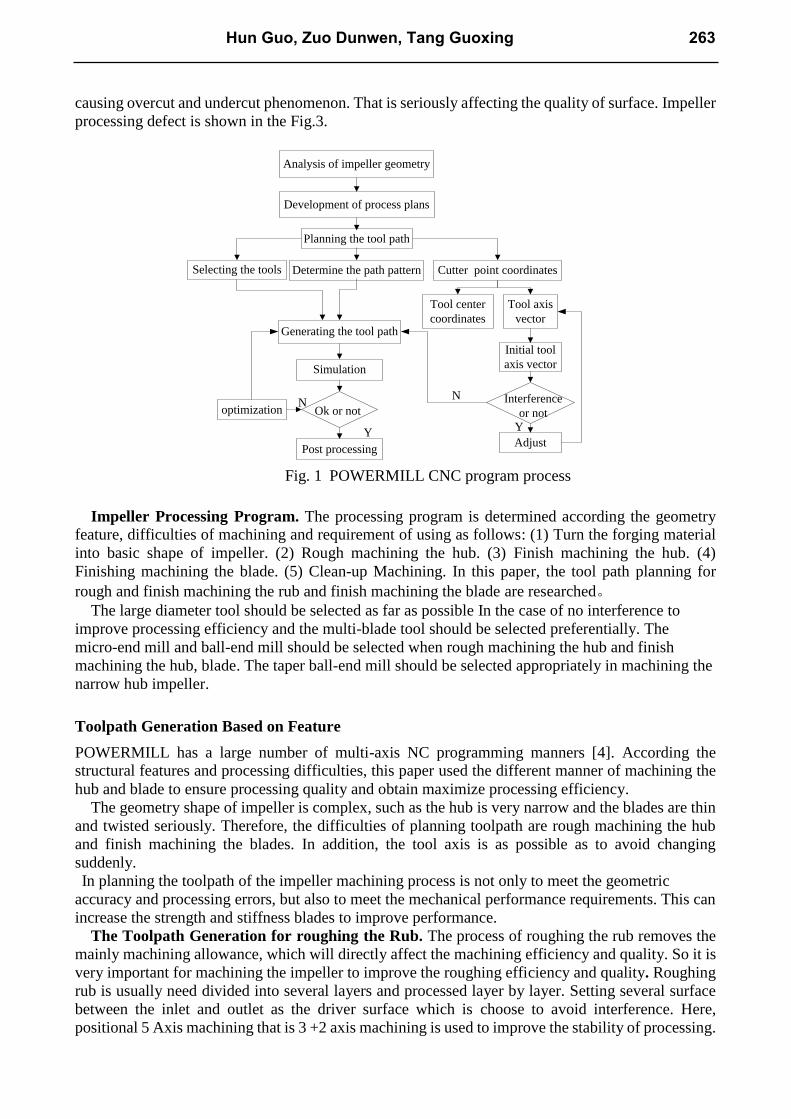
causing overcut and undercut phenomenon. That is seriously affecting the quality of surface. Impeller
processing defect is shown in the Fig.3.
Analysis of impeller geometry
Development of process plans
Planning the tool path
Selecting the tools Determine the path pattern
Generating the tool path
Cutter point coordinates
Adjust
Tool center
coordinates
Tool axis
vector
Initial tool
axis vector
Interference
or not
Simulation
Ok or not
Post processing
YY
NN
optimization
Impeller Processing Program. The processing program is determined according the geometry feature, difficulties of machining and requirement of using as follows: (1) Turn the forging material
into basic shape of impeller. (2) Rough machining the hub. (3) Finish machining the hub. (4)
Finishing machining the blade. (5) Clean-up Machining. In this paper, the tool path planning for
rough and finish machining the rub and finish machining the blade are researched。
The large diameter tool should be selected as far as possible In the case of no interference to
improve processing efficiency and the multi-blade tool should be selected preferentially. The
micro-end mill and ball-end mill should be selected when rough machining the hub and finish
machining the hub, blade. The taper ball-end mill should be selected appropriately in machining the
narrow hub impeller.
Toolpath Generation Based on Feature
POWERMILL has a large number of multi-axis NC programming manners [4]. According the structural features and processing difficulties, this paper used the different manner of machining the
hub and blade to ensure processing quality and obtain maximize processing efficiency.
The geometry shape of impeller is complex, such as the hub is very narrow and the blades are thin
and twisted seriously. Therefore, the difficulties of planning toolpath are rough machining the hub
and finish machining the blades. In addition, the tool axis is as possible as to avoid changing
suddenly.
In planning the toolpath of the impeller machining process is not only to meet the geometric
accuracy and processing errors, but also to meet the mechanical performance requirements. This can
increase the strength and stiffness blades to improve performance.
The Toolpath Generation for roughing the Rub. The process of roughing the rub removes the
mainly machining allowance, which will directly affect the machining efficiency and quality. So it is
very important for machining the impeller to improve the roughing efficiency and quality. Roughing
rub is usually need divided into several layers and processed layer by layer. Setting several surface
between the inlet and outlet as the driver surface which is choose to avoid interference. Here,
positional 5 Axis machining that is 3 +2 axis machining is used to improve the stability of processing.
Fig. 1 POWERMILL CNC program process
Hun Guo, Zuo Dunwen, Tang Guoxing 263
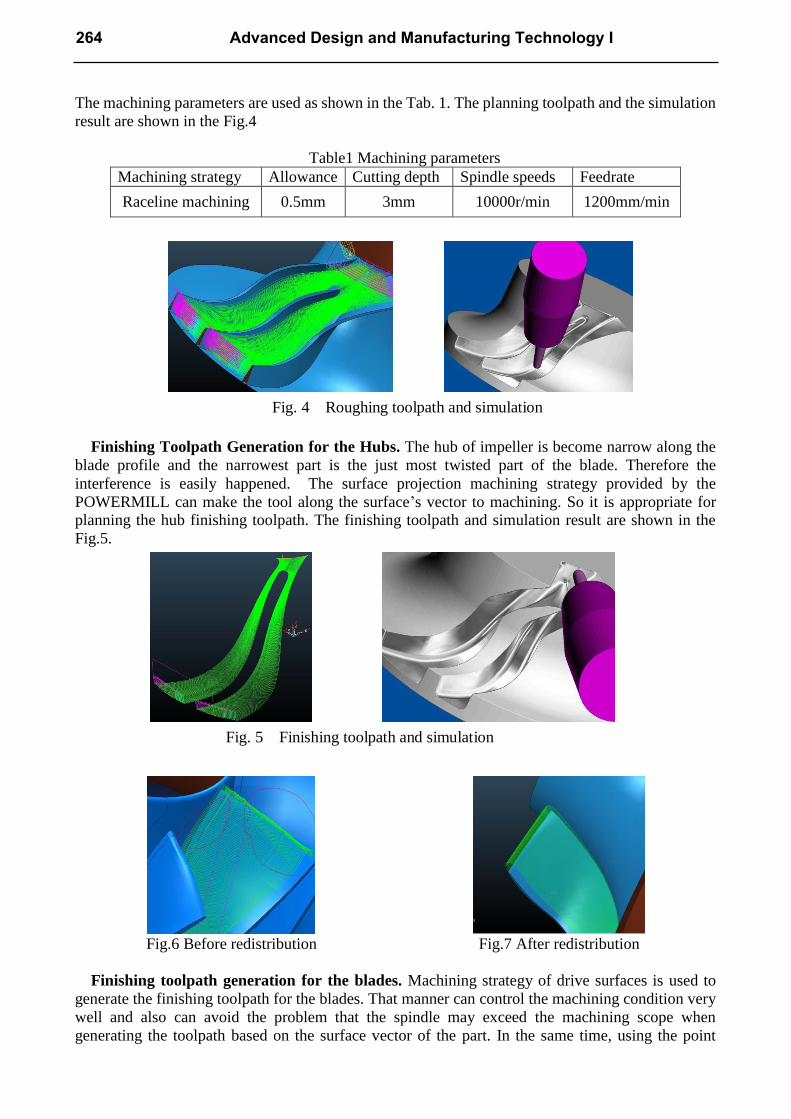
The machining parameters are used as shown in the Tab. 1. The planning toolpath and the simulation
result are shown in the Fig.4
Table1 Machining parameters
Machining strategy Allowance Cutting depth Spindle speeds Feedrate
Raceline machining 0.5mm 3mm 10000r/min 1200mm/min
Finishing Toolpath Generation for the Hubs. The hub of impeller is become narrow along the
blade profile and the narrowest part is the just most twisted part of the blade. Therefore the
interference is easily happened. The surface projection machining strategy provided by the
POWERMILL can make the tool along the surface’s vector to machining. So it is appropriate for planning the hub finishing toolpath. The finishing toolpath and simulation result are shown in the
Fig.5.
Fig.6 Before redistribution Fig.7 After redistribution
Finishing toolpath generation for the blades. Machining strategy of drive surfaces is used to
generate the finishing toolpath for the blades. That manner can control the machining condition very
well and also can avoid the problem that the spindle may exceed the machining scope when
generating the toolpath based on the surface vector of the part. In the same time, using the point
Fig. 5 Finishing toolpath and simulation
Fig. 4 Roughing toolpath and simulation
264 Advanced Design and Manufacturing Technology I
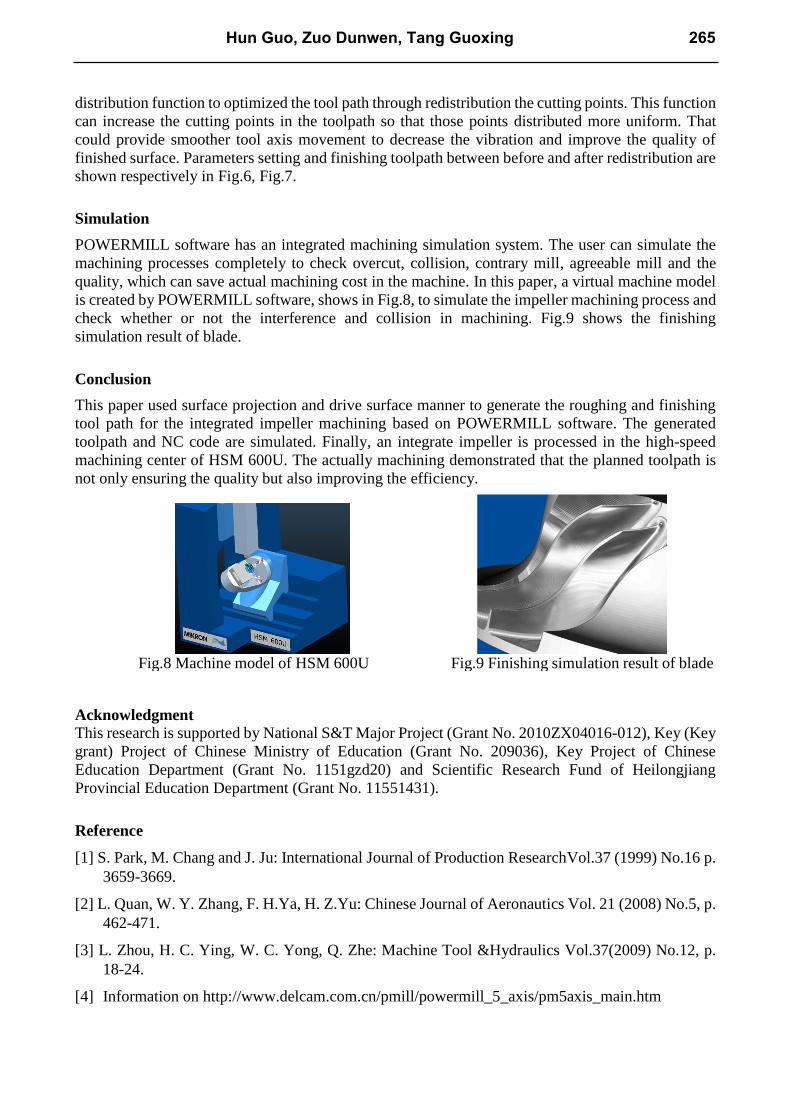
distribution function to optimized the tool path through redistribution the cutting points. This function
can increase the cutting points in the toolpath so that those points distributed more uniform. That
could provide smoother tool axis movement to decrease the vibration and improve the quality of
finished surface. Parameters setting and finishing toolpath between before and after redistribution are
shown respectively in Fig.6, Fig.7.
Simulation
POWERMILL software has an integrated machining simulation system. The user can simulate the
machining processes completely to check overcut, collision, contrary mill, agreeable mill and the
quality, which can save actual machining cost in the machine. In this paper, a virtual machine model
is created by POWERMILL software, shows in Fig.8, to simulate the impeller machining process and
check whether or not the interference and collision in machining. Fig.9 shows the finishing
simulation result of blade.
Conclusion
This paper used surface projection and drive surface manner to generate the roughing and finishing
tool path for the integrated impeller machining based on POWERMILL software. The generated
toolpath and NC code are simulated. Finally, an integrate impeller is processed in the high-speed
machining center of HSM 600U. The actually machining demonstrated that the planned toolpath is
not only ensuring the quality but also improving the efficiency.
Acknowledgment
This research is supported by National S&T Major Project (Grant No. 2010ZX04016-012), Key (Key
grant) Project of Chinese Ministry of Education (Grant No. 209036), Key Project of Chinese
Education Department (Grant No. 1151gzd20) and Scientific Research Fund of Heilongjiang
Provincial Education Department (Grant No. 11551431).
Reference
[1] S. Park, M. Chang and J. Ju: International Journal of Production ResearchVol.37 (1999) No.16 p.
3659-3669.
[2] L. Quan, W. Y. Zhang, F. H.Ya, H. Z.Yu: Chinese Journal of Aeronautics Vol. 21 (2008) No.5, p.
462-471.
[3] L. Zhou, H. C. Ying, W. C. Yong, Q. Zhe: Machine Tool &Hydraulics Vol.37(2009) No.12, p.
18-24.
[4] Information on http://www.delcam.com.cn/pmill/powermill_5_axis/pm5axis_main.htm
Fig.8 Machine model of HSM 600U Fig.9 Finishing simulation result of blade
Hun Guo, Zuo Dunwen, Tang Guoxing 265

Finite Element Analysis of Cold Extrusion Combination Mold Interference Fit
Zhang Yana, Huang Qianguib
College of Mechanical Engineering, Heilongjiang Institute of Science and Technology, Harbin 150027
[email protected], [email protected]
Keywords: cold extrusion; ANSYS; stress; interference fit; plastic deformation
Abstract: Aiming at the shortage of tradition design method of cold extrusion stress, and according
to the basic equation of elasticity mechanics, the stress distribution at dynamic and static state
interference fit of the interlining and outerlining of combination mold extrusion tube is analyzed by
using ANSYS software .The result shows: The most fit stress is concentrated on the inner surface of
interlining and the contacting surface with the value 1350 MPa, which does not exceed the material
allowable stress.This method can fastly and accurately find the most stress of interference fit, which
provides more convenience and accurate numerical computes method for design and optimization.
Preface
With the rapid development of machinery industry and manufacturing increased competition, to
produce the final shape of parts as close as possible, even in a fully finished parts as objective should
be an inevitable trend and direction of development of plastic processing technology change. At
present, the cold extrusion technology as a precision forming technology has a rapid development and
wide application the field of metal plastic forming [1]. However, the traditional method of cold
extrusion stress design is more complex and stress can not reflect intuitively, difficult to observe and
control the whole stress of the assembly process. For this reason, the problem of interference of cold
extrusion dies is analyzed by using the finite element analysis software, aimed at making the dynamic
and static interference stress changes in the assembly more intuitive, more optimal in design
parameters.
Mold structure
Cold extrusion is based on rough metal extrusion without heating the plastic deformation theory,
using the mold installed in cold forging machine shown in Figure 1, under the considerable pressure
and a certain speed, the metal is plastic deformation in the mold cavity, by the gap between the punch
and cavity die or the export of the cavity die, the parts with required shape, size and performance can
be obtained.
outerlining
interlining
blank
Fig.1 Schematic drawing of the combination
mold
1.billet; 2. extrusion tube outerlinin; 3. mold base;
4 mold; 5. extrusion producture; 6. extrusion shaft;
7. extrusion tube interlining; 8. extrusion slice
interlining
Fig. 2 Metal extrusion way
© (2011) Trans Tech Publications, Switzerlanddoi:10.4028/www.scientific.net/AMR.142.266
Working Condition
Picture 2 is extrusion way, the metal billet is in the three stresses status at the action of the extrusion
shaft through extrusion slice. The extrusion shaft squeezes billet with the pushing of extrusion
plunger, when the pressure arrive a certain number the billet may be squeezed out from the hole of
mold then become extrusion production. In the process of working the main force part is the
interlining and outerlining of interference fit extrusion tube. Its load ability is more and has a function
of bearing variable loading and shock, but the process accuracy need better, which needs to use
penetration method or the expansion and contraction method to assembly. Among many of factors
involved, the main certain factor is the most allowable interference and the minimum compute
interference, the former is decided by promising strength condition of fit part material ,the later is
decided by promising strength condition of linking, that is decided by delivering a burden condition.
Then each factor’s influence is considered, through necessity revise then the most interference and
minimum compute interference is get. When choosing the standard fit we must consider part strength
storage and combined strength storage [2].
Finite Element Theory of Combined Mold Exposure
The problem of combination mold touching strength belongs to elasticity in engineering. When using
the method of finite element analysis, we must base on elasticity basic equation and relevant
concepts. We should study and analyze the inner stress and deformation of the elastic body from three
aspects: static equilibrium condition, deformation compatibility condition and physical conditions
[3].
Equilibrium Equation. When the object keeps static or move at equal velocity straightly under
forces, we call the object be in equilibrium. Every object in equilibrium, the relation between stress
branch and physical strength branch should satisfy the following three equations:
0,0,0
z
zzyxzy
zyyxyzxxyx Pzyx
Pzyx
Pxzyx
where x , y , z , xy , yz , zx , xP , yP , zP are respectively unit stress, unit shearing stress, physical
strength components in three axis.
Geometry Equation. The displacement and strain are all physicals which describe objects
deformation after force and there are some relations between the two physicals. In the case of small
displacement and small deformation, Its expression is:
z
u
x
w
y
w
z
v
x
v
y
u
z
u
y
u
x
uzxyzxyzyx
,,;,,
Where x , y , z , xy, yz
, zx, u ,v, w are linear strain, angle strain, displacement components in
three axis[4].
Physics equation. The common physical equation in the finite element analysis is expressed in the
form of stress to strain, for isotropic linear elastic material, expressed as a matrix equation:
zx
yz
xy
z
y
x
zx
yz
xy
z
y
x
E
)1(2
2100000
)1(2
210000
)1(2
21000
111
11
1
)21)(1(
)1(
or abbreviated as ][D
Hun Guo, Zuo Dunwen, Tang Guoxing 267
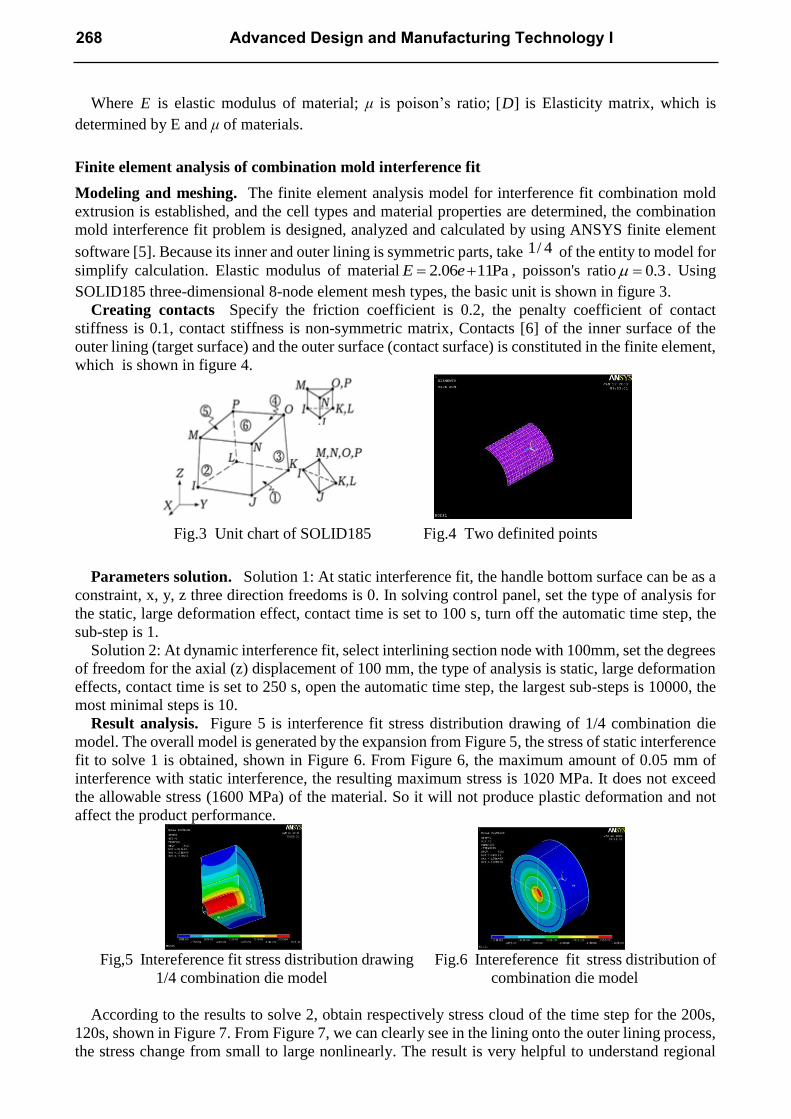
Where E is elastic modulus of material; μ is poison’s ratio; ][D is Elasticity matrix, which is
determined by E and μ of materials.
Finite element analysis of combination mold interference fit
Modeling and meshing. The finite element analysis model for interference fit combination mold
extrusion is established, and the cell types and material properties are determined, the combination
mold interference fit problem is designed, analyzed and calculated by using ANSYS finite element
software [5]. Because its inner and outer lining is symmetric parts, take 1/ 4 of the entity to model for
simplify calculation. Elastic modulus of material 2.06 11PaE e , poisson's ratio 0.3 . Using
SOLID185 three-dimensional 8-node element mesh types, the basic unit is shown in figure 3.
Creating contacts Specify the friction coefficient is 0.2, the penalty coefficient of contact
stiffness is 0.1, contact stiffness is non-symmetric matrix, Contacts [6] of the inner surface of the
outer lining (target surface) and the outer surface (contact surface) is constituted in the finite element,
which is shown in figure 4.
Fig.3 Unit chart of SOLID185 Fig.4 Two definited points
Parameters solution. Solution 1: At static interference fit, the handle bottom surface can be as a
constraint, x, y, z three direction freedoms is 0. In solving control panel, set the type of analysis for
the static, large deformation effect, contact time is set to 100 s, turn off the automatic time step, the
sub-step is 1.
Solution 2: At dynamic interference fit, select interlining section node with 100mm, set the degrees
of freedom for the axial (z) displacement of 100 mm, the type of analysis is static, large deformation
effects, contact time is set to 250 s, open the automatic time step, the largest sub-steps is 10000, the
most minimal steps is 10.
Result analysis. Figure 5 is interference fit stress distribution drawing of 1/4 combination die
model. The overall model is generated by the expansion from Figure 5, the stress of static interference
fit to solve 1 is obtained, shown in Figure 6. From Figure 6, the maximum amount of 0.05 mm of
interference with static interference, the resulting maximum stress is 1020 MPa. It does not exceed
the allowable stress (1600 MPa) of the material. So it will not produce plastic deformation and not
affect the product performance.
Fig,5 Intereference fit stress distribution drawing Fig.6 Intereference fit stress distribution of
1/4 combination die model combination die model
According to the results to solve 2, obtain respectively stress cloud of the time step for the 200s,
120s, shown in Figure 7. From Figure 7, we can clearly see in the lining onto the outer lining process,
the stress change from small to large nonlinearly. The result is very helpful to understand regional
268 Advanced Design and Manufacturing Technology I
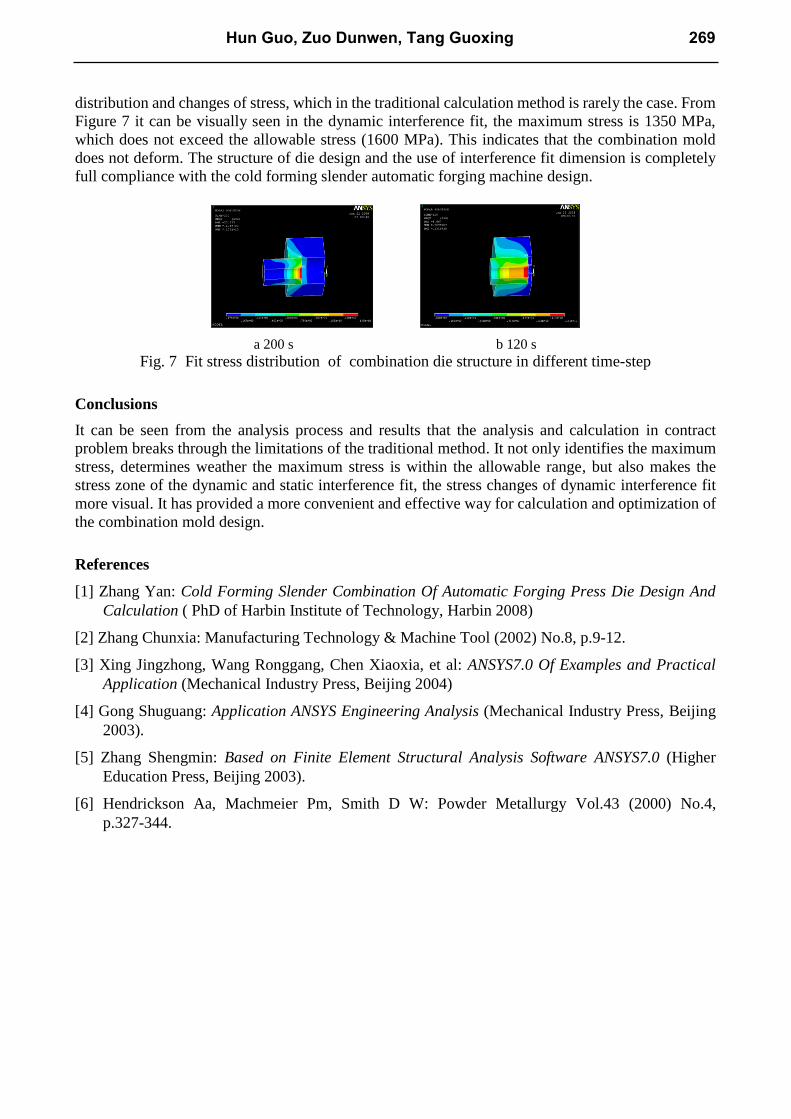
distribution and changes of stress, which in the traditional calculation method is rarely the case. From
Figure 7 it can be visually seen in the dynamic interference fit, the maximum stress is 1350 MPa,
which does not exceed the allowable stress (1600 MPa). This indicates that the combination mold
does not deform. The structure of die design and the use of interference fit dimension is completely
full compliance with the cold forming slender automatic forging machine design.
a 200 s b 120 s
Fig. 7 Fit stress distribution of combination die structure in different time-step
Conclusions
It can be seen from the analysis process and results that the analysis and calculation in contract
problem breaks through the limitations of the traditional method. It not only identifies the maximum
stress, determines weather the maximum stress is within the allowable range, but also makes the
stress zone of the dynamic and static interference fit, the stress changes of dynamic interference fit
more visual. It has provided a more convenient and effective way for calculation and optimization of
the combination mold design.
References
[1] Zhang Yan: Cold Forming Slender Combination Of Automatic Forging Press Die Design And
Calculation ( PhD of Harbin Institute of Technology, Harbin 2008)
[2] Zhang Chunxia: Manufacturing Technology & Machine Tool (2002) No.8, p.9-12.
[3] Xing Jingzhong, Wang Ronggang, Chen Xiaoxia, et al: ANSYS7.0 Of Examples and Practical
Application (Mechanical Industry Press, Beijing 2004)
[4] Gong Shuguang: Application ANSYS Engineering Analysis (Mechanical Industry Press, Beijing
2003).
[5] Zhang Shengmin: Based on Finite Element Structural Analysis Software ANSYS7.0 (Higher
Education Press, Beijing 2003).
[6] Hendrickson Aa, Machmeier Pm, Smith D W: Powder Metallurgy Vol.43 (2000) No.4,
p.327-344.
Hun Guo, Zuo Dunwen, Tang Guoxing 269

Coagulant Prepared by Gangue and its Application in Treatment of Coal Washing Wastewater
Luo Kejie1, a, Ren Guangmeng1, b 1School of Resource and Environment Engineering, Heilongjiang Institute of Science and
Technology, Harbin, People’s Republic of China
[email protected], [email protected]
Keywords: polymeric ferric aluminum sulfate and silicate; coagulant; Gangue; processing conditions
Abstract. For solving the question about PFASS production using gangue, the best conditions for
withdrawing the alkali and the silicon from the gangue during producing PFASS were obtained by
using orthogonal experimental method. That is, the best acid soak conditions are: acid soak time (A)
1.5h, ratio of NaCl flux to gangue quality (B) 0.05:1, solid to liquid ratio (C) 1:10; the best alkaline
leaching conditions are: alkaline leaching time 2h, concentration of the lye 5mol/L, solid to liquid
ratio(C) is 1:10. PFASS, a high molecular inorganic coagulant, was prepared by gangue that is a kind
of waste solid in mine. Processing conditions of the coagulant preparation were studied. The
coagulant was used to treat a coal washing wastewater. The experimental results show that effluent
quality is good. SS and turbidity of coal washing wastewater decrease evidently. And huge amounts
of coal can be recycled.
Introduction
The gangue used in this study is taken from a coal washery. It is hard and its surface is black gray in
color. The maximum diameter of the gangue particles is 100mm and the minimum one is less
than1mm. The gangue disintegrators are jaw breaker and disc grinder. Their disintegrated granularity
is less than 0.3mm.
The gangue-crushing instrument uses the jaw crusher and the disk crusher, crushing
granularity<0.3mm.After the crushing gangue carries on the roasting, the temperature cannot
excessively be high in this process.when the temperature surpasses 850℃ γ-A12O3 transforms
gradually asδ- A12O3,causes the response to lose activeness, The highest dissolves rate the roasting
temperature of A12O3 in the gangue is generally in 600~800℃scopes.This experiment uses the
roasting temperature is 800℃, the roasting time is 1.5 hours. After the roasting the gangue semblance
assumes the iron grey.
Main chemical compositions of the gangue determined by chemical analysis are showed in
Table1.
Table 1Main chemical composition of gangue
Compositions SiO2 Al2O3 Fe2O3
mass fractions[%] 61.7 19.6 5.2
Process and Parameters Control of PFASS Prepared By Gangue
The disintegrated and calcined gangue was dipped in sulfate acid with a certain concentration. The
pH value of the filtrate after dip was adjusted by a highly concentrated alkali solution. A catalytic
oxidation reaction catalyzed by sodium nitrite was conducted in the filtrate, using air as oxidant at the
normal temperature. And polymeric ferric aluminum sulfate was prepared. The filter residue after dip
was extracted by sodium hydroxide with a certain concentration. The extract was used to prepared
activity polymeric silicon acid. The PFASS was obtained through combination of polymeric ferric
aluminum sulfate and activity polymeric silicon acid under certain conditions.
© (2011) Trans Tech Publications, Switzerlanddoi:10.4028/www.scientific.net/AMR.142.270
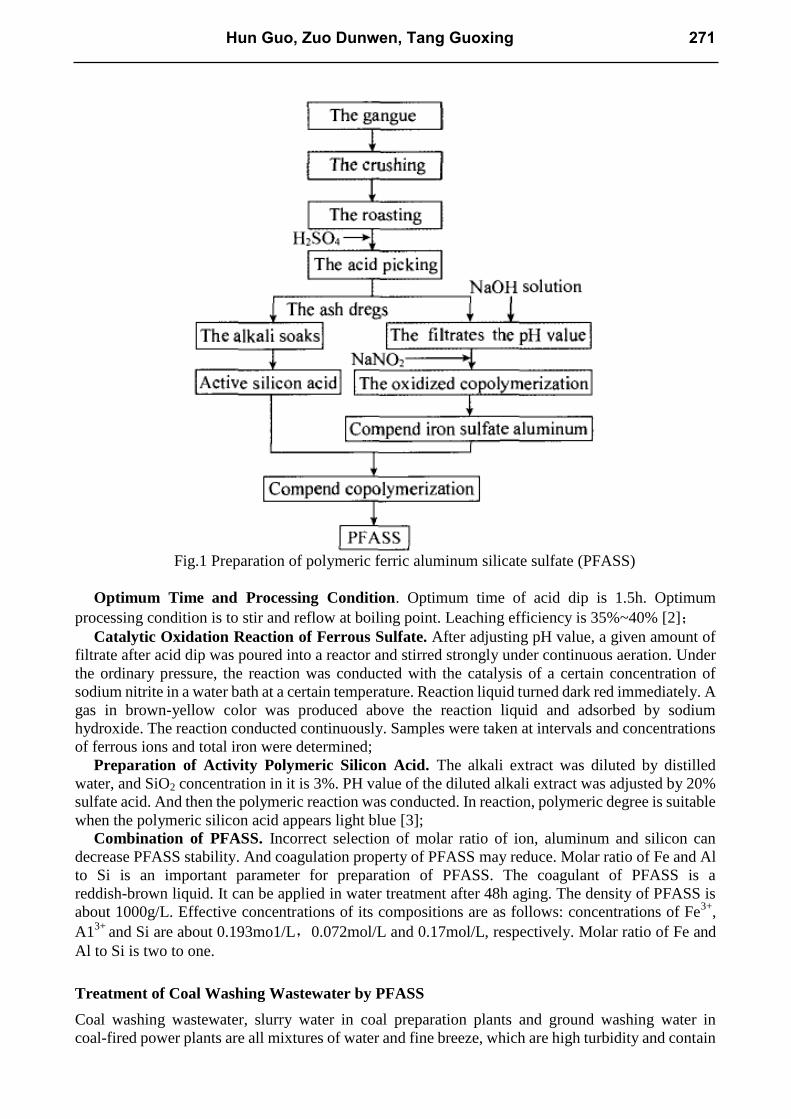
Fig.1 Preparation of polymeric ferric aluminum silicate sulfate (PFASS)
Optimum Time and Processing Condition. Optimum time of acid dip is 1.5h. Optimum
processing condition is to stir and reflow at boiling point. Leaching efficiency is 35%~40% [2];
Catalytic Oxidation Reaction of Ferrous Sulfate. After adjusting pH value, a given amount of filtrate after acid dip was poured into a reactor and stirred strongly under continuous aeration. Under
the ordinary pressure, the reaction was conducted with the catalysis of a certain concentration of
sodium nitrite in a water bath at a certain temperature. Reaction liquid turned dark red immediately. A
gas in brown-yellow color was produced above the reaction liquid and adsorbed by sodium
hydroxide. The reaction conducted continuously. Samples were taken at intervals and concentrations
of ferrous ions and total iron were determined;
Preparation of Activity Polymeric Silicon Acid. The alkali extract was diluted by distilled
water, and SiO2 concentration in it is 3%. PH value of the diluted alkali extract was adjusted by 20%
sulfate acid. And then the polymeric reaction was conducted. In reaction, polymeric degree is suitable
when the polymeric silicon acid appears light blue [3];
Combination of PFASS. Incorrect selection of molar ratio of ion, aluminum and silicon can
decrease PFASS stability. And coagulation property of PFASS may reduce. Molar ratio of Fe and Al
to Si is an important parameter for preparation of PFASS. The coagulant of PFASS is a
reddish-brown liquid. It can be applied in water treatment after 48h aging. The density of PFASS is
about 1000g/L. Effective concentrations of its compositions are as follows: concentrations of Fe3+
,
A13+
and Si are about 0.193mo1/L,0.072mol/L and 0.17mol/L, respectively. Molar ratio of Fe and
Al to Si is two to one.
Treatment of Coal Washing Wastewater by PFASS
Coal washing wastewater, slurry water in coal preparation plants and ground washing water in
coal-fired power plants are all mixtures of water and fine breeze, which are high turbidity and contain
Hun Guo, Zuo Dunwen, Tang Guoxing 271
fine particles. Surfaces of the solid particles usually carry negative charge. The solid particles keep
disperse state in wastewater, because like charges repel each other. Because of interactions (like
adsorption, solution, chemical combination, etc.) among interfaces of the solid particles, property of
coal washing wastewater is very complicated. It possesses not only property of suspended solution,
but also property of colloid. Large amount of coal washing wastewater was discharged, which did not
reach the discharging standard. Water bodies were polluted, river channels were choked and coal
slimes run away. And the wastage of large amount of coal slimes caused enormous economical losses
for our country and more shortage in water resource for coal mining industry, which seriously
restricts the development of coal mining production. It is significant to develop new technologies to
treat coal washing wastewater.
The coal washing wastewater used in the experiment was taken from a coal washing plant and its
compositions were showed in Table 2.
Table 2 Main compositions of coal washing wastewater from a coal washing plant
Items Measurement value
pH 8.9
SS[mg·L-1
] 104
Density[g·cm-3
] 1.4 Inorganic carbon[mg·L
-1] 60.2
Organic carbon[mg·L-1
] 8.4 Total carbon[mg·L
-1] 68.6
Experimental Contents. On the basis of coagulation sedimentation principles, effect factors are
alkalinity of coagulant, pH value of wastewater, time of coagulation, dosages of coagulant, etc.
Contents of experiments are as follows: effects of pH value, alkalinity of coagulant, coagulant
dosages and reaction (coagulation and sedimentation) on treatment performance. Parallel
experiments were also conducted.
Analysis Methods. Turbidity was measured by DS-3 photoelectric turbidity meter. Colority was
determined by diluted multiples method. PH value was determined by test strip colorimetry.
Results. After dosage of a certain amount of coagulant, coagulating sedimentation reactions were
conducted in six 1L beakers, stirred under the speed of 200 rounds per minutes for 2 minutes by
DBJ-621 fixed time agitator. Then rotate speeds were decreased and stirred for further 8 minutes.
Stilling for a while, water samples were taken from the point of 25mm away from the liquid surface
and analyzed.
The experimental results show that under conditions of about 50~70 mg/L of PFASS dosages, 1.5
of optimum alkalinity and 15min of reaction time, SS in effluent deduced to 20NTU and colority
decreased 50%. Water quality of effluent for parallel experiments is stable, which can reach the
standards.
Conclusions
The process flow of the high molecular inorganic coagulant prepared by gangue is simple. The
gangue was reclaimed and used in coal washing wastewater treatment. Multitude of coal was recycled
for coal washing plant and its production profits increased. Production of coagulants by gangue is a
prosperous business.
Acknowledgement
This paper was supported by the project of the young teacher in Heilongjiang Institute of Science and
Technology (06-23).
References
[1] Liu Shenyong, Zhang Quanguo: Resource Saving and Comprehensive Utilization, Vol. 2 (1997),
p.21.
272 Advanced Design and Manufacturing Technology I

[2] Luo Daocheng, Liu Junfeng: Coal Chemical Industry, Vol. 1 (2009), p.37.
[3] Li Chao, XuYan: Mining Industry Express, Vol.8 (2008), p.24.
[4] Sui Zhihui, Liu Anjun, Zhao Xin: Chemical Minerals and Processing, Vol. 3 (2007), p.36.
Hun Guo, Zuo Dunwen, Tang Guoxing 273
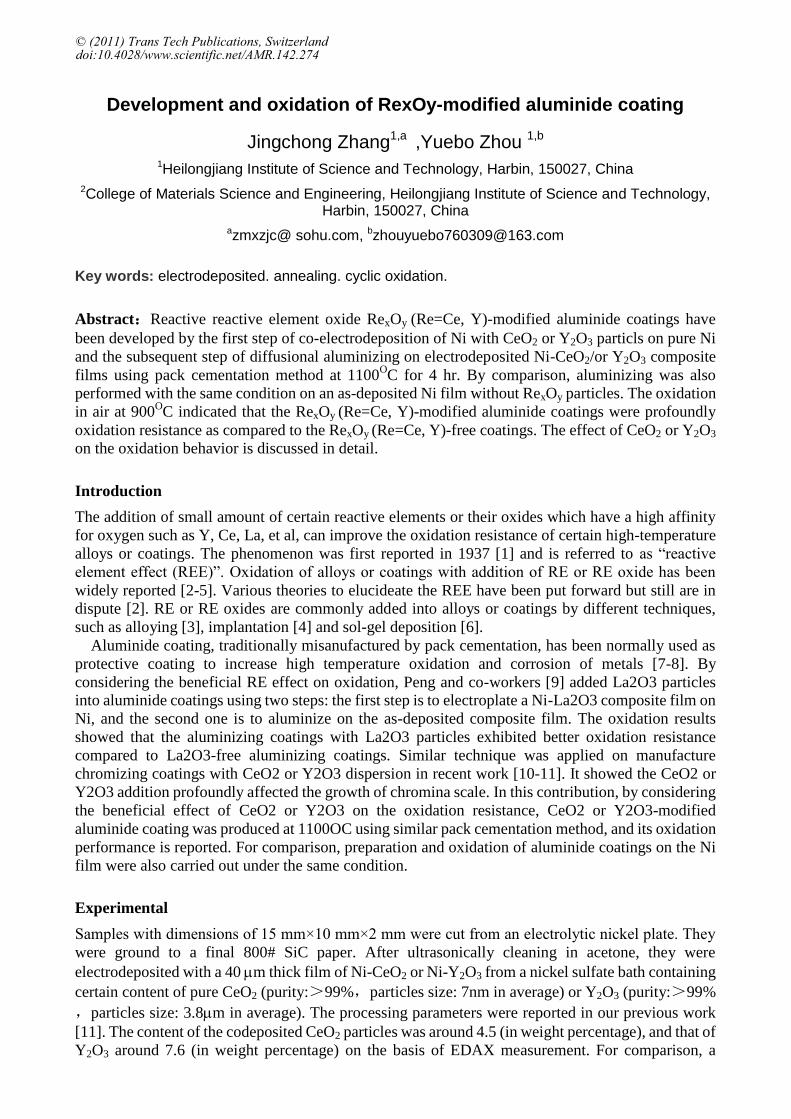
Development and oxidation of RexOy-modified aluminide coating
Jingchong Zhang1,a ,Yuebo Zhou 1,b 1Heilongjiang Institute of Science and Technology, Harbin, 150027, China
2College of Materials Science and Engineering, Heilongjiang Institute of Science and Technology, Harbin, 150027, China
azmxzjc@ sohu.com, [email protected]
Key words: electrodeposited. annealing. cyclic oxidation.
Abstract:Reactive reactive element oxide RexOy (Re=Ce, Y)-modified aluminide coatings have
been developed by the first step of co-electrodeposition of Ni with CeO2 or Y2O3 particls on pure Ni
and the subsequent step of diffusional aluminizing on electrodeposited Ni-CeO2/or Y2O3 composite
films using pack cementation method at 1100OC for 4 hr. By comparison, aluminizing was also
performed with the same condition on an as-deposited Ni film without RexOy particles. The oxidation
in air at 900OC indicated that the RexOy (Re=Ce, Y)-modified aluminide coatings were profoundly
oxidation resistance as compared to the RexOy (Re=Ce, Y)-free coatings. The effect of CeO2 or Y2O3
on the oxidation behavior is discussed in detail.
Introduction
The addition of small amount of certain reactive elements or their oxides which have a high affinity
for oxygen such as Y, Ce, La, et al, can improve the oxidation resistance of certain high-temperature
alloys or coatings. The phenomenon was first reported in 1937 [1] and is referred to as “reactive
element effect (REE)”. Oxidation of alloys or coatings with addition of RE or RE oxide has been
widely reported [2-5]. Various theories to elucideate the REE have been put forward but still are in
dispute [2]. RE or RE oxides are commonly added into alloys or coatings by different techniques,
such as alloying [3], implantation [4] and sol-gel deposition [6].
Aluminide coating, traditionally misanufactured by pack cementation, has been normally used as
protective coating to increase high temperature oxidation and corrosion of metals [7-8]. By
considering the beneficial RE effect on oxidation, Peng and co-workers [9] added La2O3 particles into aluminide coatings using two steps: the first step is to electroplate a Ni-La2O3 composite film on
Ni, and the second one is to aluminize on the as-deposited composite film. The oxidation results
showed that the aluminizing coatings with La2O3 particles exhibited better oxidation resistance
compared to La2O3-free aluminizing coatings. Similar technique was applied on manufacture
chromizing coatings with CeO2 or Y2O3 dispersion in recent work [10-11]. It showed the CeO2 or
Y2O3 addition profoundly affected the growth of chromina scale. In this contribution, by considering
the beneficial effect of CeO2 or Y2O3 on the oxidation resistance, CeO2 or Y2O3-modified
aluminide coating was produced at 1100OC using similar pack cementation method, and its oxidation
performance is reported. For comparison, preparation and oxidation of aluminide coatings on the Ni
film were also carried out under the same condition.
Experimental
Samples with dimensions of 15 mm×10 mm×2 mm were cut from an electrolytic nickel plate. They
were ground to a final 800# SiC paper. After ultrasonically cleaning in acetone, they were
electrodeposited with a 40 m thick film of Ni-CeO2 or Ni-Y2O3 from a nickel sulfate bath containing
certain content of pure CeO2 (purity:>99%,particles size: 7nm in average) or Y2O3 (purity:>99%
,particles size: 3.8m in average). The processing parameters were reported in our previous work
[11]. The content of the codeposited CeO2 particles was around 4.5 (in weight percentage), and that of
Y2O3 around 7.6 (in weight percentage) on the basis of EDAX measurement. For comparison, a
© (2011) Trans Tech Publications, Switzerlanddoi:10.4028/www.scientific.net/AMR.142.274
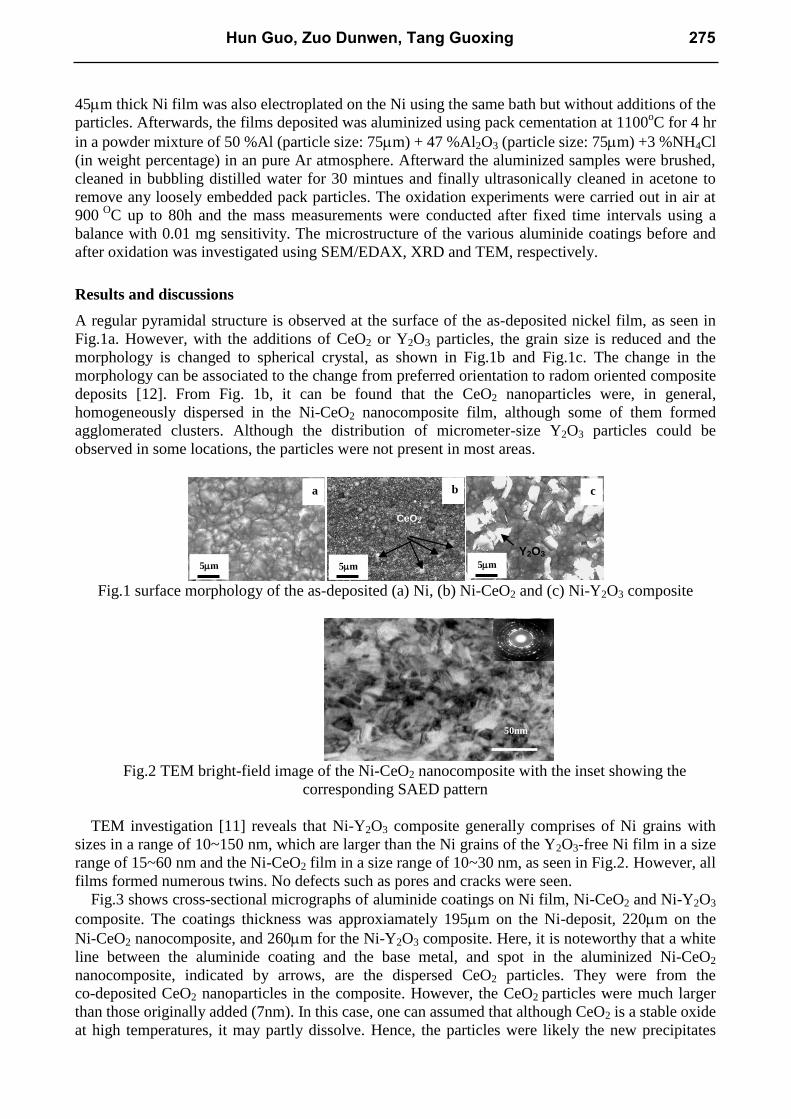
45m thick Ni film was also electroplated on the Ni using the same bath but without additions of the
particles. Afterwards, the films deposited was aluminized using pack cementation at 1100oC for 4 hr
in a powder mixture of 50 %Al (particle size: 75m) + 47 %Al2O3 (particle size: 75m) +3 %NH4Cl
(in weight percentage) in an pure Ar atmosphere. Afterward the aluminized samples were brushed,
cleaned in bubbling distilled water for 30 mintues and finally ultrasonically cleaned in acetone to
remove any loosely embedded pack particles. The oxidation experiments were carried out in air at
900 O
C up to 80h and the mass measurements were conducted after fixed time intervals using a
balance with 0.01 mg sensitivity. The microstructure of the various aluminide coatings before and
after oxidation was investigated using SEM/EDAX, XRD and TEM, respectively.
Results and discussions
A regular pyramidal structure is observed at the surface of the as-deposited nickel film, as seen in
Fig.1a. However, with the additions of CeO2 or Y2O3 particles, the grain size is reduced and the
morphology is changed to spherical crystal, as shown in Fig.1b and Fig.1c. The change in the
morphology can be associated to the change from preferred orientation to radom oriented composite
deposits [12]. From Fig. 1b, it can be found that the CeO2 nanoparticles were, in general,
homogeneously dispersed in the Ni-CeO2 nanocomposite film, although some of them formed
agglomerated clusters. Although the distribution of micrometer-size Y2O3 particles could be
observed in some locations, the particles were not present in most areas.
Fig.1 surface morphology of the as-deposited (a) Ni, (b) Ni-CeO2 and (c) Ni-Y2O3 composite
Fig.2 TEM bright-field image of the Ni-CeO2 nanocomposite with the inset showing the
corresponding SAED pattern
TEM investigation [11] reveals that Ni-Y2O3 composite generally comprises of Ni grains with
sizes in a range of 10~150 nm, which are larger than the Ni grains of the Y2O3-free Ni film in a size
range of 15~60 nm and the Ni-CeO2 film in a size range of 10~30 nm, as seen in Fig.2. However, all
films formed numerous twins. No defects such as pores and cracks were seen.
Fig.3 shows cross-sectional micrographs of aluminide coatings on Ni film, Ni-CeO2 and Ni-Y2O3
composite. The coatings thickness was approxiamately 195m on the Ni-deposit, 220m on the
Ni-CeO2 nanocomposite, and 260m for the Ni-Y2O3 composite. Here, it is noteworthy that a white
line between the aluminide coating and the base metal, and spot in the aluminized Ni-CeO2
nanocomposite, indicated by arrows, are the dispersed CeO2 particles. They were from the
co-deposited CeO2 nanoparticles in the composite. However, the CeO2 particles were much larger
than those originally added (7nm). In this case, one can assumed that although CeO2 is a stable oxide
at high temperatures, it may partly dissolve. Hence, the particles were likely the new precipitates
5m
a
CeO2
5m
b
Y2O3 5m
c
50nm
Hun Guo, Zuo Dunwen, Tang Guoxing 275
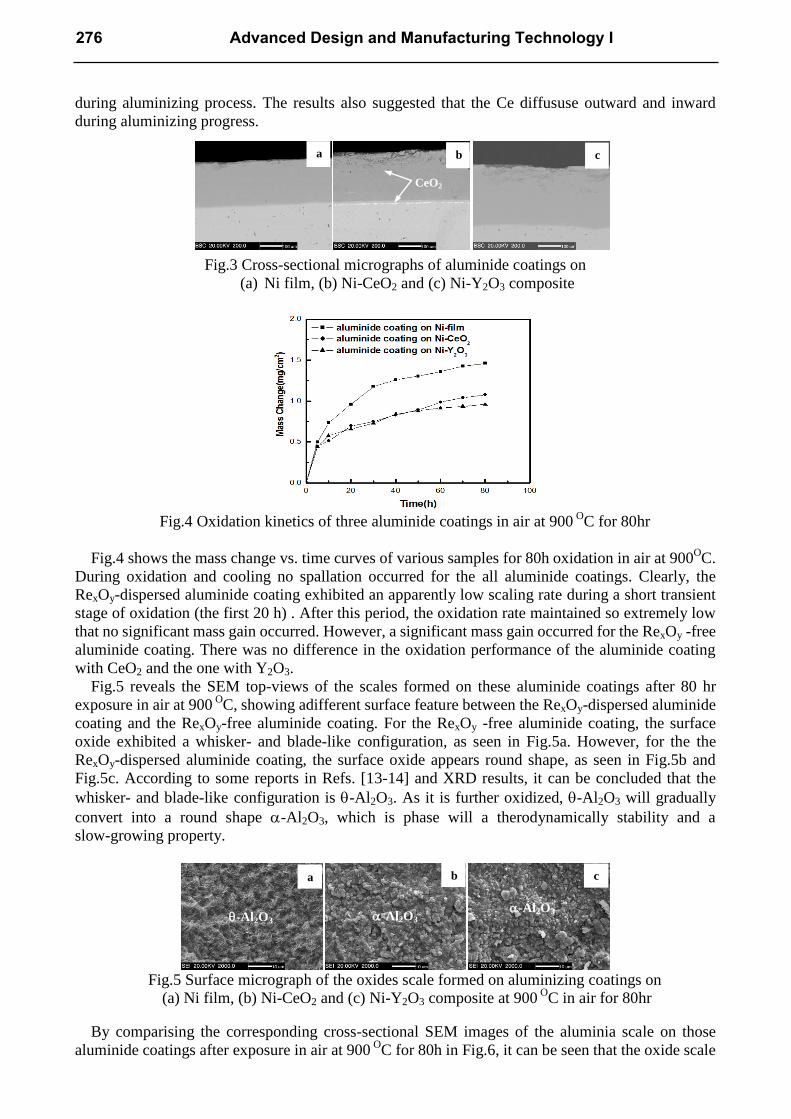
during aluminizing process. The results also suggested that the Ce diffususe outward and inward
during aluminizing progress.
Fig.3 Cross-sectional micrographs of aluminide coatings on
(a) Ni film, (b) Ni-CeO2 and (c) Ni-Y2O3 composite
Fig.4 Oxidation kinetics of three aluminide coatings in air at 900
OC for 80hr
Fig.4 shows the mass change vs. time curves of various samples for 80h oxidation in air at 900OC.
During oxidation and cooling no spallation occurred for the all aluminide coatings. Clearly, the
RexOy-dispersed aluminide coating exhibited an apparently low scaling rate during a short transient
stage of oxidation (the first 20 h) . After this period, the oxidation rate maintained so extremely low
that no significant mass gain occurred. However, a significant mass gain occurred for the RexOy -free
aluminide coating. There was no difference in the oxidation performance of the aluminide coating
with CeO2 and the one with Y2O3.
Fig.5 reveals the SEM top-views of the scales formed on these aluminide coatings after 80 hr
exposure in air at 900 O
C, showing adifferent surface feature between the RexOy-dispersed aluminide
coating and the RexOy-free aluminide coating. For the RexOy -free aluminide coating, the surface
oxide exhibited a whisker- and blade-like configuration, as seen in Fig.5a. However, for the the
RexOy-dispersed aluminide coating, the surface oxide appears round shape, as seen in Fig.5b and
Fig.5c. According to some reports in Refs. [13-14] and XRD results, it can be concluded that the
whisker- and blade-like configuration is -Al2O3. As it is further oxidized, -Al2O3 will gradually
convert into a round shape -Al2O3, which is phase will a therodynamically stability and a
slow-growing property.
Fig.5 Surface micrograph of the oxides scale formed on aluminizing coatings on
(a) Ni film, (b) Ni-CeO2 and (c) Ni-Y2O3 composite at 900 O
C in air for 80hr
By comparising the corresponding cross-sectional SEM images of the aluminia scale on those
aluminide coatings after exposure in air at 900 O
C for 80h in Fig.6, it can be seen that the oxide scale
a
-Al2O3
b
-Al2O3
c
-Al2O3
a
CeO2
b c
276 Advanced Design and Manufacturing Technology I
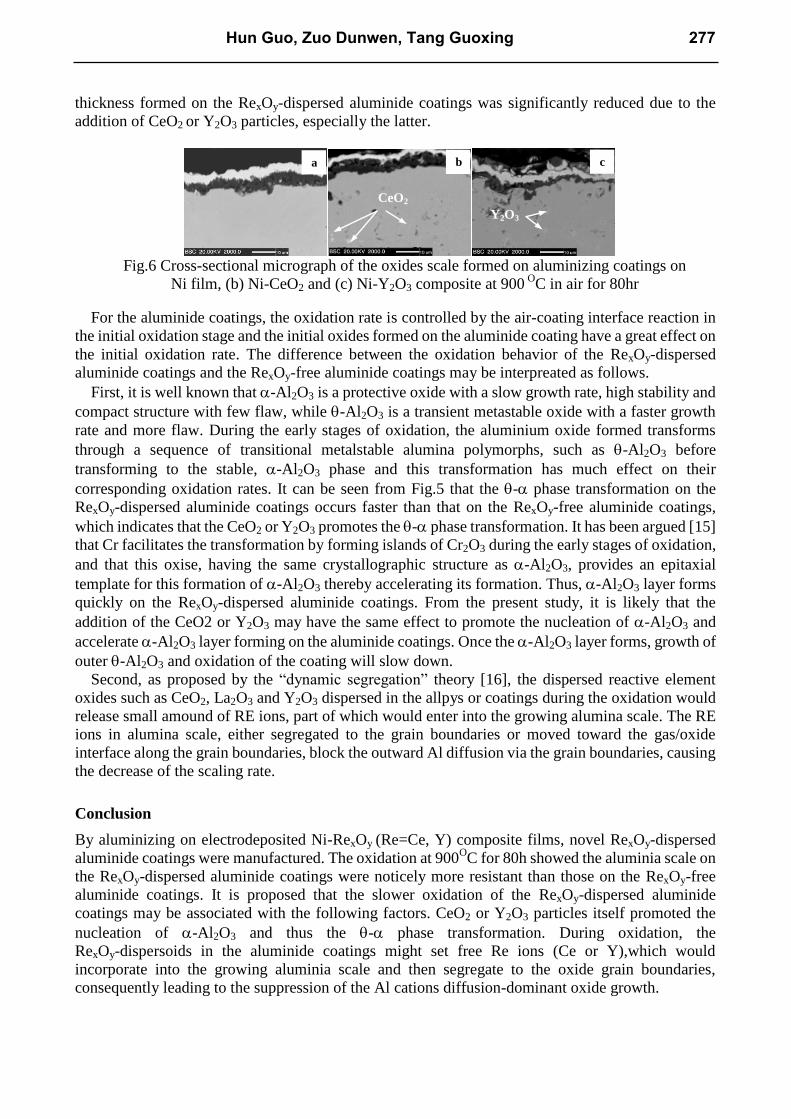
thickness formed on the RexOy-dispersed aluminide coatings was significantly reduced due to the
addition of CeO2 or Y2O3 particles, especially the latter.
Fig.6 Cross-sectional micrograph of the oxides scale formed on aluminizing coatings on
Ni film, (b) Ni-CeO2 and (c) Ni-Y2O3 composite at 900 O
C in air for 80hr
For the aluminide coatings, the oxidation rate is controlled by the air-coating interface reaction in
the initial oxidation stage and the initial oxides formed on the aluminide coating have a great effect on
the initial oxidation rate. The difference between the oxidation behavior of the RexOy-dispersed
aluminide coatings and the RexOy-free aluminide coatings may be interpreated as follows.
First, it is well known that -Al2O3 is a protective oxide with a slow growth rate, high stability and
compact structure with few flaw, while -Al2O3 is a transient metastable oxide with a faster growth
rate and more flaw. During the early stages of oxidation, the aluminium oxide formed transforms
through a sequence of transitional metalstable alumina polymorphs, such as -Al2O3 before
transforming to the stable, -Al2O3 phase and this transformation has much effect on their
corresponding oxidation rates. It can be seen from Fig.5 that the - phase transformation on the
RexOy-dispersed aluminide coatings occurs faster than that on the RexOy-free aluminide coatings,
which indicates that the CeO2 or Y2O3 promotes the - phase transformation. It has been argued [15]
that Cr facilitates the transformation by forming islands of Cr2O3 during the early stages of oxidation,
and that this oxise, having the same crystallographic structure as -Al2O3, provides an epitaxial
template for this formation of -Al2O3 thereby accelerating its formation. Thus, -Al2O3 layer forms
quickly on the RexOy-dispersed aluminide coatings. From the present study, it is likely that the
addition of the CeO2 or Y2O3 may have the same effect to promote the nucleation of -Al2O3 and
accelerate -Al2O3 layer forming on the aluminide coatings. Once the -Al2O3 layer forms, growth of
outer -Al2O3 and oxidation of the coating will slow down.
Second, as proposed by the “dynamic segregation” theory [16], the dispersed reactive element
oxides such as CeO2, La2O3 and Y2O3 dispersed in the allpys or coatings during the oxidation would
release small amound of RE ions, part of which would enter into the growing alumina scale. The RE
ions in alumina scale, either segregated to the grain boundaries or moved toward the gas/oxide
interface along the grain boundaries, block the outward Al diffusion via the grain boundaries, causing
the decrease of the scaling rate.
Conclusion
By aluminizing on electrodeposited Ni-RexOy (Re=Ce, Y) composite films, novel RexOy-dispersed
aluminide coatings were manufactured. The oxidation at 900OC for 80h showed the aluminia scale on
the RexOy-dispersed aluminide coatings were noticely more resistant than those on the RexOy-free
aluminide coatings. It is proposed that the slower oxidation of the RexOy-dispersed aluminide
coatings may be associated with the following factors. CeO2 or Y2O3 particles itself promoted the
nucleation of -Al2O3 and thus the - phase transformation. During oxidation, the
RexOy-dispersoids in the aluminide coatings might set free Re ions (Ce or Y),which would
incorporate into the growing aluminia scale and then segregate to the oxide grain boundaries,
consequently leading to the suppression of the Al cations diffusion-dominant oxide growth.
a c
Y2O3
b
CeO2
Hun Guo, Zuo Dunwen, Tang Guoxing 277

Acknowledgements
Project supported by Scientific Research Fund of Heilongjiang Provincial Education Department
(No.11541305) and (N o.11531319).
References
[1] PFEIL L B: Improvement in heat-resisting alloys [P]. 1937, UK Patent, No. 459848.
[2] MOON D P: Mater Sci Tech Vol.5 (1989), p.754-763.
[3] Cueff R, Buscail H, Caudron E, Issartel C and Riffard F: Applied Surface Science Vol.207
(2003), p.246-254.
[4] Li M S and HOU P Y: Acta Materialia Vol.55 (2007), p.443-453.
[5] Mitra S K, Roy S K and Bose S K: Oxid Met Vol.34 (1990), p.101-121.
[6] Riffard F, Buscail H, Caudron E, Cueff R, Issartel C and Perrier S: Applied Surface science
Vol.199 (2002),p.107-122.
[7] Ching-Yuan Bai, Yi-Jun Luo and Chun-Hao Koo: Surface and Coatings Technology Vol.183
(2004) No.1, p.74-88
[8] Li M J, Sun X F., Guan H R., et al: Surface and Coatings Technology Vol.167 (2003) No.1, p.
106-111
[9] Peng X, Li T and Pan W P: Scripta Materialia Vol.44(2001), p.1033-1038
[10] ZHU L, PENG X, YAN J and WANG F: Oxid Met, Vol.62 (2004), p.411-426.
[11] Zhou Y B, Chen H, Zhang H, Wang Y: Vacuum Vol.82 (2008) No.8, p.748-753
[12] Meenu Srivastava, V. K. William Grips and K.S. Rajam: Applied Surface Science Vol.253
(2007), p.3814-3824
[13] SUSAN D F and MARDER A R: Oxid Met Vol.57 (2002), p.159-180.
[14] LIU H F and CHEN W X: Corrosion Science Vol.49 (2007), p.3453-3478.
[15] Brumm M W, Grabke H J: Corr.osion Science Vol.33 (1992), p.1677-1690
[16] PINT B A: Oxid Met Vol.45(1996), p.1-37.
278 Advanced Design and Manufacturing Technology I
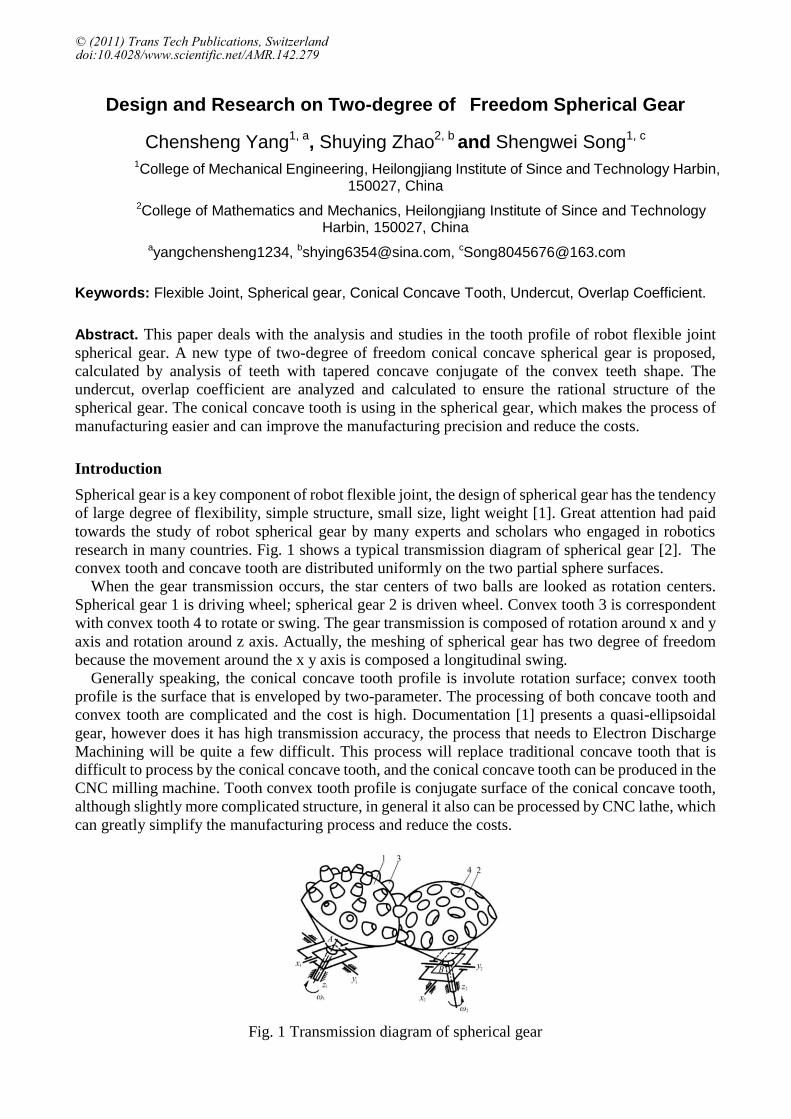
Design and Research on Two-degree of Freedom Spherical Gear
Chensheng Yang1, a, Shuying Zhao2, b and Shengwei Song1, c 1College of Mechanical Engineering, Heilongjiang Institute of Since and Technology Harbin,
150027, China
2College of Mathematics and Mechanics, Heilongjiang Institute of Since and Technology Harbin, 150027, China
ayangchensheng1234, [email protected], [email protected]
Keywords: Flexible Joint, Spherical gear, Conical Concave Tooth, Undercut, Overlap Coefficient.
Abstract. This paper deals with the analysis and studies in the tooth profile of robot flexible joint
spherical gear. A new type of two-degree of freedom conical concave spherical gear is proposed,
calculated by analysis of teeth with tapered concave conjugate of the convex teeth shape. The
undercut, overlap coefficient are analyzed and calculated to ensure the rational structure of the
spherical gear. The conical concave tooth is using in the spherical gear, which makes the process of
manufacturing easier and can improve the manufacturing precision and reduce the costs.
Introduction
Spherical gear is a key component of robot flexible joint, the design of spherical gear has the tendency
of large degree of flexibility, simple structure, small size, light weight [1]. Great attention had paid
towards the study of robot spherical gear by many experts and scholars who engaged in robotics
research in many countries. Fig. 1 shows a typical transmission diagram of spherical gear [2]. The
convex tooth and concave tooth are distributed uniformly on the two partial sphere surfaces.
When the gear transmission occurs, the star centers of two balls are looked as rotation centers.
Spherical gear 1 is driving wheel; spherical gear 2 is driven wheel. Convex tooth 3 is correspondent
with convex tooth 4 to rotate or swing. The gear transmission is composed of rotation around x and y
axis and rotation around z axis. Actually, the meshing of spherical gear has two degree of freedom
because the movement around the x y axis is composed a longitudinal swing.
Generally speaking, the conical concave tooth profile is involute rotation surface; convex tooth
profile is the surface that is enveloped by two-parameter. The processing of both concave tooth and
convex tooth are complicated and the cost is high. Documentation [1] presents a quasi-ellipsoidal
gear, however does it has high transmission accuracy, the process that needs to Electron Discharge
Machining will be quite a few difficult. This process will replace traditional concave tooth that is difficult to process by the conical concave tooth, and the conical concave tooth can be produced in the
CNC milling machine. Tooth convex tooth profile is conjugate surface of the conical concave tooth,
although slightly more complicated structure, in general it also can be processed by CNC lathe, which
can greatly simplify the manufacturing process and reduce the costs.
Fig. 1 Transmission diagram of spherical gear
© (2011) Trans Tech Publications, Switzerlanddoi:10.4028/www.scientific.net/AMR.142.279

Tooth Profile Equation of Conical Concave tooth
It is assumed that concave tooth profile is cone with a angle α, its cross-section is shown in Fig. 2.
Conical teeth concave tooth profile is ABCD, CD is tooth space top, o' is face apex. Addendum circle
is coincident with the pitch circle of the spherical gear. o1x1y1 is the consolidation that lies in the gear
1, then
cot2
)2
( 22 SSRoo (1)
Where R is spherical radius, S is chord length of AB
Concave tooth equation of section BD can be determined by the following equation:
sin1 ux cos1 uOOy (2)
and 22
1
2
1 Ryx
so 222
max sin)(cos)( OOROOu (3)
222
min sin)(cos)( OOROOu f (4)
Where Rf is root radius.
umin≤u≤umax (5)
Fig. 2 Conical concave tooth Fig.3 Coordinate
Coordinate transformation. In terms of the transmission of spherical gears, its ratio is 1, it can be
looked essentially the move as pure rolling of two equivalent spheres in space. The mesh between the
concave and convex teeth can be simplified as a pair of plane gears with ratio 1, so do not take into
account z-axis in all of the coordinate system, as shown in Fig. 3. Let p as the mesh point, xpy is fixed
coordinate system. The center is o1and o2 separately. Coordinate o1x1y1 lies in gear 1 and coordinate
o2x2y2 lies in gear 2, y1 y2 y is coincident initially, the coordinate transformation relation is as follows:
Transformation from the coordinate o1 to o is
11
: 1
1
011 y
x
y
x
oo M
100
cossin
0sincos
01 R
M (6)
Transformation from the coordinate o to o2 is
11
: 202
2
2 y
x
y
x
oo M
100
coscossin
sinsincos
20
R
R
M (7)
Transformation from the coordinate o1 to maybe follows o1→o→o2
280 Advanced Design and Manufacturing Technology I

11
1
1
01202
2
y
x
y
x
MM (8)
Local coordinate system oSxSyS is built in pitch circle of gear 2 to facilitate the observation.
1100
10
001
1
2
2
y
x
Ry
x
s
s
(9)
Consideration of convex tooth profile Normal vector of concave tooth profile is:
)sin,(cos1 n (10)
Meshing equation:
0)12( nν
Velocity equation:
ijrων yx )1()1()1( (11)
])([)2()2()2( ijrων ayx
0)( xyx Rnxnyn
Then arranged
R
uOO
cos)()cos( (12)
Each u is given according to equation (3)~(5), and each φ will be obtained,at the same time we can
get concave tooth profile equation by transformation from the coordinate o1 to os.
sin2sin2cos 112 ayxxxs
RayxRyys sin2cos2sin 112 (13)
Undercutting test of concave tooth. Meshing condition in coordinate o1 can be determined by
the follow equation:
0),,( 11 yxf (14)
If generating surface is undercut, meshing velocity is
0)3(rν or 0)12()1(
ννr (15)
Where νr (1) is meshing velocity of generating surface, νr
(12) is relatively velocity of mesh point.
Equation (15) can be shown in coordinate o1.
0)12(
1
)1(
r1 νν (16)
And )12()1(
11 xrx νν )12()1(
11 yry νν (17)
Equation (14) derivative of t is
01
1
1
1
dt
df
dt
dy
y
f
dt
dx
x
f
Because )1(1
1rxdt
dx
)1(1
1rydt
dy , let
dt
d=1, then
f
y
f
x
fryrx
)12(
1
)12(
111
(18)
And )2,2()12( xya in coordinate O1
cos2sin)2(
sin2cos)2()12(
xya
xya
If we express x y with x1 y1
1
)12(
1 2cos yax 1
)12(
1 2sin xay
And 0)12(
1 n so
)sincos(2)cos( 11 xya (19)
Hun Guo, Zuo Dunwen, Tang Guoxing 281
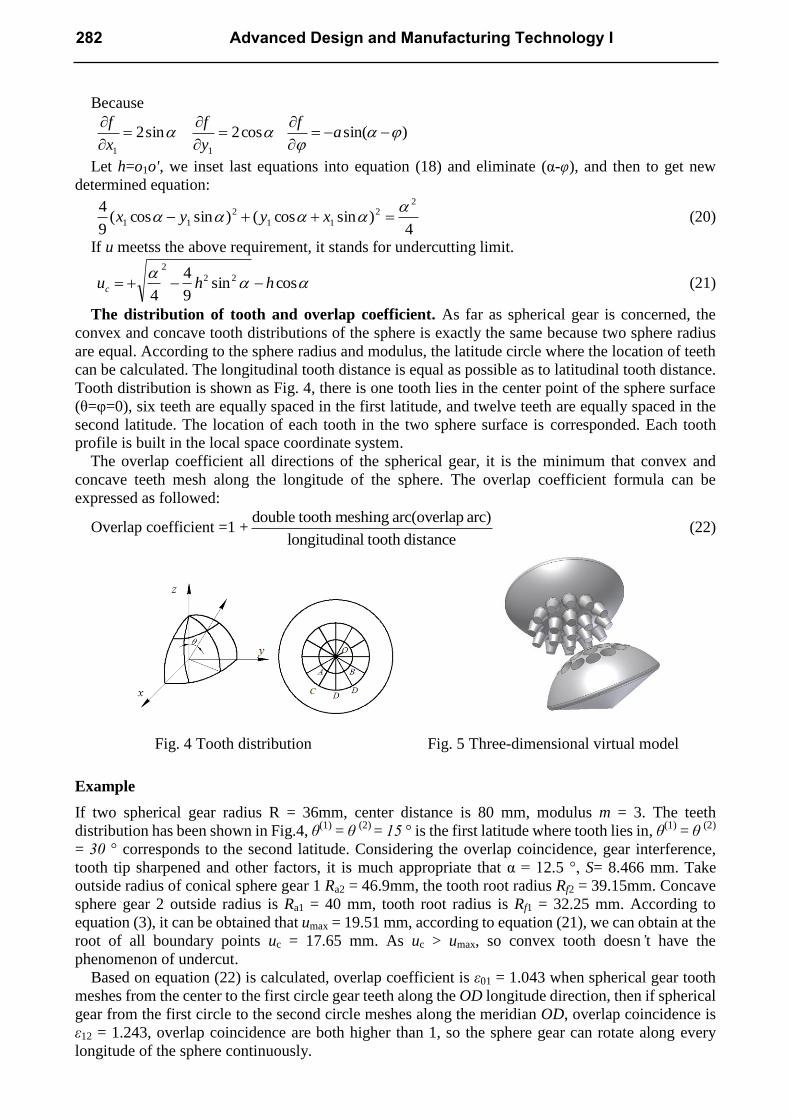
Because
sin21
x
f cos2
1
y
f )sin(
a
f
Let h=o1o', we inset last equations into equation (18) and eliminate (α-φ), and then to get new
determined equation:
4)sincos()sincos(
9
4 22
11
2
11
xyyx (20)
If u meetss the above requirement, it stands for undercutting limit.
cossin9
4
4
22
2
hhuc (21)
The distribution of tooth and overlap coefficient. As far as spherical gear is concerned, the
convex and concave tooth distributions of the sphere is exactly the same because two sphere radius
are equal. According to the sphere radius and modulus, the latitude circle where the location of teeth
can be calculated. The longitudinal tooth distance is equal as possible as to latitudinal tooth distance.
Tooth distribution is shown as Fig. 4, there is one tooth lies in the center point of the sphere surface
(θ=φ=0), six teeth are equally spaced in the first latitude, and twelve teeth are equally spaced in the
second latitude. The location of each tooth in the two sphere surface is corresponded. Each tooth profile is built in the local space coordinate system.
The overlap coefficient all directions of the spherical gear, it is the minimum that convex and
concave teeth mesh along the longitude of the sphere. The overlap coefficient formula can be
expressed as followed:
Overlap coefficient =1 +double tooth meshing arc(overlap arc)
longitudinal tooth distance (22)
Fig. 4 Tooth distribution Fig. 5 Three-dimensional virtual model
Example
If two spherical gear radius R = 36mm, center distance is 80 mm, modulus m = 3. The teeth
distribution has been shown in Fig.4, θ(1)
= θ (2)
= 15 ° is the first latitude where tooth lies in, θ(1)
= θ (2)
= 30 ° corresponds to the second latitude. Considering the overlap coincidence, gear interference,
tooth tip sharpened and other factors, it is much appropriate that α = 12.5 °, S= 8.466 mm. Take
outside radius of conical sphere gear 1 Ra2 = 46.9mm, the tooth root radius Rf2 = 39.15mm. Concave
sphere gear 2 outside radius is Ra1 = 40 mm, tooth root radius is Rf1 = 32.25 mm. According to
equation (3), it can be obtained that umax = 19.51 mm, according to equation (21), we can obtain at the
root of all boundary points uc = 17.65 mm. As uc > umax, so convex tooth doesn’t have the
phenomenon of undercut.
Based on equation (22) is calculated, overlap coefficient is ε01 = 1.043 when spherical gear tooth
meshes from the center to the first circle gear teeth along the OD longitude direction, then if spherical
gear from the first circle to the second circle meshes along the meridian OD, overlap coincidence is
ε12 = 1.243, overlap coincidence are both higher than 1, so the sphere gear can rotate along every
longitude of the sphere continuously.
282 Advanced Design and Manufacturing Technology I

Conclusion
A new type of two-degree of freedom conical concave spherical gear is proposed, the undercut and
Overlap coefficient are analyzed and calculated to ensure rational structure of the spherical gear. This
kind of spherical gear has the advantages of good processing technology, high machining accuracy,
simple processing and so on.
References
[1] Guixian Li: Spatial Geometry Modeling and Its Application I Engineering (Higher Education
Press, China 2007).
[2] Zhiquan Liu, Guixian Li, Huamin Li: Robot Vol.12 (1990) No.3, p. 36.
[3] Zhiquan Liu: The ASME Vol.26 (1990), p.419-422.
[4] Huran Liu, Dongfu Zhao, Deyu Song: Modern Theries of Gear Meshing (Zhejiang University
Press, China 2008).
Hun Guo, Zuo Dunwen, Tang Guoxing 283

An Algorithm for Computation of Radial-Harmonic-Fourier Moments
Yongjing Jiang1, 2, a, Ziliang Ping2, b 1School of Electronic Engineering, Beijing University of Posts and Telecommunications, Beijing
100080, China
2College of Physics and Electronics Information, Inner Mongolia Normal University, Huhhot, China
a [email protected], [email protected]
Keywords: radial-harmonic-fourier moments, basis functions, fast algorithm
Abstract. A fast algorithm for the computation of radial- harmonic-fourier moments (RHFM) is
presented in this paper. This algorithm is based on some properties of the radial- harmonic-fourier
(RHF) basis functions. As RHF basis functions have specific symmetry or anti-symmetry about the
x-axis, the y-axis, the origin, and the straight line of y=x, we can compute one eighth range of the RHF
basis functions instead of the whole. Both theoretical analysis and experimental testing show that the
fast algorithm makes the time of the computation shorter than the direct method.
Introduction
Moments are invariant descriptors for translation, rotation, and scaling of the image [1, 2]. They have been used in a variety of applications in image analysis, such as pattern recognition [3], object
classification [4], image watermarking [5]. Hu moments and Zernike moments are applied widely in
image analysis at presents. RHFM have better performance in describing image than Hu moments
and Zernike moments which proposed by ping [6, 7].
Accurate and fast computation of the moments is essential to the applications. Previously, we
compute the RHFM of a digital image by the direct method. In this paper, a fast algorithm for the
computation of RHFM is proposed according to the properties of the radial-harmonic-Fourier (RHF)
basis functions. As the RHF basis functions have specific symmetric or anti-symmetric properties
about the x-axis, the y-axis, the origin and the straight line of y=x, we can compute only one-eighth of
the basis function to obtain the whole. This fast algorithm can be used on the reconstruction of the digital image function.
In section 2, the definition of the RHFM is given. In section 3, the direct method for computing
RHFM is described. In section 4, a fast algorithm for the computation of RHFM is given by
introducing the symmetric or an-symmetric properties of the RHF basis functions. Experiment results
are presented in section 5. In section 6, the conclusions are given.
Radial-harmonic-Fourier moments
In this section, we describe the RHFM. The computation of the RHFM is projecting the digital image
function onto the RHF basis functions. The RHF basis functions pnm(r, θ) which consist of two
separable function sets: the radial function Tn(r) and the angular function exp(jmθ) are defined in the
polar coordinates: pnm(r, θ)= Tn(r) exp(jmθ) (1)
Where,
even is whileπcos2/
odd is whileπ)1sin(2/r
0 while/1
)(
nrnr
nrn
nr
rTn (2)
The RHF basis functions pnm(r, θ) are orthogonal inside of the unit circle, 0≤r≤1,0≤θ≤2π:
© (2011) Trans Tech Publications, Switzerlanddoi:10.4028/www.scientific.net/AMR.142.284

mlnkklnm rrrprp π2dd),(),(π2
0
1
0 (3)
Where δnkδml is Kronecker symbols.
A digital image can be decomposed orthogonally by the pnm(r, θ) in the polar coordinates.
00
)jexp()(),(),(n m
nnm
n m
nmnm mrTrprf (4)
Where φnm are the coefficients of the decomposition and defined it as the RFHM:
dd)jexp()(),(2
1 π2
0
1
0rrmrTrf nnm (5)
Direct method
RHFM are integrals inside a unit circle defined in polar coordinates. For a digital image, the
integrals are replaced by summations to get the moments, and the image coordinates must be
normalized into [0, 1] in Cartesian coordinates.
1
dd)jexp()(),(π2
1
22
max
min
max
min
yx
yxmrTrfx
xx
y
yy
nnm (6)
Where,
xy
yxr
/arctan
22
(7)
To compute the moments for a digital image, there are three steps. The first, transform the image
coordinates into a unit circle with origin at the image centre. The second compute the values of the
RHF basis function at each pixel position. The third, to project the image function onto those
orthogonal basis functions to obtain the coefficients of projection. For a specific n and m, the
coefficient of projection on the RHF basis function is one moment of the image function. One
moment can be obtained at a single loop; the entire set of RHFM can be obtained concurrently in a
single iteration of the loop in the algorithm. The image function can be reconstructed by the RHFM:
max max
min0
)jexp()(),(n
n
m
m
nnm mrTrf (8)
Fig. 1 Eight symmetrical points on the Integral area inside a unit circle
The fast algorithm
Computation of RHFM is projecting the image function onto the RHF basis functions. For a digital
image, we will compute the values of RHF basis functions to all image pixels inside a unit circle.
RHF basis functions are defined in the complex domain:
pnm(r, θ)= Tn(r) exp(jmθ) (9)
With Euler’s formulas, it can be written as:
Hun Guo, Zuo Dunwen, Tang Guoxing 285

pnm(r, θ)= Tn(r) cos mθ+jTn(r) sin mθ=Repnm+jIm pnm (10)
With the properties of sine and cosine functions, the real part and the imaginary part of the RHF
have specific symmetric or anti-symmetric properties which depend on the value of m in the angular
fourier complex function.
In order to represent the symmetry or anti-symmetry properties of the RHF basis functions, we
suppose there is a point p1 on Cartesian coordinates in the first one-eighth range of the unit circle in
Fig. 1, the symmetrical points with respect to the x-axis, y-axis, the origin, and the line y=x are point
p8, p4, p5 and p2. And point p3, p6, p7 are the symmetrical points of the point p2 with respect to the
y-axis, the origin, and x-axis. Obviously, those eight points have the same values of radius r. The
symmetry or anti-symmetry properties of the RHF basis functions can be obtained by the
relationships of those eight points [8]. The relationship of those eight points which depend on the
values of m can be written as:
Re pn, m=4k(p1)=Rep(p2)=Rep(p3)=Rep(p4)=Rep(p5)=Rep(p6)=Rep(p7)=Rep(p8) (11)
Im pn, m=4k=-Imp(p2)=Imp(p3)=-Imp(p4)=Imp(p5)=-Imp(p6)=Imp(p7)=-Imp(p8) (12)
Re pn, m=4k+1(p1)=Imp(p2)=Imp(p3)=-Rep(p4)=-Rep(p5)=-Imp(p6)=-Imp(p7)=Rep(p8) (13)
Im pn, m=4k+1=Rep(p2)=-Rep(p3)=Imp(p4)=-Imp(p5)=-Rep(p6)=Rep(p7)=-Imp(p8) (14)
Re pn, m=4k+2(p1)=-Rep(p2)=-Rep(p3)=Rep(p4)=Rep(p5)=-Rep(p6)=-Rep(p7)=Rep(p8) (15)
Im pn, m=4k+2=Imp(p2)=-Imp(p3)=-Imp(p4)=Imp(p5)=Imp(p6)=-Imp(p7)=-Imp(p8) (16)
Re pn, m=4k+3(p1)=-Imp(p2)=-Imp(p3)=-Rep(p4)=-Rep(p5)=Imp(p6)=Imp(p7)=Rep(p8) (17)
Im pn, m=4k+3=-Rep(p2)=Rep(p3)=Imp(p4)=-Imp(p5)=Rep(p6)=-Rep(p7)=-Imp(p8) (18)
Additional, when the point p1 on the line of x=0, y=0, or y=x, there are only three points p3, p5 and
p7 correspond with p1. With the properties of RHF basis functions, the summations range is
one-eighth of the whole when we compute the values of the basis functions by the fast algorithm. So
with the proposed method, the computation time for evaluating the moments is reduced compared to
the direct method.
On image function reconstruction process, the value of one image pixel can be obtained at a single
loop with the direct method, while with the fast algorithm we can obtain the values of eight image
pixels at a single loop.
Experimental results
A binary image of letter E (Fig. 2a) whose size is 64×64 pixels is used in the computation of RHFM
using the direct and fast algorithm. All programs were implemented with Matlab R2007a.
a.64×64 binary letter E b.Reconstruction of 64×64 binary letter E
Fig.2 Test images
In the first experiment, we compute a set of RHFM for some digital images by direct method and
fast algorithm. Some RHFM of 64×64 binary letter E image are listed in table 1 and table 2 to show
the accuracy of the fast algorithm. In the second experiment, we compute the RHFM of 64×64 binary
letter E image (Fig. 2a) with the direct and the fast algorithm, up to the maximum radial order Nmax=5,
286 Advanced Design and Manufacturing Technology I

10, 15, 20, 30, and the maximum angular order Mmax=5, 10,15,20,30 respective. The times taken to
compute the RHFM of binary letter E image with the direct and the fast algorithm are tabulated in
table 3. The fast algorithm takes about one-fourth times which taken by direct method on computation
of the moments. In the third experiment, we reconstruct the image function of the 64×64 binary letter
E with the direct method and the fast algorithm using the moments computed in the experiment 2. The
reconstructed image is given in the Fig. 2b to show that the method of reconstructing the image
function with the moments is accurate and the effective. The times taken to reconstruct with the direct
and the fast algorithm are tabulated in table 4. The fast algorithm takes about half the times which
taken by the direct method on the reconstruction process.
Table 1 The RHFM of the 64×64 binary letter E image computed by direct method
m=0 m=1
n=0 92.93954902545993 + 0i 4.331276180464587 + 0.074498871977385i
n=1 -30.183853370215054 + 0i 5.586821142926761 - 0.212955777594652i
n=2 -54.27887936300729 + 0i -0.697364987943702 + 0.822436089948245i
n=3 23.265745316715563 + 0i -0.882963866269998 + 1.049013493473147i
n=4 -5.184243771301225 + 0i -4.366123206393093 + 0.866897880684694i
Table 2 The RHFM of the 64×64 binary letter E image computed by the fast algorithm
m=0 m=1
n=0 92.9395490254597 + 0i 4.331276180464599 + 0.074498871977383i
n=1 -30.18385337021502 + 0i 5.586821142926762 - 0.212955777594649i
n=2 -54.278879363007384 + 0i -0.697364987943707 + 0.822436089948226i
n=3 23.26574531671559 + 0i -0.882963866269995 + 1.04901349347314i
n=4 -5.184243771301215 + 0i -4.366123206393087 + 0.866897880684696i
Table 3 CPU elapsed time for computing RHFM of the 64×64 binary letter E image computed by
direct method and fast algorithm
Computation time(s)
direct method fast algorithm
Nmax=Mma =5 2.28205 0.90801
Nmax=Mmax=10 7.99583 2.10931
Nmax=Mmax=15 17.46854 4.11197
Nmax=Mmax=20 30.56944 6.86397
Nmax=Mmax=30 67.61923 14.70251
Where, Nmax is the maximum radial order, Mmax is the maximum angular order
Table 4 CPU elapsed time for reconstructing of the 64×64 binary letter E image computed by
direct method and fast algorithm
Computation time(s)
direct method fast algorithm
Nmax=Mma =5 0.78093 0.47156
Nmax=Mmax=10 1.53475 0.74660
Nmax=Mmax=15 2.47721 1.06528
Nmax=Mmax=20 3.61156 1.41263
Nmax=Mmax=30 6.36014 2.21322
The experimental results show that the moments computed by the fast algorithm are accurately,
and the computation with the fast algorithm is faster than the direct method on computing the RHFM
and reconstructing the image function.
Hun Guo, Zuo Dunwen, Tang Guoxing 287

Conclusion
In this paper, a fast algorithm for computation of RHFM and reconstruct the image function is
proposed. As the symmetric or anti-symmetric properties of RHF basis functions, times taken to
compute the RHFM and reconstruct the image function are reduced. The experimental results show
that the proposed method is an effective and fast algorithm to compute the RHFM and reconstruct the
image function.
References
[1] M. K. Hu: Visual Pattern recognition by moment invariants, IRE Trands. Inf. Theory IT-8 (1962)
179-187
[2] M.R. Teague: J. Opt. Soc. Am. Vol.70 (1980), p.920-930
[3] S. O. Belkasim: Patter Recognition Vol.24 (1991) No.12, p.1117-1138.
[4] A. Khotanzad, J.H. Lu: IEEE Trans. Acoust., Speech Signal Process Vol.38 (1990) No.6,
p.1028–1038.
[5] H. S. Kim, H.-K. Lee: IEEE Transactions on Circuits and Systems for Video Technology Vol.13
(2003) No.8, p.766-775
[6] H. P. Ren, Z.L. Ping, Wurigen, Y.L. Sheng: J. Opt. Soc. Am. A Vol.20 (2003) No.4, p. 631-637.
[7] Ziliang Ping, Haiping Ren: Pattern recognition Vol.40 (2007), p.1245-1254
[8] Sun-kyoo Hwang: Pattern Recognition Vol.39 (2006), p.2065-2076
288 Advanced Design and Manufacturing Technology I

Applied Research on Synesthesia Theory in Industrial Design
Wei Wang1, a, Dan Su1, b 1 School of Mechanical Engineering, Heilongjiang Institute of Science & Technology, Harbin 150027,
China
[email protected],[email protected]
Keywords: Industrial design, synesthesia, emotional design.
Abstract. Synesthesia is a physical, psychological phenomenon. It has a wide range of expression
and application in many areas and can produce wonderful aesthetic experience. In this paper, the
theoretical system of synaesthesia was consolidated, combined with industrial design, synesthesia in
its application system was researched systemly.
Introduction
Synaesthesia is a psychological phenomenon that created interaction among various sensory. That is
the stimulation of a sensory triggers another feeling phenomenon. In psychology, it is called
"synaesthesia" phenomenon. In daily life, people always say "someone has a sweet voice, something
is delightful, such as the spring breeze was blowing and so on. They are all is a kind of synaesthesia.
The former describes the acoustically of wonderful sounds with the taste of sweet. The latter
describes the things which bring people's subjective feelings with the sense of touch. Classification
from the perspective of sensory, this description is wrong and is not logical. It is this illogical
description make people feel very image, specific, and even impossible to replace.
Synesthesia theory is widely used in literature, painting, art design, music and many other areas.
Theoretical system of synaesthesia
The physiological basis of synaesthesia. The feeling of human is divided into three major
categories: chemical (such as taste, smell); machinery (such as touch, hearing); optical (such as
visual). Each different sense corresponds to a feeling organ of the body. After the human body stimuli
by external factors, the stimulate signals are transformed into electrical signals by receptors, the
electrical signals are transmitted to the brain by the nerves, and then the brain makes corresponding
sense. On the face of a fancy, this process can not reflect the physiological basis of synaesthesia out.
However, the brain is an extremely complex organ, one of the region excited by the stimuli will
impact on other regions. Thus, series of reactions are created, and they influence people's subjective
feelings. It is shown in Fig.1.
Fig.1 Schematic diagram of brain stimulation
Types of synesthesia. In general, Synesthesia can be divided into three kinds: sensory synesthesia,
representation synaesthesia and multiple synesthesias.
(a) Sensory Synesthesia
Sensory synesthesia is the inter-conversion of different feelings. The most common is the "color -
auditory” synaesthesia. That is the color sense can cause corresponding auditory. For example, heavy
© (2011) Trans Tech Publications, Switzerlanddoi:10.4028/www.scientific.net/AMR.142.289

colors correspond to the basses, while light colors correspond to the high pitches. Color has
temperature sensation, too. For example, red, orange, yellow will make people feel warm. In addition,
sensory synesthesia has many other forms; here we will not list them.
(b) Representation synaesthesia
Representation synaesthesia is a kind of synaesthesia which is more advanced and more complex
than sensory synesthesia. From a psychological point, representation is a repetition process of
objective target in conception.
(c) Multiple synesthesia
Multiple synesthesia is the co-transfer of more than two representations. That is after the first
synesthesia, an additional one or several synesthesias will appear.
Synaesthesia in industrial design
Applying in industrial design, synaesthesia has two main lines: on the one hand is specific design
elements (such as: shape, color, texture, etc.); on the other hand is the context of product.
Synaesthesia impact on the design elements. Most of synaesthesia impacts on the design elements
are carrying around the visual. The three main forms of synaesthesia are visual - tactile, visual -
auditory, and visual-sense of taste. While in visual elements, form, color and texture are the three
basic elements. These elements are interwoven overlapping, interrelated and influence mutually.
They form a complex system of synesthesia.
(a)Visual-tactile synaesthesia
Tactile is the general name of mechanical stimulation such as the contact, sliding, and pressure.
Most animals’ tactile organs are all over the body, such as human skin is on the human body surface.
Depending on free nerve endings of epidermis, human can experience a variety of sensory. Here the
common tactile experience is listed which generate synaesthesia with visual: cold-hot, soft-hard,
smooth-rough and light-heavy. In addition, there are tactile such as pressure, pain, itching and so on
which are difficult to produce with synesthesia one visual element, they need combination of many
factors to form synesthesia.
(1) Point tactile synesthesia
Table 1 Tactile synesthesia of point
Point Form
Tactile
synesthesia
cold-hot soft-hard smooth-rough light-heavy
Table 1 lists the relationship between the points form and tactile synesthesia. But this
understanding is a narrow understanding. In most cases, form synesthesia also dependents on the
environment which has comparison relationship with itself. For example, if the most weight and
rough point in the design is transferred to a rough black stone, it may be the lightest and most smooth
point. In the design, using synesthesia of a variety of points can produce rich visual effect.
(2) Tactile synesthesia of line, face and body
The production of tactile synesthesia of line, face and body has many similarities in some extent
with tactile synesthesia of point. The law is shown in Table 2.
Table 2 Physical characteristics and tactile synesthesia
Physical
characteristics
line, face and
body
Shrink
Radial
Shake
Expand
Radiation
Smooth
Smooth
Tremble
Organic
Form
Angular
Smooth
Geometry
Form
Rule
Smooth
Smooth
Messy
Block
Tremble
Small
body;
Up
Body
large;
Down
Tactile
synesthesia Cold Hot Soft Hard Smooth Rough light weight
290 Advanced Design and Manufacturing Technology I
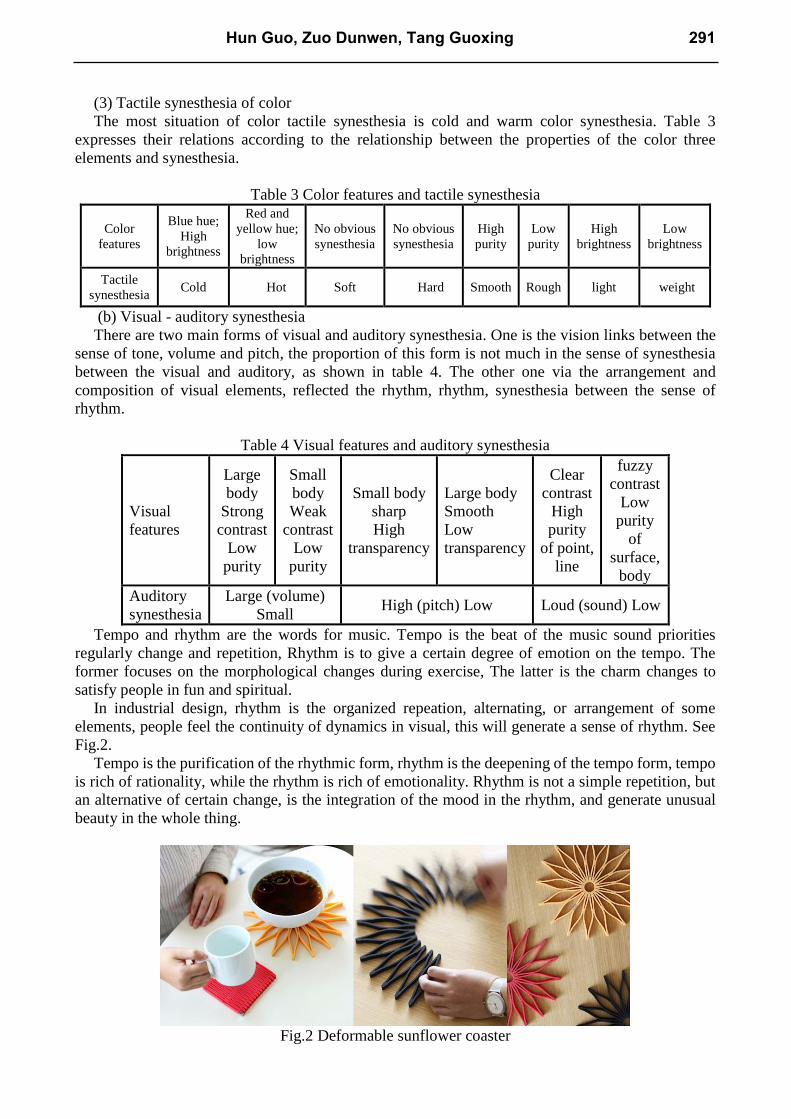
(3) Tactile synesthesia of color
The most situation of color tactile synesthesia is cold and warm color synesthesia. Table 3
expresses their relations according to the relationship between the properties of the color three
elements and synesthesia.
Table 3 Color features and tactile synesthesia
Color
features
Blue hue;
High
brightness
Red and
yellow hue;
low
brightness
No obvious
synesthesia
No obvious
synesthesia
High
purity
Low
purity
High
brightness
Low
brightness
Tactile
synesthesia Cold Hot Soft Hard Smooth Rough light weight
(b) Visual - auditory synesthesia
There are two main forms of visual and auditory synesthesia. One is the vision links between the
sense of tone, volume and pitch, the proportion of this form is not much in the sense of synesthesia
between the visual and auditory, as shown in table 4. The other one via the arrangement and
composition of visual elements, reflected the rhythm, rhythm, synesthesia between the sense of
rhythm.
Table 4 Visual features and auditory synesthesia
Visual
features
Large
body
Strong
contrast
Low
purity
Small
body
Weak
contrast
Low
purity
Small body
sharp
High
transparency
Large body
Smooth
Low
transparency
Clear
contrast
High
purity
of point,
line
fuzzy
contrast
Low
purity
of
surface,
body
Auditory
synesthesia
Large (volume)
Small High (pitch) Low Loud (sound) Low
Tempo and rhythm are the words for music. Tempo is the beat of the music sound priorities
regularly change and repetition, Rhythm is to give a certain degree of emotion on the tempo. The
former focuses on the morphological changes during exercise, The latter is the charm changes to
satisfy people in fun and spiritual.
In industrial design, rhythm is the organized repeation, alternating, or arrangement of some
elements, people feel the continuity of dynamics in visual, this will generate a sense of rhythm. See
Fig.2.
Tempo is the purification of the rhythmic form, rhythm is the deepening of the tempo form, tempo
is rich of rationality, while the rhythm is rich of emotionality. Rhythm is not a simple repetition, but
an alternative of certain change, is the integration of the mood in the rhythm, and generate unusual
beauty in the whole thing.
Fig.2 Deformable sunflower coaster
Hun Guo, Zuo Dunwen, Tang Guoxing 291
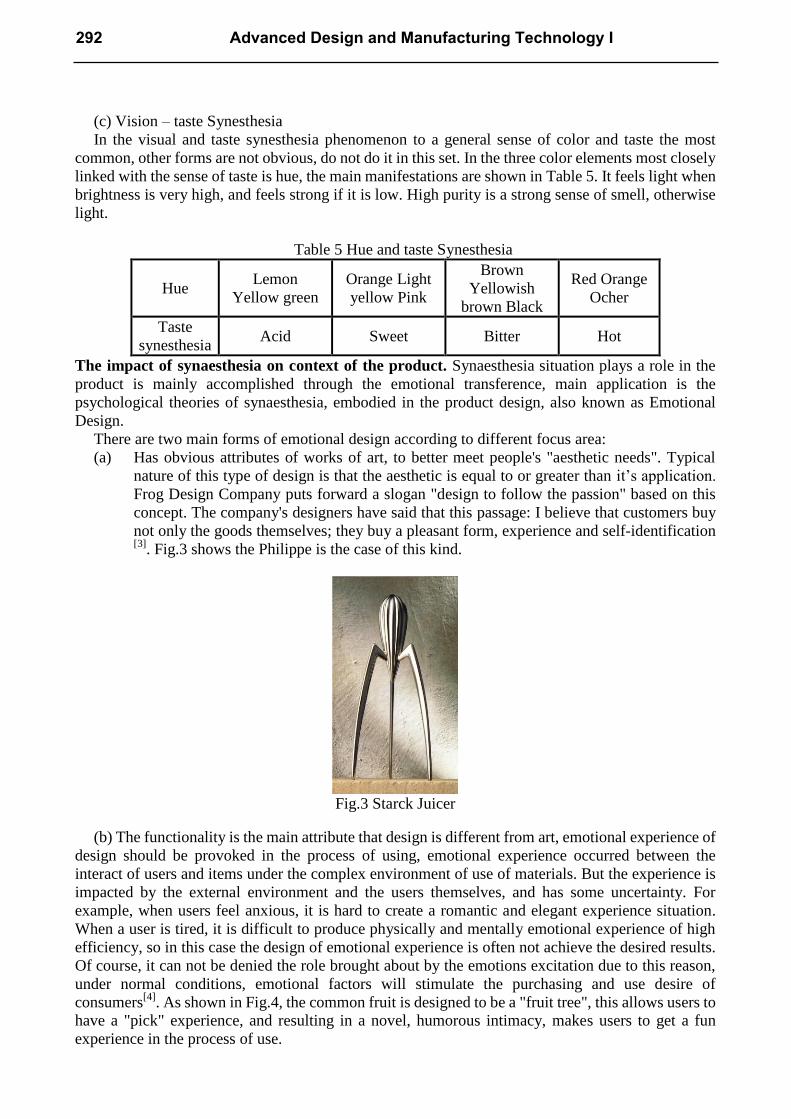
(c) Vision – taste Synesthesia
In the visual and taste synesthesia phenomenon to a general sense of color and taste the most
common, other forms are not obvious, do not do it in this set. In the three color elements most closely
linked with the sense of taste is hue, the main manifestations are shown in Table 5. It feels light when
brightness is very high, and feels strong if it is low. High purity is a strong sense of smell, otherwise
light.
Table 5 Hue and taste Synesthesia
Hue Lemon
Yellow green
Orange Light
yellow Pink
Brown
Yellowish
brown Black
Red Orange
Ocher
Taste
synesthesia Acid Sweet Bitter Hot
The impact of synaesthesia on context of the product. Synaesthesia situation plays a role in the
product is mainly accomplished through the emotional transference, main application is the
psychological theories of synaesthesia, embodied in the product design, also known as Emotional
Design.
There are two main forms of emotional design according to different focus area:
(a) Has obvious attributes of works of art, to better meet people's "aesthetic needs". Typical
nature of this type of design is that the aesthetic is equal to or greater than it’s application.
Frog Design Company puts forward a slogan "design to follow the passion" based on this
concept. The company's designers have said that this passage: I believe that customers buy
not only the goods themselves; they buy a pleasant form, experience and self-identification
[3]. Fig.3 shows the Philippe is the case of this kind.
Fig.3 Starck Juicer
(b) The functionality is the main attribute that design is different from art, emotional experience of
design should be provoked in the process of using, emotional experience occurred between the
interact of users and items under the complex environment of use of materials. But the experience is
impacted by the external environment and the users themselves, and has some uncertainty. For
example, when users feel anxious, it is hard to create a romantic and elegant experience situation.
When a user is tired, it is difficult to produce physically and mentally emotional experience of high
efficiency, so in this case the design of emotional experience is often not achieve the desired results.
Of course, it can not be denied the role brought about by the emotions excitation due to this reason,
under normal conditions, emotional factors will stimulate the purchasing and use desire of
consumers[4]
. As shown in Fig.4, the common fruit is designed to be a "fruit tree", this allows users to
have a "pick" experience, and resulting in a novel, humorous intimacy, makes users to get a fun
experience in the process of use.
292 Advanced Design and Manufacturing Technology I

Conclusions
Synaesthesia as a psychological phenomenon, a rhetorical approach and a physiological
phenomenon, widely exists in real life, but how to guide the designer to design a systematic event in
the design through the application of the theory is an unusual topic. In this paper, synesthesia has been
discussed from various angles on the design based on physiology and psychology, and analysis and
research are applied.
The theory of synesthesia sporadic distributed among a number of propositions, which is lack of
understanding and application of systematic. Hope that this paper can give a little try, and make the
synesthesia theory to play stronger guiding role in the design.
Fig.4 Mini fruit tree on the table
Acknowledgement
This work is supported by the educated program of Heilongjiang (11541311).
References
[1] Kevin T. Dann: Bright Colors, Falsely Seen (Matherne Yale University Press, 1998)
[2] John C Gammack: Synaesthesia and Knowing (Murdoch University Press, 1999)
[3] John E. Harrison: Synaesthesia: The Strangest Thing (Oxford University Press, 2001)
[4] PAUL THEOBALD: 《Language of Vision》, 1994
Hun Guo, Zuo Dunwen, Tang Guoxing 293


Keywords Index
2.25 Cr-1Mo-0.25V 253
7022 Aluminum Alloy 63
A
Accuracy 174
Accuracy Assessment 204
AD9910 162
Adaboost Algorithm 21
Aging Treatment 95
Annealing 274
ANSYS 266
Aphrodisium Sauteri (Matsushita) 139
Application 1
Asynchronous Data Fusion 16
Austenitic Stainless Steel 103
Autobody Panel’s Edge 31
B
Ball Bearing 77
Basis Functions 284
Batch Adsorption Process 143
Bionic Design 139
Blade 223
Bonding Strength 112
C
Center Extraction 214
Characteristics Analysis 51
Charging 180
Chip Breaking 248, 253
Chip Configuration 26
Chip Curl 248
CNC Grinder 55
Coagulant 270
Coherent Lattice 99
Cold Extrusion 266
Complexity 174
Complicated Groove Insert 248
Composite Material 143
Conflict Resolving Matrix 228
Confusion Network 174
Conical Concave Tooth 279
Construction Vehicle 87
Contact Analysis 77
Contract-Net 6
Contrast 209
Cr(VI) 143
Cutting Force 209, 253
Cutting Parameters 11, 103
Cutting Temperature 26, 253
Cyclic Oxidation 274
D
DACS System 72
Data Fusion 16
DDS 162
Deformation Control 148
Described Methods 126
Digital Shipbuilding 72
Digital Video Projector 194
Dispersed Precipitates 99
Distortion 122, 174
Distributed Information Fusion 16
Distribution 209
Drawing 31, 107
DSP 180
Dual-Jacklift Type 91
Dual-Lifting Type 91
Dual-Source Model 63
Dynamic Equilibrium 258
Dynamic Pressure Effect 258
E
Edge Detection 199
Electric Spindle 258
Electrical Resistively of Dust 134
Electrodeposited 274
Elevator Type 91
Ellipse Fitting 199
Embedded System 87
Emotional Design 289
Equiaxed Grain 68
Error 204
ESP 134
F
Fast Algorithm 284
Fatigue 82
296 Advanced Design and Manufacturing Technology I
Fe-Based Bulk Amorphous Alloy 59
Feature 1
Field Programmable Gate Array(FPGA)
188
Finite Element Analysis (FEA) 238
Finite Element Model (FEM) 40, 77, 223
Flexible Joint 279
Fly Ash (FA) 143
FMS 219
Form Prototype 126
Frequency Hopping (FH) 162
Friction Mechanism 117
Friction Property 117
Friction Stir Welding (FSW) 63
Full Immersion Test 59
Fuzzy Predictive Control 45
G
Gangue 270
Gear Hobbing Machine 238
Glass Cutting Machine 157
Grating 219
Growth Rate 82
Guide Characteristics 130
Guide Plate 130
H
HCl Solution 59
Heat Treatment Deformation 148
High Efficient 91
High Speed Dry Cutting 26
High Speed Hard Cutting 26
High Speed Machining (HSM) 11
High Speed Milling (HSM) 262
High Strength Steel 248
High Support Based Type 91
High Temperature 248
Hydraulic Servo System 243
Hydroforming 51
I
Image Segmentation 21
Impeller 262
Industrial Design 289
Inner Race 55
Intensity Factor 82
Interference Fit 266
Internal Flow Field 130
Inverter 188
K
Key Technology 51
L
Lattice 174
Least Square 199
Liftable Bridge Support Type 91
M
Machinability 253
Machining Process 262
Majority Column 35
Manufacturing Execution System(MES)
6
Marine Diesel Engine 82
Material Recognition 219
Material Removal 223
Mathematical Model 243
Medical Image 21
Memory Alloy 35
Mg-Zr Alloys 99
Micro-Milling Tool 40
Microstructure 68, 95
Milling Force 11
Mobile Communication 87
Modal 223
Modal Analysis 238
Mode Analysis 40
Monte Carlo Method 166
Multi-Agent (MA) 6
Multi-Resolution Analysis 184
Multi-Sensor 16
N
Nano-Size Particles 99
NC Machining 209
NC System 233
NCD 77
Neutron Radiation 166
Numerical Control System 157
Numerical Simulation 31, 122
O
OPC 87
Open Style 233
Optical Measurement 204
Hun Guo, Zuo Dunwen, Tang Guoxing 297
Optimisation Design 243
Overlap Coefficient 279
P
Parallel Machine Tool (PMT) 233
Parameter Optimization 45
Passivation 59
PC 157
PCBN Cutter 26
Performance 1, 153
Phase Error 194
Phase Measurement Profilometry 194
Phase Shifting 194
Phasic Difference CheckingCircuit
170
PID Control 45
Pipeline Elbow 130
Piston 82
Plastic Deformation 266
Polymeric Ferric AluminumSilicate
270
Polymeric Ferric AluminumSulfate
270
Powder Metallurgy MechanicalStructural Parts
148
Precision Control 72
Process Conditions 270
Product Design Style 126
Programmable Multi-AxisController
233
Property Analysis 95
Q
Quay Container Crane 91
R
Radial-Harmonic-FourierMoments
284
Reconfigurable Design 35
Reference Point 214
Region Growing 21
Remote Monitoring 87
Residual Stress 112, 122
Reverse Engineering (RE) 214
Rotary Speed 170
Rotation Inertia 228
Rubber Shock Absorber 243
S
Section Damage 184
Semantic Matrix 126
Sensor 170
Sequential Algorithm 214
Shielding Material 166
Simulation 107
Single Crystal Silicon 117
Slope 68
Small Diameter Deep Hole 103
Special-Shaped Cross-Section Pipe 51
Spherical Gear 279
Spherical Roller 55
Spinning Technology 1
Spoken Document Classification 174
Spring Back 31
SPWM 180
Stamping 107
Standard Test 204
Static Analysis 40
Static Equilibrium 258
Steel Wire Rope (SWR) 184
Steering Gear System 45
Stress 266
Superfine Cellulosine with Sub-Nanometer
258
Surface Roughness (SR) 117
Suspensory Wire 95
SVPWN 188
Synesthesia 289
T
Telescopic Poles 35
Temperature Field Simulation 63
Three Dimensional Measuring 219
Three-Level 188
Tool Design 139
Toolpath 262
Torque 170
Transformation 55
Tribology 117
TRIZ 228
Twist Drill 103
U
Undercut 279

298 Advanced Design and Manufacturing Technology I
V
Vacuum Heat Treatment 153
Vibration 68
Vibration Test Equipment 243
W
W-Cu Alloys 153
Wavelet Analysis 184
Wear Property 117
Winged Rigid Body 228
Wood Industry 134
Workflow 6
X
X-Ray Diffraction (XRD) 112
Z
Zernike Moment 199
Zinc-Plated Film 112

Authors Index
B
Bu, G.B. 209, 223
C
Cao, H. 228
Chang, G.X. 188
Chang, J.X. 174
Che, X.Q. 214
Chen, C. 166
Chen, M.W. 130
Chen, Z. 35
Cheng, J.T. 204, 214, 219
Chi, H.Y. 228
D
Deng, J. 95
Du, Y.H. 162
F
Feng, M.J. 16
G
Gao, Z. 68, 126
Gui, W.S. 243
Guo, X.Y. 68
H
He, R. 87
He, W.T. 194, 199, 219
Hu, S.G. 51
Huang, M.M. 63
Huang, Q.G. 266
Huang, S.J. 87
Huang, Z.R. 103
J
Ji, B.Z. 139
Ji, X. 11
Ji, X.M. 126
Jiang, J.X. 31
Jiang, Y.J. 284
Jin, W.Z. 243
Jing, Z.Q. 143
K
Kang, S.C. 21
L
Lei, X.B. 134
Li, M.W. 148, 153
Li, W. 188
Li, Y.F. 248
Lin, G.B. 99
Lin, H.P. 233
Liu, B. 31, 107
Liu, E.L. 248
Liu, G.X. 72
Liu, L. 55
Liu, L.F. 99
Liu, M.H. 238
Liu, M.J. 31
Liu, R.B. 219
Liu, S.P. 91
Liu, S.W. 139
Liu, X.L. 188, 238, 248,253
Liu, Y.B. 11
Liu, Y.W. 122
Liu, Z.N. 134
Lu, W.Z. 40, 63, 77
Luo, K.J. 270
M
Ma, J.J. 214
Ma, L.J. 77
Meng, X.L. 194, 199
O
Ouyang, Q.R. 162
P
Pan, X.L. 68
Ping, Z.L. 284
Q
Qin, Y. 16
300 Advanced Design and Manufacturing Technology I
Qing, Z.H. 26, 139
R
Ren, G.M. 270
S
Shao, D.L. 63
Shen, X.P. 148, 153
Song, S.L. 87, 170
Song, S.W. 279
Su, D. 289
Su, F.T. 87
Sun, C.T. 262
Sun, H.J. 262
Sun, Y.L. 117
W
Wang, H.F. 63
Wang, L.J. 16
Wang, M. 166
Wang, M.D. 35
Wang, P. 21
Wang, Q. 170
Wang, R. 6
Wang, S.S. 219
Wang, W. 157, 289
Wang, X.F. 112, 262
Wang, X.H. 16
Wang, X.Z. 248
Wang, Y.L. 95, 130
Wang, Y.X. 253
Wang, Z. 143
Wang, Z.D. 99, 130
Wen, D.Z. 63
Wu, L.Y. 95, 130
Wu, T. 209
Wu, W.H. 223
X
Xiang, X.Z. 174
Xiao, F. 248
Xiao, H.X. 59
Xiao, S.B. 214
Xie, F. 26
Xie, R. 82
Xie, S.K. 68
Xin, J.L. 21
Xu, F. 40, 77
Xu, Y.M. 233
Xuan, L.P. 180, 184
Xue, H.Q. 143
Y
Yan, F.G. 253
Yan, Y.B. 148, 153
Yang, C.S. 279
Yang, G.X. 45
Yang, L.Y. 258
Ye, X.F. 21
Yi, R.X. 68
Yin, S.W. 21
Yu, S.X. 45, 117
Yuan, J.J. 77
Yue, H.Y. 204
Z
Zhai, Y.S. 253
Zhang, C.G. 26
Zhang, D. 148, 153
Zhang, H.P. 253
Zhang, J.C. 274
Zhang, J.P. 59
Zhang, K. 139
Zhang, L. 174
Zhang, Q. 87
Zhang, Y. 266
Zhao, B. 1
Zhao, C. 11, 194, 199,204, 209, 223
Zhao, S.Y. 279
Zhao, W. 170
Zhao, W.L. 204
Zheng, X.Q. 68
Zheng, Z. 99
Zhou, H.D. 134
Zhou, L. 117
Zhou, P. 11
Zhou, Y.B. 274
Zhou, Y.Q. 31
Zhou, Z. 16
Zhu, C.L. 243
Zhu, L.J. 40
Zhu, X.L. 117
Zou, D.W. 117
Zuo, D.W. 26, 40, 77,209