Advanced Technology to Lead the Industry - CAPCOM
56
Advanced Technology to Lead the Industry http://www.capcom.co.jp/ ©CAPCOM CO., LTD. ALL RIGHTS RESERVED. 3-1-3 Uchihirano-machi, Chuo-ku, Osaka, 540-0037, Japan PHONE: 81-6-6920-3600 FAX: 81-6-6920-5100 The print of this catalog uses environment-friendly vegetable oil ink. http://www.capcom.co.jp/ir/english/ Capcom Investor Relations Website Smartphone Access If you have a smartphone that reads QR codes (two-dimensional bar codes), scan the image on the right for easy access to the site. The cover image shows Capcom’s development offices in Osaka. The building at lower right is R&D Building #2, boasting one of the newest development facilities in Japan, just completed in 2016. At upper left is the R&D Building, completed in 1996. These two buildings will serve as a base as we move forward with the strengthening of our development structure. Cover Image We have been focusing on IR activities by providing our shareholders and investors with timely and updated information through our website. CAPCOM CO., LTD. INTEGRATED REPORT 2016 Code Number: 9697 2016 CAPCOM INTEGRATED REPORT Code Number: 9697
-
Upload
khangminh22 -
Category
Documents
-
view
3 -
download
0
Transcript of Advanced Technology to Lead the Industry - CAPCOM

Advan
ced T
echn
ology
to Lea
d the
Indu
stry
http://www.capcom.co.jp/
©CAPCOM CO., LTD. ALL RIGHTS RESERVED.
3-1-3 Uchihirano-machi, Chuo-ku,Osaka, 540-0037, JapanPHONE: 81-6-6920-3600FAX: 81-6-6920-5100
The print of this catalog usesenvironment-friendly vegetable oil ink.
http://www.capcom.co.jp/ir/english/
CapcomInvestor Relations Website
Smartphone Access
If you have a smartphone that
reads QR codes (two-dimensional
bar codes), scan the image on the
right for easy access to the site.
The cover image shows Capcom’s development offices in Osaka.The building at lower right is R&D Building #2, boasting one of the newest development facilities in Japan, just completed in 2016. At upper left is the R&D Building, completed in 1996. These two buildings will serve as a base as we move forward with the strengthening of our development structure.
Cover Image
We have been focusing on IR activities by providing
our shareholders and investors with timely and
updated information through our website.
CA
PCO
M C
O., LTD
. INTEG
RA
TED R
EPOR
T2016
Code N
umber: 9697
2016CAPCOM INTEGRATED REPORT
Code Number: 9697
$100Global Game Market (Billions of dollars)
100Over
The global game market continues to grow beyond previous market forecasts and is expected to exceed 100 billion dollars in 2017. The market is becoming increasingly active, as each new generation of major home video game consoles drive unit sales higher amid the launch of virtual reality (VR) games in 2016. Mobile content markets mainly in Asia and developing countries are expanding beyond the scale of the game console market. Going forward, the game market is expected to continue growing, expanding to nearly 200 countries worldwide through various devices used for gaming.
Game Market Expanding More Rapidlythan Anticipated
Global Game Market to Exceed 100 Billion Dollars in 2017
2018 (Year)(forecast) (forecast) (forecast)
2017201620152014
103.294.2
85.8
68.8
100.6
Source: International Development Group
billion
CAPCOM INTEGRATED REPORT 20161 CAPCOM INTEGRATED REPORT 2016 2

© 1998-2016 TENCENT INC. ALL RIGHTS RESERVED.
$ billion30Massive Asian Online Market Exceeds 30 Billion Dollars
Asian Online Market (Billions of dollars)
The Asian region is a massive market valued at 30 billion dollars, and boasts a 54% global share of the online game market utilizing smartphones and PCs. In the past, a market could not be established in the Asian region as it was plagued by issues such as pirated games. The ability to authenticate online game purchases and the spread of smartphones coupled with a great number of potential users, including the world’s largest population of 1.3 billion people in China, caused the region to grow rapidly into a major market. Driven by PC online games for core users and mobile games for casual users, this market is forecast to continue growing significantly.
Massive Online Growth Potential
2018 (Year)
(forecast) (forecast) (forecast)2017201620152014
MobileContents
PC Online
20.7
33.537.1 39.1 39.7
30Over
Source: International Development Group
CAPCOM INTEGRATED REPORT 2016 CAPCOM INTEGRATED REPORT 20163 4

people2,000Capcom Developers Exceed 2,000 in 2016. On Track to Become One of the Largest Studios in Japan
Capcom’s Global Development Studios
Vancouver
Toronto
Taiwan
JapanSouth Korea
Capcom Developers (People)
2,052
2022
(Years ended March 31)
20162015201420132012
1,9021,8081,623
1,455
Personnel costs comprise approximately 80% of game software development costs, thus investment in people is indispensable to maintain a competitive edge. To increase quality and accumulate expertise, Capcom is engaged in strengthening internal development and plans to expand its development structure to 2,500 employees, one of the largest in Japan, in fiscal 2021. To this end, Capcom is hiring a wide range of people without regard for nationality or gender to secure human resources necessary for developing content popular throughout the world. Furthermore, in 2016 Capcom commenced operations at its new R&D facility incorporating world-class development equipment and technologies.
Human Resource Capabilities CreatingContent Popular Throughout the World
(Projected)
2,000Over2,500
CAPCOM INTEGRATED REPORT 2016 CAPCOM INTEGRATED REPORT 20165 6

%50.050No Growth Without Governance Reforms: Half of Board of Directors Are External Directors
Four Features of Capcom Corporate Governance
Please refer to “Governance Reforms for Further Growth” on page 67.
1.
2.
3.
4.
Transitioned to a company with an audit andsupervisory committee to strengthen governance.
Proactive appointment of external directors.
Full disclosure of 73 Corporate Governance Code items.
Mechanism for reflecting investor and analystopinions in management.
External Director Ratio (%)
50.0
27.3 27.3
42.9
2017 (Years ended March 31)
20162015201420132012
Capcom believes strong governance is indispensable for enhancing corporate value. Thus, we invite experts with the highest level of acumen in their respective areas of specialization to serve as external directors who provide Capcom with opinions, advice and checks that increase Board of Director transparency and reliability. They also enhance dialogues with analysts and investors in an attempt to strengthen management monitoring functions. Currently, external directors comprise 50% of the Board of Directors. Also, in June 2016, Capcom made significant changes to its corporate governance organizational design to increase corporate value and control risks in accordance with the promotion of growth strategies, establishing a structure to strengthen a wide range of monitoring functions in overall management.
Reforms Aimed at Transparent Decision-Making and Heightened Reliability
30.0 30.0
CAPCOM INTEGRATED REPORT 2016 CAPCOM INTEGRATED REPORT 20167 8
SECOND TO NONE
Introduction
Corporate Philosophy and Contents
1
9
Capcom’s ValueCreation Activities
To Our Stakeholders (From the CEO & COO)
Capcom’s Business Model
Capcom History
Financial and Non-Financial Highlights
Financial Highlights
Non-Financial Highlights
11
13
15
17
17
19
Message fromManagement
Growth Strategy
ESG Information
Business Activity Achievements
Financial and Corporate Data
The Latest Development Report 2016
11-Year Summary of Consolidated Financial Indicators
Financial Review
Consolidated balance sheets
Consolidated statements of income / Consolidated statements of comprehensive income
Consolidated statements of changes in net assets
Consolidated statements of cash flows
Independent Auditor’s Report
Stock Data
Corporate Data
77
79
83
85
86
87
88
89
90
The COO’s Discussion of Growth StrategiesGrowth Strategy 1 Consumer Business Expansion
Growth Strategy 2 Overhaul the Online Business
Conversation: An Analyst’s Perspective on Capcom’s Strategy for Growth
3537
39
41
The CEO’s Discussion of Initiatives for Enhancing Corporate Value
Financial Strategy According to the CFO
Game Industry Characteristics and Capcom Business Characteristics
21
31
33
Business Segments Highlights
Digital Contents
Arcade Operations
Amusement Equipments
Other Businesses
43
45
49
51
53
Environmental
Social
Corporate GovernanceDirectors
Principal Discussions at Board of Directors Meetings Held in Fiscal 2015
Dialogue Between an External Director and Institutional Investors
Governance Reforms for Further Growth
Transition into a Company with an Audit and Supervisory Committee
Corporate Governance Structure and Initiatives
Internal Management Structure and Initiatives
55
56
6161
63
65
67
69
71
75
Governance MeritsP9, PP67–70
Subject Index
Editorial Policy
External EnvironmentPP1–4, P33, PP45–52
Growth StrategyPP24–25, PP35–42
Business DetailsPP13–16, P34, PP43–54
Relationship with StakeholdersPP13–14, P27, PP56–60
Senior Management PerspectivesPP11–12, PP21–30, PP31–32, PP35–36, PP41–42
Game marketDiagram 11, 12, 21, 23, 25
Arcade facilities marketDiagram 27, 28, 29
Amusement equipments marketDiagram 30, 31
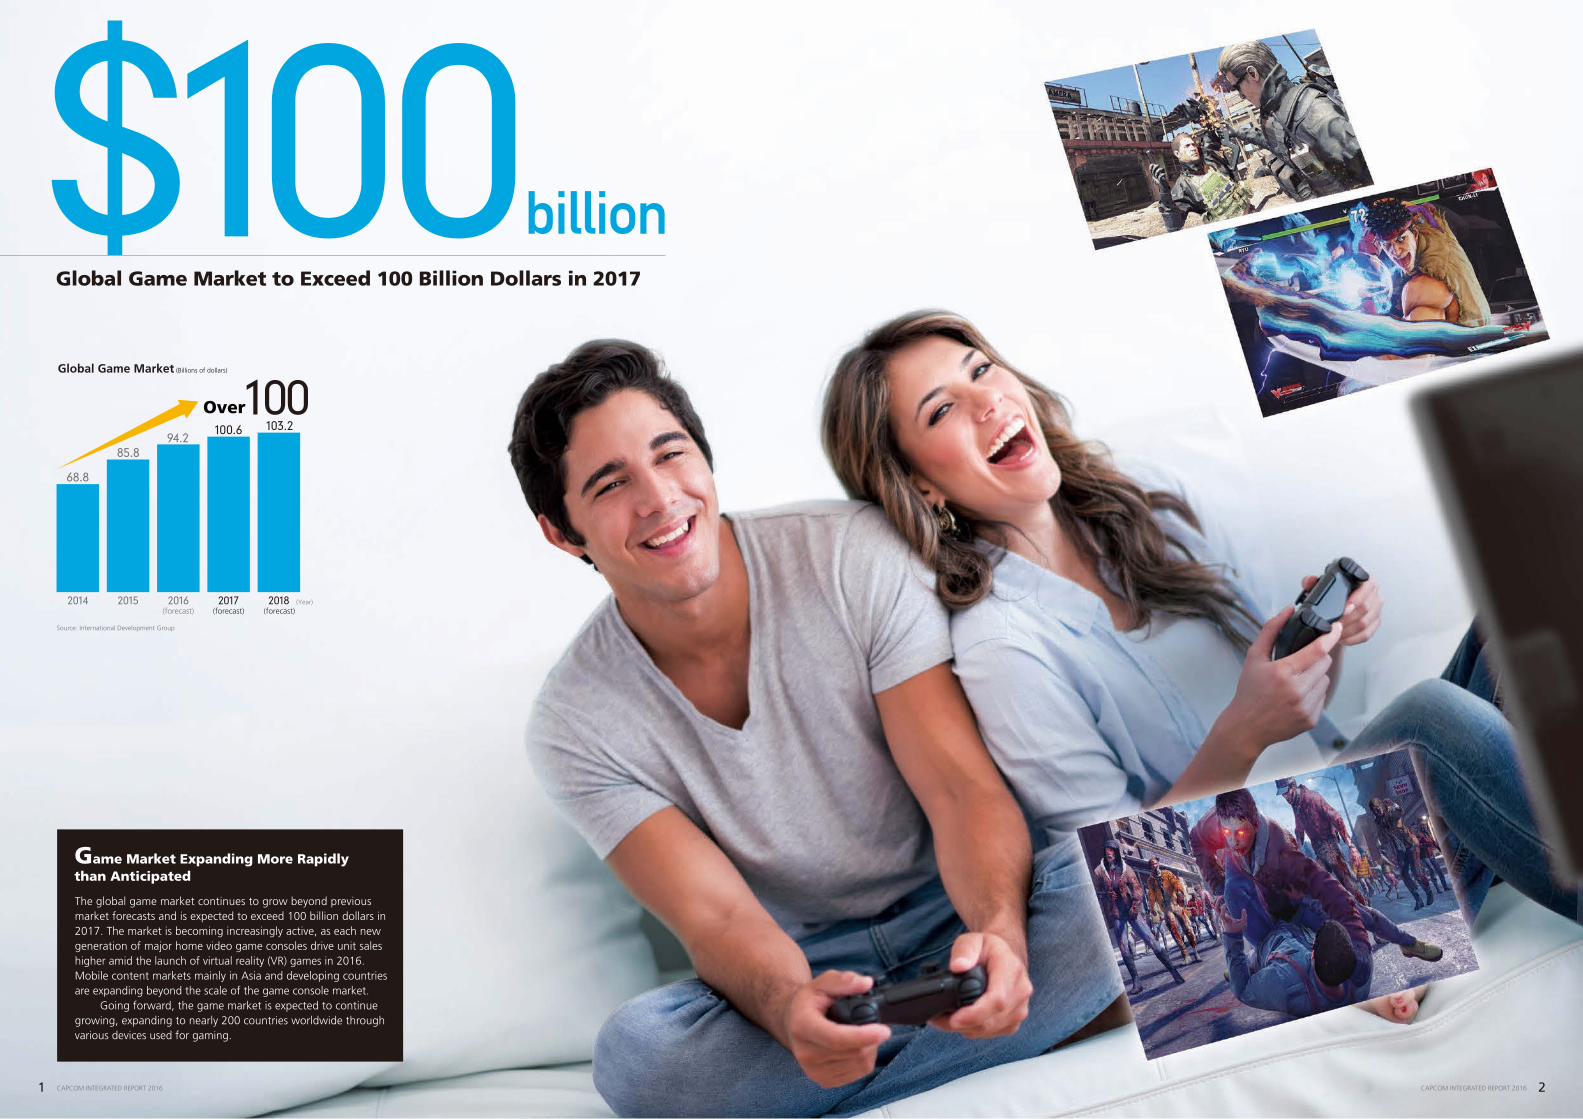
Capcom’s Integrated Report conveys annual performance and initiatives aimed at improving corporate value over the medium- to long-term to shareholders, investors and all other stakeholders. This report is issued with the intent of creating opportunities for further dialogue. This report was created according to the “International Integrated Reporting Framework” announced by the International Integrated Reporting Council (IIRC). Furthermore, we aim to express ideas in a simple and easily understood manner and visually represent important items to aid understanding. In addition to a printed version, this report is also available online.
Period and Scope
This report reviews the fiscal year ended March 31, 2016 (April 1, 2015–March 31, 2016). When necessary, it also includes references to fiscal periods before and after this timeframe. Unless otherwise indicated, the scope of data presented in this report is on a consolidated basis.
Market Data
Performance and Financial ConditionPP17–20, P26, PP31–32, PP43–54, PP77–87
External AssessmentsPP41–42, PP58–60, PP65–66, P74
World-Class Development CapabilitiesSeparate volume: The Latest Development Report 2016
Separate Volume
Our principle is to be a creator of entertainment culture. Through development of highly creative software contents that excite people and stimulate their senses, we have been aiming to offer an entirely new level of game entertainment. Since Capcom’s establishment in 1983, we have developed numerous products with world-class development capabilities as our strength. Game content, an artistic media product that fascinates people, consisting of highly creative, multi-faceted elements such as characters, storyline, worldview and music, makes use of a variety of media that permeates our daily lives. Going forward, Capcom aims to become a unique company recognized around the world for content brimming with originality.
“Capcom: Creator of Entertainment Culture that Stimulates Your Senses”
Corporate Philosophy2013 2014 2015 2016 2017
(Plan)
25.9%29.8%
25.6%
18.3%
11.3%10.9
billion yen
14.0billion yen
9.7billion yen 9.0
billion yen5.2billion yen
Title Region AlliancesMobile contents
3
2
Taiwan
PC browser games
Titles
PC online games
1Title
Titles
Qihoo 360 Technology Co., Ltd.ChinaMonster Hunter Hunting Quest(Simplified Chinese version)
Teeplay Interactive Ltd.China
South KoreaTaiwan
Hong Kong
Street Fighter Battle Combination
Nexon Korea CorporationSouth KoreaStreet Fighter IV Arena
Tencent Holdings Ltd.ChinaMonster Hunter Online
Cayenne Entertainment Technology Co., Ltd.(Taiwan)BLUE PANDA Network Technology Co., Ltd.(China)
ChinaOnimusha Soul(Simplified Chinese version)
Tencent Holdings Ltd.ChinaMonster Hunter Mezeporuta Kaitakuki (Simplified Chinese version)
Hong Kong
China
South Korea
Reinforce business alliances with powerful
local companies
Capcom BranchCAPCOM TAIWAN CO., LTD.
CAPCOM INTEGRATED REPORT 2016 CAPCOM INTEGRATED REPORT 20169 10
Message fromManagement
Growth Strategy Business Activity Achievements
ESG Information Financial and Corporate Data
Capcom’s ValueCreation Activities

To Our Stakeholders (From the CEO & COO)
Promoting Growth Strategies and Governance Reforms Aimed at Enhancing Corporate Value
Creating Entertaining Games that Continue to Excite People Around the World ––––
This is the cornerstone of Capcom’s business activities and the source of our corporate value. Through our business
activities, we bring the Company economic benefits while providing society with new value. We believe the value
of a corporation stems from shared value creation.
As the game market expands globally, in addition to pursuing short-term profit, Capcom is promoting growth
strategies from a medium- to long-term perspective in order to continue enhancing corporate value into the future.
Going forward, we will transform our fundamental revenue model from a one-time sale “transactional model”
to an ongoing “recurring revenue model,” while at the same time thoroughly executing our Single Content Multiple
Usage strategy and constructing a portfolio to achieve stable earnings. We will also engage in governance reforms
to control risks that increase proportionally with the acceleration of our growth strategies, thoroughly implement
management visualization and systemization and create a structure enabling rational management decisions based
on an institutional design with external directors at its core.
Furthermore, we will make an effort to strengthen non-financial capital not reflected in quantitative data.
In addition to enhancing Capcom’s highly original content, the source of our competitive edge, and the development
structure that creates it, we will build positive relationships with business partners, regional communities, employees
and a variety of stakeholders among other important “capital” comprising Capcom corporate value.
Through these various initiatives, we believe we can contribute to shareholder and investor profits by becoming
a company of sustainable growth.
Chairman and Chief Executive Officer (CEO)
Kenzo TsujimotoPresident and Chief Operating Officer (COO)
Haruhiro Tsujimoto
Corporate Value Enhancement
Promote Growth Strategy Promote Governance Reforms
Increase Financial Capital
• Achieve medium-term business goals• Increase ROE• Increase net cash
Increase Non-Financial Capital
• Enhance development structure• Increase stock of IPs• Build relationships with stakeholders
CAPCOM INTEGRATED REPORT 2016 CAPCOM INTEGRATED REPORT 201611 12
Message fromManagement
Growth Strategy Business ActivityAchievements
ESG Information Financial and Corporate Data
Capcom’s ValueCreation Activities

Social Issues INPUT Business Activities OUTPUT/OUTCOME Impact on Society
The use of advanced development capabilities to create original contents for branding is the source of Capcom’s long-term earnings. Capcom pursues high added value through business activities making use of abundant capital (inputs) within and outside the Company, regularly developing and releasing products (outputs) for multiple game platforms and media. The value (outcome) generated from these activities is provided to society and reinvested for the future. Through these activities, we make an effort to respond to social issues while expanding corporate value.
Contributing to the Creation of a Rich Culture and Society through Game Development and Multiple Usage
Human Capital
World’s top game development human resources
Increase intellectual property (technology & new series)
Expand new titlesIncrease catalog sales
Expand Mobile and PC Games
Create a variety of content derived from a single hit title
Increase collaborations with companies in Asia
Increase digital download ratio
Expand global fan segment
Product brand powerCumulative total of 71 million-seller titles
New technological development structure (VR, etc.)
Generational and interregional communication gaps
Company-wide
Digital Contents
Single Content Multiple Usage
Use games to invigorate communications going beyond location and generation
Contribute to VR and simulation technology advances and industry creation
Export Japan game culture globally
Utilize characters to stimulate interest in regional communities
Utilize arcades as a place where seniors can meet
Increase the number of young people who want to become game creators
New industries created from new technologies
Overconcentration in large cities
Declining regional populations
Contents industry promotion
Senior citizen social isolation
Shortage of human resources involved with intellectual property
Intellectual Capital
Production Capital
Social Capital
Projects are started after a two-step approval process. Once concepts and plans are refined, the project is approved for trial by management before full development.
Net sales as of March 31, 2016
24.4
Planning
New Title Production Flow
Necessary tasks are allocated, including the creation of a proprietary development engine and arrangement of planners, designers, programmers and sound creators. Efforts are made to improve quality and ensure development efficiency.
Development
Checks are conducted from the user’s perspective by a team comprising several hundred people. This involves not only a bug check, but also verification of game quality and ease of game play.
Quality Assurance
Online promotions and user events conducted to ensure the game world is always top of mind.
Sales and Promotion
Net sales as of March 31, 2016
52.5 billionyen
billionyen
Popular Capcom content
Single Content Multiple Usage
Digital downloadcontents
Game multi-platform developmentNew users increase as online content grows
PC Online MobileContents
Home videogames
EventsConcerts,
theatrical productions
Arcade OperationsShopping centers, large-scale facilities
MoviesHollywood movies, animated movies,
CG movies
Arcade gamemachines
Video games, pachinko and pachislo
Strategy books, illustrated compilations,
comics
Publishing Character merchandisingFigures, T-shirts,
Food, etc.
Multimedia development of contentMultimedia deployment accelerates as users increase
Please refer to pages 37–38
Please refer to pages 39–40
1Growth Strategy
Consumer Business Expansion
2Growth Strategy
Overhaul the Online Business
Stable structure for series
development
60-Month Title Development Plan
52-Week Map
Capcom’s Business Model
Cutting-edge developmentenvironment
Core fansOverseas affiliate publishersDomestic cooperating companies
Utilization of assets previously purchased from other companies
[Canada]CAPCOM GAME STUDIO VANCOUVER, INC. BEELINE INTERACTIVE CANADA, INC.
[Japan]K2 CO., LTD.
CAPCOM INTEGRATED REPORT 2016 CAPCOM INTEGRATED REPORT 201613 14
Message fromManagement
Growth Strategy Business ActivityAchievements
ESG Information Financial and Corporate Data
Capcom’s ValueCreation Activities

Capcom History
1983 1984 1985 1986 1987 1988 1989 1990 1991 1992 1993 1994 1995 1996 1997 1998 1999 2000 2001 2002 2003 2004 2005 2006 2007 2008 2009 2010 2011 2012 2013 2014 2015 2016
Capcom Sales
In 1983, Capcom Co., Ltd., was established in Osaka. The Nintendo Entertainment System (NES) came out that same year, but it was difficult to create high-quality arcade-level content for, so Capcom focused business development on the creation of arcade games using the proprietary high-spec circuit board “CP System.”
In the 1990s, the arrival of Super NES prompted Capcom to formally enter home video game development. Numerous hit titles were created that drew on Capcom’s arcade game development expertise. The Single Content Multiple Usage strategy was launched in 1994 with the release of a Hollywood movie and TV animation series based on Street Fighter.
In 2000, Capcom listed its shares on the First Section of the Tokyo Stock Exchange. In the 2000s, Capcom created one hit title after another that gained popularity overseas. The Hollywood movie version of Resident Evil earned 102 million dollars globally, part of a five title hit series that continues to spread the Capcom brand throughout the world.
With the adoption of smartphones and tablets, the market for game apps not requiring consoles is growing rapidly. Capcom established Beeline, a development company for smartphone game apps, which created hits including Smurfs’ Village. In recent years, Capcom has focused efforts on PC online games and digital download contents.
1983The Nintendo Entertainment System (NES) was launched to massive success.
2000PlayStation 2 was launched.
2005Microsoft Corporation launched the Xbox 360.
2010Smartphone adoption increases, game apps not requiring a game console became popular.
2012Wii U was launched.
2013PlayStation 4 was launched.
2013Xbox One was launched.
1990Next-generation Super NES was launched.
1994PlayStation was launched.3D game popularity skyrockets.
Game Industry History
Genesis Big Hits Drive Business Expansion Going Global Multimedia
Distribution of app Smurfs’ Village for iOS began. It became the top download in approximately 100 countries around the world.
Released Monster Hunter 4 for Nintendo 3DS. Return of the “Monster Hunter Craze” selling more than four million units.
Released Dead Rising 3 the first title in this series for Xbox One. More than one million units sold.
Released Street Fighter II for Super NES.
Released Breath of Fire for Super NES.
Released Resident Evil for PlayStation, a long selling title which had record breaking sales, and established the genre of survival horror.
Released Onimusha for PlayStation 2. The first game for PlayStation 2 that becomes a million-seller in Japan.
Released Devil May Cry for PlayStation 2.
Released Sengoku BASARA for PlayStation 2.
Released Dead Rising for Xbox 360. Became a million-seller, unprecedented for a new title created for new game console.
Released our first originally developed coin-op Little League.
Released our first arcade video game Vulgus.
Released our first home video game 1942 for Nintendo Entertainment System (NES).
Released Mega Man for NES.
2013
1992
2006
1983
1984
1985
1987
2010
1993
1996
2001
2005
Note: 1983–1988: Fiscal years ended December 31 1989–2016: Fiscal years ended March 31
77,021million yen
From Capcom of Japan to Capcom of the World
“Nintendo Entertainment System”, “Super NES”, Wii U logo and Wii U are registered trademarks of Nintendo Co., Ltd. , and “PlayStation” are registered trademarks of Sony Computer Entertainment Inc. is a registered trademark of Sony Computer Entertainment Inc. “SONY” is a registered trademark of Sony Corporation. © Sony Computer Entertainment Inc. CAPCOM INTEGRATED REPORT 2016 CAPCOM INTEGRATED REPORT 201615 16
Message fromManagement
Growth Strategy Business Activity Achievements
ESG Information Financial and Corporate Data
Capcom’s ValueCreation Activities
Financial Highlight
Capital Investments Costs (Millions of yen)
Operating Income/Operating Margins
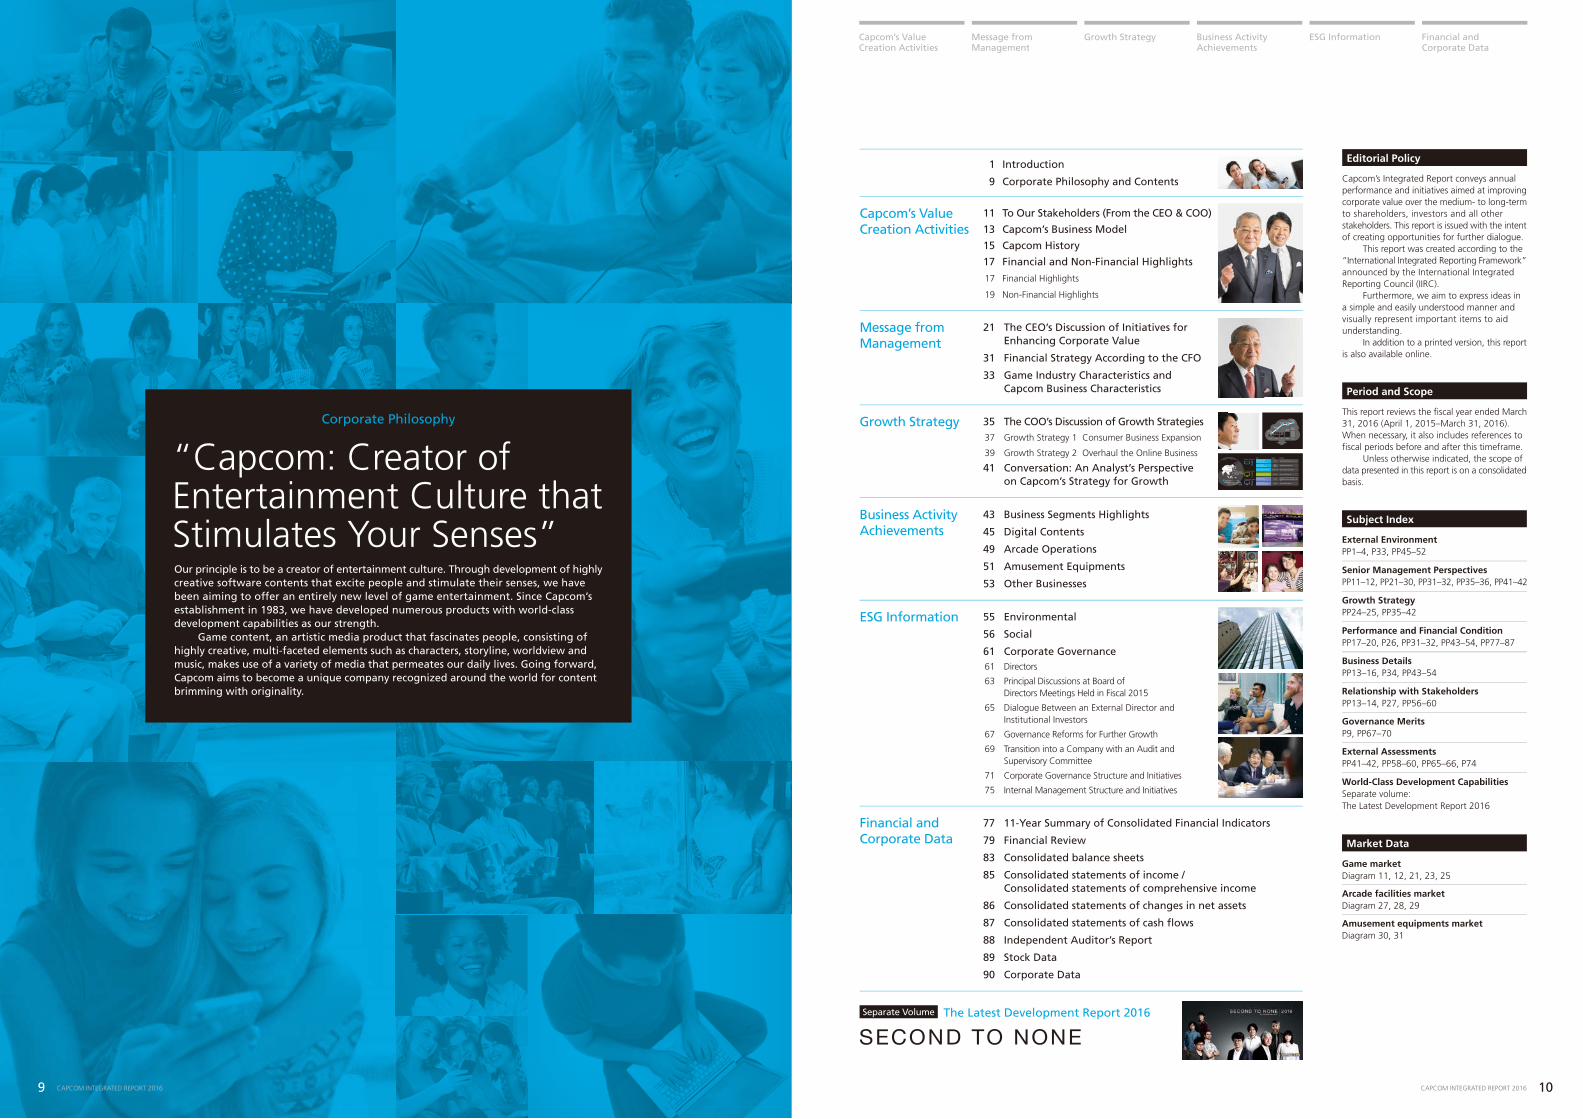
In line with structural reforms conducted in the fiscal year ended March 2004, operating income increased steadily until the fiscal year ended March 2009. In the fiscal year ended March 2010, the postponed release of major titles and the failure of some titles to meet sales targets overseas resulted in a temporary decline in income. In the fiscal year ended March 2011, we promoted profit structure reforms aimed at more efficient development investment. We promoted streamlined development by transitioning to in-house production and strengthened our digital download strategy in response to rapid changes in the market beginning in the fiscal year ended March 2013. As a result, operating income and operating margins underperformed until the fiscal year ended March 2014 while these reforms were implemented. However, in the fiscal year ended March 2015, the operating margin improved substantially to 16.5% due to the effect of improvements in the cost of sales ratio resulting from these reforms. In the fiscal year ended March 2016, although the cost to sales ratio temporarily worsened in the Amusement Equipments business, Consumer business growth caused operating income to increase, resulting in operating margins of 15.6%.
Capcom’s capital investment is mainly used to (1) purchase development equipment, (2) expand business offices in Japan and overseas and (3) open new amusement arcades. From the fiscal year ended March 2007 to the fiscal year ended March 2009 and again in the fiscal year ended March 2013, capital investment was high due to development environment improvements in line with the transition to next generation game consoles in the Consumer area. In the fiscal years ended March 2015 and March 2016, capital investments increased substantially in line with an increase in development employees required to expand our title lineup and the construction of two new development buildings.
(Years ended March 31)
2013 2014 2015 2016
10,151 10,299 10,58212,029
12,029
2012
12,318
2011
14,295
2010
5,587
2009
14,618
2008
13,121
2007
9,602
2006
6,580
million yen
0.9point DOWN
5,9376.7% UP
million yen
7.7% UP19.8% UP
(Years ended March 31)
2013 2014 2015 2016
3,0772,252
5,5645,937
2012
2,240
2011
1,725
2010
1,636
2009
2,061
2008
3,166
2007
3,804
2006
1,600
15.613.7% UP
%
(Years ended March 31)
2013 2014 2015 20162012201120102009200820072006
Capcom has its fundamental dividend policy of providing a continued and stable dividend to the shareholders. In accordance with its policy, an annual dividend of 20 yen per share was paid from the fiscal year ended March 1998 to that ended March 2006. Cash dividend per share for the fiscal year ended March 2007 to 2008 was raised to 30 yen thanks to its stable revenue base brought by its structural reform. Moreover, we continued to incrementally increase dividend payments in line with earnings based on our policy of providing stable dividends aiming for a payout ratio of 30%; from the fiscal year ended March 2009, the annual dividend was increased to 35 yen and again up to 40 yen since the fiscal year ended March 2011.
Although net assets increased between the fiscal years ended March 2007 and March 2009, stable net income resulted in ROE of around 14%. In the fiscal years ended in March 2010, 2013 and 2014, this figure declined due to decreases in net income from the recognition of special losses on restructuring and business restructuring expenses. From the fiscal year ended March 2015, ROE once again improved on the elimination of special losses and improved profitability, as we remain on track to meet our March 2017 goal of a three-year average of 8–10%.
Performance was sluggish in the fiscal years ended in March 2010, 2013 and 2014, as (1) a complete overhaul to the Amusement Equipments’ underperforming profit structure, (2) development structure revisions in line with enhanced digital downloads in the Consumer business and (3) strengthened Mobile Contents business management capabilities in line with development organization integration resulted in the recognition of special losses on restructuring and business restructuring expenses. From the fiscal year ended March 2015, income increased two years in a row due to the benefits realized from development organization reforms.
At Capcom, we believe the generation of creative and original content is the source of corporate growth, thus 80% or more of our annual development investments are allocated to the Digital Contents business. Recently in the Consumer segment, development costs have been trending higher in line with increasingly high-performance hardware, but we have been able to control these increases by promoting development efficiency through increased employee utilization rates. Although costs have increased significantly since the fiscal year ended March 2008, we expect them to remain around 30 billion yen going forward.
Net Income Attributable to Owners of the Parent (Millions of yen)
(Years ended March 31)
2013 2014 2015 2016
2,9733,444
6,6167,745
7,745
2012
6,723
2011
7,750
2010
2,167
2009
8,063
2008
7,807
2007
5,852
2006
6,941
million yen
Dividend per Share/Dividend Payout Ratio
R&D Investment Costs/Internal R&D Ratio Return on Equity (ROE) (%)
10.60.8point UP
%
40.0±0
yen 29.05.0point DOWN
%
Operating Income (Millions of yen) Operating Margins (%)
(Years ended March 31)
2013 2014 2015 20162012201120102009200820072006
(Years ended March 31)
2013 2014 2015 2016
40.00 40.00 40.00 40.00
2012
40.00
2011
40.00
2010
35.00
2009
35.00
2008
30.00
2007
30.00
2006
20.00
27,255
17.1% UP
million yen 69.9
0.1point DOWN
%
R&D Investment Costs (Millions of yen) Internal R&D Ratio (%)
Dividend per Share (Yen) Dividend Payout Ratio (%)
(Years ended March 31)
2013 2014 2015 2016
30,97826,691 25,301 27,255
2012
30,648
2011
26,086
2010
19,126
2009
19,744
2008
18,458
2007
13,068
2006
12,288
8
gfCm-
e
2ueiar
e
0
2
clo
dt
g
a
0
Net Sales (Millions of yen)
For the four fiscal years beginning in the fiscal year ended March 2005, net sales increased on the stability of popular titles in the Consumer business. In the fiscal years ended March 2010 and March 2012, net sales declined due to the postponed release of titles. However, the promotion of structural reforms in the Consumer business resulted in Capcom achieving net sales of 100 billion yen in the fiscal year ended March 2014 for the first time. Although net sales decreased significantly in the fiscal year ended March 2015 due to a decline in pachislo machine releases, net sales increased in the fiscal year ended March 2016 on the release of major titles in the Consumer business.
(Years ended March 31)
2013 2014 2015 2016
94,075102,200
64,27777,021
77,021
2012
82,065
2011
97,716
2010
66,837
2009
91,878
2008
83,097
2007
74,542
2006
70,253
million yen
19.3
13.815.8
14.3
3.8
13.811.5
4.9 5.4
9.8 10.6
9.4
12.9
15.8 15.9
8.4
14.6 15.0
10.8 10.1
16.515.6
16.0 27.9 22.6 26.798.0
30.5 34.577.5 65.5
34.0 29.0
54.8 47.7 47.9 55.264.1 70.0 69.9
occrd
aef
Mr
4,np
d
0po
tge6
a
0
o(37 dnco
d
7
0m
henao
a
0
Financial and Non-Financial Highlights
Please refer to “11-Year Summary of Consolidated Financial Indicators” on pages 77–78.
CAPCOM INTEGRATED REPORT 2016 CAPCOM INTEGRATED REPORT 201617 18
Message fromManagement
Growth Strategy Business Activity Achievements
ESG Information Financial and Corporate Data
Capcom’s ValueCreation Activities
Human Capital
Content Developers (People)
(Years ended March 31)
2013 2014 2015 2016
1,6231,808 1,902
2,052
2,052
2012
1,455
2011
1,339
2010
1,132
2009
1,047
2008
809
2007
728
2006
705
150people
people UP
Production Capital
Software Shipments by Hardware Manufacturer (Thousands of units)
(Years ended March 31)
2013 2014 2015 20162012201120102009200820072006
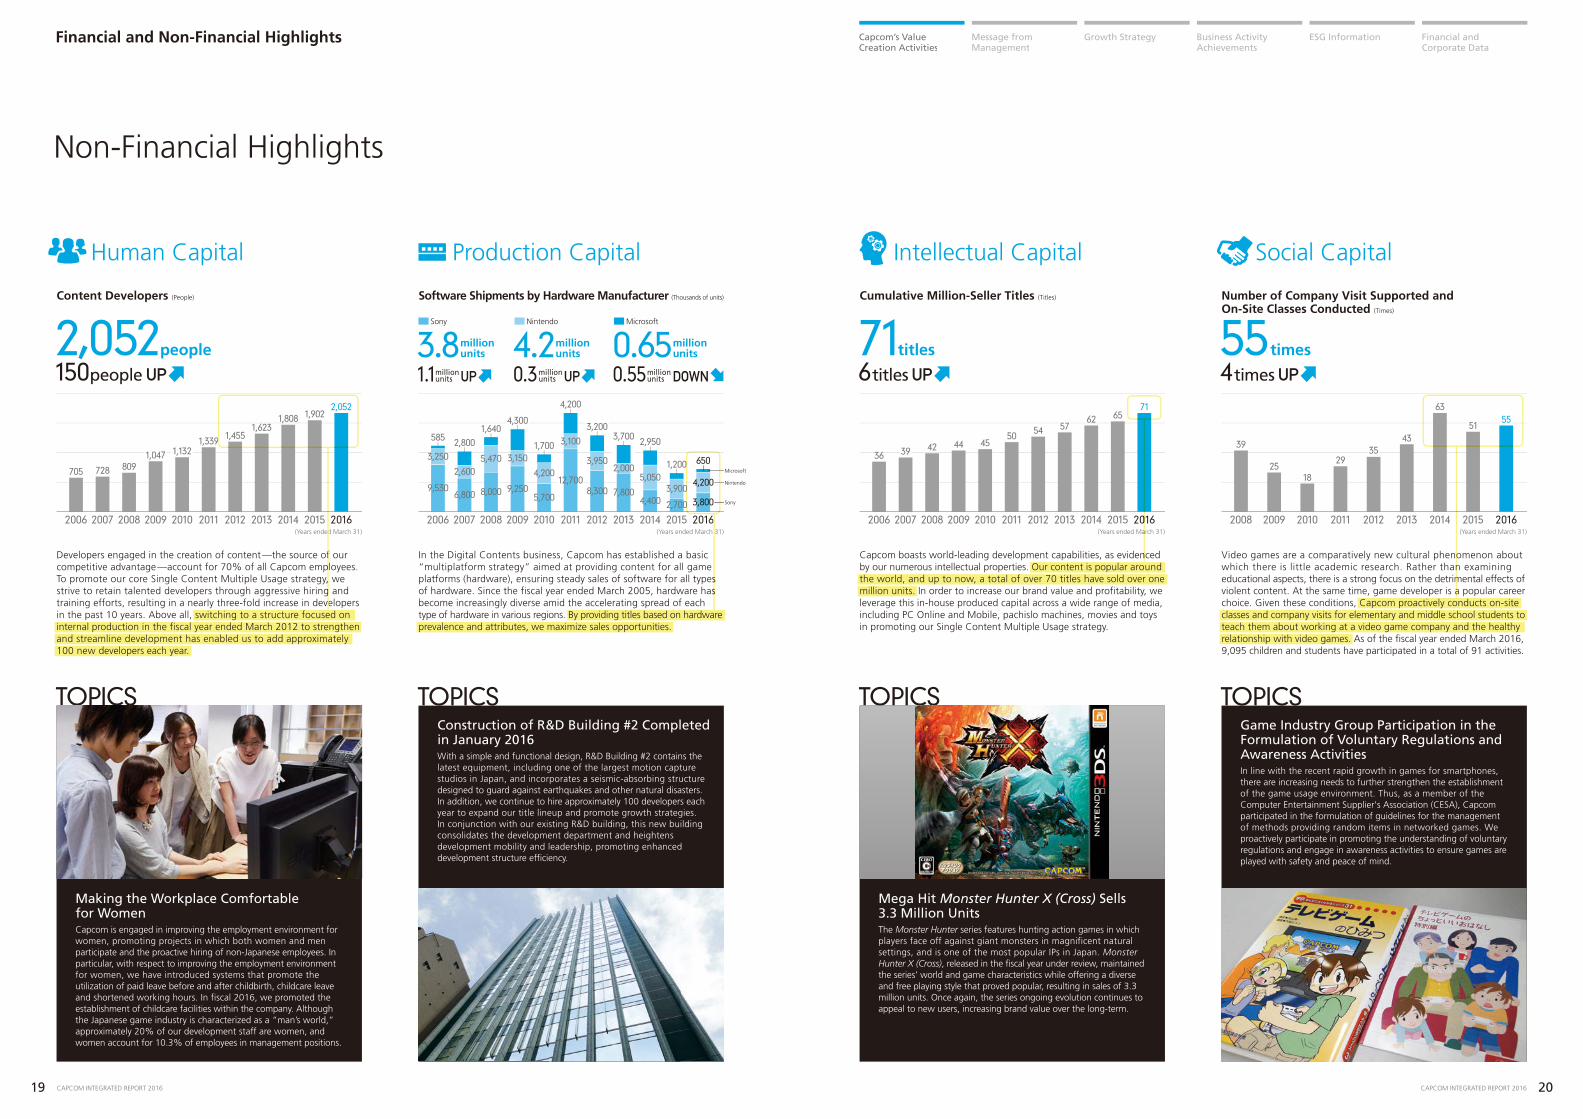
In the Digital Contents business, Capcom has established a basic “multiplatform strategy” aimed at providing content for all game platforms (hardware), ensuring steady sales of software for all types of hardware. Since the fiscal year ended March 2005, hardware has become increasingly diverse amid the accelerating spread of each type of hardware in various regions. By providing titles based on hardware prevalence and attributes, we maximize sales opportunities.
Intellectual Capital
Cumulative Million-Seller Titles (Titles)
716
titles
titles UP
Social Capital
Number of Company Visit Supported and On-Site Classes Conducted (Times)
(Years ended March 31)(Years ended March 31)
2013 2014 2015 2016
5762 65
71
2012
54
2011
50
2010
45
2009
44
2008
42
2007
39
2006
36
455
UPtimes
million units3.8
1.1 UPmillion units
million unitsUPmillion
units
Sony
million units4.2
0.3
Nintendo
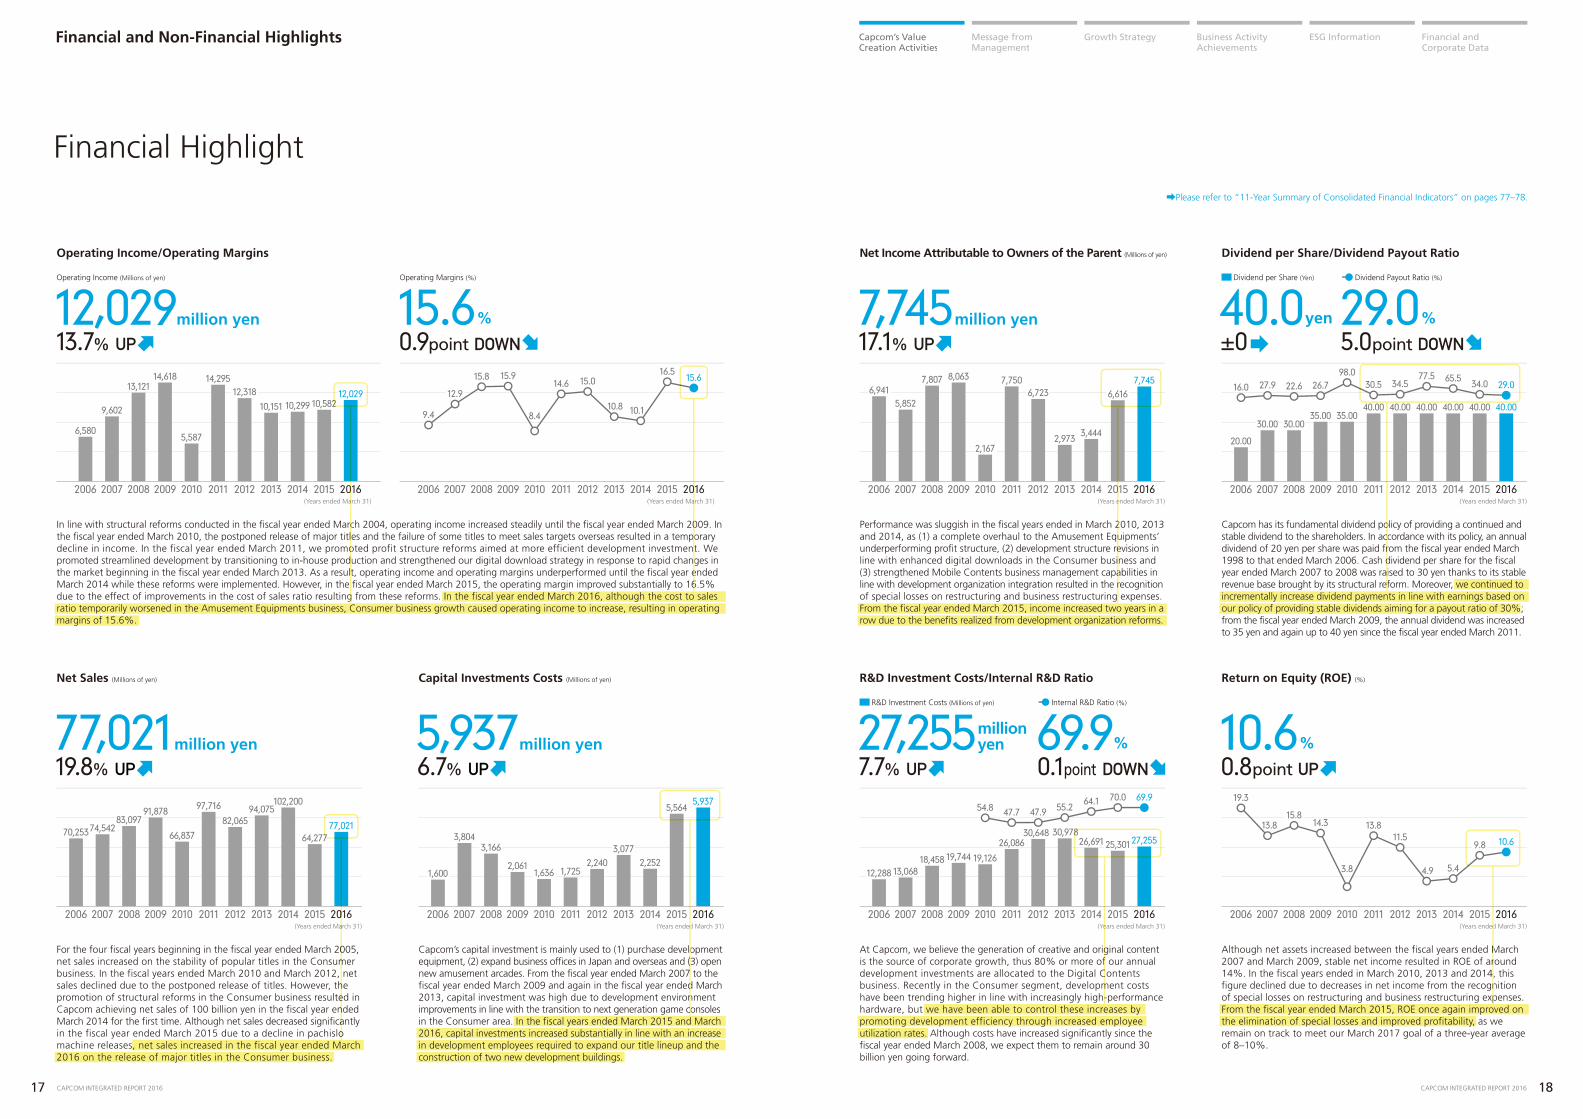
Developers engaged in the creation of content—the source of our competitive advantage—account for 70% of all Capcom employees. To promote our core Single Content Multiple Usage strategy, we strive to retain talented developers through aggressive hiring and training efforts, resulting in a nearly three-fold increase in developers in the past 10 years. Above all, switching to a structure focused on internal production in the fiscal year ended March 2012 to strengthen and streamline development has enabled us to add approximately 100 new developers each year.
million units0.65
0.55 DOWN
Microsoft
Sony
Nintendo
Microsoft
TOPICS
3,800
Capcom is engaged in improving the employment environment for women, promoting projects in which both women and men participate and the proactive hiring of non-Japanese employees. In particular, with respect to improving the employment environment for women, we have introduced systems that promote the utilization of paid leave before and after childbirth, childcare leave and shortened working hours. In fiscal 2016, we promoted the establishment of childcare facilities within the company. Although the Japanese game industry is characterized as a “man’s world,” approximately 20% of our development staff are women, and women account for 10.3% of employees in management positions.
Making the Workplace Comfortable for Women
Capcom boasts world-leading development capabilities, as evidenced by our numerous intellectual properties. Our content is popular around the world, and up to now, a total of over 70 titles have sold over one million units. In order to increase our brand value and profitability, we leverage this in-house produced capital across a wide range of media, including PC Online and Mobile, pachislo machines, movies and toys in promoting our Single Content Multiple Usage strategy.
Video games are a comparatively new cultural phenomenon about which there is little academic research. Rather than examining educational aspects, there is a strong focus on the detrimental effects of violent content. At the same time, game developer is a popular career choice. Given these conditions, Capcom proactively conducts on-site classes and company visits for elementary and middle school students to teach them about working at a video game company and the healthy relationship with video games. As of the fiscal year ended March 2016, 9,095 children and students have participated in a total of 91 activities.
a
0
n
6
ss
9
d
fp,gve
TOPICS TOPICS TOPICS
4,200
2,0005,050
3,900
3,950
3,100
4,200
3,1505,4702,600
3,250
7,8004,400 2,700
8,30012,700
5,7009,2508,0006,800
9,530
5851,640
4,300
4,200
3,2003,700 2,950
1,200
2,800
650
Financial and Non-Financial Highlights
Non-Financial Highlights
With a simple and functional design, R&D Building #2 contains the latest equipment, including one of the largest motion capture studios in Japan, and incorporates a seismic-absorbing structure designed to guard against earthquakes and other natural disasters. In addition, we continue to hire approximately 100 developers each year to expand our title lineup and promote growth strategies. In conjunction with our existing R&D building, this new building consolidates the development department and heightens development mobility and leadership, promoting enhanced development structure efficiency.
Construction of R&D Building #2 Completed in January 2016
The Monster Hunter series features hunting action games in which players face off against giant monsters in magnificent natural settings, and is one of the most popular IPs in Japan. Monster Hunter X (Cross), released in the fiscal year under review, maintained the series’ world and game characteristics while offering a diverse and free playing style that proved popular, resulting in sales of 3.3 million units. Once again, the series ongoing evolution continues to appeal to new users, increasing brand value over the long-term.
Mega Hit Monster Hunter X (Cross) Sells 3.3 Million Units
In line with the recent rapid growth in games for smartphones, there are increasing needs to further strengthen the establishment of the game usage environment. Thus, as a member of the Computer Entertainment Supplier's Association (CESA), Capcom participated in the formulation of guidelines for the management of methods providing random items in networked games. We proactively participate in promoting the understanding of voluntary regulations and engage in awareness activities to ensure games are played with safety and peace of mind.
Game Industry Group Participation in the Formulation of Voluntary Regulations and Awareness Activities
1,700
times
20162008 2013 2014 2015
43
63
51
2012
35
2011
29
2010
18
2009
25
39
onma
55
CAPCOM INTEGRATED REPORT 2016 CAPCOM INTEGRATED REPORT 201619 20
Message fromManagement
Growth Strategy Business Activity Achievements
ESG Information Financial and Corporate Data
Capcom’s ValueCreation Activities
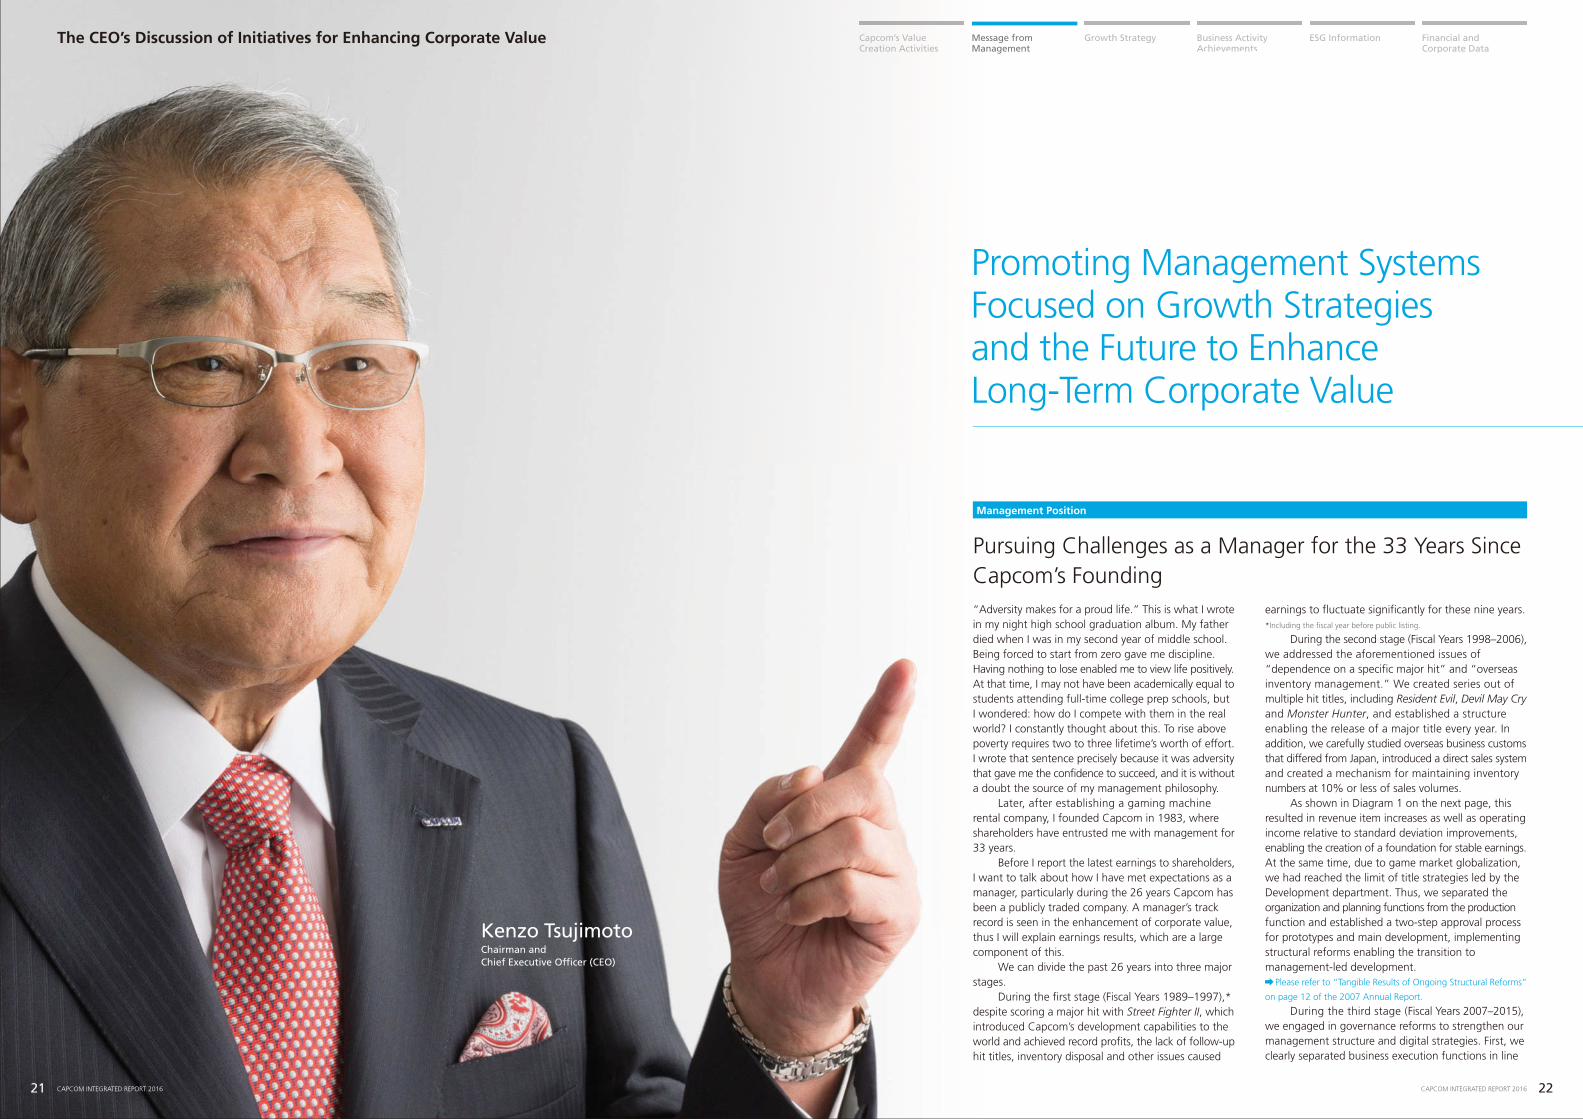
Pursuing Challenges as a Manager for the 33 Years SinceCapcom’s Founding“Adversity makes for a proud life.” This is what I wrote in my night high school graduation album. My father died when I was in my second year of middle school. Being forced to start from zero gave me discipline. Having nothing to lose enabled me to view life positively. At that time, I may not have been academically equal to students attending full-time college prep schools, but I wondered: how do I compete with them in the real world? I constantly thought about this. To rise above poverty requires two to three lifetime’s worth of effort. I wrote that sentence precisely because it was adversity that gave me the confidence to succeed, and it is without a doubt the source of my management philosophy. Later, after establishing a gaming machine rental company, I founded Capcom in 1983, where shareholders have entrusted me with management for 33 years. Before I report the latest earnings to shareholders, I want to talk about how I have met expectations as a manager, particularly during the 26 years Capcom has been a publicly traded company. A manager’s track record is seen in the enhancement of corporate value, thus I will explain earnings results, which are a large component of this. We can divide the past 26 years into three major stages. During the first stage (Fiscal Years 1989–1997),* despite scoring a major hit with Street Fighter II, which introduced Capcom’s development capabilities to the world and achieved record profits, the lack of follow-up hit titles, inventory disposal and other issues caused
earnings to fluctuate significantly for these nine years.*Including the fiscal year before public listing.
During the second stage (Fiscal Years 1998–2006), we addressed the aforementioned issues of “dependence on a specific major hit” and “overseas inventory management.” We created series out of multiple hit titles, including Resident Evil, Devil May Cry and Monster Hunter, and established a structure enabling the release of a major title every year. In addition, we carefully studied overseas business customs that differed from Japan, introduced a direct sales system and created a mechanism for maintaining inventory numbers at 10% or less of sales volumes. As shown in Diagram 1 on the next page, this resulted in revenue item increases as well as operating income relative to standard deviation improvements, enabling the creation of a foundation for stable earnings. At the same time, due to game market globalization, we had reached the limit of title strategies led by the Development department. Thus, we separated the organization and planning functions from the production function and established a two-step approval process for prototypes and main development, implementing structural reforms enabling the transition to management-led development. Please refer to “Tangible Results of Ongoing Structural Reforms”
on page 12 of the 2007 Annual Report.
During the third stage (Fiscal Years 2007–2015), we engaged in governance reforms to strengthen our management structure and digital strategies. First, we clearly separated business execution functions in line
Management Position
Promoting Management Systems Focused on Growth Strategies and the Future to Enhance Long-Term Corporate Value
Chairman and Chief Executive Officer (CEO)
Kenzo Tsujimoto
The CEO’s Discussion of Initiatives for Enhancing Corporate Value
CAPCOM INTEGRATED REPORT 2016 CAPCOM INTEGRATED REPORT 201621 22
Message fromManagement
Growth Strategy Business ActivityAchievements
ESG Information Financial and Corporate Data
Capcom’s ValueCreation Activities

The Game Industry has High Growth Potential and Social ValueThe game industry’s rise began in 1983, driven by the momentum created with the release of the Nintendo Entertainment System (NES) in Japan. Although there is no global data published before the year 2000, my sense is that when viewed from a long-term perspective, the industry has basically been on a growth trajectory for about 30 years. This is perhaps supported by the fact that sales units increase after each home video game console cycle. Furthermore, since 2007, the spread of computers accompanied with smartphone and internet environment improvements have enabled general gaming devices to gain traction in the market, which has been a factor driving rapid market expansion in developed as well as developing countries. Looking 10–20 years ahead, I expect there will still be strong growth potential in the game market. One reason is because games are not bound to any one device. Dedicated game consoles, game consoles
equipped with DVD and Blu-ray players, mobile phones enabling game play and other past transitions tell the story of the spread of games. Recently, wearables and virtual reality (VR) devices have heightened expectations of new gaming experiences. High affinity with cutting-edge IT technologies such as AI is an extremely strong advantage for games. The second reason, which I myself can confirm, is that simulation technologies are the essence of games. Utilizing game console performance representing the world’s most advanced computers, games are programmed to imagine all potential player movements. Thus, taking the long-term view, game simulation technology created and refined on the most advanced computers can be used for medical, education or training applications and even for economic and financial forecasting. Until now, the value games have provided to
society involved the alleviation of stress and other psychological benefits, but the application and diffusion of these simulation technologies will resolve new social issues, creating a whole new future of enjoyment for
the game industry. As one of the founding members and promoters of the game industry, I will build the foundation for bringing new gaming possibilities to life.
Market Growth Forecast
Our Current Theme: Controlling Risks for Sustainable GrowthThe fourth stage (beginning in April 2016) will be the culmination of my experience as a manager. The main theme will be controlling risks to further enhance corporate value as a sound growth strategy. [Diagram 2]
As a manager, I classify corporate risks into two main categories: earnings volatility risks and management decision risks. I will discuss management decision risks in a moment, but first I would like to discuss the control of earnings volatility risks. To mitigate earnings volatility risks over the medium- to long-term, measures enabling sustainable growth must include (1) transforming the foundation of our Consumer business model from a traditional one-time sale “transactional model” to a continuous “recurring revenue model” and (2) creating a business portfolio with diversified earnings risks based on the thorough development of Capcom’s basic strategy, Single Content Multiple Usage. As mentioned above, earnings in Capcom’s core Consumer business fluctuate depending on whether or not we create hit titles. Although we are able to achieve limited results (control earnings volatility) through the distributed release of multiple hit titles, this is not the stable growth to which I refer. Since 2013, game
consoles have been equipped with full-fledged online functionality, enabling the continuous sales of past hit titles and additional content providing earnings stability each year. Currently, the ratio of download sales is 26%, and by improving this to 50% over the medium-term, we can further enhance stability. Until now, Single Content Multiple Usage has not been deployed on a scale that mitigated Consumer volatility. However, at present Mobile and PC Online account for 75% of the market as game consoles, and since both are recurring revenue businesses, we will further improve expense to revenue ratio stability through the thorough multiuse of popular content (IP). At the core of these two measures lies Capcom’s biggest strength: the possession of numerous popular IPs. In the game industry—what I call the “hit business”—we will build a management foundation enabling sustainable growth and formulate strategies to enhance corporate value.
Management Issues
Past stages
Past and Future Management StagesDiagram 2
Normal Distribution of Operating Income in Each StageDiagram 1
Stage 1 (Fiscal Years 1989–1997)Global hit title creationManifestation of issues related to expansion
Stage 2 (Fiscal Years 1998–2006)Structure enabling release of major title every yearThorough sales and inventory management
Stage 3 (Fiscal Years 2007–2015)Governance reforms to strengthen management structureDigital strategy promotion
The CEO’s Discussion of Initiatives for Enhancing Corporate Value
with strategy as well as management strategy decision- making functions, putting myself as the Chairman and CEO in charge of management strategy and the President as COO in charge of business execution. The business of the president is to engage in both medium- to long- term growth and short-term performance. However, in my experience, when engaged in management, there is a tendency to spend 70% of one’s time on performance. Thus, it is not always possible to ensure medium- to long-term growth. I will not always be involved in
management, so promoting management systems to strengthen governance in a variety of ways, including the separation of supervision and execution, is an attempt to ensure the Company functions properly into the future. The COO will discuss our digital strategy. Please refer to “COO Discussion on Growth Strategy” on page 35.
As a result, with the structural reforms and synergies achieved in the second stage, compared to the previous stage, all revenue items substantially increased. [Diagram 1]
Stage 4 (from FY ending March 2017)Control risk to further enhance corporate value
Future stageStage 1 (1990–1998 (ended March 31))*1
Cumulative net sales 460.7 billion yenCumulative operating income48.5 billion yenOperating margin 10.5%
22(18) (8) 2 12
*1 Ordinary income is substituted as the fiscal year ended March 31, 1990 was before public listing. *2 Relative standard deviation of operating income at each stage period.
15(5) 0 5 10 18.7 23.7(1.3) 3.7 8.7 13.7
119%
(billion yen) (billion yen)
(billion yen)
Stage 2 (1999–2007 (ended March 31))
Cumulative net sales 527.1 billion yenCumulative operating income 61.5 billion yenOperating margin 11.7%
Stage 3 (2008–2016 (ended March 31))
Cumulative net sales 759.1 billion yenCumulative operating income103 billion yenOperating margin 13.6%
Earnings volatility risks
Measure 1 Transform business model from transactional to recurring
Measure 2 Create stable business portfolio
Management decision risks Please refer to page 28
Measure 1 Management visualization centeredon numbers
Measure 2 Institutional design with external directors at its core
*2
24%*2
*2
Average value 5.7 billion yen Average value 6.8 billion yen Average value 11.4 billion yen
41%
CAPCOM INTEGRATED REPORT 2016 CAPCOM INTEGRATED REPORT 201623 24
Message fromManagement
Growth Strategy Business Activity Achievements
ESG Information Financial and Corporate Data
Capcom’s ValueCreation Activities

The CEO’s Discussion of Initiatives for Enhancing Corporate Value
Third Straight Year of Operating Income Gains Mark the Beginning of Sustainable Growth
Performance
Medium-Term Business Goal Progress Analysis
Medium-Term Business Goals Cumulative targets for the 5 years starting FY ending March 2014
Cumulative operating income(2014–2018 (ending March 31)) 70 billion yen
Operating margins in FY ending March 2018 20 %
In terms of our cumulative target for operating income, subtracting the four fiscal years up to March 31, 2017, we are aiming for operating income of 23.5 billion yen in the fiscal year ending March 31, 2018. To achieve this ambitious target, we must achieve growth at Capcom and expand the Asian business, including collaborations with Tencent Holdings. Accordingly, with respect to Capcom titles next fiscal year (ending March 31, 2018), we have plans to release a larger lineup than we did this fiscal year (ending March 31, 2017), while at the same time increasing the download sales ratio to acquire additional profit. Our full-fledged efforts in the Asian business began last fiscal year, with Monster Hunter Online (MHO) currently in the market. Monthly sales numbers are on track as we are just seeing the beginning of contributions to Capcom earnings. In addition to ensuring MHO is a thorough success, we will also release other titles and develop areas in Asia other than China. Please refer to
“Growth Strategy 2: Overhaul the Online Business” on page 39.
Now, I will provide an explanation of each business segment. As the segment numbers back calculated from the fiscal year ending March 31, 2018 indicate, we are within range of being able to achieve targets in the Digital Contents and Amusement Equipments businesses. On the other hand, Arcade Operations and Other Businesses present more of a challenge. If numbers for the fiscal year ending March 31, 2018, were replaced with numbers from this fiscal year’s plans, these two segments would fall short of targets by 6.6 billion yen. Thus, we will achieve a minimum of 10% growth in Capcom businesses, and the remainder, including the shortfalls, will be supplemented by Asian business growth, which was not included in projections at the beginning of the fiscal year.
Medium-Term Business Goal Progress Analysis 1: Cumulative Operating Income
As indicated in the diagram, operating margins have improved to 16%. As for the other four percentage points, we will achieve steady improvements on a point-by-point basis in Capcom businesses, and along with Asia business results, we are aiming for margins of 20%. Even if, for example, Asian licensing were excluded, I think we can still achieve this in an additional one to two years. Now, I will cover business segments, which are displayed on the diagram showing a five year period. First, with respect to Arcade Operations and Other Businesses, we expect it will be difficult to achieve medium-term business goals. In addition to market sluggishness caused by the consumption tax hike and other reasons, we did not factor in the construction of our new development building when the medium-term management plan goals were being formulated. In the Amusement Equipments business, profit margins have been on the decline since rules affecting pachislo model certification methods were changed in September 2014. That being said, next fiscal year thorough cost management should enable us to improve margins. At the same time, we are generally on track to achieve Digital Contents business targets. This is due to (1) outsourced title profitability improvements, (2) streamlining internal title production and (3) increases in the DLC sales ratio in the Consumer business, which supplements the struggling Mobile and PC Online businesses. To achieve consolidated operating margins of 20%, we need to make up for businesses falling short of targets. We will cover these with Digital Contents business earnings. Profit margins in the Mobile and PC Online business are currently near zero, but these are businesses with the potential to achieve 30% margins. Furthermore, if we expand the high-margin Asian licensing business, we will be able to achieve Digital Contents business operating margins of 30%.
Medium-Term Business Goal Progress Analysis 2: Operating Margins
Achieve the combined total sales projection of 4.5 million units for Monster Hunter X (Cross) and Street Fighter V
Achieve next fiscal year projections (operating income of 3 billion yen) with sales of pachislo machines compliant with revised pachislo model certification methods
1
2
3
4
Achieve projections for the next fiscal year in digital download sales (sales of 9 billion yen)
Make Monster Hunter Explore a hit
Operating Income (Millions of yen)
Diagram 4
(Years ending March 31)
Net Income Attributable to Owners of the Parent (Millions of yen)
Diagram 5
(Years ending March 31)
(Plan)
(Years ending March 31)
2013 2014 2015 2016 2017
94,075102,200
64,27777,021
85,000
millionyen
millionyen
millionyen
Net Sales (Millions of yen)
Diagram 3
(Plan)2013 2014 2015 2016 2017
10,151 10,29912,029
13,600
(Plan)2013 2014 2015 2016 2017
2,973 3,444
6,6167,745
9,000
Digital Contents
Arcade Operations
Amusement Equipments
Other Businesses
Adjustment
Operating IncomeTotals
4.5
Actual
3/‘14
10.2
Actual
3/‘15
12.2
Actual
3/‘16
14.3
Plan
3/‘17
15.8
Remaining
3/‘18
57.0
CumulativeTarget
3/‘18
Operating Income by Business Segment (Billions of yen)
1.6 0.9 0.7 0.8 4.5 8.5(3.7)
7.1 2.7 2.8 3.0 4.4 20.0
1.0 0.7 0.5 0.2 3.1 5.5(2.9)
(3.9) (4.0) (4.2) (4.7) (4.2) (21.0)
10.3 10.6 12.0 13.6 23.5 70.0
Difference
3/‘17-3/’18
Digital Contents
Arcade Operations
Amusement Equipments
Other Businesses
Operating Income Totals
6.8
15.2
30.8
38.6
10.1
Actual
3/‘14
22.5
10.2
36.3
30.8
16.5
Actual
3/‘15
23.1
7.7
21.1
25.0
15.6
Actual
3/‘16
24.2
8.9
20.0
10.0
16.0
Plan
3/‘17
22.0
15.0
27.0
45.0
20.0
Target
3/‘18
Operating Margin by Business Segment (%)
Note: Figures for 18/3 are the remainders after actual results from 14/3 through 16/3 and the forecasted results for 17/3 have been deducted from the cumulative targets.
10,582
1. Current Market TrendsAlthough it is a short-term trend, the game market in 2015 was worth 85.8 billion dollars (up 24.7% from the previous fiscal year). This substantial growth was due to rapid expansion of the mobile market, mainly in developing countries. We expect continued growth in 2016 and forecast 94.2 billion dollars (up 9.8% from the previous fiscal year). As in 2015, the mobile market will continue to expand, driven mainly by casual users. However, although the core user segment comprising the PC online and consumer markets is diverging, we expect it to plateau at 2014 levels.
2. Performance in the Fiscal Year Ended March 31, 2016Given these conditions, in the year ended March 31, 2016, operating income grew for the third straight year, with net sales of 77.021 billion yen (up 19.8% from the previous fiscal year), operating income of 12.029 billion yen (up 13.7% from the previous fiscal year) and net income attributable to owners of the parent of 7.745 billion yen (up 17.1% from the previous fiscal year). [Diagram 3,4,5]
Reasons for the increases in sales and profit include (1) sales of the extremely popular Monster Hunter X (Cross), the latest title in this series, which surpassed three million units, (2) strong sales of Resident Evil 0 HD Remaster and HD versions of other past hits and (3) the growth of catalog sales via download. With regard to the three consecutive years of operating income growth, the decision to implement reforms changing
core Consumer Online business systems over the past three years has significantly improved profitability and is also proving effective in terms of mitigating earnings volatility over the medium-term. Please refer to page 21 of the Integrated Report 2015.
Regarding the four issues raised at the beginning of the fiscal year, to begin with, two core titles sold 4.7 million units, exceeding initial projections of 4.5 million units. Compared to initial projections of nine billion yen for digital download sales, results were 10.9 billion yen. Moreover, downloads of Monster Hunter Explore exceeded three million. However, some pachislo machines in the Amusement Equipments business struggled, falling short of the three billion yen operating income forecast at 2.8 billion yen.
3. Forecast for the Fiscal Year Ending March 31, 2017Next fiscal year (ending March 31, 2017), we expect operating income to increase for the fourth year in a row, with net sales of 85 billion (up 10.4% from the previous fiscal year), operating income of 13.6 billion yen (up 13.1% from the previous fiscal year) and net
Message fromManagement
Growth Strategy Business Activity Achievements
ESG Information Financial and Corporate Data
Capcom’s ValueCreation Activities
77,021 12,029 7,745
CAPCOM INTEGRATED REPORT 2016 CAPCOM INTEGRATED REPORT 201625 26

Addressing Social Issues as a Game Company Aiming to Create Shared Value
development program that enables employees in all positions to acquire professional skills and augment their practical experience in game production. In addition, we constructed a new R&D building that contains the world’s most advanced development equipment and technologies, creating a development environment that maximizes developer motivation. Regarding remuneration, in addition to regular bonuses, Capcom has introduced a system offering incentives and assignment allowances for each title in an attempt to further increase motivation. In my view, the most critical aspect of human resource development is providing an environment that enables employees to take on new challenges.
Capcom is promoting growth strategies aimed at continuously improving corporate value, and in particular, economic value. At the same time, the more we accelerate our execution of growth strategies, the higher the risks become. Governance is useful for avoiding and minimizing these risks. As risks can be broadly categorized into earnings volatility risks and management decision risks, I will now explain how governance can be used to control management decision risks.
Measure 1: Management Visualization Centered on NumbersIn line with changes in company scale and business characteristics, I think it is important that management also be able to flexibly change its management style. For example, when a company is small, management is like the pilot of a propeller aircraft engaging in visual flight. They are always present and make decisions based on confirming conditions with their own eyes. On the other hand, when a company is large, management is more like the pilot of a jumbo jet. In this case, it is too risky to make decisions based solely on visual flight. Accordingly, the pilot switches to instrument flight to control the aircraft. Similarly, corporate managers must rely on numbers to make decisions. For this reason, I require that materials (documents) used for decision-making are, in principle, quantitatively focused. Specifically, these materials compare and contrast net sales, year-on-year performance and earnings forecasts, which make it easier to identify problems by
enabling us to confirm complex combinations of data. Furthermore, these materials are used by external directors for supervisory purposes and provided to investors as part of our IR activities. This is part of the mechanism I call “management visualization.” Management decisions based on visualizing operations enable us to evaluate the Company with two sets of eyes using a system attempting to achieve management transparency. Even when I talk with developers, numbers are the common language. Using only qualitative words and sentences leaves significant room for arbitrariness on the part of the person in charge. In comparison, numbers enable comparisons from a variety of angles, facilitating decisions based on real conditions. “Business going well should be left alone. The manager’s job is to make changes to ensure businesses facing problems are able to move forward according to plans. Top management exists to make decisions, not constantly hang around the workplace.” The risk control efforts I am engaged in at present, involve teaching next- generation members to effectively utilize the management experience I have accumulated as founder of the Company. The systemization of management will enable Capcom to continue functioning steadily into the future.
Measure 2: Institutional Design Focused on External DirectorsFor the past 17 years, Capcom has executed a variety of governance reforms. Please refer to page 67
Since introducing the external director system in the fiscal year ended March 31, 2002, external directors have increased to account for 50% of the Board of Directors as
Managers typically tell their employees to do this, but I think that if employees are being urged to, they must be provided with a proper safety net. Without a safety net in place, no one will jump onto the flying trapeze, even if they are pushed. The manager’s role is to push employees to take on one new challenge after another, identify obstacles and come up with solutions. This enables employees to take on challenges without fear of failure, leading to a virtuous cycle that creates business opportunities. The management visualization initiatives in which I am engaged (see the next section) play a role in providing employees with a space in which they are free to grow and be active.
CSR (Corporate Social Responsibility)
Emphasizing Objectivity to Create Systems Ensuring Capcom’s Long-Term Survival
Corporate Governance
The CEO’s Discussion of Initiatives for Enhancing Corporate Value
1. Basic Approach to CSRI believe that, in addition to traditional corporate social responsibility (CSR) that prevents and mitigates the negative impacts of business activities on society, promoting the creation of shared value (CSV) to resolve social issues through business activities will result in enhanced corporate value. How do games, which are not a daily necessity, provide society with value? The clue to answering this question dates back 50 years. At that time, I was running a candy store. One day, as I was looking at children lined up at the cotton candy machine in front of the store, I realized that what the kids were so fascinated with was not the cotton candy but the playful way it was made. I became convinced that, as the economy grew, stress would accumulate along with material wealth. Adults also need an outlet for play (games). Later, driven by the popularity of Space Invaders, games would go on to become a nine trillion yen industry. In recent years, games have become eSports, enjoyed just like traditional sports, enabling the creation of social value as one means by which people around the world have come to relieve stress.
2. Commitment to Regional CommunitiesThe promotion of our Single Content Multiple Usage strategy provides society with a wide range of benefits. Specifically, these include the use of popular Capcom IPs as local creation activities to support (1) economic development, (2) cultural development, (3) awareness for improved public safety and (4) awareness of elections. For example, (1) involves working with local municipalities to support the revitalization of towns. Holding events that make use of popular IPs or offering real-life experiences of game worlds appeals to young people and families which has a major economic impact in supporting local tourism. Further, regarding
income attributable to owners of the parent of nine billion yen (up 16.2% from the previous fiscal year). There are two main reasons for this forecast. First, in the Digital Contents business, three major titles will be released mainly targeting the Consumer sub-segment. Along with Mobile and PC Online recovery, we are projecting net sales of 59 billion yen (up 12.2% from the previous year) and operating income of 14.3 billion yen (up 17.5% from the previous year). Second, in the
Amusement Equipments business, we will expand our title lineup with the release of four pachislo machines targeted to sell 55,000 units (up 13,000 units from the previous fiscal year). We are projecting net sales of 15 billion yen (up 12.4% from the previous year). I believe results are the only way to earn the trust of investors and enable Capcom to grow sustainably and enhance corporate value. I will make every effort to achieve fiscal year objectives.
(2)(3)(4), the common issue is attracting and approaching young people, to which we have proactively made proposals to museums, police departments and election committees and produced quantifiable results. At the same time, these four activities deliver value to Capcom in the form of (1) improved existing user (fan) satisfaction through event participation and (2) enhanced favorable impression of games among middle-aged and seniors. With respect to (2) in particular, this segment cannot be considered current users, thus the contribution of popular Capcom contents to local communities enables the cultivation of new game users through smartphones and other familiar means. Furthermore, in the realm of educational support activities, Capcom is unique in carrying out career education as well as game literacy education, which raises awareness regarding the proper way to interact with video games. These efforts are aimed at supporting the healthy development of young people and easing the concerns society has about the influence of video games.
3. Commitment to EmployeesAs can be seen from the fact that labor costs account for approximately 80% of development costs, the game industry is a labor-intensive industry and an extraordinarily intellectually-intensive industry, thus human resources are an especially important management resource. I am aware that diversity is critical for creating content popular throughout the world. For this reason, Capcom promotes the retention and development of global human resources, including support for employees raising children by offering childcare leave and shortened working hours, as well as the promotion of female employees to management positions. Furthermore, as the development of human resources is directly linked to strengthening our development capabilities, Capcom implements a
Message fromManagement
Growth Strategy Business Activity Achievements
ESG Information Financial and Corporate Data
Capcom’s ValueCreation Activities
CAPCOM INTEGRATED REPORT 2016 CAPCOM INTEGRATED REPORT 201627 28

The CEO’s Discussion of Initiatives for Enhancing Corporate Value
of June 2016.[Diagram 6] The reason for this is based in part on investor concerns that “as a founder-owned Company, Capcom can quickly make management decisions and respond to changes in the business environment, but isn’t there a risk of arbitrary decisions and execution?” External director appointment criteria has not changed since the system was introduced, but in short, we appoint directors who are specialists and command the highest level of ‘insight’ into their respective areas, and are able to objectively make decisions regarding Capcom’s management and business activities. With the avoidance of business investment risk as a priority issue, Capcom appoints individuals from Japan’s leadership class (in terms of business crisis management, law and government) who are able to provide sound opinions without making allowances for industry conditions, who are not intimidated by the company founder and who are able to determine validity from the general public’s point of view. Furthermore, in June 2016 Capcom transitioned from a company with a board of corporate auditors to a company with an audit and supervisory committee. [Diagram 7] To maintain stable corporate management, we must further strengthen our management base and ability to thoroughly manage risks. This transition
strengthens the Board of Directors supervisory function and is intended to enable the flexible diffusion of management and deepen understanding among overseas institutional investors through quick decision-making. Please refer to “Governance Reforms for Further Growth” on
page 67.
The biggest reason for this change to institutional design is “monitoring validity.” A conventional company with a board of corporate auditors emphasizes “monitoring legality” to avoid legal risks. However, I have always believed the utilization of governance to increase economic value requires a business execution validity monitoring function. In recognition of the importance of this function, Capcom established the Audit Committee in the fiscal year ended March 31, 2012. Changing to a company with an audit and supervisory committee enables external directors to confirm the validity of quantitative data in Board of Director meeting materials as well as information gathered from the directly subordinate Internal Auditing Division. As a result, this facilitates more rational decisions that make growth strategies more robust and contribute to the enhancement of both economic value and corporate value. For additional details, please refer to the Governance section in this report.
Transition into a company with an audit and supervisory committeeDiagram 7
Dividends Per Share Since Public Listing (yen)
Diagram 8
The reason I think stable dividends are important is, for example, because a sudden decrease or cessation of dividends can be the difference between life and death for pensioners who depend on dividends to cover part of their lifestyle expenses. Regular and stable revenue enables the reliable establishment of future lifestyle plans. This belief is based on my background, on having lost my father when I was young, and even though I opened a retail business, I struggled and felt gratitude for the stable revenue I earned each day. Capcom shareholders represent all types of people, and I assume some of them may be facing these kinds of issues, which is why we have never once failed to provide dividends during the 26 years since we went public in 1990.[Diagram 8]
In terms of our shareholder return policy, (1) Capcom will enhance its corporate value through investment and growth; (2) the Company will continue to provide shareholders with stable dividends in line with earnings (aiming for a payout ratio around 30%) and (3) we will raise earnings per share through share buybacks. I believe that the manager’s corporate social responsibility is to build relationships of co-existence and co-prosperity with stakeholders by offering employment, achieving corporate growth, earning profits, paying taxes and providing dividends. Accordingly, over the past 10 years Capcom dividends have doubled. We place importance on the effective use of shareholders’ equity, and have established a target to increase ROE from an average of 6.7% during the past three years to 8–10%. Please refer to page 32
2. Dividends for This Fiscal Year and the NextIn the fiscal year ended March 31, 2016, major titles and catalog sales in the Consumer business contributed to growth in sales and profit. Accordingly, in line with our basic policy, we maintained the full-year dividend at 40 yen per share, a payout ratio of 29.0%, in the fiscal year ended March 31, 2016. In the fiscal year ending March 31, 2017, we plan on paying a full-year dividend of 40 yen per share, a payout ratio of 25.0%. As this dividend payout ratio is under 30%, it will be necessary to consider an increase in the dividend in the event next fiscal year’s consolidated performance forecasts are achieved. Going forward, we will continue to strengthen shareholder return by securing investment capital, buying back shares and gradually raising the dividend in line with earnings. As a senior manager with 50 years of experience in this industry, my goal is to increase market capitalization and achieve corporate growth exceeding that of the past 33 years to continue meeting the expectations of all Capcom shareholders.
July 2016
1. Basic Policy Regarding DividendsI believe one of our management priorities is to share profits with all our shareholders. Our basic policy is to
provide stable and continuous dividends that take into account our financial condition and future business strategies.
The Conviction to Maintain Dividends for 26 Years Since Going Public
Shareholder Return
1991 1992 1993 1994 1995 1996 1997 1998 1999 2000 2001 2002 2003 2004 2005 2006 2007 2008 2009 2010 2011 2012 2013 2014 2015 2016
40
20
30
40 40
30
53
20 20 20 20 20 20 20 20 20
30 30
40 40 40 40 40
(Years ending March 31) (Years ending March 31)
2013 2014 2015 2016 2017
50.0%
Ratio of External Directors (%)
Diagram 6
(Plan)
Formerly
Audit and Supervisory Committee
From June 18, 2016
External Directors
27.3
42.9
2017
40
30.0 30.0
50.0 35 35
Audit
Audit and Supervision
Board of Directors
Board of Directors
Board of Corporate Auditors
15
Message fromManagement
Growth Strategy Business Activity Achievements
ESG Information Financial and Corporate Data
Capcom’s ValueCreation Activities
Chairman andChief Executive Officer (CEO)
Kenzo Tsujimoto
CAPCOM INTEGRATED REPORT 2016 CAPCOM INTEGRATED REPORT 201629 30

Liquidity in Hand (Millions of yen)
Diagram 10
Building a Stable Financial Foundation to Conduct Efficient Development Investments
(Years ended March 31)
2007 20092008 2010 20122011 2013 2014 2015 2016
Net Cash on a Historical Basis (Billions of yen)
Diagram 9
13.0 12.2 11.3
15.8 55,129
14.3
22.6 21.2
(Years ended March 31)
Capcom established the following ROE targets as an index of capital efficiency.
We are on track at present, having averaged 10.2% in the past two fiscal years. To achieve our objectives, we are placing priority on net margin improvement. Based on our growth strategy, we aim to further improve title lineup expansion in each business. Regarding TAT and financial leverage, we are cognizant that these are issues we need to address going forward. To this end, we will raise funds mainly through debt financing within the commitment line.
Newly Appointed CFOI was appointed Chief Financial Officer (CFO) by consensus at the Board of Directors meeting held in June 2016. Up to now, I have been engaged in two initiatives: improving net cash and increasing capital efficiency. These initiatives are aimed at creating a lean financial foundation and securing funding to invest in growth. Currently, Capcom is executing growth strategies aimed at increasing corporate value over the medium- to long-term while increasing investment in R&D to enhance the development environment in the core Digital Contents business and promote enhancements to our title lineup. I will more closely scrutinize the selection and concentration of invested capital and thoroughly review cost of sales, selling, general and administrative expenses and other costs to improve our earnings structure and support the achievement of growth strategies from a funding perspective.
Consumer game software development expenses have been on the rise following the arrival of high performance and multifunctional current game consoles. In addition to requiring a development period of two or more years for a major title and add-on contents, the investment payback period is lengthening. We must keep a certain amount of cash on hand to cover ongoing investments, including post-release upgrades to online games and network infrastructure maintenance. To address these funding procurement issues, we determine the level of cash and cash equivalents that needs to be maintained in consideration of reserves from the investment plan and risk management. This amount will then be supplemented with cash on hand (28,429 million yen) as well as an unused 26.7 billion yen commitment line of credit (total contract value: 26.7 billion yen) to maintain an appropriate range. [Diagram 10]
Financial Strategy According to the CFO
Increasing Capital Efficiency
Securing Net Cash and Risk Management
Fund Procurement
To achieve stable medium- to long-term growth, we recognize that it is critical to secure a sufficient amount of investment for the Digital Contents business, the source for our original IP. Specifically, in addition to an enhanced title lineup and new technologies including VR, we must invest in hiring more developers and preparing our development environment. Accordingly, we will allocate about 80% of management resources (R&D investment and capital expenditure totaling 34.5 billion yen in the fiscal year ending March 31, 2017), amounting to an investment of 27.5 billion yen in the Digital Contents business.
Investment Strategy
Moving average for three fiscal years endedMarch 2015 Moving average for three fiscal years endingMarch 2017
6.7%
8–10%
ROE components
Net margin (%)
TAT (%)
Financial leverage (times)
3/‘13 3/‘14 3/‘15 3/‘16
3.2
90.1
1.66
3.4
105.8
1.51
10.3
63.8
1.41
10.1
68.1
1.50
2011
61,511
2012
42,287
2013
48,022
2015 2016Cash and cash equivalents at end of yearUnused Commitment Line of Credit
billion yen million yen
26,700
28,42927,99826,11831,522
20,000
22,287
26,500
to enhancing development investment in line with lineup expansion, thus we expect a recovery from next fiscal year and an increase in net cash. [Diagram 9]
For Capcom to efficiently generate net cash, we formulated two new financial strategies focused on generating cash flows through process management. The first is to thoroughly manage return on investment. Accordingly, we manage a database able to compare the ROI status of each title while ascertaining and analyzing the investment profitability of each project. The second strategy is to maximize working capital efficiency. To this end, we are creating a framework to manage our investment turnover period and turnover ratio in a more visible manner. Moreover, net cash in the fiscal year under review was 15.8 billion yen, which decreased for the second year in a row. This was due
27.6
7.39.2
15.8
35,011
26,70026,50016,500
2014
52,618 54,698 55,129
Director, Executive Corporate Officer and Chief Financial Officer (CFO)
Kenkichi Nomura
CAPCOM INTEGRATED REPORT 2016 CAPCOM INTEGRATED REPORT 201631 32
Message fromManagement
Growth Strategy Business Activity Achievements
ESG Information Financial and Corporate Data
Capcom’s ValueCreation Activities

Diagram 13
Game Industry Characteristics and Capcom Business Characteristics
Game Industry Characteristics Capcom Business Characteristics
Diagram 11
Threat of New Entrants
Consumer (Package + Digital Download Contents)
Mobile Contents PC Online
High capital and differentiatedtechnology requirements
Few capital or differentiated technology requirements
Ongoing capital investment and cutting-edge technologies required
Threat of Substitute Services and Products
Users somewhat compartmentalized
From standpoint of mobility, low user outflow to other two markets
Users somewhat compartmentalized
Buyer PowerMany transactions withmajor overseas retailers with strong purchase power
Direct sales to users Direct sales to users
Supplier Power(Hardware Manufacturers)
Content is flexibly compatible with all platforms
Content is flexibly compatible with all platforms
Content is flexibly compatible with all platforms
Degree of Rivalry
Appropriate environment at present, expected to soften somewhat in the future
Many new entrants, tough environment
Appropriate environment at present
Normal LowHighExtremely
Normal
High
Low Low
Low
Low Low
Low
HighNormal Normal
Normal
Consumer
Characteristics of Each Market
PC Online
Market Profitability
Market Stab
ility
Stability
Stability
Current Predictions
Mobile
Consumer
Digital Contents Business Portfolio
Diagram 14
Diagram 15
Diagram 12
Five Competitive Factors in Each Business (Five Forces Analysis)
Net Sales by Business Segments (Millions of yen)
Total Business Portfolio
PC Online
Profitability
Profitability
Mobile
Cultivating core user segments in the Asian region
Mobile Market Characteristics
Package and digital download contents are a 21.7 billion dollar market, forecast to remain nearly flat with growth to 22.1 billion dollars in 2018. The customer segment is composed mainly of core users who are highly loyal to game titles. They have a relatively high willingness to purchase sequels and a low sensitivity to price and economic conditions. This market is the lowest among the three in terms of margin, yet occupies a high position in the Japanese industry overall. Hereafter, we expect the digital sales ratio to increase, shrinking the gap between the other two markets’ margins.
Consumer Market Characteristics(Package + Digital Download Contents)
PC Online Market Characteristics
This is a 25.1 billion dollar market, forecast to grow to 27.8 billion dollars in 2018. The customer segment is primarily composed of core users who demonstrate the highest loyalty toward game titles. They have a fairly strong willingness to engage in ongoing purchases, and are unique for having the lowest sensitivity to price and economic conditions. In terms of profitability, PC Online is comparatively high among the three markets, typically generating stable earnings over the long term. Going forward, we do not anticipate any major changes and expect the market to remain stable.
This business distributes games featuring popular Capcom content on smartphones, cultivating new markets such as the casual user segment to create new earnings opportunities. However, in sufficient know-how in ongoing game operations, which differs from Consumer, has resulted in sales underperforming market growth.
Mobile Contents Business (Proportion of Net Sales: 4%)
PC Online Business (Proportion of Net Sales: 9%)
This business distributes games featuring popular Capcom content to PC online users, cultivating core users in the Asian region to create new earnings opportunities. In particular, there is great business growth potential in entering China, the world’s largest market.
Consumer Business (Proportion of Net Sales: 55%)Package + Digital Download Contents
Capcom’s core business is to create a multitude of original content for home video game consoles. The regular release of sequers of popular IPs and an increased download sales ratio have, in recent years, led to a greater volume of sales and operating margins over 20%.
Sales volume expansionOperating margins over 20%
Low earnings due to insufficient expertise in ongoing game operations
Digital Contents Business (Proportion of Net Sales: 68%)
Digital Contents business
Arcade Operations Business (Proportion of Net Sales: 12%)
By opening facilities in large commercial complexes in Japan, this business has secured a stable stream of customers and maintains operating margins of around 10%. At the same time, sales in this business are low due to our strategy of carefully limiting the number of facilities and the impact of the consumption tax increase. In recent years, we have focused efforts on services for new customers including young children and seniors.
The Pachinko and Pachislo and Arcade Games Sales sub-segments maintain operating margins around 20–30% due to the release of machines featuring popular Capcom content and the culmination of development expertise. However, legal changes and other external factors impacting the gaming machine business may pose a significant risk of postponed sales, so this business experiences substantial earnings volatility.
Other Businesses (Proportion of Net Sales: 3%)
Our character licensing business involves the use of popular Capcom characters for publishing and films in Japan and overseas, providing high profitability and stable margins around 30%. At the same time, licensed products bring in a low return, so the amount of sales in this business is small at this moment.
Other Businesses
Arcade Operationsbusiness
Digital ContentsBusiness
ArcadeOperations
Business
AmusementEquipments
Business
Other BusinessesOther BusinessesOther Businesses
9,056
52,577AmusementEquipmentsbusiness
13,343
2,043
77,021
Source: Created by Capcom based on data from the International Development Group Note: Calculations based on earnings in the fiscal year ended March 2016
Note: Calculations based on earnings in the fiscal year ended March 2016
Trending towardgeneration of stableearnings over the long-term
Many core users, strong loyalty
Rapid growth, but intense competition
Please refer to page 46
This is a 39 billion dollar market, forecast to grow to 53.3 billion dollars in 2018. The customer segment is primarily composed of casual users, many of whom play games just to pass the time, thus they demonstrate the lowest loyalty toward game titles. They have a limited willingness to purchase games and have the highest sensitivity to price and economic conditions. Although this is the most profitable among the three markets, only a limited number of titles are able to generate stable earnings over the long term. Going forward, we expect smartphones will continue to grow rapidly as the most pervasive game device. Please refer to page 47
Please refer to page 45
Please refer to page 49
Please refer to page 51
Please refer to page 53
Please refer to page 48
Amusement Equipments Business (Proportion of Net Sales: 17%)
CAPCOM INTEGRATED REPORT 2016 CAPCOM INTEGRATED REPORT 201633 34
Message fromManagement
Growth Strategy Business ActivityAchievements
ESG Information Financial and Corporate Data
Capcom’s ValueCreation Activities

New Sales Strategy Based on Digital Distribution
Aiming for Medium- to Long-Term Growth through Opportunities inthe Changing Business Environment
Games connected to the internet played with multiple people are already commonplace, and in recent years, even more online innovations are taking place in the game industry. The biggest transformation is the “distribution revolution” spawned by the digital distribution of games. For the past several years, this trend has accelerated substantially, as can clearly be seen in Capcom’s operating results. As the ratio of digital download contents sales increases, inventory return ratios improve and operating margins expand. Also, in line with the growth of digital distribution, performance has improved in Asia, where package sales had been virtually impossible until now due to the flood of pirated games. In terms of game sales strategies going forward, the key to success will be the degree to which we are able to utilize digital distribution. The ability to distribute
games throughout the world without the significant labor and costs involved in overseas sales networks is paving the way for an environment in which we are able to compete with major overseas game companies on an equal footing. Furthermore, support for multiple languages is another critical point. At present, games can be purchased online almost anywhere. There are many developing markets that can suddenly transform into promising opportunities. In anticipation of such developments, new games released in the fiscal year ended March 31, 2016, were available in 14 different languages. Please refer to page 3 of The Latest Development Report.
In light of these new trends, Capcom will strengthen digital download contents in the Consumer business and implement measures to set the Online business on a growth trajectory.
Investing 80% of Management Resources in the Digital Contents BusinessThe Digital Contents business is our core business, accounts for 68% of net sales and generates original content, which is the source of our corporate value. We are allocating approximately 80% of management resources in this business, which I believe is the key to achieving our medium-term business goals. For the
Digital Contents business to grow, in addition to further expansion of the Consumer business, we must overhaul the struggling Online business and establish a growth trajectory. On the following pages, I will explain our strategies for achieving these goals.
Pages 37–38
1Growth Strategy
DigitalContents
Other Businesses
Arcade Operations
Amusement Equipments
Ratio of Sales by Business
GrowthBusinesses
Consumer Business Expansion• Stable provision of core brands• Strengthen digital downloads (full-game/add-on)• Pursue new technologies and businesses
Pages 39–40
2Growth Strategy
Overhaul the Online Business• Strengthen development structure via the newly established Mobile Business Division• Promote business alliances in Asian region
68%Consumer BusinessOnline Business
The COO’s Discussion of Growth Strategies
President and Chief Operating Officer (COO)
Haruhiro Tsujimoto
CAPCOM INTEGRATED REPORT 2016 CAPCOM INTEGRATED REPORT 201635 36
Message fromManagement
Growth Strategy Business ActivityAchievements
ESG Information Financial and Corporate Data
Capcom’s ValueCreation Activities

The COO’s Discussion of Growth Strategies
Stable Provision of Core Brands
Strengthen Digital Downloads (Full-Game/Add-On)
Pursue New Technologies and Businesses
Measure 1
Measure 2
Measure 3
One important strategy for Capcom to achieve ongoing and stable growth in the Consumer business—referred to as the hit business—is transforming the foundation of our Consumer business model from a traditional one-time sale “transactional model” to a continuous “recurring revenue model.”[Diagram 16] Going forward, the consumer market will continue to maintain a scale of 22 billion dollars as the number of game makers’ declines due to high barriers to entry. Companies that possess an abundance of popular IPs and strong technological capabilities will easily win the market and enjoy profits in this environment. For Capcom, the Consumer business is the source of our corporate value. We will implement the following three measures, each positioned as one of the most important strategies for growth over the medium- to long-term.
Capcom’s biggest strength is the in-house creation of powerful brands and ownership of numerous popular IPs. At the same time, unit sales of major titles has fluctuated depending on the fiscal year, thus high earnings volatility was an issue. For this reason, we shortened the sales cycle for titles in each series from three to four years to two and a half years and increased the number of titles released in a single fiscal year. Employing a medium-term strategic (60-month) map, we are forming a title portfolio enabling sustainable growth and establishing a structure
The merits of digital downloads include (1) avoiding inventory risk and reducing package production costs through full-game downloads, (2) additional earnings opportunities through full-game downloads of catalog titles whose package sales are difficult for retailers and (3) anchor users through ongoing add-on contents and stable acquisition of additional revenue over the long term. These represent one measure to counter concerns over intense sales volatility due to dependence on hit titles in the Consumer business and skyrocketing development costs. In addition to the stable provision of core brands, the accumulation of steady digital download
sales each fiscal year will further the transition to a recurring revenue business model.[Diagram 18] At present, we are focused on points (1) and (2), but going forward, we will strengthen point (3) to increase the digital download ratio, which is currently 26%, to 50% over the medium-term. This will bolster additional recurring revenue by anchoring users for more than one year after launch, and as these games will have a large number of active users, it will also lead to the acquisition of new users, effectively controlling sales volatility each fiscal year.
In the game industry, once neglected, it is difficult to pursue research on cutting-edge technologies. Constant technological research in new areas and continued exploration of gaming possibilities are the stepping stones for establishing a groundbreaking position in the next-generation. In 2016, new devices including PlayStation VR and Oculus Rift appeared on the market and brought with them huge expectations in what has been called “VR year one.” Capcom’s specialty in the action and horror genres is extremely compatible with VR and by offering
Catalog Sales Volume and Ratio Increases
A
B
C
D
E
Major titles released
every 2.5 years
Additional digital downloads
60-Month Sales Plan and 52-Week Human Resources Plan
Digital Download Sales Volume and Ratio Increases
Title
Stabilize annual earnings
1st year 2nd year 3rd year 4th year 5th year
2013
2011 2012 2013 2014 2015 2016
2014 2015 2016 2017
To achieve stable earnings growth, it is important to steadily provide numerous popular titles and shorten development periods.
Digital download sales of mainly full games (new and past titles) are growing on track and expected to comprise approximately 30% of the digital download sales ratio in the fiscal year ending March 2017. Going forward, we will strengthen additional digital download content and raise the digital download ratio to 50% overall.
The penetration of digital download sales is driving the sales ratio of our recurring revenue model higher each year and generating continuous profits, unlike the transactional model.
(Plan)
Developers 1 2 3 4 5 6 7 8 9 10 11 12 (Month)
1
2
3
4 ……
2,000
60-month mapObjective Effective utilization of R&D resources
52-week map
Project A Project B Project C
Digital download sales ratio
29.8%Digital download sales
Full game digital downloads
Catalog digital download titles
Catalog sales ratio
Catalog sales
Download new full games
Download catalog title full games
Download additional stories, stages, items, etc.
Diagram 16
46.7%46.2%
25.9%25.6%
18.3%
11.3%
23.4%18.4%
7
14.0
million units
billion yen
22.9%
Catalog titles of major IPs creates
a solid earnings base
Street Fighter series
Resident Evil series
Monster Hunter series
32.6%
10.9billion yen
4millionunits
9.7billion yen 9.0
billion yen5.2billion yen
Diagram 17
Diagram 18
Consumer Business ExpansionGrowth Strategy 1
that appropriately allocates employees to teams when needed from 2,000 developers via a 52-week map. These two maps enable the stable release of multiple major titles each fiscal year and control earnings volatility.[Diagram 17] Furthermore, we think the creation of new brands that will become our future primary sources of earnings is indispensable for medium- to long-term growth. Thus, we are allocating approximately 20% of development investments toward new IP development.
new experiences with VR, our games will be even more appealing. This fiscal year, we are proactively approaching this development with RESIDENT EVIL 7 biohazard, which offers full Playstation VR support. We are also focusing efforts on eSports as a new genre. With the Street Fighter series in particular, we had held events mainly in North America, which were well attended. However, going forward we plan to develop activities in other regions. With these new business challenges, we will attempt to maximize earnings through the active use of content and enhanced brand value.
Establishing a High Earnings Structure and Stable Portfolio
Objective
3.9millionunits
3.9millionunits
5.7millionunits
6millionunits
CAPCOM INTEGRATED REPORT 2016 CAPCOM INTEGRATED REPORT 201637 38
Message fromManagement
Growth Strategy Business Activity Achievements
ESG Information Financial and Corporate Data
Capcom’s ValueCreation Activities

IP
Market
Target
The COO’s Discussion of Growth Strategies
New Mobile Game Strategy
Alliances and Titles in the Asian Region
Capcom Brand
Capcom Brand
Broad segment including all genders or agesCapcom fans
Beeline Brand
Develop apps using IP from other companies
GlobalMainly in Japan
Casual female users
Strengthen the licensing business in the Asian region with planned
distribution of four titles using popular brands including Monster Hunter,
Sengoku BASARA and Mega Man
Before Development Resources Split
After Development Resources Concentrated
Title Region AlliancesMobile contents
3
2In the PC Online business, we are engaged in negotiations in China, the world’s largest online game market, as well as in South Korea and Thailand. Similarly, in terms of Mobile Content, we are enhancing development making use of leading titles in the Asian market where the adoption of smartphones continues at a brisk pace.
By integrating the Capcom and Beeline Brand organizations, which until now had promoted independent strategies, development and management expertise has been concentrated in the Mobile Business Division. Quick decision-making enables global expansion of titles utilizing proprietary content.
Taiwan
PC browser games
Titles
PC online games
1Title
Titles
Qihoo 360 Technology Co., Ltd.ChinaMonster Hunter Hunting Quest(Simplified Chinese version)
Teeplay Interactive Ltd.China
South KoreaTaiwan
Hong Kong
Street Fighter Battle Combination
Nexon Korea CorporationSouth KoreaStreet Fighter IV Arena
Tencent Holdings Ltd.ChinaMonster Hunter Online
Cayenne Entertainment Technology Co., Ltd.(Taiwan)BLUE PANDA Network Technology Co., Ltd.(China)
ChinaOnimusha Soul(Simplified Chinese version)
Tencent Holdings Ltd.ChinaMonster Hunter Mezeporuta Kaitakuki (Simplified Chinese version)
Hong Kong
China
South Korea
Diagram 19
Diagram 20
Overhaul the Online BusinessGrowth Strategy 2
Supporting Capcom’s Sustainable Growth Differently than the Consumer Business
Strengthen Development Structure via the Newly Established Mobile Business Division
Promote Business Alliances in the Asian Region
Measure 1
Measure 2
Capcom has yet to make full use of its competitive advantage in the rapidly expanding online market (PC Online and Mobile Contents), namely, its rich library of popular IPs. In particular, the Mobile Contents business struggled in the fiscal year ended March 31, 2016 with net sales of only 3.3 billion yen. However, as success in the high-growth potential Online business is indispensable for corporate growth over the medium- to long-term, we are focused on this area as one of the most important issues for Capcom. Online games are a management business, providing a stable source of profit supporting Capcom’s sustainable growth in a way different from that of the Consumer business. Furthermore, these businesses enable the creation of synergies with content (IP) created in the Consumer business, playing a significant part in enhancing brand value. To alleviate investor concerns, we will implement the following two measures.
The conditions necessary for success in the Mobile business include (1) ownership of popular content that can be differentiated amidst numerous competing titles and (2) management expertise in analyzing user trends and the incorporation of those trends into development. Until now, we developed the Capcom brand, which utilized popular Capcom content in Japan, and the Beeline brand, which licensed content from other companies for global use in games targeting women and families. Under the Capcom brand, although we unified our domestic development structure and achieved a hit with Monster Hunter Explore, other existing titles struggled, adversely affecting sales for the past few years. Under the Beeline brand, we have been unable to generate ongoing hit titles since 2010 and sales have continued to decline. In April 2016, both structures were
We believe the licensing of existing Online content in Asia has the potential to significantly accelerate Capcom growth.[Diagram 20] There are two ways to proceed in Asia: (1) engage in Capcom development and management through subsidiaries in the Asian region and (2) engage in development and management through business alliances with major Asian management companies. At present, we are focusing efforts on the latter. In terms of an example of full-fledged development in Asia, we can point to Monster Hunter Online (MHO), launched in collaboration with Tencent Holdings in China in December 2015. The game was well-received by users after distribution, giving us a solid footing in terms of content development in China.
The reason we are promoting business alliances in addition to internal development is to avoid country risk in Asia and gain management expertise. Thus, we have determined that at this time, alliances with leading companies in countries other than Taiwan are an effective means of maximizing earnings. Developing hit content from the Consumer business under our Single Content Multiple Usage strategy, making use of this content in the domestic PC Online business and licensing the content in Asia is a business model enabling Capcom to earn double or triple profits from the same content. In addition, we can also apply Online business management expertise to the Consumer business; thus promoting these strategies will enhance synergies with the Digital Contents business.
integrated to establish the Mobile Business Division in order to focus on global development of Capcom IP. Next fiscal year, we will combine our library of popular content with our management expertise to release new titles in the Sengoku BASARA, Mega Man and Monster Hunter series and promote a structure for the ongoing release of titles. In addition, we will attempt to expand profits in Asia via licensing hit titles from Japan and overseas in the Asian region, while at the same time moving forward with M&A, targeting development companies as part of management line integration.[Diagram 19]
Through these measures, we first aim to acquire a 5% share in the domestic market over the medium term, then will attempt to maximize profit opportunities overseas by leveraging market analysis capabilities and management expertise cultivated in foreign markets under the Beeline brand.
ⓒ 2011 Peanuts Worldwide LLC
Global expansion focused in Asia
Develop apps using proprietary IP
Develop apps using proprietary IP
Reinforce business alliances with powerful
local companies
Capcom BranchCAPCOM TAIWAN CO., LTD.
CAPCOM INTEGRATED REPORT 2016 CAPCOM INTEGRATED REPORT 201639 40
Message fromManagement
Growth Strategy Business Activity Achievements
ESG Information Financial and Corporate Data
Capcom’s ValueCreation Activities

Profile: Jay Defibaugh
Conversation: An Analyst’s Perspective on Capcom’s Strategy for Growth
Haruhiro TsujimotoPresident and Chief OperatingOfficer (COO),
Capcom Co., Ltd.Senior Analyst, Research DivisionCLSA Securities Japan Co., Ltd.
Jay Defibaugh
Service managedover the long-term
Move towardmaximizing usage of IP
Conversation
Jay: The digital distribution of games has solved a number of distribution issues overall, and Capcom has been able to steadily grow its sales in the US, Europe and Asia as well. However, as some of your overseas competitors have already grown their ratio of digital distribution to nearly 40%, I feel that Capcom’s ratio is still quite low. How do you plan on improving this going forward?Tsujimoto: At present, the merits of digital distribution
translate only to sales: however, if we utilize the always-online connectivity of consoles, we can offer new and improved ways to enjoy games as a service
managed over the long-term, which will stimulate new needs. To this end, we plan to coordinate with first party developers, who maintain the user data.Jay: In terms of improved profitability from digital sales, you are able to create sales opportunities in Southeast Asia and other regions where until now package sales had been impossible. At the same time, post-sales
management and marketing capabilities will become more critical. Does Capcom possess this operational expertise?Tsujimoto: Although there is still room for improvement in this area, we will utilize our experience in the Online and Mobile businesses to create a new internal structure geared toward service-oriented management. We will pursue a policy whereby we gradually increase the digital download ratio while researching competitor products and user behaviors.Jay: Investors consider Capcom to be a “company able to create powerful content,” but my sense is that you haven’t put out much successful new content recently despite the ongoing release of new high-performance game consoles. Going forward, will you be able to continuously release quality IP? Also, some overseas competitors have shortened the time required to develop sequels using a two-team system. What kinds of initiatives is Capcom engaged in?Tsujimoto: The creation of new IP is the cornerstone of our business, so we must perpetually engage in it. If we are unable to continue generating content qualitatively equal to global AAA titles, Capcom has no future as a company specializing in games. In terms of shortening the time required for development, we are engaged in streamlining from a technical standpoint, including the development of our RE ENGINE and innovations in 3D scanning systems, which will enable us to develop major IP on a two and a half year cycle. Jay: A lot of Capcom IP is lying dormant, and although
Analyst Jay Defibaugh and President and COO Haruhiro Tsujimoto discuss how Capcom will promote its growth strategy amid a major revolution in the Consumer game market driven by the expansion of digital distribution.
you are skilled at creating IP, I get the impression you are not as skilled in terms of marketing aimed at leveraging IP. The ideal scenario is one in which you make the most of your IP to maximize profits. What
are your thoughts?Tsujimoto: Despite our basic strategy of Single Content Multiple Usage, it’s true at present there are some IPs we certainly have not made the most of. Titles that had large fanbases in the past are
powerful assets, thus we are beginning to move toward maximizing usage through region-based testing of individual IP and the release of promising IP remakes and reimagined titles.Jay: The subject of IP usage also applies to Mobile games. Capcom has yet to realize major success in this ever-expanding market.Tsujimoto: Mobile platform strategy is one of the issues we must address in the Mobile business. Considering future smartphone performance enhancements, I think there is a significant opportunity for us to leverage our strengths. Recently, we switched over to a development structure mainly focused on Capcom IP and integrated our Mobile structure in order to create hit titles.Jay: Alternatively, wouldn’t focusing on the Consumer business, with its strengths in in-house resources, while
collaborating with other companies on licensing for Mobile achieve higher management efficiency?Tsujimoto: Going forward, regardless of the platform, there is the potential to transition any category of game into the long-term operational model. Thus, the accumulation of data analysis, marketing and other Mobile management expertise will be effective not only in the Mobile business, but also in the Consumer business. If we license out titles, it will be difficult to accumulate in-house expertise. This is why we must continue to invest in comprehensive internal strengths —even in the Mobile business—to achieve success.
After the ConversationI sensed the COO’s confidence in terms of Capcom IPs. I have no doubt about his basic strategy of creating excellent content and maximizing the usage of these assets. Compared to competitors, Capcom has allocated a modest amount of resources to the Mobile business. Given their business structure this is understandable, but the fact is, when looking at the game industry overall, the mobile market is expanding rapidly. In certain situations, being flexible with regard to development and borrowing some of the strengths of other companies would be entirely acceptable from the investors’ point of view. I feel this would present Capcom with significant opportunities. (Jay)
Graduated from Penn State University in 1989: began covering the game industry as an analyst in 1999. Joined CLSA Securities in 2013.
Focusing on Growth: Adapting to the Operational Model and Maximizing Utilization of Proprietary Content
CAPCOM INTEGRATED REPORT 2016 CAPCOM INTEGRATED REPORT 201641 42
Message fromManagement
Growth Strategy Business ActivityAchievements
ESGESG InInforformatmationion FinFi ancn ial and CorCorporate Data
Capcom’s ValueCreation Activities

This business develops and sells package games and digital download content for the Consumer sub-segment. It also develops and manages Mobile Contents and PC Online Games. Consumer games produce creative original content with a focus on action and adventure. Many of these million-seller titles are used for smartphone, tablet device and PC online games distributed worldwide in an attempt to maximize earnings.
We operate “Plaza Capcom” amusement facilities in Japan. These arcades are predominantly in large commercial complexes and host various events designed to attract families and female customers. We have diligently followed a scrap-and-build policy to maximize our efficiency in arcade operations.
We focused efforts on cultivating new customer segments, including free game experience tours for middle-aged and elderly persons, and the establishment of a timed rate structured play area for kidsFour arcades were opened, three unprofitable arcades were closedSales at existing arcades slumped at 96% of those in the previous year
The pachislo machine Resident Evil 6 sold 37,000 unitsIn the Arcade Games Sales sub-segment, new arcade game machine Luigi Mansion Arcade and new music game crossbeats REV struggled
Maximized earnings and strengthened brand power of proprietary content through execution of lateral development of integrated sales of games based on the Single Content Multiple Usage strategyHeld events contributing to maximizing sales of major titles Monster Hunter X (Cross) and Resident Evil-related titles
The addition of new hunting techniques, hunting styles and other elements to the world and gameplay of the original series have proven popular, causing this spinoff title to surpass initial sales projections of 2.5 million units to sell 3.3 million units.
The first title in this series to introduce cross-platform gameplay enabling players on PlayStation 4 and PCs to battle one another. Capcom plans to continuously update game content from the next fiscal year forward.
52,577Net sales
million yen
million yen
million yen
million yen
23.1%Operating margins
9,056Net sales
7.7%Operating margins
Digital Contents
Arcade Operations
Here, we are engaged in two businesses based on the contents used for our home video games. The Pachinko & Pachislo (PS) business is involved in the development, manufacture and sales of frames and LCD devices for gaming machines as well as software. The Arcade Games Sales business develops, produces and sells arcade games for amusement facilities, creating synergy between businesses.
Amusement Equipments
Based on our Single Content Multiple Usage strategy of developing game content for various media, we pursue a variety of copyright-related business opportunities including publishing (walkthrough and strategy guides as well as game settings collections) and licensing (music CDs and licensed merchandise). Furthermore, we are concentrating on developing game content into movie and TV animation programs.
Other Businesses
Mobile Contents
Consumer (Package + Digital Download Contents)
Monster Hunter X (Cross) surpassed initial projections to sell 3.3 million unitsResident Evil Revelations 2 was released last year and maintained brisk sales at 850,000 unitsStreet Fighter V sold 1.4 million units mainly overseas, falling short of sales projections
Online game Monster Hunter Frontier G contributed to stabilitySales of the new online game Dragon’s Dogma Online were firmIn China, Monster Hunter Online services were official launched
PC Online
Monster Hunter X (Cross) Street Fighter V
In November 2015, we opened a themed restaurant enabling patrons to vicariously experience the world of Capcom games inside Aeon LakeTown kaze (Koshigaya, Saitama Prefecture). The restaurant offers food and beverages based on Capcom intellectual properties such as Monster Hunter and Resident Evil as well as the sale of limited-edition merchandise.
Capcom Café
This new pachislo machine is part of the Resident Evil series, extremely popular in the home video game and pachislo machine markets. It incorporates Movision, a movable liquid crystal screen made popular by the Resident Evil 5 machine, while faithfully recreating the world of Resident Evil 6, both of which garnered fan support and lead to sales of 37,000 units, surpassing projections.
In conjunction with the sales launch of core title Monster Hunter X (Cross), Monster Hunter Festa’16 was held in five locations across Japan in January 2016. 50,000 people came out for this event, which included the “Karioh Ketteisen” to determine Japan’s top hunters and stage events featuring game developers.
Pachislo Machine Resident Evil 6
Monster Hunter Festa’16
New app Monster Hunter Explore achieved more than 3 million downloadsExisting titles under the Capcom and Beeline brands continued to struggle amid a fiercely competitive environment
13,343Net sales
21.1%Operating margins
2,043Net sales
25.0%Operating margins
2016
Net sales/Operating margins
45,351
2014 2015
22.5
(Years ended March 31)
65,824
6.8
52,577
23.1
2016
9,24110,620
2014 2015
15.210.2
(Years ended March 31)
9,056
7.7
2016
7,540
23,160
2014 2015
30.8 36.3
(Years ended March 31)
13,343
21.1
2016
2,1442,594
2014 2015
38.630.8
(Years ended March 31)
2,043
25.0
Net sales/Operating margins
Net sales/Operating margins
Net sales/Operating margins
Business Activity AchievementsBusiness Overview Operating Results for This Fiscal Year Main Products for This Fiscal Year (Output)
Business Segments Highlights
CAPCOM INTEGRATED REPORT 2016 CAPCOM INTEGRATED REPORT 201643 44
Message fromManagement
Growth Strategy Business Activity Achievements
ESG Information Financial and Corporate Data
Capcom’s ValueCreation Activities
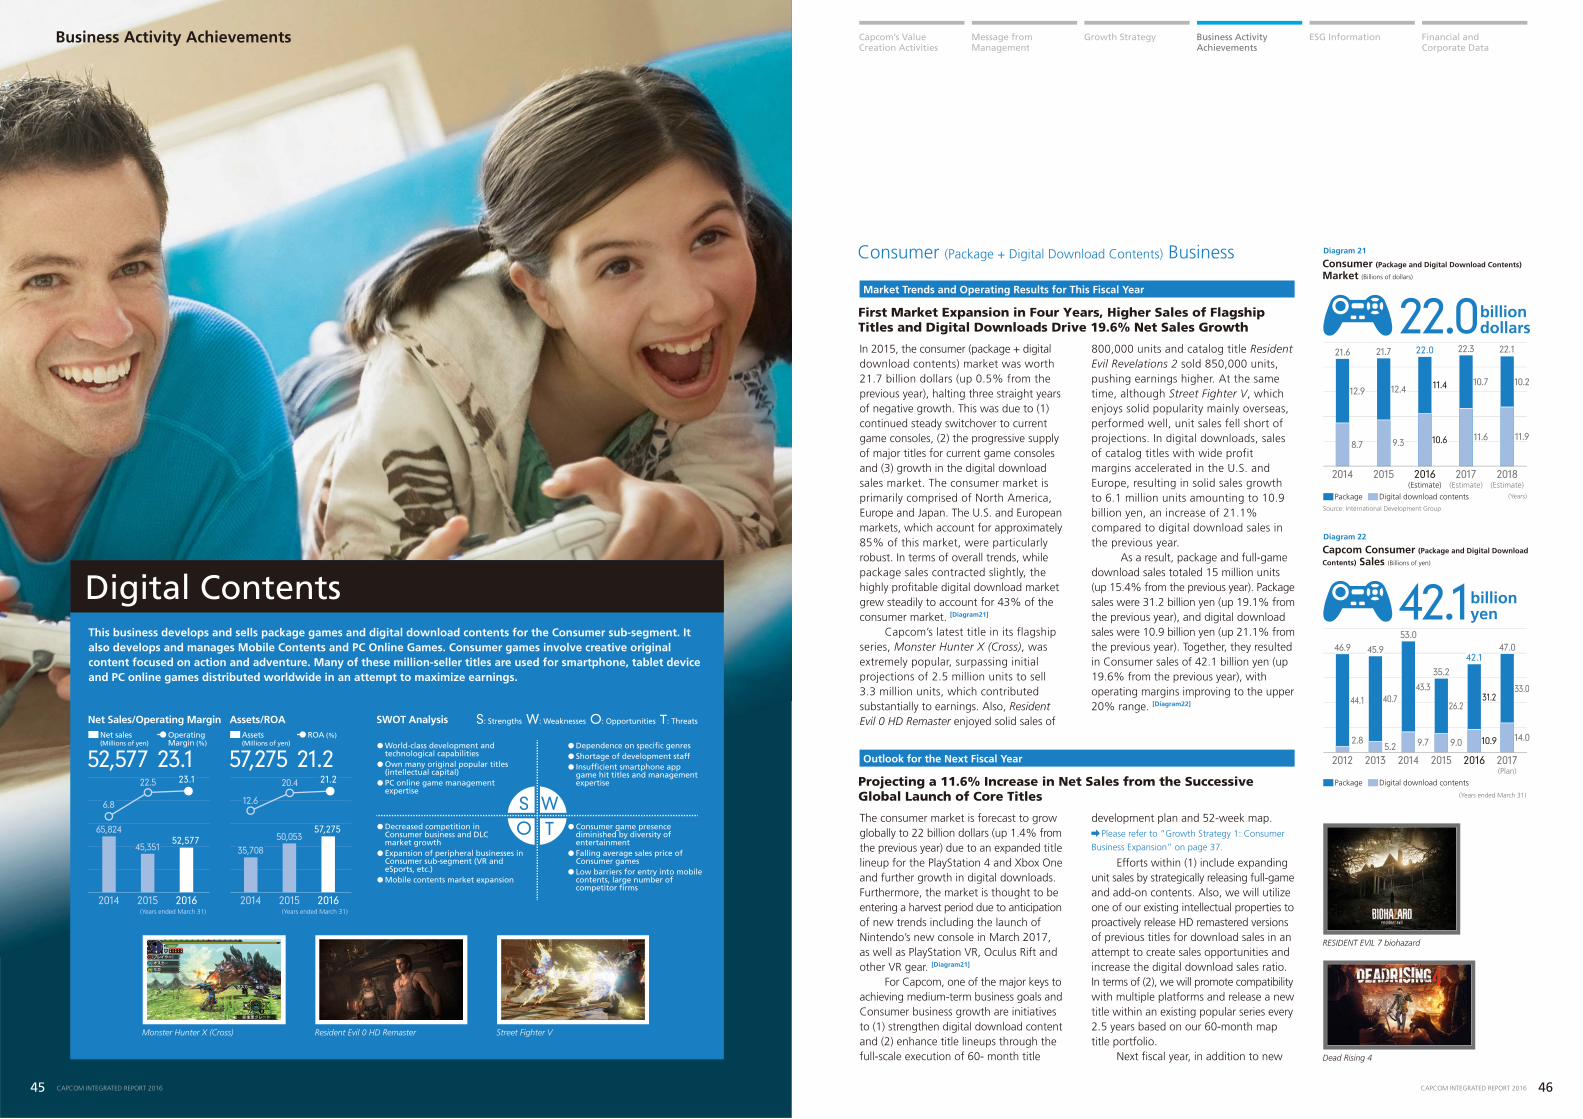
Consumer (Package + Digital Download Contents) Business
First Market Expansion in Four Years, Higher Sales of Flagship Titles and Digital Downloads Drive 19.6% Net Sales Growth
Market Trends and Operating Results for This Fiscal Year
This business develops and sells package games and digital download contents for the Consumer sub-segment. It also develops and manages Mobile Contents and PC Online Games. Consumer games involve creative original content focused on action and adventure. Many of these million-seller titles are used for smartphone, tablet device and PC online games distributed worldwide in an attempt to maximize earnings.
Digital Contents
S: Strengths W: Weaknesses O: Opportunities T: ThreatsSWOT Analysis
S WO T
2016
Net Sales/Operating Margin
65,824
2014 2015
22.5
(Years ended March 31)
52,577
2016
Assets/ROA
50,05335,708
2014 2015
12.6
20.4
(Years ended March 31)
57,275
21.2
Monster Hunter X (Cross) Resident Evil 0 HD Remaster Street Fighter V
Projecting a 11.6% Increase in Net Sales from the Successive Global Launch of Core Titles
Outlook for the Next Fiscal Year
Consumer (Package and Digital Download Contents) Market (Billions of dollars)
Source: International Development Group
Package Digital download contents
21.7
9.3
12.4
21.6
8.7
12.9
22.0
10.6
11.4
22.3
11.6
10.7
22.1
11.9
10.2
22.0
Diagram 21
2014 2015 2016(Estimate) (Estimate) (Estimate)
2017 2018
(Years)
In 2015, the consumer (package + digital download contents) market was worth 21.7 billion dollars (up 0.5% from the previous year), halting three straight years of negative growth. This was due to (1) continued steady switchover to current game consoles, (2) the progressive supply of major titles for current game consoles and (3) growth in the digital download sales market. The consumer market is primarily comprised of North America, Europe and Japan. The U.S. and European markets, which account for approximately 85% of this market, were particularly robust. In terms of overall trends, while package sales contracted slightly, the highly profitable digital download market grew steadily to account for 43% of the consumer market. [Diagram21]
Capcom’s latest title in its flagship series, Monster Hunter X (Cross), was extremely popular, surpassing initial projections of 2.5 million units to sell 3.3 million units, which contributed substantially to earnings. Also, Resident Evil 0 HD Remaster enjoyed solid sales of
800,000 units and catalog title Resident Evil Revelations 2 sold 850,000 units, pushing earnings higher. At the same time, although Street Fighter V, which enjoys solid popularity mainly overseas, performed well, unit sales fell short of projections. In digital downloads, sales of catalog titles with wide profit margins accelerated in the U.S. and Europe, resulting in solid sales growth to 6.1 million units amounting to 10.9 billion yen, an increase of 21.1% compared to digital download sales in the previous year. As a result, package and full-game download sales totaled 15 million units (up 15.4% from the previous year). Package sales were 31.2 billion yen (up 19.1% from the previous year), and digital download sales were 10.9 billion yen (up 21.1% from the previous year). Together, they resulted in Consumer sales of 42.1 billion yen (up 19.6% from the previous year), with operating margins improving to the upper 20% range. [Diagram22]
The consumer market is forecast to grow globally to 22 billion dollars (up 1.4% from the previous year) due to an expanded title lineup for the PlayStation 4 and Xbox One and further growth in digital downloads. Furthermore, the market is thought to be entering a harvest period due to anticipation of new trends including the launch of Nintendo’s new console in March 2017, as well as PlayStation VR, Oculus Rift and other VR gear. [Diagram21]
For Capcom, one of the major keys to achieving medium-term business goals and Consumer business growth are initiatives to (1) strengthen digital download content and (2) enhance title lineups through the full-scale execution of 60- month title
development plan and 52-week map. Please refer to “Growth Strategy 1: Consumer
Business Expansion” on page 37.
Efforts within (1) include expanding unit sales by strategically releasing full-game and add-on contents. Also, we will utilize one of our existing intellectual properties to proactively release HD remastered versions of previous titles for download sales in an attempt to create sales opportunities and increase the digital download sales ratio. In terms of (2), we will promote compatibility with multiple platforms and release a new title within an existing popular series every 2.5 years based on our 60-month map title portfolio. Next fiscal year, in addition to new
52,577 23.1 57,275 21.2
billion dollars
Capcom Consumer (Package and Digital Download
Contents) Sales (Billions of yen)
35.2
9.0
26.2
46.9
2.8
44.1
42.1
10.9
31.2
47.0
14.0
33.0
42.1
Diagram 22
2012
45.9
5.2
40.7
2013
53.0
9.7
43.3
2014 2015 2016(Plan)2017
(Years ended March 31)
billion yen
RESIDENT EVIL 7 biohazard
Dead Rising 4
Net sales (Millions of yen)
Operating Margin (%)
Assets (Millions of yen)
ROA (%)
6.8
23.1
45,351
Business Activity Achievements
World-class development and technological capabilitiesOwn many original popular titles (intellectual capital)PC online game management expertise
Decreased competition in Consumer business and DLC market growthExpansion of peripheral businesses in Consumer sub-segment (VR and eSports, etc.)Mobile contents market expansion
Dependence on specific genresShortage of development staffInsufficient smartphone app game hit titles and management expertise
Consumer game presence diminished by diversity of entertainmentFalling average sales price of Consumer gamesLow barriers for entry into mobile contents, large number of competitor firms
Package Digital download contents
CAPCOM INTEGRATED REPORT 2016 CAPCOM INTEGRATED REPORT 201645 46
Message fromManagement
Growth Strategy Business Activity Achievements
ESG Information Financial and Corporate Data
Capcom’s ValueCreation Activities

Mobile Contents Business
Despite 73% Growth and Continued Market Expansion, Sales and Profit Declined Due to Challenges Surrounding the Creation of a Hit Title
Market Trends and Operating Results for This Fiscal Year
Projecting 21.2% Increase in Net Sales through Efforts Focused on Creating Hit Titles in Japan and Overseas Under a New Organization
Outlook for the Next Fiscal Year
Mobile Contents Market (Billions of dollars)
Diagram 23
Source: International Development Group
2014 2015 2016(Estimate) (Estimate) (Estimate)
2017 2018
(Years)
22.5
AsiaNorth America Europe Other
39.0
45.7
26.1
7.34.9
7.2
50.7
9.7
27.7
7.95.2
53.3
11.1
28.5
8.2
5.3
1.911.6
5.43.5
4.8
22.9
6.64.4
45.7
PC Online Business
Although the Market Was Flat, the Launch of New Titles in Japan and Overseas Resulted in an 18.3% Increase in Net Sales
Market Trends and Operating Results for This Fiscal Year
Projecting a 12.7% Increase in Net Sales Due to the Promotion of Licensing Businesses in the Growing Asia Market
Outlook for the Next Fiscal Year
In 2015, the mobile contents market was worth 39 billion dollars (up 73.3% from the previous year), expanding in scale to surpass the consumer market. The main reasons for this were (1) the ongoing adoption of smartphones throughout the world and (2) the increase of popular native app games particularly in Japan and Asia that continue to attract game users. By region, the Asian market including Japan was worth 22.9 billion dollars (up 97.4% from the previous year), while developing country, Eastern European and other regional markets grew rapidly to 4.8 billion dollars (up 152.6% from the previous year). The freemium (virtual item purchases/in-game purchases),a earnings model where users download a game for free, then purchase access to additional items and other game content as needed, has predominated in the market since about 2010. With freemium games, the key to manageability is using content power (brand/game function) to offer the appropriate services and premium games.
For game companies with many popular software titles and mobile development companies with operational expertise, the opportunity to improve earnings is growing. In Japan in particular, numerous distributions of a wide range of games that offer a style of play matching the national identity, such as those that take advantage of idle moments and games that use popular content, are driving rapid market expansion. [Diagram23]
In September 2015, Capcom launched Monster Hunter Explorer, which has exceeded 3 million downloads and is generally selling as projected. However, regarding other existing titles, both Capcom and Beeline brand performance has been lackluster and continue to struggle amid an intensely competitive environment. As a result, net sales declined to 3.3 billion yen (down 19.5% from the previous year). In terms of profit, although contributions from new titles secured earnings, profitability was declined compared to the previous year. [Diagram24]
titles in global core series such as RESIDENT EVIL 7 biohazard and Dead Rising 4, we will attempt to increase sales by aggressively launching major titles including a Monster Hunter-related title. We will also strengthen digital download sales to increase unit sales
10.0% compared to the previous year to 16.5 million units, forecasting net sales of 47 billion yen (up 11.6% from the previous year) and a high level of operating income about the same as the fiscal year under review.
In 2016, the annual shipment of smartphones is expected to maintain a single-digit growth rate at approximately 1.48 billion units (up 3.1% from the previous year) compared to approximately 1.43 billion units (up 10.1% from the previous year) in 2015. However, the
demand for smartphones as game devices is expected to further increase in Japan and Asia amid ongoing expanded adoption in India, the Middle East and Africa, which we think will lead to the expansion of global game contents. As a result, we expect the 2016 mobile market
Despite sluggish sales of package games for PC in the U.S. and Europe and games played through SNS, the Chinese and Asian markets, which account for nearly half the overall market, continued to grow to 25.1 billion dollars (up 1.6% from the previous year), about the same scale as the market in the previous year. [Diagram25]
For Capcom, in addition to stable earnings contributions from firm favorite Monster Hunter Frontier G (MHFG), sales
of Dragon’s Dogma Online were on track. Also, in December 2015, we launched Monster Hunter Online in collaboration with China’s Tencent Holdings Ltd., which contributed royalty revenue. As a result, net sales were 7.1 billion yen (up 18.3% from the previous year). In terms of profit, the recognition of amortization expenses related to the launch of new title services caused profitability to decline. [Diagram26]
to increase to 45.7 billion dollars (up 17.2% from the previous year) and grow to 53.3 billion dollars (up 36.7% from 2015) in 2018. [Diagram23]
In 2016, Capcom unified its Group-wide mobile development structure and established the new Mobile Business Division. We combined the organizations of the Capcom and Beeline brands, which up to now had promoted independent strategies and concentrated development
and management know-how. We will expand titles in Japan and overseas utilizing proprietary content based on quick decision-making facilitated by organizational unification. Next fiscal year, this new organization will distribute titles using popular brands including Monster Hunter, Sengoku BASARA and Mega Man, thus we expect net sales of 4 billion yen (up 21.2% from the previous year).
In 2016, we expect the market to continue growing to 26.5 billion dollars (up 5.6% from the previous year). While the U.S. and Europe are expected to remain stable, the Asian market, focused on China is expected to continue growing driven by core MMO online games. We expect this market to continue expanding, from 10.6 billion dollars in 2015, to 11.2 billion dollars (up 5.7% from 2015) in 2018. [Diagram25]
In addition to ongoing major updates to MHFG, Capcom will grow Dragon’s Dogma Online into a new flagship title in an attempt to establish dual pillars for
expanded earnings in Japan. Furthermore, we intend to improve our position in the Chinese market through an ongoing proactive cooperative relationship with China’s Tencent Holdings on Monster Hunter Online. At the same time, with respect to other titles, we will proceed with negotiations with local companies to develop similar licensing businesses in the Asian region. As a result of these measures, we expect net sales of 8 billion yen (up 12.7% from the previous year) as well as an increase in operating income.
billion dollars
Capcom Mobile Contents Sales (Billions of yen)
Diagram 24
3.3billion yen
4.1
6.3
3.34.0
2012
11.0
2013
6.5
2014 2015 2016(Plan)2017
(Years ended March 31)
PC Online Market (Billions of dollars)
Diagram 25
Source: International Development Group
2014 2015 2016(Estimate) (Estimate) (Estimate)
2017 2018
(Years)
24.7
AsiaNorth America Europe Other
25.126.5
11.0
6.0
6.3
3.1
27.6
3.3
11.4
6.1
6.7
27.8
3.5
11.2
6.0
7.0
9.1
6.1
6.6
2.8 2.8
10.6
5.8
5.7
26.5billion dollars
Capcom PC Online Sales (Billions of yen)
Diagram 26
7.1billion yen
6.06.6
7.18.0
2012
6.7
2013
6.3
2014 2015 2016(Plan)2017
(Years ended March 31)
Monster Hunter Explorer
Dragon’s Dogma Online
Monster Hunter Frontier G
Monster Hunter Online© 1998 – 2016 TENCENT INC. ALL RIGHTS RESERVED.
Business Activity Achievements
CAPCOM INTEGRATED REPORT 2016 CAPCOM INTEGRATED REPORT 201647 48
Message fromManagement
Growth Strategy Business Activity Achievements
ESG Information Financial and Corporate Data
Capcom’s ValueCreation Activities

( )
Sales and Profit Declined Due to 7.5% Drop in Market Coupled with Downward Trend at Existing Stores
Market Trends and Operating Results for This Fiscal Year
We operate “Plaza Capcom” amusement facilities in Japan. These arcades are predominantly in large commercial complexes and host various events designed to attract families and female customers. We have diligently followed a scrap-and-build policy to maximize our efficiency in arcade operations.
Arcade Operations
Plaza Capcom KyotoAsobi Oukoku Peekaboo
Amuse Factory Tokoname Capcom Café KyaraCap Okazaki
Amid Signs of Recovery in the Market Environment, Capcom Expects Operating Income to Increase 14.4% through the Creation of New Earnings Opportunities
Outlook for the Next Fiscal Year
Arcade Operations Market (Billions of yen)
422.2Diagram 27
2016
9,24110,620
2014 2015
15.2
10.2
(Years ended March 31)
9,056
7.7
2016
6,3156,657
2014 2015
24.314.9
(Years ended March 31)
6,574
10.6
(Years ended March 31)
During the previous fiscal year (ended March 31, 2015), the size of the domestic arcade facilities market shrank to 422.2 billion yen (down 7.5% from the previous year). [Diagram27] This was due to the decline in personal consumption following the consumption tax increase implemented in April 2014, the spread of smartphones and the impact of scrambling to win shares of consumer free time amid a variety of leisure activities. Companies across the board closed unprofitable arcades and attempted to streamline management, resulting in the total number of arcades decreasing to 15,612 (down 2.8% from the previous year), [Diagram28] and annual sales per facility declined to 27.04 million yen (down 4.8% from the previous year), reducing the overall scale of this market. This fiscal year (ended March 31, 2016), market contraction slowed due to the resurgence of prizes and recovery from the impact of the consumption tax hike. With the slow pace of market recovery, Capcom strived to expand its customer base
by means of community-based store strategies. For example, for the middle-aged and seniors capcom conducted service days and free game experience tours ; for woman and families capcom set up additional Asobi Oukoku peekaboo sites and kids’Corners that targeted children. Nonetheless, segment results were soft, partly because of the lack of a high-performance product as well as sluggish demand due to the dispersion of entertainment toward smartphone games. During the period under review, Capcom developed arcade operations through its scrap and build strategy, and opened four arcades including the “Amuse Factory Tokoname” (Aichi Prefecture) and the innovative “Capcom Café” (Saitama Prefecture), while closing three arcades, bringing the total number of arcades to 34. As a result, net sales were 9.056 billion yen (down 2.0% from the previous fiscal year), and operating income was 699 million yen (down 25.6% from the previous fiscal year), with both sales and profit declining year on year. [Diagram29]
In terms of market outlook, we expect conditions to remain the same as in the previous year. In addition to the ongoing resurgence in prize games, we expect the introduction of popular arcade cabinets to increase customer traffic. Furthermore, revisions to the Entertainment and Amusement Trades Act (Entertainment and Amusement Trades Rationalizing Act) in June 2016 relaxed restrictions on the amount of time young people can spend in arcades when accompanied by a guardian, which is expected to give the market a boost. Next fiscal year (ending March 31, 2017), Capcom will promote streamlining of arcade management through its ongoing scrap and build policy to ensure earnings at the same level as the previous fiscal year through the creation of new earnings opportunities. Ongoing senior events will be held with the aim of attracting middle-aged and senior
customers, Capcom characters will be used to create themed “Capcom Café” restaurants and “Chara Cap” stores specializing in character merchandise will be opened among other efforts focused on expanding customers and creating new earnings opportunities. In terms of the opening and closing of facilities, in an attempt to further strengthen efficient arcade management operations, we will open new facilities in locations with high concentrations of customers to secure new revenue streams. Next fiscal year, we plan to open three facilities with no closures, resulting in a total of 37 facilities. As a result of these measures, expecting year on year sales of existing stores to be 100%, we forecast net sales of 9 billion yen (down 0.6% from the previous year) and operating income of 800 million yen(up 14.4% from the previous year).
billion yen
Number of Amusement Arcades (by number of machines) (Facilities)
15,612
Diagram 28
(Years ended March 31)
facilities
Below 50 machinesOver 101 machines 51–100 machines
Capcom
Adores
Aeon Fantasy
Sega Sammy
Bandai Namco
9.0
12.8
58.8
38.0
58.6
0.7
0.6
2.7
1.8
Undisclosed
7.7
5.1
4.7
4.7
−
NetsalesBillionsof yen
Operatingmargin
(%)
Comparison of Arcade Operations Performance (Year ended March 31, 2016)
Diagram 29
Net Sales/Operating Margin Assets/ROA
9,056 7.7 6,574 10.6Source: JAMMA “Survey on the Amusement Industry”
Source: JAMMA “Survey on the Amusement Industry”
470.0 456.4422.2
487.5495.8
2011 2012 2013 2014 2015
18,638
9,194
6,5516,5516 5516 5516,5516,551
18,114
8,798
6,6946,6946,6946,694
16,991
8,376
6,4596,4596,4596,459
16,069
7,450
6,5356,5356,5356,535
15,612
7,923
5,6985,6985,6985,698
2011 2012 2013 2014 2015
1,9902,893 2,622 2,156 2,084
Business Activity Achievements
Net sales (Millions of yen)
Operating Margin (%)
Assets (Millions of yen)
ROA (%)
S: Strengths W: Weaknesses O: Opportunities T: ThreatsSWOT Analysis
S WO T
Specialize in opening arcades in large shopping centers to secure a stable customer baseSales floor planning and management capabilities supporting customersThorough scrap-and-build strategy focused on investment efficiency to ensure sustainable earnings
Expand ability to draw customers by introducing popular machinesIncrease customers with appeals targeting seniors and childrenMultifaceted roll-out of merchandise sales, restaurants and other businesses using Capcom contents
Low sales growth rate due to small number of carefully selected facilitiesLittle synergy with proprietary contents
Potential customer segment shrinking due to falling birth rateIncreased consumption taxEntertainment diversification due to rapid growth of games for smartphones ( )
Operatingincome
Billionsof yen
Source: Financial reports and earnings materials of each company (Aeon Fantasy fiscal year ended February 2016)
Note: Segments include businesses other than arcade facilities operations and exclude corporate.
CAPCOM INTEGRATED REPORT 2016 CAPCOM INTEGRATED REPORT 201649 50
Message fromManagement
Growth Strategy Business Activity Achievements
ESG Information Financial and Corporate Data
Capcom’s ValueCreation Activities

We are engaged in two businesses that utilize the contents used for our home video games. The Pachinko & Pachislo (PS) business is involved in the development, manufacture and sales of frames and LCD devices for gaming machines as well as software. The Arcade Games Sales business develops, produces and sells arcade games for amusement facilities, creating synergy between businesses.
Amusement Equipments
Gaming Machines Market (Billions of yen)
1,069.3Diagram 30
Arcade Game Market (Billions of yen)
151.1Diagram 31
2016
7,540
23,160
2014 2015
30.8 36.3
(Years ended March 31)
13,343
21.1
2016
8,760
20,083
2014 2015
35.531.2
(Years ended March 31)
12,314
22.8
2011 2012 2013 2014 2015
2011 2012 2013 2014 2015
1,173.6 1,201.7 1,202.91,125.5 1,069.3
161.6173.8 167.5 163.5
151.1
Amid Continued Severe Market Conditions, Net Sales Increased 77.0% on Launch of Popular Pachislo Machines
Market Trends and Operating Results for This Fiscal Year
Projecting Increases in Net Sales of 12.4% and Operating Income of 6.7% on Provision of New Machines Making Use of Popular Brands
Outlook for the Next Fiscal Year
In the previous fiscal year (ended March 31, 2015), the gaming machine market shrank to 1,069.3 billion yen (down 5% from the previous year). This was due to a temporary decline in the number of new machines launched resulting from changes to rules concerning pachislo machine model certification*1 by the Security Electronics and Communications Technology Association that went into effect in September 2014 in the pachislo market, as well as the fifth straight year of declines in the Pachinko market. [Diagram30] In the arcade game market, although sales of claw crane and prize games were firm, arcade game and coin-operated game sales declined significantly, resulting the third consecutive year of negative growth at 151.1 billion yen (down 7.5% from the previous year). [Diagram31] This year (ended March 31, 2016), the gaming machine market remained weak on the
impact of pachinko machine gambling restrictions and pachislo machine third stage rule changes.*2 In the arcade game machine market, despite continued sluggishness in coin-operated games, popular music games and kids’ card games helped maintain the same level as in the previous year. This fiscal year (ended March 31, 2016), In the Pachinko and Pachislo sub-segment, the popularity of the Resident Evil 6 brand resulted in sales of 37,000 units, driving sales beyond initial projections to support earnings. In the Arcade Games Sales sub-segment, sales of Luigi Mansion Arcade were weak reflecting the sluggish market, while crossbeats REV. for arcades also struggled. As a result, net sales were 13.343 billion yen (up 77.0% from the previous year) and operating income was 2.812 billion yen (up 2.8% from the previous year).
In terms of the market outlook, despite the passage of rule changes affecting pachislo machines, top-selling product sales lots are on the decline, thus we anticipate demand will weaken. With respect to Pachinko machines, cabinet profitability will decline in line with gambling restrictions, thus investment in hall gaming machines will be increasingly selective. Accordingly, companies will steer towards cabinet development focused on efficiency and control development costs. In the PS sub-segment, Capcom aims to increase unit sales by (1) stably providing proprietary cabinets, (2) securing a strong sales network and improving development quality through an alliance with major sales company Fields Corp., and (3) releasing proprietary pachislo machines not dependent on gambling with a variety of
clever video elements and playing styles making use of popular consumer content. Next fiscal year, we are projecting sales of 55,000 units comprising four machines including Super Street Fighter IV and Devil May Cry X (Cross). In the Arcade Games Sales sub-segment, we expect performance to remain at the same level as in the previous year based on the resurgence of prizes and sales of popular arcade games. Accordingly, we plan to release new machines making use of popular content belonging to other companies, including Mario Party Fushigi no Challenge World. As a result of these measures, we expect sales and profits to rise in the next fiscal year. We forecast sales of 15 billion yen (up 12.4% from the previous year) and operating income of 3 billion yen (up 6.7% from the previous year).
billion yen
billion yen
886.9886.9886.9886.9
286.7
826.7826.7826.7826.7
375.0
772.9772.9772 9772 9772.9772.9
430.0
651.2651.2651.2651.2
474.3
643.7643.7643.7643.7
425.6
Pachinko Pachislo
*1 Model certification: A public test to verify whether or not gaming machines are in accordance with regulations conducted by the Security Communications Association on behalf of public safety commissions in each of Japan’s administrative divisions.
*2 Changes to certification methods: Three self-imposed restraints implemented in stages. Up to November 2014 (1) guarantee a minimum (55%) ball dispensing ratio, (2) implement limits on penalty functions, and from December 2015 (3) implement functional limitations in sub-substrates. Devil May Cry X (Cross) Mario Party Fushigi no Challenge WorldSuper Street Fighter IVResident Evil 6
Net Sales/Operating Margin Assets/ROA
13,343 21.1 12,314 22.8
(Years ended March 31)
Source: Manufacturer sales base complied by Capcom using Pachinko Maker Trends (2013, 2014, 2015); Yano Research Institute Ltd.
(Years ended March 31)
Source: JAMMA “Survey on the Amusement Industry”
Licensed by Nintendo © 2012 Nintendo© CAPCOM CO., LTD. 2016 ALL RIGHTS RESERVED.
Business Activity Achievements
Net sales (Millions of yen)
Operating Margin (%)
Assets (Millions of yen)
ROA (%)
S: Strengths W: Weaknesses O: Opportunities T: ThreatsSWOT Analysis
S WO T
High quality development capabilities cultivated through home video gamesMultiple usage of rich in-house contentsAbility to observe real-time market trends through company-owned arcades
Market recovery via introduction of popular machinesLong-term profit opportunity with pay-as-you-go modelDemand generated by installing new cabinets compliant with rule changes
Small title lineupShortage development staff
Declining operator and hall investment appetiteLong-term market stagnation Market fluctuations resulting from changes to The Entertainment Establishments Control Law and certification rules
CAPCOM INTEGRATED REPORT 2016 CAPCOM INTEGRATED REPORT 201651 52
Message fromManagement
Growth Strategy Business Activity Achievements
ESG Information Financial and Corporate Data
Capcom’s ValueCreation Activities

Based on a Single Content Multiple Usage strategy of developing game content for various media, we will pursue a variety of copyright-related business opportunities including publishing (walkthrough and strategy guides as well as game settings collections) and licensing (music CDs and licensed merchandise). Furthermore, we are concentrating on developing game content into movie and TV animation programs.
Other Businesses
2016
2,1442,594
2014 2015
38.630.8
(Years ended March 31)
2,043
25.0
2016
6,534
4,331
2014 2015
23.1
10.1
(Years ended March 31)
4,926
10.4
List of Our Main Content that Has Been Adapted into Movies and Theatrical Productions
Diagram 33
RESIDENT EVIL: AFTERLIFERESIDENT EVIL: RETRIBUTIONRESIDENT EVIL: EXTINCTIONRESIDENT EVIL: APOCALYPSERESIDENT EVILSTREET FIGHTERSILENT HILLFINAL FANTASY: THE SPIRITS WITHINSUPER MARIO BROS.HOUSE OF THE DEAD
Capcom
Capcom
Capcom
Capcom
CapcomCapcomKonami
Square
NintendoSega
$296,221,663
$240,159,255
$147,717,833
$129,394,835
$102,441,078$99,423,521$97,607,453
$85,131,830
$20,915,465$13,818,181
Originalwriter
companyTitle
Box-officerevenue
(worldwide)
Revenue Ranking of Japanese Game Contents that Have Been Adapted into Hollywood Movies
Diagram 32
Aug. 1994Dec. 1994Mar. 2002
Sep. 2004
Nov. 2007
Oct. 2008
Sep. 2010
Jun. 2011
Feb. 2012
Sep. 2012
Dec. 2016
Apr. 1995
Mar. 2002
Apr. 2009
Apr. 2016
Oct. 2016
Feb. 2009
Jul. 2009
Aug. 2009
Jan. 2013
Jun. 2013
Aug. 2015
Oct. 2015
Jul. 2012
Animated movieHollywood movieHollywood movie
Hollywood movie
Hollywood movie
CG movie
Hollywood movie
Animated movie
Movie
Hollywood movie
Hollywood movie
TV animation
TV animation
TV animation
TV animation
TV animation
Takarazuka Revue Company
Theatrical productionTakarazuka Revue Company
Takarazuka Revue Company
Takarazuka Revue Company
Theatrical production
Theatrical production
TV drama
Movie
Resident Evil The Escape 2 Monster Hunter The Real 2
Street Fighter IIStreet FighterResident EvilResident Evil: ApocalypseResident Evil: ExtinctionResident Evil: DegenerationResident Evil: Afterlife 3DSengoku BASARA –The Last Party–Ace AttorneyResident Evil: RetributionResident Evil: The Final Chapter
Street Fighter II VMega Man Battle NetworkSengoku BASARAGyakuten Saiban: Sono “Shinjitsu”, Igiari!Monster Hunter Stories RIDE ON
Phoenix Wright: Ace Attorney –The Truth Comes Back to LifeSengoku BASARAPhoenix Wright: Ace Attorney 2Prosecutor Miles Edgeworth: Ace Attorney 3
Sengoku BASARA
Sengoku BASARA vs Devil May CryBIOHAZARD THE STAGE
Sengoku BASARA –MOONLIGHT PARTY–
TV animation
Theatrical production
TV drama
2,043 25.0 4,926 10.4
As of June 30, 2016 (Capcom figures)
Gyakuten Saiban: Sono “Shinjitsu”, Igiari!© CAPCOM/Yomiuri TV, A-1 Pictures
Monster Hunter Stories RIDE ON© CAPCOM/MHST Committee
Business Activity Achievements
Net Sales/Operating Margin Assets/ROANet sales (Millions of yen)
Operating Margin (%)
Assets (Millions of yen)
ROA (%)
S: Strengths W: Weaknesses O: Opportunities T: ThreatsSWOT Analysis
S WO T
Synergetic effect from multifaceted use of rich contentsBrand value increased through high media exposure High profitability
Expansion into film, animation, comics, stage productions, orchestral performances and other development mediaContents business demand area expansion
Low return of sales from licensed products
Direct competition with other company’s contents as a result of globalization
Net Sales Declined 4.7% Remaining the Same as the Previous Fiscal Year, While Operating Income Decreased 22.7%
Operating Results for This Fiscal Year
Further Enhancement of Single Content Multiple Usage Developments
Outlook for the Next Fiscal Year
Capcom’s strength is its ability to utilize its rich library of content across multiple mediums, reaping the benefits of the highly synergetic effects of consumer and online games. In particular, the brand value of our movie-related business has risen through extensive media exposure. This leads to greater sales of video game software and the long-term maintenance of content value, completing a virtuous sales cycle. These projects were implemented across all business segments, with each division involved in the launch of arcade games, mobile contents, walkthrough and strategy guides and character merchandise, as well as movies, TV animation, theatrical productions and other events in a variety of areas in connection with the release of our game software. [Diagram32,33] Please refer to “Capcom’s Business Model” on
pages 13–14.
This fiscal year, in conjunction with the release of Monster Hunter X (Cross), we held “Monster Hunter Festa ’16” in January 2016 in five cities across Japan. We also made efforts to appeal to existing users and acquire new fans through experience-based events including “Resident Evil The Escape 2” and “Monster Hunter The Real 2” conducted in collaboration with Universal Studios Japan at “Universal Cool Japan 2016” held in February 2016. We also continue appealing to non-game users through the Sengoku BASARA series TV animation and theatrical productions. As a result, net sales were 2.043 billion yen (down 4.7% from the previous year) and operating income was 511 million yen (down 22.7%), reflecting the recognition of amortization expenses in line with our new R&D facility, which was responsible for declines in sales and profit.
Until now, Capcom has aggressively promoted the horizontal deployment of intellectual properties (contents) based on the Single Content Multiple Usage strategy. In Japan, TV animation “Gyakuten Saiban: Sono “Shinjitsu”, Igiari!” will be broadcast in conjunction with the release of Ace Attorney 6. In line with the October 2016 release of Consumer game Monster Hunter Stories, the first Monster Hunter TV animation will be broadcast. In conjunction with the overseas release of RESIDENT EVIL 7 biohazard, the Hollywood movie “Resident Evil: The Final Chapter” will be released
in Japan in December 2016, then globally in January 2017. We will endeavor to expand licensing earnings and improve brand value through movies and other media for a variety of other series. As a result of these measures, the next fiscal year earnings forecast calls for net sales of 2 billion yen (down 2.1% from the previous year)and operating income of 200 million yen (down 60.9% from the previous year). The reason for the decline in profitability is the recognition of amortization expenses in line with our new R&D building.
CAPCOM INTEGRATED REPORT 2016 CAPCOM INTEGRATED REPORT 201653 54
Message fromManagement
Growth Strategy Business Activity Achievements
ESG Information Financial and Corporate Data
Capcom’s ValueCreation Activities
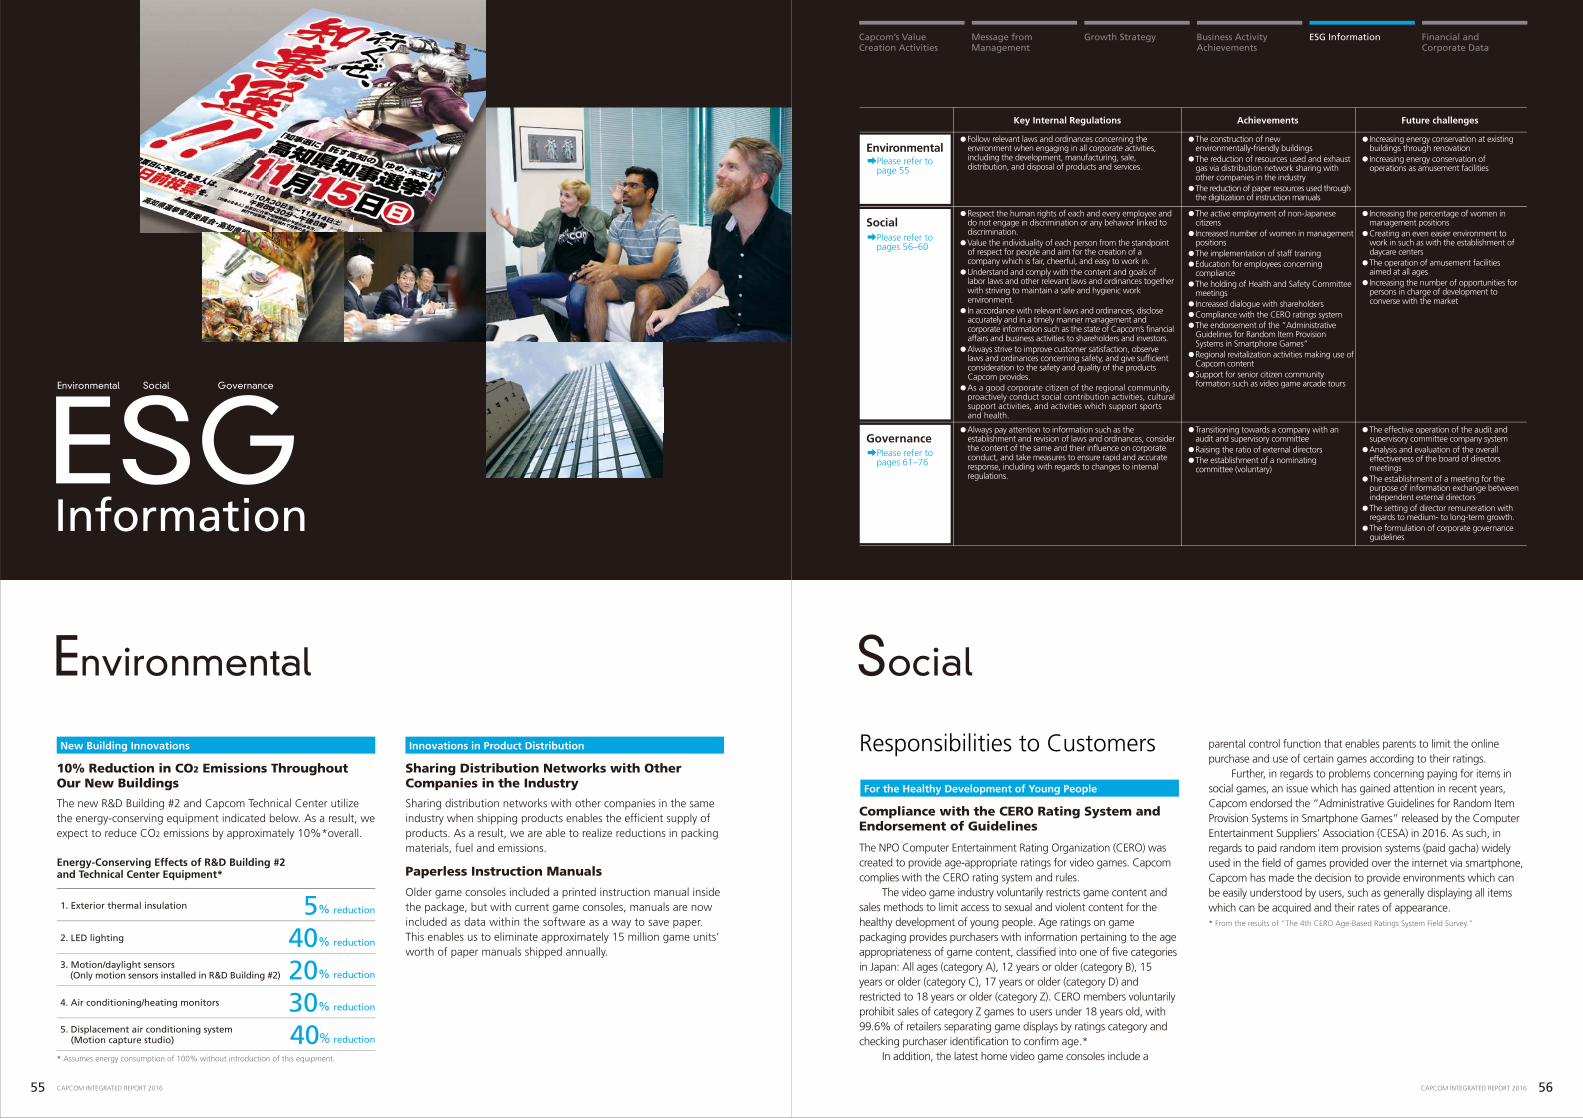
Responsibilities to Customers
ESGInformation
Achievements Future challengesKey Internal Regulations
Environmental
Social
Please refer to page 55
Please refer to pages 56–60
Please refer to pages 61–76
The new R&D Building #2 and Capcom Technical Center utilize the energy-conserving equipment indicated below. As a result, we expect to reduce CO2 emissions by approximately 10%*overall.
New Building Innovations
10% Reduction in CO2 Emissions Throughout Our New Buildings
The NPO Computer Entertainment Rating Organization (CERO) was created to provide age-appropriate ratings for video games. Capcom complies with the CERO rating system and rules. The video game industry voluntarily restricts game content and sales methods to limit access to sexual and violent content for the healthy development of young people. Age ratings on game packaging provides purchasers with information pertaining to the age appropriateness of game content, classified into one of five categories in Japan: All ages (category A), 12 years or older (category B), 15 years or older (category C), 17 years or older (category D) and restricted to 18 years or older (category Z). CERO members voluntarily prohibit sales of category Z games to users under 18 years old, with 99.6% of retailers separating game displays by ratings category and checking purchaser identification to confirm age.* In addition, the latest home video game consoles include a
For the Healthy Development of Young People
Compliance with the CERO Rating System and Endorsement of Guidelines
Innovations in Product Distribution
Sharing distribution networks with other companies in the same industry when shipping products enables the efficient supply of products. As a result, we are able to realize reductions in packing materials, fuel and emissions.
Sharing Distribution Networks with Other Companies in the Industry
Older game consoles included a printed instruction manual inside the package, but with current game consoles, manuals are now included as data within the software as a way to save paper. This enables us to eliminate approximately 15 million game units’ worth of paper manuals shipped annually.
Paperless Instruction ManualsEnergy-Conserving Effects of R&D Building #2 and Technical Center Equipment*
Environmental
SocialEnvironmental
Social Governance
parental control function that enables parents to limit the online purchase and use of certain games according to their ratings. Further, in regards to problems concerning paying for items in social games, an issue which has gained attention in recent years, Capcom endorsed the “Administrative Guidelines for Random Item Provision Systems in Smartphone Games” released by the Computer Entertainment Suppliers’ Association (CESA) in 2016. As such, in regards to paid random item provision systems (paid gacha) widely used in the field of games provided over the internet via smartphone, Capcom has made the decision to provide environments which can be easily understood by users, such as generally displaying all items which can be acquired and their rates of appearance.
Governance
* From the results of “The 4th CERO Age-Based Ratings System Field Survey.”
* Assumes energy consumption of 100% without introduction of this equipment.
5% reduction
40% reduction
20% reduction
30% reduction
40% reduction
1. Exterior thermal insulation
2. LED lighting
3. Motion/daylight sensors (Only motion sensors installed in R&D Building #2)
4. Air conditioning/heating monitors
5. Displacement air conditioning system (Motion capture studio)
Follow relevant laws and ordinances concerning the environment when engaging in all corporate activities, including the development, manufacturing, sale, distribution, and disposal of products and services.
Increasing the percentage of women in management positions Creating an even easier environment to
work in such as with the establishment of daycare centers The operation of amusement facilities
aimed at all ages Increasing the number of opportunities for
persons in charge of development to converse with the market
The effective operation of the audit and supervisory committee company system Analysis and evaluation of the overall
effectiveness of the board of directors meetings The establishment of a meeting for the
purpose of information exchange between independent external directors The setting of director remuneration with
regards to medium- to long-term growth. The formulation of corporate governance
guidelines
Increasing energy conservation at existing buildings through renovation Increasing energy conservation of
operations as amusement facilities
The active employment of non-Japanese citizens Increased number of women in management
positions The implementation of staff training Education for employees concerning
compliance The holding of Health and Safety Committee
meetings Increased dialogue with shareholders Compliance with the CERO ratings system The endorsement of the “Administrative
Guidelines for Random Item Provision Systems in Smartphone Games” Regional revitalization activities making use of
Capcom content Support for senior citizen community
formation such as video game arcade tours
Transitioning towards a company with an audit and supervisory committee Raising the ratio of external directors The establishment of a nominating
committee (voluntary)
The construction of new environmentally-friendly buildings The reduction of resources used and exhaust
gas via distribution network sharing with other companies in the industry The reduction of paper resources used through
the digitization of instruction manuals
Respect the human rights of each and every employee and do not engage in discrimination or any behavior linked to discrimination. Value the individuality of each person from the standpoint
of respect for people and aim for the creation of a company which is fair, cheerful, and easy to work in. Understand and comply with the content and goals of
labor laws and other relevant laws and ordinances together with striving to maintain a safe and hygienic work environment. In accordance with relevant laws and ordinances, disclose
accurately and in a timely manner management and corporate information such as the state of Capcom’s financial affairs and business activities to shareholders and investors. Always strive to improve customer satisfaction, observe
laws and ordinances concerning safety, and give sufficient consideration to the safety and quality of the products Capcom provides. As a good corporate citizen of the regional community,
proactively conduct social contribution activities, cultural support activities, and activities which support sports and health.
Always pay attention to information such as the establishment and revision of laws and ordinances, consider the content of the same and their influence on corporate conduct, and take measures to ensure rapid and accurate response, including with regards to changes to internal regulations.
CAPCOM INTEGRATED REPORT 2016 CAPCOM INTEGRATED REPORT 201655 56
Message fromManagement
Growth Strategy Business Activity Achievements
ESG Information Financial and Corporate Data
Capcom’s ValueCreation Activities

Social
Responsibilities to Business Partners
Capcom has established its own “Regulations Concerning the Management of Purchasing Transactions” and “Regulations Concerning the Management of Outsourced Transactions” in order to carry out free competition and fair business transactions. In line with this, Capcom fairly evaluates conditions such as capability and cost to select suppliers and development outsourcers. In addition, as regards business transactions with specified involved parties such as subsidiaries, Capcom compares such business transactions with standard conditions and does not engage in transactions which would be disadvantageous to Capcom or which would unfairly profit the specified involved party.
Basic Policies Regarding Business Transactions
Promotion of Fair Business Transactions Based on Each Regulation
Responsibilities to the General Public
Utilizing the power of our content to capture the attention of people, Capcom is engaged in the following four regional revitalization activities: 1) Economic promotion which supports the promotion of tourism industries; 2) cultural promotion which supports education concerning local history and culture; 3) the improvement of public order through coordination with the police; and 4) raising awareness about voting in elections in coordination with the Committee for Election Administration. In 2015, Capcom supported historical and cultural education. Capcom concluded the Comprehensive Agreement to Promote Vitalization of Local Economy with the city of Kofu in Yamanashi Prefecture and implemented a variety of plans whose goal is to support the promotion of industry in the city as part of regional revitalization efforts until 2019, including providing the city with characters for premium gift certificates and the design for a character called “Kofu BASARA Shingen-kun” who will be the honorary head of a group for promoting Kofu tourism PR. (For details concerning the Comprehensive Agreement to Promote Vitalization of Local Economy, please see the separate booklet, The Latest Development Report.) Capcom also jointly sponsored a
Contributions to Regional Revitalization
Support Activities Using Popular Games to Attract Customers and Raise Awareness
Monthly Health and Safety Committee meetings include the attendance of an employee representative, an observer and a company representative. At these meetings, the results of hours worked are analyzed in terms of overtime and workload appropriateness, causal factors and improvement policies are discussed and occupational injuries and workplace environment conditions are reported to the committee to promote the creation of a comfortable working environment. Attention is also focused on prevalent illnesses and ailments common among game creators, with public health and industrial doctors regularly invited to perform physical exams and reexaminations to ascertain employee health conditions. These activities have resulted in a steady increase in the number of employees submitting medical certificates for physical examinations and reexaminations each year.
Occupational Health and Safety
Monthly Health and Safety Committee Meetings in Order to a Comfortable Work Environment
Video games are a comparatively new cultural phenomenon about which there is little academic research. Rather than examining the educational aspects, discussions tend to focus on the detrimental effects of violent content. For example, some local municipalities have designated certain games to be harmful to the healthy development of young people. At the same time, the idea of a future career as a video game creator is very popular among children, and some schools have even begun to incorporate handheld video game consoles into the classroom in recent years. As part of its social responsibility (CSR) efforts as a video game software producer and based around a desire to promote understanding in society of video games, Capcom accepts student visits to its offices, with a focus on elementary and junior high school students, and also actively conducts on-site classes at schools. At these events, Capcom conducts a program with two sessions: one is a career education support session which introduces the work done in a game software company and the difficulty and rewards of that work, and the other is a game literacy education support session which helps students use their own judgement to establish a healthy relationship with games. These programs have in turn been well-received in educational environments. Capcom has also incorporated opinions from educators to improve its educational efforts. In fiscal 2011, Capcom launched its second educational program, focused on the educational theme of career education support. In fiscal 2013, Capcom started a new class program on work and mathematics targeted towards elementary and junior high school students to help prevent children from losing interest in math, a challenge in recent years.
Educational Assistance as a Game Company
Company Visits for Children and On-site Classes at Schools
Providing Career Paths for Employees and Improving the Work Environment
Company-wide Training and Level-based Training
To provide career paths and improve the work environment, Capcom provides the following training.
Corporate Governance and CSR
Action Criteria and Compliance-related Employee Education
The Capcom Code of Conduct calls for “free competition and fair trade,” “respect for human rights and individuality and the prohibition of discrimination” and “environmental conservation and protection.” To ensure a concrete understanding of these concepts, we created the Capcom Group Code of Conduct Handbook, which is distributed to all employees and contains illustrated case studies presented in an easily understandable Q&A format. We also make use of the company intranet to provide e-learning sessions on legal compliance and disseminate personal information protection rules to all employees.
Responsibilities to Employees
Capcom is currently engaged in initiatives aimed at improving the work environment for women, promoting gender equality and proactively hiring foreigners. In terms of improving the work environment for women, we introduced systems enabling women to take a leave of absence before and after giving birth, childcare leave and shortened working hours, and promote their use throughout the company. In fiscal 2015, 24 employees utilized the childcare leave system. The utilization rate among women was 100% (in fiscal 2014, 21 employees utilized this system, of which five were men and the utilization rate among women was 100%). The return rate after childcare leave was also high. In fiscal 2015, 17 employees returned
Promotion of Diversity
Initiatives Aimed at Improving the Work Environment for Women, Promoting Gender Equality and Proactively Hiring Foreigners
to the workplace. Excluding those still on leave, 94.4% returned (in fiscal 2014, 17 employees returned, a return rate of 94.4%). As a result, in the Japanese game industry, known for being a male-dominated industry, nearly 16% of Capcom’s developers are women, and we have 24 female managers (representing 10.3% of managers overall). Further, Capcom has drawn up a “General Employer Action Plan” based on the “Act for the Promotion of Women's Success” which aims for 1) women comprising no less than 20% of regular employees and 2) women in no less than 15% of management positions within a five year period by the end of fiscal 2021. To further increase the proactive involvement of women, we are hastening the establishment of a daycare facility in fiscal 2016. In recognition of Capcom’s efforts toward improving the workplace environment for women, since 2012 we have earned the “Kurumin” mark, the symbol of a “company supporting childcare,” from the Ministry of Health, Labor and Welfare. In terms of the proactive employment of non-Japanese citizens, Capcom is making efforts to strengthen overseas expansion capabilities including creating an English hiring website. We currently employ 91 foreigners (representing 4.0% of our employees). Going forward, we will create a system for improving motivation in an attempt to increase the ratio of foreign employees, including the support for career advancement and the promotion of non-Japanese citizens to management positions.
Capcom School Visit Feedback
We received a wide range of comments after our Capcom school visits and student company visits.
”I realized that I was playing games too much. In the future, I want to decide how long I will play.” (Elementary school student)
”Hearing my studies now will help me in the future makes me want to keep trying hard.” (Junior high school student)
”Some parts were hard for a fourth grader, but everyone seemed really interested, such as students talking about it between each other after.” (Elementary school teacher)
”As there are limited ways to get information on the game industry, from the perspective of career education I felt it was useful even for high school students.” (Junior high school teacher at an integrated junior and senior high school)
Major Training Programs
An on-site class
(Left) Kofu BASARA Shingen-kun(Right) Commercials for Kochi prefectural governor’s electionCapcom Group Code of Conduct Handbook
Early CareerLevel-based training
Training for new hiresMentor trainingFollow-up trainingTraining for management candidatesManagement by Objectives (MBO)Mental healthcareCompliance trainingPersonal information trainingEnglish instruction
Management-levelMid-level
Company-wide training
Compulsory
Optional
special exhibition of arms and armor connected to famous military commanders appearing in Sengoku BASARA at the Saitama Prefectural Museum of History and Folklore. In addition, Capcom collaborated in activities to spread awareness of the Kochi prefectural governor's election announced in November by offering Chosokabe Motochika, who appears in Sengoku BASARA, as a character for education on the election.
Action criteria and compliance are the lynchpin of corporate governance and the foundation upon which we fulfill CSR. Capcom will continue to instill this understanding in all its officers and employees.
As a result of these efforts, Capcom has welcomed 2,437 children as part of 313 different field trips into its offices (as of the end of March 2016). Capcom has also held 91 on-site classes for some 9,095 students at schools such as Nara Prefectural Seisho Junior High School (as of the end of March 2016).
“Kurumin” mark
24
Ratio of Female Employees and Number of Female Managers
Number of Female Managers (People) Ratio of Female Employees (%)
2012
20
2013
19
2011
11
2010
10
2014
20
2015
24
20 1920
(Fiscal year)
19%People
21 2121
CAPCOM INTEGRATED REPORT 2016 CAPCOM INTEGRATED REPORT 201657 58
Message fromManagement
Growth Strategy Business Activity Achievements
ESG Information Financial and Corporate Data
Capcom’s ValueCreation Activities

Video games are a comparatively new cultural phenomenon about which there is little academic research. Rather than examining the educational aspects, discussions tend to focus on the detrimental effects of violent content. For example, some local municipalities have designated certain games to be harmful to the healthy development of young people. At the same time, the idea of a future career as a video game creator is very popular among children, and some schools have even begun to incorporate handheld video game consoles into the classroom in recent years. As part of its social responsibility (CSR) efforts as a video game software producer and based around a desire to promote understanding in society of video games, Capcom accepts student visits to its offices, with a focus on elementary and junior high school students, and also actively conducts on-site classes at schools. At these events, Capcom conducts a program with two sessions: one is a career education support session which introduces the work done in a game software company and the difficulty and rewards of that work, and the other is a game literacy education support session which helps students use their own judgement to establish a healthy relationship with games. These programs have in turn been well-received in educational environments. Capcom has also incorporated opinions from educators to improve its educational efforts. In fiscal 2011, Capcom launched its second educational program, focused on the educational theme of career education support. In fiscal 2013, Capcom started a new class program on work and mathematics targeted towards elementary and junior high school students to help prevent children from losing interest in math, a challenge in recent years.
Social
Today, amusement facilities, otherwise known as video game arcades, are becoming increasingly popular among retired senior citizens as spaces for communication with other people. Since 2012, Capcom has held video game arcade tours on long public holidays and Respect-for-the-Aged Day for senior citizens where they can try out coin-operated games and crane games so that more people can make use of such facilities. In addition, as part of efforts to create arcades where senior citizens can comfortably enjoy themselves, since 2012 Capcom has encouraged arcade staff to get the Service Assistant certification. Currently, 27 staff have received this certification.
Community Building Support for Senior Citizens
Regular Video Game Arcade Tours
Third-Party Assessment of IR Activities
High Praise for Proactive IR Initiatives
In recognition of our ongoing pursuit of timely and appropriate information disclosure, our IR activities and various IR tools have received a number of awards from third-party organizations. In addition to receiving the Special Prize at the Nikkei Annual Report Awards 2015 in the fiscal year ended March 2016, our IR website was selected by Daiwa Investor Relations for the Internet IR Grand Prize and we ranked second overall in the Fiscal 2015 Listed Company Website Quality Ranking. With an awareness of the importance of accountability, we will continue our efforts to earn the trust of investors and provide timely disclosure.
Responsibilities to Shareholders and Investors
To ensure our General Shareholders’ Meetings are lively, we hold our meeting about 10 days before the period when most Japanese companies typically hold their meetings in an attempt to encourage the attendance of as many shareholders as possible. In addition, voting rights can be exercised via computer, smartphone, mobile phone and Internet. Participating in the digital exercise of voting rights platform, institutional investors are ensured a sufficient amount of time to consider proposals starting on the day the convocation notices are distributed. We also post convocation notices in English on our corporate website to promote the exercise of voting rights by shareholders in Japan and overseas.
Initiatives for the General Shareholders’ Meeting
Making Shareholders’ Meetings Lively and Facilitating the Exercise of Voting Rights
Capcom believes that the timely and appropriate disclosure of information is the duty of every listed company, and that accountability to our shareholders and investors is indispensable from the perspective of corporate governance. To this end, Capcom is promoting highly transparent management via the implementation of a basic policy for IR activities which involves (1) the establishment of a responsible investor relations framework, (2) the thorough disclosure of information, and (3) the creation of a system for the timely disclosure of information.
Basic Policies Regarding IR Activities
1. Disclosure Policies
Through meetings with investors and analysts, Capcom’s IR Department attempts to promote an understanding of
Making Use of Shareholder and Investor Opinions
Reflecting Results of Dialogues with Investors and Analysts in Management
To prevent the unauthorized disclosure of quarterly earnings information prior to official announcements, Capcom has established a quiet period starting approximately one month prior to the scheduled earnings announcement. During this period, we refuse all inquiries relating to our business performance. However, if significant changes to our earnings outlook are anticipated during the quiet period, we will disclose this information pursuant to the Timely Disclosure Rules and other regulations.
3. Quiet Period
Capcom provides timely disclosure in accordance with the Securities and Exchange Law and other regulations including the “Rules on Timely Disclosure of Corporate Information” by Issuer of Listed Security (hereinafter Timely Disclosure Rules) stipulated by the Financial Instruments and Exchange Act and the Tokyo Stock Exchange.
2. Disclosure Criteria
Fiscal 2015 Third Party Evaluations
Integrated Reports
IR Website
18th Nikkei Annual Report Awards Special Prize
League of American Communications Professionals (LACP) 2014 Vision Awards Annual Report Competition, Bronze Award, Technology/Software category
Daiwa Investor Relations Co., Ltd. 2015 Internet IR Grand Prize
Morningstar Inc./Gómez Consulting Ranked 4th overall in Gomez IR Website Ranking 2015
Nikko Investor Relations Co., Ltd.Ranked 2nd overall in the Fiscal 2015 Listed Company Website Quality Ranking
A discussion with shareholders Our earnings presentation
management policies, strategies and future outlook with them. Furthermore, their opinions are gathered and provided to management, and are utilized for corporate management going forward. As a company based in Osaka, proactive IR meetings with these parties enables us to minimize asymmetric information as we strive to achieve appropriate corporate value. This fiscal year, meetings with investors in Japan and overseas and conference calls amounted to 370 points of contact with investors. In addition, we conducted various initiatives in accordance with our adoption of our Corporate Governance Code. Specifically, our General Affairs Section collaborated with the Investor Relations Section on takeover defense measures, engaged in numerous discussions with shareholders in Japan and overseas concerning the validity of their content, and made changes where necessary while promoting understanding of the necessity of these measures. Furthermore, we set up small meetings between external directors and investors to facilitate frank discussions pertaining to governance. We also arranged opportunities for senior management to exchange opinions directly with investors, who were provided with a chance to experience the latest virtual reality (VR) technologies. At our earnings presentation, we showed videos of developer interviews related to titles of interest to investors, as well as a variety of other new initiatives aimed at reflecting stock market opinions and demands. In addition, Capcom conducts a perception gap study every year targeting investors and analysts in Japan and overseas. Being aware of investor perception gaps with regard to management objectives, business strategy and shareholder’s return enables us to fine-tune corporate management and IR activities. Questionnaires are also given to attendees at our semiannual Presentation of
Fiscal 2015 IR Measures
Visited by requests
Visited domestic investors
Visited overseas investors
Total
186
99
85
370
IR Events
CEO small meeting
COO small meeting
External director small meetings
Supplementary explanatory earnings administrative officer conference call
Latest technology experience-based event
Showed developer interviews during earnings presentation
Conducted perception gap study
Event DetailsSpeaker: Kenzo Tsujimoto, Chairman and CEO
Speaker: Haruhiro Tsujimoto, President and COO
Speaker: Takayuki Morinaga, External Director
Conference call before/after earnings announcement to explain the results
Conducted experience-based demonstration of latest VR technologies, promoted understanding of Capcom development technologies
Used developer videos to explain development status of latest titles of high interest to the market
Conducted assessment survey targeting investors and analysts in Japan and overseas regarding Capcom’s management targets, strategies and IR activities, provided feedback to management
Since 2001, Capcom has made proactive use of its corporate website as a tool for disseminating information pertaining to IR activities. The main reasons for this are to ensure fairness for a wide range of stakeholders, including investors, analysts, the mass media and job-seekers, and because it easily ensures information is available for inspection immediately in about 200 countries worldwide. Capcom’s corporate website is also positioned as our most cost-effective tool.
IR Activities on Our Website
Utilizing a Website That Anyone Can Access
Capcom IR activities are conducted by five full-time staff members in addition to the chairman, the president and the IR director on behalf of shareholders and investors in Japan and overseas. For earnings information and other IR-related inquiries, please use the contact information below.
IR Team
Full-Time Staff Engaged in a Wide Variety of Activities
Public Relations & Investor Relations SectionPHONE: +81-6-6920-3623E-mail: [email protected] Hours: 9:00–12:00, 13:00–17:30 (JST) (excluding weekends and public holidays)
By category Frequency
It is our policy to disclose as much information as possible, including the disclosure of information not required by the Timely Disclosure Rules and other regulations, to accommodate our investors’ needs. We also disclose information through our corporate website in an attempt to provide quick and fair disclosure. Shareholders are informed of operating results and business conditions through shareholder letters.
Perception Gap Study Investor Feedback (Excerpts)
Even though you had popular IPs, no results were seen in mobile. I have the impression that not many measures are being taken towards further reinforcement, including outsourcing.
In terms of shortening the development period for popular series titles, other than Monster Hunter the lineup was not mentioned, so I am uneasy about its progress.
Leaving treasury stock on the balance sheet long term is a problem. I understand keeping it for M&As, etc., but in principle, it should be retired.
I would like to know the state of the development system, so I would like a meeting to be held with developers.
How about releasing catalog sales ratios as material for evaluating strategies for anchoring long-term users.
As a result of these efforts, Capcom has welcomed 2,437 children as part of 313 different field trips into its offices (as of the end of March 2016). Capcom has also held 91 on-site classes for some 9,095 students at schools such as Nara Prefectural Seisho Junior High School (as of the end of March 2016).
Financial Results and individual investor briefing sessions, allowing us to make proactive use of market opinions as one criterion in management decisions. Specific examples of how this information is used include (1) medium-term business goal revisions, (2) enhanced business strategies, (3) information disclosure content and timing reviews and (4) group meetings with management.
CAPCOM INTEGRATED REPORT 2016 CAPCOM INTEGRATED REPORT 201659 60
Message fromManagement
Growth Strategy Business Activity Achievements
ESG Information Financial and Corporate Data
Capcom’s ValueCreation Activities

Director and Executive Corporate Officer, Chief Financial Officer (CFO)
Kenkichi Nomura
External Independent Director
External Independent Director
Apr. 1957 Entered into the Ministry of FinanceNov. 1973 Personal Secretary to the Minister of FinanceJan. 1977 Executive Secretary to the Prime MinisterJun. 1988 Deputy Vice Minister of FinanceJun. 1990 Director-General of the Budget Bureau of the Ministry of
FinanceJun. 1991 Administrative Vice Minister of FinanceMay 1994 Governor of the Export-Import Bank of JapanOct. 1999 Governor of Japan Bank for International CooperationSep. 2001 Advisor of the Kansai Electric Power Co., Inc.Jan. 2002 Chairman of Yomiuri International Economic Society
(to present)Jul. 2002 President of Japan Investor Protection FundJun. 2004 External Corporate Auditor of Shiseido Co., Ltd.Aug. 2004 President of Capital Market Promotion Foundation
(Currently Capital Market Promotion Public Interest Incorporated Foundation)
Jun. 2007 External Director of the Company (to present)Jan. 2014 Advisor of Capital Market Promotion Public Interest
Incorporated Foundation (to present)
Jun. 1988 Entered into the CompanyApr. 1997 General Manager of Overseas Business Dept. of the
CompanyJul. 1999 Corporate Officer, General Manager of Overseas
Business Dept. of the CompanyOct. 2002 General Manager of General Affairs Dept. of the CompanyApr. 2004 Senior Manager of Investor Relations Section of the
CompanyJun. 2004 Corporate Auditor of the Company (full-time) Jun. 2016 Director (Full-time member of the Audit and Supervisory
Committee) of the Company (to present)
Apr. 1975 Admitted to Japanese Bar (The Dai-ichi Tokyo Bar Association) Ozaki & Momo-o
Aug. 1978 Weil, Gotshal & Manges in New YorkMar. 1979 Admitted to New York BarApr. 1989 Partner of Momo-o, Matsuo & Namba (to present)Apr. 1997 Lecturer of Nihon University, Faculty of Law:
International Transaction LawJun. 1999 External Corporate Auditor of Victor Company of
Japan, LimitedJun. 2000 External Corporate Auditor of Billing System CorporationJun. 2003 External Corporate Auditor of Yamanouchi
Pharmaceutical, Co., Ltd.Jun. 2004 External Director of the said CompanyApr. 2005 External Director of Astellas Pharma Inc. Lecturer of
Hitotsubashi University Faculty and Graduate School of Law: World Business Law
Jun. 2007 External Director of the CompanyOct. 2008 External Director of JVC KENWOOD Holdings, Inc.Jun. 2009 External Corporate Auditor of Toray Industries, Inc.Mar. 2015 External Director of TonenGeneral Sekiyu K.K. (to present)Jun. 2016 External Director (Audit and Supervisory Committee) of
the Company (to present)
Apr. 1964 Entered into The Export-Import Bank of JapanApr. 1992 General Manager of Personnel Division of the said BankApr. 1994 General Manager, Osaka Branch of the said BankApr. 1996 Senior General Manager of the said BankSep. 1998 Managing Director of Yazaki CorporationSep. 2000 Senior Managing Director of the said CompanyJun. 2006 Vice Chairman of the said CompanyJun. 2007 Director and Executive Councilor of the said CompanyJun. 2008 Advisor of the said CompanyJun. 2009 External Director of the CompanyJun. 2016 External Director (Audit and Supervisory Committee) of
the Company (to present)
Chairman and Chief Executive Officer (CEO)
Kenzo Tsujimoto
Jul. 1985 President and Representative Director of the CompanyApr. 2001 Chief Executive Officer (CEO) of the Company (to present)Jul. 2007 Chairman and Representative Director of the Company
(to present)
President and Chief Operating Officer (COO)
Haruhiro Tsujimoto
Apr. 1987 Entered into the CompanyJun. 1997 Director of the CompanyFeb. 1999 Managing Director of the CompanyApr. 2001 Senior Managing Director of the CompanyJul. 2004 Director and Executive Corporate Officer of the CompanyApr. 2006 Director and Executive Vice President of the CompanyJul. 2007 Representative Director, President and Chief Operating
Officer (COO) of the Company (to present)Feb. 2015 Representative Director, in charge of Consumer Games
Business of the CompanyJul. 2016 Representative Director, in charge of Global Marketing
Business of the Company (to present)
Director and Executive Corporate Officer
Yoichi Egawa
Apr. 1985 Entered into the CompanyApr. 1999 General Manager of Creative Division 5 of the CompanyAug. 1999 Corporate Officer, General Manager of Creative
Division 5 of the CompanyApr. 2005 Corporate Officer, Head of Contents Expansion
Business Division of the CompanyApr. 2006 Corporate Officer, Head of Pachinko & Pachislo
Business Division of the CompanyApr. 2011 Managing Corporate Officer of the CompanyApr. 2013 Executive Corporate Officer of the Company (to present)Jun. 2013 Director, in charge of Arcade Business and Pachinko &
Pachislo Business of the CompanyApr. 2015 Director, in charge of Amusement Equipments Business
and Arcade Operation Business of the CompanyJul. 2016 Director, in charge of Amusement Equipments Business,
Arcade Operations Business and Consumer Games Development (to present)
Director <A member of the Audit and Supervisory Committee>
Makoto Matsuo
External Independent DirectorDirector <A member of the Audit and Supervisory Committee>
Takayuki Morinaga
Apr. 1979 Entered into Fuji Bank Ltd. (Currently Mizuho Bank Ltd.)Apr. 2007 Corporate Officer and Division Manager of Finance and
Foreign Exchange Administration Service Division of Mizuho Bank Ltd.
Apr. 2009 Corporate Officer in charge of Internal Control of the Company
Jul. 2010 Managing Corporate Officer in charge of Financial and Accounting Division of the Company
Jun. 2015 Managing Corporate Officer in charge of Financial and Accounting Division and Secretarial Affairs, PR and IR Division of the Company
Apr. 2016 Executive Corporate Officer and Head of Finance, Accounting and Public Relations Division (to present)
Jun. 2016 Chief Financial Officer (CFO) and in charge of Corporate Management of the Company (to present)
Director
Hiroshi Yasuda
External Independent Director
Apr. 1975 Entered into the National Police AgencyNov. 1995 Chief of Ehime Prefectural Police HeadquartersJan. 2001 Chief of Miyagi Prefectural Police HeadquartersAug. 2005 Chief of Chiba Prefectural Police HeadquartersJan. 2007 Director General of Kanto Regional Police BureauMar. 2008 Resigned from the National Police AgencyJun. 2008 External Corporate Auditor of the Chugoku Electric
Power Co., Inc.Jun. 2016 External Director of the Company (to present)
Director
Masao Sato
External Independent DirectorDirector
Toru Muranaka
Apr. 1995 Registered Lawyer (Osaka Bar Association)Entered into Daiichi Law Office (Currently Daiichi Law Office, P.C.)
Dec. 2007 Partner of Daiichi Law Office, P.C. (to present)May 2014 Outside Audit & Supervisory Board Member of Furuno
Electric Co., Ltd. (to present)Jun. 2015 Outside Audit & Supervisory Board Member of Suzuken
Co., Ltd. (to present)Jun. 2016 External Director of the Company (to present)
Director <Full-time member of the Audit and Supervisory Committee>
Kazushi Hirao
External Independent Director
Apr. 1979 Entered into National Tax AgencyJul. 1986 District Director of Ijuin Tax OfficeJul. 1997 Deputy Commissioner (Revenue Management and
Collection) of Hiroshima Regional Taxation BureauJul. 1999 Deputy Commissioner (Large Enterprise Examination
and Criminal Investigation) of Hiroshima Regional Taxation Bureau
Jul. 2003 Director of Commissioner's Secretariat, the National Tax Agency
Jul. 2007 Assistant Regional Commissioner (Management and Co-ordination) of Nagoya Regional Taxation Bureau
Jul. 2008 Executive Director of National Tax CollegeJul. 2009 Director-General of Kanazawa Regional Tax TribunalJul. 2010 Director-General of Sapporo Regional Tax TribunalJul. 2011 Vice President of National Tax CollegeJun. 2012 External Corporate Auditor of the Company (full-time) Jun. 2016 Director (Full-time member of the Audit and Supervisory
Committee) of the Company (to present)
Director <Full-time member of the Audit and Supervisory Committee>
Yoshihiko Iwasaki
Director <A member of the Audit and Supervisory Committee>
Tamio Oda
May 2001 Advisor of the CompanyJun. 2001 Director of the CompanyJun. 2003 Managing Director of the CompanyJul. 2004 Director, Executive Corporate Officer, Chief Financial
Officer (CFO) and in charge of Corporate Strategies, Administration, President's Office, Affiliated Companies’ Management of the Company
Jul. 2007 Director, in charge of Corporate Management of the Company
Jul. 2010 Director, Chief Financial Officer (CFO) of the CompanyApr. 2011 Director, Executive Vice President of the CompanyJun. 2016 Director (Audit and Supervisory Committee) of the
Company (to present)
Directors(As of July 1, 2016)
Kenzo Tsujimoto Haruhiro Tsujimoto Kenkichi Nomura Kazushi Hirao
Makoto Matsuo Yoshihiko Iwasaki Toru MuranakaMasao Sato Takayuki Morinaga
Hiroshi Yasuda
Yoichi EgawaTamio Oda
Governance
CAPCOM INTEGRATED REPORT 2016 CAPCOM INTEGRATED REPORT 201661 62
Message fromManagement
Growth Strategy Business Activity Achievements
ESG Information Financial and Corporate Data
Capcom’s ValueCreation Activities

Note: Light blue highlights indicate external director comments.Mr. Iechika was appointed to the board as an external director for five years beginning in 2002. Legally, he was not an external corporate auditor, but in practice, he conducted audits in the same capacity as an external corporate auditor.
The Code, which went into effect as of June 2015 in Japan, consists of 73 principles. To ensure continuity within the organization and its mechanisms and promote growth strategies, in addition to providing more substantial content for the 26 items that we must focus more of our efforts on, which include expanded business execution functions and the establishment of a nominating committee, Capcom plans to disclose in total all 73 items. Allow me to ask: what is the reason for publishing all items? For example, even if we were to only disclose the compulsory 11 items, the Code does not define each of the terms but rather the Company interprets them; thus, in the case that we comply (and thus are not required to explain ourselves), there is the possibility of a difference in interpretations arising. For this reason, we will record items that clearly require an explanation (due to non-compliance) under “explain,” while at the same time disclosing Capcom’s view on all 73 items. Going forward, each company must disclose their response to the Code. I think some companies will disclose only the bare minimum, while others will take the opportunity to carefully disclose their point of view. Considering the risk of mistakenly assuming a company is in compliance, from the perspective accountability, Capcom believes it appropriate to disclose descriptions of all items.
I don’t object to Capcom adopting this stance, but it appears there are several incomplete descriptions. For example, in supplementary principle 4.11.3 “Analysis and Evaluation of Board of Director Effectiveness,” there is a description of internal control systems, but there is no description regarding Board of Director deliberations, thus from a self-evaluation perspective this response is insufficient. I would like to see disclosure pertaining to analysis and evaluation packed with concrete details, including preparations for Board of Director meetings, the provision of materials, explanation of items for deliberation as well as agenda selection policies and board discussions aimed at improving efficacy. Furthermore, operations after the Code is submitted are critical, thus I would like Capcom to continue making improvements in areas where there are deficiencies going forward. As you point out, self-evaluation of these principles is important. To execute growth strategies, we need to compare the current and ideal states of the Board and of course make improvements in areas where there are differences. Moreover, in item (4) of the explanation of this supplementary principle, details regarding Board of Director meeting discussions and small meetings with external director Morinaga among other initiatives are disclosed in the integrated report. Our adoption of proxy advisor opinions has been well received outside the Company. This particular code is for institutional investors in the U.S. and Europe, so we can consider externally entrusting supplementary principle 4.11.3. I personally think of takeover defense measures up to now and the introduction of this code as opportunities, and that the Company, which has utilized the transition to a company with audit and supervisory committee as a contributor to its growth strategies, is more keenly aware of governance compared to other companies. Rather than an end in itself, governance is a means to an end. To achieve results, we need to use the code appropriately
Corporate Governance
Item 1
Board ofDirectors
Principal Discussions at Board of Directors Meetings Held in Fiscal 2015
Matsuo
Matsuo
Matsuo
Oda
Oda
Oda
Discussion on Corporate Governance Codes(Hereinafter, “Codes”)
Iechika
Iechika
Iechika
At Capcom Board of Directors Meetings, three external directors take the lead in offering aggressive opinions and advice to ensure management transparency and corporate health. (As of March 31, 2016)In addition, they focus on promoting growth strategies utilizing corporate governance, vigorously discuss the ideal state of the Company’s organizational design related to corporate governance and their accountability to shareholders and investors. The heated discussion with external directors produced numerous suggestions, two of which are presented in this section.
(In response to an explanation) If organizational design is for promoting growth strategy, I think the company with a board of corporate auditors we have operated under up to now functions sufficiently. At the present time, is there something we are lacking? The global video game software market is undergoing significant changes and growth, so we must promote an aggressive growth strategy to enhance Capcom’s corporate value. To promote these growth strategies, speedy and accurate decision-making are a necessity. Under certain conditions, in a company with audit and supervisory committee, some of the important business execution can be delegated to the president and other executive directors. Comprehensive audit and supervisory functions are necessary for ensuring appropriate delegation. As the monitoring of legality in a company with audit and supervisory committee is conducted as a matter of course, the monitoring is also verified. For this reason, auditing and supervisory committee members have Board of Director voting rights as corporate directors. For Capcom to grow, I think this transition is a good idea. In addition to auditing focused on legality up to now and internal auditing of execution, there is merit in this transition as it will strengthen the monitoring function by enabling validity monitoring. As a result, as we execute growth strategies, we will be able to ensure a system for monitoring deviations in budgetary and financial management. Governance configuration is a means not an end. For example, when considering and executing policies aimed at enhancing corporate value, the degree to which we are able to make effective judgements is an issue of governance. Furthermore, the audit and supervisory committee is hybrid governance, so we must sufficiently consider the relationship between execution and supervision. By absorbing auditors into the Board of Directors, auditor and supervisory committee member independence will be
Item 2
Morinaga
Discussion on the Transition to a Company with Audit and Supervisory Committee
rather than wave it around. Management entails taking on risk. Use of the code is the means by which to control risk. We must constantly review our governance structure and control risks to develop a future vision and move forward.
lost, resulting in the issue of how to distribute authority. Finally, with respect to agenda criteria at Board of Director meetings, after considering Capcom’s present situation, I’d like you to consider what agenda items would be narrowed down and delegated to the president, etc., to enable the Board of Directors to make the most of its traditional function. There are many agenda items brought up as resolutions with content sufficient for reporting items, such as management system and partial personnel reshuffling. In terms of forward-looking policies, audit and supervisory committee members make decisions from a stance different from business execution, and we will create an organizational structure able to narrow down important issues for discussion at Board of Director meetings. A company with audit and supervisory committee is a good institutional design in terms of governance strength from the perspective of overseas institutional investors. In addition, we can expect effective governance due to director, audit and supervisory committee member terms of office. Furthermore, governance is not over once mechanisms are created, because the way in which operations are conducted is also important. Transitioning from a company with a board of corporate auditors with a complete auditing function to a company with audit and supervisory committee with a new auditing function requires a considerable amount of investigative work, including external directors, thus I would like you to respond after careful consideration.
As a mechanism of internal control and internal audit,until now it was under the Board of Directors, which itself had been audited by the Board of Corporate Auditors. Transitioning to an audit and supervisory committee, audit and supervisory committee members will be part of the Board of Directors, with internal controls and internal auditing directly under the audit and supervisory committee, enabling the efficient execution of business. However, as the audit function in each department up to now will be dissolved, you need to consider how you are going to respond. Understood.
Iwasaki
Kenzo Tsujimoto
Matsuo
Matsuo
Oda
Oda
Iechika
Kenzo Tsujimoto
CAPCOM INTEGRATED REPORT 2016 CAPCOM INTEGRATED REPORT 201663 64
Message fromManagement
Growth Strategy Business Activity Achievements
ESG Information Financial andCorporate Data
Capcom’s ValueCreation Activities

Corporate Governance
Dialogue Between an External Director and Institutional Investors
The Role Demanded of External Directors Under the New Governance Structure
Held July 2016: Theme
Small Meeting
Takayuki MorinagaCapcom Co., Ltd. External Director, Chairman of the Audit and Supervisory Committee
At the Shareholders’ meeting in June 2016, the transition to a company with an audit and supervisory committee was approved and adopted. With consideration also for the evaluation of foreign shareholders, the transition was decided to function as a mechanism for supporting growth strategies going forward. In addition, by directly linking the Internal Audit Division to the Audit and Supervisory Committee, we will further strengthen audit and supervisory functions. This is an attempt to improve management’s
Takayuki Morinaga, External Director and Chairman of the Audit and Supervisory Committee
Q In terms of game company growth strategies, how well the development structure and environment is established is an
extremely important point, so what do you think your role should be as an external director?
control) concerning the legality and validity of executive division strategies, and decisions related to the pros and cons of executing takeover defense measures.
rash actions are taken, there are at present six external directors comprising a governance structure able to provide sufficient protection. It’s not at all the case that just because this is an owner-run company no one can say anything. We routinely say whatever is on our mind and fully express our opinions. Also, debates during Board of Director meetings frequently become heated, but this is not a problem. If anything, without constructive and passionate discussions, we would probably be unable to generate truly effective measures and polices.
Q At an owner-run company like Capcom, to what degree are Audit and Supervisory Committee member opinions reflected
in Board of Director resolutions? At various companies around the world, family feuds are becoming a problem. This isn’t an issue at Capcom?
Q In your role as external director, in addition to that kind of risk management, aren’t you also asked to correct the
Company’s trajectory to avoid missed opportunities? Looking at the profiles of all the current external directors, I get the impression that there is a lack of people able to provide advice on the direction of growth strategy. For example, other companies in this industry are raking in huge profits in the mobile games area. Has Capcom failed to achieve success in this area because there are few external directors with ample management experience?
Q In terms of your supervisory function as an external director, what do you attach the most importance to?
A The most important evaluation criterion is whether an action leads to shareholder profits. For example, evaluations (risk
Q How have you responded to recent requests for Board of Director evaluations?
A In light of our transition to a new governance structure, our policy is to continue exploring the ideal state of the Board of
Directors. We plan to begin examining this issue during the current fiscal year, so right now I would ask you to please wait a bit longer until we have come to a conclusion with respect to the evaluation criteria.
Q I want you to discuss your thoughts regarding how to indicate objectives to investors going forward.
A We will not only simply respond to market changes, but also want to pursue business that I hope enables us to create
markets ourselves. There is no first-mover advantage in following changes. Rather than focusing on how to pursue, it is important to focus on how we can create markets on our own. To this end, we external directors will proactively propose structures and directions for the Company.
A Chairman Tsujimoto possesses a unique and excellent management intuition, a skill most ordinary managers are
unable to replicate. Thus, I want to respect the distinctiveness that is the positive aspect of an owner-run company. Even in the event
A Beyond aiming to enhance corporate value, I am cognizant that course adjustments are also one of our critical roles.
Risks pertaining to growth strategies involve investment risks as well as risks in not investing. The decision not to invest has the potential for a missed opportunity. In order for Capcom to break the 100 billion yen net sales barrier, , there are three issues I think need to be addressed: the aforementioned improvements to the development structure, aggressive and bold challenges in new areas such as mobile games and expanding into new, high-potential overseas markets, such as Asian. To achieve sustainable growth, we must not only manage risks, but also flexibly execute course adjustments. I will leverage my management experience up to now to fulfil this major role.
A R&D department is Capcom’s lifeline, which I am fully aware is an important asset. Thus, skill enhancement and other
human resources development training is essential for improving our developers’ capabilities. At the same time, we cannot ignore the efficacy of alliances and collaborations with other companies. I think it is desirable for management to skillfully utilize external resources in areas outside the Company’s core competence or when it would take too much time for one company to achieve an objective alone. These are the kinds of proposals I want to make.
Q&A Summary
risk management function by making directors of auditors who traditionally had no voting power. As the Chairman of the Audit and Supervisory Committee, I feel it is important to have skills enabling me to accurately judge the appropriateness of strategies in response to a given situation.
Participants
Capcom Co., Ltd. : Takayuki Morinaga (External Director, Chairman of the Audit and Supervisory Committee)/Tamio Oda (Director, Audit and Supervisory Committee)/Kenkichi Nomura (Director, Executive Corporate Officer and Chief Financial Officer)
Investors in Attendance : Akitsugu Era (BlackRock Japan Co., Ltd.)/Iichiro Yamaguchi (Daiwa Asset Management Co. Ltd.)/Daisuke Oshidari (JPMorgan Asset Management (Japan) Ltd.)/ Kenji Kido (Mizuho Trust & Banking Co., Ltd.)/Tomoaki Ito (Nikko Asset Management Co., Ltd.)/ Mitsuyasu Iwao (Nissay Asset Management Corporation)/Naoki Iwata(Nomura Asset Management Co.,Ltd.)/Akio Otani (Tokio Marine Asset Management Co., Ltd.)
CAPCOM INTEGRATED REPORT 2016 CAPCOM INTEGRATED REPORT 201665 66
MMMMesMesMesMesMesMesMesM sagsagsagsagsagsagsass gsss ggge fe fe fe fffffffffe fe fe ffe fe fe fe fe fe fe feee ffroromromromromomommomooooomrMaMananManMannnnnnnnageageageageageageageageageaggegeeeeemenmenmememememmmmememmemenenenmmenmememmenmeneenmmmmmmm nmmm tttttttttttt
GGroGroGroGroGroGroGror hhhhhwthwthwthwthw StSttttttttStSttttttSttttttttttttttttttStStSS ratratratattegegegyegyegygygyyyegyyee BusBBuBusBusussusBBusuB iiiiiineineineneneineness ssssss sssssssssss AAAAAAAccctAAAAActAAAAAAAAAAcAAAAAAccA iviiviviiitttty tytyttttytytytAchAchAchAchAAAchievievievieevvvvvvvevevvvememememememeeeeeeeeemmeeeeememmeeemeeeemmmmmmem ntssntsn s
ESG Information FinFinFinnFinnF nancancancancaancccialialialialialiala ananananananndddddCorCoCororCorCo porporpoporporporporpo ateateateatateateateatetee DaDaDaDaDaDaDaDDatattatatata
CapCapCapCapaaaaa comcomcomc ’’s ’ssssss’ss ’’’s’s sssssssssssssssss lVaValValValVaVVaVa ueueueueeeeeeeeeeCreCreCrerCCCC atiatiatittt onoonnn nn ActAcAcAcActttiviviiviiviivvivivv tietietietieieieeieieieieeiieieeieieieieieiieeieieeeieeieiesssss

Audit
Corporate Governance
Course of Governance Reforms Four Features of Capcom Corporate Governance
One of the purposes of Capcom's governance reforms is the creation of systems for management - that is, making management more transparent and visible. Generally, the strengths of an owner-run company are momentum via fast decision making, and managerial flexibility that makes it possible to not dwell on the past and implement structural reforms. Conversely, concerns over the founder's complacency and the difficulty of passing on management to the next generation can be presented as weaknesses of this system. In order to eliminate these concerns, Capcom believes the creation of management systems which are easily visible from outside the company as well such as with external directors and stock markets. In addition, formal systems alone are meaningless; the systems must also be effective. To this end, Capcom has implemented the governance reforms listed in the table below. Specifically, in 2001 Capcom was one of the first Japanese companies to bring on board external directors. This was because Capcom sought differing opinions, such as dispassionate judgement of our management and business activities by experts with high level knowledge in a variety of fields. In that same time period, Capcom strengthened its investor relations activities, the main point of which was to engage in highly transparent management by promoting dialogue with stock markets and releasing relevant information. In addition, in 2011 Capcom established its own Audit Committee. From another perspective, legal auditing provided by corporate
auditors was initiated as a unique organization in Capcom for the management of risk in the administration of business matters and preceded the concept of the "propriety audit" in today's company with an audit and supervisory committee. Since 2014, Capcom has released portions of Board of Directors meeting discussions and held meetings between external directors and institutional investors. Amidst a string of corporate scandals both in Japan and overseas, the purpose of the meetings was to have institutional investors determine whether management monitoring by external directors was functioning effectively. And in 2016, Capcom significantly changed its organizational design, transitioning from being a company with a corporate auditor system to a company with an audit and supervisory committee. A more detailed description is provided on the following page, however Capcom has broadly strengthened supervisory functions across the entirety of its management, including 1) giving voting rights at Board of Directors meetings to directors who are Audit and Supervisory Committee members; 2) implementing propriety audits in addition to legal audits; and 3) making it possible for the Audit and Supervisory Committee to engage in systematic monitoring using internal control systems. Capcom believes that corporate governance is essential to corporate growth and as such will continue to strengthen its governance system both in terms of organization and operation.
Jul. 1999
Jun. 2001
Jun. 2001
Jun. 2001
Feb. 2002
Apr. 2003
Jun. 2003
Apr. 2011
Jan. 2014
Jun. 2014
Sep. 2014
Jun. 2015
Jun. 2016
Jun. 2016
Main Governance Reform Initiatives
Clearly separated execution of management and supervision
Strengthened management monitoring functions
Strengthened auditing functions
Secured transparency
Secured fairness and propriety of director remuneration decisions
Prevented violations of laws and ordinances
Strengthened management monitoring functions
Strengthening risk management through auditing the state of business administration
Promoted understanding of agenda items
Clarified director management responsibilities
Provided example of effectiveness of management monitoring functions
Provided example of effectiveness of management monitoring functions
Strengthened supervisory function of Board of Directors meetings
Introduced Corporate Officer System
Brought on board first two external directors
Increased number of external auditors by one, appointing three
Strengthened investor relation activities
Established Remuneration Committee
Established Compliance Committee
Increased number of external directors by one, appointing three
Established Audit Committee
Strengthened shareholder relations activities
Shortened director terms from two years to one year
Released major Board of Directors' meeting discussions in the annual report
Held small group meeting between external directors and institutional investors
Transitioned into a company with an audit and supervisory committee with a 50% ratio of external directors
Established Nominating CommitteeSecured objectivity and propriety of decision process for selecting director candidates
Measure Purpose
Items which contribute to growth strategy
Items which contribute to managementsystem
Items which serve as a base for the above
Ensure diversity within the Company, including promoting the activity of women.Thorough disclosure of information.Duties, etc. of the Board of Directors, etc.
So-called cross-shareholdings.Selection and dismissal of key members of management staff.Quality and standard of determining independence of independent external directors.
Basic policy for capital policy.Establishing an environment to support the risk-taking of the Board of Directors. Role and duties of independent external directors, etc.
Capcom established an Audit and Supervisory Committee and grants voting rights at Board of Directors' meetings to directors who are also Audit and Supervisory Committee members. In addition, Capcom aims to further strengthen supervisory functions across the entirety of management and further enhance corporate governance via the implementation of propriety audits together with conventional legal audits.
Transition into a company with an audit and supervisory committee to strengthen governance
Full disclosure of 73 Corporate Governance Code items
1
Capcom has reached our highest ever rate of external directors at 50% through proactively appointing external directors since June 2001. The advice, opinions, and scrutiny provided by external directors increases the transparency and credibility of Board of Directors' meetings and vitalizes the same while also strengthening the function of the meetings to supervise management.
Proactive appointment of external directors2
Capcom has disclosed all 73 of its Corporate Governance Code items in order to revalidate the current state of the company’s governance system and its ideal state, together with achieving accountability for each item. Capcom attaches particular importance to 26 items which are comprised of 10 items which contribute to our growth strategy, 3 items which contribute to our management system, and 13 items which serve as the base for achieving these, and provides greater detail concerning the same.
Mechanism for reflecting investor and analyst opinions in management3
Capcom’s IR Department engages in discussions with analysts and investors over 350 times per year. In addition to promoting understanding of management policies and business strategies, the IR Department applies these activities to corporate management, summarizing market opinions and providing feedback to management personnel. Capcom is also further enhancing events and tools for investors, strengthening shareholder and investor relation activities.
4
50%
Governance Reforms for Further Growth
Please refer to the Corporate Governance page on Capcom’s investor relations site:http://www.capcom.co.jp/ir/english/president/governance.html
Month/year
Formerly
ShareholdersInvestors
PR and IR Department (SR/IR)
Over 350 discussion per yearIR eventsIR toolsPerception gap studies
Managementpersonnel
External Directors
Audit and Supervisory Committee
From June 18, 2016
Percentage of External Directors
Audit and Supervison
Board of Directors
Board of Directors
Board of Corporate Auditors
CAPCOM INTEGRATED REPORT 2016 CAPCOM INTEGRATED REPORT 201667 68
Message fromManagement
Growth Strategy Business Activity Achievements
ESG Information Financial and Corporate Data
Capcom’s ValueCreation Activities

Structure and Merits of a Company with an Audit and Supervisory Committee Message from the Chairman of the Audit and Supervisory Committee
Capcom aims to maximize long term corporate value based on its growth strategy. However, in order to ensure stable corporate management, Capcom believes it is essential to have a management base which can engage in thorough risk management. As such, on June 18, 2016 Capcom transitioned from a company with a corporate auditor system to a company with an audit and supervisory committee in order to strengthen the monitoring function of Board of Directors' meetings to further strengthen our management base, as well as to functionally expand management via fast decision making and increase understanding among overseas investors.
1. StructureA company with an audit and supervisory committee is one type of organizational design for a public company introduced with the revisions to the Companies Act made in 2014. In a company with an audit and supervisory committee, there are no auditors or auditor system. Instead, directors who are Audit and Supervisory Committee members are selected and an Audit and Supervisory Committee is established comprised of a majority of external directors. In other words, it is like a company with a corporate auditor system which has given Board of Directors meeting voting rights to its auditors. This type of structure makes it possible to further strengthen the monitoring function of Board of Directors' meetings.
2. MeritsThis transition offers the four merits listed in the table above to Capcom.
As concerns merit 1, not only is there no such corporate auditor system in Europe and North America as found in Japan, auditors have no voting rights in Board of Directors meetings. As such, overseas institutional investors and others found it difficult to understand the monitoring function of our Board of Directors meetings. Compared with the corporate auditor system, a company with an audit and supervisory committee is a much easier to understand organizational design. As concerns merit 2, by narrowing down Board of Directors meeting agenda items to highly important topics such as management policies and business strategy, management can be developed more quickly and flexibly, and external directors can focus further on their supervisory function. Merit 3 not only gives the Audit and Supervisory Committee the right to state its opinions on director selection and remuneration at general shareholder meetings but also strengthens Capcom’s risk management through the monitoring of the administration of business matters. As regards merit 4, as auditors are independent, they fundamentally engage in their own auditing, but Audit and Supervisory Committee members can order staff in the Internal Audit Department, an organization under their direct control, to implement an internal audit, and can scrutinize the resulting report. As the scope of business grows larger, such as through the expansion of the number of subsidiaries both domestic and international, the auditing function grows stronger than having several corporate auditors check the entirety of the companies in a group.
“It is said that the transition to a company with an audit and supervisory committee in order to further the growth strategy was necessary, but what is lacking now?” “In order to strengthen monitoring functions, why is a company with a nominating committee not acceptable?” – As this is an important change to the company’s organizational design, there were many questions from the Board of Directors and investigating the necessity of this move was discussed over many hours. Initially, there were concerns about what it meant to so easily transition to the organizational design in fashion today. However, we have reached the conclusion that a company with an audit and supervisory committee is the best method to further enhance governance and increase corporate value. In my experience managing risk as part of corporate management, a company’s fate is determined by how quickly it can gather data both internally and externally. For global companies, in addition to auditing the lawfulness of the administration of business matters, the necessity of auditing the propriety of the administration of business matters is increasing. This is because business risk expands in proportion to the implementation of a company’s growth strategy, which also significantly influences
corporate value. Because of this, , we have established an Internal Audit Department under the direct control of the Audit and Supervisory Committee in order to make it possible to gather information and audit it in an agile manner. It has also become clear in recent years, through corporate scandals both in Japan and overseas, that the presence or absence of a system like this significantly influences the effectiveness of risk management. However, in “auditing of propriety,” the Audit and Supervisory Committee must have the ability to appropriately evaluate propriety, which I feel is a large responsibility. In addition, as concerns a company with a nominating committee, another possible organizational design in the Companies Act is North American-style “monitoring” (with a supervisory body). We found this differs from the conventional Japanese-style “management” (with an ultimate decision-making body concerning the administration of business matters) not only in terms of the composition of directors but also the corporate culture, and arranging these would have required a significant amount of time. The Nominating Committee and Remuneration Committee established as part of our transition are advisory committees, the Audit and Supervisory Committee holds the right to express its opinion at general shareholders meetings concerning director selection and remuneration. We acknowledge that this will serve as a strong check and balance function and that at this time a company with an audit and supervisory committee is the best for Capcom. Conversely, while obvious, no organization is perfect. I do not mean this in the sense of “ploughing the field and forgetting the seed” but rather that what is important is to what extent we make use of this system to improve Capcom’s governance system. It is my desire to fulfil my role of risk control in Capcom’s growth strategy based on a firm understanding of the balance between execution and supervision and the independence of auditing as discussed at the Board of Directors.
Takayuki MorinagaExternal DirectorChairman of the Audit and Supervisory Committee
Serving in the role of risk control for company growth
Ratio of Internal Directors to External Directors
Company with a Corporate Auditor System
Merits of the Transition for Capcom
Company with an Audit and Supervisory Committee (from June 18, 2016)
Appointment/Disapproval
Appointment/Disapproval
Audit
Board of Directors Board of Corporate Auditors
Audit/Supervision
Appointment/Disapproval
Appointment/Disapproval
External directors comprise at least half
External auditors comprise at least half
Board of Directors
2015
10
20172016
7
12
50.0
2014
10
2013
11
2012
11
2011
9
2010
9
2009
9
2008
9
2007
9
30.030.027.327.3
33.333.333.333.333.3
2006
8
2005
7
2004
7
2003
8
2002
7
2001
7
37.5
42.942.9
37.5
28.6
0.0
(Fiscal years ending March 31)
42.9
Audit and SupervisoryCommittee
12Directors (people) External director ratio (%)
people 50.0%
External directors
Voting rights in Board of Directors meetings for directorswho are Audit and Supervisory Committee membersA portion of important business administration matterscan be entrusted to directors
Adds propriety audits to legal audits
Audit and Supervisory Committee members can engage in systematic audits using internal control systems
Shareholders’ Meeting Shareholders’ Meeting
Corporate Governance
Transition into a Company with an Audit and Supervisory Committee
CAPCOM INTEGRATED REPORT 2016 CAPCOM INTEGRATED REPORT 201669 70
Message fromManagement
Growth Strategy Business Activity Achievements
ESG Information Financial and Corporate Data
Capcom’s ValueCreation Activities

Corporate Governance
Shareholders and investors have made the practical and effective functioning of internal control into a key issue amidst an epidemic of corporate misconduct in Japan and overseas. In this section, Capcom will explain the corporate governance structure and systems that it has initiated so far based on the key concepts of “effectiveness and visibility” in terms of the results of third party assessment. (Assessment areas are highlighted in yellow.)
Corporate Governance Structure and Initiatives
Capcom is aware that comprehensive corporate governance ranks among management’s most important priorities. Because of this, in addition to enhancing management soundness and transparency, by building a trusting relationship with our stakeholders, such as shareholders, business partners, employees and regional society, we are increasing corporate value.
Corporate Governance Structure
Enhancing Management Health and Transparency while Responding to Changes in the Environment
Capcom’s general shareholders’ meeting serves as its highest decision-making body and determines important matters as well as reports audit results of consolidated financial statements. We have scheduled the meeting to take place around 10 days prior to the date on which most other companies in Japan hold their general shareholders’ meetings to ensure as many shareholders as possible can be in attendance. We have also made it possible for shareholders to exercise their voting rights over the Internet using a computer or smartphone. In addition, we participate in an electronic voting rights exercise platform for institutional investors. Seven resolutions were brought up for discussion at this year’s shareholders’ meeting, all of which were approved and passed.
Determines Important Matters as the Highest Decision-Making Body
In addition to the regular Board of Directors meeting being convened once every month, it is also convened when the need arises. The Board of Directors is composed of a total of twelve directors. Of that total, five directors are Audit and Supervisory Committee members. Also, of the twelve directors, six are external directors. All six of the external directors have been registered with Tokyo Stock Exchange, Inc. as independent directors.
Management Decisions that Incorporate Outside Opinions
We have established an internal auditing division as an internal audit organization in support of the Audit and Supervisory Committee. This division primarily conducts regular monitoring of each division and Group companies from the standpoint of risk management. In addition information is collected and analyzed from the standpoint of legality, propriety, and efficiency so internal operational risk and inefficiencies are properly understood, working to prevent the occurrence of crises and improve operations. In addition, in the event of an unforeseen situation, the Audit and Supervisory Committee contributes to the formulation of appropriate management decisions by quickly reporting to the Audit and Supervisory Board with a report examining and analyzing the causal factors in an attempt to minimize losses to the company.
Ensuring and Verifying Legal Compliance and Operating Efficiencies
The President and Executive Corporate Officers participate in the Corporate Management Meeting, which is held the day before a meeting of the Board of Directors. At the Corporate Management Meeting we ensure the fairness and transparency of the decision process with careful review of special items, items brought up to the Board of Directors and items delegated to executive corporate officers such as the President.
Supporting the Board of Directors’ Decisions
In order to clarify monitoring and business operation functions, Capcom adopted the corporate officer system. The Board of Corporate Officers is convened once a month. At the Board of Corporate Officers, in addition to executing business based on Board of Directors’ decisions, there are reports on policies for execution of business and the formulation of plans. Also, there are reports at the monthly meetings of the Board of Directors about the status of business execution by the Corporate Officers.
Executing Operations Based on Clear Management Policy
We have developed a group-wide internal controls framework through close communication and collaboration between parent company and subsidiaries based on monthly subsidiary board meetings and the “Management Regulations for Subsidiaries.” Through this framework, we ensure that our operations are being undertaken properly so that corporate governance functions effectively.
Ensuring Effective Government through Close, Group-wide Collaboration
and this audit corporation or the engagement partners at this firm who perform audits at Capcom.
The Audit and Supervisory Committee is composed of five directors (three of whom are external directors). Also, the collection and sharing of information is carried out by selecting two full time members of the Audit and Supervisory Committee in addition to using an internal control system to carryout organizational audits and supervision. In addition to formulating auditing policies and providing consultation regarding audit results, the Audit and Supervisory Committee cooperates with the Internal Audit Division and gives advice to audited divisions regarding items to be improved, etc., working to see that internal control functions effectively in each division.
They also objectively and fairly check the legality and propriety of execution of operations by directors by exchanging opinions and information with the Accounting Auditors and attending important meetings.
Accounting Auditors Partner with Internal Auditing Department to Monitor Management
NEW
NEW
Audit
Note: Assistants to certified audit operations; Certified public accountants: 10; Others: 7 (those who have passed the certified public accountant exam and persons in charge of system audits)
Names of Certified Public AccountantsAuditing Company
Masaaki Doi
Hiroshi Miura
Takuya Obata
Designated andEngagement Partner
KPMG AZSA LLC
Auditor Remuneration (Year ended March 31, 2016)Audit Operations Non-Audit Operations
0 million yen
–
0 million yen
41 million yen
2 million yen
43 million yen
Delivery company
Consolidated subsidiary
Total
Implementation
Shareholders’ Meeting (Convened on June 17, 2016)
AuditAudit and Supervisory Committee (newly established for the year ending March 31, 2017)
SupervisionBoard of Directors(Convened 14 times in the year ended March 31, 2016)
Internal Auditing Division
Affiliate Companies
In June 2016 Capcom established a voluntary nominating committee with an external director as committee chairman as a consulting organization to the Board of Directors in order to ensure the objectivity and propriety of the decision process to select candidates for director.
A Consulting Organization For Selecting Candidates for Director
The Nominating Committee
Capcom has established a voluntary remuneration committee with an external director as committee chairman as a consulting organization to the Board of Directors in order to ensure the objectivity and appropriateness of the decision process for setting compensation of directors (excluding directors who are members of the Audit and Supervisory Committee).
Recommending Details of Director Compensation
The Remuneration Committee(Convened two times in the year ended March 31, 2016)
In order to ensure compliance, the Compliance Committee meets quarterly and has an external director with the qualification of a lawyer as the chairman. In order to prevent illegal activities and misconduct Capcom has established Compliance Hotline Rules and, so that all employees can directly report illegal activities or misconduct, we have also established an internal hotline, and conduct periodic compliance checks to regularly monitor status, etc. To ensure effectiveness, problems confirmed by this committee and issues that must be dealt with are properly disposed of.
Focusing on Compliance as an Important Management Issue
The Compliance Committee(Convened four times in the year ended March 31, 2016)
Capcom has engaged KPMG AZSA LLC for financial audits as prescribed by the Companies Act and financial audits as prescribed by the Financial Instruments and Exchange Law. There is no relationship involving financial or other interests between Capcom
Ensuring and Verifying Accounting Transparency
AuditAccounting Auditors
ImplementationCorporate Management Council (Convened 24 times in the year ended March 31, 2016)
ImplementationBoard of Corporate Officers (Convened 12 times in the year ended March 31, 2016)
Approval/Disapproval Approval/Disapproval Approval/Disapproval
Audit and Supervision Linked
Audit ReportDeliberation Request Recommendations
Appointment/Discharge/Supervision
Notification Reporting
Reporting
Internal Audit
Linked
Direction
Direction/Supervision
Reporting
(Pursuant to the Financial Instruments and Exchange Act)
Direction
Shareholders’ Meeting
Board of Directors
Directors (Excluding directors who serve as members of the
Audit and Supervisory Committee)
The Nominating Committee (Voluntary)
The Remuneration Committee(Voluntary)
The Compliance Committee
Operational DivisionsAffiliate Companies
Directors who serve as members of the Audit and Supervisory Committee
Audit and Supervisory
Accounting Auditors
Internal Audit Division, etc.
Representative DirectorsExecutive Directors
Corporate Management Council
Board of CorporateOfficers
(As of June 18, 2016)
CAPCOM INTEGRATED REPORT 2016 CAPCOM INTEGRATED REPORT 201671 72
Message fromManagement
Growth Strategy Business Activity Achievements
ESG Information Financial and Corporate Data
Capcom’s ValueCreation Activities

Corporate Governance
External directors ensure the effectiveness of the corporate governance function by playing key roles in the Compliance, Nominating and Remuneration Committees. They also focus efforts on compliance and the prevention of corrupt or illegal activities, and openly exchange opinions and provide counsel at Board of
Directors meetings in an effort to strengthen the management audit function. Also, the Secretariat staff helps with the work of the external directors not Members of the Audit and Supervisory Committee and with regards to external directors who are Members of the Audit and Supervisory Committee, the full-time staff of the Internal Audit Task Force helps with their work.
External Directors
Using External Perspectives to Ensure Effective Governance An analysis of an assessment performed by a third-party organization
into the validity and effectiveness of Capcom’s corporate governance shows that the company ranked 35th among 3,460 listed companies in Japan in the “NEEDS-Cges” assessment developed by Nikkei Digital Media, Inc. “NEEDS-Cges” has an established reputation as a system that quantitatively assesses corporate governance using scores on a scale of 1 to 10 for eight categories, including “capital efficiency,” “information disclosure,” and “shareholder and capital composition,” among others, assigned based on some 130 indicators calculated from data of publicly released company documents, such as financial reports.
Capcom’s total score was 8.75 points, placing us in the top 1.1% of Japan’s listed companies. Our score also exceeded the average for all listed companies and for the industry, at 5.45 points and 7.77 points, respectively. We continued to receive the full 10 points for “shareholder and capital composition” and “information disclosure” important for corporate governance. The main reasons for each of these perfect scores are given in the chart provided below, but in particular, areas highlighted in yellow indicate measures that received particular notice. Going forward, we continue making improvements based on consideration of external data to earn an even stronger assessment, and further promote the external visibility of our governance by posting this and other data on our corporate website.
Third-Party Assessment
Promoting More “Visible” Governance
To ensure fairness and transparency, the compensation of Directors is consulted on with the voluntary Remuneration Committee which has an external director as chairman and is decided upon by the Board of Directors based on this committee’s recommendations. The current remuneration system is composed of set monthly remuneration and performance-based bonuses paid in cash but the percentage of set remuneration is high. Because of this, we are looking into introducing a new remuneration system to increase the directors’ incentive to increase corporate value over the medium- to long-term. And also, as part of an overall environment to support risk-taking, the remuneration linked to performance will be set to an appropriate percentage.
To ensure fairness and transparency of Directors’ remuneration, the Board of Directors consults the Remuneration Committee, which has an external director as chairman. The Remuneration Committee considers each board member’s position, duties, tenure, full/part-time service, etc. as well as Capcom’s earnings and individual job performance, and recommends an appropriation amount. The Board of Directors makes a decision based on this.a. Monthly remuneration is fixed.b. The amount of bonus is determined within the reasonable range based on
the monthly remuneration and the Company’s performance.c. Other than the remunerations listed above, appropriate remuneration based
on individual achievement may be paid within a determined range.
The remuneration of the directors who serve as members of the Audit and Supervisory Committee is not linked to performance from the perspective of securing their independence and thus determined through discussions, taking the difference of full-time or part-time service into account, by the directors who serve as members of the Audit and Supervisory Committee.
Officer Remuneration
The following presents the number of votes in favor, opposed or abstained for the matters to be resolved at the year ended March 31, 2015, general shareholders’ meeting, and the results of voting.
Shareholders’ Meeting Resolutions
The Remuneration Committee Makes Recommendations to Ensure Fairness and Transparency
ExternalDirectors
ExternalAuditors
Board of Directors and External Auditors Rate of Attendance (Year ended March 2016)
Officer Remuneration (Year ended March 31, 2016)Total remuneration, etc. by type of director for delivery companies, total amount by type of remuneration, etc., and number of directors the remuneration was paid to
Hiroshi Yasuda
Makoto Matsuo
Takayuki Morinaga
Yoshihiko Iwasaki
Akihiko Matsuzaki
Appointed with overall consideration for character, business acumen and successive appointments to important posts
A legal professional able to provide precise guidance and advice and ensure the effectiveness of corporate governance
Appointed with overall consideration for management experience at other companies, professional career, track record, and personal connections in the business world
It was determined that his professional experience in tax administration would be of benefit to the company
Appointed to leverage the wealth of experience and knowledge accumulated during many years in law enforcement administration to help the company further enhance its corporate governance
Board of Directors Attended 14 of 14 meetings (100%)
Board of Directors Attended 14 of 14 meetings (100%)
Board of Directors Attended 14 of 14 meetings (100%)Board of Corporate Auditors Attended 13 of 13 meetings (100%)
Board of Directors Attended 14 of 14 meetings (100%)Board of Corporate Auditors Attended 13 of 13 meetings (100%)
Independentdirector Reasons for selection Board of Directors/Board of Corporate Auditors
Rate of Attendance (Year ended March 2016)
Note: The listing of total of consolidated remuneration, etc. is restricted to persons with 100 million yen or more.
Source: NEEDS-Cges from Nikkei Digital Media Inc.
Director (excluding external directors)
324
28
56
265
28
56
50
–
–
9
0
–
7
2
5
–
–
–
Type of directorTotal
Remune-ration
(million yen)
Numberof
directors paid
Basic rem-uneration
Stock options Bonus Severance
Total of remuneration, etc. by type(million yen)
Auditor (excluding external auditors)
External director
Name
Total of consolidated
remuneration, etc.
(million yen)
Type of director
Type of company
Please refer to the “Shareholders Meeting Resolutions” section of our IR web page for information about the conditions for each proposal to be passedhttp://www.capcom.co.jp/ir/english/stock/meeting.html
KenzoTsujimoto 100 Director Delivery
company 80 – 20 –
Basic rem-uneration
Stockoptions Bonus Severance
Total of consolidated remuneration, etc. by type (million yen)
Notes 1: The above includes three directors who left office due to their tenure ending at the conclusion of the 36th Regular General Meeting of Shareholders held on June 12, 2015.
2: The above includes one auditor who died in office on March 2, 2016.
Name
450,336
446,497
448,133
448,116
445,388
455,128
438,455
453,673
453,725
3,570
3,517
6,905
10,744
9,108
9,125
11,854
2,115
18,788
0
0
0
0
0
0
0
0
0
98.60
98.61
97.88
97.04
97.40
97.39
96.80
98.92
95.29
Approved
Approved
Approved
Fourth proposal:Appointment of Five Directors who are Members of the audit and supervisory committee Kazushi Hirao Yoshihiko Iwasaki Tamio Oda Makoto Matsuo Takayuki Morinaga
Fifth proposal:Election of One Director who is a substitute member of the audit and supervisory committee
Sixth Proposal:Determination of the Amount of Remuneration for Directors (excluding Directors who are members of the audit and supervisory committee)
Seventh proposal:Determination of Amount of Remuneration for Directors who are members of the audit and supervisory committee
444,350454,862446,190427,051454,919
12,8892,380
11,04930,191
2,323
00000
96.5898.8696.9892.8298.87
Approved
Approved
Approved
Approved
457,069 174 0 99.34
99.21456,489 242 511
99.21456,467 264 511
First proposal: Proposed Appropriation of Retained Earnings
Second proposal: Partial Amendments to the Articles of Incorporation
Third proposal: Election of Seven Directors (excluding Directors whoare members of the audit and supervisory committee)
Kenzo Tsujimoto
Haruhiro Tsujimoto
Yoichi Egawa
Kenkichi Nomura
Hiroshi Yasuda
Masao Sato
Toru Muranaka
ApprovalVotes
VotesOpposed
AbstainedVotes
ApprovalRate (%)
VotingResultsResolutions Approval
VotesVotes
OpposedAbstained
VotesApprovalRate (%)
VotingResultsResolutions
Total amount of consolidated remuneration, etc. by director of delivery company
Total Score
Rank
Capital efficiency
Equity market’s assessment
Stability
Shareholder and capital composition
Board of Directors (organization)
Board of Directors (actions)
Shareholder returns
Information disclosure
6
9
7
10
9
9
9
10
Areas that Received Particular NoticeScoreHighest Rated Categories
Board of Director members Managing Corporate Officers External director ratioAdoption of the Corporate Officer System
Board of Directors(organization)
Tobin’s Q-related valuesPBR-related valuesEquity market’s assessment 9
Ratio of institutional investor shareholdingsRatio of foreign investor shareholdingsCross-shareholding ratio
Shareholder and capital composition 10
9
Shareholder return ratioShareholder returns 9
Amount of director treasury stock holdingsAmount of president’s treasury stock holdingBoard of Directors (actions) 9
Changes in accounting policy Date of general shareholders’ meeting Corporate website
10Information disclosure
Third-Party Assessment Results of Capcom’s Corporate GovernanceDetails of Highest Rated CategoriesDetails of Capcom’s
Corporate GovernanceAssessment
Comparison of the Industry Averageand the Average for All ListedCompanies
Equity market’s assessment
Shareholderand capital
composition
Board ofDirectors (actions)
Board of Directors (organization)
Shareholderreturns
Stability
Informationdisclosure
Capital efficiency
Capcom Video Game Industry AverageAverage for All Listed Companies
2
4
6
8
10
Categories Score
Policy Regarding Deciding the Calculation Method and Amount of Directors’ Remuneration1 Regarding Remuneration of Directors (excluding directors who are members of the Audit and Supervisory Committee)
2 The remuneration of the directors who serve as members of the Audit and Supervisory Committee
8.75
35
Board of Directors Attended 13 of 14 meetings (92.9%)
CAPCOM INTEGRATED REPORT 2016 CAPCOM INTEGRATED REPORT 201673 74
Message fromManagement
Growth Strategy Business Activity Achievements
ESG Information Financial and Corporate Data
Capcom’s ValueCreation Activities

As part of directors’ due diligence, Capcom developed the following internal control system based on the Companies Act and its enforcement regulations to ensure that all Group company practices comply with regulations and are executed in an efficient manner.
Status of Internal Control System
1. Creation of a Structure to Ensure Directors Perform their Duties in Accordance with Laws and Regulations As noted on page 72, Capcom has established the Compliance
Committee chaired by an external director who is qualified as a lawyer and consisting of directors and directors who serve as members of the Audit and Supervisory Committee to prevent any violation of laws and regulations. In addition, the Company is working to improve the effectiveness of compliance on a group-wide basis by measures to maintain the functionality of the department responsible for accepting the consultation requests and whistleblower reports such as announcing necessary matters through the Company’s intranet. Furthermore, the “Capcom Code of Conduct” was formulated to strengthen our compliance system. Capcom is dedicated to proactively preventing illegal acts and misconduct, and ensuring legal compliance through the promulgation of corporate ethics and principles. During the period under review, the Compliance Committee met four times and conducted compliance training sessions for new employees. Also, “e-learning sessions on legal compliance and personal information protection rules” were given to all employees. Compliance is the foundation of corporate governance and the basis for the fulfillment of corporate social responsibility.
Initiatives to Strengthen Compliance
Strengthening Risk Management through the Development of Our Internal Control System
Focusing on the Viability and Effectiveness of Our Compliance System
Building Mechanisms for the Appropriate Protection of Information Assets
As a company primarily engaged in the planning and development of software, Capcom is an environment where the latest information technology is always in use. Compared to companies in other lines of business, we face relatively high information security risks. Accordingly, to protect Capcom’s information assets from a variety of threats and maintain an information security policy appropriate for a corporation trusted by society, we publish internal information regulation collections, including “Basic Security Policies,” “System Usage Policies” and “Basic Disclosure Policies,” etc. We use a firewall to protect us from external attacks via the Internet, and our internal system requires each user to have a unique ID, password and PIN to access the system, thereby reducing the risk of unwelcome intruders. Furthermore, we are in the process of patching known security holes. Over the past few years, we have been implementing measures to prevent information leaks, which include the (1) identification of information leak risks, (2) creation of an early response structure to respond to information leaks and (3) establishment of a response process to minimize damage in event information is leaked. Moreover, to prevent the remote takeover of computers and other cyber-attacks that are on the rise recently, we constantly monitor for suspicious communications with external networks and implement virus detection on computers issued to employees.
Information Security Initiatives
to management at subsidiaries, we are working to have the internal control system for the entire Capcom Group work effectively by continually monitoring the business status of subsidiaries by collecting information from Capcom’s Directors who hold two posts concurrently and dispatched employees, etc.
Capcom will continue to instill this understanding in all its officers and employees.
Compliance Structure
Status of Training Programs (Year ended March 31, 2016)
Internal Reporting System• Hotline for notifications• Compliance advice
Headquarters / Domestic Subsidiaries / Overseas Subsidiaries
Board of Directors
Compliance CommitteeIn charge: External Directors, Compliance Committee Chairman
Reporting
Reporting/Consultation
Reporting/Consultation
Guidance/Investigation/Feedback
Compliance training curriculum
Personal information protectiontraining curriculum
2
2
All employees
All employees
No. ofTimes
TargetActivity
Corporate Governance
Internal Control System and Initiatives
To strengthen the management monitoring function and enhance corporate value, Capcom strives to prevent illegal activities and ensure compliance through regular Compliance Committee checks while attempting to invigorate and heighten the monitoring function of the Board of Directors in accordance with advice and recommendations from the three external directors.
2. Develop a System to Maintain Appropriate Business Practices(1) System for storage and management of information related to directors’ performance of duties
(2) System Regulations, etc. Concerning Risk Management
The appropriate management and storage of documents and information such as the minutes from board meetings is conducted in accordance with “document management regulations.”
(8) Other Systems to Ensure that Audit and Supervisory Committee Audits are Carried out EffectivelyRegarding the expenses incurred in the execution of operations by Directors who are Members of the Audit and Supervisory Committee, in addition to having established a budget of a given size, we bear the costs for applicable expenses when requested to pay ahead of time.
(9) Overview of Operational Status of the System to Ensure Appropriate OperationsIn addition to the above systems, the Compliance Committee, which has an External Director as chairman, meets once a quarter and reports on inherent risks and the probability of actualization, etc.to the Board of Directors, working for early discovery and prevention of illegal activities and misconduct. Also, in order to deepen Directors’ understanding of compliance, with e-learning and checking the effectiveness of use of periodic compliance check sheets, we are preventing insider trading and the leakage of information, ensuring information security, and thoroughly promulgating observance of laws and regulations. Additionally, with regards to Capcom Group companies, in addition to conveying Capcom’s management policies
We are working to see that with “crisis management regulations,” and other such means the system-wide risk management structure functions to proactively prevent crises and execute the appropriate actions if unforeseen events occur.
(3) System to Ensure that Directors Perform Duties EfficientlyCapcom introduced a Corporate Officer System under which the duties of the Board of Directors, which decides business policy, and corporate officers, who execute operations, are separated and promote smooth and flexible business operations through speedy decision-making and enhanced management efficiency.
Group’s compliance system with “Risk Management Regulations.”
(5) System to Ensure the Appropriateness of Duties in the Capcom GroupCapcom requires the reporting of important subsidiary information, such as the current state of business and business forecasts. This is accomplished through close cooperation and mutual understanding between the parent and subsidiaries based on convening Board of Directors meetings at subsidiaries in which Capcom directors, etc. participate and “Subsidiary Management Regulations,” etc. Also, we are aiming for rationalization of duties so that corporate governance functions, and we are promoting the maintenance of the overall
(6) System for Employees Who Help in the Duties of the Audit and Supervisory Committee, System Regarding the Independence of the Employees Concerned from the Director and System to Ensure Effectiveness of Direction Given to the Employees ConcernedThe Audit and Supervisory Committee works so that the internal controls function effectively, auditing the execution of operations by directors and employees based on auditing policies and, as necessary, submitting items found in audits and making advice and suggestions for corrections, etc. Because of this, we have established an Internal Auditing Division directly under the control of the Audit and Supervisory Committee to enable the work of the Committee to be performed duties smoothly and appropriately. This Division has a full-time staff of 18 who help with execution of operations of the Audit and Supervisory Committee and the consent of the Audit and Supervisory Committee is obtained regarding the reassignment of members of this staff.
(7) System for Capcom Group Employees and Directors to Report to the Audit and Supervisory Committee, System for Other Reports to the Audit and Supervisory Committee, System to Prevent Unfavorable Treatment Due to Having Made a ReportWhen the Audit and Supervisory Committee request a Capcom employee or director for information regarding the execution of operations, that employee or director responds promptly and appropriately and also reports appropriately about the required items. Also, when an employee or director of Capcom or the Capcom Group makes a report to the Audit and Supervisory Committee, she/he is not treated unfavorably because of that report.
(4) System to Ensure that Performance of Duties by Employees Conforms with Laws and Regulations, etc.The “Capcom Code of Conduct” is our guideline for legal compliance. We seek to prevent illegal activities and misconduct through employee training and monitoring programs.
CAPCOM INTEGRATED REPORT 2016 CAPCOM INTEGRATED REPORT 201675 76
Message fromManagement
Growth Strategy Business Activity Achievements
ESG Information Financial and Corporate Data
Capcom’s ValueCreation Activities

11-Year Summary of Consolidated Financial Indicators
For the Year:
Net salesOperating incomeNet income (loss) before income taxesNet income attributable to owners of the parentDepreciation & amortizationCapital expendituresR&D expenses
At Year-End:
Total assetsNet assetsNet cashDeveloper numbers
Cash Flows:
Cash flows from operating activitiesCash flows from investing activitiesCash flows from financing activitiesNet increase (decrease) in cash and cash equivalentsCash and cash equivalents at end of year
Per Share Data:
Net income (loss) per shareDividend per shareNet assets per share
Financial Index:
Operating marginROEROANet worth ratioInterest coverage ratio (times)Debt-equity ratio
Stock Information:
Price earnings ratio (times)Number of outstanding shares (thousands shares)Foreign investors (%)
Digital Contents Business:
Consumer business net salesOnline business net sales
Financial Index
¥
¥
¥
¥
¥
¥
¥
¥
¥
¥
¥
¥
¥
¥
¥
¥
¥
¥
¥
¥
¥
¥
¥
¥
¥
2006
70,253 6,580 6,912 6,941 1,936 1,600 1,864
98,457 39,464
(678)705
13,921 (1,779)
(18,259)(4,885)40,652
125.19 20.00
716.91
9.4 19.3 6.8
40.1 82.6
149.4
9.7 58,435 23.35
42.7 1.5
2007
74,542 9,602 9,986 5,852 2,774 4,495 1,828
91,478 45,144
9,200 728
16,063 (6,715)
(15,206)(5,654)35,020
107.52 30.00
799.35
12.9 13.8 6.2
49.3 237.3 102.8
15.7 62,269 32.60
43.8 2.7
2008 2009
66,837 5,587 1,124 2,167 3,368 2,205 2,125
86,621 53,956 12,299 1,132
14,320 (1,618)
(10,747)1,203
29,815
35.71 35.00
913.18
8.4 3.8 2.3
62.3 86.9 60.5
49.5 67,723 24.22
38.7 8.5
2011
97,716 14,295 10,807 7,750 3,315 2,758 2,924
90,408 58,007 27,655
1,339
22,392 (2,046)
(12,919)5,196
35,011
131.18 40.00
981.76
14.6 13.8 8.8
64.2 155.8 55.9
12.1 67,723 22.17
63.6 10.5
2012 2013Millions of yen Millions of yen
Millions of yen Millions of yen Thousands of U.S. dollars
Millions of yen Millions of yen Thousands of U.S. dollars
Billions of yen Billions of yen
yen yen
% %
U.S. dollars
¥
¥
¥
¥
¥
83,097 13,121 1 1,962 7,807 3,393 4,503 2,972
93,606 53,660 13,061
809
7,452 (3,374)(2,448)(2,256)32,763
132.90 30.00
881.13
15.8 15.8 8.4
57.3 103.7 74.4
25.6 66,719
27.72
51.6 4.1
¥
¥
¥
¥
¥
94,075 10,151 3,719 2,973 3,406 8,724 1,982
104,365 62,828 14,327 1,623
6,647 (1,375)1,162 9,235
31,522
51.64 40.00
1,091.08
10.8 4.9 2.9
60.2 62.4 66.1
28.6 67,723 32.37
45.9 17.7
82,065 12,318 1 1,425 6,723 3,123 4,153 2,236
98,247 59,352 1 1,348
1,455
(7,672)(4,794)
587 (12,724)22,287
1 16.10 40.00
1,030.70
15.0 1 1.5 7.1
60.4 –
65.5
16.3 67,723 27.05
46.9 12.9
2014 2016 2016
¥
¥
¥
¥
¥
102,200 10,299 5,315 3,444 4,638 8,064 2,002
96,611 63,875 22,670
1,808
13,201 (6,155)
(15,099)(5,404)26,1 18
61.1 1 40.00
1,135.91
10.1 5.4 3.4
66.1 136.8 51.2
32.0 67,723 37.29
53.0 12.8
¥
¥
¥
¥
¥
91,878 14,618 12,448 8,063 4,143 2,906 2,329
106,210 59,349 7,378 1,047
(551)(2,715)
(342)(4,454)28,611
130.98 35.00
961.38
15.9 14.3 8.1
55.9 –
79.0
13.3 67,394 33.73
60.0 6.6
2010
¥
¥
¥
¥
¥
$
$
$
$
687,695 107,408
69,156 51,003 73,879
9,588
1,009,441 671,150 141,259
38,812 (14,641)
(9,956)3,852
253,836
1.23 0.36
11.94
ThousandsThousands
Resident Evil 4(PS2)
Onimusha DAWN of DREAMS
Monster Hunter Freedom
Lost Planet Extreme Condition
Dead Rising
Monster Hunter Freedom 2
Monster Hunter Freedom Unite (Best Price included)
Monster Hunter Tri
Resident Evil 5
Monster Hunter X (Cross)
Street Fighter V
Resident Evil Revelations 2
Monster Hunter 4 Ultimate
Resident Evil Revelations 2
Resident Evil (HD Remastered)
Resident Evil 6
Dragon's Dogma
DmC Devil May Cry
Resident Evil: Operation Raccoon City
Monster Hunter 3 (Tri) G
Street Fighter X Tekken
Monster Hunter Freedom 3
Dead Rising 2
MARVEL VS. CAPCOM 3 Fate of Two Worlds
Consumer Game Sales (Package Software and Full-game Digital Content)
Total number of units
Sales of major titles
13,400
1,810
640
610
12,200
1,370
1,220
1,220
15,750
2,320
1,300
1,060
13,900
1,350
1,150
950
21,700
4,600
2,300
2,000
17,000
1,700
1,600
1,400
16,700
5,000
1,300
1,200
17,500
4,100
1,200
1,200
15,000
3,300
1,400
850
Devil May Cry 4
Resident Evil 4 Wii edition
Resident Evil: The Umbrella Chronicles
18,100
4,400
2,500
2,200
Resident Evil 5
Street Fighter IV
Monster Hunter Freedom Unite (Best Price included)
2015
¥
¥
¥
¥
¥
64,277 10,582 10,701 6,616 3,535
10,177 823
100,773 71,331 21,212
1,902
4,286 (5,496)1,278 1,879
27,998
1 17.67 40.00
1,268.56
16.5 9.8 6.7
70.8 50.2 41.3
20.3 67,723 36.87
35.2 10.1
Monster Hunter 4
Dead Rising 3
Resident Evil Revelations
13,000
3,400
1,100
900
77,021 12,029 1 1,150 7,745 5,712
1,073
113,057 75,168 15,821
4,347 (1,639)(1,1 15)
431 28,429
137.75 40.00
1,336.86
15.6 10.6 7.2
66.5 36.5 50.4
19.9 67,723
39.35
42.1 10.4
. . . . . . . . . . . . . . . . . . . . . . . . . . . . . . . . . . . . . . . . . . . . . . . .
. . . . . . . . . . . . . . . . . . . . . . . . . . . . . . . . . . . .
. . . . . . . . . .
. . .
. . . . . . . . . . . . . . . . . . . . . . .
. . . . . . . . . . . . . . . . . . . . . . . . . . . . . . . . .
. . . . . . . . . . . . . . . . . . . . . . . . . . . . . . . . . . . . . . . . .
. . . . . . . . . . . . . . . . . . . . . . . . . . . . . . . . . . . . . . . . . . . . .
. . . . . . . . . . . . . . . . . . . . . . . . . . . . . . . . . . . . . . . . . . . . . .
. . . . . . . . . . . . . . . . . . . . . . . . . . . . . . . . . . . . . . . . . . . . . . . .
. . . . . . . . . . . . . . . . . . . . . . . . . . . . . . . . . .
. . . . . . . . . . . . .
. . . . . . . . . . . . . .
. . . . . . . . . . . . . .
. . .
. . . . . .
. . . . . . . . . . . . . . . . . . . . . . . .
. . . . . . . . . . . . . . . . . . . . . . . . . . . . . . . . . . .
. . . . . . . . . . . . . . . . . . . . . . . . . . . . . . . . . .
. . . . . . . . . . . . . . . . . . . . . . . . . . . . . . . . . . . . .
. . . . . . . . . . . . . . . . . . . . . . . . . . . . . . . . . . . . . . . . . . . . . . . . . . . . . .
. . . . . . . . . . . . . . . . . . . . . . . . . . . . . . . . . . . . . . . . . . . . . . . . . . . . . .
. . . . . . . . . . . . . . . . . . . . . . . . . . . . . . . . . . . . . . .
. . . . . . . . . . . . . . . . . . . . .
. . . . . . . . . . . . . . . . . . . . . . . . . . . . . . . . . . . . . .
. . . . . . . . . . . . . . . . . . . . . . . . .
. . .
. . . . . . . . . . . . . . . . . . . . . . . . . . . . . . . .
. . . . . . . . . . . . . . . . . . . . . .
. . . . . . . . . . . . . . . . . . . . . . . . . . .
. . . . . . . . . . . . . . . . . . . . . . . . . . . . . . . .
. . . . . . . . . . . . . . . . . . . . . . . . . . . . . . . . . .
Thousands of U.S. dollars
CAPCOM CO., LTD. AND ITS CONSOLIDATED SUBSIDIARIES. YEARS ENDED MARCH 31
CAPCOM INTEGRATED REPORT 2016 CAPCOM INTEGRATED REPORT 201677 78
Message fromManagement
Growth Strategy Business ActivityAchievements
ESG Information Financial and Corporate Data
Capcom’s ValueCreation Activities

Capcom announced that in the fiscal year ended March 31, 2016 net sales increased to 77,021 million yen (up 19.8% from the previous year), operating income increased to 12,029 million yen (up 13.7 % from the previous year), and ordinary income increased to 11,348 million yen (up 4.6 % from the previous year). Net income attributable to owners of the parent for the year increased to 7,745 million yen (up 17.1% from the previous year).
(1) Net salesIn this fiscal year, net sales were 77,021 million yen (up 19.8% from the previous fiscal year). This increase was driven by our core business, Digital Contents, in which Monster Hunter X (Cross) performed favorably, selling 3.3 million units to exceed initial projections of 2.5 million units. Digital download sales of Resident Evil Revelations 2 and other previously developed catalog titles also strongly contributed to results. In addition, the launch of Dragon’s Dogma Online, a new service in the PC Online business was solidly on track. Furthermore, in the Amusement Equipments business, Capcom pachislo frame Resident Evil 6 sold 37,000 units, surpassing unit sales in the previous fiscal year. The increase in net sales was driven primarily by the Digital Contents and Amusement Equipments businesses.
(2) Operating incomeCost of sales increased to 47,175 million yen (up 22.9% from the previous fiscal year) and the cost of sales ratio was 61.2%, up 1.5 percentage points from the previous fiscal year. This was mainly due to (1) increased general costs associated with Capcom pachislo machines in the Amusement Equipments business and (2) increased development costs associated with the expansion of new titles in the Digital Contents business. With regard to (1), this was mainly due to the rebound effect of attempting to lower costs by reusing certain components used in Sengoku BASARA 3 machines sold in the previous fiscal year. This fiscal year, the cost ratio is expected to return to normal levels.
Selling, general and administrative expenses were 17,816 million yen (up 15.7% from the previous fiscal year) and SG&A as a percentage of sales was 23.1%, down 0.9 percentage points compared to the previous fiscal year. As increased sales caused the fixed overheard rate to decline, the SG&A expenses ratio on a consolidated basis fell adequately within Capcom’s assumed 25% range. As a result, operating income was 12,029 million yen (up 13.7% from the previous fiscal year). Despite this increase, lower profitability in the Amusement Equipments business dampened overall earnings, resulting in an operating margin of 15.6% (down 0.9 percentage points from the previous fiscal year).
(3) Net income attributable to owners of the parentThis fiscal year, regarding non-operating expenses, price adjustments in line with an Advanced Pricing Agreement (an APA is a contract between Capcom and tax authorities in Japan and overseas specifying the pricing method Capcom will apply to its related-company transactions) resulted in the recognition of an exchange loss related to transactions with overseas subsidiaries amounting to 752 million yen. However, operating income growth offset this loss, resulting in ordinary income of 11,348 million yen (up 4.6% from the previous fiscal year). Special losses amounting to 197 million yen were also recognized, resulting in net income attributable to owners of the parent of 7,745 million yen (up 17.1% from the previous fiscal year) and the net margin was 10.1% (down 0.2 percentage points from the previous fiscal year).
(1) Digital Contents businessIn the Digital Contents business, the latest title in the flagship series, Monster Hunter X (Cross) (for the Nintendo 3DS system), was a major hit, with sales of more than 3 million units, surpassing the initially-planned 2.5 million units, which contributed significantly to both sales and profits. Additionally, Resident Evil 0 (HD Remastered) (for PlayStation 4, PlayStation 3, Xbox One, Xbox 360 and PC) steadily increased unit sales, while Street Fighter V (for PlayStation 4 and PC) remained a perennial favorite and maintained steady sales
mainly overseas. Moreover, sales of catalog titles grew, while digital downloads also became a stable source of revenue from a solid performance thanks to the synergistic effects from package sales. Meanwhile with regard to online games, Dragon’s Dogma Online (for PlayStation 4, PlayStation 3 and PC), an online open-world action game where players can freely experience a host of adventures, performed favorably. At the same time, mobile contents sales improved as downloads of Monster Hunter Explore (for Android and iOS) surpassed 3 million, indicating signs of a breakthrough in the current situation of the mobile contents segment. The resulting net sales were 52,577 million yen (up 15.9 % from the previous fiscal year), and operating income was 12,167 million yen (up 19.2% from the previous fiscal year).
(2) Arcade Operations businessIn the Arcade Operations business, with the slow pace of market recovery, the Company strived to expand its customer base by means of community-based store strategies. For example, measures were taken to attract customers including women and families by holding various events and conducting service days for the middle-aged and seniors by offering “free game experience tours” and setting up additional “Asobi Oukoku Peekaboo” sites and “Kids’ Corner” sections targeting younger children. Nonetheless, the segment results were soft, partly because of
the lack of a high-performance product as well as sluggish demand due to the dispersion of entertainment, resulting from the overlapping of arcade game players with smartphone users. During the period under review, the Company developed its arcade operations through its scrap and build strategy, and opened four arcades including the Amuse Factory Tokoname (Aichi Prefecture) and the innovative Capcom Café (Saitama Prefecture), while closing three arcades, bringing the total number of arcades to 34. The resulting net sales were 9,056 million yen (down 2.0% from the previous fiscal year), and operating income was 699 million yen (down 25.6% from the previous fiscal year).
(3) Amusement Equipments businessIn the Pachinko & Pachislo sub-segment, Resident Evil 6 demonstrated its strengths as a major brand by strongly increasing unit sales, backing the improvement in revenue as it contributed to the increase in sales. However, sales of Asura’s Wrath remained weak. Meanwhile, in the Arcade Games Sales sub-segment, sales of Luigi Mansion Arcade were weak reflecting the sluggish market, while crossbeats REV. for arcades also struggled. The resulting net sales were 13,343 million yen (up 77.0% from the previous fiscal year), and operating income was 2,812 million yen (up 2.8% from the previous fiscal year).
1. Operating Results
2. Sales and Profits
3. Status of Each Operational Department
Net Sales (Millions of yen) Operating Income (Millions of yen)
Cost of sales (Millions of yen)
Cost of sales ratio (%)
Selling, general and administrative expenses (Millions of yen)
SG&A expenses ratio (%)
Research and development expenses (Millions of yen)
R&D expenses ratio to net sales (%)
CAPCOM CO., LTD. AND ITS CONSOLIDATED SUBSIDIARIES. YEARS ENDED MARCH 31
Financial Review
2012
Cost of sales/Cost of sales ratio
2012
Selling, general and administrative expenses/SG&A expenses ratio
20122013 2013 2013
49,60920,150
2014 2014 2014
61,911
60.5
21,942
1,982
2015 2015 2015
72,25119,749
2,002
2016 2016 2016
38,379
59.7
15,403
823
Research and development expenses/R&D expenses ratio to net sales
47,175
19.3 2.1 2.01.3
1,073
1.4
(185)
5,803
7,226
(101)
64,277
Other Businesses
Digital Contents
173179
250
Selling, general andadministrative expenses
UP 2,413
10,5823,861
12,029
574
Increase in net gross profit
Increase in research and development expenses
Increase in salaries and bonuses
Increase in promotion expenses
Increase in provision for accrued bonuses
Increase in advertising expenses
462
775from the previous fiscal year
UP 12,744from the previous fiscal year
UP 1,44777,021
Arcade Operations
Amusement Equipments
70.765.8 61.2 24.6 24.0
17,816
23.1
2,236
2.723.3
2015
2016
2015
2016
Increase in other selling, general and administrative expenses
CAPCOM INTEGRATED REPORT 2016 CAPCOM INTEGRATED REPORT 201679 80
Message fromManagement
Growth Strategy Business Activity Achievements
ESG Information Financial andCorporate Data
Capcom’s ValueCreation Activities

(4) Other BusinessesThe net sales from Other Businesses, mainly consisting of the publication of game guidebooks and sale of character merchandise, were 2,043 million yen (down 4.7% from the previous fiscal year), and operating income was 511 million yen (down 22.7% from the previous fiscal year).
(1) AssetsTotal assets as of the end of the fiscal year ended March 31, 2016 increased by 12,284 million yen from the end of the previous fiscal year to 113,057 million yen. Primary increases were as follows: 7,991 million yen in work-in-progress for game software, 5,161 million yen in buildings and structures.
(2) LiabilitiesTotal liabilities as of the end of the fiscal year ended March 31, 2016 increased by 8,446 million yen from the end of the previous fiscal year to 37,888 million yen. Primary increases were 5,646 million yen in accrued income taxes and 3,571 million yen in long-term borrowings. Primary decrease was 1,955 million yen in short-term borrowings.
(3) Net assetsNet assets as of the end of the fiscal year ended March 31, 2016 increased by 3,837 million yen from the previous fiscal year to 75,168 million yen. The Primary increase was 7,745 million yen in net income attributable to owners of the parent. The Primary decreases were 1,494 million yen in cumulative translation adjustments which related to foreign exchange translation of the net assets of foreign consolidated subsidiaries and 2,249 million yen in cash dividends.
Cash and cash equivalents as of the end of the fiscal year ended March 31, 2016 increased by 431 million yen from the end of the previous fiscal year to 28,429 million yen. Cash flow positions of each activity and their factors are described below.
(1) Cash flows from operating activitiesNet cash gained from operating activities was 4,347 million yen (4,286 million yen in the previous fiscal year). The primary items increasing cash flows were 11,150 million yen in net income before income taxes (10,701 million yen in the previous fiscal year) and 5,712 million yen increase in depreciation and amortization (3,535 million yen in the previous fiscal year). The primary items decreasing cash flows were 8,778 million yen increase in work-in-progress for game software (6,443 million yen in the previous fiscal year) and 2,208 million yen increase in accounts receivable, trade (decrease of 10,382 million yen in the previous fiscal year).
(2) Cash flows from investing activitiesNet cash used in investing activities was 1,639 million yen (5,496 million yen in the previous fiscal year). The Primary item increasing cash flows was 5,813 million yen in payment for acquisition of tangible fixed assets (5,465 million yen in the previous fiscal year). The Primary item decreasing cash flows was 4,205 million yen in withdrawal of time deposit (no withdrawal in the previous fiscal year).
(3) Cash flows from financing activitiesNet cash used in financing activities was 1,115 million yen (1,278 million yen gained in the previous fiscal year). The Primary increases used were as follows: 2,228 million yen in dividends paid by parent company (2,251 million yen in the previous fiscal year), 883 million yen in repayment for long-term borrowings (3,169 million yen in the previous fiscal year) and 496 million yen in repayment for lease obligations (406 million yen in the previous fiscal year). The Primary decrease was 2,500 million yen provided from long-term borrowings (8,162 million yen in the previous fiscal year).
Shareholders’ equity ratio to total assets: Shareholders’ equity / Total assetsShareholders’ equity ratio to total assets based on fair market value: Total of the capital stock at market price / Total assetsDebt amortization ratio to cash flows: Interest-bearing debt / Cash flows from operating activitiesInterest coverage ratio: Cash flows from operating activities / Interest payments
Note 1: Percentage figures are calculated on a consolidated basis.
Note 2: Total market value of shares is calculated based on the number of shares as of the end of the fiscal year excluding treasury stock.
Note 3: Cash flows used are for cash flows from operating activities.
Note 4: The interest-bearing debt refers to the debts posted in the consolidated balance sheets for which we are paying interest.
Note 5: As the cash flows from operating activities fell into the red in the fiscal year ended March 2012, we have omitted the debt amortization ratio to cash flows from operating activities and interest coverage ratio.
4. Analysis of Assets, Liabilities and Net Assets
Liabilities, Net Assets (Millions of yen)
Cash Flows from Investing Activities (Millions of yen)
Cash Flows from Financing Activities (Millions of yen)
Cash Flows from Operating Activities (Millions of yen)
Assets (Millions of yen)
5. Analysis of Cash Flow
from the previous fiscal year
UP 12,284
100,773(3,775)
3,497
1,062
2015
2016 113,057
100,773964
(452)
3(1,494)
(168)
2015
2016
3,571
113,057
Liabilities8,446 UP
Net assets3,837 UP
Currentassets10,258 UP
Fixedassets2,027 UP
Cash on hand and in banks
Work-in-progressfor game software
Other current assets
Tangible fixed assets
Intangible fixed assets
Notes and accountsreceivable, trade
Investments and other assets
Valuation difference on available-for-sale securities
Electronically recordedmonetary obligations
Notes and accounts payable, trade
Retained earnings
Cumulative translation adjustments
7,9911,340
2,828
5,646Accrued income taxes
Other liabilities
1,874
(1,955)
672
(2,533)
Deferred tax assets
5,496
Other net assets
(702)
Net income before income taxes
Others
5,712
(2,208)
(8,778)
1,718
(2,545)Others total
Increase in other current liabilities
11,150
Others 259
4,205
(290)
(5,813)
2,500Repayments of
long-term borrowings
Proceeds fromlong-term
borrowings
(883)
(504) Others
Other long-term liabilities
+4,347
(1,639)
(1,115)
Dividends paid byparent company
(2,228)
Increase in work-in-progress
for game software
Payments into time deposits
Proceeds from sales of tangible fixed assets
Payment for acquisition of intangible fixed assets
Trends of Cash Flow Indicators
Year endedMarch 2014
Year endedMarch 2015
Year endedMarch 2016
66.1
114.053.4
136.8
70.8
133.3256.5
50.2
66.5
136.5290.1
36.5
Shareholders’ equity ratio to total assets (%)
Shareholders’ equity ratio to total assets based on fair market value (%)
Debt amortization ratio to cash flows (%)
Interest coverage ratio (times)
from the previous fiscal year
UP 12,284
Increase in accounts receivable, trade
Depreciation and amortization
Long-term borrowings
CAPCOM INTEGRATED REPORT 2016 CAPCOM INTEGRATED REPORT 201681 82
Message fromManagement
Growth Strategy Business ActivityAchievements
ESG Information Financial andCorporate Data
Capcom’s ValueCreation Activities

(Assets)
Current assets:
Cash on hand and in banks
Notes and accounts receivable, trade
Merchandise and finished goods
Work in progress
Raw materials and supplies
Work in progress for game software
Deferred tax assets
Other
Allowance for doubtful accounts
Total current assets
Fixed assets:
Tangible fixed assets, net of accumulated depreciation
Buildings and structures, net
Machinery and vehicles, net
Tools, fixtures and furniture, net
Equipment for amusement facilities, net
Land
Leased assets, net
Construction in progress
Total tangible fixed assets
Intangible assets
Online contents in progress
Other
Total intangible assets
Investments and other assets
Investments in securities
Claims in bankruptcy and reorganization
Lease deposits
Deferred tax assets
Other
Allowance for doubtful accounts
Total investments and other assets
Total fixed assets
Total assets
32,204
8,005
1,225
1,672
1,020
16,833
2,042
2,712
(56)
65,659
6,136
22
1,578
1,101
4,953
995
2,541
17,328
7,895
2,772
10,668
621
66
4,036
1,595
876
(78)
7,1 17
35,1 13
100,773
¥
¥
¥
¥
$
$
$
$
28,429
9,879
1,704
2,085
1,954
24,825
3,382
3,673
(18)
75,917
1 1,297
23
1,875
1,342
5,234
1,042
8
20,825
2,395
5,740
8,135
454
65
3,867
2,952
916
(78)
8,179
37,140
1 13,057
253,836
88,213
15,221
18,621
17,452
221,653
30,200
32,797
(163)
677,833
100,869
211
16,744
1 1,989
46,738
9,303
80
185,937
21,388
51,253
72,641
4,062
584
34,535
26,359
8,184
(696)
73,028
331,608
1,009,441
36,189
7,932
13,367
4,693
57,770
364
18,575
–
60,712
199,604
99,209
5,366
168
20,741
4,487
8,713
138,686
338,291
296,779
190,436
350,870
(162,016)
676,069
20
(2,485)
(2,453)
(4,918)
671,150
1,009,441
Current fiscal year(As of March 31, 2016)
Current fiscal year(As of March 31, 2016)
Previous fiscal year(As of March 31, 2015)
CAPCOM CO., LTD. AND ITS CONSOLIDATED SUBSIDIARIES. MARCH 31, 2016 AND 2015CAPCOM CO., LTD. AND ITS CONSOLIDATED SUBSIDIARIES. MARCH 31, 2016 AND 2015
Please refer to Notes to Consolidated Financial Statements of our website at:http://www.capcom.co.jp/ir/english/data/annual.html
Please refer to Notes to Consolidated Financial Statements of our website at:http://www.capcom.co.jp/ir/english/data/annual.html
(Liabilities)
Current liabilities:
Notes and accounts payable, trade
Electronically recorded monetary obligations
Short-term borrowings
Lease obligations
Accrued income taxes
Deferred tax liabilities
Accrued bonuses
Asset retirement obligations
Other
Total current liabilities
Long-term liabilities:
Long-term borrowings
Lease obligations
Deferred tax liabilities
Liabilities for retirement benefits for employees
Asset retirement obligations
Other
Total long-term liabilities
Total liabilities
(Net assets)
Shareholders’ equity:
Common stock
Capital surplus
Retained earnings
Treasury stock
Total shareholders’ equity
Accumulated other comprehensive income:
Net unrealized gain or loss on securities, net of tax
Cumulative translation adjustments
Accumulated adjustments for retirement benefits
Total accumulated other comprehensive income
Total net assets
Total liabilities and net assets
3,089
988
3,452
483
823
147
1,832
6
6,421
17,246
7,540
589
48
2,101
489
1,427
12,195
29,442
33,239
21,328
33,801
(18,140)
70,228
170
1,215
(283)
1,102
71,331
100,773
4,053
888
1,497
525
6,470
40
2,080
–
6,799
22,355
11,1 1 1
601
18
2,323
502
975
15,532
37,888
33,239
21,328
39,297
(18,145)
75,719
2
(278)
(274)
(550)
75,168
1 13,057
Current fiscal year(As of March 31, 2016)
Current fiscal year(As of March 31, 2016)
Previous fiscal year(As of March 31, 2015)
Consolidated balance sheets
. . . . . . . . . . . . . . . . . . . . . . . . . . . . . . . . . . . . . . . . . . . . . . . . . . . . . . .
. . . . . . . . . . . . . . . . . . . . . . . . . . . . . . . . . . . . . . . . . . .
. . . . . . . . . . . . . . . . . . . . . . . . . . . . . . . . . . . . . . . . . . . . . . . . .
. . . . . . . . . . . . . . . . . . . . . . . . . . . . . . . . . . . . . . . . . . . . . . . . . . . . . . . . . . . . . . . . . . . . .
. . . . . . . . . . . . . . . . . . . . . . . . . . . . . . . . . . . . . . . . . . . . . . . . . . . . . . . .
. . . . . . . . . . . . . . . . . . . . . . . . . . . . . . . . . . . . . . . . . . . . .
. . . . . . . . . . . . . . . . . . . . . . . . . . . . . . . . . . . . . . . . . . . . . . . . . . . . . . . . . . . . . . . . . . .
. . . . . . . . . . . . . . . . . . . . . . . . . . . . . . . . . . . . . . . . . . . . . . . . . . . . . . . . . . . . . . . . . . . . . . . . . . . . . . . . . . . .
. . . . . . . . . . . . . . . . . . . . . . . . . . . . . . . . . . . . . . . . . . . . . . . . .
. . . . . . . . . . . . . . . . . . . . . . . . . . . . . . . . . . . . . . . . . . . . . . . . . . . . . . . . . . . . . . . .
. . . . . . . . . . . . . . . . . . . . . . . . . . . . . . . . . . . . . . . . . . . . . . . . . . . .
. . . . . . . . . . . . . . . . . . . . . . . . . . . . . . . . . . . . . . . . . . . . . . . . . . . . .
. . . . . . . . . . . . . . . . . . . . . . . . . . . . . . . . . . . . . . . . . . . . . . . .
. . . . . . . . . . . . . . . . . . . . . . . . . . . . . . . . . . . . .
. . . . . . . . . . . . . . . . . . . . . . . . . . . . . . . . . . . . . . . . . . . . . . . . . . . . . . . . . . . . . . . . . . . . . . . . . . . . . . . . . . .
. . . . . . . . . . . . . . . . . . . . . . . . . . . . . . . . . . . . . . . . . . . . . . . . . . . . . . . . . . . . . . . . .
. . . . . . . . . . . . . . . . . . . . . . . . . . . . . . . . . . . . . . . . . . . . . . . . . . . . . . . . .
. . . . . . . . . . . . . . . . . . . . . . . . . . . . . . . . . . . . . . . . . . . . . . . . . . . .
. . . . . . . . . . . . . . . . . . . . . . . . . . . . . . . . . . . . . . . . . . . . . . . . . . . . .
. . . . . . . . . . . . . . . . . . . . . . . . . . . . . . . . . . . . . . . . . . . . . . . . . . . . . . . . . . . . . . . . . . . . . . . . . . . . . . . . .
. . . . . . . . . . . . . . . . . . . . . . . . . . . . . . . . . . . . . . . . . . . . . . . . . . . . . . . . .
. . . . . . . . . . . . . . . . . . . . . . . . . . . . . . . . . . . . . . . . . . . . . . . . . . . . . . . . .
. . . . . . . . . . . . . . . . . . . . . . . . . . . . . . . . . . . . .
. . . . . . . . . . . . . . . . . . . . . . . . . . . . . . . . . . . . . . . . . . . . . . . . . . . . . . . . . . . . . . . . . . . . . .
. . . . . . . . . . . . . . . . . . . . . . . . . . . . . . . . . . . . . . . . . . . . . . . . . . . . . . . . . . . . . . . .
. . . . . . . . . . . . . . . . . . . . . . . . . . . . . . . . . . . . . . . . . . . . . . . . . . . . . . . . . . . . . . . . . . . . . . . . . . . . . . . . .
. . . . . . . . . . . . . . . . . . . . . . . . . . . . . . . . . . . . . . . . . . . . . .
. . . . . . . . . . . . . . . . . . . . . . . . . . . . . . . . . . . . . . .
. . . . . . . . . . . . . . . . . . . . . . . . . . . . . . . . . . . . . . . . . . . . . . . . . . . . . . . . . . . . . . . . . . .
. . . . . . . . . . . . . . . . . . . . . . . . . . . . . . . . . . . . . . . . . . . . . . . . . . . . . . . . . . . . . . . . . . . . . . . . . . . . .
¥
¥
¥
¥
. . . . . . . . . . . . . . . . . . . . . . . . . . . . . . . . . . . . . . . . . . . . . .
. . . . . . . . . . . . . . . . . . . . . . . . . . . . . . . . . .
. . . . . . . . . . . . . . . . . . . . . . . . . . . . . . . . . . . . . . . . . . . . . . . . . . . . . . . . . . . . .
. . . . . . . . . . . . . . . . . . . . . . . . . . . . . . . . . . . . . . . . . . . . . . . . . . . . . . . . . . . . . . . . . . . . .
. . . . . . . . . . . . . . . . . . . . . . . . . . . . . . . . . . . . . . . . . . . . . . . . . . . . . . . . . . . . . . .
. . . . . . . . . . . . . . . . . . . . . . . . . . . . . . . . . . . . . . . . . . . . . . . . . . . . . . . . . . . . . . .
. . . . . . . . . . . . . . . . . . . . . . . . . . . . . . . . . . . . . . . . . . . . . . . . . . . . . . . . . . . . . . . . . . . . .
. . . . . . . . . . . . . . . . . . . . . . . . . . . . . . . . . . . . . . . . . . . . . . . . . . . . . . .
. . . . . . . . . . . . . . . . . . . . . . . . . . . . . . . . . . . . . . . . . . . . . . . . . . . . . . . . . . . . . . . . . . . . . . . . . . . . . . . . . . . .
. . . . . . . . . . . . . . . . . . . . . . . . . . . . . . . . . . . . . . . . . . . . . . . . . . . . . . . . . . . .
. . . . . . . . . . . . . . . . . . . . . . . . . . . . . . . . . . . . . . . . . . . . . . . . . . . . . . . . . . . . . .
. . . . . . . . . . . . . . . . . . . . . . . . . . . . . . . . . . . . . . . . . . . . . . . . . . . . . . . . . . . . . . . . . . . . .
. . . . . . . . . . . . . . . . . . . . . . . . . . . . . . . . . . . . . . . . . . . . . . . . . . . . . . . . . . . . . . .
. . . . . . . . . . . . . . . . . . . . . . . . . . . . . .
. . . . . . . . . . . . . . . . . . . . . . . . . . . . . . . . . . . . . . . . . . . . . . . . . . . . . . .
. . . . . . . . . . . . . . . . . . . . . . . . . . . . . . . . . . . . . . . . . . . . . . . . . . . . . . . . . . . . . . . . . . . . . . . . . . . . . . . . . . . .
. . . . . . . . . . . . . . . . . . . . . . . . . . . . . . . . . . . . . . . . . . . . . . . . . . . . . . . .
. . . . . . . . . . . . . . . . . . . . . . . . . . . . . . . . . . . . . . . . . . . . . . . . . . . . . . . . . . . . . . . . . . . . . . . . .
. . . . . . . . . . . . . . . . . . . . . . . . . . . . . . . . . . . . . . . . . . . . . . . . . . . . . . . . . . . . . . . . . . . . . . . .
. . . . . . . . . . . . . . . . . . . . . . . . . . . . . . . . . . . . . . . . . . . . . . . . . . . . . . . . . . . . . . . . . . . . . . . .
. . . . . . . . . . . . . . . . . . . . . . . . . . . . . . . . . . . . . . . . . . . . . . . . . . . . . . . . . . . . . . . . . . . .
. . . . . . . . . . . . . . . . . . . . . . . . . . . . . . . . . . . . . . . . . . . . . . . . . . . . . . . . . . . . . . . . . . . . . . . . .
. . . . . . . . . . . . . . . . . . . . . . . . . . . . . . . . . . . . . . . . . . . . . . . . . . . . . .
. . . . . . . . . . . . . . . . . . . . . . . . . .
. . . . . . . . . . . . . . . . . . . . . . . . . . . . . . . . . . . . . . . . . . . . . .
. . . . . . . . . . . . . . . . . . . . . . . . . . . .
. . . . . . . . . . . . . . . . . . . . . . .
. . . . . . . . . . . . . . . . . . . . . . . . . . . . . . . . . . . . . . . . . . . . . . . . . . . . . . . . . . . . . . . . . . . . . . . .
. . . . . . . . . . . . . . . . . . . . . . . . . . . . . . . . . . . . . . . . . . . . . . . . . . . .
Millions of yen Millions of yen Thousands of U.S. dollars Millions of yen Millions of yen Thousands of U.S. dollars
Consolidated Financial Statement
CAPCOM INTEGRATED REPORT 2016 CAPCOM INTEGRATED REPORT 201683 84
Message fromManagement
Growth Strategy Business ActivityAchievements
ESG Information Financial and Corporate Data
Capcom’s ValueCreation Activities

Balance as of March 31, 2014Cumulative effect due to changes in accounting policiesBalance as of April 1, 2014Changes of items during the fiscal year Cash dividends Net income attributable to owners of the parent Repurchase of treasury stock Disposal of treasury stock Net changes of items other than shareholders’ equityTotal changes of items during the fiscal yearBalance as of March 31, 2015
33,239
33,239
– 33,239
Common stock Capital surplus Retained earnings Treasury stock Total shareholders’ equity
Shareholders’ equityMillions of yen
CAPCOM CO., LTD. AND ITS CONSOLIDATED SUBSIDIARIES. YEARS ENDED MARCH 31
Net sales
Cost of sales
Gross profit
Reversal of allowance for sales returns
Net gross profit
Selling, general and administrative expenses
Operating income
Non-operating income:
Interest income
Dividend income
Settlement received
Exchange gains, net
Other
Total
Non-operating expenses:
Interest expense
Exchange losses, net
Commission fees
Other
Total
Ordinary income
Special losses:
Loss on sales and/or disposal of fixed assets
Impairment loss
Total
Net income before income taxes
Income taxes-current
Income taxes -deferred
Total
Net income
Net income attributable to owners of the parent
64,277 38,379 25,898
87 25,985 15,403 10,582
98 13 92
292 168 664
85 –
83 226 396
10,851
100 49
150 10,701 1,146 2,937 4,084 6,616 6,616
¥
¥
¥
¥
21,328
21,328
0
0 21,328
¥
¥
29,160 273
29,433
(2,249)6,616
4,367 33,801
¥
¥
(18,134)
(18,134)
(5)0
(5)(18,140)
¥
¥
65,593 273
65,866
(2,249)6,616
(5)0
4,361 70,228
¥
¥
Balance as of March 31, 2014Cumulative effect due to changes in accounting policiesBalance as of April 1, 2014Changes of items during the fiscal year Cash dividends Net income attributable to owners of the parent Repurchase of treasury stock Disposal of treasury stock Net changes of items other than shareholders’ equityTotal changes of items during the fiscal yearBalance as of March 31, 2015
99
99
71 71
170
Net unrealized gain orloss on securities, net of tax
Cumulative translationadjustments
Accumulated adjustments forretirement benefits
Total accumulated othercomprehensive income
Total net assetsAccumulated other comprehensive income
Millions of yen
¥
¥
(1,647)
(1,647)
2,863 2,863 1,215
¥
¥
(169)
(169)
(114)(1 14)(283)
¥
¥
(1,717)
(1,717)
2,820 2,820 1,102
¥
¥
63,875 273
64,149
(2,249)6,616
(5)0
2,820 7,181
71,331
¥
¥
Balance as of April 1, 2015Cumulative effect due to changes in accounting policiesBalance as of April 1, 2015Changes of items during the fiscal year Cash dividends Net income attributable to owners of the parent Repurchase of treasury stock Disposal of treasury stock Net changes of items other than shareholders’ equityTotal changes of items during the fiscal yearBalance as of March 31, 2016
33,239
33,239
– 33,239
Common stock Capital surplus Retained earnings Treasury stock Total shareholders’ equity
Shareholders’ equityMillions of yen
¥
¥
21,328
21,328
– 21,328
¥
¥
33,801
33,801
(2,249)7,745
5,496 39,297
¥
¥
(18,140)
(18,140)
(5)
(5)(18,145)
¥
¥
70,228 –
70,228
(2,249)7,745
(5)–
5,491 75,719
¥
¥
Balance as of April 1, 2015Cumulative effect due to changes in accounting policiesBalance as of April 1, 2015Changes of items during the fiscal year Cash dividends Net income attributable to owners of the parent Repurchase of treasury stock Disposal of treasury stock Net changes of items other than shareholders’ equityTotal changes of items during the fiscal yearBalance as of March 31, 2016
170
170
(168)(168)
2
Net unrealized gainon securities, net of tax
Cumulative translationadjustments
Accumulated adjustments forretirement benefits
Total accumulated othercomprehensive income
Total net assetsAccumulated other comprehensive income
Millions of yen
¥
¥
1,215
1,215
(1,494)(1,494)
(278)
¥
¥
(283)
(283)
9 9
(274)
¥
¥
1,102
1,102
(1,653)(1,653)
(550)
¥
¥
71,331 –
71,331
(2,249)7,745
(5)–
(1,653)3,837
75,168
¥
¥
Balance as of April 1, 2015Cumulative effect due to changes in accounting policiesBalance as of April 1, 2015Changes of items during the fiscal year Cash dividends Net income attributable to owners of the parent Repurchase of treasury stock Disposal of treasury stock Net changes of items other than shareholders’ equityTotal changes of items during the fiscal yearBalance as of March 31, 2016
296,779
296,779
– 296,779
Common stock Capital surplus Retained earnings Treasury stock Total shareholders’ equity
Shareholders’ equityThousands of U.S. dollars
$
$
190,436
190,436
– 190,436
$
$
301,796
301,796
(20,082)69,156
49,074 350,870
$
$
(161,970)
(161,970)
(45)
(45)(162,016)
$
$
627,041 –
627,041
(20,082)69,156
(45)–
49,028 676,069
$
$
1,524
1,524
(1,503)(1,503)
20
$
$
10,854
10,854
(13,339)(13,339)
(2,485)
$
$
(2,534)
(2,534)
80 80
(2,453)
$
$
9,843
9,843
(14,762)(14,762)
(4,918)
$
$
636,885 –
636,885
(20,082)69,156
(45)–
(14,762)34,265
671,150
$
$
Balance as of April 1, 2015Cumulative effect due to changes in accounting policiesBalance as of April 1, 2015Changes of items during the fiscal year Cash dividends Net income attributable to owners of the parent Repurchase of treasury stock Disposal of treasury stock Net changes of items other than shareholders’ equityTotal changes of items during the fiscal yearBalance as of March 31, 2016
Net unrealized gain orloss on securities, net of tax
Cumulative translationadjustments
Accumulated adjustments forretirement benefits
Total accumulated othercomprehensive income
Total net assetsAccumulated other comprehensive income
Thousands of U.S. dollars
¥
¥
$
$
77,021 47,175 29,846
– 29,846 17,816 12,029
95 13 – –
195 304
1 19 752 59 55
985 1 1,348
92 105 197
1 1,150 6,377
(2,972)3,405 7,745 7,745
687,695 421,209 266,486
– 266,486 159,078 107,408
855 120
– –
1,742 2,718
1,067 6,714
528 491
8,802 101,323
826 938
1,764 99,559 56,944
(26,541)30,403 69,156 69,156
Previous fiscal yearFrom April 1, 2014to March 31, 2015
Current fiscal yearFrom April 1, 2015to March 31, 2016
Current fiscal yearFrom April 1, 2015to March 31, 2016
Previous fiscal yearFrom April 1, 2014to March 31, 2015
Current fiscal yearFrom April 1, 2015to March 31, 2016
Current fiscal yearFrom April 1, 2015to March 31, 2016
Consolidated statements of income CAPCOM CO., LTD. AND ITS CONSOLIDATED SUBSIDIARIES. YEARS ENDED MARCH 31Consolidated statements of changes in net assets
. . . . . . . . . . . . . . . . . . . . . . . . . . . . . . . . . . . . . . . . . . . . . . . . . . . . . . . . . . . . . . . . . . . . . . . . . . . . . . . . .
. . . . . . . . . . . . . . . . . . . . . . . . . . . . . . . . . . . . . . . . . . . . . . . . . . . . . . . . . . . . . . . . . . . . . . . . . . . .
. . . . . . . . . . . . . . . . . . . . . . . . . . . . . . . . . . . . . . . . . . . . . . . . . . . . . . . . . . . . . . . . . . . . . . . . . . . . .
. . . . . . . . . . . . . . . . . . . . . . . . . . . . . . . . . . . . . . . . . .
. . . . . . . . . . . . . . . . . . . . . . . . . . . . . . . . . . . . . . . . . . . . . . . . . . . . . . . . . . . . . . . . . . . . . . .
. . . . . . . . . . . . . . . . . . . . . . . . . . . . . . .
. . . . . . . . . . . . . . . . . . . . . . . . . . . . . . . . . . . . . . . . . . . . . . . . . . . . . . . . . . . . . . . . . . . .
. . . . . . . . . . . . . . . . . . . . . . . . . . . . . . . . . . . . . . . . . . . . . . . . . . . . . . . . . . . . . . . . . . . . . . . .
. . . . . . . . . . . . . . . . . . . . . . . . . . . . . . . . . . . . . . . . . . . . . . . . . . . . . . . . . . . . . . . . . . . . . .
. . . . . . . . . . . . . . . . . . . . . . . . . . . . . . . . . . . . . . . . . . . . . . . . . . . . . . . . . . . . . . . . . .
. . . . . . . . . . . . . . . . . . . . . . . . . . . . . . . . . . . . . . . . . . . . . . . . . . . . . . . . . . . . . . . . .
. . . . . . . . . . . . . . . . . . . . . . . . . . . . . . . . . . . . . . . . . . . . . . . . . . . . . . . . . . . . . . . . . . . . . . . . . . . . . . . . . . . .
. . . . . . . . . . . . . . . . . . . . . . . . . . . . . . . . . . . . . . . . . . . . . . . . . . . . . . . . . . . . . . . . . . . . . . . . . . . . . . . . . . . . .
. . . . . . . . . . . . . . . . . . . . . . . . . . . . . . . . . . . . . . . . . . . . . . . . . . . . . . . . . . . . . . . . . . . . . .
. . . . . . . . . . . . . . . . . . . . . . . . . . . . . . . . . . . . . . . . . . . . . . . . . . . . . . . . . . . . . . . . .
. . . . . . . . . . . . . . . . . . . . . . . . . . . . . . . . . . . . . . . . . . . . . . . . . . . . . . . . . . . . . . . . . . . . .
. . . . . . . . . . . . . . . . . . . . . . . . . . . . . . . . . . . . . . . . . . . . . . . . . . . . . . . . . . . . . . . . . . . . . . . . . . . . . . . . . . . .
. . . . . . . . . . . . . . . . . . . . . . . . . . . . . . . . . . . . . . . . . . . . . . . . . . . . . . . . . . . . . . . . . . . . . . . . . . . . . . . . . . . . .
. . . . . . . . . . . . . . . . . . . . . . . . . . . . . . . . . . . . . . . . . . . . . . . . . . . . . . . . . . . . . . . . . . . . . .
. . . . . . . . . . . . . . . . . . . . . . . . . . . . . . . . . . .
. . . . . . . . . . . . . . . . . . . . . . . . . . . . . . . . . . . . . . . . . . . . . . . . . . . . . . . . . . . . . . . . . . . . . . .
. . . . . . . . . . . . . . . . . . . . . . . . . . . . . . . . . . . . . . . . . . . . . . . . . . . . . . . . . . . . . . . . . . . . . . . . . . . . . . . . . . . . .
. . . . . . . . . . . . . . . . . . . . . . . . . . . . . . . . . . . . . . . . . . . . . . . . . . . .
. . . . . . . . . . . . . . . . . . . . . . . . . . . . . . . . . . . . . . . . . . . . . . . . . . . . . . . . . . . . . . . . . . .
. . . . . . . . . . . . . . . . . . . . . . . . . . . . . . . . . . . . . . . . . . . . . . . . . . . . . . . . . . . . . . . .
. . . . . . . . . . . . . . . . . . . . . . . . . . . . . . . . . . . . . . . . . . . . . . . . . . . . . . . . . . . . . . . . . . . . . . . . . . . . . . . . . . . . . . . .
. . . . . . . . . . . . . . . . . . . . . . . . . . . . . . . . . . . . . . . . . . . . . . . . . . . . . . . . . . . . . . . . . . . . . . . . . . . . . . .
. . . . . . . . . . . . . . . . . . . . . . . . .
CAPCOM CO., LTD. AND ITS CONSOLIDATED SUBSIDIARIES. YEARS ENDED MARCH 31
Net income
Other comprehensive income
Net unrealized gain or loss on securities, net of tax
Cumulative translation adjustments
Adjustments for retirement benefits
Total other comprehensive income
Comprehensive income
Comprehensive income attributable to:
Owners of the parent
Non-controlling interests
6,616
71 2,863 (1 14)
2,820 9,436
9,436 –
¥
¥
¥
¥
¥
¥
$
$
$
7,745
(168)(1,494)
9 (1,653)6,092
6,092 –
69,156
(1,503)(13,339)
80 (14,762)54,393
54,393 –
Millions of yen Millions of yen
Consolidated statements of comprehensive income
. . . . . . . . . . . . . . . . . . . . . . . . . . . . . . . . . . . . . . . . . . . . . . . . . . . . . . . . . . . . . . . . . . . . . . . . . . . . . .
. . . . . . . . . . . . . . . . . . . . . . . . . .
. . . . . . . . . . . . . . . . . . . . . . . . . . . . . . . . . . . . . . . . . . . . . .
. . . . . . . . . . . . . . . . . . . . . . . . . . . . . . . . . . . . . . . . . . . . .
. . . . . . . . . . . . . . . . . . . . . . . . . . . . . . . . . . . . . . . . . . . . . . .
. . . . . . . . . . . . . . . . . . . . . . . . . . . . . . . . . . . . . . . . . . . . . . . . . . . . . . . . . . . . .
. . . . . . . . . . . . . . . . . . . . . . . . . . . . . . . . . . . . . . . . . . . . . . . . . . . . . . . . . . . . . . . .
. . . . . . . . . . . . . . . . . . . . . . . . . . . . . . . . . . . . . . . . . . . . . . . . . . . . . . . . . . . .
Millions of yen Millions of yen Thousands of U.S. dollars
Thousands of U.S. dollars
Consolidated Financial Statement
Please refer to Notes to Consolidated Financial Statements of our website at:http://www.capcom.co.jp/ir/english/data/annual.html
Please refer to Notes to Consolidated Financial Statements of our website at:http://www.capcom.co.jp/ir/english/data/annual.html
CAPCOM INTEGRATED REPORT 2016 CAPCOM INTEGRATED REPORT 201685 86
Message fromManagement
Growth Strategy Business ActivityAchievements
ESG Information Financial and Corporate Data
Capcom’s ValueCreation Activities

CAPCOM CO., LTD. AND ITS CONSOLIDATED SUBSIDIARIES. YEARS ENDED MARCH 31
Cash flows from operating activities:
Net income before income taxes
Depreciation and amortization
Impairment loss
Amortization of goodwill
Decrease in allowance for doubtful accounts
(Decrease) increase in accrued bonuses
Decrease in allowance for sales returns
Increase in liabilities for retirement benefits for employees
Interest and dividend income
Interest expense
Exchange (gains) losses, net
Loss on sales and/or disposal of fixed assets
Decrease (increase) in accounts receivable, trade
(Increase) decrease in inventories
(Increase) decrease in work in progress for game software
Increase in online contents in progress
(Decrease) increase in notes and accounts payable, trade
(Increase) decrease in other current assets
Decrease in other current liabilities
Other
Subtotal
Interest and dividends received
Interest paid
Income taxes paid
Net cash provided by operating activities
Cash flows from investing activities:
Proceeds from time deposits
Payment for acquisition of tangible fixed assets
Proceeds from sales of tangible fixed assets
Payment for acquisition of intangible assets
Payment for purchase of investments in securities
Payment for other investing activities
Proceeds from other investing activities
Net cash used in investing activities
Cash flows from financing activities:
Net (decrease) increase in short-term borrowings
Proceeds from long-term borrowings
Repayments of long-term borrowings
Repayments of lease obligations
Payment for repurchase of treasury stock
Proceeds from sales of treasury stock
Dividends paid by parent company
Net cash provided by (used in) financing activities
Effect of exchange rate changes on cash and cash equivalents
Net increase (decrease) in cash and cash equivalents
Cash and cash equivalents at beginning of year
Cash and cash equivalents at end of year
10,701 3,535
49 63 (1)(3)
(87)207
(1 11)85
(188)100
10,382 (764)
(6,443)(3,347)(7,856)
(239)(497)(393)
5,187 1 18 (85)
(934)4,286
– (5,465)
206 (195)(12)
(141)111
(5,496)
(1,050)8,162
(3,169)(406)
(5)0
(2,251)1,278
1,811 1,879
26,1 18 27,998
¥
¥
¥
¥
$
$
11,150 5,712
105 –
(38)263
– 264
(109)119 60 92
(2,208)(1,651)(8,778)1,479
935 (1,260)1,718
(2,545)5,309
130 (120)(972)
4,347
4,205 (5,813)
4 (290)(13)
(1 13)380
(1,639)
– 2,500 (883)(496)
(5)–
(2,228)(1,1 15)
(1,160)431
27,998 28,429
99,559 51,003
938 –
(345)2,348
– 2,362 (976)
1,066 537 826
(19,714)(14,749)(78,377)13,207 8,357
(1 1,253)15,340
(22,723)47,405
1,167 (1,076)(8,683)38,812
37,550 (51,907)
42 (2,598)
(116)(1,009)3,397
(14,641)
– 22,321 (7,892)(4,437)
(45)–
(19,901)(9,956)
(10,362)3,852
249,983 253,836
Consolidated statements of cash flows
. . . . . . . . . . . . . . . . . . . . . . . . . . . . . . . . . . . . . . . . . . . . . . .
. . . . . . . . . . . . . . . . . . . . . . . . . . . . . . . . . . . . . . . . . . . . . . . . . .
. . . . . . . . . . . . . . . . . . . . . . . . . . . . . . . . . . . . . . . . . . . . . . . . . . . . . . . . . . . . . . . . . . . .
. . . . . . . . . . . . . . . . . . . . . . . . . . . . . . . . . . . . . . . . . . . . . . . . . . . . . . . . .
. . . . . . . . . . . . . . . . . . . . . . . . . . . . . . .
. . . . . . . . . . . . . . . . . . . . . . . . . . . . . . . . . . . . . . .
. . . . . . . . . . . . . . . . . . . . . . . . . . . . . . . . . . . . . . .
. . . . . . . . . . . . . . .
. . . . . . . . . . . . . . . . . . . . . . . . . . . . . . . . . . . . . . . . . . . . . . . . . . .
. . . . . . . . . . . . . . . . . . . . . . . . . . . . . . . . . . . . . . . . . . . . . . . . . . . . . . . . . . . . . . . . . . . .
. . . . . . . . . . . . . . . . . . . . . . . . . . . . . . . . . . . . . . . . . . . . . . . . . . . . .
. . . . . . . . . . . . . . . . . . . . . . . . . . . . . . . . .
. . . . . . . . . . . . . . . . . . . . . . . . . . .
. . . . . . . . . . . . . . . . . . . . . . . . . . . . . . . . . . . . . . . . . . . . . .
. . . . . . . . . . . . . .
. . . . . . . . . . . . . . . . . . . . . . . . . . . . . . . . . . . . . . . .
. . . . . . . . . . . . . . .
. . . . . . . . . . . . . . . . . . . . . . . . . . . . . . . . . . .
. . . . . . . . . . . . . . . . . . . . . . . . . . . . . . . . . . . . . . . . . . . .
. . . . . . . . . . . . . . . . . . . . . . . . . . . . . . . . . . . . . . . . . . . . . . . . . . . . . . . . . . . . . . . . . . . . . . . . . . . . . . . . . .
. . . . . . . . . . . . . . . . . . . . . . . . . . . . . . . . . . . . . . . . . . . . . . . . . . . . . . . . . . . . . . . . . . . . . . . . . . . . . .
. . . . . . . . . . . . . . . . . . . . . . . . . . . . . . . . . . . . . . . . . . . . . . . . .
. . . . . . . . . . . . . . . . . . . . . . . . . . . . . . . . . . . . . . . . . . . . . . . . . . . . . . . . . . . . . . . . . . . . . . . . .
. . . . . . . . . . . . . . . . . . . . . . . . . . . . . . . . . . . . . . . . . . . . . . . . . . . . . . . . . . . . . . . . . .
. . . . . . . . . . . . . . . . . . . . . . . . . . . . . .
. . . . . . . . . . . . . . . . . . . . . . . . . . . . . . . . . . . . . . . . . . . . . . . . . . . .
. . . . . . . . . . . . . . . . . . . . . . . . . . . .
. . . . . . . . . . . . . . . . . . . . . . . . . . . . . . . . .
. . . . . . . . . . . . . . . . . . . . . . . . . . . . . . . . .
. . . . . . . . . . . . . . . . . . . . . . . . .
. . . . . . . . . . . . . . . . . . . . . . . . . . . . . . . . . . . . . . . . .
. . . . . . . . . . . . . . . . . . . . . . . . . . . . . . . . . . . . . . .
. . . . . . . . . . . . . . . . . . . . . . . . . . . . . . . . . . . . . .
. . . . . . . . . . . . . . . . . . . . . . . . . .
. . . . . . . . . . . . . . . . . . . . . . . . . . . . . . . . . . . . . . . . .
. . . . . . . . . . . . . . . . . . . . . . . . . . . . . . . . . . . . . . . .
. . . . . . . . . . . . . . . . . . . . . . . . . . . . . . . . . . . . . . . . . . . . . . .
. . . . . . . . . . . . . . . . . . . . . . . . . . . . . . . . . . . .
. . . . . . . . . . . . . . . . . . . . . . . . . . . . . . . . . . . . . . . . .
. . . . . . . . . . . . . . . . . . . . . . . . . . . . . . . . . . . . . . . . . . . .
. . . . . . . . . . . . . . . . . .
. . . . . .
. . . . . . . . . . . . . . . . . . . .
. . . . . . . . . . . . . . . . . . . . . . . . . .
. . . . . . . . . . . . . . . . . . . . . . . . . . . . . . . . . . .
Millions of yen Millions of yen Thousands of U.S. dollars
Previous fiscal yearFrom April 1, 2014to March 31, 2015
Current fiscal yearFrom April 1, 2015to March 31, 2016
Current fiscal yearFrom April 1, 2015to March 31, 2016
Consolidated Financial Statement / Independent Auditor’s Report
Please refer to Notes to Consolidated Financial Statements of our website at:http://www.capcom.co.jp/ir/english/data/annual.html
CAPCOM INTEGRATED REPORT 2016 CAPCOM INTEGRATED REPORT 201687 88
Message fromManagement
Growth Strategy Business ActivityAchievements
ESG Information Financial and Corporate Data
Capcom’s ValueCreation Activities

(As of March 31, 2016)
Note: Capcom owns 11,495 thousand shares as treasury stocks.The stocks owned by the company are excluded from the above list.
Major ShareholdersNumber of Shares Held
(in thousands)
Percentage ofShareholding
(%)
Stock Price
High
Low
Trading Volume
ByNumber ofShares Held
5,000–9,999
456 / 0.67%
1,000–4,999
1,328 / 1.96%
500–999
544 / 0.80%
100–499
1,376 / 2.03%
Less than 100
59 / 0.09%
10,000–49,999
2,186 / 3.23%
50,000–99,999
1,433 / 2.12%
100,000–499,999
13,063 / 19.29%
500,000–999,999
12,467 / 18.41%
More than 1,000,000
34,807 / 51.40%
Foreign Investors
26,651 / 39.35%
Domestic Companies
5,896 / 8.71%
ByInvestor
Type
Individuals and Other Investors
24,209 / 35.75%
Financial Institutions
10,125 / 14.95%
Securities Companies
841 / 1.24%
1,200
1,600
2,000
2,400
2,800
3,200
24,000
18,000
12,000
6,000
0
Number of Shares Authorized
Number of Shares Issued
Number of Shareholders
150,000,000 shares
67,723,244 shares
11,564
Crossroad Limited
Japan Trustee Services Bank, Ltd. (Trust Account)
Yoshiyuki Tsujimoto
Haruhiro Tsujimoto
Ryozo Tsujimoto
Kenzo Tsujimoto
The Master Trust Bank of Japan, Ltd. (Trust Account)
GOLDMAN,SACHS & CO.REG
Pictet and Cie (Europe) S.A.
JPMorgan Chase Bank 385174
5,276
2,553
2,325
2,202
2,199
2,009
1,844
1,650
1,151
1,062
9.38
4.54
4.14
3.92
3.91
3.57
3.28
2.94
2.05
1.89
2,389
2,413
1,541
143,234,700
2015
2,745
3,075
1,944
162,642,100
2016
1,958
2,330
1,396
150,408,300
201420132010 201220112006 2007 2008
1,476
1,959
1,250
178,008,200
1,891
2,311
1,473
227,386,800
1,746
3,640
1,475
179,636,900
1,590
1,907
1,145
149,613,900
1,766
2,010
1,297
181,065,800
1,209
1,450
1,000
93,995,100
1,692
2,445
1,102
137,965,900
3,400
3,490
1,660
191,795,000
2009
(Yen)
(Thousand shares)
(Yen)
(Years Ended March 31)
(CY2016)8 9 10 11 12 1 2 3 4 5 6 7
Stock Data Shareholders’ Breakdown
Major Shareholders (Top 10)
Stock Price Range
Trading Volume
11-Year Trend of Stock Price and Trading Volume
(CY2015)8 9 10 11 12 1 2 3 4 5 6 7
(CY2014)
(CY2016)(CY2015)(CY2014)
1 2 3 4 5 6 7
8 9 10 11 12 1 2 3 4 5 6 78 9 10 11 12 1 2 3 4 5 6 71 2 3 4 5 6 7
Head Office
R&D Building R&D Building #2
CAPTRON CO., LTD. / K2 CO., LTD. / Enterrise CO., LTD. / Capcom Mobile, Inc. / CAPCOM U.S.A., INC. / CAPCOM ASIA CO., LTD. / CE EUROPE LTD. / CAPCOM ENTERTAINMENT GERMANY GmbH / BEELINE INTERACTIVE, INC. / BEELINE INTERACTIVE CANADA, INC. / CAPCOM ENTERTAINMENT KOREA CO., LTD. / CAPCOM ENTERTAINMENT FRANCE, SAS / CAPCOM GAME STUDIO VANCOUVER, INC. / BEELINE INTERACTIVE EUROPE LTD. / CAPCOM TAIWAN CO., LTD.
Corporate Profile Major Offices
Capcom’s Subsidiaries (As of June 30, 2016)
Name of CompanyDate of EstablishmentDate of InitiationBusiness Segments
Paid-in CapitalEnd of TermNumber of Employees
CAPCOM CO., LTD.May 30, 1979June 11, 1983Planning, development, manufacture, sale and distribution of home video games, online games, mobile games and arcade games as well as management of amusement arcades. ¥ 33,239 millionMarch 312,839 (Including consolidated subsidiaries)2,114 (Capcom CO., LTD.)
3-1-3 Uchihirano-machi, Chuo-ku, Osaka, 540-0037, JapanPHONE: 81-6-6920-36003-2-8 Uchihirano-machi, Chuo-ku, Osaka, 540-0037, JapanPHONE: 81-6-6920-76003-1-10 Uchihirano-machi, Chuo-ku, Osaka, 540-0037, JapanPHONE: 81-6-6920-7750Shinjuku Mitsui Building 2-1-1 Nishi Shinjuku, Shinjuku-ku, Tokyo, 163-0448, JapanPHONE: 81-3-3340-07103902 Hatta, Iga, Mie, 518-1155, JapanPHONE: 81-595-20-2030
Head Office
R&D Building
R&D Building #2
Tokyo Branch
Ueno Facility
Stock Data / Corporate Data
Number of shares held (in thousands) / (%)
Separate Volume The Latest Development Report 2016
P3P11
P13
Developers Discuss Capcom Development
P15 Utilizing Popular Characters for Regional Growth
RE ENGINE Tomofumi Ishida3D Scanning Makoto FukuiVirtual Reality Kazuhiro TakaharaLocalization Miguel E. Corti
P5P6P7P8
Technologies Underpinning the Development
SECOND TO NONE
Jun Takeuchi Managing Corporate OfficerHead of Consumer Games Development Division 1
RESIDENT EVIL 7 biohazard Delivers a Fresh Taste of Fear to the World01
Miwa Hara Senior ManagerSection 3, Department 1, Consumer Games Development Division 1
Virtual Love in the Palm of Your Hand A Game Developed by Women, for Women03
Kento Kinoshita DirectorSection 2, Department 4, Consumer Games Development Division 3
Diving into a World of Adventure in Online Development04
P9
Joe Nickolls Studio DirectorCapcom Game Studio Vancouver, Inc.
Wowing U.S. and European Fans with the Most Intense Zombie Action Game Ever!02
P1 Message from the Head of Consumer Games Development
Yoichi Egawa Director and Executive Corporate Officer
Second to None: Continuously Rising to the Challenge Without Fear of Change, We Aspire to Be the World’s No.1 Game Developer
CAPCOM INTEGRATED REPORT 2016 CAPCOM INTEGRATED REPORT 201689 90
Message fromManagement
Growth Strategy Business Activity Achievements
ESG Information Financial and Corporate Data
Capcom’s ValueCreation Activities

SECOND TO NONEThe Latest Development Report
2016Name of Company
Date of Establishmen
Date of Initiation
Business Segments
Paid-in Capital
End of Term
Number of Employees
Head Office
R&D Building
R&D Building #2
Tokyo Branch
Ueno Facility
CAPCOM CO., LTD.
May 30, 1979
June 11, 1983
Planning, development, manufacture and sale of home video games, online games, mobile games and arcade games as well as management of amusement arcades.
¥33,239 million
March 31
2,839 (Including consolidated subsidiaries)2,114 (Capcom CO., LTD.)
3-1-3 Uchihirano-machi, Chuo-ku, Osaka, 540-0037, Japan
PHONE: 81-6-6920-3600 FAX: 81-6-6920-5100
3-2-8 Uchihirano-machi, Chuo-ku, Osaka, 540-0037, Japan
PHONE: 81-6-6920-7600 FAX: 81-6-6920-7698
3-1-10 Uchihirano-machi, Chuo-ku, Osaka, 540-0037, Japan
PHONE: 81-6-6920-7750
Shinjuku Mitsui Building 2-1-1 Nishi Shinjuku, Shinjuku-ku, Tokyo, 163-0448, Japan
PHONE: 81-3-3340-0710 FAX: 81-3-3340-0711
3902 Hatta, Iga, Mie, 518-1155, Japan
PHONE: 81-595-20-2030
Corporate Profile (As of March 31, 2016)
Mar. 1991
Jun. 1992
Jul. 1993
Dec. 1994
Mar. 1996
Aug. 2001
Oct.
Mar. 2002
Sep. 2004
Jul. 2005
Aug. 2006
Dec.
Mar. 2007
Feb. 2009
Apr.
Jul.
Oct.
Nov. 2010
Sep. 2013
Nov.
Mar. 2015
Dec.
Released the arcade video game Street Fighter II and it triggered the Street Fighter II boom.
Released Street Fighter II for Super NES, and it was a mega-hit.
Opened CapcoCircus Nigata East, the largest arcade in Nigata.
Premiere of the Hollywood movie Street Fighter.
Released Resident Evil for PlayStation, a long selling title which had record breaking sales, and established the genre of survival horror.
Released Devil May Cry for PlayStation 2, and it was a mega-hit.
Released Phoenix Wright: Ace Attorney for Game Boy Advance, and it drew public attention as a courtroom battle title.
Premiere of the Hollywood movie Resident Evil which recorded sales of 102 million dollars worldwide.
Premiere of the Hollywood movie Resident Evil: Apocalypse and it grossed 100 million dollars worldwide.
Released Sengoku BASARA for PlayStation 2, which enjoyed popularity especially among young gamers for its innovative worldview.
Released Dead Rising for Xbox 360. More than 1 million units were sold, an extraordinary feat for a new title for a new game console.
Released software Lost Planet for Xbox 360. Over 1 million units were sold following the trails of Dead Rising, another exceptional accomplishment for a new title.
Monster Hunter Freedom 2 becomes the first Japanese PSP software to exceed 1 million units shipped.
Takarazuka Revue Company launches theatrical performance of Phoenix Wright: Ace Attorney - The Truth Comes Back to Life.
Began broadcasting the TV animation program Sengoku BASARA.
Initial shipments of Monster Hunter Tri, a third-party title for the Wii, surpass one million units.
Sengoku BASARA character Date Masamune used for PR activities in support of the Miyagi Prefecture gubernatorial elections.
Distribution of social game Smurfs' Village for iPhone began. It became the top download in 100 countries around the world.
Released Monster Hunter 4 for Nintendo 3DS.The Monster Hunter Craze sparked again with the sales over 4 million units sales.
Released Dead Rising 3 for Xbox One. Capcom’s first title for this new game console, marked over 1 million units sales.
Signed a regional invigoration and inclusion agreement with the city of Kofu for the use of Sengoku BASARA characters in regional invigoration activities and the promotion of tourism in Kofu, Yamanashi Prefecture.
Officially launched Monster Hunter Online in China in cooperation with Tencent Holdings Ltd.
History
Please see the Capcom Integrated Report 2016.
http://www.capcom.co.jp/©CAPCOM CO., LTD. ALL RIGHTS RESERVED.
3-1-3 Uchihirano-machi, Chuo-ku,Osaka, 540-0037, JapanPHONE: 81-6-6920-3600 FAX: 81-6-6920-5100

Message from the Head of Consumer Games Development
Second to None: Continuously Rising to the Challenge Without Fear of Change, We Aspire to Be the World’s No.1 Game Developer
Taking an Offensive Position Toward Changing Market Trends
The Chairman issued a manifesto, which reemphasized that we will not compromise on the products we release to market; an insistence on quality and the development of the world’s number one games. He demands we reflect on whether we are maintaining a balance between meeting our ship-dates and craftsmanship. As I am in charge of Consumer Games Development, my mission is to see these directives carried out anew. Although I have just been appointed, there is no time to waste. First, I think there is a need to understand what issues we’re facing on the frontlines of development, so I am deepening communications with R&D staff across all ages and functions. At present, Capcom is focusing efforts on retaining talented employees and making capital expenditures in an attempt to strengthen development capabilities. In addition to aggressive hiring activities focused on new graduates, we constructed a second R&D building. Furthermore, we have established an environment enabling
development teams to take on new challenges, including the creation of one of Japan’s largest motion capture and 3D scanning studios. These investments further advance our development technologies and enable us to adapt to a game market that is transitioning from a transactional model to an operation-focused, recurring revenue model of business. Releasing games that continue to hold users’ attention while maintaining a sense of speed will be indispensable in game development going forward. To this end, we will concentrate development resources internally and respond to changing market trends.
During discussions between marketing and senior management (which included development staff as well), two issues came into view: strengthening our development structure and brand management. First, regarding the former, at present domestic development is conducted under three divisions. Division 1 creates global contents including Resident Evil. Division 2 works with online games such as Street Fighter. Division 3 develops contents for Japan, including Monster Hunter and Sengoku BASARA. Although the divisions interact, because each is so focused on getting the best results within their area, it is difficult to say there is overall
coordination. For this reason, I think we must mobilize technologies and expertise in an attempt to optimize R&D overall. Also, to further expand the organization, we must develop core human resources able to drive and lead younger employees. As for the latter, brand management, we will plan out sales launch timing and platform compatibility for each brand individually, such as for Monster Hunter or Resident Evil. Production is the role of the development side, but the when and how of sales is the role of the business side, thus we will link these two in an attempt to maximize value. To address these issues, our immediate objective is to create an environment in which the entire Company can engage in the development of interesting games. I am able to understand both the spirit of R&D and the mind of business precisely because I ascended to a management position after experiencing game development. Armed with this understanding, I will build a soil bed in which our next buds can sprout and grow.
A new wave is fast approaching the global game market. This year, all eyes are focused on virtual reality (VR). Hardware manufacturers are releasing a variety of gear, which have been a hot topic of conversation. Additionally, eSports (electronic sports), which bring the thrill of baseball or soccer matches to competitive video games, are increasing in popularity around the world. To catch this wave, Capcom will release RESIDENT EVIL 7 biohazard in January 2017 (see page 3). This title’s shocking world
of horror and incredible VR technology will showcase Capcom’s production capabilities to the world. In terms of eSports, in addition to the global Capcom Pro Tour sponsored by subsidiary Capcom U.S.A., INC., we will collaborate with other companies to create eSports event opportunities throughout the year with the aim of acquiring new users. Going forward, as we aim to become the world’s number one game developer, we feel that while it is of course necessary to advance and expand upon existing content, it is also necessary to take on new challenges. We cannot ignore genres such as shooting and strategy games with massive numbers of players when considering Consumer, Online and eSports market growth potential. We will make use of our strengths and keep a close watch on market trends while moving forward with the kind of game creation only possible at Capcom. The new challenges have only just begun.
In July 2016, Director and Executive Corporate Officer Yoichi Egawa was placed in charge of Consumer Games Development. Egawa joined Capcom shortly after its founding, working in arcade video game development, Capcom’s core business at that time. Later, he developed home video games and contributed to the establishment of the Pachinko & Pachislo and Mobile Contents businesses. This game development pioneer spearheads Capcom R&D.
DEVELOPMENTSTRATEGY
Yoichi EgawaDirector and Executive Corporate Officer
After joining Capcom, Egawa worked in the development of arcade games for amusement facilities as a programmer involved in the development of CP system boards. Later, after developing home video games, he established the Pachinko & Pachislo (P&S) business in 1996 and the Mobile Contents business in 1999. After serving as General Manager of Creative Division 5 in 1999, Egawa was appointed Corporate Officer, Head of Contents Expansion Business Division. He was appointed Managing Corporate Officer in 2011 and Executive Corporate Officer in 2013, his current position. At present, he is in charge of Consumer Games Development and Amusement Equipments Business.
Weeding Out Issues to Build Fertile Ground for Game Creation
After These Challenges, More Challenges Await!
Visiting the workplace to understand actual development conditions. Seeing things from a different perspective than immediate supervisors raises awareness of potential issues.
Positioned between the development workplace and senior management to better communicate the ideas and contentions of both.
Proactively listening to the opinions of young team members. Occasionally, heated debates about production take place over meals together.
21

subjects in 360 degrees with one shot. Beyond that, we steadily increased the precision of our VR technologies (see page 7), which was a new challenge for us altogether. At first, the development team members were understandably anxious, as we were simultaneously taking on some non-conventional processes. However, as the completed product began to take shape, the team became energized. Of course, Resident Evil is a wildly popular series in the United States and Europe. We localized, or “cultural-ized” (see page 8), the game’s content for suitability with other cultures in order to achieve player immersion across the globe.
This year marks the 20th anniversary of Resident Evil, Capcom’s flagship title and a series that has sold a cumulative total of 69 million units. The Resident Evil
In the dimly lit interior of a dilapidated mansion strewn with broken furniture and tinged with humidity and heat... The trailer for RESIDENT EVIL 7 biohazard (hereinafter, RESIDENT EVIL 7) was shown at this year’s E3, with the January 2017 release date greeted by loud cheers from the audience. Seeing that reaction, I thought
to myself “right on!” The Resident Evil series involves fending off a terrifying onslaught of zombies while attempting to escape from desperate situations and make it out alive by any means possible. We’ve been evolving the series, which has let users enjoy this terrifying world, ever since the first game was released in 1996. However, we’ve heard some fans say “the old Resident Evil was scarier.” Of course, the stronger the initial shock, the longer people will remember it. But
was that why it felt scarier? Or did we leave something behind in the process of moving the game forward? Now, with the arrival of promising new trends in VR, we are once again engaged in developing a kind of terror only Capcom—who built the survival horror market—can provide. Crafting a story that delivers a palpable experience of fear through virtual reality, we also revamped our conventional third-person perspective (TPS) game system with a highly immersive isolated view (first person perspective).
world has been embraced in every country, adapted into Hollywood movies and amusement park attractions, and has become a franchise that even people who do not play games are familiar with. I have strong feelings for this series, having been personally involved since the first game. However, I am exceptionally enthusiastic about this new title. This is because this year, which some are calling “VR year one,” we will attempt to take the lead in this new market with RESIDENT EVIL 7. If we fail to deliver in terms of the game world or technology, we will be unable to create the kind of innovative game players demand. In order to succeed with both of these and take on the challenges in this new market, a balance between the wild instinct of inspiration and rationality of data analysis is indispensable. Being satisfied with the status quo means game over. Despite this difficult struggle, I am enjoying the challenge. Increasing the focus on fear, we will take you deeper into the world’s ultimate survival horror game. I want everyone to experience the upcoming RESIDENT EVIL 7.
Development was plagued by a series of difficulties. This was because, in addition to the high-resolution, high-performance PlayStation 4 and Xbox One, we also decided to make the game compatible with the new PlayStation VR. With VR, we couldn’t bring the game to market unless it had photorealistic graphics on par with live-action films. To create that level of quality, conventional production methods would take too long and cost too much. Thus, we had to rethink the way we make games. In order to carry out asset-based (graphic and 3D model elements) development, which is globally the mainstream, we began developing our new RE ENGINE (see page 5). To produce these assets, we adopted 3D scanning (see page 6), facilitating instant data creation by recording
RESIDENT EVIL 7 biohazard Delivers a Fresh Taste of Fear to the World
An Overwhelmingly Terrifying Experience in this Horrific Return to Form
Bringing New Technologies to Match the High-Spec, Next-Generation Game Consoles
The Ongoing Pursuit of the Global Pinnacle in Horror Entertainment
Ensuring unity in direction by maintaining close communications with development team members. A variety of technologies were adopted for the development of this installment.
Using the RE ENGINE to carefully check the placement and details of meticulously designed dilapidated mansion walls, furniture and other props.
RESIDENT EVIL 7 incorporates psychological horror elements into the story to provide an unprecedented sense of fear in a startling virtual reality world.
As a Managing Corporate Officer, focuses efforts on global strategy and development management. Worked on Lost Planet 2 and Resident Evil 5. Currently heading up development of the new RESIDENT EVIL 7 biohazard.
Jun TakeuchiManaging Corporate OfficerHead of Consumer Games Development Division 1
Developers Discuss Capcom Development 01
43

Painstakingly Crafted Reality with Resident Evil-Appeal
An Engine Enabling the Artist to Fulfill Their Every Wish
RE ENGINECapcom’s newest game engine, developed for this title. It enables photorealistic graphics that rival live-action film, with details ranging from the textures of various objects to motes of dust floating in the air.
3D ScanningIn RESIDENT EVIL 7 biohazard, Capcom utilizes 3D scanning, employing its world-class, large-scale camera system to create more realistic characters.
Up to now, Capcom had built MT Framework, an innovative proprietary development engine used to make high-quality games. However, conventional engine specs were insufficient for bringing the realistic world pursued by creators in RESIDENT EVIL 7 biohazard (hereinafter, RESIDENT EVIL 7) to life. Thus, this time we ended up simultaneously working on the development of both the game and the new RE ENGINE. The main feature of the RE ENGINE is its ability to dramatically reduce the time required for various game development processes. For example, the time required to test program changes has been reduced 90%, and materials made separately by creators can be combined in real time, which enables them to be used to instantly create other materials. This engine also supports the high-resolution
graphics required for VR compatibility at a rate of 60 frames per second. We faced numerous difficulties in trying to make these features a reality, however the team pulled together as one to make it happen. Creating an interesting game should not be hindered by development engine constraints. If an artist expresses a desire to do something, the engine must evolve to make it happen. For this reason, all of us on the engine development team work in constant close contact with the game development team to promote improvements. This kind of flexibility can only be achieved through in-house production and is connected to enhancing Capcom quality. I hope everyone will stop to admire the overwhelming high-quality of RESIDENT EVIL 7, the first title created using the RE ENGINE.
The theme of RESIDENT EVIL 7 is “fear that sticks with you.” Terror waits in the humid and stifling air—I want to create a realistic sense of that in 3DCG, so it clings to your body and memory. To pursue realism, we created one of the world’s largest scale 3D scanning systems, an important tool contributing to the meticulously crafted reality of our games. Leveraging the merits of possessing such a system in-house, we paid particular attention on this title to technologies that faithfully reproduce human expressions. This degree of reproduction is unlike anything that has come before, achieving realism that is truly human. Using this system, we are able to generate data on expressions from a variety of angles with just one shot, dramatically increasing development speed. However, we are not merely pursuing
efficiency or photorealism. On top of overwhelming realism, we’ve added characters and other touches typical of Resident Evil, resulting in a game that appeals like only Capcom games can. To achieve this, the work flow was revised to complete casting, special-effects makeup and costume coordination in the steps prior to character design. In doing so, we further enhanced accuracy and were able to better reflect the feeling of the Resident Evil world in the 3D data, creating reality so convincing it is as if the characters actually exist. I want everyone to play this new title to experience realism in a game like never before.
Rendering an image using the RE Engine A character generated using the 3D scanning system
Joined Capcom in 1995. Worked as the character lead on the Resident Evil series from 2005. Currently a technical artist on this title working to improve the development environment, including asset pipeline development and creation of flows and tools.
Makoto Fukui Technical ArtistSection 1
Technologies Underpinning the Development of
RESIDENT EVIL 7 biohazard
Joined Capcom in 2003. Involved with developing the MT Framework engine. After that, responsible for successive engine development as a technology leader.
Tomofumi Ishida Lead ProgrammerTechnology Section
65

Virtual RealityVirtual reality (VR) is a technology that gives users the experience of actually being inside a virtual world.RESIDENT EVIL 7 biohazard is fully compatible with PlayStation VR and is Capcom’s first VR title.
LocalizationWhen people hear the word “localization,” many imagine it simply involves language translation. However, localization at Capcom means game content is tailored to the cultural expectations of each country where the game is sold.
A sample of the various target languages.
Korean
Chinese
German
Russian
French
Arabic
Localization Means Translating Culture
The Resident Evil series has a multitude of fans throughout the world. As one of our major titles this fiscal year, RESIDENT EVIL 7 will be localized into 13 languages and sold in all major regions, including North America, Europe, Asia and Japan. This installment is sure to go down in series’ history, and localization began early in the planning and development stages. We had an American writer create the script based on concepts established by the Japanese design team, while creators and staff in Japan and overseas worked to move development forward. We on the localization team are responsible for bridging these efforts. This back and forth is not limited to language. We also translate non-text elements like cultural aspects and design intentions. On this title, we paid particular attention to
reality for all users, especially those in the U.S. and Europe. The story takes place in America, and players are sure to notice if any aspect of the game is incongruent with the culture and climate of the United States. If too many elements are out of place, the dark world and atmosphere of the Resident Evil series may be lost. Thus, the localization check is not limited to the game’s script and plot, but extends to voice actor performances and motion capture movements as well. At the same time, we are careful to avoid changing the unique ideas Capcom is known for. Working closely with designers in Japan, we successfully achieved a high degree of realism and maintained the unique flavor of Capcom. All these efforts are aimed at providing players around the world with a realistic horror game. I want everyone to experience the new world of Resident Evil.
I Want to Show Capcom Means Business With VR
Capcom’s first VR demo, KITCHEN, was shown at E3 in 2015. Seeing the terrified reactions of show-goers who experienced the demo displayed the affinity between horror and VR and made me confident that utilizing VR in the Resident Evil series would lead to success. The global release of VR headsets in 2016 has led to this year being called “VR year one,” and this is truly a time when the game market is evolving. Thus, establishing RESIDENT EVIL 7—VR content only Capcom can create—at the center of this market has become one of our objectives. To this end, it is critical to provide content with a sense of realism never seen before intermingled with the enjoyable game play expected from Capcom—which provides us creators with new challenges daily as we proceed with development.
One of the appeals of VR is the ability to break through the “controller wall.” Until now, players had to use controllers to change the point of view during a game. In other words, players were only able to experience the game through the screen and controller. However, with VR the point of view changes by actually turning one’s head, allowing players to also peer in and around. What if there are some hidden items down there? This fuses realistic experiences with fun. VR even enables us to incorporate ideas that until now were not possible. When this game is complete, I want everyone to put on a VR headset and try it out. I’m sure then you’ll understand that we mean business.
Miguel E. CortiGroup LeaderLocalization GroupGlobal R&D Section
Joined Capcom in 2007. Involved in the translation of numerous titles including Resident Evil 5. Since Lost Planet 2, engaged in enhancing localization quality not only in terms of translation, but also through assistance and observation during motion capture filming and involvement in game script production.
Joined Capcom in 2007. Involved in the development of Lost Planet 2. After that, responsible for basic game engine development and in charge of VR technical development on this latest title.
Kazuhiro TakaharaProgrammerTechnology Section
Technologies Underpinning the Development of
RESIDENT EVIL 7 biohazard
87

Wowing U.S. and European Fans with the Most Intense Zombie Action Game Ever!
Using Cutting-Edge Technologies to Bring a Flood of Ideas to Life
CV is equipped with a soundstage and animation motion capture system, providing an environment that supports creative game production.
The development team constantly demos the game. This provides an important opportunity to check each other’s progress and exchange ideas on improvements for the game.
What is behind the government conspiracy to unleash hordes of zombies? Frank will have to get to the truth first…or die trying.
Frank is Back in Dead Rising 4 this new game will be set in the town of Willamette, Colorado, where the townspeople are being attacked and turned into zombies. As chaos ensues, it’s up to Frank West to shoot, smash and splatter his way to the truth. A fan-favorite, Frank is the main character from the original game. Dead Rising 4 is packed with new elements beyond imagination, which ramps the fun up to new dizzying heights.
Our aim with Dead Rising 4 is to provide fans with action and survival that exceeds their expectations while adding humor to the fun. The development team came up with one idea after another, like “let’s have faster, scarier zombies that run, jump and climb to get at you,” or “why don’t we create the ultimate combination and let
Frank combo himself in an Exo Suit?” and “how about if we include fights between survivors that haven’t turned into zombies yet?” and even “let’s make it so that four users can enjoy online multiplayer action together.” Once we decided on the direction of the planning, we next started developing the programs for the animation and game. We maintained the high-quality graphics players demand while enabling the main character to be moved freely. Though you cannot see it onscreen, we used a number of advanced AI and other programs to make the game interesting, all of which are working behind the scenes. The uncompromising efforts of the creators have resulted in a distinctive new title that will amaze users with the sheer number of zombies appearing onscreen at once, as well as the ability to freely combine weapons and vehicles enabling an unlimited number of ways in
The Dead Rising series features action adventure games in which players repel zombie hordes using a variety of weapons while attempting to uncover the truth behind a mysterious outbreak. Compared to other Capcom zombie games like Resident Evil, a survival horror game focused on fear, Dead Rising is an exhilarating, open-world sandbox action game where players mow down zombies by the truck-load. In addition to the fighting and weapons typical of the zombie genre, the incorporation of humor and a high degree of freedom that enables players to follow the story or just explore and have fun has made this a popular title in the U.S. and Europe. The latest entry in the series, Dead Rising 4, is scheduled to be released in December 2016 for the Xbox One and Windows 10. As in the original title,
which to take down the undead. I think the fans are really going to be pleased!
Whether a game is considered fun or not is closely related to the culture and customs of a country or region, so I think it was worthwhile to develop Dead Rising, which targets users in the U.S. and Europe, at Capcom Game Studio Vancouver (CV). This is because, by putting yourself within
a country and culture you are better able to naturally understand and express what that culture feels is interesting or fun. However, development collaboration between Japan and Canada is indispensable for making the title even better. At the development stage, the game visuals and programs are continuously shared globally in an attempt to refine them. We strengthen our support for promotional strategies aimed at target segments through teleconferences and business trips between Japan and Canada. No matter which country we are in, we are able to use the common language of gaming to move forward in the same direction.
The kind of game creation we aim for at CV is focused on taking on challenges rather than fearing risks. Titles that simply make the grade are meaningless. To enable staff to make the most of their abilities, we create spaces where opinions can be exchanged freely, hold classes on specific subjects and provide other opportunities for learning. In this way, we strive to make CV the most creative game studio in North America.
Capcom Game Studio Vancouver’s Strengths and the Keys to Successful Global Collaboration
Has engaged in development of soccer and other sports games for major game companies. Currently Studio Director of Capcom Game Studio Vancouver and in charge of Dead Rising 4.
Joe NickollsStudio DirectorCapcom Game Studio Vancouver, Inc.
Developers Discuss Capcom Development 02
109

Players tap their foreheads on the smartphone during visitations to recreate touching through the glass.
The word “paruma” in the title comes from the Latin “palma,” or palm. This word was chosen because players often touch the young man’s hand in the game.
In the “fantasy dream app,” incredible events offer players a break from the main story. Here, the team is brainstorming about what kind of fantasies would be interesting.
Communication is deepened through conversations over text messaging apps.
focused on getting development started, but as we consulted with our superiors the weaknesses in our business plan became clear. We revised our plan, analyzed which users to target, broke down the market and competitive trends visually using numbers and graphs, and then resubmitted our proposal. It took a few years, but in doing so we had the opportunity to create a new genre. As the project got going, the team grew more enthusiastic and things began moving forward. The numerous revisions made at the proposal stage had heightened the quality of the game’s planning and scenario. Furthermore, embodying the spirit of true artisans, our creative members of the team were meticulous down to the finest detail—resulting in quality that, without exaggeration, I can say is on par with a console title. I was reminded once again of the true strength of Capcom, a company with years and years of experience making games.
The game industry is generally described as a difficult place for women, but in my everyday work at Capcom I barely sense
Toraware no Paruma, a romance game for women released in August 2016, is a distinctively unique title for Capcom, mainly known for action games. The concept is “experiencing love behind glass.” The player reaches out by communicating with their
love interest through the smartphone screen. This is a kind of game never seen before that women of all ages can enjoy. The player is brought to a lonely island in a distant sea, where she meets a young man with amnesia being held captive in a room there. The player interacts with him by providing advice, and before she knows it, becomes smitten with him. Despite this unusual
scenario, we successfully created a sense of togetherness by incorporating text messages and other smartphone features into the game. Also, visits with the young man incorporate 3D modeling, and during these, the smartphone LCD screen acts as the visitation room glass barrier. Here, players can enjoy some unconventional touch controls, such as using their foreheads to tap the screen!
any differences between men and women. If one has skills in planning and technology, opportunities will present themselves regardless of gender. If anything, getting people working together in development may be easier when women are around, as we tend to have a strong sense of group orientation. Be that as it may, women can never fully separate life events from work. Personally, when I returned to work after giving birth to my first son, I felt torn between childrearing and my job. At that time, there were still very few women who had returned to work after giving birth. My husband (who also works in game development) encouraged me, telling me “in the future, there will be more developer-moms. You have to blaze a trail for them.” This gave me the push forward to take on both roles. At present, there are many women who returned to work after childbirth and are playing active roles now, taking advantage of support systems that provide leave for childcare and shortened working hours. As our user base becomes more diverse, it naturally follows that us developers also becoming diverse is a good thing. The important thing is the will to create interesting games. If you have that, you can play an active role in a wider range of fields.
The clear difference from standard romance games is rather than playing up the part of the young man’s preferred “type” of woman, you are simply yourself. Accumulated player data is used to conduct a unique analysis based on Jung’s eight types which shapes the young man so he will warm up to any and all players. This is how we make women’s dreams a reality.
If there are no games women can enjoy, we should just make one! This project started with that simple thought, but the road to product launch was by no means an easy one. While a typical smartphone game usually takes 2-3 months to develop, this title took about three and a half years from initial proposal to release. Our proposal won out in an internal call for projects, but even so there is a lack of successful women’s romance games, thus there was a bit of a wait until development was green lighted. Thinking about it now, the initial proposal did not go beyond simply emphasizing the game’s appeal. We were just
Never Giving Up Led to Better, More Interesting Ideas
Making a Romance Game for Women Like Never Before
Virtual Love in the Palm of Your HandA Game Developed by Women, for Women
An Environment Where You can Speak Your Mind, Regardless of Gender
Developers Discuss Capcom Development 03
Responsible for the Onimusha series as a designer. After giving birth and taking childcare leave in 2004, was the background section leader on E.X. Troopers and Lost Planet. Has worked as a project manager since 2015.
Miwa HaraSenior ManagerSection 3, Department 1Consumer Games Development Division 1
1211

Bringing the World of Dragon’s Dogma to Online Multi-Player
Creating a new game involves working with colleagues to forge a path where no path exists. Unimaginable difficulties await us along the way. Fortunately, my colleagues at Capcom are dependable and bustling with ideas and technological expertise. And thanks to the collective strengths of these co-workers, Dragon’s
Diving into a World of Adventure in Online Development
Worked on the Monster Hunter and Dragon’s Dogma series as a planner. Made his directorial debut on the console title Dragon’s Dogma: Dark Arisen.
Kento KinoshitaDirectorSection 2, Department 4Consumer Games Development Division 3
Dogma Online was launched in August 2015. It has gotten off to an excellent start, with one million downloads in the first month. This title is based on Dragon’s Dogma, which was released in 2012 for home video game consoles. In the original, players became the Arisen and set out alongside their pawns in an expansive open-world fantasy adventure. The game both proved popular and heightened anticipation for the next title in this series. Usually,
development of a sequel would only have been for another console game, but the reason we developed an online version was because of extremely strong user demand to bring this world to online multi-player gaming. However, we quickly hit a major wall. Dragon’s Dogma Online development staff, including myself, had almost no experience with online development. We gathered in-house programmers and built a server from the ground up. As in the game world, we cleared missions one by
one on our quest in development to deliver this title to the world.
With Dragon’s Dogma Online, we aimed to create a world of adventure with long-lasting fun. We created a new story centered on five dragons, with Season One revolving around the Golden Dragon. The game is offered as a freemium title (basic play is free) for PC, PS4 and PS3 in order to widen the point of entry and encourage casual participation from new users. The real challenge for online games comes after release. Running the title in such a way that users want to continue playing is a must. We stumbled a bit immediately after release, but once we analyzed the data on how users were playing the game, we began to amass management know-how.
Our Goal was Richer Content to Create Long-Lasting Appeal
Looking Ahead to Season Three, a New Start
Now, we are ready for Season Two. This adventure revolves around the Spirit Dragon, with a story that unfolds in an expansive open world. In addition to new dungeons and action, we introduced a new system enabling players to customize their own private rooms. We also improved settings that had caused some users stress, and even added other elements such as narration at story ends to provide a sense of anticipation for subsequent developments.
In terms of the appeal of online games from the game provider’s perspective, the biggest merit is the ability to immediately understand if and how users are enjoying the game. If the game is interesting, players will visit every day. If it is too difficult, many will stop playing. All this can be understood just by looking at the data. As Capcom
is managing the game’s server, updates and revamps are much easier than with Consumer games. Utilizing both the content we provide and feedback from users, we check solutions and perform adjustments on a daily basis. In this way, we make use of accumulated management know-how to hold events and implement updates aimed at further enhancing user satisfaction. We released version 2.0 in June 2016 (the first stage of Season Two), but are moving ahead without a break to simultaneously create the Season Three framework. The world of online games spreads ever outward. Once we have established a solid foundation in Japan I’d like to consider bringing this game overseas, where there are a great many online game players.
Analyzing an enormous user log to repeatedly consider events and updates.
The appeal of this title is the fun of adventuring in a world of fantasy. Creating the scenes and characters is a critical element.
A new area in version 2.0 of Dragon’s Dogma Online where a battle unfolds against a grotesque foe called “Shinshokuma.”
Developers Discuss Capcom Development 04
1413

Kochi Prefecture: Mascot for gubernatorial election
Okayama Prefecture: Co-sponsorship of special museum exhibit
Wakayama Prefecture: Support for campaign to attract visitors
Okazaki, Aichi Prefecture: Support for tourism promotion
Miyagi Prefecture: Mascot for gubernatorial election
Ibaraki Prefecture: Co-sponsorship of special museum exhibit
Saitama Prefecture: Co-sponsorship of special museum exhibit
Kofu, Yamanashi Prefecture: Conclusion of comprehensive partnership agreement
Ueda, Nagano Prefecture: Support for tourism event
Kyoto: Mascot for vehicle-related theft prevention awareness
Hyogo Prefecture: Mascot for vehicle-related theft prevention awareness
Osaka: Mascot for vehicle-related theft prevention awareness
While this action game for home video game consoles is based around the warlords and historical facts of the Warring States (Sengoku) Period, its fresh, unique take on this theme proved popular and ignited interest in history nationwide; in total, the series has sold 3.8 million units.
Cultural Promotion
Participation in ElectionsPublic Safety
Economic Development Sengoku BASARA Character Used in
Wakayama Prefecture Tourism Promotion Campaign
Wakayama Prefecture, August 2016Example 1
The Taiga Drama Sanada Maru/Sanada Yukimura & Sengoku Wakayama Promotional Campaign Association used a character from Sengoku BASARA Sanada Yukimura-den, the latest title in the series, as a campaign character. A stamp rally was conducted around historic Sanada-related areas and the game character appeared on a pamphlet providing Wakayama Prefecture sightseeing and gourmet dining information, bringing a sense of excitement to Wakayama Prefecture tourism measures.
Conclusion of a Comprehensive Partnership Agreement with a Regional Municipality, a Game Industry First
Kofu, Yamanashi Prefecture, March 2015Example 2
Using costumed Sengoku BASARA characters including Takeda Shingen, these activities began with a stamp rally and the distribution of premium merchandise gift vouchers in support of tourism promotion activities leading to local revitalization. Looking ahead to 2019, when Kofu celebrates 500 years since its establishment, we plan to utilize local hero Takeda Shingen to expand these measures and generate buzz that attracts people from all over Japan.
Special Museum Exhibit at the Saitama Prefectural Museum of History and Folklore
Saitama Prefecture, July–August 2015Example 3
Inspired by interest in the game characters, a special exhibit titled Sengoku Guide—Cool Basara Style was held at the Saitama Prefectural Museum of History and Folklore to teach young people about the history of Saitama from July 18 to August 30, 2015. The display, which featured arms, armor, helmets and ink paintings, attracted nearly 14,000 people, more than twice as many as any other exhibition project in the past.
Collaboration with Tsuchiura City Museum Draws 28,000 People
Tsuchiura, Ibaraki Prefecture, March 2013Example 4
Capcom co-sponsored The BASARA’s Armory: The Armor and Blades of Busho Who Tore Across Sengoku special exhibition held at the Tsuchiura City Museum in Ibaraki Prefecture. The exhibit featured Sengoku BASARA character illustrations and panels that drew a wide range of age groups to the museum. During the seven-week special exhibit, 28,000 people, equivalent to an entire year’s worth of visitors, attended the exhibit, the first achievement of this magnitude for the museum.
See “Message from the Mayor of Kofu” on page 18
Support for
Economic Development
Support for
Cultural Promotion
Capcom uses Sengoku BASARA characters, which are extremely popular with young men and women, to increase tourist numbers and sales of tie-in merchandise at events. By appealing to the youth and family demographics in particular, we have realized significant economic results.
Capcom co-sponsors events at museums to increase the number of visitors and support historical and cultural enlightenment. These activities aim to provide young people with opportunities to learn about local history and culture through their interest in Sengoku BASARA characters.
The ability to stimulate regional economies and cultures is the unifying force behind games with historical themes. Among these, Sengoku BASARA was responsible for igniting a renewed interest in history, and continues to be popular among young people, from teenagers to people in their 30s. In this way, game content popular among the young people expected to lead this regional growth can become a trigger for local revitalization. Utilizing these strengths, in recent years Capcom has focused CSR activities on
regional municipalities. For example, leveraging the extraordinarily high visibility of Sengoku BASARA, Capcom supports regional growth from four angles: economic development, cultural promotion, public safety and participation in elections. Efforts including gubernatorial election posters targeting young people, vehicle-related theft prevention posters and collaborations with museums to increase attendance are already demonstrating results. The following section introduces examples of Capcom initiatives aimed at regional growth.
Utilizing Popular Characters for Regional Growth
Initiatives Across Japan
1615
The Appeal of Sengoku BASARA

I Feel a Definite Response, with an Influx of New Visitors in Addition to Traditional Tourists
Support for
Public Safety
Support for
Participation in Elections
Kofu was established as a castle town in 1519 under the rule of Takeda Nobutora, the father of Takeda Shingen. After the Warring States Period, during which the Takeda clan was very active, Ko-Edo culture flourished during the Edo Period and with the promotion of new industries in the Meiji Period, Kofu culture blossomed. In 2019, we celebrate 500 years since the establishment of Kofu, then two years after that, the 500th anniversary of the birth of Takeda Shingen, then in 2027, the Linear Chuo Shinkansen will commence operations. I am aware that my mission is to prepare a foundation for the creation of Kofu’s bright future through further developments going forward. I believe it is important to enhance the visibility of Kofu and ensure that people understand the city’s appeal,
as well as to provide people who will raise the next generation of children with a sense of what Kofu has to offer. Thus, we must engage in measures aimed at encouraging people to relocate here. As part of these activities, we have concluded a comprehensive partnership agreement for local revitalization with Capcom. Since last year, we have been engaged in three major projects: the KOFU SAMURAI Wi-Fi & Sengoku BASARA Stamp Rally (approximately 6,500 participants), the KOFU & Sengoku BASARA Warring States Treasure Hunt Game (approximately 2,000 participants) and the tourism PR website “Master Shingen Returns!” The events attracted a large number of people, from young women with a strong interest in history and families with small children, to foreign tourists
from England who learned of the event online and other new visitors in addition to traditional tourists. The special website received over 70,000 page views in March alone. All of these results were better than anticipated, which made me once again realize the power of popular games. From the natural wonders of Shosenkyo Gorge, to wine, jewelry and other specialty products representing Japan and historical resources dating from Master Shingen to the present, everyone who visits Kofu will feel its rich charm. In particular, Takeda Shingen is an important tourism resource and the pride of Kofu. Even today he is loved by local residents as the region’s hero. At last year’s event, his armor-clad figure issued orders and Kofu was introduced through a dialogue with Master Shingen on our official website, among other PR efforts I myself lead personally. Going forward, in addition to the partnership agreement centered on the promotion of tourism currently under development, we will attempt to cooperate with the activities of other cities, which I believe will lead to revitalization of the region.
Promoting Gubernatorial Elections with a Mascot Based on Local Hero Chosokabe Motochika
Kochi Prefecture, November 2015Example 7
A character based on local hero Chosokabe Motochika was used in an attempt to increase voter turnout and stimulate interest among young people, who have little interest in elections, in the Kochi Prefecture gubernatorial elections held in November 2015. A variety of media, including posters displayed throughout the prefecture, television commercials, radio and newspaper advertisements and streetcars wrapped in promotional materials were used to announce the elections, which resulted in significant buzz being generated on social media, mainly Twitter and Facebook.
Promoting Gubernatorial Elections with Overwhelmingly Popular Mascot Date Masamune
Miyagi Prefecture, October 2009Example 8
Aiming to raise the voter participation rate among young people and spread awareness of Miyagi Prefecture gubernatorial elections, Date Masamune, a well-known feudal lord from the Sengoku Period and overwhelmingly popular Sengoku BASARA game character, was chosen as the election awareness mascot. In addition to election posters displayed throughout the prefecture, multimedia including television commercials and public transit ads were vigorously employed in a broad appeal that resulted in raising the voter participation rate 6.2 percentage points.
Using Three Capcom Characters to Prevent Vehicle-Related Theft and Other Crime in the Keihanshin Area
Osaka, Kyoto, Hyogo, February 2014Example 5
The Sengoku BASARA characters Sanada Yukimura, Keiji Maeda and Kuroda Kanbei, associated with Osaka, Kyoto and Hyogo Prefectures, were used as mascots in a joint-campaign aimed at preventing vehicle-related theft and other crime in these areas. In addition to displaying awareness posters, 25,000 leaflets were distributed by police departments and auto parts retailers as part of a broad promotion aimed at reducing crime in these three Kinki region prefectures.
First Use of Date Masamune in an Osaka Police Department Vehicle-Related Theft Prevention Awareness Poster
Osaka, April 2013Example 6
Date Masamune, a character appearing in Sengoku BASARA, was the first mascot utilized for the Osaka Police Department vehicle-related theft prevention campaign. Vehicle-related crimes are common in Osaka, which in 2012 had the highest incidence of vehicle-related thefts in Japan and has since remained at a high level. Amid these conditions, Capcom contributed to police department public relations awareness activities through the use of characters popular with young people that were displayed on posters and distributed on leaflets.
Capcom supports the maintenance and improvement of local public safety in conjunction with police departments by holding events and creating posters to raise awareness featuring warlords from Sengoku BASARA who are associated with each prefecture. These efforts have yielded quantitative results with respect to the reduction of crime.
Capcom supports awareness of elections and increased rates of youth participation in voting through the creation of awareness posters and events held in conjunction with election committees making use of local hero characters that appear in Sengoku BASARA.
Messagefrom the Mayor of Kofu
Mayor of Kofu, Yamanashi PrefectureYuichi Higuchi
1817