advanced manufacturing technology as a strategy in
277
ADVANCED MANUFACTURING TECHNOLOGY AS A STRATEGY IN ENHANCING PERFORMANCE OF LARGE MANUFACTURING COMPANIES IN KENYA Edward Musebe Achieng A THESIS SUBMITTED IN PARTIAL FULFILMENT OF THE REQUIREMENTS FOR THE AWARD OF THE DEGREE OF DOCTOR OF PHILOSOPHY IN BUSINESS ADMINISTRATION, FACULTY OF BUSINESS AND MANAGEMENT SCIENCES, UNIVERSITY OF NAIROBI 2021
-
Upload
khangminh22 -
Category
Documents
-
view
1 -
download
0
Transcript of advanced manufacturing technology as a strategy in
ADVANCED MANUFACTURING TECHNOLOGY AS A STRATEGY IN
ENHANCING PERFORMANCE OF LARGE MANUFACTURING COMPANIES
IN KENYA
Edward Musebe Achieng
A THESIS SUBMITTED IN PARTIAL FULFILMENT OF THE REQUIREMENTS
FOR THE AWARD OF THE DEGREE OF
DOCTOR OF PHILOSOPHY IN BUSINESS ADMINISTRATION,
FACULTY OF BUSINESS AND MANAGEMENT SCIENCES,
UNIVERSITY OF NAIROBI
2021

ii

iii
DEDICATION
To all people of goodwill, and who work towards making the world a paradise for all her
inhabitants as they all embrace love for one another.

iv
ACKNOWLEDGEMENT
Great work of knowledge relies on what already has been done in unveiling what is yet to
be known. This thesis is the outcome of the never-ending search for knowledge through
consulting different people, literature, institutions, people and learning experiences from
strategy and management experts. This experience was awesome to me as the researcher
and appreciate the role of other researchers, practitioners, and friends for encouraging me
along the way. A few of the people who made this a reality need to be mentioned by name.
A lot of gratitude goes to Professor Zack Awino, Professor Peter K‘Obonyo and Dr.
Kitiabi, my supervisors, who constantly encouraged and guided me to complete the
research. Their experience, intellect, patience, and kindness are unmatched and their
resilience in encouraging me towards completing the research without giving up along the
way. Without their consistent and illuminating instruction, this thesis could not have
reached its present form.
Special thanks go to Dr. Okech, Chairman Department of Economics, Chandaria School
of Business at the United States International University for constantly reminding me of the
value in completing projects once initiated. In this regard I also recognize Professor Martin
Ogutu and Dr. Ogola for the timely advice and motivation to complete the research.
My gratitude also goes to the Achieng’s family on the financial, moral and spiritual
assistance towards my successful completion of the thesis. Special thanks to my Father Mr.
Stephen Hannington Achieng and my mother, Consolata Awino Nyar Obis, who would
have been elated to share this moment with me, on their ever presence by my side
throughout this process.
God bless you all.
v
TABLE OF CONTENTS
DECLARATION ………………………………………………………………………. ii
DEDICATION ………………………………………...………………….…………… iii
ACKNOWLEDGEMENT ……………………………………………...……..……… iv
LIST OF TABLES ……………………………………………………………….……. ix
LIST OF FIGURES ......................................................................................................... xii
ABBREVIATIONS AND ACRONYMS ......................................................................xiii
ABSTRACT ..................................................................................................................... xv
CHAPTER ONE: INTRODUCTION ............................................................................. 1
1.1 Background of the Study ........................................................................................... 1
1.1.1 Advanced Manufacturing Technology ...................................................................... 3
1.1.2 Competitive Advantage ............................................................................................. 6
1.1.3 Organizational Resources .......................................................................................... 9
1.1.4 Organizational Performance .................................................................................... 12
1.1.5 Large Manufacturing Companies in Kenya ............................................................. 15
1.2 Research Problem ................................................................................................... 18
1.3 Research Objectives ................................................................................................ 21
1.4 Value of the Study ................................................................................................... 21
1.5 Organization of the Study ....................................................................................... 23
CHAPTER TWO: LITERATURE REVIEW .............................................................. 24
2.1 Introduction ............................................................................................................. 24
2.2 Theoretical Foundation ........................................................................................... 24
2.2.1 Resource Based View .......................................................................................... 25
2.2.2 Contingency Theory ............................................................................................. 28
2.3 Advanced Manufacturing Technology and Organizational Performance .............. 31
2.4 Advanced Manufacturing Technology, Competitive Advantage and Organizational
Performance ............................................................................................................ 38
2.5 Advanced Manufacturing Technology, Organizational Resources and
Organizational Performance................................................................................... 44
2.6 Advanced Manufacturing Technology, Competitive Advantage, Organizational
Resources, and Organizational Performance .......................................................... 48
2.7 Knowledge Gaps ..................................................................................................... 53
2.8 Conceptual Framework ........................................................................................... 61
2.9 Conceptual Hypotheses ........................................................................................... 63

vi
CHAPTER THREE: RESEARCH METHODOLOGY .............................................. 65
3.1 Introduction ............................................................................................................. 65
3.2 Research Philosophy ............................................................................................... 66
3.3 Research Design ...................................................................................................... 70
3.4 Population of the Study ........................................................................................... 72
3.5 Data Collection ....................................................................................................... 73
3.6 Operationalization of Key Study Variables ............................................................ 75
3.7 Data Analysis .......................................................................................................... 81
CHAPTER FOUR:DATA ANALYSIS, FINDINGS AND DISCUSSION ................. 88
4.1 Introduction ............................................................................................................. 88
4.2 Data Analysis .......................................................................................................... 89
4.2.1 Reliability Test ................................................................................................ 90
4.2.2 Validity Test .................................................................................................... 92
4.2.3 Diagnostic Tests .............................................................................................. 94
4.2.3.1 Normality Test........................................................................................ 94
4.2.3.2 Multi-collinearity Test ............................................................................ 98
4.2.3.3 Linearity Test ....................................................................................... 100
4.2.3.4 Heteroscedasticity Tests ....................................................................... 104
4.3 Descriptive Statistics ............................................................................................. 105
4.3.1 Background Information ............................................................................... 105
4.3.1.1 Position / Title of the Respondent ........................................................ 106
4.3.1.2 Number of Years Worked with the Organization ......................... 107
4.3.1.3 Market Coverage ........................................................................... 108
4.3.1.4 Number of Years in Operation ...................................................... 109
4.3.1.5 Number of Permanent Employees in the Organization ................. 110
4.3.1.6 Manufacturing Strategy Implementation ...................................... 111
4.3.2 Advanced Manufacturing Strategy ........................................................ 112
4.3.2.1 Design Technologies in the Organization ..................................... 112
4.3.2.2 Manufacturing Technologies in the Organization ......................... 113
4.3.2.3 Planning Technologies in the Organization .................................. 115
4.3.2.4 Joint Descriptive Statistics for Advanced Manufacturing
Technology .................................................................................... 117
4.3.3 Competitive Advantage .......................................................................... 119
4.3.3.1 Cost Leadership Strategies ............................................................. 119
4.3.3.2 Differentiation Strategies ............................................................... 122

vii
4.3.3.3 Focus Strategies .............................................................................. 124
4.3.3.4 Joint Descriptive Statistics for Competitive Advantage ................ 125
4.3.4 Organizational Resources ........................................................................ 127
4.3.4.1 Assets Owned by the Organization ................................................ 127
4.3.4.2 Physical Facilities Owned by the Organization ............................. 130
4.3.4.3 Employee Capabilities .................................................................... 131
4.3.4.4 Joint Descriptive Statistics for Organizational Resources ............. 133
4.3.5 Organizational Performance .................................................................... 135
4.3.5.1 Financial Performance Gross Revenues ......................................... 135
4.3.5.2 Financial Performance Gross Profits .............................................. 136
4.3.5.4 Non-Financial Organizational Performance .................................. 137
4.3.5.4 Customer Satisfaction..................................................................... 138
4.3.5.5 Employee Retention ....................................................................... 140
4.4 Tests of Hypothesis ............................................................................................... 143
4.4.1 Advanced Manufacturing Technology and Performance of Large
Manufacturing Companies in Kenya. ...................................................... 144
4.4.2 Advanced Manufacturing Technology, Competitive Advantage and
Performance of Large Manufacturing Companies in Kenya ................. 146
4.4.3 Advanced Manufacturing Technology, Organizational Resources and
Performance of Large Manufacturing Companies in Kenya. ................ 155
4.4.4 The Joint Effect of Advanced Manufacturing Technology, Competitive
Advantage, Organizational Resources on Performance of Large
Manufacturing Companies in Kenya. .................................................... 161
4.5 Discussion of Findings .......................................................................................... 169
4.5.1 Advanced Manufacturing Technology and Performance of Large
Manufacturing Companies in Kenya ..................................................... 170
4.5.2 Advanced Manufacturing technology, Competitive Advantage and
Performance of Large Manufacturing Companies in Kenya ................. 176
4.5.3 Advanced Manufacturing Technology, Organizational Resources and
Performance of Large Manufacturing Companies in Kenya ................. 180
4.5.4 The Joint Effect of Advanced Manufacturing Technology, Competitive
Advantage, Organizational Resources and Performance of Large
Manufacturing Companies in Kenya. .................................................... 182
CHAPTER FIVE: SUMMARY, CONCLUSION AND RECCOMENDATIONS .. 185
5.1 Introduction ........................................................................................................... 185
5.2 Summary ............................................................................................................... 185
5.3 Conclusion ............................................................................................................ 189
5.3.1 Advanced Manufacturing Technology and Performance of Large

viii
Manufacturing Companies in Kenya ..................................................... 189
5.3.2 Advanced Manufacturing Technology, Competitive Advantage and
Performance of Large Manufacturing Companies in Kenya ................. 190
5.3.3 Advanced Manufacturing Technology, Organizational Resources and
Performance of Large Manufacturing Companies in Kenya ................. 190
5.3.4 The Joint effect of Advanced Manufacturing Technology, Competitive
Advantage, and Organizational Resources on Performance of Large
Manufacturing Companies in Kenya ..................................................... 191
5.4 Implications of Research Findings ........................................................................ 192
5.4.1 Theoretical Implications ........................................................................ 192
5.4.2 Implication for Practice ......................................................................... 195
5.4.3 Contribution to Knowledge ................................................................... 197
5.5 Limitations of the Study ........................................................................................ 200
5.6 Directions for Future Research ............................................................................. 201
References ....................................................................................................................... 204
Appendices ...................................................................................................................... 251
Appendix I: Research Questionnaire.............................................................................. 251
Appendix II: Letter of Introduction ............................................................................... 258
Appendix III: Manufacturing Companies in Kenya that are members of the Kenya
Association of Manufacturers with more than 100 employees and have
implemented Design Technologies, Manufacturing Technologies and
Planning Technologies in their production Process. .............................. 259
Appendix IV: Similarity Index Report ...………………………………………...……261

ix
LIST OF TABLES
Table 2.1: Summary of Major Knowledge Gaps ............................................................... 54
Table 3.1: Operationalization of Key Study Variables …………………………………..76
Table 3.2: Study Objectives, Hypotheses and Analytical Models ……………………….83
Table 4.1: Cronbach’s alpha (α) …………………………………………………………91
Table 4.2: Skewness and Kurtosis on the Study Variables ……………………………...95
Table 4.3: Test of Normality for each Dimension of the Study Variables ……....………97
Table 4.4: Multi-Collinearity Values of the Study variables …………………....………98
Table 4.5: Heteroscedasticity Coefficients ………...……………………… …………104
Table 4.6: Respondents Job Position/Title ……...……… ……………………………106
Table 4.7: Number of Years Worked with the Current Organization …… …...……...107
Table 4.8: Market Coverage …………………………………… ……………...……..108
Table 4.9: Number of Years in Operation ………………………………..…………….109
Table 4.10: Number of Permanent Employees in the Organization ………………...….110
Table 4.11: Manufacturing Strategy Implementation ……………………….……..…..111
Table 4.12: Design Technologies in the Organization ……………… …………….…..112
Table 4.13: Manufacturing Technologies ……………………..…………………….….114
Table 4.14: Planning Technologies ……………………… ……………………………116
Table 4.15: Application of Technology in the Manufacturing Process ………… …….118
Table 4.16: Cost Leadership …………………..………………………………..………120
Table 4.17: Differentiation Strategies ………………… ………………………………122
Table 4.18: Focus Strategies ………………………..…………………………………..124
Table 4.19: Descriptive Statistics for Joint Effect of Competitive Advantage …. …….125
Table 4.20: Assets ………………………..………………………………….…………128
Table 4.21: Physical Facilities ………………………… ………………………….….130
Table 4.22: Employee Capabilities …………………………… ………………….…..131
Table 4.23: Descriptive Statistics for Organizational Resources …………… ………..134
Table 4.24: Financial Performance Gross Revenues ………… …………………...….135
Table 4.25: Financial Performance Gross Profits ………… ……………………...…..137
Table 4.26: Customer Satisfaction …………… ………………………………………139
Table 4.27: Employee Retention ………………………………………… ……….….141

x
Table 4.28: Regression Outcomes for the effect of Advanced Manufacturing
Technology on Performance of Large Manufacturing companies in
Kenya……………………………………………………………….…….145
Table 4.29: Regression Outcomes for the effect of Advanced Manufacturing
Technology on Performance of Large Manufacturing Companies in
Kenya …………………………………………………………..………...148
Table 4.30: Regression Outcomes for the effect of Advanced
Manufacturing Technology on Competitive Advantage ………………….149
Table 4.31: Regression Outcome for the effect of Competitive Advantage on
Performance of Large Manufacturing Companies in Kenya ........................151
Table 4.32: Regression Outcomes for the Effect of Advanced Manufacturing
Technology and Competitive Advantage on Performance of Large
Manufacturing Companies in Kenya .…………………………….………..153
Table 4.33: Summary of Findings of the Test of Mediation …………………….……..154
Table 4.34: Combined Regression Analysis Results for Moderation Test …………….158
Table 4.35: Summary of Findings of the Test of Moderation …………………………160
Table 4.36: Regression Outcomes for the effect of Advanced Manufacturing
Technology on Performance of Large Manufacturing Companies
in Kenya …………………………………………………………...……...162
Table 4.37: Regression Outcome for the effect of Competitive Advantage on
Performance of Large Manufacturing Companies in Kenya ………………163
Table 4.38: Regression Outcome for the effect of Organizational Resources on
Performance of Large Manufacturing Companies in Kenya ……………...164
Table 4.39: Regression Results for the joint Effect of Advanced Manufacturing
Technology, Competitive Advantage, Organizational Resources on
Performance of Large Manufacturing Companies in Kenya. ……………..165
Table 4.40: Summary of Tests of the Hypotheses and Results…………………..……..167
xi
LIST OF FIGURES
Figure 2.1: Conceptual Model ............................................................................................ 62
Figure 4.1: Scatter Plot Diagram Advanced Manufacturing Technology .......................... 100
Figure 4.2: Scatter Plot Diagram Competitive Advantage ................................................. 101
Figure 4.3: Scatter Plot Diagram Organizational Resources .............................................. 102
Figure 4.4: Scatter Plot Diagram Performance of Large Manufacturing
Companies in Kenya ……………………………………… ………………..103
Fig 4.5: Advanced Manufacturing Technology and Performance of Large
Manufacturing companies in Kenya ………………………… ………………..147

xii
ABBREVIATIONS AND ACRONYMS
AMT: Advanced Manufacturing Technology
AfDB: African Development Bank
BPM: Business Process Management
CA: Competitive Advantage
DCA: Dynamic Capabilities approach
DIT: Disruptive Innovation Theory of strategy
FDI: Foreign Direct Investment
GDP:
GMP:
Gross Domestic Produce
Good Manufacturing Practice
GoK: Government of Kenya
ILO: International Labour Organization
IMF: International Monetary Fund
KAM: Kenya Association of Manufacturers
KER: Kenya Economic Report
KSh.: Kenya Shillings
KIPPRA: Kenya Institute for Public Policy Research and Analysis
KNBS: Kenya National Bureau of Statistics
KSC: Kenyan State Corporations
LMC: Large Manufacturing Companies
MPM: Manufacturing Process Management
xiii
MT: Manufacturing Technology
NSE: Nairobi Securities Exchange
OC: Organizational Competencies
OR:
PESTEL:
Organizational Resources
Political, Economic, Social, Technological, Environmental and Legal
External Analysis
PPM: Production Process Management
RBV: Resource Based View of Strategy
ROI: Return on Investment
ROK: Republic of Kenya
SMEs:
SWOT
Small and Medium Enterprises
Strength, Weakness, Opportunity, Threat Internal Analysis
VRIO: Valuable, Rare, non- Imitable and Organizational
WCM: World Class Manufacturing
WTO: World Trade Organization

xiv
ABSTRACT
The purpose of this research was to contribute to the extant knowledge on the relationship
between AMT, competitive advantage, organizational resources, and performance of large
manufacturing companies in Kenya. The study investigated the mediating and moderating roles
of competitive advantage and organizational resources on the relationship between AMT and
performance of large manufacturing companies in Kenya. A review of conceptual and empirical
literature was done and four hypotheses were formulated to aid the research. The positivist
research philosophy and descriptive cross-sectional research design was employed. The
population of the study was a census of 55 manufacturing companies that apply design
technologies, manufacturing technologies and planning technologies in their operation and were
members of Kenya Association of Manufacturers as at December 2020. Primary data was
collected using a structured self-administering Likert questionnaire anchored on a five-point
scale while secondary data was collected online from the company’s annual reports. Descriptive
and inferential statistics were used to analyze collected data, while regression analysis was used
to test the study hypotheses. Results revealed that AMT statistically predicts performance of
large manufacturing companies in Kenya. Results show that competitive advantage statistically
predicts performance but partially mediates the relationship between AMT and performance of
large manufacturing companies in Kenya. Results also show that although organizational
resources statistically predict performance it is not significant on moderating the relationship
between AMT and performance of large manufacturing companies in Kenya. Further, the joint
effect of AMT, competitive advantage and organizational resources on performance was found
to be statistically significant. The study contributes to theory building by demonstrating that
AMT is one of the strategies that can be implemented by manufacturing companies to meet their
stakeholder needs and improve performance and since resources do not moderate the relationship
between AMT and performance, organizations with different resources would observe similar
impact on their performance when they apply AMT in their operations. The value of resource-
based theory and contingency theory in strategy were confirmed as resources were found to
statistically predict performance. Further, the combined effect of AMT, competitive advantage
and organizational resources was found to be significant in predicting performance than either
of the variables independently, confirming synergy between the variables and their positive
impact on performance of large manufacturing companies in Kenya. This study may have been
constrained by using one respondent per organization and combining many industries at different
levels of AMT adoption. Future researchers could involve more respondents across management
hierarchy in each organization involved in a similar study to further validate their findings by
focusing on firms at same level of AMT adoption that apply similar technologies in their
manufacturing process. The implications of the study include: AMT, competitive advantage and
resources have varying effects on performance; AMT can be used as a manufacturing strategy by
organizations to improve their performance; and senior Managers need to carefully appraise
investments in AMT which on their own do not lead to improved organizational performance as
other variables that were not in the current study also affect the relationship between AMT and
performance.

1
CHAPTER ONE
INTRODUCTION
1.1 Background of the Study
Globally, it has been observed that organizations have to be dynamic in their operations to
meet the ever-changing customer preferences and market environments. Organizations use
performance to measure the extent to which they satisfy preference of their customers.
Performance in the past has been determined using financial indicators, but according to
Barney and Hesterly (2012), organizations now have the option of using either financial or
non-financial performance indicators to effect desired changes in their operations and also
make investment decisions. Measuring performance helps organizations identify strategies
and goals they need to implement to achieve desired changes in their operations. Some of
these strategies include applying advanced manufacturing technology and using resources
owned by organizations in their production processes (Monday, Akinola, Ologbenla, &
Aladeraji, 2015). Advanced manufacturing technology help organizations to achieve above
average performance in their industry, satisfy the needs of their customer, manage
operation costs and production flexibility.
According to Barney and Arikan (2008), the resource-based view of strategy offers an
explanation on observed difference in performance between organizations in the same or
similar industries and environments. The resource-based view of strategy posits that
organizations develop competitive advantage and attain superior performance when they
recognize strategic resources they own, use these resources to exploit their internal
strengths and existing opportunities while minimizing their weaknesses and threats in their
external operating environments (Galbreath, 2004; Lippman & Rumelt, 2003; Fahy, 2002;
& Barney, 1991). Further, organizations use resources they own to sustain competitive
advantage by proactively responding to dynamic factors in the external environment (Teece
& Pisano,1994). In contrasting the resource-based view and knowledge-based view of
strategy, Theriou, Aggelidis and Theriou (2009) confirm that resources are a vital variable
for developing and sustaining competitive advantage, which is built around tangible and
intangible resources. Eisenhardt and Martin (2000) on the other hand observed that the
resource-based view theory fails to explain with certainty the mechanisms which resources
actually contribute to competitive advantage.

2
Performance of organizations is a key indicator used in management of both public and
private organizations. Breznik and Lahovnik (2016), in their empirical study using the
resource-based view theory in dynamic environments, found that organizations develop
competitive advantage by transforming and aligning resources they own to the existing
opportunities in business environments. Gupta, Dangayach, and Rao (2015) through a
conceptual study posited that advanced manufacturing technology provides competitive
advantage and enables organizations to improve their performance. Morin and Audebrand
(2014) confirmed that a positive relationship exists between efficiency and productivity
with organizational performance while a conceptual study by Gathungu and Mwangi
(2012) in Kenya, concluded that organizational performance is influenced positively by
dynamic capabilities. Organizations integrate advanced manufacturing technology across
all their business processes to maximize effects of dynamic capabilities on performance in
their operating environments (Kearney, 2017; Mclaughlin, 2017).
The contribution to GDP from the manufacturing sector in Kenya has been erratic even as
the country anticipates the sector to grow and contribute 15% to GDP by 2025, compared
to 9.2% in 2016 and 7.8% in 2018 (KAM, 2019). To achieve the anticipated growth in
GDP, the Government of Kenya has developed various strategies and initiatives to propel
it to become a newly industrialized country and also be the 5th largest economy in sub-
Saharan Africa. Manufacturing companies in Kenya apply advanced manufacturing
technology to improve their performance and achieve the projected contribution to GDP.
Bigsten (2010) noted that Kenya’s manufacturing sector is mostly agro-processing, with
the overall structure consisting of SME’s and large firms (KNBS, 2019).
According to KER (2017), micro, small and medium firms make up 80% of the companies
in the manufacturing sector while large manufacturing companies comprise only 20% but
contribute 80% of the sector’s GDP (KNBS, 2018). Manufacturing companies adopt
advanced manufacturing technology to compete globally, manage production costs,
provide desired quality by customers, and introduce flexibility in their production processes
(Nyori & Ogola, 2015). The motivation of this study was to investigate the role of
competitive advantage and organizational resources on the relationship between advanced
manufacturing technology and performance of large manufacturing companies in Kenya.
3
1.1.1 Advanced Manufacturing Technology
Different studies define advanced manufacturing technology differently, within the general
theme of integrated or stand-alone computer systems controlling the manufacturing process
(Nyori & Ogola, 2015). Gunawardana (2006) posits that advanced manufacturing
technology can be identified by using either the classical continuum or level of integration
of technology in the production process. The classical continuum covers the whole
manufacturing process using the just in time concept as opposed to the level of integration
which is concerned with the level of automation in the whole production process.
According to Youssef (1992), advanced manufacturing technology involves adopting stand
alone or integrated technology in the manufacturing process, which improves
organizational performance. Integrating technology into the production process, improves
information processing time in the production process that leads to quick decision making.
Advanced manufacturing technology enables all decision makers in the organization to
access real time data on the manufacturing process to make real time changes in the
production system and also make long term strategic decisions.
Baldwin, Sabourin and West (1999) on the other hand define advanced manufacturing
technology in terms of technologies incorporating the use of both hardware technologies
and software technologies towards improving performance. This study adopted the
definition of advanced manufacturing technology as, the use of technology to manage and
control production processes with the objective of improving organizational performance
using design technologies, manufacturing technologies and planning technologies as the
dimensions of advanced manufacturing technology.
Due to globalization, manufacturing companies contend with challenges of meeting and
exceeding their global customer needs and expectations. Customer expectations include
having a fair price for the product, receiving good service/product and feeling valued.
Manufacturing companies have relied on mass production since the industrial revolution
era to manage production costs and deliver fair priced products to their customers, but they
are now adopting advanced manufacturing technology to satisfy needs of their customers
by using automated production systems to plan, control the production process, and
maintain performance and reliability of finished products. (Jonsson, 2000).

4
Muogbo (2013) observed that manufacturing organizations have continued to invest in
advanced manufacturing technology to mitigate manufacturing challenges associated with
global competition, develop and achieve competitive advantage and enhance their
performance. Managers can use advanced manufacturing technology as a tool to develop
superior products that meet the desired quality, price, and performance by global
customers. When organizations invest in advanced manufacturing technology in their
production processes, they expect to achieve the following benefits: 1) increased market
share; 2) improved production efficiency 3) flexible and focused production and 4)
sustained competitive advantage. These benefits emanate from the overall concept of
synergy and integrated manufacturing technology (Pearce & Robinson, 2013).
Due to dynamic market conditions, and increased global mobility, advanced manufacturing
technologies have continued to gain importance in industries as they address both current
and future industry needs in meeting customer preferences (Jabar, Soosay & Santa, 2010).
Organizations use customer preferences to understand what drives customer purchasing
decisions. Factors that drive customer purchasing decisions include convenience,
product/service user interface, stability/reliability of the product, price of the product and
available varieties to choose from (Saberi, Yussuf, Zulkifli & Ahmad, 2010). Human labor
has been observed to be cheap in developing economies but constitute a significant
proportion of production costs in other economies (Gunawardana, 2006). Manufacturing
organizations in economies where human labor costs are high, adopt advanced
manufacturing technology to replace expensive human labor. This reduces their production
costs enabling them to have a more flexible market penetration using pricing strategies.
Due to the high cost associated with implementing technology in manufacturing processes,
adoption of advanced manufacturing technology and its successful implementation is
generally an expensive undertaking for organizations in terms of resources and time.
Organizations develop both financial and non-financial performance metrics to determine
the gains and also monitor the benefits of investing in advanced manufacturing technology.
This forms part of the justification for investing in advanced manufacturing technology.
Generally, the expected and resultant benefits on investing in technology to the
organization in the long run, is used to justify the initial high investment costs (McKinsey
& Company, 2020).

5
Advanced manufacturing technology helps organizations develop objectives in line with
Porter’s (1990) generic competitive strategies, by aligning organizational manufacturing
strategies to desired organizational objectives (Tanwar, 2013). Advanced manufacturing
technology also enables organizations to attain cost leadership production strategies, which
aim at providing services and products to their customers at the least overall cost, but
meeting the customer expectations in full as well as differentiation strategies that are aimed at
addressing and meeting specific customer needs (Oyedijo, 2013). Taylor (1911), reckons that
productivity at the workplace can be increased by simplifying and optimizing jobs, a tenet
that leads to mass production and low costs of production. Advanced manufacturing
technology aims at reducing production costs through use of small batch production runs.
Although several researchers observe a positive relationship between advanced
manufacturing technology and performance, other studies have found no significant
relationship between advanced manufacturing technology and organizational performance.
Other studies have found that advanced manufacturing technology on its own, is not
sufficient to enable organizations achieve lower costs of production, better quality, and
higher performance (Gichunge, 2007). Further, Industry 4.0 technologies has brought an
advancement in digital technologies, which changes traditional manufacturing architecture and
enhances advanced manufacturing capabilities to effectively aid digital transformations of an
organization to achieve their sustainable development goals (de Sousa Jabbour, 2018b; Tealukdarie
et al., 2018). However, Industry 4.0 technologies pose a challenge because they are relatively new
and manufacturing companies face difficulties such as skill gaps, financial constraints and
operational complexities when implementing them (Sung, 2018; Raj et al., 2019).
In volatile business environments, manufacturing companies practicing remanufacturing
and recycling face problems such as high levels of production losses, excess inventory, and
delayed sales order dispatch, which affect the overall operations performance. The role of
advanced manufacturing technology on performance has been previously investigated and
analyzed using linear regression between the two variables. This study used four variables,
advanced manufacturing technology, competitive advantage, organizational resources and
performance to investigate the relationship between advanced manufacturing technology
and performance in large manufacturing companies in Kenya.

6
1.1.2 Competitive Advantage
Manufacturing organizations are deemed to have competitive advantage when they can
deliver better or the same benefits in a product or service to their customers at reduced
costs with higher customer experience compared to competing products by other
organizations (Wen-Cheng, Chien-Hung & Yin- Chieng, 2011). Porter (1995) proposed
two major types of competitive advantage based on cost leadership and differentiated
operations. Cost leadership manufacturing operations are premised on focusing the
attention and resources of the organization on reducing the cost at which it is able to offer
products or services, optimizing its value chain activities to achieve low-cost-position
while maintaining value that meets the customers need (Kimiti, Muathe, & Murigi, 2020).
Further, manufacturing companies are also deemed to be implementing differentiated
manufacturing operations when they manufacture a product or provide a service with high
quality, achieve fast delivery, are involved in new product designs and product
development, and provide products with unique features to the market (Abu-Aliqah, 2012).
The level to which manufacturing companies develop and sustain competitive advantage
can be ascertained by using financial or non-financial performance indicators.
Manufacturing organizations are faced with new and different challenges due to the
turbulent global business environment coupled with the advent of the fourth industrial
revolution. Turbulence in the manufacturing sector has increased over time due to advances
in information technology, improved production technology, changing production methods
and increased customer awareness, among other factors (Hakkak & Ghodsi, 2015).
Globalization on the other hand has reduced the gap in technology and access to
information that existed between developed and developing economies. These changes in
the external environment have led organizations to adopt advanced manufacturing
technologies in their operations to sustain their market share and also manage competition.
Organizations respond to environment and competitor challenges differently. The response
that promises to maintain competitive advantage and counter the challenge posed by
competition, should complement implementation of strategies that promise results that are
proportional to the threat of competition, to sustain the already developed competitive
advantage, reduce product cost and increase product visibility (Karakaya, 2011).

7
Manufacturing companies have been forced to change their strategies and maintain their
competitiveness due to the external environmental challenge posed by Covid-19 to reduce
its impact on their operations. Companies that effectively mitigated the effects of the
pandemic had supply chain risk management strategies in place, business continuity
strategies, diversified supply chains from a geographic perspective, multi-sourced key
commodities or strategic components, and considered inventory strategies to buffer against
supply chain disruption as methods of sustaining competitive advantage (Deloitte, 2020).
Barney (1991) linked organizational resources to competitive advantage by suggesting that
organizations can employ resources that are both scarce and valuable to create competitive
advantage. Further, if these resources are inimitable and difficult to substitute in the
organizations process, then organizations that own them can sustain the so developed
competitive advantage. Organizations tend to acquire knowledge for a period of time to
develop unmatched attributes or a combination of superior attributes which includes unique
capabilities. The unique attributes then allow the organization to perform better than other
organizations and achieve above average returns, in the same industry and environment.
For organizations to survive in their business environments, they should always conduct
an internal environment analysis. Organizations that understand their strengths and
weaknesses have an opportunity to mitigate against their weaknesses and exploit their
strengths to benefit from the opportunities that exist in the external environment (Al-
Ansaari, Bederr, & Chen, 2015). Competitive advantage allows manufacturing
organizations to become market leaders, by implementing efficient and unique
management methods that competitors are not able to imitate easily. It is true that
organizations that do not understand their strengths do not knowingly exploit opportunities
in their external environment to maintain their performance.
Keegan (2016) used the value chain analysis to explain how organizations can develop
competitive advantage by adding specific value to their products or services. Value addition
improves key product or service aspects along the value chain that contribute to the success
of the related activities. Therefore, every organization should develop its unique and
specific way to achieve sustainable competitive advantage, through special and unique
processes.

8
According to Barney (1986) competitive advantage enables organizations to have the
necessary information about the market by interpreting the industry environment.
Organizations may have competitive advantage that they are not exploiting (Kay, 1993).
This is referred to as potential competitive advantage which emanates from the distinctive
capabilities owned by an organization that other organizations do not have and are not able
to develop quickly. This could be due to lack of knowledge on the existence of this
competitive advantage, lack of sufficient finances to deploy the necessary organizational
processes to exploit the competitive advantage, lack of organizational competencies to
effectively incorporate the competitive advantage in the organizational strategies, and fear
of alerting other organizations on the existence of the potential competitive advantage.
Durmaz and İlhan (2015) observed that organizations use potential competitive advantage
to grow their market share in order to counter competitive environments in market
conditions by realizing that growth is a necessity for businesses. Businesses that do not
register growth face the risk of stagnating and finally being overtaken by other competing
organizations. Further, lack of business growth is one of the reasons that lead to acquisitions
and mergers with the primary aim of increased market share by the acquiring organizations.
Therefore, when organizations do not use their potential competitive advantage, they
provide an opportunity to others that have identified it to take over their operations.
Although organizations need to be aware of the nature of their external environment as well
as their internal capabilities to employ the strategic resources they own, to achieve
competitive advantage and above average performance in their industry (Porter, 1985;
Barney, 1991), this alone cannot lead to developing or sustaining competitive advantage
and improved performance. Progressive organizations always challenge their processes
once they know their performance to build a strong focus on their objectives (Zairi, 1994).
Organizations need to take further steps, to maintain and improve their performance. As
manufacturing organizations aim to deploy their resources efficiently in order to gain and
maintain competitive advantages for survival, they have to contend with competitors,
consumers, suppliers, technological developments, and economical impediments to achieve
this objective by employing manufacturing strategies and world class manufacturing
methods that eliminate these impediments (Dangayach & Sharma, 2011).

9
1.1.3 Organizational Resources
Organizational resources can be classified broadly into two categories, tangible (financial
or physical) or intangible (employee’s knowledge, experiences and skills and
organization’s reputation). Attributes of tangible resources are relatively easy to observe
directly while attributes of intangible resources can only be observed indirectly through
their effects on operations of the organization and performance (Helfat, 2000). Further,
Barney (1991), classifies resources into three broad categories that include physical capital
resources, human capital resources and organizational capital resources.
According to Wernerfelt (1984), and using the resource-based view, resources can also be
defined as physical assets, intangible assets, and organizational capabilities owned and
controlled by the organization. Day (1994) describes organizational capabilities as
competencies or expertise employed in organizations operations underlined with
accumulated know-how. Organizational capabilities have been identified as the most
essential resources organizations employ towards developing and sustaining competitive
advantage due to their resistance to duplication. Intangible resources have been observed
to be generally diverse by nature and immobile, exhibiting individualistic characteristics,
consequently posing a difficulty for other organizations to easily reproduce them fully.
Resources contribute to the organization’s market position through the process of
improving customer value or lowering the unit production cost or both of them (Gitahi &
K’Obonyo, 2018). In so doing, resources allow manufacturing companies to achieve
efficient and optimal production processes, as they strive to meet customer needs that
include product quality, price, choice and convenience. Although Wernerfelt (1984)
reiterates that organizations acquire competitive advantage through both tangible and
intangible resources they own or control, not all resources owned or controlled by
organization are used or lead to developing and sustaining competitive advantage.
According to Galbreath, (2004) and Fahy, (2002), organizations need to build capacity for
exploiting resources they own or control to develop and sustain competitive advantage.
Organizations should periodically conduct an audit for the resources they own or control
periodically to identify strategic resources they can use to effectively neutralize threats, from
both the external and internal operating environments.

10
Organizational, or structural capital refers to organizational structure, the coordination
systems, and informal relationships that the organization maintains with its environment
(Wright et al. 1994). It represents a special and critical element of intangible resources in
an organization that could be both a liability or an asset depending on how the organization
exploits its value. Structural capital allows organizations to have and develop a supportive
infrastructure that enables it to function in a repeatable and scalable way. This is the
resource that always remains in the organization even when there is a high turn-over of the
human resource as it is embedded in the organizations processes, data, systems, designs,
and knowledge. Some structural capital represented by intellectual property such as
patents, trademarks, copyrights and trade secrets, qualifies for special legal protection
(Weinzimmer & Esken 2017).
Organizations that identify the structural resources they own and use them in developing
their strategies observe an increase in their ability to acquire, utilize and spread
organizational knowledge (Wolff et al. 2015; Wang 2008). The increased knowledge base
on its part is associated with the organization’s innovativeness, proactiveness and risk-
taking propensity. Organizations use these attributes in their industry as weapons against
their competitors to grow their market and launch new products (Dada & Fogg 2016;
Eisenhardt 1989; Noruzy et al. 2013). Dada and Fogg (2016) linked the capability of a
manufacturing company to identify emerging business trends that are both industry specific
and also due to the general environment, to increased knowledge and use of the resources
they own. This ultimately improves risk awareness and their exposure to risk consequently
providing the manufacturing company with more confidence in adapting to environmental
changes and uncertainty. Therefore, manufacturing companies with a high level of
organizational knowledge are more likely to take high-risk-and-high-return adventures
(Fernández-Mesa & Alegre, 2015; Kamasak, 2017).
Therefore, structural resources, through organizational learning, influences a
manufacturing companies’ ability to engage in superior innovative, proactive and risk-
taking activities relative to its competitors. Bamiatzi et al. (2016) reckons that when
manufacturing companies enhance their ability to innovate, seek existing opportunities and
take advanced manufacturing actions, the organizational learning that they consequently
develop, can lead to sustained competitive advantage.

11
The resource-based view of strategy places intangible resources at a higher level compared
to tangible resources in terms of creating competitive advantage as they cannot be readily
obtained in the factor market. Barney, (1991); Kor and Mesko, (2013); Dierickx and Cool,
(1989); and Peteraf and Barney, (2003), proposed that the sources of inimitability
observed in the characteristics of intangible resources can be explained by the following
mechanisms: historical uniqueness, causal ambiguity and social complexity. It has also
been observed that time compression diseconomies and interconnectedness of resources
generally aid the organizations to improve their performance (Dierickx & Cool,
1989; Bharadwaj, 2000).
Resource historical uniqueness refers to “unique historical events such as the formation of
the organization, building of unique valuable organizational culture, the location of the
factory creating distinctive location advantages and choice of market entrance decisions as
a first mover, that determine the long-term performance of the firm (Barney, 1991). Unique
historical conditions make organizations to exclusively own or control resources making
them difficult to imitate by their rivals in the industry.
According to Bharadwaj (2000), causal ambiguity relates to the observed ambiguity on the
relationship between the resource portfolio of an organization and its performance. Further,
causal ambiguity explains why organizations do not understand the link between resources
they own or control and their contribution to sustained competitive advantage, ( Barney,
1991). Organizations then continue to sustain the developed competitive advantage as
others are not able to imitate their strategies as they do not understand what is the real cause
of the observed better performance (Centobelli, Cerchione, Esposito, 2018).
Organizations also develop competitive advantage using socially complex resources that
include interpersonal relations among managers, corporate reputation of organizations
among customers and suppliers, organizational culture, favorable corporate reputation and
sophisticated in-secret technology for the manufacturing firms because they are
imperfectly imitable (Chari & David, 2012; Grimpe & Hussinger, 2014; Gupta et al.,
2017; Wei et al., 2017; Raithel & Schwaiger, 2015; Stan, 2017). This study investigated
the role of organizational resources on the relationship between advanced manufacturing
technology and performance of large manufacturing companies in Kenya.
12
1.1.4 Organizational Performance
Depending on the parameters being used by the researcher, organizational performance has
many definitions in academic literature (Gavrea, Ilies & Stegerean, 2011). Various
researchers have defined organizational performance using outcomes expected without
relating them to the inputs of the process. The simple definition of performance as the
relationship between output and input from a production process cannot be used when input
variables have not been fully identified. Kaplan and Norton (1992) describe performance
as a set of indicators used by organizations to compare actual outcomes to the desired or
planned outcomes. Some of the variables that have been used to define performance include
strategic orientation (Ahmed, Khuwaja, Brohi, & Othman, 2018).
According to Gautam and Jain (2014) performance of organizations are measurable
valuable outcomes or achievements by a team, individual or contributions towards an
objective of the organization by an individual irrespective of the method they employ.
Ogbeiwi (2017) on the other hand describes performance as the realization of goals that
are measurable using financial or non-financial indicators, specific to a particular objective,
and meaningful to the organization. There is increased emphasis on using non-financial
indicators to measure performance arising from the behavioral school of management.
Using performance management systems encourages innovation (Ismail, 2016).
Organizations implement performance management and measurement systems to monitor
and maintain organizational control, as a process of keeping the organization on track, in
attaining desired goals and objectives through implementation of specified action plans.
Further through performance measurement, manufacturing companies are able to;
Understand their performance relative to competitors in the same industry, compare
performance between product lines/business units and identify product lines that require
close attention, develop a culture in the organization that holds employees more responsible
for their performance, and understand what makes the company successful. Kaplan and
Norton (1992) developed a performance management framework that encompasses a more
balanced view between internal and external factors, financial and non-financial measures
in the organization, known as the balanced score card to assist organizations determine
their performance (Shutibhinyo, 2013).

13
Currently, the main trend in evaluating company activity shows a shift away from pure
financial performance measures (Stobierski, 2020). This shift is explained by many
reasons. In particular, inaccuracies in the way of presenting information to different groups
of stakeholders, distortions in accounting systems, and growing difference between market
value and book value of a company that inevitably leads to changes in corporate evaluation.
Financial reports also do not always provide the possibility to compare company results.
The improvements in financial figures can be driven by many factors that do not depend
on the company itself. Kotane and Kuzmina-Merlino (2012), posit that, non-financial
measures lead to better compliance with long-term corporate strategy by linking them to
the strategy and thereby showing what measures drive the financial performance. Also,
non-financial measures help with the identification of long-term benefits for investors.
Non-financial measures take into account intangible assets, as this provides a view on the
actual efficiency and effectiveness of the actual operations.
The level of technology in a manufacturing company has been found to have a positive and
significant impact on performance through various research. Wanjiru, Gichira, and Wanjau
(2017), found the level of technology in agro-processing companies in Kenya to have a
positive influence on performance. Ahmad, Shamsuddin, Wahab, and Seman, (2019) also
found that in trying to outperform each other in their industries, manufacturing companies
employ technology to develop competitive advantage which allows them to effectively
respond to customer issues related to cost, quality, delivery and flexibility. Manufacturing
companies understand that they need time to develop technological competency as this is
not a short-term process (Hansen, & Lema, 2019).
Empirical and conceptual research reveals that several factors including culture,
organizational resources (intellectual capital, human capital, organizational learning),
management of enterprise risk, corporate structure, the strategic integration of human
resource management, managerial practices related to strategies and corporate governance
and supply chain management and technological capability, especially in the fourth
industrial revolution impact the performance of manufacturing companies (Harrison &
Baird, 2015; Al-Tit, 2017; ). Using performance, manufacturing companies can choose
appropriate strategies to mitigate these factors (Witman, 2018; Szalavetz, 2018).

14
According to Yuliansyah and Razimi (2021), non-financial performance measures
contribute to eliminating cheating mostly through managerial actions, that are short term
oriented and simply serve to increase the financial measures on the account of future
revenues as an increase in financial measures based on cheating shows up in the non-
financial measures. An example of this could be more orders done, however, with higher
amounts of complaints and wrong deliveries.
Performance measurement indicators must be relevant to the performance being measured
and aligned to the goals in the process of determining the overall efficiency and
effectiveness of the organization’s actions. Wholey (1996), relates performance to the
perception that exists in people’s minds. The perception also relates expected service,
components, products, consequences, to the economy, efficiency, effectiveness, cost
effectiveness or equity within the operations of an organization.
Jenatabadi (2015) has proposed using the operating organizational environment to analyze
organizational performance. This method relates the performance measurement to earlier
set objectives and targets, and identifying relevant and recognizable features related to
performance. In the post-industrial environment, organizational performance is hinged on
the ability to forecast market demands and create production systems that react quickly to
meet customer needs. Koetter and Kochanowski (2014) have associated performance to the
rate at which strategy responds to the changing operating environment and prudent
management of resources within the organization.
Despite the difficulty in defining organizational performance, the central question in its
measurement is to determine the parameters, which impact the organization and individual
processes (Kaganski, Majak, Karjust & Toompalu, 2017). Organizations are encouraged
to use common parameters in the industry when they are comparing their performance
against other players in the same industry, but maintain the same parameters compared to
a baseline when they seek to know if they are improving especially after introducing new
processes. This study defines performance as the extent to which organizations fulfil the
needs of stakeholders. The study investigated how advanced manufacturing technology
affects organizational performance and the effect of organizational resources and
competitive advantage on this relationship.
15
1.1.5 Large Manufacturing Companies in Kenya
The manufacturing sector in Kenya is made up of large manufacturing companies, medium
enterprises, small enterprises and micro enterprises. The KNBS (2016) report categorizes
the sector using the number of employees and annual turnover. All enterprises with
employees below 100 are either micro, with a maximum of 9 employees, small with a
maximum of 49 employees or medium with a maximum of 99 employees. Further, the
MSMEs Act 2012 of Kenya has categorized companies using annual turnover, number of
employees and total assets. Using the MSME’s Act 2012, micro enterprise consists of
enterprises whose annual turnover is less than KSh. 500,000, employs less than ten people
and whose total assets and financial investment is less than KSh. 10,000,000.
In this study, companies with an annual turnover of over KSh. 100 million, employing 100
permanent (full-time) employees and, having a registered capital of over Ksh. 100 million
were considered as large manufacturing companies. This definition has also been
previously used by other studies in determining the size of large manufacturing companies
in Kenya and in line with the MSME’s Act 2012. Globally, the size of micro, small and
medium enterprises vary from one region to another, according to the number of employees
and the annual turnover. According to the North American Industry Classification (NAICs)
code (2019) and Act 5/2015 regarding business financing, a microenterprise is one which
has fewer than ten workers and an annual turnover below Ksh. 200 million or total assets
below Ksh.200 million. A small business is one which has a maximum of 49 workers and
a turnover or total asset below Ksh 800 million while medium-sized businesses are those
that have fewer than 250 workers and a turnover below Ksh. 4 billion. Large companies,
meanwhile, are those that exceed these parameters.
Most economies rely on the manufacturing sector to create employment, provide
opportunities for investment, and manufacture products for consumption. Manufacturing
has been found to be one of the routes that developed economies used in their path to
becoming industrialized economies (Sheena, 2008). Countries industrialize by
transforming and relocating the available labor from the agriculture sector to the
manufacturing sector. Studies show that 1 job in the manufacturing sector creates 2.91 jobs
in the other sectors of the economy (Bivens, 2019).
16
The manufacturing companies in Africa have gone through changes that involved national
policies that impact businesses, changes in domestic product demand and the ever-
changing world market dynamics. Nyabuto (2017) observed that the importance of the
manufacturing sector to GDP in African countries has undergone cyclical changes since
their independence, but in the recent years all the African Countries are emphasizing the
improvement of their manufacturing sector to manage their balance of payments, increase
opportunities for employment due to their growing populations, increase production
efficiency to effectively utilize the dwindling natural resources, and compete with other
countries globally.
According to the Kenya National Bureau of Statistics (2019), there has been slow growth
in the manufacturing sector in Kenya. Available statistics by the Kenya National Bureau of
Statistics (2019) show that there was an increase (4.2%) of real value add in 2018 compared
to the anticipated growth of 0.5% in 2017. An expansion of the manufacturing sector
volume of output was realized in 2018 compared to the contraction reported in 2017, while
the financial sector recorded an increase in credit demand of KSh 20 billion in 2018
compared to 2017, which was an increase of 6.3%. Formal employment in the
manufacturing sector increased by 1.4 per cent in 2018 accounting for 11.1 per cent of the
total formal employment while the number of employees in the economic processing zones
was observed to have grown by 4.0% in 2018. Further, the contribution to GDP by the
manufacturing sector has been erratic with the current contribution at 9% from 7.8% in 2018
and expected to be at 15% in 2025 in line with the Government plans and projections.
Micro, small and medium enterprises in Kenya contribute approximately 20% of the
portion of GDP attributed to manufacturing sector while large manufacturing companies
contribute 80% (KNBS, 2018). Organizations over the years have used economies of scale
and time to gain competitive advantage. This is a major advantage for large manufacturing
companies in Kenya compared to many MSME’s which are forced to close down after only
a short time of operation. Lack of sufficient finances to support the business was the main
reason that led to approximately 29.6% of the MSME’s closing down (KNBS, 2016).
Challenges posed by lack of operating funds for the MSME’s, and increased operating
expenses, losses due to market competition, and declining revenues from the businesses led
to their closure (KNBS, 2016).

17
Globalization has affected the manufacturing industry through the advancement of
information and communications technologies which have simplified hitherto business
processes that were deemed to be complicated. Organizations are integrating more globally
in terms of sourcing, manufacturing and distribution of their products (Georgise, Klause-
Dieter, & Seifert, 2014). The manufacturing function plays a major role in a manufacturing
company’s competitiveness and performance in its industry. Therefore, manufacturing
companies in Kenya need to identify capabilities that assist them to formulate and
implement manufacturing strategies to enable their businesses attain desired objectives as
they address issues on cost, quality, timeliness, and flexibility, and also focus on increasing
market share and profitability.
Manufacturing companies globally have adopted advanced manufacturing technology in
their production management processes to meet the following customer needs and also
improve their performance; 1) Create Industry strategy by understanding the internal
strengths and weaknesses, 2) Identify the appropriate competencies which includes having
employees with the correct skills and knowledge, 3) Focus on improving the production
processes by having a clear focus on end-to-end process perspective while deciding on the
most appropriate technology, 4) Implement new efficient and flexible technologies to
reduce waste in the production process (Watson, 2019).
Countries require industrial development to achieve structural transformation (Achuka,
2016). The competitive environment created in Kenya and complemented by the East
African regional integration initiatives have imposed different effects on structural
transformation and growth of manufacturing companies. The share of manufactured
exports by Kenya has reduced in the region due to; improved performance of
manufacturing sector in partner states, proliferation of counterfeit products, liberalization
of trade, and relocation of manufacturing companies to other regional markets. Swamidass
and Waller (1990) suggest that the complexity associated with investigations on justifying
the benefits of advanced manufacturing technology require a steady production process
which is provided by large manufacturing companies. Following this suggestion by
Swamidass and Walter (1990), the researcher used large manufacturing companies in
Kenya, which have a steady manufacturing process for the study.

18
1.2 Research Problem
The effect of globalization, increased customer awareness, and demand for products having
superior qualities in the market, are some of the reasons that have led manufacturing
companies to develop unique ways of operation, to effectively compete in the resulting
turbulent, dynamic, and competitive manufacturing environment. Manufacturing
companies, in their effort to find a solution to this emerging global trend have deployed
advanced manufacturing technology as a strategy in their production process to improve
performance (Swamidass & Kotha, 2000). Advanced manufacturing technology allows
manufacturing companies to develop and sustain competitive advantage therefore earning
above average returns from their investments (Shishodia & Singh, 2012).
Swamidass and Kotha (2000) found that the inherent information processing capability of
advanced manufacturing technologies moderated the relationship between advanced
manufacturing technology, and performance. Raghed, Inda, and Noriza (2018) on the other
hand found a significant relationship between advanced manufacturing technology and
performance of Lean, Agile, Resilient, and Green (LARG) supply chains. Further,
Gunawardana (2006) determined that benefits organizations gain by using advanced
manufacturing technology to improve performance of organizations, include developing
and sustaining product quality. Consistent product quality is one of the product attributes
that organizations use to enhance customer loyalty to sustain product demand, earning
them a competitive edge over their competitors. Once organizations learn how to sustain
their competitive advantage, they maintain and improve their performance.
Sanjeev and Sandeep (2012) found in their study that advanced manufacturing technology
enabled manufacturing organizations to attain flexibility, quality, reduce delivery times,
and gain global competitiveness. These are some of the product and service selling points
to grow the market share of an organization. Percival and Cozzarin (2010) on the other
hand found contrary results to this finding observing that some organizations failed to
achieve the expected positive results associated with adoption and use of advanced
manufacturing technology. Some organizations fail to realize the intended benefits of
adopting advanced manufacturing technology in their process due to poor implementation
and lack of proper and acceptable methods to assess their effectiveness.

19
Countries achieve economic prosperity by providing an environment that would nurture a
competitive manufacturing industry. Economic prosperity is achieved through full
employment and wealth creation. Sheena (2008) observed that industrialization is one of
the drivers that countries use to develop and improve their GDP. Countries achieve full
industrialization when they fully transform the agricultural products and other raw
materials into finished products thus adding total value accompanied with the requisite
comparative advantage. Manufacturers in Kenya have an opportunity to increase and
improve their performance by enhancing value addition to reduce the export of raw
materials especially agriculture-based products (World Bank, 1993).
According to the Big 4 Agenda, the government of Kenya expects the manufacturing sector
to contribute 15% to the Nation’s GDP by 2025 (GOK, 2018). The contribution to GDP by
the manufacturing sector in Kenya averaged 10% for six years, between 2008 and 2014 and
has been declining. The sector contributed 8.5% with a growth of only 0.2% in 2017
(AfDB, 2018). Rodrik (2015), classifies this type of performance of the economy as
premature de-industrialization. The World Bank (2019) report is positive on the prospects
of the Kenyan economy and forecasted that the economy would register an improved
growth of 5.8% in 2018 compared to the reported growth of 4.9% in 2017. Further, it is
estimated that the Kenyan economic growth increase to 6.0% in 2020 (KEU, 2018).
The unemployment rate in Kenya was observed to be 7.4% in 2015/ (KNBS (2018a). The
youth in this category are ordinarily very restless and can be used to destabilize the political
environment with adverse consequences to the business and manufacturing environment.
The manufacturing sector, when well-developed can create employment opportunities,
since the sector is able to generate four times the number of employment opportunities
compared to the other sectors of the economy (World Bank, 2015)
Large manufacturing companies contribute over 80% to GDP of the manufacturing sector
in Kenya (KNBS, 2018). This justifies the need for Kenya to develop and adopt policies
skewed towards improving performance of large manufacturing companies, that constitute
approximately 20% of the manufacturing companies and are a vital component of the
development strategy for the Country to achieve the desired economic growth by 2030 and
also to become the 5th largest economy in Sub-Saharan Africa by 2025.

20
Boyer (1997) and Dean and Snell (1996), using an empirical study, found a positive
relationship between advanced manufacturing technology strategy with performance. Dean
and Snell (1996) investigated the internal consistency of an organization. They found that
when advanced manufacturing technology is viewed on its own, it may show inhibited
results and thus appear to be insignificant in any relationship. Williams and Novak, (1990)
confirmed the findings of Dean and Snell (1996) through their empirical study that indeed
advanced manufacturing technology complements marketing strategies therefore providing
competitive advantage to the organization. These studies did not consider the effect of
organizational resources on this relationship with advanced manufacturing technology.
Dangayach and Deshmukh (2015) in an exploratory study on small and medium enterprises
found that implementing advanced manufacturing technology helped firms in India
develop competitive advantage in quality. Srivastava, Franklin, and Martinette (2013) in
their exploratory study on sustainable competitive advantage in companies found similar
results to Dangayach and Deshmukh (2015). Advanced manufacturing technology is vital
when organizations need to take long term perspectives in building organizational
resources and capabilities that provide the highest entry barriers. Ship (2012) in a
conceptual study in small and medium enterprises in South Africa found that advanced
manufacturing technology helped organizations to become flexible by utilizing their
resources to respond quickly and satisfy the ever-changing customer needs.
Despite many studies that have been done on advanced manufacturing technology,
researchers have not combined advanced manufacturing technology, competitive
advantage, organizational resources, and organizational performance to determine their
independent effect and the synergy of the four variables acting together. Large
manufacturing companies in Kenya have the requisite financial resources required to
comprehensively invest in advanced manufacturing technology, own strategic resources
and have a greater role on the Government to achieve the desired development goals. This
study therefore sought to bridge this gap by investigating the relationship between the four
variables together by answering the following research question: What is the role of
competitive advantage and organizational resources on the relationship between advanced
manufacturing technology and performance of large manufacturing companies in Kenya?

21
1.3 Research Objectives
The main objective of the study was to examine the relationships between the variables
advanced manufacturing technology, competitive advantage, organizational resources and
performance of large manufacturing companies in Kenya.
Specific Objectives
The specific objectives of the study were:
i. To establish the effect of advanced manufacturing technology on performance of
large manufacturing companies in Kenya.
ii. To ascertain the role of competitive advantage on the relationship between
advanced manufacturing technology and performance of large manufacturing
companies in Kenya.
iii. To determine the effect of organizational resources on the relationship between
advanced manufacturing technology and performance of large manufacturing
companies in Kenya
iv. To establish the joint effect of advanced manufacturing technology, competitive
advantage and, organizational resources on performance of large manufacturing
companies in Kenya.
1.4 Value of the Study
The study findings are deemed to have the potential to add value to the resource-based
theory and the contingency theories by investigating more into joint influences of advanced
manufacturing technology, competitive advantage and organizational resources on
organizational performance. Use of technology as a manufacturing strategy is indeed
preferred to enable manufacturing organizations meet their stakeholder needs. The study
demonstrated the value and application of resource-based view and contingency theories
in manufacturing organizations.
The study is useful to management practice as managers can use linkages of advanced
manufacturing technology and performance to make informed decisions when investing
and integrating new technology in the organization’s production system to reduce costs
and improve product quality. This helps manufacturing companies to develop new products
and markets to further enhance their performance and meet customer needs.

22
Further, the study is useful to management practice as research on linkages of advanced
manufacturing technology, competitive advantage, and organizational resources may offer
solutions towards performance improvement in manufacturing organizations. The use of
design technologies allows developing economies to develop competitive advantage in
manufacturing and effectively compete globally with other manufacturing companies from
the developed economies. This enhances customer satisfaction and also provides an
informed environment for investment as both financial and non-financial indicators are
considered to provide the overall performance of organizations.
The study demonstrated linkages between advanced manufacturing technology,
competitive advantage, organizational resources and performance of organizations in a
developing economy context, Kenya, and more specifically within the large manufacturing
organizations that are members of Kenya Association of Manufacturers and also listed in
the manufacturing sector on the Nairobi Securities Exchange. Companies listed on the
Nairobi Securities Exchange are well-known business organizations which could be used
by other companies for benchmarking. The study took place at a time of increased business
environment turbulence in Kenya with the Government implementing Vision 2030 and the
Big 4 Agenda which are key strategies aimed at transforming Kenya from a developing
economy status to a developed economy status.
The findings of this study have also extended knowledge and opened new frontiers in the
field of strategic management. That competitive environment partially mediates the
relationship between advanced manufacturing technology and performance implies that
there are implications on deciding on which of the generic strategies to implement together
with advanced manufacturing technology for optimum results. Differentiation strategies
were specifically found to have a higher impact on performance when implemented
together with advanced manufacturing technology compared to cost leadership strategies.
Further, the findings of this study that organizational resources do not moderate the
relationship between advanced manufacturing technology and performance despite
organizational resources being significant in this relationship should encourage replication
of a similar study in a different context but having larger sample sizes to test the hypothesis
further and serve as a reference point and a basis for other future research studies.
23
1.5 Organization of the Study
This research report is organized into five chapters as described below:
Chapter One: This section of the study introduced the background of the study. The
chapter discussed the concepts, context, theory and research problem that guided the
research. The main objective and the specific objectives of the study were also developed
in the chapter together with a discussion on the values the study.
Chapter Two: This section provides the critical review of previous empirical and
conceptual research literature related to the variables of the study, research problem, and
theories that guided the study. In particular, the chapter broadly explains the theoretical
perspective of advanced manufacturing technology and performance of large
manufacturing companies. The discussions on the theoretical and conceptual perspectives
of advanced manufacturing technology and performance are grounded on both the
resource-based view theory of the firm and the contingency theory of management. The
discussions are linked to advanced manufacturing technology as a manufacturing strategy
and organizational performance in line with the study objectives. Finally, the chapter
identified gaps in the reviewed literature and justified how the study addressed these gaps
including the developing of the conceptual model and hypotheses that guided the study.
Chapter Three: This section presents the methodology adopted for the study. The chapter
provides a detailed description of all aspects of the design and procedures of the study. It
discusses the research philosophy, research design, study population, data collection and
questionnaire design and pre-test. Operationalization of research variables, data validity,
reliability and testing of assumptions used in the research are also presented. Finally, the
chapter presents a discussion of data analytical techniques used in the study.
Chapter Four: This section presents an output of the results of the study. The chapter has
three sections. The first part presents the preliminary analysis of the data. The second
section presents descriptive statistics of the of the data from the organizations that were
surveyed, while the last section presents the findings of the relationships of the hypotheses
tested. Finally, the summary of key findings emanating from the study are presented.
Chapter Five: This section provides six sections: The first section presents an
interpretation of general and major findings of the study followed by, summary and
implication of the findings to management practices and limitations of the study. The
chapter closes with directions for future research.

24
CHAPTER TWO
LITERATURE REVIEW
2.1 Introduction
An overview of the study was mentioned in the previous chapter. Manufacturing has
evolved from a previously labor-intensive process to the current technology-based
processes with the attendant impact to organizational performance. Technology is being
incorporated in the production processes to enable organizations meet customer needs. This
chapter discusses the theories that supported the study through a review of literature. The
theories include the resource-based view which is the main theoretical foundation of the
study and the contingency theory which provided the relationship between advanced
manufacturing technology and organizational performance. These theories establish the
theoretical foundations from which the conceptual framework and research propositions
were derived. The theories also guided the study on the relationship between the study
variables.
Knowledge gaps to be addressed in the study were identified and as a result the conceptual
model of the study was developed. The knowledge gaps that were identified enabled the
study to contribute towards addressing strategy, policy, and management issues that had
not been previously discussed. The study hypotheses that were used to determine the
relationships of the study variables; advanced manufacturing technology, competitive
advantage, organizational resources, and performance are presented.
2.2 Theoretical Foundation
The main theory that guided the study was the resource-based view (RBV). The study was
anchored on this theory due to the understanding that resources are essential and vital
variables for successful organizational performance (Collins, 2020). Ulrich and Barney
(1984) relate resources positively to performance, while Wernerfelt (1984) notes that the
resource-based view focuses on how resources help organizations to improve their
performance relative to their competitors in the same environment. Gitahi and K’Obonyo
(2018), on the other hand observed that resources on their own do not lead to improved
organizational performance as other variables also impact performance.

25
The resource-based view theory has been used successfully to identify different types of
competencies (Collis & Montgomery, 1997). These includes distinctive competencies
which emanate from the ability of an organization to accomplish a task better than any of
its competitors. There are two main distinctive competencies as espoused by the resource-
based view; resources and capabilities. Barney (1991), Prahalad & Hammel (1990) and
Porter (1990) identified development of distinctive or core competencies as pre-requisite
for organizations to sustain competitive advantage using the resource-based view.
The study also used the contingency theory which addressed issues regarding structural
analysis of organizations (Scott, 1992). The contingency theory posits that operating
environment affect the way the organization develops and implements its strategy (Betts
& Patterson, 2016). According to Islam and Hui Hu (2012), the design and the how of
managing organizations are influenced by contingent factors like technology, culture and
the external environment. This theory posits that there is no universal organizational
structure that can be implemented in all organizations with similar results. On the contrary,
other factors including; use of appropriate technology, nature of the operating environment,
organizational size and type of management structure, and the available management
information system, also have an impact on organizational effectiveness.
2.2.1 Resource Based View
The significance of resources to competitive positioning of an organization in the industry
was recognized by Penrose (1959) even before the emergence of the resource-based theory
of strategy. Penrose (1959) argued that organizations own different types of resources
which they use to achieve their goals, including better performance, using different
strategies. Arising from this argument by Penrose (1959), researchers have investigated the
relationship between resources, competitive advantage and performance in organizations.
Alalie, Harada, Mdnoor (2018) used the resource-based view to show that technology helps
organizations develop and sustain competitive advantage. Rapid progress and changes in
technology has been observed as a key challenge in managing organizational behavior.
Technology leads to increased knowledge, development and improvement of
organizations, cost management and improved performance (Breznik, 2012).

26
The resource-based view holds that organizations are successful and gain competitive
advantage if they develop and implement strategies that recognize and use the resources
they control. Akwesi (2019) notes the significance of identifying and prioritizing resources
that fit the resource-based view based on their overall effect on performance. When
organizations identify the strategic resources they own, they can use them in SWOT
analysis to develop effective competitive strategies. Resources also enable organizations
to engage and operate at different strategic levels (Madhani, 2010).
Barney (1992) expanded the definition of resources to include everything used by the
organization to transform inputs into useful outputs through efficient and effective
processes. This broad definition includes both tangible and intangible resources controlled
by the organization. Tangible resources include assets, while intangible resources include
capabilities, organizational attributes, and knowledge controlled and owned by the
organization.
Further, Barney (1992) classifies resources into three categories as either, physical capital
resources, human capital resources, or organizational capital resources. Physical capital
resources include the organizations land, manufacturing equipment, buildings, inventory,
technology and geographic location. Human capital resources on the other hand include
the experience, judgement, and intelligence of the individual managers and workers in the
organization while, organizational capital resources consist of the organization's structure,
planning, controlling and coordinating systems and, the informal relations among groups
within the organization and between the organization and others in its environment.
To manage global complexities in meeting customer demands, resource-based view
represents a critical success factor in the use of technology and it is critical while making
decisions in organizations (AL-Shbiel, & NH Al-Olimat, 2016). The understanding and
use of technology leads to proper operational fundamentals in manufacturing organizations
to be created especially in organizations that aim to be competitive globally. Government
policy makers and managers in organizations are interested in understanding how global
and organizational resources impact international competitiveness as it is a key to growth
and business sustainability emanating from the effects of globalization (Liu, 2017).

27
International competitiveness is currently being driven by the fourth industry revolution
which is the new technological revolution. In this new dispensation, the resource-based
view is still relevant in explaining the observed competitiveness through new technology
and business models like the internet of things, artificial intelligence and the sharing
economy being used by organizations (Delgado, Ketels, Porter, & Stern, 2012; Schwab,
2015).
The resource-based view gives managers a useful framework to develop and gain sustained
competitive advantage in their organizations despite its limitations that have been observed.
The limitations are associated to the framework’s incapacity to perform an empirical study
on measuring performance due to the difficulty in composing a homogenous sample,
secondly it focuses more on the internal analysis of the organization without considering
the opportunities and threats presented by external factors, and finally it has a limited ability
to make forecasts that are strategically significant (Priem & Butler, 2001). However, Teece
and Pissano (1994) and Barney, Ketchen and Wright (2011) defend the resource-based
view as its usefulness appears greater in generating understanding and providing a structure
for developing strategy.
The RBV is one of the most widely accepted strategic theories in the field of strategic
management. It has been widely used to explain the difference in performance between
organizations operating in the same industry and environment (Bertram, 2016). There has
been debate on the effect of internal organizational resources and capabilities (Prahalad &
Hamel,1990) compared to environmental factors (Porter, 1979) to sustaining competitive
advantage. The external environment, operating environment, and organizational resources
are important variables in creating competitive success (Hart, 1995b).
According to McKiernan (1997), despite the criticisms on the suitability of resource-based
view to explain the relationship of resources and competitive advantage in organizations,
it has contributed immensely on core competences as strategic assets which enable
organizations through innovation strategies to develop new products. Hence, the resource-
based view should be considered as an enabler to organizations in developing strategic
capability. This helps organizations to be proactive to changes in the external environment.

28
2.2.2 Contingency Theory
The contingency theory has been used to explain the varying performance observed in
different organizations or different operating environments. The theory relies on several
factors to show how strategies adopted by management in different operating environments
impact the performance of their organizations. Tosi and Slocum (1984) identified three
broad areas in clarifying the concepts of the contingency theory. These include,
effectiveness, environment and congruency of the variables that allow management to
understand how they can apply the contingency theory to understand and improve the
performance of their organizations. Generally, the contingency theory holds that due to
many different exigencies, there is no single best method to manage an organization.
Effectiveness of an organization in the contingency theory includes all the parameters that
are used to measure performance of the organization. These include financial and non-
financial indicators like profit, market share, morale, growth, flexibility, efficiency, and
quality among others. Further, with the current effects of globalization, effectiveness is also
regarded as the ability of an organization to adopt new methods of operation in line with
the business environment to bolster their growth (Aldrich, McKelvey, & Ulrich, 1984).
Technology is one of the operating methods that manufacturing companies adopt to compete
globally and maintain their competitive advantage. The time that organizations take to
effectively adopt technology in their operating systems is dependent upon the contingent
factors in the operating environment (Van de Ven, Hudson, & Schroeder, 1984).
The contingency theory has been used to investigate different aspects of organizational
management with two assumptions that are diametrically opposite (Thai, 2012). The first
assumption is that there is only one way for managing organizations in an optimal way
while the second assumption suggests that there is no way that is effective and efficient on
its own in managing organizations. In effect, the contingency theory is premised upon the
understanding that all outcomes observed from the interaction of two or more variables,
depends on other variables (Boyd, et. al., 2012). Emanating from the conclusion of Boyd
et. al (2012), contingencies have an impact on the three levels of an organization’s strategy.
Further, research has confirmed the causal relationships between contingency factors and
adoption of management practices in organizations (Doh, park & Kim, 2017).

29
One of the factors on which the contingency theory is premised on is the operating
environment of the organization. The operating environment consists of political, economic,
legal, and social elements (Mintzberg, 1989). The four elements in the operating
environment have an impact on the competitive positioning of organizations that can be
determined using the five forces position analysis which helps organizations to determine
the competitive intensity and attractiveness of a market (Majumdar, & Bhattacharya, 2014;
Billy & Abdel-Kader, 2014). The operating environment as a contingent factor together with
the five forces can influence directly the behavior and performance of an organization.
Organization size is the second contingency factor. This factor determines the level of
operations which manufacturing companies can engage in. Large manufacturing
companies tend to own more resources and can invest in the most current technology to
improve their performance. The size of the organization as a contingent factor also impacts
on the capabilities and implementation of strategies (Doh, et al. 2017). Related to their size,
large manufacturing companies obtain comparative advantage compared to medium and
small companies as they can practice mass production targeting large markets or have a
diversified production strategy of manufacturing many products targeting small markets.
Globalization has led organizations to adopt technology to meet the varying demands of the
consumer. Manufacturers have to keep up with the changing demands of consumers to keep
their market share by engaging more skilled workers and incorporating advanced
manufacturing technologies and the fourth industrial revolution in their production process.
Advanced manufacturing technologies has made the manufacturing industry to be more
efficient (Tsai & Liao, 2017).
A study by Woodward (1965) confirmed that indeed different technologies require
different strategies to achieve optimal performance. This is in agreement with the
contingency theory where the performance of organizations depends also on the kind of
technology employed (Jesmin & Hui Hu, 2012). Further, Billy and Abdel-Kader (2014)
describe technology as including; production materials, production equipment, tasks for
employees, available software and knowledge. According to Huselid (1995) adoption of
performance management systems is influenced by technological complexity, task
uncertainty, and technological independence using the generic contingency perspective.

30
Age and power are the other contingency factors. Young manufacturing companies have a
lot to learn in the operating environment and are more innovative as they try many
alternative products to establish their niche market, while older manufacturing companies
have more experience in managing their markets despite the dynamic operating
environment (Fernández-Robin, Celemín-Pedroche, Santander-Astorga, & Alonso-
Almeida, 2019). Although the contingency theory relates the age of the organization to
ease of developing market efficiency, recognizing and employing appropriate
manufacturing processes to meet consumer needs, it can also act as a barrier to change.
There is a significant correlation between technology and the organizational structure
(Freeman, 1973). Using this approach of the contingency theory Harney (2016) observed
that managing the human resource should be synchronized with the nature of the prevailing
aspects of the operating environment of the organization. This contradicts the universal
human resource theory which recognizes the impact of the following human resource
activities that include; recruitment, Selection, Compensation, Employee participation,
Internal labor market and Training on the performance of the organization and are
considered to be independent of the operating environment (Syed & Jamal, 2012). The
contingency theory recognizes the context and discards the one-size-fits all approach in the
implementation of human resource practices. This encourages organizations to implement
diverse synergy strategies to improve performance.
The contingency theory also uses the systems approach with specific regard to fit. The
systems approach posits that organizational design can only be understood by investigating
the contingencies, structural alternatives and performance criteria existing in an
organization simultaneously. Further, the systems approach according to Van de Ven and
Drazin, (1985) found that there was no best way that an organization could implement the
selection, interaction and pattern approaches to fit organizational structure. It is therefore
possible that multiple and equally effective alternatives may exist to achieve the same
objective. Although the contingency theory posits that there is no best way to manage
organizations and by extension, there is equally no best strategy that organizations can use
to develop and sustain competitive advantage, Perrow (1980) is critical of its deterministic
assumptions and the concept of effectiveness.

31
2.3 Advanced Manufacturing Technology and Organizational Performance
Decisions involving the investment and adoption of manufacturing technologies in
production process by organizations are considered to be strategic as they are both long term
and expensive to implement. Organizations that operate in dynamic environments often
make strategic decisions to maintain their market share and meet the needs of their
customers among other reasons. Management in manufacturing organizations have the
responsibility to choose the type of technology to adopt as it must fit the manufacturing
process based on the technology acceptance model and innovation diffusion (Jones,
Lanctot, & Teegen, 2001). Further, the chosen technology should have positive
characteristics and outcomes to performance such as cognitive usefulness and ease of use,
relative superiority and ease of compatibility (Davis 1986, 1989; Davis, Bagozzi, &
Warshaw. 198; Venkatesh, 2000; Tatnall, 2011).
Manufacturing organizations use technology in their operations to develop competitive
advantage in their industry. This is critical for organizations that have regional and global
markets where competition is high and the awareness of customers on issues like product
price, quality and customer satisfaction are also high. Competition in regional and global
markets is high due to availability of similar and substitute products. Manufacturing
organizations in these markets deploy technology in their operations to maintain product
positioning and sustain their developed competitive advantage (García-Sánchez, García-
Morales, & Martín-Rojas, 2018).
Large manufacturing companies adopt new technology in their operations faster compared
to small or medium companies due to their high technology capabilities and the resources
they own (Zahra & George, 2002). The investing decision in technology is determined by
the return on investment and the expected improvement on organizational performance.
The magnitude of the improvement in performance, determines the effectiveness of the
technology in meeting the desired levels of performance. Organizations of all sizes, large,
medium and small invest in some kind of technology to improve their performance.
Further, investing in technology encourages absorptive capacity in organizations and lead
them to achieve stability strategies, expansion strategies, retrenchment strategies or
combination strategies, that form part of their long-term objectives. (Ren, 2019).

32
According to Bayus (1994), a new competitive environment for manufacturing companies
has evolved out of the factors associated with globalization, dynamic markets, increasing
consumer awareness, complexity and business uncertainty. It causes a shift in the
manufacturing strategies employed by organizations from employing efficient production
systems alone to embracing technology that offers both efficient transformation of raw
materials into finished products coupled with flexibility in addressing particular consumer
demands in their markets (Tracey, Vonderembse, & Lim, 1998).
Organizations in the industrial era practiced mass production to achieve economies of scale
using productivity improvement systems. Hawkins (2001) identifies productivity
improvement systems to include; lean manufacturing, supply chain responsiveness, the
internet, Just in Time and waste reduction. During the industrial era, manufacturing
companies employed strategies that were geared to achieving high production efficiency
at low total unit production costs (Skinner, 1986). This has changed in the post-industrial
era where manufacturing companies now use manufacturing strategies that anticipate
changes in the market and use flexible production systems (Tracey, Vonderembse, & Lim,
1998). These strategies include advanced manufacturing technology.
Manufacturing companies achieve their objectives when they align their operation
strategies to their corporate and business level strategies. This allows management in
manufacturing companies to choose appropriate technologies to employ while utilizing the
existing employee capabilities to improve organizational performance. Organizations are
able to realize the full potential of the chosen technology by matching available skills to the
adopted technology, or by managing skill gaps by training employees on the new
technology (Ward, Leong & Boyer, 1994).
Hayes and Pissano (1994) observed that manufacturing systems and strategies have been
changing from the industrial to post-industrial era. These changes have been brought about
by the need to efficiently carry out responsible manufacturing which entails conserving the
environment while providing consumers with their preferred products. Competition has
also contributed to manufacturing companies investing in advanced manufacturing
technology thereby transitioning manufacturing from the earlier preferred economies of
scale to economies of scope (Goldhar & Jelinek, 1983; Hayes & Pisano, 1994)

33
Researchers define advanced manufacturing technology broadly as the application of
stand- alone, intermediate or integrated computer systems in the production process with the
objective of improving organizational performance. Díaz-Reza, Mendoza-Fong, Blanco-
Fernández, Marmolejo-Saucedo, and García-Alcaraz, (2019) found in a survey study
involving 383 respondents that stand-alone advanced manufacturing systems were ranked
as the best, integrated advanced manufacturing systems were ranked at the second position
while intermediate advanced manufacturing systems were third in enabling organizations
improve their performance. This finding advocates the use of advanced manufacturing
technology in all organizations as the cost of investing in stand-alone advanced
manufacturing technology is relatively low and is affordable to all organizations.
All the three classifications of advanced manufacturing technology, stand-alone,
intermediate and integrated systems use one or a group of computers to manage the
manufacturing processes. Researchers have identified different groups depending on their
impact and expected outcome in the manufacturing process. Kotha and Swamidass (1999)
identified four groups of advanced manufacturing technology as follows: (1) Product
design technologies that included computer aided design (CAD) and computer aided
engineering (CAE); (2) Process technologies that include flexible manufacturing systems
(FMS), numerically controlled machines (NC), and programmable logic controllers (PLC);
(3) Logistics/planning technologies that include all production scheduling systems, shop
floor control systems and materials requirements planning systems (MRP I).
Nyori and Ogolla (2015) on the other hand consider advanced manufacturing technology
to consist of three groups, design technologies, manufacturing technologies and planning
technologies while Cook and Cook (1994) have the following family of technologies;
CAD, Computer aided manufacturing (CAM), FMS MRP II, automated material handling
systems, robotics, CNC, computer-integrated manufacturing (CIM) systems, and just-in-
time (JIT). This study has conceptualized advanced manufacturing technology to include
three groups. The first group, design technologies consist of CAD, CAE, Computer aided
process planning (CAPP) and Group technology (GT). This group of advanced
manufacturing technologies are concerned with the manufacturing processes that involving
product definition, and design-related information processing functions.

34
The second group, manufacturing technologies, consist of CAM, Computer Integrated
Manufacturing (CIM), Computer Numerically Controlled machines (CNC), Numerically
Controlled machines (NC), FMS, PLC, computer aided inspection (CAI), Industrial robots,
Automated Guided Vehicles (AGV), and Automated Storage and Retrieval Systems (AG/
AS). These technologies are used to manage all the manufacturing processes. The third
group, planning technologies consist of MRP I, Manufacturing resource planning (MRP II),
Computer preventive maintenance planning (CPM), JIT, Management information systems
(MIS), Enterprise resource planning (ERP), Total quality management (TQM) and
Customer relationship management (CRM). This group of technologies relate to
controlling and monitoring the material flow and related logistical information for the
production process.
Organizations adopt advanced manufacturing technology as part of their manufacturing
business level strategy to implement either cost leadership or differentiation strategies in
their operations. Business-level competitive strategy has grown in both sophistication and
acceptance in enabling organizations to develop competitive advantage (Prahalad &
Hamel, 1990). For organizations to maintain the developed competitive advantage and
improve their performance, they employ both advanced manufacturing technology and
their core competencies to realize both their short term and long-term objectives.
Organizations use flexible manufacturing technologies to adequately respond to the
changing environment factors in the market that relate to customer choice.
Advanced manufacturing technology enables organizations that operate in broad markets
to shift from mass production to mass customization of products by lowering their unit cost
of production and increasing productivity (Nyori & Ogola, 2015). The ability for
organizations to successfully practice mass customization in their production process is
limited by the extent to which they have the requisite consumer information. Mass
customization also depends on the competence exhibited by employees in using advanced
manufacturing technology to translate consumer perspectives into the required product
quickly, easily, and in a cost effectively manner. Employees are required to continuously
increase their knowledge either through training by the organization or on through their own
initiatives to remain relevant in the new dispensation of employing mass customization.

35
The findings from a study by Kotha and Swamidass (2000) in 160 manufacturing
organization in the US show that a fit exists between advanced manufacturing technology
and organizational performance. Specifically, Kotha and Swamidass (2000) found a
significant and positive relationship between advanced manufacturing technology and cost
leadership strategies. Organizations implement cost leadership strategies to have the
greatest impact on their revenues and profits by offering competitively priced product.
Advanced manufacturing technology allows organizations to carry out large scale
production to achieve economies of scale with the attendant low production costs. Through
applying advanced manufacturing technology organizations realize better profits,
increased market share, improved business sustainability, creates more capital for business
growth and, reduced competition from the marketplace.
The study by Kotha and Swamidass (2000) also found a significant and positive
relationship between advanced manufacturing technology and differentiation strategies in
organizations that show superior growth. Through advanced manufacturing technology,
organizations are able to provide customers with unique, different and distinct products
from their competitors and gain competitive advantage in the market. Manufacturers are
also able to carry out successful product innovation, offer their customers product-level
differentiation and price differentiation as they build their brand through coupled with user
convenience from the offer of a variety of products. When organizations apply advanced
manufacturing technology to achieve differentiation, they improve their performance
through; reduced price competition, unique products offering, better profit margins,
consumer brand loyalty and no perceived substitutes.
Finally, on the generic strategies and advanced manufacturing technology, Kotha and
Swamidass (2000) found a significant and positive relationship between advanced
manufacturing technology and focus strategies in organizations. Organizations use
advanced manufacturing technologies to concentrate on particular markets that they
understand well enough their pertinent dynamics and the specific unique consumer needs,
to develop unique and low-cost or well-specified products required by these markets.
Organizations improve their performance by offering excellent customer service and build
strong brand loyalty amongst their customers.

36
Despite the benefits that organizations expect to gain by applying advanced manufacturing
technology in their production process, Hyneck and Janecek (2012) observed that
organizations do not automatically achieve higher productivity, better product quality, and
lower production costs just by using advanced manufacturing technology. Organizations
should own strategic resources besides applying advanced manufacturing technology in
their production process to realize the expected benefits (Amit & Schoemaker 1993);
Grunert & Hildebrandt, 2004). Organizations need both financial resources to acquire the
appropriate technology besides the other strategic resources that would lead to improved
performance.
Ghani, Jayabalan, and Sugumar, (2002) in a study carried out in 27 organizations involving
927 employees, found that organizations only reported modest benefits from what they
expected after applying advanced manufacturing technology in their operations. Ghani, et.
al (2002) identified mechanistic structures as one of the reasons for this finding. Sinqobile
and Alan (2019) found in a descriptive study that organizational structure contributed to
organizational performance as it inhibits or promotes performance depending on the
effectiveness between Supervisory relationships and workflow influence. Further, Prahalad
and Hamel, (1990) reckon distinct competencies that emanate from organizational
structures make organizations to create sustainable competitive advantage. Arising from
these findings, organizations need to implement structures that can create synergy with
advanced manufacturing technology to fully realize the intended benefits.
Chamarbagwala, Ramaswamy, and Wunnava, (2000) found a discrepancy between
technology levels in developed and developing economies due to differences in access to
better financial position, employees with higher skills and experience, and employees
having a broad knowledge of technologies in developed Countries compared to developing
Countries while Putranto, Stewart, Moore, and Diatmoko, (2003) in an empirical study
found that manufacturing companies in developing economies do not have the same
capability as those in developed economies in terms of available technology. These
observations bring to the fore the difference in expectations on performance between
developed economies and developing economies when they apply advanced manufacturing
technology in their production systems.

37
Hasan, Nuri, Turan, and Tolga (2013) in an empirical study on advanced manufacturing technology
noted that product innovation, offering higher quality products and speed to market are
important strategies for survival in dynamic environments. These attributes associated with
product development enable manufacturing companies to maintain their leadership
position. Through advanced manufacturing technologies and correct implementation of
Porter’s five forces in their external environment organizations can maintain and improve
their performance. According to Sun (2001) the learning curve associated with advanced
manufacturing technologies in China, affects the payback time and level of organizational
performance. There is a need to determine other variables that could reduce the learning
curve for organizations to realize the benefits of advanced manufacturing technologies.
Nyori and Ogola (2015) observed that changes in the manufacturing processes and systems
used in design and production processes are a requirement for organizations to meet the
emerging customer needs and that advanced manufacturing technologies provide a solution
and benefits to manufacturing companies in meeting the complexity and turbulence in the
industry environment. Further, Gunawardana (2010) found that advanced manufacturing
technologies enhance organizational performance as they allow the use of computer
technologies in managing the complete range of production activities in a manufacturing
process, thereby increasing production efficiency.
Dangayach and Deshmuk (2015) have presented a seamless link between the technological
potential and the global manufacturing challenge to meet the ever-changing customer needs
although companies that use advanced manufacturing technology in different
configurations, find it difficult to attach and identify resultant benefits to a particular
configuration. Kotha and Orne, (1989), using conceptual models positively link
manufacturing strategy, business strategy, structure, environment, and performance. The
flexibility of advanced manufacturing technology has enabled organizations to; create new
opportunities, adjust their production processes quickly and easily to meet customer needs
and economies of scale based on low volume and low cost of production to achieve similar
results as mass production for a stable growth in dynamic consumer markets (Hewitt-
Dundas, 2000).

38
2.4 Advanced Manufacturing Technology, Competitive Advantage and
Organizational Performance
Change is a vital business characteristic. The manufacturing industry has witnessed great
transformations in the last 25 years according to Donald, Andrew, Matteo, Andrea, David,
Steven, and Michael (2013). This transformation has been caused by the changing and
unpredictable consumer demands, competitive markets coupled with increasing
manufacturing capabilities globally, and increasing availability of advanced manufacturing
technologies (Leong, Snyder & Ward, 1990). Global competition has made the
manufacturing industry environment become turbulent making the changes to be inevitable
in response to issues such as increased availability of both cheap and expensive labor
supply in the developing and developed economies respectively. Foreign direct
investments on the other hand are unlocking new sources of competitive advantage (Donald
et al. 2013).
According to Oxford Economics (2013), globally, manufacturing companies are
undergoing a great transformation with uncertain prospects for the global manufacturing
landscape. Financial crisis and recession have highlighted structural problems in developed
economies inhibiting growth of the manufacturing sector while the emergence of a huge
middle class which requires consumer goods and huge infrastructure investment have led
to growth of the manufacturing sector in developing economies. External market shifts and
technological changes in both developed and developing economies have led to new
operating environments that require manufacturing companies to embrace new tactics to
develop competitive advantage in a new era of growth, change, and economic opportunity.
Oxford Economics (2013) reckon that competitiveness rests on the transformation speed
to respond to market shifts and technology trends from their findings in a study of more
than 300 global executives.
The rapid changes witnessed in the global markets have resulted in manufacturing
companies investing in product innovation to reduce the product life cycle and improve
product quality in response to the informed customer demands. This phenomenon is
replacing the traditional mass production operations with low-volume, high-variety
production systems (Gunawardana, 2010).

39
Manufacturing organizations are able to address the dynamic operating environment and
improve their performance in cost management and process leadership by applying
advanced manufacturing technology in their operations (Shahmansouri, Esfahan, & Niki,
2013). Managing costs is one of the main tasks for managers in any organization as it
determines the difference between organizations that are thriving and those that are
struggling. Low costs proffer competitive advantage and better margins to organizations
while developing their pricing policies. Low costs and product prices also grow the
consumer base and increase the market share as more consumers are able to purchase the
products. Process leadership on the other hand relates to effectiveness and efficiency by
the organization in transforming information, materials or business commitments into
outputs that are valued by customers.
Results from studies done by various researchers, have confirmed that advanced
manufacturing technology has a positive relationship with performance in several ways.
Nyori and Ogolla (2015) observed that advanced manufacturing technology leads to
reduced employee turnover. Employee turnover is expensive to the organization as the
replacement exercise may include training the new employee to attain the required skills
and competence to effectively perform the tasks. Employee turnover affects productivity
as the exiting employees are already familiar with the objectives of the organization and
their individual roles to make the organization achieve the desired performance. High
employee turnover also reduces the overall morale and motivation of employees in the
organization.
Haruna, Gakure and Orwa (2015) noted that advanced manufacturing technology enabled
small and medium scale enterprises in Nigeria to develop and manufacture high quality,
high precision products at low cost with short delivery times. One of the parameters that
consumers use to maintain their product loyalty is the quality of the product. Loyal
customers are instrumental to organizations for growing the brand of the product,
increasing sales revenues and growing the market share. Dangayach, and Deshmukh (2005)
in their study on small and medium enterprises in India also found that advanced
manufacturing technology enabled these companies to entrench quality in their production
process.
40
Mora‐Monge, González, Quesada and Rao, (2008) in their study on advanced
manufacturing technologies in North America found that there was increased performance
associated with implementation of advanced manufacturing technologies which made
multi-national companies in North America extend the use of these technologies in their
manufacturing companies in other markets in the developing economies. Therefore,
advanced manufacturing technology allows transfer of skills and knowledge by multi-
national companies from developed economies to developing economies. Since the HR
costs are generally higher in developed economies compared to developing economies,
multi-national companies are able to use advanced manufacturing technology in their
production plants located in developing economies and supply their global markets without
impacting on product quality while reducing their overall HR and product costs.
Small and medium enterprises realize benefits in their operations when they apply CAD,
CAM, virtual manufacturing technology, and integrated virtual private networks in varying
configurations in their manufacturing processes (Haruna, Gakure & Orwa, 2015). All
organizations can apply advanced manufacturing technology that suits their operations
depending on their manufacturing strategy. Further, the manufacturing strategy determines
whether the organization adopts stand-alone, intermediate or integrated advanced
manufacturing technologies. Integrated advanced manufacturing technology deploys all or
most of the advanced manufacturing technology groups namely; design technologies,
manufacturing technologies and planning technologies in their production process.
Swamidass and Newell (1987) describe strategy as a set of actions or patterns of actions
executed by organizations to achieve desired goals. According to porter (1987),
organizations can implement three types of strategies depending on their product
positioning in the market. These strategies include cost leadership strategies, differentiation
strategies and focus strategies. Whereas cost leadership strategies and differentiation
strategies target broad markets, focus strategies target niche markets where the
organization offers more specialized products and more attention to the customers to
cultivate customer loyalty. Organizations use advanced manufacturing technology to
deliver their strategy in their preferred markets. This is possible due to ease of adaptability
and flexibility associated with advanced manufacturing technology.

41
Kotha and swamidass (2000) found in their empirical study a significant relationship
between differentiation strategies and advanced manufacturing technology. Manufacturing
companies are able to use advanced manufacturing technology to meet the specific needs
of their customers, by differentiating their products at the market place. Whereas
organizations that are competing in international markets should focus their differentiation
strategy on specific segments, the general aim of the differentiation strategy is to help the
organization enhance the experience a customer gets from using its product/service by
providing them products that exhibit greater reliability, durability, convenience, or ease of
use compared to their competitors (Dopico & Calvo-Poral, 2011; Porter, 1985).
Manufacturing companies operating in open markets can use advanced manufacturing
technology as part of their manufacturing strategy to compete effectively against their
competitors. Open markets are characterized by high quality substitute products where
customers have a wide selection of products that meet their needs while manufacturers
easily access resources for manufacturing. Gaining competitive advantage in these markets
requires more than strategic resources for companies to achieve above average returns on
their investments. Manufacturing companies can use advanced manufacturing technology
to achieve and sustain competitive advantage to reduce their product cost, increase their
product quality, reduce the production and delivery time and practice continuous
innovation (Alnawaiseh, AL- Rawashdi, & Alnawaiseh, 2014).
Swink and Nair (2007) in their empirical study from 224 companies found that companies
that employed design technology groups of advanced manufacturing technology gained
competitive advantage and achieved better performance compared to their competitors.
Further, Swink and Nair (2007) also found that planning technology and manufacturing
technology groups of advanced manufacturing technology had a positive impact on new
product development and process flexibility. Regarding the relationship between process
flexibility and advanced manufacturing technology, Cook and Cook, (1994) also found that
advanced manufacturing technology allowed manufacturers to be more flexible as they
were able to integrate product design and production processes which enhanced their
competitive advantage and performance. Manufacturing flexibility allows organizations
effectively react to changing customer needs.

42
Marri, Gunasekaran, Sohag (2007) in an empirical study carried out in Pakistan concluded
that lack of accepting long term objectives hindered effective utilization of advanced
manufacturing technology. Long term objectives determine the competitive strategy being
pursued by the organization. These objectives are determined by organizations in relation
to their growth strategies that address both market and product growth, performance
improvement and diversification to mitigate business risk. When organizations fail to
recognize long term objectives, in effect they also lack annual plans and budgets and may
not be consistent in identifying their performance indicators. In these circumstances,
investing in advanced manufacturing technology may not have the desired impact to the
organization.
Kotha and swamidass (2000); Dean and Snell (1996); Parthasarthy and Sethi (1992) in
empirical studies found no significant relationship between advanced manufacturing
technology and cost leadership strategies although there was a significant relationship
between advanced manufacturing technology and performance. These findings allude to
the long-held position that cost leadership relates strongly with mass production and
therefore organizations that implement cost leadership strategies and do not practice mass
production may not find value from investing in advanced manufacturing technology,
which allows organizations to achieve superior growth strategies with higher performance.
Burcher and Lee (2000) in a study in organizations in UK did not find a significant
relationship between planning technology groups and manufacturing technology groups of
advanced manufacturing technology and performance. Burcher and lee (2000) advise that
more time is required in order to assess the real cause of performance improvement in
organizations that have implemented advanced manufacturing technology in their
production process. The cost related to the implementation of these two advanced
manufacturing technology groups are high especially when complex manufacturing
processes are involved. The high investment costs are not consistent with cost efficiency
resulting in the findings of Burcher and Lee (2000). Davenport (1998) and O’leary (2000)
found that implementing some advanced manufacturing technologies such as ERP are high.
Since planning technologies, which includes ERP technologies, is associated to lower cost
efficiency, the usage of the technology may appear to be high.

43
Despite the findings from studies that show that advanced manufacturing technology does
not have a positive impact to performance in manufacturing organizations, Saberia and
Yusuff (2011) hold the view that advanced manufacturing technologies are important when
manufacturing organizations are implementing strategies to help them gain competitive
advantage. In a study they conducted in Malaysia, they observed that advanced
manufacturing technology helped companies increase product quality, reduce lead-times,
and achieve greater flexibility. The pre-requisite required by manufacturing organizations
to achieve these benefits includes, possessing appropriate technological skills that are
aligned to the manufacturing strategy, culture and the organizational structure.
In a cross-sectional study done by Theodoroua and Florou, (2008) in manufacturing
organizations in Greece, financial performance was observed to be greater for organizations
which emphasized a higher level of flexibility and the middle level of cost. Further, quality
and product innovation were also observed to have a positive relationship with
performance. Flexibility in manufacturing systems refer to the ease and ability to
effectively manage variations in the production process. Advanced manufacturing
technology allows manufacturing companies to achieve both machine flexibility and routing
flexibility which are essential towards producing new types of products, and the ability to
change the order in which operations are executed or the ability to use two or more
machines to perform the same task, and the system’s ability to handle large-scale changes
like significant increase in volume and/or capability.
Finally, Kotturu and Mahanty (2017) in their study concluded that advanced manufacturing
technology enabled organizations to; achieve high product quality standards, offer
competitive product prices, meet customer delivery schedules and service level agreements,
develop new products to meet market demands, manufacturing flexibility, and reliability.
For organizations to sustain competitive advantage and improved performance through
applying advanced manufacturing technology in their process, they also need to continue
training all their workforce and raising the awareness on the use of technology, carry out
capacity expansion that addresses organizational capabilities, invest in research and
development and manage the cultural orientations that do not support embracing
technology and change.

44
2.5 Advanced Manufacturing Technology, Organizational Resources and
Organizational Performance
Recognizing sources of sustained competitive advantage that impact on organizational
performance is a major area of study in strategy. Researchers have been involved in
different investigations to determine why organizations in the same competitive
environment achieve different performance (Bridoux, 1997). Researchers have used the
resource-based view as one of the theories to explain this observed difference in
performance. The theory is premised on organizations competing on the basis of the
resources and capabilities they own. Resources owned by organizations fall under two main
categories, tangible and intangible resources and include anything used by individual
employees or a group of employees to help them achieve their goals and subsequently the
goals of the organization (Halbesleben, Neveu, Paustian- Underdahl, & Westman, 2014;
Collis, 1994). Resources can also be strategic or non-strategic.
Using the resource-based view, Barney (1991) proposes characteristics that a resource
should have to confer competitive advantage to an organization. This view has been
improved by other researchers who have determined that resources alone may not lead to
better performance as other organizational orientations have been found to be significant
and positively related to organizational performance (Porter, 1991; Grant, 1996; Newbert,
et al., 2008; Herath &Mahmood, 2014; Gitahi & K’Obonyo, 2018; Jeong, Pae, & Zhou,
2006; Paladino, 2009). Further, organizations need a combination of both tangible and
intangible resources to attain higher profits (Greco, 2013).
Further, in an empirical study carried out in 102 firms in Vietnam, Tuan and Takahashi
(2009) found that organizations are able to transform and enhance the competitive value of
resources they own using different types of technology. Organizations are able to
incorporate advanced manufacturing technology in their operations and using different
resources be able to develop different capabilities with attendant performance levels.
Kaplan and Norton (1996) have provided a model that organizations can use to measure
their performance which is the level which the organization meets its goals and objectives.
Organizations in the past have used financial indicators to measure performance, but this
has changed as non-financial indicators have also been found to provide a reliable measure
on organizational performance.

45
Organizations are facing new and dynamic operating environments, informed investors
demanding high returns on their investments and ever-growing competitiveness from the
operating environment. The non-renewable strategic resources owned by organizations are
also diminishing and there is need to use efficient methods when using these resources in
the manufacturing process. Unsal and Cetindamar (2015) found in an empirical study on
technology management capability that organizations investing in technology are more at
ease in containing the emerging competition spurred on by globalization. Rapid growth in
technology has given rise to several opportunities that organizations can use to sustain their
competitive advantage. Advanced manufacturing technology has the capability of
interfacing effectively with the fourth industry era technology, where availability of
information and data management determine the performance of organizations.
Further, Unsal and Cetindar (2015) recommend that organizations should excel in efficient
manufacturing methods that offer cost effective production processes, possess sufficient
flexibility to allow them quickly adapt to the changes in the market and, invest in resource
development and renewal. Organizations lose their market share when they fail to
anticipate changes in the market, are not able to meet specifications of emerging product
trends or fail to meet the new customer needs. Advanced manufacturing technology as an
aid to the manufacturing process contributes to the organization’s ability to develop
competitive advantage by providing organizations with the solution to these issues.
The recommendations of Unsal and Cetinder (2015) for organizations to use advanced
manufacturing technology in their production processes to improve performance is
consistent with the findings of Wu and Wang (2007) from the empirical study they
conducted in Taiwan. Wu and Wang (2007) found that technology contributes towards
improving organizational performance by creating and sustaining competitive advantage.
Advanced manufacturing technology is a technological asset or strategic resource owned
and used by organization to improve the efficiency and effectiveness of their
manufacturing processes. Wu and Wang (2007) advocate organizations to mature in the
use of advanced manufacturing technology to realize the full positive impact of technology
on performance especially when organizations have to quickly adapt to changing
environmental conditions and rapid technological progress.

46
Levinthal and Myatt (1994) argue that performance of manufacturing organizations is
determined by how resilient they are to the product market fluctuations and in accordance
with the strategic resources they own. The resilience of organizations is an indication of
the level they can proactively anticipate adverse market conditions and mitigate the market
fluctuations using appropriate manufacturing systems. Markets determine the consumption
rate and capacity of goods and services offered by manufacturing organizations. The
appetite of the market to consume products on the other hand is determined by the nature
of the distribution channel and the marketing strategy used. Advanced manufacturing
technology fits in all marketing strategies and is used by organizations to maintain their
market share by consistently delivering quality products at the customer preferred price,
place and time.
Results of an empirical study by Kashan and Mohannak (2015) on organizational micro
processes show that organizational capability development explains the ability of
organizations to develop and sustain competitive advantage. Organizational capability
emanates from the successful management of organizational resources to meet customer
needs. Further, organizational capability and the benefits attributed to strategic resources
using the resource-based view of strategy, are developed over time by organizations.
Consequently, for organizations to realize the full benefits of investing in advanced
manufacturing technology, there is a learning period which organizations use to embed it
in its production processes.
From the recommendations of Kashan and Mohannak (2015) in their empirical studies on
performance, Yousef (1992) described advanced manufacturing technology as a strategy
and resource which when appropriately implemented, controlled and evaluated, improves
the performance of an organization. For organizations in developing economies,
performance of advanced manufacturing technology follows a path that depends on the
adoption and implementation process. The adoption process on the other hand is influenced
by the preferred configuration which may be stand alone, intermediate or integrated within
the production system and the size of the organization. Both small and large companies use
advanced manufacturing technology to gain competitive advantage by reducing their
production costs as they improve their performance (Li & Xie, 2012).

47
Day (1994) defines organizational capabilities to include accumulated latent capabilities or
expertise that organizations employ in their operations. More recently, Lee (2010) found
that technological competence was a factor towards organizations achieving better
performance. Technological competence relates to the level of technical knowledge, skills,
experience and abilities of employees in an organization and are used to enhance the
competitive advantage and performance of organizations. The results from a study on small
and medium sized enterprises by Aggelopoulos, Eriotis, Georgopoulos, and Tsamis (2016)
confirm the assertion of Day (1994) and emphasize that that design, which can be carried
out effectively using advanced manufacturing technology is a positive factor in the
innovation strategy.
Wernerfelt (1984) reckons that intangible resources are not susceptible to imitation easily
making them to be important variables for organizations to sustain their performance.
Unlike physical resources, intangible resources are developed in the organization over a
long period of time leading them to be part of the core competencies in an organization.
Volna and Papuna (2013) have advanced the argument that organizations can use their core
competencies to build permanent and sustainable competitive advantage in their markets
and strengthen their brand reputation. Advanced manufacturing technology enables the
positive brand perception and reputation by consumers to be realized in the product offering
(Youssef, 1992).
Grant (2002) on the other hand observed that competitors can easily identify and place a
value on tangible resources, making them easy to duplicate or access. This observation by
Grant (2002) is consistent with Michalisin, Smith, and Kline, (1997); and Carmeli and
Tishler, (2004) that tangible assets devoid of other aspects of process enhancement are a
liability and provide organizations with a limited contribution to competitive advantage.
Availability of financial resources on the other hand in an organization has been linked to
breakthrough transactions as organizations may be constrained to innovate when they do
not have sufficient financial resources (Lee, 2001). This study investigated the role of
advanced manufacturing technology and organizational resources on performance in large
manufacturing companies in Kenya as they are deemed to have sufficient financial
resources to adopt and implement technological strategies in their operations.
48
2.6 Advanced Manufacturing Technology, Competitive Advantage, Organizational
Resources, and Organizational Performance
The demand by investors in manufacturing organizations for improved performance has
forced many of them to invest in advanced manufacturing technologies (Swink & Nair,
2007). The investments vary from adopting stand-alone computer technology systems to the
more complex integrated computer technology systems that are compatible with their
business. The investment costs also vary with stand-alone computer technologies being
cheaper compared to the complex integrated computer technology systems. The desire and
aim of organizations when investing in advanced manufacturing technology is to enhance
their performance.
Several studies have confirmed that advanced manufacturing technology allows
organization to realize a wide range of benefits that include increase in; market share,
productivity and production efficiency, improved flexibility, enhanced quality, reduced
production costs, enhanced competitive advantage, enhanced organizational performance;
and potential source for innovation (Kotha & swamidas, 2000). The benefits associated
with flexibility enables organizations to produce a wide variety of products, as increased
production efficiency leads to reduction of waste in the production process and low unit
production costs, while organizations meet the changing consumer needs using enhanced
quality (Kotha & Swamidass, 2000).
Due to the Corvid-19 pandemic, all manufacturing organizations have been adversely
affected by the economic downturn experienced globally. Organizations have to implement
different strategies using well thought out turn-around business principles to regain their
pre- Corvid-19 market share and product positioning, which is not easy (Rumelt, 2009).
One of the options for organizations is to develop flexible and optimal turnaround strategies
in their business recovery plans for them to even remain in business. Technology plays an
important role as cost containment is the main task for Managers to implement in
developing products whose price fit in the disposable income of consumers (Penros, 1959).
Strategic and manufacturing flexibility which organizations get by using advanced
manufacturing technology are important factors that influence selection of turn-around
strategies in economic downturns to manage performance.

49
Indeed, Dean and Snell (1996); Gerwin and Kolodny (1992); and Porter (1983) concur in
the findings from their studies on effects of strategies on performance, that there is a
significant relationship between flexible strategies with performance. Further, Joiner,
Sarah Yang Spencer, and Salmon, (2009), found that both financial and non- financial
indicators are used to measure performance in organizations practicing flexible
manufacturing strategies and these organizations achieve higher performance.
Advanced manufacturing technology is applied in the manufacturing process to utilize its
flexibility which allows the manufacturing process to adapt easily to changes in the type
and quantity of the product being manufactured. Organizations are then also able to
implement make-to-order strategies that allow customers to customize the products they
want. By using the make-to-order strategy, organizations do not require to have large
warehouse space for storing raw materials or finished product, reducing their material
holding costs and unit production costs as well.
Zummato and O’Connor (1992) link this flexibility of advanced manufacturing technology
to increased productivity and organizational performance as routine tasks are performed
by advanced manufacturing technology consequently reducing unit production costs while
increasing production efficiencies. In a study carried out by McDermott and Stock (1999)
in 97 manufacturing organizations, they found the ability of advanced manufacturing
technology to provide flexibility and efficiency on the product by end users to be its most
distinguishing feature. This feature is important in maintaining customer loyalty.
Further, Mcdermott and Stock (1999) observed that the combination of flexibility and
efficiency achieved by manufacturing organizations through advanced manufacturing
technology, allow organizations to achieve efficiency with low production volumes and
product customization at low costs which contradicts the traditional operations
management and manufacturing strategies. Over and above the operational benefits,
manufacturing organizations also benefit at the organizational level by improving work
flow, enhancing communication, increasing employee retention, conserving strategic
resources by using efficient and improved manufacturing processes by using advanced
manufacturing technology (Zairi, 1992).

50
Cagliano and Spina (2000); Zummato and O’Conor (1992); Szwejczewski, Sweeney and
Cousens (2016); and Scherrer and Deflorin (2017) found in different empirical studies that,
planning technology groups of advanced manufacturing technology reduce operation costs
and enable organizations to develop efficient and effective production plans. Organizations
also develop and implement manufacturing strategies that use existing products to develop
competitive advantage and in turn improve organizational performance. Production plans
endear organizations to their customers by providing them with reliable delivery timelines.
Organizations develop and sustain competitive advantage in their production process when
they recognize the advantages associated with technology. Szász, Scherrer and Deflorin
(2016) recommend the use of advanced manufacturing technology in decision making to
enable optimal decisions to be made from the data captured by the technology system that
incorporates all aspects of the business. Decision making should be made by competent
employees who have the full understanding of the impact their decisions have on strategy
execution and subsequent organization performance. When organizations have the ability
and a platform they can use to make decisions, forecasting and planning for the future
becomes easy, and incidences of reacting to the environment are reduced.
José, Macarena, and Pedro (2016) concur with Szász et.al (2016) that responsiveness is
one of the key performance indicators that organizations need to address arising from the
challenges posed by today’s markets. Findings of a study conducted by Jose et al (2016)
involving 441 Spanish industrial companies show that manufacturing organizations invest
in advanced manufacturing technology to improve their competitiveness in their various
industries and markets. The study also found that performance of organizations improved
when implementation of advanced manufacturing technology includes internal integration
being supplemented by external integration.
Internal and external integration relates to the efficiency with which the supply chain
management works. Internal integration is present when more than one function in the
organization are interdependent and the effect of silos within the organization is eliminated.
Advanced manufacturing technology helps organizations to achieve full internal
integration which is a pre-requisite for external integration. This hastens proper decision-
making eliminating delays that would lead to increasing operation costs.

51
Hou, Chen and Xua (2017) posit that with the current environmental concerns, advanced
manufacturing technology offers a solution for manufacturing organizations to comply
with global environmental standards without affecting their performance. Organizations
are concerned with meeting new stringent manufacturing regulations that insist they use
efficient production processes, especially when they are using natural resources, to reduce
their ultimate depletion. Environmental conservation is now a global concern and an
agenda at global meetings, especially with the adverse effects of global warming that are
now being experienced due to toxic emissions that are responsible for the destruction of
the ozone layer. Proper planning and design of production processes can assist
organizations meet these requirements, besides the approved good manufacturing practices
that have been in use for a long time.
Ocampo, Clark, and Tanudtanud (2015) agree that an optimal manufacturing strategy has
a great potential in supporting business strategy when structural decisions are aligned to
technology. The intended technology to be used in achieving organizational goals should
be easy to implement with regard to its utilization by employees and the organization’s
ability to finance the acquisition. Technology at times undergo rapid changes with adverse
impact on production processes. Advanced manufacturing technology is easy to upgrade
especially when it is adopted in an integrated manner where upgrading a section would
contribute large positive changes to the whole system inadvertently ensuring that
competitive advantage for the manufacturing process is still maintained.
Nair and swink (2007) found in an empirical study on the internal and external means used
by manufacturing organizations to engage in process technology development, that internal
process technology, has a significant relationship with quality, delivery and process
flexibility. When organizations are engaged in process technology development, they look
beyond the current strategy as replacing technology is expensive. Therefore, the developed
technology should have the ability to be used in manufacturing various products and meet
the quality specifications over a period of time albeit with minimum modifications in
response to the market demands. Speed to the market forms a major competitive advantage
to manufacturing companies. This allows organizations to test their new products in the
market and respond to any required changes to meet the taste of their customers.

52
Itami (1987); Jacobs and Whybark (2000) on the other hand found that product
technologies enabled research and development in organizations to impact positively with
performance more specifically on reducing the overall cost of the research and
development function. This emanates from the flexibility associated with advanced
manufacturing technology which enables a multidisciplinary team to undertake research
on either new or existing products. The resultant product could still be produced using the
same process with a few adjustments to the production equipment attachments, thereby
greatly reducing the total cost of research and development. Besides developing new
products, technology allows organizations to improve their operating processes through
research and ultimately increasing the process efficiency and organizational performance.
Davenport (1993); Schoonhoven (1981) and Wheelwright (1978) ascertained that there
was a positive relationship between technology, competitive resources and the utilization
of organizational resources to performance especially for certain product functionality and
cost conditions. When organizations categorize the resources they own into two main
clusters of competitive resources and other resources, they can efficiently determine a
process in which to exploit the competitive resources to give them an edge in their industry
and improve their performance. This is especially true where process technology and
innovation is of primary importance as the design of the product stabilizes during the
maturity stage. Organizations use both the design and planning taxonomies of advanced
manufacturing technology to align the production process to meet their desired objectives.
Boyer, Leong, Ward, and Krajewski (1997) and Swamidass and Kotha (1998) found no
direct relationship between advanced manufacturing technology and performance using
various studies. The finding by these researchers may have been caused by other exogenous
factors, as there exists enough evidence to the significant and positive between advanced
manufacturing technology, organizational resources and performance in organizations.
Advanced manufacturing technology, when viewed as a technological resource, may not
provide competitive advantage as it is easy to copy and be used by other organizations, but
when organizations use their competencies which include employee skills in the use of
technology, it forms a positive synergy and optimizes performance. This study investigated
the role of competitive advantage and organizational resources on this relationship.

53
2.7 Knowledge Gaps
Literature shows that organizations can achieve competitive advantage by differentiating
itself from its competitors. It follows that if the environment changes such that numerous
competitors have attained competencies indistinguishable to those characterizing a
particular organization, the firm loses its competitive position and would do well to
reconsider its strategy. There is no link between critical organization resource, business
processes, organizational competencies and organizational performance from this
observation. This study aims at investigating the relationship between advanced
manufacturing technology, organizational resources, competitive advantage and
organizational performance.
Other prior studies in advanced manufacturing technology and performance have addressed
the rate of adoption of advanced manufacturing technology in developed economies,
demographic variables, and infrastructural variables. This study aims at investigating the
Kenyan industry environment where both competitive advantage and organizational
resources have an impact on performance.
The effects of advanced manufacturing technology on many aspects of performance are
still not clear (Boyer, 1969). The literature review indicates that there is no difference in
performance when you compare the investment patterns of manufacturing organizations in
terms of those that adopt advanced manufacturing technology and those employing other
manufacturing strategies. Swamidass and Kotha (1998) also failed to observe a direct
relationship between advanced manufacturing technology and performance suggesting that
other variables either mediate or moderate this relationship. Indeed, Das and Ramayan
(2003) attempt to give groups of variables that moderate this relationship.
Das and Ramayan (2003) have identified market and product factors, manufacturing
practice factors, and work organization factors as variables that affect the relationship
between advanced manufacturing technology and organizational performance. This study
investigated the role of competitive advantage and organizational resources on the
relationship between advanced manufacturing technology and performance in large
manufacturing companies in Kenya. Table 2.1 gives the summary of major knowledge gaps
and the contribution of this study to this relationship.

54
Table 2.1: Summary of Major Knowledge Gaps
Author and Year
Focus of Study Methodology Main Findings/Conclusions Knowledge Gaps Contribution of this
Study
Bag,
Gupta, and
Kumar,
(2020)
Investigate the
impact of
advanced
manufacturing
technology on
degree of Industry
4.0 application
and sustainable
development.
Descriptive online
survey design
involving 124
manufacturing
organizations
There is a significant
relationship between industry
4.0, advanced manufacturing
technology and sustainable
development
Although study findings
show a significant
relationship between
Industry 4.0, advanced
manufacturing technology
and sustainable
development, there is need
to relate this finding to
performance
Current study endeavors to determine the effect
of advanced
manufacturing
technology, competitive advantage and
organizational resources
on performance of large
manufacturing companies
Díaz-Reza,
Mendoza-
Fong, Blanco-
Fernández,
Marmolejo-
Saucedo, and
García-
Alcaraz,
(2019).
To determine
the contribution
of AMT
configuration
and their
benefits to the
organization.
A survey of 383
respondents using a
quantitative and
statistical point of
view and evaluated
using the partial least
square technique on
the contribution of
AMT configuration and benefits.
AMT configurations have an
impact on organizational
performance with Stand-
Alone AMT contributing
more to organizational
performance, followed by
Integrated Systems while
Intermediate Systems
configuration contributes the least to performance.
Study findings provide a
relationship between AMT
configuration ranking to
performance, but the study
does not provide the
mechanism and variables
through which
organizations achieve the stated improved
performance.
This study included
competitive advantage and
organizational resources as
other variables that affect
the relationship between
AMT and organizational
performance
Zhu, Anqi Liu
and Wang
(2019).
Investigate the
relationship
between
organizational
learning, regarded
as intangible
resources, and
firm performance
A cross sectional
survey of 450
participants who were
either founders or
professional managers
in an executive
training program
The results show that
organizations are
increasingly realizing the
necessity to utilize
entrepreneurial orientation to
make the most out of the
knowledge generated from
learning process.
The results show a
moderated mediation in
the relationship between
the variables, which is
rather hard to decipher for
organizations and to
implement in their day-to-
day operations
The study tested the
moderation effect of
resources on the relationship
between advanced
manufacturing technology
and performance of large
manufacturing companies in
Kenya

55
Table 2.1: Summary of Major Knowledge Gaps Cont…
Author and
Year Focus of Study Methodology
Main
Findings/Conclusions Knowledge Gaps
Contribution of this
Study
Kamasak (2017). To study the effect
of resources and
capabilities on the
performance of
organizations with
regard to their
contribution to
market share, sales
turnover and
profitability
A cross-sectional
survey research
design with a
modified Galbreath
and Galvin’s (2008)
questionnaire
applied on 243
Turkish firms
operating in different
industries.
Intangible resources together
with capabilities have a
stronger relationship with
organizational resources
than tangible resources.
Study findings do not
provide the explanation as
to why intangible
resources have a stronger
relationship to
performance compared to
tangible resources
Having competitive
advantage as one of the
variables in the study,
provides a way of identifying
how resources impact
organizational performance
Kotturu and
Mahanty
(2017)
To explore
competitive
priorities and
factors affecting
the relationship
between SMEs
and entry in
global value chains.
A survey in the Indian
automotive industry to
investigate
determinants of SME
integration into global
value chains using
qualitative feedback
loop analysis
Product quality standards is
the most important priority
for joining global production
networks, followed by price
competitiveness, timely
delivery, innovativeness,
manufacturing flexibility,
service, and dependability
The study does not
provide the basis on which
organizations can achieve
the identified factors to
maintain competitive
advantage and improved
performance
This study used AMT to
show that technology can
help organizations to
obtain the factors required
to effectively compete in
global markets and achieve
improved performance.
Breznik and
Lahovnik
(2016)
Determine the
Relevance of
Dynamic
capabilities in
relation to a
dynamic
manufacturing
environment
Case study on firms
with the ability to
change their resources
and capabilities, to
create competitive
advantage in their
operating
environments
Dynamic capabilities enable
organizations to improve
their performance.
The study only considers
the relationship of
dynamic capability with
performance.
This study investigated the
role of competitive
advantage and,
organizational resources,
with the underlying theory
of RBV to show the
relationship between
manufacturing strategy
(AMT) and organizational performance.

56
Table 2.1: Summary of Major Knowledge Gaps Cont…
Author and
Year Focus of Study Methodology Main Findings/Conclusions Knowledge Gaps
Contribution of this
Study
Abungu,
Maingi,
and Ombara,
(2016)
Determine
effect of AMTs
on technical
labour in
manufacturing companies in
Kenya
A conceptual study on
manufacturing
companies in Nairobi
and Atsi River in
Kenya,
AMT has a significant and
positive impact on the
performance of organizations
and enhances staff retention
The sample size was
limited to companies in
Nairobi and Atsi River
area which may not be
generalised for the whole
economic region of Kenya
This study sampled Large
manufacturing companies
in Kenya to provide
representative results for
the whole of the economic
area, Kenya
José,
Macarena,
and Pedro
(2016)
To explore the
mediating role
of internal and
external
integration on
the effect of
AMT on supply
chain
responsiveness
A sample of 441
Spanish industrial
companies was used
to test the model
through structural
equation modelling.
Supplementing Internal
integration with external
integration ensures that
implementation of AMT
results in improved
responsiveness and
organizational performance
The study uses only
Internal integration and
external integration which
are some of the conditions
that organizations use to
improve SCM. Good
forecasts and planning
also lead to enhanced organizational
performance.
This study addressed the
effect planning using
AMT as one of the factors
used to improve SCM and
improve performance
Dangayach
and
Deshmukh
(2015)
Effects of
Implementation
of AMT in
Indian
Automobile
Companies on performance
This was an
exploratory survey
study on the effects of
AMT on performance
in India
AMT is a source of
competitive advantage in
organizations and lead to
improved performance
The study found AMT to
be a source of competitive
advantage, but did not
show the relationship
between resources in this
relationship.
This study considered the
role of organizational
resources, on the
relationship between AMT
and performance besides
competitive advantage .
Nyori and
Ogola (2015)
AMT adoption
in
manufacturing companies in
Kenya
A survey study on the
adoption of AMT in
Kenya
Clear benefits were observed
in terms of competitive
advantage and performance for the companies that had
adopted AMT.
The study used only the
relationship between AMT
adoption and performance
Incorporation of
organizational resources
and competitive advantage on relation between AMT
and performance

57
Table 2.1: Summary of Major Knowledge Gaps Cont……
Author and
Year Focus of Study Methodology Main Findings/Conclusions Knowledge Gaps
Contribution of this
Study
Rioba (2014)
Importance of
manufacturing
industry for the
growth of
Economies.
A survey study using
in 42 companies using
regression analysis to
test Kaldor’s’ three
growth laws in the
manufacturing
industry in Kenya
Manufacturing does not
support the growth of the
economy in Kenya
The study did not use
manufacturing strategy to
arrive at the stated
conclusion
This study used AMT as
the manufacturing strategy
to relate the manufacturing
industry with growth of
the economy
Alnawaiseh,
AL-
Rawashdi,
and
Alnawaiseh,
(2014).
Using value
chain analysis to
achieve
competitive
advantage
An empirical study
using descriptive and
statistical analysis that
involved 93
companies
Manufacturing companies
need to train their employees
to appreciate and effectively
use the data emanating from
analysis of competitive
advantage from the value
chain
The study did not use
manufacturing strategy
and competitive advantage
as variables of
performance
This study used the
concepts of the value chain
analysis to increase
knowledge on AMT as a
manufacturing strategy,
competitive advantage and
performance
Kitenga and
Kuria (2014)
Theoretical
underpinnings
of dynamic
capabilities
Conceptual study
design discussing the
theoretical
underpinnings of
dynamic capabilities
Dynamic capabilities are an
extension of the Resource
Based View.
The role of manufacturing
strategy to performance of
organizations is not
addressed
Provide the role of AMT
as a manufacturing
strategy and its effect on
organizational
performance
Srivastava1,
Franklin, and
Martinette,
(2013)
Building a
sustainable
competitive
advantage in
companies
Exploratory study on
sustainable
competitive advantage
in companies in
developed countries
Organizations need to take
long term perspectives in
building resources and
capabilities that provide the
highest entry barriers that
includes technology to
forestall competition.
The study did not consider
the context of developing
Countries in terms of
building competitive
advantage
The study interrogated the
resource utilization in
developing companies and
the impact it has on
performance and
competitive advantage

58
Table 2.1: Summary of Major Knowledge Gaps Cont……
Author and
Year Focus of Study Methodology Main Findings/Conclusions Knowledge Gaps
Contribution of this
Study
Kazoscu
(2011).
To determine
the role of
strategic
flexibility and
resources in the
choice of
turnaround
strategies
A conceptual study
using two stages view
of turnaround
strategies consisting
of retrenchment and
recovery to determine
both the focus of retrenchment and
focus of recovery
Strategic alliances enabled
firms to push the limits of
technology by combining
their technological and
creative resources and by
providing more access to
capital as well as greater
managerial capabilities.
The study did not consider
other variables that
organizations operating in
declining economic
conditions can use to
navigate in their markets
and regain their product
positioning
This study used AMT
together with the effects of
competitive advantage
from organizational
resources to show that
organizations gained
pertinent benefits that can be used in turn around
strategies
Bigsten,
Kimuyu, and
Söderbom
(2010)
Government
policies and
how they affect
the economy
An empirical study on
the policies in the
manufacturing sector
in Kenya and their
impact on the Economy
There is a need for the formal
manufacturing sector to have
a high rate of growth to
enable absorption of the
rapidly growing labour force in Kenya.
The study did not consider
the strategy which the
manufacturing sector
would employ to increase
its growth in the manufacturing sector
The study used AMT to
show that policies in the
manufacturing sector can
improve performance and
the growth economies
Percival and
Cozzarin
(2010)
To understand
the differences
between
implementation
on AMT returns
between
different
organizations
The study used
complementarity
analysis of 26 AMT
and 12 Management
practices to determine
the impact of
organizational fit
Environmental differences if
analysis on AMT
dependencies is not included
may lead to inconclusive or
misleading results for the
majority of senior managers
engaging in strategic AMT
investment decision making
Returns of AMT depend
on factors like plant size
and management
involvement which
generates differences in
the observed return on
investment, other factors
also impact this relationship
This study used regression
analysis to relate other
factors competitive
advantage and
organizational resources
besides management,
engineering environment
and technology used by organizations
Bridoux
(2008)
Relationship
between the
resource-based
view and
organizational Performance
Conceptual study on
the resource-based
view of the firm
Organizations gain
competitive advantage and
improved performance using
strategic resources
The study does not relate
other variables like
business processes and
AMT strategy to
performance
The study incorporated
AMT as a manufacturing
strategy on the effect of
resources as moderating
variables and competitive advantage on performance

59
Table 2.1: Summary of Major Knowledge Gaps Cont……
Author and
Year Focus of Study Methodology Main Findings/Conclusions Knowledge Gaps
Contribution of this
Study
Swink & Nair
(2007).
To understand
the relationship
between Design
manufacturing
integration and
process flexibility.
An empirical study
using regression
analysis to analyse
data from 224
manufacturing
companies
There is a positive
relationship between the
AMT groups of Design,
Planning and Manufacturing
technologies with
performance
The study did not consider
other variables in the
relationship between AMT
and performance
The study included the
effect of organizational
resources and competitive
advantage in investigating
the relationship between
AMT and performance
Dı´az, lvarez
Gil, and
Machuca,
(2005)
To determine
the effect of
Performance
measurement
Systems on
AMT
A survey study
carried out in Europe
on performance
measurement systems
in the aeronautical
industry
Financial and non‐financial
indicators can be used to
measure performance in a
company and a correlation
exists between AMT, competitive advantage and
performance
The study concentrated on
one type of industry, the
aeronautical industry and
thus the findings could be
biased
This study interrogated
different types of
manufacturing industries
in Kenya
Ghani,
Jayabalan,
and Sugumar,
(2002).
Determine the
relationship
between AMT,
organizational
structure and
performance
A cross sectional
survey carried out in
27 firms in India
AMT on its own leads only to
modest benefits compared to
the expected benefits and
identifies mechanistic
organizations as the cause of
the discrepancy
The study is lacking in
giving direction on what
other factors can aid AMT
to improve organizational
performance
This study introduced
other variables besides
change in organizational
structures to enable
organizations
implementing AMT to realize favourable benefits
Burcher,
and Gloria
(2000).
Determine the
relationship
between AMT
investments and
Competitiveness
strategies in
Organizations.
A case study
involving four
organizations in UK
to demonstrate how
AMT arise from
business strategy to
improve organizational
performance
Investments in AMT need to
be appraised over a period of
time to determine the impact
of the investment on
performance and that AMT is
positively related with
delivery and flexibility
The study shows that
AMT is positively related
to delivery and flexibility
but does not show how
this relates to performance
The current study provided
a basis of explaining how
delivery and flexibility
leads to improved
organizational
performance when
organizations implement
AMT

60
Table 2.1: Summary of Major Knowledge Gaps Cont……
Author and Year
Focus of Study Methodology Main Findings/Conclusions Knowledge Gaps Contribution of this Study
McDermott,
and Stock,
(1999)..
To determine
the effects of
Organizational
Culture on the
implementation of AMT
An empirical study
together with
regression analysis
used to analyse data
from 97 manufacturing plants
Cultural characteristics, as
defined by the competing
values model, are
significantly related to AMT
implementation outcomes
The study only considered
culture as a variable on
attaining the desired and
expected benefits after
implementing AMT
This study used
competitive advantage and
organizational resources to
determining the relation
between AMT and performance
Tracey,
Vonderembse,
and Lim,
(1998)
To determine
the relationship
between
investing in
AMT and
involvement of
managers in
strategy
formulation and
their effect on
performance
A survey study using
Linear structural
equation analysis
Results show that
Management involvement in
strategy formulation leads to
high organizational
performance with
investments in AMT as
measured by customer
satisfaction and marketing
performance.
The study concentrated
and confirmed the effect
of manufacturing strategy
using AMT on
performance but did not
show the role of
competitive advantage and
resources owned by the
organization on
performance after
organizations implement
AMT
This study added to the
knowledge of the
importance of involving
managers in strategy
formulation together with
the contribution of
organizational resources to
performance after
investing in AMT
Barney (1986)
Firm resources
and sustained
competitive
advantage
Empirical Study
Competitive market
imperfections, market entry
barriers and other constraints require differing company
resources
The immobility of
resources for the
development of successful
strategy was not addressed
Identify the resources in an
organization that lead to
successful strategy
Michael
Porter (1985)
Competitive
Advantage
Conceptual Study
Sets out the concept of the
value chain
Does not align the role of
resources in
manufacturing strategy to performance
Determine the role of
resources in the
relationship of AMT and performance
Source: Author (2019)
61
2.8 Conceptual Framework
The main theory used in developing the conceptual framework on which linkages in the
conceptual framework are anchored was the resource-based view of strategy. The
conceptual model, figure 2.1, provides inter-relationship among the four variables in the
study: Advanced manufacturing technology, the independent variable; Organizational
resources, moderating variable; competitive advantage, intervening variable and
performance, dependent variable. The rationale for the framework was developed
consistently in the literature review.
From literature review it has been shown that there is a strong significant association
between the execution of advanced manufacturing technology and performance of
manufacturing companies (Dangayach & Deshmukh, 2001). Other studies also confirm a
significant relationship between advanced manufacturing technology and performance in
small and medium enterprises in Nigeria (Dauda & Chukwudumeb, 2015). Integration of
advanced manufacturing technology has also been shown in studies to have a significant
relationship with performance (Rahman & David, 2009). Industries which have adopted
advanced manufacturing technology have been shown to perform well.
Other research studies also show no direct relationship between advanced manufacturing
technology and performance. This therefore calls for investigations into other variables as
advanced by Swamidass, (2008) to further understand the relationship between advanced
manufacturing technology and organizational performance. This study investigated other
indicators that significantly affect the relationship between advanced manufacturing
technology and performance in large manufacturing companies in Kenya.
The indicators that were used to measure advanced manufacturing technology included
Product design technologies, manufacturing technologies and planning technologies. Both
financial and non-financial indicators were used to measure performance according to
Norton (2015). The indicators used in the study to measure organizational resources
included both tangible and intangible assets while generic strategies which included cost
leadership, differentiation and focus were used to investigate the mediation effect due to
competitive advantage (Porter,1980).

H1
Mediating Variable
H2
COMPETITIVE ADVANTAGE
ADVANCED MANUFACTURING
TECHNOLOGY
ORGANIZATIONAL
PERFORMANCE
H4
Independent Variable Dependent Variable
Moderating Variable
H3
Figure 2.1: Conceptual Model 62 Source (Author) 2019
ORGANIZATIONAL RESOURCES
Design Technologies
Manufacturing Technologies
Planning Technologies
Firm Assets
Physical Facilities
Capabilities
Financial Indicators
Non-Financial Indicators
Cost leadership Strategies
Differentiation Strategies
Focus Strategies

63
The research tested the mediation effect of competitive advantage on the relationship
between advanced manufacturing technology and organizational performance of large
manufacturing companies in Kenya. Mediating variables are relevant when a researcher
wants to comprehend the process by which two variables are related (Mackinon, 2011). The
mediation indicators included; cost leadership, differentiation and, focus generic strategies.
The study also tested the moderating effect of organizational resources on the relationship
between advanced manufacturing technology and organizational performance of large
manufacturing companies in Kenya. Moderating variables are important whenever a
researcher wants to evaluate whether two variables have similar relation across groups
(Mackinon, 2011). Moderation indicators included; organizational assets, physical
facilities, and employee capabilities.
2.9 Conceptual Hypotheses
The study tested the following hypotheses:
H1: There is a significant relationship between advanced manufacturing technology and
performance of large manufacturing companies in Kenya.
H2: Competitive advantage mediates the relationship between advanced manufacturing
technology and performance of large manufacturing companies in Kenya.
H3: Organizational resources moderate the relationship between advanced
manufacturing technology and performances of large manufacturing companies in
Kenya.
H4: There is a significant joint effect of advanced manufacturing technology,
competitive advantage and, organizational resources on performance of large
manufacturing companies in Kenya.
64
This chapter presented a review of literature related to the study and research pertinent to
the empirical studies on advanced manufacturing technology, competitive advantage,
organizational resources and organizational performance. The theoretical foundation of the
study was discussed with the resource-based view as the main theory guiding the study and
the contingency theory of management as the second theory guiding the study. The
relationship between competitive advantage and resources was expounded together with
the three approaches of the contingency theory of management. This section also discussed
the combined relationship between advanced manufacturing technology, competitive
advantage, organizational resources and performance of large manufacturing companies in
Kenya. The chapter discussed each of the variables in the concept model separately, and
when combined to determine and show the effect of synergy between all the variables and
justify why they were included in the model.
In order to show the gaps that are currently existing as elicited in chapter 1, the chapter
used the existing empirical literature and reviewed it critically in relationship with the
linkages between all the variables and the existing relationship among them. The existing
gaps in the reviewed literature were identified and a summary provided within the chapter.
The tentative analysis of the variables laid down a firm foundation for the research
hypotheses towards the end of the chapter.
There were four hypotheses that were developed from the conceptual framework which
was developed consistently from the literature review. The developed hypotheses sought
to identify the relationship between advanced manufacturing technology and performance
of large manufacturing companies in Kenya, the mediation role of competitive advantage
on the relationship between advanced manufacturing technology and performance of large
manufacturing companies in Kenya, the moderating role of organizational resources on the
relationship between advanced manufacturing technology and performance of large
manufacturing companies in Kenya and finally, the synergy between all the variables
advanced manufacturing technology, competitive advantage, organizational resources and
performance of large manufacturing companies in Kenya. This study is different from other
studies since it used an integrated approach that would simultaneously consider all four
variables in a single investigation.

65
CHAPTER THREE
RESEARCH METHODOLOGY
3.1 Introduction
The literature review used in the study was presented in the preceding chapter. Concepts
on advanced manufacturing technology, competitive advantage, organizational resources
and organizational performance were reviewed to understand the type of relationship that
exist between variables of the study. The literature review provided insights on
performance indicators. Further, it was observed that both financial and non-financial
indicators can be used by manufacturing companies to track and measure their performance
(Kaplan & Norton, 2015).
Strategic management theories that guided the study were discussed with a view to laying a
foundation of understanding relationships between and among variables of the study in the
current field of strategy. The study identified two theories of strategy, resource-based view
and contingency theory that were used to discuss relationships between variables of the study.
Subsequently, the conceptual model and four (4) hypotheses were developed to test the
significance of these relationships.
This chapter presents the preferred methodology used by the researcher in this study. It
includes the research philosophy and research design that was employed in the study. The
philosophy used in a study depends on the belief held by the researcher towards meeting
the objective of the study and to a great extent determines the research design. The
population of the study was also determined in this chapter as well as the development of
data collection tools and methods. Data collection instrument that was used in the study
was also developed and later administered to the identified respondents in the study.
Operationalization of study variables which is key in developing data collection
instruments as it determines data analysis methods to be used in a research study is
presented in this chapter. According to Heale and Twycross, (2015) the quality of a
research study is achieved through measurement of validity and reliability of data collected.
Validity and reliability of the data in the study is presented in this chapter. The analytical
models that were used in the study are also presented.

66
3.2 Research Philosophy
Research philosophy, which is a belief in the method the researcher prefers to employ in
collecting and analyzing research data, is always incorporated in scientific investigations.
According to Crotty (1998), the research philosophy adopted in research has a relationship
to the methodology employed by the researcher. This relationship guides the researcher on
how the data collected in the study should be analyzed. Al-Ababneh (2020) posits that
research philosophy is directly linked to four steps that include epistemology, theoretical
perspective, methodology and methods of the research. Saunders and Thornhil (2009) on
the other hand link research philosophy to four steps that include ontology, epistemology,
axiology and data collection techniques. Crotty (1998) suggests that both epistemology and
ontology can be used interchangeably as they tend to emerge together.
Moser (2010) defines epistemology as the theory of knowledge. Epistemology provides
the source of knowledge in a study, in relation to the true nature of knowledge, origin, and
scope and can be classified into three distinct parts; 1) what knowledge consists of, which
is the true justified belief in issues, 2) the basis of the knowledge as determined by pure
reason, and 3) the extent of knowledge that is determined by objective or subjective facts.
Crotty (1998) on the other hand defines epistemology as what is entailed in knowledge and
deals with its nature, possibility, scope and general basis, while Tennis (2008) defines
epistemology in relation to the knowledge validity claims and what would lead and assure
a researcher that the source of evidence in research is acceptable.
Cunningham and Fitzgerald (1996) reckon that researchers can use epistemology to
understand knowledge by considering seven key issues which relate to research. These
issues are broadly embraced in three categories including 1) what should constitute or count
as knowledge, 2) where is knowledge located, and 3) how is knowledge attained? Further,
Cunningham and Fitzgerald (1996) infer from these three broad categories that truth does
not exist in the mind of skeptics while in the mind of reductionists truth does exist albeit in
very limited domain of operational statements that must be verified by data. Epistemology
embodies pragmatism where knowledge is never certain and should be evaluated as a tool.
Consequently, knowledge is considered to be anything that leads most people to achieve
satisfaction of their needs, including the need for more knowledge.

67
Ontology is the study of being that is concerned with what actually exists in the world
about which humans can acquire knowledge. Ontology helps researchers recognize how
certain they can be about the nature and existence of objects they are researching. Ontology
helps researchers to determine what ‘truth claims’ can they make about reality? Who
decides the legitimacy of what is ‘real’? How do they deal with different and conflicting
ideas of reality?
Positivism, as one of the epistemological positions in qualitative research, focuses on the
importance of being objective with the adduced evidence. According to Ritchie and Lewis
(2003), the methods used in qualitative research aim at addressing research questions
related to understanding the social phenomena and context of the study. Qualitative
research methods are better at investigating complex relationships among and between
variables as well as time related inquiries (Snape & Spencer, 2003). Positivism, allows the
researcher to be objective while conducting the study as the facts encountered are very
distinct. As a result, the researcher develops objective recommendations.
Emanating from the definition of epistemology, a researcher does not discover anything
new but rather unveils what has been in existence all along. Besides the truth on a
parameter being the same despite the prevailing environmental conditions, the variables
being investigated through the people involved, are a fundamental part of objectivity in
research. The truth can only be unveiled if the researcher employs appropriate methods to
the study. These methods according to Ormston, Spencer, Barnard, and Snape (2014),
should include careful objective and direct observation without any undue influence using
deduction that emanate from abstract positions.
Positivism as a research philosophy is regarded as being objective, value-free, can be
generalized using a sample that is representative of the population and replicated in
different contexts (Wellington, 2000). Therefore, positivism is regarded as a synonymous
scientific method in carrying out qualitative investigations by researchers. Nevertheless,
positivism has often been criticized as being soft and unscientific (Denzin & Lincoln,
2000). Kalelioglu (2020) observes that for positivism to be considered as a scientific
research philosophy and as one of the methods used to conduct scientific research, it must
assure the researcher on the possibility of replicability and universality.

68
Post-positivism has been presented as a second version of the positivist research
philosophy following the criticism of the positivist thinking and tradition (Ormston et al,
2014). Critiques view the positivist philosophy as being rigid and not amenable to change
despite the normal and natural changes that are accustomed to life. Proponents of the
second view of positivism rely on using deductions and conclusions derived from testing
propositions instead of relying only on careful observation. Further, this school of thought
recommend for the propositions to be empirical as opposed to the notion of using
observations alone. The third school of thought emanating from post-structuralism and
deconstruction are the other basis on which positivism in qualitative research has been
criticized (Denzin & Lincoln, 1994). The critiques of the positivist view find it difficult to
clearly separate and describe the concept of reality as espoused by positivism and meaning
(Denzin & Lincoln, 1994).
Therefore, the critiques of the positivism approach in qualitative research hold the view
that a researcher is not capable of generating absolute relationships between variables as it
is bound to suppress diversity. Denzin and Lincoln (1994) in their discussion on positivism
observed that it resulted in a crisis of some sort for the findings of a research as they cannot
be uniform and globally acceptable due to differences that are expected due to context and
concept of the research. Yet another challenge on positivism emanates from the critical
theory in the form of Neo Marxism which encompasses feminism, and race research. Neo
Marxism maintains that material condition, social, political, gender, and cultural factors
have a major influence on people's lives and therefore how they view the world.
Neo Marxism theory does not contemplate research to produce findings that are independent
of bias from political, race, class or gender as these factors are ever present if they have
been determined to be a primary focus in the data for the research. Emanating from this
theory, it is not possible for a researcher to be objective and fail to be influenced by bias
resulting from this type of research environment, in arriving at conclusions and deductions.
Bowles and Klein, (1983); Oakley, (1981); Roberts, (1981) responded to these challenges
by advocating for greater equality between the researcher and research participants
especially in feminist research as there appeared to be a power imbalance in the way research
was structured and conducted in environments where politics, race, class or gender factors
are dominant.
69
The observed power imbalance puts in question the specific role of both the researcher and
the respondents in the study. The imbalance is addressed by specifying the role of each
participant in the study. Reason, (1994); Whyte, (1991); Reason and Rowan, (1981)
recommend that since social research has become a collaborative process, the different
roles for all individuals involved in a study need to be clearly specified especially with
qualitative studies which have embraced new ways of involving the study population in the
research. The perspective of the researcher is still important in any research as they are
responsible for the accuracy of the findings and subsequent recommendations adduced from
the research data.
While epistemology is the study of knowledge, Ontology is the study of being and form of
existence. In a research, ontology is concerned with what actually exists in the world about
which researchers can acquire knowledge (Moon & Blackman, 2014). Researchers use
ontology in their investigations to understand how certain they can be about what they are
investigating. Bryman (2008) conceptualized ontology in a social perspective as a
philosophical consideration in research that concerns the nature of social entities. Using
the perspective of Bryman (2008), ontology leads a researcher to identify social entities
that can be objective and therefore exist independently from social actors or those that are
social constructions in themselves built up from the perceptions, actions and interpretations
of the individuals in society. Ormston et al (2014) assert that ontology asks if a social
reality exists independently from human conceptions and interpretations.
Chamberlayne, Bormat, and Wengraf, (2000); Roberts, (2002) advocates for research
participants telling their own story within their own context directly, to provide greater
understanding of the phenomena being researched while generating research evidence.
Bogdan and Taylor, (1975); Cicourel, (1964); Glaser and Strauss, (1967) have stressed the
importance of positivism in understanding qualitative research outcomes through rigorous
data collection and analysis. Finally, positivism and post-positivism views differ on the
accuracy level with which reality can be known with certainty. This research employed the
positivist research philosophy as it was determined to be the most suitable philosophy to
enable the development and testing of the research hypotheses.

70
3.3 Research Design
There are various definitions of research designs depending on the nature of the study being
undertaken. Research design according to Lewis, Clayden, O'Connor, Mitchell, and
Sanderson, (2000) is a plan for a study which provides the researcher with a complete
methodology for collecting data. Moser and Kalton (1979) on the other hand define it as a
plan used by the researcher to identify the main focus of the study involving subject of the
study, research sites, and data collection procedures for purposes of answering the research
question. A comprehensive research design which should also be appropriate to the study
objectives provides results that are credible. O'Connor and Molloy (2001) define it as a
planned strategic tool that a researcher uses as a guide to the research, to develop an action
plan or implementation road map for the research strategy
The researcher adopted a research design that led to the study incorporating all the
components in the investigation, to answer the research problem. Akhtar (2016) identifies
four main research designs: exploratory, descriptive, explanatory and experimental. These
research designs can be further expanded into twelve specific designs according to the
University of Southern California libraries (2016). These are; Action, case study, causal,
cohort, cross-sectional, descriptive, experimental, exploratory, historical, longitudinal,
meta- analysis, and observational research design. This study employed both the cross
sectional and descriptive research designs using the experience of Awino and Gituro (2011);
Chiyonge-Sifa (2009); Pertusa-Ortega (2009) and Kariuki (2014) who have used cross-
sectional survey before and found it appropriate and reliable to use in similar studies.
Cross-sectional research design was adopted in the study because of the three distinctive
features that were important to the study, namely: a) no specific time frame; b) relies on the
current status of the subjects involved in the study; and c) random allocation is not used in
the selection of groups in the study. According to Lavrakas (2006) cross-sectional surveys
capture the current status of the population of interest from which data is collected and allow
the researcher or other researchers in different contexts to repeat the study periodically.
However, when the study is repeated using the cross-sectional design, it is advisable that
respondents to the earlier surveys are not sampled again to avoid bias or low response rates
from participants (Shafiei, Biggs, 2018).

71
A descriptive research design describes the phenomenon completely together with all its
related characteristics. This helps the researcher know the cause and mechanism of the
phenomenon but cannot conclusively ascertain all the reasons for the effects on the specific
findings for a particular research problem. This research design is used to collect and collate
information which leads to better understanding of the existing status of the phenomena.
Further, it enables the researcher to describe all the available detailed information with
respect to variables of the study. The advantages associated with this research design
include the opportunity to observe the subject in its normal environment (Mustafa, 2010).
Other advantages of descriptive research design include: it may be used as a pre-cursor to
employing quantitative research designs in subsequent studies enabling identification of
variables that can undergo quantitative testing and yield large and rich amounts of data
used in providing useful recommendations to be used in practice after carrying out detailed
analysis (Jackson, 2009). Descriptive research designs enable the researcher to provide
summary reports of the research including; measures of central tendency for the variables
in the study such as the mean, median, mode, deviation from the mean, variation,
percentage, and correlation between variables but cannot be used to draw inferences
between the variables in the study (Crotty, 1998). The limitations of the descriptive
research design can be useful in developing a more focused study.
The limitations for descriptive research designs include the following; the researcher
cannot use the results to derive a definite finding or fail to reject a hypothesis; It is not
possible to replicate the results of a study as they often just observe the parameter under
investigation, and the descriptive function of research is heavily dependent on
instrumentation for measurement and observation. The other limitation is that researchers
cannot use it to create a causal relationship between the variables in the study hence, it has
a low requirement for internal validity (Crotty, 1998). This design was considered
appropriate for the study due the need to collect data from the target organizations and
carry out data analysis to test the developed hypotheses of the study. This approach enabled
the researcher to develop an appropriate tool for data collection that led to understanding
the relationships among and between the study variables. This study used both the
descriptive research and the cross-sectional survey design.

72
3.4 Population of the Study
Population in research, is defined as a group of individuals or objects with a common
bearing to the main focus of the investigation. The researcher needs to identify beneficiaries
of the findings of research since this determines the composition of the population.
Research population should be well defined, noting the common binding characteristic to
avoid ambiguity when collecting data (Singleton, & Straits, 2010). Populations for research
may be inordinately large and researchers use samples representing the population in all
aspects to reduce costs, while still being in control of the study.
The population of this study comprised large manufacturing companies in Kenya that were
members of the Kenya Association of Manufacturers (KAM) as at December 31st 2020.
The target population in the study comprised 55 companies, selected from the list obtained
from the database of KAM. The target population, was made up of companies with more
than 100 employees that had been in operation for at least 3 years, having a working capital
of Ksh.100 million and which had implemented design technologies, manufacturing
technologies and planning technologies in their production processes. The list of the 55
companies used in the study is attached in appendix III.
In this study, companies with an annual turnover of over KSh. 100 million, employing 100
employees, with a registered capital of over Ksh. 100 million were considered as large
manufacturing companies in Kenya. The other criteria was the ability of the company to
invest in advanced manufacturing technology and the period that the company had been in
operation which was taken as 5 years or above as at the time of data collection. MSME’s
companies were excluded in this study.
Large manufacturing companies in Kenya have been observed to contribute approximately
80% of the GDP from the manufacturing sector. According to Singleton and Straits (2010),
researchers need to carry out sampling of the target population to have a small
representation of the population. There are two types of sampling methods: a) Probability
sampling which involves random selection, allowing the researcher to make strong
statistical inferences about the whole group and b) non-probability sampling which
involves non-random selection based on convenience or other criteria, allowing easy
collect data. This was a census study.

73
3.5 Data Collection
Primary data which was collected using a self-administering structured questionnaire and
secondary data on the financial performance was used in the study. The financial data was
from the organization’s annual financial reports and from the annual reports and Capital
Markets Authority reports. The researcher used the Likert scale to rate the responses for
the primary data. Healy (2012) recommends the use of structured questionnaires for
interviews of more than thirty (30) respondents and may be carried out over the telephone,
face to face, e-mail, or through mail. The questionnaire included open-ended questions,
and interval scale questions anchored on five-point Likert type scale items.
The questionnaire used in the study was structured into five parts to capture primary data
relating to the respondent and general organization’s information, advanced manufacturing
technology, competitive advantage, organizational resources and non-financial indicators
on organizational performance. Secondary data on performance collected included gross
revenue, net profit for a period of three years between 2015 and 2017. Advanced
manufacturing technologies section of the questionnaire was divided into three segments,
design technologies, manufacturing technologies and planning technologies. The questions
on competitive advantage were developed from Porters (1998) generic strategies on cost
leadership, differentiation and focus strategies. Suggestions recommended by Barney
(1991) in the model developed on firm resources and sustained competitive advantage was
used to develop the questions on the resources, assets, physical facilities and employee
capabilities in the organizations. The final part of the questionnaire contained non-financial
performance indicators on customer satisfaction and employee retention.
A total of 55 sets of questionnaires were distributed to respondents for data collection by
the Research Assistant. One questionnaire was presented in each of the 55 companies to
the Manufacturing Director or Senior Managers in the Technical Department. The
questionnaires were administered by the Research Assistant to respondents in management
positions in the technical department because they were assumed to have the widest and
deep understanding of the whole organization policies and strategies. This is supported by
Hambrick and, Mason, (1984) who posited that organizations are a reflection of their top
echelon.

74
Once the respondent had been identified from the customer care desk, they were physically
contacted and given the questionnaire or alternatively the questionnaire was dropped and
later picked from the customer care office. A letter of introduction from the University of
Nairobi accompanied the questionnaire which showed the identity of the researcher and
authority given to the researcher to collect data from the organization. The researcher also
used other personal networks through friends and colleagues to reach the respondents where
a delay was observed. Telephone reminders were done where necessary to encourage the
respondents to fill and return the questionnaire.
The response rate of the questionnaire distributed to the respondents was 81.8%. The
response rate is the ratio of questionnaires received back from the respondents to the total
number of questionnaires distributed to the eligible respondents in the selected sample.
According to Johnson and Owens (2003), response rates in research should have a definition
to enable the full understanding of its import. In this study, the response rate is determined
by the number of fully completed questionnaires received from the respondents compared
to the total number dispatched to the respondents. Draugalis, Coons and Plaza (2008)
recommend that every respondent in the study sample should be accounted for clearly.
Very low response rates for individual items on a questionnaire can cause a problem during
data analysis, particularly if they represent important study variables. For this study, the 10
missing respondents were due to blank and unfilled questionnaire (a total of 3), respondents
being out of office during the data collection period after receiving questionnaires (a total
of 4), and lack of communication and feedback with respondents (a total of 3).
Fowler (2002) recommends that response rates should be over 70% although there is no
agreed-upon standard for acceptable response rates. Bailey (1987) recommends the
minimal acceptable response rate of 75%. Schutt (1999) on the other hand reckons that
response rates below 60% is unacceptable, though Babbie (1990) stated that a 50%
response rate was adequate. Hence, the response rate in this study of 81.8% meets the
recommendation by Fowler (2002). Credibility of survey research is key to acceptability of
the results from the study. Therefore, survey research should meet a minimum threshold on
response rates, scientific rigor, and the samples representing the population well to
generalize the results (Draugalis, Coons and Plaza, 2008).

75
3.6 Operationalization of Key Study Variables
Tariq (2015) affirms that research requires strong theoretical framework and methodology.
To derive the proper research framework, the theory and research must be linked, and the
importance of theory in the research must not be underestimated. Daniel (2012) on the other
hand states that the theory factor must not be ignored while deriving the theoretical
framework. The operationalization of the variables must be linked with the theory and
bounded with the experiments in order to find the accurate results. To understand the
difference between the variables, the research difference first must be understood to use the
variables properly within the research framework.
Operationalizing of the study variables involves finding a measurable index that is valid
and quantifiable for all the study variables. The index should also be able to be manipulated
at two or more levels. This is important as it is understood that not all variables in a study
are measurable especially when they are subjective compared to objective variables which
are easily measurable. Operationalization of variables helps the researcher to define the
exact variable increasing the quality of variable and efficiency of design. The clarity of the
study hypotheses is improved besides being made strong by operationalizing the study
variables. A failure in the process can lead to non-standardized variables with errors in the
research.
This study had four variables namely; advanced manufacturing technology as an
independent variable, competitive advantage was the intervening variable between the
independent and dependent variable, organizational resources was the moderating variable
between the independent and dependent variables while organizational performance which
was the dependent variable was the fourth variable of the study. These variables were
operationalized as indicated in table 3.1. The following dimensions were used to
operationalize the study variables: independent variable; design technologies,
manufacturing technologies and planning technologies; organizational performance;
financials, customer satisfaction and employee retention; competitive advantage; cost
leadership, differentiation and focus generic strategies while the dimension used to
operationalize for organizational resources were assets, physical facilities and employee
capabilities.

76
Table 3.1: Operationalization of the Key Variables of the Study
Variable Dimension Definition of
Variable Operational Indicator Measurement
Section of
Questionnaire
Supporting
Literature
Design
Technologies
The variable
identifies the
production
processes that
relate to product
innovation,
definition, design,
and processing
information functions.
Utilization of the following design
technologies:
Computer aided design (CAD),
Computer aided engineering
(CAE),
Computer aided process planning
(CAPP), and
Group Technology (GT)
5-point
Likert type
scale
Dangayach,
G. S., and
Deshmukh,
S. G.,
(2015), Utilization of the following
manufacturing technologies:
Computer Aided Manufacturing
(CAM),
Computer Integrated Manufacturing
(CIM),
Computer Numerically Controlled
Machines (CNC),
Numerically controlled machines
(NC),
Flexible Manufacturing Systems
(FMS),
Computer Aided Inspection (CAI),
Industrial Robots (IR)
Automated Guided Vehicles (AGV),
Automated Storage and Retrieval
Systems (AS/RS), and
Program Logic Controllers (PLC).
Advanced
Manufacturing
Technology
(AMT)
Manufacturing
Technologies
The variable
identifies
production
processes that are
used on the shop
floor
Part II
Nyori, G.
M., and
Ogola, J.M., (2015),
Rioba, M.
E., (2014).
Swamidas
and Kotha
(1997)

77
Table 3.1: Operationalization of the Key Variables of the Study ............ Contd
Variable Dimension Definition of
Variable
Operational Indicator
Measurement
Section of
Questionnaire
Supporting
Literature
Advanced
Manufacturing
Technology
(AMT)
Planning
Technologies
The variable
identifies
technologies that
control and
monitor the
material flow in
the production
process.
Utilization of the following planning
technologies:
Materials Requirement Planning
(MRP),
Manufacturing Resource Planning
(MRPII),
Computer Preventive Maintenance
Planning (CPM),
Just in Time (JIT),
Management Information Systems
(MIS),
Entreprise Resource Planning
(ERP),
Total Quality Management (TQM),
and
Customer Relationship Management
(CRM)
5-point
Likert type
scale
Part II
Dangayach,
G. S., and
Deshmukh,
S. G.,
(2015),
Nyori, G.
M., and
Ogola, J.M.,
(2015),
Rioba, M.
E., (2014).
Swamidas
and Kotha
(1997
Competitive
Advantage
Cost leadership
The variable
identifies a set of
production
processes that
lead to
manufacturing of
goods or services
acceptable to
customers at low
cost
Developing strategies that lead to:
High process engineering skills,
Design of products,
Inexpensive capital,
Supervision of labor,
Production cost control,
Employee Incentives,
Manufacturing cost management
5-point
Likert type
scale
Part III
Ansoff, H.
I., (1965),
Awino, Z.
B.,
Wandera,
R., M.,
Imaita, I.,
and
K’Obonyo, P. (2002),

78
Table 3.1: Operationalization of the Key Variables of the Study ............Contd
Variable
Dimension Definition of
Variable
Operational Indicator
Measurement Section of
Questionnaire
Supporting
Literature
Competitive
Advantage
Differentiation
The variable
identifies
ability to
manufacture
products or
service with
special appeal
to different
customers
Implementing strategies that enable
organization to achieve superior
outcomes in:
Customer service,
Unique products,
Reputable brand name,
Use of technology,
Distributorships,
Customer loyalty
5-point Likert
type scale
Part III
Barney, J. B., (1995).
Porter, M.
E., and
Kramer, M.
R. (2006).
Prahalad, C.
and Hamel,
G., (1990).
Focus
The variable
identifies ability
to produce
products to meet
the changing
needs of
customers
Having strategies that lead to:
Small niche market,
Small target market
Organizational
Resources
Firm Assets
These are
resources with
economic value
owned by the
organization with
the potential of
providing a future
benefit.
Assets include
Pooling of resources and expertise,
Organizations Inventory,
Owning a reputable brand name,
Owning Patents,
Having strategic partnerships,
Location of operation
Ownership of Trade marks
5-Point
Likert type
scale
Part IV
Bridoux , F. (1997).
Ainuddin,
R. A.,
Beamish, P.
W.,
Hulland, J.
S., & Rouse, M. J. (2007)

79
Table 3.1: Operationalization of the Key Variables of the Study ........... Contd
Variable Dimension Definition of
Variable
Operational Indicator
Measurement
Section of
Questionnaire
Supporting
Literature
Organizational
Resources
Physical
facilities
These are the
resources used to
carry out
manufacturing
The operational indicator used in the
study includes:
Offices
Production facilities,
Land,
Equipment replacement strategy
5-point
Likert type
scale
Part IV
Bridoux , F.
(1997).
Ainuddin,
R. A.,
Beamish, P.
W.,
Hulland, J.
S., and
Rouse, M. J.
(2007)
Capabilities
The ability of the
organization to
effectively
manage resources
to gain
competitive
advantage.
The company's organizational
capabilities that focus on meeting the
customer demand including:
Human resource development,
Industry technological needs,
Training policy
HR development policy,
Performance management system,
Employees Skills development,
Coaching at the workplace
ROA (Gross revenues/Average
Assets)
ROI (Gross Profit /Value of
investments)
ROE (Net Income/ (Assets -
Debt)
Bridoux , F. (1997). From the Christensen,
Organizational
Performance
Financials
The financial
performance of
the organization
financial statements of
the
organization
Part V
Raynor, M.E.,
McDonald,
R. (2015). for the last Jusoh, R., & three years Parnell, J.
A. (2008).
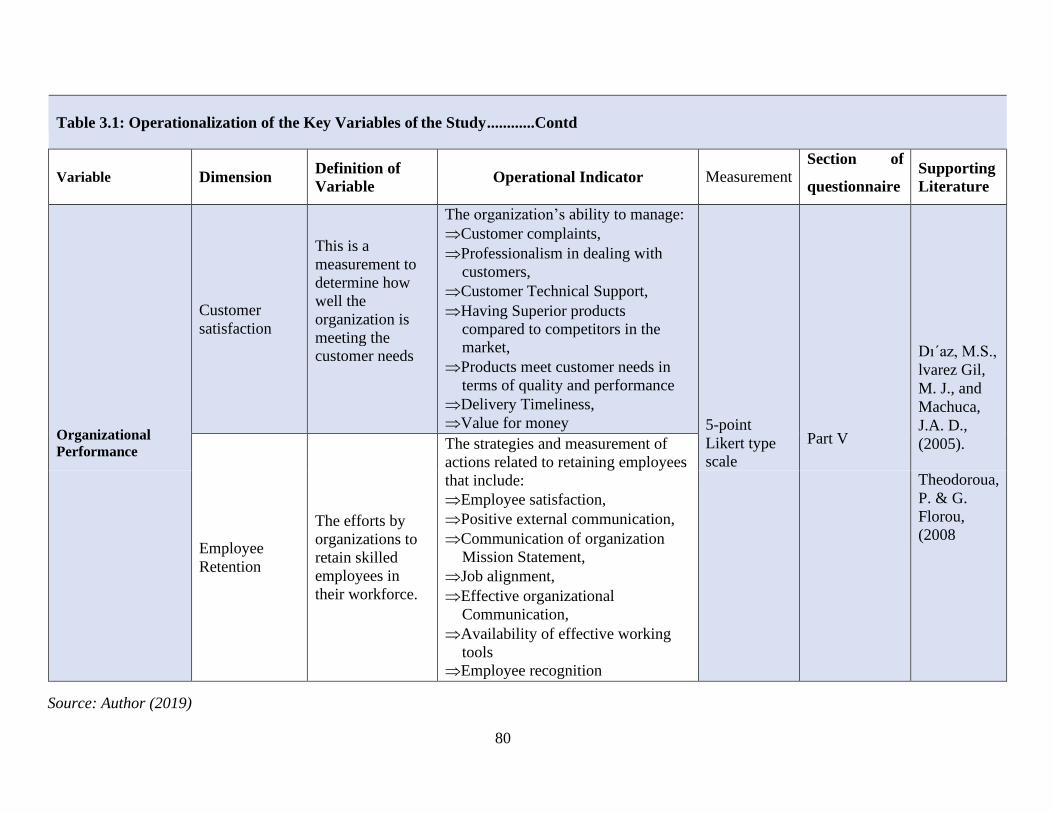
80
Table 3.1: Operationalization of the Key Variables of the Study ............Contd
Variable
Dimension Definition of
Variable
Operational Indicator
Measurement Section of
questionnaire
Supporting
Literature
Organizational
Performance
Customer
satisfaction
This is a
measurement to
determine how
well the
organization is
meeting the
customer needs
The organization’s ability to manage:
Customer complaints,
Professionalism in dealing with
customers,
Customer Technical Support,
Having Superior products
compared to competitors in the
market,
Products meet customer needs in
terms of quality and performance
Delivery Timeliness,
Value for money
5-point
Likert type
scale
Part V
Dı´az, M.S.,
lvarez Gil,
M. J., and
Machuca,
J.A. D.,
(2005). The strategies and measurement of
actions related to retaining employees
that include:
Employee satisfaction,
Positive external communication,
Communication of organization
Mission Statement,
Job alignment,
Effective organizational
Communication,
Availability of effective working
tools
Employee recognition
Employee
Retention
The efforts by
organizations to
retain skilled
employees in
their workforce.
Theodoroua,
P. & G.
Florou,
(2008
Source: Author (2019)

81
3.7 Data Analysis
Data analysis in qualitative research is the process of analyzing and attaching meaning that
is relevant to the research from all the information provided by the participants in the
research. The results from observing the objects in the research also forms part of data
analysis (Cohen et al., 2007). Nieuwenhuis (2007) defines qualitative data analysis which
includes all the steps from developing the instrument to collect the data to documenting the
collected data as an iterative process to build quality into the research. Gibbs (2007) on the
other hand describes qualitative data analysis as a process of using appropriate and
acceptable methods to transform collected data from a study sample to be used by the
researcher to arrive at findings that can be generalized across the whole population.
Marshall and Rossman (1999) on their part state that qualitative data analysis involves
using a manageable process to generate logical and general statements about variables.
Muijs (2011) provides the difference between quantitative and qualitative data analysis by
stating that qualitative methods aim at providing meaning of relationships between
particular events of interest. Creswell (2013) extended this definition of data analysis by
explaining meaning as the objective of the researcher by establishing patterns and themes
using both inductive and deductive procedures. This involves using logic to transform the
raw information to identify patterns and relationships to answer the research objective.
When engaging in qualitative data analysis, the researcher identifies recurring features,
different steps, procedures and processes in the study. Khan (2006) has identified
organizing collected data as the first step in data analysis. Different methods are used to
organize the data depending on the research philosophy and data collection methods
employed by the investigation. Data analysis can only proceed after collected data has been
successfully organized (Khan, 2006). When analyzing the data, the researcher describes
different aspects of the study. The third stage which is interpretation of the data involves
explaining the findings, attaching significance of the results to the study and developing
patterns into an analytic framework, (Patton, 2002). As the researcher carries out these steps
in analyzing data and attaching meaning to the collected data, it is important to take note
of; the setting of the study environment, individuals or objects being studied, and the
purpose of any activities.
82
The study adopted a positivist philosophy which was used to guide data analysis. Positivism
holds that hypothesis testing using quantitative techniques be done to either reject or fail to
reject the hypotheses developed for the study (Stiles, 2003). Before data analysis was done,
preliminary tests on data reliability and validity were conducted. Reliability is the ability
with all other things being similar, that a respondent to a questionnaire should get a similar
score on a questionnaire if they complete the same questionnaire at two different points in
time, (Cronbach, 1951). In statistical terms, reliability is premised on the idea that
individual items (or sets of items), in similar conditions and environment should produce
outcomes consistent with the overall questionnaire (Creswel, 2014). Cronbach alpha
coefficient was performed to test the reliability of the data.
In order to use regression analysis to test the relationships between the variables in the
study, the main assumptions of regression analysis, normality and collinearity were tested
using the Kurtosis and skewness tests. In order to establish the relationship between the
four variables used in the study; advanced manufacturing technology, competitive
advantage, organizational resources and performance of large manufacturing companies in
Kenya; descriptive statistics which included; frequencies and percentages, mean scores,
standard deviation and coefficient of variation, were used.
Inferential statistics involving the determination of correlation, simple linear, stepwise and
multiple regression analysis were also carried out to test the four hypotheses that were
developed in the study. Inferential statistics were used to include deductions made that
extended beyond the immediate data alone both in terms of context and concept. The
statistical significance of each hypothesized relationship was interpreted based on model
fitness (R2) which provided an indication of how much the dependent explained the
observed results, analysis of variance (ANOVA, F) indicated the link that a set of scores
had to the mean of the sample, student t-test, Beta coefficients (β) and Probability (p)
values which provided the significance of the variables and hence enabled the researcher
to reject or fail to reject the hypothesis. Data is presented in the form of tables and figures.
The variables of the study were within interval and ratio scales and the analysis was carried
out using SPSS. The specific regression models used in the study are presented in table 3.2.

83
Table 3.2: Study Objectives, Hypotheses and Analytical Models
Objective Hypotheses Analytical model Interpretation
Objective 1:
Determine the
effect of
advanced
manufacturing
technology
(AMT) on Performance
(P) of Large
Manufacturing
Companies in
Kenya (LMC)
in Kenya
H1: There is a
significant
relationship
between AMT
and
Performance of
large
manufacturing
companies in
Kenya
Simple régression analysis:
Y=β0 +β1 AMT +ε1
Where;
Y = Performance of large manufacturing
companies in Kenya (P);
AMT = Advanced Manufacturing
technology; β0 = Regression Constant β1= Coefficient of AMT
R to assess the strength of the relationship between AMT
and performance of large manufacturing companies in
Kenya
R2 to assess how much change in Performance is due to
AMT in large manufacturing companies in Kenya;
F- test: To assess the overall robustness and significance
of the simple regression model;
t – test to determine the significance of AMT;
P value to be used to test the hypothesis.
The value for β1 gave an indication on the change in
Performance for each incremental change in AMT
Objective 2:
Determine the
mediation role
of competitive
advantage on
the relationship
between AMT
and
Performance of
LMC in Kenya
H2:
Competitive
advantage
mediates the
relationship
between AMT
and
Performance of
LMC in Kenya
(Use Baron and
Kenny 4-Step Model)
Step I: Simple regression analysis
Y = β2 +β3 AMT + ε2;
Where;
Y = Performance of large manufacturing
companies in Kenya (P);
AMT= Advanced Manufacturing
technology; β2, = Regression constants;
β3=Coefficient of AMT
Step I: Simple regression with advanced manufacturing
technology predicting performance of large manufacturing
companies in Kenya. Proceed to STEP II if the results
establish that an effect to be mediated exists if the p-value
for the effect of advanced manufacturing technology on
performance of large manufacturing companies in Kenya is
significant.

84
Table 3.2: Study Objectives, Hypotheses and Analytical Models…….Contd
Objective Hypotheses Analytical model Interpretation
Objective 2:
Determine the
mediation role
of competitive
advantage on
the relationship
between
advanced
manufacturing
technology and
Performance of
large
manufacturing
companies in
Kenya
H2:
Competitive
advantage
mediates the
relationship
between AMT
and
Performance of
large
manufacturing
companies in
Kenya (Use
Baron and
Kenny 4-Step
Model)
Step II: CA= β4 + β5 AMT + ε3;
Where;
CA = Competitive advantage;
AMT= Advanced Manufacturing
technology; β4, = Regression constants; β5 =Coefficient of AMT
Step II: Simple regression with advanced manufacturing
technology predicting competitive advantage (mediating
variable). Proceed to STEP III if the results of the analysis
confirm that advanced manufacturing technology is
correlated with competitive advantage.
Step III: Y= β6 + β7 CA + ε4;
Where;
CA = Competitive advantage;
Y= Performance of large manufacturing
companies in Kenya; β6, = Regression constants; β7 =Coefficient of competitive advantage
Step III: Simple regression with performance of large
manufacturing companies in Kenya predicting competitive
advantage. Proceed to STEP IV if the results show that the
effect of competitive advantage on performance of large
manufacturing companies is significant.
Step IV: Y= β8 + β9 CA + β10 AMT + ε5
Where;
Y= Performance of large manufacturing
companies in Kenya;
CA = Competitive advantage;
AMT = Advanced manufacturing
technology β8 = Regression constants;
β9, = Coefficient of competitive
advantage
β10 = Coefficient of AMT
Step IV: Multiple regression with competitive advantage
and advanced manufacturing technology predicting
performance of large manufacturing companies in Kenya.
To establish that competitive advantage completely mediates
the relationship between advanced manufacturing technology
and performance of large manufacturing companies in
Kenya, the effect of advanced manufacturing technology on
performance of large manufacturing companies should be
zero when competitive advantage is controlled.

85
Table 3.2: Study Objectives, Hypotheses and Analytical Models…….Contd
Objective Hypotheses Analytical model Interpretation
Objective 3:
Establish the
moderation
role of
Organizational
resources (OR)
on the
relationship
between
advanced
manufacturing
technology and
performance of
large
manufacturing
companies in
Kenya
H3:
Organizational
Resources
moderates the
relationship
between
advanced
manufacturing
technology and
performance of
large
manufacturing
companies in
Kenya ( Use
Baron and
Kenny 3-Step
Model)
Three step forward moderating model:
Step I:
Y = β11 + β12 AMT +ε6;
Where;
Y = Performance of large manufacturing
companies in Kenya (P);
AMT= Advanced Manufacturing technology; β11 = Regression constant
β12 = Coefficient of advanced
manufacturing technology
Step I: Simple regression with advanced manufacturing
technology predicting performance of large manufacturing
companies in Kenya. Proceed to STEP II if the results
establish that an effect to be moderated exists if the p-value
for the effect of advanced manufacturing technology on
performance of large manufacturing companies in Kenya is
significant.
Step II::
Y = β13 +β14 AMT + β15 OR +ε7
Where;
Y = Performance of large manufacturing
companies in Kenya (P);
AMT= Advanced Manufacturing
technology; OR = Organizational resources β13 = Regression constant
β14 = Coefficient of advanced manufacturing technology
β15= Coefficient of organizational
resources
Step II: Enter OR in the regression model. This is a multiple
regression model, Organizational resources, advanced
manufacturing technology and performance of large
manufacturing companies in Kenya. Proceed to step III if the
relationship between advanced manufacturing technology,
organizational resources and performance of large
manufacturing companies in Kenya is significant.
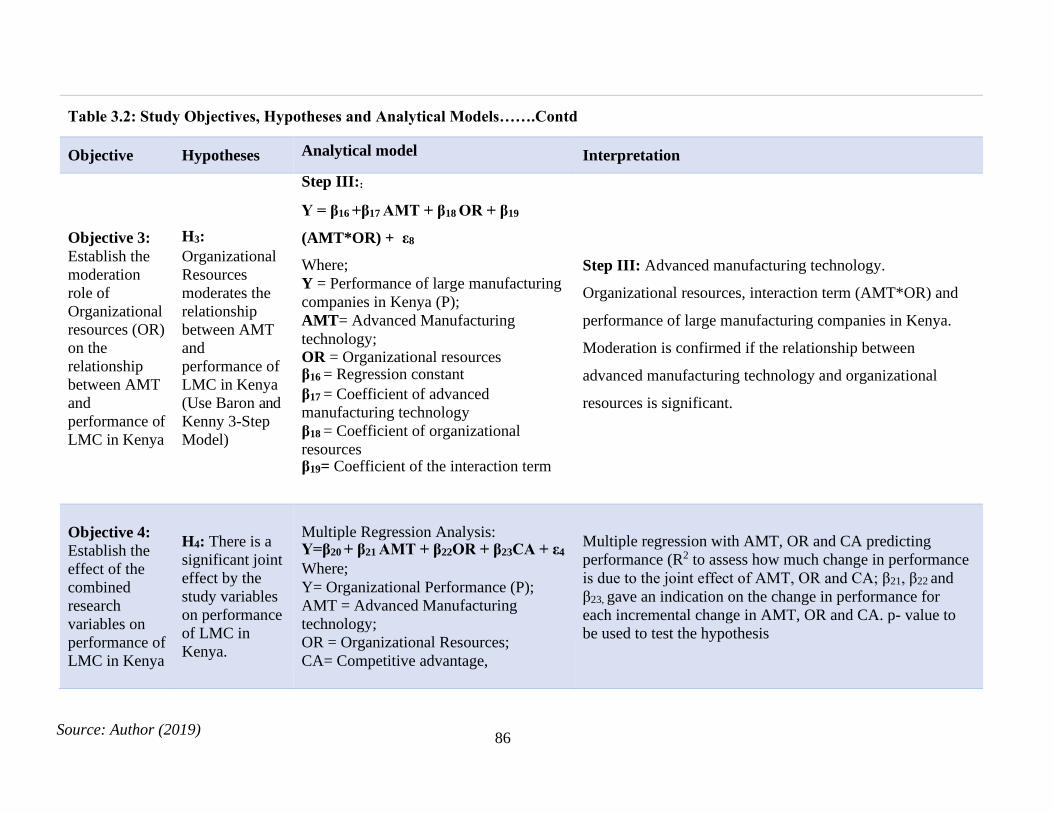
Source: Author (2019) 86
Table 3.2: Study Objectives, Hypotheses and Analytical Models…….Contd
Objective Hypotheses Analytical model Interpretation
Objective 3:
Establish the
moderation
role of
Organizational
resources (OR)
on the
relationship
between AMT
and
performance of
LMC in Kenya
H3:
Organizational
Resources
moderates the
relationship
between AMT
and
performance of
LMC in Kenya
(Use Baron and
Kenny 3-Step
Model)
Step III::
Y = β16 +β17 AMT + β18 OR + β19
(AMT*OR) + ε8
Where;
Y = Performance of large manufacturing
companies in Kenya (P);
AMT= Advanced Manufacturing
technology; OR = Organizational resources β16 = Regression constant
β17 = Coefficient of advanced
manufacturing technology
β18 = Coefficient of organizational
resources β19= Coefficient of the interaction term
Step III: Advanced manufacturing technology.
Organizational resources, interaction term (AMT*OR) and
performance of large manufacturing companies in Kenya.
Moderation is confirmed if the relationship between
advanced manufacturing technology and organizational
resources is significant.
Objective 4:
Establish the
effect of the
combined
research
variables on
performance of
LMC in Kenya
H4: There is a
significant joint
effect by the
study variables
on performance
of LMC in
Kenya.
Multiple Regression Analysis: Y=β20 + β21 AMT + β22OR + β23CA + ε4
Where;
Y= Organizational Performance (P);
AMT = Advanced Manufacturing
technology;
OR = Organizational Resources;
CA= Competitive advantage,
Multiple regression with AMT, OR and CA predicting
performance (R2 to assess how much change in performance
is due to the joint effect of AMT, OR and CA; β21, β22 and
β23, gave an indication on the change in performance for
each incremental change in AMT, OR and CA. p- value to
be used to test the hypothesis
87
This chapter provided a general overview of the methodology used by the researcher in this
study. The research used the positivist research philosophy as this was the most suitable to
enable the development and testing of the developed hypotheses to test the relationship
between advanced manufacturing technology, competitive advantage, organizational
resources and performance of large manufacturing companies in Kenya.
The cross-sectional research design was adopted and presented in the chapter due to the three
distinctive features that were deemed to be important for the study. The three features for the
cross- sectional design that were considered for the research include: no time dimension,
reliance on existing difference, and selection of groups based on existing differences. The
purposeful sampling method was used to select 55 manufacturing companies that were
members of Kenya Association of Manufacturers and/or listed in the manufacturing sector
of the Nairobi securities exchange database. The other criterion used to get a homogenous
population was to select companies with more than 100 employees with a turn over
exceeding KSh. 100 million.
The chapter presented the instrument used for data collection which was a structured
questionnaire that had five sections to collect primary data for the study. The five sections of
the questionnaire related to the five variables in the study. A total of 55 questionnaires were
distributed to the respondents who were senior Managers in the technical department of the
companies by the researcher. Operationalization of the key study was done by developing a
dimension, definition, operational indicator, measurement of the variable and identifying the
section of the questionnaire relating to the particular variable and the supporting literature.
The chapter also presented the methods to be used in carrying out data analysis. Both
descriptive and inferential statistics were used to analyze the data using linear and multiple
regression models. A summary of the study objectives, hypotheses and analytical models that
was used in the study was presented in the chapter. The analytical models included; the four-
step regression model which was used to test the mediation effect of competitive advantage
on the relationship between the independent and dependent variable; the three-step
moderation model used to test the moderating effect of organizational resources on the
relationship between advanced manufacturing technology and performance of large
manufacturing companies in Kenya. Linear and multiple regression models which were used
in the study were also presented in the analytical model summary.

88
CHAPTER FOUR
DATA ANALYSIS, FINDINGS AND DISCUSSION
4.1 Introduction
The chapter presents a detailed description of research data, analysis of the data, results,
findings and discussion of the study. The research hypotheses and objectives were tested using
this data. The main objective of the study was to investigate the effect of competitive
advantage and organizational resources on the relationship between, advanced manufacturing
technology and organizational performance of large manufacturing companies in Kenya. The
independent variable was advanced manufacturing technology, performance of large
manufacturing companies in Kenya was the dependent variable, competitive advantage was
the mediating variable while organizational resources was the moderating variable.
The target respondents were senior technical and operation managers in manufacturing
companies that were members of Kenya Association of Manufacturers (KAM). Companies in
the KAM database were considered because it represents and advocates for manufacturing
companies in Kenya The target population consisted 55 companies selected from all the
manufacturing companies in the KAM. These companies had over 100 employees and applied
design technologies, manufacturing technologies and planning technologies in their production
processes. Subsequently, 55 self-administering structured questionnaires were given to
sampled respondents in these companies to obtain responses for the study. A total of 45
questionnaires were returned by the respondents representing a response rate of 81.8%. Both
bivariate and multivariate data analyses were done.
Diagnostic tools that included normality, linearity, and heteroscedasticity tests were used to
verify the quality of the data collected on the variables of the study. The research used
descriptive statistics to determine the summary of the results for the study. Measures of the
variables consisting of, means, standard deviations, and coefficients of variation were
computed and are presented in tables and figures. Simple and multiple linear regression
analyses were also conducted to test the hypotheses. The focus of the tests was on the
relationships the study aimed to investigate and to help in testing the hypotheses. The results
obtained were used to make final conclusions regarding the relationships between the study
variables with respect to the objectives of the study.

89
4.2 Data Analysis
Data analysis is used to synthesize information collected in a research study to test the
hypotheses developed and provide answers to the research questions. According to Berinato
(2019) data analysis should enable the researcher communicate in simple terms to all the
audience by answering both academic, business and technical questions. Researchers use data
analysis to explain complex results so that both technical and non-technical stakeholders may
easily comprehend the solution to the issue under investigation.
The purpose of analyzing data is to obtain useful and relevant information relating to the matter
under investigation. Results emanating from data analysis can be presented using full
description or summary of the collected data. It is also used to identify existing relationships
between study variables, compare study variables under different study conditions set by the
researcher, identify observable differences between study variables and provide a forecast or
inference on the outcome of the study (Savenye & Robinson, 2005).
According to Shepard (2002), wrong statistical analysis employed by researchers in a study
tend to distort scientific findings and mislead other readers and users of subsequent erroneous
inferences. This could ultimately have a negative influence on public perception on research
from wrong application of data analysis methods. To avoid this occurrence, the researcher has
to determine appropriate diagnostic tools to assure the public on the accuracy and integrity of
data used in research to validate findings and recommendations. Further, using reliability and
validity tests give researchers confidence that results of the study address stated objectives.
It is important for the integrity of data to be maintained during the process of data analysis. The
most likely factors that impinge on integrity of data analysis include the environment and
context that was used to collect the data (Smeeton &Goda, 2003). Face to face interviews are
bound to produce data with different integrity compared to data obtained using survey
questionnaires due to the different interaction occurring within a dyadic relationship between
these two methods of data collection. Further, researchers at times decide to enhance a
significant finding by determining how to present derived data, which portion of the data to
present, why, how and to whom (Shamoo, Resnik, 2003). Resulting from this observation, it is
recommended that researchers keep the evidence of raw data used in their data analysis for
further reference and concurrence to support conflicting results.

90
4.2.1 Reliability Test
According to Mohajan (2017), for a researcher to declare that an investigation has produced
good results, reliability and validity tests should be done on the research instruments before
analyzing the data. These are the two most important and fundamental features in the evaluation
of the measurement instrument or tool used in the investigation. Validity relates to how well an
instrument measure what it is meant to measure in a study while reliability on the other hand is
concerned with the faith that one can have in the data obtained by using the study instrument and
by extension the degree to which any measuring tool controls for errors.
According to Taber (2018), researchers use Cronbach’s alpha statistic (α) to test for reliability.
Although a high value of α signifies reliability of the research instrument, Taber (2018) is of
the view that a very high value on the other hand is not desired. There is a difference in observed
reliability in quantitative research compared to qualitative research. This difference arises from
the difficulty in achieving exact results in a repeat study and research process in a qualitative
research study. Therefore, reliability in qualitative research also represents the consistency in the
study as well (Carcary, 2009; Grossoehme, 2014).
Leung (2015) acknowledges the difficulty to always obtain replicability of results in qualitative
research and suggests that results are acceptable when they are within developed margins and
findings as long as there is a similarity in the methods used in both studies. This is more
pronounced with cross sectional studies as they use data collected at a specific period during the
study. To improve reliability of the study, constant data comparison should be used (Silverman,
2009). Researchers are encouraged to determine a comprehensively inclusive scope and analysis
methods while maintaining quantitative aspects of data.
Cronbach’s (α) has been considered by qualitative researchers to be an appropriate measure of
data reliability. Cronbach’s (α) is also used to measure the internal consistency reliability when
measurements represent multiple questionnaires. Several researchers have proposed different
values of Cronbach’s (α) for different conditions faced by a researcher. Since there is still no
consensus as to what is the best Cronbach’s (α) coefficient to assure reliability of the instrument
used in the study, different researchers use different cut-off points of Cronbach’s (α) coefficient
depending on the type of study they are conducting (Taber, 2018).

91
Bathgate, Crowell, Schunn, Cannady, and Dorph, (2015) reckon that a Cronbach’s (α) of 0.77
is acceptable for the instrument used to collect data. Cortina (1993) recommends that for a
population of 25 to 50 respondents, a minimum Cronbach’s (α) coefficient of 0.5 is suitable
for predictive research while Gardner (1995) provides a minimum range for Cronbach’s (α)
coefficient of between 0.7 and 0.8 for basic and applied qualitative research respectively.
Murphy and Davidshofer (1988) on the other hand reject using a Cronbach’s alpha (α) below
0.6. Lin, Liang and Tsai (2015) concur with Davidshofer (1988) and suggest that researchers
should aim at a high value of Cronbach’s (α) when the research includes a wide range of items
that are used in investigating different science concepts. Lin, et. al. (2015) recommends
Cronbach’s alpha of 0.81. The current study adopted a Cronbachs’s (α) coefficient between
the range of 0.58 to 0.97 to be satisfactory. The results are presented in Table 4.1.
Table 4.1: Cronbach’s alpha (α)
Variable Cronbach’s alpha (α) Number of items in the scale
Advanced Manufacturing Technology
0.9 22
Competitive Advantage 0.8 15
Organizational Resources 0.9 17
Organizational Performance 0.9 14
Acceptable values of α for the study are between 0.58 and 0.97
Source: Author (2019)
Results of the study show that the least Cronbach’s (α) coefficient for the study variables was
0.8. Advanced manufacturing technology had Cronbach’s (α) of 0.9, competitive advantage
(0.8), organizational resources (0.9) and performance of large manufacturing companies in
Kenya (0.9). These results meet the acceptable range of the Cronbach’s (α) of 0.58 - 0.97
adopted by the study. Hence, the Cronbach (α) result confirms the reliability of the study
instrument and collected data can be used to provide reliable deductions on the study variables
as advocated by Murphy and Davidshofer (1988).

92
4.2.2 Validity Test
It is only when the researcher uses a valid research instrument that the ensuing results and
recommendations can be valid. Using appropriate research tools, processes, and data
collection methods in qualitative research helps the researcher to affirm the study validity.
Therefore, researchers use validity as a process to interrogate if the research question lead to
the appropriate outcome, and the choice of methodology elicits appropriate responses to the
research question (Leung, 2015). Sürücü and Maslakçı, (2020) are of the view that researchers
should test validity of the research instrument to avoid ambiguity and inconclusive findings
at the end of the study by taking extra care in building quality in the research process.
According to Ghauri and Gronhaug, (2005) researchers can determine how well they covered
the area of their research using validity, Field, (2005) asserts that while the researcher is bound
in the area of the study collecting data, it is only validity that explains how well the collected
data covers the actual area of investigation. Waterman (2013) noted a challenge in assessing
validity in qualitative research. This emanates from different approaches used in adopting
research philosophies that ultimately determine research designs adopted for the study.
Therefore, the research philosophy leads to a research methodology that enables the researcher
to arrive at an appropriate context for the findings to be valid. Finfgeld-Connett, (2010);
Palinkas, Horwitz, Green, Wisdom, Duan, and Hoagwood, (2013), posit that for the findings
of a study to be valid, sampling procedures and methods should be appropriate, purposeful,
and adaptive to the research objective.
Awino and Gituro (2011) regard validity to have three genres that include face or logical
validity which uses a superficial and subjective assessment to determine whether the study
instrument is measuring the correct dimensions of the variable. It is a subjective judgment on
the operationalization of a dimension with an indication of the degree to which a measure
appears to be related to a specific dimension. Face validity is used to evaluate the appearance
of the questionnaire in terms of feasibility, readability, consistency of style and formatting,
and the clarity of the language used. The second genre is content validity, which is the degree
to which items in the research instrument reflect the content universe to which the instrument
is generalized (Straub & Boudreau, 2004). It is associated with both the sampling adequacy
of the test content and responses.

93
Content validity is also associated with relevance of test content universe and test responses
to a behavioral universe, and clarity of content and technical quality of test items. In general,
content validity calls for the evaluation of the survey instrument so that it includes all the
essential items while eliminating undesirable items relative to the construct dimension (Lewis,
1995; Boudreau, 2001). Specifically, the judgmental approach to establish content validity
involves literature reviews followed by a review using experts in the subject matter.
The third genre according to Awino and Gituro (2011) is construct validity which is the
demonstration that a test is measuring the construct it claims to be measuring. It refers to how
well the concept, idea, or behavior that is a construct is translated into a functioning and
operating reality. It has two components that include convergent and discriminant validity.
Discriminant validity measures the extent to which one latent variable discriminates from all
other latent variables in the study while convergent validity refers to the degree to which two
measures of dimensions that theoretically should be related, are in fact related.
Taherdoost (2016) adds criterion validity as the fourth genre of validity. It determines the
extent to which a measure is related to an outcome or how well one measure predicts an
outcome for another measure. There are two main types of criterion validity namely;
concurrent validity and predictive validity. Concurrent validity is related to the accurate
prediction and can also refer to when scores from the predictor measure are taken first and
then the criterion data is collected later. Predictive validity on the other hand is a type of
evidence that can be gathered to defend the use of a test for predicting other outcomes. It
refers to the extent to which the results of a particular test, or measurement, correspond to
those of a previously established measurement for the same construct.
The measurement scales used in the questionnaire were deemed to have face validity because
they reflected key issues in advanced manufacturing technology, competitive advantage,
organizational resources and performance of large manufacturing companies in Kenya. Each
section of the questionnaire had specific variables determined through consistent expert
judgement of the researcher and reviewed literature to confirm if the theoretical dimensions
emerge as conceptualized for this study. Hence, the questionnaire as developed was deemed
to be a valid instrument to collect data for this study

94
4.2.3 Diagnostic Tests
Qualitative researchers at times adopt a hermeneutic perspective on collected data.
Hermeneutic perspective is considered to represent the view that collected data is an
interpretation of the questionnaire by the respondent that can never be judged to be true or
false. Therefore, the collected data is deemed to present only one possible interpretation
among many alternatives that exist. The meaning and accuracy of the collected data has
therefore to be verified using accepted tools to give credibility and acceptance to the overall
results of the study. This study used the following diagnostic tools; normality, linearity, multi-
collinearity, and heteroscedasticity as preliminary tools to test the quality of the collected data.
These tools helped the researcher to validate the results obtained through statistical analytical
methods.
4.2.3.1 Normality Test
Normality tests arise from the need to confirm that the variables in the study have a normal
distribution before using parametric tests for further analysis of the data. A number of
statistical tests used in research to analyze data including correlation, regression, t-tests, and
analysis of variance, assume that the data is normally distributed. According to Razali and
Wah (2011) normality tests can involve either theory driven methods or descriptive statistics.
Researchers can use different methods to test normality of data. Seier (2002), broadened the
scope for testing normality of data by classifying the methods used in carrying out the test into
four major categories namely; Skewness and Kurtosis, empirical distribution, regression and
correlation and other special tests. Arshad, Rasool and Ahmad (2003) proposed a similar
number of categories for testing normality in data as Seier (2002) that include tests based on;
moment ratio techniques, chi-square, correlation and empirical distribution function.
Shapiro – Wilk (SW) test is another method that can be employed to test for normality in data.
Razali and Wah (2011) reckon that SW is a very powerful method to test for normality in data
and confirmed that it can be used in all types of distributions and sample sizes. Royston (1992)
improved the Shapiro-Wilk test to enhance its use and allow normality of any size of data in
the range of 3 ≤ n ≤ 5000 to be tested. Further, Park (2008) also recommends that researchers
use the Skewness and Kurtosis coefficient normality tests for descriptive statistics.

95
According to Mendes and Pala (2003), the SW test was the first test to identify data that was
skewed and failed the normality test and also data with Kurtosis. It is now the preferred test
used by researchers due to its excellent power properties. To interpret the SW test, the
expected values lie between 1 and 0. A value of SW=1 indicates normality while values of W
close to 0 indicate lack of normality in the research data. This study used both the Skewness
test, Kurtosis test and the SW test to confirm normality of data.
The three normality tests were preferred in determining normality of data in the study due to
the strength envisaged in the SW test to accurately confirm normality in small population
samples and its ability to compare empirical data with a theoretical distribution while the
Skewness and Kurtosis tests are associated with descriptive research (Park, 2008). The three
methods were therefore appropriate in this study to determine normality of the data used. A
value of skewness test and kurtosis test of zero indicates a perfectly normal distribution.
The target population in the study was 55 organizations which allows using the Skewness and
Kurtosis tests. According to Park (2008) in reasonably large samples (more than 200),
skewness test does not make a substantive difference in the analysis. Results for normality
test on the study variables are presented in Table 4.2.
Table 4.2: Skewness, Kurtosis and Shapiro-Wilk of the Study Variables
Descriptive Statistics
VARIABLES
Skewness Kurtosis SW
Statistic Std.
Error Statistic
Std.
Error Statistic
Sig.
Advanced Manufacturing
Technology -0.525 0.357 0.042 0.702 .949 .048
Competitive Advantage -0.278 0.357 -0.461 0.702 .980 .633
Organizational Resources -1.134 0.357 2.361 0.702 .929 .010
Organizational Performance
of Large Manufacturing
Companies in Kenya
-0.424
0.357
-0.318
0.702
.942
.027
Source: Author (2019)

96
From Table 4.2, the skewness of the study variables was: advanced manufacturing technology
(-0.525); competitive advantage (-0.278); organizational resources (-1.134) and organizational
performance of large manufacturing companies in Kenya (-0.424). According to Hippel
(2010), a skew that falls between -2 and +2 for a sample size of 50 observations represents
fairly distributed data. Hence, using skewness test, data collected on all variables in the study
was normally distributed. Further, using Karl Pearson’s coefficient of skewness, the variable,
organizational resources, shows a slightly longer left-hand tail while the other variables,
advanced manufacturing technology, competitive advantage and organizational performance
are normally distributed.
Further, from the results in Table 4.2, the Kurtosis of the variables which is a measure of the
combined weight of the tails relative to the rest of the distribution were: advanced
manufacturing technology (0.042), competitive advantage (-0.461), organizational resources
(2.361) and organizational performance of large manufacturing companies in Kenya (-0.318).
Positive kurtosis for advanced manufacturing technology and organizational resources shows
that the weight in the tails of data for these variables is more than what is expected in a normal
distribution, while negative kurtosis for competitive advantage and organizational
performance of large manufacturing companies in Kenya shows that the weight in the tails is
less than the normal distribution.
Results in Table 4.2 also show the results were: Advanced manufacturing technology (0.949),
competitive advantage (0.980), organizational resources (0.929) and performance of large
manufacturing companies in Kenya (0.942). All the Shapiro – Wilk test values for the study
variables were close to 1 confirming normality of the data. Considering that Shapiro – Wilk
test, is a very effective descriptive normality test (Razali &Wah, 2011), these results allow the
researcher to proceed and perform parametric tests on the data. Normality tests were also done
on the study variable dimensions and the results are presented in table 4.3.
Shapiro – Wilk (SW) test results for the normality test of the study variable dimensions show
that: (a) The SW of dimensions of advanced manufacturing technology were between, 0.844
and 0.976; (b) competitive advantage, 0.837 and 0.940; (c) organizational resources, 0.837 and
0.910; and (d) performance of large manufacturing companies in Kenya, 0. 904 and 0.939.
From these results, data for all the study variable dimensions were normally distributed.

97
Table 4.3: Test of Normality for each Dimension of the Study Variables
Scale Skewness Kurtosis Shapiro-Wilk
Study Variable Dimensions
Statistic
Std
Error
Statistic
Std.
Error
Statistic
Sig.
Advanced manufacturing Technologies
Design Technologies -0.024 0.369 -1.109 0.724 0.933 0.018
Manufacturing Technologies
-0.242
0.369
-0.556
0.724
0.976
0.520
Planning Technologies -1.179 0.369 0.452 0.724 0.844 0.00
Competitive Advantage
Cost Leadership -0.619 0.369 -0.383 0.724 0.931 0.016
Differentiation -0.774 0.369 0.256 0.724 0.94 0.033
Focus 0.393 0.369 -1.204 0.724 0.889 0.001
Organizational Resources
Assets -0.937 0.369 0.171 0.724 0.902 0.002
Physical facilities -0.877 0.369 -0.389 0.724 0.837 0.00
Employee Capabilities -0.987 0.369 2.71 0.724 0.91 0.003
Organizational Performance
Customer satisfaction -0.306 0.369 -0.579 0.724 0.939 0.028
Employee Retention -0.873 0.369 1.942 0.724 0.904 0.002
Source: Author (2019)
Although the SW test has been observed to be the best normality test, it exhibits limitations
with a bias by sample size with larger samples being more likely to give a statistically
significant result compared to small sample sizes (Razali & Wah, 2011). This explains the
observed low significance values (< 0.005) of the SW test for the study variable dimensions
compared to the significant values (> 0.005) for the SW test on the study variables.

98
4.2.3.2 Multi-collinearity Test
Multi-collinearity is said to exist when the degree of association between the study variables
is high. Multi-collinearity reduces the precision of the estimate coefficients, weakening the
statistical ability of the regression model. When multi-collinearity exists in regression models,
it is not possible to rely fully on the p-values to identify statistically significant variables
(Mundfrom, Smith, & Kay, 2018). According to Jamal (2017), multi-collinearity exists either
as structural multi-collinearity which occurs when model terms are created using other terms
in the model or data multi- collinearity which results from the data itself.
In order to identify this problem, an iteration procedure is done among the study variables to
eliminate any pair that show a tendency of association. Mugenda and Mugenda (2012)
confirm the possibility of multi-collinearity in regression models where there is a significant
correlation among some of the study variables, especially when the regression model has
many variables. Researchers can use both the Variance Inflation Factor (VIF) and Tolerance,
to identify the presence of multi-collinearity (Woolriddge, 2000). High values of VIF or low
values of the tolerance index may indicate that severe effects of multi-collinearity exist.
Unfortunately, Green (2000) posits that there is no theoretical way to determine the threshold
value for “high” VIF or “low” tolerance index. According to Gitahi and K’Obonyo (2016) the
tolerance index provides a measure of how much variance is shared with some other
independent variable in the study. Table 4.4 presents multi- collinearity results of the study.
Table 4.4: Multi-Collinearity Values of the Study variables
Variable Collinearity Statistics
Tolerance VIF
Competitive Advantage 0.509 1.963
Organizational Resources 0.600 1.668
Advanced Manufacturing Technology 0.653 1.531
a. Dependent Variable: Organizational Performance in Large manufacturing
Companies in Kenya
Source: Author (2019)

99
According to Akinwande, Dikko, and Samson, (2015), a value of VIF close to 1 indicates that
multicollinearity does not exist among and between the study variables, while values of VIF
greater than 5 show high incidents of multi-collinearity and would lead to estimating the
coefficients of the variables poorly, consequently generating p-values that are not reliable. In
such instances, the remedy would be to: (a) remove the identified variables that are highly
correlated from the regression model, (b) combine the correlated variables, or (c) perform an
analysis designed for highly correlated variables, such as principal components analysis or
partial least squares regression.
Results in table 4.4 show low values of VIF in the study variables. Specifically, the results
show VIF for advanced manufacturing technology of 1.531, organizational resources (1.668),
and competitive advantage of (1.963). Therefore, using VIF, the results confirm that there was
no multicollinearity between and among all the variables in the study. Therefore, the
coefficients obtained from the regression model lead to accurate recommendations regarding
the relationship between advanced manufacturing technology, competitive advantage,
organizational resources and performance of large manufacturing companies in Kenya.
Further, this eliminates erroneous findings and recommendations in the study.
According to Gitahi and K’Obonyo (2016), tolerance, which is the reciprocal of variance
inflation factor, can also be used to identify the existence of multicollinearity. Tolerance is
considered to be the percentage of the variance in a given predictor that cannot be explained
by the other predictors in the study (Senaviratna, 2019). Values of tolerance close to 1
indicates that there is little multicollinearity, whereas a value close to zero suggests that
multicollinearity may be present among the study variables. Similar to VIF, there is no
consensus on the value of tolerance that would provide a cutoff on minimum or maximum
values, for determining presence or lack of multicollinearity (Midi, Sarkar, & Rana, 2013).
According to Mayers (1990) and Menard (2002), a tolerance value below 0.1 or 0.2 would
indicate existence of multicollinearity respectively. The results in table 4.4 show tolerance
results for advanced manufacturing technology to be 0.653, organizational resources (0.600)
and competitive advantage (0.509). According to Hosmer, Lemeshow, and Sturdivant, (2013),
these values show that there was no multicollinearity among the variables in the study

100
4.2.3.3 Linearity Test
The linear relationship of the variables was further explored using scatter diagram. The Q-Q
plot was used in the scatter plot. The Q-Q plot, is a graphical tool used to help researchers
determine if a set of data that is being analyzed came from normal or exponential distributions.
Q-Q plots are subjective but allows the researcher to see at-a-glance if the assumptions in the
study are realistic. If the assumptions are found not to be realistic, the Q-Q plots allows the
researcher to determine the sets of data responsible for the violation of the assumptions. Figure
4.1 presents the Q-Q plot for advanced manufacturing technology.
Figure 4.1: Scatter Plot Diagram of Advanced Manufacturing Technology
Source: Author (2019)
Figure 4.2 presents the Q-Q plots for competitive advantage. The plots appear to fall on a
straight line indicating normal distribution of the data for the study variable, competitive
advantage a common procedure is to test out several different distributions with the Q- Q plot
to see if one fits the data well.

101
Figure 4.2: Scatter Plot Diagram of Competitive Advantage
Source: Author (2019)
The points are mostly clustered on the 45-degree line, suggesting the competitive advantage
sample data is normally distributed. If the data does not fall on the 45-degree line and follows
a curve, it shows that the data is not normally distributed and is skewed. The assumption of
normality is an important assumption for many statistical tests, as the researcher assumes that
the sampling was done from a normally distributed population.
Figure 4.3 presents results for the Q-Q plots of organizational performance study variable.
The results indicate a possible minor skew of the data to the right as most of the data appear
to fall on the straight line. This may be caused by outliers in the sampled data which if ignored
does not affect the normality of the data and allows for parametric tests to be done.

102
Figure 4.3: Scatter Plot Diagram Organizational Resources
Source: Author (2019)
Figure 4.4 presents the results for the Q-Q scatter plot for performance of large manufacturing
companies in Kenya variable. Rhiel and Chaffin (1996) reckon that if the skewness of the
parent population is in the opposite direction of the rejection region, then the observed
skewness in the direction of the rejection region tail as well as the significance is high. The
significance is lower than the nominal when the skewness is observed to be in the same
direction as the one for the rejection region tail. The results in figure 4.4 show the plots were
relatively linear as they are generally clustered around the 45- degree line.
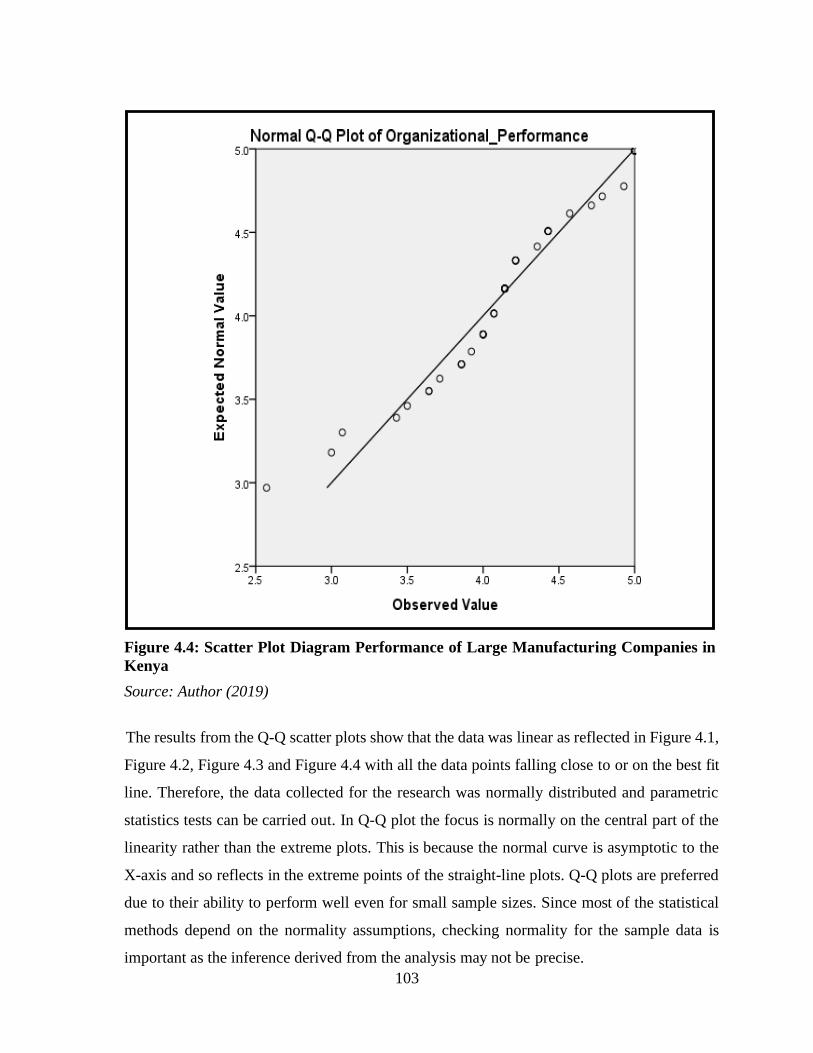
103
Figure 4.4: Scatter Plot Diagram Performance of Large Manufacturing Companies in
Kenya
Source: Author (2019)
The results from the Q-Q scatter plots show that the data was linear as reflected in Figure 4.1,
Figure 4.2, Figure 4.3 and Figure 4.4 with all the data points falling close to or on the best fit
line. Therefore, the data collected for the research was normally distributed and parametric
statistics tests can be carried out. In Q-Q plot the focus is normally on the central part of the
linearity rather than the extreme plots. This is because the normal curve is asymptotic to the
X-axis and so reflects in the extreme points of the straight-line plots. Q-Q plots are preferred
due to their ability to perform well even for small sample sizes. Since most of the statistical
methods depend on the normality assumptions, checking normality for the sample data is
important as the inference derived from the analysis may not be precise.

104
4.2.3.4 Heteroscedasticity Tests
A priori probability of having an erratic value of homoscedasticity being relatively high leads
to heteroscedasticity. Homoscedasticity refers to the assumption that the dispersion observed
in variables used in a study are the same according to the Gauss-Markov conditions.
Researchers often assume that homoscedasticity exists in regression analysis, though in some
contexts it may be more reasonable to suppose that the potential dispersion in observations in
the sample are different (Olofin, Kouassi, & Salisu, 2009).
According to Olofin, Kouassi, and Salisu, (2009) Heteroscedasticity is likely to be a problem
when the values of the variables in the regression equation vary substantially in different
observations. This study used the Glejser test which allows the researcher to explore the nature
of heteroscedasticity more closely (Baltagi, 2008). This test rejects the null hypothesis of
homoscedasticity if the estimate of β is significantly different from 0 (If the Sig. value in the
test is > 0.05 it indicates no heteroscedasticity but if the Sig. value is < 0.05, then
heteroscedasticity is confirmed)
Table 4.5: Heteroscedasticity Coefficients
Variable
Unstandardized
Coefficients
Standardized
Coefficients
t
Sig.
B Std. Error Beta
(Constant) 0.466 0.264 1.768 0.085
Advanced Manufacturing
Technology 0.021 0.044 0.092 0.474 0.638
Competitive Advantage -0.031 0.086 -0.078 -0.356 0.724
Organizational Resources -0.026 0.07 -0.077 -0.377 0.708
a. Dependent Variable:
Source: Author (2019)
The results for heteroscedasticity are presented in table 4.5. From the results, the significant
value for advanced manufacturing technology was 0.638, competitive advantage (0.724), and
organizational resources (0.708). All these values are > 0.05 indicating no presence of
heteroscedasticity in the study variables.

105
4.3 Descriptive Statistics
Descriptive Statistics involves presentation of numerical facts, or data, in either tables or
graphical form, together with the methodology for analyzing the data. They seek to describe
the main features of both quantitative and qualitative data quantitatively. Descriptive statistics
are used to summarize the inherent characteristics of a sample while inferential statistics uses
the results from the sample to learn and have more information and knowledge about the
population it represents (Hofer & Schendel, 1978). Therefore, descriptive statistics differs
from inferential statistics as they are not developed on the basis of probability theory.
Statistical inference in research describes the probabilistic process used to interpret data from
a sample and relate the findings to the population represented by the sample. More
specifically, when researchers encounter data that is prone to random variation caused by
observational errors, random sampling and random experimentation, they use statistical
inference to draw conclusions relating to these data sets. (Das & Sahu, 2015). Inferential
statistics requires that the conclusions derived from the results should be logical and
reasonable when they are applied to known practical situations and should be able to be
objectively applied to other similar or related situations.
4.3.1 Background Information
Background information in the research study is useful to identify the salient features and
information about the respondent or the subject of interest in the research. Background
information also helps researchers to broadly determine and categorize samples or population
in the study using appropriate methods to filter the population and select the target population.
The information is included either at the beginning of the questionnaire or at the end depending
on the design of the questionnaire.
The design of a questionnaire is determined by the type of investigation being conducted. The
information to be collected using the questionnaire is either qualitative for a qualitative study
or quantitative for a quantitative study. While a qualitative questionnaire leads to better
understanding or generation of hypotheses on study subjects, quantitative information is used
to test specific hypotheses that have previously been generated. Background information in
this study was included at the beginning of the questionnaire.

106
4.3.1.1 Position / Title of the Respondent
The title or position of respondents in organizations providing data to be analyzed in a study
helps researchers to determine suitability of the respondent in providing required information.
Results presented in Table 4.6 show that out of the respondents in the study, 28.6% held the
position of Engineering manager, 25.7% were Director Technical Services, 25.7% were
Director of Manufacturing, while 20.7% held the position of Factory Manager. These results
indicate that respondents were in the top tier management positions in their organizations.
This cadre of employees is responsible for controlling and overseeing the entire organization.
Further, they are key players in developing goals, strategic plans, company policies, and
making decisions on the direction of organizations. In addition, top-level managers play a
significant role in the mobilization of outside resources, manage manufacturing operations,
and are privy to the required information regarding variables in the study.
Table 4.6: Respondents Job Position/Title
Job Position/Title Frequency Percentage (%)
Engineering Manager 10 28.6
Director Technical Services 9 25.7
Director Manufacturing 9 25.7
Factory Manager 7 20.0
Total 35 100
Missing (System) 10
Total 45 100
Source: Author (2019)
Information provided by this group of employees is deemed to be a true reflection of the issues
and performance within the organization (Hambrick & Mason, 1984). The data provided by
the respondents in the study was presumed to be relevant, accurate and appropriate for use in
data analysis to help the researcher arrive at conclusions, inferences and recommendations
related to the study variables.
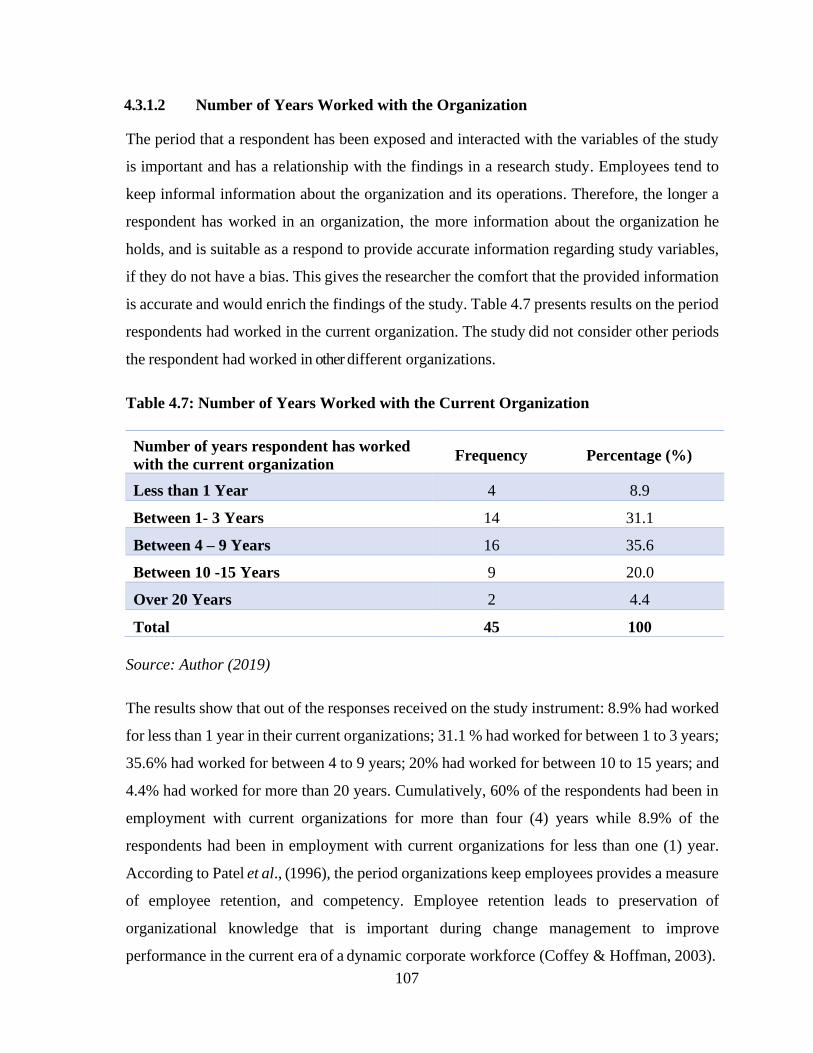
107
4.3.1.2 Number of Years Worked with the Organization
The period that a respondent has been exposed and interacted with the variables of the study
is important and has a relationship with the findings in a research study. Employees tend to
keep informal information about the organization and its operations. Therefore, the longer a
respondent has worked in an organization, the more information about the organization he
holds, and is suitable as a respond to provide accurate information regarding study variables,
if they do not have a bias. This gives the researcher the comfort that the provided information
is accurate and would enrich the findings of the study. Table 4.7 presents results on the period
respondents had worked in the current organization. The study did not consider other periods
the respondent had worked in other different organizations.
Table 4.7: Number of Years Worked with the Current Organization
Number of years respondent has worked
with the current organization Frequency Percentage (%)
Less than 1 Year 4 8.9
Between 1- 3 Years 14 31.1
Between 4 – 9 Years 16 35.6
Between 10 -15 Years 9 20.0
Over 20 Years 2 4.4
Total 45 100
Source: Author (2019)
The results show that out of the responses received on the study instrument: 8.9% had worked
for less than 1 year in their current organizations; 31.1 % had worked for between 1 to 3 years;
35.6% had worked for between 4 to 9 years; 20% had worked for between 10 to 15 years; and
4.4% had worked for more than 20 years. Cumulatively, 60% of the respondents had been in
employment with current organizations for more than four (4) years while 8.9% of the
respondents had been in employment with current organizations for less than one (1) year.
According to Patel et al., (1996), the period organizations keep employees provides a measure
of employee retention, and competency. Employee retention leads to preservation of
organizational knowledge that is important during change management to improve
performance in the current era of a dynamic corporate workforce (Coffey & Hoffman, 2003).

108
4.3.1.3 Market Coverage
Organizations achieve market coverage by using different strategies that include; concentrated
marketing, differentiated marketing, or undifferentiated marketing. Farris et. al., (2010)
reckon that market coverage can be determined by market share controlled by the
organization, representing the volume of goods or service level within a particular geographic
area, compared to the volume of similar goods by competition. Vargo and Lusch (2004) define
market share to be the way that an organization predicts market dynamics and implements
either proactive or reactive strategies to meet the consumer needs in the market.
Knowledge of market coverage provides organizations with an opportunity to introduce new
products and also enhances their ability to increase or maintain their market share. Market
coverage in this study was determined by geographic area where the organization owned
active retail and/or wholesale outlets that sold their products. Results on market coverage are
presented in table 4.8.
Table 4.8: Market Coverage
Market Coverage (Area) Frequency Percentage (%)
National 7 15.6
Regional (within East Africa) 24 53.3
Continental (Within Africa) 1 2.2
Global (Africa and Beyond) 13 28.9
Total 45 100
Source: Author (2019)
Results for market coverage in Table 4.8 show that 15.6% of the organizations retail or
wholesale outlets were National, 53.3% were Regional (Within East Africa), 2.2% were
Continental (Within Africa), while 28.9% were Global (international market - Africa and
beyond). The results also show that 68.9% of the organizations had their market coverage in
Kenya and the East African region, implying that more than 50% of their products are used in
the East African market. Further, 28.9% had a global market coverage that required them to
implement manufacturing strategies to make them compete effectively in the global market.

109
4.3.1.4 Number of Years in Operation
The resilience of an organization to market dynamics is correlated to the time it has been in
operation. In Kenya, 46% of MSME’s close down after 1 year while 15% of the remaining
MSME’s close down one year later (KNBS, 2019). According to Zontanos & Anderson
(2004), over two thirds of small businesses close down between one (1) and ten (10) years
after they begin operations. Further, in Canada 30% of small businesses shut down within one
year and up to 75% after 9 years (Industry Canada, 2010), while in the United States (Small
Business Administration, 2010) 33% of start-ups close by the end of the second year and 50%
fail after 4 years. Table 4.9 presents results on the number of years the organizations had been
in operation since incorporation.
Table 4.9: Number of Years in Operation
Number of years the Organization has been in
Operation Frequency Percentage (%)
Less than 1 year 1 2.2
Between 1 – 3 Years 2 4.4
Between 4 – 6 Years 7 15.6
Between 7 – 10 Years 9 20.0
Over 10 Years 26 57.8
Total 45 100
Source: Author (2019)
The results in Table 4.9 show that 2.2% of the organizations had been in operation for less
than 1 year, 4.4% for between 1 and 3 years, 15.6% between 4-6 years, 20% between 7-10
years, and 57.8% for over 10years. The results also show that 93.4% of the organizations had
been in operation for more than 4 years. This period (4 years) is considered by the study to be
adequate for the organizations to have generated reliable and valid data from their operations
to enable plausible conclusions, inferences and recommendations to be made on the
relationships that exist between and among the study variables. It can also be inferred from
the results that since 77.8% of the organizations had been in operation for 7 years and above,
they could be in their second cycle of a 5-year manufacturing strategy implementation.

110
4.3.1.5 Number of Permanent Employees in the Organization
The size of organizations is determined using either the number of employees, the total annual
revenues, or the capital investment employed (ILO, 2020). Dogan and Bera (2019) found that
part time employees and casual employees have a low job satisfaction in an organization,
leading to low employee productivity, while, Odero and Makori (2018) found that permanent
employee involvement in decision making in organizations accounts favorably for
performance within the organization. Permanent employees were considered to indicate the
real size of the company in line with other similar studies (Awino, 2011).
Table 4.10: Number of Permanent Employees in the Organization
Number of permanent employees in the
organization Frequency Percentage (%)
Less than 50 1 2.2
Between 50-100 9 20.0
Between 101-200 9 20.0
Over 200 26 57.8
Total 45 100
Source: Author (2019)
The results presented in Table 4.10 show that only 2.2% of the organizations in the study had
less than 50 permanent employees. Most of the organizations (57.8%) had over 200 permanent
employees, 20.0% had between 50 and 100 permanent employees and another 20.0% also had
between 101 and 200 permanent employees. The results also show that a total of 97.8% of the
organizations had more than 50 permanent employees.
Further, the results show that 77.8% of the organizations in the study had more than 100
permanent employees and were regarded as large manufacturing companies when the number
of employees is used in determining the size of the organization. This proportion was
considered to be adequate for the analysis of investigating the study variables to proceed with
the dependent variable being performance of large manufacturing companies in Kenya.

111
4.3.1.6 Manufacturing Strategy Implementation
There are various manufacturing strategies that manufacturing organizations implement in
their operations to meet the challenges of the operating environment and also fulfil their
customer needs. Cousens et al. (2009) suggested a framework that enables manufacturing
organizations to establish competitive capability in flexible manufacturing by implementing
strategic plans to address challenges in their manufacturing processes. Wei, Song, and Wang,
(2017) have shown the influence of manufacturing flexibility on business models and firm
performances, considering their contextual fit with the market environment.
Table 4.11: Manufacturing Strategy Implementation
Organizations with Manufacturing
Strategy Frequency Percentage (%)
Yes 38 84.44
No 4 8.89
System (Missing) 3 6.67
Total 45 100
Source: Author (2019)
The results in Table 4.11 revealed that 84.44% of the companies in the study had implemented
a formal manufacturing strategy within the last six years, while 8.89% of the companies had
not implemented a formal manufacturing strategy within this time frame. Daniel (2014)
reiterates the influences of strategic planning, whether formal or informal, and strategic
organization on performance. Strategy exploits the opportunities within the environment
consequently having a positive relationship to performance.
The results in Table 4.11 and the results in Table 4.9 show a slight difference between
organizations that had implemented a manufacturing strategy in the last 6 years (84.44%) and
those that had been in operation for more than 6 years (89.4%). This implies that
approximately 5.04% of the companies that that have been in operation for more than 6 years
did not have a strategic plan.

112
4.3.2 Advanced Manufacturing Strategy
The study investigated the relationship between advanced manufacturing technology and
organizational performance of large manufacturing companies in Kenya. Respondents were
required to indicate the extent to which advanced manufacturing technology was applied in
the operations of the organizations. A Likert scale of 1-5 was used where 1= Not at all, 2=
Small extent, 3= Moderate extent, 4= Great extent, and 5= Very great extent. Advanced
manufacturing dimensions in the study included; design technologies, manufacturing
technologies and planning technologies. Results for the application of advanced
manufacturing technology in the operations of large manufacturing companies in Kenya are
presented in the following sections.
4.3.2.1 Design Technologies in the Organization
Managers apply technology in manufacturing operations in their organizations to benefit from
the value they expect to gain which includes developing competitive advantage in their
operating industries (Mohanty, Gahan, & Choudhury, 2014). The indicators that were used
for design technology in the study included; Computer aided design (CAD), Computer aided
Engineering (CAE), Computer aided process planning (CAPP) and Group technology (GT).
Results on application of design technologies are presented in Table 4.12.
Table 4.12: Design Technologies in the Organization
Design technology
Indicator Min Max Mean
Std. Deviation
Coefficient of
Variation
Computer Aided Design 1 5 3.2 1.4 0.45
Computer Aided
Engineering
1 5 2.8 1.4 0.49
Computer Aided Process
Planning
1 5 2.8 1.3 0.49
Group Technology 1 5 2.4 1.5 0.62
Average 1 5 2.8 1.4 0.51
Source: Author (2019)
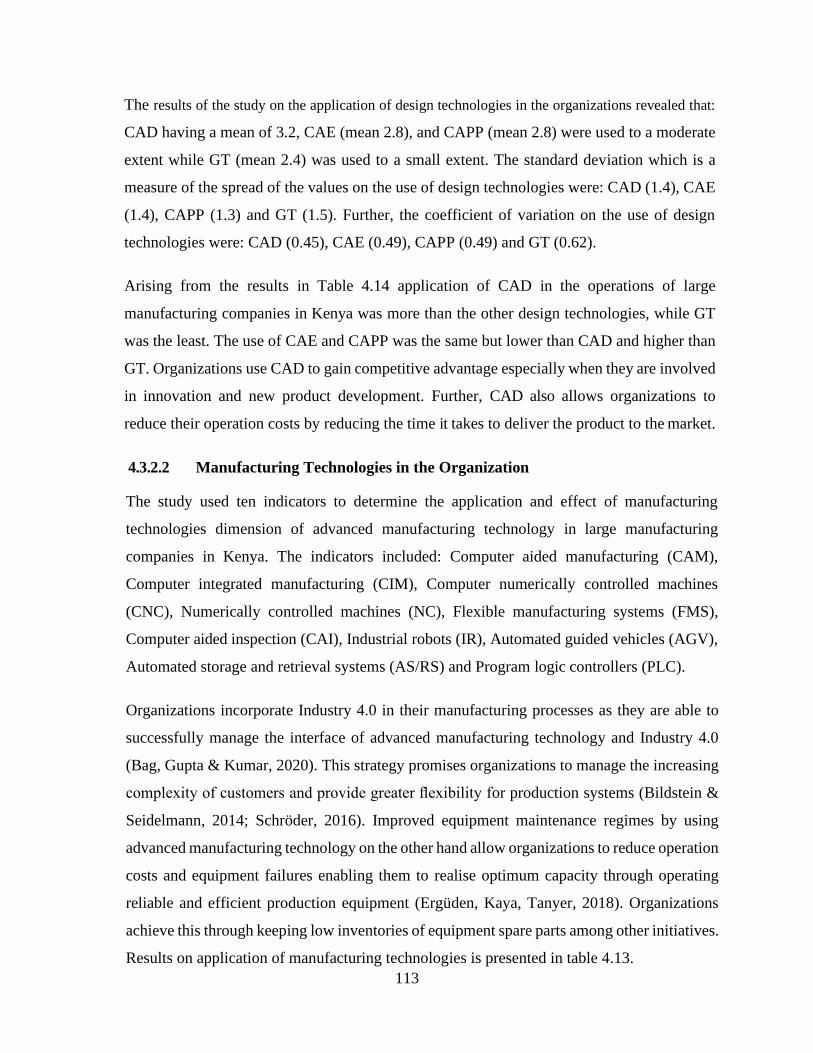
113
The results of the study on the application of design technologies in the organizations revealed that:
CAD having a mean of 3.2, CAE (mean 2.8), and CAPP (mean 2.8) were used to a moderate
extent while GT (mean 2.4) was used to a small extent. The standard deviation which is a
measure of the spread of the values on the use of design technologies were: CAD (1.4), CAE
(1.4), CAPP (1.3) and GT (1.5). Further, the coefficient of variation on the use of design
technologies were: CAD (0.45), CAE (0.49), CAPP (0.49) and GT (0.62).
Arising from the results in Table 4.14 application of CAD in the operations of large
manufacturing companies in Kenya was more than the other design technologies, while GT
was the least. The use of CAE and CAPP was the same but lower than CAD and higher than
GT. Organizations use CAD to gain competitive advantage especially when they are involved
in innovation and new product development. Further, CAD also allows organizations to
reduce their operation costs by reducing the time it takes to deliver the product to the market.
4.3.2.2 Manufacturing Technologies in the Organization
The study used ten indicators to determine the application and effect of manufacturing
technologies dimension of advanced manufacturing technology in large manufacturing
companies in Kenya. The indicators included: Computer aided manufacturing (CAM),
Computer integrated manufacturing (CIM), Computer numerically controlled machines
(CNC), Numerically controlled machines (NC), Flexible manufacturing systems (FMS),
Computer aided inspection (CAI), Industrial robots (IR), Automated guided vehicles (AGV),
Automated storage and retrieval systems (AS/RS) and Program logic controllers (PLC).
Organizations incorporate Industry 4.0 in their manufacturing processes as they are able to
successfully manage the interface of advanced manufacturing technology and Industry 4.0
(Bag, Gupta & Kumar, 2020). This strategy promises organizations to manage the increasing
complexity of customers and provide greater flexibility for production systems (Bildstein &
Seidelmann, 2014; Schröder, 2016). Improved equipment maintenance regimes by using
advanced manufacturing technology on the other hand allow organizations to reduce operation
costs and equipment failures enabling them to realise optimum capacity through operating
reliable and efficient production equipment (Ergüden, Kaya, Tanyer, 2018). Organizations
achieve this through keeping low inventories of equipment spare parts among other initiatives.
Results on application of manufacturing technologies is presented in table 4.13.

114
Table 4.13: Manufacturing Technologies
Manufacturing Technology
Indicator Min Max Mean
Std.
Deviation
Coefficient
of Variation
Computer Aided Manufacturing 1 5 3.3 1.3 0.39
Computer Integrated
Manufacturing 1 5 3.0 1.3 0.42
Computer Numerically
Controlled Machines 1 5 3.1 1.6 0.5
Numerically Controlled
Machines 1 5 3.2 1.6 0.49
Flexible Manufacturing Systems 1 5 3.0 1.3 0.44
Computer Aided Inspection 1 5 2.3 1.3 0.55
Industrial Robots 1 5 1.5 1 0.72
Automated Guided Vehicles 1 5 1.7 1.2 0.72
Automated Storage and
Retrieval Systems 1 5 2.3 1.5 0.66
Program Logic Controllers 1 5 3.2 1.6 0.50
Average 1 5 2.7 1.4 0.54
Source; Author (2019)
The results from the study on the application of manufacturing technologies revealed that:
CAM (mean 3.3), CIM (3.0), CNC (3.1), NC (3.2), FMS (3.0), and PLC (3.2) were used to a
moderate extent; while CAI (2.3), IR (1.5), AGV (1.7), and AS/ RS (2.3) were used to a small
extent. Organizations applied CAM the most while IR was the least applied in their operations.
The standard deviation on the application of manufacturing technologies were: CAM (1.3),
CIM (1.3), CNC (1.6), NC (1.6), FMS (1.3), CAI (1.3), PLC (1.6), IR (1.0), AGV (1.2), and
AS/RS (1.5) while the coefficient of variation on the use of manufacturing technologies were:
CAM (0.39), CIM (0.42), CNC (0.5), NC (0.49), FMS (0.43), CAI (0.55) PLC (0.5), Industrial
robots (0.71); AGV (0.72); and AS/RS (0.66).

115
Further, the results in Table 4.13 show that CAM, PLC and, NC were the top three applied
manufacturing technology indicators by large manufacturing companies in Kenya in their
production processes. These three technologies incidentally are related as CAM in most cases
is associated with the use of NC and PLC. The results also show application of IR, CAI, AGV
and AS/RS technologies were the least out of all the manufacturing technology indicators
considered in the study. None of the manufacturing technologies are used to a great extent by
large manufacturing companies in Kenya.
4.3.2.3 Planning Technologies in the Organization
The study used eight indicators to determine the application and effect of planning
technologies dimension of advanced manufacturing technology in large manufacturing
companies in Kenya. The planning technology indicators used in the study included; Materials
requirement planning (MRP), Manufacturing resource planning (MRPII), Computer
preventive maintenance planning (CPM), Just in time (JIT), Management information systems
(MIS), Enterprise resource planning (ERP), Total quality management (TQM) and, Customer
relationship management (CRM).
Findings of the study presented in Table 4.14 show that; MRP, ERP, MIS, TQM, and CRM
planning technology indicators were used to a great extent; while, MRP II, CPM, JIT were
used to a moderate extent. Further, the results show that large manufacturing companies in
Kenya apply ERP more than any of the other planning technology indicators used in the study.
Organizations use ERP to generate real time information on the production process and also
develop data that they analyze to have up to date information and understand the
manufacturing process.
Results also show that CRM was used by the organizations to a great extent. Organizations
use CRM which is a process with a series of activities to manage current customers, nurture
new prospects, and pursue sales opportunities. The main purpose of applying CRM in the
business process is to collect and integrate customer feedback in the product/service offered
to consumers to improve both business to business (B2B) and business to consumer (B2C)
performance. Organizations also use CRM to actively listen, pay attention to detail, and
develop product consistency which leads to strengthening customer relationships over time.

116
Table 4.14: Planning Technologies
Planning Technology
Indicator Minimum Maximum Mean
Std.
Deviation
Coefficient
of Variation
MRP
1
5
3.7
1.4
0.38
MRPII
1
5
3.2
1.4
0.43
CPM
1
5
3.2
1.3
0.42
JIT
1
5
2.9
1.3
0.47
MIS
1
5
3.7
1.4
0.36
ERP
1
5
4.2
1.3
0.30
TQM
1
5
3.7
1.2
0.32
CRM
1
5
3.9
1.3
0.33
Average
1
5
3.55
1.32
0.38
Source: Author (2019)
Results in Table 4.14 show the standard deviation (σ) on the application of planning
technologies were: MRP (1.4), MRP II (1.4), MIS (1.4), CPM (1.3), JIT (1.3), CRM (1.3),
ERP (1.3), and TQM (1.2). Although MRP and MRP II were used at different rates, their
standard deviation was the same. The standard deviation for TQM was the lowest at σ = 1.2.
The coefficient of variation for the application of the planning technology indicators were:
MRP (0.38), MRP II (0.43), MIS (0.42), CPM (0.47), JIT (0.36), CRM (0.30), ERP (0.32),
and TQM (0.33). Managers in manufacturing organizations expect to use planning
technologies to grow their revenues.

117
The results show that ERP is used more than any other planning technology and the extent of
variability about its mean is also the lowest at CV=0.30, while JIT is the least used planning
technology but with the highest variability about the mean at CV = 0.47. Organizations choose
to apply ERP in their production systems due to the flexibility that makes it possible to be
integrated with various operations. Its use is further enhanced by its ability to be used either
as a stand-alone technology that is easy to use in simple organizations or integrated within the
operations of a complex production system. On the other hand, JIT, though popular in
developed economies, is a challenge in developing economies due to poor infrastructure
which is one of the factors that determine its effectiveness in achieving delivery standards.
4.3.2.4 Joint Descriptive Statistics for Advanced Manufacturing Technology
The findings in Table 4.15 revealed that large manufacturing companies in Kenya apply the
use of advanced manufacturing technologies in their production processes. The overall use of
advanced manufacturing technology by large manufacturing companies in Kenya was to a
moderate extent (mean, 3.00). The application of planning technologies in the production
process was to a great extent (mean, 3.55) while the application of both manufacturing
technologies (mean, 2.70) and design technologies (mean, 2.80) was to a moderate extent.
Therefore, large manufacturing companies in Kenya use advanced manufacturing technology
to a moderate extent and in particular apply planning technologies in their production process
more than design technologies and manufacturing technology dimensions of advanced
manufacturing technology.
Further, managers in manufacturing companies embrace advanced manufacturing technology
in their production process at varying levels. Despite organizations applying both design and
manufacturing technologies to a moderate extent, the results in Table 4.15 show that design
technology is used slightly more than the manufacturing dimension. ERP (mean, 4.20) is the
most widely used technology from the advanced manufacturing technologies considered in
the study, while IR (mean, 1.5) is the least used technology among the technologies in the
planning dimension. Five of the most widely used technologies ERP, MRP, MIS, TQM, and
CRM are planning technologies while the least used technologies IR, AGV and AS/RS are
manufacturing technologies.

118
Table 4.15: Application of Technology in the Manufacturing Process
Design Technologies
Min Max Mean Std. Deviation Coefficient of Variation
CAD 1 5 3.2 1.4 0.45
CAE 1 5 2.8 1.4 0.49
CAPP 1 5 2.8 1.3 0.48
GT 1 5 2.4 1.5 0.62
Average 1 5 2.8 1.4 0.51
Manufacturing Technologies
CAM 1 5 3.30 1.30 0.39
CIM 1 5 3.00 1.30 0.42
CNC 1 5 3.10 1.60 0.50
NC 1 5 3.20 1.60 0.49
FMS 1 5 3.00 1.30 0.44
CAI 1 5 2.30 1.30 0.55
Industrial Robots
1 5 1.50 1.00 0.72
AGV 1 5 1.70 1.20 0.72
AS/RS 1 5 2.30 1.50 0.66
PLC 1 5 3.20 1.60 0.50
Average 1 5 2.66 1.36 0.54
Planning Technologies
MRP 1 5 3.70 1.40 0.38
MRPII 1 5 3.20 1.40 0.43
CPM 1 5 3.20 1.30 0.42
JIT 1 5 2.90 1.30 0.47
MIS 1 5 3.70 1.40 0.36
ERP 1 5 4.20 1.30 0.3
TQM 1 5 3.70 1.20 0.32
CRM 1 5 3.90 1.30 0.33
Average 1 5 3.55 1.32 0.38
TOTAL AVERAGE
1 5 3.00 1.36 0.45
Source: Author (2019)

119
The results in table 4.15 show that large manufacturing companies in Kenya are likely to use
planning technologies compared to manufacturing and design technologies in their production
process. Planning technologies enable organizations in decision making regarding when and
how they manufacture their products and services to optimize on the use of resources they own,
while meeting the needs of their consumers. Further, the results from this study show that
large manufacturing companies in Kenya employ advanced manufacturing technologies at
different levels in their production process from a great extent to a moderate extent.
4.3.3 Competitive Advantage
The second objective of the study was to investigate the relationship between advanced
manufacturing technology, competitive advantage and organizational performance of large
manufacturing companies in Kenya. Data was collected through a Likert scale to determine
the effect of cost leadership, differentiation and focus attributes of competitive advantage on
the relationship between advanced manufacturing technology and performance of large
manufacturing companies in Kenya. Respondents were required to indicate using a Likert
scale ranging between 1-5, where, 1= Strongly disagree: 2=Moderately disagree: 3=Neutral:
4= Moderately agree: 5= Strongly agree, on the attributes of competitive advantage and
performance.
4.3.3.1 Cost Leadership Strategies
The study used seven aspects associated with cost leadership strategies. The aspects included;
Employees possessing high Process engineering skills, products designed with ease of
manufacturing concepts, easy and sustained access to inexpensive capital, Management
supervision of labour, Management of production costs, Incentives for employees based on
performance and controlling overall operation costs in the organization.
Results presented in table 4.16 show that out of the seven aspects of cost leadership strategies:
respondents strongly agree that the organizations’ management always had tight control on
production costs. In manufacturing organizations, production costs consist of all the costs that
are incurred to purchase all the production inputs and the attendant costs of transforming them
into finished products for use by consumers.

120
Table 4.16: Cost Leadership
Cost Leadership
Indicator
Min
Max
Mean
Std.
Deviation
Coefficient of
Variation
High Process
engineering skills
among employees
1
5
4.0
0.8
0.20
Our products are
designed for ease of
manufacture
1
5
4.2
0.9
0.22
The organization has
sustained access to
inexpensive capital
1
5
3.5
1.2
0.34
Management exercises
close supervision of
labour
1
5
4.3
0.8
0.18
Management always
has tight production
cost control
1
5
4.5
0.8
0.17
Employees are given
incentives based on
quantitative targets.
1
5
3.6
1.2
0.32
Management always
ensure that all costs in
the organization are kept at the minimum
possible level.
1
5
4.4
0.8
0.19
Average
1
5
4.1
0.9
0.23
Source: Author (2019)
Respondents moderately agreed that their organizations had high process engineering skills
among employees, products in their companies were designed for ease of production,
management exercised close supervision of labour, management always ensured that all costs
were maintained at minimum levels, employees were given incentives based on quantitative
targets and their organizations had sustained access to inexpensive capital. These findings
indicate that organizations are aware of the make-up of their costs, which they manage in
order to achieve low unit production costs in their endeavour to improve their performance.

121
Further, the results show that respondents consider managing production costs (mean, 4.5) to
be the best benefit organizations achieve by using advanced manufacturing technology
followed by; management always ensuring that all costs in the organization are kept at the
minimum possible level (4.4), Management exercises close supervision of labour (4.3), their
products having been designed for ease of manufacture (4.2), High Process engineering skills
among employees (4.0) and, Employees are given incentives based on quantitative targets
(3.6).
The standard deviation on the seven aspects in the study on cost leadership strategies were:
High Process engineering skills among employees (0.8), Our products are designed for ease
of manufacture (0.9), The organization has sustained access to inexpensive capital (1.2),
Management exercises close supervision of labour (0.8), Management always has tight
production cost control (0.8), Employees are given incentives based on quantitative targets
(1.2), and Management always ensure that all the costs are kept at the minimum possible level
(0.8). The standard deviations are low, indicating consensus by all the respondents.
Further, the coefficient of variation on the aspects on cost leadership strategies were: High
Process engineering skills among employees (0.20), Our products are designed for ease of
manufacture (0.22), The organization has sustained access to inexpensive capital (0.34),
Management exercises close supervision of labour (0.18), Management always has tight
production cost control (0.17), Employees are given incentives based on quantitative targets
(1.32), and Management always ensure that all the costs are kept at the minimum possible
level (0.19). The low values of coefficient of variation further shows that respondents were in
agreement that advanced manufacturing technology has a positive effect on cost leadership.
Cost leadership strategies are based on managing all the costs in the organization processes to
achieve low unit production costs. The results in table 4.16 suggest that advanced
manufacturing technologies enable organizations to achieve low costs through managing of
production costs which include managing direct material costs, direct labour costs,
manufacturing overhead costs. Compared with all the aspects on cost leadership in the study,
results show that providing incentives based on production quantity to employees was the
least. This aspect has adverse impacts on the quality as employees would be motivated more
by the quantities they produce.

122
4.3.3.2 Differentiation Strategies
Respondents were required to indicate their level of concurrence with aspects relating to
differential strategy practices in their organization. Results show that the level of concurrence
on the aspects of differentiation strategies were: respondents moderately agreed with all the
aspects which included: their organization offers customer service for all purchases of
products having, their products were unique, organizations had cultivated a reputable brand
image in their industry, the organization employed the most current technology in production,
the organization used dealers or agents to distribute their products, and they had loyal
customers to their products.
Table 4.17: Differentiation Strategies
Differentiation Indicator
Min
Max
Mean
Std.
Deviation
Coefficient of
Variation
The organization has
cultivated a reputable brand
image in the industry
1
5
4.3
0.8
0.18
Our products are unique
1
5
4.2
0.9
0.22
Our customers are loyal to
our products
1
5
4.2
0.8
0.18
The organization offers
customer service for all
purchases of our products
1
5
4.1
1.1
0.28
The organization uses
dealers/agents to distribute
its products
1
5
4.1
1.2
0.30
The organization employs
the most current technology
in production
1
5
3.8
1.1
0.28
Average
1
5
4.1
1.0
0.24
Source: Author (2019)

123
The results from the study on how advanced manufacturing technology impacts the aspects
of differentiation strategies and performance revealed that respondents moderately agreed
that; the organization has cultivated a reputable brand image in the industry (mean, 4.3), their
products were unique (4.2), Their customers were loyal to their products (4.2), their
organizations offered customer service for the purchase of all their products (4.1), their
organizations used dealers/agents to distribute their products (4.1) and, their organizations
applied the most current technology in the production process (3.8). The results are presented
in Table 4.17.
The standard deviation on how advanced manufacturing technology impacts the aspects of
differentiation strategies and performance were: the organization has cultivated a reputable
brand image in the industry (0.8), their products were unique (0.9), Their customers were
loyal to their products (0.8), their organizations offered customer service for the purchase of
all their products (1.1), their organizations used dealers/agents to distribute their products
(1.2) and, their organizations applied the most current technology in the production process
(1.1). The low standard deviations show that the respondents did not have divergent views.
Further, the coefficient of variation was: the organization has cultivated a reputable brand
image in the industry (0.18), their products were unique (0.22), Their customers were loyal to
their products (0.18), their organizations offered customer service for the purchase of all their
products (0.28), their organizations used dealers/agents to distribute their products (0.30) and,
their organizations applied the most current technology in the production process (0.28).
The mean aggregate score in Table 4.17 on the effect of advanced manufacturing technology,
differentiation strategies and organizational performance was 4.1. This result indicates that
respondents agree that advanced manufacturing technology influence differentiation
strategies and performance in large manufacturing companies in Kenya. This result is
supported by the low value of the aggregate standard deviation of 1.0 confirming that most of
the respondents had the same opinion and further supported by the low aggregate coefficient
of variation at 0.24. However, the respondents with a mean of 3.8 agree that their organizations
employ the most current technology with a low standard deviation of 1.1 and coefficient of
variation of 0.28. This points to the resilience of advanced manufacturing technology in
helping organizations maintain their competitive advantage.

124
4.3.3.3 Focus Strategies
Respondents were required to indicate the level of their concurrence with two main aspects in
relation to focus strategy practices in their organization. Findings of the study revealed that
respondents were neutral on whether their organizations focused on a small niche market.
Similarly, respondents remained neutral when asked whether their organizations
manufactured products that were aimed at a small target market.
The standard deviation on concurrence of respondents with aspects of focus strategies in the
study findings were: Organizations focused on a small niche market (1.6) and organizations
manufacture products that are aimed at a small target market (1.6). Further, the findings on
coefficient of variation on concurrence of respondents with aspects of focus strategies were:
Organizations focused on a small niche market (0.58); organizations manufacture products
that are aimed at a small target market (0.60). The values for standard deviation and coefficient
of variation indicates that there were divergent views on the aspects of focus strategies
practices and advanced manufacturing technology. These findings are presented in Table 4.18.
Table 4.18: Focus Strategies
Focus Indicator Minimum Maximum Mean Std.
Deviation
Coefficient of
Variation
Focuses on a small niche market
1 5 2.7 1.6 0.58
Manufactures products
that are aimed at a small target market
1
5
2.7
1.6
0.6
Average 1 5 2.7 1.6 0.59
Source: Author (2019)
Organizations implement focus strategies in niche or narrow markets to meet more specific
needs of customers using cost leadership or differentiation strategies (Davidson, 2001; Porter,
1980, 1985, 1987, Cross, 1999; Hlavacka, 2001). Thompson (2008) identified focus strategies
to be effective in developing competitive advantage when organizations satisfy certain
operational conditions.

125
4.3.3.4 Joint Descriptive Statistics for Competitive Advantage
The joint effect of competitive advantage considers the aspects of all the three generic
strategies. The findings are presented in table 4.19. and the aggregate score for competitive
advantage shows that the mean on the joint effect of competitive advantage was 3.6 with a
standard deviation of 1.6 and a coefficient of variation of 0.35.
Table 4.19: Descriptive Statistics for Joint Effect of Competitive Advantage
Competitive Advantage Indicator Mean Std.
Deviation
Coefficient of
Variation
Cost Leadership
High Process engineering skills among employees 4.1 0.8 0.20
Our products are designed for ease of manufacture 4.2 0.9 0.22
The organization has sustained access to inexpensive capital 3.5 1.2 0.34
Management exercises close supervision of labour 4.3 0.8 0.18
Management always has tight production cost control 4.5 0.8 0.17
Employees are given incentives based on quantitative targets. 3.6 1.2 0.32
Management always ensure that all the costs are kept at the minimum possible level.
4.4 0.8 0.19
Average 4.1 1.0 0.23
Differentiation
The organization offers customer service for all purchases of our Products
4.1 1.10 0.28
Our products are unique 4.2 0.90 0.22
The organization has cultivated a reputable brand image in the Industry
4.3 0.78 0.18
The organization employs the most current technology in
production 3.8 1.10 0.28
The organization uses dealers/agents to distribute its products 4.1 1.20 0.30
Our customers are loyal to our products 4.2 0.80 0.18
Average 4.1 1.00 0.24
Focus
Focuses on a small niche market 2.7 1.6 0.58
Manufactures products that are aimed at a small target market 2.7 1.6 0.60
Average 2.7 1.6 0.59
Aggregate total 3.6 1.2 0.35
Source: Author (2019)

126
The results in table 4.19 show that respondents moderately agree that advanced manufacturing
technology enable organizations to develop competitive advantage. The low standard
deviation observed (1.2) indicates respondents did not have a lot of divergent views on all the
aspects of competitive advantage except with regard to focus strategies where a high standard
deviation (1.6) was recorded. This finding is also evident in the observed values for coefficient
of variation (0.58 and 0.60) by the focus strategies and may be due to the limited aspects that
were considered for this generic strategy. It is also possible to infer from these results that
large manufacturing companies in Kenya do not implement focus strategies.
The aggregate mean for the generic strategies in Table 4.19 show that; cost leadership had a
mean of 4.1, differentiation strategies also had a mean of 4.1 while focus strategies had a mean
of 2.7. The results show that while the respondents moderately agreed that advanced
manufacturing technology had a positive impact on both cost leadership and differentiation
strategy aspects in the study, they were neutral with regard to focus strategies. Although the
mean and standard deviation for cost leadership and differentiation were similar, the results
in Table 4.21 indicate that the coefficient of variation for differentiation aspects was higher at
0.24 compared to that of cost leadership which was 0.23.
The emphasis on cost control by organizations, which is one of the attributes of cost leadership
strategies, was exhibited by the respondents agreeing strongly that management in their
organizations always had a tight control on the production costs (the aspect had a mean of
4.5). Further, respondents moderately agreed that their management always ensured that all
the costs within the organization were maintained at the minimum possible level (mean of
4.4) while exercising close supervision of labour (mean of 4.3) and simple product designs to
maintain low unit production costs (4.2)
Results also show that respondents moderately agreed that their organization offer customer
service for all purchases of their products (4.1), had unique products (4.2), had cultivated a
reputable brand image in the industry (4.3), employ the most current technology in production
(3.8), use dealers/agents to distribute their products (4.1) and that they have loyal customers
(4.2). It can be inferred from these results that large manufacturing companies in Kenya use
advanced manufacturing technology to operate in broad markets by implementing either the
cost leadership or differentiation strategies.

127
4.3.4 Organizational Resources
The study also investigated the relationship between advanced manufacturing technology,
competitive advantage, organizational resources, and performance of large manufacturing
companies in Kenya. The study considered resources to include both tangible and intangible
resources in the form of assets, physical facilities, and employee capabilities owned by the
organization. Respondents were required to indicate the extent to which resources contributed
to this relationship. Data was collected using a Likert scale where, 1 = Not at all: 2 = Small
extent: 3 = Moderate extent: 4 = Great extent: 5= Very great extent. Results are presented in the
next sub-sections.
4.3.4.1 Assets Owned by the Organization
Respondents in the study were required to show their extent of agreement on provided
statements in the questionnaire on assets owned by their organizations using the Likert scale
with 1 representing not at all and 5 representing to a very great extent. Results using the mean
indicate that to a very great extent; organizations had developed a reputable brand name in
their industry (mean, 4.5) and the leadership team regularly accessed the organizational
inventory (4.5); to a great extent; leaders in organizations pool resources and expertise toward
a shared goal (4.3), organizations have an effective product distribution network (4.1),
organizations are located in prime areas in relation to their customers (4.2), organizations had
strategic partnership contracts with other global manufacturers (3.7), and the organizations
had their own registered trademarks (4.0). Further, to a moderate extent, organizations patent
their products (3.4).
The standard deviation on respondents’ views on the indicators for assets were: The leaders
effectively pool resources and expertise toward a shared goal (0.7), The leadership regularly
access inventory of the organization (0.6), The organizational has developed a reputable brand
name in the industry (0.6), The organization has patented its products (1.4), The organization
has an effective product distribution network (1.2), The organization has strategic partnership
contracts with other global manufactures (1.5), The organization is located in a prime area in
relation to the customers (0.9), and The organization has its own registered trademarks (1.4).
the greatest variation was observed on developing strategic partnerships, ownership of
trademarks and patenting of products.

128
Further, the results indicate the coefficient of variation on respondents’ views on asset
indicators were: The leaders effectively pool resources and expertise toward a shared goal
(0.15), The leadership regularly access inventory of the organization (0.13), The
organizational has developed a reputable brand name in the industry (0.13), The organization
has patented its products (0.36), The organization has an effective product distribution
network (0.29), The organization has strategic partnership contracts with other global
manufactures (0.41), The organization is located in a prime area in relation to the customers
(0.21), and The organization has its own registered trademarks (0.35). Results are presented
in table 4.20.
Table 4.20: Assets
Assets Indicator
Min
Max
Mean Std.
Deviation
Coefficient
of
Variation
The organizational has developed a
reputable brand name in the industry
1
5
4.5
0.6
0.13
The leadership regularly access
inventory of the organization
1
5
4.5
0.6
0.13
The leaders effectively pool resources
and expertise toward a shared goal.
1
5
4.3
0.7
0.15
The organization is located in a prime
area in relation to the customers
1
5
4.2
0.9
0.21
The organization has an effective
product distribution network
1
5
4.1
1.2
0.29
The organization has its own
registered trade marks
1
5
4.0
1.4
0.35
The organization has strategic partnership contracts with other global manufactures
1
5
3.7
1.5
0.41
The organization has patented its
products
1
5
3.4
1.4
0.36
Average
1
5
4.1
1.0
0.25
Source: Author (2019)

129
The aggregate results show that assets owned by the organization contribute to a great extent
on the relationship between and among the study variables (Mean 4.1) and considered together
with the standard deviation (1.0) and coefficient of variation (0.25), the respondent’s views
were not very divergent on this observation. These results are similar to the finding in an
empirical study by Ongeti and Machuki (2018) on government owned companies in Kenya,
which found that the independent effect of tangible resources on performance are statistically
significant for current assets owned by an organization.
The results also show that advanced manufacturing technology allows; organizations to
develop a reputable brand name in the industry (mean,4.5), management to have regular access
to inventory (4.5), and the leaders to effectively pool resources and expertise toward a shared
goal (4.3). These asset indicators are regarded by the respondents as the most important in
enabling the organizations to improve their performance. The standard deviation of these asset
indicators is low ranging between 0.6 and 0.7 which shows that this is a generally held view
by most of the respondents. On the other hand, developing strategic partnership contracts with
other global manufactures (mean, 3.7) and owning patents for products (mean, 3.4), were not
regarded as very important by the respondents and with a standard deviation of 1.5 and
1.4 respectively show that the respondents held divergent views about them.
Further, the respondents had divergent views on their organizations having strategic
partnership contracts with other global manufactures (standard deviation 1.5, coefficient of
variation 0.41). The other indicators that raised an equally high divergent opinion among the
respondents relate to the effectiveness of the product distribution network with standard
deviation of 1.2 and a coefficient of variation of 0.29 and ownership of registered trademarks
which had a standard deviation of 1.4 and a coefficient of variation of 0.35.
The result show that respondents did not assign high value to the effect of advanced
manufacturing technology towards crafting strategic partnerships, developing product
distribution networks and having registered trademarks which are part of the manufacturing
strategy. Indeed, manufacturing strategy is designed to use resources of the manufacturing
system to support the business strategy to meet the business objectives while these are
operational outcomes.

130
4.3.4.2 Physical Facilities Owned by the Organization
The study identified three indicators to be used in the questionnaire on physical facilities
owned by the organization. These were; organizations owning sufficient office and production
space, organizations owning land for future expansion of their facilities and organizations
having a replacement strategy for their production equipment. The findings are presented in
Table 4.21.
Table 4.21: Physical Facilities
Physical Facility Indicator
Minimum
maximum
Mean Std.
Deviation
Coefficient
of Variation
The organization has
sufficient office and
production space
1
5
4.3
1.2
0.27
organization owns land for
expansion of its facilities 1 5 4 1.4 0.36
The organization has a
replacement strategy for its production equipment
1
5
4
1.1
0.26
Average 1 5 4.1 1.2 0.3
Source: Author (2019)
The aggregate score in Table 4.21 shows that the mean was 4.1 and the standard deviation was
1.2. The result shows that respondents agree to a great extent that physical facilities, being
organizational resources, influence performance. The low standard deviation shows that only
a few respondents held a different opinion. The results also indicate that the mean of the
responses on the indicators were; The organization has sufficient office and production space
(4.3), organization owns land for expansion of its facilities (4), and the organization has a
replacement strategy for its production equipment (4). Further, the standard variation and
coefficient of variation provided the level of divergent views by the respondents and were
noted as: The organization has sufficient office and production space (1.2, 0.27), organization
owns land for expansion of its facilities (1.4, 0.36) and the organization has a replacement
strategy for its production equipment (1.1, 0.26) respectively. The responses did not have a
lot of variations except on ownership of land for expansion.

131
4.3.4.3 Employee Capabilities
The study used six indicators on employee capability. The indicators included; encouragement
of employees to develop their own skills, availability of a training and development policy
that support use of technology in production, an effective performance management system,
embracing coaching at the workplace, and a policy on human resource development. The
results are presented in Table 4.22.
Table 4.22: Employee Capabilities
Employee Capability
Indicators
Min
Max
Mean
Std.
Deviation
Coefficient
of Variation
The organization encourages
employee own skills
development
1
5
4.2
0.7
0.16
The organization has a training and development policy that
support use of technology in
production
1
5
4.0
1.0
0.25
The organization practices an
effective performance
management system
1
5
4.0
0.7
0.18
The organization embraces
coaching at the workplace
1
5
4.0
0.9
0.23
The organization has an
overall approach to human
resource development
1
5
3.9
1.0
0.25
Human resource development
programs are tied to the
industry technological needs
1
5
3.8
1.0
0.27
Average
1
5
4.0
0.9
0.22
Source: Author (2019)

132
Human resource development programs are tied to the industry technological needs. Results
on employee capabilities show that: the managers agree to a great extent that; organizations
had an overall approach to human resource development, human resource development
programs were tied to the industry technological needs in the organization, organization had
training and development policies that supported use of technology in production, the
organization practices an effective performance management system, the organization
encourages employee own skills development, and the organization embraces coaching at the
workplace towards employee capabilities and resource within their organizations.
Table 4.22 shows that the aggregate score for employee capabilities mean is 4 and the standard
deviation is 0.9. The results show that the respondents to a great extent agree that employee
capabilities have an impact on the relationship between advanced manufacturing technology
and performance of large manufacturing companies in Kenya. The results also show that the
respondents agree to a great extent that their organizations encourage employees to develop
their own skills (mean, 4.2), their organization had a training and development policy that
supported the use of technology in production (4.0), organizations have a performance
management system in place (4), Coaching is embraced at the workplace (4), organizations
had an overall approach to human resource development (3.9) and human resource
development programs are tied to the industry technological needs (3.8).
The results on variations observed from the respondents using both standard deviation and
coefficient of variation indicates that the respondents had more divergent views relating to;
human resource development programs being tied to the industry technological needs
(standard deviation 1, coefficient of variation 0.27), organizations having training and
development policies that support use of technology in production (1, 0.25), and organizations
having an overall approach to human resource development (1, 0.25).
Arising from these results, employee capabilities, which are measures related to how well
employees carry out the work they are expected to do, contribute to a great extent on the
relationship between advanced manufacturing technology, organizational resources and
performance of large manufacturing companies in Kenya. Further, advanced manufacturing
technology allows employees to improve their skills, aptitude, and any other quality related
to effective delivery of the tasks required by the work they are employed to do.

133
4.3.4.4 Joint Descriptive Statistics for Organizational Resources
The aggregate mean of the results for the joint effect of the indicators of organizational
resources on the relationship between advanced manufacturing technology and performance
of large manufacturing companies in Kenya was 4.1. This aggregate joint result for
organizational resources show that, assets owned by the organization, physical facilities and
employee capabilities contribute to a great extent on the relationship between advanced
manufacturing technology, organizational resources and performance of large manufacturing
companies in Kenya. Results are presented in Table 4.23. The aggregate standard deviation
on the dimensions used for organizational resources in the study were: Assets (4.1), physical
facilities (4.1) and employee capability (4.0). These results show that the respondents agreed
to a great extent that all the dimensions of organizational resources had an impact on advanced
manufacturing technology and performance. Further, the results indicate that divergent views
were more on the dimension of physical facilities which had a standard deviation of 1.2 and
assets (1.0) compared to employee capabilities which had a standard deviation of (0.9).
Further, the joint effect for organizational resources results show that the coefficient of
variation for the assets and employee capabilities was the same at 0.25 and were lower than
the coefficient of variation for physical assets which was 0.3. This further confirms that the
respondents had more divergent views on the impact of physical assets compared to assets
and employee capability. From the results, respondents also had divergent views on some
indicators of organizational resources including; organizations having patents for their
products (Standard deviation 1.4 and coefficient of variation 0.36), organizations having
strategic partnership contracts with other global manufactures (1.5, 0.41), organizations
having their own registered trademarks (1.4, 0.35) and organizations owning land for
expansion of their facilities (1.4, 0.36).
Arising from these results, the organizational indicators that impact the relationship between
advanced manufacturing technology and performance of large manufacturing companies in
Kenya include: developing a reputable brand name (4.5), regularly access inventory by
management (4.5), owning sufficient office and production space (4.3), pooling of resources
and expertise toward a shared goal (4.3), location of the organization relative to the customers
(4.2) and the organization encouraging employee to develop their own skills (4.2).

134
Table 4.23: Descriptive Statistics for Organizational Resources
Indicators of Organizational Resources
Min
Max
Mean
Std.
Deviation
Coefficient
of Variation
Assets
The leaders effectively pool resources and expertise toward a shared goal.
1 5 4.3 0.7 0.15
The leadership regularly access inventory of the organization
1 5 4.5 0.6 0.13
The organizational has developed a reputable brand name in the industry
1 5 4.5 0.6 0.13
The organization has patented its products 1 5 3.8 1.4 0.36
The organization has an effective product
distribution network 1 5 4.1 1.2 0.29
The organization has strategic partnership contracts with other global manufactures
1 5 3.7 1.5 0.41
The organization is located in a prime area in relation to the customers
1 5 4.2 0.9 0.21
The organization has its own registered trade marks
1 5 4.0 1.4 0.35
Physical Facilities
The organization has sufficient office and production space
1 5 4.3 1.2 0.27
The organization owns land for expansion of its facilities
1 5 4.0 1.4 0.36
The organization has a replacement strategy
for its production equipment 1 5 4.0 1.1 0.26
Employee Capabilities
The organization has an overall approach to human resource development
1 5 3.9 1.0 0.25
Human resource development programs are tied to the industry technological needs
1 5 3.8 1.0 0.27
The organization has a training and
development policy that support use of
technology in production
1
5
4.0
1.0
0.25
The organization practices an effective performance management system
1 5 4.0 0.7 0.18
The organization encourages employee own skills development
1 5 4.2 0.7 0.16
The organization embraces coaching at the Workplace
1 5 4.0 0.9 0.23
Aggregate Total 1 5 4.1 1.0 0.25
Source: Author (2019)
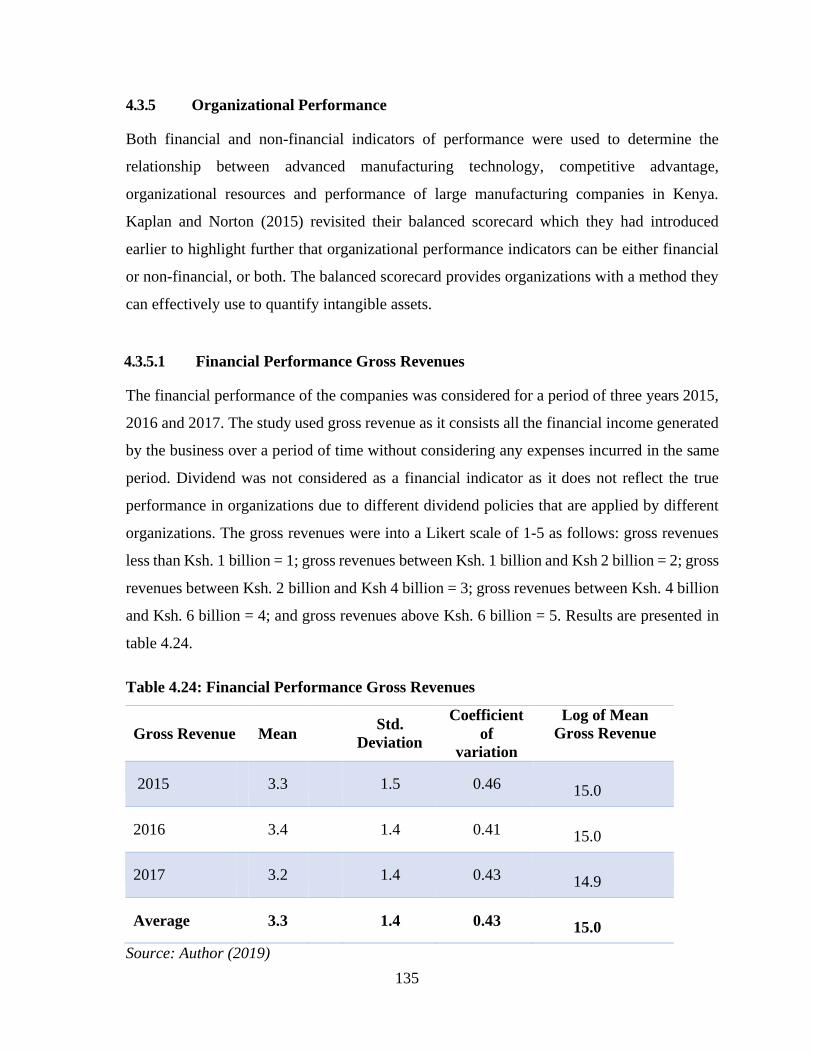
135
4.3.5 Organizational Performance
Both financial and non-financial indicators of performance were used to determine the
relationship between advanced manufacturing technology, competitive advantage,
organizational resources and performance of large manufacturing companies in Kenya.
Kaplan and Norton (2015) revisited their balanced scorecard which they had introduced
earlier to highlight further that organizational performance indicators can be either financial
or non-financial, or both. The balanced scorecard provides organizations with a method they
can effectively use to quantify intangible assets.
4.3.5.1 Financial Performance Gross Revenues
The financial performance of the companies was considered for a period of three years 2015,
2016 and 2017. The study used gross revenue as it consists all the financial income generated
by the business over a period of time without considering any expenses incurred in the same
period. Dividend was not considered as a financial indicator as it does not reflect the true
performance in organizations due to different dividend policies that are applied by different
organizations. The gross revenues were into a Likert scale of 1-5 as follows: gross revenues
less than Ksh. 1 billion = 1; gross revenues between Ksh. 1 billion and Ksh 2 billion = 2; gross
revenues between Ksh. 2 billion and Ksh 4 billion = 3; gross revenues between Ksh. 4 billion
and Ksh. 6 billion = 4; and gross revenues above Ksh. 6 billion = 5. Results are presented in
table 4.24.
Table 4.24: Financial Performance Gross Revenues
Gross Revenue
Mean
Std.
Deviation
Coefficient
of
variation
Log of Mean
Gross Revenue
2015 3.3 1.5 0.46 15.0
2016 3.4 1.4 0.41 15.0
2017 3.2 1.4 0.43 14.9
Average 3.3 1.4 0.43 15.0
Source: Author (2019)

136
From the results, the aggregate mean was 3.3 indicating that the average gross revenues for
large manufacturing companies in Kenya over the three years considered by the study was
between Ksh. 4 billion and Ksh. 6 billion. The results also show that the mean increased
between 2015 and 2016 from 3.3 to 4.4 indicating an overall improvement of gross revenues
and performance in the organizations that were considered for the study, but dropped in 2017
to 3.2 which was lower than the gross revenues for 2015. This is line with the expected
business performance in Kenya as 2017 represented the year when general elections were held
which had an adverse effect on business especially large manufacturing companies.
4.3.5.2 Financial Performance Gross Profits
Researchers have used various financial ratios, including gross profits, to determine the
performance of an organization (Mochklas, Jusni, & Fatihudin, 2018). Researchers have a
leeway on what type of financial ratio thy can use in a study. Generally, the financial ratio is
determined by the financial performance of the organization that would lead to comprehensive
results and findings. This study used gross profit to determine the financial performance of
large manufacturers companies in Kenya. Gross profits represent the profit the organization
makes after deducting all the cost of sales.
Data was collected and transformed to allow the researcher carry out descriptive statistics tests
using a Likert scale with 1 as the minimum value and 5 the maximum as follows: gross profits
below Ksh. 1 million = 1; gross profits between Ksh 1 million and Ksh.100 million = 2; gross
profits between Ksh. 100 million and Ksh 300 million = 3; gross profits between Ksh. 300
million and Ksh. 600 million = 4; gross profits above Ksh. 600 million = 5. Results are shown
in Table 4.25.
The aggregate mean for the period of the study for gross profits was 3.6 indicating that large
manufacturing companies generated an average profit of Ksh. 500 million during this period.
The results also show that the gross profit mean for the selected period of the study was: for
the year 2015, between Ksh. 100 million and Ksh. 300 million, for the year 2016, between
Ksh. 300 million and Ksh. 600 million, while the gross profits for the year 2017 were between
Ksh. 100 million and Ksh. 300 million. Gross profits were observed to have increased then
dropped between 2015 and 2017 due to the political factors experienced in Kenya in 2017.

137
Table 4.25: Financial Performance Gross Profits
Gross profits
Mean
Std.
Deviation
Coefficient of
Variation Lo of Gross Profits
mean
2015
3.4
1.7
0.49 19.6
2016
3.8
1.4
0.36 19.7
2017
3.4
1.4
0.43 19.6
Average
3.6
1.5
0.43 19.7
Source: Author (2019)
Further, the findings show that the standard deviation on gross profits reduced between 2015
and 2016 from 1.7 to 1.4 but remained at the same value in 2017. This was also observed with
the coefficient of variation which reduced between 2015 and 2016 from 0.49 to 0.36 but
increased once more to 0.43 in 2017. The increase in 2017 was occasioned by political factors
in Kenya as a result of the general elections that were conducted in 2017.
4.3.5.4 Non-Financial Organizational Performance
Financial reports are considered as the main source of information regarding performance of
organizations and are used to evaluate business activities. According to Kotane and Kuzmina-
Merlino (2011) management should not rely only on the financial performance to determine
organizational performance. Organizations are encouraged to use other non-financial
indicators such as product quality, innovations, market share, customer satisfaction, employee
satisfaction among others to determine performance as well.
This study used customer satisfaction and employee retention to evaluate the non-financial
performance of large manufacturing companies in Kenya. Customer satisfaction is a measure
used by organizations to find out the happiness which consumers derive in using their
products, services, and capabilities, while employee retention helps organizations to sustain
productivity flow, reduce company costs and reduce the time required to train employees.

138
Data was collected using a Likert scale ranging between 1-5. Respondents were required to
agree with one of the following non-financial indicator statements that closely represented
how advanced manufacturing technology impacted operations in their organization; where,
1= Strongly disagree: 2=Moderately disagree: 3=Neutral: 4= Moderately agree: 5= Strongly
agree. Results on the two dimensions used in this study are presented in the next section.
4.3.5.4 Customer Satisfaction
The study used seven (7) indicators for customer satisfaction to investigate the effect of
advanced manufacturing technology on the performance of large manufacturing companies
in Kenya. The indicators included: Rating of products by customers, extent to which the
products met the needs and expectations of customers on quality and performance, meeting
delivery timelines as specified by customers, competitiveness and value of products in the
perspective of consumers, rating by customers on their concerns regarding the performance
of the product, rating by customers with regard to dealing with them professionally and, the
technical support competence levels expected by customers.
Findings from the study show respondents moderately agreed that: Customers rated products
from their organization highly (Mean, 4.4), products from their organization met the needs
and expectations regarding quality and performance of their customers(4.3), their organization
always met the timelines on delivery specified by their customers (4.3), customers always
found their products to be competitive and represented best value for total cost of lifetime
ownership (4.3), their response to customer concerns were rated highly (4.2), customers rated
their organization highly with regard to dealing with them professionally (4.1) and, their
technical support met the desired competence levels expected by their customers (4.1). The
results are presented in Table 4.26
The standard deviation on customer satisfaction indicators used in the study which provided
a measure on the divergent views of respondents was low ranging between 0.7 and 0.9. This
indicates that respondents did not have divergent views on these indicators. Further, the
coefficient of variation also shows similar results with values ranging between 0.16 and 0.21.
The highest variation was observed on the indicator that evaluated how the technical support
met the desired competence levels expected by their customers (COV 0.21)

139
Table 4.26: Customer Satisfaction
Customer Satisfaction
Indicator
Minimum
Maximum
Mean
Std.
Deviation
Coefficient
of variation
Products from our organization
are rated highly by our
customers
1
5
4.4
0.7
0.16
Products from our organization
meet the needs and expectations
regarding quality and
performance of our customers
1
5
4.3
0.7
0.16
Our organization always meets
the timelines on delivery
required by our customers
1
5
4.3
0.8
0.18
Our customers always find our
products to be competitive and
represent best value for total cost
of lifetime ownership
1
5
4.3
0.7
0.17
Our customers rate how our
organization responds to their
concerns highly
1
5
4.2
0.8
0.19
Customers rate our organization
highly with regard to dealing
with them professionally
1
5
4.1
0.7
0.17
Our technical support meets the
desired competence levels
expected by our customers
1
5
4.1
0.9
0.21
Average 1 5 4.2 0.7 0.18
Source: Author (2019)

140
4.3.5.5 Employee Retention
The study used indicators of employee retention to investigate the relationship between
advanced manufacturing technology and performance of large manufacturing companies in
Kenya. The indicators included: clear communication of organization mission to the
employees, the understanding by employees how their jobs align to the organization mission,
availability of appropriate tools required by employees to perform their expected roles,
employee’s motivation to work in their organization, effective communication between
managers and employees, employee’s recommendation of the organization to prospective
employees and, employee’s recognition for their achievements.
Findings of the study on aspects of employee retention show that respondents moderately
agreed that: The organization clearly conveyed its mission to its employees (Mean, 4.2),
employees understood how their jobs aligned with the organization mission (4.1), employees
in the organization had the tools and resources they required to do their job (4.1), employees
are always happy to work in our organization (4.0), there is effective communication from
managers to employees in the organization (4.0), our employees always recommend our
organization to prospective employees (3.8) and, employees in the organization receive the
right amount of recognition for their work (3.8). Results are presented in Table 4.27.
Arising from these results, clear communication of the company mission to the employees
was regarded as the most important indicator and reason leading to satisfactory employee
retention. Organizations define their mission using a mission statement which describes the
organization, providing reasons for its incorporation and existence. The mission statement
also clearly identifies the primary customers that the organization targets to serve by
manufacturing specific products that meet the needs of the identified market. The second
important indicator identified by the study is the ease with which employees match their work
requirements and output to the overall mission of the organization.
The results on standard deviation on the aspects of employee retention as reported by the
managers in the survey did not show a lot of divergent views as it had a range between 0.7
and 1.0, with most of the responses having a standard deviation of 0.9. Similarly, the
coefficient of variation varied between 0.18 and 0.25 with employee recognition having the
highest coefficient of variation of 0.25.
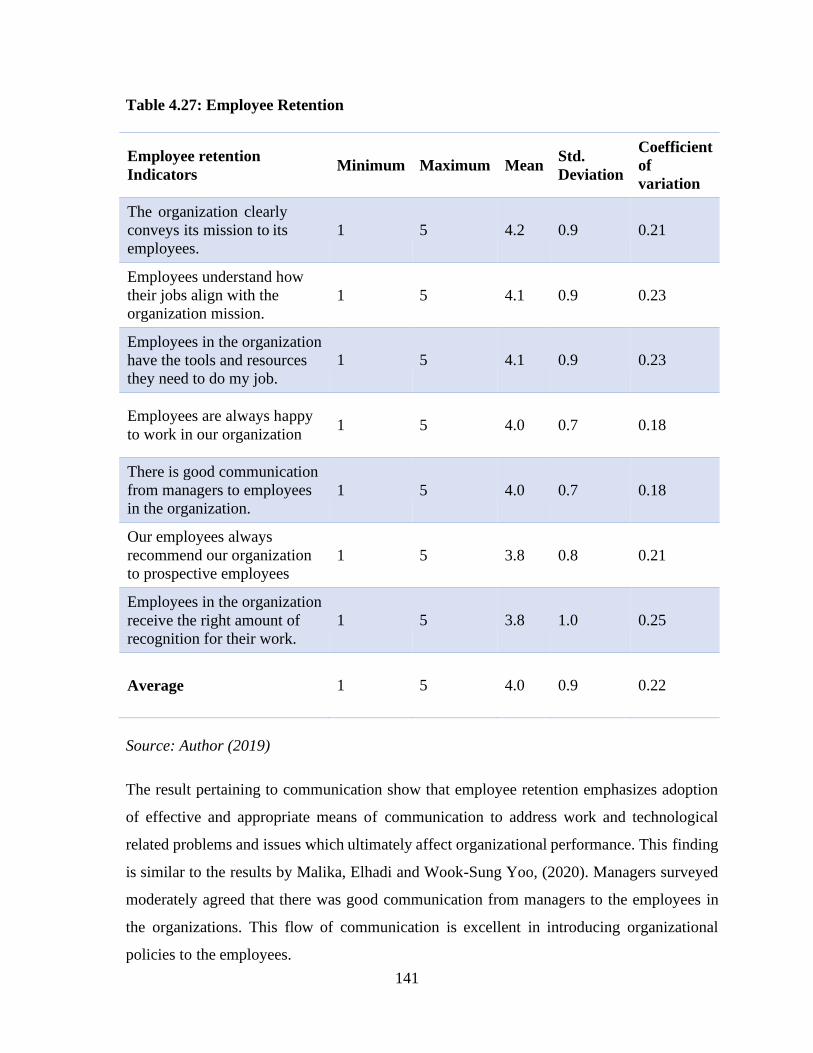
141
Table 4.27: Employee Retention
Employee retention
Indicators
Minimum
Maximum
Mean
Std.
Deviation
Coefficient
of
variation
The organization clearly
conveys its mission to its
employees.
1
5
4.2
0.9
0.21
Employees understand how
their jobs align with the
organization mission.
1
5
4.1
0.9
0.23
Employees in the organization
have the tools and resources
they need to do my job.
1
5
4.1
0.9
0.23
Employees are always happy
to work in our organization
1
5
4.0
0.7
0.18
There is good communication
from managers to employees
in the organization.
1
5
4.0
0.7
0.18
Our employees always
recommend our organization
to prospective employees
1
5
3.8
0.8
0.21
Employees in the organization
receive the right amount of
recognition for their work.
1
5
3.8
1.0
0.25
Average
1
5
4.0
0.9
0.22
Source: Author (2019)
The result pertaining to communication show that employee retention emphasizes adoption
of effective and appropriate means of communication to address work and technological
related problems and issues which ultimately affect organizational performance. This finding
is similar to the results by Malika, Elhadi and Wook-Sung Yoo, (2020). Managers surveyed
moderately agreed that there was good communication from managers to the employees in
the organizations. This flow of communication is excellent in introducing organizational
policies to the employees.

142
Nasir and Mahmood (2018) in their study on effect of employee retention on organizational
competence found that organizations use retention of their employees as a human resource
strategy. Employee retention involves having the right employees in the right positions within
the organization. Organizations also develop a training needs assessment to determine the
appropriate training required to improve the skills of employees and allow for either job
enrichment or enlargement.
This study investigated how advanced manufacturing technology affects employee retention.
Employees consider non-monetary factors as presented in this study, like, understanding how
their jobs align to the company mission, good and effective communication between managers
and employees, having the appropriate tools including technology to effectively carry out their
roles, and recognition in the process of carrying out their respective duties at work, as
important towards employee retention. Indeed, managing employee turnover is a big challenge
for organizations (Hayward, 2011).
Employee recruitment process can be very expensive when new prospective employees do not
have positive information about the organization. New employees seek information about their
prospective employers before making informed decisions on changing their jobs as a
safeguard to keeping their jobs after recruitment. New employees are also cautious in getting
deeply involved in the operations in a new job when they have limited or no communication
that is relevant to their work delivery. The findings of this study are therefore favourable to
Human Resource Managers as the executives surveyed to a moderate extent said that advanced
manufacturing technology made their employees recommended their organizations to
prospective employees.
Globalization has made it possible for employees to seek and get employers who are willing
to remunerate them according to their skill and education level. Therefore, employee mobility
has increased across organizations hampering strategy implementation, as the team of
employees keep on shifting from one organization to another similar organization as long as
they are promised an incremental benefit in excess of their current earnings. To maintain the
same workforce, the working environment should be conducive to the employees to feel they
belong. Respondents agree to a moderate extent that employees in their organizations were
always happy to work in their organization.
143
4.4 Tests of Hypotheses
This section presents the results for the tests of hypotheses as guided by the objectives of the
study. The objective of the study was to determine the relationship between advanced
manufacturing technology, competitive advantage, organizational resources and
organizational performance of large manufacturing companies in Kenya. The study
investigated four specific objectives. The first specific objective was to establish if there was
a significant relationship between advanced manufacturing technology and performance of
large manufacturing companies in Kenya. Advanced manufacturing technology which was
the independent variable of the study was operationalized through design technologies,
manufacturing technologies and planning technologies while both financial and non-financial
indicators were used to operationalize organizational performance.
The second specific objective of the study was to ascertain the role of competitive advantage
on the relationship between advanced manufacturing technology and performance of large
manufacturing companies in Kenya. Competitive advantage was operationalized using cost
leadership strategies, differentiation strategies and focus strategies. The third specific
objective was to determine the effect of organizational resources on the relationship between
advanced manufacturing technology and performance of large manufacturing companies in
Kenya. Organizational resources as a variable were operationalized in terms of assets, physical
facilities and employee capabilities.
The fourth specific objective was to establish the joint effect of advanced manufacturing
technology, competitive advantage and organizational resources on performance of large
manufacturing companies in Kenya. Financial and non-financial indicators were used to
operationalize the performance of large manufacturing companies in Kenya. Financial
indicators included the financial performance of the organizations for three years (2015, 2016,
and 2017) while non-financial indicators included customer satisfaction and employee
retention. The study developed hypotheses to investigate the specific objectives of the study
which were tested one at a time and to establish the statistical significance in the test of each
hypothesis, various forms of regression analysis were used. The study adopted 95%
confidence level in every inferential statistics test. The results for the first objective and
hypothesis one are presented in the next section.

144
4.4.1 Advanced Manufacturing Technology and Performance of Large Manufacturing
Companies in Kenya.
The first specific objective of the study was addressed using the following hypothesis:
H1: There is a significant relationship between advanced manufacturing technology and
performance of large manufacturing companies in Kenya
Simple regression analysis was used to test this hypothesis. The results are presented in Table
4.28. The model summary shows a moderately strong positive relationship between advanced
manufacturing technology and performance of large manufacturing companies in Kenya
(R=0.565). Results from the model summary also show that advanced manufacturing
technology accounts for 31.9% of variations in performance of large manufacturing
companies in Kenya while 68.1% of performance is accounted for by other extraneous factors
(R2= 0.319). These results show that advanced manufacturing technology has a positive effect
on the performance of large manufacturing organizations and the finding suggest that
organizations that invest in advanced manufacturing technology and implement it
appropriately realize better performance in the industry compared to organizations that fail to
embrace advanced manufacturing technology or do not implement it appropriately.
Results in Table 4.28 also provide the ANOVA summary statistics for the effect of advanced
manufacturing technology on performance of large manufacturing companies in Kenya. The
results show a significant F-ratio at a confidence level of 95% (F=19.662, p< .05). This is
evidence that the regression model attained goodness of fit and was thus appropriate for
analyzing data for this study.
Regression coefficients on the effect of advanced manufacturing technology on performance
of large manufacturing companies in Kenya are presented in Table 4.28. The results show that
advanced manufacturing technology statistically predicts performance of large manufacturing
companies in Kenya at a confidence level of 95% (β=.318, t = 4.434, p< .05). This implies that
a unit change in advanced manufacturing technology explains 0.318 of variance in performance
of large manufacturing companies in Kenya. Arising from these results, we fail to reject
hypothesis one (H1) that there is a significant relationship between advanced manufacturing
technology and performance of large manufacturing companies in Kenya.

145
Table 4.28: Regression Outcomes for the effect of Advanced Manufacturing
Technology on Performance of Large Manufacturing Companies in Kenya
Model Results
Summary
R R
Square Adjusted R Square
Std. Error of the Estimate
.565a
0.319
0.303
0.43722
ANOVA
Sum of
Squares Df Mean Square F Sig.
Regression 3.759 1 3.759 19.662 .000b
Residual 8.029 42 0.191
Total
11.787
43
Coefficients
Unstandardized
Coefficients
Standardized
Coefficients t Sig.
B Std. Error Beta
(Constant) 3.142 0.23
13.677 0.000
Advanced
Manufacturing
Technology
0.318
0.072
0.565
4.434
0.000
a. Dependent Variable: Performance of Large Manufacturing Companies in Kenya
b. Predictors: (Constant), Advanced Manufacturing Technology
Source: Author (2019)
From the regression output in Table 4.28 regression model for the test of hypothesis one can
be specified as follows:
Y= 3.142 + 0.318 AMT + ε
The fitted regression model shows a linear positive relationship between advanced
manufacturing technology and performance of large manufacturing companies in Kenya with
a gradient of 0.318, and an intercept of 3.142.

146
4.4.2 Advanced Manufacturing Technology, Competitive Advantage and Performance
of Large Manufacturing Companies in Kenya
Objective two was set to investigate the mediating role of competitive advantage (CA) in the
relationship between advanced manufacturing technology (AMT) and performance of large
manufacturing companies in Kenya (Y). To accomplish this, the following hypothesis was
formulated and tested using the four-step path model proposed by Baron and Kenny (1986),
Kenny (2018) and Rockwood and Hayes (2020).
H2: Competitive advantage mediates the relationship between advanced manufacturing
technology and performance of large manufacturing companies in Kenya.
The four steps suggested by Baron and Kenny (1986) and Kenny (2018) are interpreted as
follows:
Step I: Analysis using simple linear regression is used to confirm the significance of the
relationship between the independent and dependent study variables. This step is used in the
study to show whether a significant relationship exists between the two variables. Mediation
by a third variable can exist in a relationship between two variables only when there is a
significant relationship between them. If the effect is significant, the study proceeds to the
second step of mediation, as potential for mediation would have been supported.
Step II: Once again simple linear regression is used to test the significance of the relationship
between the independent variable of the study and the mediator as the dependent variable.
This is used to confirm whether there is a significant relationship between the two variables.
If the effect is significant, a high chance of mediation exists and the test for mediation
proceeds to the third step.
Step III: The mediator is used as the independent variable in simple linear regression analysis
to determine the significance of the relationship between the dependent variable and the
mediator. Once again if the effect is significant, the test proceeds to the fourth step as there is
a high chance for mediation. However, if the effect is not significant, the process is terminated,
since the possibility of mediation does not exist. The three steps are used to determine whether
zero-order relationships among the study variables exist or does not exist.

147
Step IV: The last step of the model proposed by Baron and Kenny (1987) and Kenny (2018)
is used to finally confirm mediation between the independent variable and the dependent
variable. In this step, the dependent variable is regressed on the independent variable and the
mediator simultaneously. Multiple regression analysis is used to carry out the mediation test
by controlling the mediating variable and testing the significance of the independent variable.
Mediation is supported by the multiple regression analysis results if the effect of the mediator
remains significant after controlling for the independent variable.
If the independent variable is not significant when the mediator is controlled, the finding
supports full mediation. If the independent variable is not significant but has a positive value
above zero, partial mediation is implied. In this study, the independent variable was advanced
manufacturing technology, the dependent variable was performance of large manufacturing
companies in Kenya, while the mediating variable was competitive advantage. The results of
the test of the second hypothesis (H2) are presented in the following section.
Step I: Advanced Manufacturing Technology and Performance of Large
Manufacturing Companies in Kenya
In the first step, a simple regression analysis was performed with advanced manufacturing
technology (AMT) predicting performance of large manufacturing companies in Kenya (Y).
Fig 4.5 shows Step I of the mediation test in the relationship between advanced manufacturing
technology and performance of large manufacturing companies in Kenya. The findings of
Step I are presented in table 4.29.
Fig 4.5: Advanced Manufacturing Technology and Performance of Large
Manufacturing Companies in Kenya
Independent variable Dependent variable
Performance of Large
Manufacturing Companies in Kenya
Advanced Manufacturing
Technology

148
Table 4.29: Regression Outcomes for the effect of Advanced Manufacturing
Technology on Performance of Large Manufacturing Companies in Kenya
Model Result
s
Summary
R R Square Adjusted R Square Std. Error of
the Estimate
.565a 0.319 0.303 0.43722
ANOVA
Sum of
Squares df Mean Square F Sig.
Regression 3.759 1 3.759 19.662 .000b
Residual 8.029 42 0.191
Total
11.787
43
Coefficient
s
Unstandardized
Coefficients
Standardized
Coefficients t Sig.
B Std. Error Beta
(Constant) 3.142 0.23
13.677 0.000
Advanced
Manufacturing
Technology
0.318
0.072
0.565
4.434
0.000
a. Dependent Variable: Performance of Large manufacturing Companies in Kenya
b. Predictors: (Constant), Advanced Manufacturing Technology
Source: Author (2019)
The results in Table 4.29 show a significant F-ratio (F= 19.662, p <.005). These results
confirm that the regression model attained goodness of fit, justifying the use of simple linear
regression. The effect of advanced manufacturing technology on performance of large
manufacturing companies in Kenya is also supported by the significance of the beta coefficient
(β=.318, t = 4.434, p< .05), which means that a unit change in advanced manufacturing
technology causes a change in large manufacturing companies performance by 31.9%.

149
There is evidence from these results that the first condition for inferring mediation is satisfied.
The process therefore proceeds to Step II. From the regression output in Table 4.29 regression
equation for step I of the mediation model can be specified as follows:
Y = 3.142 + 0.318 AMT + ε
Step II: Advanced Manufacturing Technology and Competitive Advantage
In the second step, competitive advantage was regressed on advanced manufacturing
technology. The findings are presented in Table 4.30.
Table 4.30: Regression Outcomes for the effect of Advanced Manufacturing
Technology on Competitive Advantage
Model Results
Summary
R R Square Adjusted R
Square Std. Error of the Estimate
.574a 0.329 0.313 0.4499
ANOVAa
Sum of
Square
s
Df Mean
Square F Sig.
4.176 1 4.176 20.63 .000b
Residual 8.501 42 0.202
Total 12.677 43
Coefficientsa
Unstandardized
Coefficients
Standardized
Coefficients t Sig.
B Std. Error Beta
(Constant) 2.888 0.236 12.217 0.000
Advanced
Manufacturing
Technology
0.335
0.074
0.574
4.542
0.000
a. Dependent Variable: Competitive Advantage
b. Predictors: (Constant), Advanced Manufacturing Technology
Source: Author (2019)

150
The model summary shows a moderately strong positive relationship between advanced
manufacturing technology and competitive advantage (R=0.574). Results from the model
summary also show that advanced manufacturing technology accounts for 32.9% of variations
in competitive advantage while 67.1% of competitive advantage is accounted for by other
extraneous factors (R2= 0.329). These results show that advanced manufacturing technology
has a positive effect on competitive advantage.
Results in Table 4.30 also provide the ANOVA summary statistics for the effect of advanced
manufacturing technology on competitive advantage. The results show a significant F-ratio at
a confidence level of 95% (F=20.63, p< .05). This is evidence that the regression model
attained goodness of fit and was thus appropriate for analyzing data for this study. Regression
coefficients for the effect of advanced manufacturing technology on competitive advantage
are also presented in Table 4.30. The analysis results show that advanced manufacturing
technology statistically predicts the value of competitive advantage at a confidence level of
95% (β=.335, t = 4.542, p< .05). This implies that a unit change in advanced manufacturing
technology explains 0.335 of variance in competitive advantage.
The regression for Step II can be specified as follows:
Y=2.888 + 0.335 AMT + ε
Arising from these results, there is a significant relationship between advanced manufacturing
technology and competitive advantage and there is evidence from these results that the second
condition for inferring mediation is satisfied. The process therefore proceeds to Step III.
Step III: Competitive Advantage and Performance of Large Manufacturing Companies
in Kenya
In the third step, a simple linear regression analysis was used to determine the effect of
competitive advantage on performance of large manufacturing companies in Kenya. The
model summary in Table 4.31 shows a moderately strong positive relationship between
competitive advantage and performance of large manufacturing companies in Kenya (R=
0.540). The results also show that competitive advantage explained 29.2% of change in
performance of large manufacturing companies in Kenya (R2=0.292)

151
Table 4.31: Regression Outcome for the effect of Competitive Advantage on
Performance of Large Manufacturing Companies in Kenya
Model Results
Summary
R R Square Adjusted
R Square
Std. Error of the Estimate
.540a 0.292 0.275 0.44589
ANOVAa
Sum of
Squares df Mean Square F Sig.
Regression 3.437 1 3.437 17.286 .000b
Residual 8.35 42 0.199
Total 11.787 43
Coefficientsa
Unstandardized
Coefficients
Standardized
Coefficients t Sig.
B Std. Error Beta
(Constant) 2.079 0.495 4.199 0.000
Competitive
Advantage 0.521 0.125 0.54 4.158 0.000
a. Dependent Variable: Performance of Large Manufacturing Companies in Kenya
b. Predictors: (Constant), Competitive Advantage
Source: Author (2019)
Regression coefficients for the effect of competitive advantage on performance of large
manufacturing companies in Kenya in Step III of the mediation model are presented in Table
4.31. The ANOVA results in the table show a significant F-ratio (F= 17.286, p <.005) which
confirms that the regression model was fit for use in the analysis. The results show that
advanced manufacturing technology has a significant effect on performance of large
manufacturing companies in Kenya (β=.521, t = 4.158, p< .05). This suggests that one unit of
increase in competitive advantage increases performance of large manufacturing companies
in Kenya by 0.521. Regression model for Step III can be specified as follows:
Y=2.079 + 0.521 AMT + ε
152
Arising from these results, there is a significant relationship between competitive advantage
and performance of large manufacturing companies in Kenya and there is evidence from these
results that the third condition for inferring mediation is satisfied. The process therefore
proceeds to Step IV.
Step IV: Advanced Manufacturing Technology, Competitive Advantage and
Performance of Large Manufacturing Companies in Kenya
The fourth step involved a multiple regression model with advanced manufacturing
technology (AMT) and competitive advantage (CA) as predictor variables and performance
of large manufacturing companies in Kenya (Y) as the criterion variable. Results are presented
in Table 4.32. As illustrated in the table, there is a strong correlation among advanced
manufacturing technology, competitive advantage and performance of large manufacturing
companies in Kenya (R=0.623). The results also show that advanced manufacturing
technology and competitive advantage together explained 38.8% of change in performance of
large manufacturing companies in Kenya (R2 = 0.388).
The ANOVA results in Table 4.32 show a significant F-ratio (F= 13.017, p <.005). These
results confirm that the regression model attained fitness justifying the use of multiple
regression model. The table also presents the regression coefficients for the effect of advanced
manufacturing technology and competitive advantage on performance of large manufacturing
companies in Kenya. The analysis results show that advanced manufacturing technology
statistically predicts the value of performance of large manufacturing companies in Kenya in
the presence of competitive advantage at a confidence level of 95% (β=.380, t = 2.547, p<.05).
This suggests that one unit of increase in advanced manufacturing technology in the presence
of competitive advantage increases performance of large manufacturing companies in Kenya
by 0.380.
Further, table 4.32 also shows that competitive advantage is also significant in predicting
performance of large manufacturing companies in Kenya in the presence of advanced
manufacturing technology (β=.322, t = 2.158, p< .05). This suggests that one unit of increase
in competitive advantage in the presence of advanced manufacturing technology increases
performance of large manufacturing companies in Kenya by 0.322. The regression model for
Step IV can be specified as follows: Y=2.246 + 0.380 AMT + 0.322 CA + ε

153
Table 4.32: Regression Outcomes for the Effect of Advanced Manufacturing
Technology and Competitive Advantage on Performance of Large
Manufacturing Companies in Kenya
Model Results
Summary
R R Square Adjusted R Square
Std. Error of the Estimate
.623a 0.388 0.359 0.41933
ANOVAa
Sum of Squares
Df Mean Square F Sig.
Regression 4.578 2 2.289 13.017 .000b
Residual 7.209 41 0.176
Total 11.787 43
Coefficientsa
Unstandardized Coefficients
Standardized Coefficients
t
Sig.
B Std. Error Beta
(Constant) 2.246 0.47 4.776 0.000
Advanced Manufacturing Technology
0.214
0.084
0.380
2.547
0.015
Competitive Advantage
0.310 0.144 0.322 2.158 0.037
a. Dependent Variable: Performance of Large Manufacturing Companies in Kenya
b. Predictors: (Constant), Competitive Advantage, Advanced Manufacturing Technology
Source: Author (2019)
To confirm full mediation in the study, it is required that, the coefficient for the effect of
competitive advantage on performance of large manufacturing companies in Kenya must be
significant while the coefficient for the effect of advanced manufacturing technologies on
performance of large manufacturing companies in Kenya should not be significant. These
results show that full mediation was not confirmed. Arising from these results, we reject
hypothesis two (H2) on full mediation that competitive advantage mediates the relationship
between advanced manufacturing technology and performance of large manufacturing
companies in Kenya. The summary for mediation is presented in Table 4.33

154
Table 4.33: Summary of Findings of the Test of Mediation
Step
Regression Model Results
Interpretation of results
Step I:
Effect of advanced
manufacturing technology
(AMT), on performance
of large manufacturing
companies in Kenya (P)
Simple regression model with
AMT predicting P.
Specified regression equation:
P = 3.142 + 0.318 AMT + ε
Results: F= 19.662, p <.005
Effect of AMT on P was
significant and the study
Proceeded to Step II as
potential for mediation
was confirmed.
Step II:
Effect of advanced
manufacturing technology
(AMT) on competitive
advantage (M)
Simple regression with AMT
predicting Competitive
advantage.
Specified regression equation:
M=2.888 + 0.335 AMT +ε
Results: F=20.63, p< .05 Effect
of AMT on competitive
advantage was significant and the
study proceeded to Step III as a
high chance of mediation exists.
Step III:
Effect of competitive
advantage (M) on
performance of large
manufacturing companies
in Kenya (P)
Simple regression analysis
with competitive advantage
predicting P.
Specified regression equation:
Y=2.079 + 0.521 AMT + ε
Results: F= 17.286, p <.005
Effect of competitive advantage on
performance of large
manufacturing companies in Kenya
was significant and the study
proceeded to Step IV as there is a
high chance of full mediation
Step IV:
Effect of advanced
manufacturing technology
(AMT) and competitive
advantage (M) on
performance of large
manufacturing companies
in Kenya (P)
Multiple regression with AMT
and M Predicting P
Specified regression equation
P=2.246 + 0.214 AMT + 0.310
M + ε
Results:
a) β=.310, t = 2.158, p< .05
Competitive advantage was
significant and,
b) β=.214, t = 2.547, p<.05
AMT was also significant
c) Arising from these results,
we reject hypothesis two
(H2) on FULL mediation
that competitive advantage
mediates the relationship
between advanced
manufacturing technology
and performance of large
manufacturing companies in
Kenya
Source: Author (2019)

155
4.4.3 Advanced Manufacturing Technology, Organizational Resources and
Performance of Large Manufacturing Companies in Kenya.
The third objective of the study was to determine the effect of organizational resources on the
relationship between advanced manufacturing technology and performance of large
manufacturing companies in Kenya. To accomplish this, the following hypothesis was
formulated and tested using the three-step model (Baron & Kenny, 1986; Kenny, 2018).
H3: The relationship between advanced manufacturing technology and performances of large
manufacturing companies in Kenya is moderated by organizational resources
The three steps suggested by Kenny (2018) and Baron and Kenny (1986) are interpreted as:
Step I: Simple linear regression analysis is used to confirm the significance of the relationship
between the independent and dependent study variables. This step is used in the study to show
whether a significant relationship exists between the two variables which is a pre-requisite for
moderation. This step allows the next steps of moderation to determine the effect of the
moderator on the relationship between the independent variable and the dependent variable.
Step II: Multiple regression analysis with the independent variable and the moderating
variable as predictors and the dependent variable as the criterion variable is done. The analysis
is used to determine the effect of both variables on the dependent variable as well as the model
which should be significant for the analysis to proceed to the third step.
Step III: The interaction term of the independent variable and the moderator variable is
introduced in the multiple regression model that was used to analyze the independent variable,
moderating variable and the dependent variable. To confirm moderation, the effect of the
interaction term should be significant. Complete moderation occurs when the independent
variable and the moderator variable are not significant with the interaction term added or If
the independent variable and moderator are significant after adding the interaction term. Data
collected in the study on advanced manufacturing technology as the independent variable,
organizational resources as the moderating variable and performance of large manufacturing
companies in Kenya as the dependent variable were used in this analysis. The results of the
test of the third hypothesis (H3) are presented in the following section.

156
The first step of testing for moderation used simple regression analysis to test the relationship
between advanced manufacturing technology and performance of large manufacturing
companies in Kenya. The results are presented in Table 4.34 model 1. The model summary
shows a moderately strong positive relationship between advanced manufacturing technology
and performance of large manufacturing companies in Kenya (R=0.565). Results from the
model summary also show that advanced manufacturing technology accounts for 31.9% of
variations in performance of large manufacturing companies in Kenya (R2= 0.319).
Results in Table 4.34 model 1 also provide the ANOVA summary statistics for the effect of
advanced manufacturing technology on performance of large manufacturing companies in
Kenya. The results show a significant F-ratio at a confidence level of 95% (F=19.662, p< .05).
This is evidence that the regression model attained goodness of fit and was thus appropriate
for analyzing data for this study.
Regression coefficients for the effect of advanced manufacturing technology on performance
of large manufacturing companies in Kenya presented in Table 4.34 model 1 show that
advanced manufacturing technology statistically predicts the value of performance of large
manufacturing companies in Kenya at a confidence level of 95% (β=.318, t = 4.434, p< .05).
This implies that a unit change in advanced manufacturing technology explains 0.318 of
variance in performance of large manufacturing companies in Kenya. Arising from these
results, the analysis proceeds to the second step of testing for moderation in which multiple
linear regression analysis was done to establish the joint effect of organizational resources and
advanced manufacturing technology on performance of large manufacturing companies in
Kenya.
The results for step two are presented in Table 4.34 model 2 and show a strong relationship
among organizational resources, advanced manufacturing technology and performance of
large manufacturing companies in Kenya (R=0.698). Results from the model summary also
show the joint effect of advanced manufacturing technology and organizational resources
accounts for 48.7% of variations in performance of large manufacturing companies in Kenya
(R2= 0.487). Further, The ANOVA results in Table 4.34 model 2 show a significant F-ratio
(F= 19.429, p <.005). This confirms that the regression model attained goodness of fit,
justifying use of multiple regression model.

157
Table 4.34: Combined Regression Analysis Results for Moderation Test
Model
Summary
R R Square Adjusted R Square Std. Error of the
Estimate
1 .565a 0.319 0.303 0.43722
2 .698a 0.487 0.462 0.38419
3 .702a 0.493 0.455 0.38662
Anova
F Sig.
1 Regression 19.662 .000b
2 Regression 19.429 .000b
3 Regression 12.952 .000b
Coefficients
Unstandardized Coefficients
Standardized Coefficients
t Sig.
B
Std. Error
1
(Constant) 3.142 0.23 13.677 0.000
Advanced
Manufacturing
Technology
0.318
0.072
0.565
4.434
0.000
2
(Constant) 1.912 0.392 4.876 0.000
Advance
Manufacturing
Technology
0.199
0.071
0.353
2.802
0.008
Organizational Resources
0.391 0.107 0.461 3.66 0.001
3
(Constant) 1.244 1.037 1.199 0.237
Advanced
Manufacturing
Technology
0.471
0.397
0.837
1.186
0.242
Organizational Resources
0.565 0.272 0.666 2.079 0.044
(OR *AMT) -0.069 0.098 0.611 -0.697 0.49
Source: Author (2019)
Model 1: Predictors, Advanced manufacturing technology; Dependent variable, performance of
large manufacturing companies in Kenya.
Model 2: Predictors, organizational resources, Advanced manufacturing technology; Dependent
variable, performance of large manufacturing companies in Kenya.
Model 3: Predictors, (OR*AMT), Organizational resources, Advanced manufacturing
technology; Dependent variable, Performance of large manufacturing companies in
Kenya

157
The table also presents the regression coefficients for the effect of advanced manufacturing
technology and organizational resources on performance of large manufacturing companies
in Kenya. The analysis results show that advanced manufacturing technology statistically
predicts the value of performance of large manufacturing companies in Kenya in the presence
of organizational resources at a confidence level of 95% (β=.353, t = 2.802, p<.05). This
suggests that one unit of increase in advanced manufacturing technology in the presence of
organizational resources increases performance of large manufacturing companies in Kenya
by 0.353.
Further, table 4.34 model 2 show that organizational resources is also significant in predicting
performance of large manufacturing companies in Kenya in the presence of advanced
manufacturing technology (β=.461, t = 3.660, p< .05). This suggests that one unit of increase
in organizational resources in the presence of advanced manufacturing technology increases
performance of large manufacturing companies in Kenya by 0.461. Arising from these results,
there is a significant relationship between advanced manufacturing technology and
organizational resources on the performance of large manufacturing companies in Kenya and
there is evidence from these results that the second condition for inferring moderation is
satisfied as both the variables in the model and the model itself are significant. The process
therefore proceeds to the third step of testing for moderation.
In the third step, the interaction term (OR*AMT) was introduced into the regression model
that had advanced manufacturing technology and organizational resources. Performance of
large manufacturing companies in Kenya was then regressed on the three predictors. Results
are presented in Table 4.34 model 3. As shown in the table, the relationship among advanced
manufacturing technology, organizational resources, the interaction term (OR*AMT) and
performance of large manufacturing companies in Kenya is strong (R=0.702). The results also
show that advanced manufacturing technology, organizational resources and the interaction
term (OR*AMT) together explained 49.3% of change in performance of large manufacturing
companies in Kenya (R2 = 0.493). The ANOVA results in Table 4.34 model 3 show a
significant F-ratio (F= 12.952, p <.005). These results confirm that the regression model
attained fitness justifying the use of multiple regression model.

159
Regression coefficients for the three steps of moderation show that in the first step in Table
4.34 model 1, advanced manufacturing technology statistically predicts the value of
performance of large manufacturing companies in Kenya at a confidence level of 95%
(β=.318, t = 4.434, p< .05). In the second step, advanced manufacturing technology
statistically predicts the value of performance of large manufacturing companies in Kenya in
the presence of organizational resources at a confidence level of 95% (β=.353, t = 2.802,
p<.05) and also organizational resources is significant in predicting performance of large
manufacturing companies in Kenya in the presence of advanced manufacturing technology
(β=.461, t = 3.660, p< .05). In the third step, the β coefficients of advanced manufacturing
technology was 0.837 while the β coefficient of organizational resources was 0.666.
Further, the table also presents the regression coefficients for the effect of advanced
manufacturing technology, organizational resources and the interaction term on performance
of large manufacturing companies in Kenya. The analysis results show that advanced
manufacturing technology does not statistically predict the value of performance of large
manufacturing companies in Kenya in the presence of organizational resources and the
interaction term at a confidence level of 95% (β=.837, t = 1.186, p>.05). The results also show
that organizational resources statistically predict the value of performance of large
manufacturing companies in Kenya in the presence of advanced manufacturing technology
and the interaction term (OR*AMT) at a confidence level of 95% (β=.666, t = 2.079,
p<.05).The results in Table 4.34 also show that the interaction term is not significant in the
relationship between advanced manufacturing technology and organizational resources with
performance of large manufacturing companies in Kenya (β= -0.611, t = -0.697, p>.05)
The results in step three of the moderation model provided insufficient evidence to support
the third hypothesis (H3) that the relationship between advanced manufacturing technology
and performance of large manufacturing companies in Kenya is moderated by organizational
resources. Arising from these results, we reject Hypothesis three (H3) that resources moderate
the relationship between advanced manufacturing technology and performance of large
manufacturing companies in Kenya. These results contradict Prescott (1986) results that
environment modify the strength of the relationship between strategic variables and
performance.

160
Table 4.35: Summary of Findings of the Test of Moderation
Step
Regression Model Results
Interpretation of results
Step I:
Effect of advanced
manufacturing technology
(AMT), on performance
of large manufacturing
companies in Kenya (P)
Simple regression model with
AMT predicting P.
Specified regression equation:
P = 3.142 + 0.318 AMT + ε
Results: F= 19.662, p <.005
Effect of AMT on P was
significant and the study
Proceeded to Step II as
potential for moderation
in the relationship
between advanced
manufacturing
technology and
performance of large
manufacturing
companies in Kenya was
confirmed.
Step II:
Multiple regression with
advanced manufacturing
technology and
organizational resources
as the predictor variables
and performance of large
manufacturing companies
in Kenya as criterion
variable
Effect of advanced manufacturing
technology on performance of
large manufacturing companies in
Kenya in the presence of
organizational resources. Results
at a confidence level of 95%
β=.353, t = 2.802, p<.05.
The analysis results show that
advanced manufacturing
technology statistically predicts
the value of performance of large
manufacturing companies in
Kenya in the presence of
organizational resources.
Effect of organizational resources
on performance of large
manufacturing companies in
Kenya in the presence of advanced
manufacturing technology. Results
at a confidence level of 95%
β=.461, t = 3.660, p< .05.
Results show that organizational
resources is significant in
predicting performance of large
manufacturing companies in
Kenya in the presence of
advanced manufacturing
technology
The model was significant with F= 19.429, and p <.005. Proceed to
step III as potential for moderation exists.
Step III:
Effect of interaction term
(AMT*OR) on the
multiple regression of
advanced manufacturing
technology and
organizational resources
on performance of large
manufacturing companies
in Kenya
Multiple regression with the
interaction term (AMT*OR)
introduced in the multiple
regression in STEP II. Effect of
the interaction term (AMT*OR) at
a confidence of 95% β= -0.611, t =
-0.697, p>.05)
Results show that the interaction
term is not significant in the
relationship between advanced
manufacturing technology and
organizational resources with
performance of large
manufacturing companies in
Kenya. Hence we reject hypothesis
(H3).
Source: Author (2019)

161
4.4.4 The Joint Effect of Advanced Manufacturing Technology, Competitive Advantage,
Organizational Resources on Performance of Large Manufacturing Companies in
Kenya.
The study sought to establish whether the joint effect of advanced manufacturing technology,
competitive advantage and organizational resources was greater than their individual effects
on performance of large manufacturing companies in Kenya. The following hypothesis was
formulated and tested:
H4: There is a significant joint effect of advanced manufacturing technology, competitive
advantage and, organizational resources on the performance of large manufacturing
companies in Kenya.
Simple and multiple linear regression analyses were used to test this hypothesis. The results
are presented in table 4.35, 4.36, 4.37 and 4.38. The simple linear regression analyses were
performed to allow for comparison of the findings with the findings of the joint effect of all
the three predictor variables on the performance of large manufacturing companies in Kenya.
The results in Table 4.35 indicate a moderately strong and significant relationship between
advanced manufacturing technology and performance of large manufacturing companies in
Kenya (R=0.565). Results from the model summary also show that advanced manufacturing
technology accounts for 31.9% of variations in performance of large manufacturing
companies in Kenya (R2= 0.319). Further, the ANOVA and coefficient summary statistics
show a significant F-ratio at a confidence level of 95% (F=19.662, p< .05) and also that
advanced manufacturing technology statistically predicts the value of performance of large
manufacturing companies in Kenya at a confidence level of 95% (β=.318, t = 4.434, p< .05).
The model summary results in Table 4.36 show a moderately strong positive relationship
between competitive advantage and performance of large manufacturing companies in Kenya
(R=0.540). Results from the model summary also show that competitive advantage accounts
for 29.2% of variations in performance of large manufacturing companies in Kenya while
70.8% of performance is accounted for by other extraneous factors (R2= 0.292). These results
show that competitive advantage has a positive effect on the performance of large
manufacturing organizations and the finding suggest that competitive advantage allows large
manufacturing companies in Kenya to improve their performance.

162
Table 4.36: Regression Outcomes for the effect of Advanced Manufacturing
Technology on Performance of Large Manufacturing Companies in Kenya
Model Results
Summary
R R
Square Adjusted R Square
Std. Error of the Estimate
.565a 0.319 0.303 0.43722
a. Predictors: (Constant), Advanced Manufacturing Technology
ANOVA
Sum of
Squares df Mean Square F Sig.
Regression 3.759 1 3.759 19.662 .000b
Residual 8.029 42 0.191
Total 11.787 43
a. Dependent Variable: Organizational Performance
b. Predictors: (Constant), Advanced Manufacturing Technology
Coefficients
Unstandardized
Coefficients
Standardized
Coefficients t Sig.
B Std. Error Beta
(Constant) 3.142 0.23
13.677 0.000
Advanced
Manufacturing
Technology
0.318
0.072
0.565
4.434
0.000
a. Dependent Variable: Organizational Performance
Source: Author (2019)
Results in Table 4.36 also provide the ANOVA summary statistics for the effect of
competitive advantage on performance of large manufacturing companies in Kenya. The
results show a significant F-ratio at a confidence level of 95% (F=17.286, p< .05). Further,
regression coefficients for the effect of competitive advantage on performance of large
manufacturing companies in Kenya in Table 4.36 show that competitive advantage statistically
predicts the value of performance of large manufacturing companies in Kenya at a confidence
level of 95% (β=.521, t = 4.151, p< .05). This implies that a unit change in competitive
advantage explains 0.521 of variance in performance of large manufacturing companies in
Kenya.

163
Table 4.37: Regression Outcome for the effect of Competitive Advantage on
Performance of Large Manufacturing Companies in Kenya
Model Results
Summary
R R
Square Adjusted
R Square
Std. Error of the Estimate
.540a 0.292 0.275 0.44589
a. Predictors: (Constant), Competitive Advantage
ANOVAa
Sum of
Squares df
Mean
Square F Sig.
Regression 3.437 1 3.437 17.286 .000b
Residual 8.35 42 0.199
Total 11.787 43
a. Dependent Variable: Organizational Performance
b. Predictors: (Constant), Competitive Advantage
Coefficientsa
Unstandardized Coefficients
Standardized Coefficients
t Sig.
B Std. Error Beta
(Constant) 2.079 0.495
4.199 0.000
Competitive Advantage
0.521 0.125 0.54 4.158 0.000
a. Dependent Variable: Organizational Performance
Source: Author (2019)
The results in Table 4.37 indicate a strong and significant correlation between organizational
resources and performance of large manufacturing companies in Kenya (R=0.623). Results
from the model summary also show that organizational resources accounts for 38.8% of
variations in performance of large manufacturing companies in Kenya (R2= 0.388). Further,
the ANOVA and coefficient summary statistics show a significant F-ratio at a confidence level
of 95% (F=26.655, p< .05) and also that organizational resources statistically predict the value
of performance of large manufacturing companies in Kenya at a confidence level of 95%
(β=.528, t = 5.163, p< .05). This implies that a unit increase in organizational resources
increases performance of large manufacturing companies in Kenya by 0.528 units.

164
Table 4.38: Regression Outcome for the effect of Organizational Resources on
Performance of Large Manufacturing Companies in Kenya
Model Results
Summary
R
R Square Adjusted
R Square
Std. Error of the Estimate
.623a 0.388 0.374 0.41435
a. Predictors: (Constant), Organizational Resources
Anova
Sum of
Squares df
Mean
Square F Sig.
Regression 4.576 1 4.576 26.655 .000b
Residual 7.211 42 0.172
Total 11.787 43
a. Dependent Variable: Organizational Performance
b. Predictors: (Constant), Organizational Resources
Coefficients
Unstandardized Coefficients
Standardized Coefficients
t
Sig.
B
Std. Error
Beta
(Constant) 1.961 0.423
4.641 0.000
Organizational Resources
0.528 0.102 0.623 5.163 0.000
a. Dependent Variable: Organizational Performance
Source: Author (2019)
A multiple regression analysis was performed to test the joint effect of all the predictor
variables on performance of large manufacturing companies in Kenya. The results are
presented in Table 4.38. It is evident from the table that the strength of the relationship
advanced manufacturing technology, competitive advantage, organizational resources, and
performance of large manufacturing companies in Kenya is strong (R=0.701). The results
show that the joint effect of advanced manufacturing companies, competitive advantage and
organization resources account for 49.2% of variations in performance of large manufacturing
companies in Kenya (R2 = 0.492). The results suggest that organizations that correctly
implement advanced manufacturing technologies in their operations, own strategic resources
and develop competitive advantage in their industries expect to improve their performance.
Further, the results also indicate that 50.8% of performance in large manufacturing companies
in Kenya is accounted for by other factors that were not considered in this study.

165
Table 4.39: Regression Results for the joint Effect of Advanced Manufacturing
Technology, Competitive Advantage, Organizational Resources on
Performance of Large Manufacturing Companies in Kenya.
Model Results
Summary
R
R Square
Adjusted
R Square
Std. Error of
the Estimate
.701a 0.492 0.454 0.38699
ANOVA
Sum of
Squares
df
Mean Square
F
Sig.
Regression
5.797
3
1.932
12.903
.000b
Residual 5.99 40 0.15
Total 11.787 43
Coefficients
Unstandardized
Coefficients
Standardized
Coefficients
t
Sig.
B
Std. Error
Beta
(Constant) 1.752 0.467
3.752 0.001
Advanced
Manufacturing
Technology
0.178
0.079
0.316
2.266
0.029
Competitive Advantage
0.097 0.152 0.101 0.640 0.526
Organizational
Resources 0.352 0.123 0.415 2.853 0.007
a. Dependent Variable: Organizational Performance
b. Predictors: (Constant), Organizational Resources, Advanced Manufacturing Technology, Competitive Advantage
Source: Author (2019)

166
The ANOVA results in Table 4.38 showing a significant (F= 12.903, p <.005) is a
confirmation that regression model attained goodness of fit justifying the use of multiple
regression model. Further, using the standardized coefficients, regression results in Table 4.42
show that advanced manufacturing technology statistically predicts the value of performance
of large manufacturing companies in Kenya in the presence of competitive advantage and
organizational resources at a confidence level of 95% (β = .316, t = 2.266, p< .05). This
suggests that one unit of increase in advanced manufacturing technology in the presence of
competitive advantage and organizational resources increases performance of large
manufacturing companies in Kenya by 0.316 units.
Results in table 4.38 also show that competitive advantage is not statistically significant in
predicting the value of performance of large manufacturing companies in Kenya in the
presence of advanced manufacturing technology and organizational resources at a confidence
level of 95% (β = .101, t = 2.266, p>.05). Further, the results show that organizational
resources statistically predict the value of performance of large manufacturing companies in
Kenya in the presence of advanced manufacturing technology and competitive at a confidence
level of 95% (β = .415, t = 2.266, p< .05). This suggests that one unit of increase in
organizational resources in the presence of advanced manufacturing technology and
competitive advantage increases performance of large manufacturing companies in Kenya by
0.415 units.
From the regression output in Table 4.38 regression model for the test of hypothesis one can
be specified as follows:
Y = 1.752 + 0.316 AMT + 0.101 CA + 0.415 OR
These results confirm the hypothesis that the joint effect of advanced manufacturing
technology, competitive advantage and organizational resources on performance of large
manufacturing companies in Kenya is greater than the effect of each variable on the said
performance. Table 4.39 presents a summary of the results on the tests of the hypotheses the
study used to investigate the relationship between advanced manufacturing technology,
competitive advantage, organizational resources and performance of large manufacturing
companies in Kenya.

167
Table 4.40: Summary of Tests of the Hypotheses and Results
Objective Hypothesis Research Findings Remarks on
Study Hypothesis
Objective 1: To
establish the
effect of
Advanced
manufacturing
technology on
performance of
large
manufacturing
companies in
Kenya
H1: There is a
significant
relationship
between advanced
manufacturing
technology and
performance of
large manufacturing
companies in
Kenya.
The results indicated that:
There was a significant
relationship between advanced
manufacturing technology and
performance of large
manufacturing companies in
Kenya.
Advanced manufacturing
technology has a positive effect on
the performance of large
manufacturing organizations
FAILED TO
REJECT
hypothesis (H1)
arising from the
results of the study
Objective 2: To
ascertain the role
of competitive
advantage on the
relationship
between
advanced
manufacturing
technology and
performance of
large
manufacturing
companies in
Kenya.
H2: Competitive
advantage mediates
the relationship
between advanced
manufacturing
technology and
performance of
large manufacturing
companies in
Kenya.
The results show that:
Competitive advantage was
significant in the presence of
advanced manufacturing
technology in the relationship with
performance of large
manufacturing companies in
Kenya
Advanced manufacturing
technology was significant in the
presence of competitive advantage
in the relationship between
advanced manufacturing
technology and performance of
large manufacturing companies in
Kenya
The hypothesis
(H2) on full
mediation was
REJECTED
arising from the
results of the study

169
Table 4.40: Summary of Tests of the Hypotheses and Results ….Cont.
Objective
Hypothesis Research Findings
Remarks on
Study Hypothesis
Objective 3: To
determine the
effect of
organizational
resources on the
relationship
between
advanced
manufacturing
technology and
performance of
large
manufacturing
companies in
Kenya
H3: Organizational
resources moderate
the relationship
between advanced
manufacturing
technology and
performances of
large manufacturing
companies in
Kenya.
The results indicated that:
The interaction term (advanced
manufacturing
technology*organizational
resources) on performance of large
manufacturing companies in
Kenya was NOT significant in the
relationship between advanced
manufacturing technology and
Performance of large
manufacturing companies in
Kenya
The hypothesis
(H3) was
REJECTED
arising from the
results of the
study.
Objective 4: To
establish the joint
effect of
advanced
manufacturing
technology,
competitive
advantage and,
organizational
resources on
performance of
large
manufacturing
companies in
Kenya.
H4: There is a
significant
combined effect of
advanced
manufacturing
technology,
competitive
advantage and,
organizational
resources on
performance of
large manufacturing
companies in
Kenya.
The results indicated that there was a
significant joint effect of advanced
manufacturing technology,
competitive advantage, and
organizational resources on
performance of large manufacturing
companies in Kenya.
Failed to
REJECT
hypothesis (H4)
arising from the
results of the study
Source: Author (2019)

169
4.5 Discussion of Findings
The study developed four objectives to investigate the relationships between the study
variables. The first objective of the study was to establish the effect of advanced
manufacturing technology on performance of large manufacturing companies in Kenya. The
second objective was to ascertain the role of competitive advantage on the relationship
between advanced manufacturing technology and performance of large manufacturing
companies in Kenya. The third objective was to determine the role of organizational resources
on the relationship between advanced manufacturing technology and performance of large
manufacturing companies in Kenya and the fourth objective developed by the study was to
establish the joint effect of advanced manufacturing technology, competitive advantage, and
organizational resources on performance of large manufacturing companies in Kenya.
Further, the study tested four conceptual hypotheses. The first conceptual hypothesis (H1)
tested if there was a significant relationship between advanced manufacturing technology and
performance of large manufacturing companies in Kenya. The second hypothesis (H2) tested
the mediation effect of competitive advantage on the relationship between advanced
manufacturing technology and performance of large manufacturing companies in Kenya. The
third hypothesis (H3) was used to test the moderation effect on the same relationship while
the fourth hypothesis (H4) was used to establish whether the joint effect of advanced
manufacturing technology, competitive advantage and organizational resources was greater
than their individual effects on performance of large manufacturing companies in Kenya
To establish the statistical significance in the test of each hypothesis, various forms of
regression analysis were used. The discussion of the results was based on four areas that
included determining the strength of the relationship between the variables (R), the proportion
of the variance for a dependent variable that was explained by an independent variable or
variables in a regression model (R2), the appropriateness of the model used to test the data (F-
statistic) and the significance of the regression model at a 95% level of confidence (p-Value).
The discussion of the results was also based on what the findings mean in relation to the
theoretical foundation adopted by the study, the observed consistency and inconsistencies of
the results with previous similar studies and unique findings of the study. The discussion is
aligned to the research objectives.
170
4.5.1 Advanced Manufacturing Technology and Performance of Large Manufacturing
Companies in Kenya
The first objective of the study was intended to investigate the effect of advanced
manufacturing technology on performance of large manufacturing companies in Kenya. In
order to achieve this objective, the hypothesis that there is a significant relationship between
advanced manufacturing technology and performance of large manufacturing companies in
Kenya was developed and tested. Advanced manufacturing technology was operationalized
by design technologies, manufacturing technologies and planning technologies. Financial and
non-financial indicators were used to operationalize performance. The following dominant
findings of the study are discussed.
First, the results in Table 4.28 revealed a moderately strong positive relationship between
advanced manufacturing technology and performance of large manufacturing companies in
Kenya (R=0.565, R2= 0.319, β=.318, t = 4.434, F=19.662, p< .05). This implies that change
in advanced manufacturing technology influences a change in organizational performance.
This finding also suggests that organizations that invest in advanced manufacturing technology
and implement it appropriately realize better performance in the industry compared to
organizations that fail to embrace advanced manufacturing technology or do not implement it
appropriately. Further, the findings indicate that advanced manufacturing technology allows
organizations to compete effectively both in the local market and the export or global markets
as demonstrated by García-Sánchez, García-Morales and Martín-Rojas (2018), who found in
their study that organizations use technology to maintain product positioning and sustain their
developed competitive advantage as one way of improving their performance.
Second, the study found that large manufacturing companies use advanced manufacturing
technology to a moderate extent in their operations. High investment costs limit utilization of
advanced manufacturing technology by large manufacturing companies despite the benefits
associated with technology. The findings of the current study are similar with Zahra and
George (2002), Tracey, Vonderembse, and Lim (1998) and Ren (2019) who found that large
manufacturing companies invest and utilize technology in their operations to a moderate
extent due to their high technology capabilities and the resources they own that allows them
to respond to the new shift in the manufacturing environment caused by globalization.
171
The findings in this study on application of advanced manufacturing technology are similar
to the findings by Haruna, Gakure and Orwa (2015) in a study in 250 small manufacturing
firms in Kaduna, Nigeria. Haruna, et. al. (2015) found that advanced manufacturing
technology had a significant and positive relationship with performance of small and medium
companies as the organizations that applied advanced manufacturing technology in their
production process reported better performance compared to those that did not. Further, the
finding of this study support the finding by Hasan, Nuri, Turan, and Tolga (2013); Walters
(2008); Gunawardana (2006); Sohal and Schroder (1999); Small and Yasin (1997); Sohal
(1996) and Swamidass (1995); that organizations improve their performance when they apply
advanced manufacturing technology in managing their manufacturing processes.
Manufacturing companies observe increased product quality, reduced lead-times, and greater
flexibility when they apply advanced manufacturing technology.
The third finding of the study was that large manufacturing organizations in Kenya use
planning technologies more than either design technologies or manufacturing technologies in
their operations. This finding supports the finding by Nyori and Ogolla (2015) who found that
large manufacturing companies had a bias in investing in planning technologies. Management
in manufacturing organizations have the responsibility to choose the type of technology to
adopt as it must fit the manufacturing process based on the technology acceptance model and
innovation diffusion. Further, the chosen technology should have positive characteristics and
outcomes to performance such as cognitive usefulness and ease of use, relative superiority
and ease of compatibility (Davis, 1986, 1989; Davis, Bagozzi, & Warshaw. 1989; Venkatesh,
2000; Tatnall, 2011 Jones, Lanctot, & Teegen,2001).
The finding in this study also show that manufacturing companies apply both design
technologies and manufacturing technologies to a moderate extent in their manufacturing
processes while applying planning technologies to a great extent. These results support the
findings by José, José, Julio, José, and Jorge, (2019); Yungao Ma and Weixuan (2019);
Saberia, and Yusuff, (2011). Finding in this study on application of design technologies and
manufacturing technologies are consistent with production methods as product design should
incorporate the methods to be used in manufacturing the product to achieve the desired output.
172
The finding in this study on the application of design technologies and manufacturing
technologies also supports the findings by Muogbo (2013) who found that manufacturing
organizations apply both design technologies and manufacturing technologies to mitigate
manufacturing challenges associated with global competition, develop and achieve
competitive advantage to enhance their performance relative to other manufacturing
companies. Manufacturing companies apply both product design technologies and
manufacturing technologies to optimize their existing manufacturing capabilities and reduce
the time production managers need to introduce new tools, jigs and attachments in the
production process to manage manufacture of complex products ultimately increasing the
overall production efficiency.
The study found that the most applied technology out of the three technology dimensions
considered in the study were planning technologies. It was noted from the study that five of
the most widely used technologies in the production process were; enterprise resource
planning, materials requirement planning, management information systems, total quality
management and customer relationship management. The study also found that enterprise
resource planning was the most widely used technology by organizations while the application
of industrial robots was the least used technology. This supports the finding by Duplaga and
Astani (2003) who found that enterprise resource planning is widely used to manage
information and organizations by integrating processes, information and employees across all
functions allowing organizations to share information on a single database in real- time,
compared to any other advanced manufacturing technology.
The study found the application of enterprise resource planning technology was high in
response to the new operating environment. Globalization has made manufacturing
companies seek better ways to achieve quick customer response, on-time customer order
deliveries, optimized inventory levels and, better resource management to improve their
performance, which they manage using enterprise resource planning technologies.
Application of industrial robot technologies was observed to be low in the study. This supports
the finding by Carbonero, Ernst and Weber, (2018) on the application of industrial robots in
developing economies.

173
Fourth, the findings of the study revealed that most organizations had implemented a
manufacturing strategy as part of their corporate strategy. Organizations implement a
manufacturing strategy with the realization that global trade is based on goods and not services
while services depend on manufactured goods. Manufacturing has also been considered as the
key to economic growth. This result supports the result by Skinner (1996) who found that
organizations develop manufacturing strategies to create a high-quality manufacturing sector
to improve their performance. Mass production systems are used by manufacturing companies
use traditional production methods to achieve high production efficiency at low total unit
production costs. Agile production systems incorporate advanced manufacturing systems in
their production systems to enhance these benefits.
Further, manufacturing companies achieve their objectives when they align their
manufacturing strategies to their corporate and business level strategies. According to Ward,
Leong and Boyer (1994), aligning these strategies allows management to choose appropriate
technologies to employ while utilizing the existing employee capabilities to improve
organizational performance and also link intelligent networking of machines and processes in
their industry with the aid of information and communication technology. This observation
explains the exogenous factors that were not part of the study and were found to affect the
relationship between advanced manufacturing technology and performance of large
manufacturing companies in Kenya which also agrees with the finding by Hayes and Pissano,
(1994).
Although the finding of this study revealed a positive relationship between advanced
manufacturing technology and performance of large manufacturing companies in Kenya,
other studies have observed no improvement in performance attributed to the use of advanced
manufacturing technology in the production process. The empirical study by Gichunge
(2007) and Dean and Snell (1996) found that advanced manufacturing technology on its own,
is not sufficient to enable organizations achieve lower costs of production, better quality, and
higher performance. Therefore, the significance of other variables that include the working
environment, nature of production processes, organizational goals and, competencies
involved in the relationship between advanced manufacturing strategy and organizational
performance is also important in determining the expected outcome (Thomson, 1972).

174
Empirical results of the current study revealed that advanced manufacturing technology
accounts for 31.9% of performance in large manufacturing companies in Kenya while 68.1%
is explained by other exogenous factors. This finding supports the finding by Raymond (2005),
Lei, Hitt, and Goldhar, (1996), Nyori (2015), and Ern, Abdullah, and Yau, (2015) who also
found that advanced manufacturing technology on its own does not confer better performance
for organizations. The finding from these studies show that although there was a significant
positive relationship between advanced manufacturing technology and performance in
organizations with regard to increased productivity, cost reductions, flexibility, and quality
integration there were still other variables that organizations had to consider to realize the full
benefits of using advanced manufacturing technologies. These studies identified
organizational structure, organizational culture and the operating environment as some of the
factors that affect performance of manufacturing organizations.
The findings of this study contradict the findings by Swamidass and Kotha, (1997) and Gupta
(1998). In a study done in 101 companies in the US, Gupta (1998) found no significant
relationship between advanced manufacturing technology and organizational performance.
They found that other factors within the organization that include; effective implementation
of advanced manufacturing technology, organizational culture, organizational capability with
requisite core competencies, employee competencies and leadership styles affect the outcomes
observed after implementing advanced manufacturing technology. This finding shows that
both the contingency theory and the resource-based theory were relevant in this study.
The finding of this study to the effect that other factors also affect performance of large
manufacturing companies in Kenya besides advanced manufacturing technology are
synonymous with the contingency theory that was used in the study. The contingency theory
supports interactions within manufacturing organization operations rather than simple linear
relations in determining performance. The finding by Gupta (1998); Udo and Ehi (2009);
McDermott and Stock (1999); Hyneck and Janecek (2012); Swamidass and Nair (2004);
Swamidas and Kotha (2000); Parthasarthy and Sethi (1992) and Yasin and Michael (1997)
that advanced manufacturing technology does not lead automatically to improved financial
performance are consistent with this theory, and the finding of the current study, in which no
single process or management process can produce the best performance results on its own.

175
The resource-based view on the other hand perceives organizations as consisting of a bundle
of resources that affect the way in which it performs. According to this view, the organizations
abilities enable it to add value to the customer value chain, by developing new products,
managing costs and product quality by drawing on its resources and capabilities. It has been
shown that resources with certain attributes, that are strategic in nature, are the ones capable
of making organizations to develop sources of competitive advantage (Madhani, 2010).
Findings from the current study show that advanced manufacturing technologies allow
organizations to develop and sustain competitive advantage leading to above average returns.
Indeed, competitive advantage in manufacturing results from advanced manufacturing
technology, which in turn, is driven by external and internal learning (Schroeder, Bates, &
Junttila, 2002).
Advanced manufacturing technology allows organizations to model their operations in a
unique way and they are different from other resources such as standard equipment and
employees with generic skills. Standard equipment that are available in common factor
markets are not as effective in achieving high levels of plant performance, since they are freely
available to competitors (Bates, & Flynn, 2017). The dimensions of advanced manufacturing
technology, design, manufacturing and planning technologies can be used as independent
technologies or integrated within the production process. This characteristic of advanced
manufacturing technology further allows organizations the freedom and flexibility of
choosing which technologies to incorporate in their process, increasing the heterogenous
nature of advanced manufacturing technology.
Finally, with regard to the first objective, this study contributes to the growing body of
literature on the relationship between advanced manufacturing technology and organizational
performance. This study provides a framework for understanding how advanced
manufacturing technology may be appropriately viewed as a predictor of organizational
performance. The results of this study confirm that advanced manufacturing technology has a
positive relationship with performance of large manufacturing companies in a developing
economy. Therefore, organizations should expect to increase both their financial and financial
performance by investing more in advanced manufacturing technology.

176
4.5.2 Advanced Manufacturing technology, Competitive Advantage and Performance
of Large Manufacturing Companies in Kenya
The second objective was aimed at establishing the role of competitive advantage in the
relationship between advanced manufacturing technology and performance of large
manufacturing companies in Kenya. In order to address this objective, the study developed
and tested the hypothesis that competitive advantage mediates the relationship between
advanced manufacturing technology and performance of large manufacturing companies in
Kenya. Competitive advantage was operationalized in terms of cost leadership strategies,
differentiation strategies, and focus strategies while performance of large manufacturing
companies in Kenya was operationalized through financial and non-financial performance
indicators.
The study investigated if there was zero order relationship among the variables. The finding
was that all the variables in the current study that were used to test this hypothesis on
mediation had not been controlled for or “partialed out”. This result revealed that a linear
relationship existed between the variables and statistical tests on correlation between them
could have assumed correlation values ranging between -1 and +1 if significant relationships
were confirmed between any of them and a value of 0 if there was no relationship.
Empirical results from the current study show that competitive advantage does not fully
mediate the relationship between advanced manufacturing technology and performance of
large manufacturing companies in Kenya. Although full mediation was not confirmed in this
study, the results of the study confirm that partial mediation by competitive advantage on the
relationship between advanced manufacturing technology and performance of large
manufacturing companies in Kenya.
This finding is contrary to the finding by Sheridan (1992) on US manufacturing executives
who found that competitive advantage fully mediates this relationship. The study by Sheridan
(1992) provided evidence that advanced manufacturing technology allowed manufacturing
companies to integrate product design and production processes leading to manufacturers
developing competitive advantage in their industry. The observed difference in the findings
between the current study and Sheridan (1992) may be due to the observed low application of
design technologies and manufacturing technologies in the current study.

177
Empirical finding of the current study is similar to the findings done by Congen (2005) in 399
metal machining firms. The study found that competitive advantage partially mediates the
relationship between advanced manufacturing companies and organizational performance.
This finding is attributed to organizations developing a strategy-technology fit where the
manufacturing technology employed in production processes must be aligned with the desired
competitive advantage and the flexibility-efficiency trade-off by advanced manufacturing
technologies. Further, in support of this finding on mediation by competitive advantage on the
relationship between competitive advantage and performance, there are special requirements
that include organizations adopting specific technologies that are combined to support specific
competitive requirements (Congen, 2005).
Results from the current study are also similar to the empirical findings on small and micro
enterprises by Rangone (1998) who found that competitive advantage partially mediates the
relationship between advanced manufacturing technology and organizational performance.
The findings in both studies are similar despite the adoption of non-conventional finance
models in the study by Rangone (1998) to investigate investments by small-medium firms in
advanced manufacturing technology and their impact on performance. Further, the findings
are similar although a difference in the study populations between the two studies, as the
population in the study by Rangone (1998) were small-medium firms while the current study
population were large manufacturing companies.
Despite results from the current study showing that competitive advantage does not fully
mediate the relationship between advanced manufacturing technologies and performance of
large manufacturing companies in Kenya, the relationship between competitive advantage and
performance of large manufacturing companies was found to be significant. Results from the
current study show that the relationship between competitive advantage and performance of
large manufacturing companies in Kenya is moderately strong and competitive advantage
explains 29.2% of the variations in performance of large manufacturing companies in Kenya
(R=0.540, R2=0.292). Further, the results show that for every unit change of competitive
advantage, there is a change of 0.521 units in performance of large manufacturing companies
in Kenya. These results show that competitive advantage positively impacts the performance
of large manufacturing companies in Kenya.

178
The results from the current study also revealed that advanced manufacturing technologies
are positively related with competitive advantage with advanced manufacturing technology
explaining 32.9% of the variations in competitive advantage (R=0.574, R2=0.329). The results
also show that a unit change in advanced manufacturing technology causes a change of
0.335 units in competitive advantage. These results show that advanced manufacturing
technology enables large manufacturing companies in Kenya to develop competitive
advantage and therefore attain above average performance. Results also show that large
manufacturing companies can use design technologies, manufacturing technologies or
planning technologies which were the dimensions of advanced manufacturing technology
used in the study, to develop competitive advantage based on either cost leadership or
differentiation depending on the manufacturing strategy they intend to implement.
The results from the current study support findings from previous investigations. First, these
results support the findings by Stalk and Hout (1990) who found that advanced manufacturing
technology helps manufacturing companies to develop competitive advantage in their
industry. Advanced manufacturing technology allows manufacturing companies to realize
substantial reduction of production cycle times which has immeasurable value in as it
determines when the company delivers the desired product or offer required services to their
customers. Advanced manufacturing technology also has a positive relationship to
productivity, quality, and innovation capability, which lead to improvement in the
performance of manufacturing companies as shown by the results from the current study.
Second, the findings of this study are similar to the findings by McKenna (1992) who
observed that advanced manufacturing technology enable manufacturing companies to re-
engineer their production processes much more easily since they are flexible and as a result
gain more dramatic performance. This leads manufacturing companies to develop competitive
advantage and become competitive periodically before competitors discover the reason of
their competitiveness, especially when their competitive advantage depends on process
efficiencies. The finding in the current study also supports findings by swamidas and Kotha
(2000) who found that profitable manufacturing companies emphasizing a differentiation
strategy approach observe improved performance by employing advanced manufacturing
technology in their production process.

179
Third, the findings of this study are consistent with the results by Adler (1988) who
demonstrated that competitive advantage enables a positive relationship between advanced
manufacturing technology and performance of manufacturing companies in cost and process
leadership. Manufacturing companies determine within the value chain the activities that can
enhance performance. These are the activities that ultimately lead them to develop
competitive advantage relative to other organizations in the same operating environment. This
is especially feasible when manufacturing companies employ advanced manufacturing
technology within their production process while implementing differentiation strategies.
Fourth, the results in the current study are similar to the results by Cook (1994) who found
that advanced manufacturing technology enabled manufacturing companies to develop
competitive advantage in their operations. The empirical results by Cook (1994) show that
manufacturing companies use advanced manufacturing technology to deliver customer needs
along the manufacturing value chain that incorporates quality, production flexibility and
reduction in production costs. Similarly, Schonberger (1986) found that advanced
manufacturing technology helped manufacturing companies to create flexibility in their
operations.
Fifth, the findings of this study support the findings of Hopp, Antons, Kaminski, & Salge,
(2018), Dangayach, Pathak, and Sharma (2006), Oxford Economics (2013), Haruna, Gakure
and Orwa (2015), Burcher and Lee (2000) and Rahardjo and Salleh bin Yahya (2010) who
found that advanced manufacturing technology helps manufacturing companies to develop
competitive advantage in their operations. Manufacturing companies use advanced
manufacturing technology after evaluating their internal strengths to match the turbulence in
the external environment.
Advanced manufacturing technology is a tool that manufacturing companies use to provide
them with a competitive edge and give the required strategic competitive benefit to adequately
manage the internal organizational weaknesses. Subsequently, manufacturing companies
meet customer needs with regard to product quality, production process flexibility,
appropriate product cost and pricing to sustain their performance as competitiveness rests on
the transformation speed required to respond to market shifts and technology trends.

180
4.5.3 Advanced Manufacturing Technology, Organizational Resources and
Performance of Large Manufacturing Companies in Kenya
The third objective of the study was intended to establish the effect of organizational resources
on the relationship between advanced manufacturing technology and performance of large
manufacturing companies in Kenya. In order to fulfil this objective, the study developed and
tested the hypothesis that “Organizational resources moderate the relationship between
advanced manufacturing technology and performances of large manufacturing companies in
Kenya.”
Results from the current study show that organizational resources do not moderate the
relationship between advanced manufacturing technology and performance of large
manufacturing companies in Kenya. The results from the current study support the findings
by Tuan and Takahashi (2009) who found in their empirical study in 102 industries in Vietnam
that although strategic resources are positively related to performance, different groups of
resources support different capabilities and that manufacturing processes that lead to
competitive advantage resulting from quality capability have more impact on performance
than those which lead to cost reduction capabilities.
Results from the current study also support the finding of Unsal and Cetindamar (2015) who
found in an empirical study that technology management is an important source of competitive
advantage and it contributes to firm performance in a positive way. Unsal and Cetindamar
(2015) observed a strong positive and significant relationship between technology and
competitive advantage which also had a strong positive and significant relationship with
performance. Unsal and Cetindamar (2015) reckon that resources failed to moderate this
relationship as technology is a special type of resource owned by the organization and applied
to transform inputs into finished products.
Results from the current study support the empirical findings by Ahmad, Lazim, Shamsuddin,
Wahab, and Seman, (2019) in a study involving 302 large and small manufacturing companies
in Malaysia. They found a significant and positive relationship between advanced
manufacturing technology and performance. Further, Ahmad et. al (2019) demonstrated that
manufacturing companies observed an increase in performance as a result of increasing
technological capability through better quality, cost, flexibility and delivery.
181
Similarly, results from the current study are consistent and support the findings by Cook and
Cook (1994) who found in their empirical study that resources did not moderate the relation
between advanced manufacturing technology and performance. Measures of success at
achieving competitive advantage through advanced manufacturing technology depend on
identifying appropriate strategies that exploit the existing organizational resources.
Manufacturing organizations that seek excellence in niche markets globally, employ
technology in their production processes to develop and sustain competitive advantages.
Likewise, manufacturers that aim to attain world-class standards realize that the need to meet
customer needs is paramount in achieving their performance objectives. To consistently meet
this requirement, World-class manufacturing systems should be flexible, timely, and
responsive.
The results from this study are not consistent with the results of the study by Kotha, Zheng
and George, (2011) whose study found that resources moderate the relationship between
technology. The results from their study revealed that there is a positive moderation depending
on the age of the company. Manufacturing companies are faced with a dilemma when they
set up their operations as to when they should invest in technology to balance between
straining their constrained resources by investing in technology upfront at start-up or
implement a strategy to gradually build –up of technology in their operations. Further,
empirical studies by Helfat and Peteraf, (2003); Lavie, (2006), Sapienza et al., (2006), Ahuja
and Lampert, (2001) highlight the critical role of timing on capability development by
manufacturing companies and choice of entering global markets.
Despite the results for the current study indicating that organizational resources do not
moderate the relationship between advanced manufacturing technologies and performance of
large manufacturing companies in Kenya, the coefficient of advanced manufacturing
technology is observed to increase from 0.318 in the first step to 0.353 in the second step and
finally to 0.837 in the third step of the moderation model. This finding reveals that a unit
change in advanced manufacturing technology explains 0.837 of variance in performance of
large manufacturing companies in Kenya in the presence of organizational resources and the
interaction term (AMT*OR) compared to 0.353 without the interaction term.

182
4.5.4 The Joint Effect of Advanced Manufacturing Technology, Competitive Advantage,
Organizational Resources and Performance of Large Manufacturing Companies
in Kenya.
The fourth objective of the study was to investigate the joint effect of advanced manufacturing
technology, competitive advantage and organizational resources on performance of large
manufacturing companies in Kenya. This objective was implemented by the study developing
and implementing the hypothesis that there is a significant relationship between the joint effect
of advanced manufacturing technology, competitive advantage and organizational resources
on performance of large manufacturing companies in Kenya. Arising from literature review
empirically identifying that the joint effect of the study variables has a positive synergy on the
dependent variable, this hypothesis was modified as “The joint effect of advanced
manufacturing technology competitive advantage and organizational resources on
performance of large manufacturing companies in Kenya is greater than the effect of each
individual predictor on performance of large manufacturing companies in Kenya”.
The study developed four regression models to determine the statistical significance of the
results from the study in explaining the relationship between and among the study variables
and compare their individual and joint effect on performance of large manufacturing
companies in Kenya. First, the results in the first regression model show a moderately strong
and significant relationship between advanced manufacturing technology and performance of
large manufacturing companies in Kenya and that advanced manufacturing technology
accounts for 31.9% of variations in performance of large manufacturing companies in Kenya.
Further, the results also show that a unit change in advanced manufacturing technology
explains 0.318 of variance in performance of large manufacturing companies in Kenya,
(R=0.565, R2= 0.319, F=19.662, β=.318, t = 4.434, p< .05).
Second, the results in the second regression model show a moderately strong positive
relationship between competitive advantage and performance of large manufacturing
companies in Kenya and that competitive advantage accounts for 29.2% of variations in
performance of large manufacturing companies in Kenya while 70.8% of performance is
accounted for by other extraneous factors. The results also show that a unit change in
competitive advantage explains 0.521 of variance in performance of large manufacturing
companies in Kenya (R=0.540, R2= 0.292, F=17.286, β=.521, t = 4.151, p< .05).

183
Third, the results in the third regression model show a strong and statistically significant
correlation between organizational resources and performance of large manufacturing
companies in Kenya, organizational resources accounts for 38.8% of variations in
performance of large manufacturing companies in Kenya, and a unit increase in organizational
resources increases performance of large manufacturing companies in Kenya by 0.528 units
(R=0.623, R2= 0.388, F=26.655, β=.528, t = 5.163, p< .05).
Fourth, the results from the fourth multiple regression model revealed a strong and statistically
significant relationship between advanced manufacturing technology, competitive advantage,
organizational resources, and performance of large manufacturing companies in Kenya, the
joint effect of these variables account for 49.2% of variations in performance of large
manufacturing companies in Kenya, and a unit increase in advanced manufacturing
technology in the presence of competitive advantage and organizational resources increases
performance of large manufacturing companies in Kenya by 0.316 units (R=0.701, R2 = 0.492,
F=12.903, β (AMT) = .316, t = 2.266, p< .05).
The results also show that a unit increase in organizational resources in the presence of
advanced manufacturing technology and competitive advantage increases performance of
large manufacturing companies in Kenya by 0.415 units (β (OR) = .415, t = 2.266, p< .05).
Further, the results found that competitive advantage was not statistically significant in
predicting the value of performance of large manufacturing companies in Kenya in the
presence of advanced manufacturing technology and organizational resources at a confidence
level of 95% (β = .101, t = 2.266, p>.05).
Arising from the findings in the study, the joint effect of the three variables in the study,
advanced manufacturing technology, competitive advantage and organizational resources
were greater than the individual effects on performance of large manufacturing companies in
Kenya. This finding reveals a positive synergy between the three variables to performance of
large manufacturing companies in Kenya. This finding supports the finding by Leonidou,
Palihawadana, and Theodosiou, (2011) who found that the joint effect of strategy, competitive
advantage and organizational resources had a positive impact on performance in a study they
conducted on national export programs. The synergy from these three variables allows
companies to produce better products with the required customer appeal.

184
The results of the current study also support the finding by Tracey, Vonderembse and Lim,
(1998) who found a positive and significant relationship between the joint effect of advanced
manufacturing technology, organizational capabilities, competitive advantage and
performance of organizations. Empirical results from the study by Tracey, Vonderembse and
Lim, (1998) show that competitive capabilities developed through advanced manufacturing
technology and resources owned by manufacturing companies lead to high levels of
performance as measured by customer satisfaction and marketing performance. Customer
satisfaction provides feedback to manufacturing companies on product quality and price
acceptance by consumers.
The findings of the current study are consistent with the results of Abungu, Maingi and
Ombara (2016) who found in their study on manufacturing companies in Kenya that the joint
effect of advanced manufacturing technology and competitive advantage improved
performance of manufacturing companies. Further, they also found that advanced
manufacturing technology improved staff retention. Organizations need to retain staff to
develop and entrench organizational capabilities, which form part of the intangible
organizational resources. Staff retention contributes immensely to skills and organizational
memory retention.
The results in the current study support the finding by Nyori and Ogola (2015) who found that
advanced manufacturing technology led to development of competitive advantage by
manufacturing companies with observed improvement in their performance. Results from this
study show that organizations can develop both cost leadership and differentiation competitive
advantages when they use advanced manufacturing technology.
Although the joint effect of the study variables is significant and have a strong relationship
with performance of large manufacturing companies in Kenya, the effect of competitive
advantage in the presence of organizational resources and advanced manufacturing was not
significant. Although empirical results from different studies show that advanced
manufacturing technology improve performance of manufacturing companies, there is a need
to show how organizations achieve competitive advantage when they adopt advanced
manufacturing technology in their production process (Rahardjo & Salleh bin Yahya, 2010).

185
CHAPTER FIVE
SUMMARY CONCLUSION AND RECCOMENDATIONS
5.1 Introduction
The chapter provides a summary of the study, particularly the findings, conclusions and
recommendations. Further, implications of the study for theory, policy and practice are
discussed, and suggestions made on areas for further investigations. The chapter ends with
implications and recommendations. The chapter consists of five sections that provide a
summary of the research findings; implications for theory, manufacturing Companies and
practitioners; limitations of the study, conclusions of the study and the last section that
concludes the final chapter of the thesis presents suggestions for further research.
5.2 Summary
The broad objective of the study was to investigate the role of competitive advantage and
organizational resources on the relationship between advanced manufacturing technology and
performance of large manufacturing companies in Kenya. The overview of the background
was discussed. The theoretical framework used in the study was discussed. The objectives of
the study were formulated on the basis of the effect of competitive advantage and
organizational resources on the relationship between advanced manufacturing technology and
performance of large manufacturing companies in Kenya. The objective on the combined
effect of advanced manufacturing technology, competitive advantage and organizational
resources on performance of large manufacturing companies in Kenya was also developed
and analyzed to determine the synergy between and among the study variables.
The structure of the thesis comprises a brief description of the conceptual, contextual and
theoretical foundations of the study. This is followed by statement of the research problem
and explication of the conceptual and contextual gaps. The identified gaps capture the un-
answered questions in the relationships among the study variables. The research gaps further
give rise to research objectives which are linked to hypotheses in chapter three of the study.
All the foregoing is presented in chapter one. Chapter two critically reviews pertinent theories
and empirical studies and gaps in knowledge identified accordingly. Conceptual framework
is developed based on the gaps from the literature review and research objectives. Findings
from descriptive data analysis and tests of hypothesis are hereby summarized.

186
The study used a descriptive survey cross-sectional research design. A self-administered
questionnaire was used to collect primary data, while secondary data was collected from the
organization’s annual financial reports and Capital Markets Authority reports using forms
specifically designed for the purpose. Findings on demographic data show that a majority
(28.6%) of the respondents held the position of Engineering Manager. This position is
important and key to the technical operations associated with advanced manufacturing
technology in organizations. The results also show that 25.7% of the respondents held the
position of Director Technical Services. This too is an important position in terms of
organizational strategy formulation and implementation. The two positions cumulatively
represented 54.3% of the respondents in the study.
Results of the study show that 35.6% of the respondents had worked in their organizations for
between 4 to 9 years, while cumulatively, 60% of the respondents in the study had worked for
the current organization for more than four years while only 8.9% of the respondents had
worked in the current organizations for less than 1 year. Further, findings of the current study
revealed that 94.6% of the companies had been in operation for a period longer than 3 years.
This finding fulfilled one of the requirements of the study which was to include large
manufacturing companies in Kenya which had been carrying out manufacturing processes for
more than 3 years. The number of years’ employees work in an organization helps to
determine employee retention abilities of the organization as well as preservation of
institutional memory while small and micro companies on average have a lifespan of 3 years
(KNBS, 2019).
On the implementation of a manufacturing strategy, results show that 84.44% of the
companies in the study had implemented a formal manufacturing strategy within the last six
years, while 8.89% of the companies had not implemented a formal manufacturing strategy
within this time frame. The results also show a slight difference between organizations that
had implemented a manufacturing strategy in the last 6 years (84.44%) and those that had been
in operation for more than 6 years (89.4%). This implies that approximately 5.04% of the
companies that that have been in operation for more than 6 years did not have a formal strategic
plan. Daniel (2014) reiterates the influences of strategic planning, whether formal or informal,
and strategic organization on performance. These results show that large manufacturing
companies in Kenya employ strategic planning in their operations.

187
Regarding application of advanced manufacturing technology in the production process,
findings of the study revealed that large manufacturing companies in Kenya apply advanced
manufacturing technologies in their production processes to a moderate extent. Further,
finding show that planning technologies are applied to a great extent while design technologies
and manufacturing technologies are applied to a moderate extent by large manufacturing
companies in their production process. Arising from this result, large manufacturing
companies in Kenya are likely to use planning technologies compared to design technologies
and manufacturing technologies in their production process.
Further, managers in manufacturing companies embrace advanced manufacturing technology
in the production process of their companies at varying levels. Despite organizations applying
both design and manufacturing technologies to a moderate extent, the results show that design
technology is used slightly more than the manufacturing technology dimension. On the
technology indicators used by large manufacturing companies in Kenya, enterprise resource
planning is the most widely used technology while industrial robots are the least used
technologies. Five of the most widely used technologies, enterprise resource planning, material
resource planning, management information systems, total quality management and customer
relationship management are planning technologies while the least used technologies which
include industrial robots, automated guided vehicles and automated storage and retrieval
systems are manufacturing technologies.
Empirical results of the study had the following results. In regard to the first objective of the
study, advanced manufacturing technology was found to be positively and moderately related
to performance of large manufacturing companies in Kenya. The results show that
manufacturing companies that effectively implement appropriate advanced manufacturing
technologies in their production operations achieve better performance compared to those that
do not. This finding support the finding by Nyori and Ogolla, (2015), Gunawardana (2006),
Kotha and Swamidass (1999) and Hynek and Janecek, (2012). Manufacturing companies
employ advanced manufacturing technology for various reasons including managing their
inventory, planning their manufacturing operations, addressing both current and future
industry needs to meet customer preferences and improving their performance (Jabar, Soosay
& Santa, 2010; Saberi, Yussuf, Zulkifli & Ahmad, 2010).

188
On the second objective of the study, findings revealed that competitive advantage does not
fully mediate the relationship between advanced manufacturing technology and performance
of large manufacturing companies in Kenya. This finding contradicts the finding by Sheridan
(1992) done in the US in companies that applied design technologies in their production
process more than large manufacturing companies in Kenya where planning technologies are
applied more. Further, the results of this study also contradict the results by Congen (2005)
who conducted a study in small manufacturing firms. Arising from the finding of the current
study, it is concluded that advanced manufacturing technology directly impacts performance
of large manufacturing companies in Kenya. Further, the finding from the current study shows
that advanced manufacturing technology enables large manufacturing companies in Kenya to
develop competitive advantage in their respective industries and achieve improved
performance compared to companies that do not.
The third objective of the study was to establish the role of organizational resources on the
relationship between advanced manufacturing technology and performance of large
manufacturing companies in Kenya. Empirical results emanating from a stepwise regression
analysis revealed that organizational resources do not moderate this relationship. Emanating
from this finding, the study concludes that organizational resources do not alter the
relationship between advanced manufacturing technology and performance of large
manufacturing companies in Kenya. The study considered organizational resources to include
assets, physical facilities and employee capabilities. This finding shows that once
organizations have effectively implemented advanced manufacturing technology in their
production processes, they achieve better performance in their operations irrespective of the
assets, physical facilities and employee capabilities in their organizations.
The last objective was intended to establish whether the joint effect of advanced
manufacturing technology, competitive advantage and organizational resources was greater
than their individual effects on performance of large manufacturing companies in Kenya. The
finding of the result revealed that the joint effect was greater than the individual effects of the
variables. This finding reveals that advanced manufacturing technology, competitive
advantage and organizational resources together form a super-additive synergy where the
whole is greater than the sum of parts (Eye, Schuster, Rogers, 1998).

189
5.3 Conclusion
This section presents the conclusion of the study. The conclusions emanate from the results
of the tests of the four hypotheses. The objectives and hypotheses of the study were developed
from the theoretical and empirical literature review. The hypotheses in the study were
confirmed or failed to be confirmed based on the statistical significance of the various
statistical tests. Conclusions of this study are drawn from the findings in relation to the
corresponding research objectives.
5.3.1 Advanced Manufacturing Technology and Performance of Large
Manufacturing Companies in Kenya
The first objective of the study was to establish the effect of advanced manufacturing
technology on performance of large manufacturing companies in Kenya. The findings of the
current study reveal that there is a moderately strong positive and significant relationship
between advanced manufacturing technology and performance of large manufacturing
companies in Kenya. Arising from this finding, the study concludes that organizations that
invest in advanced manufacturing technology and implement it appropriately realize better
performance in the industry compared to organizations that fail to embrace it or do not
implement it appropriately.
Results from the current study reveal that advanced manufacturing technology allows large
manufacturing companies in Kenya to develop competitive advantage through applying
design technologies, manufacturing technologies and planning technologies in their
production processes. Further, the findings show that application of planning technologies in
the production processes is more than either design technologies or manufacturing
technologies. The study concludes that manufacturing companies in developing economies
that employ planning technologies experience better product manufacturing scheduling than
those that do not and also realize improved performance. Production planning helps
manufacturing companies to know the market demand and how it can be satisfied. This makes
the companies to achieve reduced labor costs by improving production cycle times, improving
process flow, reducing inventory costs by decreasing the need for safety stocks and excessive
work-in-process inventories, optimizing equipment usage, increasing production capacity and
improving on-time deliveries of products and services.

190
5.3.2 Advanced Manufacturing Technology, Competitive Advantage and Performance
of Large Manufacturing Companies in Kenya
The second objective of the study sought to ascertain the role of competitive advantage in the
relationship between advanced manufacturing technology and performance of large
manufacturing companies in Kenya. The study used path analysis proposed by Baron and
Kenny (1986). The findings of the study show that competitive advantage does not mediate
this relationship leading the study to conclude that advanced manufacturing technology
directly impacts performance of large manufacturing companies in Kenya.
Although results from the study revealed that competitive advantage does not fully mediate
the relationship between advanced manufacturing technology and performance of large
manufacturing companies in Kenya, the relationship between advanced manufacturing
technology and competitive advantage was found to be positive and moderately strong.
Arising from this observation, the study concludes that large manufacturing companies
develop competitive advantage in their operating industries when they adopt and effectively
implement advanced manufacturing technology in their operations, allowing them to
manufacture products that meet market requirements.
5.3.3 Advanced Manufacturing Technology, Organizational Resources and
Performance of Large Manufacturing Companies in Kenya
The study investigated the effect of organizational resources on the relationship between
advanced manufacturing technology and performance of large manufacturing companies in
Kenya as the third objective. The researcher developed the third hypothesis to test this
relationship using organizational resources as a moderator. The results of the study show that
organizational resources do not moderate this relationship.
Arising from this finding, the study concludes that large manufacturing companies in Kenya
realize benefits associated with correctly implementing advanced manufacturing technology
irrespective of the resources they own. The study also concludes that advanced manufacturing
technology allows large manufacturing companies to change the way resources are produced
and applied in transforming consumer behavior. This enables large manufacturing companies
to develop competitive advantage and improve their performance.

191
5.3.4 The Joint effect of Advanced Manufacturing Technology, Competitive
Advantage, and Organizational Resources on Performance of Large
Manufacturing Companies in Kenya
The fourth objective aimed at establishing the joint effect of advanced manufacturing
technology, competitive advantage, and organizational resources on performance of large
manufacturing companies in Kenya. When variables were combined, they were expected to
produce positive synergy and have a bigger impact on performance compared to their
individual effects. Results show that, advanced manufacturing technology, organizational
resources and competitive advantage jointly have a significant effect on performance of large
manufacturing companies in Kenya. The joint effect was found to be greater than the
individual effect of the variables on performance.
Arising from the finding of the joint effect of the study variables, the researcher concluded
that the concept of synergy was confirmed and concludes that large manufacturing companies
achieve better performance when they adopt advanced manufacturing technologies which
helps them to enhance their competitive advantage and also change the way resources are
produced and applied in managing consumer purchase behavior.
Finally, the results confirmed that; advanced manufacturing technology is positively related
to performance of large manufacturing companies in Kenya, competitive advantage does not
have a mediating role on the relationship between advanced manufacturing technology and
performance of large manufacturing companies in Kenya, organizational resources do not
moderate this relationship and the joint effect of advanced manufacturing technology,
competitive advantage and organizational resources was greater than their individual effect
on performance of large manufacturing companies in Kenya.
The findings provide empirical evidence to support theoretical understanding of the resource-
based view and contingency theory of strategy. The study also revealed that competitive
advantage does not mediate the relationship between advanced manufacturing technology and
performance of large manufacturing companies in Kenya. Further, organizational resources
do not moderate this relationship. The study concludes that manufacturing companies that
correctly implement advanced manufacturing technology perform better than those that fail
to embrace it.

192
5.4 Implications of Research Findings
The current study examined the relationship between advanced manufacturing technology,
competitive advantage, organizational resources and performance of large manufacturing
companies in Kenya. The study also examined the mediating role of competitive advantage
and the moderating role of organizational resources on this relationship. Results of this study
have contributed to theory, practice, and knowledge in the field of management generally and
strategic management in particular as presented below:
5.4.1 Theoretical Implications
First, the current study adds to both the growing conceptual and empirical investigations on
the relationship between advanced manufacturing technology and performance. This study
revealed that organizations that implement advanced manufacturing technology in their
production process achieve better performance compared to those which fail to embrace
technology. The study revealed that large manufacturing companies in developing economies
apply planning technologies more than design technologies or manufacturing technologies in
their operations.
Manufacturing companies in developing economies use planning technologies in their
production process to effectively forecast market demand. Planning technologies help
manufacturing companies to meet customer needs, reduce their labor costs by reducing the
production cycle time, improve process flow, reduce inventory costs by decreasing the need
for safety stocks and excessive work-in-process inventories, optimize equipment usage,
increase capacity and achieve improved on-time deliveries of products and services. This adds
to the body of knowledge to the effect that advanced manufacturing technology influences
performance of manufacturing companies in developing economies.
Second, research in advanced manufacturing technology has been concentrated more on its
adoption by small and medium enterprises. This study investigated its application and impact
on performance of large manufacturing companies in a developing economy. Findings of the
study confirm the impact of technology on performance in large manufacturing companies in
developing economies is similar to that in small and medium companies implying that
company size does not affect the expected outcomes when applying technology.

193
Third, the findings of the current study show that advanced manufacturing technology
explains 31.9% of variations in performance of large manufacturing companies in Kenya. This
implies that there are other exogenous factors that explain the other 68.1% of variations in
performance. Therefore, manufacturing companies have to determine and manage these
factors to further improve their performance as they apply advanced manufacturing
technology in their production process. Further, various dimensions of advanced
manufacturing technology have been used to relate performance to the dimensions (Darban,
Wan Ismail, 2012). The current study employed three dimensions of advanced manufacturing
technology that included design technologies, manufacturing technologies and planning
technologies, that allowed the researcher to compare the effects of each dimension on
performance. This provided an alternative method of investigating the effect of advanced
manufacturing technology on performance.
Fourth, the study found that competitive advantage does not fully mediate the relationship
between advanced manufacturing technology and performance of large manufacturing
companies in Kenya, but that advanced manufacturing technology allows organizations to
develop competitive advantage in their operating environment. Manufacturing companies rely
on competitive advantage to effectively compete, especially in the global market as
protectionist barriers crumble in emerging markets around the world. The arrival of
multinational companies in developing economies to exploit new opportunities for growth is a
boon to local consumers, who benefit from the wider choices now available. Local
manufacturing companies have to develop new methods to compete against the multinationals
who wield substantial financial resources, superior products, powerful brands, and seasoned
marketing and management skills (Dawar & Frost, 1999). Manufacturing companies in
developing economies can use advanced manufacturing technology to effectively compete in
protecting their local markets.
Fifth, the findings show that organizational resources do not moderate the relationship
between advanced manufacturing technology and performance of large manufacturing
companies in Kenya. There exists a gap between the costs on research and development
compared to the value of resources owned by manufacturing companies and the expected
outcomes from investing in expensive technology is important in managing global
competition.

194
The finding from the current study show that technology assists managers in manufacturing
companies to close this gap without relying only on the resources they own. Further, finding
of the current study show that managers can also consider other factors including their
inescapably dual role, the variety of internal markets to be served, legitimate resistance to
change, the right degree of promotion, the choice of implementation site, and the need for one
person to take overall responsibility besides resources they own to improve the performance
of their companies after implementing advanced manufacturing technology in their
production process (Leonard-Barton & Kraus, 1985).
The current study has made contribution to the resource-based theory which posits that
organizations perform better when they own strategic resources (Barney, 1991). Resources
owned by manufacturing companies include all assets, capabilities, organizational processes,
firm attributes, information, knowledge that they control directly and which they use to
develop and implement both organizational strategies and manufacturing strategies to
improve their efficiency and effectiveness (Daft, 1983). Further, Barnes (1991) identifies
physical capital resources to include the technology used in a firm, a firm's plant and
equipment, its geographic location, and its access to raw materials. The current study
concluded that manufacturing companies that apply advanced manufacturing technology
perform better than those that do not embrace technology in their operations, consequently
adding to the body of knowledge on the resource-based theory.
The current study has also made contribution to the contingency theory which posits that there
is no one perfect way that manufacturing companies can be managed to deliver the best
performance. Findings of this study show that advanced manufacturing technology on its own
does not fully enable large manufacturing companies to meet increased requirements for
competitiveness, innovation, quality, flexibility and information processing capability. In
order for large manufacturing companies to fully achieve the required performance, findings
in the study reveal that effects of other factors on performance need to be considered as
advanced manufacturing technology explains only 31.9% of performance. This finding
confirms the contingency theory in that other factors including; the implementation process
of advanced manufacturing technology, organizational culture, leadership, external
environment and internal environment factors including employee skills also impact
performance besides just adopting advanced manufacturing technology (Raymond, 2005).

195
5.4.2 Implication for Practice
The finding of the current study that advanced manufacturing technology has a positive
significant relationship on performance of large manufacturing companies in Kenya has
implications on operations in manufacturing companies. Manufacturing has been described
as a complex production process that involves transforming raw materials into finished
products that meet the quality and other specifications like reliability, durability and
performance at the best price to meet customer needs. Manufacturing depends on many other
industries to supply the required raw materials and to distribute the finished products. Due to
competitiveness observed in the manufacturing industry, companies can use advanced
manufacturing technology to obtain better performance and meet customer needs.
The study also revealed that there was a significant relationship between the two variables,
advanced manufacturing technology and organizational performance in manufacturing
companies. Using this finding, managers in manufacturing companies can use advanced
manufacturing technology to enhance organizational performance through better
organizational design and improve stakeholder engagement in meeting their needs. The
stakeholders include; a) creditors, who would benefit from the improved performance b)
directors of the company find it easy to manage the companies c) employees are motivated by
the working environment, d) government (and its agencies) gain more taxes from the
operations of the companies, e) owners (shareholders) of the company would realize above
average returns to their investments.
Findings of the current study show a positive relationship between advanced manufacturing
technology and organizational performance. The finding also show that advanced
manufacturing technology allows manufacturing companies to develop competitive advantage
in their industry. Therefore, industry practitioners can use this finding to develop competitive
advantage which is an important factor in market and product development. This increases
organizational performance and enables local companies to effectively compete with
multinational companies arising from competition brought about by globalization and collapse
of protectionism by Governments. Further, this encourages investment in the manufacturing
sector that helps developing economies to provide employment opportunities (Boyer et al.,
2017).

196
Second, the finding in this study helps Directors and Managers to carefully appraise
investments in their companies. The finding from the current study show that advanced
manufacturing technology accounts for 31.9% of organizational performance while the
remaining 68.1% is accounted for by other variables. Hence, advanced manufacturing
technology on its own does not lead to great improvement in organizational performance.
Organizations should find a fit between advanced manufacturing technology dimension and
the desired organizational operating strategy incorporating other variables to achieve great
improvement in organizational performance. Swamidass and Kotha (2000) and Saberi et al.
(2010) proposed and grouped the variables in 3 categories including; technological,
organizational and internal/external variables.
Third, results from the current study show that design technologies and manufacturing
technologies are used to a moderate extent by manufacturing companies in Kenya. Further,
28.9% of the companies in the study are multinational companies with operations in all the
continents. The low utilisation of design technologies compared to planning technologies as
observed in the study implies that multinational companies carry out research and
development activities in developed countries which have better resource endowment and
exporting the new product and service innovations to Kenya for production. This finding
informs Company Executives to liaise with their parent companies in developed economies to
increase the use of design technologies in developing economies to benefit fully from local
inventions that effectively meet the needs of the local customers.
Fourth, the results of the current study show that when technology is incorporated in the
production process, it aids organizations to improve their performance. Organizations realize
the full benefits from investing in technology when they use appropriate skilled labor having
adequate capabilities to correctly manage the technology. Therefore, findings of the current
study guides managers to realize that when organizations invest in new technologies within
their production process, they also need to carry out a training needs assessment and plan on
how to develop and improve employee skills in line with the new technology. Well trained
employees build individual and subsequently team capabilities that can be utilized to achieve
the full potential of advanced manufacturing technology. This study assumed that all the
employees had the requisite skills and knowledge to effectively use all the technology
associated with design, manufacturing and planning within the production process.

197
5.4.3 Contribution to Knowledge
A conceptual model was developed to investigate the following variables; advanced
manufacturing technology, competitive advantage, organizational resources and
organizational performance. The ensuing hypotheses from the model were tested empirically
to determine mediation by competitive advantage and moderation by organizational resources
on the relationship between advanced manufacturing technology and organizational
performance. The model used both financial and non-financial performance indicators to
determine organizational performance. This contributes to addressing the knowledge gaps on
organizational performance.
Further, the study linked advanced manufacturing technology, competitive advantage and
organizational resources providing the basis to determine their individual effect on
organizational performance. Results of the study demonstrated that all the three variables used
in the study, advanced manufacturing technology, competitive advantage and organizational
resources had varying positive and significant effects on performance. The effect on
performance due to organizational resources was more than the effect observed from either
advanced manufacturing technology or competitive advantage. Performance is a key
deliverable for Managers of manufacturing companies. The finding of this study allows
managers in manufacturing companies of all sizes and different economies to use advanced
manufacturing technology and organizational resources to develop and sustain competitive
advantage in their manufacturing processes.
Findings of the current study show a positive and significant relationship between different
taxonomies of advanced manufacturing technology and non-financial organizational
performance. Non-financial organizational performance includes; speed of product to market,
employee motivation, customer responsiveness, product quality, and employee retention
among others. The non-financial benefits associated with advanced manufacturing technology
may be used to increase the motivation of employees. Managers in manufacturing companies
can adopt and implement different taxonomies of advanced manufacturing technology to
benefit from the positive performance outcomes and also reduce the hiring and training cost
associated with new employees. This finding allows Directors and Managers flexibility when
determining the type of technology to adopt and integrate within their production process.

198
The study identified that organizations use different technologies at different levels within
their production process. Among the technologies used in the study, planning technologies
were used more than any other technology whereas the use of robots was low. The results of
the study identify the existing opportunity for companies to exploit by increasing the use of
robots in their production process. This further helps manufacturing companies to develop and
sustain competitive advantage by integrating the use of robots in their manufacturing process
to further enhance efficiency, reliability, product consistency, and reduce production costs to
meet customer needs. The expected high returns associated with using robots in the
manufacturing process justifies the initial high investments costs of adopting the use of robots.
This finding further contributes to addressing the knowledge gaps on existing opportunities
for improving manufacturing firm performance.
Results of the study show that competitive advantage had a partial mediation between
advanced manufacturing technology and performance of large manufacturing companies in
Kenya. Specifically, the study found that organizations implemented both the cost leadership
and differentiation strategies moderately. The flexibility associated with advanced
manufacturing technology allows organizations to implement either differentiation or cost
leadership strategies or both of the strategies at the same time within the same manufacturing
process without worrying about being stuck in the middle according to Potter (1990) as both
strategies require different operating conditions when traditional production methods are
used. This finding of the study encourages more research.
The results of the study show that organizations using advanced manufacturing technology
develop and sustain competitive advantage in their production process. Organizations achieve
this favorable operating condition by; managing their operation costs, improving product
quality, and reducing their product delivery costs. These operational activities have a
remarkable positive effect on the way organizations achieve profits by exercising optimal
production associated with efficient transformation of raw materials into finished products.
Cost control is at times detrimental to the operations of an organization when it is implemented
in an appropriate way despite being derived from production efficiencies associated with
advanced manufacturing technology through better utility of production material, labor, and
financial resources. The current study adds knowledge to managing operations in
manufacturing organizations.

199
The resource-based view of strategy emphasizes on resources as the source of competitive
advantage as long as they have four characteristics of being rare, having value, not easy to
imitate and hard to substitute. Results of the current study show that organizational resources
have a more significant impact on the performance of organizations compared to advanced
manufacturing technology and competitive advantage. The result therefore contributes to
increased understanding of the resource-based view of strategy as postulated by Barney
(1991) and Wernerfelt (1989).
The research also serves as a reference point for studying the relationship between advanced
manufacturing technology, competitive advantage, organizational resources and performance.
The research tested competitive advantage as a mediating variable in this relationship. The
mediation effect on the relationship was not fully confirmed by the results of the study. This
result implied that competitive advantage partially mediates the relationship although there
was a strong positive effect due to competitive advantage on each of the variables. This
encourages more research to confirm other linkages between these variables leading to
addition to the body of knowledge.
Further, the research also tested organizational resources as a moderating variable on the
relationship between these variables. The moderation effect on this relationship was not
confirmed despite organizational resources having a significant effect on performance. These
results show that organizational resources have no effect on the strength of the relationship
between these variables. In arriving at this result, advanced manufacturing technology has the
ability to improve performance of any organization irrespective of its size. This encourages
more research leading to addition to the body of knowledge.
Other studies conducted in different contexts and using different methodologies in analysing
the results, have been used to determine the exact relationship between the variables used in
the study. Therefore, this study continues to add to the body of knowledge in pursuit of better
organizational performance. Previous studies focused on examining one or two variables, or
different context of advanced manufacturing technology and performance. The study,
therefore, contributes to increased understanding that combining different variables may
result in more complex capacities which are harder to be imitated by competitors.

200
5.5 Limitations of the Study
There were limitations in this study that present an opportunity for other researchers to
continue investigating the relationships between variables in this study. First, is the
assumption that the manufacturing companies in the survey were at the same level of
implementation of advanced manufacturing technology in their operations. The study
considered 55 manufacturing companies which might be at different levels of adoption and
implementation of advanced manufacturing technology. Hence, generalizing the results could
be limited and can be misleading. Future investigations should consider organizations at
similar levels of adoption and implementation of advanced manufacturing technology.
The study used a cross sectional descriptive research design which captures the attributes of
variables under research at a point in time. Although cross-sectional descriptive research
designs have advantages such as; relatively easy and quick to conduct, low data collection
costs, ability to measure all the attributes of variables under investigation and are good for
descriptive analysis and generating hypotheses, they have disadvantages which include
limitation on timeline-based research, difficult to have a homogenous sample, and they have
a possibility of having a bias. The study was therefore limited to using performance from the
manufacturing company’s data collected at one point in time which may not be representative
of the actual performance of the company. A longitudinal design, would enable the researcher
to compare the performance over a period of time.
The study used the number of employees in the company to determine the population of the
study. This criteria of identifying the population to be included in the study led to data
collection from companies with more than 100 employees which were considered to be large
manufacturing companies. In effect, the assumption was that all companies with more than
100 employees have the same characteristics, which may not be true as it is evident that
management complexities in an organization increase with the size and number of employees.
This is a limitation on the requirement of homogeneity required for cross-sectional research
designs and could have negative impacts on the results from the study. Further, the
respondents to the study instrument were limited to one individual from each company. The
selection of one respondent is yet another limitation of the study as the selected respondent
may lack objectivity when responding to the data collection instrument.

201
Organization culture takes a long time to evolve and organizations develop unique identities
using their organizational culture. Organizational culture also has an impact on organizational
performance depending on employee skills, exhibited knowledge on process factors, and
problem-solving ability (Motilewa, Agboola, Adeniji, 2015). The underlying characteristic in
an organization includes the values and beliefs that are generally in play within the
organization. Organizational culture may allow companies to manipulate organizational
performance leading to misleading information on performance being disseminated to the
public. These are factors that ultimately add and lead to impacting performance in an
organization. This study did not include organizational culture as a variable in determining
organizational performance.
A more complex statistical model to test the relationships between and among the four
variables in the current study would help researchers have a better interpretation of the results
and lead to a better understanding of these relationships compared to the simple and multiple
regression analysis that was used to test the relationship between and among the study
variables. The study used financial data for a period of three years in analysing the financial
performance of the organizations. Three years may not be a sufficient period to determine the
financial performance of an organization and may not provide sufficient data for analysis and
inference. This is a limitation towards developing and analysing the financial performance of
the organizations in the study.
5.6 Directions for Future Research
The quality of collected data in a study determines the veracity of the results, conclusions and
the resultant inference from the study. Researchers find it easier to collect less structured data
during a research study which in itself has been found to be very productive though fraught
with many challenges (Holden, McDougald Scott, Hoonakker, Hundt, & Carayon, 2015). The
study used structured data that was collected from one individual in each of the organizations
in the study population. There may be a bias in the data collected by relying on only one
individual as there might be lack of objectivity while responding to the study instrument used
to collect data. Some of the data was also not cross cutting in the organization but specific to
particular departments and may have required the input of other Managers within the
organization. Future researchers should involve more people in management hierarchy.

202
The study involved four variables namely advanced manufacturing technology, competitive
advantage, organizational resources and performance of large manufacturing companies in
Kenya. The data involved in this study is complex since it is large and is collected from many
disparate sources. The study posed a challenge in determining the amount of data to collect
and statistical models to use for analyzing the resultant data. Although the study relied on
descriptive, simple linear and multiple regression models of statistics, future researchers
should consider developing and incorporating more statistical models.
The study investigated the mediating effect of competitive advantage on the relationship
between advanced manufacturing technology and performance of large manufacturing
companies in Kenya. The investigation failed to fully confirm this relationship. Future
research should consider investigating further full mediation of competitive advantage on the
two variables, advanced manufacturing technology and organizational performance by
focusing on, cost leadership, differentiation and focus strategies as espoused by Potter (1986).
The mechanism through which competitive advantage enhances organizational performance
after adoption of advanced manufacturing technology in the production process appears to be
more complex than initially was conceived.
The study investigated the moderating effect of organizational resources on the relationship
between advanced manufacturing technology and performance of large manufacturing
companies in Kenya. The investigation failed to confirm the existence of this aspect of
organizational resources between the two variables and therefore resources do not affect the
strength of the relationship either positively or negatively. It had been expected that
organizational resources would either amplify or weaken the relationship between these two
variables from the resource-based view of strategy. Future research should consider
investigating further the moderation effect of organizational resources on this relationship.
The study confirmed the use of advanced manufacturing technology as a manufacturing
strategy used by organizations to improve their performance. Further, the study also
confirmed that organizations use different technologies at different levels within their
production process. Future researchers should investigate the different roles of these
technologies towards performance to establish the optimal mix on the adoption of these
technologies.
203
Finally, the study used cross-sectional data and the cross-sectional approach applied did not
allow making observations for comparison at a later point in time as would have been the case
if a longitudinal study approach had been used. If the investigation had used a longitudinal
study it could have been possible to further explore whether the interaction effect of advanced
manufacturing technology and manufacturing companies’ performance would become
important if all the companies were at the same level of adoption. Part of the observed
differences on performance in different companies in the study may be caused by the
difference existing due to the different strategic implementation stage. Many authors have
recommended longitudinal studies, to allow researchers to have a comparison on the data at
different points in time, although these studies are normally more expensive, they add value
to the research (Yoon, 2008; Adam & Swamidass, 2009; Snell and Dean, 2002). to provide
valuable insights on advanced manufacturing technology investment in a dynamic world.

204
References
Abdul Ghani, K., Jayabalan, V., & Sugumar, M., (2002). Impact of advanced manufacturing
technology on organizational structure. The Journal of High Technology Management
Research
Acar, A. Z., Zehir, C., Özgenel, N., & Özşahin, M. (2013). The effects of customer and
entrepreneurial orientations on individual service performance in banking sector.
Procedia-Social and Behavioural Sciences, 99, 526-535.
Achuka, V., (2016). ‘Bribes you have to pay ‘to survive’ in Kenya’, Africa Review,
Adam, E.E., & Swamidass, P.M., (2009). Assessing operation management from a strategic
perspective. Journal of Management 15 (2), 181–203.
Adler, P.S., (1988). Managing flexible automation. California Management Review 20, 35–
56.
AfDB. (2018). Draft final East African region energy/power sector outlook and diagnostic
report. AfDB Group.
Aggelopoulos, E., Eriotis, N., Georgopoulos, A., & Tsamis, A., (2016). R&D Activity and
Operating Performance of Small and Medium-Sized Enterprises (SME’s): The Case of
a Small Open Economy. Journal of Accounting and Taxation Vol. 8(4), pp. 40-50.
Aguinis, H., & Edwards, J. R., & Bradley, K. J., (2016). Improving Our Understanding of
Moderation and Mediation in Strategic Management Research. Organizational
Research Sage publications
Aguinis, H., & Pierce, C. A. (1998). Heterogeneity of Error Variance and The Assessment of
Moderating Effects of Categorical Variables: A Conceptual Review. Organizational
Research Methods, 1, 296-314.

205
Ahmad, N., Lazim, H. M., Shamsuddin, A., Wahab, E., & Seman, N. A. A., (2019). The
Relationship between Technological Capability and Manufacturing Performance.
International Journal of Recent Technology and Engineering (IJRTE)
Ahmed, A., Khuwaja, F. M., Brohi, N. A., & Othman, I. bin L. (2018). Organizational Factors
and Organizational Performance: A Resource-Based view and Social Exchange Theory
Viewpoint. International Journal of Academic Research in Business and Social Sciences,
8(3), 579–599.
Ahmed, U., Khalid, N., Ammar, A., & Shah, M. H. (2017). Assessing Moderation of Employee
Engagement on the Relationship between Work Discretion, Job Clarity and Business
Performance in the Banking Sector of Pakistan. Asian Economic and Financial Review,
7(12), 1197-1210.
Ahuja, G, Lampert, CM. (2001). Entrepreneurship in the large corporation: A longitudinal
study of how established firms create breakthrough inventions, Strategic Management
Journal, 22: 521-543.
Aiken, L. A., & West, S. G. (1991). Multiple Regression: Testing and Interpreting
Interactions. Newbury Park, CA: Sage.
Ainuddin, R. A., Beamish, P. W., Hulland, J. S., & Rouse, M. J. (2007). Resource attributes
and firm performance in international joint ventures. Journal of World Business.
Ainuddin, R. A., Beamish, P. W., Hulland, J. S., & Rouse, M. J. (2007). Production,
information costs and economic organization. American Economic Review
Akhtar, I. M., (2016). Research Design. University of Southern California libraries
Alcaraz, J. L. G., Iniesta, A. A., & Castelló, M. C. J., (2012). Benefits of advanced
manufacturing technologies. African Journal of Business Management Vol. 6(16), pp.
5524-5532,

206
Al-Ansaari, Y., Bederr, H., & Chen, C. (2015). Strategic orientation and business
performance: An empirical study in the UAE context. Management Decision, 53(10),
2287-2302.
Alnawaiseh, M. A. L. I., AL-Rawashdi, F. M. & Alnawaiseh, M., (2014). The Extent of
Applying Value Chain Analysis to Achieve and Sustain Competitive Advantage in
Jordanian Manufacturing Companies. International Business Research; Vol. 7, No. 8;
ISSN 1913-9004 E-ISSN 1913-9012
Aldrich, H., McKelvey, B., & Ulrich, D. (1984). Design strategy from the population
perspective. Journal of Management, 10, 67-86.
AL-Shbiel, S., & NH Al-Olimat. (2016). Impact of Information Technology on Competitive
Advantage in Jordanian Commercial Banks. Accounting Information System
Effectiveness as a Mediating Variable. International Journal of Academic Research in
Accounting, Finance and Management Sciences, 6(3), 202–211.
Al-Tit, A. A., (2017). Factors affecting the organizational performance of manufacturing
firms. International Journal of Engineering Business Management
Alalie, H., Harada, Y., Mdnoor, I., (2018). A Resource-Based View: How Information
Technology Creates Sustainable Competitive Advantage to Improve Organizations.
Journal of Advance Management Research, ISSN: 2393-9664 Vol.06 Issue-12,
Alcaraz, J. L.G., Iniesta, A. A., & Castelló, M. C. J., (2012). Benefits of advanced
manufacturing technologies. African Journal of Business Management Vol. 6(16), pp.
5524-5532.
Ali, D., & Anıl, I., (2016). The Comparison of The Individual Performance Levels Between
Full-Time and Part-Time Employees: The Role of Job Satisfaction. Elsevier Ltd.
Althouse, L. A., Ware, W. B. & Ferron, J. M. (1998). Detecting Departures from Normality:
A Monte Carlo Simulation of a New Omnibus Test Based on Moments. American
Educational Research Association, San Diego, CA.

207
Amaningsih, J., Mahmood, H., Muchdie (2017). Manufacturing Strategy and Competitive
Advantage: A Mediating role of Organizational Culture (A Case Study of Small Industry
Batik Trusmi Indonesia). American Journal of Applied Sciences
Amit, R., & Shoemaker. P. J., (1993). ‘Strategic Assets and Organizational Rent.’ Strategic
Management Journal 13 (3): 33–46.
Anderson, T.W. & Darling, D.A. (1954). A Test of Goodness of Fit. Journal of the American
Statistical Association, Vol 49, No. 268, 765-769.
Andae, G. (2015). ‘Mumias Sugar hires 8 managers to drive turnaround’, Business Daily
Ansoff, H. I., (1965). Corporate Strategy. New York McGraw-Hill.
Arshad, M., Rasool, M.T. & Ahmad, M. I., (2003). Anderson Darling and Modified Anderson
Darling Tests for Generalized Pareto Distribution. Pakistan Journal of Applied
Sciences 3(2), pp. 85-88
Awino, Z. B., (2011). Strategic Management: An Empirical Investigation of Selected Strategy
Variables on Firms Performance: A Study of Supply Chain Management in Large
Private Manufacturing Firms in Kenya. Business Administration and Management
(BAM) Vol. 1(1), pp. 09-18,
Awino, Z. B., & Gituro, W., (2011). An Empirical Investigation of Supply Chain Management
Best Practices in Large Private Manufacturing Firms in Kenya. Prime Journals
Business Administration and Management (BAM). Vol. 1(2): 26-31,
Awino, Z. B., Wandera, R., M., Imaita, I., & K’ Obonyo, P. (2002). Challenges Facing the
Implementation of Differentiation Strategy at the Mumias Sugar Company LTD,
Baldwin, J., D. Sabourin & D. West. (1999). Advanced Technology in the Canadian Food
Processing Industry, Catalogue 88-518, Ottawa: Statistics Canada.
Baltagi, B. H., (2008). Forecasting with panel data. https://doi.org/10.1002/for.1047

208
Barney, J. B., (2001). Strategic Factor markets: Expectations, Luck, and Business strategy,
Management Science
Barney, J. B., (1995). Looking inside for competitive advantage. Academy of Management
Executive.
Barney, J. B., (1991). “Firm Resources and Sustained Competitive Advantage”, Journal of
Management.
Barney, J. B., & Hesterley, W. S., (2012). Strategic Management and Competitive Advantage:
Concepts, Pearson 4th Edition
Barney, J. B, & Hesterly, W.S., (2010). Strategic management and competitive advantage
concept. Upper saddle River, N.J: Pearson Prentice Hall.
Barney, J.B., Ketchen, & D. J., Wright, M (2011). The Future of Resource-Based Theory:
Revitalization or Decline? Journal of Management
Baron, M. R., & Kenny, D. A., (1986). The Moderator-Mediator Variable Distinction in
Social Psychological Research: Conceptual, Strategic, and Statistical Considerations.
Journal of Personality and Social Psychology
Bathgate, M., Crowell, A., Schunn, C., Cannady, M., & Dorph, R. (2015). The learning
benefits of being willing and able to engage in scientific argumentation. International
Journal of Science Education, 37(10), 1590–1612.
Bayus, B.L., (1994). Are product life cycles really getting shorter? Journal of Product
Innovation Management 11, 300–308.
Becker, P. H., (1993). Common pitfalls in published grounded theory research. Quality Health
Research 3:254–60.
Berinato, S., (2019). Data Science and the Art of Persuasion. Harvard Business Review
Bernard HR. (2002) Research methods in anthropology: Qualitative and quantitative
approaches. 3rd Alta Mira Press; Walnut Creek, CA

209
Bertram, M. (2016). Theoretical foundation: The resource-based view (RBV) of the firm. In:
The Strategic Role of Software Customization. Springer Gabler, Wiesbaden
Bigsten, (2010). The Manufacturing Sector in Kenya: Policies for Prosperity. Oxford
University Press
Bildstein, A.; Seidelmann, J. (2014). Industries 4.0-Readiness: Migration zur Industrie 4.0-
Fertigung. In Industrie 4.0 in Produktion, Automatisierung und Logistik; Springer
Vieweg: Wiesbaden, Germany, 2014; ISBN 978-3658046811.
Billy W. B., & Abdel-Kader, M., (2014). "Contingency theory, performance management and
organisational effectiveness in the third sector ", International Journal of Productivity
and Performance Management, Vol. 63 Issue 6 pp. 680 - 703
Bloom, N., Genakos, C., Sadun, R., & Reenen, J., van (2012). Management practices across
firms and countries. Academy of Management Perspectives, 26(1), 12-34.
Bogdan, R. & Taylor, S.J. (1975). Introduction to Qualitative Research Methods: A
Phenomenological Approach to the Social Sciences, New York: John Wiley
Bowles, G. & Klein, R.D. (1983). Theories of Women's Studies, London: Routledge and
Kegan Paul
Boyd, B. K., Haynes, K. T., Hitt, M. A., Bergh, D. D., & Ketchen, D. J. (2012). Contingency
hypotheses in strategic management research: Use, disuse, or misuse? Journal of
Management, 38, 278-313.
Boyer, K.K., (1997). Advanced manufacturing technology and performance: a longitudinal
analysis. Academy of Management, 243–247.
Boyer, K.K., Leong, G.K., Ward, P., Krajewski, L., (2017). Unlocking the potential of
advanced manufacturing technologies. Journal of Operations Management 15 (4), 331–
347.

210
Boyer, K. K., Leong, G. K., Ward, P. T., & Krajewski, L.J., (1997). Unlocking the potential
of advanced manufacturing technologies. Journal of Operations Management, vol. 15,
no. 4, pp. 331–347.
Boyer, K.K., Ward, P.T. & Leong, K.G. (1996), ``Approaches to the factory of the future: an
empirical taxonomy'', Journal of Operation Management, Vol. 14 No. 4, pp. 297-313.
Brandyberry, A., Rai, A., & White, G. P., (1999). Intermediate Performance Impacts of
Advanced Manufacturing Technology Systems: An Empirical Investigation. Decision
Sciences Journal
Breznik, L. (2012). Can Information Technology be a source of Competitive Advantage?
Economic and Business Review.
Breznik, L., Lahovnik, M., (2016) Dynamic capabilities and competitive advantage: findings
from case studies, Management Journal
Bridoux, F. (1997). A resource-based approach to performance and competition: An
Overview of the Connections between Resources and Competition Organization and
Competitive Interactions.’ Strategic Management Journal.
Bromiley, P. & Fleming, L. (2002), “The resource-based view of strategy: A
behavioralcritique”, In M. Augier & M. J. G (Eds.), In Change, Choice and
Organisation: Essays in Memory of Richard M Cyert (pp. 319-336). Cheltenham, UK:
Edward Elgar.
Burcher, P. G., & Gloria L. L., (2000). "Competitiveness strategies and AMT investment
decisions", Integrated Manufacturing Systems, Vol. 11 Issue: 5, pp.340-347,
Burcher P. & Lee G. (2000). Competitiveness strategies and AMT investment decisions.
Integrated Manufacturing Systems, 11(5): 340-347.
Bryman, A. (2008). Social research methods. Oxford: Oxford University Press.
Carbonero, F., Ernst, E., & Weber, E., (2018). Robots worldwide: The impact of automation
on employment and trade. ILO

211
Carcary M. (2009). The research audit trail – Enhancing trustworthiness in qualitative
inquiry. Electron Journal of Business Research Methods. 7:11–24.
Carmeli, A., & Tishler, A. (2004). The relationships between intangible organizational
elements and organizational performance. Strategic Management Journal, 25(13),
1257–1278.
Centobelli, P., Cerchione, R., Esposito, E. (2018). Aligning enterprise knowledge and
knowledge management systems to improve efficiency and effectiveness performance: A
three-dimensional fuzzy-based decision support system. Journal of Expert System
Appliances 91, 107–126.
Cetin, A. T., (2010). The Effects of Human Resource, Marketing and Manufacturing
Performance on Financial Performance Journal of Global Strategic Management.
Doi:10.20460/Jgsm.201041584
Chamberlayne, P., Bormat, J. and Wengraf, T. (2000). The Turn to Biographical Methods in
Social Science: Comparative Issues and Examples. London: Routledge
Chamarbagwala, R., Ramaswamy, S., Wunnava, P. V, (2000). The role of foreign capital in
domestic manufacturing productivity: empirical evidence from Asian economies.
Applied Economics 32 (4), 393–398.
Chavez, R., Fynes, B., Gimenez, C., & Wiengarten, F. (2012). Assessing the effect of industry
clock speed on the supply chain management practice-performance relationship Supply
Chain Management: An International Journal, 17(3), 235-248.
Che Rose, R., Abdullah, H., & Ismad, A. I., (2010). A Review on the Relationship between
Organizational Resources, Competitive Advantage and Performance. The Journal of
International Social Research
Christensen, C.M., Raynor, M.E., McDonald, R. (2015). What is Disruptive Innovation?
Harvard Business Review.

212
Chromjakovaa, F., (2017). Managerial model of business performance in industry 4.0 concept
concentrated on effective manufacturing process. New Trends and Issues. Proceedings
on Humanities and Social Sciences Volume 4, Issue 10, 351-360
Chung, C. (1996). Human Issues Influencing the Successful Implementation of Advanced
Manufacturing Technology. Journal of Engineering and Technology Management Jet-
M 13: 283-299.
Cicourel, A.V. (1964). Method and Measurement in Sociology. New York: Free Press
Coffey, J.W., & Hoffman, R. R., (2003). Knowledge modeling for the preservation of
institutional memory. Journal of Knowledge Management
Cohen, J. (1978). Partialed products are interactions; partialed powers are curve
components. Psychological Bulletin, 85, 858-866.
Coleman, S., Göb, R., Manco, G., Pievatolo, A., Tort-Martorell, X., & Reis, M.S. (2016). How
can SMEs benefit from big data? Challenges and a path forward. Journal of Qualitative
Reliability Engineering International 32, 2151–2164.
Collins, C. J., (2020). Expanding the resource-based view model of strategic human resource
management. The International Journal of Human Resource Management
Collis, D.J., & Montgomery, C. A., (1997). ‘Competing on Resources: Strategy in the 1990’s.’
Harvard Business Review 73 (4): 118–28.
Collis, D. J. (1994). Research note: how valuable are organizational capabilities? Strategic
management journal, 15(1), 143-152.
Congden, S. W., (2005) "Firm performance and the strategic fit of manufacturing
technology", Competitiveness Review: An International Business Journal, Vol. 15 Issue:
1, pp.14-32.
Connor, T., (2002). The resource-based view of strategy and its value to practising managers.
Wiley Inter Science.

213
Cook, B. M., (1990). “Flexible Manufacturing: Something that People Do”, Industry Week,
Vol. 239, 5, pp. 36-47.
Cook, J. S., (1994). Achieving Competitive Advantages of Advanced Manufacturing
Technology. Benchmarking for Quality Management & Technology, Vol. 1 No. 2, pp.
42-63.
Cook, J. S., & Cook, L. L., (1994). Achieving Competitive Advantages of Advanced
Manufacturing Technology. Benchmarking for Quality Management & Technology,
Vol. 1 No. 2, pp. 42-63. MCB University Press, 1351-3036.
Cousens, A., Szwejczewski, M., & Sweeney, M. (2009). A process for managing
manufacturing flexibility. International Journal of Operations and Production
Management 357–385
Cortina, J. M. (1993). What is coefficient alpha? An examination of theory and applications.
Journal of Applied Psychology, 78(1), 98–104.
Coyne, I. T., (1997). Sampling in qualitative research. Purposeful and theoretical sampling;
merging or clear boundaries? Journal of Advanced Nursing. 26:623–30.
Creswell, J.W. (1998). Qualitative inquiry and research design: Choosing among five
traditions. Thousand Oaks, CA: Sage Publications
Cresswell, J. W, & Plano C. V. L. (2011) Designing and conducting mixed method research.
2nd Sage; Thousand Oaks, CA
Cricelli, L., and Greco, M. (2013), Relational capital and performances in interuniversity
research consortia. International Journal of Engineering Business Management, Vol. 5
No. 4, pp. 1–7.
Cronbach, L. J. (1951). Coefficient alpha and the interval structure of tests. Psychometrika,
16, 297–334.
Crotty, M., (1998). The foundations of social Research: Meaning and Perspective in the
Research Process, London: Sage Publication, p. 115

214
Daneil, U., A., (2012). Theoretical Constructs, Concepts, and Applications. American
International Journal of Contemporary Research, 2(9).
Dangayach, G., Pathak, S. C., Sharma, A. D., (2006). Advanced manufacturing technology: a
way of improving technological competitiveness. International Journal of Global
Business and Competitiveness
Dangayach, G. S., & Deshmukh, S. G., (2015). “Advanced manufacturing technology
implementation: Evidence from Indian small and medium enterprises (SMEs)”, Journal
of Manufacturing Technology Management
Dangayach, G. S., & Deshmukh, S. G., (2005) "Advanced manufacturing technology
implementation: Evidence from Indian small and medium enterprises (SMEs)", Journal
of Manufacturing Technology Management,
Darban, M., Wan Ismail, W., (2012). Advanced Manufacturing Technology Adoption in
SMEs: An Integrative Model. Journal of technology management & innovation
Das, R. P., & Sahu, T. L., (2015). Relationship between emotional intelligence and gender
difference: An empirical study. Prabandhan: Indian Journal of Management 8 (9), 15-23
Davenport, T.H., (1998). Putting the enterprise into the enterprise system. Harvard Business
Review 76, 121–131.
Davenport, T. H., (1993). Innovation: Reengineering Work Through Information Technology.
Boston, MA: Harvard Business School Press.
Davis, F.D. (1986). A technology acceptance model for empirically testing new end-user
information systems: Theory and results. Doctoral dissertation. Sloan School of
Management. Massachusetts Institute of Technology.
Davis, F.D. (1989). Perceived usefulness, perceived ease of use, and user acceptance of
information technology. MIS Quarterly 13 (3): 319–340.

215
Davis, F.D., Bagozzi, R. P., & Warshaw. P. R., (1989). User acceptance of computer
technology: A comparison of two theoretical models. Management Science 35 (8): 982–
1003.
Dawar, N., & Frost, T., (1999). Competing with Giants: Survival Strategies for Local
Companies in Emerging Markets. Harvard Business Review
Day, G., (1994). “The Capabilities of Market-driven Organizations”, Journal of Marketing.
Dean, J. W. & Snell, S. A., (1996). “The strategic use of integrated manufacturing: An
empirical examination,” Strategic Management Journal., vol. 17, no. 6, pp. 459–480,
Delgado, M., Ketels, C., Porter, M.E., & Stern, S. (2012). The Determinants of National
Competitiveness (NBER Working Paper No. 18249). doi: 10.3386/w18249
Deloitte (2016). 2016 Global Manufacturing Competitiveness Index. Deloitte.com
Deloitte (2019). Global Human Capital Trends Leading the social enterprise: Reinvent with
a human focus. Deloitte.com
Denis, K., (2017). Market Share as a Measure of Performance: Conceptual Issues and
Financial Accountability for Marketing Activities within a Firm Journal of Research in
Marketing Volume 7 No.3
Denzin, N.K. & Lincoln, Y.S. (2000) Handbook of Qualitative Research, Thousand Oaks,
CA: Sage Publications 2nd edition,
Denzin, N.K. & Lincoln, Y.S. (1994) Handbook of Qualitative Research, Thousand Oaks,
CA: Sage Publications 2nd edition
Despeisse, M., & Ford, S., (2015) The Role of Additive Manufacturing in Improving
Resource Efficiency and Sustainability. Journal of Centre for Technology
Management Working Paper

216
Diab, S. M., (2014). Using the Competitive Dimensions to Achieve Competitive Advantage: A
Study on Jordanian Private Hospitals. International Journal of Academic Research in
Business and Social Sciences, Vol. 4, No. 9ISSN: 2222-6990
Dı´az, M.S., lvarez Gil, M. J., & Machuca, J.A. D., (2005). Performance measurement
systems, competitive priorities, and advanced manufacturing Technology Some
evidence from the aeronautical sector. International Journal of Production and
Operations Management
Diaz, M.S., Machuca, J.A.D., & Alvarez-Gil, M.J., (2003). A view of developing patterns
of investment in AMT through empirical taxonomies: new evidence. Journal of
Operations Management 21 (5), 577–606.
Díaz-Reza, J. R., Mendoza-Fong, J. R., Blanco-Fernández, J., Marmolejo-Saucedo, J. A., &
García-Alcaraz, J. L., (2019). The Role of Advanced Manufacturing Technologies in
Production Process Performance: A Causal Model. Journal of Applied Sciences
Dogan, O. & Bera, A. K., (2019) "Heteroskedasticity-Consistent Covariance Matrix
Estimators for Spatial Autoregressive Models,". Spatial Economic Analysis 14(2),
pp.241-268,
Doh, K., Park, S., & Kim, D.Y. (2017). Antecedents and consequences of managerial behavior
in agritourism. Journal of Tourism Management 61, 511–522
Donald, H., Andrew, B., Matteo, F., Andrea, G, David, H., Steven, M., & Michael, O., (2013).
The World’s Industrial Transformation a Chatham House Report. The Royal Institute
of International Affairs.
Dopico, D. C., & Calvo-Poral, C., (2011). Analysis of Value Chain and Sources of
Differentiation in International Fashion Markets. European Research Studies Journal
XIV(1):15-28 ·

217
Dorrington P., Lewis A. & Millward H. (2003). Assessing the operational impact of
implementing advanced engineering design-led technologies within a selection of
manufacturing SMEs. Procedure of the 3rd Advanced Engineering Design Conf., Czech
Technical University, Prague, Czech Republic, June 2003
Duplaga, E. A., & Astani, M., (2003). Implementing ERP in Manufacturing. Journal in
Information Systems Management ·
Dundas, N. H. (2000). The Adoption of Advanced Manufacturing Technology and Strategic
Complexity. Northern Ireland Economic Research Centre
Durban, M., & Ismail, W. M. W., (2012). Advanced Manufacturing Technology Adoption in
SMEs: An Integrative Model. Journal of Technology Management and Innovation
7(4):112-120.
Durmaz Y., & İlhan, A., (2015). Growth Strategies in Busınesses and A Theoretical Approach.
International Journal of Business and Management; Vol. 10, No. 4;
Ebner, D., (2014). Formal and Informal Strategic Planning the Interdependency between
Organization, Performance and Strategic Planning. Springer Gabler
Edwards, J. R., & Lambert L. S. (2007). Methods for integrating moderation and mediation:
A general analytical framework using moderated path analysis. Psychological Methods,
12, 1-22.
Eisenhardt, K. M., & Martin, J. A. (2000). Dynamic capabilities: What are they? Strategic
Management Journal.
Enos, D. D. (2007). Performance improvement: Making it Happen. Auerbach Publications.
Ergüden, A.E., Kaya, C.T., & Tanyer, B. (2018). Re-Construction of Accounting Systems ın
the Rise of Revolutionary Changes in Industry 4.0. Account. Audit Review, 18, 139–
148.

218
Ern, S. Y., Abdullah, A. B., & Yau, F. S. (2015). Effects of Advanced Manufacturing
Technology Adoption and Market Competition on Management Accounting Systems of
Manufacturing Firms in Malaysia. In International Conference on Social Science
Research, ICSSR 2015 (Vol. 2015, pp. 376–386).
Essays, UK. (2018). Limitations of The Resource Based View Management Essay. Retrieved
from; https://www.ukessays.com/essays/management/limitations-of-the-resource-
based-view-management-essay.php
Eye, A., Schuster, C., Rogers, W. (1998). Modelling Synergy using Manifest Categorical
Variables. International Journal of Behavioral Development
Fahy, J. (2002). A resource-based analysis of sustainable competitive advantage in a global
environment. International Business Review.
Farris, P., Bendle, N. T., Pfeifer, P. E., & Reibstein, D. J. (2010). Marketing metrics: The
definitive guide to measuring marketing performance. Wharton.
Fernández-Robin, C., Celemín-Pedroche, M. S., Santander-Astorga, P. S., & Alonso-
Almeida, M., (2019). Green Practices in Hospitality: A Contingency Approach. Journal
of Sustainability.
Fincham, J. E., (2008). Response Rates and Responsiveness for Surveys, Standards. American
Journal of Pharmaceutical Education
Finfgeld-Connett D. (2010). Generalizability and transferability of meta-synthesis research
findings. Journal of Advanced Nursing. 2010; 66:246–54.
Fisher, N. I., (2019). A comprehensive approach to problems of performance measurement.
Journal of Royal Statistics Society 182, Part3, pp.1–36
Fitzpatrick, A. R., (1983). The Meaning of Content Validity. University of Massachusetts,
Flynn, B. B., Huo, B., & Zhao, X. (2010). The impact of supply chain integration on
performance: a contingency and configuration approach. Journal of Operations
Management, 28(1), 58-71

219
Fowler FJ. (2002). Survey Research Methods. 3rd ed. Thousand Oaks, CA: Sage Publications;
2002.
Freeman, J., (1973). Environment, technology and the administrative intensity of
organizations. American Society Review, 38(6): 750-763.
Freyermuth. (2007). Retaining Employees in a Tightening Labour Market. RSM McGladrey.
Galbreath, J. T. (2004). Determinants of Firm Success: A Resource-based Analysis. Curtin
University of Technology.
Gallo, A., (2017). Contribution Margin: What It Is, How to Calculate It, and Why You Need
It. Harvard Business Review
García-Sánchez, E., García-Morales, V. J., & Martín-Rojas, R., (2018). Influence of
Technological Assets on Organizational Performance through Absorptive Capacity,
Organizational Innovation and Internal Labour Flexibility. MDPI Journal
Sustainability
Gardner, P. L. (1995). Measuring attitudes to science: Unidimensionality and internal
consistency revisited. Research in Science Education, 25(3), 283–289.
Gautam, A., & Jain, s., (2014). Performance Management System: A Strategic Tool for Human
Resource Management. Prabandhan Guru
Gavrea, C., Ilies, L., & Stegerean, R., (2011). Determinants of Organizational Performance:
the case of Romania. Management & Marketing Challenges for the Knowledge Society
(2011) Vol. 6, No. 2, pp. 285-300
Georgise, F. B., Klause-Dieter, T., & Seifert, M., (2014). Integrating Developing Country
Manufacturing Industries into Global Supply Chain. Journal of Industrial Engineering
and Management
Gertz, G., (n.d). Kenya’s Trade Liberalization of the 1980s and 1990s: Policies, Impacts, and
Implications. Retrieved from https://carnegieendowment.org/files/kenya_background.pdf

220
Gerwin, D & Kolodny, H., (1992). Management of Advanced Manufacturing Technology:
Strategy Organization and Innovation. New York: Wiley,
Ghani, K. A., Jayabalan, V., & Sugumar, M., (2002). Impact of advanced manufacturing
technology on organizational structure. The Journal of High Technology Management
Research 13(2):157-175
Gichunge, E. M. (2007). The Effect of Formal Strategic management on Organizational
Performance: A Study of Selected medium sized Manufacturing Enterprises in Nairobi,
Kenya. PhD Dissertation.
Gitahi, A. W., & K’Obonyo, P. O., (2018) The Relationship Between Organizational
Resources and Firm Performance of Companies Listed on The Nairobi Securities
Exchange International Journal of Economics, Commerce and Management United
Kingdom Vol. VI, Issue 5.
Glaser, B.G. and Strauss, A.L. (1967) The Discovery of Grounded Theory: Strategies for
Qualitative Research, Chicago: Aldine de Gruyter
GOK. (2018). Kenya national AGOA strategy and action plan: 2018-2023. Ministry of
Industry, Trade and Cooperatives. Government Printers, Nairobi.
Goldhar, J.D., Jelinek, M., (1983). Plan for economies of scope. Harvard Business Review 61
6 , 141–148.
Grant R.M (2002). Contemporary strategy analysis; concept, technique, applications
(4thED). Mssachusetts: Blackwell
Grant, R. M., (1996). Toward a knowledge-based theory of the firm. Strategic Management
Journal.
Grant, R. M., (1991). “The Resources-Based Theory of Competitive Advantage: Implications
for Strategy Formulation”, California Management Review.
Grant, R.M., Krishnan, R., Shani, A.B., & Baer, R., (1991). Appropriate manufacturing
technology: a strategic approach. Sloan Management Review 33

221
Greco, M., (2013). Relational Capital and Performances in Interuniversity Research
Consortia. Research Article sagepub.com
Greene, W.H., (2000). Econometric Analysis, Fourth Edition, Prentice-Hall, Upper Saddle
River, New Jersey,
Grossoehme, D. H., (2014). Overview of qualitative research. Journal of Health Care
Chaplain. 2014; 20:109–22.
Gunawardana, K. D., (2006). Introduction of Advanced Manufacturing Technology: a
literature review. Sabaragamuwa University Journal
Gupta, A., Prinzinger,J., & Messerschmidt, D.C., (1998) "Role of organizational commitment
in advanced manufacturing technology and performance relationship", Integrated
Manufacturing Systems, Vol. 9 Issue: 5, pp.272-278,
Gupta, S., Dangayach, G. S., Singh, A. K., & Rao, P.N (2015) Analytic Hierarchy Process
(AHP) Model for Evaluating Sustainable Manufacturing Practices in Indian Electrical
Panel Industries. Journal of Social and Behavioral Sciences
Habibi, M., Kermanshachi, S., & Rouhanizadeh, B., (2019). Identifying and Measuring
Engineering, Procurement, and Construction (EPC) Key Performance Indicators and
Management Strategies. Infrastructures, 4, 14; doi:10.3390
Halbesleben, J. R. B., Neveu, J. P., Paustian-Underdahl, S. C., & Westman, M. (2014). Getting
to the “COR”: Understanding the role of resources in conservation of resources theory.
Journal of Management, 40, 1334–1364. doi: 10.1177/0149206314527130
Hakkak, M., & Ghodsi, M., (2015). Development of a Sustainable Competitive Advantage
Model Based On Balanced Scorecard. International Journal of Asian Social Science,
vol. 5, issue 5, 298-308
Hambrick, D. C.& Mason, P.A. (1984). Upper echelons: The organization as a reflection of
its top managers, Academy of Management Review, 9(2): 193206.
222
Haradhan M., (2017) Two Criteria for Good Measurements in Research: Validity and
Reliability, MPRA Munich Personal RePEc Archive
Harney, B. (2016) ‘Contingency theory’ in Johnstone, S. and Wilkinson, A. (2016) An
Encyclopedia of Human Resource Management, Cheltenham: Edward Elgar, pp. 72-73
Harrison, G. L., & Baird, K. M. (2015). The organizational culture of Public Sector
Organizations in Australia. Australian Journal of Management, Vol. 40(4) 613–629.
Hart, S.L., (1995). A Natural-Resource-Based View of the Firm. The Academy of
Management Review Vol. 20, No. 4
Haruna, S. M., Gakure, R., & Orwa, G., (2015). Effect of advanced manufacturing technology
(amt) on the product output of manufacturing small and medium scale enterprises in
Nigeria. International Academic Journal of Innovation, Leadership and
Entrepreneurship Volume 1, Issue 5, pp. 1-18
Hayes, R.H., Pisano, G.P., (1994). Beyond world-class: the new manufacturing strategy.
Harvard Business Review 72 1, 77– 86.
Hayward, A. (2011). Parental leave pays off for business -Fair Work Ombudsman Nicholas
Wilson.
Hawkins, L., (2001). Fundamental Productivity Improvement Tools and Techniques. PRIME
Faraday Partnership Wolfson School of Mechanical and Manufacturing Engineering
Loughborough University, Loughborough, Leics LE11 3TU
Helfat, C. E. (2000). The evolution of firm capabilities. Strategic Management Journal, 21(10-
11), pp. 955-959.
Helfat, CE., & Peteraf, M. (2003). The dynamic resource-based view: Capability lifecycles,
Strategic Management Journal, 24(10): 997-1010.
Herath, H. M., & Mahmood, R. (2014). Strategic orientations and SME performance: the
moderating effect of absorptive capacity of the firm. Asian Social Science, 10(13): 95.

223
Hewitt-Dundas, N., (2000). The Adoption of Advanced Manufacturing Technology and
Strategic Complexity. Northern Ireland Economic Research Centre
Hill, C. W. L., & Rothaermel, F. T. (2003). The performance of incumbent firms in the face
of radical technological innovation. Academy of Management Review.
Hofer, C.W., & Schendel, D. (1978). Strategy formulation: analytical concepts. St. Paul: Wets
Publish., 1978
Holden, R. J., McDougald Scott, A. M., Hoonakker, P. L., Hundt, A. S., & Carayon, P. (2015).
Data collection challenges in community settings: insights from two field studies of
patients with chronic disease. Quality of life Research: an international journal of
quality-of-life aspects of treatment, care and rehabilitation, 24(5), 1043–1055.
Holdford, D. A., (2018) Resource-based theory of competitive advantage – a framework for
pharmacy practice innovation research. US National Library of Medicine National
Institutes of Health
Hongjia Ma, Qing Sun, Yang Gao, & Yuan Gao (2019). Resource Integration,
Reconfiguration, and Sustainable Competitive Advantages: The Differences between
Traditional and Emerging Industries. Sustainability
Hopp, C., Antons, D., Kaminski, J., & Salge, T. O., (2018). Disruptive Innovation:
Conceptual Foundations, Empirical Evidence, and Research Opportunities in the
Digital Age. Journal of Product Innovation Management 35(3):446-457
Huselid, M. A. (1995). ‘The impact of human resource management practices on
turnover, productivity, and corporate financial performance.’ Academy of
management Journal, Vol. 38, pp. 635-670.
Huton, S. (2019). (2019) "Manufacturing capabilities and performance improvement: How
strategic alignment can deliver a lasting competitive edge", Strategic Direction,
Hynek, J., (2010). Advanced manufacturing technology benefits: Expectations vs. reality.
International conference on System Science and Simulation in Engineering. Proceedings

224
Hynek J., & Janeček, V., (2012). The Post-implementation Assessment of Advanced
Technology Utilization Journal of Competitiveness Vol. 4, Issue 3, pp. 3-13, ISSN 1804-
171X (Print), ISSN 1804-1728
Ireland, R. D., Hitt, M. A., & Sirmon, D. G. (2003). A model of strategic entrepreneurship:
The construct and its dimensions. Journal of Management.
Isa C., H., Foong S.Y., (2005) Adoption of advanced manufacturing technology (AMT) and
management accounting practices: the case of manufacturing firms in Malaysia. World
Review of Science, Technology and Sustainable Development,
Ishmael, O. (2013). Synergy: adaptability concept in managerial decisions accountant‘s
perspective. European Scientific Journal, 8(12).
Ismail, H. N. (2016). Training and organizational commitment: exploring the moderating role
of goal orientation in the Lebanese context. Human Resource Development
International, 19(2), 152-177.
Ismail, W., (2009). Advanced manufacturing technology adoption in developing countries:
The role of buyer-supplier relationships. Journal of Manufacturing Technology
Management
Ismail, W.K., & Darban, M., (2012). Advanced Manufacturing Technology Adoption in
SMEs: An Integrative Model. Journal of Technology Management Innovation, Volume
7, Issue 4
Itami, H., (1987) Mobilizing Invisible Assets. Cambridge, MA: Harvard University Press,
1987
Jabar, J., Soosay, C., & Santa, R. (2010). Organizational learning as an antecedent of
technology transfer and new product development: A study of manufacturing firms in
Malaysia. Journal of Manufacturing Technology Management.
Jackson, S.L. (2009). Research Methods and Statistics: A Critical Thinking Approach 3rd
edition. Belmont, CA: Wadsworth.

225
Jacobs, F. R., Whybark, D. C., & Ridge, B., (2000). Why ERP? A Primer on SAP
Implementation. IL: Irwin/McGraw-Hill,
Jaleha, A. A., & Machuki, V. N., (2018). Strategic Leadership and Organizational
Performance: A Critical Review of Literature. European Scientific Journal Vol.14,
No.35 ISSN: 1857 – 7881
James, D. B., (2000), JALT Testing & Evaluation Shiken: SIG Newsletter, 4 (2)
Janice A. B., J. A., & Boal, K. B., (1994). Strategic resources: traits, configurations and paths
to sustainable competitive advantage. Strategic management journal, vol. 15, 131-148
Jeong, I., Pae, J. H., & Zhou, D. (2006). Antecedents and consequences of the strategic
orientations in new product development: The case of Chinese manufacturers. Industrial
Marketing Management, 35(3), 348-358. http://dx.doi.org/10.1016/j.indmarman.
Jenatabadi, H. S., (2015). An Overview of Organizational Performance Index: Definitions and
Measurements. https://www.researchgate.net/publication/275659514
Jesmin I. J., & Hui Hu, (2012). A review of literature on contingency theory in managerial
accounting African Journal of Business Management Vol. 6(15), pp. 5159-5164,
Johnson T, Owens L. (2007). Survey response rate reporting in the professional literature.
Paper presented at the 58th Annual Meeting of the American Association for Public
Opinion Research, Nashville, May 2003.
Joiner, T.A., Sarah Yang Spencer, X. & Salmon, S. (2009), "The effectiveness of flexible
manufacturing strategies: The mediating role of performance measurement systems",
International Journal of Productivity and Performance Management, Vol. 58 No. 2, pp.
119-135. https://doi.org/10.1108/17410400910928725
JoLaine R. D., Stephen, J.C., & Cecilia M. P., (2008) Best Practices for Survey Research
Reports: A Synopsis for Authors and Reviewers American Journal of Pharmaceutical
Education

226
Jones, G.K., Lanctot, A., Jr., & Teegen, H.J. (2001). Determinants and performance
impacts of external technology acquisition. Journal of Business Venture 16, 255–
283.
Jonsson, P., (2000). An empirical taxonomy of advanced manufacturing technology.
International Journal of Operations & Production Management 20 (12), 1446–1474.
José, M., Macarena, S., & Pedro G., (2016) Improving supply chain responsiveness
through Advanced Manufacturing Technology: the mediating role of internal and
external integration. Journal of Production Planning & Control, 27:9, 686-697,
DOI: 10.1080/09537287.2016.1166277
Judd, C. M., & Kenny, D. A. (2010). Data analysis. The handbook of social psychology.
New York: Wiley.
Jusoh, R., & Parnell, J. A. (2008). Competitive Strategy and Performance Measurement in
the Malaysian Context: An Exploratory Study. Management Decision.
Kaganski, S., Majak, J., Karjust, K., and Toompalu, S., (2017). Implementation of Key
Performance Indicators Selection Model as Part of the Enterprise Analysis Model.
Procedia CIRP 63 283 – 28
KAM (2019). Manufacturing Priority Agenda 2019 ISBN:978-9966-1866-3-8
Kaplan, R. S & Norton, D. P., (2015). Balanced Scorecard Success: The Kaplan-Norton
Collection. HBR
Karakaya, S., & Yannopoulos, F., (2011). Impact of market entrant characteristics on
incumbent reactions to market entry. Journal of Strategic Marketing 19(2):171-185
Kashan, A. J., & Mohannak, K., (2015). An Empirical Study of Capability Development within
Product Innovation Projects. Journal of Technology Management Innovation. 2015,
Volume 10, Issue
Kay, J., (1993). The Structure of Strategy. Business Strategy Review

227
Kazozcu, S.B. (2011). Role of strategic flexibility in the choice of turnaround strategies: A
resource-based approach. Procedia–Social and Behavioral Sciences. Vol. 24, p.444-459.
Kearney, A.T., (2017). Technology and Innovation for the Future of Production: Accelerating
Value Creation. World Economic Forum
Kenny (2018): Mediation. http://davidakenny.net/cm/mediate.htm
Kenny, D. A., (2018). Moderator Variables. http://davidakenny.net/cm/moderation.htm
Ketokivi M & Jokinen M (2006) Strategy, uncertainty and the focused factory in international
process manufacturing, Journal of Operations Management.
Kimuyu, P. (2007), “Corruption, Firm Growth and Export Propensity in Kenya” International
Journal of Social Economics
KIPPRA (2013), Creating an Enabling Environment for Stimulating Investment for
Competitive and Sustainable Counties.ROK
Kishawy, H. A., & Rosen, M. A., (2012). Sustainable Manufacturing and Design: Concepts,
Practices and Needs. Journal of Sustainality
Kitenga, G.M, & Kuria J. T., (2014). Theoretical underpinnings of dynamic capabilities
European Journal of Business and Social Sciences.
KNBS (2019), Economic Survey 2019. Government Printing Press, ISBN: 978-9966-102-08-
9
KNBS (2018a), Economics Survey 2018. Government Printing Press
KNBS (2016). Micro, Small and Medium Establishment (MSME) Survey. Government
Printing Press
Knott, P. J., (2015). "Does VRIO help managers evaluate a firm’s resources?", Management
Decision, Vol. 53 Issue: 8, pp.1806-1822,
Koc, T. & E. Bozdag, (2009), “The impact of AMT practices on firm performance in
manufacturing SMEs”. Robotics and Computer-Integrated Manufacturing.

228
Kogut, B., & Zander, U. (1992). Knowledge of the Firm, Combinative Capabilities, and the
Replication of Technology. Organization Science.
Kong, T., Feng, T., & Chunming Ye (2016). Advanced Manufacturing Technologies and
Green Innovation: The Role of Internal Environmental Collaboration. Sustainability
Kotha, R., Zheng, Y., & George, G., (2011). Entry into new niches: the effects of firm age and
the expansion of technological capabilities on innovative output and impact. Strategic
Management Journal
Kotha, S. & Swamidass, P. M. (1999). Strategy, advanced manufacturing technology and
performance: empirical evidence from U.S. manufacturing firms, Journal of Operations
Management 18 2000 257–277
Koetter, F., & Kochanowski, M., (2014). A Model-Driven Approach for Event-Based Business
Process Monitoring. Information Systems and e-Business Management 13(1)
Kotane, I & Kuzmina-Merlino, I., (2011). Non-financial indicators for evaluation of business
activity. Journal of European Integration Studies
Kotturu, C. M. V.V., & Mahanty, B., (2017) "Determinants of SME integration into global
value chains: Evidence from Indian automotive component manufacturing industry",
Journal of Advances in Management Research, Vol. 14 Issue: 3, pp.313-331,
Kovala, O., Nabareseh, S., Stankallaa, R & Chromjakovaa, F., (2019). Continuous
Improvement and Organizational Practices in Service Firms: Exploring Impact on Cost
Reduction. Serbian Journal of Management 14 (1)
Kronos (2016): The Future of Manufacturing: 2020 and Beyond The management and
technology priorities enabling global competitiveness in the years ahead. Industry Week
Lawrence, A., Palinkas, S. M., Horwitz, C. A., Green, J, P., Wisdom, N. D., & Kimberly H.,
(2016). Purposeful sampling for qualitative data collection and analysis in mixed
method implementation research. Administration and Policy in Mental Health and
Mental Health Services Research

229
Lavie, D. (2006). Capability reconfiguration: An analysis of incumbent responses to
technological change, Academy of Management Review, 31(1): 153-174.
Lavrakas, P., J., (2006) Cross-Sectional Survey Design : Encyclopedia of Survey Research
Methods, sage
Lee, C.-Y., (2010). A theory of firm growth: Learning capability, knowledge threshold, and
patterns of growth. Research Policy 39, 278-289.
Leeuwen, G., Bartelsman, E. J., & Nieuwenhuijsen, H., (1995). Adoption of Advanced
Manufacturing Technology and Firm Performance in The Netherlands. Economics of
Innovation and New Technology 6(4):291-312
Lei, D., Hitt, M. A., & Goldhar J. D., (1996) Advanced Manufacturing Technology:
Organizational Design and Strategic Flexibility. Sage Publications
Leonard-Barton, D., & Kraus, W. A., (1985). Implementing New Technology. Harvard
Business Review
Leong, G.K., Synder, D., & Ward, P., (2010). Research in the process and content of
manufacturing strategy. Omega 18, 109–122
Leonidou, L. C., Palihawadana, D., & Theodosiou, M., (2011). National Export-Promotion
Programs as Drivers of Organizational Resources and Capabilities: Effects on Strategy,
Competitive Advantage, and Performance. Journal of International Marketing
Leung, L., (2015) Validity, reliability, and generalizability in qualitative research.
Management
Lewis, J., Clayden, M., O'Connor, W., Mitchell, L. & Sanderson, T. (2000). Lone Parents and
Personal Advisers: Roles and Relationships. Sage Publications
Lewis, M. W, & Boyer, K. K., (2002) Factors Impacting AMT Implementation an Integrative
and Controlled Study. Journal of Engineering Technology Management, 19(2), pp. 111-
130.

230
LI, P., Xie, W. (2012). A strategic framework for determining e-commerce adoption. Journal
of Technology Management in China, 7 (1), 22-35.
Liao, Y., Deschamps, F., Loures, E.D.F.R., Ramos, L.F.P. (2017). Past, present and future of
Industry 4.0-a systematic literature review and research agenda proposal. International
Journal of Production 55, 3609–3629.
Lin, T.-C., Liang, J.-C., & Tsai, C.-C. (2015). Conceptions of memorizing and understanding
in learning, and self-efficacy held by university biology majors. International Journal of
Science Education, 37(3), 446–468.doi:10.1080/09500693.2014.992057.
Lippman, S. A., & Rumelt, R. P. (2003). A bargaining perspective on resource advantage.
Strategic Management Journal.
Liu, C. (2017). International Competitiveness and the Fourth Industrial Revolution.
Entrepreneurial Business and Economics Review, 5(4), 111-133.
http://doi.org/10.15678/EBER.2017.050405
Lu, Y. (2017). Industry 4.0: A survey on technologies, applications and open research issues.
Journal of Industrial Information Integration 6, 1–10.
Madhani, P. M., (2010). Resource Based View (RBV) of Competitive Advantage: An
Overview. The Icfai University Press.
Maike S., & Patricia D., (2017) "Linking QFD and the manufacturing network strategy:
Integrating the site and network perspectives", International Journal of Operations &
Production Management, Vol. 37 Issue: 2, pp.226-255,
Majumdar, S., & Bhattacharya, P. P., (2014). Porter Five Forces Analysis of theLeading
Mobile Cellular Telephony Service Provider in India. International Journal of Computer
Science and Mobile Computing
Makari, Ogola & Ogutu (2015). Advanced Manufacturing Technology and Size as
Determinants of Organizational Structure. Journal of Technology Management

231
Maket, L., & Korir, M., (2017). Resource Inimitability: The Strategic Resource Characteristic
for Sustainable Competitiveness in Universities. European Journal of Business and
Innovation Research Vol.5, No.1, pp.51-66,
Malika, H,. Elhadi M, &. Wook-SungYoo, S., (2020). Comparing mobile apps by identifying
‘Hot’ features. Future Generation Computer Systems Volume 107, Pages 659-669
Mansfield, E. (1993). The diffusion of flexible manufacturing systems in Japan, Europe and
USA. Journal of Management Science
Marketplace Oxford Economics (2013) Manufacturing Transformation Achieving
competitive advantage in a changing global London: Corporate Document Services
Marri,H. B., Gunasekaran, A., & Sohag,R.A., (2007) "Implementation of advanced
manufacturing technology in Pakistani small and medium enterprises: An empirical
analysis", Journal of Enterprise Information Management, Vol. 20 Issue: 6, pp.726-739,
Martin, L. (2007). “Exploring business support needs for innovation and growth in rural
areas”, ISBE Conference Proceedings, Glasgow, 7-9 November.
McDermott, C. M., & Stock, G. N., (1999). Organizational Culture and Advanced
Manufacturing Technology Implementation. Journal of Operations Management
17(5):521-533
McKenna, J.F., (1992). “Not a Facility, But a Capability (Allen-Bradley’s Electronic
Manufacturing Strategy EMS”, Industry Week, Vol. 241, pp. 60-1.
McKiernan P., (1997). Strategy past; Strategy futures. Long Range Planning 30(5): 790–798.
Mendes. M. & Pala. A. (2003). Type I Error Rate and. Power of Three Normality Tests.
Pakistan Journal of Information and Technology 2(2), pp. 135-139.
Meredith, J. (1987). The Strategic Advantages of new Manufacturing Technologies for Small
Firms. Strategic Management Journal 8: 249-258.

232
Meredith, J., & Vineyard, M., (2013). A longitudinal study of the role of manufacturing
technology in business strategy. International Journal of Operations and Production
Management 13 (12), 4–24.
Michalisin, M.D., Smith, R.D., & Kline, D.M. (1997). In search of strategic assets. The
International Journal of Organizational Analysis, 5(4), 360–387.
Miller D. (2002). Knowledge Inventories and Managerial Myopia. Strategic Management
Journal
Mintzberg, H. (1989). The structuring of organizations. In Readings in Strategic
Management; Asch, D., Bowman, C., Eds.; Macmillan Education Ltd.: London, UK,
Mochklas, M., Jusni, & Fatihudin, D (2018). How measuring financial performance.
International Journal of Civil Engineering and Technology
Mody, A., Suri, R. & Sanders, J., (1992). “Keeping Pace with Change: Organizational and
Technological Imperatives”, World Development, Vol. 20 No. 12, pp. 1797-816.
Mohanty, M. K., Gahan, P., & Choudhury, S., (2014). Technology Management in
Manufacturing Sector - A case study from Indian Manufacturing Industry and
Application of Gregory Model. Asian Journal of Research in Business Economics and
Management Vol. 4, No. 8, pp. 216-233. ISSN 2249-7307
Mohajan, H., (2017): Two Criteria for Good Measurements in Research: Validity and
Reliability. Annals of Spiru Haret University, Vol. 17, No. 4 pp. 56-82
Monday, J. U., Akinola, G. O., Ologbenla, P., & Aladeraji, O. K., (2015). Strategic
Management and Firm Performance: A Study of Selected Manufacturing Companies in
Nigeria European Journal of Business and Management. www.iiste.org ISSN 2222-
1905 (Paper) ISSN 2222-2839
Mora‐Monge, C. A., González, M. E., Quesada, G., & Rao, S. S., (2008) "A study of AMT in
North America: A comparison between developed and developing countries", Journal of
Manufacturing Technology Management, Vol. 19 Issue: 7, pp.812-829,

233
Moser, C. & Kalton, G. (1979) Survey Methods in Social Investigation, 2nd edition, London:
Heinemann
Moskal, B.S., (1992). “Industry Shows a Split Personality”, Industry Week, Vol. 241, 6 July,
p. 66.
Mugenda, O. M. & Mugenda, A. G. (2012). Research Methods. Quantitative and Qualitative
Approaches. Nairobi: African Centre for Technology Studies.
Muhammad Usman Tariq (2015). Operationalizing Variables in Theoretical Frameworks: A
Comparative Analysis ResearchGate
Mundfrom, D., Smith, M. L. D., & Kay, L., (2018). The Effect of Multicollinearity on
Prediction in Regression Models. General Linear Model Journal
Muogbo, U. S. (2013). The Impact of Strategic Management on Organisational Growth and
Development: A Study of Selected Manufacturing Firms in Anambra State. IOSR
Journal of Business and Management, 7(1), 24-32.
Murphy, K. R., & Davidshofer, C. O. (1988). Psychological testing. Principles, and
Applications, Englewood Cliffs.
Mustafa A., (2010), Research Methodology, Delhi: A.I.T.B.S Publishers
Nasir, S. Z., & Mahmood, N. (2018). A Study of Effect of Employee Retention on
Organizational Competence. International Journal of Academic Research in Business
and Social Sciences, 8(4), 408–415.
Newbert, S. L., Gopalakrishnan, S., & Kirchoff, B. A. (2008). Looking beyond resources:
Exploring the importance of entrepreneurship to firm-level competitive advantage in
technologically intensive industries. Technovation, 28: 6-19.http://dx.doi.org/10.1016/j.
North American Industry Classification (NAICs) code (2019)
Nwonu, C., (2017). Effect of Organisational Structure on Performance of Selected
Manufacturing Companies in Enugu State Nigeria. The international journal of Business
& Management

234
Nyabuto, L. (2017). Factors affecting organizational performance in the manufacturing
sector: a case study of BIDCO Africa. Management University of Africa
Nyori, G. M., and Ogola, J.M., (2015). Advanced manufacturing technology adoption in
manufacturing companies in Kenya International Journal of Research in Engineering
and Technology
Oakley, A. (1981) 'Interviewing women - a contradiction in terms' in H. Roberts (ed.) Doing
Feminist Research, London: Routledge & Kegan Paul
O'Connor, W. and Molloy, D. (2001). Hidden in Plain Sight: Homelessness Among Lesbians
and Gay Youth. London: National Centre for Social Research
Odero, J. A., & Makori, E. M., (2018). Employee Involvement and Employee Performance:
The Case of Part Time Lecturers in Public Universities in Kenya. International Journal
of Management and Commerce Innovations ISSN 2348-7585
OECD. (2017). Enhancing the contributions of SMEs in a global and digitalized economy.
Meeting of the OECD Council at Ministerial Level Paris, 7-8 June 2017.
Ogbeiwi, O., (2017). Why written objectives need to be really SMART. British Journal of
Health Care Management 23(7):324-336
O’Leary, D., (2000). Enterprise Resource Planning Systems. Cambridge University Press,
New York.
Olesen, D.E., (1993) “The Future of Industrial Technology”, Industry Week, 20 December,
pp. 50-2.
Olofin, S, Kouassi, E., & Salisu, A., (2009). Testing for heteroscedasticity and serial
correlation in a two-way error component model. Conference: African Econometric
Society Annual Conference On Econometric Modelling for Africa,
Ongeti, W. J., & Machuki, V. N., (2018). Organizational Resources and Performance of
Kenyan State Corporations. European Scientific Journal Vol.14, No.34

235
Ormston, R., Spencer, L., Barnard, M., & Snape, D. (2014). The foundations of qualitative
research. Industrial Journal
Oyedijo, A. (2013). Business Policy and Strategic Management (2nd ed.). Ikeja: Strategic
International Press Ltd.
Paladino, A. (2009). Financial champions and masters of innovation: Analyzing the effects of
balancing strategic orientations. Journal of Product Innovation Management, 26, 616-
626. http://dx.doi.org/10.1111/ j.1540-5885.2009.00687.x
Palinkas LA, Horwitz SM, Green CA, Wisdom JP, Duan N, & Hoagwood K. (2013)
Purposeful Sampling for Qualitative Data Collection and Analysis in Mixed Method
Implementation Research. Administration Policy Mental Health. 2013:1–12
Park, H.M. (2008). Univariate Analysis and Normality Test Using SAS, Stata, and SPSS.
Technical Working Paper. The University Information Technology Services (UITS)
Center for Statistical and Mathematical Computing, Indiana University.
Patel, V.L. Kaufman, D.R. & Magder, S.A. (1996). The Acquisition of medical expertise in
complex dynamic environments. Hillsdale, NJ: Lawrence Erlbaum. Pp. 127-165.
Patton, M. Q., (2002) Qualitative research and evaluation methods. 3rd Sage Publications;
Thousand Oaks, CA
Patton, M. Q., (1999) Enhancing the quality and credibility of qualitative analysis. Health
Services Res; 34:1189–208
Paul, B. V., (2015). The Resource-Based View on Project Risk Management. Journal of
Construction Engineering and Management 142(9) DOI: 10.1061/(ASCE)CO.1943-
7862.0001136
Parthasarthy, R., Sethi, S.P., (1992). The impact of flexible automation on business strategy
and organizational structure. Academy of Management Review 17 1 , 86–111
Pavitt, K., (1991). Key Characteristics of the Large Innovating Firm, British Journal of
Management.

236
Pearce, J. A., & Robinson, R. B. (2013). Strategic Management: Planning for Domestic and
Global Competition (13th ed.). New York: McGraw-Hill Irwin.
Percival, J.C. & Cozzarin,B.P., (2010), “Complementarities in the implementation of
advanced manufacturing technologies”. Journal of High Technology Management
Research.
Percival, J. & B. Cozzarin, (2010). "Selecting manufacturing business practices for maximum
competitive advantage". Journal of Manufacturing Technology Management. 21(1): p.
100-121.
Penrose, E., (1959). The Theory of the Growth of the Firm, Oxford: Basil Blackwell.
Peteraf. M. (1993). "The cornerstones of competitive advantage: A resource-based view".
Strategic Management Journal. 14(3), pp. 179-192.
Pine, B.J., (1993). Mass Customization: The New Frontier in Business Competition. Harvard
Business School Press, Boston.
Porter, M. E. (1996). What Is Strategy? Harvard Business Review, Nov.-Dec., 61-78.
Porter, M.E., (1992). Capital disadvantage: America’s failing capital investment system.
Harvard Business Review 70 5, 65–82.
Porter, M. E., (1991) The Competitive Advantage of Nations, The Free Press, New York, NY,
Porter, M. E. (1991). Towards a Dynamic Theory of Strategy, Strategic Management
Journal,12, 95-117
Porter, M. E. (1990). The Competitive Advantage of Nations, New York, The Free Press
Porter, M. E. (1987). From Competitive Advantage to Corporate Strategy, Harvard Business
Review, 65, 43-59.
Porter, M. E. (1985). Competitive Advantage, New York, The Free Press

237
Porter, M.E., (1983). “The technology dimension of competitive strategy,” in Research on
Technological Innovation, Management and Policy.vol.1, Greenwich, CT: JAI Press,
pp. 1–33
Porter, M. E. (1981). The Contributions of Industrial Organization to Strategic Management.
The Academy of Management Review, 6 (4), 609-621
Porter, M. E. (1980). Competitive Strategy, New York, The Free Press
Porter, M. E. & J. W. Rivkin (1998). Activity Systems as Barriers to Imitation. Working Paper
98-066, Harvard
Porter, M. E., & Kramer, M. R. (2006). Strategy and society: The link between competitive
advantage and corporate social responsibility. Harvard Business Review.
Powel, W. W., (1996). Fields of Practice: Connections between Law and Organizations.
Wiley online library.
Prahalad C. K., (1996). A Resource-Based Theory of the Firm: Knowledge versus
Opportunism. Organization Science.
Prahalad, C.K. & Bettis, R., (1986). The Dominant Logic: A New Linkage Between Diversity
and Performance, Strategic Management Journal, 6, 485-501.
Prahalad, C. K., & Hamel, G., (1990). ‘The Core Competence of the Corporation.’ Harvard
Business Review 68 (3): 79–91.
Priem, R. L., & Butler, J. E., (2001). Is The Resource-Based View a Useful Perspective for
Strategic Management Research? The Academy of Management Review 26(1):22
Putranto, K., Stewart, D., Moore, G., & Diatmoko, R., (2003). Implementing a technology
strategy in developing countries: the experience of the Indonesian rolling stock industry.
Technological Forecasting & Social Change 70, 163–176.
238
Putterill, M., Maguire, W., & Sohal, S. A., (1996). Advanced manufacturing technology
investment: criteria for organizational choice and appraisal. Journal of Integrated
Manufacturing Systems
Raduan, C., Abdullah, H. & Alimin, I. I. (2010). A Review of the Relationship between
Organizational Resources, Competitive Advantage and Performance, Journal of
International Social Research, 3.
Raghed, I. E., Inda, S., & Noriza M. J., (2018) The Moderating Role of Advance
Manufacturing Technology (AMT) On the Relationship between LARG-Supply Chain
and Supply Chain Performance. Asian Social Science; Vol. 11, No. 28
Rahardjo, J., & Salleh bin Yahya (2010). Advanced Manufacturing Technology
Implementation Process in SME: Critical Success Factors. Journal Teknik Industrie
Vol. 12, No. 2, 101-108 ISSN 1411-2485
Rangone A. (1998). On the applicability of analytical techniques for the selection of AMTs in
small-medium sized firms. Small Business Economics, 10(3): 293-304.
Raymond, L., (2005). Operations management and advanced manufacturing technologies in
SMEs: A contingency approach. Journal of Operations Management
Razali,N. M., & Wah,Y. B., (2011) Power comparisons of Shapiro-Wilk, Kolmogorov-
Smirnov, Lilliefors and Anderson-Darling tests Journal of Statistical Modelling and
Analytics Vol.2 No. I, 21-33, 2011
Reason, P. (1994) Participation in Human Inquiry, London: Sage
Reason, P. & Rowan, J. (1981) Human Inquiry: A Sourcebook of New Paradigm Research,
Chichester: Wiley
Ren, M. (2019). Why technology adoption succeeds or fails: an exploration from the
perspective of intra-organizational legitimacy. The Journal of Chinese Sociology J.
https://doi.org/10.1186/s40711-019-0109-x

239
Richard, P., Devinney, T., Yip, G., & Johnson, G., (2009). Measuring Organizational
Performance: Towards Methodological Best Practice. Journal of Management 3
Rioba, M. E., (2014). Manufacturing industry and economic growth in Kenya, University of
Nairobi
Ritchie, J & Lewis, J., (2003). Qualitative Research Practice a Guide for Social Science
Students and Researchers SAGE Publications Ltd 6 Bonhill Street London EC2A4PU
Roberts, H. (1981) Doing Feminist Research, London: Routledge
Roberts, B. (2002). Biographical Research, Buckingham. Open University Press
Rodrik, D. (2015). Coordination failures and Government policy: A model with application
in East Asia and Europe. Journal of International Economics, 40: 1-22.
Rohana, O., Roshayani, A., Nooraslinda, A. A., & Siti, M. M. A., (2014). Organizational
Resources and Sustained Competitive Advantage of Cooperative Organizations in
Malaysia. Procedia - Social and Behavioral Sciences 170 120 – 127
Rolstadas A., (1998). Entreprise Performance Measurement, International Journal of
Operations and Production Management, vol. 18, no. 9-10,
Ron, S. (2009). A scientific critique of the Resource-Base View (RBV) in strategy theory, with
competence-based remedies for the RBV's conceptual deficiencies and logic problems.
Journal of Research in Competence-Based Management
Rosnah, M. Y., Lo Woon, c., & Hasmi, M. S. J., (2005). Advanced Manufacturing
Technologies in SMEs. European Journal of Business and Management Vol.7,
No.2, 2015
Royston, P., (1993). A Toolkit for Testing for Non-Normality in Complete and Censored
Samples. Journal of the Royal Statistical Society. Series D (The Statistician) Vol. 42,
No. 1, pp. 37-43
Rumelt R. P., (2009). Strategy in a structural break. McKinsey Quarterly 1:35-42.

240
Rumelt, R.P., (1991) “How Much does Industry Mater?” Strategic Management Journal
Saberia, S., &. Yusuff, R. M., (2011). Advanced Manufacturing Technology Implementation
Performance: Towards A Strategic Framework. Proceedings of the 2011 International
Conference on Industrial Engineering and Operations Management Kuala Lumpur,
Malaysia, January 22 – 24.
Saberi, S., Mohd. Yusuff, R., Zulkifli, N., & Megat Ahmad, M. M. H., (2010). Effective
Factors on Advanced Manufacturing Technology Implementation Performance: A
Review Journal of Applied Sciences Volume 10 (13): 1229-1242,
Sanchez, R., (2008). A scientific critique of the resource-based view (RBV) in strategy theory,
with competence-based remedies for the RBV's conceptual deficiencies and logic
problems. A Focused Issue on Fundamental Issues in Competence Theory Development.
Research in Competence-Based Management, Volume 4 Emerald Group Publishing
Limited, pp.3 – 78
Sanjeev, G., & Sandeep, G., (2012). Advanced manufacturing technology effectiveness: A
review of literature and some issues. Frontiers of Mechanical Engineering, Volume 7,
Number 3, Page 256
Sapienza, HJ, Autio, E, George, G, & Zahra, S. (2006). A capabilities perspective on the
effects of early internationalization on survival and growth, Academy of Management
Review, 31(4): 914-933.
Sauser, W. I., (2005). Ethics in Business: Answering the Call. Journal of Business Ethics
Savastano, M., Amendola, C., Bellini, F., & D’Ascenzo, F. (2019). Contextual Impacts on
Industrial Processes Brought by the Digital Transformation of Manufacturing: A
Systematic Review. Sustainability Journal 11, 891
Savenye, W. C., & Robinson, R.S., (2005). Using qualitative research methods in higher
education. Journal of Computing in Higher Education volume 16, pages65–95(2005)
Schmalansee, R., (1985). Do Markets Differ Much? American Economic Review. 75(3), 341-
351.

241
Shepard, R.J. (2002). Ethics in exercise science research. Sports Med, 32 (3): 169-183.
Scherer, F. M., (1980). Industrial Market Structure and Economic Performance. Houghton
Mifflin Company.
Schonberger, R.J., (1986). World Class Manufacturing Enterprise Strategy, The Free Press,
NewYork, NY, 1986.
Schoonhoven, C. B., (1981). “Problems with contingency theory: Testing assumptions hidden
within the language of contingency theory,” Administration Science Quarterly Journal.,
vol. 26, pp. 349–377,
Schröder, C. (2016). The Challenges of Industry 4.0 for Small and Medium-Sized Enterprises;
Friedrich- Ebert-Stiftung: Bonn, Germany.
Schroeder G. R., Bates, K. A., & Junttila, M. A., (2002). A resource‐based view of
manufacturing strategy and the relationship to manufacturing performance. John Wiley
& Sons, Ltd
Schwab, K. (2015). The fourth industrial revolution: What it means and how to respond.
Foreign Affairs. https://www.foreignaffairs.com/articles/2015-12-12/fourth-industrial-
revolution
Schwab, K. (2016). The fourth industrial revolution. New York, NY: Crown Business.
Seier, E. (2002). Comparison of Tests for Univariate Normality. Statistical Journal, 1, pp.1-
17.
Sethi A.K. & Sethi S.P. (1990). Flexibility in Manufacturing: A Survey. The International
Journal of Flexible Manufacturing Systems, 2(4): 289-32
Shahmansouri, Esfahan, & Niki, (2013). Explain the theory of Competitive Advantage and
Comparison with Industries. International Journal of Economy
Shamoo, A.E.,& Resnik, B.R. (2003). Responsible Conduct of Research. Oxford University
Press.

242
Shapiro, S.S. & Wilk, M.B. (1965). An Analysis of Variance Test for Normality (Complete
Samples). Biometrika, Vol. 52, No. 3/4, pp. 591-611.
Sheena, P. (2008). Beyond industrialization: New approaches to development strategy based
on service sector. UNU-WIDER Research Paper No. 60.
Sheridan, J.H., (1992) “The CIM Evolution: Bringing People Back into the Equation”,
Industry Week, Vol. 241, pp. 29-30
Shishodia, Y., & Singh, P. M. (2012). Advanced Manufacturing Technologies: Literature
Review. International Journal of Engineering, Business and Enterprise Applications
(IJEBEA) ISSN (Print): 2279-0020 ISSN
Shortridge, R. T., (2004). Market valuation of successful versus non-successful R&D efforts
in the pharmaceutical industry. Journal of Business Finance Account. 31(9-10):1301-
1325.
Shrouf, F.; Ordieres, J.; Miragliotta, G. (2014). Smart factories in Industry 4.0: A review of
the concept and of energy management approached in production based on the Internet
of Things paradigm. In Proceedings of the 2014 IEEE International Conference on
Industrial Engineering and Engineering Management, Bandar Sunway, Malaysia, 9–12;
pp. 697–701.
Shutibhinyo, W. (2013). Balanced Scorecard Attributes: Key Determinant and Perceived
Benefits. Global Journal of Business Research, v. 7 (2) pp. 1-8,
Sirmon DG, Hitt MA. (20030. Managing resources: Linking unique resources, management
and wealth creation in family firms. Entrepreneurship Theory and Practice 27:339-58.
Sinqobile, N., & Alan, P., (2019). An Investigation of the Impact of Organisational Structure
on Organisational Performance. Journal of Financial Risk and Management Reviews
Silverman D. (2009) Doing Qualitative Research;.3rd ed. Newbury Park, London: SAGE
Publications Ltd
243
Singhry, H. B., & Rahman, A. A, (2016). Effect of advanced manufacturing technology,
concurrent engineering of product design, and supply chain performance of
manufacturing companies. The International Journal of Advanced Manufacturing
Technology, 2016, Volume 86, Number 1-4, Page 663
Singleton, R. A. Jr., & Straits, B. C. (2010). Approaches to social research (5th ed.). New
York: Oxford University Press.
Sirén, C., & Kohtamäki, M. (2016). Stretching strategic learning to the limit: the interaction
between strategic planning and learning. Journal of Business Research, 69(2), 653-663.
Skinner, W., (1986). The productivity paradox. Harvard Business Review
Small, M. H., (1998). Objectives for adopting advanced manufacturing systems: promise and
performance, Industrial Management & Data Systems, Vol. 98 No. 3, 129-137
Small M.H. (1999). Assessing manufacturing performance: an advanced manufacturing
technology portfolio perspective. Industrial Management & Data Systems, 99(6): 266-
277
Small, M. H., & Yasin, M. M. (1997). Advanced manufacturing technology: Implementation
policy and performance. Journal of Operations Management Volume 15, Issue 4,
November 1997, Pages 349-370
Smeeton, N., Goda, D. (2003). Conducting and presenting social work research: some basic
statistical considerations. British Journal of Social Work, 33: 567-573.
Snape, D., & Spencer, L. (2003). The foundations of qualitative research. Los Angeles: Sage.
Snell, S.A., & Dean, J.W., (2012). Integrated manufacturing and human resource
management: A human capital perspective. Academy of Management Journal 35 (3),
467–504
Sohal, S. A., (1996). Assessing AMT implementations: an empirical field study, Technovation,
Vol. 16 No. 377-383.

244
Sohal, A. S., & Schroder, R., (1999). Organizational characteristics associated with AMT
adoption. International Journal of Operations & Production Management ISSN: 0144-
3577
Spradley J. P. (1979) The ethnographic interview. Holt, Rinehart & Winston; New York.
Srivastava, M., Franklin, A., & Martinette, L., (2013) Building a Sustainable Competitive
Advantage Journal of Technology Management & Innovation
Stan, S. (2017). Intangible Resource Management - an Organizational Approach.
International conference KNOWLEDGE-BASED ORGANIZATION 23(1)
Stank, T. P., Keller, S. S., & Daugherty, P. J. (2001). Supply chain collaboration and logistical
service performance. Journal of Business, Logistics 22(1), 29-48.
http://dx.doi.org/10.1002/j.21581592.2001.tb00158.x
Stalk, G. & Hout, T. M., (1990) Competing against Time: How Time-based Competition Is
Reshaping Global Markets, The Free Press, New York, NY.
Stock, G.N. & McDermott, C. M., (2001). “Organizational and strategic predictors of
manufacturing technology implementation success: an exploratory study”.
Stock, T. & Seliger, G. (2016). Opportunities of sustainable manufacturing in Industry 4.0.
Procedia CIRP 40, 536–541.
Striteska, M., & Spickova, M., (2012). Review and Comparison of Performance
Measurement Systems. Journal of Organizational Management Studies
Sun, H., Tian, Y., & Cui, H., (2001). Evaluating advanced manufacturing technology in
Chinese state-owned enterprises: a survey and case studies. International Journal of
Advanced Manufacturing Technology 18 (7), 528–536.
Swamidass, P.M, Baines, T., & Darlow, N., (2001) "The role of manufacturing and marketing
managers in strategy development: Lessons from three companies", International
Journal of Operations & Production Management, Vol. 21 Issue: 7, pp.933-948,

245
Swamidass, P. M., & Kotha, S., (2000). Strategy, Advanced Manufacturing Technology and
Performance: Empirical Evidence from U.S. Manufacturing Firms. Journal of
Operations Management 18 257–277
Swamidass, P. M., & Kotha, S., (1998). “Explaining manufacturing technology use, firm size
and performance using a multidimensional view of technology,” Journal of Operational
Management vol. 17, pp. 23–37, 1998.
Swamidass, P.M. & Newell, W.T., (1987), "Manufacturing strategy, environmental
uncertainty and performance: a path analytic model". Management Science. 33 (4): p.
509 - 524.
Swamidass, P. M. & Waller M. A., (1990). “A classification of approaches to planning and
justifying new manufacturing technologies.” Journal of Manufacturing Systems, 9, 3,
181–193
Swink , M., & Nair, A., (2007) Capturing the competitive advantages of AMT: Design–
manufacturing integration as a complementary asset Journal of Operations
Management Volume 25, Issue 3, , Pages 736-754
Syed, Z., & Jamal, W., (2012). Universalistic Perspective of HRM and Organisational
Performance: Meta-Analytical Study. International Bulletin of Business Administration
ISSN: 1451-243X Issue 13 EuroJournals
Szász, L., Scherrer-Rathje, M., & Deflorin, P., (2016). Benefits of internal manufacturing
network integration The moderating effect of country context. International Journal of
Operations & Production Management 36(7):757-780
Szwejczewski, M., Sweeney, M. T., & Cousens, A., (2016) "The strategic management of
manufacturing networks", Journal of Manufacturing Technology Management, Vol. 27
Issue: 1, pp.124-149,
Taber, K.S. (2018). The Use of Cronbach’s Alpha When Developing and Reporting Research
Instruments in Science Education. Research in Science Education 48, 1273–1296.
https://doi.org/10.1007/s11165-016-9602-2

246
Tanwar, R. (2013). Porter’s Generic Competitive Strategies. IOSR Journal of Business and
Management Volume 15, Issue 1
Tatnall, A. (2011). Innovation translation, innovation diffusion and the technology
acceptance model: Comparing three different approaches to theorizing technological
innovation. In Actor-network theory and technology innovation: advancements and new
concepts, ed. A. Tatnall, 52–66. Hershey: IGI Global.
Taylor, F. W., (1911). The principles of scientific management. New York, London, Harper
& Brothers
Teece, D. J. (2014). A dynamic capabilities-based entrepreneurial theory of the multinational
enterprise. Journal of International Business Studies.
Teece, D. J. (2007). Explicating dynamic capabilities: the nature and micro foundations of
(sustainable) enterprise performance. Strategic Management Journal.
Teece, D. J., & Pisano, G. (1994). The dynamic capabilities of firms: An introduction.
Industrial and Corporate Change 1: 537–556.
Teresko, J., (1990) “Engineering: Where Competitive Success Begins”, Industry Week, Vol.
239, pp. 30-8.
Thai, M. T. T., (2014). Contingency Perspective. Wiley Encyclopedia of Management,
Edition: 3rd Edition, Wiley,
The 2014 Industry week. www.industryweek.com/resources/us500/2014
Theodoroua, P. & Florou, G., (2008), “Manufacturing strategies and financial performance—
The effect of advanced information technology: CAD/CAM systems”. Journal of
Engineering
Theriou, G.N., Aggelidis, V., &, Theriou, N. G. (2009). A Theoretical Frame work
Contrasting the Resource-Based Perspective and the Knowledge-Based View, European
Research Studies.

247
Thomson, T. M., (1972). Management by Objectives. Annual Handbook for Group
Facilitators by J. William Pfeiffer & John E. Jones (Eds.), San Diego,
Thornhill, S., & White, R. E. (2007). Strategic purity: A multiindustry evaluation of pure vs.
hybrid business strategies. Strategic Management Journal, 28, 553–561.
Tosi, H. L., & Slocum, J. W., (1984). Contingency Theory: Some Suggested Directions.
Journal of Management
Tracey, M., Vonderembse, M. A., & Lim, J., (1998). Manufacturing technology and strategy
formulation: keys to enhancing competitiveness and improving performance. Journal of
Operations Management 17 1999 411–428
Trochim, W.M.K. (2006). Research methods knowledge base. Retrieved on January 25, 2018
from http://www.socialresearchmethods.net
Tsai, K.H.; Liao, Y.C. (2017). Innovation capacity and the implementation of eco-innovation:
Toward a contingency perspective. Business Strategy Environment 26, 1000–1013.
Tuan, N. P., & Takahashi, Y., (2009). Resources, Organizational Capabilities and
Performance: Some Empirical Evidence from Vietnam’s Supporting Industries.
International Review of Business Research Papers Vol. 5 No. 4 Pp.219-231
Udo, G., & Ehie, I. (1996). Critical Success Factors for Advanced Manufacturing Systems.
Computers and Industrial Engineering 31(2): 91-94.
Ulrich, D., & Barney, J. B., (1984). Perspectives in Organizations: Resource Dependence,
Efficiency, and Population. The Academy of Management Review Vol. 9, No. 3
Unsal, E., & Cetindamar, D., (2015). Technology Management Capability: Definition and Its
Measurement. European International Journal of Science and Technology Vol.
4 No. 2
Upton, D. M., (1997). “Process range in manufacturing: An empirical study of
flexibility,” Management Science Journal, vol. 43, no. 8, pp. 1092–1097, 1997.

248
Van de Ven, A., Hudson, R., & Schroeder, D. (1984). Designing new business startups:
Entrepreneurial, organizational, and ecological considerations. Journal of
Management, 10,
Vargo, S. L., & Lusch, R. F. (2004). Evolving to a new dominant logic for marketing. Journal
of marketing, 1-17.
Venkatesh, V. (2000). Determinants of perceived ease of use: Integrating control, intrinsic
motivation and emotion into the technology acceptance model. Information Systems
Research 11 (4): 342–365.
Volberda, H. W., Niels van der Weerdt, Verwaal, E., & Stienstra, M., (2012). Contingency
Fit, Institutional Fit, and Firm Performance: A Metafit Approach to Organization–
Environment Relationships Organization Science Vol. 23, No. 4, pp. 1040–1054 ISSN
Volna, J., & Papula, J., (2013). Core Competence for Sustainable Competitive Advantage.
Conference: Multidisciplinary Academic Research, At Prague
Vonderembse, M.A., Raghunathan, T.S., Rao, S., (1997). A post-industrial paradigm: to
integrate and automate manufacturing. International Journal of Production Research 35
9 , 2579– Ž .2599.
Ward, P.T., Leong, G.K., & Boyer, K.K., (1994). Manufacturing Proactiveness and
Performance. Decision Sciences 25 3 , 337–358.
Walters, A., Milward, H., & Lewis, A., (2006). Case studies of advanced manufacturing
technology implementation in small companies. International Journal of Innovation and
Technology Management 03(02):149-169
Wang, C. K., & Ang, B. L. (2004). Determinants of Venture Performance in Singapore.
Journal of Small Business Management.
Wanjiru, A. I., Muathe, S., M., & Kinyua-Njuguna, W. J., (2019) The Mediating Effect of
Competitive Advantage on the Relationship between Corporate Strategies and
Performance of Manufacturing Firms in Nairobi City County, Kenya. Journal of
Business and Management Volume 21, Issue 4. Ser.

249
Waterman, A. S. (2013). The humanistic psychology-positive psychology divide: Contrasts in
philosophical foundations. Association of Medical Psychology; 68:124–33.
Watson, R. (2019) Jump starting digital transformation in manufacturing, Global
Manufacturing Journal
Wei, Z.; Song, X.; & Wang, D. (2017) Manufacturing flexibility, business model design, and
firm performance. International Journal of Production and Economics 193, 87–97.
Wellington, J. (2000). Educational research: Contemporary issues and practical approaches.
London: Continuum.
Wernerfelt, B. (1984). ‘A Resource Based View of the Firm.’ Strategic Management Journal
5 (3): 171–80.
Wheelwright, S. C., (1978). “Reflecting corporate strategy in manufacturing decisions,”
Business Horizons, vol. 21, pp. 57–66,
Wholey J. S., (1996). Formative and Summative Evaluation: Related Issues in Performance
Measurement, American Journal of Evaluation, vol. 17, no. 2,
Whyte, W.F. (1991) Participatory Action Research, Newbury Park, CA: Sage
Wooldridge, J. M., (2000) Introductory Econometrics: A Modern Approach, South Western,
World Bank (2016a). Kenya Economic Update. Washington, DC: World Bank.
World Bank (2015). Ease Doing Business 2018: Reforming to create jobs. Washington DC:
World Bank.
Wright, P. M., McMahan, G. C. & McWilliams, A. (1994). Human resources and sustained
competitive advantage: a resource-based perspective. International Journal of Human
Resource Management, 5(2), 301-326.
Wu, L. Y., & Wang, C. J. (2007). Transforming resources to improve performance of
technology-based firms: A Taiwanese Empirical Study, Journal of Engineering
Technology Management, 24: 251261
250
Yasin, M. M., & Michael, H. S., (1997). Advanced manufacturing technology:
Implementation policy and performance. Journal of Operations Management
Yoon, S.J., (2008). An exploratory study of the relationship between advanced manufacturing
technology and organization structure. Dissertation, The Pennsylvania State University,
USA.
Yuheng Li, Xun Wang, Hans Westlund, & Yansui Liu (2014) Physical Capital, Human
Capital, and Social Capital: The Changing Roles in China's Economic Growth Journal
of Growth and Change 46(1) DOI:
10.1111/grow.12084
Zahra, S.A. & George, G. (2002). Absorptive capacity: A review, reconceptualization, and
extension. Academic Management Review 27, 185–203.
Zairi, M., (1992). Measuring success in AMT implementation using customer–supplier
interaction criteria. International Journal of Operations and Production Management 12
10 , 34–55.
Zulkiffli, S. (2014). Business performance for SMEs: subjective or objective measures?
Review of Integrative Business and Economics Research, 3(1), 371.

251
Appendices
Appendix I: Research Questionnaire
The questionnaire is designed to collect data from large manufacturing companies in Kenya
to be used in evaluating advanced manufacturing technology, competitive advantage,
organizational resources and performance of large manufacturing companies in Kenya. All
information in this questionnaire will remain absolutely confidential and will be seen only by
academic researchers involved in this study. The data shall be for academic purposes only and
will be treated with strict confidence. Your co-operation in facilitating the study is highly
appreciated.
Part I: Respondent’s and Organizational Information
Name of Organization………………………………………………………………
Please state your position/title ……………………………………………………
I. Number of years you have worked with the organization (Tick (√) as appropriate)
Less than 1 Year [ ] Between 1- 3 Years [ ] Between 4 – 9 Years [ ]
Between 10 -15 Years [ ] Between 16-19 Years [ ] Over 20 Years [ ]
II. What is the market coverage of your organization? (Tick (√) as appropriate)
National [ ] Regional (within East Africa) [ ]
Continental (Within Africa) [ ] International (Africa and Beyond) [ ]
III. What is the number of years the organization has been in operation? (Tick (√) as appropriate)
Less than 1 year [ ] Between 1 – 3 Years [ ]
Between 4 – 6 Years [ ] Between 7 – 10 Years [ ] Over 10 Years [ ]

252
IV. Number of permanent employees in the organization? (Tick (√) as appropriate)
Less than 50 [ ] Between 50-100 [ ] Between 101-200 [ ]
Over 200 [ ]
V. Has your Organization implemented any manufacturing strategy in the last 6 years? (Tick (√)
as appropriate)
YES [ ] NO [ ]
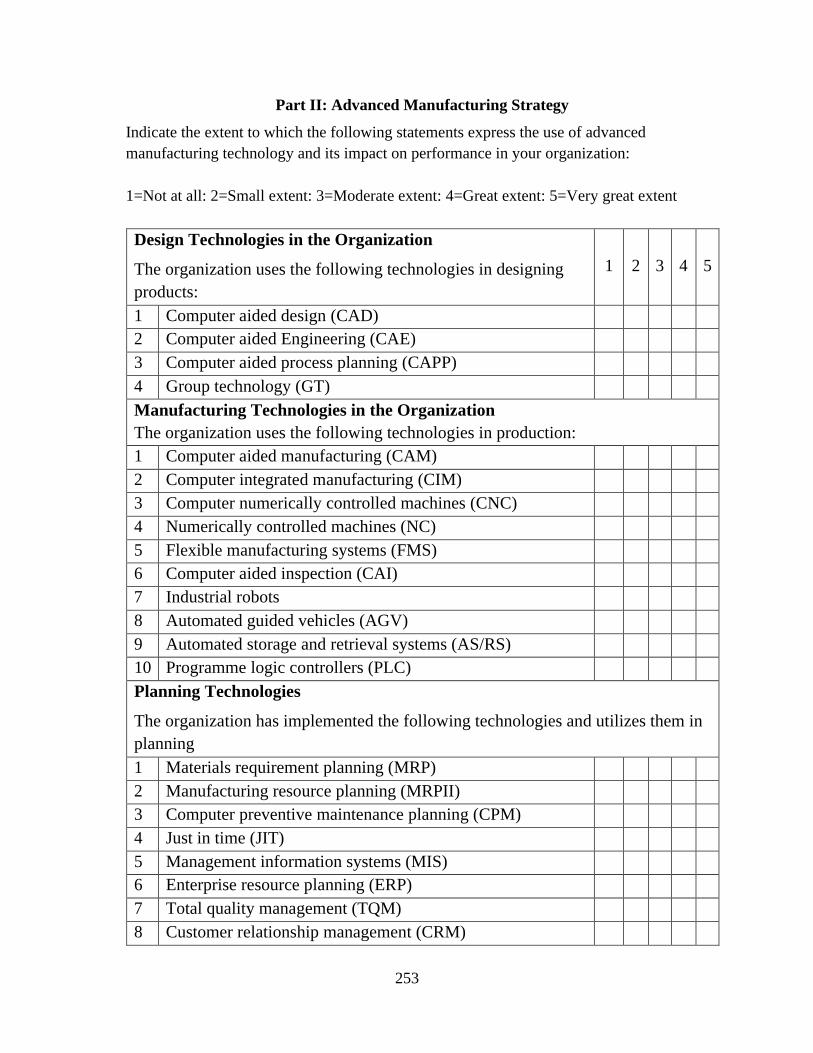
253
Part II: Advanced Manufacturing Strategy
Indicate the extent to which the following statements express the use of advanced
manufacturing technology and its impact on performance in your organization:
1=Not at all: 2=Small extent: 3=Moderate extent: 4=Great extent: 5=Very great extent
Design Technologies in the Organization
The organization uses the following technologies in designing
products:
1
2
3
4
5
1 Computer aided design (CAD)
2 Computer aided Engineering (CAE)
3 Computer aided process planning (CAPP)
4 Group technology (GT)
Manufacturing Technologies in the Organization
The organization uses the following technologies in production:
1 Computer aided manufacturing (CAM)
2 Computer integrated manufacturing (CIM)
3 Computer numerically controlled machines (CNC)
4 Numerically controlled machines (NC)
5 Flexible manufacturing systems (FMS)
6 Computer aided inspection (CAI)
7 Industrial robots
8 Automated guided vehicles (AGV)
9 Automated storage and retrieval systems (AS/RS)
10 Programme logic controllers (PLC)
Planning Technologies
The organization has implemented the following technologies and utilizes them in
planning
1 Materials requirement planning (MRP)
2 Manufacturing resource planning (MRPII)
3 Computer preventive maintenance planning (CPM)
4 Just in time (JIT)
5 Management information systems (MIS)
6 Enterprise resource planning (ERP)
7 Total quality management (TQM)
8 Customer relationship management (CRM)

254
Part III: Competitive Advantage
Indicate the level to which the you agree with the following statements on how advanced
manufacturing technology relates to your firm’s competitive environment and performance.
1= Strongly Disagree: 2= Moderately Disagree: 3= Neutral: 4= Moderately Agree:
5= Strongly Agree
Cost Leadership
Our organization exhibits the following characteristics:
1 2 3 4 5
1 High Process engineering skills among employees
2 Our products are designed for ease of manufacture
3 The organization has sustained access to inexpensive capital
4 Management exercises close supervision of labour
5 Management always has tight production cost control
6 Employees are given incentives based on quantitative targets.
7 Management always ensure that all the costs are kept at the minimum
possible level.
Differentiation
Our organization practices the following:
1 The organization offers customer service for all purchases of our
Products
2 Our products are unique
3 The organization has cultivated a reputable brand image in the
Industry
4 The organization employs the most current technology in production
5 The organization uses dealers/agents to distribute its products
6 Our customers are loyal to our products
Focus
Our Organization,
1 Focuses on a small niche market
2 Manufactures products that are aimed at a small target market

255
Part IV: Organizational Resources
Indicate the extent to which these statements represent the effect of advanced manufacturing
technology on resource position and performance in your organization
1=Not at all; 2=Small extent: 3=Moderate extent: 4=Great extent: 5=Very great extent
Assets 1 2 3 4 5
A The leaders effectively pool resources and expertise toward a shared goal.
B The leadership regularly access inventory of the organization
C The organizational has developed a reputable brand name in the Industry
D The organization has patented its products
E The organization has an effective product distribution network
F The organization has strategic partnership contracts with other global manufactures
G The organization is located in a prime area in relation to the Customers
H The organization has its own registered trade marks
Physical Facilities
A The organization has sufficient office and production space
B The organization owns land for expansion of its facilities
C The organization has a replacement strategy for its production Equipment
Employee Capabilities
A The organization has an overall approach to human resource Development
B Human resource development programs are tied to the industry
technological needs
C The organization has a training and development policy that support use of technology in production
D The organization practices an effective performance management system
E The organization encourages employee own skills development
F The organization embraces coaching at the workplace

256
Part V: Organizational Performance
a) Financial Performance
Fill in the table below the information required:
2013 2014 2015 2015 2016 2017
Gross revenue (Ksh. ‘000)
Gross profit (Ksh.’000)
Net profit (Ksh. ‘000)
Market share (%)
b) Non-Financial Performance
Use the keys provided to Tick (√) as appropriate: 1= Strongly Disagree: 2= Moderately
Disagree: 3= Neutral: 4= Moderately Agree: 5= Strongly Agree on how advanced
manufacturing technology impacts non-financial performance in your organization
Customer satisfaction 1 2 3 4 5
A Our customers rate how our organization responds to their concerns highly
B Customers rate our organization highly with regard to dealing with them professionally
C Our technical support meets the desired competence levels expected by our customers
D Products from our organization are rated highly by our customers
E Products from our organization meet the needs and expectations regarding quality and performance of our customers
F Our organization always meets the timelines on delivery required by our customers
G Our customers always find our products to be competitive and represent best value for total cost of lifetime ownership
Employee Retention
A Employees are always happy to work in our organization
B Our employees always recommend our organization to prospective employees
C The organization clearly conveys its mission to its employees.
D Employees understand how their jobs aligns with the organizations mission.
E There is good communication from managers to employees in the organization.
F Employees in the organization have the tools and resources they need to do my job.
G Employees in the organization receive the right amount of recognition for their work.

257
Thank you for having completed filling the questionnaire.
All the information provided will be treated with high confidentiality.
Should you require to get the results of the study kindly indicate the appropriate contact in
the space provided, or contact:
The Ph. D Co-Ordinator,
School of Business,
University of Nairobi,
P.O. Box 30197, 00100,
Nairobi.
E-mail: [email protected].
Name: ………...................................................................................................................................
Contact information
………………………………………………………………………………………………………
………………………………………………………………………………………………………
………………………………………………………………………………………………………
………………………………………………………………………………………………………
………………………………………………………………………………………………………

258
Appendix II: Letter of Introduction
LETTER OF INTRODUCTION
RE: RESEARCH STUDY
I am a student carrying out my Ph.D. thesis at the University of Nairobi on advanced
manufacturing technology, competitive advantage, resources and business processes,
competencies and, performance in large manufacturing companies in Kenya, focussing on the
manufacturing industry in Kenya. The key objective of the study is to contribute to the
intellectual field of management in Kenya and globally on advanced manufacturing
technology strategy and performance.
Please respond to the questionnaire items as completely as probable. All the data gathered in
this study will be treated with absolute confidentiality and the questionnaire will not take you
more than 30 minutes to complete. Should you require to get the results of the study kindly
indicate the appropriate contact in the space provided, or contact myself on the address given
below or the Ph.D Co-Ordinator School of Business, University of Nairobi, P.O. Box 30197,
00100, Nairobi. E-Mail, [email protected].
I thank you in advance and look forward to your feedback. Your co-operation will be highly
appreciated.
Yours Sincerely,
Eng. Musebe Edward Achieng

259
Appendix III: Manufacturing Companies in Kenya that are members of the Kenya
Association of Manufacturers with more than 100 employees and have
implemented Design Technologies, Manufacturing Technologies and
Planning Technologies in their production Process.
Company Main Product
Manufactured
Location
(County)
1 Butali Sugar Mills Ltd Sugar Kakamega
2 Cadbury Kenya Ltd Chocolates Nairobi
3 Chemelil Sugar Company Ltd Sugar Kisumu
4 Coastal Bottlers Ltd Soft Drinks Mombasa
5 Bidco Africa Ltd Edible Cooking fats Kiambu
6 British American Tobacco Kenya Plc Cigarettes Nairobi
7 Broadway Bakery Ltd Bread Kiambu
8 Brookside Dairy Ltd Milk Nairobi
9 Butali Sugar Mills Ltd Sugar Kakamega
10 Crown Beverages LTD Water Nakuru
11 Del Monte Kenya Ltd Fruits packaging Kiambu
12 DPL Festive Ltd Containers Nairobi
13 East African Breweries Ltd Beer Nairobi
14 East African Seed Co. Ltd Quality maize seed Trans Nzoia
15 Eastern Produce Kenya Ltd (Kakuzi) Fruit packaging Embu
16 Equator Bottlers Ltd Soft Drink Uasin Gishu
17 Farmers Choice Ltd Meat Products Naurobi
18 Githunguri Dairy Farmers Co-
operative Society Milk Kiambu
19 Highlands Mineral Water Co. Ltd Water Nakuru
20 James Finlay Kenya Ltd Tea Kericho
21 Kapa Oil Refineries Ltd Edible oil Mombasa
22 Kenchic Ltd Meat products Nairobi
23 Kenya Seed Company Ltd Quality seed Trans Nzoia
24 Kenya Wine Agencies Ltd Wines Nairobi
25 Keroche Industries Ltd Beer Nakuru
26 Kevian Kenya Ltd Fruit juice Kiambu
27 Kibos Sugar and Allied Industries Sugar Kisumu
28 Mastermind Tobacco (K) Ltd Cigarettes Nairobi
29 Mount Kenya Bottlers Ltd Soft drinks Nanyuki
30 Mumias Sugar Co. Ltd Sugar Kakamega
31 Nairobi Bottlers Ltd Soft drinks Nairobi
32 Nairobi Flour Mills Ltd Flour Nairobi
33 Nestle Kenya Ltd Stimulant drinks Nairobi

260
Company Main Product Manufactured
Location
(County)
34 New Kenya Co-Operative
Creameries Ltd
Milk Nairobi
35 Njoro Canning Factory(Kenya) Ltd Fruits and
vegetables
Nakuru
36 Nzoia Sugar Sugar Bungoma
37 Proctor & Allan (E.A.) Ltd Cereals Nairobi
38 Pwani Oil Products Ltd Edible oil products Mombasa
39 Rift Valley Bottlers Ltd Soft drinks Uasin gishu
40 South Nyanza Sugar Company Sugar Migori
41 Unga Group Flour Nairobi
42 Kenya Orchards Packed food Nairobi
43 Carbacid Investments Carbon Dioxide Nairobi
44 B O C Industrial Gases Nairobi
45 Williamson Tea Kenya Tea Kericho
46 Sasini Agricultural
Products
Muranga
47 The Limuru Tea Co. Ltd Tea Kiambu
48 Kapchorua Tea Tea Nandi
49 Kakuzi Agricultural Muranga
50 Eaagads
51 ARM cement Cement Machakos
52 Bamburi Cement Cement Mombasa
53 Crown Paints Kenya Paints Nairobi
54 East African Cables Electrical Cables Nairobi
55 East African Portland Cement Cement Machakos
Source: KAM (2018)
261
Appendix IV: Similarity Index Report
ADVANCED MANUFACTURING TECHNOLOGY AS A STRATEGY IN ENHANCING
PERFORMANCE OF LARGE MANUFACTURING COMPANIES IN KENYA
by
Eng. Edward Musebe Achieng
D80/60446/20
Submission date: 14-Oct-2019 12:16PM (UTC+0300)
Submission ID: 1192433343
File name: RESEARCH THESIS 2019 DRAFT 5.doc (1.3M)
Word count: 63132
Character count: 377076
SIGNED…………………………………………. DATE……………………………
Supervisor,
Prof. Zack B. Awino,
Faculty of Business and Management Science
University of Nairobi.
SIGNED………………………………………… DATE………………………………
Dean,
Faculty of Business and Management Science
University of Nairobi
262
COMPETITIVE ADVANTAGE AND ORGANIZATIONAL
RESOURCES: RELATIONSHIP BETWEEN ADVANCED
MANUFACTURING TECHNOLOGY AND PERFORMANCE
OF LARGE MANUFACTURING COMPANIES IN KENYA ORIGINALITY REPORT
13% 6% 5% 9%
SIMILARITY INDEX INTERNET SOURCES PUBLICATIONS STUDENT PAPERS
PRIMARY SOURCES
Submitted to Kenyatta University
1
Student Paper
Submitted to Mount Kenya University
2
Student Paper
kam.co.ke
3
Internet Source
link.springer.com
4
Internet Source
www.sxf.uevora.pt
5
Internet Source
Submitted to University of Nairobi
6
Student Paper
digitalcommons.ilr.cornell.edu
7
Internet Source
pdfs.semanticscholar.org
8
Internet Source
1%
<1%
<1%
<1%
<1%
<1%
<1%
<1%

263