Food Consumption, Trade Reforms and Trade Patterns in Contemporary India: How Do Australia and NZ...
32
Food Consumption, Trade Reforms and Trade Patterns in Contemporary India: How Do Australia and NZ Fit in? * Srikanta Chatterjee, Allan Rae and Ranjan Ray ** Working Paper 2/06 Centre for Applied Economics and Policy Studies Massey Universuty, Palmerston North New Zealand * The research for this paper started when Ranjan Ray visited Massey University during June/July 2005. He acknowledges the financial support of the Venture Trust in making that visit possible. The authors also acknowledge the painstaking and skilful research assistance of Geoffrey Lancaster, funded by an ARC grant, and the financial support from the New Zealand Foundation for Research, Science and Technology grant IERX0301. ** Srikanta Chatterjee is a Professor in the Department of Applied and International Economics, Massey University, New Zealand, as is Allan Rae who is also Director of the Centre for Applied Economics and Policy Studies. Ranjan Ray is a Professor in the School of Economics, University of Tasmania. 1
-
Upload
independent -
Category
Documents
-
view
1 -
download
0
Transcript of Food Consumption, Trade Reforms and Trade Patterns in Contemporary India: How Do Australia and NZ...

Food Consumption, Trade Reforms and Trade Patterns in Contemporary India: How Do Australia and NZ Fit in?*
Srikanta Chatterjee, Allan Rae and Ranjan Ray**
Working Paper 2/06 Centre for Applied Economics and Policy Studies
Massey Universuty, Palmerston North New Zealand
* The research for this paper started when Ranjan Ray visited Massey University during June/July 2005. He acknowledges the financial support of the Venture Trust in making that visit possible. The authors also acknowledge the painstaking and skilful research assistance of Geoffrey Lancaster, funded by an ARC grant, and the financial support from the New Zealand Foundation for Research, Science and Technology grant IERX0301. ** Srikanta Chatterjee is a Professor in the Department of Applied and International Economics, Massey University, New Zealand, as is Allan Rae who is also Director of the Centre for Applied Economics and Policy Studies. Ranjan Ray is a Professor in the School of Economics, University of Tasmania.
1
Abstract
This paper examines how the patterns of India’s food consumption and imports have been changing in recent times as a consequence of its faster economic growth and generally rising affluence levels to identify the areas of trade interest for Australia and New Zealand. After a broad review of India’s economic and trade policy reforms and their impact on economic growth and trade patterns since the early 1990s, the paper goes on to estimate, using National Sample Survey data, expenditure elasticities of demand for selected items of food. These estimates help explain the observed switch from cereal to non-cereal food items during the 1990s when income/total expenditure increased. The estimates of marginal budget shares of each food product indicate how consumption patterns may continue to evolve over time in the future. The expected changes are then linked to Australia’s and New Zealand’s trade with India in these products and how it has evolved through the 1990s when India gradually opened up its import market in several areas including agricultural products. The findings point to policy directions for Australia and New Zealand to pursue in order to increase their market shares in India. Key words: India, food consumption, Australasia, trade, demand systems
2

Food Consumption, Trade Reforms and Trade Patterns in Contemporary India: How Do Australia and NZ Fit in?
1. Introduction, motivation and organisation of the study
Since the early 1990s, the Indian economy has been growing rapidly both by its own historical standards and relative to many other economies, developed and developing. This has engendered several structural changes both within the economy and in its relationship to the rest of the world. While the observed transformation in many areas is policy-induced – and desirable – some are more like ‘side-effects’ that need deeper analysis and may call for policies to deal with them. Despite all the structural changes of the Indian economy over more than half a century, it is still heavily dependent on its agricultural and farming sector. This dependence is not so much in terms of the share of agriculture in the gross domestic product (GDP) – currently 25 percent, and steadily declining, as the share of services increases. In terms of labour employment and absorption, however, agriculture still accounts for around 65 percent of all employment in the economy (Jha 2004). The other significance of the sector stems from its obvious connection with food security and human nutrition – an issue of national priority since planned economic development began in India in the 1950s. This paper has three interrelated aims: to examine how the recent economic reforms have impacted on India’s agricultural and farming sector; how India’s faster economic growth of recent years has impacted on the patterns of food consumption in urban and rural sectors, and how these changes together have impacted on India’s trade patterns involving cereal and non-cereal food products. Since both Australia and New Zealand are significant net exporters of food products, the other aim of the study is to examine how trade between these countries and India has been changing in recent years. The study presents some econometric estimates involving the demand responses of Indian households at different income levels to income (expenditure) and price changes over time. The estimated results are then used to consider if they have any long term implications for India’s trade with Australia and New Zealand. The study is organised in the following way: the next section briefly surveys India’s economic reform policies since the early 1990s, and notes some of its major outcomes. Section 3 goes into some details of the reforms in India’s agricultural and farming sector and their impact on food consumption and the states of nutrition in rural and urban India. Section 4 considers India’s trade policy reforms since the 1990s; section 5 goes on to examine how India’s agricultural trade has evolved over this reform period, with a particular focus on how Australia and New Zealand fit into this evolving trade pattern; a broad overview of the observed changes to India’s food consumption is presented in section 6, followed by econometric modelling of food consumption, discussion of some data issues, and reporting of the findings on expenditure and price responses. These findings are then combined in
3

section 7 with observations on the evolving patterns of India’s trade in cereal and non-cereal food and other agricultural products - both globally, and with Australia and New Zealand - to shed light on where the best prospects for these two countries lie. The paper concludes in Section 8 on the theme of strategic trade and general economic policy directions for Australia and New Zealand in regard to the changes in India.
2. Recent economic reforms in India: A broad overview Three decades of planned economic development till the early 1980s saw the Indian economy achieve an annual average rate of GDP growth of around 3.5 percent – the so-called ‘Hindu rate of growth’. Although the planning models used by India did accept in principle an active role for the private sector, much of the key-sector investment was the domain of the public sector both at the central and state government levels. Achievement of national self-sufficiency in the major strategic areas of the economy had been an overarching aim of India’s planned development efforts. The strategy of import-substituting industrialisation initiated in the mid-1950s was an embodiment of this objective. Economic policies pursued in the different areas were conservative and protectionist, with the aim of reducing dependence on external trade, imports in particular, and investment. Indeed, as will be shown in section 5 below, these policies have succeeded in making India self-sufficient in respect of most foods in recent times. Some of the unwanted outcomes of these policies however have, over the years, included an overvalued exchange rate; proliferation of inefficient, high cost manufacturing industries; high landed costs of essential imported inputs requiring subsidisation of exports to make them competitive; policy-induced deterioration in agricultural terms of trade vis-à-vis industries, and a heavy fiscal burden to sustain the protectionist structure. These and other aspects of India’s economic policies and their outcomes need not detain us as they have been covered extensively in the literature (for example, Ahluwalia and Little, 1998; Bardhan, 1984; Bhagwati 1993; Srinivasan 2003). From the early 1980s, the fiscal pressures started to mount and the government resorted increasingly to borrowing both at home and abroad to cover its expenditures on investment, and even consumption. Some minor changes involving a degree of liberalisation in industrial policy and some relaxation of import restrictions were introduced in the 1980s. There was a noticeable increase, to over 5 percent, in the annual average real GDP growth rate through India’s sixth and seventh Five Year Plans covering the 1980s. However the fiscal deficits kept increasing and, by the early 1990s, gross deficits had grown to around 10 percent of GDP, and the costs of servicing the debt kept increasing and reached over 4 percent of GDP in 1990-91. Added to this was the steep rise in oil prices in the period leading up to the Gulf crisis of 1990, and the rupee exchange rate came under intense pressure as the non-resident Indian (NRI) and other offshore investors started withdrawing their deposits or capital from Indian banks and other financial institutions. India’s foreign exchange reserves declined to a level that could cover no more than two weeks’ imports, and the prospect of India defaulting on short term foreign debt looked imminent. An Extended Financing Facility of US$4.8 billion was arranged with the
4

International Monetary Fund, and a programme of extensive economic reforms was initiated in 1991. The sum borrowed was soon repaid, but the reforms that radically altered the very ideological basis of economic policy-making in India have continued apace. Given the background in which the new policy regime was initiated over the period 1991-93, its aims and scope were largely predictable. These were to: address the structural imbalances that contributed to the large and growing fiscal and balance of payments deficits; begin a process to liberalise international trade and industrial investment including foreign investment; manage the exchange rate in a manner that helps it respond more to market forces, and to take steps to make the rupee convertible - initially for current account transactions. The details of these policies are not the focus of this research; and they are well covered in the literature (for example Srinivasan 2003, Joshi and Little 1996). Aspects of the reforms in trade policies are covered later in the text. Some of the major outcomes of the reforms are noted briefly first. The growth rate of real GDP from 1992/93 to 1999/2000 was 6.46 percent, and the per capita income growth that suffered an unprecedented decline in 1991/92 increased to 3.9 percent over the decade to 2002. In more recent years, the growth rate of real GDP has reached double digit levels. It is also remarkable that this acceleration in growth has been achieved with relatively stable inflation rates. Per capita income is now around US$2,530 at the purchase power parity exchange rate (World Bank 2003), and a large ‘middle class’ of some 200 million people with adequate purchasing power to command a more diverse bundle of consumer goods, including food, has emerged as the most rapidly growing section of the population (Bijapurkar 2003). The balance of payments deficit that was part of the trigger for the radical policy departure, has turned exceptionally strong, with rapidly rising exports that has pushed the current account surplus to over US$100 billion a year in recent years. The government fiscal deficits however, after a noticeable initial decline, have risen steadily both at the central and the state levels, and are again a cause for concern. One significant positive outcome of all the changes has been a reduction in the share of the population in poverty from around 39 percent in the late 1980s to 26 percent in 1999/2000 (Govt of India 2003). Let us note in passing some of the major changes affecting the industrial sector, long dominated by various policy-induced constraints. Two changes stand out: industrial licensing, a persistent and much criticised feature of India’s industrial policy, was abolished in 1991 with some exceptions; and the public sector’s exclusive role in respect of the development of certain industries was sharply reduced from 17 to 3 over the decade of the 1990s. Barriers to entry into industry that thwarted competition thus came to be loosened over the reform period. The environment for foreign direct investment was also made less stringent. Manufacturing production grew rapidly from a negative figure of -0.8 percent in 1991-92 to over 14 percent a year by 1995-96. But the rate declined over the next five years to around 3 percent. Productivity growth too seems to have declined during the 1990s.Thus, the impact of the reforms on the economy has been a mixed one, some positive changes and some disappointing ones.
5
3. Agricultural and farm sector reforms and outcomes The economic reform package of 1991-93 did not contain any specific policies for the Indian agricultural and farm sector directly. But changes taking place in other sectors of the economy have had several significant effects on Indian agriculture, both in terms of production and consumption. Two main objectives of agricultural policy in India since the early days of planned development have been to (a) raise food output through increased production, and (b) improve the availability of food for the consumers. Policies used to achieve these objectives included (i) the use of minimum support prices (MSPs) via regular and guaranteed procurement of specific food grains; (ii) the use of open market operations to maintain price stability through different seasons of the year, and from year to year; (iii) the maintenance of buffer stocks of foodgrains, and (iv) the use of the public distribution system (PDS) to make foodgrains available at reasonable prices to ensure a degree of food security for the low income people in particular. The implementation of these measures needed an established administrative set up, and the two institutions that constituted this set up were the Commission on Agricultural Costs and Prices (CACP), which has the task of setting the appropriate MSP, and the Food Corporation of India which is responsible for procuring the foodgrains, and ensuring that the growers received a price that was not below the MSP, and that adequate buffer stocks were maintained to support the PDS. Over three decades since the early 1960s, India emerged from being a country with a massive shortage of foodgrains to a grain surplus country, with much improved food security at the national level. Prices of staple food items have remained relatively stable, and farm incomes have in general terms improved, more so in regions with reliable irrigation systems and better access to new farming technology. The economic reforms of the 1990s have had several significant impacts on the agricultural sector. These include a more open economy that has reduced the protective structure supporting industry. This has helped improve agriculture’s domestic terms of trade, thus providing greater incentives for investment in this sector. More importantly, the MSPs that used to be based entirely on domestic factors because of the elaborate border controls came for the first time to take international prices into consideration. The depreciation of the rupee in June 1991 made the generally lower domestic MSPs of foodgrains face more competition from imports. This led to intense lobbying by (big) farmers to increase the MSP to protect domestic farming against cheaper imports. The procurement price of wheat and rice was raised sharply through the 1990s. One consequence of this rather perverse incentive structure in an economy that seeks to promote greater international openness has been burgeoning buffer stocks of wheat and rice procured at raised MSPs. At the same time, wholesale and retail prices of wheat and rice in the private markets rose through the 1990s as larger government procurement combined with a stagnant per capita production of these crops started having their impact. An ominously paradoxical development against the backdrop of India’s faster economic growth has been a decline in per capita cereal consumption resulting from higher PDS and private retail prices of foodgrains which, in turn, are linked to the higher MSPs and large government stockpiles of grains. An extensive and
6
growing literature addresses the causes and implications of these interrelated developments for food security and human nutrition (Chand 2005, Radhakrishna 2005, Landes and Gulati 2004). We too go into some aspects of these recent developments in food production and consumption in India in section 6 below. The focus of this paper relates to another aspect of these developments, viz. the observed diversification of food consumption in both rural and urban India. With rising incomes, the patterns of diet normally change from a basic cereal-based diet to non-cereal items. Several recent studies have found evidence of this in the Indian context. Analyses of expenditure patterns of Indian households in urban and rural areas based on National Sample Survey data provide evidence to show that the income elasticity of demand for cereals is very low or zero for the population as whole, even though households at low income levels may still have a positive income elasticity of demand for cereals (Kumar 2000). A varied diet is likely to include protein, fats and other non-cereal items such as fruits and vegetables. Changes in India’s import policies, required under the Uruguay Round Agreement on Agriculture (URAA), have seen greater tariffication of agricultural imports. However, for most agricultural imports, the tariff bindings are still sufficiently high to prevent imports. In respect of some high-value processed-food items imports at bound rates are now occurring, as will be documented later in the paper. It is these types of changes that are the principal interest of this paper. Before moving on to the empirical investigation into the changing consumption patterns of Indian households, a brief survey of the major trade policy initiatives in recent years is addressed in the next section.
4. Agricultural trade policy reform As noted earlier, from the very early years of India’s planned economic development
until the early 1990s, India’s trade policy regime was characterised by strong control over exports and imports of both agricultural and manufactured products. The instruments of control were also many and varied, making India one of the most restricted markets in the world. A cautious beginning was made in the 1980s to dismantle some of the more obstructive barriers to allow greater competition in the traded sector of the economy.
A more wide-ranging package of reforms was introduced in 1991 to open the economy up to international competition. This package included depreciation of the rupee, and its partial convertibility for current but not for capital account transactions; reduction in canalisation (i.e. importation via the state monopolies) of exports and imports; selective abolition of import controls, abolition of export control on all but a few selected items, and expansion in the number of items available for easier foreign participation and investment with less stringent regulations.
While these were largely “emergency measures” taken in response to the economic crisis of 1990-91 alluded to earlier, a more comprehensive export-import policy package was announced in 1992 covering the period up to 1997. The reforms to be implemented in this period included the aim of eliminating restrictive licensing arrangements, and reducing quantitative restrictions on imports and exports generally, and reducing basic tariffs
7

significantly. With the exception of the items on banned, restricted and state monopoly lists, all products could be freely imported without needing a licence. The reduction in the weighted average tariff rates was sizeable – from over 72 percent in 1991-92 to around 25 percent in 1996-97. They have since risen however to over 35 percent. Maximum tariff rates likewise have been reduced in steps from over 300 percent to about 40 percent for most items, with reductions in countervailing duties too. Restrictions on agricultural trade, not part of the 1991 package, have also come to be gradually reduced in the subsequent trade policy changes. The specific changes affecting agricultural items include curtailment of the activities of the State Trading Corporation, once an important regulatory arm of the government controlling agricultural trade; enhanced market access for many agricultural items through the removal of quotas; reduction of tariffs and easing of the licensing arrangements; and allowing private sector participation in the import of food items.
As a signatory to the Uruguay Round Agreement on Agriculture (URRA) of 1994, India has proceeded to address issues affecting market access, domestic support, export competition, subsidy and sanitary and phytosanitary standards (SPS) to reduce agricultural trade barriers. The bound rates of agricultural tariffs came to be set between 0 and 100 percent for primary products, 150 percent for processed products, and 300 percent for edible oils. Having lost the balance of payments waiver that permitted restrictive trade practices, India proceeded to accelerate the removal of quantitative restrictions (QRs). By April 2001, India completed the removal of QRs on agricultural imports (www.ers.usda.gov/Briefing/India/policy.htm) thus making it possible now to import virtually all items subject to the applicable tariff and to SPS. The average bound tariff for agricultural items in the year 2002/03 was 115 percent, with a much lower applied tariff rate of 33 percent.
Restrictive trade policies adversely affect not just imports but export competitiveness too. Acceptance of this has led Indian trade policy makers in recent times to provide export incentives in a number of ways. Thus, exporting activities requiring an imported input are liable to a lower import tariff on that input; export restrictions on most products have been removed, and some exports are given subsidies permitted under the WTO rules. Government support for infrastructure and finance is also made available to set up agro-processing zones if such processing is export-oriented. To assist export promotion, Special Economic Zones (SEZs) are being created where export-oriented production will be permitted under relaxed rules regarding imports and foreign collaboration.
The most recent foreign trade policy announcement covering the period 2004-09 has emphasised the need to boost India’s export performance with the aim of doubling India’s share of global trade to 1.7 percent by 2009. Further reduction in tariff rates and streamlining of procedures to reduce transaction costs would be the means by which such an increase is to occur.
In the agricultural areas, new schemes to boost exports of fruits, vegetables, flowers and minor forest products have been announced. Foreign investment of up to 100 percent will
8

be allowed to set up and develop free trade and warehousing zones (FTWZs) with the aim to making India a “global trading hub”.
5. Agriculture in India’s total trade
India’s international commodity trade expanded considerably since the trade policy and macroeconomic reforms of the early 1990s. Between 1990 and 2003, total trade more than tripled, from $41 billion to $140 billion (Table 1). Imports (at 9.5% per year) grew slighter faster than exports (9.2%) over this period, and India’s trade deficit increased from $5.9 billion in 1990 to over $14 billion by 2003. India’s total trade in agricultural commodities also grew rapidly over this period, although not quite as fast as for total trade. Agricultural trade showed an increasing surplus since 1990, with growth in both exports and imports (Figure 1). Total agricultural trade increased from $5.9 billion in 1990 to $15.7 billion in 2003. Exports of agricultural commodities grew at a slower pace than for total exports, and its share of the latter declined from almost 27% in 1990 to 17% in 2003. Agricultural imports, in contrast, grew more rapidly than did total imports and agriculture’s share of total imports rose from under 5% to almost 7% over 1990-2003. Agriculture’s trade balance has shown a declining trend since peaking in 1996, reflecting the more rapid growth in agricultural imports since that time. Our demand analysis reported below points to increasing consumption shares of dairy products, other animal products, processed foods, and fresh fruits and vegetables as food expenditures rise. To what extent are these trends observed in India’s recent patterns of agricultural imports? In recent times India has been remarkably successful in maintaining or increasing its self-sufficiency in most foods (Figure 2). The only exception is vegetable oils, where less than 60% of domestic supplies were produced locally in 2000 compared with around 90% in the early 1990s. All other foods in the figure show self-sufficiency levels of 100% or more by 2000, with upward trends in sufficiency most notable for cereals, pulses, meats and fish. This is in line with India’s long-standing policy of minimising trade dependence in respect of foods and some other selected items.
We find that edible oils (HS15) have been India’s major agricultural import since the mid-1990s, and these have comprised over 40% of India’s total agricultural imports since 1998 (Table 2). The major products within this commodity group in 2003 were palm oil (71% of total imports of HS15 – the principal suppliers were Indonesia and Malaysia) and soybean oil (22% of HS15 imports - Argentina and Brazil were the main suppliers). The other major import commodity group has been pulses (lentils, chickpeas, dry peas etc). Taking edible oils and pulses together, India has emerged during the 1990s as the world’s major importer of these commodities. Cereal imports have declined dramatically from the mid-1990s surge where they accounted for over 10% of total imports. Over that period India increased wheat imports in particular in response to the domestic production and stocks situation. Imports of cereals had fallen to almost nothing since 2000. Non-food agricultural commodities accounted for around 20% of India’s agricultural imports in recent years, with cotton being the major single commodity in this group. Along with edible oils, cotton is one of the few
9

groups shown in Table 2 whose share of total agricultural imports has tended to increase since 1990. Given the predominance of edible oils in India’s recent agricultural trade, the principle suppliers of those products have also been the major sources for India’s agricultural imports. Leading exporters to India in 2003 were Indonesia (28% share), Malaysia (12.9%), Argentina (9.9%) and the USA (5.5%). As discussed earlier, India has managed to remain self-sufficient in dairy and other animal products, and in fruits and vegetables, over the 1990s, despite increasing consumption. Thus imports of these products make up a very low share of total food imports. Fruits made up 9% and processed foods 6% of total agricultural imports in 2003, but these shares have been trending downwards over time. However, dairy products had only a 0.6% share of total imports in 2003, and for meat and fish, and vegetables other than pulses, the shares were much lower still. 5.1 India’s agricultural imports from Australasia Since the early 1990s, India’s agricultural imports from Australia and New Zealand, both in value and share terms, have shown declining trends. Combined, both countries contributed 20% (US$260 million) of India’s imports in 1992, but just 4% ($208 million) by 2003 (Table 3), perhaps not surprising as India’s import growth has been driven by increased demand for primarily vegetable oils and pulses. By commodity, the major agricultural imports from Australasia are mainly non-food – wool, cotton, and hides and skins, but also pulses – these four commodities accounted for 90% of India’s total agricultural imports from Australasia on average over 2000-2003 (Table 4). This trade has been a fluctuating one however, with wool exports to India varying between $88 and $136 million, and that of cotton between almost zero and $54 million, since 1995. Of food items other than pulses, over recent times cereals have only been important during the mid-1990s, when Australia increased its wheat exports in response to India’s domestic shortfalls (Figure 3). Of the foods that have shown an increasing share of Indian household expenditures – fruits, animal products and processed foods – imports of these from Australasia totalled $16.7 million on average over 2000-2003, or just 7.5% of India’s total agricultural imports from Australasia (Table 4). Further, in only the cases of processed foods and fruits can a consistent upward trend be observed – the annual average growth rates between 1997 and 2003 are 5.5% for fruits and 20% for processed foods. Imports of meats and fish from Australasia have been negligible. Instability in India’s annual imports of these foods from Australasia is evident since 1995 – such imports fluctuated between $0.7 million to $18 million for dairy, between $0.03 million and $8 million for fresh fruit and nuts, from $1.3 million to $5.2 million for processed foods and between zero and $0.26 million for meats and fish. Table 4 also shows that Australasia’s share of India’s imports has fallen not just for agricultural products in total, but for many commodities as well. Between 1996-99 and 2000-03, Australasia’s share of India’s wool imports has fallen from 71% to 66%, from 68% to 32% for cereals, from 23% to 10% in the case of pulses and from 54% to 51% for dairy
10

products. To the extent that these broad commodity aggregates are differentiated by country of origin, this could reflect changes in India’s preferences. But loss of market share could also indicate loss of competitiveness, or India’s trade preferences, or increased competition from subsidised exports from elsewhere. Of all the commodities in the table, only for fruits and processed foods did the import shares of Australasia increase over this period, but in both cases Australia and New Zealand supplied no more than 2% of India’s total imports of these products. For all meats and fish, Australasia’s share of Indian imports was less than 1% on average in recent years.
6. Changes in food consumption patterns: a broad overview A significant feature of recent economic growth in India has been its impact on the pattern of consumption expenditure. Since the changing nature of consumer preferences in India has significant implications for her trade patterns, especially in agricultural products, we present some evidence of these changes in this section. The calculations, that have been reported below, are based on the 43rd (1987/1988) and 57th (2001/2002) rounds of the National Sample Survey (NSS). These surveys, which are quite extensive in their coverage, contain a wealth of household-level information on the quantity and value of consumption for a variety of food items in each of the constituent States and separately for rural and urban areas. Recent economic reforms and growth over the 1990s have continued the structural shifts in consumption patterns earlier observed during 1977-88 by Kumar and Mathur (1996). The per capita consumption of total cereals has continued to fall in both urban and rural households, while that of animal products, edible oils, vegetables and fruits has continued to increase in rural and urban regions. There are some notable differences between both sets of time periods however. Kumar and Mathur indicate increases in per capita consumption of rice and pulses in urban and rural households, and for wheat in rural households between 1977-1988. Table 5 shows that between 1988 and 2002, however, per capita consumption of rice, wheat and pulses declined in both urban and rural households.
Kumar and Mathur found per capita consumption of all non-staples higher in both rural and urban households in 1987 than in 1977, and higher in urban than rural households. However rural households had higher growth rates over that period for only the livestock products but not fruits and vegetables. We also find that per capita consumption of non-staples is higher in both rural and urban households in 2002 compared with 1988. While levels of per capita consumption of the non-staple foods remains higher in urban compared with rural areas in 2002, these gaps closed somewhat between 1988 and 2002 with higher rates of increase for some non-staple foods shown for rural households. Comparing 2002 with 1988, overall cereal monthly consumption per capita has clearly declined from 11.1kg to 9.4kg in urban areas and from 14.8kg to 12.2kg in rural households. At the same time, per capita consumption of meats, fish and eggs rose from 2kg
11

to 2.5kg in urban areas, and from 0.9kg to 1.5 kg in rural households. Consumption of dairy products rose from 4.5kg to 5.3kg in urban areas and from 3.3kg to 3.9kg per capita in rural households. Fruits and vegetables consumption increased from 11.5kg to 13.4kg in urban, and from 7kg to 9.5kg in rural households. Cereals share of total expenditure on foods continues to fall (Table 5), continuing the trend observed by Kumar and Mathur during 1977-87. During the following decade this decline was most noticeable in rural households, and by 2002 cereals accounted for one-third of total food expenditure. In urban households, the share of cereals in total spending declined from 27% in 1988 to 24% by 2002. The share of pulses in both urban and rural food expenditure also declined between 1988 and 2002. Livestock products increased their share of food expenditure in both rural and urban regions over this period: from 18.6% to 21.3% in urban households and from 14.3% to 17.4% in rural areas, a continuation of trends noted earlier by Gandhi and Mani (1995). Dairy products accounted for the largest share of this spending on livestock products. Vegetables and fruits also increased their shares of food expenditure in rural and urban areas. While quantity consumption data are less meaningful for beverages and processed foods, the expenditure shares of these product groups are shown in Table 5. By 2002, processed foods took 13.5% of total food spending in urban households, about the same as in 1988, and in rural households the share was 9.3%, up from 8.3% in 1988. Beverages accounted for over 6% of the food budget in urban households and almost 4% in rural regions. To the extent that westernisation of Asian diets involves increased spending on animal products, fruits and vegetables, and processed foods, we note that the combined shares of these items rose from 44% to 50% in urban, and from 33% to 41% in rural households between 1988 and 2002. In each case by 2002, these shares are greater than the shares of the staple cereals and pulses. For rural households, this was not the case in 1988. In the absence of a detailed econometric investigation into the causes of these changes in food consumption during the 1990s, it is not possible to explain to what extent this is due to changing food habits and preferences, or to inflation and changing relative prices between the food constituents. Tables 6 and 7 provide evidence on how the prices have moved during this period by reporting, in the rural and urban areas respectively, the State-wise median unit value index of the food items in 2001/2002 with 1987/1988 adopted as the base year. It is clear that there has been a differential inflation in the unit values, in both rural and urban areas, with pulses registering a large increase, and oils, meat, fish, eggs and vegetables/fruits recording smaller increases. Table 8 compares the per capita figures on production and availability of cereals with the all-India figures on cereal consumption for 1987/1988 and 2001/2002 reported earlier. It is clear that while the per capita production of cereals has increased significantly between 1988 and 2000, though declining between 2000 and 2002, there has been a marked decline in both the per capita availability and per capita consumption of cereals over this period. Chand (2005) argues that the procurement policy of the government of India, which changed in the 1990s and caused the procurement prices of rice and wheat to be set higher than international
12

prices, reduced the attractiveness of the public distribution system vis-à-vis the open market prices, and this may have contributed to the decline in cereal consumption. 6.1 Expenditure elasticities of demand 6.1.1 The demand model In order to get some insight into the changes in food consumption patterns, discussed above, we present estimates of expenditure elasticities. These will provide an explanation for the switch from cereals to non-cereal items in India during the 1990s as income/total expenditure increased. To do so, we employ the Quadratic Almost Ideal (QAI) Demand System proposed by Blundell, Pashardes and Weber (1993). The QAI extends the widely used Almost Ideal (AI) demand system by allowing for a non-monotonic relationship between the marginal budget share and income. Though the AI has been widely used in analysing consumption in developing countries (for example, Ma, et. al. 2004), there is now considerable evidence to suggest that the linearity of budget shares in the logarithm of household expenditure makes it a very restrictive model (see, for example, Meenakshi and Ray’s 1999 study on India). The QAI model is given, in budget share (wi) terms, as ( ) ( )
2
1log log log
nR
i i ij j i ij
w p xα γ β λβ=
Rx⎡ ⎤= + + + ⎣ ⎦∑ (1) i = 1,…,n where pjs are the household specific unit values of the various items, obtained by dividing the value by the quantities, and ( ), , ,i ij iα γ β λ are the demand system parameters. xR is the per capita real expenditure of the household, and is defined as follows log log logRx x= − Ρ
w pΡ =∑ (2)
where x is money expenditure, and 1k k=
is the Stone Price Index. log logn
k λ represents the generalisation of the QAI over the AI, and when 0λ = , QAI reduces to the AI. The expenditure elasticity, iη , is given by 2 logi i
ii
xw
β λβη += (3)
6.1.2 Results Looking first at the elasticity estimates for urban households in 2002, we note they exceed unity for processed foods, meats, fish and eggs, and dairy products, while those for vegetables and fruits, and beverages, are close to unity (Table 9). The cereals showed the lowest elasticity values. The processed food conditional elasticity in 2002 was almost double its 1988 estimate. Our findings are somewhat similar for rural households, with above-unity elasticities estimated for dairy products, meats, fish and eggs, processed food, wheat and beverages, and for this collection of foods the 2002 elasticities, with the exception of meats, fish and eggs, were greater than their 1988 estimates. As with urban consumption, the lowest
13
elasticities were for traditional cereals, which were also considerably lower than the 1988 estimates. Marginal expenditure shares for each food product are given by the product of the conditional expenditure elasticity and the expenditure share. The results in Table 9 indicate how consumption patterns may continue to evolve in the future as food expenditures rise. For a given increase in food expenditures of urban households in 2002, the largest shares of that increase are estimated to be allocated to dairy products and processed foods, followed in importance by vegetables and fruit, rice and meats, fish and eggs. The results are rather similar for rural households, with the largest share of the increase allocated to dairy products, followed by rice, processed foods, vegetables and fruit and wheat. For urban households, the marginal expenditure share for processed foods doubled from 1988 to 2002. In rural regions, the marginal shares increased noticeably for dairy, processed foods, fruits and vegetables and for wheat. In order to gain further insight into the changing pattern of food consumption, in response to income changes, we used the parameter estimates of the QAI demand system, estimated separately for each of the constituent States of India, to calculate State-specific expenditure elasticities. Since preferences vary widely between the various regions, especially with regard to the consumption of rice and wheat, it seems sensible to undertake such State level regional estimation. Table 10 presents the expenditure elasticities, by deciles, of selected items from three regionally distant States. Of these, A.P. in the South is primarily a rice eating State, while Bihar in the East has a greater share of wheat in the food basket. The elasticity estimates reveal some common features, notwithstanding the regional heterogeneity in food consumption. The expenditure elasticities of rice and wheat decline sharply as one moves up the decile groups, with these items displaying mild inferiority at the top decile. A significant exception is wheat in the primarily rice consuming State of Andhra Pradesh. This may provide a partial explanation for the observed diversification of food habits away from rice and wheat over the 1990s, since over the reforms period, the higher decile groups witnessed greater income increases than those in the lower deciles. In contrast, the non-cereal items, dairy and meat, fish and eggs, are highly elastic items right across the decile spectrum and this explains the significant increase in their consumption over the 1990s, as discussed earlier.
7. Discussion of India’s food consumption and trade pattern in the 1990s
The results of the detailed econometric estimates of food consumption in rural and urban India reported above clearly identify the consumption items that experienced the largest shares of the observed increase in food expenditure, and that showed the highest expenditure elasticities. These are dairy products, processed foods, meat, fish and eggs, and fruits and vegetables. With an established land use pattern and limited surplus land in India, such increases must be largely met through increased imports of these products. With the complete removal of QR by 2001, tariffs are now the only instrument for restricting imports of these (and other) products. A 35 percent tariff was imposed on items from which QR was removed.
14

As is to be expected, imports of all these items have increased significantly over the period 1990 -2004 as Table 11 reports. Being the latest year for which the required information on imports is available, the year 2004 is chosen. Being also three years after the completion of India’s tariffication of its imports, it is likely to reflect the impact of the removal of QR on the selected imports beyond an initial transition period.
Table 11 extends the information presented in Tables 3 and 4 by putting Indian imports of the six selected food items from Australasia alongside those from other major source-countries for the years 1990 and 2004. The Table lists the top four sources from which India imported these six items in the two years. By including India’s total imports of the selected items, and the four major sources from which they came in the two selected years, the table sheds more light on the relative position of Australia and New Zealand vis-à-vis these other sources. Even where Australia and New Zealand did not feature among the top four sources, the imports from them are also shown for comparative purposes. In four out of the six items, viz. dairy products, fish, fruits and other processed foods, the rates of growth of imports from Australia and New Zealand between 1990 and 2004 are higher than the comparable rates from the world as a whole. In dairy products, even though Australia lost its ranking among the top four sources, the value of imports from it increased significantly. New Zealand did not figure at all as a significant source in 1990, but is among the top four in 2004. Likewise, in fish, where import growth has been spectacular, both countries figure in 2004, even if the amounts imported from them are small. The picture with regard to meat is a little complex; while Australia’s share has declined, New Zealand has become an import source in 2004, even if the amount is small. Both countries are relatively significant sources of India’s fruit imports in 2004, even if neither is among the top four. In other processed food, both countries have again shown significant increases, without becoming one of the top four. Only in respect of vegetables have both countries experienced a sizeable reduction in their total exports to India over the period.
An interesting feature of the information reported in this Table must be the changes in the major import-source countries in respect of these products over the period. In 1990, when the demand for these products was more modest, and imports of them were subject to QR, the import volumes were small, and the leading import sources shared those volumes in the manner shown in the Table. As the import volumes grew over time, competition must have become more intense and the search widened for import sources as indicated in the Table. The major suppliers in 2004 could also reflect India’s trade agreement partners. In particular, the South Asian Preferential Trade Agreement (SAPTA), which commenced in 1995, groups India with six other countries including Nepal, Bangladesh and Pakistan. The latter three countries feature in the ‘top four’ list for four of the commodities in the table, which could be partly driven by preferences given by India and may not reflect underlying comparative advantages. Of all SAPTA members, India has offered the largest number of tariff preferences, even though the majority of these are for non-agricultural products.
The fact that Australia and New Zealand have got what in most cases is no more than a toehold in the large and growing Indian market must be considered disappointing These are
15

markets that need to be targeted for better results over time. Indeed, Australia has recently taken several initiatives, in collaboration with Indian businesses, to increase its food and beverage exports, including fruits, to A$250 million over the next five year period (www.domain-b.com/economy/trade/20060201). As major exporters to the world of dairy products, meat, fish, fruits and vegetables, both Australia and New Zealand have comparative advantage in these areas; they also have an established reputation as exporters of quality processed foods. With a greater focus, the Indian market could yield significant dividends.
8. Summary, conclusion and some policy directions
The analysis above has established a number of interrelated developments in the Indian economy: the average level of affluence has been increasing in India as the rate of GDP growth and per capita income growth has accelerated in the decade of the 1990s; this has contributed to a structural shift in the patterns of food consumption away from cereals to some non-cereal items such as meat, dairy products, fish, fruits and vegetables and processed foods. The marginal budget shares of selected food items indicate how consumption patterns are likely to evolve in the future as food expenditures rise.
The evidence cited above points to the possibility of continuing increase in the demand for the products just mentioned. Australia and New Zealand are significant exporters of these and other food products to the rest of the world. Although their exports of these products to India are not always large, they do have an export presence in the Indian market, and in respect of some of them their position has strengthened over the period 1990-2004. The major sources of India’s imports of these products have changed over the period, indicating perhaps increased competition and a more discerning Indian consumer in a market that is not just large but more open and unrestricted. To increase their market shares in the Indian market for these products, Australia and New Zealand must adopt a consistent policy involving identifying their own capacities to satisfy India’s growing demand for the selected products. This might involve forming strategic alliances with Indian businesses engaged in producing, importing and distributing these products. Participation in joint ventures in the SEZ’s collaborating with Indian interests could be a useful way to strengthen trade ties with India. Such participation would involve, for example, sharing expertise and assisting with technologies to harvest, package, store and distribute food products so as to avoid post-harvest waste and to improve food hygiene that are often among the problems a developing country like India faces.
The prospects of continuing rapid economic growth in India opens up many opportunities for resource-rich countries like Australia and New Zealand. Some of these have been addressed in this paper. There is no doubt that the Indian market is a difficult one to penetrate, given the long history of its closed nature; but changes are afoot and so must be the prospects for countries that can adapt themselves to the changes and take steps to identify the opportunities for collaboration and cooperation in line with their own comparative advantage.
16

Table 1 India’s total trade (US$million) Exports Imports Trade Balance
Year Total % Agr &
Fooda Total % Agr & Good Total Agr &
Food 1990 17940 26.6 23799 4.5 -5859 3685
1991 17900 26.0 19509 3.8 -1610 3909
1992 20711 24.7 24452 5.2 -3741 3826
1993 22237 25.2 23304 4.4 -1067 4569
1994 26330 24.5 28655 7.7 -2325 4255
1995 31699 27.3 36592 5.7 -4893 6547
1996 33469 29.4 39113 5.8 -5644 7587
1997 34794 27.7 41429 6.4 -6636 6985
1998 33207 25.6 42425 9.2 -9218 4616
1999 36672 22.4 49713 8.0 -13042 4257
2000 45250 20.3 51377 5.7 -6128 6264
2001 44306 19.7 51908 7.3 -7602 4957
2002 52471 18.4 61118 6.8 -8647 5510
2003 63029 16.8 77201 6.6 -14173 5499 a Agr & Food = HS1-24 + HS41 +HS51-52. Source: COMTRADE.
17

Table 2 Composition of India’s agricultural imports (%)
Animal/Veg Fats
Hides, Skins Wool Cotton Pulses Fruit &
Nuts Cereals Other
Processed Foods Year
HS15 HS41 HS51 HS52 HS0713 HS8 HA10 HS9, 16-23
Othera Total
1990 18.5 9.8 12.2 2.9 27.3 12.2 3.1 9.8 4.2 100
1991 18.6 10.1 12.9 2.3 16.2 19.9 0.6 13.5 5.8 100
1992 8.6 7.2 10.5 8.0 10.2 17.0 23.6 10.5 4.4 100
1993 10.7 10.9 12.9 2.4 18.1 21.6 5.6 12.7 5.1 100
1994 12.7 5.4 6.3 8.3 9.0 14.6 0.1 40.8 2.9 100
1995 36.2 6.3 8.6 8.6 10.1 15.5 0.2 10.1 4.5 100
1996 42.1 5.8 9.0 1.6 11.8 14.3 5.1 7.1 3.3 100
1997 33.8 5.5 7.2 2.5 12.9 13.6 10.0 11.3 3.1 100
1998 51.9 3.8 3.4 3.8 4.9 10.0 7.2 12.1 2.9 100
1999 52.5 3.8 3.1 7.9 2.3 10.4 5.3 10.8 3.9 100
2000 51.5 6.6 3.8 10.1 3.8 13.4 0.3 6.8 3.6 100
2001 42.0 5.8 3.8 12.8 18.6 6.7 0.0 7.2 3.2 100
2002 47.4 4.8 4.7 8.3 14.7 9.4 0.0 7.3 3.4 100
2003 52.4 4.4 4.6 9.3 10.9 9.1 0.0 6.1 3.1 100
a Other includes live animals, meats, dairy, fish etc. Source: COMTRADE
18

Table 3 Australasia’s share of India’s agricultural imports
From: (US $million) Year
Total (US $million)
Australia New Zealand
Australasia’s Share of Total
(%)
1990 1083 134 46 16.6
1991 750 64 42 14.1
1992 1283 223 37 20.3
1993 1032 109 43 14.7
1994 2199 119 41 7.3
1995 2099 110 39 7.1
1996 2251 255 46 13.4
1997 2658 455 41 18.7
1998 3890 378 45 10.9
1999 3967 205 49 6.4
2000 2930 138 41 6.1
2001 3780 238 48 7.6
2002 4142 160 47 5.0
2003 5115 168 40 4.1
Source: COMTRADE
19
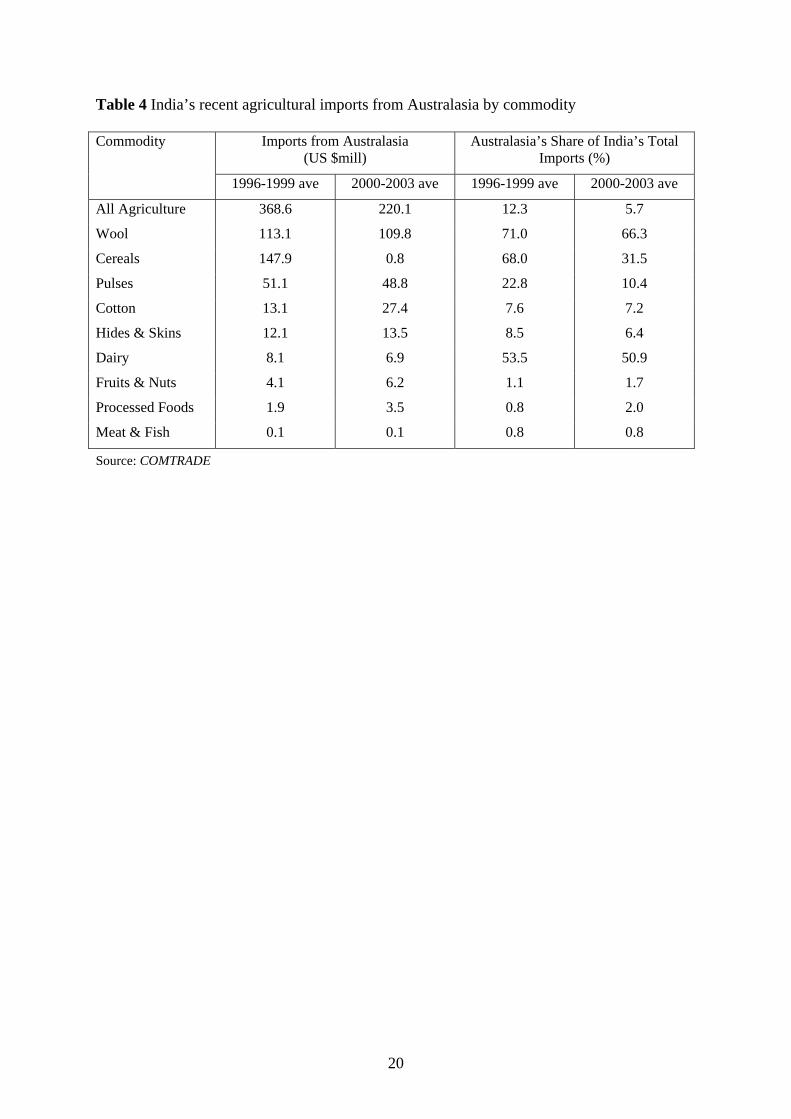
Table 4 India’s recent agricultural imports from Australasia by commodity
Imports from Australasia (US $mill)
Australasia’s Share of India’s Total Imports (%)
Commodity
1996-1999 ave 2000-2003 ave 1996-1999 ave 2000-2003 ave
All Agriculture 368.6 220.1 12.3 5.7
Wool 113.1 109.8 71.0 66.3
Cereals 147.9 0.8 68.0 31.5
Pulses 51.1 48.8 22.8 10.4
Cotton 13.1 27.4 7.6 7.2
Hides & Skins 12.1 13.5 8.5 6.4
Dairy 8.1 6.9 53.5 50.9
Fruits & Nuts 4.1 6.2 1.1 1.7
Processed Foods 1.9 3.5 0.8 2.0
Meat & Fish 0.1 0.1 0.8 0.8
Source: COMTRADE
20

Table 5 All-India mean consumption and expenditure shares
Urban Rural
1988 2002 1988 2002 Food Items
(Round 43) (Round 57) Change
(Round 43) (Round 57) Change
Consumption/Capita (kg/30 days)
Rice 5.65 4.85 -14.2 7.35 6.79 -7.7
Wheat 4.57 4.03 -11.7 4.80 4.05 -15.7
Cereals Nes 0.83 0.56 -32.5 2.59 1.38 -46.8
Total Cereals 11.05 9.44 -14.5 14.75 12.21 -17.2
Pulses 1.06 0.86 -18.8 0.97 0.77 -20.9
Dairy 4.52 5.25 16.2 3.34 3.94 17.9
Edible Oils 0.56 0.69 23.6 0.35 0.51 45.4
Meat/Fish/Eggs 2.01 2.49 23.8 0.91 1.50 65.6
Veg/Fruit 11.46 13.44 17.3 6.99 9.48 35.6
Sugar/Spices 1.63 1.46 -10.4 1.53 1.34 -12.7
Share of Total Food Expenditure (%)
Rice 16.33 14.06 -13.9 24.97 21.32 -14.6
Wheat 9.07 8.70 -4.1 10.99 9.58 -12.8
Cereals Nes 1.80 1.18 -34.4 5.87 2.83 -51.7
Total Cereals 27.20 23.94 -12.0 41.82 33.74 -19.3
Pulses 6.16 5.66 -8.1 6.48 6.31 -2.6
Dairy 13.23 15.71 18.7 9.87 12.02 21.8
Edible Oils 8.65 6.55 -24.4 7.41 6.53 -11.9
Meat/Fish/Eggs 5.37 5.58 4.0 4.27 5.34 25.1
Veg/Fruit 12.29 15.03 22.3 10.32 14.56 41.1
Sugar/Spices 8.12 7.44 -8.4 8.73 8.36 -4.2
Processed Food 13.59 13.49 -0.7 8.28 9.31 12.5
Beverages 5.38 6.61 22.8 2.83 3.83 35.5
Share of Total Expenditure (%)
All Food 66.1 50.0 -24.4 72.6 60.9 -16.1
Source: Own calculations based on NSS Rounds 43, 57.
21

Table 6 Unit value index of food items (Round 43, 1987/1988 = 1.0) in Round 57 (2001/2002) in rural areas based on median purchase
State Rice Wheat Cereal Pulse Dairy Oils Meat/Eggs Veg/Fruit Sugar/Spices Other Beverages
Andhra Pradesh 3.18 3.13 3.00 3.08 3.33 1.88 1.56 2.01 2.89 1.93 2.02
Assam 2.67 3.33 6.00 3.84 3.01 1.62 1.74 2.91 2.95 1.72 2.10
Bihar 2.18 2.50 2.00 3.78 2.67 1.43 3.20 2.78 3.16 1.67 0.10
Gujarat 3.24 3.20 2.99 3.18 3.00 2.09 1.56 2.60 2.88 1.90 3.00
Haryana 3.00 3.00 2.00 3.79 3.00 1.44 8.67 2.65 2.96 2.06 3.50
Himachal Pradesh 2.86 3.23 3.00 4.01 3.00 1.69 2.50 2.82 2.96 1.42 0.22
Jammu & Kashmir 3.27 3.20 3.50 3.62 2.52 1.54 3.01 2.73 3.15 0.89 1.07
Karnataka 2.86 3.28 2.88 3.24 3.20 1.67 1.05 1.88 2.73 2.54 2.48
Kerala 3.18 3.88 3.33 3.52 3.11 1.69 2.12 1.90 2.90 0.79 4.91
Madhya Pradesh 2.75 2.42 2.73 3.37 2.50 1.33 2.29 2.51 2.98 2.00 2.50
Maharashtra 3.11 2.91 3.27 3.23 3.00 1.64 1.55 2.34 2.82 1.76 2.78
Orissa 2.18 3.56 2.50 3.38 2.50 1.43 3.33 3.12 3.32 1.66 3.00
Punjab 2.75 3.05 2.67 3.76 3.02 1.50 3.97 3.02 2.76 1.12 3.33
Rajasthan 2.80 2.92 2.00 3.89 2.50 1.34 3.33 2.77 2.80 2.29 3.00
Tamil Nadu 2.17 4.31 2.73 3.16 2.86 1.64 1.19 2.43 3.01 2.12 2.57
Uttar Pradesh 2.50 2.81 2.25 3.17 2.90 1.39 2.67 3.62 3.40 2.06 3.00
West Bengal 2.53 3.20 2.50 3.88 3.00 1.60 1.16 3.20 3.35 1.63 0.61
All India 2.56 2.80 2.75 3.47 2.92 1.60 1.71 2.72 3.03 1.75 0.67
R43 denotes Round 43 (1987/88), R57 denotes Round 57 (2001/2002).
22

Table 7 Unit value index of food items (Round 43, 1987/1988 = 1.0) in Round 57 (2001/2002) in rban areas based on median purchase
State Rice Wheat Cereal Pulse Dairy Oils Meat/Eggs Veg/Fruit Sugar/Spices Other Beverages
Andhra Pradesh 3.69 3.35 3.41 2.92 3.00 1.85 2.19 2.51 2.87 2.08 2.89
Assam 2.88 3.45 4.00 3.69 2.68 1.76 2.12 2.57 2.99 0.70 2.35
Bihar 2.35 2.43 2.10 3.13 2.49 1.43 2.00 2.71 2.99 0.84 1.85
Gujarat 3.23 3.00 2.73 3.04 3.02 1.76 2.57 2.28 2.80 1.22 1.53
Haryana 2.89 2.80 2.86 3.79 3.20 1.44 2.69 2.73 2.57 1.04 13.96
Himachal Pradesh 3.25 3.00 2.80 3.87 3.03 1.61 3.46 2.95 2.94 0.57 2.19
Jammu & Kashmir 3.67 3.40 3.37 3.54 2.90 1.64 1.60 2.62 3.22 0.35 0.25
Karnataka 3.50 3.60 3.14 3.11 3.00 1.83 1.74 2.14 2.94 1.72 3.66
Kerala 3.28 4.71 3.33 3.64 2.60 1.79 2.71 2.14 3.02 0.32 4.47
Madhya Pradesh 3.00 2.82 3.67 3.04 2.73 1.27 1.48 2.66 2.69 1.10 3.47
Maharashtra 3.38 3.33 3.60 3.12 3.00 1.83 2.25 2.72 2.86 0.89 2.59
Orissa 2.31 3.50 2.40 2.81 2.80 1.43 1.51 2.67 3.11 0.66 0.12
Punjab 3.00 3.00 2.57 3.83 3.08 1.56 2.00 2.80 2.57 0.96 7.85
Rajasthan 2.97 2.87 2.00 3.75 2.72 1.36 0.68 2.39 2.79 1.51 35.00
Tamil Nadu 2.61 5.16 2.80 3.19 2.98 1.77 2.01 2.40 2.89 1.56 3.83
Uttar Pradesh 2.50 2.68 3.50 3.19 2.80 1.38 1.61 3.10 2.93 0.86 0.24
West Bengal 2.98 3.57 3.14 3.71 2.59 1.68 1.64 2.93 3.52 0.73 1.90
All India 3.00 3.25 3.20 3.23 2.79 1.60 1.80 2.64 2.88 1.07 3.00 R43 denotes Round 43 (1987/88), R57 denotes Round 57 (2001/2002).
23

Table 8 Comparison of per capita production, availability and consumption of cereals in India (gms./day)
NSS Round Per Capita Production (gm./day)
Per Capita Availability (gm./day)
Per Capita Consumption (gm./day)
43 (1987/1988) 476.1 444.35 431.0
55 (1999/2000) 530.15 430.45 381.5
57 (2001/2002) 498.8 395.4 365.5
Sources: Economic Survey, various issues; NSS Rounds 43, 55, 57; Chand (2005)
24

Table 9 All-India mean conditional expenditure elasticities and marginal expenditure shares
Urban Rural
1988 2002 1988 2002 Food items
(Round 43) (Round 57)
% Change (Round 43) (Round 57)
% Change
Expenditure Elasticities
Rice 0.63 0.65 2.5 0.84 0.71 -15.2
Wheat 0.57 0.70 23.5 0.65 1.04 60.1
Cereals Nes 0.21 0.68 221.7 0.47 0.58 23.7
Pulses 0.87 0.76 -12.2 0.99 0.88 -10.6
Dairy 1.62 1.63 0.8 1.65 1.88 13.7
Edible Oils 1.02 0.81 -20.2 1.01 0.80 -21.1
Meat/Fish/Eggs 1.41 1.24 -12.4 1.41 1.36 -3.3
Veg/Fruit 1.16 0.97 -16.7 0.98 0.86 -12.3
Sugar/Spices 0.84 0.70 -16.5 0.85 0.77 -10.0
Processed Food 0.83 1.60 92.9 1.24 1.48 19.4
Beverages 0.94 0.95 1.4 1.05 1.29 22.8
Marginal Expenditure Shares
Rice 0.10 0.09 -11.2 0.21 0.15 -27.8
Wheat 0.05 0.06 17.8 0.07 0.10 39.5
Cereals Nes 0.00 0.01 112.3 0.03 0.02 -40.5
Pulses 0.05 0.04 -19.7 0.06 0.06 -13.4
Dairy 0.21 0.26 19.5 0.16 0.23 38.8
Edible Oils 0.09 0.05 -39.9 0.07 0.05 -30.2
Meat/Fish/Eggs 0.08 0.07 -8.6 0.06 0.07 20.6
Veg/fruit 0.14 0.15 2.3 0.10 0.13 23.8
Sugar/spices 0.07 0.05 -23.6 0.07 0.06 -13.3
Processed Food 0.11 0.22 91.4 0.10 0.14 34.2
Beverages 0.05 0.06 24.2 0.03 0.05 66.3
Source: Own calculations based on NSS Rounds 43, 57.
25

Table 10 Expenditure elasticities, by deciles of selected items in selected States of rural India in 2001/2002
Decile Group
Stat
e
Item 1 2 3 4 5 6 7 8 9 10
Rice 0.97 0.87 0.87 0.84 0.78 0.76 0.73 0.68 0.67 0.51
Wheat 1.22 1.35 1.39 1.41 1.31 1.54 1.53 1.45 1.41 1.49
Dairy 1.32 1.41 1.61 1.37 1.37 1.44 1.49 1.55 1.35 1.49
And
hra
Prad
esh
(AP)
Meat, Fish & Eggs 1.23 1.24 1.31 1.37 1.30 1.24 1.23 1.26 1.28 1.21
Rice 0.89 0.71 0.57 0.60 0.35 0.21 0.30 -0.01 -0.04 -0.74
Wheat 1.15 0.91 0.82 0.82 0.69 0.48 0.61 0.38 0.41 -0.07
Dairy 2.44 2.82 2.44 3.42 2.92 2.27 5.13 3.37 8.23 3.06 Bih
ar
Meat, Fish & Eggs 1.25 1.36 1.56 2.03 1.81 1.50 2.10 1.97 1.74 1.54
Rice 0.97 0.59 0.51 0.43 0.41 0.37 0.15 0.04 0.08 -0.20
Wheat 1.31 1.26 1.26 1.19 1.13 1.15 1.12 1.08 1.07 1.00
Dairy 1.62 1.78 2.03 2.01 1.88 1.87 1.89 1.82 1.82 1.63
Mah
aras
htra
Meat, Fish & Eggs 1.44 1.49 1.59 1.37 1.31 1.35 1.35 1.58 1.30 1.42
26

Table 11 India’s Top 4 Sources of Selected Imports: 1990 and 2004 (US$000)
Dairy products (HS04)
Fish (HS03) Meats (HS02) Fruit (HS08) Vegetables (HS07) Preocessed foods (HS16-23)
Source Value Source Value Source Value Source Value Source Value Source Value 1990 EU15 1961 EU15 11 Australia 9 Vietnam 25,604 Australia 63,938 USA 75,902 Switzerland 92 WORLD 11 WORLD 9 USA 22,289 Myanmar 57,032 EU15 10,215 Sri Lanka 11 Pakistan 18,467 Other
Asian nes 45,731 Malaysia 5,118
Australia 9 Nigeria 13,853 Turkey 33,581 Nepal 1,381 WORLD 2,074 WORLD 132,292 WORLD 298,445 WORLD 94,317 Also: Also: Also: NZ 93 NZ 3,196 NZ 301 Australia 24 2004 EU15 9161 Bangladesh 8018 EU15 211 USA 104,295 Myanmar 171,515 Brazil 303,792 China 2210 USA 1155 USA 21 Ivory
Coast 79,480 Cabada 119,933 EU15 58,432
Nepal 1045 EU15 826 Nepal 18 Guinea-Bissau
69,042 Iran 28,717 Pakistan 33,364
NZ 671 Myanmar 649 Israel 13 Indonesia 64,090 EU15 21,169 USA 29,447 WORLD 14,629 WORLD 14,072 WORLD 288 WORLD 625,309 WORLD 435,934 WORLD 612,266 Also:
Australia 342 Also: Also: Also: Also: Also:
Australia 91 NZ 10 Australia 3987 Australia 20,063 Australia 12,989 NZ 44 Australia 3 NZ 1921 NZ 263 NZ 1,719 Source: COMTRADE
27

Figure 1. India's Agricultural Trade
0
2000
4000
6000
8000
10000
12000
1990 1991 1992 1993 1994 1995 1996 1997 1998 1999 2000 2001 2002 2003
US$
mill
ion
exports Imports Trade balance
Source: COMTRADE.
28

Figure 2. India's Food Self-Sufficiency
50
60
70
80
90
100
110
120
Cereals
- Exc
luding Bee
r
Rice (M
illed Equiva
lent)
Wheat
other ce
reals
Starch
y Roots
Pulses
Oilcro
ps
Vegeta
ble Oils
Vegeta
bles
Fruits
- Exc
luding Wine
Meat
Milk - E
xcluding B
utter
Eggs
Fish, S
eafood
%
199019952000
Source: FAO food balance sheets. Self-sufficiency = production / domestic supply including net imports
29

Figure 3 India's Major Agr&food Imports from Australasia
0
100
200
300
400
500
600
1995 1996 1997 1998 1999 2000 2001 2002 2003
US$
mill
ion others
cottonpulsescerealswool
Source: COMTRADE
30

References Ahluwalia, M.S. and IMD Little (1998). India’s Economic Reforms and Development: Essays for Manmohan Singh, Oxford: Oxford University Press. Bardhan, P. (1984). The Political Economy of Development in India, Oxford: Basil Blackwell. Bhagwati, J. (1993). India in Transition: Freeing the Econom, Oxford: Clarendon Press. Bijapurkar, R. (2003). “The New Improved Indian Consumer”, Business World (available on line at http://www.businessworldindia.co/Dec 0803/coverstory01.asp.Dec 8, 2003) Blundell, R., P. Pashardes and G. Weber (1993). “What do we Learn about Consumer
Demand Patterns from Micro Data?”, American Economic Review 83(3), 570-597.
Chand, R (2005). “Whither India’s Food Policy? From Food Security to Food Deprivation”, Economic and Political Weekly 40(11), 1055-1062.
Gandhi, V.P. and G. Mani (1995). “Are Livestock Products Rising in Importance? A Study of the Growth and Behaviour of their Consumption in India”. Indian Journal of Agricultural Economics 50(3), 283-293.
Govt of India (2003). Economic Survey 2002-03, New Delhi: Ministry of Finance (http://www. Indiabudget.nic.in.), May 12.
Jha, R. (2004). “The Political Economy of Recent Economic Growth in India”, Working Paper 2004/2, ASARC, Australian National University, Canberra.
Joshi, V. and IMD Little (1996). India’s Economic Reforms, Delhi: Oxford University Press.
Kumar, P. and V.C. Mathur (1996). “Structural Changes in the Demand for Food in India”. Indian Journal of Agricultural Economics 51(4), 664-673.
Kumar, P. (2000). “Food Demand Projections in India”, Agricultural Economics Policy Papers 98-01, Indian Agricultural Research Institute, New Delhi.
Landes, R. and A. Gulati (2004). “Farm Sector Performance and Reform Agenda”, Economic and Political Weekly August 7, pp 3611 -3619.
Ma, H., A. Rae, J. Huang and S. Rozelle (2004). “Chinese Animal Product Consumption in the 1990s”, The Australian Journal of Agricultural and Resource Economics 48(4), 569-590.
Meenakshi, J.V. and R. Ray (1999). “State-Level Food Demand in India: Some Evidence on Rank-Three Demand Systems”, Journal of Quantitative Economic, 15(2), 257-276.
Radhakrishnan, R. (2005). “Food and Nutrition Security for the Poor: Emerging Perspectives and Policy Issues”, Economic and Political Weekly April 30, pp. 1817-1821.
31

Srinivasan, T.N.( (2003). “Indian Economic Reform: A Stocktaking”, SCID Working Pape, No 190, October 2003.
World Bank (2003). India: Sustaining Reform, Reducing Poverty, Washington DC: World Bank.
32