Trade-offs in CO2Oriented Vehicle Tax Reforms: A Case Study of Greece
21
Copyright belongs to the author. Small sections of the text, not exceeding three paragraphs, can be used provided proper acknowledgement is given. The Rimini Centre for Economic Analysis (RCEA) was established in March 2007. RCEA is a private, nonprofit organization dedicated to independent research in Applied and Theoretical Economics and related fields. RCEA organizes seminars and workshops, sponsors a general interest journal The Review of Economic Analysis, and organizes a biennial conference: The Rimini Conference in Economics and Finance (RCEF) . The RCEA has a Canadian branch: The Rimini Centre for Economic Analysis in Canada (RCEA- Canada). Scientific work contributed by the RCEA Scholars is published in the RCEA Working Papers and Professional Report series. The views expressed in this paper are those of the authors. No responsibility for them should be attributed to the Rimini Centre for Economic Analysis. The Rimini Centre for Economic Analysis Legal address: Via Angherà, 22 – Head office: Via Patara, 3 - 47900 Rimini (RN) – Italy www.rcfea.org - [email protected] WP 12-33 Adamos Adamou University of Cyprus, Cyprus Sofronis Clerides University of Cyprus, Cyprus Centre for Economic Policy Research, UK The Rimini Centre for Economic Analysis (RCEA), Italy Theodoros Zachariadis Cyprus University of Technology, Cyprus TRADE-OFFS IN CO 2 -ORIENTED VEHICLE TAX REFORMS:ACASE STUDY OF GREECE
-
Upload
independent -
Category
Documents
-
view
0 -
download
0
Transcript of Trade-offs in CO2Oriented Vehicle Tax Reforms: A Case Study of Greece

Copyright belongs to the author. Small sections of the text, not exceeding three paragraphs, can be usedprovided proper acknowledgement is given.
The Rimini Centre for Economic Analysis (RCEA) was established in March 2007. RCEA is a private,nonprofit organization dedicated to independent research in Applied and Theoretical Economics and relatedfields. RCEA organizes seminars and workshops, sponsors a general interest journal The Review ofEconomic Analysis, and organizes a biennial conference: The Rimini Conference in Economics and Finance(RCEF) . The RCEA has a Canadian branch: The Rimini Centre for Economic Analysis in Canada (RCEA-Canada). Scientific work contributed by the RCEA Scholars is published in the RCEA Working Papers andProfessional Report series.
The views expressed in this paper are those of the authors. No responsibility for them should be attributed tothe Rimini Centre for Economic Analysis.
The Rimini Centre for Economic AnalysisLegal address: Via Angherà, 22 – Head office: Via Patara, 3 - 47900 Rimini (RN) – Italy
www.rcfea.org - [email protected]
WP 12-33
Adamos AdamouUniversity of Cyprus, Cyprus
Sofronis CleridesUniversity of Cyprus, Cyprus
Centre for Economic Policy Research, UKThe Rimini Centre for Economic Analysis (RCEA), Italy
Theodoros ZachariadisCyprus University of Technology, Cyprus
TRADE-OFFS IN CO2-ORIENTED VEHICLETAX REFORMS: A CASE STUDY OF GREECE

1
Trade-offs in CO2-Oriented Vehicle Tax Reforms: A Case Study of Greece
Adamos Adamoua, Sofronis Cleridesa,b and Theodoros Zachariadisc*
a Department of Economics, University of Cyprus, P.O. Box 20537, 1678 Nicosia, Cyprus
b Centre for Economic Policy Research, UK
c Department of Environmental Science and Technology, Cyprus University of Technology, P.O. Box 50329, 3603 Limassol, Cyprus
* Corresponding author. E-mail: [email protected]
May 2012
ABSTRACT
We estimate demand for automobiles in Greece using a discrete choice model of
product differentiation and use the model to evaluate carbon-based tax schemes that
could shift consumer purchases towards low-CO2 cars and thus lead to the reduction
of fuel use and CO2 emissions. We find that careful policy design, supported by
appropriate modeling, can bring about substantial environmental benefits without
losing control of economic parameters such as public finances or firm profits. This
finding comes in contrast to the results of recent vehicle tax reforms in European
countries, which turned out to be more costly than initially expected. Our analysis
indicates that, especially in countries with already heavy vehicle taxation, improper
implementation of carbon-based taxes can have adverse unintended environmental
consequences.
Key words: automobile market, carbon taxation, emissions, feebates.
2
1. Introduction
It is widely accepted that global transport emissions should decrease greatly if the
world is to meet its climate goals by the year 2050 (IEA, 2009). Towards this
objective, a policy option that has been receiving increasing attention is the change in
vehicle taxation systems to encourage consumers to purchase low-CO2 cars. This
option offers some promise because it involves a market-based instrument, it is
politically more attractive than fuel tax increases, and it can lead to an economically
efficient outcome by equating marginal compliance costs across car models and
automakers (Anderson et al., 2012).
Most European Union (EU) countries have a CO2-based component in their vehicle
taxes (ACEA, 2011; OECD, 2009). Several countries use a feebate system, which
involves paying a rebate to consumers who purchase a fuel-efficient vehicle and
imposing a penalty on those who purchase gas-guzzlers. The feebate option has been
an object of debate in North America for many years (Bunch et al., 2011; Fischer,
2008; Greene et al., 1995), but there is little related research for Europe. Studies
carried out on behalf of the European Commission, the EU’s executive body, have
dealt with this issue through simple statistical/econometric methods (COWI, 2002;
TIS et al., 2002). Other studies have made descriptive ex-post assessments of taxation
schemes implemented in specific countries, such as Rogan et al. (2011) for Ireland or
Bastard (2010) for France. Recently we have explored the environmental and
economic implications of feebate schemes in Germany in an ex ante analysis which is
– to our knowledge – the first one of its kind in Europe (Adamou et al., 2012)1.
In this paper we extend our analysis to Greece. We specify a nested multinomial logit
model in line with Berry (1994) and estimate it econometrically with the aid of
detailed data from the Greek car market for the period 1998-2008. We simulate two
alternatives: (i) the adoption of a feebate scheme and (ii) the partial replacement of the
current registration tax with a system that calculates tax levels as a function of a
1 In a related study, Vance and Mehlin (2009) examined whether tax incentives promote the
purchase of more efficient vehicles in Germany. However, they estimated a variant of the
nested logit equation that departs somewhat from the underlying theoretical utility
framework.
3
vehicle’s CO2 emissions. The policy implications from the Greek case study are
relevant to the large number of European countries that, like Greece, impose a
registration tax on newly purchased automobiles2.
2. The model
We employ the nested logit model proposed by Berry (1994) to estimate demand for
automobiles. The utility of buying an automobile depends on its price, its observed
characteristics (such as engine size) and an unobserved characteristic. The nested logit
model has been widely used because it produces sensible substitution patterns
depending on predetermined classes of products and is much easier to implement than
the more general random coefficient model.
The model assumes that products are grouped in different categories within one or
more nests. In our data the nest comprises automobile models grouped on the basis of
body type and engine size (e.g. sedan cars with engine size ranging from 1.4 to 1.8
liters). Consumers are identical (up to an idiosyncratic taste shock) within each group
but different across groups. Berry (1994) has shown that utility-maximizing behavior
by consumers leads to the following demand equation:
ln( jS ) − ln( 0S ) = jgjjj SPx ξσαβ ++− )ln( / , (1)
where jS is the market share of product j (sales divided by the size of the potential
market), 0S is the outside good share, jP is the observed price of product j, jx is a
vector of observed attributes of product j (such as horsepower, engine size, emission
levels etc.), jξ is a disturbance summarizing unobserved characteristics of product j,
gjS / is the share of the model within its group, and β, α, σ are the demand parameters
to be estimated.
Firms are assumed to compete by choosing prices to maximize total profits from all
their products. Calculation of profits must carefully account for all taxes. The
automobile taxation system in Greece in the 1998-2008 period had two main
2 Austria, Belgium, Cyprus, Denmark, Finland, Hungary, Ireland, Malta, Netherlands,
Norway, Portugal, Romania, Slovenia and Spain. See ACEA (2011) and Braathen (2012).

4
components. One was an ad valorem tax (t) imposed on the import price (marginal
cost, denoted by Cj). The second was the value added tax (v), which is applied to the
final price less the amount of the ad valorem tax. The resulting first order condition is
jP = jC (1+v+tj ) + ])1(1[
1
,/ gfggfg
g
SS σσασ
−−−
−, (2)
where gfS / =∑f
gjS / denotes the share of firm f’s products within group g and
gfS , =∑f
jS represents the firm’s group g sales as a percentage of the potential
market (Verboven, 1996).3 Estimates for public revenues and firm profits can be
obtained from this first order condition and welfare can be computed using
Trajtenberg’s (1989) formula – see Adamou et al. (2012) for details.
3. Data
Data were obtained from a private vendor (JATO Dynamics) specializing in the
collection of automotive data worldwide. For each one of a few thousand models or
model versions every year, the dataset contains 17 distinct vehicle attributes such as
vehicle weight and engine size, as well as information on sales volume and sales
price. Details are provided in the Appendix. Table 1 below summarizes the average
prices, sales, engine capacity and CO2 emissions by vehicle class. The ‘small’ class
contains automobiles with engine capacity between 0.6 and 1.4 liters, the ‘medium’
class contains cars with engine capacity from 1.4 to 1.8 liters and the rest are
considered as large automobiles. As expected, larger cars have higher CO2 emissions
and prices but lower sales. This classification is the one we use in the demand
estimation below.
3 The supply model assumes that pricing decisions are taken centrally by manufacturers,
rather than by retailers. Personal communications with several representatives of major car
retailers in Greece have convinced us that this is a reasonable assumption.

5
Table 1: Descriptive statistics of the Greek dataset by vehicle class (obs: 3909)
Class observations
Prices
(thousand
€’2005)
Sales
Engine
Capacity
(liters)
CO2 emissions
(grams per
kilometer)
Small 1196 13.349 1470 1.164 153.69
Medium 1437 22.368 591 1.652 183.77
Large 1276 44.084 181 2.472 237.92
One of the most interesting features of the dataset is the variability of CO2 emissions
of relatively similar cars. If one observes the CO2 performance of vehicles within the
same segment, other attributes being equal, CO2 emissions can vary by up to a factor
of two. This indicates that appropriate incentives can encourage consumers to buy
low-CO2 cars without having to deviate radically from their preferred type of vehicle.
In the United Kingdom it has been assessed that choosing the lowest CO2 emitters in
any car market segment can make a difference of about 25% to fuel efficiency and
CO2 emissions (King, 2007). The same observation has recently been made for
Germany (Zachariadis, 2012). This means that even if consumers do not shift away
from their preferred market segment, it is still possible to reduce new car CO2
emissions by a considerable amount through e.g. a higher tax on high-CO2 cars of that
segment. The analysis is the following sections serves to quantify the extent to which
such a shift is possible.
4. Estimation
The demand equation (1) can be estimated with the standard Ordinary Least Squares
(OLS) method. However, OLS will product biased estimates because of the
endogeneity of the price and within-share variables. In order to address the
endogeneity problem we estimated demand using Instrumental Variable (IV)
methods. In the econometric model the parameter σ was allowed to vary across
groups; σg’s were estimated by interacting ln (Sj/g) with a set of group-specific

6
dummy variables Gjg that take the value of 1 if product j belongs to group g and 0
otherwise.
Table 2 presents the estimation results using OLS and IV methods. The choice of
instruments for the IV estimation (number of models in the group, CO2 emission of
own models and CO2 emission of own models squared) was guided by the
appropriate tests for instrument relevance and overidentification. The Anderson
canonical correlation LM statistic – a test of the null hypothesis that the model is
under-identified – was rejected. The Sargan statistic – a test of the null hypothesis that
the instruments are valid – could not be rejected. Instrumenting for the endogenous
variables causes their coefficients to fall, as expected. This means that IV is indeed an
improvement on OLS and hence the discussion in the rest of the paper is based on the
IV estimates.
Engine capacity, horsepower, torque, climate control and airbags are important car
attributes for the demand side. CO2 emissions turned out to be statistically
insignificant; this supports the statement made by Greene (2010) that consumers
substantially undervalue fuel economy relative to its expected present value. SUVs,
sports and luxury cars have a positive and significant coefficient but MPVs have a
significantly negative coefficient. Dummy variables denoting the country of origin of
car models have the expected sign (e.g. German cars are highly regarded while
Chinese and Romanian cars are not).
Based on these estimates, the average own price elasticities are -6.08 (-1.66 for small,
-3.78 for medium and -12.84 for large cars). Average markups per model are €5,881
(€8,171 for small, €6,050 for medium and €3,545 for large cars). Public revenues for
year 2008 are found to be €1,089 million (at 2005 prices) or €4,372 per car; these
represent the total revenues from both the ad valorem tax and the VAT. Average CO2
emissions are 167.5 grams per kilometer per car. Retailer profits are found to be
20,490 million €2005 throughout 1998-2008, or €7,219 per car; for 2008 the
corresponding profits are 1,765 million €2005 or €7,086 per car. Finally, welfare – as
defined in this specification – is about €728 per car in 1998, increases to €1069 for
1999 and €1199 for 2000, and then gradually declines to €882 for 2008.

7
Table 2: Estimation results.
Variables OLS IV
Price (thousand 2005 €) -0.013*** -0.077***
σsmall
0.866*** 0.383***
σmedium
0.981*** 0.544***
σ large
1.178*** 0.736***
Engine capacity 0.297*** 0.561***
CO2 emissions -0.0021*** 0.0013
Horsepower 0.0022*** 0.0061***
Torque -0.00043 0.0025***
Climate control 0.038*** 0.280***
Airbags -0.259*** 0.167***
SUV -0.071*** 0.547***
MPV -0.025 -0.439***
Luxury 0.020 0.822***
Sports -0.0044 0.151*
Country of origin effects
China -0.168 -1.163**
Czech Rep. 0.037 0.140
England 0.0057 -0.030
France 0.038** 0.017
Germany 0.101*** 0.506***
Italy 0.035* -0.176***
Korea -0.014 0.00028
Romania -0.219 -1.219**
Russia -0.214*** -0.885***
Spain 0.082*** -0.092
Sweden 0.092*** 0.221***
Switzerland 0.055 -0.132
USA -0.185*** -0.278**
Constant -4.237*** -7.109***
F-test 3363.54*** 189.69***
Underidentification test 79.42, P-value: 0.000
Overidentification test 1.81, P-value: 0.178
Notes: *, ** and *** denote significance at 1%, 5% and 10% level respectively. Year fixed
effects have also been included in the estimations but are not reported here for brevity.
8
5. Policy simulations
Having estimated the parameters of our model as described above, we proceeded to
simulate the effects of two different vehicle taxation policies on automobile sales,
prices, public revenues, firm profits, consumer welfare and sales-weighted CO2
emissions4. We used a set of J first order conditions (as in equation 2) to solve for the
new optimal prices after each new taxation scheme is introduced. All calculations
show the effect of taxation in the year 2008 because this is our last year of data. This
may not be a disadvantage as automobile demand in the Greek market may have
changed considerably post-2008 due to economic conditions in the country; years
2009-2011 have certainly not been representative of long run demand patterns.
5.1. Simulation of the effect of a CO2 feebate
Our first policy exercise assumes that a feebate jA is introduced, while all other taxes
remain the same as before. As sales-weighted average CO2 emissions of cars sold in
Greece in 2008 are found to be 159.5 grams per kilometer (g/km) per automobile, a
linear tax is introduced in such a way that it is positive for cars with CO2 emissions
over 159.5 g/km and negative for cars with emissions lower than this pivot point:
Aj = μ (CO2 – 159.5), where CO2 is the CO2 emissions level of model j.
In this exercise, coefficient μ is equal to €31, which implies that retail prices may
decline by up to 20% for individual low-CO2 car models, while they can rise by more
than 10% for big models with very high CO2 emissions. The value of μ has been set at
such a level that the government cannot subsidize any car model with a rebate higher
than the average tax imposed on all models; this ensures that the government does not
risk losing too many public revenues due to the new taxation system.
Table 3 reports the changes in sales volume resulting from the introduction of this
feebate. Total automobile sales remain essentially unchanged; they increase by only
0.4% in the feebate scenario. Low-CO2 cars experience a decline in their prices and a
consequent increase in their sales, which is stronger for the group of cars with
4 For technical details on the simulation procedure see Adamou et al. (2012).

9
emission levels below 130 g/km. As regards the feebate effect within engine size
classes, it is evident that the CO2-based tax not only shifts sales towards smaller cars,
but also provides an incentive for consumers to shift towards low-CO2 models within
their preferred size category. The shift is particularly pronounced in the cases of cars
with very high and very low CO2 emissions; especially in medium and large cars the
feebate affects very high-CO2 vehicles substantially, reducing their sales by more
than 20%, so that even models with relatively high emissions (of the group 180-200
g/km) gain sales shares despite the increase in their retail prices.
As a result of these changes in prices and sales, sales-weighted CO2 emissions are
reduced to 156.3 g/km per automobile, a 2% decline compared to observed emission
levels in 2008. Public revenues decrease by €339 per car or €81 million in total,
which represent a decrease of government revenues in 2008 by 7.4%. This is
primarily due to a significant drop in the sales of large cars, which will generally
experience an increase in their taxation under the feebate system because most large
car models emit more than 159.5 g/km. Retailer profits are found to be €7,170 per car,
which corresponds to an increase in retailer markups by €84 per car or 1.2%; this is
due to the shift of sales towards smaller cars which, as shown in section 4.1, have
higher markup levels. Finally, consumer welfare rises from €882 per car in the actual
sales of 2008 to €885 per car in the feebate scenario because of the slightly increased
car sales in the feebate case.
In summary, the feebate policy simulated here leads to modest results because of the
selected values for the implied carbon tax rate μ and the pivot point. As we have
shown in the case of Germany (Adamou et al., 2012), different values of these two
parameters can crucially influence the results. A lower pivot point, in particular, can
lead to greater environmental benefits without being detrimental to public finances.
It should be noted at this point that we have not accounted for any rebound effects in
these simulations. In theory, when consumers purchase a more fuel efficient (and low-
carbon) car it is possible that they drive more with it because fuel costs are cheaper or
that they drive more with it and drive less with a second, less fuel efficient car that
they own. Such an effect might partly offset the environmental benefit of a low-
carbon car. We have implicitly assumed here that each consumer chooses the mileage
to drive with a car before purchasing a specific car model, regardless of its size. In

10
any case, Small and Van Dender (2007) have found the rebound effect to diminish in
recent years in the US, which probably indicates a similar trend in other high-income
countries.
5.2. Partial abolition of existing automobile taxes and introduction of a CO2-based tax
The second policy exercise assumes that a part of the existing ad valorem tax on cars
is abolished and replaced by a tax based on a car’s CO2 emission levels. This is in line
with policies currently implemented in many EU countries, where a part of a car’s
registration tax is calculated on the basis of emissions and another part on another
vehicle attribute such as engine size. We chose to impose a tax equal to €15 (at 2005
prices) for each gram of CO2 emitted per kilometer above a threshold of 100 g/km; it
is straightforward to show that such a tax, for a lifetime of 150,000 kilometers,
corresponds to a carbon price of €20-30 per ton of CO2. At the same time we reduced
the ad valorem tax rates by 43% so that, if sales volumes did not change in
comparison to actual sales of 2008, government revenues would remain equal to the
actual 2008 revenues. Although it is obvious that such a taxation change will shift
sales among different engine size classes, this assumption intends to ensure that
public revenues do not deviate too much from those observed in 2008.
Table 4 reports the changes in sales volume as a result of the introduction of this tax
for a combination of engine size and emissions classes. Since the CO2-related portion
of the new tax is a linear function of emission levels above 100 g/km, whereas the
current taxes are strongly non-linear as they grow rapidly with increasing engine size,
the change in taxation system is beneficial for large cars: their engine size-related tax
decreases by a large amount, so that their retail prices decline substantially (by 5.8%).
As a result, their sales shares increase by more than 19% compared to actual shares
observed in the Greek market in 2008. Conversely, small cars experience an increase
in their prices and a subsequent fall in their sales volume.
It is interesting to observe the effects of this policy on emissions as well as public
finances and firm profits. Although the existence of a CO2-based tax mitigates a little
the increase in sales of high-CO2 cars, still the overall decline in the tax burden of

11
large automobiles dominates and leads to significantly higher sales of large cars, even
of those emitting more than 200 grams CO2 per kilometer. As a result, average
emission levels rise by 2 g/km per car, a 1.3% increase compared to actual emission
levels in 2008; combined with a slight increase in total car sales, total CO2 emissions
rise by 1.8%. Public revenues rise considerably, by €598 per car or by €155 million
(14.2%) in total, because of the increased sales of bigger cars as well as the increased
taxes imposed on smaller cars. As a result of the slight increase in total automobile
sales, consumer welfare also rises by €4.5 per car or 1% in total. Finally, firm profits
decline by €82 per car, or by -0.7% in total, because consumers increasingly purchase
larger cars, whose markups are lower as their demand is more elastic.
Overall, results of this simulation show that such a policy is environmentally
ineffective because of the current taxation system, which puts a heavy tax burden on
large cars irrespective of their emission levels; a partial abolition of this system may
have negative environmental repercussions, although it could be beneficial for public
revenues. This finding is not relevant only for Greece but also for several European
countries with similarly increasing registration taxes, such as Denmark, Ireland, the
Netherlands and Norway (Kunert and Kuhfeld, 2006).

12
Table 3: Effect of a feebate on sales volumes of cars by engine size and CO2 emissions class.
Actual sales by engine size class Simulated sales by engine size class Change compared to actual sales
CO2 emissions class Small Medium Large Small Medium Large Small Medium Large
< 130 29283 0 0 33553 0 0 14.6% - -
130-160 101742 19608 1709 104574 20723 2561 2.8% 5.7% 49.9%
160-180 14175 38305 1019 13491 37504 1291 -4.8% -2.1% 26.7%
180-200 3787 11878 6978 3202 10418 7219 -15.4% -12.3% 3.5%
> 200 0 2929 17593 0 2299 13077 - -21.5% -25.7%
Total: 148987 72720 27299 154820 70944 24148 3.9% -2.4% -11.5%
Table 4: Effect of a CO2 tax on sales volumes of cars by engine size and CO2 emissions class.
Actual sales by engine size class Simulated sales by engine size class Change compared to actual sales
CO2 emissions class Small Medium Large Small Medium Large Small Medium Large
< 130 29283 0 0 29207 0 0 -0.3% - -
130-160 101742 19608 1709 98084 19931 2355 -3.6% 1.6% 37.8%
160-180 14175 38305 1019 13380 38326 1348 -5.6% 0.1% 32.3%
180-200 3787 11878 6978 3550 12532 6991 -6.3% 5.5% 0.2%
> 200 0 2929 17593 0 2708 21822 - -7.5% 24.0%
Total: 148987 72720 27299 144221 73497 32516 -3.2% 1.1% 19.1%
13
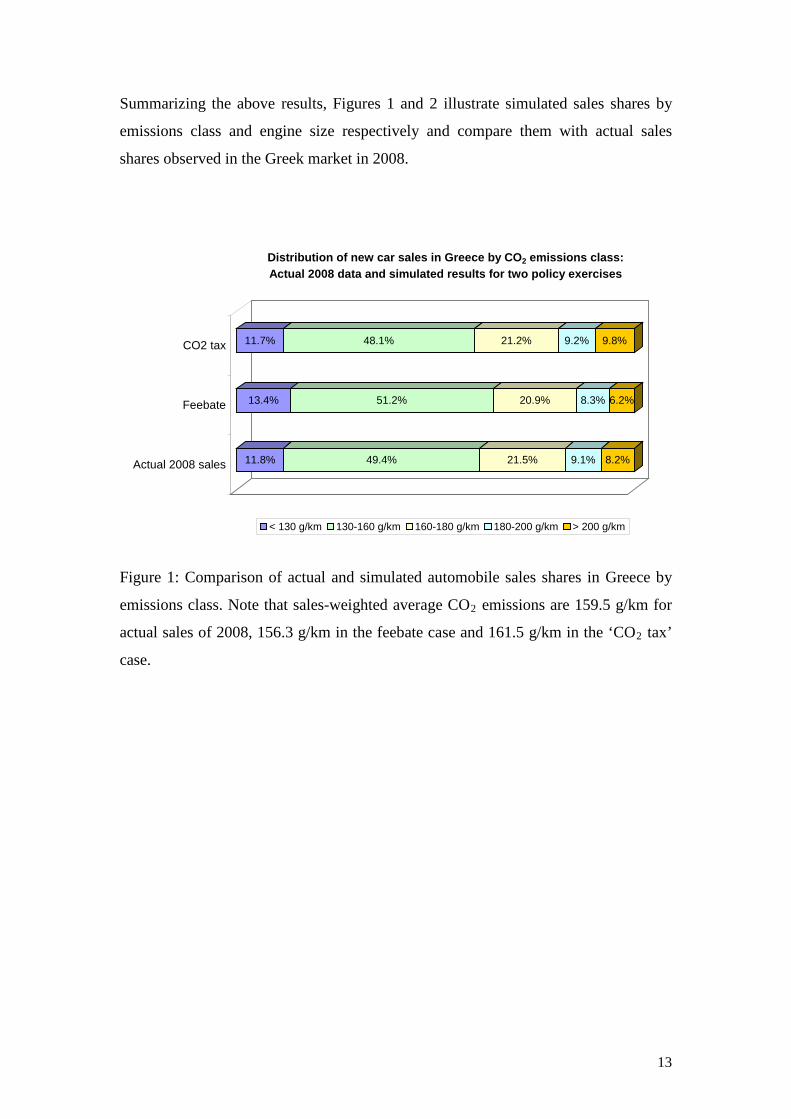
Summarizing the above results, Figures 1 and 2 illustrate simulated sales shares by
emissions class and engine size respectively and compare them with actual sales
shares observed in the Greek market in 2008.
11.8% 49.4% 21.5% 9.1% 8.2%
13.4% 51.2% 20.9% 8.3% 6.2%
11.7% 48.1% 21.2% 9.2% 9.8%
Actual 2008 sales
Feebate
CO2 tax
Distribution of new car sales in Greece by CO2 emissions class: Actual 2008 data and simulated results for two policy exercises
< 130 g/km 130-160 g/km 160-180 g/km 180-200 g/km > 200 g/km
Figure 1: Comparison of actual and simulated automobile sales shares in Greece by
emissions class. Note that sales-weighted average CO2 emissions are 159.5 g/km for
actual sales of 2008, 156.3 g/km in the feebate case and 161.5 g/km in the ‘CO2 tax’
case.

14
59.8% 29.2% 11.0%
61.9% 28.4% 9.7%
57.6% 29.4% 13.0%
Actual 2008 sales
Feebate
CO2 tax
Distribution of new car sales in Greece by engine size class: Actual 2008 data and simulated results for two policy exercises
< 1.4 liters 1.4-1.8 liters > 1.8 liters
Figure 2: Comparison of actual and simulated automobile sales shares in Greece by
engine size class.
6. Concluding remarks
We estimated a model of oligopolistic competition in order to evaluate policies aimed
at shifting consumer automobile purchases towards low-CO2 cars in Greece. We
presented the econometric analysis and the results from two simulated taxation
schemes: a feebate system, in which consumers receive a rebate when purchasing
low-CO2 cars or incur an additional fee when purchasing a high-CO2 car, and a
partial replacement of the existing Greek registration tax with an emissions-based tax.
The feebate simulation showed that a reduction of new car CO2 emissions is possible
without adverse effects on the economy, provided that crucial policy settings are
selected carefully. Conversely, the second simulation illustrated that adoption of a
CO2-based registration tax in countries that already impose a registration tax which
increases sharply with vehicle size can have negative environmental consequences,
namely higher average carbon emissions of new cars.
Overall, our simulations have shown that careful policy design can lead to appropriate
measures that bring about substantial environmental benefits without losing control of
public finances and private welfare. In recent practice, environmental reforms in
15
automobile taxation have often been designed without a sound analysis of consumer
response to these policies, thus leading to a significant loss of public revenues5. The
use of a theoretically appropriate and empirically robust modeling framework like the
one used in this paper is essential for the design of effective low-carbon transportation
policies.
Acknowledgement
We appreciate financial support from the Cyprus University of Technology. George
Tzimas, the representative of the automotive data vendor in Greece, provided much
needed additional information on the Greek car market.
5 This was indeed so in at least three cases: the CO2 rebate system in the Netherlands in year
2002, the French feebate system (‘bonus-malus’) that was launched in 2008 (Bastard, 2010)
and a CO2-based car taxation scheme introduced in Ireland in 2008 (Rogan et al., 2011).

16
References
ACEA (2011), Motor Vehicle Taxation – EU Summary. European Automobile
Manufacturers Association, Brussels. http://www.acea.be/images/uploads/files/
20110330_TaxGuide2011Highlights_update.pdf
Adamou, A., Clerides, S. and Zachariadis, T. (2012), Designing Carbon Taxation
Schemes for Automobiles: A Simulation Exercise for Germany, CEPR Discussion
Paper 8782. Available at http://dx.doi.org/10.2139/ssrn.1979508.
Anderson, S.T., Parry, I.W.H., Sallee, J. and Fischer, C. (2012), Automobile Fuel
Economy Standards: Impacts, Efficiency, and Alternatives, Review of Environmental
Economics and Policy 5, 89–108.
Bastard, L. (2010), The Impact of Economic Instruments on the Auto Industry and the
Consequences of Fragmenting Markets - Focus on the EU Case. Discussion Paper No
2010-08, International Transport Forum, Paris, France.
Berry, S. (1994), Estimating Discrete-Choice Models of Product Differentiation.
RAND Journal of Economics 25, 242–262.
Berry, S., Levinsohn, J., and Pakes A. (1995), Automobile Prices in Market
Equilibrium. Econometrica 63, 841–889.
Braathen, N.A. (2012), CO2-Based Taxation of Motor Vehicles. In Cars and Carbon:
Automobiles and European Climate Policy in A Global Context, Zachariadis Τ. (ed.),
Dordrecht, Heidelberg, London, New York: Springer Science+Business Media, ISBN
978-94-007-2122-7, DOI 10.1007/978-94-007-2123-4.
Bresnahan, T.F., Stern, S., Trajtenberg, M., (1997). Market segmentation and the
sources of rents from innovation: personal computers in the late 1980s. RAND
Journal of Economics 28, S17–S44.
Bunch, D. S., D. L. Greene, T. Lipman, E. Martin, and S. Shaheen, (2011), Potential
Design, Implementation, and Benefits of a Feebate Program for New Passenger
Vehicles in California. Final Report to California Air Resources Board and California
Environmental Protection Agency, February.

17
COWI (2002). Fiscal Measures to Reduce CO2 Emissions from New Passenger Cars.
Final Report to the European Commission.
EC (European Commission) (2005), Proposal for a Council Directive on passenger
car related taxes. Document COM(2005) 261 final, Brussels.
Fershtman, C., Gandal, N., (1998). The effect of the Arab boycott on Israel: the
automobile market. RAND Journal of Economics 29, 193–214.
Fershtman, C., Gandal, N. and Markovich, N. (1999), Estimating the Effect of Tax
Reform in Differentiated Product Oligopolistic Markets. Journal of Public Economics
74, 151–170.
Fischer, C. (2008), Comparing Flexibility Mechanisms for Fuel Economy Standards,
Energy Policy 36 (2008), 3116-3124.
Greene, D. (2010), Why the Market for New Passenger Cars Generally Undervalues
Fuel Economy, Discussion Paper No. 2010-6, International Transport Forum, Paris,
France.
Greene, D.L., Patterson, P.D., Singh.M. and Li, J. (2005), Feebates, rebates and gas-
guzzler taxes: a study of incentives for increased fuel economy. Energy Policy 33
(2005) 757–775.
IEA (International Energy Agency) (2009), Transport, Energy and CO2 - Moving
Toward Sustainability, Paris, France, 2006.
King J. (2007), The King Review of low-carbon cars − Part I: the potential for CO2
reduction. HM Treasury, London. Also at http://hm-treasury.gov.uk/king.
Kunert, U., Kuhfed, H. (2006), The Diverse Structures of Passenger Car Taxation in
Europe and the EU Commission’s Proposal for Reform. Discussion Paper 589,
German Institute for Economic Research (DIW), Berlin.
Nevo, A. (2000), A Practioner’s Guide to Estimation of Random-Coefficients Logit
Models of Demand. Journal of Economics & Management Strategy, Vol. 9, Number
4, Winter 2000, 513–548.
18
OECD (2009), Incentives for CΟ2 Emission Reductions in Current Motor Vehicle
Taxes. Document ENV/EPOC/WPNEP/T(2009)2/FINAL, Organisation for Economic
Co-operation and Development, Paris, France.
Rogan, F., E. Dennehy, H. Daly, M. Howley, and B. P. Ó Gallachóir (2011), Impacts
of an emission based private car taxation policy - First year ex-post analysis,
Transportation Research Part A, 45, 583-597.
Small, K.A. and van Dender, K. (2007), Fuel Efficiency and Motor Vehicle Travel:
The Declining Rebound Effect, Energy Journal, 28, 25-51.
TIS, INFRAS, Erasmus and DIW (2002). Study on vehicle taxation in the Member
States of the European Union. Final Report to the European Commission.
Trajtenberg, M. (1989), The welfare analysis of product innovations, with an
application to computed tomography scanners. Journal of Political Economy 50, 647–
658.
Vance, C. and Mehlin, M. (2009), Fuel Costs, Circulation Taxes, and Car Market
Shares: Implications for Climate Policy, Transportation Research Record 2134, 31-
36.
Verboven, F. (1996), International Price Discrimination in the European Car Market.
RAND Journal of Economics 27(2) 240-268.
Zachariadis, T. (2012), Gasoline, diesel, and climate policy implications – Insights
from the recent evolution of new car sales in Germany. Energy Policy (forthcoming).
Available at http://dx.doi.org/10.1016/j.enpol.2011.11.075.

19
APPENDIX
Table A1 summarizes the automobile data used in the estimation.
Table A1: Description of the Greek automobile market data.
Years: 1998-2008
Vehicle attributes:
Variable Unit
Make
Model
Vehicle length Meters
Vehicle width Meters
Engine size Liters
Max. engine power HP
Max. torque Newton-meters
Fuel type (petrol, diesel etc.)
Transmission type (manual, auto)
Body type (hatchback, convertible etc.)
Max. speed kilometers per hour
Acceleration 0-100 km/h Seconds
Fuel consumption, combined cycle liters per 100 kilometers
CO2 emissions, combined cycle grams per kilometer
Airbag for driver seat offered as standard Yes/No
Airbag for passenger seat offered as standard Yes/No
Air conditioning system offered as standard Yes/No
Climate control offered as standard Yes/No
Segment type (small, lower medium etc.)
Retail price Euros
Sales volume

20
The dataset of the Greek car market initially consisted of 50,701 observations for
market years 1998-2008, containing data about sales, prices and car model
characteristics. The database records two car models with the same engine size, fuel
and transmission type but differing in a minor characteristic (e.g. the availability or
not of climate control) as different observations. We merged such models in one, by
summing up their sales and calculating a sales-weighted average price. We then
removed from the dataset a few outliers such as models with a sales volume less than
10, models with a sales price of over €100,000 and models with engine capacity more
than 5 liters; these can be considered to belong to a very special market, oriented only
to very high income consumers. This process of model aggregation and removal led to
a dataset of 3,909 observations in total. Out of these, 546 observations involve Sport
Utility Vehicles, 442 Multi-Purpose Vehicles, 171 luxury cars and 318 sports cars; the
rest, or 62% of the sample, comprise ‘regular’ cars. Some summary statistics for key
variables are provided in Table A2 below.
Table A2: Descriptive statistics of the Greek dataset (obs: 3909)
Stats Sales
Prices
(thousand
€2005)
Engine
Capacity
(liters)
CO2
emissions
(grams per
kilometer)
Horsepower
(kilowatts)
Torque
(Newton-
meters)
Minimum 11 6.735 0.599 103 39 53
Percentile 5% 15 10.155 1.108 139 61 93
Percentile 25% 52 14.766 1.390 161 90 126
Percentile 50% 198 21.289 1.598 184 113 150
Percentile 75% 811 32.757 1.995 212 150 203
Percentile 95% 3272 61.815 3.192 286 240 320
Maximum 12844 120.866 4.966 405 420 483
Mean 726 26.697 1.801 192 127 175
Std. Dev. 1312 17.077 0.638 45 54 71
![“Yunanistan” [Greece]](https://static.fdokumen.com/doc/165x107/63250e4a85efe380f30680d9/yunanistan-greece.jpg)