
Guide to Social Rent Reforms - GOV.UK
41
housing Guide to Social Rent Reforms Archived
-
Upload
khangminh22 -
Category
Documents
-
view
4 -
download
0
Transcript of Guide to Social Rent Reforms - GOV.UK

housing
Guide to SocialRent Reforms
Guide to Social R
ent Reform
s
Archive
d

Archive
dGuide to Social Rent Reforms
March 2001
Department of the Environment, Transport and the Regions: London

Archive
dDepartment of the Environment, Transport and the RegionsEland HouseBressenden PlaceLondon SW1E 5DUTelephone 020 7944 3000Internet service www.detr.gov.uk
© Crown Copyright 2001
Copyright in the typographical arrangement and design vests in the Crown.
Extracts of this publication may be made for non-commercial in-house use, subject to the sourcebeing acknowledged.
Applications for reproduction should be made in writing to The Copyright Unit, Her Majesty’s Stationery Office, St Clements House, 1–16 Colegate, Norwich NR3 1BQ.
Further copies of this report are available from:Department of the Environment, Transport and the Regions, Free LiteraturePO Box 236WetherbyWest YorkshireLS23 7NBTel: 0870 1226 236Fax: 0870 1226 237
Published by the Department of the Environment, Transport and the Regions. Printed in the UK, March 2001 on paper comprising 75% post-consumer waste and 25% ECF pulp.
Product code 00 HC 1484.

Archive
d
CONTENTS
Page
CHAPTER 1
Introduction 5
CHAPTER 2
Calculating Restructured Rents 7
CHAPTER 3
Implementation Issues 10
CHAPTER 4
Research Studies 16
CHAPTER 5
Implications for Landlords and Tenants 18
CHAPTER 6
Conclusion 23
ANNEX A
Information for Restructuring Formula 24
ANNEX B
The Housing Corporation’s Approach to Regulation 27
ANNEX C
Tables of Implications for Landlords and Tenants 29
ANNEX D
Details of Modelling 40

Archive
d
5
CHAPTER 1
Introduction1.1 Ministers published a policy statement in December 2000, Quality and Choice: A Decent
Home for All – The Way Forward for Housing1. Amongst other things, this proposed thatrent setting in the social housing sector should be brought on to a common system basedupon relative property values and local earnings levels. This Guide sets out the detailsunderpinning the Ministerial statement and provides background information on theimplications of the proposals for tenants and landlords.
1.2 The policy statement reiterated Ministers’ objectives for social rent setting that wereoriginally set out in the Housing Green Paper, published in April 2000. These included:
• that social rents should remain affordable in the long term;
• that social rents should be fairer and less confusing for tenants;
• that there should be a closer link between rents and the qualities which tenants valuein properties; and
• that unjustifiable differences between the rents set by local authorities and byregistered social landlords should be removed.
1.3 The statement also explained that, in reaching their conclusions about rent setting,Ministers had taken very careful account of the key themes which emerged from theconsultation responses to the Housing Green Paper. In particular, Ministers wereconcerned that a new system of rent setting should not generate rents that are unaffordableto social tenants, but neither should it compromise the continued financial health of theregistered social landlord (RSL) sector.
1.4 Balancing these objectives led Ministers to conclude that social rents should, in future, beset on a basis which takes account of relative property values, local earnings levels and thesize of individual properties. Property values provide a relatively simple and transparentway of reflecting the relative attractiveness of properties to tenants. Local earningsmoderate the impact of property values on rent levels, ensuring that rents reflect localincomes and remain affordable. Property size helps to ensure a sensible pattern of rentdifferentials between properties with different numbers of bedrooms.
1.5 Underpinning this approach has been a concern about the implications for social tenantsof the new approach to rent setting. The approach needs to be readily and easilyunderstood, and needs to ensure that rents remain affordable for all groups of tenants. Asrents are restructured, tenants must be fully protected from excessive year-on-year increasesin their rents.
1 Quality and Choice: A Decent Home for All, ISBN 1 851124 632, £5 available from DETRPublications Sales Centre, Unit 21, Goldthorpe Industrial Estate, Goldthorpe, Rotherham S63 9BL.Tel: 01709 891318; Fax: 01709 881673. A free summary of the statement is available from DETR FreeLiterature, Product Code: 00 HC 1186 – see inside frontispiece for address.

Archive
d
Guide to Social Rent Reforms
6
1.6 Ministers believe that the approach which they are proposing strikes an appropriatebalance between the different policy objectives and that, once fully implemented, it willprovide a system of social rents that is both more coherent and fairer to tenants. ButMinisters also recognise that landlords, in consultation with their tenants, need to takeaccount of local factors when setting rents. For this reason, the new system builds in scopefor landlords to exercise discretion in setting rents for individual properties.
1.7 This Guide explains, in detail, the basis on which social landlords are being encouraged toset their rents. In particular, it provides:
• A full explanation of the central formula around which Ministers wish social rents tobe set in the future, and some worked examples to clarify how it can be used tocalculate rents.
• A range of specific issues which arise from the application and implementation of thisnew approach to rent setting.
• Brief progress reports and summaries of the results of a series of research projectswhich have informed Ministerial thinking on social rent setting in the period leadingup to the December policy statement, and, prior to that, the Housing Green Paper.
• An analysis of the implications of the rent restructuring proposals for tenants andlandlords.

Archive
d
7
CHAPTER 2
Calculating Restructured Rents2.1 This chapter sets out the details of the formula underpinning Ministers’ approach to rent
restructuring, and explains how it can be used to calculate rents.
Rent “formula”2.2 The Ministerial statement made clear that Ministers want social rents which reflect:
a) the size, condition and location of properties;
b) local earnings, so as to take account of affordability;
c) property size.
2.3 The statement also said that:
• 30% of a property’s rent should be based on relative property values;
• 70% of a property’s rent should be based on relative local earnings;
• a bedroom factor should be applied so that, other things being equal, smallerproperties have lower rents.
2.4 This can be expressed as a formula, in which the target rent for a property, after thecompletion of restructuring, is calculated using the following approach:
2.5 There are worked examples later in this chapter to help clarify the calculations required.Relative county earnings refers to county-level earnings divided by national averageearnings. Relative property value refers to an individual property’s value divided by thenational average value for the LA or RSL sector.
2.6 Annex A provides the information, apart from property-specific details, that landlords willneed if they are to apply the formula.
weekly rent is equal to: 70% of the average rent for the sector (LA or RSL)
multiplied by relative county earnings
multiplied by bedroom weight
plus
30% of the average rent for the sector (LA or RSL)
multiplied by relative property value

Archive
d
Guide to Social Rent Reforms
8
Increases in social rents2.7 The statement also said that local authority (LA) rent guidelines should rise by no more
than 1% in real terms in 2002/03 and 2003/04, and that the guideline limit for RSL rentsshould rise by no more than 1/2% in real terms per annum from 2002/03 onwards.
2.8 This means that each year, the target rent for each property will go up in line with theguideline for its sector2 (LA or RSL). For instance, in 2002/03 the target rent of an LAproperty will increase by 1% more than the general rate of inflation and the target rent ofan RSL property will increase by 1⁄2% more than the general rate of inflation. Restructuringis the process by which the actual rent for each property moves from its current level to its targetlevel over the ten-year implementation period.
2.9 Therefore, if a property has a rent which is currently 15% below its current target level, itsrent will need to rise over the ten-year period by the equivalent of 15% plus the nationalaverage increase in rents for the LA or RSL sector. Similarly, if a property has a rent whichis currently 15% above its current target level, its rent will need to fall over the ten-yearperiod by the equivalent of 15%, offset by the national average increase in rents for itssector.
Examples2.10 A couple of worked examples that demonstrate how the formula can be applied are given
below.
2.11 For clarity, the examples show the calculation of target rents for properties assuming thatnational average rents for the LA and RSL sectors remain at April 2000 levels, and thatrestructuring is implemented immediately rather than over a ten-year period. In reality, asnoted above, the target rent for each property will go up each year in line with theguideline for its sector.
Example 12.12 Consider a three-bedroom local authority property in Gloucestershire, for which the
authority estimates the capital value to be £60,000 in January 1999.
2.13 From the information in Annex A:
average LA rent in April 2000: £45.60
average earnings in Gloucestershire: £308.00
national average earnings: £316.40
bedroom weight: 1.05
national average LA property value in January 1999: £41,350
2 More precisely, for local authorities this is the national average increase in “rent guidelines” and forRSLs this is the increase in “guideline limit”.

Archive
d
Calculating Restructured Rents
9
2.14 Putting these figures into the formula:
2.15 Therefore, the property has a target rent in April 2000 of around £52.50 per week.
2.16 The property’s target rent derived from the formula will go up in line with the nationalaverage increase in rent guidelines in the LA sector. For instance, in 2002/03 the targetrent will rise by 1% over the general rate of inflation. At the end of the ten-yearimplementation period, a property’s actual rent should normally be no more than 5%higher or lower than its target level.
Example 22.17 Consider a one-bed RSL property in South Yorkshire, for which the landlord estimates the
capital value to be £30,000 in January 1999.
2.18 From the information in Annex A:
2.19 Putting these figures into the formula:
2.20 Therefore, the property has a target rent in April 2000 of around £41.50 per week.
2.21 The property’s target rent derived from the formula will go up in line with the increase inguideline limit for the RSL sector. For instance, in 2002/03 the target rent will rise by 1⁄2%over the general rate of inflation. At the end of the ten-year implementation period, aproperty’s actual rent should normally be no more than 5% higher or lower than itstarget level.
70% of sector-average rent: 70% x £53.50 = £37.45multiplied by relative county earnings: x £299.10/£316.40 = £35.40multiplied by bedroom weight: x 0.90 = £31.86 subtotal
30% of sector-average rent: 30% x £53.50 = £16.05multiplied by relative property value: x £30,000/£49,750 = £9.68 subtotal
adding together the sub-totals: £31.86 + £9.68 = £41.54 total
average RSL rent in April 2000: £53.50
average earnings in South Yorkshire £299.10
national average earnings: £316.40
bedroom weight: 0.90
national average RSL property value in January 1999: £49,750
70% of sector-average rent: 70% x £45.60 = £31.92
multiplied by relative county earnings: x £308.00/£316.40 = £31.07
multiplied by bedroom weight: x 1.05 = £32.63 subtotal
30% of sector-average rent: 30% x £45.60 = £13.68
multiplied by relative property value: x £60,000/£41,350 = £19.85 subtotal
adding together the sub-totals: £32.63 + £19.85 = £52.48 total

Archive
d
Guide to Social Rent Reforms
10
CHAPTER 3
Implementation Issues3.1 This chapter sets out some of the more detailed issues associated with the implementation
of rent restructuring:
• definition of property value;
• valuation base;
• method of valuation;
• updating;
• convergence and restructuring;
• discretion for landlords;
• timing and monitoring;
• Large-Scale Voluntary Transfers;
• service charges;
• Housing Revenue Account;
• relets and new build;
• fair rents;
• regulation by the Housing Corporation.
Definition of property value3.2 There are several concepts of property value devised for different purposes. In order that
rent restructuring generates a consistent and equitable pattern of rents between landlords,a common concept needs to be adopted. Open market values assuming vacant possessionand continued residential use should be used. This concept corresponds to what valuerscall Existing Use Value (EUV).
3.3 For resource accounting purposes, local authorities are required to make downwardadjustments to these Existing Use Values on the basis of a series of regional adjustmentfactors to reflect the lower value of properties when used for social housing, obtaining an“EUV-SH” measure. This reflects the fact that social housing is let at sub-market rents andthat many tenants will have rights such as secure tenure. For resource accounting purposes,the value of social housing as an asset to the authority is therefore less than what itsexisting use value assuming continued residential use would be.

Archive
d
Implementation Issues
11
3.4 A downward adjustment to open market valuations to reflect factors such as sub-marketrents should not be made for the purposes of rent restructuring. It would add an extracomplication to the process, and introduce a circularity by allowing the pattern of currentrents to influence the pattern of restructured rents. So, the property values in therestructuring formula should simply reflect Existing Use Values on the basis of continueduse as housing, with no adjustment made to the normal market values.
3.5 A useful source of information about stock valuation is A New Financial Framework forLocal Authority Housing – Guidance on Stock Valuation3. Appendix 1 to this guide sets out adefinition by the Royal Institution of Chartered Surveyors of the concept of Existing UseValue. In particular, the concept assumes that the property remains in its current use,which in this instance is housing, and is not converted into, for example, retail or officeaccommodation.
3.6 The majority of RSLs use a historic cost method to value their stock for accountingpurposes, although there are some RSLs which use EUV-SH. Landlords are required toupdate these valuations at least every five years, and more frequently in certaincircumstances. Detailed guidance on this issue can be found in Statement of RecommendedPractice (SORP): Accounting by Registered Social Landlords, published by the NationalHousing Federation.
Valuation base3.7 In order to be consistent with the basis on which DETR has consulted in the Housing
Green Paper, January 1999 should be used as the property valuation base for the purposesof calculating restructured rents. All the exemplifications of rent restructuring by DETRand its consultants have used this base, since January 1999 was the most recent date forwhich information was available when DETR began its analysis of restructuring.
3.8 As the beacon values for resource accounting are based on April 2000 valuations, there aresome arguments in favour of a move to an April 2000 base. But this marked a period ofparticularly high differentials in property prices between London and the rest of the country.In contrast, January 1999 is far more representative of the average conditions over the pastfive years. On balance, January 1999 appears to be the more suitable valuation base.However, the case for a revaluation will be considered as part of a three-year progress review.
Method of valuation3.9 The underlying principles of rent restructuring would suggest that each property requires
an individual valuation, since each property will have its own target rent based on theformula set out earlier in this guide. However, in practice, DETR recognises that this isneither practicable nor desirable. Relative property values play a fairly modest role in therestructuring formula, so small differences in individual valuations will not have a largeimpact on target rents.
3 A new financial framework for Local Authority Housing – Guidance on Stock Valuation, DETR, May2000, ISBN 1 85112 3938, £15 available on the DETR website:www.housing.detr.gov.uk/nff/stockval/index.htm or from the DETR Publications Sales Centre, Unit 21,Goldthorpe Industrial Estate, Goldthorpe, Rotherham S63 9BL, Tel: 01709 891318; Fax: 01709 881673.

Archive
d
Guide to Social Rent Reforms
12
3.10 Local authorities are being required to value their stock as a whole, using the method setout in A New Financial Framework for Local Authority Housing – Guidance on StockValuation. Since local authorities need to obtain beacon values for resource accounting,they may well consider that these provide a reasonable basis from which to derivevaluations for rent restructuring. However, as noted above, the property valuation base forthe purposes of calculating restructured rents is January 1999, whereas beacon values forresource accounting are based on April 2000 valuations.
3.11 In the RSL sector, the Housing Corporation will be issuing guidance on a number of issues,including valuation, early in 2001. It is envisaged that RSLs will be given some discretionabout how to obtain a reliable set of valuations. The focus is likely to be on obtaining areasonable and coherent pattern of values which reflects the more significant differences inthe relative market value of different properties within a landlord’s stock.
Updating3.12 Restructuring is expected to take place over a ten-year period and to be broadly complete
by March 2012. As noted above, over time there may be changes in relative propertyvalues and relative earnings between different parts of the country.
3.13 It may be desirable for social rents to reflect such changes, but it is not possible to predict,at this stage, whether and how such changes will occur. As part of the three-year progressreview, DETR will therefore consult on whether there is a case for updating earnings andcapital values, and on the timing and form of any such update.
Convergence and restructuring3.14 The policy statement noted that Ministers’ objective is to reach a position where
differences in social rents are justified by differences in objective criteria, such as the sizeand value of properties and local earnings levels.
3.15 Convergence does not imply that average rents in the LA sector will be equal to averagerents in the RSL sector. Instead, it implies that two neighbouring properties of the samesize and value would be expected to have very similar rents, regardless of whether they areowned by a local authority or RSL.
3.16 At a national level, there are likely to remain objective differences between local authorityand RSL stock, particularly in its age. Under the restructuring approach set out in SectionTwo of this guide, even when convergence is achieved, the average level of LA rents is stilllikely to be around 5% to 10% below the average level of RSL rents, compared to acurrent difference of around 15%.
3.17 Convergence implies that, to achieve an appropriate differential between the sectors, localauthority rents will have to increase slightly faster than RSL rents. Over the next fewyears, the figures in Annex A show that LA guidelines are increasing slightly faster thanRSL guidelines. This produces a movement of around 2% towards convergence betweenthe two sectors over the period up to 2003/04. Ministers intend that convergence shouldbe achieved by the end of the ten-year implementation period, but the precise path ofsocial rents over this period will be determined by Ministers in the light of subsequentspending reviews.

Archive
d
Implementation Issues
13
Discretion for landlords3.18 The policy statement noted that, although a single formula is being proposed to guide
landlords in setting rents, Ministers accept that landlords should have some discretion overthe rents that are set for individual properties. This allows landlords to take account oflocal factors and concerns, in consultation with tenants. However, there is a need toachieve the central objective of creating a more coherent pattern of rents oncerestructuring is complete. Ministers have therefore said that they wish social landlords toset rents on individual properties that are normally within a band of up to 5% higher orlower than the target rents suggested by the national approach.
Timing and monitoring3.19 The policy statement noted that landlords should aim to begin restructuring their rents in
2002/03 and to complete the process over a ten-year period. Ministers will allow landlordssome discretion over the precise pace and timing of their restructuring programmes,although they do not expect the changes to be concentrated into the later years of the ten-year implementation period.
3.20 This phasing over several years will limit the changes which tenants face in their rents inany one year. But Ministers also expect social landlords to ensure that no tenant will besubject to a change in their rent as a result of the combined influence of restructuring andconvergence of more than £2 a week in any year above the normal increase for inflation.This will significantly lessen the impact on tenants who are not receiving Housing Benefit.
3.21 Local authority landlords will be expected to produce an annual restructuring plan andprogress report as part of their business planning round. This will cover issues such as thecalculation of target rents, plans for attaining the targets over the implementation period,and progress achieved. The Housing Corporation is likely to expect all RSLs with morethan 250 homes to produce similar plans, and will be consulting with RSLs on the detailsof such plans early in 2001.
Large-scale voluntary transfers (LSVTs)3.22 The policy statement noted that past agreements governing the Large-Scale Voluntary
Transfer of local authority housing to RSLs, including those for properties due to betransferred as part of this year’s programme, have often provided guarantees to tenants thattheir rents will not increase by more than a set amount for a certain period, typicallyRPI+1% for five years. These are important guarantees which must be honoured.Commitments to lenders which may also depend on the RSLs choosing a particularpattern or level of rents must also be honoured. Ministers expect, however, that landlordsshould make progress on rent restructuring if there remains scope to do so after thesecommitments have been met. Transfers that take place in the 2001 programme and beyondwill be expected to achieve convergence and restructuring to the same timetable as othersocial stock. As noted below, the Housing Corporation will be consulting on its detailedproposals for regulation of the rent restructuring framework early in 2001.

Archive
d
Guide to Social Rent Reforms
14
Service charges3.23 In addition to their rent, many tenants also pay service charges. These reflect common
costs such as repair and maintenance of communal facilities, overheads such as insuranceand management costs, and extra services such as care and support provided by, or onbehalf of, the landlord. Unlike rents, service charges may therefore comprise elementswhich vary from tenant to tenant, depending on their individual housing circumstances.
3.24 As the policy statement noted, Ministers are keen to encourage landlords to levy servicecharges, including support charges for the Supporting People programme, on consistentand transparent principles. But landlords are not expected to apply the restructuringformula set out in Section One of this guide to these charges, given their different naturefrom rents. Instead, a different approach is proposed.
3.25 Landlords are expected to ensure that service charges closely reflect what is being providedto tenants. For RSLs, the Housing Corporation will issue guidance in early 2001 whichwill encourage landlords to examine carefully the balance between rents and servicecharges within the context of the existing legislative and regulatory framework, and tomake any necessary changes. This guidance will also cover support charges eligible forTransitional Housing Benefit, which will parallel similar guidance being issued by DETR toLSVTs and local authorities.
3.26 From 2002/03, the Corporation’s rent-influencing policy will aim to ensure that increasesin the overall quantum of rents and service charges for RSLs are limited to RPI+1⁄2%,subject to differences in timing in implementation. In looking at individual RSLs, theCorporation will need to be able to distinguish between rents, which would be expected tochange by RPI+1⁄2%, plus or minus any adjustments for rent restructuring, and servicecharges, which would normally be expected to change simply by RPI+1⁄2%. Someadditional flexibility may be needed in relation to support charges and supported housing,in line with the Housing Corporation’s current guidance. More generally, local authoritylandlords will also be expected to set service charges which are reasonable and transparent.
Housing Revenue Account (HRA)3.27 DETR will discuss initially with the local authority associations how the HRA subsidy
system will be adapted to take account of the rent reforms. There are a number of detailedissues here, but broadly the system needs to reflect changes in the average rent for anauthority, over time, from the present level to that required under the rent reforms. Thesubsidy system must also take account of any increases in rents in the local authority sectorin real terms, for example those that may be necessary to allow convergence with the RSLsector. At the same time, it must continue to distribute housing subsidy in accordance withneed, and to reflect the effect of general inflation.

Archive
d
Implementation Issues
15
Relets and new build3.28 Social landlords will have discretion over whether to use relets as a means of moving more
quickly towards target rents, or whether to keep the rents on relets in line with theirgeneral progress towards target rents for similar properties. But landlords will be expectedto apply the £2 per week limit to real rent increases to whatever starting rent they selectfor a new tenant.
3.29 Newly-provided housing funded through Social Housing Grant, and approved for fundingfrom 2002/03 onwards, will normally have rents that are set immediately at the targetlevels given by the restructuring formula. However, rents on schemes approved for fundingprior to 2002/03 should be treated in the same way as relets, with landlords havingdiscretion over whether or not to move more quickly towards target rents than for existingproperties. The valuation base used for ascribing capital values to new build should, as faras possible, be consistent with that pertaining to the existing stock.
Fair rents3.30 RSL tenants who benefit from “fair rents” protection will retain this under the
restructuring proposals. If a Rent Officer sets a fair rent which is below the target rentgiven by the formula, this lower rent will prevail. But if the Rent Officer were to set a fairrent which is above the target rent given by the formula, then it is expected that landlordswill want to use the target rent rather than the higher “fair rent”.
Housing Corporation’s approach to regulation3.31 The Housing Corporation’s approach to regulation of the rent restructuring proposals will
build upon its existing regime for rent influencing. This will continue to seek to bear downon rent increases through the issue of a guideline limit for rent increases, and to influencerent levels through the restructuring framework. Assessment of compliance with the rentrestructuring proposals will be based upon a review of data which are currently supplied tothe Corporation by RSLs. In addition, the Corporation will expect RSLs with more than250 homes to prepare a plan which demonstrates how rents will change over the ten-yearimplementation period. In assessing how RSLs are moving towards the target rent for theirproperties, the Corporation will review the rent plan as part of its lead regulationframework.
3.32 Annex B provides further details of the Corporation’s initial thoughts on implementationof the proposals. The Corporation will also be consulting in early 2001 on its detailedproposals for regulation of the rent restructuring framework, including guidance on howRSLs can derive property values and what is to be included in the rent plan.

Archive
d
Guide to Social Rent Reforms
16
CHAPTER 4
Research Studies4.1 This chapter summarises a number of studies which have been commissioned
independently or jointly by DETR to inform the development of policies to reformsocial rents.
Assessing the impact of rent policieson individual RSLs
4.2 DETR and the Housing Corporation commissioned the consultants KPMG and HACASChapman Hendy to provide an independent assessment of the impact on the finances of40 individual RSLs of the rent restructuring options set out in the Green Paper, includingthe proposal that RSL average rent increases should be linked to RPI+0%. The NationalHousing Federation were closely involved through the study’s steering group. Theconsultants also assessed the impact of the approach that Ministers set out in theDecember policy statement, of which details are given in Chapter Two of this guide.
4.3 The RSLs in the study were a sample of those whose rents were likely to fall as a result ofthe proposals in the Housing Green Paper. The consultants came to a view about thefuture financial viability of each of the 40 RSLs under each option, including the effects ofpotential corrective strategies which the RSL may be able to implement in response torent reductions.
4.4 The results indicated that only a very small proportion of RSLs would need more than tenyears to implement the approach that is set out in the December policy statement, whilstcontinuing to remain financially viable. An executive summary containing further informationabout the study and its results is being published alongside this document. It is alsoavailable on the DETR website, www.housing.detr.gov.uk/information/socialrent/index.htmor from the DETR Housing Support Unit4.
Local authority area case studies4.5 DETR has commissioned a team led by the Universities of Birmingham and Bristol to
carry out case studies with the aim of gaining insights into the practical implications ofrent restructuring for landlords and tenants. The studies are looking at a range of LAlandlords and different types of RSL, including national and local RSLs, a recent LSVT,and a Black Minority Ethnic (BME) RSL. Two studies are examining neighbouring LAlandlords which currently have large differences in their rent structures.
4 Assessing the Impact of Housing Green Paper Rent Reform Policies on Individual RegisteredSocial Landlords. DETR, Housing Support Unit, Zone 2/C6, Eland House, Bressenden Place,London SW1E 5DU, Email: [email protected]. Fax: 020 7944 4527.

Archive
d
Research Studies
17
4.6 The impacts of restructuring on landlords’ finances are being investigated through themodelling of rental income and interviews with landlord representatives. The impacts ontenants, including issues of affordability and changes in Housing Benefit status, are beingexamined through tenant surveys.
4.7 A number of other issues are also being examined. These include the use of the beaconapproach, the impacts over time of convergence and restructuring on rents for similarproperties in different sectors, and the effects of the £2 per week ceiling on annual rentchanges in excess of inflation.
4.8 The research will be continuing until early in 2001, helping to inform detailedimplementation issues such as those set out in Chapter Three of this guide. It is envisagedthat the results will be published later in 2001.
Social tenants’ attitudes to rent levelsand rent differentials
4.9 This study for DETR by the Universities of Birmingham and Bristol was published inAugust 2000, with the key findings noted in Housing Research Summary Number 1275. Itused an innovative “stated preference” approach to model tenants behaviour in response tochanges in rents. Results included that most social tenants have a strong preference forstaying in their current homes, that tenants place a high value on property condition andsecurity and that tenants are more likely to consider “trading-up” to a better standard ofaccommodation than to consider “trading down”.
Rent-setting policies in English local authorities4.10 Another study for DETR by the Universities of Birmingham and Bristol was also published
in August 2000, with the key findings noted in Housing Research Summary Number 1286.This used a postal survey to map the rent-setting policies and practices of local authoritiesin 1998/99. Results showed that around over 50% of authorities used a points-based systemand that nearly 30% of authorities were planning to change their rent-setting method,most frequently to some form of points system. The proportion of authorities using a grossvalue method had fallen substantially since the previous survey in 1994/95.
5 Housing Research Summary Number 127,2000: Social Housing Tenants’ Attitudes to rent levels andrent differentials. Available on the DETR website: www.housing.detr.gov.uk/hrs/numindex.htm or fromthe DETR Housing Support Unit, Zone 2/C6 Eland House, Bressenden Place, London SW1E 5DU.Email: [email protected]. Fax: 020 7944 4527.
6 Housing Research Summary Number 128,2000: Rent Setting Policies in English Local Authorities,1998/99, available from Housing Support Unit, see footnote 5 above.

Archive
d
Guide to Social Rent Reforms
18
CHAPTER 5
Implications for Landlordsand Tenants
5.1 The reforms to social rents set out in the December policy statement are likely to requirechanges in rents for the vast majority of properties. Most social landlords can thereforeexpect some change in their rental income and most social tenants can expect somechange in their gross rent. However, tenants who receive Housing Benefit will be largelyinsulated from these effects.
5.2 Attached at Annex C are a series of tables, summarising the implications of rent restructuringfor landlords and tenants. Tables concerned with gross rents are of most interest tolandlords; tables concerned with net rents are of most interest to tenants – since net rentstake account of Housing Benefit. The tables mostly follow a similar format to those in theSupplement to Chapter 10 of the Housing Green Paper, published in May 20007, and arebased on modelling using data from the 1996 English House Condition Survey.
5.3 Although detailed, the tables are indicative only. For instance, they do not take intoaccount the ± 5% flexibility around target rents, nor do they reflect the fact that someRSLs, in particular, may find it necessary to depart from the formula, as indicated in thepolicy statement.
5.4 Annex D provides more information about the modelling. Note, in particular, that theeffects of the restructuring approach are analysed separately for each sector (LA or RSL)and that average rents for each sector are at April 2000 levels. This is in order to provide aclear illustration of the impact of rent restructuring on the pattern of rents, without thisbeing obscured by other influences on rents, such as the impact of inflation.
5.5 In reality, restructuring will take place over ten years, in conjunction with steps toapproach convergence. Together with the effects of inflation, this means that outturnrents at the end of the restructuring period are likely to differ significantly from thoseshown here.
Table 1: The distribution of gross rents5.6 Table 1 of Annex C compares the distribution of gross rents under the restructuring
approach with unrestructured rents.
5.7 Compared to unrestructured rents, the restructuring approach narrows the range of rentsfor both LAs and RSLs. It concentrates LA rents into the range of £30 per week to £60 perweek, and RSL rents into the range of £40 per week to £70 per week.
7 Quality and Choice: A Decent Home for All – The housing green paper, DETR, ISBN 1 85112 3784,£10 available from DETR Sales Centre, Unit 21, Goldthorpe Industrial Estate, Goldthorpe, RotherhamS63 9BL. Tel: 01709 891318, Fax: 01709 881673. A free summary of the Green Paper is available fromDETR Free Literature, Product code: 0HC9021 – see inside frontispiece for address.

Archive
d
Implications for Landlords and Tenants
19
Tables 2A and 2B: Minimum, average andmaximum gross rents in each region
5.8 Tables 2A and 2B in Annex C show minimum, average and maximum gross rents byregion under the restructuring approach and with unrestructured rents. To reducedistortions from small sample sizes, minimum rents are quoted at the 21⁄2 percentile andmaximum rents at the 971⁄2 percentile8.
TABLE 2A (LA RENTS)
5.9 In most regions, average LA rents under the restructuring approach are broadly similar tounrestructured rents. The largest changes are a fall of nearly £4 per week in London and arise of around £3 per week in East of England.
5.10 Compared to unrestructured rents, the restructuring approach narrows the range of LArents within all regions. Minimum rents are increased and maximum rents are reduced.
TABLE 2B (RSL RENTS)
5.11 Compared to unrestructured rents, the restructuring approach reduces average RSL rentsby over £8 per week in the North East and East Midlands and by around £4 per week inthe South West and Yorkshire and the Humber. In contrast, it increases average rents bynearly £7 per week in London, thereby increasing the spread of average rents betweenregions. In other regions, average RSL rents are broadly similar under the restructuringapproach to unrestructured levels.
5.12 Compared to the unrestructured pattern of rents, the restructuring approach narrows therange of RSL rents within all regions. Minimum rents are increased and maximum rents arereduced.
Tables 3A and 3B: Gross rentsby type of property
5.13 Tables 3A and 3B in Annex C show the effect of restructuring on different property types:high-rise flats, low-rise flats and houses.
TABLE 3A (LA RENTS)
5.14 In the LA sector, the average unrestructured rents for high-rise flats are around £6 perweek higher than those for houses. Average unrestructured rents for low-rise flats are alsoslightly higher than those for houses.
5.15 The restructuring approach tends to reduce LA rents for flats, particularly high-rises, andincrease rents for houses. It therefore leads to average rents for flats becoming around £3per week lower than those for houses.
8 i.e. only 21⁄2% of rents are below the 21⁄2 percentile and only 21⁄2% of rents are above the 971⁄2 percentile.
Archive
d
Guide to Social Rent Reforms
20
TABLE 3B (RSL RENTS)
5.16 In the RSL sector, the average unrestructured rents for high-rise flats are around £4 perweek higher than those for houses. Average unrestructured rents for low-rise flats are fairlysimilar to those for houses.
5.17 The restructuring approach tends to reduce RSL rents for flats, particularly high-rises, andincrease rents for houses. It therefore leads to average rents for flats becoming around £4per week lower than those for houses.
Table 4: Changes in gross rents5.18 Table 4 in Annex C shows the distribution of changes in gross rents between the
restructuring approach and unrestructured rents.
5.19 Through creating a more coherent pattern of rents, the restructuring approach willgenerate changes in gross rents of more than £1 per week for the vast majority ofproperties. This is especially relevant for landlords, and for those tenants not receivingHousing Benefit.
5.20 The restructuring approach leads to increases in gross rents for around 53% of householdsand decreases in gross rents for around 47% of households. As the approach is designed toleave total rental income unchanged, the fall in rent for those households whose rentsdecrease will, on average, be slightly greater than the rise in rent for those householdswhose rents increase.
Table 5: Changes in net rents5.21 Table 5 in Annex C shows the distribution of changes in net rents between the
restructuring approach and unrestructured rents. Net rent is the rent paid by the tenantafter receipt of any Housing Benefit (HB), and therefore this table represents the changesthat will be experienced by tenants.
5.22 Around 70% of households have all or some of their rent met by HB, so that under thecurrent structure of HB they will experience no change in the net rent they actually pay.For those not receiving HB, the restructuring approach leads to around 17% of householdsfacing an increase in their net rent and around 13% of households benefiting from adecrease in their net rent.
5.23 Under the restructuring approach, around 25,000 households face an overall increase intheir net rent of more than £20 per week if they stay in their current properties. Like otherhouseholds, the impact on them will be lessened by the £2 per week ceiling on increases inrents in any year above the normal increase for inflation. Also, together with the proposedreforms of lettings systems, these households will have the option, and the opportunity, toseek alternative accommodation in the social housing sector, should they wish.

Archive
d
Implications for Landlords and Tenants
21
Tables 6A and 6B: Changes in net rents bytype of household
5.24 Compared to unrestructured net rent levels, Tables 6A and 6B in Annex C show how therestructuring approach is likely to impact on different types of household.
5.25 The effects are very similar for LA households and RSL households. The two groups whichexperience the most change from restructuring are couples with head aged under 60 whohave dependent children and all households with head aged under 60 who have nodependent children. Around 60% of couples with dependent children, and 40% ofhouseholds with no dependent children will experience a change in the net rent they pay.A slightly greater proportion of households in these groups lose rather than gain fromrestructuring.
5.26 In contrast, only 20% of households with head aged 60 and over and 15% of lone parentsaged under 60 will experience a change in the net rent they pay. To a large extent, thisreflects the high proportion of these groups who, through Housing Benefit, are insulatedfrom the effects of changes in their gross rent. Again, a slightly greater proportion ofhouseholds in these groups lose rather than gain from restructuring.
Tables 7A to 7C: Regional changes in net rents5.27 Tables 7A to 7C in Annex C give some insight into the regional distribution of
households with increases and decreases in their net rent. In order to avoid problems ofsmall sample sizes, a coarser banding of changes in net rents has been used than in theprevious tables and the nine Government Office Regions have been combined into threeregional groups:
5.28 The proportion of social households entitled to Housing Benefit, and thus insulated fromchanges in their rents under current arrangements, is considerably greater in the Norththan in the Midlands & South West or the South. Roughly 75% of households in theNorth will experience no change in net rent, compared to around 65% in the other tworegional groups.
5.29 In both the LA and RSL sectors in the North and the South, slightly more households losefrom restructuring than gain from it.
5.30 In the Midlands & South West, the impacts of restructuring on households in the LA andRSL sectors are more distinct. In the LA sector there are more losers than gainers, whereasin the RSL sector there are more gainers than losers.
5.31 Overall, it should be emphasised that most households experience little or no change inthe net rent which they actually pay.
‘North’: North East, North West, Yorkshire and the Humber;
‘Midlands & South West’: East Midlands, West Midlands, South West;
‘South’: East of England, South East, London.

Archive
d
Guide to Social Rent Reforms
22
Tables 8A to 8E: Affordability of rents bytype of household
5.32 Tables 8A to 8E in Annex C look at the affordability for different types of household ofrents under the restructuring approach, in comparison to unrestructured rents. They arebased on the following measure of affordability, in which net rent is a household’s grossrent less any Housing Benefit to which it is entitled and net income is gross income lesstaxes:
5.33 Therefore less affordable rents are associated with a higher affordability ratio.
5.34 Table 8A shows that, because of Housing Benefit, less than 5% of total households in thesocial sector currently have affordability ratios of greater than 30%. Nevertheless,compared to unrestructured rents, the restructuring approach slightly reduces the numberof households with the least affordable rents. Table 8B shows that the restructuringapproach also slightly reduces the number of households whose head is aged 60 and overwith the least affordable rents.
5.35 Table 8C examines the implications of the restructuring approach for couples whose headis aged under 60 and who have dependent children; Table 8D examines the implicationsfor lone parent households whose head is aged under 60. For both these groups, HousingBenefit prevents any significant number having an affordability ratio of greater than 30%.However, compared to unrestructured rents, the restructuring approach reduces thenumber of these households with an affordability ratio of over 25%.
5.36 Finally, Table 8E looks at the implications for households with head aged under 60 whohave no dependent children. For this group, the restructuring approach slightly increasesthe number of households with the least affordable rents.
Affordability ratio = net rent divided by net income before housing costs

Archive
d
23
CHAPTER 6
Conclusion6.1 In conclusion, this guide has set out the central formula around which Ministers wish
social rents to be set in the future. It has provided details of a range of specific issues thatarise from the application and implication of this new approach to rent setting, and hassummarised the findings of a series of related research projects.
6.2 The final section has examined the impacts of the restructuring approach on landlords andtenants. By creating a more coherent pattern of rents between and within regions, theapproach leads to changes in rents for the vast majority of properties. Most social tenantscan expect some change in their gross rent. However, those tenants who receive HousingBenefit will be largely insulated from these effects. For most types of household, therestructuring approach leads to a slight reduction in the number of households with thepoorest affordability.

Archive
d
Guide to Social Rent Reforms
24
ANNEX A
Information for RestructuringFormula
A1 This annex provides the information, apart from property-specific details, that is needed toapply the rent restructuring formula.
RentsA2 National average rents, net of service charges, in April 2000 are estimated by DETR to be
as follows:
A3 For local authorities, increases in rent guidelines above the general rate of inflation areexpected to be no greater than the following figures:
A4 For RSLs, increases in guideline limits above the general rate of inflation are expected tobe no greater than the following figures:
2001-02: 1%
2002-03: 1⁄2%
2003-04: 1⁄2%
2004-05: 1⁄2%
2001-02: 2%
2002-03: 1%
2003-04: 1%
LA sector: £45.60 per week
RSL sector: £53.50 per week
Archive
d
Annex A
25
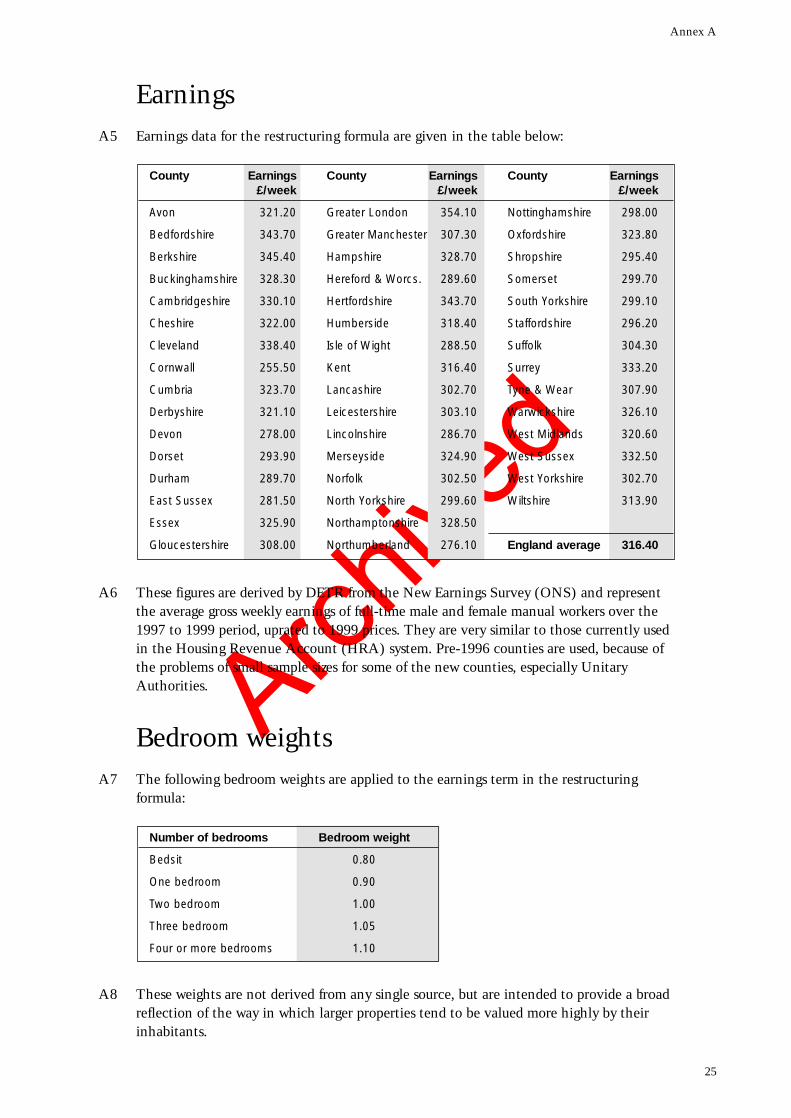
EarningsA5 Earnings data for the restructuring formula are given in the table below:
A6 These figures are derived by DETR from the New Earnings Survey (ONS) and representthe average gross weekly earnings of full-time male and female manual workers over the1997 to 1999 period, uprated to 1999 prices. They are very similar to those currently usedin the Housing Revenue Account (HRA) system. Pre-1996 counties are used, because ofthe problems of small sample sizes for some of the new counties, especially UnitaryAuthorities.
Bedroom weightsA7 The following bedroom weights are applied to the earnings term in the restructuring
formula:
A8 These weights are not derived from any single source, but are intended to provide a broadreflection of the way in which larger properties tend to be valued more highly by theirinhabitants.
Number of bedrooms Bedroom weight
Bedsit 0.80
One bedroom 0.90
Two bedroom 1.00
Three bedroom 1.05
Four or more bedrooms 1.10
County Earnings County Earnings County Earnings£/week £/week £/week
Avon 321.20 Greater London 354.10 Nottinghamshire 298.00
Bedfordshire 343.70 Greater Manchester 307.30 Oxfordshire 323.80
Berkshire 345.40 Hampshire 328.70 Shropshire 295.40
Buckinghamshire 328.30 Hereford & Worcs. 289.60 Somerset 299.70
Cambridgeshire 330.10 Hertfordshire 343.70 South Yorkshire 299.10
Cheshire 322.00 Humberside 318.40 Staffordshire 296.20
Cleveland 338.40 Isle of Wight 288.50 Suffolk 304.30
Cornwall 255.50 Kent 316.40 Surrey 333.20
Cumbria 323.70 Lancashire 302.70 Tyne & Wear 307.90
Derbyshire 321.10 Leicestershire 303.10 Warwickshire 326.10
Devon 278.00 Lincolnshire 286.70 West Midlands 320.60
Dorset 293.90 Merseyside 324.90 West Sussex 332.50
Durham 289.70 Norfolk 302.50 West Yorkshire 302.70
East Sussex 281.50 North Yorkshire 299.60 Wiltshire 313.90
Essex 325.90 Northamptonshire 328.50
Gloucestershire 308.00 Northumberland 276.10 England average 316.40

Archive
d
Guide to Social Rent Reforms
26
Property valuesA9 Individual property values for rent restructuring are based upon January 1999 vacant
possession values, assuming continued residential use. Further details are contained inSection Three of this guide.
A10 National average property values in January 1999 are estimated by DETR to be as follows:
A11 These figures are based on a survey by a national firm of locally-based valuers. Theyrepresent open market values assuming vacant possession and continued residential use.
LA sector: £41,350
RSL sector: £49,750

Archive
d
27
ANNEX B
The Housing Corporation’sapproach to regulation
B1 IntroductionB1.1 This Guide sets out the details underpinning the way in which the Government wishes
social rents to be set in the future. The Housing Corporation is now considering how therent restructuring proposals should be implemented by Registered Social Landlords (RSL’s).
B1.2 The Corporation will provide guidance to RSL’s, lenders and other stakeholders onproposals to develop its existing rent influencing regime. It will consult on these proposals.
B2 Key PrinciplesB2.1 In developing its regulatory regime, there are a number of key principles which underpin
the Corporation’s approach. These include:
B2.2 The Corporation’s rent restructuring proposals will build upon the existing regime for rentinfluencing and will continue to seek to bear down on rent increases through the issue of aguideline limit for rent increases and influence rent levels through the restructuringframework.
B2.3 RSL’s will be able to set rents at a level that allows them to meet their financialcommitments, maintain their stock and continue to function as financially viableorganisations. They must also be able to meet their obligations to tenants.
B2.4 Contractual obligations to lenders are overriding. In deciding whether to take any actionagainst an RSL, the Corporation’s paramount concern will be to protect the public andprivate investment in its stock and to retain the confidence of lenders.
B2.5 The Corporation will agree a derogation from the rent restructuring framework where anRSL can demonstrate that it cannot reasonably achieve the target rents over the 10 yearimplementation period. The Corporation will review the position periodically. Ifcircumstances change, the Corporation will review the position of the RSL taking carefulconsideration of existing commitments, including those to existing lenders. Thederogation will, therefore, be subject to periodic review rather than be time limited.

Archive
d
Guide to Social Rent Reforms
28
B3 Future rent influencing regimeB3.1 The framework for the rent influencing regime will be set out in a consultation document
to be issued early in 2001. This document will include:
• guidance for RSLs on acceptable methods for valuing properties and setting rents
• what should be included in the rent plan and the Corporation’s process of review aspart of its lead regulation regime
• what information the Corporation will collect and how it will assess it
• what constitutes failure against Performance Standards
• how the Corporation will investigate non-compliance and decide whether aderogation is appropriate
• how the Corporation will deal with stock transfer RSL’s
B4 Next StepsB4.1 The Corporation will be inviting comments from RSLs, lenders and other stakeholders on
the principles and application of its proposed rent influencing regime.
B4.2 Following consideration of responses to its consultation document, the Corporation willfinalise the principles of the regime and issue its final proposals, which will supersedeprevious guidance.
B5 Further InformationB5.1 For further information please contact Clare Miller, the Housing Corporation’s Director of
Regulation, on 020 7393 2082.

Archive
d
ANNEX C:
Tables of implications forlandlords and tenants
Table 2A: LA GROSS RENTS BY REGION Minimum, average and maximum
gross rents by region, £ per week
Region Unrestructured rents Restructuring approachMin Ave Max Min Ave Max
North East 28.40 38.40 49.20 31.10 39.70 47.80Yorkshire and the Humber 25.00 36.90 51.10 31.00 39.00 46.30North West 26.70 42.10 58.90 30.00 40.20 50.50
East Midlands 23.70 39.60 55.00 32.20 41.30 52.70West Midlands 20.80 41.20 56.80 33.00 43.40 53.60South West 24.10 44.90 67.20 32.10 43.50 55.90
East of England 20.50 47.70 69.50 36.20 50.80 68.20South East 29.70 51.80 78.70 36.70 51.40 68.60London 26.70 60.30 96.40 43.30 56.70 82.50
England 25.30 45.60 78.00 32.20 45.60 66.70
Notes: a) 1996 households and April 2000 rents.b) Min refers to the 21⁄2 percentile rent.c) Max refers to the 971⁄2 percentile rent.
Table 1: GROSS RENTS Count of households by gross rent
Unrestructured rents Restructuring approach
RangeLA RSL LA RSL
£ per week ’000 % ’000 % ’000 % ’000 %
£0 to £10 10 0% * 0% * 0% * 0%£10 to £20 20 1% 10 1% * 0% * 0%£20 to £30 190 6% 30 3% 20 1% * 0%£30 to £40 1000 30% 150 16% 950 28% 60 7%£40 to £50 1110 33% 220 24% 1520 46% 340 37%
£50 to £60 570 17% 230 25% 540 16% 280 31%£60 to £70 270 8% 150 16% 260 8% 140 15%£70 to £80 100 3% 80 9% 30 1% 50 5%£80 to £90 40 1% 30 3% 20 1% 10 1%£90 to £100 20 1% 10 1% * 0% 10 1%
£100 to £125 10 0% 10 1% * 0% * 0%£125 to £150 * 0% * 0% * 0% * 0%Over £150 * 0% * 0% * 0% * 0%
Total 3340 100% 910 100% 3340 100% 910 100%
Notes: a) Unrestructured rents refer to rents at April 2000.b) 1996 households and April 2000 rents.c) *signifies less than 5,000 households, totals may not sum because of rounding.d) 0% signifies less than 0.5%, totals may not sum because of rounding.
29

Archive
d
Guide to Social Rent Reforms
30
Table 3A: LA GROSS RENTS BY TYPE OF PROPERTY
Percentage of households by gross rent
LA flats over 5 storeys LA flats up to 5 storeys LA housesRange Unrestruc- Rest. Unrestruc- Rest. Unrestruc- Rest.£ per week tured approach tured approach tured approach
£0 to £10 0% 0% 1% 0% 0% 0%£10 to £20 1% 0% 1% 0% 0% 0%£20 to £30 3% 3% 7% 1% 5% 0%£30 to £40 21% 39% 29% 44% 32% 18%£40 to £50 23% 31% 31% 30% 36% 56%
£50 to £60 22% 21% 16% 18% 17% 14%£60 to £70 18% 5% 9% 6% 6% 9%£70 to £80 8% 0% 4% 1% 2% 1%£80 to £90 2% 0% 2% 0% 1% 1%£90 to £100 1% 0% 2% 0% 0% 0%
£100 to £125 0% 0% 0% 0% 0% 0%£125 to £150 0% 0% 0% 0% 0% 0%Over £150 0% 0% 0% 0% 0% 0%
Total 100% 100% 100% 100% 100% 100%Average (£) 50.70 43.60 46.00 44.00 44.80 46.80
Notes: a) 1996 households and April 2000 rents.b) 0% signifies less than 0.5%, totals may not sum because of rounding.
Table 2B: RSL GROSS RENTS BY REGION Minimum, average and maximum
gross rents by region, £ per week
Region Unrestructured rents Restructuring approachMin Ave Max Min Ave Max
North East 25.30 52.90 91.50 33.10 44.30 55.20Yorkshire and the Humber 12.10 49.60 82.10 35.70 45.10 54.90North West 27.50 44.20 94.60 36.50 45.90 54.00
East Midlands 30.80 54.40 74.50 39.00 46.30 61.00West Midlands 19.30 49.50 74.90 39.60 47.80 58.80South West 27.50 55.00 88.10 35.80 51.20 70.30
East of England 29.70 54.60 78.20 39.90 56.30 74.40South East 29.70 55.70 88.10 39.40 54.90 72.80London 35.30 59.50 115.70 48.70 66.10 100.00
England 27.50 53.50 88.10 37.50 53.50 80.50
Notes: a) 1996 households and April 2000 rents.b) Min refers to the 21⁄2 percentile rent.c) Max refers to the 971⁄2 percentile rent.

Archive
d
Annex C
31
Table 4: CHANGES IN GROSS RENTS WITH RESTRUCTURING APPROACH
Count and percentage of households by change in gross rent from
unrestructured rents
Range of change LA RSL£ per week ’000 % ’000 %
Down by more than £50 * 0% 10 1%Down by £30 to £50 40 1% 30 3%Down by £20 to £30 80 2% 50 6%Down by £10 to £20 350 10% 140 15%Down by £5 to £10 390 12% 90 10%Down by £2.50 to £5 350 11% 60 6%Down by £1 to £2.50 210 6% 40 4%Down by £0.01 to £1 140 4% 20 2%No change * 0% * 0%Total down/no change 1,560 47% 430 48%
Up by £0.01 to £1 150 5% 20 2%Up by £1 to £2.50 230 7% 30 3%Up by £2.50 to £5 350 11% 60 6%Up by £5 to £10 620 19% 120 13%Up by £10 to £20 320 10% 160 18%Up by £20 to £30 70 2% 70 7%Up by £30 to £50 30 1% 10 2%Up by more than £50 * 0% 10 1%Total up 1,780 53% 470 52%
Total 3,340 100% 910 100%
Notes: a) 1996 households and April 2000 rents.b) * signifies less than 5,000 households, totals may not sum because of rounding.c) 0% signifies less than 0.5%, totals may not sum because of rounding.
Table 3B: RSL GROSS RENTS BY TYPE OF PROPERTY
Percentage of households by gross rent
RSL flats over 5 storeys RSL flats up to 5 storeys RSL housesRange Unrestruc- Rest. Unrestruc- Rest. Unrestruc- Rest.£ per week tured approach tured approach tured approach
£0 to £10 0% 0% 0% 0% 0% 0%£10 to £20 7% 0% 0% 0% 1% 0%£20 to £30 0% 0% 2% 0% 5% 0%£30 to £40 13% 6% 15% 12% 18% 2%£40 to £50 7% 48% 27% 42% 21% 32%
£50 to £60 25% 20% 30% 26% 19% 37%£60 to £70 25% 11% 16% 14% 17% 18%£70 to £80 12% 13% 6% 5% 11% 7%£80 to £90 8% 0% 2% 0% 4% 3%£90 to £100 4% 0% 1% 1% 1% 1%
£100 to £125 0% 0% 1% 0% 1% 0%£125 to £150 0% 0% 0% 0% 0% 1%Over £150 0% 0% 0% 0% 0% 0%
Total 100% 100% 100% 100% 100% 100%Average (£) 57.40 53.00 53.10 51.20 53.80 56.50
Notes: a) 1996 households and April 2000 rents.b) 0% signifies less than 0.5%, totals may not sum because of rounding.

Archive
d
Guide to Social Rent Reforms
32
Table 5: CHANGES IN NET RENTS WITH RESTRUCTURING APPROACH
Count and percentage of households by change from unrestructured
rents in rent paid by tenants after housing benefit
Range of change LA RSL£ per week ’000 % ’000 %
Down by more than £50 * 0% * 0%Down by £30 to £50 10 0% 10 1%Down by £20 to £30 30 1% 10 1%Down by £10 to £20 90 3% 60 7%Down by £5 to £10 130 4% 30 3%Down by £2.50 to £5 100 3% 10 1%Down by £1 to £2.50 50 2% * 0%Down by £0.01 to £1 40 1% 10 1%Total better off 470 13% 130 14%
No change 2,310 69% 630 69%
Up by £0.01 to £1 60 2% 10 1%Up by £1 to £2.50 110 3% 10 1%Up by £2.50 to £5 120 4% 20 2%Up by £5 to £10 160 5% 40 5%Up by £10 to £20 100 3% 50 5%Up by £20 to £30 10 0% 20 2%Up by £30 to £50 * 0% * 0%Up by more than £50 * 0% * 0%Total worse off 560 17% 150 16%
Total 3,340 100% 910 100%
Notes: a) 1996 households and April 2000 rents.b) *signifies less than 5,000 households, totals may not sum because of rounding.c) 0% signifies less than 0.5%, totals may not sum because of rounding.

Archive
d
Annex C
33
Table 6A: CHANGES IN LA NET RENTS BY TYPE OF HOUSEHOLD WITH
RESTRUCTURING APPROACH Count of households by change from
unrestructured rents in rent paid by tenants after housing benefit
LA head under LA head 60 or 60 couple with LA head under LA head under
Range of change over children 60 lone parent 60 no children£ per week ’000 ’000 ’000 ’000
Down by more than £50 * * * *Down by £30 to £50 * * * 10Down by £20 to £30 * 10 * 10Down by £10 to £20 20 20 * 50Down by £5 to £10 30 40 10 50Down by £2.50 to £5 40 30 10 30Down by £1 to £2.50 20 20 * 20Down by £0.01 to £1 10 20 * 10Total better off 110 140 30 170
No change 1120 250 440 510
Up by £0.01 to £1 10 20 * 30Up by £1 to £2.50 50 40 * 20Up by £2.50 to £5 40 40 * 50Up by £5 to £10 40 60 * 50Up by £10 to £20 30 40 * 40Up by £20 to £30 * 10 * *Up by £30 to £50 * * * *Up by more than £50.00 * * * *Total worse off 180 210 10 190
Total 1410 590 480 860
Notes: a) 1996 households and April 2000 rents.b) * signifies less than 5,000 households, totals may not sum because of rounding.

Archive
d
Guide to Social Rent Reforms
34
Table 7A: REGIONAL CHANGES IN NET RENTS THE “NORTH”: NORTH EAST
YORKSHIRE AND THE HUMBER; NORTH WEST Count and percentage
of households by change from unrestructured rents in rent paid
by tenants after housing benefit
Range of change LA RSL£ per week ’000 % ’000 %
Down by more than £10 20 2% 10 3%Down by £5 to £10 40 3% * 2%Down by £0.01 to £5 70 6% 10 2%Total better off 130 11% 20 7%
No change 910 74% 190 78%
Up by £0.01 to £5 90 7% 10 3%Up by £5 to £10 70 6% 20 6%Up by more than £10 20 2% 10 5%Total worse off 180 15% 30 14%
Total 1230 100% 240 100%
Notes: a) 1996 households and April 2000 rents.b) *signifies less than 5,000 households, totals may not sum because of rounding.
Table 6B: CHANGES IN RSL NET RENTS BY TYPE OF HOUSEHOLD WITH
RESTRUCTURING APPROACH Count of households by change from
unrestructured rents in rent paid by tenants after housing benefit
RSL head under RSL head 60 or 60 couple with RSL head under RSL head under
Range of change over children 60 lone parent 60 no children£ per week ’000 ’000 ’000 ’000
Down by more than £50 * * * *Down by £30 to £50 * * * *Down by £20 to £30 * * * *Down by £10 to £20 20 20 * 20Down by £5 to £10 10 10 * 10Down by £2.50 to £5 * * * *Down by £1 to £2.50 * * * *Down by £0.01 to £1 * * * *Total better off 50 50 10 30
No change 280 60 140 140
Up by £0.01 to £1 * * * *Up by £1 to £2.50 * 10 * *Up by £2.50 to £5 * 10 * 10Up by £5 to £10 10 10 * 20Up by £10 to £20 10 20 * 20Up by £20 to £30 * * * 10Up by £30 to £50 * * * *Up by more than £50.00 * * * *Total worse off 30 50 10 50
Total 360 160 160 230
Notes: a) 1996 households and April 2000 rents.b) * signifies less than 5,000 households, totals may not sum because of rounding.

Archive
d
Annex C
35
Table 7C: REGIONAL CHANGES IN NET RENTS THE “SOUTH”: LONDON;
SOUTH EAST; EAST OF ENGLAND
Count and percentage of households by change from unrestructured
rents in rent paid by tenants after housing benefit
Range of change LA RSL£ per week ’000 % ’000 %
Down by more than £10 80 7% 50 11%Down by £5 to £10 50 5% 10 2%Down by £0.01 to £5 50 5% 10 2%Total better off 190 16% 70 14%
No change 800 67% 310 66%
Up by £0.01 to £5 100 9% 20 5%Up by £5 to £10 40 4% 20 4%Up by more than £10 60 5% 50 11%Total worse off 210 17% 90 19%
Total 1190 100% 470 100%
Notes: a) 1996 households and April 2000 rents.
Table 7B: REGIONAL CHANGES IN NET RENTS “MIDLANDS AND THE SOUTH
WEST”: EAST MIDLANDS; WEST MIDLANDS; SOUTH WEST
Count and percentage of households by change from unrestructured
rents in rent paid by tenants after housing benefit
Range of change LA RSL£ per week ’000 % ’000 %
Down by more than £10 20 2% 20 10%Down by £5 to £10 40 4% 20 8%Down by £0.01 to £5 70 7% 10 5%Total better off 120 13% 40 22%
No change 600 66% 130 66%
Up by £0.01 to £5 100 11% 10 3%Up by £5 to £10 50 6% 10 4%Up by more than £10 40 4% 10 5%Total worse off 190 21% 20 12%
Total 920 100% 190 100%
Notes: a) 1996 households and April 2000 rents.

Archive
d
Guide to Social Rent Reforms
36
Table 8B: AFFORDABILITY ANALYSIS – HEAD OF HOUSEHOLD AGED 60 OR OVER
Count and percentage of households by affordability ratio.
NB. A lower ratio indicates a more affordale rent.
Unrestructured rents Restructuring approach
Affordability LA RSL LA RSLratio ’000 % ’000 % ’000 % ’000 %
0% 700 48% 190 49% 770 52% 200 51%
Over 0% up to 5% 90 6% 20 4% 90 6% 10 4%5% to 10% 90 6% 20 5% 70 5% 20 5%
10% to 15% 140 9% 30 9% 120 8% 30 8%15% to 20% 180 12% 50 12% 160 11% 40 11%
20% to 25% 140 9% 20 5% 140 9% 30 7%25% to 30% 90 6% 20 5% 80 5% 30 9%
30% to 40% 30 2% 30 7% 30 2% 10 4%40% and higher 20 1% 10 3% 20 1% 10 2%
Total 1470 100% 390 100% 1470 100% 390 100%
Notes: a) 1996 households and April 2000 rents.b) Totals may not sum because of rounding.c) The affordability ratio is defined as (gross rent – HB) / net income before housing costs.d) A 0% affordability ratio implies a household’s rent is met fully by HB.
Table 8A: AFFORDABILITY ANALYSIS – ALL HOUSEHOLDS
Count and percentage of households by affordability ratio.
NB. A lower ratio indicates a more affordale rent.
Unrestructured rents Restructuring approach
Affordability LA RSL LA RSLratio ’000 % ’000 % ’000 % ’000 %
0% 1720 51% 490 54% 1820 54% 500 55%
Over 0% up to 5% 120 4% 20 2% 110 3% 20 2%5% to 10% 220 7% 50 5% 180 5% 50 5%
10% to 15% 430 13% 90 10% 420 13% 70 8%15% to 20% 350 11% 100 11% 350 10% 110 12%
20% to 25% 240 7% 60 7% 240 7% 70 8%25% to 30% 160 5% 40 5% 140 4% 50 6%
30% to 40% 80 3% 40 4% 70 2% 30 4%40% and higher 20 1% 10 1% 20 1% 10 1%
Total 3340 100% 910 100% 3340 100% 910 100%
Notes: a) 1996 households and April 2000 rents.b) Totals may not sum because of rounding.c) The affordability ratio is defined as (gross rent – HB) / net income before housing costs.d) A 0% affordability ratio implies a household’s rent is met fully by HB.

Archive
d
Annex C
37
Table 8C: AFFORDABILITY ANALYSIS – HEAD OF HOUSEHOLD AGED UNDER 60,
COUPLE WITH DEPENDENT CHILDREN
Count and percentage of households by affordability ratio.
NB. A lower ratio indicates a more affordable rent.
Unrestructured rents Restructuring approach
Affordability LA RSL LA RSLratio ’000 % ’000 % ’000 % ’000 %
0% 200 36% 50 36% 210 38% 50 36%
Over 0% up to 5% 10 1% * 0% 10 1% * 0%5% to 10% 70 13% 10 8% 40 8% 10 9%
10% to 15% 160 29% 30 18% 180 32% 20 13%15% to 20% 80 15% 30 21% 90 17% 30 23%
20% to 25% 20 4% 20 12% 20 4% 20 17%25% to 30% 10 3% 10 5% * 1% * 2%
30% to 40% * 0% * 0% * 0% * 0%40% and higher * 0% * 0% * 0% * 0%
Total 560 100% 140 100% 560 100% 140 100%
Notes: a) 1996 households and April 2000 rents.b) *signifies less than 5,000 households. 0% signifies less than 0.5%.c) Totals may not sum because of rounding.d) The affordability ratio is defined as (gross rent – HB) / net income before housing costs.e) A 0% affordability ratio implies a household’s rent is met fully by HB.

Archive
d
Guide to Social Rent Reforms
38
Table 8D: AFFORDABILITY ANALYSIS – HEAD OF HOUSEHOLD AGED UNDER 60,
LONE PARENT
Count and percentage of households by affordability ratio.
NB. A lower ratio indicates a more affordable rent.
Unrestructured rents Restructuring approach
Affordability LA RSL LA RSLratio ’000 % ’000 % ’000 % ’000 %
0% 410 87% 130 87% 420 88% 130 88%
Over 0% up to 5% 10 3% * 0% 10 2% * 0%5% to 10% * 1% * 1% * 1% * 0%
10% to 15% 10 3% 10 3% 10 2% * 1%15% to 20% 10 3% * 3% 20 4% 10 5%
20% to 25% 10 3% 10 3% 10 2% 10 4%25% to 30% 10 1% * 2% * 0% * 1%
30% to 40% * 0% * 0% * 0% * 1%40% and higher * 0% * 1% * 0% * 0%
Total 470 100% 150 100% 470 100% 150 100%
Notes: a) 1996 households and April 2000 rents.b) *signifies less than 5,000 households. 0% signifies less than 0.5%.c) Totals may not sum because of rounding.d) The affordability ratio is defined as (gross rent – HB)/net income before housing costs.e) A 0% affordability ratio implies a household’s rent is met fully by HB.

Archive
d
Annex C
39
Table 8E: AFFORDABILITY ANALYSIS – HEAD OF HOUSEHOLD AGED UNDER 60,
NO DEPENDENT CHILDREN
Count and percentage of households by affordability ratio.
NB. A lower ratio indicates a more affordable rent.
Unrestructured rents Restructuring approach
Affordability LA RSL LA RSLratio ’000 % ’000 % ’000 % ’000 %
0% 410 49% 110 51% 410 49% 110 50%
Over 0% up to 5% 10 1% * 1% * 1% * 1%5% to 10% 50 6% 20 7% 60 7% 10 7%
10% to 15% 110 13% 30 12% 110 13% 20 8%15% to 20% 80 10% 20 9% 70 9% 30 13%
20% to 25% 80 9% 20 8% 70 9% 10 6%25% to 30% 50 6% 10 5% 50 6% 10 6%
30% to 40% 50 6% 10 6% 40 5% 20 9%40% and higher * 0% * 1% * 1% * 1%
Total 840 100% 220 100% 840 100% 220 100%
Notes: a) 1996 households and April 2000 rents.b) *signifies less than 5,000 households. 0% signifies less than 0.5%.c) Totals may not sum because of rounding.d) The affordability ratio is defined as (gross rent – HB)/net income before housing costs.e) A 0% affordability ratio implies a household’s rent is met fully by HB.

Archive
d
Guide to Social Rent Reforms
40
ANNEX D:
Details of ModellingD1 The tables in Annex C illustrate the impacts of the restructuring approach on landlords
and tenants. They are based on modelling using the 1996 English House Condition Survey(EHCS) database. This section provides further details of the analysis.
Details of the analysisD2 A distinction between gross rents and net rents is made. Gross rent is the rent charged by
the landlord, whereas net rent is the rent paid by the tenant after the receipt of anyHousing Benefit. Therefore, the tables detailing the changes in gross rents give the likelyimpact on landlords, while the tables detailing net rents give the likely net impact ontenants.
D3 As the analysis is looking purely at the effects of restructuring, setting convergence aside,the results are presented separately for the local authority and RSL sectors. Hence, theanalysis keeps the national average LA and RSL rents fixed at the estimated April 2000levels of £45.60 per week and £53.50 per week respectively. Therefore, there is no changein the total rental income in either sector, just a change in how that total income iscollected.
D4 In reality, rent restructuring will take place over a ten-year period, between 2002/03 and2011/12, in conjunction with measures to achieve convergence. Combining the effects ofrestructuring with the effects of inflation and convergence means that the rents at the endof the ten-year period will differ significantly from those presented in the analysis.However, the analysis should give a reasonable indication of the specific effects of rentrestructuring, allowing its implications to be seen more clearly than if an attempt had beenmade also to incorporate convergence and inflation.
The English House Condition SurveyD5 The 1996 EHCS was used to simulate the effects of the restructuring approach on the gross
rents of social properties and the net rents paid by social tenants. The sample containsaround 6,000 social properties and is designed to be statistically representative at thenational and regional levels.
D6 The EHCS is currently carried out every five years by the DETR and looks at thecharacteristics and occupants of the dwellings sampled. The advantage of using it formodelling the restructuring approach is that it provides detailed information onhouseholds, including their income, and dwellings, including their property value.
D7 The survey collects detailed income information from the head of the household and anypartner, identifying each amount separately. This enables the general modelling of people’sentitlement to various benefits, such as Housing Benefit, as well as providing the ability toupdate the calculation of these benefits since the time of the survey.

Archive
d
Annex D
41
D8 The property value information for both local authority and RSL dwellings was obtainedin January 1999 by a national firm of locally-based valuers. The valuers estimated thevacant possession value of each of the sampled properties. This value assumed continuedresidential use, but was not adjusted to reflect the occupation by a secure tenant. So it wasbased on Existing Use Value for housing.
D9 As social properties are not sold on the open market as often as private properties,evidence on which to base valuations is less abundant. Valuation evidence was typicallyobtained from initial Right To Buy (RTB) sales, RTB re-sales and valuations for RTBpurposes. For most properties in the sample this provided an adequate number ofcomparable properties from which a value could be ascertained.
D10 However, there were areas where the comparable evidence was more limited. The valuersovercame this problem by adopting an investment approach to the valuations, and, veryoccasionally, by using private house sales as a source of evidence. The resulting values wereconsidered by the valuers to be accurate market values.
Modelling approachD11 To model the restructuring approach and its effects it was necessary to:
• update to April 2000 each of the gross rents recorded in the 1996 EHCS;
• update to April 2000 the incomes (which include earnings, pensions and benefitsreceived) recorded in the 1996 EHCS; and
• calculate entitlements to Housing Benefit at April 2000 in the context of the updatedrents and incomes, and taking account of changes since 1996 in the tax and benefitrules, including the Working Families Tax Credit.
D12 Carrying out these three tasks allowed the gross rents and net rents resulting from theapproach to be modelled at April 2000 levels. These were then compared to theunrestructured distribution of gross and net rents at April 2000 levels to give an indicationof the likely effects of restructuring on landlords and tenants.
D13 It should be noted that the results derived from these simulations are indicative only. Theyare inevitably subject to some statistical error, both in the modelling and sampling. Alsothey do not take into account the discretion which landlords will, in practice, have overimplementation. Nevertheless, the analysis is intended to provide a reasonable illustrationof the main effects of the restructuring approach on landlords and tenants.