Foreign Trade and Economic Reforms in South Asia
34
European Journal of Business and Management www.iiste.org ISSN 2222-1905 (Paper) ISSN 2222-2839 (Online) Vol 7, No.4, 2015 Foreign Trade and Economic Reforms in South Asia Mohammad Imran HOSSAIN 1* 1. Graduate School of Asia Pacific Studies, Ritsumeikan Asia Pacific University, 1-1 Jumonjibaru, Beppu, Oita, Japan * E-mail of the corresponding author: [email protected] Abstract As the world economy has undergone through various changes so as the countries of South Asia (SA). After following growth retarding policies for a long period of time individual countries in the region have adopted various reform measures to encourage foreign trade. This paper examines various aspects of foreign trade in major South Asian countries namely Bangladesh, India, Pakistan and Sri Lanka. Basic trends of export and import in these countries are analyzed using recent data. A panel random effect estimation is conducted using a data set ranging from 1991 to 2012 to measure the impact of conomic liberalization reforms on foreign trade of SA. The empirical results of this study suggest positive and significant association between various liberalization refomrs and trade development for the countries. This study advances that most of the countries in SA need to broaden their export markets to reap maximum benefit from various refomr initiatives. Keywords: foreign trade, economic liberalization reforms, South Asia and panel random effect model Introduction The economies of South Asia (SA) are growing faster than most other developing countries with an annual average growth rate of 7 percent or more since the early 2000s. But still the region is featured as one of the poorest in the world because about 40 percent of world’s poor are living here with more than a quarter of the region’s total population earn less than $1 a day. UNCTAD (2008) reported that the share of SA in 1 | Page www.iiste.org
-
Upload
ritsumeikan-apu -
Category
Documents
-
view
1 -
download
0
Transcript of Foreign Trade and Economic Reforms in South Asia

European Journal of Business and Management www.iiste.org
ISSN 2222-1905 (Paper) ISSN 2222-2839 (Online)Vol 7, No.4, 2015
Foreign Trade and Economic Reforms in SouthAsia
Mohammad Imran HOSSAIN1*
1. Graduate School of Asia Pacific Studies, Ritsumeikan Asia PacificUniversity, 1-1 Jumonjibaru, Beppu, Oita, Japan
* E-mail of the corresponding author: [email protected]
AbstractAs the world economy has undergone through various changes so as thecountries of South Asia (SA). After following growth retarding policiesfor a long period of time individual countries in the region haveadopted various reform measures to encourage foreign trade. This paperexamines various aspects of foreign trade in major South Asian countriesnamely Bangladesh, India, Pakistan and Sri Lanka. Basic trends of exportand import in these countries are analyzed using recent data. A panelrandom effect estimation is conducted using a data set ranging from 1991to 2012 to measure the impact of conomic liberalization reforms onforeign trade of SA. The empirical results of this study suggestpositive and significant association between various liberalizationrefomrs and trade development for the countries. This study advancesthat most of the countries in SA need to broaden their export markets toreap maximum benefit from various refomr initiatives. Keywords: foreign trade, economic liberalization reforms, South Asia andpanel random effect model
IntroductionThe economies of South Asia (SA) are growing faster than most otherdeveloping countries with an annual average growth rate of 7 percent ormore since the early 2000s. But still the region is featured as one ofthe poorest in the world because about 40 percent of world’s poor areliving here with more than a quarter of the region’s total populationearn less than $1 a day. UNCTAD (2008) reported that the share of SA in
1 | P a g ewww.iiste.org

European Journal of Business and Management www.iiste.org
ISSN 2222-1905 (Paper) ISSN 2222-2839 (Online)Vol 7, No.4, 2015
global total income is only a mere 3 percent while it is a home to 25percent of the total world population. SA has a negligible share intotal world’s exports too. In 2007, SA accounted for only 1.9 percent intotal exports of the world where that of East Asia was 15.8 percent.Hence, data shows that much works need to done in order to explore theuntapped trade opportunities of the region (ADB 2009). After suffereing from long lasting economic stagnation until the end of1980s, individual SA countries started to embrace new growth-stimulatingpolicy reforms through gradual opening up of their economies to theworld. Following the already advanced East Asian example, thesecountries have adopted an export-led growth model that focuses onselling various final goods in the overseas markets especially in the USand Europe. Through these initiatives, they have been trying to bringdynamism to their economies. After a long period of struggling witheconomic stagnation, these countries got an access to large markets ofthe developed world and very recently started to exploit their economiesof scale. Furthermore, now-a-days liberalizaton of trade started toboost growth of the productive sectors of the countries in SA.The purpose of this paper is to trace the trends and patterns ofinternational trade in four South Asian countries namely Bangladesh,India, Pakistan and Sri Lanka. The impact of major economicliberalization reforms on foreign trade (i.e. export and import) willalso be analyzed at the end. In this paper, a panel data estimation isconducted in the empirical analysis of impact of economic reforms onforeign trade in SA. The paper is organized as it follows: in the firstpart, basic trends and patterns of foreign trade for Bangladesh, India,Pakistan and Sri Lanka will be discussed. In the second section,economic liberalization reforms and their impact on foreign trade of theabove South Asian nations plus Nepal will be examined using panel dataestimation by the random effect technique. The final section concludesthe paper.
Foreign Trade of BangladeshSince the last decade Bangladesh has achieved substantial progress inits external sector. Major trade partners of the country for export areUSA, UK, Germany, Belgium, Italy, Netherlands, Canada and Japan. Now-a-
2 | P a g ewww.iiste.org

European Journal of Business and Management www.iiste.org
ISSN 2222-1905 (Paper) ISSN 2222-2839 (Online)Vol 7, No.4, 2015
days the country export mainly woven garments, knitewar, leather andleather goods, frozen foods and chemical products etc. In the past, juteand products made from jute were the main export items but the traditionhas been changed. Now the major share of export income comes fromselling of ready-made garments (RMG). On the other side, Bangladeshimports mainly primary commodities such as rice, wheat, raw jute, crudepetroleum etc, intermediate goods like petroleum, fertilizer, edibleoil, clinker etc. and capital machinery. Export earnings performance ofsome of the major sectors including woven-RMG, knit-RMG, frozen foods,and leather goods have been significantly better during the last twodecades. Table 1: Bangladesh Exports to Major Countries (1972-73 to 2011-12, in
million US$) FY U.S.A U.K German
yFrance Belgi
umItaly Nethe
rlands
Canada
Japan Others Total
1972-73
71.39 26.55 10.54 8.74 22.99 14.36 8.14 7.03 6.70 171.98 348.42
1973-74
60.04 25.16 5.14 8.05 15.83 11.05 8.90 6.29 14.25 217.05 371.76
1974-75
56.91 23.55 7.10 4.84 11.63 12.40 9.06 6.27 5.74 245.18 382.68
1975-76
61.92 29.48 7.37 8.89 17.25 23.24 8.16 6.08 9.22 208.86 380.47
1976-77
53.44 40.69 9.31 9.42 15.98 23.60 9.03 6.30 10.65 238.59 417.01
1977-78
64.92 40.98 8.54 6.22 15.95 18.58 8.97 5.84 15.13 308.61 493.74
1978-79
83.22 45.71 13.82 6.10 18.46 43.41 9.64 6.65 33.25 358.56 618.82
1979-80
87.51 48.80 16.35 7.65 26.02 31.59 15.35 9.04 34.27 472.86 749.44
1980-81
83.52 24.75 9.65 5.43 14.30 27.36 11.42 6.06 19.34 508.02 709.85
1981-82
50.43 28.36 1.22 7.26 15.89 31.40 13.30 3.66 27.64 446.73 625.89
3 | P a g ewww.iiste.org

European Journal of Business and Management www.iiste.org
ISSN 2222-1905 (Paper) ISSN 2222-2839 (Online)Vol 7, No.4, 2015
1982-83
78.86 30.96 13.75 7.26 30.29 32.14 12.79 6.68 45.01 428.86 686.60
1983-84
111.14
42.62 13.30 10.93 47.02 69.13 16.96 7.37 43.14 449.38 810.99
1984-85
165.97
43.75 18.15 11.56 72.66 51.79 16.45 12.05 65.27 476.78 934.43
1985-86
173.22
46.13 21.44 6.96 34.39 36.28 15.41 15.08 61.18 409.12 819.21
1986-87
321.43
59.99 37.67 10.01 41.87 99.67 21.83 16.33 66.30 398.67 1073.77
1987-88
356.46
73.03 61.40 26.53 42.06 115.95
27.42 24.21 57.09 446.85 1231.20
1988-89
346.08
75.70 69.85 35.04 53.17 105.67
29.17 16.66 55.02 505.2 1291.56
1989-90
444.58
97.14 83.56 62.37 62.64 131.37
38.12 22.24 55.60 526.09 1523.71
1990-91
507.29
136.90
164.91 86.40 83.55 115.94
61.86 30.25 41.26 489.19 1717.55
1991-92
673.81
130.40
180.34 116.10 82.08 147.29
81.33 27.64 40.60 514.33 1993.92
1992-93
822.51
183.42
216.21 127.36 83.14 137.40
85.80 44.38 53.31 629.36 2382.89
1993-94
734.82
259.26
275.21 157.72 98.41 170.61
104.90
57.23 61.02 614.72 2533.90
1994-95
1184.28
318.31
300.26 192.93 128.58
211.26
136.66
69.38 99.65 831.26 3472.57
1995-96
1197.54
417.70
369.18 272.88 186.93
207.10
183.22
69.09 120.80
857.98 3882.42
1996-97
1432.15
437.69
428.29 312.65 210.57
203.62
208.59
69.12 114.05
1001.55
4418.28
1997-98
1929.21
440.00
510.93 369.07 210.07
270.47
236.08
106.84
112.00
976.53 5161.20
1998-99
1968.46
491.34
625.13 345.36 227.62
270.01
251.61
104.91
92.76 935.66 5312.86
1999-2k
2273.76
499.99
658.71 367.37 225.89
248.28
282.77
110.63
97.64 987.16 5752.20
2000- 2500. 594.1 789.88 365.99 253.9 295.7 327.9 125.6 107.5 1105.9 6467.3
4 | P a g ewww.iiste.org

European Journal of Business and Management www.iiste.org
ISSN 2222-1905 (Paper) ISSN 2222-2839 (Online)Vol 7, No.4, 2015
01 42 8 1 3 6 6 8 9 02001-02
2218.79
647.96
681.44 413.69 211.39
262.31
283.36
109.85
96.13 1061.17
5986.09
2002-03
2155.45
778.25
820.72 418.51 289.48
258.99
277.95
170.26
108.03
1270.8 6548.44
2003-04
1971.59
898.65
1298.57
553.50 326.71
316.28
290.47
284.69
118.33
1544.20
7602.99
2004-05
2418.67
1351.06
944.18 625.51 327.80
369.78
290.92
335.25
122.53
1868.82
8654.52
2005-06
3039.77
1053.74
1763.38
678.94 359.33
427.89
327.20
406.97
138.45
2330.49
10526.16
2006-07
3453.52
1176.63
1956.77
731.88 435.75
516.17
459.25
458.14
147.94
2841.81
12177.86
2007-08
3590.56
1374.03
2174.74
953.13 488.39
579.23
653.88
564.43
172.56
3591.31
14110.80
2008-09
4052.00
1501.20
2269.70
1031.05
409.80
651.51
970.80
663.20
202.60
3849.33
15565.19
2009-10
3950.47
1508.54
2187.35
1025.88
390.54
623.92
1016.9
666.83
330.56
4503.68
16204.65
2010-11
5107.52
2065.38
3438.70
1537.98
666.24
866.42
1107.1
944.67
434.12
6760.06
22928.22
2011-12
5100.91
2888.57
3688.98
1380.37
741.96
977.41
691.30
993.67
600.53
7667.96
24287.66
Source: Bangladesh Economic Review, Bangladesh Ministry of Finance(2012)
Bangladesh's external sectors have experienced robust growth in recentyears, thanks to the Export Policy of 1997-2002, which has been designedin order to maximize export growth and narrow down the gap betweenimport payments and export earnings. However, during the later part of1990s the export-oriented industry was featured by some fluctuatingfortunes. Growth rates in FY1997 and FY1998 were a robust 13.8 percentand 16.8 percent, only to subsequently come down to 2.9 percent inFY1999. In FY2000 export sector was able to make some rebound and posteda growth record of 8.3 percent. The rate was 12.43 percent in thecorresponding next year. During the FY2001-02 the sector was shaken bysome domestic political turmoil to be recorded for a growth rate as low
5 | P a g ewww.iiste.org

European Journal of Business and Management www.iiste.org
ISSN 2222-1905 (Paper) ISSN 2222-2839 (Online)Vol 7, No.4, 2015
as -7.44 percent. After that export growth in Bangladesh was seen to becontinuously positive and a double digit growth rate was postedthereafter until FY2010-11 except FY2009-10.On the other hand, import composition of the Bangladesh economy showsthat the import share of ‘Principal Primary Commodities’ showed adeclining trend in the later half of 1990s but started to rise again inrecent years. The next table shows commodity-wise imports in Bangladesh.The combined shares of ‘Major Industrial Goods and Capital Goods’reported a continuous increase during the same period. The importpayment for Principal Primary Commodities in FY1998-99 was US$ 1448million representing 18.06 percent of total import. These figuresdecreased to US$ 980 million and US$ 1098 million (11.66 percent and11.73 percent) in FY 1999-2000 and FY2000-01 respectively (Rahman andYusuf, 2010 ). However, since FY2002-03 and after that an overallincreasing trend was observed in the nation’s import sector. In thecategory of Major Intermediate Goods, import has been increasingcontinuously from US$ 1037 million (12.95 percent of total imports) inFY1998-99 to US$ 5035 million (22.37 percent of total) in FY2008-09 andUS$ 4957 million (20.88 percent) in FY2009-10. Import of CapitalMachinery also was in the rising trend. Bangladesh imports a largevolume of other goods in addition to the above three mentionedcategories and the category of ‘Other Goods’ comprises around slightlymore than 50 percent of total imports of the country. For an instance,in FY2010-11, it was reported that total payment for Other Goods was US$6427 million out of US$ 9335 million of total imports (GOB 2008).
Table 2: Bangladesh’s Value of Imports by Major Commodities (In MillionUS$)
Commodity 2001-02
2002-03
2003-04
2004-05
2005-06
2006-07
2007-08
2008-09
2009-10
2010-11
2011-12
a) Major PrimaryGoods
Rice Wheat
Oilseeds Crude
8121517172242
113321119864267
133914428773252
167626231286350
185411730190604
2069180401106524
3455874537136695
2916239643159584
294075761130535
56268301081103923
4148288613177987
6 | P a g ewww.iiste.org

European Journal of Business and Management www.iiste.org
ISSN 2222-1905 (Paper) ISSN 2222-2839 (Online)Vol 7, No.4, 2015
petroleum Raw cotton
b) MajorIntermediate Goods Edible oil Petroleum
products Fertilizer Clinker Staplefiber Yarnc) CapitalMachinery
d) Other Goods
3121311251481107150392835545863
3931548364620109144412705486429
5831910471770150139573237296925
666266244012523321707539311157694
742300147314003422107650114588434
858356958317093572409758219299590
1213484410062058632347110691166411666
129150358651997955314112792142013136
1439495710502021717333118718159514246
268975111067318612414461801391232518196
208392631644392213815044281384200520100
Total Imports(a+b+c+d)
8540 9658 10903 13147 14746 17157 21629 22507 23738 33658 35516
Annual Change (%) -8.5 13.1 12.9 20.6 12.2 16.4 26.1 4.1 5.5 41.8 5.5Source: BD Economic Review, Government of Bangladesh (2012)
Major import sources of Bangladesh are India, China, Singapore, Japan,Hong Kong, Malaysia, Taiwan, South Korea and the United States ofAmerica. According to the data presented in next table, India and Chinaare two largest sources for imports of Bangladesh. In 2012, these twocountries together accounted for about 30% of total imports. China as asingle largest exporter to Bangladesh sold US$ 6455 million worth ofproducts. India, on the other hand, has exported US$ 4755 million toBangladesh in 2012. The next table summarizes country-wise imports ofBangladesh since FY1989-90.
Table 3: Bangladesh’s Country-wise Imports (In Million US$)FY Indi
aChina
Singap-ore
Japan HongKong
Taiwan
S.Korea
USA Malaysia
Others Total
7 | P a g ewww.iiste.org

European Journal of Business and Management www.iiste.org
ISSN 2222-1905 (Paper) ISSN 2222-2839 (Online)Vol 7, No.4, 2015
1989-90
145 132 323 475 157 - 126 208 41 2152 3759
1990-91
181 133 334 336 184 - 165 181 32 1964 3510
1991-92
231 149 275 286 247 - 181 230 42 1885 3526
1992-93
342 248 211 365 299 - 258 207 53 2088 4071
1993-94
414 223 200 498 331 - 284 202 57 1982 4191
1994-95
689 420 275 587 399 118 340 274 41 2691 5834
1995-96
1100 707 343 695 390 216 366 330 69 2715 6931
1996-97
922 575 297 647 409 300 360 302 197 3143 7152
1997-98
934 593 321 483 443 353 381 311 172 3529 7520
1998-99
1235 560 553 494 452 361 287 301 131 3632 8006
1999-2K
833 568 701 685 455 386 319 325 108 3994 8374
2000-01
1184 709 824 846 478 412 411 248 148 4075 9335
2001-02
1019 878 871 655 441 312 346 261 145 3612 8540
2002-03
1358 938 1000 605 433 328 333 223 169 4271 9658
2003-04
1602 1198 911 552 433 377 420 226 255 4929 10903
2004-05
2030 1642 888 559 565 439 426 329 276 5993 13147
2005- 1868 2079 849 651 625 473 489 345 332 7064 14746
8 | P a g ewww.iiste.org

European Journal of Business and Management www.iiste.org
ISSN 2222-1905 (Paper) ISSN 2222-2839 (Online)Vol 7, No.4, 2015
062006-07
2268 2571 1035 690 747 473 553 380 334 8106 17157
2007-08
3393 3137 1273 832 821 477 621 490 451 10134 21629
2008-09
2868 3452 1768 1015 851 498 864 461 703 10031 22507
2009-10
3214 3819 1550 1046 788 542 839 469 1232 10239 23738
2010-11
4569 5918 1294 1308 777 731 1124 677 1760 15500 33658
2011-12
4755 6455 1711 1456 704 739 1551 710 1407 15974 35516
Source: BD Economic Review, Government of Bangladesh (2012)
Foreign Trade of India
As indicated in the next table below during 1950s through 1970s, Indiahad on an average a small share of GDP from foreign trade. Both exportearnings and import expenses were comparatively smaller in amount. Sincethe 1980s, foreign trade has been increasing because of a series ofreform measures in the economy. In 1980-81, exports of India wereUS$8486 while imports were 15869 indicating a large trade deficit. Laterboth exports and imports had increased but increase in exports washigher than that of imports. In 1990-91, India’s exports and importswere recorded as US$18143 million and US$24075 million respectively.Till 2011-12, India never had a trade surplus and the country’s exportsand imports were counted as US$44076 million and US$49975 million in2000-01, US$185295 million and US$303696 million in 2008-09, US$178751million and US$288373 million in 2009-10, US$251136 million andUS$369769 million in 2010-11 and US$304624 million and US$489181 millionin 2011-12 fiscal years.
Table 4: Export and Import Composition of India Since FY1950-51(inmillion US dollar)
9 | P a g ewww.iiste.org

European Journal of Business and Management www.iiste.org
ISSN 2222-1905 (Paper) ISSN 2222-2839 (Online)Vol 7, No.4, 2015
1950-51
1960-61
1970-71
1980-81
1990-91
2000-01
2008-09 2009-10 2010-11
2011-12
Exports
1,269 1,346 2,031 8,486 18,143 44,076
185,295 178,751 251,136
304,624
Imports
1,273 2,353 2,162 15,869 24,075 49,975
303,696 288,373 369,769
489,181
Source: Economic Survey 2012-13 by the Planning Comission, GOI
India’s major export destinations are the United Arab Emirates (UAE),USA, China, Hong Kong, Singapore, Netherland, UK, Germany, Belgium,Indonesia, France, Japan, Saudi Arabia, Italy, Brazil, South Africa,Malaysia, South Korea, Sri Lanka and Bangladesh. India exports mostlyengineering goods, petroleum products, gems and jewelry, RMG of alltextiles, drug/pharmaceutics and fine chemls, other basic chemicals,electronic goods, cotton yarn/made-up handloom products, iron ore,plastic and linoleum and a number of other goods like tea, coffee,leather and leather manufactures etc.On the other hand, India imports mainly petroleum, crude & relatedproducts, gold & silver, pearls, precious & semi-precious stones,machinery, electrical & non-electrical, electronic goods, organic &inorganic chemicals, transport equipment, iron & steel, coal, coke &briquettes, metaliferrous ores & metal scrap, and a number of othergoods. Major trading partners for imports are China, UAE, Switzerland,Saudi Arab, USA, Germany, Iran, Australia, Nigeria, South Korea, Kuwait,Indonesia, Hong Kong, Iraq, Japan, Belgium, Singapore, South Africa,Qatar, and Malaysia. The next figures show country-wise and commodity-wise exports and imports of India.
Figure 1: India’s Export and Import by countries (Value in Rs. Crores)
10 | P a g ewww.iiste.org

European Journal of Business and Management www.iiste.org
ISSN 2222-1905 (Paper) ISSN 2222-2839 (Online)Vol 7, No.4, 2015
Source: Panning Comission, GOI (2013)
Figure 2: Share of Major Export and Import Commodities in 2010-11(percent of total values)
Source: Panning Comission, GOI (2013)
India’s exports and imports as a percentage of GDP have been rising yearafter year since independence. The following figure indicates data ofshares in GDP since 1990. The graph shows that in 1990, exports as ashare of GDP was only 7 percent and that of imports was also as low as 8percent. In the ending year of 2012, the same shares were 24 percent and32 percent respectively. Growth of exports and imports in a year on yearbasis also shifted since 1990. According to the following data, India’sgrowth rates in shares of exports and imports were 11 percent and 3percent respectively in 1990. However, in 2012 the growth rates wererecorded as 3 percent and 7 percent. These rates have been fluctuating alot in the said period. The highest growth rate of export earnings wasseen in 1995 while the lowest was -2 percent in 1997 and -5 percent2009. On the other hand, highest growth rate in import expenses wasposted as 33 percentage points in 2005 while the lowest figure wascounted as negative 2 percentage points in both the years of 1996 and2009. The following figure explains the phenomena.
11 | P a g ewww.iiste.org

European Journal of Business and Management www.iiste.org
ISSN 2222-1905 (Paper) ISSN 2222-2839 (Online)Vol 7, No.4, 2015
Figure 3: Exports and Imports as a share of GDP in India Since 1990Source: World Development Indicators, World Bank (2013)
Foreign Trade of PakistanPakistan’s foreign trade has played a crucial role in its economicdevelopment. The nation is a member of the World Trade Organization(WTO) and it maintains various bilateral and multilateral agreements oftrade (such as the South Asian Free Trade Area, SAFTA and the China-Pakistan Free Trade Agreement etc.) with many countries andinternational organizations. In the next sections foreign trade ofPakistan is described briefly. Total exports and imports of Pakistan inmillion US$ are presented in the table below.
Table 5: Exports and Imports of Pakistan (Value in Million US$)FY Exports Imports1985-86 3070 56341986-87 3686 53801987-88 4455 63911988-89 4661 70341989-90 4954 69351990-91 6131 76191991-92 6904 92521992-93 6813 99411993-94 6803 85641994-95 8137 10394
12 | P a g ewww.iiste.org

European Journal of Business and Management www.iiste.org
ISSN 2222-1905 (Paper) ISSN 2222-2839 (Online)Vol 7, No.4, 2015
1995-96 8707 118051996-97 8320 118941997-98 8628 101181998-99 7779 94321999-2000 8569 103092000-01 9202 107292001-02 9135 103402002-03 11160 122202003-04 12313 155922004-05 14391 205982005-06 16451 285812006-07 16976 305402007-08 19052 399662008-09 17688 348222009-10 19290 347102010-11 24810 404142011-12 23624 449122012-13 24460 44950
Source: Federal Bureau of Statistics, Pakistan
In the following table exports of Pakistan by various economic categoieshave been presented. Although Pakistan’s exports continue to bedominated by cotton textiles and apparel only, its export earnngsincreased greatly. The country exports mainly rice, mangoes, furniture,cotton fiber, cement, tiles, marble, textiles, clothing, leather goods,sports goods, cutlery, surgical instruments, electrical appliances,software, carpets, rugs, ice cream, livestock meat, chicken, powderedmilk, wheat, seafood, vegetables, processed food items, Pakistani-assembled Suzuki, defense equipment, salt and various engineering goods.
Table 6: Pakistan’s Exports by Economic Categories (In Million PakistaniRupees)
13 | P a g ewww.iiste.org

European Journal of Business and Management www.iiste.org
ISSN 2222-1905 (Paper) ISSN 2222-2839 (Online)Vol 7, No.4, 2015
Year Month Total PrimaryCommodities
Semi-manufactured
goods
Manufacturedgoods
2008-09 1383717.5 224873.2 130693.0 1028151.42009-10 1617457.6 287490.6 170608.5 1159358.52010-11 2120846.7 377535.8 274500.4 1468810.52011-12 2110605.5 362404.4 261831.4 1486369.72012-13 2366477.8 364127.0 391151.3 1611199.5
2012Oct.
192115.2 26123.0 27054.2 138938.0
Nov.
181960.3 25040.7 32153.6 124766.0
Dec.
191390.7 31467.3 32814.0 127109.4
2013Jan.
197186.6 43247.3 28670.4 125268.9
Feb.
179747.0 34191.4 29574.3 115981.3
Mar.
209240.8 39834.7 39414.0 129992.1
Apr.
209142.2 35727.3 40321.9 133093.0
May.
210829.2 31596.2 38581.9 140651.1
Jun.
214326.5 29186.0 38006.7 147133.8
Jul.
210465.3 29584.3 35086.5 145794.6
Aug.
204136.9 25828.4 31334.8 146973.7
Sep.
275482.9 33398.8 34272.0 207812.1
14 | P a g ewww.iiste.org

European Journal of Business and Management www.iiste.org
ISSN 2222-1905 (Paper) ISSN 2222-2839 (Online)Vol 7, No.4, 2015
Oct*
197939.6 27225.9 29689.6 141024.1
Source: Federal Bureau of Statistics, Government of Pakistan
Export in Pakistan was recorded at an average of 31461.80 millionPakistani Rupees (PKR) for the period from 1957 until 2014. In this spanof time, the maximum was reported as 275917 million PKR in September of2013 and the lowest figure was estimated as 51 million PKR in April of1958 (Pakistan Bureau of Statistics, 2014). Pakistan’s main exportpartners are United States, United Arab Emirates, Afghanistan, China,United Kingdom and Germany. On the other hand, from 1957 until 2014import value of Pakistan has reached to an average of 51989.67 millionPKR. The highest import expense was recorded at 435995 million PKR inJanuary of 2014 and the lowest figure was found to be 96 million PKR inApril of 1959. The country imports mainly fuel, machinery and transportequipment, chemicals, food and oils and manufactured goods. Theprincipal import partners are United Arab Emirates, China, Saudi Arabia,Kuwait, Japan, USA, India, UK and Malaysia. Others countries include:Malaysia, Japan, India and United States. In the next table imports ofPakistan by various economic categories are shown. The figures explaincountry-wise export and import shares of Pakistan.
Table 7: Pakistan’s Imports by Economic Categories (In Million Rupees)
Year Month TotalTotal
Consumergoods
Raw materialsCapitalgoodsConsumer
goodsCapitalgoods
2008-09 2723569.9
348657.1 133986.1 246599.8 790326.9
2009-10 2910975.3
380826.6 1509081.1 209051.4 812016.2
2010-11 3455285.6
560512.2 1826243.4 239525.0 829005.0
2011-12 4009093.0
543010.8 2292309.1 262211.7 911561.4
15 | P a g ewww.iiste.org

European Journal of Business and Management www.iiste.org
ISSN 2222-1905 (Paper) ISSN 2222-2839 (Online)Vol 7, No.4, 2015
2012-13 4349879.5
652553.3 2353818.1 293733.6 1049774.5
2012Oct.
361404.7 48490.8 197750.6 32819.3 82344.0
Nov.
346228.9 49175.3 183929.7 24034.2 89089.7
Dec.
356898.7 54619.8 189408.2 24323.2 88547.5
2013Jan.
366822.6 54515.4 206825.4 23898.2 81583.6
Feb.
331464.7 51978.8 169258.5 20454.5 89772.9
Mar.
361585.0 69119.3 189502.4 23227.1 79736.2
Apr.
384227.2 59178.0 197496.2 24694.0 102909.0
May 427530.9 65849.9 221666.5 27027.3 112987.2 Jun.
388358.4 62762.5 198998.4 24267.1 102330.4
Jul.
383244.9 53168.9 201953.0 26745.7 101377.3
Aug.
367645.0 61538.9 208163.2 24123.1 73819.8
Sep.
399041.6 64145.2 234234.5 21539.6 79122.3
Oct*
348471.0 57420.3 190642.1 22097.5 78311.1
Source: Federal Bureau of Statistics, Government of Pakistan
16 | P a g ewww.iiste.org

European Journal of Business and Management www.iiste.org
ISSN 2222-1905 (Paper) ISSN 2222-2839 (Online)Vol 7, No.4, 2015
Figure 4: Pakistan’s Exports by Country (Left graph) and Imports by
Country (Right graph) in percentage share Source: Federal Bureau of Statistics, Government of Pakistan
Foreign Trade of Sri LankaUnderstanding basic facts about Sri Lanka’s foreign trade requiresshading some lights on its balance of payments account. A comparisonwith the nineties, Sri Lanka got a decline in both exports and importsas a percent of GDP in the last decades. The shares were recorded at25.8 and 35.9 percent in the last decades while these were reported at27.7 and 37.7 percent respectively in the 1990s. The trade balance,however, was almost unchanged because of the quite similar magnitude ofthe declines. The trade balance was estimated at about -10.0 percent ofGDP both in the last decade and the nineties and Sri Lankan economyfollowed a double digit trade deficit for most of the years since 2004.Current account balance, however, improved from -4.8 percent of GDP inthe 1990s to -3.5 percent in the last decade, thanks to increased inflowof foreign remittances. The overall balance declined from 1.5 percent ofGDP in the nineties to 0.9 percent in the last decade. The total shareof exports and imports as a percent of GDP in the last decade also hasfallen down to 61.7 percent from 65.4 percent in the 1990s. In 1950, SriLanka’s total trade was about 70.6 percent of its GDP and it was 0.49percent of the world trade. This high ratio of trade to GDP indicatesthe high degree of openness of the trade regime that governed the sectorin the 1950s. However, in the face of a deteriorating terms of trade inthat period the nation started to implement and emphasize importsubstitution industrialization policies in the later part of 1950s.Hence, Sri Lanka followed an inward looking trade policy regime from1960 until 1977, except a tiny period of partial liberalization in the
17 | P a g ewww.iiste.org

European Journal of Business and Management www.iiste.org
ISSN 2222-1905 (Paper) ISSN 2222-2839 (Online)Vol 7, No.4, 2015
late 1960s. As a consequence of such policies, trade share declinedsharply to touch 37.7 percent of GDP in 1977. In the 1970s, the economyexperienced its lowest trade share in the history. Later on, economicpolicy reforms, which promoted export promotion industrializationstrategies, were started to implement in Sri Lanka from 1977. The figurebelow explains some aspects of balance of payments of Sri Lanka.
Figure 5: Sri Lanka’s Balance of Payments Account from 1950-2010 (% ofGDP)
Source: Source: Ministry of Industry and Commerce, Government of SriLanka
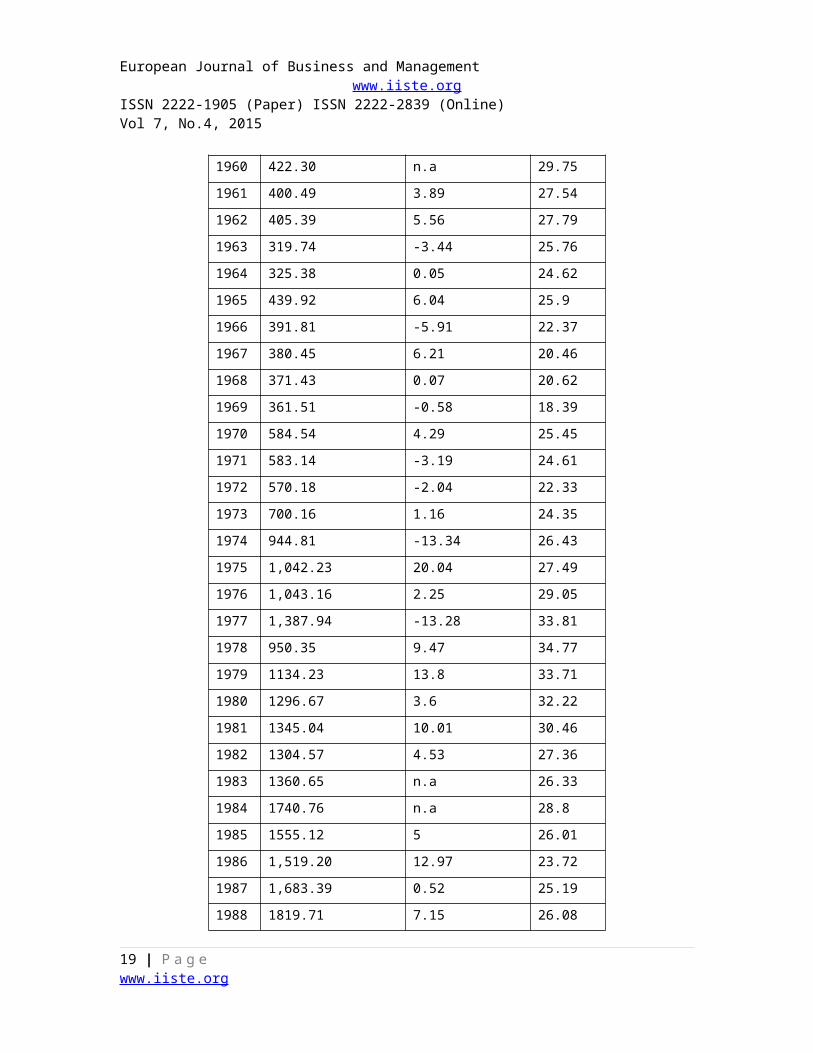
Sri Lanka’s export of goods and services since 1960 are shown in tablebelow. It is indicated that the nation’s export as a percentage of GDPhas been high since the last decades. Similarly, annual growth rateshows gradual increase except some years. In 1960s, the export share ofGDP was more than 20 percent for all years but the maximum was in 2000when the country recorded an export share of 39.02 percent of GDP. Thehighest annual growth rate of export was estimated in 1975 with a valueof 20.05 percent. Growth rate of export in Sri Lanka has beenfluctuating since 1960 until recenly. In its latest records, in 2011 thegrowth rate of export for goods and services was measured as 11 percentwhile the total amount of exports was 13643.53 million in current US$,which was about 23.06 percent of Sri Lanka’s GDP.
Table 8: Sri Lanka's Exports of Goods and Services
YearCurrent US $(million)
Annual growth(%)
% ofGDP
18 | P a g ewww.iiste.org
European Journal of Business and Management www.iiste.org
ISSN 2222-1905 (Paper) ISSN 2222-2839 (Online)Vol 7, No.4, 2015
1960 422.30 n.a 29.751961 400.49 3.89 27.541962 405.39 5.56 27.791963 319.74 -3.44 25.761964 325.38 0.05 24.621965 439.92 6.04 25.91966 391.81 -5.91 22.371967 380.45 6.21 20.461968 371.43 0.07 20.621969 361.51 -0.58 18.391970 584.54 4.29 25.451971 583.14 -3.19 24.611972 570.18 -2.04 22.331973 700.16 1.16 24.351974 944.81 -13.34 26.431975 1,042.23 20.04 27.491976 1,043.16 2.25 29.051977 1,387.94 -13.28 33.811978 950.35 9.47 34.771979 1134.23 13.8 33.711980 1296.67 3.6 32.221981 1345.04 10.01 30.461982 1304.57 4.53 27.361983 1360.65 n.a 26.331984 1740.76 n.a 28.81985 1555.12 5 26.011986 1,519.20 12.97 23.721987 1,683.39 0.52 25.191988 1819.71 7.15 26.08
19 | P a g ewww.iiste.org

European Journal of Business and Management www.iiste.org
ISSN 2222-1905 (Paper) ISSN 2222-2839 (Online)Vol 7, No.4, 2015
1989 1904.74 6.69 27.261990 2424.29 6.7 30.181991 2586.80 6.7 28.741992 3082.68 6.7 31.771993 3494.58 13.2 33.81994 3962.06 13.1 33.811995 4638.26 2.9 35.61996 4860.50 3.9 34.971997 5514.31 11.69 36.541998 5724.70 0.97 36.241999 5555.45 3.99 35.482000 6371.58 17.99 39.022001 5878.26 -5.27 37.332002 5971.10 6.26 34.912003 6543.19 3.36 34.652004 7300.26 7.74 35.332005 7892.07 6.65 32.342006 8516.55 3.84 30.132007 9419.05 7.33 29.122008 10114.27 0.39 24.842009 8972.41 -12.31 21.332010 11091.64 8.76 22.382011 13643.53 11 23.06
(Note: n.a is for no data available)Sources: World Bank national accounts data and OECD National Accounts
data files in Index Mundi Data downloaded fromhttp://www.indexmundi.com/facts/sri-lanka/imports-of-goods-and-services.
Sri Lanka’s imports of goods and services since 1960 are tabled below.Total import value, annual growth rate and import as a share of GDP areshown in different columns. Similar to export, import as a share of GDP
20 | P a g ewww.iiste.org

European Journal of Business and Management www.iiste.org
ISSN 2222-1905 (Paper) ISSN 2222-2839 (Online)Vol 7, No.4, 2015
in Sri Lanka is also high and the highest record of 49.62 percent wasseen in 2000. Annual growth of import has been fluctuating since the1960s. The latest value of import of goods and services in Sri Lanka wasestimated as 22,255.86 million USD in 2011 while the growth rate was 20percent and import as a share of GDP was 37.61 percent in the same year.
Table 9: Sri Lanka's Imports of Goods and Services
YearCurrent US $(million)
Annual growth(%)
% ofGDP
1960 464.03 n.a 32.691961 414.28 -9.88 28.491962 425.93 11.65 29.21963 341.29 -11.2 27.491964 353.22 0.43 26.721965 432.98 -2.26 25.491966 452.73 4.77 25.851967 433.33 -4.37 23.31968 424.87 11.01 23.591969 483.87 7.1 24.621970 656.81 -5.91 28.61971 630.52 -9.83 26.611972 610.39 -7.76 23.91973 735.00 -2.55 25.561974 1211.73 -2.39 33.91975 1325.39 -0.83 34.961976 1126.99 13.6 31.381977 1237.77 -5.69 30.161978 1080.85 36.92 39.551979 1539.44 18.95 45.751980 2205.45 19.25 54.81981 2054.96 -6.97 46.54
21 | P a g ewww.iiste.org

European Journal of Business and Management www.iiste.org
ISSN 2222-1905 (Paper) ISSN 2222-2839 (Online)Vol 7, No.4, 2015
1982 2205.91 14.65 46.261983 2141.14 n.a 41.431984 2099.73 n.a 34.741985 2269.74 -6.49 37.971986 2262.92 7.68 35.331987 2385.29 -0.27 35.71988 2570.61 -2 36.841989 2568.29 -2 36.761990 3057.44 7.9 38.061991 3497.08 7.9 38.851992 3981.47 7.9 41.031993 4481.46 14.5 43.351994 5345.33 14.2 45.621995 5998.54 1 46.041996 6101.19 2.8 43.91997 6580.00 10.47 43.61998 6673.56 11.49 42.251999 6774.15 7.01 43.272000 8103.47 14.89 49.622001 6860.23 -9.53 43.572002 7084.22 11.22 41.422003 7681.62 11.25 40.682004 9122.93 9.01 44.152005 10071.56 2.69 41.272006 11627.13 6.94 41.132007 12775.97 3.73 39.492008 15686.59 4.01 38.532009 11703.64 -9.59 27.822010 15209.67 12.65 30.68
22 | P a g ewww.iiste.org

European Journal of Business and Management www.iiste.org
ISSN 2222-1905 (Paper) ISSN 2222-2839 (Online)Vol 7, No.4, 2015
2011 22255.86 20 37.61(Note: n.a is for no data available)
Sources: World Bank national accounts data and OECD National Accountsdata files in Index Mundi Data downloaded from
http://www.indexmundi.com/facts/sri-lanka/imports-of-goods-and-services.
Sector-wise export of Sri Lanka from 2003 to 2010 are summarized below.The table indicates that industrial export builds the major part ofexports. Among industrial exports, ‘Food Beverage & Tobacco’ and‘Textiles & Garments’ are the two major components. Agricultural sectoris another good contributor of export in Sri Lanka. As it is indicatedin the data table ‘tea, rubber & coconut’ is the largest agricultureexport sub-sector in Sri Lanka. From the latest data available from thewebsite of Sri Lankan Ministry of Industry and Commerce, in 2010 totalexports of goods was estimated as US$ 8307.1 million of which industrialexports accounted for US$ 6172.8 million, mineral exports US$ 92.6million and agricultural exports US$ 2041.4 million.
Table 10: Sector-wise Exports (Goods) of Sri Lanka (In Million US$) 2003 2004 2005 2006 2007 2008 2009 2010
1. Industrial Exports3976.0
4506.1
4948.4
5383.4
5967.5
6159.6
5305.4
6172.8
1.1 FoodBeverage & Tobacco 145.0 175.1 318.2 363.9 513.5 458.3 406.1
503.4
1.2 Textiles & Garments
2575.0
2808.9
2894.5
3080.3
3339.6
3468.7
3274.2
3504.1
1.3 PetroleumProducts 65.0 99.6 130.9 187.2 168.9 254.8 134.7
216.3
1.4 RubberProducts 231.0 282.9 394.4 427.5 482.5 541.9 384.7
567.6
1.5 CeramicProducts 42.0 46.8 47.1 47.4 47.1 49.0 36.4 39.1 1.6 Leather,Travel
58.0 42.6 43.8 40.6 22.9 16.7 13.6 17.1
23 | P a g ewww.iiste.org

European Journal of Business and Management www.iiste.org
ISSN 2222-1905 (Paper) ISSN 2222-2839 (Online)Vol 7, No.4, 2015
Goods &Footwear 1.7 Machinery & Equipment 290.0 385.7 329.9 394.3 542.2 461.0 330.3
487.8
1.8 Diamond & Jewellery 233.0 265.3 277.9 327.0 367.2 436.1 329.8
334.7
1.9 OtherIndustrial Exports 337.0 399.2 511.7 515.2 483.6 473.1 395.6
502.7
2. Mineral Exports 84.0 120.0 143.3 136.2 127.8 122.4 88.7 92.63. Total Industrial &Mineral Exports
4060.0
4626.1
5091.7
5519.6
6095.3
6282.0
5394.1
6265.4
4. Agricultural Exports 965.01065.2
1153.8
1292.7
1507.3
1854.9
1690.3
2041.4
4.1 Tea, Rubber& Coconut 815.0 903.3 970.4
1098.1
1275.8
1567.6
1449.9
1719.4
4.2 OtherAgricultural Products 150.0 161.9 183.4 194.6 231.5 287.3 240.4
322.0
5. Unclassified 108.0 66.0 101.2 70.4 37.6 0.0 0.0 0.3
5. Total Exports5133.0
5757.3
6346.7
6882.7
7640.2
8136.9
7084.4
8307.1
Source: Ministry of Industry and Commerce, Government of Sri Lanka
In the next table commudity-wise import of goods from 2003 to 2010 inSri Lanka is shown. Intermediate goods such as petroleum, fertilizer,chemicals, garments & textiles etc compose the major share of Sri Lankanimports. Consumer goods such as food & beverages, rice, sugar and wheatetc. and investment goods such as Machinery & Equipments, TransportEquipment and Building Materials also contribute greatly to goodsimports of Sri Lanka. For an example, in 2010 the total import volumewas recorded as 13511.7 million US$ among which Intermediate Goodsconstitutes US$7495.9 million, the share of Consumer Goods was US$
24 | P a g ewww.iiste.org

European Journal of Business and Management www.iiste.org
ISSN 2222-1905 (Paper) ISSN 2222-2839 (Online)Vol 7, No.4, 2015
2870.3 million and Investments Goods captured US$ 2969.6 million.
Table 11: Commudity-wise Imports (Goods) of Sri Lanka (In MillionUS$) 2003 2004 2005 2006 2007 2008 2009 2010
1. Consumer Goods1481.0
1623.5
1644.0 1980.2 2001.8 2559.6 1971.9 2870.3
(a) Food &Beverages 701.0 779.1 752.6 956.0 1064.7 1513.0 1246.3 1641.8 (i) Rice 8.0 59.4 15.6 5.5 38.7 44.3 22.9 59.0 (ii) Sugar 116.0 111.4 132.3 223.7 154.1 206.4 218.7 363.3 (iii) Wheat 137.0 183.1 141.4 198.6 233.9 375.5 259.3 257.2 (iv) Other 440.0 425.2 463.3 528.2 638.0 886.8 745.4 962.3 (b) OtherConsumer Goods 780.0 844.4 891.4 1024.2 937.1 1046.6 725.6 1228.5
2. Intermediate Goods3811.0
4645.4
5317.2 5962.4 6513.4 8344.3 5669.1 7495.9
(i) Petroleum 838.01209.3
1655.3 2070.3 2496.8 3368.2 2166.6 3018.7
(ii) Fertilizer 88.0 106.7 135.0 164.1 192.5 576.6 193.4 240.5 (iii) Chemicals 170.0 205.9 248.6 260.8 281.4 361.4 312.5 389.9 (iv) Garments &Textiles
1372.0
1514.1
1531.0 1546.2 1632.2 1702.0 1442.0 1732.3
(v) Other1343.0
1609.4
1747.3 1921.0 1910.5 2336.1 1554.6 2114.5
3. Investments Goods1320.0
1669.9
1815.0 2245.7 2685.1 3048.0 2450.9 2969.6
(i) Machinery &Equipments 698.0 857.4 806.4 1065.4 1246.7 1330.7 1012.8 1205.9 (ii) TransportEquipment 206.0 256.6 325.3 364.5 364.5 438.8 436.3 642.2 (iii) BuildingMaterials 328.0 402.0 507.0 546.2 780.3 942.6 714.5 809.6
25 | P a g ewww.iiste.org

European Journal of Business and Management www.iiste.org
ISSN 2222-1905 (Paper) ISSN 2222-2839 (Online)Vol 7, No.4, 2015
(iv) Other 88.0 153.9 176.3 269.6 293.6 335.9 287.3 311.94. Unclassified Imports 60.0 61.1 32.6 65.4 100.2 139.4 114.8 175.9
5. Total Imports6672.0
7999.9
8808.8
10253.7
11300.5
14091.3
10206.7
13511.7
Source: Ministry of Industry and Commerce, Government of Sri Lanka
Sri Lanka’s major export partners are USA, UK, Italy, India, Belgium-Luxemburg, Germany, Singapore, UAE, Russia and Japan. In 2011, USA holdsthe maximum of about 20.3 percent of total exports of Sri Lanka. Othercountries such as UK, Italy, Belgium-Luxemburg and India had contributed10.5 percent, 5.8 percent, 5.4 percent and 4.9 percent respectively. Onthe other hand, major sources of imports for Sri Lanka are India,Singapore, China, Iran and Japan. Similar to other SA countries SriLanka rely on India for the largest share of its imports. In 2011, Indiaalone accounted for 21.9 percent of imports in the country. Other majorimport sources are Singapore, China, Iran and Japan with import sharesof 10.5 percent, 10.3 percent, 7.9 percent and 5.1 percent of SriLanka’s imports. The following two tables explain about export andimport shares of Sri Lanka’s major trade partners.
Table 12: Sri Lanka’s Major Export Destination(Values are in Million Sri Lankan Rupees and shares are in % of
total imports)Country 2007 2008 2009 2010 2011
Value Share
Value Share Value Share
Value Share
Value Share
U.S.A 217925 25.8 202510 23.0 181154 22.2
192348
19.7 237142 20.3
U.K 112618 13.3 118125 13.4 117655 14.4
111903
11.5 122969 10.5
Italy 43683 5.2 48215 5.5 50286 6.2 52689 5.4 67453 5.8Belgium-Luxembourg
44276 5.2 46085 5.2 41799 5.1 42594 4.4 62516 5.4
26 | P a g ewww.iiste.org

European Journal of Business and Management www.iiste.org
ISSN 2222-1905 (Paper) ISSN 2222-2839 (Online)Vol 7, No.4, 2015
India 57002 6.7 45320 5.2 37004 4.5 53587 5.5 57388 4.9Germany 48437 5.7 43903 5.0 39869 4.9 45244 4.6 56387 4.8Singapore 8871 1.0 8189 0.9 9943 1.2 57788 5.9 45206 3.9UAE 23139 2.7 27370 3.1 24294 3.0 32536 3.3 32972 2.8Russia 22412 2.7 23913 2.7 22116 2.7 27504 2.8 31119 2.7Japan 17660 2.1 17225 2.0 16008 2.0 19329 2.0 24653 2.1
Central Bank of Sri Lanka (2013)
Table 13: Major Sources of Imports for Sri Lanka (Values are inMillion Sri Lankan Rupees and shares are in % of total imports)
Country 2007 2008 2009 2010 2011Value Shar
eValue Shar
eValue Shar
eValue Shar
eValue Shar
eIndia 288742 23.1 37344
924.5 209179 17.8 290523 19.1 489882 21.9
Singapore
123736 9.9 134952
8.8 1224861
10.4 177133 11.6 234834 10.5
China 102195 8.2 120737
7.9 118268 10.1 140210 9.2 231309 10.3
Iran 93388 7.5 129381
8.5 103106 8.8 102475 6.7 177170 7.9
Japan 45706 3.7 46147 3.0 25739 2.2 66042 4.3 113285 5.1Malaysia 31359 2.5 38842 2.5 33083 2.8 43487 2.9 75683 3.4Switzerland
19326 1.5 16961 1.1 13861 1.2 17329 1.1 74552 3.3
UAE 36862 2.9 46273 3.0 46909 4.0 55851 3.7 72534 3.2HongKong
80181 6.4 75248 4.9 59448 5.1 65539 4.3 69871 3.1
Thailand 25533 2.0 32353 2.1 31107 2.7 35676 2.3 53273 2.4Source: Central Bank of Sri Lanka (2013)
Economic Reforms and Their Impact on Foreign Trade in SA
27 | P a g ewww.iiste.org

European Journal of Business and Management www.iiste.org
ISSN 2222-1905 (Paper) ISSN 2222-2839 (Online)Vol 7, No.4, 2015
Economic reform initiatives in SA in the 1980s and early 1990s came outas implementation of a package of Structural Adjustment Policies (SAP)under the support of the World Bank and the International Monetary Fund(IMF). Some examples include World Bank’s Structural and SectoralAdjustment Loans (SAL and SECLs) in 1980s. Reform programs include tradeliberalization, agricultural reforms, privatization, financial sectorreforms and fiscal reforms etc. (Bashar & Khan 2007). Trade Liberalization. SA countries exercised a logical sequence in reformactivities towards trade liberalization by initiating the relaxation andwithdrawal of import quota restrictions, along with the unification ofthe exchange rate and devaluation of the domestic currency. Startingfrom the mid-1980s tariff and non-tariff barriers were reducedsubstantially—the un-weighted average import duty rate declinedenormously. However, cuts in custom duties were offset by otherprotective measures like para-tariffs (World Bank 2004). The nations ofthe region reduced protection to make import less costly and helped theexport sector to demonstrate stellar performance. As a result, economiesin SA have achieved a great expansion in international trade as theyopened and liberalized gradually. Therefore, total volume of export andimport as a share of GDP has grown significantly. Both export and importshares have been increased notably after trade reform initiatives wereimplemented. Financial Reforms. Removing distortions from the economy imposed byregulatory authorities was the background of the financial sector reformprograms in the region. For an example, some of the governments createdthe comprehensive ‘Financial Sector Reform Programme (FSRP)’ in early1990s and mandated the authority to design policy that aimed atliberalizing the economy through bringing indirect control in monetarypolicy, enhancing efficiency of financial institutions especially thebanking sector and restoring order in the financial sector (Bahar,2009). Financial reform is very important in SA because capital marketsare yet to be expanded and flourished in almost all member countries.Like other developing countries banks and other financial institutionsact as key intermediaries to provide necessary funds for businesses.Thus the contribution of financial liberalization reform towardsimprovement of the productivity of domestic capital in these economieshas been acting as a crucial factor of trade and development (King
28 | P a g ewww.iiste.org

European Journal of Business and Management www.iiste.org
ISSN 2222-1905 (Paper) ISSN 2222-2839 (Online)Vol 7, No.4, 2015
Levine 1993; Hallwood MacDonald 1994).Capital Market Liberalization. Most of the countries in South Asia includingBangladesh, India and Pakistan opened their doors for foreignentrepreneurs during 1980s and the early 1990s in order to reap thebenefit of overseas capital and investment. The countries built up Boardof Investment (BOI), lifted restriction on capital and profitrepatriation and at the same time opened the industrial sector for FDI.Other measures that were also added were: tax exemptions for investorsin some key industries such as power generation, withdrawal of importduties from export oriented machineries, offering tax holiday schemesfor investment in priority and less developed sectors, reducingrestriction on entry and exit and lowering bureaucratic barriers ingetting approvals of foreign projects.Fiscal Reform. Fiscal policy in various South Asian countries includesearning and spending activities carried out by the State to allocateresources in various sectors in order to provide services while ensuringoptimum efficiency of the economic units. In the early stage ofindependence of these countries, majority of the government expenditurewas put in reconstruction and rehabilitation works. Notwithstanding, thesituation changed gradually to improve the fiscal front—a number offiscal reforms were undertaken in accordance with the ‘IMF’s EnhancedStructural Adjustment Facility (ESAF)’. For an instance, theintroduction of ‘Value Added Tax (VAT)’ that largely replaced theearlier version of differentiated sales tax in Bangladesh was one of themost important measures for the country’s fiscal reform policies. On theexpenditure side, vis-à-vis, increased emphasis was given on humanresource development and poverty alleviation programs in most of theeconomies . The governments of the individual countries have given toppriority on the education sector to improve quality and coverage. Theprovision of health and family planning services and social safety netprograms to serve the vulnerable people were also emphasized ingovernment fiscal policies (Bahar 2009).
Model Specification and Empirical FindingsAfter about three decades of the refomr measures have been adopted, onequestion arises in general: are reform initiatives to liberalize the
29 | P a g ewww.iiste.org

European Journal of Business and Management www.iiste.org
ISSN 2222-1905 (Paper) ISSN 2222-2839 (Online)Vol 7, No.4, 2015
economy became effective to promote trade in SA? By utilizing anempirical estimation we try to find out the answer. More clearly, wewill make an effort to empirically test whether the marginal impacts ofreform measures are effectively lifting foreign trade for SA countries.We use the following equation:
For the above equation, PCY represents per capita GDP; FDI implies netinflow of foreign direct investment; the variable OPN represents thetrade openness indicator in the form of total volume of export andimport as a share of GDP, RIR stands for real rate of interest which isthe financial openness indicator; MCY is Market capital as a share ofGDP— it acts as a capital account openness indicator, TAXRY is TaxRevenue as a percentage of GDP, GNEXY is Government Expenditure as ashare of GDP. TAXRY and GNEXY are proxy variables for fiscal reforms. Uis for error terms. To estimate the above equation, we utilize panel random effectsestimation technique. We use data of 5 countries from South Asia such asBangladesh, India, Nepal, Pakistan and Sri Lanka. We do not includeAfghanistan, Bhutan and Maldives in our estimation because of dataunavailability. The time horizon for the data is from 1991 to 2012. Dataare collected from the World Development Indicators of the World Bank,the Asian Development Data Source and the United Nations Conference onTrade and Development (UN Comtrade Database).The results are summarized in the table below. According to the study’sfindings, per capita GDP was negatively affecting foreign trade in SouthAsian countries. FDI as a percentage of GDP and lag values of trade openness becomesignificantly positive at 5 percent and 1 percent level respectively,Real interest rate which represents financial sector liberalization reformsand market capital as a percentage of GDP which is proxy for capital marketliberalization have negative effect on trade. Tax reveneue and gross nationalexpenditure which are fiscal reform proxies appeared as significantlypositive at 10 percent and 5 percent level respectively. The economies in SA have achieved a great expansion in internationaltrade as they were opened and liberalized gradually since the1980s.
30 | P a g ewww.iiste.org

European Journal of Business and Management www.iiste.org
ISSN 2222-1905 (Paper) ISSN 2222-2839 (Online)Vol 7, No.4, 2015
Therefore, total volume of export and import has grown enormously. Beingfactor driven economies, capital markets are yet to be expanded andflourished. Like other developing countries banks and other financialinstitutions act as key intermediaries to provide necessary funds forbusinesses. Although the contribution of financial liberalization reformto improvement of trade is not significant enough but it is a crucialfactor for the economies in the region. The impact of FDI and MarketCapital are also very important determinants for trade development inthe countries of SA.
Table 14: Results of Random-effects Regression for Impact of Reforms onForeign Trade in SA ( Dependent Variable: Total Trade as a share of
GDP)(1) (2) (3) (4) (5)
Variables Explanation lnopn lnopn lnopn lnopn lnopnlnpcy Per capita GDP 0.0392
(0.0468)
-0.00248(0.0338)
-0.00500(0.0343)
0.00402(0.0363)
-0.0201(0.0349)
lnfdiy Foreign DirectInvestment (FDI) as percentageof GDP
0.449***(0.0724)
0.0863(0.0550)
0.0913(0.0562)
0.103(0.0581)
0.156**(0.0567)
lnlagopn Lag values ofOpenness Indicator
0.885***(0.0397)
0.884***(0.0400)
0.877***(0.0411)
0.744***(0.0522)
lnrir Real Interest Rate -0.0276(0.0564)
-0.0458(0.0612)
-0.0161(0.0745)
lnmcy Market Capital aspercentage of GDP
-0.0156(0.020
-0.0273(0.021
31 | P a g ewww.iiste.org

European Journal of Business and Management www.iiste.org
ISSN 2222-1905 (Paper) ISSN 2222-2839 (Online)Vol 7, No.4, 2015
0) 1)lntaxry Tax Revenue as
percentage of GDP
0.177*(0.0837)
lngnexy Gross nationalexpenditure as percentage of GDP
1.120**(0.399)
Constant 3.217***(0.307)
0.403(0.210)
0.493(0.279)
0.545(0.288)
-4.529*(1.881)
Observations 109 109 109 109 109R-squaredNumber ofPanels
5 5 5 5 5
rmse 0.187 0.152 0.152 0.153 0.144Robust standard errors in parentheses ***p<0.01, ** p<0.05, * p<0.1
Source: Author’s Estimation
ConclusionThe implications of these findings are simple. First, the verificationof a positive relationship hypothesis between trade and the factorsconsidered in this study indicates the credibility of SA's robust growthin the external sector in recent years. Throughout the 2000s, exportgrowth in SA was seen to be continuously positive. Moreover, exportearnings performance of some of the major sectors including woven-RMG,knit-RMG, frozen foods and leather goods has experienced significantimprovement since the last two decades. Furthermore, industry leaderswere able to undertake timely measures for production of exportablegoods at a competitive price, thanks to increase in volumes rather thanthat of price of SA’s export products. Nevertheless, in some countriesin SA export trade is continued to be featured by the dominance of a fewcommodities in a narrow market and no visibility of mentionable
32 | P a g ewww.iiste.org

European Journal of Business and Management www.iiste.org
ISSN 2222-1905 (Paper) ISSN 2222-2839 (Online)Vol 7, No.4, 2015
breakthrough in the performance of the thrust sectors. It is, therefore,necessary to remove those impediments in order to maintain a sustainableexternal sector.
ReferencesAdhikary, B.K. (2011), “FDI, Trade Openness, Capital Formation, andEconomic Growth in Bangladesh: A Linkage Analysis”, International Journal ofBusiness and Management , 6(1), 16-28.Asian Development Bank (2009), Study on Intraregional Trade andInvestment in South Asia: Asian Development Bank, Philippines.Bahar, H. (2009), “Financial Liberalization and Reforms in Bangladesh”Paper Presented in the National Workshop on Strengthening the Response to the GlobalFinancial Crisis in Asia-Pacific: The Role of Monetary, Fiscal and External Debt Policies,Thimphu, Bhutan, December 9-11, 2009.Bashar, K.M. & Khan, H. (2007), “Liberalisation and Growth inBangladesh: An Empirical Investigation. The Bangladesh Development Studies,32(1), 61-76. Bhattacharya, D. & Chowdhury, T. A. (2003), “Financial Sector Reforms inBangladesh: The Next Round” Central Bank of Sri Lanka (2012), “AnnualReport 2012”, Colombo: Central Bank of Sri Lanka.CPD Occasional Paper Series. Dhaka: Centre for Policy Dialogue.Government of Bangladesh (2008). “Bangladesh Economic Review 2008 [InEnglish]”, Dhaka: Bangladesh Ministry of Finance. Government of Bangladesh (2012), “Bangladesh Economic Review 2012 [InEnglish]”, Dhaka: Bangladesh Ministry of Finance. Government of India (2013), “Economic Survey 2012-13”, New Delhi: thePlanning Comission, Government of India.Government of Pakistan (2013), “External Trade Statistics”, Islamabad:Federal Bureau of Statistics, Government of Pakistan. Government of Sri Lanka (2013), “Trade Statistics”, Colombo: Departmentof Commerce, Ministry of Industry and Commerce, Sri Lanka.Hallwood, P. and MacDonald, R. (1994), “The Order of Liberalization inDeveloping Countries” In International Money and Finance, (p.338-350). Malden:Blackwell Publishing. Index Mundi (2013), http://www.indexmundi.com/facts/sri-lanka/imports-of-goods-and-services.King, R. G. and Levine, R. (1993), “Finance and Growth: Schumpeter Might
33 | P a g ewww.iiste.org

European Journal of Business and Management www.iiste.org
ISSN 2222-1905 (Paper) ISSN 2222-2839 (Online)Vol 7, No.4, 2015
be Right” Quarterly Journal of Economics, 108(3), 717-737. Rahman, J. and Yusuf, A., (2010), “Economic Growth in Bangladesh:Experience and Policy Priorities” Journal of Bangladesh Studies, 12(1).Romer, P. M. (1986a). “Increasing returns and long-run growth” Journal ofPolitical Economy, 95(5), 1002-1037.UNCTAD (2008), “TRADE AND DEVELOPMENT REPORT, 2008”, Report by thesecretariat of theUnited Nations Conference on Trade and Development,New York and Geneva: United Nations.World Bank (2004). “World Bank Trade Policies in South Asia: anOverview”, Washington: The World Bank.World Bank (2013), “World Development Indicators”, Washington: The WorldBank.
34 | P a g ewww.iiste.org