Modelling Gender Dimensions of the Impact of Economic Reforms on Time Allocation among Market,...
24
Munich Personal RePEc Archive Modelling gender dimensions of the impact of economic reforms on time allocation among market, household, and leisure activities in Pakistan Rizwana Siddiqui Pakistan Institute of DEvelopment Economics December 2004 Online at http://mpra.ub.uni-muenchen.de/4197/ MPRA Paper No. 4197, posted 22. July 2007
-
Upload
independent -
Category
Documents
-
view
2 -
download
0
Transcript of Modelling Gender Dimensions of the Impact of Economic Reforms on Time Allocation among Market,...

MPRAMunich Personal RePEc Archive
Modelling gender dimensions of theimpact of economic reforms on timeallocation among market, household, andleisure activities in Pakistan
Rizwana Siddiqui
Pakistan Institute of DEvelopment Economics
December 2004
Online at http://mpra.ub.uni-muenchen.de/4197/MPRA Paper No. 4197, posted 22. July 2007

Modelling Gender Dimensions of the Impact of Economic Reforms on Time Allocation among Market, Household, and Leisure
Activities in Pakistan
RIZWANA SIDDIQUI*
Abstract Developing countries are increasingly concerned about gender dimensions of the impacts of economic reforms initiated under structural adjustment and stabilization programmes. This article develops a gendered Computable General Equilibrium model based on the notions of production in paid economy and unpaid care economy pioneered by Fontana and Wood and applies it to Pakistan. The study assesses the impact of two types of shocks: trade liberalisation and fiscal adjustment. Results support the contention that trade liberalisation in the presence of compensatory measure over burden women but reduces income-based poverty by all measures. In all other exercises employment in market sectors reduces. The study concludes that despite changes in structure of market employment, gender division of labour remains unequal within household economy.
Rizwana Siddiqui is Research Economist at the Pakistan Institute of Development Economics, Islamabad. Author’s Note: I am very thankful to Dr Howard White, Senior Evaluation Officer, World Bank, Washington, D. C.,
USA for his support, providing update material and most importantly for invaluable discussions. Thanks to Dr Marzia Fontana, Economics Department, University of Sussex, UK, and Dr Rehana Siddiqui, Chief of Research, PIDE, Islamabad, for their help in development of the model and for providing update material. I am also grateful to the two synonymous referees, who provided many excellent comments and suggestions. An earlier version of this paper was presented at the PIDE Seminar series in 2003.

Rizwana Siddiqui 616
I. INTRODUCTION
Women and men are different from each other not only biologically but also in terms of constraints and discriminatory behaviour they face. Women are less fed, less educated, less mobile, less empowered, and overburdened by household work such as cooking, cleaning, taking care of children and the aged, fetching water, looking after farm animals, and gathering wood [Cagatay (1995); Sathar and Kazi (1997); Siddiqui, et al. (2001)]. These activities not only restrain them from education and training but also severely constrain their ability to respond to economic incentives as men do and fail to achieve equal level of men. Men as a breadwinner receive both nutritional and educational priority [White and Masset (2002)], while women remain relatively illiterate and malnourished. Consequently, different quality and quantity of female-labour and male-labour emerges which play a very important role in determining the impact of any policy change.
A number of studies1 conducted in the late 1980s and the 1990s ask the question: Do changes in economic reforms affect men and women equally? These studies argue that ignoring gender dimensions hide the cost in terms of time, resource allocation and maintenance of human resources that results in miscalculation of the effects on women. For instance trade liberalisation policies lead to export led industrialisation and expansion of female employment. The rise in women’s employment does not accompany by a reduction in their unpaid household work but squeezes women’s leisure time. On the other hand men do very little household work. After market work they spent a large proportion of their time in leisure. The exclusion of non-market sectors hides the cost in terms of women workload, while exclusion of leisure from the model reduces flexibility of the supply of male labour more compared to female labour supply, which is already constrained by less leisure. So it is not possible to make inferences from the studies of particular sectors about the impact of economic reforms on women’s earning, employment opportunities, and well-being relative to men in the absence of linkages and feed backs among different sector i.e., between market and household economy and within the market sectors of economy [Fontana and Wood (2000)]. They should be analysed using gender aware models in the presence of all forward and backward linkages among different actors, factors and sectors, especially between paid and unpaid economies [World Bank (2001)]. Computable General Equilibrium models are considered the best to use for this type of analysis [Fontana and Wood (2000); Kabeer (2003)].2
The principle focus of this study is on the development of gendered computable general equilibrium model (GCGE) for Pakistan that captures gender dimensions of time allocation of men and women among market, household and leisure activities. Then model is used to simulate the impact of two types of macroeconomic shocks, trade liberalisation and fiscal adjustment on men and women.
The plan of the study is as follows. Section II briefly reviews existing literature on the subject. Section III gives an overview of employment by gender. Data and methodological issues in
1For detail discussions of gender issues see Cagatay (1995), Elson (1995), Kabeer (2003) and Siddiqui, et al. (2003), Siddiqui, et al. (2001) etc.
2Although a number of models exit like RMSM and Macro-Econometric Model. But is proffered over others for gender impact analysis because they need one year data. While other macro-econometric model need long series. Scarcity of gender related data is main hindrance in development of these models.

Gender and the Impact of Economic Reforms 617
development of SAM and Gendered Computable General Equilibrium Model are discussed in Section IV. Section V discusses policy shocks and simulation results. Final section concludes the paper.
II. REVIEW OF LITERATURE
Earlier research has documented good as well as bad effects of economic reforms particularly on women such as contribution of export growth to the expansion of female employment opportunities [Siddiqui (2003); Kabeer (2003)], increase work load on women, rise in unemployment in the country etc. However, it is difficult to make inferences from these studies about the impact on well-being of women in the absence of linkages and feed back between market economy and household economy and within the market economy. Most recent empirical studies analysing gender dimensions of the impact of economic reforms integrated gender dimensions in CGE models to overcome existing shortcomings.
Fontana and Wood (2000) were the first3 who called our attention to incorporate women’s household work and leisure activities in economic analysis of trade liberalisation in CGE models. They constructed gendered social accounting matrix incorporating time use module in the social accounting matrix (SAM) which shows how much time (in hours) people spend on various tasks: market work and non-market work spent either on household activities or on leisure. Then gendered CGE model is developed using SAM data. The study elaborates technical issues in calculation and incorporation of social reproduction and leisure in SAM and CGE. The study shows that gender related rigidities can be introduced in labour market by keeping low elasticity of substitution between male and female labour especially in households production sector. The simulation results of the studies provide insights of the gendered economic outcomes of trade policies. Following this study, Fontana (2001 for Bangladesh and 2002 for Zambia) extend the accounting framework to include a greater number of market activities differentiated by factor intensity, labour categories differentiated by both gender and level of education and households types. The main modification made to gender SAM here is that members of each type of household produce a particular kind of social reproduction and leisure reflecting each household education and gender composition. The studies reveal the truth that the effects are not same for all households. They differ by type of households, rich or poor. The difference in impact remains hidden when all households are assumed to be homogenous in Fontana and Wood (2000). The studies also show that the effects are not same of various policies changes, neither for all countries with same policy change.4 The magnitude of the gender impact of policy change depends on the variation in key parameters, i.e., elasticity of substitution. The greater flexibility in gender roles in the non-market sphere (introduced by larger elasticity of substitution) reduces negative impact of a decline in the garment industry on women. Contrary to the results for Bangladesh, the abolition of tariff on manufactured imports causes smaller employment and wage gains for women than women in Zambia, while promotion of non-traditional agriculture exports benefits more to women in Zambia.
3Prior to Fontana and Wood (2000), as far as I know only one study–Evans, 1972–for Australia distinguishes
between male and female labour in CGE model. 4For detail discussion see Fontana and Wood (2000), Fontana (2001, 2002, 2003).

Rizwana Siddiqui 618
Fontana (2003) explicitly highlights that the differences in resource endowments, labour market characteristics and socio cultural norm shape the way in which trade expansion affects gender inequalities in the countries. The study suggests that trade liberalisation has more favourable effects on women in a labour abundant country like Bangladesh than in a resource abundant country like Zambia. The major conclusion that can be drawn from these studies is that in the absence of non-market activities the impact on women’s employment and wages is not the same as in presence of the sectors accounting for household production and leisure. Fofana, et al. (2003) also show that impact of trade liberalisation on men and women depend on male participation in household work.
Prior to and after Fontana and Wood (2000) and Fontana (2001, 2002) most of the available SAMs with gender features limit the extensions to disaggregation of labour by gender or grouped households on the basis of male and female head of households, i.e., Evans (1972) Arndt, et al. (2003) for Mozambique and Anushree and Sangita (2003) for India. The study by Anushree and Sangita (2003) also distinguishes economy by male intensive formal sectors from female intensive informal sectors of the economy. In this set up, tariff reduction make women worse off as wages decline in informal sector of the economy after the shock.
Impact of economic reforms on women not only depends on education level and household type they belong to but also on closure the studies choose. In most of these studies investment and government consumption have been fixed at the base level in real term. Current account balance is also fixed at the base level. Therefore, outcomes are driven exclusively by the differences in the initial socioeconomic structure of the countries rather than by difference in behavioural parameters. These studies show that despite significant increase in female market participation, gender division of labour within the households remains fairly unequal. Women’s level of education seems to be important determinants of the gender allocation of time. The results of the studies [Fontana (2001, 2002)] show that the differences in impacts are more marked for women and men with low education as wage differential by gender disappear at the high education level in both countries from different continents and from different culture. The studies show that higher substitution elasticity causes a marginally higher rise in total market participation of women with no education and women with secondary education compared to highly educated women.
Earlier CGE models for Pakistan developed for trade policy analysis [Siddiqui, et al. (1999); Siddiqui and Kemal (2002), etc.] on the basis of latest available SAM based on aggregate data for the year 1989-90 [Siddiqui and Iqbal (1999)]. The focus of these studies was on income distribution, poverty, inequality, and welfare. But no CGE model for Pakistan with gender features has been developed yet.
III. EMPLOYMENT
Women roughly half of the population of Pakistan overburdened by household work have low participation in labour market relative to men. In spite of large inflow5 of females in labour market during the adjustment period,6 their participation rate remains low compared to men’s participation rate.
5A larger inflow of female into labour market resulted in higher unemployment rate, which has increased from 10 percent
in 1990-91 to 17.3 percent in 2000 for females. 6Lim (1996) and Moser (1989) found this for other developing countries too.

Gender and the Impact of Economic Reforms 619
There are many reasons for low rate of female participation, like marriage at early age, strong social and cultural influence on outside home movement of women, low human capital, and non-availability of suitable jobs. Besides, female participation is underestimated significantly, which is evident from LFS [Pakistan (1991)].
In 1991, Federal Bureau of Statistics of Pakistan revised data collection technique, which show that women participation rate in market is about 50 percent instead of 11.8 percent (calculated on the basis of old data). On the basis of revised data collection technique, the women who reported doing nothing were probed by asking further questions about the activities such as harvesting, sowing, picking cotton, drying seeds, maize and rice husking, engaged in live stock and poultry farming activities, construction work, collection of fire wood and cotton sticks, fetching water, making cloths, sewing, knitting, shopping, marketing and preparation of other goods and material for sale etc, If they are doing anyone of these activities they were included in the work force. Participation rate calculated on the basis of this definition is called ‘Improved Female Participation Rate’. Comparison of participation rates on the basis of data collected with old technique and new technique shows that female participation rate rises to 52.8 percent from 11.8 percent in 1990-1 and to 37.7 percent from 14.4 percent in 2001-2 (see Table 1).
Table 1
Labour Market Indicators by Gender (%) Labour Force Participation Rate (Refined) Literacy Rate
Year Women (OLD)
Women (New)
Men Both Women Men Both Ratio of
Women Wage to Men Wage*
1984-5 8.68 – 77.1 44.2 – – – – 1990-1 11.8 52.8 69.9 42.0 25.7 52.9 39.8 65.7 1994-5 11.4 39.8 69.1 41.3 28.6 57.0 43.3 1999-0 13.7 39.2 70.4 42.8 33.3 59.0 46.5 60.5 2001-2 14.4 37.7 70.3 43.3 36.9 62.2 50.0 –
Source: Pakistan (Various issues) Labour Force Surveys. – Not available.
* Ratio is calculated on the basis wages of labour based on data collected with old technique.
Over the period of market-led economic restructuring, the impact of SAP on women’s
employment is specified as declining share in manufacturing and increasing share in agriculture and services sector. Men’s employment share rises only in services sector. Disaggregation of data by manufacturing industries reveals that the share of female employment during the adjustment period in export oriented industries, textile, rose to 78.5 percent in 1993-4 from 74.9 percent in 1990-1 [Siddiqui, et al. (2001)]. A more recent survey of export-oriented industries [textiles, sports, surgical instruments and fisheries] shows that more females are working as temporary/casual workers and they are concentrated in textile and garment industry mainly in stitching activities i.e., 86 percent of the total employed women [Siddiqui et al. (2003)]. This shows that female intensive sectors in Pakistan are export based industries.

Rizwana Siddiqui 620
Not only quantity, quality of labour is very important in determining employment status in the country. Though literacy rate has increased during the last two decades in Pakistan, but gender gap in education is still evident i.e., 37 percent literacy rate among females and 62 percent among males in 2002 (see Table 1). This indicates heterogeneity of labour force by gender and an important reason for women to be in low paid jobs.
Contrary to the rise in female-labour force and employment, their wages fell over the adjustment period and the gap between men and women wages has widened. Ratio of female wage to male wage has fallen from 65.7 percent in 1990-1 to 60.5 percent in 1999-2000 (see Table 1).7 Besides structural factors like, gender segregation of job market by occupations and skills, under-representation of females in higher paying occupations and grades, which are result of economy wide disparities in education and training, 20 percent of wage differential is due to discrimination in labour market [Siddiqui and Siddiqui (1998)].
The division of labour is the most important single factor, which affects status of women in the country, directly and indirectly. Women perform disproportionately large amount of unpaid household work, cooking, cleaning, taking care of elders, collecting woods, fetching water etc. On average their work time is 13 percent larger than men’s work time [UNDP (1995)]. Ignoring household sector not only underestimate women working hours and their contribution to the economy but also constrain them from attaining education and training. Contrary to women, men are major player in market economy; i.e., LFPR of men remains around 70 percent. They are involved in household production but time spent on these chores is very small. Siddiqui, et al. (2001) found that on average men spend about one hour in household production. Husbands of women participating in market activities spend relatively more time on domestic chores compared to those of non-working women.
IV. DATA AND METHODOLOGICAL ISSUES IN THE DEVELOPMENT OF GENDERED COMPUTABLE
GENERAL EQUILIBRIUM MODEL
The main concern in this study is to incorporate gender into CGE model for Pakistan to overcome existing shortcomings in the analysis gender dimensions of the impact of economic reforms. Like Fontana and Wood (2000), model is made gender aware in three steps: (1) disaggregating variables by gender, (2) incorporating non-market sectors, in addition to market work: household production and leisure, (3) relating values of the key parameters to the degree of gender inequalities in the country.
(a) Extension of SAM
Aggregate SAM with market economy is taken from Siddiqui and Iqbal (1999). Using Fontana and Wood (2000) methodology, it is made gender aware by distinguishing male and female labour in labour market and their wage income in household income. Two non-market sectors,
7The ratio is calculated on the basis of wages of female labour reported on the basis of old technique. But ratio goes down further, when data for female labour participation based on revised technique is included. Because these women are employed in informal sector of the economy.

Gender and the Impact of Economic Reforms 621
household reproduction and leisure are added which are important for time use analysis. Labour use is measured in hours instead of persons, assuming all persons are involved in all activities.
Construction of the gendered SAM is not straightforward. Since 1990-1, labour force survey reports female labour force participation in two sections. The data collected on the basis of old technique shows that 3.4 million women are employed. This number increases to 15.5 million if we include data collected under revised data collection technique which reports women participation in activities such as harvesting, sowing, picking cotton, drying seeds, maize and rice husking, engaged in live stock and poultry farming activities, construction work, making cloths, sewing and knitting, shopping and marketing and preparation of goods at home which are available in the market.
Following SNA agreement, all activities are defined as productive which produce goods and services for sale, but also those, which produce goods and services for own consumption within household. But services used within a households for own consumption are defines as non-productive and but economic. Female labour engaged in harvesting, sowing, picking cotton, drying seeds, maize and rice husking, engaged in livestock and poultry farming activities is added to agriculture labour and treated as unpaid labour. Women work such as preparing meal for the members of household, cleaning, washing clothes, look after children and elder people, collecting wood, fetching water, washing and pressing clothes, caring of children or health care of ill persons, helping children to do homework or other educating activities, cleaning or arranging the house or preparation of other goods are treated as household activities if they are working for their own family. If they are involved in these activities for other households and receiving cash or in kind, they are included in market activities and included in services sector of market economy. Construction is included in services sector. In agriculture and construction all female labour based on revised estimates is unpaid. But in other sectors if females are working for other households and receiving in cash or in kind, the value of this work is calculated on the basis of average wage of that sector for females and added to existing estimates of values added of that particular sector. To some extent these estimates shows estimates for black economy or informal economy, which does not appear in the national statistics of GDP (which is calculated on the basis of old female participation rate).
On the basis of new data and old data, female time of a day is allocated to market and non-market activities. But labour force surveys do not report working hours of men spent on non-market activities. Another survey conducted for Gender Planning Network [Siddiqui, et al. (2001)] reports work hours of men spent on non-market activities. Therefore, time use data is taken from Labour Force survey and Gender Planning Net Work Survey.8 Former reports only women’s working hours in household activities, while latter reports data for both.
Leisure is non-economic and non-productive, because it cannot be rendered for some one else [see Fontana and Wood (2000) for detail discussion on the topic]. Like Fontana and Wood (2000), minimum time used for personal care (sleeping, eating, personal hygiene etc.) is ten hours a day. This time is not included in SAM. After subtracting 10 hours from total of 24 hours we have 14 hours, which are used for market, household and leisure activities. It is assumed that time used in one activity cannot be used in other.9 Subtracting time for market and household work from 14 hours a day, leisure is
8This survey is conducted in three cities of Pakistan, Sialkot, Faisalabad and Karachi. 9This is strong assumption as women usually do 2 or 3 chores at a time such as women carrying children while

Rizwana Siddiqui 622
calculated, the time that can be used for sleeping and other leisure activities such as playing games or attending a party or watching movies, etc.
The value of these activities is calculated assuming that the cost of production is purely labour cost. Under this assumption this approach may be referred as─wage (per hour) x time (hours). Average wage rate for male and female in the market presents opportunity cost of their time used in non-market activities. Therefore work in non-market sectors is evaluated using average wage rate of men and women in market sectors and time used in these activities.10 Incorporating above-mentioned information, a gendered social accounting matrix (GSAM) for Pakistan is constructed.
Table 2 shows that 51.9 percent of available men hours are allocated to market work, 10.7 percent to household work and 37.4 percent to leisure activities. On the other hand, women spend 37.7 percent, 42 percent and 20.3 percent time on these activities, respectively. Table shows long working-hours for a woman than a man. Women spend 79.7 percent of their available time in households and market work, while men spend 62.6 percent of their time in these activities.
Table 2
Time Allocation per Day by Gender among Market, Household, and Leisure Activities (%)
Men Women
Market 51.9 37.7
Household Work 10.7 42.0
Total Working Hours 62.6 79.7
Leisure 37.4 20.3
Total 100.0 100.0 Source: Gendered Social Accounting Matrix.
Table 3 presents structure of production in gendered SAM for the year 1989-90 with five market sectors, agriculture, textile, other manufacturing, services-1 and services-2. First four sectors are tradable sectors and services-2 is non-tradable sector. Two non-market sectors are ‘Household Reproduction’ and ‘Leisure’. Tradable sectors produce goods for domestic and foreign market. Manufacturing sector is divided into two sectors; export oriented ‘Textile’ and import competing ‘Other manufacturing’. Table 3 reveals that 61 percent of exports are from textile sector and 84 percent washing cloths and cooking food. This may under estimate women’s work. For example, activities such as cooking, housekeeping and looking after children are commonly under taken simultaneously. Pyatt (1990) points out it as informal character of non-market activity. He thinks that instead of disentangling these activities, they can be treated as joint product of time used in these activities.
10For detail see Fontana and Wood (2000, 2001, 2002) and Pyatt (1990, 1996). The problem of valuing outputs shifted to the problem of valuing inputs. Pyatt points out that the individuals for whom the opportunity cost of self-sufficiency exceeds price ‘P’ will buy the good from market, but will not buy the surrogate if average opportunity cost is less than P (market price). They will depend on their own efforts. Two other methods are also widely discussed in literature: (1) Use of market price of goods produced at home, (2). Wage of specialised persons in these activities in the market for example for cooking food—chef’s wage. Pyatt (1990) discusses pros and cons of various methods to measure household’s production.

Gender and the Impact of Economic Reforms 623
of total imports are ‘other manufacturing sector’. Tariff is very low on agriculture and very high on manufacturing sector, while other traded sector ‘service-1’ is unprotected tradable sector with no tariff on its imports.
Table 3
Structure of Economy in Gendered Social Accounting Matrix for 1989-90 (%) Labour Hours Wage Share
Sectors Men Women Men Women GDP Import Shares
Export Share
Agriculture 45.9 65.7 21.2 18.2 28.3 6.3 3.0
Other Manufacturing 6.3 1.0 15.56 4.6 13.9 1.7 60.9
Textile 5.7 21.9 6.2 29.8 6.0 83.6 18.7
Other Traded (Service-1) 25.7 5.9 17.0 12.0 28.2 8.3 17.4
Non-traded (Service-2) 16.4 5.4 40.1 35.3 23.6 – –
All Market Sectors 100 100 100 100 100.0 100 100
Household Reproduction 22.2 67.4 22.2 67.4 8.7
Leisure 77. 8 32.6 77.8 32.6 20.5
Total Non-market Work 100 100 100 100 29.2 Source: See text for detail for development of Gender Social Accounting Matrix. Women participation is based on new data.
Agriculture sector is the largest employer of women and men. They employ 65.7 percent and 45.9 percent of women and men, respectively. Table shows that within the manufacturing sector 21.9 percent of women labour time is used in export oriented sector, ‘textile’ and 1.0 percent in import competing sector ‘Other Manufacturing’. Import competing sector is male-labour intensive employing 6.3 percent of their labour time. Excluding time for market work and ten hours per day as minimum time required for personal care for each, rest of time is used for household work and leisure activities. Data reveals that men spent 77.8 percent of this available time in leisure activities and 22.2 percent in household work compared to 67.4 percent and 32.6 percent of women’s available time in these activities, respectively (see Table 3). Table also shows that men are receiving higher wages in import competing sectors relative to export oriented sectors. Therefore, they are concentrated in ‘other manufacturing sector’. While women are concentrated in export oriented sectors and receiving lower wages compared to wages in import competing sector.
The structure of production reveals that the share of agriculture in GDP is 28.3 percent in 1989-90. Textile and other manufacturing sectors contribute to GDP 6 percent and 14 percent, respectively. Services sector contributes about 50 percent to GDP. If we include household production and leisure in GDP, then GDP increases by 29.2 percent.
(b) Computable General Equilibrium Model
Using methodology given in Fontana and Wood (2000) computable general equilibrium model for Pakistan is extended by incorporating gender features. Model contains six blocks of equations: foreign trade, income and saving, production, demand, prices, and market

Rizwana Siddiqui 624
equilibrium. In addition to market sectors, it incorporates non-market activities such as household reproduction and leisure. Male and female in both, market and non-market activities distinguish labour. Therefore, primary factors of productions are male labour, female labour and capital. It is assumed that men and women are imperfect substitute. Female labour and male labour are aggregated into composite labour through CES (constant elasticity of substitution) function. The ratio of male and female labour depends on share parameter and varies with their wage rates, and can be substituted one for the other on the basis of elasticity of substitution. Like Fontana and Wood (2000), gender related rigidities are introduced through elasticity of substitution.
It is assumed that household consume three types of goods, market goods (Ci), home produce goods (CH), and leisure (CLE) and face two constraints, income and time. Household maximise utility subject to income and time constraints.
)( ,CzCfU i= … … … … … … (1)
Where ‘i’ stands for market goods and services, agriculture, textile, manufacturing, services-1 and services-2, and z stands for non-market services, Households social reproduction (H) and leisure (LE).
Household receive income from paid work of men and women, rent from capital, and receipts from other sources, government, firms and rest of the world. Total household income (Ym) from market sector is defined as:
)( ,,, OKLwLmH YYYYfY = … … … … … (2)
Where YLm and YLw are labour income of men and women, respectively, from market activities. Yk is capital income. Yo is sum of transfers from government, firms and rest of the world (exogenous).
Total available time of 14 hours a day of an individual is allocated to market, household and leisure activities. Time used in different activities; market, home, and leisure is separable. Time constraint for individuals is as follows:
ssss LELHTLSMTL ++= … … … … … (3)
Where s = men (m), women (w) TL = Total available labour time in hours TLSM = Time used in the market LH = Time used in household reproduction activities LE = Leisure time.
. Xz is production in non-market sphere of the economy, which does not use capital or intermediate inputs. Xz is produced with CES technology with men and women time input.
Let
)( SLZCESXZ = … … … … … … (4)

Gender and the Impact of Economic Reforms 625
Where Z = H and LE, Assuming that reproduction and leisure sectors in the model behaves like market sectors.
Labour productivity is same in the market and household activities. Greater rigidity in gender division of labour in household production than in market sectors is evident for earlier research [Fontana and Wood (2000)]. It is introduced by setting low substitution elasticity between male and female labour in reproduction than in market sectors (–0.3) in household reproduction and (–0.2) for leisure. Demand for labour in this production can be derived as in market production. Household consume all goods produced at home. So
CZXZ = … … … … … … (5)
Where XZ and CZ are production and consumption of goods produced in non-market sector of the economy.
The price of these goods (Pz) is determined through the opportunity cost of labour used in its production. Thus total income of a household (YT) is defined as sum of receipts from market economy (Ym) and non-market economy (YZ) as follows:
ZmT YYY += … … … … … … (6)
Where YZ = ∑= LEHZ
ZZ CP,
*
Maximising Stone-Geary utility function iLEH
iiHHHHH CCCCCCU βββ −π−−= )()()( … … … (7)
s.t constrains of total income YT in Equation 7 and time constraint of 14 hours in Equation 3. Demand for goods produced in market and non-market sectors are derived.
Equilibrium condition for labour: Total labour demand in the market production is equal to the total supply of labour from households to the market.
LM TLSM iSS ∑= , … … … … … (8)
Where LMS,i is demand for men and women labour in the market sectors and TSLMS is total labour supply to market sectors
Female wage and male wage are determined through demand and supply of their labour, respectively. Average wage in the market is determined in the following way.
[ ]mw
immiww
LMLMLMWLMW
W+
+=
∑ ∑ ]**[ ,, … … … (9)
Other characteristics of the model are as follows:
(a) Capital is immobile. (b) Both type of labour, men and women, is mobile.

Rizwana Siddiqui 626
(c) Home produced goods are imperfect substitutes of market goods. (d) Goods with same sectoral classification are different in qualities for domestic and foreign
markets and have different prices. (e) Imports and domestically produced goods are imperfect substitutes with separate prices. (f) All households are aggregated into one group with disaggregated men and women labour
income.
Model is solved using GAMS software. It is calibrated to the parameters calculated from gendered SAM constructed for this study and extraneous estimates of elasticities and run to produce base scenario.
Using this model, impact of trade liberalisation and stabilisation policies is simulated to analyses the gender impact of the macroeconomic shocks. Distinct closures are introduced for trade and fiscal reforms. For example, in simulations with trade liberalisation, first tariff on imports are reduced in presence of endogenously determined government revenue, which result in reduction in government revenue. In the next exercise, tax rate adjust to eliminate the impact of reduction in tariff rate on government revenue. For welfare analysis, government consumption and investment are fixed in real term. Thus change in household welfare indicates change in welfare of the country. If households are better off after the shock then the country as a whole is better off or vice versa.11
In the analysis of fiscal reforms, fiscal deficit is reduced by reducing government expenditure or increasing government revenue. In the model government budget constraint (Sg = Yg–Cg) is explicitly modelled and deficit is financed by domestic savings from household and firms and foreign savings (CAB) and rest of the saving is used for investment purposes. In the model an identity of saving and investment exists (TI = Sh + SF + Sg + e*CAB), where CAB (foreign savings) and nominal exchange rates are exogenous. Reduction in fiscal deficit releases resources for investment. In simulation with cut in government consumption expenditure, government consumption in real term also adjusts. In this exercise, welfare of the country is roughly measured by summing changes in government expenditure, household consumption expenditure and total investment goods. In simulation with increase in government revenue, tax rate and fiscal deficit adjust keeping government expenditure constant.
For poverty, first poverty line based on basic needs is estimated. It is estimated using micro households data from Households Integrated Economic Survey (HIES) for the year 1990-91. First food poverty line is determined by estimating a log linear function as follows.12
C = α + β Loge E
Where C is adult equivalent calorie intake per day and E is monthly food expenditure per adult equivalent. Basic food requirement is based on 2550 calories per adult equivalent per day. Non-food
11In simulation 1, 2 and 4 welfare of households is measured by Equivalent variation. In these exercises government consumption and total investment are constant in real terms. A positive value indicates households as well as country as whole is better off after policy shock and negative value indicate that households as well as country is worse off. In the experiment with cut in government consumption (simulation 3), government consumption and investment are not constant. We have to take into account all changes to measure welfare of the country. A very rough measure of overall welfare is percentage change in the sum of private consumption, public consumption and total investment.
12For details, see Ercelawn (1990) and Ravallion (1994).

Gender and the Impact of Economic Reforms 627
requirement is defined by taking average expenditure of other items of household 2-percentage point above and below food poverty line. The monetary value of poverty line is obtained by multiplying the quantity with their respective prices as follows
BNP =∑ Ci0 * Pc0i
Where BNP is monetary value of basic needs, C is the amount to satisfy basic need of good i and Pic
is consumer price index of ith good in the base period ‘0’. Using basic need poverty line, FGT indices—Pα class of additively decomposable poverty measures are calculated [Foster, et al. (1984)]. Indices brake down population into subgroups: population below poverty line and above poverty, estimate the gap between actual income and poverty line and severity of poverty. These indices are calculated using following equation
Pα = 1/n ∑{(Z–Y)/Z}.α
Where n is total number of households, Z is basic need poverty line based on basket of commodities required to satisfy basic needs, y is household income. α = 0 for head count ratio, α =1 for poverty gap measure and α =2 measures severity of poverty. Prices are endogenously determined in the model. With change in prices and given quantity of basic needs, monetary value of poverty line is determined before and after the shock [for detail see Decaluwe, et al. (1999)]13 as follows:
∆BNP = ∑Ci0*Pc i1 – ∑C i0*Pc i0
Note: 0 indicates the base year and 1 indicates after the shock. Poverty indicators are estimated using micro data in DAD programme [Duclos, et al. (2001)].
Changes in prices shift poverty line and the change in income of households’ shifts
distribution function (households by income bracket). These two changes determine the change in poverty as well as distribution of households by income groups. To see movement of households from one income bracket to another, the vector of simulated income is obtained by multiplying the base year income vector (taken from HIES-90-91) by the change in mean income of the group of household obtained after the policy shock. Using vectors of base year and post simulation income, density functions (percentage of households in various income brackets) are drawn before and after the shocks. The variations in density function with respect to base period show change in percentage of households within an income bracket and the gap between the rich and the poor before and after the shock.
V. SIMULATION RESULTS
(a) Trade Liberalisation
Since independence, manufacturing sector has been the most protected sector and agriculture the least protected sector. In early eighties, Pakistan has adopted trade liberalisation policies by
13However, poverty analysis approach differs from Decaluwe, et al. (1999) in some aspects, it uses actual
distribution of micro data from HIES instead of assuming beta-distribution [Siddiqui and Kemal (2002)].

Rizwana Siddiqui 628
reducing restrictions such as quotas and value limit and replace with tariff. Later policies directed more towards tariff rationalisation.
Here, trade liberalisation is introduced through tariff rationalisation. Magnitude of the imposed shocks is decided on the bases of historical evidence. Since 1990, tariff rates have been reduced on imports of agriculture, textile and other manufactured goods by 63 percent, 83 percent and 44 percent, respectively. This exercise reveals exclusively the impact of trade liberalisation through tariff reduction. The focus of the results is how economic reforms affect production activities leading to change in time allocation of men and women among market, household and leisure activities, which in turn affects wages, welfare, unemployment and poverty. It also discusses women wages relative to male wage and share of women wage income in total household’s income as a symbol of empowerment.
(a1) Tariff Reduction on Imports without Compensatory Measures
A direct, first effect of reduction in tariff on imports is a drop in domestic prices of imports
and a rise in volume of imports. This leads to many other indirect effects. For instance, consumers switch demand to imported goods from domestically produced goods of import competing sectors, as imported goods are relatively cheaper now.
Import competing sectors become relatively less profitable compared to export oriented sectors. These change boost production in textile and agriculture sectors (export oriented sector, ‘Textile’ is based on agriculture raw material), while import competing sector and non-traded sector (a larger proportion of non-traded sectors goes as intermediates to ‘other manufacturing’ sector) contract.
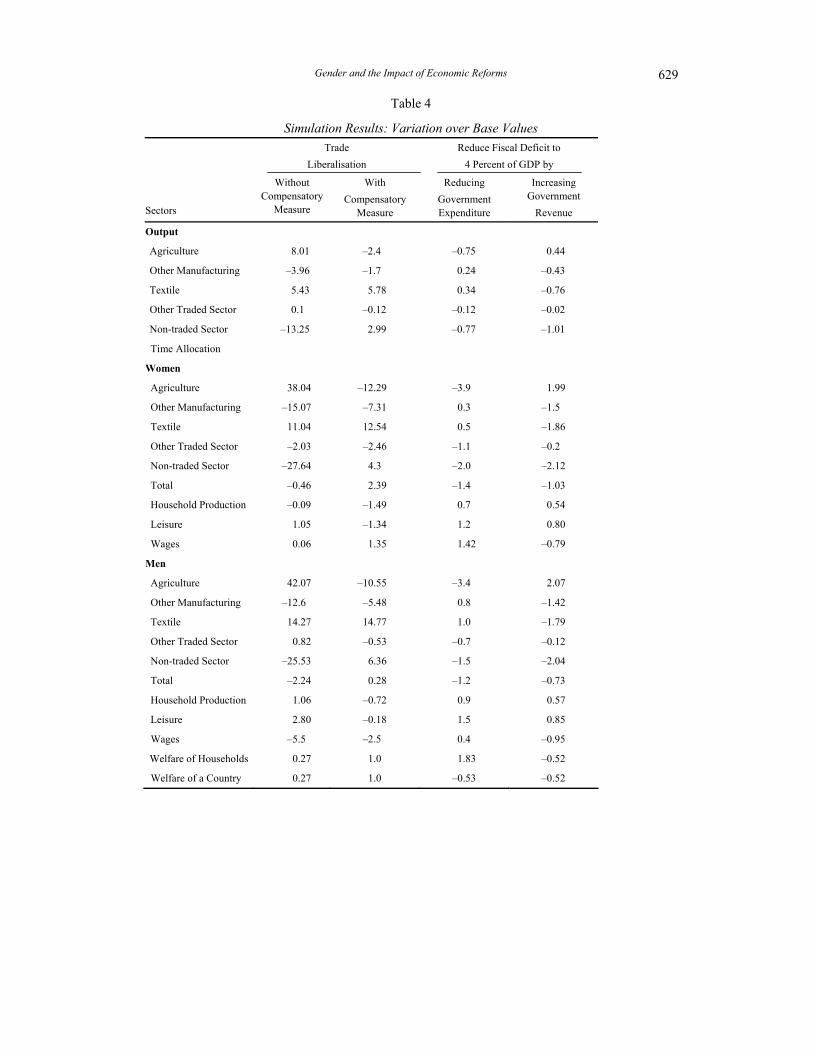
The change in structure of production leads to change in time allocation to market work and non-market work. Labour from import competing sectors and non-trading sectors move toward agriculture and textile. However, labour demand rises for both men and women in expanding sectors but not as much as drop in contracting sectors. Resultantly, aggregate demand for female in market sectors drops by very small amount, 0.5 percent but aggregate demand for male labour in market sectors fall by 2.2 percent (see Table 4).
Table 5 shows that market work declines for both, women and men, from 37.7 percent to 37.5 percent and from 51.9 percent to 50.8 percent, respectively. Household work does not change significantly. However, total working hours for both women and men decline from 79.7 and 62.6 percent to 79.5 and 61.6 percent,
Gender and the Impact of Economic Reforms 629
Table 4
Simulation Results: Variation over Base Values Trade
Liberalisation Reduce Fiscal Deficit to
4 Percent of GDP by
Sectors
Without Compensatory
Measure
With Compensatory
Measure
Reducing Government Expenditure
Increasing Government
Revenue
Output
Agriculture 8.01 –2.4 –0.75 0.44
Other Manufacturing –3.96 –1.7 0.24 –0.43
Textile 5.43 5.78 0.34 –0.76
Other Traded Sector 0.1 –0.12 –0.12 –0.02
Non-traded Sector –13.25 2.99 –0.77 –1.01
Time Allocation
Women
Agriculture 38.04 –12.29 –3.9 1.99
Other Manufacturing –15.07 –7.31 0.3 –1.5
Textile 11.04 12.54 0.5 –1.86
Other Traded Sector –2.03 –2.46 –1.1 –0.2
Non-traded Sector –27.64 4.3 –2.0 –2.12
Total –0.46 2.39 –1.4 –1.03
Household Production –0.09 –1.49 0.7 0.54
Leisure 1.05 –1.34 1.2 0.80
Wages 0.06 1.35 1.42 –0.79
Men
Agriculture 42.07 –10.55 –3.4 2.07
Other Manufacturing –12.6 –5.48 0.8 –1.42
Textile 14.27 14.77 1.0 –1.79
Other Traded Sector 0.82 –0.53 –0.7 –0.12
Non-traded Sector –25.53 6.36 –1.5 –2.04
Total –2.24 0.28 –1.2 –0.73
Household Production 1.06 –0.72 0.9 0.57
Leisure 2.80 –0.18 1.5 0.85
Wages –5.5 –2.5 0.4 –0.95
Welfare of Households 0.27 1.0 1.83 –0.52
Welfare of a Country 0.27 1.0 –0.53 –0.52

Rizwana Siddiqui 630
Table 5
Time Allocation among Market, Household, and Leisure Activities by Gender
respectively. Resultantly, leisure of men and women rises. But the rise of men leisure time is larger than women leisure time, 2.8 percent for men compared to 1.0 percent for women (see Table 4).
Results show that male wage rate decline by 5.5 percent but female wage rate rises by a very small amount 0.1 percent that reduces gender wage gap after the policy shock. Equivalent Variation (EV) shows a little improvement in terms of welfare of household and of the country as a whole, i.e., 0.3 percent over the base run. (a2) Tariff Reduction on Imports in Presence of Compensatory Measure (Adjustment in Taxes on Production)
Since 1990, Pakistan has been introducing general sales tax (GST) on both imports and domestic production along with tariff reduction, which has been standardised at 15 percent. But on a few products it is as high as 20 percent. However, a large number of commodities and services are still exempted from sales tax reducing average tax on imports to 5.6 percent and on domestic production to 5 percent.
Trade liberalisation through tariff reduction results in loss in government revenue and constrains government expenditure or increase fiscal deficit. In the model private saving, firm’s saving and foreign saving finance it. In this experiment, government revenue is fixed and tax rate on production adjusts to compensate for loss in government revenue. A direct, first effect of reduction in tariff on all imports is increase in taxes to compensate for loss in government revenue. The combined effect of tariff reduction and increase in sales tax reduce
Trade Liberalisation
Reduce Fiscal Deficit to 4 Percent of GDP by
Base
Without Compensatory
Measure
With Compensatory
Measure
Reducing Government Expenditure
Increasing Government
Revenue Women Market 37.7 37.5 38.6 37.2 37.3 Households Work 42.0 42.0 41.4 42.3 42.2 Total Working Hours 79.7 79.5 80.0 79.5 79.6 Leisure 20.3 20.5 20.0 20.5 20.4 Total 100.0 100.0 100.0 100.0 100.0 Men Market 51.9 50.8 52.1 51.3 51.5 Household Work 10.7 10.8 10.6 10.8 10.8 Total Working Hours 62.6 61.6 62.7 62.1 62.3 Leisure 37.4 38.4 37.3 37.9 37.7 Total 100.0 100.0 100.0 100.0 100.0

Gender and the Impact of Economic Reforms 631
domestic prices but not as much as in the previous exercise. Change in relative prices boost production in textile and non-trading sectors ‘service-2’ by 5.8 percent and 3 percent, respectively (see Table 4). Output in ‘other manufacturing’ sector drops by 1.7 percent compared to 4 percent in previous exercise. The production in non-traded sector increases in this experiment for two reasons. One import competing sector does not contract as much as in previous exercise. Therefore, its demand as intermediate input does not decline as much as in previous exercise. Second, increase tax makes this sector more profitable relative to other sectors. It boosts demand for labour in these sectors. Demand for female labour rises by 12.5 percent and 4.3 percent in textile and services-2 sectors, respectively. Demand for male labour rises by 14.8 percent and 6.4 percent in these sectors, respectively.
Trade liberalisation in presence of compensatory measure leads to a rise in aggregate demand for labour in the market sectors for women by 2.4 percent and for men by 0.3 percent. The increase in demand is fulfilled by increase supply of labour for both men and women from non-market sector; household social reproduction and leisure (see Table 4). Table shows that female labour in household production drops by 1.5 percent and in leisure 1.3 percent. On the other hand rise in demand for male labour in marketed sectors is fulfilled by increase supply of male labour from household production where demand for their labour reduced by 0.7 percent and their leisure time by 0.2 percent.
The results show that trade liberalisation in presence of increase in sales taxes leads to a rise in total working-hour increases for both men and women to 80 percent and 62.7 percent from 79.7 and 62.6 percent, respectively. The results suggest that impact trade liberalisation in presence of compensatory measure is not gender neutral. It over burden women as it reduces women’s leisure time from 20.3 to 20 percent of total available time. On the other hand, men’s leisure time reduces from 37.4 percent in a day to 37.3 percent.
Wage rate for women rises by 1.4 percent and for men drops by 2.5 percent. In result gender wage gap reduces after the policy shock. Equivalent Variation (EV) increases (by 1 percent), which shows households as well as country are better off after simulation in terms of income and consumption. (b) Change in Fiscal Policies
Under the rubric of SAP, Pakistan is recommended to bring fiscal deficit to the level of 4 percent of GDP. Government tries to achieve the objective through additional resource mobilisation and expenditure restraint through austerity measure. In this set of experiments, chosen policy variables are total government expenditure and government revenue, which are used alternatively to reduce fiscal deficit using different closure rules. (b1) Cut in Government Consumption to Bring Fiscal Deficit to 4 Percent of GDP
In this exercise, government final consumption expenditure is reduced by 8 percent to bring fiscal deficit to 4 percent of GDP from 5.4 percent of GDP in the base year. It leads to reduction in government expenditure on service-1 and in service-2 by 8 percent. Price deflator for public

Rizwana Siddiqui 632
consumption is kept fixed. Real government consumption adjusts. First impact is that fiscal deficit reduces. Reduction in fiscal deficit releases resources for investment and/or for private consumption, as household saving rate is determined endogenously. Thus there is a shift of resources from government consumption to investment and private consumption.
The relative change in prices shifts mobile factors of production, female and male labour, from services and agriculture sector to manufacturing. But aggregate demand for both male and female labour drops by 1.2 percent and 1.4 percent respectively in the market sectors (see Table 4). Household substitute household produced goods for market goods. This leads to a rise in demand for female labour in household production by 0.7 percent and for male labour by 0.9 percent. Table 5 shows that after the shift from market to household economy, total working hours of women and men have reduced from 79.7 percent to 79.4 percent and from 62.6 percent to 62.1 percent, respectively.
The results also show that wage rate for men and women rises by 0.4 percent and 1.4 percent, respectively. Resultantly, the gap between male and female wage reduces after the shock. Households are better off as equivalent variation (EV) rises by 1.8 percent but at the expense of government consumption, which reduces by 8 percent. Aggregate change of (–0.5) percent in household consumption, investment and government consumption shows that country is worse off after the shock. (b2) Increase Government Revenue to Bring Fiscal Deficit to 4 Percent of GDP
In this experiment, government revenue is increased by 7.5 percent to bring fiscal deficit to 4
percent of GDP and let tax rate to adjust. Resultantly, tax rate increases by 0.6 percent that lead to rise in domestic prices of domestically produced goods and imported goods that increase cost of living. These changes in policies have a big impact on household budgets.
Resources move towards agriculture sector where prices rise by higher percentage (where tax was very low in base period) than in manufacturing and services sectors. Demand for labour rises for both, women and men, in the expanding sector ‘agriculture’ and falls in all other sectors. Aggregate demand for labour drops by 1 percent and 0.7 percent for women and men in market sectors, respectively (see Table 4). In result, household income drops and household demand for household produced good rises as household substitute it for market goods. Demand for female labour rises for household production by 0.5 percent and demand for male labour by 0.6 percent. In this experiment, working hours for both men and women declines (see Table 5). Leisure of men rises more than women, 0.85 percent compared to 0.80 percent.
The results show that nominal wage rate for women fell by 0.8 percent and for men by 1.0 percent. In result gender wage gap reduces after the policy shock. Households as well as country’s welfare reduce by 0.5 percent.

Gender and the Impact of Economic Reforms 633
(c) Unemployment, Poverty, and Inequality
The objective of structural adjustment programme and stabilisation programme has been to improve efficiency, achieve higher level of output and reduce imbalances in the economies. The impact of these programme have significant implications for employment, poverty and income distribution. From the above discussion of the simulation results, it becomes clear that trade liberalisation in presence of compensatory measures change composition of employment and overburden women by increasing market work. Results also reveal that gender division of labour remains unequal in all exercises. But its implications for unemployment and poverty are not clear yet.
Although model is developed by allocating time to three types of activities, market, households and leisure. But impact on unemployment can be calculated indirectly out side the model assuming that any change in employment in market sector would add to or subtract from unemployed persons. Using average working hours (market) per day of an employed person in the market in the base year and change in total working hours in the market after the shock, the change in number of employed persons is calculated. Table 6 shows that unemployment rate among women and men increases in all exercises except in exercise-2 ‘Trade Liberalisation in Presence of Compensatory Measures’. In this experiment, unemployment rate for women becomes negative after the shock implying that trade liberalisation in presence of compensatory measures generate a large number of employment opportunities for women. Unemployment among men also reduces to 2.3 percent from 2.6 percent in the base year (see Table 6).
F-G-T indices of poverty are estimated using micro household data12. Using percentage change in household income after each policy shock and vector of income in the base year from HIES, a new vector of income is determined. Using these vectors of income density functions are drawn (see Figure 1). The results show that after each simulation poverty line as well as density function shifts showing the change in percentage of households in each income group. Change in poverty line shifts poverty line and change in income shifts density function. Variations in density are drawn on the basis of shift in density function after the policy shocks. Figure 2 shows a movement of households from the higher income bracket (500 and 1000)
Table 6
Effects of Economic Reforms on Unemployment and Poverty
Trade Liberalisation
Reduce Fiscal Deficit to 4 percent of GDP by
Unemployment Base
Without Compensatory
Measure
With Compensatory
Measure
Reducing Government Expenditure
Increasing Government
Revenue Women 9.7 12.1 –1.8 16.4 14.6 Men 2.6 4.6 2.3 3.7 3.3 Total Unemployment 3.6 5.8 2.1 5.4 4.8 Poverty Poverty Line 280.4 276.7 269.6 279.4 282.1 Head Count 30.0 30.1 29.6 30.6 31.2 Gap 6.6 6.6 6.5 68 6.9 Severity 2.1 2.1 2.1 2.2 2.2

Rizwana Siddiqui 634
Fig. 1. Density Function
Fig. 2. Variation in Density Function
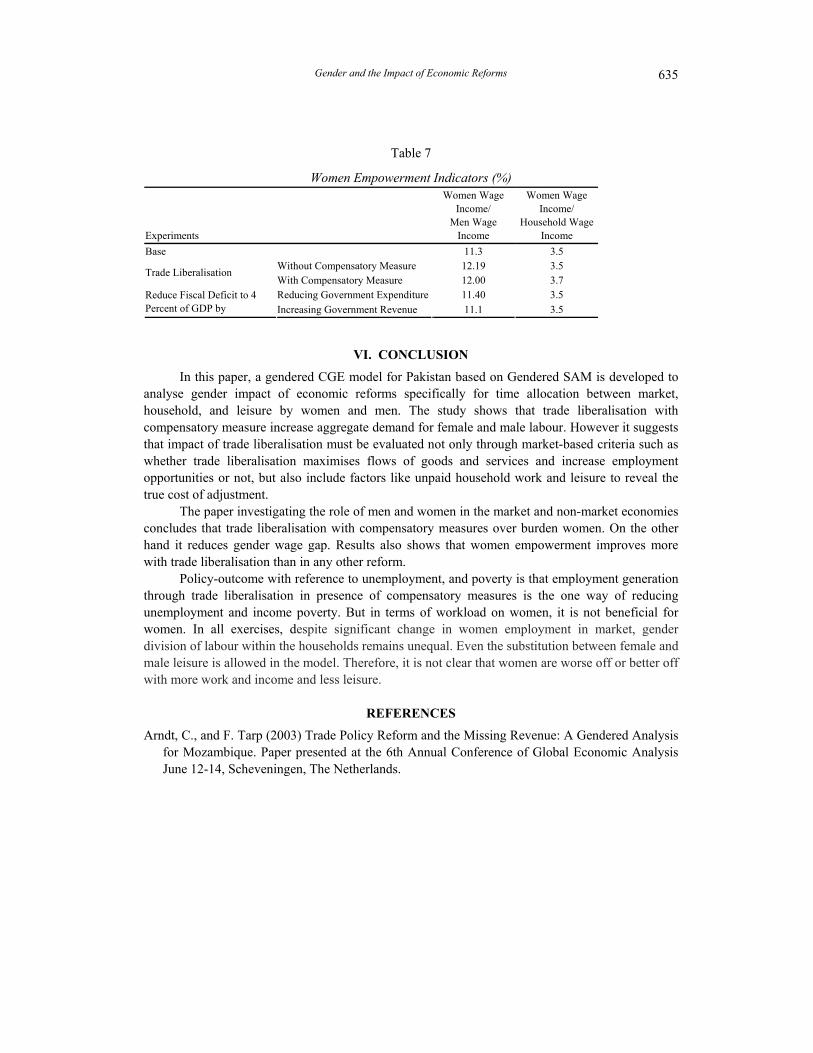
A few words for women empowerment: generally, women empowerment is linked with their
income.13 With the rise in women income, it is deduced that women is getting empowerment. Table 7 shows that women wage income relative to men wage income increases in all exercises except in exercise-4, where it reduces. The share of women wage income in total household income rises only in the second exercise ‘Trade Liberalisation with compensatory measure’s. From this we conclude that women empowerment improve with the trade liberalisation in presence of compensatory measures as both indicators show improvement in women empowerment. But in depth analysis require including more variables than just income. This needs to be explored further.
–0.0005
0
0.0005
0.001
0.0015
0.002
0.0025
0.003
–1000 –500 0 500 1000 1500 2000 2500Income Groups
Households
BaseSim 1Sim 2Sim 3
Sim 4
–0.00015
–0.0001
–0.00005
0
0.00005
0.0001
0.00015
0.0002
0.00025
0 500 1000 1500 2000 2500
Income
Diff
eren
ces
0 Variation Variation 1 Variation 2Variation 3 Variation 4
Gender and the Impact of Economic Reforms 635
Table 7
Women Empowerment Indicators (%)
Experiments
Women Wage Income/
Men Wage Income
Women Wage Income/
Household Wage Income
Base 11.3 3.5 Without Compensatory Measure 12.19 3.5 Trade Liberalisation With Compensatory Measure 12.00 3.7 Reducing Government Expenditure 11.40 3.5 Reduce Fiscal Deficit to 4
Percent of GDP by Increasing Government Revenue 11.1 3.5
VI. CONCLUSION
In this paper, a gendered CGE model for Pakistan based on Gendered SAM is developed to analyse gender impact of economic reforms specifically for time allocation between market, household, and leisure by women and men. The study shows that trade liberalisation with compensatory measure increase aggregate demand for female and male labour. However it suggests that impact of trade liberalisation must be evaluated not only through market-based criteria such as whether trade liberalisation maximises flows of goods and services and increase employment opportunities or not, but also include factors like unpaid household work and leisure to reveal the true cost of adjustment.
The paper investigating the role of men and women in the market and non-market economies concludes that trade liberalisation with compensatory measures over burden women. On the other hand it reduces gender wage gap. Results also shows that women empowerment improves more with trade liberalisation than in any other reform.
Policy-outcome with reference to unemployment, and poverty is that employment generation through trade liberalisation in presence of compensatory measures is the one way of reducing unemployment and income poverty. But in terms of workload on women, it is not beneficial for women. In all exercises, despite significant change in women employment in market, gender division of labour within the households remains unequal. Even the substitution between female and male leisure is allowed in the model. Therefore, it is not clear that women are worse off or better off with more work and income and less leisure.
REFERENCES
Arndt, C., and F. Tarp (2003) Trade Policy Reform and the Missing Revenue: A Gendered Analysis for Mozambique. Paper presented at the 6th Annual Conference of Global Economic Analysis June 12-14, Scheveningen, The Netherlands.

Rizwana Siddiqui 636
Cagatay, N. (1995) Feminisation of the Labour Force: The Effects of Long Term Development and Structural Adjustment. World Development 23:11, 1883–94.
Decaluwe, B., A. Patry, L. Savard, and E. Thorbecke (1999) Poverty Analysis within a General Equilibrium Framework. University Laval. (CREFA Working Papers No. 9909.)
Duclos J. Y., and A. Araar et Carl Fortin (2001) DAD-4: A Software for Distributional Analysis /Analyse Distributive, MIMAP Programme, International Development Research Centre, Government of Canada and CREFA, University of Laval.
Elson, D. (1995) Gender Awareness in Modelling Structural Adjustment. World Development 23:11, 1851–68.
Ercelawn, A. (1990) Absolute Poverty in Pakistan: Poverty Lines, Incidence, Intensity, Applied Economic Research Centre, University of Karachi. (Draft Paper.)
Evans, D. (1972) A General Equilibrium Analysis of Protection: the Effects of Protection in Australia. Amsterdam: North Holland.
Fofana, I., J. Cockburn, and B. Decaluwe (2003) Modelling Men and Women Work in a Computable General Equilibrium Applied to Nepal. Canada: University of Laval.
Fontana, M. (2001) Modelling the Effects of Trade on Women: The Case of Zambia. Institute of Development Studies, Brighton, Sussex, UK. (IDS Working Paper No. 139.)
Fontana, M. (2002) Modelling the Effects of Trade and Women: A Closer Look at Bangladesh. Institute of Development Studies, Brighton, Sussex, UK. (IDS Working Paper No. 139.)
Fontana, M. (2003) Modelling the Effects of Trade on Women, at Work and at Home: A Comparative Perspective. International Food Policy Research Institute Washington, D. C. USA. (TMD Discussion Paper No. 110.)
Fontana, M., and A. Wood (2000) Modelling the Effects of the Trade on Women, At Work and At Home. World Development 28:7, 1173–90.
Foster, J., J. Greer, and E. Thorbecke (1984) A Class of Decomposable Poverty Measures. Econometrica 52:3, 761–766.
Kabeer, N. (2003) Gender Mainstreaming in Poverty Eradication and the Millenniums Development Goals: A Handbook for Policy-makers and other Stakeholders’ Commonwealth Secretariat, IDRC, Canada.
Lim, L. (1996) More and Better Jobs for Women: An Action Guide. Geneva: ILO. Moser, C. O. N. (1989) Gender Planning in the Third World: Meeting Practical and Strategic
Gender Needs. World Development 17:11, 1799–825. Pakistan, Government of (1991) Labour Force Survey. Islamabad: Federal Bureau of Statistics. Pakistan, Government of (Various Issues) Labour Force Survey. Islamabad: Federal Bureau of
Statistics. Pyatt, G. (1990) Accounting for Time Use. Review of Income and Wealth Series 36:3,1: 33–52. Pyatt, G. (1996) Accounting for Income and Wealth. Presented in Economic Research Seminars
Series, ISS, The Hague, The Netherlands. Ravallion, M. (1994) Poverty Comparisons. Harwood Academic Publisher. Sathar, Z., and S. Kazi (1997) Women’s Autonomy, Livelihood and Fertility: A Case Study of Rural
Punjab. Islamabad: Pakistan Institute of Development Economics.

Gender and the Impact of Economic Reforms 637
Siddiqui, R., R. Siddiqui, Z. Iqbal (1999) The Impact of Tariff Reforms on Income Distribution in Pakistan: A CGE-based Analysis. The Pakistan Development Review 38:4, 789–804.
Siddiqui, R., and A. R. Kemal (2002) Remittances, Trade Liberalisation, and Poverty in Pakistan: The Role of Excluded Variables, in Poverty Change Analysis. DFID, UK.
Siddiqui, R., and I. Zafar (1999) Salient Features of Social Accounting Matrix of Pakistan for 1989-90. Pakistan Institute of Development Economics, Islamabad, Pakistan. (MIMAP Technical Paper Series No. 1.)
Siddiqui, R., and I. Zafar (2001) Tariff Reduction and Functional Income Distribution in Pakistan: A CGE Model. Pakistan Institute of Development Economics, Islamabad, Pakistan. (MIMAP Technical Paper Series No. 10.)
Siddiqui, R., and R. Siddiqui (1998) A Decomposition of Male-Female Earnings Differentials. The Pakistan Development Review 37:4, 885–98.
Siddiqui, R., S. Hameed, R. Siddiqui, N. Akhtar, and G. Y. Soomro (2001) Gender Dimensions of the Impact of Macroeconomic Policies (A Case Study of Pakistan), Study prepared under the Project of Gender Planning Network.
Siddiqui, R., S. Hameed, R. Siddiqui, and N. Akhtar (2003) Gender and Adjustment Policies: Evidence from Pakistan. In Swapna Mukhopadhyay and Ratna M. Sudershan (eds.) Tracking Gender Equality under Economic Reforms, Continuity and Change in South Asia. 153–95. Jointly published by IDRC, Canada and Kali for Women, India.
Sinha, A. N. Sangita (2003) Gender in a Macroeconomic Framework: A CGE Model Analysis. In Swapna Mukhopadhyay and Ratna M. Sudershan (eds.) Tracking Gender Equality under Economic Reforms, Continuity and Change in South Asia. 321–63, jointly published by IDRC, Canada and Kali for Women, India.
UNDP (1995) Human Development Report. New York and Oxford: Oxford University Press. White, H., and E. Masset (2002) Child Poverty in Vietnam: Using Adult Equivalence Scales to
Estimate Income-Poverty for Different Age Groups. Young Lives, An International Study of Childhood Poverty. (Working Paper No. 6.)
World Bank (2001) Engendering Development: Through Gender Equality in Rights, Resources, and Voice. Washington, D.C. USA. (World Bank Policy Research Report.)