Household Composition Timeline
14
10.1177/1538513203253653 ARTICLE FIELD METHODS McIlvaine-Newsad et al. / HOUSEHOLD COMPOSITION TIMELINE Household Composition Timeline HEATHER MCILVAINE-NEWSAD Western Illinois University AMY SULLIVAN MICHAEL DOUGHERTY University of Florida Those who conduct applied field research cannot ignore the importance of the household as a unit of analysis. Academics and practitioners alike have written a great deal about the prominence of households around the world and throughout history. One of the difficulties often encountered with using the household as a unit of analysis is how best to compare households for the purpose of making relevant sug- gestions for how they might best reach their goals. This article introduces a tool to document how households are affected by changes in variables such as composition, economics, politics, and the natural environment. The article provides a step-by-step methodology for documenting household composition and other changes a house- hold may experience over time. The methodology is then applied to a case study in which the benefits and drawbacks of this approach are discussed. Keywords: participatory research, agriculture, gender, household composition, methodology, farming systems Those of us who conduct field research cannot ignore the importance of the household unit. This unit of analysis is central both to the people we work with and the theoretical development of the discipline(s) we practice (Barnard and Good 1984). Because of the prominence of households cross- culturally and through time, we must be able to draw comparisons if we wish to comment on how households are affected by changes in variables such as composition, economics, politics, and the natural environment. To do this effectively, we must establish a set of rules granting us the flexibility to record and analyze households across cultures. The purpose of this article is to explain a method developed primarily for applied researchers to record and track household structural changes over time. More specifically, we are interested in these changes and how subse- quent modifications in consumption requirements and resource availability affect livelihood strategies in agricultural household units in rural communi- ties in developing countries. Field Methods, Vol. 15, No. X, Month 2003 1–14 DOI: 10.1177/1538513203253653 © 2003 Sage Publications 1
Transcript of Household Composition Timeline

10.1177/1538513203253653 ARTICLEFIELD METHODSMcIlvaine-Newsad et al. / HOUSEHOLD COMPOSITION TIMELINE
Household Composition Timeline
HEATHER MCILVAINE-NEWSADWestern Illinois University
AMY SULLIVANMICHAEL DOUGHERTY
University of Florida
Those who conduct applied field research cannot ignore the importance of thehousehold as a unit of analysis. Academics and practitioners alike have written agreat deal about the prominence of households around the world and throughouthistory. One of the difficulties often encountered with using the household as a unit ofanalysis is how best to compare households for the purpose of making relevant sug-gestions for how they might best reach their goals. This article introduces a tool todocument how households are affected by changes in variables such as composition,economics, politics, and the natural environment. The article provides a step-by-stepmethodology for documenting household composition and other changes a house-hold may experience over time. The methodology is then applied to a case study inwhich the benefits and drawbacks of this approach are discussed.
Keywords: participatory research, agriculture, gender, household composition,methodology, farming systems
Those of us who conduct field research cannot ignore the importance of thehousehold unit. This unit of analysis is central both to the people we workwith and the theoretical development of the discipline(s) we practice(Barnard and Good 1984). Because of the prominence of households cross-culturally and through time, we must be able to draw comparisons if we wishto comment on how households are affected by changes in variables such ascomposition, economics, politics, and the natural environment. To do thiseffectively, we must establish a set of rules granting us the flexibility torecord and analyze households across cultures.
The purpose of this article is to explain a method developed primarily forapplied researchers to record and track household structural changes overtime. More specifically, we are interested in these changes and how subse-quent modifications in consumption requirements and resource availabilityaffect livelihood strategies in agricultural household units in rural communi-ties in developing countries.
Field Methods, Vol. 15, No. X, Month 2003 1–14DOI: 10.1177/1538513203253653© 2003 Sage Publications
1

THE HISTORY OF KINSHIP CHARTS
The study of kinship and household composition has long fascinatedanthropologists. The kinship studies by Maine (1861), McLennon (1865),and Morgan (1871) established the cornerstone for what has become anexhaustive body of literature on kinship and household composition (e.g.,Fortes and Evans-Pritchard 1940; Hammel 1961; Fox 1967; Netting, Wilk,and Arnold 1984). The preoccupation of early anthropologists with kinshipgrew out of an interest in understanding the social organization of so-calledprimitive societies. These anthropologists were interested not only in house-holds, marriage, and family but also in the creation of social, economic, andpolitical ties through reproduction and descent (Strathern 1994:270). Today,in many non-Western societies, kinship remains an important componentthat influences production systems, rules and patterns of exchange, access toresources, and political organization.
Beginning with Malinowski (1913), anthropologists began to investigateother cultures from an emicor insider’s perspective. Kinship studies with cul-turally constructed kin relations—not necessarily biologically based—offered anthropologists a reliable tool for investigating the social organiza-tion of “primitive” cultures. Since its inception in the early 1900s, the studyof kinship has undergone radical changes in its theoretical orientation.Among the most important of these transformations has been the attentiongiven to process over structure, to epistemic science over objective science,and to the whole rather than the part (Capra, Steindl-Rast, and Matus 1991).The focus on the process of the reproduction of notable structures in the late1950s and 1960s led to the notion of the development cycle of domesticgroups (Goody 1958). This new focal point allowed for a better understand-ing of the dynamic processes of domestic or family units. The differing rolesand responsibilities of men and women within the household became moreprominent, and women were credited with responsibilities previously over-looked by researchers and field practitioners. This new focus on the domesticor household domain as a unit of analysis led to more precise definitions ofthe terms family and household. As pointed out by Henrietta Moore (1988),“The family and household are two terms which are particularly difficult toseparate clearly” (p. 54).
Nowadays, most anthropologists continue to interchange the terms familyand household, although they often mark a conceptual distinction betweenfamily as the kinship group and household as a group of people who contrib-ute to the survival of a domestic unit. For our own research, we have definedthe household as a residential unit, where the members share domestic func-
2 FIELD METHODS

tions and activities—a group of people who “eat out of the same pot” or who“share the same bowl” (Brydon and Chant 1989). Individuals who are notphysically present but contribute to or draw from the household are also con-sidered members.
In the 1960s and 1970s, scholars published many articles on various waysof recording and analyzing household structural change over time (Hammel1961; Handwerker 1973, 1977; Hammel and Laslett 1974; Brown 1977), butin the past two decades, the interest in kinship and household studies haswaned. Although academic interest has declined, the core methodologydeveloped during the 1960s and 1970s is still relevant today. Kinship studieshave not disappeared; rather, researchers have shifted their focus from kin-ship as a descriptive tool to kinship as an analytical tool. Meillassoux (1981)used kinship as an analytical tool explaining political economies, while Col-lier and Rosaldo (1981), Ortner and Whitehead (1981), and Kabeer (1994)were primarily interested in how gender and gender relations within house-holds were related to a larger picture of gender inequality.
Kinship charts show the relationships between individuals within largekinship groups, beyond the household level. However, traditional kinshipcharts were not conceptualized to present the time frame of the householddepicted. Hammel and Laslett (1974:106, fig. 31) provide an example of theattempts that have been made to represent time by writing in the dates of rele-vant events next to the specific elements on the kinship charts. In Hammel’s1972 article, “The Zadruga as Process,” he manipulates traditional kinshipcharts to map the seventy different types of work groups that he identifiesfrom a Serbian census. In his own words, Hammel admitted, “The procedurefor reconstruction is, of course, only a crude one” (1972:352). While boththese examples offer useful manipulations of traditional kinship charts, nei-ther uses a timeline representing the entire life cycle of the household.
As applied researchers, we were interested in examining the entire lifecycle of a household unit for the purpose of identifying labor and consump-tion patterns. The main goal of Hammel and Laslett’s (1974) work was notthe same. Thus, while the work of other scholars has contributed much to kin-ship studies, we have been unable to find any methodology that incorporatesthe entire time frame of a household into kinship charts, allowing researchersand others to easily identify changes in household composition over time.
The technique we propose uses a practical approach of incorporating timeinto kinship charts. As such, this article continues to build on the kinship andhousehold composition literature by providing researchers and field practi-tioners with a simple model for recording and analyzing householdcompositional change over time.
McIlvaine-Newsad et al. / HOUSEHOLD COMPOSITION TIMELINE 3

RATIONALE FOR HOUSEHOLDCOMPOSITIONAL TIMELINES
Traditional kinship charts, because they do not incorporate time, fail toadequately represent the dynamic nature of household composition. Whereasthey provide us with a snapshot of household composition at a given period,they do not give us the ability to view longitudinal changes in householdcomposition. Our rationale for developing household composition timelines(HHCT) is somewhat different.
The HHCT technique described here illustrates some of the conditionsthat influence livelihood strategies attempted by households. Since house-hold composition is an important factor governing household behavior, weneed a method to map changes in household composition over time. Thisallows us to better understand the challenges facing households at differentstages in their life cycle.
In addition to representing the membership of the household at any giventime, including attributes such as age, gender, and kinship, HHCT includes alongitudinal component. This allows researchers to document the path ahousehold has taken to its current state. HHCT rearranges the kin chart to addinformation as to when each member enters and leaves the household.Although this information may be recorded by annotating traditional kinshipcharts, it becomes visually cluttered and difficult to interpret. HHCT uses atimeline to more intuitively represent membership changes over time.
WHY IS HOUSEHOLD COMPOSITION CRITICAL?
Several decades ago, A. V. Chayanov (1966) illustrated the importance ofhousehold composition in the production decisions of agricultural house-holds. His work clearly shows how household composition affects householddecision making. His work with Russian peasants demonstrated how house-hold decisions are influenced by resources availability, activities, and theirown objectives (see Figure 1).
Since labor is one of the most important resources for rural households,documenting compositional changes over time is critical in understandinglabor availability. For many subsistence households, the primary objective isthe reproduction of the unit. To meet this objective, the household must atleast meet its subsistence requirement, which is determined by the culturalnorms governing acceptable consumption levels, given the age and sex ofeach household member. The production activities undertaken by the house-
4 FIELD METHODS

hold are determined by the objectives of the household and the resourcesavailable.
As applied researchers, we are interested in understanding household pro-duction decisions. These decisions can be analyzed only by studying thehousehold livelihood process. As illustrated above, household compositionis critical in explaining why households do what they do. We developed thistechnique to provide other researchers and practitioners with a method thatallows them to easily document household composition changes over time.
RULES FOR HOUSEHOLD COMPOSITION TIMELINES
In this section, we will construct an HHCT and explain the rules used tobuild one. Many of the rules for building HHCTs have been borrowed fromtraditional kinship charts. Our original intent was to simply modify tradi-tional kinship charts by adding a timeline. We made every effort to maintainthe standards used in constructing kinship charts. Many kinship chart ruleshad to be modified to reflect the arrival and departure of household members.Figure 2 is an HHCT representing a hypothetical household.
The rules listed below were used to construct the HHCT in Figure 2.
1. A timeline representing the time period of interest is drawn across the top ofthe diagram.
2. Each person is represented by a symbol located beneath the date he or sheenters the household.
3. Males are represented by triangles; circles represent females.4. People not born into the household must have their age designated inside their
symbol.
McIlvaine-Newsad et al. / HOUSEHOLD COMPOSITION TIMELINE 5
FIGURE 1Chayanov’s (1966) Basic Framework of Household Production
5. Each person occupies a single line; only one person per line.6. Household head or ego is designated by a shaded symbol.7. Each person has a dotted lifeline drawn from the right side of their symbol to
indicate continuance in hypothetical household up to the date that they exitthe household.
8. A letter is used to signify reason for departure (e.g., D for death or M formigration).
9. Descendants are always listed below those from whom they have descended.If deemed necessary by the researcher, a dashed line could be used to denotethe particular type of relationship that the new member of the household hasto the main caregiver (e.g., adopted son to adopted mother).
10. Kinship lines are drawn from the bottom of the symbol.11. Each mother has an offspring line, connecting the mother to her children. If
the researcher deems it necessary to represent the kinship from the father tochildren (as may be the case in male adoption of a sister’s child), the chart maybe modified to reflect this reality.
12. Marriage or some type of adult union is represented by a double solid line (=).
The example presented here implements the basic rules listed above inconstructing an HHCT for a hypothetical household. This timeline beginswith household formation in 1980 and continues until 1990, as indicated byRule 1. In accordance with Rule 3, the male is represented by a triangle andthe female by a circle. Rule 4 states that individuals not born into the house-
6 FIELD METHODS
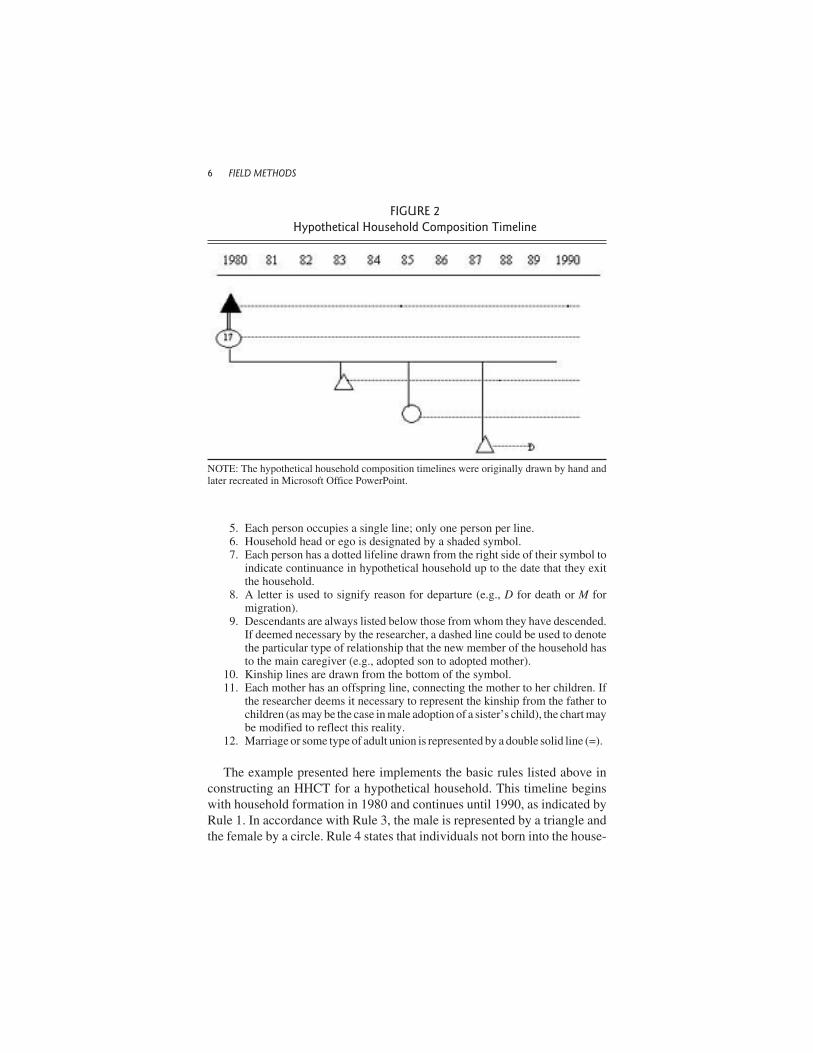
FIGURE 2Hypothetical Household Composition Timeline
NOTE: The hypothetical household composition timelines were originally drawn by hand andlater recreated in Microsoft Office PowerPoint.

hold have their age when entering the household placed inside the symbol. InFigure 2, the female was not born into the household and therefore her age isplaced inside her symbol. Each person occupies a single line as required byRule 5. The symbol representing the male is shaded to indicate that he is thehead or ego of the HHCT (Rule 6). A dotted line is drawn across the timelinefor each individual denoting his or her presence in the household (Rule 7).
Notice that the head of household is present from 1980 through 1990. Themale head and female formed a household in 1980, either by formal marriageor some other form of adult union. A double solid line is used to represent thisadult union as indicated by Rule 12. The HHCT indicates that three childrenhave been born to the head of household and the female. The first child, amale (triangle), was born in 1983. The second child, a female (circle), wasborn in 1985, and the third child, a male (triangle), was born in 1987.
And note that the symbol for each child is located beneath the date theyenter the household (Rule 2). Since these children have been born into thehousehold, no age is indicated inside their symbol (Rule 4). Their ages can becalculated at any given point by referring to the timeline. Each of these chil-dren is connected to their biological mother by a solid line (Rule 11). Thisline is drawn from the bottom of the biological mother to the top of each child(Rule 10). Since the children are descended from the household head and theadult female, the children are placed below their parents (Rule 9). Notice fur-ther that the youngest child, male, born in 1987, died in 1989. This is signifiedby the D placed beneath 1989 and terminates the dotted lifeline for that indi-vidual (Rule 8). Codes such as D for deceased can be created as needed toindicate reasons for departure from the household.
This simple hypothetical example illustrates the construction of a basicHHCT. The flexibility of this technique will be demonstrated in the follow-ing section through the use of a much more complex household taken fromactual data.
METHOD
The data used in the following example were collected in 1998 by AmySullivan in Senegal. She used direct observation and informal interviews togather information about changes in household composition over time. Keydata collected include culturally acceptable behavior regarding marriage,social relationships, and religious practices.
Households in this area are traditionally structured around the familypatriarch. This is a polygamous society in which multiple wives are present,usually within the same family compound. Data collected included the age,
McIlvaine-Newsad et al. / HOUSEHOLD COMPOSITION TIMELINE 7

gender, and relationships of all members who contributed to or consumedfrom the unit. These data included (1) the age of the head of household whenhe married his first wife; (2) the ages of any subsequent wives upon theirentry into the household; (3) the frequency, spacing, and entry points of allchildren; (4) instances (gender and age) of infant mortality; (5) age at whichdaughters are married “out of the household” or (6) at which sons leave homefor school or military, (7) to establish their own family, or (8)to work off-farm. These data were compiled to create household timelines.
Sullivan used HHCT to illustrate trends in household resource consump-tion (number, age, gender of each mouth to feed) and household resource(labor, remittances) availability. These conditions were ultimately convertedto data from which linear programming models were constructed. All house-hold activities were quantified to produce a model of the household liveli-hood system. (Livelihood systems refers to the entire range of activities avail-able to a household.) The model was then operationalized to simulatelivelihood strategies at different points in the life cycle of the household. Theresults were analyzed by posing “What if?” questions, concerning possibleadoption of improved agricultural technologies, to the model. Quite simply,household composition—as the main determinant of household labor avail-ability and consumption requirements—was critical to the household’s abil-ity to adopt new technologies.
Households in two subsistence-farming communities were examined tocreate household timelines. The dynamic nature of households is illustratedby these timelines that were used to create modified Chayanovian consumer-to-producer ratios. Each household timeline was used to create an age matrix,reflecting the age of each member of the household at any point in time sincehousehold inception. A consumer-to-producer ratio, based on individualenergy requirements in kilocalories, aggregated to the household level, wasderived from this matrix and graphed for each household. In other words,rather than graphing the ratio of consumers to producers in terms of either/or,male/female, or adult/child, thereby losing variation due to gender, age, andphysical activity level, this modification accounts for that variation withinthe household. As such, it is more indicative of existing conditions.
CASE STUDY
Both households in this case study belong to communities of subsistencefarmers. In addition to crop production activities, various domestic tasks con-sume the limited resources of these households. Men produce upland cereal
8 FIELD METHODS

grain and pulse crops, while women typically focus on rice, specialty crops,and domestic activities within the household. The limited use of improvedtechnologies and a distinct gendered division of labor characterizes their sub-sistence activities.
Household A was formed in 1973 when the male head took his wife. Asindicated by the HHCT, he was twenty-four years old and his wife was seven-teen at the time of the union. Their first child, a son, was born in 1974, fol-lowed by two more sons born in 1977 and 1979, respectively. The couple’sfirst daughter was born in 1983, followed by two more girls in 1986 and 1990.As indicated, the oldest son left home for the university in 1995, at agetwenty, and returned to the village in 1998 (see Figure 3).
Household B was formed in 1954 when the male head took his first wife.Their first child, a son, was born the following year. In 1957, the head took hissecond wife, who bore him his second and third child in 1959 and 1961,respectively. His fourth child, a daughter by his first wife, was born in 1962.By 1980, he had six more children, for a total of ten—six sons and fourdaughters. His sons were twenty-four, eighteen, fifteen, ten, seven, and twoyears old at that time. By this point, his two oldest daughters had left hishousehold as the result of their own marriages. Two children in the householdin 1980 were under five years old.
In 1980, the male head took a third wife, who bore him a child the follow-ing year. In 1984, his second-oldest son left the village and joined the mili-tary. Two years later, an adult nephew moved into the village and joined hisuncle’s household. The next child of the male head was born to the third wifein 1987, the year before his third son left the village for paid employment (seeFigure 4).
By 1990, when the fourth son left the village to seek employment, thehearth-hold (those physically present) consisted of the head; his three wives;an eighteen-year-old son; a fifteen-year-old daughter; a twelve-year-old son;daughters age ten, eight, and three; his nephew; and his nephew’s wife. Atthis time, he was receiving remittances from two of his four sons who hadmoved out of the village.
By drawing a vertical line down the HHCT from 2000, we see that in addi-tion to the male head of household and his three wives, the hearth-hold con-sisted of a twenty-six-year-old son, his wife, and infant; a twenty-year-oldson; two daughters age twelve and six, a three-year-old son; and his nephew’sfamily with four children.
Once constructed, an HHCT can be used as a guide to query householddecision makers as to strategies used during periods of high stress (limitedfemale or male labor, many children, older households) or during times of
McIlvaine-Newsad et al. / HOUSEHOLD COMPOSITION TIMELINE 9

relatively high labor availability. Households in developing countries oftenmanipulate household composition itself as a strategy. For example, the malehead of household in household B had ample male labor for agriculturalactivities and was able to send his sons in search of outside employment fromwhich he still collects remittances. Also in household B, the acquisition of athird wife added female labor to the household, which freed the first twowives for more agricultural production activities.
10 FIELD METHODS
FIGURE 3Household Composition Timeline A

FEASIBILITY: LIMITATIONS AND ADVANTAGES
The HHCTs presented here are not a replacement for traditional kinshipcharts. Kinship charts concisely describe kin relationships between individu-als within large kinship groups beyond the household level. HHCTs, as wehave structured them, focus solely on the kin relationships within the house-hold unit over time. Therefore, HHCTs are not a very effective tool for illus-trating lineage, descent, and other kinship ties over time beyond the house-hold. Although the concept of placing kinship charts on a timeline for groupsbeyond the household is feasible, showing these types of kinship changesbeyond the household over time was not our purpose. Kinship charts are stillmore effective at showing the complex, but static, relationships among multi-ple households.
McIlvaine-Newsad et al. / HOUSEHOLD COMPOSITION TIMELINE 11
FIGURE 4Household Composition Timeline B

HHCTs show dynamic changes in household composition over time.Since HHCTs deal with time explicitly, they show age cohort relationshipswithin the household unit more clearly than do traditional kinship charts.Cohorts of same-age individuals are easily identifiable using HHCTs. This isnot possible with traditional kinship charts.
Initially, HHCTs appear to be potentially useful as a participatory ruralappraisal tool. However, the rules for constructing HHCTs are likely to betoo cumbersome to use efficiently in small-group activities. Instead, HHCTsare best used as an organizational tool for researchers and field practitioners.HHCTs concisely organize data on complex kin relationships and the timingof changes in household composition. We have found this technique to behelpful for identifying when households are more likely to adopt new tech-nologies based on factors driven by household composition.
This technique can be used cross-culturally, with a wide variety of house-hold types. It uses an inductive approach based on household members’descriptions of their relationships to each other. HHCTs have been used inthree different cultures and are sufficiently flexible to accommodate allhousehold types encountered. As demonstrated in the case study above, thenotation’s flexibility allows incorporation of broader scale events such aswar and economic opportunity for regional migration.
REFERENCES
Barnard, A., and A. Good. 1984. Research practices in the study of kinship. London: AcademicPress.
Brown, S. 1977. Household composition and variation in a rural Dominican village. Journal ofComparative Family Studies 8 (2): 257–67.
Brydon, L., and S. Chant. 1989. Women in the Third World: Gender issues in rural and urbanareas. New Brunswick, NJ: Rutgers University Press.
Capra, F., D. Steindl-Rast, and T. Matus. 1991. Belonging to the universe: Explorations on thefrontiers of science and spirituality. San Francisco: Harper.
Chayanov, A. V. 1966. The theory of peasant economy. Homewood, IL: American EconomicAssociation.
Collier, J. F., and M. Z. Rosaldo. 1981. Politics and gender in simple societies. In Sexual mean-ings: The cultural construction of gender and sexuality, edited by S. B. Ortner and H. White-head, 275–329. Cambridge, UK: Cambridge University Press.
Fortes, M., and E. E. Evans-Pritchard, eds. 1940. African political systems. London: OxfordUniversity Press.
Fox, R. 1967. Kinship and marriage: An anthropological perspective. Harmondsworth, UK:Penguin.
Goody, J. 1958. The developmental cycle in domestic groups. Cambridge, UK: Cambridge Uni-versity Press.
12 FIELD METHODS

Hammel, E. A. 1961. The family cycle in a coastal Peruvian slum and village. American Anthro-pologist 63:989–1005.
. 1972. The zadruga as process. In Household and family in past time, edited by P. Laslettwith R. Wall, 335–73. Cambridge, UK: Cambridge University Press.
Hammel, E. A., and P. Laslett. 1974. Comparing household structure over time and between cul-tures. Comparative Studies in Society and History 16:73–107.
Handwerker, W. P. 1973. Technology and household configuration in urban Africa: The Bassaof Monrovia. American Sociological Review 38:182–97.
. 1977. Family, fertility, and economics. Current Anthropology 18 (2): 259–87.Kabeer, N. 1994. Reversed realities: Gender hierarchies in development thought. New York:
Verso.Maine, H. 1861. Ancient law. London: Murray.Malinowski, B. 1913. The family among the Australian Aborigines. London: Hodder.McLennon, J. F. 1865. Primitive marriage. Edinburgh, UK: Adam & Charles Black.Meillassoux, C. 1981. Maidens, meal, and money: Capitalism and the domestic community.
Cambridge, UK: Cambridge University Press.Moore, H. L. 1988. Feminism and anthropology. Minneapolis: University of Minnesota Press.Morgan, L. H. 1871. Systems of consanguinity and affinity of the human family. Washington,
DC: Smithsonian Institution.Netting, R., R. R. Wilk, and E. J. Arnold. 1984. Households: Comparative analysis and histori-
cal studies of the domestic group. Berkeley: University of California Press.Ortner, S. B., and H. Whitehead. 1981. Introduction. In Sexual meanings: The cultural construc-
tion of gender and sexuality, edited by S. B. Ortner and H. Whitehead, 5. Cambridge, UK:Cambridge University Press.
Strathern, M. 1994. New knowledge for old? Reflections following Fox’s Reproduction andSuccession. Social Anthropology 2:263–79.
HEATHER MCILVAINE-NEWSAD is an assistant professor of anthropology at WesternIllinois University in Macomb. She has conducted participatory research with a genderemphasis in the Dominican Republic, Ecuador, Germany, and the United States. Hercurrent research focuses on the role of community-supported agriculture farms in theUnited States and Germany and the state of rural health care in Illinois. Her recent pub-lications include “Ojalá que Llueva Algo en el Campo: Cultural Influences of Develop-ment” (International Journal of Agricultural Resources, Governance and Ecology, forth-coming) and “Feminism and Anti-racism in Anthropology” (with Paige Allison, Voices,2000).
AMY SULLIVAN is pursuing a Ph.D. in interdisciplinary ecology in the College of Natu-ral Resources and Environment at the University of Florida. Her research interestsinclude participatory needs assessment in small-farm livelihood systems, extension pro-gram design and delivery, and gender. Recent publications include “Gender, HouseholdComposition, and Adoption of Soil Fertility Technologies: A Study of Women RiceFarmers in Southern Senegal” (African Studies Quarterly, 2002).
MICHAEL DOUGHERTY is a Ph.D. candidate in the Department of Geography at theUniversity of Florida. His current research interest includes developing statistical meth-ods for generating topologies of rural household livelihood strategies. A recent publica-
McIlvaine-Newsad et al. / HOUSEHOLD COMPOSITION TIMELINE 13

tion of his is “Gendered Scripts and Declining Soil Fertility in Southern Ethiopia” (Afri-can Studies Quarterly, 2002 [online]).
14 FIELD METHODS