Household Environment Survey
117
Surveys Household Environment Survey 2019 _________________________________________________________________________________
-
Upload
khangminh22 -
Category
Documents
-
view
2 -
download
0
Transcript of Household Environment Survey

Surveys
Household Environment Survey
2019
_________________________________________________________________________________

1
Household Environment Survey 2019
En
vir
on
me
nt
Sta
tist
ics
En
vir
on
me
nt
Sta
tist
ics
2019
Contents
No. Subject Page
1 Tables Index 2
2 Key Results from the Household Environment Survey Index
9
3 Introduction 10
4 Data Sources 11
5 Objectives 11
6 Household Environment Survey Terminology and Concepts
12
7 Indicators and How to Calculate them 19
8 Temporal and Spatial Coverage 23
9 Adopted Statistical Classifications 23
10 Sample Selection 24
11 Data Collection Tools 24
12 Data Collection Method 25
13 Results Preparation and Review 26
14 Data Publication 26
15 Implemented Quality Procedures 27
16 Bulletin Beneficiaries and Benefits 28
17 Key Results from the Household Environment Survey
30
18 Publication Tables 43

2
Household Environment Survey 2019
En
vir
on
me
nt
Sta
tist
ics
En
vir
on
me
nt
Sta
tist
ics
2019
Tables Index
Table Number Table Title Page
2-1 Percentage distribution of households suffering from
diseases by disease type at country level 41
2-2 Percentage distribution of households suffering from
the major pollution types at country level 42
2-3 Percentage distribution of households suffering from
visual pollution at country level 42
2-4 Percentage distribution of households suffering from
sound pollution at country level 43
2-5 Percentage distribution of households suffering from
light pollution at country level 43
2-6 Percentage distribution of households suffering from
air pollution at country level 44
3-1 Average area of household yards and gardens at
country level (m2) 44
3-2 Average area of household yards and gardens by
housing type at the administrative region level (m2) 45
3-3
Percentage distribution of daylight availability in the
house at country level 45
3-4 Percentage distribution of daylight availability in the
house at the administrative region level 46
3-5 Percentage distribution of households with pool at
country level 46
3-6 Percentage distribution of household pool source at
country level 47
3-7 Percentage distribution of household pool source at
the administrative region level 47

3
Household Environment Survey 2019
En
vir
on
me
nt
Sta
tist
ics
En
vir
on
me
nt
Sta
tist
ics
2019
3-8 Average household pool size at country level 48
3-9 Average number of times households empty their pool
per year at country level 48
3-10 Average number of times households empty their pool
per year at the administrative region level 49
3-11 Percentage distribution of household pool water
disposal method at country level 49
3-12 Percentage distribution of households that have a pool
filter at country level 50
4-1 Percentage distribution of household water source at
country level 50
4-2 Percentage distribution of household water source at
the administrative region level 51
4-3 Percentage distribution of household drinking water
source at country level 51
4-4 Percentage distribution of household drinking water
source at the administrative region level 52
4-5 Percentage distribution of households using soap to
wash hands at country level 52
4-6 Percentage distribution of households using soap to
wash hands at the administrative region level 53
4-7 Percentage distribution of household main water tank
type at country level 53
4-8 Percentage distribution of household main water tank
type at the administrative region level 54
4-9 Percentage distribution of the number of times
households empty their main tank at country level 54
4-10
Percentage distribution of the number of times
households empty main tank at the administrative
region level
55

4
Household Environment Survey 2019
En
vir
on
me
nt
Sta
tist
ics
En
vir
on
me
nt
Sta
tist
ics
2019
4-11 Percentage distribution of household water availability
constancy at country level 55
4-12 Percentage distribution of household water availability
constancy at the administrative region level 56
4-13 Percentage distribution of household water break
measurements at country level 56
4-14 Percentage distribution of household water break
measurements at the administrative region level 57
4-15 Percentage distribution of waiting time for water after
a break in households at country level 57
4-16 Percentage distribution of waiting time for water after
a break in households by measurement at country level 58
5-1 Percentage distribution of household main sewage
source at country level 58
5-2 Percentage distribution of household main sewage
source at the administrative region level 59
5-3 Average times for draining the septic tank per year at
country level 59
5-4 Percentage distribution of frying oil disposal method at
country level 60
5-5 Percentage distribution of frying oil disposal method at
the administrative region level 61
5-6 Percentage distribution of types of toilets in
households at country level 61
6-1 Percentage distribution of households that clean the
house daily at country level 62
6-2 Percentage distribution of households that clean the
house daily at the administrative region level 62
6-3 Percentage distribution of the number of times
households dispose of waste at country level 63

5
Household Environment Survey 2019
En
vir
on
me
nt
Sta
tist
ics
En
vir
on
me
nt
Sta
tist
ics
2019
6-4
Percentage distribution of the number of times
households dispose of waste at the administrative
region level
63
6-5 Percentage distribution of households that sort waste
at country level 64
6-6 Total produced household waste in tons at country
level 64
6-7 Total produced household waste in tons at the
administrative region level 65
6-8 Amount of sorted household waste in tons by waste
type at country level 66
6-9 Percentage distribution of household unsorted waste
disposal by method at country level 66
6-10 Percentage distribution of household unsorted waste
disposal by method at the administrative region level 67
6-11 Number of household wasted electronics at country
level 67
6-12 Number of wasted household electronics at the
administrative region level 68
6-13 Number of wasted household electronics at country
level 69
6-14 Average number of wasted electronics produced by
households at country level 70
6-15 Average number of household wasted electronics at
the administrative region level 70
6-16 Percentage distribution of household electronic waste
disposal by method at country level 71
6-17 Percentage distribution of household electronic waste
disposal by method at the administrative region level 71
6-18 Percentage distribution of household electronic waste
disposal method by type at country level 72

6
Household Environment Survey 2019
En
vir
on
me
nt
Sta
tist
ics
En
vir
on
me
nt
Sta
tist
ics
2019
6-19 Percentage distribution of household medical waste
disposal by method at country level 73
6-20 Percentage distribution of household medical waste
disposal by method at the administrative region level 74
7-1 Total average number of cars and hybrid cars owned by
households at country level 74
7-2 Average times for changing car oil per year at country
level 75
7-3 Average times for changing car oil per year at the
administrative region level 75
7-4 Average times for changing car tire per year at country
level 76
7-5 Average times for changing car tire per year at the
administrative region level 76
7-6 Percentage distribution of households that buy
resource saving devices at country level 77
7-7
Percentage distribution of households that buy
resource saving devices by device type at the
administrative region level
77
7-8 Percentage distribution of the main coal and firewood
types used in households at country level 78
7-9
Percentage distribution of the main coal and firewood
types used in households at the administrative region
level
78
8-1 Percentage distribution of household air ventilation
through open windows at country level 79
8-2
Percentage distribution of household air ventilation
through open windows at the administrative region
level
79
8-3 Percentage distribution of households using air
filtration and ventilation devices at country level 80

7
Household Environment Survey 2019
En
vir
on
me
nt
Sta
tist
ics
En
vir
on
me
nt
Sta
tist
ics
2019
8-4
Percentage distribution of households using air
filtration and ventilation devices at the administrative
region level
80
8-5 Percentage distribution of households that use air
fresheners at country level 81
8-6
Percentage distribution of households that use air
fresheners at the administrative region level 81
8-7 Percentage distribution of the number of times
households use air fresheners at country level 82
8-8
Percentage distribution of the number of times
households use air fresheners at the administrative
region level
82
8-9 Percentage distribution of air freshener ingredients in
households at country level 83
8-10 Percentage distribution of air freshener ingredients in
households at the administrative region level 83
8-11 Percentage distribution of households that use incense
by nationality at country level 84
8-12 Percentage distribution of households that use incense
at the administrative region level 84
8-13 Percentage distribution of the number of times
households use incense at country level 85
8-14
Percentage distribution of the number of times
households use incense at the administrative region
level
85
8-15 Percentage distribution of the incense method of use in
households at country level 86
8-16 Percentage distribution of the incense method of use in
households at the administrative region level 86
8-17 Percentage distribution of household use of carpets at
country level 87

8
Household Environment Survey 2019
En
vir
on
me
nt
Sta
tist
ics
En
vir
on
me
nt
Sta
tist
ics
2019
8-18 Percentage distribution of household use of carpets at
the administrative region level 87
8-19 Percentage distribution of household use of carpets by
housing type at country level 88
8-20 Percentage distribution of household use of detergents
in cleaning floors and toilets at country level 88
8-21
Percentage distribution of household use of detergents
in cleaning floors and toilets at the administrative
region level
89
8-22 Percentage distribution of household use of pesticides
and chemical fertilizers by type at country level 89
8-23
Percentage distribution of household use of pesticides
and chemical fertilizers by type at the administrative
region level
90
8-24
Percentage distribution of household plant type at
country level 90
8-25
Percentage distribution of household plant type at the
administrative region level 91
8-26
Total number of household plants by type at country
level 92
8-27 Total number of household plants by type at the
administrative region level 92
8-28 Percentage distribution of household plant irrigation
method at country level 93
8-29 Percentage distribution of household plant irrigation
method at the administrative region level 93
8-30 Percentage distribution of household main plant
irrigation source at country level 94
8-31 Percentage distribution of household main plant
irrigation source at the administrative region level 94
9
Household Environment Survey 2019
En
vir
on
me
nt
Sta
tist
ics
En
vir
on
me
nt
Sta
tist
ics
2019
8-32 Household consumption of own production at country
level 95
8-33 Percentage distribution of household hydroponics at
country level 95
8-34 Percentage distribution of household hydroponics at
the administrative region level 96
9-1 Percentage distribution of households that buy organic
products at country level 96
9-2 Percentage distribution of households that buy organic
products by type at country level 97
9-3 Percentage distribution of household environmental
literacy at country level 97
9-4 Percentage distribution of household environmental
literacy by nationality at country level 97
9-5 Percentage distribution of household environmental
literacy by nationality at the administrative region level 98
9-6
Percentage distribution of environmental activity type
by household member participation and nationality at
country level
99
9-7
Percentage distribution of household member
participation in visiting environmental festivals at the
administrative region level
100
9-8
Percentage distribution of household member
participation in volunteer work at environmental
events or campaigns at the administrative region level
101
9-9
Percentage distribution of household member
membership in environmental associations by
nationality at the administrative region level
102
9-10
Percentage distribution of household member
participation in and attendance of environment-related 103

10
Household Environment Survey 2019
En
vir
on
me
nt
Sta
tist
ics
En
vir
on
me
nt
Sta
tist
ics
2019
courses and workshops by nationality at the
administrative region level
9-11 Percentage distribution of households with pets at
country level 103
9-12 Percentage distribution of households with pets at the
administrative region level 104
9-13 Percentage distribution of households with pets by
type at country level 104
9-14 Percentage distribution of household water overflow
or internal leakages at country level 105
9-15 Percentage distribution of household water overflow
or internal leakages at the administrative region level 105
9-16 Percentage distribution of household water overflow
or internal leakages by housing type at country level 106
9-17 Percentage distribution of safety and security measures
available in households at country level 106
9-18
Percentage distribution of households that have a
separate cabinet for fertilizers and pesticides at the
administrative region level
107
9-19 Percentage distribution of households with fire
extinguishers at the administrative region level 108
9-20 Percentage distribution households with fire alarms in
at the administrative region level 109
9-21 Percentage distribution of households with first aid
boxes at the administrative region level 110

11
Household Environment Survey 2019
En
vir
on
me
nt
Sta
tist
ics
En
vir
on
me
nt
Sta
tist
ics
2019
Key Results from the Household Environment Survey Index
No. Title Page
1 Percentage distribution of households suffering from
pollution by type (visual, sound, light, air) 28
2 Percentage of household dependence on the public
network (as a water source) in KSA 29
3 Percentage distribution of household water break
measurements at country level 30
4 Percentage distribution of household main sewage source
at country level 31
5 Total waste produced by household in tons at country level 32
6 Percentage distribution of household electronic waste
disposal by method at country level 33
7 Average number of household wasted electronics at the
administrative region level 34
8 Annual average car oil change 35
9 Annual average changed tires per household 35
10 Percentage distribution of the main coal and firewood
types used in households at country level 36
11 Percentage distribution of the number of times households
use incense at country level 37
12 Percentage distribution of household environmental
literacy at country level 38
13 Percentage distribution of households with pets at country
level 39
14 Percentage distribution of safety and security measures
available in households at country level
40

12
Household Environment Survey 2019
En
vir
on
me
nt
Sta
tist
ics
En
vir
on
me
nt
Sta
tist
ics
2019
1. Introduction The vision of the General Authority for Statistics (GASTAT) is to be the most remarkable and
innovative statistical reference for supporting the economic and social development in the
Kingdom of Saudi Arabia. Its mission is to provide updated, value added, accurate, transparent,
comprehensible, and credible statistical products and services, in accordance with the best
international standards and practices, and to achieve leadership in the development of the
statistical sector to support decision making. Therefore, it is pleased to publish its first version
of the Household Environment Survey of 2019, one of the field and sampling household surveys
in the GASTAT knowledge and natural resource survey plan. The Household Environment
Survey provides statistics on pollution and pollution types; household environment; water,
water sources, costs and breaks; sewage and sewage cost; waste, waste sorting and
components of household waste; air quality in households, as well as general statistics on the
environment and environmental literacy, etc. GASTAT hopes that the bulletin data will assist
decision-makers and researchers in developing environmental policies, and contribute to
creating a statistical database on household environment. The data can be used in preparing
and planning for future development programs, and supporting the efforts and endeavors of
all government and private entities in this regard. GASTAT would like to express its sincerest
gratitude to all partners, clients and stakeholders, as well as household members for their
cooperation in providing the required data for the survey’s questionnaire. Their cooperation
has contributed greatly to the successful release of the bulletin. GASTAT also welcomes any
suggestions or remarks that may improve the content of this bulletin or future bulletins on the
following email (sa.gov.stats@info).
Allah is the Arbiter of Success
General Authority for Statistics

13
Household Environment Survey 2019
En
vir
on
me
nt
Sta
tist
ics
En
vir
on
me
nt
Sta
tist
ics
2019
Data sources for the Household Environment Survey: The bulletin uses the household field survey (Household Environment Survey) performed by
GASTAT for the first time in 2019, intended to be held annually one of the (Environment
Statistics Surveys), designed to collect information by visiting a sample of households within
the 2010 statistical framework that represents all households across the Saudi administrative
regions. During these visits, an online questionnaire will be used to provide estimates,
indicators and accurate, detailed data on the household environmental sector in order to
support decision makers. The data will identify household environmental behaviors and
environmental awareness and support gaps, fulfill the environmental data requirements of
public and private entities and understand the household environmental situation in the
kingdom. This will help identify the ease of access to of water and sewage services, household
production of organic and hazardous waste and use of pesticides and dangerous materials.
This will, in turn, allow for the optimal planning of environmental awareness, mitigation of
certain environmental issues, thereby benefiting the society and economy as a whole; as well
as the provision of environment statistics that will help measure environment-related SDG
indicators based on the international standards, assisting decision-makers to develop optimal
plans.
Objectives: 1. Providing environment statistical data that help measure some environmental sustainable
development indicators as per the international definitions of such indicators.
2. Providing statistical data for the Environmental Statistics Report as per the UN Framework
for the Development of Environment Statistics (FDES 2013).
3. Providing data to help measure indicators of climate change and emissions from household
energy use.
4. Providing water and waste data to help fill the periodical international surveys conducted
by the United Nations Statistics Division (UNSD).

14
Household Environment Survey 2019
En
vir
on
me
nt
Sta
tist
ics
En
vir
on
me
nt
Sta
tist
ics
2019
5. Raising environmental awareness around saving water and energy resources by using
saving devices, waste sorting, environmental education and the optimal way to dispose of
electronic waste.
6. Providing an environmental database to support decision makers, policy makers,
researchers and interested parties.
Household Environment Survey Terminology and Concepts:
The latest international environment statistics concepts and relevant scientific references were
used in line with the UN recommendations. The importance of unified concepts and definitions
lies in the standardization of work methods to guide field workers. Therefore, the definitions
must be very well understood and adhered to.
Environmental Pollution
Environmental pollution is defined as the contamination of the physical and biological
components of the natural environment to such an extent that humans and other living
organisms are adversely affected. Pollutants can be solid, fluid or gaseous; as well as
naturally occurring substances, but they are considered contaminants when in excess of
natural levels. It can result in pollution of air, water, and land.
Light Pollution
Light pollution, also known as photo pollution, is the excessive use of artificial light,
resulting in the alteration of natural conditions, which adversely affects the health and
safety of humans, wildlife and plant growth, increases energy usage, and distorts
ecosystems. Some of the causes of light pollution are: Overuse of incandescent signs,
decorative lights and excessively bright street lights. Leaving lights on in the house.
Overpopulation, which leads to there being too many lights in a limited space.
Sound Pollution:
The propagation of noise with harmful impact on the activity of human or animal life. Sound
pollution is measured in decibel (dB), where the permissible limit according to WHO is 75
dB. Noise at (90) dB can cause hearing damage, whereas a noise louder than (100) can cause
15
Household Environment Survey 2019
En
vir
on
me
nt
Sta
tist
ics
En
vir
on
me
nt
Sta
tist
ics
2019
complete hearing loss. Potential sound pollution sources are factory machines, such as
grinders, generators, compressors, etc; social events with music; transportation, such as
trains, planes and cars; construction activities, such as bridge, building and road
construction; and household activities that produce loud noises.
Air Pollution:
Air pollution is a mixture of solid particles and gases in the air in amounts that can can
physiological, economical and biological harm to humans, animals, plants, and machinery
and alter nature.
Visual Pollution:
Visual pollution is an aesthetic issue and refers to the impacts of pollution that impair one's
ability to enjoy a vista or view.
Sanitation:
Adding a substance to pools to prevent infection resulting from pollutants caused by
swimmers.
Filter:
A device responsible for removing contaminants from pool water
Water Source:
All types of water bought from the national company, private sector, individuals or any
other resource for household consumption.
Water Cost:
The administered price of water provided through supply pipes by public and private
facilities (water fees).
Water Filter:
Filter designed to clear drinking water of contaminants, making it fit for human
consumption.

16
Household Environment Survey 2019
En
vir
on
me
nt
Sta
tist
ics
En
vir
on
me
nt
Sta
tist
ics
2019
Tank:
A container constructed for the purpose of storing water, or saving rain and river water for
drinking, agriculture and irrigation.
Using soap for washing hands in households:
Using soap and water to clean the hands of dirt, dust and macrobiotics that cause diseases,
such as colds.
Public Sewage Network:
The system of lines and equipment used to collect, transfer and deliver fluid waste to
treatment and disposal locations, including pipes, collecting tanks, screening chambers,
pumping stations, manholes and ventilation valves.
Treated Sewage Water:
Sewage water that has been treated chemically, mechanically or biologically for re-use.
Waste:
Waste is any substance which is discarded after use, except recycled or reused materials. Its
numbers are on the rise in developing countries, especially where there is overpopulation.
Without public health awareness, waste can lead to many hazards. It has four types:
- Organic Waste:Biodegradable materials, such as food and garden waste.
- Inorganic Waste:Non-biodegradable substances, such as plastic, minerals and fabrics.
Municipal Waste:
It incudes all waste produced by households, commerce, crafts, government buildings,
schools, and hospitals, as well as large-sized waste, such as old and used furniture, wood,
garden waste, street sweeping waste and garbage container content, but does not include
construction waste.
Household Non-Hazardous Waste:
Household waste that can be categorized under the following types of waste: organic,
plastic, mineral, and agricultural.
17
Household Environment Survey 2019
En
vir
on
me
nt
Sta
tist
ics
En
vir
on
me
nt
Sta
tist
ics
2019
Household Hazardous Waste:
Household medical waste, such as blood, tissues, needles, gauze, used bandages, as well as
chemical waste resulting from using detergents, paint, pesticides and foggers.
Waste Sorting:
Waste sorting is the process by which waste is separated in boxes in different colors into
organic waste (later turned into fertilizer), paper, minerals and glass, which helps recycle
the waste.
Selling Waste:
Disposing of waste by selling it to companies to be recycled or used as raw materials in other
industries.
Waste Incineration:
Burning waste and turning it into ash.
Waste Burial:
Shrinking solid waste and burying it in a hole in the ground that is of sufficient size, away
from water bodies, with a layer of cement and another of solid plastic on the bottom that
prevent fluids resulting from solid waste decomposition from leaking and polluting
underground water.
Waste Containers:
Containers used to store waste and undesired materials temporarily, considered to be one
way to dispose of waste.
Solid or Fluid Chemical Waste:
Leftover solid chemicals used in households, such as pesticide powders and fluid remnants,
including organic solutions, acids, paints and fluid detergents.
Plastic Waste:
Synthetic polymers made from oil derivatives. Plastic is a main component in many
disposable household items, packaging materials, bags and bottles.

18
Household Environment Survey 2019
En
vir
on
me
nt
Sta
tist
ics
En
vir
on
me
nt
Sta
tist
ics
2019
Electronic and Electric Waste:
Appliances, electronics and electric devices that cannot be used anymore, such as TVs,
computers, phones, communication devices, audiovisual recording devices, microwaves,
household appliances, and other tools and products we use in our daily lives. Based on the
European classification, they include:
Heat exchange equipment:
ACs, freezers, fridges and other machines, such as dryers.
Screens, panels and equipment with screens:
Tablets and LED and LCD display screens and plasma screens.
Bulbs:
Florescent and neon lights used at home, including LEDs.
Large equipment:
Central heating in houses, dishwashers, ovens, cooking appliances, washing machines,
dryers, fans, heaters, sport equipment, and medical equipment such as thermometers and
pressure monitors.
Small equipment:
Small household appliances, such as small fans, irons, watches, adapters, cooking
appliances, such as toasters, grills and fryers, water heating kits, vacuum cleaners and
personal items, such as toothbrushes, hair dryers, shaving machines, earphones, cameras
and speakers.
Small ICT Equipment:
Routers, keyboards, external hard drives, desktops, printers, faxes, scanners, wireless
phones and game consoles.
Tires:
The rubber cushion that fits around a wheel, and is filled with compressed air.

19
Household Environment Survey 2019
En
vir
on
me
nt
Sta
tist
ics
En
vir
on
me
nt
Sta
tist
ics
2019
Hybrid Car:
A car that uses two or more distinct types of power (gasoline and electricity).
Electric Car:
A car that is propelled by electricity. One of the applications of this technology is to replace
the original car motor with an electric one, which is the easiest way to transform a normal
vehicle into an electric one while maintaining its other components. The engine is supplied
with energy through energy storage batteries.
Motor Oil:
Motor oil is used for lubrication of internal combustion engines. The main reason for it is
to lubricate the moving parts. In addition, it cleans, prevents the corrosion of, enhances the
performance of and cools the engine by carrying heat away from moving parts. It is
enhanced with a few other additives to make it resistant to high pressures. The oil is derived
from petroleum and non-petroleum chemicals used in the petroleum industry. Generally,
the oil is made from hydrocarbons and organic substances made entirely from hydrogen and
carbon.
Firewood:
Pieces of wood that are dried to be used to light fires and get energy for various household
purposes, such as heating and cooking. There are two types of firewood:
- Local:produced in the same region.
- Imported:bought from abroad.
Resource Saving Devices:
Rationalization is the optimal use of electricity resources necessary for a household without
inconveniencing the residents, impacting their productivity or decreasing the efficiency and
productivity of household appliances. Electricity is one of the most important energies in
our daily lives, used to operate all machines at households, companies, factories and
organizations. Electricity is a non-renewable resource that must be rationalized. Energy-
saving bulbs, such as florescent and incandescent lights that carry the energy efficiency
label, are highly efficient and rationalize energy consumption.

20
Household Environment Survey 2019
En
vir
on
me
nt
Sta
tist
ics
En
vir
on
me
nt
Sta
tist
ics
2019
Water Saving Devices:
Devices that control the flow of water in sinks, bathrooms, toilets and kitchen drains.
Air Filtration and Purification Devices:
Air purifiers are devices that filter out particles and other pollutants from air in closed
spaces.
Air Fresheners:
Natural or chemical substances used to give the air a nice smell and remove bad smells,
divided into 2 types:
- Chemical Air Fresheners:made from chemicals, such as perfumes, etc.
- Natural Air Fresheners:made from natural substances, such as cinnamon and lemon peel.
Antiseptics:
An antiseptic is a fluid or solid substance that stops or slows down the growth of
microorganisms, used on floors and in bathrooms.
Incense:
A solid substance made from known and specific ratios of different plants. When burnt, it
produces only smoke (smell) and no flame.
Insecticides:
Dangerous chemicals, such as cyanide, nicotine, phosphorous and chlorine compounds, used
to kill insects and plant pests. They vary in their toxicity to humans, animals and plants.
Public Health Pesticides:
Special chemical compounds containing different percentages of high-efficiency, low-
toxicity substances, used to decrease public health pests to the level where they don’t pose
health dangers or inflict humans, such as rat and snake poison.
Chemical Fertilizer:
A substance that is added to soil to enhance plant growth.

21
Household Environment Survey 2019
En
vir
on
me
nt
Sta
tist
ics
En
vir
on
me
nt
Sta
tist
ics
2019
Household Garden:
A green space outside buildings, designed to enjoy nature, add beauty, decorate and/or
produce plants. It may have raw, natural or human-made materials.
Hydroponics:
Cultivating plants without soil by instead using mineral nutrient solutions in a water solvent,
with roots growing inside the solution or inert materials, such as glass wool or pyrite.
Domestic Agriculture:
Plants grown within the household fences, such as decorative trees, cut flowers, evergreen
trees, fruits, palm or vegetables.
- Decorative trees: Non-fruitful trees used to add beauty to the house.
- Palm trees: Trees producing dates.
- Evergreen trees other than palm:Fruitful trees, such as lemon, orange, mango and
pomegranate trees.
- Cut flowers:Flowers planted for display, such basil and cloves.
- Vegetables:Grass plants used in part or whole, raw or cooked for human consumption.
Self-Production:
Crops harvested from household gardens and planted by household members.
Organic Products:
Organic products are products that are free from GMOs and chemicals (such as preservatives
and artificial flavors). Farmers use natural fertilizers for this kind of products to improve
their produce. They are divided in two categories:
- Organic Animal Products: made from animals that are raised without the use of
antibiotics or synthetic growth hormones.
- Organic Plant Products: made with organic farming, which does not use industrial
fertilizers, pesticides containing chemicals, or genetically enhanced or modified
materials.

22
Household Environment Survey 2019
En
vir
on
me
nt
Sta
tist
ics
En
vir
on
me
nt
Sta
tist
ics
2019
Environmental Literacy:
A layperson’s understanding, skills and motivation towards his or her relationships to
natural systems, including, for instance, the different kinds of pollution and awareness of
environmental problems.
Environmental Activities:
Any activity that enhances the preservation and sustainability of the environment and
biodiversity, or any green and environmentally friendly activity in general. Such activities
can help prevent an environmental crises on planet earth and are a way to make positive
change.
This includes all the green and sustainable activities and choices, such as recycling and
efficient energy use. It also includes political and direct activities that help preserve the
environment and creative green solutions.
Greywater:
Wastewater from baths, shower drains, sinks and washing machine that does not have
chemicals. It derives its name from the color it turns into after stagnation.
- Drip Irrigation:Irrigation by allowing water to drip slowly to the roots of plants in
connected or separate drops using drippers.
- Sprinkling: Sprinkler irrigation is a method of applying irrigation water which is similar
to natural rainfall. Water is distributed through a system of pipes usually by pumping at
a certain pressure which then covers the whole area.
- Surface Irrigation: One of the traditional irrigation methods used for garden landscapes,
trees and plants.
Internal Leakage:
Leaks resulting from a damage to the internal water pipes often inside walls and floors,
which show up as cracks, disfigurations and spots of a varying color.
Water Overflow:
A domestic wastewater overflow is when blackwater or greywater overflows into the
household.

23
Household Environment Survey 2019
En
vir
on
me
nt
Sta
tist
ics
En
vir
on
me
nt
Sta
tist
ics
2019
Household Pets:
Any animals that can be kept within house fences for companionship, protection, or
guarding, such as dogs, cats, rabbits, fish, birds and turtles.
Indicators: Indicator Indicator Description / Measurement
Percentage distribution of
households suffering from
pollution by type (visual, sound,
light, air)
It is measured by asking households in the survey sample if
they buy organic products, then finding out and weighting
the percentage of households buying organic products to
total survey households.
Percentage distribution of
daylight availability in the house
across KSA
It is measured by asking households in the survey sample
about the level of daylight availability (high, medium, low,
zero), which is then weighted.
Percentage distribution of
household pool water sources
It is measured by asking households in the survey sample
about the sources of pool water (public network, pipe, well,
other), then finding out and weighting the percentage of
each source.
Percentage of household
dependence on the public
network (as a water source) in
KSA
It is measured by asking households in the survey sample
about their water source (public network, pipe, well,
other), then finding out and weighting the (percentage of
households depending on public network to total survey
households) each source.
Percentage distribution of the
main sewage source
It is measured by asking households in the survey sample
about their sewage source (public network, private
network, plant, other), then finding out and weighting the
percentage of each source.
Percentage distribution of types
of toilets in households
It is measured by asking households in the survey sample
about the type of toilets they have then weighting the
percentages.
Percentage distribution of
household waste sorting
It is measured by asking households in the survey sample if
they sort their waste, then finding out and weighting the

24
Household Environment Survey 2019
En
vir
on
me
nt
Sta
tist
ics
En
vir
on
me
nt
Sta
tist
ics
2019
(percentage of households practicing sorting waste to total
survey households) each source.
Total waste produced by
household in tons at country
level
It is measured by asking households in the survey sample
about the amount of waste they produce weekly (in kg),
then calculating and weighting the annual amount in kg.
Percentage distribution of
household disposal of electronic
waste (public garbage
containers, insinuation, selling,
delivery to recycling agencies)
It is measured by asking households in the survey sample
about their method of disposal of electronic waste (public
garbage containers, insinuation, selling, delivery to
recycling agencies), then identifying and weighting the
percentages of methods.
Average number of cars per
household
It is measured by asking households in the survey sample
about the number of cars they have then weighting the
percentages.
Annual average car oil change It is measured by asking households in the survey sample
about the number of times they change the car oil per year,
then weighting the percentages.
Annual average changed tires
per household
It is measured by asking households in the survey sample
about the number of tires they change per year, then
weighting the percentage.
Percentage distribution of coal
and firewood types used in
households at country level
It is measured by asking households in the survey sample
about the type of coal and firewood they use then
weighting the percentages.
Percentage distribution of
households using air filtration
devices
It is measured by asking households in the survey sample if
they use air filtration devices, then finding out and
weighting the percentage of households that use air
filtration and purification devices to total survey
households.
Percentage distribution of
households using air fresheners
It is measured by asking households in the survey sample if
they use air fresheners, then finding out and weighting the
percentage of households that use air fresheners to total
survey households.

25
Household Environment Survey 2019
En
vir
on
me
nt
Sta
tist
ics
En
vir
on
me
nt
Sta
tist
ics
2019
Percentage distribution of
households using incense in KSA
per nationality
It is measured by asking households in the survey sample if
they use incense, then finding out and weighting the
percentage of households that use incense to total survey
households
Percentage distribution of
households using carpets
It is measured by asking households in the survey sample if
they carpet their floors, then determining and weighting
the percentage of households that do.
Percentage distribution of
households using detergents in
cleaning floors and toilets
It is measured by asking households in the survey sample
whether they use detergents in cleaning floors and toilets,
then determining and weighting the percentage of
households that do.
Percentage distribution of
household hydroponics
It is measured by asking households in the survey sample if
they practice hydroponics, then determining and weighting
the percentage of households practicing hydroponics to
total survey households
Percentage distribution of
households buying organic
products
It is measured by asking households in the survey sample if
they buy organic products, then finding out and weighting
the percentage of households buying organic products to
total survey households
Percentage distribution of
household environmental
literacy
It is measured by asking households in the survey sample
about their environmental literacy, then determining and
weighting the level of literacy.
Percentage distribution of
household pets
It is measured by asking households in the survey sample if
they have pets, then determining and weighting the
percentage of households that have pets to total survey
households.
Percentage distribution of
household water overflow or
internal leakages
It is measured by asking households in the survey sample
whether they face overflow or leakages, and then
determine and weight the level of this problem.

26
Household Environment Survey 2019
En
vir
on
me
nt
Sta
tist
ics
En
vir
on
me
nt
Sta
tist
ics
2019
Percentage distribution of safety
and security systems in
households
It is measured by asking households in the survey sample
about their used safety and security systems and weighting
them.
The many indicators and data provided by the survey can be reviewed in the publication tables.
Coverage: • Spatial Coverage:
The Household Environment Survey data covers households across the 13 administrative
regions of the Kingdom of Saudi Arabia, which are: (Riyadh, Makkah, Madinah, Qassim,
Eastern Province, Asir, Tabuk, Hail, Northern Borders, Jazan, Najran, Al-Baha, and Al-Jouf).
A scientifically selected sample representing the region’s households is visited in each
region.
• Temporal Coverage:
1- Household profile data, housing characteristics, and household data is determined at
the time of the researcher’s visit.
2- Data related to the consumption, cost and main resource of water, waste, energy and
air quality is attributed to the last 12 months preceding the researcher’s visit to the
household.
Adopted Statistical Classifications: The data of the bulletin is based on the following classifications:
Educational level classification

27
Household Environment Survey 2019
En
vir
on
me
nt
Sta
tist
ics
En
vir
on
me
nt
Sta
tist
ics
2019
Sample Selection: The survey sample was chosen by selecting 20000 households to be a sample that represents
the survey population at country level and is distributed among the administrative regions
of the Kingdom of Saudi Arabia as follows:
• Sampling Units of the Household Environment Survey:
The basic sampling units are the enumeration areas. They are sampling units drawn in the
first stage of designing the survey sample. Households are considered secondary and
ultimate sampling units at the same time. They are sampling units drawn in the second stage
of designing the survey sample. Each secondary sampling unit is considered a part of the
basic sampling units.
Data Collection Tools: • Field Data Collection Questionnaire:
The survey form was prepared and designed by household environment survey experts at
GAStat. International recommendations, standards, and definitions were taken into
consideration in the design of the survey, which was also presented to experts and
stakeholders to obtain their insights and comments. Questions were then redrafted based
on a specific scientific approach aimed at unifying question formats used by researchers. The
questionnaire was divided into 9 thematic sections to increase its efficiency in achieving
technical specifications in the field work stage.
Administrative
Region
Number of
Households
Administrative
Region
Number of
Households
Administrative
Region
Number of
Households
Riyadh 3200 Asir 1616 Najran 960
Makkah 3424 Tabuk 1200 Al-Baha 768
Madinah 1632 Hail 1024 Al-Jouf 896
Qassim 960 Northern
Borders 592
Total 20000 Eastern
Province 2688 Jazan 1040

28
Household Environment Survey 2019
En
vir
on
me
nt
Sta
tist
ics
En
vir
on
me
nt
Sta
tist
ics
2019
The questionnaire was divided into the following 9 thematic sections:
Geographic and
distinctive data Household data Housing data Water data
Sewage data Water data Year-long energy data Housing air quality
Household agriculture
General environmental data
The complete questionnaire can be viewed and downloaded through GaStat’s official website
https://www.stats.gov.sa/sites/default/files/stmr_msh_lbyy_lmnzly2019.pdf
Upon approval, the survey questionnaire was converted into an electronic questionnaire that
can be used on an advanced data collection system on tablet devices. The system has the
following features:
1 ) Reviewing the field researcher’s work zone (survey sample).
2 ) Accessing the sample (household) using the map service on the tablet device.
3 ) Collecting high quality data using data checks and navigation services (to
automatically detect input errors and illogical inputs immediately upon data
collection).
4 ) Communicating with supervising entities by exchanging remarks with the field
researcher.
Data Collection Method: • The field research candidates in this survey were chosen based on standards related to
the nature of the work.
• All candidates (GaStat staff and collaborators from some government entities) were
qualified and trained through special training programs.
• Direct contact with households was adopted to complete the survey questionnaire and
collect the data. Field researchers visited the households located within the survey
sample after reaching them using the coordinates recorded on the tablets and the
guiding maps, introducing themselves and proving their IDs using official GaStat

29
Household Environment Survey 2019
En
vir
on
me
nt
Sta
tist
ics
En
vir
on
me
nt
Sta
tist
ics
2019
documents. They also clarified the aim of their visit, and presented an overview of the
survey and its objectives. The household data was then collected through the electronic
questionnaire.
• All field researchers used tablet devices to collect the survey questionnaire data
according to timeframes specified based on the number of family members as well as
their demographics, social and economic characteristics.
• Field researchers at all work locations in the Kingdom used the “synchronization”
feature available on the tablet devices to download and transfer the completed data of
the households directly to the database linked to them at GaStat’s headquarters where
they are stored to be reviewed and processed at a later stage.
• Electronic check rules were applied to guarantee the accuracy, consistency, and
rationality of the data entered in the survey questionnaire. These are electronic rules
that identify contradictions and they were designed by using a logical link between the
answers of the questionnaire and its variables to help field researchers directly identify
any errors upon completing the survey data with the head of the household. Those
programmed rules don’t allow any mistakes to go through when an answer contradicts
with another piece of information or another answer in the questionnaire.
• The collected data is verified and reviewed by the field researcher, his/her inspector and
the survey supervisor in the supervision area. All work areas are subjected to a
monitoring and reviewing process from the Data Quality Room at GaStat’s
headquarters. The room also controls and monitors the performance of all working
groups in the field during the data collection process, from the first day and until the
last day.
Results Preparation and Review: After reviewing the accumulated data for the Household Environment Survey, results are
calculated, extracted, uploaded, and stored on the database. The final reviewing processes

30
Household Environment Survey 2019
En
vir
on
me
nt
Sta
tist
ics
En
vir
on
me
nt
Sta
tist
ics
2019
are conducted by specialists in business statistics using modern technologies and software
designed for the purposes of reviewing and auditing.
Data Publication: First: Preparing results for publishing:
At this stage, GASTAT uploads data results to the Household Environment Survey database.
It then prepares publication tables and graphics for the data and indicators, and adds
description and methodology information as seen in this Bulletin. These are prepared in
both Arabic and English.
Second: Preparing media material and announcing the bulletin’s release date:
After GASTAT announces the bulletin’s release date on its official website at the beginning
of the calendar year, it prepares the required media materials to announce the bulletin’s
release on all media outlets, as well as its various social media platforms. The announcement
is made on the date set for publication. The bulletin is published on the official website in
various templates such as open data in Excel format
to guarantee its circulation and accessibility to all clients and parties interested in
agricultural statistics and add it to the website’s statistics library.
Third: Communicating with clients and providing them with the bulletin:
GASTAT pays great importance to communicating with clients who use its data. Therefore,
GASTAT contacts clients upon the release of the Research and Development Survey bulletin
to provide them with it. GASTAT also receives questions and enquiries from clients regarding
the bulletin and its results through various communication channels. Clients can contact
GASTAT to request data. Questions and inquiries are received via:
GASTAT official website: www.stats.gov.sa
GASTAT official email: [email protected]
Client support email: [email protected]
Visiting GASTAT HQ in Riyadh or one of its branches across the Kingdom.
Official letters.
Phone: (920020081).

31
Household Environment Survey 2019
En
vir
on
me
nt
Sta
tist
ics
En
vir
on
me
nt
Sta
tist
ics
2019
Implemented Quality Procedures: The Household Environment Survey is subject to many technical quality procedures to ensure
the quality of survey data. Such procedures include:
1. Using assessments of previous surveys conducted by GASTAT to identify the weaknesses
and strengths in survey implementation and improve procedures of statistical data
collection.
2. Training and testing researchers to guarantee their ability to properly obtain data in
line with the survey objectives.
3. Testing the electronic tools used to collect data to ensure data integrity and protection
at all stages of the survey implementation.
4. Reducing respondent burden by using appropriate statistical methods.
5. Committing to the timely publication of results based on previously set deadlines.
Several other measures are implemented by the Data Quality Room at GASTAT during the field
data collection process.
Data Quality Room:
It is an operations room that works simultaneously with the field operations of the surveys. It
is equipped with various electronic follow-up tools and monitoring and tracking screens. The
observers and quality specialists in the room review the consistency of the data and detect errors
and extreme values during the field data collection process. This is done by instantly and
immediately following up on what is being completed by the field researcher to check the
researchers’ commitment to the instructions of the survey, ensure the implementation of the
schedule of arranged visits to the establishment, ensure the rationality and reliability of the
data, and review some important survey indicators to ensure data accuracy. The room
undertakes several tasks, mainly:
Reviewing collected data and sending comments to field teams of all levels through an
automated office system connected to the tablet devices used by researchers, so that
they can get the comments automatically and instantly on site.
Contacting households by phone and asking some of the questionnaire questions to
ensure that the researchers collected the data correctly and complied with the

32
Household Environment Survey 2019
En
vir
on
me
nt
Sta
tist
ics
En
vir
on
me
nt
Sta
tist
ics
2019
instructions during their visits. These calls also seek to obtain any missing data and to
thank heads of households for their collaboration.
Responding to field inquiries, whether those of the field researchers or the heads of
households.
Checking the accuracy of the location where the questionnaire was completed by
matching the location’s coordinates to those registered in the sample file.
Bulletin Beneficiaries and Benefits: All the relevant public sectors benefit from this survey, mainly the Presidency of Meteorology
and Environment (PME), MEWA, and MoMRA, in addition to the private sector and regional
and international organizations, researchers and planners interested in environmental
statistics. The Household Environment Survey data is a statistical product that supports
decision-making in this field.
More details on the Household Environment Survey methodology can be found on GASTAT’s website.
(methodology link to be added)

33
Household Environment Survey 2019
En
vir
on
me
nt
Sta
tist
ics
En
vir
on
me
nt
Sta
tist
ics
2019
Key Results from the Household Environment Survey 1- Percentage distribution of households suffering from pollution by type (visual, sound,
light, air)
Figure 1
Survey results show that (67.87%) of households suffer from air pollution, whereas (41.18%)
suffer from visual pollution, (32.23%) from noise pollution and (9.15%) from light pollution,
as indicated by the Figure 1 above.
41.1832.23
9.15
67.8758.82
67.77
90.85
32.13
0
10
20
30
40
50
60
70
80
90
100
VisualSoundLightAir
Percentage distribution of households suffering from pollution by type (visual, sound, light, air)
Suffer From Pollution% Do Not Suffer From Pollution%

34
Household Environment Survey 2019
En
vir
on
me
nt
Sta
tist
ics
En
vir
on
me
nt
Sta
tist
ics
2019
2- Percentage of household dependence on the public network (as a water source) in KSA
Figure 2
Survey results indicate that the public network is the main water resource for (77,61%) of all
households, whereas (19,81%) rely on tanks. (2,54%) rely on a private well, and lastly, only
(0,04%) rely on other sources, as shown in Figure 2.
77.61%
19.81%
2.54% 0.04%
PERCENTAGE DISTRIBUTION OF HOUSEHOLD WATER SOURCE AT COUNTRY LEVEL
Public Network Tanks (White) Private Well Other Sources

35
Household Environment Survey 2019
En
vir
on
me
nt
Sta
tist
ics
En
vir
on
me
nt
Sta
tist
ics
2019
3- Percentage distribution of household water break measurements at country level
Figure 3
Survey results show that (83,26%) of households request a tank in case of a water break,
whereas (12.07%) await network water, and (4,67%) have a spare tank, as shown in Figure 3
above.
12.07%
4.67%
83.26%
PERCENTAGE DISTRIBUTION OF HOUSEHOLD WATER BREAK MEASUREMENTS AT COUNTRY
LEVEL
Await Network Water Have a Spare Tank Request a Tank (White)

36
Household Environment Survey 2019
En
vir
on
me
nt
Sta
tist
ics
En
vir
on
me
nt
Sta
tist
ics
2019
4- Percentage distribution of household main sewage source at country level
Figure 4
Figure 4 shows that the main sewage source for (61.66%) of households is the public
network, followed by the septic tank (37.67%), and the private network at only (0.67%).
61.66%
0.67%
37.67%
PERCENTAGE DISTRIBUTION OF HOUSEHOLD MAIN SEWAGE SOURCE AT COUNTRY LEVEL
Public Network Private Network Spetic Tank

37
Household Environment Survey 2019
En
vir
on
me
nt
Sta
tist
ics
En
vir
on
me
nt
Sta
tist
ics
2019
5- Total waste produced by household in tons at country level
Figure 5
Survey results indicate that the total amount of waste generated by households is (6,532,961)
tons, (6,519,989) tons of it is unsorted, which is much higher than sorted waste, which is only
(12,973) tons, as shown by Figure 5 above.
0
1,000,000
2,000,000
3,000,000
4,000,000
5,000,000
6,000,000
7,000,000
SortedUnsortedTotal
12,973
6,5
19,9
89
6,5
32,9
61
Total produced household waste in tons at country level

38
Household Environment Survey 2019
En
vir
on
me
nt
Sta
tist
ics
En
vir
on
me
nt
Sta
tist
ics
2019
6- Percentage distribution of household electronic waste disposal by method at country
level
Figure 6
As indicated by Figure 6 above, (85,43%) of households dispose of electronic waste through
public containers, whereas (8,01%) sell it, (1,92%) deliver it to a recycling agency, and
(4,64%) use other disposal methods.
85.43%
8.01%1.92%
4.64%
Percentage distribution of household electronic waste disposal by method at country level
Public Containers Sell It Deliver It to a Recycling Agency Other Disposal Methods

39
Household Environment Survey 2019
En
vir
on
me
nt
Sta
tist
ics
En
vir
on
me
nt
Sta
tist
ics
2019
7- Average number of household wasted electronics at the administrative region level
Figure 7
Survey results show that the average number of wasted electronics from every household at
country level is (5.81). On the level of administrative regions, Jazan witnessed the highest
average (7.55), followed by the Northern Borders (7.37). On the other hand, Tabuk witnessed
the lowest average (3.71), followed by Al-Jouf (4.71), as shown by Figure 7 above.
5.835.85
5.995.70
6.346.91
3.715.03
7.377.55
4.965.05
4.71
0.000.501.001.502.002.503.003.504.004.505.005.506.006.507.007.508.00
Al-RiyadhMeccaAl-MedinaAl-QassimThe Eastern ProvinceAseer ProvinceTabukHa'ilThe Northern BordersJazanNajranAl-BahahAl-Jouf
Average number of household wasted electronics at the administrative region level

40
Household Environment Survey 2019
En
vir
on
me
nt
Sta
tist
ics
En
vir
on
me
nt
Sta
tist
ics
2019
8- Annual average car oil change
Table 1
Average number of times for
changing the car oil
8.85
Table 1 above shows that the average number of times that households change their car oil is
(8.85) per year.
9- Annual average changed tires per household
Table 2
Annual average changed tires per
household
3.12
Survey results indicate the the average number of changed tires per household at country
level is (3,12) per year, as shown in Table 2.

41
Household Environment Survey 2019
En
vir
on
me
nt
Sta
tist
ics
En
vir
on
me
nt
Sta
tist
ics
2019
10- Percentage distribution of the main coal and firewood types used in households at country level
Figure 8
According to the survey results, local firewood represents (89.40%) of the firewood used by
households, whereas (90.24%) of all used coal is imported, as indicated in Figure 8.
89.40
9.76 10.60
90.24
0
10
20
30
40
50
60
70
80
90
100
FirewoodCoal
Percentage distribution of the main coal and firewood types used
in households at country level
Local Imported

42
Household Environment Survey 2019
En
vir
on
me
nt
Sta
tist
ics
En
vir
on
me
nt
Sta
tist
ics
2019
11- Percentage distribution of the number of times households use incense at country level
Figure 9
Survey results show that (56,86%) of households use incense in the house more than once a
week, whereas (27,08%) use it once a week, (12,67%) daily, and (3,39%) once a month, as
shown in Figure 9.
12.67%
56.86%
27.08%
3.39%
Percentage distribution of the number of times households use incense at country level
Daily More Than Once a Week Once a Week Once a Month

43
Household Environment Survey 2019
En
vir
on
me
nt
Sta
tist
ics
En
vir
on
me
nt
Sta
tist
ics
2019
12- Percentage distribution of household environmental literacy at country level
Figure 10
Survey results indicate that (51,97%) of households are somewhat literate in environment,
while (35,30%) are illiterate, and (12,73%) are literate, as shown in Figure 10 above.
12.73%
51.97%
35.30%
Percentage distribution of household environmental literacy at country level
Literate Somewhat Literate Illiterate

44
Household Environment Survey 2019
En
vir
on
me
nt
Sta
tist
ics
En
vir
on
me
nt
Sta
tist
ics
2019
13- Percentage distribution of households with pets at country level
Figure 11
Figure 11 above indicates that (6.16%) of households have pets, whereas the majority don’t at
(93,84%).
6.16%
93.84%
PERCENTAGE DISTRIBUTION OF HOUSEHOLDS WITH PETS AT
COUNTRY LEVEL
Have Pets Don't Have Pets

45
Household Environment Survey 2019
En
vir
on
me
nt
Sta
tist
ics
En
vir
on
me
nt
Sta
tist
ics
2019
14- Percentage distribution of safety and security measures available in households at country
level
Figure 12
As shown in Figure 12 above, survey results indicate that the percentages of safety and
security measures in households are divided as follows:
1- (55.73%) of households have a separate cabinet for storing fertilizers and pesticides.
2- (45.18%) have a first aid box at home.
3- (19.57%) have fire extinguishers.
4- (6.37%) have fire alarms.
55.73
19.57
6.37
45.18
44.27
80.43
93.63
54.82
0102030405060708090100
A Separate Cabinet for Sorting Fertilizers andPesticides
Fire Extinguishers
Fire Alarms
First Aid Box
Percentage distribution of safety and security measures
available in households at country level
Do Not Have Have
46
Household Environment Survey 2019
En
vir
on
me
nt
Sta
tist
ics
En
vir
on
me
nt
Sta
tist
ics
2019
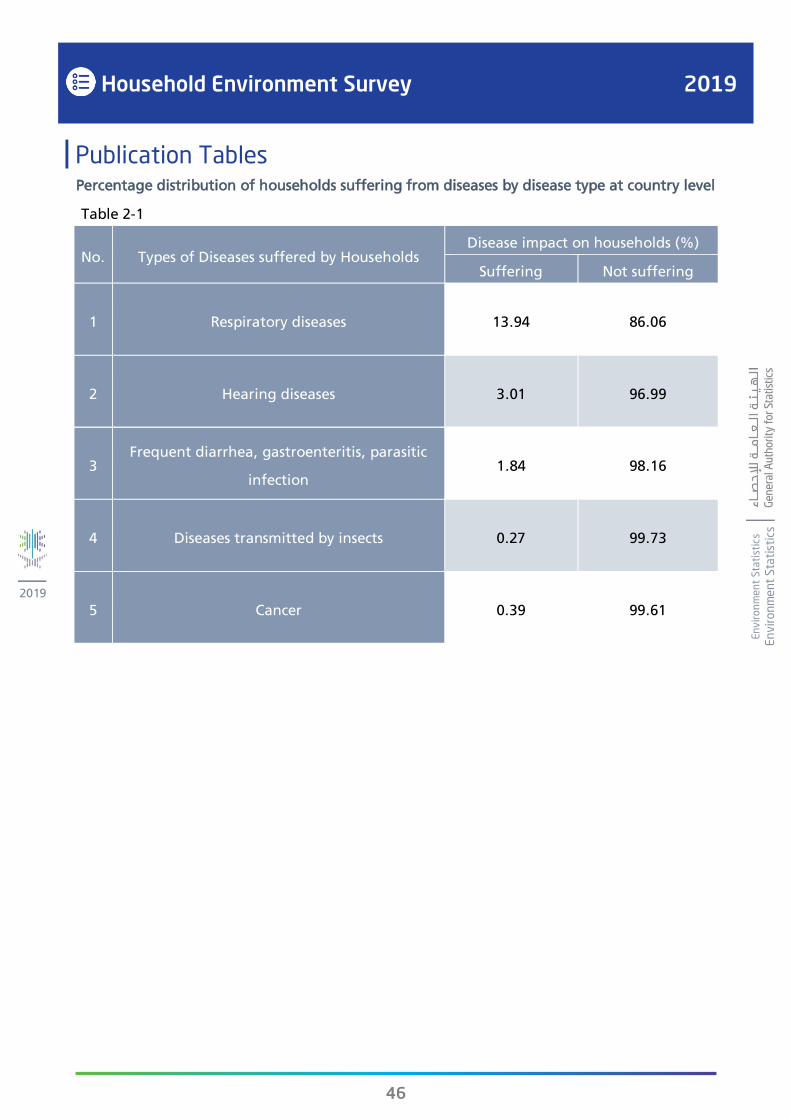
Publication Tables Percentage distribution of households suffering from diseases by disease type at country level
Table 2-1
No. Types of Diseases suffered by Households Disease impact on households (%)
Suffering Not suffering
1 Respiratory diseases 13.94 86.06
2 Hearing diseases 3.01 96.99
3 Frequent diarrhea, gastroenteritis, parasitic
infection 1.84 98.16
4 Diseases transmitted by insects 0.27 99.73
5 Cancer 0.39 99.61

47
Household Environment Survey 2019
En
vir
on
me
nt
Sta
tist
ics
En
vir
on
me
nt
Sta
tist
ics
2019
Percentage distribution of households suffering from the major pollution types at country
level
Table 2-2
No. Types of Pollution suffered by Households Pollution impact on households (%)
Suffering Not suffering
1 Visual 41.18 58.82
2 Sound 32.23 67.77
3 Light 9.15 90.85
4 Air 67.87 32.13
Percentage distribution of households suffering from visual pollution at country level
Table 2-3
No. Visual Pollution Impact on Households Pollution impact on households (%)
Suffering Not suffering
1 Antennas and wires 16.86 83.14
2 Open dumping of waste 22.01 77.99
3 Graffiti 18.38 81.62

48
Household Environment Survey 2019
En
vir
on
me
nt
Sta
tist
ics
En
vir
on
me
nt
Sta
tist
ics
2019
Percentage distribution of households suffering from sound pollution at country level
Table 2-4
No. Sound Pollution Impact on Households Pollution impact on households (%)
Suffering Not suffering
1 Noise from household appliances 6.57 93.43
2 Transportation sound pollution 26.87 73.13
3 Factory sound pollution 1.44 98.56
Percentage distribution of households suffering from light pollution at country level
Table 2-5
No. Light Pollution Impact on Households Pollution impact on households (%)
Suffering Not suffering
1 Decoration lights and signs 2.44 97.56
2 Lights resulting from overpopulation 7.22 92.78

49
Household Environment Survey 2019
En
vir
on
me
nt
Sta
tist
ics
En
vir
on
me
nt
Sta
tist
ics
2019
Percentage distribution of households suffering from air pollution at country level
Table 2-6
No. Air Pollution Impact on Households Pollution impact on households (%)
Suffering Not suffering
1 Incineration gases (cooking and heating) 8.93 91.07
2 Smoking 12.39 87.61
3 Dust and sand 54.74 45.26
4 Unpleasant smells 25.66 74.34
Average area of household yards and gardens at country level (m2)
Table 3-1
Average area of household yards and gardens (m2)
44.02

50
Household Environment Survey 2019
En
vir
on
me
nt
Sta
tist
ics
En
vir
on
me
nt
Sta
tist
ics
2019
Average area of household yards and gardens by housing type at the administrative region
level (m2)
Table 3-2
No
.
Administrative
Region
Housing Type
Traditiona
l house Villa
Floor at a
traditional
house
Floor at a
villa
Apartmen
t Other
1 Riyadh 42.20 134.92 54.05 72.35 0.08 1.62
2 Makkah 44.96 150.52 34.32 73.86 0.02 1.01
3 Madinah 58.94 132.16 89.43 62.37 0.00 1.10
4 Qassim 88.94 187.74 55.10 80.49 0.09 0.00
5 Eastern Region 32.97 158.25 27.19 58.30 0.00 0.00
6 Asir 78.93 162.75 77.46 89.92 0.00 0.00
7 Tabuk 38.37 111.89 18.35 78.19 0.00 0.00
8 Hail 62.02 112.81 62.93 67.20 0.09 0.00
9 Northern Borders 34.46 128.26 33.41 51.01 0.04 0.00
10 Jazan 90.25 119.25 43.98 94.75 0.23 0.00
11 Najran 106.68 183.82 45.73 69.11 0.39 0.00
12 Al-Baha 82.09 68.24 61.69 15.36 0.00 0.00
13 Al-Jouf 92.54 134.15 38.36 59.05 0.00 0.00
Percentage distribution of sunlight availability in the house at country level
Table 3-3
No. Degree of sunlight exposure Percentage distribution (%)
1 High 30.17
2 Medium 56.84
3 Low 10.76
4 None 2.23
Total 100.00

51
Household Environment Survey 2019
En
vir
on
me
nt
Sta
tist
ics
En
vir
on
me
nt
Sta
tist
ics
2019
Percentage distribution of sunlight availability in the house at the administrative region level
Table 3-4
No. Administrative Region Sunlight exposure (%)
High Medium Low None
1 Riyadh 26.73 52.98 16.73 3.55
2 Makkah 27.24 59.38 10.37 3.02
3 Madinah 25.83 66.50 6.91 0.77
4 Qassim 47.47 41.84 9.68 1.01
5 Eastern Region 26.52 63.37 8.78 1.33
6 Asir 33.17 57.01 8.73 1.09
7 Tabuk 39.47 51.16 8.17 1.21
8 Hail 32.56 56.84 10.60 0.00
9 Northern Borders 41.05 51.05 7.59 0.30
10 Jazan 54.53 36.98 5.96 2.54
11 Najran 42.04 57.10 0.79 0.06
12 Al-Baha 36.51 56.43 6.88 0.17
13 Al-Jouf 8.66 85.11 5.24 0.99
Percentage distribution of households with a swimming pool at country level
Table 3-5
No. Swimming pool availability Percentage distribution (%)
1 Yes 0.73
2 No 99.27
Total 100.00
52
Household Environment Survey 2019
En
vir
on
me
nt
Sta
tist
ics
En
vir
on
me
nt
Sta
tist
ics
2019
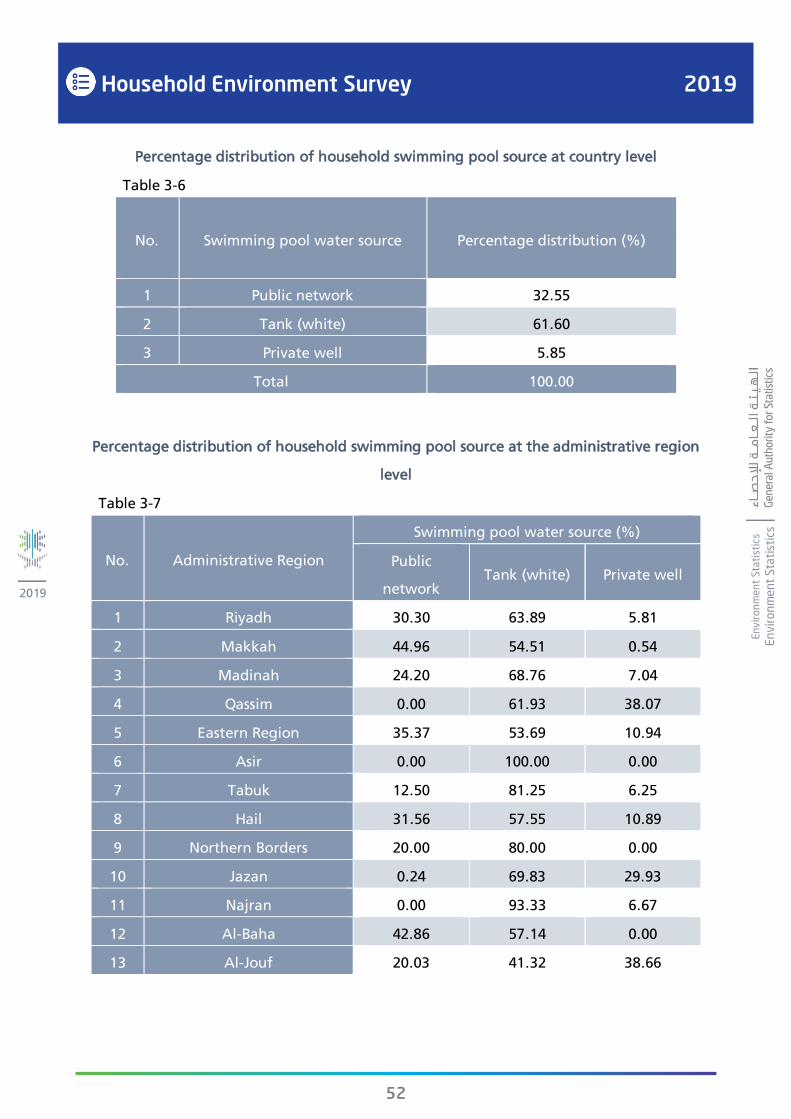
Percentage distribution of household swimming pool source at country level
Table 3-6
No. Swimming pool water source Percentage distribution (%)
1 Public network 32.55
2 Tank (white) 61.60
3 Private well 5.85
Total 100.00
Percentage distribution of household swimming pool source at the administrative region
level
Table 3-7
No. Administrative Region
Swimming pool water source (%)
Public
network Tank (white) Private well
1 Riyadh 30.30 63.89 5.81
2 Makkah 44.96 54.51 0.54
3 Madinah 24.20 68.76 7.04
4 Qassim 0.00 61.93 38.07
5 Eastern Region 35.37 53.69 10.94
6 Asir 0.00 100.00 0.00
7 Tabuk 12.50 81.25 6.25
8 Hail 31.56 57.55 10.89
9 Northern Borders 20.00 80.00 0.00
10 Jazan 0.24 69.83 29.93
11 Najran 0.00 93.33 6.67
12 Al-Baha 42.86 57.14 0.00
13 Al-Jouf 20.03 41.32 38.66

53
Household Environment Survey 2019
En
vir
on
me
nt
Sta
tist
ics
En
vir
on
me
nt
Sta
tist
ics
2019
Average household swimming pool size at country level
Table 3-8
Average swimming pool size
44.97
Average number of swimming pool water disposal per year at country level
Table 3-9
Average times of swimming pool water disposal
3.54

54
Household Environment Survey 2019
En
vir
on
me
nt
Sta
tist
ics
En
vir
on
me
nt
Sta
tist
ics
2019
Average number of times households empty their swimming pool per year at the
administrative region level
Table 3-10
No. Administrative Region Average times of swimming pool
water disposal
1 Riyadh 2.90
2 Makkah 2.38
3 Madinah 10.23
4 Qassim 11.90
5 Eastern Region 2.32
6 Asir 2.38
7 Tabuk 6.00
8 Hail 3.88
9 Northern Borders 12.00
10 Jazan 12.09
11 Najran 8.00
12 Al-Baha 2.71
13 Al-Jouf 8.59
Percentage distribution of household swimming pool water disposal method at country level
Table 3-11
No. Disposal method Percentage distribution (%)
Yes No
1 Sewage 41.56 58.44
2 Use in irrigation 54.68 45.32
3 Use in cleaning 39.80 60.20

55
Household Environment Survey 2019
En
vir
on
me
nt
Sta
tist
ics
En
vir
on
me
nt
Sta
tist
ics
2019
Percentage distribution of households that have a swimming pool filter at country level
Table 3-12
No. Availability of swimming pool
filter Percentage distribution (%)
1 Yes 92.28
2 No 7.72
Total 100.00
Percentage distribution of household water source at country level
Table 4-1
No. Water source Percentage distribution (%)
1 Public network 77.61
2 Tank (white) 19.81
3 Private well 2.54
4 Other 0.03
Total 100.00
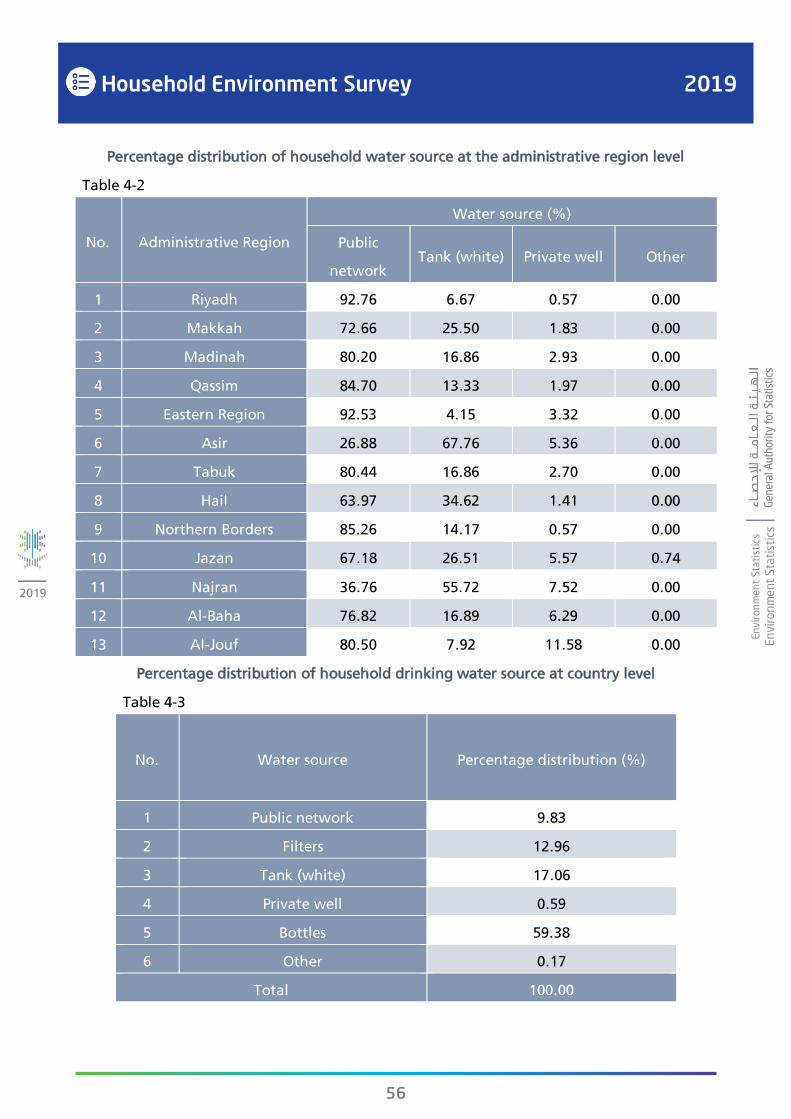
56
Household Environment Survey 2019
En
vir
on
me
nt
Sta
tist
ics
En
vir
on
me
nt
Sta
tist
ics
2019
Percentage distribution of household water source at the administrative region level
Table 4-2
No. Administrative Region
Water source (%)
Public
network Tank (white) Private well Other
1 Riyadh 92.76 6.67 0.57 0.00
2 Makkah 72.66 25.50 1.83 0.00
3 Madinah 80.20 16.86 2.93 0.00
4 Qassim 84.70 13.33 1.97 0.00
5 Eastern Region 92.53 4.15 3.32 0.00
6 Asir 26.88 67.76 5.36 0.00
7 Tabuk 80.44 16.86 2.70 0.00
8 Hail 63.97 34.62 1.41 0.00
9 Northern Borders 85.26 14.17 0.57 0.00
10 Jazan 67.18 26.51 5.57 0.74
11 Najran 36.76 55.72 7.52 0.00
12 Al-Baha 76.82 16.89 6.29 0.00
13 Al-Jouf 80.50 7.92 11.58 0.00
Percentage distribution of household drinking water source at country level
Table 4-3
No. Water source Percentage distribution (%)
1 Public network 9.83
2 Filters 12.96
3 Tank (white) 17.06
4 Private well 0.59
5 Bottles 59.38
6 Other 0.17
Total 100.00

57
Household Environment Survey 2019
En
vir
on
me
nt
Sta
tist
ics
En
vir
on
me
nt
Sta
tist
ics
2019
Percentage distribution of household drinking water source at the administrative region level
Table 4-4
No. Administrative
Region
Drinking water source (%)
Public
network Filters
Tank
(white)
Private
well Bottles Other
1 Riyadh 4.25 20.68 12.64 0.17 62.17 0.08
2 Makkah 9.56 6.63 6.63 0.68 76.38 0.12
3 Madinah 28.51 14.60 13.76 1.65 41.47 0.01
4 Qassim 7.73 33.75 27.94 0.44 30.14 0.00
5 Eastern Region 12.42 3.82 31.39 0.06 52.30 0.02
6 Asir 10.17 1.76 26.80 1.18 60.09 0.00
7 Tabuk 11.36 38.61 5.47 0.00 44.56 0.00
8 Hail 18.65 19.16 32.54 0.47 29.18 0.00
9 Northern Borders 5.92 8.42 75.01 0.32 10.34 0.00
10 Jazan 2.58 7.36 20.11 0.14 66.94 2.86
11 Najran 8.84 18.41 31.46 3.78 37.51 0.00
12 Al-Baha 4.18 22.48 0.09 0.35 72.90 0.00
13 Al-Jouf 16.46 7.57 39.85 2.48 33.64 0.00
Percentage distribution of households using soap to wash hands at country level
Table 4-5
No. Frequency of soap use in washing hands in
households
Percentage distribution
(%)
1 Regularly 81.87
2 Rare 1.23
3 When needed 16.74
4 Not used 0.16
Total 100.00

58
Household Environment Survey 2019
En
vir
on
me
nt
Sta
tist
ics
En
vir
on
me
nt
Sta
tist
ics
2019
Percentage distribution of households using soap to wash hands at the administrative region
level
Table 4-6
No. Administrative Region
Soap use for washing hands in households (%)
Regularly Rarely When
needed Not used
1 Riyadh 71.04 0.94 27.92 0.09
2 Makkah 90.76 0.65 8.48 0.10
3 Madinah 81.27 1.99 16.69 0.05
4 Qassim 0.05 0.96 38.88 0.10
5 Eastern Region 92.79 1.26 5.85 0.10
6 Asir 80.99 2.90 15.90 0.21
7 Tabuk 80.44 4.28 15.28 0.00
8 Hail 82.69 0.16 16.83 0.32
9 Northern Borders 88.52 0.82 10.60 0.06
10 Jazan 92.29 1.29 5.65 0.77
11 Najran 49.97 1.15 48.41 0.46
12 Al-Baha 89.99 0.26 9.49 0.26
13 Al-Jouf 74.78 1.90 21.84 1.48
Percentage distribution of household main water tank type at country level
Table 4-7
No. Type of main tank Percentage distribution (%)
1 Cement 83.33
2 Fiberglass 14.49
3 Tin 2.00
4 Other 0.18
Total 100.00

59
Household Environment Survey 2019
En
vir
on
me
nt
Sta
tist
ics
En
vir
on
me
nt
Sta
tist
ics
2019
Percentage distribution of household main water tank type at the administrative region level
Table 4-8
No. Administrative Region Main tank (%)
Cement Fiberglass Tin Other
1 Riyadh 95.71 4.15 0.14 0.00
2 Makkah 97.90 0.92 0.62 0.57
3 Madinah 96.35 2.90 0.52 0.24
4 Qassim 95.83 0.24 1.93 0.00
5 Eastern Region 22.27 77.32 0.33 0.08
6 Asir 98.83 0.79 0.38 0.00
7 Tabuk 90.97 6.16 2.87 0.00
8 Hail 96.17 2.89 0.93 0.00
9 Northern Borders 83.89 14.09 2.02 0.00
10 Jazan 57.85 28.48 13.67 0.00
11 Najran 71.70 6.41 21.89 0.00
12 Al-Baha 93.71 1.60 4.69 0.00
13 Al-Jouf 43.21 27.91 28.87 0.00
Percentage distribution of the number of times households empty their main tank at country
level
Table 4-9
No. Number of cleaning times Percentage distribution (%)
1 None 48.66
2 Once 45.35
3 2-5 times 5.84
4 More than 5 times 0.16
Total 100.00

60
Household Environment Survey 2019
En
vir
on
me
nt
Sta
tist
ics
En
vir
on
me
nt
Sta
tist
ics
2019
Percentage distribution of the number of times households empty main tank at the
administrative region level
Table 4-10
No. Administrative
Region
Number of cleaning times (%)
None Once 2-5 times More than 5
times
1 Riyadh 54.58 38.45 6.83 0.15
2 Makkah 41.36 53.48 5.02 0.15
3 Madinah 50.10 45.01 4.89 0.00
4 Qassim 73.63 22.96 3.29 0.12
5 Eastern Region 45.56 45.76 8.26 0.42
6 Asir 56.70 41.39 1.92 0.00
7 Tabuk 56.10 38.71 5.14 0.04
8 Hail 36.20 59.45 4.34 0.00
9 Northern Borders 55.94 40.67 3.39 0.00
10 Jazan 43.69 44.62 11.46 0.22
11 Najran 36.45 55.46 8.09 0.00
12 Al-Baha 22.85 73.59 3.29 0.26
13 Al-Jouf 42.00 54.95 2.97 0.08
Percentage distribution of household water availability constancy at country level
Table 4-11
No. Water availability constancy Percentage distribution (%)
1 Frequent 88.36
2 Sometimes 9.87
3 Rare 0.83
4 None 0.94
Total 100.00

61
Household Environment Survey 2019
En
vir
on
me
nt
Sta
tist
ics
En
vir
on
me
nt
Sta
tist
ics
2019
Percentage distribution of household water availability constancy at the administrative
region level
Table 4-12
No. Administrative Region Water availability constancy (%)
Frequent Sometimes Rare None
1 Riyadh 90.99 7.23 1.30 0.49
2 Makkah 77.39 19.92 0.66 2.03
3 Madinah 91.65 7.78 0.20 0.37
4 Qassim 93.97 5.73 0.31 0.00
5 Eastern Region 91.08 7.19 1.51 0.22
6 Asir 96.93 2.70 0.31 0.05
7 Tabuk 98.18 1.75 0.08 0.00
8 Hail 95.23 4.77 0.00 0.00
9 Northern Borders 97.51 2.43 0.06 0.00
10 Jazan 88.59 5.10 1.23 5.08
11 Najran 98.17 1.48 0.27 0.07
12 Al-Baha 97.84 1.91 0.25 0.00
13 Al-Jouf 87.81 11.75 0.37 0.07
Percentage distribution of household water break measurements at country level
Table 4-13
No. Measurements taken in water
breaks Percentage distribution (%)
1 Waiting for the network water 12.07
2 Using a spare tank 4.67
3 Requesting a tank (white) 83.26
Total 100.00

62
Household Environment Survey 2019
En
vir
on
me
nt
Sta
tist
ics
En
vir
on
me
nt
Sta
tist
ics
2019
Percentage distribution of household water break measurements at the administrative region
level
Table 4-14
No. Administrative Region
Measurements taken in water breaks (%)
Waiting for the
network water
Using a spare
tank
Requesting a
tank (white)
1 Riyadh 8.10 1.12 90.78
2 Makkah 7.60 0.99 91.41
3 Madinah 10.14 2.73 87.13
4 Qassim 2.64 0.00 97.36
5 Eastern Region 42.30 32.53 25.17
6 Asir 3.82 0.00 96.18
7 Tabuk 49.09 8.28 42.63
8 Hail 8.18 6.43 85.39
9 Northern Borders 7.33 2.92 89.75
10 Jazan 16.21 1.17 82.61
11 Najran 0.00 6.95 93.05
12 Al-Baha 26.70 4.54 68.76
13 Al-Jouf 18.47 9.41 72.12
Percentage distribution of waiting time for water after a break in households at country level
Table 4-15
No. Waiting time Percentage distribution (%)
1 Less than an hour 17.86
2 1-6 hours 51.02
3 A full day 16.68
4 More than one day 14.43
Total 100.00

63
Household Environment Survey 2019
En
vir
on
me
nt
Sta
tist
ics
En
vir
on
me
nt
Sta
tist
ics
2019
Percentage distribution of waiting time for water after a break in households by
measurement at country level
Table 4-16
No. Waiting time
Measurements taken in water breaks (%)
Waiting for the network
water Requesting a tank (white)
1 Less than an hour 11.56 88.44
2 1-6 hours 7.50 92.50
3 A full day 18.01 81.99
4 More than one day 26.06 73.94
Percentage distribution of household main sewage source at country level
Table 5-1
No. Main sewage source Percentage distribution (%)
1 Public network 61.65
2 Private network 0.67
3 Septic tank (hole) 37.67
Total 100.00

64
Household Environment Survey 2019
En
vir
on
me
nt
Sta
tist
ics
En
vir
on
me
nt
Sta
tist
ics
2019
Percentage distribution of household main sewage source at the administrative region level
Table 5-2
No. Administrative Region
Main sewage source (%)
Public network Private
network Septic tank
1 Riyadh 80.41 0.00 19.59
2 Makkah 62.99 1.96 35.05
3 Madinah 52.34 0.00 47.66
4 Qassim 62.15 0.00 37.85
5 Eastern Region 83.32 0.97 15.71
6 Asir 26.43 0.00 73.57
7 Tabuk 59.36 0.00 40.64
8 Hail 52.63 0.00 47.37
9 Northern Borders 49.32 0.00 50.68
10 Jazan 2.84 0.00 97.16
11 Najran 17.28 0.11 82.61
12 Al-Baha 0.00 0.00 100.00
13 Al-Jouf 42.64 0.00 57.36
Average times for draining the septic tank per year at country level
Table 5-3
Average times for emptying the septic tank
1.28

65
Household Environment Survey 2019
En
vir
on
me
nt
Sta
tist
ics
En
vir
on
me
nt
Sta
tist
ics
2019
Percentage distribution of frying oil disposal method at country level
Table 5-4
No
. Frying oils disposal methods Percentage distribution (%)
1 Direct disposal through the sewage system 43.01
2 Trash can 56.14
3 Other 0.85
Total 100.00

66
Household Environment Survey 2019
En
vir
on
me
nt
Sta
tist
ics
En
vir
on
me
nt
Sta
tist
ics
2019
Percentage distribution of frying oil disposal method at the administrative region level
Table 5-5
No. Administrative Region
Percentage distribution of disposal method (%)
Direct disposal in
the sewage
system
Trash can Other
1 Riyadh 35.67 62.22 2.11
2 Makkah 41.12 57.99 0.89
3 Madinah 67.50 32.48 0.02
4 Qassim 29.86 69.30 0.84
5 Eastern Region 48.10 51.82 0.08
6 Asir 43.19 56.81 0.00
7 Tabuk 36.05 63.95 0.00
8 Hail 70.16 29.84 0.00
9 Northern Borders 48.21 51.79 0.00
10 Jazan 36.20 63.80 0.00
11 Najran 42.80 57.20 0.00
12 Al-Baha 51.80 47.96 0.23
13 Al-Jouf 63.35 35.07 1.58
Percentage distribution of types of toilets in households at country level
Table 5-6
No. Type of toilet Percentage distribution (%)
Yes No
1 Squat toilet 78.67 21.33
2 Sit toilet 71.87 28.13

67
Household Environment Survey 2019
En
vir
on
me
nt
Sta
tist
ics
En
vir
on
me
nt
Sta
tist
ics
2019
Percentage distribution of households that clean the house daily at country level
Table 6-1
No. Cleaning the house daily Percentage distribution (%)
1 Cleaning 86.20
2 Not cleaning 13.80
Total 100.00
Percentage distribution of households that clean the house daily at the administrative region
level
Table 6-2
No. Administrative Region Cleaning the house daily (%)
Cleaning Not cleaning
1 Riyadh 84.02 15.98
2 Makkah 90.01 9.99
3 Madinah 83.38 16.62
4 Qassim 82.80 17.20
5 Eastern Region 85.94 14.06
6 Asir 86.16 13.84
7 Tabuk 74.11 25.89
8 Hail 74.62 25.38
9 Northern Borders 85.05 14.95
10 Jazan 97.24 2.76
11 Najran 94.19 5.81
12 Al-Baha 90.74 9.26
13 Al-Jouf 75.47 24.53

68
Household Environment Survey 2019
En
vir
on
me
nt
Sta
tist
ics
En
vir
on
me
nt
Sta
tist
ics
2019
Percentage distribution of the number of times households dispose of waste at country level
Table 6-3
No. Number of times for waste
disposal Percentage distribution (%)
1 Daily 68.20
2 More than once a week 28.69
3 Once a week 3.12
Total 100.00
Percentage distribution of the number of times households dispose of waste at the
administrative region level
Table 6-4
No. Administrative Region
Number of times for waste disposal (%)
Daily More than once a
week Once a week
1 Riyadh 74.86 22.70 1.44
2 Makkah 74.56 23.23 2.21
3 Madinah 52.39 43.39 4.22
4 Qassim 71.36 25.83 2.81
5 Eastern Region 73.94 24.14 1.91
6 Asir 53.61 41.78 4.61
7 Tabuk 43.60 50.36 6.04
8 Hail 55.61 41.09 3.30
9 Northern Borders 62.18 33.05 4.77
10 Jazan 75.47 22.99 1.53
11 Najran 46.77 43.86 9.37
12 Al-Baha 34.35 58.51 7.15
13 Al-Jouf 35.62 48.84 15.54

69
Household Environment Survey 2019
En
vir
on
me
nt
Sta
tist
ics
En
vir
on
me
nt
Sta
tist
ics
2019
Percentage distribution of households that sort waste at country level
Table 6-5
No. Waste sorting at households Percentage distribution (%)
1 Sorting 0.30
2 No sorting 99.70
Total 100.00
Total produced household waste in tons at country level
Table 6-6
No. Waste type Amount of generated waste (ton)
1 Sorted 12,973
2 Unsorted 6,519,989
Total 6,532,961

70
Household Environment Survey 2019
En
vir
on
me
nt
Sta
tist
ics
En
vir
on
me
nt
Sta
tist
ics
2019
Total produced household waste in tons at the administrative region level
Table 6-7
No. Administrative Region Quantity (ton)
1 Riyadh 2,034,142
2 Makkah 1,387,901
3 Madinah 424,687
4 Qassim 256,394
5 Eastern Region 751,561
6 Asir 521,594
7 Tabuk 242,181
8 Hail 166,213
9 Northern Borders 87,981
10 Jazan 354,376
11 Najran 160,091
12 Al-Baha 83,120
13 Al-Jouf 62,721

71
Household Environment Survey 2019
En
vir
on
me
nt
Sta
tist
ics
En
vir
on
me
nt
Sta
tist
ics
2019
Amount of sorted household waste in tons by waste type at country level
Table 6-8
No. Waste type Quantity (ton)
1 Organic 3,905
2 Plastic 3,411
3 Glass 1,701
4 Metal 1,603
5 Agricultural 1,207
6 Chemical 382
7 Medical 298
8 Batteries 466
Total 12,973
Percentage distribution of household unsorted waste disposal by method at country level
Table 6-9
No. Waste disposal method Percentage distribution (%)
1 Public container 99.62
2 Incineration 0.36
3 Burial 0.02
Total 100.00

72
Household Environment Survey 2019
En
vir
on
me
nt
Sta
tist
ics
En
vir
on
me
nt
Sta
tist
ics
2019
Percentage distribution of household unsorted waste disposal by method at the
administrative region level
Table 6-10
No. Administrative Region Disposal methods (%)
Public container Incineration Burial
1 Riyadh 99.88 0.12 0.01
2 Makkah 99.63 0.37 0.00
3 Madinah 99.51 0.44 0.05
4 Qassim 100.00 0.00 0.00
5 Eastern Region 99.93 0.07 0.00
6 Asir 99.99 0.01 0.00
7 Tabuk 98.29 1.60 0.11
8 Hail 98.67 1.08 0.25
9 Northern Borders 100.00 0.00 0.00
10 Jazan 99.34 0.66 0.00
11 Najran 99.97 0.03 0.00
12 Al-Baha 99.20 0.65 0.14
13 Al-Jouf 94.18 5.72 0.11
Number of household wasted electronics at country level
Table 6-11
Number of household wasted electronics
48,301,922

73
Household Environment Survey 2019
En
vir
on
me
nt
Sta
tist
ics
En
vir
on
me
nt
Sta
tist
ics
2019
Number of wasted household electronics at the administrative region level
Table 6-12
No. Administrative Region Number
1 Riyadh 11,923,334
2 Makkah 12,030,375
3 Madinah 2,302,190
4 Qassim 1,072,449
5 Eastern Region 6,993,319
6 Asir 2,860,947
7 Tabuk 2,126,478
8 Hail 2,378,631
9 Northern Borders 975,223
10 Jazan 2,918,094
11 Najran 1,421,895
12 Al-Baha 320,347
13 Al-Jouf 978,639

74
Household Environment Survey 2019
En
vir
on
me
nt
Sta
tist
ics
En
vir
on
me
nt
Sta
tist
ics
2019
Number of wasted household electronics at country level
Table 6-13
No. Type of wasted electronics Number
1 Heat exchange equipment 2,967,892
2 Screens, panels and equipment with
screens 1,380,954
3 Bulbs (florescent, neon...) 38,358,699
4 Small household appliances (pot,
iron, coffee machine) 1,553,763
5 Large household appliances (fridge,
washing machine, oven) 1,282,612
6 Small ICT devices (mobile phones,
game console) 2,758,002

75
Household Environment Survey 2019
En
vir
on
me
nt
Sta
tist
ics
En
vir
on
me
nt
Sta
tist
ics
2019
Average number of wasted electronics produced by households at country level
Table 6-14
Average number of household wasted electronics
5.81
Average number of household wasted electronics at the administrative region level
Table 6-15
No. Administrative Region Average
1 Riyadh 5.83
2 Makkah 5.85
3 Madinah 5.99
4 Qassim 5.70
5 Eastern Region 6.34
6 Asir 6.91
7 Tabuk 3.71
8 Hail 5.03
9 Northern Borders 7.37
10 Jazan 7.55
11 Najran 4.96
12 Al-Baha 5.05
13 Al-Jouf 4.71
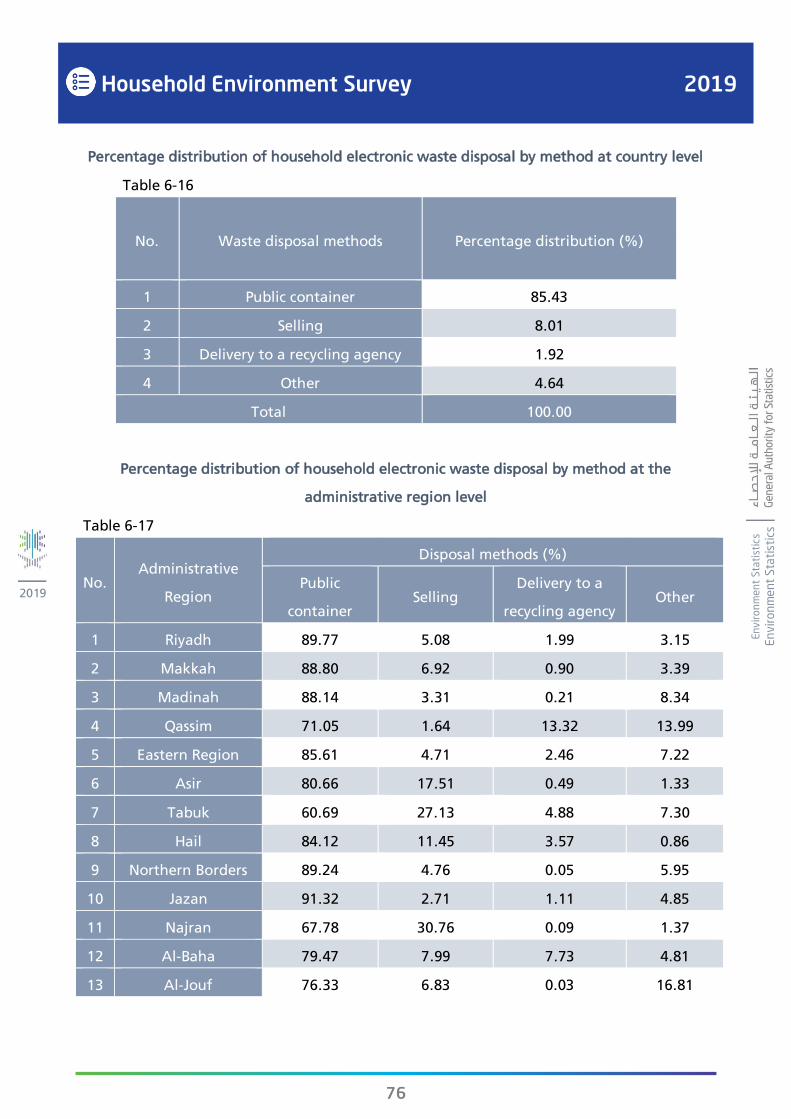
76
Household Environment Survey 2019
En
vir
on
me
nt
Sta
tist
ics
En
vir
on
me
nt
Sta
tist
ics
2019
Percentage distribution of household electronic waste disposal by method at country level
Table 6-16
No. Waste disposal methods Percentage distribution (%)
1 Public container 85.43
2 Selling 8.01
3 Delivery to a recycling agency 1.92
4 Other 4.64
Total 100.00
Percentage distribution of household electronic waste disposal by method at the
administrative region level
Table 6-17
No. Administrative
Region
Disposal methods (%)
Public
container Selling
Delivery to a
recycling agency Other
1 Riyadh 89.77 5.08 1.99 3.15
2 Makkah 88.80 6.92 0.90 3.39
3 Madinah 88.14 3.31 0.21 8.34
4 Qassim 71.05 1.64 13.32 13.99
5 Eastern Region 85.61 4.71 2.46 7.22
6 Asir 80.66 17.51 0.49 1.33
7 Tabuk 60.69 27.13 4.88 7.30
8 Hail 84.12 11.45 3.57 0.86
9 Northern Borders 89.24 4.76 0.05 5.95
10 Jazan 91.32 2.71 1.11 4.85
11 Najran 67.78 30.76 0.09 1.37
12 Al-Baha 79.47 7.99 7.73 4.81
13 Al-Jouf 76.33 6.83 0.03 16.81

77
Household Environment Survey 2019
En
vir
on
me
nt
Sta
tist
ics
En
vir
on
me
nt
Sta
tist
ics
2019
Percentage distribution of household electronic waste disposal method by type at country
level
Table 6-18
No. Type of wasted
electronics
Disposal methods (%)
Public
container Selling
Delivery to a
recycling agency Other
1 Heat exchange
equipment 37.51 43.80 6.72 11.97
2 Screens, panels and
equipment with screens 56.42 24.18 4.81 14.59
3 Bulbs (florescent,
neon...) 95.64 1.20 1.18 1.98
4
Small household
appliances (pot, iron,
coffee machine)
69.07 19.16 3.61 8.16
5
Large household
appliances (fridge,
washing machine, oven)
37.30 42.62 7.92 12.16
6 Small ICT devices (mobile
phones, game console) 41.07 33.64 1.90 23.38

78
Household Environment Survey 2019
En
vir
on
me
nt
Sta
tist
ics
En
vir
on
me
nt
Sta
tist
ics
2019
Percentage distribution of household medical waste disposal by method at country level
Table 6-19
No. Medication disposal methods Percentage distribution (%)
Yes No
1 Donating or giving excess
medication to others 9.01 90.99
2 Throwing them in the garbage 91.74 8.26
3 Throwing them in the sink or toilet 8.99 91.01

79
Household Environment Survey 2019
En
vir
on
me
nt
Sta
tist
ics
En
vir
on
me
nt
Sta
tist
ics
2019
Percentage distribution of household medical waste disposal by method at the administrative
region level
Table 6-20
No. Administrative
Region
Medication disposal methods (%)
Donating or giving
excess medication to
others
Throwing them in
the garbage
Throwing them in
the sink or toilet
Yes No Yes No Yes No
1 Riyadh 5.79 94.21 93.57 6.43 7.60 92.40
2 Makkah 12.89 87.11 89.71 10.29 10.31 89.69
3 Madinah 14.16 85.84 81.83 18.17 5.20 94.80
4 Qassim 1.58 98.42 97.77 2.23 6.66 93.34
5 Eastern Region 7.03 92.97 95.71 4.29 4.35 95.65
6 Asir 4.84 95.16 91.42 8.58 18.53 81.47
7 Tabuk 25.25 74.75 84.73 15.27 25.01 74.99
8 Hail 16.47 83.53 80.54 19.46 26.53 73.47
9 Northern Borders 13.59 86.41 88.34 11.66 5.80 94.20
10 Jazan 0.97 99.03 98.08 1.92 1.92 98.08
11 Najran 0.06 99.94 99.67 0.33 4.35 95.65
12 Al-Baha 7.62 92.38 95.56 4.44 1.49 98.51
13 Al-Jouf 18.49 81.51 90.13 9.87 7.46 92.54
Average total number of cars and hybrid cars owned by households at country level
Table 7-1
Total average number of cars Average number of hybrid cars
1.377 0.003

80
Household Environment Survey 2019
En
vir
on
me
nt
Sta
tist
ics
En
vir
on
me
nt
Sta
tist
ics
2019
Average times for changing car oil per year at country level
Table 7-2
Average number of times for changing the car oil
8.85
Average times for changing car oil per year at the administrative region level
Table 7-3
No. Administrative Region Average number of times for
changing the car oil
1 Riyadh 9.14
2 Makkah 7.81
3 Madinah 5.78
4 Qassim 9.15
5 Eastern Region 7.83
6 Asir 12.58
7 Tabuk 13.57
8 Hail 12.89
9 Northern Borders 15.63
10 Jazan 10.92
11 Najran 7.98
12 Al-Baha 7.66
13 Al-Jouf 5.10

81
Household Environment Survey 2019
En
vir
on
me
nt
Sta
tist
ics
En
vir
on
me
nt
Sta
tist
ics
2019
Average times for changing car tire per year at country level
Table 7-4
Average number of changed tires
3.12
Average times for changing car tire per year at the administrative region level
Table 7-5
No. Administrative Region Average number of changed tires
1 Riyadh 3.02
2 Makkah 2.97
3 Madinah 1.94
4 Qassim 2.48
5 Eastern Region 3.26
6 Asir 4.62
7 Tabuk 4.12
8 Hail 3.91
9 Northern Borders 2.69
10 Jazan 3.30
11 Najran 3.76
12 Al-Baha 3.12
13 Al-Jouf 1.87

82
Household Environment Survey 2019
En
vir
on
me
nt
Sta
tist
ics
En
vir
on
me
nt
Sta
tist
ics
2019
Percentage distribution of households that buy resource saving devices at country level
Table 7-6
No. Resource saving devices Percentage distribution (%)
Yes No
1 Water saving devices 14.17 85.83
2 Energy saving bulbs 57.66 42.34
3 Energy saving appliances 21.15 78.85
Percentage distribution of households that buy resource saving devices by device type at the
administrative region level
Table 7-7
No. Administrative
Region
Resource saving devices (%)
Water saving devices Energy saving bulbs Energy saving
appliances
Yes No Yes No Yes No
1 Riyadh 8.08 91.92 44.30 55.70 17.78 82.22
2 Makkah 14.81 85.19 61.80 38.20 23.79 76.21
3 Madinah 1.99 98.01 57.88 42.12 10.91 89.09
4 Qassim 9.89 90.11 48.40 51.60 18.05 81.95
5 Eastern Region 22.92 77.08 69.77 30.23 30.88 69.12
6 Asir 19.43 80.57 65.91 34.09 9.10 90.90
7 Tabuk 34.18 65.82 85.04 14.96 30.87 69.13
8 Hail 43.32 56.68 87.25 12.75 37.25 62.75
9 Northern Borders 4.24 95.76 48.62 51.38 36.69 63.31
10 Jazan 14.53 85.47 19.12 80.88 21.18 78.82
11 Najran 5.91 94.09 56.33 43.67 10.09 89.91
12 Al-Baha 10.96 89.04 71.94 28.06 7.27 92.73
13 Al-Jouf 4.30 95.70 78.20 21.80 30.57 69.43

83
Household Environment Survey 2019
En
vir
on
me
nt
Sta
tist
ics
En
vir
on
me
nt
Sta
tist
ics
2019
Percentage distribution of the main coal and firewood types used in households at country
level
Table 7-8
No. Coal and firewood use Used material (%)
Local Imported
1 Firewood 89.40 10.60
2 Coal 9.76 90.24
Percentage distribution of the main coal and firewood types used in households at the
administrative region level
Table 7-9
No. Administrative Region Firewood type (%) Coal type (%)
Local Imported Local Imported
1 Riyadh 91.38 8.62 10.67 89.33
2 Makkah 87.93 12.07 35.56 64.44
3 Madinah 60.97 39.03 30.59 69.41
4 Qassim 94.66 5.34 12.87 87.13
5 Eastern Region 38.72 61.28 9.27 90.73
6 Asir 97.45 2.55 42.38 57.62
7 Tabuk 96.78 3.22 58.68 41.32
8 Hail 7.77 92.23 2.24 97.76
9 Northern Borders 93.44 6.56 0.03 99.97
10 Jazan 100.00 0.00 45.04 54.96
11 Najran 94.35 5.65 30.77 69.23
12 Al-Baha 87.39 12.61 68.55 31.45
13 Al-Jouf 95.87 4.13 1.72 98.28

84
Household Environment Survey 2019
En
vir
on
me
nt
Sta
tist
ics
En
vir
on
me
nt
Sta
tist
ics
2019
Percentage distribution of household air ventilation through open windows at country level
Table 8-1
No. Ventilation through open
windows Percentage distribution (%)
1 Always 66.68
2 Sometimes 30.28
3 Do not open windows 3.04
Total 100.00
Percentage distribution of household air ventilation through open windows at the
administrative region level
Table 8-2
No. Administrative Region
Ventilation through open windows (%)
Always Sometimes Do not open
windows
1 Riyadh 68.26 28.73 3.00
2 Makkah 66.37 30.18 3.45
3 Madinah 60.03 37.79 2.18
4 Qassim 73.44 22.37 4.19
5 Eastern Region 65.27 32.97 1.76
6 Asir 68.65 29.91 1.45
7 Tabuk 60.55 37.73 1.73
8 Hail 72.81 26.83 0.36
9 Northern Borders 66.80 30.54 2.65
10 Jazan 56.17 32.48 11.35
11 Najran 86.37 13.36 0.27
12 Al-Baha 76.26 23.65 0.09
13 Al-Jouf 55.42 37.49 7.09

85
Household Environment Survey 2019
En
vir
on
me
nt
Sta
tist
ics
En
vir
on
me
nt
Sta
tist
ics
2019
Percentage distribution of households using air filtration and ventilation devices at country
level
Table 8-3
No. Use of air filtration devices Percentage distribution (%)
1 Used 8.66
2 Not used 91.34
Total 100.00
Percentage distribution of households using air filtration and ventilation devices at the
administrative region level
Table 8-4
No. Administrative Region Use of air filtration devices (%)
Used Not used
1 Riyadh 13.36 86.64
2 Makkah 5.75 94.25
3 Madinah 2.24 97.76
4 Qassim 6.35 93.65
5 Eastern Region 12.61 87.39
6 Asir 6.29 93.71
7 Tabuk 9.75 90.25
8 Hail 7.24 92.76
9 Northern Borders 5.10 94.90
10 Jazan 7.32 92.68
11 Najran 7.29 92.71
12 Al-Baha 6.52 93.48
13 Al-Jouf 5.40 94.60

86
Household Environment Survey 2019
En
vir
on
me
nt
Sta
tist
ics
En
vir
on
me
nt
Sta
tist
ics
2019
Percentage distribution of households that use air fresheners at country level
Table 8-5
No. Use of air fresheners Percentage distribution (%)
1 Used 51.69
2 Not used 48.31
Total 100.00
Percentage distribution of households that use air fresheners at the administrative region
level
Table 8-6
No. Administrative Region Use of air fresheners (%)
Used Not used
1 Riyadh 47.54 52.46
2 Makkah 53.29 46.71
3 Madinah 41.56 58.44
4 Qassim 55.01 44.99
5 Eastern Region 60.04 39.96
6 Asir 42.27 57.73
7 Tabuk 46.82 53.18
8 Hail 54.79 45.21
9 Northern Borders 58.22 41.78
10 Jazan 62.09 37.91
11 Najran 61.21 38.79
12 Al-Baha 58.54 41.46
13 Al-Jouf 49.28 50.72

87
Household Environment Survey 2019
En
vir
on
me
nt
Sta
tist
ics
En
vir
on
me
nt
Sta
tist
ics
2019
Percentage distribution of the number of times households use air fresheners at country level
Table 8-7
No. Number of times for using air fresheners Percentage distribution (%)
1 Daily 15.12
2 More than once weekly 58.75
3 Once a week 22.29
4 Once a month 3.84
Total 100.00
Percentage distribution of the number of times households use air fresheners at the
administrative region level
Table 8-8
No. Administrative Region
Number of times for using air fresheners (%)
Daily More than
once weekly Once a week
Once a
month
1 Riyadh 19.08 53.91 23.76 3.26
2 Makkah 12.49 59.96 22.13 5.42
3 Madinah 8.15 65.13 22.40 4.31
4 Qassim 12.69 54.11 28.32 4.89
5 Eastern Region 18.77 63.00 14.99 3.25
6 Asir 14.27 62.58 21.08 2.06
7 Tabuk 7.35 46.64 45.45 0.56
8 Hail 19.95 61.67 17.28 1.09
9 Northern Borders 22.66 64.00 12.39 0.95
10 Jazan 14.51 56.61 23.19 5.70
11 Najran 14.35 61.25 24.11 0.30
12 Al-Baha 12.29 63.20 21.42 3.08
13 Al-Jouf 10.75 52.50 33.22 3.53

88
Household Environment Survey 2019
En
vir
on
me
nt
Sta
tist
ics
En
vir
on
me
nt
Sta
tist
ics
2019
Percentage distribution of air freshener ingredients in households at country level
Table 8-9
No. Freshener ingredients Percentage distribution (%)
1 Chemical-based 80.17
2 Natural 19.83
Total 100.00
Percentage distribution of air freshener ingredients in households at the administrative
region level
Table 8-10
No. Administrative Region Freshener ingredients (%)
Chemical-based Natural
1 Riyadh 80.23 19.77
2 Makkah 77.41 22.59
3 Madinah 84.32 15.68
4 Qassim 96.81 3.19
5 Eastern Region 86.10 13.90
6 Asir 68.44 31.56
7 Tabuk 61.79 38.21
8 Hail 83.84 16.16
9 Northern Borders 90.81 9.19
10 Jazan 73.94 26.06
11 Najran 87.71 12.29
12 Al-Baha 74.15 25.85
13 Al-Jouf 79.25 20.75

89
Household Environment Survey 2019
En
vir
on
me
nt
Sta
tist
ics
En
vir
on
me
nt
Sta
tist
ics
2019
Percentage distribution of households that use incense by nationality at country level
Table 8-11
No. Nationality Incense use (%)
Used Not used
1 Saudi 88.70 11.30
2 Non-Saudi 34.95 65.05
Total 69.83 30.17
Percentage distribution of households that use incense at the administrative region level
Table 8-12
No. Administrative Region Incense use (%)
Used Not used
1 Riyadh 66.30 33.70
2 Makkah 71.39 28.61
3 Madinah 64.13 35.87
4 Qassim 67.35 32.65
5 Eastern Region 70.81 29.19
6 Asir 63.23 36.77
7 Tabuk 74.26 25.74
8 Hail 70.94 29.06
9 Northern Borders 82.52 17.48
10 Jazan 89.82 10.18
11 Najran 75.19 24.81
12 Al-Baha 81.40 18.60
13 Al-Jouf 65.34 34.66

90
Household Environment Survey 2019
En
vir
on
me
nt
Sta
tist
ics
En
vir
on
me
nt
Sta
tist
ics
2019
Percentage distribution of the number of times households use incense at country level
Table 8-13
No. Number of times for using
incense Percentage distribution (%)
1 Daily 12.67
2 More than once a week 56.86
3 Once a week 27.08
4 Once a month 3.39
Total 100.00
Percentage distribution of the number of times households use incense at the administrative
region level
Table 8-14
No. Administrative
Region
Number of times for using incense (%)
Daily More than
once a week
Once a
week
Once a
month
1 Riyadh 12.74 50.58 32.93 3.75
2 Makkah 12.84 59.99 23.42 3.75
3 Madinah 6.24 54.41 33.14 6.20
4 Qassim 4.06 45.90 45.67 4.37
5 Eastern Region 9.17 64.90 21.90 4.03
6 Asir 27.83 59.59 11.26 1.32
7 Tabuk 4.30 53.30 41.97 0.43
8 Hail 10.69 65.49 23.06 0.76
9 Northern Borders 21.33 64.39 12.04 2.25
10 Jazan 19.16 52.45 26.47 1.92
11 Najran 21.56 52.49 25.26 0.69
12 Al-Baha 10.93 62.69 25.87 0.51
13 Al-Jouf 9.87 57.18 30.44 2.51

91
Household Environment Survey 2019
En
vir
on
me
nt
Sta
tist
ics
En
vir
on
me
nt
Sta
tist
ics
2019
Percentage distribution of the incense method of use in households at country level
Table 8-15
No. Method of using incense Percentage distribution (%)
1 Inhaling 10.98
2 Smoking from afar 89.02
Total 100.00
Percentage distribution of the incense method of use in households at the administrative
region level
Table 8-16
No. Administrative Region Method of using incense (%)
Inhaling Smoking from afar
1 Riyadh 7.16 92.84
2 Makkah 11.96 88.04
3 Madinah 9.90 90.10
4 Qassim 5.63 94.37
5 Eastern Region 10.50 89.50
6 Asir 17.00 83.00
7 Tabuk 11.46 88.54
8 Hail 19.37 80.63
9 Northern Borders 23.79 76.21
10 Jazan 19.66 80.34
11 Najran 5.33 94.67
12 Al-Baha 11.48 88.52
13 Al-Jouf 6.54 93.46

92
Household Environment Survey 2019
En
vir
on
me
nt
Sta
tist
ics
En
vir
on
me
nt
Sta
tist
ics
2019
Percentage distribution of household use of carpets at country level
Table 8-17
No. Carpeting Percentage distribution (%)
1 Full coverage 17.53
2 Partial coverage 68.87
3 Not used 13.59
Total 100.00
Percentage distribution of household use of carpets at the administrative region level
Table 8-18
No. Administrative Region
Carpeting (%)
Full coverage Partial
coverage Not used
1 Riyadh 14.09 72.82 13.09
2 Makkah 14.75 67.51 17.74
3 Madinah 17.02 76.39 6.59
4 Qassim 19.47 68.23 12.30
5 Eastern Region 12.46 76.27 11.27
6 Asir 37.09 58.95 3.96
7 Tabuk 26.53 65.44 8.03
8 Hail 27.62 66.90 5.48
9 Northern Borders 19.48 74.31 6.20
10 Jazan 10.27 41.02 48.71
11 Najran 34.37 64.72 0.91
12 Al-Baha 28.83 68.81 2.36
13 Al-Jouf 26.37 62.42 11.21

93
Household Environment Survey 2019
En
vir
on
me
nt
Sta
tist
ics
En
vir
on
me
nt
Sta
tist
ics
2019
Percentage distribution of household use of carpets by housing type at country level
Table 8-19
No. Housing Type
Carpeting (%)
Full coverage Partial
coverage Not used
1 Traditional house 28.87 57.58 13.55
2 Villa 9.99 81.30 8.71
3 Floor at a traditional house 25.86 63.52 10.62
4 Floor at a villa 15.74 75.27 8.99
5 Apartment 16.15 68.00 15.85
6 Other 48.87 36.69 14.44
Percentage distribution of household use of detergents in cleaning floors and toilets at
country level
Table 8-20
No. Using detergents in cleaning
floors and toilets Percentage distribution (%)
1 Daily 33.74
2 Once a week 31.23
3 More than once a week 31.22
4 Not used 3.81
Total 100.00

94
Household Environment Survey 2019
En
vir
on
me
nt
Sta
tist
ics
En
vir
on
me
nt
Sta
tist
ics
2019
Percentage distribution of household use of detergents in cleaning floors and toilets at the
administrative region level
Table 8-21
No. Administrative Region
Using detergents in cleaning floors and toilets (%)
Daily Once a week More than
once a week Not used
1 Riyadh 27.35 34.54 32.67 5.44
2 Makkah 45.62 22.13 29.04 3.21
3 Madinah 26.22 41.59 28.26 3.93
4 Qassim 30.63 28.29 35.43 5.65
5 Eastern Region 33.99 32.78 31.27 1.95
6 Asir 29.38 24.42 41.21 4.98
7 Tabuk 8.68 55.17 31.13 5.02
8 Hail 29.90 39.60 27.44 3.06
9 Northern Borders 46.97 16.01 35.78 1.24
10 Jazan 47.91 30.11 19.88 2.10
11 Najran 23.05 42.54 33.73 0.68
12 Al-Baha 21.94 48.42 29.12 0.52
13 Al-Jouf 20.61 43.71 30.25 5.43
Percentage distribution of household use of pesticides and chemical fertilizers by type at
country level
Table 8-22
No. Types of pesticides and
chemical fertilizers
Percentage distribution (%)
Used Not used
1 Insecticides 54.77 45.23
2 Public health pesticides 25.59 74.41
3 Chemical fertilizers 1.10 98.90
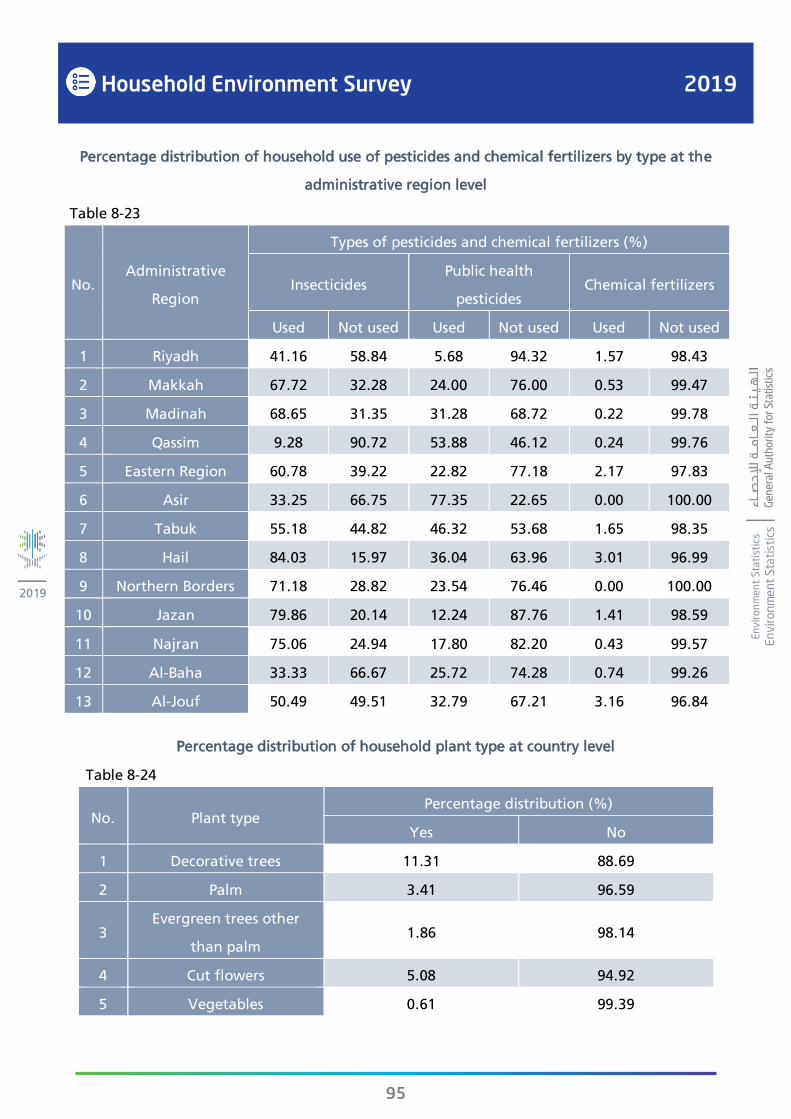
95
Household Environment Survey 2019
En
vir
on
me
nt
Sta
tist
ics
En
vir
on
me
nt
Sta
tist
ics
2019
Percentage distribution of household use of pesticides and chemical fertilizers by type at the
administrative region level
Table 8-23
No. Administrative
Region
Types of pesticides and chemical fertilizers (%)
Insecticides Public health
pesticides Chemical fertilizers
Used Not used Used Not used Used Not used
1 Riyadh 41.16 58.84 5.68 94.32 1.57 98.43
2 Makkah 67.72 32.28 24.00 76.00 0.53 99.47
3 Madinah 68.65 31.35 31.28 68.72 0.22 99.78
4 Qassim 9.28 90.72 53.88 46.12 0.24 99.76
5 Eastern Region 60.78 39.22 22.82 77.18 2.17 97.83
6 Asir 33.25 66.75 77.35 22.65 0.00 100.00
7 Tabuk 55.18 44.82 46.32 53.68 1.65 98.35
8 Hail 84.03 15.97 36.04 63.96 3.01 96.99
9 Northern Borders 71.18 28.82 23.54 76.46 0.00 100.00
10 Jazan 79.86 20.14 12.24 87.76 1.41 98.59
11 Najran 75.06 24.94 17.80 82.20 0.43 99.57
12 Al-Baha 33.33 66.67 25.72 74.28 0.74 99.26
13 Al-Jouf 50.49 49.51 32.79 67.21 3.16 96.84
Percentage distribution of household plant type at country level
Table 8-24
No. Plant type Percentage distribution (%)
Yes No
1 Decorative trees 11.31 88.69
2 Palm 3.41 96.59
3 Evergreen trees other
than palm 1.86 98.14
4 Cut flowers 5.08 94.92
5 Vegetables 0.61 99.39

96
Household Environment Survey 2019
En
vir
on
me
nt
Sta
tist
ics
En
vir
on
me
nt
Sta
tist
ics
2019
Percentage distribution of household plant type at the administrative region level
Table 8-25
No. Administrative
Region
Plant type (%)
Decorative
trees Palm
Evergreen
trees other
than palm
Cut flowers Vegetables
Yes No Yes No Yes No Yes No Yes No
1 Riyadh 14.49 85.51 3.51 96.49 0.92 99.08 5.11 94.89 0.56 99.44
2 Makkah 7.62 92.38 1.82 98.18 1.11 98.89 2.61 97.39 0.45 99.55
3 Madinah 4.56 95.44 2.96 97.04 0.46 99.54 1.88 98.12 0.02 99.98
4 Qassim 15.75 84.25 6.03 93.97 1.64 98.36 5.77 94.23 1.25 98.75
5 Eastern
Region 9.32 90.68 6.27 93.73 2.79 97.21 4.81 95.19 0.60 99.40
6 Asir 15.15 84.85 0.36 99.64 2.79 97.21 8.91 91.09 0.54 99.46
7 Tabuk 13.06 86.94 1.58 98.42 0.46 99.54 7.62 92.38 0.20 99.80
8 Hail 17.14 82.86 5.97 94.03 5.01 94.99 11.23 88.77 1.82 98.18
9 Northern
Borders 27.01 72.99 5.74 94.26 5.41 94.59 8.36 91.64 1.33 98.67
10 Jazan 15.74 84.26 3.67 96.33 4.07 95.93 8.89 91.11 1.23 98.77
11 Najran 16.66 83.34 10.60 89.40 8.22 91.78 14.25 85.75 0.50 99.50
12 Al-Baha 5.66 94.34 0.98 99.02 5.57 94.43 9.62 90.38 2.84 97.16
13 Al-Jouf 8.71 91.29 3.95 96.05 3.54 96.46 3.98 96.02 0.42 99.58

97
Household Environment Survey 2019
En
vir
on
me
nt
Sta
tist
ics
En
vir
on
me
nt
Sta
tist
ics
2019
Total number of household plants by type at country level
Table 8-26
No. Plant type Number
1 Decorative trees 4,195,433
2 Palm 1,181,460
3 Evergreen trees other than palm 466,111
Total 5,843,005
Total number of household plants by type at the administrative region level
Table 8-27
No. Administrative Region
Plant type
Decorative
trees Palm
Evergreen trees
other than palm
1 Riyadh 1,243,622 385,163 44,695
2 Makkah 831,474 170,742 63,874
3 Madinah 107,762 189,683 2,397
4 Qassim 223,048 87,768 14,844
5 Eastern Region 453,158 200,172 78,207
6 Asir 639,175 8,134 78,724
7 Tabuk 100,804 25,933 1,582
8 Hail 85,387 22,846 16,887
9 Northern Borders 85,036 7,716 12,049
10 Jazan 280,741 16,406 24,739
11 Najran 75,364 47,729 36,629
12 Al-Baha 26,711 2,338 77,451
13 Al-Jouf 43,151 16,832 14,033

98
Household Environment Survey 2019
En
vir
on
me
nt
Sta
tist
ics
En
vir
on
me
nt
Sta
tist
ics
2019
Percentage distribution of household plant irrigation method at country level
Table 8-28
No. House plant irrigation method Percentage distribution (%)
1 Drip irrigation 26.68
2 Sprinklers 37.23
3 Surface irrigation 36.09
Total 100.00
Percentage distribution of household plant irrigation method at the administrative region
level
Table 8-29
No. Administrative Region
House plant irrigation method (%)
Drip irrigation Sprinklers Surface
irrigation
1 Riyadh 29.57 45.72 24.71
2 Makkah 20.52 35.98 43.50
3 Madinah 37.19 20.46 42.35
4 Qassim 26.61 20.19 53.20
5 Eastern Region 33.81 28.02 38.16
6 Asir 6.41 42.85 50.74
7 Tabuk 55.69 37.35 6.97
8 Hail 25.22 24.83 49.94
9 Northern Borders 40.23 57.35 2.42
10 Jazan 18.24 61.09 20.67
11 Najran 13.33 17.52 69.16
12 Al-Baha 38.65 28.23 33.12
13 Al-Jouf 49.76 21.06 29.18

99
Household Environment Survey 2019
En
vir
on
me
nt
Sta
tist
ics
En
vir
on
me
nt
Sta
tist
ics
2019
Percentage distribution of household main plant irrigation source at country level
Table 8-30
No. Main irrigation source Percentage distribution (%)
1 Public network 72.30
2 Well 5.89
3 Tank 20.41
4 Greywater 1.41
Total 100.00
Percentage distribution of household main plant irrigation source at the administrative
region level
Table 8-31
No. Administrative Region
Main irrigation water source (%)
Public
network Well Tank Greywater
1 Riyadh 88.79 3.94 4.51 2.76
2 Makkah 64.25 6.76 28.99 0.00
3 Madinah 78.58 8.88 9.17 3.37
4 Qassim 79.62 7.16 7.07 6.15
5 Eastern Region 94.76 1.80 2.84 0.60
6 Asir 22.04 11.74 66.21 0.00
7 Tabuk 80.41 3.24 15.55 0.79
8 Hail 82.90 3.31 13.61 0.18
9 Northern Borders 77.47 1.15 20.91 0.46
10 Jazan 49.56 7.39 43.06 0.00
11 Najran 34.06 10.86 55.08 0.00
12 Al-Baha 42.67 13.67 43.65 0.00
13 Al-Jouf 77.78 14.54 7.05 0.63

100
Household Environment Survey 2019
En
vir
on
me
nt
Sta
tist
ics
En
vir
on
me
nt
Sta
tist
ics
2019
Household consumption of own production at country level
Table 8-32
No. Type of household production Household consumption (kg)
1 Vegetables 1,126,061
2 Fruits (except dates) 2,081,458
3 Dates 11,767,733
Total 14,975,252
Percentage distribution of household hydroponics at country level
Table 8-33
No. Hydroponics Percentage distribution (%)
1 Yes 0.70
2 No 99.30
Total 100.00

101
Household Environment Survey 2019
En
vir
on
me
nt
Sta
tist
ics
En
vir
on
me
nt
Sta
tist
ics
2019
Percentage distribution of household hydroponics at the administrative region level
Table 8-34
No. Administrative Region Hydroponics (%)
Yes No
1 Riyadh 0.61 99.39
2 Makkah 1.20 98.80
3 Madinah 0.00 100.00
4 Qassim 0.66 99.34
5 Eastern Region 0.23 99.77
6 Asir 0.25 99.75
7 Tabuk 2.37 97.63
8 Hail 0.38 99.62
9 Northern Borders 1.47 98.53
10 Jazan 1.01 98.99
11 Najran 0.13 99.87
12 Al-Baha 0.06 99.94
13 Al-Jouf 0.29 99.71
Percentage distribution of households that buy organic products at country level
Table 9-1
No. Buying organic products Percentage distribution (%)
1 Buy 26.05
2 Don’t buy 73.95
Total 100.00

102
Household Environment Survey 2019
En
vir
on
me
nt
Sta
tist
ics
En
vir
on
me
nt
Sta
tist
ics
2019
Percentage distribution of households that buy organic products by type at country level
Table 9-2
No. Buying organic products Organic product types )%(
Plant Animal
1 Buy 23.83 14.11
2 Don’t buy 76.17 85.89
Total 100.00 100.00
Percentage distribution of household environmental literacy at country level
Table 9-3
No. Level of environmental literacy Percentage distribution (%)
1 Literate 12.73
2 Somewhat literate 51.97
3 Illiterate 35.30
Total 100.00
Percentage distribution of household environmental literacy by nationality at country level
Table 9-4
No. Level of environmental
literacy
Nationality (%)
Saudi Non-Saudi
1 Literate 14.84 8.83
2 Somewhat literate 57.18 42.34
3 Illiterate 27.98 48.83

103
Household Environment Survey 2019
En
vir
on
me
nt
Sta
tist
ics
En
vir
on
me
nt
Sta
tist
ics
2019
Percentage distribution of household environmental literacy by nationality at the
administrative region level
Table 9-5
No. Administrative
Region
Level of environmental literacy (%)
Literate Somewhat literate Illiterate
Saudi Non-
Saudi Saudi
Non-
Saudi Saudi
Non-
Saudi
1 Riyadh 6.57 2.35 38.67 17.35 16.32 18.73
2 Makkah 6.91 4.53 31.27 16.04 20.29 20.96
3 Madinah 7.46 1.65 42.30 19.19 15.33 14.07
4 Qassim 14.94 3.48 37.44 13.39 10.90 19.85
5 Eastern Region 15.16 4.36 33.27 14.56 18.43 14.22
6 Asir 18.34 1.97 40.02 9.98 18.09 11.60
7 Tabuk 4.93 2.12 45.71 9.59 22.88 14.78
8 Hail 14.53 0.54 54.26 16.59 3.35 10.73
9 Northern Borders 19.97 3.15 37.36 5.50 21.18 12.83
10 Jazan 10.99 1.51 41.41 6.05 27.33 12.72
11 Najran 1.97 0.48 36.30 12.07 28.86 20.32
12 Al-Baha 8.17 1.82 59.08 10.51 12.94 7.48
13 Al-Jouf 13.36 2.97 39.61 9.65 19.35 15.05

104
Household Environment Survey 2019
En
vir
on
me
nt
Sta
tist
ics
En
vir
on
me
nt
Sta
tist
ics
2019
Percentage distribution of environmental activity type by household member participation
and nationality at country level
Table 9-6
No. Environmental activity
type
Percentage distribution (%)
Saudi Non-Saudi
Participate Don’t
participate Participate
Don’t
participate
1 Visiting environmental
festivals 12.80 52.09 2.82 32.29
2
Volunteering in
environmental events
and campaigns
3.55 61.33 0.82 34.29
3
Membership in
environmental
associations
0.91 63.98 0.26 34.85
4
Attending and
participating in
environmental
workshops and courses
2.90 61.99 0.93 34.18

105
Household Environment Survey 2019
En
vir
on
me
nt
Sta
tist
ics
En
vir
on
me
nt
Sta
tist
ics
2019
Percentage distribution of household member participation in visiting environmental festivals
at the administrative region level
Table 9-7
No. Administrative Region
Visiting environmental festivals (%)
Saudi Non-Saudi
Participate Don’t
participate Participate
Don’t
participate
1 Riyadh 13.01 48.55 2.48 35.96
2 Makkah 10.05 48.42 3.82 37.71
3 Madinah 16.19 48.90 3.92 30.99
4 Qassim 11.59 51.69 0.51 36.21
5 Eastern Region 8.23 58.63 2.99 30.14
6 Asir 11.44 65.01 0.31 23.24
7 Tabuk 33.99 39.53 6.12 20.36
8 Hail 42.05 30.09 3.38 24.48
9 Northern Borders 17.63 60.88 2.95 18.54
10 Jazan 14.12 65.61 2.21 18.06
11 Najran 17.42 49.71 1.46 31.41
12 Al-Baha 7.86 72.33 0.34 19.48
13 Al-Jouf 6.53 65.80 1.37 26.30
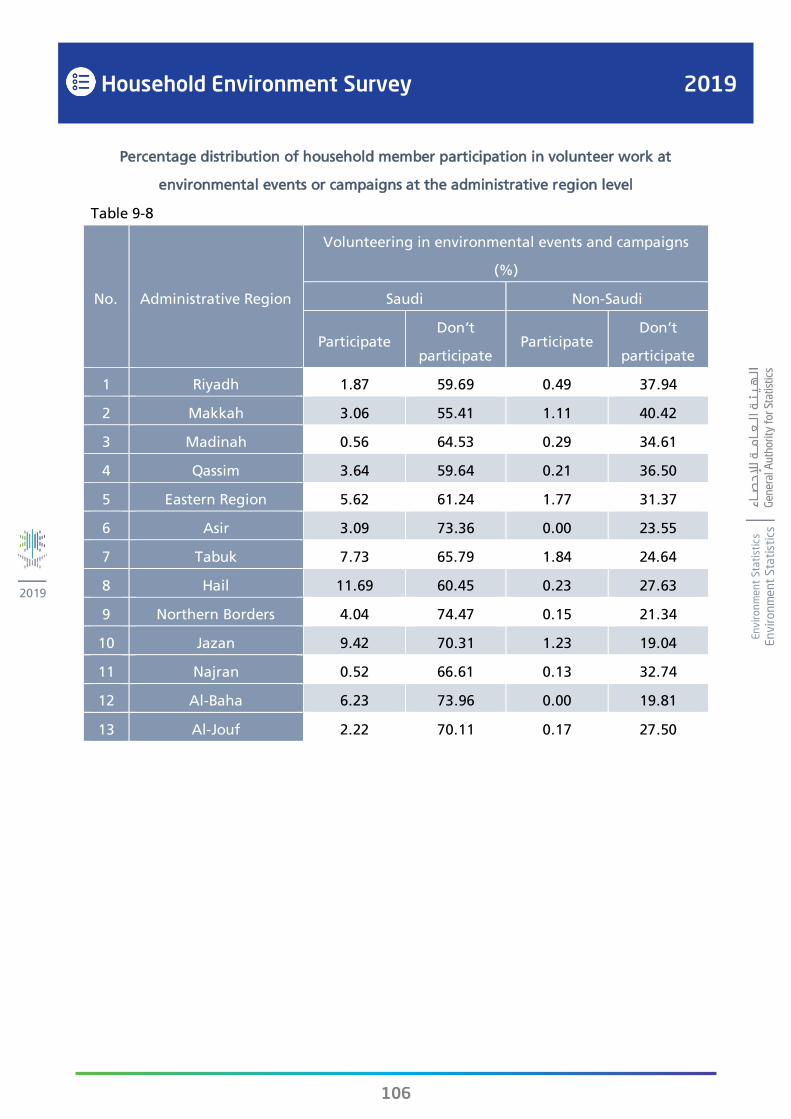
106
Household Environment Survey 2019
En
vir
on
me
nt
Sta
tist
ics
En
vir
on
me
nt
Sta
tist
ics
2019
Percentage distribution of household member participation in volunteer work at
environmental events or campaigns at the administrative region level
Table 9-8
No. Administrative Region
Volunteering in environmental events and campaigns
(%)
Saudi Non-Saudi
Participate Don’t
participate Participate
Don’t
participate
1 Riyadh 1.87 59.69 0.49 37.94
2 Makkah 3.06 55.41 1.11 40.42
3 Madinah 0.56 64.53 0.29 34.61
4 Qassim 3.64 59.64 0.21 36.50
5 Eastern Region 5.62 61.24 1.77 31.37
6 Asir 3.09 73.36 0.00 23.55
7 Tabuk 7.73 65.79 1.84 24.64
8 Hail 11.69 60.45 0.23 27.63
9 Northern Borders 4.04 74.47 0.15 21.34
10 Jazan 9.42 70.31 1.23 19.04
11 Najran 0.52 66.61 0.13 32.74
12 Al-Baha 6.23 73.96 0.00 19.81
13 Al-Jouf 2.22 70.11 0.17 27.50

107
Household Environment Survey 2019
En
vir
on
me
nt
Sta
tist
ics
En
vir
on
me
nt
Sta
tist
ics
2019
Percentage distribution of household member membership in environmental associations by
nationality at the administrative region level
Table 9-9
No. Administrative Region
Membership in environmental associations (%)
Saudi Non-Saudi
Participate Don’t
participate Participate
Don’t
participate
1 Riyadh 0.31 61.26 0.14 38.29
2 Makkah 0.72 57.76 0.26 41.27
3 Madinah 0.10 65.00 0.09 34.82
4 Qassim 1.18 62.10 0.00 36.71
5 Eastern Region 1.00 65.86 0.84 32.30
6 Asir 2.23 74.23 0.00 23.55
7 Tabuk 1.46 72.06 0.31 26.17
8 Hail 2.01 70.13 0.30 27.56
9 Northern Borders 1.55 76.97 0.00 21.48
10 Jazan 0.97 78.76 0.34 19.93
11 Najran 0.00 67.13 0.00 32.87
12 Al-Baha 6.74 73.45 0.00 19.81
13 Al-Jouf 1.92 70.41 0.12 27.55

108
Household Environment Survey 2019
En
vir
on
me
nt
Sta
tist
ics
En
vir
on
me
nt
Sta
tist
ics
2019
Percentage distribution of household member participation in and attendance of
environment-related courses and workshops by nationality at the administrative region level
Table 9-10
No. Administrative Region
Attending and participating in environmental workshops
and courses (%)
Saudi Non-Saudi
Participate Don’t
participate Participate
Don’t
participate
1 Riyadh 1.66 59.91 1.00 37.43
2 Makkah 1.91 56.56 1.00 40.53
3 Madinah 0.83 64.26 0.31 34.60
4 Qassim 3.59 59.69 0.16 36.55
5 Eastern Region 3.72 63.14 1.97 31.17
6 Asir 2.61 73.84 0.04 23.51
7 Tabuk 10.63 62.89 1.32 25.16
8 Hail 8.53 63.61 0.27 27.58
9 Northern Borders 5.90 72.62 0.46 21.22
10 Jazan 8.50 71.23 1.22 19.05
11 Najran 0.69 66.44 0.00 32.87
12 Al-Baha 5.13 75.05 0.00 19.81
13 Al-Jouf 2.92 69.41 0.26 27.42
Percentage distribution of households with pets at country level
Table 9-11
No. Household pets Percentage distribution (%)
1 Yes 6.16
2 No 93.84
Total 100.00

109
Household Environment Survey 2019
En
vir
on
me
nt
Sta
tist
ics
En
vir
on
me
nt
Sta
tist
ics
2019
Percentage distribution of households with pets at the administrative region level
Table 9-12
No. Administrative Region Household pets (%)
Yes No
1 Riyadh 5.39 94.61
2 Makkah 6.00 94.00
3 Madinah 3.71 96.29
4 Qassim 4.95 95.05
5 Eastern Region 8.92 91.08
6 Asir 7.66 92.34
7 Tabuk 4.79 95.21
8 Hail 13.84 86.16
9 Northern Borders 3.62 96.38
10 Jazan 7.70 92.30
11 Najran 2.78 97.22
12 Al-Baha 2.39 97.61
13 Al-Jouf 1.65 98.35
Percentage distribution of households with pets by type at country level
Table 9-13
No. Household pet kind Percentage distribution (%)
Yes No
1 Cat 1.74 98.26
2 Dog 0.27 99.73
3 Bird 3.41 96.59
4 Cattle 0.91 99.09
5 Other 0.47 99.53

110
Household Environment Survey 2019
En
vir
on
me
nt
Sta
tist
ics
En
vir
on
me
nt
Sta
tist
ics
2019
Percentage distribution of household water overflow or internal leakages at country level
Table 9-14
No. Water overflow or internal
leakages Percentage distribution (%)
1 Frequent 2.15
2 Rare 15.12
3 Never 82.73
Total 100.00
Percentage distribution of household water overflow or internal leakages at the
administrative region level
Table 9-15
No. Administrative Region Water overflow or internal leakages (%)
Frequent Rare Never
1 Riyadh 2.32 12.84 84.84
2 Makkah 1.66 13.49 84.84
3 Madinah 1.18 17.36 81.45
4 Qassim 0.61 8.21 91.18
5 Eastern Region 2.82 18.79 78.38
6 Asir 3.39 10.55 86.06
7 Tabuk 2.19 32.19 65.62
8 Hail 4.01 44.85 51.14
9 Northern Borders 0.67 30.93 68.40
10 Jazan 1.73 7.45 90.82
11 Najran 1.42 22.96 75.63
12 Al-Baha 4.01 5.76 90.24
13 Al-Jouf 3.72 17.58 78.70

111
Household Environment Survey 2019
En
vir
on
me
nt
Sta
tist
ics
En
vir
on
me
nt
Sta
tist
ics
2019
Percentage distribution of household water overflow or internal leakages by housing type at
country level
Table 9-16
No. Housing Type Water overflow or internal leakages (%)
Frequent Rare Never
1 Traditional house 3.41 21.46 75.14
2 Villa 2.06 13.77 84.17
3 Floor at a traditional house 2.31 19.77 77.93
4 Floor at a villa 2.32 12.61 85.08
5 Apartment 1.73 13.66 84.62
6 Other 3.35 12.71 83.95
Percentage distribution of safety and security measures available in households at country
level
Table 9-17
No. Availability in
households
Safety and security methods (%)
Separate
cabinet for
pesticides
and
fertilizers
Fire
extinguishers Fire alarms
First aid
box
1 Yes 55.73 19.57 6.37 45.18
2 No 44.27 80.43 93.63 54.82
Total 100.00 100.00 100.00 100.00

112
Household Environment Survey 2019
En
vir
on
me
nt
Sta
tist
ics
En
vir
on
me
nt
Sta
tist
ics
2019
Percentage distribution of households that have a separate cabinet for fertilizers and
pesticides at the administrative region level
Table 9-18
No. Administrative Region Separate cabinet for pesticides and fertilizers (%)
Yes No
1 Riyadh 56.14 43.86
2 Makkah 61.93 38.07
3 Madinah 42.54 57.46
4 Qassim 57.45 42.55
5 Eastern Region 62.93 37.07
6 Asir 53.31 46.69
7 Tabuk 63.50 36.50
8 Hail 49.10 50.90
9 Northern Borders 46.39 53.61
10 Jazan 31.93 68.07
11 Najran 38.85 61.15
12 Al-Baha 43.20 56.80
13 Al-Jouf 33.15 66.85

113
Household Environment Survey 2019
En
vir
on
me
nt
Sta
tist
ics
En
vir
on
me
nt
Sta
tist
ics
2019
Percentage distribution of households with fire extinguishers at the administrative region
level
Table 9-19
No. Administrative Region Fire extinguisher (%)
Yes No
1 Riyadh 20.10 79.90
2 Makkah 18.10 81.90
3 Madinah 12.37 87.63
4 Qassim 17.20 82.80
5 Eastern Region 31.65 68.35
6 Asir 12.97 87.03
7 Tabuk 33.16 66.84
8 Hail 18.70 81.30
9 Northern Borders 33.69 66.31
10 Jazan 8.04 91.96
11 Najran 4.66 95.34
12 Al-Baha 20.27 79.73
13 Al-Jouf 12.60 87.40

114
Household Environment Survey 2019
En
vir
on
me
nt
Sta
tist
ics
En
vir
on
me
nt
Sta
tist
ics
2019
Percentage distribution households with fire alarms in at the administrative region level
Table 9-20
No. Administrative Region Fire alarms (%)
Yes No
1 Riyadh 6.40 93.60
2 Makkah 4.35 95.65
3 Madinah 2.74 97.26
4 Qassim 3.51 96.49
5 Eastern Region 16.98 83.02
6 Asir 3.28 96.72
7 Tabuk 4.68 95.32
8 Hail 3.79 96.21
9 Northern Borders 8.97 91.03
10 Jazan 1.52 98.48
11 Najran 1.06 98.94
12 Al-Baha 12.97 87.03
13 Al-Jouf 3.37 96.63

115
Household Environment Survey 2019
En
vir
on
me
nt
Sta
tist
ics
En
vir
on
me
nt
Sta
tist
ics
2019
Percentage distribution of households with first aid boxes at the administrative region level
Table 9-21
No. Administrative Region First aid box (%)
Yes No
1 Riyadh 45.90 54.10
2 Makkah 43.97 56.03
3 Madinah 28.21 71.79
4 Qassim 46.02 53.98
5 Eastern Region 61.35 38.65
6 Asir 41.20 58.80
7 Tabuk 61.88 38.12
8 Hail 47.06 52.94
9 Northern Borders 43.17 56.83
10 Jazan 23.29 76.71
11 Najran 30.60 69.40
12 Al-Baha 54.77 45.23
13 Al-Jouf 31.23 68.77