Report on Household Survey on Migration in Armenia
186
Transcript of Report on Household Survey on Migration in Armenia

Report on Household Survey on Migration in Armenia
Yerevan2014
National Statistics Service of the Republic of Armenia
International Organization for Migration
IOM OIM
European Union United Nations Economic Commission for Europe
Russian-Armenian (Slavonic) University

2
UDC 314.7
The survey was conducted and report prepared within the framework of the IOM’s Project “Enhancing Knowledge and Policy Dialogue on the Role of Migration in Armenia’s Economic Development and Poverty Reduction” funded by the Institute for the Study of International Migration at Georgetown University with funding from the MacArthur Foundation; Project “Strengthening Evidence-Based Management of Labour Migration in Armenia” funded by the European Union and the IOM Development Fund, as well as the RAU’s Project “Sample Survey to Assess Migration Situation of the Republic of Armenia” funded by the Armenian State Committee of Science of the Ministry of Education and Science of Armenia.
Expert: Pedro Góis, PhD
While IOM endeavours to ensure the accuracy and completeness of the content of this Review, the views, findings, interpretations and conclusions expressed herein are those of the authors and do not necessarily reflect the official position of IOM, its Member States, or all other organizations and their members which provided support to the production of this report – the European Commission, the Georgetown University, the John D. and Catherine T. McArthur Foundation, the United Nations Economic Commission for Europe, the State Committee of Science of the Ministry of Education of the Republic of Armenia, Russian-Armenian (Slavonic) University.
IOM does not accept any responsibility for any loss, which may arise from the reliance on information contained in this paper.
Publisher:
International Organization for Migration IOM Mission in Armenia:UN House, 14 Petros Adamyan Street, 1st floor, Yerevan 0010, ArmeniaTel: (+374 10) 58 56 92 Fax: (+374 10) 54 33 65 http://www.iom.int
© Copyright: All rights reserved. No part of this publication may be reproduced, stored in a retrieval system, or transmitted in any form by any means of electronic, mechanical, photocopying, recording, or otherwise without the prior written permission of the authors and publisher.
ISBN 978-99941-0-609-7

3
Report on Household Survey on Migration in Armenia
4
Preface, foreword, abstract, acknowledgements
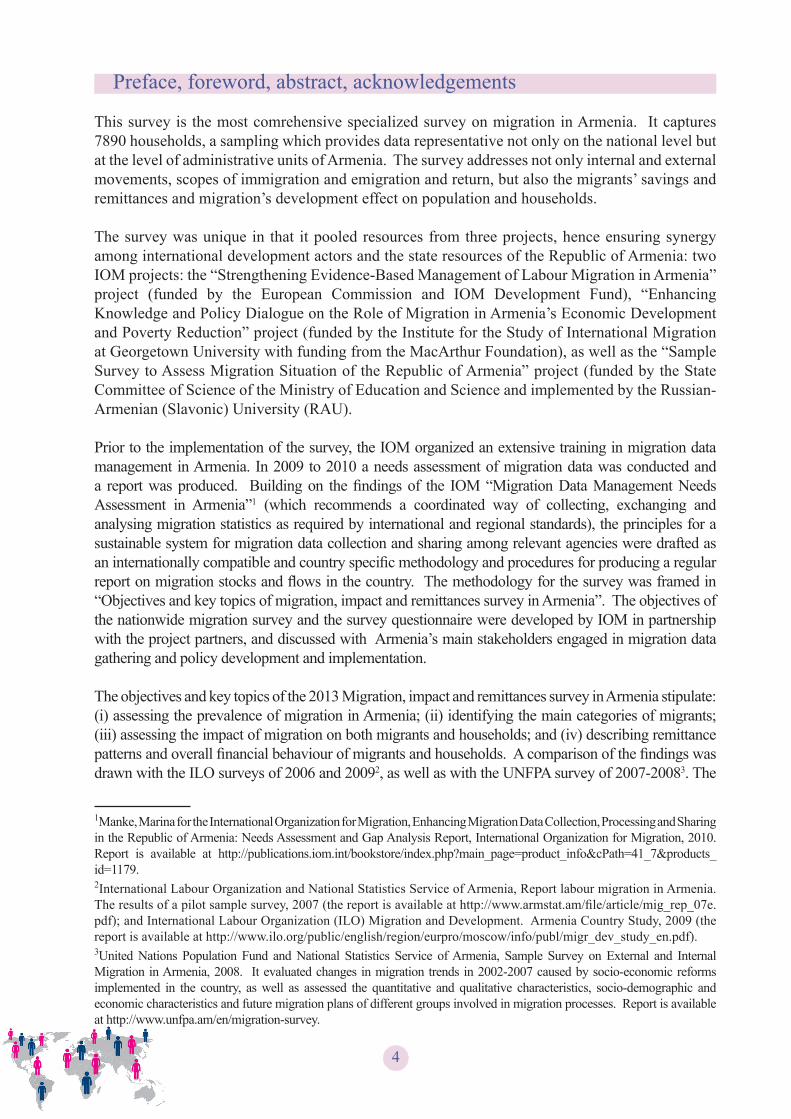
This survey is the most comrehensive specialized survey on migration in Armenia. It captures 7890 households, a sampling which provides data representative not only on the national level but at the level of administrative units of Armenia. The survey addresses not only internal and external movements, scopes of immigration and emigration and return, but also the migrants’ savings and remittances and migration’s development effect on population and households.
The survey was unique in that it pooled resources from three projects, hence ensuring synergy among international development actors and the state resources of the Republic of Armenia: two IOM projects: the “Strengthening Evidence-Based Management of Labour Migration in Armenia” project (funded by the European Commission and IOM Development Fund), “Enhancing Knowledge and Policy Dialogue on the Role of Migration in Armenia’s Economic Development and Poverty Reduction” project (funded by the Institute for the Study of International Migration at Georgetown University with funding from the MacArthur Foundation), as well as the “Sample Survey to Assess Migration Situation of the Republic of Armenia” project (funded by the State Committee of Science of the Ministry of Education and Science and implemented by the Russian-Armenian (Slavonic) University (RAU).
Prior to the implementation of the survey, the IOM organized an extensive training in migration data management in Armenia. In 2009 to 2010 a needs assessment of migration data was conducted and a report was produced. Building on the findings of the IOM “Migration Data Management Needs Assessment in Armenia”1 (which recommends a coordinated way of collecting, exchanging and analysing migration statistics as required by international and regional standards), the principles for a sustainable system for migration data collection and sharing among relevant agencies were drafted as an internationally compatible and country specific methodology and procedures for producing a regular report on migration stocks and flows in the country. The methodology for the survey was framed in “Objectives and key topics of migration, impact and remittances survey in Armenia”. The objectives of the nationwide migration survey and the survey questionnaire were developed by IOM in partnership with the project partners, and discussed with Armenia’s main stakeholders engaged in migration data gathering and policy development and implementation. The objectives and key topics of the 2013 Migration, impact and remittances survey in Armenia stipulate: (i) assessing the prevalence of migration in Armenia; (ii) identifying the main categories of migrants; (iii) assessing the impact of migration on both migrants and households; and (iv) describing remittance patterns and overall financial behaviour of migrants and households. A comparison of the findings was drawn with the ILO surveys of 2006 and 20092, as well as with the UNFPA survey of 2007-20083. The
1Manke, Marina for the International Organization for Migration, Enhancing Migration Data Collection, Processing and Sharing in the Republic of Armenia: Needs Assessment and Gap Analysis Report, International Organization for Migration, 2010. Report is available at http://publications.iom.int/bookstore/index.php?main_page=product_info&cPath=41_7&products_id=1179.2International Labour Organization and National Statistics Service of Armenia, Report labour migration in Armenia. The results of a pilot sample survey, 2007 (the report is available at http://www.armstat.am/file/article/mig_rep_07e.pdf); and International Labour Organization (ILO) Migration and Development. Armenia Country Study, 2009 (the report is available at http://www.ilo.org/public/english/region/eurpro/moscow/info/publ/migr_dev_study_en.pdf).3United Nations Population Fund and National Statistics Service of Armenia, Sample Survey on External and Internal Migration in Armenia, 2008. It evaluated changes in migration trends in 2002-2007 caused by socio-economic reforms implemented in the country, as well as assessed the quantitative and qualitative characteristics, socio-demographic and economic characteristics and future migration plans of different groups involved in migration processes. Report is available at http://www.unfpa.am/en/migration-survey.

5
2013 Migration survey addressed the: (i) general features of migration in Armenia; (ii) main types of migration in Armenia; (iii) characteristics (sociodemographic, socioeconomic/skill profile) of migrants compared to the overall population; and (iv) impact of migration (health, financial well-being, career development, social impact, remittances and their usage). These objectives formed the core of the survey methodology which is based on international and EU standards for migration data collection and sharing in Armenia.
The survey methodology and the questionnaire were developed in close cooperation among the representatives of the stakeholder institutions in Armenia, such as the Armenia National Statistics Service (ArmStat), as well as with the relevant international organizations – the IOM and the United Nations Economic Commission for Europe (UNECE).
In implementation of the national survey on migration in Armenia, the IOM partnered with the ArmStat and Russian-Armenian (Slavonic) University (RAU), which enabled joining efforts to cover a larger scope of the survey. The RAU’s “Sample Survey to Assess Migration Situation of the Republic of Armenia” project, funded by the Armenian State Committee of Science of the Ministry of Education and Science, envisaged conducting a sample survey to evaluate the volume and structure of migration flows. To ensure complementarities and to avoid duplication of efforts, the project team entered into negotiations with the State Migration Service (SMS) and other relevant stakeholders on how to combine the resources foreseen within this project and the state funding, to ensure a greater impact and better quality of results. As a result, the project team, the State Migration Service and ArmStat agreed to conduct a more comprehensive survey covering a larger number of households, followed up by a thorough analysis of the existing methodology of statistical data collection on migration and its compliance with international practices and standards. In this respect, a tripartite Memorandum of Cooperation was concluded by ArmStat, IOM and RAU on collaboration on the migration survey (signed on April 22, 2013). Another bilateral Memorandum of Cooperation was signed between IOM and ArmStat (again on April 22, 2013), to set the cooperation framework for survey implementation and modalities.
The division of labour was set between the RAU and IOM as follows:
The RAU participated in development of the survey methodology, questionnaires and other tools, and sponsored and implemented the field work of interviewing the 2,200 sample households in the city of Yerevan.
The IOM-implemented projects sponsored the training of all interviewers, piloting of the survey, publication of the questionnaires, implementation of the field work for 5,690 households, data entry and coding for all 7,890 completed questionnaires, writing of the survey analytical report by an international expert, translation of the final report and publication of the report in the Armenian and English languages.
The report was developed by an international expert and commented on by the SMS and ArmStat (the latter - only on methodology). The report was published by financial support of the IOM Development Fund.
Immense information was collected in the result of the survey and it was not possible to cover all the issues in one report. The survey anonymous database is therefore available online (http://armstat.am/file/doc/99486863.7z) and can be used by for further research on migration in Armenia.

6
We would like to acknowledge the great work done by the team which worked on the survey and its report: Dr Pedro Góis (report author), Dr Marina Manke (elaboration of methodology and training), Dr Jason Schachter (elaboration of methodology and training), Thomas Mortensen (training), Dr Ruben Yeganyan (survey coordinator for RAU), Ms Lusine Kalantaryan (ArmStat), Ms Karine Kuyumjyan (ArmStat), and Ms Kristina Galstyan (IOM Project manager), Ms Nune Asatryan (IOM), who all contributed to the survey.
We would like to thank the Project Donors, the European Union, the McArthur Foundation, the IOM Development Fund, and the Armenian Ministry of Education and Science, for the opportunity to provide technical assistance in migration data management in Armenia and for their financial support to fund the survey and report.
The survey and report benefited greatly from the input and guidance of Armenian Government officials, academia and intergovernmental organizations. We would like to express our gratitude to the Armenian National Statistics Council and in particular Mr Gagik Gevorgyan for his valuable guidance and support. We are very grateful for the guidance received from the Armenian State Migration Service and its head, Dr Gagik Yeganyan.
The team could not have efficiently carried out its task without the valuable support of the Armenian Government, which provided help and direction in welcoming and guiding the expert team – particularly, the Ministry of Labour and Social Issues, the Police, the Central Bank, the National Security Service, and the Ministry of Foreign Affairs, among others. We would also like to thank the Russian Armenian (Slavonic) University and Rector Academician Armen Darbinyan and the State Committee of Science of Armenia for their cooperation.
We extend our gratitude to the United Nations Economic Commission for Europe.
We are confident that the main findings of the survey and report will be widely used and will provide evidence base for migration policy planning in Armenia.
Dr Stepan Mnatsakanian Mrs Ilona Ter-Minasyan Chairman Head of Office National Statistics Council IOM Mission in Armenia

7
Table of contents
Preface, foreword, abstract, acknowledgements .............................................................................4Table of contents .............................................................................................................................7List of acronyms and abbreviations ................................................................................................9List of tables ..................................................................................................................................10List of figures ................................................................................................................................12Executive Summary ......................................................................................................................14Chapter 1 – Introduction ...............................................................................................................28Chapter 2 – Survey Design, Implementation and Methodology ...................................................32
Purpose and objectives of the survey .......................................................................................32Selection of households ............................................................................................................34Calculation of weights ..............................................................................................................34Implementation of the survey ...................................................................................................34Organization of the survey .......................................................................................................35Problems encountered in the field ............................................................................................35Non-response section ...............................................................................................................35Limitations of the data .............................................................................................................36The portrayal of the questionnaires used/ contents of the questionnaire .................................36Data entry and data processing (coding and checking the data) ..............................................37Consistency and cross-checking ..............................................................................................38
Chapter 3 - Characteristics of the Households Surveyed (Household roster) ..............................39Description of Sampling Population ........................................................................................39Background Characteristics of the Households .......................................................................41Household size .........................................................................................................................42Demographic Characteristics ...................................................................................................42Gender and age distribution of the members of the surveyed households ...............................43Distribution of the members of the households under survey by their place of birth .............44Distribution of the respondents of the households by nationality ...........................................44Distribution of the respondents of the households by native language ....................................45Household respondents’ Marital Status ....................................................................................45Distribution of the Household members by their level of education .......................................46Economic Characteristics of the households surveyed ............................................................48Profession and Occupation of the surveyed household members ............................................50Employment sector of the surveyed household members ........................................................52Sector of employment of the household members respondents ...............................................54Migration potential of the RA population ................................................................................56Education level and intention to migrate .................................................................................57Intention to migrate in the near future ......................................................................................58Reasons for migration among potential migrants ....................................................................59Migration from former household members ............................................................................60Household members involved in migration events since 2007 ................................................60
Chapter 4 - Characteristics of migrant population (out-flows) (emigrants) ..................................63Socio-demographic characteristics ...........................................................................................63The relationship between education and emigration ................................................................65Economic and professional status of the emigrants before leaving the RA .............................66Destinations ..............................................................................................................................69Emigrants’ status in the country of destination ........................................................................71Networks and mediators ...........................................................................................................71

8
Economic Characteristics of the migrants in the country of destination..................................73Economic status of the emigrants in the destination country ...................................................73Figuring out the circularity and migration nexus .....................................................................74Communication and Contact Between the Migrant and Family Members ..............................76On-going migration project evaluation and plans ....................................................................76Migration from the Republic of Armenia before 2007 ............................................................77Departure of the emigrants of the surveyed households from RA (those who left before 2007) ......78Household members who left the household permanently after 2007 .....................................79Future migration plans .............................................................................................................79Change in the Social Status of the Migrant Sending Households ............................................80
Chapter 5 - Characteristics of returnmigrants ...............................................................................81Demographic characteristics of the returned migrants .............................................................81Migration and brain gain and Migration and skill gain ............................................................83Returned migrants’ network in the country of destination .......................................................84Host countries before return .....................................................................................................86Returned migrants’ status in the host country ..........................................................................87Economic insertion in the country of destination ....................................................................89Problems abroad .......................................................................................................................93Reasons for return ....................................................................................................................95Reintegration programs ............................................................................................................97
Chapter 6 - Characteristics of migrant population (in-flows) (including NKR) – (immigrants) ......98Characteristics of household respondents migrated from foreign countries ..........................100Citizenship versus nationality of the newcomers ...................................................................102The Republic of Armenia as the destination country .............................................................102Socio-economic characteristics of the population in-flows....................................................104Legal status and relation with the RA authorities ..................................................................107
Chapter 7 – Remittances, their usage and financial prosperity ...................................................109Remittances sent to the RA by current emigrants ..................................................................110Remittances sent to RA by returned migrants ........................................................................111Ways of transferring financial assistance from abroad ...........................................................112Households receiving remittances from abroad in the RA .....................................................113Economic impact of migration remittances ...........................................................................114Remittances sent from the RA to a HH living in a foreign country .......................................115Use of remittances received from abroad ...............................................................................117
Conclusion and recommendations ..............................................................................................119Bibliography ...............................................................................................................................124Annexes/appendices ....................................................................................................................127

9
List of acronyms and abbreviations
AMD Armenian Dram
ARMSTAT National Statistical Service of the Republic of Armenia
EC European Commission
EU European Union
EUR Euro currency
HH Household
ILCS Integrated Living Conditions Survey
IOM International Organization for Migration
ILO International Labour Organization
MLSA Ministry of Labour and Social Affairs of Armenia
MRC Migration Resource Center
NGO Non-governmental organization
NKR Nagorno-Karabakh
RA Republic of Armenia
RAU Russian Armenian (Slavonic) University
RUB Russian Roubles
RF Russian Federation
UK United Kingdom
UN United Nations
UNDP United Nations Development Program
UNECE United Nations Economic Commission for Europe
UNFPA United Nations Population Fund
USA United States of America
USD United States dollar
WU Western Union
YSU Yerevan State University
10
List of tables
Table 1. Main sample characteristics ............................................................................................33Table 2. Non-response characteristics and weight ........................................................................36Table 3. Number and distribution of the surveyed households by marzes ...................................40Table 4. Household members interviewed by marz in frequency and percentage ........................40Table 5. Distribution of the households under survey by their residence areas as of January 1,2007 .........................................................................................................................................41Table 6. Distribution of the households that changed their dwelling, by the main purpose ofmoving .....................................................................................................................................41Table 7. Distribution of the surveyed households, by number of their members (%) ..................42Table 8. Age structure of the surveyed population, by gender (%) ...............................................44Table 9. Distribution of the household members under survey, by their place of birth (%) .........44Table 10. Distribution of the household members, by nationality and sex (%) ............................45Table 11. Main language of communication at home, by nationality of respondents (mainnationalities) (%) ...........................................................................................................................45Table 12. Marital status by gender (%) .........................................................................................46Table 13. Distribution of the Household members, by the level of education ..............................46Table 14. Education level of the household members, according to their age group ...................47Table 15. Education level of the household members, according to marz of settlement (%) .......47Table 16. Education level of the household members, by gender (%)..........................................48Table 17. Employment Status / basic socio-economic status of the household respondents, by sex (%) ..........................................................................................................................................48Table 18. Employment Status/basic socio-economic status of the household respondents, by age group (%) ................................................................................................................................49Table 19. Employment Status / basic socio-economic status of the household respondentsby respondents, marz of residence (%) .........................................................................................50Table 20. Profession and Occupation of the household members, by gender (%) .......................50Table 21. Profession and Occupation of the household members, by age group (%) ..................51Table 22. Profession and Occupation of the household members, by marz (%) ..........................52Table 23. Type of employment of the surveyed household members, by gender (%) ..................52Table 24. Type of employment of the surveyed household members, by marz (%) .....................53Table 25. Type of employment of the surveyed household members, by age group (%) .............53Table 26. Sector of employment of the surveyed household members, by gender (%)................54Table 27. Sector of employment of the surveyed household members, by marz (%) ..................55Table 28. Sector of employment of the surveyed household members, by age group (%)...........55Table 29. Location of work of the surveyed household members, by gender (%) .......................56Table 30. Intention to leave for abroad for 3 or more months, by gender (%) .............................56Table 31. Intention to leave for abroad for 3 or more months, by gender (weight sample) .........57Table 32. Intention to leave for abroad for 3 or more months, by marital status (%) ...................57Table 33. Intention to leave for abroad for 3 or more months, by education level (%) ................58Table 34. Intention to leave for abroad for 3 or more months, by age groups (%) .......................58Table 35. Household members with a migration trip for 3 or more months (since 2007) by marz ........61Table 36. Those who have gone for migration trips since 2007 by age groups ............................61Table 37. Year of the trip versus Purpose of the trip (%) ..............................................................62Table 38. Household members who left for abroad after January 2007, by age group (weighted) ........64Table 39. Household members who left for abroad after January 2007, by marz ........................65Table 40. Education Status of emigrants .......................................................................................66Table 41. Socio-economic status of the household respondents who left for abroad (%) ............66

11
Table 42. Emigrants’ socio-economic status before leaving the Republic of Armenia (%) ........67Table 43. Country/marz of the last trip .........................................................................................70Table 44. Month of the trip (weighted) .........................................................................................75Table 45. Age distribution of the surveyed households emigrants from the RA (those who left before 2007) (%) ...........................................................................................................................................77Table 46. Socio-economic status of the household respondents who left RA before 2007, by gender ..77Table 47 Education Status of the returned migrants .....................................................................78Table 48. Education Status of the returned migrants ....................................................................83Table 49. Education acquired abroad by returned migrants from Armenia (%) ...........................84Table 50. Assistance from relatives/friends during the initial phase of migration ........................84Table 51. Nature of support of the migration trip (%) ..................................................................85Table 52. Returnees’ socio-economic status before leaving the Republic of Armenia and after return (%) ..............................................................................................................................90Table 53. Education Status of the internal migrants (%) ............................................................101Table 54. Socio-economic status before arrival in Armenia .......................................................104Table 55. Main current sources of HH means of subsistence (%) ..............................................115

12
List of figures
Figure 1. Age distribution of the surveyed households’ members by sex and selected age groups ........43Figure 2. Reasons for departure (%) .............................................................................................59Figure 3. Emigrants gross revenue before leaving RA (%) ..........................................................68Figure 4. Main reasons for migration from the Republic of Armenia (%) ...................................69Figure 5. Main reasons to choose a specific destination country (%) ...........................................70Figure 6. Status in the country of destination ...............................................................................71Figure 7. Support received from family/friends in the destination country before departing RA ...........72Figure 8. Comparison of the support received from family/friends in the destination/hostcountry before departing the RA (emigrants versus returned migrants) .......................................72Figure 9. Individual or institution accountable for the job offer ...................................................73Figure 10. Distribution of the consecutive trips per migrants (%) ...............................................75Figure 11. Communication with absentee family and/or friends (%) ...........................................76Figure 12. Contemporary emigrants’ future plans ........................................................................79Figure 13. Main causes for return .................................................................................................80Figure 14. Returnees from abroad by group age (weighted) ........................................................82Figure 15. Household members who have returned from abroad versus emigrants, by marz ......82Figure 16. Reasons for departure (return migrants) ......................................................................85Figure 17. Reasons for departure (comparing return migrants; potential migrants; emigrants) ...86Figure 18. Main reasons to have chosen a specific host country in the case of the return migrants (%) ..................................................................................................................................86Figure 19. Comparison of the main reasons to choose a specific destination country (return migrants versus emigrants) (%) ....................................................................................................87Figure 20. Return migrants status in the host country ..................................................................88Figure 21. Comparison of return migrants versus emigrants’ status in the host country ..............88Figure 22. Support received from family/friends in the host country before departing for the RA ........89Figure 23. Comparison between the nature of work before leaving RA and at host country (%) ..........90Figure 24. Comparison between working sectors before and during migration (%) ....................91Figure 25. Comparison between weekly working hours in the RA and in host country ..............92Figure 26. Spending of the HH income while in the host country (%) ........................................93Figure 27. Problems linked to work in destination countries (%) ................................................94Figure 28. Institutions that helped in the solution of problems while abroad (%) ........................94Figure 29. Main reasons for return (%) ........................................................................................95Figure 30. Unemployment, employment and job search after return (%) ....................................96Figure 31. Rank of difficulties while readapting to the RA (5) ...................................................97Figure 32. Kind of courses useful for the returned migrants (%) .................................................97Figure 33. Comparing gender composition of the different migration flows (%) ........................98Figure 34. Household members who first arrived from abroad after January 2007, by marz ......99Figure 35. Regional distribution of immigrants within the Republic of Armenia (%) .................99Figure 36. Comparative household sizes (persons in the household) .........................................100Figure 37. Comparison of the marital status among migration flows (%) ..................................100Figure 38. Household members who first arrived from abroad after January 2007, by age group (weighted) .........................................................................................................................101Figure 39. Educational institution attended before arrival in RA ...............................................102Figure 40. Main reasons for leaving home country and to migrate to the RA (%) .....................103Figure 41. Main reasons to choose RA as destination country ...................................................103Figure 42. Monthly average salary in home country (in USD) ..................................................105Figure 43. Last 6 months labour insertion in RA (%) .................................................................105

13
Figure 44. Sectors of employment in RA (%) .............................................................................106Figure 45. Institution that help to find a job in RA (%) ..............................................................107Figure 46. Legal status in the Republic of Armenia (%) ............................................................107Figure 47. Problems encountered in adapting to RA (%) ...........................................................108Figure 48. Received money from abroad during the last 12 months by migratory flows (%) ....110Figure 49. Frequency of financial support given to HH members by current emigrants ............111Figure 50. Financial support given to HH members by emigrants versus returned migrants (%) ......112Figure 51. Ways of transferring financial remittances from abroad, emigrants versus returned migrants (%) .................................................................................................................113Figure 52. Remittances from abroad received in households (by marz) (%) .............................113Figure 53. Regional distribution of HH linked to emigration, returned migration and HH recipients of remittances (%) ......................................................................................................114Figure 54. Sent money or goods abroad during the last 12 months by group (%) .....................116Figure 55. Frequency of financial support sent abroad to HH members (%) .............................116Figure 56. Money received from abroad represents an opportunity to .......................................117Figure 57. Goods received from abroad by migrant group (%) ..................................................118

14
Executive Summary
There is common agreement that existing migration statistics in the Republic of Armenia tend to be scarce and susceptible to problems of comparability. The weakness of current data in the country, particularly accurate administrative data, increases the potential of using surveys to fill these gaps. This final report presents a comprehensive review of the migration situation in Armenia in 2013 based on a large and nationally representative household survey of the Republic of Armenia.
This household migration survey studies the general characteristics of migration to, from, and within, the Republic of Armenia. It intended to collect migration and related indicators essential to identifying profiles of various migrant categories in the country and for establishing priorities for evidence-based planning, decision-making and reporting. The sample provides seemingly robust estimates of the selected migration and population indicators required for effective planning and management purposes.
Given the long-standing need for improved migration data in the Republic of Armenia, household surveys have the most potential for collecting comprehensive and accurate data in the country. However, given the limitations faced by household surveys, such as their costs and complexity, it would also be in the best interest of the Republic of Armenia to try and better develop administrative data sources at its disposal. Nevertheless, taking into account the prevalence of non-registered emigration in the country, gathering administrative data on emigration may be limited unless there is a collaboration of destination countries. Quality survey sample and questionnaire design is needed, as is funding to sustain such quality and very specialized research. In addition to conducting large-scale specialized migration surveys, efforts should be directed towards capturing some migration information in on-going house-hold surveys in a regular and consistent manner. Without migration data from the entire region and standardized statistics, the complete picture will remain unclear and the ability to effectively inform migration policy diminished.
The primary focus of the current household survey was to collect comprehensive and multi-faceted information on migration and migration processes and the questionnaire was tailored to measure migration-related phenomena in a sample that represents the population of the whole Republic of Armenia. The present survey, as with most similar sample surveys, was conducted to make inferences about overall population characteristics, such as means (or proportions) or totals. The population under study was viewed as fixed and finite, and a probability sample was selected from that population. Nevertheless, there are distinctive groups of interest in the current sample survey: current migrants (both immigrants and emigrants), return migrants (those who previously lived abroad but have returned), internal migrants, and those who have never migrated (to evaluate their intention to move, or as a comparison group).
The current report provides an overview of the information collected, which highlights the major migration and population characteristics of the Republic of Armenia (RA). This report also assesses the strengths and weaknesses of using household surveys based on a representative sample of a population from an entire country to measure a migration phenomenon that has low weight and, as such, emerges as a mitigated phenomenon since migration is not only relatively rare but its study represents targeting an unknown and, sometimes, hidden population4.
4With this kind of population, traditional finite population sampling is not allowed essentially due to the following reasons: The population size N is unknown and exhaustive lists of the target population are not readily available so that labeling is not possible. In addition, units usually require remaining anonymous and, in general, there is a detectability problem.

15
Main Findings
Fieldwork was conducted in July-August 2013. The survey response rate was approximately 52 per cent5.
The final sample size is composed of 7,890 household (HH) respondents, representative of the population of RA with a margin of error of 3 per cent at the 95 per cent level of confidence and incorporates a total of 31,118 household members surveyed.
The present survey departs from a de jure (the place of usual residence) definition of household towards a de facto (the place where each person stayed the night before the survey interview) definition. Furthermore, the survey contains information on 1,972 household members who left for abroad before 2007 but are still considered members of the household; that is, in total, the household survey captured information regarding 33,090 household members.
The number of households interviewed that were associated with migration was, on average, very high in the whole sample, reaching almost one out of two households related to migrants (48.6% of the total households interviewed were associated with migration movements since January 2007).
The households with no migration-related members reached, on average, in Aragatsotn, 74.5 per cent (3 out of four HH were not associated with migration) and the lowest number occurred in Tavush (only 1.86% of the interviewed HH were not associated with migration or, 92 per cent of the HH were associated with migration movements of different natures). In Yerevan, 63.1 per cent of the interviewed households had no migrants; while in Ararat, 42 per cent; Armavir, 57.6 per cent; Gegharkunik, 47.9 per cent; Lori, 54.1 per cent; Kotayk, 22,1 per cent; Shirak, 27.1 per cent; Syunik, 63.7 per cent and Vayots Dzor, 42.8 per cent of the interviewed households had no migrants.
The gender distribution of all household members shows that women slightly outnumber men. According to the survey data, 47.5 per cent of the household members surveyed were males (n= 14.788) and 52.5 per cent women (n=16.330).
The interviewee in the household was the most informed member of the household. As a rule, the respondent was the household head, who possessed comprehensive information on the household’s activities and the socio-demographic characteristics of all household members. In 71 per cent of the surveyed households, the interviewee was the man as head of the household; in 22 per cent of the cases, the women as head of the household; in 4.4 per cent, the daughter or the son of the family, in 2.2 per cent, the mother or father (of the) household head of family and, in less than 1 per cent (0.4%), other family or household members.
As at January 1, 2007 (or later) 89.3 per cent of the households under survey were residing in the given settlement; 2 per cent were residing in other settlements of the Republic of Armenia; 1 per cent were residing in a foreign country and 7.7 per cent of household members were born after January 1, 2007. Moreover, the survey acknowledged that 3.9 per cent of the households under survey transferred themselves to another abode in the given settlement between January 1, 2007 and the present-day.
The size of the households surveyed varies between the simplest of households, the “one-person household” where a person lives alone in a whole or part of a housing unit and has independent
5In this survey have been used an old list of database of addresses of private households based on the results of the 2001 Population Census that can help to explain this response rate.

16
consumption, and a 14-member unit household. According to data, 21 per cent of the surveyed households have 4 members, 18 per cent, 5 members; 14.4 per cent, 3 members; 14 per cent, 2 members; 12.5 per cent, 6 members; 6.6 per cent, 7 members, and 2 per cent, 8 or more members.
The surveyed household members’ distribution by age group and by sex shows symmetry between the sexes along the age groups, with a bias for the oldest age groups regarding females. The age groups 0 to 14 and 65+ form 16.7 per cent and 11.6 per cent of the population, respectively, while the age group 15 to 59 constitutes 66.4 per cent of the household population, being part of what we call “active age”.
The prevailing majority of the respondents; namely, 99.1 per cent, were ethnically Armenians, 0.4 per cent were Yazidis, and 0.3 per cent were Russians. The selection also involved other ethnic groups like Kurds, Ukrainians, Assyrians, Greeks, Persians and Indians, but their proportion was lower than 0.1 per cent.
As to the respondents’ marital status, about 61.3 per cent of the adults in the sample stated that they were married and 25.4 per cent were never married. 10.4 per cent of the adults in the sample were widows or widowers, 2.9 per cent were divorced.
The educational level of the household members showed an educated population with more than 80 per cent of the interviewees having at least completed general secondary education. The majority of the household respondents had secondary education (37.3%), 0.4 per cent completed a post-graduation course; 22.1 per cent, a tertiary education; 18.5 per cent, secondary specialized training and 2.2 per cent, a vocational grade course.
Around 38 per cent of the 31,118 household respondents described themselves as labour force participants (employed including self-employed) and, of those, 61 per cent were males. About 13.9 per cent were out of employment and, of those, 59.5 per cent were females. Pensioners and allowance recipients made up about 14.9 per cent of the sample, housekeepers made up close to 8.6 per cent of the sample (of those 97% were females), pupils and students account for 15.5 per cent of the total, and other dependents accounted for about 8.5 per cent of the respondents.
When analysing these indicators by age group, one can note the higher frequency of unemployment in the age groups between 20 to 29-year-olds and the prevalence of employed/self-employed between the 35 and 54-year-old groups. As expected, the prevalence of students/pupils occurs in the group aged 19 and under. The number of pensioners/beneficiaries starts to rise after the age of 60, which is normal and predictable.
Only 8.2 per cent of the surveyed HH members have plans to move abroad. If the weight sample is considered, the number of individuals in the total population of the Republic of Armenia who see migration as an option for the future will be 213,468. The survey reveals clear differences between men and women in the serious intention to move abroad. Approximately 53.4 per cent of potential male migrants declared that they were seriously thinking of moving abroad, whereas only 46.6 per cent of potential female migrants reported an already prepared move abroad. If the potential to move is still an intention (probably yes) the gender gap increases even more (55.7% for men versus 44.3% for women). Of those intending to migrate in the future, 56 per cent plan to migrate in the subsequent 12 months, a statement that denotes a robust migration project. Of those too, we find the strongest commitment to migration amongst male respondents. 27 per cent of the household respondents who intend to migrate within the following 12 months have already made some arrangements
17
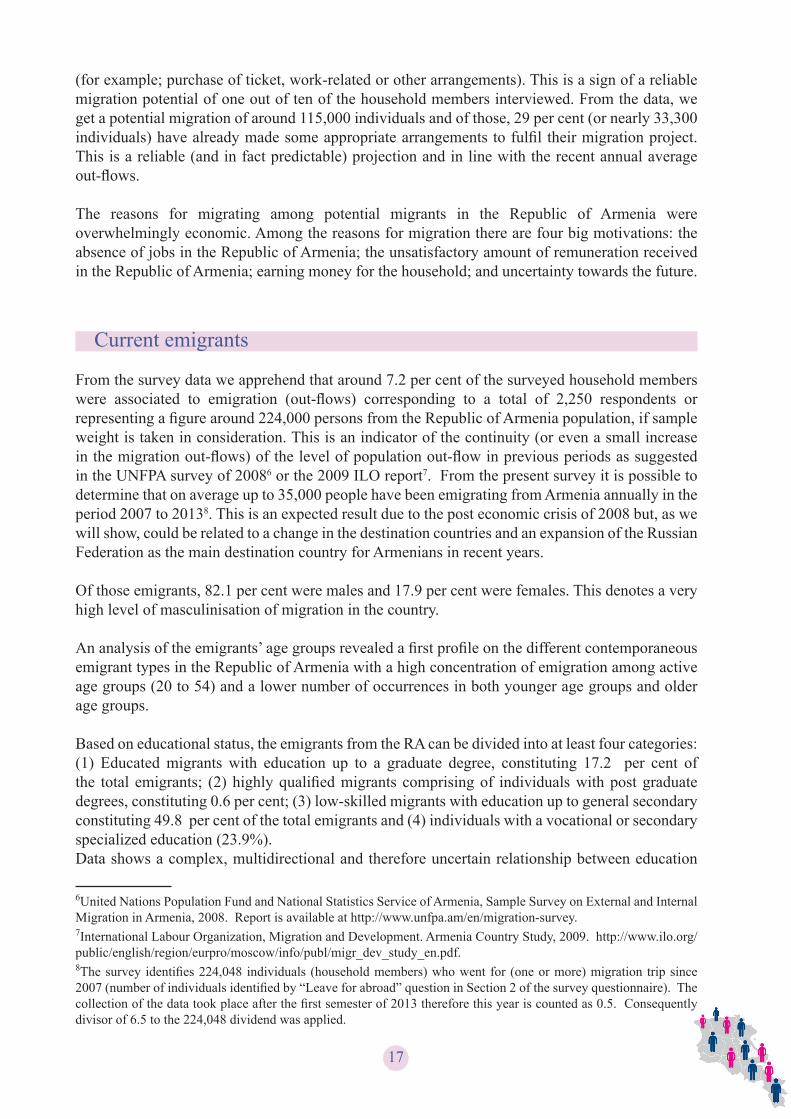
(for example; purchase of ticket, work-related or other arrangements). This is a sign of a reliable migration potential of one out of ten of the household members interviewed. From the data, we get a potential migration of around 115,000 individuals and of those, 29 per cent (or nearly 33,300 individuals) have already made some appropriate arrangements to fulfil their migration project. This is a reliable (and in fact predictable) projection and in line with the recent annual average out-flows.
The reasons for migrating among potential migrants in the Republic of Armenia were overwhelmingly economic. Among the reasons for migration there are four big motivations: the absence of jobs in the Republic of Armenia; the unsatisfactory amount of remuneration received in the Republic of Armenia; earning money for the household; and uncertainty towards the future.
Current emigrants
From the survey data we apprehend that around 7.2 per cent of the surveyed household members were associated to emigration (out-flows) corresponding to a total of 2,250 respondents or representing a figure around 224,000 persons from the Republic of Armenia population, if sample weight is taken in consideration. This is an indicator of the continuity (or even a small increase in the migration out-flows) of the level of population out-flow in previous periods as suggested in the UNFPA survey of 20086 or the 2009 ILO report7. From the present survey it is possible to determine that on average up to 35,000 people have been emigrating from Armenia annually in the period 2007 to 20138. This is an expected result due to the post economic crisis of 2008 but, as we will show, could be related to a change in the destination countries and an expansion of the Russian Federation as the main destination country for Armenians in recent years.
Of those emigrants, 82.1 per cent were males and 17.9 per cent were females. This denotes a very high level of masculinisation of migration in the country.
An analysis of the emigrants’ age groups revealed a first profile on the different contemporaneous emigrant types in the Republic of Armenia with a high concentration of emigration among active age groups (20 to 54) and a lower number of occurrences in both younger age groups and older age groups.
Based on educational status, the emigrants from the RA can be divided into at least four categories: (1) Educated migrants with education up to a graduate degree, constituting 17.2 per cent of the total emigrants; (2) highly qualified migrants comprising of individuals with post graduate degrees, constituting 0.6 per cent; (3) low-skilled migrants with education up to general secondary constituting 49.8 per cent of the total emigrants and (4) individuals with a vocational or secondary specialized education (23.9%).Data shows a complex, multidirectional and therefore uncertain relationship between education
6United Nations Population Fund and National Statistics Service of Armenia, Sample Survey on External and Internal Migration in Armenia, 2008. Report is available at http://www.unfpa.am/en/migration-survey.7International Labour Organization, Migration and Development. Armenia Country Study, 2009. http://www.ilo.org/public/english/region/eurpro/moscow/info/publ/migr_dev_study_en.pdf. 8The survey identifies 224,048 individuals (household members) who went for (one or more) migration trip since 2007 (number of individuals identified by “Leave for abroad” question in Section 2 of the survey questionnaire). The collection of the data took place after the first semester of 2013 therefore this year is counted as 0.5. Consequently divisor of 6.5 to the 224,048 dividend was applied.

18
and emigration with no consistent overall pattern emerging from the relationship between the two. Thus, from this survey it is not possible to identify a massive exodus of qualified professionals. Nevertheless, almost 39,000 individuals with a tertiary or post-graduated education are estimated to have left the country in the last 6 years (but 21,000 individuals with a tertiary and/or post-graduated education returned from abroad or immigrated to the RA within the same period).
62.8 per cent of identified emigrants had been unemployed in the Republic of Armenia immediately before emigrating; only one out of four (25.1%) had been employed (including self-employment); 5.2 per cent had been students; 2.3 per cent had been household keepers and 3.6 per cent had been under care. Of those individuals, three out of four had not had a job in the previous 6 months before leaving the RA and only 14 per cent had worked the full 6 months. Those are meaningful push factors to emigration.
In total, 51.8 per cent of the emigrants were not looking for a job in the 6 months before leaving (corresponding to despondent jobless), but 22.5 per cent had looked actively for a job for the full half year before departing without finding a job opportunity. The push factor was, for those individuals, the absence of jobs or the lack of job opportunities and this fact confirms that the fundamental causes of modern migration from Armenia are economic factors.
The funds to support the migration project are mainly auto-financed in 35.5 per cent of the cases by HH savings; selling assets (4.8%); uncompensated care (9.7%). In 12.9 per cent of the cases the employer supports the resources for migration. There is also very important financial support coming from financial institutions: bank loan (5.5%); property mortgage (1.2%) and above all debts (28.9%). There are also 1.3 per cent of other, undefined financial sources.
From the data, one understands that the main migration destination is the Russian Federation (RF), a country that is relatively close to Armenia geographically, seen as a friendly state boasting a vast growing economy, and with a visa-free entry regime with Armenia. It is not surprising then, that when analyzing the last migration trip we learn that there are more people emigrating to the RF than migrating internally within the RA.
The data from the survey concerning the destination of the last migration trip abroad reveals the Russian Federation (90.6%) as the prevalent destination. Nagorno Karabakh (NKR) (1,3%); USA (0.8%); Ukraine (0.6%); Poland (0.4%); Belgium (0.2%); Germany (0.6%); France (1.2%); Spain (0.8%); Georgia (0.3%); Turkey (0.4%); Brazil (0.1%); and Iran (0.4%) are also destination hubs. If the 28 Members States of the European Union are combined, then the EU becomes the second more important destination with attracting 4.1 per cent of the total emigration.
Around eight out of ten of the household members’ respondents had had a network of friends and/or relatives in the destination country before leaving the Republic of Armenia. This is a very high proportion and is linked to Armenia’s long history of migration, both in the twentieth century and at present. The existence of a widespread diaspora and the continuous flows of departures during the last two decades assures newcomers of a low risk of migration and explains the migrants’ location decision through three channels: firstly, they provide information about the host country/region labour market; secondly, the benefits for the migrants increase with the amount of ethnic goods available in a location; thirdly, migrants expect former migrants to help them in the settlement process. The effect of network externalities may vary for different types of migrants. For example, migrants with an irregular status or working in the informal labour market may depend more on migration networks than migrants with regular migration status.The evidence of a labour migration flow is confirmed by the fact that 79.3 per cent of the emigrants

19
had had the intention to work abroad before leaving the RA. Of those household respondents, 71.5 per cent had secured a promise of a job before leaving the RA; 4.4 per cent had concluded a written agreement to work and 1.1 per cent had made other arrangements to get a job. 22.9 per cent of the interviewed respondents didn’t have any kind of job offer or agreement.
The economic status of the emigrants seems to improve in the overwhelming majority of the respondents vis-a-vis their prior condition in the RA. The shift in labour-market status is significant for the unemployed, many of whom were able to find paid employment after migrating.
Although it is known that Armenian migrants would often engage in temporary migration, such as moving to a country and seeking low skilled employment in construction or cleaning before returning to RA, which is not explicitly framed in the present survey. The exception is found in the data on the return migrants. In one question about the reason not to communicate the return to RA authorities, 8.2 per cent of the return migrants declared they were temporary migrants (less than 6 months absentee from the Republic of Armenia’s territory). This proportion corresponded to nearly 4,000 individuals in a weighted sample.
The migrants that were/are in foreign countries (emigrants; return migrants and immigrants) completed an average of 3.2 trips between 2007 and 2013.
The migrants have regular contact with their families back home, often every day (52% of the household respondents living abroad communicate with family and/or friends every day; 38.5%, once a week; 8%, once a month and 1.5%, rarely). The majority of the migrants use phones as their mode of communication (57% of the total). Internet is also playing an important role in communication (email and Skype are used by 15.4% of the respondents). In fact, technological developments, such as mobile phones, cheap long-distance phone-calls, social networking pages and Skype have made it easier for migrants to stay in touch with family and friends at home and thus made migration seem easier. To some extent, e-mail, Skype, and affordable telephone calls may allow them to maintain strong links with family and friends in the country of origin.
For 22.9 per cent of the respondents their professional knowledge and skills improved significantly during the emigration period; for 43.1 per cent their professional knowledge and skills improved to some extent; and for 30.6 per cent their professional knowledge and skills did not develop.
According to the received and compiled responses, the portion of the households that had household members, who had emigrated some time prior to 2007, was one out of ten. This is around 10.3 per cent of the 7,890 HH interviewed. Within those HH, of the household member respondents that emigrated before 2007 and have not returned from abroad (n=2.360), 60 per cent were male migrants and 40 per cent female migrants. This corresponds to around 245,000 individuals in the weighted sample.
According to this age distribution, the vast majority of the emigrants who left before 2007 are in the working age population group (79.5% of the emigrants of the total surveyed households, who left the RA before 2007, were part of the age range 20 to 65); 2.2 per cent of this sub-sample were born abroad after 2007 and 2 per cent of the total emigrants passed away while abroad.
The data substantiates that 35.3 per cent of the emigrants who left before 2007 had a general secondary education (compared to 37.3% of the average RA population in the sample); 2.3 per cent had a diploma from a vocational (college) education (2.2% of the average RA population in the sample); 18.6 per cent had a secondary specialized diploma (compared to 18.5% of the average RA population in the sample).According to the survey data, the date of departure of the emigrants of the surveyed households

20
in RA who had left before 2007 is presented in the following proportions: 36.4 per cent left the Republic of Armenia between 1991 and 1999 (62% of these were male migrants); and 46.5 per cent left the Republic of Armenia between 2000 and 2006 (59% of these were male migrants).
Of those who moved before 2007 (n=1.924), 77 per cent moved to the Russian Federation (61% male migrants); 14.8 per cent moved to another marz or abroad (55% male migrants); 6.3 per cent moved to the USA (53.3% male migrants) and 1 per cent to NKR (67.9% male migrants). Less than 1 per cent did not mention the marz/country of destination.
Future migration plans seem to depend on the evolution of the social and economic situation in both the Republic of Armenia and the host country. In 37.8 per cent of the emigrants the intention is to return in 2013; 5.1 per cent intends to return in 2014; 10.8 per cent will return, eventually (we must underline that a total of 54.7 per cent of the respondents have plans to return). For 22.7 per cent it will depend on how the situation progresses; 12.7 per cent are considering not returning to RA; 5.1 per cent has plans to reunite with their family in the host country; and a small number (0.2%) is considering re-emigrating to a different host country.
The main reasons for return are family related causes such as: family reunification (34.9%); marriage (5.7%); other family circumstances (9.9%); the accomplishment of the migratory project (22.8%); lack of work in host country (12.9%); job offer in RA (3.8%); bad working conditions (3.7%); education or qualification (0.5%) and others (5.8%).
While most of the emigrants have not taken the citizenship of the country of current residence, a significant proportion of this very recent emigrant population (6.8%) have already taken up citizenship. The prevalent majority has legal status; a high proportion (two out of three) has only a temporary registration. A total of 4.9 per cent of the respondents had undocumented status in the host country.
The emigrants normally live in rented apartments/houses (34.5%); rented rooms (23.7); house of a relative or a friend (15.6%); dormitories (11.5%); non-residential accommodations (8.2%); and, personal houses (5.1%).
As regards health insurance, for 76.7 per cent of the identified emigrants, this was non-existent while 6.1 per cent had permanent insurance and 12.6 per cent, temporary insurance.

21
Return migrants
Return migration describes a situation where migrants return to the Republic of Armenia, usually by their own choice, often after a significant period of residence abroad. The share of household members who were directly associated to a return from abroad (n=828) was 2.7 per cent. The share of emigrants who returned was 37.8 per cent of the out-migration flows in the period from 2007 to 2013, corresponding in a weighted sample to 82,530 individuals. These numbers suggest that return migration is quite substantial and return should be addressed directly by policies designed for improving the success of this migratory in-flow.
A total of 66 per cent of the returned migrants were males, confirming the bias towards males in the out-flows in the Republic of Armenia.
The regional distribution of the return migrants differs from the regional distribution of emigrants with a noticeable distinction between regions. One can observe that the Yerevan region receives an average of 35 per cent of the returned migrants but it is only the region of origin for 18.4 per cent of the emigrants. Inversely, a region like Shirak receives only 6.7 per cent of the return migrants but is the region of origin of 17.6 per cent of the total emigrants. This data suggests redistribution of population within Armenia with a potential depopulation induced by migratory flows in some RA marzes and a diverse phenomenon in others.
Findings from the survey show that return migrants have a marginally improved education than the average population of RA. The data corroborates that 41.7 per cent of the returned emigrants have a general secondary education (compared to 37.3% of the average RA population in the sample); 3.1 per cent have a diploma from a vocational (college) education (2.2% of the average RA population in the sample); and 21.5 per cent - a secondary specialized diploma (compared to 18.5% of the average RA population in the sample).
An analysis of the survey data doesn’t show an exodus of highly educated individuals or the existence of a sharp brain drain, at least in recent years, as presented above. Neither does brain gain appear to be present in the return flow.
As regards a potential skill gain, one in two of the HH respondents returned from abroad declared they had increased their professional knowledge and skills while abroad (for 15.5%, increased significantly; 36.9%, increased to some extent). For 47.5 per cent their professional knowledge and skills did not increase while abroad). A total of 78.5 per cent of the interviewees that returned from abroad (n=766) had relatives / friends in the country of destination before leaving the Republic of Armenia, which is an indication of a strong support network. This support network is visible in the type of assistance they have: 29.6 per cent had help to find a job; 24.2 per cent had assistance in finding a domicile; 18 per cent had assistance on the travelling costs; 13.7 per cent had help for food or an abode; 1.4 per cent had support in getting a visa and 0.5 per cent had other kinds of assistance. Only 12.6 per cent had no help at all.
39.2 per cent of the returned migrants supported their migratory trip with household savings, 26.1 per cent financed their trip through debts, 16.6 per cent through uncompensated aid, 6.4 per cent were backed by the employer, 4.6 per cent supported their trip selling assets, 3 per cent with a bank loan and 1 per cent obtained funds for the trip through a property mortgage or credit.

22
The main reasons to choose a specific destination country show the prevalence of a network migration (existence of a network of friends and/or relatives in the destination country) in 40.5 per cent of the occurrences. Also worth mentioning is the labour market appeal (job offers determined 21.9% of the selected destination); the language factor (knowledge of the language explains 11.7% of the destination country’s option; the absence of entry visa (5.7%); or the nonexistence of alternatives (6.3%). A previous residence experienced in a destination country explains the recurrent preferred destination for 3 per cent of the household respondents.
Regarding the registration in the consulate of the Republic of Armenia in the host country, only 26.4 per cent of the total return migrants were registered in the diplomatic representations abroad. For 6.8 per cent the reason for non-registration was a short-term migration (less than 6 months); 30.4 per cent stated that they were not informed of the obligation to register; 43.8 per cent decided not to register because they had not found a reason to do so; 2.5 per cent alleged they had not had time to do it; 4.1 per cent indicated there was an excess of bureaucracy; for 7 per cent of the returned migrants there was no consulate of RA in the destination country (or in the region); for 3.2 per cent, it was difficult to reach a consulate of the Republic of Armenia; and for 1.9% there were other, not specified reasons.
Almost one in 10 of the returned migrants have taken the citizenship of the host country (8.5%); a significant proportion of the return migrant population (15% per cent) had residence permission; 44% had temporary registration; 18.9 per cent had permission to work; 0.8 per cent were refugees; 0.8 per cent were asylum seekers; 0.6 per cent had other unspecified statuses. Although the prevalent majority had legal status, a high proportion (more than one in ten or 11% of the respondents) had illegal status in the host country.
While in the host country, the household respondents who had returned from emigration normally resided: in rented apartments/houses (30%); with acquaintances or relatives (29%); rented rooms (19.7%); dormitories (7.3%); personal houses (6.7%); non-residential accommodation (5.4%); and other, unspecified dwellings (1.8%).
The overwhelming majority of the returned migrants had not had health insurance when residing abroad; 13.7 per cent had temporary health insurance and 8.2 per cent had permanent health insurance.
A total of 70.4 per cent of the returnees had intended to work abroad before leaving the Republic of Armenia. The evidence of a labour migration flow is, once more, confirmed by the fact that, of those household respondents, 58.3 per cent had had a promise of a job before leaving the RA; 5.9 per cent had concluded a written agreement to work and 0.7 per cent had made other arrangements to get a job, while 34.9 per cent of the interviewed returned respondents had not had any kind of job offer or agreement.
The job arrangements came from foreign employers, intermediaries or foremen in 70 per cent of the occurrences. The foremen or intermediaries and the private and public agencies in the Republic of Armenia were associated to 24.6 per cent of the job arrangements. For 5.4 per cent of the total, these job arrangements had not been carried out. For 40.9 per cent of the household respondents, they had been fully carried out; for 38.3 per cent, basically carried out; and for 15.4 per cent, they had been at least partially carried out. The cause of shortcomings was attributed to an unforeseen situation in 40.3 per cent of the events; to the employer in 29.2 per cent or to the intermediary in 23.6 per cent of the incidents.
A total of 36.3 per cent of the surveyed return migrants had no job for the full 6 months before the survey and 40.6 per cent had worked the full 6 months. If we add the pensioner/beneficiary (5.9%)
23
to the last group, we realize that bread-earners add up to less than 50 per cent of the returnees. In total, only 13.4 per cent of the jobless returning emigrants were not looking for a job in the 6 months before the survey; the remaining 86.4 per cent were actively trying to find a job opportunity.
The increase in employment probabilities was quite intense for this group of return migrants. Though, prior to returning, 7.8 per cent had had temporary work of less than 3 months; 48.4 per cent, a temporary contract of less than one year and 42.6 per cent, a termless contract. Comparisons between the nature of work before and after migration show interesting changes (see figure 26). The transition from short-time employment to a less precarious job seems to be very pronounced.
Of those, 60.7 per cent worked in the construction sector; 10.2 per cent in trade and repair; 8.6 per cent in industry; 1.4 per cent in education; 1.2 per cent in agriculture; 0.8% in public administration and 16.6 per cent in other services. Comparisons between the sectors of employment before leaving the RA and at the host country show transference from agriculture to construction as the most noticeable fact (see figure 24).
For 23.8 per cent of the respondents, as to their employment in the host country (n=488), the job they had fully matched their profession; in 19.3 per cent of the cases it matched at least partially; in 12.1 per cent it was above their profession and in 21.5 per cent there was a professional devaluation. In 23.4 per cent of the cases they stated that they had not had a profession before emigration.
As regards qualifications: for 38.7 per cent of the household respondents, the job matched fully and for 35.7 per cent, partially. In 22.1 per cent of the cases, the job they had was below their qualification and in 2.0 per cent of the cases it was above their qualification. It seems, similarly to recent emigrants, that many of the returnees saw migration as an alternative to unemployment in their home country or an alternative to the lack of opportunities for the skills they had developed.
There is also information in the survey concerning the weekly working hours: 4.4 per cent of the household respondents’ worked between 4 and 35 hours a week; 12.5 per cent, between 36 and 40 hours a week; 25.5 per cent, between 41 and 50 hours a week; 24.5 per cent, between 51 and 60 hours a week; 25 per cent, more than 61 hours a week, while 7.9 per cent decided not to respond to this question. A comparison between weekly working hours, before and after leaving the RA, shows evidence of an increment in the number of working hours in absolute terms and in percentage.
Of the returnees, 11.3 per cent were self-employed in migration. In 9.8 per cent of the total, the employer was an Armenian compatriot; in 49.2 per cent, a local compatriot; in 24.2 per cent, a local resident or local institution; in 4.7 per cent the State, and in 0.8 per cent other unspecified employers.
The respondents found their jobs through a foreign acquaintance or intermediary in the host country in 44 per cent of the total; through an acquaintance or intermediary in RA in 19.6 per cent of the total; through a foreign employer in 13.1 per cent of the total; through a foreman in the RA in 4.2 per cent; through a foreign agency in 2.7 per cent of the cases; through their own or family business abroad 2.3 per cent; through an employer living in the RA; through the internet 1.3 per cent; through a foreign state agency 1.1 per cent; a private agency 1 per cent; other, not specified, 2.7 per cent of the total. Employment was found through the RA public employment service in the case of just one individual.
The total revenue was insufficient to generate any savings in 47.9 per cent of the household respondents (2% stated that they had debts because of very low income). For 8.2 per cent of the respondents the revenue was enough to generate savings; 29.6 per cent stated that it was partially possible to save some money; 8 per cent of the respondents could save only very little money from their income.

24
Among the expenditure of the earnings mentioned above, the largest portion was for current household needs (40.8%). A considerable portion of the expenses corresponded to communal expenses (13%) or to social needs such as education, health and so on (9.1%); unforeseen circumstances accounted for 7.6 per cent of the disbursement and savings corresponded to 11.5 per cent of the revenue.
The prevalent majority of the returned migrants declared they had not had problems while abroad (86.2%). Of the remained respondents, 5.1 per cent had had problems with the police in the host country; 3.1 per cent with their employer, and health problems accounted for 1.6 per cent of the total.
In 38.7 per cent of the cases, these problems were solved by acquaintances among host country locals; for 21.7 per cent these were not solved at all; in 12.3 per cent of the cases problems were solved by the employer and, in a small number of cases, by court intervention (6.6%) or by the police (7.5%).
The decision to return seems to be strongly linked to the family (56.1% of the total) rather than to the income opportunities in different countries (see figure 31 below). It seems that return migration becomes utilitarian in the context of household decisions. Return also happens over a finite life-cycle, when the migratory project is complete (20.9%). Households also choose the length of stay overseas that balances the marginal benefit from higher savings overseas (and thus higher lifetime consumption) against the marginal utility cost of overseas work. This means for certain migrants a very short, temporary, seasonal or circulatory migration, with repetitive returns and to others a period (brief or long) depending on the financial needs and expectations from the household.
The evaluation of the migratory project in terms of competitiveness in the RA labour market after return is not, on average, optimistic. For 47.5 per cent of the respondents their competitiveness in the labour market has not improved; for 18.3 per cent it seems not to have improved. For 13.4 per cent of the respondents the migratory project corresponds to a competitive gain in comparison with the RA labour market and 20.1 per cent believe that it was rather positive.
One of the major problems faced by return migrants is the lack of information, which becomes an obstacle for return and resettlement. This information can be reciprocally advantageous but one needs to build a structure of data collection in order to focus on the country and migrants’ needs.
Only 30.4 per cent of the returned migrants informed the RA Police Passport and Visa Department about their return.
For 52.7 per cent of the return migrants, their situation had not changed after return; it had worsened for 32.8 per cent; it had improved for 12.8 per cent and had basically improved for 1.6 per cent of the migrants who had returned to the Republic of Armenia.
A prevalent majority had no difficulties in Armenia after the return (67.1%) and 14.9 per cent had just a few problems. For 8.1 per cent the return was problematic and for 9.8 per cent rather problematic.
The major problems in readapting to Armenia were related to the reintegration into the labour market (46% answered that problems were highly related to work) and to opportunities for leisure (24.8% stated that the problems they had were highly related to opportunities for leisure).

25
Immigrants (in-flows)
In this household survey there was a set of questions (37 in total) on the issue of migration in-flows (see section 5 of the questionnaire in annex). Selectivity of immigrants can be seen through demographic and socio-economic characteristics compared to similar characteristics from non-migrants at the destination country or to the other migratory flows.
A very small number of respondents arrived from abroad for the first time (specifically, immigrants and Armenian descendants born abroad) totalling 129 individuals corresponding in a weight sample to 14,312 individuals. This very limited number of respondents has, as expected, statistical consequences in many of the variables, not allowing a deeper analysis.
From the total of respondents, 41.2 per cent were males (corresponding to 5,893 individuals in a weighted sample) and 58.8 per cent were females (corresponding to 8,419 individuals in a weighted sample).
Yerevan emerges as the main destination for in-flows (immigration and return migration) but not as the prevalent destination for internal migration. Ararat is the second destination for immigrants and Kotayk is an important destination for internal migration.
The decision to migrate to the Republic of Armenia was taken personally by 34.3 per cent of the respondents, while it was a family decision in the remaining 65.7 per cent.
Among the foreign-born individuals surveyed, only 43.3 per cent were married, the smallest proportion among all the surveyed migration groups.
An analysis of the immigrants’ age groups revealed a first profile on the different contemporaneous in-flows to the Republic of Armenia with a high concentration of immigration among young age groups (0-24) and a lower number of occurrences in active age groups (25-59). In fact, in a prevalent number of cases this in-flow is not directly linked with an immigration flow but is the result of a return of second-generation emigrants, born abroad and returning with their parents to the Republic of Armenia. A total of 13, 2 per cent of the newcomers were born after 2007. This, in part, reflects the past migratory history of the RA and, simultaneously, the geo-political insertion of the country in a post-conflict region.
The share of pre-secondary respondents is disproportionate compared to the average of the RA and to the other migration groups under analysis. This dichotomy in educational attainment between the native and the newcomer populations is likely to narrow in the future if the in-flow population is integrated in the RA educational system.
As noted earlier, an important distinction can be made between data resulting from the variables “citizenship” and “nationality”. An unexpected fact coming from the survey reports to the nationality of the interviewed members of the households that migrated from abroad: 34.2 per cent were foreign-born nationals of the Republic of Armenia; 24 per cent of those household members had Armenian nationality and another one, that is, dual citizenship; 40.7 per cent had foreign citizenship and 1.1 per cent did not have a citizenship.
As for nationality, 97.9 per cent declared themselves as Armenians; 0.7 per cent, Russians; 0.6 per cent, Indians; 0.8 per cent, other nationalities.

26
In this immigration flow “push” factors seem to be the main factor. An interesting disclosure from data is that geo-political instability generates an important reason to leave the host country (37.4%); an extra 2.8 per cent of political persecuted persons declared this as the reason for migration. Family reasons are linked to 36.5 per cent of the reasons for emigration; lack of employment or other economic reasons are related to a very small number of respondents.
The rationale to choose the RA as the destination country is mainly connected to emotional reasons or family (58.2% of the total); in a small number of respondents economic or employment reasons were underlined (4.7%); education or training was important in 4.6 per cent of the total; other unspecified motives accounted for 10.3 per cent.
For a total of 65.5 per cent of the respondents, migration to the Republic of Armenia was the only destination available. Further inquiry is needed to understand the reason for this.
The characteristics of the in-flow population differ in some important respects from the previous migrant profiles presented above. An analysis of the data concerning the socio-economic status before arrival in the Republic of Armenia shows a large number of inactivity among the respondents (60.6%); one in five was jobless before migration. Despite the fact that it is too simplistic to stress a relationship between immigration, inactivity rate and unemployment, one should expect in a migration inflow a higher number of labour migrants. These features also direct us towards a hypothesis: this flow is a counter flow of historical emigration movements rather than a labour migration flow.
Regarding the legal status of the foreign-born in the Republic of Armenia, 41.3 per cent are citizens of RA; 17.4 per cent of the foreign-born applied to receive RA citizenship; 4.8 per cent of the foreign-born possess a residence permit; 2.5 per cent have the right to work; 14.5 per cent of the foreign-born have temporary registration and 17.6 per cent of the foreign-born (corresponding to a weighted value of 1,787 individuals) do not have legal status.
Economy and Remittances
The large remittances sent by RA emigrants to their families back home has helped reduce poverty, furthered human development and eased social tensions. Armenia is among the top 20 countries that receive the highest amount of remittances (in relation to its GDP) (Makaryan and Galstyan, 2012: 7).
As expected, the remittances received are proportionally higher among contemporary emigrant households as 78.5 per cent of the households with emigrants received remittances from abroad during the last 12 months. One out of four of the internal migrants received remittances from abroad in the last year; four out of ten of the returned migrants received remittances from abroad in the last 12 months and one out of two foreign-born residents also received remittances from abroad in the last 12 months.
Two out of four of returned migrants sent remittances to their HH members when abroad. A total of 47.7 per cent of the respondents did it regularly; 13.1 per cent, occasionally and 4.4 per cent, rarely. Around 15.9 per cent could not help their household; in 11.4 per cent of the cases it was not needed and in 0.7 per cent of the total it was the HH in the RA that sent money abroad.
If one compares the configurations of money transfers between present and past emigrants, the picture looks very clearly structured. Nowadays emigrants tend to send money more regularly to their HH (as

27
economic reasons were the main motive for them to leave the RA, this seems normal). For a certain proportion of returned migrants it was impossible to send remittances home (and we can assume that for a portion of those, this was the main reason to return).
Contemporary migrants abroad usually send financial remittances to the Republic of Armenia by bank transfer (82.8%); remittance service providers (like Western Union) (8.5%); by post (0.2%); by courier (0.2%); they carry the money themselves on visits home (3.8%) or they send money by a carrier (4.5%).
Past migrants show a very similar structure. The preferred mode of sending remittances to the households is through banks (79.1%); remittance service providers (like Western Union) (7.3%); by post (0.4%); and by courier (0.2%). A proportion of money is also transferred through friends and relatives when they visit the country (5.3%); or carried by migrants themselves on visits home (7.3%).
In this survey one out of four of the migrant households interviewed (25%) declared to have received remittances from their migrant counterparts. This corresponds to approximately 25.5 per cent of the internal migrants. This is slightly lower than the state average of 28 per cent considering the respondents’ total.
Financial remittances, which are received by one quarter of the Republic of Armenia households, have become nowadays an important way to improve the socioeconomic situation of many households.
Remittances are not equally distributed across the territory of Armenia. There is a large discrepancy between regions: four out of ten households in Tavush received remittances from abroad (40.7%); in Yerevan only two out of ten (19.6%) received remittances from abroad and in Aragatsotn only 16.7 per cent of the households were receivers of remittances from abroad.
For about 1.9 per cent of the respondents (61,063 individuals in a weighted sample) the main source of subsistence was the earnings of household members permanently residing abroad. These remittances were a very important source of subsistence for more than 127,000 individuals (or 4%) of the Republic of Armenia population.
For a total of 11.2 per cent of the respondents (353,869 individuals in a weighted sample) the main source of subsistence was the earnings of household members temporarily residing abroad. These remittances were a very important source of subsistence for more than 500,000 individuals (or 17%) of the Republic of Armenia population.
As expected, most of the remittances are used in consumption and other first need items and services (e.g. medical services). The differences between the distinct migrant groups are not substantial. Migrants also occasionally send money for specific purposes, mostly to cover expenses like marriage, pay for medical services, and so on. Only a small part of the respondents received goods from abroad. The variances are not significant between all the migrant groups, compared to the group of internal migrants, as the group with a lower proportion of receivers (3.7%). We found the highest proportion of households receiving goods from abroad among the return migrants.
28
Chapter 1 – Introduction
As international migration continues to become increasingly important on a global scale, so does the need to improve the collection and quality of migration data. This need is a result of many factors, including difficulty accepting common definitions of migration, data collection issues, problems measuring the true size of migration, as well as lack of information to measure the impact of migration for both receiving and sending countries. To alleviate this dearth in information, household surveys can play an important role in collecting and improving data on migration, particularly with regards to the impact and characteristics of current and former migrants (Schachter, 2008). Nonetheless, migrant household surveys present a methodological challenge, especially in countries of origin. In measuring international migration, researchers must set up a good sample framework and develop a way to handle the large sample size and the complexity of the survey itself.
At the most fundamental level, household surveys collect information by asking questions to people interviewed. However, one of the biggest challenges faced when implementing migration household surveys is to locate those relatively rare households that include migrants. Authors like McKenzie and Mistiaen (2007) note that, even in countries with a high incidence of international migration, finding a household with an emigrant abroad or a returned migrant can be challenging because migration is always a relatively rare event.
Sample surveys are comparable to a Census, but are instead administered to a limited number of persons who represent the population as a whole. Because only a sample of the population is asked questions, sample surveys are much less costly than a population Census, and can be conducted more frequently. They also allow for more flexibility on the number and types of questions that can be asked. Surveys can be either cross-sectional (conducted at one point in time, like a Census) or longitudinal (follow a person or household members over time, e.g. panel data). Researchers often use cross-sectional surveys to measure historical data by asking retrospective life-history questions (Schachter, 2008). In the case of this project it was not economically viable and cost-effective to capture exclusively data on the geographical distribution of households with migrants and therefore the sample survey did not directly and uniquely target households with migrants. The results obtained can, however, be extrapolated to the entire population of the Republic of Armenia as the sample was designed to be representative (see below). By representative, we do not mean representative of households with migrants, but representative of the population of the Republic of Armenia including the percentage of population linked to migration flows and dynamics.
As stated above, if accurately designed, migrant household surveys can be the mainstay of micro-level data for analysing hidden migrant populations. They are particularly important in resource-poor country settings where data cannot be produced by routine or administrative data systems. As aforementioned the quality of sample survey data is directly related to the quality of its sampling design. If the sample is large enough and drawn from a representative group of the population, inferences applicable to the entire population can be made. Sample size is important since a larger sample size usually reduces the standard error associated with the sample mean (from which estimates are derived), though the actual size needed depends on the amount of variance in the population. The need for quality sampling design is even more important for measuring migration, since it is a relatively rare event compared to other characteristics of the population, as the current research will show. Migration flows, patterns and processes are part of the demography of the country but, as the analysis of the present survey will demonstrate, they have been apprehended in a comprehensive and qualitative approach, although in relation to the entire population of the Republic of Armenia.

29
In this specific survey the ‘statistical household’ was defined in a very similar way to other household surveys recently gathered in the Republic of Armenia (e.g. ILCS); that is, as a socio-economic unit that consists of one or more persons with common living and catering arrangements. Such persons are usually (though not always) related to each other by blood or by marriage and we should underline the difference between family and household. This survey is not a migration family survey but instead a migration oriented household survey. This ‘process definition’ was not produced with the intention of creating an analytical variable to research specifically migration flows and processes, but rather as a representation of the demographic landscape of the Republic of Armenia. We are aware that it is difficult to measure emigrants who are not currently present in a household. Responses are dependent namely on: the migrant still having some connection to a household in the Republic of Armenia; how household membership was defined in the particular survey and how proxy respondents express their knowledge about these topics.
There are a number of advantages to using household sample surveys to measure migration, particularly in countries that lack alternative data sources. In particular, household surveys have more flexibility in which questions can be asked so that one can measure specific topics related to migration. Although there are limits to the number of questions that can be asked (depending on many factors, usually cost), questions can be tailored to specific research needs or policy concerns, which is extremely important. There are also other advantages when compared to a decennial Census, in that using a representative sample of the population reduces cost and increases frequency of data collection. However, household surveys are faced with their own limitations, including cost of conducting them, need for large sample sizes to measure flows, difficulty finding migrants in regular sampling frames (coverage and non-response), question sensitivity (particularly money-related, e.g. remittances), respondent recall and respondent burden, and other data quality concerns exacerbated by the use of proxy respondents (Schachter, 2008).
The size of international migration is measured using two concepts: stocks and flows. International migrant stock is the total number of international migrants living in a country at a particular point in time, either measured by foreign-born (country of birth) or foreigners (nationality). Migration flows occur between two geographic areas, consisting of both an origin and a destination. In-flows are the number moving into a given geographic area (e.g. country of destination) over a given period of time (usually 12 months), while out-flows are the number moving away from that same area (for instance marz or RA) and time-period. Flows can be measured in terms of international or internal geographic areas (Schachter, 2008).
As aforementioned, defining a reference period is important for expressing and measuring the size of migration, as is identifying the origin and destination of a move. Some surveys consider any duration of stay of 6 months or longer as sufficient for identifying a migrant, while the UN recommendations call for 12 months for long-term migrants and 3 months for short-term migrants. For return migrants, who could have migrated at any period of their life, a reference period is used to restrict measurement to relatively recent return migration. In the case of this survey it was in the last 6 years (or since 2007). This chapter includes information about those members of the households whose migration movements with duration of more than three months during the period of 2007 to 2013 (and to a lesser extent, regarding a period before 2007) have taken place beyond the borders of the Republic of Armenia; that is, those household members that were/are residing in foreign countries. To sum up, in the current household survey we recognise different sets of information on international emigration from the Republic of Armenia: one is related to migration out-flows that occurred before 2007, with a second set of questions for the household members who left the country after 2007.

30
Concerning this last set of information, the survey scanned household members for information on their migrant members currently living away, if any. Proxy respondents (current non-migrants) were asked questions (age, sex, current residence, country and time of first departure, and some information about work history, reasons for move, legal status in country of destination, visa type, questions about migrant social integration, social networks, and so on) to collect information on household members living abroad. Obviously, data derived from this module is partial and biased, since an unknown number of migrants have no close relatives in their places of origin9. This module concerning relatives away is especially important however, for assessing financial flows (e.g. remittances) and other links with current migrants, and also shedding additional light on the migrants themselves, their characteristics, their places of residence, and so on.
Specialized migration surveys like the present one, have the advantage of being tailored to measure migration-related phenomena. Thus questions can be as detailed as necessary. The limits are also very visible; namely, in the frequency numbers of the household members involved in migration, which are always a very small portion of the household survey full sample.
Responses to the household survey questions allow the researchers to derive sample statistics such as means or proportions. These statistics are used to generalize from the sample to the entire population (in the case of the current survey this was adjusted through weight parameterization). Sample statistics provide a point estimate of the true population parameter. However, due to sampling error, it would be an exceptional coincidence if the point estimate provided by the sample statistic were identical to the population parameter.
The analytical report will be primarily based on a nationwide survey on migration in Armenia made in the first semester of 2013: “Integrated survey on the migration of the RA population 2007-2013”. A consortium that includes the National Statistical Service of the Republic of Armenia (ArmStat), the Armenian Russian Slavonic University, and the International Organization for Migration conducted the survey. Data collected in the survey is quite extensive, providing ample opportunities for future research to address many of the issues at hand more thoroughly.
The survey intended to measure immigration, emigration, internal migration, return, and also addressed migrants’ savings, remittances and migration’s development effects on population and households. The survey is part of a “Strengthening Evidence Based Management of Labour Migration in Armenia” (SEBMLM) Project funded by the European Commission and the co-funding Project “Enhancing Knowledge and Policy Dialogue on the Role of Migration in Armenia’s Economic Development and Poverty Reduction” funded by Institute for the Study of International Migration at Georgetown University.
Chapter 2 includes clarification on the purpose and objectives of the survey; a description of target groups, the portrayal of the questionnaires used, the justification of the sampling techniques, the process and problems in the field and the methodology followed for the analysis of data. This chapter explains how research was designed and the variables and statistical methods that were used, including an explanation on the type and number of the selected participants.
9An observation of table 2 (non-responses at the moment of the survey) suggests an indirect indicator of the high rate of migration in several territories. An average of 21.3 per cent of the non-responses were due to the nonattendance of households due to emigration. If we look at different marzes this number might be very high: 62.5 per cent of the non-responses in Tavush; 54.3 per cent of the non-responses in Gegharkunik; 42.2 per cent of the non-responses in Shirak and 28 per cent of the non-responses in Vayots Dzor, are credited to absenteeism of members abroad.

31
Chapter 3 deals with the household characterization from the sample data and provides a descriptive overview of the survey results illustrated by cross-tabulation of the data of several critical variables. Basic demographic characteristics like age, sex, education, marital status or nationality are described. We also analyse labour-force characteristics like employment status, occupation and income and household characteristics (e.g. size, composition, regional distribution) of the sample as a whole. We acknowledge that the characteristics of non-migrants are important as a comparison group to migrants and, in the case of this research they correspond to the overwhelming majority of the respondents (87%). The results of the survey are for the most part presented in the form of tables, although some graphs are also included for a better visualization of data.
Chapter 4 focuses on the findings of the field survey on the socio-demographic and economic characteristics of migrant population (out-flows); namely, percentage of households involved; average duration; key destination countries; push/pull factors; reasons for migration; legal status in destination countries; networks and mediators. Migration is a complex, multifaceted process. It involves a variety of actors and factors contributing to its occurrence at both places of origin and destination. In addition to, or instead of, the “benefits” of migration for the individual migrants and their families, it has a varying impact on the people and communities of sending and receiving areas. To measure the impact of migration, we’ve analysed the characteristics of people both before (pre-migration situation) and after their move (current characteristics). Chapter 5 presents statistical data on those members of the household who had returned to Armenia but had been residing in a foreign country for more than three months during the period prior to 2007 and in the period 2007 to 2013, namely: percentage of households involved; average duration; key destination countries; push/pull factors; reasons for migration; legal status in destination countries; networks and mediators; economic integration; problems found. Return migrants were also asked for their reasons for moving, which is particularly important for distinguishing between labour migrants, students, family-based migrants, or refugees. Reasons can be either collected objectively (what was their legal status in country/visa type?) or subjectively (why did they move?), by asking the reasons for leaving the country of origin and/or for returning. Finally, questions about migrant social integration were also analysed. During the last two decades, Armenia experienced an unprecedented high rate of migration but, on the other hand thanks to the returned migrants the migration history can be better understood.
Chapter 6 concentrates on the findings of the field survey on the socio-demographic and economic characteristics of the migrant population (in-flows). In the survey there was a set of questions (37 in total) on the issue of migration in-flows (see section 5 of the questionnaire in annex). Selectivity of immigrants can be seen through demographic and socioeconomic characteristics compared to similar characteristics from non-migrants at the destination country or to the other migratory flows.
Chapter 7 focuses on the findings of the field survey on remittances.
In the conclusion chapter we will discuss key conclusions and policy recommendations based on the survey results.
32
Chapter 2 – Survey Design, Implementation and Methodology
According to Carletto and de Braw (2008), there are two types of household surveys that collect migration data: a) specialized surveys and b) general-purpose surveys (such as the Integrated Living Conditions Survey). In the present research, the decision was made to use a specialized survey directed to capture details on migration to, from, and within, the Republic of Armenia. The above-mentioned authors noted that there are two alternative sampling designs that could be applied to collect information on migration: 1) disproportionate sampling of high migration in the primary sample units (PSUs) and 2) stratified random sampling within PSUs (two stage sampling) (Braw and Carletto 2008). According to these authors, these two methods can either be used individually or in combination with one another but if the decision not to use these strategies is taken, our objectives to survey migrants may be missed, as they appear to always be rare populations. Bilsborrow and others (1997) suggest that to find households with international migrants, it is best to conduct stratified disproportionate sampling with fractions. McKenzie and Mistien (2007) outline three approaches to sampling rare elements: (i) stratified sampling using disproportionate sampling fractions with two-phase sampling, (ii) snowball sampling and (iii) time and space sampling. Neither of these strategies was followed in the present research and one of the difficulties faced (the representation of migrant population in the sample) derives from the fact that this possibility had not been initially foreseen and thus the strategy for locating households with migrants failed at least partially.
Purpose and objectives of the survey
The 2001 Republic of Armenia population Census provided a frame for sample selection. The sample is stratified according to the following variables: geographic region, urbanisation and population size of locality. The surveys, in general, are typically designed to provide relatively precise population level estimates by age groups, sex, urban/rural residence and regions. In this survey there were two sampling stages and the ultimate-sampling unit was the household. The statistical aim was to generate survey data that was representative at the level of marzes. To this end, the team sought to find a representative sample of the Republic of Armenia population despite the fact that one out of three categories was not present (households with internal migrants, households with international migrants, and households with no migrants). Given the dual purpose of measuring migration flows and explaining the process of migration, a specialized migration survey that captures information at the individual and household level was used.
The final sample size is composed of 7,890 household respondents (this is, representative of the population of RA and comparable to ILCS sample size comprising 7,872 H/H)10 and incorporates a total of 31,118 household members surveyed. Furthermore, the survey contains information on 1,972 household members who left for abroad before 2007. In total, the household survey captured information regarding 33,090 household members.
The survey covers: the usual residents present; the usual residents temporarily absent; migrants (internal and international migrants whom, as of January 1 2007, were part of the household plus including basic questions on a subsample of H/H members who left for abroad before 2007 and have not returned to RA since then). The sample includes subsamples of individuals, who either
10The Integrated Living Conditions Survey (ILCS) was first conducted in Armenia in 1996 (in a one-month period), followed by another one in 1998/99. Thereafter, it has been conducted every year since 2001.

33
intend to migrate, or who have left the country and later returned; third countries nationals, and internal migrants11. Migration is defined here as a move from one place of residence in order to go and live in another place, for a continuous period of at least three months12. The sample was proportionately allocated across the 10 marzes and Yerevan City on the basis of the total population in each of the regions. The number of households sampled; the distribution by sampled areas by marzes; and the response of eligible target groups and individuals for the country are presented in the following table.
Table 1. Main sample characteristics
RA Marzes and Yerevan City
D RHouseholds successfully interviewed
Total number of households by migration status of actual or former household memberNon migrants
Emigrants Internal migrants
Immigrants Returned Migrants
Yerevan City 0.018 0.082 2.200 1388 364 150 58 240Aragatzotn 0.045 0.125 400 298 80 7 0 15Ararat 0.033 0.100 660 277 158 104 27 94Armavir 0.024 0.045 620 357 162 37 11 53Gegharkunik 0.041 0.160 620 297 275 36 3 9Lori 0.042 0.180 680 368 205 25 2 80Kotayk 0.025 0.059 740 164 271 176 9 120Shirak 0.042 0.176 620 168 340 57 3 52Syunik 0.033 0.080 520 331 104 59 2 24Vayots Dzor 0.049 0.144 400 171 112 82 1 34
Tavush 0.045 0.134 430 8 179 113 13 107Total 0.011 0.107 7.890 3837 2250 846 129 828Notes: r is the predicted or anticipated prevalence (coverage rate) for the indicator being estimated (response rate of population, %) (Taken from results of ILCS); d is the margin of error to be tolerated at the 95 percent level of confidence
The number of households interviewed that were related with migration was, on average, very high in the whole sample, reaching almost one out of two households related to migrants (48.6% of the total households interviewed were linked with migration movements since January 2007). As we analyse data referring to the percentage of migration participated households in the full sample it turns out that the number of individuals by household linked with migration is imbalanced by marz. The households with no migration-related members reached, on average, in Aragatsotn, 74.5 per cent (3 out of four HH were not related with migration) and the lowest number occurs in Tavush (only 1.86% of the interviewed HH were not associated to migration). In Yerevan, 63.1 per cent of the interviewed households had no migrants; Ararat 42 per cent; Armavir 57.6 per cent; Gegharkunik 47.9 per cent; Lori 54.1 per cent; Kotayk 22.1 per cent; Shirak 27.1 per cent; Siunik 63.7 per cent and in Vayots Dzor 42.8 per cent of the interviewed households had no migrants.
11Data on individuals who have left (emigrated) from households was obtained from household members remaining behind (proxy respondents) but there are, obviously, limitations in the data obtained from those types of respondents.12The options available were: Job / Looking for a job; Family reasons (family unification, marriage, divorce, etc.). Permanent residence; Study/education; Forced migration / escape
34
Selection of households
The study used the National Statistical Service of the Republic of Armenia sampling frame that has marzes as stratum comprising both urban and rural areas13. The sample design for the study was multi-stage, with the first stage covering the marzes developed during the 2001 Census. The frame for sample selection was designed according to the database of addresses of private households based on the results of the 2001 Population Census14. For the purpose of drawing the sample, the general population was divided into 48 strata including 12 communities of Yerevan City (currently, the administrative districts). According to this division, a two-tier sample was drawn stratified by regions and by Yerevan. All regions and Yerevan, as well as all urban and rural communities were included in the sample in accordance to the shares of their resident households within the total number of households in the country. In the first round, enumeration area – that is, primary sample units were selected by using PPS method. The households to be surveyed were selected in the second round from each PSU (enumeration area) by using systematic random selection method. At the household level, interviews were held with the most informed household member. This is a technique commonly used in most household surveys in developing countries; that is, based on stratified multi-stage area probability designs. The first-stage units, or primary sampling units, are usually geographic area units. At the second stage, a list of households or dwelling units is created, from which the sample of households is selected. At the last stage, a list of house members or residents is created, from which the sample of persons is selected.
Calculation of weights
The survey producers stipulated weights in their data files to allow estimation of characteristics of their finite target population (the population of Republic of Armenia). These weights contain adjustments for known differences between the survey producer’s survey and target populations (H/H). Sampling weights were needed to correct imperfections in the sample that might lead to bias and other departures between the sample and the reference population.
Implementation of the survey
The main mode of data collection was face-to-face interviews (paper and pencil). The interviews took place exclusively at the respondents’ place of residence, that is, in apartments or houses. The field staff was mainly recruited specifically for the survey. The respondents’ participation in the survey was not compulsory. In the case of an ultimate sampling unit that could not be identified, it was replaced. In the case of an ultimate sampling unit that could not be contacted it was replaced. In the case of an ultimate sampling unit refusing to participate, it was replaced.
13Geographically, Armenia is divided into 11 marzes, including the capital city. Two-thirds of Armenia’s total population of about 3.2 million resides in the 10 marzes outside Yerevan: Aragatsotn, Ararat, Armavir, Gegharkunik, Lori, Kotayk, Shirak, Syunik, Vayots Dzor, and Tavush. The capital city, Yerevan, is home to the rest.14The developing of a new database considering the results of the 2011 Population Census is still in process and, as such, has not been used in this stage.

35
Organization of the survey
Training courses were organized for the field and post-field staff. Fieldwork was conducted from July to August 2013, with visits of interviewers to households. The paper version of the questionnaire was completed in pen, while fieldwork was checked by means of double rechecking interviews (selectively). With the several groups of respondents (where it was possible) the main mode of data collection was direct face-to-face interviews; otherwise, the interview was done with the most informed member of HH.
Interviewers submitted completed questionnaires to the head office for verification and coding. Collected information was coded using corresponding classifiers. It was exposed to logical check and double input. Afterwards, the two databases were compared, passing logical programming check and correction. This resulted in a database composed of 7,890 households.
Problems encountered in the field
The main issues faced during the fieldwork were: (a) the departure from an old list of addresses, which created difficulties for interviewers in several aspects (workload, time, etc.); (b) respondents’ willingness to participate in the survey due to, for instance, painful subject of survey, sizeable amount of sensitive (especially income-related) questions, length of interview because of quite long questionnaire.
Non-response section
Non-response is a commonly encountered phenomenon in social surveys. Non-response rates have been used as a proxy for survey quality as they indicate the relative potential for non-response bias. Whether non-response affects the statistical analysis of the survey data depends on the variables one is interested in. If one aims to use the survey to estimate the fraction in the population with a certain characteristic, then a systematically high or low non-response among those who have this characteristic biases the estimate. If one aims to estimate a model, and the only difference between the ultimate sample of respondents and the intended survey sample lies in the distribution of explanatory variables (on which one conditions in the analysis), then non-response does not affect estimation results.
In the Integrated Survey of the Migration of the Republic of Armenia Population 2007-2013 there was a high level of non-response mainly due to key problems encountered in the field. The survey response rate was approximately 52 per cent15. The main reasons for non-response are transcribed in the table 2 below. Among the different reasons for non-response one needs to look carefully at the indicator on “closed door (empty dwelling) because household members are absent abroad” and the indicator on “the refusal to answer the survey questionnaire”. The issue of “closed doors” has emerged as a significant problem. The locked houses often belonged to entire families who have migrated, either within the Republic of Armenia or overseas, thus leaving no household member residing in the domicile during the time of the interview. Given the restrictions of this survey process and limited reach, the survey was not able to capture the members of such
15In this survey have been used an old list of database of addresses of private households based on the results of the 2001 Population Census that can help to explain this response rate.

36
households. Hence, this could be seen as a limitation of the survey. A synthesis on the non-response characteristics and weight can be perceived in the next table.
Table 2. Non-response characteristics and weight
RA Marzes and Yerevan City
Interview took place fully
Closed door (empty dwelling): HH in RA
Closed door (empty dwelling): HH abroad
Address not found
Address used for another purpose
Refused HH
Interview is not possible in Armenian
Non-response: other reasons
Total non-response
Yerevan City 2.200 625 163 244 32 779 24 909 2.776
Aragatzotn 400 129 51 7 3 22 0 24 236Ararat 660 167 151 0 0 20 0 12 350Armavir 620 269 153 34 3 21 0 41 521Gegharkunik 620 231 298 13 0 6 1 0 549Lori 680 439 231 44 8 68 10 19 819Kotayk 740 405 207 13 2 74 0 9 710Shirak 620 159 158 71 25 45 0 11 469Syunik 520 366 39 7 26 1 0 10 449Vayots Dzor 400 128 21 13 1 4 0 0 167
Tavush 430 248 112 5 3 28 0 1 397Total 7.890 3.166 1.584 451 103 1.068 35 1.036 7.443
Limitations of the data
There are a number of important methodological and data issues that users need to be aware of when using data from this survey. Like all sample surveys, this migration and remittances household survey can only produce estimates and these estimates are limited by a number of factors, namely, sampling variability, that is, all samples can differ from the population by chance. This is referred to as “sampling error”. Findings from the survey seem to corroborate previous findings from other surveys on certain variables but, in this specific survey, if a sample under-represents sections of the population or if a large proportion of people does not answer some questions, the estimates may differ substantially from the population that are not a result of chance (that is, there is possibly a bias in the achieved sample vis-à vis migration in the Republic of Armenia).
The portrayal of the questionnaires used/ contents of the questionnaire
The survey questionnaire obtained information on a variety of demographic, social, and economic characteristics, such as education, marriage status, housing conditions, labour force participation, skills, languages, and access to finance. These topics were embedded in modules comprising eight sections (see the questionnaire in Appendix 1):
Section 1 includes sociodemographic, economic and labour market insertion characteristics of each of the household members under survey: the households residing since January, 1, 2007 including the resettled ones from foreign countries, from other marzes of Republic of Armenia or from other settlements of the same marz. Section 1 also includes a set of questions on household members’ migration prospectives, plans, destinations and needs.
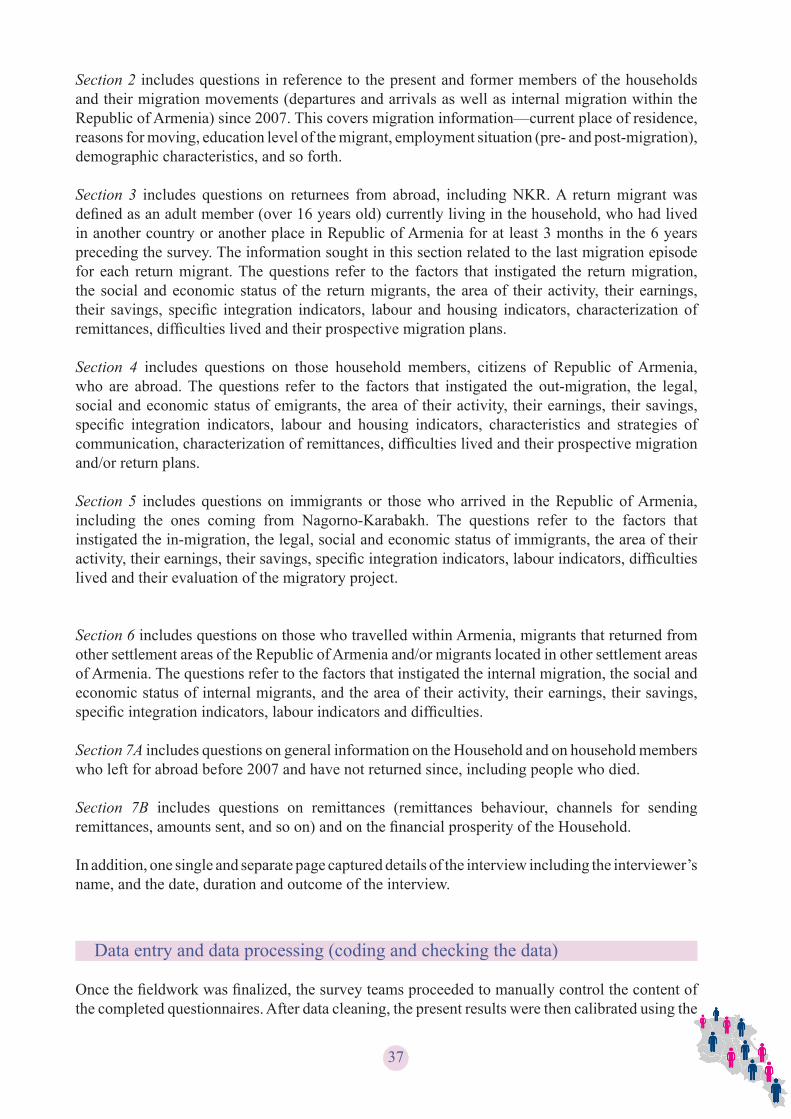
37
Section 2 includes questions in reference to the present and former members of the households and their migration movements (departures and arrivals as well as internal migration within the Republic of Armenia) since 2007. This covers migration information—current place of residence, reasons for moving, education level of the migrant, employment situation (pre- and post-migration), demographic characteristics, and so forth.
Section 3 includes questions on returnees from abroad, including NKR. A return migrant was defined as an adult member (over 16 years old) currently living in the household, who had lived in another country or another place in Republic of Armenia for at least 3 months in the 6 years preceding the survey. The information sought in this section related to the last migration episode for each return migrant. The questions refer to the factors that instigated the return migration, the social and economic status of the return migrants, the area of their activity, their earnings, their savings, specific integration indicators, labour and housing indicators, characterization of remittances, difficulties lived and their prospective migration plans.
Section 4 includes questions on those household members, citizens of Republic of Armenia, who are abroad. The questions refer to the factors that instigated the out-migration, the legal, social and economic status of emigrants, the area of their activity, their earnings, their savings, specific integration indicators, labour and housing indicators, characteristics and strategies of communication, characterization of remittances, difficulties lived and their prospective migration and/or return plans.
Section 5 includes questions on immigrants or those who arrived in the Republic of Armenia, including the ones coming from Nagorno-Karabakh. The questions refer to the factors that instigated the in-migration, the legal, social and economic status of immigrants, the area of their activity, their earnings, their savings, specific integration indicators, labour indicators, difficulties lived and their evaluation of the migratory project.
Section 6 includes questions on those who travelled within Armenia, migrants that returned from other settlement areas of the Republic of Armenia and/or migrants located in other settlement areas of Armenia. The questions refer to the factors that instigated the internal migration, the social and economic status of internal migrants, and the area of their activity, their earnings, their savings, specific integration indicators, labour indicators and difficulties.
Section 7A includes questions on general information on the Household and on household members who left for abroad before 2007 and have not returned since, including people who died.
Section 7B includes questions on remittances (remittances behaviour, channels for sending remittances, amounts sent, and so on) and on the financial prosperity of the Household.
In addition, one single and separate page captured details of the interview including the interviewer’s name, and the date, duration and outcome of the interview.
Data entry and data processing (coding and checking the data)
Once the fieldwork was finalized, the survey teams proceeded to manually control the content of the completed questionnaires. After data cleaning, the present results were then calibrated using the

38
Statistical Package for Social Sciences (SPSS). Data on the questionnaires needed to be subjected to different types of checks; these typically include range checks, checks against reference data, skip checks, consistency checks and typographic checks (Munoz 2003). Removing name fields, addresses and the names of the interviewers has anonymised the data obtained. In the process of validation and error correction, imputation was avoided in the case of missing values.
A multifaceted analytic framework was used to develop the present report. Data analysis comprises a collection of methods to deal with data/information obtained through the survey. The aim and purpose of data analysis was to extract as much information as possible that is pertinent to the subject under consideration. Majority of the results are obtained using statistical tabulations, providing summary statistics.
The analytical method followed took the sample weights into consideration and used a design-based approach for analysing survey data. This is the most commonly used approach for estimating finite population quantities for large-scale surveys. Survey weighting was used to produce estimates of unknown finite population quantities – which are the descriptive quantities of interest in the case of a finite target population.
The survey data was analysed using the SPSS software package. The current reports present a detailed picture of the situation in the Republic of Armenia based on the analyses produced by an international consultant with support from IOM office in Armenia. As the main SPSS datasets include more than 500 variables for the survey, the presentation of data has necessarily been selective. The current research project employs mostly descriptive statistical techniques such as frequencies and cross-tabulations. This report presents a descriptive analysis of the results by key variables and key subjects and then moves on to analyse key assumptions in conclusion chapters.
Consistency and cross checking
The very large questionnaire length (277 questions) was alleviated by the fact that some of the questions were guided to specific characteristics of the migratory process (for example, in or out migration, return migration or internal migration). The length of the interviews depended on the size and the migration experience of households. On average, the interview time was 45 minutes and the mode was 40 minutes.
The interviewee in the household was the most informed member of the household. As a rule, the respondent was the household head, who possessed comprehensive information on the household’s activities and the socio-demographic characteristics of all household members. In 71 per cent of the surveyed households, the interviewee was the man; in 22 per cent of the cases, the woman; in 4.4 per cent, the daughter or the son of the family, in 2.2 per cent, the mother or father (of the) household head of family and, in less than 1 per cent, other family or household members.

39
Chapter 3 - Characteristics of the Households Surveyed (Household roster)
This chapter will focus on the findings of field survey on the socio-demographic and economic characteristics of household members, although the main unit of analysis used will typically be the individual. However, we also report on the migration behaviour of households. Households are, therefore, divided into migrant households and non-migrant households for analytical purposes. This chapter provides a descriptive overview of the survey results illustrated by cross-tabulations the data of several variables. Basic demographic characteristics like age, sex, education, marital status or nationality are described. We also analysed labour-force characteristics like employment status, occupation or income and the household characteristics (e.g. size, composition, regional distribution) of the sample as a whole.
We understand characteristics of non-migrants to be important as a comparison group to migrants and, in the case of this research, they correspond to the overwhelming majority of the respondents (around 87% of the household members respondents were not (or are) not migrants).
A migrant household is defined as a household in which at least one household member is a migrant as defined above. A non-migrant household is a household from which no member has ever left the usual place of current residence, or has an intention of staying away, for a period of at least three months.
In the past, very few nationally representative household surveys have collected detailed data on migration and remittances in the Republic of Armenia, with the exceptions of the recent “Sample survey on external and internal migration in Republic of Armenia” funded by the United Nations Population Fund in 2008, and the ETF large-scale migration and skills survey carried out in Armenia in 2011 and 2012. As a result, little is known about the characteristics of households that have former and current members who are internal or international migrants or who have received internal and international remittances from former and current household members. Even less is known about the age, gender, and skill composition of internal and international migrants in the Republic of Armenia. For these reasons, this household migration survey represents a unique source of information on household composition and characteristics and individual-level out and in-migration; and internal migration remittances and return migration patterns.
Description of Sampling Population
The final sample is composed of 7,890 household respondents, comprising a total of 31,118 household members surveyed. Furthermore, the survey contains information on 1,972 household members who went abroad before 2007. In total, the household survey captured information regarding 33,090 household members. The present survey departs from a de jure (the place of usual residence) definition of household and not a de facto (the place where each person stayed the night before the survey interview) definition. Those 1,972 household members who left before 2007 will be analysed in a separate section. The number, sample coverage, share in the sample and distribution of the surveyed households by marzes is shown in Table 3 below.

40
Table 3. Number and distribution of the surveyed households by marzes
RA Marzes and Yerevan City
D R Sample coverage
Share in the Sample (%)
Yerevan City 0.018 0.082 2200 27.9Aragatzotn 0.045 0.125 400 5.1Ararat 0.033 0.100 660 8.4Armavir 0.024 0.045 620 7.9Gegharkunik 0.041 0.160 620 7.9Lori 0.042 0.180 680 8.6Kotayk 0.025 0.059 740 9.4Shirak 0.042 0.176 620 7.9Syunik 0.033 0.080 520 6.5Vayots Dzor 0.049 0.144 400 5.1
Tavush 0.045 0.134 430 5.5Total 0.011 0.107 7890 100Notes: r is the predicted or anticipated prevalence (coverage rate) for the indicator being estimated (response rate of population, %) (Taken from results of ILCS); d is the margin of error to be tolerated at the 95 percent level of confidence
Table 3 represents the number and structure of the households under survey, by marzes. The largest portion, as expected, is representing the city of Yerevan (27.9%), followed by Kotayk (9.4%) and Lori (8.6%) and Ararat (8.4%), Armavir, Gegharkunik and Shirak with an equal proportion (7,9%), Syunik (6.5%), Tavush (5.5%) and Aragatsotn and Vayots Dzor (5.1%). On average, the households’ interviewees were described as 71.7 per cent urban households and 28.3 per cent rural households.
The gender distribution of all household members shows that women slightly outnumber men. Females constitute 52.5 per cent of the household population interviewed, with males constituting the remaining 47.5 per cent.
The regional distribution of the household members in frequency resulting from the survey is portrayed in the table 4 below. Table 4. Household members interviewed by marz in frequency and percentage
RA Marzes and Yerevan City
Frequency Percentage
Yerevan City 8.854 27.5Aragatzotn 1.567 5Ararat 2.383 7.7Armavir 2.560 8.2Gegharkunik 2.500 8.0Lori 2.408 7.7Kotayk 3.280 10.5Shirak 2.576 8.3Syunik 1.778 5.7Vayots Dzor 1.672 5.4
Tavush 1.840 5.9Total 31.118 100

41
Background Characteristics of the Households
According to the survey, 99.8 per cent of the households surveyed were established before 2007, that is, prior to the reference year for this survey. Only 0.2 per cent were formed after January 1, 2007.
Table 5. Distribution of the households under survey by their residence areas as of January 1, 2007
PercentageThe given settlement 89.3Other settlement of RA 2.0Abroad (included NKR) 1.0Was born after 01.01.2007 7.7
Additionally, the survey identified the areas of residence of the households under survey in 2007 (see Table 5 above). As of January 1, 2007 (or later) 89.3 per cent of the households under survey were residing in the given settlement; 2 per cent were residing in other settlements of the Republic of Armenia; 1 per cent were residing in a foreign country and 7.7 per cent of the household members were born after January 1, 2007. Moreover, the survey acknowledged that 3.9 per cent of the households under survey transferred themselves to another abode in the given settlement between January 1, 2007 and the present-day.
Table 6. Distribution of the households that changed their dwelling, by the main purpose of moving
PercentageImprovement of housing conditions 18.9Improvement of the residential environment 7.9Separation from the parental H/H 25.2Family circumstances 28.5Solution of household’s financial problems 10.3
Other 9Not mentioned 0.2Total 100
A review of the data received for this topic (n=445) reveals that more than 50 per cent of the households that changed their dwellings have done so due to related family occurrences and, of those, 28.5 per cent due to family circumstances (not defined) and 25.2 per cent due to separation from the parental household (see table 6). One out of ten (10.3%) changed their dwelling due to financial problems, 18.9 per cent moved to improve housing conditions and 7.9 per cent in order to improve the residential environment.
According to the received and compiled responses (n=445), 30.1 per cent of the house’s previous residents moved to another domicile in the given settlement, 6.7 per cent moved to another settlement in the Republic of Armenia; 27 per cent moved to a foreign country. In 24 per cent of the answers there was no one living in the abode prior to the surveyed household, 1.3 per cent still lives in the same dwelling, and 5.6 per cent of the surveyed household prefer not to answer this question.
We have information on the country of destination of those 27 per cent who moved abroad (n=125): 59 per cent moved to the Russian Federation; 9.6 per cent to the United States of America; 2.4 per cent to the Republic of Nagorno-Karabakh and 15.2 per cent to other countries (13.6% did not

42
mentioned the country of destination)16.
Household size
The surveyed households had an average household size of 3.89 at the time of the survey, compared to 3.95 persons per household in January 2007. The household size fluctuates greatly across the sample (see table 7 below). The size of the household surveyed varies between the simplest of the households, the “one-person household” where a person lives alone in a whole or part of a housing unit and has an independent consumption, and a 14-member-unit household. According to data, 21 per cent of the surveyed households have 4 members; 18 per cent, 5 members; 14.4 per cent, 3 members; 14 per cent, 2 members; 12.5 per cent, 6 members; 6.6 per cent, 7 members and 2 per cent, 8 or more members. This data compares with the results of the UNFPA 2008 survey, where the households comprised of 2-5 members amounted to 68.4 per cent, whereas by the Census of 2001, that index was 66.6 per cent. As compared to the results of the 2001 Census, only slight changes occurred as to the specific weight of the households comprised of 4 members, but there was an increase in the proportion of the households containing 5 and 6 persons by 0.6 percentage points and 0.8 percentage points, respectively. Apart from that, a decrease was observed in the specific weight of the households comprised of 1 or 2 persons (by 1.7 percentage points) and 7 and more persons (by 1.1 percentage points). The average number of the household members was 4.1 persons according to the results of both the UNFPA survey (2007) and the census and decreased to 3.89 persons in the present survey.
Table 7. Distribution of the surveyed households by number of their members (%)
1 person 2 person 3 person 4 person 5 person 6 person 7 person 8 and more
persons
Average number
Total
IOM survey
7.11 14 14.4 21 18.5 12.5 6.6 2 3.89 100
2008 UNFPA sample
9.8 11.8 13.4 22 21.2 13.8 4.8 3.2 4.1 100
Per 2001 census
11 12.8 13.2 22 18.6 11.9 5.8 4.7 4.2 100
Demographic Characteristics
Demographic characteristics are the quantifiable statistics of a given population. A demographic profile of the total households surveyed including household composition, age, sex, place of birth, nationality, marital status and education profile is presented in this report in order to facilitate the profiling and the construction of a typology on the different migrants and migration households.
16Beside those major destinations, from the 27per cent who moved to a foreign country we have information on the following countries: France; Belgium; Germany; Greece: Kazakhstan; The Netherlands; Ukraine.

43
Gender and age distribution of the surveyed households members
According to the survey data, 47.5 per cent of the household members surveyed were males (n= 14.788) and 52.5 per cent, women (n=16.330). These proportions are comparable to the results of the 2008 UNFPA survey and the results of the 2001 Census (48% male & 52% female. The distribution by gender is in line with the expected result based on the theoretical construction of the sample. (See Figure 1 below).
Figure 1. Age distribution of the members of the surveyed households by sex and selected age groups
The surveyed household members’ distribution by age group and by sex shows symmetry between the sexes along the age groups with a bias for the oldest age groups regarding females (see figure 1 above for absolute figures). The age groups 0-14 and 60+ form 16.7 percent and 16.9 per cent of the population, respectively, while the age group 15-59 constitutes 66.5 percent of the household population being part of what we call “active age”.
According to the survey data, the age structure is represented by the following proportions: 16,7 per cent aged 0 to 14 years old; 66.5 per cent, labour capable age (15- 59 years old) and 16.9 per cent people above the labour capable age (60-64 years old 5.3% and 65 and more years old 11.6%). Young people aged 15-29 comprised 25.7 per cent of the respondent population (within this cohort 49.5% were men and 50.5% were women). (See Table 8 below).

44
Table 8. Age structure of the surveyed population by gender (%)
Male Female Total0-4 7 5.6 6.35-9 6.2 4.6 5.410-14 5.5 4.4 515-19 6.8 6.2 6.520-24 10 9.7 9.925-29 9.8 8.8 9.330-34 7.8 7.3 7.535-39 6 5.7 5.840-44 5.5 5.6 5.545-49 5.9 6.8 6.450-54 7.9 8.7 8.355-59 7.2 7.3 7.360-64 4.9 5.6 5.365 and more 9.4 13.6 11.6Total 100 100 100
Distribution of the household members under survey by their place of birth
As of January 1, 2007 (or later) 77.1 per cent of the members of households under survey were residing in the same settlement where they were born (n=24.078); 6.8 per cent were born in other settlements in the same marz; 9.9 per cent were born in other settlements of the Republic of Armenia, and 6.2 per cent of the household members were born abroad (including NKR) (n=1.774); that is, nearly 17 per cent of the households members were born elsewhere. A total of 7.7 per cent of the surveyed household members were born after January of 2007. This data gives us a first indication on the migratory processes to, from, and within, the Republic of Armenia. The prevalent processes are of immobility (77.1%) but 22.9 per cent of the interviewees were/are involved in migratory processes.
Table 9. Distribution of the household members under survey by their place of birth (%)
PercentThe given settlement 77.1Other settlements of the same marz 6.8Other marzes of RA 9.9Abroad (included NKR) 6.2Born after 01.01.2007 7.7
Distribution of the households respondents by nationality
The prevailing majority of the respondents, namely 99.1 per cent, were Armenians, 0.4 per cent were Yazidis, and 0.3 per cent were Russians. The selection also involved other ethnic groups like Kurds, Ukrainians, Assyrians, Greeks, Persians and Indians, but their proportion was very low, below 0.1 per cent, therefore they have not been represented separately.

45
There were certain differences between nationality and sex of the non-Armenian respondents that are worth mentioning (see table 10 below).
Table 10. Distribution of the household members by nationality and sex (%)
Male FemaleArmenian 47.6 52.4Russian 18.5 81.5Yazidi 55.5 44.5Kurdish 42.9 57.1Assyrian 42.9 57.1Greek 0 100Ukrainian 0 100Persian 66.7 33.3Indian 50 50Other 41.7 58.3Total 47.5 52.5
Among the Armenian nationals, 0.6 per cent (n=183) had dual citizenship and 18 respondents stated that they did not possess any citizenship (stateless). 1.1 per cent of the household respondents are foreigners.
Distribution of the households respondents by native language
While Armenian is the predominant language spoken by household member respondents (98.8% use Armenian as first language) other language groups are significant among respondents namely Russian, Yazidi, Kurdish, Assyrian and Ukrainian (see table 11 below).
Table 11. Main language of communication at home by nationality of respondents (main nationalities) (%)
Armenian Russian Yazidi Kurdish Assyrian Ukrainian TotalArmenian 99.5 0.4 - - - - 100Russian 24.7 75.3 - - - - 100Yezidi 8.8 - 91.2 - - - 100Kurdish 85.7 - - 14.3 - - 100Assyrian 14.3 14.3 - - 71.4 - 100Ukrainian 40 30 - - - 30 100
Household respondents’ Marital Status
As to respondents’ marital status, about 61.3 per cent of the adults in the sample stated that they were married, while 25.4 per cent had never been married; 10.4 per cent of the adults in the sample were widows or widowers, and 2.9 per cent were divorced. There were certain differences between the marital status of male and female. When analysing more closely the data on marital status of the interviewees one realises that more females were widowed (84.8% of the widowed household respondents were

46
females) and divorced (78.2% of the HH divorced were females) than male respondents. More male respondents were single (56.5% of the HH single were males) and also more male respondents were married (although only 48.7% of the married household respondents were males).
Table 12. Marital status by gender (%)
Male FemaleNever married 30.9 20.6Married 64.3 58.7Widowed 3.4 16.5Divorced 1.4 4.2
Distribution of the Household members by their level of education
The educational level of the household members showed an educated population with more than 80 per cent of the interviewees having at least a completed general secondary education. The majority of the household respondents had secondary education (37.3%), 0.4 per cent had completed a post graduation course, 22.1 per cent, a tertiary education, 18.5 per cent, a secondary specialized training and 2.2 per cent, a vocational grade course (see table 13). The gender variation in education level is significant. Women are generally better educated than men. The female respondents present a higher educated profile corresponding to a greater number of women with secondary specialized training (4.5% above the average) and tertiary education (2.2% above the average). Male household respondents are somewhat above the average regarding postgraduate education (0.5% versus 0.3%) and in vocational (college) education. The following table shows the distribution of respondents by their educational attainment.
Table 13. Distribution of the Household members by the level of education
Male Female Average totalPrimary and lower 11.2 9.7 10.4Basic school (grades 8-9) 9.7 8.4 9General secondary 38.8 35.9 37.3Vocational (college) 2.7 1.8 2.2Secondary specialized 16.1 20.6 18.5Tertiary 20.9 23.1 22.1
Post-graduate 0.5 0.3 0.4 Cross tabulation of the variables “age group” and “education level” produces interesting results, some of them hardly surprising. Firstly, old generations have less post secondary grades and it is among young generations that one can find more post graduate individuals. Secondly, there seems to be a changing profile in the population regarding the diminished secondary specialized education in favour of a tertiary education. Thirdly, there is a 100 per cent school enrolment for juveniles.

47
Table 14. Education level of the household members according to their age group
Primary and lower
Basic school (grades 8-9)
General secondary
Vocational (college)
Secondary specialized
Tertiary Post-graduate
0-9 1.399 0 0 0 0 0 010-14 1.099 413 38 0 1 0 015-19 5 632 1.136 25 93 103 020-24 9 85 1.306 76 442 1.077 2725-29 13 123 1.167 60 474 1.026 2030-34 12 132 1.029 45 486 683 1635-39 8 74 821 49 409 459 740-44 7 81 677 53 459 422 845-49 4 64 806 53 537 482 550-54 7 118 1.071 86 739 570 655-59 16 129 902 66 611 525 660-64 12 111 612 52 466 403 665 and more 416 639 1.170 76 601 611 16Total 3,007
(10.4%)2,601 (9.%) 10,735
(37.3%)641
(2.2%)5,318
(18.5%)6,361
(22.1%)117
(0.4%)
When we cross education and marz of residence variables, for example, we find that there are remarkable differences. Yerevan shows the most qualified population with more tertiary educated respondents (12.3% above the national average) and double the postgraduate individuals vis-à-vis the Republic of Armenia’s average. By contrast, Gegharkunik presents one of the highest levels of respondents with only primary and lower education achievement (12.1%) and the lowest number of respondents with a secondary specialized diploma (12.3%).
Table 15. Education level of the household members according to marz of settlement (%)
Primary and lower
Basic school (grades
8-9)
General secondary
Vocational (college)
Secondary specialized
Tertiary Post-graduate
Yerevan 9.6 7.6 27.6 1.5 18.5 34.4 0.9Aragatsotn 12.1 10.2 45.6 2.1 12.8 16.8 0.4Ararat 9.3 8.5 35.7 1.5 24.4 20.5 0.1Armavir 9.5 8.3 45.7 4 17.2 15.2 0.1Gegharkunik 12.1 9.4 49.6 0.2 12.3 16.1 0.3Lori 9.8 12 40.3 1.2 19.4 17 0.3Kotayk 12.4 10.2 40.9 3 17.4 15.8 0.3Shirak 8.5 8.2 44.7 3.1 15.9 19.5 0.1Syunik 10.8 7.8 30.5 5.9 23.1 21.4 0.6Vayots Dzor 9.4 8 40.8 1.1 24.1 16.4 0.3Tavush 14.5 13.2 31.5 3.5 20.8 16.5 0Total 10.4 9 37.3 2.2 18.5 22.1 0.4
When analyzing the figures concerning education by gender we recognize that the educational level among men exceeded that among women in primary and lower education (by 1.5%), general

48
secondary education (by 2.9%), vocational education by (0.9%) and post-graduate education (by 0.2%). The educational level among women exceeded that among men in secondary specialized education (4.5%) and tertiary education (by 2.2%).
Table 16. Education level of the household members by gender (%)
Primary and lower
Basic school (grades
8-9)
General secondary
Vocational (college)
Secondary specialized
Tertiary Post-graduate
Male 11.2 9.7 38.8 2.7 16.1 20.9 0.5Female 9.7 8.4 35.9 1.8 20.6 23.1 0.3
Total 10.4 9 37.3 2.2 18.5 22.1 0.4
Economic Characteristics of the households surveyed
Economic characteristics that profile the population consist of employment status, type of professional status, private or public employment status, existence of written contract, nature of work, working hours, salary, occupation of the unemployed, and the location of jobs. In addition, several characteristics can be combined from the household sample to provide information on employment situation or employment status by cross tabulation with independent variables.All the surveyed household members in the sample were asked to describe their current basic socio-economic status. According to Table 17, about 38 percent of the sample out of the 31,118 household respondents described themselves as labour-force participants (employed (including self-employed)), and of those, 61% were males. About 13.9 percent were unemployed but actively seeking work (looked for an income generating employment/job during the last 4 weeks) and, from those, 59.5 per cent were females. Retired adults, pensioners and allowance recipients made up about 14.9 per cent of the sample, housekeepers made up close to 8.6 percent of the sample (of those, 97% were females), pupils and students account for 15.5 per cent of the total, and other dependents accounted for about 8.5 per cent of the respondents. It is important to note that only 47 per cent of the surveyed respondents worked at least one hour in the week preceding the survey17.
Table 17. Employment Status / basic socio-economic status of the household respondents by sex (%)
Employment status Male Female TotalEmployed (including self-employed) 48.7 28.2 38Pupil/student 16.5 14.7 15.5H/H keeper 0.5 15.8 8.6Pensioner/beneficiary 12 17.5 14.9Dependents 9.4 7.7 8.5Jobless 11.8 15.7 13.9Other 1.1 0.3 0.7Total 100 100 100
17The 2010 labour force survey showed that 19per cent of all employment in Armenia takes the form of temporary, seasonal, occasional or one-off activities. A sizeable proportion of the population therefore has no social protection except whatever they can provide for themselves (European Training Foundation, 2013: 6).

49
If one compares the results from the present survey with the UNFPA 2008 survey we clearly note the rise in unemployment (from 9.2 % of the respondents in 2008 to 13.9% in 2013); the decrease in the employed/self-employed respondents (from 40.4% in 2008 to 38% in 2013); the shrinkage in the percentage of the household keepers (from 10.3% in 2008 to 8.6% in 2013) and the rise of pensioners/dependents (from 13.1 in 2008 to 14.9 in 2013)18.
When analyzing these indicators by age group (see table 18 below) one can note the higher frequency of unemployment in the age groups between 20-29 years old and the prevalence of employed/self-employed between 35 and 54 years old age groups. As expected, the prevalence of students/pupils occurs in the 19 and under age group. The number of pensioners/beneficiaries starts to rise after 60 years old.
Table 18. Employment Status/basic socio-economic status of the household respondents by age group (%)
Employed (including self-
employed)
Pupil/student
H/H Keeper Pensioner/ beneficiary
Dependents Jobless Other
0-4 0 0 0 0 100 0 05-9 0 72.5 0 0.1 26.9 0.5 010-14 0.1 98.6 0 0 1.3 0 015-19 4.4 68.4 1.2 0.4 2.4 18.5 4.720-24 35.8 18.5 9.6 0.7 1.2 32.8 1.425-29 54.2 2.2 16.1 1.4 1 24.6 0.530-34 59.5 0.9 15.9 2.5 1 19.7 0.435-39 65 0.2 13.6 3.7 0.7 16.5 0.440-44 66.8 0 12.5 4.3 0.3 15.5 0.545-49 66.4 0 15 4.7 0.5 13.1 0.450-54 63.7 0.1 13.1 7.1 0.4 15.3 0.355-59 58.4 0 12.2 11.7 0.3 16.9 0.560-64 46.1 0 7.2 36.6 0.3 9.6 0.165 and more 8.2 0 0.4 91.1 0.1 0 0.2Average total
38 15.5 8.6 14.9 8.5 13.9 0.7
The analysis of the employment status of the household member respondents by region of settlement allows us to apprehend the differences between the diverse environments inside the Republic of Armenia. If one analyses the employment/self-employment status we stress the fact that respondents from Aragatsotn are 10 percent below the average of the country and almost 8 percent above the average regarding unemployment. On the contrary, we observe that the respondents in Syunik are more than 7 percent above the average of RA regarding employment and self-employment and 5 percent below the average regarding jobless status of the respondents. Similar to Syunik is the marz of Gegharkunik (7 % above the average of RA regarding employment and self-employment and 4 % below the average regarding jobless status of the respondents).
18In 2011, the total employment rate was 51.4%, with unemployment at 18.4%. Youth unemployment was particularly high (39% in 2010) and tends to be higher among women and urban and better-educated youth. Moreover, the rate of informal employment (self-employment and unregistered employment) is very high, accounting for 59.2% of the total working age population (ILO, 2011).

50
Table 19. Employment Status / basic socio-economic status of the household respondents by respondents’ marz of residence (%)
Employed (including self-em-ployed)
Pupil/student
H/H Keeper Pensioner/ beneficiary
Dependents Jobless Other
Yerevan 35.2 15.7 8.6 14.8 7.7 17.9 0.2Aragatsotn 28.2 17.3 8 17 6.6 21.4 1.4Ararat 44.5 14.5 10 11.7 9.4 9.3 0.5Armavir 39.5 15.2 10.8 12.1 8.4 13 1.1Gegharkunik 45.1 15.4 5.8 15 8.2 9.2 1.4Lori 36.8 15.9 7.1 18.1 7.1 14.2 0.8Kotayk 34.7 15.5 13.4 12.2 10.4 12.9 0.9Shirak 37.8 14.2 8 16.8 8.5 13.6 1.1Syunik 45.3 16.5 5.6 15.8 8.2 8 0.6Vayots Dzor 37.6 14.1 5.6 18.4 10.4 13.5 0.6Tavush 39.9 16.8 7.4 15.5 10.5 9.3 0.4Average Total
38 15.5 8.6 14.9 8.5 13.9 0.7
Profession and Occupation of the surveyed household members
Among the surveyed respondents the occupation that represented the largest number of residents was the highly qualified specialist category (24.8%), the qualified specialist category represented 20 per cent of the total respondents. The service sector employees accounted for 2.5 per cent of the respondents; skilled workers in the agricultural sector, 4.5 per cent; skilled workers in non-agricultural sector were 8.2 per cent of the total; office workers, around 0.7 per cent; and military personnel, 0.6 per cent. Finally, 38.6 per cent of the total respondents stated they did not have a profession.
Table 20. Profession and Occupation of the household members by gender (%)
Profession and Occupation Male Female TotalHighly qualified specialist 22.5 24.5 24.8Qualified specialist 18.4 22.8 20Office workers 0.4 1.1 0.7Service sector employee 3.7 2.4 2.5Skilled worker in agricultural sector
4 4.2 4.5
Skilled worker non-agricultural sector
13.6 3.6 8.2
Military personnel 1.3 0 0.6Do/does not have profession 36 41.5 38.6Total 100 100 100
An analysis of the same statistics by gender introduces new data to be considered (see table 20 above). 55.7 per cent of the highly-qualified specialists are females. 58.8 per cent of the qualified specialists are also female and the same is valid for office workers (77% are females) and skilled workers in the

51
agricultural sector. On the contrary, 57.1 per cent of the respondents that do not have a profession are also females. The males are the prevalent sex in the service sector employee category (56.6%), the skilled worker non-agricultural sector category (76.8%), and the military personnel category (97.5%).
The cross tabulation between age groups and profession and occupation indicates a higher predominance of highly qualified specialists in the ages between 20 and 29; a prevalence of skilled workers in the agricultural sector in the ages of 50 to 59 and a higher frequency of skilled workers in non agricultural sector in the age groups of 30 to 44 years old. A cross-tabulation between profession and occupation of the household members and age is shown in Table 21.
Table 21. Profession and Occupation of the household members by age group (%)
Highly qualified specialist
Qualified specialist
Office worker
Service sector
employee
Skilled worker in
agricultural sector
Skilled worker non-agricultural
sector
Military personnel
Do/does not have
profession
Total
15-19 4.6 4.9 0.1 1 0.3 0.9 1.4 86.9 10020-24 34.4 15.6 0.5 2.4 1.3 5.7 1 39 10025-29 33.9 17.5 0.7 3.5 2.2 7.9 1.2 33.1 10030-34 26.9 20.3 0.9 3.5 2.7 10.5 1.2 34 10035-39 24 22.9 1.2 5.1 4.2 10.3 0.4 32 10040-44 23.8 26.2 1 3.8 4.1 11.4 0.5 29.2 10045-49 23.7 27.4 1 3.5 5.9 8.7 0.6 29.2 10050-54 21 28.2 0.7 3.3 7.5 10.1 0.2 28.9 10055-59 22.4 27.1 0.9 3.9 6.1 9.3 0.2 30 10060-64 23.6 26.2 1.1 3.5 5.4 8 0.1 32 10065 and more
16.7 17.5 0.5 1.3 5.5 8.4 0 50.1 100
Average total
23.6 20.7 0.7 3 4.1 8.2 0.6 39 100
An analysis of the cross tabulation of the variable “profession and occupation” by marz is significant and suggests differences as shown in the next table. We find a higher proportion of highly qualified specialists among the respondents from Yerevan (14.2% above the national average). Respondents from Vayots Dzor represent the higher percentage of qualified specialists (5.5% above average). Skilled workers in agricultural sector are over-represented in Gegharkunik (13.2% above RA average).

52
Table 22. Profession and Occupation of the household members by marz (%)
Highly qualified specialist
Qualified specialist
Office worker
Service sector
employee
Skilled worker in
agricultural sector
Skilled worker non-agricultural
sector
Military personnel
Do/does not have
profession
Total
Yerevan 37.8 21.3 0.3 1 0.2 4 0.2 35.3 100Aragatsotn 16.9 17.5 1.3 2.3 2.3 2.9 1.1 55.6 100Ararat 21.7 22.9 0.6 4.2 5.4 11.3 0.5 33.2 100Armavir 15.1 21.1 0.5 2.8 2.8 6.2 0.7 50.7 100Gegharkunik 17.8 12 0.3 4.1 17.3 16.8 0.4 31.3 100Lori 16.6 23.1 0.7 1.2 6.3 14.2 0.9 37 100Kotayk 17.5 18.9 1 6.1 2.2 13.7 0.8 40 100Shirak 19.2 20.6 1 2.4 4.6 7.6 0.6 44 100Syunik 21.9 26 2 5.4 2.2 10.2 1.3 30.9 100Vayots Dzor 17.4 26.2 0.4 1.7 0.1 0.9 0.4 52.4 100Tavush 18 19.8 1.9 7.7 11 8.1 1.3 32.1 100Average total
23.6 20.7 0.7 3.0 4.1 8.2 0.6 39 100
Employment sector of the surveyed household members
Regarding the employment sector of the surveyed household members, a cross tabulation by gender shows significant differences concerning the characterization of the population. Female respondents are over-represented in the ‘employee in public sector’ category, the ‘own-account worker in agriculture’ category, and the unpaid family worker category. (See table 23 below).
Table 23. Type of employment of the surveyed household members by gender (%)
Sector of employment Male Female AverageTotal
Employee in public sector 18.6 37.3 26Employee in private sector 52.4 31.1 43.9Employer 1.6 0.5 1.2Own-account worker in agriculture
12.4 19.2 15.1
Own-account worker in non-agricultural sector
12.6 6.2 10
Unpaid (contributing) family worker
2.3 5.5 3.6
Not mentioned 0.1 0.1 0.1Total 100 100 100
An analysis of the cross tabulation of the variable “type of employment” by marz is significant and suggests differences as shown in the next table. We find a higher proportion of employees in the public sector among the respondents from Aragatsotn (8.4% above the national average). The respondents from Yerevan represented the higher percentage of employees in the private sector (11.2% above the average). The own-account workers in agricultural sector are over-represented in Gegharkunik (8.4% above the

53
RA average) and in Vayots Dzor (15.9% above the RA average) and under-represented in Yerevan. Unpaid family workers were not part of the sample in Yerevan and were almost double the RA average in Tavush.
Table 24. Type of employment of the surveyed household members by marz (%)
Employee in public
sector
Employee in private
sector
Employer Own-account
worker in agriculture
Own-account worker in non-
agricultural sector
Unpaid (contributing) family worker
Not mentioned
Total
Yerevan 33.9 54.1 1.3 0.5 9.9 0 0.2 100Aragatsotn 35.6 42.9 0.7 15.3 4.4 1.1 0 100Ararat 27.3 41.1 1.4 18.7 9 2.3 0.2 100Armavir 21 38.1 1.4 19.3 12.8 7.4 0 100Gegharkunik 17.4 35.1 1.5 24.7 11.2 10.1 0 100Lori 24.2 37.7 0.6 24 10.7 2.6 0.2 100Kotayk 23.1 52.7 1.3 11.9 9.6 1.5 0 100Shirak 18 48.3 0.7 18.2 7.5 7.2 0.2 100Syunik 27.8 35.8 1.3 17.1 13.4 4.7 0 100Vayots Dzor 23.9 35.5 1.6 31.2 6.8 0.5 0.5 100Tavush 25.5 34.1 0.4 19.2 12.9 7.9 0 100Average total
26 43.9 1.2 15.1 10 3.6 0.1 100
The cross tabulation between ‘age groups’ and ‘type of employment’ indicates a higher predominance of employees in the private sector in the younger age groups; a prevalence of employees in the public sector in the older ages groups (older than 45 to 49 years old) and a higher prevalence of unpaid workers in the younger age groups. A cross-tabulation between type of employment of the household member respondents and age is shown in Table 25.
Table 25. Type of employment of the surveyed household members by age group (%)
Employee in public
sector
Employee in private sector
Employer Own-account worker in agriculture
Own-account worker in non-
agricultural sector
Unpaid (contributing) family worker
Not mentioned
Total
15-19 11.2 50.5 0 7.5 9.3 20.6 0.9 10020-24 20.9 57.9 0.5 6.6 8.3 5.7 0.1 10025-29 26.7 52.1 0.8 6.6 9.2 4.5 0.1 10030-34 24.6 50.4 1 8.9 11.8 3.1 0.3 10035-39 24.7 45.2 1.6 13.5 12 2.8 0.3 10040-44 25.8 41.9 1.5 15.4 13.3 1.6 0.6 10045-49 25.4 41.4 1.4 18.2 9.8 3.7 0.1 10050-54 26.4 38.7 1.2 21.4 9.2 3.1 0 10055-59 28.4 38.7 1.2 18.8 9.8 3 0 10060-64 34.8 32.3 1 20 8.4 3.5 0 10065 and more
26.2 23.1 2.2 38.4 6 4.2 0 100
Average total
26 43.9 1.2 15.1 10 3.6 0.1 100

54
Sector of employment of the household members respondents
In order to understand the dependency of sector of employment and gender we present in the next table an analytical cross-tabulation placing the categories of the dependent variable (gender) as column headings, and the independent variable (sector of employment) as row headings. One can observe an over-representation of female respondents vis-a-vis the insertion in the agricultural sector, education and healthcare and, as expected, a very low presence in the construction sector.
Table 26. Sector of employment of the surveyed household members by gender (%)
Sector of employment Male Female Average total
Agriculture 17.2 26.7 21Industry 8.6 6 7.5Construction 26.2 0.9 16.1Trade and Repair 12.2 11.7 12Public Administration 7.7 6.6 7.3Education 2.9 18.8 9.2Healthcare 1.7 9.4 4.8Other services 23.3 19.7 21.9Not mentioned 0.1 0.2 0.1Total 100 100 100
An analysis of the cross tabulation of the sector of employment of the respondents by marz is significant and suggests regional differences as shown in the next table. We find among the respondents from Yerevan the lowest proportion of employed individuals in the agriculture sector. The agriculture sector is over represented in the respondents from Gegharkunik, Armavir and Vayots Dzor. Industry is the sector of employment of nearly 15 per cent of Kotayk marz (almost double the average total for the RA). The construction sector serves as a good example for the analysis of the sector of employment in the Republic of Armenia. Only 9.9 per cent of the respondents in Yerevan worked in this sector, 26 per cent of the respondents (almost all male) worked in this sector in Shirak and 22.9 per cent in Gegharkunik. We also need to highlight the prevalence of the “other services” in Yerevan (39.3% of the respondents). It is well known that imbalances in labour-markets within a country and/or a region drive and will continue to drive migratory processes so this is an indicator we will continue to explore below in this report.

55
Table 27. Sector of employment of the surveyed household members by marz (%)
Agriculture Industry Construction Trade &
Repair
Public administration
Education Healthcare Other services
Not mentioned
Total
Yerevan 1.6 8.2 9.9 14.5 7.9 10.6 7.7 39.3 0.3 100Aragatsotn 17.7 4.6 17.9 7.1 13.7 14.6 5.1 19.2 0 100Ararat 24.6 13.2 13.6 13.5 4.7 11.1 5.8 13.3 0.2 100Armavir 34.2 2.6 14.3 10.8 8.1 6.4 2.3 21.2 0.1 100Gegharkunik 36.4 2.4 22.9 10.2 4.9 8.6 3.9 10.7 0 100Lori 28.9 5.9 22.1 11.3 6 8.2 3.6 13.2 0.6 100Kotayk 15.6 14.8 21.6 10 8.4 6.1 4.2 19.3 0 100Shirak 26 4.8 26 12 3 10.7 2.5 15 0.1 100Syunik 25.2 12.4 10.6 10.6 8.9 9.9 3.7 18.6 0 100Vayots Dzor 33.9 7.2 12.1 10.4 8.5 5.6 5.1 16.6 0.6 100Tavush 27.3 2.9 16.5 13.9 9.5 9.6 2.6 17.6 0 100Average total
21 7.5 16.1 12 7.3 9.2 4.8 21.9 0.1 100
The cross tabulation between ‘age groups’ and ‘sector of employment’ indicates a higher predominance of polarized employees in the agriculture sector of both younger and older age groups; and a prevalence of under 35 year-olds in “other services” sector. A cross-tabulation between sector of employment of the household member respondents and age is shown in Table 28.
Table 28. Sector of employment of the surveyed household members by age group (%)
Agriculture Industry Construction Trade &
Repair
Public administration
Education Healthcare Other services
Not mentioned
15-19 34.6 4.7 14 13.1 2.8 7.5 1.9 20.6 0.920-24 14.2 6.8 19.7 14.3 7.9 6.3 3.7 26.9 0.325-29 12.5 8.1 19.5 14.2 8.6 7 4.3 25.7 0.230-34 14.4 6.6 18.6 13.7 9.3 6.9 4.3 25.9 0.235-39 17.4 7 19.3 14.3 7.2 8 4.1 22.7 0.240-44 19.4 7.6 15.8 15.4 8.1 9.5 5.3 18.5 0.545-49 25.4 7 15 10.3 6.8 10 5 20.3 0.350-54 26.9 9.1 14.9 9.3 5.7 10.5 5.4 18.1 0.155-59 24.5 8.2 13.4 9.7 5.9 11 5.8 21.4 0.160-64 25.8 7.2 11.2 8.3 7.4 15.4 5.5 19.3 065 and more
44.3 6.4 5.5 6.4 5.1 11.3 5.1 15.7 0
Averagetotal
21 7.5 16.1 12 7.3 9.2 4.8 21.9 0.1
Employment and income generation are fundamental elements for the characterization of the respondents’ economic status. From the analysis, we found that only 47.5 per cent of the sample respondents had an income generating employment/job at least for one hour during the last 7 days preceding the survey (n=25.831). Of those, 60.2 per cent were males, that is, there is a bias towards males having an income generating employment vis-à-vis females.

56
When asked where their place of work was, 81.7 per cent of the respondents declared they work in the same marz where they live (1.6% of the total worked in a different settlement in the same marz so they were local commuters); 3.2 per cent worked in a different marz (regional commuters) and 15.1 per cent worked abroad (included NKR). The frequency total was 12,272 respondents to this question.
Table 29. Locale of work of the surveyed household members by gender (%)
Male Female TotalIn the same settlement 53.4 46.6 100In another settlement of this RA marz
64.7 35.3 100
In another RA marz 75.7 24.3 100
Abroad (included NKR) 90.7 9.3 100Average total 60.2 39.8 100
Migration potential of the RA population
The survey also collected information on the migration intention of the household members. The data is very elucidative regarding various dimensions. First of all, there is a clarification on the weight of the migration on the household members total reaching 8.1 per cent of the total of the surveyed household members (that is, 8.1% stated that household members are already abroad when asked intention to go abroad for 3 or more months). Secondly, there is a sex bias regarding migration: 84.1% of those household members already abroad were males and the intention to migrate is biased towards males while the intention not to migrate is biased towards females (see table 30 below).
The data on prospective migrants is taken from the results of the respondents’ answer to the question ‘Do/does you/your H/H member intend to leave for migration trip for abroad for 3 of more months?’ Those who answered ‘yes’ are prospective migrants and those who answered ‘no’ are classified as non-migrants. The data on potential migrants was weighted to represent the population as a whole and to show the real potential of international migration in the Republic of Armenia.
Table 30. Intention to leave for abroad for 3 or more months by gender (%)
Male Female Average total
No 42.5 57.5 76.5Rather No 43.8 56.2 8Already abroad 84.1 15.9 8.1
Rather Yes 55.7 44.3 2.8Yes 53.4 46.6 4.6Total 46.8 53.2 100
Only 7.4 per cent of the surveyed HH members have plans to move abroad (2.8% + 4.6%). If the weight sample is considered, the number will be above 213,000 individuals seeing migration

57
as an option for the future in the Republic of Armenia total population. The survey reveals clear differences between men and women in the serious intention to move abroad. Approximately 53.4 per cent of men declared that they were seriously thinking of moving abroad, whereas only 46.6 per cent of women reported a planned move abroad. If the potential to move is still an intention (rather yes) the gap increases even more (55.7% for men versus 44.3% for women).
Table 31. Intention to leave for abroad for 3 or more months by gender (weight sample)
Male Female TotalNo 828,680 1,128,785 1,957,465Rather No 98,746 123,882 222,628Already abroad 172,750 123,882 204,259
Rather Yes 47,285 36,696 83,981Yes 69,298 60,188 129,486Not mentioned 305 460 725Total 1,217,064 1,381,520 2,598,584
Non-migrants were the majority in the Republic of Armenia survey sample and the percentage of respondents not seriously considering a move abroad is thus prevalent (76.5% answer ‘No’; and 8 per cent ‘Rather No’ to the question ‘Do/does you/your H/H member intend to leave for migration trip for abroad for 3 of more months?’) if a weight sample is considered, this is approximately 5 out of 6 individuals in the sample don’t intend to move abroad. Those seriously considering working abroad were classified as prospective migrants, corresponding to answer totals of 2.8 per cent of the household respondents ‘Rather yes’ and 4.6 per cent ‘Yes’ to the above question. If the weight sample is considered, the number will be above 200,000 individuals seeing migration as an option for the future.
Table 32. Intention to leave for abroad for 3 or more months by marital status (%)
Never married Married Widowed Divorced Average total
No 74 74.5 88.3 78.8 76.5Rather No 8 8.3 5.8 7.5 8Already Abroad 9.3 9 1.2 3.8 8.1Yes 3.3 2.8 1.6 3.7 2.8Rather yes 5.4 4.4 3.2 6.3 4.6Total 100 100 100 100 100
Expectations regarding the marital status of prospective migrants were not fulfilled (see table 32). One expects the never married individuals to have more inclination to migrate; nonetheless data suggests very similar distribution among marital status groups. Prospective migrants are equally likely to be married (4.4% of the respondents answer yes and 2.8% rather yes); not married (5.4% of the respondents answer yes and 3.3% rather yes) or widowed (1.6% of the respondents answer yes and 3.2% rather yes).
Education level and intention to migrate
A cross tabulation involving ‘the intention to leave for abroad for 3 or more months’ and ‘education level’ of the respondents shows a greater propensity to migrate by the highly educated individuals (see table 33 below) that turns to a very high propensity to migrate among the individuals with a tertiary or higher education.

58
There is also an interesting relationship between the comparative education levels of men and women and the intention to migrate. The overall trend for the Republic of Armenia is that the intention to migrate is more significant at the lower levels of education for men but at the higher levels for women. This structure of potential migrants can have a significant impact on the nature of the emigrant population and the type of employment obtained abroad.
Table 33. Intention to leave for abroad for 3 or more months by education level (%)
Primary and lower
Basic School (grades 8-9)
General Secondary
Vocational (college
Secondary specialized
Tertiary Postgraduate Total
No 2.4 9.1 41 2.4 20.5 24.2 0.4 100Rather No 0.7 8 42.1 3.1 20.1 25.5 0.5 100Already Abroad
0.2 5.5 51.1 3.3 21.6 17.7 0.6 100
Rather yes 0.4 7.9 37.3 2.5 22.3 29 0.6 100Yes 1 6.2 38.3 1.2 21.9 30.8 0.6 100
Average total
2 8.6 41.6 2.5 20.6 24.2 0.4 100
Additionally, information was compiled about the intention to migrate of the household members of over 15 years old by age groups. The distribution is very homogeneous vis-à-vis the national average, although we can find more individuals intending to migrate in the age groups 20-44 years old (see table 34 below).
Table 34. Intention to leave for abroad for 3 or more months by age groups (%)
15-19 20-24 25-29 30-34 35-39 40-44 45-49 50-54 55-59 60-64 65 and +
Average total
No 85.4 71.4 65.9 68.3 70.3 72.2 74.4 76.2 79.1 83.4 91.1 76.5Rather No 7.3 9.7 10.2 9.4 9.1 7.3 7.7 7.1 7.6 6.7 5.4 8Already Abroad
2 9.7 13.4 13.2 11.3 11.5 9.9 9 6.9 3.6 0.6 8.1
Rather yes 2 3.4 4.3 3.7 4 3.4 2.4 2.9 2.4 2.2 1.1 2.8
Yes 3.3 5.8 6.1 5.4 5.1 5.6 5.5 4.9 3.9 4.1 1.8 4.6Total 100 100 100 100 100 100 100 100 100 100 100 100
Intention to migrate in the near future
Of those intending to migrate in the future, 56 per cent plan to migrate in the subsequent 12 months, a statement that denotes a robust migration project and, again, we find the strongest commitment to migration amongst male respondents. 27 per cent of the household respondents who intend to migrate within the following 12 months have already made some arrangements (e.g. purchase of ticket, work related or other arrangements). This is a sign of a reliable migration potential of one out of ten of the household members interviewed. From the data we get a potential migration of around 115,000 individuals and of those, 29 per cent (or nearly 33,300 individuals) have already made some appropriate arrangements to fulfil their migration project. This is a trustable (and in fact predictable) projection and in line with the recent annual average out-flows.

59
Reasons for migration among potential migrants
The reasons for migrating among potential migrants in the Republic of Armenia were overwhelmingly economic. Among the reasons for migration there are four big motivations: the absence of jobs in the Republic of Armenia; the unsatisfactory amount of remuneration received in the Republic of Armenia; earning money for the Household; and uncertainty towards the future. Together these motivations represent three out of four of the reasons to emigrate (see figure 2 below).
Figure 2. Reasons for departure (%)
While those are the main reasons for departure, the surveyed household members that intended to migrate in the subsequent 12 months stated different purposes for leaving the Republic of Armenia. Among male prospective migrants the main reason to leave is to look for a job (70.3%); to obtain permanent residence abroad (22.3%); family reasons (4.7%); education related reasons (1.3%) or other reasons not defined (1.3%). Among the female household members that intend to migrate in the subsequent 12 months, the influential reasons are very different. The main reason to leave is to look for a job but in a smallest proportion than males (39.8%) or to obtain permanent residence abroad (33.8%). Family reasons account for one out of five reasons (20%) and education was three times higher stated as important than for the male counterpart household respondents (3.8%) finally, 2.6 per cent declared other non specified purposes as push factors to leave the Republic of Armenia.
Regarding the prospective emigrants, around six out of ten anticipate some sort of support vis-à-vis their migratory trip. The main expected support is, in decreasing order of importance: finding a job; help for lodging; funding to pay for the voyage; sponsorship to get a visa. This support is expected from people residing abroad (76.8%), from both people residing in the Republic of Armenia and abroad (14.1%) or from people residing in the Republic of Armenia (8.7%).
As expected, the main envisaged destination hubs are: the Russian Federation (76%), EU countries (7.5%), USA (7.2%), NKR (2%) and other non-specified countries accounted for 8% of the total19. One must highlight the existent bias of the intention to migrate concerning female respondents towards NKR (seven out of ten of the prospective/potential migrants for NKR are women) and male
19Brazil, Belarus, Canada, Czech Republic, Iran, Lebanon, Latvia, Norway, Switzerland, Arabic Republic of Syria, Turkey, Ukraine and Uzbequistan.

60
respondents (six out of ten migrants towards Russian Federation are men). It must be emphasized that visa constraints tend to affect migrant flows: Armenians do not need a visa to enter Russian Federation but they still need a visa for both the EU countries and USA.
Migration from former household members
The survey included a set of questions related to previous members of the household and their relation to migration. Around 1.5 per cent of the sample total, corresponding to 47,000 individuals left their dwellings for abroad, according to the current residents in those abodes.
Another set of questions was asked concerning HH members who left after January 1st 2007. Of those, only a small number of individuals were associated to migration (n=132) while a higher number simply left the household (n=342) corresponding to a total of around 15,000 individuals. From those linked with migration, 93 per cent took one trip with the aim of migrating, 2.9 per cent of the individuals took two trips with the aim of migrating, 3.8 per cent of the individuals took three trips with the aim of migrating and 0.3 per cent accomplished 5 trips with the aim of migrating. This indicates a low level of circularity from those household members.
Household members involved in migration events since 2007
The data for this tendency are obtained from the household questionnaire that lists all individuals who were/are part of the household but took part in one or more trips with the objective of migration since 2007.
Those numbers included the internal migrants, and the international migrants (out-flows, in-flows and return migration). Of the total intertwined household members 12.8 per cent were part of one or more migration trip which occurred after 2007. Of those, 66.8 per cent were males and 33.2 per cent were females suggesting a bias on males regarding migration flows in RA [a slightly increase on the proportion of males when one compares the present survey with the UNFPA survey of 2007 (62.3% of males and 37.7% of females)].
When disaggregated by marz we can obtain a more distinct regional distribution of the migrants (see table 35 below) controlling for their regional distribution within the country.
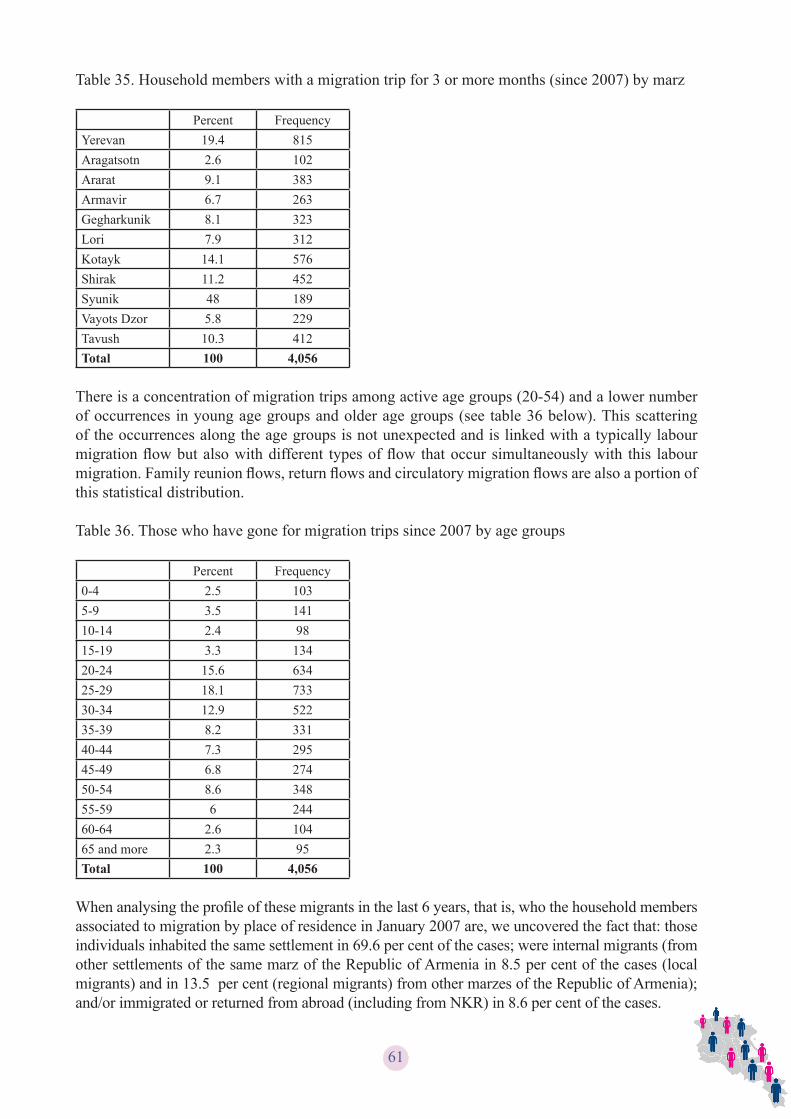
61
Table 35. Household members with a migration trip for 3 or more months (since 2007) by marz
Percent FrequencyYerevan 19.4 815Aragatsotn 2.6 102Ararat 9.1 383Armavir 6.7 263Gegharkunik 8.1 323Lori 7.9 312Kotayk 14.1 576Shirak 11.2 452Syunik 48 189Vayots Dzor 5.8 229Tavush 10.3 412Total 100 4,056
There is a concentration of migration trips among active age groups (20-54) and a lower number of occurrences in young age groups and older age groups (see table 36 below). This scattering of the occurrences along the age groups is not unexpected and is linked with a typically labour migration flow but also with different types of flow that occur simultaneously with this labour migration. Family reunion flows, return flows and circulatory migration flows are also a portion of this statistical distribution.
Table 36. Those who have gone for migration trips since 2007 by age groups
Percent Frequency0-4 2.5 1035-9 3.5 14110-14 2.4 9815-19 3.3 13420-24 15.6 63425-29 18.1 73330-34 12.9 52235-39 8.2 33140-44 7.3 29545-49 6.8 27450-54 8.6 34855-59 6 24460-64 2.6 10465 and more 2.3 95Total 100 4,056
When analysing the profile of these migrants in the last 6 years, that is, who the household members associated to migration by place of residence in January 2007 are, we uncovered the fact that: those individuals inhabited the same settlement in 69.6 per cent of the cases; were internal migrants (from other settlements of the same marz of the Republic of Armenia in 8.5 per cent of the cases (local migrants) and in 13.5 per cent (regional migrants) from other marzes of the Republic of Armenia); and/or immigrated or returned from abroad (including from NKR) in 8.6 per cent of the cases.

62
When one does a cross tabulation between those ‘who have gone for migration trips since 2007’ and ‘Nationality’ we can see that 98.9 per cent of those migrants were Armenian nationals, 0.4 per cent, Russians; 0.5 per cent, Yazidis and 0.2 per cent, from other nationalities.
The main reason that migrants leave RA is to pursue economic opportunity, followed by marriage or family reasons; to acquire a permanent residence abroad; and finally, education. On average 55.8 per cent of the household members that travelled with the intention of migrating in the period 2007 to 2013 did so in search of, or because of, a job; one out of 3 (30.1%) due to family reasons; 10.2 per cent to take up permanent residence; 3.2 per cent for education or study reasons and 0.7 per cent due to reasons of forced migration.
Table 37. Year of the trip versus Purpose of the trip (%)
Job / Looking for a job
Family reasons (family unification, marriage, divorce,
etc.)
Permanent residence
Study/education
Forced migration /
escape
Total
2007 47.5 39.3 10.1 3.0 0.1 1002008 47.6 34.1 15.8 2.5 0 1002009 57.3 25.8 12.1 4.7 0 1002010 56.7 30.6 8.5 4.3 0 1002011 59.4 30.3 7.4 2.9 0 1002012 55.5 30.1 8.4 4.0 2.0 1002013 69.3 17.5 9.8 1.3 2.1 100
Average total 55.8 30.1 10.2 3.2 0.7 100 In the following chapters we will analyse the distinct type of migration that those migration trips lead to; namely, emigration, internal migration and return migration. The differences and similarities between those types of flows and a characterization of the individual migrants related with those flows will be demonstrated. The chapter will normally be based on answers from proxy household members once the emigrants were absent from the abode.

63
Chapter 4 - Characteristics of migrant’s population (out-flows) (emigrants)
This chapter will focus on the findings of the field survey on the socio-demographic and economic characteristics of migrant population (out-flows) namely: percentage of households involved; average duration; key destination countries; push/pull factors; reasons for migration; legal status in destination countries; networks and mediators.
Throughout the history of Armenia as an independent state, the emigration flow has always dominated the migration picture. Although it was huge during the 90s, it has gradually decreased down to the present. Thus, according to estimations, 1.0 to 1.1 million people emigrated from Armenia from 1988 to 2001, and 150,000 from 2002 to 2007 (Chobanyan, 2012: 3). The present survey will generally analyse out-migration flows from 2007 onwards.
For this survey, an emigrant is a person who used to live in a household in the Republic of Armenia, but left before the interview to live abroad for at least 3 months.
Socio-demographic characteristics
A number of questions were used to measure the stock and flow (size) of migrants from the Republic of Armenia. As usual, place of birth was used to determine population stock, while previous place of residence (marz) was used to measure migration flows. The reference period was before and after January 1st 2007.
From the survey data we apprehend that around 7.2 per cent of the surveyed household members were associated to emigration (out-flows) corresponding to a total of 2,250 respondents or representing a figure around 224,000 persons from the Republic of Armenia population, if sample weight is taken into consideration. This is an indicator of the continuity (or even a small increase in the migration out-flow) of the level of population out-flow in previous periods, as suggested in the UNFPA survey of 2008 or the 2009 ILO’s Report. From the present survey it is possible to determine that an average of up to 35,000 people have been emigrating annually from Armenia in the period 2007 to 201320. This is an unexpected result due to the post economic crisis of 2008 but, as we will show, could be related with a change in the destination countries and with an expansion of the Russian Federation as the main destination country for Armenians in recent years.
Of those emigrants, 82.1 per cent were males and 17.9 per cent females, which denotes a high level of masculinization of migration in the country, which needs to be addressed and further problematized by migration research and RA migration policies. Masculinization of international migration should be understood as a combination of a number of structural factors at the macro, meso and micro level in both sending and receiving societies. At macro level, one needs to tackle historical events, macroeconomic trends, demographic transitions, political institutional characteristics, macro-economic shifts in gender systems and migration networks. We also need to comprehend, at the meso level, specifically, the cultural and sociological characteristics of the
20 The survey identifies 224,048 individuals (household members) who went for (one or more) migration trip since 2007 (number of individuals identified by “Leave for abroad” question in Section 2 of the survey questionnaire). The collection of the data took place after the first semester of 2013 therefore this year is counted as 0.5. Consequently divisor of 6.5 to the 224,048 dividend was applied

64
sending society that push or obstruct the females as independent migrants.
An analysis of the emigrants’ age groups revealed a first profile on the different contemporaneous emigrant types in the Republic of Armenia. While one must underline the presence of emigrants in all the age groups representing the entire RA population, there is a high concentration of emigration among active age groups (20-54) and a smaller number of occurrences in both young age groups and older age groups. The prevalent differential vis-a-vis the same groups in the representative sample of the entire population of the Republic of Armenia occurs in the age groups 20-54 years old (see table 38 below).
Table 38. Household members who left for abroad after January 2007 by age group (weighted)
Male Female RA average total Migrants by age group
0-4 7 5.6 6.3 1.85-9 6.2 4.6 5.4 2.210-14 5.5 4.4 5 1.215-19 6.8 6.2 6.5 1.420-24 10 9.7 9.9 13.725-29 9.8 8.8 9.3 18.330-34 7.8 7.3 7.5 13.635-39 6 5.7 5.8 9.240-44 5.5 5.6 5.5 9.045-49 5.9 6.8 6.4 9.050-54 7.9 8.7 8.3 10.355-59 7.2 7.3 7.3 6.760-64 4.9 5.6 5.3 2.665 and more 9.4 13.6 11.6 0.8Total 100 100 100 100
As we analyse the data referring to the number of individuals by household linked with emigration, we note that the data is imbalanced by marz. The proportion of the households members involved in out-flows from Yerevan corresponds to 16.2 per cent of the total emigration flow, 15.1 in Shirak, 12.2 per cent in Gegharkunik, 12 per cent in Kotayk, 8 per cent in Tavush, 7.2 per cent in Armavir, 7.0 per cent in Ararat, 5 per cent in Vayots Dzor, 4.6 per cent in Syunik, and 3.6 per cent in Aragatsotn (see table 39 below). The first conclusion is that emigration is not affecting the Republic of Armenia regions in a homogeneous way and it is possible that one might find different varieties of migration in RA. The root of the emigration causality seems to be the jobless growth in the Republic of Armenia economy. This trend of rising unemployment is compounded by the existence of regional imbalances in development within the country, which might have collectively accelerated the phenomenon of migration. All theories of migration concede that migration occurs when the region of origin lacks the opportunities that the destination region promises. It is inherently a combination of pull and push factors. Variation in economic development across regions is a primary motive for migration to greener pastures. Data from the economic insertion of migrants before and after migration will help to explain this hypothesis.

65
Table 39. Household members who left for abroad after January 2007 by marz
Frequency Frequency weighted PercentYerevan 364 41,218 16.2Aragatsotn 80 7,339 3.6Ararat 158 14,227 7.0Armavir 162 18,650 7.2Gegharkunik 275 26,.213 12.2Lori 205 25,798 9.1Kotayk 271 25,065 12.0Shirak 340 39,449 15.1Syunik 104 7,307 4.6Vayots Dzor 112 3,944 5Tavush 179 14,788 8Total 2.250 224,048 100
The relationship between education and emigration
The question controlling a traditional liaison between emigration and education can be stated very simply: is there a unidirectional relationship between education and migration, with a higher probability that either higher educated or lower educated individuals will be more likely to migrate?
Based on educational status, emigrants from RA can be divided into at least four categories: (1) Educated migrants with education up to a graduate degree, constituting 17.2 per cent of the total emigrants; (2) highly qualified migrants comprising of individuals with post graduate degrees, constituting 0.6 per cent; (3) low-skilled migrants with education up to general secondary constituting 49.8 per cent of the total emigrants; and (4) individuals with a vocational or secondary specialized education (23.9%) (See table 40 below). When analysing the variances between the sub-sample of emigrants with the total sample, we recognize that the emigrants in the sample are on average more educated than the average sample, with the exception of the interviewed emigrants with a tertiary education. This data can guide us to move away from the hypothesis that there is a higher probability that either higher educated or lower educated individuals will be more likely to migrate. The data suggest, on the contrary, that intermediate educated individuals (general secondary educated) will have, on average, a slightly higher probability to migrate for abroad.
Our data shows, consequently, a more complex, multidirectional and therefore uncertain relationship between education and emigration with no consistent overall pattern emerging from the relationship between education and emigration. Thus, from this survey it is not possible to identify a massive exodus of qualified professionals, although a number near 39,000 individuals with a tertiary or post-graduated education is estimated to have left the country in the last 6 years (but 21,000 individuals with a tertiary and/or post-graduated education returned from abroad or immigrated to RA within the same period).

66
Table 40. Education Status of emigrants
Average Total RA
Return from abroad
Immigrants Internal migrants Emigrants %
Primary and lower
10.4 5.2 18.7 7.7 3
Basic school (grades 8-9)
9 8 21.3 4.8 5.5
General secondary
37.3 41.7 27.8 32.2 49.8
Vocational (college)
2.2 3.1 0.9 1.8 3
Secondary specialized
18.5 21.5 11.1 17.7 20.9
Tertiary 22.1 20.6 19.4 35.1 17.2Post-graduate 0.4 0 0.9 0.8 0.6
Economic and professional status of the emigrants before leaving the RA
The major elements to underline in relation to the economic insertion are that 62.8 per cent of the interviewed were unemployed in the Republic of Armenia immediately before leaving for emigration; only one out of four (25.1%) was employed (including self-employment), 5.2 per cent were students, 2.3 per cent were household keepers and 3.6 per cent were under care. Of those individuals, three out of four had no job in the last 6 months before leaving RA and only 14 per cent worked the full 6 months. These are meaningful push factors to emigration. Not surprisingly, the long-term unemployed get despondent.
In total, 51.8 per cent of the emigrants were not looking for a job in the 6 months before leaving (corresponding to despondent jobless), but 22.5 per cent looked actively for a job for the full half year before departing without finding a job opportunity. The push factor was, for those individuals, the absence of jobs or the lack of job opportunities and this fact confirms that the fundamental cause of modern migration from Armenia is “economic factors”.
Table 41. Socio-economic status of the household respondents who left for abroad (%)
Before leaving (%)Employed (including self-employment) 25.1Pupil/student 5.2H/H keeper 2.3Pensioner / allowance, beneficiary 0.5Under care 3.6Jobless 62.8Other 0.5
Of those household members interviewed that were employed before their departure, 53 per cent had a written contract and 47 per cent worked without a contract; that is, in the informal economy. Moreover, data shows that the state authorized body did not register up to 90.4 per cent of the activity exerted. The fact that emigrants were unemployed, were linked to labour precariousness and worked in the informal

67
labour market, simultaneously reinforces their risks of becoming unemployed and of being excluded from the national labour market and, therefore, seems to act as a push factor to emigration.
Table 42. Emigrants’ socio-economic status before leaving the Republic of Armenia (%)
Before leaving RA (%)Employee in public sector 6.8Employee in private sector 52Own-account worker in agricultural sector 21Own-account worker in non-agricultural sector 16.8Unpaid (contributing) family worker 3.4Total 100
Table 42 shows the prevalence of the RA private sector as employer for those emigrants (52%) and twenty one per cent of the household respondent members were self-employed persons in agricultural sector or in non-agricultural sector (16.8%). Six point eight per cent of the total were employees of the RA public sector and 3.4 per cent were unpaid family workers.
The nature of the work of emigrants before leaving Republic of Armenia was defined in 70.1 per cent of the cases, as termless and in 26.7 per cent of the cases, as temporary (7.9% less than 3 months plus 18.6% less than one year).
Prior to the departure, emigrants from the RA had been engaged in agriculture (27.1%); construction (25.4%); other services (20.1%); trade and repair (12%); industry (7.9%); public administration (6.8%) and healthcare (0.7%).
In twenty six percent of the respondents that were employed in RA before departure (n=558) the job fully matched their profession; in 17 per cent it matched at least partially; in 14 per cent it was above their profession; and in 21.8 per cent there was a professional devaluation. In 21.3 per cent of the cases they stated that they did not have a profession before emigration.
As regards qualifications: for 38.9 per cent of the household respondent the job matched fully and for 28.1 per cent, partially. In 30.1 per cent of the cases the job was below their qualification and in 2.2 per cent, above their qualification. It seems that many of the respondents saw migration as an alternative to unemployment in their home country or an alternative to the lack of opportunities for the skills they have developed.
There is also information in the survey concerning the weekly working hours. 19 per cent of the respondents’ worked between 10 and 35 hours a week; 25.5 per cent, between 35 and 40 hours a week; 21.5 per cent, between 41 and 50 hours a week; 13.8 per cent, between 51 and 60 hours a week; and 14 per cent, more than 61 hours a week.
A total of 34.6 per cent of the respondents had a day-off regularly; 40.9 per cent had a day-off but not regularly and 23.5 per cent of the respondents almost never had a day off from work. As shown in figure 3, there is a broad range of salaries earned by emigrants before leaving the Republic of Armenia. One out of three respondents had a monthly salary below 60.000 Armenian Dram (AMD) before taxes; one out of three received more than 60.001 AMD a month before taxes. Additionally, 5.6 per cent of the household respondents to this question had other sources of income (for instance, pension,

68
allowance, income from property rent) corresponding to an income of less than 30.000 AMD in 55 per cent of the occurrences. In general, as expected, there were a large number of individuals that did not answer this question.
Figure 3. Emigrants gross revenue before leaving RA (%)
The total revenue was insufficient to generate any savings for 92 per cent of the household respondents (15.1% stated they had debts because of scarce revenue). Only 0.1 per cent of the household members respondents affirmed that the income they had in RA before emigrating was enough to accumulate money.
After the analysis of the data it comes as no surprise that economic reasons pushed the majority of the migration flows from RA. The reason for migration has, primarily, been the search for a job or better employment, but family related reasons were also found to be an important motive for migration. The emigrated household members were offered a list of factors and asked to pick the three main reasons that compelled them to leave. The results obtained point to the fact that the absence of jobs (30.4%) the need to improve the revenue in order to support the HH (24.9%), and the search for a better job (21.1) were the principal reasons endorsed. Different and complementary family reasons were also migration push factors such as family reunification (2.8%); marriage (1.9%); and other family reasons (6.5%). This data compares with previous analysis from the UNFPA (2007) report (75% of migrants were labour migrants; the rest were their family members) and also with the data from the ILO report (2009) that identified Armenia’s emigration flows during 2002-08 as predominantly involving labour migrants.

69
Figure 4. Main reasons for migration from the Republic of Armenia (%)
Decision to migrate is normally taken inside the family, either by the migrant himself (53.9%) or the family (45%). Only in a small number of cases was the decision external to the migrant or his/her family. More often the migrant is motivated by his/ her immediate family members to migrate and his or her relatives help them in the initial phase of emigration, either with financial support or supporting with the relocation (housing or help to find a job) in the country of destination.
The funds to support the migration project are mainly auto-financed: in 35.5 per cent of the cases by HH savings; selling assets (4.8%); uncompensated care (9.7%). In 12.9percent of the cases the employer supports the resources for migration. There is also very important financial support coming from financial institutions: bank loan (5.5%); property mortgage (1.2%) and above all debts (28.9%). There are also 1.3percent of other financial sources not defined.
Destinations
From the literature on the last decade’s history of migration from the Republic of Armenia, it is generally believed that the traditional destinations for Armenian migrants have been the Russian Federation, the European Union and the United States of America. The survey reveals that while the RF and the UE continue to be the preferred destinations, the low numbers of migrants heading to the USA and the dispersion of destination countries is also an important result from the survey. According to the World Bank (2011) the top destination countries from Armenia were the Russian Federation, USA, Ukraine, Azerbaijan, Georgia, Israel, Germany, France, Spain and Greece. When analyzing the data from the survey, the destination of the last migration trip abroad reveals the Russian Federation (90.6%) as the prevalent destination. NKR (1,3%), USA (0.8%); Ukraine (0.6%); Poland (0.4%); Belgium (0.2%); Germany (0.6%); France (1.2%); Spain (0.8%); Georgia (0.3%); Turkey (0.4%); Brazil (0.1%); and Iran (0.4%) are also destination hubs. If we combine the 28 European Union countries, then the EU becomes the second more important destination with 4.1% of the total.

70
From the data one realizes that the main migration destination is the Russian Federation, a country that is relatively close to RA geographically, seen as a friendly state boasting a vast growing economy, and with a visa-free border entry regime with Armenia. It is not surprising then that, when analyzing the last migration trip, we learn that there are more people emigrating to RF than migrating internally within the RA.
Table 43. Destination of the last trip
Frequency Per centRA 846 20.9NKR 112 2.8Russian Federation 2734 67.5USA 31 0.8Other 330 9.1Total 4,043 100
The main reasons to choose a specific destination country were also the object of a set of specific questions. When the 3 main options completed by respondents are added, the results show the prevalence of the network migration (existence of a network of friends and/or relatives in the destination country) in almost 30 per cent of the occurrences, that is, the previous migration flows explain the current ones. Also worth mentioning is the labour market appeal (job offers determined 26.5% of the elected destination); the language burden (knowledge of the language explains 14.3% of the destination country option; absence of entry visa (6.8%); or the nonexistence of alternatives (6.7%). A previous residence experienced in a destination country explains the recurrent preferred destination for 6.2 per cent of the household members’ respondents. This is a strong pointer of a potential high level of circulatory or repetitive migration among current emigrants that needs to be corroborated.
Figure 5. Main reasons to choose a specific destination country (%)

71
Emigrants’ status in the country of destination
The findings on the emigrants’ status in the country of destination reveals interesting trends: while most migrants have not taken up citizenship of the country of current residence, a significant proportion of these very recent emigrant population (6.8 per cent) has already taken up citizenship (see figure 6 below). Although the prevalent majority had legal status, while a high proportion (two out of three) had only temporary or not permanent registration. 4.9 per cent of the respondents had illegal status in the host country.
Figure 6. Status in the country of destination
The household emigrants normally live in rented apartments/houses (34.5%); rented rooms (23.7%); house of a relative or a friend (15.6%); dormitories (11.5%); non-residential accommodations (8.2%); and, personal homes (5.1%).
As regards health insurance, for 76.7 per cent of the total respondents this was non-existent, while 6.1 per cent had permanent insurance and 12.6 per cent, temporary insurance.
Networks and mediators
Around eight out of ten of the household members’ respondents had a network of friends and/or relatives in the destination country before leaving the Republic of Armenia. This is a very high proportion and is linked to Armenia’s long history of migration both in the XX century and at present. The existence of a wide spread diaspora and the continuous flows of departures during the last two decades assures newcomers a low risk of migration and explains migrants’ location decision through three channels: first, they provide information about the host country/region labour-market; second, migrants’ utility increases with the amount of ethnic goods available in a location; third, migrants expect previous migrants to help them in the settlement process.
The effect of network externalities may vary for different types of migrants. For example, migrants with an illegal status or working in the informal labour-market may depend more on migration networks than legal migrants.

72
Figure 7. Support received from family/friends in the destination country before departing RA
When one compares the patterns of the support received in the past by migrants from RA (this is, return migrants) and the patterns of the support received in recent years by new migrants, they overlap in all categories except in relation to the help to get a job in the destination country (see figure 8 below). Reasoning on the prevalence of support received can be found in the rational of the migration network nowadays which is more dense and effective in specific labour-markets (e.g. in Russian Federation) and potentially more accurate in finding jobs for co-nationals.
Figure 8. Comparison in the support received from family/friends in the destination/host country before departing the RA (emigrants versus return migrants)

73
Economic Characteristics of the migrants in the country of destination
The evidence of a labour migration flow is confirmed by the fact that 79.3 per cent of the emigrants had the intention to work abroad before leaving the RA. Of those household respondents, 71.5 per cent had a promise of a job before leaving the RA; 4.4 per cent, a written agreement to work and 1.1 per cent, other arrangements to get a job. 22.9 per cent of the interviewed respondents didn’t have any kind of job offer or agreement.
As we can see from figure 9, those arrangements came from foreign employers, intermediaries or foremen in 3 out of four of the occurrences. The foremen or intermediaries living in the Republic of Armenia were reliable for 19 per cent of the job arrangements.
Figure 9. Individual or institution accountable for the job offer
In only 1.7 per cent of the total these job arrangements were not carried out. For 39.7 per cent of the household respondents they were fully carried out; for 48.9 per cent basically carried out and for 9.3 per cent at least partially carried out. The cause of failings was attributed to an unforeseen situation in 46.1 per cent of the events; to the employer in 29.1 per cent or to the intermediary in 19.1 per cent of the incidents.
Economic status of the emigrants in the destination country
We learned from literature on migration that migrants are normally willing to accept low-paid jobs because they believe that these jobs are only temporary and for the short-term. On the other hand, these jobs pay more than what they would have earned in their home countries and, thus, they can remit more and accumulate more wealth in a short time. In the case of the present survey one may confirm this trend, as the economic status of the emigrants seems to improve in the overwhelming majority of the respondents vis-a-vis their prior condition in the RA. The shift in labour-market status is significant for unemployed, many of whom were able to find paid employment after migrating.

74
A total of 12.9 per cent of the surveyed household members’ emigrants had no job for the full 6 months before the survey and 36.3 per cent worked the full 6 months. In total, only 12 per cent of the jobless emigrants were not looking for a job in the 6 months before the survey, all the other complementary 88 per cent were actively trying to find a job opportunity.
Figuring out the circularity and migration nexus
The benefits of a labour movement “back and forth” between the home and host countries is now assumed by the literature on migration, migration policies and different agencies related with migration. The emerging importance of circular or repeated migration comes from its potential benefits to all countries involved in migration - be it the home or sending country, the host or receiving country or a third country, as well as to the migrants themselves. But the big question remains: how can we figure out and measure the importance of circular or repeat migration within migration flows? Unfortunately, empirical evidence about circular migration is scarce and empirical analyses are limited due to missing or problematic data.
How can we define circular migration? Firstly, circular migration should be differentiated from the one-time emigration or out-migration and the eventual permanent return migration. Secondly, there is a full typology of circular migration ranging from seasonal and non-seasonal migration; and mobility of professionals or brain circulation and one needs to differentiate between those different varieties. Thirdly, unregulated systems and spontaneous circulation (e.g. nomads and traders) should also be differentiated from regulated systems and managed circulation. Formal circulatory migration can be regulated politically. Informal circulatory or repeated migration should be comprehended profoundly (Newland et al., 2008).
In the present survey, several questions are directed to reveal if there is a sizeable circular or repetitive migration between the Republic of Armenia nationals and one or several destination countries. Data on the number of trips related to migration, months and year of those trips, information on before and after migration experiences can contribute to our knowledge about circular migration. Nevertheless, there are some limitations on the data collected, namely, the duration of migration trips or the country of destination of every one of those migration journeys is not explicit in the survey. Other limitations arise, since this survey just collected the migration history for a limited period of time (last six years) and reported related observations of only parts of migrants’ lives.
Bearing the statistical caveats in mind, when one observes the data from different trips alongside the month calendar checking for repetitive trips every year within the same season it is not possible to determine a regular pattern related to a circular migration or even special seasons for a seasonal migration (see Table 44 below). Although it is known that Armenian migrants would often engage in temporary migration moving to a country and seeking low skilled employment such as construction or cleaning, before returning to RA, that is not explicitly framed in the present survey. The exception is found on the data on the return migrants. In one question about the reason not to communicate the return to RA authorities, 8.2 per cent of the return migrants declared they were temporary migrants (less than 6 months absent from the Republic of Armenia territory). This proportion corresponded to near 4,000 individuals in a weighted sample.
The migrants that were/are in foreign countries (emigrants; return migrants and immigrants) did an average of 3.2 trips between 2007 and 2013.

75
Table 44. Month of the trip (weighted)
trip 1 trip 2 trip 3 trip 4 trip 5 trip 6 trip 7 trip 8 trip 9 trip 10 trip 11 trip 12 trip 13
January 6%23,961
4.6%8,647
6.7%8,718
2.9%2,683
6.7%4,978
3.4%1,656
7.1%2,927
2.9%666
5.2%1.081
3.8%170
14.6%279
0%0
0%0
February 11.2%44,841
4.1%7,725
16.2%21,040
3.8%3,512
13.4%9,995
3.2%1,564
13.8%5,730
3.2%730
12.7%2.643
1.6%70
0%0
0%0
0%0
March 19%75,683
3.6%6,811
27.5%35,797
3.8%3,445
37.3%27,856
3%1,444
32.3%13,410
5.2%1,191
39.6%8.237
22.7%1,004
35.7%684
0%0
64.3%677
April 15.7%62,483
3.9%7,381
19.6%25,458
2.9%2,687
20.7%15,504
2.5%1,239
27.8%11,546
2.3%527
21.6%4.505
4.5%201
37.6%721
8.7%100
18.5%195
May 12%47,925
6.5%12,417
8.6%11,208
4.3%3,937
7.7%5,737
2.9%1,408
8.2%3,414
2.0%453
8.1%1.694
12.7%562
4.2%81
0%0
17.2%181
June 7.8%30,989
5.9%11,144
5.3%6,912
2.1%1,939
2.9%2,171
3.7%1,792
1.7%695
1.6%381
1.8%373
3.4%153
0%0
0%0
0%0
July 4.1%16,326
2.6%4,950
2.0%2,625
1%927
0.3%216
1.0%497
0.7%271
1.4%317
1.3%260
0%0
0%0
0%0
0%0
August 6.4%25,460
4.3%8,106
1.3%1,731
1.7%1,515
1%768
1.4%661
1%397
4.3%984
0.6%130
3.9%174
0%0
0%0
0%0
September 6.5%25,904
6.3%12,003
3.7%4,787
3.1%2,838
4.3%3,228
3.6%1,733
1.9%805
1.8%412
3.0%620
0%0
8%153
0%0
0%0
October 4.8%19,354
19.6%37,242
2.8%3,657
25%22,806
2.1%1,541
27.5%13,394
2.4%1,004
30.9%7,146
2.6%531
12.3%546
0%0
22.4%259
0%0
November 3.4%13,753
21.7%41,239
2.0%2,640
26.9%24,594
2.3%1,683
27.5%13,394
1.1%465
26.1%6,041
2.5%527
16.9%747
0%0
50%576
0%0
December 3.1%12,397
17%32,313
4.3%5,619
22.4%20,495
1.4%1,068
21%10220
2.0%821
18.5%4,267
1.0%212
18.1%802
0%0
18.9%218
0%0
Figure 10. Distribution of the consecutive trips per migrants (%)

76
Two out of three respondents did between one and three trips between RA and the host country in the last 6 years. Unfortunately, we don’t have data on the duration of the trips and the regularity of those trips so it is not possible to define a pattern on circulatory or recurrent migration. Future research must address this issue in a more direct way in order to separate the seasonal migration flows to those definable as circulatory movements.
Communication and Contact between the Migrant and Family Members
This section gives details about the contact and communication between the migrant and his/ her family back home. The migrants have regular contact with their families back home, often every day (52% of the household respondents living abroad communicate with family and/or friends every day; 38.5% once a week; 8% once a month; and, 1.5% rarely). The majority of the migrants use phones as their mode of communication (57% of the total). Internet is also playing an important role in communication (email and Skype are used by 15.4% of the respondents). In fact, technological developments, such as mobile phones, cheap long-distance phone-calls, social networking pages and Skype have made it easier for migrants to stay in touch with family and friends at home and thus made migration seem easier. To some extent, e-mail, Skype, and affordable telephone calls may allow them to maintain strong links with family and friends in the country of origin.
Figure 11. Communication with absentee family and/or friends (%)
On-going migration project evaluation and plans
For 22.9 per cent of the respondents their professional knowledge and skills improved significantly during the emigration period; for 43.1 per cent their professional knowledge and skills improved to some extent; and for 30.6 per cent their professional knowledge and skills did not develop.

77
Migration from the Republic of Armenia before 2007
The Armenian diaspora is divided into “old” and “new”. The “old” are the descendants of the “ethnic Armenians” (communities that emerged more in the beginning of the 20th century after the Genocide and mass deportations of Western Armenians from the Ottoman Empire21). Those who left Soviet Armenia after the collapse of the USSR and Armenia became an independent state (since 1991) are considered “new” diaspora members.
According to the received and compiled responses, the portion of the households that had household members who had emigrated some time prior to 2007 was one out of ten. This is around 10.3 per cent of the 7,890 HH interviewed. Within those HH, of the household member respondents that emigrated before 2007 and have not returned from abroad (n=2.360), 60 per cent were male migrants and 40 per cent female migrants. This corresponds to around 245,000 individuals in the weighted sample.
Table 45. Age distribution of the surveyed households emigrants from the RA (those who left before 2007) (%)
Age groups Percent0-9 510-19 1020-29 1530-39 2440-49 2550-59 1360-69 370+ 1Not mentioned 4Total 100
According to this age distribution, the vast majority of the emigrants who left before 2007 are in the working age population group (79.5% of the total surveyed households emigrants from RA who left before 2007 were part of the age range 20-65); 2.2 per cent of this sub-sample were born abroad after 2007 and 2 per cent of the total emigrants passed away while abroad.
Table 46. Socio-economic status of the household respondents who left RA before 2007 by gender
Male FemaleEmployed (including self-employment) 89.8 10.2Pupil/student 58.6 41.4H/H keeper 2 98Pensioner/ allowance, beneficiary 45.5 54.5Under care 57.5 42.5Jobless 85.6 14.4Other 90.9 9.1Average total 82.2 17.8
21Rossi-Longhi, Pier, Therése Lindström and Kristina Galstyan for the International Organization for Migration, “Review of Migration Management in the Republic of Armenia. Assessment Mission Report.” International Organization for Migration / Yerevan: Lusakn Publishing (2008)

78
The data corroborates that 35.3 per cent of the emigrants who left before 2007 had a general secondary education (compared to 37.3% of the average RA population in the sample); 2.3 per cent had a diploma from a vocational (college) education (2.2% of the average RA population in the sample); and 18.6 per cent, a secondary specialized diploma (compared to 18.5% of the average RA population in the sample).
Table 47. Education Status of the return migrants
Average Total RA
Return from abroad
immigrants Internal migrants
Emigrants %
Emigrants that left
before 2007Primary and lower
10.4 5.2 18.7 7.7 3 9.6
Basic school (grades 8-9)
9 8 21.3 4.8 5.5 10.7
General secondary
37.3 41.7 27.8 32.2 49.8 35.3
Vocational (college)
2.2 3.1 0.9 1.8 3 2.3
Secondary specialized
18.5 21.5 11.1 17.7 20.9 18.6
Tertiary 22.1 20.6 19.4 35.1 17.2 23.2Post-graduate 0.4 0 0.9 0.8 0.6 0.2
Departure of the surveyed households emigrants from RA (those who left before 2007)
Armenia has a very significant and ancient diaspora that is estimated at around 8 million people, compared to a national population of just over 3.2 million in 2010. This diaspora population includes many generations of migrants and refugees and the most recent flows of people born in Armenia are still substantial: 870,200 migrants were registered as living out of the country in 2010 (28.3% of the total population) (European Training Foundation 2013).
Armenia gained independence from the Soviet Union in 1990 and like most former Soviet republics, experienced significant emigration immediately after independence, primarily of ethnic minorities (mostly Russians). In 2010, the population of Armenia was estimated at 3 million, a decline of almost one million since independence.
According to the survey data, the date of departure of the surveyed households emigrants from RA who left before 2007 is represented by the following proportions: 36.4 per cent left the Republic of Armenia between 1991 and 1999 (of those, 62% were male migrants); 46.5 per cent left the Republic of Armenia between 2000 and 2006 (of those, 59% were male migrants).From those who moved before 2007 (n=1.924), 77 per cent moved to the Russian Federation (61% male migrants); 14.8 per cent moved to other marzes or abroad (55% male migrants); 6.3 per cent moved to the USA (53.3% male migrants) and 1 per cent to NKR (67.9% male migrants). The marz/country of destination for less than 1 per cent is not mentioned.

79
Household members who left the household in a permanent condition after 2007
We also have information on household members who left the household permanently after 2007 (n=470 or 1.5% of the HH members sample total). Of those, 470 individuals, 28 per cent undertook migration and among those, in 93 per cent of the cases, this corresponded to only one migration trip (3% were involved in 2 migration trips; 4% in 3 migration trips). This data suggests a low level of circularity or at least that there are no records specifically pertaining to a migration circular process.
Future migration plans
Future migration plans seem to be dependent on the social and economic development both of the Republic of Armenia and the host country. For 37.8 per cent of the respondents the intention is to return in 2013; 5.1 per cent intend to return in 2014; 10.8 per cent will return eventually (we must underline that a total of 54.7 per cent of the respondents have return plans). For 22.7 per cent it will depend on how the situation progresses; 12.7 per cent are considering not returning to RA; 5.1 per cent have plans to reunite with the family in the host country; a small number (0.2%) is considering re-emigrating to a different host country.
Figure 12. Contemporary emigrants’ future plans
The main causes for return are family related causes; that is, family reunification (34.9%); marriage (5.7%); other family circumstances (9.9%); the accomplishment of the migratory project (22.8%); lack of work in the host country (12.9%); job offer in RA (3.8%); bad working conditions (3.7%); education or qualification (0,5%) other causes (4,9%).

80
Figure 13. Main causes for return
Change in the Social Status of the Migrant Sending Households
It is expected that immigrants improve their occupational position over their migration cycle. This suggests that out-migration favours those in the upper part of the skill distribution. On the other hand, the percentage of those in the intermediate category increases slightly, while those classified as low skilled remain roughly stable.

81
Chapter 5 - Characteristics of return migrants
This chapter will present statistical data on those members of the household who have returned to Armenia but had been residing in a foreign country for more than three months during the period 2007 to 2013. An important amount of the data and socio-economic description has common characteristics with the previous chapter, meaning that current migrants and returned migrants share different patterns and characters, displaying the continuity of the out-flow movements. Nonetheless, data presented in this chapter is collected directly from returned migrant respondents while in the previous chapter it was normally collected from proxy respondents.
Armenia has a long history of migration, and return has always been part of its migration cycle. However, as is the case in the overwhelming majority of countries, Armenia does not record returned migrants. As a consequence, there are few statistics available for deriving a comprehensive and accurate appreciation of the return phenomenon22.
Demographic characteristics of the returned migrants
In this household survey there was a set of questions on the issue of return migration (see section 3 of the questionnaire in annex) and it is possible to draw some extrapolations on the profile of returnees. Return migration describes a situation where migrants return to the Republic of Armenia, usually of their own choice, often after a significant period abroad. There were 2.7 per cent of the household members directly associated to a return from abroad (n=828). The share of emigrants who returned was 37.8 per cent of the out-migration flows in the period 2007 to 2013, corresponding in a weighted sample to 82,530 individuals. These numbers suggest that return migration is quite substantial and return should be addressed directly by policies designed for improving the success of this migratory in-flow.
According to previous surveys, the return to Armenia was mainly affected by “push” factors in host countries rather than “pull” factors in Armenia. Returnees to Armenia seem to have diverse socio-economic backgrounds and migration experiences. Among returnees one can find students, labour migrants (high-skilled, low-skilled, seasonal), migrants that moved with the intention of permanent residence, rejected asylum seekers, irregular migrants, retired persons, and so on.
As expected, the returns correspond, as far as gender imbalance is concerned, to the departures of migrants. A total of 66 per cent of the returned migrants were males, confirming the bias towards males in the out-flows of the Republic of Armenia.
22Chobanyan, Haykanush (2012) Return Migration to Armenia: Issues of Reintegration, CRIS Brief, 2012/01, Robert Schuman Centre for Advanced Studies, European University Institute, Florence.
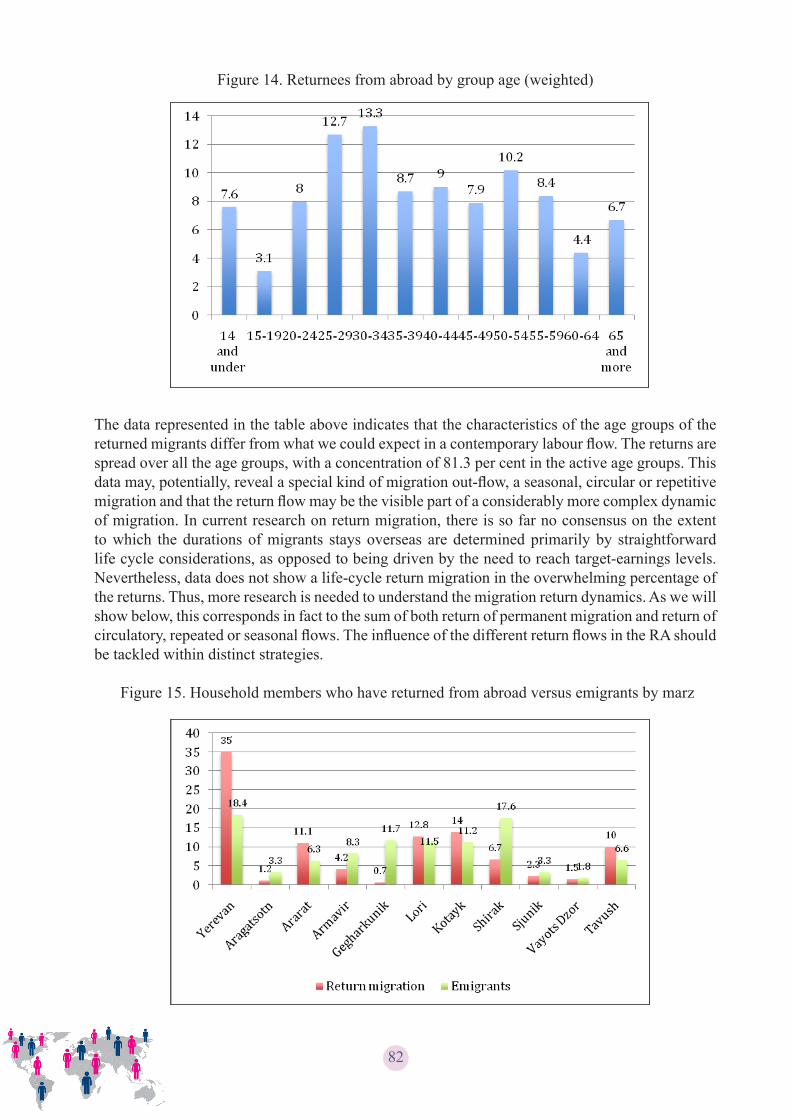
82
Figure 14. Returnees from abroad by group age (weighted)
The data represented in the table above indicates that the characteristics of the age groups of the returned migrants differ from what we could expect in a contemporary labour flow. The returns are spread over all the age groups, with a concentration of 81.3 per cent in the active age groups. This data may, potentially, reveal a special kind of migration out-flow, a seasonal, circular or repetitive migration and that the return flow may be the visible part of a considerably more complex dynamic of migration. In current research on return migration, there is so far no consensus on the extent to which the durations of migrants stays overseas are determined primarily by straightforward life cycle considerations, as opposed to being driven by the need to reach target-earnings levels. Nevertheless, data does not show a life-cycle return migration in the overwhelming percentage of the returns. Thus, more research is needed to understand the migration return dynamics. As we will show below, this corresponds in fact to the sum of both return of permanent migration and return of circulatory, repeated or seasonal flows. The influence of the different return flows in the RA should be tackled within distinct strategies.
Figure 15. Household members who have returned from abroad versus emigrants by marz

83
The regional distribution of returned migrants differs from the regional distribution of emigrants with a noticeable distinction between regions. One can observe that the Yerevan region receives an average of 35 per cent of the returned migrants but it is only the origin region for 18.4 per cent of the emigrants. Inversely, a region like Shirak receives only 6.7 of the returned migrants but is the origin region of 17.6 per cent of the total emigrants. This data suggest a potential depopulation induced by migratory flows in certain regions and the diverse phenomenon in other marzes of the Republic of Armenia.
Table 48. Education Status of the return migrants
Average total RA
Return from abroad
Return migrants
(weighted)
Immigrants Internal migrants
Emigrants %
Primary and lower
10.4 5.2 4,476 18.7 7.7 3
Basic school (grades 8-9)
9 8 6,607 21.3 4.8 5.5
General secondary
37.3 41.7 34,592 27.8 32.2 49.8
Vocational (college)
2.2 3.1 2,395 0.9 1.8 3
Secondary specialized
18.5 21.5 16,174 11.1 17.7 20.9
Tertiary 22.1 20.6 18,286 19.4 35.1 17.2Post-graduate 0.4 0 - 0.9 0.8 0.6
Since data was collected for both migrants and non-migrant household members, we can compare across groups. Findings from the survey show that returned migrants have a marginally improved education than the average population of RA. The data corroborate that 41.7 per cent of the returned migrants have a general secondary education (compared to 37.3% of the average RA population in the sample); 3.1 per cent have a diploma from a vocational (college) education (2.2% of the average RA population in the sample); 21.5 per cent a secondary specialized diploma (compared to 18.5% of the average RA population in the sample). Nonetheless, based on table 48 one may also hypothesize to be in presence of a generational difference behind the lower education levels of some of the returned migrants in Armenia, particularly with respect to tertiary education as the last diploma achieved when compared with the total sample or with the emigrants sub-sample.
Migration and brain gain and Migration and skill gain
An analysis of the survey data as presented above does not show an exodus of highly educated individuals or the existence of a sharp brain drain, at least in recent years. Nevertheless, neither does there appear to be a brain gain present in the return flow. There is no evidence in the data that returned migrants received education or training in the host country of destination. As we can observe in the table 49 below, only a small percentage of Armenian returnees studied and/or attended formal training abroad. Of those, around 2 in 5 attended a college, university or post-graduation education.

84
Table 49. Education acquired abroad by returned migrants from Armenia (%)
Frequency Frequency Weighted PercentSchool 53 5,117 6.6Vocational college 2 286 0.2College 5 396 0.6University 13 1,728 1.6PhD 2 226 0.2Short-term courses 11 1,002 1.4N/A 717 72,868 89.3Total 803 81,623 100
As regards a potential skill gain, one in two of the HH respondents who had returned from abroad declared that they had increased their professional knowledge and skills while abroad (for 15.5% increased significantly; 36.9% increased to some extent). For 47.5 per cent, their professional knowledge and skills had not increased while abroad.
Returned migrants’ network in the country of destination
A total of 78.5 per cent of the interviewees that returned from abroad (n=766) had relatives / friends in the country of destination before leaving the Republic of Armenia, which is an indication of a potentially strong support network. This support network is visible in the type of assistance they received: 29.6 per cent had help to find a job; 24.2 per cent, assistance to find a domicile; 18 per cent had assistance on the travelling costs; 13.7 per cent, for food or an abode; 1.4 per cent, support in getting a visa and 0.5 per cent, other kinds of assistance. Only 12.6 per cent had no help at all.
Table 50. Assistance from relatives/friends during the migration initial phase
PercentYes, getting a visa 1.4Yes, traveling costs 18Yes, for food/abode 13.7Yes, to find a job 29.6Yes, to find an abode 24.2Other 0.5No 12.6Total 100
The decision to migrate was in most cases taken by the individuals themselves (52.5%) and in 46.6 per cent was part of a family migration project.

85
Table 51. Nature of support of the migration trip (%)
PercentH/H savings 39.3Selling assets 4.6Uncompensated care 16.6Property mortgage/credit 1Bank loan 3Debt 26.1Employer 6.4Other 2.5Total 100
As indicated in the Table 51 above, 39.3 per cent of the returned migrants supported their migratory trip with household savings, 26.1 per cent financed their trip through debts, 16.6 per cent through uncompensated care, 6.4 per cent were backed by the employer, 4.6 per cent supported their trip selling assets, 3 per cent with a bank loan and 1 per cent obtained funds for the trip throughout a property mortgage or credit.
Figure 16. Reasons for departure (return migrants)
If one compares different migration groups, the push factors remain equivalent giving us the confidence to define the economic conditions in the home country as the main reason to migrate.

86
Figure 17. Reasons for departure (comparing return migrants; potential migrants; emigrants)
Host countries before return
The main reasons to choose a specific destination country were also the object of a set of specific questions regarding the returned migrants. When the main options chosen by respondents were added, the results show the prevalence of a network migration (existence of a network of friends and/or relatives in the destination country) in 40.5 per cent of the occurrences. Also worth mentioning is the labour market appeal (job offers determined 21.9% of the elected destination); the language burden (knowledge of the language explains 11.7% of the destination country’s option; absence of entry visa (5.7%); or the nonexistence of alternatives (6.3%). A previous residence experienced in a destination country explains the recurrent preferred destination for 3 per cent of the household respondents.
Figure 18. Main reasons to have chosen a specific host country in the case of the return migrants (%)
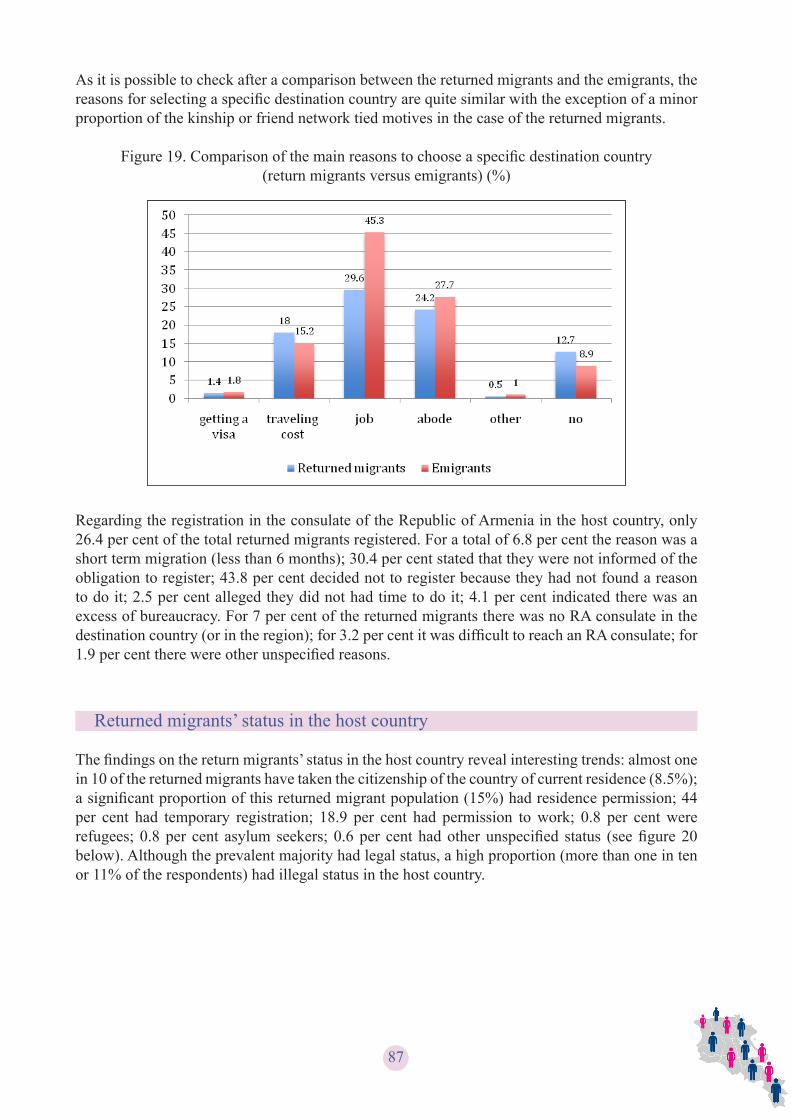
87
As it is possible to check after a comparison between the returned migrants and the emigrants, the reasons for selecting a specific destination country are quite similar with the exception of a minor proportion of the kinship or friend network tied motives in the case of the returned migrants.
Figure 19. Comparison of the main reasons to choose a specific destination country(return migrants versus emigrants) (%)
Regarding the registration in the consulate of the Republic of Armenia in the host country, only 26.4 per cent of the total returned migrants registered. For a total of 6.8 per cent the reason was a short term migration (less than 6 months); 30.4 per cent stated that they were not informed of the obligation to register; 43.8 per cent decided not to register because they had not found a reason to do it; 2.5 per cent alleged they did not had time to do it; 4.1 per cent indicated there was an excess of bureaucracy. For 7 per cent of the returned migrants there was no RA consulate in the destination country (or in the region); for 3.2 per cent it was difficult to reach an RA consulate; for 1.9 per cent there were other unspecified reasons.
Returned migrants’ status in the host country
The findings on the return migrants’ status in the host country reveal interesting trends: almost one in 10 of the returned migrants have taken the citizenship of the country of current residence (8.5%); a significant proportion of this returned migrant population (15%) had residence permission; 44 per cent had temporary registration; 18.9 per cent had permission to work; 0.8 per cent were refugees; 0.8 per cent asylum seekers; 0.6 per cent had other unspecified status (see figure 20 below). Although the prevalent majority had legal status, a high proportion (more than one in ten or 11% of the respondents) had illegal status in the host country.

88
Figure 20. Return migrants status in the host country
Once again, the differences between the out-flow (emigrants) and the in-flow (return migration) are very insignificant, showing a pattern of the migratory flows from the Republic of Armenia, namely, with a high proportion of temporary migration and a relevant proportion of illegal migrants in host countries.
Figure 21. Comparison of return migrants versus emigrants’ status in the host country
While in the host country, the household respondents who had returned from emigration, normally resided in rented apartments/houses (30%); with acquaintances or relatives (29%); rented rooms (19.7%); dormitory (7.3%); personal house (6.7%); non-residential accommodation (5.4%) and other, unspecified, abodes (1.8%). The overwhelming majority of the returned migrants did not have health insurance when residing abroad; 13.7 per cent had temporary health insurance and 8.2 per cent had permanent health insurance.

89
The health status, at the time of leaving for abroad, was declared as good by 55.6 per cent of the return migrants household respondents; as satisfactory by 30.9 per cent; as excellent by 10.4 per cent and as bad by 3 per cent of the interviewed HH members. After their return, their health had deteriorated, as only 9.4 per cent of the respondents declared that they are in excellent health; 49.6 per cent, good health; 30.8 per cent, satisfactory and 10.2 per cent stated they were in bad health.
Economic insertion in the country of destination
A total of 70.4 per cent of the questioned HH members had the intention to work abroad before leaving the Republic of Armenia. The evidence of a labour migration flow is, once more, confirmed by the fact that, of those household respondents, 58.3 per cent had a promise of a job before leaving the RA; 5.9 per cent had a written agreement to work and 0.7 per cent had other arrangement to get a job. 34.9 per cent of the interviewed respondents did not have any kind of job offer or agreement.
As we recognize from figure 22, those arrangements came from foreign employers, intermediaries or foremen in 70 per cent of the occurrences. The foremen or intermediaries, the private and public agencies in the Republic of Armenia were reliable for 24.6 per cent of the job arrangements. Figure 22. Support received from family/friends in the host country before departing for the RA
For 5.4 per cent of the total, these job arrangements were not carried out. For 40.9 per cent of the household respondents they were fully carried out; for 38.3 per cent, basically carried out; and for 15.4 per cent, at least partially carried out. The cause of failings was attributed to an unforeseen situation in 40.3 per cent of the events; to the employer in 29.2 per cent or to the intermediary in 23.6 per cent of the incidents.
A total of 36.3 per cent of the returned migrants of the surveyed households had no job for the full 6 months before the survey and 40.6 per cent worked the full 6 months. If we add the pensioner/beneficiary (5.9%) to the last group, we realize that bread-earners totalize less than 50 per cent of the returnees. In

90
total, only 13.4 per cent of the jobless emigrants were not looking for a job in the 6 months before the survey; all the other complementary 86.4 per cent were actively trying to find a job opportunity.
Table 52. Returnees’ socio-economic status before leaving the Republic of Armenia and after return (%)
Before leaving RA After returning to RA
Employee in public sector 8.9 2.0Employee in non-public sector 15.7 86.7Employer 0.6 0.8Own-account worker in agricultural sector 7.4 10.2*Own-account worker in non-agricultural sector
5.3
Unpaid (contributing) family worker 2.7 0.2Pupil/student 8.5 -H/H keeper 5 -Pensioner / beneficiary 5.9 -Under care 4.8 -Jobless 35.1 -Total 100 100
*own-account worker without division between sectors
Of those interviewed that were employed in the host country, only 22.9 per cent had a written contract and three in four worked deprived of a contract, that is, laboured in the informal or shadow economy. Moreover, the state authorized body did not register 63.6 per cent of the activity exerted, steering these migrants into a difficult situation in case of accident, labour abuse or dismissal.
The increase in employment probabilities was quite intense for this group of returned migrants. Though, prior to returning, 7.8 per cent had had temporary work of less than 3 months; 48.4 per cent had a temporary contract of less than one year and 42.6%, a termless contract. Comparisons between the nature of work before and after migration show interesting changes (see figure 26 below). The transition from short-time employment to a less precarious job seems to be very clear.
Figure 23. Comparison between the nature of work before leaving RA and at host country (%)

91
Before leaving the Republic of Armenia, 60.7 per cent of the migrants worked in the construction sector; 10.2 per cent in trade and repair; 8.6 per cent in industry; 1.4 per cent in education; 1.2 per cent in agriculture; 0.8per cent in public administration and 16.6 per cent worked in other services. Comparisons between the sectors of employment before leaving the RA and at the host country show transference from agriculture to construction as the most noticeable fact (see figure below).
Figure 24. Comparison between working sectors before and during migration (%)
In 23.8 per cent of the respondents, as to their employment in the host country (n=488) the job they had matched fully their profession; in 19.3 per cent of the cases it matched at least partially; in 12.1 per cent it was above their profession and in 21.5 per cent there was a professional devaluation. In 23.4 per cent of the cases they stated that they did not have a profession before emigration.
As regard to qualifications, for 38.7 per cent of the household respondents the job matched fully and for 35.7 per cent, partially. In 22.1 per cent of the cases, the job they had was below their qualification and in 2.0 per cent of the cases beyond their qualification. It seems, much like recent emigrants, that many of the respondents saw migration as an alternative to unemployment in their home country or an alternative to the lack of opportunities for the skills they have developed.
There is also information in the survey concerning the weekly working hours. 4.4 per cent of the household respondents worked between 4 and 35 hours a week; 12.5 per cent, between 36 and 40 hours a week; 25.5 per cent, between 41 and 50 hours a week; 24.5 per cent, between 51 and 60 hours a week; and 25 per cent, more than 61 hours a week. 7.9 per cent decided not to respond to this question. A comparison between weekly working hours, before and after leaving the RA, show evidence of an increment in the number of working hours in absolute terms and in percentage.

92
Figure 25. Comparison between weekly working hours in the RA and in host country
A total of 34.4 per cent of the respondents had a day-off regularly; 44.1 per cent had a day-off but not regularly and 20.7 per cent of the respondents almost never had a day off from work.
There is a broad range of salaries gained by emigrants in the host country, between 0 and 4.000.000 Armenian Dram or 0 and 7.000 dollars (USD). As expected, there were a very large number of individuals, who did not answer this question, either in AMD or in USD (an average of four out of five refused to answer or declared a zero wage). As regard to the same question in Roubles (RUB) two out of three of the total respondents did not answer this question or declared a zero wage. There is a broad range of salaries earned by emigrants in the host country between 0 and 45.000 RUB. Within the same question but in Euros (EUR), 98.8 per cent have declared zero as income. Taking into account the small number of respondents it is not possible to get strong indications due to the dispersion of declared revenues.
From the respondents, 11.3 per cent were self-employed; in 9.8 per cent of the total, the employer was an Armenian compatriot; in 49.2 per cent a local compatriot; in 24.2 per cent a local resident or local institution; in 4.7 per cent the State and in 0.8 per cent other unspecified employers.
The respondents found their jobs through foreign acquaintances or intermediaries in the host country in 44 per cent of the total; through acquaintances or intermediaries in the RA in 19.6 per cent of the total; through a foreign employer in 13.1 per cent of the total; through a foreman in the RA in 4.2 per cent; through a foreign agency in 2.7 per cent of the cases; through their own or family business abroad in 2.3 per cent; through an employer living in the RA; through the internet 1.3 per cent; through a foreign state agency 1.1 per cent; a private agency 1 per cent; other, unspecified, 2.7 per cent of the total; the employment was found through the RA public employment service in the case of just one individual.
94.3 per cent of the respondents did not have any social or economic income apart from the one coming from labour during their stay abroad (that is, pension, allowance, income from property rent, etc.).
The total revenue was insufficient to generate any savings in 47.9 per cent of the household respondents (2% stated that they had debts because of their very low income). For 8.2 per cent

93
of the respondents the revenue was enough to generate savings; 29.6 per cent stated that it was partially possible to save some money; 8 per cent of the respondents could save only very few money from their income.
Among the expenditures of the earnings mentioned above, the largest portion was for current household needs (40.8%). A considerable portion of the expenses corresponded to communal expenses (13%) or to social needs such as education, health and so on (9.1%); unforeseen circumstances accounted for 7.6 per cent of the disbursement and savings corresponded to 11.5 per cent of the revenue.
Figure 26. Spending of the HH income while in the host country (%)
Problems abroad
63.3 per cent of the respondents had no problems related to their work abroad. Nevertheless, 15.6 per cent had salary delays or were paid partially; 9.2 per cent had hard working conditions; 8.7 per cent were working without receiving any salary.

94
Figure 27. Problems linked to work in destination countries (%)
The prevalent majority of the returned migrants declared that they did not have problems while abroad (86.2%). From the remained respondents, 5.1 per cent had problems with the police in the host country; 3.1 per cent had problems with their employer and health problems accounted for 1.6 per cent of the total.
In 38.7 per cent of the cases, these problems were solved by acquaintances among the locals in the host countries. For 21.7 per cent these problems were not solved at all. In 12.3 per cent of the cases, problems were solved by the employer and in a small number of cases by court intervention (6.6%) or by the police (7.5%).
Figure 28. Institutions that helped in the solution of problems while abroad (%)
0 0

95
For 54.7 per cent of the respondents receiving a consultation on legal issues, existing risks, rights and responsibilities before departure would have been most welcome.
An overwhelming majority of 91.4 per cent of the respondents did not participate in any integration program provided by the state (e.g. language courses, vocational trainings, etc.) during their residence abroad.
A total of 77.2 per cent of the respondents did not feel that they needed any kind of support from Armenian compatriots while in the host country. When support was needed, 13.7 per cent did not look for help inside Armenian communities; 1.3 per cent turned to the Armenian communities when facing problems but did not get support and in 2.1 per cent of the cases, they got the support they needed. For 13.7 per cent there was no Armenian community in the host country.
Reasons for return
The decision to return seems to be strongly associated to family (56.1% of the total) rather than to the income opportunities in different countries (see figure 31 below). It seems that return migration becomes utilitarian in the context of the household decision. Return is also happening over a finite life cycle when the migratory project is complete (20.9%). Households also choose the length of stay overseas that balances the marginal benefit from higher savings overseas (and thus higher lifetime consumption) against the marginal utility cost of overseas work. This means for certain migrants a very short, temporary, seasonal or circulatory migration, with repetitive returns and to others a period (brief or long) depending on the financial needs and expectations of the household (see also the chapter on remittances).
Figure 29. Main reasons for return (%)
The evaluation of the migratory project in terms of competitiveness in the RA labour market after return is not, on average, optimistic. For 47.5 per cent of the respondents their competitiveness in the labour market has not improved; for 18.3 per cent it seems not to have improved. For 13.4 per cent of the respondents the migratory project corresponds to a competitive gain in comparison with the RA labour market and 20.1 per cent believe that it was rather positive.
1

96
One of the major problems faced by return migrants is the lack of information, which turns into an obstacle for return and resettlement. This information can be reciprocally advantageous but one needs to build a structure of data collection.
Only 30.4 per cent of the returned migrants informed the RA Police Passport and Visa Department about their return.
Information about the reasons not to communicate their return is very explicit and explains the different profiles of the returned migrants; namely, 8.2 per cent were temporary migrants (absent from the RA for 6 months or less); 43.3 per cent felt that there was no sense in communicating the return; 38.9 per cent of the respondents said that they were not aware that they had to formally communicate their return; for 0.6 per cent it was too bureaucratic; 5.3 per cent had no time to do it and in the case of others, no reasons were presented (2.8%).
The overwhelming majority of the respondent returnees had found a job after 6 months.ly 5.9 per cent were still looking for one, in comparison with a departure proportion of 72.3 per cent at the exact moment of return to the RA. One in five had no job and was not looking for one after 6 months.
Figure 30. Unemployment, employment and job search after return (%)
For 52.7 per cent of the returned migrants, their situation had not changed after return; it had worsened for 32.8 per cent; it had improved for 12.8 per cent and had basically improved for 1.6 per cent of the migrants returned to the Republic of Armenia.
A prevalent majority had no difficulties in Armenia after the return (67.1%) and 14.9 per cent had just a few problems. For 8.1 per cent the return was problematic and for 9.8 per cent rather problematic.
The major problems in readapting to Armenia were related to the reintegration in the labour market (46% answered that problems were highly related to work) and to leisure capabilities (24.8% stated that the problems they had were highly related to leisure capabilities). (See figure 31 below).
2

97
Figure 31. Rank of difficulties while readapting to the RA (5)
Scale = from “1” (highly related) to “5” (not related)
Reintegration programs
79.6 per cent of the returned migrants had never heard about reintegration programs aimed at returned migrants and 99.4 per cent had never been involved in a single one of the programs. Of those who were aware, 11.6 per cent did not participate because they thought that the existing programs were either not useful or interesting; 3.3 per cent because the conditions were not satisfactory; 3.3 per cent were not informed in due time.
Confronted with the typology of courses to be chosen from after returning, 47.9 per cent thought that none of the courses offered would be useful; 15.5 per cent considered that the crafts courses would be useful; 14.8 per cent, the business and management courses; 11.4 per cent, the informatics courses and 9.5 per cent, the language courses.
Figure 32. Kind of courses useful for the returned migrants (%)
3
4

98
Chapter 6 - Characteristics of migrant populations (in-flows) (including NKR) – (immigrants)
This chapter will focus on the findings of the field survey on the socio-demographic and economic characteristics of the migrant population (in-flows).
In this household survey there was a set of questions (37 in total) on the issue of migration in-flows (see section 5 of the questionnaire in annex). Selectivity of immigrants can be seen through demographic and socio-economic characteristics compared to similar characteristics from non-migrants at the destination country, or to the other migratory flows.
A very small number of respondents arrived from abroad for the first time (specifically, immigrants and Armenian descendants born abroad) totalling 129 individuals corresponding in a weight sample to 14,312 individuals. This very limited number of respondents has, as expected, statistical consequences in many of the variables, not allowing a deeper analysis.
Of the total number of respondents, 41.2 per cent were males (corresponding to 5,893 individuals in a weighted sample) and 58.8 per cent were females (corresponding to 8,419 individuals in a weighted sample).
As we can observe in the next figure, a comparison between the different migration flows shows a very distinct gender composition with an inversion of the prevalence of the males (linked to international out and in flows of Armenians) and to internal migrants or the in-flow from migrants to RA.
Figure 33. Comparing gender composition of the different migration flows (%)
The flows into the Republic of Armenia show a distinct pattern in relation to the other migration flows in this research survey concerning their geographical distribution. The majority of the overseas-born persons have moved to Yerevan, Ararat and Tavush. Nonetheless, as shown by Figure 34, Yerevan is the prevalent destination for in-flows (45% of the total).
5

99
Figure 34. Household members who first arrived from abroad after January 2007, by marz
When comparing the different migration flows in the Republic of Armenia, differentiations begin to appear (see figure 35 below). Yerevan emerges as the main destination for in-flows (immigration and return migration) but not as the prevalent destination for internal migration. Ararat is the second destination for immigrants and Kotayk is an important destination for internal migration.
Figure 35. Regional distribution of migrants within the Republic of Armenia (%)
The distribution of households by size differs sharply between migratory flows as shown in the next figure. Among foreign-born households, about the same proportion had 1 member (4.3%) and 8 or more members (5.5%). Two in three households had between 3 and 5 members.
6 6

100
Figure 36. Comparative household sizes (persons in the household)
The decision to migrate to the Republic of Armenia was in 34.3 per cent taken by the individuals themselves and in the remaining 65.7 per cent, it was a family decision.
Among the foreign-born surveyed, only 43.3 per cent were married, the smallest proportion among all the surveyed migration groups. One explanation can be found in the age composition of this migratory flow (as shown below).
Figure 37. Comparison of the marital status among migration flows (%)
Characteristics of household respondents migrated from foreign countries
An analysis of the immigrants’ age groups revealed a first profile on the different contemporaneous in-flows to the Republic of Armenia with a high concentration of immigration among young age groups
7 7

101
(0-24) and a lower number of occurrences in active age groups (25-59). In fact, in a prevalent number of cases this in-flow is not directly linked with an immigration flow but it is the result of a return of second-generation emigrants, born abroad and returning with their parents to the Republic of Armenia. A total of 13.2 per cent of the newcomers were born after 2007. This, in part, reflects the past migratory history of the RA and, simultaneously, the geo-political insertion of the country in a post-conflict region.
Figure 38. Household members who first arrived from abroad after January 2007, by age group (weighted)
The share of pre-secondary respondents is disproportionate compared to the average of the RA and to the other migration groups under analysis. This dichotomy in educational attainment between the native and the newcomer populations is likely to narrow in the future, if the in-flow population is integrated in the RA educational system.
Table 53. Education Status of the internal migrants (%)
Average total RA
Return from abroad
Immigrants Internal migrants
Emigrants
Primary and lower
10.4 5.2 18.7 7.7 3
Basic school (grades 8-9)
9 8 21.3 4.8 5.5
General secondary
37.3 41.7 27.8 32.2 49.8
Vocational (college)
2.2 3.1 0.9 1.8 3
Secondary specialized
18.5 21.5 11.1 17.7 20.9
Tertiary 22.1 20.6 19.4 35.1 17.2Post-graduate 0.4 0 0.9 0.8 0.6
From a political perspective, it is important to receive international migrants with educated and skilled persons for the future development of the country. In the case of the in-flows to the RA, data shows an interesting proportion of post-graduate individuals (0.9%). This is above the average of
8

102
the RA. However, as expected, due to the age distribution of immigrants, the prevalent majority of the respondents can be found in the secondary or primary segments (see figure 38 above).
Figure 39. Educational institution attended before arrival in RA
Regarding educational institutions attained before arrival in the Republic of Armenia, as shown by figure 36, the prevalent majority did not provide any information. From the small proportion of respondents (one third) responding to this question: 5.6 per cent attended a university; 1.2 per cent a college and 28.4 per cent a school.
Citizenship versus nationality of the newcomers
As noted earlier, an important distinction can be made between data resulting from the variables “citizenship” and “nationality”. An unexpected fact coming from the survey reports to the nationality of the interviewed members of the households that migrated from abroad: 34.2 per cent were foreign-born nationals of the Republic of Armenia; 24 per cent of those household members had Armenian nationality and also another one, that is, dual citizenship; 40.7 per cent had foreign citizenship and 1.1 per cent did not have any citizenship.
As for nationality, 97.9 per cent declared themselves as Armenians; 0.7 per cent, Russians; 0.6 per cent, Indians; and 0.8 per cent, other nationalities.
This nationality versus citizenship profile of the newcomers seems to indicate a special type of immigration resulting from previous emigration flows and also as counter-flows from previous migration out-flows (spouses, husbands).
The Republic of Armenia as the destination country
Knowledge on why some people migrate, why they choose a specific destination and how they integrate in the destination society still remains fairly slim. Two general influences on the incentive to emigrate are usually distinguished: “push”, or supply side factors affecting the interest and
9

103
willingness to emigrate and “pull”, or demand side factors that affect the demand for immigrants in the destination country.
In this immigration flow “push” factors seem to be the main factor. An interesting disclosure from data is that geo-political instability generates an important reason to leave the host country (37.4%); an extra 2.8 per cent of politically persecuted persons declared this as the reason for migration. Family reasons are linked to 36.5 per cent of the reasons for emigration; lack of employment or other economic reasons are related to a very small number of respondents.
Figure 40. Main reasons for leaving home country and to migrate to the RA (%)
The rationale to choosing the RA as the destination country is mainly connected to emotional reasons or family (58.2% of the total); in a small number of respondents economic or employment reasons were underlined (4.7%); education or training was important in 4.6 per cent of the total; other non specified motives accounted for 10.3 per cent.
Figure 41. Main reasons to choose RA as destination country
0
1

104
For a total of 65.5 per cent of the respondents, migration to the Republic of Armenia was the only destination available. Further inquiry is needed to understand the reason for this.
Socio-economic characteristics of the population in-flows
The characteristics of the in-flow population differ in some important respects from the previous migrant profiles presented above. An analysis of the data concerning the socio-economic status before arrival to the Republic of Armenia shows a large number of inactivity among the respondents (60.6%); one in five was jobless before migration. Despite the fact that it is too simplistic to stress a relationship between immigration, inactivity rate and unemployment, one should expect a higher number of labour migrants in a migration inflow. These features also direct us towards a hypothesis: this flow is a counter flow of historical emigration movements rather than a labour migration flow.
Table 54. Socio-economic status before arrival in Armenia
Frequency Frequency weighted PercentEmployed in public sector 5 742 3.9Employed in non-public sector
10 1,466 7.8
Employer 1 61 0.8Own-account worker in non-agricultural sector
15 1,908 11.6
Unpaid (contributing) family worker
2 221 1.6
Pupil / student 41 4,461 31.8H/H keeper 5 494 3.9Pensioner / allowance beneficiary
4 506 3.1
Under care 26 2,211 20.2Jobless persons 20 2,244 15.5Total 129 14,314 100
The monthly average salary of the foreign-born in the home country was below 200 USD/month for 89 per cent of the respondents. We should note that there are a large number of questions related to revenue, with a very high non-response rate.

105
Figure 42. Monthly average salary in home country (in USD)
Regarding other sources of income abroad, only 8.3 per cent of the foreign-born respondents received a pension, allowance, income from properties, etc.
Among the foreign-born the entire revenue was insufficient to generate any savings in 54.7 per cent of the immigrants’ household respondents. For 17.5 per cent of the respondents the revenue was enough to generate savings; 20.8 per cent stated that it was partially possible to save some money; 6.2 per cent of the respondents could save only very little money from their income. As to the existence of a work contract or a promise before leaving the country of origin, 96.1 per cent of the foreign-born respondents had no contract or promise; 2.5 per cent had only a promise of a work contract and 1.4 per cent of the foreign-born respondents had a written contract.
Figure 43. Last 6 months labour insertion in RA (%)
2
3

106
Each and every one of the foreign-born respondents, if employed, was working in the non-public sector. Of those, 78 per cent had no written contract. 72.5 per cent of the contracts were not limited in time and in 27.5 per cent of the cases, they were temporary (less than one year).
Figure 44. Sectors of employment in RA (%)
Of those foreign-born employed, 55.5 per cent had a job in construction and 44.5 per cent in trade and repair, the only two sectors mentioned. 49.4 per cent of the respondents had no profession. For 22.6 per cent their job matched their profession and for 28 per cent, it did not match.
For 72 per cent of the foreign-born respondents the job matched at least partially their qualification and for the remaining 28 per cent it was below their qualification. Furthermore, for 49.4 per cent the job was basically satisfactory; for 22.6 per cent it was fully satisfactory and for 28 per cent was not at all satisfactory.
A total of 55.5 per cent of the foreign-born declared that they worked 48 hours a week; 22.6 per cent worked 50 hours a week and 22 per cent worked an average of 54 hours a week.
All the working foreign-born respondents (100%) stated that they had days off but not regularly.
A total of 27.5 per cent of the foreign-born respondents earned up to 50.000 AMD on average per month without taxes; 28 per cent earned up to 60.000 AMD on average per month; 22 per cent earned up to 120.000 AMD on average per month; 22.6 per cent did not answer this question.
For 90.4 per cent of the foreign-born respondents, the salary was the exclusive source of income and for 94.5 per cent it was not possible, with this income, to save any money.
3

107
Figure 45. Institution that help to find a job in RA (%)
Intermediaries in the Republic of Armenia (28.8%); employers living in the Republic of Arme-nia (16.3%) and foreign intermediaries or foreign friends were the main intermediaries between jobseekers and the labour market in the RA.
Legal status and relation with the RA authorities
Regarding the legal status of the foreign-born in the Republic of Armenia: 41.3 per cent are citizens of RA; 17.4 per cent of the foreign-born applied to receive RA citizenship; 4.8 per cent of the foreign-born possess a residence permit; 2.5 per cent have the right to work; 14.5 per cent of the foreign-born have a temporary registration and 17.6 per cent of the foreign-born (corresponding to a weighted value of 1,787 individuals) do not have a legal status.
Figure 46. Legal status in the Republic of Armenia (%)
4
5

108
A total of 42.9 per cent of the newcomers informed the Ministry of Diaspora upon their arrival; 40.4 per cent, the Visa and Passport department of police; and 15 per cent of the total foreign-born newcomers did not informed the RA authorities.
A large number of foreign-born individuals (98.9% of the respondents) answered that they never had problems in the RA, but the small number of respondents that had problems solved them with a gift/bribe.
For the majority of the foreign-born respondents, the migratory project in the Republic of Armenia was fully successful (22.6%) or at least partially successful (39.2%). A total of 35.7 per cent of the respondents declared that the migratory project was not so fruitful or that it was not really rewarding (2.5%). A prevalent majority of the foreign-born (48.2%) had no difficulties to adapt to the RA; 4.2 per cent had small difficulties; 23.3 per cent had medium difficulties and 24.3 per cent had serious difficulties.
Figure 47. Problems encountered in adapting to RA (%)
Scale = from “1” (highly related) to “5” (not related)
The major problems the foreign-born found in adapting to Armenia were related to integration into Armenian society (64.9 per cent answered that problems were highly related to adaptation in general); to education (54.9 per cent) and to leisure capabilities (48 per cent stated that the problems they had were highly related to leisure capabilities). (See figure 47 above).
6

109
Chapter 7 – Remittances, their usage and financial prosperity
This chapter will focus on the findings of the field survey on remittances, namely: amount remitted to households in Armenia; amount remitted from Armenia; frequency of remission; method of remitting; usage (for consumption, education, improvement of housing conditions, for re-migrating, for investing into own business, etc.); and financial behaviour and entrepreneurship potential. In this household survey there was a set of questions (28 in total) on the issue of remittances and financial prosperity (see section 7b of the questionnaire in annex); 2 questions more in section 3 (returnees from abroad) and 2 more in section 4 (those who are abroad).
The large remittances sent by the RA emigrants to their families back home has helped reduce poverty, furthered human development and eased social tensions. Armenia is among the top-20 countries that receive the highest amount of remittances (in relation to its GDP) (Makaryan and Galstyan, 2012: 7).
In fact, Armenia is unusually dependent on remittances. From 2003 to 2007 remittances accounted for 17 per cent to 24 per cent of GDP, and some 36 per cent of all households in the country are said to have received remittances (ILO 2009). Since its independence, Armenia has sought to safeguard continued emigration through bilateral agreements on migration with four destination countries (Georgia, Russia, Ukraine and Belarus) although implementation is not always effective. It has also signed readmission agreements with ten countries since independence, including several EU member states (European Training Foundation 2013: 6). For instance, Armenia signed a Mobility Partnership with the EU in 201123. In its most simplistic sense, remittances are all the household income obtained from or sent abroad (between resident and non-resident households), regardless of the relationship between sender and receiver. “Household income” not only includes money, but also remittances made in-kind. It is interesting to note that from emigrants point of view remittances are seen as a regular, fixed kind of expenditure. This explains why there is no contradiction with the data presented above regarding the very low number of emigrants who could save any money.
Household surveys can inform us about the characteristics of migrant remittance senders, as well as the characteristics of remittance recipients. These in turn can help measure the impact that remittances have on individuals residing in migrant sending and receiving countries. To measure remittances, the most basic question is whether or not a person (or household) sent or received money (or goods) to or from a person living abroad, normally over a 12 month’ period, as well as the amount received. Additional questions are often asked about the frequency of sending, how remittances were sent as well as information about transactions and what the money was used for.
Monetary remittances include cash sent or given to other people, as well as payment made through money transfers, cheques, etc. through either formal or informal channels. “In-Kind” remittances should include a number of things, such as goods, donations and payments made on behalf of others (Schachter, 2008). Remittances are an integral part of migration and are resilient to any economic recession or business cycle. This financial aid helps individual recipients at the micro-level, as well as governments at the macro-level.
23Taking into consideration the European integration as a political priority for the development of the Republic of Armenia, the mobility facilitation of people and stimulation and intensification of contacts between citizens of Armenia and citizens of the EU as important elements of Armenia’s European rapprochement, we highlight the Joint Declaration on a Mobility Partnership between Armenia and the EU signed on October 27, 2011. Ten EU member states (Belgium, Bulgaria, the Czech Republic, France, Germany, Italy, the Netherlands, Poland, Romania and Sweden) participated. This is a flexible and non-legally binding framework for well-managed movements of people, and it is expected to enhance Armenia’s ability to manage migration, inform, integrate and protect migrants and returnees, as well as to boost Armenia’s capacity to curb irregular migration and human trafficking.

110
A summary of remittances received from abroad by the different migratory flows show different remittance profiles (see figure 48 below). As expected, the remittances received are proportionally higher among the contemporary emigrant households as 78.5 per cent of the households with emigrants received remittances from abroad during the last 12 months. One out of four of the internal migrants received remittances from abroad in the last year; four out of ten of the returned migrants received remittances from abroad in the last 12 months and one out of two foreign-born residents also received remittances from abroad in the last 12 months.
Figure 48. Received money from abroad during the last 12 months by migratory flows (%)
Remittances sent to the RA by current emigrants
When asked if the household members abroad support the household (or other persons living in the RA), the results show that there is a clear dependency nexus (see figure 49 below). Not only did three out of four receive remittances from abroad during the last 12 months but also 47.7 per cent of the HH respondents received remittances on a regular basis; 22.1 per cent received remittances occasionally and 9.1 per cent rarely received money from abroad. Around 15 per cent are not able to help their households; in 4 per cent of the cases it is not necessary and in 0.7 per cent of the total it is the HH in the RA that sends money abroad.
8

111
Figure 49. Frequency of financial support given to HH members by current emigrants
Remittances sent to RA by returned migrants
When we ask contemporaneous returned migrants if they supported the household members while abroad, the results show there is a dependency nexus (see figure 48 above). Two out of four of returned migrants sent remittances to their HH members when abroad. A total of 47.7 per cent of the respondents did it regularly; 13.1 per cent occasionally and 4.4 per cent rarely. Around 15.9 per cent could not help their household; in 11.4 per cent of the cases it was not need and in 0.7 per cent of the total it was the HH in the RA that sent money abroad.
If one compares the configurations of money transfers between present and past emigrants, the picture looks very clearly structured. Nowadays emigrants tend to send money more regularly to their HH (as economic reasons were the main motive for them to leave the RA, this seems normal). For a certain proportion of returned migrants it was impossible to send remittances home (and we can assume that for a portion of those, this was the main reason to return).
9

112
Figure 50. Financial support given to HH members by emigrants versus returned migrants (%)
Ways of transferring financial assistance from abroad
Household survey data can not only help measure the size and trends of remittance flows through measurement of remittances made in-cash and in-kind, but also by determining the means of remittance transmittal, e.g. what percentage of remittances are sent or received via non-bank or informal channels.
Contemporary migrants abroad usually send financial remittances to the Republic of Armenia by bank transfer (82.8%); remittance service providers (like Western Union) (8.5%); by post (0.2%); by courier (0.2%); they carry the money themselves on visits home (3.8%) or they send money by a carrier (4.5%).
Past migrants show a very similar structure. The preferred mode of sending remittances to the households is through the banking channel (79.1%); remittance service providers (like Western Union) (7.3%); by post (0.4%); by courier (0.2%). A proportion of money is also transferred through friends and relatives when they visit the country (5.3%); or carried by migrants themselves on visits home (7.3%). (See figure 52 below). The 2007 ILO survey showed a structure of remittances different from the present survey namely, bank transfers (40.0%); through friends/relatives travelling home (27.5%) and money transfer organizations (18.3%) (ILO 2009).
0

113
Figure 51. Ways of transferring financial remittances from abroad, emigrants versus returned migrants (%)
Households receiving remittances from abroad in the RA
Non-migrants can provide information about remittances received from persons living abroad. In this survey one out of four of the migrant households has received remittances from their migrant counterparts. This corresponds to approximately 25.5 per cent of the internal migrants. This is slightly lower than the state average of 28% considering the total respondents.
Financial remittances, which are received by one quarter of the Republic of Armenia households, have become an important way to improve the socioeconomic situation of many households.
Figure 52. Remittances from abroad received in households (by marz) (%)
1
1

114
Remittances are not broadly distributed across the territory of Armenia (see figure 52 above). There is a large discrepancy between regions: four out of ten households in Tavush received remittances from abroad (40.7%); in Yerevan only two out of ten (19.6%) received remittances from abroad and in Aragatsotn only 16.7 per cent of the households were receivers of remittances from abroad.
Comparisons with the regional distribution of emigrants and/or return migrants show another disproportion in the reception of remittances. Households in regions like Shirak are disproportionally negative receivers vis-à-vis the proportion of emigrants and, contrariwise, HH in regions like Yerevan are positive receivers. This can be linked to overlapped migration flows (e.g. internal migration flows and international migration flows); to different time frames of migration flows from different regions and to different destination countries and to the conjuncture or economic difference in between those destination countries.
Figure 53. Regional distribution of HH linked to emigration, returned migration and HH recipients of remittances (%)
Economic impact of migration remittances
The economic impact of migration remittances can be evaluated by the number of individuals reliant on the money sent from abroad. In the survey, different questions helped to measure this impact but the percentages (or the absolute number of individuals depending on remittances) show a very significant picture regarding the remittance dependency nexus.
2

115
Table 55. Main current sources of HH means of subsistence (%)
Main current sources of HH means of subsistence % Frequency weightedEarnings of HH permanently residing abroad 1.9 61,063Temporary job of HH members abroad 11.2 353,869Support from other persons staying abroad 1.6 49,497Permanent Job in RA 53.4 1,693,534Occasional earnings in RA 4.3 136,158Pension/Benefit 14.7 466,299Support from those living in RA 0.7 23,008Personal business 10.9 346,637Other source 1.3 43,738
For a total of 1.9 per cent of the respondents (61,063 individuals in a weighted sample) the main source of subsistence was the earnings of household members permanently residing abroad. These remittances were a very important source of subsistence for more than 127,000 individuals (or 4%) of the Republic of Armenia population.
For a total of 11.2 per cent of the respondents (353,869 individuals in a weighted sample) the main source of subsistence was the earnings of household members temporary residing abroad. These remittances were a very important source of subsistence for more than 500,000 individuals (or 17%) of the Republic of Armenia population.
A total of 14.7 per cent of the respondents declared that remittances were the main current source of subsistence for their household and for 28 per cent they were a very important source of subsistence; that is, remittances from abroad were an important source of income for more than 870,000 individuals in the Republic of Armenia.
Remittances sent from the RA to a HH living in a foreign country
A very large majority among all migrant groups did not sent money or goods abroad in the last 12 months (see figure below). Even among immigrants (new arrival to the RA from abroad for the first time) the number is very low.

116
Figure 54. Sent money or goods abroad during the last 12 months by group (%)
When asked ‘How many times have you sent money in the last 12 months?’ a total of 68 per cent (returned migrants); 63 per cent of the emigrants and 35 per cent of the internal migrants and 25 per cent (immigrants) of the respondents noted that they had sent money only once. 47 per cent of the immigrants; 34 per cent of the internal migrants; 31 per cent of the return migrants and 22 per cent of the emigrants had sent money abroad to HH members twice. A total of 26 per cent of the immigrants as well as 25 per cent of the internal migrants and 13 per cent of the immigrants had sent money on three occasions.
Figure 55. Frequency of financial support sent abroad to HH members (%)
4
4

117
Use of remittances received from abroad
A less well-known, but potentially more significant, impact of migration on levels of human capital relates to how remittances are spent. The ways people use remittances have traditionally been criticised by development economists because this money is typically used to finance consumption, a practice not considered productive in development terms. In this context, education should have been seen as a productive expenditure, but it rarely figures among the uses of remittances reported by families of migrants.
As expected, most of the remittances are used in consumption and other first need items and services (e.g. medical services). The differences between the distinct migrant groups are not substantial (see figure 56 below). Migrants also occasionally send money for specific purposes, mostly to cover expenses like marriage, pay for medical services, and so on.
Figure 56. Money received from abroad represents an opportunity to...
Only a small part of the respondents received goods from abroad. The variances are not significant amongst all the migrant groups compared with the group of internal migrants - as the group with a lower proportion of receivers (3.7%) - and we found the highest proportion of households receiving goods from abroad among the return migrants.
5

118
Figure 57. Goods received from abroad by migrant group (%)
6

119
Conclusion and recommendations
The growing demand for indicators to monitor and evaluate policies and interventions means that there is an increasing need to communicate research findings to household survey end-users, policy and/or decision makers. This section will discuss key conclusions and policy recommendations based on the survey results.
Migration is increasingly being accepted as a demographic, economic and social factor that contributes to changes in demographic parameters such as size, growth, composition and the geographical distribution of populations as well as to either increase or decrease of economic development and social transformation. In the last few decades, migration, both internal and international, emerged as one of the main factors in development and social transformation in all regions of the world (Castles, 2000; IOM, 2005). The volume, types, flows (directions) into and out of a country, district or sub-district within a country and the causes and consequences of migration have changed over the last decades due to transformations derived from global economic, social and political processes (Skeldon, 1997, 2003; Hass et al., 2010; Castles, 2000).
Migration, both internal and international, has a multifaceted impact on the demographic and socio-economic dimensions of social reality/our lives. As a demographic component, migration affects the size, growth, distribution and composition of a given population. International migration (as well as internal migration) can induce the advancement of economic growth and development but it can also have negative impacts in the economy and development of different territories. In internal migration, for example, there is not a win-win situation. If a region is losing population to another one the effect will be unbalanced and the consequences unpredictable. Migratory movements also influence social changes, social adaptability and social integration, not only of the migrants themselves, but also of their households and, more largely, of the whole population.
This report has shown that migration, both internal and international, can be important not only as a demographic process but also as an instrumental factor for the socio-economic development of the Republic of Armenia. An analysis of the volume, pattern and main features of migration are beneficial for policy makers as well as planners to formulate better policies on socio-economic and political development in the country for the near future. It is widely known that there is a strong link between migration and development in a given country (such as in the areas of education, housing, labour market, etc.) and the evidence collected from this and past migration surveys in the Republic of Armenia suggests that migration (and remittances) are critical for a large proportion of the households in the country.
Reliable migration statistics are vital for policy makers in order to make effective decisions and mitigate the negative consequences of migration. In fact, this kind of information serves the needs of not only of the policy makers, but also international organizations, and individual countries’ statistical agencies and researchers. The “Integrated survey on the migration of the RA population 2007-2013” conducted as part of the “Strengthening Evidence Based Management of Labour Migration in Armenia” (SEBMLM) is an important source of detailed information on migration and remittances in the Republic of Armenia. The data contains a series of demographic, economic, migration and remittance variables that will be a vital contribution to the research and policy making communities.
Among the main caveats of the present survey is the fact that most of the information concerning emigrants was not collected directly from emigrants themselves, but from other, less reliable, persons (proxies). We also need to consider the high rate of non-responses since it complicates a correct evaluation, as well as the situations where the entire household emigrates and thus there

120
is no one left to provide the needed information. Likewise, there were a very high number of household respondents with no connection to migration. Consequently, the coverage of the sample regarding specifically migrants is not optimal, but it can provide us with a picture, non-existent previously, of recent migration and remittances patterns in the RA after 2007.
One advantage of this survey is that it can provide us with a precise sense of the range of options available for policies regarding contemporaneous migration from, to and within the Republic of Armenia. The survey has also identified some data issues and some topics that merit further investigation. It is clear that the study of international migration out-flows suffers from a lack of appropriate datasets. Future research will be much improved if it achieves to better characterize emigration flows and stocks. For instance, it would be very useful to have databases on Armenian immigrants from a selection of destination countries by characteristics of those migrants (e.g. year of arrival, education, gender, age, origin marz in RA, etc.). In order to provide timely and comparable statistical data, a continuous monitoring of emigration, immigration, return and internal migration processes should be established and surveys should be carried with a regular periodicity. Also, a better and focused survey sampling would enable researchers to compare and monitor the different integration phases and migration processes across countries, which is crucial since policy recommendations can differ according to the context. It should be borne in mind that any particular data source not only provides benefits, but also presents limitations. Thus, there is no unique source of data ensuring the amount and quality of the necessary information. Therefore, improvements should be made in the field of combining data from household surveys with data from administrative sources. The establishment of a permanent migration observatory (in order to gather and disseminate reliable knowledge on migration and migrants, their evolution and effects in the Republic of Armenia) could be foreseen by the RA authorities.
In the intra-census period of 2001 and 2011 the resident population fell from 3.2 to 3.0 million persons, with a natural balance of plus 126,000 persons. Yet, the net migration balance shows that there were 320,000 less individuals, corresponding to 10 per cent of the 2001 population. The present survey confirms an outflow of circa 35 thousands individuals per year in the period 2007 to 2013, similar to emigration in the period 2001 to 2007. Major outflows were directed toward the Russian Federation, European Union and USA. The main push factor for emigration is not demographic but overall economic and employment factors. Thus only structural changes in the economy of the country will impact migration trends. Current status of internal and international migration in the Republic of Armenia will benefit from making a proper population projection and a labour force projection for the upcoming period enhancing policy options. Migration policies should not start from the assumption that migration is a rare occurrence, a south–north phenomenon or a one–off event.
As this research has shown, policies need to be based on an understanding of the multifaceted nature of migration, including temporary, circular and seasonal migration. There are temporary migration schemes that work, and schemes that do not work. There are formal temporary migration schemes and, what is most common in the RA, informal temporary migration schemes not evaluated by the authorities. What is not in doubt is that there is a demand for workers in certain countries such as the Russian Federation or the European Union, and demand for employment from people from the Republic of Armenia and this demand takes the form of both permanent and temporary migration. There is a need to examine the evidence, to learn the lessons and to understand what can be done to make long-term migration, temporary migration, and circular migration and return schemes effectively work and deliver development benefits for all involved.

121
Survey findings confirm previous findings in household surveys on migration in the Republic of Armenia and permit a characterisation of recent migration flows. There is a large outflow of Armenian nationals to a diverse number of destination countries, although the Russian Federation is the prevalent destination for nine out of ten migrants. On the contrary, the European Union countries account for less than five per cent of the migration out-flows. Available evidence suggests Armenia is in the intersection of two different migration systems, the European migration system and the Euro-Asian migration system; that is, belonging to both but with distinct scales of incorporation (Kritz and Zlotnik, 1992).
It is our perception that the two main receivers (the Russian Federation and the European Union) should be the main destination of migration agreements namely related to: visa agreement; temporary, repetitive or circulatory migration; social security or pensions24; schooling and education; remittances and taxation; return; highly skill migration; family reunion; visa facilitation and readmission. These can assume the format of bilateral agreements and or projects in cooperation. Working closely with these countries, those initiatives might facilitate legal migration and balance the supply of qualifications and skills in the Republic of Armenia with employment opportunities available in the destination countries’ labour markets.
Furthermore, one way of reducing the proportion of irregular migration from the RA might be to open up more transparent and efficient channels for legal migration. Migration, especially legal migration, can bring several benefits to the destination countries, migrants and to the Republic of Armenia. Nevertheless, whilst opening up channels for legal migration may undercut traffickers and smugglers, it will not satisfy the latent potential for migration from the country. Migration still needs to be managed and illegal migration tackled from the origin.
In order to respond to information needs regarding employment opportunities, employment conditions, housing and schooling in destination countries we recommend the adoption of a Support Centre for Immigrants in the Country of Origin. Its objective would be to support and provide information to potential migrants in the Republic of Armenia (200,000 potential as this survey has shown) seeking, by means of personalized services, to provide useful and up to date information to individuals, ensuring means for legal immigration and establishing the necessary articulation to streamline admission into destination countries. The Support Center for Immigrants in the Country of Origin could function as a bridge between the country of origin and the destination countries, contributing in a direct and practical manner towards the integration of immigrants in those countries. In this regard it is worthwhile mentioning the Migration Resource Centers (MRC-s), which operate in the structure of the Ministry of Labour and Social Affairs of Armenia. The Migration Resource Centres inform, orient, and train labour migrants in preparation for employment and stay abroad, and reintegration upon their return home. MRC-s provide information about destination countries and their migration and labour legislation; the procedures required to depart and reside abroad; and possibilities of legal migration and dangers of irregular migration. Linked to the employment centres, the MRC-s also provide information about vacancies in Armenia and in those foreign states, with whom the Armenian Ministry of Labour has working arrangements, or with whom bilateral or multilateral labour agreements were concluded. The first MRC in Armenia was established by IOM in 2006 and transferred to the Ministry of Labour’s State Employment Agency in 2010. Later the IOM MRC model was replicated in two more locations within State Employment Agency with assistance from the EU-funded ILO run project and in 4 more locations with assistance of EU-funded project run by the People in Need NGO.
24Armenia is a partner of the Agreement on guaranteeing rights of CIS citizens in the field of pension provision (in force since 1993).

122
While there is a clear case for accompanying migration, exactly how this should be achieved will depend on the RA government and other Armenian institutions identifying migration hot-spots and working out whether it is appropriate to understand the benefits (but also the limitations) of having a large Armenian diaspora abroad. In fact, in addition to the aforementioned push factor of poor economic circumstances and a clearly sub-dimensioned labour market vis-à-vis the needs of the native population, in Armenia the existence of a very substantial diaspora acts also as a pull factor, drawing others from Armenia to seek opportunities and find ready assistance from a dense network of friends and relatives in the outside world. To make migration a less arduous process from a sending country perspective, migrant support requires some combination of: better access to information on the job market in the RA and abroad; mechanisms that allow access to services, housing, food, etc. and to reduce potential harassment while abroad; personal and welfare insurance in the RA and abroad and improved education facilities for the children of migrant families in the RA and abroad.
One the other hand, if the Republic of Armenia wants to benefit from the sustainable return of their migrants, it clearly needs to pursue policies – better governance, less bureaucracy and economic growth – that will make migrants want to return and ensure that those migrants who have returned have a sense that they, and their country, are moving towards a brighter future. The dilemma present in the data of return migration can be expressed as follows: a migrant, normally a migrant worker, decides to leave his/her country because another place offers better conditions (e.g. income, living standard, etc.). After a while, the migrant decides to return to his/her home country, even though the same conditions that pushed him/her to migrate in the first place apparently hold. What drives him/her to return? Borjas and Bratsberg (1996) point out that a migrant might return because of the following reasons: failure (low wages or unemployment) or success. Both reasons are unquestionably present in the return migration to the Republic of Armenia. Still, a third possibility can be hypothesized related to some indicators of a meaningful circular, repetitive or temporary migration among the surveyed households. For this third possibility definition we need to distinguish between two alternative motivations for return migration: return decisions of life cycle migrants and return decisions from the so-called ‘target-earners’. The first category of returned migrants is classical: after a career cycle of labour migration, migrants decide to return to the country of origin permanently. The second type needs an intricate explanation. In the case of the return migration to the Republic of Armenia, we believe that a distinction between permanent and temporary migration is the key for understanding many aspects of migrant return behaviour. Although data does not provide all the evidence we need, our main hypothesis is that temporary stays abroad are used to accumulate resources for later use in the Republic of Armenia, either for consumption or investment and that the duration of the migratory project depends on the proposed use of the accumulated resources. The type of destination countries, the political economy of migration and contextual evolution of the economies of both the origin and the host country will provide cycles of greater return or cycles of larger duration of the stay abroad. Temporary migration can enable migrants to learn new skills and, in many cases, it can play a useful role in exposing migrants – as well as host societies – to new ideas and ways of doing things, some of which may be usefully continued or adopted after the migrants’ return. Further study is needed in order to understand the constraints and opportunities faced by returned migrants and what policies can be envisaged to help them.
Regarding the non-movers-emigration-return an interesting question arises: who leaves the Republic of Armenia and who stays? Is out-migration positively or negatively selective? As is widely known, migration can have a negative effect on the local stock of human capital by removing individuals with particular skills or it can have a positive affect by stimulating investment in the acquisition of human capital by potential migrants (Stark and Wang, 2002). These two effects can act in opposite directions and only a longitudinal study can support one of those hypotheses. The

123
present survey does not allows us to have a detailed portrayal of the kind of skills, qualifications and professions lost or gained in regional or national spaces.
Migrants and their families in the RA have long been aware of the value of remittances and this survey shows a high dependency rate from a large proportion of households’ vis-à-vis remittances from abroad. If the potential of remittances is to be maximized, then more needs to be done to understand remittances and their use and how to increase the flow of remittances towards investments (and not only mere consumption). For instance, if transactions costs could be reduced then the market for remittance services would work better and would offer better and cheaper services to informed customers.
Of particular interest to the Republic of Armenia are questions of: brain drain (the emigration of highly educated individuals); policies to support circular and temporary migration and policies to encourage return migration (and to facilitate reintegration); the effect migration has on the distribution of poverty, low income and labour in the country; rural to-urban migration; migration and entrepreneurship and investment (for both returned migrants and regarding the use of remittances). Without being exhaustive, the following topics emerge as important for future research from the present survey:
(i) There is a need to identify which individual, contextual or even institutional factors can make migration succeed or fail. (ii) Research is also needed to investigate which types of labour-market intermediation would be more efficient in matching the RA supply and the destination countries’ demand for labour. This would involve studying in more detail how migrants find their jobs but also the impact of job-search methods on the occupations they find. (iii) Another line of research that deserves to be pursued concerns the relationship between migration and development. How is the country affected by alternative modes of migration such as circular or temporary migration? Does circular migration result in more money injected in the economy (or in money better invested) than permanent migration? (iv) The interplay between internal and international migration deserves closer scrutiny. Because of the selectivity between internal and international migrants, the contexts and policy implications of the two phenomena can differ. But what are the similarities between the two phenomena? How can research on internal migration draw from advances in research on international migration?(v) It is known and confirmed by the present survey that the profile of Armenians abroad and immigrants in the RA is gender balanced towards males. The economic and social consequences of the gender imbalance in migration flows would also need to be studied as it might result in a lost in social cohesion in the country. Policy–makers should pay careful attention to the experiences and concerns of female migrants to ensure that their migration is beneficial. A migration based gender research analysis is thus needed in the near future.

124
Bibliography
Bilsborrow, R. E. (2007) Surveys of International Migration: Issues and Tips.‖ Paper presented at the Sixth Coordination Meeting on International Migration United Nations, New York, 1–5.http://www.un.org/esa/population/meetings/sixthcoord2007/Bilsborrow_paper.pdf.
Borjas, George and B. Bratsberg (1996) Who leaves? The outmigration of the foreign-born”, The Review of Economics and Statistics, 165-176.
Carletto, C., and A. de Braw (2007) Measuring Migration using Household Surveys Operational vehicle, Operation Note no. 2, World Bank, Washington, D.C.
Castles S. (2000) International Migration at the beginning of the twenty-first century: Global trends and issues, Oxford, Oxford Blackwell Publishers.
Chambers, R.L. and C.J. Skinner (eds.) (2003). Analysis of Survey Data. Chichester. Wiley. 398 p.
Chobanyan, Haykanush (2012) Return Migration to Armenia: Issues of Reintegration, CRIS Brief, 2012/01, Robert Schuman Centre for Advanced Studies, European University Institute, Florence.
European Training Foundation (2013) Migration and Skills in Armenia and Georgia: comparative report, Dublin. (Accessed 01.03.2014 http://www.etf.europa.eu/webatt.nsf/0/B711838175EB762EC1257B4D0042FF65/$file/Migration&skills_Armenia&Georgia.pdf).
Hass. H., Vargas-Silva C. and Vezzoli (2010) Global Migration Futures: A conceptual and methodological framework for research and analysis. Oxford. International Migration Institute (IMI). University of Oxford.
International Labour Organization (ILO) (2009) Migration and Development. Armenia Country Study, ILO Subregional Office for Eastern Europe and Central Asia, Yerevan. (Available at http://www.ilo.org/public/english/region/eurpro/moscow/info/publ/migr_dev_study_en.pdf accessed 30 March 2014).
International Labour Organization and National Statistics Service of Armenia, (2007) Report labour migration in Armenia. The results of a pilot sample survey. (Report is available at http://www.armstat.am/file/article/mig_rep_07e.pdf).
International Organization for Migration (IOM) (2005) World Migration 2005: Costs and Benefits of International Migration. Geneva. IOM.
International Organization for Migration (IOM) and Ministry of Labour and Social Affairs of Armenia (2011), Assessment of Labour Market Potential in Armenia (http://publications.iom.int/bookstore/index.php?main_page=product_info&cPath=41_7&products_id=984)
International Organization for Migration (IOM) (2007), Profile of Potential Labour Migrants: Analytical Report on a Sample Survey Conducted in Armenia (http://publications.iom.int/bookstore/index.php?main_page=product_info&cPath=41_7&products_id=800)
125
Rossi-Longhi, Pier, Therése Lindström and Kristina Galstyan for the International Organization for Migration, “Review of Migration Management in the Republic of Armenia. Assessment Mission Report.” International Organization for Migration / Yerevan: Lusakn Publishing (2008); http://publications.iom.int/bookstore/index.php?main_page=product_info&cPath=41_7&products_id=808
Galstyan Kristina, Prutsch Franz and Rossi-Longhi Pier, and for the International Organization for Migration, “Progress Review of Migration Management in the Republic of Armenia. Follow-Up on the 2008 Migration Management Assessment Report.” International Organization for Migration (2011); http://publications.iom.int/bookstore/index.php?main_page=product_info&cPath=41_7&products_id=980
IOM, Migration in Armenia: A Country Profile (2008);http://publications.iom.int/bookstore/index.php?main_page=product_info&cPath=42&products_id=501
Kritz, M.M., and H. Zlotnik (1992) ‘‘Global interactions: migration systems, processes and policies’’, in M.M. Kritz, L.L. Lim and H. Zlotnik (Eds), International Migration Systems. A Global Approach, Clarendon Press, Oxford: 1–16.
Lehtonen, R. and E.J. Pahkinen (2004). Practical Methods for Design and Analysis of Complex Surveys. Second edition. Chichester. Wiley.
Lohr, S.L. (1999). Sampling: Design and Analysis. Duxbury Press. 512 p.
Manke, Marina for the International Organization for Migration (2010) Enhancing Migration Data Collection, Processing and Sharing in the Republic of Armenia. Needs Assessment and Gap Analysis Report.
Makaryan, Gagik and Galstyan, Mihran (2012) Costs and Benefits of Labour Mobility between the EU and the Eastern Partnership Partner Countries. Country report: Armenia, CASE report. (available at http://www.case-research.eu/sites/default/files/Armenia%20country%20study%20-%20final.pdf) accessed 25 February 2014.
McKenzie, David J., and Johan Mistien (2007) Surveying Migrant Households: A Comparison of Census-Based, Snowball, and Intercept Point Surveys.‖ http://siteresources.worldbank.org/INTMIGDEV/Resources/2838212-1160686302996/mckenziemistiaen.pdf (accessed on 11 March 2014).
Minasyan A., Poghosyan A., Gevorgyan L., Chobanyan H. 2008. Study on Return Migration to Armenia in 2002-2008. Yerevan, Asoghik. http://www.osce.org/yerevan/item_11_35901.html
Newland, K., D. R. Agunias, et al. (2008). “Learning by doing: Experiences of circular migration.” Insight, Migration Policy Institute (MPI) (Sept. 2008). http://www.migrationpolicy.org/pubs/Insight-IGC-Sept08.pdf
Pfeffermann, D. (1993). “The Role of Sampling Weights When Modeling Survey Data,” International Statistical Review, 61, pp. 317-337.

126
Schachter, J. (2008) Enhancing Data on Migration in West and Central Africa. The Utilization of Household Surveys for the Measurement of Migration in West and Central Africa: Past, Present, and Future, IOM; Genève. (Available at http://www.iom.int/jahia/webdav/site/myjahiasite/shared/shared/mainsite/published_docs/brochures_and_info_sheets/Migration%20Profile%20Report.pdf accessed 15 January 2014).
Skeldon. R. (1997) Migration and Development: A Global Perspective. Harlow. Essex. Addison Wesley Longman.
Skeldon. R. (2003) Interlinkages between internal and international migration and development in the Asian Region. In Proceedings of the Adhoc Expert Group Meeting on Migration and Development. ESCAP Bangkok. 27-29 August.2003.
Skinner, C.K., Holt D., Smith, T.M.F. (1989). Analysis of Complex Surveys. Chichester. Wiley. 328 p.
Stark, Oded and Wang, Yong (2002) “Inducing human capital formation: migration as a substitute for subsidies,” Journal of Public Economics, Elsevier, vol. 86(1), pp. 29-46.
Yansaneh, I. S. (2003) An Overview of Sample Design Issues for Household Surveys in Developing Countries, Technical Report on Surveys in Developing and Transition Countries, United Nations.
UNFPA, 2007. “The Sample Survey on External and Internal Migration in RA”, conducted by the National Statistical Service of RA and the Ministry of Labour and Social Issues of RA, Yerevan.http://www.armstat.am/file/article/rep_migr_08e.pdf
UNDP, 2009. “Armenia National Human Development. Migration and Human Development: Opportunities and Challenges”, Armenia. http://europeandcis.undp.org/home/show/87C7B39D-F203-1EE9-B27B76D1ABF1CEE6
World Bank (2011) Migration and Remittances Factbook 2011 (2nd Edition), The International Bank for Reconstruction and Development / The World Bank Washington DC. (Available at http://siteresources.worldbank.org/INTLAC/Resources/Factbook2011-Ebook.pdf accessed 30 March 2014)

127
Annexes/appendices
Annex 1.Objectives and key topics of 2013 migration, impact and remittances survey (MIRS) in Armenia

128
1. Objectives of the survey
• To assess the prevalence of migration in Armenia, including the scope of “return” vs. “non-return” migration (for example, number of households and persons who have left the country without prospects of coming back) and youth migration (16 to 30 year-old, as per the Republic of Armenia’s State Youth Policy from 1998)• To identify main categories of migrants (short- versus long-term, seasonal, return, student and so on) and describe their main characteristics • To assess impact of migration on both migrants and households (health, financial well-being, career well-being, social well-being and so on)• To describe remittance patterns and overall financial behaviour of migrants and households (saving and consumption behaviour, potential to engage in entrepreneurship, level of financial skills and knowledge)• To compare the dynamics of the migration patterns and migrant characteristics with the previous ILO survey from 2007.2. Target of the survey
The target of the survey is to query the situation and behaviour of several groups in the Armenian population, both at the individual and household level:a. Households without migrants (as a reference group to assess impact of migration)b. Households with migrants (prime focus of the survey)Foreigners in Armenia and immigration will not be a focus of the survey. Under “migrants”, the following individuals will be understood:• Persons absent from their place of residence at the time of the survey for at least 3 months – proxy for “current migrants” and “diaspora” (if absent for at least 12 months)• Persons absent from their place of residence at the time of the survey for less than 3 months but intending to stay away for at least 3 months – proxy for “current migrants”• Persons present at their place of residence who have been absent from the place of residence for at least 3 months since 2000 – proxy for “return migrants”• Persons present at their place of residence at the time of the survey with no migration history but who intend to “migrate – depart for a period of at least 3 months” in the future – proxy for “potential migrants”• Persons not included into any of the above 3 categories (for example, regardless of their presence at their place of residence at the time of the survey) who work away from their municipality of residence (either in another municipality/region in Armenia or abroad) – proxy for one category of “migrant workers”Information on “migrants” will be collected from migrants themselves or any other adult member of the household with knowledge of the migrant’s situation – “proxy” respondents.
3. Content of the survey
3.1. General features of migration in Armenia
• Percentage of total population involved in migration (in general, and various types of migration )• Average number of household members participating in migration• Prevalence of whole-household migration (to be proxied by asking all surveyed population if they aware of such households, how long ago they departed, purpose of departure and so on – can be extended based on the available space)• Average duration of migration (among all migrant types)• Frequency of migration

129
• Main destinations (Russia, other CIS (please specify), Europe (please specify country), Africa, other countries (please specify) – for all migrants and for various types of migrants• Purpose of migration (work, family reunification, study, resettlement)• Push/pull factors (reason for migration – unsatisfactory financial well-being (insufficient income); lack of job; lack of career opportunities (improvement of current employment); environmental degradation; persecution; social inequality; pessimism about future) – for all migrants and for various migrant types• Networks of migration (any facilitation to select a method of migration, any support during the migration process)• Legal status while in migration (regular (all legal procedures on work and residence adhered to), semi-regular (some legal procedures on work and residence adhered to), irregular (no legal procedures on work and residence adhered to), illegal border crossing, acquisition of destination country citizenship)
3.2. Main types of migration in Armenia to be described via the survey
• Short-term versus long-term; for instance, duration of migration • Seasonality of migration• Circular (repetitive departure abroad and return to Armenia)• Frontier worker migration• Diaspora:• Potential to return• Potential to contribute to Armenia’s development (financially, such as investment, commercial business; and philanthropically, or via skill transfer)• Return migration - specifically issues of reintegration (into labour force and socially)• Labour migration• Student migration• Investors and entrepreneurs• Family reunification• Presence of children and elderly in households left behind (need to see if we can gather data on abandoned children)
3.3. Characteristics of migrants compared to overall population
3.3.1. Socio-demographic characteristics of migrants and by type of migration
• Sex• Age• Marital status• Presence of children
3.3.2. Socioeconomic/skill profile of migrants and specific categories of migrants in particular – before, during and after migration
• Level of education• Level of professional training• “Soft skills”• Professional skill level
130
3.4. Impact of migration
3.4.1. Health before, during and after migration
3.4.2. Financial well-being
Of general population, of migrants before, during and after migration. For all types of migrants in general and specific types of migrants in particular. • Income• Savings• Consumption
3.4.3. Career development
3.4.4. Social impact of migration• Confidence about the well-being of the children (next generation) • Migrants’ rights issues, violation of rights while abroad (issue of equal pay, legal contract in place, proper registration, transfer of pensions and work experience years, and so on) • Integration / Reintegration issues
3.5. Remittances and their usage
• Amount remitted to households in Armenia• Amount remitted from Armenia• Frequency of remittance• Method of remittance• Usage (for consumption, education, improvement to domicile, re-migrating, investing in own business and so on)• Financial behaviour and entrepreneurship potential

131
Annex 2. Survey Questionnaire
RA NATIONAL STATISTICAL SERVICE INTERNATIONAL ORGANIZATION FOR MIGRATION
RUSSIAN-ARMENIAN (SLAVONIC) UNIVERSITY
COMPREHENSIVE SURVEY OF THE MIGRATION OF THE RA POPULATION 2007-2013QUESTIONNAIRE
Confidentiality of the information provided is guaranteed by RA Law on State Statistics.According to RA law on State Statistics, the information obtained during the survey will be pub-lished in summarized form only, for the purpose of statistical analysis of migration.
COVER SHEET
SECTION A.
1. Number of questionnaire (H/H)
2. Marz(name)
3. Territory(name)
4. Settlement (town-1/ village-2)
SECTION B. INTERVIEW RESULT
5. Interview took place in full
6. Interview took place partially
7. Section 2 completed(Yes-1/ No-2)
8. Section 3 completed (Yes-1/ No-2)
9. Section 4 completed (Yes-1/ No-2)
10. Section 5 completed (Yes-1/ No-2)
11. Section 6 completed (Yes-1/ No-2)
12. TOTAL x (people)
13. Interview took place (visit) I II III
14. Interview duration (minute)
Code Date Signature15. Interviewer Submitted
16. Group leader Submitted
17. Checker-encoder Checked/encoded
18. Data enterer Entered

132
#Se
rial n
umbe
r of H
/H m
embe
r 1
23
45
67
Tran
sitio
n
Nam
e of
H/H
mem
ber..
......
......
......
......
......
......
......
......
......
1.
Lis
t all
thos
e w
ho, a
s of J
anua
ry 1
, 200
7 (o
r si
nce
the
time
ther
eaft
er w
hen
your
H/H
was
est
ablis
hed)
wer
e a
mem
ber
of y
our
H/H
at a
ny ti
me
-do
not m
entio
n th
ose
who
hav
e di
ed.
H/H
mem
bers
are
pre
sent
ed a
ccor
ding
to th
eir r
elat
ion
to th
e re
spon
dent
(the
1st
regi
ster
ed p
erso
n), u
sing
the
code
s bel
ow.
2.Sp
ouse
7.M
othe
r-in
-law
/fath
er-in
-law
3.D
augh
ter/s
on8.
Gra
ndm
othe
r/gra
ndfa
ther
4.M
othe
r/fat
her
9.G
rand
child
5.Si
ster
/bro
ther
10.O
ther
rela
tive
6.D
augh
ter-
in-la
w/s
on-
in-la
w11
.Non
-rel
ativ
e
1
Now
, ple
ase
pres
ent t
he fo
llow
ing
data
on
you
and
all o
f you
r H/H
mem
bers
2.G
ende
r1.
mal
e2.
fem
ale
3.D
ate
of B
irth
mon
th
year
4.
* Th
e qu
estio
n re
fers
to c
hild
ren
17 y
ears
old
and
you
nger
(bor
n in
199
6 or
late
r)H
e/sh
e is
:1.
Chi
ld w
ith tw
o pa
rent
s2.
Sing
le m
othe
r's c
hild
3. S
ingl
e fa
ther
’s c
hild
4.
Liv
ing
with
gua
rdia
n as
par
ents
hav
e go
ne a
broa
d5.
Livi
ng w
ith g
uard
ian
for o
ther
reas
ons
5.Pl
ace
of b
irth
.(fi
ll in
the
first
line
with
one
cod
e fr
om 1
-4)
1. T
he g
iven
settl
emen
t 2
. Ano
ther
settl
emen
t in
the
sam
e m
arz
3. A
noth
er R
A m
arz
4.A
broa
d (I
nclu
des N
KR
) (m
entio
n th
e co
untry
/the
curr
ent n
ame
of th
e st
ate)
,
Fille
d in
by
enco
der
6.
Whe
re w
ere/w
as y
ou/h
e/sh
e res
idin
g on
1 J
anua
ry 2
007?
(Do
not t
ake
an a
bsen
ce o
f le
ss th
an 3
-mon
ths i
nto
acco
unt)
1. In
this
settl
emen
t3.
Abr
oad
(inc
ludi
ng N
KR
)2.
Ano
ther
RA
settl
emen
t 4.
Was
bor
n af
ter 0
1.01
.200
7
SEC
TIO
N 1
. SO
CIO
-DE
MO
GR
APH
IC A
ND
EC
ON
OM
IC C
HA
RA
CT
ER
IST
ICS
OF
H/H
ME
MB
ER
S(Q
uest
ion
the
mos
t inf
orm
ed m
embe
r of
H/H
)
Spe
cial
Que
stio
nnai
re C
odes
: 97
. NO
INFO
RM
ATIO
N /
IS N
OT
AWA
RE,
98.
FIN
DS
IT H
AR
D T
O A
NSW
ER /
DO
ES N
OT
REM
EMB
ER, 9
9. R
EFU
SES
TO A
NSW
ER

133
#Se
rial n
umbe
r of H
/H m
embe
r 1
23
45
67
Tran
sitio
n
Nam
e of
H/H
mem
ber..
......
......
......
......
......
......
......
......
......
7.
Nat
iona
lity
1. A
rmen
ian
4. K
urdi
sh7.
Ukr
aini
an10
. Ara
b2.
Rus
sian
5. A
ssyr
ian
8.
Jew
ish
11. I
ndia
n3.
Yaz
idi
6. G
reek
9. P
ersi
an12
. Oth
er
8.W
hat c
ount
ry a
re/is
you
/he/
she
curr
ently
a c
itize
n of
?1.
RA
3. O
ther
(spe
cify)
2.RA
and
othe
r co
untry
(sp
ecify
) ....
......
......
......
......
.....
4. D
oes n
ot h
ave
citiz
ensh
ip
Fille
d in
by
enco
der
9.
Whi
ch is
you
r/hi
s/he
r na
tive
lang
uage
(the
mai
n la
ngua
ge
of c
omm
unic
atio
n at
hom
e)?
1. A
rmen
ian
3. Y
azid
i5.
Ass
yria
n7.
Ukr
aini
an2.
Rus
sian
4. K
urdi
sh6.
Gre
ek8.
Oth
er
#10
-14
ques
tions
refe
r to
indi
vidu
als 6
yea
rs o
ld a
nd o
lder
(bor
n in
200
7 or
ear
lier)
10.
Do
you
know
any
lang
uage
oth
er th
an y
our
nativ
e on
e to
any
ext
ent?
1. Y
es
1
112.
No
2
12
11.
Plea
se, n
ame
thos
e la
ngua
ges a
nd th
e le
vel o
f you
r ab
ility
to
und
erst
and,
spea
k, w
rite
and
rea
d in
thos
e la
ngua
ges.
(Men
tion
the t
wo m
ain
lang
uage
s).
Cod
es fo
r an
swer
s:5.
Exce
llent
4. G
ood
3. S
atis
fact
ory
2.
Poo
r
1. C
anno
t
A.F
ill in
the
first
lang
uage
with
wor
ds...
......
......
......
......
......
.
A1
Fille
d in
by
enco
der
A1.
unde
rsta
ndA
2.w
rite
A3.
read
A4.
spea
k
B
B.F
ill in
the
seco
nd la
ngua
ge w
ith w
ords
.......
......
......
......
......
..
Fille
d in
by
enco
der
B1.
unde
rsta
ndB
2.w
rite
B3.
read
B4.
spea
k
12.
Wha
t is y
our/
his/
her
leve
l of e
duca
tion?
1.Pr
imar
y an
d lo
wer
4. P
re-v
ocat
iona
l 2.
Bas
ic sc
hool
(gra
des 8
-9)
5.V
ocat
iona
l (c
olle
ge)
3.G
ener
al se
cond
ary
6. H
ighe
r edu
catio
n7.
Pos
tgra
duat
e

134
#Se
rial n
umbe
r of H
/H m
embe
r 1
23
45
67
Tran
sitio
n
Nam
e of
H/H
mem
ber..
......
......
......
......
......
......
......
......
......
13.
Do
you
atte
nd a
ny e
duca
tiona
l ins
titut
ion?
(if
seve
ral,
men
tion
only
the
high
est o
ne)
1. S
choo
l5.
Pos
tgra
duat
e st
udy/
resi
denc
y/
doct
oral
2. V
ocat
iona
l col
lege
3. C
olle
ge, t
rain
ing
colle
ge6.
Sho
rt te
rm tr
aini
ng4.
Uni
vers
ity7.
No
14.
Do/
does
you
/he/
she
plan
to g
et/c
ontin
ue y
our/
his/
her
educ
atio
n in
the
com
ing
year
? If
yes
, in
wha
t edu
catio
nal
inst
itutio
n?1.
Sch
ool
5. P
ostg
radu
ate
stud
y/
2. V
ocat
iona
l col
lege
resi
denc
y/ d
octo
ral
3. C
olle
ge, t
rain
ing
colle
ge6.
Sho
rt te
rm tr
aini
ng4.
Uni
vers
ity7.
No
15.
Wha
t is y
our/
his/
her
basi
c so
cio-
econ
omic
stat
us?
(ask
ev
eryo
ne, r
egar
dles
s of a
ge)
1.Em
ploy
ed, (
incl
udin
g se
lf-em
ploy
ed)
4.Pe
nsio
ner/b
enef
icia
ry5.
Dep
ende
nt2.
Pupi
l/stu
dent
6.U
nem
ploy
ed3.
Hea
d of
the
H/H
7.
Oth
er (s
peci
fy)
# 16
-33
que
stio
ns re
fer t
o in
divi
dual
s 15
year
s old
and
old
er (b
orn
in 1
998
or e
arlie
r)
16.
You
r/hi
s/her
mar
ital s
tatu
s1.
Nev
er m
arrie
d2.
Mar
ried/
livin
g to
geth
er3.
Wid
ow/w
idow
er4.
Div
orce
d/se
para
ted
17.
Do/
Doe
s you
/he/
she
have
a p
rofe
ssio
n: if
yes
, ple
ase
spec
ify?
(if th
ere
are
man
y, p
leas
e, m
entio
n th
e m
ain
one)
1.
Hig
hly
qual
ified
spec
ialis
t2.
Ave
rage
qua
lifie
d sp
ecia
list
6. S
kille
d w
orke
r not
in
agric
ultu
ral s
ecto
r3.
Off
ice
empl
oyee
4. S
ervi
ce se
ctor
em
ploy
ee7.
Mili
tary
per
sonn
el8.
Do/
does
not
hav
e pr
ofes
sion
5. S
kille
d w
orke
r in
agric
ultu
ral
sect
or
18.
Did
/do
you/
he/
she
wor
k or
hav
e an
inco
me
gene
ratin
g em
ploy
men
t/job
at l
east
1 h
our
duri
ng
the
last
7 d
ays p
rece
ding
the
surv
ey (e
ven
if yo
u ha
ve b
een
abse
nt fr
om w
ork
tem
pora
rily
for
vari
ous r
easo
ns)?
1. Y
es
1
20
2. N
o2
19
19.
Did
/do
you/
he/s
he lo
ok fo
r an
inco
me
gene
ratin
g em
ploy
men
t/job
dur
ing
the
last
4 w
eeks
?
1. Y
es
1
33
2. N
o2
34

135
#Se
rial n
umbe
r of H
/H m
embe
r 1
23
45
67
Tran
sitio
n
Nam
e of
H/H
mem
ber..
......
......
......
......
......
......
......
......
......
20.
Whe
re is
you
r/hi
s/he
r pl
ace
of w
ork?
1.In
the
give
n se
ttlem
ent
3.In
ano
ther
RA
mar
z2.
In a
noth
er se
ttlem
ent o
f thi
s RA
mar
z4.
Abr
oad
(incl
uded
NK
R)
21.
Wha
t do/
does
you/
he/s
he w
ork
as:
1.Em
ploy
ee in
pub
lic se
ctor
2.Em
ploy
ee in
priv
ate
sect
or3.
Empl
oyer
4.Se
lf-em
ploy
ed in
agr
icul
tura
l sec
tor
5.Se
lf-em
ploy
ed in
ano
ther
sect
or6.
Mem
ber o
f fam
ily, w
orki
ng w
ithou
t rem
uner
atio
n
1-2
22
3-6
23
22.
Do/
does
you
/he/
she
have
a w
ritt
en w
ork
cont
ract
?1.
Yes
242.
No
23.
Was
you
r/hi
s/he
r ac
tivity
reg
iste
red
with
the
com
pete
nt st
ate
auth
ority
?1.
Yes
2. N
o
24.
Wha
t is t
he n
atur
e of
you
r/hi
s/he
r w
ork
1. te
mpo
rary
< 3
mon
ths
3. U
nlim
ited
2. te
mpo
rary
< 1
yea
r
4. O
ther
(spe
cify
)
25.
In w
hich
sect
or is
you
r/hi
s/her
wor
k?
1.A
gric
ultu
re5.
Sta
te m
anag
emen
t2.
Indu
stry
6. E
duca
tion
3.C
onst
ruct
ion
7. H
ealth
care
4.Tr
ade
and
reno
vatio
n8.
Oth
er se
rvic
es
26.
Doe
s you
r/hi
s/he
r jo
b m
atch
you
r/hi
s/he
r sp
ecia
lisat
ion?
1.
Yes
, ent
irely
2.So
mew
hat
3. N
ot re
ally
4. N
o 5.
Doe
sn’t
have
a sp
ecia
lisat
ion
27.
Doe
syou
r/hi
s/he
r jo
b m
atch
you
r/hi
s/he
r qu
alifi
catio
n?1.
Yes
, com
plet
ely
2.Y
es, p
artia
lly
3.N
o, it
is h
ighe
r 4.
No,
it is
low
er
28.
How
man
y ho
urs d
o/do
es y
ou/h
e/sh
e us
ually
wor
k a
wee
k?
(n
umbe
r of h
ours
)
29.
Do/
does
you
/he/
she
have
day
s off
?
1. Y
es, r
egul
arly
2. Y
es, b
ut n
ot re
gula
rly3.
Alm
ost n
ever
30.
How
muc
h is
you
r/hi
s/he
r m
onth
lyav
erag
e sa
lary
, with
out t
axes
?
AM
DU
SD
RU
B
EUR
O

136
#Se
rial n
umbe
r of H
/H m
embe
r 1
23
45
67
Tran
sitio
n
Nam
e of
H/H
mem
ber..
......
......
......
......
......
......
......
......
......
31.
How
satis
fied
are
you/
is h
e/sh
e w
ith y
our/
his/h
er
curr
ent j
ob?
1.Fu
lly2.
Bas
ical
ly s
atis
fied
3. N
ot fu
lly sa
tisfie
d4.
Not
satis
fied
1
33
2-4
32
32.
Are
you
goi
ng to
cha
nge
your
cur
rent
job?
1. Y
es3.
Pro
babl
y no
t2.
Per
haps
4. N
o
33.
Thr
ough
who
m/w
hich
inst
itutio
n di
d yo
u lo
ok fo
r or
find
w
ork?
(men
tion
the
mai
n 2)
1.R
A S
tate
Em
ploy
men
t Age
ncy
2.R
A P
rivat
e Em
ploy
men
t Age
ncy
3.A
n em
ploy
er li
ving
in th
e R
A4.
A f
orem
an li
ving
in th
e R
A5.
Acq
uain
tanc
e/ In
term
edia
ry li
ving
in th
e R
A6.
Ow
n/fa
mily
bus
ines
s7.
Fore
ign
Stat
e Se
rvic
e8.
Fore
ign
Priv
ate
Stru
ctur
e9.
Fore
ign
empl
oyer
10.F
orei
gn fo
rem
an11
.For
eign
acq
uain
tanc
e/ in
term
edia
ry12
.Ow
n bu
sine
ss a
broa
d13
.Int
erne
t/ ot
her M
ass M
edia
14.A
ppoi
ntm
ent
15.O
ther
(ple
ase,
spec
ify)
# 34
-36
ref
er to
eve
ryon
e
34.
Is h
e/sh
e cu
rren
tly a
mem
ber
of y
our
H/H
, ev
en if
he/
she
does
n’t p
erm
anen
tly li
ve
with
you
?
1.Y
es
1
37
2. N
o2
35
35.
Has
he/
she
unde
rtak
en tr
avel
(d
epar
ture
/arr
ival
/ret
urn
from
a tr
ip st
arte
d be
fore
200
7) fo
r lo
nger
than
3 m
onth
s sin
ce
2007
, whi
le b
eing
a m
embe
r of
you
H/H
?
1. Y
es2.
No
1
36
2
EN
D
36.
How
man
y of
the
trip
s wer
e fo
r m
igra
tion
–fo
r th
e pu
rpos
es o
f lab
our,
fam
ily r
euni
ficat
ion,
pe
rman
ent r
esid
ence
, stu
dy p
urpo
ses o
r ba
sed
on
the
mili
tary
-pol
itica
l situ
atio
nof
the
coun
try
of o
rigi
n (a
s a r
efug
ee)
0. N
one
0
EN
D
1. N
umbe
r (s
peci
fy)
2
54
# 37
–51
que
stio
ns re
fer t
o 15
yea
r old
and
old
er p
eopl
e (b
orn
in 1
998
and
earl
ier)
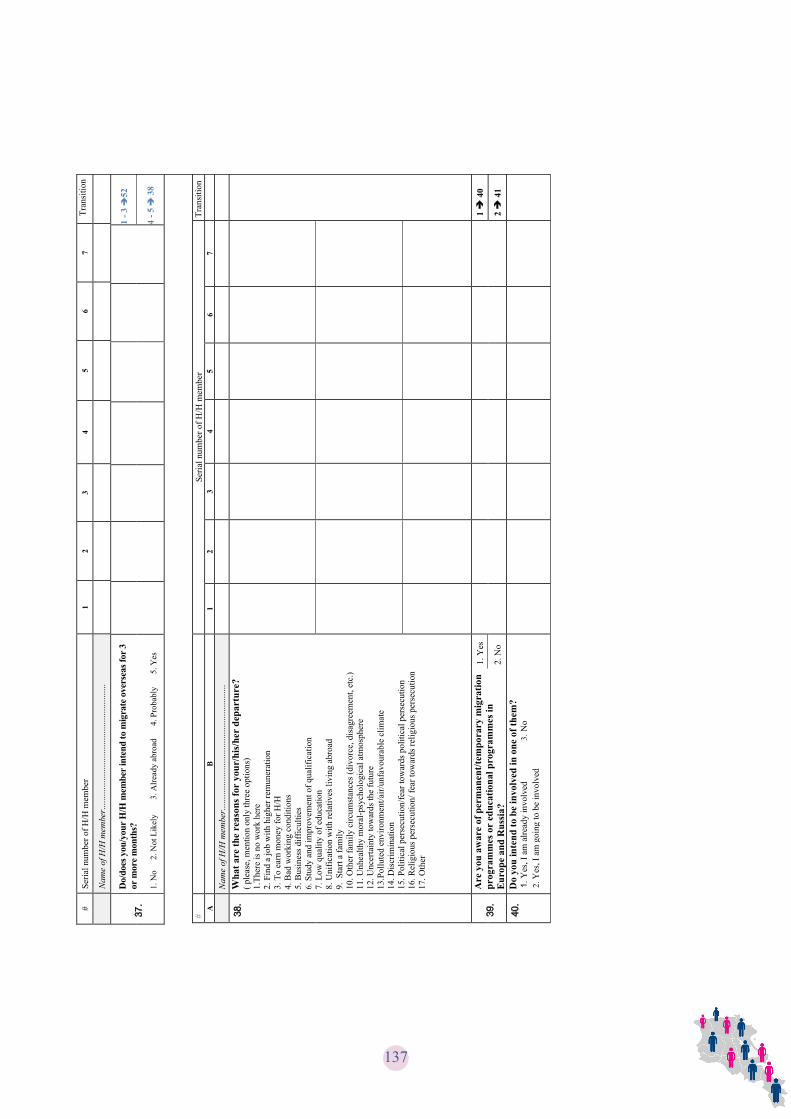
137
#
Seria
l num
ber o
f H/H
mem
ber
12
34
56
7Tr
ansi
tion
Nam
e of
H/H
mem
ber..
......
......
......
......
......
......
......
......
......
37.
Do/
does
you
/you
r H/H
mem
ber i
nten
d to
mig
rate
ove
rsea
s for
3
or m
ore m
onth
s?
1. N
o2.
Not
Lik
ely
3. A
lread
y ab
road
4. P
roba
bly
5
. Yes
1-3
52
4-5
38
#Se
rial n
umbe
r of H
/H m
embe
rTr
ansi
tion
AB
12
34
56
7N
ame
of H
/H m
embe
r.....
......
......
......
......
......
......
......
......
...
38.
Wha
t are
the
reas
ons f
or y
our/
his/
her
depa
rtur
e?( p
leas
e, m
entio
n on
ly th
ree
optio
ns)
1.Th
ere
is n
o w
ork
here
2. F
ind
a jo
b w
ith h
ighe
r rem
uner
atio
n3.
To
earn
mon
ey fo
r H/H
4. B
ad w
orki
ng c
ondi
tions
5. B
usin
ess d
iffic
ultie
s 6.
Stud
y an
d im
prov
emen
t of q
ualif
icat
ion
7. L
ow q
ualit
y of
edu
catio
n 8.
Uni
ficat
ion
with
rela
tives
livi
ng a
broa
d 9.
Sta
rt a
fam
ily
10. O
ther
fam
ily c
ircum
stan
ces (
divo
rce,
dis
agre
emen
t, et
c.)
11. U
nhea
lthy
mor
al-p
sych
olog
ical
atm
osph
ere
12. U
ncer
tain
ty to
war
ds th
e fu
ture
13.P
ollu
ted
envi
ronm
ent/a
ir/un
favo
urab
le c
limat
e14
. Dis
crim
inat
ion
15. P
oliti
cal p
erse
cutio
n/fe
ar to
war
ds p
oliti
cal p
erse
cutio
n16
. Rel
igio
us p
erse
cutio
n/ fe
ar to
war
ds re
ligio
us p
erse
cutio
n17
. Oth
er
39.
Are
you
aw
are
of p
erm
anen
t/tem
pora
ry m
igra
tion
prog
ram
mes
or
educ
atio
nal p
rogr
amm
es in
E
urop
e an
d R
ussi
a?
1. Y
es
1
40
2. N
o2
41
40.
Do
you
inte
nd to
be
invo
lved
in o
ne o
f the
m?
1.Y
es, I
am
alre
ady
invo
lved
2.
Yes
, I a
m g
oing
to b
e in
volv
ed3.
No
41.
Whi
ch o
f the
men
tione
d be
low
are
impo
rtan
t to
know
be
fore
dep
artu
re (
men
tion
3 m
ain
optio
ns)
1. T
he p
roce
dure
for o
btai
ning
wor
k an
d re
side
nce

138
#Se
rial n
umbe
r of H
/H m
embe
rTr
ansi
tion
AB
12
34
56
7N
ame
of H
/H m
embe
r.....
......
......
......
......
......
......
......
......
...
41.
Whi
ch o
f the
men
tione
d be
low
are
impo
rtan
t to
know
be
fore
dep
artu
re (
men
tion
3 m
ain
optio
ns)
1. T
he p
roce
dure
for o
btai
ning
wor
k an
d re
side
nce
2. O
ppor
tuni
ty a
nd p
roce
dure
for a
sylu
m re
ques
t3.
Job
avai
labi
lity
and
amou
nt o
f rem
uner
atio
n4.
Pro
cedu
re to
get
lega
l ass
ista
nce/
cons
ulta
tion
5. L
ist o
f fre
e se
rvic
es p
rovi
ded
to m
igra
nts
6. R
ight
of m
igra
nts i
n th
e co
untry
of e
ntry
7. C
urre
nt e
duca
tiona
l pro
gram
mes
8. O
ppor
tuni
ties t
o so
lve
heal
thca
re is
sues
9. Is
sues
rela
ted
to in
sura
nce
10. R
isks
of t
raff
icki
ng a
nd th
e m
eans
to a
void
them
42
.T
hrou
gh w
hich
of t
he fo
llow
ing
sour
ces w
ould
you
like
to
rece
ive
that
info
rmat
ion?
(pl
ease
,men
tion
2 m
ain
optio
ns)
1. T
V5.
Info
rmat
ion
cent
re2.
Rad
io6.
Pos
ters
/leaf
lets
3. P
ress
7. S
peci
al tr
aini
ng4.
Inte
rnet
/soc
ial n
etw
ork
8. O
ther
43.
Are
/Is y
ou/h
e/sh
e aw
are
that
the
maj
ority
of t
hose
w
ho a
pply
for
asyl
um in
Eur
ope
are
refu
sed
and
that
thos
e pe
ople
who
hav
e be
en r
efus
ed, a
s wel
l as
thos
e w
ho h
ave
the
stat
us o
f irr
egul
ar m
igra
nts,
are
forc
ed to
ret
urn
to th
eir
coun
trie
s?
1. Y
es
1
44
2. N
o2
45
44.
Will
this
cir
cum
stan
ce m
ake
you
avoi
d go
ing
toE
urop
e?1.
Yes
2. N
o
3. T
here
is n
o in
tent
ion
to g
o to
Eur
ope
45.
Do/
does
you
/he/
she
plan
to le
ave
for
a m
igra
tion
trip
in th
e up
com
ing
12 m
onth
s?1.
Yes
1
46
2. N
o2
52
46.
For
wha
t pur
pose
are
/is y
ou/h
e/sh
e pl
anni
ngto
leav
e?1.
Job/
look
ing
for a
job
2.Pe
rman
ent r
esid
ence
3.Fa
mily
4.Ed
ucat
ion
5.O
ther
(ple
ase,
men
tion)
47.
Hav
e ac
tual
step
s bee
n ta
ken
for
the
plan
ned
trip
(p
urch
ase
of ti
cket
, wor
k-re
late
d or
oth
er
arra
ngem
ents
, etc
.)?
1. Y
es
2. N
o

139
• IF
THE
H/H
MEM
BER
(B1.
54=1
) WH
O H
AS
MA
DE
A M
IGR
ATIO
N T
RIP
IS P
RES
ENT
IN T
HE
GIV
EN S
ETTL
EMEN
T D
UR
ING
TH
E SU
RVEY
, TH
E IN
TERV
IEW
MU
ST B
E C
ON
TIN
UED
PER
SON
ALL
Y W
ITH
HIM
/HER
.• I
F TH
E H
/H M
EMB
ER (B
1.54
=1) W
HO
HA
S M
AD
E A
MIG
RAT
ION
TR
IP IS
AB
SEN
T O
R N
OT
AVA
ILA
BLE
IN T
HE
GIV
EN S
ETTL
EMEN
T D
UR
ING
TH
E SU
RVEY
, CO
NTI
NU
E TH
E IN
TERV
IEW
WIT
H T
HE
FIR
ST R
EGIS
TER
ED O
R W
ITH
TH
E M
OST
INFO
RM
ED H
/H M
EMB
ER.
#Se
rial n
umbe
r of H
/H m
embe
rTr
ansi
tion
AB
12
34
56
7N
ame
of H
/H m
embe
r.....
......
......
......
......
......
......
......
......
...
48.
Hav
e/ha
s you
/he/
she
rece
ived
, /do
/doe
s you
/he/
she
expe
ct
any
supp
ort f
or th
e tr
ip?
(men
tion
2 m
ain
optio
ns)
1-5
49
1.Y
es, i
n ge
tting
the
visa
2.Y
es, i
n fin
anci
ng th
e tri
p3.
Yes
, in
findi
ng a
job
4.Y
es, f
or a
ccom
mod
atio
n5.
Yes
, oth
er (p
leas
e, m
entio
n)
6.N
o
6
50
49.
From
who
m h
as th
at su
ppor
t com
e -d
o yo
u/do
es h
e/sh
e ex
pect
that
supp
ort?
1. F
rom
peo
ple
resi
ding
in R
A2.
Fro
m p
eopl
e re
sidi
ng a
broa
d3.
Fro
m p
eopl
e re
sidi
ng b
oth
in R
A a
nd a
broa
d
50.
Whe
re d
o yo
u/do
es h
e/sh
e pl
an to
leav
e fo
r?1.
RA
(men
tion
mar
z)2.
NK
R3.
RF
4. U
SA5.
Oth
er (m
entio
n th
e co
untry
)
Fille
d in
by
enco
der
51.
If o
ne o
f the
rea
sons
for
your
/his/
her
depa
rtur
e is
inco
me
diss
atis
fact
ion,
whi
chis
the
net m
onth
ly in
com
e in
cas
e of
w
hich
you
/he/
she
wou
ld n
ot le
ave?
(if in
com
e is
not
a fa
ctor
in th
e pl
anne
d de
part
ure,
regi
ster
0,
othe
rwis
e sp
ecify
the
amou
nt)
#52
-53
ques
tions
refe
r to
ever
yone
52.
Hav
e/ha
s you
/he/
she
ever
take
n a
trip
for
3 or
mor
e m
onth
s sin
ce 2
007
(dep
artu
re /
arri
val /
ret
urn
from
the
trip
mad
e be
fore
200
7)
1. Y
es
1
53
2. N
o2
EN
D
53.
How
man
y of
the
trip
s wer
e fo
r m
igra
tion
-wor
k,fa
mily
reu
nific
atio
n, p
erm
anen
t res
iden
ce, s
tudy
pu
rpos
es o
r ba
sed
on th
e m
ilita
ry-p
oliti
cal s
ituat
ion
of th
e ex
it co
untr
y (a
s a r
efug
ee)
0. N
one
0
EN
D
1. Num
ber
(spe
cify
)2
54
54.
Indi
vidu
al su
rvey
res
pond
ents
, tho
se w
ho h
ave
gone
on
mig
ratio
n tr
ips s
ince
200
7 (fo
r int
ervi
ewer
: don
’t as
k qu
estio
ns,
just
wri
te d
own
“1”`
in th
e “1
men
tion”
col
umns
of t
he re
spon
dent
s to
que
stio
ns #
36 a
nd 5
3.”)
B
2

140
SEC
TIO
N 2
. TH
E S
CH
ED
UL
E O
F M
IGR
ATIO
N D
EPA
RT
UR
ES
AN
D A
RR
IVA
LS
FRO
M T
HE
GIV
EN
SE
TT
LE
ME
NT
OF
PRE
SEN
T A
ND
AB
SEN
T H
/H M
EM
BE
RS
SIN
CE
200
7
The
Pro
cedu
re fo
r Fi
lling
in th
e Ta
ble
of th
e Se
ctio
n 2
Col
umn
(see
nex
t pag
e)
All
the
trips
(sta
rting
from
the
depa
rture
/arri
val/r
etur
n of
the
trip
unde
rtake
n be
fore
200
7) o
f eac
h H
/H m
embe
rs w
ho h
ave
mad
e tri
ps si
nce
1 Ja
nuar
y, 20
07 fo
r 3 m
onth
s or m
ore f
or w
ork/
fam
ily/ p
erm
anen
t res
iden
ce/st
udy o
r bec
ause
of m
ilita
ry-p
oliti
cal s
ituat
ion
of th
e EXI
T co
untry
(B1.
54 =
1) a
re to
be
com
plet
ed:
• For
form
er H
/H m
embe
rs fi
ll in
onl
y th
e trip
s mad
e whi
le b
eing
a m
embe
r of H
/H, i
nclu
ding
the t
rips m
ade w
hen
beco
min
g a p
art o
f the
H/H
and/
or le
avin
g th
e H/H
. a)
In th
e 1st
col
umn
writ
e do
wn
the
seria
l num
ber o
f H/H
mem
ber w
hose
B1.
54=1
: Tr
y to
form
ulat
e th
e qu
estio
ns w
ith a
per
sona
l app
roac
h, tr
ying
to
rem
embe
r the
nam
es o
f H/H
mem
bers
: for
exam
ple,
“Wha
t was
the n
atur
e of A
rmen
’s tri
p in
200
8?” a
nd so
on.
b)
Writ
e all
entri
es h
oriz
onta
lly. T
his m
eans
writ
e dow
n al
l the
char
acte
ristic
s of t
he tr
ip (d
epar
ture
s/arri
vals)
of t
he g
iven
H/H
mem
ber (
2.1.
Yea
r and
mon
th
of th
e tri
p 2.
2. P
urpo
se o
f the
trip
, 2.3
. Nat
ure o
f the
trip
, 2.4
. The
coun
try/
regi
on o
f dep
artu
re /a
rriv
al )
acco
rdin
g to
the c
olum
ns an
d m
akin
g ap
prop
riate
no
tes i
n th
e “Tr
ansit
ion”
fiel
d an
d on
ly af
ter t
hat m
ove o
n to
the n
ext H
/H m
embe
r. 2.
1. F
irst y
ear a
nd m
onth
of t
he tr
ip
c) F
ill in
the
colu
mns
for e
ach
H/H
mem
ber s
tarti
ng fr
om th
e ye
ar a
nd m
onth
of t
he fi
rst d
epar
ture
/arri
val s
ince
1 Ja
nuar
y 20
07, i
ndic
atin
g th
e ye
ar w
ith
four
char
acte
rs, a
nd th
e mon
th w
ith tw
o ch
arac
ters
, in
the a
ppro
pria
te ro
w. T
he y
ear o
f the
firs
t tri
p ca
n be
earl
ier t
han
2007
onl
y if
the fi
rst t
rip
of th
e H/H
m
embe
r afte
r 1 J
anua
ry 2
007
is a
retu
rn fr
om a
trip
mad
e bef
ore 2
007.
d) E
ach
succ
essiv
e ent
ry n
ot o
nly
signi
fies t
he b
egin
ning
of t
he tr
ip, b
ut th
e end
of t
he p
revi
ous o
ne. I
f the
re is
one
reco
rd o
r the
trip
has
an o
dd se
rial n
umbe
r, it
mea
ns th
at th
e H/H
mem
ber e
ither
has
arr
ived
at t
hat s
ettle
men
t for
the fi
rst t
ime,
or is
an
abse
ntee
of t
hat s
ettle
men
t.2.
2. P
urpo
se o
f the
trip
– se
e pos
sible
ver
sions
of t
he an
swer
s at t
he b
otto
m o
f the
tabl
e on
the n
ext p
age.
2.3.
Nat
ure o
f the
trip
- se
e pos
sible
ver
sions
of t
he an
swer
s at t
he b
otto
m o
f the
tabl
e on
the n
ext p
age.
2.4.
Ser
ial n
umbe
r of t
he tr
ip (d
epar
ture
/arr
ival
) – w
rite d
own
the t
rips o
f H/H
mem
ber,
starti
ng fr
om th
e firs
t one
2.
5. T
he co
untr
y/m
arz o
f the
last
trip
(dep
artu
re/a
rriv
al) –
writ
e dow
n ac
cord
ing
to o
rder
, des
crib
ed in
the c
olum
n.
e) C
odin
g pr
oced
ure o
f “Tr
ansit
ion”
fie
ld -
A fu
rther
inte
rvie
w w
ith ea
ch H
/H m
embe
r dep
ends
on
THE
NAT
UR
E O
F H
IS/H
ER L
AST
T
RIP
(s
ee p
rom
ptin
g co
des 2
.3 li
ne o
f the
tabl
e on
the f
ollo
win
g pa
ge 11
) acc
ordi
ng to
the c
ondi
tions
men
tione
d be
low,
on
the b
asis
of th
e int
ervi
ewed
mem
ber’s
last
note
in th
e “2.
3 N
atur
e of t
he tr
ip”
latti
ce.
• IF
2.3
= 1
→ B
3 (S
ectio
n 3)
• IF
2.3
= 2
→ B
4 (S
ectio
n 4)
• IF
2.3
= 3
→ B
5 (S
ectio
n 5)

141
• IF
2.3
= 4
→ B
6 (S
ectio
n 6)
• IF
2.3
= 5
→ B
6 (S
ectio
n 6)
• IF
2.3
= 6
→ B
6 (S
ectio
n 6)
:f)
If
the
H/H
mem
ber
who
took
the
mig
ratio
n tri
p is
in th
at s
ettle
men
t dur
ing
the
inte
rvie
w, c
ontin
ue th
e in
terv
iew
with
him
/her
per
sona
lly in
ac
cord
ance
with
“Tr
ansi
tion”
not
e.g)
If th
e H
/H m
embe
r who
took
the
mig
ratio
n tri
p is
out
of t
hat s
ettle
men
t dur
ing
the
inte
rvie
w, is
abr
oad
or in
ano
ther
RA
settl
emen
t, or
he/
she
is
unav
aila
ble
at th
at ti
me,
con
tinue
filli
ng in
the
ques
tionn
aire
with
the
mos
t inf
orm
ed m
embe
r.

142
Se
rial N
o.
of H
/H
mem
ber
acco
rdin
g to
B1
2.1.
–2.
3.
Cha
ract
eris
tics
of th
e tr
ip
2.4.
The
seri
al n
umbe
r of
the
trip
(ret
urn/
depa
rtur
e/ar
riva
l)2.
5. C
ount
ry/r
egio
n of
the
last
trip
III
III
IVV
VI
VII
VII
IIX
X1.
RA (m
entio
n th
e reg
ion)
2.
NK
R
3. R
F
4
. USA
5.
Oth
er (m
entio
n th
e co
untr
y)
Settl
emen
t(to
wn-
1, v
illag
e-2)
Tra
nsiti
on
12
34
56
78
910
1112
1314
1515
.116
17
2.1
Beg
inni
ngY
ear
To b
e fil
led
in b
y th
e en
code
r1
2
Mon
thM
entio
n th
e co
untry
/regi
on if
2
.5=1
or
2.5
=52.
2Pu
rpos
e
2.3
Nat
ure
2.1
Beg
inni
ngY
ear
To b
e fil
led
in b
y th
e en
code
r1
2
Mon
thM
entio
n th
e co
untry
/regi
on if
2.5=
1 or
2.5
=52.
2Pu
rpos
e
2.3
Nat
ure
2.1
Beg
inni
ngY
ear
To b
e fil
led
in b
y th
e en
code
r1
2
Mon
thM
entio
n th
e co
untry
/regi
on if
2
.5=1
or
2.5
=52.
2Pu
rpos
e
2.3
Nat
ure
2.1
Beg
inni
ngY
ear
To b
e fil
led
in b
y th
e en
code
r1
2
Mon
thM
entio
n th
e co
untry
/regi
on if
2
.5=1
or 2
.5=5
2.2
Purp
ose
2.3
Nat
ure
2.1
Beg
inni
ngY
ear
To b
e fil
led
in b
y th
e en
code
r1
2
Mon
thM
entio
n th
e co
untry
/regi
on if
2
.5=1
or
2.5
=52.
2Pu
rpos
e
2.3
Nat
ure
2.1
Beg
inni
ngY
ear
To b
e fil
led
in b
y th
e en
code
r1
2
Mon
thM
entio
n th
e co
untry
/regi
on if
2
.5=1
or
2.5
=52.
2Pu
rpos
e
2.3
Nat
ure
2.1
Beg
inni
ngY
ear
To b
e fil
led
in b
y th
e en
code
r
12
Mon
thM
entio
n th
e co
untry
/regi
on if
2
.5=1
or
2.5
=52.
2Pu
rpos
e
2.3
Nat
ure
2.2.
Purp
ose
of th
e tr
ip2.
3.N
atur
e of
the
trip

143
1. Jo
b / L
ooki
ng fo
r a jo
b1.
Ret
urn
from
abr
oad
- A
per
son
arriv
ed fr
om a
broa
d (in
clud
ed N
KR
), w
ho w
as
resi
ding
in A
rmen
ia
2. F
amily
(fam
ily u
nific
atio
n,
mar
riage
, div
orce
, etc
.)2.
Lea
ve f
or a
broa
d –
A p
erso
n w
ho h
as l
eft A
rmen
ia t
o go
to
anot
her
coun
try
(incl
uded
NK
R)
3. P
erm
anen
t res
iden
ce3.
Firs
t arr
ival
fro
m a
broa
d- A
per
son
who
has
arr
ived
fro
m a
broa
d an
d w
ho h
as
neve
r res
ided
in A
rmen
ia4.
Stu
dy/e
duca
tion
4. R
etur
n fr
om a
noth
er R
A se
ttlem
ent -
A p
erso
n w
ho h
as a
rriv
ed fr
om a
noth
er R
A
settl
emen
t who
pre
viou
sly
resi
ded
in th
e gi
ven
settl
emen
t5.
For
ced
mig
ratio
n / e
scap
e5.
Lea
ve fo
r ano
ther
RA
settl
emen
t - A
per
son
who
has
left
the
give
n se
ttlem
ent f
or
anot
her R
A se
ttlem
ent
6. F
irst a
rriv
al fr
om a
noth
er R
A se
ttlem
ent -
A p
erso
n w
ho h
as a
rriv
ed fr
om a
noth
er
RA
settl
emen
t who
has
n’t r
esid
ed in
this
giv
en se
ttlem
ent b
efor
e

144
SEC
TIO
N 3
. RE
TU
RN
EE
S FR
OM
AB
RO
AD
(IN
CL
UD
ING
NK
R)
Thi
s sec
tion
shou
ld b
e fil
led
in if
the
natu
re o
f the
last
trip
of H
/H m
embe
r(s)
in S
EC
TIO
N 2
is “
Ret
urn
from
Abr
oad”
(2.3
= 1
)
H/H
Ser
ial N
umbe
rR
egio
nTe
rrito
ryRe
spon
dent
’s se
rial n
umbe
r fro
m B
1
#Th
e se
rial n
umbe
r fro
m B
1 of
the
H/H
who
has
retu
rned
fr
om a
broa
d,
Tran
sitio
n
Nam
e of
H/H
mem
ber …
……
……
……
……
……
.……
….
1.W
hat w
as y
our
soci
o-ec
onom
ic st
atus
bef
ore
you
last
left
Arm
enia
?(a
sk e
very
body
, reg
ardl
ess o
f age
)1.
Empl
oyee
in p
ublic
sect
or2.
Empl
oyee
in p
rivat
e se
ctor
3. E
mpl
oyer
4. S
elf-e
mpl
oyed
in ag
ricul
tura
l sec
tor
5.Se
lf-em
ploy
ed in
anot
her s
ecto
r6.
Mem
ber o
f fam
ily, w
orki
ng w
ithou
t rem
uner
atio
n7.
Pup
il/stu
dent
8.
H/H
hol
der
9. P
ensio
ner/b
enef
icia
ry10
. Und
er ca
re11
. Une
mpl
oyed
12. O
ther
2.*
The
ques
tion
refe
rs to
peo
ple
6 ye
ars a
nd o
lder
(bor
n in
20
07 a
nd b
efor
e th
at)
Hav
e yo
u at
tend
ed a
ny e
duca
tiona
l ins
titut
ion
in
the
coun
try
of e
ntry
(if t
here
are
seve
ral,
plea
se
men
tion
the
high
est)
1.Sc
hool
5. G
radu
ate
cour
se, r
esid
ency
, D
octo
ral c
andi
danc
y5.
Post
grad
uate
stud
y/po
st g
rad.
re
side
ncy/
doct
oral
6. S
hort
cour
se7.
No
2. V
ocat
iona
l Col
lege
3. C
olle
ge, t
rade
scho
ol4.
Uni
vers
ity
6. sh
ort-t
erm
cou
rse
7. N
o
The
follo
win
g qu
estio
ns re
fer t
o in
divi
dual
s 15
year
s old
and
old
er (b
orn
in 1
998
or e
arlie
r)
3.D
id y
ou h
ave
rela
tives
/frie
nds i
n th
e co
untr
y of
ent
ry b
efor
e le
avin
g?1.
Yes
1
4
2. N
o2
5
4.H
ave
you
rece
ived
any
ass
istan
ce fr
om th
em o
nyo
ur tr
ips?
( m
entio
n 2
mai
n op
tions
)1.
Yes
,in
getti
ng a
vis
a2.
Yes
, in
payi
ng t
he ra
vel
cost
s3.
Yes
, fo
rfo
od/a
ccom
mod
atio
n
4. Y
es, i
n fin
ding
a jo
b5.
Yes
, in
findi
ng
acco
mm
odat
ion
6.O
ther
7. N
o

145
#Th
e se
rial n
umbe
r fro
m B
1 of
the
H/H
who
has
retu
rned
fr
om a
broa
d,
Tran
sitio
n
Nam
e of
H/H
mem
ber …
……
……
……
……
……
.……
….
5.W
ho m
ade
the
deci
sion
on
your
goi
ng a
broa
d?1.
I2.
My
fam
ily
3. O
ther
6.W
hat w
ere
the
mai
n re
ason
s for
you
r/hi
s/he
r de
part
ure?
( men
tion
3 g
ener
al a
nsw
ers)
1Th
ere
is n
o w
ork
here
2. F
ind
a be
tter j
ob w
ith h
ighe
r rem
uner
atio
n3.
To
earn
mon
ey fo
r H/H
, 4.
Bad
wor
king
con
ditio
ns5.
Diff
icul
ties f
or e
ntre
pren
eurs
hip
6. S
tudy
and
impr
ovem
ent o
f qua
lific
atio
n7.
Low
qua
lity
of e
duca
tion
8. U
nific
atio
n w
ith re
lativ
es li
ving
abr
oad
9. S
tart
a fa
mily
10
. Oth
er fa
mily
circ
umst
ance
s (di
vorc
e, d
isag
reem
ent,
etc.
)11
. Unh
ealth
y m
oral
-psy
chol
ogic
al a
tmos
pher
e12
. Unc
erta
inty
tow
ards
the
futu
re13
.Pol
lute
d en
viro
nmen
t/air/
unfa
vour
able
clim
ate
14. D
iscr
imin
atio
n 15
. Pol
itica
l per
secu
tion/
fear
of p
oliti
cal p
erse
cutio
n16
.Rel
igio
us p
erse
cutio
n/ fe
ar o
f rel
igio
us p
erse
cutio
n17
. Oth
er (s
peci
fy)
7.B
y w
hat m
eans
(fun
ds) w
as th
e tr
ip m
ade?
1.H
/H sa
ving
s2.
Selli
ng a
sset
s3.
Unc
ompe
nsat
ed a
id p
rovi
ded
4.Pa
wni
ng a
sset
s 5.
Ban
k lo
an/lo
an6.
Deb
t7.
Empl
oyer
8.O
ther
(spe
cify
)
8.W
hat w
as th
e m
ain
reas
on fo
r yo
ur c
hoic
e of
that
pa
rtic
ular
cou
ntry
? ( g
ive
3 m
ain
answ
ers)
1.V
isa
not r
equi
red
2.C
omm
and
of la
ngua
ge3.
Job
offe
r4.
Res
iden
cy e
xper
ienc
e
5.A
cqua
inta
nce/
rela
tive
6.Ec
onom
ic a
ttrac
tiven
ess
7.D
epar
ture
and
oth
er e
xpen
ses a
ffor
dabi
lity
8.La
ck o
f an
alte
rnat
ive
9.O
ther
(spe
cify
)

146
.
#Th
e se
rial n
umbe
r fro
m B
1 of
the
H/H
who
has
retu
rned
fr
om a
broa
d,
Tran
sitio
n
Nam
e of
H/H
mem
ber …
……
……
……
……
……
.……
….
9.D
id y
ou r
egist
ered
at t
he A
rmen
ian
cons
ulat
e of
the
coun
try
of e
ntry
?1.
Yes
1
11
2. N
o2
10
10.
Whi
ch is
the
mai
n re
ason
for
not r
egis
teri
ng?
1.Iw
as a
bsen
t les
s tha
n 6
mon
ths
2.I d
id n
ot k
now
that
I sh
ould
be
regi
ster
ed3.
I do
not c
onsi
der i
t im
porta
nt/I
saw
no
poin
t4.
I did
not
hav
e en
ough
tim
e5.
Ther
e w
as m
uch
bur
eauc
racy
6.It
was
far/v
ery
diff
icul
t to
get t
here
7.Th
ere
was
no
Arm
enia
n co
nsul
ate
ther
e8.
Oth
er (s
peci
fy)
11.
Wha
t leg
al r
esid
ence
stat
us d
id y
ou h
ave
in th
e co
untr
y w
here
you
res
ided
? (g
ive
2 ge
nera
l ans
wer
s)1.
Citi
zen
2.R
ight
to re
side
nce
3.R
ight
to w
ork
4.R
efug
ee5.
Asy
lum
seek
er6.
Tem
pora
ry re
gist
ratio
n7.
Had
no
lega
l sta
tus
8.O
ther
(spe
cify
)12
.W
hat t
ype
of a
ccom
mod
atio
n w
ere
you
livin
g in
th
ere?
1.O
wn
apar
tmen
t/hou
se2.
In th
e ho
me
of a
cqua
inta
nces
/rela
tives
3.
Ren
ted
apar
tmen
t/hou
se4.
Ren
ted
room
/ “co
rner
”5.
Dor
mito
ry6.
Ada
pted
non
-res
iden
tial a
ccom
mod
atio
n7.
Oth
er(s
peci
fy)
13.
Did
you
hav
e he
alth
insu
ranc
e in
that
cou
ntry
?
1.
Yes
, per
man
ent i
nsur
ance
2.
Yes
, tem
pora
ry in
sura
nce
3. N
o
14.
How
was
you
r he
alth
bef
ore
leav
ing
and
at th
e tim
e of
ret
urn
1. E
xcel
lent
2. G
ood
3. S
atis
fact
ory
4. B
ad
14.1
Whe
n le
avin
g
14.2
On
retu
rnin
g
15.
Did
you
hav
e an
y in
tent
ion
to w
ork
abro
ad
befo
re le
avin
g?1.
Yes
1
16
2. N
o2
20
16.
Did
you
hav
e a
prel
imin
ary
arra
ngem
ent/p
rom
ise
abou
t wor
k?1
-3
17
1 Y
es, a
writ
ten
cont
ract
3. Y
es, o
ther
(spe
cify
)2.
Yes
, a p
rom
ise
4. N
o4
20
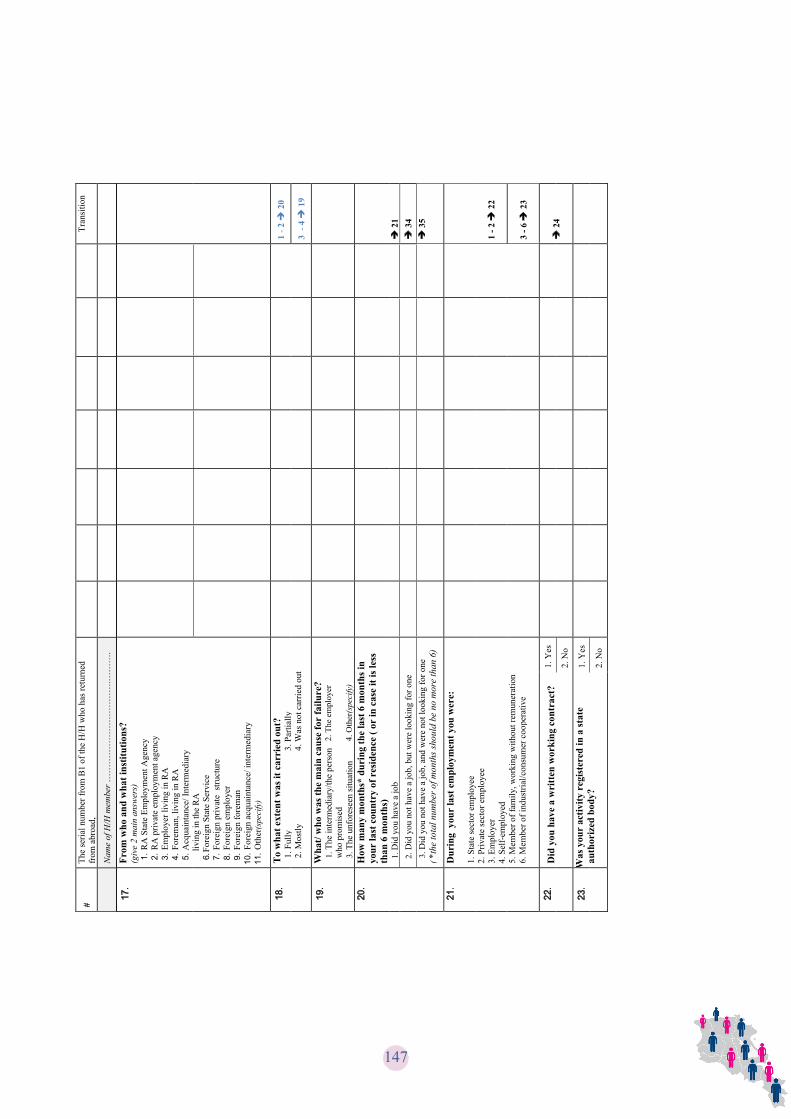
147
#Th
e se
rial n
umbe
r fro
m B
1 of
the
H/H
who
has
retu
rned
fr
om a
broa
d,
Tran
sitio
n
Nam
e of
H/H
mem
ber …
……
……
……
……
……
.……
….
17.
From
who
and
wha
t ins
titut
ions
?(g
ive
2 m
ain
answ
ers)
1.R
A S
tate
Em
ploy
men
t Age
ncy
2.R
A p
rivat
e em
ploy
men
t age
ncy
3.Em
ploy
er li
ving
in R
A4.
Fore
man
, liv
ing
in R
A5.
Acq
uain
tanc
e/ In
term
edia
ryliv
ing
in th
e R
A6.
Fore
ign
Stat
e Se
rvic
e7.
Fore
ign
priv
ate
stru
ctur
e8.
Fore
ign
empl
oyer
9.
Fore
ign
fore
man
10.F
orei
gn a
cqua
inta
nce/
inte
rmed
iary
11.O
ther
(spe
cify
)
18.
To
wha
t ext
ent w
as it
car
ried
out
?
1. F
ully
3.
Par
tially
2.
Mos
tly4.
Was
not
car
ried
out
1-2
20
3-4
19
19.
Wha
t/ w
ho w
as th
e m
ain
caus
e fo
r fa
ilure
? 1.
The
inte
rmed
iary
/the
pers
on
who
pro
mis
ed2.
The
em
ploy
er
3.Th
e un
fore
seen
situ
atio
n4.
Oth
er(s
peci
fy)
20.
How
man
y m
onth
s* d
urin
g th
e la
st 6
mon
ths i
n yo
ur la
st c
ount
ry o
f res
iden
ce (
or in
cas
e it
is le
ss
than
6 m
onth
s)
1.D
id y
ou h
ave
a jo
b
212.
Did
you
not
hav
e a
job,
but
wer
e lo
okin
g fo
r one
34
3.D
id y
ou n
ot h
ave
a jo
b, a
nd w
ere
not l
ooki
ng fo
r one
(*th
e to
tal n
umbe
r of m
onth
s sho
uld
be n
o m
ore
than
6)
35
21.
Dur
ing
you
r la
st e
mpl
oym
ent y
ou w
ere:
1. S
tate
sect
or e
mpl
oyee
2. P
rivat
e se
ctor
em
ploy
ee3.
Em
ploy
er4.
Sel
f-em
ploy
ed5.
Mem
ber o
f fam
ily, w
orki
ng w
ithou
t rem
uner
atio
n6.
Mem
ber o
f ind
ustri
al/c
onsu
mer
coo
pera
tive
1-2
22
3-6
23
22.
Did
you
hav
e a
wri
tten
wor
king
con
trac
t?
1. Y
es
242.
No
23.
Was
you
r ac
tivity
reg
iste
red
in a
stat
e au
thor
ized
bod
y?1.
Yes
2. N
o

148
#Th
e se
rial n
umbe
r fro
m B
1 of
the
H/H
who
has
retu
rned
fr
om a
broa
d,
Tran
sitio
n
Nam
e of
H/H
mem
ber …
……
……
……
……
……
.……
….
24.
Wha
t was
the
natu
re o
f the
wor
k?1.
Tem
pora
ry, l
ess t
han
3 m
onth
s
3.
Term
less
2.Te
mpo
rary
, les
s tha
n 1
year
4.O
ther
(spe
cify
) …
……
…25
.In
wha
t sec
tor
did
you
wor
k?
1.A
gric
ultu
re5.
Stat
e m
anag
emen
t2.
Indu
stry
6. E
duca
tion
3.C
onst
ruct
ion
7. H
ealth
care
4.Tr
ade
and
reno
vatio
n8.
Oth
er se
rvic
es
26.
Did
the
job
mat
ch y
our
prof
essi
on?
1.Y
es, f
ully
2.R
athe
r yes
3.
Rat
her n
o4.
No
5. D
on’t
have
a p
rofe
ssio
n 27
.D
id th
e jo
b m
atch
you
r qu
alifi
catio
n?1.
Yes
, ful
ly2.
Yes
, par
tially
3.N
o, it
was
hig
her
4.N
o, it
was
low
er28
.H
ow m
any
hour
s on
aver
age
did
you
wor
k w
eekl
y?(n
umbe
r of h
ours
)
29.
Did
you
hav
e da
ys o
ff?
1.
Yes
, reg
ular
ly
2.
Yes
, not
regu
larly
3.N
o
30.
Wha
t pro
blem
s did
you
hav
e co
nnec
ted
with
you
r w
ork?
(acc
ept a
ll an
swer
s)
1. u
npai
d ov
ertim
e w
ork
1
11
11
11
2. h
eavy
wor
king
con
ditio
ns2
22
22
22
3. u
ndes
irabl
e w
ork
oblig
atio
ns3
33
33
33
4. sa
lary
del
ays/
pay
ing
parti
ally
or n
ot fu
lly4
44
44
44
5. p
robl
ems w
ith a
utho
ritie
s
5
55
55
55
6. o
ther
(spe
cify
)6
66
66
66
7. d
idn’
t hav
ean
y pr
oble
ms
77
77
77
77
32

149
#Th
e se
rial n
umbe
r fro
m B
1 of
the
H/H
who
has
retu
rned
fr
om a
broa
d,
Tran
sitio
n
Nam
e of
H/H
mem
ber …
……
……
……
……
……
.……
….
31.
Dur
ing
your
wor
k ha
ve y
ou b
een
subj
ecte
d to
hum
an
righ
ts v
iola
tions
/ for
ms o
f coe
rcio
n lik
e th
ese?
(acc
ept a
ll an
swer
s)
1.D
ebt b
onda
ge1
11
11
11
2.V
iola
tion
of se
curit
y m
aint
enan
ce ru
les
22
22
22
23.
Lim
it of
mov
emen
t3
33
33
33
4.Se
izur
e of
doc
umen
ts4
44
44
44
5.Ph
ysic
al/s
exua
l vio
lenc
e5
55
55
55
6.In
volv
emen
t in
crim
inal
act
ivity
66
66
66
67.
Thre
at o
f bei
ng h
ande
d ov
er to
the
auth
oriti
es7
77
77
77
8.O
ther
(spe
cify
)8
88
88
88
32.
How
muc
h w
as y
our/
his/h
er
mon
thly
ave
rage
sala
ry, w
ithou
t ta
xes?
AM
D
USD
RU
B
EUR
O
33.
Who
was
you
r em
ploy
er?
1. M
e, m
ysel
f2.
Com
patri
ot fr
om A
rmen
ia3.
Loca
l com
patri
ot4.
Loca
l res
iden
t/loc
al in
stitu
tion
5. S
tate
6. O
ther
(spe
cify
)34
.T
hrou
gh w
hom
did
you
find
/ loo
k fo
r w
ork?
(giv
e 2
mai
n an
swer
s)
1.R
A S
tate
Em
ploy
men
t Age
ncy
2.R
A p
rivat
e em
ploy
men
t age
ncy
3.Em
ploy
er li
ving
in th
e R
A4.
Fore
man
livi
ng in
RA
5.A
cqua
inta
nce/
inte
rmed
iary
livi
ng in
the
RA
6.O
wn/
fam
ily b
usin
ess
7.Fo
reig
n St
ate
Serv
ice
8.Fo
reig
n pr
ivat
e st
ruct
ure
9.Fo
reig
n em
ploy
er10
.Fo
reig
n ta
skm
aste
r11
.Fo
reig
n ac
quai
ntan
ce/ i
nter
med
iary
12.
Ow
n/fa
mily
bus
ines
s abr
oad
13.
Inte
rnet
14.
Oth
er (s
peci
fy)
35.
Did
you
hav
e an
y ot
her
sour
ce o
f inc
ome
duri
ng
your
stay
abr
oad
(pen
sion
, allo
wan
ce, i
ncom
e fr
om p
rope
rty
rent
, etc
.)?
1. Y
es1
36
2. N
o2
37

150
36.
How
muc
h w
as th
at in
com
e pe
r A
MD
#Th
e se
rial n
umbe
r fro
m B
1 of
the
H/H
who
has
retu
rned
fr
om a
broa
d,
Tran
sitio
n
Nam
e of
H/H
mem
ber …
……
……
……
……
……
.……
….
mon
th w
ithou
t tax
es o
n av
erag
e?U
SD
RU
B
EUR
O37
.D
id y
our
tota
l inc
ome
allo
w y
ou to
save
any
mon
ey?
1. Y
es, a
con
side
rabl
eam
ount
2. Y
es, a
certa
in am
ount
3. Y
es, v
ery
little
4. N
o5.
No,
I ev
en h
ad d
ebts
.
1-3
38
4-5
39
38.
How
is/w
as/w
ill th
e in
com
e be
use
d?(G
ive
3 m
ain
optio
ns)
1.H
H's
daily
exp
ense
s2.
Cer
emon
ies (
wed
ding
par
ty, b
irthd
ay p
arty
, fun
eral
, etc
.)3.
Com
mun
al a
nd d
omes
tic n
eeds
(im
prov
emen
t of h
ousi
ng
and
livin
g co
nditi
ons,
etc.
) 4.
Educ
atio
nal,
heal
th a
nd o
ther
soci
al n
eeds
5.A
cqui
sitio
n of
item
s for
long
term
use
6.A
cqui
sitio
n of
pro
perty
(hou
sing
, lan
d, e
tc.)
7.In
vest
men
t in
prod
uctio
n/bu
sine
ss8.
8.Fi
nanc
ial i
nves
tmen
t (ba
nk d
epos
it, se
curit
ies,
etc.
) 9.
Savi
ngs
10. U
nfor
esee
n ci
rcum
stan
ces
11.O
ther
(spe
cify
)
39.
Did
you
fina
ncia
lly su
ppor
t you
r H
/H o
r ot
her
pers
ons l
ivin
g in
the
RA
dur
ing
your
stay
abr
oad?
1.
Yes
, reg
ular
ly5.
No,
I w
as n
ot a
ble
to2.
Yes
, som
etim
es6.
No,
ther
e w
as n
o ne
ed3.
Yes
, rar
ely
7. N
o, I
did
not w
ish
to d
o so
4. N
o, it
was
not
pos
sibl
e8.
No,
it w
as th
ey w
ho
supp
orte
d m
e
1-3
40
4-8
41
40.
How
was
the
mon
ey m
ainl
y se
nt?
1.B
ank
trans
fer
2. M
oney
tran
sfer
org
anis
atio
ns (e
.g. M
oney
Gra
m)
3. P
ost
4. C
ourie
r5.
Bro
ught
per
sona
lly6.
By
mea
ns o
f peo
ple
com
ing
7. O
ther
(spe
cify
)

151
47.
Did
you
feel
the
need
for
supp
ort f
rom
the
loca
l A
rmen
ian
com
mun
ity in
the
coun
try
of e
ntry
, and
if
yes,
did
you
turn
to th
em a
nd d
id y
ou g
et a
ny r
eal
supp
ort?
1.Th
ere
was
no
com
mun
ity th
ere
2.Th
ere
was
no
need
3.I n
eede
d su
ppor
t but
did
n’t t
urn
to th
em
4.I t
urne
d to
them
but
did
n’t g
et su
ppor
t 5.
I tur
ned
to th
em a
nd g
ot so
me
supp
ort
6.I t
urne
d to
them
and
got
full
supp
ort
41.
To
wha
t ext
ent d
id y
our
prof
essi
onal
kno
wle
dge
and
skill
s inc
reas
e ab
road
?1.
Sig
nific
antly
2
. To
som
e ex
tent
3. D
idn’
t inc
reas
e
42.
On
the
who
le, d
id y
our
trip
con
trib
ute
to y
our
beco
min
g m
ore
com
petit
ive
in th
e la
bour
mar
ket o
f A
rmen
ia?
1. Y
es
2.
To
a ce
rtain
ex
tent
3. N
ot re
ally
4. N
o
43.
With
whi
ch o
f the
inst
itutio
ns/g
roup
s/in
divi
dual
s m
entio
ned
belo
w d
id y
ou h
ave
prob
lem
s? (i
ndic
ate
2 m
ain
answ
ers)
1. P
olic
e8.
Par
tner
s2.
Tax
serv
ice
9. M
igra
nts o
f oth
er3.
Oth
er a
utho
ritie
s4.
Edu
catio
nN
atio
nalit
ies
10. E
mpl
oyer
5. H
ealth
care
6. C
rimin
al w
orld
7. N
eigh
bour
s
11. O
ther
(spe
cify
)12
. No
one
1-1
1
44
12
45
44.
How
and
by
who
m w
ere
thes
e pr
oble
ms s
olve
d? (g
ive
2 m
ain
answ
ers)
1. T
hrou
gh th
e co
urts
6. A
cqua
inta
nces
am
ong
loca
ls
2. P
olic
e
7. N
GO
s3.
Oth
er a
utho
ritie
s8.
Brib
e/gi
ft4.
Em
ploy
er
9. O
ther
(spe
cify
)5.
Crim
inal
wor
ld10
. The
y w
ere
not r
esol
ved
45.
Wou
ld it
hav
e bee
n us
eful
to re
ceiv
e a
cons
ulta
tion
on le
gal i
ssue
s, ex
istin
g ri
sks,
your
ri
ghts
and
obl
igat
ions
in th
at co
untr
y be
fore
yo
ur d
epar
ture
?
1. Y
es
2. N
o
46.
Did
you
par
ticip
ate i
n st
ate i
nteg
ratio
n pr
ogra
ms,
lang
uage
cour
ses,
voca
tiona
l tra
inin
gs, e
tc.,
orga
nize
d by
the s
tate
dur
ing
your
stay
abro
ad?
1. Y
es
2. N
o
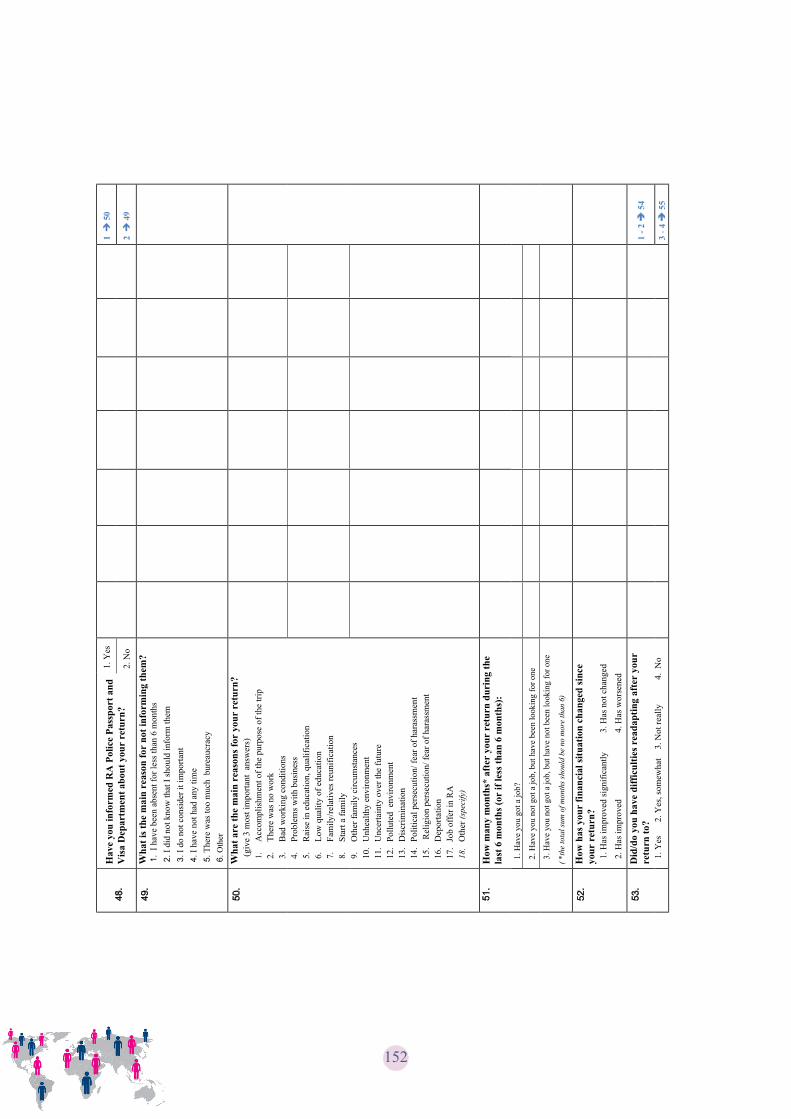
152
48.
Hav
e yo
uin
form
ed R
A P
olic
e Pa
sspo
rt a
nd
Vis
a D
epar
tmen
t abo
ut y
our
retu
rn?
1. Y
es1
50
2. N
o2
49
49.
Wha
t is t
he m
ain
reas
on fo
r no
t inf
orm
ing
them
?1.
I hav
e be
en a
bsen
t for
less
than
6 m
onth
s2.
I did
not
kno
w th
at I
shou
ld in
form
them
3.I d
o no
t con
side
r it i
mpo
rtant
4.I h
ave
not h
ad a
ny ti
me
5.Th
ere
was
too
muc
h b
urea
ucra
cy6.
Oth
er
50.
Wha
t are
the
mai
n re
ason
s for
you
r re
turn
?(g
ive
3 m
ost i
mpo
rtant
ans
wer
s)
1.A
ccom
plis
hmen
t of t
he p
urpo
se o
f the
trip
2.Th
ere
was
no
wor
k3.
Bad
wor
king
con
ditio
ns4.
Prob
lem
s with
bus
ines
s5.
Rai
se in
edu
catio
n, q
ualif
icat
ion
6.Lo
w q
ualit
y of
edu
catio
n7.
Fam
ily/re
lativ
es re
unifi
catio
n8.
Star
t a fa
mily
9.O
ther
fam
ily c
ircum
stan
ces
10.
Unh
ealth
y en
viro
nmen
t11
.U
ncer
tain
ty o
ver t
he fu
ture
12
.Po
llute
d e
nviro
nmen
t13
.D
iscr
imin
atio
n14
.Po
litic
al p
erse
cutio
n/ fe
ar o
f har
assm
ent
15.
Rel
igio
n pe
rsec
utio
n/ fe
ar o
f har
assm
ent
16.
Dep
orta
tion
17.
Job
offe
r in
RA
18.
Oth
er (s
peci
fy)
51.
How
man
y m
onth
s* a
fter
you
r re
turn
dur
ing
the
last
6 m
onth
s (or
if le
ss th
an 6
mon
ths)
:
1. H
ave
you
got a
job?
2. H
ave
you
not g
ot a
job,
but
hav
e be
en lo
okin
g fo
r one
3. H
ave
you
not g
ot a
job,
but
hav
e no
t bee
n lo
okin
g fo
r one
(*th
e to
tal s
um o
f mon
ths s
houl
d be
no
mor
e th
an 6
)
52.
How
has
you
r fin
anci
al si
tuat
ion
chan
ged
sinc
e yo
ur r
etur
n?1.
Has
impr
oved
sign
ifica
ntly
3. H
as n
ot c
hang
ed
2. H
as im
prov
ed4.
Has
wor
sene
d
53.
Did
/do
you
have
diff
icul
ties r
eada
ptin
g af
ter
your
re
turn
to?
1. Y
es2.
Yes
, som
ewha
t3.
Not
real
ly4.
No
1-2
54
3-4
55

153
2. S
ocia
l sup
port
22
22
22
23.
Doc
umen
t iss
ues
33
33
33
34.
Leg
al a
ssis
tanc
e
44
44
44
4
5. V
ocat
iona
l stu
dy5
55
55
55
6. B
usin
ess d
evel
opm
ent
66
66
66
67.
Bus
ines
s loa
ns7
77
77
77
8. O
ther
(spe
cify
)8
88
88
88
54.
To
wha
t ext
ent w
ere/
are
your
diff
icul
ties r
eada
ptin
g to
Arm
enia
con
nect
ed to
thes
e, p
leas
e e
valu
ate,
w
here
“1
“is h
ighl
y co
nnec
ted
and
“5”
is n
ot
conn
ecte
d?1.
Lega
l/doc
umen
t iss
ues
2.H
ousi
ng/d
omes
tic p
robl
ems
3.W
ork
prob
lem
s
4.Ed
ucat
iona
l/hea
lth is
sues
5.So
cial
secu
rity
issu
es
6.Pr
oble
m re
adap
ting
to th
e en
viro
nmen
t
7.Pr
oble
m o
f lei
sure
opp
ortu
nitie
s
55.
Hav
e you
ever
hea
rd a
bout
rein
tegr
atio
n pr
ogra
ms f
or re
turn
ing,
real
ized
by
stat
e/in
tern
atio
nal o
rgan
izat
ions
?
1. Y
es1
56
2. N
o2
60
56.
Whi
ch o
f the
follo
win
g so
urce
s inf
orm
ed y
ou a
bout
th
is?(U
p to
2 an
swer
s)
1. F
orm
al in
stitu
tions
2. T
V
3. R
adio
4. P
ress
5. In
tern
et/s
ocia
l med
ia6.
Pos
ters
/bro
chur
es7.
Acq
uain
tanc
e / f
riend
8. O
ther
(spe
cify
)
57.
Hav
e you
par
ticip
ated
in su
ch a
pro
gram
?1.
Yes
1
58
2. N
o2
59
58.
Whi
ch o
f the
follo
win
g pr
ogra
mm
es h
ave y
ou b
een
invo
lved
in?
(acc
ept a
ll an
swer
s)
601.
Lan
guag
e co
urse
s1
11
11
11

154
59W
hy d
id n
ot y
ou p
artic
ipat
e?1.
I w
as n
ot in
form
ed in
due
tim
e2.
It w
as n
ot u
sefu
l/not
inte
resti
ng3.
Cond
ition
s wer
e not
satis
facto
ry4.
Oth
er(s
peci
fy)
60If
you
had
bee
n of
fere
d pa
rtic
ipat
ion
in th
ese
cour
se o
n yo
ur r
etur
n, w
hich
of t
he b
elow
m
entio
ned
wou
ld b
e us
eful
for
you?
1. B
usin
ess O
rgan
izat
ion
and
Man
agem
ent
2. C
ompu
ter s
kills
3. T
each
ing
of tr
ades
4. L
angu
age
cour
ses
5. O
ther
(spe
cify
)6.
Non
e of
them
EN
D
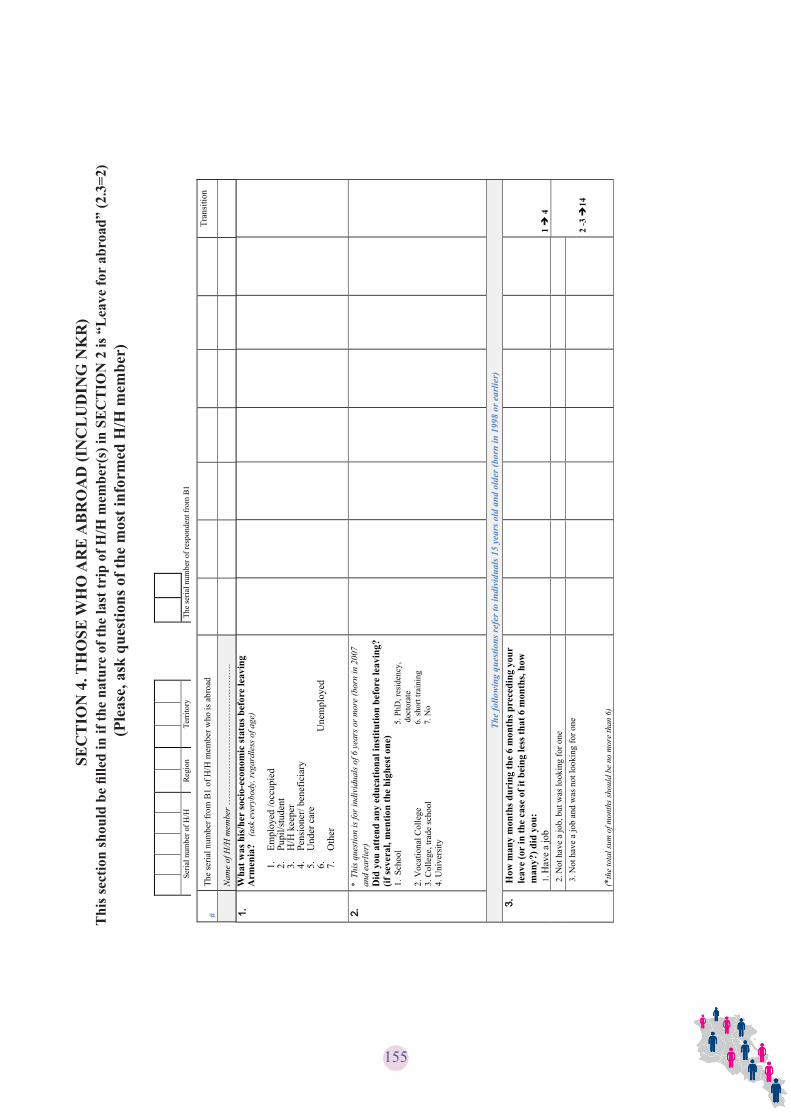
155
SEC
TIO
N 4
. TH
OSE
WH
O A
RE
AB
RO
AD
(IN
CL
UD
ING
NK
R)
Thi
s sec
tion
shou
ld b
e fil
led
in if
the
natu
re o
f the
last
trip
of H
/H m
embe
r(s)
in S
EC
TIO
N 2
is “
Lea
ve fo
r ab
road
” (2
.3=2
) (P
leas
e, a
sk q
uest
ions
of t
he m
ost i
nfor
med
H/H
mem
ber)
Seria
l num
ber o
f H/H
Reg
ion
Terri
tory
The
seria
l num
ber o
f res
pond
ent f
rom
B1
#Th
e se
rial n
umbe
r fro
m B
1 of
H/H
mem
ber w
ho is
abr
oad
Tran
sitio
n
Nam
e of
H/H
mem
ber …
……
……
……
……
……
……
…..…
.
1.W
hat w
as h
is/h
er so
cio-
econ
omic
stat
us b
efor
e le
avin
gA
rmen
ia?
(ask
eve
rybo
dy, r
egar
dles
s of a
ge)
1.Em
ploy
ed /o
ccup
ied
2.Pu
pil/s
tude
nt3.
H/H
kee
per
4.Pe
nsio
ner/
bene
ficia
ry5.
Und
er c
are
6.U
nem
ploy
ed7.
Oth
er
2.*
This
que
stio
n is
for i
ndiv
idua
ls o
f 6 y
ears
or m
ore
(bor
n in
200
7 an
d ea
rlier
)D
id y
ou a
tten
d an
y ed
ucat
iona
l ins
titut
ion
befo
re le
avin
g?(if
seve
ral,
men
tion
the
high
est o
ne)
1.Sc
hool
5. P
hD, r
esid
ency
,do
ctor
ate
2. V
ocat
iona
l Col
lege
3. C
olle
ge, t
rade
scho
ol4.
Uni
vers
ity
6. sh
ort t
rain
ing
7. N
o
The
follo
win
g qu
estio
ns re
fer t
o in
divi
dual
s 15
year
s old
and
old
er (b
orn
in 1
998
or e
arlie
r)3.
How
man
y m
onth
s dur
ing
the
6 m
onth
s pre
cedi
ng y
our
leav
e (o
r in
the
case
of i
t bei
ng le
ss th
at 6
mon
ths,
how
m
any?
) did
you
: 1.
Hav
e a
job
1
42.
Not
hav
e a
job,
but
was
look
ing
for o
ne
2-3
143.
Not
hav
e a
job
and
was
not
look
ing
for o
ne
(*th
e to
tal s
um o
f mon
ths s
houl
d be
no
mor
e th
an 6
)

156
4.In
his
last
job
in R
A h
e w
as:
1.em
ploy
ed in
stat
e se
ctor
2.em
ploy
ed in
non
-sta
te se
ctor
3.em
ploy
er4.
self-
empl
oyed
in ag
ricul
tura
l sec
tor
5.se
lf-em
ploy
ed in
oth
er se
ctor
6.fa
mily
mem
ber w
orki
ng
with
out p
ay
444
1-2
5
3-6
6
5.D
id h
e /s
he h
ave
a w
ritt
en w
ork
cont
ract
?
1. Y
es
7
2. N
o6.
Was
the
activ
ity r
egis
tere
d by
the
stat
e 1.
Yes
au
thor
ized
bod
y?2.
No
7.
Wha
t was
the
natu
re o
f his/
her
wor
k?1.
tem
pora
ry, l
ess t
han
3 m
onth
s
3.
term
less
2. te
mpo
rary
, les
s tha
n on
e ye
ar4.
Oth
er (s
peci
fy)(p
leas
e,sp
ecify
)8.
In w
hich
sect
ors d
id h
e/sh
e m
ainl
y 1.
Agr
icul
ture
w
ork?
5. S
tate
gov
e5.S
tate
gov
erna
nce
2.In
dustr
y6.
Edu
catio
n3.
Con
stru
ctio
n 7.
Hea
lth4.
Trad
e an
d re
nova
tion
8. O
ther
serv
ices
9.D
id h
is/he
r jo
b m
atch
1.Y
es, f
ully
2. Y
es, p
artia
lly
his/
her
prof
essi
on?
3.N
o, it
was
hig
her
4.N
o, it
was
low
er5.
Don
’t ha
ve p
rofe
ssio
n10
.D
id th
e jo
b m
atch
his
/her
1.
Yes
, ful
ly2.
Yes
, par
tially
qual
ifica
tion?
3. N
o, it
was
hig
her
4. N
o, it
was
low
er11
.H
ow m
any
hour
s on
aver
age
did
he/s
he w
ork
wee
kly?
(num
ber o
f hou
rs)
12.
Did
he/
she
have
day
s off
?
1.
Yes
, reg
ular
ly 2
. Yes
, but
not
regu
larly
, 3. A
lmos
t not
13
.H
ow m
uch
was
his
/her
ave
rage
mon
thly
sala
ry w
ithou
t ta
xes?
(A
MD
)
14.
Did
he/
she
have
oth
er so
urce
of i
ncom
e (p
ensi
on, a
llow
ance
, inc
ome
from
pro
pert
y re
nt, e
tc.)
in A
rmen
ia b
efor
e le
avin
g?
1. Y
es
1
15
2. N
o2
16
15.
How
muc
h w
as h
is/h
er a
vera
ge m
onth
ly in
com
e?
(AM
D)
16.
Did
his/
her i
ncom
e allo
w h
im/h
er to
save
mon
ey?
1.
Yes
, a c
onsi
dera
ble
amou
nt
2.Y
es, t
o a c
erta
in am
ount
3.Y
es, v
ery
little
4. N
o
5. N
o,I e
ven
had
debt
sTh
e qu
estio
ns 1
7-53
rela
te to
H/H
mem
ber’
s la
test
trip
abro
ad
17.
Did
he/
she
have
any
rel
ativ
es/fr
iend
s in
the
coun
try
of e
ntry
bef
ore
his/
her
depa
rtur
e?1.
Yes
1
18
2.
No
2
19

157
18.
Did
he/
she
rece
ived
any
supp
ort f
rom
them
dur
ing
the
trip
?(m
entio
n 2
gene
ral a
nsw
ers)
.
1.Y
es, i
n ge
tting
a v
isa
2.Y
es, i
n tr
avel
cos
ts3.
Yes
, for
abo
de
4.Y
es, i
n fin
ding
a jo
b
5. O
ther
(spe
cify
)6.
No
19.
Who
mad
e th
e de
cisi
on o
n hi
s/he
r go
ing
abro
ad?
1. H
e H
imse
lf/sh
e he
rsel
f
2. F
amily
3. O
ther
(spe
cify
)20
.W
hat w
ere
the
mai
n re
ason
s for
goi
ng a
broa
d?(g
ive
3 m
ain
optio
ns).
1.Th
ere
was
no
wor
k he
re2.
To fi
nd b
ette
r and
wel
l pai
d w
ork
3.To
ear
n m
oney
for H
/H4.
Bad
wor
king
con
ditio
ns5.
Diff
icul
ties f
or e
ntre
pren
eurs
hip
6.Ed
ucat
ion/
train
ings
7.Lo
w q
ualit
y of
edu
catio
n8.
Fam
ily re
unifi
catio
n9.
Mar
riage
10.O
ther
fam
ily c
ircum
stan
ces (
reun
ion,
mar
riage
, etc
.)11
.Unh
ealth
y m
oral
-psy
chol
ogic
al a
tmos
pher
e 12
.Lac
k of
per
spec
tives
for t
he c
ount
ry/s
ettle
men
t 13
.Env
ironm
enta
l rea
sons
(air
cont
amin
atio
n, c
limat
e)14
.Pol
itica
l rep
ress
ion
15.R
elig
ious
repr
essi
on16
.Mis
sing
the
fam
ily/c
lose
one
s 17
.Oth
er
21.
Gen
eral
ly th
roug
h w
hat m
eans
was
the
trip
mad
e?
1.H
/H sa
ving
s 2.
Sel
ling
asse
ts3.
Unc
ompe
nsat
ed a
id p
rovi
ded
4.A
sset
mor
tgag
e
5.B
ank
loan
6.D
ebt
7.Em
ploy
er8.
Oth
er (s
peci
fy)
22.
Wha
t was
the
mai
n re
ason
for
him
/her
to le
ave
for
that
pa
rtic
ular
cou
ntry
?(g
ive
3m
ain
optio
ns)
1.A
bsen
ce o
f vis
a re
quire
men
ts
2. K
now
ledg
e of
lang
uage
7.
Ava
ilabi
lity
of e
xpen
ses
for l
eave
and
oth
er
expe
nses
8.
Abs
ence
of o
ther
op
tions
9.
Oth
er (m
entio
n)
3. Jo
b of
fer
4. R
esid
ence
exp
erie
nce
5.A
cqua
intan
ce/fr
iend/
relat
ive
6. E
cono
mic
attr
activ
enes
s

158
23.
How
do
you
com
mun
icat
e w
ith H
/H m
issi
ng m
embe
r?(m
entio
n 2
gene
ral o
ptio
ns)
1. P
hone
4.
Pho
ne, e
-mai
l, sk
ype
2. E
-mai
l, sk
ype
3. O
ther
5. T
here
is n
o w
ish
6. It
is n
ot p
ossi
ble
1-4
24
5-6
25
24.
How
oft
en d
o yo
u co
mm
unic
ate?
1.A
lmos
t eve
ry d
ay3.
At l
east
onc
e a
mon
th2.
At l
east
onc
e a
wee
k4.
Rar
ely
25.
Wha
t leg
al r
esid
ence
stat
us d
oes h
e/sh
e ha
ve
in th
e co
untr
y w
here
he/
she
resi
des n
ow?
(men
tion
2 ge
nera
l opt
ions
)1.
Citi
zen
of th
e co
untry
2.
Rig
ht o
f res
iden
ce3.
Rig
ht to
wor
k4.
Asy
lum
seek
er5.
Ref
ugee
6. T
empo
rary
regi
stra
tion
7. H
as n
o le
gal s
tatu
s 8.
Oth
er (s
peci
fy)
26.
Wha
t typ
e of
acc
omm
odat
ion
is h
e/sh
e liv
ing
in th
ere?
1.
Pers
onal
apa
rtmen
t/hou
se2.
Apa
rtmen
t/hom
e of
a re
lativ
e/fr
iend
3.R
ente
d ap
artm
ent/h
ouse
4.R
ente
d ro
om/“
corn
er”
5.D
orm
itory
6. A
dapt
ed n
on-r
esid
entia
l acc
omm
odat
ion
7. O
ther
(men
tion)
27.
Doe
s he/
she
have
hea
lth in
sura
nce
in th
at c
ount
ry?
1. Y
es, p
erm
anen
t ins
uran
ce
2. Y
es, t
empo
rary
insu
ranc
e3.
No
28.
How
was
his
/her
hea
lth st
ate
whe
n le
avin
g an
d ho
w is
it
now
?1.
Exc
elle
nt2.
Goo
d3.
Sat
isfa
ctor
y4.
Bad
28.1
.
Whi
le le
avin
g
28.2
.N
ow

159
29.
Did
he/
she
inte
nd to
wor
k ab
road
bef
ore
leav
ing?
1. Y
es
1
302.
No
2
3430
.D
id h
e/sh
e ha
ve a
pre
limin
ary
arra
ngem
ent/p
rom
ise
abou
t wor
k?1
Yes
, a w
ritte
n ag
reem
ent
2. Y
es, a
pro
mis
e3.
Yes
, oth
er (s
peci
fy)
4. N
o
1-3
31
4
34
31.
With
who
m a
nd w
hich
inst
itutio
ns w
as th
at?
(giv
e 2
mai
n an
swer
s)1.
RA
Sta
te E
mpl
oym
ent
Age
ncy
6.St
ate
serv
ice
in th
e co
untry
of e
ntry
2. P
rivat
eem
ploy
men
t ag
ency
in th
e R
A7.
Priv
ate
stru
ctur
e in
the
coun
try
of e
ntry
3. E
mpl
oyer
livi
ng in
the
RA
4. F
orem
an li
ving
in th
e R
A5.
Int
erm
edia
ry li
ving
in th
e R
A
8. E
mpl
oyer
in th
e co
untry
of
entry 9. F
orem
an li
ving
in th
e co
untry
of e
ntry
10. I
nter
med
iary
in th
eco
untry
of e
ntry
11. O
ther
(spe
cify
)32
.T
o w
hat e
xten
t has
the
arra
ngem
ent/p
rom
ise
carr
ied
out?
1.Fu
lly2.
Bas
ical
ly3.
Parti
ally
4.W
as n
ot c
arrie
d ou
t
1-2
34
3-4
3333
.W
hat o
r w
ho w
as th
e m
ain
caus
e of
shor
tcom
ings
?
1. T
he in
term
edia
ry/th
e pe
rson
who
had
pro
mis
ed
2.
Em
ploy
er3.
Unf
ores
een
situ
atio
n
4.
Oth
er (s
peci
fy)
#Th
e se
rial n
umbe
r fro
m B
1 of
H/H
mem
ber w
ho is
abr
oad
Tran
sitio
n
Nam
e of
H/H
mem
ber …
……
……
……
……
……
……
…..…
.
34.
Whi
le r
esid
ing
in th
at c
ount
ry, h
ow m
any
mon
ths d
urin
g th
e la
st 6
mon
ths*
(or
less
than
6 m
onth
s)ha
s he/
she
35
**1.
Hav
e a
job
2. D
id n
ot h
ave
a jo
b, b
ut w
as lo
okin
g fo
r one
46
3. D
id n
ot h
ave
a jo
b an
d w
as n
ot lo
okin
g fo
r one
(*th
e to
tal s
um o
f mon
ths s
houl
d be
no
mor
e th
an 6
)
47
** 3
5 -4
6 qu
estio
ns re
fer o
nly
to th
ose
mem
bers
of H
/H a
broa
d, w
ho d
id n
ot h
ave
a jo
b at
the
time
of th
e in
terv
iew
(B1.
18=2
), bu
t bef
ore
that
hav
e ev
er w
orke
d in
this
cou
ntry
(see
th
e no
te fo
r the
pre
viou
s que
stio
n 34
.1 >
0)
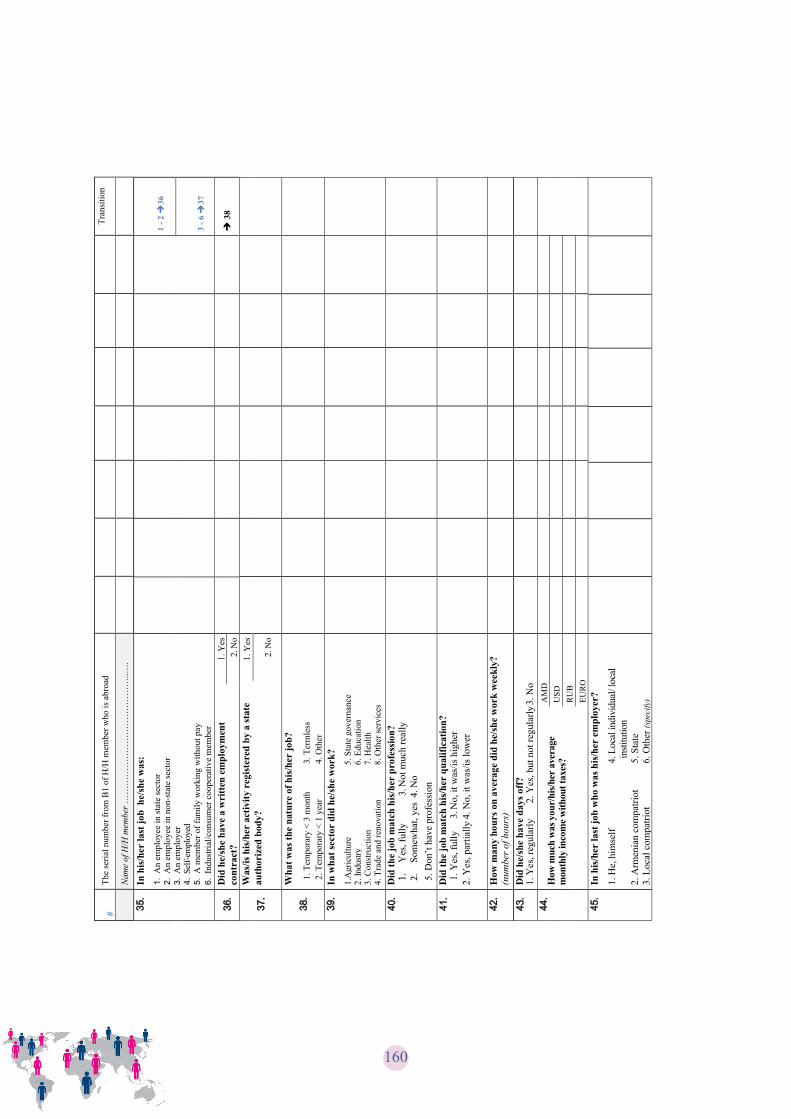
160
35.
In h
is/h
er la
st jo
b h
e/sh
e w
as:
1.A
n em
ploy
ee in
stat
e se
ctor
2.A
n em
ploy
ee in
non
-sta
te se
ctor
3.A
n em
ploy
er4.
Self-
empl
oyed
5.A
mem
ber o
f fam
ily w
orki
ng w
ithou
t pay
6.In
dust
rial/c
onsu
mer
coo
pera
tive
mem
ber
1-2
36
3-6
37
36.
Did
he/
she
have
a w
ritte
n em
ploy
men
t co
ntra
ct?
1. Y
es
382.
No
37.
Was
/is h
is/h
er a
ctiv
ity r
egis
tere
d by
a st
ate
auth
oriz
ed b
ody?
1. Y
es
2. N
o
38.
Wha
t was
the
natu
re o
f his/
her
job?
1. T
empo
rary
< 3
mon
th
3.
Ter
mle
ss2.
Tem
pora
ry <
1 y
ear
4.
Oth
er
39.
In w
hat s
ecto
r di
d he
/she
wor
k?1.
Agr
icul
ture
5.
Sta
te g
over
nanc
e2.
Indu
stry
6. E
duca
tion
3. C
onst
ruct
ion
7. H
ealth
4. T
rade
and
reno
vatio
n8.
Oth
er se
rvic
es40
.D
id th
e jo
b m
atch
his
/her
pro
fess
ion?
1.Y
es, f
ully
3.
Not
muc
h re
ally
2.So
mew
hat,
yes
4. N
o 5.
Don
’t ha
ve p
rofe
ssio
n41
.D
id th
e jo
b m
atch
his
/her
qua
lific
atio
n?1.
Yes
, ful
ly
3. N
o, it
was
/is h
ighe
r2.
Yes
, par
tially
4. N
o, it
was
/is lo
wer
42.
How
man
y ho
urs o
n av
erag
e di
d he
/she
wor
k w
eekl
y?(n
umbe
r of h
ours
)
#Th
e se
rial n
umbe
r fro
m B
1 of
H/H
mem
ber w
ho is
abr
oad
Tran
sitio
n
Nam
e of
H/H
mem
ber …
……
……
……
……
……
……
…..…
.
43.
Did
he/
she
have
day
s off
?1.
Yes
, reg
ular
ly2.
Yes
, but
not
regu
larly
3. N
o44
.H
ow m
uch
was
you
r/hi
s/her
ave
rage
m
onth
ly in
com
e with
out t
axes
?
AM
DU
SDR
UB
EUR
O45
.In
his
/her
last
job
who
was
his
/her
em
ploy
er?
1. H
e, h
imse
lf
4. L
ocal
indi
vidu
al/ l
ocal
in
stitu
tion
2. A
rmen
ian
com
patri
ot5.
Sta
te3.
Loc
al c
ompa
triot
6. O
ther
(spe
cify
)

161
#Th
e se
rial n
umbe
r fro
m B
1 of
H/H
mem
ber w
ho is
abr
oad
Tran
sitio
n
Nam
e of
H/H
mem
ber …
……
……
……
……
……
……
…..…
.
46.
Thr
ough
who
m h
as h
e/sh
e lo
oked
for/
foun
d a
job?
(giv
e 2
gene
ral o
ptio
ns)
1.R
A S
tate
Em
ploy
men
t Age
ncy
2.R
A P
rivat
e em
ploy
men
t age
ncy
3.Em
ploy
er li
ving
in th
e R
A4.
Fore
man
livi
ng in
RA
5.
Inte
rmed
iary
livi
ng in
the
RA
6.Pe
rson
al/fa
mily
bus
ines
s in
RA
(als
o ag
ricul
ture
)7.
Fore
ign
stat
e se
rvic
e 8.
Fore
ign
priv
ate
inst
itutio
n 9.
Fore
ign
empl
oyer
10.
Fore
ign
task
mas
ter
11.
Fore
ign
inte
rmed
iary
/ rel
ativ
e12
.Pe
rson
al/ f
amily
bus
ines
s abr
oad
13.
Inte
rnet
/ ot
her m
ass m
edia
14.
Oth
er (p
leas
e, sp
ecify
)
47.
Doe
s/di
d he
/she
hav
e ot
her
sour
ce o
f inc
ome
such
as p
ensi
on, a
llow
ance
, inc
ome
from
prop
erty
ren
t?
1. Y
es1
48
2. N
o2
49
48.
How
muc
h w
as y
our/
his/h
er a
vera
ge
mon
thly
non
-wag
e inc
ome w
ithou
t tax
es?
AM
D
USD
RU
B
EUR
O49
.D
id/d
oes h
e/sh
e fin
anci
ally
su
ppor
t you
r H
/H o
r ot
her
pers
ons l
ivin
g in
the
RA
dur
ing
his/
her
trip
? 1
-3
501.
Yes
, reg
ular
ly5.
No,
can
not
2. Y
es, s
omet
imes
6. N
o, n
o ne
ed3.
Yes
, rar
ely
7. N
o, th
ere
is n
o w
ish
4. N
o, it
is n
ot p
ossi
ble
8. N
o, h
/h m
embe
rs h
elp
him
/her
4-8
51
50.
How
was
the
mon
ey m
ainl
y se
nt?
1. B
ank
trans
fer
4.C
ouri
er
2 . M
oney
tran
sfer
sys
tem
(e.g
. M
oney
Gra
m)
5.B
roug
ht p
erso
nally
6.W
ith a
rriv
ing
peop
le
3. P
ost
7. O
ther

162
51.
Whi
le a
broa
d, w
ith
whi
ch o
f the
follo
win
g in
stitu
tions
/gro
ups/i
ndiv
idu
als d
oes h
e/sh
e hav
e co
nflic
ts/p
robl
ems?
(m
entio
n 2
mai
n op
tions
)1.
Pol
ice
7. N
eigh
bour
s2.
Tax
serv
ice
8. P
artn
ers
3. O
ther
aut
horit
ies
9. F
orei
gn m
igra
nts
4. E
duca
tion
10. E
mpl
oyer
5. H
ealth
care
11. O
ther
6.
Crim
inal
wor
ld12
. No
one
1-11
52
12
53
52.
How
and
by
who
m
wer
e the
pro
blem
s so
lved
(m
entio
nge
nera
l 2
optio
ns)
1.Th
roug
h th
e co
urts
6. L
ocal
rela
tives
/frie
nds
2. P
olic
e7.
NG
O s
3. O
ther
aut
horit
ies
8. B
ribe/
gift
4. E
mpl
oyer
9. O
ther
5. C
rimin
alw
orld
10. T
hey
wer
e no
t res
olve
d53
.T
o w
hat e
xten
t can
his
/her
pro
fess
iona
l kno
wle
dge
and
skill
s inc
reas
e du
ring
the
trip
?1.
Sig
nific
antly
2.
To
som
e ex
tent
3. W
ill n
ot in
crea
se
#Th
e se
rial n
umbe
r fro
m B
1 of
H/H
mem
ber w
ho is
abr
oad
Tran
sitio
n
Nam
e of
H/H
mem
ber …
……
……
……
……
……
……
…..…
.
54.
Wha
t are
his
/her
furt
her
mig
ratio
n pl
ans?
1. W
ill re
turn
in 2
013
2. W
ill re
turn
in 2
014
3. W
ill re
turn
, eve
ntua
lly4.
It d
epen
ds o
n ho
w th
ings
go
5.
Pro
babl
y w
ill n
ot re
turn
6. H
as a
lread
y se
ttled
dow
n
7. Is
tryi
ng to
take
us t
here
8. Is
goi
ng to
mov
e to
ano
ther
cou
ntry
1-4
55
5-8
EN
D
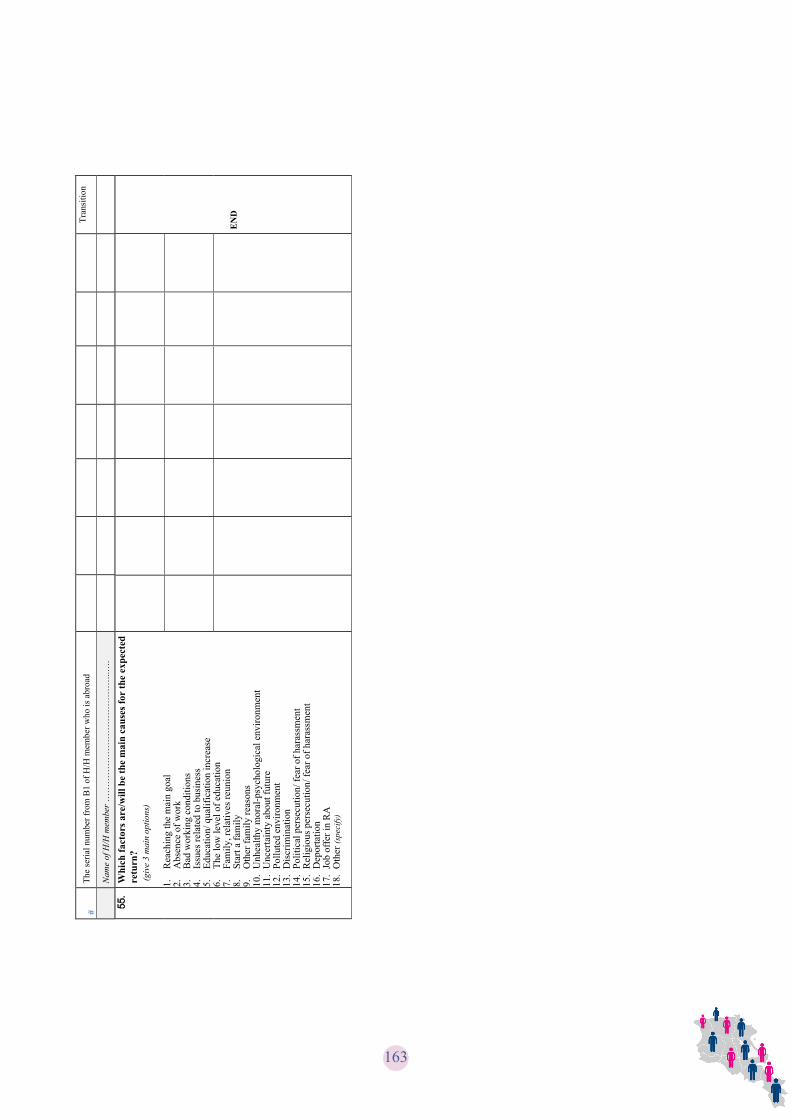
163
#Th
e se
rial n
umbe
r fro
m B
1 of
H/H
mem
ber w
ho is
abr
oad
Tran
sitio
n
Nam
e of
H/H
mem
ber …
……
……
……
……
……
……
…..…
.
55.
Whi
ch fa
ctor
s are
/will
be
the
mai
n ca
uses
for
the
expe
cted
re
turn
?(g
ive
3 m
ain
optio
ns)
1.R
each
ing
the
mai
n go
al2.
Abs
ence
of w
ork
3.B
ad w
orki
ng c
ondi
tions
4.Is
sues
rela
ted
to b
usin
ess
5.Ed
ucat
ion/
qua
lific
atio
n in
crea
se6.
The
low
leve
l of e
duca
tion
7.Fa
mily
, rel
ativ
es re
unio
n8.
Star
t a fa
mily
9.O
ther
fam
ily re
ason
s10
.U
nhea
lthy
mor
al-p
sych
olog
ical
env
ironm
ent
11.
Unc
erta
inty
abo
ut fu
ture
12.
Pollu
ted
envi
ronm
ent
13.
Dis
crim
inat
ion
14.
Polit
ical
per
secu
tion/
fear
of h
aras
smen
t15
.R
elig
ious
per
secu
tion/
fear
of h
aras
smen
t16
.D
epor
tatio
n17
.Jo
b of
fer i
n R
A18
.O
ther
(spe
cify
)
EN
D
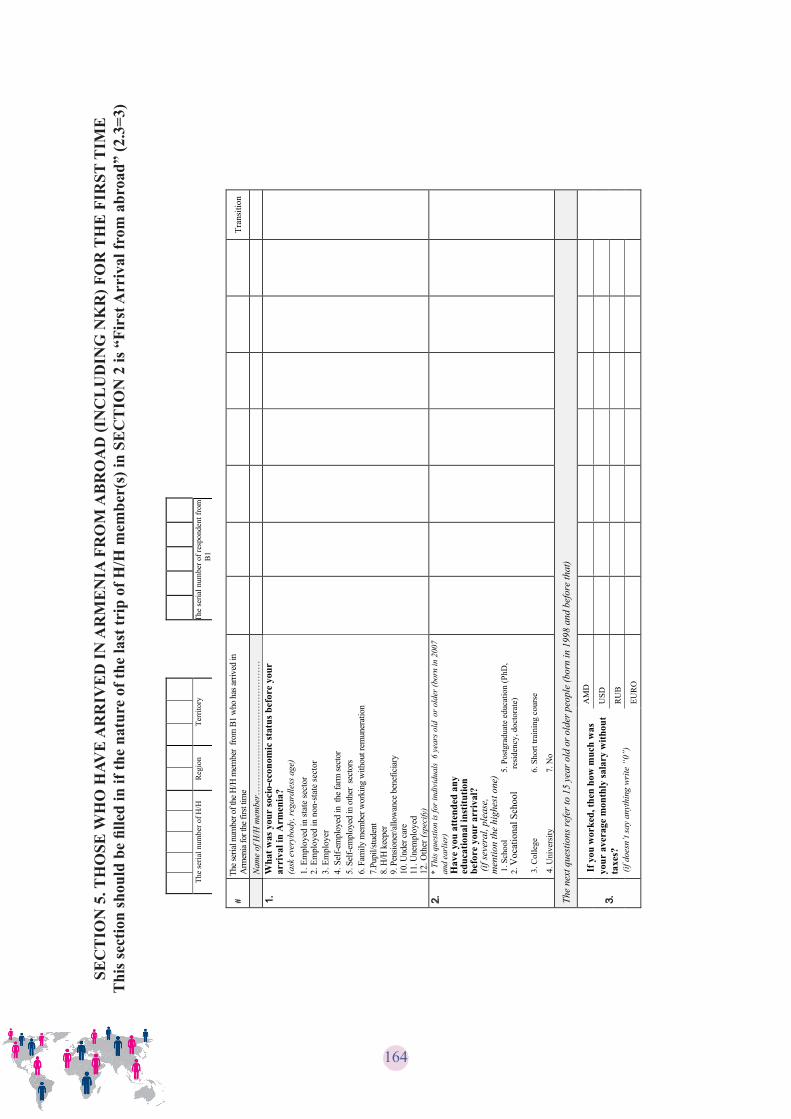
164
SEC
TIO
N 5
. TH
OSE
WH
O H
AVE
AR
RIV
ED
IN A
RM
EN
IA F
RO
M A
BR
OA
D (I
NC
LU
DIN
G N
KR
) FO
R T
HE
FIR
ST T
IME
T
his s
ectio
n sh
ould
be
fille
d in
if th
e na
ture
of t
he la
st tr
ip o
f H/H
mem
ber(
s) in
SE
CT
ION
2 is
“Fi
rst A
rriv
al fr
om a
broa
d” (2
.3=3
)
The
seria
l num
ber o
f H/H
R
egio
nTe
rrito
ryTh
e se
rial n
umbe
r of r
espo
nden
t fro
m
B1
#Th
e ser
ial n
umbe
r of t
he H
/H m
embe
r fro
m B
1 w
ho h
as ar
rived
in
Arm
enia
for t
he fi
rst ti
me
Tran
sitio
n
Nam
e of
H/H
mem
ber…
……
……
……
……
……
……
……
1.W
hat w
as y
our
soci
o-ec
onom
ic st
atus
bef
ore
your
ar
riva
l in
Arm
enia
? (a
sk e
very
body
, reg
ardl
ess a
ge)
1. E
mpl
oyed
in st
ate
sect
or2.
Em
ploy
ed in
non
-sta
te se
ctor
3. E
mpl
oyer
4.Se
lf-em
ploy
ed in
the
farm
sect
or5.
Sel
f-em
ploy
ed in
oth
er s
ecto
rs6.
Fam
ily m
embe
r wor
king
with
out r
emun
erat
ion
7.Pu
pil/s
tude
nt8.
H/H
kee
per
9. P
ensio
ner/a
llow
ance
ben
efic
iary
10. U
nder
care
11. U
nem
ploy
ed12
. Oth
er(s
peci
fy)
2.6
*Th
is q
uest
ion
is fo
r ind
ivid
uals
6 y
ears
old
or o
lder
(bor
n in
200
7 an
d ea
rlie
r)H
ave
you
atte
nded
any
ed
ucat
iona
l ins
titut
ion
befo
re y
our
arri
val?
(if se
vera
l, pl
ease
, m
entio
n th
e hi
ghes
t one
)1.
Sch
ool
5. P
ostg
radu
ate
educ
atio
n (P
hD,
resi
denc
y,do
ctor
ate)
2.V
ocat
iona
l Sch
ool
3. C
olle
ge6.
Sho
rt tra
inin
g co
urse
4. U
nive
rsity
7. N
o
The
next
que
stio
ns re
fer t
o 15
yea
r old
or o
lder
peo
ple
(bor
n in
199
8 an
d be
fore
that
)
3.6If y
ou w
orke
d, th
en h
owm
uch
was
yo
ur a
vera
ge m
onth
ly sa
lary
with
out
taxe
s?
(if d
oesn
’t sa
y an
ythi
ng w
rite
“0”
)
AM
D
USD
RU
B
EUR
O

165
#Th
e ser
ial n
umbe
r of t
he H
/H m
embe
r fro
m B
1 w
ho h
as ar
rived
in
Arm
enia
for t
he fi
rst ti
me
Tran
sitio
n
Nam
e of
H/H
mem
ber…
……
……
……
……
……
……
……
4.D
id y
ou h
ave
othe
r so
urce
of i
ncom
e in
you
r ex
it co
untr
y (p
ensi
on, a
llow
ance
, inc
ome
from
pro
pert
y re
nt, e
tc.)?
1.Y
es1
5
2. N
o2
6
5.6
How
muc
h w
as y
our/
his/h
er a
vera
ge
mon
thly
inco
me?
AM
D
USD
RU
B
EUR
O
6.5Did
you
r tot
al in
com
e allo
w y
ou to
save
any
mon
ey?
1.
Yes
, a c
onsi
dera
ble
am
ount
2.Y
es to
som
eex
tent
3.Y
es, v
ery
little
4.N
o5.
No,
I ev
en h
ad d
ebts
7.W
ho m
ade
the
deci
sion
to c
ome
to A
rmen
ia?
1.I
2. M
y fa
mily
3.
Oth
er
8.W
hat w
ere t
he m
ain
reas
ons f
or le
avin
g th
at co
untr
y?
(men
tion
3 ge
nera
l opt
ions
)1.
Ther
e w
as n
o em
ploy
men
t the
re2.
To fi
nd a
bet
ter a
nd w
ell p
aid
job
3.To
ear
n m
oney
for H
/H4.
Bad
wor
king
con
ditio
ns5.
Bus
ines
s diff
icul
ties
6.Ed
ucat
ion/
incr
ease
of q
ualif
icat
ion
7.Lo
w le
vel o
f edu
catio
n8.
Fam
ily re
unifi
catio
n9.
Star
ting
a fa
mily
10
.O
ther
fam
ily c
ircum
stan
ces
11.
Mis
sing
mot
her l
and
and
rela
tives
12.
Unh
ealth
y ps
ycho
-mor
al a
tmos
pher
e 13
.U
ncer
tain
ty a
bout
the
futu
re14
.En
viro
nmen
tal p
ollu
tion
(air,
clim
ate)
15
.D
iscr
imin
atio
n16
.Po
litic
al p
erse
cutio
n, fe
ar to
be
hara
ssed
17
.R
elig
ious
per
secu
tion,
fear
to b
e ha
rass
ed
18.
Geo
-pol
itica
l ins
tabi
lity
19.
Oth
er (
spec
ify)
9.D
id y
ou h
ave
the
oppo
rtun
ity to
mov
e to
an
othe
r co
untr
y in
stea
d of
Arm
enia
?
1.Y
es
1.Y
es2.
No

166
#Th
e ser
ial n
umbe
r of t
he H
/H m
embe
r fro
m B
1 w
ho h
as ar
rived
in
Arm
enia
for t
he fi
rst ti
me
Tran
sitio
n
Nam
e of
H/H
mem
ber…
……
……
……
……
……
……
……
10.
Wha
t wer
e th
e m
ain
reas
ons f
or c
omin
g to
Arm
enia
?(m
entio
n 3
gene
ral o
ptio
ns )
1.A
vaila
bilit
y of
wor
k2.
Ava
ilabi
lity
of b
ette
r and
wel
l pai
d w
ork
3.To
ear
n m
oney
for H
/H4.
Bus
ines
s opp
ortu
nitie
s5.
Educ
atio
n/tra
inin
gs6.
Fam
ily re
unifi
catio
n7.
Mar
riage
8.O
ther
fam
ily c
ircum
stan
ces
9.M
issi
ng re
lativ
es/m
othe
rland
10.A
vaila
bilit
y of
shel
ter
11.H
ealth
y ps
ycho
-mor
al a
tmos
pher
e 12
.Sta
ble
geop
oliti
cal e
nviro
nmen
t13
.Abs
ence
of d
iscr
imin
atio
n14
.Oth
er (s
peci
fy)
11.
Whi
ch o
f the
se b
odie
s hav
e be
enin
form
ed th
at y
ou a
re
resi
ding
in A
rmen
ia?
(giv
e 2
mai
n op
tions
)
1.V
isa
and
pass
port
depa
rtmen
t of p
olic
e2.
Min
istry
of d
iasp
ora
3.M
igra
tion
serv
ice
4.
Non
e of
the
men
tione
d12
.W
hat i
s the
lega
l bas
e fo
r re
sidi
ng in
Arm
enia
?(m
entio
n
2 ge
nera
l opt
ions
)
1.R
A c
itize
n2.
App
lied
to re
ceiv
e R
A c
itize
nshi
p3.
Res
iden
ce p
erm
it4.
Rig
ht to
wor
k 5.
Ref
ugee
6.A
sylu
m se
eker
7.Te
mpo
rary
regi
stra
tion
8.D
on’t
have
a le
gal s
tatu
s9.
Oth
er (s
peci
fy)
13.
Did
you
hav
e a
prel
imin
ary
arra
ngem
ent/p
rom
ise
abou
t wor
k be
fore
you
r ar
riva
l?
1-3
14
1. Y
es, a
writ
ten
cont
ract
2. Y
es, a
pro
mis
e3.
Yes
, oth
er (s
peci
fy)
4. N
o4
17

167
#Th
e ser
ial n
umbe
r of t
he H
/H m
embe
r fro
m B
1 w
ho h
as ar
rived
in
Arm
enia
for t
he fi
rst ti
me
Tran
sitio
n
Nam
e of
H/H
mem
ber…
……
……
……
……
……
……
……
14.
From
who
, wha
t ins
titut
ions
?(m
entio
n ge
nera
l 2 o
ptio
ns)
1.R
A st
ate
empl
oym
ent a
genc
y
2.R
A p
rivat
e ag
ency
3.
Empl
oyer
resi
ding
in A
rmen
ia4.
Inte
rmed
iary
/frie
nd re
sidi
ng in
Arm
enia
5.Fo
reig
n st
ate
serv
ice
6.Fo
reig
n pr
ivat
e en
tity
7.Fo
reig
n em
ploy
er8.
Fore
ign
inte
rmed
iary
/frie
nd9.
Oth
er (s
peci
fy)
15.
To
wha
t ext
ent w
as th
e ar
rang
emen
t/pro
mis
e ca
rrie
d ou
t?
1. F
ully
2. B
asic
ally
3. P
artia
lly4.
Was
nor
car
ried
out
1-2
17
3-4
16
16.
Who
and
wha
t was
the
mai
n re
ason
for
shor
tcom
ings
?
1. T
he in
term
edia
ry/th
e pe
rson
who
had
pro
mis
ed
2. E
mpl
oyer
1.
3. U
nfor
esee
n si
tuat
ion
4. O
ther
(spe
cify
)
17.
In th
e la
st 6
mon
ths*
sinc
e yo
u ha
ve b
een
livin
g he
re (o
r if
less
than
6 m
onth
s) h
ave
you:
1. H
ad a
job
18
**
2. H
ave
not h
ad a
job
but h
ave
been
look
ing
for o
ne
29
3. H
ave
not h
ad a
job
and
have
not
bee
n lo
okin
g fo
r one
(*
the
tota
l num
ber o
f mon
ths s
houl
d be
not
mor
e th
an 6
)
30
** A
sk 1
8-29
que
stion
s to
thos
e, w
ho h
ave
arriv
ed fr
om a
broa
d fo
r the
firs
t tim
e an
d wh
o di
dn’t
have
wor
k at
the
time
of in
terv
iew
(B1.
18=2
) , b
ut h
ave
ever
w
orke
d be
fore
that
whi
le li
ving
in R
A (i
f the
ans
wer
to p
revi
ous q
uest
ion
#17.
1 is
>0)
18.
Whi
leliv
ing
in A
rmen
ia, y
ou w
ere?
1.A
n em
ploy
ee in
stat
e se
ctor
1-2
192.
An
empl
oyee
in p
ublic
sect
or3.
An
empl
oyer
4.
A se
lf-em
ploy
ed in
agr
icul
tura
l sec
tor
5.A
self-
empl
oyed
in o
ther
sect
or6.
A m
embe
r of f
amily
wor
king
with
out p
aym
ent
3-6
20

168
#Th
e ser
ial n
umbe
r of t
he H
/H m
embe
r fro
m B
1 w
ho h
as ar
rived
in
Arm
enia
for t
he fi
rst ti
me
Tran
sitio
n
Nam
e of
H/H
mem
ber…
……
……
……
……
……
……
……
19.
Hav
e/ha
d yo
u a
wri
tten
empl
oym
ent
cont
ract
?1.
Yes
21
2. N
o
20.
Was
the
activ
ity r
egis
tere
d by
a st
ate
auth
oriz
ed b
ody?
1.Y
es
2.N
o
21.
Wha
t was
the
natu
re o
f thi
s w
ork?
1. T
empo
rary
< 3
mon
th
3.
Ter
mle
ss2.
Tem
pora
ry <
1 y
ear
4.
Oth
er(s
peci
fy)
22.
In w
hat s
ecto
r ha
ve y
ou w
orke
d?1.
Agr
icul
ture
5.
Sta
te g
over
nanc
e2.
Indu
stry
6. E
duca
tion
3. C
onst
ruct
ion
7. H
ealth
4. T
rade
and
reno
vatio
n8.
Oth
er se
rvic
es
23.
Did
the
job
mat
ch y
our
prof
essi
on?
1. Y
es, f
ully
2. S
omew
hat,
yes
3.N
ot re
ally
muc
h4.
No
5. D
on’t
have
a p
rofe
ssio
n
24.
Did
the
job
mat
ch y
our
qual
ifica
tion?
1.Y
es, f
ully
3. N
o, it
is h
ighe
r 2.
Yes
, par
tially
4. N
o, it
is lo
wer
25.
How
muc
h w
ere
you
satis
fied
with
you
r jo
b?1.
Yes
, ful
ly2.
Yes
, bas
ical
ly3.
Bas
ical
ly n
o4.
No
26.
How
man
y ho
urs o
n av
erag
e di
d yo
u w
ork
wee
kly?
(n
umbe
r of h
ours
)
27.
Did
you
hav
e da
ys o
ff?
1. Y
es, r
egul
arly
2. Y
es, b
ut n
ot re
gula
rly
3. N
o

169
#Th
e ser
ial n
umbe
r of t
he H
/H m
embe
r fro
m B
1 w
ho h
as ar
rived
in
Arm
enia
for t
he fi
rst ti
me
Tran
sitio
n
Nam
e of
H/H
mem
ber…
……
……
……
……
……
……
……
28.
6H
ow m
uch
is yo
ur a
vera
ge m
onth
ly in
com
e w
ithou
t tax
es?
(A
MD
)
29.
1Ba
sical
ly th
roug
h w
ho/w
hich
inst
itutio
n di
d yo
u lo
ok fo
r or
find
a jo
b?
(giv
e 2
mai
n op
tions
)
1.R
A st
ate
empl
oym
ent a
genc
y
2.R
A p
rivat
e ag
ency
3.Em
ploy
er re
sidi
ng in
Arm
enia
4. In
term
edia
ry/fr
iend
resi
ding
in A
rmen
ia5.
Priv
ate/
fam
ily b
usin
ess i
n A
rmen
ia6.
For
eign
stat
e se
rvic
e 7.
For
eign
priv
ate
entit
y 8.
For
eign
em
ploy
er
9. F
orei
gn in
term
edia
ry/fr
iend
10. O
wn/
fam
ily b
usin
ess i
n ab
road
11. I
nter
net,
othe
r Mas
s Med
ia12
. Oth
er (s
peci
fy)
30.
Do
you
have
any
oth
er so
urce
s of i
ncom
e (p
ensi
on, a
llow
ance
, inc
ome
from
pro
pert
y re
nt e
tc.)?
1.Y
es1
31
2. N
o2
32
31.
6H
ow m
uch
is th
at a
vera
ge m
onth
lyIn
com
e?
AM
D
USD
RU
B
EUR
O
32.
5 Doe
s you
r inc
ome a
llow
you
to sa
ve/a
ccum
ulat
e any
m
oney
?
1.Y
es, a
con
side
rabl
e A
mou
nt
2
.Yes
, a ce
rtain
amou
nt
3. Y
es, v
ery
little
4
. No
5.
No,
I ev
en h
ave
debt
s
33.
Whi
ch o
f the
bel
ow m
entio
ned
inst
itutio
ns/g
roup
s/ind
ivid
uals
did
you
have
co
nflic
ts/p
robl
ems w
hile
livi
ng in
Arm
enia
? (m
entio
n 2
gene
ral o
ptio
ns)
1-10
34
1.Po
lice
7.
Nei
ghbo
urs
2. T
ax se
rvic
e8.
Par
tner
s3.
Oth
er a
utho
ritie
s
9.Em
ploy
er4.
Edu
catio
n5.
Hea
lth6.
Crim
inal
wor
ld
10
. Oth
er (S
peci
fy)
11.
Non
e of
them
11
35

170
#Th
e ser
ial n
umbe
r of t
he H
/H m
embe
r fro
m B
1 w
ho h
as ar
rived
in
Arm
enia
for t
he fi
rst ti
me
Tran
sitio
n
Nam
e of
H/H
mem
ber…
……
……
……
……
……
……
……
34.
How
and
by
who
m th
e pro
blem
s wer
e/w
ill (i
s) so
lved
?(m
entio
n ge
nera
l 2 o
ptio
ns)
1.Th
roug
h th
e co
urts
2. P
olic
e3.
Oth
er a
utho
ritie
s4.
Em
ploy
er5.
Crim
inal
wor
ld6.
Loca
l rel
ativ
es/fr
iend
s7.
NG
Os
8. B
ribe/
gift
9. O
ther
10. T
hey
wer
e no
t res
olve
d
35.
In y
our
estim
atio
n, w
as th
is tr
ip to
Arm
enia
succ
essf
ul
on th
e w
hole
?
1. Y
es, c
ompl
etel
y 2
. Yes
, som
ewha
t 3
. No,
not
muc
h 4.
No
36.
Hav
e/D
o yo
u /h
ave/
diff
icul
ties i
n fu
lly a
dapt
ing
to
Arm
enia
?1.
Yes
2. S
omew
hat
3.N
ot re
ally
4.
No
1-3
37
4
EN
D
37.
Dur
ing
the
time
resi
ding
in A
rmen
ia, d
id y
ou fa
ce
follo
win
g pr
oble
ms?
To
wha
t ext
ent w
ere/
are y
our
diffi
culti
es a
dapt
ing
to A
rmen
ia re
late
d to
thes
e? P
leas
e, es
timat
e, co
nsid
erin
g 1
is fu
lly re
late
d, 5
is u
nrel
ated
1. L
egal
/doc
umen
t iss
ues.
2. S
helte
r /do
mes
tic is
sues
3. E
mpl
oym
ent i
ssue
s4.
Edu
catio
nal/h
ealth
issu
es
5. S
ocia
l pro
tect
ion
issu
es6.
Ada
ptin
g pr
oble
ms
7. P
robl
ems o
f lei
sure
tim
e op
portu
nitie
s
EN
D

171
SEC
TIO
N 6
. TH
OSE
WH
O T
RAV
EL
LE
D W
ITH
IN A
RM
EN
IA
Thi
s sec
tion
is fi
lled
in, i
f in
SEC
TIO
N 2
the
natu
re o
f the
last
trip
of H
/H m
embe
r w
as c
heck
ed “
Ret
urn
from
Ano
ther
RA
Set
tlem
ent”
(2.3
= 4
) or
“
Dep
artu
re to
Ano
ther
RA
Set
tlem
ent”
(2.3
=5) o
r “F
irst
Arr
ival
from
Ano
ther
RA
Set
tlem
ent”
(2.3
=6)
Seria
l Num
ber o
f H/H
Reg
ion
Terr
itory
Seria
l num
ber o
f Res
pond
ent
from
B1
#Th
e se
rial n
umbe
r of H
/H m
embe
r fro
m B
1,
who
trav
elle
d w
ithin
the
Rep
ublic
of A
rmen
ia
Tran
sitio
n
Nam
e of
H/H
mem
ber…
……
……
……
……
……
.……
……
..Pl
ease
, che
ck th
e na
ture
of t
he la
st tr
ip o
f H/H
mem
ber
acco
rdin
g to
B2
1.R
etur
n fr
om a
noth
er R
A se
ttlem
ent (
B2.
3 =
4)2.
Dep
artu
re to
ano
ther
RA
settl
emen
t (B
2.3
= 5)
3.Fi
rst a
rriv
al fr
om a
noth
er R
A se
ttlem
ent (
B2.
3 =
6)
The
ques
tions
# 1
-17
refe
r to
EX
IT se
ttlem
ent,
wher
e th
e la
st tr
ips w
ere
mad
e (r
etur
n/de
part
ure/
arri
val)
1.W
hat w
as y
our/
his/
her
soci
o-ec
onom
ic st
atus
in
the
EX
IT se
ttle
men
t?
(ask
eve
rybo
dy,
rega
rdle
ss o
f age
)
1.Em
ploy
ed/se
lf-em
ploy
ed2.
Pupi
l/stu
dent
3.
H/H
kee
per
4.Pe
nsio
ner/a
llow
ance
be
nefic
iary
5.
Und
er ca
re6.
Une
mpl
oyed
7.
Oth
er (
spec
ify)
2.*
The
ques
tion
refe
rs to
6 y
ear-
old
or o
lder
indi
vidu
als
(bor
n in
200
7 an
d ea
rlie
r)W
ere
you
atte
ndin
g an
y ed
ucat
iona
l ins
titut
ion
befo
re
your
trip
?(if
seve
ral,
plea
se m
entio
n th
e hi
ghes
t one
) 1.
Scho
ol2.
Voc
atio
n sc
hool
3.C
olle
ge4.
Uni
vers
ity5.
Post
grad
uate
edu
catio
n (P
hD, r
esid
ency
, doc
tora
te)
6.Sh
ort t
rain
ing
cour
se7.
No
The
next
que
stio
ns re
fer t
o 15
yea
r old
and
old
er in
divi
dual
s bor
n in
199
8 an
d ea
rlie
r

172
#Th
e se
rial n
umbe
r of H
/H m
embe
r fro
m B
1,
who
trav
elle
d w
ithin
the
Rep
ublic
of A
rmen
ia
Tran
sitio
n
Nam
e of
H/H
mem
ber…
……
……
……
……
……
.……
……
..3.
In w
hat k
ind
of a
bode
doe
s he/
she
live
ther
e?1.
Ow
n ap
artm
ent /
hou
se2.
Acq
uain
tanc
e / f
riend
’s a
partm
ent /
hou
se3.
Ren
ted
apar
tmen
t / h
ouse
4. R
ente
d ro
om
5. D
orm
itory
6. A
dapt
ed n
on-r
esid
entia
l acc
omm
odat
ion
7. O
ther
(spe
cify
)
4.In
the
6 m
onth
s pre
cedi
ng th
e tr
ip (o
r in
cas
e it
is le
ss
than
6 m
onth
s) h
ow m
any
mon
ths:
1. D
id y
ou h
ave
a jo
b 1
5
2. D
id y
ou n
ot h
ave
a jo
b, b
ut w
ere
look
ing
for o
ne
13
3. D
id y
ou n
ot h
ave
a jo
b an
d w
ere
not l
ooki
ng fo
r one
( * th
e to
tal n
umbe
r of m
onth
s sho
uld
be n
o m
ore
than
6)
5.Y
ou/h
e/sh
e w
ere/
was
:
1. E
mpl
oyee
in st
ate
sect
or2.
Em
ploy
ee in
non
-sta
tese
ctor
3. E
mpl
oyer
4.Se
lf-em
ploy
ed in
ag
ricul
tura
l sec
tor
5.Se
lf-em
ploy
ed in
anot
her
sect
or6.
Fam
ily m
embe
r wor
king
w
ithou
t rem
uner
atio
n
1-2
6
3-6
7
6.D
o/di
d he
hav
e a
wri
tten
em
ploy
men
t co
ntra
ct?
1.Y
es
82.
No
7.W
as/is
you
r ac
tivity
reg
iste
red
by th
e st
ate
auth
oriz
ed b
ody?
1. Y
es
2. N
o
8.W
hat w
as th
e na
ture
of y
our/
his j
ob?
1. T
empo
rary
< 3
mon
th
3.
Ter
mle
ss2.
Tem
pora
ry <
1 y
ear
4.
Oth
er (s
peci
fy)

173
#Th
e se
rial n
umbe
r of H
/H m
embe
r fro
m B
1,
who
trav
elle
d w
ithin
the
Rep
ublic
of A
rmen
ia
Tran
sitio
n
Nam
e of
H/H
mem
ber…
……
……
……
……
……
.……
……
..9.
In w
hat s
ecto
r w
ere/
was
you
/he
/she
wor
king
?1.
Agr
icul
ture
5.
Sta
te g
over
nanc
e2.
Indu
stry
6. E
duca
tion
3. C
onst
ruct
ion
7. H
ealth
4. T
rade
and
reno
vatio
n8.
Oth
er se
rvic
es10
.D
id th
e jo
b m
atch
you
r pr
ofes
sion
?1.
Yes
, ful
ly
2.Y
es, p
artia
lly3.
Not
muc
h re
ally
4.
No
5.D
on’t
have
a p
rofe
ssio
n
11.
Did
the
job
mat
ch y
our
qual
ifica
tion?
1.Y
es, f
ully
2.
Yes
, par
tially
3. N
o, it
was
hig
her
4. N
o, it
was
low
er
12.
How
muc
h w
as y
our/
his a
vera
ge m
onth
ly in
com
e w
ithou
t tax
es?
(AM
D)
13.
Did
/do
you
have
oth
er so
urce
s of i
ncom
e (p
ensi
on,a
llow
ance
, inc
ome
from
pro
pert
y re
nt, e
tc.)?
1. Y
es1
14
2. N
o2
15
14.
How
muc
h w
as th
at a
vera
ge m
onth
ly in
com
e?(A
MD
)
15.
Did
you
r/hi
s/her
tota
l inc
ome a
llow
for s
avin
g an
y m
oney
?
1. Y
es, a
con
side
rabl
e am
ount
2.
Yes
, a ce
rtain
amou
nt3.
Yes
, ver
y lit
tle4.
No
5. N
o, I
even
had
deb
ts16
.W
ho d
ecid
ed o
n yo
ur/h
is/h
er tr
ip?
1.I d
id2.
My
fam
ily
3.
Oth
er (s
peci
fy)

174
#Th
e se
rial n
umbe
r of H
/H m
embe
r fro
m B
1,
who
trav
elle
d w
ithin
the
Rep
ublic
of A
rmen
ia
Tran
sitio
n
Nam
e of
H/H
mem
ber…
……
……
……
……
……
.……
……
..17
.W
hat w
ere
the
mai
n re
ason
s for
you
r/hi
s/he
r tr
ip?
(giv
e 3
mai
n op
tions
)
1.Th
ere
was
no
wor
k2.
To fi
nd b
ette
r and
wel
l pai
d w
ork
3.To
ear
n m
oney
for H
/H4.
Bad
wor
king
con
ditio
ns5.
Diff
icul
ties f
or e
ntre
pren
eurs
hip
6.Ed
ucat
ion/
train
ings
7.Lo
w q
ualit
y of
edu
catio
n8.
Fam
ily re
unifi
catio
n9.
Mar
riage
10.O
ther
fam
ily c
ircum
stan
ces (
reun
ion,
mar
riage
, etc
.)11
.Che
aper
acc
omm
odat
ion
12.U
nhea
lthy
mor
al-p
sych
olog
ical
atm
osph
ere
13.
Unc
erta
inty
abo
ut th
e fu
ture
14.
Envi
ronm
enta
l rea
sons
(air
cont
amin
atio
n, c
limat
e)15
.Dis
crim
inat
ion
16.P
oliti
cal r
epre
ssio
n17
.Rel
igio
us re
pres
sion
18.O
ther
(spe
cify
)
The
next
que
stio
ns re
fer t
o th
e E
NTR
Y se
ttlem
ent,
whe
re th
e m
igra
nt is
livi
ng a
t the
tim
e of
inte
rvie
w.
18.
1W
hat w
as th
e m
ain
reas
on fo
r ch
oosi
ng e
xact
ly th
is se
ttle
men
t?1.
Job
offe
r5.
Aff
orda
bilit
y of
dep
artu
rean
d ot
her c
osts
6.A
bsen
ce o
f alte
rnat
ive
2.R
esid
ency
exp
erie
nce
3.Fr
iend
/rela
tive
4.Ec
onom
ic a
ttrac
tiven
ess
7. O
ther
(spe
cify
)19
.D
id y
ou h
ave
othe
r so
urce
s of i
ncom
e (p
ensi
on, a
llow
ance
, inc
ome
from
pro
pert
y re
nt, e
tc.)?
1. Y
es
2. N
o
20.
1D
id y
ou h
ave
a pr
elim
inar
y ar
rang
emen
t/pro
mis
e ab
out
wor
k?
1.Y
es, a
writ
ten
cont
ract
2.
Yes
, a p
rom
ise
3.Y
es, o
ther
(spe
cify
)4.
No
1-3
21
4
24
21.
From
who
and
whi
ch in
stitu
tions
was
it?
(men
tion
2 m
ain
optio
ns)
1.St
ate
empl
oym
ent a
genc
y2.
Priv
ate
empl
oym
ent a
genc
y3.
Empl
oyer
4.Fr
iend
s / a
cqua
inta
nce
5.O
ther

175
1 1
22.
To
wha
t ext
ent w
as th
e ar
rang
emen
t/pro
mis
e ca
rrie
dou
t?1
-2
24
#Th
e se
rial n
umbe
r of H
/H m
embe
r fro
m B
1,
who
trav
elle
d w
ithin
the
Rep
ublic
of A
rmen
ia
Tran
sitio
n
Nam
e of
H/H
mem
ber…
……
……
……
……
……
.……
……
..
2 21. F
ully
2.B
asic
ally
3.
Par
tially
4. W
as n
ot c
arrie
d ou
t3
-4
2323
.W
hat o
r w
ho w
as th
e m
ain
reas
on fo
r sh
ortc
omin
gs?
1.
The
inte
rmed
iary
/the
pers
on w
ho h
ad p
rom
ised
2. E
mpl
oyer
3
. U
nfor
esee
n si
tuat
ion
4. O
ther
(spec
ify)
24.
Dur
ing
the
peri
od o
f liv
ing
in th
e gi
ven
sett
lem
ent,
for
how
man
y of
the
last
6 m
onth
s* (a
lso
in c
ase
it is
less
than
6
mon
ths)
did
you
: 1.
Hav
e a
job
2. D
id y
ou n
ot h
ave
a jo
b, b
ut w
ere
look
ing
for o
ne3.
Did
you
not
hav
e a
job
and
wer
e no
t loo
k fo
r one
(* th
e to
tal n
umbe
r of m
onth
s sho
uld
be n
ot m
ore
than
6)
25.
2 Dur
ing
your
tim
e re
sidi
ng in
that
sett
lem
ent w
ith w
hich
of
thes
e in
stitu
tions
/gro
ups/
indi
vidu
als d
id y
ou m
ostly
fa
ce p
robl
ems?
(giv
e 2
mai
n op
tions
)
1.Po
lice
2.Ta
x se
rvic
e3.
Oth
er a
utho
ritie
s4.
Educ
atio
nal
5. H
ealth
car
e6.
Crim
inal
wor
ld7.
Nei
ghbo
urs
8. P
artn
ers
9.Em
ploy
er10
. Oth
er11
. No
one
1-1
0
26
11
EN
D
26.
2 How
and
with
who
se su
ppor
t wer
e the
pro
blem
s sol
ved?
(giv
e 2
mai
n op
tions
)
1.Po
lice
EN
D
1. C
ourt
2. P
olic
e3.
Oth
er a
utho
ritie
s4.
Em
ploy
er5.
Crim
inal
wor
ld6.
Loca
l rel
ativ
es/fr
iend
s7.
NG
Os
8. B
ribe/
gift
9. O
ther
(spe
cify
)10
.The
y w
ere
not r
esol
ved

176
SECTION 7A. GENERAL INFORMATION ABOUT H/H (Direct questions to the most informed H/H member. Respondent’s serial number ` _______)
# Code Transition
1. Your H/H was establishedBefore 2007 1 x
In 2007 or later, please indicate the year 2
2. How many members does your H/H have? (mention the number)
In 2007 January 1/after 2007 , from the date of its establishmentNow
3.
In what abode do you live?1. Own apartment/house 3. Rented apartment / house 5. Dormitory2. Acquaintance / friend’s
apartment/house 4. Rented room/ “corner” 6. Adapted, non-residential accommodation
7.Other
4.Where did your H/H live on January 1, 2007/ at the time it was established? 1. In this abode 2. In another abode in this settlement 3. In another settlement of RA 4. Abroad
1 9
2 - 4 5
5.
What was the main reason for your H/H to move into this abode?
1. Improvement of housing conditions
3.Separation from the parental H/H 5. Solution of H/H’s financial problems
2. Improvement of residential environment
4. Family circumstances 6. Other (specify)
6.
Were there other residents in this abode who were not members of your H/H before you moved in and if yes, where did they move to?1. There were no other residents 2. All of them, or part of them are still living in this abode3. They have moved to another abode in this settlement 4. All have moved to another settlement in RA 5. Other (specify) 6. They all went abroad
1 - 5 9
6 7
7.Please, indicate the country they moved to?1. NKR 2. RF 3. USA 4. Other (specify the country)
Filled in by encoder
8. How many people went away? (Please, indicate the number)
9. Do you have H/H members, who went abroad before 2007 and have not returned since then, including people who died there?
1. Yes (mention number) 1
2. No 2 x 7B.
Please, give the following information about them and their children, born abroad:1 2 3 4 5 6 7 Transition
H/H member’s name who left before 200710. Date of birth
11. Gender: 1. male 2. female
12. Date of departure: four characters
13. Is he/she alive? 1. Yes 1 152. No 2 14
14. Please, mention, date of death END
15.
Please, mention present country of residence 1. NKR 2. RF 3. USA 4. Other (specify the country)
Filled in by encoder............
16.
Which is his/her/their current socio-economic status?1. Employed (also self-employed)
4. Pensioner/beneficiary
5. Under care2. pupil/student 6. Unemployed3. Householder 7. Other(specify)
17.
What is the probability of their return?1. Will come for sure 2. Will most probably come 3.Will probably not come4. Will not come
7B.

177
SEC
TIO
N 7
B. R
EM
ITTA
NC
ES
AN
D F
INA
NC
IAL
PRO
SPE
RIT
Y
Cod
eT
rans
ition
1.H
ow w
ould
you
ass
ess y
our
H/H
’s c
urre
nt fi
nanc
ial s
ituat
ion?
1.V
ery
good
2.
Goo
d 3
. M
oder
ate
4.
Bad
5.
Ver
y ba
d
2.H
as th
e fin
anci
al si
tuat
ion
of y
our
hous
ehol
d im
prov
ed o
ver
the
last
five
yea
rs?
I. Ye
s, it
has i
mpr
oved
(gi
ve 3
mai
n p
oint
s)1)
Due
to a
new
job
for h
ouse
hold
mem
ber(
s)/p
rom
otio
nsin
cur
rent
job/
sala
ry in
crea
se2)
Due
to st
artin
g up
/exp
andi
ngow
n bu
sine
ss3)
Due
to g
oing
abr
oad
(mig
ratio
n)
4)D
ue to
H/H
mem
ber(
s) a
cqui
ring
new
skill
s and
/or e
duca
tion
5) O
ther
(spe
cify
)
II. N
o, it
has
got
wor
se(g
ive
3 m
ain
poi
nts)
1)D
ue to
H/H
mem
ber’
(s) l
oss o
f job
2)D
ue to
a w
orse
ning
situ
atio
n in
my
HH
mem
ber’
(s’)
job/
jobs
/bus
ines
s 3)
Due
to in
crea
sed
cost
s of l
ivin
g/in
flatio
n/un
expe
cted
fina
ncia
l los
s4)
Due
to a
fam
ily si
tuat
ion
5)D
ue to
goi
ng a
broa
d (m
igra
tion)
7)O
ther
(spe
cify
)
III.
It h
as re
mai
ned
the
sam
e
3.D
o yo
u be
lieve
that
you
r fin
anci
al si
tuat
ion
will
impr
ove
over
the
com
ing
5 ye
ars?
I. Ye
s, it
will
impr
ove
(giv
e 3
mai
n p
oint
s)
1)D
ue to
impr
oved
eco
nom
ic/p
oliti
cal s
ituat
ion
in th
e co
untry
2)Ju
st a
gen
eral
feel
ing
3) H
ope
that
I/m
y H
/H m
embe
rs w
ill fi
nd w
ell-p
aid
job
4)D
ue to
star
ting
up/e
xpan
ding
own
busi
ness
5) G
oing
abr
oad
(mig
ratio
n)6)
Oth
er (s
peci
fy)
II. N
o, it
will
get
wor
se (
give
3 m
ain
poi
nts)
1)D
ue to
eco
nom
ic/p
oliti
cal s
ituat
ion
in th
e co
untry
2)
Dan
ger o
f los
ing
job
3) R
educ
tion
in re
mitt
ance
s fro
m H
/H m
embe
r(s )
wor
king
abr
oad
4) Ju
st a
gen
eral
feel
ing
5) Il
lnes
s, he
alth
issu
es6)
Oth
er (s
peci
fy)
III.
It w
ill re
mai
n th
e sa
me

178
4.W
ho m
akes
the
deci
sion
s on
curr
ent f
inan
cial
exp
ense
s in
your
H/H
?In
dica
te th
e se
rial n
umbe
r of H
/H m
embe
r(s)
who
mak
e(s)
dec
isio
ns a
ccor
ding
to B
1
5.Pl
ease
list
the
curr
ent s
ourc
es o
f you
r H
/H m
eans
of s
ubsi
sten
ce a
ccor
ding
to
thei
r im
port
ance
.( 1
-the
mos
t im
porta
nt, 2
-les
s im
porta
nt a
nd so
on
. Sou
rces
whi
ch d
o no
t brin
g in
com
e: <
0>).
1.Pe
rman
ent j
ob in
RA
2.O
ccas
iona
l ear
ning
s in
RA
3.Pe
nsio
n/be
nefit
4.Su
ppor
t fro
m in
divi
dual
(s) l
ivin
g in
RA
5.Su
ppor
t fro
m st
ruct
ure(
s) in
RA
6.Ea
rnin
gs o
f HH
mem
ber(
s) p
erm
anen
tly re
sidi
ng a
broa
d
7.Te
mpo
rary
em
ploy
men
t of H
/H m
embe
rs a
broa
d
8. S
uppo
rt fr
om o
ther
per
sons
abr
oad
9. P
erso
nal B
usin
ess (
incl
udin
g ag
ricul
ture
)
10. P
erce
ntag
es fr
om fi
nanc
ial a
nd o
ther
inve
stm
ents
11. O
ther
(spe
cify
)
6.D
oes a
ll th
e in
com
e re
ceiv
ed b
y yo
ur
H/H
let y
ou m
ake
savi
ngs/
acc
umul
ate
mon
ey?
1.Y
es, a
con
side
rabl
e am
ount
2.
Yes
, a c
erta
in a
mou
nt
3.Y
es, j
ust a
lit
tle
7
4. N
o
5. N
o, w
e ev
en h
ave
debt
s
8
7.H
ow w
ere/
are/
will
thes
e in
com
es u
sed?
Yes
No
1.B
uy fo
od a
nd/o
r clo
thes
for H
/H1
22.
Buy
hou
seho
ld it
ems
12
3.Pa
y fo
r edu
catio
n of
oth
er H
/H m
embe
rs/ f
or p
rofe
ssio
nal t
each
ing
12
4.Pa
y fo
r med
ical
serv
ices
12
5.Pa
y th
e de
bts
12
6.Pa
y fo
r fam
ily o
ccas
ions
(mar
riage
, fu
nera
l and
oth
er e
vent
s)1
2
7.Pa
y fo
r goi
ng a
broa
d (f
or m
igra
tion)
12
8.Pa
y fo
r lei
sure
tim
e/ to
uris
m (t
rave
l, et
c.)
12
9.B
uy la
nd, h
ouse
, apa
rtmen
t1
2
10.
Ren
t lan
d1
2
11.
Bet
ter t
he la
nd
12
12.
Buy
equ
ipm
ent f
or th
e fa
rm (i
nclu
ding
ani
mal
s, fe
ed, t
rees
, see
ds, e
tc.)
12
13.
Inve
st in
non
-far
m b
usin
ess
12
14.
Oth
er fi
nanc
ial i
nves
tmen
ts1
2
15.
Pay
for a
partm
ent b
uild
ing/
reno
vatio
n 1
2
16.
Mak
e sa
ving
s (B
ank
and
othe
r)1
2
17.
Oth
er (s
peci
fy)
12
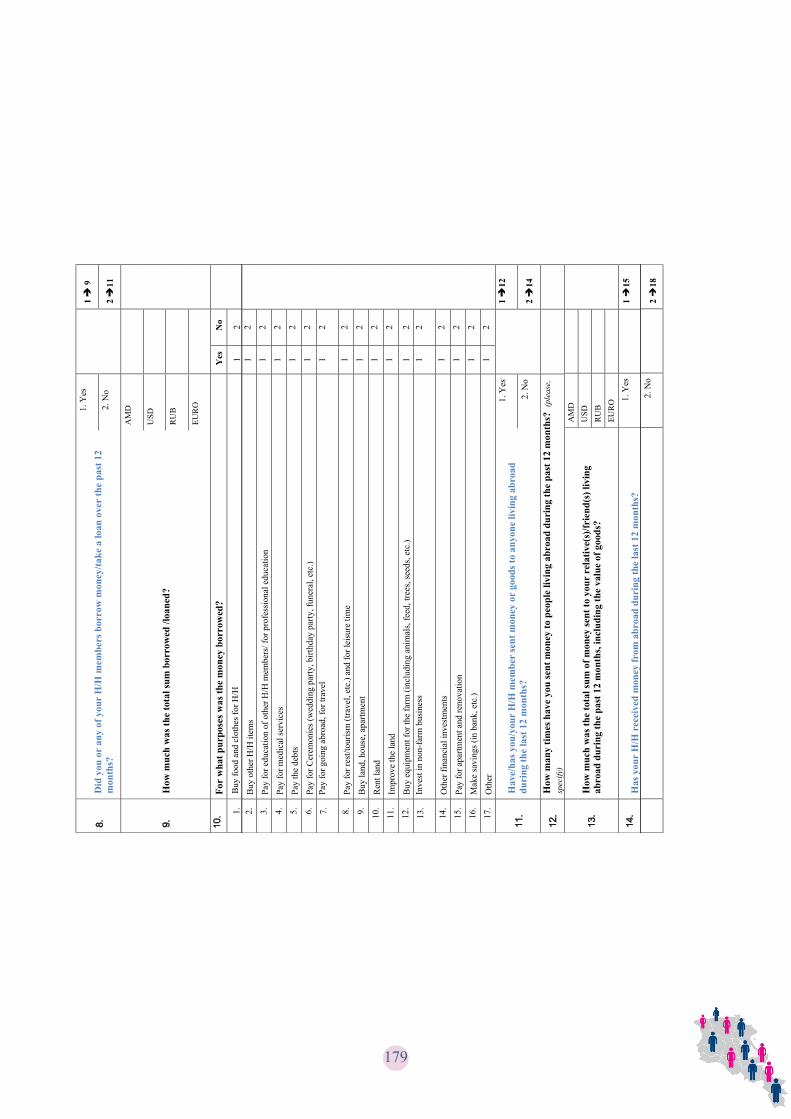
179
8.D
id y
ou o
r an
y of
you
r H
/H m
embe
rs b
orro
w m
oney
/take
a lo
an o
ver
the
past
12
mon
ths?
1. Y
es1
9
2. N
o2
11
9.H
ow m
uch
was
the
tota
l sum
bor
row
ed/lo
aned
?
AM
D
USD
RU
B
EUR
O
10.
For
wha
t pur
pose
s was
the
mon
ey b
orro
wed
?Y
esN
o
1.B
uy fo
od a
nd c
loth
es fo
r H/H
12
2.B
uy o
ther
H/H
item
s1
2
3.Pa
y fo
r edu
catio
n of
oth
er H
/H m
embe
rs/ f
or p
rofe
ssio
nal e
duca
tion
12
4.Pa
y fo
r med
ical
serv
ices
12
5.Pa
y th
e de
bts
12
6.Pa
y fo
r Cer
emon
ies (
wed
ding
par
ty, b
irthd
ay p
arty
, fun
eral
, etc
.)1
2
7.Pa
y fo
r goi
ng a
broa
d, fo
r tra
vel
12
8.Pa
y fo
r res
t/tou
rism
(tra
vel,
etc.
) and
for l
eisu
re ti
me
12
9.B
uy la
nd, h
ouse
, apa
rtmen
t1
2
10.
Ren
t lan
d1
2
11.
Impr
ove
the
land
12
12.
Buy
equ
ipm
ent f
or th
e fa
rm (i
nclu
ding
ani
mal
s, fe
ed, t
rees
, see
ds, e
tc.)
12
13.
Inve
st in
non
-far
m b
usin
ess
12
14.
Oth
er fi
nanc
ial i
nves
tmen
ts1
2
15.
Pay
for a
partm
ent a
nd re
nova
tion
12
16.
Mak
e sa
ving
s (in
ban
k, e
tc.)
12
17.
Oth
er1
2
11.
Hav
e/ha
s you
/you
r H
/H m
embe
r se
nt m
oney
or
good
s to
anyo
ne li
ving
abr
oad
duri
ng th
e la
st 1
2 m
onth
s?
1. Y
es1
12
2. N
o2
14
12.
How
man
y tim
es h
ave
you
sent
mon
ey to
peo
ple
livin
g ab
road
dur
ing
the
past
12
mon
ths?
(pl
ease
,sp
ecify
)
13.
How
muc
h w
as th
e to
tal s
um o
f mon
ey se
nt to
you
r re
lativ
e(s)
/frie
nd(s
) liv
ing
abro
ad d
urin
g th
e pa
st 1
2 m
onth
s, in
clud
ing
the
valu
e of
goo
ds?
AM
DU
SDR
UB
EUR
O
14.
Has
you
r H
/H r
ecei
ved
mon
ey fr
om a
broa
d du
ring
the
last
12
mon
ths?
1. Y
es1
15
2. N
o2
18

180
2. N
o2
18
15.
How
muc
h w
as th
e to
tal m
oney
rec
eive
d fr
om a
ll so
urce
s abr
oad?
AM
D
USD
RU
B
EUR
O
16.
Whe
n se
ndin
g m
oney
to
your
H/H
, w
hich
mea
ns o
f m
oney
tra
nsfe
r ha
s be
en u
sed
mor
e fr
eque
ntly
?(m
entio
n 3
mai
n on
es, w
ritin
g th
eir n
umbe
rs)
1.B
ank
trans
fer (
chec
k, p
aym
ent o
rder
s, de
posi
ts a
nd so
on)
2.M
oney
tran
sfer
org
aniz
atio
ns (f
or e
xam
ple
Mon
eyG
ram
)
3.Po
st (m
oney
ord
ers a
nd so
on)
4.Fo
rwar
der /
cou
rier
5.W
as b
roug
ht p
erso
nally
(dur
ing
hom
e vi
sit)
6.W
as b
roug
ht b
y re
turn
ees
7.O
ther
(ple
ase,
spec
ify).
17.
Did
the
mon
ey r
ecei
ved
with
in th
e la
st 1
2 m
onth
s giv
e yo
u or
ano
ther
mem
ber
of y
our
H/H
an o
ppor
tuni
ty to
:Y
esN
o
1.B
uy fo
od a
nd/o
r clo
thes
for H
/H1
2
2.B
uy o
ther
hou
seho
ld it
ems
12
3.Pa
y fo
r pro
fess
iona
l edu
catio
n of
H/H
mem
ber
12
4.Pa
y fo
r med
ical
serv
ices
12
5.Pa
y de
bts
12
6.Pa
y fo
r cer
emon
ies (
wed
ding
par
ty, b
irthd
ay p
arty
, fun
eral
, etc
.)1
2
7.Pa
y fo
r goi
ng a
broa
d (m
igra
tion)
12
8.Pa
y fo
r res
t/tou
rism
(tra
vel e
tc.)
and
for l
eisu
re ti
me
12
9.B
uy la
nd, h
ouse
, apa
rtmen
t1
2
10.
Ren
t (m
ore)
land
12
11.
Impr
ove
land
12
12.
Acq
uire
pro
perty
, equ
ipm
ent f
or th
e fa
rm1
2
13.
Inve
st in
non
-agr
icul
tura
l bus
ines
s1
2
14.
Mak
e ot
herf
inan
cial
inve
stm
ents
12
15.
Pay
for a
partm
ent a
nd re
nova
tion
12
16.
Mak
e sa
ving
s (in
ban
k an
d so
on)
12
17.
Oth
er (p
leas
e, sp
ecify
)1
2

181
18.
In a
dditi
on to
mon
ey, h
ave
you
or a
ny m
embe
r(s)
of y
our
H/H
rec
eive
d an
y ite
m/p
arce
l (in
clud
ing
food
) fro
m a
nyon
e liv
ing
abro
ad d
urin
g th
e la
st 1
2 m
onth
s?1.
Yes
1
19
2.N
o2
20
19.
Dur
ing
the
last
12
mon
ths w
hat k
ind
of g
oods
(inc
ludi
ng fo
od) h
ave
you
rece
ived
? C
an y
ou g
ive
your
ass
essm
ent o
f the
ir
valu
e?(s
ever
al a
nsw
ers a
re p
ossi
ble)
a) T
ype
of g
ood
(s)
b) q
uant
ity (p
er it
em)
c) A
sses
sed
Valu
ed)
M
eans
of s
endi
ng
AM
DU
SDR
UB
EUR
O
1. P
ost
2. S
ea/la
nd tr
ansp
ort
3. A
ir tr
ansp
ort
4. W
as b
roug
ht p
erso
nally
5. W
as se
nt w
ith o
ther
rela
tives
6. W
as se
nt w
ith o
ther
per
sons
7. O
ther
(spe
cify
).....
......
......
.1.
Veh
icle
2. E
lect
rical
equ
ipm
ent
3. C
loth
es (i
nclu
ding
shoe
s)
4.O
ther
(spe
cify
)
20.
Plea
se, t
ell m
e ha
ve y
ou e
ver
hear
d of
thes
e fin
anci
al st
ruct
ures
/ to
ols?
Hav
e yo
u m
aste
red
and
take
n ad
vant
age
of th
em o
ver
the
past
two
year
s?
Hav
e yo
u he
ard
of
them
?1.
Yes
2. N
om
ove
to n
ext
Hav
e yo
u m
aste
red
them
?1.
Yes
2. N
o
mov
e to
nex
t
Hav
e yo
u ta
ken
adva
ntag
e of
them
ov
er th
e pa
st tw
o ye
ars?
1. Y
es
2. N
o1.
Pens
ion
fund
2.In
vest
men
t ban
k ac
coun
t3.
Loan
s4.
Bank
loan
with
colla
tera
l5.
Bank
loan
with
out c
olla
tera
l6.
Cre
dit c
ard
7.C
urre
nt b
ank
acco
unt
8.Sa
ving
acc
ount
, ba
nk d
epos
it 9.
Mic
rofin
ance
loan
10.
Insu
ranc
e11
.St
ocks
12.
Bon
ds13
.C
ell p
hone
pay
men
ts a
ccor
ding
to in
voic
e
21.
Plea
se, t
ell m
e if
thes
e st
atem
ents
rel
ate
to y
ou
(ass
ess c
ompl
ianc
e ra
te 1
-5
scal
e: 1
. com
plet
ely
agre
e, 5
. com
plet
ely
disa
gree
)
1.B
efor
e m
akin
g a
ny p
urch
ase,
I ca
refu
lly c
onsi
der i
f I c
an a
ffor
d it
or n
ot2.
I am
livi
ng in
the
pres
ent a
nd d
on’t
thin
k ab
out t
omor
row
.3.
I spe
nd m
oney
with
gre
ater
ple
asur
e th
an I
do
thin
king
abo
ut sa
ving
it
4.I p
ay m
y bi
lls o
n tim
e5.
I am
read
y to
risk
par
t of m
y m
oney
in o
rder
to sa
ve/ i
nves
t 6.
I car
eful
ly m
onito
r my
finan
cial
reso
urce
s7.
I hav
e lo
ng-te
rm fi
nanc
ial g
oals
and
striv
e to
ach
ieve
them
8.M
oney
is fo
r spe
ndin
g

182
THA
NK
YO
U F
OR
YO
UR
CO
OPE
RAT
ION
22.
In th
e pa
st 1
2 m
onth
s, ha
ve y
ou b
een
in a
situ
atio
n, w
hen
your
inco
me
didn
’t co
ver
your
exp
ense
s?1.
Yes
2. N
o
23.
If y
ou w
ere
give
n a
job
oppo
rtun
ity, w
ho w
ould
you
pre
fer
to b
e?1.
Hire
d w
orke
r
2
. Se
lf-em
ploy
ed, e
mpl
oyer
24.
Reg
ardl
ess o
f you
r pr
efer
ence
is it
pos
sibl
e th
at in
the
com
ing
five
year
s you
will
bec
ome
self-
empl
oyed
/ sta
rt
your
ow
n bu
sine
ss?
1. I
am a
lread
y a
self-
empl
oyed
busi
ness
man
2. It
is p
ossi
ble
3.
It is
rath
er p
ossi
ble
4.
It is
rath
er im
poss
ible
5
. It i
s not
pos
sibl
e
25.
Hav
e yo
u ta
ken
entr
epre
neur
ship
cla
sses
whi
le st
udyi
ng in
any
edu
catio
nal i
nstit
utio
n?1.
Yes
2. N
o
26.
Do
you
have
a b
usin
ess (
incl
udin
g ag
ricu
lture
)? H
ave
you
part
icip
ated
in b
usin
ess m
anag
emen
t? H
ave
you
take
n st
eps t
o st
art y
our
own
busi
ness
? 1.
Yes
2
. I h
ave
take
n st
eps t
o st
art m
y ow
n bu
sine
ss
3. N
o
27.
Let
’s fo
r a
mom
ent i
mag
ine
that
you
hav
e in
heri
ted
a la
rge
sum
of m
oney
, how
wou
ld y
ou m
anag
e th
e m
oney
? 1.
I w
ould
star
t a b
usin
ess
2. I
wou
ld b
uy a
hou
se (p
ay th
e lo
an)
3.
I w
ould
dep
osit
it/ m
ake
inve
stm
ents
4.
I w
ould
spen
d it
to b
uy th
ings
whi
ch I
have
alw
ays d
ream
t ofh
avin
g (f
or e
xam
ple,
a c
ar).
I wou
ld w
ill tr
avel
and
so o
n 5.
I w
ould
wor
k le
ss
6. I
wou
ldpa
y m
y de
bts
7. O
ther
(ple
ase,
men
tion)
28.
Do
you
agre
e w
ith th
e fo
llow
ing
stat
emen
ts?
1.A
gree
2
.Mor
e lik
ely
to a
gree
3
. Mor
e pr
one
to d
isag
ree
4.
Com
plet
ely
dis
agre
e
1.It
is d
iffic
ult t
o st
art a
bus
ines
s whe
n th
ere
is n
o fin
anci
al su
ppor
t2.
It is
diff
icul
t to
star
t a b
usin
ess w
hen
the
adm
inis
trativ
e fu
nctio
ns a
re c
ompl
icat
ed3.
It is
diff
icul
t to
get e
noug
h in
form
atio
n on
how
to st
art a
bus
ines
s4.
It m
akes
no
sens
e to
star
t a b
usin
ess w
hen
ther
e is
a ri
sk o
f fai
lure
5.A
seco
nd c
hanc
e m
ust b
e gi
ven
to th
ose
who
hav
e al
read
y st
arte
d a
busi
ness
and
faile
d.

183

184
International Organization for Migration
Report on Household Survey on Migration in Armenia
Prepared for publication by the Project Development and Implementation Unit of IOM Mission in Armenia
Author: Pedro Góis
Proof-Reader: Maronanik Haroutunian
Technical Editor: A. Kurghinyan
Cover Page: S. Davidyan
Layout and printed at Tigran Mets Publishing House2 Arshakunyats Avenue, 0023 Yerevan
Tel.: (+374 60) 623219