effect of improved sweet potato varieties on household
76
EFFECT OF IMPROVED SWEET POTATO VARIETIES ON HOUSEHOLD FOOD SECURITY IN BUNGOMA COUNTY, KENYA Victor Kilui Wabwile A Thesis Submitted to the Graduate School in Partial Fulfilment for the Requirements of the Award of a Master of Science Degree in Agricultural and Applied Economics of Egerton University. EGERTON UNIVERSITY FEBRUARY 2016
-
Upload
khangminh22 -
Category
Documents
-
view
3 -
download
0
Transcript of effect of improved sweet potato varieties on household
EFFECT OF IMPROVED SWEET POTATO VARIETIES ON HOUSEHOLD
FOOD SECURITY IN BUNGOMA COUNTY, KENYA
Victor Kilui Wabwile
A Thesis Submitted to the Graduate School in Partial Fulfilment for the Requirements
of the Award of a Master of Science Degree in Agricultural and Applied Economics of
Egerton University.
EGERTON UNIVERSITY
FEBRUARY 2016

ii
DECLARATION AND APPROVAL
Declaration
This research thesis is my original work and has not been submitted for an award of any
degree in any other University.
__________ ______________
Signature Date
Kilui Victor Wabwile
KM17/3585/13
Approval
This research thesis has been submitted with our approval as Supervisors.
__________________ __________________
Signature Date
Professor B.K Mutai (PhD)
Professor Department of Agricultural Economics and Agribusiness Management, Egerton
University, Njoro (Kenya)
_______________ ___________________
Signature Date
Dr Jackson K Langat (PhD)
Department of Agricultural Economics and Agribusiness Management, Egerton University,
Njoro (Kenya)

iii
COPYRIGHT
© 2016 Victor Kilui Wabwile
All Rights Reserved.
Whole or no part of this thesis may be reproduced, transmitted or stored in any form
or means such as electronic, mechanical or photocopying including recording or any
information storage and retrieval system, or translated in any language, without prior written
permission of the author or Egerton University on that behalf.

iv
DEDICATION
This book is heartily dedicated to my lovely parents and all my relatives and friends,
especially my father Dr. Kiiya Wycliffe, my mother Gladys Wabwile and the people who
helped in making my life joyful.

v
ACKNOWLEDGEMENT
My sincere gratitude to GOD THE ALMIGHTY, Egerton University for giving me
the opportunity to pursue masters degree, I would like to acknowledge the African Economic
Research Consortium (AERC) through the Collaborative Masters of Science in Agricultural
and Applied Economics (CMAAE) secretariat for the facilitation they offered me pursue
Master degree in Agricultural and Applied Economics in University of Pretoria and also all
the financial support including the research fund which enabled me to complete the program.
Moreover I appreciate the contribution of the entire staff of the department of Agricultural
Economics and Agribusiness Management of Egerton in helping me achieve my academic
goals in this degree program.Special appreciation also goes to my supervisors Proff. B.K
Mutai and Dr. Jackson k Lang’at for their great contribution in my research project. Their
valuable guidance, support and dedication have made it possible for me to accomplish the
project. I am also indebted to Dr Japheth Wanyama and Geofrey Muricho from CYMMT for
there advice and guidance. The moral and financial support from my family is highly
appreciated and above all God for giving me the chance to go through this master degree
program.Appreciation goes the fellow colleagues for sharing with me useful ideas during
entire period of study and research. I also wish to thank the enumerators at CREADIS
organization who assisted me during data collection. Above all, Honour and thanks go to the
almighty God for His unreceding love, mercy, care, strength and guidance during the entire
period of study.

vi
ABSTRACT
Kenya’s Agricultural Sector Development Strategy (ASDS), envisions a food secure
and prosperous nation with the overall goal of the agricultural sector to achieve an average
growth rate of 7 percent per year. The strategy has, among others, target to reduce food
insecurity by 30 percent to surpass the MDGs by the year 2015. About 60 per cent of
households in western Kenya live below poverty line an indication of a high proportion of the
population without adequate quantity and quality of food intake. With the adoption of
agricultural intensification strategies which entails investments in modern inputs and
technologies, the development of the (ISVs) improved sweet potato varieties by Kenya
Agriculture and Livestock Research Organization(KALRO) is better option to increase
agricultural production and quality produce and reduce food insecurity. However, before
undertaking any impact assessment, it was imperative to establish whether the participation
by farmers was instrumental in the adoption of technologies and innovations. This study
aimed at shedding light on the potential contribution of improved sweet potato varieties on
food security in Bungoma East Sub county, Bungoma County. The analysis was based on the
data collected from a sample of 164 farm households in the sub county. A multistage
sampling procedure was used to arrive at the sample, with semi structured questionnaires
employed as the research instrument to collect qualitative and quantitative data through face
to face interviews. Household Dietary Diversity Index (HDDS) method was used to measure
food security (assess the access and quality of food intake). I used descriptive statistics,
Heckman two step model and endogenous switching probit model to analyse. SPSS and
STATA computer programs were used to process the data. The results show that adoption of
improved sweet potato varieties were largely influenced by extension contact and also
education level but negatively influenced by farming experience as expected. However the
adoption of ISVs (Improved Sweetpotato Varieties) had a robust and positive effect on
farmer’s household food security. In counterfactual case, adopters have 7.8% probability of
being food secure while non adopters would have 6.8% probability of being food insecure
hence better-off not adopting the ISVs through reduced food security. The need to strengthen
extension services by the government since farmers get most of their information about new
technologies from them, diversifying farm income through creation of sustainable off-farm
activities and strengthen contractual agreements in marketing to wipe out middlemen in the
process and assure farmers constant market for their produce are among the public policy
recommendations that would help increase probability of being food secure.

vii
TABLE OF CONTENTS
DECLARATION AND APPROVAL.................................................................................... ii
DEDICATION ..................................................................................................................... iv
ACKNOWLEDGEMENT ..................................................................................................... v
ABSTRACT ........................................................................................................................ vi
LIST OF TABLES ............................................................................................................... ix
LIST OF FIGURES .............................................................................................................. x
LIST OF ABBREVIATIONS .............................................................................................. xi
CHAPTER ONE ................................................................................................................... 1
INTRODUCTION ................................................................................................................ 1
1.1 Background Information .............................................................................................. 1
1.2 Statement of the Problem ............................................................................................. 5
1.3 Objectives of the Study ................................................................................................ 5
1.3.1 General Objective .................................................................................................... 5
1.3.2 Specific Objectives .................................................................................................. 6
1.4 Research Questions/Hypothesis ................................................................................... 6
1.5 Justification of the Study ............................................................................................. 6
1.6 Scope and Limitations ................................................................................................. 6
1.7 Definition of Terms. .................................................................................................... 7
CHAPTER TWO .................................................................................................................. 8
LITERATURE REVIEW ...................................................................................................... 8
2.1 Household Food Security in Relation to Income .......................................................... 8
2.2 Indicators of Food Insecurity ....................................................................................... 9
2.3 Impact of Agricultural Technologies on Food Security .............................................. 10
2.4 Factors that Influence Adoption of Agricultural Technologies ................................... 13
2.5 Theoretical Framework .............................................................................................. 15
2.6 Conceptualization Framework ................................................................................... 16
CHAPTER THREE ............................................................................................................. 17
METHODOLOGY.............................................................................................................. 17
3.1 Study Area ................................................................................................................ 17

viii
3.2 Sample Size Determination........................................................................................ 17
3.3 Sampling Procedure................................................................................................... 19
3.4 Data Collection Method ............................................................................................. 19
3.5 Methods of Data Analysis .......................................................................................... 19
3.6 Measurement of Food Security .................................................................................. 20
3.7 Analytical Framework ............................................................................................... 21
3.7.1 Characterization of Sweet Potato Farmers .............................................................. 21
3.7.2 To Determine Factors Influencing the Extent of Adoption of the Improved Sweet
potato Varieties ............................................................................................................... 21
3.7.3 To Determine the Effect of the Improved Sweet potato Varieties on Household Food
Security.(ibid) ................................................................................................................. 23
CHAPTER FOUR ............................................................................................................... 26
RESULTS AND DISCUSSIONS ........................................................................................ 26
4.1 Descriptive Results .................................................................................................... 26
4.1.1 Socio-Economic Characteristics of Adopters and Non Adopters Sweet Potato
Farmers 26
4.2 Factors Influencing Adoption and the Extent of Adoption of the ISVs. ...................... 34
4.2.1 Factors Influencing Adoption of the Improved Sweet Potato Varieties. .................. 34
4.2.2 Factors Influencing the Extent of Adopting the ISVs. ............................................. 36
4.3 Effect of Improved Sweet potato Varrieties on Household Food Security. ................. 39
4.3.1 Determinants of Food Security Status. .................................................................... 39
4.3.2 Mean Treatment effects on Food Security .............................................................. 42
CHAPTER FIVE ................................................................................................................ 44
CONCLUSION AND RECOMMENDATION ................................................................... 44
5.1 Conclusion ................................................................................................................ 44
5.2 Recommendation ....................................................................................................... 45
5.3 Further Research ....................................................................................................... 46
6.0 REFERENCES.............................................................................................................. 47
APPENDIX ........................................................................................................................ 58
QUESTIONNAIRE ......................................................................................................... 58

ix
LIST OF TABLES
Table 1: Description of variables used in Heckman Two-Step Procedure -----------------------22
Table 2: Description of variables used in the Endogenous Switching probit model. ----------25
Table 3: Association of Household Characteristics by Farmer Type (Dummy Variables) ----27
Table 4: Mean Difference of Household Characteristics by Farmer Type (Continuous
Variables) --------------------------------------------------------------------------------------------------30
Table 5: Institutional Characteristics for Discrete Dummy Variables (Chi2 test). --------------32
Table 6: Main Source of Information about the Farmer Groups. ----------------------------------32
Table 7: Main Source of Credit Among the Farmer Groups ---------------------------------------33
Table 8: Main Extension Sources amoung the Farmer Groups ------------------------------------34
Table 9: The Heckman Two-Step Selection Equation ----------------------------------------------36
Table 10: The Heckman Two-step Outcome Equation ---------------------------------------------37
Table 11: Validity of Selected Instruments used in the Endogeneous Switching Probit Model
--------------------------------------------------------------------------------------------------------------40
Table 12: Full Information Maximum Likelihood Estimates of the Switching Regression
Model (Dependent variables: Food Security Status) ------------------------------------------------41
Table 13: Mean Treatment effects on Food Security -----------------------------------------------43

x
LIST OF FIGURES
Figure 1: Sweet Potato Production Trend in Kenya. ------------------------------------------------- 4
Figure 2: Conceptual Framework. ---------------------------------------------------------------------16
Figure 3: Map of Bungoma County. -------------------------------------------------------------------18

xi
LIST OF ABBREVIATIONS
CBO: Community Based Organizations
FAO: Food and Agricultural Organizations (United Nations)
GOK: Government of Kenya
KARI: Kenya Agricultural Research Institute
KACE: Kenya Agricultural Commodity Exchange.
MDG: Millennium Development Goals
MOA: Ministry of Agriculture
NGO: Non-Government Organizations
OFSP: Orange Fleshed Sweet Potato
OAF: One Acre Fund
USAID: United States Agency for International Development
HCDA: Horticultural Crops Development Authority
KNBS: Kenya National Bureau of Statistics
CBS: Central Bearue of Statistics.
IAR4D: Integrated Agricultural Research for Development
CREADIS: Community Research in Environment and Development Initiatives
ISVs: Improved Sweet potato Varrieties.

1
CHAPTER ONE
INTRODUCTION
1.1 Background Information
Achieving food security is a prerequisite to realizing the first and the third United
Nations MDGs (Millennium development Goals) that are concerned with reducing the
proportion of people who suffer from hunger and is the major objective of the Kenya
government. The scarcity of productive land is a central issue in agricultural policy (GOK,
2004). Agricultural production is concentrated in high potential areas where population
density is high. Nevertheless 80% of the country is classified as semi arid. At low levels of
income, the paramount concern for the human being is to meet the energy needs to overcome
hunger. Cereals provide the cheapest source of energy but with the increasing population and
decreasing farm sizes, farm households have diversified to other crops like the sweet potato
(Ipomoea batatas l). Generally, traditional foods are used to fill in the gaps and in so doing
they contribute to the food security and also provide dietary diversity for the people
(Musinguzi et al., 2006).
The nutritional aspect of food security is often overlooked in favor of simply ensuring
people are eating regular meals. However, an important part of food security is access to
"nutritionally adequate and safe foods" (Radimer, 2002). International studies report that
healthy food is more expensive than unhealthy food, and local studies have shown that people
in welfare or low-income categories are less likely to buy and eat healthy food (Kettings and
Voevodin, 2009). In Kenya, over 75% of sweet potato production is concentrated in western,
central and coastal areas of the country. Out of this, over 80% is grown in the Lake Victoria
basin (Gruneberg et al., 2004). In western Kenya, farmers grow landrace varieties that are
preferred locally but lack consumption appeal for distant markets.
The food crop come in a range of skin and flesh colors, from white, to orange, to deep
purple fleshed roots. New and improved high-yielding varieties have been introduced to
farmers throughout Kenya, the orange fleshed sweet potato (OFSP) has a lot of nutritional
benefits and it has a high content of β-carotene (a chemical element used by the body to
generate Vitamin A) and sufficient dry matter to satisfy consumer preferences and taste.
Subsequent studies demonstrated that the consumption of just small amounts of foods derived
from the new OFSVs could eliminate or greatly reduce Vitamin A deficiencies in both young
children and pregnant and lactating women (Harvest Plus, 2003). The most traded variety is
the red skinned and yellow fleshed (RSYF) sweet potato, due to its high consumer demand. It

2
has the highest market share of 73% (USAID, 2012), especially in Nairobi and Kisumu,
where it is traded mainly in the informal markets. The red and white skinned sweet potatoes
(RWSWF) are more popular in Mombasa, where the agro-ecological factors favor its
production.
It is among the world’s most important, versatile, and underexploited food crops with
more than 133 million tons in annual production. Worldwide, sweet potato is the sixth most
important food crop after rice, wheat, potatoes, maize, and cassava while in most of the
developing nations sweet potato is the fifth most important food crop (CIP, 2013). It is an
important food security crop for rural household and has a high yield potential that may be
realized within a relatively short growing season. It is also adaptable to a wide ecological
range of 0 to 2000 meters above sea level. Sweet potatoes is grown in a wide range of soil
type, but does best on soils of friable/loose nature, which permit expansion of tubers. Sweet
potatoes grow best in fertile sandy loams and do poorly in clay soils. The crop does poorly in
water logged, too shallow or stony soils. Poorly aerated and bulky soils retard tuber
formation and reduced yields. The crop is sensitive to saline and alkaline soils and they
should be avoided. Too high fertility may result in excessive vegetative growth at the expense
of tuber and starch formation. It grows best at 24 0C, when temperatures fall below 120C or
exceeds 350C growth is retarded. 750 – 1000mm ideal but crop can withstand drought though
under drought conditions, yield s are drastically reduced if drought occurs in the first 6 weeks
after planting and also during root formation and development.
The area under production grew from 20,181 hectares yielding 527,470 tons
(valued at KSh 4 billion) in 2009 to 22,989 hectares in 2011 yielding 1,000,267 tons valued
at KSh 7.6 billion (HCDA, 2012). Sweet potato is the third most important food crop in
Kenya after maize and Irish potato (CIP, 2013). It is a low-input crop making it ideal for
many smallholder households. Its contribution to nutrition security has increasingly been
recognized, prompting several entities to support tailor-made interventions specifically
targeting the sweet potato value chain. The sweet potato is widely enjoyed, and with
increasing awareness of its nutritional value and the steadily growing Kenyan population,
demand is expected to increase significantly. This presents increased production potential for
domestic consumption and subsequent marketing opportunities that cannot be satisfied by the
prevailing production levels. The crop is mainly consumed fresh, with negligible exploitation
of processing opportunities due to lack of consumer awareness on utilization of sweet potato
in processed form.

3
Generally, production of sweet potato in Kenya has steadily increased over the years
as shown in Figure1 below. According to the MOA (2011), sweet potato production
increased by 89% between 2004 and 2009, a scenario attributed to use of improved cultivars
and farming methods which have helped increase yield per unit area (MOA, 2010; Kenyon et
al., 2006). In the recent past, there have been renewed efforts by the government and other
players in the agriculture sector to promote production of traditional high value crops of
which sweet potato is among them. For example, through the traditional high value crops
(THVC) programmed, the government distributes to farmers improved planting materials for
the crops as one of the activities in efforts to promote their production.
Important research efforts have been devoted to select, breed, and disseminate new
sweetpotato varieties that enhance the productivity and quality of food crops, alleviating
poverty and food insecurity. The crop is considered as one of the "orphaned" crops along
with cassava, amaranth and millet among others because less research and promotion has
been accorded to them compared to crops like maize and rice ,but increasingly more such
crops are being liberated from their orphaned nature as their qualities of nutrition; low input
requirements and drought tolerant are being appreciated in the face of population pressure
increase need for food (KACE, 2012). These efforts are a result of the recognition of the
important role of these crops in contributing to food security through increasing food supply
to both the producers and consumers and generating income to the producers.
It is produced on small scale in a household based subsistence economy in Africa
(Kisiangani and Pasteur, 2008). The crop is typically a small farmer crop and often grown on
marginal soils with limited outputs. Sweet potatoes can be boiled, roasted, fried, creamed or
baked in their skins (Tewe et al., 2003). They are easily combined with both sweet and
savory dishes and are mostly grown on small scale in compound gardens. Research has
developed utilization methods like making of chips, blending of sweet potato flour with
wheat flour for products like chapati, mandazi or porridge (Nungo et al., 2007). These
different methods are intended to increase utilization hence, increasing sweet potato
production leading to improve incomes and food security among the poorer segments of the
rural population. However, there is limited documentation of farmers’ dietary habits and
consumption patterns.

4
Figure 1: Sweet Potato Production Trend in Kenya.
Source: FAOSTAT (2013).
The use of sweet potato flour blended with wheat flour for chapati has been adopted
in the north rift (Rono et al., 2006). Thus, sweet potato is an important tropical food crop
with versatile utility. The tubers are used as a subsidiary food after boiling, baking and frying.
Tubers also form an industrial raw material for the production of starch; alcohol, pectin etc.
and the surplus as well as culled tubers can be used fresh or dehydrated in rations for
livestock (Nedunchezhiyan et al., 2006).
In Kenya, sweet potato is recognized as an alternative food crop among many
households, whose main staple food is maize (Low et al., 1997). It is often considered
“subsistence”, “food security” or “famine relief” crop (Günter et al., 2010). Its importance is
evident when there is shortage in maize supply, usually when there is shortfall in production
or immediate time before harvest of maize. In such cases, sweet potato and other indigenous
tubers such as cassava become very important in the diet of many rural households. On the
other hand, demand for sweet potato among the urban population is growing rapidly due to
changing consumption patterns and population growth. Therefore, the importance of sweet
potato in Kenya cannot be overemphasized due to the potential that it holds for both
producers (as an income generating enterprise) and consumers (as a source of nutritious
staple food). There millions of dollars invested in sweet potato research, but very little is
known about their impacts and whether these improved varieties are widely adopted and their
distributional impacts on the poor. Policy makers and donors need information on these
impacts to allocate resources to fruitful lines of research and to strengthen the role of
agricultural research in fighting poverty, hunger, and malnutrition.
0
200000
400000
600000
800000
1000000
1200000
1400000
2002 2003 2004 2005 2006 2007 2008 2009 2010 2011 2012 2013Year
Production(tonnes

5
International organizations and governments expect improved varieties to alleviate
malnutrition and hunger, but, to date, impact assessment studies have mainly focused on
productivity and aggregate welfare measures. Fewer studies document the impact of
technology adoption on household food security (Kabunga et al., 2014; Rusike et al., 2010
and Shiferaw et al., 2014). Various reasons explain the limited number of studies on food
security. Nutrition is one of the last outcomes to be affected along the long adoption impact
pathway (Chung, 2012). Because of the important lag between adoption and improvement in
nutritional status, one might fail to detect impact. Moreover, measuring food security, due to
its multidimensionality, is challenging and consensus on the methodology to use is lacking
(Barrett, 2010; Coates, 2013).
1.2 Statement of the Problem
The new improved sweet potato varieties (ISVs) were developed by KARI (Ndolo,
2011) with several objectives: to increase household income and reduce poverty, reduce
household food insecurity, improve nutrition and health and increase production through
sound agricultural practises. More farmers are increasingly adopting the improved varieties
(KARI, 2014). Despite this adoption rates food insecurity in the Bungoma county still high,
with statistics showing 60% of the population largely exposed to food insecurity and same
percentage of households in the large western Kenya living below poverty line (CBS, 2008).
However, the potential of the crop’s contribution to food security, increased incomes and
reduction of nutritional deficit is unclear since the food crop has yet to be fully exploited in
this part of the country. NGOs and governments expect improved varieties to alleviate food
insecurity, but, to date, impact assessment studies have mainly focused on productivity and
aggregate welfare measures.The increasing sweet potato production was therefore likely to
offer farmers an escaping route to increased food security in the near future. This study
therefore was aimed to fill this knowledge gap by examining if the adoption of this improved
varieties plays a role in contributing to food security.
1.3 Objectives of the Study
1.3.1 General Objective
To contribute towards food security by examining the contribution of the improved
sweet potatoes varieties on household food security in Bungoma County.

6
1.3.2 Specific Objectives
a) To characterize the household socio-economic attributes of sweet potato farmers.
b) To determine factors influencing adoption and the extent of adoption of the ISVs.
c) To determine the effect of the improved sweet potato varieties on household food
security.
1.4 Research Questions/Hypothesis
To achieve the objectives of the study the following research questions were asked:
a) Socio-economic attributes do not significantly differ amoung sweet potato farmers in
Bungoma county?
b) What factors influence adoption and the extent of adopting the improved sweet potato
varieties?
c) There is no significant effect of improved sweet potato varieties effect on household
food security.
1.5 Justification of the Study
Maize is the strongly preffered main staple food and also the most common crop
grown by rural poor households in Bungoma county. With the recent challenges specifically
the maize lethal neucrosis disease (MLND) and sugar sector, households are largely exposed
to food insecurity (OAF, 2013). Agricultural technologies are aimed at improving quality and
increasing yields in terms of production. The improved sweet potato varieties are said to be
drought resistant, rich in vitamin A, high quality and high yielding. Therefore the adoption of
this sweet potato varieties by farmers is likely to have a positive impact on household food
security in terms of utilization, access, availabilty and stability. This study adds to the thin
literature on food security impacts of technology adoption by rigorously documenting the
linkages between adoption of improved sweet potato varieties and household dietary diversity
other than focussing on outcome and production.
1.6 Scope and Limitations
The study was confined to Bungoma East Sub-County where the scope covered sweet
potato farmers in this area. It is a small geographical area of the country; hence the results
may not apply to others areas. The period of study under consideration was limited to 2014.
Variables on socio economic, institutional are only selected and not necessarily mean that all
variables are included.

7
1.7 Definition of Terms.
Food Security: Food security in this case is defined as “ a situation in which all people, at all
times, have physical, social and economic access to sufficient food which meets their dietary
needs and food preferences for an active and healthy life”
Improved variety: New seed varieties that result in outputs that are of higher quality in some
respect, even if yield does not improve.
Agricultural technology: Risk mitigating, quality improving, yield increasing and cost
saving technologies.
Dietary diversity: It’s the economic ability of a household to consume a variety of foods.
Adoption: Process in which farmers make decision to acquire and use new agricultural
technology.
Household : Defined as an independent male or female producer and his/her dependants who
must have lived together for a period not less than six months. The members are answerable
to one person as the head and share the same eating arrangement.
Staple Food: Type of food that is eaten regularly and in such quantities as to constitute the
dominant part of the diet and supply a major proportion of energy and nutrient needs.
Availability of food: It relates to volume of supply derived from domestic agricultural output
and net food imports at the national level.

8
CHAPTER TWO
LITERATURE REVIEW
2.1 Household Food Security in Relation to Income
Temporary food insecurity is the result of short term fluctuations in production and
consumption brought about by fluctuations in household incomes and availability of food at
the household level. Temporary food insecurity is thus a manifestation of temporary lack of
access to sufficient food, (Obasanjo et al.,1992). The analysis of food security has a long
history in research on poverty, living standards and income distribution, (Hadaad, 2000).
Relevant issues in this study were the share of specific items across different income levels,
and the importance of child nutrition in poor families. Lundberg et al.(1996) discusses a
number of studies that show that control over both earned and unearned income results in
different expenditure patterns.
Rural food consumption patterns are substantially more diverse. It involves
consumption of several crops including cassava, sorghum, millet, rice, bananas, maize
etc(Alberto, 1981). Access to food encompasses physical and economic aspect. Physical
access to food relate both to the adequacy of supply and to the efficiency of the distribution
system, including storage, preservation, transport, marketing and processing. Economic
access to food relates to the ability of group of people to establish entitlements over a
requisite amount of food (Obasanjo et al.,1992).
Jacoby (1992) states that the farm - household is conceptualized as being endowed
with a stock of resources termed the household resource base. These resources are allocated
to a range of activities that are required to maintain the household’s level of subsistence
consumption and possibly to generate a surplus. More so, a remarkable division of labor
based on gender characterizes production at all levels within the household. Furthermore,
Maxwell et al. (1992) postulated that most families access food by consuming what they
produce or by purchasing food in the growing season from income earned from their harvest
time sales or from off farm work. Therefore, farmers are expected to generate income from
the sale of their produce which can be used to purchase food besides consuming what they
produce from any farming activity. The income generated can also be used to serve as capital
for the production of other commodities such as livestock, hence diversification of farm
enterprise and increased food base.
We hypothesize that the adoption of improved sweet potato varieties can lead to
greater diet diversity and improved food security through various ways. First, adoption is

9
expected to have a direct and positive impact on farm income. As a result of this income
growth, we expect a shift away from staples and greater consumption of meat, dairy products,
fresh fruits and vegetables. In low-income countries such as Kenya, a large share of income is
spent on food and food consumption is highly responsive to changes in income. Thus, food
consumption patterns should adjust quickly to income growth by moving from a staples-
based diet and more towards a diverse diet. Moreover, income increases can enable
precautionary savings and allow the household to take steps to insure itself against food-
related shocks (Alwang’ et al., 2001).
Second, adoption of improved varieties, through higher yield, can indirectly affect
food consumption patterns and food security through changes in production patterns. This
pathway is complex and depends on factors such as household structure and market
orientation. For a household involved in the sweet potato market as seller, adoption of
improved varieties might result in more land being allocated towards sweet potato
production, augmenting the income effect of adoption on food security. Because of greater
sweet potato production due to adoption of improved varieties, a household might move land
away from sweet potato towards a more diverse production system. This substitution effect is
expected to improve food security as greater agricultural production diversity should lead to
greater diet diversity (Jones et al., 2014). The direction of changes in production patterns
following adoption is unclear, but the expected effects (either income or substitution) should
lead to improved diet and food security among rural households.
2.2 Indicators of Food Insecurity
There are approximately 200 definitions and 450 indicators of food security
(Hoddinott, 1999) and like the concepts of health or social welfare; there is no single, direct
measure of food security- that can effectively capture the multiple dimensions to the problem
(Riely et al., 1999). Consensus has still not been reached on acceptable indicators and
methods of measuring household food security (Haddad et al., 1994). No method has been
accepted as a "gold standard" for an analysis of household food security (Maxwell, 1996).
The choice of a particular indicator must be based on the specific objectives of the research,
and the trade-offs between resource constraints and information needs.
Export horticulture farming was established to have a positive impact on food security
on small holder farmers in Mbooni and Kirinyaga counties in Kenya (Jane et al.,2013). Small
holder farmers (both growers and non- growers) in Mbooni however were consuming less
than the recommended per capita calorie intake. The study recommends that policies aimed at

10
encouraging smallholder farmers to participate in export horticulture farming should be
promoted in after the household surpass the minimum recommended caloric intake.
In the work by Maxwell et al. (1992), a distinction is made between "process
indicators"— those that describe food supply and food access—and "outcome indicators" that
describe food consumption measurement. These include dietary diversity, household caloric
acquisition, and food balance sheet. These are necessary to identify the food insecure, to
assess the severity of their food shortfall and to characterize the nature of their insecurity
(seasonal versus chronic). Maxwell et al. (1992) lists 25 broadly defined indicators. Riely et
al. (1995) list 73 of such indicators, somewhat more disaggregated than those found in
Maxwell and Frankenberger.
Dietary diversity is one of the outcome indicators of food security. This is the sum of
the number of different foods consumed by an individual over a specified time period.
According to Hoddinott (1999), households become better-off if they consume a wider
variety of foods.In the study conducted by Hoddinott et al. (2002) in 10 countries (India, the
Philippines,Mozambique, Mexico, Bangladesh, Egypt, Mali, Malawi, Ghana, and Kenya),
levels of caloric acquisition was found to be correlated with dietary diversity. Dietary
diversity was also found to track seasonal changes in food security. Dietary diversity is
highest just after harvest time and lowest during the hunger season; and also appears to
capture differences in distribution within the household.
2.3 Impact of Agricultural Technologies on Food Security
In sub-Saharan Africa, where questions are often raised about the adoption and impact
of agricultural technology, quantitative evidence of the relationship between agricultural
technology and household welfare is scarce (Minten and Barrett, 2008). In more recent
studies in Tanzania, Amare et al. (2012) found that maize and pigeon pea intensification
results in higher per capita income and per capita expenditure on food. However, they used a
binary treatment effect approach, which does not account for the heterogeneous effects of
adoption. Asfaw et al. (2012) in Tanzania found that adoption of improved varieties of
pigeon peas significantly increased per capita consumption expenditure and reduced poverty.
Kassie et al. (2011) assessed the link between the adoption of improved groundnut varieties
and poverty, and found that poverty was significantly reduced when improved varieties of
groundnut were adopted. Similarly, Kijima et al. (2008) in Western Uganda found that the
introduction of a new variety of rice for Africa (NERICA) decreased poverty to a significant
extent without worsening income distribution. Alene et al. (2009) found that adoption of

11
improved maize varieties in West and Central Africa increased from less than 5% in the
1970s to 60 % in 2005, significantly reducing poverty. Karanja et al. (2003) also showed that
the adoption of maize technologies in areas of Kenya with high agricultural potential is likely
to have a substantially greater positive impact on household incomes than in areas with a low
agricultural potential.
Adoption of improved bean varieties led to high farm income among the household
interviewed in Rwanda (Larochelle, 2014). This resulted to more available food channels
hence more food secure households. Food security was measured by use of HDDS
(Household Dietary Diversity Score) while the GMM Poisson model was used to control for
the endogeneity of the adoption decision and identify the treatment effects. A study done in
the Rift Valley of Ethiopia, found out that the use of improved agricultural technologies
resulted in positive and negative impacts. The positive impacts are related to economic and
social improvements: increased yield of crops, increased production and income of the
beneficiary households. Improved technologies also led to diversification of production,
change in food habits particularly of irrigation adopters, improved health, increased asset
building and better living conditions. Moreover, the use of improved agricultural inputs
enhanced the market integration and induced a high demand for farm activities (Bezabih et
al., 2010).
The impact of OVOP(one village one product) on household food security in Thyolo
district, Malawi found that household farm income for OVOP beneficiaries was higher than
their counterpart non beneficiaries(Juliana, 2007). The OVOP beneficiaries were also found
to be better off in terms of household food security through increased food basket, enterprise
diversification and food access which was attained through higher farm income. However,
farmers’ socio-economic characteristics did not adequately explain the disparity in household
farm income. This implies that there are some other factors that are closely associated with
agricultural production and participation in programs such as OVOP, which may require
further investigation. Participation in OVOP and household size were found to be positively
associated with household farm income.
The propensity score matching (PSM) approach showed that the impact of the Girinka
one cow per poor family program has a positive impact on household income and crop
production at the household level (Mutarutwa, 2014). The study objectives were to analyze
the impact of the program on household income, on crop production at the household level
and to evaluate the constraints facing the implementation of the program. Logistic regression

12
results of the factors that influence the participation in Girinka programGatsibo, Rwanda
identified gender, household size, land size and crop input to be significant.
Direct effects of adoption of Bacillus thuringiensis (Bt) cotton on yields, pesticide
demand, household income and poverty in the Punjab province of Pakistan were examined
through a propensity score matching approach. Their findings reveal that adoption of the new
technology exerts a positive and significant impact on cotton yields, household income and
poverty reduction, and a negative effect on the use of pesticides. The positive and significant
impact of the technology on yields and household income is consistent with the potential role
of new agricultural technology in directly reducing rural poverty through increased farm
household income (Ali and Abdoulai, 2009).
Impact of the IAR4D on Enhancing Smallholder Farmers Income and Food Security
through Agricultural Research and Development in West Africa by Adeolu et al.
(2013).Using propensity score (PSM) and double-difference methods (DDM) to control for
project placement and self selection biases, showed that IAR4D increased participants’
income by about 13.9%, and improved food security by about 22.9%. The PSM results
indicated that participants in the IAR4D will likely be farmers with small household size, and
considerable farming experience, with some level of productive assets, who reside near all
weather roads, have low level of education. It can be safely concluded from the results that
the IAR4D enhances the income and food security status of the participants.
Access to formal credit has a marginally beneficial effects on household annual
income in that it enables households to reduce their borrowing from informal
sources.However, these effects are very small and do not cause any significant difference
between the per capita incomes, food security, and nutritional status of credit program
members and non members (Diagne, 2001). This study assesed the impact of access to credit
on income and food security in Malawi.
Technology adoption also reduces relative food insecurity in a significant way
(Kabunga et al., 2014). The study on Impact of tissue culture banana technology on farm
household income and food security in Kenya employed the Household Food Insecurity
Access Scale (HFIAS) – a tool that has not been used for impact assessment before.
Estimates of treatment-effects models show that tissue culture (TC) banana adoption,
combined with improved crop management, causes considerable increases in farm and
household income. These results indicate that TC technology can be welfare enhancing for
adopting farm households.
13
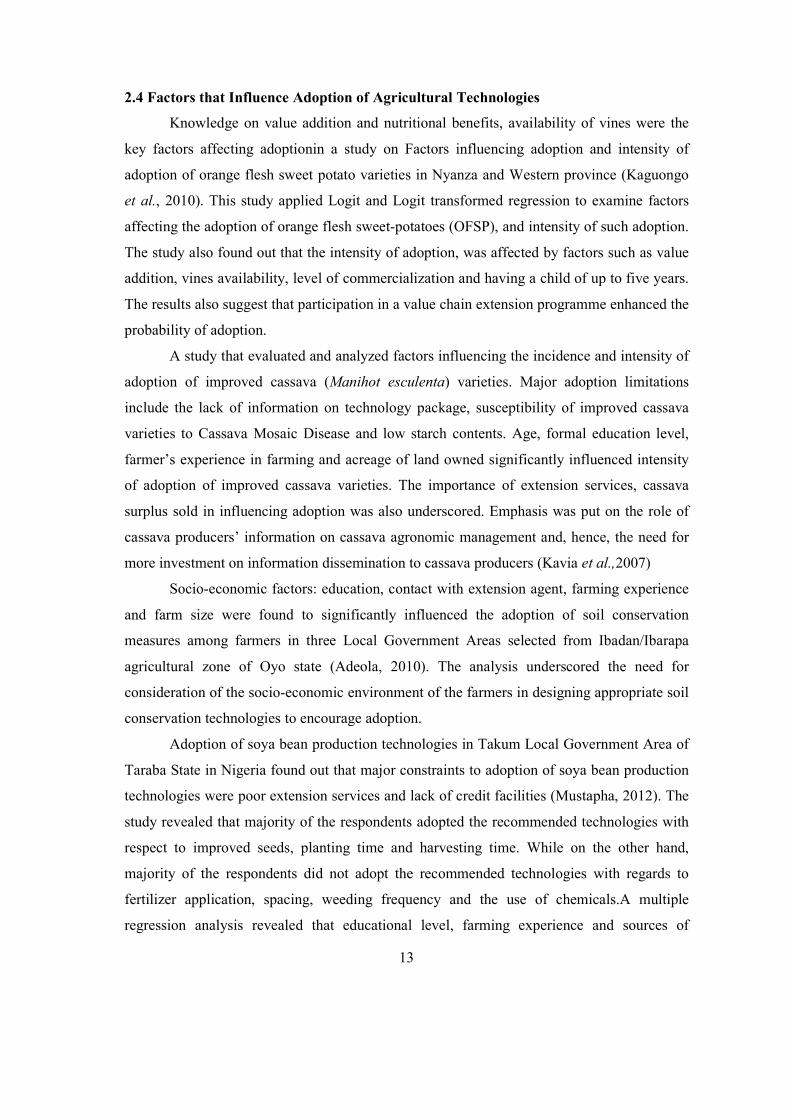
2.4 Factors that Influence Adoption of Agricultural Technologies
Knowledge on value addition and nutritional benefits, availability of vines were the
key factors affecting adoptionin a study on Factors influencing adoption and intensity of
adoption of orange flesh sweet potato varieties in Nyanza and Western province (Kaguongo
et al., 2010). This study applied Logit and Logit transformed regression to examine factors
affecting the adoption of orange flesh sweet-potatoes (OFSP), and intensity of such adoption.
The study also found out that the intensity of adoption, was affected by factors such as value
addition, vines availability, level of commercialization and having a child of up to five years.
The results also suggest that participation in a value chain extension programme enhanced the
probability of adoption.
A study that evaluated and analyzed factors influencing the incidence and intensity of
adoption of improved cassava (Manihot esculenta) varieties. Major adoption limitations
include the lack of information on technology package, susceptibility of improved cassava
varieties to Cassava Mosaic Disease and low starch contents. Age, formal education level,
farmer’s experience in farming and acreage of land owned significantly influenced intensity
of adoption of improved cassava varieties. The importance of extension services, cassava
surplus sold in influencing adoption was also underscored. Emphasis was put on the role of
cassava producers’ information on cassava agronomic management and, hence, the need for
more investment on information dissemination to cassava producers (Kavia et al.,2007)
Socio-economic factors: education, contact with extension agent, farming experience
and farm size were found to significantly influenced the adoption of soil conservation
measures among farmers in three Local Government Areas selected from Ibadan/Ibarapa
agricultural zone of Oyo state (Adeola, 2010). The analysis underscored the need for
consideration of the socio-economic environment of the farmers in designing appropriate soil
conservation technologies to encourage adoption.
Adoption of soya bean production technologies in Takum Local Government Area of
Taraba State in Nigeria found out that major constraints to adoption of soya bean production
technologies were poor extension services and lack of credit facilities (Mustapha, 2012). The
study revealed that majority of the respondents adopted the recommended technologies with
respect to improved seeds, planting time and harvesting time. While on the other hand,
majority of the respondents did not adopt the recommended technologies with regards to
fertilizer application, spacing, weeding frequency and the use of chemicals.A multiple
regression analysis revealed that educational level, farming experience and sources of

14
information had significantly and positively influenced the adoption of improved soya bean
production technologies by respondents. The study recommends that agricultural extension
services should adequately be provided with input support services in the form of credit
facilities among others.
Technology adoption can be increased by increases in: access to extension services,
amount of land owned, and diversity of farm tools owned by farmers. However, some
farmers are not well endowed with regard to the agricultural assets and services alluded to.
(Barungi et al., 2012). His study that aimed at determining factors that influence the
incidence and intensity of technology adoption Bukwo and Kween districts, on the slopes of
Mt. Elgon in eastern Uganda was analyzed using descriptive statistics and double hurdle
models. The findings revealed further that on average, the incidence of technology adoption
is appreciably high and the intensity of use is moderately high. Nonetheless, a considerable
percentage of farmers are using the technologies on small scale. We note that Thus, the study
recommended support to farmers by both Government and non-Government actors in line
with the factors identified as potential catalysts of adoption of soil erosion control
technologies.
A study to identify the socio-economic factors that influence farmers’ decision to
adopt hybrid maize indicates that the mean predicted probability of technology adoption to be
age, income, education and extension visits (Ebojei et al., 2009). On the contrary, farming
experience, family size, farm size had no significant influence on participation in hybrid
maize. This study done in Giwa Local Government Area of Kaduna state, Nigeria suggests
the need to bring more area under hybrid maize cultivation. Furthermore, there is a need for
special training, seminars, field demonstrations and technical support for the maize farmers.
As most of the households had no formal education, the extension program should be
intended to the less educated farmers. In addition, the credit facility particularly the procedure
for loan should be made simple to improve the adoption rate of hybrid maize in the study
area.
Factors including farm size, education level of farmers and access to extension
services to significantly influence adoption of improved maize varieties (IMV). This study
examined factors influencing adoption of IMV among farmers in Nigeria (Olusegun et al.,
2011).The results also indicate that farmers across the entire agro-ecological regions of
country share some negative sentiments regarding adoption of IMV. Renewed emphasis on
interventions that would enable farmers gain more access to farmland, and promote formal

15
education and extension service are advocated. An attempt to incorporate variables that
capture farmers’ perception/experience on agro-climatic/ecologically related concerns in
adoption study could aid better understanding of what drives farmers’ adoption decisions
across the country especially in the light of the emerging climate change issues and its
implication on food production.
2.5 Theoretical Framework
This study assumes that there is potential for the households adopting the new sweet
potato varieties to increase their purchasing power due to increase in income and food
security thus impacting positively on their livelihoods. Farmers make choices of what to grow
and which technologies to adopt with the goal to maximize their expected utility. The
decision to adopt the new sweet potato varieties is predicted by perceived utility which is
expected to be higher. Profit maximization framework was used to examine the decision to
adopt or not (Pryanishnikov and Katarina, 2003). It is assumed that sweet potato farmers will
only adopt the improved varieties if the expected net benefit from this option is significantly
greater than is the case without it. Suppose that Ui andUj represent a household’s utility for
two choices, then the model is specified as;
Where Ui and Uj are perceived utilities of adopters and non adopter’s choices and j,
respectively,Xn is the vector of explanatory variables that influence the perceived
attractiveness of each choice, βi and βj are parameters to be estimated, ℇi and ℇj are error
terms assumed to be independently and identically distributed (Greene, 2000). In the case of
improved sweet potato varieties, if a household decides to use option i, then the expected
utility from option i is greater than the utility from option j, which is defined as;
The probability that a farmer adopts improved varieties and chooses option i instead of j, is
then defined as:
where P is a probability function, U ni, Unj represent a household’s utility for two choices and
Xn is the vector of explanatory variables that influence the perceived attractiveness of each

16
choice, ℇ*=ℇi-ℇj is a random disturbance term, β*=(βi-βj) is the net influence of the vector of
independent variables influencing adoption of improved varieties, and F(β*Xn) is a
cumulative distribution function of ε* evaluated at β* Xn . The exact distribution of F depends
on the distribution of the random disturbance term, ε*. Depending on the assumed
distribution that the random disturbance term follows, several qualitative choice models can
be estimated (Greene, 2003). This theoretical framework emphasizes any household decision
on the alternative choices.
2.6 Conceptualization Framework
Conceptual framework serves as a simplification to the understanding of the
relationship between the dependent and independent variables. The change in the independent
variable has an effect on the dependent variable. The variable in the dependent variable is
countered by the independent variable.
Figure 2: Conceptual Framework.
Source: Author
Cultural factors
Socio-economic factors
Age, Household size, Ge
nder, Farm size, Marital
status, livestock ownersh
ip, Off farm income,Far
ming Exp,farm income,
Occupation
Institutional factors
Training, Land tenure,
extension service,
membership to group,
Contractual arrangement,
Infrastructure, Access to
credit
Market factors
Distance to market,
Price of output,
Information
availability
Extent of adoption
Decision to Adopt
Increased Income
Increased Food Security Status

17
CHAPTER THREE
METHODOLOGY
3.1 Study Area
The study was conducted in Bungoma East sub county, Bungoma County. The county
borders the Republic of Uganda to the West, Teso and Busia districts to the South West,
Mumias to the South, Trans-Nzoia to the North East. The population of Bungoma is
estimated at 1,630,934 (KNBS, 2009) of which female constitute 52% while male are 48%
whilePoverty level index stand at 53%. The County has an area of 3,032.2 sq. Km and a
population density of 453.5 people per sq. Km. Itlies between 1,200 and 1,800 meters above
sea level and experiences mean temperatures of 23oC. Its latitude stands at 10 13’ with the
longitude of 34056’North East of the equator in Western Kenya. It also experiences a bimodal
type of rainfall with the average annual rainfall ranging from 1200mm to 1800mm per
annum. Most of the rain fall is experienced in the months of April-May and July-August.
The coldest months are July, August and September. Bungoma is divided into nine
administrative and political divisions: Bumula, Kanduyi, Kimilili, Sirisia, Kabuchai, Webuye
East, Webuye West, Tongaren, and Mt. Elgon which are further divided into 46 political
wards and 88 administrative Locations.
The main economic activity in most part of Bungoma County is subsistence
agriculture. Main crops grown in the area are Sugarcane, Maize, Sunflower, and Coffee,
Tobacco, Potatoes, Beans and cotton. The population of sweet potato farmers in Bungoma
County is estimated at 102,682. Of the total labour force of about 565,000, 52% are engaged
in agricultural production accounting for 60% all household incomes;19% wage employment,
13% urban self employment. Agriculturally potential land is estimated at 183,800 ha with
Sugarcane, the main cash crop occupying 27,000 ha (KNBS, 2004) . The county has good
physical and varying soil type’sproperties, with inherently fertile deep rich Andosols and
Nitisols towards the slopes of Mt. Elgon. The western part of the district has Acrisols, while
the centre of the district is predominantly Feralsols. The eastern part of the district comprises
Acrisols and Feralsols. Figure 2 below shows the study area.
3.2 Sample Size Determination
The required sample size was determined by proportion sample size formula by
(Anderson et al., 2007). 2
2
E
pqzn

18
Figure 3: Map of Bungoma County.
Source: World Resource Institute.(2013)

19
Where n = sample size, p = proportion of the population containing the major interest, q = 1-
p, z= confidence level (α = 0.05), E = acceptable/allowable error. Since the proportion of the
population was not known, p=0.5, q = 1-0.5= 0.5, Z = 1.96 and E = 0.08. This resulted to a
sample population of 164 respondents.
3.3 Sampling Procedure
The target population was sweet potato farmers within Bungoma East Sub-County,
Bungoma County. Multi-stage sampling method was used to select appropriate sample size.
Bungoma East Sub-County was purposively selected because of the majority of adopters of
ISVs farmers in the county. Three locations in the sub-county including Sitikho, Matulo and
Bokoli were also purposively selected. The farmers in the area were then stratified into two
groups: those who have adopted the new improved varieties and those who are still using the
local varieties (non adopters). With the adopters, purposive sampling farmers who have been
in existence for more than a year was done using a source list obtained from the extension
officer from Ministry of Agriculture and Fisheries Offices containing sweet potato farmers
both adopters and non adopters. From each of the group, farmers were selected proportionate
to the size of the group using a systematic random sampling procedure to select a total sample
of 164 farmers (93 adopters and 71 non adopters).
3.4 Data Collection Method
A cross sectional data was collected from a sample of sweet potato farmers. The
methods for data collection included observations, semi-structured questionaire were used by
use of face to face interview. Primary data was collected through the administration of semi-
structured questionnaire to the 164 respondents in the study area. The pre-tested semi-
structered questionnaire were administered to the farmers by team of trained enumerators.
3.5 Methods of Data Analysis
Data from the field was edited, coded to ensure consistency, uniformity, and accuracy,
and then entered into SPSS for analysis. Both qualitative and quantitative techniques were
used to analyze the data collected. Qualitative data for objective one was analyzed using
descriptive statistics such as mean, percentage, standard deviation, tabulation, ratio and
frequency distribution. Both SPSS and STATA computer programs were used to process the
data.

20
3.6 Measurement of Food Security
Diet diversity is usually measured as the count of the number of food items or food
groups consumed over a predetermined period of time (Ruel, 2003). Measures of dietary
diversity based on the number of food groups consumed, rather than food items, are likely to
more accurately reflect the diversity of macro and micronutrient intakes. Diets consisting of a
limited number of food items, especially starchy staples, can lack the macro and
micronutrient adequacy despite meeting calorie requirements (Kennedyet al., 2011).This
study measured food security status using indicators of food consumption which is an
outcome indicator of food availability, access and other underlying factors. This was done
using 7 day recall where Household Dietary Diversity Score (HDDS) (Hoddinott and
Yohannes, 2002). Dietary diversity defined as the number of different foods or food groups
eaten over a reference time period without regard to the frequency of consumption was used
to assess quality of food intake. The food groups considered were as follows: Cereals, Milk
and milk products, Fish and seafood ,Fruits ,Root and tubers, Eggs, Oil/fats, Vegetables,
Pulses/legumes, Meat, Sugar/honey
A food group is counted only once, regardless of the number of times it was
consumed over the last seven days, our reference period. This means that the HDDS ranges
for a minimum of one and to a maximum of 12. A high HDDS reflects a diverse diet and
suggests food security while a low HDDS is indicative of food insecurity. HDDS is an
attractive proxy indicator because; Obtaining these data is relatively straightforward, It is
associated with a number of nutrition indicators such as birth weight, child anthropometric
status, hemoglobin concentrations and protein adequacy (Swindale and Bilinsky, 2006) and a
more diversified diet is highly correlated with such food security indicators as household per
capita consumption (Hoddinott and Yohannes, 2002).
In order to distinguish between different levels of food security, the following cut-off
values are set for the HDDS. Households consuming less than 6 food groups are considered
to be food insecure; those consuming 6 to 12 food groups are food secure. A shorter recall
period would risk missing foods served habitually but infrequently at the household level or it
would overestimate the consumption if the survey is done over those special days.

21
3.7 Analytical Framework
3.7.1 Characterization of Sweet Potato Farmers
Descriptive statistics was used to analyse this objective. These was captured through
quantitative and qualitative variables that are important in understanding the socioeconomic
characteristics of sweet potato farmers. Mean, frequencies and standard deviations of various
variables were obtained. The t-test and Chi-square tests were used to compare the selected
household and farm characteristics between the two categories of farmers (adopters and non
adopter’s farmers).
3.7.2 To Determine Factors Influencing the Extent of Adoption of the Improved Sweet
potato Varieties
Previous studies on adoption have typically adopted a Heckman two-step analytical
approache involving the unobservable decision to adopt and the observed degree or extent of
adoption (Vance and Geoghegan, 2004; Alene et al., 2008). In the second step, an additional
regressor in the equation was included to correct for potential selection bias. This regressor is
Inverse Mills Ratio (IMR). IMR is computed as:
� =� (���� ,ã�)
�(�� ,ã)------------------------------------------------------------------------------------------ (9)
Where, ᵠ is the standard normal probability density function. The second-stage equation is
given by:
� = (��|� = 1) = �(��) + �� (���� ,ã�)
�(�� ,ã)------------------------------------------------------- (10)
Where E is the expectation operator, Y is the (continuous) proportion of land allocated
on improved sweet potato production, x is a vector of independent variables affecting the
extent of adopting the, and β is the vector of the corresponding coefficients to be estimated.
So Yi can be expressed as following:
��∗ = �′�� + ��� +ui------------------------------------------------------------------------------- (11a)
Where ��~ N (0,��)
Yi * is only observed for those farmers who have adopted the ISVs
(��= 1), in which case Yi= Yi *.
Heckman Two Step model
Step 1: Selection Equation

22
Y = β0+β1X1+β2X2+ …………. +βnXn+ε
Y(0,1)=β0+β1age+β2gend+β3Educ+β4Hsize+β5Output+β6OffFmInc+β7creditamt+β8
Nolvstck+β9Swtprce+β10Trnct+β11extct+β12farmexp+β13lnwealth+β14+ε------------(10a)
Step 2: Outcome Equation
Y(Extadpt)=β0+β1age+β2gend+β3Educ+β4Hsize+β5Occup+β6OffFmInc+β7credit+β8
Distmkt+β9FmInc+β10grpmshp+β11extsrvce+β12farmsize+β13lnwealth+β14IMR+ε-------(11b)
Table 1: Description of variables used in Heckman Two-Step Procedure
Variable Description of the
variables
Measurement
Dependent Variables
Extadpt Extent of adoption Proportion of land allocated
Independent Variables
Ageyrs Age in years Household head age in years
Gnder Gender Sex of the household head (Dummy 1=Male
0=Female)
Hsize Household size The size of households members
Edulevel Education level Farmers level of education
Offincm Off farm income Off-farm income in KES
Dstmkt Market distance(km) Distance to the near markets(km)
lnwealth Wealth in Kshs Value of household assets in KES
Creditamt Credit amount Kshs Amount of credit borrowed in KES
Extcnct Extension Contact Number of extension contact with farmer
Trncnct Training Contact Number of training contact with farmer
Grpmbshp Group membership Membership (Dummy 1=yes, 0=otherwise)
swtprice Sweet potato price (Kshs) Price paid for sweet potato in KES
Occupation Farmers occupation Occupation of the farmer (Dummy)
Nolvstock Number of Livestock Number of livestock owned
Farmexp Farming Experience (yrs) Years
Output Output (kg) kilograms
Landtnr Landtenure 0=without title deeds, 1= with title deeds
Grphtrgty Group heterogeneity Group heterogeneity index
23
3.7.3 To Determine the Effect of the Improved Sweet potato Varieties on Household
Food Security.(ibid)
In assesing the effect of ISVs on household food security, a model that can be
employed is the following: F = P'X + γ1+ ε, Where F is the food security status of a certain
household, X is a vector of exogenous household characteristics, and I is a dummy variable (I
= 1 if the individual has adopted ISVs, and 0 otherwise). However, this model is subject to
misinterpretation because the adoption decision is voluntary, thus resulting in the familiar
problem of self-selectivity bias (Maddala). If the adoption decision is based on individual
self-selection, it is likely that ISVs adopters have systematically different characteristics from
non adopters. This subsample heterogeneity is econometrically problematic when unobserved
characteristics are distributed differently across adopters and non adopters. Thus, unobserved
variables may influence both the adopters’ decision and food security status, resulting in
inconsistent estimates of the effect of ISVs on household food security. A more general
model for econometric analysis is the endogenous switching regression model (Gould and
Lin; Lee; Maddala; Willis and Rosen).
Endogenous Switching Probit Model
The aim of the study was to provide empirical evidence on the effect of improved
sweet potato varieties on household food security. Endogenous switching regression model is
used, where both observable and unobservable characteristics are accounted for, thus
controlling for a 'hidden bias' which could arise when unobservable variables are not taken
into account. Ignoring the endogeneity of adoption of improved sweet potato varieties would
result in biased estimated parameters. To address the endogeneity problem, this study used
the endogeneity switching probit model, which accounts for the correlation in the unobserved
characteristics in the decision to adopt the ISVs and food security status, which is the
outcome variable. Following Lokshin and Sajaia (2011), we consider a household with two
binary outcome equations (whether food secure or not) and the criterion function Ii (binary
variable of household adoption of improved sweet potato varieties) that determines the
regime faced by the household. The potential values are represented as;
�� = 1 �� ��� + � > 0------------------------------------------------------------------------------ (12a)
�� = 0 �� ��� + � ≤ 0------------------------------------------------------------------------------ (12b)
Regime 1: Y*1i = β1X1i + ε1iIi=1 if (I*
i>0) ----------------------------------------------------- (13a)
Regime 2: Y*0i= β0X0i + ε0iIi=0 if otherwise -------------------------------------------------- (13b)

24
Where Y*1i and Y*0i are latent variables (household food security status) that defines observed
food security status Y1 and Y0 (whether the household is food secure or not, respectively), Z is
a vector of exogenous variables determining adoption of ISVs, Xi is a vector of exogenous
variables determining food security status, γ and β are the vector of parameters estimated
while μi, ε1i and ε0i are disturbance terms. Equation (12) is a probit specification for ISV use.
The observed food security status Yi is defined as Yi=Y1 if Ii=1 and Yi=Y0i if Ii=0. With the
assumption of joint normal distribution of μi, ε1i, and ε0i with mean of zero, the correlation
matrix written as;
Ω=�
1 �� ��
1 ���
1
�----------------------------------------------------------------------------------- (14)
Where ρ0 is the correlation between ε0 and μ, ρ1 is the correlation between ε1 and μ while ρ10
is the correlation between ε0 and ε1. Consequently, the log likelihood function for the model
is given by;
Ln (ξ) = )},,,(ln{ 111, 0Yi0,ci
2
i
ii ZX
+ )},,,(ln{ 111, 0Yi0,ci
2
i
ii ZX
+ )},,,(ln{ 111, 0Yi0,ci
2
i
ii ZX
+ )},,,(ln{ 111, 0Yi0,ci
2
i
ii ZX
------------------------------------------------------------------ (15)
Where ωi is an optional weight for the ith household and ϕ2 is cumulative function of bivariate
normal distribution (Lokshin and Sajaia, 2011). Previous studies have used the switching
probit regression model in social research (Ayuya et al., 2015; Floro and Swan, 2013;
Gregory and Coleman-Jensen, 2013; Lokshin and Glinskaya, 2009).The advantage of
endogenous switching probit model specification in Eqtn (15) is the possibility of deriving
probabilities in counterfactuals cases for household’s food security status on adoption of
ISVs. Following Aakvik, Heckman, and Vytlacil (2000) and Lokshin and Sajaia (2011) two
cases are defined as;
TT(x) = Pr (Y1 = 1|I = 1, X = x) – Pr (Y0 = 1| I = 1, X = x)
= )(
,(),( 0,0021,112
ZF
ZXZX ------------------------------------------------------------ (16a)
TU(x) = Pr (Y1 = 1|I = 0, X = x) – Pr (Y0 = 1| I = 0, X = x)

25
=)(
,(),( 0,0021,112
ZF
ZXZX
----------------------------------------------------(16b)
Where F is the cumulative function of the univariate normal distribution, Eqtn (16a)
computes the effects of treatment on the treated (TT), which is the difference between the
predicted probability of being food secure for adopters of ISVs and the probability of being
food insecure had they not adopted the ISVs. Computing the average of TT(x) on households
that have adopted the ISV, results in the average treatment effect on the treated (ATT). The
effect of the treatment on the untreated (TU) was computed by Eqtn (16b), which is the
expected effect on food security status if the non adopters’ households had adopted the ISV.
Computing the average of TU(x) of households that did not adopt the ISVs results in average
treatment effect on the untreated (ATU) (Aakvik et al., 2000; Lokshin and Sajaia, 2011).
Table 2: Description of Variables used in the Endogenous Switching probit Model
Variables Description of the variables
Food security status (Food insecure =0, Food secure =1
Off farm income Off-farm income
Market distance Distance to the near markets(km)
Wealth Value of household assets Kshs
Information about group Source of information about groups
Sweet potato price Price paid for sweet potato(Kshs)
Number of groups Number of groups farmer belong
Number of livestock Number of livestock owned
Output Output from last season(kg)
Group heterogeneity whether members were from same neighborhood, occupation, relative, friends.
Household head Household head gender (Female=0, Male=1)
Education head 1 = not gone to school; 2 = primary; 3 = secondary; 4 = university
Marital status of head 1 = single; 2 = married; 3 = widowed; 4=separated.
Farmer to Farmer
extension
Dummy = 1 if the household head got information from fellow
farmers, 0 otherwise
Non-governmental
extension
Dummy = 1 if the household head got information from non
governmental organization extension workers, 0 otherwise
Government extension Dummy = 1 if the household head got information from
government extension workers, 0 otherwise

26
CHAPTER FOUR
RESULTS AND DISCUSSIONS
This chapter presents the results of the analysis of the data obtained. It has been subdivided
into sections according to the objectives of the study. The discussion of results is presented
while making a comparison of the findings with those of other studies.
4.1 Descriptive Results
4.1.1 Socio-Economic Characteristics of Adopters and Non Adopters Sweet Potato
Farmers
The results of gender and occupation of farmers are presented in Table 3. A large
proportion of adopters farmers (61%) were females while males constituted only 39%.
However, among non adopters females were 51%, while males were 49%. The chi square test
however indicates that there was no significant association between gender and decision to
adopt. The type of occupation revealed (40%) of adopters and 56% of non adopters derived
their livelihoods from farming. The results also indicated that 15% of the adopters engaged in
business activities compared to 8% of non adopters. A slightly higher percentage of adopters
(24%) were engaged in off-farm employment compared to 11% of non adopters. However,
the chi square test reveals that these association was not significant.
Most non adopter households (42%) owned land without titles. The remainder 58%
were distributed between those that owned land with title deed, rented, inherited and
communal land at 15%, 22%, 18% and 1% respectively. On the other hand most (40%)
adopter farmers owned land with titles. The remainder 60% was distributed between those
that owned land without title deed, rented, inherited and communal land at 38%, 11%, 9%
and 2% respectively. This means that households that had secure land can undertake long
term plans and also try out new technologies such as planting improved sweet potato
varieties. The chi square results confirmed that the association between adopter and non
adopter farmers in terms of land tenure was significant 1% level.
The marital status of the household head revealed that a high proportion of the
farmers (71%) were married, for adopters and 64% for non adopters farmers. However,
majority of single farmers (14%), were adopters members while 7% were non adopters. A
greater percentage of the single farmers in terms of marital status were youths, explaining
why majority were non group farmers. Married households are able to make up rational
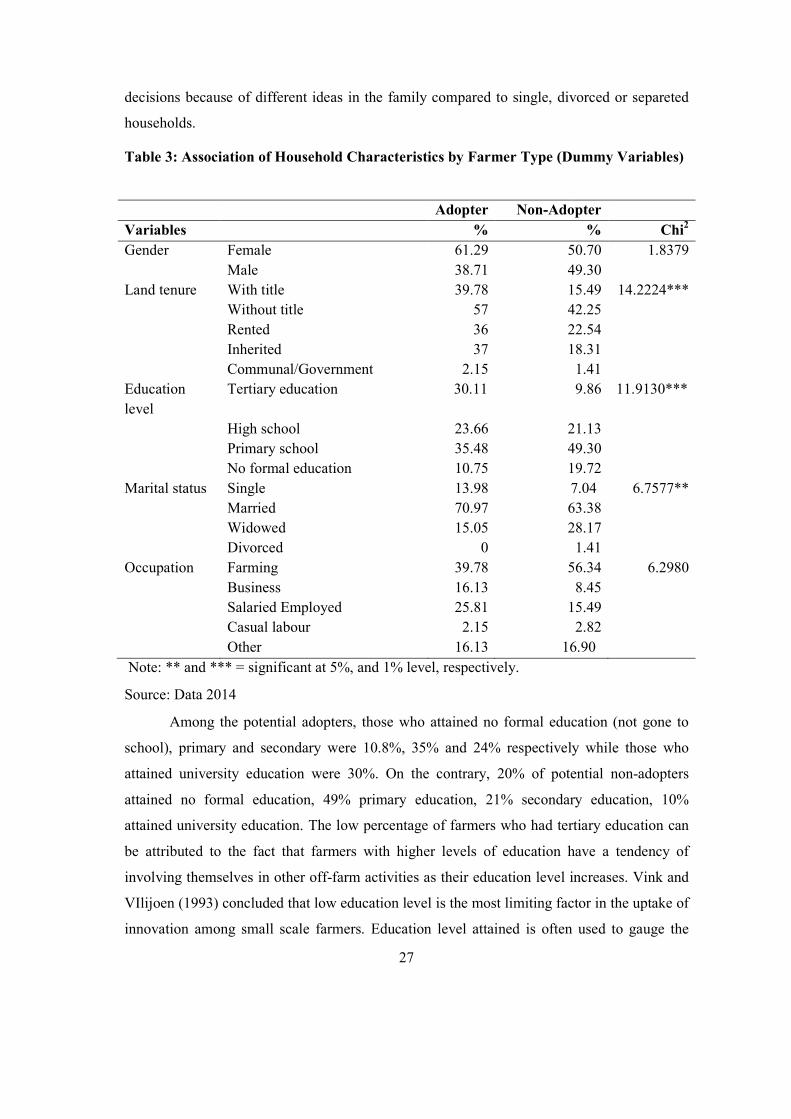
27
decisions because of different ideas in the family compared to single, divorced or separeted
households.
Table 3: Association of Household Characteristics by Farmer Type (Dummy Variables)
Adopter Non-Adopter
Variables % % Chi2
Gender Female 61.29 50.70 1.8379
Male 38.71 49.30
Land tenure With title 39.78 15.49 14.2224***
Without title 57 42.25
Rented 36 22.54
Inherited 37 18.31
Communal/Government 2.15 1.41
Education
level
Tertiary education 30.11 9.86 11.9130***
High school 23.66 21.13
Primary school
No formal education
35.48
10.75
49.30
19.72
Marital status Single 13.98 7.04 6.7577**
Married 70.97 63.38
Widowed
Divorced
15.05
0
28.17
1.41
Occupation Farming 39.78 56.34 6.2980
Business 16.13 8.45
Salaried Employed 25.81 15.49
Casual labour 2.15 2.82
Other 16.13 16.90
Note: ** and *** = significant at 5%, and 1% level, respectively.
Source: Data 2014
Among the potential adopters, those who attained no formal education (not gone to
school), primary and secondary were 10.8%, 35% and 24% respectively while those who
attained university education were 30%. On the contrary, 20% of potential non-adopters
attained no formal education, 49% primary education, 21% secondary education, 10%
attained university education. The low percentage of farmers who had tertiary education can
be attributed to the fact that farmers with higher levels of education have a tendency of
involving themselves in other off-farm activities as their education level increases. Vink and
VIlijoen (1993) concluded that low education level is the most limiting factor in the uptake of
innovation among small scale farmers. Education level attained is often used to gauge the

28
level of technical skills acquired and hence a measure of the quality of human capital. There
is, however, statistically significant association between the level of education attained by the
household head and the adoption status of improved sweet potato varieties. Hence, it would
be of interest to strengthen the extension services and trainings to bridge the skill gap. This is
further supported by the fact that a greater proportion (30%) of the adopters have tertiary
education qualification.
The mean difference of household characteristics by farmer type are presented in
Table 4. The aggregated mean age was 45 years, while the mean age of adopters was 43 years
and non adopters 48 years. The t-test result show a statical diffirence on age at 5%
significance level. It shows that non adopters had statistically higher mean age than the
adopters. Age of the household head plays an imperative role in the uptake of new
technologies. This may be attributed to the failure of the older farmers to embrace new ways
of doing things and thus still continue the old ways of doing things (Langyintuo and
Mulugetta, 2005). The farming households in the county can therefore be regarded as young
and who belong to economically active group.
The aggregate mean household size was 5 persons. However, the mean household size
of non group farmers and group farmers was 4 and 5 persons respectively. Household size
has been linked to the availability of “own” farm labour in adoption studies. Amsalu and De
Jan (2007) found out that household size had a significant and positive effect among the
determinants of adoption. The argument was that larger households have the capacity to relax
the labour constraints required during the introduction of new technologies.
The aggregate years of experience of a sweet potato farmer was 3 years. Non adopter
farmers had more years of experience at 4 years while the adopter farmers had experience of
2 years. The t-test results however revealed that the difference in years of experience was
statistically significant at 1% between the two categories of farmers. However, non adopters
can be assumed to be rigid to new technologies having adopted earlier. Adopters with less
experience are able to give change a try. This result is in line with studies such as that of
Kassie et al., (2013) in the adoption of improved wheat varieties who found same results.
Distance from the household to urban market is often used to proxy for the ease of
access to market and the state of the road infrastructure and hence a measure of the
transaction cost .The distance to the market shows that the adopters covered an average of
2.59 kilometers, and non adopters covered 2.65 kilometers. The t-test result indicates that
there was a significant difference between non adopters and adopters farmers at 10% level in

29
terms of distance to market. This means that as distance to the market increases, the cost of
accessing the information about the improved variety increases among farmers. Location
from the trading centre here plays a role of a proxy for information access and the potential
market for the purchase of farm inputs including vines.
The results of the sweet potato selling price shows that the aggregate sweet potato
selling price was 29 Kenya shillings per 2kg. There were differences in prices because
adopters sold their produce at a higher price of 38 Kenya shillings per 2kg, while the non
adopters farmers sold at 18 Kenya shillings per 2kg. The t-test result at 1% level confirmed
that there was strong significant difference between adopter and non adopters’ selling price.
Higher selling price of the ISVs farmers reveals the value and quality which increases the
bargaining power of improved sweet potato in terms of output price. This high price is able to
cover the cost of production.
Income from farming was found to have an aggregated mean of 575 Kenya shillings
per season. However, the non adopter farmers had a lower mean farm income of Ksh 240
compared to ksh 1096 per season obtained by the adopters. The result show a statiscally
strong significant difference at 1% that adopters had more incomes from their production
than the non adopters. Serman and Filson, (1999) argue that high farm income improves the
capacity to adopt agricultural innovations as they have the necessary capital to jumpstart the
innovation. Morover, the adopters had slightly more off-farm income at Ksh 6,165 per season
than the non adopter farmers who had a mean off-farm income of Ksh 3,311 per season . Off-
farm income comprised of income from business, employment and other incomes apart from
the farm income. The influence of off-farm income in the adoption of new technologies is
derived from the fact that income earned can be used to finance the uptake of new innovation
(Amsalu and De Jan 2007).
Farm size had an overall mean of 0.33 hectares. The potential adopters had relatively
bigger size of land indicated by the mean of 0.43 hectares compared to potential non-
adopters who had a mean of 0.23 hectares. The effect of land size on adoption of improved
varieties in past studies has been that small sizes of land hinder adoption since farmers fear
lose of agricultural land and large tracts of land encourages adoption due to the larger
capacity in terms of resource base ( Gebremedhin and Swinton, 2003).
The potential adopters were found to have a mean of 13 contacts with extension
officers within the last 12 months as shown in Table 4. The potential non adopters had a
mean of 5 contacts with extension officers. Extension contact was strongly significant at 1%

30
with an overall mean of 8 contacts. The number of contacts with extension officers was a
proxy for access to information and thus according to the innovation diffusion theory it
contributes to the awareness and subsequent adoption of the innovation (Dolisca et al., 2006).
Table 4: Mean Difference of Household Characteristics by Farmer Type (Continuous
Variables)
Adopter = 93 Non Adopter = 71 Aggregat=164 t-test
Variable Mean Std.dev Mean Std.dev Mean
Age 42.86 14.23 47.75 14.53 44.98 2.1591**
Household size 4.83 2.15 5.46 2.35 5.10 1.8017*
School years 12.56 6.66 9.35 6.13 11.17 -3.1630***
Experience(yrs) 2.17
1.01 4.45 2.19 3.16 8.9076***
Distance to market(Km)
2.59 2.36 2.98 2.65 2.76 0.9876*
Selling Price(KES) 37.88 20.34 18.07 11.24 29.30 -7.3882***
LogFarm Income 3.04 1.05 2.38 1.17 2.75 -3.8279***
Off-farm Income 3.79 0.62 3.52 0.44 3.67 -3.0680***
Farm Size(ha) 0.43 0.38 0.21 0.13 0.33 -4.7910***
Extension 12.97 7.09 5.49 6.33 9.73 -7.0050***
*, **, ***: significant at10%, 5% and 1% level respectively
Group membership positively and significantly contributes to the uptake of new
innovation and also information sharing and resource mobilization and higher market
bargaining power (Shiferaw et al., 2006) presented in Table 5 below. Among the non-
adopters 53.52% of the respondents did not involve themselves in group activities while
46.48% were involved. Among the potential adopters 20.43% did not involve themselves in
group activities compared to 79.57% who did. They get to exchange ideas and learn about the

31
benefits of various upcoming technologies. Group members also may easily organize and
receive training on diverse agricultural technology issues that influences the adoption of the
improved sweet potato varieties in view of sustainable agricultural production.
Majority (90.32%) of the adopters had access to extension services, (9.68%) of the
potential adopters had no access to extension services On the other hand non adopters had a
slightly lower almost equal number 53.52% and 46.48% of those who accessed and had no
access on extension services respectively. Extension services positively and significantly
influenced the level of adoption of the improved services. This is because extension services
provide information, knowledge and skills that enable farmers to be aware and use the
technology. Extension services plays a central role of providing support for institutional
mechanisms designed to support the dissemination and diffusion of knowledge among
farmers and demonstration of gains from new technologies (Baidu-Forson, 1999).
Access to trainings by the households was proportionally high (88.17% and 76.06%)
for both the adopters of the improved varieties and the non adopters. On the adopters, the
proportion of the households that had accessed trainings were 88.17% compared with 11.83%
of their counterparts who did not (Figure 5). The proportions of households who had accessed
trainings were 76.06% and 23.94% for the non-adopter farms respectively. There is however
a statistically strong association between access to farmer trainings and adoption of the
improved varieties.
Credit service is prior instrumental in the growth and development of farming
enterprises just like any other entrepreneurial venture. Credit is necessary for enhanced
expansion of business activities. On the adopters household, 52.69% had accessed credit
whereas 47.31% had not (Figure 5). Non adopter households were less involved in credit with
26.76% accessing credit. It is apparent that access to credit is better for the adopter
households than their non-adopter counterparts. The association between the adoption of
improved sweet potato varieties in household and access to credit is statistically significant at
1%.

32
Table 5: Institutional Characteristics for Discrete Dummy Variables (Chi2 test).
Variable Adopter = 93 Non Adopter= 71 Chi2
Livestock Yes 87 (93.55) 58 (81.69) 0.019**
Ownership No 6 (6.45) 13 (18.31)
Group Yes 74 (79.57) 33 (46.48) 0.000***
Membership No 19 (20.43) 38 (53.52)
Extension Yes 84 (90.32) 38 (53.52) 0.000***
No 9 (9.68) 33 (46.48)
Training Yes 82 (88.17) 54 (76.06) 0.041**
No 11 (11.83) 17 (23.94)
Credit Yes 49 (52.69) 19 (26.76) 0.001***
No 44 (47.31) 52 (73.24)
**, ***: significant at 5% and 1% level respectively. Figures in parentheses are percentages
The main information source on existing groups is presented in Table 6. The results
reveal that 64.38% of the respondents acknowledged that the main source of information is
from fellow farmers followed by self initiative at 17.81%. Extension officers came third at
10.96% and self help groups at 7%. The implication of the results is that there is a strong
social capital among the farmers and thus an approach that can be used to create awareness is
to involve the model farmers and the communication can trickle down to the rest of the
society.
Table 6: Main Source of Information about the Farmer Groups.
Variables Adopter Non Adopter
Percent Percent
Fellow farmers 64.38 48.48
Extension Officers 10.96 21.21
Self Initiative 17.81 15.15
Self help groups 6.85 15.15
Total 100 100

33
The main source of credit was found to be commercial banks with 36% followed
closely by informal lenders with 32% for the potential adopters, the others includes farmer
groups, SACCO and micro finance with 18%, 8% and 6% respectively. On the other hand
more than half 57.89% of the non adopters accessed credit from the informal lenders. This
results are consistent with the Tegemeo survey, (2004). It found out that the informal money
lenders are more important than the formal banking institutions. They provide close to 20%
of the agricultural credit in Kenya.
Table 7: Main Source of Credit Among the Farmer Groups
Variables Adopter Non Adopter
Percent Percent
Commercial banks 36 21.06
SACCO 8 5.26
Micro finance 6 10.53
Informal lenders 32 57.89
Farmer groups 18 5.26
Total 100 100
Source: Data 2014
A majority 64.29% of potential adopters accessed the extension service from the Non
govermental extension service compared to 30.95% of the non adopters. This is however
because of the accredited CREADIS limited which was contracted by KARI to distribute the
improved sweet potato vines in the area on their behalf. NGOs play a very important role in
ensuring adoption of new technologies by farmers in the rural areas. Moreover, non-
governmental extension officers could be using other motivational factors to influence
farmers to adopt the improved varieties since they have an interest of achieving such goals in
the various projects they are undertaking in the country (Oscar et al., 2015). On the other
hand only 32.14% and 3.57% of the adopters accessed the extension service from
Government and Farmer to farmer extension respectively.

34
Table 8: Main Extension Sources amoung the Farmer Groups
Variables Adopter Non Adopter
Percent Percent
Farner to Farmer Extension 3.57 0
Government Extension 32.14 69.05
Non Govermental 64.29 30.95
Total 100 100
4.2 Factors Influencing Adoption and the Extent of Adoption of the ISVs.
4.2.1 Factors Influencing Adoption of the Improved Sweet Potato Varieties.
To determine the factors influencing adoption of the improved sweet potato varieties,
a probit model was estimated in the first step of the Heckman two step selection equations.
The procedure was chosen for estimation to correct the sample selection bias as proposed by
Heckman (1979).. Five variables (Education level, Farming experience, sweet potato price,
Extension contact and Training contact) were significantly found to influence the farmers’
decision to adopt the improved sweet potato varieties at different significant levels. The
Inverse Mills Ratio (IML/Lambda) term was significant and positive at (0.058), which
suggest that the error term in the selection and outcome equation are positively correlated.
This implies that unobserved factors that influence adoption of improved sweet potato
varieties are more likely to be associated with higher scores on the dependent variable. The
marginal effects were used to interpret the results.
Unexpectedly, education level of the household head was found to have a negative
significant influence on adoption of the improved sweet potato varieties. An increase in
education of the household head by a level reduced the probability adopting the improved
sweet potato varieties by 1.63%, all other factors held constant. This implies that as the
education level increases, adoption of the improved varieties reduces. This can be explained
by the fact that educated farmers are more likely to earn higher wages from off‐farm work;
they are expected to have a higher proportion of off‐farm income to on‐farm income given
the same proportion of on and off farm work time. Therefore, it seems plausible if highly
educated farmers, who are more reliant on off‐farm income, have fewer incentives to spend
time and effort on farming, including adoption of technology such as ISVs. However, this
study is inconsistent with many other studies that suggest education empowers individuals

35
with technological skill and knowledge that will accelerate individual to adopt the
technological (Faturoti et al., 2006).
Farming experience negatively and significantly influenced adoption of improved
sweet potato varieties. One year increase in farming years increased the probability of not
adopting the improved sweet potato variety by 4.94%, ceteris paribus. This implies that
farmers with many years of adoption have already made up rigid decisions on what they
know about the sweet potato varieties. These farmers have held on what they know since they
started adopting the varieties, so any changes on the technology can no longer change their
understanding further. Though older farmers might have more experience with traditional
technologies they have a higher level of risk averseness towards technologies. These findings
however are inconsistent with a study by Masuki et al. (2003).He found that older farmers
were more receptive towards new agricultural technologies due to adequate experience and
accumulation of capital.
As expected sweet potato price had a positive significant influence on the adoption of
the ISVs. This implies that a one shilling increase in the price of ISVs increased adoption by
0.4%. the high quality and favourability in the market translates its high price than the local
variety. This is however common with farmers in that with the existence of a new profitable
technology, farmers would want to adopt the new technology so as to cover up there cost of
production and yield enough profit in the market. The quil business in Kenya is an example
of the above.
The result also suggested that adoption of ISVs could be motivated by frequent
contacts with extension agents. Extension contact was found to be positively significant at
1%. Extension agents popularizes innovation by making farms exchange idea, experiences,
and makes it cheaper to source information, knowledge and skills in order to enable farmers
to improve their livelihood. Farmers who have frequent contacts with extension agents had a
higher probability of adopting the improved varieties. This was presumed; as farmers were
privileged with materials and managerial support, followed by cheap and timely availability
of knowledge and skills, which apparently helped them, apply new technology. This finding
is in conformity with Conroy (2005), Freeman and Omiti (2003) and Chirwa (2005).

36
Table 9: The Heckman Two-Step Selection Equation
Variable dy/dx Std. Err. p>|z|
Genderhead 0.0136 0.3103 0.508
Household size -0.0393 0.0821 0.218
Education level -0.0163 0.1763 0.087*
Farming Experienc -0.0494 0.1119 0.000***
No.Livestock 0.0346 0.0436 0.123
Swtprice 0.0018 0.0107 0.046**
Lnwealth -1.1153 0.1781 0.916
Extension contact 0.0064 0.0271 0.001***
Training contact -0.0686 0.0916 0.027**
mills lambda 0.3572 0.1887 0.008*
Rho 0.8820
Sigma 0.4050
*, **, ***: significant at 10%, 5% and 1% level respectively
4.2.2 Factors Influencing the Extent of Adopting the ISVs.
To determine the factors influencing the extent of adoption of the improved sweet
potato varieties, OLS regression was estimated in the second step of the Heckman outcome
equation. The Inverse Mills Ratio estimated from the first equation was added to the second
equation as an independent variable so as to capture the selection bias effect. The variable
was found to be statistically significant at 5% level justifying existence of selection problem
and the use of the model.
The household size was significant at 5% with negative coefficient which indicates
that there is a negative relationship between household size and adoption of improved
sweetpotato technology. The larger the household size the lower the level of adoption of
improved sweet potato varieties. This could be explained by the fact that the average
agricultural land available per household is about 0.33 ha (Jaetzold et al., 2006). However
this was interesting and inconsistent with many past studies since sweet potato is far much
labour intensive. This is concluded by the fact that a small household size is not pressured by
the need of to produce more food for a large family size consumption, hence it open and
willing to try out new technologies than a larger household size.

37
Table 10: The Heckman Two-step Outcome Equation
Variable Coef. Std. Err. P>z
Genderhead 0.0136 0.090 0.880
Hhsize -0.0393 0.0217 0.070*
Education level -0.0163 0.0631 0.797
Group heterogeinty 0.0718 0.0392 0.067*
Occupation -0.0165 0.0396 0.676
Off-farm 0.1081 0.0865 0.211
Output 0.0000 0.0000 0.026**
Landtenure 0.0972 0.0421 0.021**
Farming experience -0.0494 0.0604 0.414
Number of livestock 0.0346 0.0142 0.015**
Market distance -0.026 0.0188 0.167
Group membership 0.2419 0.1282 0.059*
Sweet potato price 0.0018 0.0034 0.605
Credit amount 0.044 0.0236 0.063*
LnWealth -0.1153 0.0845 0.173
Extension contact 0.0064 0.009 0.478
Training contact -0.0686 0.0334 0.040**
*, **, : significant at 10% and 5% level respectively
Group heterogeneity index had a positive significant influence on adoption of the
improved sweet potato varieties. The level of heterogeneity shows a high level of diversity
among the group members. Its role during group meetings is key since it determines variety
and quality of information, knowledge and experiences to be exchanged among the group
members. Hence, groups with members from different background are important during their
formation. Social capital and networks were found to be important in influencing diffusion of
most sustainable agricultural practices in Ethiopia as they exchange of information, facilitates
timely input access including credit and loans (Teklewold et al., 2013).
Output of sweet potato was found to be a very important factor that influenced the
adoption of improved sweet potato varieties among farmers in the study area. The yield
variable was found to be positive and significant at 1% level of significance. Yield is a direct
measure of seeds performance, and a crop variety that is high yielding stands to be adopted

38
by farmers since high yield would raise output and subsequent gross earning. This finding
agrees with that of Ojiako et al. (2007) that yield of soybean was significant in influencing
the adoption of improved soybean in northern Nigeria. Adesina and Zinna (1993) also
reported that yield significantly influenced farmer’s decision to adopt improved mangrove
swamp varieties of rice in Sierra Leone.
As expected, land tenure had a positive significant effect with having land rights
increasing the probability of adoption of the ISVs by 7.38%, all other factors held constant.
Secure land tenure provides farmers with full rights of land ownership and usage thus
influencing the decision to adopt a new technology. Land ownership with title deeds accords
the farmers the right to usage (security of tenure) thus creating an incentive to the farmers to
adopt new, long term and even riskier technologies. Similar results were found by Arellanes
and Lee (2001) where they concluded that farmers with security of tenure were four times
likely to employ more of the new techniques due to security of land access and usage.
The analysis shows that the extent of adoption increases with the livestock number.
This probably is due to the fact that wealthier households are better able to bear possible risks
associated with adoption of technologies. There was a positive association between adoption
and livestock ownership, probably because wealthier households, and may be more able to
finance the purchase of inputs, for example improved seeds. In addition, livestock may serve
as a proxy for the availability of manure. Such kind of land fertility augmenting practice is
important given that the adoption rate of commercial fertilizer is very low in our study area.
As expected group membership postively and significantly influenced the adoption of
ISVs. According to Blackburn et al. (1982), participation in social groups is important
because it indicates the extent of contact, which farmers have with organized groups and
other public services and mass media. Groups provide forum for improving dialogue among
farmers, thereby providing opportunity for efficient ways of ascertaining consensus on
opinion about the relevance of technologies being presented to them (Norman et al., 1989).
Farmers who are members of any local organization are more likely to be aware of new
information and ISVs technologies (Wasula, 2000).
There is also that tendency that farmers will adopt new innovations because majority
of them had access to credit which would enable them to purchase inputs and pay for labour
required in the adoption of new varieties. Credit access enables the farmers get resources that
they could invest in marketing activities such as value addition to improve incomes and
transportation to better markets with better prices. The CREADIS program model also

39
incorporates a microfinance project whereby farmers can access loans to meet their daily
needs. This could act as an incentive given the fact that rural farmers have limited access to
finance. Availability of loan upon participation in the program therefore leads to increased
probability of adoption.
Training contact negatively and significant influenced the extent of adoption of the
innovation. This result is inconsistent with results of earlier studies (Baidu- Forson, 1999;
Faturoti et al. (2006) and Mazvimavi and Twomlow, 2009). The negative effect of training
contacts implies that most of the training done was general to all farmers, customizing the
trainings to individual needs of each farmer would better improve extent of adoption. The
more contacts the farmer has with officers they tend to reduce potential intensity of adoption.
However, intensive discussions with farmers on the kind of training topics they receive
revealed that agricultural training services are more focused on intensifying crop and
livestock production and also value addition at the expense of adopting new technologies and
techniques.
4.3 Effect of Improved Sweet potato Varrieties on Household Food Security.
4.3.1 Determinants of Food Security Status.
To determine the effects of ISVs on food security status, the endogenous switching
regression probit model was used for analysis. The endogenous switching probit model is
identified by functional form (Lokshin and Sajaia, 2011; Gregory and Coleman-Jensen,
2013). Hence, the study used exclusion restriction methodology to improve on identification.
The study used gender head, sweet potato unit price, farmer to farmer extension and non-
govermental extension as instruments. This study however is consistent and exclusive to
studies such as Ayuya et al., 2015, Di Falcao et al., (2011), Asfaw et al., (2012) and also
Negash and Swinen (2013) who used agricultural information sources as intruments in their
studies. However, sweetpotato and gender head are exclusive for this study. Table 11 presents
tests that indicated the above variables as valid instruments. Sargan’s test showed the
correlation between the instruments excluded and error terms. Sargan test was Pr>χ2(1)=
0.5745 and Pr>χ2(1)= 0.4520 showing that the excluded instruments were uncorrelated with
the error terms.

40
Table 11: Validity of Selected Instruments used in the Endogeneous Switching Probit
Model
Variable First stage Second Stage
Farmer type Food status Coef Std. Error Coef Std. Error
Genderhead -0.3402 0.3416 -0.5568* 0.3297
Sweet price 0.0693*** 0.0194 0.0129 0.0135
Farmer to farmer Extension -0.4803 0.9921 -1.7451 1.0075
Non-govermental Extension 1.3843 1.0303 -1.9017* 1.1145
Constant -1.3285 2.3308 -5.9924* 1.9204
Wald test 128.92 90.40**
Note: *, **, ***= significant at 10%, 5% and 1% respectively.
The likelihood-ratio test for the joint independence of the equations was significant in
both farmer types. Wald χ2 test statistics (53.94) for the farmer type, indicates a joint
significance of the intruments excluded helping in testing the hypothesis of weak instruments.
Hence, we fail to reject the hypothesis of weak intruments. The determinants of food security
status are shown in Table 12. The independent variables were selected from past studies on
derteminants of food security status (Kassie et al., 2013; Shiferaw et al., 2014; Christian and
Coleman, 2013). The ρ0 and ρ1 (measures of food security status) have opposite signs
implying that differences in observed resource endowments and unobservable household
characteristics are both important in explaining the difference in food security between the
groups. The correlation coefficient of the adopter outcome equation is positive and
significant. Suggesting that individuals who choose to adopt the ISVs would be more food
secure than a random individual from a sample would have had they not adopted the ISVs.the
likelihood ratio tests for the joint independence of equations was significant in validating the
use the switching probit model as opposed to the bivariate probit model. This also justifies
why we reject the null hypothesis that there is no significant effect of ISV effect on
household food security and accept the alternative.
Participation of the household head in off-farm income-generating activities increase
the likelihood of household being food secure in all the two household type. Results show the
vital role of off-farm activities in enhancing household income diversification. These could
be explained by the uncertainties and risks facing agriculture in most developing countries.

41
Additionally, participation in off-farm activities increases the access of the decision maker to
more information on how to build their household human development indicators. Similar
findings were reported by Krishna and Shariff (2011), where participation in off-farm
reduced the likelihood of a household being multidimensional poor and increased the
probability of escaping poverty in India respectively.
Table 12: Full Information Maximum Likelihood Estimates of the Switching Regression Model (Dependent variables: Food Security Status)
Adopter Non Adopter
Variable Coef. Std. Error. Coef. Std. Error.
Marital status 0.2941 0.4300 0.4191 0.3222
Household size 0.0676 0.1361 -0.0617 0.0869
Off-farm income 1.4673** 0.7458 0.9798* 0.5303
Farm size -1.7234** 0.8621 0.1405 0.2227
Output of sweetpotato 0.0009*** 0.0004 0.0003 0.0002
Landtenure -0.5533* 0.3025 0.1431 0.2068
Number of livestock 0.0329 0.1035 0.0540 0.0528
Market distance -0.0986 0.1399 -0.0046 0.0821
Training contact 0.2304 0.1812 -0.0779 0.1213
Government extension 0.1413* 0.6473 0.7694 0.3980
Cultural belief -0.1210 0.5069 0.3062 0.4276
Sweet potato buyers type -0.4944*** 0.1502 -0.2035** 0.0885
Constant -3.9313 2.9448 -4.6600 2.1551
ρ0
-0.4710 0.8893
ρ1 0.9842** 0.8674 Lr. Test for independent. Eqns. (rho 1= rho0) chi2(2)= 2.90 prob>chi2=0.0054***
Note: *, **, ***= significant at 10%, 5% and 1% respectively
Landtenure had a negative and significant effect on food security at 10% level. This
results justifies significant association of landtenure of sweetpotato farmers. A high number
of farmers without tittle deed on both the adopters and non adopters with 38% and 42% are
not able to undertake risk or enterpreneural ventures such as adopting of new technologies.
This farmers have to be sure on the good perfomance of the technologies before adopting
them since many of them have no secure rights on their land.

42
The output of sweet potatoes realised by an household, not surprisingly, had a positive
impact on food security for adopter household. High output positively increased the
likelihood of an adopter household being food secure. An increase in production leads to a
substantial increase in food surplus and hence the surplus could be sold to earn extra income.
These households can therefore buy other food groups and diversify their diet.
Surprisingly Sweet potato buyer type had a negative effect on food security (in favour
of middlemen) in both the households but significantly on the adopter household. Hence
where there was existence of middlemen the adopters sold their output to them. Middlemen
are known to exploit the farmers by offering lower prices compared to the market prices and
in turn farmers end up not breaking even in their enterprises. On the other hand, selling of the
sweet potato on the market also attract dismal prices since it will be competing with the other
local varrietis. These affects food security in the sense that the farmers will be dicouraged to
produce for commercial purpose and just produce for subsistence. There would be low or no
surplus produce for sell to get extra income to buy food. Hence consumers and farmers would
no physical, social and economic access to sufficient food which meets their dietary needs.
Consistent with a study by Shiferaw et al., (2014) on Adoption of improved wheat
varieties and impacts on household food security in Ethiopia, government extention contact
positively and significantly at 5% increased the likelihood of the adopter household being
food secure. Farmers who came to know improved varieties via extension agents are more
likely to be more food secure compared to those who were informed by other dissemination
pathways, probably because the predominant public extension system provides more reliable
information on improved varieties and associated agronomic practices. However, constant
visits by CREADIS extension officers on the adopters in the county led to farmers’
willingness to learn a lot of the topics including value addition, Marketing and production
techniques.
Cultural belief although not significant, its coefficient shows it could affect food
security status negatively. This is a great concern in the study area; since farmers have
negative belief in new technologies especially the improved varieties therefore they tend to
stick on the local varieties.
4.3.2 Mean Treatment effects on Food Security
The effect of adoption of improved sweet potato varieties on food security is shown in
Table 13, which was estimated by equation 16a and 16b as detailed by Lokshin and Sajaia
(2011). The values across the diagonals (in cell (a) and (d)) represent the mean values of

43
participants and non- participants in the sample. The values in cell (b) and (c) are the
counterfactual expected values. The average treatment effect on the treated (ATT) was
0.0778, which is the actual effect that adopters experience through adoption. This implies that
among the adopters, their adoption of improved sweet potato varieties led to a higher
probability or more likelihood of being more food secure compared to the counterfactual case
of not adopting the ISVs. Hence, adoption of the ISVs substantially improved the food
security of the adopter households.
Table 13: Mean Treatment effects on Food Security
Treatment effects Decision stage
Adopter
(ATT)
Non adopter
(ATU)
Average treatment effects
(ATE)
Adopter (a) 0.7835(0.0330) (c) 0.7057(0.0309) 0.0778**
Non adopter (b) 0.5207(0.0489) (d) 0.5885(0.0323) -0.0678
Heterogeneity effects 0.2627*** 0.1171**
Notes: **,*** imply significance at 5% and 1% respectively. The stardard errors are in
parentheses
In addition, results also confirm the presence of heterogeneity and sorting based on
comparative advantages (differences in food security status between the adopters and non
adopters caused by unobserved factors), the sample can therefore be concluded to the entire
population. To the government agricultural policy makers and nongovernmental
organizations, their interest is to understand what would be effects of ISVs on food security
status on non adopter households if they were to adopt ISVs. The finding were interesting and
is given by average treatment effect on the untreated (ATU) which shows that for non-
adopters food security would decline if the non adopters were to adopt the ISVs. However,
negative and insignificant, these households presumably have better alternatives than the
improved sweet potato varieties and they fare better, atleast interms of food security, by not
adopting. These findings are consistent with other studies’ results (Negash and Swinnen,
2013; Suri, 2011; Zeitlin et al.,2010) that farmers with low expected net returns do not adopt
a technology and the ones who have higher expected returns do apply them.

44
CHAPTER FIVE
CONCLUSION AND RECOMMENDATION
5.1 Conclusion
The study aimed to characterize sweet potato farmers, determine factors influencing
adoption and the extent of adoption of the ISVs and lastly to assess the contribution of the
ISVs on household food security in Bungoma county, Kenya. Majority (57%) of the sweet
potato farmers had adopted improved varrieties while only 43% were still planting the local
varrieties. This mainly is because of the location of the KARI which together with CREADIS
which is a non govermental organization was contracted by KARI to distribute, contract and
educate sweet potato farmers on the new improved varrieties in the area. Findings of the
study revealed that household socio-economic characteristics, institutional factors and the
social capital dimensions are very important in influencing the adoption of ISVs and its
extent of adoption.
Specifically, five variables were found to be significant from the study that influence
adoption. Education level, price of sweet potato and extension contact were found to
positively influence the level of adoption while farming experience and training contact
negatively and significantly affected adoption. Farming experience had a negative influence
because older farmers tend to be conservative in their approach of doing things while training
contact. Education level was positive since more skills and knowledge is gained with increase
in level of education, while sweet potato price attracts more farmers since it’s easy to break
even. Extension agents popularizes innovation by making farms exchange idea, experiences,
and makes it cheaper to source information, knowledge and skills in order to enable farmers
to improve their livelihood.
Eight variables were significant in influencing the extent of adoption. Output, land
tenure, number of livestock, group membership, credit amount, training and group
heterogeneity index had a positive influence on the extent of adoption. Household size had a
negative influence. The negative effect of training contacts implies the more the farmer has
contacts with officers they tend to reduce potential intensity of adoption. Household size was
also negatively significant. This is concluded by the fact that a small household size is not
pressured by the need to produce more food for a large family size consumption, hence its
open and willing to try out new technologies than a larger household size.
We find that adopting the improved sweet potato varrieties increased households’
food security significantly. The effects are substantial. Our findings indicate improvements in
45
increased food diet diversity and household overall income. Adoption of the improved
varrieties reduces liquidity constraints as they can be harvested at periods of food shortages
and can contribute to mitigate seasonal gaps in food availability. In addition, adoption of the
varriety improves access to other food groups and farm inputs for these households, which
improves overall crop productivity. Our analysis also suggests that adoption of the ISVs is
heterogeneous across households.We find rational sorting based on comparative advantage
from the technology/crop where adopters gain significantly from adopting which they may
not otherwise. Households who do not adopt, appear to do this because they would not
benefit. This is in line with findings of other studies. We have found that non-participating
households have made a rational choice not to participate in that they are better off without
adopting the sweet potato improved varrieties.
5.2 Recommendation
The adoption analysis results show that prices of sweet potato, farming experience,
extension contact, education level and training influence the adoption of improved sweet
potato varieties. These results provide strong evidence for the positive impact of adoption of
modern agricultural technologies for a major food staple on alleviating food insecurity in
Kenya. However, exploiting the full benefits of the technology in improving food and
nutritional security will require increased investments and policy support for improving sweet
potato productivity through greater access to variety information from extension agents,
persistent encouragement to farmer’s education and also better producer prices.
Participation in off-farm income activities by the household head, high output,
government extension, land tenure and sweet potato buyer type were important drivers in
determining food security status. Participating in off-farm income activities increased the
probability of being food secure in both the household types. This raises a policy concern on
the importance of diversifying farm income through creation of sustainable off-farm
activities. Of concern also is the effect of government extension which significantly increased
the probability of being food secure. Farmers should be sensitized on socio-cultural aspects
that hinder adoption of technologies in the county. This calls for the need to strengthen
extension services by the government since farmers get most of their information about new
technologies from them. Further, the choice of the sweet potato buyers should be cautious by
the farmers since it negatively reduced the probability of the adopters being food secure. For
public policy, these findings underpin the importance to strengthen contractual agreements in

46
marketing to wipe out middlemen in the process and assure farmers constant market for their
produce.
5.3 Further Research
The main intention of the study was to examine the contribution of the improved
sweet potatoes varieties on household food security. However, there are several areas for
further research.
1. This study mainly focussed on food security in the county, it will be wise if further
research largely focusses on the nutritional aspects and also income, since the
improved sweet potato apart from enhancing the food security it also has effects on
household income and nutritional status because of the existence high levels of
vitamin A in the them in form of beta-carotene, vitamin B1 and B2.
2. The study has its limitations interms of the methodology and also data that are used.
Methodologically, the use of survey data is an important contribution to the existing
studies, and we have used advanced econometric techniques that are standard in the
literature for the type of data set that we have, but it is well known that identification
of causal effects based on cross-section data is difficult. Therefore future research
should focus on collecting better data sets, including panel and time series data,and on
using different methods, such a s field experiments.

47
6.0 REFERENCES
Aakvik, A., Heckman, J. and Vytlacil, E. (2000). Treatment effects for discrete outcomes
when responses to treatment vary among observationally identical persons: An
application to Norwegian vocational rehabilitation programmes. (NBER), Technical
Working Paper 262. http://www.nber.org/papers/T0262.
Abadie A. (2003). Semi-parametric instrumental variable estimation of treatment response
models. Journal of Econometrics 113: 231–263.
Adeolu, B., Luke, O., Olufemi, A., Kaku, S., and Adewale, A. (2013). Enhancing
Smallholder Farmers Income and Food Security through Agricultural Research and
Development in West Africa: Impact of the IAR4D1 in the KKM PLS. Invited paper
presented at the 4th International Conference of the African Association of
Agricultural Economists, September 22-25, Hammamet, Tunisia.
Adesina, A. A. and Zinna, M. M., (1993). Technology characteristics, farmer perceptions and
adoption decisions; A Tobit model application in Sierra Leon. Agricultural
Economics. 9: 297-311
Adeola.(2010).Influence of Socio-Economic Factors on the Adoption of Soil Conservation
Measures in Ibadan/Ibarapa Agricultural Zone of Oyo State.
Alene, A. D., Menkir, A., Ajala, S. O., Badu-Apraku, A. S., Olanrewaju, V., Manyong, M.
(2009). The economic and poverty impacts of maize research in West and Central.
Agricultural Economics, 40: 535–550.
Amare, M., Asfaw, S., and Shiferaw, B. (2012).Welfare Impacts of Maize- Pigeon pea
Intensification in Tanzania. Agricultural Economics, 43(1): 1–17.
Ali, A. and Abdulai, A. (2013). Direct effects of adoption of Bacillus thuringiensis (Bt)
cotton on yields, pesticide demand, household income and poverty in Pakistan.
Journal of Agricultural Economics, 61(1): 175–192.
Ali, R. (2005). Impact of Rural Road Improvement on High Yield Variety Technology
Adoption: Evidence from Bangladesh. Ph.D. Thesis, Department of Applied
Economics and Management, Cornell University, Ithaca.
Alwang, J., Siegel, P.B. and Jorgensen S.L. (2001). Vulnerability: A view from different
disciplines." Social protection discussion paper series.

48
Amsalu, A. and De Jan G. (2007). Determinants of Adoption and Continued use of Stone
Terraces for Soil and Water Conservation in an Ethiopian Highland Watershed.
Ecological economics 61: 294 – 302.
Anderson, D., Sweeny, J., Williams, T., Freeman, J. and Shoesmith, E. (2007). Statistics for
Business and Economics. Thomons Learning.
Ashenafi G., (2007). Triticale Crop and Food Security, and Determinants Influencing the
Adoption of Triticale: Example from the Amhara Region, Ethiopia “Utilization of
diversity in land use systems: Sustainable and organic approaches to meet human
needs” University of Kassel, Department of Development Economics and
Agricultural Policy, Germany Tropentag, October 9-11, 2007, Witzenhausen.
Arellanes, P. and Lee, R.D. (2003). The Determinants of Adoption of Sustainable Agriculture
Technologies. Evidence from the hill sides of Hunduras. In: Proceedings of 25th
International Conference of Agricultural Economists (IAAE), 16-22 August, 2003,
Durban South Africa
Asfaw, S., Kassie, M., Simtowe, F. and Leslie, L. (2012a). Poverty reduction effects of
agricultural technology adoption: micro evidence from Rural Tanzania. Journal of
Development Studies, 48(9): 1288–1305.
Asfaw, S., Shiferaw, B., Simtowe, F and Lipper, L. (2012b). Impact of modern agricultural
technologies on smallholder welfare: evidence from Tanzania and Ethiopia. Food
Policy, 7(3): 283– 295.
Ayuya, O.I, Gido E.O., Bett H.K., Lagat J.K and Kahi A.K. (2015). Effect of Certified
Organic Production Systems on Poverty among Smallholder Farmers: Empirical
Evidence from Kenya. World Development, 67, 27-37.
Baidu-Forson, J. (1999). Factors Influencing Adoption of Land-enhancing Technology in the
Sahel: Lessons From a Case Study in Niger. Agricultural Economics, 20(3): 231-
239.
Barungi, D.H., Ng’ong’ola1, A., Edriss1, J., Mugisha, M., Waithaka, J., and Tukahirwa
(2013). Factors Influencing the Adoption of Soil Erosion Control Technologies by
Farmers along the Slopes of Mt. Elgon, Uganda. Journal of Sustainable Development,
6(2).

49
Barrett, C. B., Bachke, M. E., Bellemare, M. F., Michelson, H. C., Narayanan, S. and Walker
T. F. (2011). Smallholder Participation in Contract Farming: Comparative Evidence
From Five Countries. World Development, 40(4), 1269-1279
Blackburn, D.J., G.L. Brinkman and H.C. Driver, (1982). Understanding Behavior and
Economic Characteristics in Working with Operations of Small Farms: A Case Study
in Ontario Canada. John Wiley, New York.
Bezabih, E., Hadera, G., and Nigatu, R. (2010). Impacts of Improved Seeds and
Agrochemicals on Food Security and Environment in the Rift Valley of Ethiopia:
Implications for the Application of an African Green Revolution. Dry lands
Coordination Group Report, 56(2): 46-59.
CBS (2008).Geographic Dimensions of Well-Being in Kenya: Where Are The Poor? From
District to Locations. Nairobi, Kenya: The Central Bureau of Statistics of Government
of Kenya, International Livestock Research Institute (ILRI), The Rockefeller
Foundation and World Resource Institute (WRI).
Conroy, (2005) Participatory livestock research: A guide, London, ITDG publishing Federal
Ministry of Agriculture (FMA) (2005). Annual Report, Nigeria
Chirwa, E.W. 2005. “Adoption of Fertilizer and Hybrid Seeds by Smallholder Maize Farmers
in Southern Malawi”. Development Southern Africa, Vol. 22 (1): 1–12.
Chung, K. (2012). An Introduction to Nutrition-Agriculture Linkages. Michigan State
University, Department of Agricultural, Food, and Resource Economics.
Diagne, A., and Zeller, M. (2001). Access to Credit and its Impact on Welfare in Malawi.
Research Report 116. IFPRI Washington, D.C.
Ebojei C.O., Ayinde T.B. and Akogwu G.O.(2009).Socio-Economic Factors Influencing the
Adoption of Hybrid Maize in Giwa Local Government Area of Kaduna State, Nigeria.
The Journal of Agricultural Science, 7(1): 234-263.
Fadare O. A and Akerele D. (2011). Factors Influencing Adoption Decisions of Maize
Farmers in Nigeria. International Journal of Food and Agricultural Economics, 2(3):
45-54.
Faturoti, B. O., Emah, G. N., Isife, B. I., Tenkouano, A. and Lemchi, J. (2006). Prospects and
Determinants of Adoption of IITA Plantain and Banana Based Technologies in

50
Three Niger Delta States of Nigeria. African Journal of Biotechnology, 5(14): 1319-
1323. ISSN 1684–5315
FAOSTAT (2013). Statistics Database. Available at http://www.fao.org/crop/statistics.
Feeder, G., Just E.R and D Ziberman (1985). Adoption of Agricultural Innovations in
Developing countries. A survey Economic Development cultural change, 33: 255-298.
Fuglie K, O. (2007). Priorities for sweet potato research in developing countries: Results of a
survey.Hortscience,42(5): 1200-1206.
Floro, M. S., and Swain, R. B. (2013). Food Security, gender, and occupational choice among
urban low-income households. World Development, 42: 89-99.
Freeman, A.H., and J.M. Omiti. 2003. “Fertilizer use in semi-arid areas of Kenya: analysis of
smallholder farmers‟ adoption behavior under liberalized markets”. Nutrient Cycling
in Agroecosystems, 66: 23–31.
Government of Kenya (2004).Strategy for Revitalizing Agriculture 2004-2014 Ministries of
Agriculture, Livestock and Fisheries Development, and Cooperative Development
and Marketing, Nairobi, Kenya.
Gregory, C. A., and Coleman-Jensen, A. (2013). Do High Food Prices Increase Food
Insecurity in the United States? Applied Economic Perspectives and Policy, 35(4),
679–707.
Government of Kenya (2008). First Medium Term Plan (2008-2012), Kenya Vision 2030, A
Globally Competitive and Prosperous Kenya. 63 – 70.
Greene, W. H. (2002). Econometric Analysis, 5th edition, Prentice Hall, Upper Saddle River,
New Jersey: Prentice-Hall.663 –728.
Gunther, B., Jochen, K., and Jörg, P.(2010). Rural Electrification in Rwanda –An Impact
Assessment Using Matching Technique.
Gruneberg, .J. W., Abidin, E., Ndolo, P.,Pareira, C. A., and Hermanan, M. (2004). Variance
Component Estimations and Allocations of Resources for Breeding Sweet Potato
Under East African Conditions. Plant Breeding, 123:311-316.
Hagenimana, V.,Oyunga, M.A., Low J., Njoroge S.M., and Kabira J.(1999). The Effects of
Women Farmers’ Adoption of Orange-Fleshed Sweet Potatoes: June 1999 Raising
Vitamin A Intake in Kenya. International Center for Research on Women.

51
Harvest Plus (2012). Disseminating Orange-Fleshed Sweet Potato: Uganda Country Report.
Washington, D.C.: Harvest Plus.
Haddad, L. (2000).Women's Status: Levels, Determinants, Consequences for Malnutrition,
Interventions, and Policy, Asian Development Review, 17(2):96-131.
Hoddinott J., and Yohannes, Y. (2002). Dietary Diversity as a Food Security Indicator. Food
and Nutritional Technical Assistant Project.
H.C.D.A. (2009). Horticultural Crops Development Authority Strategic plan 2009-2013.
Nairobi: Government Printer.
IFAD (1998). Household Food Security and the Role of Women: IFAD's Experience in
Guatemala.
International Potato Center, (2013). Facts and Figures. Accessed at http://cipotato.org/sweetp
otato/facts on June 2013.
Jacoby, H.G. (1992).Productivity of Men and Women and the Sexual Division of Labour in
Peasant Agriculture of the Peruvian Sierra. Journal of Development Economics, 37:
265-287.
Jane, C., John, M., Rose, N., Beatrice, M. (2013). Impact of Export Horticulture Farming on
Food Security of Smallholder Farmers in Mbooni and Kirinyaga counties, Kenya. 4th
AAAE Conference September 22-25, 2013,Commercializing Agriculture in Africa:
Social Economic and Environmental Impacts.
Jaetzold, R., Schmidt, H., Hornetz, B., Shisanya, C. A., (2006). Farm Management Hand
book of Kenya. Natural Conditions and Farm Information , 2nd Edition , vol, 11/c.
Ministry of Agriculture/GTZ, Nairobi, Kenya (Eastern province).
Jones, A.D., Shrinivas and Bezner-Kerr. (2014). Farm production diversity is associated with
greater household dietary diversity in Malawi: Findings from nationally representative
data. Food Policy 46:1-12.
Juliana, (2007).The Impact of “One Village One Product (OVOP)” on Household Income –
Implications on Food Security: The Case of Bvumbwe Operation Area, Thyolo
District, Malawi.

52
Kabunga, N.S., Dubois, T.,and Qaim, M. (2014). Impact of Tissue Culture Banana
Technology on Farm Household Income and Food security in Kenya. Food Policy
45(0):25-34.
Kapinga, R., Rugutu, C., Carey, T., Rees, D., Chirima, B., Amour, R., and Rwiza, E.
(2000).Tanzania sweet potato varieties and their associate acceptable. Qualities by
end users. In. African Potato Association Conference Proceeding, 5: 527-530.
Karanja, D.D., Renkow, M., and Crawford, E.W. (2003).Welfare Effects of Maize
Technologies in Marginal and High Potential Regions of Kenya. Agricultural
Economics, 29(3): 331–341.
Kijima, Y., Otsuka, K., and Serunkuuma, D. (2008).Assessing the Impact of NERICA on
Income and Poverty in Central and Western Uganda. Agricultural Economics, 38(3):
327–337.
Kassie, M., Shiferaw, B. and Geoffrey, M. (2011) Agricultural technology, crop income, and
poverty alleviation in Uganda. World Development, 39(10), pp. 1784–1795.
Kassie, M., Simon, W., and Jesper, S. (2014). What determines Gender Inequality in
Household Food security in Kenya? Application of Exogenous Switching Regression.
World Development, 56, 153– 171.
Kassie, M., Jaleta, M., Shiferaw, B., Mmbando, F., and Mekuria, M. (2013). Adoption of
Interrelated Sustainable Agricultural Practices in Smallholder System: Evidence from
Rural Tanzania. Technological Forecast and Social Change, 80, 525–540.
Kavia, F.Y., Mushongi1, C., and Sonda G.B. (2007).Factors Affecting Adoption of Cassava
Varieties: A Case of Cassava Mosaic Disease Tolerant Varieties in Lake ZoneRegions
– Tanzania. African Crop Science Conference Proceedings 8(1): 8-75.
Kaguongo, W., Ortmann G.F., Wale, E., Darroch M.A.G., and Low, J. (2010). Factors
Influencing Adoption and Intensity of Adoption of Orange Flesh Sweet Potato
Varieties: Evidence from an Extension Intervention in Nyanza and Western Province,
Kenya. Paper Presented at the joint 3rd African Association of Agricultural
Economists (AAAE) and 48th Agricultural Economists Association of South Africa
(AEASA) Conference, Cape Town, South Africa, September 19 – 23, 2010.
Kenya Agricultural Commodity Exchange (2012). Everything is Sweet about Potato. Daily
Nation. 23rd April 2012.

53
Kenyon, L., Anandajayasekeram, P., and Ochieng, C. (2006). A Synthesis / Lesson-Learning
Study of the Research Carried Out on Root and Tuber Crops Commissioned through
the DFID RNRRS Research Programmes Between 1995 and 2005. DFID, United
Kingdom.
Kennedy, G., Ballard, T., Dop, M. C and European Union. (2011). Guidelines for Measuring
Household and Individual Dietary Diversity: Food and Agriculture Organization of
the United Nations.
Kettings, C., and Sinclair, A. J. (2009). A Healthy Diet Consistent with Australian Health
Recommendations is too Expensive for Welfare-Dependent Families. Australian and
New Zealand Journal of Public Health, 33(6): 566–572.
Krishna, A., and Shariff, A. (2011). The Irrelevance of National Strategies? Rural Poverty
Dynamics in States and Regions of India, 1993–2005. World Development, 39(4),
533–549.
Langyintuo, A. and Mulugetta, M. (2005). Modeling Agricultural Technology Adoption
Using the Software STATA. International Maize and Wheat Improvement Center
(CIMMYT) Training manual no. 1/2005 (part two). Mount Pleasant, Harare,
Zimbabwe.
Larochelle, (2014).Impacts of Improved Bean Varieties on Food Security in Rwanda Selected
Paper prepared for presentation at the Agricultural & Applied Economics
Association’s2014 AAEA Annual Meeting, Minneapolis, MN, July27-29, 2014.
Low, J. W. (1997). Combating Vitamin A Deficiency Through the Use of Sweet Potato:
Results from Phase I of an Action Research Project in South Nyanza, Kenya. CIP.
Lundberg, Shelly and Robert A. Pollack. (1996). Bargaining and Distribution in Marriage.
Journal of Economic Perspectives 10: 139-158.
Low, J.W., Arimond, N., Osman, B., Cunguara, F., Zano, M., and Tschirley, D. (2007).
Seeking Sustainable Health Improvements Using Orange-Fleshed Sweet Potato.
LEISA Magazine, 23(2): 1-2.
Lokshin, M. and Glinskaya, E. (2009).The Effect of Male Migration on Employment Patterns
of Women in Nepal.The World Bank Economic Review, 23(3): 481-507.

54
Lokshin, M, and Sajaia (2011). Impact of Interventions on Discrete Outcomes: Maximum
Likelihood Estimation of the Binary Choice Models with Binary Endogenous
Regressors. The Stata Journal, 11(3): 368-385.
Ojiako, G. U., and Muguire, S. (2007). Intervention for Information Systems Introduction in
NHS. Health Informatics Journal (ISSN 1755-9278), Vol. 5, No. 3, pp. 23-28.
Masuki, F. G. K., Khamaldin, D. M., Siza, D. T., Filbert, B. R., Amon, Z. M. and Nuhu H.
(2003). Smallholder System Innovations Programme, Soil-Water Management
Research Group, Sokoine University of Agriculture, Morogoro, Tanzania.
Mazvimavi, K. and Twomlow S., (2009). Socio-Economic and Institutional Factors
Influencing Adoption of Conservation Farming by Vulnerable Households in
Zimbabwe. Agricultural Systems 101: 20–29.
Mutarutwa, (2014). The Impact of the Girinka One Cow per poor family Program on
Household Income in Gatsibo District, Rwanda.
Mignouna, D.B., Manyong V. M., Mutabazi K. D., and Senkondo. E. M. (2011).
Determinants of Adopting Imazapyr-Resistant Maize for Striga Control In Western
Kenya: A Double-Hurdle Approach. Journal Of Development And Agricultural
Economics 3: 572-580.
Musinguzi, E., Kikafunda, J.K., and Kiremire, B.T.(2006). Utilization of Indigenous Food
Plants in Uganda: A Case Study of South-Western Uganda. African Journal of Food
Agriculture Nutrition and Development.
Mustapha, S. B., Makinta, A. A., Zongoma, B. A. and Iwan, A. S. (2012). Socio-Economic
Factors Affecting Adoption of Soya Bean Production Technologies in Takum Local
Government Area of Taraba State, Nigeria. Asian Journal Agriculture and Rural
Development, 2(2): 271-276.
Maxwell, D. (1995). Measuring Food Insecurity: The Frequency and Severity of Coping
Strategies. Washington, D.C. International Food Policy Research Institute. Food
Consumption and Nutrition Division.
Maxwell, S. and Frankenberger, T.R. (1992). Household Food Security: Concepts, Indicators,
Measurements. A Technical Review. UNICEF.
Ministry of Agriculture, Annual report (2010, 2011). National Roots and Tuber Crops Policy.
Nairobi, Kenya.
55
Ministry of Agriculture, (2010a). Agricultural Sector Development Strategy 2010 – 2020.
Nairobi, Kenya.
Mwema, C. M., Lagat, J. K. and Mutai, B. K. (2013). Economics of Harvesting and
Marketing Selected Indigenous Fruits in Mwingi District, Kenya. A paper presented
at the 4th International Conference of the African Association of Agricultural
Economists, September 22-25, 2013, Hammamet, Tunisia.
Norman, D., D. Baker, G. Heinrich, C. Joha, Maskiara and F. Worman, 1989. Farmers
Groups for Technology Development, Experiences in Botswana, in Chambers;
Farmers Innovation and Agricultural Research. Intermediate Technology Publication,
London
Ndiema, A. C. (2002). Factors Affecting the Adoption of Wheat Production Technologies by
Farmers in Njoro and Rongai Divisions of Nakuru Districts, Kenya. MSc. Thesis,
Egerton University, Kenya
Nedunchezhiyan, M., Mahapatra, S., Sahoo, N., Acharya, R., and Ranasingh, N. (2006).
Sweet Potato: A Successful Crop in Nuapada District. Orissa review February-March
2006: 1-2.
Negash, M., and Swinnen, J. (2013). Bio-fuels and Food security: Micro evidence from
Ethiopia. Energy Policy, 61, 963–976.
Nungo, R.A., Ndolo P. J., Kapinga, R and Agili S. (2007). Development and Promotion of
Sweet Potato Products in Western Kenya. Proceedings of the 13th ISTRC Symposium:
790 – 794.
Odendo M. and Ndolo P.J. (2002). Impact of Improved Sweet Potato Varieties in Western
Kenya: Journal ofAgricultural Research, 5(21):467-700.
Pryanishnikov, I. and Z. Katarina. (2003). Multinomial Logit Models for Australian Labor
Market. Australian Journal of Statistics,4: 267–282.
Radimer, K. (2002). Measurement of Household Food Security in the USA and other
Industrialized Countries. Public Health Nutrition, 5(6A): 859– 864.
Ruel, M.T. (2003). Operationalizing Dietary Diversity: A Review of Measurement Issues and
Research Priorities.The Journal of Nutrition,133(11): 3911-3926.
Rono, C.S., Wanyama, J.M., Mose, L.O., Mutoko, C.M., Lusweti, E. Wanjekeche, E.and
Wachiye, B. (2006). Assessing the Impact of Sweet Potato Production and Utilisation

56
Technologies on Food Security in North Rift Region. A paper presented in 10th.
KARI Biennial Scientific conference and the second Agricultural forum held between
13th. – 17th. November 2006 in Nairobi, Kenya.
Rosembaum, P.R., Rubin, D.B. (1983). The Central Role of the Propensity Score in
Observational Studies for Causal Effects. Biometrika, 701: 41–55.
Rusike, J., Mahungu, N.M., Jumbo, S.M., Sandifolo, V.S. and Malindi, G. (2010). Estimating
Impact of Cassava Research for Development Approach on Productivity, Uptake and
Food Security in Malawi. Food Policy,35(2):98-111.
Sargan, J. (1958). The Estimation of Economic Relationships using Instrumental Variables.
Econometrics, 26, 393–415.
Shiferaw, B., Kassie, M., Jaleta, M. and Yirga, C. (2014). Adoption of Improved Wheat
Varieties and Impacts on Household Food Security in Ethiopia. Food Policy 44:272-
284.
Shiferaw, F., Kilmer, R. and Gladwin, C. (2003). Determinants of Food Security in Southern
Ethiopia at the Household Level. A Selected Paper Presented at the 2003 American
Agricultural Economics Association Meetings in Montreal, Canada. Agricultural
Economics, 33(3):351-63.
Swindale, A. and Bilinsky, P. (2006). Household Dietary Diversity Score (HDDS) for
Measurement of Household Food Access. Washington, DC: Food and Nutrition
Technical Assistance II Project (FANTA-II Project). Academy for Educational
Development (AED).
Singh S., Raina C.S, Bawa A.S. and Saxena D.C. (2003). Optimization of Processing
Variables in the Preparation of Sweet Potato Chips Using Response Surface
Methodology, Department of Food Technology, Saint Longowal Institute of
Engineering and Technology, Longowal, India.
Suri, T.(2011).Selection and Comparative Advantage in Technology Adoption. Econometrica
79(1),159–209.
Tewe, O.O., Ojeniyi, F.E. and Abu, O.A. (2003). Sweet potato Production, Utilization, and
Marketing in Nigeria.Social Sciences Department, International Potato Center (CIP),
Lima, Peru, June 2003.

57
Teklewood, H., Kassie, M. and Shiferaw, B. (2013). Adoption of Multiple Sustainable
Agricultural Practises in Rural Ethiopia. Journal of Agricultural Economics, 64(3),
597-623
Wasula, S.L., 2000. Influence of Socio-Economic Factors on Adoption of Agroforestry
Related Technology. The Case of Njoro and Rongai Districts, Kenya. Unpublished
Msc. Thesis, Egerton University, Njoro, Kenya.
Wanyama, J. M., Nyambati, E. M., Mose, L. O., Mutoko, C. M., Wanyonyi, W. M.,
Wanjekeche, E. and Rono, S. C. (2010). Assessing Impact of Soil Management
Technologies on Smallholder Farmers’ Livelihoods in North Western Kenya. African
Journal of Agricultural Research,5(21):2899-2908.
Winters, P., De Janvry, A., Saudolet, E., Stamoulis, K. (1998). The Role of Agriculture in
Economic Development: Visible and Invisible Surplus Transfers. Journal of
Development Studies, 345: 71–97.
Wooldridge, J. M. (2010). Econometric Analysis of Cross Section and Panel Data.
Cambridge, Mass.: MIT Press.
Zeitlin, A., Teal, F., Caria, S., Dzene, R. and Opoku, E. (2010). Heterogeneous Returns and
the Persistence of Agricultural Technology Adoption. CSAE Discussion Paper.
Oxford University.

58
APPENDIX
QUESTIONNAIRE
The purpose of this study is purely academic and more so to contribute to the understanding
of improved sweet potato varieties among farmers in the district. Respondents are requested
to VOLUNTARILY participate in answering this questionnaire and are assured that any
information shared will be strictly CONFIDENTIAL.
SECTION A: General Information
1. Date of interview _______________________________________________ 2. Name of enumerator_____________________________________________ 3. Sub county _______________________________________________________ 4. Division_______________________________________________________ 5. Relation to the household head……………………………………Age……….. SECTION B: SOCIO-ECONOMIC CHARATERISTICS OF THE RESPONDENT
1.0. Have you adopted the improved sweet potato varieties?
1. YES [ ] 2. NO [ ]
1.1. Gender
1.2. Age (Years)
1.3. Marital Status
M F <18 19-29
30-39
40-49
50-59
>60 Single Married Widowed Divorced
1.4. Household size (number of people living and eating together) ……………………
1.5. Number of schooling years……2………………………………..
1.6. What is the education level of the household head? (Tick appropriately) 1= Not gone to
school [ ]; 2= primary [ ]; 3= secondary [ ]; 4= college [ ]; 5= university [ ] University
1.7. What is your occupation?
1=casual laborer [ ]; 2=Salaried employed [ ]; 3=Business person [ ]; 4=Farming [ ]
Others, Specify……………………………………..
1.8. What was the estimated amount of income for the year (in KES)?

59
1=From farm production KES [ ]; 2= From off-farm KES [ ]; 3= From employment [ ]
Total income KES …………………………………..
1.9.What is the size of the land under sweet potato (acres)………………………………...?
1.10. Indicate the land tenure system on the land in use and how you acquired it?
Total Size
Tenure System( Acres) Owned Rented in Rented out communal
Acres [ ]
1.11. Apart from sweet potato farming, of the total land can you tell us what other activity are
engaged in the plot(s) and the number of acres under each enterprise? What is the tenure of
each parcel of land (in case having several parcel of land)?
Plot/ parcel Land use Acres Land tenure
1
2
3
4
5
Land use1= Maize acres under each enterprise[ ]; 2=Bean farming (acres) [ ]; 3=Sugarcane
growing (acres) [ ]; 4== Animal feed cultivation / Grazing [ ]; 5=Others specify [ ]
Land tenure: 1=owned with title deed 2=owned without title deed 3= Rented 4=owned by
parents 5=Communal/ government/ cooperative
1.12. How long have you been living in Bungoma South Sub-County (in
years)...........................
1.13 Of the years you have been living in Bungoma, how long have you been doing sweet
potato farming (in years)? …………….
1.14 Do you own any livestock ……………..(1=Yes, 0=No)If yes tell me the type and
number of livestock owned
Are there any cultures or belief that hinder you from adopting the improved varieties?
Livestock type Number owned Number sold Gross income Oxen Cows donkeys poultry goats sheep Total

60
SECTION C: FOOD SECURITY Dietary Diversity Data (24 hr. recall) Did YOU OR ANYONE ELSE IN YOUR HOUSEHOLD eat any kind of the following foods yesterday during the day and at night? Food group Examples
( any other locally available food)
Code 1 Yes 2 No
2.1. Cereals millet, sorghum, maize, rice, wheat, or
2.2 Root and tubers potatoes, yams, manioc, cassava or any other foods
2.3.Pulses/legumes beans, peas, lentils, or nuts 2.4. Milk and milk products cheese, yogurt, milk or other
milk products
2.5. Eggs eggs 2.6. Meat beef, pork, lamb, goat, rabbit
wild game, chicken, duck, or other birds, liver, kidney, heart, or other organ
2.7. Fish and seafood fresh or dried fish or shellfish 2.8. Oil/fats Oil/ fat 2.9. Sugar/honey Sugar, honey 2.10. Fruits Mangoes, oranges,
pineapples
2.11. Vegetables Kales, cabbage, carrots, French beans,
2.12.Miscellaneous coffee, tea This can be done manually or on a spread sheet. The HDDS variable will be calculated for each household. The value of this variable will range from 0-12. HDDS (0-12)
The total number of food groups consumed by members of the household. Values for A through to L will either be “0” or “1”
The average HDSS indicator is calculated for the sample population Average HDDS
Sum (HDDS)
Total number of households
HDDS target will be establishes by taking the average diversity of households with the highest diversity (Upper tercile of diversity)
Household food consumption diary.

61
I would like to ask you about all the different foods that your household members have eaten
in the last 7 days. Could you please tell me how many days in the past week your household
has eaten the following foods? (For each food, ask what the primary source of each food item
eaten that week was, as well as the second main source of food, if any)
Food item DAYS eaten in past week (0-7 days)
Sources of food (see codes below)
primary secondary
1 – Maize 2 – Rice 3 – Bread/wheat
4 – Tubers
5–Groundnuts & Pulses
6–Fish (eaten as a main food)
7 – Fish powder (used for flavor only)
8–Red meat (sheep/goat/beef)
9–White meat (poultry
10–Vegetable oil, fats
11 – Eggs
12–Milk and dairy products (main food)
13–Milk in tea in small amounts
14–Vegetables (including leaves)
15 – Fruits
16 – Sweets, sugar
Food source codes: Purchase =1 Own production =2 Traded goods/services, barter =3, Borrowed = 4 Received as gift= 5 Food aid =6, other (specify) =7
SECTION D: GROUP PARTICIPATION
3.1 Do you belong to a farmer group/organization in the community?

62
1. Yes 2. No
3.2 If yes, how many groups do you belong to...................?
3.3 Give the names of the farmer group(s)
1. ………………………………………………….. 2. …………………………………………………..
3.4 Are there any requirements before one joins a farmer group?
1. Yes 2. No
3.5 If Yes, what are the requirements?
1=Pay membership fee [ ]; 2=Minimum farm size requirement [ ]; 3=Quality of the output [ ]
4=Declare your property[ ]; 5=Be from the same village[ ]; 5=Other,specify..........................
3.6 What kind of relationship exists between the members of your group?
1. Relatives
2. Neighbors
3. Friends
4. Farmers
3.6 From a scale of 1-10 how do you rate your decision making in the groups? 3.7 From a scale of 1-10 how do you rate your trust on members on the group? 3.8 How did you get information about the farmer groups? 1=Fellow farmers [ ]; 2=Export agents [ ]; 3=Media advertisement [ ]; 4=Self-initiative [ ]
5=Friends [ ]; 6= Other (specify) ……………
3.8 If NOT a group member, give reasons
......................................................................................................................................................
......................................................................................................................................................
3.9 Would you like to be a member?
1. Yes 2. No
3.10 If Yes, what stops you from being a member?
1. Lack of trust with members
2. Don’t meet the quality standards
3. Don’t meet the minimum quantity delivery
4. High membership fee
5. Lack of time to attend meetings
6. Distance with group members
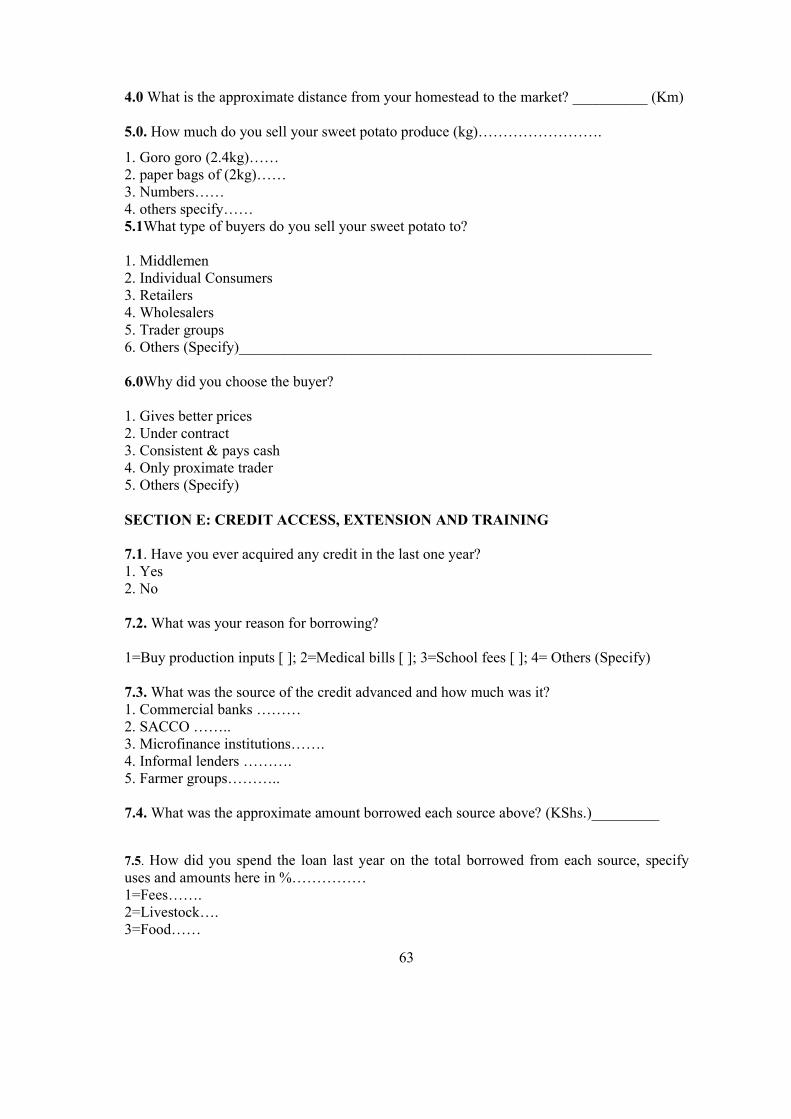
63
4.0 What is the approximate distance from your homestead to the market? __________ (Km) 5.0. How much do you sell your sweet potato produce (kg)…………………….
1. Goro goro (2.4kg)…… 2. paper bags of (2kg)…… 3. Numbers…… 4. others specify…… 5.1What type of buyers do you sell your sweet potato to? 1. Middlemen 2. Individual Consumers 3. Retailers 4. Wholesalers 5. Trader groups 6. Others (Specify)_______________________________________________________ 6.0Why did you choose the buyer? 1. Gives better prices 2. Under contract 3. Consistent & pays cash 4. Only proximate trader 5. Others (Specify) SECTION E: CREDIT ACCESS, EXTENSION AND TRAINING 7.1. Have you ever acquired any credit in the last one year? 1. Yes 2. No 7.2. What was your reason for borrowing? 1=Buy production inputs [ ]; 2=Medical bills [ ]; 3=School fees [ ]; 4= Others (Specify) 7.3. What was the source of the credit advanced and how much was it? 1. Commercial banks ……… 2. SACCO …….. 3. Microfinance institutions……. 4. Informal lenders ………. 5. Farmer groups……….. 7.4. What was the approximate amount borrowed each source above? (KShs.)_________ 7.5. How did you spend the loan last year on the total borrowed from each source, specify uses and amounts here in %…………… 1=Fees……. 2=Livestock…. 3=Food……

64
4=Household items….. 5=Crops…….. 7.6. If No in no. 7.1, give reason (please tick one that is most applicable) 1. No collateral 2. Defaulted on previous loan 3. High interest rate 4. Not aware of credit facilities 5. Others (Specify)_______________________________________________________ 8.Does your household own any of the following assets? Asset Name Number Current Unit value Total Value Ox-Ploughs Ox-cart Panga Knife Hoes Wheel Barrow Bicycle Tractor Radio Mobile phone Television Other Specify 8. Have you ever attended any training or seminar on sweet potato? 1. Yes 2. No 8.1. Did you pay for the training? 1.Yes 2.No 8.2. If yes in 7.1, then how much?........................... 8.3. How long did the training take………………. 9. If yes, which topics were discussed? 1. Production of sweet potato 2. Marketing of sweet potato 3. Sweet potato value addition techniques 4. Others____________________________________________________________ 10. How many times are you visited per month by extension officer? _________________ 11. If yes,who provided the extension service or technical advice on sweet potato production? 1=Fellow farmer [ ]; 2= Government officers [ ]; 3=NGOs [ ]; officers [ ]; 4=Other sources (Specify)_______________________________ 12. Do cultural belief hinder your adoption of ISVs-----------------------------------------

65
1.YES 2.NO 13. Have you been contracted by any organization………. Your participation in this study is greatly appreciated.Thank you for your time!Once again, I
assure you that your identity will remain STRICTLY CONFIDENTIAL.