armenia in ireland: indo-european cognates - Ulster University
Upload
khangminh22Category
view
2download
0
Report No. 97520
Republic of Armenia Drivers of Dynamism
June 2015
Macroeconomics and Fiscal Management
Europe and Central Asia Region
Document of the World Bank
Pub
lic D
iscl
osur
e A
utho
rized
Pub
lic D
iscl
osur
e A
utho
rized
Pub
lic D
iscl
osur
e A
utho
rized
Pub
lic D
iscl
osur
e A
utho
rized

ii
CURRENCY EQUIVALENTS
(Exchange Rate as of June 2, 2015)
Currency Unit Armenian Dram US$1.00 AMD 477.19
Weights and Measures: Metric System
ABBREVIATIONS AND ACRONYMS
ACEO Armenian Center of Excellence in Oncology
ADA Armenian Development Agency
ADS Armenia Development Strategy
AMD Armenian Dram
ANEL Armenian National Engineering Lab
ANQA Armenian National Centre for Professional
Education Quality Assurance Foundation
AUA American University of Armenia
CANDLE Center for the Advancement of Natural
Discoveries using Light Emission
CBA Central Bank of Armenia
CEM Country Economic Memorandum
CEW Clean Energy and Water
CIT Corporate Income Tax
CNRS French National Centre for Scientific
Research
DCFTA Deep and Comprehensive Free Trade
Agreement
EBRD European Bank for Reconstruction and
Development
ECA Europe and Central Asia
EDMC Enterprise Development & Market
Competitiveness
EEU Eurasian Economic Union
EIF Enterprise Incubator Foundation
ES Enterprise Surveys
FD Foreign Direct Investment
FSU Former Soviet Union
GCI Global Competitiveness Index
GDP Gross Domestic Product
GERD Gross Expenditure on R&D
GII Global Innovation Index
HEI Higher Education Institutions
ICT Information And Communications
Technology
IFRS International Financial Reporting Standards
IPR Intellectual Property Rights
ISFIE Initial Strategy for the Formation of the
Innovation Economy
KEI Knowledge Economy Index
MENA Middle East and North Africa
MTS Mobile TeleSystems
NAS National Academy of Sciences
NCIE National Center of Innovation and
Entrepreneurship
NGO Non-governmental Organization
NIS National Innovation System
OECD Organization for Economic Co-operation and
Development
PPP Purchasing Power Parity
QA Quality Assurance
R&D Research and Development
RCA Revealed Comparative Advantages
S&T Science and Technology
SCPEC State Commission for the Protection of
Economic Competition
SCS State Committee of Science
SDS Strategy for the Development of Science
SME DNC Small and Medium Entrepreneurship
Development National Center of Armenia
SME Small and Medium Enterprise
SNCO State Non-Commercial Organizations
STI Science, Technology And Innovation
STIP Science Technology Innovation Partnership
TFP Total Factor Productivity
UNCTAD United Nations Conference on Trade and
Development
UNECE United Nations Economic Commission for
Europe
USAID United States Agency for International
Development
USD United States Dollar
USSR Union of Soviet Socialist Republics
VAT Value Added Tax
WGI World Governance Indicators
YPI Yerevan Physics Institute

iii
Vice President:
Country Director:
Senior Practice Director:
Practice Director:
Practice Manager
Task Team Leader:
Laura Tuck
Henry Kerali
Marcelo Giugale
Satu Kähkönen
Miria Pigato Donato De Rosa

iv
Acknowledgments
This study was prepared by a team initially led by Ulrich Bartsch and then by Donato De Rosa. Several
authors contributed in various ways. Naoko Kojo, Elena Bondarenko, Ekaterina Vostroknutova, Moritz
Meyer and Tigran Kostanyan contributed to Chapter 1. David Gould, Hernan Winkler, Tu Chi Nguyen,
Dobrina Gogova, Georgi Lyudmilov Panterov, Moritz Meyer, Rachel Li Jiang and Artsvi Khachatryan
contributed to Chapter 2. Hania Sahnoun, Pluvia Zuniga, Ekaterina Ushakova, Rachel Li Jiang and Artsvi
Khachatryan contributed to Chapter 3. Pluvia Zuniga, Artsvi Khachatryan and Tigran Kostanyan
contributed to Chapter 4. Jorge Pena, Hania Sahnoun, Moritz Meyer, Rachel Li Jiang, Itzhak Goldberg
and Artsvi Khachatryan contributed to Chapter 5. Pluvia Zuniga and Hania Sahnoun contributed to
Chapter 6. Zakia Nekaien-Nowrouz and Gayane Davtyan provided excellent support to the team.
The Bank’s team benefited from the guidance of Henry Kerali (Country Director, South Caucasus),
Marcelo Giugale (Senior Practice Director, MFM), Satu Kähkönen (Practice Director, MFM), Laura
Bailey (Country Manager, Armenia), Miria Pigato (Practice Manager, MFM), Ivailo Izvorski (Practice
Manager, MFM) and Rashmi Shankar (Program Leader, South Caucasus). Yutaka Yoshino, Mariana
Iootty and Vahram Avanesyan were peer reviewers for the report.

v
Contents
Acknowledgments ........................................................................................................................................................ iv
Overview ....................................................................................................................................................................... 1
Introduction .......................................................................................................................................................... 1 Key Findings ........................................................................................................................................................ 2 The Way Forward: Using Public Policy to Boost Innovation .............................................................................. 5
1. Armenia’s Growth: Past and Future ..................................................................................................................... 8
Slowing Growth in a Changing Economy ............................................................................................................ 9 The Impact of Changing Growth Patterns on Poverty and Shared Prosperity .................................................... 11 Long-Term Drivers of Growth: Domestic Policies And External Conditions .................................................... 13 Conclusion: Drivers of Dynamism ..................................................................................................................... 15
2. Global Connectivity ............................................................................................................................................ 17
Trade ................................................................................................................................................................... 18 Investment .......................................................................................................................................................... 21 Information ......................................................................................................................................................... 24 Labor Mobility ................................................................................................................................................... 28 Leveraging Connectivity .................................................................................................................................... 37
3. The Knowledge Economy .................................................................................................................................. 39
Governance ......................................................................................................................................................... 40 Information and Communication Technology .................................................................................................... 43 Human Capital .................................................................................................................................................... 45 The Creation and Use of Knowledge.................................................................................................................. 48 Leveraging Knowledge....................................................................................................................................... 52
4. The National Innovation System ........................................................................................................................ 54
The Legal and Strategic Framework for Innovation ........................................................................................... 54 Institutions, Funding Mechanisms and Policies ................................................................................................. 57 Toward an Integrated Innovation System ........................................................................................................... 66
5. The Policy Environment ..................................................................................................................................... 67
Productivity ........................................................................................................................................................ 69 International Orientation..................................................................................................................................... 73 Innovation ........................................................................................................................................................... 74 Enterprise Performance and Policy .................................................................................................................... 82
6. Innovation and Dynamism: The Way Forward ................................................................................................... 84
Boosting the Supply of Innovation ..................................................................................................................... 84 Boosting Demand for Innovation ....................................................................................................................... 87 Creating a More Dynamic Armenian Economy ................................................................................................. 90
Annexes ....................................................................................................................................................................... 91
References ................................................................................................................................................................. 110

vi
Figures
Figure 1.1: GDP Growth, 1990-2014 ............................................................................................................. 8 Figure 1.2: GNI Per Capita in Current US$, Atlas Method, 1992-2014 ......................................................... 8 Figure 1.3. Composition of Growth by Expenditure, 2001-2014 ................................................................... 9 Figure 1.4. Composition of Growth by Production, 2001-2014 ..................................................................... 9 Figure 1.5. Moderate and Extreme Poverty Rates, 2001-2014 ......................................................................12 Figure 1.6. Percentage Growth Rate of Mean Consumption among the Bottom 40%, 2007-2013 ...............12 Figure 1.7. Growth Composition by Factor, 1998-2012 ................................................................................13 Figure 1.8. Estimated Growth Effects Arising from Persistence in Growth Patterns, Structural Reforms,
Stabilization Policies, and External Conditions .............................................................................................15 Figure 2.1. Trade-to-GDP Ratio and GDP per Capita, 2011-2013 ................................................................18 Figure 2.2. Trade-to-GDP Ratio, Armenia and Comparators, 2003-2013 .....................................................18 Figure 2.3. Merchandise Exports by Sector, 2011-2013 ...............................................................................18 Figure 2.4. Export Product Concentration .....................................................................................................20 Figure 2.5. Export Market Concentration ......................................................................................................20 Figure 2.6. Armenian Export Destinations, 2012-2014 ................................................................................20 Figure 2.7. FDI as a Share of GDP, 2002-2012 .............................................................................................21 Figure 2.8. FDI as a Share of GDP, Armenia and Compar ...........................................................................21 Figure 2.9. Ten Largest Sources of FDI , 2001-2012 ....................................................................................22 Figure 2.10. Total FDI by Sector, 2003-2015................................................................................................23 Figure 2.11. FDI by Sector, Pre- and Post-Crisis ..........................................................................................23 Figure 2.12. FDI by Source Country and Sector ...........................................................................................24 Figure 2.13. Internet Cost and Speed, Armenia and Comparators, 2013.......................................................25 Figure 2.14. Global Connectivity Based on Outgoing Communications per Capita, 2000 ...........................26 Figure 2.15. Global Connectivity Based on Outgoing Communications per Capita, 2010 ...........................27 Figure 2.16. Armenia’s Major Communications Partners by Share of Total Outgoing Communications ....28 Figure 2.17. Number of Migrants as a Share of the Total Home-Country Population ..................................29 Figure 2.18. Skilled Migrants as a Share of the Total Home-Country Population ........................................30 Figure 2.19. Highly Educated Emigrants as a Share of the Total Highly Educated Population, 1990 and
2010 ...............................................................................................................................................................31 Figure 2.20. Skilled and Unskilled Armenian Migrants by Destination Country, 1990 and 2010 ................31 Figure 2.21. Quarterly Out-Migration, 2009-2013 ........................................................................................32 Figure 2.22. Migrants by Destination, 2009-2013 .........................................................................................32 Figure 2.23. Skill Distribution of Migrants and Non-Migrants Across Countries .........................................33 Figure 2.24. Migrants by Occupation and Destination ..................................................................................33 Figure 2.25. Monthly Wages of Migrants and Non-Migrants .......................................................................33 Figure 2.26. Remittances by Country of Origin, 2010-12, and as a Share of Armenian GDP, 1995-2013 ...34 Figure 2.27. Armenian Migrants in the Private Sector of European Countries .............................................35 Figure 2.28. FDI from Major Armenian Migrant Destinations in Europe .....................................................35 Figure 2.29. Trade Flows, FDI and the Size of the Diaspora, 2000-2010, Conditional Correlations ............36 Figure 2.30. Social and Political Values, Armenia, Russia and the US, 1990 and 2010 ...............................37 Figure 3.1. Armenia’s Performance Across the Six Dimensions of Governance ..........................................41 Figure 3.2. Armenia’s Performance in Governance and Business Regulation ..............................................41 Figure 3.3. Doing Business Areas in 2015 ....................................................................................................42 Figure 3.4. Firms’ Perceptions of the Governance Environment ..................................................................43 Figure 3.5. Web and Email Use by Armenian Firms .....................................................................................45 Figure 3.6. Tertiary Enrollment .....................................................................................................................46 Figure 3.7. Tertiary Graduates in Science and Engineering ..........................................................................46 Figure 3.8. Researchers .................................................................................................................................46

vii
Figure 3.9. R&D Personnel ...........................................................................................................................46 Figure 3.10. Use and Retention of Talent ......................................................................................................47 Figure 3.11. Availability of Skills in the Enterprise Sector ...........................................................................48 Figure 3.12. Gross Expenditures on R&D, 2011 ...........................................................................................49 Figure 3.13. Budgeted and Actual Expenditures on R&D, 2002-2013 .........................................................49 Figure 3.14. Scientific Publications, 2013 .....................................................................................................50 Figure 3.15. Citable Documents 2013 ...........................................................................................................50 Figure 3.16. Quality of Armenian Research: H-Index of Scientific Publications (1996-2013) .....................50 Figure 3.17. Revealed Scientific Advantage –The first 15 Scientific Disciplines (1996-2013) ....................50 Figure 3.18. University-Industry Collaboration ............................................................................................51 Figure 3.19. Patent Applications ...................................................................................................................51 Figure 3.20. Trademark Applications ............................................................................................................51 Figure 4.1. Research Organizations ..............................................................................................................58 Figure 4.2. STI Budget, 2008-2013 ...............................................................................................................61 Figure 4.3. The Evolution of the STI Budget, ...............................................................................................61 Figure 4.4. Composition of the STI Budget by Program, 2008-2013 ............................................................61 Figure 4.5. Execution of the STI Budget by Agency, 2008-2013 .................................................................61 Figure 4.6. The STI Budget by Program, 2013 .............................................................................................62 Figure 4.7. Public Research Spending by Discipline .....................................................................................62 Figure 5.1. Key Obstacles to Doing Business, 2009 and 2013 ......................................................................68 Figure 5.2. Armenia Shows a Wide Dispersion in TFP Across Firms ..........................................................69 Figure 5.3. Determinants of Firm Level Productivity in Armenia.................................................................72 Figure 5.4. Contributions of Policy Variables to the Probability of Exporting .............................................74 Figure 5.5. Contributions of Policy Variables to the Probability of Receiving FDI ......................................74 Figure 5.6. Innovation in the Enterprise Sector .............................................................................................76 Figure 5.7 Average Expenditure on In-House R&D as a Percentage of Annual Turnover ...........................76 Figure 5.8. Contributions of Policy Variables to the Probability of Investing in R&D .................................77 Figure 5.9. Percentage of Firms that Make and/or Buy Knowledge ..............................................................78 Figure 5.10. Product Innovation at the Global Technological Frontier and the Adoption of Existing
Technologies .................................................................................................................................................78 Figure 5.11. Percentage of Firms Engaging in Product and Process Innovation ...........................................79 Figure 5.12. Percentage of Firms Engaging in Organizational or Marketing Innovation ..............................79 Figure 5.13. Percentage of Firms Engaging in Product Innovation by Size and Age ....................................79 Figure 5.14. Percentages of Foreign-Owned and Domestic Firms that Are Engaged in Innovation .............80 Figure 5.15. Foreign-Owned Firms Spend More on Knowledge ..................................................................80 Figure 5.16. Differences Between Innovative and Non-Innovative Firms’ Perception of the Policy
Environment ..................................................................................................................................................80
Tables
Table 1.1. Selected Economic Indicators ......................................................................................................11 Table 2.1. Armenia: Services Exports, 2003-2013 ........................................................................................19 Table 2.2. Armenia’s Revealed Comparative Advantages, 2003 and 2013...................................................19 Table 2.3. Export Growth Decomposition, Intensive and Extensive Margins, 2003-2013 ..........................21 Table 2.4. FDI Inflows Before and After the Crisis ......................................................................................22 Table 2.5. Share of FDI Inflows by Largest Contributor, 2001-2012 ...........................................................22 Table 2.6. Average FDI Stocks by Source Country ......................................................................................23 Table 2.7. Migrants and Labor Migrants by Year .........................................................................................31 Table 3.1. Armenia's Doing Business Performance 2014-2015 ....................................................................42 Table 5.1. Policy Environment and Firm-Level Variables ...........................................................................71

viii
B
Box 1.1. Armenia’s Economic Structure before and after the Crisis .............................................................10 Box 1.2. Contributors to Growth in Post-Communist Economies .................................................................14 Box 2.1. Armenia’s Accession to the Eurasian Economic Union .................................................................37 Box 3.1. The World Governance Indicators ..................................................................................................40 Box 3.2. The Information and Communication Technology Sector in Armenia ...........................................44 Box 4.1. The Three Horizons of the National Innovation Strategy ...............................................................55 Box 4.2. The Enterprise Incubator Foundation (EIF) ....................................................................................57 Box 5.1. The Enterprise Survey and BEEPS V ............................................................................................67 Box 5.2. Innovation in Israel .........................................................................................................................75 Box 5.3. The Views of High-Tech Entrepreneurs on the Quality of Public Governance ..............................81 Box 5.4. The Views of High-Tech Entrepreneurs on the Relationship between Workforce Skills and
Innovation ......................................................................................................................................................82 Box 6.1. Intellectual Property Rights and Innovation: Lessons from the International Experience ..............86

1
Overview
1. Prior to the onset of the global financial crisis in 2008 Armenia experienced an unprecedented 15 years of continuous economic growth driven by major structural reforms. Between 1994 and
2008 the economy grew at an average rate of 9 percent per year, generating a tenfold increase in per
capita income. Growth during this period was highly inclusive, and the poverty rate declined from 67
percent in 2001 to 26 percent in 2008.1
Economic expansion was driven by the construction sector, and
the unemployment rate dropped from 38.4 percent in 2001 to 28.7 percent in 2007.2 A number of key
structural reforms underpinned Armenia’s transition from a centrally planned economy to a competitive
market, including the elimination of price controls, the liberalization of trade and investment policies, the
privatization of asset ownership, and the restructuring of state-owned industries. Despite the tumult of the
early transition these reforms ultimately contributed to a dramatic and sustained increase in the
productivity and efficiency of the Armenian economy.
2. Armenia was hit hard by the global financial crisis; its recovery has been moderate, and the drivers of growth have shifted. Growth slowed from nearly 14 percent in 2007 to less than 7 percent in
2008, then plunged to - 14 percent in 2009. Between 2010 and 2014 the economy rebounded at an
average rate of 4.2 percent a year, a modest pace compared with its pre-crisis performance. A
combination of domestic consumption supported by large remittance inflows and mineral exports
bolstered by high international commodity prices has fuelled post-crisis growth. The poverty rate has also
risen in the wake of the crisis and is currently estimated at over 30 percent.
3. Armenia’s pre-crisis growth model was predicated on an economic restructuring process which—while highly beneficial—was incomplete, and significant structural rigidities were left unaddressed. The liberalization of the 1990s facilitated an economy-wide reallocation of productive
factors, greatly increasing the efficiency of both the public and private sectors. However, the crisis
revealed serious unresolved weaknesses in economic governance and a lack of competition in critical
industries. Returning the economy to a high-growth trajectory will require further structural reforms
designed to incentivize investment, spur innovation and accelerate the growth of total factor productivity.
4. The objective of this report is to facilitate a productive policy dialogue in support of Armenia’s efforts to build a more dynamic economy capable of thriving in an increasingly knowledge-driven global marketplace. The report supports the objectives of the Armenian government’s national
development strategy, which focuses on economic versatility and robust job creation. While Armenia
faces a complex set of macroeconomic challenges, this report will concentrate on a select number of
issues crucial to the creation of a more open, adaptable and resilient economy.
5. Armenia’s medium-term outlook is complicated by a mix of adverse domestic and external factors, but there is reason for cautious optimism. Despite its considerable progress over the past two
decades Armenia is still struggling to free itself from the vestiges of central planning. As the period of
macroeconomic adjustment following the global financial crisis comes to a close the authorities are
1 Calculated according to the international poverty line of US$2.50 per day in purchasing-power parity terms. 2 Since 2008 the indicators are not comparable with the data of previous years. The number of unemployed has been
calculated by the NSS of RA since 2008 based on the ILO standard definition used by EU countries. The later
partially differs from the methodology used in 2001-2007, which is based on the expanded definition of
unemployment recommended by the ILO for use in transition countries.
2
renewing their efforts to build a sophisticated modern economy based on human-capital accumulation and
technological innovation. Recognizing that Armenia is at a critical juncture in its development, this report
identifies a number of reforms designed to increase competitiveness on both the supply and demand sides
of the economy.
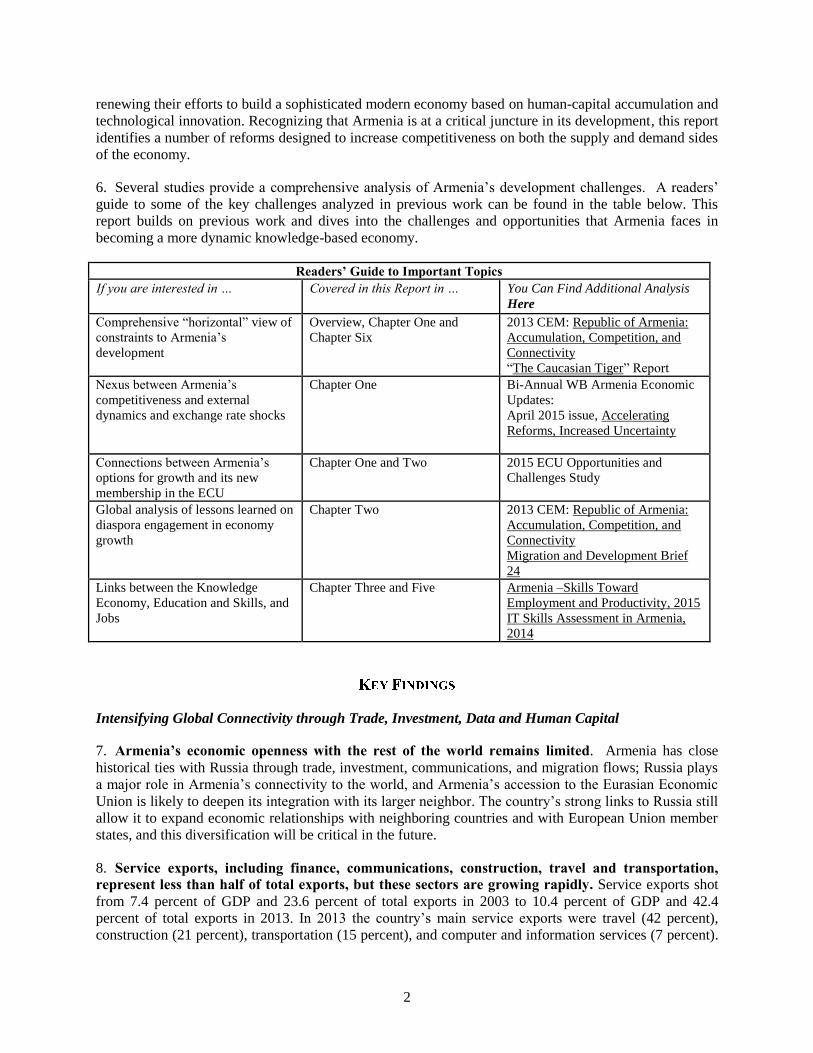
6. Several studies provide a comprehensive analysis of Armenia’s development challenges. A readers’
guide to some of the key challenges analyzed in previous work can be found in the table below. This
report builds on previous work and dives into the challenges and opportunities that Armenia faces in
becoming a more dynamic knowledge-based economy.
Readers’ Guide to Important Topics If you are interested in … Covered in this Report in … You Can Find Additional Analysis
Here
Comprehensive “horizontal” view of
constraints to Armenia’s
development
Overview, Chapter One and
Chapter Six
2013 CEM: Republic of Armenia:
Accumulation, Competition, and
Connectivity
“The Caucasian Tiger” Report
Nexus between Armenia’s
competitiveness and external
dynamics and exchange rate shocks
Chapter One Bi-Annual WB Armenia Economic
Updates:
April 2015 issue, Accelerating
Reforms, Increased Uncertainty
Connections between Armenia’s
options for growth and its new
membership in the ECU
Chapter One and Two 2015 ECU Opportunities and
Challenges Study
Global analysis of lessons learned on
diaspora engagement in economy
growth
Chapter Two 2013 CEM: Republic of Armenia:
Accumulation, Competition, and
Connectivity
Migration and Development Brief
24
Links between the Knowledge
Economy, Education and Skills, and
Jobs
Chapter Three and Five Armenia –Skills Toward
Employment and Productivity, 2015
IT Skills Assessment in Armenia,
2014
Intensifying Global Connectivity through Trade, Investment, Data and Human Capital
7. Armenia’s economic openness with the rest of the world remains limited. Armenia has close
historical ties with Russia through trade, investment, communications, and migration flows; Russia plays
a major role in Armenia’s connectivity to the world, and Armenia’s accession to the Eurasian Economic
Union is likely to deepen its integration with its larger neighbor. The country’s strong links to Russia still
allow it to expand economic relationships with neighboring countries and with European Union member
states, and this diversification will be critical in the future.
8. Service exports, including finance, communications, construction, travel and transportation, represent less than half of total exports, but these sectors are growing rapidly. Service exports shot
from 7.4 percent of GDP and 23.6 percent of total exports in 2003 to 10.4 percent of GDP and 42.4
percent of total exports in 2013. In 2013 the country’s main service exports were travel (42 percent),
construction (21 percent), transportation (15 percent), and computer and information services (7 percent).

3
Meanwhile, merchandise exports are heavily concentrated in mining commodities and food and beverage
products, which together make up over 90 percent of merchandise exports.
9. Large foreign investment inflows have helped increase domestic competition and reorient certain sectors toward export markets. FDI in Armenia has averaged around 5 percent of GDP, the
bulk of which has gone to the financial sector, telecommunications and mining. Russia is the country’s
largest foreign investor by far. Foreign investment in finance and telecoms has focused on domestic
markets, while FDI in the mining sector has boosted exports. The information and communications
technology (ICT) sector has attracted both domestic and export-oriented investment projects.
10. Exporters and foreign-owned firms tend to perform better than purely domestic firms. Exporters
have greater financial resources, make more use of ICT, have better access to infrastructure, are more
integrated with import markets, and are more productive overall. Foreign-owned firms and firms with
substantial foreign shareholders are more productive than domestic firms and are able to attract or train
more highly skilled workers. Improving the policy framework for FDI and exports would encourage the
entry of additional foreign firms and accelerate productivity spillovers.
11. Armenian firms spend only 0.1 percent of their annual turnover on research and development, well below the average for regional comparators. Most innovation takes place in older and larger firms
and in firms with foreign ownership. The climate for small domestic startups is generally inhospitable,
especially in the manufacturing sector. Weaknesses in the policy and institutional environment, corruption
and limited workforce capacity represent binding constraints on the development of innovative firms.
12. Broadband internet and mobile telecom coverage has expanded significantly since 2010. About
46 percent of Armenia’s population has internet access, in line with comparable countries, and the cost of
connecting is relatively low. Armenia’s internet providers depend heavily on Russian infrastructure, and
this connectivity facilitates the tight trade and investment links between the two countries. Expanding
digital access is crucial to overcoming Armenia’s geographic isolation and fostering the growth of
information-driven industries.
13. Armenia’s large diaspora community is increasingly important to its economic development. In
recent years an estimated 600,000 Armenian emigrants have generated remittances totaling between 15
and 20 percent of GDP. Remittances are crucial to alleviating poverty, but emigration has also reduced
the country’s stock of human capital as emigrants tend to be relatively highly skilled. Armenia’s diaspora
has not leveraged its full potential as a conduit for trade and investment flows; nevertheless, many
Armenian emigrants are highly successful, and there are a number of prominent examples of productive
cooperation in workforce skills and business development. In addition, large private transfers from the
diaspora to finance public projects and NGO activities indicate a strong degree of commitment to the
country’s future. Though often generating important and highly visible results at the local level, these
remain isolated initiatives. Armenia has not yet capitalized on the opportunities presented by the diaspora
to stimulate trade, investment and human-capital formation.
Building a Knowledge-Based Economy
14. Armenia is striving to build a knowledge-based economy. The development of sophisticated,
information-driven industries requires a foundation of sound governance, modern ICT infrastructure,
adequate human capital and effective protection of intellectual property. A country’s policy and
institutional environment shapes the incentives of knowledge creators and users, with important
economy-wide spillover effects. Armenia has made substantial progress in laying the groundwork for a
knowledge-based economy, particularly by improving regulatory efficiency. The country performs well
on most business-climate indicators, and in recent years it has ranked among the top third of countries in

4
the Doing Business report. However, Armenia’s governance environment does not match its business
climate; its score on the World Governance Indicators is worse than in 60 percent of countries worldwide,
and it performs especially poorly against European comparators. While the country’s governance
framework is generally adequate in principle, in practice its public institutions are weak and susceptible to
undue influence, and official rules and regulations are poorly enforced. Efforts to improve the regulatory
framework must therefore be accompanied by changes in behavioral norms in the public administration
underpinned by a stronger focus on transparency and accountability.
15. ICT use remains limited. In recent years the production of ICT goods and services has begun to
occupy a small but significant role in the Armenian economy. In 2014 the sector employed 11,600 people
and accounted for 4.4 percent of GDP and 4.6 percent of total goods and services exports. However, the
sector is largely focused on the export market, which limits its contact with public institutions, and its
domestic presence is shallow. Yet the experience of more developed countries has shown that the
diffusion of ICT to other sectors of the domestic economy is critical to sustaining productivity growth. In
Armenia ICT remains limited to basic functions, and local internet content and e-commerce systems are
underdeveloped. Consequently, ICT is having no observable spillover effect on the productivity of more
traditional economic sectors.
16. The supply of workers with advanced qualifications in science and engineering is small and persistently diminished by emigration, and Armenian enterprises are generally reluctant to invest in workers’ skills. Human capital was one of the country’s greatest strengths during the Soviet period,
but it has been severely depleted since Armenia transitioned to a market economy. Armenia lags behind
its peers in educational achievement, with a tertiary enrollment rate of 46 percent in 2014, far below the
OECD average of 71 percent and the Russian rate of 76 percent. Only 15.9 percent of tertiary graduates
complete degrees in science or engineering, and just 16 percent of Armenian enterprises invest in
workforce skills through on-the-job training.
17. Despite low rates of public and private investment the quality of Armenia’s scientific output is relatively high. Research and development (R&D) intensity, defined as gross domestic expenditure on
R&D as a share of GDP, decreased from 2.5 percent in 1990 to a mere 0.27 percent in 2009, and it has
remained at similar levels ever since. Armenian firms tend not to collaborate with Armenian researchers
due to the theoretical focus of many research projects, the low administrative capacity of academic
institutions, and a lack of market incentives for firms to seek scientific and technological support.
Nevertheless, Armenian researchers continue to produce world-class scientific publications.
18. Armenia is gradually developing a national innovation system. A national innovation system is
the set of institutions, policies and funding arrangements that drive the creation and use of knowledge.
The government has strengthened the legal and regulatory framework for science, technology and
innovation (STI) and adopted a national science policy as well as ancillary policies designed to encourage
innovation in the business sector. However, the government’s STI agenda is still in its early stages, and at
present the linkages between public polices, academic institutions and private firms continue to be
undermined by regulatory gaps, administrative and scientific capacity constraints, and a lack of market
demand.
19. While the authorities have formulated an appropriate strategic framework to support the development of a knowledge-based economy, implementation remains a serious challenge. Better
coordination between the Ministry of Education and the Ministry of Economy could enable the
government to craft industrial policies that more effectively promote innovation. Developing monitoring
and evaluation frameworks that include specific quantitative targets, well-defined actions and dedicated
financing mechanisms would help ensure that individual initiatives are properly aligned with the
government’s broader strategic objectives. Finally, the public STI budget amounts to just 1.2 percent of

5
total expenditures and is heavily focused on basic research. Increasing public STI funding and broadening
its orientation to include market-ready technologies designed to increase economic efficiency could
greatly accelerate the expansion of traditional sectors.
20. Armenia’s policy environment does not allow competitive pressures to enforce firm-level efficiency. The result is that relatively efficient firms coexist alongside inefficient competitors without the
latter being forced from the market. This heterogeneous distribution of productivity across firms is due in
part to a legacy of central planning and in part to weaknesses in the current policy environment. Indeed,
policy factors are estimated to account for 36 percent of the variation in firm-level productivity in
Armenia, a higher share than in any comparable country. Among these, the overall quality of governance
and the availability of skilled workers have the largest impact on firm-level productivity. While formal
regulations are adequate, mechanisms for implementation and enforcement are lacking. The insufficient
supply of highly educated workers and limited training efforts by firms themselves account for an
additional 22 percent of productivity variation.
21. Armenia has begun to elaborate a national strategic vision supporting the development of knowledge-based industries. However, much work remains in terms of defining priorities, establishing
funding arrangements, creating implementation mechanisms, and ensuring that the realities of the private
sector accurately reflect the design of public policies. In this context policymakers should consider the
following measures:
Creating a national innovation council comprising both public and private stakeholders. Establishing a forum for dialogue on innovation would promote better alignment of public and
private interests, enable the rapid incorporation of feedback into new policy initiatives, facilitate
effective monitoring, evaluation and oversight of STI-related programs, and support the
implementation of joint innovation and technology agendas.
Refocusing public R&D towards applied research. This would help better connect public
research organizations with the national economy and promote projects that generate tangible
economic benefits.
Increasing funding for public R&D in line with the objectives of the government’s national science strategy. An increase in the public science budget should also include funding for
graduate schools in science and engineering and support new master’s, doctoral and post-doctoral
programs.
Implementing monitoring and evaluation frameworks for all publicly funded science and technology programs and conducting impact evaluations for selected programs. Impact
evaluations could be quasi-experimental in cases where data were available over a sufficient
timespan. Experimental approaches could also be considered for new initiatives and pilot
programs. This would allow policymakers to assess the potential impact of programs and improve
their design.
Revising the legal framework for protecting rights to intellectual property generated by publicly funded research. Intellectual property rights should be based on international best
practices, and incentives to create new forms of intellectual property should be consistent with the
ways in which researchers and academic organizations are evaluated and financed.

6
Supporting the commercialization of new technologies through the creation of dedicated market platforms. Establishing formal systems to disseminate new technologies to the private
sector would help to mobilize existing knowledge and create a marketplace for innovation.
Strengthening incentives for scientific collaboration with the diaspora community. The
government could explore multiple avenues for accessing the skills, resources and professional
networks of Armenian scientists abroad.
Adopting international standards for evaluating R&D and private-sector innovation. The
OECD and Eurostat Oslo Manual for Innovation and the OECD R&D Frascati Manual provide a
sound methodology for assessing the development of the STI sector and situating Armenia’s
progress in an international context.
Analyzing the prospective benefits of new technologies and the feasibility of implementing them. These analyses would identify opportunities for innovation in sectors with a high impact
on economic and social development.
22. The preceding recommendations deal with the supply of scientific research and technological innovation, but a number of key demand-side factors also inhibit the development of a knowledge-based economy. Surveys and interviews reveal that the concentration of power among a relatively small
political-economic elite is widely perceived to constrain investment and stifle innovation. There is
evidence that economic power is unbalanced, that political connections allow certain firms to obtain
favorable treatment, and that political ties combine with concentrated markets to suppress economic
competition. This can result in higher prices, less foreign or domestic investment, lower overall growth
and fewer professional opportunities for individuals and firms. To reverse these perceptions, the supply-
side reforms listed above should be complemented by demand-side measures, which could include:
Enactment of a Tax Code. Consolidating tax policies and tax-administration principles across
government agencies would increase the transparency of the tax system and promote internal
consistency. This in turn would allow for expansion of the tax base and rationalization of the tax
regime. Eliminating loopholes in the tax legislation would help to ensure the equal treatment of
all taxpayers.
Increasing firm-level disclosure requirements. Recent reforms to Armenia’s accounting rules
require greater disclosure of firm-level information, paving the way for adoption of International
Financial Reporting Standards (IFRS). Efforts are underway to strengthen state control of audit
firms, including the establishment of a supervisory audit inspector and new rules mandating
financial audits for large firms. However, auditors and regulators lack the capacity to enforce
IFRS, and the financial statements of many Armenian firms do not yet meet these standards.
Public access to financial statements remains limited, and those that are available are rarely
presented in a user-friendly format. Increasing access to non-financial information, such as
ownership structures and investor rights, would further bolster private-sector transparency.
Strengthening conflict-of-interest regulations. Government officials must disclose potential
conflicts of interest in order to safeguard the integrity of the public administration. Transparency
requirements, institutional arrangements and enforcement mechanisms could all be strengthened
by consistent implementation of the 2011 Law on Public Service, the provisions of which include
online publication of conflict-of-interest declarations, which would greatly facilitate public
accountability.

7
Enhancing the legal framework for economic competition. The current legislation does not
clearly define economic entities or establish a methodology for identifying anticompetitive
agreements and market dominance. Reform measures could reaffirm the investigative powers of
oversight agencies and rationalize the criteria for imposing penalties. The State Commission for
the Protection of Economic Competition (SCPEC) should broaden its focus beyond price
fluctuations and concentrate on eliminating actual and potential barriers to entry and competition.
Greater attention to prevailing market conditions would allow the authorities to focus on sectors
that are more prone to restrictive practices.
Reinforcing intra-governmental accountability to stop anticompetitive policy interventions. Strengthening the SCPEC's advocacy mandate would help it to identify and eliminate distortive
policies. The SCPEC could play a pivotal role in bringing potentially anticompetitive regulations
to the attention of other government agencies as well as the general public.
Reforming the rules for providing public support to specific firms and sectors. The
introduction of a comprehensive state-aid framework would eliminate distortions, remove barriers
to entry and level the playing field for Armenian firms. Stricter rules for public support would
help redirect resources to economy-wide objectives and discourage anticompetitive patronage.
Completing a comprehensive catalogue of all state-aid programs would represent a crucial step
toward ensuring transparency and accountability in the use of public funds.
.

8
The Armenian economy grew rapidly from 1994 to 2008, generating a tenfold-increase in income per
capita and yielding dramatic improvements in poverty indicators. However, the impact of the 2009 global
financial crisis caused output to contract by more than 14 percent. Post-crisis growth has been moderate,
and earlier gains in poverty reduction have been partially reversed. The composition of growth shifted in
the wake of the crisis. Whereas growth had previously been driven by consumption and investment and
led by the construction sector, after 2009 the construction sector shrank dramatically, and the
agricultural and service sectors led the recovery. Although the pre-crisis period was marked by a positive
global economic environment, increases in domestic productivity made a larger contribution to growth
than external conditions. As Armenia strives to accelerate growth in the post-crisis period, a renewed
focus on domestic production efficiency will both increase output and reinforce macroeconomic
resilience.
1.1. Prior to the global financial crisis Armenia experienced a period of unprecedented economic growth that lasted for almost 15 years. Between 1994 and 2008 the economy continuously expanded at
an average rate of 9 percent per year, and per capita income rose tenfold (see Figure 1.1 and Figure 1.2).3
Moreover, GDP growth accelerated in the run-up to the crisis, averaging over 13 percent during 2002-07.
1.2. Armenia was hit hard by the global financial crisis, and recent growth has been modest compared with the pre-crisis period. The growth rate dropped from nearly 14 percent in 2007 to less
than 7 percent in 2008, and the economy contracted by 14 percent in 2009. Despite a steady recovery
during 2010-12, recent growth has been subdued. Between 2010 and 2014 the economy expanded by an
average rate of 4.2 percent a year, reasonably strong in global terms but far below its pre-crisis average.
Figure 1.1: GDP Growth, 1990-2014
Figure 1.2: GNI Per Capita in Current US$, Atlas Method, 1992-2014
Source: WDI.
1.3. Armenia may now be facing a long period of modest and uneven global economic growth, an external environment that IMF Managing Director Christine Lagarde has termed the “new mediocre.”4 Both global and regional growth are expected to slow over the medium term, with
downward trends projected for trade volumes, capital flows and commodity prices. In order to sustain its
3 GNI per capita in current US dollars, Atlas method.
4 “Lift Growth Today, Tomorrow, Together” a speech by Christine Lagarde at the Atlantic Council, April 9, 2015.
https://www.imf.org/external/np/speeches/2015/040915.htm.
-50.0
-40.0
-30.0
-20.0
-10.0
0.0
10.0
20.0
0
500
1000
1500
2000
2500
3000
3500
4000
4500

9
recovery Armenia will have to adapt to this new international context. Meeting this challenge will require
increasing domestic productivity in the absence of strong export demand while also building
macroeconomic resilience against external shocks. In this difficult context Armenia’s economic
dynamism—its ability to rapidly adapt to new conditions, exploit emerging opportunities, progressively
diversify the drivers of growth and respond effectively to unpredictable downturns—will be central to its
success.
1.4. This chapter lays the groundwork for an analysis of economic dynamism by examining Armenia’s recent economic performance, evaluating its impact on household welfare, and assessing the country’s medium-term growth prospects. Each of the next three sections addresses a key research
question, while the fourth and final section summarizes the conclusions and introduces the following
chapters. The three questions for this chapter are:
How is the evolving structure of the Armenian economy affecting its growth trajectory?
How has the country’s slowing growth rate affected poverty and shared prosperity?
What roles have domestic and external conditions played in Armenia’s recent growth?
1.5. As the economy accelerated in the pre-crisis period private consumption and investment became increasingly critical to growth. During 2001-08 private consumption and investment grew at
annual average rates of 8.5 percent and 22.3 percent, respectively, up from 5.9 percent and 5.2 percent
during 1996-2001 (Figure 1.3). The construction sector accounted for the bulk of capital formation during
this period. The trade balance was deeply negative as import demand far outstripped exports.
Figure 1.3. Composition of Growth by Expenditure, 2001-2014
(in percentage points and shares of GDP)
Figure 1.4. Composition of Growth by Production, 2001-2014
(in percentage points)
Source: NSS.
1.6. The composition of growth shifted dramatically in the years following the crisis. Investment
contracted sharply in the post-crisis period, and although private consumption swiftly recovered, its
contribution to growth has been far more modest. Indeed, consumption has diminished further since 2013
due to a decline in remittance inflows. Meanwhile, net exports have made a positive contribution to
growth in the post-crisis period, as import growth has fallen and high prices for mining-sector
commodities have boosted export values.
-5.0
0.0
5.0
10.0
15.0
20.0
2001-2008 2010-2014
Net exports Private consumption
Public consumption Investments
Real GDP growth -10.0
0.0
10.0
20.0
2001-2008 2010-2014
Net indirect taxesServicesConstructionElectricity, gas, steam, water and air conditioning supplyManufacturingMining and quarryingAgricultureReal GDP growth

10
1.7. Growth slowed as the economy adjusted to the post-crisis environment. The collapse of the
construction sector prompted a major supply-side shift, as construction’s share in GDP growth dropped
from 2.5 percent per year over 2001-2008 to -0.7 percent in 2010-2014. Growth during the post-crisis
recovery was less robust, but it was driven by a more balanced combination of industry, services and
agriculture. However, unpredictable commodity prices and weakening external demand among Armenia’s
major trading partners, Russia and the EU, caused the mining and industrial sectors to slow in 2014,
though services and agriculture have continued to register modest growth (Figure 1.4).
Box 1.1. Armenia’s Economic Structure before and after the Crisis
Armenia’s economic liberalization in the 1990s facilitated its transition away from industry and toward services,
while agriculture remained broadly stable. After 2009 the share of services in GDP continued to climb, rising
from 45 percent in 2008 to 53 percent in 2014. Meanwhile, the share of agriculture rose from 16 percent to 19
percent, and the sector continued to employ close to 40 percent of the labor force. Utilities modestly increased
their share of GDP, while the mining and manufacturing sectors remained broadly stable. Extractive industries
and metallurgical products now constitute over two-thirds of total exports, and the diamond-processing and
jewelry industries represent 2 percent of total manufacturing. Underpinning all of these trends was the dramatic
decline of the construction sector, which fell from 25 percent of GDP in 2008 to just 9 percent in 2014.
Armenia’s GDP Composition
Source: Armenia National Statistical Services, staff calculations.
1.8. Armenia’s short- and medium-term outlook is uncertain and complicated by a worsening external environment. Global growth is projected to remain sluggish, averaging about 3.3 percent
through 2017. Russia and the EU together account for half of Armenia’s total exports, and weak demand
by key trading partners is likely to constrain the growth of Armenian exports. Russia’s economic
difficulties, if they continue, could have an especially severe impact on Armenia. Russia is the destination
for close to 25 percent of Armenia’s exports; it is also the source of 40 percent of its foreign direct
investment (FDI) and at least 70 percent of its remittance inflows. Falling global prices for base metals,
which comprise half of Armenia’s export basket, are further undermining the country’s external position.
1.9. Armenia’s capacity to counter external shocks is limited. Tighter monetary policies, a
deteriorating fiscal outlook and a rising debt burden have constrained the government’s ability to mount
an effective policy response over the near term. The Armenian dram depreciated by 17 percent against the
US dollar in 2014, following the downward trend of the Russian ruble. In an effort to slow depreciation
and mitigate inflationary pressures the Central Bank of Armenia (CBA) raised the policy rate to a 13-year
45 51 50 50 51 53 54
16 17 17 20 19 19 19 2
2 3 3 3 2 2 25
19 17 13 12 11 9
3 3 3 4 4 5 5
9 9 10 11 10 10 10
0
20
40
60
80
100
2008 2009 2010 2011 2012 2013 2014
% G
DP
Services Agriculture Mining Construction Electricity, gas, and water Manufacturing

11
high of 10.5 percent in 2015. Though largely successful in achieving its immediate objectives, this move
sharply limited the government’s ability to use monetary stimulus policies. A fiscal impulse launched in
2009 to counter the effects of the global financial crisis exhausted the country’s fiscal buffers, and the
still-diminished fiscal envelope has curbed the government’s latitude for a future countercyclical
response. Finally, a recent US$500 million Eurobond issue has brought the stock debt close to its
statutory ceiling of 50 percent of GDP, reducing any potential recourse to deficit spending.
Table 1.1. Selected Economic Indicators
Sources: National Statistical Service of Armenia, Ministry of Finance of Armenia, Central Bank of Armenia, World Bank staff
calculations.
1.10. Armenia’s robust growth in the pre-crisis period generated major improvements in poverty indicators. The shares of the population in moderate and extreme poverty both fell sharply between the
mid-1990s and late-2000s (Figure 1.5). The moderate poverty rate fell from 92 percent in 2001 to 76
percent in 2008, while the extreme poverty rate dropped from 67 percent to 26 percent over the same
period.4 These figures are based on World Bank estimates, but national statistics present a similar picture.
1.11. Pre-crisis growth was highly inclusive. The World Bank’s key indicator of shared prosperity is
the growth rate of mean consumption among the bottom 40 percent of the welfare distribution. According
to this metric growth in the early 2000s economic growth substantially benefited the poor and vulnerable.
4 For the purposes of this analysis the moderate poverty line is defined as US$5 per day in purchasing-power parity terms, and
the extreme poverty line is set at US$2.50 per day.
Projections
2009 2010 2011 2012 2013 2014 2015 2016 2017Income and pricesReal GDP (annual percentage change) -14.1 2.2 4.7 7.2 3.5 3.4 0.8 2.7 3.0
GDP (current US$, billions) 8.6 9.3 10.1 10.0 10.4 10.9 9.7 10.1 10.8
GNI Per Capita (US$) Atlas 3,240 3,370 3,430 3,710 3,830 3,810 3,650 3,630 3,610
CPI (annual percentage change, end of period) 3.4 8.1 7.5 2.5 5.8 3.0 4.5 4.0 4.0
Investment and saving Gross Investment 34.7 32.9 27.3 25.4 21.7 19.8 19.2 19.9 20.5
Public 7.0 5.5 4.7 3.3 3.0 3.0 2.1 2.4 2.6
Private 27.6 27.3 22.6 22.1 18.7 16.8 17.1 17.5 17.9
Private Consumption (annual percentage change) -4.4 3.8 2.9 9.1 0.9 0.4 2.1 3.4 1.6
Fiscal operationsRevenue (incl. grants) 21.5 21.9 22.7 23.0 24.5 24.7 25.0 24.7 25.0
Expenditure 29.1 26.9 25.5 24.5 26.2 26.7 27.6 26.7 26.9
Current 22.4 21.4 20.9 21.3 23.2 23.7 25.0 24.4 24.3
Capital 7.0 5.5 4.7 3.3 3.0 3.0 2.5 2.4 2.6
Overall Fiscal Balance (incl. grants) -7.6 -5.0 -2.8 -1.5 -1.7 -2.0 -2.6 -2.1 -1.9
Primary Fiscal Balance -7.1 -4.1 -1.9 -0.5 -0.6 -0.6 -0.8 -0.5 -0.3
Total Public Debt 40.4 40.0 42.2 44.6 43.9 47.6 52.4 52.6 53.5
External Public Debt 35.7 34.7 36.4 37.7 37.0 40.1 44.2 44.4 43.8
Debt Service (in percent of revenue, incl. grants) 5.3 6.5 7.0 13.0 36.2 14.3 19.6 12.6 13.2
External sectorExports (annual percentage change) -22.4 44.6 24.9 3.5 7.0 20.6 6.2 4.2 7.5
Import (annual percentage change) -23.1 13.9 8.0 2.2 2.6 10.7 0.1 3.5 4.4
Current Account Balance (in percent of GDP) -18 -14 -11 -11 -8 -8 -10 -9 -9
External debt (in percent of GDP) 54 61 64 67 75 63 71 69 64
Public Debt Service Ratio (in percent of exports goods and nfs) 7 7 6 12 34 10 13 9 9
Nominal Exchange Rate (LCU/US$, end of period) 378 363 386 404 406 475 499 501 504
Real Effective Exchange Rate Index (1997=100) 129 129 128 122 124 126 128 130 132
(in percent of GDP, unless otherwise indicated)
(in percent of GDP, unless otherwise indicated)

12
Prior to the crisis, the annual growth rate of mean consumption among the bottom 40 percent was 4.3
percent, significantly above the national average of 3.5 percent (Figure 1.6).
1.12. Poverty indicators deteriorated after the crisis, and despite the modest recovery poverty rates have not yet returned to their 2008 levels. Extreme poverty rose from 26 percent in 2008 to a post-crisis
peak of 36 percent before stabilizing at just over 30 percent from 2012 through 2014. Rural and urban
areas both experienced similar poverty trends, though poverty rates remain lowest in the capital city of
Yerevan (25.6 percent) and highest in rural areas (31.1 percent). Between 2008 and 2009 poverty in
Yerevan increased dramatically from 20.1 percent to 26.7 percent before declining slightly to 25.6 percent
in 2013, with corresponding patterns observed in smaller cities and rural areas.
Figure 1.5. Moderate and Extreme Poverty Rates, 2001-2014
Figure 1.6. Percentage Growth Rate of Mean Consumption among the Bottom 40%, 2007-2013
Source: World Bank. Source: World Bank Armenia Poverty Assessment 2015, based
on data from the Integrated Living Conditions Survey.
1.13. Inequality has also increased since 2008. The impact of the crisis and the sluggish recovery have
undermined previous gains in shared prosperity. The economic contraction of 2009 hit the bottom 40
percent especially hard; their consumption fell by 7.5 percent in a single year, a significantly larger drop
than the 5.5 percent experienced by the economy as a whole. Between 2010 and 2013 the average
consumption of the bottom 40 percent grew by 2.1 percent, well below the 3 percent rate for the total
population. Moreover, recent growth has been increasingly unbalanced, and between 2012 and 2013
consumption among the bottom 40 percent fell by 0.34 percent, even though the total population saw its
average consumption increase by 2 percent (Figure 1.6).
1.14. The unemployment rate rose in 2014 as migrant workers returned from Russia. Both during
and after the financial crisis emigration mitigated pressure on the domestic labor market, and
unemployment remained more or less stable even as the economy struggled. However, the economic
slowdown in Russia has prompted a large number of Armenian workers to return home, pushing the
unemployment rate from 16.2 percent in 2013 to 17.6 percent in 2014.
1.15. A combination of slowing economic growth, rising unemployment and declining remittances could have a deeply negative impact on poverty. If current trends continue, income and consumption
growth among the poor and vulnerable are likely to deteriorate, and the government’s capacity to mitigate
these effects through fiscal stabilization and antipoverty policies is limited. The replacement of
unemployment benefits with active labor market policies implies that there will be no direct support to the
transitory poor. Existing safety nets have relatively low coverage and will not be sufficient to compensate
for projected income losses, especially if the trends described above persist through the medium term.
91.7
76.1
84.5 78.1
67.1
26.0
35.9
30.2
0
10
20
30
40
50
60
70
80
90
100
US$5 per day
US$2.5 per day
1.70
3.50
-5.48
3.00 2.15
1.14
4.29
-7.46
2.11
-0.34
-10
-8
-6
-4
-2
0
2
4
6
2007 - 2013 2007 - 2009 2009 - 2010 2010 - 2013 2012 - 2013
all bottom 40

13
1.16. In an environment marked by slow and uneven global growth, tightening external financing constraints, falling commodity prices, and an uncertain outlook for its major trading partners, fostering more robust and inclusive growth poses a serious challenge for Armenian policymakers. The country’s economic prospects are further complicated by the unpredictable effects of intensifying
regional integration within the Eurasian Economic Union (EEU). In this context understanding the factors
that drive Armenia’s long-run growth trajectory will be vital to maintaining sound macroeconomic
management and advancing the country’s development objectives.
Figure 1.7. Growth Composition by Factor, 1998-2012
Source: Conference Board, 2014.
Note: Capital includes non-ICT assets (transport equipment, plants, machinery, other equipment, and construction, buildings
and other structures).
1.17. Efficiency gains were the main driver of Armenia’s rapid expansion in the 1990s and early 2000s, but the potential for further efficiency improvements is now largely exhausted. At the start of
its transition Armenia, like its regional neighbors, had low levels of total factor productivity (TFP) due to
the inefficient allocation of resources under central planning. Following the shift to a market economy in
the early 1990s TFP became the main contributor to economic growth (Figure 1.7), as labor and capital
were redeployed to more productive sectors and private-sector competition increased firm-level
efficiency. Over time, however, efficiency gains began to yield diminishing returns, and capital
accumulation assumed a larger role in increasing productivity. Labor’s contribution to growth has been
almost negligible, as large numbers of Armenia workers have sought employment abroad. Labor force
participation bottomed out at 59 percent in 2007-09 and has risen only modestly in the years since,
reaching 63 percent in 2013.
1.18. Structural reforms have positively influenced Armenia’s growth, but like improvements in TFP the impact of an enhanced policy framework has diminished over time. Regression analysis
indicates that the Armenian economy has benefited from structural reforms, which yielded an important
increase in domestic credit to the private sector, as well as promoting better institutional quality and
facilitating infrastructure development. Structural factors contributed 1.6 percentage points to GDP
growth during 2000-10 and about 1.2 percentage points during 2005-10 (Figure 1.8A). Improved
stabilization policies also contributed to growth, but to a smaller extent. Persistence in growth patterns
played an important role in boosting output, especially in the 2010s, while inadequate stabilization
policies undermined growth. While structural factors were a major driver of Armenia’s robust expansion
in the 2000s, by the 2010s their contribution to annual GDP growth had fallen to an average of just 0.4
percentage points.
-20
-15
-10
-5
0
5
10
15
20
25
1998 1999 2000 2001 2002 2003 2004 2005 2006 2007 2008 2009 2010 2011 2012
Per
cen
t
Labor Capital Total Factor Productivity GDP Growth

14
Box 1.2. Contributors to Growth in Post-Communist Economies
In most former Soviet republics structural policies played a major role in economic growth during the late 1990s
and 2000s, reflecting the radical institutional transformation that followed the collapse of central planning.
Structural reforms contributed an average of about 70 percent to per capita GDP growth over the period. In some
countries growth was led by an increase in domestic credit to the private sector (Armenia, Azerbaijan, Georgia,
Kazakhstan and Russia), while rising government consumption was the driving force in others (Belarus,
Kyrgyzstan and Moldova). Resource-rich countries such as Kazakhstan and Russia also benefited from favorable
external conditions, especially high oil, gas and mineral prices.
The Estimated Growth Contributions of Persistence in Growth Patterns, Structural Reforms, Stabilization Policies and External Conditions in Former Soviet Republics, 2000-10
Source: World Bank staff calculations based on Araujo et al., 2014.
Note: “The 2000s”: Avg. [2006-2010] – Avg. [1996-2000] = 2010-2000. See Annex 1.
1.19. Reform momentum has slowed since the 2000s, and the authorities have made limited progress in addressing a number of key structural obstacles. Since the launch of the structural reform
agenda in the mid-1990s the role of private markets has rapidly expanded, while the public sector’s
growth has been contained. Market-liberalization policies have been adopted to ensure free price
formation, promote trade and investment openness, protect and adjudicate private property rights, and
restructure the industrial sector. However, reform progress slowed in the 2000s, leaving the country with
unresolved weaknesses in its competitive framework, integration into international trade and capital
markets, corporate governance policies, property rights enforcement mechanisms, tax and customs
administrations, anticorruption legislation and public oversight institutions.6
1.20. External conditions have played a relatively modest role in Armenia’s growth. Despite the
large share of commodities in Armenia’s total merchandise exports, external conditions5 have had only a
marginal economic impact since the transition, though a recent decline in base-metal prices cut GDP
growth by 0.3 percentage points between 2010 and 2013.6 Nevertheless, compared to other commodity
exporters such as Peru, a fellow metals exporter, Armenia’s growth has been highly resilient to external
conditions (Figure 1.8B).
6 Mitra et al. (2007). 5 External conditions in the model refer to commodity prices and terms of trade growth. They do not include
remittances, which would be relevant in the Armenian context. 6 Data for the net barter terms-of-trade index, which is a proxy for terms-of-trade variables, are only available after 2000, limiting
the timeframe for which the impact of term-of-trade changes on growth can be estimated. Prior to the 2000s the contribution of
external conditions to growth is estimated based on the international commodity export price index.
-2
-1
0
1
2
3
4
5
6
7
8
9
Azerbaijan Moldova Belarus Kazakhstan Russia Kyrgyzstan Armenia Georgia
An
nu
aliz
ed G
DP
per
cap
ita
gro
wth
,
%
Persistence Structural Reforms Stabilization Policies External Conditions

15
Figure 1.8. Estimated Growth Effects Arising from Persistence in Growth Patterns, Structural Reforms, Stabilization Policies, and External Conditions
A. 1996-2013 B. Armenia and Peru: The 2000s
Source: World Bank staff calculations based on Araujo et al., 2014.
Note: The period 1996-2013, consists of 4 data points (2000, 2005, 2010, 2013) and captures the average values of the following
time periods: “The 2000s”: Avg. [2006-2010] – Avg. [1996-2000] = 2010-2000; “Early 2000s”: Avg. [2001-2005] –Avg. [1996-
2000] = 2005-2000; “Late 2000s”: Avg. [2006-2010] –Avg. [2001-2005] = 2010-2005; “Early 2010s”: Avg. [2011-2013] –Avg.
[2006-2010] = 2013-2010. See Annex 1.
1.21. The global financial crisis substantially altered Armenia’s macroeconomic position; while consumption proved relatively resilient, net exports turned positive, and investment collapsed. In
the pre-crisis period private investment, focused on the construction sector, was the major contributor to
growth, supported by robust consumption. However, the post-crisis recovery was led by the growth of net
exports, while large remittance inflows bolstered consumption. On the supply side the construction
sector’s precipitous decline has increased the prominence of services. Together, services, agriculture,
mining and industry have become the drivers of a slower but more evenly balanced growth pattern.
1.22. No single sector is likely to replace construction as a dominant economic force in the post-crisis period. Mining and mineral exports have the greatest potential for rapid growth, but as discussed in
Chapter 2 Armenia’s limited trade openness and the inherent volatility of international commodity prices
temper the mining sector’s growth prospects. Increased public investment could offset the diminished role
of the construction sector in gross capital formation, which has been negative since 2010. However, the
government’s limited resource envelope and the priority of rebuilding fiscal buffers makes such an
expansion unlikely.
1.23. The pre-crisis expansion was highly inclusive, but important gains in poverty reduction and shared prosperity could be lost if growth remains weak over the medium term. The incidence of
extreme poverty declined sharply from 67 percent in 2001 to 26 percent in 2008. However, the impact of
the crisis halted and then partially reversed these gains, and the extreme poverty rate has again risen
above 30 percent. A similar pattern was observed in shared prosperity. The average consumption of the
bottom 40 percent grew faster than the national average until 2009, but it fell further during the crisis and
has recovered more slowly. If current growth patterns continue over the medium term, the achievements
of the pre-crisis period may be largely erased.
1.1 2.3
7.4 7.2
1.6
0.6
1.1 0.4
-2
-1
0
1
2
3
4
5
6
7
8
9
The 2000s Early 2000 Late 2000s Early 2010s
An
nu
aliz
ed G
DP
per
cap
ita
gro
wth
, %
Persistence Structural Reforms
Stabilization Policies External Conditions
-1
0
1
2
3
4
5
An
nu
aliz
ed G
DP
per
cap
ita
gro
wth
, %
Peru Armenia

16
1.24. Since Armenia’s transition to a market economy domestic factors have influenced growth to a much greater extent than external conditions. Unlike other commodity exporters, domestic
developments have been much more important to Armenia’s growth than export prices. First-generation
structural reforms and economic liberalization measures spurred an increase in TFP that far outweighed
the impact of changes in the external environment.
1.25. Armenia will need a new growth model in order to achieve its development objectives and resume a convergence trajectory. Armenia’s per capita income is still less than a tenth of the OECD
average. Accelerating income growth to a rate consistent with economic convergence will not be possible
under either Armenia’s current or historic growth models. The reallocation of productive factors is now
largely complete, and the returns to gross fixed capital formation are diminishing. In this context a
comprehensive shift toward a more flexible, innovative economy will be vital to sustain further increases
in productivity growth. Going forward, a renewed focus on structural reforms will help alleviate
remaining constraints on economic efficiency, facilitate the growth of sophisticated, knowledge-based
sectors, and promote the development of a more adaptable and dynamic growth model.
1.26. The following chapters will examine the drivers of dynamism in the Armenian economy. Chapters 2-5 present an empirical analysis of various aspects of Armenia’s economic model, and the sixth
chapter offers policy options for accelerating inclusive growth. Chapter 2 examines Armenia’s
international connectivity and finds that in addition to trade and investment openness, the free flow of
data and human capital is critical to expanding opportunities for Armenian firms. Chapter 3 benchmarks
Armenia’s progress against four critical elements of a knowledge-based economy: governance,
information and communications technology (ICT), workforce skills and the overall economic capacity to
create and use knowledge. Chapter 4 explores Armenia’s national innovation system, the web of public-
and private-sector actors and policies that constitutes the institutional foundation for economic
innovation. Chapter 5 evaluates the role of government policy in building a more dynamic economy by
estimating its impact on the productivity, international integration and innovative capacity of Armenian
firms. Chapter 6 concludes the report and presets policy options for promoting sustainable, broad-based
growth through economic dynamism.

17
In an increasingly interconnected global economy a country’s access to international markets via trade,
investment, technology and labor mobility are vital to its growth and development. Armenia’s global
connectivity, however, is limited across all of these dimensions. The country has active trade embargoes
with two of its four neighbors, and Russia continues to play a dominant role in its economy, a role that
may become even more important following Armenia’s accession to the EEU. Armenia’s merchandise
trade equals less than 80 percent of GDP, well below the share of comparable countries, especially in
Europe. Trade is relatively diversified in terms of export destinations, yet concentrated in terms of
products, a reflection of Armenia’s geography and resource endowments. Foreign investors have pursued
emerging opportunities in the financial services, communications and mining sectors, but investment in
information and communications technology (ICT) has been low and inconsistent. Expanded internet
services could substantially boost trade and investment, but despite improvements since 2010 Armenia’s
internet coverage and speed remain limited. Among Armenia’s greatest assets is its large diaspora
community, and remittances have substantially increased household welfare, mitigated unemployment
pressures, and strengthened the resilience of private consumption. However, the migration of Armenian
workers to foreign labor markets has also significantly reduced the country’s aggregate human capital.
Going forward, Armenia could do much more to leverage the potential of its diaspora to increase
international trade and investment flows and to shape the evolution of its domestic institutions.
2.1. A growing body of research has found that a country’s connectivity to external markets is a major determinant of its economic growth trajectory and the quality of its development.7
Connectivity comprises four basic dimensions—trade, investment, technology and labor mobility—and
depends not only on physical links such as roads, ports, and fiber-optic cables, but also intangible
connections such as diplomatic ties, trade and immigration policies, customs protocols and the removal of
informal economic barriers. Connectivity can directly impact output by maximizing gains from
specialization and trade, harnessing the potential of existing absolute and comparative advantages, and it
can indirectly accelerate long-term growth through technology transfer and the cultivation of dynamic
comparative advantage. The importance of technology transfer is further underscored by evidence of
increasing returns to technological accumulation, as the acquisition of new technologies builds an
economy’s capacity to exploit future innovations.
2.2. This chapter will examine Armenia’s global connectivity along each of the four dimensions described above and describe how these links are shaping its economy. Trade, investment, technology
and labor mobility are related phenomena with overlapping effects, and in Armenia labor mobility has
especially pivotal implications for the other dimensions of connectivity due to the country’s large
diaspora community. The diaspora facilitates the formation of transnational social networks, increasing
Armenians’ exposure to new technologies, access to diverse educational institutions, experience with
different public administrative systems and capacity to identify and exploit global economic
opportunities. In a densely interconnected global economy the potential of labor mobility to shape
national economic growth extends far beyond its immediate impacts on employment, remittances and
relative factor intensity. An actively engaged diaspora can speed productivity growth, strengthen
investment inflows, augment social spending and influence the course of public sector reform. In light of
the enormous potential of global connectivity, this chapter addresses the following research questions:
To what extent is Armenia leveraging its global trade ties?
Is foreign investment increasing the efficiency and openness of the Armenian economy?
7 See, for example, Frankel and Romer (1999), Duernecker et al. (2014), Kali et al. (2007), Kali and Reyes (2007).

18
Is Armenia exploiting the full potential of digital connectivity to overcome its geographic
isolation?
How is the Armenian diaspora contributing to economic development at home?
2.3. Armenia is less open to trade than many comparable countries. Trade openness, defined as total
imports and exports as a share of GDP, has declined over the past decade from a peak of 82 percent in
2003 to 75 percent in 2013. Armenia is not only less open to trade than would be predicted by its income
level (Figure 2.1), it is also significantly less open than other post-Soviet states (Figure 2.2).
Figure 2.1. Trade-to-GDP Ratio and GDP per Capita, 2011-2013
Figure 2.2. Trade-to-GDP Ratio, Armenia and Comparators, 2003-2013
Source: World Bank staff calculations based on WDI data.
Note: In order to account for cyclical fluctuations, trade and GDP in the left panel are averages for 2011-2013.
2.4. Industrial commodities dominate Armenia’s merchandise exports, while travel, construction and transportation lead a rapidly growing service export sector. The composition of exports has
changed significantly over the last decade.
The share of non-metal extractive industries
in total exports declined from 53 percent in
2001-03 to 20 percent in 2011-13, while the
share of metals increased from 22 to 50
percent over the same period (Figure 2.3).
Service exports grew at an average annual
rate of 18 percent from 2003 to 2013. In 2003
service exports equaled 31 percent of the
value of merchandise exports and comprised
7.4 percent of GDP. By 2013 they had grown
to 74 percent of merchandise exports and
10.4 percent of GDP. In 2013 the sectors
which accounted for the largest share of
services exports were travel (42 percent),
construction (21 percent), transportation (15
Armenia
0
50
100
150
200
250
300
350
400
450
500
6.0 8.0 10.0 12.0
Tra
de
as %
of
GD
P
Ln of GDP per capita (PPP 2011)
40
60
80
100
120
140
160
180
2003 2004 2005 2006 2007 2008 2009 2010 2011 2012 2013
Armenia Georgia Moldova
Belarus Russia Serbia
Figure 2.3. Merchandise Exports by Sector, 2011-2013
Source: World Bank staff calculations based on WITS data.
Note: AGR = Agriculture, meat and dairy, seafood (HS 1-10, 12-
14); F&B = Food, beverages, tobacco, wood, paper (HS 11, 15-24,
44-48); EXT= Extractive industries (HS 25-27, 68-71); CHE =
Chemicals, plastics, rubber (HS 28-36, 38-40); TEX = Textiles,
apparel, leather, footwear (HS 41-42, 50-65); MET = Iron, steel, and
other metals (HS 26, 72-83); MAC = Machinery, electronics,
transportation equip. (HS 84-89); OTH = Other industries (HS 37,
43, 49, 66-67, 90-97).
4.8%
19.6%
20.0%
1.5% 1.7%
50.2%
1.3% 0.8%
AGR
F&B
EXT
CHE
TEX
MET
MAC
OTH

19
percent), and computer and information services (7 percent).
Table 2.1. Armenia: Services Exports, 2003-2013
CATEGORY 2003
2013
US$
mill
% of
total
% of
merch.
export
% of
GDP US$
mill % of total
% of
merch.
export
% of
GDP CAGR
03-13
Total services 207.4 100.0 30.9 7.4 1082.4 100.0 73.7 10.4 0.18
Transport 73.0 35.2 10.9 2.6 164.2 15.2 11.2 1.6 0.08
Travel 72.7 35.1 10.8 2.6 458.1 42.3 31.2 4.4 0.20
Communications 16.7 8.1 2.5 0.6 36.2 3.3 2.5 0.3 0.08
Construction 7.9 3.8 1.2 0.3 222.3 20.5 15.1 2.1 0.40
Insurance 7.4 3.6 1.1 0.3 19.5 1.8 1.3 0.2 0.10
Financial services 1.6 0.8 0.2 0.1 9.0 0.8 0.6 0.1 0.19
Computer and
information 11.0 5.3 1.6 0.4 74.6 6.9 5.1 0.7 0.21
Royalties and license
fees 0.0 0.0 0.0 0.0 0.0 0.0 0.0 0.0
Other business services 6.7 3.2 1.0 0.2 52.6 4.9 3.6 0.5 0.23
Personal, cultural and
recreational services 2.3 1.1 0.3 0.1 19.0 1.8 1.3 0.2 0.24
Government services
n.i.e. 8.0 3.9 1.2 0.3 26.9 2.5 1.8 0.3 0.13
Source: World Bank staff calculations based on UNCTAD data.
Note: CAGR is the compound annual growth rate.
2.5. Armenia has a revealed comparative advantage (RCA) in resource- and labor-intensive industries. Over the 2003-13 period Armenia’s RCAs were focused on a mix of primary and refined
commodities in the agricultural and resource sectors and a narrow range of finished goods produced from
those commodities. The major change in RCA over the period reflected Armenia’s decreased
competitiveness in non-metal extractive industries.
Table 2.2. Armenia’s Revealed Comparative Advantages, 2003 and 2013 Sector 2003 2013
Agriculture, meat and dairy, seafood 0.270 1.435
Foods, beverages, tobacco, wood, paper 1.880 3.712
Extractive industries 4.797 0.980
Chemicals, plastics, rubber 0.086 0.132
Textiles, apparel, leather, footwear 0.095 0.546
Iron, steel and other metals 3.158 4.898
Machinery, electronics, transportation eq. 0.053 0.030
Other industries 0.129 0.142
Source: World Bank staff calculation based on UNCTAD data.
Note: The RCA index is defined as the ratio of two shares. The numerator is the share of each export in the country’s total
exports. The denominator is the global share of each export in total world exports. The index assigns a value of between 0 and
+∞ to each export, and a country is determined to have a revealed comparative advantage if the value exceeds 1.
2.6. Armenia appears to be diversifying its exports in terms of both products and markets. Between
2003 and 2013 Armenia’s mix of export products diversified more rapidly than its range of export

20
destinations. Export product concentration8 has fallen by 57 percent since 2003, the largest decrease
among comparable countries (Figure 2.4). Meanwhile, market concentration has dropped by 35 percent
and is now lower than Russia and Belarus, higher than Moldova, Macedonia, Albania and Azerbaijan, and
on par with Bosnia and Georgia (Figure 2.5).
Figure 2.4. Export Product Concentration Figure 2.5. Export Market Concentration
Source: World Bank staff calculation based on WITS data.
2.7. Two-thirds of Armenian exports are bound for Europe and Russia. Over 2012-14
Armenia’s largest export markets were the EU-
27 with 33 percent of total exports and non-EU
Europe and Russia with 31 percent, followed by
North America with 13 percent, and the Middle
East and North Africa (MENA) with 11 percent
(Error! Reference source not found.). The
share of MENA exports fell from 28 to 11
percent between 2002-04 and 2012-14 due in
large part to a decline in shipments to Israel. In
2002-04 Israel received the largest share of
Armenian exports of any single country (21
percent), followed by Belgium (19 percent). By
2012-14 Russia had become Armenia’s largest
export partner (22.4 percent) followed by
Bulgaria (9.2 percent). The export shares of
Canada and China experienced the strongest growth over the period.
2.8. Export growth has been driven by increases in existing products in established markets. An
analysis of export growth over the last decade reveals that 69 percent of the increase in exports was driven
by changes on the extensive margin, led by export diversification in established markets (46 percent).
While the largest single expansion occurred on the intensive margin, with a dramatic rise in exports of
existing products to established markets (96 percent), this was offset by the decline or termination of
other existing exports to established markets, which cut growth on the intensive margin by 37 and 28
percent, respectively.
8 Export concentration is measured by a variation on the Herfindahl-Hirshman index, which sums the squares of market shares
for major export products and major export markets.
0.092
0.084
0.729
0.088
0.014
0.044
0.035
0.032
0.178
0.083
0.195
0.516
0.049
0.026
0.044
0.018
0.053
0.140
0.00 0.20 0.40 0.60 0.80
ALB
ARM
AZE
BLR
BIH
GEO
MKD
MDA
RUS
2003 2013
0.235
0.090
0.092
0.224
0.083
0.054
0.156
0.077
0.051
0.571
0.138
0.281
0.243
0.124
0.091
0.106
0.184
0.055
0.00 0.20 0.40 0.60
ALB
ARM
AZE
BLR
BIH
GEO
MKD
MDA
RUS
2003 2013
Figure 2.6. Armenian Export Destinations, 2012-2014
Source: World Bank staff calculation based on WITS data.
9.0%
33.2%
11.4%
13.4%
1.7%
31.3%
Asia EU27 MENA
North America Other Rest of Europe

21
Table 2.3. Export Growth Decomposition, Intensive and Extensive Margins, 2003-2013
Armenia Albania Belarus
Bosnia and
Herzegovina Macedonia Moldova
Increase in exports of existing products to established
markets 96 41 96 60 55 54
Decrease in exports of existing products to established
markets -37 -3 -7 -6 -12 -17
Termination of exports of existing products to
established markets -28 -4 -3 -8 -10 -13
Intensive margin (net) 31 34 86 46 33 24 Introduction of new exports to new markets 0 1 0 0 0 1
Increase in new products to established markets 17 48 1 7 23 12
Introduction of existing exports to new markets 6 2 0 6 2 6
Diversification of exports to established markets 46 14 13 40 43 57
Extensive margin (net) 69 66 14 54 67 76 Total 100 100 100 100 100 100
Source: World Bank staff calculation based on WITS data.
2.9. While Armenia’s trade performance has been mixed, foreign direct investment (FDI) inflows have remained relatively strong over time. FDI represented 5 percent of GDP in 2012, down from a
peak of 9 percent in 2009 but close to its decade average (Figure 2.7). Armenia’s FDI levels are similar to
those of Georgia and Bosnia and Herzegovina and near the middle of the range for comparable countries
(Figure 2.8).
Figure 2.7. FDI as a Share of GDP, 2002-2012 Figure 2.8. FDI as a Share of GDP, Armenia and Compar
Source: UNCTAD. Source: World Development Indicators.
2.10. Russia is the largest source of Armenian FDI. From 2001-2012 Russia accounted for 40 percent
of FDI, and it remained Armenia’s largest single investor both before and after the financial crisis. France
has increased its investment in Armenia since 2008. It now represents the second-largest share of FDI,
accounting for about a third of total inflows in the post-crisis period. Canada, the United States and
Greece all significantly decreased their investment in Armenia in the wake of the crisis (Figure 2.9 and
Table 2.4).
0
1
2
3
4
5
6
7
8
9
10
9.6
7.7 7.1
6.2
5.0 4.9
3.7 3.4 2.6 2.3 2.3 2.3
0.0
2.0
4.0
6.0
8.0
10.0
12.0

22
Figure 2.9. Ten Largest Sources of FDI , 2001-2012 (in US$ millions)
Table 2.4. FDI Inflows Before and After the Crisis
2001-2012
Pre-crisis (2001-
2008)
Post crisis
2009-2012
Russian Federation 38.23 36.77 41.14
France 13.91 6.45 28.83
Germany 8.55 10.25 5.13
United States 6.82 8.87 2.72
Greece 6.23 9.35 0.00
Argentina 5.04 4.71 5.71
Canada 4.12 6.18 0.00
Cyprus 3.18 3.26 3.01
Lebanon 2.82 2.81 2.83
United Kingdom 2.54 3.15 1.32
Source: UNCTAD. Source: UNCTAD.
2.11. Armenia’s dependence on Russia as its primary source of FDI is not extreme by international standards. Although Russia has consistently accounted for the bulk of FDI inflows, at just under 40
percent Russia’s share of FDI is not overwhelming. Armenia ranks 111th in the world in terms of the share
of its largest FDI contributor, and among comparable countries its FDI is less dominated by a single
source than that of Belarus, Tajikistan and Moldova (Table 2.5).
Table 2.5. Share of FDI Inflows by Largest Contributor, 2001-2012
Country Largest FDI flow contributor
Average Annual Share of FDI Inflows as a percentage
of Total Inflows World Rank Belarus Russian Federation 99.4 31
Tajikistan China 77.0 44
Moldova Romania 42.5 99
Armenia Russian Federation 38.2 111
Ukraine Cyprus 34.7 124
Azerbaijan Turkey 33.0 128
Kyrgyz Republic Russian Federation 31.1 132
Kazakhstan Netherlands 26.1 144
Georgia United States 14.2 166 Source: UNCTAD.
2.12. Armenia’s FDI stock presents a similar picture, with Russia assuming a dominant but not overwhelming position. Other countries with sizeable FDI stocks in Armenia include France, the US and
Germany. While France’s FDI inflows increased dramatically after 2009, its share of the total FDI stock
rose by only 3 percent due to its relatively low initial base (Table 2.6).
2,713
905
465
352
269
217
210
202
97
97
0 500 1000 1500 2000 2500 3000
Russian Federation
France
Germany
Argentina
United States
Lebanon
Cyprus
Greece
Switzerland
Canada

23
Table 2.6. Average FDI Stocks by Source Country (in % of total FDI stock)
Country of Origin 2001-2012 2001-2008 2009-2012
Russian Federation 42.7 35.3 57.6
France 8.6 7.7 10.2
United States 8.6 10.4 5.0
Greece 9.7 14.6 0.0
Germany 4.3 4.8 3.3
Canada 5.7 7.3 2.5
Argentina 3.3 2.4 5.0
Cyprus 3.6 3.2 4.3
Switzerland 2.5 2.4 2.8
United Kingdom 3.4 4.5 1.0
Source: UNCTAD.
2.13. Financial services, communications and metals are the top three targets of FDI. The largest
investments by individual companies are by the German firm ProCredit Holding (US$487 million),
followed by Orange/France Telecom (US$402 million) and the Russian firm Mobile TeleSystems
(US$319 million). Other notable source of FDI include Russian energy company Gazprom (US$270
million), which is investing in renewable energy, and the Indian firm Mahindra Group (US$227 million),
which is investing in the automotive industry. Investments in financial services represent the largest share
of FDI over the period (Figure 2.10 and Figure 2.11). The sources of FDI in the financial services sector
are very diverse, encompassing 20 companies from 9 different countries. By comparison, investment in
communications, the second largest sector for FDI, includes 8 companies based in 6 countries. Foreign
investment in financial services and communications has increased significantly in recent years, while
investment in metals and textiles has declined.9
Figure 2.10. Total FDI by Sector, 2003-2015 Figure 2.11. FDI by Sector, Pre- and Post-Crisis (in millions of 2010 US$)
Source: FDIMarkets.
9 These sectoral FDI data are estimates of capital investment for the period 2003-2014. Unlike the country-level data, these
figures are taken from corporate announcements about planned investments and may over- or under-estimate actual FDI flows.
They may also be distorted by the timing of investment flows, as planned investments may be implemented over a period of
years. The data presented here are published by FDI Markets.
Financial Services
Communications
Metals
Alternative/Renewa
ble energy
Software & IT
services
Automotive OEM0 200 400 600 800 1000
Financial Services
Communications
Metals
Alternative energy
Software & IT
Rubber
Transportation
Semiconductors
Business Services
Industrial Machinery
Textiles2003-2008 2009-2014

24
2.14. FDI in the financial services sector originates primarily from Germany and Russia; in communications from Russia and France; in metals from the US, Germany and Russia; and in ICT and semiconductors from the US. Gazprom launched the largest single
FDI project by a Russian company
(US$200 million) in 2009. Mobile
TeleSystems accounted for the largest
Russian investment in the
communications sector, with 5
different projects totaling US$319
million. Germany and France were
second and third in terms of overall
FDI flows after Russia. However,
their combined investment portfolio is less diversified than that of Russia or the US. German FDI in
particular tends to be concentrated in financial services and metals. The largest single investment in
financial services was undertaken by ProCredit Holding (US$487million), while the German firm
Cronimet Ferrolegierungen Handelsges launched a large project in the metals sector (US$221 million).
French FDI focused almost entirely on the communications sector, where Orange invested US$402
million between 2008 and 2013. Investments by US firms were largely devoted to ICT and
semiconductors, but also included a large 2005 investment in metals by the US firm Global Gold
(US$220.8 million). High-tech sectors attracted investments from Intel (US$35 million), Microsoft
(US$26 million) and Oracle (US$22 million).
2.15. Internet access in Armenia is low by OECD standards, but roughly in line with comparable countries. In 2013 46.3 percent of Armenia’s population had access to internet, slightly higher than the
rate in Georgia (43.1 percent), but lower than that of Azerbaijan (58.7 percent), as well as Russia, the EU
and the OECD average (78 percent). Armenia has an average of 7.88 broadband internet subscribers per
100 people, far below the OECD average (27.8) and the rate of the leading comparator country, Belarus
(29.8). The proportion of broadband internet subscriptions in Armenia has increased since 2010, and the
gap with the OECD is gradually narrowing.
2.16. Internet affordability and speed are also similar to comparable countries, but far behind the OECD average. Armenia’s bandwidth was 55,146 kilobytes per second per user in 2013, with an average
monthly cost of US$11. Serbia, which had the fastest internet connection among comparable countries
(108,874 kb/s per user) also had the highest cost (US$18 per month). All Balkan countries had higher
costs relative to their speeds, while costs were lower in Russia and Belarus. The average OECD speed
was 318,845 kb/s per user, triple the speed of Serbia and more than 5 times that of Armenia. However, the
average monthly cost for OECD countries was also much higher (US$31). Armenia’s internet bandwidth
has increased dramatically in since 2012, but the pace of growth has been even faster in the OECD,
widening the speed gap over time.
Figure 2.12. FDI by Source Country and Sector (in millions of 2010 US$)
Source: FDI Markets.
0
100
200
300
400
500
600
Russia Germany France USA
Financial Services Communications
Metals Software & IT services
Hotels & Tourism Semiconductors
Business Services

25
Figure 2.13. Internet Cost and Speed, Armenia and Comparators, 2013
Source: World Development Indicators.
2.17. International telephone calls can be used as a proxy for ICT connectivity between countries. Bilateral data flows would provide a more precise metric of connectivity, but information on data flows is
inadequate to allow for meaningful analysis. Consequently, the number of international telephone calls is
the best measure currently available. Figure 2.14 and Figure 2.15 diagram international communication
networks based on the number of phone calls between countries. The position and size of each country
reflects the extent of its connections with other countries in the network. Countries with higher degrees of
connectivity (more connections) will be located in the center of the network, while countries with fewer
connections will be in the periphery.
2.18. Armenia has low overall connectivity, but is closely linked with Russia. Nevertheless, Armenia
is better integrated in the global network than many countries in Latin America, which were among the
least integrated both in 2000 and 2010. Between 2000 and 2010 Armenia’s connectivity became more
closely aligned with that of comparable countries, and its connections to Europe markedly increased.
[CELLRANGE]
[CELLRANGE]
[CELLRANGE] [CELLRANGE] [CELLRANGE]
[CELLRANGE]
[CELLRANGE]
[CELLRANGE]
[CELLRANGE]
[CELLRANGE]
0
5
10
15
20
25
30
35
0 50 100 150 200 250 300 350
inte
rnet
aff
ord
abil
ity (
US
$/m
on
th)
internet speed (Mbs/second)

26
Figure 2.14. Global Connectivity Based on Outgoing Communications per Capita, 2000
Source: World Bank staff calculations.
Note: The size of the country (node) represents the total outgoing communications from that country relative to the rest of the
world as a share of the population of the sending country, while the width of the arrows between countries represent the bilateral
flow of communications between two countries in a given year.

27
Figure 2.15. Global Connectivity Based on Outgoing Communications per Capita, 2010
Source: World Bank staff calculations.
Note: The size of the country (node) represents the total outgoing communications from that country relative to the rest of the
world as a share of the population of the sending country, while the width of the arrows between countries represent the bilateral
flow of communications between two countries in a given year.
2.19. Armenia has diversified its connections in recent years but it remains heavily focused on Russia. Russia accounts for the bulk of Armenia’s outgoing communications, a pattern which changed
little between 2000 and 2010. However, Armenia added France and Turkey to its list of top
communications partners. This corresponds with changes in its trade, investment, and labor migration
profile. While Armenia remains closely connected to Russia, it is gradually expanding its links to the
wider world.

28
Figure 2.16. Armenia’s Major Communications Partners by Share of Total Outgoing Communications
A. 2000
B. 2010
Source: World Bank staff calculations.
Note: The size of the country (node) represents the total outgoing communications from that country relative to the rest of the
world as a share of the population of the sending country, while the width of the arrows between countries represent the bilateral
flow of communications between two countries in a given year.
2.20. Armenia has a large diaspora community with roots stretching back over centuries. The most
recent wave of emigration began in the early 1990s following the breakup of the former Soviet Union.
Although the total number of Armenian migrants is small in absolute terms, relative to the domestic
population Armenia’s diaspora is one of the largest in the world (Figure 2.17). While other former
communist countries experienced similar levels of emigration after the fall of the Soviet Union,
Armenia’s was among the largest in per-capita terms.

29
Figure 2.17. Number of Migrants as a Share of the Total Home-Country Population A. 1990
B. 2010
Source: World Bank staff calculations.
Note: The size of the node represents the number of migrants as a share of the home-country population. Arrows indicate the size
and direction of the flow of migrants.
2.21. Large-scale emigration has substantially reduced Armenia’s human capital stock. Over the
past 25 years Armenia has experienced a substantial and accelerating “brain drain” effect, as skilled
professionals have left to pursue opportunities abroad. Even before 1990 Armenia already had the largest
number of high-skilled emigrants, in per capita terms, in the former Soviet Union. From 1990 to 2000 that
share grew rapidly across the board, but the emigration of skilled professionals was especially rapid in
Armenia, ranking it among the countries with the highest human capital exports in the world.

30
Figure 2.18. Skilled Migrants as a Share of the Total Home-Country Population A. 1990
B. 2010
Source: World Bank staff calculations.
Note: The size of the node represents the stock of migrants with completed tertiary education as a share of the total home-country
population. Arrows indicate the size and direction of the flow of educated migrants.

31
2.22. The importance of emigration is underscored by Armenia’s relative scarcity of highly educated workers. In 2010 just 14.4 percent of Armenians
had completed tertiary education,
compared to an OECD average of 25
percent. Educated emigrants
represented a remarkable 43 percent of
Armenia’s total educated population in
2010, compared to just 12 percent in
1990. While Armenia’s proportion of
highly skilled emigrants is not the
highest in the world, emigration by
skilled workers has increased
dramatically over the period.
Figure 2.20. Skilled and Unskilled Armenian Migrants by Destination Country, 1990 and 2010 A. Share of total Armenian migrants by destination
country, 1990
B. Share of total Armenian migrants by destination
country, 2010
C. Skilled Armenian migrants as a share of total
Armenian migrants by destination country, 1990
D. Skilled Armenian migrants as a share of total
Armenian migrants by destination country, 2010
Source: World Bank staff calculations.
Note: Arrows indicate the size of the flow of Armenian migrants to each destination country.
2.23. Russia is the most common destination for both skilled and unskilled Armenian migrants. Russia accounts for 80 percent of all Armenian migrants, and its share of the skilled emigrant workforce
increased to 68 percent in 2010. Meanwhile, Western countries have surpassed the former Soviet states to
become the second-largest destination for skilled migrants. In 2010 the US was home to 38 percent of
Armenia’s skilled migrant workforce.
Figure 2.19. Highly Educated Emigrants as a Share of the Total Highly Educated Population, 1990 and 2010
Source: Barro and Lee.
Note: Share of emigrants with completed tertiary education as a percentage
of total population 25 and older with completed tertiary education.
Table 2.7. Migrants and Labor Migrants by Year
0%
50%
100%
150%
200%
250%
1990 2010

32
2.24. The pace of out-migration has remained relatively stable over time, with regular seasonal peaks and a temporary surge in migration to Russia in 2010. Household surveys do not account
for migrants whose entire family has moved abroad,
and thus captures only about a third of the stock of
Armenians abroad (Table 2.7). People are recorded
as migrants if their remaining household members
report them as having left in the previous 4 years.
Migration peaks during the third quarter of the year, highlighting its partial seasonality (Figure 2.21).
Many are labor migrants (around 60 percent). The number of migrants to Russia is increasing over time,
while the number bound for other countries in the former Soviet Union is declining (Figure 2.22).
Figure 2.21. Quarterly Out-Migration, 2009-2013 Figure 2.22. Migrants by Destination, 2009-2013
Source: ILCS. Source: ILCS.
Note: The former Soviet Union (FSU) includes Ukraine,
Belarus, Moldova, Armenia, Kazakhstan, Uzbekistan,
Turkmenistan, Kyrgyzstan, Tajikistan, Georgia, and
Azerbaijan.
2.25. The skill profile of migrants has remained stable over time, with the most highly skilled workers moving primarily to the US and Europe to seek employment in the service sector. The share
of migrants with tertiary education is similar to the share of the population as a whole. However, the share
of migrants with upper secondary or vocational education is higher than the share of the total population.
Migrants abroad seem to be less skilled than domestic migrants, but this difference is not significant.
Migrants to Europe and the US, although small in number, are much more skilled than those bound for
other countries, and the share of skilled migrants to the US and Europe has increased in recent years.
Migrants to other former Soviet countries also tend to have higher skill levels, whereas most migrants to
Russia and other destinations worldwide are largely medium-skilled (Figure 2.23). Migrants to Russia and
other former Soviet countries primarily work in construction, whereas migrants to Europe and the US
tend to work in services. A significant share of migrants bound for minor destinations have moved from
construction to manufacturing in recent years (Figure 2.24). The average wages of migrants are higher
than the wages of non-migrants, which suggests a high return to migration (Figure 2.25).
0
50,0
00
100
00
01
50
00
02
00
00
0
# m
igra
nts
abro
ad
Russia Europe/US FSU Other
20092010
20112012
20132009
20102011
20122013
20092010
20112012
20132009
20102011
20122013
Year Migrants % labor migrants
2009 165,005 57.88
2010 200,754 53.10
2011 204,660 54.48
2012 199,050 64.50
2013 201,582 63.74
Source: Integrated Living Conditions Survey (ILCS).

33
Figure 2.23. Skill Distribution of Migrants and Non-Migrants Across Countries
Source: ILCS. Note: FSU includes Ukraine, Belarus, Moldova, Armenia, Kazakhstan, Uzbekistan, Turkmenistan, Kyrgyzstan, Tajikistan,
Georgia, and Azerbaijan. Low=from no education to lower secondary; Medium=upper secondary and vocational; High:
tertiary and post graduate.
Figure 2.24. Migrants by Occupation and
Destination Figure 2.25. Monthly Wages of Migrants and Non-
Migrants
Source: ILCS. Note: FSU includes Ukraine, Belarus, Moldova, Armenia, Kazakhstan, Uzbekistan, Turkmenistan, Kyrgyzstan, Tajikistan,
Georgia, and Azerbaijan.
2.26. Migrants tend to be younger than non-migrants, predominantly male, and equally likely to come from rural and urban areas. Migrants to Russia are younger than those going to Europe and the
US, likely due to the larger share of semiskilled construction workers bound for Russia. Migrants are
evenly divided between urban and rural areas, but the share of migrants from rural areas has increased in
recent years, possibly reflecting expanded access to information and opportunities. More than 80 percent
of migrants are male, and this gender imbalance has increased even further in recent years. Around 50
percent of migrants are children of the head-of-household, while a third are household heads themselves.
2.27. Armenian migrants to Russia are more likely to come from a household in the bottom 40 percent of the income distribution. In 2009 most migrants came from the bottom deciles, but in 2013
the share from the middle deciles increased. This was probably driven by a rise in the number of migrants
going to Europe and the US, which are relatively skill-intensive destinations. Conversely, migrants to
Russia are the most likely to come from a household in the bottom 40 percent. Migrants to other
destinations tend to be more evenly distributed across income levels.
2.28. Remittances from Russia account for the largest share of total remittances. Remittances have
become increasingly important as a share of GDP, reaching 20 percent in 2013 (Figure 2.26). Not all
households with migrant members receive remittances, while some households receive remittances from
02
04
06
08
01
00
%
Domestic Abroad Non-migrant
20092010
20112012
20132009
20102011
20122013
20092010
20112012
2013
Low Medium High
02
04
06
08
01
00
%
Russia Europe/US FSU Other
20092010
20112012
20132009
20102011
20122013
20092010
20112012
20132009
20102011
20122013
Low Medium High
02
04
06
08
01
00
%
Russia Europe/US FSU Other
20092010
20112012
20132009
20102011
20122013
20092010
20112012
20132009
20102011
20122013
Agriculture Manufacturing
Construction Services
0
100
200
300
400
US
D 2
005
PP
P
Abroad Non-migrant
20092010
20112012
20132009
20102011
20122013

34
non-members or from members who have left the household permanently. In 2013 63.6 percent of
Armenian households neither sent migrants abroad nor received remittances; 13.4 percent of households
received remittances despite having no migrant members; 6.1 percent had migrant members but received
no remittances; and 16.8 percent of households had migrant members and received remittances. At least
45 percent of remittance households receive remittances from Russia, whereas 25-30 percent receive
remittances from Europe, the US or Canada. The average income of remittance-receiving households is
close to the national average, but remittances make up around 60 percent of that income, and recent
increases in household income have been largely driven by remittances.
Figure 2.26. Remittances by Country of Origin, 2010-12, and as a Share of Armenian GDP, 1995-2013
Source: National Accounts.
The Diaspora and the Armenian Private Sector
2.29. The international movement of labor has implications that extend far beyond employment and remittances. Labor migration not only creates new income opportunities for migrants, it also
exposes them to new industries and new productive technologies. And while migrants directly contribute
to domestic consumption through remittances, a well-established diaspora community with close ties to
its home country can accelerate growth through investment and trade. This section explores the extent to
which the Armenian diaspora in Europe plays a role in the development of Armenia’s private sector.10
2.30. Armenians make up a very small share of all European migrants, especially when compared to migrants from more developed economies. Armenia’s migrant community is dwarfed by migrants
from the OECD and middle-income countries such as Romania and Bulgaria, among others (Figure 2.27).
The comparison is even starker when focusing on the fraction of foreign-born shareholders and managers
of European firms. However, Armenian migrants are more likely to be shareholders in European firms
than migrants born in Georgia and Azerbaijan.
2.31. Armenia attracts little FDI from the European countries where its diaspora resides. There is a
limited correlation between migrant destinations, FDI, and the presence of foreign subsidiaries in
Armenia. Large diaspora communities have the potential to facilitate cross-border information flows and
spur increased investment in their country of origin.11
Conversely, expanding business ties and investment
10 The firm-level data used in this section is taken from Amadeus and includes registered firms with more than 5
employees. The final sample includes 724,529 firms in 2011, the most recent year for which data on managers and
shareholders are available. European economies included in this sample include Austria, Belgium, Bulgaria, Bosnia-
Herzegovina, Czech Republic, Germany, Spain, Estonia, Finland, France, UK, Greece, Croatia, Hungary, Ireland, Italy,
Lithuania, Latvia, Netherlands, Norway, Poland, Portugal, Romania, Russia, Serbia, Slovakia, Slovenia, Sweden and Ukraine. 11 See, e.g., Gould (1994) and Ghatak et al. (2009).
0
200
400
600
800
1000
1200
Europe US/Canada Russia Other
US
D m
illi
on
( 2
00
5 P
PP
)
2010 2011 2012
-
5.0
10.0
15.0
20.0
25.0
-
500
1,000
1,500
2,000
2,500
3,000
3,500
%G
DP
MIl
lion
US
D (
20
05
PP
P)
Remit (2005 USD PPP) %GDP

35
flows can promote increased migration. While Armenia accounts for a somewhat smaller share of
European migrants than the Baltic States, the latter have been much more successful in attracting
subsidiaries of European firms. Armenia’s relatively poor performance in attracting European FDI is
explained by a number of factors, including EU membership, geography, the investment climate, and the
overall quality of governance. When compared to its most closely comparable neighbors, Azerbaijan and
Georgia, Armenia attracts roughly the same share of European subsidiaries.
Figure 2.27. Armenian Migrants in the Private Sector of European Countries
Source: World Bank staff calculations based on Amadeus.
Figure 2.28. FDI from Major Armenian Migrant Destinations in Europe
Source: World Bank staff calculations based on Amadeus.
2.32. The Armenian diaspora has untapped potential to support increased international trade and investment flows. Globally, the size of a country’s diaspora is correlated with both trade and investment.
Holding the GDP per capita and population size of the sending and receiving countries constant, as well
as the distance between them, and using a dummy variable for common language, there is a significant
positive association between the size of the diaspora and international trade and investment. Armenian
migrant destinations receive fewer imports from their home country compared to other migrant groups,
but in terms of exports from their destination country to their country of origin, Armenian migrants are
similar to other groups.

36
Figure 2.29. Trade Flows, FDI and the Size of the Diaspora, 2000-2010, Conditional Correlations
A. Imports from migrants’ country of birth B. Exports to migrants’ country of birth
C. FDI to migrants’ country of birth D. FDI from migrants’ country of birth
Source: World Bank staff calculations.
Note: Each variable is separately regressed on a group of explanatory variables (GDP and population of sending and receiving
economies, common language indicator and distance). Graphs show plots of the residuals of each regression.
The Diaspora and the Armenian Public Sector
2.33. Migration can positively or negatively affect a country’s domestic governance institutions. On
one hand, the emigration of skilled professionals can erode the quality of a country’s public
administration, while the emigration of dissidents may reduce pressures for reform. On the other hand,
migration can strengthen the public sector by expanding access to international education opportunities
and increasing exposure to the political systems and social norms of countries with highly effective
governments. Li et al. (2013) show that skilled migrants have positive effects on home country’s political
institutions according to metrics of voice and accountability, political stability and absence of violence,
government effectiveness, regulatory quality, rule of law, and control of corruption. Docquier et al.
(2010) find that migration improves home-country institutions according to metrics of political rights,
civil liberties, and the openness of political institutions. These analyses, however, assume that migrants
are attracted only to countries with markedly higher institutional quality. In cases where the countries of
origin and destination have similar governance indicators, the impact of migration is far less clear.
2.34. There is evidence that over the past 20 years Armenia’s large migrant population may have influenced domestic social and political values. Political preferences may shift as the home country’s
population is exposed to the international experience of the diaspora. In the last 20 years Armenians have
become measurably less tolerant of bribery, tax evasion and the exploitation of social benefits, while
-10
-50
510
Imp
ort
s f
rom
im
mig
ran
ts' cou
ntr
y o
f b
irth
-10 -5 0 5 10Stock of Foreign Born (log)
All diasporas Armenian Diaspora
Fitted values
-10
-50
5
Exp
ort
s t
o im
mig
rants
' cou
ntr
y o
f b
irth
-10 -5 0 5 10Stock of Foreign Born (log)
All diasporas Armenian Diaspora
Fitted values
-50
5
FD
I to
im
mig
ran
ts' co
un
try o
f bir
th
-5 0 5Stock of Foreign Born (log)
All diasporas Armenian Diaspora
Fitted values
-50
510
FD
I fr
om
im
mig
ran
ts' co
un
try o
f bir
th
-5 0 5 10Stock of Foreign Born (log)
All diasporas Armenian Diaspora
Fitted values

37
attitudes toward democracy have become more favorable. However, Armenians now prefer a strong
leader more intensely and are less inclined to be led by a technocratic expert. Armenians have adopted
more progressive attitudes toward gender equality and are less likely to believe that leaders must be men
or that universities should admit male student only. Nevertheless, Armenians still tend to believe that men
should have preferential access to employment when jobs are scarce (Figure 2.30).
Figure 2.30. Social and Political Values, Armenia, Russia and the US, 1990 and 2010
Source: World Values Survey.
2.35. There is a high degree of overlap between different dimensions of connectivity. This section
summarizes the answers to the research questions posed at the beginning of the chapter. Trade,
investment, information flows and labor mobility are highly correlated with one another. Russia plays a
dominant role in Armenia’s connectivity to the world, and its ties to Russia may deepen following
Armenia’s accession to the Eurasian Economic Union (Box 2.1). However, Armenia’s close links with
Russia have not prevented it from expanding its connectivity, both with neighboring countries and with
Western Europe. Successfully leveraging international connectivity to accelerate growth and development
will require a high degree of policy openness coupled with strong domestic and transnational institutions.
Box 2.1. Armenia’s Accession to the Eurasian Economic Union
In September 2013 Armenia announced its intention to seek membership in the Eurasian Economic Union (EEU).
The announcement triggered a series of reforms designed to harmonize Armenia’s tax and customs regime with
other EEU member states. This process was completed in January 2015, and Armenia formally joined the EEU,
acquiring customs-free access to a common market of 170 million consumers.
It is unclear to what extent EEU accession will promote—or inhibit—further structural reforms. Prior to 2013 the
Armenian government’s development strategy was guided by a planned Association Agreement with the EU
0
.5 1
1.5 2
Valu
e
RUS USA ARM 1990 2010 1990 2010 1990 2010
Bribery
0
1
2
3
4
Valu
e
RUS USA ARM 1990 2010 1990 2010 1990 2010
Tax evasion
0
1
2
3
Valu
e
RUS USA ARM 1990 2010 1990 2010 1990 2010
Exploiting social programs
-2
-1 0
1
Valu
e
RUS USA ARM 1990 2010 1990 2010 1990 2010
Support for democracy
-2 -1
.5
-1 - .5
0 .
5
Valu
e
RUS USA ARM 1990 2010 1990 2010 1990 2010
Support for strong leader
-2
-1.5
-1 - .5
0
Valu
e
RUS USA ARM 1990 2010 1990 2010 1990 2010
Support for expert leader
-1
- .5 0
.5 1
V
alu
e
RUS USA ARM 1990 2010 1990 2010 1990 2010
Support for male leader
0
.2
.4
.6
.8
Valu
e
RUS USA ARM 1990 2010 1990 2010 1990 2010
Male employment preference
-2
-1.5
-1 - .5
0
Valu
e
RUS USA ARM 1990 2010 1990 2010 1990 2010
Male-only university admission

38
including a Deep and Comprehensive Free Trade Agreement. The prospect of closer ties with the EU anchored a
far-reaching institutional and regulatory reform program. It is uncertain whether the EEU will provide similar
support for structural reforms, or to what extent the Armenian government will be able to pursue its stated
intention to further strengthen its ties with European partners.
Armenia tends to import technologically advanced goods from the EU and a mix of energy and basic goods from
Russia. While Armenian exports to the EU consist mostly of metals and minerals, exports to Russia include
higher-value-added goods such as processed food and manufactures. Consequently, the trade-diversion effects of
EEU accession could inhibit Armenia’s ability to develop more sophisticated industries and shift into higher-
value sectors. However, Armenia could attract more market-seeking FDI if its policy environment were more
supportive than those of other EEU members and if investors came to regard Armenia as a base for expanding
into the wider EEU market. If increased foreign investment brought new technologies to Armenia, positive
productivity spillovers could compensate for the disadvantages of trade diversion.
2.36. Armenia is not taking full advantage of current opportunities to expand international trade, but export diversification should not be regarded as a priority objective. Armenia’s total trade value
amounts to less than 80 percent of GDP, far lower than in many countries with similar income levels,
especially small European economies that are either in the EU or on the path to EU accession. Two-thirds
of Armenian exports are bound for either Russia or the EU, and the export mix is focused on metals,
minerals, and food and beverages, with the budding ICT sector contributing less than 2 percent. However,
this export profile is fully consistent with the country’s factor endowments and should not be treated as a
cause for policy action, as Armenian policymakers lack the tools necessary to influence trade outcomes.13
2.37. Sizeable foreign investment inflows have helped increase domestic competition and export orientation. Armenia’s inbound FDI is comparable to countries of a similar size and income level. The
financial sector, telecoms and mining have been the primary beneficiaries of foreign investment. Foreign
investors have spurred the development of the domestic finance and telecom markets, while investment in
the mining sector has boosted Armenia’s export capacity. The technology sector has attracted a number of
substantial investment projects, which are primarily export-oriented.
2.38. Armenia is not efficiently exploiting the potential of digital connectivity, which is crucial to overcome its geographic isolation. Internet service and broadband coverage have expanded rapidly since
2010, but Armenia still lags behind more developed economies. The cost of connecting is relatively
modest, which facilitates access, but average speeds are slow, which limits business applications.
Armenia’s dense information connectivity with Russia mirrors the close trade, investment and migration
links between the two countries. As the global digital economy continues to expand, improving internet
access, speed and service quality will become increasingly crucial to stimulating trade and investment
flows.
2.39. Armenia’s large diaspora community has had a limited impact on its economic development. Remittances are a key element of household consumption and vital to poverty alleviation, but emigration
has also significantly reduced the domestic stock of skilled labor. An estimated 600,000 Armenians are
currently living abroad, but they do not appear to be having a significant impact on trade and investment
flows between their home and destination countries. Nevertheless, many individual members of the
diaspora are highly successful, and there have been a number of important philanthropic initiatives
targeting workforce skills and business development in Armenia. Though many of these efforts have had
a highly visible impact at the local level, these remain isolated initiatives. Overall, Armenia is still far
from fully leveraging its greatest asset and transforming the diaspora into an organized force for
economy-wide growth and development.
13
Gill et al. (2014)

39
A knowledge economy is built on sound governance institutions, modern ICT infrastructure, adequate
human capital and the ability to create and use knowledge. Armenia faces challenges in all of these
areas. Its governance environment reflects the dominance of powerful elites, and while significant
progress has been made in formal business regulation, weak institutions often prevent their effective
implementation. Human-capital constraints are preventing Armenia from fully exploiting its scientific and
technological potential. Although the country was once a major regional technology center, a decline in
educational achievement and a dearth of scientists and engineers is jeopardizing what remains of
Armenia’s scientific base. Private firms rarely invest in the skills of their employees, and low levels of
investment in science and technology by both the public and private sectors limits Armenia’s ability to
create and use knowledge.
3.1. A knowledge economy leverages intellectual capabilities rather than physical inputs in production. According to one of many definitions, a knowledge economy is one in which the production
of economic output is based on knowledge-intensive activities that accelerate the pace of technical and
scientific progress. Its distinguishing characteristic is dependence on knowledge, information, and high
skill levels—or intellectual capabilities—rather than on physical inputs and resources.12
Since the late 20th
century global economic development has been shaped by the gradual transition away from a physical
economy and towards a knowledge-based economy. This has influenced technological advancement in
more developed countries and the convergence of less developed economies.
3.2. Governance, information flows, human capital, and knowledge generation are the pillars of a knowledge economy. According to the World Bank’s Knowledge Economy Index
13 four pillars are
critical to the establishment of a knowledge economy. First is the governance environment, the prevailing
formal and informal rules that shape incentives to invest and innovate. Second is use of information and
communication technology to facilitate the effective creation, dissemination, and processing of
information. Third is the availability of adequate human capital, as influenced by education and training,
particularly at the tertiary level and in the science and technology fields. Fourth is the ability of the
economy to create and use knowledge by investing in research and development, encouraging
internationally recognized knowledge outputs (e.g. patents and publications), facilitating knowledge use
by enterprises, and fostering collaboration between science and industry.
3.3. This chapter assesses whether Armenia is adequately equipped to move towards a knowledge economy by examining Armenia’s comparative standing across these four dimensions. Armenia’s
progress is assessed against that of its neighbors in the Caucasus (Georgia and Azerbaijan), its EEU
partners (Belarus, Kazakhstan and Russia), comparable small economies in Southeast Europe (Albania,
FYR Macedonia, and Serbia), and new EU member states.14
Depending on data availability comparisons
are made to the OECD average, which proxies for the developed world standard. This chapter addresses
the following research questions:
Are the formal rules and informal norms that constitute the governance environment consistent
with a level playing field?
Is the production and use of ICT contributing to a more efficient economy?
12 Powell and Snellman (2004). Also, see OECD (2005). 13 See http://data.worldbank.org/data-catalog/KEI. The KEI was last estimated in 2012. The present analysis does not estimate a
summary KEI indicator for Armenia. It is based on a modified version of the KEI pillars with the aim of broadening their scope
by using both country- and firm-level data. 14 Bulgaria, Croatia, Czech Republic, Estonia, Hungary, Latvia, Lithuania, Poland, Romania, Slovak Republic, Slovenia.

40
Do Armenia’s research and enterprise sectors have adequate human capital?
Are Armenia’s public and private sectors investing in knowledge creation and use?
3.4. Armenia’s governance and regulatory environment is more developed than in its EEU partners, but far less developed than in new EU member states and OECD countries. The World
Governance Indicators (WGI) summarize six dimension of governance (see Box 3.1) that capture the
extent to which a country’s formal rules and informal norms are conducive to economic development.
According to this measure Armenia’s governance environment is far inferior to that of new EU member
states and advanced OECD economies. The gap is widest with respect to voice and accountability, control
of corruption and rule of law. This is less a reflection of state efficiency or sophistication as it is indicative
of a political system where decision making is dominated by a powerful elite. Armenia’s governance
environment is however better developed than in Belarus, Kazakhstan or Russia. This suggests that
Armenia could benefit from improvements to its investment climate that attract greater foreign direct
investment aimed at serving the wider EEU market.
Box 3.1. The World Governance Indicators
The WGI compile and summarize information from 32 existing data sources that report the views and
experiences of citizens, entrepreneurs, and experts from around the world on the quality of various aspects of
governance in the public, private and NGO sectors. Six broad dimensions of governance are measured:
Voice and Accountability – captures perceptions of the extent to which a country's citizens are able to
participate in selecting their government, as well as freedom of expression, freedom of association and a free
media.
Political Stability and Absence of Violence/Terrorism – captures perceptions of the likelihood of political
instability and/or politically-motivated violence, including terrorism.
Government Effectiveness – captures perceptions of the quality of public services, the quality of the civil
service and the public administration’s relative independence from political pressures, the quality of policy
formulation and implementation, and the credibility of the government's commitment to such policies.
Regulatory Quality – captures perceptions of the ability of the government to formulate and implement sound
policies and regulations that permit and promote private sector development.
Rule of Law – captures perceptions of the extent to which agents have confidence in and abide by the rules of
society, and in particular the quality of contract enforcement, property rights, the police, and the courts, as well as
the likelihood of crime and violence.
Control of Corruption – captures perceptions of the extent to which public power is exercised for private gain,
including both petty and grand forms of corruption, as well as for "capture" of the state by elites and private
interests.

41
Figure 3.1. Armenia’s Performance Across the Six Dimensions of Governance
Source: World Governance Indicators 2013, percentile rank (0-100). See Box.
Note: EEU is the average of Belarus, Kazakhstan and Russia. SEE is the average of Albania, FYR Macedonia and Serbia. EU
NMS is the average of Bulgaria, Croatia, Czech Republic, Estonia, Hungary, Latvia, Lithuania, Poland, Romania, Slovak
Republic and Slovenia.
3.5. Armenia’s regulatory framework is relatively well-designed by international standards, but the actual enforcement of business regulations is inconsistent and vulnerable to undue influence. Figure
3.2 plots Armenia’s overall performance on the 2013 WGI against its “distance to frontier” performance
in the Doing Business report. The former captures the overall governance environment, providing a
summary of the country’s formal and informal institutions, while the latter reflects the quality of official
regulations in a number of areas relevant for doing business. Armenia’s overall WGI score is below the
global median. Its relative ranking with OECD countries and new EU members is particularly low, but
still far better than that of other EEU member states. In terms of official regulations, however, Armenia is
in the top third of countries worldwide and relatively close to the EU and OECD averages. This strongly
implies that the letter of the law differs significantly from the reality of its implementation.
Figure 3.2. Armenia’s Performance in Governance and Business Regulation
Source: World Governance Indicators 2013, percentile rank (0-100) and Doing Business 2013, distance to frontier
(0-100).
Note: EEU is the average of Belarus, Kazakhstan and Russia. SEE is the average of Albania, FYR Macedonia and
Serbia. EU NMS is the average of Bulgaria, Croatia, Czech Republic, Estonia, Hungary, Latvia, Lithuania, Poland,
Romania, Slovak Republic and Slovenia.
39.7 57.9
49.8
58.9
45.0
29.4 0.0
20.0
40.0
60.0
80.0
100.0Control of Corruption
Government Effectiveness
Political Stability and
Absence ofViolence/Terrorism
Regulatory Quality
Rule of Law
Voice and Accountability
Armenia EEU SEE EU NMS OECD
Armenia
EEU average SEE average
EU NMS average
OECD average
50
55
60
65
70
75
80
85
90
95
20 30 40 50 60 70 80 90 100
DB
20
13
- D
ista
nce
to F
ron
tier
(0
-
10
0)
WGI 2013 - percentile (0-100)

42
3.6. Armenia has made substantial progress in improving regulatory efficiency. In 2015 Doing
Business ranked Armenia 45th globally, up four positions from 2014. This places Armenia among the top
third of countries included in the report (Table 3.1). Armenia performs particularly well in the areas of (i)
starting a business, where it nears best practice, (ii) registering property, (iii) getting credit, and (iv)
paying taxes. The biggest improvement has been in the area of paying taxes; yet, businesses continue to
cite tax administration as a major impediment to their operations (Figure 3.3). This may be another
indication of the gap between the law as it is written and as it is actually enforced. Armenia continues to
perform poorly in the areas of getting electricity, enforcing contracts and trading across borders.
Table 3.1. Armenia's Doing Business Performance 2014-2015 Rank Distance to frontier (%)
DB 2015 DB 2014 Change DB 2015 DB 2014 Change
Doing Business - Overall 45 49 4 70.6 69.31 1.29
Starting a Business 4 5 1 97.77 97.51 0.26
Dealing with Construction Permits 81 82 1 73.78 73.64 0.14
Getting Electricity 131 132 1 64.02 63.99 0.03
Registering Property 7 7 No change 93.03 93 0.03
Getting Credit 36 30 -6 65 65 No change
Protecting Minority Investors 49 48 -1 60 60 No change
Paying Taxes 41 73 32 82.1 74.46 7.64
Trading Across Borders 110 124 14 68.81 64.46 4.35
Enforcing Contracts 119 119 No change 53.33 53.33 No change
Resolving Insolvency 69 67 -2 48.14 47.74 0.4 Source: Doing Business.
Note: The distance to frontier score measures how far an economy is on average at a point in time from the best performance
achieved by any economy on each Doing Business indicator since 2005, or the third year in which data for the indicator were
collected. The measure is normalized to range between 0 and 100, with 100 representing the frontier.
Figure 3.3. Doing Business Areas in 2015
Source: Doing Business 2015.
97.77
73.78
64.02
93.03
65
60 82.1
68.81
53.33
48.14
0
20
40
60
80
100Starting a Business
Dealing with Construction
Permits
Getting Electricity
Registering Property
Getting Credit
Protecting Minority Investors
Paying Taxes
Trading Across Borders
Enforcing Contracts
Resolving Insolvency

43
3.7. Based on Armenian firms’ perceptions, corruption is worse than in European comparators and tax administration stands out as an especially serious issue. The World Bank’s 2013 Enterprise
Surveys collected responses from firms on a variety of issues, including perceptions of the regulatory
environment. The surveys indicate that senior management in Armenian firms spend 12.2 percent of their
time dealing with government regulation, a figure that is in line with comparator averages but
significantly higher than top performers like Georgia (0.9 percent), Lithuania (6 percent), and Estonia (6.5
percent). Obtaining business licenses is cited as a major constraint by only 4.7 percent of Armenian firms,
which is on par with European countries. However, a higher proportion of Armenian firms (10.6 percent)
report that they expect to provide gifts in exchange for an operating license (Figure 3.4). Tax
administration towers above all other concerns and represents a far higher share than comparators, with
nearly one-third of Armenian firms citing it as a major constraint.
Figure 3.4. Firms’ Perceptions of the Governance Environment
Source: Enterprise Surveys 2012-2013.
Note: EEU is the average of Belarus, Kazakhstan and Russia. SEE is the average of Albania, FYR Macedonia and
Serbia. EU NMS is the average of Bulgaria, Croatia, Czech Republic, Estonia, Hungary, Latvia, Lithuania, Poland,
Romania, Slovak Republic and Slovenia.
3.8. In advanced economies ICT production and use has been critical to income convergence. The
internet revolution of the 1990s led to a divergence in incomes per capita in advanced OECD economies.
While ICT use in many OECD economies remained limited, U.S. productivity growth began to accelerate
due to the diffusion of ICT technology across most sectors of the economy. This halted a secular process
of income convergence that began after the Second World War. Disparities in productivity growth among
OECD countries reflected differing degrees of adaptability to technological shocks, with the countries
enjoying higher levels of competition in factor and product markets benefiting the most.15
15 See Conway et al. (2006).
12.2
4.7
10.6
29.3 0.0
5.0
10.0
15.0
20.0
25.0
30.0
Management time dealing with
government regulation (%)
Firms identifying business
licensing and permits as a majorconstraint (%)
Percent of firms expected to give
gifts to get an operating license
Firms identifying tax
administration as a majorconstraint (%)
Armenia EEU SEE EU NMS

44
3.9. The productivity benefits of ICT use are not automatic and depend on complementary investments in skills development and organizational restructuring.16
More productive firms use
digital technologies more effectively. Evidence from high-income countries suggests that investing in
digital technologies but not in reorganization may even reduce firm productivity growth.17
Investment
differences partly explain the heterogeneity in the use and impact of digital technologies. Investments in
computerized information for instance are comparable among firms in the U.S. and Brazil. However, U.S.
firms focus significantly more on training, skills development and business process improvements; as a
result, the impact of digital technologies on productivity is higher among U.S. firms. In addition, firms are
more likely to develop new management practices in countries with less distorted labor and product
market regulations.18
Similarly, firms in more contested industries—those with more competitors or
higher firm entry and exit rates—are more likely to use the internet to sell or purchase their products or
services.
3.10. ICT production in Armenia has steadily grown in recent years. In 2003 the ICT sector only
employed 3,000 professionals. In 2014 the sector employed 11,600 and accounted for 4.4 percent of GDP
and 4.6 percent of total goods and services exports.19
The majority of ICT exports are destined for North
America and Europe, allowing Armenia to innovate through interactions with developed economies (see
Box 3.2).20
The Armenian ICT sector is comparatively small, however its rapid development and growth
prospects make it an attractive option for foreign investment. Nearly 80 percent of the companies now
active in the sector were formed from 2000-2010. This includes local startups as well as international
subsidiaries. The number of operating IT companies reached 200 in 2010, of which 72 were subsidiaries
of foreign companies with a market share of 52 percent. The sector is primarily oriented towards
exporting software.21
Since 1991 there has been a shift towards developing software and applications and
modernizing telecommunication infrastructure, in addition to outsourcing and IT-based services.
16 “Firms investing in the skills of their workforce use digital technologies more productively. It follows that a shortage of skills
at the country level lowers aggregate productivity growth despite investments in broadband infrastructure. And, countries also
need to provide other backbone infrastructure such as energy or logistics. For instance, selling goods over the internet to
costumers in foreign countries requires basic trade logistics such as ports, air, or land transport” – World Bank (2015). 17 Bresnahan et al. (2002); Brynolfsson and Hitt (2003); Bloom et al. (2012). 18 De Rosa and others (2009) estimated that removing anticompetitive regulation in energy, telecommunications and transport in
Croatia would increase GDP per capita by 1.35–2.77 percent. 19 Employment, GDP and export estimates for the ICT sector are from EIF and are not corroborated by other sources. 20 EIF Armenia IT Sector Reports. 21 World Bank (2013).
Box 3.2. The Information and Communication Technology Sector in Armenia
The Armenian ICT sector has matured in recent years and is primed for further expansion. While comparatively
small in size, the sector’s rapid growth and development prospects have helped attract foreign investment. North
America in particular is a major source of foreign investment. Local companies moreover, are becoming
increasingly active in engineering, systems development, and research and development. Armenia has a
comparative advantage in several areas important for further ICT development, including a competitive cost base
and a large number of graduates with relevant higher education credentials. Armenia faces a number of
competitive disadvantages as well, including poor internet connectivity, lack of office space and a relatively high
risk profile.
The ICT sector is creating jobs, particularly for women who make up 35 percent of the sector’s workforce.
Between 2008 and 2010 the sector employed nearly 5,000 professionals, 83 percent of whom were technical
specialists. The average monthly salary of IT specialists in Armenia is US$1,200–1,500, which is 4 to 5 times
higher than the national average.
Since 1991 the sector has focused increasingly on developing software and applications and modernizing
telecommunication infrastructure, as well as on outsourcing and IT-based services. In the early 2000s the
Armenian government declared ITC as a priority growth area for the country’s economic development. Nearly 80

45
3.11. ICT use among Armenian firms compares favorably with peer countries, but businesses outside the ICT sector are not leveraging the full potential of information technology. In the World Bank’s 2013
Enterprise Surveys 75.6 percent of Armenian
firms reported having their own website. 89.4
percent of firms stated that they use email to
interact with clients and suppliers. Armenia
scored higher than most comparators in web
use, on par with new EU member states and
better than both Western Balkan economies and
EEU partners (Figure 3.5). Local internet
content production is still relatively
underdeveloped compared to neighboring
countries. During focus group interviews the
majority of ICT firms stated that domestic
companies outside of the sector are not
investing in digital technologies. For example,
relatively few firms buy and sell products and
services online.
3.12. While it has narrowed the gap since 2009, Armenia lags behind the OECD and Russia in tertiary enrollment. The average tertiary enrollment rate in Armenia was 46 percent in 2014,
substantially below the OECD average of 71 percent and the Russian rate of 76 percent (Figure 3.6).
Armenia’s neighbors Georgia and Azerbaijan had lower enrollment rates at 27.9 percent and 20.4 percent,
respectively. Albania and Serbia showed higher rates of enrollment at 55.5 percent and 52.4 percent,
respectively.
3.13. Tertiary graduates make up a quarter of the labor force, but Armenia’s supply of science and engineering graduates lags behind comparators. In 2011, the latest year for which WDI data was
available, tertiary graduates made up 22.9 percent of the Armenian labor force, which is only 5.1
percentage points below the OECD average. However, only 15.9 percent of tertiary graduates completed
degrees in science or engineering, making Armenia the lowest rated country among its peers and
substantially below the OECD average (Figure 3.7). Russia ranked highest with 28.1 percent. Belarus
came in close second with 27.2 percent, followed by Serbia. These three countries outperformed the
percent of firms now active in the sector were formed between 2000–2010. This includes local startups as well as
international subsidiaries. The number of operating IT firms reached 200 in 2010, of which 72 were subsidiaries
of foreign companies with a market share of 52 percent. Foreign companies in Armenia employ over half the
ICT workforce.
The ICT sector is primarily oriented towards exporting software, with a majority of firms specializing in internet
services, web development and IT consulting. Internet services generated more than 34 percent of the sector’s
revenues in 2010. The size of the domestic market totaled US$91 million in 2010, and the turnover of the
software and services sector reached US$150 million.
Source: World Bank (2013).
Figure 3.5. Web and Email Use by Armenian Firms
Source: Enterprise Surveys 2012-2013.
Note: EEU is the average of Belarus, Kazakhstan and Russia. SEE
is the average of Albania, FYR Macedonia and Serbia. EU NMS
is the average of Bulgaria, Croatia, Czech Republic, Estonia,
Hungary, Latvia, Lithuania, Poland, Romania, Slovak Republic
and Slovenia.
58.3
61.1
72.5
75.6
90.6
78.7
93.2
89.4
0.0 50.0 100.0
EEU
SEE
EU NMS
Armenia
Firms using e-mail to interact with clients/suppliers
Firms having their own Web site

46
OECD average (22.2 percent). Georgia, Azerbaijan and Albania performed worse than the OECD
average, yet ranked higher than Armenia.
Figure 3.6. Tertiary Enrollment (percent gross)
Figure 3.7. Tertiary Graduates in Science and Engineering
(percent of tertiary graduates)
Source: Global Competitiveness Index (2014-2015).
3.14. A dearth of new graduates undermines Armenia’s traditional strength in science and engineering. While Armenia has 1,500 researchers per million people, a higher number than many of its
peers (Figure 3.8), this number has been steadily declining in the last few years (Figure 3.9). In 2012 it
was estimated that around 5,600 staff, including 4,500 scientists, worked at public research organizations.
This represents a decrease of 19 percent since 2008. 42.8 percent of researchers are women according to
2011 UNESCO statistics. Women are underrepresented in engineering and technology (35.1 percent), but
are prevalent in medical and health sciences (58.6 percent) and agriculture (54.6 percent). These figures
contrast drastically with the situation prior to 1991, when the number of scientists in Armenia surpassed
27,000.
Figure 3.8. Researchers (headcount per million population, 2011)
Figure 3.9. R&D Personnel
Source: UNESCO and Global Innovation Index 2014. Source: NSS.
3.15. Emigration has taken a severe toll on the Armenian science sector. Following the fall of the
Soviet Union a large number of scientists migrated, primarily to Europe and North America. As in other
former Soviet countries the emigration of skilled professionals spurred a further deterioration in human
capital as former scientists began pursuing careers outside of science.
3.16. With its networks and financial resources, the Armenian diaspora is a potential source of expertise, scientific collaboration and funding. Created in 2002 the Diaspora Ministry has taken steps
0 20 40 60 80
Azerbaijan
Georgia
Macedonia, FYR
Kazakhstan
Armenia
Serbia
Albania
OECD average
Russian Federation
0 5 10 15 20 25 30
Armenia
Azerbaijan
Albania
Georgia
OECD average
Serbia
Belarus
Russian Federation
2,649 2,603
2,081 1,813
1,504 1,418 1,292
952 855 763 714 545
0
500
1,000
1,500
2,000
2,500
3,000
0
1,000
2,000
3,000
4,000
5,000
6,000
7,000
8,000
20032004200520062007200820092010201120122013
Other Support personnel Researchers & technicians

47
to promote linkages with the diaspora and incentivize return migration. More systemic measures are
needed to promote innovation and enhance interactions in science and technology with Armenians located
abroad.22
The Armenian diaspora can serve as a valuable source of expertise and funding for innovative
entrepreneurship domestically. While brain drain reduces opportunities for the most educated and
entrepreneurial, the diaspora represents an asset of networks and resources.
3.17. Armenia’s capacity for attracting and retaining highly educated professionals is limited. On a scale of 1 to 7 (with 7 being the
highest), Armenia scored 3.6 on the Global
Competitiveness Index (GCI) for its efficiency
in using talent. This is far behind more
developed economies and reflects a downward
trend since 2009. Armenia’s ranking for its
ability to retain talent is even lower at 2.6
(Figure 3.10). This places Armenia near the
bottom of its peer group, and only above Serbia
(1.8) and Macedonia (2.5). The OECD average
is 4.13, which is significantly higher than
Armenia and its highest scoring peer Azerbaijan
(3.5). Armenia’s score is, however, roughly in
line with that of new EU members. Armenia ranked 2.5 in its ability to attract talent again placing it
above Serbia and Macedonia but below other comparators and substantially below the OECD average
(4.0).
3.18. Armenian businesses do not perceive the supply of educated labor to be an issue, but they are concerned with the quality of education. A significant gap exists between the quality of professionals
the economy requires and what is supplied by the Armenian education system.23
According to a recent
study the inadequate quality of human capital is a binding constraint on economic growth.
24 Similarly, the
World Bank Enterprise Survey found that an inadequately educated workforce is among the top ten
constraints for businesses in Armenia. Yet another survey revealed that a lack of highly qualified labor is
the second most important constraint for business expansion after limited market size. 25
22 In Spring 2008 the government initiated reforms aimed at implementing a coordinated and productive state policy on Armenia-
diaspora relations. The Diaspora Ministry of the Republic of Armenia was created and was commissioned with the Elaboration of
the Concept on Armenia Diaspora Partnership Development and the Elaboration of the Charter of the RA Ministry of Diaspora.
The policy approach national authorities follow is the provision of incentives for the diaspora to visit Armenia (“Come Home”)
in order to encourage return migration. Several initiatives also exist for collaboration with the Armenian diaspora: “Ayastan” All-
Armenian Fund and support to Armenia Diaspora Conferences. 23 EV Consulting (2014). 24 Survey on Growth Constraints, EV Consulting, 2013; sample size – 48 local companies. 25 EV Consulting (2014).
Figure 3.10. Use and Retention of Talent
Source: GCI (2014-2015).
Box 3.3. Skills not just diplomas
The skills problem in the ECA region relates more to the quality and relevance of the education than to problems
of access. Ministries of education are constrained in a number of ways from effectively managing their education
and training sectors. The three most important and interrelated impediments to improving quality and relevance
are the lack of systematic data on key skills-related performance issues (i.e., how much students are learning and
whether they are finding jobs after they graduate), the legacy of central planning, and inefficient use of resources.
Lack of data on student learning and employment outcomes makes it difficult for education ministries to address
the legacy of central planning, which emphasizes centralized management based on inputs. Ministries of
education in the region continue to micromanage the sector using detailed norms and regulations. This input-
00.5
11.5
22.5
33.5
44.5
5
EU
average
OECD
average
Armenia EU
average
OECD
average
Armenia
Efficient use of talent (1-7 best) Country capacity to retain
talent, 1-7 (best)
2014 2009

48
Figure 3.11. Availability of Skills in the Enterprise Sector
Source: Enterprise Surveys 2012-2013.
Note: EEU is the average of Belarus, Kazakhstan and Russia. SEE is the average of Albania, FYR Macedonia and
Serbia. EU NMS is the average of Bulgaria, Croatia, Czech Republic, Estonia, Hungary, Latvia, Lithuania, Poland,
Romania, Slovak Republic and Slovenia.
3.19. While average skill levels in the private sector are high and managers are experienced, insufficient on-the-job training has limited worker productivity. According to the World Bank’s
2013 Enterprise Surveys the Armenian manufacturing sector employs a large proportion of skilled
workers (76.8 percent), which is in line with new EU members (79.3 percent), EEU partners (79.1
percent) and SEE countries (78.8). Average managerial experience levels are also on par with
comparators at 15.5 years. However, Armenian firms lag behind their peers in providing on-the-job
training to employees. Only 16.2 percent of Armenian firms provide such training, compared to around
40 percent in comparable countries. The share of workers receiving training is also relatively low at 39.6
percent. Insufficient on-the-job training opportunities can negatively affect labor quality, since this type
of learning increasingly takes place after secondary or tertiary education. In the US it is estimated that
on-the-job training contributes between 25 and 50 percent of all human capital.26
Studies in OECD
countries demonstrate that adult education and training significantly enhance worker productivity.27
3.20. Armenia was an important center for science and technology during the communist period, and at its height it accounted for one-third of the electronics output of the USSR. The collapse of the
26 Heckman et al. (1998). 27 A study by the OECD (2004) shows, among other things, that employee training affects wage growth of young or highly
educated employees, and that training of employees allows them to attain and maintain the competences required to bring
productivity into line with market wages of older and low-educated workers.
76.8
16.2
39.6
15.5 0.010.020.030.040.050.060.070.080.0
Skilled production workers (%)
Firms offering formal training
(%)
Workers offered formal training
(%)
Years of the top manager's
experience working in the firm'ssector
Armenia EEU SEE EU NMS
oriented style of management leads to the inefficient use of resources and results in a rigid education sector not
the type of flexible sector needed to create modern, skilled workforces.
Source: Sondergaard et al. (2012).

49
Soviet Union weakened Armenia’s economic ties, disrupted financial flows, and radically altered supply
and demand for R&D. Before 1991 the Armenian Academy of Sciences encompassed 25 institutes. 30
more operated under other state agencies and ministries, as well as 26 project institutes, 16 construction
bureaus, 5 scientific laboratories, and 7 science research and normative research outlets. The government
also operated more than 10 higher education and professional development institutions.
3.21. Armenia’s public research and science sector is part of its legacy as a former member of the Soviet Union. Under the USSR the country excelled in applied physics, chemistry and material sciences,
particularly for military uses, and several private and public institutions were integrated into regional
value chains. As in other former Soviet republics, however, the end of Soviet subsidies left many
scientific professionals without work and encouraged an exodus of skilled scientists that continues today.
3.22. R&D intensity has decreased dramatically since the collapse of the USSR. Gross domestic
expenditures on R&D as a share of GDP fell from 2.5 percent in 1990 to 0.27 percent in 2011.28
This
decline is also reflected in the number of researchers and research institutes. The former decreased by
nearly 75 percent, while the latter fell by 50 percent.
3.23. Armenia displays low levels of R&D intensity compared to other transitional economies. Armenia invests much more than Georgia, Kazakhstan or Macedonia, but its level of R&D intensity is
lower than Bulgaria, Croatia or Serbia. In 2011 R&D investment in Armenia represented 0.27 of GDP,
when Bulgaria and Croatia invested 0.7 and 0.75 respectively. Average R&D intensity in EU countries
stands at 2.1 percent of GDP.
3.24. Most R&D spending is public, yet it amounts to just one percent of the national budget. The
central government plays an important role in financing R&D, but expenditures have remained at around
1 percent of total spending (Figure 3.13). There is no information available on R&D spending by private
firms, but the available evidence suggests that private research spending is minimal.
Figure 3.12. Gross Expenditures on R&D, 2011 (% of GDP)
Figure 3.13. Budgeted and Actual Expenditures on R&D, 2002-2013
(% of total government spending)
Source: UNESCO Institute database. Source: Staff calculations based on MoF data.
3.25. Armenia’s science sector performs well by some measures. The 2014 Global Innovation Index
(GII) notes the country’s weaknesses in education29
and limited connectivity between the public and
28 See UNECE, 2014; INCONet 2014. 29 Armenia ranks low in terms of public expenditure on education relative to GDP.
1.12
0.78 0.75 0.70
0.40
0.27 0.22 0.21 0.18 0.16 0.15
0.02
0.0
0.2
0.4
0.6
0.8
1.0
1.2
0.00
0.20
0.40
0.60
0.80
1.00
1.20
200220032004200520062007200820092010201120122013
R&D as % of budget total expenditure, actual
R&D as % of budget total expenditure, plan

50
private sectors. Nevertheless, Armenia performs relatively well in terms of scientific publications. In 2013
it ranked above most of comparator countries and just below Croatia and Serbia. The quality of its
publications is also high compared to peer economies.
3.26. Armenian institutions tend to focus on basic research rather than applied sciences. Most
Armenian research institutions specialize in different forms of basic research, focusing on chemistry,
Earth and planetary sciences, material sciences, mathematics, physics and astronomy. During 2004-2013
physics and chemistry led overall publications, with 2,724 and 793 articles, respectively. By contrast,
Armenian scientists made few contributions to applied fields such as engineering, which offer greater
opportunities for productivity spillovers. Cross-cutting disciplines such as computer science also
performed poorly despite the relative importance of Armenia’s ICT sector.
Figure 3.14. Scientific Publications, 2013 (per billion US$ GDP)
Figure 3.15. Citable Documents 2013
Source: World Bank and Global Innovation Index based on
SCIMAGO Database (SCOPUS).
Source: SCIMAGO.
Figure 3.16. Quality of Armenian Research: H-Index of Scientific Publications (1996-2013)
Figure 3.17. Revealed Scientific Advantage –The first 15 Scientific Disciplines (1996-2013)
Source: Staff calculations based on SCIMAGO (February 2015).
Note: The H index is the economy’s number of published articles (H) that have received at least H citations in the period
1993-2013.
3.27. Scientific achievements do not seem to impact national technological performance or firm-level innovation. Armenia ranks 90th out of 140 countries on GCI measures of business sophistication,
which include knowledge-intensive employment, the number of firms offering formal training, the
amount of R&D performed by businesses, cluster development, and the maturity of innovation linkages.
This indicates that scientific output is not translated into economic value or diffused into the rest of the
economy.
60.4
40.6 33.8
19.3 18.9 12.8 10.7 9.6 6.8 5.2 4.2 2.1
0.0
10.0
20.0
30.0
40.0
50.0
60.0
70.0 325
143
106 105 78 68 62 60 52 45 44 36
0
50
100
150
200
250
300
350
0
50
100
150
200
250
300
350
400
00.5
11.5
22.5
33.5
44.5
5
Agricultural and
Biological Sciences
Decision Sciences
Neuroscience
Social Sciences
Computer Science
Multidisciplinary
Biochemistry,
Genetics and…Immunology and
Microbiology
Pharmacology,
Toxicology and…
Engineering
Chemistry
Earth and Planetary
Sciences
Materials Science
Mathematics
Physics and
Astronomy

51
3.28. Cooperation between scientific institutions and private firms is infrequent due to supply and demand factors. Armenia scores poorly on the GCI dimension of university-industry collaboration, an
area that is key for transforming academic research to commercial applications (Figure 3.18). Armenia
scored 3.05 out of 7, above Albania and Georgia but behind most of its peers, including Azerbaijan
(3.15), Russia (3.6) and Macedonia (3.7), and far behind the OECD average (4.7). Overall, Armenia’s
GCI score reflects an inability to foster knowledge diffusion. The overall orientation of research towards
basic research discourages private-sector collaboration. Furthermore, the legal framework governing
cooperation and linkages between the public and private sectors are not clearly defined, and there is no
intermediary institution tasked with facilitating public-private collaboration. As discussed in the next
chapter, a number of vital elements of a well-functioning national innovation system, such as efficient
cooperation between education, science, R&D and industry are not yet in place, and their establishment
will require a well-targeted long-term policy agenda.
Figure 3.18. University-Industry Collaboration
Source: GCI (2014-2015).
3.29. Armenia’s weak technological performance is reflected in its relatively low number of patent applications per capita. Armenia is near the bottom of its benchmarking group with just 44 patent
applications in 2013. The number of patent applications has decreased in the last decade from 68 per
million people in 2002 (Figure 3.19). However, Armenia has performed better in trademark applications,
which doubled from 811 to 1623 over the same period (Figure 3.20).
Figure 3.19. Patent Applications (per million people)
Figure 3.20. Trademark Applications (per million people)
Source: World Development Indicators (World Bank).
0
1
2
3
4
5
Albania Georgia Armenia Azerbaijan Serbia Kazakhstan Russia Macedonia,
FYR
OECD
average
(1-7 best)
232 229
129 121 114 91
78 74 70 68
29
0
59
313
173
22
129
74
1
27 8
44
17 31
0
50
100
150
200
250
300
350
2002 2013
1905
1451
1126
842 811 791 636 606
317 310 299
0
2125
1467 1547
1134
1623
1193 1214 1114
617 653
446
959
0
500
1000
1500
2000
25002002 2013

52
3.30. Quality certification is relatively infrequent, which reduces economic confidence in Armenian firms. The number of ISO-9001 certificates remained at around 35 over the 2010-13 period, while ISO
14001 certificates were below 10 per year. The adoption of internationally recognized quality standards is
critical to global competitiveness. By alleviating asymmetric information and signaling performance to
external parties quality certification facilitates firms’ integration into global value chains. Certification
facilitates firm growth, and this effect tends to be more intense in developing counties, where buyers have
greater difficulty acquiring information about sellers. Weaknesses in Armenia’s quality infrastructure
constrain the ability of Armenian firms to reap these benefits (Box 3.3).
3.31. Strong institutions and complementary markets are essential to a knowledge-based economy. As illustrated by the benchmarking exercise presented above, Armenia suffers from weaknesses in
governance, limited ICT use, low workforce skills and an inadequate knowledge base. Institutional
deficiencies are the most critical, since they shape the incentives of knowledge creators and users,
affecting all four dimensions of the knowledge economy.
3.32. Armenia has made significant progress in strengthening the formal rules for doing business, but informal norms prevent the creation of a level playing field. Armenia has made remarkable strides
in improving regulatory efficiency, and it performs well on most dimensions of doing business. However,
these reforms will be unable to stimulate investment and innovation so long as informal practices
continue to pervade the private sector. Altering established behaviors is not easy, as it requires
confronting powerful vested interests that have a strong stake to impede the creation of a level playing
field.
Box 3.4. Armenia – National Quality Infrastructure
Armenia’s national quality infrastructure suffers from significant weaknesses that hinder technology upgrading
and undermine the competitiveness of its exports. Lack of modern quality infrastructure has severely constrained
the ability of Armenian firms to move up the value chain or to find export markets. Most of Armenia’s potential
export destinations, including the EU, USA and Russia, often require higher certification standards than those
applied domestically. As identified in the report on Quality Infrastructure prepared by the World Bank and PTB
(the German Authority for Metrology), less than half of Armenia’s domestic enterprises have obtained
international quality certifications.
Significant reforms have taken place in the National Quality Infrastructure in recent years. Since the adoption of
the “Strategy for the Reform of the Republic of Armenia´s Quality Infrastructure (2010-2020) by the government
in 2010, several major reforms have taken place; most notably new laws on Metrology, Standardization,
Accreditation, and Certification in line with international best practice were developed with the support of donors
and adopted in 2012. One of the most important reforms implemented as a result of the new laws was the
transformation of the accreditation function from being a department within Ministry of Economy (MoE) into an
independent NAB established in 2013 with an accreditation council represented by public and private sector
stakeholders.
The major gaps identified in the National Institute of Metrology (NIM) include the fact that: (i) while the agency
is overstaffed, personnel skills are obsolete due to lack of training, and therefore staff are not well versed in
industrial metrology procedures, (ii) the premises for metrology activities is not suitable for operations and in dire
need of renovation, (iii) equipment is outdated and non-functional and needs to be upgraded, and (iv) as a
consequence of the above, internationally recognized metrology procedures are not currently applied and need to
be adopted. The newly created National Accreditation Body (NAB) does not have the skills or funding to fulfill
the mandate of NAB or to achieve the goal of international recognition in the future. The National Institute of
Standards (SARM) is in better condition than the other Quality institutes; however, significant effort is required
to attain the goal of the government to be able to support the dual standards of GOST and the ISO.

53
3.33. ICT production is robust in Armenia, but ICT use is limited. In recent years Armenia has
developed a vibrant ICT sector, which is almost entirely focused on exports. Its success is due to in large
part to its limited interaction with the domestic governance environment, and it has little incentive to
integrate into domestic markets. Yet the experience of more developed countries shows that sustained
growth comes from the diffusion of ICT to the entire economy. In Armenia ICT use is limited to basic
functions, and local internet content and e-commerce systems are underdeveloped.
3.34. The supply of workers with advanced qualifications in science and engineering is very limited, and enterprises do not invest in workers’ skills. Armenia’s human capital stock has been
significantly depleted since the collapse of the Soviet Union. The persistent effects of brain drain and a
paucity of new graduates, especially in science and engineering, have diminished the pool of scientific
professionals available to both the public and private sectors. Furthermore, private firms do little to invest
in the skills of their employees, which is a crucial supplement to formal education.
3.35. Public and private investment in the creation of knowledge is low, and knowledge use in the economy is inadequate. Armenia’s scientific and technological base is eroding over time. Public
investment in R&D is low, and private investment is almost nonexistent. Armenian firms have few
incentives to innovate and rarely collaborate with research institutions. The economic impact of public
R&D is diminished by a general focus on basic research rather than applied sciences, administrative
capacity constraints in the research sector, and a lack of market incentives for firms to seek scientific and
technological support.

54
A national innovation system is the set of institutions, policies and funding arrangements that support the
creation and use of knowledge. The Armenian authorities have taken important steps to establish the
legal and regulatory framework for science, technology and innovation (STI). However, the government’s
STI policies are not well aligned with the objectives of the country’s research institutions or the
incentives of the private sector. Just 1.2 percent of the government budget is devoted to STI, and public
funding is primarily focused on basic research. Meanwhile, direct collaboration between scientific
institutions and private firms is almost nonexistent due to regulatory obstacles, capacity constraints and a
lack of private-sector demand. Progress has been made in facilitating international cooperation, but
opportunities to connect with the country’s scientific diaspora remain underexploited.
4.1. A sound innovation framework is fundamental to the development of a knowledge economy. A
country’s aggregate ability to create and use new forms of knowledge depends on a wide range of factors,
including education levels, international openness, the quality of governance, the intensity of domestic
market competition, and the protection of intellectual property. However, many governments ignore these
fundamental prerequisites and instead focus on a narrower set of policies intended to stimulate science,
technology and innovation (STI). Yet the STI output cannot be accelerated without first establishing an
adequate legal and institutional framework based on the four pillars of a knowledge economy: good
governance, ICT development, human capital and knowledge creation.
4.2. This chapter describes Armenia’s national innovation system. A national innovation system is
the network of public and private actors, policies and funding arrangements through which new forms of
knowledge are produced. According to the OECD (1997), “The concept of national innovation systems
rests on the premise that understanding the linkages among the actors involved in innovation is key to
improving technology performance. Innovation and technical progress are the result of a complex set of
relationships among actors producing, distributing and applying various kinds of knowledge. The
innovative performance of a country depends to a large extent on how these actors relate to each other as
elements of a collective system of knowledge creation and use as well as the technologies they use. These
actors are primarily private enterprises, universities and public research institutes and the people within
them.”30
In light of the potentially transformative role of the national innovation system, this chapter
focuses on two key questions:
Is Armenia’s legal and strategic framework capable of supporting the development of a
successful and dynamic national innovation system?
Are the country’s policy implementation mechanisms and funding arrangements adequate to
achieve the government’s objectives for the knowledge economy?
4.3. Armenia’s primary public research and development (R&D) agency is the State Committee of Science (SCS).31
Established in 2007 as part of the Ministry of Education and Science, the SCS is tasked
with developing and implementing the government’s STI policies and R&D programs. Its main objectives
include: (1) increasing STI output and training scientific personnel; (2) promoting the development of a
science sector that supports economic productivity, government efficacy, national defense, and positive
30 OECD (1997), p. 9.
31 The SCS was established by Presidential Resolution N 231, 1 October, 2007.

55
social and cultural outcomes; (3) elaborating and implementing national STI policy; and (4) supporting
investment in basic and applied research. It operates under three principal financing mechanisms: (i)
current expenditures, (iii) targeted programs, and (iii) additional contractual or thematic funding.
4.4. The National Academy of Sciences (NAS) is Armenia’s main implementing agency for R&D projects. The NAS coordinates the country’s network of public research institutions, and it plays an
important role in elaborating and implementing the national STI strategy. The Ministry of Economy is
responsible for designing and implementing innovation policy in coordination with the Ministry of
Education and Science and other ministries and organizations. These stakeholders jointly invest in R&D
and, in principle, provide a two-way link between research institutions the public and private sectors.
4.5. Since the early 2000s the government has produced a series of policy documents establishing the current legal framework and strategy for the STI sector. The Law on Scientific and Technological
Activity passed in 2000 defines the relationship between R&D organizations, public agencies, and
consumers in the public and private sectors. It emphasizes the importance of promoting innovation and
commercializing research outcomes as a driver of economic growth. The 2006 Law on State Support for
Innovation and the 2011 Law on the National Academy of Sciences complete the modern framework for
STI.
4.6. These laws establish the NAS as the highest self-governing scientific organization, with the authority to undertake and coordinate basic and applied research. The NAS is a major government
agency, and the head of the NAS participates in government sessions. Its current expenditures are
included as a line item in the national budget. However, additional funding for targeted programs or under
contractual arrangements involves a competitive bidding process with the SCS and other Armenian
research institutes.
4.7. The government has drafted a set of complementary strategies aimed at building a knowledge-based economy. Armenia is striving to create a private sector in which intellectual power and knowledge-
creation accelerate economic growth and promote social development. This is reflected in the current
national strategies for innovation, industrial development and science.32
These documents focus on short-
and medium-term objectives, some highly ambitious, and include a number of specific policy measures.
4.8. The authorities are working to modernize Armenia’s innovation system. Its efforts include
reforming public institutions and strengthening the country’s research networks. The government is also
attempting to build the national capacity for R&D and develop an STI sector capable of meeting the
challenges set out in its national strategies.
Box 4.1. The Three Horizons of the National Innovation Strategy
In February 2011 the government approved the concept paper for the Initial Strategy for the Formation of an
Innovation Economy, based on research conducted by the Ministry of Economy, as well as measures to build the
country’s legal, business, educational, financial and innovation infrastructure. The government’s strategy is
based around a set of three “strategic horizons.”
32 National strategies for STI serve several functions. First, they articulate the government's vision regarding the contribution of
STI to social and economic development. Second, they set priorities for public investment in STI and identify the focus of
government reforms (e.g. university research funding and evaluation systems). Third, the development of these strategies can
serve to engage stakeholders ranging from the research community, funding agencies, business, and civil society to regional and
local governments in policy making and implementation. In some cases, national strategies outline the specific policy instruments
to be used to meet a set of goals or objectives. In others, they serve as visionary guideposts for various stakeholders (OECD,
2013).

56
• Horizon 1: The Development of Existing Resources (2011-2014)
Goals: Formation of the NAS
Measures: (i) Legal reforms; (ii) Development of supportive financial and physical infrastructure; (iii) Private-
sector engagement; (iv) Educational modernization; and (v) System-forming measures.
• Horizon 2: Expansion and Capacity Building (2011-2017)
Goals: (i) Adoption of international standards in the private sector; (ii) Harmonization of educational credentials
with international standards; (iii) Establishment of new STI institutions; (iv) Support for innovative startup firms;
and (v) Technological modernization of existing firms.
• Horizon 3: Establishing Armenia as a Global Center for R&D (2011-2020)
Goals: (i) Creation of an internationally recognized engineering university and national science laboratory; (ii)
Global leadership in R&D on par with Israel, Singapore and Ireland; and (iii) Worldwide expansion of Armenian
technology companies.
The strategy’s ultimate goal is to attract leading global technology companies to Armenia and support the
globalization of Armenian technology firms.
Source: Initial Strategy for the Formation of an Innovation Economy, concept version, February 7, 2011.
4.9. STI policies are guided by the Strategy for the Development of Science (SDS) and the Science Development Action Plan (SDAP). The SDS (2011-2020) lays out the government’s strategic vision for
building a competitive knowledge-based economy, while the SDAP (2011-2015) operationalizes this
vision through active support to R&D activities. The overarching objective of the SDS and SDAP is for
Armenia to become competitive within the European Union in basic and applied research. The SDS
targets: (i) the creation of an institutional system for the sustainable development of science and
technology; (ii) the efficient production of scientific outputs and the modernization of research
infrastructure; (iii) the promotion of advances in basic and applied research; (iv) the exploitation of
synergies in education, science and innovation; and (v) the development of an international reputation for
scientific excellence.
4.10. The SDAP focuses on a set of operational objectives. These include: (i) improving the
management of the STI sector and ensuring its sustainable development; (ii) increasing the number of
new specialists entering the research, education and technological development fields, and upgrading
educational and research infrastructure; (iii) creating the necessary conditions for the development of
integrated STI systems; and (iv) fostering international cooperation in R&D. Disciplines of particular
focus include Armenian Studies; Humanities and Social Sciences; Life Sciences; Renewable Energy and
New Energy Sources; Advanced Technologies, Information Technology; Astronomy and Space Sciences;
Earth Sciences and Ecological Sustainability; and Foundations of Applied Research.
4.11. Innovation policy is set by the Ministry of Economy. Its primary strategic documents are the
Initial Strategy for the Formation of the Innovation Economy (ISFIE) and the Strategy for Export-led
Industrial Policy (SEIP). ISFIE envisions Armenia’s transformation into an R&D center for multinational
corporations, with key milestones up through 2020 including legal reforms, the development of
innovation and business support institutions and instruments, educational modernization, the adoption of
international standards, the establishment of national centers of excellence in innovation, and the global
expansion of Armenian technology companies. The ISFIE explicitly addresses the development of the
NAS’s infrastructure and systemic capabilities. The strategy enjoys broad political support and makes use
of a wide range of policy instruments.
4.12. The SEIP guides industrial policy toward the objective of transforming Armenia into a producer of high-value, knowledge-intensive goods and services. Armenia is attempting to shift its
export profile from a focus on resource-based industries toward increasingly skill- and knowledge-

57
intensive sectors. Its long-term goal is to foster economic diversification by expanding currently export
sectors and those with export potential, with particular emphasis on small and medium enterprises.33
Priority industries include mining and metallurgy, light manufacturing, food production, jewelry,
machinery, precision instruments and industrial chemicals.
4.13. Armenia has also promulgated a national strategy for the growth of the ICT sector. In
December 2000 the government declared ICT a priority sector and established the ICT Master Strategy,
and in July 2001 the IT Development and Support State Council was founded. The Master Strategy
identifies goals and proposes measures designed to increase the global competitiveness of the Armenian
ICT industry.34
In 2008 the government followed up by adopting a 10-year ICT development strategy
focused on building infrastructure, increasing workforce skills, and creating financing mechanisms for
start‐up companies.
Key Agencies
4.14. The NAS and SCS are Armenia’s two main implementing agencies for R&D, but they are not the only important actors in the sector. While the NAS is the highest self-governing organization
devoted to basic and applied research, other relevant agencies include the National Center of Innovation
and Entrepreneurship (NCIE) and the Enterprise Incubator Foundation (EIF).
Box 4.2. The Enterprise Incubator Foundation (EIF)
The EIF is one of the largest technology startup promoters and consulting companies in the region. Established
in 2002 under the framework of the World Bank’s “Enterprise Incubator” project, its stated goal is to support the
development of the Armenian technology sector by creating a supportive environment for innovation,
technological advancement and company growth. EIF activities cover every aspect of sector development,
including technology-related legal, business and educational reforms, opening investment channels and creating
funding schemes for startups, and providing business consulting and workforce development services. The EIT
is a nexus for public and private institutions, international organizations, government agencies, and firms
ranging major multinationals to small startups.
The objectives of EIF are to: (i) develop an effective ICT infrastructure to enhance technological progress and
speed the transition to a knowledge-based economy; (ii) expand nationwide access to computers and internet;
(iii) promote Armenian technology firms and increase their global competitiveness; (iv) create new channels for
attracting FDI to the Armenian technology sector; (v) build linkages with businesses and research networks both
in Armenia and abroad; (vi) foster the establishment and growth of startups; (vii) enhance the professional skills
of the domestic workforce; and (viii) improve local firms’ access to international experience and best practices.
Source: USAID (2013).
4.15. The NCIE operates under the authority of the Ministry of Economy and plays an important role in shaping innovation policy. The NCIE promotes the commercial application of innovative ideas
and new forms of intellectual property, and it provides scientific and technical information services to
entrepreneurs. The NCIE also finances the gathering of information on industries and markets, as well as
assessments of potential investment projects.
33 This policy framework attempts to coordinate all the activities and tools used by the government to boost the development of
the real economy. Sectoral strategies are being developed based on this policy framework, and the initiative will complement
other sectoral and cross-cutting initiatives. 34 The strategy identifies the following actions as critical to boost Armenia’s global competitiveness of the Armenian ICT sector:
(1) make better use of the strong mathematical, algorithmic, and logical capacities of the country’s existing professionals; (2)
leverage the ICT resources of the Armenian diaspora to promote investment; (3) attract and retain educated professionals to the
ICT sector; and (4) maximize the value of limited resources by creating a culture of collaboration among Armenian ICT firms.

58
4.16. A number of other agencies are involved in innovation. The Armenian
Development Agency (ADA) is tasked with
implementing the Strategy for Export-led
Industrial Policy and with attracting increased
FDI. It serves as a one-stop shop for foreign
investors. The Industrial Development Fund, a
separate organ of the Ministry of Economy, is
charged with implementing industrial policies,
including those administered by ADA. The
Small and Medium Entrepreneurship
Development National Center of Armenia
supports small and medium enterprise (SME) development by providing information, training and
consulting services. It also offers financial support through a number of instruments, such as loan
guarantees for startups and SME expansions, as well as franchising programs and international assistance.
The National Competitiveness Foundation is a public-private partnership that draws on international
business executives of Armenian origin to attract FDI and promote economic development and
international competitiveness.
Research Institutes
4.17. In 2012 there were 82 research organizations in Armenia. These organizations operate under
various ministries, as well as the NAS and the Yerevan Municipal Government. The NAS alone
encompasses 35 research institutions. Leading organizations include the Yerevan Physics Institute, a
prominent center for high-energy physics research, as well as the Yerevan Computer Research and
Development Institute and the Yerevan Automated Control Systems Research Institute.
4.18. Most of these organizations are focused on basic research. In many developed countries public
research organizations concentrate on specific technologies and applied research, but the NAS institutes
are oriented toward basic research, often with no clear application. And whereas public research
organizations in OECD economies often enjoy strong linkages with the private sector, few NAS institutes
have meaningful connections with private firms.
4.19. The SCS is currently developing an evaluation system for public research organizations and projects. Two types of evaluation are being considered: (i) an evaluation of ongoing research activities
based on 7 criteria and 43 sub-criteria, and (ii) an evaluation of 3- and 5-year scientific programs. The 7
criteria used by type (i) evaluations are: research; personnel; infrastructure; integration with international
research; integration with the higher education system; commercialization of research results; and
financial activities. The results of the evaluation will influence future financing decisions.
4.20. Steps have been taken to improve coordination among research organizations. Acknowledging the fragmentation of resources across institutions and the need for better public research
management, the NAS has pursued a set of reforms designed to improve research performance and
maximize the impact of limited resources. In 2006 the government adopted a resolution to strengthen the
NAS’s infrastructure and reorganize some of its institutes. For example, the government created the
Scientific and Technological Center for Organic and Pharmaceutical Chemistry by merging of the
Institute of Fine Organic Chemistry with the Institute of Organic Chemistry and the Molecular Structure
Research Center.35
35 IncoNet (2014).
Figure 4.1. Research Organizations
Source: SCS.
1
1
2
2
4
8
10
19
35
0 10 20 30 40
Min Econ.
Min Territ. Admin.
Min Cult.
Yerev Municip.
Min Agr.
Min Health.
Others
Min Ed & Sc
NAS

59
4.21. However, little progress has been made in promoting the commercial applicability of public research. The 2011 Law on the National Academy of Sciences emphasized the commercialization of
public research, but few practical steps have been taken to accomplish this objective. Nevertheless, the
law explicitly empowered the NAS and its institutes to actively promote commercial applications.
4.22. Current legislation does not regulate attribution and the commercial exploitation of intellectual property rights resulting from publicly financed research. Unlike many advanced
economies, Armenian universities and other academic institutions are not guaranteed ownership over their
research products. This greatly reduces incentives to develop commercially applicable outputs. Rules
governing ownership and revenue rights for intellectual property differ widely across institutions, and few
organizations have adopted policies based on international best practices. There is no legal obligation for
research organizations to specify internal rules for intellectual property or include such rules in
employment contracts. Moreover, there are currently no national laws establishing ownership of
collaborative research products.
4.23. Government approval is required to commercialize new technologies, which reduces prospective revenues for research organizations. The Law on State Non-Commercial Organizations
mandates that research institutions acquire government approval before selling their research products.
However, there are some exceptions, including the Charter of Yerevan State Medical University, which
allows university involvement in a wide range of business activities. And several institutions, including
the State Agrarian University, have started reforming their legal status in order to access new funding
sources and expand their private sector linkages.
Universities
4.24. The Armenian higher education system consists of 22 public institutions and over 70 private institutions. There are also 4 international universities established through bilateral agreements.
Armenia’s leading universities are Yerevan State University, the State Engineering University of
Armenia, the State Medical University, the State Agrarian University, the Russian-Armenian State
University, the French University, and the American University of Armenia.
4.25. After the fall of the Soviet Union research and teaching in Armenia were administratively divided, with the former exclusively confined to the NAS. There are no aggregate statistics on R&D
among Armenian universities that would allow an analysis of recent trends. However, observations and
interviews indicate that university R&D is modest but gradually increasing, particularly in leading state
universities. One advantage of universities over public research institutes is that the latter have greater
flexibility in allocating revenue.36
Yet Armenian universities lack modern technological infrastructure,
including internal information networks and digital libraries linked to international databases.
4.26. From a public policy perspective research undertaken by higher education institutions and individual academics is underdeveloped and undervalued. In a recent study Armenian academics
consistently described the purpose of university education as reproducing existing knowledge rather than
producing new knowledge, and stated that knowledge creation plays a negligible role in universities.37
4.27. Public policies do little to stimulate university research. A 2013 World Bank report found that
the existing legislation “neither allows nor motivates [higher education institutions] to be actively
engaged in R&D”. University professors are not required to conduct research, and those who wish to do
so often have limited time and resources—particularly since Armenian professors often work for multiple
36 Ibid. 37 See: “Higher Education in Armenia Today: a focused review”-Report for the Open Society Foundation, Armenia CEU Higher
Education Observatory, Budapest, July 2013.

60
institutions. Of the professors who do conduct research many appear to prefer theoretical inquiries, which
require fewer financial resources.
4.28. The lack of university research undermines the quality of higher education. Many advanced
degree programs, especially in science, technology, engineering and math, should require research studies
as an essential component of the discipline. University research also helps promote new research careers,
and it can attract talented, inquisitive students to science and technology.
4.29. The quality of higher education in Armenia is generally weak. Armenia ranks low in key
indicators, including the effectiveness of management schools, the availability of research and training
services, and access to on-the-job training opportunities. Public spending on education relative to GDP is
also very low by international standards.
4.30. Higher education reforms have allowed the establishment of private universities and introduced a quality-assurance system. In 2005 Armenia officially joined the Bologna Process, and in
2010 it became part of the European Higher Education Area. The Ministry of Education and Science is
currently reforming the structure, content and management of higher education, in an effort to further
integrate Armenia into the European Higher Education Area. In addition, higher education institutions are
subject to national quality standards set out by the Armenian National Centre for Professional Education
Quality Assurance Foundation.39
4.31. Current legislation limits the ability of higher education institutions to engage in commercial activities and collaborate with industry. Both the Law on Higher Education and the Law on State Non-
Commercial Organizations, mentioned above, constrain university engagement in the private sector. The
Law on Higher Education defines higher education institutions as separate legal organizations and the
Law on State Non-Commercial Organizations stipulates that the founder is responsible for final decisions.
Higher education institutions are not legally required to follow a sample charter developed by the
Ministry of Education and Science. Most state universities, however, have adopted the sample charter
voluntarily.
4.32. Aligning education programs with private sector demand is a priority challenge. Greater
educational responsiveness to changing labor market conditions is an essential prerequisite for the
development of a knowledge-based economy. As discussed in Chapter 3, a lack of human capital is a
binding constraint on business development in Armenia.
Funding for Science, Technology and Innovation
4.33. STI spending is not a high priority in the national budget. In 2014 the STI budget was just 1.2
percent of the total government budget. The annual STI budget averaged US$24.3 million during 2008-
2013. The budget-execution rate was close to 100 percent (Figure 4.2), though actual disbursements have
fallen short of allocations in recent years, reflecting a government-wide trend in the capital budget. STI
spending declined marginally in real terms in 2009 and 2010, falling by 1.6 and 1.2 percent, respectively,
then grew by 8.6 percent per year over 2011-2013 (Figure 4.3).
39
This organization conducts external quality assurance in accordance with the norms set by the national legislation and
regulations, as well as with European Standards and Guidelines. It also developed Guidelines, Criteria and Standards for Quality
Assurance taking into account the local needs and international good practices, and it has developed a Strategic Plan for the
Transitional Period 2011-2015 to establish a quality culture at tertiary level. The quality assurance framework includes
mandatory institutional audit and voluntary program accreditation.

61
Figure 4.2. STI Budget, 2008-2013 (in US$ millions)
Figure 4.3. The Evolution of the STI Budget, 2008-2013
(in US$ millions and %)
Source: MOF and World Bank staff calculations.
4.34. The STI budget is executed more consistently than the overall budget. During 2009-13 the STI
budget grew at a lower average rate than total expenditures. At the budget-revision stage total
expenditures were increased by between 3.2 and 9.2 percent, while STI spending was either left
unchanged or decreased. The only exception is 2013, when the STI budget was revised upwards by 1.7
percent due to an increased allocation for the Center for the Advancement of Natural Discoveries using
Light Emissions.
Figure 4.4. Composition of the STI Budget by Program, 2008-2013
(in %)
Figure 4.5. Execution of the STI Budget by Agency, 2008-2013
(in %)
Source: MOF and World Bank staff calculations.
4.35. Total STI budget is heavily concentrated in terms of both programs and spending agencies. 70 percent of the total budget is devoted to “Other Expenditures” (Figure 4.4), which primarily covers the
basic operating costs of the country’s research institutes. The SCS is the major spending agency,
responsible for 80 percent of the total STI budget, followed by the Ministry of Defense at around 12
percent (Figure 4.5).
4.36. Little funding is allocated to programs directly linked to R&D. Direct R&D support represents
only 10 percent of the STI budget. More resources are distributed through the SCS, which limits the role
of line ministries in mainstreaming R&D into policymaking and program implementation.
0.0
10.0
20.0
30.0
2008 2009 2010 2011 2012 2013
US
$ m
ln
Initial plan Revised plan Actual
-5
0
5
10
15
0
10
20
30
2008 2009 2010 2011 2012 2013
per
cen
t
US
$ m
ln
STI budget, actual, US$ million
Spending growth rate, % (RHS)
Research
excellence
1%
Technology
transfer
19%
Direct
support
10% "Other"
(salaries,
mantenance, other
current
expenditures etc.) …
Ministry of Education and
ScienceMinistry of Diaspora
PM's Office
State Committee on
ScienceMinistry of Finance
Ministry of Economy
Ministry of Culture
Ministry of Defense

62
4.37. Only 15 percent of the total STI budget goes to applied research. In 2013 the three
largest STI programs focused on maintaining
infrastructure and building scientific capacity (72
percent); R&D and engineering activities (12
percent); and thematic research programs (8
percent). Applied research programs represented
only 3 percent of the budget and programmatic
research programs 0.02 percent (Figure 4.6).
While some R&D and engineering programs
involve applied research, combining this category
with “applied research programs” yields a total of
just 15 percent of the STI budget dedicated to
applied research. This share is far below global
averages. Although cross-country data are not
directly comparable, applied research40
represents
more than 30 percent of gross STI expenditures in
most new EU members, such as Bulgaria (72.5 percent in 2013), Romania (39.2 percent in 2012), Croatia
(36.9 percent in 2011) and Hungary (36.3 percent in 2012).
4.38. Armenia’s expenditure patterns are not consistent with national strategies, which emphasize the development of new technologies and the commercial application of research. Over 2003-2011 the share of
natural sciences in total research spending has
fallen from 89 percent to 72 percent.
Technological sciences experienced the largest
single drop, from 51 percent to 43 percent.
Spending on humanities research, meanwhile,
has dramatically increased, rising from 4 percent
to 21 percent over the period. The share devoted
to agricultural sciences is small and has been
gradually diminishing. Public funding for R&D
does not appear to be well aligned with the goals
of the ISFIE and SDS, both of which target the creation of a technology-driven economy based on the
commercial application of science.
4.39. Consolidating the Ministry of Economy’s science programs within the 2014 STI budget increases the total by 13.1 percent. In addition to programs listed under the “science” category, the
Ministry of Economy implemented several STI-related programs under other budget lines. In 2014 these
programs included: (i) ICT support; (ii) sector-specific R&D; (iii) financing for the National
Competitiveness Foundation; (iv) certain export-oriented industrial policies; (v) the establishment of a
40
Applied research is defined according to the OECD’s Frascati Manual. See:
http://www.oecd.org/innovation/inno/frascatimanualproposedstandardpracticeforsurveysonresearchandexperimentaldevelopment
6thedition.htm
Figure 4.6. The STI Budget by Program, 2013 (in %)
Source: MOF and World Bank staff calculations.
Figure 4.7. Public Research Spending by Discipline (in %)
Source: Statistics on Science 2003-2013, Armstatbank.am.
2.79%
7.90% 1.59%
12.05% 0.10%
71.89%
3.68%
Center of excellence
Thematic research
programs
Programmatic
research programs
R&D and engineering
activities
Applied research
51 44 44 44 38 43 42 42 43
38 43 41 41 48 36 35 35 29
4 5 6 6 6 9 12 14 21
7 8 9 9 8 12 11 9 7
0%
20%
40%
60%
80%
100%
2003 2004 2005 2006 2007 2008 2009 2010 2011
Natural Sciences Technological Sciences
Humanities Other Disciplines

63
nuclear medicine center; and (vi) the protection of intellectual property rights. The overall budget-
execution rate for the Ministry of Economy’s STI-related programs was 96.1 percent, and spending on
categories (ii), (iii) and (v) was executed at 100 percent. Category (vi), the protection of intellectual
property rights, had the lowest execution rate at 84.8 percent.
Public Research Programs
4.40. State R&D programs are financed through basic, targeted or thematic funding. Basic funding
covers 191 programs in public research institutes and universities. Targeted funding covers 12 programs
in both public and private research institutes and universities. Thematic funding targets individual
researchers, doctoral students and research teams with a maximum of 5 members. It encompasses
researchers from both public and private research institutions.
4.41. Competitive financing, including peer review, supports one-third of scientific research projects. Shortly after the creation of the SCS in 2007 competitive financing was introduced to
complement basic funding of public R&D institutions. Targeted and thematic funding are both
competitive, and projects are evaluated by independent peer reviewers. In 2013 the peer-review system
comprised 1,500 independent experts.
4.42. Funding for large-scale public research projects is being expanded. In accordance with the
strategic orientation of the ISFIE and SDS the government’s priority public research initiatives include
the Alikhanyan National Science Laboratory’s Yerevan Physics Institute, the Center for the Advancement
of Natural Discoveries using Light Emission, and the Armenian Center for Excellence in Oncology.
Human Capital Development and Labor Mobility
4.43. The authorities have launched a number of initiatives designed to support the professional development of young scientists. Special funding programs for researchers under the age of 35 include
project-based financing, stipends, funding for international conferences and summer courses, financial
support for publications, funding for equipment and materials, and thematic funding for scientific teams
comprised mainly of young scientists.
4.44. However, much more could be done to encourage return migration among young scientists and to strengthen links with Armenian scientists studying or working abroad. Few post-doctoral
positions are available in Armenian universities, which discourages the return of doctoral students
studying abroad. Low salaries for Armenian scientists create a further disincentive. While some funding is
available for international collaboration, there are no specific programs aimed at connecting national
researchers with Armenian scientists working outside the country.
Research and Innovation Infrastructure
4.45. Steps have been taken to improve research infrastructure. In 2008 the government published
two key strategic documents, “The Creation of Scientific Innovation Structures at Universities and Large
Scientific Centers” and “The Order, Criteria and Principles for Establishing Scientific Centers.” Policy
guidelines for the establishment of research universities are currently being developed, and the SCS
recently established a funding program for research infrastructure.
4.46. The NAS is actively supporting innovation through targeted initiatives. These include the
creation of the Science Development Foundation to support research activities with innovative potential,
develop commercial applications for research outcomes and promote infrastructure modernization. A set

64
of innovative research projects has been compiled and will be submitted to the authorities together with
plans to establish a dedicated technology transfer office.
4.47. Innovation centers are a key element of the national innovation infrastructure, and many operate with a combination of public and private financing. The Gyumri Technology Center (GTC)
focuses on the development of technical and business skills. It supports technological entrepreneurship,
facilitates the commercialization of innovative research, promotes the creation of new technology
companies, and works to increase foreign investment in the sector. The Armenian-Indian Center for
Excellence in ICT is a joint initiative between the Armenian and Indian governments. The center provides
specialized infrastructure for the delivery of IT-related training and R&D. The Microsoft Innovation
Center of Armenia (MIC Armenia) was established in May 2011 and focuses on providing support to IT
startups. The IBM Innovative Solutions and Technologies Center works to develop and strengthen the
technological educational capabilities of Armenian higher educational institutions. Since 2008, the
Ministry of Economy has received allocations from the state budget to support Gyumri Technopark. The
aim is to turn Gyumri into a Center of Excellence for education and research, for IT, and generally hi‐tech
projects and startups.
4.48. The standardization of academic qualifications credentials, and accreditation systems is an important component of the government’s agenda for upgrading the national STI infrastructure. The 2010-2020 reform strategy is aimed at achieving compliance with international and European
standards. Reforms will focus on qualitative metrics, certification standards, technical regulations and
market controls. Issues that significantly impede the development of export sectors will be prioritized.
Collaboration with the Private Sector
4.49. The current legal framework does not encourage the development of productive relationships between the science sector and private firms. The regulatory constraints described above and an overall
lack of clarity regarding rules and procedures limit scientific organizations’ engagement in commercial
activities. 41
Consequently, the current system does not encourage the commercial application of research.
4.50. The absence of a mediating organization is a major obstacle to public-private collaboration in STI. Public research organizations face an unclear and generally adverse regulatory environment that
inhibits their engagement with the private sector; meanwhile, private firms lack information on the
potential benefits of working with public researchers. Without an institutional catalyst to promote public-
private collaboration even the recently created “technoparks” and other modern research facilities cannot
effectively commercialize R&D outcomes.42
STI in the Private Sector
4.51. The government offers a small matching grant program to support R&D by private firms, but venture financing is virtually absent. In 2011 the SCS launched a new program to provide
competitive matching grants for research projects undertaken by private firms. Currently, 75 percent of
these grants are publicly financed, with the other 25 percent financed by the firm. In 2011 17 projects
were funded by matching grants, and 16 more were funded in 2013. Financing is provided for up to 16
months, with a maximum amount of AMD 25 million.
4.52. Armenia’s tax code includes incentives for private R&D investment. Scientific research,
experiments and product development expenses can be deducted from a company’s taxable income, as
41
UNECE (2014). 42
European Commission (2014a).

65
can investments in ICT systems. Transactions related to scientific and research work are exempt from
VAT, and there is a 50 percent exemption on land tax for scientific and research institutes and
organizations.
4.53. Tax incentives have both advantages and limitations. There are no data available to assess the
impact of scientific tax incentives in Armenia. However, in developing economies worldwide such tax
exemptions have proven difficult to implement. For instance, they may exclude startups (with no
imposable revenue). Incentives may tend to benefit large firms and can increase incentives for tax evasion
if monitoring is inadequate or legal provisions are not clearly defined. Nevertheless, tax incentives may
be preferable to grants or loans if they are sufficiently demand-driven and market-based.43
4.54. The government’s industrial policies include specific measures to promote innovation. The
Ministry of Economy’s export-promotion strategy supports innovation through reforms to improve the
general business environment,38
as well as targeted policies such as tax exemptions, co-financing for
training and business services, and export requirements. These are implemented through the SME
Development National Center and complementary initiatives such as the SME Investments program.
However, a lack of impact evaluation makes the effectiveness of these policies difficult to assess.
International Collaboration
4.55. Increasing Armenia’s integration into the global scientific and technological community is among the government’s main objectives for the sector. The SDS sets ambitious targets for
international scientific cooperation, and its overarching goal is for Armenia to become competitive with
the European Research Area by 2020. The SDS Action Plan includes objectives for developing
international R&D and technological cooperation. Armenian scientists are involved in several European
research projects, including scientific resource databases, the operation of the Large Hadron Collider, and
environmental monitoring in the Black Sea.
4.56. The SCS has established several bilateral cooperation programs in recent years. Programs
with Belarus, France, Germany and Russia provide a framework for exchanging scientists and
implementing joint initiatives supported by financial contributions from both partners. These programs
are thematically broad, but relatively small-scale in terms of budget costs.
4.57. The NAS has created an extensive network of international academic partnerships, but a lack of financing has limited its impact. The NAS has collaboration agreements with institutions in Russia,
Georgia, Moldova, Belarus, Ukraine, Turkmenistan, Hungary, China and Romania. However, due to
financial constraints only the agreement with Russia, which is financed by Russian partners, has yielded
significant results. Yerevan State University, the State Engineering University of Armenia, and Yerevan
State Medical University maintain their own international cooperation networks supporting education and
research activities with academic institutions in more than 30 countries worldwide. The Yerevan Physics
institute alone participates in 37 international projects, receiving around US$10 million in external
support.
4.58. Armenia actively participates in EU research networks. Under the EU’s Seventh Framework
Program Armenia is involved in 45 projects financed by a total EU contribution of €3.22 million. Three
43
Countries around the world are increasingly introducing special fiscal incentives for business R&D. In 2012 27 of the 34
OECD countries and a number of non-OECD economies give preferential tax treatment to R&D expenditures. 38 Measures include reforms to the regulatory business framework, reinforcing infrastructure, access to credit and attraction of
FDI.

66
new FP7 projects involving Armenian stakeholders aimed at fostering research-industry partnerships were
recently launched with a €3 million commitment.39
4.59. Advanced cooperation is underway with French and US counterparts. The SCS and the French
National Center for Scientific Research signed a bilateral cooperation agreement in January 2009, which
provides a framework for exchanging scientists, implementing joint scientific and research programs, and
organizing joint scientific conferences and seminars. Over the past few years USAID has invested nearly
US$45 million in STI partnership projects. In addition, the Microsoft Innovation Center and the
Armenian National Engineering Lab, as well as the Enterprise Development and Market Competitiveness,
Clean Energy and Water, and Energy Assistance to Strengthen Energy Security and Regional Integration
programs all aim at increasing the use of technology for economic growth.
4.60. The Armenian government is aware of the importance of developing a national innovation system, but its efforts are still in a nascent stage. Armenia has developed a strategic vision for the STI
sector and established policies and tools to encourage innovation. Yet most of the government’s
initiatives are at an early stage in their implementation, and in many cases the multiple actors involved are
not effectively pursuing their shared priorities.
4.61. The effectiveness of the national innovation system is compromised by conflicting priorities and the duplication of efforts. While national strategies are critical to sound policy, overlapping
mandates by the Ministry of Education and the Ministry of Economy have resulted in ambiguous and
conflicting policies. While both strategies share several common objectives, including the need to
increase aggregate R&D investment and promote the commercial application of research, closer inter-
ministerial collaboration will be necessary to create a more efficiently coordinated framework for STI
policy.
4.62. Financing mechanisms and regulatory policies are not fully developed. Public spending on STI
is inadequate to achieve the government’s objectives, and the composition of STI spending does not
accurately reflect its priorities for the sector. Funding levels stagnated over the 2008-2013 period; applied
research accounts for only a small fraction of total R&D expenditures; and support for innovation and
technological diffusion among firms is minimal. The implementation of sector strategies is undermined
by inadequate monitoring and evaluation mechanisms, and financing is rarely tied to performance. As a
result, individual and institutional incentives are poorly aligned with the objectives of STI policy.
39 European Commission (2014b).

67
Policy actions affect the incentives of firms to become more productive, internationally oriented and
innovative. Over one-third of productivity at the firm level can be explained by the policy environment,
particularly the quality of governance and workforce education and training policies. International
orientation is also influenced by policy, and external openness can have important spillovers on domestic
productivity. Exporters tend to have better access to finance and higher rates of ICT use, while foreign-
owned firms are associated with better workforce skills and higher productivity. Overall Armenian firms
are characterized by low levels of innovation, with negligible investment in R&D and little propensity to
introduce new products and processes. Innovation is most likely among older, larger and foreign-owned
firms. The quality of governance, particularly its ability to combat corruption, and the availability of
workforce skills are the most relevant constraints to the emergence of an innovative enterprise sector.
5.1. The policy environment shapes incentives for doing business and ultimately determines the dynamism of an economy. The competitiveness of an economy depends on the efficiency of its
producers, and their ability to optimally employ labor, capital, technology, and other inputs in the
production process. Whereas exogenous factors such as historical legacies or geographic conditions play
an important role, governments make choices that shape firm incentives to be efficient, invest and
innovate. Some of the areas under the control of policymakers include macroeconomic stability; taxation;
openness to international trade flows, capital, people and data; investment in infrastructure and education;
regulation of capital and labor markets; and public sector governance.
5.2. Armenian firms perceive the policy environment to be an obstacle to doing business. Based on
responses to the 2013 Enterprise Survey (Box 5.1), over half of Armenian firms cite tax rates and tax
administration as the most important constraints on doing business. 10 percent of firms are primarily
concerned with political instability, 7.8 percent with customs and trade regulation, and 6.7 percent with
access to finance (Figure 5.1A). Taxation and customs, along with corruption, affect the quality of public
governance. Firm perceptions appear to have shifted since 2009, when informal practices and access to
finance were the most frequently cited obstacles (Figure 5.1B).
Box 5.1. The Enterprise Survey and BEEPS V
The empirical analysis in this section is based on firm-level data from the 2009 and 2013 Enterprise Surveys
(ES) for Armenia and other Europe and Central Asia (ECA) countries. The ES takes a representative sample of
each economy’s non-agricultural business sector and assesses constraints on firm-level growth. A standardized
methodology is applied allowing for cross-country comparisons and analysis. The data for ECA were collected
through a joint initiative between the World Bank and the European Bank for Reconstruction and Development
known as the 5th
Business Environment and Enterprise Performance Survey (BEEPS V). The BEEPS V sample
includes countries in the MENA region and comparisons with Israel are used in this section as a benchmark for
Armenia’s performance in innovation.
The sampling frame for the most recent Armenian ES is the 2013 Armenia Business Directory, which contains
1,737 non-agricultural businesses. The ES sample was obtained through a stratified, random sampling process
across three dimensions: industry, firm size, and region. Industry strata include manufacturing, retail and non-
retail services, with one-third of surveyed firms coming from the manufacturing sector. Firms were divided into
small (5-19 permanent full-time employees), medium (20-99) and large (more than 99) enterprises. Firms were
also divided geographically into the northern, southeastern, southwestern and Yerevan regions.

68
Figure 5.1. Key Obstacles to Doing Business, 2009 and 2013
A. 2013 B. 2009
Source: Enterprise Survey.
Note: The Enterprise Survey presents firms with a list of potential business obstacles and asks respondents to select the one
they perceive to be the most important.
5.3. Econometric analysis can be used to isolate the effect of different policy variables on enterprise performance. The following sections use Enterprise Survey data for the manufacturing sector in Armenia
and other countries to assess the effect of government policy changes on firm-level productivity, export
propensity, and the ability to attract FDI and encourage innovation (see Annex 3-A). To reinforce the
validity of results and overcome the small size of the Armenian sample, data for Armenia are compared to
those of other countries in the region and the sample for each country uses combined observations from
the 2009 and 2013 surveys.40
The effect of the policy environment on productivity, international
orientation (as measured by exports and FDI) and innovation is isolated from other possible influences,
such as idiosyncratic firm-level characteristics or industry and regional fixed effects. The following
questions are addressed:
Which policy areas have the largest impact on the productivity of Armenian manufacturing
firms?
Which policy areas are associated with export competitiveness and FDI attractiveness?
Which policy areas have the largest effect on enterprise innovation?
40 The underlying assumption for all countries is that the 2009 and 2013 samples are independent random draws
from the same populations. This is not an unreasonable assumption considering that the population of manufacturing
firms is not likely to have substantially changed in four years.
28.3
23.6
10 7.8
6.7 5.7 5.4
4.1 3.4 1.8 1.7
0.7 0.4 0.3 0.2
0
5
10
15
20
25
30T
ax r
ates
Tax
adm
inis
trat
ion
Poli
tica
l in
stab
ilit
y
Cu
sto
ms
and t
rad
e re
gula
tions
Acc
ess
to f
inan
ce
Pra
ctic
es o
f th
e in
form
al…
Co
rru
pti
on
Acc
ess
to l
and
Inad
equ
atel
y e
duca
ted…
Lab
or
regula
tions
Bu
sin
ess
lice
nsi
ng
and…
Ele
ctri
city
Tra
nsp
ort
atio
n
Cri
me,
thef
t an
d d
isord
er
Co
urt
s% f
irm
s se
ein
g t
his
as
top
ob
stac
le
Armenia ECA Average
21.8
16 15.9
12.6 10.4
6.3 5
3.8 2.9 2.5
1.5 0.4 0.4 0.2 0.2
0
5
10
15
20
25
Pra
ctic
es o
f th
e in
form
al s
ecto
r
Tax
rat
es
Poli
tica
l in
stab
ilit
y
Acc
ess
to f
inan
ce
Cu
sto
ms
and t
rad
e re
gula
tions
Tax
adm
inis
trat
ion
Tra
nsp
ort
atio
n
Co
rru
pti
on
Inad
equ
atel
y e
duca
ted…
Ele
ctri
city
Cri
me,
thef
t an
d d
isord
er
Bu
sin
ess
lice
nsi
ng
and p
erm
its
Co
urt
s
Acc
ess
to l
and
Lab
or
regula
tions
% f
irm
s se
ein
g t
his
as
top
ob
stac
le
Armenia ECA average

69
5.4. Firm-level decisions influence the overall productivity of an economy. GDP per capita growth
may be decomposed into labor productivity growth and labor force participation growth. An economy’s
labor productivity is affected by aggregate total factor productivity (TFP)—the efficiency with which
labor and capital are employed—and factor accumulation (the capital/labor ratio). Each of these aggregate
components is determined at the level of individual enterprises. The sum of firm-level decisions to
increase capacity utilization, introduce process innovation or adopt better management practices leads to
efficiency gains in the economy as a whole. Firm-level decisions to invest in physical or human capital
and employ additional workers likewise translate into higher aggregate levels of physical and human
capital and greater labor force participation.
5.5. Econometric analysis allows isolation of policy environment effects from the effects of other possible determinants on firm-level productivity. This section examines the effect of the policy
environment on total factor productivity, a measure of the efficiency with which factors of production are
employed by firms. The effects of the policy environment are isolated from those of other possible
determinants of firm performance, in particular those that are not directly and immediately influenced by
government policy. These include a firm’s region and sector of operation and idiosyncratic firm-level
features. The analysis uses the concept of demeaned productivity, the share of TFP that is exclusively
associated with the policy environment.41
Figure 5.2. Armenia Shows a Wide Dispersion in TFP Across Firms
A. Kernel density estimates of TFP (subtracting the
constant term)
B. Kernel density estimates of demeaned TFP (portion
of TFP associated only with policy)
Note: Kernel density estimates of ln(TFP) estimated as the Solow residual with constant by country input-output elasticities. Panel
A plots the distribution of [ln(TFP)- αp], where the latter is the constant technical efficiency term capturing measurement errors,
differences in deflators, and unobserved idiosyncratic firm characteristics. Panel B plots [ln(TFP)- αp-W-D-u], i.e. the distribution
of ln(TFP) exclusively due to X, the policy environment. See Annex 3-A and Pena (2015).
5.6. In Armenia a large number of relatively efficient firms coexist alongside significantly less efficient competitors. This is reflected in a flat distribution of productivity across firms with very long
tails on both ends (Figure 5.2). Among comparator countries only Albania has a more spread out
distribution of productivity across firms. Panel A shows the distribution of productivity correcting for
possible measurement errors and for unobserved firm-level features as captured in the constant term.
41 See Pena (2015) and Annex for details.

70
Panel B shows the distribution of demeaned productivity, or the portion of TFP that is explained solely by
the policy environment, discounting other possible determinants such as firm-level features, region and
sector of operation. In each case a very heterogeneous business sector is observed, with the policy
environment preventing the exit of less efficient firms and their replacement by more efficient firms, an
outcome which would increase aggregate productivity and the efficiency of the economy as a whole.
5.7. Firm-level productivity is influenced by enterprise characteristics, invariant external conditions and the policy environment. A firm’s sector, region of operation and individual
characteristics (i.e. age, size, ownership structure, inherited market power, etc.) all affect its efficiency.
Most of these factors are not influenced by public policy. The policy environment does, however,
influence firm behavior, as policy decisions affect the quality of infrastructure, the provision of public
services, the effectiveness of governance, access to finance, innovation incentives, the availability of
skilled labor, and economic openness.
5.8. The policy environment in Armenia has a larger impact on firm-level productivity than in other countries in the region. Policy factors account for 35.7 percent of the overall variation in firm-
level productivity in Armenia, a higher share than in comparator countries (Figure 5.3). While the
majority of variation in productivity is linked to firm characteristics and exogenous factors, public policy
nevertheless plays an important role in determining economic efficiency.
5.9. Among policy factors the overall quality of governance and the availability of skilled labor have the largest impact on firm-level productivity. When non-policy-related factors are removed from
the equation, the variables connected with formal and informal interactions between firms and the state
account for 42.1 percent of productivity variation (Figure 5.3). The second most significant contributor is
the availability of skilled workers (21.6 percent). Access to finance is the third most significant
contributor with 14.8 percent, followed by international orientation (12.8 percent), innovation, and ICT
use.
5.10. The policy environment can affect both the productivity within firms and the efficiency of resource allocation across firms. Figure 5.3, Panel C, compares the Olley and Pakes (1996)
decomposition of demeaned TFP for Armenian firms in 2009-2013 with other countries. The aggregate
demeaned TFP of the Armenian manufacturing industry is positively influenced by the policy
environment. This implies that favorable policy conditions are conducive to greater productivity. The
Olley and Pakes method allows for the decomposing of aggregate TFP into an average component and an
allocative efficiency component. The former reflects the productivity of the average firm, while the latter
provides a measure of the efficiency with which resources are distributed among firms. The positive sign
for both components indicates that the policy environment can positively influence both average
productivity and the efficient allocation of resources, limiting the waste that would result from allowing
less efficient firms to employ more labor and capital.

71
Table 5.1. Policy Environment and Firm-Level Variables Policy Environment: Infrastructure Shipm. lss. exp. (%) Shipment losses, exports
Power outages (ln) Total duration of power outages in one year
Generator (d) Electricity from a generator
Policy Environment: Governance Customs exp. (ln) Days to clear customs to export (exporters only)
Customs imp. (ln) Days to clear customs to import (importers only)
Manager's time (%) Manager's time spent in bureaucratic issues
Inf. payms. taxes (d) Gifts in tax inspections
Security (d) Security expenses
Auditory (d) External auditory
Courts (d) Conflicts with clients with a court involved
Inf. comp. (d) Informal competitors
Policy Environment: Finance Purchs. aft. delivery (%) Purchases paid after delivery
Sales aft. delivery (%) Sales paid after delivery
Fix. assets internal (%) New fixed assets financed by internal funds
Fix. assets equity (%) New fixed assets financed by equity
Fix. assets banks (%) New fixed assets financed by private banks
Overdraft (d) Overdraft facility
Loan (d) Loan
Subsidy (d) Subsidies from national, local or supra-national sources
Policy Environment: Innovation and ICT ISO (d) Quality certification
R&D sub. (d) R&D outsourced with external firms
R&D p.worker R&D expenditure per worker
Sales new prds. (%) % annual sales accounted for by new products
Forgn. tech. (d) Foreign technology
Staff compts. (%) Staff with computer
Web page (d) Website use with clients
Policy Environment: Labor skills Manager exp. (%) Experience of the manager
Prod. staff (%) Staff - production workers
Skilled staff (%) Staff - skilled workers
High school staff (%) Staff - university education
Training (%) Employee training
Policy Environment: Openness FDI (d) Firm owned by foreign firms
Exports (d) Direct exports (export of total sales>=10%)
Exports exp. (ln) Exporting experience in years
Imports (d) Direct imports
Firm Level Undiversified (%) Sales from main product
Shareholder (%) Largest owner’s share of firm’s capital
Inc. (d) Publicly listed company
Local (d) Main market is local
Age (ln) Age of the firm in years
Market share (%) Firm’s market share
Source: Enterprise Survey. See Pena (2015) and Annex 3-A.
Note: (ln): logarithms; (d): Dummy (binary, yes/no) variable.
.

72
Figure 5.3. Determinants of Firm Level Productivity in Armenia
A. Policy explains a large share of firm level
productivity (Determinants of TFP, percentage share by
variable blocks)
B. Within policy, governance and labor skills are the
most important areas (Contributions of policy
variables to aggregate demeaned productivity,
percentage share)
C. Good policy has a positive influence on both
average productivity and efficient resource allocation
(Olley and Pakes (1996) decomposition of demeaned
aggregate productivity)
D. Better skills and efficient customs have the largest
effect on productivity
(Percentage relative contributions of policy variables to
aggregate and average demeaned productivity)
Source: Staff calculations based on Enterprise Survey 2009 and 2013. See Pena (2015) and Annex 3-A for details.
55.6 50.0
71.8
46.9
61.2 67.6 71.6
5.9 9.2
3.9
6.0
8.4 3.6
5.0
2.9 13.7
4.8
25.5
10.1 11.8 2.8 35.7
27.0 19.5 21.6 20.3 17.1 20.6
0%
10%
20%
30%
40%
50%
60%
70%
80%
90%
100%
Policy
Other Enterprise Characteristics
Location, Sector, Size
Constant Technical Efficiency
0.0 0.0 1.6 0.0 0.2 0.0 3.4
42.1 34.1
0.0
37.9
24.0
7.9 9.1
14.8
16.3
52.1
15.5 31.8
25.9 12.7
8.7
0.0
46.3
18.5 9.9
66.2
28.5
21.6
25.2
0.0
0.0 21.5
0.0
34.8
12.8
24.4
0.0
28.1
12.6
0.0 11.4
0%
10%
20%
30%
40%
50%
60%
70%
80%
90%
100%
Infrastructure Governance
Finance Innovation and ICT
Labor skills Openess
1.03
0.76
0.53 0.56
0.16 0.23
0.63
0.72
0.11
0.42
0.17
0.26
0.02
0.48
0.31
0.65
0.11
0.38
-0.09
0.21 0.15
-0.20
0.00
0.20
0.40
0.60
0.80
1.00
1.20
Dem. Agg. Prod. Dem. Avg. Prod. Dem. Alloc. Eff.
7.4
14.3
36.7
8.3
6.5
-4.9
20.2
17.0
24.6
-30.1
7.7
13.7
42.9
11.4
7.4
-7.0
16.2
11.9
20.9
-25.2
-50 0 50
FDI (d)
Imports (d)
Skilled staff (%)
Sales new prds. (%)
Forgn. tech. (d)
Subsidy (d)
Overdraft (d)
Courts (d)
Manager's time (%)
Customs imp. (ln)
%Avg. Prod. %Agg. Prod.

73
5.11. The availability of skilled labor has the largest positive effect on productivity, while customs inefficiency on the import side has the largest negative impact. Panel D of Figure 5.3 depicts the
percentage contribution to aggregate and average demeaned TFP for individual variables. The availability
of skilled labor is clearly the strongest determinant of firm-level productivity. The fact that the effect on
the average firm (+42.9 percent) is larger than the aggregate effect (+36.7 percent) indicates that the
benefits of a qualified workforce are not limited to high-market-share firms, but evenly distributed across
the economy. The number of days to clear customs to import has a larger negative contribution to
aggregate TFP (-30.1 percent) than to average TFP (-25.2 percent), indicating that the negative effect is
concentrated in high-market-share firms. The amount of time managers spend dealing with bureaucratic
requirements is associated with more productive firms. The fact that the aggregate effect (+24.6 percent)
is larger than the average effect (+20.9 percent) reflects that larger firms are more likely to face more
bureaucratic requirements. Access to finance, an efficient judiciary and importing activities are all
associated with higher productivity, with a higher aggregate than average effect reflecting that larger
firms benefit more from these areas. Foreign ownership, use of foreign technology and product innovation
are also associated with higher productivity. However, the fact that the average effect is higher than the
aggregate effect suggests that the benefits are rather evenly distributed regardless of a firm’s market
share. Government subsidies have a negative effect on productivity, with the higher-average-than-
aggregate effect indicating that smaller firms are most negatively affected by the receipt of government
transfers.
5.12. Export propensity is positively correlated with access to finance, higher rates of ICT use, increased importing activity, access to infrastructure and productivity. The probability of exporting
is positively associated with access to external finance (34.9 percent of the total contribution of policy
variables) indicating either that exporters have better access to finance or that access to bank credit
facilitates their decision to export. ICT use is the second most important correlate of export propensity
(18.5 percent). Reflecting the importance of embodied technology, use of foreign intermediate and capital
inputs is associated with a greater probability of exporting (12.9 percent), as is access to infrastructure and
firm-level productivity (Figure 5.4). It is important to recall that this refers to demeaned productivity, or
the portion of productivity relating to the policy environment. The entire effect of TFP is likely to be
much larger. This is consistent with worldwide empirical evidence that firm-level productivity, together
with prior exporting experience, are the primary determinants of export propensity.42
5.13. Foreign-owned firms employ more highly skilled labor and are more productive. The presence
of foreign-owned firms is beneficial for domestic productivity growth. Foreign affiliates tend to be more
capital and skill intensive and invest more in R&D.43
Foreign affiliates also generate positive productivity
spillovers on the domestic economy by accelerating the diffusion of new technology and management
practices among local firms. In Armenia foreign ownership is associated with more sophisticated
workforce skills, which accounts for 34.9 percent of the total contribution of policy variables, and higher
productivity (31.4 percent) (Figure 5.5).
42 See Wagner (2007) for a survey of the empirical evidence on the determinants of exporting.
43 See Keller, 2004; Keller and Yeaple, 2003.

74
Figure 5.4. Contributions of Policy Variables to the Probability of Exporting
(percentage share)
Figure 5.5. Contributions of Policy Variables to the Probability of Receiving FDI
(percentage share)
Source: Pena (2015). See Annex 3-A for details.
5.14. Product and process innovation lead to greater productivity. From a theoretical standpoint the
development of new technologies should lead to greater efficiency in production, increasing the quantity
and quality of economic output produced using the same inputs. However, the relationship between
innovation and productivity is not easily established on the basis of firm-level empirical data. Whereas
there is evidence of a strong correlation among developed countries, in developing countries data-quality
issues and the derivative nature of innovation can obscure results. Nevertheless, a recent analysis carried
out by the European Bank for Reconstruction and Development (EBRD) utilizes a robust methodology to
establish the empirical connection between innovation and productivity in transitional economies.44
The
analysis reveals that product innovation is associated with a 43 percent increase in labor productivity,
while the introduction of new processes is associated with a 20 percent increase. In this section Armenia’s
performance with respect to innovation is benchmarked against a number of neighboring countries.
Comparisons with Israel are also made where relevant data are available (Box 5.2).
44 See EBRD (2014) and Crépon et al. (1998).
10.9 0.0
24.5 14.6
0.0 1.1
72.5
12.6
15.0
0.0
5.5
0.0 0.0
1.2
10.1
0.0
26.8
10.6
8.2 15.9
6.5
34.9
22.4
11.0
0.0
22.6
42.6
5.3 18.5
0.0
0.0
10.2 0.0
28.0
10.4 0.0
49.8 0.0
59.1 69.2
0.0
0.0 12.9 12.9
37.8
0.0 0.0 12.3
4.1
0%
10%
20%
30%
40%
50%
60%
70%
80%
90%
100%
Demeaned productivity Infrastructure
Governance Finance
Innovation and ICT Labor skills
Openess
31.4
0.0 0.0
43.0
0.0 0.0
31.3
0.0
0.0 0.0
0.0
0.0 3.6
0.4
14.5
0.0
43.7
3.6
16.4 4.9
9.1
4.3
41.0
39.4 25.5
3.4
0.0
6.0
5.7
0.0
0.0
0.0
4.9
0.0
3.5
34.9 59.0
0.0 27.9
63.4 85.4
49.7
9.1 0.0
16.9
0.0 12.0
6.0 0.0
0%
10%
20%
30%
40%
50%
60%
70%
80%
90%
100%
Demeaned productivity Infrastructure
Governance Finance
Innovation and ICT Labor skills
Openess

75
Box 5.2. Innovation in Israel
Israel is often cited as an example of a relatively small economy that has successfully integrated into world
markets by leveraging the innovation of its enterprise sector. Israel shares some commonalities with Armenia,
including a complex and difficult relationship with its neighbors and a large diaspora population.
In 1968 the Kachalsky Committee appointed by Prime Minister Levi Eshkol recommended that Israel
dramatically increase the amount of R&D activity in the private sector. The Office of the Chief Scientist (OCS)
was established in 1976 and empowered to subsidize commercial R&D projects undertaken by private firms.
Between 1969 and 1987 industrial R&D expenditures grew at a rate of 14 percent per year and high-tech exports
increased from US$422 million in 1969 to more than US$3 billion in 1987 (in constant 1987 dollars).
Multinational companies have also established R&D centers in Israel. Initial entrants included Motorola (1964),
IBM (1972), Intel (1974), and National Semiconductors (1978), with more recent firms including Google and
Oracle.
However, government support for R&D can have little impact in the absence of an adequately trained workforce
and friendly investment climate. Israel benefited from the large-scale immigration of about 1 million migrants
from the former Soviet Union, many of whom had advanced degrees in science and technology. Israel ranked at
the top of the World Bank Doing Business report in the areas of financial liberalization and international
openness to trade and investment. This policy stance enabled Israeli firms to take full advantage of the
worldwide ICT boom and leverage the globalization of U.S. capital markets to finance startups and initial public
offerings.
Source: Goldberg et al. (2011).
5.15. Armenian firms lag behind comparators in the acquisition of embodied technology, but are more likely to use foreign technology and adopt international quality standards. Firms in countries
like Armenia, which operate far from the technological frontier, innovate by adopting foreign production
processes and technologies. Enterprise Survey data reveal that only 26.5 percent of Armenian
manufacturing firms invest in fixed assets. This compares with a rate of over 40 percent in EEU partners
and in the Western Balkans, and over 50 percent in new EU members (Figure 5.6). By underinvesting in
fixed assets Armenian firms are not fully exploiting the most common channel for technological
growth—the acquisition of technology that is embodied in machinery and equipment. One possible
reason for Armenian firms’ relatively low rates of investment in fixed assets may be the comparative
scarcity of bank credit. Banks finance fewer than 10 percent of investments in Armenia, a similar share to
SEE and EEU countries, but substantially lower than the average for new EU members. However, a large
share of Armenian manufacturers widely utilize foreign-licensed technology (23.3 percent), a higher
proportion than most comparators, with the exception of Slovakia (35.1 percent) and Estonia (24.9
percent). This may reflect weak linkages between producers and domestic suppliers of technology in
Armenia. 23.6 percent of surveyed firms have some form of internationally recognized quality
certification. This is lower than the average for new EU members (30.6 percent), but far higher than for
EEU partners (13.7 percent).
5.16. Business investment in R&D is important for technological adoption and innovation.
Embracing new products and manufacturing processes, upgrading antiquated systems, using licensed
technology, improving organizational efficiency, and pursuing quality certification are all elements of
innovation.45
R&D can be defined as the performance of creative work on a systematic basis to increase a
firm’s stock of knowledge. Firm-level investment in R&D is necessary to develop new products, adapt
existing products for specific markets, and reengineer production processes. According to EBRD (2014)
firms in transitional economies that invest in R&D are 22 percent more likely to introduce new products
or processes and 20 percent more likely to introduce marketing or organizational innovations.46
Product
45 Oslo Manual (2005).
46 See also Crespi and Zuñiga (2010) for an analysis of South American countries.

76
or process innovation may not always involve in-house R&D investment. Research and development can
be contracted out when there is a functional link between science and industry, and the use of foreign-
licensed or patented technologies can improve the ability of firms to innovate.
Figure 5.6. Innovation in the Enterprise Sector
Source: Enterprise Surveys 2012-2013.
Note: EEU is the average of Belarus, Kazakhstan and Russia. SEE is the average of Albania, FYR Macedonia and Serbia. EU
NMS is the average of Bulgaria, Croatia, Czech Republic, Estonia, Hungary, Latvia, Lithuania, Poland, Romania, Slovak
Republic and Slovenia.
5.17. Armenian firms are characterized by low R&D investment. Armenian and ECA
firms lag behind Israel in spending
on in-house R&D (Figure 5.7).
Armenia is just below the ECA
average at 0.1 percent, compared
with 1.3 percent in Israel. The
difference is more pronounced
among high-tech and medium-tech
manufacturing and knowledge-
intensive services. Almost 12
percent of annual turnover is spent
on in-house R&D in Israel for firms
in knowledge-intensive services
compared to less than 0.4 percent in
most ECA countries.47
47 EBRD (2014).
26.5
9.5
23.6
23.3 0.0
10.0
20.0
30.0
40.0
50.0
60.0Firms buying fixed assets (%)
Investment financed by banks (%)
International quality certification
(%)
Licensed foreign technology (%)
Armenia EEU SEE EU NMS
Figure 5.7 Average Expenditure on In-House R&D as a Percentage of Annual Turnover
Source: BEEPS V, MENA ES and EBRD (2014).
Note: Data represent unweighted cross-country averages.
0.00 0.20 0.40 0.60 0.80 1.00 1.20 1.40
ARM
BEL
BUL
FYR
GEO
MDA
RUS
UKR
ISR
ECA

77
5.18. Labor skills and external financing are the two most significant determinants of in-house R&D investment among Armenian manufacturers. The availability
of skilled workers accounts for 64.6 percent
of the probability that Armenian firms will
invest in R&D. This reflects the importance
of qualified engineers, researchers and other
specialized personnel to lead research and
development activities. Access to external
financing is the second most important
factor at 12.8 percent. There are a number of
factors that make R&D investment risky for
banks. It is often difficult to collateralize the
intangible benefits associated with R&D and
assess the potential profitability of early
stage technologies. Cash flows from
innovation activities may also be volatile. At
the same time banks may be more inclined
to provide financing to borrowers with
whom they have a long-term relationship.
Another important determinant of the
probability of investing in R&D is export orientation (10 percent). Exporting firms are able to spread the
fixed costs of R&D over a larger customer base, and competition in foreign markets increases the
incentive to innovate.48
The quality of governance carries a similar weight (9.5 percent), indicating that
efficient interactions with the state incentivize and improve the ability to innovate.
5.19. Few firms purchase knowledge or invest in producing it. Only 3 percent of surveyed firms in
Armenia spend on in-house R&D, and around 4 percent purchase knowledge in the form of outsourced
R&D or external licensing. In contrast a relatively large share of Israeli firms (14 percent) invest in
producing knowledge. Figure 5.9 compares the propensity of Armenian firms to produce knowledge or
purchase it. The horizontal axis shows the percentage of firms that only buy knowledge, while the vertical
axis shows the percentage of firms that invest in producing knowledge or employ a combination of
investment and knowledge-purchasing strategies. Cross-country differences reflect income levels for the
most part, with firms in low-income countries being less likely to invest in purchasing knowledge or in-
house R&D. Armenia is among the low innovation group in the 2014 EBRD Transition Report, along
with Albania, Azerbaijan, Georgia and Uzbekistan.
5.20. Armenia lags behind comparators in introducing new products and marketing techniques, two important innovation outputs. Product innovation in the Enterprise Survey refers to the
introduction of new or significantly improved products or services in the last three years. This does not
include aesthetic changes and resale. Marketing method innovation refers to the introduction of new or
significantly improved marketing methods in the last three years. A brief analysis of technological and
non-technological innovation at the firm level reveals that a majority of Armenian enterprises are
characterized by low product innovation and a low incidence of organizational and marketing innovation.
48
See EBRD (2014)
Figure 5.8. Contributions of Policy Variables to the Probability of Investing in R&D
(percentage share)
Source: Pena (2015). See Annex 3-A for details.
0.0 0.0 13.1
29.6
12.9 1.1
11.8 3.1
22.6 0.0
0.0
0.0
0.0
0.0 9.5
9.9 16.7
0.0
10.9
0.0
9.2 12.8
1.7 5.0 12.0
7.8 54.3 16.8 0.0
0.0 0.0
21.0
4.0
29.2
19.7
64.6
61.8
43.8
17.1 61.1
0.0 40.4
10.0 4.0
21.3 20.3
3.5 15.5
2.1
0%
10%
20%
30%
40%
50%
60%
70%
80%
90%
100%
Armenia Albania Serbia Georgia Belarus Moldova Russia
Demeaned productivity Infrastructure
Governance Finance
Innovation and ICT Labor skills
Openess

78
Figure 5.9. Percentage of Firms that Make and/or Buy Knowledge
Source: BEEPS V, MENA ES and EBRD (2014).
5.21. Innovative firms in Armenia are farther from the global technological frontier than most ECA countries. None of the Armenian firms surveyed had
introduced a new product to international
markets in the last three years, while 5
percent of Israeli firms had (Figure 5.10).
The share of firms that introduced new
products at the local or firm level was
higher in Armenia than in Israel, but
lagged behind the ECA average. This
suggests that Armenian firms have
considerable scope for adopting new
technologies.
5.22. Product innovation is more common than process innovation.
Productivity-enhancing innovations include new or significantly improved production or delivery
methods such as new inventory management software and quality-control measures. Firms may use
process innovation to produce new products or to produce existing products more efficiently. Around 2.2
percent of respondents in Armenia had introduced a new process without engaging in product innovation.
This is a relatively low rate when compared to the ECA average of 8 percent, and particularly to countries
such as Moldova (15 percent) and Macedonia (10 percent). The share of firms that reported introducing
both product and process innovations is low (Figure 5.11).
5.23. There is a low incidence of organizational and marketing innovation in Armenia when compared to the ECA average. Around 4.4 percent of surveyed Armenian firms reported introducing an
organizational or marketing innovation. Firms in ECA are introducing a greater number of new
organizational or marketing measures than firms in Israel. Around 14 percent of surveyed firms in ECA
reported adopting new organizational practices or marketing techniques over the last three years, with
marketing innovation leading in most countries. Around 7 percent of Armenian firms introduced new
marketing arrangements and only 2.5 percent reported initiating new organizational practices (Figure
5.12). Organizational innovation typically includes the introduction of a supply-chain management
system or the decentralization of decision-making responsibilities. Marketing innovations are often aimed
at better addressing customer needs, expanding to new markets or repositioning in existing markets.
ALB ARM
AZE
BEL BOS
BUL
CRO
CZE
EST
MKD
GEO HUN
JOR
KAZ
KOS
KGZ
LAT
LIT
MDA
MON
MNG
POL
ROM SER
UKR
UZB
SVK
TJK
TUR RUS
SLO
ISR
02468
101214161820222426
0 2 4 6 8 10 12 14 16 18
Sh
are
of
firm
s th
at m
ake
or
mak
e &
bu
y, p
erce
nt
Share of firms that only buy, percent
Figure 5.10. Product Innovation at the Global Technological Frontier and the Adoption of Existing Technologies
Source: BEEPS V, MENA ES and EBRD (2014). Note: Based on cleaned data. Data represent unweighted cross-country
averages and indicate the percentage of surveyed firms that have
introduced new products in the last three years.
-2
3
8
13
18
ALB ARM BEL BUL FYR GEO RUS UKR ISR ECA
new
New to international market new to country, local market or firm

79
Figure 5.11. Percentage of Firms Engaging in Product and Process Innovation
Figure 5.12. Percentage of Firms Engaging in Organizational or Marketing Innovation
Source: BEEPS V, MENA ES and EBRD (2014).
Note: Charts are based on self-reported data. Firms were not
asked to provide a description of their organizational and
marketing innovations. Data represent unweighted averages and
show the share of surveyed firms that have introduced
organizational and marketing innovations in the last three years.
5.24. Innovation is more likely among larger and older firms. Around 8 percent of large firms have
introduced a new product compared to 5 percent of small firms. Around 6.5 percent of older firms
introduced a new product over the last three years, while none of the younger firms surveyed had done so.
This suggests that firms founded prior to the fall of the Soviet Union may have more connections to
businesses and research facilities in other parts of the former USSR, thereby facilitating the transfer and
diffusion of knowledge (Figure 5.13).
Figure 5.13. Percentage of Firms Engaging in Product Innovation by Size and Age
By size By age
Source: BEEPS V, MENA ES and EBRD (2014).
5.25. Foreign ownership is associated with a greater propensity to innovate, as well as higher spending on in-house R&D and the acquisition of external knowledge. The share of foreign-owned
firms that have introduced a new product over the last three years is significantly higher than the share of
domestically owned firms (Figure 5.14). The impact of foreign ownership on organizational and
0
5
10
15
20
25
30
35
GEO ALB HUN ISR ARM UKR MDA ECA FYR
product and process product only
process only
0
10
20
30
40
50
60
AZE GEO ALB UKR MNGMDA ISR ARM ECA BEL
marketing only
organisational only
organisational and marketing
0
2
4
6
8
10
12
14
16
18
20Small (5-19 employees) Medium/large (20+ employees)
0
2
4
6
8
10
12
14
16
18 Young (less than 5 years) Old (5+years)

80
marketing innovation is significant even when foreign investors hold a stake lower than 25 percent. This
suggests that foreign owners may be an important source of information on new organizational and
marketing techniques. Around 16 percent of foreign-owned firms reported pursuing external knowledge,
compared to only 8 percent of domestic firms. By contrast, the percentage of firms that produce
knowledge (Figure 5.15) is low whether the firm is domestically or internationally owned.
Figure 5.14. Percentages of Foreign-Owned and Domestic Firms that Are Engaged in Innovation
Figure 5.15. Foreign-Owned Firms Spend More on Knowledge
Source: BEEPS V, MENA ES and EBRD (2014).
Note: Cleaned data for product and process innovations, unadjusted data for organizational and marketing innovations. Foreign-
owned firms are firms where the foreign stake is 25 percent or more. Domestic firms are firms where foreign ownership accounts
for less than 25 percent. The acquisition of external knowledge includes R&D outsourcing and the purchasing or licensing for
patented and non-patented inventions.
Figure 5.16. Differences Between Innovative and Non-Innovative Firms’ Perception of the
Policy Environment
Source: BEEPS V, MENA ES and EBRD (2014).
Note: Values on the vertical axis correspond to firms’ perceptions that have introduced a new product in the last
three years; values on the horizontal axis correspond to other firms’ views. Values are averages across firms on
a scale of 0 to 4, where 0 means” no obstacle” and 4 is “a very severe obstacle”.
5.26. Innovative firms view corruption as the most significant constraint on their operations. A
firm’s ability to innovate depends on several factors that are influenced by the policy environment.
0
2
4
6
8
10
12
14
16
Product
innovation
Process
innovation
Organisational
innovation
Marketing
innovation
Domestic firms Foreign-owned firms
0
2
4
6
8
10
12
14
16
Domestic firms Foreign-owned firms
% of firms investing in in-house R&D
% of firms engaged in acquisition of external knowledge

81
Widespread corruption, insufficient public investment in training and education, excessive bureaucracy
and inconsistent policy implementation may increase the cost of introducing new products or processes,
and create uncertainty regarding the returns to investment in productive technologies. As Figure 5.16
illustrates Armenian firms that have introduced a new product in the last three years generally perceive
policy factors to be a more important constraint than firms which are not engaged in product innovation.
Business licensing, access to land and tax administration are notable exceptions. Differences between the
perceptions of innovative and non-innovative firms are relatively significant with respect to corruption,
transport, telecommunication and skills development. Innovative firms in Armenia are also constrained by
other issues such as access to finance, customs and trade.
Box 5.3. The Views of High-Tech Entrepreneurs on the Quality of Public Governance
Aram Salatyan is the Regional Director of National Instruments Corporation (NI), an international measurement
and automation firm that provides engineering services. NI is a more established firm and encounters relatively
few constraints with respect to the regulatory framework, tax regime and financing. “Those are the problems of
startups,” according to Salatyan. Nevertheless, Salatyan revealed several institutional barriers that make doing
business more difficult for his company. These include double taxation, which makes it harder for NI to recruit
experts from the United States. Export procedures also take “a long time, and a lot of money and effort,”
according to Salatyan. Export procedures are not unlike those in other countries, but according to Salatyan in
Armenia “they take twice as long as elsewhere.” Salatyan’s opinions are supported by the 2013 Enterprise Survey
for Armenia, where tax rates, tax administration, and customs and trade regulations were among the top four most
cited business concerns by firms. The 2015 Doing Business report ranks Armenia 110 out of 189 countries in the
ease of trade across borders.
Barriers to trade, combined with the country’s small size and landlocked geography, inhibit international
integration, which is critical to preventing the monopolization of domestic markets. Currently the market power
of large firms poses a major barrier for smaller businesses. Andrew Mkrtchyan, Chairman of Ameriabank and
CEO of Ameria Group of Companies, explained that large companies have an advantage over SMEs in
overcoming the challenges of regional transport infrastructure, and in achieving the scale and reputation
necessary to penetrate the Russian market, Armenia’s biggest export destination.
Other governance issues that frequently arose during interviews included difficult judicial processes, corruption
and taxation. Aleksandr Khachaturyan, managing partner of local law firm TK Equity Partners CJSC, and
Osipyan, CEO of Instigate Robotics, discussed the need for judicial and tax administration reform. The role of
private institutions, particularly those involved in financing, was also cited. Ruben Vardanyan, a board member
of the International Finance Corporation, has served as Advisor to the President and Chairman of the Board at
Sberbank since August 2013 and previously served as Co-Head of CJSC "Sberbank CIB" (formerly, Troika
Dialog). Vardanyan suggested improving the quality of banking infrastructure to make credit and financing more
accessible. Professor Hajian, Dean of the College of Science and Engineering at AUA, and Noubar Afeyan, CEO
of Flagship Ventures and an MIT lecturer, added that there is a very active venture capitalist and investment
community of diaspora Armenians, which if properly tapped by startups could serve as a new source of financing.
The infrastructure for initiating such a network, however, is still largely missing.
5.27. The few businesses involved in innovative fields report skills, governance and financial constraints. Skills shortages are particularly acute among high-tech firms (see Box 5.4). According to a
study on innovation in the energy sector important constrains for small, high-tech businesses in Armenia
include: (i) a shortage of qualified specialists in the fields of technology transfer, commercialization, and
management, and a lack of intermediary organizations providing innovation support; (ii) a limited
awareness of intellectual-property-related issues among executives involved in technological
development; and (iii) a small number of financial institutions providing loans on suitable terms and a
lack of mature venture capital funds.49
49 European Commission (2014a).

82
Box 5.4. The Views of High-Tech Entrepreneurs on the Relationship between Workforce Skills and Innovation
Human capital was an issue of particular concern during interviews with Armenian technology firms. The ICT and software
solutions company OVAK delivers ICT equipment and services such as programming, industrial software design and
automation. The firm requires highly skilled labor trained in specific areas and access to an extensive network of experts. CEO
Robert Hovakimyan explained that OVAK invests heavily in collaborative programs with universities to develop skills and
support knowledge exchange between businesses and academia. In forming this partnership OVAK was not only motivated by
the prospect of recruiting trained engineering students, but also by the quality of university faculty and their networks of
experts. Hovakimyan stated that, “in the universities such as the State Engineering University and Yerevan State University
the faculty may be old but some are really strong and have good networks of [local and international] contacts.” In return for
their collaboration professors working with OVAK can keep up-to-date on career prospects.
Hovakimyan’s perspective was echoed in interviews with other CEOs. Hovhannes Avoyan, CEO of the ICT incubator
Monitis, believes that he could double the size of his business if he had sufficient access to qualified experts, managers and
marketing personnel. In order to create a pool of qualified employees some Armenian firms have initiated in-house training
programs and a few have even begun writing undergraduate curricula for major universities. For example, Mentor Graphics, a
branch of the leading American electronic design automation firm Mentor Graphics Corporation, writes an undergraduate
curriculum for the American University of Armenia (AUA). Irina Dumanyan, the Managing Director of Mentor Graphics,
pointed out that state university programs are often outdated and professors do not always understand the needs of private
firms. Mentor Graphics’ collaboration with AUA allows them to educate new, industry-relevant talent for the company’s
R&D work in Armenia.
Some firms highlighted specific priorities for public investment in workforce skill development and education. The Armenian-
U.S. tablet-making company Minno recommended that the government provide “more industry-oriented applied laboratories
in the universities, and more opportunities for our professors to go abroad to study and invite professors from abroad to lecture
at local universities.”
5.28. The policy environment influences firm efficiency and accounts for a significant share of the variation in firm-level productivity. In Armenia relatively efficient firms coexist alongside less efficient
competitors, dragging down overall productivity. The heterogeneous distribution of productivity across
firms is due in part to historic legacies and other inherited firm-level characteristics, such as the location
of firms and their sector of operation. Weakness in the policy environment are also a significant
determinant of productivity. Government policy plays an important role in promoting the efficient
reallocation of labor and capital from less efficient to more efficient firms and sectors. Indeed policy
factors are estimated to account for 36 percent of the variation in firm-level productivity, a higher
proportion than in all comparators considered in the analysis.
5.29. The quality of governance and availability of skilled workers have the most significant effect on firm-level productivity. Improvements in both of these areas will be gradual, and persistent
coordinated action will be necessary to ensure lasting progress. Governance accounts for 42 percent of the
share of productivity that can be influenced by policy, and includes both formal and informal aspects of
the regulatory environment. While formal regulations in Armenia are typically adequate, mechanisms for
implementing and enforcing existing regulations are deficient. These issues are compounded by the
inadequate supply of highly educated workers and limited training efforts by firms. Human capital
accounts for an additional 22 percent of productivity variation at the firm level.
5.30. The policy environment also influences the international orientation of Armenian manufacturers. Armenia’s trade openness is limited and FDI levels are relatively low, especially in the
manufacturing sector. However, international openness is highly beneficial in the manufacturing sector.
Exporters have greater financial resources, higher rates of ICT use, better access to infrastructure, are
more integrated into import markets, and are more productive overall. Foreign-owned firms and firms
with substantial foreign shareholders are more productive than domestic firms and are able to attract or

83
train more highly skilled workers. Improving the policy framework for exports and FDI would encourage
the entry of new exporters and foreign-owned firms.
5.31. Armenian firms, particularly relatively smaller and younger firms, demonstrate low levels of innovation. Surveyed firms reported spending only 0.1 percent of their annual turnover on R&D. This
rate is lower than that of most ECA countries and far below innovation-driven economies such as Israel.
Very few Armenian firms develop new products or production processes, even compared with other small
economies in ECA. Most innovation takes place in older, larger and foreign-owned firms. The climate for
small domestic startups is generally inhospitable, especially in the manufacturing sector.
5.32. Innovative firms are particularly constrained by weaknesses in the policy environment, especially low governance quality and a limited availability of skilled labor. Corruption and
inadequate workforce skills represent binding constraints on the development of innovative firms,
especially entrepreneurs in the nascent ICT sector and in other high-tech industries. Consequently,
measures to promote good governance and human-capital formation are essential prerequisites for
promoting innovation among Armenian firm

84
In order to build a more dynamic, sophisticated and adaptable economy Armenia must establish a policy
framework capable of not only increasing the supply of new technologies and productive systems, but
also bolstering private-sector demand for innovation. On the supply side Armenia has made progress in
implementing key legal and regulatory reforms, developing a national scientific strategy supported by
sound governance mechanisms, and taking its first steps towards integrating the public research sector
into the broader national economy. However, increasing economic dynamism also requires robust private
demand for innovation, which only an open and competitive marketplace can generate. High
bureaucratic costs, weak governance institutions and the dominance of a small business elite all diminish
competitive incentives, discouraging the emergence of pioneering startups and reducing demand for new
productive technologies among existing firms. A comprehensive strategy for promoting economic
dynamism in Armenia must reflect not only supply-, but also demand-side constraints on firm-level
innovation.
6.1. This chapter discusses policy options to improve the dynamism of the Armenian economy. The
previous chapters established the potential economic impact of greater openness to trade, capital and data
flows and underscored the critical importance of leveraging the resources of the diaspora. In order to
successfully build a knowledge economy Armenia will need to improve its governance environment, ICT
connectivity, workforce skills and the ability to create and use knowledge. Policy and institutional
reforms in these areas have been discussed at length in several previous studies. World Bank (2013), for
instance, presents a comprehensive assessment of the policies needed to enhance Armenia’s ability to
accumulate capital, connect with the world and open its markets to competition. The policy
recommendations in this chapter build on the findings of previous analytical work with a focus on
realizing the Armenian economy’s potential for innovation and dynamism.
6.2. Innovation in Armenia faces constraints on both the supply and demand sides. While some
elements of a strong national innovation system are in place, the government’s efforts to foster the
development of a knowledge-based economy are inhibited by poor policy coordination, a lack of strategic
focus and weak administrative capacity. Moreover, innovation is also constrained on the demand side, as
limited economic openness and low levels of competition reduce incentives to adopt new technologies
and production processes. In this context, the following chapter considers two key questions:
How can an improved policy framework increase the supply of innovation generated by both
the public and private sectors?
How can regulatory reforms enhance competition and bolster demand for innovation by
Armenian firms?
6.3. Armenia’s national innovation strategies focus on supply-side issues, but a lack of coordination limits their effectiveness. As discussed in Chapter 4, Armenia has created the foundations for a national
innovation system by developing strategies for promoting the growth of the science and technology
sectors. However, the government’s two main strategic documents have overlapping priorities, and no
mechanisms are in place for jointly implementing programs with a common target. Moreover, although
building a knowledge-based economy requires active, productive collaboration between public scientific
institutions and private firms, Armenia’s science policies are not coordinated with its industrial policies,
and the government’s current efforts concentrate almost exclusively on the supply side.

85
6.4. New governance mechanisms will be necessary to improve policy coordination and enhance the impact of innovation strategies. Many OECD countries have established innovation councils
comprising representatives from the public and private sectors. These councils are tasked with defining
policy priorities and monitoring the impact of innovation programs and national strategies. In Armenia an
innovation council could mainstream innovation into the policy process and coordinate the development
of a unified national innovation strategy. An innovation council could also provide input into budget
allocation and program planning to ensure that innovation policies and programs and well designed and
appropriately resourced.
6.5. Public research institutions must shift their focus from basic to applied research. Armenia’s
universities and other research institutions are weakly connected to the private sector. As a result public
research tends to be highly academic and largely unresponsive to the needs of industry. The government
should take steps to encourage partnerships between firms and research institutions and a larger share of
research funding should reflect the priorities of the private sector. This reorientation toward industry-
focused applied research could be supported by the addition of dedicated budget lines for funding
research projects and fields that are clearly linked to economic innovation or national development
priorities. Collaborative research by the public and private sectors should follow the example of the
public-private partnerships established through the European Technology Platforms. Universities and
public research institutions should also develop technology-transfer strategies and channels through
which to disseminate their findings to the private sector.
6.6. Improving collaboration between Armenia’s scientific organizations and private-sector firms will require institutional reform. The legal and governance framework in which universities and
research institutes operate does not incentivize the production of economically applicable innovations and
encourages the scientific community to isolate itself from the national economy. While some firms have
begun engaging with universities to develop market-oriented vocational curricula, policymakers and
educators could do much more to support active collaboration between science and industry. Promoting
joint research and training initiatives, creating professional exchange programs, academic fellowships and
other systems for transferring knowledge and experience, designing Master’s and Doctoral courses that
directly involve private counterparts and are tailored to meet the needs of the private sector, and
developing agreements to share public and private scientific facilities would both increase the supply of
innovation and enhance its economic applicability.
6.7. National innovation strategies should broaden their focus to include technology transfer, adaptation and upgrading outside the high-tech industrial and research sectors. The ISFIE places a
strong emphasis on the national R&D system and on attracting investment by high-tech multinational
companies with the objective of transforming Armenia into a regional technology hub. However, far less
attention is devoted to innovation outside the technology sector. Technological extension services
provided by public or private institutions, or through public-private partnerships, could greatly accelerate
productivity growth throughout the Armenian economy by supporting innovation and technology transfer
among firms in traditional industries and sectors. These programs should not focus exclusively on
sophisticated ICT systems and cutting-edge equipment, but should also target innovative managerial
techniques, new organizational practices, improved quality-control systems, production-process
refinements, basic ICT connectivity, energy efficiency, and other forms of broadly construed productive
technology.
6.8. An adequate legal framework and dedicated organizations are necessary to build commercial research capacity and facilitate technology transfer. Two essential components of a national
innovation system are: (i) a clear legal framework entitling researchers and research institutions to benefit
from the creation and exploitation of the intellectual property generated by publicly-funded research, and

86
(ii) intermediary organizations tasked with developing and managing research partnerships and
technology-transfer arrangements (Box 6.1).
Box 6.1. Intellectual Property Rights and Innovation: Lessons from the International Experience
Creating incentives for applied research and active technology transfer by public research institutions begins with
a transparent and unified legal framework governing the rights to intellectual property produced by publicly-
funded research. Well-designed intellectual property rights enable researchers and institutions to benefit from the
commercialization of technologies. They define responsibilities for different stakeholders involved in the research
process and create incentives for researchers to develop and disseminate market-oriented technologies. These
incentives typically include rights to product royalties and other forms of revenue, as well as equity participation
in subsidiary technologies.
In China the Science and Technology Advancement Law and the Science and Technology Findings Conversion
Law of 1998 included provisions for inventor compensation and incentives for firm creation. In 2002 a
ministerial decree explicitly allowed for the ownership and commercialization of intellectual property rights. In
some cases researchers can even use their findings as investment collateral. University researchers are also
allowed to take part-time jobs in private firms as long as they continue to execute their academic responsibilities.
In Brazil the 2004 Innovation Law (Law nº 10.973) provided rules and incentives for intellectual property rights
and collaborative public-private research relationships at universities and research institutions. The law enables
researchers and research institutions to share between 5 and 33 percent of the licensing income generated by new
technologies. The law encourages the public and private sectors to share staff, funding and research facilities.
Researchers are authorized to conduct joint projects with outside institutions and may request special leave to
become involved with a startup company. Complementary incentives include fiscal exemptions for private and
collaborative R&D investment and subsidies for patenting.
In Malaysia the Technology Fund finances the development of products and services from newly-created or
licensed technologies by both public and private research institutions. In Croatia the Proof of Concept Program
strives to accelerate the commercialization of research findings by financing up to 75 percent of the total cost of
verifying and protecting intellectual property rights, demonstrating the practical applications of new technologies
and assessing their commercial potential. And in South Africa the Innovation Fund is designed to promote patent
applications at research institutions by rewarding researchers for each South African patent granted.
Source: OECD (2008), Zuniga (2011) and Correa and Zuniga (2013) –Innovation Policy Platform.
6.9. Policy options for improving the supply of innovation in Armenia include:
Creating a National Innovation Council comprising representatives from the public and private sectors. This institution would align the interests of stakeholders, enhance consultative and
participatory processes, evaluate the impact of innovation programs, and implement joint public-
private innovation and technology strategies.
Refocusing public R&D towards applied technology and market-driven research. Encouraging
research into technologies with clear commercial applications would help maximize the impact of
public research on economic productivity.
Increasing funding for public R&D in line with the objectives of the ISFIE and SDS. Funding
should be increased not only for R&D projects but also for graduate and post-graduate programs in
science and technology.
Establishing a monitoring and evaluation system for all science and technology programs and mandating impact evaluations for selected programs. Impact evaluations could be quasi-

87
experimental, given adequate data, and experimental approaches could also be considered for new
initiatives and pilot programs.
Revising the legal framework to clarify and enhance the protection of intellectual property rights in line with international best practices. Incentives should also be reflected in the way
researchers and public research organizations are evaluated and financed.
Creating market platforms to promote the commercialization of new technologies produced by public research institutions. Specialized systems for marketing technological innovations would
further leverage the economic impact of public R&D investment.
Facilitating cooperation with the Armenian scientific diaspora. Armenian research institutions
and private firms are currently making only limited use of the enormous talent and expansive
professional networks of Armenian scientists abroad.
Adopting international standards for measuring the impact of R&D projects and innovation programs. Assessments based on the OECD and Eurostat Oslo Manual for Innovation and OECD
R&D Frascati Manual should be implemented annually for R&D projects and every other year for
innovation programs. This will allow Armenia to gauge its progress against international
comparators.
Undertaking studies designed to identify emerging opportunities in the Armenian R&D sector. Reflecting the government’s overarching objectives and the specific goals of its R&D policies these
studies should focus on technologies with a large potential impact on economic and social
development.
6.10. An uneven economic playing field can slow technology transfer and stifle innovation. A
regulatory regime that does not facilitate competition among firms discourages the adoption of new
productive technologies. This is true for both physical technologies and organizational systems, and
market competition has been found to be the most important factor in determining the relative
sophistication of management practices.51
Creating incentives to adopt more efficient processes and
production systems is particularly important for Armenia, which is far from the technological frontier,
since the ability to innovate and adopt new technologies is essential to long-run convergence with
developed economies.52
6.11. Despite recent reforms, Armenia’s regulatory framework for competition remains deeply flawed. As discussed at length in World Bank (2013) Armenia’s current legislation does not effectively
deter anticompetitive behavior, nor does it provide regulators with adequate authority to enforce a level
playing field, and government agencies tend to focus on monitoring prices rather than addressing
anticompetitive practices. Moreover, the contestability of markets is not taken into account in defining
market dominance, and as a result imperfect competition is inaccurately identified in national legislation.
6.12. Armenia’s compares poorly against its peers in terms of competitive markets. Indicators of the
intensity of local market competition, the extent of market dominance, and the effectiveness of
50 This section draws extensively on World Bank (2013). 51 Syverson (2004), Bloom and van Reenen (2007), Bloom et al. (2012). 52 See, for example, Aghion and Griffith (2005), Acemoglu et al. (2006), Bloom, Sadun, and Van Reenen (2012),
Inklaar, Timmer, and van Ark (2008).

88
competition policy place Armenia low in the international rankings. In the 2014-2015 Global
Competitiveness Index Armenia ranked 85th out of 144 countries in intensity of local competition, 93
rd in
the extent of market dominance and 105th in the effectiveness of anti-monopoly policy.
6.13. Weak competitive incentives explain why many Armenian firms are slow to innovate. While
the country’s fast-growing ICT sector has a relatively high rate of technological uptake, other sectors
frequently rely on outdated technologies and tend to be relatively uncompetitive in international
markets.53
Whereas firms in the ICT sector are highly exposed to international competition—with a global
operational focus and a large share of foreign investors--firms in traditional sectors tend to have a local or
regional perspective, with little incentive to innovate or enter new markets because the returns to
innovation and entrepreneurship are diminished by the structural economic power of incumbent firms.
6.14. Ownership of economic assets is highly concentrated. Focus groups identified 32 individuals
who together own 126 firms, of which 52 were among the 1,000 largest taxpayers and accounted for 60
percent of the total sales attributable to the 1,000 largest taxpayers. Econometric analysis found that the
firms believe to be owned by these 32 individuals had significantly higher sales and larger assets than
their peers, even after controlling for firm size and sector. A complementary analysis of publicly available
data established that at least 57 firms were owned by just 5 individuals, a subset of the 32 individuals
identified through the focus groups. Of these 57 firms, 31 were among the 1,000 largest taxpayers and
accounted for nearly 8 percent of their assets, 15 percent of their sales, and 14 percent of their taxes.
Sectors in which the firms of the top five owners operate are highly concentrated, since each of the five
individuals owns at least one company that has a substantial share of the relevant market.
6.15. Business elites often have close political connections and may receive preferential treatment. Focus group discussions indicated that owners of powerful business interests are often personally linked
to the political leadership. Political connections may present an obstacle to the entry of new firms and the
expansion of more productive firms by enabling low-productivity incumbents to defend their market
position. While these large incumbent firms contribute to overall growth, they can hinder economic
development by stifling competition and diminishing incentives to innovate.
6.16. Business elites benefit from preferential tax policies and tax administration. Preferential tax
policies may include: (i) a special concessional regime for petroleum products; (ii) a personal income tax
that is basically a wage tax with little focus on other income; and (iii) insufficient mechanisms or
authority to undertake tax audits of individuals, including persons with significant assets or income. Key
tax administration challenges include: (i) a lack of systematic investments in human and technical
capacity; (ii) undeveloped risk-management mechanisms, including prohibitions on indirect audits; (iii)
the limited use of e-filing; (iv) excessive contact between taxpayers and officials; (v) perceptions of
corruption; (vi) a weak appeals system with low credibility among taxpayers; and (vii) vague internal
rules and significant personal discretion in applying them within the State Revenue Committee.
6.17. Fiscal incentives to specific sectors or firms are not transparent and are often used to favor powerful incumbents. The criteria for granting state support do not focus on ensuring minimal distortion
to competition, as it is in the EU, where state aid is regulated by EU treaties. In Armenia the state can
grant deferral of tax payments, as well as offering direct subsidies, guarantees, government loans and
subsidies for interest payments. Business projects that satisfy certain criteria can benefit from government
support programs, including both financial and technical assistance. The government's website publishes
a list of requirements, selection criteria, and a scoring system for applicants, but potential distortions to
competition are not considered. Large companies account for 68 percent of all loans granted by the
53 See, among others, Parente and Prescott (1999) or Acemoglu et al. (2006).

89
government. Two companies in particular have received significant credit support, while three other
companies account for a sizeable portion of outstanding tax arrears.54
6.18. The systemic advantages of business elites result in a general welfare loss. It is estimated that
under-collection of direct taxes and duties owed by business elites amounts to between 1.4 and 2.6
percent of GDP, as weaknesses in tax policy and administration have eroded the tax bases. The welfare
loss due to distorted food prices is estimated at 2.3 percent of per capita GDP and 4.2 percent of per capita
consumption.55
Empirical evidence on food-price elasticities indicates that the total consumer welfare loss
is US$295 million per year, about US$91 per capita or 2.4 percent of per-capita GDP.
6.19. Greater disclosure of firm-level information would enable further analysis and more effective policy recommendations. Incomplete information limits assessments of the extent to which market
concentration and anticompetitive behaviors are distorting economic sectors, slowing growth and
diminishing fiscal revenues. The disclosure of three types of firm-level information is particularly
important in Armenia: (i) financial information, (ii) non-financial disclosures, and (iii) trade data. Firm-
level trade data are important to limit opportunities for corruption in the application of import duties, but
statistics on firm exports and imports are not readily accessible.56
Under the current customs code there is
a valuation option that includes the application of referential prices, which interviewees identify as below
market. The discretionary application of this valuation method creates distortions by allowing some
companies to pay lower taxes. Disclosure of information on fiscal incentives is also critical to identifying
anticompetitive distortions.
6.20. Policy reforms designed to enhance competition and incentivize innovation include:
Establishing a unified tax code. A single tax policy supported by clear rules for tax administration
would increase the transparency of the tax system, reduce anticompetitive advantages, and enable
policymakers to expand the tax base and rationalize tax rates.
Strengthening disclosure requirements for firms. Recent reforms to Armenia’s accounting rules
require greater disclosure of firm-level information, paving the way for adoption of International
Financial Reporting Standards, and efforts are underway to enhance state control over audit firms.
However, auditors and regulators continue to face serious capacity constraints and the financial
statements of many Armenian enterprises fall short of international standards. Publication of financial
statements remains limited and inconsistent and additional work will be required to increase access to
non-financial information, such as ownership structure and investor rights.
Tightening conflict-of-interest regulations. The disclosure of potential conflicts of interest among
members of the legislature is important to ensure the integrity of the public trust. Consistent
implementation of the relevant provisions of the 2011 Law on Public Service, including online
publication of conflict-of-interest declarations, would greatly enhance public accountability.
Reinforcing the legal framework for competition. To ensure a level playing field in the private
sector reforms clarifying the definition of economic entities, anticompetitive practices and market
dominance should be complemented by more robust regulatory authority. The State Commission for
54 World Bank (2013). 55 Food prices in Armenia are about 17 percent higher on average relative to the other CIS countries, even after
adjusting for per capita GDP, cost of imports, product variables and time control variables (World Bank, 2013). 56 By contrast these data are available in a number of countries, including Argentina, Peru, Brazil, Chile, Germany,
Indonesia, Korea, Taiwan and the United Kingdom.

90
the Protection of Economic Competition (SCPEC) needs to shift focus from price fluctuations to
actual and potential barriers to market entry and contestability.
Eliminating anticompetitive government interventions and distortive regulations. Strengthening
the SCPEC's advocacy mandate would enable it to draw attention to inefficient policies and open
excessively concentrated markets to greater competition. The SCPEC could also help to deter the
passage of new anticompetitive regulation by increasing the awareness of other government agencies,
regulators and the public regarding the distortive effects of specific provisions. Close collaboration
with other regulatory agencies will help to avoid duplicative efforts and maximize the impact of
limited institutional capacity.
Reforming state aid to minimize potentially distortive effects on competition. The introduction of
a comprehensive state aid framework could help prevent the abuse of these policies by entrenched
incumbents. Reforming incentives would also support the achievement of economy-wide
development objectives, including increasing R&D output, accelerating technology transfer and
boosting innovation.
6.21. Policies and institutional arrangements that facilitate the emergence of more competitive firms, incentivize innovation and promote the spread of new productive technologies are the foundation of economic dynamism.57
In Armenia, as in many other countries in the former Soviet
sphere, market mechanisms remain compromised by a confluence of historical influences, geographic
factors and contemporary policy decisions that discourage technological adaptation and limit international
integration. In this context policymakers may target the development of high-tech manufacturing without
first ensuring that the country’s underlying physical capital, human capital and institutional structure are
capable of fostering and sustaining highly sophisticated, globally competitive industries.
6.22. Weaknesses in Armenia’s national innovation system reduce the supply of innovation and slow its adoption by firms. Armenia has begun to define an effective national strategy for promoting
innovation supported by an improved legal framework and appropriate institutional mechanisms and
funding arrangements. However, important progress has yet to be achieved in a number of key areas,
including the active engagement of the private sector in research and development, as well as the long-
term process of levelling the economic playing field. These deficiencies prevent private firms from fully
leveraging the knowledge base of public research institutions and undermine demand for new productive
technologies.
6.23. Armenia has completed the first generation of reforms that have transformed it into a market economy, yet limited competition and the dominance of business elites threaten its ultimate goal of convergence with the industrialized world. Market incentives drive efficiency improvements,
encouraging the entry of pioneering firms, the opening of new markets and the adoption of new
technologies. However, when the fundamental elements of a competitive policy framework are
compromised by the influence of powerful firms, these incentives cannot function effectively. In order to
achieve its development objectives Armenia must further strengthen its economic policies and institutions
to support more robust competition and spur more rapid technological advancement.
57
The focus on underlying capabilities, endowments or assets has been emphasized in a number of recent World
Bank reports, including: “Diversified Development. Making the Most of Natural Resources in Eurasia” (2014),
“Implications of a Changing China for Brazil: A New Window of Opportunity” (2014), “China 2030. Building a
Modern, Harmonious, and Creative Society” (2013) and “Does what you Export Matter? In Search of Empirical
Guidance for Industrial Policies” (2012).

91
Annexes
Annex 1. Decomposition of Effects on Long-Run Growth
Theoretical Background
Structural factors are expected to influence long-run aggregate supply. In basic neoclassical long-run
models output per capita is determined by the long-run aggregate supply curve based on an aggregate
production function including capital accumulation and technology. In the empirical model used in this
analysis structural policy variables reflecting human capital, financial development, infrastructure or trade
openness proxy for these effects. Furthermore, we consider institutional quality and government
consumption, which could affect capital formation and allocative efficiency.
Cyclical factors and stabilization policies also have potential effects on growth. Over the short-term
demand factors should be taken into account. For example, expansive monetary policy can boost output in
the short run. However, higher inflationary pressures can cause cyclical distortions that might adversely
affect the allocation of productive factors in the economy. Ensuring a stable macroeconomic environment
will support the most efficient allocation of resources, as will institutional stability and a level regulatory
playing field. In our empirical model stabilization policies such as the inflation rate, a proxy for exchange
rate misalignment, and banking crisis reflect this channel.
External conditions are particularly important for emerging and developing economies. Virtually all
developing countries are commodity exporters and higher export prices, as observed over the last decade,
will impact their income through export revenues. While the impact of commodity price booms may be
temporary, they they can influence long-term aggregate supply if revenue windfalls are spent wisely, e.g.
on institution building. Abundant international liquidity similarly eases access to finance and supports
capital accumulation in capital-scarce countries. In our empirical model external factors are captured by
the terms-of-trade growth, growth in (country-specific) commodity prices and time dummies reflecting
global effects such as liquidity.
Data and Methodology
The analysis employs the methodology of Araujo et al (2014) that builds on and expands the econometric
approach developed by Loayza et al (2005). Using dynamic panel data regressions this approach
investigates how aggregate economic, political and social variables affect per-capita GDP growth rates
using a sample of 126 countries during the 1970-2010 period. The dataset is extended to include 2010-
2013 data for Armenia. To smooth out cyclical short-run effects the model is estimated using the 5-year
averages of non-overlapping panel data. The period used in this study, 1996-2013, consists of 4 data
points (2000, 2005, 2010 and 2013) and captures average values for the following time periods:
The 2000s: Avg.[2006-2010] – Avg.[1996-2000] = 2010-2000
Early 2000s: Avg.[2001-2005] – Avg.[1996-2000] = 2005-2000
Late 2000s: Avg.[2006-2010] – Avg.[2001-2005] = 2010-2005
Early 2010s: Avg.[2011-2013] – Avg.[2006-2010] = 2013-2010
The “Early 2000s” period reflects change between the 1996-2000 and 2001-2005 averages; the “Late
2000s” measures performance between the 2001-2005 and 2006-2010 averages; and the “Early 2010s”
compares 2006-2010 averages with 2013 values.

92
The model incorporates the most relevant factors influencing growth in neoclassical models. Variables are
grouped to capture the effects of different policies on GDP per capita growth over time.58
Structural
policy variables which reflect the effects of capital accumulation and technology are proxied by human
capital (schooling), financial development (private credit/GDP), trade openness and infrastructure
(telephone lines). The effects of government consumption and institutional quality (polity2) on capital
formation and allocative efficiency are also considered. Stabilization policies such as the inflation rate, a
proxy for exchange rate misalignment, and the banking crisis reflect macroeconomic environment
inductive for efficient allocation of resources. External factors, captured by the terms-of-trade growth,
growth in (country-specific) commodity prices, and time dummies capturing global effects such as
liquidity, reflect commodity price booms and access to international liquidity, both of which are favorable
conditions for commodity exporters. The model also includes a growth-persistence parameter capturing
the effects of past shocks and interventions, which is introduced by the lagged dependent variable. See
Table A-1.1 for a detailed description of variables and their sources.
The following model is estimated to explain per capita GDP growth in country c in year t as the dynamic
(“steady-state”) process:
(1)
where lnyct is the natural log of real PPP GDP per capita of country c in period t; Xct is a vector of growth
determinants; ac and bt are country and year fixed effects; and ect is an error term. The model is estimated
using the System Generalized Methods of Moments (GMM) method, which uses internal instruments to
prevent endogeneity biases due to the lagged depended and explanatory variables.
The main finding of this study is that the structure of growth drivers in Armenia have remained mostly
unchanged over the past two decades. This study finds that external conditions have played a relatively
modest role in the recent growth of the Armenian economy. Like other countries in the region Armenia is
reaping the growth benefits of structural changes in the financial sector and infrastructure. Past reforms
continue to drive growth, and structural features remain a robust determinant of economic performance.
Stabilization-related variables were not an essential driver of growth, reflecting macroeconomic
instability and periods of high inflation volatility, particularly in the late 1990s and 2000s.
58 While the model was developed and variables were chosen to reflect the Latin American & Caribbean region
(LAC), it could be relevant for other countries, although fitted values might be further away from the regression line.

93
Table A1-1. Description of Variables
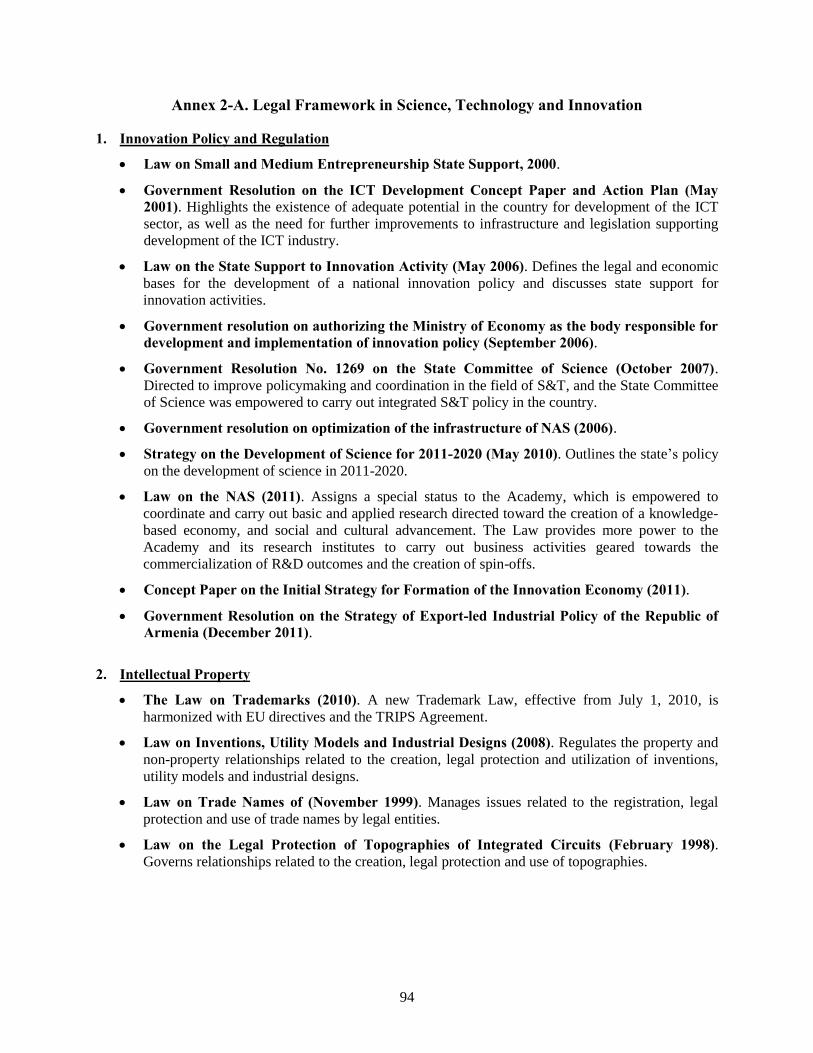
94
Annex 2-A. Legal Framework in Science, Technology and Innovation
1. Innovation Policy and Regulation
Law on Small and Medium Entrepreneurship State Support, 2000.
Government Resolution on the ICT Development Concept Paper and Action Plan (May 2001). Highlights the existence of adequate potential in the country for development of the ICT
sector, as well as the need for further improvements to infrastructure and legislation supporting
development of the ICT industry.
Law on the State Support to Innovation Activity (May 2006). Defines the legal and economic
bases for the development of a national innovation policy and discusses state support for
innovation activities.
Government resolution on authorizing the Ministry of Economy as the body responsible for development and implementation of innovation policy (September 2006).
Government Resolution No. 1269 on the State Committee of Science (October 2007). Directed to improve policymaking and coordination in the field of S&T, and the State Committee
of Science was empowered to carry out integrated S&T policy in the country.
Government resolution on optimization of the infrastructure of NAS (2006).
Strategy on the Development of Science for 2011-2020 (May 2010). Outlines the state’s policy
on the development of science in 2011-2020.
Law on the NAS (2011). Assigns a special status to the Academy, which is empowered to
coordinate and carry out basic and applied research directed toward the creation of a knowledge-
based economy, and social and cultural advancement. The Law provides more power to the
Academy and its research institutes to carry out business activities geared towards the
commercialization of R&D outcomes and the creation of spin-offs.
Concept Paper on the Initial Strategy for Formation of the Innovation Economy (2011).
Government Resolution on the Strategy of Export-led Industrial Policy of the Republic of Armenia (December 2011).
2. Intellectual Property
The Law on Trademarks (2010). A new Trademark Law, effective from July 1, 2010, is
harmonized with EU directives and the TRIPS Agreement.
Law on Inventions, Utility Models and Industrial Designs (2008). Regulates the property and
non-property relationships related to the creation, legal protection and utilization of inventions,
utility models and industrial designs.
Law on Trade Names of (November 1999). Manages issues related to the registration, legal
protection and use of trade names by legal entities.
Law on the Legal Protection of Topographies of Integrated Circuits (February 1998). Governs relationships related to the creation, legal protection and use of topographies.

95
3. Science and scientific activities
Law on Scientific and Technological Activity, (December 2000). Regulates the relationships
between R&D performers, state bodies and R&D outcome consumers, and outlines the general
principles of forming and implementing state policy in the field of S&T.
Science and Technology Development Priorities for 2015-2019 (December 2014). Defines the
following science and technology priorities: Armenian studies, life sciences, renewable energy,
new energy sources, advanced technologies, information technologies, space, earth sciences,
sustainable use of natural resources and basic sciences for key applied research.

96
Annex 2-B. List of Research Organizations
Institute of Mathematics
Institute of Mechanics
Institute for Informatics and Automation Problems
Institute for Physical Research
Institute of Radiophysics & Electronics
Institute of Applied Problems of Physics
Byurakan Astrophysical Observatory after V. Hambardzumyan
Institute of Geological Sciences
Institute of Geophysics and Engineering Seismology after A. Nazarov of NAS
Institute of Chemical Physics after A. Nalbandyan of NAS
Scientific Technological Centre of Organic and Pharmaceutical Chemistry
Institute of General and Inorganic Chemistry after M. Manvelyan
G.S.Davtyan Institute of Hydroponics Problems
Institute of Botany
Scientific Centre of Zoology and Hydroecology
Institute of Biochemistry after H. Buniatian
Institute of Physiology after L. Orbeli
Institute of Molecular Biology
Centre for Ecological Noosphere Studies
Institute of History
Institute of Oriental Studies
Institute of Archaeology and Ethnography
Museum-Institute of Genocide
Shirak Armenology Research Centre
M.Kotanyan Institute of Economics
Institute of Philosophy, Sociology and Law
Institute of Literature after M.Abeghyan
Institute of Linguistics after H. Atcharian
Institute of Arts
National Bureau of Expertises
Armbiotechnology Scientific and Production Centre SNCO
International Scientific-Educational Centre
CJSC ''Department of Hydromechanics and Vibro-techniques'' at NAS
"Armenian Encyclopaedia" Publishing House State Non-Profit Organization
Yerevan State University
State Engineering University of Armenia
National University Of Architecture And Construction Of Armenia
Yerevan State Medical University after M. Heratsi
Armenian National Agrarian University
Research Centre for Soil Science, Agrochemistry and Land-Reclamation Named After H.Petrosyan
Scientific Centre of Viticulture, Fruit Growing and Wine Making SNPO
Scientific Centre of Agrobiotechnology SNCO
Centre for the Advancement of Natural Discoveries using Light Emission
A.I. Alikhanyan National Science Laboratory (Yerevan Physics Institute) Foundation
Armenian State Pedagogical University after Kh. Abovyan
Armenian State University of Economics
Yerevan State Linguistic University after V. Brusov
Goris State University
Gyumri State Pedagogical Institute
Yerevan Komitas State Conservatory
Russian - Armenian (Slavonic) University
Unesco Chair - Life Sciences International Postgraduate Educational Centre
National Institute of Education CJSC
The Mesrop Mashtots Institute of Ancient Manuscripts

97
Research Institute of Epidemiology, Virology and Medical Parasitology named after A.B. Alexanian
SNCO
Haematology Centre after prof. R. Yolyan
Scientific Centre of Trauma and Orthopaedics
Scientific Research Institute of Spa Treatment And Physical Medicine
National Centre for Disease Control and Prevention
Scientific Centre of Radiation Medicine and Burns CJSC
Scientific-Research Institute of General Hygiene and Occupational Diseases Named After
N.B.Hakobian
Food Safety Risk Analysis and Assessment Research Centre State Non-Commercial Organization
Scientific Centre of Agriculture State Non-Commercial Organization
Scientific Centre of Vegetable and Industrial Crops (SCVIC)
'Crops experimental station'' State Closed Joint-Stock Company
Scientific Research Centre of the Historical and Cultural Heritage
SJSC "Centre for Restoration of the Monuments"
Ervand Kochar Museum
'Service for the Protection of Historical Environment and Cultural Museum-Reservations'' NSO of
the Ministry of
National Institute of Metrology CJSC
"Scientific Research Institute of Cardiology after l.A. Hovhannisyan"
"Armatom" Armenian Scientific Research Institute For Nuclear Plant Operation CJSC
National Archives of Armenia
"Noravank'' Foundation
Appraisal and Testing Center SNCO
Public Administration Academy of the Republic of Armenia
"Arabkir" Joint Medical Centre – Institute of Child and Adolescent Health (Arabkir JMC)
Institute of Water Problems and Hydro-Engineering Named After I.V. Eghiazarov
"Multi Agro" Scientific and Production Centre
Barva Innovation Centre
Armenian Institute of Applied Chemistry "ARIAC"
'Precision Sensors & Instruments Ltd'' (PSI)
"Yerevan Telecommunication Research Institute" CJSC
Source: SCS.

98
Annex 2-C. State Budget Financing for Research
State budget financing of NAS by research institutes in 2012-2013, mln. AMD 2012 2013 Institute of Mathematics 63.4 67.7
Institute of Mechanics 145.9 151.7
Institute for Informatics and Automation Problems 225.4 246.7
CJSC “Department of Hydromechanics and Vibro-techniques” at NAS 3.2 4.4
Byurakan Astrophysical Observatory after V. Hambardzumyan 65.5 202.0
Institute for Physical Research 147.0 169.5
Institute of Applied Problems of Physics 197.0 210.6
Institute of Radiophysics & Electronics 163.8 155.3
Centre for Ecological Noosphere Studies 100.2 102.7
Institute of Botany 97.7 106.7
Scientific Centre of Zoology and Hydroecology 91.1 108.4
Armbiotechnology scientific and production centre SNCO 233.5 244.8
G.S.Davtyan Institute of Hydroponics Problems 58.5 54.4
Institute of Molecular Biology 150.0 139.0
Institute of Physiology after L. Orbeli 106.6 110.0
Institute of Biochemistry after H. Buniatian 139.9 165.0
Institute of Chemical Physics after A. Nalbandyan of NAS 95.2 91.4
Institute of General and Inorganic Chemistry after M. Manvelyan 99.6 95.8
Scientific Technological Centre of Organic and Pharmaceutical Chemistry 247.3 275.8
Institute of Geological Sciences 161.0 161.6
Institute of Geophysics and Engineering Seismology after A. Nazarov of NAS 59.1 85.1
Institute of History 127.9 150.3
Institute of Philosophy, Sociology and Law 39.6 44.2
M.Kotanyan Institute of Economics 83.1 144.3
Institute of Linguistics after H. Atcharian 54.4 70.8
Institute of Literature after M.Abeghyan 46.5 51.9
Institute of Oriental Studies 73.0 79.5
Institute of Arts 65.3 66.8
Institute of Archaeology and Ethnography 280.5 306.9
Museum-Institute of Genocide 90.5 92.0
Shirak Armenology Research Centre 21.2 23.6
National Bureau of Expertises 171.7 173.1
ISTC Armenian office 7.8 9.3
NAS 557.8 616.3
Total 4270.5 4777.7 Source: staff calculations based on MOF data.

99
Annex 3-A. Policy Environment Analysis
As detailed in Pena (2015) the econometric methodology used to assess the effects of the policy
environment on enterprise performance consists of two steps:
a. Identification of statistically significant policy environment (X) effects on productivity and other
performance variables. For the identification of the statistically significant X effects on economic
performance, the analysis uses a simultaneous equations system that relates the interactions
between the policy environment with productivity, demand for labor, exports, FDI inflows and
R&D activity. Estimation always controls for firms’ size, region and sector. The X elasticities and
semi-elasticities with respect to firms’ economic performance provide a measure of the sensitivity
of outcome variables form marginal changes in the policy environment.
b. Evaluation of relative policy environment contribution to aggregate (weighted average)
productivity. The analysis also evaluates the policy environment in terms of the Olley and Pakes
(O&P) decomposition of aggregate productivity (or weighted average using the share of sales as
weights) into average productivity and allocative efficiency and on the average values of the
remaining firms’ economic performance variables.
Estimation of policy environment effects on productivity
In the system of equations, policy environment information (X) and other firm-level information (W) are
both used as proxies of idiosyncratic firm-level differences. Specifically, we assume that cross-sectional
ln(TFP), which we refer to as ωi, is determined by:
= a +a +a +w (1.a)
w = a + a + a + a +w ,
(1.b)
.
The first equation is a Cobb Douglas production function, where lower cases denote variables in logs and y
is sales, l is labor, m is materials and k is capital stock, with productivity the residual of the production
process. The second equation gives form to TFP by decomposing it into a wide set of firm level attributes
such as location, sector of activity and firm size (all represented by dummy variables included in the matrix
D), policy environment variables (X), other firm level attributes (W), a constant technical efficiency term
αp, and by an error term (uω,i).
The complete list of X and W variables are in Tables 1.1 and 1.2 respectively. We considered an initial set
comprised by more than 50 variables, which was eventually reduced to 35 due to data quality. Note that
there are three types of variables depending on how we measure them: i) dummy or dichotomous variables
which we denote by d; ii) variables in percentage (%) and iii) variables in natural logarithms (ln). The
parameters of the first two are interpreted as semi-elasticities (provided productivity is in logs), while the
interpretation of the effect of variables in logs is as an elasticity.
Summary of econometric issues regarding data quality To carry out the analysis, we pool together observations for manufacturing firms from years 2009 and
2012. This is due to small sample size in some countries and to increase the degrees of freedom in the
analysis. We implicitly assume the 2009 and 2012 samples are independent random draws of the same
underlying populations (Table A3-1).

100
Table A3-1. Manufacturing firms surveyed by country and year
Country 2009 2012 Total Albania 65 110 175
Belarus 104 117 221
Georgia 125 111 236
Russia 706 1,373 2,079
Serbia 136 118 254
Moldova 108 108 216
Armenia 115 109 224
Total 1,359 2,046 3,405 Source: Author’s calculations with BEEPs data.
Missing values are found for production function variables y, l, m, k, and for X and W variables. The
model uses an imputation strategy based on the method of multiple imputation by chained equations
(MICE) (van Buuren, et al., 1999 and Raghunathan et al., 2001), which has been shown to work well
under different missing data patterns (Escribano and Pena, 2014). The general idea of MICE is to use
Markov-Chain Monte Carlo (MCMC) simulation to create several copies of the data. In each link of the
Markov chain, say t, MI first takes draws from the distribution of the variables conditional on the set of
information, or what we observe, X(t+1) ∼ F (Xmis|Xobs; θ(t)). This is the imputation step. In the
prediction step the method draws a new set of parameters from its posterior distribution, p(θ|X(t+1),
Xobs), which will be used in the imputation step at t+1 to draw a new set of missing values estimates. The
process is repeated until convergence is achieved, and estimated imputations and parameters do not
change significantly.
Summary of econometric issues in productivity estimation
We estimate equation (1.a) and (1.b) using 6 different methods for each country considered: Armenia,
Albania, Belarus, Georgia, Moldova, Russia and Serbia. We want the estimates (elasticities and semi-
elasticities) to be robust for all of the methods proposed. The different productivity measures derive from:
i) different functional forms of the production function, Cobb-Douglas and Translog; ii) different sets of
assumptions (technology and market conditions), either the Solow residual or OLS estimation of (1); and
iii) different levels of aggregation in measuring input-output elasticities of equation (6) at the industry
level or at the aggregate country level. The productivity measures used in this report are summarized in
Table A3-2 below:
Table A3-2. Summary of Estimation Methods of Productivity Equation
Functional forms of production function
Estimation procedure
Aggregation level of coefficients of PF
Result
1. Solow´s Residual Two-step
estimation
1.1 Unrestricted coefficients 2 (ω) measures; 2 (X)
elasticities & semi-elast. 2.2 Unrestricted coefficient
2. Cobb-Douglas Single-step
estimation
2.1 Restricted coefficient 2 (ω) measures; 2 (X)
elasticities & semi-elast. 2.2 Unrestricted coefficient
3. Translog Single-step
estimation
3.1 Restricted coefficient 2 (ω) measures; 2 (X)
elasticities & semi-elast. 3.2 Unrestricted coefficient
Total 6 (ω) measures; 6 (X) elasticities & semi-elast.

101
Endogeneity of the inputs. There is an identification issue separating TFP from the production
function (PF). When a PF input is influenced by unobserved common causes affecting productivity—
such as a firm’s fixed effects—there is a simultaneous equation problem in equations (1.a) and (1.b)
and hence in the single step estimation procedure.
o Solution: To address this problem (Marschak and Andrews, 1944, and Griliches and Mairesse,
1995) the analysis follows the approach proposed by Escribano and Guasch (2005, 2008). The
usually unobserved firm-specific fixed effects, which are the main cause of the inputs’ endogeneity,
are proxied by a long list of observed firm-specific fixed effects deriving from the Enterprise
Survey. Controlling for the largest possible set of X variables and plant characteristics (W), under
standard regularity conditions estimation yields consistent and unbiased least squares estimators of
the parameters of the PF and the X elasticities.
Endogeneity of X variables: For consistency in estimation the error term must be uncorrelated with
any variable contained in the X vector. It can be argued that the error term may contain unmeasured
effects correlated with X, thus rendering the OLS estimator of X effects inconsistent.
o Solution: Correction for observable fixed effects. By using the full set of information contained in
the X variables we are able to control for more than 35 variables in the estimation, eliminating a
large degree of endogeneity and spurious correlations as expectation of the outcome variables is
conditioned on as much information as possible.
Selection of the relevant model. The population model is unknown and needs to be approximated
based on a broad set of more than 35 variables, including X and other controls.
o Solution: The econometric methodology applied for the selection of variables goes from the
general to the specific; otherwise, an omitted variables problem would generate biased and
inconsistent parameter estimates. Estimation proceeds by removing the less significant variables
from the regressions one by one until a final set of variables is obtained, all significant in at least
one of the regressions and with parameters varying within a reasonable range of values.
Heteroskedasticity in the error term.
o Solution: the heteroskedasticity of the error is addressed by using robust (White) standard errors. In
response to the fact that data was collected using a random sampling by clusters, cluster standard
errors are also computed, allowing for correlation within industry and region.
Estimation of the effects on other firm performance measures
We decompose firm level productivity into two terms. The first is demeaned productivity, ωd, the part of
productivity related to the policy environment, and is computed as:
w = w - a - a - a - ˆ
w ,= a . (2)
The other productivity measure is the remainder or undemeaned productivity:
w = w -w . (3)
We use both measures of productivity as explanatory variables as each offers different interpretations.
Demeaned productivity is the share of productivity explained by the policy environment. The remainder
contains the constant technical efficiency (αp), firm level variables (W and D) or unpredictable shocks (u).

102
Demand for labor is assumed to be determined by both firm level productivities, by real wages in logs
(lnWi) or wi in logs, output (yi), firm level differences approximated by X, firm level variables W,
sector/location/size information (D), and an error term (L
i ), with variables other than real wage assumed
to shift labor demand:
= g
0+g +g +g w +g w + g + g + g +
, . (4)
The probability of firms entering the export market is modeled through:
= d
0+d w +d w + d + d + d +
, . (5)
The probability of receiving foreign direct investment (FDI) is modeled through:
= r
0+ r w + r w + r + r + r +
,. (6)
The probability of investing in R&D is modeled through:
=j
0+j w +j w + j + j + j +
,. (7)
Since the variables yri, with r = Exp, FDI and RnD, are binary random variables taking 0 and 1 values,
1( / ) ( / )r r
it itP y x E y x
, the conditional probability, is equal to the conditional expectation, which
is usually assumed to follow a Probit or a Logit model. In general linear probability models (LPM)
approximate well Probit and Logit nonlinear models when the variables are evaluated close to their
sample means. Since we are interested in the mean X contributions relative to the mean values of the
economic performance variables we will concentrate only on linear probability specifications.
International comparisons: demeaned log-productivity
Interpretation of TFP is assumed conditional on the understanding of firms’ operating conditions. Any
productivity measure is subject to measurement errors, unmeasured effects, differences in the deflators
used, etc. To make cross-country comparisons based on X impacts on productivity it is desirable to create
an index (demeaned productivity). After subtracting the mean (that is, the constant term, time effects,
industry effects and firm level effects) from firm level log-productivity we can concentrate on the part of
log-productivity explained by the X variables. Thus, demeaned log-productivity at the firm level is
simply:
w = a (8)
Expression (8) is comparable across countries because the set of X variables is the same in all countries
and the same methodology is applied to select the set of significant X variables. In addition O&P
decompositions can be easily computed based on the demeaned portion of productivity. This allows for
international comparisons of X impacts on aggregate productivity. The Olley and Pakes (O&P)
decomposition of aggregate productivity in logs is:
w = w + cov( ,w ) (9)

103
Where ωi is aggregate log-productivity (or weighted average productivity, where the weights are given by
the shares of sales), w is un-weighted average log-productivity, and the last term is the covariance
between share of sales and firm-level productivity, the allocative efficiency term, which describes the
ability of markets to reallocate resources from less to more productive establishments.
The useful additive property of equation (9) in logarithms, allows obtaining an exact closed form solution
of the decomposition of aggregate log-productivity. Following Escribano et al. (2008b) we can express
aggregate log-productivity as a weighted sum of the average values of two composite terms: a) the X, W
and D variables, the intercept and the productivity residuals (uω); and b) the sum of the covariances
between the share of sales and X, W, D and the productivity residuals:
w = a + a + a + a + ˆ( , )a + ˆ( , )a + ˆ( , )a + cov( , ˆ
w ,) (10)
The contributions of X variables to aggregate log-productivity of equation (10) can be computed for the
whole sample, by industry/sector, by region, by firm size, etc., n being the number of firms contained in
each sub-sample.
Table A3-3. Summary of Information of Production Function Variables Albania Belarus Georgia Russia Serbia Moldova Armenia Sales (y) (ln) N 153 187 187 1,628 236 200 170
% lost 12.6 15.4 20.8 21.7 7.1 7.4 24.1
Mean 17.3 21.7 12.8 17.5 18.3 15.3 18.4
S.D 1.7 2 2.1 1.9 1.8 2 1.7
Labor (l) (ln) N 172 221 234 2,076 254 216 224
% lost 1.7 0.0 0.8 0.1 0.0 0.0 0.0
Mean 10.6 11.4 11 11.4 11.2 11.1 11
S.D 1.4 1.4 1.2 1.4 1.3 1.3 1.3
Materials (m) (ln) N 66 158 173 1,192 219 165 143
% lost 62.3 28.5 26.7 42.7 13.8 23.6 36.2
Mean 16.2 20.4 12 16.3 17.1 14.2 17.2
S.D 2.4 2.4 2.2 2.2 2.1 2.2 1.9
Capital stock (k) (ln)
N 63 138 163 904 207 144 113
% lost 64.0 37.6 30.9 56.5 18.5 33.3 49.6 Mean 16.3 19.5 11 15.2 16.7 13.5 17.2
S.D 2.2 2.5 2.3 2.4 2.3 2.4 2.4
.

104
Table A3-4. Policy Environment Variables (X) in Armenia
N % lost Mean S.D I. Infrastructure
Shipm. lss. exp. (%) 221 1.3 0.26 1.5 Power outages (ln) 195 12.9 0.47 0.99
Generator (d) 222 0.9 0.16 0.37
II. Informality, bureaucracy, corruption Customs exp. (ln) 220 1.8 0.32 0.76 Customs imp. (ln) 216 3.6 0.87 1.4
Manager's time (%) 215 4.0 12 14
Inf. payms. taxes (d) 221 1.3 0.059 0.24 Security (d) 224 0.0 0.54 0.5
Auditory (d) 224 0.0 0.24 0.43 Courts (d) 222 0.9 0.24 0.43
Inf. comp. (d) 215 4.0 0.22 0.41
III. Finance Purchs. aft. delivery (%) 222 0.9 22 28
Sales aft. delivery (%) 220 1.8 30 33
Fix. assets internal (%) 220 1.8 23 39
Fix. assets equity (%) 220 1.8 10 28 Fix. assets banks (%) 220 1.8 7.1 22
Overdraft (d) 212 5.4 0.39 0.49
Loan (d) 223 0.4 0.45 0.5 Subsidy (d) 222 0.9 0.036 0.19
IV. Innovation ISO (d) 221 1.3 0.32 0.47 R&D sub. (d) 224 0.0 0.2 0.4
R&D p.worker 201 10.3 1.2 3.4
Sales new prds. (%) 219 2.2 12 20 Forgn. tech. (d) 222 0.9 0.27 0.45
Staff compts. (%) 189 15.6 31 28
Web page (d) 224 0.0 0.63 0.48
V. Labor skills Manager exp. (%) 224 0.0 2.7 0.63
Prod. staff (%) 217 3.1 69 19
Skilled staff (%) 210 6.3 45 30
High school staff (%) 221 1.3 42 28
Training (%) 222 0.9 0.16 0.37
VI. Openess FDI (d) 223 0.4 0.099 0.3
Exports (d) 223 0.4 0.2 0.4
Exports exp. (ln) 216 3.6 0.35 0.84 Imports (d) 221 1.3 0.35 0.48
.
Table A3-5. Other Firm Level Variables (W) in Armenia N % lost Mean S.D
Undiversified (%) 222 0.9 76 25
Shareholder (%) 218 2.7 81 24
Inc. (d) 224 0.0 0.96 0.19 Local (d) 224 0.0 0.2 0.4
Age (ln) 224 0.0 2.6 0.7 Market share (%) 170 24.1 7.1 13
.

105
Table A3-6. Armenia - Robust Productivity Estimations, X and W Elasticities and Semi-Elasticities
Single step with Solow residual
Two-steps
Cobb Douglas Translog
Restricted Unrestricted Restricted Unrestricted Restricted Unrestricted II. Informality, bureaucracy, corruption Customs imp. (ln) -0.199* -0.162 -0.091 -0.143 -0.05 -0.131
Manager's time (%) 0.012* 0.013* 0.013** 0.016*** 0.014** 0.013**
Courts (d) 0.362** 0.352** 0.498*** 0.376** 0.499*** 0.330**
III. Finance Overdraft (d) 0.295** 0.285** 0.241* 0.182 0.213 -0.021
Subsidy (d) -1.408*** -1.460*** -1.233*** -1.113*** -1.127*** -1.042***
IV. Innovation Forgn. tech. (d) 0.197 0.184 0.282** 0.328** 0.301** 0.288* Sales new prds. (%) 0.007** 0.007** 0.004 0.003 0.005 0.004
V. Labor skills Skilled staff (%) 0.007*** 0.006** 0.006** 0.004* 0.007*** 0.006**
VI. Openess Imports (d) 0.28 0.194 0.08 0.146 0.088 0.087
FDI (d) 0.568*** 0.585*** 0.572*** 0.645*** 0.642*** 0.586***
Firm level variables (W) Undiversified (%) -0.002 -0.002 -0.003 -0.004 -0.003 -0.003
R2 0.277 0.333 0.741 0.781 0.76 0.835
N 224 224 224 224 224 224
Significance is given by robust standard errors corrected by clusters, *p<.1, **p<.05, *** p<.01. Source: author’s calculations with BEEPs data.
Table A3-7. Armenia - Robust X and W Elasticities and Semi-Elasticities on Labor Demand and on the Probabilities of Exporting Receiving FDI and Investing in R&D, OLS Estimations
Labor demand Prob. Exports Prob. FDI Prob. R&D [1] [2] [1] [2] [1] [2] [1] [2] Demeaned Prd. -0.341***
0.053*
0.204***
0.002
Undem. Prd. -0.355***
0.001
-0.006
0.001
Total productivity
-0.352***
0.012
0.034*
0.001
Generator (d) 0.564*** 0.566*** -0.098 -0.095 Power outages (ln)
-0.063** -0.062**
-0.021 -0.021
Customs exp. (ln) -0.077* -0.094 -0.080** -0.080**
Manager's time (%)
-0.003** -0.001 Inf. payms. taxes (d) -0.167* -0.164
Overdraft (d) 0.234** 0.238***
Purchs. aft. Delv. (%)
0.002* 0.002*
Sales aft. Delivery (%)
-0.002** -0.002** -0.001* -0.001 Fix. assets banks (%) 0.005*** 0.005*** -0.004*** -0.005***
ISO (d)
0.083 0.086*
Staff compts. (%) 0.004** 0.004**
R&D p. Worker (ln) -0.028*** -0.028**
Manager exp. (%) 0.167** 0.168** 0.060* 0.060* Training (%)
0.161** 0.161**
Prod. staff (%)
-0.002** -0.002*
High school staff (%) -0.005*** -0.005***
Exports exp. (ln) 0.206*** 0.206***
0.106* 0.135** 0.07 0.071
Age (ln) 0.185*** 0.184*** -0.106*** -0.111*** -0.054 -0.072**
Market share (%)
-0.005* -0.005*
0.003* 0.003*
Shareholder (%)
-0.003*** -0.003*** -0.002*** -0.002** 0.002** 0.002**
Employment
0.120*** 0.122***
-0.03 -0.03
Sales (y) (ln) 0.635*** 0.635***
Real wage p.worker -0.224*** -0.225***
R-sqr 0.815 0.815 0.362 0.359 0.303 0.223 0.222 0.222
N 224 224 224 224 224 224 222 222
Results from equations (4), (5), (6) and (7). Significance is given by robust standard errors corrected by clusters, *p<.1, **p<.05, *** p<.01.
Source: author’s calculations with BEEPs data.

106
Table A3-8. Decomposition of Aggregate Productivity into Components
ALB BLR GRG RUS SRB MLD ARM Shipm. lss. exp. (%) 0 -0.05 0 0 -0.37 0 0
Generator (d) 0 0 0 -0.54 0 0 0
Customs exp. (ln) 0 -3.07 0 -0.53 0 0 0
Customs imp. (ln) 0 -1.93 0 0 0 0 -7.57
Manager's time (%) 2.96 2.89 0 0 0 0 6.19
Inf. payms. taxes (d) 0 0 -0.31 0 0 -1.71 0 Security (d) 6.19 0 0 -0.03 0 0 0
Courts (d) 0 0 0 0.92 0 0 4.28
Loan (d) 0 0.66 0 0.69 6.1 0 0
Fix. assets internal (%) 4.37 0 3.01 0 0 0 0
Fix. assets banks (%) 0 0 0 0 1.74 0 0
Fix. assets equity (%) 0 0 0 0 0 -0.43 0
Overdraft (d) 0 0 0 0.86 0 0 5.08
Subsidy (d) 0 -2.35 -1.85 -0.49 -0.28 0 -1.24 Sales aft. delivery (%) 0 -7.42 0 0 0 -5.22 0
Purchs. aft. delivery (%) 0 0 0 0 -3.89 0 0
ISO (d) 0 0 0 1.35 0 7.72 0 Forgn. tech. (d) 0 0 0 0 0 3.5 1.64
Sales new prd. (%) 0 0 0 0 0 0 2.09
R&D sub. 0 3.26 9.1 0 0 0 0 Web page (d) 0 0 0 1.61 5.04 0 0
Staff compts. (%) 0 0 0 1.63 5.64 3.22 0
Prod. staff (%) 0 0 0 2.6 0 0 0
High school staff (%) 1.73 0 0 0 0 0 0 Training (%) 5.04 0 0 0 0 0 0
Skilled staff (%) 0 7.05 0 0 0 0 9.24
Manager exp. (%) 0 0 0 3 0 0 0
Imports (d) 6.56 4.13 0 1.75 0 0 3.61
FDI (d) 0 0 6.2 0 0 0 1.85
Exports (d) 0 0 6.43 -0.09 0 0 0
Age (ln) 0 -15.41 -12.76 0 -5.63 -13.73 0
Local (d) 0 0 -9.86 -2.09 0 0 0
Shareholder (%) -0.67 -0.87 -1.74 -0.07 0 -1.31 0
Undiversified (%) -12.95 0 -34.74 0 0 0 -3.44
Ind/reg/time dummies 8.46 6.34 7.79 2.12 -4.62 1.36 -3.23
Constant technical efficiency 49.68 102.96 103.77 55.86 85.02 86.4 66.66
Results from equation (10). Source: author’s calculations with BEEPs data.

107
Table A3-9. Probability of Exporting, Decomposition into Components
ALB BLR GRG RUS SRB MLD ARM
Demeaned Prod. (ln) 0 0 27.6 254.54 20.44 1.23 19.09
Undem. Prod. (ln) 0 0 0 0 0 0 0
Power outages (ln) 0 0 -10.51 -4.2 0 0 -14.12
Generator (d) -33.12 0 0 0 0 0 -7.86
Customs imp. (ln) 0 0 0 -19.68 0 0 0
Manager's time (%) 0 0 18.88 0 12.41 17.03 0
Inf. payms. taxes (d) 0 -1.07 -1.24 3.25 0 0 0
Security (d) 0 0 0 0 -9.93 0 0
Courts (d) 0 6.84 0 0 0 0 17.69
Loan (d) 0 0 0 0 0 16.3 22.08
Fix. assets internal (%) 0 1.09 0 0 0 0 0
Fix. assets banks (%) -4.67 0 0 0 0 -12.14 -16.4
Fix. assets equity (%) 0 -0.3 0 0 0 0 0
Sales aft. delivery (%) 44.94 -20.35 0 0 0 17.24 -22.38
Purchs. aft. delivery (%) 0 0 0 -18.55 -9.14 0 0
Subsidy (d) 0 0 0 0 0 0 0
ISO (d) 0 0 0 0 0 14.31 0
Web page (d) 0 0 19.34 0 0 15.75 32.29
Staff compts. (%) 0 0 0 -27.16 0 0 0
R&D subc. (d) 0 0 0 9.21 0 0 0
Prod. staff (%) 110.19 -66.56 -112.01 0 0 0 0
FDI (d) 0 0 0 0 0 13.18 0
Imports (d) 28.45 0 0 14.26 31.55 0 22.47
Age (ln) 0 0 0 -69.07 0 0 -136.96
Local (d) 0 0 -39.14 -47.47 -7.99 0 0
Inc. (d) 52.74 13.75 0 0 0 0 0
Shareholder (%) 124.9 0 0 0 0 0 -130.23
Market share (%) 0 -11.33 14.97 9.15 0 0 -16.25
Employment (ln) 97.99 211.08 81.16 35.92 30.52 117.82 211.41
Ind/reg/time dummies 27.19 47.3 -22.33 37.37 38.1 -2.98 -67.77
Constant -348.61 -80.45 123.19 -77.57 -5.96 -97.75 186.95
Results from equation (14). Source: author’s calculations with BEEPs data.

108
Table A3-10. Probability of Receiving FDI Decomposition into Components
ALB BLR GRG RUS SRB MLD ARM
Demeaned Prod. (ln) 0 0 94.2 151.52 0 0 150.27
Undem. Prod. 0 0 0 0 0 0 0
Shipm. lss. exp. (%) 0 0 0 -1.71 0 0 0
Power outages (ln) 0 0 0 0 0 -16.77 0
Customs exp. (ln) 0 0 0 0 0 0 -26.58
Customs imp. (ln) 0 0 0 0 0 -22.72 0
Manager's time (%) 0 0 -7.83 0 -23.23 0 -42.92
Inf. payms. taxes (d) 0 0 0 0 0 0 0
Auditory (d) 0 29.29 0 30.66 46.51 0 0
Inf. comp. (d) 0 0 0 -13.18 0 0 0
Courts (d) 0 0 0 0 0 0 0
Security (d) 0 30.34 0 0 0 0 0
Loan (d) 0 0 20.45 0 0 0 0
Fix. assets int. (%) 0 0 -30.53 0 0 0 0
Fix. assets banks (%) 0 7.66 -4.92 0 0 0 0
Purchs. aft. delivery (%) 29.83 0 0 29.02 62.8 0 0
Sales aft. delivery (%) 38.57 0 0 0 0 0 -20.76
Subsidy (d) -3.68 -4.53 0 0 0 0 0
ISO (d) 0 0 0 0 0 0 27.38
Web page (d) 0 0 0 0 0 0 0
Forgn. tech. (d) 0 17.64 0 17.02 0 0 0
Prod. staff (%) 103.84 -230.19 0 -105.81 0 -224.88 -167.1
High school staff (%) 0 0 61.21 0 0 0 0
Manager exp. (%) 0 0 0 -116.05 0 168.71 0
Training (%) 0 0 0 18.71 0 0 0
Exports exp. (ln) 0 0 0 0 0 0 43.59
Imports (d) 0 43.49 0 0 26.96 27.6 0
Age (ln) 0 -211.74 0 -131.2 0 -322.41 -143.42
Inc. (d) -87.87 0 0 0 0 71.86 0
Undiversified (%) 0 0 0 0 0 0 0
Shareholder (%) 0 0 0 0 0 0 -194.47
Market share (%) 0 0 -11.86 9.2 27.87 0 0
Employment (ln) 196.24 131.04 0 0 79.91 252.46 0
D 21.74 2.72 10.38 -5.19 -1.26 53.65 -28.58
Constant -198.68 284.29 -27.92 216.99 -119.57 112.5 502.6
Results from equation (15). Source: author’s calculations with BEEPs data.

109
Table A3-11. Probability of investing in R&D, decomposition into components
ALB BLR GRG RUS SRB MLD ARM
Demeaned Prod. (ln) 0 67.71 52.89 16.95 24.8 0.9 0
Undem. Prod. 0 0 0 0 0 0 0
Power outages (ln) -113.9 0 0 0 0 0 -8.34
Customs exp. (ln) -14.41 13.07 0 0 -13.69 0 -25.19
Auditory (d) 35.3 0 0 0 0 0 0
Inf. comp. (d) 0 -11.71 0 -2.98 0 0 0
Security (d) 0 32.5 0 0 0 0 0
Courts (d) 0 0 0 10.29 18.03 0 0
Overdraft (d) 0 8.48 0 0 0 15.8 0
Loan (d) 0 0 21.37 0 0 0 0
Fix. assets internal (%) 0 21.04 0 8.11 9.55 24.18 0
Fix. assets equity (%) 8.78 0 0 2.19 0 6.46 0
Fix. assets banks (%) 0 0 0 1.67 0 0 0
Purchs. aft. delivery (%) 0 0 0 0 0 0 33.84
Sales aft. delivery (%) 0 0 0 12.18 0 0 0
Subsidy (d) 0 11.4 0 0 0 0 0
ISO (d) 0 7.26 0 0 0 0 0
Web page (d) 0 0 0 12.03 0 0 0
Staff compts. (%) 0 13.56 25.32 16.28 0 25.01 0
Forgn. tech. (d) 0 0 12.07 0 0 0 0
Prod. staff (%) -151.59 -272.18 0 0 60.5 0 0
High school staff (%) 59.42 0 0 17.36 0 0 0
Skilled staff (%) 99.87 0 0 0 0 0 0
Training (%) 0 0 30.54 21.1 22.7 0 23.21
Manager exp. (%) 0 49.25 0 19.66 0 0 147.95
Exports (d) 0 18.17 0 3.05 0 13.25 0
Exports exp. (ln) 19.96 0 0 0 18.92 0 26.37
Imports (d) 0 0 36.27 0 21.58 0 0
Age (ln) 139.79 86.56 0 0 0 0 0
Local (d) -22.43 0 0 -23.86 0 0 0
Inc. (d) 0 0 0 0 -48.98 0 0
Shareholder (%) 0 0 0 0 0 0 123.24
Undiversified (%) 0 0 134.26 0 -54.48 0 0
Market share (%) 0 0 -12.82 0 7.43 0 22.3
Employment (ln) 0 0 0 0 41.28 0 -94.25
D -237.19 -50.33 -0.99 -33.5 -72.75 -66.9 -104.15
Constant 276.4 105.21 -201.05 19.48 65.09 81.28 -45.1
Results from equation (16). Source: author’s calculations with BEEPs data.

110
References
Acemoglu, D., P. Aghion and F. Zilibotti. 2006. “Distance to Frontier, Selection, and Economic
Growth, Journal of the European Economic Association, Volume 4, Issue 1, pages 37–74,
March.
Aghion, P. and R. Griffith (2005) Competition and Growth. Reconciling Theory and Evidence. The
MIT Press, Cambridge MA.
Araujo, Jorge de Thompson; Brueckner, Markus; Clavijo, Mateo; Vostroknutova, Ekaterina; Wacker,
Konstantin M. 2014. Beyond Commodities: the Growth Challenge of Latin America and the
Caribbean. Washington, DC: World Bank Group.
Arezki, Rabah and Markus Brueckner. 2012. “Commodity Windfalls, Democracy, and External Debt.”
Economic Journal 122: 848-866.
Bloom, Nicholas, Raffaella Sadun, and John Van Reenen. 2012. “Americans Do IT Better: US
Multinationals and the Productivity Miracle.” American Economic Review 102 (1): 167–201.
Bresnahan, T. F., E. Brynjolfsson, and L. M. Hitt. 2002. “Information technology, workplace
organization, and the demand for skilled labour: firm-level evidence.” The Quarterly Journal
of Economics 117 (1): 339–76.
Brynjolfsson, E., and L. M. Hitt. 2003. “Computing productivity: Firm-level evidence.” The Review of
Economics and Statistics 85 (4): 793–808.
Conway Paul, Donato De Rosa, Giuseppe Nicoletti and Faye Steiner. 2006. “Product Market
Regulation and Productivity Convergence.” OECD Economic Studies 43: 39-76.
Correa, Paulo and Pluvia Zuniga 2013. “Public Policies to foster Knowledge Transfer from Public
Research.” Policy Brief, Report number 90534, vol. (1) and Innovation Policy Platform,
World Bank.
Crépon, B., E. Duguet and J. Mairesse. 1998. “Research, innovation and productivity: An econometric
analysis at the firm level.” Economics of Innovation and New Technology, Vol. 7(2), pp. 115-
158.
Crespi, G. and P. Zuniga. 2012. “Innovation and productivity: Evidence from six Latin American
countries”, World Development, vol. 40, No. 2, pp. 273-290.
De Rosa, Donato, Sanja Madzarevic-Sujster, Ana-Maria Boromisa and Velimir Sonje. 2009. “Barriers
to Competition in Croatia: The Role of Government Regulation”. Policy Research Working
Paper, No. WPS 5100. The World Bank.

111
Docquier, Frédéric, Elisabetta Lodigiani, Hillel Rapoport and Maurice Schiff. 2010. “Emigration and
the quality of home country institutions”. Discussion Paper 2010-35, Université Catholique de
Louvain, Institut de Recherches Economiques et Sociales (IRES).
Duernecker, Georg, Moritz Meyer and Fernando Vega-Redondo. 2014. “The Network Origins of
Economic Growth.” University of Mannheim, Department of Economics, Working Paper 14-
06
European Bank for Reconstruction and Development. 2014. Transition Report 2014: Innovation in
Transition. EBRD, London.
European Commission. 2014a. “Armenia Country Report on Energy” prepared by NAS and European
Commission.
European Commission. 2014b. Participation of Eastern Partnership Countries in FP 7: Lessons Learned.
EV Consulting Research Center. 2014. National Competitiveness Report of Armenia.
Frankel, J.A. and D. Romer. 1999. “Does Trade Cause Growth?” American Economic Review 89:379-
399.
Ghatak, Subrata, Monica Ioana Pop Silaghi, and Vince Daly. 2009. “Trade and migration flows
between some CEE countries and the UK.” The Journal of International Trade & Economic
Development 18.1: 61-78.
Gill, Indermit S., Ivailo Izvorski, Willem van Eeghen, and Donato De Rosa. 2014. Diversified
Development: Making the Most of Natural Resources in Eurasia. ECA Regional Flagship
Report Washington, DC: World Bank.
Goldberg, Itzhak, John Gabriel Goddard, Smita Kuriakose, and Jean-Louis Racine. 2011. Igniting
Innovation: Rethinking the Role of Government in Emerging Europe and Central Asia.
Washington, DC: World Bank.
Gould, David M. 1994. “Immigrant links to the home country: empirical implications for US bilateral
trade flows.” The Review of Economics and Statistics 76.2: 302-316.
Heckman, James J., Lance Lochner, and Christopher Taber. 1998. “Explaining Rising Wage Inequality:
Explorations with a Dynamic General Equilibrium Model of Earnings with Heterogenous
Agents.” Review of Economic Dynamics 1 (1): 1–58.
IncoNet .2014. Armenia Country Report
Kali, R. and J. Reyes. 2007. “The Architecture of Globalization: A Network Approach to International
Economic Integration.” Journal of International Business Studies 38.4: 595-620.

112
Kali, R., F. Mendez, and J. Reyes. 2007. “Trade structure and economic growth.” Journal of
International Trade and Economic Development 16, 245-269.
Keller, W. 2004. “International Technology Diffusion.” Journal of Economic Literature, Volume XLII
(September 2004), pp.752 – 782.
Keller, W. and S. Yeaple. 2003. “Multinational Enterprises, International Trade, and Productivity
Growth: Firm Level Evidence from the United States”, IMF Working Papers 248.
Li, Xiaoyang, McHale, John and Xuan, Zhou (November 5, 2013). Does Brain Drain Lead to
Institutional Gain?
Loayza, Norman, Pablo Fajnzylber, and César Calderón. 2005. Economic Growth in Latin America and
the Caribbean: Stylized Facts, Explanations, and Forecasts. Washington, DC: The World
Bank Group
Mitra, S. et al. 2007. The Caucasian Tiger: Sustaining Economic Growth in Armenia. Washington DC:
The World Bank.
OECD. 1997. National Innovation Systems. OECD, Paris.
OECD. 2004. “Improving Skills for More and Better Jobs: Does Training Make a Difference?” In
OECD Employment Outlook 2004, 183–224. OECD, Paris.
OECD. 2005. “The Measurement of Scientific and Technological Activities: Guidelines for Collecting
and Interpreting Innovation Data: Oslo Manual, Third Edition” prepared by the Working Party
of National Experts on Scientific and Technology Indicators. OECD, Paris.
OECD. 2008. Education at a Glance. OECD, Paris.
Olley, G. S. and A. Pakes. 1996. “The Dynamics of Productivity in the Telecommunications Equipment
Industry”. Econometrica, Vol. 64, 6, 1263-1297.
Parente, Stephen L., and Edward C. Prescott, ‘‘Monopoly Rights: A Barrier to Riches,’’ American
Economic Review 89 (5): 1216-1233
Pena, Jorge. 2015. Econometric methods used to assess business environment and other firm level
variables on firm performance in Armenia and Comparators.
Powell, Walter W. and Kaisa Snellman. 2004. “The Knowledge Economy.” Annual Review of
Sociology 30: 199-220.
Sondergaard, Lars; Murthi, Mamta; Abu-Ghaida, Dina; Bodewig, Christian; Rutkowski. 2012. Skills,
Not Just Diplomas: Managing Education for Results in Eastern Europe and Central Asia.
World Bank.

113
UNECE. 2014. “Innovation Performance Review of Armenia.” UNECE, Geneva.
USAID. 2013. ICT Country Profile, Armenia
Wagner, Joachim. 2007. “Exports and Productivity: A Survey of the Evidence from Firm Level Data.”
The World Economy, 30(1), pp. 60-82.
World Bank. 2013. “Republic of Armenia: Accumulation, Competition, and Connectivity.” The World
Bank, Washington DC.
World Bank. 2015. “World Development Report 2016.” The World Bank, Washington DC.
Zuniga, Pluvia 2011. “The State of Patenting at Research Institutions in Developing Countries: Policy
Approaches and Practices.” WIPO Economic Research Working Papers 04, World Intellectual
Property Organization - Economics and Statistics Division, revised Dec 2011.
Copyright © 2022 FDOKUMEN