Republic of Indonesia
182
Table of Contents Filed Pursuant to Rule 424(b)(1) Registration No. 333-221871 PROSPECTUS Republic of Indonesia U.S.$1,000,000,000 2.95% Bonds Due 2023 U.S.$1,250,000,000 3.50% Bonds Due 2028 U.S.$1,750,000,000 4.35% Bonds Due 2048 The Republic of Indonesia (the “Republic” or “Indonesia”) is offering U.S.$1,000,000,000 in aggregate principal amount of its 2.95% bonds due 2023 (the “2023 Bonds”), U.S.$1,250,000,000 in aggregate principal amount of its 3.50% bonds due 2028 (the “2028 Bonds”) and U.S.$1,750,000,000 in aggregate principal amount of its 4.35% bonds due 2048 (the “2048 Bonds”, together with the “2023 Bonds” and the “2028 Bonds” the “Bonds”). Interest on each series of the Bonds will accrue from December 11, 2017 and be payable semi-annually in arrears on January 11 and July 11 of each year, beginning on July 11, 2018 until maturity. The Republic may not redeem the Bonds prior to maturity. The Bonds contain “collective action clauses.” Under these provisions, which differ from the terms of the Republic’s public external indebtedness issued prior to January 8, 2015, modifications affecting the reserve matters listed in the indenture, including modifications to payment and other important terms, may be made to a single series of debt securities issued under the indenture (including the Bonds) with the consent of the holders of 75% of the aggregate principal amount outstanding of that series, and to two or more series of debt securities issued under the indenture either (x) with the consent of holders of 75% of the aggregate principal amount of the outstanding debt securities of all the series affected by the proposed modification (taken in aggregate) if the modification is uniformly applicable; or (y) with the consent of the holders of 66 2 /3% of the aggregate principal amount outstanding of all series of debt securities that would be affected and 50% in aggregate principal amount outstanding of each affected series of debt securities. Application has been made for the listing of the Bonds on the Singapore Exchange Securities Trading Limited (“SGX-ST”). The SGX-ST assumes no responsibility for the correctness of any of the statements made or opinions or reports contained in this prospectus. Admission of the Bonds to the official list of the SGX-ST is not to be taken as an indication of the merits of the Republic or the Bonds. You should read this prospectus carefully. You should not assume that the information in this prospectus is accurate as of any date other than the date on the front of these documents. The Republic expects to deliver the Bonds to investors in registered book-entry form only through the facilities of The Depository Trust Company (“DTC”), Clearstream Banking S.A. (“Clearstream”), and Euroclear Bank SA/NV (“Euroclear”), on or about December 11, 2017. For the 2023 Bonds Per Bond Total For the 2028 Bonds Per Bond Total For the 2048 Bonds Per Bond Total Price to investors 99.764% U.S.$997,640,000 Price to investors 99.576% U.S.$1,244,700,000 Price to investors 99.166% U.S.$1,735,405,000 Underwriting discounts and commissions 0.04% U.S.$399,056 Underwriting discounts and commissions 0.04% U.S.$497,880 Underwriting discounts and commissions 0.04% U.S.$694,162 Proceeds, before expenses, to the Republic 99.724% U.S.$997,240,944 Proceeds, before expenses, to the Republic 99.536% U.S.$1,244,202,120 Proceeds, before expenses, to the Republic 99.126% U.S.$1,734,710,838 Neither the Securities and Exchange Commission nor any other regulatory body has approved or disapproved these securities or determined if this prospectus is truthful or complete. Any representation to the contrary is a criminal offense. Joint Lead Managers and Joint Bookrunners ANZ Citigroup Deutsche Bank Goldman Sachs Mandiri Securities Co-Managers PT Danareksa Sekuritas PT Trimegah Sekuritas Indonesia Tbk PT Bahana Securities The date of this prospectus is December 4, 2017.
-
Upload
khangminh22 -
Category
Documents
-
view
2 -
download
0
Transcript of Republic of Indonesia

Table of Contents
Filed Pursuant to Rule 424(b)(1) Registration No. 333-221871
PROSPECTUS
Republic of Indonesia U.S.$1,000,000,000 2.95% Bonds Due 2023 U.S.$1,250,000,000 3.50% Bonds Due 2028 U.S.$1,750,000,000 4.35% Bonds Due 2048
The Republic of Indonesia (the “Republic” or “Indonesia”) is offering U.S.$1,000,000,000 in aggregate principal amount of its 2.95% bonds due 2023 (the “2023 Bonds”), U.S.$1,250,000,000 in aggregate principal amount of its 3.50% bonds due 2028 (the “2028 Bonds”) and U.S.$1,750,000,000 in aggregate principal amount of its 4.35% bonds due 2048 (the “2048 Bonds”, together with the “2023 Bonds” and the “2028 Bonds” the “Bonds”). Interest on each series of the Bonds will accrue from December 11, 2017 and be payable semi-annually in arrears on January 11 and July 11 of each year, beginning on July 11, 2018 until maturity. The Republic may not redeem the Bonds prior to maturity.
The Bonds contain “collective action clauses.” Under these provisions, which differ from the terms of the Republic’s public external indebtedness issued prior to January 8, 2015, modifications affecting the reserve matters listed in the indenture, including modifications to payment and other important terms, may be made to a single series of debt securities issued under the indenture (including the Bonds) with the consent of the holders of 75% of the aggregate principal amount outstanding of that series, and to two or more series of debt securities issued under the indenture either (x) with the consent of holders of 75% of the aggregate principal amount of the outstanding debt securities of all the series affected by the proposed modification (taken in aggregate) if the modification is uniformly applicable; or (y) with the consent of the holders of 662/3% of the aggregate principal amount outstanding of all series of debt securities that would be affected and 50% in aggregate principal amount outstanding of each affected series of debt securities.
Application has been made for the listing of the Bonds on the Singapore Exchange Securities Trading Limited (“SGX-ST”). The SGX-ST assumes no responsibility for the correctness of any of the statements made or opinions or reports contained in this prospectus. Admission of the Bonds to the official list of the SGX-ST is not to be taken as an indication of the merits of the Republic or the Bonds.
You should read this prospectus carefully. You should not assume that the information in this prospectus is accurate as of any date other than the date on the front of these documents.
The Republic expects to deliver the Bonds to investors in registered book-entry form only through the facilities of The Depository Trust Company (“DTC”), Clearstream Banking S.A. (“Clearstream”), and Euroclear Bank SA/NV (“Euroclear”), on or about December 11, 2017. For the 2023 Bonds Per Bond Total For the 2028 Bonds Per Bond Total For the 2048 Bonds Per Bond TotalPrice to investors 99.764% U.S.$997,640,000 Price to investors 99.576% U.S.$1,244,700,000 Price to investors 99.166% U.S.$1,735,405,000Underwriting discounts and
commissions 0.04% U.S.$399,056Underwriting discounts and
commissions 0.04% U.S.$497,880Underwriting discounts and
commissions 0.04% U.S.$694,162Proceeds, before expenses, to the
Republic 99.724% U.S.$997,240,944Proceeds, before expenses, to the
Republic 99.536% U.S.$1,244,202,120Proceeds, before expenses, to
the Republic 99.126% U.S.$1,734,710,838
Neither the Securities and Exchange Commission nor any other regulatory body has approved or disapproved these securities or determined if this prospectus is truthful or complete. Any representation to the contrary is a criminal offense.
Joint Lead Managers and Joint Bookrunners
ANZ Citigroup Deutsche Bank Goldman Sachs Mandiri SecuritiesCo-Managers
PT DanareksaSekuritas
PT Trimegah Sekuritas IndonesiaTbk
PT BahanaSecurities
The date of this prospectus is December 4, 2017.

Table of Contents
Republic of Indonesia

Table of Contents
TABLE OF CONTENTS
Page
CERTAIN DEFINED TERMS AND CONVENTIONS ii
ENFORCEMENT iii
PRESENTATION OF INFORMATION iv
FORWARD-LOOKING STATEMENTS v
DATA DISSEMINATION vi
USE OF PROCEEDS vi
SUMMARY 1
SUMMARY OF THE OFFERING 2
REPUBLIC OF INDONESIA 6
Overview 6
Land and People 7
Government and Political Developments 8
Foreign Relations and International and Regional Organizations 20
Economy and Gross Domestic Product 23
Privatization of State-Owned-Enterprises 39
Labor and Employment 41
Infrastructure Development 44
Foreign Investment 47
Foreign Trade and Balance of Payments 56
Financial System 68
Monetary Policy 77
Government Budget 80
Public Debt 97
Foreign Exchange and Reserves 104
Debt-to-GDP Ratios 107
DESCRIPTION OF THE BONDS 108
TAXATION 123
UNDERWRITING 127
OFFICIAL STATEMENTS 133
VALIDITY OF THE BONDS 133
AUTHORIZED REPRESENTATIVE 133
GENERAL INFORMATION 133
FURTHER INFORMATION 134
DEBT TABLES OF THE REPUBLIC OF INDONESIA T-1
-i-

Table of Contents
CERTAIN DEFINED TERMS AND CONVENTIONS
Unless otherwise indicated, all references in this prospectus to “Rupiah” or “Rp” are to the currency of Indonesia, those to “dollars”, “U.S. dollars” or “U.S.$” are to the currency of the United States of America, those to “Euro” or “€ ” are to the currency of the European Union, those to “SDR” are to Special Drawing Rights of the International Monetary Fund (“IMF”) and those to “ID” are to Islamic Dinars of the Islamic Development Bank. References in this prospectus to “Indonesia” or the “Republic” are to the Republic of Indonesia and references to the “Government” are to the Government of Indonesia.
In addition, unless otherwise indicated, all references in this prospectus to (i) “tons” are to metric tons, each of which is equal to 1,000 kilograms or approximately 2,204.6 pounds, (ii) “barrels” are to U.S. barrels, each of which is equal to 159.0 liters, (iii) “LNG” are to liquefied natural gas and (iv) “LPG” are to liquefied petroleum gas. Measures of distance referred to herein are stated in kilometers or “km” each of which is equal to 1,000 meters or approximately 0.62 miles. Measures of area referred to herein are stated in square kilometers, each of which is equal to approximately 0.39 square miles, or in hectares, each of which is equal to approximately 2.47 acres.
The Ministry of Energy and Mineral Resources publishes an average monthly and annual price for Indonesian crude oil which is commonly referred to as the Indonesian Crude Price (the “ICP”). ICP is calculated as the sum of (i) 50.0% of the average price for Indonesian crude oil published by Platts, a division of The McGraw-Hill Companies, and (ii) 50.0% of a crude oil price for Indonesian crude oil published by RIM Intelligence Co. of Japan for the relevant period. The Government evaluates the methodology of the calculation of the ICP from time to time and, if appropriate, adjusts the formula to ensure that the ICP closely tracks world market prices for Indonesian crude oil. The Government uses the ICP for various accounting and other purposes. For instance, the Ministry of Finance uses the ICP as an assumption underlying the preparation of the Government budget. See “Republic of Indonesia — Government Budget.”
Statistical information included in this prospectus is the latest official data publicly available at the date of this prospectus. Financial data provided in this prospectus may be subsequently revised in accordance with Indonesia’s ongoing maintenance of its economic data. The Republic has no obligation to distribute such revised data to any holder of Bonds.
In August 2014, the Republic revised its methodology in compiling balance of payments data, using the sixth edition of Balance of Payments and International Investment Position Manual (“BPM6”). This revised methodology was implemented to comply with international best practices. BPM6 will be implemented gradually in Indonesia’s balance of payments (BOP) statistics. The first phase of implementation, which began in the second quarter of 2014, involves reclassifying existing data components and improving the methodology in accordance with BPM6, using sources of data currently available.
The shift to the new methodology impacts the following data:
• In the goods account, the changes include: (a) reclassifying “goods for processing” as “manufacturing services on physical inputs owned by others” and “repairs on goods” as “maintenance and repair services” in the services account; and (b) incorporating only “goods procured in ports by carriers” and “general merchandise on a balance of payments basis.”
• In the services account, the changes include: (a) combining “information and computer services” and “communication services (excluding postal and couriers)” into “telecommunication, computer and information services”; (b) reclassifying “postal and couriers services” to “transportation services”; and (c) incorporating the “financial intermediation services” section into “indirectly measured estimates” (“FISIM”).
• The income account and current transfers account are renamed the primary income account and secondary income account, respectively, to comply with the terms used in the System of National Accounts 2008 and adjustments were made to the accounts after the implementation of FISIM.
-ii-

Table of Contents
• In the financial account, the changes include: (a) the presentation format of direct investment data, which was previously based on the directional principle of investment (direct investments abroad and foreign direct investments in Indonesia) that was based on the principle of assets-liabilities (“direct investments — asset” and “direct investments — liability”). Notwithstanding the change, the net value of direct investments according to BPM6 is the same as that in the fifth edition of Balance of Payments and International Investment Program Manual, or BPM5; and (b) including financial derivative data as an independent component, which is consistent with the information displayed by Indonesia’s International Investment Position Statistics.
• In the current account, the changes include: (a) the calculation of several indicators associated with the account; (b) reclassifying “goods for processing” from goods to services; and (c) recording net values instead of gross values. While the changes resulted in smaller values of imports of goods and services and current account receipts, and larger values of indicators for reserve adequacy and the debt service ratio, the level of the current account remains unchanged from the previous methodology.
The shift to the new methodology does not affect the “net errors and omissions,” “total balance,” and “reserves and related items” values in the current and financial accounts.
In this prospectus, gross domestic product, or GDP, is shown in both current and constant market prices. GDP at current market prices value a country’s output using the actual prices for each year, while GDP at constant market prices (also referred to as “real” GDP) value output using the prices from a base year, thereby eliminating the distorting effects of inflation and deflation. In 2015, Statistics Indonesia (Badan Pusat Statistik or BPS) adopted the calendar year 2010 as the base year (the Base Year) for the calculation of Indonesia’s GDP in constant market prices. Unless stated otherwise, all GDP growth rates in this prospectus (in aggregate or by sector) are period-on-period comparisons based on constant market prices using the Base Year. Percentage shares of Indonesia’s GDP represented by various sectors (unless otherwise noted) use current market prices.
ENFORCEMENT
The Republic is a sovereign nation. Consequently, it may be difficult for holders of Bonds to obtain or enforce judgments against the Republic. The Republic has irrevocably waived, to the fullest extent permitted by law, any immunity, including foreign sovereign immunity, from jurisdictions in which it might otherwise be entitled, in any action arising out of or in relation to the Bonds, which may be instituted by the Trustee (as defined herein) or a holder of any Bonds in any New York state or federal court sitting in the Borough of Manhattan, the City of New York.
The Republic’s waiver of immunity is a limited and specific waiver for the purposes of the Bonds and the Indenture (as defined herein) and under no circumstances should it be interpreted as a general waiver by the Republic or a waiver with respect to proceedings unrelated to the Bonds or the Indenture. Furthermore, the Republic specifically does not waive any immunity in respect of:
• actions brought against the Republic arising out of or based upon U.S. federal or state securities laws;
• attachment under Indonesian law;
• present or future premises of the mission as defined in the Vienna Convention on Diplomatic Relations signed in 1961;
• consular premises as defined in the Vienna Convention on Consular Relations signed in 1963;
• any other property or assets used solely or mainly for governmental or public purposes in the Republic or elsewhere; and
• military property or military assets or property or assets of the Republic related thereto.
-iii-

Table of Contents
Because the Republic has not submitted to jurisdiction or waived its sovereign immunity in connection with any action arising out of or based on United States federal or state securities laws, it will not be possible to obtain a judgment in the United States against the Republic based on such laws unless a court were to determine that the Republic is not entitled to sovereign immunity under the U.S. Foreign Sovereign Immunities Act of 1976 (the Immunities Act) with respect to such actions. The Republic may assert immunity to such actions or with respect to the property or assets described above. Investors may have difficulty making any claims based upon such securities laws or enforcing judgments against the property or assets described above.
The Republic has appointed the Chief Representative of Bank Indonesia New York as its authorized agent upon whom process may be served in any action arising out of or based on the Bonds. Such appointment is irrevocable until all amounts in respect of the principal and interest, due or to become due on or in respect of the Bonds, have been paid by the Republic to the Trustee or the Paying Agent or unless and until a successor has been appointed as the Republic’s authorized agent. The Republic has agreed that it will at all times maintain an authorized agent to receive such service, as provided above. The Chief Representative of Bank Indonesia is not the agent for receipt of service of process for actions under the United States federal or state securities laws.
The Republic is subject to suit in competent courts in Indonesia. However, the Law on State Treasury (Law No. 1 of 2004, dated January 14, 2004) prohibits the seizure or attachment of property or assets owned by the Republic. Furthermore, a judgment of a non-Indonesian court will not be enforceable by the courts of Indonesia, although such a judgment may be admissible as evidence in a proceeding on the underlying claim in an Indonesian court. Re-examination of the underlying claim de novowould be required before the Indonesian court.
PRESENTATION OF INFORMATION
For ease of presentation, certain financial information relating to the Republic included herein is presented as translated into U.S. dollars. Unless otherwise specified herein, all translations of Rupiah into U.S. dollars or from U.S. dollars into Rupiah were made at the middle exchange rate, the mid-point between the buy and sell rate (the BI middle exchange rate), between the Rupiah and the U.S. dollar, as announced by Bank Indonesia, as of the respective dates to which such information relates. These translations should not be construed as a representation that the Rupiah amount actually represents such U.S. dollar amount or could be converted into U.S. dollars at the rate indicated or any other rate. The BI Transaction Exchange Rate — Mid-Rate was Rp13,514 = U.S.$1 on November 30, 2017. In addition, unless otherwise specified herein, all translations of Rupiah into currencies other than U.S. dollars, or from such other currencies into Rupiah, were made at the BI middle exchange rate between the Rupiah and such other currencies as announced by Bank Indonesia as of the respective dates to which such information relates.
-iv-
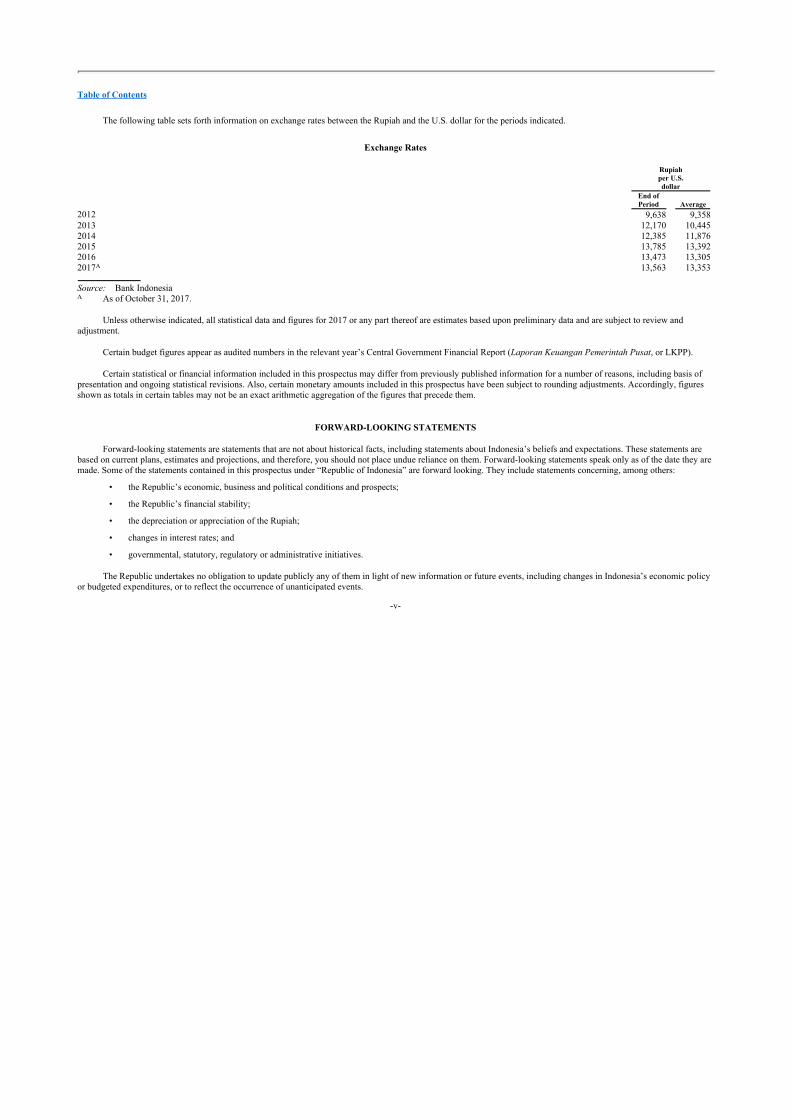
Table of Contents
The following table sets forth information on exchange rates between the Rupiah and the U.S. dollar for the periods indicated.
Exchange Rates
Rupiahper U.S.dollar
End ofPeriod Average
2012 9,638 9,3582013 12,170 10,4452014 12,385 11,8762015 13,785 13,3922016 13,473 13,3052017A 13,563 13,353
Source: Bank Indonesia A As of October 31, 2017.
Unless otherwise indicated, all statistical data and figures for 2017 or any part thereof are estimates based upon preliminary data and are subject to review and adjustment.
Certain budget figures appear as audited numbers in the relevant year’s Central Government Financial Report (Laporan Keuangan Pemerintah Pusat, or LKPP).
Certain statistical or financial information included in this prospectus may differ from previously published information for a number of reasons, including basis of presentation and ongoing statistical revisions. Also, certain monetary amounts included in this prospectus have been subject to rounding adjustments. Accordingly, figures shown as totals in certain tables may not be an exact arithmetic aggregation of the figures that precede them.
FORWARD-LOOKING STATEMENTS
Forward-looking statements are statements that are not about historical facts, including statements about Indonesia’s beliefs and expectations. These statements are based on current plans, estimates and projections, and therefore, you should not place undue reliance on them. Forward-looking statements speak only as of the date they are made. Some of the statements contained in this prospectus under “Republic of Indonesia” are forward looking. They include statements concerning, among others:
• the Republic’s economic, business and political conditions and prospects;
• the Republic’s financial stability;
• the depreciation or appreciation of the Rupiah;
• changes in interest rates; and
• governmental, statutory, regulatory or administrative initiatives.
The Republic undertakes no obligation to update publicly any of them in light of new information or future events, including changes in Indonesia’s economic policy or budgeted expenditures, or to reflect the occurrence of unanticipated events.
-v-

Table of Contents
Forward-looking statements involve inherent risks and uncertainties. The Republic cautions you that a number of important factors could cause actual results to differ materially from those expressed in any forward-looking statement. These factors include, but are not limited to:
• adverse external factors, such as high international interest rates and recession or low growth in the Republic’s trading partners. High international interest rates could increase the Republic’s current account deficit and budgetary expenditures. Recession or low growth in the Republic’s trading partners could lead to fewer exports from the Republic and, indirectly, lower growth in the Republic;
• instability or volatility in the international financial markets. This could lead to domestic volatility, making it more difficult for the Government to achieve its macroeconomic goals. This could also lead to declines in foreign direct and portfolio investment inflows;
• adverse domestic factors, such as a decline in domestic savings and investment, increases in domestic inflation, high domestic interest rates and exchange rate volatility. Each of these factors could lead to lower growth or lower international reserves; and
• other adverse factors, such as adverse oil price movements, climatic or seismic events, international or domestic hostilities, political uncertainty and delays in implementing and realizing infrastructure projects and economic policies.
DATA DISSEMINATION
Indonesia subscribes to the IMF’s Special Data Dissemination Standard, which is designed to improve the timeliness and quality of information of subscribing member countries. This standard requires subscribing member countries to provide schedules, referred to as the “Advance Release Calendar”, indicating, in advance, the date on which data will be released. For Indonesia, precise dates or “no-later-than-dates” for the release of data are disseminated three months in advance through the Advance Release Calendar, which is published on the Internet under the IMF’s Dissemination Standards Bulletin Board. Summary methodologies of all metadata to enhance transparency of statistical compilation are also provided on the Internet under the IMF’s Dissemination Standards Bulletin Board. The internet website for Indonesia’s Advance Release Calendar and metadata is located at http://dsbb.imf.org/Pages/SDDS/ARCCtyCtgList.aspx?ctycode=IDN. Neither Indonesia nor any agents or underwriters acting on behalf of Indonesia in connection with the offer and sale of securities, as contemplated in this prospectus, accept any responsibility for information included on that website, and its contents are not intended to be incorporated by reference into this prospectus.
USE OF PROCEEDS
Indonesia will use the net proceeds from the sale of securities offered by this prospectus for the general purposes of the Republic, including to partially fund its general financing requirements.
-vi-
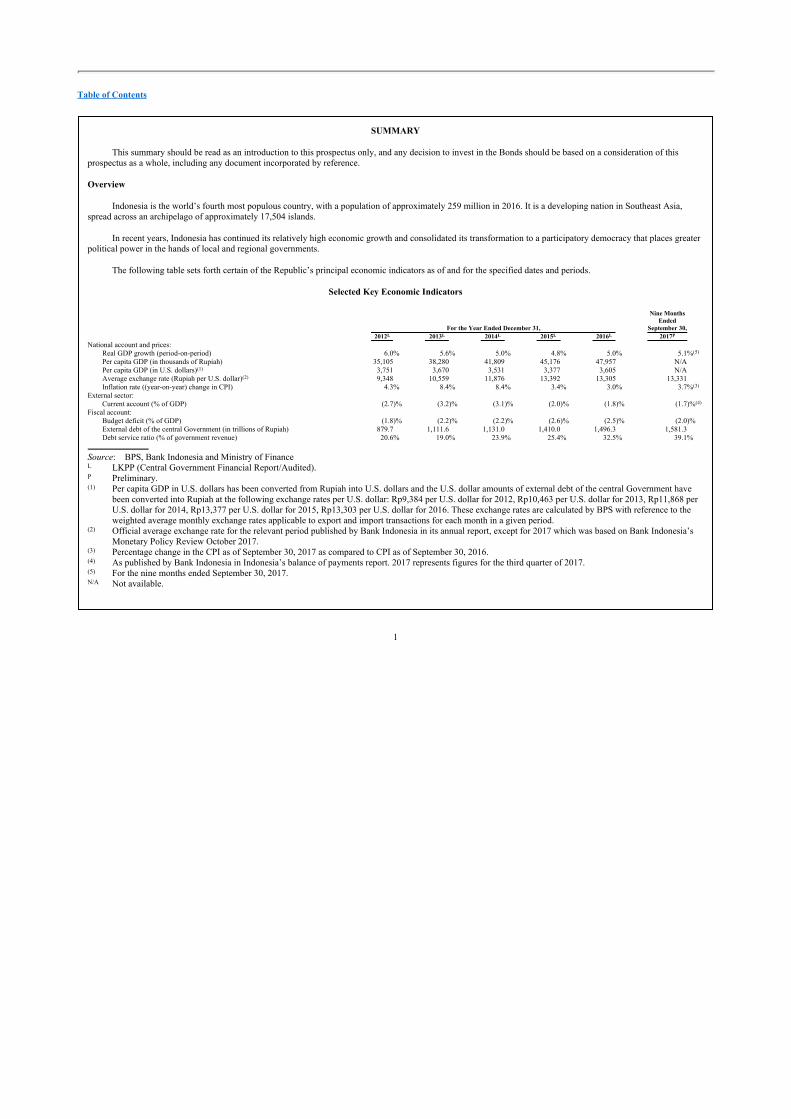
Table of Contents
SUMMARY
This summary should be read as an introduction to this prospectus only, and any decision to invest in the Bonds should be based on a consideration of this prospectus as a whole, including any document incorporated by reference.
Overview
Indonesia is the world’s fourth most populous country, with a population of approximately 259 million in 2016. It is a developing nation in Southeast Asia, spread across an archipelago of approximately 17,504 islands.
In recent years, Indonesia has continued its relatively high economic growth and consolidated its transformation to a participatory democracy that places greater political power in the hands of local and regional governments.
The following table sets forth certain of the Republic’s principal economic indicators as of and for the specified dates and periods.
Selected Key Economic Indicators
For the Year Ended December 31,
Nine MonthsEnded
September 30,2012L 2013L 2014L 2015L 2016L 2017P
National account and prices:Real GDP growth (period-on-period) 6.0% 5.6% 5.0% 4.8% 5.0% 5.1%(5)
Per capita GDP (in thousands of Rupiah) 35,105 38,280 41,809 45,176 47,957 N/APer capita GDP (in U.S. dollars)(1) 3,751 3,670 3,531 3,377 3,605 N/AAverage exchange rate (Rupiah per U.S. dollar)(2) 9,348 10,559 11,876 13,392 13,305 13,331Inflation rate ((year-on-year) change in CPI) 4.3% 8.4% 8.4% 3.4% 3.0% 3.7%(3)
External sector:Current account (% of GDP) (2.7)% (3.2)% (3.1)% (2.0)% (1.8)% (1.7)%(4)
Fiscal account:Budget deficit (% of GDP) (1.8)% (2.2)% (2.2)% (2.6)% (2.5)% (2.0)% External debt of the central Government (in trillions of Rupiah) 879.7 1,111.6 1,131.0 1,410.0 1,496.3 1,581.3Debt service ratio (% of government revenue) 20.6% 19.0% 23.9% 25.4% 32.5% 39.1%
Source: BPS, Bank Indonesia and Ministry of Finance L LKPP (Central Government Financial Report/Audited). P Preliminary. (1) Per capita GDP in U.S. dollars has been converted from Rupiah into U.S. dollars and the U.S. dollar amounts of external debt of the central Government have
been converted into Rupiah at the following exchange rates per U.S. dollar: Rp9,384 per U.S. dollar for 2012, Rp10,463 per U.S. dollar for 2013, Rp11,868 per U.S. dollar for 2014, Rp13,377 per U.S. dollar for 2015, Rp13,303 per U.S. dollar for 2016. These exchange rates are calculated by BPS with reference to the weighted average monthly exchange rates applicable to export and import transactions for each month in a given period.
(2) Official average exchange rate for the relevant period published by Bank Indonesia in its annual report, except for 2017 which was based on Bank Indonesia’s Monetary Policy Review October 2017.
(3) Percentage change in the CPI as of September 30, 2017 as compared to CPI as of September 30, 2016. (4) As published by Bank Indonesia in Indonesia’s balance of payments report. 2017 represents figures for the third quarter of 2017. (5) For the nine months ended September 30, 2017. N/A Not available.
1

Table of Contents
SUMMARY OF THE OFFERING
The following overview should be read as an introduction to, and is qualified in its entirety by reference to, the more detailed information appearing elsewhere in this prospectus. This overview may not contain all of the information that prospective investors should consider before deciding to invest in the Bonds. Accordingly, any decision by a prospective investor to invest in the Bonds should be based on a consideration of this prospectus as a whole.
Issuer Republic of Indonesia
Bonds U.S.$1,000,000,000 2.95% Bonds due 2023 (the “2023 Bonds”), U.S.$1,250,000,000 3.50% Bonds due 2028 (the “2028 Bonds”) and U.S.$1,750,000,000 4.35% Bonds due 2048 (the “2048 Bonds”, together with the “2023 Bonds” and the “2028 Bonds”, the “Bonds”)
The 2023 Bonds, 2028 Bonds and 2048 Bonds are being issued under the indenture to be dated as of December 11, 2017 (the “Indenture”).
Public Offering Price For the 2023 Bonds, 99.764% of the principal amount of the 2023 Bonds
For the 2028 Bonds, 99.576% of the principal amount of the 2028 Bonds
For the 2048 Bonds, 99.166% of the principal amount of the 2048 Bonds
Maturity The 2023 Bonds: January 11, 2023
The 2028 Bonds: January 11, 2028
The 2048 Bonds: January 11, 2048
Interest The 2023 Bonds will bear interest from December 11, 2017 at a rate of 2.95% per annum. Interest will be paid on January 11 and July 11 of each year, commencing on July 11, 2018.
The 2028 Bonds will bear interest from December 11, 2017 at a rate of 3.50% per annum. Interest will be paid on January 11 and July 11 of each year, commencing on July 11, 2018.
The 2048 Bonds will bear interest from December 11, 2017 at a rate of 4.35% per annum. Interest will be paid on January 11 and July 11 of each year, commencing on July 11, 2018.
Withholding Tax and Additional Amounts The Republic will make all payments of principal, premium (if any) and interest on the Bonds without withholding or deduction on account of any present or future taxes, duties, assessments or other
2

Table of Contents
government charges withheld or assessed by the Republic or any political subdivision or authority thereof or therein having power to tax, unless the deduction or withholding is required by law. If the Republic is required to make any deduction or withholding, it will pay the holders, subject to specified exceptions, the additional amounts required to ensure that the net amount they receive after such withholding or deduction shall equal the amount they would have received without this withholding or deduction. See “Description of the Bonds — Additional Amounts.”
Further Issues The Republic may from time to time, without the consent of holders of the Bonds, create and issue additional Bonds having the same terms as the Bonds in all respects, except for issue date, issue price, original interest accrual date and the first interest payment on the Bonds; provided, however, that any additional Bonds subsequently issued shall be issued, for U.S. federal income tax purposes, either (a) as part of the “same issue” as the Bonds, or (b) in a “qualified reopening” of the Bonds, unless such additional Bonds have a separate CUSIP, ISIN or other identifying number from the previously outstanding Bonds. Such additional Bonds will be consolidated with and will form a single series with the previously outstanding Bonds.
Form and Settlement The Bonds to be delivered to investors will be issued in global form and registered in the name of the clearing system or its nominee or custodian. Clearing systems include DTC in the United States and Euroclear and Clearstream, Luxembourg in Europe. See “Description of the Bonds — Global Bonds.”
Denominations The Republic will issue the Bonds only in minimum denominations of U.S.$200,000 and integral multiples of U.S.$1,000 in excess thereof.
Status of the Bonds The Bonds will constitute direct, general, unconditional and unsubordinated obligations of the Republic for which the full faith and credit of the Republic is pledged. The Bonds rank and will rank without any preference among themselves and equally with all other unsubordinated public external indebtedness of the Republic. It is understood that this provision will not be construed to require the Republic to make payments under any series of the Bonds ratably with payments being made under any other public external indebtedness. See “Description of the Bonds — Status of the Bonds.”
Negative Pledge The Bonds will contain certain covenants, including a negative covenant that will restrict the Republic from creating or permitting to exist (subject to certain exceptions) any security interest on any of its present or future revenues or assets. See “Description of the Bonds — Negative Pledge.”
3
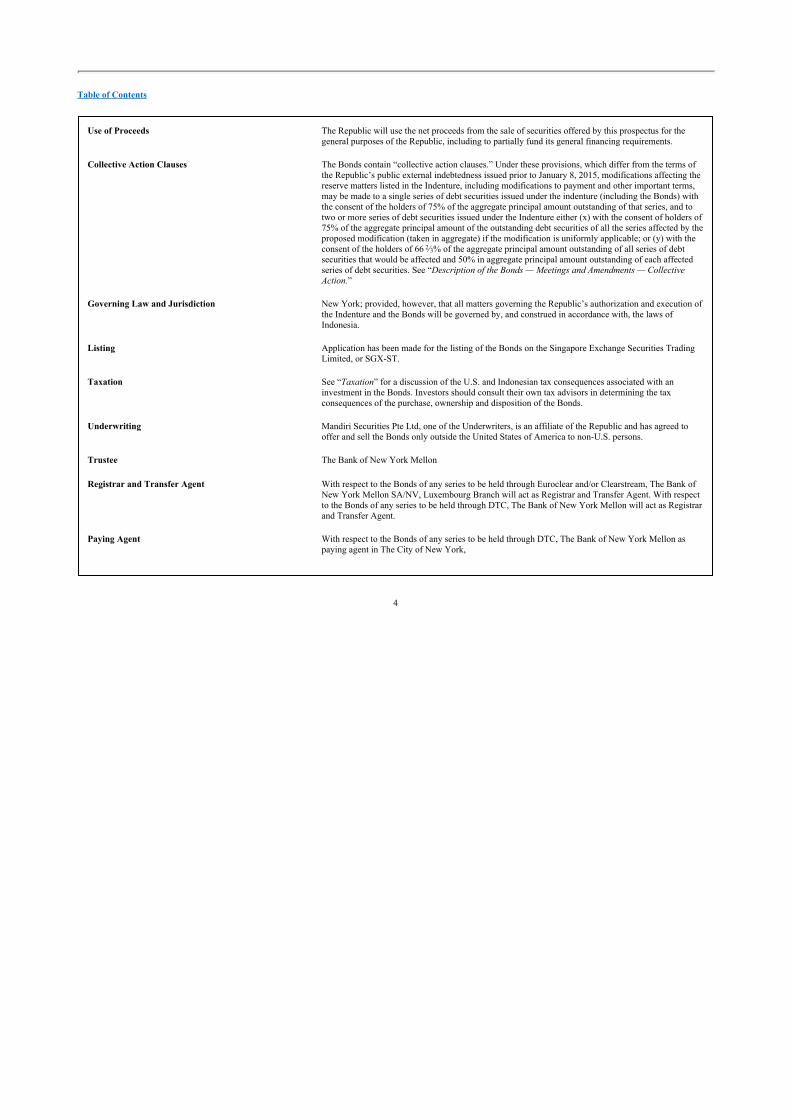
Table of Contents
Use of Proceeds The Republic will use the net proceeds from the sale of securities offered by this prospectus for the general purposes of the Republic, including to partially fund its general financing requirements.
Collective Action Clauses The Bonds contain “collective action clauses.” Under these provisions, which differ from the terms of the Republic’s public external indebtedness issued prior to January 8, 2015, modifications affecting the reserve matters listed in the Indenture, including modifications to payment and other important terms, may be made to a single series of debt securities issued under the indenture (including the Bonds) with the consent of the holders of 75% of the aggregate principal amount outstanding of that series, and to two or more series of debt securities issued under the Indenture either (x) with the consent of holders of 75% of the aggregate principal amount of the outstanding debt securities of all the series affected by the proposed modification (taken in aggregate) if the modification is uniformly applicable; or (y) with the consent of the holders of 66 2⁄3% of the aggregate principal amount outstanding of all series of debt securities that would be affected and 50% in aggregate principal amount outstanding of each affected series of debt securities. See “Description of the Bonds — Meetings and Amendments — Collective Action.”
Governing Law and Jurisdiction New York; provided, however, that all matters governing the Republic’s authorization and execution of the Indenture and the Bonds will be governed by, and construed in accordance with, the laws of Indonesia.
Listing Application has been made for the listing of the Bonds on the Singapore Exchange Securities Trading Limited, or SGX-ST.
Taxation See “Taxation” for a discussion of the U.S. and Indonesian tax consequences associated with an investment in the Bonds. Investors should consult their own tax advisors in determining the tax consequences of the purchase, ownership and disposition of the Bonds.
Underwriting Mandiri Securities Pte Ltd, one of the Underwriters, is an affiliate of the Republic and has agreed to offer and sell the Bonds only outside the United States of America to non-U.S. persons.
Trustee The Bank of New York Mellon
Registrar and Transfer Agent With respect to the Bonds of any series to be held through Euroclear and/or Clearstream, The Bank of New York Mellon SA/NV, Luxembourg Branch will act as Registrar and Transfer Agent. With respect to the Bonds of any series to be held through DTC, The Bank of New York Mellon will act as Registrar and Transfer Agent.
Paying Agent With respect to the Bonds of any series to be held through DTC, The Bank of New York Mellon as paying agent in The City of New York,
4

Table of Contents
USA. The Bank of New York Mellon, London Branch as paying agent in the City of London, England for any Bonds held through Euroclear and Clearstream.
Singapore Listing Agent Allen & Gledhill LLP
5

Table of Contents
REPUBLIC OF INDONESIA
Overview
Indonesia is the world’s fourth most populous country, with a population of approximately 259 million in 2016. It is a developing nation in Southeast Asia, spread across an archipelago of approximately 17,504 islands.
In recent years, Indonesia has continued its relatively high economic growth and consolidated its transformation to a participatory democracy that places greater political power in the hands of local and regional governments.
The following table sets forth certain of the Republic’s principal economic indicators as of and for the specified dates and periods.
Selected Key Economic Indicators
For the Year Ended December 31,
Nine MonthsEnded
September 30,2012L 2013L 2014L 2015L 2016L 2017P
National account and prices:Real GDP growth (period-on-period) 6.0% 5.6% 5.0% 4.8% 5.0% 5.1%(5)
Per capita GDP (in thousands of Rupiah) 35,105 38,280 41,809 45,176 47,957 N/APer capita GDP (in U.S. dollars)(1) 3,751 3,670 3,531 3,377 3,605 N/AAverage exchange rate (Rupiah per U.S. dollar)(2) 9,348 10,559 11,876 13,392 13,305 13,331Inflation rate ((year-on-year) change in CPI) 4.3% 8.4% 8.4% 3.4% 3.0% 3.7%(3)
External sector:Current account (% of GDP) (2.7)% (3.2)% (3.1)% (2.0)% (1.8)% (1.7)%(4)
Fiscal account:Budget deficit (% of GDP) (1.8)% (2.2)% (2.2)% (2.6)% (2.5)% (2.0)% External debt of the central Government (in trillions of Rupiah) 879.7 1,111.6 1,131.0 1,410.0 1,496.3 1,581.3Debt service ratio (% of government revenue) 20.6% 19.0% 23.9% 25.4% 32.5% 39.1%
Source: BPS, Bank Indonesia and Ministry of Finance L LKPP (Central Government Financial Report/Audited). P Preliminary. (1) Per capita GDP in U.S. dollars has been converted from Rupiah into U.S. dollars and the U.S. dollar amounts of external debt of the central Government have been
converted into Rupiah at the following exchange rates per U.S. dollar: Rp9,384 per U.S. dollar for 2012, Rp10,463 per U.S. dollar for 2013, Rp11,868 per U.S. dollar for 2014, Rp13,377 per U.S. dollar for 2015, Rp13,303 per U.S. dollar for 2016. These exchange rates are calculated by BPS with reference to the weighted average monthly exchange rates applicable to export and import transactions for each month in a given period.
(2) Official average exchange rate for the relevant period published by Bank Indonesia in its annual report, except for 2017 which was based on Bank Indonesia’s Monetary Policy Review October 2017.
(3) Percentage change in the CPI as of September 30, 2017 as compared to CPI as of September 30, 2016. (4) As published by Bank Indonesia in Indonesia’s balance of payments report. 2017 represents figures for the third quarter of 2017. (5) For the nine months ended September 30, 2017. N/A Not available.
6

Table of Contents
Land and People
Area
Situated between Malaysia, Singapore and the Philippines to the north and Australia to the south, the Republic of Indonesia covers a total land area of approximately 1,913,579 square km, comprising approximately 17,504 islands (of which an estimated 957 are inhabited) and forming part of the world’s largest archipelago.
The main islands of Indonesia are Sumatera, Java, Bali, Kalimantan (also known as Borneo, the northern part of which belongs to Malaysia and Brunei), Sulawesi and Papua (the eastern part of which belongs to Papua New Guinea). Indonesia extends 5,120 km across the equator from Nanggroe Aceh Darussalam, or Aceh, in the west to Papua in the east. Jakarta, Indonesia’s capital and largest city, is located on the northern coast of the western part of Java.
In recent years, the Government has implemented various measures to address haze and other adverse effects caused by forest and field fires related to land clearance for agriculture in the islands of Sumatera and Kalimantan.
Volcanic and Other Natural Disasters
Indonesia is located in one of the most volcanically and seismically active regions in the world. Because it is located in the convergence zone of three major lithospheric plates, it is subject to significant seismic activity that can lead to destructive volcanic eruptions, earthquakes and tsunamis, or tidal waves, including the 2004 earthquake and subsequent Indian Ocean tsunami that devastated the Province of Aceh. In addition to these geological events, Indonesia has also been struck by other natural disasters such as heavy rains and flooding. All of these natural disasters have resulted in loss of life, the displacement of people and destruction of property, and could have significant economic and developmental effects. Recently, in December 2016, an earthquake hit the Province of Aceh resulting in approximately 100 deaths, hundreds of injuries and damage to houses and other property. Total government expenditures related to post-natural disaster relief efforts in 2016 were Rp2.9 trillion in 2016.
Population
Indonesia had a population of approximately 259 million in 2016 and is the fourth most populous country in the world, after China, India and the United States. The population is primarily concentrated in Java (estimated at approximately 148 million in 2016). In 2016, Jakarta, the capital, was estimated to have a population of approximately 10 million.
Indonesia’s population is young and growing. In 2016, the Government estimated that approximately 26.8% of the population was under 15 years of age and approximately 43.6% was under 25 years of age. The population growth rate during the period of 2010 to 2016 was 1.4% per annum.
According to the 2010 census, approximately 87.2% of the Indonesian population is Muslim and 9.9% is Christian, with the remaining population consisting of Hindus, Buddhists and followers of other religions. Indonesia’s population is primarily of Malay descent, but consists of more than 300 ethnic groups, including the Acehnese, Batak and Minangkabau in Sumatera; the Javanese and Sundanese in Java; the Madurese in Madura; the Balinese in Bali; the Sasak in Lombok; the Minahasan, Makassarese, Toraja and Bugis in Sulawesi; the Dayak in Kalimantan; and the Dani and Asmat in Papua. The country’s population also includes people of Chinese, Arab, Eurasian, Indian and Pakistani backgrounds.
The national language is Bahasa Indonesia, which is based on the Malay language. English is widely used and taught in most secondary schools. In total, approximately 500 languages and dialects are spoken throughout Indonesia.
7
Table of Contents
Government and Political Developments
Political History and Development of Political Parties
From 1605 until its independence in 1945, Indonesia was under almost continuous Dutch colonial rule and was known as the Netherlands East Indies. The period of Dutch administration was interrupted by a short period of British colonial rule in the 19th century and ended by the Japanese occupation, which lasted from 1942 to 1945.
Indonesia proclaimed its independence on August 17, 1945 and adopted its Constitution in that year. The Constitution has been amended several times and remains in place today (despite being replaced from 1949 until its re-adoption in 1959). In 1966, executive power was transferred from President Soekarno to General Soeharto. General Soeharto served as Indonesia’s President until 1998, when he resigned in the aftermath of social unrest that followed the 1997 Asian financial crisis, which coincided with the country’s worst drought in 50 years, falling prices for export commodities, severe depreciation in the value of the Rupiah and rapid inflation.
The post-Soeharto era, which is known in Indonesia as the Reformasi, led to changes in various governmental institutions and structural reforms of the judiciary, legislature, and executive office. Between 1999 and 2002, the Constitution was amended to strengthen constitutional checks and balances and the separation of powers and provide for a more direct democracy. Prior to these amendments, and throughout the period of President Soeharto’s administration, the Government had been highly centralized. Power during the Soeharto period was concentrated in the Presidency and the military exerted significant influence over the Government, including by holding a specified number of allocated seats in the legislature. The major goals of the amendments and other political reforms since the end of the Soeharto regime have been to (i) increase the level of direct democracy; (ii) reduce the influence of the military in the Government; (iii) disperse power to regional and local government authorities; and (iv) improve the transparency and integrity of the judicial system.
Indonesia’s most recent presidential election was held in July 2014. In this election, President Joko Widodo and Vice President Muhammad Jusuf Kalla were elected to serve until 2019. Although presidential candidates are nominated individually (along with their respective vice-presidential candidates), relationships with and support from political parties have a considerable effect on election results. Accordingly, the legislative election results are an important indicator of the outcome of the presidential elections.
A total of 15 parties (including three local parties in Aceh) took part in the 2014 legislative election. In addition to presidential and legislative elections, each of Indonesia’s 34 provinces conducts their own gubernatorial elections, with governors serving five-year terms.
General elections are expected to be held in Indonesia in April 2019 for President, the People’s Consultative Assembly, provincial legislatures and local legislatures. While Indonesia has successfully conducted elections in the past, the country continues to face various socio-political issues and has, from time to time, experienced political instability and social and civil unrest. Since 2000, thousands of Indonesians have participated in demonstrations in Jakarta and other Indonesian cities both for and against former President Megawati, former President Yudhoyono and current President Joko Widodo, as well as in response to specific issues, including reductions in fuel or electricity subsidies, privatization of state assets, anticorruption measures, decentralization and provincial autonomy, actions of former Government officials and their family members, and the American-led military campaigns in the Middle-East. More recently, gubernatorial elections in Jakarta in February and April 2017 led to protests with religious undertones. Former education and culture minister Anies Baswedan won the election for Jakarta governor in April 2017, defeating then-incumbent governor Basuki Tjahaja Purnama who was later convicted of blasphemy charges. Although these demonstrations were generally peaceful, some have turned violent. As events surrounding the recent Jakarta gubernatorial election have highlighted, political campaigns in Indonesia may bring a degree of political and social uncertainty to Indonesia that could lead to further civil disturbances.
8

Table of Contents
Central Government
The Government is based on the Constitution, under which the Republic is structured as a unitary republic. The Constitution enshrines a set of fundamental principles known as Pancasila (the five principles), encompassing belief in one supreme God, humanity, the unity of Indonesia, democracy led by the wisdom of deliberations among representatives and social justice for all.
The Constitution vests the sovereignty in the country’s people and establishes the office of the President, the People’s Consultative Assembly (Majelis Permusyawaratan Rakyat or MPR) (which consists of the People’s Representative Council (Dewan Perwakilan Rakyat or DPR) and the Regional Representatives’ Council (Dewan Perwakilan Daerah or DPD)), the Supreme Audit Agency (Badan Pemeriksa Keuangan or BPK), the Supreme Court (Mahkamah Agung), the Constitutional Court (Mahkamah Konstitusi) and the Judicial Commission (Komisi Yudisial).
The MPR has the authority to amend the Constitution and inaugurate and dismiss the President. The MPR has a bicameral structure, consisting of the DPR, which is the principal legislative body, and the DPD. The DPR has 560 members. The DPD currently has 132 members, consisting of four members from each province with the exception of Indonesia’s newest province, North Kalimantan, where elections will not be held until 2019.
Members of the DPR are elected by a proportional representation system. The DPD members are elected in non-partisan elections based on a plurality of votes within the relevant electorate.
Each of the DPR and the President has the power to initiate legislation. All legislation, including the Republic’s budget, must be approved by both the DPR and the President. While the DPD is able to initiate legislation regarding regional matters, this is subject to approval from both the DPR and the President.
The President has the authority and responsibility for the conduct of the administration of the Republic. This includes the authority to declare war, make peace, conclude treaties with other states and propose statutes; these presidential actions must, however, be approved by the DPR before taking effect. Constitutional amendments in 1999 restrict the President and Vice President to a maximum of two five-year terms.
The President is assisted in the administration of his responsibilities by ministers who are appointed and dismissed by the President and who are responsible only to the President.
Judicial System
The Constitution states that the Indonesian judicial system must be independent and that judicial authority is to be exercised by the courts free from the influence of non-judicial power. The Republic’s judicial power is exercised by the Supreme Court, various lower courts and the Constitutional Court. The courts below the Supreme Court are organized by subject matter jurisdiction. These courts include the general, religious, military and administrative courts. The general district courts have jurisdiction over all criminal and civil cases not within the limited jurisdiction of any of the special courts. The religious courts have jurisdiction over cases such as family law among Muslims. The military courts have jurisdiction over cases involving military personnel. The administrative courts have jurisdiction over actions involving certain Government decisions.
Furthermore, there are several special courts under the general courts and the administrative courts such as (i) commercial courts, which have jurisdiction over bankruptcy cases and intellectual property rights cases (except trade secrets); (ii) juvenile courts, which have jurisdiction over child cases; (iii) human rights courts, which have jurisdiction over gross violations of human rights cases; (iv) corruption courts, which have jurisdiction over corruption cases; (v) labor courts, which have jurisdiction over industrial relations cases; (vi) fishery courts, which have jurisdiction over criminal fishery cases; and (vii) tax courts which have jurisdiction over tax disputes. The Supreme Court also has the authority to issue opinions on legal matters to various Government authorities and officials, to order a court to adjudicate a particular matter or to set aside an unlawful decision. The Constitutional Court has exclusive jurisdiction with respect to questions of constitutional law.
9

Table of Contents
Regional Governments and Regional Autonomy
Indonesia has 34 provinces, including the special region of the capital of Jakarta. Each province is headed by a governor and consists of several subdivisions. There are two types of subdivisions, namely kabupaten, or regencies, and kota, or municipalities. Political and governmental arrangements in regencies and municipalities are generally similar, but municipalities tend to be more urban. Regencies and municipalities are divided into kecamatan, or districts, which in turn are further divided into villages or kelurahan, or sub-districts.
Over the past eighteen years, the central Government has promoted and created significant regional autonomy through legislation. Under current law, government matters are divided into three areas:
(i) matters that are solely under the authority of the central Government, such as foreign affairs, defense, security, judicial, national fiscal and monetary matters, and religion;
(ii) matters that are concurrently implemented between the central Government, Provincial Governments and Regency/Municipality Governments. These include:
(a) basic services such as education, health, public works, social issues, manpower and housing as well as other matters such as land policy, micro and medium enterprises, investment, culture, communication, environment, food sustainability and information;
(b) matters that relate to potential development of a region, such as maritime and fisheries, tourism, forestry, energy and mineral resources, trade, industry and transmigration; and
(iii) matters that are solely under the authority of the President as head of Government (such as Army, Navy and Air Force affairs, the appointment and the replacement of ambassadors and consuls, the granting of pardon and rehabilitation, amnesty and abolition, award of titles, decorations and other marks of state honor).
The provinces of Aceh, Jakarta, Yogyakarta, Papua and West Papua enjoy special autonomy from the central Government. In Papua and West Papua, a portion of the population has shown support for the Free Papua Movement (generally known by its Indonesian initials, OPM). While there have been some violent incidents involving the armed wing of the OPM, including those targeting the Indonesian police, the National Armed Forces and police have taken measures to maintain security and order in these provinces, and the Government has continued its policy of promoting social welfare in Papua and West Papua. The Government is addressing the concerns of certain groups seeking greater independence by expanding the powers of the local governments, investing in infrastructure, improving judicial access, instituting affirmative action programs, working to resolve differences among local ethnic groups, increasing welfare programs and infrastructure development and fostering business growth and investment in areas populated by these groups.
Terrorism
Several terrorism-linked bombing incidents have taken place in Indonesia over the years, including incidents linked to ISIS and Jemaah Islamiah, a Southeast Asian terrorist network linked to other terrorist organizations outside the region. In response to these incidents, security forces and the judiciary took action to bring the perpetrators to justice and have targeted terrorist networks. Since the emergence of ISIS, several terror attacks have been committed by ISIS or ISIS affiliated groups in Indonesia. On January 14, 2016, multiple explosions and gunfire took place near the Sarinah shopping mall in central Jakarta that killed eight people and injured 23 people (commonly known as the Sarinah bombing). On July 18, 2016, Indonesian National Armed Forces and police troops killed Santoso, the leader of a pro-ISIS group, who had been a fugitive for years.
The most recent terror incident occurred on May 24, 2017, and is commonly known as the Kampung Melayu bombing, in which two suicide bombers set off explosives near the Kampung Melayu bus station, one of Jakarta’s busiest transit hubs, killing three police officers, the two suicide bombers, and wounding at least ten other people. In June 2017, the anti-terror squad of Indonesia’s national police arrested 36 men suspected of
10
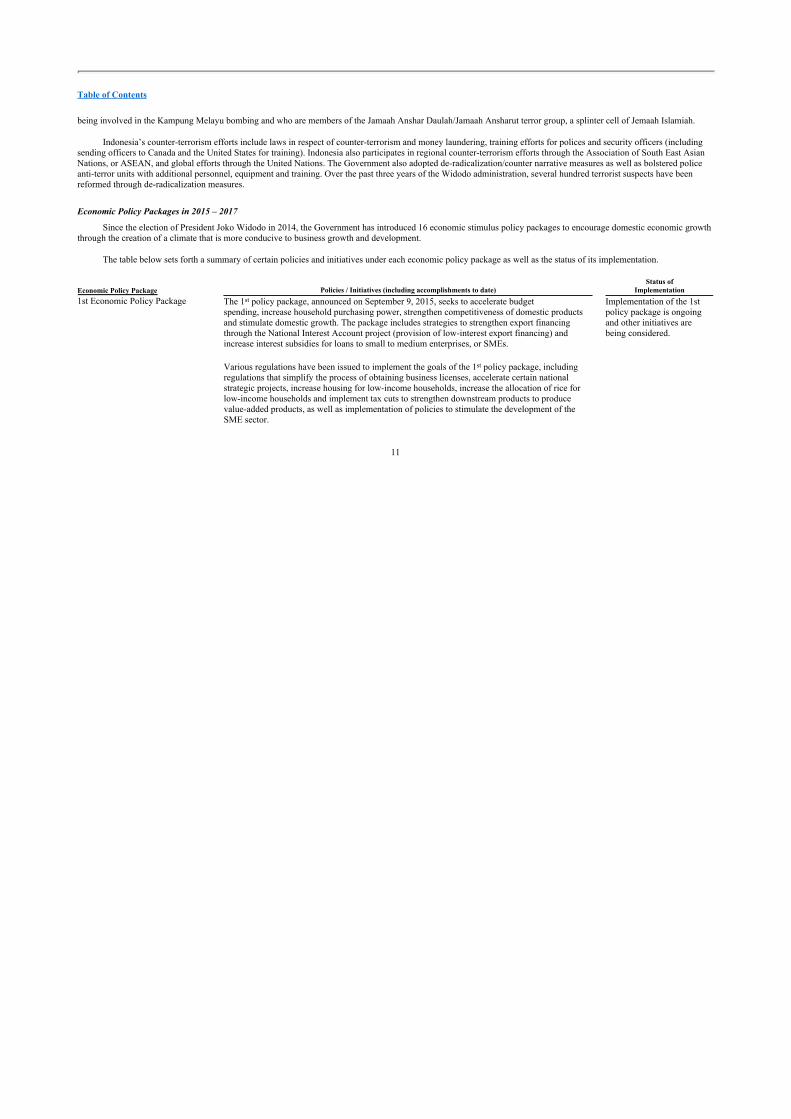
Table of Contents
being involved in the Kampung Melayu bombing and who are members of the Jamaah Anshar Daulah/Jamaah Ansharut terror group, a splinter cell of Jemaah Islamiah.
Indonesia’s counter-terrorism efforts include laws in respect of counter-terrorism and money laundering, training efforts for polices and security officers (including sending officers to Canada and the United States for training). Indonesia also participates in regional counter-terrorism efforts through the Association of South East Asian Nations, or ASEAN, and global efforts through the United Nations. The Government also adopted de-radicalization/counter narrative measures as well as bolstered police anti-terror units with additional personnel, equipment and training. Over the past three years of the Widodo administration, several hundred terrorist suspects have been reformed through de-radicalization measures.
Economic Policy Packages in 2015 – 2017
Since the election of President Joko Widodo in 2014, the Government has introduced 16 economic stimulus policy packages to encourage domestic economic growth through the creation of a climate that is more conducive to business growth and development.
The table below sets forth a summary of certain policies and initiatives under each economic policy package as well as the status of its implementation.
Economic Policy Package Policies / Initiatives (including accomplishments to date)Status of
Implementation
1st Economic Policy Package The 1st policy package, announced on September 9, 2015, seeks to accelerate budget spending, increase household purchasing power, strengthen competitiveness of domestic products and stimulate domestic growth. The package includes strategies to strengthen export financing through the National Interest Account project (provision of low-interest export financing) and increase interest subsidies for loans to small to medium enterprises, or SMEs.
Various regulations have been issued to implement the goals of the 1st policy package, including regulations that simplify the process of obtaining business licenses, accelerate certain national strategic projects, increase housing for low-income households, increase the allocation of rice for low-income households and implement tax cuts to strengthen downstream products to produce value-added products, as well as implementation of policies to stimulate the development of the SME sector.
Implementation of the 1st policy package is ongoing and other initiatives are being considered.
11

Table of Contents
Economic Policy Package Policies / Initiatives (including accomplishments to date)Status of
Implementation
2nd Economic Policy Package The 2nd policy package, announced on September 29, 2015, includes initiatives to simplify the process to obtain industrial investment permits, grant tax incentives by eliminating value added tax, or VAT, for selected transportation sector industries, strengthen integrated logistics facilities and maintain the stability of the Rupiah. This package also simplifies the requirements to obtain tax holidays and the approval process for tax allowances.
A number of policies and regulations have been implemented under the 2nd policy package. One policy aims to attract investment by fast-tracking services for issuing investment licenses at industrial estates within 3 hours. As of February 2017, the service has been utilized by 284 companies with a total investment value of Rp219 trillion.
Another initiative in the package is the establishment of Bonded Logistics Centers, or BLCs. BLCs are multipurpose logistics warehouses that enjoy exemptions from import duty and tax.
The Government has also put into place certain stimulus programs to increase corporate investment and the competitiveness of domestic products. This fiscal stimulus is implemented in the form of tax holidays and tax allowances.
Implementation of the 2nd policy package is ongoing and other initiatives are being considered.
3rd Economic Policy Package The 3rd policy package, announced on October 7, 2015, includes policies to reduce fuel, gas and industrial electricity subsidies, ease land permit approvals for investment activities, and expand the availability of commercial loans for SMEs to include salaried employees as eligible recipients.The Government has taken certain immediate measures to implement the 3rd policy package. Prices for jet fuel, diesel fuel and certain other fuels have been lowered with effect from October 1, 2015. In addition, electricity billing rates have been lowered.
To improve access to bank lending under the people’s business credit program (a program aimed at supporting SMEs in Indonesia referred to by its Indonesian initials KUR), the Government has lowered the rate of interest on KUR from about 22% to 12%.
The Government has also revised regulations to streamline land permit approvals for investment activities.
Implementation of the 3rd policy package is ongoing and other initiatives are being considered.
12

Table of Contents
Economic Policy Package Policies / Initiatives (including accomplishments to date)Status of
Implementation
4th Economic Policy Package The 4th policy package, announced on October 15, 2015, includes policies to promote a fair, simplified and projectable provincial wage system, subsidize small business loans and expand credit available for small businesses in sectors such as farming, fishery, manufacturing, creative businesses and overseas Indonesian workers. The package also includes incentives to encourage businesses to not reduce staff numbers.
One key policy in the package is the Government Regulation on Wage Systems that introduces a minimum wage calculation to benefit workers. Various other regulations have been implemented to support workers’ wages. 14 provinces set a minimum wage in 2016.
In addition, the Government has implemented an amendment to the KUR program that broadens the scope of eligible borrowers and business sectors to further support business growth at the grassroots level.
Implementation of the 4th policy package is ongoing and other initiatives are being considered.
5th Economic Policy Package The 5th policy package, announced on October 22, 2015, introduces tax incentives for asset revaluations in order to encourage companies and state-owned-enterprises, or SOEs, to revalue their asset base. It also proposes eliminating the double-taxation system for real estate investment trusts, or REITs, to encourage more domestic REIT issuances.
The Government has adopted policies that address asset revaluations and rescind double-taxation on investment funds for real estate, property and infrastructure. In addition, the Government has implemented policies that simplify the licensing of Sharia banking products and support the expansion of Sharia banks in Indonesia.
Implementation of the 5th policy package is ongoing and other initiatives are being considered.
13

Table of Contents
Economic Policy Package Policies / Initiatives (including accomplishments to date)Status of
Implementation
6th Economic Policy Package The 6th policy package, announced on November 5, 2015, introduces tax incentive schemes to encourage development of special economic zones, or SEZs, adjusts water-based resource processing permits to protect natural resources and shortens the import processes for pharmaceutical products through the use of an online system.
The Government has implemented three policies aimed at deregulation. The first policy aims to increase the number of SEZs by providing incentives for investors such as tax breaks, while benefitting workers. As of July 2017, there were 12 SEZs. By 2025, the Government aims to have 25 SEZs established.
The Government adopted Government Regulation concerning Commercial Exploitation of Water Resources and the Government Regulation concerning the System for Provision of Drinking Water. Under these two Government Regulations, the Government shall continue to honor contracts for cooperation in water resources management until the expiration of these contracts. The Government will strengthen control over the operation of such cooperation by strengthening the licensing regime for water use.
The Government has streamlined import processing for raw materials for pharmaceuticals and food products, reducing processing times to 5.7 hours. In addition, with the introduction of an online services system, 100% paperless processing was achieved ahead of target.
Implementation of the 6th policy package is ongoing and other initiatives are being considered.
7th Economic Policy Package The 7th policy package, announced on December 4, 2015, seeks to support the industrial sector through an income tax waiver for workers in labor-intensive sectors and free leasehold certificates for SMEs operating in 34 state-owned areas.
The Government has expanded the scope of incentives and facilities for doing business, not only for labor-intensive industries, but also by improving services for citizens in processing land titles. The Government implemented policies that streamline land title issuances. These include increasing the number of land surveyors, decreasing the number of days required for land registration to 14 days and introducing an electronic land-registration system.
The Government has also adopted two policies providing income tax relief for employees working in labor-intensive industries for a period of two years. In addition, certain footwear and garment manufacturers now benefit from additional tax incentives.
Implementation of the 7th policy package is ongoing and other initiatives are being considered.
14

Table of Contents
Economic Policy Package Policies / Initiatives (including accomplishments to date)Status of
Implementation
8th Economic Policy Package The 8th policy package, announced on December 21, 2015, introduces policies to exempt airplane spare parts from import duty in order to improve Indonesian airlines’ competitiveness, introduces incentives to accelerate oil refinery development across Indonesia, and, through the “one map policy,” intends to harmonize all maps in Indonesia under one reference map for use in Government development projects.
Pursuant to the Presidential Regulation concerning Accelerated Implementation of the One Map Policy, ministries and government institutions are preparing thematic maps on a 1: 50,000 scale under their individual action plans. The process is scheduled for completion by year-end 2019.
The Government also implemented a Presidential Regulation that supports the accelerated construction and expansion of domestic oil refineries. The Government is also providing fiscal and non-fiscal incentives for construction, expansion and refurbishment of new and existing oil refineries.
Moreover, the Government has introduced certain incentives for aircraft maintenance companies, including a 0% import duty on 21 tariff items related to spare parts and components for aircraft repairs or maintenance.
Implementation of the 8th policy package is ongoing and other initiatives are being considered.
9th Economic Policy Package The 9th policy package, announced on January 27, 2016, introduces policies to improve national logistic performance through a single-billing system for port services conducted by SOEs, introduces an “Integrated National Single Window” to simplify the submission of trade documents to a single point of collection, requires the use of Rupiah for payments related to transportation activities, and eliminates the price difference between private commercial and state postal services.Certain regulations governing postal rates have been brought into alignment to promote efficiency in postal services. The revised regulations eliminate the requirement that rates for commercial postal services must be higher than the Government-set rates for the universal postal service.
In addition, payments for port services provided by state-owned port operators are to be combined through an electronic single billing system. This measure is intended to strengthen the implementation of Regulation of the Minister of SOEs Number 2 of 2013 concerning Guidelines for Formulation of Information Technology Management for SOEs.
Indonesia is implementing the Indonesia National Single Window, or INSW, which manages the smooth processing of export and import documents. The INSW Portal has been introduced at 21 ports of entry and covers approximately 34,000 importers and approximately 26,000 exporters as of September 2015.
Implementation of the 9th policy package is ongoing and other initiatives are being considered.
15
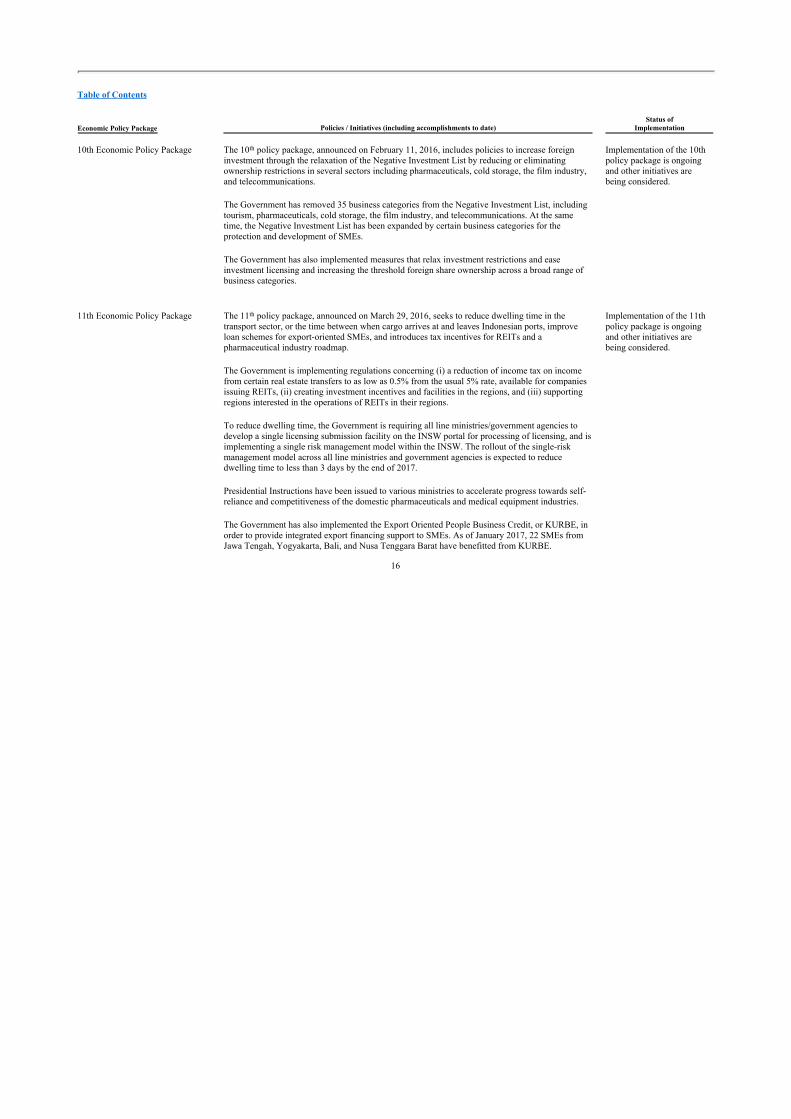
Table of Contents
Economic Policy Package Policies / Initiatives (including accomplishments to date)Status of
Implementation
10th Economic Policy Package The 10th policy package, announced on February 11, 2016, includes policies to increase foreign investment through the relaxation of the Negative Investment List by reducing or eliminating ownership restrictions in several sectors including pharmaceuticals, cold storage, the film industry, and telecommunications.
The Government has removed 35 business categories from the Negative Investment List, including tourism, pharmaceuticals, cold storage, the film industry, and telecommunications. At the same time, the Negative Investment List has been expanded by certain business categories for the protection and development of SMEs.
The Government has also implemented measures that relax investment restrictions and ease investment licensing and increasing the threshold foreign share ownership across a broad range of business categories.
Implementation of the 10th policy package is ongoing and other initiatives are being considered.
11th Economic Policy Package The 11th policy package, announced on March 29, 2016, seeks to reduce dwelling time in the transport sector, or the time between when cargo arrives at and leaves Indonesian ports, improve loan schemes for export-oriented SMEs, and introduces tax incentives for REITs and a pharmaceutical industry roadmap.
The Government is implementing regulations concerning (i) a reduction of income tax on income from certain real estate transfers to as low as 0.5% from the usual 5% rate, available for companies issuing REITs, (ii) creating investment incentives and facilities in the regions, and (iii) supporting regions interested in the operations of REITs in their regions.
To reduce dwelling time, the Government is requiring all line ministries/government agencies to develop a single licensing submission facility on the INSW portal for processing of licensing, and is implementing a single risk management model within the INSW. The rollout of the single-risk management model across all line ministries and government agencies is expected to reduce dwelling time to less than 3 days by the end of 2017.
Presidential Instructions have been issued to various ministries to accelerate progress towards self-reliance and competitiveness of the domestic pharmaceuticals and medical equipment industries.
The Government has also implemented the Export Oriented People Business Credit, or KURBE, in order to provide integrated export financing support to SMEs. As of January 2017, 22 SMEs from Jawa Tengah, Yogyakarta, Bali, and Nusa Tenggara Barat have benefitted from KURBE.
Implementation of the 11th policy package is ongoing and other initiatives are being considered.
16

Table of Contents
Economic Policy Package Policies / Initiatives (including accomplishments to date)Status of
Implementation
12th Economic Policy Package The 12th policy package, announced on April 28, 2016, focuses on enhancing the ease of doing business in Indonesia by reducing fees and waiting times for business applications, building construction permits, property registration, electricity installation, and access to banks.
The Government has introduced measures that reduce the number of applications, forms and procedures to establish a business as well as reduce associated costs and minimum capital requirements.
Various other improvements have been implemented, including simplification of obtaining construction permits, improving adjudication of small claims and simplification of tax-paying procedures.
Implementation of the 12th policy package is ongoing and other initiatives are being considered.
13th Economic Policy Package The 13th policy package, announced on August 28, 2016, includes social housing initiatives as well as additional measures designed to make conducting business easier. The package also includes policies to improve site and environmental planning.
The Government has accelerated the implementation of the “National One Million Housing Program” (a five-year government program to build one million homes for people with low incomes). The focus is on streamlining the number of licenses and time to process licenses to construct houses for low-income-earner households from 33 licenses and stages to 11 licenses and stages. By reducing the number of licenses and stages, the time it will take to construct these houses has been reduced to 44 days compared to 770 - 980 days prior to implementation of the 13th economic policy package.
Implementation of the 13th
policy package is ongoing and other initiatives are being considered.
17

Table of Contents
Economic Policy Package Policies / Initiatives (including accomplishments to date)Status of
Implementation
14th Economic Policy Package The 14th policy package, announced on November 10, 2016, focuses on accelerating e-commerce businesses by creating an “Electronic-Based National Trading System,” which will be regulated under a presidential regulation that will include policies related to funding support, tax relaxation, consumer protection, human resources capacity improvement, logistics support, communication infrastructure, cyber-security, and the formation of an operation management committee to develop an E-Commerce Roadmap.
The Government has issued Presidential Regulation No. 74 of 2017 on E-Commerce Road Map for the Year of 2017-2019, or E-Commerce Road Map. This E-Commerce Road Map provides direction and strategic guidance to various Government agencies to support and accelerate development of e-commerce in Indonesia. The guidelines instruct the central, local and regional governments to develop sectoral policies and programs.
The E-Commerce Road Map consists of eight key areas: (i) funding, (ii) taxation, (iii) customer protection, (iv) education and human resources, (v) telecommunication infrastructure, (vi) logistics, (vii) cyber-security, and (viii) establishment of a coordinating function (in the form of steering and management committee). These key areas are further divided into 26 programs, which must be carried out by the respective Governmental stakeholders in the 2017-2019 period. Implementation of the E-Commerce Road Map is ongoing.
Implementation of the 14th
policy package is ongoing.
18

Table of Contents
Economic Policy Package Policies / Initiatives (including accomplishments to date)Status of
Implementation
15th Economic Policy Package The 15th policy package, announced on June 15, 2017, focuses on improving the national logistics system to accelerate the business development and competitiveness of national logistics service providers. The goals of the policy package are to strengthen the INSW, increase the competitiveness of logistics service providers and create market opportunities for shipping companies, marine insurance and ship maintenance businesses. This package aims to (i) reduce the import duty of 115 types of ship spare parts to 0%, (ii) increase opportunities for national shipping companies that service approximately U.S.$600 million in exports and imports per year, (iii) produce 70 - 100 new ships with a total value of U.S.$700 million, (iv) open new job opportunities for 2,000 sailors, and (v) develop regional logistics systems to support the flow of goods, control inflation, and reduce the damage of post-harvest products up to 30%.Various regulations have been issued to, among others:
• increase the role and scale of national transport and insurance companies, import and export companies as well as domestic shipyard and ship maintenance businesses;
• enhance the ease of doing business and reduce the costs for national logistics service providers by (i) reducing transportation services operational fees, (ii) removing licensing requirements for transportation of goods, (iii) reducing port business investment costs, (iv) standardizing documents for the domestic flow of goods, (v) developing regional distribution centers, (vi) easing procurement of certain ships, and (vii) introducing a cargo security fee-recovery mechanism;
• strengthen the organization and authority of the INSW, including through (i) the grant of independent authority to the INSW agency to develop an electronic system for import-export, customs and port services and supervision for the entire territory of Indonesia, (ii) supervision of import-export activities which have the potential of facilitating illegal trading, (iii) development of a risk management system for the flow of goods and reducing dwelling times, and (iv) development of the INSW agency as a competent authority in the integration of the ASEAN Single Window and protecting and implementing of free trade agreements.
The Government has established an import-export commerce team to support the flow of goods. This team aims to reduce the number of barriers and restrictions to the average non-tariff barriers of ASEAN countries of 17%.
Implementation of the 15th
policy package is ongoing.
19

Table of Contents
Economic Policy Package Policies / Initiatives (including accomplishments to date)Status of
Implementation
16th Economic Policy Package The 16th policy package, announced on August 31, 2017, aims at speeding up the issuance of business permits while providing greater certainty on the cost and time involved and improving coordination between ministries and provincial administrations through the reform of all licensing related regulations issued by ministries or head of state agencies, governors and regents or mayors.
The policy package also includes the issuance of Presidential Regulation Number 91 of 2017 on expediting business operations, establishment of a work unit to guide and settle licensing delays in business operations, application of a licensing checklist in special economic zones, free trade zones, industrial and tourism zones and application of licensing through shared use.
Implementation of the 16th
policy package is ongoing.
Foreign Relations and International and Regional Organizations
Indonesia maintains close diplomatic relationships with neighboring countries and its major economic partners.
The Republic is one of the five founding members of ASEAN, an organization that was established in 1967 to ensure regional stability and is now committed to reducing development gaps among its member states (Brunei Darussalam, Cambodia, Indonesia, Laos, Malaysia, Myanmar, Philippines, Singapore, Thailand and Vietnam), which have entered into various agreements on mutual assistance and cooperation in several areas.
The Republic’s other principal memberships in international and regional organizations include:
• United Nations;
• the IMF;
• the World Bank and certain World Bank-related organizations;
• the Asian Development Bank or ADB;
• ASEAN+3 (ASEAN nations and China, Japan and South Korea);
• The Group of Twenty, or G20, in which it is the only ASEAN member state that concurrently enjoys membership;
• the Islamic Development Bank;
• World Trade Organization;
• the Asia Pacific Economic Cooperation, or APEC, where it was one of the 12 founding economies and continues to play an important role;
• the Asian Infrastructure Investment Bank, an initiative by the government of China that aims to support the building of infrastructure in the Asia-Pacific region; and
• the Indian Ocean Rim Association.
Indonesia also seeks to lead other developing countries through its membership in the following organizations of developing countries: the Non-Aligned Movement, the Organization of the Islamic Conference, the Group of 77 and China, the Developing 8, the Group of 15, and as observer at the G-24 Forum.
20

Table of Contents
The Republic has been a member of the Organization of Petroleum Exporting Countries, or OPEC, since 1962. In view of the shift in its status from a net exporter to a net importer of oil, the Republic suspended its membership in OPEC effective January 2009. The Republic reactivated its OPEC membership effective January 2016, but due to policy considerations and its continuing status as a net importer of oil, the Republic decided to suspend its OPEC membership during the November 30, 2016 OPEC meeting. On May 24, 2017, Indonesia sent OPEC a letter requesting reactivation of its membership on the condition that Indonesian crude oil production would not have to be cut.
Indonesia became a member of the Indian Ocean Rim Association, or IORA (an association that connects countries along the Indian Ocean region) in 1997. Since joining IORA, Indonesia has been an active member and has directly engaged in a number of initiatives and Indonesia continues to promote economic and maritime diplomacy in the Indian Ocean region. Recently, Indonesia hosted the leader’s summit of IORA in Jakarta in March 2017, which concluded with the enactment of the IORA Concord (also referred to as the Jakarta Concord), which aims to lay the foundation and set the course for cooperation within IORA in the coming years to overcome the increasingly complex problems in the Indian Ocean region.
The following table shows Indonesia’s capital participation in major international financial organizations as of September 30, 2017.
As ofSeptember 30, 2017contributed capital
Name of organizationDate of
admission Subscribed Paid in(in millions of U.S. dollars)
Asian Development Bank 1966 7,696.0(1) 408.6(1)
IMF 1996(2) 6,569.6(1) 6,569.6(1)
World Bank GroupInternational Bank for Reconstruction and Development 1966(2) 2,303.1 167.2International Development Association 1968 33.7 20.7International Finance Corporation 1968(3) 31.6 31.6Multilateral Investment and Guarantee Agency 1986 18.5 3.8
Islamic Development Bank(4) 1975 1,608.0 181.6International Islamic Trade Finance Corporation 1992 2.1 2.1The Islamic Corporation for the Insurance of Investment and Export Credit 1992 0.7 0.2Islamic Corporation For The Development Of The Private Sector 1992 21.8 7.8
International Fund for Agricultural Development 1977 65.0 65.0Common Fund for Commodities 1980 1.3 1.3Credit Guarantee and Investment Facility 2012 12.6 12.6ASEAN Infrastructure Investment Bank 2015 672.1 268.8ASEAN Infrastructure Fund(5) 2012 120.0 120.0International Rubber Consortium Limited 2002 4.0 4.0
Source: Bank Indonesia and Ministry of Finance (1) Denominated in SDR of the IMF. Converted to U.S. dollars using the exchange rate on September 29, 2017 of U.S.$1.413 to SDR 1. (2) Indonesia rejoined the IMF and The International Bank for Reconstruction and Development in 1966, it originally became a member of these organizations in 1954
and resigned its memberships in 1965. (3) Indonesia rejoined the International Finance Corporation in 1968, it originally became a member in 1956 and resigned its membership in 1961. (4) Denominated in ID (ID 1 = SDR 1). See footnote (1) above. (5) As of January 2015.
21

Table of Contents
Foreign Relations
Indonesia embraces a foreign policy that is free and active while remaining committed to playing an important role in the maintenance of peace and security in the world. This policy is ingrained in Indonesia’s Constitution and is further testament that the aspirations of the international community as enshrined in the Charter of the United Nations is aligned to that of Indonesia. In this respect, Indonesia assumes leadership roles in advancing the interests of not just certain blocs of like-minded countries, as is likely the norm in international relations but rather continuously and persistently assumes the bridge-building negotiating role in constructing platforms that accommodate the interests of all countries for the common benefit of all.
Indonesia continues its active participation in the forums deemed crucial to how life would turn out for the billions in the world for decades to come. In this context, Indonesia has shown active participation in the Third International Conference on Financing for Development held in Addis Ababa, Ethiopia, from July 13 to 16, 2015, the United Nations Sustainable Development Summit held in New York, United States of America, from September 25 to 27, 2015, the G20 Summit held in Antalya, Turkey, from November 15 to 16, 2015, the 21st session of the Conference of the Parties of the United Nations Framework Convention on Climate Change held in Paris, France, from November 30, 2015 to December 11, 2015, the G20 Summit held in Hangzhou, China from September 3 to 5, 2016, the APEC Summit held in Lima, Peru from November 19 to 20, 2016, the G20 Summit held in Hamburg, Germany from July 7 to 8, 2017 and the APEC Summit held in Da Nang, Vietnam from November 11 to 12, 2017.
In recognition of Indonesia’s active role in reducing hunger and malnutrition in the country as mandated by the Millennium Development Goals, or MDGs, the Government received an award from the United Nations Food and Agriculture Organization which was presented during a special event on June 7, 2015 with the theme Completing the MDGs Round: Recognizing Achievements in the Fight Against Hunger.
In recent times, Indonesia has enjoyed increasingly close and strong relations with Australia. In August 2014, the two countries signed a reaffirmation of the 2006 “Lombok Treaty,” which provided a framework for security cooperation. The 2014 agreement further emphasized the importance of intelligence and security cooperation based on the principles of mutual trust and respect between the two countries. Following the signing of the agreement, information sharing and the exchange of intelligence cooperation, joint coordinated patrol and military exercises and cooperation against human trafficking have been restored.
Indonesia and China encourage the implementation of the ASEAN-China Maritime Cooperation Year 2015 as stipulated in the 17th ASEAN-China Summit in Nay Pyi Taw.
Maritime Boundaries Delimitation and the South China Sea
The Government has a nine priority agenda, known as the Nawa Cita (nine objectives), to implement the vision of “realization of sovereign, independent, and characteristically Indonesia, based on mutual cooperation.” In line with the Nawa Cita, the Government has conducted border diplomacy with its ten neighboring countries, namely, India, Thailand, Malaysia, Singapore, Vietnam, the Philippines, Palau, Papua New Guinea, Timor Leste, and Australia.
Indonesia has agreed on the following maritime boundaries:
• Several Territorial Sea boundaries with Malaysia (northern part of the Malacca Strait) and Singapore (central, western and eastern part of the Singapore Strait), and completion of all Territorial Sea boundaries with Papua New Guinea;
• Exclusive Economic Zone with the Philippines, Australia, and Papua New Guinea; and
• Continental Shelf with India, Thailand, Malaysia (Malacca Strait and South China Sea), Vietnam, Australia and Papua New Guinea.
22

Table of Contents
Negotiations on the following maritime boundaries are ongoing:
• Remaining segments of Territorial Sea boundaries with Malaysia, Singapore and Timor-Leste;
• Exclusive Economic Zone with India, Thailand, Malaysia, Vietnam, Palau and Timor-Leste; and
• Continental Shelf with Malaysia, the Philippines, Palau, and Timor Leste.
Indonesia aims to resolve these maritime boundaries through peaceful and diplomatic channels in accordance with international law.
Indonesia is working to ensure its national interest and to ensure that stability and security are maintained in the South China Sea. These aims are advanced both on a bilateral basis with China as well as through initiatives advanced through ASEAN. In line with this, in November 2017, China and the ten member states of the ASEAN, including Indonesia, announced an agreement to begin discussions on a Code of Conduct, or COC, to implement the 2002 ASEAN-China Declaration on the Conduct of Parties in the South China Sea (frequently referred to as the DOC) based on a negotiating framework agreed in August 2017. Most recently, the Ministry of Foreign Affairs hosted a workshop on the South China Sea in November 15-17, 2017 attended by representatives from Brunei Darussalam, China, the Philippines, Indonesia, Laos, Malaysia, Myanmar, Singapore, Vietnam and Taiwan to explore opportunities for cooperation between stakeholders and encourage dialogue on cooperation projects and maritime borders. Indonesia is also scheduled to host the 7th ASEAN Maritime Forum and the 5th Expanded ASEAN Maritime Forum in December 2017. Matters to be discussed in these forums include the importance of strengthening linkages in maritime cooperation to further promote mutual trust and confidence to ensure security, peace and stability in the region, including matters relating to safety and freedom of navigation and overflight.
While Indonesia does not have overlapping territorial claims in the South China Sea with China, it continues to establish communication and consultation with China to push for dispute resolution and the avoidance of conflict in this area. In May of 2017, the foreign ministers of Indonesia and China signed a Plan of Action for the Implementation of the Comprehensive Strategic Partnership for 2017-2012, which included China’s commitment to the full implementation of the DOC and to expedite the adoption of a COC. Indonesia has also encouraged cooperation between the Indonesian Maritime Security Board and the Chinese Coast Guard to enhance mutual trust and prevent potential conflict.
Indonesia continues to pursue the economic development of its exclusive economic zone off the coast of the Natuna Islands in the North Natuna Sea (which is also referred to as a part of the South China Sea). According to press reports, Indonesia has taken action against foreign-flagged fishing vessels in this zone, which have included Chinese vessels, which China has said is a traditional Chinese fishing ground.
Economy and Gross Domestic Product
Introduction
Indonesia has a balanced and diversified economy. The main challenges currently facing Indonesia’s economy include uncertainty in relation to the global economic recovery and commodity prices, which are crucial factors in determining the Republic’s export performance.
Domestically, factors that affect the economy are demographic growth and job creation, the country’s progress in implementing its infrastructure programs, maintaining relatively stable and low inflation and balancing domestic budgetary pressures against the burden of serving external debt.
23

Table of Contents
Principal Sectors of the Economy
Indonesia’s principal economic sectors are manufacturing industry (including coal, oil and gas); agriculture, forestry and fishery; wholesale and retail trade, repair of motor vehicles and motorcycles; construction; and mining and quarrying.
24

Table of Contents
The tables below show the composition of Indonesia’s GDP by sector at current prices and constant market prices, respectively, for the periods indicated.
Gross Domestic Product by Industry (at current prices)
Year Ended December 31,
For the NineMonths EndedSeptember 30,
2012 % 2013 % 2014 % 2015 % 2016 % 2017P %(in billions of Rupiah and percentage of GDP)
Manufacturing IndustryCoal Industry and Oil and Gas Refining 298,403 3.5 314,216 3.3 337,201 3.2 320,330 2.8 286,061 2.3 231,607 2.3Non-Coal, Oil and Gas Manufacturing Industries 1,549,748 18.0 1,693,211 17.7 1,890,383 17.9 2,098,047 18.2 2,258,515 18.2 1,809,195 17.9Total Manufacturing Industry 1,848,151 21.5 2,007,427 21.0 2,227,584 21.1 2,418,376 21.0 2,544,576 20.5 2,040,802 20.2
Wholesale and Retail Trade; Repair of Motor Vehicles and Motorcycles 1,138,484 13.2 1,261,146 13.2 1,419,239 13.4 1,535,288 13.3 1,635,960 13.2 1,319,897 13.1
Agriculture, Forestry, and FisheryAgriculture, Livestock, Hunting, & Agriculture
Services 902,126 10.5 994,778 10.4 1,089,550 10.3 1,183,971 10.3 1,266,361 10.2 1,070,480 10.6Forestry and Logging 65,882 0.8 69,599 0.7 74,618 0.7 82,860 0.7 85,545 0.7 65,643 0.7Fishery 184,254 2.1 210,671 2.2 245,488 2.3 288,917 2.5 317,092 2.6 259,488 2.6Total Agriculture, Forestry, and Fishery 1,152,262 13.4 1,275,048 13.4 1,409,656 13.3 1,555,747 13.5 1,668,998 13.5 1,395,611 13.8
Mining and QuarryingOil, Gas and Geothermal Mining 492,894 5.7 520,088 5.4 509,783 4.8 384,516 3.3 369,354 3.0 288,365 2.9Coal and Lignite Mining 270,519 3.1 281,193 2.9 259,767 2.5 229,974 2.0 231,698 1.9 236,048 2.3Metal Ore 100,845 1.2 98,468 1.0 93,615 0.9 74,264 0.6 73,301 0.6 66,072 0.7Other Mining and Quarrying 136,050 1.6 149,996 1.6 176,258 1.7 192,940 1.7 219,595 1.8 163,262 1.6Total Mining and Quarrying 1,000,308 11.6 1,050,746 11.0 1,039,423 9.8 881,694 7.6 893,947 7.2 753,748 7.5
Construction 805,208 9.3 905,991 9.5 1,041,950 9.9 1,177,084 10.2 1,287,659 10.4 1,029,692 10.2Government Administration, Defense
Compulsory Social Security 340,568 4.0 372,195 3.9 404,630 3.8 450,233 3.9 478,636 3.9 362,627 3.6Information and Communication 311,362 3.6 341,009 3.6 369,457 3.5 405,992 3.5 449,141 3.6 382,012 3.8Transportation and Warehousing 313,156 3.6 375,306 3.9 466,969 4.4 579,060 5.0 647,154 5.2 540,505 5.4Financial and Insurance Service 320,534 3.7 370,132 3.9 408,439 3.9 465,020 4.0 520,926 4.2 427,814 4.2Education Service 270,372 3.1 307,862 3.2 341,818 3.2 388,042 3.4 418,258 3.4 321,340 3.2Other* 929,294 10.8 1,041,470 10.9 1,177,068 11.1 1,312,730 11.4 1,418,520 11.4 1,153,681 11.4Gross Value Added at Basic Prices 8,429,700 97.8 9,308,332 97.5 10,306,232 97.5 11,169,265 96.9 11,963,776 96.4 9,727,728 96.4Taxes less Subsidies on Products 186,005 2.2 237,802 2.5 263,473 2.5 362,452 3.1 443,034 3.6 367,001 3.6Total GDP 8,615,705 100.0 9,546,134 100.0 10,569,705 100.0 11,531,717 100.0 12,406,810 100.0 10,094,728 100.0
Source: BPS P Preliminary. * Includes the Procurement of Electricity and Gas; Procurement of Water, Management of Trash, Waste and Recycle; Accommodation and Food Beverages Supply; Real Estate; Corporate Services; Health
Service and Social Activity; and Other Services sectors.
25

Table of Contents
Gross Domestic Product by Industry (at constant 2010 prices)
Year Ended December 31,
For the NineMonths EndedSeptember 30,
2017P
2012 % 2013 % 2014 % 2015 % 2016P % 2017P %(in billions of Rupiah and percentage of GDP)
Manufacturing IndustryCoal Industry and Oil and Gas Refining 227,456 2.9 221,450 2.7 216,751 2.5 214,312 2.4 221,263 2.3 166,444 2.3Non-Coal, Oil and Gas Manufacturing
Industries 1,470,331 19.0 1,550,512 19.0 1,637,506 19.1 1,720,221 19.2 1,796,293 19.0 1,406,076 19.0Total Manufacturing
Industry 1,697,787 22.0 1,771,962 21.7 1,854,257 21.6 1,934,533 21.5 2,017,555 21.4 1,572,520 21.4Wholesale and Retail Trade;
Repair of Motor Vehicles and Motorcycles 1,067,912 13.8 1,119,272 13.7 1,177,298 13.7 1,207,751 13.4 1,255,225 13.3 981,945 13.3Agriculture, Forestry, and
FisheryAgriculture, Livestock, Hunting, & Agriculture
Services 816,304 10.6 847,764 10.4 880,390 10.3 906,805 10.1 935,455 9.9 770,292 10.3Forestry and Logging 58,872 0.8 59,229 0.7 59,574 0.7 60,757 0.7 59,709 0.6 45,421 0.6Fishery 164,264 2.1 176,149 2.2 189,090 2.2 204,017 2.3 214,523 2.3 169,513 2.3Total Agriculture, Forestry,
and Fishery 1,039,441 13.5 1,083,142 13.3 1,129,053 13.2 1,171,579 13.0 1,209,687 12.8 985,227 13.2Mining and Quarrying
Oil, Gas and Geothermal Mining 323,632 4.2 313,328 3.8 307,162 3.6 307,326 3.4 315,504 3.3 230,761 3.2Coal and Lignite Mining 230,589 3.0 247,595 3.0 251,074 2.9 232,725 2.6 223,099 2.4 171,633 2.4Metal Ore 91,615 1.2 98,609 1.2 98,258 1.1 87,703 1.0 89,303 0.9 68,644 0.9Other Mining and
Quarrying 125,726 1.6 131,523 1.6 137,996 1.6 139,573 1.6 147,580 1.6 114,718 1.5Total Mining and
Quarrying 771,562 10.0 791,054 9.7 794,490 9.3 767,327 8.5 775,486 8.2 585,755 7.9Construction 728,226 9.4 772,720 9.5 826,616 9.7 879,164 9.8 925,063 9.8 725,086 9.8Government Administration, Defense
Compulsory Social Security 282,235 3.7 289,449 3.5 296,330 3.5 310,054 3.5 319,953 3.4 235,763 3.2Information and
Communication 316,279 4.1 349,150 4.3 384,476 4.5 421,741 4.7 459,170 4.9 373,482 5.1Transportation and
Warehousing 284,663 3.7 304,506 3.7 326,933 3.8 348,774 3.9 375,764 4.0 300,908 4.0Financial and Insurance
Service 280,896 3.6 305,515 3.7 319,826 3.7 347,309 3.9 378,235 4.0 299,797 4.1Education Service 232,704 3.0 250,016 3.1 263,685 3.1 283,020 3.2 293,878 3.1 220,128 3.0Other* 858,558 11.1 916,526 11.2 978,408 11.4 1,028,927 11.5 1,086,176 11.5 852,293 11.5Gross Value Added at Basic Prices 7,560,263 97.8 7,953,312 97.5 8,351,369 97.5 8,700,179 96.9 9,096,191 96.4 7,132,903 96.6Taxes less Subsidies on
Products 166,821 2.2 203,186 2.5 213,498 2.5 282,332 3.1 336,844 3.6 268,944 3.6Total GDP 7,727,083 100.0 8,156,498 100.0 8,564,867 100.0 8,982,511 100.0 9,433,034 100.0 7,401,847 100.0
Source: BPS P Preliminary. * Includes the Procurement of Electricity and Gas; Procurement of Water, Management of Trash, Waste and Recycle; Accommodation and Food Beverages Supply; Real Estate; Corporate Services; Health
Service and Social Activity; and Other Services sectors.
26

Table of Contents
Manufacturing Industry
Indonesia’s principal manufacturing industries include food products and beverages, coal and refined petroleum products, fabricated metal products, computer, electronic and optical products and electrical equipment. Other major manufacturing industries include transport equipment and chemicals, pharmaceuticals and botanical products. Manufacturing has been the largest contributor to economic growth since the 1980s. The manufacturing industry sector consists of the sub-sectors of (i) coal industry and oil and gas refining and (ii) non-coal, oil and gas manufacturing industries.
In 2012, Indonesia’s manufacturing industries grew by 5.6%. Non-coal, oil, and gas manufacturing industries grew by 7.0% during 2012 mainly driven by the chemical, pharmacy, and traditional medicine manufacturing sub-sector, which grew by 12.8%. Coal, oil and gas manufacturing industries declined by 2.4% in 2012 due to a decrease in coal manufacturing, LNG manufacturing and petroleum refining.
In 2013, Indonesia’s manufacturing industries grew by 4.4%, compared to a rate of 5.6% in the previous year. Non-coal, oil and gas manufacturing industries grew by 5.5% during 2013 mainly driven by the transport equipment manufacturing sub-sector, which grew by 15.0%. Coal, oil and gas manufacturing industries declined by 2.6% in 2013, primarily due to a contraction in coal manufacturing, LNG manufacturing and petroleum refining.
In 2014, Indonesia’s manufacturing industries grew by 4.6%, compared to a rate of 4.4% in the previous year. Non-coal, oil and gas manufacturing industries grew by 5.6% during 2014 mainly driven by the food and beverage manufacturing sub-sector, which grew by 9.5%. Coal, oil and gas manufacturing industries declined by 2.1% in 2014, primarily due to a contraction in LNG manufacturing and petroleum refining, which was partially offset by an increase in coal manufacturing.
In 2015, Indonesia’s manufacturing industries grew by 4.3%, compared to 4.6% in the previous year. Non-coal, oil and gas manufacturing industries grew by 5.1% during 2015 mainly driven by the metal goods industry, computers, electronics, optics, and electrical equipment sub-sector, which grew by 7.8%. Coal, oil, and gas manufacturing industries declined by 1.1% in 2015, primarily due to a contraction in LNG manufacturing and petroleum refining, which was partially offset by an increase in coal manufacturing.
In 2016, Indonesia’s manufacturing industries grew by 4.3%, the same as in the previous year. Non-coal, oil and gas manufacturing industries grew by 4.4% during 2016, mainly driven by growth in the food and beverage manufacturing sub-sector, which grew by 8.5%. Coal, oil, and gas manufacturing industries grew by 3.2% during 2016 compared to the previous year, primarily due to the demand recovery in the industry, after experiencing a downturn driven by declines in commodities prices.
During the nine months ended September 30, 2017, Indonesia’s manufacturing industries grew by 4.2% compared to 4.6% in the same period in 2016. Non-coal, oil and gas manufacturing industries grew by 4.7% during the nine months ended September 30, 2017, mainly driven by growth in the chemicals, pharmaceuticals and botanical manufacturing sub-sector, which grew by 6.8%. Coal, oil, and gas manufacturing industries contracted by 0.1% during the nine months ended September 30, 2017 compared to the same period in 2016 primarily due to maintenance and renovation works carried out on refineries by operators as well as decreased investment into the oil and gas sector due to the low oil price environment, which partially offset the 3.6% growth in coal production.
Wholesale and retail trade; repair of motor vehicles and motorcycles
The wholesale and retail trade; repair of motor vehicles and motorcycles sector includes wholesale and retail trade, as well as the repair of motor vehicles, including motorcycles. In recent years, this has generally been the third largest segment of the economy, behind manufacturing and agriculture, forestry and fishery.
27

Table of Contents
In 2012, the wholesale and retail trade; repair of motor vehicles and motorcycles sector grew by 5.4%. This growth was driven by the wholesale of non-cars and motorcycles sub-sector, which grew by 5.1% and the wholesale and retail trade of cars, motorcycles and repairs sub-sectors, which grew by 6.6% in 2012.
In 2013, the wholesale and retail trade; repair of motor vehicles and motorcycles sector grew by 4.8%, compared to 5.4% in 2012. Growth in this sector was driven primarily by growth in the wholesale and retail trade of cars, motorcycles, and repairs sub-sectors, which grew by 7.3%. The wholesale and retail trade of non-cars and motorcycles sub-sectors grew by 4.1% in 2013.
In 2014, the wholesale and retail trade; repair of motor vehicles and motorcycles sector grew by 5.2%, compared to 4.8% in 2013. This growth was driven by the wholesale of non-cars and motorcycles sub-sector, which grew by 5.2% and the wholesale and retail trade of cars, motorcycles, and repairs sub-sector, which grew by 5.0% in 2014.
In 2015, the wholesale and retail trade; repair of motor vehicles and motorcycles sector grew by 2.6%, compared to 5.2% growth in 2014. Growth in this sector was mainly driven by the wholesale of non-cars and motorcycles sub-sector, which grew by 3.1%. The wholesale and retail trade of cars, motorcycles, and repairs sub-sector grew by 0.3% in 2015.
In 2016, the wholesale and retail trade; repair of motor vehicles and motorcycles sector grew by 3.9%, compared to 2.6% 2015. This growth was mainly driven by the wholesale and retail trade of non-cars and motorcycles sub-sector, which grew by 4.0%. The wholesale and retail trade of cars, motorcycles, and repairs sub-sector also grew by 3.8% in 2016.
During the nine months ended September 30, 2017, the wholesale and retail trade, repair of motor vehicles and motorcycles sector grew by 4.8%. This growth was mainly driven by the wholesale and retail trade of non-cars and motorcycles sub-sector, which grew by 4.9%. The wholesale and retail trade of cars, motorcycles, and repairs sub-sector also grew by 4.1% during the nine months ended September 30, 2017 compared to the same period in 2016.
Agriculture, forestry and fishery
The agriculture, forestry and fishery sector consists of the sub-sectors of (i) agriculture, livestock, hunting & agriculture services, (ii) forestry and logging and (iii) fishery.
In 2012, the agriculture, forestry, and fishing sector grew by 4.6%. This growth was mainly driven by the fishery sub-sector, which grew by 6.3%. The agriculture, livestock, hunting & agriculture services sub-sector the forestry sub-sector, grew by 4.6% and 0.2%, respectively, in 2012.
In 2013, the agriculture, forestry and fishery sector grew by 4.2%, slower than its growth of 4.6% in 2012. This growth was mainly driven by the fishery sub-sector, which grew by 7.2% compared to 2012. The agriculture, livestock, hunting & agriculture services sub-sector and the forestry sub-sector, grew by 3.9% and 0.6%, respectively, in 2013.
In 2014, the agriculture, forestry, and fishery sector grew by 4.2%, the same rate as in 2013. This growth was mainly driven by the fishery sub-sector, which grew by 7.3% compared to 2013. The agriculture, livestock, hunting & agriculture services sub-sector and the forestry sub-sector, grew by 3.8% and 0.6%, respectively, in 2014.
In 2015, the agriculture, forestry, and fishery sector grew by 3.8%, slower than its growth of 4.2% in 2014. This growth was mainly driven by the fishery sub-sector, which grew by 7.9% compared to 2014. The agriculture, livestock, hunting & agriculture services sub-sector and the forestry sub-sector, grew by 3.0% and 2.0%, respectively, in 2015.
28

Table of Contents
In 2016, the agriculture, forestry, and fishery sector grew by 3.3%, slower than its growth of 3.8% in 2015. This growth was mainly driven by the fishery sub-sector, which grew by 5.1% compared to the same period in 2016. The agriculture, livestock, hunting & agriculture services sub-sector grew by 3.2% while the forestry sub-sector contracted by 1.7% in 2016.
During nine months ended September 30, 2017, the agriculture, forestry, and fishery sector grew by 4.3% compared to 2.7% in the same period in 2016. This growth was mainly driven by the fishery sub-sector, which grew by 6.8% compared to the same period in 2016. The agriculture, livestock, hunting & agriculture services sub-sector, and the forestry sub-sector grew by 3.9% and 2.1%, respectively, during the nine months ended September 30, 2017.
The following table sets forth production statistics for Indonesia’s most important agricultural products for the periods indicated.
Production of Principal Agricultural Products by Sub-sectors
Year Ended December 31,2012 2013 2014 2015 2016
(in thousands of tons)Food crops
Rice 69,056 71,280 70,846 75,398 79,358Cassava 24,177 23,937 23,436 21,801 20,400Corn 19,387 18,512 19,008 19,612 23,578Sweet Potato 2,483 2,387 2,382 2,298 2,136Soybeans (shelled) 843 780 955 963 675Peanuts (shelled) 713 702 639 605 510Mung bean 284 205 245 271 190
Estate cash cropsDry Rubber 3,012 3,237 3,153 3,145 3,158Coffee 691 676 644 639 639Cocoa 741 721 728 593 657Tea 146 145 154 133 144Sugarcane 2,592 2,551 2,579 2,498 2,223Tobacco 261 164 198 194 196Palm Oil 26,016 27,782 29,278 31,070 33,229LivestockMeat 2,669 2,882 2,925 3,057 3,356Eggs 1,629 1,728 1,753 1,896 2,031Milk 960 787 801 835 913
Fish productsCaptured Fish 5,829 6,115 6,484 6,678 6,399Farmed Fish 9,676 13,301 14,359 15,634 16,675
Forestry(1)
Logs 30,908 32,456 36,975 38,813 37,552Sawn Timber 1,100 993 1,159 1,765 1,820Plywood 3,311 3,262 3,579 3,641 3,636
Sources: BPS, Ministry of Agriculture, Ministry of Marine Affairs and Fishery, and Ministry of Environment and Forestry (1) All units are in thousands of cubic meters.
29

Table of Contents
Mining and Quarrying
Indonesia is a significant player in the global mining and quarrying industry with significant production of natural gas, coal, crude oil, tin, nickel, bauxite and copper.
In 2012, the mining and quarrying sector grew by 3.0%, primarily due to growth in the coal and lignite mining and the other mining and quarrying sub-sectors, which grew by 15.7% and 6.0%, respectively. This was partially offset by a contraction in the metal ore and oil, gas and geothermal mining sub-sector, which contracted 4.0% and 3.6%, respectively.
In 2013, the mining and quarrying sector grew by 2.5% compared to 3.0% in the previous year, primarily due to growth in the metal ore, coal and lignite mining, and the other mining and quarrying sub-sectors, which grew by 7.6%, 7.4% and 4.6%, respectively. This was partially offset by a 3.2% contraction in the oil, gas and geothermal mining sub-sector.
In 2014, the mining and quarrying sector grew by 0.4%, compared to 2.5% in the previous year, primarily due to growth in the other mining and quarrying and the coal and lignite mining sub-sectors, which grew by 4.9% and 1.4%, respectively. This was partially offset by contraction in the oil, gas and geothermal mining and the metal ore sub-sectors, which contracted by 2.0% and 0.4%, respectively.
In 2015, the mining and quarrying sector contracted by 3.4% compared to an increase of 0.4% the previous year, primarily due to contraction in the metal ore and the coal and lignite mining sub-sector, which contracted by 10.7% and 7.3%, respectively. This was partially offset by growth in the other mining and quarrying and the oil, gas and geothermal mining sub-sector which were 1.1% and 0.1%, respectively.
In 2016, the mining and quarrying sector grew by 1.1% compared to a contraction by 3.4% the previous year, primarily due to growth in the other mining and quarrying, the oil, gas and geothermal mining, and the metal ore sub-sectors, which grew by 5.7%, 2.7% and 1.8%, respectively. This was partially offset by a 4.1% contraction in the coal and lignite mining sub-sector in 2016.
During the nine months ended September 30, 2017, the mining and quarrying sector grew by 1.2% compared to 0.9% in the same period in 2016, primarily due to growth in the metal ore mining, the other mining and quarrying, and the coal and lignite mining sub-sectors, which grew by 4.6%, 3.8%, and 3.6%, respectively. This was partially offset by contraction in the oil, gas and geothermal mining sub-sector, which contracted by 2.8% during the nine months ended September 30, 2017.
As products in the mining and quarrying sector are internationally traded commodities with prices set by the world markets, the performance of this sub-sector is primarily affected by international market prices. See “— Foreign Trade and Balance of Payments — Exports and Imports.”
Oil and Natural Gas
The oil and gas market in Indonesia is characterized by the presence of large, diversified companies with highly vertically integrated operations throughout oil exploration, production, refining, transportation and marketing. In 2015 and 2016, the contribution of the Indonesian oil and gas industry to Indonesia’s GDP decreased due to a decrease in international crude oil prices. Oil and gas exports are Indonesia’s largest exports, contributing approximately 8.9% of total exports in 2016, and approximately 5.2% of the Government’s domestic revenue (inclusive of income tax revenue from the oil and gas sub-sector) in 2016. Pertamina, an SOE, plays an important role in the production of oil and gas in Indonesia.
30

Table of Contents
The following table sets forth crude oil production by source for the periods indicated.
Crude Oil Production by Source(1)
Year Ended December 31,Nine Months Ended
September 30,2012 2013 2014 2015 2016 2017P
(in millions of barrels)Pertamina 45 44 42 32 30 14Production sharing contracts(2) 269 257 247 243 274 132Total 314 300 289 275 304 145
Source: Ministry of Energy and Mineral Resources P Preliminary. (1) Includes production of crude oil condensate. (2) Most of the production under production sharing contracts is provided to Pertamina. Production sharing contracts are a common type of joint cooperation contract
used in Indonesia’s oil and gas upstream sector, under which the Government and the contractor agree to split the production measured in revenue based on agreed percentages.
The table below sets forth Indonesia’s proven crude oil reserves for the periods indicated based on estimates prepared by the Ministry of Energy and Mineral Resources’ Reserve Oil and Gas Evaluation Team, which is composed of representatives from the Oil and Gas Directorate of the Ministry of Energy and Mineral Resources, the Center of Research and Development of Oil and Gas Technology of the Ministry of Energy and Mineral Resources, as well as SKK Migas, which are based on the applicable Annual Reserve Oil and Gas Report received by SKK Migas from various oil and gas contractors. SKK Migas is a government entity responsible for supervising upstream oil and gas activities. Proven crude oil reserves include developed and undeveloped volumes that are economically recoverable at either current prices or forecasted future prices as calculated by each relevant contractor under the coordination of SKK Migas. Estimates of proven crude oil reserves are comparable to estimates prepared using international standards and includes total volume without regard to the direct economic benefit of Indonesia. Estimates are prepared pursuant to the Petroleum Resources Management System sponsored by the Society of Petroleum Engineers.
Proven Crude Oil Reserves
Year Proven Crude Oil Reserves(in million stock tank barrels)
2012 3,741.32013 3,692.52014 3,624.52015 3,602.52016 3,306.9
Source: Ministry of Energy and Mineral Resources
31

Table of Contents
The following table sets forth Indonesia’s crude oil exports by source for the periods indicated.
Crude Oil Exports(1)
Year Ended December 31,
NineMonths EndedSeptember 30,
2012 2013 2014 2015 2016 2017P
(in millions of barrels)Production sharing contracts(2) 85 96 96 123 127 77.1Government and government-designated(3) 20 21 14 5 0 0.8Total 105 117 110 128 127 77.9
Source: Ministry of Energy and Mineral Resources P Preliminary. (1) Includes exports of crude oil condensate. (2) Most of the production under production sharing contracts is provided to Pertamina. Production sharing contracts are a common type of joint cooperation contract
used in Indonesia’s oil and gas upstream sector, under which the Government and the contractor agree to split the production measured in revenue based on agreed percentages.
(3) Exports by Pertamina and entities designated by SKK Migas are reported together.
The following table sets forth the average price of Indonesian crude oil, measured by the ICP, for the periods indicated.
Average Price of Crude Oil
Year Ended December 31,Nine Months Ended
September 30,2012 2013 2014 2015 2016 2017P
(in U.S. dollars per barrel)ICP(1) 112.7 106.0 97.0 49.2 40.1 48.8
Sources: Directorate General of Oil and Gas, Ministry of Energy and Mineral Resources P Preliminary. (1) For a description of the ICP, see “Certain Defined Terms and Conventions.”
The following table sets forth natural gas production by source for the periods indicated.
Natural Gas Production by Source(1)
Year Ended December 31,Nine Months Ended
September 30,2012 2013 2014 2015 2016 2017P
(in millions of cubic feet)Pertamina 330 295 309 323 299 147Production sharing contracts(2) 2,281 2,304 2,267 2,195 2,222 1,026Total 2,611 2,599 2,576 2,518 2,521 1,173
Source: Ministry of Energy and Mineral Resources P Preliminary.
32

Table of Contents
(1) Includes LPG. (2) Most of the production under production sharing contracts is provided to Pertamina. Production sharing contracts are a common type of joint cooperation contract
used in Indonesia’s oil and gas upstream sector, under which the Government and the contractor agree to split the production measured in revenue based on agreed percentages.
The table below sets forth Indonesia’s proven natural gas reserves for the periods indicated based on estimates prepared by the Ministry of Energy and Mineral Resources’ Reserve Oil and Gas Evaluation Team, which is composed of representatives from the Oil and Gas Directorate of the Ministry of Energy and Mineral Resources, the Center of Research and Development of Oil and Gas Technology of the Ministry of Energy and Mineral Resources, as well as SKK Migas, which are based on the applicable Annual Reserve Oil and Gas Report received by SKK Migas from various oil and gas contractors. Proven natural gas reserves represent marketable volumes that generate sales revenue. Estimates of proven natural gas reserves are comparable to estimates prepared using international standards and includes total volume without regard to the direct economic benefit of Indonesia. Estimates are prepared pursuant to the Petroleum Resources Management System sponsored by the Society of Petroleum Engineers.
Proven Natural Gas Reserves
Year Proven Natural Gas Reserves (in trillions of standard cubic feet of gas)
2012 103.32013 101.52014 100.32015 98.02016 101.2
Source: Ministry of Energy and Mineral Resources
Minerals
The Republic’s major mineral products are coal, nickel, copper and bauxite, and it has substantial resources of each of these minerals. In recent years, the Government has pursued policies designed to increase the production and export of value-added products using these mineral resources.
Grasberg Copper Mine
Under Law No. 4 of 2009 on Mineral and Coal Mining enacted by the Government in January 2009, or the Mining Law, two new types of licenses were created: ijin usaha pertambangan, or IUP, and ijin usaha pertambangan khusus, or IUPK. Subsequent to the enactment of the Mining Law, the Government issued various regulations thereunder, including (i) regulations mandating the domestic processing and refining of minerals, (ii) regulations requiring the reclamation of areas affected by mining activities, (iii) regulations related to local community development and empowerment, optimization and conservation of mineral resources, and job opportunities for local mining service providers and local communities surrounding a mining area and (iv) regulations relating to procedures for the granting of a production operation special mining permit, which provide guidelines for the granting of an operation production IUPK in order to continue the operation of a contract of work.
Pursuant to the Mining Law, contracts of work issued under the prior mining law, including Freeport’s , contract of work, will remain valid until the end of their terms. Under the current regulations, however, contract of work holders, including Freeport, are required to refine their mining products in Indonesia and, contract of work holders, including Freeport, are required to convert their contract of work into an IUPK to continue the export of concentrate.
33

Table of Contents
On February 20, 2017, Freeport-McMoRan Inc., the parent company of PT Freeport Indonesia, or Freeport, the operator of the Grasberg copper mine in the province of Papua, announced that Freeport had provided to the Government formal notice of an impending dispute pursuant to the dispute resolutions provisions of the contract of work entered into between Freeport and the Government.
On April 4, 2017, the Government granted Freeport a temporary special mining permit, which was effective from February 2017 to October 2017. In August 2017, Freeport agreed to convert its contracts of work into an IUPK and to transfer to Indonesia a 51% stake in the Grasberg copper mine. The timing and valuation for the transfer of the 51% stake is still under discussion. Freeport also agreed to build a smelter to process copper concentrate in Indonesia in order to support job creation and increase the amount of processing work done in Indonesia. In exchange, the Government agreed to grant Freeport an initial five-year license expiring in 2021 and to extend Freeport’s permit to operate the mine for two additional ten-year terms until 2041, subject to the construction of certain smelters, submission of the applicable permit applications and certain other conditions.
Construction
Over the last five years, besides the development of a basic public services infrastructure, the main drivers of the construction sector were improvement works in the areas of communications and logistics infrastructure, transportation and electrification.
In 2012, the construction sector grew by 6.6%, primarily due to infrastructure development and construction in the private sector.
In 2013, the construction sector grew by 6.1% compared to a growth of 6.6% in 2012, primarily due to a slowdown in Government budget disbursements compared to the previous year.
In 2014, the construction sector grew by 7.0% compared to a growth of 6.1% in 2013, primarily due to an increase in the production of construction raw materials.
In 2015, the construction sector grew by 6.4% compared to a growth of 7.0% in 2014, primarily due to an acceleration of the implementation of Government development projects in the fourth quarter of 2015.
In 2016, the construction sector grew by 5.2% compared to a growth of 6.4% in 2015, primarily due to several infrastructure projects implemented by the public and private sectors such as airports, industrial zones, bridges, and highways.
During the nine months ended September 30, 2017, the construction sector grew by 6.7% compared to a growth of 5.6% in the same period in 2016, primarily due to several infrastructure projects conducted by the public and private sectors such as roads, high ways, light rail transit, and bridges.
Transportation and Warehousing
The transportation and warehousing sector comprises the sub-sectors of (i) railway transport, (ii) land transport, (iii) sea transport, (iv) river, lake and ferry transport, (v) air transport and (vi) warehousing and support activities for transportation; postal and courier.
In 2012, the transportation and warehousing sector grew by 7.1%. The sea transport and the road transportation sub-sectors grew by 8.7% and 7.5%, respectively. The warehousing and support activities for the transportation; postal and courier sub-sectors grew by 6.5%.
In 2013, the transportation and warehousing sector grew by 7.0% compared to 7.1% in 2012. The warehousing and support activities for the transportation; postal and courier and road transport sub-sectors grew by 8.0% and 7.5%, respectively.
34

Table of Contents
In 2014, the transportation and warehousing sector grew by 7.4%, compared to 7.0% in 2013. The railway transport sub-sector had the highest growth, which grew by 20.8% in 2014 compared to the previous year.
In 2015, the transportation and warehousing sector grew by 6.7%, compared to 7.4% in 2014. The air transport sub-sector had the highest growth, which grew by 9.4% in 2014 compared to the previous year.
In 2016, the transportation and warehousing sector grew by 7.7% compared to 6.7% in 2015. The sub-sector contributing the highest growth was air transport at 13.3%, followed by land transport at 7.6% and warehousing and support activities of transportation, postal and courier at 7.5%.
During the nine months ended September 30, 2017, the transportation and warehousing sector grew by 8.3% compared to 7.7% in the same period in 2016. The sub-sector contributing the highest growth was railway transport at 17.7%, followed by air transport at 13.6% and warehousing and support activities for transportation; postal and courier at 8.4%.
Other sectors
None of the other sectors shown in the tables above comprised more than 5% of GDP, at either current prices or constant prices, for the periods indicated.
Gross Domestic Product
In this prospectus, GDP is shown in both current and constant prices. GDP at current prices value a country’s output using the actual prices for each year, while GDP at constant prices (also referred to as “real” GDP) value output using the prices from a base year, thereby eliminating the distorting effects of inflation and deflation.
35

Table of Contents
The following table shows the distribution of GDP in the Indonesian economy by expenditure at current prices and constant prices, respectively, for the periods indicated (at current prices).
Gross Domestic Product by Expenditure
(at current prices)
Year Ended December 31,
Nine MonthsEnded
September 30,2012 % 2013 % 2014 % 2015 % 2016 % 2017P %
(in billions of Rupiah and percentage of GDP)GDP 8,615,705 100.0 9,546,134 100.0 10,569,705 100.0 11,531,717 100.0 12,406,810 100.0 10,094,728 100.0Add: Imports of goods and services 2,152,937 25.0 2,359,212 24.7 2,580,508 24.4 2,389,633 20.7 2,271,178 18.3 1,859,495 18.4Total supply of goods and services 10,768,642 125.0 11,905,346 124.7 13,150,213 124.4 13,921,350 120.7 14,677,988 118.3 11,954,223 118.4Less: Exports of goods and services 2,118,979 24.6 2,283,777 23.9 2,501,425 23.7 2,439,107 21.2 2,367,332 19.1 2,026,118 20.1Total domestic expenditure 8,649,663 100.4 9,621,569 100.8 10,648,788 100.7 11,482,243 99.6 12,310,656 99.2 9,928,105 98.3
Allocation of total domestic expenditure:Household consumption expenditure 4,768,745 55.3 5,321,088 55.7 5,915,194 56.0 6,477,577 56.2 7,009,577 56.5 5,664,544 56.1NPISHs consumption expenditure 89,586 1.0 103,929 1.1 124,242 1.2 130,951 1.1 144,470 1.2 118,739 1.2Government consumption expenditure 796,848 9.2 908,574 9.5 996,197 9.4 1,124,812 9.8 1,172,420 9.4 810,622 8.0Total consumption 5,655,179 65.6 6,333,591 66.3 7,035,634 66.6 7,733,339 67.1 8,326,468 67.1 6,593,905 65.3Gross domestic fixed capital formation 2,819,027 32.7 3,051,496 32.0 3,436,924 32.5 3,782,143 32.8 4,040,498 32.6 3,190,132 31.6Change in inventories (residual)(1) 175,457 2.0 236,482 2.5 176,231 1.7 (33.239) (0.3) (56,310) (0.5) 144,067 1.4Total domestic expenditure 8,649,663 100.4 9,621,569 100.8 10,648,789 100.7 11,482,243 99.6 12,310,656 99.2 9,928,105 98.3
Source: BPS P Preliminary. (1) Includes statistical discrepancies.
36

Table of Contents
Gross Domestic Product by Expenditure
(at constant 2010 prices)
Year Ended December 31,(1)
For theNine Months
EndedSeptember 30,
2012 % 2013 % 2014 % 2015 % 2016P % 2017P %(in billions of Rupiah and percentage of GDP)
GDP 7,727,083 100.0 8,156,498 100.0 8,564,867 100.0 8,982,511 100.0 9,433,034 100.0 7,401,847 100.0Add: Imports of goods and services 1,910,300 24.7 1,945,867 23.9 1,987,114 23.2 1,859,712 20.7 1,817,549 19.3 1,419,279 19.2Total supply of goods and services 9,637,383 124.7 10,102,365 123.9 10,551,981 123.2 10,842,223 120.7 11,250,583 119.3 8,821,126 119.2Less: Exports of goods and services 1,945,064 25.2 2,026,114 24.8 2,047,887 23.9 2,004,416 22.3 1,969,635 20.9 1,593,405 21.5Total domestic expenditure 7,692,319 99.6 8,076,251 99.0 8,504,093 99.3 8,837,806 98.4 9,280,948 98.4 7,227,721 97.6
Allocation of total domestic expenditure:Household consumption expenditure 4,195,788 54.3 4,423,417 54.2 4,651,018 54.3 4,881,904 54.3 5,126,499 54.3 4,007,804 54.1NPISHs consumption expenditure 81,919 1.1 88,618 1.1 99,420 1.2 98,800 1.1 105,341 1.1 83,556 1.1Government consumption expenditure 681,819 8.8 727,812 8.9 736,283 8.6 775,427 8.6 774,298 8.2 519,734 7.0Total consumption 4,959,525 64.2 5,239,847 64.2 5,486,722 64.1 5,756,131 64.1 6,006,139 63.7 4,611,094 62.3Gross domestic fixed capital formation 2,527,729 32.7 2,654,375 32.5 2,772,471 32.4 2,911,471 32.4 3,041,825 32.2 2,366,768 32.0Change in inventories (residual)(2) 205,065 2.7 182,029 2.2 244,901 2.9 170,204 1.9 232,984 2.5 249,859 3.4Total domestic expenditure 7,692,319 99.6 8,076,251 99.0 8,504,093 99.3 8,837,806 98.4 9,280,948 98.4 7,227,721 97.6
Source: BPS P Preliminary. (1) Calculated with calendar year 2010 as the Base Year. (2) Includes statistical discrepancies.
Inflation
The Government sets inflation targets periodically and targeted an inflation rate of 4.0%(±1.0%) for 2017 and 3.5% (±1.0%) for 2018. Bank Indonesia enacts and implements policies to achieve the inflation target in coordination with the Government.
In addition, the Inflation Management and Monitoring Team (Tim Pemantauan dan Pengendalian Inflasi or TPI) is responsible for identifying and analyzing the sources of inflation and making policy recommendations to maintain low and stable inflation levels in the medium-to-long term. The TPI at the national level consists of a number of governmental authorities, including Bank Indonesia, the Ministry of Finance, the Ministry of Transportation, the Ministry of Trade, the Ministry of Agriculture, the Ministry of Energy and Mineral Resources, and the Coordinating Ministry of Economic Affairs. Since 2010, the TPI has also been formed in various regions to strengthen policy coordination, particularly in monitoring and controlling regional inflation.
37

Table of Contents
The following table shows the Consumer Price Index, or CPI, as of the end of the periods indicated and the percentage change against the previous period.
Changes in Consumer Price Index
As of December 31,As of
September 30,2012 2013 2014 2015 2016 2017P
CPI 135.5(1) 146.8(1) 119.0(2) 123.0(2) 126.7(2) 130.1(2)
Annual percentage year-on-year 4.3% 8.4% 8.4% 3.4% 3.0% 3.7%(3)
Source: BPS P Preliminary. (1) Calculated on the basis of 2007 CPI = 100. (2) Calculated on the basis of 2012 CPI = 100. (3) Percentage change in the CPI as of September 30, 2017 compared to CPI as of September 30, 2016.
The following table shows percentage changes years-on-year in the CPI for certain commodities for the periods indicated.
Inflation by Commodity
For the year ended December 31,Nine months ended
September 30,2012 2013 2014 2015 2016 2017
Food 5.7% 11.4% 10.6% 4.9% 5.7% 1.0% Processed food, beverages and cigarettes 6.1% 7.5% 8.1% 6.4% 5.4% 4.2% Housing 3.4% 6.2% 7.4% 3.3% 1.9% 5.6% Clothing 4.7% 0.5% 3.1% 3.4% 3.1% 2.7% Health 2.9% 3.7% 5.7% 5.3% 3.9% 3.3% Education, recreation and sports 4.2% 3.9% 4.4% 4.0% 2.7% 3.2% Transportation, communication, and financial Service 2.2% 15.4% 12.1% (1.5)% (0.7)% 4.7%
Source: BPS
Indonesia measures annual inflation by year-on-year changes in the CPI.
In 2012, annual inflation was 4.3% due primarily to higher prices in processed foods, beverages and cigarettes; food and clothing, which were 6.1%, 5.7%, and 4.7% higher, respectively.
In 2013, annual inflation was 8.4%, which was higher than the 4.3% annual inflation in 2012. Increases in transportation and communication prices contributed to the increased rate of inflation as both sectors witnessed price increases of 15.4%. In 2013, prices for food increased by 11.4%, prices for processed food, beverages and cigarettes increased by 7.4%, and prices for housing and utilities increased by 6.2%.
In 2014, annual inflation was 8.4%, which was in line with the 2013 inflation rate. Increases in transportation and communication prices made the greatest contribution to the increase in the inflation rate, as transportation and communication prices in 2014 were 12.1% higher on average. In 2014 prices for food increased by 10.6%, prices for processed food, beverages, cigarettes and tobacco increased by 8.1%, and prices for housing increased by 7.4%.
In 2015, annual inflation was 3.4%, which was lower than the 8.4% annual inflation in 2014. This decrease was primarily due to smaller increases in the prices for food and housing, which increased by 4.9% and 3.3%, respectively, while prices for transportation, communication, and financial services decreased by 1.5%.
38

Table of Contents
In 2016, annual inflation was 3.0% which was lower than the 3.4% annual inflation in 2015. This decrease was primarily due to smaller increases in the prices for housing; health; and education, recreation and sports, which increased by 1.9%, 3.9% and 2.7%, respectively.
Inflation was 3.7% as of September 30, 2017. This was primarily due to higher prices in housing; transportation, communication, and financial services; and processed food, beverages and cigarettes, which were at 5.6%, 4.7%, and 4.2%, respectively.
Privatization of State-Owned-Enterprises
The sale by the Government of SOE shares to private investors has been an important means for the Government to promote private investment and to improve the efficiency, transparency, public accountability and corporate governance of the SOEs.
As of January 2017, there were 118 SOEs that comprised 20 listed SOEs, 84 non-listed SOEs, and 14 special purpose entities. In addition, there were 24 enterprises in which the Government owned a minority stake. Most SOEs were in the manufacturing industry (29), warehouse and transportation industry (24) and insurance and financial service industry (19).
39

Table of Contents
The following table sets forth significant full and partial privatizations since 2011 (including prior periods where relevant):
State-Owned-Enterprises Privatizations
SOEYear ofoffering
Governmentequity
interest afteroffering
Proceeds tothe
Government
Proceedsto
SOE(percentages) (in billions of Rupiah)
PT Bank Tabungan Negara (Persero) Tbk 2009 72.9 — 1,8192012(3) 60.0 135.9 1,870
PT Garuda Indonesia (Persero) Tbk 2011 69.1 — 3,1872014(3) 60.5 11.2 1,448.9
PT Kertas Basuki Rachmat Tbk(1) 2011 — 2.6(2) — PT Atmindo Tbk(1) 2011 — 9.0(2) — PT Jakarta International Hotel Development, Tbk(1) 2011 — 18.5(2) — PT Waskita Karya (Persero) Tbk 2012 68.0 — 1,171PT Semen Baturaja (Persero) Tbk 2013 76.2 — 1,309PT Sarana Karya (Persero)(4) 2013 — 48.2 — PT Kertas Padalarang (Persero)(5) 2013 — 12.1 — PT Waskita Karya (Persero) Tbk(6) 2015 68.0 — 5,289PT Aneka Tambang (Persero) Tbk(6) 2015 65.0 — 5,381PT Adhi Karya (Persero) Tbk(6) 2015 51.0 — 2,727PT Wijaya Karya (Persero) Tbk(6) 2016 65.0 — 6,149(7)
PT Krakatau Steel (Persero) Tbk(6) 2016 80.0 — 1,875(7)
PT Pembangunan Perumahan (Persero) Tbk(6) 2016 51.0 — 4,412(7)
PT Jasa Marga (Persero) Tbk(6) 2016 70.0 — 1,786(7)
PT Waskita Beton Precast Tbk 2016 60.0 — 5,167PT Garuda Maintenance Facility Tbk 2017 90.0 — 1,129
Source: Ministry of State-Owned-Enterprises (1) Minority Ownership by Government. (2) Sale of unsold shares from 2007. (3) Rights issue through the issuance of new shares. (4) Pursuant to Government Regulation No. 91 of 2013, sales of shares held by the Republic in PT Sarana Karya (Persero) have been made using strategic sales method
to PT Wijaya Karya (Persero), Tbk with total gross proceeds of Rp50 billion on December 30, 2013. (5) Pursuant to Government Regulation No. 35 and 36 of 2013, sales of shares held by the Republic in PT Kertas Padalarang (Persero) have been made using strategic
sales method to Perum Peruri with total gross proceeds of Rp13 billion on December 18, 2013. (6) Rights issues carried out through the execution of pre-emptive rights using the addition of State Capital Investment Fund, or PMN, from the Government. (7) Subject to ongoing verification of costs associated with the privatization.
40

Table of Contents
Labor and Employment
Labor
The following table sets forth the proportion of the employed labor force in each sector of the economy as of the period indicated.
As of DecemberAs of
February As of AugustAs of
February As of AugustAs of
February As of AugustAs of
FebruarySector 2012 2013(1) 2014(2) 2014(2) 2015(2) 2015(2) 2016(2) 2016(2) 2017(2)
% %(in
millions) %(in
millions) %(in
million) %(in
million) %(in
million) %(in
million) %(in
million) %Agriculture 35.2 34.8 40.8 34.6 39.0 34.0 40.1 33.2 37.8 32.9 38.3 31.7 37.8 31.9 39.7 31.9Industry 13.9 13.3 15.4 13.0 15.3 13.4 16.4 13.6 15.2 13.2 16.0 13.2 15.5 13.1 16.6 16.6Construction 6.1 5.6 7.2 6.1 7.3 6.4 7.7 6.4 8.2 7.1 7.7 6.4 8.0 6.7 7.2 7.2Trade 20.9 21.4 25.8 21.8 24.8 21.6 26.6 22.1 25.7 22.4 28.5 23.6 26.7 22.5 29.1 29.1Transportation, warehouses, and
communications 4.5 4.5 5.3 4.5 5.1 4.5 5.2 4.3 5.1 4.4 5.2 4.3 5.6 4.7 5.7 4.6Financial 2.4 2.6 3.2 2.7 3.0 2.6 3.6 3.0 3.3 2.9 3.5 2.9 3.5 3.0 3.6 2.9Public services 15.4 16.4 18.5 15.6 18.4 16.1 19.4 16.1 17.9 15.6 19.8 16.4 19.5 16.4 20.9 16.8Others (mining, electricity, gas and water) 1.6 1.5 1.9 1.6 1.7 1.5 1.8 1.5 1.6 1.4 1.7 1.4 1.8 1.5 1.8 1.4Total 100 100 118.2 100 114.6 100.0 120.8 100 114.8 100 120.7 100 118.4 100 124.5 100
Source: BPS (1) Estimation using results of back-casting from population projection weighing results. (2) Estimation using population projections weighing results.
41

Table of Contents
Employed Labor Force of Indonesia by Gender
The following table sets forth Indonesia’s employed labor force by gender as of the period indicated.
As ofFebruary As of August
As ofFebruary As of August
As ofFebruary As of August
As ofFebruary As of August
As ofFebruary As of August
As ofFebruary
2012 2012 2013 2013 2014 2014 2015 2015 2016 2016 2017(in
millions) %(1)(in
millions) %(1)(in
millions) %(1)(in
millions) %(1)(in
millions) %(1)(in
millions) %(1)(in
million) %(1)(in
million) %(1)(in
million) %(1)(in
million) %(1)(in
million) %(1)
Male 70.3 61.6 70.1 62.3 71.4 61.6 70.3 62.4 72.5 61.4 71.5 62.3 73.4 60.8 72.2 62.8 73.7 61.1 72.9 61.6 74.8 60.1Female 43.8 38.4 42.4 37.7 44.6 38.5 42.4 37.6 45.6 38.6 43.2 37.7 47.4 39.2 42.7 37.2 46.9 38.9 45.5 38.4 49.7 39.9Total 114.1 100.0 112.5 100.0 115.9 100.0 112.8 100.0 118.2 100.0 114.6 100.0 120.8 100.0 114.8 100.0 120.7 100.0 118.4 100.0 124.5 100.0
Source: BPS (1) Percentages are calculated as percentages of the employed labor force.
Employment and Unemployment in Indonesia(1)
The following table sets forth Indonesia’s employment and unemployment rate as a percentage of Indonesia’s working age population as of the period indicated.
As ofFebruary As of August
As ofFebruary As of August
As ofFebruary As of August
As ofFebruary As of August
As ofFebruary As of August
As ofFebruary
2012 2012 2013 2013 2014 2014 2015 2015 2016 2016 2017(in
millions) %(in
millions) %(in
millions) %(in
millions) %(in
millions) %(in
millions) %(in
million) %(in
million) %(in
million) %(in
million) %(in
million) %Employed 114.1 65.2 112.5 63.6 115.9 65.1 112.8 62.7 118.2 65.2 114.6 62.6 120.8 65.5 114.8 61.7 120.7 64.3 118.4 62.6 124.5 65.3Unemployed(2) 7.8 4.4 7.3 4.2 7.2 4.1 7.4 4.1 7.1 3.9 7.2 4.0 7.5 4.0 7.6 4.1 7.0 3.7 7.0 3.7 7.0 3.7Total 121.8 69.6 119.8 67.8 123.2 69.1 120.2 66.8 125.3 69.1 121.9 66.6 128.3 69.5 122.4 65.8 127.7 68.1 125.4 66.3 131.5 69.0
Source: BPS (1) Working age population refers to all persons in Indonesia 15 years old or older and includes certain non-workforce categories such as students and home makers. (2) The Government defines unemployment to include all persons 15 years old and older without work who (i) are looking for work, (ii) have established a new business,
(iii) are not looking for work because they do not expect to find work, and (iv) have made arrangements to start work on a date subsequent to the unemployment measurement date.
42

Table of Contents
Despite improvements in recent years, unemployment is expected to remain a problem in Indonesia if economic growth and job creation fail to keep pace with population growth. Youth unemployment (between the ages of 15 to 24) remains a particular problem, but has improved in recent years. The Government has sought to address employment issues through a number of policies and regulations, including efforts to create new areas of work and to develop existing areas of work through employee-employer relationships and entrepreneurial programs. The Government provides various forms of assistance (including tax relief and infrastructure support) to encourage employers to create jobs for employees while also creating and developing productive and sustainable working opportunities through entrepreneurial programs, the use of technology and encouraging voluntary work. As of February 2017, Indonesia had its lowest unemployment rate in 10 years. This improvement was due in part to a narrowing of the gap between workforce skills and the skills required in available jobs.
Regional Governments have the power to establish minimum wage requirements through tripartite wage boards and do so from the beginning of each calendar year. The table below sets out the national average monthly minimum wage for each year and the average increase across the country for each year.
YearNational averageminimum wage
Increase in averageminimum wage
2012 Rp1,088,902.6 10.1% 2013 Rp1,296,908.5 19.1% 2014 Rp1,584,391.3 14.8% 2015 Rp1,782,211.3 12.8% 2016 Rp1,967,538.8 9.9% 2017 Rp2,142,854.6 8.9%
Source: Kemnaker (the Ministry of Manpower)
Pension and Health Funds
In November 2011, the Government enacted a law creating the Social Security Administering Agencies (Badan Penyelenggara Jaminan Sosial or BPJS), namely Law No. 24 of 2011, or the BPJS. The BPJS consists of the (i) BPJS for Health Coverage, or BPJS Kesehatan, which provides healthcare services for all citizens and (ii) BPJS for Social Security Benefit for Workers, or BPJS Ketenagakerjaan, which provides social security benefits for private sector and informal workers. BPJS Kesehatan and BPJS Ketenagakerjaan took over the functions of the Government’s other social security administering agencies, namely PT Jamsostek (Persero) and PT Askes (Persero), on January 1, 2014.
In order to implement the BPJS, PT Asabri (Persero) and PT Taspen (Persero) will assign: (i) the provision of healthcare benefits and pensions for police and armed forces to be administered by PT Asabri (Persero) and (ii) the provision of pensions and retirement benefits to be administered by PT Taspen (Persero) and BPJS Ketenagakerjaan. The assignments are expected to be completed by no later than 2029.
Income Distribution
As of March 2017, Indonesia had a Gini Index of 0.39. The Gini Index is a measure of income distribution that ranges between 0.0 and 1.0, with higher numbers indicating greater inequality.
The percentage of people living below the poverty line in Indonesia has exhibited a decreasing trend since the Asian financial crisis in 1998. BPS measures poverty using a basic needs approach and defines poverty as an economic inability to fulfill food and non-food basic needs, measured by consumption and expenditure. Based on this methodology, approximately 49.5 million people, or 24.2% of the population, were living below the poverty line in 1998, this decreased to approximately 27.8 million, or 10.6% of the population, as of March 2017.
43

Table of Contents
Regional Growth
As the island with the highest population density, high consumption and an industrial base, Java has historically been the main contributor to Indonesia’s economic growth. Based on preliminary data for the nine months ended September 30, 2017, Java contributed 58.5% of the country’s GDP, Sumatera contributed 21.5%, Kalimantan contributed 8.1%, Sulawesi contributed 6.2%, Bali & Nusa Tenggara contributed 3.2% and Maluku & Papua contributed 2.5%.
To promote more sustainable and equitable economic growth across Indonesia in the longer term, the Government allocates and transfers amounts from the central budget to local and regional governments. In practice, this means that in all regions other than Java, the Government’s revenues are lower than the Government’s expenditures. From 2014 to 2016, net transfers from Java to all the other regions were equivalent to Rp840 trillion. For more information, see “—Central Government Revenue and Expenditure.”
Infrastructure Development
A key priority of the Government is to encourage infrastructure development as a means to accelerate economic growth particularly in rural areas, support further industrial development and tourism, enhance urban transportation and improve the lives and economic welfare of Indonesians by reducing unemployment and poverty.
The Government has introduced a number of sector-specific reforms to encourage infrastructure development, including the requirement that the relevant ministries prepare long-term infrastructure development master plans for their respective sectors. See “— Government and Political Development — Economic Policy Packages in 2015 – 2017.”
As part of its National Medium Term Plan for 2015 – 2019, the Government has selected a list of projects called National Strategic Projects, which consists of 245 projects across fifteen sectors (including roads, railways, seaports, airports, zones, housing, borders, water, dams, irrigation, technology, smelter, energy, agriculture/fishery and seawall), and two programs (including electricity and airplane industry programs). The Government estimates that the total cost of the infrastructure projects under the National Medium Term Plan will be approximately Rp4,197 trillion (U.S.$345.1 billion). Indonesia’s infrastructure investment requirements exceed available public sector funding. As a result, the Government expects to pay for approximately 40% of this cost using public sector funding (state and regional budgets and SOEs) as well as private sector investment. The public sector funds would primarily be used to support basic infrastructure projects, food security (e.g., irrigation, dams) and transportation, logistics and connectivity projects as well as urban transportation.
In addition to maintaining and upgrading existing infrastructure, the Government has identified a number of priority infrastructure projects in its National Medium Term Plan for 2015 – 2019. The Committee for Acceleration of Priority Infrastructure Delivery (Komite Percepatan Penyediaan Infrastruktur Prioritas or KPPIP) has designated 37 priority projects in five main sectors: water and sanitation, energy and electricity, transportation, toll roads and information technology. The priority projects have an estimated cost of Rp2,433 trillion and are eligible to receive certain direct administrative support provided by KPPIP.
The Government expects to finance the remaining cost of the priority infrastructure projects through greater private sector participation, specifically: partnerships between the Government and the private sector (i.e., private public partnerships, or PPPs), and increased borrowing by the Government and SOEs.
The Government recognizes the important role of PPPs in the development of infrastructure projects and has adopted regulations that provide the legal and regulatory framework for PPPs — from procurement of the PPP concessionaire to the provision of Government support and guarantees. For a discussion of these guarantees, see “— Public Debt — Contingent Liabilities.”
44

Table of Contents
Completion timeline for 37 priority projects
The below table shows the construction commencement dates for the 37 priority projects under the National Medium Term Plan for 2015 - 2019 as well as expected commercial operation dates.
Priority Projects
ConstructionCommencement
Date
ExpectedCommercialOperation
Date
Roads and BridgesBalikpapan - Samarinda Toll Road 2016 2018Serang - Panimbang Toll Road 2017 2018Manado - Bitung Toll Road 2017 2018Eight sections of the Sumatera toll road:
Medan - Binjai 2015 2017Palembang - Indralaya 2015 2018Bakauheni - Terbanggi Besar 2015 2019Pekanbaru - Dumai 2016 2019Terbanggi Besar - Pematang Panggang 2017 2021Pematang Panggang - Kayu Agung 2018 2021Palembang - Tanjung Api-api 2016 2019Kisaran - Tebing Tinggi 2017 2019
Yogyakarta - Bawen Toll Road 2018 2020Probolinggo - Banyuwangi Toll Road 2017 2019
Water and SanitationJakarta Sewerage System (JSS) 2016 2022West Semarang Drinking Water Supply System 2017 2017National Capital Integrated Coastal Development (NCICD) Phase A 2016 2018Water Supply System (SPAM) Umbulan 2018 2022Water Supply System (SPAM) Lampung 2018 2020
RefineriesOil refinery in Bontang 2018 2022Oil refinery in Tuban 2018 2021Refinery Development Master Plan (RDMP) 2017 2025
ElectricityPLTU Mulut Tambang 2017 2023The 500kV Sumatera Transmission 2016 2019Central - West Java Transmission Line 2017 2019PLTU Indramayu 2017 2019PLTU Batang 2016 2019
PortsBitung International Hub Seaport 2020 2022Kuala Tanjung International Hub Seaport 2019 2021Patimban Seaport 2018 2019Inland Waterways / Cikarang-Bekasi-Java Sea (CBL) 2018 2021
Public TransportationMRT Jakarta (North - South Corridor) 2013 2019Light Rail Transit (LRT) South Sumatera 2015 2018Light Rail Transit (LRT) Jakarta, Bogor, Depok, Bekasi 2015 2019
RailwaysSoekarno-Hatta International Airport (SHIA) Express Railway 2018 2022Makassar - Parepare Railway 2015 2018East Kalimantan Railway 2017 2021
Information TechnologyPalapa Ring Broadband 2016 2018
45
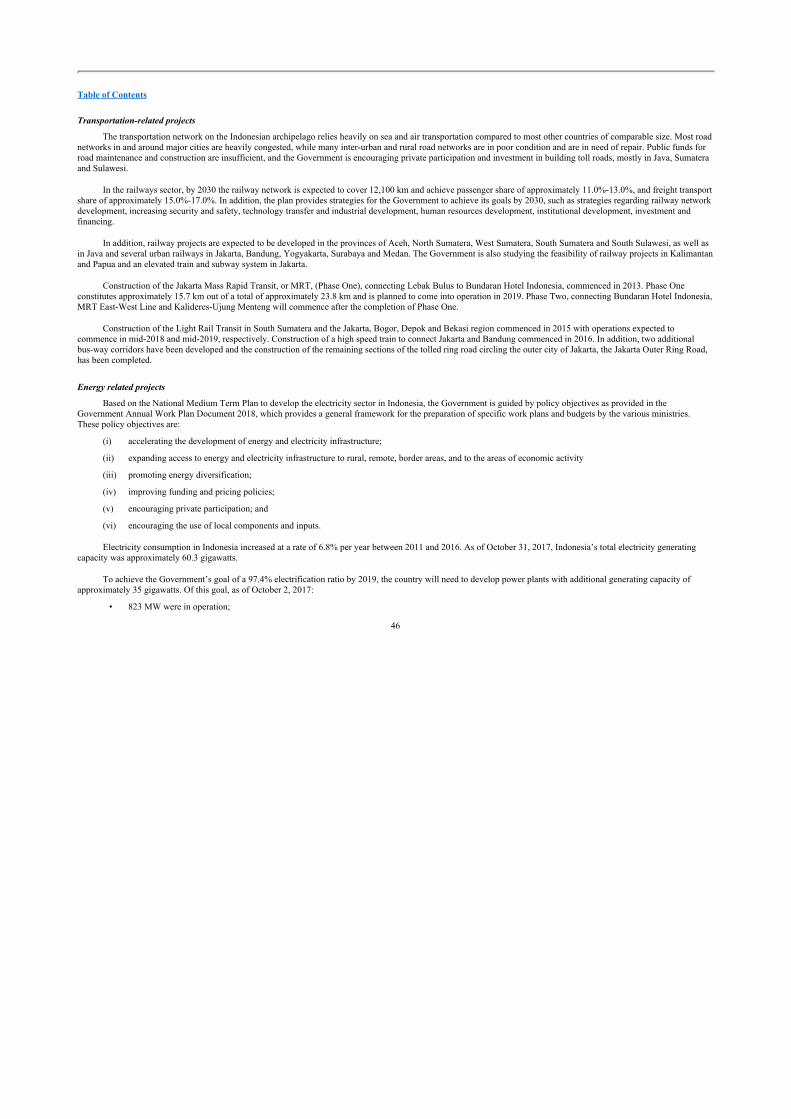
Table of Contents
Transportation-related projects
The transportation network on the Indonesian archipelago relies heavily on sea and air transportation compared to most other countries of comparable size. Most road networks in and around major cities are heavily congested, while many inter-urban and rural road networks are in poor condition and are in need of repair. Public funds for road maintenance and construction are insufficient, and the Government is encouraging private participation and investment in building toll roads, mostly in Java, Sumatera and Sulawesi.
In the railways sector, by 2030 the railway network is expected to cover 12,100 km and achieve passenger share of approximately 11.0%-13.0%, and freight transport share of approximately 15.0%-17.0%. In addition, the plan provides strategies for the Government to achieve its goals by 2030, such as strategies regarding railway network development, increasing security and safety, technology transfer and industrial development, human resources development, institutional development, investment and financing.
In addition, railway projects are expected to be developed in the provinces of Aceh, North Sumatera, West Sumatera, South Sumatera and South Sulawesi, as well as in Java and several urban railways in Jakarta, Bandung, Yogyakarta, Surabaya and Medan. The Government is also studying the feasibility of railway projects in Kalimantan and Papua and an elevated train and subway system in Jakarta.
Construction of the Jakarta Mass Rapid Transit, or MRT, (Phase One), connecting Lebak Bulus to Bundaran Hotel Indonesia, commenced in 2013. Phase One constitutes approximately 15.7 km out of a total of approximately 23.8 km and is planned to come into operation in 2019. Phase Two, connecting Bundaran Hotel Indonesia, MRT East-West Line and Kalideres-Ujung Menteng will commence after the completion of Phase One.
Construction of the Light Rail Transit in South Sumatera and the Jakarta, Bogor, Depok and Bekasi region commenced in 2015 with operations expected to commence in mid-2018 and mid-2019, respectively. Construction of a high speed train to connect Jakarta and Bandung commenced in 2016. In addition, two additional bus-way corridors have been developed and the construction of the remaining sections of the tolled ring road circling the outer city of Jakarta, the Jakarta Outer Ring Road, has been completed.
Energy related projects
Based on the National Medium Term Plan to develop the electricity sector in Indonesia, the Government is guided by policy objectives as provided in the Government Annual Work Plan Document 2018, which provides a general framework for the preparation of specific work plans and budgets by the various ministries. These policy objectives are:
(i) accelerating the development of energy and electricity infrastructure;
(ii) expanding access to energy and electricity infrastructure to rural, remote, border areas, and to the areas of economic activity
(iii) promoting energy diversification;
(iv) improving funding and pricing policies;
(v) encouraging private participation; and
(vi) encouraging the use of local components and inputs.
Electricity consumption in Indonesia increased at a rate of 6.8% per year between 2011 and 2016. As of October 31, 2017, Indonesia’s total electricity generating capacity was approximately 60.3 gigawatts.
To achieve the Government’s goal of a 97.4% electrification ratio by 2019, the country will need to develop power plants with additional generating capacity of approximately 35 gigawatts. Of this goal, as of October 2, 2017:
• 823 MW were in operation;
46
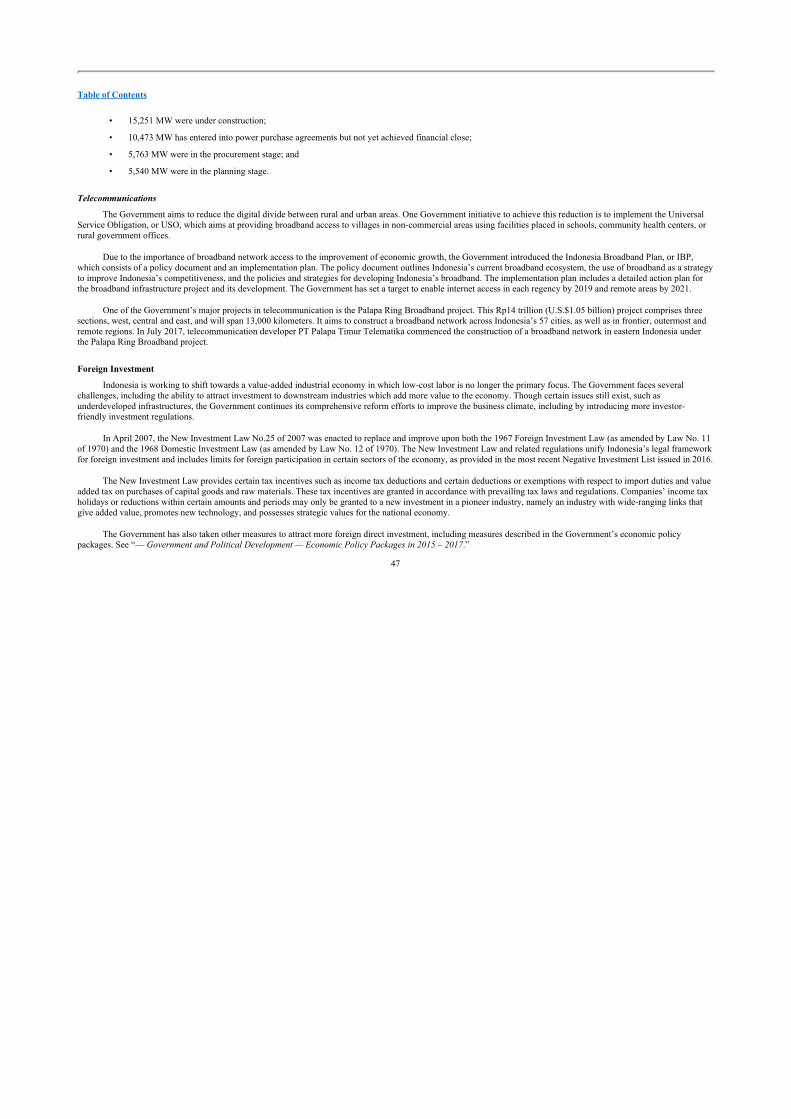
Table of Contents
• 15,251 MW were under construction;
• 10,473 MW has entered into power purchase agreements but not yet achieved financial close;
• 5,763 MW were in the procurement stage; and
• 5,540 MW were in the planning stage.
Telecommunications
The Government aims to reduce the digital divide between rural and urban areas. One Government initiative to achieve this reduction is to implement the Universal Service Obligation, or USO, which aims at providing broadband access to villages in non-commercial areas using facilities placed in schools, community health centers, or rural government offices.
Due to the importance of broadband network access to the improvement of economic growth, the Government introduced the Indonesia Broadband Plan, or IBP, which consists of a policy document and an implementation plan. The policy document outlines Indonesia’s current broadband ecosystem, the use of broadband as a strategy to improve Indonesia’s competitiveness, and the policies and strategies for developing Indonesia’s broadband. The implementation plan includes a detailed action plan for the broadband infrastructure project and its development. The Government has set a target to enable internet access in each regency by 2019 and remote areas by 2021.
One of the Government’s major projects in telecommunication is the Palapa Ring Broadband project. This Rp14 trillion (U.S.$1.05 billion) project comprises three sections, west, central and east, and will span 13,000 kilometers. It aims to construct a broadband network across Indonesia’s 57 cities, as well as in frontier, outermost and remote regions. In July 2017, telecommunication developer PT Palapa Timur Telematika commenced the construction of a broadband network in eastern Indonesia under the Palapa Ring Broadband project.
Foreign Investment
Indonesia is working to shift towards a value-added industrial economy in which low-cost labor is no longer the primary focus. The Government faces several challenges, including the ability to attract investment to downstream industries which add more value to the economy. Though certain issues still exist, such as underdeveloped infrastructures, the Government continues its comprehensive reform efforts to improve the business climate, including by introducing more investor-friendly investment regulations.
In April 2007, the New Investment Law No.25 of 2007 was enacted to replace and improve upon both the 1967 Foreign Investment Law (as amended by Law No. 11 of 1970) and the 1968 Domestic Investment Law (as amended by Law No. 12 of 1970). The New Investment Law and related regulations unify Indonesia’s legal framework for foreign investment and includes limits for foreign participation in certain sectors of the economy, as provided in the most recent Negative Investment List issued in 2016.
The New Investment Law provides certain tax incentives such as income tax deductions and certain deductions or exemptions with respect to import duties and value added tax on purchases of capital goods and raw materials. These tax incentives are granted in accordance with prevailing tax laws and regulations. Companies’ income tax holidays or reductions within certain amounts and periods may only be granted to a new investment in a pioneer industry, namely an industry with wide-ranging links that give added value, promotes new technology, and possesses strategic values for the national economy.
The Government has also taken other measures to attract more foreign direct investment, including measures described in the Government’s economic policy packages. See “— Government and Political Development — Economic Policy Packages in 2015 – 2017.”
47

Table of Contents
Foreign Investment in Indonesia
Foreign investment in Indonesia is divided into direct investments, portfolio investments and other investments, and information about these types of investments is included in the Republic’s reports on its balance of payments published by the Bank Indonesia. Due to the different concept and method of compiling investment statistics, foreign direct investment statistical data published by Bank Indonesia are not comparable to the “administrative” foreign direct investment statistical data published by the Indonesia Investment Coordinating Board (Badan Koordinasi Penanaman Modal or BKPM) under “Direct Investments Realizations.”
The following table sets out the amounts of foreign investments in Indonesia by non-residents.
Foreign Investment in Indonesia
Year ended December 31,
Nine MonthsEnded
September 30,2012 2013 2014 2015 2016P 2017P
(in millions of U.S. dollars)Direct Investments
Equity Capital 18,615 20,004 21,895 18,822 4,670 14,224Debt instrument 2,586 3,278 3,225 957 (201) 1,228
Total direct investments 21,201 23,282 25,121 19,779 4,469 15,451Portfolio investments:
Equity securities 1,698 (1,856) 3,259 (1,547) 1,319 (384) Debt securities 12,976 14,001 20,221 18,998 15,459 21,009
Total portfolio investments 14,673 12,145 23,480 17,451 16,777 20,625Financial derivatives (320) (679) (597) (647) (618) (456) Other investments 7,275 2,645 7,699 1,748 (8,987) 1,236
Total foreign investment 42,829 37,393 55,702 38,332 11,641 36,856
Source: Bank Indonesia P Preliminary.
48

Table of Contents
Foreign Direct Investment in Indonesia by Country of Origin(1)
Year Ended December 31,Nine Months Ended
September 302012 2013 2014 2015 2016P 2017P
(in millions of U.S. Dollars)North America 1,018 1,112 (1,129) 706 (371) (2,693)
USA 830 741 (1,098) 603 (336) (2,610) Canada 187 152 106 81 (3) (26) Other North America (2) — 219 (138) 22 (32) (57)
Central and South America — (106) 94 395 301 54Argentina — — 0 1 0 0Brazil — 3 (1) 23 17 9Mexico — 0 1 0 1 1Cayman Islands — 30 53 34 5 (169) Other Central and South America — (139) 42 337 279 213
Europe 253 (1,652) 272 (66) 2,148 5,156European Union (226) (1,730) 345 (2) 1,545 4,690
Austria 1 103 44 (6) 52 58Belgium 41 50 (46) 84 23 (6) Denmark (7) -6 17 13 8 (6) Finland 9 7 2 7 1 96France (49) 47 (158) 59 (106) (252) Germany (1,300) (1,292) (354) (479) 105 316Greece — — — 0 8 (6) Ireland 7 8 6 2 4 11Italy 18 18 18 14 10 8Luxembourg 939 83 572 518 143 111Netherlands (829) (767) (555) (57) (580) 3,951Portugal — — — — 0 0Spain — 3 0 0 2 106Sweden 28 (21) 36 (13) 11 31United Kingdom 915 1,108 764 (148) 1,858 260Other European Union — (1,071) 0 5 5 12
Russia — 0 0 0 0 0Turkey 21 17 12 8 4 0Other Europe 458 61 (86) (72) 600 465
Asia 17,051 17,860 21,218 15,047 14,576 14,142Japan 7,962 5,836 5,793 4,010 2,512 2,175People’s Republic of China 335 67 1,068 324 355 1,676South Korea 692 866 953 228 199 370India 8 9 3 37 54 29Hong Kong SAR 212 416 290 1,239 1,562 346Taiwan 105 100 87 21 24 9Saudi Arabia — 0 0 0 0 0ASEAN 7,588 10,582 13,084 9,229 9,829 9,314
Brunei Darussalam — (3) (3) (3) (3) (3) Cambodia — 0 — — — 0Lao PDR — — — — — 0Malaysia (508) (281) 755 330 867 1,079Myanmar — — — 0 0 0Philippines 5 8 1 2 10 9Singapore 7,972 10,723 12,090 8,847 8,331 8,390Thailand 117 131 231 47 612 (174) Vietnam 3 5 9 6 11 12
Other Asia 149 (16) (60) (40) 41 221Australia and Oceania 116 249 211 (61) (3) 114
Australia 116 249 188 (64) (6) 134New Zealand — 0 19 7 0 (20) Other Australia and Oceania — 0 4 (4) 2 (1)
Africa 17 590 857 584 (13,143) 15South Africa 17 15 11 7 (1) 2Other Africa — 575 847 578 (13,142) 13
Others 684 763 288 36 339 60Total 19,138 18,817 21,811 16,641 3,848 16,848
Source: Bank Indonesia P Preliminary. (1) Presents foreign direct investment in accordance with the directional principle prescribed by BPM5. (2) Includes Bermuda, Greenland and Saint Pierre & Miquelon.
49
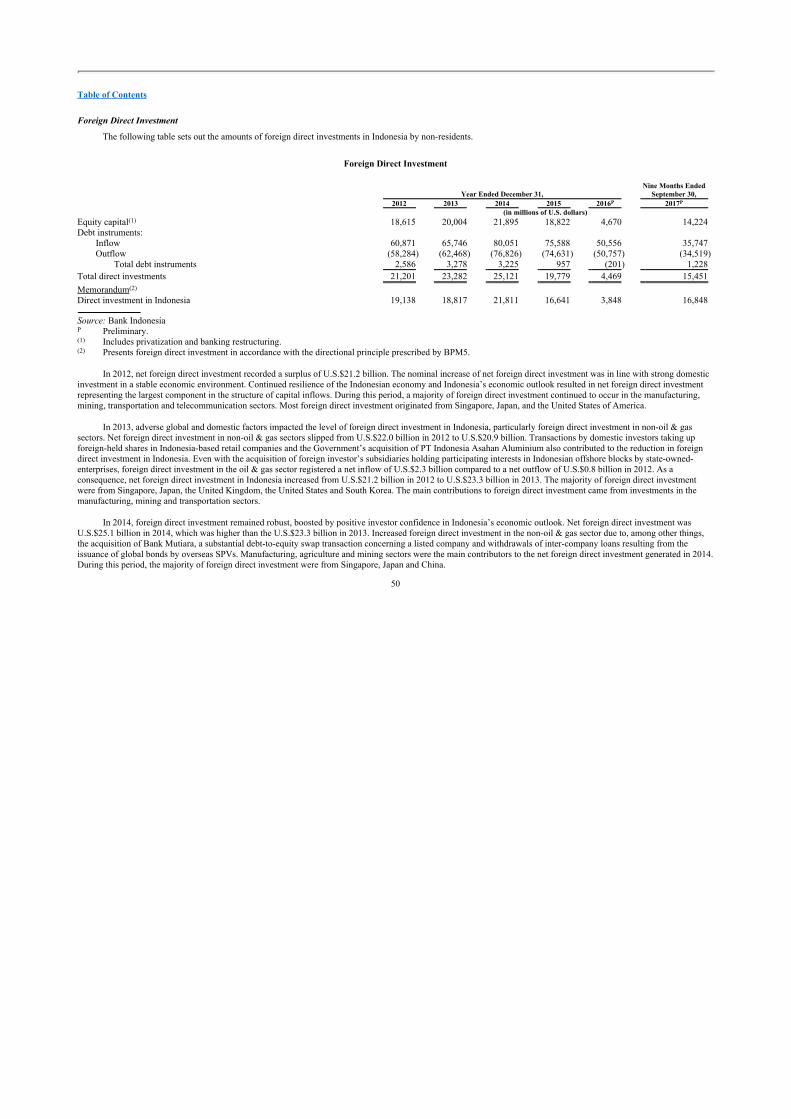
Table of Contents
Foreign Direct Investment
The following table sets out the amounts of foreign direct investments in Indonesia by non-residents.
Foreign Direct Investment
Year Ended December 31, Nine Months Ended
September 30,2012 2013 2014 2015 2016P 2017P
(in millions of U.S. dollars)Equity capital(1) 18,615 20,004 21,895 18,822 4,670 14,224 Debt instruments:
Inflow 60,871 65,746 80,051 75,588 50,556 35,747Outflow (58,284) (62,468) (76,826) (74,631) (50,757) (34,519)
Total debt instruments 2,586 3,278 3,225 957 (201) 1,228Total direct investments 21,201 23,282 25,121 19,779 4,469 15,451
Memorandum(2)
Direct investment in Indonesia 19,138 18,817 21,811 16,641 3,848 16,848
Source: Bank Indonesia P Preliminary. (1) Includes privatization and banking restructuring. (2) Presents foreign direct investment in accordance with the directional principle prescribed by BPM5.
In 2012, net foreign direct investment recorded a surplus of U.S.$21.2 billion. The nominal increase of net foreign direct investment was in line with strong domestic investment in a stable economic environment. Continued resilience of the Indonesian economy and Indonesia’s economic outlook resulted in net foreign direct investment representing the largest component in the structure of capital inflows. During this period, a majority of foreign direct investment continued to occur in the manufacturing, mining, transportation and telecommunication sectors. Most foreign direct investment originated from Singapore, Japan, and the United States of America.
In 2013, adverse global and domestic factors impacted the level of foreign direct investment in Indonesia, particularly foreign direct investment in non-oil & gas sectors. Net foreign direct investment in non-oil & gas sectors slipped from U.S.$22.0 billion in 2012 to U.S.$20.9 billion. Transactions by domestic investors taking up foreign-held shares in Indonesia-based retail companies and the Government’s acquisition of PT Indonesia Asahan Aluminium also contributed to the reduction in foreign direct investment in Indonesia. Even with the acquisition of foreign investor’s subsidiaries holding participating interests in Indonesian offshore blocks by state-owned-enterprises, foreign direct investment in the oil & gas sector registered a net inflow of U.S.$2.3 billion compared to a net outflow of U.S.$0.8 billion in 2012. As a consequence, net foreign direct investment in Indonesia increased from U.S.$21.2 billion in 2012 to U.S.$23.3 billion in 2013. The majority of foreign direct investment were from Singapore, Japan, the United Kingdom, the United States and South Korea. The main contributions to foreign direct investment came from investments in the manufacturing, mining and transportation sectors.
In 2014, foreign direct investment remained robust, boosted by positive investor confidence in Indonesia’s economic outlook. Net foreign direct investment was U.S.$25.1 billion in 2014, which was higher than the U.S.$23.3 billion in 2013. Increased foreign direct investment in the non-oil & gas sector due to, among other things, the acquisition of Bank Mutiara, a substantial debt-to-equity swap transaction concerning a listed company and withdrawals of inter-company loans resulting from the issuance of global bonds by overseas SPVs. Manufacturing, agriculture and mining sectors were the main contributors to the net foreign direct investment generated in 2014. During this period, the majority of foreign direct investment were from Singapore, Japan and China.
50

Table of Contents
In 2015, sustained foreign investor confidence in the outlook for the Indonesian economy prompted foreign investors to continue investing in Indonesia, resulting in net foreign direct investment of U.S.$19.8 billion. Nevertheless, in line with the slowdown in the domestic economy, 2015 net foreign direct investment was lower than the previous year’s foreign direct investment, which reached U.S.$25.1 billion. In 2015, the majority of direct investment inflows were from ASEAN countries followed by Japan, and other Asian developing countries (including China). Meanwhile, the sectors attracting the most foreign direct investment in 2015 were agriculture, manufacturing and the mining sector, the same as in 2014.
In 2016, despite a challenging global economic environment, net foreign direct investment was U.S.$4.5 billion compared to U.S.$19.8 billion in 2015. The decrease was mainly driven by divestment activities in the banking sector, including divestment by a foreign SPV of its interests in one of the largest private banks in Indonesia to a domestic entity in the last quarter of 2016. Manufacturing, trade and the agricultural sectors were the main contributors to net foreign direct investment in 2016. The majority of foreign direct investment was from ASEAN countries followed by other Asian developing countries (including China) and Japan.
In the nine months ended September 30, 2017, net foreign direct investment was U.S.$15.5 billion compared to U.S.$13.8 billion in the same period in 2016. This increase was mainly due to a promising domestic economic outlook and a more conducive investment climate. The manufacturing, trade, and the agriculture sectors were the main contributors to net foreign direct investment in the nine months ended September 30, 2017. The majority of the foreign direct investment was from ASEAN countries followed by Japan and Europe.
Foreign Portfolio Investment
The following table sets out the amounts of foreign portfolio investments in Indonesia by non-residents.
Foreign Portfolio Investments
Year Ended December 31, Nine Months Ended
September 30,2012 2013 2014 2015 2016P 2017P
(in millions of U.S. dollars)Equity securities:
Inflows 51,527 61,640 51,200 44,763 52,052 34,591(Outflows) (49,829) (63,496) (47,940) (46,310) (50,734) (34,975)
Net equity securities 1,698 (1,856) 3,259 (1,547) 1,319 (384) Debt securities (net) 12,976 14,001 20,221 18,998 15,459 21,009
Total portfolio investments 14,673 12,145 23,480 17,451 16,777 20,625
Source: Bank Indonesia P Preliminary.
In 2012, foreign portfolio investments recorded a net inflow of U.S.$14.7 billion. These inflows were mainly due to foreign investment in Government and corporate bonds and domestic stocks. The Government believes that the favorable condition of Indonesia’s economy and higher yields compared to other countries in the region were the key factors driving these inflows. Issuances of Government bonds and private corporate bonds denominated in foreign currencies succeeded in generating additional inflows of foreign investment during 2012. Inflows of foreign capital in Indonesia were also driven by economic stimulus policies implemented in several advanced nations.
In 2013, foreign capital inflows in the form of portfolio investment fell from the previous year. Foreign portfolio investments were U.S.$12.1 billion, down from U.S.$14.7 billion in 2012. A decline in capital inflows
51

Table of Contents
occurred mainly in the third and fourth quarters of 2013. This was due to global uncertainty related to the announcement of tapering of monetary stimulus in the United States, negative perceptions of foreign investors concerning the current account deficit in Indonesia and a surge in inflation expectations following the fuel-subsidized price hike. The downturn in foreign portfolio investments in Indonesia in 2013 was mainly due to the private sector, particularly the stock market. In contrast to the private sector, foreign portfolio investments in the public sector recorded a surplus. The surplus resulted from issuances of Government global bonds and Sharia-compliant Sukuk instruments, with the remainder coming from high net placements by foreigners in Rupiah-denominated Indonesian Government bonds. The public sector surplus was further reinforced by foreign inflows into Bank Indonesia certificates after the change in the minimum holding period policy, which was reduced from six months to one month effective as of September 2013.
In 2014, foreign capital inflows in the form of portfolio investment were U.S.$23.5 billion, an increase from inflows of U.S.$12.1 billion of foreign portfolio investment recorded in the previous year. The increase was primarily due to the first three quarters of 2014 in line with an increase in debt securities issued by the public sector. Throughout 2014, Rupiah-denominated portfolio instruments were a major contributor to the increase in portfolio investments inflows. Non-resident inflows into Rupiah-denominated Government debt securities on a net basis reached U.S.$11.6 billion, an increase compared to the U.S.$4.7 billion recorded in 2013.
In 2015, foreign capital inflows in the form of portfolio investment were U.S.$17.5 billion, a substantial decrease from the U.S.$23.5 billion recorded in the previous year. The decrease was primarily due to net sales of domestic stocks by non-residents and lower foreign net purchases of Government debt securities.
In 2016, foreign capital inflows in the form of portfolio investment were U.S.$16.8 billion, lower than the U.S.$17.5 billion recorded in the previous year. The decrease was caused by widespread global uncertainty in the wake of the U.S. presidential election, combined with expectations of a further increase in the U.S. Federal Funds Rate. This prompted a net foreign capital outflow from Indonesia, especially in the fourth quarter of 2016. In addition, the decrease was also caused by a decrease in the issuances of both global corporate bonds and Government global bonds
In the nine months ended September 30, 2017, foreign capital inflows in the form of portfolio investment were U.S.$20.6 billion, higher than the U.S.$17.1 billion recorded in the same period in 2016. The increase resulted from higher global corporate bonds issuances for expansion and refinancing purposes issued to exploit lower interest rates. Furthermore, the increase was also supported by higher foreign capital inflows to long-term public sector debt instruments denominated in Rupiah. These developments were in line with continued economic growth in Indonesia and investor confidence in the domestic economic outlook.
52

Table of Contents
Other Foreign Investment
The following table sets out the amounts of other investments (other than portfolio or foreign direct investments) in Indonesia by non-residents, mainly consisting of loans received and paid.
Other Foreign Investments
Year Ended December 31,Nine Months Ended
September 30,2012 2013 2014 2015 2016P 2017P
(in millions of U.S. dollars)LoansBank sector:
Disbursements 2,836 5,735 8,436 8,663 3,991 2,089Debt repayments (2,440) (4,051) (5,885) (7,402) (5,307) (3,307)
Total bank sector 396 1,684 2,551 1,261 (1,316) (1,218) Corporate sector:
Disbursements 31,360 26,394 29,058 21,710 15,655 13,441Debt repayments (28,358) (25,283) (22,824) (22,088) (20,374) (11,222)
Total corporate sector 3,001 1,111 6,234 (378) (4,718) 2,219Other (net)(1) 3,878 (151) (1,086) 865 (2,954) (235)
Total other investments 7,275 2,645 7,699 1,748 (8,987) 1,236
Source: Bank Indonesia P Preliminary. (1) Consists of loans of public sector and trade credit, currency and deposits, and other liabilities of private sector and public sector.
In 2012, foreign other investment recorded a net inflow of U.S.$7.3 billion. The surplus was mainly attributable to the increase in other investment liabilities in the public sector. Although there was an increase in debt repayment in the private sector, withdrawals surpassed the level of repayment.
In 2013, foreign other investment fell from a surplus of U.S.$7.3 billion in 2012 to U.S.$2.6 billion in 2013. Foreign other investment in the public sector contributed mostly to the reduced surplus in other investment in Indonesia. Meanwhile, foreign other investment in the private sector posted a surplus bolstered by net disbursement of non-affiliated foreign borrowing and expansion of non-resident deposits held in domestic banks.
In 2014, foreign other investment recorded a net inflow of U.S.$7.7 billion compared to the net inflow of U.S.$2.6 billion recorded in 2013. Stronger other investment performance in Indonesia primarily stemmed from the private sector. The foreign other investment surplus in the private sector was due to the drawing down of non-affiliated external loans and an increase in non-resident deposits at domestic banks. Foreign other investment in the public sector recorded net repayment of foreign loans was U.S.$4.2 billion in 2014, an increase from U.S.$1.4 billion in 2013. These developments were in line with Government policy to reduce sources of fiscal financing from foreign loans.
In 2015, foreign other investments fell from a surplus of U.S.$7.7 billion in 2014 to U.S.$1.7 billion in 2015. The decrease was primarily due to a net repayment of corporate foreign loans following a slowdown in domestic economic growth.
In 2016, foreign other investments fell from a surplus of U.S.$1.7 billion in 2015 to a deficit of U.S.$9.0 billion in 2016. The deficit was primarily due to net payments of foreign loans by both the public and private sectors.
53

Table of Contents
In the nine months ended September 30, 2017, foreign other investments increased from a deficit of U.S.$7.0 billion in the nine months ended September 30, 2016 to a surplus of U.S.$1.2 billion in the same period in 2017. The surplus was primarily due to net withdrawals of foreign loans by the private sector.
Direct Investment Realizations
Foreign Direct Investment
In 1973, the Republic established the Badan Koordinasi Penanaman Modal, or BKPM, an investment services agency of the Government, to accelerate economic growth by attracting foreign capital investment. BKPM’s main function is to implement the Government’s objectives for investment in the country.
Under Indonesian law, most direct equity investments by foreign persons are subject to approval by the BKPM, regardless of the size of the investment. The BKPM reviews applications for approval based on the Negative Investment List, which lists those business sectors that are closed to foreign investment and those that are open to foreign investment subject to certain conditions, including limits on the percentage of foreign capital ownership; and also based on criteria established by the particular ministry that regulates the sector in which the foreign investor seeks to invest. Upon receiving approval, a foreign investor may complete the investment, but is not obligated to do so.
Due to the different concept and method of compiling investment statistics, “administrative” foreign direct investment statistical data published by the BKPM and “Balance of Payment” foreign direct investment statistical data published by Bank Indonesia are not comparable. BKPM calculates foreign direct investment based on realized investments in Indonesian companies owned by foreign investors within a certain reporting period. BKPM’s realization data covers the total value of investments funded by foreign investors, other foreign creditors, as well as domestic investors and creditors. In comparison, Bank Indonesia’s calculation method covers the entire flow of investments stemming from foreign investors over a certain reporting period. In addition, Bank Indonesia excludes from its calculations foreign investments made by investors with a non-resident ownership of less than 10% per individual investors while BKPM has no such minimum ownership requirement. In terms of sector coverage, BKPM excludes certain sectors from its calculation, including investments in oil and gas, banking, non-bank financial institutions, insurance, leasing, investment sectors licensed by technical/sectoral agencies, investments through the stock market and household investments. Bank Indonesia covers all economic sectors. As a result the data regarding realized foreign direct investments is not comparable to those under “Foreign Investment in Indonesia” in the table above.
54

Table of Contents
The following table sets forth the amount of realized foreign direct investment by sector of the economy for the periods indicated.
Realized Foreign Direct Investment by Sector(1)
Year Ended December 31,Nine Months Ended
September 30,2012 2013 2014 2015 2016P 2017P
(in millions of U.S. dollars)Primary Sector
Food Crops & Plantation 1,602 1,605 2,207 2,072 1,589 1,093.5Livestock 20 11 31 75 49 145.6Forestry 27 29 53 19 78 40.4Fishery 29 10 35 53 43 46.3Mining 4,255 4,816 4,665 4,017 2,742 3,206.4
Total Primary Sector 5,933 6,472 6,991 6,236 4,502 4,532.1Secondary sector:
Food Industry 1,783 2,118 3,140 1,521 2,115 1,465.4Textile Industry 473 751 422 433 321 243.6Leather Goods & Footwear Industry 159 96 211 162 144 258.9Wood Industry 76 39 64 47 267 384.6Paper and Printing Industry 1,307 1,169 706 707 2,787 505.3Chemical and Pharmaceutical Industry 2,770 3,142 2,323 1,956 2,889 2,216.4Rubber and Plastic Industry 660 472 544 694 737 520.5Non Metallic Mineral Industry 146 874 917 1,303 1,076 506.6Metal, Machinery & Electronic Industry 2,453 3,327 2,472 3,092 3,897 3,136.0Medical Precision & Optical Instruments, Watches & Clock Industry 3 26 7 7 9 2.1Motor Vehicles & Other Transport Equipment Industry 1,840 3,732 2,061 1,757 2,369 1,149.5Other Industry 100 112 152 83 75 94.5
Total Secondary Sector 11,770 15,859 13,019 11,763 16,688 10,483.4Tertiary sector:
Electricity, Gas & Water Supply 1,515 2,222 1,249 3,029 2,140 2,686.2Construction 240 527 1,384 954 187 108.6Trade & Repair 484 606 867 625 670 1,028.7Hotel & Restaurant 768 462 513 650 888 912.3Transport, Storage & Communication 2,808 1,450 3,001 3,281 750 871.4Real Estate, Ind. Estate & Business Activities 402 678 1,168 2,433 2,321 2,034.8Other Services 646 342 337 294 818 1,227.3
Total Tertiary Sector 6,862 6,286 8,519 11,276 7,775 8,869.2Total 24,565 28,617 28,530 29,276 28,964 23,884.7
Source: BKPM P Preliminary. (1) Excludes foreign investment in oil and natural gas projects, banking, non-bank financial institutions, insurance, leasing, mining in terms of contracts of work, coal
mining in terms of agreement of work, investment in which licenses were issued by a technical/sectoral agency, portfolio as well as household investment.
Domestic Direct Investment
In addition to direct equity investments by foreign persons, BKPM also approves certain types of domestic direct investments. The following table sets forth the amount of realized domestic direct investment by sector of the economy for the periods indicated.
55

Table of Contents
Realized Domestic Direct Investment by Sector(1)
Year Ended December 31,Nine Months Ended
September 30,2012 2013 2014 2015 2016P 2017P
(in billions of Rupiah)Primary sector:
Food Crops & Plantation 9,631 6,589 12,707 12,041 20,999 12,015.1Livestock 97 361 651 325 466 620.6Forestry 145 — — 472 204 18.6Fishery 15 4 22 275 3 30.5Mining 10,481 18,762 3,141 3,947 6,034 19,885.4
Total Primary Sector 20,369 25,716 16,521 17,060 27,705 32,570.2Secondary sector:
Food Industry 11,167 15,081 19,596 24,534 32,028 27,927.0Textile Industry 4,451 2,446 1,451 2,725 3,210 6,968.1Leather Goods & Footwear Industry 77 80 103 5 69 104.4Wood Industry 57 391 585 1,185 3,151 1,077.6Paper and Printing Industry 7,561 6,849 4,094 6,529 5,258 8,065.7Chemical and Pharmaceutical Industry 5,069 8,886 13,314 20,712 30,054 9,900.1Rubber and Plastic Industry 2,855 2,905 2,117 3,696 3,577 2,790.2Non Metallic Mineral Industry. 10,731 4,625 11,923 20,502 15,405 4,731.1Metal, Machinery & Electronic Industry 7,226 7,568 5,293 7,938 11,568 9,821.8Medical Precision & Optical Instruments, Watches & Clock Industry — 210 — — 5 — Motor Vehicles & Other Transport Equipment Industry 664 2,069 490 1,071 1,714 1,082.8Other Industry 31 62 68 147 744 542.1
Total Secondary Sector 49,889 51,171 59,035 89,045 106,784 6,968.1Tertiary sector:
Electricity, Gas & Water Supply 3,797 25,831 36,297 21,947 22,794 21,931.2Construction 4,587 6,033 12,098 17,165 14,039 19,562.3Trade & Repair 1,030 2,205 518 1,427 4,513 2,005.8Hotel & Restaurant 1,015 1,402 1,731 3,977 1,560 3,196.4Transport, Storage & Communication 8,612 13,178 15,715 21,339 26,770 25,685.4Real Estate, Ind. Estate & Business Activities 58 2,152 13,112 6,510 9,193 14,305.2Other Services 2,825 462 1,100 1,001 2,873 2,436.5
Total Tertiary Sector 21,924 51,264 80,571 73,361 81,742 89,122.8Total 92,182 128,151 156,126 179,466 216,231 194,704.0
Source: BKPMP Preliminary. (1) Excludes domestic investment in oil and natural gas projects, banking, non-bank financial institutions, insurance, leasing, mining in terms of contracts of work, coal
mining in terms of agreement of work, investment in which licenses were issued by a technical/sectoral agency, portfolio as well as household investment.
Foreign Trade and Balance of Payments
Membership in International and Regional Free Trade Agreements
The Government supports the liberalization of international trade and investment through its membership in several international and regional trade organizations. Indonesia is a signatory to the GATT 1947 and a founding member of the World Trade Organization through the ratification of Law No. 7 of 1994 on Agreement Establishing the World Trade Organization. ASEAN has served as the forum for the negotiation of a number of regional agreements, and in 2015, ASEAN leaders adopted the ASEAN Economic Community Blueprint 2025, which is a roadmap for strategic integration of the economies of the ASEAN Member States.
56

Table of Contents
ASEAN Member States have entered into six free trade agreements, namely: the ASEAN Trade in Goods Agreement, or ATIGA, the ASEAN-China Free Trade Agreement, or ACFTA, the ASEAN-Korea Free Trade Agreement, or AKFTA, the ASEAN-Japan Closer Economic Partnership, or AJCEP, the ASEAN-India Free Trade Agreement, or AIFTA, and the ASEAN-Australia and New Zealand Free Trade Agreement, or AANZFTA. In addition, Indonesia has entered into two bilateral trade agreements: the Indonesia-Japan Economic Partnership Agreement, or IJ-EPA, and the Indonesia-Pakistan Preferential Trade Agreement, IP-PTA. These free trade agreements covers three core areas, namely: trade in goods, trade in services and investments.
Various regional and bilateral free trade agreements of which Indonesia is a party are currently in different stages of negotiations.
Tariff Reforms
The Minister of Finance is authorized to set rates for import duties. The Republic maintains a policy of using tariff rates to promote the competitiveness of Indonesian products in international markets and to reduce price distortions in order to support the establishment of free trade. The Republic has implemented preferential tariff commitments under the ATIGA, the ACFTA, the AKFTA, the AJCEP, the AIFTA, the AANZFTA, the IJ-EPA and the IP-PTA.
Exports and Imports
Beginning in 2012, the Republic started using a revised methodology in compiling exports and imports data. This revised methodology was implemented in order to comply with international best practices and to improve consistency with other Bank Indonesia publications. As a result of this change, the classification of certain export and import products has changed. Revisions following classification changes were carried out for data published in 2005 onwards. Since March 1, 2014, exporters must declare the value of their exported goods using terms of delivery cost insurance freight in order to enhance the validity and accuracy of freight and insurance data for export activities. The requirements introduced in 2014 have not changed the business process of export transactions, in which the export value is still the real transaction value agreed by exporters and importers.
The following table shows Indonesia’s exports and imports for the periods indicated.
Exports and Imports(1)
Year Ended December 31,Nine Months Ended
September 30,2012 2013 2014 2015 2016P 2017P
(in millions of U.S. dollars)Exports:
Oil and gas exports (f.o.b.) 35,571 33,588 28,752 17,184 12,891 11,245Non-oil and gas exports (f.o.b.) 151,775 148,501 146,541 131,941 131,554 112,078
Total exports (f.o.b.) 187,347 182,089 175,293 149,124 144,445 123,323Total imports (c.i.f.) (189,138) (186,186) (177,813) (142,379) (135,716) (112,927)
Balance of trade (1,791) (4,097) (2,520) 6,746 8,729 10,396
Source: Bank Indonesia P Preliminary. (1) Indonesia’s trade statistics, which are used as a basis for the balance of payments statistics, are compiled by Bank Indonesia and differ in coverage and timing from
similarly titled data compiled by BPS.
57

Table of Contents
In 2012, Indonesia recorded a trade deficit of U.S.$1.8 billion. Exports decreased 2.0% due to the global economic slowdown, reflected by weak growth in world trade volume and demand from Indonesia’s trading partner countries, and the steady decline in commodity prices. Imports accelerated by 13.2% in line with strong domestic demand and mounting consumption of oil-based fuels.
In 2013, Indonesia recorded a trade deficit of U.S.$4.1 billion, which was an increase from the deficit of U.S.$1.8 billion recorded in 2012. Exports decreased by 2.8% as a result of the global economic slowdown, with weaker growth in emerging market countries reducing demand for Indonesia’s exports. Exports contracted further because of the simultaneous deterioration in Indonesia’s terms of trade and downward movement in global commodity prices. In addition, structural problems related to the export of natural resource-based commodities and worsening terms of trade resulted in the weaker performance of Indonesia’s commodity exports. At the same time, although imports declined by 1.6%, overall imports remained high as domestic production was unable to keep pace with the burgeoning demand from the middle class, particularly in relation to technological goods. Oil imports remained high due to heavy reliance on imported oil in the national energy supply structure.
In 2014, Indonesia recorded a trade deficit of U.S.$2.5 billion, which was smaller than the 2013 deficit of U.S.$4.1 billion. This smaller deficit was attributable to a steeper contraction in imports of 4.5% than the contraction in exports of 3.7%, each compared against the previous year. The decline in imports was in line with a moderation in domestic demand. The contraction in exports was largely attributable to a slower than expected global economic recovery and the ongoing decline in global commodity prices.
In 2015, the trade balance recorded a surplus of U.S.$6.7 billion, higher than the trade deficit of U.S.$2.5 billion in the previous year. This was caused by a 19.9% decrease in imports, which was larger than the 14.9% decrease in exports. Imports decreased sharply in line with limited domestic demand, while persistently low commodity prices and sluggish growth in trade partner countries, such as the United States, China and Singapore resulted in a contraction in exports.
In 2016, Indonesia recorded a trade surplus of U.S.$8.7 billion, higher than the U.S.$6.7 billion surplus recorded in 2015. The higher deficit was caused by a 4.6% decrease in imports, which was higher than the 3.1% decrease in exports, each compared against the previous year. Exports contracted at a lower rate compared to 2015, primarily due to improvements in commodity prices such as coal and palm oil resulting in higher coal and palm oil exports, especially during the second half of 2016.
In the nine months ended September 30, 2017, Indonesia recorded a trade surplus U.S.$10.4 billion, higher than the U.S.$5.4 billion surplus recorded in the same period in 2016. The higher trade surplus was caused by an increase in exports of 18.3% to U.S.$123.3 billion, which was higher than the increase in imports of 14.3% to U.S.$112.9 billion in the same period in 2016. The increase in exports in the nine months ended September 30, 2017 was primarily driven by higher commodity prices and improvements in global demand during the period and the increase in imports was in line with increased domestic economic activities in the nine months ended September 30, 2017.
58

Table of Contents
The following table sets forth Indonesia’s exports by major commodity groups for the periods indicated.
Exports by Sector
Year Ended December 31,
Nine MonthsEnded
September 30,2012 2013 2014 2015 2016P 2017P
(in thousands of U.S. Dollars)General merchandise 185,337,265 180,293,992 173,759,963 147,724,654 143,063,896 122,075,102
AgriculturalCoffee bean 1,241,922 1,166,406 1,030,826 1,210,617 1,000,542 935,205Tea 126,754 131,112 108,843 89,969 85,057 66,535Spices 631,746 554,137 577,627 780,981 698,006 437,729Tobacco 60,791 93,458 82,397 58,878 49,440 42,863Cocoa bean 388,326 443,372 201,407 118,047 85,498 40,983Shrimp and prawn 1,111,388 1,467,208 1,786,335 1,331,640 1,441,142 1,091,639Other agricultural products 2,023,351 1,931,996 2,139,877 2,174,509 2,135,090 1,726,213
Total Agricultural products 5,584,278 5,787,688 5,927,312 5,764,642 5,494,777 4,341,167Manufacture products
Textile and Textile products 12,510,222 12,770,966 12,847,055 12,338,750 11,883,621 9,381,172Processed wood products 3,338,150 3,510,392 3,906,760 3,813,415 3,691,540 2,730,269Palm oils 17,685,127 16,518,525 17,461,545 15,402,551 14,357,677 13,834,391Chemicals 3,634,536 3,498,625 3,851,429 2,805,673 3,236,877 3,376,580Base metal products 9,303,974 8,614,179 9,085,294 7,580,115 7,436,783 6,616,358Electrical apparatus, measuring instruments and others 11,157,423 10,716,148 10,108,187 8,777,604 8,386,801 6,631,147Cement 20,050 49,657 37,365 62,539 82,332 97,385Paper and paper products 3,938,382 3,732,138 3,779,966 3,599,154 3,442,980 2,803,921Processed rubber 10,368,180 9,306,376 7,022,184 5,843,690 5,538,628 5,649,808Oil products(1) 3,270,001 3,846,251 3,165,942 1,401,627 672,387 1,117,615Liquefied Petroleum Gas(1) 9,176 10,534 4,538 12,231 44,880 54,172Other manufacture products 40,215,423 40,604,203 47,338,146 44,550,999 47,852,307 38,013,825
Total Manufacture products 115,450,644 113,177,996 118,608,410 106,188,347 106,626,841 90,306,643Mining products
Copper ore 2,565,990 2,999,560 1,673,548 3,277,196 3,481,608 2,045,778Nickel ore 1,458,409 1,677,366 85,913 0 0 69,834Coal 26,248,270 24,359,167 20,818,030 16,004,035 14,563,340 14,665,712Bauxite 637,597 1,318,775 47,742 744 431 23,757Crude oil(1) 12,723,142 12,187,863 8,839,625 5,641,245 4,941,223 3,690,567Natural Gas(1) 17,670,962 15,689,119 14,941,959 9,338,774 6,579,074 5,839,503
o/w Liquefied Natural Gas 11,943,550 10,568,458 10,293,714 6,894,365 4,816,387 4,066,982Other mining products 455,659 591,546 213,410 182,769 179,479 128,187
Total Mining products 61,760,030 58,823,397 46,620,227 33,444,764 29,745,154 26,463,339Other merchandise(2) 2,542,238R 2,504,910 2,604,014 1,326,902 1,197,124 963,953
Other goods(3) 2,009,286 1,795,235 1,532,832 1,399,827 1,380,875 1,248,149Total Exports 187,346,476R 182,089,227 175,292,795 149,124,482 144,444,771 123,323,251
Memorandum(4)
Non-oil & gas exports 151,775,044 148,500,805 146,540,725 131,940,836 131,553,644 112,077,920Oil & gas exports 35,571,432 33,588,422 28,752,069 17,183,646 12,891,123 11,245,332
Source: Bank Indonesia P Preliminary. R Revised. (1) As a component of oil and gas exports. (2) Consists of art goods, goods not elsewhere specified, and goods procured in ports by carriers. (3) Consists of non-monetary gold and merchanting goods. (4) Presents the classification of exports based on two main groups of commodities: (i) oil and gas and (ii) non-oil and gas.
59
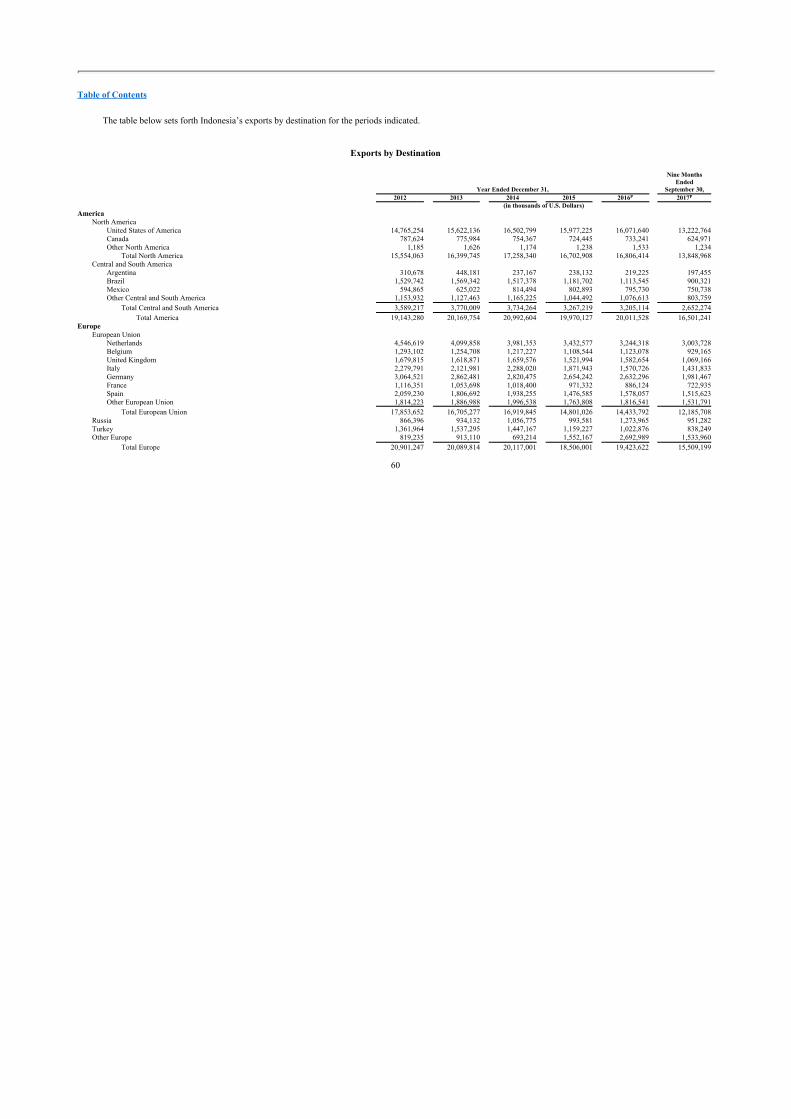
Table of Contents
The table below sets forth Indonesia’s exports by destination for the periods indicated.
Exports by Destination
Year Ended December 31,
Nine MonthsEnded
September 30,2012 2013 2014 2015 2016P 2017P
(in thousands of U.S. Dollars)America
North AmericaUnited States of America 14,765,254 15,622,136 16,502,799 15,977,225 16,071,640 13,222,764Canada 787,624 775,984 754,367 724,445 733,241 624,971Other North America 1,185 1,626 1,174 1,238 1,533 1,234
Total North America 15,554,063 16,399,745 17,258,340 16,702,908 16,806,414 13,848,968Central and South America
Argentina 310,678 448,181 237,167 238,132 219,225 197,455Brazil 1,529,742 1,569,342 1,517,378 1,181,702 1,113,545 900,321Mexico 594,865 625,022 814,494 802,893 795,730 750,738Other Central and South America 1,153,932 1,127,463 1,165,225 1,044,492 1,076,613 803,759
Total Central and South America 3,589,217 3,770,009 3,734,264 3,267,219 3,205,114 2,652,274Total America 19,143,280 20,169,754 20,992,604 19,970,127 20,011,528 16,501,241
EuropeEuropean Union
Netherlands 4,546,619 4,099,858 3,981,353 3,432,577 3,244,318 3,003,728Belgium 1,293,102 1,254,708 1,217,227 1,108,544 1,123,078 929,165United Kingdom 1,679,815 1,618,871 1,659,576 1,521,994 1,582,654 1,069,166Italy 2,279,791 2,121,981 2,288,020 1,871,943 1,570,726 1,431,833Germany 3,064,521 2,862,481 2,820,475 2,654,242 2,632,296 1,981,467France 1,116,351 1,053,698 1,018,400 971,332 886,124 722,935Spain 2,059,230 1,806,692 1,938,255 1,476,585 1,578,057 1,515,623Other European Union 1,814,223 1,886,988 1,996,538 1,763,808 1,816,541 1,531,791
Total European Union 17,853,652 16,705,277 16,919,845 14,801,026 14,433,792 12,185,708Russia 866,396 934,132 1,056,775 993,581 1,273,965 951,282Turkey 1,361,964 1,537,295 1,447,167 1,159,227 1,022,876 838,249Other Europe 819,235 913,110 693,214 1,552,167 2,692,989 1,533,960
Total Europe 20,901,247 20,089,814 20,117,001 18,506,001 19,423,622 15,509,199
60

Table of Contents
Year Ended December 31,
Nine MonthsEnded
September 30,2012 2013 2014 2015 2016P 2017P
(in thousands of U.S. Dollars)Asia and Middle East
ASEANBrunei Darussalam 116,854 88,505 98,873 85,589 85,377 49,285Philippines 3,667,656 3,774,591 3,887,862 3,920,827 5,260,823 4,725,299Cambodia 290,684 317,085 416,644 429,207 424,465 360,323PDR Laos 23,736 5,086 6,212 7,135 5,863 2,397Malaysia 11,000,550 10,475,415 9,454,669 7,489,169 6,801,105 6,054,803Myanmar 412,643 576,497 587,710 612,315 606,350 558,059Singapore 16,138,033 15,724,945 15,648,800 11,770,922 11,194,483 9,433,411Thailand 6,491,642 6,051,348 5,762,720 5,414,929 5,359,904 4,693,018Vietnam 2,266,667 2,558,864 2,443,990 2,716,595 3,016,614 2,547,465
Total ASEAN 40,408,467 39,572,336 38,307,481 32,446,688 32,754,984 28,424,059Hong Kong SAR 2,644,935 2,646,008 2,760,064 2,048,572 2,127,953 1,727,174India 12,500,116 12,969,881 12,242,603 11,635,073 10,076,131 10,257,071Iraq 44,886 171,973 70,480 94,987 91,069 91,861Japan 28,968,734 26,677,721 20,802,334 17,455,820 15,652,802 12,528,174South Korea 14,269,724 11,260,652 10,079,871 7,334,452 6,369,436 5,553,051Pakistan 1,377,718 1,412,462 2,048,086 1,988,062 2,017,977 1,795,870People’s Republic of China 21,523,958 22,425,902 17,301,903 14,611,015 16,670,696 15,513,448Saudi Arabia 1,767,167 1,728,619 2,155,351 2,060,074 1,327,878 1,079,912Taiwan 6,044,791 5,792,218 7,924,755 5,573,652 4,214,622 3,537,117Other Asia and Middle East 5,166,760 4,987,194 7,186,956 6,159,489 5,577,849 4,660,319
Total Asia and Middle East 134,717,255 129,644,966 120,879,884 101,407,884 96,881,397 85,168,056Australia and Oceania
Australia 4,718,098 4,344,740 5,000,046 3,652,251 3,202,772 1,875,103New Zealand 356,826 444,951 481,487 446,040 378,687 306,209Other Australia and Oceania 373,454 488,064 367,443 345,654 346,007 266,631
Total Australia and Oceania 5,448,377 5,277,755 5,848,975 4,416,946 3,927,466 2,447,943Africa
South Africa 1,642,411 1,245,443 1,378,907 665,661 727,757 522,577Other Africa 2,951,669 3,156,584 3,479,381 2,838,590 2,294,232 2,217,283
Total Africa 4,594,079 4,402,028 4,858,288 3,504,251 3,021,989 2,739,860Unclassified exports(1) 2,542,238R 2,504,910 2,596,043 1,319,272 1,178,768 956,951Total (f.o.b.) 187,346,076R 182,089,227 175,292,795 149,124,482 144,444,771 123,323,251
Source: Bank Indonesia P Preliminary. R Revised. (1) Consists of goods procured in ports by carriers and merchanting goods.
61

Table of Contents
The following table sets forth Indonesia’s imports by major commodity groups for the periods indicated.
Imports by Sector(1)
Year Ended December 31,
Nine MonthsEnded
September 30,2012 2013 2014 2015 2016P 2017P
(in thousands of U.S. Dollars)General Merchandise 189,094,827 186,153,764 177,787,488 141,672,713 134,883,521 112,295,114
Consumption GoodsFood and beverages, primary, mainly for household 1,537,179 1,394,325 1,541,254 1,320,173 1,729,432 1,598,178Food and beverages, processed, mainly for household 2,759,331 2,812,575 2,750,512 2,332,869 3,008,370 2,084,847Passenger motor cars 1,498,307 1,171,510 784,431 583,152 594,978 448,279Transport equipment, nonindustrial 367,729 383,485 268,909 243,873 142,456 125,624Durable consumer goods 1,592,871 1,624,973 1,415,739 1,073,667 1,208,820 1,110,257Semi-durable consumer goods 1,921,446 2,150,785 1,952,560 1,965,991 2,221,224 1,997,270Non-durable consumer goods 1,910,634 2,154,691 2,158,041 2,023,181 2,154,671 1,796,800Fuels and lubricants, processed, oil products(2) 13,720,367 14,736,636 14,504,300 8,181,422 5,146,414 5,161,948Goods not elsewhere specified 224,769 450,718 531,831 737,074 824,708 696,125
Total Consumption Goods 25,532,632 26,879,699 25,907,577 18,461,404 17,031,073 15,019,328Raw materials and auxiliary goods
Food and beverages, primary, mainly for industry 4,005,713 4,348,635 4,934,923 4,100,987 4,423,376 3,859,172Food and beverages, processed, mainly for industry 3,317,376 3,294,925 3,247,084 2,726,501 3,459,829 2,627,149Industrial supplies, primary 5,480,589 6,180,739 5,967,884 4,616,310 3,986,892 3,570,283Industrial supplies, processed 58,236,091 56,624,346 56,247,051 49,421,677 47,297,837 39,084,946Parts and accessories for capital goods 18,011,245 17,191,495 15,552,758 14,628,024 15,529,878 12,418,898Parts and accessories for transport equipment 8,267,873 8,980,793 7,128,761 6,139,368 6,384,650 5,316,014Fuels and lubricants, primary 11,008,146 13,322,222 12,896,531 8,011,548 7,197,942 5,464,634
o/w Crude oil(2) 10,987,073 13,236,094 12,600,220 7,725,385 6,874,010 4,992,437Fuels and lubricants, processed 18,405,384 17,706,610 15,702,783 8,292,444 6,784,224 7,111,564
o/w Oil products(2) 15,540,944 14,408,358 12,442,784 6,057,936 4,721,414 5,041,303o/w Liquefied Petroleum Gas(2) 2,626,816 3,094,502 3,039,246 2,061,615 1,841,452 1,868,827
Total Raw materials and auxiliary goods 126,732,417 127,649,765 121,677,775 97,936,858 95,064,628 79,452,659Capital Goods
Capital goods (except transport equipment) 26,642,473 25,541,302 25,570,739 22,424,297 19,855,824 14,741,184Passenger motor cars 1,498,307 1,171,510 784,431 583,152 594,978 448,279Other transport equipment, industrial 7,945,543 4,196,809 3,093,174 1,847,542 1,865,130 2,233,817
Total Capital Goods 36,086,323 30,909,621 29,448,344 24,854,992 22,315,931 17,423,279Other merchandise(3) 743,455 714,679 753,791 419,459 471,889 399,848
Other goods(4) 43,071 32,398 25,620 706,213 832,395 632,181Total 189,137,898 186,186,162 177,813,107 142,378,926 135,715,916 112,927,296
Source: Bank Indonesia P Preliminary. (1) Data collected on a cost, insurance and freight basis. (2) As a component of oil and gas imports. (3) Consists of goods procured in ports by carriers. (4) Consists of nonmonetary gold.
62

Table of Contents
The following table sets forth Indonesia’s imports by country of origin for the periods indicated.
Imports by Place of Origin(1)
Year Ended December 31,
Nine MonthsEnded
September 30,2012 2013 2014 2015 2016P 2017P
(in thousands of U.S. Dollars)America
North AmericaUnited States of America 9,701,647 8,966,943 8,139,708 7,608,621 7,338,417 5,850,873Canada 1,809,859 2,104,103 1,908,631 1,621,298 1,382,005 1,111,323Other North America 15,931 1,094 111,336 1,756 2,008 1
Total North America 11,527,437 11,072,140 10,159,676 9,231,676 8,722,430 6,962,197Central and South America
Argentina 1,749,601 1,683,663 1,465,715 1,298,541 1,373,780 842,990Brazil 1,934,842 2,205,400 2,548,178 2,425,680 2,347,422 1,136,755Mexico 566,649 516,890 186,888 197,406 177,236 133,036Other Central and South America 561,260 600,191 540,815 392,383 449,709 483,508
Total Central and South America 4,812,353 5,006,144 4,741,596 4,314,010 4,348,148 2,596,290Total America 16,339,789 16,078,284 14,901,271 13,545,685 13,070,578 9,558,487
EuropeEuropean Union
Netherlands 845,501 999,770 912,737 794,586 710,662 671,939Belgium 618,879 652,619 583,997 560,461 492,260 483,152United Kingdom 1,280,884 1,063,795 899,185 816,947 892,660 681,109Italy 1,508,328 1,692,133 1,720,992 1,417,856 1,388,461 1,158,187Germany 4,050,293 4,389,557 4,104,817 3,453,948 3,152,972 2,515,762France 1,638,856 1,568,430 1,334,831 1,337,879 1,360,419 1,240,357Spain 521,227 573,305 555,106 473,990 484,441 360,639Other European Union 3,144,422 2,704,189 2,646,741 2,484,948 2,222,940 1,960,199
Total European Union 13,608,391 13,643,796 12,758,406 11,340,613 10,704,815 9,071,346Russia 1,743,576 2,038,204 1,583,207 983,680 846,317 867,961Turkey 409,525 1,409,107 1,035,394 249,109 308,327 434,588Other Europe 1,679,654 1,717,109 1,408,827 1,335,978 1,857,943 1,386,894
Total Europe 17,441,145 18,808,216 16,785,834 13,909,380 13,717,402 11,760,789
63

Table of Contents
Year Ended December 31,
Nine MonthsEnded
September 30,2012 2013 2014 2015 2016P 2017P
(in thousands of U.S. Dollars)Asia and Middle East
ASEANBrunei Darussalam 480,349 677,923 610,286 126,168 88,029 36,793Philippines 801,738 775,382 694,808 684,289 816,532 609,738Cambodia 11,053 17,752 18,722 21,133 25,197 20,640PDR Laos 3,278 7,543 51,265 1,027 4,196 5,933Malaysia 12,786,250 13,878,131 10,714,357 8,464,345 7,197,766 6,276,191Myanmar 63,359 72,997 122,243 159,685 112,955 114,651Singapore 27,435,575 26,687,954 24,699,196 17,784,006 14,501,421 13,025,735Thailand 11,369,461 10,721,002 9,770,883 8,074,329 8,647,172 6,746,056Vietnam 2,543,876 2,686,495 3,399,903 3,146,337 3,228,483 2,331,540
Total ASEAN 55,494,939 55,525,180 50,081,662 38,461,319 34,621,750 29,167,277Hong Kong SAR 1,897,323 1,956,494 1,892,903 1,806,733 1,814,777 2,024,320India 4,310,220 3,960,489 3,937,401 2,742,320 2,858,593 2,864,255Iraq 200 49 342 243 106 58Japan 22,674,852 19,188,165 16,866,526 13,255,694 12,981,644 11,020,483South Korea 12,238,061 11,761,514 11,732,612 8,424,260 6,657,910 6,111,886Pakistan 271,276 162,555 158,655 173,600 156,774 139,253People’s Republic of China 29,486,325 29,792,501 30,631,469 29,381,441 30,677,815 24,163,101Saudi Arabia 5,447,047 6,929,195 6,343,400 3,332,183 2,720,977 1,935,373Taiwan 4,731,457 4,488,642 3,748,062 3,145,310 2,877,222 2,380,567Other Asia and Middle East 6,879,661 5,840,125 8,180,995 4,617,161 3,661,908 3,593,889
Total Asia and Middle East 143,431,361 139,604,909 133,574,026 105,340,264 99,029,475 83,400,462Australia and Oceania
Australia 5,227,751 5,088,023 5,637,313 4,811,041 5,241,353 4,527,082New Zealand 692,249 796,396 837,703 637,396 660,958 527,125Other Australia and Oceania 69,803 86,192 42,249 29,367 37,469 98,870
Total Australia and Oceania 5,989,802 5,970,611 6,517,265 5,477,803 5,939,779 5,153,077Africa
South Africa 650,838 624,337 477,411 231,880 288,464 178,305Other Africa 4,541,508 4,385,126 4,803,509 3,454,454 3,198,328 2,476,327
Total Africa 5,192,346 5,009,463 5,280,920 3,686,335 3,486,792 2,654,632Unclassified imports(2) 743,455 714,679 753,791 419,459 471,889 399,848Total 189,137,898 186,186,162 177,813,107 142,378,926 135,715,916 112,927,296
Source: Bank Indonesia P Preliminary. (1) Data collected on a cost, insurance and freight basis. (2) Consists of goods procured in ports by carriers.
Balance of Payments
Balance of payments figures measure the relative flow of goods, services and capital into and out of a country as represented in the current account and the capital and financial account. The current account tracks a country’s trade in goods and services, as well as income and current transfer transactions. The capital and financial account covers all transactions involving capital transfers, acquisition or disposal of non-produced, non-financial assets, and financial assets and liabilities. A balance of payments surplus indicates a net inflow of foreign currencies, while a balance of payments deficit indicates a net outflow of foreign currencies.
64

Table of Contents
The following table sets forth the Republic’s balance of payments for the periods indicated.
Balance of Payments(1)
Year Ended December 31,
Nine MonthsEnded
September 30,2012 2013 2014 2015 2016P 2017P
(in millions of U.S. Dollars)Current account (24,418) (29,109) (27,510) (17,519) (16,790) (11,503)
Goods(2) 8,680 5,833 6,983 14,049 15,437 15,777Total exports (f.o.b.) 187,346 182,089 175,293 149,124 144,445 123,323
Non-oil and gas exports 151,775 148,501 146,541 131,941 131,554 112,078Oil and gas exports 35,571 33,588 28,752 17,184 12,891 11,245
Total imports (f.o.b.) (178,667) (176,256) (168,310) (135,076) (129,008) (107,546) Non-oil and gas imports (137,857) (132,959) (127,729) (112,189) (111,320) (91,299) Oil and gas imports (40,810) (43,297) (40,582) (22,887) (17,688) (16,247)
Services (10,564) (12,070) (10,010) (8,697) (7,015) (5,597) Primary income (26,628) (27,050) (29,703) (28,379) (29,656) (24,799) Secondary income 4,094 4,178 5,220 5,508 4,444 3,116
Capital account 51 45 27 17 41 16Financial account 24,858 21,926 44,916 16,843 28,576 23,425
(i) Public sector 7,030 9,730 14,136 17,588 15,082 15,515Portfolio investment 4,577 11,105 18,345 17,778 18,629 16,969
Assets (4,674) 848 2,965 392 1,795 (99) Liabilities 9,251 10,257 15,380 17,386 16,835 17,069
Other investment 2,453 (1,376) (4,209) (190) (3,547) (1,454) Assets (1) 0 0 0 (269) 0Liabilities 2,453 (1,376) (4,209) (190) (3,279) (1,454)
Loans (2,220) (527) (1,243) 202 (1,484) (1,553) Drawings 3,332 4,947 4,035 5,139 3,709 1,719Repayments (5,553) (5,474) (5,278) (4,937) (5,193) (3,273)
Other liabilities 4,674 (848) (2,965) (392) (1,795) 99(ii) Private sector 17,828 12,196 30,780 (745) 13,494 7,910
Direct investment 13,716 12,170 14,733 10,704 16,063 14,378Assets (7,485) (11,112) (10,388) (9,075) 11,594 (1,073) Liabilities 21,201 23,282 25,121 19,779 4,469 15,451
Portfolio investment 4,629 (233) 7,722 (1,595) 366 1,795Assets (793) (2,121) (379) (1,660) 423 (1,761) Liabilities 5,422 1,888 8,100 65 (57) 3,556
Financial derivatives 13 (334) (156) 20 (9) (59) Other investment (530) 593 8,480 (9,874) (2,926) (8,204)
Assets (5,352) (3,427) (3,427) (11,812) 2,783 (10,894) Liabilities 4,822 4,020 11,907 1,938 (5,709) 2,690
Errors and omissions (275) (186) (2,184) (439) 263 (1,325) Overall balance 215 (7,325) 15,249 (1,098) 12,089 10,612
Reserves and related items (215) 7,325 (15,249) 1,098 (12,089) (10,612)
Memorandum(3)
Reserve asset position 112,781 99,387 111,862 105,931 116,362 129,402
Source: Bank IndonesiaP Preliminary. (1) Bank Indonesia uses (+) and (-) signs in its published data to follow BPM5 whereby (+) means inflow and (-) means outflow. In financial account, (+) denotes increase in liabilities or decrease in assets, while
(-) represents increase in assets or decrease in liabilities. The table above has been adjusted to align with the formatting of this prospectus. (2) The calculation of export and import figures included in the balance of payments data compiled by Bank Indonesia differs in coverage and timing from the data on export/import trade compiled by BPS.
65

Table of Contents
(3) Presents the position of reserve assets at the end of period. A surplus/deficit in the overall balance of payments during a reporting period will increase/decrease the outstanding amount of reserve assets at the end of that period.
In 2012, the balance of payments recorded a U.S.$0.2 billion surplus. Slowing growth in world demand and plunging export commodity prices in contrast to buoyant domestic demand and mounting consumption of oil-based fuels led to a reduced non-oil and gas trade surplus and a widening oil and gas trade deficit. As a result, the current account recorded an overall deficit of about 2.8% of GDP. Nevertheless, this deficit was offset by an increase in the capital and financial account surplus over the previous year, enabling Indonesia to chart a balance of payments surplus of U.S.$0.2 billion and maintain a sufficient level of international reserves. The increased capital and financial account surplus was driven not only by portfolio investment, but also foreign direct investment, with an added boost from the growing proportion of export earnings received through the domestic banking system. The success in boosting inflows of foreign investment and curbing the current account deficit at no more than 3.0% of GDP was due to the series of policies launched by Bank Indonesia and the Government, encompassing monetary and macro prudential policy, exchange rate management, fiscal management, and improvements to the investment climate.
In 2013, the weakening global economy combined with the lack of support from the domestic economy led to mounting pressure on Indonesia’s balance of payments. The global economic slowdown caused exports to contract further while imports remained high due to demand from middle class consumers and high oil imports. The slowdown in exports combined with the high demand for imports resulted in a widening of the current account deficit.
Amid discussions regarding the tapering of the monetary stimulus package by the U.S. monetary authority following improvements in the U.S. economy there was a gradual reduction in the supply of liquidity to emerging market countries, including Indonesia. As a result, foreign capital inflows into Indonesia began to weaken. Negative perceptions among foreign investors were exacerbated by the rising current account deficit and inflation expectations. These conditions had a negative impact on the capital and financial account surplus.
The current account deficit increased from 2.6% of GDP in March 2013 to 4.2% of GDP in June 2013. In the capital and financial account, capital outflows increased in July 2013, triggered by global concerns over the planned tapering by the U.S. monetary authority. Between the months of June to September 2013, the current account still posted a sizeable deficit at 3.7% of GDP. Capital outflows continued through August 2013 as a result of lingering concerns over tapering.
In 2013, Bank Indonesia, in conjunction with the Government, introduced a range of policies designed to bring down the current account deficit to a more sustainable level. The policies can be grouped into three major areas. The first group addressed monetary policy, consisting of a number of measures implemented by Bank Indonesia designed to influence interest rate policy, exchange rate policy and macro prudential policy. The second group of policies addressed fiscal policy, such as the reduction to the fuel subsidies and tax instruments for reducing imports. Both monetary policy and fiscal policy were directed towards managing domestic demand in order to curb excessive imports. The third group of policies related to structural policies, including those for improving the investment climate and measures to promote economic self-reliance, which in turn will support the balance of payments in the long run.
These stabilization policies successfully reduced the current account deficit. The reduction was achieved through a fall in imports following more moderate domestic demand, an increase in exports in line with improved economic growth in advanced countries and a depreciation in the exchange rate. The rebalancing of the current account deficit was further aided by increases in the capital and financial account surplus resulting from corporate drawings of foreign borrowings, withdrawals from offshore deposits held by domestic banks and stable inflows of direct investment. The surplus in the capital and financial account was sufficient to finance the current account deficit, with the result that, in the last quarter of 2013, after three straight quarters of deficit, the balance of payments returned to surplus.
66

Table of Contents
Despite developments in the last quarter of 2013, the overall balance of payments in 2013 resulted in a U.S.$7.3 billion deficit in contrast with the U.S.$0.2 billion surplus of 2012. The 2013 balance of payments deficit reflects the current account deficit of U.S.$29.1 billion, or 3.2% of GDP, up from the 2012 deficit of U.S.$24.4 billion or 2.7% of GDP, and a reduced capital and financial surplus, which declined from U.S.$24.9 billion in 2012 to U.S.$21.9 billion in 2013.
In 2014, the current account improved, with the deficit falling from U.S.$29.1 billion or 3.2% of GDP in 2013 to U.S.$27.5 billion or 3.1% of GDP in 2014. This improvement was mainly the result of new policies instituted by Bank Indonesia in close cooperation with the Government. The improvement in the current account was also supported by improved performances in the goods trade balance, services and secondary income accounts. Improvements in the trade balance were mainly attributable to an increase in the non-oil and gas trade surplus compared with 2013, as non-oil and gas imports contracted following moderate demand in the domestic market, as reflected in the decrease in imports of consumption goods, raw materials, and capital goods. Meanwhile, non-oil and gas exports contracted in nominal terms due to a weakening in global demand, especially from China, and the ongoing decline in global commodity prices. Nevertheless, the improvement in the trade balance was contained by the widening oil and gas trade deficit. Declines in the oil and gas trade balance were attributable to the high domestic energy needs, boosting oil and gas imports amid the decreasing oil exports, in line with the decline in oil production and the global oil price.
The narrowing deficit in the services account was attributable to reduced payments for transportation services, in line with the decrease in imports of goods, increased receipts of travel services, along with the rise in the number of foreign travelers visiting Indonesia, and the increased receipt of remittances from Indonesian workers abroad. On the other hand, the deficit in the income account grew, along with the increase in Indonesia’s foreign liability position, mainly due to increased interest payments on the Government’s debt securities.
Improvement in Indonesia’s economic fundamentals led to an increase in foreign direct investment in 2014. The capital and financial account posted a record high of foreign capital inflow, mainly in the form of portfolio investments. Foreign capital inflows in 2014 reached U.S.$23.5 billion, a significant increase from U.S.$12.1 billion in 2013. The increased inflows of foreign portfolio investments, in addition to the impact of increases in net foreign buying in Rupiah-denominated portfolio instruments, was supported by the Government’s steps to issue foreign currency bonds as a source of fiscal financing.
The capital and financial account surplus in 2014 also benefitted from the increased foreign direct investment inflows compared with 2013, with the capital and financial account recording a U.S.$44.9 billion surplus, almost double the surplus of 2013. The lower current account deficit and the higher capital and financial account surplus resulted in the balance of payments in 2014 swinging back to a surplus of U.S.$15.2 billion from a deficit of U.S.$7.3 billion in 2013. This surplus in turn increased international reserves from U.S.$99.4 billion as of December 31, 2013 to U.S.$111.9 billion as of December 31, 2014.
In 2015, the current account continued to improve, with the deficit falling from U.S.$27.5 billion or 3.1% of GDP in 2014 to U.S.$17.6 billion or 2.0% of GDP in 2015. The improvement in the current account was mainly attributed to the narrowing of the oil and gas trade deficit due to the drop in oil imports brought about by the fall in global crude oil prices and the lower consumption of oil-based fuels as a positive impact of the Government subsidy reforms. On the other hand, the decline in imports of non-oil and gas was in line with reduced domestic demand. The decline in the services account deficit resulted from a decline in transportation services (freight) in line with fewer imports of goods.
Amid growing uncertainty in the global financial markets, the capital and financial account in 2015 posted a surplus of U.S.$16.8 billion, lower than the surplus of U.S.$44.9 billion in 2014. The decrease was primarily due to decline in direct investment inflows and lower corporate funding needs through foreign borrowing in line with slowing domestic economy. In addition, foreign portfolio inflows decreased sharply as uncertainty in the global financial markets increased, although the uncertainty eased in the fourth quarter of 2015. Meanwhile, other
67

Table of Contents
investments recorded a deficit of U.S.$9.9 billion, due to increase in private sector deposits in foreign banks as investors’ perception of the domestic economy weakened. Indonesia’s overall balance of payments in 2015 recorded a deficit of U.S.$1.1 billion. As a consequence, international reserves decreased from U.S.$111.9 billion as of December 31, 2014 to U.S.$105.9 billion as of December 31, 2015.
In 2016, the current account deficit increased compared to 2015, but improved as a percentage of GDP, with the deficit of U.S.$17.5 billion or 2.0% of GDP in 2015 falling to U.S.$16.8 billion or 1.8% of GDP in 2016. The higher current account deficit was mainly due to lower non-oil and gas trade surplus and a higher deficit in the primary income account and lower surplus in the secondary income account, each as compared to 2015, which was partially offset by a lower deficit in the services account due to a lower deficit in transportation services. The lower non-oil and gas trade surplus was partially offset by a lower oil and gas trade deficit due to the drop in oil imports brought about by the fall in global crude oil prices and lower consumption of oil based fuels mainly due to Government subsidy reforms.
Amid growing uncertainty in the global financial markets, the capital and financial account for 2016 posted a surplus of U.S.$28.8 billion, higher than the U.S.$16.9 billion surplus in 2015. The increase was primarily the result of positive sentiment towards the domestic economic outlook and easing global risk. Net direct investment increased from U.S.$10.7 billion in 2015 to U.S.$15.9 billion in 2016. The portfolio investment account also recorded a surplus due to positive sentiment concerning the sound implementation of the Tax Amnesty Law. The other investment deficit shrank on net withdrawals of Government foreign loans and net withdrawals of private sector deposits abroad.
Indonesia’s overall balance of payments in 2016 recorded a surplus of U.S.$12.1 billion compared to the deficit of U.S.$1.1 billion in 2015. The surplus resulted in higher international reserves from U.S.$105.9 billion as of December 31, 2015 to U.S.$116.4 billion as of December 31, 2016.
Indonesia’s overall balance of payments surplus for the nine months ended September 30, 2017 was U.S.$10.6 billion compared to U.S.$7.6 billion in the same period in 2016. The higher surplus was a result of a capital and financial surplus that outpaced the current account deficit that in turn led to an increase in official reserve assets to U.S.$129.4 billion as of September 30, 2017. The current account deficit in the nine months ended September 30, 2017 was U.S.$11.5 billion (1.5% of GDP), lower than the deficit in same period of 2016 of U.S.$15.0 billion (2.2% of GDP). The narrower current account deficit was primarily due to the higher non-oil and gas trade surplus. The services account and the income account recorded higher deficits. The higher deficit in the services account was primarily due to an increase in freight services payments. The capital and financial account surplus in the nine months ended September 30, 2017 was U.S.$23.4 billion, higher than the surplus in the same period of 2016 of U.S.$20.9 billion. This increased surplus was driven by an increase in direct investment inflows, in line with increasing domestic investment, and a decrease in other investment deficit, particularly on account of lesser outflows of domestic private deposits overseas.
Financial System
Indonesia Deposit Insurance Corporation and Liquidity Support
Since September 2005, the Indonesia Deposit Insurance Corporation, or IDIC, has insured customers’ deposits and actively participated in maintaining the stability of the financial system. The IDIC membership is compulsory for every bank conducting business in Indonesia. The prevailing IDIC coverage is up to Rp2 billion for each depositor in any one bank. The IDIC will pay, in accordance with its procedures, deposit insurance claims when a member bank has its license revoked by the Indonesia Financial Service Authority (Otoritas Jasa Keuangan or OJK). The maximum amount of deposit insured can be adjusted, among others, in the event of a crisis that can potentially decrease public trust in the banking system or affect the stability of the financial system.
The Government’s policy on addressing sudden reversals in capital flows involves, among others, the implementation of a Crisis Management Protocol, which involves cooperation between the Ministry of Finance,
68

Table of Contents
Bank Indonesia, OJK and IDIC. In the event of a financial crisis, policy steps could include executing buybacks for stabilization in the event of a disruption; taking steps to enhance cooperation among Government institutions, Bank Indonesia, SOEs, regulators and other market participants to maintain stability of the sovereign bond market; and encouraging the placement of funds in instruments with a longer maturity by issuing longer term securities and debt switching to lengthen debt maturities and reduce risks associated with refinancing.
In April 2016, the parliament passed Law No. 9 of 2016 Law concerning Prevention and Resolution of Financial System Crisis, which provides a clear division of responsibilities between the Ministry of Finance, Bank Indonesia, OJK and IDIC in preventing and resolving crises in the financial system through the establishment of a Financial System Stability Committee with representatives from each of the Ministry of Finance, Bank Indonesia, OJK and IDIC. The Financial System Stability Committee aims to provide a coordinated policy response on the basis of regular monitoring of key areas of the financial system.
The Banking System
The Government’s policies for the banking sector emphasize the strengthening of the banking system.
The law governing Bank Indonesia, Indonesia’s central bank, was amended in 2004 to, among other things, provide that Bank Indonesia will conduct monetary policy to achieve an inflation target as determined by the Government in consultation with Bank Indonesia. It also provides for the creation of the Bank Indonesia Supervisory Board, or Supervisory Board, to assist the DPR in conducting oversight of Bank Indonesia’s internal financial management. The Supervisory Board comprises five members chosen by the DPR and appointed by the President for three-year tenures. The January 2004 amendment also stipulates that Bank Indonesia is the lender of last resort to ensure the stability of the financial system. Bank Indonesia’s banking supervision function was transferred to the OJK on December 31, 2013. The latest amendment to the Central Bank Law was in 2008, mainly to amend the collateral requirement on Sharia financing, certain provisions of which were revoked by the Law on Financial System Crisis Prevention and Management enacted in April 2016.
The authorities implement risk mitigation by strengthening micro and macro-prudential surveillance. Micro-prudential surveillance is performed on an individual bank or financial institution in order to ensure the fulfillment of prudential regulations through on-site and off-site supervision. Additionally, macro-prudential surveillance also aims to ensure that prudential regulations are adhered to at the industry level as an aggregate.
Under a framework of strengthening micro-prudential surveillance, a number of measures have been introduced by Bank Indonesia and the OJK to bolster and improve surveillance in order to better anticipate the symptoms of troubled banks on a risk basis, as well as enhance the quality of human resources through training, attachments and certification programs.
In addition, improvements to the tools and methodologies used in surveillance are ongoing in order to reinforce macro-prudential aspects, among others, stress testing, probability of default analysis, transition matrices and other early warning mechanisms. The creation of the financial system safety net also assists authorities to mitigate potential systemic risks that might arise.
OJK has issued banking regulations that are in line with the international standards, such as the Basel framework. In terms of the capital reforms, OJK issued its rule for the Basel III capital framework in December 2013, which was amended in February 2016. These cover (i) raising the quality of regulatory capital, (ii) setting a minimum Tier 1 and CET 1 ratio of 6% and 4.5%, respectively, as well as a minimum capital requirement based on risk profile between 8% to 14%, and (iii) building-up of adequate buffers above the minimum capital requirement based on risk profile (including a capital conservation buffer, countercyclical buffer and capital surcharge for D-SIBs). In 2015, OJK issued regulation regarding D-SIB methodology and capital surcharge application which was applied for the first time in January 2016.
69

Table of Contents
As part of its Basel III implementation policies, OJK issued regulations for the Basel III Liquidity framework, Liquidity Coverage Ratio, or LCR, and Net Stable Funding Ratio, or NSFR. The LCR regulation was issued in December 2015 and requires banks to maintain short-term liquidity through high quality liquid assets that meet their liquidity needs for thirty days. The NSFR regulation was issued in July 2017 and uses NSFR as an indicator to evaluate a bank’s long-term liquidity risk by comparing the amount of stable funding available to the bank with the amount of stable funding required by the bank. It aims to reduce long-term liquidity risk by requiring banks to fund activities from stable and adequate sources of funds.
Under the Financial System Crisis Prevention and Management law, OJK has issued regulations concerning a systemic bank recovery plan in April 2017. These regulations establish the requirements for systemic banks to prepare and submit recovery plans. Systemic banks are also required to have guidelines in relation to the recovery plan in place, which are prepared by taking into account the governance principles supporting the implementation of the recovery plan. Moreover, systemic banks are also obliged to evaluate and perform stress testing in order to assess the adequacy of their recovery plans at least once a year.
As of July 31, 2017, total banking assets were Rp6,911.2 trillion, consisting of assets of commercial banks of Rp6,792.5 trillion and assets of rural credit banks of Rp118.7 trillion.
Islamic Financial System
The Government believes that the Islamic finance banking industry has an opportunity to grow rapidly in Indonesia, which has the largest Muslim population in the world. The industry provides the Muslim community with alternative financial products and services that conform to Sharia principles. These Sharia principles as applied to the Islamic finance banking industry includes Sharia concepts related to mudarabah (profit and loss sharing), wadiah (safekeeping), musharaka (joint venture), murabahah(cost plus), and ijar (leasing). Sharia prohibits riba, or usury, defined as interest paid on all loans of money. Furthermore, investments in some businesses that provide goods or services considered contrary to Islamic principles (such as pork or alcohol) are also considered haraam (sinful and prohibited) under Sharia principles. To assist with the development and growth of Islamic financial services in Indonesia, these alternative financial products are considered an integral part of the banking industry and contribute to enhancing the stability of the Indonesian financial system by supporting national economic development in Indonesia.
In July 2008, the Sharia Banking Law was enacted to facilitate the expansion of the Indonesian Islamic banking industry. The Sharia Banking Law applies Sharia principles to banking for Sharia banks and Sharia divisions of conventional banks, prohibiting the payment and receipt of interest and providing that returns on funds that are distributed or lent out must be based on the actual profits generated. The Sharia Banking Law also prohibits Islamic banking business and transactions that would support practices or products forbidden or discouraged by Sharia principles. This law also requires existing Sharia divisions of commercial banks to operate as separate Islamic commercial banks if such a division’s assets account for at least half of the parent commercial bank’s assets or within 15 years of the enactment of the Sharia Banking Law. The Government believes that this legislation will better position Indonesia as a venue for Islamic banking and finance.
One of the main challenges for Indonesia’s Sharia capital markets is the small number of companies that issue Sharia-compliant products such as Islamic bonds, or Sukuk. For example, of the 93 underwriters licensed by OJK as of September 30, 2017, only 27 were involved in issuances of Sukuk, and only 47 of 87 investment managers licensed by OJK as of September 30, 2017 managed Sharia funds.
The Indonesian Islamic financial industry has been developing under the regulatory authority of OJK (since December 31, 2013) and previously Bank Indonesia, which formulates and publishes a strategic plan for the development of the industry. OJK has established a new strategic plan for the development of Indonesia’s Islamic banking industry for 2015-2019. This new strategic plan is expected to provide guidelines that include detailed initiatives as well as specific objectives for the Sharia banking industry to achieve. This strategic plan for
70

Table of Contents
the development of the national Sharia banking industry is recognized as the “Roadmap of Indonesian Islamic Banking 2015-2019” with a view to “establish an Islamic banking industry that provides significant contributions to sustainable economic growth, equitable development, financial system stability and is highly competitive.” The roadmap includes, among others, the following measures: (i) issuance of regulations concerning new Sharia investment products such as project-based Sharia funds, (ii) developing a Sharia-compliant set of securities laws, (iii) building infrastructure that supports the Islamic financial system, including a Sharia stock online trading system, more varied Sharia stock indexes and other systems that support the liquidity of Sukuk, and (iv) development of a Sharia capital markets information technology infrastructure.
OJK and Bank Indonesia have issued various regulations in order to support the growth and development of the Sharia banking industry with due observance to precautionary principles and Sharia principles.
As of July 31, 2017, the assets of Sharia banks were Rp388.7 trillion, or 5.5% of the country’s total banking assets.
The Sharia Non-Bank Financial Industry (Industri keuangan Non Bank Syariah or IKNB Sharia) is also supervised by OJK and consists of the Sharia Insurance Company, the Sharia Pension Fund, the Sharia Financial Institution and other Sharia Financial Service Institutions. OJK issued a regulation to govern the Sharia pension funds which came into force in September 2016. Under the regulation, management of Sharia pension funds may be conducted by way of: (i) establishment of Sharia pension fund, (ii) conversion of pension fund into Sharia pension fund, (iii) formation of Sharia unit in Employee Pension Fund, or (iv) sale of Sharia investment package in financial institution pension fund. There are currently no established Sharia pension funds in Indonesia.
Anti-Money Laundering Regime
Various financial regulatory agencies in the Republic were formed to combat money laundering activities within Indonesia. In 2002, the Government enacted an anti-money laundering law, or 2002 AML Law, and established a financial intelligence unit, the Indonesian Financial Transaction Reports and Analysis Centre, or INTRAC/Pusat Pelaporan Analisis Transaksi Keuangan or PPATK. The PPATK’s duties were later expanded to include matters relating to countering terrorism financing, and consequently, the PPATK was appointed to be the focal point of countering money-laundering and financing of terrorism in Indonesia.
Some of the significant progress made in implementing the Government’s anti-money laundering laws and countering financing of terrorism, or CFT, national strategies in the last few years includes: promulgating a new Anti-Money Laundering Law, namely, Law No. 8 of 2010 on the Prevention and Eradication of Money Laundering Crimes, or 2010 AML Law, and the ratification of the UN Convention against Transnational Organized Crime. The 2010 AML Law came into force on October 22, 2010 replacing the 2002 AML Law, as amended, to be in line with current international standards and best practices.
As part of the implementation of the Government’s policy to prevent and eradicate the crime of money laundering, the PPATK has issued and continues to issue various regulations as further implementation of the 2010 AML Law.
On March 13, 2013, the DPR adopted the Law No. 9 of 2013 on the Prevention and Eradication of the Financing of Terrorism, or Law No. 9. Law No. 9 comprehensively regulates: (i) the criminalization of terrorist financing offenses and other offenses related to terrorism financing offenses; (ii) the application of the principle of recognizing users of financial services; reporting and compliance monitoring; (iii) surveillance activities through a remittance transfer system or through other systems by financial service providers; (iv) control disposition of cash and/or other payment instruments into or outside the Indonesian customs area; (v) blocking mechanisms relating to the movement of cash and/or other payment instruments; (vi) the inclusion in the list of suspected terrorists and terrorist organizations; and (vii) arrangements regarding the setting of the investigation, prosecution, and examination at trial.
71

Table of Contents
Terrorism financing within the scope of Law No. 9 includes acts committed, directly or indirectly, in order to provide, gather, give, or lend funds to those who are known to intend to commit an act of terrorism. In addition to individuals, Law No. 9 regulates the criminalization of terrorist financing to terrorist organizations. Terrorist organizations within Law No. 9 can include a collection of people who have a common goal and that, based on a court decision, have committed an act of terrorism. Parties that are named in lists of terrorist organizations also fall within the scope of Law No. 9.
OJK issued a new regulation concerning the implementation of anti-money laundering and prevention of terrorism financing in financial services sector in March 2017, namely the OJK Regulation No. 12/POJK.01/2017. This regulation requires any financial service provider to identify, assess and understand the risk of money laundering and/or terrorism financing crimes related to customers, countries, geographic areas, products, services, transaction or delivery channels. To perform these types of activities, the financial service provider must establish policies, supervision and maintenance procedures and mitigation of money laundering and terrorism financing risks and establish a special task force and/or appoint an officer to act as a person-in-charge for the implementation of anti-money laundering and anti-terrorism financing programs. The financial service provider is required to submit suspicious financial transaction reports, cash transaction reports and other reports to the PPATK.
Bank Indonesia
Bank Indonesia’s statutory mandate states that “the objective of Bank Indonesia is to achieve and maintain the stability of the Rupiah.” Rupiah stability can be measured in terms of its value vis-à-vis either domestic or external goods. Rupiah stability relative to domestic goods is reflected in the inflation rate, while stability relative to external goods is represented by the exchange rate of the Rupiah against other currencies. Market conditions determine the Rupiah exchange rate, consistent with the floating exchange rate system adopted by Bank Indonesia in August 1997. See “Foreign Exchange and Reserves — Exchange Rates.” Bank Indonesia may, however, continue to use its policy instruments to minimize exchange rate fluctuations.
Bank Indonesia, as a separate legal entity from the Government, has its own assets and its own liabilities. The foreign exchange reserves held by Bank Indonesia are recorded on the assets side of the Bank Indonesia balance sheet, while certain items of foreign debt (such as loans from the IMF) are liabilities of Bank Indonesia.
72

Table of Contents
The following table sets forth the balance sheet of Bank Indonesia and was prepared in accordance with the Monetary and Financial Statistics Manual published by the IMF, as of the dates indicated.
Analytical Balance Sheet of Bank Indonesia
As of December 31,As of
October 31,2012 2013 2014 2015 2016 2017P
(in billions of Rupiah)Base Money (M0) 704,843 821,679 918,421 945,916 989,565 1,013,392
Currency in Circulation(1) 439,720 500,020 528,537 586,763 612,545 612,230Commercial Banks Demand Deposits at Bank Indonesia 239,957 253,655 287,484 308,756 288,824 316,455Private sector Demand Deposits 133 451 1,397 366 361 109Bank Indonesia Certificates (SBI)(2) 25,033 67,552 101,002 50,031 87,835 84,598
Factors Affecting Base Money (M0) 704,843 821,679 918,421 945,916 989,565 1,013,392Net Foreign Assets 1,056,084 1,169,689 1,351,402 1,422,446 1,525,701 1,682,140Claims on Non-Residents 1,152,721 1,279,282 1,424,331 1,529,331 1,642,137 1,800,595Liabilities to Non-Resident (96,636) (109,593) (72,929) (106,886) (116,436) (118,455) Claims on Other Depository Corporations 3,226 2,315 1,489 465 362 261Liquidity Credits 1,137 1,016 978 56 56 56Other Claims 2,089 1,300 511 409 307 205Net claims on central Government 200,520 185,249 168,098 91,814 82,455 41,153Claims on central Government 252,214 245,029 237,218 241,710 207,515 194,703Liabilities to central Government (51,694) (59,781) (69,120) (149,895) (125,060) (153,550) Claims on Other Sectors 13,508 8,116 7,927 7,865 7,505 7,327Claims on Other Financial Institutions 202 6 1 0 0 — Claims on Private Sectors 13,306 8,109 7,926 7,865 7,505 7,327Open Market Operations(3) (344,565) (193,362) (246,403) (177,243) (259,798) (301,249) Other Liabilities to Commercial & Rural Banks (50,407) (68,872) (74,899) (83,990) (80,483) (80,390) Deposits included in Broad Money (M2) — — — — 0 — Deposits excluded from Broad Money (M2) (35) (15) (17) (192) (9) (30) Shares and Other Equity (169,783) (284,545) (288,822) (313,331) (252,816) (299,671) Net Other items (3,705) 3,106 (353) (1,918) (33,352) (36,149)
Source: Bank IndonesiaP Preliminary. (1) Currency outside banks plus cash in vault. (2) SBI which is used to fulfill the secondary statutory reserve requirement of banks and accounted for as primary money supply components. Included in Base Money
since October 2009. (3) Consists of total SBI after it is reduced by the SBI used to fulfill the secondary statutory reserve requirement of banks, and is accounted for as a primary money
supply component (see footnote 2). Such SBI types include: Syariah SBI, Third Party Syariah SBI, Bank Indonesia Facility, Fine Tune Operation, Government Bonds, State Syariah Negotiable Paper, and Reserve Reverse Repo Government Bonds.
Banks and Other Financial Institutions
The Indonesian financial system consists of banks and non-bank financial institutions. Non-bank financial institutions consist of, among others, insurance companies, pension funds, finance companies, venture capital companies, securities companies, mutual funds, credit guarantee companies and pawn shops.
73

Table of Contents
The following table sets forth the total number of financial institutions in operation and their share of total assets of the financial system as of September 30, 2017.
Indonesian Financial Institutions as of September 30, 2017
Number ofinstitutions Assets*
Percentageof totalassets
(in trillions of Rupiah) (%)Banking:
Commercial banks 115 7,150.0 74.2Rural credit banks 1,622 121.6 1.3
Total banking 1,737 7,271.9 75.4Insurance:
Life insurance 61 519.2 5.4General insurance & Reinsurance 86 148.9 1.5Social insurance(1) 5 450.3 4.7
Total insurance 152 1,184.4 72.3Pension funds:
Financial institution pension funds 24 75.7 0.8Employer pension funds 214 183.3 1.9
Total pension funds 249 258.9 2.7Finance companies(2) 198 468.1 4.9Venture capital companies 67 11.9 0.1Securities companies(3)(4) 114 40.3 0.4Mutual funds (collective investment schemes, not institutions) 1,425 338.8 3.5Credit guarantee companies 23 17.3 0.2Pawn shops 12 48.3 0.5
Total 3,977 9,639.9 100.00
Sources: OJK* Unaudited other than in respect of Banking, Securities Companies, and Mutual Funds. (1) Social insurance encompasses traffic and public transportation, health social security programs, worker social security programs and insurance for civil servants and
the armed forces. (2) Finance companies provide financing for leasing, factoring, consumer finance and credit cards. (3) Includes 21 securities companies that are not members of a securities exchange but act as broker-dealers. (4) Assets as of December 31, 2016.
Indonesian banks are divided into two categories: commercial banks and rural banks. Both commercial and rural banks may operate under either conventional banking principles or under Sharia principles.
The OJK is responsible for the regulation and supervision of the insurance industry. Development of this sub-sector has required the implementation of more robust regulatory requirements and, in particular, improved capital requirements, including requirements to continuously maintain a specified ratio of risk-weighted assets to risk-weighted liabilities.
Pension funds are divided into two categories: employer pension funds and financial institution pension funds. Employer pension funds may be run either as defined benefit plans or as defined contribution plans, while financial institution pension funds may only be run as defined contribution plans.
74

Table of Contents
Indonesia’s other non-bank financial institutions include finance companies, guarantee companies, venture capital companies, Indonesia export credit agencies, infrastructure financing companies and secondary mortgage facilities companies.
Bank Assets and Liabilities
The following table sets forth the consolidated balance sheets of the commercial banks as of the dates indicated.
Consolidated Balance Sheet of Commercial Banks
As of December 31,As of
September 30,2012 2013 2014 2015 2016 2017P
(in trillions of Rupiah)Assets
Loans 2,725.7 3,319.8 3,706.5 4,092.1 4,413.4 4,580.5Interbank Assets 166.6 171.9 182.4 211.9 207.1 251.2Placements at Bank Indonesia 580.7 506.5 569.0 685.6 717.8 688.9Securities (including Government Bonds) 429.9 520.6 636.7 660.8 860.5 982.3Equity Participation 15.1 15.7 21.0 25.6 33.9 36.5Other Claims 176.5 183.1 245.4 155.5 171.3 291.6Others 168.1 236.9 254.2 297.7 325.8 339.3
Total Assets 4,262.6 4,954.5 5,615.2 6,129.4 6,729.8 7,150.3
LiabilitiesThird Party Funds 3,225.2 3,603.6 4,114.4 4,413.1 4,836.8 5,142.9Liabilities owed to Bank Indonesia 1.9 1.8 2.1 0.7 0.8 1.5Interbank Liabilities 124.7 115.8 133.0 161.1 168.5 192.7Securities 42.1 54.5 54.3 65.5 93.2 108.1Borrowing 75.3 112.9 145.9 177.7 179.7 181.1Other Liabilities 60.3 85.1 120.7 109.6 100.7 88.9Guarantee Deposits 5.0 5.9 5.6 6.3 5.2 5.1Others 202.7 352.2 317.1 383.9 432.3 436.2
Capital:Paid in Capital 123.3 138.1 153.4 164.3 176.7 193.4Reserves 38.7 50.6 67.6 81.7 64.8 65.0Current Earnings/Loss 92.8 106.7 112.2 104.6 106.5 99.9Retained Earnings/Loss 150.0 201.1 256.6 323.8 411.2 474.5Estimates of Additional Paid in Capital 89.4 92.6 97.9 96.2 111.7 121.7Others 31.2 33.6 34.4 40.9 41.7 44.4
Total Liabilities 4,262.6 4,954.5 5,615.2 6,129.4 6,729.8 7,150.3
Source: Bank Indonesia up to December 31, 2013. OJK from January 1, 2014 onwards. P Preliminary.
75

Table of Contents
The following table shows the average capital adequacy ratio of the banking system as of the dates indicated:
Average Capital Adequacy Ratios
As of December 31, As of September 30,2012 2013 2014 2015 2016 2017P
(percentages)CAR 17.4 18.1 19.6 21.4 22.9 23.3
Source: Bank Indonesia and OJKP Preliminary.
Non-Performing Loans
Since the beginning of 2005, Indonesian banks have been required to calculate their non-performing loans, or NPLs, using international best practices-based standards that require banks to classify as “non-performing” all loans to any borrower if any of that borrower’s loans are non-performing. Banks nationwide are required to apply the same uniform loan classification system to all loans meeting one of three criteria: (i) loans greater than Rp10 billion that are made to one borrower or one similar project; (ii) loans between Rp1 billion and Rp10 billion that are made to one of the 50 largest debtors of the lending bank; and (iii) loans based on joint financing to one borrower or one project.
The following table shows the gross NPL ratios as of the dates indicated.
Non-Performing Loans Ratios
As of December 31, As of September 30,2012 2013 2014 2015 2016 2017P
(percentages)Gross NPL ratio 1.9 1.8 2.2 2.4 2.9 2.9
Source: Bank Indonesia and OJK P Preliminary.
Capital Markets and Capital Markets Regulation
The Indonesian capital markets are regulated by the OJK, which superseded the Capital Markets and Financial Institutions Supervisory Agency (Badan Pengawas Pasar Modal dan Lembaga Keuangan or Bapepam-LK) and assumed its duties and functions when Bapepam-LK and the Ministry of Finance’s Directorate General of Financial Institution, or DJLK, were merged into a single unit on December 31, 2012.
The regulatory framework for the Indonesian capital markets is provided by the Capital Markets Law No. 8 of 1995 on Capital Markets, or Capital Markets Law. The Capital Markets Law granted the original regulatory authority (and its successors, including OJK) authority in the fields of regulation, development, supervision and law enforcement. The law also provides the authority and responsibilities of self-regulatory organizations, capital market institutions, professionals and firms conducting business in the capital markets. According to the Capital Markets Law, OJK is responsible for the guidance, regulation and day-to-day supervision necessary to implement orderly, fair and efficient capital markets and to protect the interests of investors and the public.
Over the past few years, OJK has introduced rules to strengthen its supervisory and enforcement capacity over Indonesia’s capital markets and to promote sound and transparent capital markets. It has exercised its
76
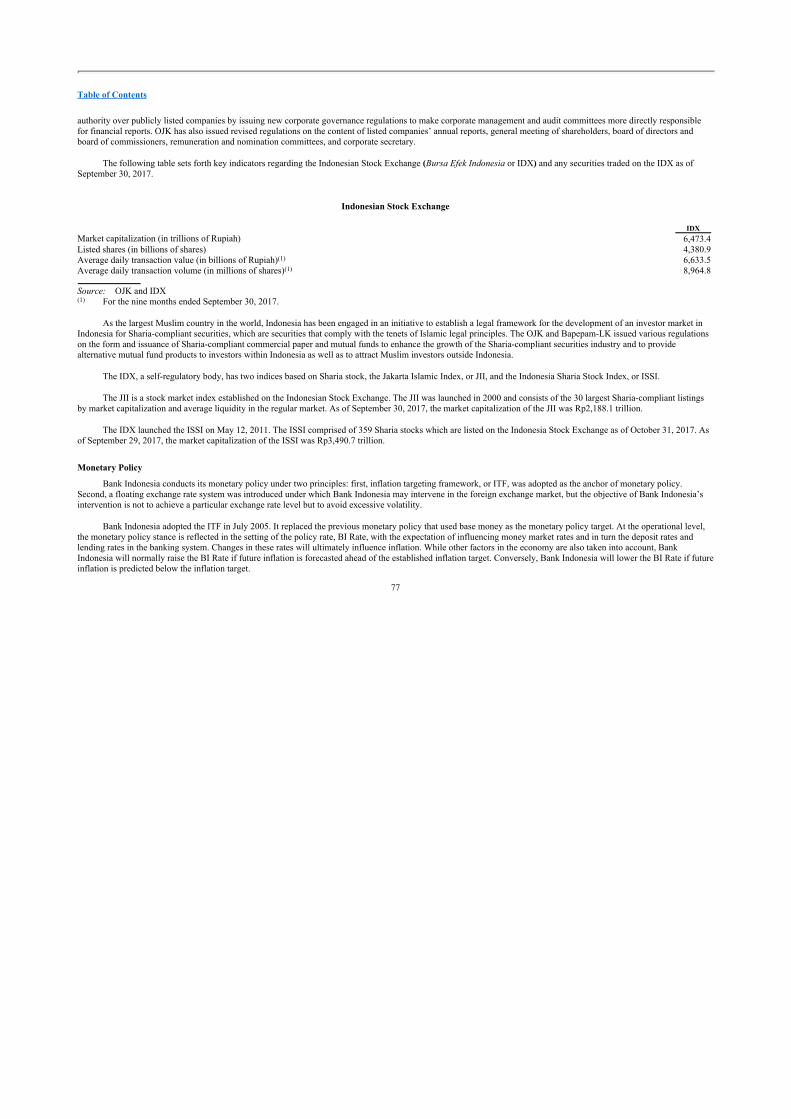
Table of Contents
authority over publicly listed companies by issuing new corporate governance regulations to make corporate management and audit committees more directly responsible for financial reports. OJK has also issued revised regulations on the content of listed companies’ annual reports, general meeting of shareholders, board of directors and board of commissioners, remuneration and nomination committees, and corporate secretary.
The following table sets forth key indicators regarding the Indonesian Stock Exchange (Bursa Efek Indonesia or IDX) and any securities traded on the IDX as of September 30, 2017.
Indonesian Stock Exchange
IDX
Market capitalization (in trillions of Rupiah) 6,473.4Listed shares (in billions of shares) 4,380.9Average daily transaction value (in billions of Rupiah)(1) 6,633.5Average daily transaction volume (in millions of shares)(1) 8,964.8
Source: OJK and IDX(1) For the nine months ended September 30, 2017.
As the largest Muslim country in the world, Indonesia has been engaged in an initiative to establish a legal framework for the development of an investor market in Indonesia for Sharia-compliant securities, which are securities that comply with the tenets of Islamic legal principles. The OJK and Bapepam-LK issued various regulations on the form and issuance of Sharia-compliant commercial paper and mutual funds to enhance the growth of the Sharia-compliant securities industry and to provide alternative mutual fund products to investors within Indonesia as well as to attract Muslim investors outside Indonesia.
The IDX, a self-regulatory body, has two indices based on Sharia stock, the Jakarta Islamic Index, or JII, and the Indonesia Sharia Stock Index, or ISSI.
The JII is a stock market index established on the Indonesian Stock Exchange. The JII was launched in 2000 and consists of the 30 largest Sharia-compliant listings by market capitalization and average liquidity in the regular market. As of September 30, 2017, the market capitalization of the JII was Rp2,188.1 trillion.
The IDX launched the ISSI on May 12, 2011. The ISSI comprised of 359 Sharia stocks which are listed on the Indonesia Stock Exchange as of October 31, 2017. As of September 29, 2017, the market capitalization of the ISSI was Rp3,490.7 trillion.
Monetary Policy
Bank Indonesia conducts its monetary policy under two principles: first, inflation targeting framework, or ITF, was adopted as the anchor of monetary policy. Second, a floating exchange rate system was introduced under which Bank Indonesia may intervene in the foreign exchange market, but the objective of Bank Indonesia’s intervention is not to achieve a particular exchange rate level but to avoid excessive volatility.
Bank Indonesia adopted the ITF in July 2005. It replaced the previous monetary policy that used base money as the monetary policy target. At the operational level, the monetary policy stance is reflected in the setting of the policy rate, BI Rate, with the expectation of influencing money market rates and in turn the deposit rates and lending rates in the banking system. Changes in these rates will ultimately influence inflation. While other factors in the economy are also taken into account, Bank Indonesia will normally raise the BI Rate if future inflation is forecasted ahead of the established inflation target. Conversely, Bank Indonesia will lower the BI Rate if future inflation is predicted below the inflation target.
77

Table of Contents
In order to strengthen its monetary policy framework, Bank Indonesia introduced a new benchmark rate effective from August 19, 2016, namely the Bank Indonesia 7-Day Reverse Repo Rate, or BI Repo Rate, to replace the BI Rate. The BI Repo Rate changes the tenor of the policy rate from a 360 day tenor (used in the BI Rate) to 7-day tenor money market rates. The change aims to improve the effectiveness of monetary policy in influencing money market rates and bank rates, both lending and funding rates. The enhancement is directed to strengthen the effectiveness of policy rate setting as a tool to achieve monetary policy operational targets as reflected in the overnight interbank rates.
Implementation of the BI Repo Rate is also complemented by normalization of the interest rate corridor in which the Lending Facility, or LF, and the Deposit Facility, or DF, are positioned symmetrically from the BI Repo Rate at a spread of 75 basis points, or bps.
In order to ensure financial and macroeconomic stability, Bank Indonesia also deploys a variety of policy instruments (policy mix approach) which consist of (i) policy rate to anchor inflation expectation complemented by (ii) exchange rate flexibility to lessen pressure on current account, (iii) capital flow management to dampen short-term excessive volatility of exchange rate, (iv) appropriate macro-prudential measures, and (v) ensure good communication to the public. Bank Indonesia also pursues financial market deepening to support the stability of the Rupiah exchange rate and enhance the effectiveness of transmission of monetary policy.
In October 2016, Bank Indonesia lowered the BI Repo Rate by 25 bps from 5.00% to 4.75%, while also lowering the DF and LF rates by 25 bps to 4.0% and 5.5%, respectively.
In November 2016, Bank Indonesia held the BI Repo Rate at 4.75%, while maintaining the Deposit Facility and Lending Facility rates at 4.00% and 5.50%, respectively. The decision to maintain the BI Repo Rate reflects Bank Indonesia’s response to increasing uncertainty in the global financial markets following the US elections against a stable domestic macroeconomic backdrop, as reflected by low inflation and a narrower current account deficit.
In its subsequent monthly meetings from December 2016 through July 2017, Bank Indonesia held the BI Repo Rate at 4.75%, while maintaining the DF and LF rates at 4.00% and 5.50%, respectively. These decisions reflected Bank Indonesia’s efforts to maintain macroeconomic and financial system stability, while preserving the recovery momentum of the domestic economy in light of the uncertain direction of US economic, monetary and trade policies, the geopolitical risks in Europe and in the Korean Peninsula, the rising global inflation and domestic risks related to the impact of administered prices in response to inflation.
In August 2017, Bank Indonesia lowered the BI Repo Rate by 25 bps from 4.75% to 4.50%, while also lowering the DF and LF rates by 25 bps to 3.75% and 5.25%, respectively. The decision to lower rates reflected Bank Indonesia’s belief that monetary policy may be eased given the lower inflation rates projected for 2017 and 2018 and a controlled current account deficit. In addition, Bank Indonesia believes that external risks may be caused by the Federal Open Market Committee of the United States Federal Reserve increasing the Federal Funds Rate (the interest rate at which depository institutions lend reserve balances to other depository institutions overnight) and its intention to decrease over time the size of its balance sheet are diminishing. The monetary policy easing is expected to reinforce intermediation in the banking sector, strengthen financial system stability as well as support higher economic growth.
In September 2017, Bank Indonesia lowered the BI Repo Rate by 25 bps from 4.50% to 4.25%, while also lowering the DF and LF rates by 25 bps to 3.50% and 5.00%, respectively. These rate cuts are expected to support the ongoing improvements in banking intermediation and domestic economic recovery. Bank Indonesia estimated that this policy rate level was sufficient and aligned with forecasted inflation levels and other macroeconomic indicators.
In October 2017, Bank Indonesia maintained the BI Repo Rate at 4.25%, while maintaining the DF and LF rates at 3.50% and 5.00%, respectively. The decision to maintain the rate level is consistent with efforts to
78
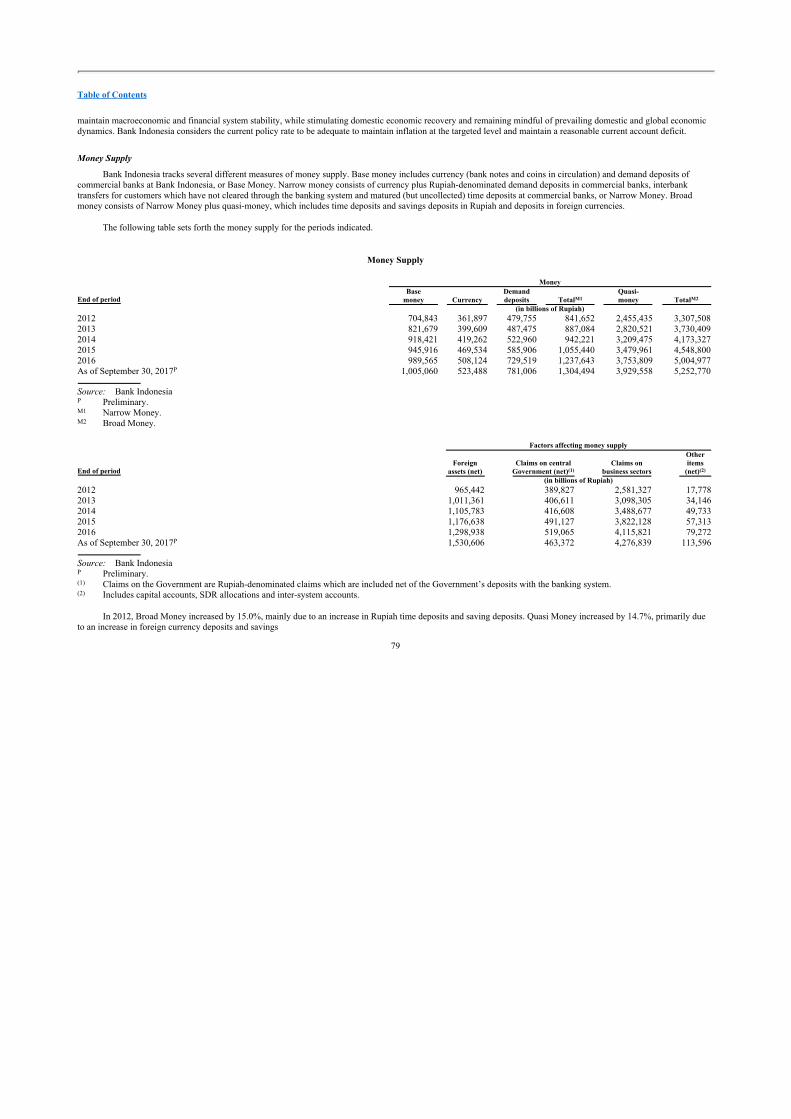
Table of Contents
maintain macroeconomic and financial system stability, while stimulating domestic economic recovery and remaining mindful of prevailing domestic and global economic dynamics. Bank Indonesia considers the current policy rate to be adequate to maintain inflation at the targeted level and maintain a reasonable current account deficit.
Money Supply
Bank Indonesia tracks several different measures of money supply. Base money includes currency (bank notes and coins in circulation) and demand deposits of commercial banks at Bank Indonesia, or Base Money. Narrow money consists of currency plus Rupiah-denominated demand deposits in commercial banks, interbank transfers for customers which have not cleared through the banking system and matured (but uncollected) time deposits at commercial banks, or Narrow Money. Broad money consists of Narrow Money plus quasi-money, which includes time deposits and savings deposits in Rupiah and deposits in foreign currencies.
The following table sets forth the money supply for the periods indicated.
Money Supply
Money
End of periodBase
money CurrencyDemanddeposits TotalM1
Quasi-money TotalM2
(in billions of Rupiah)2012 704,843 361,897 479,755 841,652 2,455,435 3,307,5082013 821,679 399,609 487,475 887,084 2,820,521 3,730,4092014 918,421 419,262 522,960 942,221 3,209,475 4,173,3272015 945,916 469,534 585,906 1,055,440 3,479,961 4,548,8002016 989,565 508,124 729,519 1,237,643 3,753,809 5,004,977As of September 30, 2017P 1,005,060 523,488 781,006 1,304,494 3,929,558 5,252,770
Source: Bank Indonesia P Preliminary. M1 Narrow Money. M2 Broad Money.
Factors affecting money supply
End of periodForeign
assets (net)Claims on central
Government (net)(1)Claims on
business sectors
Otheritems
(net)(2)
(in billions of Rupiah)2012 965,442 389,827 2,581,327 17,7782013 1,011,361 406,611 3,098,305 34,1462014 1,105,783 416,608 3,488,677 49,7332015 1,176,638 491,127 3,822,128 57,3132016 1,298,938 519,065 4,115,821 79,272As of September 30, 2017P 1,530,606 463,372 4,276,839 113,596
Source: Bank Indonesia P Preliminary. (1) Claims on the Government are Rupiah-denominated claims which are included net of the Government’s deposits with the banking system. (2) Includes capital accounts, SDR allocations and inter-system accounts.
In 2012, Broad Money increased by 15.0%, mainly due to an increase in Rupiah time deposits and saving deposits. Quasi Money increased by 14.7%, primarily due to an increase in foreign currency deposits and savings
79

Table of Contents
deposits. Narrow Money increased by 16.4%. Growth in Narrow Money was mainly driven by increasing demand in Rupiah deposits in line with growth in lending.
In 2013, Broad Money increased by 12.8%, less than the 15.0% increase in the prior, primarily due to lower net domestic assets in the midst of minimum net foreign assets. Quasi Money increased by 14.9% compared to the 14.7% increase in the prior year, primarily due to an increase in foreign currency deposits. Narrow Money growth slowed to 5.4% compared to the 16.4% increase in the prior year, primarily due to a decline in Rupiah demand deposits and the downturn of currency outside commercial and rural banks.
In 2014, Broad Money increased by 11.9% compared to the 12.8% increase resulting from slower Government expansion. Quasi money growth slowed to 13.8% compared to the growth of 14.9% in the prior year, primarily due to sharp decline in foreign currency deposits (consisting of, time deposits, saving deposits and demand deposits). Narrow Money growth increased by 6.2% compared to the increase of 5.4% in the prior year, driven by increasing growth of Rupiah demand deposits.
In 2015, Broad Money growth slowed to 8.9% compared to the increase of 11.9% in the previous year resulting from lower growth in quasi-money. Quasi-money growth deceased to 8.4% from the 13.8% increase in 2014, primarily due to a decline in time deposits. Narrow Money growth increased by 12.0% compared to the increase of 6.2% in the previous year, primarily due to an increase in currency outside commercial and rural banks as well as Rupiah demand deposits.
In 2016, Broad Money grew by 10.0% compared to 8.9% in the previous year, due to accelerated growth in Narrow Money. Quasi-money decreased to 7.9% compared to the 8.4% increase in the previous year, due to a decline in foreign currency deposits. Narrow Money increased to 17.3% compared to the 12.0% increase in the previous year, mainly due to an increase in currency outside commercial and rural banks as well as Rupiah demand deposits.
As of September 30, 2017, Broad Money grew by 10.9% compared to 5.1% in the same period in 2016, due to accelerated growth in Narrow Money and Quasi-money. Narrow Money growth increased by 15.9% as of September 30, 2017, compared to 5.9% in the same period in 2016, due to an increase in Rupiah demand deposits. Quasi-money increased by 9.2% as of September 30, 2017, compared to 5.1% in the same period in 2016.
Government Budget
Fiscal Policy
Since 2001, the focus of the Government’s fiscal policy has been to promote fiscal consolidation and reduce Government debt gradually in order to achieve fiscal sustainability. As a result of the overall macroeconomic situation and current policy challenges, since 2006, the Government has also focused fiscal policy on providing a modest degree of stimulus to the overall economy, within the constraints of the Government’s overall fiscal situation.
80

Table of Contents
Central Government Revenues and Expenditures
Year Ended December 31,2012L 2013L 2014L 2015L 2016L 2016RR 2017R 2017A 2018C
(in trillions of Rupiah)Revenues and grants:
Domestic revenueTax revenue 980.5 1,077.3 1,146.9 1,240.4 1,285.0 1,539.2 1,472.7 878.9 1,618.1Non-tax revenue 351.8 354.8 398.6 255.6 262.0 245.1 260.2 217.9 275.4
Total domestic revenue 1,332.3 1,432.1 1,545.5 1,496.0 1,546.9 1,784.2 1,733.0 1,096.8 1,893.5Grants 5.8 6.8 5.0 12.0 9.0 2.0 3.1 2.5 1.2
Total revenues and grants 1,338.1 1,438.9 1,550.5 1,508.0 1,555.9 1,786.2 1,736.1 1,099.3 1,894.7Expenditures:
Central government expenditures 1,010.6 1,137.2 1,203.6 1,183.3 1154.0 1,306.7 1,367.0 808.4 1,454.5Transfer to regions and rural fund(1) 480.6 513.3 573.7 623.1 710.3 776.3 766.3 566.6 766.2
Total central and transfer expenditures 1,491.2 1,650.5 1,777.3 1,806.4 1,864.3 2,082.9 2,133.3 1,375.0 2,220.7Suspend(2) 0.2 0.1 (0.1) 0.1 — — — — —
Total expenditures 1,491.4 1,650.6 1,777.2 1,806.5 1,864.3 2,082.9 2,133.3 1,374.0 2,220.7Primary balance(3) (52.8) (98.6) (93.3) (142.5) (125.6) (105.5) (178.0) (102.9) (87.3) Surplus/(deficit) (153.3) (211.7) (226.7) (298.5) (308.3) (296.7) (397.2) (275.7) (325.9) Financing:(4)(5)
Debt financing 140.8 223.2 255.7 380.9 403.0 371.6 461.3 360.0 399.2Investment financing (25.7) (16.9) (8.9) (59.7) (89.1) (94.0) (59.7) (0.14) (65.7) On-Lending 2.8 0.3 2.5 1.5 1.7 0.5 (3.7) 2.3 (6.7) Government guarantee — (0.7) (1.0) — (0.7) (0.7) (1.0) — (1.1) Other financing 57.3 31.4 0.5 0.3 19.6 19.3 0.3 0.3 0.2
Total Financing 175.2 237.4 248.9 323.1 334.5 296.7 397.2 362.2 325.9
Source: Ministry of Finance L LKPP (Central Government Financial Report/Audited). RR Central Government revenues and expenditures included in the assumptions for the 2016 Revised Budget. R Central Government revenues and expenditures included in the assumptions for the 2017 Revised Budget. C Central Government revenues and expenditures included in the assumptions for the 2018 Budget. A Preliminary for the nine months ended September 30, 2017. (1) Starting from the fiscal year, or FY, 2015, central Government allocates rural fund based on law number 6/2014. (2) Realized expenditures calculated by the Ministry of Finance differed from the figures calculated by line ministries and such discrepancies have been subtracted and
added, respectively, to totals for such years after the fiscal year is over. “Suspend” is not reported in the current year. (3) Primary balance represents revenues minus expenditures excluding interest expenditures. (4) In 2012, total financing of Rp175.2 trillion exceeded the budget deficit of Rp153.3 trillion and the Government added the difference of Rp21.9 trillion to its reserves.
In 2013, total financing of Rp237.4 trillion exceeded the budget deficit of Rp211.6 trillion and the Government added the difference of Rp25.7 trillion to its reserves. In 2014, total financing of Rp248.9 trillion exceeded the budget deficit of Rp226.7 trillion and the Government added the difference of Rp22.2 trillion to its reserves. In 2015, total financing of Rp323.2 trillion exceeded the budget deficit of Rp298.5 trillion and the Government added the difference of Rp24.7 trillion to its reserves. In 2016, total financing of Rp330.6 trillion exceeded the budget deficit of Rp305.4 trillion and the Government added the difference of Rp25.2 trillion to its reserves.
(5) As of FY 2017, the Financing line items have been reclassified and the previously reported data has been restated across the periods shown.
81

Table of Contents
2017 Budget
On November 18, 2016, the DPR and the President enacted the law on state budget year 2017, or 2017 Budget.
Policies underlying the 2017 Budget are aimed at supporting the Government’s development targets, primarily supporting sustainable growth and employment, poverty eradication, inequality reduction and maintaining balance with fiscal resilience and controlling risk.
The main policies underlying the 2017 Budget include: (i) optimization of state revenue, mainly through taxation, (ii) emphasis on priority spending to accelerate infrastructure development and reduction of poverty and the social gap and (iii) stronger risk management, including managing the deficit and debt ratios to achieve fiscal sustainability.
The key macroeconomic assumptions underlying the 2017 Budget, as compared to the Revised 2016 Budget, are as follows:
• a real GDP growth rate of 5.1% in the 2017 Budget, compared to 5.2% in the Revised 2016 Budget;
• an inflation rate of 4.0% in the 2017 Budget, the same as the Revised 2016 Budget;
• three-month Indonesian treasury bills yield of 5.3% in the 2017 Budget, compared to 5.5% in the Revised 2016 Budget;
• an exchange rate of Rp13,300 to U.S.$1 in the 2017 Budget, compared to Rp13,500 to U.S.$1 in the Revised 2016 Budget;
• average oil production by the Republic of 815 thousand barrels of oil per day in the 2017 Budget, compared to 820 thousand barrels of oil per day in the Revised 2016 Budget;
• gas production by the Republic of 1.15 million barrels of oil equivalent of gas per day in the 2016 Budget, the same target as in the Revised 2016 Budget;
• an average ICP of U.S.$45 per barrel in the 2017 Budget, compared to U.S.$40 per barrel in the Revised 2016 Budget; and
• a revised projected nominal GDP of Rp13,716.7 trillion in the 2017 Budget (calculated at current market prices), compared to Rp16,626.5 trillion in the Revised 2016 Budget (calculated at current market prices).
The Government continues to seek to optimize the contribution of non-tax revenue as one of the sources of state revenue in light of current conditions and expected challenges in 2017. Based on macroeconomic assumptions underlying the 2017 Budget, non-tax revenue is targeted at Rp250.0 billion, an increase of 2.0% compared to the Revised 2016 Budget.
The 2017 Budget includes a target fiscal deficit of 2.41% of the projected GDP in 2016, compared to 2.35% in the Revised 2016 Budget. Total expenditure under the 2017 Budget is estimated at Rp2,080.5 trillion, a decrease of Rp2.5 trillion compared to the Revised 2016 Budget. The 2017 Budget total revenue (including grants) amounts to Rp1,750.3 trillion, a decrease of Rp35.9 trillion compared to the Revised 2016 Budget. Allocation of the transfer to region and rural funds increased to Rp764.9 trillion, higher than the Ministry/Agencies allocation of Rp763.6 trillion in the Revised 2016 Budget.
Tax revenues comprise the biggest portion of revenue targets in the 2017 Budget. In 2017, tax policies primarily aim to (i) optimize tax revenue to improve the tax ratio and fulfillment of state budget needs, (ii) improve people’s purchasing power, investment, and the competitiveness of national industries, (iii) encourage the downstreaming of domestic businesses, (iv) control consumption of particular goods with
82

Table of Contents
negative externalities, (vi) increase tax compliance, (vii) support information transparency in the international taxation field and preventing tax evasion, and (viii) improve the quality of service and competence of human resource in order to optimize tax revenue.
In the 2017 Budget, the main policies underlying the central Government’s expenditure are: (i) improvement of public service through bureaucratic reform policies and continuous improvement of the welfare of government officials, (ii) continuous improvement in non-priority spending efficiencies, (iii) allocation of 20% of the state budget to the education budget and 5% of the state budget to health, (iv) allocation of a significant portion of the budget to support the acceleration of infrastructure development, (v) supporting the sustainability of social security health programs, (vi) accelerating the reduction of poverty and inequalities through the expansion of social protection programs, (vii) continuing the development of priority programs in the areas of education, health, agriculture, energy, maritime and marine, tourism and industries.
The 2017 Budget allocates Rp764.9 trillion for the transfer to regions and rural fund, Rp677.1 trillion to the balanced fund, Rp92.8 trillion to the revenue sharing funds, Rp410.8 trillion to the general allocation funds and Rp173.4 trillion to the specific purpose funds. The allocation to the rural funds increased from Rp47.0 trillion in the Revised 2016 Budget to Rp60.0 trillion in the 2017 Budget.
To preserve fiscal sustainability, the deficit target in the 2017 Budget is approximately 2.41% of GDP, within the safe harbor limit of 3.0% of GDP mandated by law. The 2017 Budget projects a deficit of Rp330.2 trillion. The Government expects to finance the projected deficit from both domestic and international sources. Rp357.0 trillion in 2017 is expected to be sourced domestically (Rp400.0 trillion is the net target to be achieved by issuing Government securities).
Revised 2017 Budget
The 2017 Revised Budget was approved on July 26, 2017. The key macroeconomic assumptions underlying the 2017 Revised Budget, as compared to the 2017 Budget, are as follows:
• a real GDP growth rate of 5.2% in the 2017 Revised Budget, compared to 5.1% in the 2017 Budget;
• an inflation rate of 4.3% in the 2017 Revised Budget, compared to 4.0% in the 2017 Budget;
• three-month Indonesian treasury bills yield of 5.2% in the 2017 Revised Budget, compared to 5.3% in the 2017 Budget;
• an exchange rate of Rp13,400 to U.S.$1 in the 2017 Revised Budget, compared to Rp13,300 in the 2017 Budget;
• average oil production by the Republic of 815 thousand barrels of oil per day in the 2017 Revised Budget, the same as in the 2017 Budget;
• gas production by the Republic of 1.15 million barrels of oil equivalent of gas per day in the 2017 Revised Budget, the same as in the 2017 Budget;
• an average ICP of U.S.$48 per barrel in the 2017 Revised Budget, compared to U.S.$45 per barrel in the 2017 Budget; and
• a revised projected nominal GDP of Rp13,613.2 trillion in the 2017 Revised Budget (calculated at current market prices), compared to Rp13,716.7 trillion in the 2017 Budget (calculated at current market prices).
The 2017 Revised Budget includes a target fiscal deficit of 2.9% of the projected GDP in 2016, compared to 2.4% in the Revised 2016 Budget. Total expenditure under the 2017 Revised Budget is estimated at Rp2,133.3 trillion, an increase of Rp50.4 trillion compared to the Revised 2016 Budget. The 2017 Revised Budget total revenue (including grants) amounts to Rp1,736.1 trillion, a decrease of Rp50.1 trillion compared to the Revised 2016 Budget. Allocation of the transfer to region and rural funds increased to Rp766.3 trillion, higher than the Ministry/Agencies allocation of Rp763.6 trillion in the Revised 2016 Budget.
83
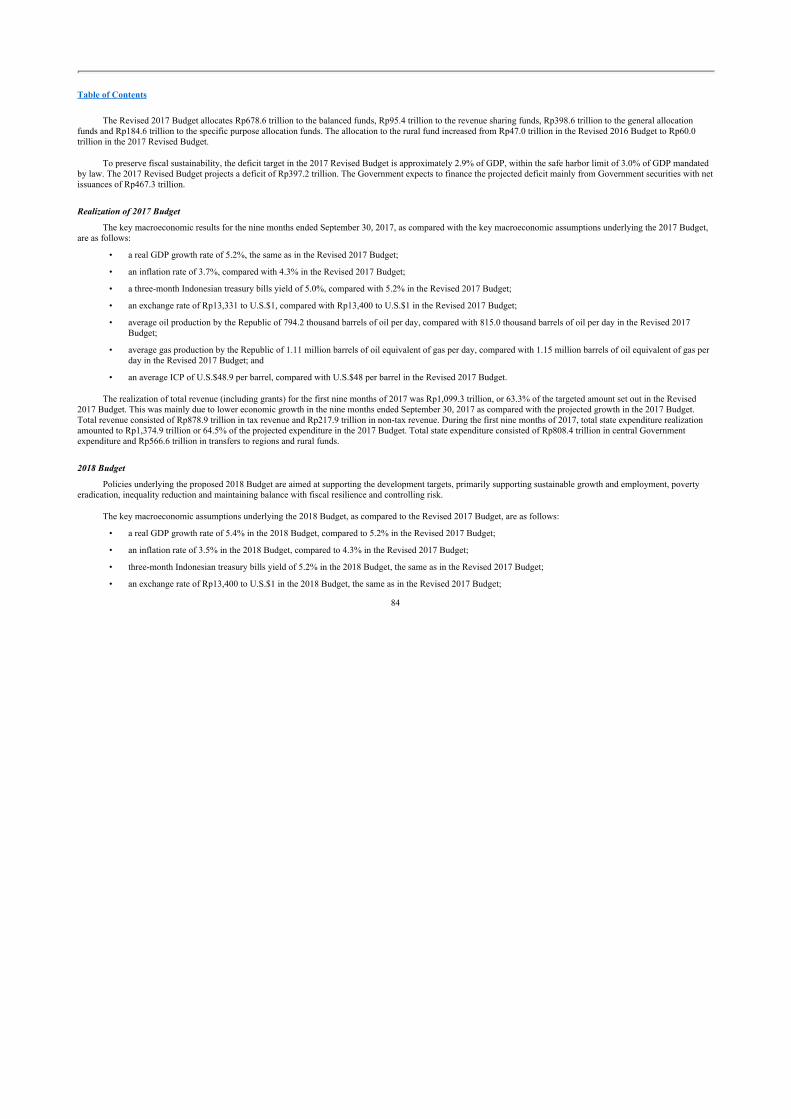
Table of Contents
The Revised 2017 Budget allocates Rp678.6 trillion to the balanced funds, Rp95.4 trillion to the revenue sharing funds, Rp398.6 trillion to the general allocation funds and Rp184.6 trillion to the specific purpose allocation funds. The allocation to the rural fund increased from Rp47.0 trillion in the Revised 2016 Budget to Rp60.0 trillion in the 2017 Revised Budget.
To preserve fiscal sustainability, the deficit target in the 2017 Revised Budget is approximately 2.9% of GDP, within the safe harbor limit of 3.0% of GDP mandated by law. The 2017 Revised Budget projects a deficit of Rp397.2 trillion. The Government expects to finance the projected deficit mainly from Government securities with net issuances of Rp467.3 trillion.
Realization of 2017 Budget
The key macroeconomic results for the nine months ended September 30, 2017, as compared with the key macroeconomic assumptions underlying the 2017 Budget, are as follows:
• a real GDP growth rate of 5.2%, the same as in the Revised 2017 Budget;
• an inflation rate of 3.7%, compared with 4.3% in the Revised 2017 Budget;
• a three-month Indonesian treasury bills yield of 5.0%, compared with 5.2% in the Revised 2017 Budget;
• an exchange rate of Rp13,331 to U.S.$1, compared with Rp13,400 to U.S.$1 in the Revised 2017 Budget;
• average oil production by the Republic of 794.2 thousand barrels of oil per day, compared with 815.0 thousand barrels of oil per day in the Revised 2017 Budget;
• average gas production by the Republic of 1.11 million barrels of oil equivalent of gas per day, compared with 1.15 million barrels of oil equivalent of gas per day in the Revised 2017 Budget; and
• an average ICP of U.S.$48.9 per barrel, compared with U.S.$48 per barrel in the Revised 2017 Budget.
The realization of total revenue (including grants) for the first nine months of 2017 was Rp1,099.3 trillion, or 63.3% of the targeted amount set out in the Revised 2017 Budget. This was mainly due to lower economic growth in the nine months ended September 30, 2017 as compared with the projected growth in the 2017 Budget. Total revenue consisted of Rp878.9 trillion in tax revenue and Rp217.9 trillion in non-tax revenue. During the first nine months of 2017, total state expenditure realization amounted to Rp1,374.9 trillion or 64.5% of the projected expenditure in the 2017 Budget. Total state expenditure consisted of Rp808.4 trillion in central Government expenditure and Rp566.6 trillion in transfers to regions and rural funds.
2018 Budget
Policies underlying the proposed 2018 Budget are aimed at supporting the development targets, primarily supporting sustainable growth and employment, poverty eradication, inequality reduction and maintaining balance with fiscal resilience and controlling risk.
The key macroeconomic assumptions underlying the 2018 Budget, as compared to the Revised 2017 Budget, are as follows:
• a real GDP growth rate of 5.4% in the 2018 Budget, compared to 5.2% in the Revised 2017 Budget;
• an inflation rate of 3.5% in the 2018 Budget, compared to 4.3% in the Revised 2017 Budget;
• three-month Indonesian treasury bills yield of 5.2% in the 2018 Budget, the same as in the Revised 2017 Budget;
• an exchange rate of Rp13,400 to U.S.$1 in the 2018 Budget, the same as in the Revised 2017 Budget;
84

Table of Contents
• average oil production by the Republic of 800 thousand barrels of oil per day in the 2018 Budget, compared to 815 thousand barrels of oil per day in the Revised 2017 Budget;
• gas production by the Republic of 1.2 million barrels of oil equivalent of gas per day in the 2018 Budget, compared to 1.15 million barrels of oil equivalent of gas per day in the Revised 2017 Budget;
• an average ICP of U.S.$48 per barrel in the 2018 Budget, the same as in the Revised 2017 Budget t; and
• a projected nominal GDP of Rp14,850.5 trillion in the 2018 Budget (calculated at current market prices), compared to Rp13,613.2 trillion in the Revised 2017 Budget (calculated at current market prices).
The Government continues to seek to strengthen and widen the sources of central Government revenue by focusing on increasing the share of tax revenue to 11.5% of GDP, primarily supported by higher income tax and excise and customs tax revenue. This goal is supported through the successful tax amnesty program implemented from 2015 to 2017 and the Government intends to implement legislation in 2018 relating to open access of tax-related financial information. Based on macroeconomic assumptions underlying the 2018 Budget, tax revenue is targeted at Rp1,618.1 trillion, an increase of 9.9% compared to the Revised 2017 Budget.
The 2018 Budget projects a deficit of Rp325.9 trillion. The Government expects to finance the projected deficit from both domestic and international sources. Total expenditure under the 2018 Budget is estimated at Rp2,220.7 trillion, an increase of Rp87.4 trillion compared to the Revised 2017 Budget. The 2018 Budget total revenue (including grants) amounts to Rp1,894.7 trillion, an increase of Rp158.6 trillion compared to the Revised 2017 Budget. Money allocated for transfer to region and rural funds decreased to Rp766.2 trillion, lower than the Ministry/Agencies allocation of Rp776.3 trillion in the Revised 2017 Budget. To preserve fiscal sustainability, the deficit target in the 2018 Budget is approximately 2.19% of GDP compared to 2.9% in the Revised 2017 Budget, within the safe harbor limit of 3.0% of GDP mandated by law.
The Government intends to pursue a structural reform in terms of spending that will move away from consumptive spending towards productive spending. The goal is to boost economic growth, alleviate poverty and create more jobs. The Government intends to pursue these goals by further improving the fuel subsidy and electricity subsidy scheme as well as issuing new regulations to accelerate infrastructure spending. The oil price in the 2018 Budget is assumed at U.S.$48/barrel, the same as in the Revised 2017 Budget and an assumed exchange rate at Rp13,400 per U.S.$1 and production of 800 thousand barrels per day.
Fuel subsidies (kerosene and diesel fuel) and the subsidy for 3kg liquefied petroleum gas, or 3kg LPG, is budgeted at Rp46.9 trillion. The main policy reasons for the continuation of the limited subsidy support for fuel and 3kg LPG are to increase and develop the construction of an urban gas network for households and to increase the role of local government in controlling and supervising the consumption of subsidized fuel and 3kg LPG. In addition, electricity subsidies are budgeted at Rp47.7 trillion.
The allocation for central Government expenditures in the 2018 Budget is Rp1,454.5 trillion, higher than the Rp1,351.6 trillion in the Revised 2017 Budget. Central Government expenditures in in the 2018 Budget are directed at: (i) poverty alleviation by increasing the Program Keluarga Harapan, a poverty alleviation program, to 10 million beneficiary families from 6 million in 2017 as well as increasing coverage of the Bantuan Pangan Non Tunai food program, (ii) accelerating infrastructure development through 856 km of road construction and 781 km irrigation construction, (iii) further development of the agriculture, tourism, and fisheries sectors, (iv) reform of government bureaucracy to improve civil servant management and the provision of civil services and (v) defense and democracy through the allocation for minimum essential forces, or MEF, and preparation for the 2019 presidential election.
85

Table of Contents
Central Government Finances
The following table sets forth information regarding the revenues and expenditures of the central Government for the periods indicated.
Central Government Revenues.
The following table sets forth central Government revenues by category for the periods indicated.
Central Government Revenues
Year Ended December 31,
Nine MonthsEnded
September 30,2012L 2013L 2014L 2015L 2016L 2017R 2017A
(in trillions of Rupiah)Domestic revenue:
Tax revenue:Domestic tax
Income tax:Oil and gas 83.5 88.7 87.4 49.7 36.1 41.8 38.6Non-oil and gas 381.6 417.7 458.7 552.6 630.1 742.2 418.0
Total income tax 465.1 506.4 546.2 602.3 666.2 784.0 851.6Value added tax (VAT) 337.6 384.7 409.2 423.7 412.2 475.5 307.3Land and building tax 29.0 25.3 23.5 29.3 19.4 15.4 1.9Excises 95.0 108.5 118.1 144.6 143.5 153.2 80.9Other taxes 4.2 4.9 6.3 5.6 8.1 8.7 4.8
Total domestic taxes 930.9 1,029.9 1,103.2 1,205.5 1,249.5 1,436.7 851.6International trade taxes:
Import duties 28.4 31.6 32.3 31.2 32.5 33.3 24.6Export tax 21.2 15.8 11.3 3.7 3.0 2.7 2.6
Total international trade taxes 49.7 47.4 43.6 34.9 35.5 36.0 27.2Total tax revenue 980.5 1,077.3 1,146.9 1,240.4 1,285.0 1,472.7 878.9
Non-tax revenue:Natural resources:
Oil 144.7 135.3 139.2 48.0 31.4 57.4 61.0Gas 61.1 68.3 77.7 30.2 12.6 14.8 —
Total oil and gas 205.8 203.6 216.9 78.2 44.1 72.2 61.0General mining 15.9 18.6 19.3 17.7 15.8 17.9 16.5Forestry 3.2 3.1 3.7 4.2 3.8 4.0 2.7Fishery 0.2 0.2 0.2 0.1 0.4 1.0 0.4Geothermal 0.7 0.9 0.8 0.9 0.9 0.7 0.5
Total non-oil and gas 20.0 22.8 24.0 22.8 20.8 23.4 20.1Total natural resources 225.8 226.4 240.8 101.0 64.9 95.6 81.1
Profit transfer from SOEs 30.8 34.0 40.3 37.6 37.1 41.0 38.9Other non-tax revenue 73.5 69.7 87.7 81.7 118.0 85.1 64.2Public Service Agency (BLU) Income(1) 21.7 24.6 29.7 35.3 41.9 38.5 33.7
Total non-tax revenue 351.8 354.8 398.6 255.6 262.0 260.2 217.9Total domestic revenue 1,332.3 1,432.1 1,545.5 1,496.0 1,546.9 1,733.0 1,096.8
Grants 5.8 6.8 5.0 12.0 9.0 3.1 2.5Total revenue and grants 1,338.1 1,438.9 1,550.5 1,508.0 1,555.9 1,736.1 1,099.2
Source: Ministry of Finance L LKPP (Central Government Financial Report/Audited). R Central Government revenues included in the assumptions for the 2017 Revised Budget. A Preliminary. (1) Includes Government’s share of Bank Indonesia’s profits representing amounts in excess of Bank Indonesia’s capital ratio requirements, which excess amounts are
transferred to the central Government to be used for repayments of certain central Government obligations to Bank Indonesia.
86

Table of Contents
Sources of Central Government Revenues.
The central Government derives its revenues from both tax and non-tax sources. The main sources of tax revenues include income tax, value-added tax, or VAT, customs duties and excises. The main sources of non-tax revenues are revenues generated from the sale of natural resources, profit transfers from SOEs and other non-tax revenues. Although oil and gas have historically been the single largest source of income tax and non-tax revenues for the central Government, this has changed in recent years. In 2012, income tax from oil and gas as well as revenues generated from the sale of oil and gas constituted 18.0% and 58.5% of total income tax revenue and total non-tax revenues, respectively. In 2016, these ratios have decreased to 5.4% and 16.8% respectively, primarily driven by lower oil prices and declines in oil and gas production.
Indonesian income tax comprises both corporate income tax and personal income tax. Generally, a flat corporate income tax rate of 25% applies to taxable business profits. Listed companies that meet certain conditions are eligible for a reduction of 5 percentage points from the standard rate, giving them an effective tax rate of 20%. Small enterprises, being corporate taxpayers with an annual gross turnover of up to Rp50 billion, are entitled to a 50% discount of the standard tax rate so that their effective tax rate will be 12.5%, to be imposed proportionally on taxable income of the part of gross turnover up to Rp4.8 billion. Certain enterprises with gross turnover of up to Rp4.8 billion are subject to a final tax at 1% of revenue.
Personal income tax rates are set at a maximum rate of 30% for annual taxable income above Rp500 million, 25% for annual taxable income above Rp250 million and up to Rp500 million, 15% for annual taxable income above Rp50 million and up to Rp250 million, and 5% for annual taxable income from Rp0 up to Rp50 million.
VAT is typically levied at a 10% rate on events involving the transfer of value-added goods or the provision of value-added services in the Indonesian customs area. There are certain VAT exemptions available on, among others, delivery and/or import of value-added goods designated as strategic goods (such as certain capital goods in the form of machinery and plant and equipment or specifically supporting the achievement of certain national objectives). Exports of value-added goods and certain services are subject to a VAT rate of 0%.
Customs duties consist of import duty and export duty. Import duty is applied on importation of goods and is payable at rates from 0% and 150% on cost, insurance and freight, or CIF, level. Export of certain goods are subject to export duty on certain tariff based on the type of the products and calculated based on either certain percentage of customs value (ad valorem) or specifically based on duty rate/quantity in certain currency. Excises are generally imposed on certain goods, the distribution and consumption of which are required to be controlled due to their potential negative effects on society or the environment (such as ethyl alcohol and its concentrate, alcoholic drinks and tobacco products).
Other than the taxes described above, deliveries or imports of certain manufactured taxable goods may be subject to a luxury tax, the rates of which by law may be increased up to 200%. These rates currently range between 10% - 125%. Further, a property tax, called Land and Building Tax (Pajak Bumi dan Bangunan, or PBB), is chargeable on all land and/or buildings unless exempted. Certain documents are subject to nominal stamp duty that is payable as a fixed amount of either Rp6,000 or Rp3,000.
Central Government revenues were Rp1,338.1 trillion in 2012, primarily driven by increases in total tax revenues. Total tax revenues were Rp980.5 in 2012, driven by increased revenue from income tax, value added tax and excise tax. Income tax revenues were Rp465.1 trillion in 2012, primarily driven by non-oil and gas income tax. Value added tax revenues were Rp337.6 trillion in 2012, primarily driven by an increase in domestic consumption. Excise tax revenues were Rp95.0 trillion in 2012, primarily due to increase in tobacco customs tariff. Total non-tax revenues were Rp351.8 trillion in 2012, mainly driven by higher revenues generated from the sale of oil and gas, which were Rp205.8 trillion.
Central Government revenues increased by 7.5% from Rp1,338.1 trillion in 2012 to Rp1,438.9 trillion in 2013, primarily driven by an increase in total tax revenues. Total tax revenue increased by 9.9% from
87

Table of Contents
Rp980.5 trillion in 2012 to Rp1,077.3 trillion in 2013, driven by increased revenues from income tax and value added tax. Income tax increased by 8.9% from Rp465.1 trillion in 2012 to Rp506.4 trillion in 2013, primarily due to increased non-oil and gas income tax. Value added tax increased by 14.0% from Rp337.6 trillion in 2012 to Rp384.7 trillion in 2013, primarily driven by certain technical improvements in the VAT administration system. Total non-tax revenues increased by 0.9% from Rp351.8 trillion in 2012 to Rp354.8 trillion in 2013.
Central Government revenues increased by 7.8% from Rp1,438.9 trillion in 2013 to Rp1,550.5 trillion in 2014, primarily driven by increases in both tax and non-tax revenues. Total tax revenues increased by 6.5% from Rp1,077.3 trillion in 2013 to Rp1,146.9 in 2014, driven by increased revenues from income tax, value added tax and excise tax. Income tax increased by 7.9% from Rp506.4 trillion in 2013 to Rp546.2 trillion in 2014, primarily due to increased non-oil and gas income tax. Value added tax increased by 6.4% from, Rp384.7 trillion in 2013 to 409.2 trillion in 2014, primarily driven by an increase in economic growth coupled with stable inflation. Excise tax increased by 8.8% from Rp108.5 trillion in 2013 to Rp118.1 trillion in 2014, primarily due to increases in cigarette production. Total non-tax revenues increased by 12.3% from Rp354.8 trillion in 2013 to Rp398.6 trillion in 2014, mainly driven by higher revenues generated from the sale of oil and gas, which increased by 6.5% from Rp203.6 trillion to Rp216.9 trillion. Profit transfers from SOEs and other non-tax revenues increased from Rp34.0 trillion and Rp69.7 trillion in 2013 by 18.5% and 25.8% to Rp40.3 trillion and Rp87.7 trillion, respectively.
Central Government revenues declined by 2.7% from Rp1,550.5 trillion in 2014 to Rp1,508.0 trillion in 2015, primarily driven by a decrease in non-tax revenues, which was partly offset by an increase in tax revenues. Total non-tax revenues declined by 35.9% from Rp398.6 trillion in 2014 to Rp255.6 trillion, mainly driven by a decrease in revenues generated from the sale of oil and gas, which declined by 63.9% from Rp216.9 trillion in 2014 to 78.2 trillion in 2015, mainly driven by lower oil prices and a decline in oil production. Total tax revenues increased by 8.2% from Rp1,146.9 trillion in 2014 to Rp1,240.4 trillion in 2015, mainly driven by increased revenues from income tax, value added tax and excise tax. Income tax increased by 10.3% from Rp546.2 trillion in 2014 to Rp602.3 trillion in 2015, primarily due to an increase in non-oil and gas income tax. Value added tax increased by 3.5% from Rp409.2 trillion in 2014 to Rp423.7 trillion in 2015, primarily driven by increased domestic imports. Excise tax increased by 22.4% from Rp118.1 trillion in 2014 to Rp144.6 trillion in 2015, primarily due to an increase in excise tariff of tobacco.
Central Government revenues increased by 3.2% from Rp1,508.0 trillion in 2015 to Rp1,555.9 trillion in 2016, primarily driven by an increase in tax revenues. Total tax revenues increased by 3.6% from Rp1,240.4 trillion in 2015 to Rp1,285.0 trillion in 2016, mainly driven by increased revenues from income tax, which increased by 10.6% from Rp602.3 trillion in 2015 to Rp666.2 trillion due to increased non-oil and gas income tax. This was offset partly by declines in value added tax and land and building tax of 2.7% and 33.8%, respectively, due to lower economic growth. Total non-tax revenues increased by 2.5% from Rp255.6 trillion in 2015 to Rp262.0 trillion in 2016. Other non-tax revenues increased by 44.4% from Rp81.7 trillion in 2015 to Rp118.0 trillion in 2016 primarily due to decrease in economic transactions subject to stamp tax duties. This was offset by a further decline in revenues generated from the sale of oil and gas by 43.6% from Rp78.2 trillion in 2015 to Rp44.1 trillion in 2016, due to lower oil prices and declining oil production.
Central Government revenues increased by 1.6% from Rp1,081.1 trillion in the nine months ended September 30, 2016 to Rp1,099.2 trillion in the nine months ended September 30, 2017, primarily driven by increased international trade tax and value added tax of 9% and 14%, respectively, primarily driven by an increase in household consumption and higher export-import activities. These increases were supported by increased revenues from income tax, primarily due to effects from the tax amnesty program and revaluation tax.
Tax Amnesty
In July 2016, the Government passed a tax amnesty law which grants a certain tax amnesty to any individual or corporate taxpayer who met the requirements and submitted their application before March 31, 2017. 973,462 taxpayers participated in the program, which has concluded as of March 31, 2017.
88

Table of Contents
As of March 31, 2017, Rp4,884.3 trillion in assets had been declared and the Government had collected Rp135.7 trillion as penalties under the scheme. Of the assets declared under the program, 75.8% are onshore, 21.2% are offshore and 3.0% have been repatriated (predominantly from Singapore). Most of the penalties collected, or Rp114.5 trillion of the total, as of March 31, 2017, represent “redemption” money, or the fee payable to the Government in exchange for the amnesty.
The Government hopes that the success of the tax amnesty program will continue to improve tax compliance in Indonesia. The submissions of annual tax reports by taxpayers who are required to submit one has risen in tandem with the number of registered taxpayers in the past few years. The compliance rate for annual tax rate submissions was 56.2% in 2013, 59.1% in 2014, 60.4% in 2015, 63.1% in 2016 and 70.4% as of July 31, 2017.
89

Table of Contents
Central Government Expenditure.
The following table sets forth the expenditures of the central Government for the periods indicated.
Central Government Expenditures
Year Ended December 31,
Nine MonthsEnded
September 30,2012L 2013L 2014L 2015L 2016L 2017R 2017A
(in trillions of Rupiah)Central government expenditures:
Personnel expenditures 197.9 221.7 243.7 281.1 305.1 343.7 237.0Good and services expenditures 140.9 169.7 176.6 233.3 259.6 296.2 166.6Capital expenditures 145.1 180.9 147.3 215.4 169.5 224.6 90.6Interest payments:
Domestic debt 70.2 98.7 118.8 141.9 167.8 202.9 161.6Foreign debt 30.3 14.3 14.6 14.1 15.0 16.3 11.2
Total interest payments 100.5 113.0 133.4 156.0 182.8 219.2 172.7Subsidies:
Energy subsidies 306.5 310.0 341.8 119.1 106.8 89.9 60.7Non-energy subsidies 39.9 45.1 50.2 66.9 67.4 79.0 36.6
Total subsidies 346.4 355.0 392.0 186.0 174.2 168.9 97.3Grant expenditures 0.1 1.3 0.9 4.3 7.1 5.5 2.4Social assistance(1) 75.6 92.1 97.9 97.2 49.6 59.0 42.7Other expenditures 4.1 3.4 11.7 10.1 6.0 49.9 4.0
Total central Government expenditures 1,010.5 1,137.2 1,203.6 1,183.3 1,154.0 1,367.0 808.4Transfers to Regions and Rural Fund
Transfer to RegionsBalanced funds:
General transfer funds:Revenue sharing funds 111.5 88.5 103.9 78.1 90.5 95.4 67.5General allocation funds 273.8 311.1 341.2 352.9 385.4 398.6 332.3
Total general transfer funds 385.4 399.6 445.2 430.9 475.9 494.0 399.8Specific allocation funds:
Physical special allocation fund 25.9 30.8 31.9 54.9 75.2 69.5 33.1Non-physical special allocation fund(2) 56.0 68.0 78.7 97.2 88.8 115.1 71.6
Total specific allocation funds 82.0 98.7 110.6 152.1 163.9 184.6 104.7Total balanced funds 467.3 498.3 555.7 583.0 639.8 678.6 504.5
Regional incentive fund(3) 1.4 1.4 1.4 1.7 5.0 7.5 7.5Specific autonomy funds(4) 12.0 13.6 16.1 17.1 18.3 19.4 14.3Specific Fund for Special Region of Yogyakarta(5) — — 0.4 0.5 0.5 0.8 0.6
Total Transfer to Regions 480.6 513.3 573.7 602.4 663.6 706.3 526.9Rural Fund(6) — — — 20.8 46.7 60.0 39.6
Total transfers to regions and Rural Fund 480.6 513.3 573.7 623.1 710.3 766.3 566.6Suspend(7) 0.2 0.1 (0.1) 0.1 — — —
Total expenditures 1,491.4 1,650.6 1,777.2 1,806.5 1,864.3 2,133.3 1,375.0
Source: Ministry of Finance L LKPP (Central Government Financial Report/Audited). R Central Government expenditures included in the assumptions for the 2017 Revised Budget. A Preliminary. (1) Consists of Social Assistance from Ministries/Agencies Spending and Social Assistance for Disaster Relief. (2) Included under “Others” before FY 2016 except the regional incentive fund. (3) Included under “Others” before FY 2016. (4) Consists of specific autonomy fund and additional specific infrastructure autonomy fund for Papua and West Papua Provinces. (5) Starting from FY 2013, central Government allocates a specific fund for Yogyakarta’s privilege in other expenditures. In FY 2014, this fund was allocated in specific autonomy and adjustment
funds as part of transfer to regions. (6) Starting from FY 2015, central Government allocates to the rural fund based on law number 6/2015. (7) Realized expenditures calculated by the Ministry of Finance differed from the figures calculated by line ministries and such discrepancies have been subtracted and added, respectively, to totals for
such years after the fiscal year is over. “Suspend” is not reported in the current year.
90

Table of Contents
The following table sets forth, by percentage, the allocation of central Government development expenditures by function for the periods indicated.
Allocation of Central Government Development Expenditures by Function
Year Ended December 31,2012L 2013L 2014L 2015L 2016L 2017R
(percentages)General public services 64.1 62.1 66.3 52.8 36.9 26.5Defense 6.1 7.7 7.2 9.0 8.1 8.4Public order and safety 2.9 3.2 2.9 4.5 9.2 10.6Economic affairs 10.4 9.5 8.1 15.0 12.2 23.9Environmental protection 0.9 0.9 0.8 0.8 0.7 0.9Housing and community amenities 2.6 3.0 2.2 1.4 1.7 2.3Health 1.5 1.5 0.9 2.0 4.9 4.2Tourism and culture 0.2 0.2 0.1 0.3 0.4 0.5Religion 0.3 0.3 0.3 0.4 4.8 0.7Education 10.4 10.1 10.2 12.1 11.0 10.5Social protection 0.5 1.5 1.1 1.8 10.1 11.3
Total 100.0 100.0 100.0 100.0 100.0 100.0
Source: Ministry of FinanceL LKPP (Central Government Financial Report/Audited). R 2017 Revised Budget.
Fuel Prices and Subsidies
The basic price and retail price of certain types of fuel are set by the Government through the Minister of Energy and Mineral Resources taking into consideration fuel purchasing cost, distribution cost, storage cost, and margin. Although the Government subsidy for fuel was eliminated in 2015, kerosene and gasoil continue to be subsidized by the Government. Historically, spending on subsidies has consumed a large portion of the Indonesian state budget. However, the Government in recent years has been implementing measures to raise subsidized fuel prices and reduce energy subsides by controlling the consumption of subsidized fuel through regulations, increased supervision and distribution management. In the past, fuel hike announcements have resulted in protests in major cities across Indonesia.
With recent global and domestic economic challenges, greater emphasis has been placed on improving national competitiveness. The Government is pursuing a more focused subsidy regime to provide direct subsidies to low income households and to allocate a large part of the budget for infrastructure development. Following the adjustment of fuel subsidies, the Government has implemented a conditional cash transfer program for low-income households. “Smart cards” have been introduced to provide improved health care services, better facilities, education assistance and other kinds of social assistance.
The savings from reductions in fuel subsidies have been allocated to more productive Government spending. For example, spending for energy subsidies on average for the period of 2011 to 2014 was Rp303.5 trillion, compared to average energy subsidy spending of Rp112.9 trillion for 2015 and 2016 and average energy subsidy spending of Rp96.6 trillion estimated for 2017 and 2018. Spending for infrastructure from 2011 to 2014 on average amounted to Rp142.5 trillion, Rp262.6 trillion on average for 2015 and 2016 and Rp404.9 trillion on average estimated for 2017 and 2018.
91

Table of Contents
The table below sets forth the amount of subsidies for the periods indicated.
Year Ended December 31,
Nine monthsended
September 30,2012L 2013L 2014L 2015L 2016L 2017R 2017P
(in trillions of Rupiah)Subsidies:
Energy subsidies 306.5 310.0 341.8 119.1 106.8 89.9 60.7Non-energy subsidies 39.9 45.1 50.2 66.9 67.4 79.0 36.6
Total subsidies 346.4 355.0 392.0 186.0 174.2 168.9 97.3
Source: Ministry of FinanceL LKPP (Central Government Financial Report/Audited). R 2017 Revised Budget. P Preliminary.
Deficit Financing. The following table sets forth, by amount, information on deficit financing for the periods indicated.
Deficit Financing(1)
Year Ended December 31,2012L 2013L 2014L 2015L 2016L 2017R 2017A
(in trillions of Rupiah)Debt financing
Government securities (net) 159.7 224.7 264.6 362.3 407.3 467.3 381.7Loans
Domestic loans (net) 0.8 0.5 0.9 0.8 1.1 1.7 0.1Foreign loans:
Gross drawings:Program loan 15.0 18.4 17.8 55.1 35.3 20.1 10.9Project loan 16.4 36.9 34.8 28.7 28.1 37.4 8.9
Total gross drawing 31.4 55.3 52.6 83.8 63.4 57.5 19.8Amortization (51.1) (57.2) (62.4) (66.0) (68.7) (65.2) (41.6)
Total foreign loan (net) (19.7) (1.9) (9.8) 17.8 (5.3) (7.7) (21.8) Total loans (net) (18.9) (1.5) (8.9) 18.7 (4.3) (6.0) (21.7) Total debt financing 140.8 223.2 255.7 380.9 403.0 461.3 360.0
Investment financingInvestment to SOEs (7.6) (2.0) (3.0) (64.5) (50.5) (6.4) — Investment to other institutions — (1.0) (1.0) (7.1) (10.8) (3.2) — Investment to public service agencies (17.3) (12.9) (3.5) (6.9) (25.3) (48.2) (0.4) Investment in financial organizations/institutions (0.9) (1.0) (1.4) (0.3) (3.8) (2.0) — Revenue of investment 0.1 0.1 0.0 19.1 1.4 — —
Total investment financing (25.7) (16.9) (8.9) (59.7) (89.1) (59.7) (0.4) Lending — — — — — — —
On-lending to SOEs/local government/institutions/other agencies: 2.8 0.3 2.5 2.3 1.7 (3.7) 2.3Lending reserves — — — (0.8) — — —
Total lending 2.8 0.3 2.5 1.5 1.7 (3.7) 2.3Mandatory guarantee — (0.7) (1.0) — (0.7) (1.0) — Other financing 57.3 31.4 0.5 0.3 19.6 0.3 0.3
Total financing (net) 175.2 237.4 248.9 323.1 334.5 397.2 362.2
Source: Ministry of FinanceL LKPP (Central Government Financial Report/Audited). R 2017 Revised Budget.
92

Table of Contents
A Preliminary for the nine months ended September 30, 2017. (1) As of FY 2017, the deficit financing line items have been reclassified and the data previously reported has been restated across the periods shown.
Central Government Expenditures.
Total expenditures consist primarily of two components: (i) central Government expenditures and (ii) transfers to regions and rural fund. Central Government expenditures consist primarily of personnel, goods and services, capital, interest and social expenditures, as well as energy subsidies. Regional transfers consist primarily of expenditures for general and specific funds on the regional and rural level.
Total expenditures increased by 15.2% from Rp1,295.0 trillion in 2011 to Rp1,491.4 trillion in 2012. Total central Government expenditures increased by 14.3% from Rp883.7 trillion in 2011 to Rp1,010.5 trillion in 2012, primarily due to higher expenditures for personnel, goods and services, capital and energy subsidies. Total transfers to regions and rural fund increased by 16.8% from Rp411.3 trillion in 2011 to Rp480.6 trillion in 2012, primarily driven by general higher allocation funds and revenue sharing funds.
Total expenditures increased by 10.7% from Rp1,491.4 trillion in 2012 to Rp1,650.6 trillion in 2013. Total central Government expenditures increased by 12.5% from Rp1,010.5 trillion in 2012 to Rp1,137.2 trillion in 2013, primarily due to higher expenditures for personnel, goods and services, capital, interest and social assistance. Total transfers to regions and rural fund increased by 6.8% from Rp480.6 trillion in 2012 to Rp513.3 trillion in 2013, primarily driven by higher general allocation funds, which were partly offset by lower revenue sharing funds.
Total expenditures increased by 7.7% from Rp1,650.6 trillion in 2013 to Rp1,777.2 trillion in 2014. Total central Government expenditures increased by 5.8% from Rp1,137.2 trillion in 2013 to Rp1,203.6 trillion in 2014, primarily due to higher expenditures for personnel, goods and services, interest and energy subsidies; these increases were partly offset by lower capital expenditures, due to lower capital expenditures for equipment and machineries. Total transfers to regions and rural fund increased by 11.8% from Rp513.3 trillion in 2013 to Rp573.7 trillion in 2014, primarily driven by higher total general transfer funds.
Total expenditures increased by 1.6% from Rp1,777.2 trillion in 2014 to Rp1,806.5 trillion in 2015. Total central Government expenditures decreased by 1.7% from Rp1,203.6 trillion in 2014 to Rp1,183.3 trillion in 2015, primarily due to a sharp decline in expenditures for energy subsidies of 65.2%, due to the Government’s implementation of a range of changes to its pricing policy for gasoline and automotive diesel fuel as a reaction to declining international oil prices. This was partly offset by higher expenditures for personnel, goods and services, capital and interest. Total transfers to regions and rural fund increased by 8.6% from Rp573.7 trillion in 2014 to Rp623.1 trillion in 2015, primarily driven by higher total specific allocation funds and the rural fund, which were partly offset by lower revenue sharing funds.
Total expenditures increased by 3.2% from Rp1,806.5 trillion in 2015 to Rp1,864.3 trillion in 2016. Total central Government expenditures decreased by 2.8% from Rp1,183.3 trillion in 2015 to Rp1,150.7 trillion in 2016, primarily due to lower capital and social assistance expenditures, which declined by 22.7% and 49.0%. This was partly offset by higher expenditures for personnel, goods and services and interest. Total transfers to regions and rural fund increased by 14.0% from Rp623.1 trillion in 2015 to Rp710.3 trillion in 2016, primarily driven by higher total general transfer funds, the physical special allocation fund and the rural fund.
Total expenditures increased by 5.3% from Rp1,305.4 trillion in the nine months ended September 30, 2016 to Rp1,375.0 trillion in the same period in 2017. Total central Government expenditures increased by 5.3% from Rp767.7 trillion in the nine months ended September 30, 2016 to Rp808.4 trillion in the same period in 2017, primarily due to the continuing development of programs executed by the line ministries as well as macroeconomic indicators such as the Rupiah exchange rate that affects the amount paid for energy subsidies and
93

Table of Contents
interest payments. Total transfers to regions and rural fund increased by 13.1% from Rp501.0 trillion in the nine months ended September 30, 2016 to Rp566.6 trillion in the same period in 2017, primarily due to higher distributions to the regional incentive fund and balance fund.
94
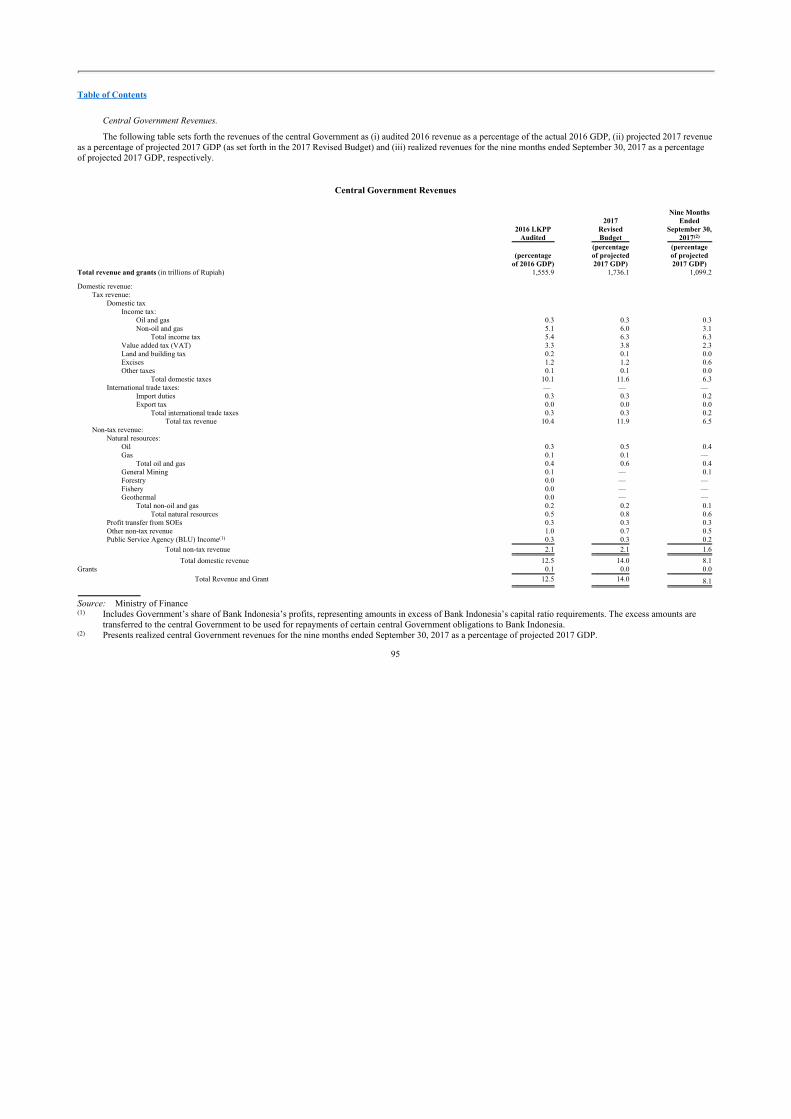
Table of Contents
Central Government Revenues.
The following table sets forth the revenues of the central Government as (i) audited 2016 revenue as a percentage of the actual 2016 GDP, (ii) projected 2017 revenue as a percentage of projected 2017 GDP (as set forth in the 2017 Revised Budget) and (iii) realized revenues for the nine months ended September 30, 2017 as a percentage of projected 2017 GDP, respectively.
Central Government Revenues
2016 LKPPAudited
2017RevisedBudget
Nine MonthsEnded
September 30,2017(2)
(percentageof 2016 GDP)
(percentageof projected2017 GDP)
(percentageof projected2017 GDP)
Total revenue and grants (in trillions of Rupiah) 1,555.9 1,736.1 1,099.2
Domestic revenue:Tax revenue:
Domestic taxIncome tax:
Oil and gas 0.3 0.3 0.3Non-oil and gas 5.1 6.0 3.1
Total income tax 5.4 6.3 6.3Value added tax (VAT) 3.3 3.8 2.3Land and building tax 0.2 0.1 0.0Excises 1.2 1.2 0.6Other taxes 0.1 0.1 0.0
Total domestic taxes 10.1 11.6 6.3International trade taxes: — — —
Import duties 0.3 0.3 0.2Export tax 0.0 0.0 0.0
Total international trade taxes 0.3 0.3 0.2Total tax revenue 10.4 11.9 6.5
Non-tax revenue:Natural resources:
Oil 0.3 0.5 0.4Gas 0.1 0.1 —
Total oil and gas 0.4 0.6 0.4General Mining 0.1 — 0.1Forestry 0.0 — — Fishery 0.0 — — Geothermal 0.0 — —
Total non-oil and gas 0.2 0.2 0.1Total natural resources 0.5 0.8 0.6
Profit transfer from SOEs 0.3 0.3 0.3Other non-tax revenue 1.0 0.7 0.5Public Service Agency (BLU) Income(1) 0.3 0.3 0.2
Total non-tax revenue 2.1 2.1 1.6
Total domestic revenue 12.5 14.0 8.1Grants 0.1 0.0 0.0
Total Revenue and Grant 12.5 14.0 8.1
Source: Ministry of Finance(1) Includes Government’s share of Bank Indonesia’s profits, representing amounts in excess of Bank Indonesia’s capital ratio requirements. The excess amounts are
transferred to the central Government to be used for repayments of certain central Government obligations to Bank Indonesia. (2) Presents realized central Government revenues for the nine months ended September 30, 2017 as a percentage of projected 2017 GDP.
95

Table of Contents
Central Government Expenditures.
The following table sets forth the expenditures of the central Government as (i) audited 2016 expenditures as a percentage of the actual 2016 GDP, (ii) projected 2017 expenditures as a percentage of projected 2017 GDP (as set forth in the 2017 Revised Budget) and (iii) realized expenditures for the nine months ended September 30, 2017 as a percentage of projected 2017 GDP, respectively.
Central Government Expenditure
2016 LKPPAudited
2017RevisedBudget
Nine MonthsEnded September 30,
2017(5)
(percentageof 2016 GDP)
(percentageof projected2017 GDP)
(percentageof projected 2017
GDP)Total expenditures (in trillions of Rupiah) 1,864.3 2133.3 1,374.0
Central government expenditures:Personnel expenditures 2.5 2.8 1.7Good and services expenditures 2.1 2.4 1.2Capital expenditures 1.3 1.8 0.7Interest payments: — — —
Domestic debt 1.4 1.6 1.2Foreign debt 0.1 0.1 0.1
Total interest payments 1.5 1.8 1.3Subsidies: — — —
Energy subsidies 0.9 0.7 0.4Non-energy subsidies 0.5 0.6 0.3
Total subsidies 1.4 1.4 0.7Grant expenditures 0.1 0.0 0.0Social assistance 0.4 0.5 0.3Other expenditures 0.0 0.4 0.0
Total central Government expenditures 9.3 11.0 5.9Transfers to Regions and Rural Fund: — — —
Transfer to Regions — — — Balanced funds: — — —
General transfer funds: — — — Revenue sharing funds 0.7 0.8 0.5General allocation funds 3.1 3.2 2.4
Total general transfer funds 3.8 4.0 2.9Specific allocation funds: — — —
Physical special allocation fund 0.6 0.6 0.2Non-physical special allocation fund(1) 0.7 0.9 0.5
Total specific allocation funds 1.3 1.5 0.8Total balanced funds 5.2 5.5 3.7
Regional incentive fund(2) 0.0 0.1 0.1Specific autonomy funds 0.1 0.2 0.1Specific Fund for Special Region of Yogyakarta 0.0 0.0 0.0
Total transfer to Regions 5.3 5.7 3.9Rural Fund(3) 0.4 0.5 0.3
Total transfers to regions and rural fund 5.7 6.1 4.2Suspend(4) — — —
Total expenditures 15.0 17.2 10.1
Source: Ministry of Finance (1) Included under “others” before FY 2016 except regional incentive fund. (2) Included under “others” before FY 2016. (3) Starting from FY 2015, central Government allocates rural fund based on law number 6/2015. (4) Realized expenditures calculated by the Ministry of Finance differed from the figures calculated by line ministries and such discrepancies have been subtracted and
added, respectively, to totals for such years after the fiscal year is over. “Suspend” is not reported in the current year. (5) Presents realized central Government expenditures for the nine months ended September 30, 2017 as a percentage of projected 2017 GDP.
96

Table of Contents
Central Government Deficit Financing. The following table sets forth the budgeted deficit financing of the Government, by amount and as a percentage of the actual 2016 GDP, projected 2017 GDP (as set forth in the 2017 Revised Budget) and the realized nine months ended September 30, 2017 deficit financing as a percentage of projected 2017 GDP.
Central Government Deficit Financing(1)
2016 LKPPAudited
2017RevisedBudget
As ofSeptember 30,
2017(2)
(percentagesof 2016 GDP)
(percentagesof projected2017 GDP)
(percentagesof projected2017 GDP)
Total financing (net) (in trillions of Rupiah) 334.5 397.2 362.2Debt financing
Government securities (net) 3.28 3.43 2.80Loans
Domestic loans (net) 0.01 0.01 (0.0) Foreign loans:
Gross drawings:Program loan 0.28 0.15 0.08Project loan 0.23 0.27 0.07
Total gross drawing 0.51 0.42 0.15Amortization (0.55) (0.48) (0.31)
Total foreign loan (net) (0.04) (0.06) (0.16) Total loans (net) (0.03) (0.04) (0.16) Total debt financing 3.25 3.39 2.64
Investment financingInvestment to SOEs (0.41) (0.05) — Investment to other institutions (0.09) (0.02) — Investment to public service agencies (0.20) (0.35) (0.00) Investment in financial organizations/institutions (0.03) (0.01) Revenue of investment (0.72) (0.44) (0.00)
Total investment financingLending 0.01 (0.03) 0.02
On-lending to SOEs/local government/institutions/other agencies: — — — Lending reserves 0.01 (0.03) 0.02
Total lending (0.01) (0.01) — Mandatory guarantee 0.16 0.00 0.00Other financing 2.7 2.92 2.66
Source: Ministry of Finance(1) As of FY 2017, the central Government deficit financing line items have been reclassified and the previously reported data has been restated across the periods
shown. (2) Presents realized central Government deficit financing for the nine months ended September 30, 2017 as a percentage of projected 2017 GDP.
Public Debt
Over the last decade, Indonesia has made substantial improvement in its public debt management. The reduction of public debt in percentage-of-GDP terms has been a consistent key fiscal policy objective of the Government. To achieve this objective, the Government’s policy has emphasized the strengthening of public debt
97

Table of Contents
management, the lengthening and balancing of the maturities of public debt and the growth of public debt at sustainable levels. Pursuant to these policies, the Republic successfully reduced its public debt as a percentage of GDP from 39.0% in 2006 to 23.1% in 2011 and 23.0% in 2012. Public debt as a percentage of GDP was 24.9% in 2013, 24.7% in 2014, 27.4% in 2015, 28.3% in 2016 and 29.1% in the nine months ended September 30, 2017.
As of December 31, 2016, the total public debt was U.S.$261.6 billion, 21% of which consisted of loans and 79% of which consisted of securities. As of September 30, 2017, total public debt was U.S.$286.6 billion, 19.1% of which consisted of loans and 80.9% of which consisted of securities, including domestic and foreign issuances of bonds and Sukuk.
Public External Debt of the Republic
Public external debt of the Republic consists of central Government debt (other than public domestic debt) and debt of Bank Indonesia owed to creditors outside Indonesia. The discussion below treats the external debt of Bank Indonesia as part of the Republic’s external debt. However, SBI, which are issued by Bank Indonesia in its role as formulator and implementer of the Republic’s monetary policy, are not considered liabilities of the Republic. Accordingly, SBI are not reflected in the Government debt discussions in this prospectus. See “— Financial System — Bank Indonesia.” The discussion of debt of the Republic in this section differs from the discussion of “Government debt” elsewhere in this prospectus, in which Bank Indonesia debt is excluded and only central Government debt, which depends on central Government revenue for its repayment, is included. See “— Government Budget — Central Government Finances.”
The following table sets forth information on the outstanding public external debt of the Republic in terms of creditor type as of the dates indicated.
Outstanding Public External Debt of the Republic by Source(1)
As of December 31,As of
September 30,2012 2013 2014 2015 2016 2017P
(in billions of U.S. dollars)Concessional Loans:
Multilateral creditors 23.8 23.7 23.5 26.1 27.5 27.8Bilateral creditors 37.2 31.5 26.9 24.7 23.5 23.1
Semi-concessional Loans:Export agency creditors 0.00 0.00 0.0 0.0 0.0 0.1
Commercial(2) 29.9 36.0 40.5 51.4 60.4 66.2Total 91.0 91.2 90.9 102.2 111.4 117.2Total public external debt of the Republic, as a percentage of GDP for the period indicated(3) 10.3% 10.4% 10.7% 12.4% 12.1% 11.5%
Source: Ministry of Finance P Preliminary. (1) Foreign currency values of outstanding external debt have been converted into U.S. dollars at the applicable BI middle exchange rates as of the respective dates
indicated. (2) Includes securities (bonds and Sukuk) issued in international capital markets and commercial bank borrowings. (3) In calculating as a percentage of GDP, GDP in U.S. dollars has been converted from Rupiah into U.S. dollars at the applicable BI middle exchange rates as of the
respective dates indicated.
98

Table of Contents
Sources of Public External Borrowing
The sources of the Republic’s public external borrowings are concessional loans from multilateral creditors and bilateral creditors, semi-concessional loans from export agency creditors, and commercial creditors, including international bondholders.
The World Bank and the ADB, have been important sources of funds for the Republic, and the Republic has secured substantial commitments from the Japan Bank for International Cooperation, or JBIC, in recent years.
In 2014, the Republic drew down program loans of U.S.$773.84 million from the World Bank, U.S.$100 million from Agence Française de Développement, U.S.$400 million from ADB and U.S.$200 million from KfW Bankengruppe. In 2015, the Republic drew down program loans of U.S.$2.1 billion from the World Bank, U.S.$1.4 billion from ADB, U.S.$245 million from KfW Bankengruppe, and U.S.$100 million from Agence Française de Développement. Additionally, the Republic utilized the contingency facilities provided by the World Bank in the amount of U.S.$2 billion and from ADB in the amount of U.S.$500 million in 2015. In 2016, the Republic drew down program loans of U.S.$1.1. billion from the World Bank, U.S.$1 billion from ADB, U.S.$440 million KfW Bankengruppe, and U.S.$110 million from Agence Française de Développement. In addition, as of July 2017, the Republic had drawn down program loans of U.S.$647 million from the World Bank and U.S.$171 million from Agence Française de Développement.
Since 2012, the Government has expanded its sources of external financing by accessing the international capital markets (including the Islamic financial markets).
The total outstanding external public debt of the Republic as of September 30, 2017 was U.S.$117.2 billion.
The following table sets forth the outstanding amounts of international development assistance received by the Republic as of the dates indicated.
International Development Assistance(1)(2)
As of December 31,As of
September 30,2012 2013 2014 2015 2016 2017
(in millions of U.S. dollars)Bilateral loans 32,186.2 27,016.6 23,095.7 21,555.9 20,847.2 20,775.2Multilateral loans:
International Monetary Fund — — — — — — International Bank for Reconstruction and Development 10,463.4 11,335.6 12,176.3 14,380.0 15,811.8 16,462.9Asian Development Bank 10,379.1 9,387.2 8,630.1 9,193.9 9,311.1 8,852.1International Development Association 2,208.2 2,097.7 1,879.8 1,677.3 1,474.5 1,415.4Islamic Development Bank 526.5 545.1 581.5 643.4 701.0 836.3Nordic Investment Bank 32.4 27.6 21.9 16.7 12.0 11.3European Investment Bank 58.8 48.9 38.5 27.6 22.0 19.1International Fund for Agricultural Development 130.7 137.7 145.2 155.2 166.2 182.3Asian Infrastructure Development Bank — — — — — 14.5Multilateral Investment Guarantee Agency — — — — — —
Total multilateral loans 23,799.2 23,579.8 23,473.4 26,094.2 27,498.6 27,794.0Total loans 55,985.4 50,596.4 46,569.1 47,650.0 48,345.8 48,569.2
Source: Ministry of Finance (1) The term international development assistance includes any concessionary loans provided by international financial institutions or foreign Governments, excluding grants.
99

Table of Contents
(2) Foreign currency values of international development assistance have been converted into U.S. dollars at the applicable BI middle exchange rates as of the respective dates indicated.
The following table sets forth the external public debt of the Republic by currency as of the dates indicated.
Outstanding External Public Debt of the Republic by Major Currency
As of December 31, As of September 30,2014 2015 2016 2017P
In millionsof originalcurrency
In millionsof
U.S. dollars(1)
In millionsof originalcurrency
In millionsof
U.S. dollars(1)
In millionsof originalcurrency
In millionsof
U.S. dollars(1)
In millionsof originalcurrency
In millionsof
U.S. dollars(1)
U.S. dollars 59,993 59,993 70,817 70,817 75,267 75,267 83,411.8 83,411.8Japanese yen 2,203,955 18,469 2,126,845 17,657 2,053,751 17,708 2,049,132.1 18,195.1Euros 5,055 6,150 5,999 6,554 8,676 9,150 9,984.4 11,762.7SDR 4,669 5,680 3,783 5,246 3,585 4,830 1,480.7 2,090.4British pounds 246 383 180 267 129 161 117.2 157.2Others Multiple
currency 1,825Multiple
currencies 1,581Multiple
currencies 1,507Multiple
currencies 1,583.8Total N/A 92,500 N/A 102,121 N/A 108,624 N/A 117,201.0
Source: Ministry of Finance P Preliminary. (1) Calculated based on the applicable BI middle exchange rates as of the date indicated for each column.
The following table sets forth the external debt service requirements of the central Government for the years indicated.
External Debt Service Requirements of the Central Government(1)
PeriodPrincipal
repaymentInterest
repayment Total(in millions of U.S. dollars)
2015 5,925.6 3,328.6 9,254.22016 6,038.7 3,618.7 9,657.42017(P) 1,750.7 719.8 2,470.52018(P) 8,380.2 4,109.0 12,489.32019(P) 10,379.8 3,736.5 14,116.3
Source: Ministry of Finance (1) Foreign currency values of outstanding external debt have been converted into U.S. dollars at the applicable BI middle exchange rates as of September 30, 2017. (P) Projected based on external debt outstanding and exchange rates as of September 30, 2017.
Payment History of External Debt
Indonesia maintains a policy of external debt management and has a history of servicing its external debt obligations in accordance with its terms.
In the wake of the Asian financial crisis in 1997, the Paris Club, an informal voluntary group of 18 creditor countries that seeks to coordinate solutions for payment difficulties experienced by debtor nations by extending
100

Table of Contents
or guaranteeing bilateral credits, played an important role in easing Indonesia’s foreign exchange burden. Between 1998 and 2000, Indonesia twice rescheduled certain payments of its Paris Club foreign debt. Pursuant to an April 2002 agreement, Paris Club debt payments of principal and interest of approximately U.S.$5.4 billion that were due to certain of Indonesia’s creditors between April 2002 and December 2003 were rescheduled.
In addition, on March 10, 2005, the Paris Club offered to permit Indonesia, as well as other countries affected by the December 2004 tsunami, to defer debt services payments through the end of 2005 to allow these countries to commit additional government resources to the tsunami-related humanitarian and relief efforts. On May 10, 2005, 18 individual Paris Club members and Indonesia signed a memorandum of understanding to reschedule some payments of principal and interest due under official development assistance and non-official development assistance.
While there have been a number of reschedulings of Indonesia’s external debt to its bilateral creditors as described above, Indonesia has not defaulted on, and has not attempted to restructure, the payment of principal or interest on any of its external securities in the last 20 years.
External Debt of Bank Indonesia
Under Indonesian law, Bank Indonesia has the ability to incur external debt primarily to meet balance of payments needs and maintain adequate foreign exchange reserves.
The following table sets forth the outstanding multilateral and commercial external debt of Bank Indonesia by type of credit as of the dates indicated.
Outstanding Multilateral and Commercial External Debt of Bank Indonesia(1)
As of December 31, As of September 30,2012 2013 2014 2015 2016 2017P
(in millions of U.S. dollars)Multilateral 3,053 3,050 2,868 2,747 2,654 2,796Commercial(2) 354 244 223 190 167 121
Total 3,407 3,294 3,092 2,937 2,821 2,917
Source: Bank Indonesia P Preliminary. (1) Foreign currency values of outstanding external debt have been converted into U.S. dollars at the applicable BI middle exchange rates as of the respective dates
indicated. (2) Includes bonds issued in international capital markets and commercial bank borrowings but excludes SBI owned by non-residents, currencies and deposits and other
liabilities.
The following table sets forth the external debt service requirements of Bank Indonesia for the years indicated.
External Debt Service Requirements of Bank Indonesia
PeriodPrincipal
repaymentInterest
repayment Total(in millions of U.S. dollars)
2015 32.6 2.9 35.52016 48.3 4.2 52.52017(P) 149.7 7.3 157.02018(P) 0.0 1.4 1.42019(P) 0.0 1.4 1.4
101

Table of Contents
Source: Bank Indonesia (P) Projected based on external debt outstanding as of September 30, 2017.
In order to strengthen its international reserves and support its balance of payments, the Republic has entered into a swap arrangement with ASEAN as well as bilateral swap arrangements with other countries. See “— Foreign Exchange and Reserves — Regional Swap Arrangements of the Republic.”
External Debt of State-Owned-Enterprises
The following table sets forth the outstanding direct external debt of SOEs as of the dates indicated.
Outstanding Direct External Debt of State-Owned-Enterprises(1)
As of December 31,As of
September 30,2012 2013 2014 2015 2016 2017P
(in millions of U.S. dollars)Financial institutions:
Bank 4,036 3,071 4,082 5,103 4,485 4,012Non-bank 957 797 1,583 2,816 3,497 4,015
Total financial institutions 4,993 3,868 5,665 7,919 7,981 8,027Non-financial institutions 14,789 20,806 25,034 24,704 22,884 24,020
Total 19,782 24,674 30,699 32,623 30,865 32,047
Source: Bank Indonesia P Preliminary. (1) Foreign currency values of outstanding direct external debt have been converted into U.S. dollars at the applicable BI middle exchange rates as of the respective dates
indicated.
For a discussion of the Republic’s guarantee of certain external debt in connection with infrastructure projects in the country, see “— Public Debt — Contingent Liabilities.”
Domestic Debt of the Central Government
The following table sets forth the outstanding domestic debt of the Government as of the dates indicated.
Domestic Debt of the Central Government
As of December 31,As of
September 30,2012 2013 2014 2015 2016 2017P
Total domestic public debt, in trillions of Rupiah(1) 1,098.0 1,264.0 1,477.8 1,755.2 2,019.2 2,285.2
Source: Ministry of Finance P Preliminary. (1) Excludes SBI, which are obligations of Bank Indonesia and not of the Government. See “— Financial System — Bank Indonesia.”
102

Table of Contents
Domestic Debt Service Requirements of the Central Government
The following table sets forth the debt service requirements for the central Government for the years indicated.
Direct Domestic Debt Service Requirements of the Central Government(1)
Period
Principalrepayment and
redemptionInterest
repayment Total(in trillions of Rupiah)
2015 147.4 111.0 258.42016 309.8 148.3 458.12017(P) 62.6 33.8 96.52018(P) 238.4 154.3 392.82019(P) 206.3 141.2 347.4
Source: Ministry of Finance (1) Foreign currency values of outstanding direct domestic debt service, which are in U.S. dollars, have been converted into Rupiah based on the exchange rate as of
September 30, 2017 of U.S.$1=13,429. (P) Projected based on external debt outstanding and exchange rates as of September 30, 2017.
Contingent Liabilities from Government Guarantees
As part of the Government’s policy to prioritize infrastructure development, the Government has provided support to encourage investments in infrastructure projects in the form of credit and investment guarantees. External debts of SOEs are not direct obligations of the Republic, unless such debts are explicitly guaranteed by the Republic.
Starting from 2008 the Government has been allocating a contingent budget with respect to these guarantees. Any unused budget allocation may be transferred to a guarantee reserve fund. This reserve fund, together with the relevant annual budget allocations, serves as reserves for any claim that arises from these guarantees.
As of September 30, 2017, the Government has accumulated an amount of Rp2.3 trillion in the guarantee reserve fund. The credit guarantees that the Government has provided to infrastructure projects include:
• full default risk guarantee on PT PLN’s loans for the construction of coal power plants with an aggregate capacity of 10,000 MW and its associated transmission lines. The total amount outstanding under these loans was Rp39,926.2 billion as of September 30, 2017;
• partial default risk guarantee for local government-owned water companies’ loans in connection with the Millennium Development Goals in water provision. The total amount outstanding under these loans was Rp169.0 billion as of September 30, 2017;
• business viability guarantee on PT PLN to support the construction of renewable, coal and steam power plants with an aggregate capacity of 10,000 MW related to the Fast Track 2 program. The total amount outstanding was Rp21,418.8 billion as of September 30, 2017;
• full default risk guarantee on PT Hutama Karya (Persero)’s loans and bonds for the construction of Sumatera Toll Road. The total amount outstanding was Rp6,500 billion as of September 30, 2017; and
• guarantee for infrastructure financing through direct loans from international financial institutions to SOEs. The total amount outstanding was Rp997.1 billion as of September 30, 2017.
As of September 30, 2017, no claims from the foregoing guarantees have arisen.
103

Table of Contents
Foreign Exchange and Reserves
Exchange Rates
From 1978 to 1997, Indonesia maintained a managed floating exchange rate system under which the Rupiah was linked to a basket of currencies, the composition of which was based on Indonesia’s main trading partners. Indonesia has adopted a free floating exchange rate system since August 1997, under which market forces determine the exchange rate for the Rupiah. See “— Monetary Policy.”
The following table sets forth information on exchange rates between the Rupiah and the U.S. dollar for the periods indicated.
Exchange Rates
Rupiahper U.S.dollar
End ofPeriod Average
2012 9,638 9,3582013 12,170 10,4452014 12,385 11,8762015 13,785 13,3922016 13,473 13,3052017A 13,563 13,353
Source: Bank Indonesia A As of October 31, 2017.
By the end of 2014, the Rupiah had depreciated by 1.8% to Rp12,385 per U.S. dollar from Rp12,170 per U.S. dollar at the end of 2013. On average, the Rupiah depreciated by 12% to Rp11,876 per U.S. dollar from Rp10,445 per U.S. dollar in 2013. The Rupiah’s depreciation was triggered by slowing domestic economic growth and domestic political conditions. Externally, pressure on the Rupiah mainly came from concerns toward the impact of the U.S. Federal Reserve Bank’s normalization policy, a slowing global economy and an escalation of geopolitical tensions at the Russian-Ukrainian border. Rupiah depreciation in 2014 was broadly in line with downward movements of other regional currencies and in line with an increase of the U.S. Dollar Index, which measures the value of the U.S. dollar against a basket of foreign currencies.
By the end of 2015, the Rupiah had depreciated by 11.3% to Rp13,785 from Rp12,385 per U.S. dollar at the end of 2014. On average, the Rupiah depreciated 11.3% from Rp11,876 per U.S. dollar in 2014 to Rp13,392 per U.S. dollar in 2015. Uncertainty surrounding the timing of an increase of the Federal Funds Rate as part of the gradual normalization of U.S. monetary policy, the Greek debt crisis and global monetary policy divergence were the primary external factors affecting the Rupiah. In addition, in line with the market reaction to the devaluation of the Renminbi, nearly all global currencies, including the Rupiah, experienced depreciatory pressures. Domestically, pressure was exerted from a slowing domestic economy.
By the end of 2016, the Rupiah appreciated by 2.3% to Rp13,473 per U.S. dollar from Rp13,785 per U.S. dollar at the end of 2015. On average the Rupiah appreciated from Rp13,392 per U.S. dollar in 2015 to Rp13,305 per U.S. dollar, a gain of 0.7%. Despite external pressures stemming from the timing of an increase of the Federal Funds Rate, the result of the UK referendum, the appreciation of the U.S. Dollar Index and the reaction of global markets to the U.S. election in November 2016, domestic factors remained conducive for Rupiah stability, particularly due to low inflation, an improved current account deficit and a sustained economic recovery. In addition, the successful tax amnesty program further bolstered investor confidence.
104

Table of Contents
The Rupiah depreciated by 0.66% from Rp13,473 per U.S. dollar as of December 31, 2016 to Rp13,563 per U.S. dollar as of October 31, 2017. On average, the Rupiah depreciated by 0.36% from Rp13,305 per U.S. dollar as of December 31, 2016 to Rp13,353 per U.S. dollar as of October 31, 2017. The depreciation was in line with prevailing trends for most other global currencies against the U.S. dollar. The U.S. dollar appreciated globally as a result of the financial markets’ response to the nomination of a new U.S. Federal Reserve Governor, the intention to gradually normalize monetary policy, growing expectations of a further increase in the U.S. Federal Funds Rate as well as plans in the U.S. for tax reform.
Prudential Policies on Foreign Exchange and Rupiah
Under Law No. 24 of 1999 on Foreign Exchange Activities and Exchange Rate System, every resident may freely own and use foreign currency. Foreign currency is also generally freely transferable within or from Indonesia although by regulation most domestic transactions are prohibited from using foreign currency. Bank Indonesia has the authority to request information and data regarding foreign exchange activities and implement provisions regarding foreign exchange activities based on prudential principles.
To maintain the stability of the Rupiah, and to prevent the utilization of the Rupiah for speculative purposes by foreign parties, the Rupiah is non-internationalized. Regulations prohibit banks from conducting, among others, the following transactions: (i) extensions of loans or of overdrafts in Rupiah or foreign currencies to foreign parties, (ii) transfers of Rupiah to foreign parties or offshore banks in excess of U.S.$1 million without underlying transactions, and (iii) purchases of Rupiah-denominated securities issued by foreign parties.
Bank Indonesia has issued several regulations concerning foreign currency transactions relating to the Rupiah in order to deepen financial markets. A deep foreign exchange market is distinguished by adequate liquidity, convenient transactions, fair prices and minimal risk in order to maintain economic stability. Bank Indonesia strives towards the creation of a liquid, efficient and secure domestic foreign exchange market through amendments to regulations concerning foreign exchange transactions.
On January 1, 2015, Bank Indonesia regulations came into effect to mitigate risks relating to external borrowing by non-bank corporations. Under these regulations, corporate issuers of debt must, subject to certain limited exceptions:
• hedge at least 25% of their open foreign exchange positions (i.e., the excess of foreign currency liabilities that fall due within the following three to six months over foreign currency assets);
• maintain a 70% minimum liquidity ratio of foreign currency assets to foreign currency liabilities maturing within three months after the end of a quarter; and
• maintain a minimum credit rating (issuer and/or issue) of BB- by a rating agency acknowledged by Bank Indonesia.
105

Table of Contents
International Reserves
The following table sets forth the Republic’s total official international reserves, expressed in (i) U.S. dollar equivalents and (ii) the number of months of imports and Government external debt repayments, in each case at the end of the periods indicated. These reserves consist of foreign exchange, gold, SDRs and a reserve position with the IMF. Indonesia complies with the IMF’s Special Data Dissemination Standard requirement on international reserves and foreign exchange currency liquidity.
Official International Reserves of the Republic
As of December 31,As of
September 30,2012 2013 2014 2015 2016 2017P
(in millions of U.S. dollars, except for months)Gold 3,935 3,023 3,027 2,661 2,876 3,326SDRs 2,715(1) 2,712 2,551 2,442 1,499 1,578Reserve position with the IMF 224 224 211 202 1,056 1,112Foreign exchange(2) and others 105,907 93,247 106,073 100,073 110,341 123,386Total 112,781 99,386 111,862 105,931 116,362 129,402Total as number of months of imports and Government external debt repayments 6.2 5.5 6.4 7.4 8.4 8.6
Source: Bank IndonesiaP Preliminary. (1) The increase in SDRs is due to certain refunds from the IMF. (2) Converted into U.S. dollars at the applicable BI middle exchange rates as of the respective dates indicated.
Foreign reserves totaled U.S.$112.8 billion, U.S.$99.4 billion, U.S.$111.9 billion, U.S.$105.9 billion and U.S.$116.4 billion as of December 31, 2012, 2013, 2014, 2015, 2016, respectively. As of September 30, 2017, foreign reserves increased to U.S.$129.4 billion which is equal to 8.6 months of import coverage and government external debt service requirements. In addition, the coverage ratio is in excess of the recommended international adequacy ratio of thee months of import coverage.
Regional Swap Arrangements of the Republic
Following the experience of the Asian crisis in 1997 to 1998, ASEAN recognized a need to strengthen regional self-help and support mechanisms in East Asia and endeavored to prevent future financial crises. In 2000, ASEAN members agreed to strengthen the existing cooperative frameworks among monetary authorities through the Chiang Mai Initiative, or CMI. The CMI involves an expanded ASA (extending its coverage to all members of ASEAN and increasing the size) and a network of BSAs among ASEAN+3 countries. The objectives of these bilateral swap arrangements are to address short-term liquidity difficulties in the region and to supplement existing international financial arrangements.
The ASA was originally created by five ASEAN member states in 1977 with a size of U.S.$100 million. After the CMI, it has been enlarged to include all ten ASEAN countries and increased in size to U.S.$2 billion.
Since CMI’s inception in 2000, ASEAN+3 member countries undertook a review to explore ways of enhancing its effectiveness. On 2010, ASEAN+3 member countries entered into a multilateral currency swap contract which covers all ASEAN+3 member countries with a total size of U.S.$120 billion (the CMI Multilateralization or CMIM). CMIM was developed from the CMI-BSA network to facilitate prompt and simultaneous currency swap transactions through establishing a common decision making mechanism under a
106

Table of Contents
single contract. The CMIM objectives are the same as the BSAs. In May 2012 and in response to the global and regional economic developments, the ASEAN+3 Finance Ministers and Central Bank Governors agreed to strengthen the CMIM as a regional financial safety net by doubling the total size to U.S.$240 billion and launching a crisis prevention program called the CMIM Precautionary Line, or CMIM-PL. This arrangement became effective on July 17, 2014. In addition to the role of providing liquidity support for ASEAN+3 member countries, CMIM has contributed to the development of the regional surveillance capacity by establishing the ASEAN+3 Macroeconomic Research Office, or AMRO, as an ASEAN+3 independent surveillance unit since early 2011.
Under the ASA, BSA, and CMIM, a total of U.S.$46.1 billion of foreign currency swap is currently available to the Republic as of August 31, 2017. Up to 30.0% of the amount available under the BSAs and CMIM may be activated without participating in any IMF program, but greater amounts requires participation in an IMF program. The Republic also has a U.S.$22.76 billion swap line in place with Japan. The swap line increased from U.S.$12.0 billion in December 2013. These swap arrangements will contribute to greater financial stability and sustainable economic growth in the region.
Bank Indonesia has also established a Bilateral Currency Swap Agreement, or BCSA, with Korea amounting to KRW 10.7 trillion/Rp115 trillion which was signed in March 2014.
A BCSA entered into between Bank Indonesia and the Reserve Bank of Australia became effective on December 15, 2015. The BCSA with the Reserve Bank of Australia is for an initial period of three years.
As of August 31, 2017, no drawdowns on existing bilateral and regional swap arrangements have been made.
Debt-to-GDP Ratios
The following table sets forth the central Government’s debt-to-GDP ratio and debt service to GDP ratio as of the dates indicated. Under the State Finances Law No. 17 of 2003, the Republic’s debt-to-GDP ratio must remain below 60%.
Debt-to-GDP Ratios
As of December 31,As of
September 30,2012L 2013L 2014L 2015L 2016L 2017P
(percentages, unless indicated otherwise)Debt-to-GDP ratio(1) 23.0 24.9 24.7 27.4 28.3 29.1Debt service to GDP ratio(1) 3.2 2.9 3.5 3.3 4.1 3.2Total public debt of the central Government (in billion U.S.$)(2) 204.5 194.9 209.7 229.4 261.6 286.6
— % in Loans 31.2 30.1 26.0 23.9 21.0 19.1— % in Bonds 68.8 69.9 74.0 76.1 79.1 80.9
Source: Ministry of Finance, Bank Indonesia(1) Outstanding foreign currency debt was converted to Rupiah using the BI middle exchange rate as of each period indicated in the table. (2) The following exchange rates were used: Rp9,670 per U.S.$ for 2012, Rp12,189 per U.S.$ for 2013, Rp12,440 per U.S.$ for 2014, Rp13,795 per U.S.$. for 2015,
Rp13,436 per U.S.$ for 2016 and Rp13,492 per U.S.$ for September 30, 2017. L LKPP (Audited). P Preliminary.
107

Table of Contents
DESCRIPTION OF THE BONDS
Global Bonds
The Depository Trust Company, or DTC, Euroclear Bank SA/NV, or Euroclear, and Clearstream Banking S.A., or Clearstream, are under no obligation to perform or continue to perform the procedures described below, and they may modify or discontinue them at any time. Neither Indonesia nor the trustee will be responsible for DTC’s, Euroclear’s or Clearstream’s performance of their obligations under their rules and procedures. Additionally, neither the Republic nor the Trustee will be responsible for the performance by direct or indirect participants of their obligations under their rules and procedures.
This section of this prospectus is only a summary of the material provisions of the Bonds and the Indenture and it does not contain all of the information that may be important to you as a potential investor in the Bonds. The Republic urges you to read the Indenture for a complete description of its obligations and your rights as a holder of the Bonds. Copies of the Indenture are available for inspection free of charge at the corporate trust office of the Trustee.
The Bonds will be issued pursuant to the Indenture to be dated as of December 11, 2017 between the Republic, Bank Indonesia, The Bank of New York Mellon, as trustee, and other parties named therein.
General Terms of the Bonds
Basic Terms of the Bonds
The Bonds will:
• be direct, general, unconditional and unsubordinated obligations of the Republic, for which the full faith and credit of the Republic is pledged;
• rank without any preference among themselves and equally with all other unsubordinated public external indebtedness of the Republic. It is understood that this provision will not be construed to require the Republic to make payments under any series of the Bonds ratably with payments being made under any other public external indebtedness;
• not be redeemable before maturity at the option of the Republic or repayable at the option of the holder and not be entitled to the benefit of any sinking fund. The Republic may at any time, however, purchase any series of the Bonds and hold or resell them or surrender them to the Registrar for cancellation.
• be represented by one or more registered global securities (see “Global Bonds”);
• be eligible for settlement in DTC, Euroclear and Clearstream;
• contain “collective action clauses” under which the Republic may amend certain key terms of each series of Bonds including the maturity date, interest rate and other terms, with the consent of less than all of the holders of such series of Bonds; and
• pay all amounts due in respect of principal or interest in U.S. dollars.
The 2023 Bonds will:
• be initially issued in aggregate principal amount of U.S.$1,000,000,000;
• be issued in minimum denominations of U.S.$200,000 and integral multiples of U.S.$1,000 in excess thereof;
• bear interest at 2.95% per annum on the outstanding principal amount from December 11, 2017;
• pay interest on January 11 and July 11 of each year, commencing July 11, 2018; and
• mature on January 11, 2023.
108

Table of Contents
The 2028 Bonds will:
• be initially issued in aggregate principal amount of U.S.$1,250,000,000;
• be issued in minimum denominations of U.S.$200,000 and integral multiples of U.S.$1,000 in excess thereof;
• bear interest at 3.50% per annum on the outstanding principal amount from December 11, 2017;
• pay interest on January 11 and July 11 of each year, commencing July 11, 2018; and
• mature on January 11, 2028.
The 2048 Bonds will:
• be initially issued in aggregate principal amount of U.S.$1,750,000,000;
• be issued in minimum denominations of U.S.$200,000 and integral multiples of U.S.$1,000 in excess thereof;
• bear interest at 4.35% per annum on the outstanding principal amount from December 11, 2017;
• pay interest on January 11 and July 11 of each year, commencing July 11, 2018; and
• mature on January 11, 2048.
Status of the Bonds
The Bonds will be direct, general, unconditional and unsubordinated obligations of the Republic, for which the full faith and credit of the Republic is pledged. The Bonds will rank without any preference among themselves and equally with all other unsubordinated Public External Indebtedness of the Republic. It is understood that this provision shall not be construed so as to require the Republic to make payments under the Bonds ratably with payments being made under any other Public External Indebtedness.
Payment of Principal and Interest
The Republic will make payments to the registered holders of the Bonds. While the Bonds are held in global form, holders of beneficial interests in the Bonds will be paid in accordance with the procedures of the relevant clearing system and its direct participants, if applicable. Neither the Republic nor the Trustee nor any Agent shall have any responsibility or liability for any aspect of the records of, or payment made by the relevant clearing system or its direct participants in making payments to holders of the Bonds from the funds they receive.
For purposes of this section, “Business Day” means any day except Saturday, Sunday or any other on which commercial banks in New York City, Jakarta, or the city where the relevant paying or transfer agent is located are authorized or obligated by law, regulation or executive order to be closed. In any case where the date of payment of the principal, interest or premium, if any, on the Bonds is not a Business Day, then such payment will be made on the next succeeding Business Day, and no interest on the Bonds will accrue as a result of the delay in payment.
If the money that the Republic pays to the Trustee or to any paying agent appointed by the Trustee at the expense of the Republic to make payments on any Bonds is not claimed at the end of one year after the applicable payment was due and payable, then the money will be repaid to the Republic on the Republic’s written request. The Republic will hold such unclaimed money in trust for the relevant holders of those Bonds. After any such repayment, neither the Trustee nor any paying agent will be liable for the payment. However, the Republic’s obligations to make payments on the Bonds as they become due will not be affected until the expiration of the prescription period, if any, specified in the Bonds. See “— Prescription” below.
If the Republic at any time defaults in the payment of any principal of, or interest on, the Bonds, the Republic will pay interest on the amount in default (to the extent permitted by law) calculated, for each day until paid, at the rate or rates specified in such Bonds.
109

Table of Contents
Additional Amounts
The Republic will make all principal and interest payments on the Bonds, to the extent permitted by law, without withholding or deducting any present or future taxes, levies, imposts, duties, assessments or other charges of whatever nature imposed by the Republic or any of its political subdivisions (“Indonesian Taxes”). If Indonesian law requires the Republic to withhold or deduct any Indonesian Taxes, the Republic will pay the holders of Bonds such additional amounts (“Additional Amounts”) necessary to ensure that they receive the same amount as they would have received without any withholding or deduction. The Republic will not, however, pay any Additional Amounts in connection with any Indonesian Taxes that are imposed due to any of the following:
i. the holder has or had some connection with the Republic other than merely owning or holding the Bonds or receiving principal and interest payments on the Bonds;
ii. any estate, inheritance, gift, sales, transfer or personal property tax or any similar tax, assessment or other governmental charge;
iii. any tax, assessment or other governmental charge that would not have been imposed but for the failure of a holder or beneficial owner of a Bond to comply with any certification, identification or other reporting requirement concerning the nationality, residence, identity or connection with the Republic of such holder or beneficial owner or other person, if compliance with the requirement is a precondition to exemption from all or any portion of such withholding or deduction, provided that (a) the Republic or the Republic’s agent has notified the holders of such certification, identification or other reporting requirement at least 15 days before the applicable payment date and (b) in no event shall such holder’s or beneficial owner’s or other person’s obligation to satisfy such a requirement require such holder or beneficial owner or other person to provide any materially more onerous information, documents or other evidence than would be required to be provided had such holder or beneficial owner or other person been required to file Internal Revenue Service Forms W-8BEN, W-8BEN-E, W-8ECI, W-8EXP and/or W-8IMY;
iv. the holder has failed to present any such Bonds for payment (where such presentment is required) within 30 days after the date on which such payment has been made available to the holder except to the extent that the holder thereof would have been entitled to such Additional Amounts on presenting such Bond for payment on the last of such 30 days;
v. any tax, assessment or other governmental charge that would not have been imposed but for the failure by a holder or beneficial owner (or any financial institution through which the holder or beneficial owner holds any Bonds or through which payment on the Bonds is made) to comply with any certification, information, identification, documentation or other reporting requirements (including entering into and complying with an agreement with the Internal Revenue Service) imposed pursuant to, or under an intergovernmental agreement entered into between the United States and the government of another country in order to implement the requirements of, Sections 1471 through 1474 of the Internal Revenue Code as in effect on the date of issuance of the Bonds or any successor or amended version of these provisions, to the extent such successor or amended version is not materially more onerous than these provisions as enacted on such date; or
vi. the holder is a fiduciary or partnership or other than the sole beneficial owner of such payment to the extent such payment would be required to be included in the income, for tax purposes, of a beneficiary or settlor with respect to such fiduciary or a member of such partnership or a beneficial owner who would not have been entitled to the Additional Amounts had such beneficiary, settlor, member or beneficial owner been the holder.
Any reference to “principal” or “interest” on the Bonds includes any Additional Amounts which may be payable on the Bonds.
The Republic will pay any present or future stamp, court or documentary taxes or any excise or property taxes, charges or similar levies which arise in the Republic or any political subdivision thereof or taxing authority thereof or therein in respect of the creation, issue, execution, delivery or registration of the Bonds or any other document or instrument referred to therein.
110

Table of Contents
Unless the context requires otherwise, any references in this prospectus to principal or interest on the Bonds will include additional amounts payable by the Republic in respect of such principal or interest.
Negative Pledge
So long as any Bond remains outstanding, the Republic will not create or permit the creation of any mortgage, charge, lien, pledge or any other security interest on any of its present or future assets or revenues, or any part thereof, to secure any Public External Indebtedness (as defined below), unless the Republic shall procure that all amounts payable under the Bonds are secured equally and ratably.
“Indebtedness” means any indebtedness for money borrowed or any guarantee of indebtedness for money borrowed which is issued by and in the name of the Republic and is backed by the full faith and credit of the Republic. As used in the preceding sentence, money borrowed “by and in the name of the Republic” shall not include the borrowings of any state-owned-enterprises or other agency, authority, department or instrumentality which under the laws of the Republic constitutes a juridical entity or statutory body separate from the Republic so long as such Indebtedness does not carry the full faith and credit of the Republic.
“External Indebtedness” means Indebtedness which is denominated or payable by its terms in, or at the option of the holder thereof payable in, a currency or currencies other than the lawful currency of the Republic.
“Public External Indebtedness” means External Indebtedness which (i) is publicly issued or privately placed in the capital markets, (ii) is in the form of, or represented by, bonds, debentures, notes or other similar instruments or book entries and (iii) is, or is eligible to be, quoted, listed or ordinarily purchased and sold on any stock exchange, automated trading system or over-the-counter or other securities market.
“Security Interest” means any security interest, lien, pledge, mortgage, deed of trust, charge or other encumbrance, security interest or preferential arrangement which has the practical effect of constituting a security interest with respect to the payment of any obligations with or from the proceeds of any assets or revenues of any kind whether in effect on the date the Indenture becomes effective or at any time thereafter.
Notwithstanding the above, the Republic may create or permit the creation of any Security Interests:
1. securing Public External Indebtedness incurred, assumed or guaranteed by the Republic solely to finance or refinance the acquisition, construction or development of the property over which such Security Interest has been created or permitted to be created, provided that such Security Interest does not extend to any other property of the Republic; however, in the case of construction, the Security Interest may extend to: unimproved real property for the construction, any trust account into which the proceeds of the offering creating such Public External Indebtedness may be temporarily deposited pending use in the construction, and the revenues to be generated by the operation of, or loss or damage to, the property to be constructed;
2. existing on any property or asset at the time of its acquisition (or arising after its acquisition pursuant to an agreement entered into prior to, and not in contemplation of, such acquisition), and extensions and renewals of such Security Interest limited to the original property or asset covered thereby and securing any extension or renewal of the original secured financing;
3. arising out of the renewal, extension or replacement of any indebtedness permitted under paragraph 2 above; provided, however, that the principal amount of such Public External Indebtedness is not increased;
4. arising in the ordinary course of borrowing activities of the Republic to secure Public External Indebtedness with a maturity of one year or less;
5. in existence as of the date of the issuance of the Bonds;
6. pursuant to any order of attachment, distraint or similar legal process arising in connection with court proceedings which proceedings are being contested in good faith; or
7. arising by operation of law, provided that any such Security Interest is not created or permitted to be created by the Republic for the purpose of securing any Public External Indebtedness.
111

Table of Contents
Events of Default
Each of the following events will constitute an Event of Default:
i. the Republic defaults in any payment of the principal of or interest on any of the Bonds and such default is not cured within 30 days;
ii. the Republic defaults in the performance of any other covenant in the Bonds and such default continues for a period of 60 days after written notice thereof has been given to the Republic by holders representing at least 10% of the aggregate principal amount of the Bonds outstanding;
iii. any Public External Indebtedness in a principal amount in excess of U.S.$50,000,000 (or the equivalent amount thereof in any other currency) is accelerated (other than by optional or mandatory prepayment or redemption);
iv. the Republic defaults in the payment of principal or interest in excess of U.S.$50,000,000 (or the equivalent amount thereof in any other currency) payable (whether upon maturity, acceleration or otherwise) in connection with Public External Indebtedness beyond any applicable grace and waiver periods and such default shall not have been cured or waived within 30 days after written notice thereof has been given to the Republic pursuant to the Indenture by any holder; or
v. the Republic declares a moratorium with respect to the payment of principal of or interest on any Public External Indebtedness.
If an Event of Default under the Bonds shall have occurred and be continuing then in each and every such case, upon notice in writing by the holders (the “Demanding Holders”) (acting individually or together) of not less than 25% of the aggregate outstanding principal amount of the Bonds to the Republic, with a copy to the Trustee, of any such Event of Default and its continuance, the Demanding Holders may, and the Trustee at the written request of such holders shall (subject to receiving indemnity and/or security to its satisfaction), declare the principal amount of all the Bonds due and payable immediately, and the same shall become and shall be due and payable upon the date that such written notice is received by or on behalf of the Republic, unless prior to receiving such notice all Events of Default in respect of all the Bonds shall have been cured or waived; provided that if, at any time after the principal of the Bonds shall have been so declared due and payable, and before the sale of any property pursuant to any judgment or decree for the payment of monies due which shall have been obtained or entered in connection with the Bonds, the Republic shall pay or shall deposit (or cause to be paid or deposited) with the Trustee or Paying Agent a sum sufficient to pay all matured installments of interest and principal upon all the Bonds which shall have become due otherwise than solely by acceleration (with interest on overdue installments of interest, to the extent permitted by law, and on such principal of each Bond at the rate of interest specified herein, to the date of such payment of interest or principal) and such amount as shall be sufficient to cover the fees and reasonably incurred expenses of the Trustee, including, without limitation, the fees and expenses of its counsel, and if any and all Events of Default hereunder, other than the nonpayment of the principal of the Bonds which shall have become due solely by acceleration, shall have been cured, waived or otherwise remedied as provided herein, then, and in every such case, the holders of more than 50% in aggregate principal amount of the Bonds then outstanding, by written notice to the Republic and to the Trustee, may, on behalf of all of the holders, waive all defaults and rescind and annul such declaration and its consequences, but no such waiver or rescission and annulment shall extend to or shall affect any subsequent default, or shall impair any right consequent thereon.
Notwithstanding the foregoing, in the case of an Event of Default specified in (ii) above, the principal amount of and the accrued interest on the Bonds may only be declared immediately due and payable if such event is materially prejudicial to the interests of the holders of Bonds.
Purchases of Bonds by the Republic
The Republic may at any time purchase or acquire any of the Bonds in any manner and at any price in the open market. The Bonds which are purchased or acquired by the Republic may, at the Republic’s discretion, be held, resold or surrendered to the Registrar for cancellation.
112

Table of Contents
Enforcement
Except as provided in Section 4.7 of the Indenture, no holder of any Bonds shall have any right by virtue of or by availing itself of any provision of the Indenture or the Bonds to institute any suit, action or proceeding in equity or at law upon or under or with respect to the Indenture or the Bonds, or for any other remedy hereunder or under the Bonds, unless (a) such holder previously shall have given to the Trustee written notice of default and of the continuance thereof with respect to the Bonds, (b) the holders of not less than 25% in aggregate principal amount outstanding of the Bonds shall have made written request to the Trustee to institute such action, suit or proceeding in its own name as Trustee hereunder and shall have provided to the Trustee such indemnity and/or other security to its satisfaction as it may require against the costs, expenses and liabilities to be incurred therein or thereby, and (c) the Trustee for 60 days after its receipt of such notice, request and provision of indemnity and/or other security shall have failed to institute any such action, suit or proceeding and no direction inconsistent with such written request shall have been given to the Trustee pursuant to Section 4.9 of the Indenture, it being understood and intended, and being expressly covenanted by every holder of Bonds with every other holder of Bonds and the Trustee, that no one or more holder shall have any right in any manner whatsoever by virtue or by availing itself of any provision of the Indenture or of the Bonds to affect, disturb or prejudice the rights of any other holder of Bonds or to obtain priority over or preference to any other such holder, or to enforce any right under the Indenture or under the Bonds, except in the manner herein provided and for the equal, ratable and common benefit of all holders. For the protection and enforcement of this “Enforcement” section, each and every holder and the Trustee shall be entitled to such relief as can be given either at law or in equity.
Meeting, Amendments and Waivers — Collective Action
The Republic may call a meeting of holders of any series of the Bonds at any time regarding the Indenture. The Republic will determine the time and place of the meeting and will notify the holders of the time, place and purpose of the meeting not less than 30 and not more than 60 days before the meeting.
In addition, the Republic or the Trustee will call a meeting of holders of a series of the Bonds if at least 10% in aggregate principal amount of such Bonds have delivered a written request to the Republic or the Trustee (with a copy to the Republic) setting forth the purpose of the meeting. Within 10 days of receipt of such written request or copy thereof, the Republic will notify the Trustee and the Trustee will notify the holders of the time, place and purpose of the meeting called by the holders, to take place not less than 30 and not more than 60 days after the date on which such notice is given.
Only holders of the Bonds and their proxies are entitled to vote at a meeting of holders. The Republic will set the procedures governing the conduct of the meeting and if additional procedures are required, the Republic will consult with the Trustee to establish such procedures as are customary in the market.
Modifications may also be approved by holders of the Bonds pursuant to written action with the consent of the requisite percentage of the Bonds of the relevant series. The Republic will solicit the consent of the relevant holders to the modification not less than 10 and not more than 30 days before the expiration date for the receipt of such consents as specified by the Republic.
The holders of a series of the Bonds may generally approve any proposal by the Republic to modify or take action with respect to any Non-Reserved Matter (as defined below) relating to the Indenture or the terms of such Bonds with the affirmative vote (if approved at a meeting of the holders) or consent (if approved by written action) of holders of more than 50% of the outstanding principal amount of the Bonds of that series.
However, holders of any series of debt securities issued under the Indenture (including the Bonds) may approve, by vote or consent through one of three modification methods, any modification, amendment, supplement or waiver (each, a “Modification”) proposed by the Republic that would do any of the following (such subjects referred to as “Reserved Matter Modification”) with respect to such series of debt securities:
• change the date on which any amount is payable;
• reduce the principal amount (other than in accordance with the express terms of the Bonds of that series and the Indenture);
• reduce the interest rate;
113

Table of Contents
• change the method used to calculate any amount payable (other than in accordance with the express terms of the Bonds and the Indenture);
• change the currency or place of payment of any amount payable;
• permit early redemption of the Bonds of a series, or if early redemption is already permitted, set a redemption date earlier than the date previously specified or reduce the redemption price;
• modify the Republic’s obligation to make any payments (including any redemption price therefor);
• change the identity of the obligor;
• change the definition of “Outstanding” or the percentage of affirmative votes or written consents, as the case may be, required for the taking of any action pursuant to Section 11.4, Section 11.5 and Section 11.6 of the Indenture;
• change the definition of “Uniformly Applicable” or “Reserve Matter Modification”;
• authorize the Trustee, on behalf of all holders of the Bonds, to exchange or substitute all the Bonds for, or convert all the Bonds into, other obligations or securities of the Republic or any other person;
• change the legal ranking, governing law, submission to jurisdiction, the Republic’s obligation to appoint and maintain an agent for service of process or waiver of immunities provisions of the terms of such Bonds.
A Reserved Matter Modification, including the payment terms of any series of the Bonds, can be made without your consent, as long as the change is approved, pursuant to one of the three following modification methods, by vote or consent:
• in the case of a proposed modification to a single series of the debt securities, the holders of more than 75% of the aggregate principal amount of that series;
• where such proposed modification would affect the outstanding debt securities of any two or more series (including the Bonds), the holders of more than 75% of the aggregate principal amount of the outstanding debt securities of all the series affected by the proposed modification, taken in the aggregate, if certain “uniformly applicable” requirements are met; or
• where such proposed modification would affect the outstanding debt securities of any two or more series (including the Bonds) issued under the Indenture, whether or not the “uniformly applicable” requirements are met, the holders of more than 662/3% of the aggregate principal amount of the outstanding debt securities of all the series (including the Bonds) affected by the proposed modification, taken in the aggregate, and the holders of more than 50% of the aggregate principal amount of the outstanding debt securities of each series affected by the modification, taken individually.
Any modification consented to or approved by the holders of debt securities pursuant to the above provisions will be conclusive and binding on all holders of the relevant series of debt securities or all holders of all series of debt securities affected by a cross-series modification, as the case may be, whether or not they have given such consent or approval, and on all future holders of those debt securities whether or not notation of such modification is made upon the debt securities. Any instrument given by or on behalf of any holder of a debt security in connection with any consent to or approval of any such modification will be conclusive and binding on all subsequent holders of that debt security.
For so long as any series of Existing Debt Securities (as defined below) are outstanding, if the Republic certifies to the Trustee and to the trustee under the applicable Existing Indenture (for the benefit of the holders of the affected Existing Debt Securities) that a cross series modification is being sought simultaneously with an Existing Indenture Reserve Matter Modification (as defined below), the Existing Debt Securities affected by such
114

Table of Contents
Existing Indenture Reserve Matter Modification shall be treated as “Series affected by that proposed Modification” as that phrase is used in the Indenture; provided that if the Republic seeks a cross-series modification with single aggregated voting, in determining whether such Modification will be considered Uniformly Applicable, the holders of any series of Existing Debt Securities affected by the Existing Indenture Reserve Matter Modification shall be deemed “Holders of debt securities of all Series affected by that Modification,” for the purpose of the Uniformly Applicable definition. It is the intention of this clause that in respect of any cross-series modification, the votes of the holders of the affected Existing Debt Securities be counted for purposes of the voting thresholds specified in the Indenture for the applicable cross series modification as though those Existing Debt Securities had been affected by that cross series modification, although it is acknowledged and agreed that the effectiveness of any Modification, as it relates to the affected Existing Debt Securities, shall be governed exclusively by the terms and conditions of those Existing Debt Securities and by the applicable Existing Indenture; provided, however, that no such Modification as to the Bonds will be effective unless such Modification shall have also been adopted or deemed adopted by the holders of the affected Existing Debt Securities pursuant to the amendment and modification provisions of such Existing Debt Securities.
“Existing Debt Securities” means any of the 2004 Debt Securities, 2009 Debt Securities, 2010 Debt Securities, 2014 Debt Securities or 2015 Debt Securities, as applicable;
“Existing Indenture” means any of the 2004 Indenture, 2009 Indenture, 2010 Indenture, 2014 Indenture, 2015 Indenture or 2015 December Indenture, as applicable;
“Existing Indenture Reserve Matter Modification” means any modification to the terms and conditions of one or more series of the Existing Debt Securities, pursuant to Clauses 12.2.2 and 12.4 of the 2009 Indenture or Clauses 12.2.2 and 12.10 of the 2015 Indenture, as applicable;
“2004 Debt Securities” means debt securities authenticated and delivered under the 2004 Indenture;
“2009 Debt Securities” means debt securities authenticated and delivered under the 2009 Indenture;
“2010 Debt Securities” means debt securities authenticated and delivered under the 2010 Indenture;
“2014 Debt Securities” means debt securities authenticated and delivered under the 2014 Indenture;
“2015 Debt Securities” means debt securities authenticated and delivered under the 2015 Indenture;
“2015 December Debt Securities” means debt securities authenticated and delivered under the 2015 December Indenture;
“2004 Indenture” means the indenture dated as of March 10, 2004 between the Republic of Indonesia, as issuer, and The Bank of New York Mellon (formerly, The Bank of New York), as trustee;
“2009 Indenture” means the indenture dated as of January 28, 2009 between the Republic of Indonesia, as issuer, and The Bank of New York Mellon, as trustee;
“2010 Indenture” means the indenture dated as of January 28, 2009 between the Republic of Indonesia, as issuer, and The Bank of New York Mellon, as trustee, as amended by the first supplemental indenture dated as of January 5, 2010;
“2014 Indenture” means the indenture dated as of January 28, 2009 between the Republic of Indonesia, as issuer, and The Bank of New York Mellon, as trustee, as amended by the first supplemental indenture dated as of January 5, 2010 and second supplemental indenture dated as of June 21, 2014;
115
Table of Contents
“2015 Indenture” means the indenture dated as of January 28, 2009 between the Republic of Indonesia, as issuer, and The Bank of New York Mellon, as trustee, as amended by the first supplemental indenture dated as of January 5, 2010, second supplemental indenture dated as of June 21, 2014 and third supplemental indenture dated as of January 8, 2015; and
“2015 December Indenture” means the indenture dated as of January 28, 2009 between the Republic of Indonesia, as issuer, and The Bank of New York Mellon, as trustee, as amended by the first supplemental indenture dated as of January 5, 2010, second supplemental indenture dated as of June 21, 2014, third supplemental indenture dated as of January 8, 2015 and fourth supplemental indenture dated as of December 1, 2015.
The Republic may select, in its discretion, any modification method for a Reserved Matter Modification in accordance with the Indenture and to designate which series of debt securities will be included for approval in the aggregate of modifications affecting two or more series of debt securities. Any selection of a modification method or designation of series to be included will be final for the purpose of that vote or consent solicitation.
“Non-Reserved Matter Modification,” as referred to above, means a Modification other than a Modification constituting a Reserved Matter.
“Uniformly Applicable,” as referred to above, means a Modification by which (A) Holders of debt securities of all Series affected by that Modification are invited to exchange, convert or substitute their debt securities on the same terms for (x) the same new instruments or other consideration or (y) new instruments or other consideration from an identical menu of instruments or other consideration. It is understood that a Modification will not be considered to be Uniformly Applicable if each exchanging, converting or substituting Holder of debt securities of any Series affected by that Modification is not offered the same amount of consideration per amount of principal, the same amount of consideration per amount of interest accrued but unpaid and the same amount of consideration per amount of past due interest, respectively, as that offered to each other exchanging, converting or substituting Holder of debt securities of any Series affected by that Modification (or, where a menu of instruments or other consideration is offered, each exchanging, converting or substituting Holder of debt securities of any Series affected by that Modification is not offered the same amount of consideration per amount of principal, the same amount of consideration per amount of interest accrued but unpaid and the same amount of consideration per amount of past due interest, respectively, as that offered to each other exchanging, converting or substituting Holder of debt securities of any Series affected by that Modification electing the same option under such menu of instruments).
Before soliciting any consent or vote of any holder of a series of the Bonds for any change to a Reserved Matter, the Republic will provide the following information to the Trustee for distribution to the holders of such Bonds:
• a description of the Republic’s economic and financial circumstances that are, in the Republic’s opinion, relevant to the request for the proposed Modification, a description of the Republic’s existing debts and a description of any broad policy reform program and provisional macroeconomic outlook;
• if the Republic shall at the time have entered into an arrangement for financial assistance with multilateral and/or other major creditors or creditor groups and/or an agreement with any such creditors regarding debt relief, (x) a description of any such arrangement or agreement and (y) where permitted under the information disclosure policies of the multilateral or other creditors, as applicable, a copy of the arrangement or agreement;
• a description of the Republic’s proposed treatment of foreign debt instruments that are not affected by the proposed Modification and its intentions with respect to any other major creditor groups; and
• if the Republic is then seeking a Reserve Matter Modification affecting any other series of debt securities, a description of that proposed Modification.
116
Table of Contents
In determining whether the holders of the requisite principal amount of Bonds outstanding have taken any action or instruction under the Indenture or the Bonds, a debt security will be disregarded and deemed not to be outstanding, and may not be counted in a vote or consent solicitation for or against a proposed Modification, if on the record date for the proposed Modification or other action or instruction hereunder, the debt security is held by the Republic or by a Public Sector Instrumentality, or by a corporation, trust or other legal entity that is controlled by the Republic or a Public Sector Instrumentality, except that (x) debt securities held by the Republic or any Public Sector Instrumentality or any corporation, trust or other legal entity controlled by the Republic or by a Public Sector Instrumentality that have been pledged in good faith may be regarded as outstanding if the pledgee establishes to the satisfaction of the Trustee the pledgee’s right so to act with respect to such debt securities and that the pledgee is not the Republic, a Public Sector Instrumentality or a corporation, trust or other legal entity that is controlled by the Republic or a Public Sector Instrumentality, and in case of a dispute concerning such right, the advice of counsel shall be full protection in respect of any decision made by the Trustee in accordance with such advice, and any certificate, statement or opinion of counsel may be based, insofar as it relates to factual matters or information that is in the possession of the Trustee, upon the certificate, statement or opinion of or representations by the Trustee; and (y) in determining whether the Trustee will be protected in relying upon any such action or instructions hereunder, or any notice from holders, only debt securities that a responsible officer of the Trustee has received an officer’s certificate will be so disregarded.
As used in the preceding paragraph, “Public Sector Instrumentality” means any department, ministry or agency of the central Government of the Republic, Bank Indonesia or a corporation, trust or other legal entity that is controlled by the central government of the Republic or by a Public Sector Instrumentality if the Republic or any of the foregoing has the power, directly or indirectly, through the ownership of voting securities or other ownership interests, by contract or otherwise, to direct the management of or to elect or to appoint a majority of the board of directors or other persons performing similar functions in lieu of, or in addition to, the board of directors of that legal entity.
Other Amendments
The Republic and the Trustee may, without the vote or consent of any holder of the debt securities (including the Bonds), amend the Indenture or such debt securities for the purposes of:
• adding covenants by the Republic for the benefit of the holders;
• surrendering any of the Republic’s right or powers with respect to the debt securities of that series;
• securing the debt securities of that series;
• curing any ambiguity or curing, correcting or supplementing any provision which may be defective or inconsistent with any other provision.
Further Issues
The Republic may from time to time, without the consent of holders of the Bonds, create and issue additional Bonds having the same terms as the Bonds in all respects, except for issue date, issue price, original interest accrual date and the first interest payment on the Bonds; provided, however, that any additional Bonds subsequently issued shall be issued, for U.S. federal income tax purposes, either (a) as part of the “same issue” as the Bonds, or (b) in a “qualified reopening” of the Bonds, unless such additional Bonds have a separate CUSIP, ISIN or other identifying number from the previously outstanding Bonds. Such additional Bonds will be consolidated with and will form a single series with the previously outstanding Bonds.
Global Bonds
DTC, Euroclear, and Clearstream, Luxembourg, are under no obligation to perform or continue to perform the procedures described below, and they may modify or discontinue them at any time. Neither the Republic nor
117

Table of Contents
the Trustee nor any Agent will be responsible for DTC’s, Euroclear’s or Clearstream’s performance of their obligations under their rules and procedures. Additionally, neither the Republic nor the Trustee nor any Agent will be responsible for the performance by direct or indirect participants of their obligations under their rules and procedures.
The Bonds will initially be issued to investors in global form, the ownership and transfer of which are recorded in computerized book-entry accounts, eliminating the need for physical movement of Bonds. The Republic refers to the intangible Bonds represented by a global Bond as “book-entry” Bonds.
The Republic will deposit any global Bond it issues with a clearing system or its nominee. The global Bond will be registered in the name of the clearing system or its nominee or the common depositary. Unless a global Bond is exchanged for certificated securities, as discussed below under “— Certificated Securities,” it may not be transferred, except as a whole among the clearing system, its nominees or common depositaries and their successors. Clearing systems include DTC in the United States and Euroclear and Clearstream in Europe.
Clearing systems process the clearance and settlement of book-entry Bonds for their direct participants. A “direct participant” is a bank or financial institution that has an account with a clearing system. The clearing systems act only on behalf of their direct participants, who in turn act on behalf of indirect participants. An “indirect participant” is a bank or financial institution that gains access to a clearing system by clearing through or maintaining a relationship with a direct participant. Euroclear and Clearstream are connected to each other by a direct link and participate in DTC through their New York depositaries, which act as links between the clearing systems. These arrangements permit you to hold book-entry Bonds through participants in any of these systems, subject to applicable securities laws.
If you wish to purchase book-entry Bonds, you must either be a direct participant or make your purchase through a direct or indirect participant. Investors who purchase book-entry Bonds will hold them in an account at the bank or financial institution acting as their direct or indirect participant.
When you hold Bonds in this manner, you must rely on the procedures of the institutions through which you hold your Bonds to exercise any of the rights granted to holders. This is because the legal obligations of the Republic run only to the registered owner of the global Bond, which will be the relevant clearing system or its nominee or common depositary. For example, once the Republic arranges for payments to be made to the registered holder, the Republic will no longer be liable for the amounts so paid on the security, even if you do not receive it. In practice, the clearing systems will pass along any payments or notices they receive from the Republic to their participants, which will pass along the payments to you. In addition, if you desire to take any action which a holder of a Bond is entitled to take, then the clearing system would authorize the participant through which you hold your book-entry Bonds to take such action, and the participant would then either authorize you to take the action or would act for you on your instructions. The transactions between you, the participants and the clearing systems will be governed by customer agreements, customary practices and applicable laws and regulations, and not by any legal obligation of the Republic.
As an owner of book-entry Bonds represented by a global Bond, you will also be subject to the following restrictions:
• you will not be entitled to (a) receive physical delivery of the Bonds in certificated form or (b) have any of the Bonds registered in your name, except under the circumstances described below under “— Certificated Securities”;
• you may not be able to transfer or sell your Bonds to some insurance companies and other institutions that are required by law to own their Bonds in certificated form;
• you may not be able to pledge your Bonds in circumstances where certificates must be physically delivered to the creditor or the beneficiary of the pledge in order for the pledge to be effective; and
118

Table of Contents
• none of the Republic, the Trustee, any paying agent, any registrar or any agent of the Republic or the Trustee shall have any responsibility or obligation to any beneficial owner in a global Bond, or participant or other person with respect to the accuracy of the records of the relevant clearing system or its nominee or common depositary, with respect to any ownership interest in the Bonds or with respect to the delivery to any participant, beneficial owner or other person of any notice (including any notice of redemption) or the payment of any amount, under or with respect to such Bonds. All notices and communications to be given to the holders and all payments to be made to holders under the Bonds and the Indenture will be given or made only to or upon the order of the registered holders (which shall be the relevant clearing system or its nominee or common depositary in the case of the global Bond). The rights of beneficial owners in the global Bond shall be exercised only through the relevant clearing system or its nominee or common depositary subject to the applicable procedures. The Republic, the Trustee, any paying agent, any registrar and any agent of the Republic or the Trustee shall be entitled to rely and shall be fully protected in relying upon information furnished by the relevant clearing system or its nominee or common depositary with respect to its members, participants and any beneficial owners. The Republic, the Trustee, any paying agent, any registrar and any agent of the Republic or the Trustee shall be entitled to deal with the relevant clearing system or its nominee or common depositary, that is the registered holder of any global Bond for all purposes relating to such global Bond (including the payment of principal, premium, if any, and interest and additional amounts, if any, and the giving of instructions or directions by or to the owner or holder of a beneficial ownership interest in such global Bond) as the sole holder of such global Bond and shall have no obligations to the beneficial owners thereof. None of the Republic, the Trustee, any paying agent, any registrar or any agent of the Republic or the Trustee shall have any responsibility or liability for any acts or omissions of the relevant clearing system or its nominee or common depositary with respect to such global Bond, for the records of any such depositary, including records in respect of beneficial ownership interests in respect of any such global Bond, for any transactions between the relevant clearing system or its nominee or common depositary and any participant or between or among the relevant clearing system or its nominee or common depositary, any such participant and/or any holder or owner of a beneficial interest in such global Bond, or for any transfers of beneficial interests in any such global Bond.
The Clearing Systems
The following description reflects the Republic’s understanding of the current rules and procedures of DTC, Euroclear and Clearstream, Luxembourg. The Republic has obtained the information in this section from sources it believes to be reliable, including from DTC, Euroclear and Clearstream, Luxembourg. These systems could change their rules and procedures at any time, and the Republic takes no responsibility for their actions.
It is important for you to establish at the time of the trade where both the purchaser’s and seller’s accounts are located to ensure that settlement can be made on the desired value date, i.e., the date specified by the purchaser and seller on which the price of the Bonds is fixed.
When book-entry Bonds are to be transferred from a DTC seller to a Euroclear or Clearstream, Luxembourg purchaser, the purchaser must first send instructions to Euroclear or Clearstream, Luxembourg through a participant at least one business day prior to the settlement date. Euroclear or Clearstream, Luxembourg will then instruct its New York depositary to receive the Bonds and make payment for them. On the closing date, the New York depositary will make payment to the DTC participant through which the seller holds its Bonds, which will make payment to the seller, and the Bonds will be credited to the New York depositary’s account. After settlement has been completed, Euroclear or Clearstream, Luxembourg will credit the Bonds to the account of the participant through which the purchaser is acting. This Bonds credit will appear the next day, European time, after the settlement date, but will be back-valued to the value date, which will be the preceding day if settlement occurs in New York. If settlement is not completed on the intended value date, the Bonds credit and cash debit will instead be valued at the actual settlement date.
119

Table of Contents
A participant in Euroclear or Clearstream, Luxembourg, acting for the account of a purchaser of Bonds, will need to make funds available to Euroclear or Clearstream, Luxembourg in order to pay for the Bonds on the value date. The most direct way of doing this is for the participant to preposition funds (i.e., have funds in place at Euroclear or Clearstream, Luxembourg before the value date), either from cash on hand or existing lines of credit. The participant may require the purchaser to follow these same procedures.
When book-entry Bonds are to be transferred from a Euroclear or Clearstream, Luxembourg seller to a DTC purchaser, the seller must first send instructions to and preposition the Bonds with Euroclear or Clearstream, Luxembourg through a participant at least one business day prior to the settlement date. Euroclear or Clearstream, Luxembourg will then instruct its New York depositary to credit the book-entry Bonds to the account of the DTC participant through which the purchaser is acting and to receive payment in exchange. The payment will be credited to the account of the Euroclear or Clearstream, Luxembourg participant through which the seller is acting on the following day, but the receipt of the cash proceeds will be back-valued to the value date, which will be the preceding day if settlement occurs in New York. If settlement is not completed on the intended value date, the receipt of the cash proceeds and Bonds debit will instead be valued at the actual settlement date.
Certificated Securities
The Republic will issue Bonds in certificate registered form only if:
• the depositary notifies the Republic that it is unwilling or unable to continue as depositary, is ineligible to act as depositary or, in the case of DTC, ceases to be a clearing agency registered under the U.S. Securities Exchange Act of 1934 and Bank Indonesia does not appoint a successor depositary or clearing agency within 90 days;
• The Republic decides it no longer wishes to have all or part of the Bonds represented by a global Bond.
If a physical or certificated security becomes mutilated, defaced, destroyed, lost or stolen, the Republic may execute, and the Trustee or the Registrar shall authenticate and deliver, a substitute security in replacement. In each case, the affected holder will be required to furnish to the Republic and to the Trustee an indemnity under which it will agree to pay the Republic, the Trustee and any of their respective agents for any losses they may suffer relating to the security that was mutilated, defaced, destroyed, lost or stolen. The Republic and the Trustee (or the Registrar) may also require that the affected holder present other documents or proof. The affected holder may be required to pay all taxes, expenses and reasonable charges associated with the replacement of the mutilated, defaced, destroyed, lost or stolen security.
If the Republic issues certificated securities, a holder of certificated securities may exchange them for Bonds of a different authorized denomination by submitting the certificated securities, together with a written request for an exchange, at the office of the Registrar as specified in the Indenture in New York City, or at the office of any paying agent. In addition, the holder of any certificated security may transfer it in whole or in part by surrendering it at any of such offices together with an executed instrument of transfer.
The Republic will not charge the holders for the costs and expenses associated with the exchange, transfer or registration of transfer of certificated securities. The Republic may, however, charge the holders for certain delivery expenses as well as any applicable stamp duty, tax or other governmental or insurance charges. The Registrar may reject any request for an exchange or registration of transfer of any security made within 15 days of the date for any payment of principal of, or premium or interest on the Bonds.
Trustee
The Indenture establishes the obligations and duties of the Trustee, the right to indemnification of the Trustee and the liability and responsibility, including limitations, for actions that the Trustee takes. The Trustee is
120

Table of Contents
entitled to enter into business transactions with the Republic or any of its affiliates without accounting for any profit resulting from these transactions.
Paying Agents, Transfer Agents, Registrar
The Bank of New York Mellon, The Bank of New York Mellon SA/NV, Luxembourg Branch and The Bank of New York Mellon, London Branch will be appointed as the paying agents, transfer agents and registrar. Bank Indonesia may at any time appoint additional or other paying agents, transfer agents and, in respect of registered Bonds, registrars and terminate the appointment of those or any paying agents, transfer agents and registrar, provided that while the Bonds are outstanding Bank Indonesia will (i) in the case of debt securities which are specified to be held through Euroclear and/or Clearstream, maintain a transfer agent and registrar in Luxembourg and a paying agent in the City of London, England and (ii) in the case of debt securities which are specified to be held through DTC, maintain a transfer agent, registrar and paying agent in The City of New York. If the relevant debt securities are listed on the Singapore Stock Exchange and the rules of such exchange so require, Bank Indonesia will maintain a paying agent in Singapore.
Notices
The Republic will mail any notices to the holders of the certificated securities at their registered addresses as reflected in the register maintained by the Registrar. The Republic will consider any mailed notice to have been given five Business Days after it has been sent. The Republic will give notices to the holders of a global Bond in accordance with the procedures and practices of the depositary and such notices shall be deemed given upon actual receipt thereof by the depositary. The Republic will also publish notices to the holders if and so long as the Bonds are listed on the SGX-ST and the rules of such exchange so require, in a leading newspaper having general circulation in Singapore (which is expected to be the Business Times). If publication in a leading newspaper in Singapore is not practicable, the Republic will have validly given notice if it gives notice in accordance with the rules of the exchange on which the Bonds are listed. The Republic will consider any published notice to be given on the date of its first publication.
Prescription
Claims against the Republic for the payment of principal, interest, premium, if any, or other amounts due on the Bonds will be prescribed unless made within five years, with respect to principal, and two years, with respect to interest, premium, if any, or other amounts due on the Bonds, in each case from the date on which such payment first became due.
Governing Law and Jurisdiction
The Indenture and the Bonds will be governed by and construed in accordance with the law of the State of New York without regard to any conflicts of laws principles thereof that would require the application of the laws of a jurisdiction other than the State of New York, except for the Republic’s authorization and execution, which shall be governed by and interpreted in accordance with the laws of the Republic.
The Republic will irrevocably submit to the jurisdiction of any federal court in the Southern District of New York or any state court in the Borough of Manhattan, The City of New York, and any appellate court from any thereof, in any action or proceeding arising out of or relating to the Bonds, and the Republic will irrevocably agree that all claims in respect of such action or proceeding may be heard and determined in such New York state or federal court. The Republic will irrevocably waive, to the fullest extent permitted by law, the defense of an inconvenient forum to the maintenance of such action or proceeding and any right of jurisdiction in such action or proceeding on account of the place of residence or domicile of the Republic. The Republic has appointed the Chief Representative of Bank Indonesia New York in The City of New York as its authorized agent (the “Process Agent”) upon which process may be served in any action by the Trustee or a holder arising out of or based on the Bonds or the Indenture which may be instituted in any federal court in the Southern District of New York or any
121

Table of Contents
state court in the Borough of Manhattan, The City of New York, and the Republic will expressly accept the jurisdiction of any such court in respect of such action. Such appointment shall be irrevocable until all amounts in respect of the principal and interest, due or to become due on or in respect of all the Bonds have been paid by the Republic to the Trustee or unless and until the appointment of a successor as such Process Agent located in the Borough of Manhattan, The City of New York, and such successor’s acceptance of such appointment. Service of process upon the Process Agent at 200 Vesey Street, New York, New York, 10285 (phone: 1-212-732-1958 fax: 1-212-732-4003), or at such other address in the United States as may be the office of the Process Agent at the time of such service, and written notice of such service mailed or delivered to the Republic shall be deemed in every respect service of process upon the Republic. The failure of the Process Agent to advise the Republic of its receipt of such service shall have no effect on the validity or timeliness of any such service. Notwithstanding the foregoing, any action by the Trustee or a holder arising out of or based on the Bonds or the Indenture may be instituted by such Person in any competent court in the Republic.
The Republic will waive irrevocably, to the fullest extent permitted by law, any immunity to which it might otherwise be entitled under the Immunities Act or otherwise in any action arising out of or based on the Bonds or the Indenture which may be instituted as provided herein in any federal court in the Southern District of New York, any state court in the Borough of Manhattan, The City of New York or in any competent court in the Republic; such waiver shall not be subject to retraction or modification by the Republic. Notwithstanding anything to the contrary in the Indenture or the Bonds, such waiver of immunity shall not be deemed or interpreted to include any waiver of immunity in respect of (i) actions brought against the Republic arising out of or based upon U.S. federal or state securities laws; (ii) attachment under Indonesian law; (iii) present or future “premises of the mission” as defined in the Vienna Convention on Diplomatic Relations signed in 1961; (iv) “consular premises” as defined in the Vienna Convention on Consular Relations signed in 1963; (v) any other property or assets used solely or mainly for governmental or public purposes in the Republic or elsewhere; (vi) military property or military assets or property or assets of the Republic related thereto; or (vii) assets or property forming part of the cultural heritage of the Republic and/or Bank Indonesia.
Notwithstanding anything to the contrary herein, none of the provisions described in this “Governing Law and Jurisdiction” section shall apply to actions brought under the United States federal securities laws or any state securities laws and the Process Agent is not the agent for receipt of service for any action or proceeding under these laws.
Currency Indemnity
The Republic’s obligation to any holder under a series of the Bonds that has obtained a court judgment affecting those Bonds will be discharged only to the extent that the holder or the Trustee may purchase U.S. dollars, referred to as the “agreement currency,” with the judgment currency. If the holder or the Trustee cannot purchase the agreement currency in the amount originally to be paid, the Republic agrees to pay the difference. The holder and the Trustee, however, agree to reimburse the Republic for the excess if the amount of the agreement currency purchased exceeds the amount originally to be paid to the holder or the Trustee. If the Republic is in default of its obligations under such Bonds, however, the holder or the Trustee will not be obligated to reimburse the Republic for any excess.
122
Table of Contents
TAXATION
The following discussion provides a general summary of some of the primary tax consequences of purchasing, owning or selling the debt securities. For further information, you should consult your tax advisor to determine the tax consequences relevant to your particular situation. In addition, you may be required to pay stamp taxes and other charges under the laws of the country where you purchase the debt securities.
Indonesian Taxation
The following is a summary of certain Indonesian tax consequences that may be relevant to non-resident holders of the debt securities in connection with the holding and disposition of the debt securities. The Republic uses the term “non-resident holders” to refer to:
(a) An individual who does not reside in Indonesia, an individual who does not physically present in Indonesia for more than 183 days during 12-month period; and
(b) A corporation which is established and domiciled outside of Indonesia,
whether or not carried out a business or activities through a permanent establishment in Indonesia.
In determining the residency of an individual or entity, a tax treaty may stipulate different provisions on the tax resident definition and override the provisions described above.
If a non-resident has a permanent establishment in Indonesia, the permanent establishment will be subject to Indonesian tax obligations and is required to register with the Indonesian Tax Office, or ITO, to obtain a tax ID number and report its business to be confirmed as a VAT-able taxpayer (if applicable), maintain bookkeeping, prepare financial statements, and file monthly and annual tax returns. The taxable income of the permanent establishment is subject to corporate income tax at a flat rate of 25%. The taxable income will include all income, including but not limited to foreign source income directly or indirectly attributable to such permanent establishment. In addition, the after-tax taxable income of a permanent establishment in Indonesia is also subject to a branch profits tax at the rate of 20% (which may be reduced according to an applicable tax treaty). Under the Republic’s income tax treaty with the United States, the U.S.-Indonesia Treaty, the applicable branch profit tax rate for permanent establishment of a United States resident is 10%. The branch profit tax can be exempted if all the after-tax income are reinvested in Indonesia no later than the following fiscal year in one of the following investment forms: (1) as a founding shareholder or a participant founder in a newly established Indonesian company through capital participation; (2) as a shareholder in an established Indonesian company through capital participation; (3) acquisition of fixed assets used by the permanent establishment to conduct its business or activities in Indonesia; or (4) investment in the form of intangible assets used by the permanent establishment to conduct its business or activities in Indonesia. The investment procedure for the exemption of branch profit tax should be in accordance with requirements set out in the Minister of Finance Regulation No. 14/PMK.03/2011 dated January 24, 2011.
Taxation of Interest
Payments of interest on the Bonds issued to non-residents will generally be subject to an Indonesian withholding tax (unless the Bonds are held and owned by a permanent establishment in Indonesia, as discussed below) assessed at a rate of 20% of the gross amount of the interest payment, although this can be reduced based on the applicable tax treaty. If a non-resident qualifies for benefits under the U.S.-Indonesia Treaty, the withholding tax is reduced to 10% of the gross amount of the interest payment. Accordingly, subject to certain exceptions, the Republic will be required to pay Additional Amounts in respect of interest payments on the Bonds. Under current practice, the Republic pays withholding tax on the amounts of interest payments it makes to non-residents, but it does not pay withholding tax on the Additional Amounts that it pays to non-residents.
123

Table of Contents
If an individual or entity holds Bonds through a permanent establishment in Indonesia, the permanent establishment will be taxed on the interest at a flat income tax rate of 25%. Interest payments on the Bonds made to the permanent establishment will be subject to a 15% withholding tax, which will be deducted by the Republic from each interest payment. If the permanent establishment in Indonesia is a bank or a government-approved pension fund, the interest payments on the Bonds will not be subject to withholding tax.
Taxation of Dispositions
Generally, gains resulting from the sale or other disposition of Bonds by a non-resident will not be subject to income, withholding or capital gains tax, unless the Bonds are held and owned through a permanent establishment in Indonesia. If the Bonds are held and owned by a permanent establishment in Indonesia, the permanent establishment will be taxed on any profit at a flat income tax rate of 25%.
Under the U.S.-Indonesia Treaty, a U.S. resident shall be exempt from Indonesian tax on gains derived from the sale, exchange, or other disposition of Bonds held as capital assets unless:
(a) the recipient of the gain has a permanent establishment or fixed base in Indonesia and gain from the disposition of Bonds is effectively connected with such permanent establishment or fixed base; or
(b) the recipient of the gain is an individual and is present in Indonesia for a period or periods aggregating 120 days or more during the taxable year.
Other Indonesian Taxes
There are no other material Indonesian taxes or duties (e.g., inheritance taxes, gift duties, stamp duty or similar taxes) that a holder of Bonds will be required to pay in relation to any of the payments made by the Republic.
This summary is based on Indonesian laws, rules, and regulations in effect as of the date of this prospectus, all of which are subject to change and may apply retroactively. It is not intended to constitute a complete analysis of the tax consequences under Indonesian law of the receipt, ownership, or disposition of the debt securities, in each case by non-resident holders, nor to describe any of the tax consequences that may be applicable to citizens or residents of the Republic.
If you are not a non-resident holder, you should consult your tax advisor about the consequences of holding these debt securities.
United States Federal Income Taxation
The following is a summary of the material U.S. federal income tax considerations that may be relevant to a holder of any Bonds. This summary is based on provisions of the Internal Revenue Code of 1986, as amended, applicable Treasury regulations, laws, rulings and decisions now in effect, all of which are subject to change, possibly with retroactive effect. This summary deals only with beneficial owners of Bonds that will hold Bonds as capital assets, and does not address particular tax considerations that may be applicable to investors that are subject to special tax rules, such as banks, tax-exempt entities, insurance companies, regulated investment companies, dealers in securities or currencies, traders in securities electing to mark to market, persons that will hold Bonds as a position in a “straddle” or conversion transaction, or as part of a “synthetic security” or other integrated financial transaction, entities taxed as partnerships or the partners therein, persons subject to the alternative minimum tax, U.S. expatriates or persons that have a “functional currency” other than the U.S. dollar.
This summary addresses only U.S. federal income tax consequences, and does not address consequences arising under state, local, foreign tax laws or the Medicare tax on net investment income. Investors should consult their own tax advisors in determining the tax consequences to them of holding Bonds under such tax laws, as well as the application to their particular situation of the U.S. federal income tax considerations discussed below.
124

Table of Contents
As used herein, a “U.S. holder” is a beneficial owner of any Bond that is a citizen or resident of the United States or a U.S. domestic corporation or that otherwise will be subject to U.S. federal income taxation on a net income basis in respect of the Bonds. A “Non-U.S. holder” is a beneficial owner of any Bond that is an individual, corporation, foreign estate, or foreign trust that is not a U.S. holder.
U.S. Holders
Payments of Interest and Additional Amounts. The gross amount of stated interest and additional amounts (i.e., without reduction for Indonesian withholding tax at the appropriate Indonesian withholding tax rate applicable to the U.S. holder) will be taxable to a U.S. holder as ordinary interest income at the time it accrues or is actually or constructively received, in accordance with the holder’s method of accounting for U.S. federal income tax purposes.
Subject to generally applicable restrictions and conditions, Indonesian withholding tax paid at the appropriate rate applicable to the U.S. holder (which may be 10% if the U.S. holder qualifies for the benefit of the U.S.-Indonesia Treaty) will be treated as foreign income tax eligible (i) for credit against a U.S. holder’s U.S. federal income tax liability, or (ii) at the election of such U.S. holder, for deduction in computing such U.S. holder’s taxable income (provided that the U.S. holder elects to deduct, rather than credit, all foreign income taxes paid or accrued for the relevant taxable year). Interest and additional amounts will constitute income from sources without the United States for foreign tax credit purposes. Such income generally will constitute “passive category income.” The calculation of foreign tax credits and, in the case of a U.S. holder that elects to deduct foreign taxes, the availability of such deduction, involves the application of rules that depend on a U.S. holder’s particular circumstances. U.S. holders should consult their own tax advisors regarding the availability of foreign tax credits or deductions in their particular situations.
Sale, Exchange and Retirement of Bonds. Upon the sale, exchange or retirement of a Bond, a U.S. holder generally will recognize gain or loss equal to the difference between the amount realized on the sale, exchange or retirement (less any accrued interest, which will be taxable as such) and the U.S. holder’s tax basis in such Bond. A U.S. holder’s tax basis in a bond will generally equal the cost of the Bond to such holder. Gain or loss recognized by a U.S. holder generally will be long-term capital gain or loss if the U.S. holder has held the Bond for more than one year at the time of disposition. Long-term capital gains recognized by an individual holder generally are subject to tax at a lower rate than short-term capital gains or ordinary income. The deduction of capital losses is subject to limitations.
Specified Foreign Financial Assets. Individual U.S. holders that own “specified foreign financial assets” with an aggregate value in excess of U.S.$50,000 are generally required to file an information statement along with their tax returns, currently on Form 8938, with respect to such assets. “Specified foreign financial assets” include any financial accounts held at a non-U.S. financial institution, as well as securities issued by a non-U.S. issuer (which may include Bonds issued in certificated form) that are not held in accounts maintained by financial institutions. Higher reporting thresholds apply to certain individuals living abroad and to certain married individuals. Regulations extend this reporting requirement to certain entities that are treated as formed or availed of to hold direct or indirect interests in specified foreign financial assets based on certain objective criteria. U.S. holders who fail to report the required information could be subject to substantial penalties. In addition, the statute of limitations for assessment of tax would be suspended, in whole or part. Prospective investors should consult their own tax advisors concerning the application of these rules to their investment in the Bonds, including the application of the rules to their particular circumstances.
Non-U.S. Holders
Payments of Interest. Subject to the discussions below under “Information Reporting and Backup Withholding,” payments of interest on the Bonds to a Non-U.S. holder generally will be exempt from U.S. federal income taxes, including withholding tax. However, to receive this exemption a Non-U.S. holder may
125

Table of Contents
be required to satisfy certification requirements, described below under “Information Reporting and Backup Withholding,” to establish that it is not a U.S. holder.
Sale, Exchange and Retirement of Bonds. Subject to the discussions below under “Information Reporting and Backup Withholding,” a Non-U.S. holder generally will not be subject to U.S. federal income tax on gain recognized on a sale, exchange or retirement of Bonds, provided, in the case of a non-U.S. holder that is an individual, the non-U.S. holder is not present in the United States for 183 days or more in the year of the sale and certain other conditions are met.
Information Reporting and Backup Withholding
Information returns will be filed with the IRS in connection with payments on the Bonds made to, and the proceeds of dispositions of any Bonds effected by, certain U.S. holders. In addition, certain U.S. holders may be subject to backup withholding in respect of such amounts if they do not provide their taxpayer identification numbers to the person from whom they receive payments. Non-U.S. holders may be required to comply with applicable certification procedures to establish that they are not U.S. holders in order to avoid the application of such information reporting requirements and backup withholding. The amount of any backup withholding from a payment to a U.S. or non-U.S. holder will be allowed as a credit against the holder’s U.S. federal income tax liability and may entitle the holder to a refund, provided that the required information is timely furnished to the IRS.
126

Table of Contents
UNDERWRITING
Subject to the terms and conditions contained in an underwriting agreement, which consists of a terms agreement dated December 4, 2017 and the underwriting agreement standard terms filed as an exhibit to the registration statement, the Republic has agreed to sell to each of the underwriters and each of the underwriters have agreed to purchase from the Republic, severally and not jointly, the principal amounts of the Bonds listed opposite its name in the table below.
UnderwritersPrincipal Amount
of 2023 BondsPrincipal Amount
of 2028 BondsPrincipal Amount
of 2048 Bonds
Australia and New Zealand Banking Group Limited U.S.$ 200,000,000 U.S.$ 250,000,000 U.S.$ 350,000,00Citigroup Global Markets Inc. U.S.$ 200,000,000 U.S.$ 250,000,000 U.S.$ 350,000,00Deutsche Bank AG, Singapore Branch U.S.$ 200,000,000 U.S.$ 250,000,000 U.S.$ 350,000,00Goldman Sachs (Singapore) Pte. U.S.$ 200,000,000 U.S.$ 250,000,000 U.S.$ 350,000,00Mandiri Securities Pte Ltd U.S.$ 200,000,000 U.S.$ 250,000,000 U.S.$ 350,000,00
Total U.S.$1,000,000,000 U.S.$1,250,000,000 U.S.$1,750,000,000
Australia and New Zealand Banking Group Limited, Citigroup Global Markets Inc., Deutsche Bank AG, Singapore Branch, Goldman Sachs (Singapore) Pte. and Mandiri Securities Pte Ltd are acting as joint lead managers and Goldman Sachs (Singapore) Pte. is acting as billing and delivering bank in connection with the offering of the Bonds. Mandiri Securities Pte Ltd, one of the underwriters, is an affiliate of the Republic and has agreed to offer and sell the Bonds only outside the United States of America to non-U.S. persons.
The underwriting agreement provides that the underwriters are obligated to purchase all of the Bonds if any are purchased. The underwriting agreement also provides that if an underwriter defaults, the purchase commitment of the non-defaulting underwriters may be increased or the offering of the Bonds may be terminated.
The Republic has agreed to indemnify the underwriters against certain liabilities, including liabilities under the Securities Act of 1933, or contribute to payments which the underwriters may be required to make in that respect.
The Republic estimates that its out-of-pocket expenses for this offering will be approximately U.S.$1,834,080. The underwriters have agreed to reimburse the Republic for certain of its expenses.
The underwriters have advised the Republic that they propose to offer the Bonds to the public initially at the public offering price that appears on the cover page of this prospectus. After the initial public offering, the underwriters may change the public offering price and any other selling terms.
Any underwriter who is not registered as a broker-dealer with the Securities and Exchange Commission will not engage in any transaction related to the Bonds in the United States except as permitted by the Securities Exchange Act of 1934. To the extent the underwriters intend to make any offers or sales of the Bonds in the United States, or to nationals or residents of the United States, they will do so only through one or more registered broker-dealers in compliance with applicable securities laws and regulations, as well as with applicable laws of the various states.
In connection with this offering of the Bonds, the underwriters may engage in overallotment, stabilizing transactions and syndicate covering transactions. Overallotment involves sales in excess of the offering size, which create a short position for the underwriters. Stabilizing transactions involve bids to purchase the Bonds in the open market for the purpose of pegging, fixing or maintaining the price of the Bonds. Syndicate covering transactions involve purchases of the Bonds in the open market after the distribution has been completed in order to cover short positions. Any of these activities may cause the price of the Bonds to be higher than it would otherwise be in the absence of those transactions. If the underwriters engage in stabilizing or syndicate covering transactions, they may discontinue them at any time but they must end no later than the earlier of 30 days after the issue date of the Bonds and 60 days after the date of the allotment of the Bonds.
127

Table of Contents
The Bonds are a new issue of securities with no established trading market. The Republic has been advised by the underwriters that they intend to make a market in the Bonds, but the underwriters are not obligated to do so and may discontinue any market-making activities at any time without notice. No assurance can be given as to the liquidity of or the trading market for the Bonds.
Settlement and Delivery
The Republic expects that delivery of the Bonds will be made against payment therefor on or about the closing date specified on the cover page of this prospectus, which will be the fifth business day following the date of pricing of the Bonds. Under Rule 15c6-l of the Exchange Act, trades in the secondary market generally are required to settle in two business days, unless the parties to a trade expressly agree otherwise. Accordingly, purchasers who wish to trade Bonds prior to the delivery of the Bonds hereunder will be required, by virtue of the fact that the Bonds initially will settle in T+5, to specify alternative settlement arrangements to prevent a failed settlement. Purchases of the Bonds who wish to trade the Bonds prior to their date of delivery hereunder should consult their advisors.
Other Relationships
The underwriters have in the past and may in the future provide investment and commercial banking and other related services to the Republic or its affiliates in the ordinary course of business for which the underwriters and/or their respective affiliates have received or may receive customary fees and reimbursement of out of pocket expenses. The underwriters and their respective affiliates are full service financial institutions engaged in various activities which may include securities trading, commercial and investment banking, financial advice, investment management, principal investment, hedging, financing and brokerage activities.
In the ordinary course of their various business activities, the underwriters and their respective affiliates may make or hold (on their own account, on behalf of clients or in their capacity of investment advisers) a broad array of investments and actively trade debt and equity securities (or related derivative securities) and financial instruments (including bank loans) for their own account and for the accounts of their customers and may at any time hold long and short positions in such securities and instruments and enter into other transactions, including credit derivatives (such as asset swaps, repackaging and credit default swaps) in relation thereto. Such transactions, investments and securities activities may involve securities and instruments of the Republic or its subsidiaries, jointly controlled entities or associated entities, including the Bonds offered hereby, may be entered into at the same time or proximate to offers and sales of Bonds or at other times in the secondary market and be carried out with counterparties that are also purchasers, holders or sellers of Bonds. The underwriters or certain of their respective affiliates may purchase Bonds and be allocated Bonds for asset management and/or proprietary purposes and not with a view to distribution. The underwriters and their affiliates may also make investment recommendations and/or publish or express independent research views in respect of such securities or financial instruments and may hold, or recommend to clients that they acquire, long and/or short positions in such securities and instruments.
Selling Restrictions
Canada
The Bonds may only be offered or sold to a resident of Canada pursuant to an exemption from the requirement to file a prospectus in the applicable Canadian province or territory in which such offer or sale is made, and only by a registrant duly registered under the applicable securities laws of that province or territory or by a registrant that is relying in that province or territory on the “international dealer” exemption provided by Section 8.18 of National Instrument 31-103 Registration Requirements, Exemptions and Ongoing Registrant Obligations (NI 31-103). Furthermore, the Bonds may only be offered or sold to or for the benefit of residents of any such province or territory that are purchasing, or deemed to be purchasing, as principal, that are “accredited
128

Table of Contents
investors” as defined in National Instrument 45-106 Prospectus Exemptions (NI 45-106) and a “permitted client” as defined in NI 31-103. Each Canadian purchaser hereby acknowledges that any resale of the Bonds must be made in accordance with an exemption from, or in a transaction not subject to, the prospectus requirements of applicable securities laws and that it shall be deemed to represent and warrant it is an accredited investor and is purchasing as principal (or deemed principal) in connection with any purchase of Bonds hereunder.
Securities legislation in certain provinces or territories of Canada may provide a purchaser with remedies for rescission or damages if this prospectus (including any amendment hereto) contains a misrepresentation, provided that the remedies for rescission or damages are exercised by the purchaser within the time limit prescribed by the securities legislation of the purchaser’s province or territory. The purchaser should refer to any applicable provisions of the securities legislation of the purchaser’s province or territory of residence for particulars of these rights or consult with a legal advisor.
Pursuant to section 3A.4 of NI 33-105, the underwriters are not required to comply with the disclosure requirements of NI 33 105 regarding underwriter conflicts of interest in connection with this offering. The Republic and the underwriters hereby notify prospective Canadian purchasers that: (a) the Republic or the underwriters may be required to provide personal information pertaining to the purchaser as required to be disclosed in Schedule I of Form 45-106F1 under NI 45-106 (including its name, address, telephone number, email and the aggregate purchase price of any Bonds purchased) (“personal information”), which Form 45-106F1 may be required to be filed by the Republic or the underwriters under NI 45-106, (b) such personal information may be delivered to the Ontario Securities Commission (the “OSC”) in accordance with NI 45-106, (c) such personal information is collected indirectly by the OSC under the authority granted to it under the securities legislation of Ontario, (d) such personal information is collected for the purposes of the administration and enforcement of the securities legislation of Ontario, and (e) the public official in Ontario who can answer questions about the OSC’s indirect collection of such personal information is the Administrative Support Clerk at the OSC, Suite 1903, Box 55, 20 Queen Street West, Toronto, Ontario M5H 3S8, Telephone: (416) 593-3684. Prospective Canadian purchasers that purchase Bonds in this offering will be deemed to have authorized the indirect collection of the personal information by the OSC, and to have acknowledged and consented to its name, address, telephone number, email and other specified information, including the aggregate purchase price paid by the purchaser, being disclosed to other Canadian securities regulatory authorities, and to have acknowledged that such information may become available to the public in accordance with requirements of applicable Canadian laws.
Upon receipt of this prospectus, each Canadian purchaser hereby confirms that it has expressly requested that all documents evidencing or relating in any way to the sale of the securities described herein (including for greater certainty any purchase confirmation or any notice) be drawn up in the English language only. Par la réception de ce document, chaque acheteur canadien confirme par les présentes qu’il a expressément exigé que tous les documents faisant foi ou se rapportant de quelque manière que ce soit à la vente des valeurs mobilières décrites aux présentes (incluant, pour plus de certitude, toute confirmation d’achat ou tout avis) soient rédigés en anglais seulement.
European Economic Area
In relation to each Member State of the European Economic Area that has implemented the Prospectus Directive (each such Member State, a “Relevant Member State”), each underwriter has represented and agreed that with effect from (and including) the date on which the Prospectus Directive is implemented in that Relevant Member State (the “Relevant Implementation Date”) it has not made and will not make an offer of the Bonds which are the subject of the offering contemplated by this prospectus to the public in that Relevant Member State except that it may, with effect from and including the Relevant Implementation Date, make an offer of such Bonds to the public in that Relevant Member State:
(a) at any time to any legal entity which is a qualified investor as defined in the Prospectus Directive;
129

Table of Contents
(b) at any time to fewer than 150 natural or legal persons (other than qualified investors as defined in the Prospectus Directive) subject to obtaining the prior consent of the joint lead managers; or
(c) at any time in any other circumstances falling within Article 3(2) of the Prospectus Directive,
provided that no such offer of Bonds shall require the Republic or the joint lead managers to publish a prospectus pursuant to Article 3 of the Prospectus Directive or supplement a prospectus pursuant to Article 16 of the Prospectus Directive.
For the purposes of this provision, the expression an “offer of Bonds to the public” in relation to any of the Bonds in any Relevant Member State means the communication in any form and by any means of sufficient information on the terms of the offer and the Bonds to be offered so as to enable an investor to decide to purchase or subscribe the Bonds, as the same may be varied in that Member State by any measure implementing the Prospectus Directive in that Member State and the expression “Prospectus Directive” means Directive 2003/71/EC (and amendments thereto, including the 2010 PD Amending Directive), and includes any relevant implementing measure in the Relevant Member State and the expression “2010 PD Amending Directive” means Directive 2010/73/EU.
Hong Kong
Each underwriter has represented and agreed that:
(a) it has not offered or sold and will not offer or sell in Hong Kong, by means of any document, any Bonds other than (i) to “professional investors” as defined in the Securities and Futures Ordinance (Cap. 571) of Hong Kong (“SFO”) and any rules made under that Ordinance; or (ii) in other circumstances which do not result in the document being a “prospectus” as defined in the Companies (Winding up and Miscellaneous Provisions) Ordinance (Cap. 32) of Hong Kong or which do not constitute an offer to the public within the meaning of that Ordinance; and
(b) it has not issued or had in its possession for the purposes of issue, and will not issue or have in its possession for the purposes of issue, whether in Hong Kong or elsewhere, any advertisement, invitation or document relating to the Bonds, which is directed at, or the contents of which are likely to be accessed or read by, the public of Hong Kong (except if permitted to do so under the securities laws of Hong Kong) other than with respect to Bonds which are or are intended to be disposed of only to persons outside Hong Kong or only to “professional investors” as defined in the SFO and any rules made thereunder.
Italy
No prospectus has been nor will be published in Italy in connection with the offering of the Bonds and such offering has not been cleared by the Italian Securities Exchange Commission (Commissione Nazionale per le Societa e la Borsa, the “CONSOB”) pursuant to Italian securities legislation. Accordingly, the Bonds may not and will not be offered, sold or delivered, nor may copies of this prospectus or any other documents relating to the Bonds (the “Offer Materials”) be distributed in Italy, in an offer to the public of financial products under the meaning of Article 1, paragraph 1, letter t) of the Italian Legislative Decree No. 58 of February 24, 1998 as amended (the “Consolidated Financial Act”) unless an exception applies. Therefore, the Bonds may only be offered, transferred or delivered, and copies of Offer Materials may only be distributed, within the territory of Italy: (a) to qualified investors (investitori qualijicati), as defined in Article 26, paragraph 1, letter d) of CONSOB Regulation No. 16190 of October 29, 2007, as amended (the “Intermediaries Regulation”), pursuant to Article 100, paragraph 1, letter a) of the Consolidated Financial Act and Article 34-ter, paragraph 1, letter b) of CONSOB Regulation No. 11971 of May 14, 1999, as amended (the “Issuers Regulation”); or (b) in any other circumstances where an express exemption from compliance with the restrictions on offers to the public applies, including, without limitation, as provided under Article 100 of the Consolidated Financial Act and Article 34-ter of the Issuers Regulation.
130

Table of Contents
Any offer, sale or delivery of the Bonds or distribution of copies of offer materials in Italy may and will be effected in accordance with all Italian securities, tax, exchange control and other applicable laws and regulations, and, in particular, will be: (i) made via investment firms, banks or financial intermediaries authorized to carry out such activities in Italy in accordance with the Consolidated Financial Act, the Issuers Regulation, the Intermediaries Regulation and Italian Legislative Decree No. 385 of September 1, 1993 (the “Consolidated Banking Act”), all as amended; (ii) in compliance with Article 129 of the Consolidated Banking Act and the implementing guidelines of the Bank of Italy, as amended, pursuant to which the Bank of Italy may request information on the offering or issue of securities in Italy; and (iii) in compliance with any other applicable laws and regulations, including any conditions, limitations or requirements that may be, from time to time, imposed by the relevant Italian authorities concerning securities, tax matters and exchange controls.
Any investor purchasing the Bonds in an offering is solely responsible for ensuring that any offer or resale of the Bonds it purchases in the offering occurs in compliance with applicable Italian laws and regulations.
The offer materials and the information contained therein are intended only for the use of its recipient and, unless in circumstances which are exempted from the rules governing offers of securities to the public pursuant to Article 100 of the Consolidated Financial Act and Article 34-ter of the Issuers Regulation, is not to be distributed, for any reason, to any third party resident or located in Italy. No person resident or located in Italy other than the original recipients of this document may rely on it or its content.
Japan
The Bonds have not been and will not be registered under the Financial Instruments and Exchange Act of Japan (Act No. 25 of 1948, as amended) and each underwriters has represented and agreed that it has not directly or indirectly offered or sold and will not offer or sell any Bonds, directly or indirectly, in Japan or to, or for the benefit of, any resident of Japan (as defined under Item 5, Paragraph 1, Article 6 of the Foreign Exchange and Foreign Trade Act (Act No. 228 of 1949, as amended)), or to others for reoffering or resale, directly or indirectly, in Japan or to, or for the benefit of, a resident of Japan, except pursuant to an exemption from the registration requirements of, and otherwise in compliance with, the Financial Instruments and Exchange Act and any other applicable laws, regulations and ministerial guidelines of Japan.
Singapore
This prospectus has not been registered as a prospectus with the Monetary Authority of Singapore. Accordingly, this prospectus and any other document or material in connection with the offer or sale, or invitation for subscription or purchase, of the Bonds may not be circulated or distributed, nor may the Bonds be offered or sold, or be made the subject of an invitation for subscription or purchase, whether directly or indirectly, to persons in Singapore other than (i) to an institutional investor under Section 274 of the Securities and Futures Act, Chapter 289 of Singapore statutes (the “SFA”), (ii) to a relevant person pursuant to Section 275(1), or any person pursuant to Section 275(1A), and in accordance with the conditions specified in Section 275, of the SFA, or (iii) otherwise pursuant to, and in accordance with the conditions of, any other applicable provision of the SFA. Where the Bonds are subscribed or purchased under Section 275 of the SFA by a relevant person which is:
(a) a corporation (which is not an accredited investor (as defined in Section 4A of the SFA)) the sole business of which is to hold investments and the entire share capital of which is owned by one or more individuals, each of whom is an accredited investor; or
131
Table of Contents
(b) a trust (where the trustee is not an accredited investor) whose sole purpose is to hold investments and each beneficiary of the trust is an individual who is an accredited investor, securities (as defined in Section 239(1) of the SFA) of that corporation or the beneficiaries’ rights and interest (howsoever described) in that trust shall not be transferred within six months after that corporation or that trust has acquired the Bonds pursuant to an offer made under Section 275 of the SFA except:
(1) to an institutional investor or to a relevant person defined in Section 275(2) of the SFA, or to any person arising from an offer referred to in Section 275(1 A) or Section 276(4)(i)(B) of the SFA;
(2) where no consideration is or will be given for the transfer;
(3) where the transfer is by operation of law;
(4) as specified in Section 276(7) of the SFA; or
(5) as specified in Regulation 32 of the Securities and Futures (Offers of Investments) (Shares and Debentures) Regulations 2005 of Singapore.
United Kingdom
Each underwriter has represented and agreed that:
(a) it has only communicated or caused to be communicated and will only communicate or cause to be communicated an invitation or inducement to engage in investment activity (within the meaning of Section 21 of the Financial Services and Markets Act 2000, the “FSMA”) received by it in connection with the issue or sale of the Bonds in circumstances in which Section 21(1) of the FSMA does not apply to the Republic; and
(b) it has complied and will comply with all applicable provisions of the FSMA with respect to anything done by it in relation to the Bonds in, from or otherwise involving the United Kingdom.
132

Table of Contents
OFFICIAL STATEMENTS
Information in this prospectus whose source is identified as a publication of the Republic or one of its agencies or instrumentalities relies on the authority of the publication as a public official document of the Republic. All other information in this prospectus and in the registration statement for the Bonds that the Republic has filed with the SEC is included as a public official statement made on the authority of Luky Alfirman, Director General of Budget Financing and Risk Management of the Ministry of Finance of the Republic of Indonesia.
VALIDITY OF THE BONDS
The validity of the Bonds will be passed upon for the Republic as to Indonesian law by the Legal Bureau of the Ministry of Finance and Cleary Gottlieb Steen & Hamilton LLP, special New York counsel to the Republic, as to all matters of U.S. law and Soemadipradja & Taher as to all matters of Indonesian law. Certain legal matters will be passed upon for the underwriters by Norton Rose Fulbright, as to all matters of U.S. law, and Assegaf Hamzah & Partners, as to all matters of Indonesian law.
AUTHORIZED REPRESENTATIVE
The authorized representative of the Republic in the United States of America is the Chief Representative of Bank Indonesia New York, whose address is 25/F, 200 Vesey Street, New York, New York, 10285.
GENERAL INFORMATION
1. The issue of the Bonds has been authorized by the Minister of Finance of the Republic of Indonesia pursuant to the authority conferred upon her by Article 5 of Law No.24 of 2002 on Government Debt Securities.
The implementation of the Bonds’ authorization has been delegated to the Director General of Budget Financing and Risk Management of the Ministry of Finance pursuant to Minister of Finance Decree No.648/KMK.01/2015 on Mandates Granted by the Minister of Finance to the Directorate General of Budget Financing and Risk Management for and on behalf of the Minister of Finance to Sign Letters and/or Decrees of the Minister of Finance in connection with the implementation of budget financing and risk management, and Articles 29 and 33 of Minister of Finance Regulation No.137/PMK.08/2013 on the Sale and Repurchase of Government Debt Securities in Foreign Currency in the International Market, as amended by Ministry of Finance Regulation No.264/PMK.08/2015.
2. Other than as disclosed in this prospectus, there has been no material adverse change in the financial position or affairs of the Republic since September 30, 2017 and the Republic is not a party in any litigation, arbitration or administrative proceeding that is material in the context of the issue of the Bonds and is not aware of any such litigation, arbitration or administrative proceeding whether pending or threatened.
3. For so long as the Bonds are listed on the SGX-ST and the rules of the SGX-ST so require, the Republic will appoint and maintain a paying agent in Singapore, where the Bonds may be presented or surrendered for payment or redemption in the event any global bonds are exchanged for certificated bonds. In addition, in the event any global bonds are exchanged for certificated bonds, an announcement of such exchange shall be made by or on behalf of the Republic through the SGX-ST. Such announcement shall include all material information with respect to the delivery of the certificated bonds, including details of the paying agent in Singapore.
133

Table of Contents
4. For so long as the Bonds are listed on the SGX-ST and the rules of the SGX-ST so require, the Bonds will be traded on the SGX-ST in a minimum board lot size of S$200,000 or its equivalent in foreign currencies. Accordingly, the Bonds will be traded on the SGX-ST in a minimum board lot size of U.S.$200,000 following listing.
5. The Bonds have been accepted for clearance through DTC, Euroclear and Clearstream, Luxembourg. With respect to the 2023 Bonds, the CUSIP number is 455780CC8, the Common Code is 173392109, and the International Securities Identification Number (ISIN) is US455780CC89. With respect to the 2028 Bonds, the CUSIP number is 455780CD6, the Common Code is 173392117, and the ISIN is US455780CD62. With respect to the 2048 Bonds, the CUSIP number is 455780CE4, the Common Code is 173392133, and the ISIN is US455780CE46.
FURTHER INFORMATION
The Republic filed a registration statement with respect to the Bonds with the Securities and Exchange Commission under the Securities Act of 1933 and its related rules and regulations. This prospectus does not contain all of the information described in the registration statement. You can find additional information concerning the Republic and the Bonds in the registration statement and any pre- or post-effective amendment, including its various exhibits, which may be inspected at the public reference room maintained by the Commission at 100 F Street, N.E., Washington, D.C. 20549. Please call the Commission at 1-800-SEC-0330 for further information on the operation of the public reference room. In addition, the Commission maintains an Internet site at http://www.sec.gov that contains information regarding issuers that file electronically with the Commission.
134

Table of Contents
DEBT TABLES OF THE REPUBLIC OF INDONESIA
External Loans of the Republic of Indonesia as of September 30, 2017 T-2
Domestic Loans of the Republic of Indonesia as of September 30, 2017 T-28
Guaranteed Domestic Loans of the Republic of Indonesia as of September 30, 2017 T-32
Guaranteed External Loans of the Republic of Indonesia as of September 30, 2017 T-33
Foreign Currency-Denominated Bonds of the Republic of Indonesia as of September 30, 2017 T-34
Domestic Currency-Denominated Bonds of the Republic of Indonesia as of September 30, 2017 T-36
T-1

Table of Contents
External Loans of the Republic of Indonesia as of September 30, 2017
CURRENCYBASE
INTERESTRATE BASIS
INTERESTRATE
COMMITMENTCHARGE
ISSUEDATE
MATURITYDATE ORIGINAL AMOUNT OUTSTANDING BALANCE
(In OriginalCurrency)
(In US Dollars) (In OriginalCurrency)
(In US Dollars)
MULTILATERALACU FIXED 1.00 — 2005 2021 15,792,505.68 22,294,752.69 3,429,599.45 4,841,668.14ACU FIXED 2.50 — 2011 2030 3,400,000.00 4,799,881.71 1,741,512.69 2,458,545.56ACU FIXED 5.10 — 2009 2024 21,591,000.00 30,480,660.57 7,092,842.64 10,013,178.13ACU FIXED 5.10 — 2011 2027 32,711,000.00 46,179,097.22 20,360,655.55 28,743,746.51ACU FIXED 5.50 — 2000 2017 12,223,800.06 17,256,704.21 — — ACU LIBOR
6 MONTHS1.20 — 2011 2026 26,998,000.00 38,113,884.22 15,174,875.19 21,422,825.25
ACU LIBOR6 MONTHS
1.20 — 2011 2026 4,600,000.00 6,493,957.60 2,869,264.56 4,050,626.61
ACU LIBOR6 MONTHS
1.20 — 2011 2027 6,910,000.00 9,755,053.71 4,031,218.97 5,690,992.41
ACU LIBOR6 MONTHS
1.20 — 2011 2027 25,730,000.00 36,323,810.69 15,434,735.44 21,789,677.74
ACU NO INTERESTRATE
— — 1998 2023 3,131,007.99 4,420,137.64 1,130,641.87 1,596,160.95
ACU NO INTERESTRATE
— — 1999 2019 3,156,294.86 4,455,835.87 526,049.11 742,639.26
ACU NO INTERESTRATE
— — 2000 2025 5,844,756.59 8,251,217.72 2,501,400.64 3,531,302.11
ACU NO INTERESTRATE
— — 2000 2025 6,090,240.59 8,597,774.82 2,630,961.64 3,714,207.25
ACU NO INTERESTRATE
— — 2003 2027 5,075,319.75 7,164,980.71 1,727,434.93 2,438,671.56
ACU NO INTERESTRATE
— — 2003 2022 3,052,974.10 4,309,974.86 1,191,542.72 1,682,136.50
ACU NO INTERESTRATE
— — 2003 2020 11,281,618.41 15,926,598.19 1,851,441.12 2,613,734.81
ACU NO INTERESTRATE
— — 2003 2020 7,335,873.77 10,356,272.45 1,014,549.62 1,432,270.05
ACU NO INTERESTRATE
— — 2003 2021 21,775,820.80 30,741,577.63 4,265,085.11 6,021,148.24
ACU NO INTERESTRATE
— — 2003 2021 9,133,200.10 12,893,611.79 1,949,531.72 2,752,212.25
ACU NO INTERESTRATE
— — 2004 2021 19,692,523.29 27,800,524.21 3,823,413.71 5,397,627.51
ACU NO INTERESTRATE
— — 2004 2021 4,420,843.19 6,241,036.58 928,772.54 1,311,175.98
ACU NO INTERESTRATE
— — 2004 2022 28,236,017.44 39,861,630.47 7,528,815.78 10,628,654.45
ACU NO INTERESTRATE
— — 2004 2021 6,984,444.78 9,860,149.63 1,276,367.84 1,801,886.66
ACU NO INTERESTRATE
— — 2004 2021 27,911,624.64 39,403,675.45 5,448,972.17 7,692,477.01
ACU NO INTERESTRATE
— — 2005 2022 5,434,193.23 7,671,613.14 1,467,673.43 2,071,958.49
ACU NO INTERESTRATE
— — 2005 2021 18,503,633.59 26,122,133.06 3,408,207.49 4,811,468.47
ACU NO INTERESTRATE
— — 2005 2021 14,614,000.00 20,631,020.96 3,580,276.69 5,054,383.70
ACU NO INTERESTRATE
— — 2005 2022 5,089,255.27 7,184,653.90 1,398,059.08 1,973,681.82
ACU NO INTERESTRATE
— — 2006 2026 25,151,545.67 35,507,189.41 9,250,976.70 13,059,880.54
ACU NO INTERESTRATE
— — 2006 2027 6,533,166.90 9,223,067.15 2,671,454.30 3,771,371.95
ACU NO INTERESTRATE
— — 2006 2017 8,060,000.00 11,378,543.11 2,468,697.99 3,485,134.80
ACU NO INTERESTRATE
— — 2006 2022 27,520,000.00 38,850,807.23 12,008,559.68 16,952,842.92
ACU NO INTERESTRATE
— — 2006 2027 21,424,082.44 30,245,018.06 8,523,715.41 12,033,184.02
ACU NO INTERESTRATE
— — 2006 2029 11,017,000.00 15,553,028.46 5,119,115.75 7,226,808.84
ACU NO INTERESTRATE
— — 2006 2023 17,654,654.43 24,923,603.78 8,091,716.57 11,423,318.34
ACU NO INTERESTRATE
— — 2006 2023 5,203,055.56 7,345,309.18 2,601,527.80 3,672,654.62
ACU NO INTERESTRATE
— — 2007 2030 10,274,000.00 14,504,113.14 6,894,612.97 9,733,331.38
ACU NO INTERESTRATE
— — 2008 2032 10,274,000.00 14,504,113.14 5,447,167.26 7,689,928.97
T-2

Table of Contents
CURRENCYBASE
INTERESTRATE BASIS
INTERESTRATE
COMMITMENTCHARGE
ISSUEDATE
MATURITYDATE ORIGINAL AMOUNT OUTSTANDING BALANCE
(In OriginalCurrency)
(In US Dollars) (In OriginalCurrency)
(In US Dollars)
ACU NO INTERESTRATE
— — 2008 2029 31,920,000.00 45,062,418.86 3,195,942.48 4,511,807.61
ACU NO INTERESTRATE
— — 2009 2023 2,114,000.00 2,984,397.04 1,165,558.01 1,645,453.11
ACU NO INTERESTRATE
— — 2009 2033 9,172,816.91 12,949,540.03 8,408,415.50 11,870,411.69
ACU NO INTERESTRATE
— — 2009 2027 63,357,279.70 89,443,367.02 25,542,291.58 36,058,817.10
ACU NO INTERESTRATE
— — 2009 2021 87,550,000.00 123,596,953.97 8,464,203.03 11,949,168.62
ACU NO INTERESTRATE
— — 2011 2026 31,255,000.00 44,123,618.46 14,190,423.89 20,033,045.90
ACU NO INTERESTRATE
— — 2011 2018 4,000,000.00 5,646,919.66 1,986,957.75 2,805,047.69
ACU NO INTERESTRATE
— — 2011 2025 30,400,000.00 42,916,589.39 16,162,929.86 22,817,691.58
ACU NO INTERESTRATE
— — 2011 2026 24,560,000.00 34,672,086.69 14,615,516.93 20,633,162.46
ACU NO INTERESTRATE
— — 2011 2027 4,940,000.00 6,973,945.78 2,857,075.33 4,033,418.71
ACU NO INTERESTRATE
— — 2013 2027 123,750,000.00 174,701,576.86 605,820.07 855,254.32
ACU NO INTERESTRATE
— — 2013 2028 30,000,000.00 42,351,897.42 13,846,443.68 19,547,438.75
ACU NO INTERESTRATE
— — 2013 2034 8,000,000.00 11,293,839.31 4,417,659.70 6,236,542.35
ACU NO INTERESTRATE
— — 2013 2027 187,000,000.00 263,993,493.92 116,760,495.66 164,834,284.51
ACU NO INTERESTRATE
— — 2014 2028 174,010,000.00 245,655,122.34 4,881,990.93 6,892,052.63
ADB ADBFLOATINGRATE
6.01 0.75 1995 2019 18,341,247.85 18,341,247.85 4,603,147.85 4,603,147.85
ADB ADBFLOATINGRATE
6.01 0.75 1997 2022 35,709,678.32 35,709,678.32 15,942,378.32 15,942,378.32
ADB ADBFLOATINGRATE
6.29 0.75 1997 2021 7,744,717.08 7,744,717.08 3,141,817.08 3,141,817.08
ADB ADBFLOATINGRATE
6.29 0.75 1997 2022 26,385,417.31 26,385,417.31 10,745,717.31 10,745,717.31
ADB ADBFLOATINGRATE
6.29 0.75 1997 2022 23,507,364.74 23,507,364.74 10,970,064.74 10,970,064.74
ADB ADBFLOATINGRATE
6.29 0.75 1997 2023 3,791,494.19 3,791,494.19 2,075,594.19 2,075,594.19
EUR FIXED 0.75 — 1990 2029 2,584,960.64 3,045,343.05 2,386,117.52 2,811,085.90EUR FIXED 0.75 — 1993 2031 2,900,307.95 3,416,853.83 2,706,954.09 3,189,063.58EUR FIXED 0.75 — 1995 2035 4,731,711.93 5,574,431.51 4,475,943.71 5,273,110.88EUR FIXED 0.95 — 2012 2032 6,288,000.00 7,407,895.04 6,062,321.62 7,142,023.26EUR FIXED 0.95 — 2017 2035 93,150,000.00 109,740,048.14 300,000.00 353,430.11JPY COST OF ADB
BORROWING0.19 — 1990 2017 1,631,009,728.00 14,482,428.30 104,221,528.00 925,427.23
JPY COST OF ADBBORROWING
0.27 — 1993 2018 5,080,843,555.00 45,114,968.49 901,341,655.00 8,003,395.48
SDR FIXED 0.75 — 1995 2035 5,443,536.82 7,684,803.77 3,357,621.87 4,740,055.24SDR FIXED 0.75 — 1998 2037 15,352,987.26 21,674,271.38 8,344,463.26 11,780,128.40SDR FIXED 0.75 — 1999 2024 11,685,982.89 16,497,451.62 7,454,826.53 10,524,201.61SDR FIXED 0.75 — 1999 2024 14,782,026.94 20,868,229.62 9,429,863.55 13,312,420.45SDR FIXED 0.75 — 1999 2024 71,023,331.75 100,265,762.03 45,307,718.19 63,962,261.10SDR FIXED 0.75 — 1999 2024 3,796,673.79 5,359,877.96 2,469,411.87 3,486,142.61SDR FIXED 0.75 — 2000 2040 17,500,000.00 24,705,273.50 13,416,662.00 18,940,703.09SDR FIXED 0.75 — 2001 2025 35,414,178.85 49,995,255.66 23,922,127.08 33,771,582.40SDR FIXED 0.75 — 2001 2026 4,586,620.69 6,475,069.63 3,212,539.78 4,535,238.50SDR FIXED 0.75 — 2006 2044 13,638,602.14 19,254,022.63 12,254,215.48 17,299,642.57SDR FIXED 0.75 — 2006 2026 47,370,000.00 66,873,646.03 31,982,869.65 45,151,173.82SDR FIXED 0.75 — 2008 2048 42,033,300.00 59,339,667.00 39,788,458.40 56,170,556.96SDR FIXED 0.75 0.10 2001 2026 30,282,980.86 42,751,389.97 21,210,546.21 29,943,562.57SDR FIXED 0.75 0.10 2002 2026 55,551,518.00 78,423,739.73 37,494,479.72 52,932,078.63SDR FIXED 0.75 0.10 2007 2026 81,950,000.00 115,691,266.45 51,258,135.23 72,362,642.84SDR FIXED 0.75 0.10 2007 2026 89,508,359.06 126,361,628.04 58,170,231.54 82,120,655.96SDR FIXED 0.75 0.10 2007 2026 38,320,880.79 54,098,733.74 23,811,028.33 33,614,740.98
T-3

Table of Contents
CURRENCYBASE
INTERESTRATE BASIS
INTERESTRATE
COMMITMENTCHARGE
ISSUEDATE
MATURITYDATE ORIGINAL AMOUNT OUTSTANDING BALANCE
(In OriginalCurrency)
(In US Dollars) (In OriginalCurrency)
(In US Dollars)
SDR FIXED 0.75 0.10 2007 2026 90,839,733.85 128,241,169.65 62,911,339.28 88,813,819.59SDR FIXED 0.75 0.20 2000 2025 54,139,161.47 76,429,873.77 35,181,798.97 49,667,198.03SDR FIXED 0.75 0.20 2004 2026 3,409,938.20 4,813,911.76 2,303,153.46 3,251,430.64SDR FIXED 0.75 0.20 2006 2026 45,655,179.05 64,452,781.99 31,842,361.57 44,952,814.35SDR FIXED 0.75 0.20 2007 2025 39,654,356.29 55,981,241.00 25,745,503.47 36,345,697.40SDR FIXED 0.75 0.30 2001 2026 2,776,666.13 3,919,902.64 1,874,258.13 2,645,946.27SDR FIXED 0.75 0.30 2004 2026 21,585,432.18 30,472,800.32 14,570,163.78 20,569,136.06SDR FIXED 0.75 0.30 2004 2026 31,597,889.30 44,607,685.54 21,328,575.18 30,110,187.61SDR FIXED 0.75 0.30 2004 2026 15,647,425.32 22,089,938.40 10,560,245.74 14,908,214.81SDR FIXED 0.75 0.30 2005 2026 17,899,858.06 25,269,765.08 12,082,401.74 17,057,087.97SDR FIXED 0.75 0.30 2005 2025 19,832,773.80 27,998,520.05 12,897,569.26 18,207,884.35SDR FIXED 0.75 0.30 2005 2025 47,003,493.74 66,356,238.18 30,563,463.99 43,147,356.39SDR FIXED 0.75 0.30 2005 2026 51,647,003.45 72,911,619.74 33,592,604.44 47,423,684.58SDR FIXED 0.75 0.30 2005 2025 22,683,184.63 32,022,530.29 14,709,378.32 20,765,669.39SDR FIXED 0.75 0.30 2005 2025 9,920,000.00 14,004,360.75 6,451,757.78 9,108,139.46SDR FIXED 0.75 0.35 2000 2025 21,799,222.51 30,774,614.52 14,179,984.81 20,018,308.74SDR FIXED 0.75 0.50 2001 2025 87,499,973.21 123,526,329.66 56,918,391.66 80,353,396.17SDR FIXED 0.75 0.50 2003 2026 36,831,596.23 51,996,266.18 25,753,832.66 36,357,455.97SDR FIXED 0.75 0.50 2008 2026 78,598,745.26 110,960,199.89 62,878,996.16 88,768,159.84SDR FIXED 0.75 0.50 2008 2026 119,359,231.74 168,502,997.96 95,487,385.44 134,802,398.44SDR FIXED 1.00 — 1978 2018 23,699,221.26 33,456,899.59 1,010,945.23 1,427,181.62SDR FIXED 1.00 — 1979 2019 24,316,665.63 34,328,564.28 1,759,208.25 2,483,526.91SDR FIXED 1.00 — 1982 2031 23,677,606.53 33,426,385.43 8,288,368.49 11,700,937.73SDR FIXED 1.00 — 1987 2017 44,222,106.34 62,429,670.38 2,315,567.40 3,268,955.76SDR FIXED 1.00 — 1987 2017 56,771,000.00 80,145,318.95 3,158,121.23 4,458,414.22SDR FIXED 1.00 — 1988 2018 19,549,392.77 27,598,462.57 1,442,729.04 2,036,743.74SDR FIXED 1.00 — 1988 2018 36,930,000.00 52,135,185.72 1,906,500.51 2,691,463.80SDR FIXED 1.00 — 1989 2018 18,188,411.64 25,677,124.80 2,284,791.12 3,225,507.97SDR FIXED 1.00 — 1989 2018 23,050,823.57 32,541,537.18 2,234,833.23 3,154,980.92SDR FIXED 1.00 — 1990 2019 75,438,000.00 106,498,081.25 12,901,805.29 18,213,864.47SDR FIXED 1.00 — 1990 2018 37,995,569.90 53,639,482.63 3,773,224.56 5,326,773.99SDR FIXED 1.00 — 1990 2018 21,624,640.75 30,528,152.23 3,367,729.58 4,754,324.59SDR FIXED 1.00 — 1992 2020 5,005,641.53 7,066,613.89 1,537,936.86 2,171,151.47SDR FIXED 1.00 — 1993 2020 16,152,741.26 22,803,308.03 5,052,464.12 7,132,714.74SDR FIXED 1.00 — 1993 2020 14,034,831.60 19,813,391.61 4,239,996.04 5,985,729.25SDR FIXED 1.00 — 1993 2021 12,771,721.99 18,030,221.99 5,026,446.65 7,095,985.10SDR FIXED 1.00 — 1994 2021 3,213,127.76 4,536,068.58 1,169,150.53 1,650,524.77SDR FIXED 1.00 — 1994 2021 10,903,599.89 15,392,938.14 4,598,980.28 6,492,518.04SDR FIXED 1.00 — 1995 2021 15,872,600.44 22,407,824.85 5,869,196.12 8,285,719.73SDR FIXED 1.00 — 1995 2022 18,791,399.38 26,528,380.63 8,144,650.01 11,498,046.05SDR FIXED 1.00 — 1996 2022 12,044,448.58 17,003,508.36 6,013,704.76 8,489,726.90SDR FIXED 1.00 — 1996 2022 24,324,297.73 34,339,338.74 13,584,390.59 19,177,490.56SDR FIXED 1.00 — 1996 2023 6,772,673.31 9,561,185.51 3,366,088.67 4,752,008.06SDR FIXED 1.00 — 1998 2024 8,799,589.62 12,422,643.90 5,359,156.86 7,565,682.05SDR FIXED 1.00 — 1998 2024 10,500,492.66 14,823,859.60 6,938,654.04 9,795,505.47SDR FIXED 1.04 — 2011 2032 30,300,000.00 42,775,416.39 25,088,922.55 35,418,782.47SDR FIXED 1.50 — 2000 2022 27,021,578.85 38,147,171.18 12,593,705.96 17,778,911.43SDR FIXED 1.50 — 2001 2022 31,003,569.50 43,768,666.50 14,182,620.88 20,022,030.16SDR FIXED 1.50 — 2001 2022 41,698,812.97 58,867,461.65 19,091,302.97 26,951,763.50SDR FIXED 1.50 — 2002 2023 74,834,759.90 105,646,469.16 37,417,367.90 52,823,217.57SDR FIXED 1.50 — 2003 2023 34,040,313.67 48,055,729.09 17,011,013.39 24,014,956.46SDR FIXED 1.50 — 2003 2023 23,962,479.29 33,828,548.83 11,959,161.58 16,883,106.15SDR FIXED 1.50 — 2003 2023 25,379,731.97 35,829,326.83 13,609,761.97 19,213,308.10SDR FIXED 1.50 — 2004 2024 13,780,339.38 19,454,117.33 8,038,539.38 11,348,246.51SDR FIXED 1.50 — 2004 2024 24,491,233.81 34,575,007.40 14,281,299.81 20,161,338.15SDR FIXED 1.50 — 2004 2024 14,539,228.48 20,525,463.77 8,495,349.65 11,993,139.23SDR FIXED 1.50 — 2005 2024 13,363,082.85 18,865,063.80 7,794,166.85 11,003,258.50SDR FIXED 1.50 — 2005 2025 2,945,949.87 4,158,885.56 2,086,713.87 2,945,876.39SDR FIXED 1.50 — 2005 2025 11,109,376.50 15,683,439.13 6,852,110.83 9,673,329.83SDR FIXED 1.50 — 2006 2025 34,207,410.13 48,291,624.16 24,230,254.13 34,206,574.58SDR FIXED 1.50 — 2006 2026 14,588,899.05 20,595,585.20 10,583,599.22 14,941,183.62SDR FIXED 1.50 — 2007 2026 32,326,766.09 45,636,662.71 24,269,671.99 34,262,221.95SDR FIXED 1.50 — 2007 2026 20,457,033.08 28,879,805.55 16,195,153.08 22,863,182.07SDR FIXED 1.50 — 2007 2027 31,155,525.08 43,983,186.74 25,985,213.46 36,684,103.16SDR FIXED 1.50 — 2008 2027 49,323,505.71 69,631,468.48 43,160,092.83 60,930,394.14SDR FIXED 1.50 — 2008 2028 31,335,612.80 44,237,421.96 28,754,790.45 40,593,997.85SDR FIXED 1.50 — 2009 2028 20,162,000.00 28,463,298.53 15,690,883.90 22,151,290.18SDR FIXED 2.08 — 2012 2032 15,870,000.00 22,404,153.74 13,267,598.02 18,730,265.01USD ADB
FLOATINGRATE
1.54 0.15 2008 2023 280,000,000.00 280,000,000.00 151,666,666.63 151,666,666.63
USD ADBFLOATINGRATE
1.56 — 2007 2022 300,000,000.00 300,000,000.00 137,500,000.00 137,500,000.00
T-4

Table of Contents
CURRENCYBASE
INTERESTRATE BASIS
INTERESTRATE
COMMITMENTCHARGE
ISSUEDATE
MATURITYDATE ORIGINAL AMOUNT OUTSTANDING BALANCE
(In OriginalCurrency)
(In US Dollars) (In OriginalCurrency)
(In US Dollars)
USD ADBFLOATINGRATE
1.56 — 2008 2023 350,000,000.00 350,000,000.00 189,583,333.37 189,583,333.37
USD ADBFLOATINGRATE
1.85 0.75 2002 2022 13,302,586.29 13,302,586.29 5,674,586.29 5,674,586.29
USD ADBFLOATINGRATE
1.89 0.75 2002 2021 3,740,483.16 3,740,483.16 1,469,711.71 1,469,711.71
USD ADBFLOATINGRATE
1.94 — 2006 2021 200,000,000.00 200,000,000.00 103,000,000.00 103,000,000.00
USD ADBFLOATINGRATE
1.96 — 2005 2020 200,000,000.00 200,000,000.00 83,840,000.00 83,840,000.00
USD ADBFLOATINGRATE
1.96 0.75 2005 2020 300,000,000.00 300,000,000.00 125,760,000.00 125,760,000.00
USD ADBFLOATINGRATE
1.96 0.75 2002 2021 7,674,317.41 7,674,317.41 2,999,417.41 2,999,417.41
USD ADBFLOATINGRATE
1.97 0.75 2002 2022 45,725,660.56 45,725,660.56 22,383,060.56 22,383,060.56
USD ADBFLOATINGRATE
6.01 — 1994 2019 29,253,194.61 29,253,194.61 7,314,394.61 7,314,394.61
USD ADBFLOATINGRATE
6.01 0.75 1995 2020 33,606,224.45 33,606,224.45 9,862,624.45 9,862,624.45
USD ADBFLOATINGRATE
6.01 0.75 1995 2020 72,544,748.53 72,544,748.53 24,189,248.53 24,189,248.53
USD ADBFLOATINGRATE
6.01 0.75 1996 2021 18,409,025.85 18,409,025.85 7,611,825.85 7,611,825.85
USD ADBFLOATINGRATE
6.01 0.75 1999 2021 138,135,722.55 138,135,722.55 56,777,822.55 56,777,822.55
USD ADBFLOATINGRATE
6.01 0.75 1999 2022 29,195,109.95 29,195,109.95 14,132,909.95 14,132,909.95
USD ADBFLOATINGRATE
6.29 — 1993 2018 75,244,156.07 75,244,156.07 8,061,556.07 8,061,556.07
USD ADBFLOATINGRATE
6.29 — 1994 2019 70,767,436.63 70,767,436.63 11,160,136.63 11,160,136.63
USD ADBFLOATINGRATE
6.29 — 1994 2019 102,584,042.07 102,584,042.07 21,146,242.07 21,146,242.07
USD ADBFLOATINGRATE
6.29 — 1994 2019 50,134,842.52 50,134,842.52 10,178,942.52 10,178,942.52
USD ADBFLOATINGRATE
6.29 — 1995 2019 60,048,841.89 60,048,841.89 12,388,441.89 12,388,441.89
USD ADBFLOATINGRATE
6.29 — 1995 2018 79,765,037.67 79,765,037.67 8,331,837.67 8,331,837.67
USD ADBFLOATINGRATE
6.29 0.75 1993 2018 100,742,271.86 100,742,271.86 5,549,871.86 5,549,871.86
USD ADBFLOATINGRATE
6.29 0.75 1995 2020 66,633,307.73 66,633,307.73 16,590,407.73 16,590,407.73
USD ADBFLOATINGRATE
6.29 0.75 1996 2020 49,402,320.29 49,402,320.29 14,725,720.29 14,725,720.29
USD ADBFLOATINGRATE
6.29 0.75 1996 2020 65,760,427.05 65,760,427.05 19,277,627.05 19,277,627.05
T-5

Table of Contents
CURRENCYBASE
INTERESTRATE BASIS
INTERESTRATE
COMMITMENTCHARGE
ISSUEDATE
MATURITYDATE ORIGINAL AMOUNT OUTSTANDING BALANCE
(In OriginalCurrency)
(In US Dollars) (In OriginalCurrency)
(In US Dollars)
USD ADBFLOATINGRATE
6.29 0.75 1996 2020 75,548,631.11 75,548,631.11 18,936,531.11 18,936,531.11
USD ADBFLOATINGRATE
6.29 0.75 1996 2021 71,392,056.38 71,392,056.38 23,967,656.38 23,967,656.38
USD ADBFLOATINGRATE
6.29 0.75 1996 2021 17,774,261.89 17,774,261.89 5,993,961.89 5,993,961.89
USD ADBFLOATINGRATE
6.29 0.75 1996 2021 57,516,466.32 57,516,466.32 21,520,466.32 21,520,466.32
USD ADBFLOATINGRATE
6.29 0.75 1996 2021 10,822,536.74 10,822,536.74 3,992,536.74 3,992,536.74
USD ADBFLOATINGRATE
6.29 0.75 1996 2021 15,710,504.09 15,710,504.09 6,136,604.09 6,136,604.09
USD ADBFLOATINGRATE
6.29 0.75 1996 2021 23,981,368.88 23,981,368.88 9,040,468.88 9,040,468.88
USD ADBFLOATINGRATE
6.29 0.75 1996 2022 27,382,259.83 27,382,259.83 13,255,359.83 13,255,359.83
USD ADBFLOATINGRATE
6.29 0.75 1997 2022 44,621,710.54 44,621,710.54 18,212,910.54 18,212,910.54
USD ADBFLOATINGRATE
6.29 0.75 1997 2022 15,381,230.44 15,381,230.44 7,188,930.44 7,188,930.44
USD ADBFLOATINGRATE
6.29 0.75 1997 2022 33,406,604.41 33,406,604.41 16,769,904.41 16,769,904.41
USD ADBFLOATINGRATE
6.29 0.75 1998 2022 7,045,606.52 7,045,606.52 3,225,306.52 3,225,306.52
USD ADBFLOATINGRATE
6.29 0.75 1998 2022 9,890,602.41 9,890,602.41 4,786,302.41 4,786,302.41
USD ADBFLOATINGRATE
6.29 0.75 1998 2022 84,043,480.07 84,043,480.07 40,683,980.07 40,683,980.07
USD ADBFLOATINGRATE
6.29 0.75 1998 2022 8,623,203.53 8,623,203.53 4,328,703.53 4,328,703.53
USD ADBFLOATINGRATE
6.29 0.75 1998 2020 187,516,246.86 187,516,246.86 55,368,846.86 55,368,846.86
USD ADBFLOATINGRATE
6.29 0.75 1998 2022 6,479,097.77 6,479,097.77 3,136,597.77 3,136,597.77
USD ADBFLOATINGRATE
6.29 0.75 2000 2025 5,174,296.04 5,174,296.04 3,458,196.04 3,458,196.04
USD ADBFLOATINGRATE
6.29 0.75 2001 2025 21,509,284.24 21,509,284.24 14,376,184.24 14,376,184.24
USD ADBFLOATINGRATE
6.29 0.75 2001 2024 3,824,991.90 3,824,991.90 2,313,791.90 2,313,791.90
USD COST OF ADBBORROWING
6.01 — 1992 2017 98,065,757.18 98,065,757.18 5,424,557.18 5,424,557.18
USD COST OF ADBBORROWING
6.01 — 1993 2017 125,782,313.05 125,782,313.05 6,935,813.05 6,935,813.05
USD COST OF ADBBORROWING
6.01 — 1993 2017 25,241,397.09 25,241,397.09 1,391,997.09 1,391,997.09
USD FIXED 0.25 0.25 2011 2051 125,000,000.00 125,000,000.00 99,037,195.88 99,037,195.88USD FIXED 0.75 — 1968 2018 5,867,960.53 5,867,960.53 176,399.89 176,399.89USD FIXED 0.75 — 1968 2018 2,300,310.89 2,300,310.89 103,513.50 103,513.50USD FIXED 0.75 — 1969 2019 17,559,603.96 17,559,603.96 1,054,426.18 1,054,426.18USD FIXED 0.75 — 1969 2019 32,395,479.04 32,395,479.04 1,943,729.36 1,943,729.36USD FIXED 0.75 — 1969 2019 15,805,812.23 15,805,812.23 948,348.95 948,348.95USD FIXED 0.75 — 1970 2020 35,734,930.29 35,734,930.29 3,216,143.45 3,216,143.45USD FIXED 0.75 — 1970 2020 17,443,123.46 17,443,123.46 1,569,880.82 1,569,880.82
T-6

Table of Contents
CURRENCYBASE
INTERESTRATE BASIS
INTERESTRATE
COMMITMENTCHARGE
ISSUEDATE
MATURITYDATE ORIGINAL AMOUNT OUTSTANDING BALANCE
(In OriginalCurrency)
(In US Dollars) (In OriginalCurrency)
(In US Dollars)
USD FIXED 0.75 — 1970 2020 19,142,570.31 19,142,570.31 1,722,831.61 1,722,831.61USD FIXED 0.75 — 1970 2020 3,517,527.02 3,517,527.02 316,577.08 316,577.08USD FIXED 0.75 — 1970 2020 12,772,164.91 12,772,164.91 1,149,495.13 1,149,495.13USD FIXED 0.75 — 1970 2020 4,350,782.85 4,350,782.85 391,569.95 391,569.95USD FIXED 0.75 — 1970 2020 4,497,027.17 4,497,027.17 404,732.23 404,732.23USD FIXED 0.75 — 1970 2020 14,979,041.15 14,979,041.15 1,348,113.47 1,348,113.47USD FIXED 0.75 — 1971 2021 7,566,936.76 7,566,936.76 908,032.56 908,032.56USD FIXED 0.75 — 1971 2021 14,968,798.12 14,968,798.12 1,571,843.70 1,571,843.70USD FIXED 0.75 — 1971 2021 34,305,419.93 34,305,419.93 3,602,069.03 3,602,069.03USD FIXED 0.75 — 1971 2021 4,019,075.98 4,019,075.98 482,289.10 482,289.10USD FIXED 0.75 — 1972 2021 12,533,749.01 12,533,749.01 1,504,049.53 1,504,049.53USD FIXED 0.75 — 1972 2021 6,257,472.04 6,257,472.04 844,758.76 844,758.76USD FIXED 0.75 — 1972 2021 12,891,464.45 12,891,464.45 1,739,882.45 1,739,882.45USD FIXED 0.75 — 1972 2022 9,550,169.95 9,550,169.95 1,289,272.90 1,289,272.90USD FIXED 0.75 — 1972 2022 8,252,642.11 8,252,642.11 1,114,106.27 1,114,106.27USD FIXED 0.75 — 1972 2022 10,969,224.25 10,969,224.25 1,480,842.00 1,480,842.00USD FIXED 0.75 — 1972 2022 39,991,131.55 39,991,131.55 5,398,802.88 5,398,802.88USD FIXED 0.75 — 1973 2023 3,600,000.00 3,600,000.00 504,000.00 504,000.00USD FIXED 0.75 — 1973 2022 5,000,000.00 5,000,000.00 825,000.00 825,000.00USD FIXED 0.75 — 1973 2023 13,500,000.00 13,500,000.00 2,430,000.00 2,430,000.00USD FIXED 0.75 — 1973 2023 14,000,000.00 14,000,000.00 2,520,000.00 2,520,000.00USD FIXED 0.75 — 1973 2023 46,000,000.00 46,000,000.00 7,590,000.00 7,590,000.00USD FIXED 0.75 — 1973 2023 7,702,697.88 7,702,697.88 1,386,297.88 1,386,297.88USD FIXED 0.75 — 1973 2023 50,000,000.00 50,000,000.00 9,000,000.00 9,000,000.00USD FIXED 0.75 — 1973 2023 14,896,026.07 14,896,026.07 2,678,026.07 2,678,026.07USD FIXED 0.75 — 1973 2023 9,992,038.40 9,992,038.40 1,798,566.76 1,798,566.76USD FIXED 0.75 — 1974 2023 5,000,000.00 5,000,000.00 975,000.00 975,000.00USD FIXED 0.75 — 1974 2024 6,500,000.00 6,500,000.00 1,365,000.00 1,365,000.00USD FIXED 0.75 — 1974 2024 14,618,111.19 14,618,111.19 3,074,911.19 3,074,911.19USD FIXED 0.75 — 1974 2024 30,000,000.00 30,000,000.00 6,300,000.00 6,300,000.00USD FIXED 0.75 — 1978 2026 40,000,000.00 40,000,000.00 10,200,000.00 10,200,000.00USD FIXED 0.75 — 1978 2026 28,673,287.20 28,673,287.20 7,311,683.00 7,311,683.00USD FIXED 0.75 — 1978 2026 49,000,000.00 49,000,000.00 12,495,000.00 12,495,000.00USD FIXED 0.75 — 1979 2026 9,546,068.80 9,546,068.80 2,434,247.00 2,434,247.00USD FIXED 0.75 — 1979 2025 67,000,000.00 67,000,000.00 17,085,000.00 17,085,000.00USD FIXED 0.75 — 1979 2029 5,500,000.00 5,500,000.00 2,090,871.00 2,090,871.00USD FIXED 0.75 — 1979 2026 11,147,915.92 11,147,915.92 3,008,718.00 3,008,718.00USD FIXED 0.75 — 1980 2026 26,163,597.26 26,163,597.26 6,671,701.00 6,671,701.00USD FIXED 0.75 — 1980 2026 36,526,866.92 36,526,866.92 9,314,334.00 9,314,334.00USD FIXED 0.75 — 1980 2029 35,058,626.71 35,058,626.71 9,465,822.00 9,465,822.00USD FIXED 0.75 — 1980 2026 30,000,000.00 30,000,000.00 7,650,000.00 7,650,000.00USD FIXED 2.00 — 2011 2030 4,670,000.00 4,670,000.00 5,651,379.42 5,651,379.42USD FIXED 2.50 — 2013 2032 1,600,000.00 1,600,000.00 304,867.33 304,867.33USD FIXED 4.22 — 2007 2027 600,000,000.00 600,000,000.00 479,940,000.00 479,940,000.00USD FIXED 4.25 — 2008 2027 200,000,000.00 200,000,000.00 159,980,000.00 159,980,000.00USD FIXED 4.41 — 2008 2033 600,000,000.00 600,000,000.00 576,900,000.05 576,900,000.05USD FIXED 4.45 — 2008 2030 51,965,239.80 51,965,239.80 51,965,239.80 51,965,239.80USD FIXED 4.58 — 2005 2025 400,000,000.00 400,000,000.00 263,520,000.00 263,520,000.00USD FIXED 4.69 — 2008 2033 200,000,000.00 200,000,000.00 200,000,000.00 200,000,000.00USD FIXED 4.69 — 2008 2033 750,000,000.00 750,000,000.00 750,000,000.00 750,000,000.00USD FIXED 4.73 — 2006 2026 530,000,000.00 530,000,000.00 395,592,000.00 395,592,000.00USD FIXED 4.92 0.25 2002 2021 193,047,093.88 193,047,093.88 69,807,224.79 69,807,224.79USD FIXED 4.93 0.25 2001 2021 208,900,000.00 208,900,000.00 73,385,000.00 73,385,000.00USD FIXED 4.93 0.25 2001 2021 12,476,343.76 12,476,343.76 3,276,498.49 3,276,498.49USD FIXED 4.93 0.25 2005 2023 44,595,402.62 44,595,402.62 20,507,954.03 20,507,954.03USD FIXED 4.98 0.25 2002 2022 29,496,020.73 29,496,020.73 11,252,970.70 11,252,970.70USD FIXED 4.98 0.25 2003 2023 12,742,289.93 12,742,289.93 5,451,670.03 5,451,670.03USD FIXED 5.03 0.25 2004 2024 187,774,783.44 187,774,783.44 95,282,276.16 95,282,276.16USD FIXED 5.04 0.25 2003 2023 132,048,021.39 132,048,021.39 58,485,152.56 58,485,152.56USD FIXED 5.04 0.25 2004 2024 8,871,239.64 8,871,239.64 4,071,922.32 4,071,922.32USD FIXED 5.05 0.25 2001 2021 10,293,124.91 10,293,124.91 3,610,224.91 3,610,224.91USD FIXED 5.08 0.30 2004 2023 44,929,928.35 44,929,928.35 19,326,757.46 19,326,757.46USD FIXED 5.10 — 2008 2024 16,807,000.00 16,807,000.00 10,253,755.58 10,253,755.58USD FIXED 5.15 0.25 2005 2025 80,000,000.00 80,000,000.00 46,770,796.58 46,770,796.58USD FIXED 5.20 — 2007 2026 174,107,151.67 174,107,151.67 123,995,140.00 123,995,140.00USD FIXED 5.22 — 2004 2024 300,000,000.00 300,000,000.00 163,045,000.00 163,045,000.00USD FIXED 5.28 0.25 2005 2025 66,612,197.07 66,612,197.07 39,375,643.62 39,375,643.62USD FIXED 5.28 0.25 2005 2025 68,139,964.66 68,139,964.66 40,925,503.96 40,925,503.96USD FIXED 5.28 0.25 2005 2025 36,374,143.71 36,374,143.71 22,290,082.59 22,290,082.59USD FIXED 5.30 — 2000 2020 64,967,320.20 64,967,320.20 19,095,887.26 19,095,887.26USD FIXED 5.48 0.25 2006 2026 61,765,082.04 61,765,082.04 39,995,755.86 39,995,755.86USD LIBOR
6 MONTHS1.20 — 2011 2026 8,230,000.00 8,230,000.00 7,304,211.76 7,304,211.76
T-7

Table of Contents
CURRENCYBASE
INTERESTRATE BASIS
INTERESTRATE
COMMITMENTCHARGE
ISSUEDATE
MATURITYDATE ORIGINAL AMOUNT OUTSTANDING BALANCE
(In OriginalCurrency)
(In US Dollars) (In OriginalCurrency)
(In US Dollars)
USD LIBOR6 MONTHS
1.20 0.25 2016 2032 216,500,000.00 216,500,000.00 14,500,000.00 14,500,000.00
USD LIBOR6 MONTHS
1.47 — 2008 2030 41,190,000.00 41,190,000.00 41,190,000.00 41,190,000.00
USD LIBOR6 MONTHS
1.48 — 2007 2027 18,060,077.89 18,060,077.89 13,601,016.06 13,601,016.06
USD LIBOR6 MONTHS
1.49 0.15 2010 2035 39,126,659.64 39,126,659.64 37,497,185.87 37,497,185.87
USD LIBOR6 MONTHS
1.49 0.15 2010 2035 35,000,000.00 35,000,000.00 21,112,834.14 21,112,834.14
USD LIBOR6 MONTHS
1.49 0.15 2010 2034 99,481,861.00 99,481,861.00 92,814,663.75 92,814,663.75
USD LIBOR6 MONTHS
1.55 — 2009 2024 200,000,000.00 200,000,000.00 150,444,632.00 150,444,632.00
USD LIBOR6 MONTHS
1.55 0.15 2008 2023 200,000,000.00 200,000,000.00 136,152,138.00 136,152,138.00
USD LIBOR6 MONTHS
1.56 — 2009 2024 300,000,000.00 300,000,000.00 215,209,026.00 215,209,026.00
USD LIBOR6 MONTHS
1.56 0.15 2009 2034 83,134,598.43 83,134,598.43 78,453,511.15 78,453,511.15
USD LIBOR6 MONTHS
1.57 0.15 2009 2033 17,232,130.44 17,232,130.44 16,549,506.61 16,549,506.61
USD LIBOR6 MONTHS
1.57 0.75 2007 2022 200,000,000.00 200,000,000.00 120,380,000.00 120,380,000.00
USD LIBOR6 MONTHS
1.59 — 2011 2025 200,000,000.00 200,000,000.00 157,084,582.00 157,084,582.00
USD LIBOR6 MONTHS
1.62 0.15 2013 2031 45,520,000.00 45,520,000.00 13,032,508.24 13,032,508.24
USD LIBOR6 MONTHS
1.66 0.15 2011 2036 95,554,169.88 95,554,169.88 93,044,892.53 93,044,892.53
USD LIBOR6 MONTHS
1.66 0.15 2012 2036 180,000,000.00 180,000,000.00 103,111,997.21 103,111,997.21
USD LIBOR6 MONTHS
1.67 0.15 2010 2025 200,000,000.00 200,000,000.00 163,408,344.00 163,408,344.00
USD LIBOR6 MONTHS
1.68 — 2009 2033 20,487,155.57 20,487,155.57 20,487,155.57 20,487,155.57
USD LIBOR6 MONTHS
1.68 — 2010 2033 100,000,000.00 100,000,000.00 99,880,000.00 99,880,000.00
USD LIBOR6 MONTHS
1.69 — 2011 2026 200,000,000.00 200,000,000.00 169,430,976.00 169,430,976.00
USD LIBOR6 MONTHS
1.73 0.15 2016 2031 500,000,000.00 500,000,000.00 500,000,000.00 500,000,000.00
USD LIBOR6 MONTHS
1.74 0.15 2012 2030 75,000,000.00 75,000,000.00 38,096,176.64 38,096,176.64
USD LIBOR6 MONTHS
1.74 0.15 2012 2030 57,750,000.00 57,750,000.00 44,318,647.75 44,318,647.75
USD LIBOR6 MONTHS
1.74 0.15 2012 2027 300,000,000.00 300,000,000.00 262,500,000.00 262,500,000.00
USD LIBOR6 MONTHS
1.77 0.15 2012 2027 300,000,000.00 300,000,000.00 250,000,000.00 250,000,000.00
USD LIBOR6 MONTHS
1.77 0.15 2013 2033 49,500,000.00 49,500,000.00 27,601,891.13 27,601,891.13
USD LIBOR6 MONTHS
1.77 0.15 2013 2028 400,000,000.00 400,000,000.00 383,333,333.33 383,333,333.33
USD LIBOR6 MONTHS
1.77 — 2013 2029 99,900,000.00 99,900,000.00 87,600,000.00 87,600,000.00
USD LIBOR6 MONTHS
1.77 — 2014 2030 500,000,000.00 500,000,000.00 500,000,000.00 500,000,000.00
USD LIBOR6 MONTHS
1.78 — 2009 2034 250,000,000.00 250,000,000.00 250,000,000.00 250,000,000.00
USD LIBOR6 MONTHS
1.78 — 2009 2034 750,000,000.00 750,000,000.00 750,000,000.00 750,000,000.00
USD LIBOR6 MONTHS
1.79 0.15 2016 2033 108,700,000.00 108,700,000.00 1,500,000.00 1,500,000.00
USD LIBOR6 MONTHS
1.80 — 2009 2034 66,999,926.05 66,999,926.05 66,999,926.05 66,999,926.05
USD LIBOR6 MONTHS
1.80 — 2010 2034 18,718,505.27 18,718,505.27 18,718,505.27 18,718,505.27
USD LIBOR6 MONTHS
1.80 — 2010 2034 205,000,000.00 205,000,000.00 119,435,500.76 119,435,500.76
USD LIBOR6 MONTHS
1.82 0.64 2004 2028 46,372,873.95 46,372,873.95 37,560,700.05 37,560,700.05
USD LIBOR6 MONTHS
1.82 0.75 2004 2028 51,938,068.39 51,938,068.39 41,632,292.74 41,632,292.74
T-8

Table of Contents
CURRENCYBASE
INTERESTRATE BASIS
INTERESTRATE
COMMITMENTCHARGE
ISSUEDATE
MATURITYDATE ORIGINAL AMOUNT OUTSTANDING BALANCE
(In OriginalCurrency)
(In US Dollars) (In OriginalCurrency)
(In US Dollars)
USD LIBOR6 MONTHS
1.82 0.75 2005 2025 53,986,552.56 53,986,552.56 39,914,423.63 39,914,423.63
USD LIBOR6 MONTHS
1.83 — 2002 2021 22,078,416.75 22,078,416.75 9,383,590.62 9,383,590.62
USD LIBOR6 MONTHS
1.83 0.75 2002 2022 25,421,968.55 25,421,968.55 11,734,163.93 11,734,163.93
USD LIBOR6 MONTHS
1.83 0.75 2002 2022 53,130,639.12 53,130,639.12 26,130,810.84 26,130,810.84
USD LIBOR6 MONTHS
1.85 0.75 2002 2020 22,156,540.62 22,156,540.62 7,007,748.48 7,007,748.48
USD LIBOR6 MONTHS
1.86 — 2010 2034 149,980,000.00 149,980,000.00 149,826,594.31 149,826,594.31
USD LIBOR6 MONTHS
1.86 — 2010 2034 779,674,925.30 779,674,925.30 779,674,925.30 779,674,925.30
USD LIBOR6 MONTHS
1.86 — 2010 2034 200,000,000.00 200,000,000.00 200,000,000.00 200,000,000.00
USD LIBOR6 MONTHS
1.86 — 2010 2034 219,770,854.89 219,770,854.89 219,770,854.89 219,770,854.89
USD LIBOR6 MONTHS
1.86 — 2010 2034 500,000,000.00 500,000,000.00 500,000,000.00 500,000,000.00
USD LIBOR6 MONTHS
1.86 — 2014 2030 500,000,000.00 500,000,000.00 499,458,864.01 499,458,864.01
USD LIBOR6 MONTHS
1.86 0.15 2016 2031 500,000,000.00 500,000,000.00 500,000,000.00 500,000,000.00
USD LIBOR6 MONTHS
1.86 — 2014 2029 400,000,000.00 400,000,000.00 400,000,000.00 400,000,000.00
USD LIBOR6 MONTHS
1.86 0.15 2013 2033 224,000,000.00 224,000,000.00 8,241,506.78 8,241,506.78
USD LIBOR6 MONTHS
1.86 0.15 2015 2030 400,000,000.00 400,000,000.00 400,000,000.00 400,000,000.00
USD LIBOR6 MONTHS
1.86 0.15 2015 2030 400,000,000.00 400,000,000.00 400,000,000.00 400,000,000.00
USD LIBOR6 MONTHS
1.87 0.75 2002 2021 17,173,858.28 17,173,858.28 6,866,168.95 6,866,168.95
USD LIBOR6 MONTHS
1.87 0.75 2002 2022 33,707,580.57 33,707,580.57 14,470,708.68 14,470,708.68
USD LIBOR6 MONTHS
1.87 0.75 2002 2022 8,131,097.74 8,131,097.74 3,776,034.44 3,776,034.44
USD LIBOR6 MONTHS
1.87 0.75 2004 2019 100,000,000.00 100,000,000.00 25,680,000.00 25,680,000.00
USD LIBOR6 MONTHS
1.87 — 2013 2033 300,000,000.00 300,000,000.00 300,000,000.00 300,000,000.00
USD LIBOR6 MONTHS
1.87 — 2013 2033 400,000,000.00 400,000,000.00 400,000,000.00 400,000,000.00
USD LIBOR6 MONTHS
1.89 0.75 2005 2030 17,547,670.21 17,547,670.21 14,774,727.13 14,774,727.13
USD LIBOR6 MONTHS
1.90 0.50 2012 2023 2,000,000,000.00 2,000,000,000.00 2,000,000,000.00 2,000,000,000.00
USD LIBOR6 MONTHS
1.93 0.25 2007 2026 25,729,879.62 25,729,879.62 18,503,705.65 18,503,705.65
USD LIBOR6 MONTHS
1.94 0.75 2002 2022 26,027,942.66 26,027,942.66 12,284,761.76 12,284,761.76
USD LIBOR6 MONTHS
1.94 0.75 2002 2022 114,207.93 114,207.93 55,707.93 55,707.93
USD LIBOR6 MONTHS
1.94 0.75 2002 2022 57,253,175.39 57,253,175.39 28,656,777.82 28,656,777.82
USD LIBOR6 MONTHS
1.94 0.75 2002 2025 29,581,191.58 29,581,191.58 19,813,086.90 19,813,086.90
USD LIBOR6 MONTHS
1.94 0.75 2002 2025 129,187,219.09 129,187,219.09 86,559,912.72 86,559,912.72
USD LIBOR6 MONTHS
1.95 0.75 2003 2027 101,942,064.03 101,942,064.03 81,909,452.46 81,909,452.46
USD LIBOR6 MONTHS
1.95 0.75 2003 2027 152,506,250.43 152,506,250.43 120,688,486.38 120,688,486.38
USD LIBOR6 MONTHS
1.95 0.75 2007 2022 400,000,000.00 400,000,000.00 240,760,000.00 240,760,000.00
USD LIBOR6 MONTHS
1.96 — 2014 2033 47,380,000.00 47,380,000.00 15,800,000.00 15,800,000.00
USD LIBOR6 MONTHS
1.96 0.75 2002 2022 10,205,208.43 10,205,208.43 5,034,113.62 5,034,113.62
USD LIBOR6 MONTHS
1.96 0.75 2002 2022 64,645,578.09 64,645,578.09 32,748,671.32 32,748,671.32
USD LIBOR6 MONTHS
1.96 — 2006 2021 400,000,000.00 400,000,000.00 187,320,000.00 187,320,000.00
T-9

Table of Contents
CURRENCYBASE
INTERESTRATE BASIS
INTERESTRATE
COMMITMENTCHARGE
ISSUEDATE
MATURITYDATE ORIGINAL AMOUNT OUTSTANDING BALANCE
(In OriginalCurrency)
(In US Dollars) (In OriginalCurrency)
(In US Dollars)
USD LIBOR6 MONTHS
1.96 0.75 2006 2030 143,052,258.39 143,052,258.39 117,807,341.76 117,807,341.76
USD LIBOR6 MONTHS
1.97 0.75 2002 2022 13,084,300.82 13,084,300.82 6,611,564.86 6,611,564.86
USD LIBOR6 MONTHS
1.97 0.75 2002 2022 15,868,761.92 15,868,761.92 8,043,134.16 8,043,134.16
USD LIBOR6 MONTHS
1.97 0.75 2002 2023 61,588,530.21 61,588,530.21 34,325,857.20 34,325,857.20
USD LIBOR6 MONTHS
1.97 0.75 2002 2024 176,882,876.15 176,882,876.15 109,446,956.89 109,446,956.89
USD LIBOR6 MONTHS
1.97 0.75 2002 2017 250,000,000.00 250,000,000.00 17,225,000.00 17,225,000.00
USD LIBOR6 MONTHS
1.97 — 2011 2035 525,373,015.50 525,373,015.50 525,373,015.50 525,373,015.50
USD LIBOR6 MONTHS
1.97 — 2013 2034 325,000,000.00 325,000,000.00 31,800,319.00 31,800,319.00
USD LIBOR6 MONTHS
2.00 — 2011 2035 8,455,447.92 8,455,447.92 8,455,447.92 8,455,447.92
USD LIBOR6 MONTHS
2.00 — 2012 2036 139,640,000.00 139,640,000.00 84,588,808.90 84,588,808.90
USD LIBOR6 MONTHS
2.00 — 2012 2036 80,000,000.00 80,000,000.00 56,187,369.95 56,187,369.95
USD LIBOR6 MONTHS
2.00 — 2012 2037 100,000,000.00 100,000,000.00 100,000,000.00 100,000,000.00
USD LIBOR6 MONTHS
2.00 — 2012 2037 300,000,000.00 300,000,000.00 300,000,000.00 300,000,000.00
USD LIBOR6 MONTHS
2.02 0.25 2004 2024 29,978,870.93 29,978,870.93 14,789,324.01 14,789,324.01
USD LIBOR6 MONTHS
2.05 — 2011 2035 175,000,000.00 175,000,000.00 122,301,608.46 122,301,608.46
USD LIBOR6 MONTHS
2.05 — 2012 2037 266,000,000.00 266,000,000.00 250,386,429.21 250,386,429.21
USD LIBOR6 MONTHS
2.06 — 2010 2035 200,000,000.00 200,000,000.00 200,000,000.00 200,000,000.00
USD LIBOR6 MONTHS
2.06 — 2010 2035 600,000,000.00 600,000,000.00 600,000,000.00 600,000,000.00
USD LIBOR6 MONTHS
2.06 — 2011 2035 112,650,000.00 112,650,000.00 108,518,088.00 108,518,088.00
USD LIBOR6 MONTHS
2.06 — 2011 2036 400,000,000.00 400,000,000.00 400,000,000.00 400,000,000.00
USD LIBOR6 MONTHS
2.06 — 2013 2037 650,000,000.00 650,000,000.00 522,045,027.77 522,045,027.77
USD LIBOR6 MONTHS
2.06 — 2013 2037 80,000,000.00 80,000,000.00 37,451,344.88 37,451,344.88
USD LIBOR6 MONTHS
2.06 0.25 2016 2036 300,000,000.00 300,000,000.00 33,500,000.00 33,500,000.00
USD LIBOR6 MONTHS
2.07 — 2011 2035 44,000,000.00 44,000,000.00 32,526,115.69 32,526,115.69
USD LIBOR6 MONTHS
2.07 — 2011 2035 250,000,000.00 250,000,000.00 128,970,217.52 128,970,217.52
USD LIBOR6 MONTHS
2.07 — 2012 2029 29,600,000.00 29,600,000.00 2,735,219.82 2,735,219.82
USD LIBOR6 MONTHS
2.09 — 2011 2035 150,000,000.00 150,000,000.00 94,745,178.00 94,745,178.00
USD LIBOR6 MONTHS
2.11 — 2009 2033 50,000,000.00 50,000,000.00 48,010,337.19 48,010,337.19
USD LIBOR6 MONTHS
2.13 0.25 2004 2024 54,410,915.71 54,410,915.71 29,179,804.39 29,179,804.39
USD LIBOR6 MONTHS
2.13 0.25 2005 2025 39,549,612.47 39,549,612.47 22,452,358.11 22,452,358.11
USD LIBOR6 MONTHS
2.13 0.25 2005 2025 14,500,000.00 14,500,000.00 8,630,000.00 8,630,000.00
USD LIBOR6 MONTHS
2.16 0.25 2015 2035 500,000,000.00 500,000,000.00 500,000,000.00 500,000,000.00
USD LIBOR6 MONTHS
2.16 0.25 2016 2037 400,000,000.00 400,000,000.00 400,000,000.00 400,000,000.00
USD LIBOR6 MONTHS
2.17 — 2009 2033 275,000.00 275,000.00 275,000.00 275,000.00
USD LIBOR6 MONTHS
2.18 0.25 2016 2036 400,000,000.00 400,000,000.00 400,000,000.00 400,000,000.00
USD LIBOR6 MONTHS
2.33 0.25 2016 2032 216,500,000.00 216,500,000.00 14,500,000.00 14,500,000.00
USD LIBOR6 MONTHS
2.52 0.25 2002 2022 2,041,270.03 2,041,270.03 753,494.09 753,494.09
T-10

Table of Contents
CURRENCYBASE
INTERESTRATE BASIS
INTERESTRATE
COMMITMENTCHARGE
ISSUEDATE
MATURITYDATE ORIGINAL AMOUNT OUTSTANDING BALANCE
(In OriginalCurrency)
(In US Dollars) (In OriginalCurrency)
(In US Dollars)
USD LIBOR6 MONTHS
2.74 — 2009 2034 5,000,000.00 5,000,000.00 5,000,000.00 5,000,000.00
USD LIBOR6 MONTHS
2.83 0.15 2015 2030 100,000,000.00 100,000,000.00 100,000,000.00 100,000,000.00
USD LIBOR6 MONTHS
2.85 — 2009 2033 115,000,000.00 115,000,000.00 114,946,689.77 114,946,689.77
USD LIBOR6 MONTHS
2.85 — 2009 2033 296,075,410.72 296,075,410.72 296,075,410.72 296,075,410.72
USD LIBOR6 MONTHS
2.93 — 2013 2033 25,000,000.00 25,000,000.00 915,653.97 915,653.97
USD LIBOR6 MONTHS
3.25 0.75 2012 2020 500,000,000.00 500,000,000.00 500,000,000.00 500,000,000.00
USD LIBOR 6 MTH 1.79 0.15 2014 2032 74,400,000.00 74,400,000.00 39,063,286.53 39,063,286.53USD NO INTEREST
RATE— — 2008 2024 5,190,000.00 5,190,000.00 3,828,030.20 3,828,030.20
USD NO INTERESTRATE
— — 2011 2026 133,605,199.60 133,605,199.60 111,344,062.25 111,344,062.25
USD NO INTERESTRATE
— — 2011 2029 10,000,000.00 10,000,000.00 7,760,089.31 7,760,089.31
USD NO INTERESTRATE
— — 2012 2029 65,000,000.00 65,000,000.00 20,760,380.96 20,760,380.96
USD NO INTERESTRATE
— — 2013 2034 10,000,000.00 10,000,000.00 8,302,857.00 8,302,857.00
USD NO INTERESTRATE
— — 2014 2027 100,000,000.00 100,000,000.00 38,337,813.00 38,337,813.00
USD NO INTERESTRATE
— — 2016 2030 8,000,000.00 8,000,000.00 208,955.00 208,955.00
USD NO INTERESTRATE
— — 2016 2030 13,870,000.00 13,870,000.00 146,313.00 146,313.00
USD NO INTERESTRATE
— — 2016 2030 311,760,000.00 311,760,000.00 32,094,328.00 32,094,328.00
BILATERALAUD NO INTEREST
RATE— — 2007 2047 290,024,929.00 227,379,587.33 287,124,679.71 225,105,791.45
CAD NO INTERESTRATE
— — 1971 2021 4,000,000.00 3,214,530.09 350,000.00 281,271.38
CAD NO INTERESTRATE
— — 1972 2021 1,306,665.45 1,050,078.85 114,165.45 91,747.07
CAD NO INTERESTRATE
— — 1972 2022 6,000,000.00 4,821,795.14 675,000.00 542,451.95
CAD NO INTERESTRATE
— — 1973 2023 7,023,677.48 5,644,455.65 959,773.10 771,304.88
CAD NO INTERESTRATE
— — 1973 2023 27,007,701.72 21,704,267.47 3,717,701.72 2,987,666.01
CAD NO INTERESTRATE
— — 1973 2023 22,191,471.21 17,833,788.00 3,328,747.21 2,675,089.52
CAD NO INTERESTRATE
— — 1973 2024 11,114,463.50 8,931,944.34 1,930,416.13 1,551,345.18
CAD NO INTERESTRATE
— — 1975 2024 12,417,888.39 9,979,418.98 2,171,388.39 1,744,998.33
CAD NO INTERESTRATE
— — 1975 2024 1,930,011.01 1,551,019.62 304,591.37 244,779.53
CAD NO INTERESTRATE
— — 1976 2024 9,399,999.29 7,554,145.15 1,463,999.85 1,176,517.89
CAD NO INTERESTRATE
— — 1976 2026 9,951,251.60 7,997,149.43 2,237,690.25 1,798,280.66
CAD NO INTERESTRATE
— — 1977 2027 3,797,863.76 3,052,086.84 947,863.76 761,734.14
CAD NO INTERESTRATE
— — 1978 2027 18,482,976.01 14,853,520.64 4,589,281.21 3,688,095.64
CAD NO INTERESTRATE
— — 1978 2027 19,479,946.48 15,654,718.54 4,729,946.48 3,801,138.82
CAD NO INTERESTRATE
— — 1979 2029 12,847,053.89 10,324,310.33 3,854,116.37 3,097,293.26
CAD NO INTERESTRATE
— — 1981 2030 21,059,866.01 16,924,393.26 6,844,456.73 5,500,428.03
CAD NO INTERESTRATE
— — 1982 2030 31,544,124.46 25,349,884.32 10,251,840.76 8,238,712.66
CAD NO INTERESTRATE
— — 1982 2024 1,480,843.82 1,190,054.26 262,093.82 210,627.12
CAD NO INTERESTRATE
— — 1983 2033 14,999,731.83 12,054,272.33 5,777,556.89 4,643,032.62
CAD NO INTERESTRATE
— — 1984 2034 855,778.37 687,731.33 353,009.03 283,689.54
T-11

Table of Contents
CURRENCYBASE
INTERESTRATE BASIS
INTERESTRATE
COMMITMENTCHARGE
ISSUEDATE
MATURITYDATE ORIGINAL AMOUNT OUTSTANDING BALANCE
(In OriginalCurrency)
(In US Dollars) (In OriginalCurrency)
(In US Dollars)
CAD NO INTERESTRATE
— — 1984 2035 49,977,499.08 40,163,543.68 21,727,499.08 17,460,924.90
CAD NO INTERESTRATE
— — 1998 2020 14,217,906.08 11,425,971.73 1,895,720.88 1,523,462.95
CAD NO INTERESTRATE
— — 2000 2021 14,342,221.64 11,525,875.76 4,412,991.08 3,546,423.16
CAD NO INTERESTRATE
— — 2002 2023 10,880,981.79 8,744,310.85 6,528,588.99 5,246,586.44
CHF NO INTERESTRATE
— — 1985 2020 51,000,000.00 52,501,574.27 7,083,333.25 7,291,885.23
CHF NO INTERESTRATE
— — 2002 2023 5,666,667.17 5,833,508.77 3,400,000.37 3,500,105.33
CNY FIXED 2.50 0.35 2008 2025 1,550,083,479.73 233,555,714.81 1,162,562,609.83 175,166,786.12DKK NO INTEREST
RATE— — 1998 2020 14,799,999.00 2,342,813.95 1,973,333.80 312,375.29
DKK NO INTERESTRATE
— — 2000 2021 19,733,332.00 3,123,751.94 6,071,794.60 961,154.46
DKK NO INTERESTRATE
— — 2002 2023 19,733,332.00 3,123,751.94 11,839,999.20 1,874,251.16
EUR EURIBOR6 MTH
0.35 — 2002 2021 443,556,823.87 522,554,452.00 207,418,318.11 244,359,594.36
EUR EURIBOR6 MTH
0.41 — 2002 2021 8,914,411.33 10,502,071.16 3,968,696.40 4,675,522.64
EUR EURIBOR6 MTH
0.46 — 2004 2018 74,927,500.00 88,272,114.41 41,159,500.00 48,490,021.59
EUR EURIBOR6 MTH
0.46 0.25 2005 2021 48,496,003.31 57,133,158.75 31,467,893.31 37,072,336.30
EUR EURIBOR6 MTH
0.50 — 2002 2021 44,306,219.50 52,197,172.96 19,725,128.65 23,238,181.08
EUR FIXED 0.15 — 2007 2037 13,594,264.00 16,015,407.25 13,594,264.00 16,015,407.25EUR FIXED 0.15 — 2008 2038 8,554,232.85 10,077,744.76 8,554,232.85 10,077,744.76EUR FIXED 0.15 — 2008 2038 10,198,683.34 12,015,072.47 10,198,683.34 12,015,072.47EUR FIXED 0.15 — 2008 2039 6,888,831.50 8,115,734.84 6,888,831.50 8,115,734.84EUR FIXED 0.15 — 2010 2040 3,695,046.00 4,353,135.01 3,695,046.00 4,353,135.01EUR FIXED 0.15 — 2011 2046 7,349,158.79 8,658,046.59 7,349,158.79 8,658,046.59EUR FIXED 0.15 — 2013 2051 12,430,000.55 14,643,788.07 12,430,000.54 14,643,788.06EUR FIXED 0.15 — 2016 2054 6,979,739.37 8,222,833.43 2,093,921.81 2,466,850.03EUR FIXED 0.20 — 2003 2038 10,840,484.34 12,771,178.46 9,291,843.75 10,946,724.43EUR FIXED 0.22 — 2014 2037 48,000,000.00 56,548,817.08 47,358,696.00 55,793,296.61EUR FIXED 0.25 — 1997 2029 15,683,499.59 18,476,736.45 10,531,095.31 12,406,687.13EUR FIXED 0.25 — 1997 2029 12,337,976.78 14,535,374.83 8,650,101.85 10,190,688.07EUR FIXED 0.40 0.40 2014 2034 11,523,700.00 13,576,075.07 11,523,700.00 13,576,075.07EUR FIXED 0.40 0.40 2015 2034 7,730,000.00 9,106,715.75 7,730,000.00 9,106,715.75EUR FIXED 0.50 — 1993 2038 63,683,736.16 75,025,832.23 38,763,402.25 45,667,177.98EUR FIXED 0.50 — 1993 2036 13,102,993.03 15,436,640.75 7,820,132.62 9,212,901.02EUR FIXED 0.50 — 1993 2045 47,838,742.36 56,358,839.39 31,863,636.93 37,538,562.00EUR FIXED 0.63 — 1998 2031 2,285,816.28 2,692,920.97 1,530,279.00 1,802,822.23EUR FIXED 0.75 — 1989 2029 20,451,675.25 24,094,125.89 8,385,186.96 9,878,591.74EUR FIXED 0.75 — 1991 2031 79,311,596.61 93,437,020.18 41,130,364.17 48,455,696.66EUR FIXED 0.75 — 1991 2033 58,747,437.15 69,210,376.61 30,871,803.69 36,370,082.91EUR FIXED 0.75 — 1993 2033 10,839,387.88 12,769,886.72 5,966,265.07 7,028,859.00EUR FIXED 0.75 — 1995 2035 11,654,155.01 13,729,764.16 7,193,022.00 8,474,101.78EUR FIXED 0.75 0.24 1998 2038 12,271,005.15 14,456,475.53 8,794,220.40 10,360,474.18EUR FIXED 0.75 0.25 1995 2035 8,513,009.04 10,029,178.98 5,112,009.83 6,022,460.60EUR FIXED 0.75 0.25 1995 2035 14,902,735.11 17,556,917.53 9,198,735.11 10,837,033.11EUR FIXED 0.75 0.25 1998 2038 10,946,905.65 12,896,553.44 7,817,799.29 9,210,152.12EUR FIXED 0.75 0.25 1999 2039 76,609,991.67 90,254,258.44 55,259,657.67 65,101,422.36EUR FIXED 0.75 0.25 1999 2039 11,759,713.27 13,854,122.39 8,675,600.63 10,220,728.19EUR FIXED 0.75 0.25 2000 2040 8,087,557.32 9,527,954.16 6,210,557.32 7,316,659.79EUR FIXED 0.75 0.25 2000 2040 14,622,947.80 17,227,300.01 11,215,698.64 13,213,218.56EUR FIXED 0.75 0.25 2001 2035 2,652,707.18 3,125,155.27 1,963,707.18 2,313,444.13EUR FIXED 0.75 0.25 2001 2041 19,186,858.51 22,604,044.84 15,097,931.12 17,786,878.02EUR FIXED 0.75 0.25 2001 2041 20,221,794.79 23,823,303.64 16,513,889.51 19,455,019.11EUR FIXED 0.75 0.25 2003 2043 10,500,383.02 12,370,504.97 9,025,342.82 10,632,759.59EUR FIXED 0.75 0.25 2004 2044 9,000,000.00 10,602,903.20 7,971,000.00 9,390,637.94EUR FIXED 0.75 0.25 2006 2045 6,000,000.00 7,068,602.13 5,700,000.00 6,715,172.03EUR FIXED 0.75 0.25 2006 2046 8,821,144.12 10,392,193.03 8,674,144.12 10,219,012.27EUR FIXED 0.75 0.25 2011 2051 19,000,000.00 22,383,906.76 18,817,730.81 22,169,175.36EUR FIXED 1.00 — 2008 2028 36,800,000.00 43,354,093.09 36,312,282.54 42,779,512.98EUR FIXED 1.00 — 2011 2034 30,299,373.00 35,695,702.11 30,108,039.40 35,470,291.93EUR FIXED 1.41 0.50 2017 2032 150,000,000.00 176,715,053.36 150,000,000.00 176,715,053.36EUR FIXED 1.50 — 1983 2022 4,691,855.66 5,527,476.82 665,616.35 784,162.86EUR FIXED 1.50 — 1983 2020 16,098,616.22 18,965,785.50 1,211,760.34 1,427,575.29EUR FIXED 1.50 — 1983 2024 17,419,324.92 20,521,712.89 2,740,772.43 3,228,904.97
T-12

Table of Contents
CURRENCYBASE
INTERESTRATE BASIS
INTERESTRATE
COMMITMENTCHARGE
ISSUEDATE
MATURITYDATE ORIGINAL AMOUNT OUTSTANDING BALANCE
(In OriginalCurrency)
(In US Dollars) (In OriginalCurrency)
(In US Dollars)
EUR FIXED 1.50 — 1983 2025 11,820,945.61 13,926,260.23 930,703.68 1,096,462.34EUR FIXED 1.50 — 1984 2023 27,187,576.20 32,029,693.19 3,578,057.00 4,215,310.22EUR FIXED 1.50 — 1984 2023 9,390,859.40 11,063,374.80 1,837,339.86 2,164,570.74EUR FIXED 1.50 — 1985 2027 26,359,240.46 31,053,830.56 5,119,728.56 6,031,554.04EUR FIXED 1.50 — 1987 2025 34,256,161.71 40,357,196.30 10,251,794.68 12,077,642.96EUR FIXED 1.50 — 1988 2024 7,351,925.52 8,661,306.07 2,099,990.23 2,473,999.24EUR FIXED 1.50 — 1988 2027 6,342,039.25 7,471,558.70 2,022,802.42 2,383,064.25EUR FIXED 1.95 — 2002 2023 106,768,936.24 125,784,521.77 12,190,613.78 14,361,766.43EUR FIXED 2.00 — 1982 2026 4,729,449.85 5,571,766.55 331,317.08 390,324.77EUR FIXED 2.00 — 1982 2023 12,193,549.04 14,365,224.46 2,362,134.69 2,782,831.72EUR FIXED 2.00 — 1984 2024 27,251,857.27 32,105,422.75 1,109,503.33 1,307,106.27EUR FIXED 2.00 — 1984 2024 26,570,305.19 31,302,486.00 1,109,503.33 1,307,106.27EUR FIXED 2.00 — 1988 2018 20,042,641.74 23,612,243.36 978,612.62 1,152,903.88EUR FIXED 2.00 — 1988 2018 38,105,704.07 44,892,343.52 189,080.48 222,755.78EUR FIXED 2.00 — 1988 2026 5,158,480.87 6,077,208.15 1,735,936.23 2,045,107.09EUR FIXED 2.00 — 1988 2018 20,451,675.25 24,094,125.89 1,533,875.68 1,807,059.48EUR FIXED 2.00 — 1989 2020 25,564,594.06 30,117,657.36 2,495,104.34 2,939,483.31EUR FIXED 2.00 — 1989 2027 28,503,045.77 33,579,448.36 9,083,829.38 10,701,662.62EUR FIXED 2.00 — 1989 2020 16,616,986.14 19,576,477.28 1,621,817.89 1,910,664.23EUR FIXED 2.00 — 1989 2020 12,424,392.71 14,637,181.47 1,510,228.36 1,779,200.57EUR FIXED 2.00 — 1989 2020 10,772,919.94 12,691,580.81 1,347,254.14 1,587,200.58EUR FIXED 2.00 — 1989 2027 33,043,769.71 38,928,876.85 12,825,545.57 15,109,779.80EUR FIXED 2.00 — 1989 2029 33,122,379.46 39,021,487.03 14,752,188.21 17,379,558.18EUR FIXED 2.00 — 1990 2018 5,828,727.44 6,866,825.87 860,504.25 1,013,760.36EUR FIXED 2.00 — 1990 2020 5,675,339.88 6,686,119.93 801,194.30 943,887.29EUR FIXED 2.00 — 1990 2020 15,653,712.23 18,441,643.95 2,673,545.16 3,149,704.50EUR FIXED 2.00 — 1990 2020 16,361,340.20 19,275,300.71 2,863,234.69 3,373,177.81EUR FIXED 2.00 — 1990 2020 6,074,147.55 7,155,955.39 1,062,975.78 1,252,292.14EUR FIXED 2.00 — 1990 2029 37,767,402.61 44,493,790.45 17,100,989.89 20,146,682.27EUR FIXED 2.00 — 1991 2021 17,383,923.96 20,480,007.00 4,435,968.32 5,226,015.86EUR FIXED 2.00 — 1991 2026 19,223,588.36 22,647,316.29 6,453,834.45 7,603,264.66EUR FIXED 2.00 — 1991 2026 8,402,989.03 9,899,564.37 3,529,532.33 4,158,143.29EUR FIXED 2.00 — 1992 2022 20,093,770.93 23,672,478.68 8,988,511.36 10,589,368.43EUR FIXED 2.00 — 1992 2022 9,816,804.12 11,565,180.43 4,755,014.52 5,601,884.30EUR FIXED 2.00 — 1993 2023 23,519,426.54 27,708,244.77 7,055,828.06 8,312,473.55EUR FIXED 2.00 — 1993 2023 11,043,904.63 13,010,827.97 3,502,860.70 4,126,721.44EUR FIXED 2.00 — 1993 2023 23,723,943.24 27,949,185.97 8,152,037.81 9,603,918.64EUR FIXED 2.00 — 1993 2023 36,659,627.88 43,188,720.65 12,164,656.68 14,331,186.36EUR FIXED 2.00 0.25 1994 2024 9,246,473.91 10,893,274.20 4,445,457.16 5,237,194.66EUR FIXED 2.00 0.25 1995 2025 10,276,966.81 12,107,298.26 4,789,782.34 5,642,844.28EUR FIXED 2.00 0.25 1995 2025 21,609,068.50 25,457,651.29 13,168,068.50 15,513,306.18EUR FIXED 2.00 0.25 2001 2031 9,428,222.29 11,107,392.03 6,442,277.74 7,589,649.70EUR FIXED 2.06 — 2000 2021 65,882,617.61 77,616,335.25 15,882,617.61 18,711,317.46EUR FIXED 2.06 — 2015 2033 140,000,000.00 164,934,049.81 140,000,000.00 164,934,049.81EUR FIXED 2.08 — 2016 2034 100,000,000.00 117,810,035.58 100,000,000.00 117,810,035.58EUR FIXED 2.14 — 1998 2020 68,087,026.99 80,213,350.72 9,078,274.59 10,695,118.52EUR FIXED 2.20 — 1995 2028 40,998,276.13 48,300,083.69 25,522,146.20 30,067,649.52EUR FIXED 2.20 — 1996 2029 45,463,607.02 53,560,691.60 26,660,958.63 31,409,284.85EUR FIXED 2.20 — 1999 2028 15,882,218.85 18,710,847.68 7,964,561.00 9,383,052.15EUR FIXED 2.27 0.60 2013 2022 189,512,795.50 223,265,091.80 128,988,408.35 151,961,289.77EUR FIXED 2.30 0.25 2013 2028 7,500,000.00 8,835,752.67 2,490,075.00 2,933,558.24EUR FIXED 2.35 — 2002 2025 9,365,347.00 11,033,318.63 4,305,956.00 5,072,848.30EUR FIXED 2.35 — 2004 2028 2,456,933.28 2,894,513.97 1,427,858.00 1,682,160.02EUR FIXED 2.50 — 1988 2018 9,075,604.32 10,691,972.68 394,788.76 465,100.78EUR FIXED 2.50 — 1989 2020 22,689,010.80 26,729,931.70 2,960,915.91 3,488,256.09EUR FIXED 2.50 — 1990 2020 63,635,189.45 74,968,639.33 8,304,177.92 9,783,154.96EUR FIXED 2.50 — 1990 2020 10,890,725.19 12,830,367.22 1,422,600.91 1,675,966.64EUR FIXED 2.50 — 1998 2020 373,234.23 439,707.38 49,734.26 58,591.95EUR FIXED 2.50 — 1998 2020 87,269,876.71 102,812,672.80 11,635,832.18 13,708,178.03EUR FIXED 2.50 — 2000 2021 681,124.10 802,432.54 209,464.92 246,770.70EUR FIXED 2.50 — 2000 2021 94,195,606.50 110,971,877.53 28,983,123.90 34,145,028.58EUR FIXED 2.50 — 2002 2023 1,171,713.55 1,380,396.15 703,020.00 828,228.11EUR FIXED 2.50 — 2002 2023 87,951,147.33 103,615,277.96 52,770,684.00 62,169,161.59EUR FIXED 2.95 — 2002 2023 127,398,151.49 150,087,807.59 76,438,891.25 90,052,684.98EUR FIXED 3.00 — 1979 2018 12,081,694.28 14,233,448.33 33,220.06 39,136.56EUR FIXED 3.00 — 1980 2022 18,104,110.50 21,328,459.02 426,934.30 502,971.45EUR FIXED 3.00 — 1981 2022 19,780,035.58 23,302,866.95 495,988.58 584,324.32EUR FIXED 3.00 — 1982 2023 22,834,193.64 26,900,971.65 880,018.94 1,036,750.63EUR FIXED 3.00 — 1998 2020 39,514.54 46,552.09 5,268.64 6,206.99EUR FIXED 3.04 — 2000 2021 78,434,007.67 92,403,132.34 24,133,540.51 28,431,732.66EUR FIXED 3.09 — 2013 2031 74,700,000.00 88,004,096.58 74,700,000.00 88,004,096.58EUR FIXED 3.14 — 1998 2020 42,596,662.13 50,183,142.81 5,679,554.85 6,691,085.59EUR FIXED 3.50 — 1989 2020 30,642,252.46 36,099,648.52 1,074,679.29 1,266,080.05EUR FIXED 3.50 — 1991 2018 9,233,324.62 10,877,783.02 173,770.56 204,719.16
T-13

Table of Contents
CURRENCYBASE
INTERESTRATE BASIS
INTERESTRATE
COMMITMENTCHARGE
ISSUEDATE
MATURITYDATE ORIGINAL AMOUNT OUTSTANDING BALANCE
(In OriginalCurrency)
(In US Dollars) (In OriginalCurrency)
(In US Dollars)
EUR FIXED 3.50 — 1991 2018 389,620.78 459,012.38 686.64 808.93EUR FIXED 3.50 — 1991 2018 8,079,797.46 9,518,812.26 164,717.53 194,053.78EUR FIXED 3.50 — 1991 2018 13,549,992.26 15,963,250.70 38,681.49 45,570.68EUR FIXED 3.50 — 1992 2020 6,230,222.41 7,339,827.24 281,431.46 331,554.50EUR FIXED 3.50 — 1992 2020 137,432.79 161,909.62 14,803.01 17,439.43EUR FIXED 3.50 — 1992 2022 13,526,459.96 15,935,527.29 1,331,187.24 1,568,272.16EUR FIXED 3.50 — 1992 2020 18,206,475.65 21,449,055.44 1,351,601.38 1,592,322.07EUR FIXED 3.50 — 1992 2020 109,333.99 128,806.41 9,800.95 11,546.50EUR FIXED 3.50 — 1992 2020 21,037,749.11 24,784,579.71 2,152,892.67 2,536,323.62EUR FIXED 3.50 — 1992 2020 9,003,023.06 10,606,464.67 559,966.65 659,696.91EUR FIXED 3.50 — 1992 2021 3,534,454.15 4,163,941.69 438,557.24 516,664.44EUR FIXED 3.50 — 1992 2018 127,109.09 149,747.26 10,592.34 12,478.84EUR FIXED 3.50 — 1992 2020 149,656.00 176,309.79 19,122.77 22,528.54EUR FIXED 3.50 — 1992 2017 22,505,962.01 26,514,281.85 625,165.66 736,507.89EUR FIXED 3.50 — 1992 2017 7,775,702.56 9,160,557.95 215,991.66 254,459.85EUR FIXED 3.50 — 1992 2020 7,317,552.82 8,620,811.58 591,213.79 696,509.18EUR FIXED 3.50 — 1993 2018 14,439,792.79 17,011,525.02 802,210.69 945,084.70EUR FIXED 3.50 — 1993 2018 13,080,216.27 15,409,807.44 363,339.37 428,050.24EUR FIXED 3.50 — 1993 2020 880,994.92 1,037,900.43 110,612.57 130,312.71EUR FIXED 3.50 — 1993 2021 7,283,797.57 8,581,044.51 1,118,185.15 1,317,334.32EUR FIXED 3.50 — 1993 2018 14,762,920.87 17,392,202.33 820,162.45 966,233.67EUR FIXED 3.50 — 1993 2018 14,363,452.83 16,921,588.89 797,969.63 940,088.30EUR FIXED 3.50 — 1993 2021 4,044,243.75 4,764,525.00 783,187.48 922,673.45EUR FIXED 3.50 — 1993 2021 193,810.87 228,328.65 42,408.81 49,961.83EUR FIXED 3.50 — 1993 2021 592,381.06 697,884.34 74,047.62 87,235.53EUR FIXED 3.50 — 1993 2018 16,060,696.35 18,921,112.08 1,338,391.50 1,576,759.50EUR FIXED 3.50 — 1993 2021 6,200,975.03 7,305,370.89 870,296.32 1,025,296.40EUR FIXED 3.50 — 1993 2021 14,040,345.75 16,540,936.32 2,200,038.97 2,591,866.69EUR FIXED 3.50 — 1993 2018 21,801,531.65 25,684,392.19 1,816,794.35 2,140,366.07EUR FIXED 3.50 — 1994 2020 13,940,467.87 16,423,270.16 1,548,940.83 1,824,807.74EUR FIXED 3.50 — 1994 2020 47,963,507.34 56,505,825.06 5,329,278.54 6,278,424.94EUR FIXED 3.50 — 1994 2020 11,572,422.11 13,633,474.60 1,607,280.84 1,893,538.13EUR FIXED 3.50 — 1994 2020 25,419,580.53 29,946,816.87 3,530,497.27 4,159,280.09EUR FIXED 3.50 — 1995 2020 17,353,302.98 20,443,932.41 2,892,217.28 3,407,322.21EUR FIXED 3.50 — 1995 2020 2,324,306.37 2,738,266.16 387,384.27 456,377.55EUR FIXED 3.50 — 1995 2020 40,900,997.80 48,185,480.06 7,952,971.73 9,369,398.82EUR FIXED 3.50 — 1995 2020 33,066,866.27 38,956,086.92 5,511,144.47 6,492,681.26EUR FIXED 3.50 — 1995 2021 2,119,489.64 2,496,971.50 588,747.18 693,603.26EUR FIXED 3.50 — 1996 2021 15,966,578.92 18,810,232.31 3,548,128.62 4,180,051.59EUR FIXED 3.50 — 1996 2020 11,114,110.88 13,093,537.98 2,161,077.18 2,545,965.79EUR FIXED 3.50 — 1996 2021 52,160,219.17 61,449,972.76 11,591,159.73 13,655,549.40EUR FIXED 3.50 — 1997 2024 26,162,220.30 30,821,721.04 10,174,196.82 11,986,224.89EUR FIXED 3.50 — 1997 2024 10,896,066.51 12,836,659.83 4,540,027.80 5,348,608.37EUR FIXED 3.50 — 1997 2026 29,601,111.93 34,873,080.50 15,622,809.06 18,405,236.91EUR FIXED 3.50 — 1997 2024 39,703,257.12 46,774,421.34 15,440,155.62 18,190,052.83EUR FIXED 3.50 — 1998 2026 20,481,742.00 24,129,547.54 10,240,870.96 12,064,773.72EUR FIXED 3.50 — 1998 2024 2,165,651.00 2,551,354.21 902,354.63 1,063,064.31EUR FIXED 3.50 — 1998 2024 2,172,917.74 2,559,915.16 905,382.31 1,066,631.22EUR FIXED 3.50 — 1998 2027 11,118,943.63 13,099,231.45 6,177,190.82 7,277,350.70EUR FIXED 3.50 — 1998 2020 725,397.77 854,591.37 96,719.66 113,945.47EUR FIXED 3.50 — 1998 2026 15,647,789.02 18,434,665.81 7,823,894.44 9,217,332.82EUR FIXED 3.50 — 1998 2029 24,898,895.81 29,333,398.01 15,907,627.94 18,740,782.14EUR FIXED 3.50 — 1998 2026 34,193,032.06 40,282,823.23 18,046,322.41 21,260,378.85EUR FIXED 3.50 — 1998 2023 32,681,718.35 38,502,344.02 11,801,731.62 13,903,624.22EUR FIXED 3.50 — 1999 2027 68,632,224.56 80,855,648.17 36,222,563.00 42,673,814.36EUR FIXED 3.50 — 1999 2024 28,814,782.89 33,946,705.97 11,205,748.83 13,201,496.68EUR FIXED 3.50 — 1999 2024 28,509,805.56 33,587,412.07 11,087,146.65 13,061,771.41EUR FIXED 3.50 — 1999 2024 28,649,482.83 33,751,965.91 11,141,465.49 13,125,764.46EUR FIXED 3.50 — 1999 2024 22,262,341.12 26,227,271.99 8,657,577.20 10,199,494.78EUR FIXED 3.50 — 1999 2026 21,667,405.42 25,526,378.03 11,435,575.13 13,472,255.13EUR FIXED 3.50 — 1999 2024 22,435,697.06 26,431,502.69 8,724,993.25 10,278,917.65EUR FIXED 3.50 — 2000 2021 545,474.35 642,623.53 167,838.31 197,730.37EUR FIXED 3.50 — 2002 2023 487,625.30 574,471.54 292,575.14 344,682.88EUR FIXED 3.60 — 1988 2018 5,790,724.31 6,822,054.37 8,630.88 10,168.04EUR FIXED 3.60 — 1989 2018 22,841,196.11 26,909,221.26 263,606.72 310,555.17EUR FIXED 3.60 — 1989 2020 33,334,317.79 39,271,171.65 563,082.89 663,368.15EUR FIXED 3.60 — 1989 2018 1,667,336.12 1,964,289.28 13,311.73 15,682.55EUR FIXED 3.60 — 1990 2018 22,867,352.58 26,940,036.21 408,170.15 480,865.40EUR FIXED 3.60 — 1990 2018 5,332,072.04 6,281,715.97 2,119.25 2,496.69EUR FIXED 3.60 — 1990 2018 18,121,166.93 21,348,553.21 53,793.79 63,374.48EUR FIXED 3.60 — 1990 2018 172,419.84 203,127.87 5,776.10 6,804.83EUR FIXED 3.60 — 1990 2018 1,511,323.13 1,780,490.32 31,530.65 37,146.27EUR FIXED 3.60 — 1990 2018 1,734,738.50 2,043,696.04 15,687.82 18,481.83EUR FIXED 3.60 — 1991 2021 9,213,866.91 10,854,859.88 1,376,777.11 1,621,981.60
T-14

Table of Contents
CURRENCYBASE
INTERESTRATE BASIS
INTERESTRATE
COMMITMENTCHARGE
ISSUEDATE
MATURITYDATE ORIGINAL AMOUNT OUTSTANDING BALANCE
(In OriginalCurrency)
(In US Dollars) (In OriginalCurrency)
(In US Dollars)
EUR FIXED 3.60 — 1991 2018 226,996.59 267,424.76 6,305.48 7,428.49EUR FIXED 3.60 — 1991 2020 500,818.80 590,014.81 46,701.73 55,019.32EUR FIXED 4.66 0.25 2009 2024 30,887,392.01 36,388,447.52 27,637,392.01 32,559,621.36EUR FIXED 5.46 0.25 2002 2025 14,762,877.57 17,392,151.32 6,375,000.00 7,510,389.77EUR FIXED 5.89 0.25 2002 2024 74,649,000.00 87,944,013.46 30,617,000.00 36,069,898.59EUR FIXED 5.90 — 2002 2021 144,434,768.96 170,158,652.70 64,146,327.03 75,570,810.70EUR FIXED 7.90 — 1993 2018 59,590,374.63 70,203,441.55 4,965,864.69 5,850,286.96EUR FIXED 7.90 — 1993 2018 39,612,027.31 46,666,943.47 3,301,002.67 3,888,912.42EUR LIBOR
6 MONTHS0.41 — 2002 2021 25,642,468.30 30,209,401.03 11,416,026.89 13,449,225.34
EUR NO INTERESTRATE
— — 1988 2018 8,676,273.37 10,221,520.74 867,634.68 1,022,160.73
EUR NO INTERESTRATE
— — 1989 2023 9,419,953.94 11,097,651.09 2,710,568.40 3,193,321.60
EUR NO INTERESTRATE
— — 1991 2021 11,527,048.90 13,580,020.41 2,881,767.09 3,395,010.83
EUR NO INTERESTRATE
— — 1991 2021 14,668,834.26 17,281,358.86 3,792,512.01 4,467,959.75
EUR NO INTERESTRATE
— — 1993 2023 6,197,338.07 7,301,086.19 2,169,068.24 2,555,380.07
EUR NO INTERESTRATE
— — 1994 2024 4,957,713.28 5,840,683.78 1,988,280.79 2,342,394.31
EUR NO INTERESTRATE
— — 1996 2033 1,801,798.89 2,122,699.91 1,531,529.07 1,804,294.94
EUR NO INTERESTRATE
— — 1998 2020 10,938,301.78 12,886,417.22 1,148,574.09 1,353,135.54
EUR NO INTERESTRATE
— — 2000 2021 11,235,774.01 13,236,869.36 3,457,161.85 4,072,883.61
EUR NO INTERESTRATE
— — 2002 2023 13,287,968.55 15,654,560.48 7,972,781.19 9,392,736.36
EUR NO INTERESTRATE
— — 2011 2020 18,768,936.24 22,111,690.46 18,768,936.24 22,111,690.46
EUR NO INTERESTRATE
— 0.15 2008 2023 6,102,500.00 7,189,357.42 4,475,166.68 5,272,195.46
EUR NO INTERESTRATE
— 0.25 2012 2027 7,999,999.99 9,424,802.83 7,999,999.99 9,424,802.83
EUR NO INTERESTRATE
— 0.25 2012 2027 8,000,000.00 9,424,802.85 8,000,000.00 9,424,802.85
GBP FIXED 3.34 — 1997 2022 18,955,087.60 25,428,266.87 5,791,832.35 7,769,748.25GBP LIBOR
6 MONTHS1.06 — 2002 2021 214,661,736.76 287,968,910.79 95,567,405.21 128,203,759.09
JPY FIXED 0.01 — 2014 2054 5,111,000,000.00 45,382,740.38 2,864,875,552.00 25,438,447.15JPY FIXED 0.01 0.10 2008 2038 646,301,237.00 5,738,783.26 646,301,237.00 5,738,783.26JPY FIXED 0.01 0.10 2009 2039 3,886,000,000.00 34,505,444.95 1,538,669,208.00 13,662,497.59JPY FIXED 0.01 0.10 2013 2053 1,727,000,000.00 15,334,766.71 297,898,894.00 2,645,170.84JPY FIXED 0.10 — 2015 2055 75,218,000,000.00 667,892,577.94 6,744,645,965.00 59,888,576.95JPY FIXED 0.15 0.10 2008 2023 30,768,000,000.00 273,202,143.61 17,581,704,000.00 156,115,419.30JPY FIXED 0.15 0.10 2010 2025 27,195,000,000.00 241,475,958.64 20,720,000,000.00 183,981,682.77JPY FIXED 0.15 0.15 2009 2024 28,083,000,000.00 249,360,887.90 20,059,275,000.00 178,114,824.79JPY FIXED 0.20 0.10 2009 2049 48,150,000,000.00 427,544,306.26 42,412,779,163.00 376,601,085.02JPY FIXED 0.30 — 2014 2054 7,075,000,000.00 62,821,930.77 2,304,486,047.00 20,462,510.66JPY FIXED 0.30 0.10 2011 2051 26,966,000,000.00 239,442,570.35 4,451,109,108.00 39,523,288.80JPY FIXED 0.30 0.10 2013 2053 5,104,000,000.00 45,320,584.41 146,127,599.00 1,297,529.03JPY FIXED 0.40 — 2005 2045 2,880,815,148.00 25,579,981.60 2,597,375,000.00 23,063,196.11JPY FIXED 0.40 — 2005 2045 26,306,000,000.00 233,582,149.96 13,227,094,233.00 117,448,989.15JPY FIXED 0.40 — 2006 2046 23,125,703,144.00 205,342,943.04 21,498,519,000.00 190,894,483.73JPY FIXED 0.40 — 2006 2046 1,550,354,185.00 13,766,253.47 1,499,485,000.00 13,314,564.36JPY FIXED 0.40 — 2007 2047 6,210,886,208.00 55,149,097.30 6,004,607,000.00 53,317,456.58JPY FIXED 0.51 — 1998 2028 15,171,500,000.00 134,714,194.03 5,895,875,000.00 52,351,978.95JPY FIXED 0.65 0.10 2008 2048 5,846,601,826.00 51,914,461.51 5,846,601,826.00 51,914,461.51JPY FIXED 0.70 0.10 2007 2022 23,182,000,000.00 205,842,826.74 12,142,944,000.00 107,822,358.64JPY FIXED 0.70 0.10 2008 2023 22,080,000,000.00 196,057,700.56 11,565,708,000.00 102,696,834.96JPY FIXED 0.70 0.10 2009 2024 9,293,000,000.00 82,516,495.08 5,752,799,000.00 51,081,546.37JPY FIXED 0.70 0.10 2010 2025 8,997,000,000.00 79,888,185.32 6,426,420,000.00 57,062,913.41JPY FIXED 0.75 — 2001 2041 5,705,511,965.00 50,661,664.69 4,583,068,000.00 40,695,007.86JPY FIXED 0.75 — 2004 2044 558,369,285.00 4,957,998.10 485,109,000.00 4,307,488.91JPY FIXED 0.75 — 2004 2044 4,517,356,107.00 40,111,524.05 4,200,303,000.00 37,296,274.81JPY FIXED 0.75 — 2005 2045 677,399,208.00 6,014,915.36 610,665,000.00 5,422,353.97JPY FIXED 0.75 — 2005 2045 16,068,683,783.00 142,680,670.00 14,488,100,000.00 128,645,995.09JPY FIXED 0.75 — 2006 2046 8,040,654,742.00 71,396,389.48 7,513,341,000.00 66,714,146.74JPY FIXED 0.75 — 2006 2046 27,642,000,000.00 245,445,061.55 38,019,000.00 337,586.85JPY FIXED 0.75 — 2007 2047 8,619,294,974.00 76,534,381.93 8,288,733,000.00 73,599,181.73JPY FIXED 0.75 — 2007 2047 26,016,000,000.00 231,007,116.75 13,362,999,458.00 118,655,749.38JPY FIXED 0.80 — 2013 2028 19,848,000,000.00 176,238,824.31 19,848,000,000.00 176,238,824.31
T-15

Table of Contents
CURRENCYBASE
INTERESTRATE BASIS
INTERESTRATE
COMMITMENTCHARGE
ISSUEDATE
MATURITYDATE ORIGINAL AMOUNT OUTSTANDING BALANCE
(In OriginalCurrency)
(In US Dollars) (In OriginalCurrency)
(In US Dollars)
JPY FIXED 0.80 0.10 2010 2025 8,391,000,000.00 74,507,253.87 6,792,707,000.00 60,315,331.30JPY FIXED 0.80 0.10 2011 2026 8,291,000,000.00 73,619,311.38 6,711,753,000.00 59,596,506.34JPY FIXED 0.80 0.10 2013 2028 15,490,000,000.00 137,542,290.84 15,490,000,000.00 137,542,290.84JPY FIXED 0.95 — 2001 2041 41,034,000,000.00 364,358,319.06 11,074,926,950.00 98,338,981.51JPY FIXED 0.95 — 2003 2043 48,538,362,136.00 430,992,738.65 40,573,509,000.00 360,269,423.84JPY FIXED 1.00 — 1998 2028 48,500,000,000.00 430,652,104.95 27,207,298,000.00 241,585,157.81JPY FIXED 1.00 — 1998 2028 98,524,758,827.00 874,843,191.31 55,269,966,000.00 490,765,509.25JPY FIXED 1.00 — 1999 2029 35,280,000,000.00 313,266,108.51 19,791,201,000.00 175,734,481.86JPY FIXED 1.00 — 1999 2029 45,200,000,000.00 401,350,002.96 25,356,097,000.00 225,147,557.66JPY FIXED 1.00 — 2000 2030 35,964,000,000.00 319,339,635.10 21,929,250,000.00 194,719,127.27JPY FIXED 1.30 — 2004 2034 3,382,052,096.00 30,030,677.41 2,722,104,000.00 24,170,717.89JPY FIXED 1.30 — 2004 2034 5,382,263,817.00 47,791,407.06 4,332,042,000.00 38,466,041.36JPY FIXED 1.30 — 2004 2034 9,093,144,720.00 80,741,895.14 7,318,839,000.00 64,987,080.85JPY FIXED 1.30 — 2004 2034 10,551,284,688.00 93,689,339.40 8,324,712,000.00 73,918,654.55JPY FIXED 1.30 — 2004 2034 56,647,456,984.00 502,996,836.91 45,553,398,000.00 404,487,973.95JPY FIXED 1.30 — 2005 2035 10,794,000,000.00 95,844,511.77 9,214,380,000.00 81,818,394.70JPY FIXED 1.30 — 2005 2035 9,345,000,000.00 82,978,225.17 6,943,208,710.00 61,651,699.92JPY FIXED 1.30 — 2005 2035 9,677,262,639.00 85,928,526.30 8,258,460,000.00 73,330,374.90JPY FIXED 1.30 — 2005 2035 13,690,981,879.00 121,568,044.64 11,683,070,000.00 103,738,942.02JPY FIXED 1.30 — 2005 2035 16,401,023,543.00 145,631,655.92 14,000,840,000.00 124,319,406.54JPY FIXED 1.30 — 2005 2045 2,606,700,483.00 23,146,001.03 2,239,830,000.00 19,888,402.15JPY FIXED 1.40 — 2014 2039 4,954,000,000.00 43,988,670.68 336,405,688.00 2,987,089.02JPY FIXED 1.40 — 2014 2039 10,029,000,000.00 89,051,751.76 9,554,358,849.00 84,837,211.34JPY FIXED 1.40 0.10 2008 2038 8,591,830,235.00 76,290,510.85 8,591,830,235.00 76,290,510.85JPY FIXED 1.40 0.10 2008 2038 12,297,000,000.00 109,190,287.31 12,132,920,403.00 107,733,354.86JPY FIXED 1.40 0.10 2008 2038 14,641,000,000.00 130,003,659.15 9,223,200,205.00 81,896,713.04JPY FIXED 1.40 0.10 2009 2039 5,659,000,000.00 50,248,665.19 3,379,141,279.00 30,004,831.03JPY FIXED 1.40 0.10 2009 2039 6,060,000,000.00 53,809,314.56 5,047,813,898.00 44,821,684.14JPY FIXED 1.40 0.10 2009 2039 7,490,000,000.00 66,506,892.08 5,765,586,394.00 51,195,091.07JPY FIXED 1.40 0.10 2010 2043 36,994,000,000.00 328,485,442.69 1,706,628,617.00 15,153,880.54JPY FIXED 1.40 0.10 2013 2038 3,311,000,000.00 29,399,775.66 585,557,378.00 5,199,412.73JPY FIXED 1.50 — 2006 2036 11,729,000,000.00 104,146,774.00 10,584,701,000.00 93,986,057.03JPY FIXED 1.50 — 2006 2036 15,671,499,292.00 139,153,900.16 14,128,302,000.00 125,451,195.79JPY FIXED 1.50 — 2007 2037 11,777,000,000.00 104,572,986.39 11,202,477,000.00 99,471,552.59JPY FIXED 1.50 — 2007 2037 833,233,056.00 7,398,630.30 792,519,000.00 7,037,112.90JPY FIXED 1.50 — 2007 2037 1,520,108,426.00 13,497,688.52 1,445,925,000.00 12,838,982.37JPY FIXED 1.50 — 2007 2037 4,498,000,000.00 39,939,652.95 64,805,810.00 575,438.32JPY FIXED 1.50 — 2007 2037 10,046,900,990.00 89,210,702.26 9,556,794,000.00 84,858,834.08JPY FIXED 1.50 — 2007 2037 23,210,292,485.00 206,094,047.74 22,052,628,000.00 195,814,652.95JPY FIXED 1.50 — 2007 2047 7,801,000,000.00 69,268,393.21 6,143,471,137.20 54,550,490.25JPY FIXED 1.80 — 2001 2041 6,350,883,729.00 56,392,194.77 4,474,160,000.00 39,727,967.46JPY FIXED 1.80 — 2001 2041 18,473,896,575.00 164,037,576.22 12,919,820,000.00 114,720,570.69JPY FIXED 1.80 — 2001 2041 19,906,758,134.00 176,760,562.75 13,723,960,000.00 121,860,871.39JPY FIXED 1.80 — 2002 2023 208,605,798,990.00 1,852,299,514.23 125,163,468,000.00 1,111,379,607.36JPY FIXED 1.80 — 2002 2042 13,784,512,741.00 122,398,544.90 10,646,180,000.00 94,531,955.19JPY FIXED 1.80 — 2002 2042 25,541,797,385.00 226,796,470.27 19,738,783,000.00 175,269,040.17JPY FIXED 1.80 — 2003 2033 16,526,621,188.00 146,746,890.77 12,898,784,000.00 114,533,783.11JPY FIXED 1.80 — 2003 2033 54,150,511,998.00 480,825,401.57 42,263,808,000.00 375,278,306.77JPY FIXED 1.80 — 2004 2034 14,542,600,396.00 129,129,927.26 11,705,001,000.00 103,933,676.68JPY FIXED 2.10 — 1998 2028 411,741,033.00 3,656,023.56 210,882,000.00 1,872,510.87JPY FIXED 2.20 — 1998 2028 20,000,000,000.00 177,588,496.89 10,243,884,000.00 90,959,798.09JPY FIXED 2.20 — 2000 2021 145,473,600,380.00 1,291,721,901.41 44,761,104,000.00 397,452,858.92JPY FIXED 2.30 — 1995 2025 194,000,000.00 1,722,608.42 80,427,000.00 714,145.50JPY FIXED 2.30 — 1995 2025 351,467,896.00 3,120,832.77 145,707,000.00 1,293,794.36JPY FIXED 2.30 — 1995 2025 934,666,009.00 8,299,296.58 387,532,000.00 3,441,061.27JPY FIXED 2.30 — 1995 2025 3,221,493,655.00 28,605,010.80 1,287,240,000.00 11,429,950.84JPY FIXED 2.30 — 1995 2025 3,845,709,495.00 34,147,688.43 1,582,411,000.00 14,050,899.55JPY FIXED 2.30 — 1995 2025 4,399,191,845.00 39,062,293.36 1,824,015,000.00 16,196,204.11JPY FIXED 2.30 — 1995 2025 4,810,783,364.00 42,716,989.32 1,994,678,000.00 17,711,593.39JPY FIXED 2.30 — 1995 2025 10,780,551,260.00 95,725,094.69 4,469,946,000.00 39,690,549.57JPY FIXED 2.30 — 1995 2025 11,723,113,208.00 104,094,502.67 4,122,993,000.00 36,609,806.48JPY FIXED 2.30 — 1998 2028 428,467,622.00 3,804,546.05 219,429,000.00 1,948,403.31JPY FIXED 2.30 — 1998 2028 902,092,741.00 8,010,064.70 462,021,000.00 4,102,480.75JPY FIXED 2.50 — 1989 2020 16,407,974,169.00 145,693,373.48 1,636,212,000.00 14,528,621.48JPY FIXED 2.50 — 1989 2020 32,500,000,000.00 288,581,307.44 3,963,410,000.00 35,192,801.22JPY FIXED 2.50 — 1989 2020 45,500,000,000.00 404,013,830.42 5,548,780,000.00 49,269,974.99JPY FIXED 2.50 — 1989 2020 668,267,374.00 5,933,829.92 81,490,000.00 723,584.33JPY FIXED 2.50 — 1989 2020 1,388,000,000.00 12,324,641.68 169,265,000.00 1,502,975.85JPY FIXED 2.50 — 1989 2020 1,892,600,047.00 16,805,199.88 230,800,000.00 2,049,371.25JPY FIXED 2.50 — 1989 2020 4,107,054,241.00 36,468,279.46 500,855,000.00 4,447,304.33JPY FIXED 2.50 — 1989 2020 4,318,099,836.00 38,342,242.96 526,590,000.00 4,675,816.33JPY FIXED 2.50 — 1989 2020 5,754,000,472.00 51,092,214.75 701,705,000.00 6,230,736.81JPY FIXED 2.50 — 1989 2020 6,128,094,441.00 54,413,954.03 747,020,000.00 6,633,107.95JPY FIXED 2.50 — 1989 2020 9,673,338,109.00 85,893,678.73 1,179,670,000.00 10,474,791.11
T-16

Table of Contents
CURRENCYBASE
INTERESTRATE BASIS
INTERESTRATE
COMMITMENTCHARGE
ISSUEDATE
MATURITYDATE ORIGINAL AMOUNT OUTSTANDING BALANCE
(In OriginalCurrency)
(In US Dollars) (In OriginalCurrency)
(In US Dollars)
JPY FIXED 2.50 — 1989 2020 20,086,675,774.00 178,358,127.91 2,449,590,000.00 21,750,950.30JPY FIXED 2.50 — 1989 2020 21,492,360,017.00 190,839,795.50 2,621,015,000.00 23,273,105.71JPY FIXED 2.50 — 1990 2020 235,014,453.00 2,086,793.17 40,117,000.00 356,215.89JPY FIXED 2.50 — 1990 2020 262,511,572.00 2,330,951.77 44,807,000.00 397,860.39JPY FIXED 2.50 — 1990 2020 3,183,774,639.00 28,270,087.63 543,564,000.00 4,826,535.69JPY FIXED 2.50 — 1990 2020 3,563,807,735.00 31,644,562.94 608,447,000.00 5,402,659.41JPY FIXED 2.50 — 1990 2020 5,038,015,667.00 44,734,681.48 860,146,000.00 7,637,601.76JPY FIXED 2.50 — 1990 2020 5,169,088,886.00 45,898,536.28 882,525,000.00 7,836,314.41JPY FIXED 2.50 — 1990 2020 5,798,781,903.00 51,489,848.10 990,031,000.00 8,790,905.86JPY FIXED 2.50 — 1990 2020 5,804,927,440.00 51,544,416.93 991,081,000.00 8,800,229.25JPY FIXED 2.50 — 1990 2020 6,072,912,334.00 53,923,968.66 1,036,826,000.00 9,206,418.54JPY FIXED 2.50 — 1990 2020 6,150,050,482.00 54,608,911.04 1,050,000,000.00 9,323,396.09JPY FIXED 2.50 — 1990 2020 7,324,427,534.00 65,036,703.82 1,250,508,000.00 11,103,791.80JPY FIXED 2.50 — 1990 2020 7,629,785,467.00 67,748,106.63 1,302,637,000.00 11,566,667.34JPY FIXED 2.50 — 1990 2020 10,669,485,788.00 94,738,897.18 1,821,617,000.00 16,174,911.25JPY FIXED 2.50 — 1990 2020 12,351,246,399.00 109,671,964.13 2,108,743,000.00 18,724,424.98JPY FIXED 2.50 — 1990 2020 15,865,951,772.00 140,880,526.34 2,708,370,000.00 24,048,767.87JPY FIXED 2.50 — 1990 2020 38,122,500,000.00 338,505,873.63 6,508,719,000.00 57,793,681.19JPY FIXED 2.50 — 1992 2022 15,891,138,604.00 141,104,170.93 4,263,468,000.00 37,857,143.68JPY FIXED 2.50 — 1995 2025 2,699,554,273.00 23,970,489.28 1,119,280,000.00 9,938,562.64JPY FIXED 2.50 — 1995 2025 2,788,907,810.00 24,763,897.30 1,156,340,000.00 10,267,634.12JPY FIXED 2.50 — 1995 2025 2,796,236,510.00 24,828,971.94 1,159,383,000.00 10,294,654.21JPY FIXED 2.50 — 1995 2025 2,833,282,030.00 25,157,914.85 1,119,790,000.00 9,943,091.15JPY FIXED 2.50 — 1995 2025 4,063,855,000.00 36,084,695.05 1,564,799,000.00 13,894,515.12JPY FIXED 2.50 — 1995 2025 5,313,543,703.00 47,181,211.97 2,203,149,000.00 19,562,695.97JPY FIXED 2.50 — 1995 2025 5,854,899,193.00 51,988,137.36 2,427,617,000.00 21,555,842.70JPY FIXED 2.50 — 1995 2025 6,043,377,777.00 53,661,718.78 2,505,749,000.00 22,249,609.92JPY FIXED 2.50 — 1995 2025 6,767,086,104.00 60,087,832.48 2,805,850,000.00 24,914,334.20JPY FIXED 2.50 — 1995 2025 11,416,106,238.00 101,368,457.36 4,733,480,000.00 42,030,579.91JPY FIXED 2.50 — 1995 2025 12,070,722,652.00 107,181,074.61 4,946,966,000.00 43,926,212.80JPY FIXED 2.50 — 1995 2025 16,269,800,349.00 144,466,469.43 6,730,606,000.00 59,763,910.13JPY FIXED 2.50 — 1995 2025 17,312,000,000.00 153,720,602.91 7,178,131,000.00 63,737,674.74JPY FIXED 2.50 — 1996 2026 2,810,949,132.00 24,959,611.56 1,302,602,000.00 11,566,356.56JPY FIXED 2.50 — 1996 2026 8,769,146,199.00 77,864,974.62 4,016,277,000.00 35,662,229.78JPY FIXED 2.50 — 1998 2028 4,567,508,445.00 40,556,847.96 2,337,405,000.00 20,754,812.03JPY FIXED 2.50 — 1998 2028 9,323,394,424.00 82,786,380.08 4,760,217,000.00 42,267,989.09JPY FIXED 2.60 — 1991 2021 194,631,018.00 1,728,211.50 37,968,000.00 337,134.00JPY FIXED 2.60 — 1991 2021 200,178,233.00 1,777,467.58 39,056,000.00 346,794.82JPY FIXED 2.60 — 1991 2021 651,445,609.00 5,784,462.33 127,104,000.00 1,128,610.42JPY FIXED 2.60 — 1991 2021 1,037,969,432.00 9,216,571.56 202,520,000.00 1,798,261.12JPY FIXED 2.60 — 1991 2021 1,399,761,668.00 12,429,078.53 273,112,000.00 2,425,077.48JPY FIXED 2.60 — 1991 2021 1,557,812,516.00 13,832,479.16 303,960,000.00 2,698,989.98JPY FIXED 2.60 — 1991 2021 2,378,518,888.00 21,119,879.71 464,088,000.00 4,120,834.52JPY FIXED 2.60 — 1991 2021 2,449,654,289.00 21,751,521.15 477,968,000.00 4,244,080.93JPY FIXED 2.60 — 1991 2021 2,845,039,950.00 25,262,318.42 555,120,000.00 4,929,146.32JPY FIXED 2.60 — 1991 2021 3,222,570,056.00 28,614,568.62 628,784,000.00 5,583,240.27JPY FIXED 2.60 — 1991 2021 3,234,643,273.00 28,721,771.84 631,144,000.00 5,604,195.71JPY FIXED 2.60 — 1991 2021 4,001,649,299.00 35,532,344.20 780,800,000.00 6,933,054.92JPY FIXED 2.60 — 1991 2021 4,279,485,327.00 37,999,368.33 835,016,000.00 7,414,461.82JPY FIXED 2.60 — 1991 2021 4,917,735,157.00 43,666,659.73 959,552,000.00 8,520,269.87JPY FIXED 2.60 — 1991 2021 5,438,475,879.00 48,290,537.84 1,066,112,000.00 9,466,461.38JPY FIXED 2.60 — 1991 2021 6,414,874,621.00 56,960,397.08 1,251,672,000.00 11,114,127.45JPY FIXED 2.60 — 1991 2021 6,808,900,693.00 60,459,121.98 1,328,560,000.00 11,796,848.67JPY FIXED 2.60 — 1991 2021 11,882,285,431.00 105,507,860.46 2,318,488,000.00 20,586,839.95JPY FIXED 2.60 — 1991 2021 12,303,062,863.00 109,244,122.05 2,400,592,000.00 21,315,876.25JPY FIXED 2.60 — 1991 2021 67,520,000,000.00 599,538,765.49 13,174,632,000.00 116,983,154.70JPY FIXED 2.60 — 1992 2022 1,033,537,194.00 9,177,215.84 277,277,000.00 2,462,060.28JPY FIXED 2.60 — 1992 2022 1,580,332,873.00 14,032,446.97 423,973,000.00 3,764,636.39JPY FIXED 2.60 — 1992 2022 1,703,332,270.00 15,124,610.88 456,973,000.00 4,057,657.41JPY FIXED 2.60 — 1992 2022 2,816,681,234.00 25,010,509.33 755,678,000.00 6,709,986.01JPY FIXED 2.60 — 1992 2022 2,897,870,095.00 25,731,419.72 777,469,000.00 6,903,477.55JPY FIXED 2.60 — 1992 2022 3,056,748,027.00 27,142,164.37 820,094,000.00 7,281,963.04JPY FIXED 2.60 — 1992 2022 3,236,198,575.00 28,735,582.03 868,230,000.00 7,709,383.03JPY FIXED 2.60 — 1992 2022 3,928,065,926.00 34,878,966.17 1,053,866,000.00 9,357,723.94JPY FIXED 2.60 — 1992 2022 4,425,641,115.00 39,297,147.67 1,187,362,000.00 10,543,091.64JPY FIXED 2.60 — 1992 2022 7,467,391,930.00 66,306,145.43 1,999,503,000.00 17,754,436.61JPY FIXED 2.60 — 1992 2022 9,906,513,776.00 87,964,144.54 2,657,842,000.00 23,600,108.29JPY FIXED 2.60 — 1992 2022 15,575,368,644.00 138,300,315.30 4,178,746,000.00 37,104,861.05JPY FIXED 2.60 — 1992 2022 66,170,000,000.00 587,551,541.95 17,752,922,000.00 157,635,736.67JPY FIXED 2.60 — 1992 2022 580,619,754.00 5,155,569.47 155,771,000.00 1,383,156.89JPY FIXED 2.60 — 1992 2022 424,812,454.00 3,772,090.26 113,971,000.00 1,011,996.93JPY FIXED 2.60 — 1992 2022 436,534,443.00 3,876,174.78 117,106,000.00 1,039,833.93JPY FIXED 2.60 — 1993 2023 10,893,524,544.00 96,728,232.48 2,915,066,000.00 25,884,109.46JPY FIXED 2.60 — 1993 2023 444,688,561.00 3,948,578.66 140,985,000.00 1,251,865.71
T-17
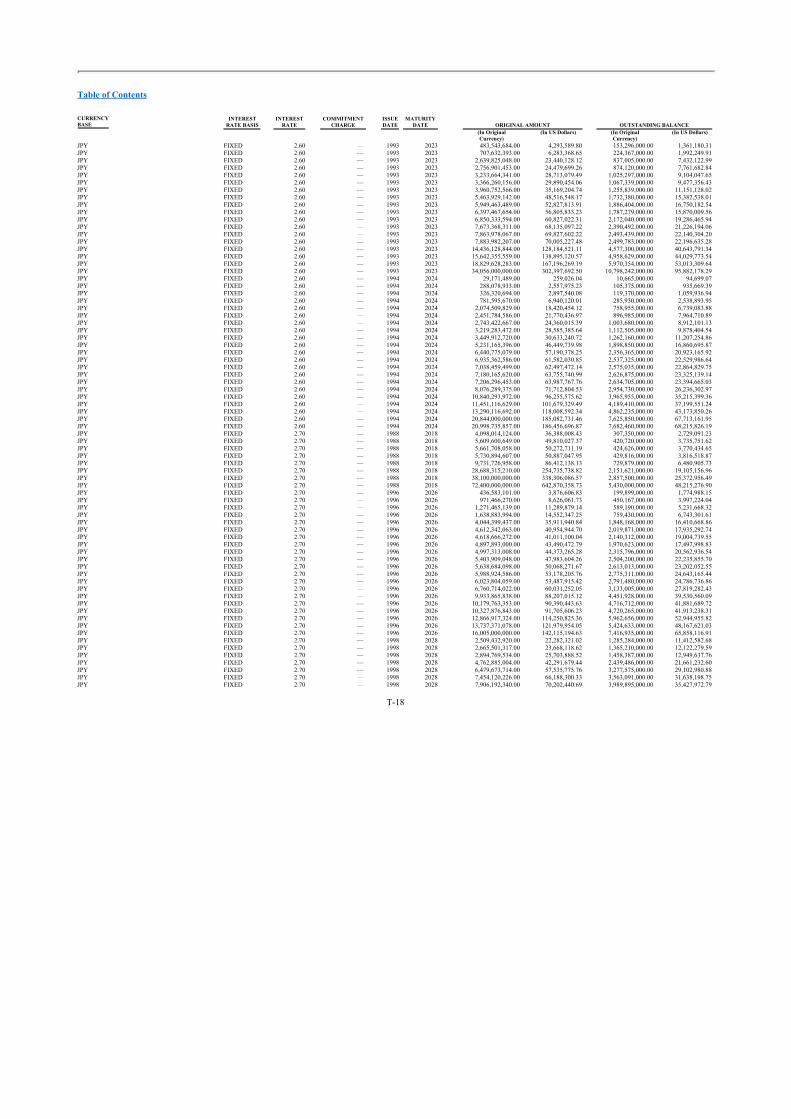
Table of Contents
CURRENCYBASE
INTERESTRATE BASIS
INTERESTRATE
COMMITMENTCHARGE
ISSUEDATE
MATURITYDATE ORIGINAL AMOUNT OUTSTANDING BALANCE
(In OriginalCurrency)
(In US Dollars) (In OriginalCurrency)
(In US Dollars)
JPY FIXED 2.60 — 1993 2023 483,543,684.00 4,293,589.80 153,296,000.00 1,361,180.31JPY FIXED 2.60 — 1993 2023 707,632,393.00 6,283,368.65 224,367,000.00 1,992,249.91JPY FIXED 2.60 — 1993 2023 2,639,825,048.00 23,440,128.12 837,005,000.00 7,432,122.99JPY FIXED 2.60 — 1993 2023 2,756,901,453.00 24,479,699.26 874,120,000.00 7,761,682.84JPY FIXED 2.60 — 1993 2023 3,233,664,341.00 28,713,079.49 1,025,297,000.00 9,104,047.65JPY FIXED 2.60 — 1993 2023 3,366,260,156.00 29,890,454.06 1,067,339,000.00 9,477,356.43JPY FIXED 2.60 — 1993 2023 3,960,752,566.00 35,169,204.74 1,255,839,000.00 11,151,128.02JPY FIXED 2.60 — 1993 2023 5,463,929,142.00 48,516,548.17 1,732,380,000.00 15,382,538.01JPY FIXED 2.60 — 1993 2023 5,949,463,489.00 52,827,813.91 1,886,404,000.00 16,750,182.54JPY FIXED 2.60 — 1993 2023 6,397,467,654.00 56,805,833.23 1,787,279,000.00 15,870,009.56JPY FIXED 2.60 — 1993 2023 6,850,333,594.00 60,827,022.31 2,172,040,000.00 19,286,465.94JPY FIXED 2.60 — 1993 2023 7,673,368,311.00 68,135,097.22 2,390,492,000.00 21,226,194.06JPY FIXED 2.60 — 1993 2023 7,863,978,067.00 69,827,602.22 2,493,439,000.00 22,140,304.20JPY FIXED 2.60 — 1993 2023 7,883,982,207.00 70,005,227.48 2,499,783,000.00 22,196,635.28JPY FIXED 2.60 — 1993 2023 14,436,128,844.00 128,184,521.11 4,577,300,000.00 40,643,791.34JPY FIXED 2.60 — 1993 2023 15,642,355,559.00 138,895,120.57 4,958,629,000.00 44,029,773.54JPY FIXED 2.60 — 1993 2023 18,829,628,283.00 167,196,269.19 5,970,354,000.00 53,013,309.64JPY FIXED 2.60 — 1993 2023 34,056,000,000.00 302,397,692.50 10,798,242,000.00 95,882,178.29JPY FIXED 2.60 — 1994 2024 29,171,489.00 259,026.04 10,665,000.00 94,699.07JPY FIXED 2.60 — 1994 2024 288,078,933.00 2,557,975.23 105,375,000.00 935,669.39JPY FIXED 2.60 — 1994 2024 326,320,694.00 2,897,540.08 119,370,000.00 1,059,936.94JPY FIXED 2.60 — 1994 2024 781,595,670.00 6,940,120.01 285,930,000.00 2,538,893.95JPY FIXED 2.60 — 1994 2024 2,074,509,829.00 18,420,454.12 758,955,000.00 6,739,083.88JPY FIXED 2.60 — 1994 2024 2,451,784,586.00 21,770,436.97 896,985,000.00 7,964,710.89JPY FIXED 2.60 — 1994 2024 2,743,422,667.00 24,360,015.39 1,003,680,000.00 8,912,101.13JPY FIXED 2.60 — 1994 2024 3,219,283,472.00 28,585,385.64 1,112,505,000.00 9,878,404.54JPY FIXED 2.60 — 1994 2024 3,449,912,720.00 30,633,240.72 1,262,160,000.00 11,207,254.86JPY FIXED 2.60 — 1994 2024 5,231,165,396.00 46,449,739.98 1,898,850,000.00 16,860,695.87JPY FIXED 2.60 — 1994 2024 6,440,775,079.00 57,190,378.25 2,356,365,000.00 20,923,165.92JPY FIXED 2.60 — 1994 2024 6,935,362,586.00 61,582,030.85 2,537,325,000.00 22,529,986.64JPY FIXED 2.60 — 1994 2024 7,038,459,499.00 62,497,472.14 2,575,035,000.00 22,864,829.75JPY FIXED 2.60 — 1994 2024 7,180,165,620.00 63,755,740.99 2,626,875,000.00 23,325,139.14JPY FIXED 2.60 — 1994 2024 7,206,296,453.00 63,987,767.76 2,634,705,000.00 23,394,665.03JPY FIXED 2.60 — 1994 2024 8,076,289,375.00 71,712,804.53 2,954,730,000.00 26,236,302.97JPY FIXED 2.60 — 1994 2024 10,840,293,972.00 96,255,575.62 3,965,955,000.00 35,215,399.36JPY FIXED 2.60 — 1994 2024 11,451,116,629.00 101,679,329.49 4,189,410,000.00 37,199,551.24JPY FIXED 2.60 — 1994 2024 13,290,116,692.00 118,008,592.34 4,862,235,000.00 43,173,850.26JPY FIXED 2.60 — 1994 2024 20,844,000,000.00 185,082,731.46 7,625,850,000.00 67,713,161.95JPY FIXED 2.60 — 1994 2024 20,998,735,857.00 186,456,696.87 7,682,460,000.00 68,215,826.19JPY FIXED 2.70 — 1988 2018 4,098,014,124.00 36,388,008.43 307,350,000.00 2,729,091.23JPY FIXED 2.70 — 1988 2018 5,609,600,649.00 49,810,027.37 420,720,000.00 3,735,751.62JPY FIXED 2.70 — 1988 2018 5,661,708,058.00 50,272,711.19 424,626,000.00 3,770,434.65JPY FIXED 2.70 — 1988 2018 5,730,894,607.00 50,887,047.95 429,816,000.00 3,816,518.87JPY FIXED 2.70 — 1988 2018 9,731,726,958.00 86,412,138.13 729,879,000.00 6,480,905.73JPY FIXED 2.70 — 1988 2018 28,688,315,210.00 254,735,738.82 2,151,621,000.00 19,105,156.96JPY FIXED 2.70 — 1988 2018 38,100,000,000.00 338,306,086.57 2,857,500,000.00 25,372,956.49JPY FIXED 2.70 — 1988 2018 72,400,000,000.00 642,870,358.73 5,430,000,000.00 48,215,276.90JPY FIXED 2.70 — 1996 2026 436,583,101.00 3,876,606.83 199,899,000.00 1,774,988.15JPY FIXED 2.70 — 1996 2026 971,466,270.00 8,626,061.73 450,167,000.00 3,997,224.04JPY FIXED 2.70 — 1996 2026 1,271,465,139.00 11,289,879.14 589,190,000.00 5,231,668.32JPY FIXED 2.70 — 1996 2026 1,638,883,994.00 14,552,347.25 759,430,000.00 6,743,301.61JPY FIXED 2.70 — 1996 2026 4,044,399,437.00 35,911,940.84 1,848,168,000.00 16,410,668.86JPY FIXED 2.70 — 1996 2026 4,612,342,063.00 40,954,944.70 2,019,871,000.00 17,935,292.74JPY FIXED 2.70 — 1996 2026 4,618,666,272.00 41,011,100.04 2,140,312,000.00 19,004,739.55JPY FIXED 2.70 — 1996 2026 4,897,893,000.00 43,490,472.79 1,970,623,000.00 17,497,998.83JPY FIXED 2.70 — 1996 2026 4,997,313,008.00 44,373,265.28 2,315,796,000.00 20,562,936.54JPY FIXED 2.70 — 1996 2026 5,403,909,048.00 47,983,604.26 2,504,200,000.00 22,235,855.70JPY FIXED 2.70 — 1996 2026 5,638,684,098.00 50,068,271.67 2,613,013,000.00 23,202,052.55JPY FIXED 2.70 — 1996 2026 5,988,924,586.00 53,178,205.76 2,775,311,000.00 24,643,165.44JPY FIXED 2.70 — 1996 2026 6,023,804,059.00 53,487,915.42 2,791,480,000.00 24,786,736.86JPY FIXED 2.70 — 1996 2026 6,760,714,022.00 60,031,252.05 3,133,005,000.00 27,819,282.43JPY FIXED 2.70 — 1996 2026 9,933,865,838.00 88,207,015.12 4,451,928,000.00 39,530,560.09JPY FIXED 2.70 — 1996 2026 10,179,763,353.00 90,390,443.63 4,716,712,000.00 41,881,689.72JPY FIXED 2.70 — 1996 2026 10,327,876,843.00 91,705,606.23 4,720,265,000.00 41,913,238.31JPY FIXED 2.70 — 1996 2026 12,866,917,324.00 114,250,825.36 5,962,656,000.00 52,944,955.82JPY FIXED 2.70 — 1996 2026 13,737,371,078.00 121,979,954.05 5,424,633,000.00 48,167,621.03JPY FIXED 2.70 — 1996 2026 16,005,000,000.00 142,115,194.63 7,416,935,000.00 65,858,116.91JPY FIXED 2.70 — 1998 2028 2,509,432,920.00 22,282,321.02 1,285,284,000.00 11,412,582.68JPY FIXED 2.70 — 1998 2028 2,665,501,317.00 23,668,118.62 1,365,210,000.00 12,122,279.59JPY FIXED 2.70 — 1998 2028 2,894,769,534.00 25,703,888.52 1,458,387,000.00 12,949,637.76JPY FIXED 2.70 — 1998 2028 4,762,885,004.00 42,291,679.44 2,439,486,000.00 21,661,232.60JPY FIXED 2.70 — 1998 2028 6,479,673,714.00 57,535,775.76 3,277,575,000.00 29,102,980.88JPY FIXED 2.70 — 1998 2028 7,454,120,226.00 66,188,300.33 3,563,091,000.00 31,638,198.75JPY FIXED 2.70 — 1998 2028 7,906,192,340.00 70,202,440.69 3,989,895,000.00 35,427,972.79
T-18

Table of Contents
CURRENCYBASE
INTERESTRATE BASIS
INTERESTRATE
COMMITMENTCHARGE
ISSUEDATE
MATURITYDATE ORIGINAL AMOUNT OUTSTANDING BALANCE
(In OriginalCurrency)
(In US Dollars) (In OriginalCurrency)
(In US Dollars)
JPY FIXED 2.70 — 1998 2028 8,093,719,955.00 71,867,578.05 4,145,526,000.00 36,809,886.56JPY FIXED 2.70 — 1998 2028 8,742,020,786.00 77,624,116.56 4,476,591,000.00 39,749,553.34JPY FIXED 2.70 — 1998 2028 9,148,152,658.00 81,230,333.99 4,685,583,000.00 41,605,282.10JPY FIXED 2.70 — 1998 2028 16,008,569,778.00 142,146,892.21 8,199,450,000.00 72,806,400.04JPY FIXED 2.70 — 1998 2028 26,783,193,096.00 237,819,350.19 13,528,011,000.00 120,120,956.97JPY FIXED 2.70 — 1998 2028 29,283,319,347.00 260,019,033.33 12,896,856,000.00 114,516,663.58JPY FIXED 2.86 0.20 2011 2022 3,286,537,998.00 29,182,567.15 1,812,411,998.00 16,093,176.12JPY FIXED 3.00 — 1987 2017 961,638,075.00 8,538,793.01 24,040,000.00 213,461.37JPY FIXED 3.00 — 1987 2017 2,034,227,087.00 18,062,766.54 50,855,000.00 451,563.15JPY FIXED 3.00 — 1987 2017 2,088,271,304.00 18,542,648.10 52,206,000.00 463,559.25JPY FIXED 3.00 — 1987 2017 5,487,457,198.00 48,725,463.78 137,186,000.00 1,218,132.78JPY FIXED 3.00 — 1987 2017 8,401,789,791.00 74,603,061.01 210,044,000.00 1,865,069.91JPY FIXED 3.00 — 1987 2017 11,375,075,866.00 101,004,131.25 284,376,000.00 2,525,095.32JPY FIXED 3.00 — 1987 2017 11,891,145,849.00 105,586,535.88 297,278,000.00 2,639,657.66JPY FIXED 3.00 — 1987 2017 27,166,000,000.00 241,218,455.32 679,150,000.00 6,030,461.38JPY FIXED 3.00 — 1988 2018 1,074,669,920.00 9,542,450.79 53,732,000.00 477,109.26JPY FIXED 3.00 — 1988 2018 1,115,073,692.00 9,901,213.04 55,752,000.00 495,045.69JPY FIXED 3.00 — 1988 2018 1,554,505,492.00 13,803,114.69 77,724,000.00 690,144.42JPY FIXED 3.00 — 1988 2018 1,666,534,685.00 14,797,869.49 83,326,000.00 739,886.95JPY FIXED 3.00 — 1988 2018 1,694,683,228.00 15,047,812.36 84,734,000.00 752,389.18JPY FIXED 3.00 — 1988 2018 1,843,835,802.00 16,372,201.43 92,190,000.00 818,594.18JPY FIXED 3.00 — 1988 2018 1,929,728,294.00 17,134,877.36 96,486,000.00 856,740.19JPY FIXED 3.00 — 1988 2018 4,477,452,605.00 39,757,203.90 223,434,000.00 1,983,965.41JPY FIXED 3.00 — 1988 2018 5,194,429,281.00 46,123,544.41 259,720,000.00 2,306,164.22JPY FIXED 3.00 — 1998 2028 6,068,600,000.00 53,885,677.61 2,394,485,000.00 21,261,649.60JPY FIXED 3.00 — 2000 2021 7,252,245,722.00 64,395,770.84 2,231,460,216.00 19,814,083.28JPY FIXED 3.00 — 2002 2023 6,352,091,212.00 56,402,916.52 3,811,254,720.00 33,841,749.85JPY FIXED 3.45 0.20 2008 2018 3,747,785,104.00 33,278,176.16 432,417,104.00 3,839,615.18JPY LIBOR
6 MONTHS0.02 0.10 2009 2024 9,361,000,000.00 83,120,295.97 5,242,160,000.00 46,547,365.74
KRW FIXED 0.20 — 2011 2041 62,746,000,000.00 54,737,653.42 37,838,399,100.00 33,009,039.24KRW FIXED 1.50 — 2007 2037 14,124,233,500.00 12,321,540.79 14,124,233,500.00 12,321,540.79KRW FIXED 1.50 — 2007 2037 19,102,895,130.00 16,664,769.91 19,102,895,130.00 16,664,769.91KRW FIXED 1.50 — 2007 2037 23,717,066,770.00 20,690,029.34 23,717,066,770.00 20,690,029.34KRW FIXED 1.50 — 2008 2018 5,211,839,950.00 4,546,646.62 2,605,918,000.00 2,273,321.59KRW FIXED 1.50 — 2009 2039 32,354,707,860.00 28,225,238.03 32,354,707,860.00 28,225,238.03KRW FIXED 2.00 — 2000 2030 32,899,947,110.00 28,700,887.75 22,207,446,000.00 19,373,083.27KRW FIXED 2.00 — 2005 2035 19,312,358,510.00 16,847,499.23 17,381,088,000.00 15,162,719.08KRW FIXED 2.50 — 1998 2027 27,366,962,730.00 23,874,084.74 14,367,654,000.00 12,533,893.24KRW FIXED 2.50 — 2000 2030 44,912,981,250.00 39,180,684.06 29,193,424,000.00 25,467,432.59KRW FIXED 3.00 — 2001 2025 13,203,435,770.00 11,518,265.57 5,868,192,000.00 5,119,227.68KRW FIXED 3.50 — 1995 2020 7,097,568,890.00 6,191,697.73 1,182,928,140.00 1,031,949.62KRW FIXED 3.50 — 1998 2020 1,975,272,210.00 1,723,165.87 263,364,000.00 229,750.54KRW FIXED 3.50 — 2000 2021 2,893,852,000.00 2,524,506.23 890,408,000.00 776,764.17KRW FIXED 3.50 — 2002 2023 4,214,155,990.00 3,676,298.25 2,528,472,000.00 2,205,760.11KWD FIXED 4.00 — 1998 2021 8,493,122.17 28,183,782.57 1,551,900.00 5,149,862.59KWD FIXED 4.00 — 2006 2018 3,290,614.12 10,919,653.69 947,200.00 3,143,211.44SAR FIXED 2.00 — 2010 2035 135,000,000.00 35,997,631.93 77,936,074.61 20,781,586.13SAR FIXED 2.00 — 2014 2038 131,250,000.00 34,997,697.71 9,852,103.48 2,627,054.78SAR FIXED 4.00 — 1998 2020 60,289,000.00 16,076,009.12 9,163,687.66 2,443,489.30SAR FIXED 4.00 — 2000 2022 55,534,672.39 14,808,271.82 13,751,145.32 3,666,730.87SAR FIXED 4.00 — 2002 2023 43,585,196.89 11,621,954.63 23,398,270.62 6,239,128.40USD FIXED 0.15 — 2011 2051 40,000,000.00 40,000,000.00 465,045.10 465,045.10USD FIXED 0.15 — 2011 2051 100,000,000.00 100,000,000.00 31,914,445.70 31,914,445.70USD FIXED 0.15 — 2014 2054 35,000,000.00 35,000,000.00 19,041,740.85 19,041,740.85USD FIXED 0.15 — 2014 2054 50,000,000.00 50,000,000.00 10,696,082.12 10,696,082.12USD FIXED 0.30 — 1995 2026 7,138,645.00 7,138,645.00 2,959,926.04 2,959,926.04USD FIXED 0.70 — 2003 2034 9,189,324.98 9,189,324.98 7,396,286.02 7,396,286.02USD FIXED 0.70 — 2004 2034 9,996,353.40 9,996,353.40 8,533,472.46 8,533,472.46USD FIXED 1.00 — 1999 2029 40,476,113.17 40,476,113.17 20,238,056.63 20,238,056.63USD FIXED 1.00 — 2002 2033 18,995,245.31 18,995,245.31 11,689,381.81 11,689,381.81USD FIXED 1.25 — 1991 2021 21,429,286.50 21,429,286.50 4,181,324.34 4,181,324.34USD FIXED 1.25 — 1994 2025 100,000,000.00 100,000,000.00 36,585,365.30 36,585,365.30USD FIXED 1.25 — 1995 2025 10,803,940.50 10,803,940.50 4,216,172.00 4,216,172.00USD FIXED 1.25 — 1996 2027 8,000,000.00 8,000,000.00 3,707,317.10 3,707,317.10USD FIXED 1.50 — 1998 2020 4,798,984.84 4,798,984.84 639,864.68 639,864.68USD FIXED 1.50 — 2000 2021 10,633,417.60 10,633,417.60 3,271,820.98 3,271,820.98USD FIXED 2.18 0.50 2015 2020 8,500,000.00 8,500,000.00 5,312,500.00 5,312,500.00USD FIXED 2.23 0.50 2014 2022 61,370,000.00 61,370,000.00 55,233,000.00 55,233,000.00USD FIXED 2.35 0.50 2014 2021 28,899,916.70 28,899,916.70 23,119,933.36 23,119,933.36USD FIXED 2.37 0.50 2012 2017 5,010,750.00 5,010,750.00 626,343.75 626,343.75USD FIXED 2.37 0.50 2012 2017 5,950,000.00 5,950,000.00 743,750.00 743,750.00USD FIXED 2.41 — 2008 2023 200,000,000.00 200,000,000.00 120,000,000.00 120,000,000.00USD FIXED 2.43 — 2010 2025 31,621,674.97 31,621,674.97 23,716,256.12 23,716,256.12
T-19

Table of Contents
CURRENCYBASE
INTERESTRATE BASIS
INTERESTRATE
COMMITMENTCHARGE
ISSUEDATE
MATURITYDATE ORIGINAL AMOUNT OUTSTANDING BALANCE
(In OriginalCurrency)
(In US Dollars) (In OriginalCurrency)
(In US Dollars)
USD FIXED 2.50 — 1998 2020 5,695,211.78 5,695,211.78 759,361.64 759,361.64USD FIXED 2.50 — 2000 2021 16,032,752.00 16,032,752.00 4,933,154.60 4,933,154.60USD FIXED 2.50 — 2002 2023 23,006,345.64 23,006,345.64 13,803,807.40 13,803,807.40USD FIXED 2.85 0.25 2016 2027 220,000,000.00 220,000,000.00 220,000,000.00 220,000,000.00USD FIXED 2.99 — 1998 2020 258,782.72 258,782.72 34,504.38 34,504.38USD FIXED 2.99 — 1998 2020 517,565.44 517,565.44 69,008.76 69,008.76USD FIXED 2.99 — 1998 2020 19,201,331.80 19,201,331.80 2,560,177.65 2,560,177.65USD FIXED 2.99 — 1998 2020 29,982,736.92 29,982,736.92 3,997,698.36 3,997,698.36USD FIXED 3.00 — 1976 2017 968,944.76 968,944.76 25,033.77 25,033.77USD FIXED 3.00 — 1978 2020 4,374,934.36 4,374,934.36 525,940.48 525,940.48USD FIXED 3.00 — 1978 2020 4,682,116.54 4,682,116.54 776,543.19 776,543.19USD FIXED 3.00 — 1978 2020 13,000,000.00 13,000,000.00 1,715,868.18 1,715,868.18USD FIXED 3.00 — 1979 2021 7,436,058.97 7,436,058.97 1,562,689.75 1,562,689.75USD FIXED 3.00 — 1979 2020 3,726,929.58 3,726,929.58 448,039.10 448,039.10USD FIXED 3.00 — 1979 2025 5,078,561.44 5,078,561.44 1,209,010.06 1,209,010.06USD FIXED 3.00 — 1980 2021 3,447,842.77 3,447,842.77 571,834.62 571,834.62USD FIXED 3.00 — 1980 2020 472,380.17 472,380.17 73,071.29 73,071.29USD FIXED 3.00 — 1980 2021 12,666,627.79 12,666,627.79 2,661,895.28 2,661,895.28USD FIXED 3.00 — 1980 2023 1,484,683.42 1,484,683.42 409,536.64 409,536.64USD FIXED 3.00 — 1980 2021 3,055,582.97 3,055,582.97 506,777.78 506,777.78USD FIXED 3.00 — 1980 2021 5,000,000.00 5,000,000.00 948,892.41 948,892.41USD FIXED 3.00 — 1980 2021 8,204,264.63 8,204,264.63 1,724,128.78 1,724,128.78USD FIXED 3.00 — 1980 2023 2,202,200.70 2,202,200.70 603,780.77 603,780.77USD FIXED 3.00 — 1980 2024 6,544,886.74 6,544,886.74 2,063,543.37 2,063,543.37USD FIXED 3.00 — 1981 2022 11,549,008.34 11,549,008.34 2,677,166.31 2,677,166.31USD FIXED 3.00 — 1981 2028 286,567.60 286,567.60 134,129.33 134,129.33USD FIXED 3.00 — 1981 2021 5,891,944.06 5,891,944.06 1,108,640.62 1,108,640.62USD FIXED 3.00 — 1981 2022 3,944,534.89 3,944,534.89 998,551.39 998,551.39USD FIXED 3.00 — 1981 2024 531,110.00 531,110.00 178,132.29 178,132.29USD FIXED 3.00 — 1981 2025 25,959.68 25,959.68 8,707.04 8,707.04USD FIXED 3.00 — 1982 2023 10,032,171.27 10,032,171.27 2,750,535.06 2,750,535.06USD FIXED 3.00 — 1982 2026 1,175,983.03 1,175,983.03 485,550.50 485,550.50USD FIXED 3.00 — 1982 2020 2,989,279.25 2,989,279.25 456,930.71 456,930.71USD FIXED 3.00 — 1982 2023 1,992,780.74 1,992,780.74 504,468.90 504,468.90USD FIXED 3.00 — 1982 2023 2,562,415.83 2,562,415.83 648,670.73 648,670.73USD FIXED 3.00 — 1982 2027 1,477,873.60 1,477,873.60 664,952.19 664,952.19USD FIXED 3.00 — 1982 2023 432,142.26 432,142.26 116,769.23 116,769.23USD FIXED 3.00 — 1982 2023 638,194.40 638,194.40 188,193.56 188,193.56USD FIXED 3.00 — 1982 2024 961,572.11 961,572.11 303,175.40 303,175.40USD FIXED 3.00 — 1982 2023 1,499,827.39 1,499,827.39 411,209.92 411,209.92USD FIXED 3.00 — 1982 2024 2,777,890.23 2,777,890.23 875,843.46 875,843.46USD FIXED 3.00 — 1982 2024 843,707.62 843,707.62 282,976.12 282,976.12USD FIXED 3.00 — 1982 2025 1,500,000.00 1,500,000.00 532,805.89 532,805.89USD FIXED 3.00 — 1983 2020 1,241,416.94 1,241,416.94 225,136.43 225,136.43USD FIXED 3.00 — 1983 2025 3,494,360.09 3,494,360.09 1,309,404.06 1,309,404.06USD FIXED 3.00 — 1983 2026 194,518.25 194,518.25 76,629.63 76,629.63USD FIXED 3.00 — 1983 2023 2,813,520.54 2,813,520.54 734,921.67 734,921.67USD FIXED 3.00 — 1983 2024 3,236,313.66 3,236,313.66 1,020,380.16 1,020,380.16USD FIXED 3.00 — 1983 2024 5,150,000.00 5,150,000.00 1,727,289.45 1,727,289.45USD FIXED 3.00 — 1983 2024 9,891,529.89 9,891,529.89 3,118,709.44 3,118,709.44USD FIXED 3.00 — 1983 2024 2,944,145.46 2,944,145.46 987,455.07 987,455.07USD FIXED 3.00 — 1983 2024 2,454,752.10 2,454,752.10 773,961.33 773,961.33USD FIXED 3.00 — 1983 2024 4,000,000.00 4,000,000.00 1,179,537.33 1,179,537.33USD FIXED 3.00 — 1983 2025 3,888,752.52 3,888,752.52 1,381,300.68 1,381,300.68USD FIXED 3.00 — 1983 2024 1,308,344.76 1,308,344.76 412,509.72 412,509.72USD FIXED 3.00 — 1983 2024 6,300,771.48 6,300,771.48 2,113,253.38 2,113,253.38USD FIXED 3.00 — 1983 2026 2,254,774.76 2,254,774.76 930,971.11 930,971.11USD FIXED 3.00 — 1984 2026 2,100,000.00 2,100,000.00 827,286.95 827,286.95USD FIXED 3.00 — 1984 2028 1,170,000.00 1,170,000.00 547,622.79 547,622.79USD FIXED 3.00 — 1984 2025 4,244,083.29 4,244,083.29 1,423,448.76 1,423,448.76USD FIXED 3.00 — 1984 2025 14,211,986.92 14,211,986.92 5,048,154.85 5,048,154.85USD FIXED 3.00 — 1984 2025 4,371,308.92 4,371,308.92 1,466,119.67 1,466,119.67USD FIXED 3.00 — 1984 2025 3,936,113.36 3,936,113.36 1,398,123.23 1,398,123.23USD FIXED 3.00 — 1984 2025 190,000.00 190,000.00 63,725.23 63,725.23USD FIXED 3.00 — 1984 2025 5,382,648.18 5,382,648.18 2,016,982.24 2,016,982.24USD FIXED 3.00 — 1984 2026 70,000.00 70,000.00 27,576.43 27,576.43USD FIXED 3.00 — 1984 2026 1,200,000.00 1,200,000.00 472,735.27 472,735.27USD FIXED 3.00 — 1984 2027 1,000,000.00 1,000,000.00 431,551.50 431,551.50USD FIXED 3.00 — 1984 2027 1,832,922.00 1,832,922.00 756,792.79 756,792.79USD FIXED 3.00 — 1985 2028 1,959,000.00 1,959,000.00 916,917.41 916,917.41USD FIXED 3.00 — 1985 2029 41,000.00 41,000.00 19,921.89 19,921.89USD FIXED 3.00 — 1985 2026 4,171,491.72 4,171,491.72 1,563,138.06 1,563,138.06USD FIXED 3.00 — 1985 2026 236,726.33 236,726.33 93,257.67 93,257.67USD FIXED 3.00 — 1985 2027 4,075,000.00 4,075,000.00 1,682,521.75 1,682,521.75
T-20

Table of Contents
CURRENCYBASE
INTERESTRATE BASIS
INTERESTRATE
COMMITMENTCHARGE
ISSUEDATE
MATURITYDATE ORIGINAL AMOUNT OUTSTANDING BALANCE
(In OriginalCurrency)
(In US Dollars) (In OriginalCurrency)
(In US Dollars)
USD FIXED 3.00 — 1985 2027 2,368,361.35 2,368,361.35 1,065,617.27 1,065,617.27USD FIXED 3.00 — 1985 2027 31,812.36 31,812.36 14,313.50 14,313.50USD FIXED 3.00 — 1985 2026 3,364,173.60 3,364,173.60 1,325,302.99 1,325,302.99USD FIXED 3.00 — 1986 2030 1,717,011.62 1,717,011.62 952,413.49 952,413.49USD FIXED 3.00 — 1986 2027 3,322,901.37 3,322,901.37 1,434,003.19 1,434,003.19USD FIXED 3.00 — 1986 2026 1,751,927.71 1,751,927.71 723,351.67 723,351.67USD FIXED 3.00 — 1986 2028 2,125,851.34 2,125,851.34 956,502.58 956,502.58USD FIXED 3.00 — 1986 2028 696,000.00 696,000.00 338,187.47 338,187.47USD FIXED 3.00 — 1986 2030 530,451.46 530,451.46 285,317.54 285,317.54USD FIXED 3.00 — 1986 2026 980,434.21 980,434.21 404,810.58 404,810.58USD FIXED 3.00 — 1986 2027 196,750.33 196,750.33 84,908.10 84,908.10USD FIXED 3.00 — 1986 2028 100,000.00 100,000.00 46,805.65 46,805.65USD FIXED 3.00 — 1987 2027 1,775,032.25 1,775,032.25 766,018.64 766,018.64USD FIXED 3.00 — 1987 2020 28,145,215.18 28,145,215.18 3,247,524.74 3,247,524.74USD FIXED 3.00 — 1987 2029 602,842.71 602,842.71 292,922.04 292,922.04USD FIXED 3.00 — 1987 2028 7,967,453.98 7,967,453.98 3,871,396.16 3,871,396.16USD FIXED 3.00 — 1987 2028 1,229,291.00 1,229,291.00 572,540.75 572,540.75USD FIXED 3.00 — 1987 2030 1,772,055.62 1,772,055.62 953,147.62 953,147.62USD FIXED 3.00 — 1987 2031 1,215,946.77 1,215,946.77 674,476.35 674,476.35USD FIXED 3.00 — 1987 2028 51,760.06 51,760.06 25,150.51 25,150.51USD FIXED 3.00 — 1987 2029 585,448.98 585,448.98 284,470.37 284,470.37USD FIXED 3.00 — 1988 2020 13,440,456.60 13,440,456.60 2,067,762.46 2,067,762.46USD FIXED 3.00 — 1988 2021 320,000.00 320,000.00 61,468.73 61,468.73USD FIXED 3.00 — 1988 2021 13,498,690.51 13,498,690.51 2,076,721.49 2,076,721.49USD FIXED 3.00 — 1998 2028 23,144,879.93 23,144,879.93 10,682,252.27 10,682,252.27USD FIXED 3.00 — 2000 2021 30,110,604.00 30,110,604.00 9,264,801.30 9,264,801.30USD FIXED 3.00 — 2000 2021 31,020,258.14 31,020,258.14 9,544,694.84 9,544,694.84USD FIXED 3.00 — 2002 2023 37,248,966.66 37,248,966.66 22,349,382.41 22,349,382.41USD FIXED 3.00 — 2002 2023 40,365,251.55 40,365,251.55 24,219,148.52 24,219,148.52USD FIXED 3.00 — 2007 2022 215,591,695.42 215,591,695.42 119,773,164.13 119,773,164.13USD FIXED 3.00 — 2011 2027 68,724,795.00 68,724,795.00 50,221,968.00 50,221,968.00USD FIXED 3.00 — 2011 2020 25,956,194.65 25,956,194.65 2,692,390.94 2,692,390.94USD FIXED 3.00 — 2012 2027 56,251,831.86 56,251,831.86 49,220,352.87 49,220,352.87USD FIXED 3.00 — 2012 2028 92,999,886.66 92,999,886.66 84,693,920.33 84,693,920.33USD FIXED 3.00 — 2012 2028 122,429,913.50 122,429,913.50 64,788,781.43 64,788,781.43USD FIXED 3.00 0.20 2012 2028 132,189,694.53 132,189,694.53 83,836,268.63 83,836,268.63USD FIXED 3.00 0.20 2013 2026 116,999,053.39 116,999,053.39 105,299,148.05 105,299,148.05USD FIXED 3.00 0.20 2015 2031 53,405,755.75 53,405,755.75 4,129,153.88 4,129,153.88USD FIXED 3.00 0.20 2015 2031 198,772,234.89 198,772,234.89 26,788,938.92 26,788,938.92USD FIXED 3.00 0.20 2016 2032 78,099,963.04 78,099,963.04 8,047,652.65 8,047,652.65USD FIXED 3.00 0.20 2016 2032 219,398,580.06 219,398,580.06 18,487,782.15 18,487,782.15USD FIXED 3.17 — 2002 2023 103,597,572.22 103,597,572.22 62,158,544.17 62,158,544.17USD FIXED 3.31 — 2000 2021 103,930,586.08 103,930,586.08 31,978,641.94 31,978,641.94USD FIXED 3.34 — 1998 2020 47,441,078.37 47,441,078.37 6,325,477.09 6,325,477.09USD FIXED 3.34 — 1998 2020 52,676,184.61 52,676,184.61 7,023,491.29 7,023,491.29USD FIXED 3.40 0.25 2015 2026 45,000,000.00 45,000,000.00 45,000,000.00 45,000,000.00USD FIXED 3.40 0.25 2015 2026 200,000,000.00 200,000,000.00 200,000,000.00 200,000,000.00USD FIXED 3.47 0.25 2016 2028 220,000,000.00 220,000,000.00 220,000,000.00 220,000,000.00USD FIXED 3.50 — 1992 2017 49,999,762.00 49,999,762.00 1,351,345.24 1,351,345.24USD FIXED 3.50 — 1993 2018 9,500,000.00 9,500,000.00 513,513.75 513,513.75USD FIXED 3.50 — 1993 2018 14,417,830.17 14,417,830.17 779,342.37 779,342.37USD FIXED 3.50 — 1993 2018 16,141,687.99 16,141,687.99 872,523.94 872,523.94USD FIXED 3.50 — 1999 2024 29,997,556.36 29,997,556.36 11,350,426.88 11,350,426.88USD FIXED 3.50 — 1999 2024 36,862,932.00 36,862,932.00 13,948,136.65 13,948,136.65USD FIXED 3.50 — 1999 2024 16,367,091.06 16,367,091.06 6,635,307.24 6,635,307.24USD FIXED 3.50 — 2000 2025 25,801,356.59 25,801,356.59 11,854,677.39 11,854,677.39USD FIXED 3.50 — 2000 2025 18,000,000.00 18,000,000.00 8,270,270.40 8,270,270.40USD FIXED 3.50 — 2003 2028 10,199,208.00 10,199,208.00 6,340,048.22 6,340,048.22USD FIXED 3.50 0.25 2000 2017 2,670,000.00 2,670,000.00 68.96 68.96USD FIXED 3.71 — 2010 2025 300,000,000.00 300,000,000.00 240,000,000.00 240,000,000.00USD FIXED 3.77 — 2009 2024 300,000,000.00 300,000,000.00 210,000,000.00 210,000,000.00USD FIXED 3.90 — 2012 2032 29,999,128.00 29,999,128.00 29,999,128.00 29,999,128.00USD FIXED 3.90 0.25 2014 2025 200,000,000.00 200,000,000.00 188,236,000.00 188,236,000.00USD FIXED 4.88 — 2002 2021 3,612,250.00 3,612,250.00 1,608,173.66 1,608,173.66USD FIXED 4.88 — 2002 2021 6,503,500.00 6,503,500.00 2,895,358.20 2,895,358.20USD FIXED 4.88 — 2002 2021 7,736,823.62 7,736,823.62 3,444,433.86 3,444,433.86USD FIXED 4.88 — 2002 2021 8,402,393.59 8,402,393.59 3,740,745.65 3,740,745.65USD FIXED 5.30 — 2009 2024 42,500,000.00 42,500,000.00 27,625,000.00 27,625,000.00USD FIXED 5.30 — 2009 2024 47,685,000.00 47,685,000.00 33,379,500.00 33,379,500.00USD FIXED 5.30 — 2010 2025 47,600,000.00 47,600,000.00 35,700,000.00 35,700,000.00USD FIXED 5.30 — 2010 2025 2,550,000.00 2,550,000.00 1,912,500.00 1,912,500.00USD FIXED 5.30 — 2011 2026 45,900,000.00 45,900,000.00 39,015,000.00 39,015,000.00USD FIXED 5.30 — 2012 2027 96,900,000.00 96,900,000.00 96,900,000.00 96,900,000.00USD FIXED 6.65 — 1999 2029 11,000,000.00 11,000,000.00 8,198,527.02 8,198,527.02
T-21

Table of Contents
CURRENCYBASE
INTERESTRATE BASIS
INTERESTRATE
COMMITMENTCHARGE
ISSUEDATE
MATURITYDATE ORIGINAL AMOUNT OUTSTANDING BALANCE
(In OriginalCurrency)
(In US Dollars) (In OriginalCurrency)
(In US Dollars)
USD FIXED 6.65 — 1999 2029 14,000,000.00 14,000,000.00 10,434,488.83 10,434,488.83USD FIXED 7.21 — 1993 2023 20,000,000.00 20,000,000.00 9,141,532.55 9,141,532.55USD FIXED 7.31 — 1995 2025 5,000,000.00 5,000,000.00 2,996,923.64 2,996,923.64USD FIXED 7.31 — 1995 2025 20,000,000.00 20,000,000.00 11,987,694.51 11,987,694.51USD FIXED 7.44 — 1994 2026 15,000,000.00 15,000,000.00 9,773,743.53 9,773,743.53USD FIXED 7.44 — 1994 2026 10,000,000.00 10,000,000.00 6,515,829.00 6,515,829.00USD FIXED 7.80 — 1992 2022 25,000,000.00 25,000,000.00 10,960,155.29 10,960,155.29USD FIXED 8.38 — 1994 2024 25,000,000.00 25,000,000.00 14,253,015.54 14,253,015.54USD FIXED 8.90 — 1991 2021 25,000,000.00 25,000,000.00 5,000,000.00 5,000,000.00USD FIXED 9.02 — 1989 2020 25,000,000.00 25,000,000.00 4,879,753.65 4,879,753.65USD FIXED 9.30 — 1990 2020 25,000,000.00 25,000,000.00 3,750,000.00 3,750,000.00USD LIBOR
6 MONTHS1.80 0.13 2005 2018 29,749,989.46 29,749,989.46 2,158,234.54 2,158,234.54
USD LIBOR6 MONTHS
1.81 — 2002 2021 40,958,829.46 40,958,829.46 18,234,870.76 18,234,870.76
USD LIBOR6 MONTHS
1.91 — 2002 2021 119,126,030.97 119,126,030.97 53,034,908.97 53,034,908.97
USD LIBOR6 MONTHS
2.35 — 2013 2028 49,500,000.00 49,500,000.00 26,071,951.40 26,071,951.40
USD LIBOR6 MONTHS
3.50 0.30 2014 2028 20,000,000.00 20,000,000.00 1,082,318.92 1,082,318.92
USD LIBOR 6 MTH 1.79 — 2002 2021 2,022,528.97 2,022,528.97 900,429.90 900,429.90USD LIBOR 6 MTH 1.93 — 2002 2021 5,744,421.36 5,744,421.36 2,557,416.41 2,557,416.41USD LIBOR 6 MTH 2.40 0.65 2011 2018 25,500,000.00 25,500,000.00 2,550,000.00 2,550,000.00USD NO INTEREST
RATE— — 1988 2020 100,000,000.00 100,000,000.00 9,900,990.06 9,900,990.06
USD NO INTERESTRATE
— — 1998 2020 6,930,693.07 6,930,693.07 627,062.63 627,062.63
USD NO INTERESTRATE
— — 2014 2021 11,449,584.98 11,449,584.98 6,392,903.02 6,392,903.02
USD NO INTERESTRATE
— 0.25 2011 2022 15,863,433.84 15,863,433.84 8,724,888.55 8,724,888.55
USD USTREASURY6 MTH
1.00 — 2002 2021 106,419,729.67 106,419,729.67 47,378,063.69 47,378,063.69
USD USTREASURY6 MTH
1.00 — 2002 2021 166,146,162.32 166,146,162.32 73,968,271.20 73,968,271.20
COMMERCIAL CREDITCHF LIBOR
6 MONTHS0.85 0.25 2010 2019 4,092,750.00 4,213,251.33 1,023,187.44 1,053,312.77
EUR EURIBOR6 MTH
1.25 0.60 2015 2024 17,311,440.00 20,394,613.62 8,030,880.00 9,461,182.59
EUR EURIBOR6 MTH
1.26 0.50 2011 2025 7,349,158.78 8,658,046.57 3,737,100.29 4,402,679.18
EUR EURIBOR6 MTH
1.45 0.80 2010 2018 9,807,591.00 11,554,326.45 2,124,837.45 2,503,271.76
EUR EURIBOR6 MTH
1.48 1.00 2010 2019 3,695,046.00 4,353,135.01 1,055,727.40 1,243,752.83
EUR EURIBOR6 MTH
2.53 0.80 2016 2022 4,851,290.00 5,715,306.47 2,778,570.00 3,273,434.31
EUR EURIBOR6 MTH
2.90 0.50 2015 2023 6,433,650.00 7,579,485.35 2,813,900.00 3,315,056.59
EUR EURIBOR6 MTH
2.93 0.55 2015 2023 21,650,868.50 25,506,895.88 1,764,891.18 2,079,218.93
EUR EURIBOR6 MTH
2.95 — 2016 2027 6,979,739.37 8,222,833.43 1,944,029.57 2,290,261.93
EUR EURIBOR6 MTH
3.08 1.35 2014 2021 13,623,393.79 16,049,725.07 426,674.00 502,664.79
EUR EURIBOR6 MTH
3.13 — 2013 2020 183,686,700.00 216,401,366.62 183,686,700.00 216,401,366.62
EUR EURIBOR6 MTH
3.19 0.90 2013 2020 214,863,498.48 253,130,764.00 124,951,388.31 147,205,275.02
EUR EURIBOR6 MTH
3.26 — 2013 2022 12,430,000.55 14,643,788.07 6,923,872.61 8,157,016.79
EUR EURIBOR6 MTH
3.33 1.30 2013 2021 12,895,668.04 15,192,391.11 4,049,713.03 4,770,968.36
EUR FIXED 0.99 0.40 2016 2022 6,014,940.00 7,086,202.95 1,061,460.00 1,250,506.40EUR FIXED 1.95 0.50 2014 2021 49,547,538.00 58,371,972.15 44,520,386.72 52,449,483.43EUR FIXED 2.04 0.60 2013 2019 98,043,234.14 115,504,769.02 64,356,805.33 75,818,775.26EUR FIXED 2.70 0.65 2013 2021 119,328,023.33 140,580,386.74 71,020,309.98 83,669,052.45EUR FIXED 4.06 0.75 2010 2021 40,921,595.05 48,209,745.69 20,852,040.31 24,565,796.11EUR LIBOR 6 MTH 0.88 — 2002 2019 409,190.68 482,067.69 163,676.32 192,827.13
T-22

Table of Contents
CURRENCYBASE
INTERESTRATE BASIS
INTERESTRATE
COMMITMENTCHARGE
ISSUEDATE
MATURITYDATE ORIGINAL AMOUNT OUTSTANDING BALANCE
(In OriginalCurrency)
(In US Dollars) (In OriginalCurrency)
(In US Dollars)
EUR LIBOR 6 MTH 0.88 — 2002 2019 680,805.36 802,057.04 272,322.12 320,822.79EUR LIBOR 6 MTH 0.88 — 2002 2020 405,190.75 477,355.37 162,076.25 190,942.09GBP LIBOR
6 MONTHS1.31 — 2002 2021 5,338,370.90 7,161,429.31 2,376,642.75 3,188,268.36
GBP LIBOR6 MONTHS
3.10 0.50 2014 2020 2,724,288.25 3,654,635.11 1,702,679.59 2,284,146.18
JPY COMMERCIALINTERESTREFERENCERATE
2.20 0.20 2012 2025 2,064,733,000.00 18,333,641.50 136,330,400.00 1,210,535.54
USD COMMERCIALINTERESTREFERENCERATE
2.35 0.20 2014 2020 25,500,000.00 25,500,000.00 15,300,000.00 15,300,000.00
USD FIXED 0.05 — 2016 2041 36,443,330.00 36,443,330.00 7,747,814.77 7,747,814.77USD FIXED 0.88 0.30 2016 2022 27,212,750.00 27,212,750.00 12,356,375.00 12,356,375.00USD FIXED 1.87 0.50 2015 2021 51,000,000.00 51,000,000.00 34,673,312.11 34,673,312.11USD FIXED 2.50 0.50 2016 2022 8,500,000.00 8,500,000.00 3,371,812.22 3,371,812.22USD FIXED 2.58 0.20 2014 2020 42,500,000.00 42,500,000.00 28,333,328.00 28,333,328.00USD FIXED 2.63 0.50 2012 2023 61,183,800.00 61,183,800.00 38,520,345.95 38,520,345.95USD FIXED 2.64 0.90 2013 2019 79,808,484.29 79,808,484.29 39,904,242.13 39,904,242.13USD FIXED 3.00 0.20 2014 2030 240,983,647.00 240,983,647.00 103,982,469.02 103,982,469.02USD FIXED 3.00 0.20 2014 2030 373,009,532.12 373,009,532.12 55,405,883.59 55,405,883.59USD FIXED 3.59 0.50 2010 2017 10,625,000.00 10,625,000.00 1,062,500.00 1,062,500.00USD FIXED 3.59 0.50 2010 2018 5,095,715.15 5,095,715.15 1,019,142.99 1,019,142.99USD LIBOR
3 MONTHS3.55 0.25 2013 2024 144,499,796.00 144,499,796.00 99,067,099.26 99,067,099.26
USD LIBOR6 MONTHS
1.60 0.90 2016 2022 16,978,750.00 16,978,750.00 7,066,852.19 7,066,852.19
USD LIBOR6 MONTHS
1.84 0.13 2008 2021 3,399,999.87 3,399,999.87 1,409,256.96 1,409,256.96
USD LIBOR6 MONTHS
2.07 0.35 2014 2024 119,000,000.00 119,000,000.00 30,411,350.49 30,411,350.49
USD LIBOR6 MONTHS
2.07 0.75 2012 2019 399,500,000.00 399,500,000.00 249,687,500.00 249,687,500.00
USD LIBOR6 MONTHS
2.30 — 2002 2019 9,777,985.50 9,777,985.50 3,128,955.22 3,128,955.22
USD LIBOR6 MONTHS
2.66 0.40 2015 2020 8,060,713.20 8,060,713.20 6,045,534.90 6,045,534.90
USD LIBOR6 MONTHS
2.83 0.90 2016 2022 21,245,920.00 21,245,920.00 4,451,256.29 4,451,256.29
USD LIBOR6 MONTHS
2.85 0.50 2016 2022 8,499,445.38 8,499,445.38 3,295,666.14 3,295,666.14
USD LIBOR6 MONTHS
2.94 0.50 2015 2020 8,401,427.20 8,401,427.20 7,351,248.80 7,351,248.80
USD LIBOR6 MONTHS
2.95 0.50 2015 2021 8,499,684.92 8,499,684.92 7,483,655.78 7,483,655.78
USD LIBOR6 MONTHS
3.03 0.90 2015 2021 16,998,746.25 16,998,746.25 16,824,770.97 16,824,770.97
USD LIBOR6 MONTHS
3.11 0.60 2013 2020 13,600,000.00 13,600,000.00 6,800,000.00 6,800,000.00
USD LIBOR6 MONTHS
3.13 0.25 2011 2018 9,520,000.00 9,520,000.00 2,380,000.00 2,380,000.00
USD LIBOR6 MONTHS
3.13 0.25 2011 2018 3,060,000.00 3,060,000.00 115,000.00 115,000.00
USD LIBOR6 MONTHS
3.17 0.50 2012 2018 5,057,500.00 5,057,500.00 1,685,833.32 1,685,833.32
USD LIBOR6 MONTHS
3.20 0.50 2016 2023 16,888,318.97 16,888,318.97 12,460,686.01 12,460,686.01
USD LIBOR6 MONTHS
3.23 0.50 2010 2020 11,441,362.42 11,441,362.42 8,581,021.82 8,581,021.82
USD LIBOR6 MONTHS
3.23 0.50 2014 2023 29,750,000.00 29,750,000.00 8,886,574.63 8,886,574.63
USD LIBOR6 MONTHS
3.41 — 2016 2023 25,436,250.00 25,436,250.00 17,955,000.00 17,955,000.00
USD LIBOR6 MONTHS
3.64 — 2013 2020 42,500,000.00 42,500,000.00 37,187,500.00 37,187,500.00
USD LIBOR6 MONTHS
3.82 0.50 2012 2021 5,948,900.35 5,948,900.35 4,164,230.23 4,164,230.23
USD LIBOR6 MONTHS
3.92 0.50 2016 2022 13,982,500.00 13,982,500.00 5,635,000.00 5,635,000.00
USD LIBOR6 MONTHS
3.94 0.90 2014 2021 50,896,686.75 50,896,686.75 21,705,939.93 21,705,939.93
T-23

Table of Contents
CURRENCYBASE
INTERESTRATE BASIS
INTERESTRATE
COMMITMENTCHARGE
ISSUEDATE
MATURITYDATE ORIGINAL AMOUNT OUTSTANDING BALANCE
(In OriginalCurrency)
(In US Dollars) (In OriginalCurrency)
(In US Dollars)
USD LIBOR6 MONTHS
4.05 0.25 2015 2022 19,118,822.20 19,118,822.20 4,498,546.40 4,498,546.40
USD LIBOR6 MONTHS
4.09 0.50 2015 2022 38,867,100.00 38,867,100.00 22,957,500.00 22,957,500.00
USD LIBOR6 MONTHS
4.16 0.50 2016 2022 12,716,963.90 12,716,963.90 5,674,818.30 5,674,818.30
USD LIBOR6 MONTHS
4.17 0.50 2012 2019 119,212,500.00 119,212,500.00 78,822,126.90 78,822,126.90
USD LIBOR6 MONTHS
4.17 0.50 2013 2019 39,737,500.00 39,737,500.00 26,094,246.99 26,094,246.99
USD LIBOR6 MONTHS
4.18 0.90 2014 2020 12,605,457.50 12,605,457.50 11,029,775.31 11,029,775.31
USD LIBOR6 MONTHS
4.19 0.50 2016 2022 25,425,200.00 25,425,200.00 23,611,500.00 23,611,500.00
USD LIBOR6 MONTHS
4.20 0.50 2015 2021 2,549,966.00 2,549,966.00 2,549,966.00 2,549,966.00
USD LIBOR6 MONTHS
4.22 0.50 2015 2021 15,253,990.45 15,253,990.45 15,253,990.45 15,253,990.45
USD LIBOR6 MONTHS
4.22 0.50 2015 2020 5,081,832.95 5,081,832.95 3,811,374.71 3,811,374.71
USD LIBOR6 MONTHS
4.25 — 2015 2021 21,250,000.00 21,250,000.00 18,750,000.00 18,750,000.00
USD LIBOR6 MONTHS
4.26 0.50 2012 2020 3,399,695.10 3,399,695.10 2,549,771.31 2,549,771.31
USD LIBOR6 MONTHS
4.27 0.50 2012 2018 2,549,938.80 2,549,938.80 637,484.70 637,484.70
USD LIBOR6 MONTHS
4.27 0.50 2013 2017 2,762,650.00 2,762,650.00 460,441.65 460,441.65
USD LIBOR6 MONTHS
4.29 0.50 2012 2017 8,482,881.85 8,482,881.85 1,060,360.24 1,060,360.24
USD LIBOR6 MONTHS
4.29 0.50 2012 2017 9,344,582.77 9,344,582.77 1,168,072.82 1,168,072.82
USD LIBOR6 MONTHS
4.30 0.50 2013 2020 53,007,081.00 53,007,081.00 39,755,310.74 39,755,310.74
USD LIBOR6 MONTHS
4.30 0.50 2015 2020 5,099,997.91 5,099,997.91 5,099,997.91 5,099,997.91
USD LIBOR6 MONTHS
4.30 0.50 2012 2018 2,547,429.60 2,547,429.60 636,857.40 636,857.40
USD LIBOR6 MONTHS
4.31 0.50 2012 2019 9,349,625.15 9,349,625.15 4,674,812.59 4,674,812.59
USD LIBOR6 MONTHS
4.31 0.50 2012 2020 9,349,987.52 9,349,987.52 5,843,742.20 5,843,742.20
USD LIBOR6 MONTHS
4.33 0.50 2012 2020 12,324,003.63 12,324,003.63 9,243,002.73 9,243,002.73
USD LIBOR6 MONTHS
4.39 — 2015 2021 6,375,000.00 6,375,000.00 5,622,500.00 5,622,500.00
USD LIBOR6 MONTHS
4.39 — 2015 2021 12,069,150.00 12,069,150.00 10,376,750.00 10,376,750.00
USD LIBOR6 MONTHS
4.42 — 2013 2017 29,748,300.00 29,748,300.00 4,958,050.00 4,958,050.00
USD LIBOR6 MONTHS
4.43 0.40 2012 2018 15,299,468.75 15,299,468.75 6,119,787.50 6,119,787.50
USD LIBOR6 MONTHS
4.61 — 2012 2020 55,233,000.00 55,233,000.00 27,633,000.00 27,633,000.00
USD LIBOR6 MONTHS
4.68 — 2012 2021 121,549,234.57 121,549,234.57 99,095,534.04 99,095,534.04
USD LIBOR6 MONTHS
4.68 — 2010 2020 120,699,998.73 120,699,998.73 107,289,998.72 107,289,998.72
USD LIBOR6 MONTHS
4.70 — 2010 2017 67,998,533.75 67,998,533.75 11,348,533.75 11,348,533.75
USD LIBOR6 MONTHS
4.71 0.50 2012 2022 54,162,498.25 54,162,498.25 42,410,165.48 42,410,165.48
USD LIBOR6 MONTHS
4.80 — 2013 2020 344,228,631.00 344,228,631.00 301,199,494.31 301,199,494.31
USD LIBOR6 MONTHS
5.30 — 2013 2019 327,250,000.00 327,250,000.00 163,625,000.00 163,625,000.00
USD LIBOR 6 MTH 1.88 — 2002 2020 499,342.36 499,342.36 199,736.92 199,736.92USD LIBOR 6 MTH 4.40 0.50 2015 2021 7,649,872.50 7,649,872.50 6,693,638.44 6,693,638.44USD LIBOR 6 MTH 4.40 0.50 2015 2021 5,950,000.00 5,950,000.00 5,206,250.00 5,206,250.00USD LIBOR 6 MTH 5.14 0.75 2014 2020 15,966,400.00 15,966,400.00 13,970,600.00 13,970,600.00
T-24

Table of Contents
CURRENCYBASE
INTERESTRATE BASIS
INTERESTRATE
COMMITMENTCHARGE
ISSUEDATE
MATURITYDATE ORIGINAL AMOUNT OUTSTANDING BALANCE
(In OriginalCurrency)
(In US Dollars) (In OriginalCurrency)
(In US Dollars)
EXPORT CREDITAUD NO INTEREST
RATE0 — 2006 2046 197,505,698.83 154,844,497.16 191,580,527.26 150,199,161.77
CHF FIXED 0.5 — 2002 2021 4,172,638.94 4,295,492.42 1,857,658.93 1,912,353.30CHF FIXED 0.5 — 2002 2021 8,378,031.74 8,624,703.05 3,729,899.73 3,839,717.80CHF FIXED 0.5 — 2002 2021 45,783,481.97 47,131,468.21 20,382,806.08 20,982,929.55CHF FIXED 0.5 — 2002 2021 78,691,638.63 81,008,527.64 35,033,517.59 36,064,996.58CHF LIBOR
6 MONTHS0.5 0.15 2008 2017 9,204,820.00 9,475,834.13 575,301.25 592,239.63
CHF LIBOR6 MONTHS
0.85 0.25 2012 2021 11,139,490.55 11,467,466.48 6,265,963.43 6,450,449.89
EUR COMMERCIALINTERESTREFERENCERATE
5.23 — 2007 2020 10,198,683.37 12,015,072.51 2,555,748.97 3,010,928.77
EUR EURIBOR6 MTH
0.263 0.15 2005 2019 315,693,445.22 371,918,560.13 47,354,016.80 55,787,784.04
EUR EURIBOR6 MTH
0.28 — 2006 2018 22,358,034.73 26,340,008.67 3,353,705.21 3,951,001.30
EUR EURIBOR6 MTH
0.377 0.15 2004 2017 307,100,397.44 361,795,087.48 15,355,019.91 18,089,754.42
EUR EURIBOR6 MTH
0.5 — 2002 2021 509,119.35 599,793.69 226,659.93 267,028.14
EUR EURIBOR6 MTH
0.5 — 2002 2021 1,226,604.22 1,445,062.87 546,083.70 643,341.40
EUR EURIBOR6 MTH
0.5 — 2002 2021 5,406,289.32 6,369,151.37 2,406,879.99 2,835,546.17
EUR EURIBOR6 MTH
0.563 — 2000 2021 38,589,509.76 45,462,315.18 11,873,695.35 13,988,404.72
EUR EURIBOR6 MTH
0.563 — 2002 2021 39,672,494.44 46,738,179.81 17,662,194.51 20,807,837.63
EUR EURIBOR6 MTH
0.646 0.40 2007 2018 31,693,100.00 37,337,652.39 6,985,751.06 8,229,915.81
EUR EURIBOR6 MTH
0.688 — 2002 2019 2,413,006.65 2,842,763.99 579,121.60 682,263.36
EUR EURIBOR6 MTH
1.65 — 2010 2019 13,490,503.00 15,893,166.38 4,734,934.79 5,578,228.36
EUR EURIBOR6 MTH
1.927 1.00 2012 2025 148,802,418.65 175,304,182.35 139,502,267.48 164,347,670.95
EUR EURIBOR6 MTH
1.93 1.00 2013 2026 147,441,457.30 173,700,833.30 138,768,430.40 163,483,137.22
EUR FIXED 0.2 — 2007 2021 1,300,000.00 1,531,530.46 841,441.00 991,301.94EUR FIXED 0.99 0.30 2015 2023 91,036,314.00 107,249,913.91 58,213,757.13 68,581,647.99EUR FIXED 2 — 1998 2019 28,942,132.31 34,096,736.37 3,858,951.07 4,546,231.63EUR FIXED 3.5 0.25 2002 2019 18,151,208.65 21,383,945.37 2,420,161.11 2,851,192.66EUR FIXED 4.46 0.25 2006 2021 59,069,277.34 69,589,536.65 17,228,539.18 20,296,948.14EUR FIXED 4.64 0.25 2007 2018 40,062,200.00 47,197,292.07 2,861,585.64 3,371,235.06EUR FIXED 4.76 0.30 2004 2018 20,589,672.42 24,256,700.40 1,715,806.86 2,021,392.67EUR FIXED 4.86 0.25 2003 2018 25,894,769.10 30,506,636.69 1,722,223.00 2,028,951.53EUR FIXED 5 — 2002 2021 82,107,476.47 96,730,847.24 36,554,248.27 43,064,572.89EUR FIXED 5.1 — 2002 2021 159,331,439.61 187,708,425.69 70,934,356.92 83,567,791.12EUR FIXED 5.32 0.30 2004 2017 7,998,204.11 9,422,687.11 333,258.61 392,612.09EUR FIXED 5.55 — 2008 2018 6,888,831.50 8,115,734.84 984,118.82 1,159,390.73EUR FIXED 5.89 0.70 2000 2020 48,298,129.20 56,900,043.19 6,760,136.30 7,964,118.98EUR FIXED 7.9 — 1995 2025 46,699,076.98 55,016,199.20 11,958,466.63 14,088,273.79GBP FIXED 3.343 — 1994 2019 45,804,271.04 61,446,470.34 6,357,392.04 8,528,447.08GBP FIXED 3.343 — 1995 2020 4,239,200.23 5,686,890.88 703,760.23 944,094.97GBP FIXED 3.343 — 1995 2020 14,764,600.00 19,806,724.03 2,460,761.00 3,301,113.07GBP FIXED 3.343 — 1996 2021 10,550,477.98 14,153,475.59 2,212,693.98 2,968,330.94JPY FIXED 2.5 — 1991 2018 8,732,774,799.00 77,542,017.51 301,130,165.00 2,673,862.67JPY FIXED 3.29 0.20 2010 2020 3,890,538,100.00 34,545,740.66 1,193,045,100.00 10,593,554.30JPY FIXED 3.46 0.20 2010 2020 1,224,793,547.00 10,875,462.25 328,535,547.00 2,917,206.70JPY FIXED 3.53 0.20 2008 2020 7,262,816,318.00 64,489,631.65 2,154,874,318.00 19,134,044.56JPY FIXED 3.96 0.20 2008 2020 10,335,280,524.00 91,771,346.66 2,419,585,524.00 21,484,527.81JPY FIXED 4 0.20 2004 2019 2,730,346,437.00 24,243,905.99 341,281,437.00 3,030,382.87JPY FIXED 4.02 0.20 2004 2018 1,453,404,590.00 12,905,396.83 179,142,590.00 1,590,683.16JPY FIXED 4.47 0.20 2004 2018 22,151,031,450.00 196,688,418.99 2,515,119,450.00 22,332,814.13JPY JAPAN PRIME
RATE0.399 — 2002 2021 18,002,459,199.00 159,851,483.47 8,014,695,593.00 71,165,887.17
JPY LIBOR6 MONTHS
0.505 — 2002 2021 40,560,049,328.00 360,149,909.69 18,057,333,978.00 160,338,739.95
JPY LIBOR6 MONTHS
0.505 — 2002 2021 50,096,017,045.00 444,823,818.35 22,302,746,808.00 198,035,564.10
T-25

Table of Contents
CURRENCYBASE
INTERESTRATE BASIS
INTERESTRATE
COMMITMENTCHARGE
ISSUEDATE
MATURITYDATE ORIGINAL AMOUNT OUTSTANDING BALANCE
(In OriginalCurrency)
(In US Dollars) (In OriginalCurrency)
(In US Dollars)
USD EURIBOR6 MTH
2.188 — 2002 2019 16,292,727.28 16,292,727.28 3,910,254.59 3,910,254.59
USD FIXED 0.6 — 1998 2019 492,891.95 492,891.95 65,719.01 65,719.01USD FIXED 1.57 0.50 2010 2017 2,549,988.24 2,549,988.24 424,998.04 424,998.04USD FIXED 1.98 0.50 2015 2020 5,100,000.00 5,100,000.00 5,100,000.00 5,100,000.00USD FIXED 2.09 0.50 2014 2020 9,775,000.00 9,775,000.00 6,109,375.00 6,109,375.00USD FIXED 2.09 0.50 2014 2020 15,300,000.00 15,300,000.00 9,562,500.00 9,562,500.00USD FIXED 2.32 0.50 2010 2018 7,649,405.47 7,649,405.47 1,529,881.15 1,529,881.15USD FIXED 2.32 0.50 2010 2018 16,574,253.78 16,574,253.78 3,314,850.82 3,314,850.82USD FIXED 2.75 — 1995 2020 15,997,162.41 15,997,162.41 2,221,828.19 2,221,828.19USD FIXED 2.93 0.60 2015 2021 60,826,000.00 60,826,000.00 47,710,250.00 47,710,250.00USD FIXED 2.95 — 1999 2024 4,757,040.00 4,757,040.00 1,849,960.00 1,849,960.00USD FIXED 2.98 — 1992 2018 25,227,367.01 25,227,367.01 1,442,425.30 1,442,425.30USD FIXED 3 — 2003 2020 183,544,240.26 183,544,240.26 48,301,115.88 48,301,115.88USD FIXED 3 — 2004 2020 221,778,501.80 221,778,501.80 60,485,045.80 60,485,045.80USD FIXED 3.1 0.50 2010 2022 85,000,000.00 85,000,000.00 42,500,000.00 42,500,000.00USD FIXED 3.11 0.30 2009 2018 55,180,494.00 55,180,494.00 16,554,148.20 16,554,148.20USD FIXED 3.3 0.50 1995 2020 19,675,009.38 19,675,009.38 3,279,168.48 3,279,168.48USD FIXED 3.47 — 2002 2032 4,221,496.00 4,221,496.00 3,078,174.14 3,078,174.14USD FIXED 3.47 — 2002 2028 49,578,503.73 49,578,503.73 30,297,974.49 30,297,974.49USD FIXED 3.5 — 1993 2018 21,704,988.54 21,704,988.54 1,205,832.64 1,205,832.64USD FIXED 3.5 — 1993 2018 79,373,378.94 79,373,378.94 4,409,632.22 4,409,632.22USD FIXED 3.5 — 1994 2018 9,307,530.17 9,307,530.17 273,750.80 273,750.80USD FIXED 3.5 — 1994 2019 32,731,188.98 32,731,188.98 3,636,798.86 3,636,798.86USD FIXED 3.5 — 1994 2019 61,182,249.28 61,182,249.28 6,798,027.84 6,798,027.84USD FIXED 3.5 — 1995 2020 50,487,396.45 50,487,396.45 8,414,566.05 8,414,566.05USD FIXED 3.5 — 1995 2020 59,280,827.40 59,280,827.40 9,880,137.90 9,880,137.90USD FIXED 3.5 — 1995 2020 20,120,470.33 20,120,470.33 3,353,411.83 3,353,411.83USD FIXED 3.5 — 1995 2020 13,287,957.55 13,287,957.55 2,583,769.58 2,583,769.58USD FIXED 3.5 — 1995 2020 48,142,346.06 48,142,346.06 9,361,011.46 9,361,011.46USD FIXED 3.5 — 1995 2021 3,533,941.43 3,533,941.43 785,320.31 785,320.31USD FIXED 3.5 — 1996 2020 18,442,939.82 18,442,939.82 3,073,823.12 3,073,823.12USD FIXED 3.5 — 1996 2021 15,909,792.29 15,909,792.29 3,093,570.86 3,093,570.86USD FIXED 3.5 — 1996 2021 27,832,921.35 27,832,921.35 5,411,957.05 5,411,957.05USD FIXED 3.5 — 1996 2019 43,870,987.96 43,870,987.96 6,093,192.91 6,093,192.91USD FIXED 3.5 — 1996 2021 35,929,415.00 35,929,415.00 8,982,353.63 8,982,353.63USD FIXED 3.5 — 1996 2021 22,901,055.96 22,901,055.96 5,725,264.08 5,725,264.08USD FIXED 3.5 — 1997 2022 30,370,120.17 30,370,120.17 8,436,144.73 8,436,144.73USD FIXED 3.5 — 1997 2022 20,107,934.10 20,107,934.10 5,026,983.66 5,026,983.66USD FIXED 3.5 — 1997 2022 26,000,234.77 26,000,234.77 7,222,287.53 7,222,287.53USD FIXED 3.5 — 1997 2022 17,998,085.00 17,998,085.00 5,499,414.88 5,499,414.88USD FIXED 3.5 — 1998 2019 5,582,294.70 5,582,294.70 744,305.96 744,305.96USD FIXED 3.58 0.50 2012 2024 339,999,999.15 339,999,999.15 237,999,999.15 237,999,999.15USD FIXED 3.625 — 2002 2021 3,069,893.30 3,069,893.30 1,366,716.52 1,366,716.52USD FIXED 3.94 0.50 1999 2023 20,134,101.99 20,134,101.99 6,711,367.35 6,711,367.35USD FIXED 3.98 0.50 2012 2023 917,999,150.00 917,999,150.00 722,743,469.33 722,743,469.33USD FIXED 4.81 0.25 2004 2018 6,871,632.07 6,871,632.07 572,600.19 572,600.19USD FIXED 5 — 2002 2021 5,189,532.86 5,189,532.86 2,310,379.16 2,310,379.16USD FIXED 5 — 2002 2021 22,504,820.79 22,504,820.79 10,019,146.41 10,019,146.41USD FIXED 5.3 — 2011 2026 4,242,605.00 4,242,605.00 3,606,214.25 3,606,214.25USD FIXED 5.86 — 2002 2021 1,612,031.35 1,612,031.35 717,676.34 717,676.34USD FIXED 5.86 — 2002 2021 1,670,681.03 1,670,681.03 743,787.20 743,787.20USD FIXED 5.86 — 2002 2021 3,186,723.90 3,186,723.90 1,418,729.46 1,418,729.46USD FIXED 5.86 — 2002 2021 12,143,884.77 12,143,884.77 5,406,457.52 5,406,457.52USD FIXED 6.5 — 1985 2017 14,211,528.50 14,211,528.50 105,278.50 105,278.50USD LIBOR
6 MONTHS1.75 — 2002 2021 38,442,110.74 38,442,110.74 17,114,428.05 17,114,428.05
USD LIBOR6 MONTHS
1.793 — 2002 2021 26,346,013.16 26,346,013.16 11,729,245.25 11,729,245.25
USD LIBOR6 MONTHS
1.793 — 2002 2021 37,653,578.29 37,653,578.29 16,763,373.26 16,763,373.26
USD LIBOR6 MONTHS
1.798 0.13 2004 2018 24,480,000.00 24,480,000.00 291,766.32 291,766.32
USD LIBOR6 MONTHS
1.798 0.13 2007 2022 29,749,989.46 29,749,989.46 10,791,172.72 10,791,172.72
USD LIBOR6 MONTHS
1.813 — 2000 2021 27,355,355.08 27,355,355.08 5,853,066.24 5,853,066.24
USD LIBOR6 MONTHS
1.813 — 2002 2021 12,019,487.33 12,019,487.33 5,351,075.25 5,351,075.25
USD LIBOR6 MONTHS
1.813 — 2002 2021 21,188,177.30 21,188,177.30 9,432,976.50 9,432,976.50
USD LIBOR6 MONTHS
1.813 — 2002 2021 73,722,259.75 73,722,259.75 32,821,150.01 32,821,150.01
T-26

Table of Contents
CURRENCYBASE
INTERESTRATE BASIS
INTERESTRATE
COMMITMENTCHARGE
ISSUEDATE
MATURITYDATE ORIGINAL AMOUNT OUTSTANDING BALANCE
(In OriginalCurrency)
(In US Dollars) (In OriginalCurrency)
(In US Dollars)
USD LIBOR6 MONTHS
1.924 — 2002 2021 86,519,017.78 86,519,017.78 38,518,268.60 38,518,268.60
USD LIBOR6 MONTHS
1.938 — 2002 2021 68,810,797.07 68,810,797.07 30,634,566.80 30,634,566.80
USD LIBOR6 MONTHS
2.014 0.20 2008 2019 67,575,000.00 67,575,000.00 14,116,071.36 14,116,071.36
USD LIBOR6 MONTHS
2.082 0.75 2011 2018 5,949,985.76 5,949,985.76 1,487,496.44 1,487,496.44
USD LIBOR6 MONTHS
2.191 0.30 2016 2022 15,287,250.00 15,287,250.00 7,643,625.00 7,643,625.00
USD LIBOR6 MONTHS
2.285 — 2002 2019 2,562,000.00 2,562,000.00 1,024,800.00 1,024,800.00
USD LIBOR6 MONTHS
3.971 1.00 2009 2017 30,174,563.88 30,174,563.88 3,134,325.83 3,134,325.83
USD LIBOR6 MONTHS
4.282 0.75 2013 2019 3,382,925.63 3,382,925.63 2,706,340.50 2,706,340.50
USD LIBOR6 MONTHS
4.582 0.50 2012 2018 2,550,000.00 2,550,000.00 364,285.74 364,285.74
USD LIBOR 6 MTH 1.793 — 2002 2021 12,288,890.02 12,288,890.02 5,469,785.01 5,469,785.01TOTAL MULTILATERAL USD 39,550,852,908.65 USD 27,690,003,062.65TOTAL BILATERAL USD 44,431,865,247.45 USD 20,566,811,389.45TOTAL EXPORT CREDIT USD 7,325,808,864.82 USD 3,072,428,472.78TOTAL COMMERCIAL BANKS USD 4,581,803,073.16 USD 2,674,190,515.43GRAND TOTAL USD 95,890,330,094.08 USD 53,980,433,440.30
T-27

Table of Contents
Domestic Loans of the Republic of Indonesia as of September 30, 2017
CURRENCY BASEINTEREST RATE
BASISINTEREST
RATEYEAR OF
CONTRACTYEAR OF
MATURITY ORIGINAL AMOUNT OUTSTANDING BALANCE(In Original Currency) (In US Dollars) (In Original Currency) (In US Dollars)
COMMERCIAL CREDITIDR JIBOR 3 MONTHS 8.006 2010 2018 2,985,000,000.00 221,242.22 639,642,854.00 47,409.05IDR JIBOR 3 MONTHS 8.006 2010 2018 6,121,479,108.00 453,711.76 1,311,745,520.00 97,223.95IDR JIBOR 3 MONTHS 8.006 2010 2018 13,497,000,000.00 1,000,370.59 2,892,214,281.00 214,365.13IDR JIBOR 3 MONTHS 8.006 2010 2018 20,664,795,000.00 1,531,633.19 4,428,170,354.00 328,207.11IDR JIBOR 3 MONTHS 8.006 2010 2018 179,335,204,000.00 13,291,965.91 38,428,972,281.00 2,848,278.41IDR JIBOR 3 MONTHS 8.006 2010 2018 4,039,163,740.00 299,374.72 865,535,084.00 64,151.73IDR JIBOR 3 MONTHS 8.006 2010 2018 7,063,996,200.00 523,569.24 1,513,713,473.00 112,193.41IDR JIBOR 3 MONTHS 8.006 2010 2018 18,359,810,000.00 1,360,792.32 3,934,245,000.00 291,598.35IDR JIBOR 3 MONTHS 8.006 2010 2018 20,077,372,120.00 1,488,094.58 4,302,294,032.00 318,877.41IDR JIBOR 3 MONTHS 8.006 2010 2018 20,261,019,988.00 1,501,706.20 4,341,647,145.00 321,794.19IDR JIBOR 3 MONTHS 8.006 2010 2018 21,015,746,169.00 1,557,644.99 4,503,374,183.00 333,781.07IDR JIBOR 3 MONTHS 8.006 2010 2018 23,055,899,126.00 1,708,857.04 4,940,549,819.00 366,183.65IDR JIBOR 3 MONTHS 8.006 2010 2018 23,925,999,708.00 1,773,347.15 5,126,999,939.00 380,002.96IDR JIBOR 3 MONTHS 8.006 2010 2018 29,085,000,000.00 2,155,721.91 6,232,500,000.00 461,940.41IDR JIBOR 3 MONTHS 8.588 2010 2018 7,499,900,000.00 555,877.56 1,607,121,438.00 119,116.62IDR JIBOR 3 MONTHS 8.588 2010 2018 12,500,000,000.00 926,474.95 2,678,571,438.00 198,530.35IDR JIBOR 3 MONTHS 8.588 2010 2018 24,997,160,000.00 1,852,739.40 5,356,534,292.00 397,015.59IDR JIBOR 3 MONTHS 8.588 2010 2018 26,869,054,400.00 1,991,480.46 5,757,654,266.00 426,745.79IDR JIBOR 3 MONTHS 8.588 2010 2018 36,300,000,000.00 2,690,483.25 7,778,571,438.00 576,532.13IDR JIBOR 3 MONTHS 8.588 2010 2018 74,999,815,000.00 5,558,835.98 16,071,388,938.00 1,191,179.14IDR JIBOR 3 MONTHS 8.588 2010 2018 19,999,331,600.00 1,482,310.38 4,285,571,065.00 317,637.94IDR JIBOR 3 MONTHS 8.588 2010 2018 37,345,000,000.00 2,767,936.55 8,002,500,000.00 593,129.26IDR JIBOR 3 MONTHS 8.588 2010 2018 49,352,000,000.00 3,657,871.33 10,575,428,573.00 783,829.57IDR JIBOR 3 MONTHS 8.588 2010 2018 49,455,000,000.00 3,665,505.48 10,597,500,000.00 785,465.46IDR JIBOR 3 MONTHS 8.588 2010 2018 49,999,974,700.00 3,705,897.92 10,714,280,296.00 794,120.98IDR JIBOR 3 MONTHS 8.588 2010 2018 32,000,354,072.00 2,371,802.11 6,857,218,736.00 508,243.31IDR JIBOR 3 MONTHS 8.588 2010 2018 32,369,999,350.00 2,399,199.48 6,936,428,440.00 514,114.17IDR JIBOR 3 MONTHS 8.588 2010 2018 41,623,305,258.00 3,085,035.97 8,919,279,706.00 661,079.14IDR JIBOR 3 MONTHS 8.588 2010 2018 3,997,500,000.00 296,286.69 856,607,146.00 63,490.00IDR JIBOR 3 MONTHS 8.588 2010 2018 9,996,499,260.00 740,920.49 2,142,106,989.00 158,768.68IDR JIBOR 3 MONTHS 8.588 2011 2018 90,000,000,000.00 6,670,619.63 19,285,714,292.00 1,429,418.49IDR JIBOR 6 MONTHS 7.597 2016 2024 9,000,000,000.00 667,061.96 1,800,000,000.00 133,412.39IDR JIBOR 6 MONTHS 7.597 2016 2024 9,986,250,000.00 740,160.84 8,987,625,000.00 666,144.75IDR JIBOR 6 MONTHS 7.597 2016 2024 10,000,000,000.00 741,179.96 2,000,000,000.00 148,235.99IDR JIBOR 6 MONTHS 7.597 2016 2024 10,100,000,000.00 748,591.76 2,020,000,000.00 149,718.35IDR JIBOR 6 MONTHS 7.597 2016 2024 14,991,429,600.00 1,111,134.72 2,998,285,920.00 222,226.94IDR JIBOR 6 MONTHS 7.597 2016 2024 19,999,980,000.00 1,482,358.43 17,999,982,000.00 1,334,122.59IDR JIBOR 6 MONTHS 7.597 2016 2024 20,000,000,000.00 1,482,359.92 13,000,000,000.00 963,533.95IDR JIBOR 6 MONTHS 7.597 2016 2024 27,975,075,000.00 2,073,456.49 22,380,060,000.00 1,658,765.19IDR JIBOR 6 MONTHS 7.597 2016 2024 30,000,000,000.00 2,223,539.88 6,000,000,000.00 444,707.98IDR JIBOR 6 MONTHS 7.597 2016 2024 49,000,000,000.00 3,631,781.80 9,800,000,000.00 726,356.36IDR JIBOR 6 MONTHS 7.597 2016 2024 59,000,000,000.00 4,372,961.76 11,800,000,000.00 874,592.35IDR JIBOR 6 MONTHS 7.597 2016 2024 88,000,000,000.00 6,522,383.63 17,600,000,000.00 1,304,476.73IDR JIBOR 6 MONTHS 7.597 2016 2024 379,986,300,000.00 28,163,823.01 75,997,260,000.00 5,632,764.60IDR JIBOR 6 MONTHS 7.597 2016 2024 14,999,996,280.00 1,111,769.66 14,999,996,280.00 1,111,769.66IDR JIBOR 6 MONTHS 7.597 2016 2024 19,988,798,000.00 1,481,529.65 19,988,798,000.00 1,481,529.65IDR JIBOR 6 MONTHS 7.597 2016 2024 20,000,000,000.00 1,482,359.92 4,000,000,000.00 296,471.98IDR JIBOR 6 MONTHS 7.597 2016 2024 20,000,000,000.00 1,482,359.92 19,000,000,000.00 1,408,241.92IDR JIBOR 6 MONTHS 7.597 2016 2024 24,824,385,366.00 1,839,933.69 17,377,069,756.00 1,287,953.58IDR JIBOR 6 MONTHS 7.597 2016 2024 29,876,750,000.00 2,214,404.83 5,975,350,000.00 442,880.97IDR JIBOR 6 MONTHS 7.597 2016 2024 30,000,000,000.00 2,223,539.88 28,500,000,000.00 2,112,362.88IDR JIBOR 6 MONTHS 7.597 2016 2024 39,735,716,500.00 2,945,131.67 7,947,143,300.00 589,026.33IDR JIBOR 6 MONTHS 7.597 2016 2024 59,801,731,000.00 4,432,384.45 59,801,731,000.00 4,432,384.45IDR JIBOR 6 MONTHS 7.597 2016 2024 19,889,625,000.00 1,474,179.14 3,977,925,000.00 294,835.83IDR JIBOR 6 MONTHS 7.597 2016 2024 39,593,750,000.00 2,934,609.40 35,634,375,000.00 2,641,148.46IDR JIBOR 6 MONTHS 7.597 2017 2024 125,000,000,000.00 9,264,749.48 125,000,000,000.00 9,264,749.48IDR JIBOR 6 MONTHS 7.6 2014 2021 5,084,000,000.00 376,815.89 4,575,600,000.00 339,134.30IDR JIBOR 6 MONTHS 7.6 2014 2021 5,144,113,000.00 381,271.35 4,629,701,700.00 343,144.21IDR JIBOR 6 MONTHS 7.6 2014 2021 6,000,000,000.00 444,707.98 5,400,000,000.00 400,237.18IDR JIBOR 6 MONTHS 7.6 2014 2021 6,923,350,000.00 513,144.83 6,231,015,000.00 461,830.34IDR JIBOR 6 MONTHS 7.6 2014 2021 7,192,000,000.00 533,056.63 6,472,800,000.00 479,750.96IDR JIBOR 6 MONTHS 7.6 2014 2021 8,620,000,550.00 638,897.16 7,758,000,495.00 575,007.45IDR JIBOR 6 MONTHS 7.6 2014 2021 9,900,000,000.00 733,768.16 8,910,000,000.00 660,391.34IDR JIBOR 6 MONTHS 7.6 2014 2021 11,006,387,000.00 815,771.35 9,905,748,300.00 734,194.21IDR JIBOR 6 MONTHS 7.6 2014 2021 15,899,880,000.00 1,178,467.24 14,309,891,999.00 1,060,620.52
T-28

Table of Contents
CURRENCY BASEINTEREST RATE
BASISINTEREST
RATEYEAR OF
CONTRACTYEAR OF
MATURITY ORIGINAL AMOUNT OUTSTANDING BALANCE(In Original Currency) (In US Dollars) (In Original Currency) (In US Dollars)
IDR JIBOR 6 MONTHS 7.6 2014 2021 19,480,353,000.00 1,443,844.72 17,532,317,700.00 1,299,460.25IDR JIBOR 6 MONTHS 7.6 2014 2021 21,636,608,000.00 1,603,662.02 19,472,947,200.00 1,443,295.82IDR JIBOR 6 MONTHS 7.6 2014 2021 25,000,000,000.00 1,852,949.90 22,500,000,000.00 1,667,654.91IDR JIBOR 6 MONTHS 7.6 2014 2021 39,104,500,000.00 2,898,347.17 35,194,050,000.00 2,608,512.45IDR JIBOR 6 MONTHS 7.6 2014 2021 39,620,000,000.00 2,936,555.00 35,658,000,000.00 2,642,899.50IDR JIBOR 6 MONTHS 7.6 2014 2021 49,682,682,400.00 3,682,380.85 44,714,414,160.00 3,314,142.76IDR JIBOR 6 MONTHS 7.6 2014 2021 59,872,679,000.00 4,437,642.97 53,885,411,100.00 3,993,878.68IDR JIBOR 6 MONTHS 7.6 2014 2021 61,480,000,000.00 4,556,774.38 55,332,000,000.00 4,101,096.95IDR JIBOR 6 MONTHS 7.6 2014 2021 64,489,123,000.00 4,779,804.55 58,040,210,700.00 4,301,824.10IDR JIBOR 6 MONTHS 7.6 2014 2021 65,658,706,000.00 4,866,491.70 59,092,835,400.00 4,379,842.53IDR JIBOR 6 MONTHS 7.6 2014 2021 83,353,009,413.00 6,177,958.01 75,017,708,469.00 5,560,162.20IDR JIBOR 6 MONTHS 7.6 2014 2021 129,526,839,360.00 9,600,269.74 85,328,202,008.00 6,324,355.32IDR JIBOR 6 MONTHS 7.6 2014 2021 3,995,738,000.00 296,156.09 3,596,164,200.00 266,540.48IDR JIBOR 6 MONTHS 7.6 2014 2021 4,224,431,660.00 313,106.41 3,801,988,494.00 281,795.77IDR JIBOR 6 MONTHS 7.6 2014 2021 16,994,768,000.00 1,259,618.14 15,295,291,200.00 1,133,656.33IDR JIBOR 6 MONTHS 7.6 2014 2021 17,987,566,000.00 1,333,202.34 16,188,809,400.00 1,199,882.11IDR JIBOR 6 MONTHS 7.6 2014 2021 18,883,370,000.00 1,399,597.54 16,995,033,000.00 1,259,637.79IDR JIBOR 6 MONTHS 7.6 2014 2021 29,467,302,525.00 2,184,057.41 26,520,572,273.00 1,965,651.67IDR JIBOR 6 MONTHS 7.6 2014 2021 34,707,250,145.00 2,572,431.82 31,236,525,131.00 2,315,188.64IDR JIBOR 6 MONTHS 7.6 2014 2021 49,230,980,000.00 3,648,901.57 44,307,882,000.00 3,284,011.41IDR JIBOR 6 MONTHS 7.6 2014 2021 19,213,840,774.00 1,424,091.37 17,292,456,693.00 1,281,682.23IDR JIBOR 6 MONTHS 7.6 2015 2021 21,984,199,600.00 1,629,424.81 19,785,779,640.00 1,466,482.33IDR JIBOR 6 MONTHS 7.818 2015 2022 2,274,745,000.00 168,599.54 2,274,745,000.00 168,599.54IDR JIBOR 6 MONTHS 7.818 2015 2022 4,694,800,000.00 347,969.17 4,694,800,000.00 347,969.17IDR JIBOR 6 MONTHS 7.818 2015 2022 4,789,300,000.00 354,973.32 4,789,300,000.00 354,973.32IDR JIBOR 6 MONTHS 7.818 2015 2022 7,124,208,000.00 528,032.02 7,124,208,000.00 528,032.02IDR JIBOR 6 MONTHS 7.818 2015 2022 8,984,600,000.00 665,920.55 8,984,600,000.00 665,920.55IDR JIBOR 6 MONTHS 7.818 2015 2022 10,382,948,000.00 769,563.30 10,382,948,000.00 769,563.30IDR JIBOR 6 MONTHS 7.818 2015 2022 16,960,998,650.00 1,257,115.23 16,960,998,650.00 1,257,115.23IDR JIBOR 6 MONTHS 7.818 2015 2022 16,994,824,000.00 1,259,622.29 16,994,824,000.00 1,259,622.29IDR JIBOR 6 MONTHS 7.818 2015 2022 19,989,800,000.00 1,481,603.91 19,989,800,000.00 1,481,603.91IDR JIBOR 6 MONTHS 7.818 2015 2022 24,999,899,000.00 1,852,942.41 24,832,006,250.00 1,840,498.54IDR JIBOR 6 MONTHS 7.818 2015 2022 31,724,998,000.00 2,351,393.27 31,724,998,000.00 2,351,393.27IDR JIBOR 6 MONTHS 7.818 2015 2022 31,999,324,400.00 2,371,725.79 31,999,324,399.00 2,371,725.79IDR JIBOR 6 MONTHS 7.818 2015 2022 32,939,895,000.00 2,441,439.00 32,939,895,000.00 2,441,439.00IDR JIBOR 6 MONTHS 7.818 2015 2022 59,920,000,000.00 4,441,150.31 59,920,000,000.00 4,441,150.31IDR JIBOR 6 MONTHS 7.818 2015 2022 88,999,094,100.00 6,596,434.49 57,849,411,165.00 4,287,682.42IDR JIBOR 6 MONTHS 7.818 2015 2022 119,999,993,200.00 8,894,159.00 119,999,993,200.00 8,894,159.00IDR JIBOR 6 MONTHS 7.818 2015 2022 129,999,984,000.00 9,635,338.27 75,172,335,600.00 5,571,622.86IDR JIBOR 6 MONTHS 7.818 2015 2022 17,490,000,000.00 1,296,323.75 12,243,000,000.00 907,426.62IDR JIBOR 6 MONTHS 7.818 2015 2022 18,622,233,744.00 1,380,242.64 13,966,675,308.00 1,035,181.98IDR JIBOR 6 MONTHS 7.818 2016 2022 220,000,000,000.00 16,305,959.09 220,000,000,000.00 16,305,959.09IDR JIBOR 6 MONTHS 7.818 2016 2023 17,598,620,000.00 1,304,374.44 7,039,448,000.00 521,749.78IDR JIBOR 6 MONTHS 7.818 2016 2023 50,000,000,000.00 3,705,899.79 45,000,000,000.00 3,335,309.81IDR JIBOR 6 MONTHS 7.818 2016 2023 59,390,001,000.00 4,401,867.85 29,695,000,500.00 2,200,933.92IDR JIBOR 6 MONTHS 7.818 2016 2023 59,997,588,000.00 4,446,900.98 11,999,517,600.00 889,380.20IDR JIBOR 6 MONTHS 7.818 2016 2023 150,000,000,000.00 11,117,699.38 30,000,000,000.00 2,223,539.88IDR JIBOR 6 MONTHS 7.818 2016 2023 179,988,181,975.00 13,340,363.32 89,994,090,987.00 6,670,181.66IDR JIBOR 6 MONTHS 7.85 2014 2022 30,216,597,315.00 2,239,593.63 30,216,597,315.00 2,239,593.63IDR JIBOR 6 MONTHS 7.85 2014 2022 37,125,341,038.18 2,751,655.87 943,529,183.00 69,932.49IDR JIBOR 6 MONTHS 7.85 2014 2022 100,000,000,000.00 7,411,799.58 100,000,000,000.00 7,411,799.58IDR JIBOR 6 MONTHS 7.868 2015 2022 19,393,500,500.00 1,437,407.39 19,393,500,500.00 1,437,407.39IDR JIBOR 6 MONTHS 7.868 2015 2022 19,777,985,000.00 1,465,904.61 19,777,985,000.00 1,465,904.61IDR JIBOR 6 MONTHS 7.868 2015 2022 19,842,749,300.00 1,470,704.81 19,842,749,300.00 1,470,704.81IDR JIBOR 6 MONTHS 7.868 2015 2022 23,669,057,000.00 1,754,303.07 23,669,057,000.00 1,754,303.07IDR JIBOR 6 MONTHS 7.868 2015 2022 24,870,275,000.00 1,843,334.94 24,870,275,000.00 1,843,334.94IDR JIBOR 6 MONTHS 7.868 2015 2022 24,955,605,500.00 1,849,659.46 24,955,605,500.00 1,849,659.46IDR JIBOR 6 MONTHS 7.868 2015 2022 29,627,645,000.00 2,195,941.67 29,627,645,000.00 2,195,941.67IDR JIBOR 6 MONTHS 7.868 2015 2022 29,857,150,320.00 2,212,952.14 29,857,150,320.00 2,212,952.14IDR JIBOR 6 MONTHS 7.868 2015 2022 34,875,000,000.00 2,584,865.11 34,875,000,000.00 2,584,865.11IDR JIBOR 6 MONTHS 7.868 2015 2022 49,783,625,450.00 3,689,862.54 49,783,625,450.00 3,689,862.54IDR JIBOR 6 MONTHS 7.868 2015 2022 18,572,804,199.00 1,376,579.02 18,572,804,199.00 1,376,579.02IDR JIBOR 6 MONTHS 7.868 2016 2022 199,500,000,000.00 14,786,540.17 119,700,000,000.00 8,871,924.10IDR JIBOR 6 MONTHS 7.891 2015 2022 29,999,816,000.00 2,223,526.24 27,499,831,333.00 2,038,232.38IDR JIBOR 6 MONTHS 7.891 2015 2022 40,000,000,000.00 2,964,719.83 36,666,666,667.00 2,717,659.85IDR JIBOR 6 MONTHS 7.891 2015 2022 100,000,000,000.00 7,411,799.58 91,666,666,667.00 6,794,149.62
T-29

Table of Contents
CURRENCY BASEINTEREST RATE
BASISINTEREST
RATEYEAR OF
CONTRACTYEAR OF
MATURITY ORIGINAL AMOUNT OUTSTANDING BALANCE(In Original Currency) (In US Dollars) (In Original Currency) (In US Dollars)
IDR JIBOR 6 MONTHS 7.891 2015 2022 48,531,841,600.00 3,597,082.83 44,487,521,467.00 3,297,325.93IDR JIBOR 6 MONTHS 7.891 2015 2022 29,858,950,000.00 2,213,085.53 27,370,704,166.00 2,028,661.74IDR JIBOR 6 MONTHS 8.1 2011 2019 13,818,637,000.00 1,024,209.68 9,870,455,000.00 731,578.34IDR JIBOR 6 MONTHS 8.1 2011 2019 13,990,250,000.00 1,036,929.29 9,993,035,714.00 740,663.78IDR JIBOR 6 MONTHS 8.1 2011 2019 34,900,000,000.00 2,586,718.06 24,928,571,428.00 1,847,655.75IDR JIBOR 6 MONTHS 8.1 2011 2019 63,070,000,000.00 4,674,622.00 45,050,000,000.00 3,339,015.71IDR JIBOR 6 MONTHS 8.1 2011 2019 70,064,000,000.00 5,193,003.26 50,045,714,286.00 3,709,288.04IDR JIBOR 6 MONTHS 8.1 2011 2019 2,644,992,000.00 196,041.51 1,889,280,000.00 140,029.65IDR JIBOR 6 MONTHS 8.1 2011 2019 3,525,132,000.00 261,275.72 2,517,951,428.00 186,625.51IDR JIBOR 6 MONTHS 8.1 2011 2019 5,787,078,775.00 428,926.68 4,133,627,697.00 306,376.20IDR JIBOR 6 MONTHS 8.1 2011 2019 17,472,250,360.00 1,295,008.18 12,480,178,828.00 925,005.84IDR JIBOR 6 MONTHS 8.1 2011 2019 24,384,892,000.00 1,807,359.32 17,417,780,000.00 1,290,970.95IDR JIBOR 6 MONTHS 8.1 2011 2019 78,961,583,930.00 5,852,474.35 56,401,131,378.00 4,180,338.82IDR JIBOR 6 MONTHS 8.1 2011 2019 4,670,999,580.00 346,205.13 3,336,428,272.00 247,289.38IDR JIBOR 6 MONTHS 8.1 2011 2019 12,588,788,040.00 933,055.74 8,991,991,458.00 666,468.39IDR JIBOR 6 MONTHS 8.1 2011 2019 14,970,500,000.00 1,109,583.46 10,693,214,286.00 792,559.61IDR JIBOR 6 MONTHS 8.1 2011 2019 20,241,750,000.00 1,500,277.94 14,458,392,858.00 1,071,627.10IDR JIBOR 6 MONTHS 8.1 2011 2019 21,664,794,693.00 1,605,751.16 15,474,853,353.00 1,146,965.12IDR JIBOR 6 MONTHS 8.1 2011 2019 73,879,900,000.00 5,475,830.12 52,771,357,142.00 3,911,307.23IDR JIBOR 6 MONTHS 8.1 2011 2019 81,235,770,936.00 6,021,032.53 58,025,550,668.00 4,300,737.52IDR JIBOR 6 MONTHS 8.1 2012 2019 5,334,070,500.00 395,350.62 3,810,050,358.00 282,393.30IDR JIBOR 6 MONTHS 8.1 2012 2019 9,994,197,760.00 740,749.91 7,138,712,686.00 529,107.08IDR JIBOR 6 MONTHS 8.1 2012 2019 15,000,000,000.00 1,111,769.94 10,714,285,714.00 794,121.38IDR JIBOR 6 MONTHS 8.1 2012 2019 2,388,000,000.00 176,993.77 1,705,714,286.00 126,424.12IDR JIBOR 6 MONTHS 8.1 2012 2019 40,985,230,000.00 3,037,743.11 29,275,164,286.00 2,169,816.51IDR JIBOR 6 MONTHS 8.1 2012 2019 97,500,000,000.00 7,226,504.60 69,642,857,142.00 5,161,789.00IDR JIBOR 6 MONTHS 8.1 2012 2019 109,354,604,000.00 8,105,144.09 78,110,431,428.00 5,789,388.63IDR JIBOR 6 MONTHS 8.1 2012 2019 125,000,000,000.00 9,264,749.48 89,285,714,286.00 6,617,678.20IDR JIBOR 6 MONTHS 8.1 2013 2019 30,000,000,000.00 2,223,539.88 21,428,571,428.00 1,588,242.77IDR JIBOR 6 MONTHS 8.2 2012 2020 3,998,154,000.00 296,335.16 3,998,154,000.00 296,335.16IDR JIBOR 6 MONTHS 8.2 2012 2020 6,296,085,000.00 466,653.20 6,296,085,000.00 466,653.20IDR JIBOR 6 MONTHS 8.2 2012 2020 7,221,363,000.00 535,232.95 7,221,363,000.00 535,232.95IDR JIBOR 6 MONTHS 8.2 2012 2020 7,221,574,662.00 535,248.64 7,221,574,662.00 535,248.64IDR JIBOR 6 MONTHS 8.2 2012 2020 7,221,597,530.00 535,250.34 7,221,597,530.00 535,250.34IDR JIBOR 6 MONTHS 8.2 2012 2020 7,258,868,115.00 538,012.76 7,258,868,115.00 538,012.76IDR JIBOR 6 MONTHS 8.2 2012 2020 10,000,000,000.00 741,179.96 10,000,000,000.00 741,179.96IDR JIBOR 6 MONTHS 8.2 2012 2020 12,470,997,700.00 924,325.36 12,470,997,700.00 924,325.36IDR JIBOR 6 MONTHS 8.2 2012 2020 12,588,845,200.00 933,059.98 12,588,845,200.00 933,059.98IDR JIBOR 6 MONTHS 8.2 2012 2020 12,921,000,000.00 957,678.62 12,921,000,000.00 957,678.62IDR JIBOR 6 MONTHS 8.2 2012 2020 15,000,000,000.00 1,111,769.94 15,000,000,000.00 1,111,769.94IDR JIBOR 6 MONTHS 8.2 2012 2020 23,645,396,000.00 1,752,549.36 23,645,396,000.00 1,752,549.36IDR JIBOR 6 MONTHS 8.2 2012 2020 28,435,788,700.00 2,107,603.67 28,435,788,700.00 2,107,603.67IDR JIBOR 6 MONTHS 8.2 2012 2020 29,964,809,000.00 2,220,931.59 29,964,809,000.00 2,220,931.59IDR JIBOR 6 MONTHS 8.2 2012 2020 37,500,000,000.00 2,779,424.84 37,500,000,000.00 2,779,424.84IDR JIBOR 6 MONTHS 8.2 2012 2020 42,419,103,000.00 3,144,018.90 42,419,103,000.00 3,144,018.90IDR JIBOR 6 MONTHS 8.2 2012 2020 44,358,646,500.00 3,287,773.98 44,358,646,500.00 3,287,773.98IDR JIBOR 6 MONTHS 8.2 2012 2020 75,961,597,700.00 5,630,121.38 75,961,597,700.00 5,630,121.38IDR JIBOR 6 MONTHS 8.2 2012 2020 30,375,000,000.00 2,251,334.12 30,375,000,000.00 2,251,334.12IDR JIBOR 6 MONTHS 8.2 2012 2020 34,552,800,000.00 2,560,984.29 34,552,800,000.00 2,560,984.29IDR JIBOR 6 MONTHS 8.2 2012 2020 51,700,000,000.00 3,831,900.39 51,700,000,000.00 3,831,900.39IDR JIBOR 6 MONTHS 8.2 2012 2020 19,678,686,500.00 1,458,544.80 19,678,686,500.00 1,458,544.80IDR JIBOR 6 MONTHS 8.2 2012 2020 26,656,477,000.00 1,975,724.65 26,656,477,000.00 1,975,724.65IDR JIBOR 6 MONTHS 8.2 2012 2020 9,944,880,000.00 737,094.57 9,944,880,000.00 737,094.57IDR JIBOR 6 MONTHS 8.2 2012 2020 11,753,000,000.00 871,108.81 11,753,000,000.00 871,108.81IDR JIBOR 6 MONTHS 8.2 2012 2020 48,000,000,000.00 3,557,663.80 48,000,000,000.00 3,557,663.80IDR JIBOR 6 MONTHS 8.2 2013 2020 114,500,000,000.00 8,486,510.52 114,500,000,000.00 8,486,510.52IDR JIBOR 6 MONTHS 8.2 2013 2020 10,487,094,000.00 777,282.39 10,487,094,000.00 777,282.39IDR JIBOR 6 MONTHS 8.2 2013 2020 102,000,000,000.00 7,560,035.58 102,000,000,000.00 7,560,035.58IDR JIBOR 6 MONTHS 8.2 2014 2020 9,804,575,000.00 726,695.45 9,804,575,000.00 726,695.45IDR JIBOR 6 MONTHS 8.2 2015 2020 142,500,000,000.00 10,561,814.41 142,500,000,000.00 10,561,814.41IDR JIBOR 6 MONTHS 8.35 2013 2021 5,358,600,000.00 397,168.69 5,358,600,000.00 397,168.69IDR JIBOR 6 MONTHS 8.35 2013 2021 8,703,936,000.00 645,118.29 8,703,936,000.00 645,118.29IDR JIBOR 6 MONTHS 8.35 2013 2021 8,796,525,740.00 651,980.86 8,796,525,148.00 651,980.81IDR JIBOR 6 MONTHS 8.35 2013 2021 9,283,249,280.00 688,055.83 9,283,249,280.00 688,055.83IDR JIBOR 6 MONTHS 8.35 2013 2021 15,189,188,000.00 1,125,792.17 15,189,188,000.00 1,125,792.17IDR JIBOR 6 MONTHS 8.35 2013 2021 19,135,696,784.00 1,418,299.49 19,135,696,784.00 1,418,299.49
T-30

Table of Contents
CURRENCY BASEINTEREST RATE
BASISINTEREST
RATEYEAR OF
CONTRACTYEAR OF
MATURITY ORIGINAL AMOUNT OUTSTANDING BALANCE(In Original Currency) (In US Dollars) (In Original Currency) (In US Dollars)
IDR JIBOR 6 MONTHS 8.35 2013 2021 25,852,017,920.00 1,916,099.76 25,852,017,584.00 1,916,099.73IDR JIBOR 6 MONTHS 8.35 2013 2021 32,000,000,000.00 2,371,775.87 32,000,000,000.00 2,371,775.87IDR JIBOR 6 MONTHS 8.35 2013 2021 36,379,900,000.00 2,696,405.28 36,379,900,000.00 2,696,405.28IDR JIBOR 6 MONTHS 8.35 2013 2021 49,350,000,000.00 3,657,723.10 49,350,000,000.00 3,657,723.10IDR JIBOR 6 MONTHS 8.35 2013 2021 85,744,388,000.00 6,355,202.19 85,744,388,000.00 6,355,202.19IDR JIBOR 6 MONTHS 8.35 2013 2021 2,594,144,020.00 192,272.76 2,594,144,020.00 192,272.76IDR JIBOR 6 MONTHS 8.35 2013 2021 2,594,518,277.00 192,300.49 2,594,518,277.00 192,300.49IDR JIBOR 6 MONTHS 8.35 2013 2021 2,639,844,384.00 195,659.98 2,639,844,384.00 195,659.98IDR JIBOR 6 MONTHS 8.35 2013 2021 39,868,277,448.00 2,954,956.82 39,868,277,448.00 2,954,956.82IDR JIBOR 6 MONTHS 8.35 2013 2021 5,000,000,000.00 370,589.98 5,000,000,000.00 370,589.98IDR JIBOR 6 MONTHS 8.35 2013 2021 10,000,000,000.00 741,179.96 10,000,000,000.00 741,179.96IDR JIBOR 6 MONTHS 8.35 2013 2021 10,485,418,600.00 777,158.21 10,485,418,600.00 777,158.21IDR JIBOR 6 MONTHS 8.35 2013 2021 29,330,000,000.00 2,173,880.82 29,330,000,000.00 2,173,880.82IDR JIBOR 6 MONTHS 8.35 2013 2021 44,205,000,000.00 3,276,386.01 44,205,000,000.00 3,276,386.01IDR JIBOR 6 MONTHS 8.35 2014 2021 17,025,000,000.00 1,261,858.88 17,025,000,000.00 1,261,858.88IDR JIBOR 6 MONTHS 8.35 2014 2021 9,897,892,450.00 733,611.95 9,897,892,000.00 733,611.92IDR JIBOR 6 MONTHS 8.35 2014 2021 9,993,870,218.00 740,725.63 9,993,870,218.00 740,725.63GRAND TOTAL 7,877,521,049,565.18 583,866,072.46 5,517,254,692,022.00 408,927,860.36
JIBOR: Jakarta Interbank Offered Rate
T-31

Table of Contents
Guaranteed Domestic Loans of the Republic of Indonesia as of September 30, 2017
CURRENCY BASEINTEREST RATE
BASISINTEREST
RATEYEAR OF
CONTRACTYEAR OF
MATURITY ORIGINAL AMOUNT OUTSTANDING BALANCE(In Original Currency) (In US Dollars) (In Original Currency) (In US Dollars)
COMMERCIAL CREDITSIDR JIBOR 3 MONTHS 1.00 2009 2019 2,926,692,300,357.00 216,920,567.77 295,812,553,653.00 21,925,033.62IDR JIBOR 6 MONTHS 0.80 2008 2018 735,387,524,690.00 54,505,449.50 122,302,663,290.00 9,064,828.29IDR JIBOR 3 MONTHS 1.50 2009 2019 3,941,771,952,000.00 292,156,237.18 779,722,290,857.00 57,791,453.52IDR JIBOR 3 MONTHS 1.50 2009 2019 1,930,063,301,490.00 143,052,423.77 620,377,489,599.00 45,981,136.20IDR JIBOR 3 MONTHS 1.50 2009 2019 2,613,011,648,159.00 193,671,186.49 839,896,601,151.00 62,251,452.80IDR JIBOR 3 MONTHS 1.50 2009 2019 327,195,149,528.00 24,251,048.73 105,169,869,491.00 7,794,979.95IDR JIBOR 3 MONTHS 1.50 2009 2019 392,100,494,133.00 29,061,702.80 42,479,750,134.00 3,148,513.94IDR JIBOR 3 MONTHS 1.50 2009 2019 668,497,080,000.00 49,547,663.80 182,054,669,994.00 13,493,527.27IDR JIBOR 3 MONTHS 1.05 2010 2020 1,067,683,579,600.00 79,134,567.12 486,026,966,748.00 36,023,344.70IDR JIBOR 6 MONTHS 1.11 2008 2018 1,911,480,000,000.00 141,675,066.71 136,534,285,717.00 10,119,647.62IDR JIBOR 6 MONTHS 0.80 2008 2018 600,635,738,985.00 44,517,917.21 85,599,749,365.00 6,344,481.87IDR JIBOR 3 MONTHS 1.10 2008 2018 1,272,913,654,892.00 94,345,808.99 82,211,120,993.00 6,093,323.52IDR JIBOR 3 MONTHS 1.12 2008 2018 1,077,577,841,221.00 79,867,909.96 113,314,140,855.00 8,398,617.02IDR JIBOR 3 MONTHS 0.83 2008 2018 2,741,298,159,500.00 203,179,525.61 293,710,517,097.00 21,769,234.89IDR JIBOR 6 MONTHS 0.80 2008 2018 1,874,314,539,154.00 138,920,437.23 257,663,017,731.00 19,097,466.48IDR JIBOR 6 MONTHS 0.80 2008 2018 1,240,660,976,852.00 91,955,305.13 115,154,367,954.00 8,535,010.97IDR JIBOR 6 MONTHS 0.80 2008 2018 1,498,513,102,430.00 111,066,787.91 195,418,143,141.00 14,484,001.12IDR JIBOR 6 MONTHS 0.71 2008 2021 1,045,924,241,800.00 77,521,808.61 522,962,120,904.00 38,760,904.31IDR JIBOR 6 MONTHS 0.71 2008 2021 1,606,612,307,950.00 119,078,884.37 703,813,663,850.00 52,165,258.22IDR JIBOR 3 MONTHS 1.00 2009 2019 1,155,352,482,512.00 85,632,410.50 247,575,531,970.00 18,349,802.25IDR JIBOR 3 MONTHS 1.00 2009 2018 2,074,739,748,000 153,775,552.03 24,237,893,830 1,796,464.11IDR JIBOR 3 MONTHS 1.00 2009 2019 1,151,004,738,533 85,310,164.43 246,643,872,548 18,280,749.52IDR JIBOR 3 MONTHS 1.00 2009 2019 1,805,307,699,643.00 133,805,788.59 234,341,014,416.00 17,368,886.33IDR JIBOR 3 MONTHS 1.20 2015 2025 2,449,962,746,818.00 181,586,328.70 2,257,798,390,987.00 167,343,491.77IDR JIBOR 3 MONTHS 1.50 2015 2025 2,225,000,000,000.00 164,912,540.76 2,097,790,192,652.00 155,484,004.79IDR SBI 12 MONTHS 4.50 2011 2024 11,175,000,000.00 828,268.60 395,102,000.00 29,284.17IDR SBI 12 MONTHS 4.50 2012 2021 44,974,000,000.00 3,333,382.75 7,449,421,006.00 552,136.16IDR SBI 12 MONTHS 4.50 2012 2022 110,000,000,000.00 8,152,979.54 64,705,882,348.00 4,795,870.32IDR SBI 12 MONTHS 4.50 2014 2024 32,350,000,000.00 2,397,717.17 17,490,111,667.00 1,296,332.02IDR SBI 12 MONTHS 4.50 2014 2023 45,000,000,000.00 3,335,309.81 37,118,859,693.00 2,751,175.49IDR SBI 12 MONTHS 4.50 2014 2026 16,870,000,000.00 1,250,370.59 13,250,281,251.00 982,084.29IDR SBI 12 MONTHS 4.50 2014 2024 7,984,000,000.00 591,758.08 1,360,896,539.00 100,866.92IDR SBI 12 MONTHS 4.50 2014 2024 17,294,000,000.00 1,281,796.62 15,802,690,680.00 1,171,263.76IDR SBI 12 MONTHS 4.00 2011 2019 24,312,000,000.00 1,801,956.72 7,899,840,082.00 585,520.31IDR SBI 12 MONTHS 4.75 2011 2019 14,700,000,000.00 1,089,534.54 4,277,031,588.00 317,005.01IDR FIXED 8.55 2016 2026 1,000,000,000,000.00 74,117,995.85 1,000,000,000,000.00 74,117,995.85IDR FIXED 8.55 2017 2027 1,968,000,000,000.00 145,864,215.83 1,968,000,000,000.00 145,864,215.83IDR FIXED 7.80 2017 2022 1,165,000,000,000.00 86,347,465.16 2,968,000,000,000.00 219,982,211.68IDR FIXED 8.40 2017 2027 2,367,000,000,000 175,437,296.18 2,367,000,000,000 175,437,296.18GRAND TOTAL 47,158,360,008,246.90 3,495,283,131.36 19,561,360,995,781.00 1,449,848,873.09
JIBOR: Jakarta Inter-Bank Offered Rate SBI: Sertifikat Bank Indonesia (Bank Indonesia Certificate)
T-32

Table of Contents
Guaranteed External Loans of the Republic of Indonesia as of September 30, 2017
CURRENCY BASEINTEREST RATE
BASISINTEREST
RATEYEAR OF
CONTRACTYEAR OF
MATURITY LOAN COMMITMENT AMOUNT OUTSTANDING BALANCE(In Original Currency) (In US Dollars) (In Original Currency) (In US Dollars)
FULLY DISBURSEDUSD LIBOR 6 MONTHS 0.79 2008 2021 592,224,258.00 592,224,258.00 218,353,957.00 218,353,957.00USD LIBOR 6 MONTHS 0.84 2008 2023 615,114,259.00 615,114,259.00 309,625,702.00 309,625,702.00USD LIBOR 6 MONTHS 2.30 2009 2022 826,483,227.00 826,483,227.00 411,413,286.00 411,413,286.00USD LIBOR 6 MONTHS 2.80 2009 2024 417,566,000.00 417,566,000.00 281,818,772.00 281,818,772.00USD LIBOR 6 MONTHS 2.80 2009 2026 481,937,182.00 481,937,182.00 373,068,404.00 373,068,404.00USD LIBOR 6 MONTHS 3.25 2008 2021 261,800,000.00 261,800,000.00 104,720,000.00 104,720,000.00USD LIBOR 6 MONTHS 3.85 2009 2023 138,336,845.00 138,336,845.00 73,385,170.00 73,385,170.00USD LIBOR 6 MONTHS 3.85 2009 2024 625,256,803.00 625,256,803.00 427,000,963.00 427,000,963.00
PARTIALLY DISBURSEDUSD LIBOR 6 MONTHS 2.01 2015 2035 575,000,000.00 575,000,000.00 230,000,000.00 230,000,000.00USD LIBOR 6 MONTHS 2.91 2015 2035 25,000,000.00 25,000,000.00 10,000,000.00 10,000,000.00USD LIBOR 6 MONTHS 2.18 2016 2036 500,000,000.00 500,000,000.00 107,650,000.00 107,650,000.00GRAND TOTAL 5,058,718,574.00 5,058,718,574.00 2,547,036,254.00 2,547,036,254.00
T-33

Table of Contents
Foreign Currency-Denominated Bonds of the Republic of Indonesia as of September 30, 2017
CURRENCYINTEREST RATE
BASISINTEREST
RATE ISSUE DATE MATURITY DATE OUTSTANDING BALANCE(In Original Currency) (In US Dollars)
I. GOVERNMENT DEBT SECURITIESUS DOLLARRI0018 FIXED 6.875% 1/17/2008 1/17/2018 1,900,000,000 1,900,000,000RI00190304 FIXED 11.625% 3/4/2009 3/4/2019 2,000,000,000 2,000,000,000RI0035 FIXED 8.500% 10/12/2005 10/12/2035 1,600,000,000 1,600,000,000RI0037 FIXED 6.625% 2/14/2007 2/17/2037 1,500,000,000 1,500,000,000RI0038 FIXED 7.750% 1/17/2008 1/17/2038 2,000,000,000 2,000,000,000RI0122 FIXED 3.700% 12/8/2016 1/8/2022 750,000,000 750,000,000RI0124 FIXED 5.875% 1/15/2014 1/15/2024 2,000,000,000 2,000,000,000RI0125 FIXED 4.125% 1/15/2015 1/15/2025 2,000,000,000 2,000,000,000RI0126 FIXED 4.750% 12/8/2015 1/8/2026 2,250,000,000 2,250,000,000RI0127 FIXED 4.350% 12/8/2016 1/8/2027 1,250,000,000 1,250,000,000RI0142 FIXED 5.250% 1/17/2012 1/17/2042 2,250,000,000 2,250,000,000RI0144 FIXED 6.750% 1/15/2014 1/15/2044 2,000,000,000 2,000,000,000RI0145 FIXED 5.125% 1/15/2015 1/15/2045 2,000,000,000 2,000,000,000RI0146 FIXED 5.950% 12/8/2015 1/8/2046 1,250,000,000 1,250,000,000RI0147 FIXED 5.250% 12/8/2016 1/8/2047 1,500,000,000 1,500,000,000RI0320 FIXED 5.875% 1/19/2010 3/13/2020 2,000,000,000 2,000,000,000RI0422 FIXED 3.750% 4/25/2012 4/25/2022 2,000,000,000 2,000,000,000RI0423 FIXED 3.375% 4/15/2013 4/15/2023 1,500,000,000 1,500,000,000RI0443 FIXED 4.625% 4/15/2013 4/15/2043 1,500,000,000 1,500,000,000RI0521 FIXED 4.875% 5/5/2011 5/5/2021 2,500,000,000 2,500,000,000RI0727 FIXED 3.850% 7/18/2017 7/18/2027 1,000,000,000 1,000,000,000RI0747 FIXED 4.750% 7/18/2017 7/18/2047 1,000,000,000 1,000,000,000RI1023 FIXED 5.375% 7/17/2013 10/17/2023 1,000,000,000 1,000,000,000USDFR0002 FIXED 4.050% 6/24/2016 6/24/2026 200,000,000 200,000,000TOTAL US DOLLAR-DENOMINATED 51,450,000,000 38,950,000,000
JAPAN YENJBIC GUARANTEED SAMURAI BONDSRIJPY0719 FIXED 2.730% 7/29/2009 7/29/2019 35,000,000,000 518,310,258RIJPY1120 FIXED 1.600% 11/12/2010 11/12/2020 60,000,000,000 888,531,871RIJPY1122 FIXED 1.130% 11/22/2012 11/22/2022 60,000,000,000 888,531,871RIJPY0825 FIXED 0.910% 8/13/2015 8/13/2025 55,000,000,000 814,487,548TOTAL JBIC GUARANTEED SAMURAI BONDS 210,000,000,000 3,109,861,548
NON-JBIC GUARANTEED SAMURAI BONDSRIJPY0619 FIXED 0.830% 6/21/2016 6/21/2019 62,000,000,000 918,149,600RIJPY0620 FIXED 0.650% 6/8/2017 6/8/2020 40,000,000,000 592,354,580RIJPY0621 FIXED 1.160% 6/21/2016 6/21/2021 38,000,000,000 562,736,851RIJPY0622 FIXED 0.890% 6/8/2017 6/8/2022 50,000,000,000 740,443,226RIJPY0624 FIXED 1.040% 6/8/2017 6/7/2024 10,000,000,000 148,088,645RIJPY0818 FIXED 1.080% 8/13/2015 8/13/2018 22,500,000,000 333,199,452RIJPY0820 FIXED 1.380% 8/13/2015 8/13/2020 22,500,000,000 333,199,452TOTAL NON-JBIC GUARANTEED SAMURAI BONDS 245,000,000,000 3,628,171,806
TOTAL JAPAN YEN-DENOMINATED 455,000,000,000 6,738,033,353
EUROEURFRNT0001 FIXED 0.90000% 4/26/2017 4/26/2020 50,000,000 58,905,018RIEUR0623 FIXED 2.62500% 6/14/2016 6/14/2023 1,500,000,000 1,767,150,534RIEUR0628 FIXED 3.75000% 6/14/2016 6/14/2028 1,500,000,000 1,767,150,534RIEUR0721 FIXED 2.87500% 7/8/2014 7/8/2021 1,000,000,000 1,178,100,356RIEUR0724 FIXED 2.15000% 7/18/2017 7/18/2024 1,000,000,000 1,178,100,356RIEUR0725 FIXED 3.37500% 7/30/2015 7/30/2025 1,250,000,000 1,472,625,445TOTAL EURO-DENOMINATED 6,300,000,000 7,422,032,241
T-34

Table of Contents
CURRENCYINTEREST RATE
BASISINTEREST
RATE ISSUE DATE MATURITY DATE OUTSTANDING BALANCE(In Original Currency) (In US Dollars)
II. GOVERNMENT ISLAMIC DEBT SECURITIESUS DOLLARSNI0322 FIXED 3.400% 3/29/2017 3/29/2022 1,000,000,000 1,000,000,000SNI0327 FIXED 4.150% 3/29/2017 3/29/2027 2,000,000,000 2,000,000,000SNI18 FIXED 4.000% 11/21/2011 11/21/2018 1,000,000,000 1,000,000,000SNI19 FIXED 6.125% 9/17/2013 3/15/2019 1,500,000,000 1,500,000,000SNI21 FIXED 3.400% 3/29/2016 3/29/2021 750,000,000 750,000,000SNI22 FIXED 3.300% 11/21/2012 11/21/2022 1,000,000,000 1,000,000,000SNI24 FIXED 4.350% 9/10/2014 9/10/2024 1,500,000,000 1,500,000,000SNI25 FIXED 4.325% 5/28/2015 5/28/2025 2,000,000,000 2,000,000,000SNI26 FIXED 4.550% 3/29/2016 3/29/2026 1,750,000,000 1,750,000,000TOTAL US DOLLAR-DENOMINATED 12,500,000,000 12,500,000,000
TOTAL FOREIGN CURRENCY-DENOMINATED BONDS IN EQUIVALENTAMOUNT OF US DOLLARS 65,610,065,594
Assumed exchange rate for conversion as of September 30, 2017 (Bank Indonesia Middle Exchange Rate) IDR/USD 13,492IDR/JPY 199.80IDR/EUR 15,895
T-35

Table of Contents
Domestic Currency-Denominated Bonds of the Republic of Indonesia as of September 30, 2017
SERIESINTEREST RATE
BASIS COUPON RATEISSUEDATE
MATURITYDATE OUTSTANDING BALANCE
(In Original Currency) (In US Dollars)I. TRADABLE SECURITIESA. GOVERNMENT DEBT SECURITIES1. TREASURY BILLSSPN03171026 FIXED ZERO COUPON 7/27/2017 10/26/2017 5,000,000,000,000 370,589,979SPN03171123 FIXED ZERO COUPON 8/24/2017 11/23/2017 5,000,000,000,000 370,589,979SPN03171221 FIXED ZERO COUPON 9/22/2017 12/21/2017 5,000,000,000,000 370,589,979SPN12171012 FIXED ZERO COUPON 10/13/2016 10/12/2017 4,050,000,000,000 300,177,883SPN12171109 FIXED ZERO COUPON 11/10/2016 11/9/2017 6,250,000,000,000 463,237,474SPN12171207 FIXED ZERO COUPON 12/8/2016 12/7/2017 5,800,000,000,000 429,884,376SPN12180104 FIXED ZERO COUPON 1/5/2017 1/4/2018 10,800,000,000,000 800,474,355SPN12180201 FIXED ZERO COUPON 2/2/2017 2/1/2018 16,050,000,000,000 1,189,593,833SPN12180301 FIXED ZERO COUPON 3/2/2017 3/1/2018 9,750,000,000,000 722,650,460SPN12180412 FIXED ZERO COUPON 4/13/2017 4/12/2018 8,050,000,000,000 596,649,867SPN12180511 FIXED ZERO COUPON 5/12/2017 5/11/2018 5,300,000,000,000 392,825,378SPN12180607 FIXED ZERO COUPON 6/8/2017 6/7/2018 5,550,000,000,000 411,354,877SPN12180712 FIXED ZERO COUPON 7/13/2017 7/12/2018 3,100,000,000,000 229,765,787SPN12180809 FIXED ZERO COUPON 8/10/2017 8/9/2018 5,000,000,000,000 370,589,979SPN12180906 FIXED ZERO COUPON 9/7/2017 9/6/2018 3,000,000,000,000 222,353,988TOTAL TREASURY BILLS 97,700,000,000,000 7,241,328,194
2. TREASURY NOTESFR0031 FIXED 11.000% 6/16/2005 11/15/2020 17,792,000,000,000 1,318,707,382FR0032 FIXED 15.000% 9/1/2005 7/15/2018 888,492,000,000 65,853,246FR0034 FIXED 12.800% 1/26/2006 6/15/2021 16,097,400,000,000 1,193,107,026FR0035 FIXED 12.900% 2/16/2006 6/15/2022 11,023,750,000,000 817,058,257FR0036 FIXED 11.500% 4/20/2006 9/15/2019 9,184,500,000,000 680,736,733FR0037 FIXED 12.000% 5/18/2006 9/15/2026 2,450,000,000,000 181,589,090FR0038 FIXED 11.600% 8/24/2006 8/15/2018 3,066,162,000,000 227,257,782FR0039 FIXED 11.750% 8/24/2006 8/15/2023 4,175,000,000,000 309,442,633FR0040 FIXED 11.000% 9/21/2006 9/15/2025 26,002,090,000,000 1,927,222,799FR0042 FIXED 10.250% 1/25/2007 7/15/2027 14,774,100,000,000 1,095,026,682FR0043 FIXED 10.250% 2/22/2007 7/15/2022 14,417,000,000,000 1,068,559,146FR0044 FIXED 10.000% 4/19/2007 9/15/2024 18,014,000,000,000 1,335,161,577FR0045 FIXED 9.750% 5/24/2007 5/15/2037 9,626,304,000,000 713,482,360FR0046 FIXED 9.500% 7/19/2007 7/15/2023 24,680,000,000,000 1,829,232,138FR0047 FIXED 10.000% 8/30/2007 2/15/2028 20,385,000,000,000 1,510,895,345FR0048 FIXED 9.000% 9/27/2007 9/15/2018 4,761,270,000,000 352,895,790FR0050 FIXED 10.500% 1/24/2008 7/15/2038 15,661,000,000,000 1,160,761,933FR0052 FIXED 10.500% 8/20/2009 8/15/2030 23,500,000,000,000 1,741,772,902FR0053 FIXED 8.250% 7/8/2010 7/15/2021 100,027,793,000,000 7,413,859,546FR0054 FIXED 9.500% 7/22/2010 7/15/2031 27,096,000,000,000 2,008,301,216FR0056 FIXED 8.375% 9/23/2010 9/15/2026 121,414,000,000,000 8,998,962,348FR0057 FIXED 9.500% 4/21/2011 5/15/2041 17,236,573,000,000 1,277,540,246FR0058 FIXED 8.250% 7/21/2011 6/15/2032 42,798,000,000,000 3,172,101,986FR0059 FIXED 7.000% 9/15/2011 5/15/2027 95,880,000,000,000 7,106,433,442FR0061 FIXED 7.000% 10/6/2011 5/15/2022 85,778,000,000,000 6,357,693,448FR0062 FIXED 6.375% 2/9/2012 4/15/2042 13,392,000,000,000 992,588,200FR0063 FIXED 5.625% 8/13/2012 5/15/2023 35,516,000,000,000 2,632,374,741FR0064 FIXED 6.125% 8/13/2012 5/15/2028 29,895,000,000,000 2,215,757,486FR0065 FIXED 6.625% 8/30/2012 5/15/2033 48,243,000,000,000 3,575,674,474FR0066 FIXED 5.250% 10/25/2012 5/15/2018 17,146,000,000,000 1,270,827,157FR0067 FIXED 8.750% 7/18/2013 2/15/2044 28,188,284,000,000 2,089,259,117FR0068 FIXED 8.375% 8/1/2013 3/15/2034 92,400,000,000,000 6,848,502,816FR0069 FIXED 7.875% 8/29/2013 4/15/2019 62,396,000,000,000 4,624,666,469FR0070 FIXED 8.375% 8/29/2013 3/15/2024 132,939,421,000,000 9,853,203,454FR0071 FIXED 9.000% 9/12/2013 3/15/2029 93,390,682,000,000 6,921,930,181FR0072 FIXED 8.250% 7/9/2015 5/15/2036 88,910,000,000,000 6,589,831,011FR0073 FIXED 8.750% 8/6/2015 5/15/2031 66,217,000,000,000 4,907,871,331FR0074 FIXED 7.500% 11/10/2016 8/15/2032 36,080,000,000,000 2,674,177,290FR0075 FIXED 7.500% 8/10/2017 5/15/2038 11,650,000,000,000 863,474,652FR0076 FIXED 7.375% 9/22/2017 5/15/2048 2,800,000,000,000 207,530,388VR0026 3 MONTH
TREASURY BILLS5.085% 11/20/2002 1/25/2018 5,442,142,000,000 403,360,658
T-36

Table of Contents
SERIESINTEREST RATE
BASIS COUPON RATEISSUEDATE
MATURITYDATE OUTSTANDING BALANCE
(In Original Currency) (In US Dollars)VR0027 3 MONTH
TREASURY BILLS5.085% 11/20/2002 7/25/2018 5,442,142,000,000 403,360,658
VR0028 3 MONTHTREASURY BILLS
4.973% 11/20/2002 8/25/2018 7,033,994,000,000 521,345,538
VR0029 3 MONTHTREASURY BILLS
4.973% 11/20/2002 8/25/2019 12,212,320,000,000 905,152,683
VR0030 3 MONTHTREASURY BILLS
4.953% 11/20/2002 12/25/2019 10,503,015,000,000 778,462,422
VR0031 3 MONTHTREASURY BILLS
5.085% 11/20/2002 7/25/2020 25,322,354,000,000 1,876,842,129
TOTAL TREASURY NOTES 1,551,847,788,000,000 115,019,847,910
3. RETAIL BONDSORI011 FIXED 8.500% 10/22/2014 10/15/2017 21,215,910,000,000 1,572,480,729ORI012 FIXED 9.000% 10/21/2015 10/15/2018 27,438,755,000,000 2,033,705,529ORI013 FIXED 6.600% 10/26/2016 10/15/2019 19,691,455,000,000 1,459,491,180TOTAL RETAIL BONDS 68,346,120,000,000 5,065,677,438TOTAL TRADABLE GOVERNMENT DEBT SECURITIES 1,717,893,908,000,000 127,326,853,543
B. GOVERNMENT ISLAMIC DEBT SECURITIES1. ISLAMIC TREASURY BILLSSPNS01122017 FIXED ZERO COUPON 6/2/2017 12/1/2017 4,500,000,000,000 333,530,981SPNS02022018 FIXED ZERO COUPON 8/3/2017 2/2/2018 7,000,000,000,000 518,825,971SPNS03112017 FIXED ZERO COUPON 5/4/2017 11/3/2017 4,000,000,000,000 296,471,983SPNS05012018 FIXED ZERO COUPON 7/6/2017 1/5/2018 2,870,000,000,000 212,718,648SPNS05102017 FIXED ZERO COUPON 4/6/2017 10/5/2017 4,000,000,000,000 296,471,983SPNS13032018 FIXED ZERO COUPON 9/14/2017 3/13/2018 3,450,000,000,000 255,707,086TOTAL ISLAMIC TREASURY BILLS 25,820,000,000,000 1,913,726,653
2. ISLAMIC TREASURY NOTESIFR0002 FIXED 11.950% 8/26/2008 8/15/2018 1,985,000,000,000 147,124,222IFR0006 FIXED 10.250% 4/1/2010 3/15/2030 2,175,000,000,000 161,206,641IFR0007 FIXED 10.250% 1/21/2010 1/15/2025 1,547,000,000,000 114,660,540IFR0008 FIXED 8.800% 4/15/2010 3/15/2020 252,000,000,000 18,677,735IFR0010 FIXED 10.000% 3/3/2011 2/15/2036 4,110,000,000,000 304,624,963PBS001 FIXED 4.450% 2/16/2012 2/15/2018 6,725,000,000,000 498,443,522PBS002 FIXED 5.450% 2/2/2012 1/15/2022 1,218,000,000,000 90,275,719PBS003 FIXED 6.000% 2/2/2012 1/15/2027 3,786,000,000,000 280,610,732PBS004 FIXED 6.100% 2/16/2012 2/15/2037 10,149,000,000,000 752,223,540PBS005 FIXED 6.750% 5/2/2013 4/15/2043 10,234,000,000,000 758,523,570PBS006 FIXED 8.250% 9/19/2013 9/15/2020 38,508,000,000,000 2,854,135,784PBS007 FIXED 9.000% 9/29/2014 9/15/2040 7,525,000,000,000 557,737,919PBS009 FIXED 7.750% 7/30/2015 1/25/2018 37,890,000,000,000 2,808,330,863PBS010 FIXED 8.625% 10/26/2015 1/25/2019 4,050,000,000,000 300,177,883PBS011 FIXED 8.750% 1/14/2016 8/15/2023 19,080,000,000,000 1,414,171,361PBS012 FIXED 8.875% 1/28/2016 11/15/2031 31,065,100,000,000 2,302,482,953PBS013 FIXED 6.250% 10/6/2016 5/15/2019 39,900,000,000,000 2,957,308,034PBS014 FIXED 6.500% 10/6/2016 5/15/2021 14,767,857,000,000 1,094,563,964PBS015 FIXED 8.000% 7/21/2017 7/15/2047 250,000,000,000 18,529,499PBS016 FIXED 6.250% 9/6/2017 3/15/2020 500,000,000,000 37,058,998TOTAL ISLAMIC TREASURY NOTES 235,716,957,000,000 17,470,868,441
3. RETAIL ISLAMIC DEBT SECURITIESSR-007 FIXED 8.250% 3/11/2015 3/11/2018 21,965,035,000,000 1,628,004,373SR-008 FIXED 8.300% 3/10/2016 3/10/2019 31,500,000,000,000 2,334,716,869SR-009 FIXED 6.900% 3/22/2017 3/10/2020 14,037,310,000,000 1,040,417,284TOTAL RETAIL ISLAMIC DEBT SECURITIES 67,502,345,000,000 5,003,138,527
TOTAL GOVERNMENT ISLAMIC DEBT SECURITIES 329,039,302,000,000 24,387,733,620
TOTAL TRADABLE SECURITIES 2,046,933,210,000,000 151,714,587,163
T-37

Table of Contents
SERIESINTEREST RATE
BASIS COUPON RATEISSUEDATE
MATURITYDATE OUTSTANDING BALANCE
(In Original Currency) (In US Dollars)II. NON-TRADABLE SECURITIESA. GOVERNMENT DEBT SECURITIES1. HELD BY BANK INDONESIASRBI01 FIXED 0.100% 8/7/2003 8/1/2043 102,763,824,519,929 7,616,648,719SU002 FIXED 0.100% 1/1/2006 4/1/2025 13,313,389,573,979 986,761,753SU004 FIXED 0.100% 1/1/2006 12/1/2025 38,367,781,515,523 2,843,743,071SU007 FIXED 0.100% 1/1/2006 8/1/2025 35,249,414,553,846 2,612,615,962TOTAL GOVERNMENT DEBT SECURITIES HELD BY BANK INDONESIA 189,694,410,163,277 14,059,769,505
2. RETAIL NON-TRADABLE BONDSSBR002 IDIC RATE IDIC RATE
+0.25% 5/25/2016 5/20/2018 3,799,125,000,000 281,583,531
B. GOVERNMENT ISLAMIC DEBT SECURITIES1. HELD BY MINISTRY OF RELIGIOUS AFFAIRSDHI 2020C FIXED 8.300% 1/3/2014 1/3/2020 3,000,000,000,000 222,353,988SDHI-2018A FIXED 6.060% 5/30/2012 5/30/2018 2,500,000,000,000 185,294,990SDHI-2019A FIXED 5.460% 3/21/2012 3/21/2019 3,000,000,000,000 222,353,988SDHI-2019B FIXED 8.050% 2/11/2014 2/11/2019 2,000,000,000,000 148,235,992SDHI-2020A FIXED 5.790% 4/27/2012 4/27/2020 1,500,000,000,000 111,176,994SDHI-2020B FIXED 6.200% 6/28/2012 6/28/2020 1,000,000,000,000 74,117,996SDHI-2021A FIXED 8.000% 4/11/2011 4/11/2021 2,000,000,000,000 148,235,992SDHI-2021B FIXED 7.160% 10/17/2011 10/17/2021 3,000,000,000,000 222,353,988SDHI-2022A FIXED 5.910% 3/21/2012 3/21/2022 3,342,000,000,000 247,702,342SDHI-2022B FIXED 8.750% 2/11/2014 2/11/2022 2,000,000,000,000 148,235,992SDHI-2024A FIXED 9.040% 2/11/2014 2/11/2024 2,000,000,000,000 148,235,992SDHI-2029A FIXED 8.430% 3/25/2014 3/25/2029 1,000,000,000,000 74,117,996SDHI-2029B FIXED 8.620% 8/13/2014 8/13/2029 2,855,000,000,000 211,606,878SDHI2019C FIXED 7.200% 4/27/2016 4/27/2019 1,000,000,000,000 74,117,996SDHI2020D FIXED 8.200% 6/29/2015 6/29/2020 1,000,000,000,000 74,117,996SDHI2020E FIXED 7.140% 3/21/2017 3/21/2020 2,000,000,000,000 148,235,992SDHI2023A FIXED 8.820% 11/4/2015 11/4/2023 1,500,000,000,000 111,176,994SDHI2025A FIXED 8.300% 7/8/2015 7/8/2025 2,000,000,000,000 148,235,992TOTAL GOVERNMENT ISLAMIC DEBT SECURITIES HELD BY MINISTRY OF RELIGIOUS AFFAIR 36,697,000,000,000 2,719,908,094
2. RETAIL NON-TRADABLE ISLAMIC DEBT SECURITIESST001 FIXED 6.900% 9/7/2016 9/7/2018 2,523,913,000,000 187,067,373TOTAL NON-TRADABLE SECURITIES 232,714,448,163,277 34,028,006,102
TOTAL DOMESTIC CURRENCY DENOMINATED BONDS 2,279,647,658,163,280 185,742,593,265
Assumed exchange rate for conversion as of September 30, 2017 (Bank Indonesia Middle Exchange Rate)
IDR/USD 13,492Indonesia Deposit Insurance Corporation (IDIC) Rate as of September 30, 2017
6%
SPN: Surat Perbendaharaan Negara (Treasury Bills) FR: Fixed Rate (Treasury Notes) ORI: Obligasi Negara Ritel (Retail Bonds) SPNS: Surat Perbendaharaan Negara Syariah (Islamic Treasury Bills) IFR: Islamic Fixed Rate PBS: Project Based Sukuk SR: Sukuk Ritel (Retail Islamic Debt Securities) SRBI: Special Rate Bank Indonesia SU: Surat Utang (Debt Securities) SBR: Saving Bonds Retail SDHI: Sukuk Dana Haji Indonesia (Hajj Fund Sukuk)
T-38
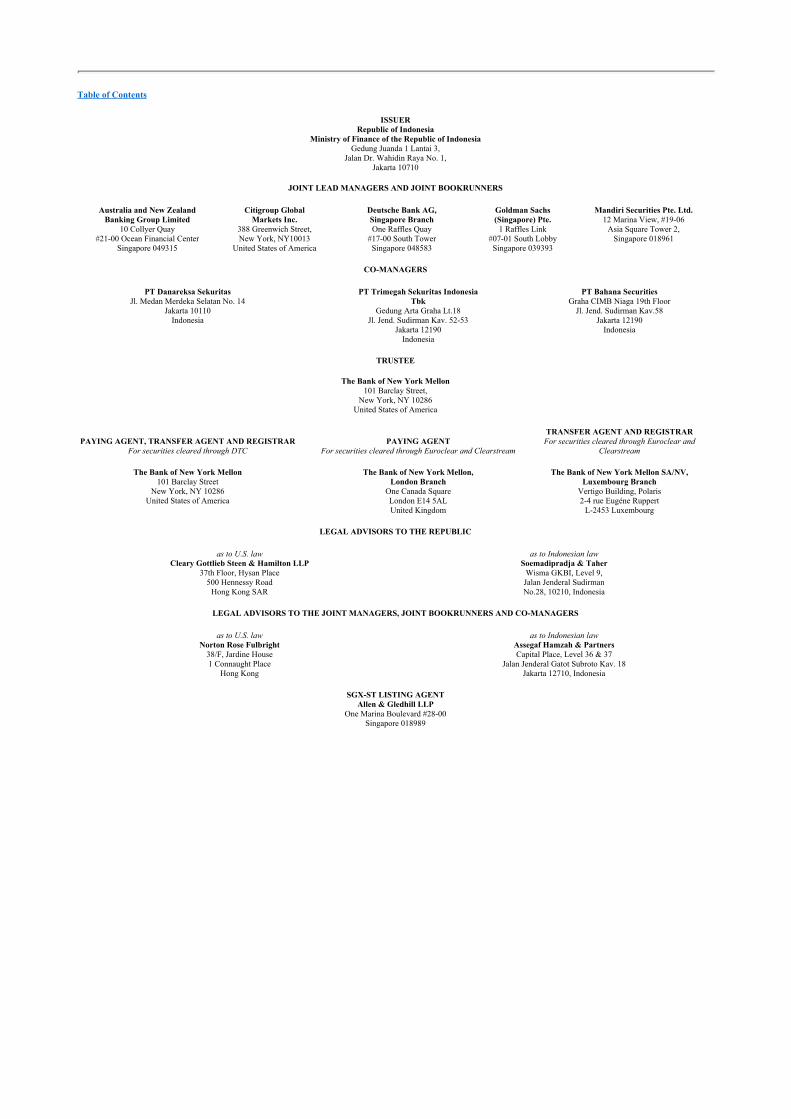
Table of Contents
ISSUER Republic of Indonesia
Ministry of Finance of the Republic of Indonesia Gedung Juanda 1 Lantai 3,
Jalan Dr. Wahidin Raya No. 1, Jakarta 10710
JOINT LEAD MANAGERS AND JOINT BOOKRUNNERS
Australia and New ZealandBanking Group Limited
10 Collyer Quay#21-00 Ocean Financial Center
Singapore 049315
Citigroup GlobalMarkets Inc.
388 Greenwich Street,New York, NY10013
United States of America
Deutsche Bank AG,Singapore BranchOne Raffles Quay
#17-00 South TowerSingapore 048583
Goldman Sachs(Singapore) Pte.
1 Raffles Link#07-01 South LobbySingapore 039393
Mandiri Securities Pte. Ltd.12 Marina View, #19-06
Asia Square Tower 2,Singapore 018961
CO-MANAGERS
PT Danareksa SekuritasJl. Medan Merdeka Selatan No. 14
Jakarta 10110Indonesia
PT Trimegah Sekuritas IndonesiaTbk
Gedung Arta Graha Lt.18Jl. Jend. Sudirman Kav. 52-53
Jakarta 12190Indonesia
PT Bahana SecuritiesGraha CIMB Niaga 19th Floor
Jl. Jend. Sudirman Kav.58Jakarta 12190
Indonesia
TRUSTEE
The Bank of New York Mellon 101 Barclay Street,
New York, NY 10286 United States of America
PAYING AGENT, TRANSFER AGENT AND REGISTRARFor securities cleared through DTC
PAYING AGENTFor securities cleared through Euroclear and Clearstream
TRANSFER AGENT AND REGISTRARFor securities cleared through Euroclear and
Clearstream
The Bank of New York Mellon101 Barclay Street
New York, NY 10286United States of America
The Bank of New York Mellon,London Branch
One Canada SquareLondon E14 5ALUnited Kingdom
The Bank of New York Mellon SA/NV,Luxembourg Branch
Vertigo Building, Polaris2-4 rue Eugéne Ruppert
L-2453 Luxembourg
LEGAL ADVISORS TO THE REPUBLIC
as to U.S. lawCleary Gottlieb Steen & Hamilton LLP
37th Floor, Hysan Place500 Hennessy Road
Hong Kong SAR
as to Indonesian lawSoemadipradja & Taher
Wisma GKBI, Level 9,Jalan Jenderal SudirmanNo.28, 10210, Indonesia
LEGAL ADVISORS TO THE JOINT MANAGERS, JOINT BOOKRUNNERS AND CO-MANAGERS
as to U.S. lawNorton Rose Fulbright
38/F, Jardine House1 Connaught Place
Hong Kong
as to Indonesian lawAssegaf Hamzah & PartnersCapital Place, Level 36 & 37
Jalan Jenderal Gatot Subroto Kav. 18Jakarta 12710, Indonesia
SGX-ST LISTING AGENT Allen & Gledhill LLP
One Marina Boulevard #28-00 Singapore 018989

Table of Contents
Until and including January 13, 2018, all dealers that effect transactions in these securities, whether or not participating in this offering, may be required to deliver a prospectus. This is in addition to the dealers’ obligation to deliver a prospectus when acting as underwriters and with respect to their unsold allotments or subscriptions.