Republic of Indonesia Indonesia Economic Quarterly FY13
513
Document of the World Bank Report No: AUS2972 . Republic of Indonesia Indonesia Economic Quarterly FY13 Compilation of the July 2012, October 2012, December 2012 and March 2013 Indonesia Economic Quarterly Reports . May 2013 . EASPI EAST ASIA AND PACIFIC . . . Public Disclosure Authorized Public Disclosure Authorized Public Disclosure Authorized Public Disclosure Authorized
-
Upload
khangminh22 -
Category
Documents
-
view
0 -
download
0
Transcript of Republic of Indonesia Indonesia Economic Quarterly FY13
Document of the World Bank
Report No: AUS2972 .
Republic of Indonesia Indonesia Economic Quarterly FY13 Compilation of the July 2012, October 2012, December 2012 and March
2013 Indonesia Economic Quarterly Reports
. May 2013
. EASPI
EAST ASIA AND PACIFIC
.
.
.
Pub
lic D
iscl
osur
e A
utho
rized
Pub
lic D
iscl
osur
e A
utho
rized
Pub
lic D
iscl
osur
e A
utho
rized
Pub
lic D
iscl
osur
e A
utho
rized
Standard Disclaimer:
.
This volume is a product of the staff of the International Bank for Reconstruction and Development/ The World Bank. The findings, interpretations, and conclusions expressed in this paper do not necessarily reflect the views of the Executive Directors of The World Bank or the governments they represent. The World Bank does not guarantee the accuracy of the data included in this work. The boundaries, colors, denominations, and other information shown on any map in this work do not imply any judgment on the part of The World Bank concerning the legal status of any territory or the endorsement or acceptance of such boundaries.
.
Copyright Statement:
.
The material in this publication is copyrighted. Copying and/or transmitting portions or all of this work without permission may be a violation of applicable law. The International Bank for Reconstruction and Development/ The World Bank encourages dissemination of its work and will normally grant permission to reproduce portions of the work promptly. For permission to photocopy or reprint any part of this work, please send a request with complete information to the Copyright Clearance Center, Inc., 222 Rosewood Drive, Danvers, MA 01923, USA, telephone 978-750-8400, fax 978-750-4470, http://www.copyright.com/. All other queries on rights and licenses, including subsidiary rights, should be addressed to the Office of the Publisher, The World Bank, 1818 H Street NW, Washington, DC 20433, USA, fax 202-522-2422, e-mail [email protected].
.
This volume provides a compilation of the four editions of the World Bank’s Indonesia Economic Quarterly (IEQ) produced over FY2013. Both English language and Indonesian language versions are included. The IEQ is a product of the World Bank’s Indonesia country office. The reports were prepared by a team supervised by Shubham Chaudhuri (Lead Economist, EASPI) and subsequently by James A. Brumby (Sector Manager, EASPI), and Ndiame Diop (Lead Economist, EASPI), and led by Ashley Taylor (EASPI). The team worked under the overall guidance of Sudhir Shetty (Sector Director, EASPR) and Stefan G. Koeberle (Country Director, EACIF) and received valuable input from Bert Hofman (Director and Chief Economist, EAPCE) and from the cross-sectoral IEQ Editorial Board comprised of members from across the Indonesia country office. The production of the report was led by the Macro and Fiscal Policy Cluster, Poverty Reduction and Economic Management (PREM) Network. The core project team, with responsibility for the economic and fiscal update sections, editing and production, was coordinated by Alex Sienaert, and comprised Arsianti, Magda Adriani, Andrew Blackman, Brendan Coates, Fitria Fitrani, Faya Hayati, Ahya Ihsan, Shakira Jones, Alex Sienaert and David Stephan (all EASPI). Additional contributions were received from Dwi Endah Abriningrum, Vivi Alatas, Erwin Ariadharma, Victor Duggan, Enda Ginting, Edgar Janz,, Yus Pakpahan, Cindy Paladines, Astrid Savitri, Staffan Synnerstrom, Kiyoshi Taniguchi, Gonzalo Varela and Matthew Wai-Poi (all EASPI), Neni Lestari, Djauhari Sitorus and The Fei Ming (all EASFP), Christopher Smith and Siwage Dharma Negara (EASHE), Jon Jellema (EASID), Fook Chuan Eng, Iwan Gunawan, Taimur Samad and Renata Simatupang (EASIS), Chandan Deuskar (EASIN), Jonathan Sariaatmadja (EACIF), David Lawrence (C3PDR), and Moez Miaoui and Stefan Handoyo (CEASB). Detailed comments and input were provided by Mark Ahern, Enrique Blanco Armas, Jim Brumby, Shubham Chaudhuri, Ndiame Diop, Anna Gueorguieva, Yue Man Lee, Hari Purnomo, Sjamsu Rahardja, Theo Thomas, Soekarno Wirokartono (all EASPI), Alexandra Drees-Gross (FFSAB), Samer Al-Samarrai (EASHE), Mustapha Benmaamar and Arlan Rahman (EASIS), Anita Kendrick, Shamima Khan, Bill Wallace (EACIF), Dini Sari Djalal (EAPXT), Tehmina Khan (EASPR), Chris Manning (Australian National University), Sudarno Sumarto (SMERU Research Institute) and Mark Vothknecht (DIW Berlin). Invaluable administrative support was provided by Titi Ananto, Nina Herawati, Sylvia Njotomihardjo, Ariza Nurana and Nayu Ramadhaningsih (all EASPI). Dissemination was organized by the Indonesia EXT team led by Dini Sari Djalal and including Farhana Asnap, Indra Irnawan, Jerry Kurniawan, Nugroho, Marcellinus Winata and Randy Salim (all EAPXT). The IEQ reports are a product of the staff of the International Bank for Reconstruction and Development / The World Bank, supported by funding from the Australian Government –– AusAID, under the Support for Enhanced Macroeconomic and Fiscal Policy Analysis (SEMEFPA) program. The findings, interpretations, and conclusions expressed in this report do not necessarily reflect the views of the Executive Directors of The World Bank or the governments they represent, AusAID or the Australian Government. The World Bank does not guarantee the accuracy of the data included in this work. The boundaries, colors, denominations, and other information shown on any map in this work do not imply any judgment on the part of The World Bank concerning the legal status of any territory or the endorsement or acceptance of such boundaries. Further editions of the Indonesia Economic Quarterly, along with links to press releases and launch presentations of the various reports can be found at the following website: http://www.worldbank.org/en/country/indonesia/publication/indonesia-economic-quarterly-reports .
Compilation of the Indonesia Economic Quarterly (IEQ) FY 2013 Reports – Indonesian language versions • Rising to present and future challenges, July 2012
• Maintaining resilience, October 2012
• Policies in focus, December 2012
• Pressures mounting, March 2013

July 2012
Rising to present and future challenges
INDONESIA ECONOMIC QUARTERLY
INDONESIA ECONOMIC QUARTERLY Rising to present and future challenges
July 2012

Preface
The Indonesia Economic Quarterly reports on and synthesizes the past three months’ key developments in Indonesia’s economy. It places them in a longer-term and global context, and assesses the implications of these developments and other changes in policy for the outlook for Indonesia’s economic and social welfare. Its coverage ranges from the macroeconomy to financial markets to indicators of human welfare and development. It is intended for a wide audience, including policy makers, business leaders, financial market participants, and the community of analysts and professionals engaged in Indonesia’s evolving economy.
This Indonesia Economic Quarterly was prepared and compiled by the macro and fiscal policy cluster of the World Bank’s Jakarta office, under the guidance of Lead Economist Shubham Chaudhuri and Country Economist Ashley Taylor. The team included Magda Adriani (commodity prices), Andrew Blackman (international environment, external sector, financial markets and current account), Fitria Fitrani (labor market), Faya Hayati (prices and property market), Ahya Ihsan (fiscal, budget execution and roads) and David Stephan (real sector and risks). Additional contributions were received from Dwi Endah Abriningrum (fiscal and roads), Neni Lestari (banking), The Fei Ming (corporate sector), Gonzalo Varela and Victor Duggan (global linkages and economic performance) and Matthew Wai-Poi (poverty). Arsianti, Faya Hayati, Yus Medina Pakpahan and Ashley Taylor shared the editing and production. Enrique Blanco Armas, Mustapha Benmaamar, Shubham Chaudhuri, Dini Sari Djalal, Alex Drees-Gross, Anna Gueorguieva, Bert Hofman, Tehmina Khan, Sjamsu Rahardja and Samer Al-Samarrai provided detailed comments and input. Dini Sari Djalal, Farhana Asnap, Indra Irnawan, Jerry Kurniawan, Nugroho, Marcellinus Winata and Randy Salim organized the dissemination and Titi Ananto, Nayu Ramadhaningsih and Nina Herawati provided valuable administrative support.
This report is a product of the staff of the International Bank for Reconstruction and Development / The World Bank, supported by funding from the Australian Government -AusAID under the Support for Enhanced Macroeconomic and Fiscal Policy Analysis (SEMEFPA) program.
The findings, interpretations, and conclusions expressed in this report do not necessarily reflect the views of the Executive Directors of The World Bank or the governments they represent, AusAID or the Australian Government. The World Bank does not guarantee the accuracy of the data included in this work. The boundaries, colors, denominations, and other information shown on any map in this work do not imply any judgment on the part of The World Bank concerning the legal status of any territory or the endorsement or acceptance of such boundaries.
For more World Bank analysis of Indonesia’s economy:For information about the World Bank and its activities in Indonesia, please visit www.worldbank.org/id
In order to be included on an email distribution list for this Quarterly series and related publications, please contact [email protected]. For questions and comments relating to this publication, please contact [email protected].
Table of contents
Preface i i i �
Executive Summary: Rising to present and future challenges vii i
A. � ECONOMIC AND FISCAL UPDATE 1 �
1.� The global economic outlook remains weak and financial markets turbulent 1�2.� Growth slowed in Q1 but remains solid against global headwinds 2�3.� The balance of payments recorded a third consecutive deficit in Q1 2012 5�4.� Spillovers from global financial market turbulence were seen again in May 8�5.� Fuel subsidy spending remains high but a price hike in 2012 is now unlikely 10�6.� The lower risk of a hike in subsidized fuel prices subdues the inflation outlook 14�7.� Poverty continues to fall, but at a slowing rate 16�8.� External uncertainty remains the greatest near-term risk to the economy 18�
B. � SOME RECENT DEVELOPMENTS IN INDONESIA’S ECONOMY 21 �
1.� Drivers and implications of recent trends in Indonesia’s current account 21�a.� Recent dynamics in Indonesia’s current account ...................................................................... 21�b.� Long-term sustainability and near-term financing ..................................................................... 23�c.� Recent policy measures to mitigate external vulnerabilities ..................................................... 25�d.� Concluding remarks ...................................................................................................................... 25�
2.� Identifying the constraints to budget execution in the infrastructure sector 26�a.� Delays during budget preparation present the main bottlenecks, with procurement and
implementation also affecting disbursements ............................................................................ 27�b.� Addressing budget execution challenges is critical for Indonesia ........................................... 29�
C. � INDONESIA 2014 AND BEYOND: A SELECTIVE LOOK 31 �
1.� Investing in Indonesia’s roads 31�a.� Under-investment, undersupply and deterioration in quality .................................................... 31�b.� National roads are in good condition, but heavily congested ................................................... 33�c.� Sub-national roads condition has deteriorated due to maintenance backlog ......................... 34�d.� Towards improved roads infrastructure performance .............................................................. 35�
2.� The role of the global marketplace in enhancing domestic competitiveness 36�a.� Some evidence on how greater integration can help improve productivity ............................. 36�b.� The importance of FDI for enhancing Indonesia’s productive capacity ................................... 37�c.� Imports as instruments to facilitate innovation and promote competition .............................. 39�d.� Exporting as a means to drive productivity and growth ............................................................ 41�
APPENDIX: A SNAPSHOT OF INDONESIAN ECONOMIC INDICATORS 42 �
LIST OF FIGURES
Figure 1: Amidst equity market volatility, the Rupiah has continued to gradually depreciate ..... ix�Figure 2: Capital spending, although up in nominal terms, continues to come in well below
Budget allocations ......................................................................................................... x�Figure 3: Equity market movements continue to be affected by developments in the Euro zone . 1�Figure 4: Global commodity prices have come down, but remain relatively high by historical
levels ............................................................................................................................... 1�Figure 5: Indonesia’s major trading partner growth is set to remain weak in 2012, before picking
up slightly in 2013 .......................................................................................................... 2�Figure 6: GDP growth slowed to 6.3 percent in the first quarter of 2012… ...................................... 3�Figure 7: …driven by a slowdown in the manufacturing and trade sectors .................................... 3�Figure 8: Higher frequency indicators are pointing to a slight moderation in activity ................... 4�Figure 9: A widening current account deficit contributed to overall balance of payments
outflows in Q1 2012… .................................................................................................... 6�Figure 10: …as the non-oil & gas trade surplus has narrowed sharply ........................................... 6�Figure 11: The trade balance has moved into deficit as export growth has come down ............... 7�Figure 12: The latest bout of international financial market turmoil in May spilled over to
Indonesian assets … ...................................................................................................... 8�Figure 13: …as foreign investors reduced their domestic debt and equity holdings in May and
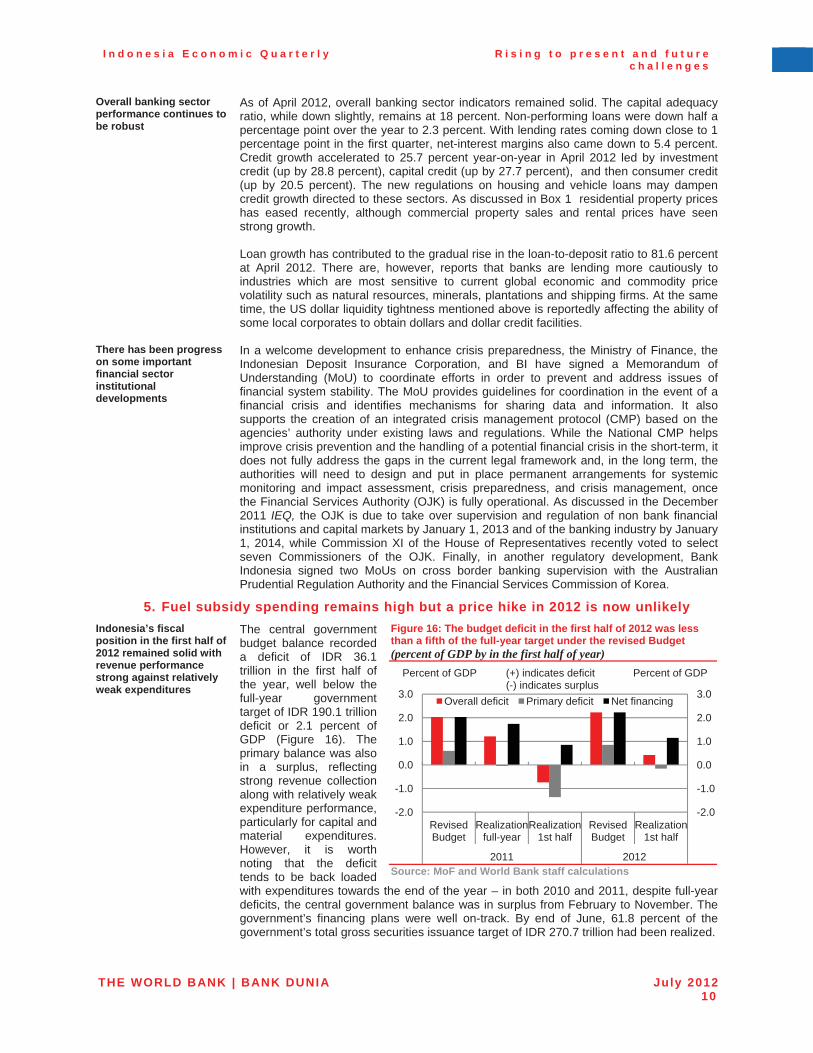
reserves declined ........................................................................................................... 8�Figure 14: Jakarta’s commercial property prices move up… ........................................................... 9�Figure 15: …but, nationwide, residential house price growth has eased in 2012 ........................... 9�Figure 16: The budget deficit in the first half of 2012 was less than a fifth of the full-year target
under the revised Budget ............................................................................................ 10�Figure 17: Crude prices have fallen sharply and with them the likelihood of any subsidized fuel
price hike in 2012 ......................................................................................................... 12�Figure 18: Headline inflation has eased up but core inflation remains relatively low ................... 15�Figure 19: The gap between Indonesian and international rice prices once again moved towards
record levels ................................................................................................................. 15�Figure 20: The national poverty rate continued to decline in 2012 but the fall was the lowest in
the last decade ............................................................................................................. 16�Figure 21: Poverty rates are relative high in Eastern Indonesia ..................................................... 16�Figure 22: The remaining poor live increasingly far below the poverty line… .............................. 17�Figure 23: …while a large number of Indonesians just above the poverty line remain vulnerable
to falls back into poverty ............................................................................................. 17�Figure 24: Unemployment continued decline in year to February 2012… ..................................... 18�Figure 25: China’s appetite for energy is a key driver of global consumption of liquid fuels ...... 20�Figure 26: China’s effect on commodity prices is considerable – yet it still trails the US ........... 20�Figure 27: The recent move into a current account deficit is part of a medium-term trend… ..... 23�Figure 28: …and is projected to remain at around 1 percent of GDP over the medium-term ...... 23�Figure 29: FDI has become a larger proportion of total financial account inflows since 2008-0924�Figure 30: Key infrastructure sectors received significant budget increases in 2011 .................. 26�Figure 31: But low 2010 and 2011 budget outcomes highlighted the ongoing challenges in
budget execution .......................................................................................................... 26�Figure 32: Identified critical issues within each step of budget execution in 2010 and 2011 ...... 27�Figure 33: Physical progress on the Double Track (2010) project experienced significant delays
relative to plans ............................................................................................................ 28�Figure 34: Actual physical progress of the Highway Construction and Maintenance West Java
(2010) project was in line with the plan ...................................................................... 28�Figure 35: Financial disbursements on the Power Plant and Transmission Sulawesi-Maluku-
Papua (2010) project were skewed towards the year end… ..................................... 29�Figure 36: …while disbursements for the Highway Agency of West Java Province (2010), a non-
construction project, were more evenly spread through the year ........................... 29�Figure 37: After a steep fall, Indonesia’s investment in roads has only now returned to pre
1997/1998 crisis levels … ............................................................................................. 31�Figure 38: … but no longer keeps pace with increasing traffic demand and growth .................... 32�Figure 39: …which led to a deterioration in road infrastructure and services .............................. 32�Figure 40: …and higher transport cost in term of trip time ............................................................. 32�Figure 41: Central government spending on national roads almost tripled in real terms between
2005 and 2011 ............................................................................................................... 34�
Figure 42: The share of district roads in good condition has been supported by new construction .................................................................................................................. 34�
Figure 43: Indonesian firms that are integrated into the world economy have performed better 36�Figure 44: Imports have been on the rise, driven by expansions in intermediate and capital
goods imports .............................................................................................................. 39�Figure 45: The relationship between intermediate imports growth and export growth is very
strong ............................................................................................................................ 39�Figure 46: Sectors that imported more of their inputs have generated more employment… ...... 40�Figure 47: …and have increased demand for domestic intermediates faster ............................... 40�
LIST OF APPENDIX FIGURES
Appendix Figure 1: Quarterly and annual GDP growth ................................................................... 42�Appendix Figure 2: Contributions to GDP expenditures ................................................................. 42�Appendix Figure 3: Contributions to GDP production ..................................................................... 42�Appendix Figure 4: Motor cycle and motor vehicle sales ............................................................... 42�Appendix Figure 5: Consumer indicators ......................................................................................... 42�Appendix Figure 6: Industrial production indicators ....................................................................... 42�Appendix Figure 7: Real trade flows ................................................................................................. 43�Appendix Figure 8: Balance of Payments ......................................................................................... 43�Appendix Figure 9: Trade balance ..................................................................................................... 43�Appendix Figure 10: Reserves and capital inflows .......................................................................... 43�Appendix Figure 11: Term of trade and export and import chained Fisher price indices ............ 43�Appendix Figure 12: Inflation and monetary policy ......................................................................... 43�Appendix Figure 13: Monthly breakdown of CPI .............................................................................. 44�Appendix Figure 14: Inflation among neighboring countries ......................................................... 44�Appendix Figure 15: Domestic and international rice prices .......................................................... 44�Appendix Figure 16: Poverty and unemployment rate .................................................................... 44�Appendix Figure 17: Regional equity indices ................................................................................... 44�Appendix Figure 18: Dollar index and Rupiah exchange rate ......................................................... 44�Appendix Figure 19: 5 year local currency government bond yields ............................................. 45�Appendix Figure 20: Sovereign USD Bond EMBI spreads .............................................................. 45�Appendix Figure 21: International commercial bank lending ......................................................... 45�Appendix Figure 22: Banking sector indicators ............................................................................... 45�Appendix Figure 23: Government debt ............................................................................................. 45�Appendix Figure 24: External debt .................................................................................................... 45�
LIST OF TABLES
Table 1: Some of Indonesia’s major export commodities have seen marked price falls in recent months ......................................................................................................................... viii�
Table 2: Under the baseline scenario growth is projected at of 6.0 percent in 2012 ...................... ix�Table 3: The impact of a severe global downturn on economic growth in 2013 would be
significant ....................................................................................................................... x�Table 4: Under the baseline scenario GDP growth of 6.0 percent is projected for 2012, rising to
6.4 percent in 2013 ......................................................................................................... 5�Table 5: The current account is projected to move into a small deficit in 2012 and financial
inflows to come down .................................................................................................... 7�Table 6: The projections for Indonesia’s external accounts are driven by a range of dynamics... 7�Table 7: Strong revenues outcome were seen in H1 2012 and disbursement rates, while
improving overall, remain relatively low for capital expenditures ........................... 11�Table 8: The Government’s macro framework for 2013 projects growth to move up to around 7
percent .......................................................................................................................... 13�Table 9: Subsidy spending in 2012 is projected to significantly exceed the revised Budget
allocation ....................................................................................................................... 14�Table 10: The impact of a global downturn on economic growth would be significant ............... 19�Table 11: The current account surplus is projected to shift into a deficit in 2012 ........................ 22�Table 12: The state of Indonesia’s road network, 2009 .................................................................... 33�
LIST OF APPENDIX TABLES
Appendix Table 1: Budget outcomes and estimates ....................................................................... 46�Appendix Table 2: Balance of Payments .......................................................................................... 46�
LIST OF BOXES
Box 1: Commercial property prices have been increasing strongly, while residential price growth has come down .................................................................................................. 9�
Box 2: The “China effect” on global commodity prices .................................................................. 20�Box 3: What is the current account balance? ................................................................................... 22�Box 4: Do local manufacturing firms benefit from greater integration? Some case studies from
Jakarta and Surabaya .................................................................................................. 37�Box 5: The potential benefits of input quality and variety for manufacturing competitiveness .. 40�
THE WORLD BANK | BANK DUNIA July 2012vi i i
Executive�summary:Rising�to�present�and�
future�challenges
The global growth outlook remains weak and financial markets turbulent
The near-term global economic outlook is fragile and emerging economies, including Indonesia, again face the risk of a potential crisis that is not of their making. The growth outlook for Indonesia’s major trading partners (MTP), at 3.3 percent in 2012, remains relatively weak as increased Euro zone uncertainty adds to the ongoing drags on global growth from budget cutting and deleveraging in developed economies, and capacity constraints in some developing economies. Recent international financial market turbulence looks set to continue in the near-term and, while this baseline scenario remains the most likely outcome, capital flows to emerging economies and sentiment are likely to remain volatile. Further enhancing crisis preparedness is therefore a policy priority for economies such as Indonesia but, at the same time, it is important to push ahead with reforms and investments which can support medium-term growth in what is likely to be a weaker global economic environment.
However, to date Indonesia’s growth performance has remained solid
Indonesia’s GDP growth remained a solid 6.3 percent year-on-year in the first quarter of 2012, down slightly from an average of 6.5 percent in 2011. Seasonally-adjusted growth overall came down off the highs of the final quarter of 2011 but consumption growth held up well. However, investment growth dipped and, reflecting the relative weakness of external demand, net exports again were a drag on growth. Inflation, although picking up somewhat, has remained relatively low and price expectations came down with the reduced likelihood of a subsidized fuel price increase in 2012, as oil prices declined.
Indonesia is not, however, immune to spillovers from international developments through both trade channels…
Non-oil commodity prices have also seen sizeable drops in recent months, including the prices of some of Indonesia’s key commodity exports such as coal, rubber, palm oil and copper (Table 1). Falling international commodity prices, and weaker volumes, contributed to a sharp slowdown in export growth in recent months. With import growth still relatively strong, the trade balance moved into deficit in April and May. This trend has contributed to the current account balance turning into deficit which, while consistent with stronger domestic economic performance relative to the external environment, adds additional importance to the continuation of strong stable capital flows, such as FDI, to meet Indonesia’s external financing needs.
Table 1: Some of Indonesia’s major export commodities have seen marked price falls in recent months
Change in international commodity price
Share of Indonesia’stotal goods export value in 2011 (percent)
Threemonths to June 2012
Year to June 2012
Coal -19.4 -29.0 13.4
Palm oil -13.4 -11.9 8.5
Rubber -18.6 -35.2 5.8
Copper -12.4 -18.1 4.1Note: International commodity prices in US dollar Source: BPS and World Bank
THE WORLD BANK | BANK DUNIA July 2012ix
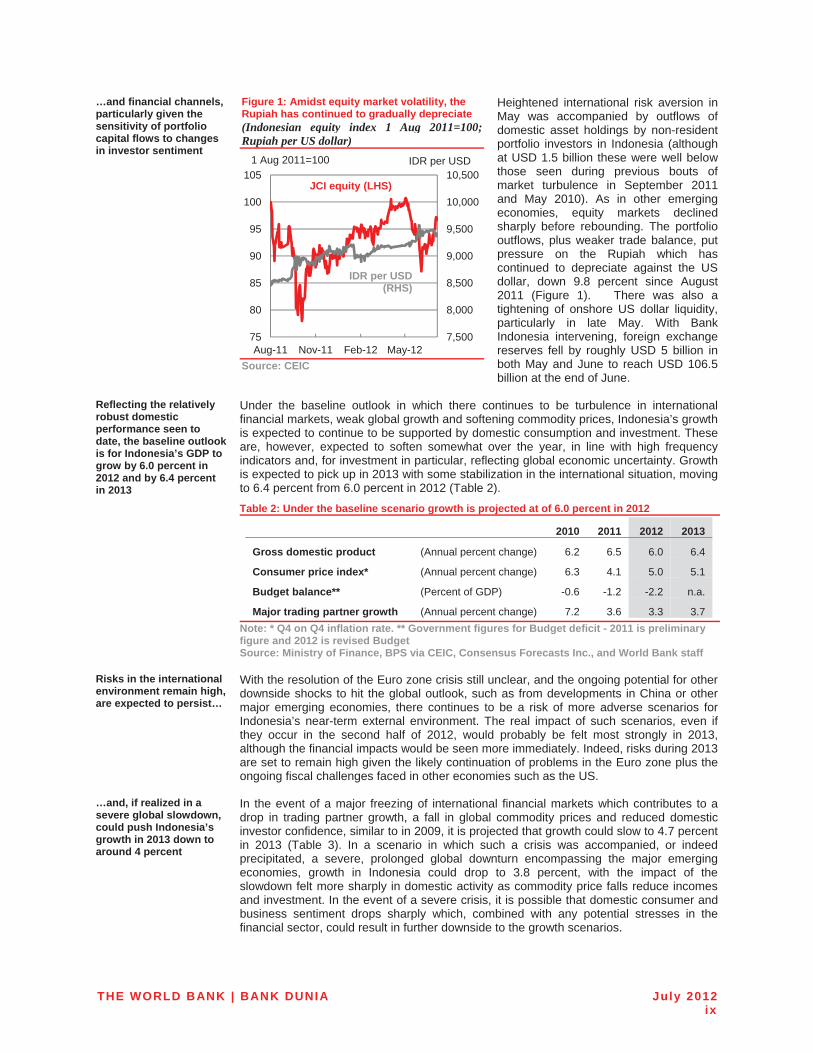
…and financial channels, particularly given the sensitivity of portfolio capital flows to changes in investor sentiment
Heightened international risk aversion in May was accompanied by outflows of domestic asset holdings by non-resident portfolio investors in Indonesia (although at USD 1.5 billion these were well below those seen during previous bouts of market turbulence in September 2011 and May 2010). As in other emerging economies, equity markets declined sharply before rebounding. The portfolio outflows, plus weaker trade balance, put pressure on the Rupiah which has continued to depreciate against the US dollar, down 9.8 percent since August 2011 (Figure 1). There was also a tightening of onshore US dollar liquidity, particularly in late May. With Bank Indonesia intervening, foreign exchange reserves fell by roughly USD 5 billion in both May and June to reach USD 106.5 billion at the end of June.
Figure 1: Amidst equity market volatility, the Rupiah has continued to gradually depreciate (Indonesian equity index 1 Aug 2011=100; Rupiah per US dollar)
Source: CEIC
Reflecting the relatively robust domestic performance seen to date, the baseline outlook is for Indonesia’s GDP to grow by 6.0 percent in 2012 and by 6.4 percent in 2013
Under the baseline outlook in which there continues to be turbulence in international financial markets, weak global growth and softening commodity prices, Indonesia’s growth is expected to continue to be supported by domestic consumption and investment. These are, however, expected to soften somewhat over the year, in line with high frequency indicators and, for investment in particular, reflecting global economic uncertainty. Growth is expected to pick up in 2013 with some stabilization in the international situation, moving to 6.4 percent from 6.0 percent in 2012 (Table 2).
Table 2: Under the baseline scenario growth is projected at of 6.0 percent in 2012
2010 2011 2012 2013
Gross domestic product (Annual percent change) 6.2 6.5 6.0 6.4
Consumer price index* (Annual percent change) 6.3 4.1 5.0 5.1
Budget balance** (Percent of GDP) -0.6 -1.2 -2.2 n.a.
Major trading partner growth (Annual percent change) 7.2 3.6 3.3 3.7Note: * Q4 on Q4 inflation rate. ** Government figures for Budget deficit - 2011 is preliminary figure and 2012 is revised Budget Source: Ministry of Finance, BPS via CEIC, Consensus Forecasts Inc., and World Bank staff
Risks in the international environment remain high, are expected to persist…
With the resolution of the Euro zone crisis still unclear, and the ongoing potential for other downside shocks to hit the global outlook, such as from developments in China or other major emerging economies, there continues to be a risk of more adverse scenarios for Indonesia’s near-term external environment. The real impact of such scenarios, even if they occur in the second half of 2012, would probably be felt most strongly in 2013, although the financial impacts would be seen more immediately. Indeed, risks during 2013 are set to remain high given the likely continuation of problems in the Euro zone plus the ongoing fiscal challenges faced in other economies such as the US.
…and, if realized in a severe global slowdown, could push Indonesia’s growth in 2013 down to around 4 percent
In the event of a major freezing of international financial markets which contributes to a drop in trading partner growth, a fall in global commodity prices and reduced domestic investor confidence, similar to in 2009, it is projected that growth could slow to 4.7 percent in 2013 (Table 3). In a scenario in which such a crisis was accompanied, or indeed precipitated, a severe, prolonged global downturn encompassing the major emerging economies, growth in Indonesia could drop to 3.8 percent, with the impact of the slowdown felt more sharply in domestic activity as commodity price falls reduce incomes and investment. In the event of a severe crisis, it is possible that domestic consumer and business sentiment drops sharply which, combined with any potential stresses in the financial sector, could result in further downside to the growth scenarios.
7,500
8,000
8,500
9,000
9,500
10,000
10,500
75
80
85
90
95
100
105
Aug-11 Nov-11 Feb-12 May-12
JCI equity (LHS)
IDR per USD (RHS)
1 Aug 2011=100 IDR per USD
THE WORLD BANK | BANK DUNIA July 2012x
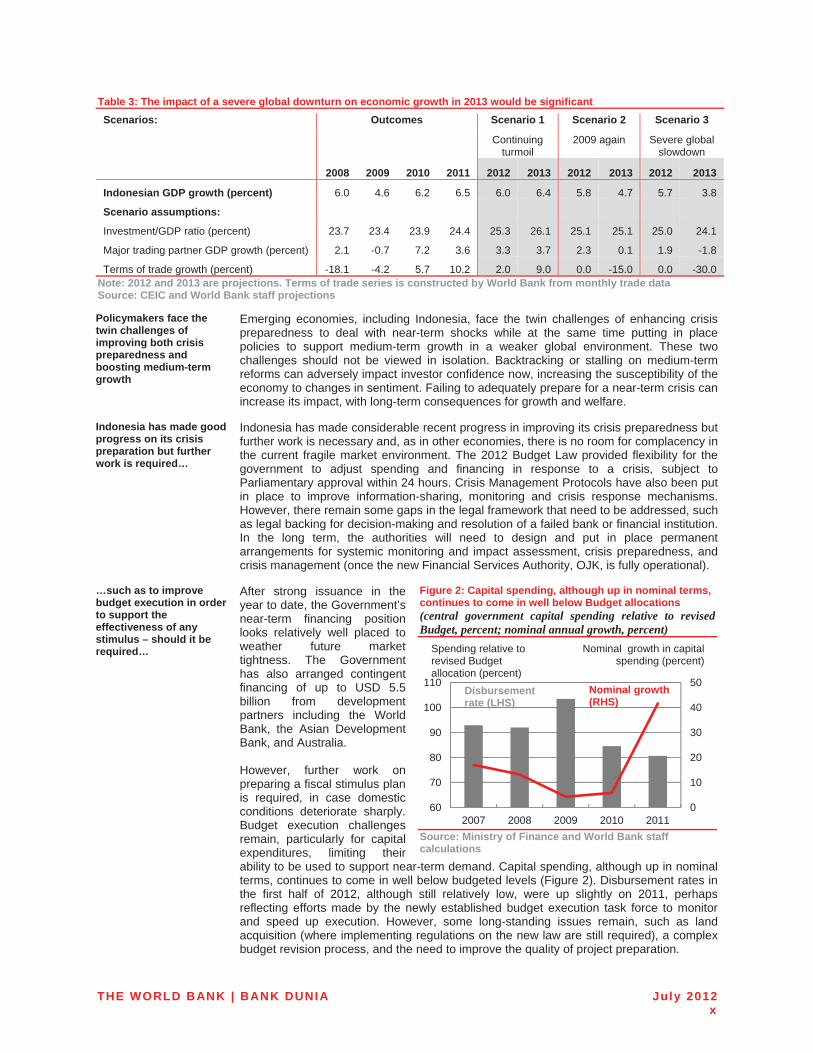
Table 3: The impact of a severe global downturn on economic growth in 2013 would be significant Scenarios: Outcomes Scenario 1 Scenario 2 Scenario 3
Continuing turmoil
2009 again Severe global slowdown
�� 2008 2009 2010 2011 2012 2013 2012 2013 2012 2013
Indonesian GDP growth (percent) 6.0 4.6 6.2 6.5 6.0 6.4 5.8 4.7 5.7 3.8
Scenario assumptions: �� � �� �� � �Investment/GDP ratio (percent) 23.7 23.4 23.9 24.4 25.3 26.1 25.1 25.1 25.0 24.1
Major trading partner GDP growth (percent) 2.1 -0.7 7.2 3.6 3.3 3.7 2.3 0.1 1.9 -1.8
Terms of trade growth (percent) -18.1 -4.2 5.7 10.2 2.0 9.0 0.0 -15.0 0.0 -30.0 Note: 2012 and 2013 are projections. Terms of trade series is constructed by World Bank from monthly trade data Source: CEIC and World Bank staff projections
Policymakers face the twin challenges of improving both crisis preparedness and boosting medium-term growth
Emerging economies, including Indonesia, face the twin challenges of enhancing crisis preparedness to deal with near-term shocks while at the same time putting in place policies to support medium-term growth in a weaker global environment. These two challenges should not be viewed in isolation. Backtracking or stalling on medium-term reforms can adversely impact investor confidence now, increasing the susceptibility of the economy to changes in sentiment. Failing to adequately prepare for a near-term crisis can increase its impact, with long-term consequences for growth and welfare.
Indonesia has made good progress on its crisis preparation but further work is required…
Indonesia has made considerable recent progress in improving its crisis preparedness but further work is necessary and, as in other economies, there is no room for complacency in the current fragile market environment. The 2012 Budget Law provided flexibility for the government to adjust spending and financing in response to a crisis, subject to Parliamentary approval within 24 hours. Crisis Management Protocols have also been put in place to improve information-sharing, monitoring and crisis response mechanisms. However, there remain some gaps in the legal framework that need to be addressed, such as legal backing for decision-making and resolution of a failed bank or financial institution. In the long term, the authorities will need to design and put in place permanent arrangements for systemic monitoring and impact assessment, crisis preparedness, and crisis management (once the new Financial Services Authority, OJK, is fully operational).
…such as to improve budget execution in order to support the effectiveness of any stimulus – should it be required…
After strong issuance in the year to date, the Government’s near-term financing position looks relatively well placed to weather future market tightness. The Government has also arranged contingent financing of up to USD 5.5 billion from development partners including the World Bank, the Asian Development Bank, and Australia.
However, further work on preparing a fiscal stimulus plan is required, in case domestic conditions deteriorate sharply. Budget execution challenges remain, particularly for capital expenditures, limiting their ability to be used to support near-term demand. Capital spending, although up in nominal terms, continues to come in well below budgeted levels (Figure 2). Disbursement rates in the first half of 2012, although still relatively low, were up slightly on 2011, perhaps reflecting efforts made by the newly established budget execution task force to monitor and speed up execution. However, some long-standing issues remain, such as land acquisition (where implementing regulations on the new law are still required), a complex budget revision process, and the need to improve the quality of project preparation.
Figure 2: Capital spending, although up in nominal terms, continues to come in well below Budget allocations (central government capital spending relative to revised Budget, percent; nominal annual growth, percent)
Source: Ministry of Finance and World Bank staff calculations
0
10
20
30
40
50
60
70
80
90
100
110
2007 2008 2009 2010 2011
Disbursementrate (LHS)
Nominal growth (RHS)
Spending relative to revised Budget allocation (percent)
Nominal growth in capital spending (percent)

THE WORLD BANK | BANK DUNIA July 2012xi
… to ensure that social programs can reach those in need of support during a crisis…
Although steps have been made to enhance the ability of the Government to target the poor and vulnerable, further improvement in the social safety net, expanding programs that work, and filling gaps in the existing coverage is required to protect the vulnerable from moving into poverty in the event of a crisis. In addition, social promotion programs are also required to help move out of poverty the remaining poor, many of whom are far below the poverty line (a feature which is likely to be one reason why, although poverty continues to decline, moving to 12.0 percent in March 2012, the rate of poverty reduction has fallen in recent years).
… and to reduce the opportunity costs and inefficiencies of fuel subsidies
With the Indonesian Crude Price moving down to USD 99 per barrel in June, it looks unlikely that its six month average will exceed the revised Budget threshold of USD 121 necessary to allow the Government to hike the subsidized fuel price. However, even with the fall in the oil price, in the absence of any price adjustment the fiscal burden, opportunity costs and inefficiencies of fuel subsidies will remain high. Recent Government forecasts project fuel subsidy spending in 2012 to come in almost 60 percent above theirrevised Budget allocation and to account for 20 percent of total central government spending excluding regional transfers. As highlighted in the April 2012 IEQ, the decision not to increase prices therefore represents a missed, or delayed, opportunity to redirect spending at a time when risks remain in the global environment.
There is also a need to focus in on policies and investments which can boost medium-term growth through improving productivity and addressing key infrastructure constraints
Indonesia, and other emerging economies, should prepare for a likely long period of global economic volatility and weaker demand by re-emphasizing medium-term development strategies. These include productivity-enhancing reforms and stimulating increased investment, from domestic and foreign investors, as a pre-requisite for moving growth in Indonesia up to 7 percent or higher and to produce quality jobs for the roughly two million workers joining the labor force each year. Coordination, clarity and consistencyof regulatory policies are particularly important to support these investments, along with addressing Indonesia’s infrastructure weaknesses.
To give a scale of the infrastructure challenges which are faced, while the total number of vehicles in Indonesia has increased threefold between 2001 and 2010, the national road network, that serves more than one third of vehicle traffic (in vehicle-km), only grew by a quarter. While the government has set ambitious targets for public private partnership (PPP) funding of infrastructure projects, much of the infrastructure investment will still need to come from the public sector given the limited performance on PPPs to date.
Greater access to domestic and international markets has the potential to play an important role in improving domestic economic performance…
Facilitating international and domestic trade also has an important role to play in enabling Indonesia to harness the strength of its domestic market and to tap into the rising importance of the East Asia region within global demand. With further improvements inskills and infrastructure, for example, access to international trade and investment networks can also help to promote improvements in productivity and in the competitiveness of domestic firms, as seen in the relative performance of those manufacturing firms more closely integrated with global markets. For example, in the same industry and province, those manufacturing firms which are exporters or that use imported materials are, on average, 19 percent more productive than non-integrated plants – while foreign-owned plants are 38 percent more productive than their domestic counterparts.
…but recent announcements in this area have raised some concerns both about the direction of policy-making and the difficulties in policy coordination and communication
Recent policy announcements have, however, raised some concerns on the direction of trade and investment policy making. These measures include, for example, restrictions onimported horticulture products and new divestment regulations and processing requirements in the mining sector. While the aims of these policies may originate in the development objectives of promoting domestic productivity, jobs and growth, their presentation, which has been often changing, highlights coordination and communication issues. As well as their uncertain effectiveness in meeting those development objectives and the risk of adverse long-term consequences, there is a concern that the expansion of such policies could weaken the confidence of investors in the domestic economic outlook at a time when it is needed most.

THE WORLD BANK | BANK DUNIA July 2012xi i
THE WORLD BANK | BANK DUNIA July 20121
A. ECONOMIC�AND�FISCAL�UPDATE
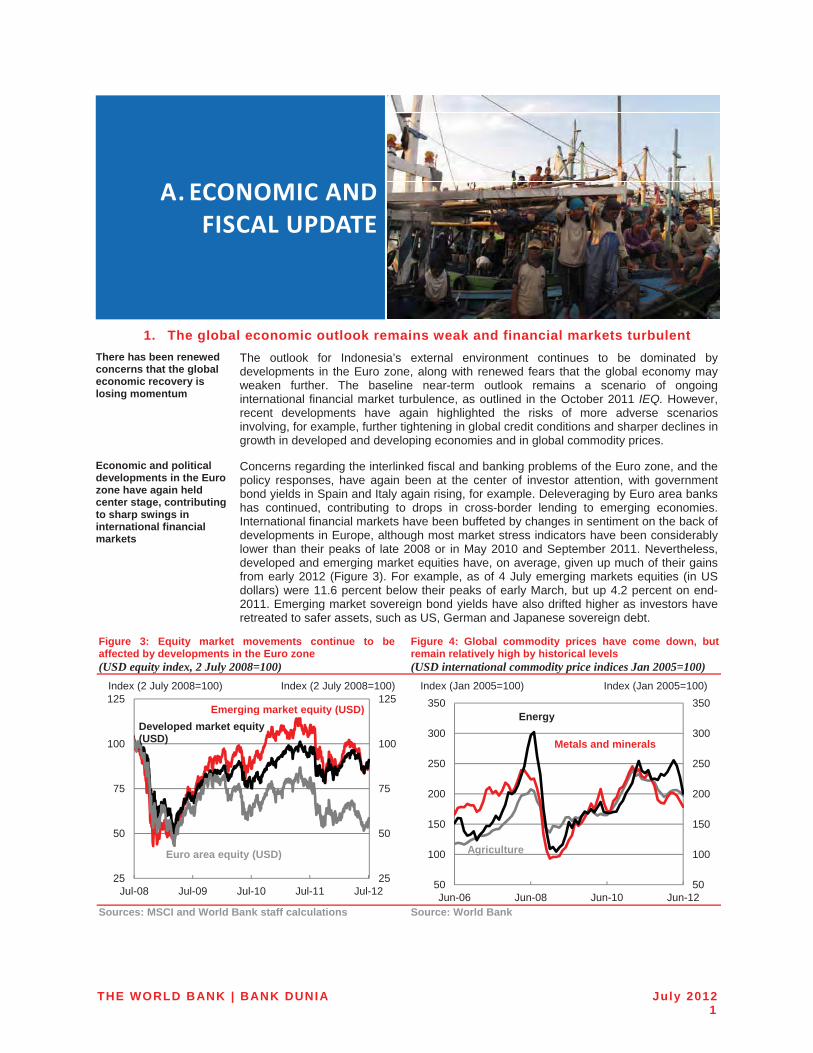
1. The global economic outlook remains weak and financial markets turbulent There has been renewed concerns that the global economic recovery is losing momentum
The outlook for Indonesia’s external environment continues to be dominated by developments in the Euro zone, along with renewed fears that the global economy mayweaken further. The baseline near-term outlook remains a scenario of ongoing international financial market turbulence, as outlined in the October 2011 IEQ. However, recent developments have again highlighted the risks of more adverse scenarios involving, for example, further tightening in global credit conditions and sharper declines in growth in developed and developing economies and in global commodity prices.
Economic and political developments in the Euro zone have again held center stage, contributing to sharp swings in international financial markets
Concerns regarding the interlinked fiscal and banking problems of the Euro zone, and the policy responses, have again been at the center of investor attention, with government bond yields in Spain and Italy again rising, for example. Deleveraging by Euro area banks has continued, contributing to drops in cross-border lending to emerging economies. International financial markets have been buffeted by changes in sentiment on the back of developments in Europe, although most market stress indicators have been considerably lower than their peaks of late 2008 or in May 2010 and September 2011. Nevertheless, developed and emerging market equities have, on average, given up much of their gains from early 2012 (Figure 3). For example, as of 4 July emerging markets equities (in US dollars) were 11.6 percent below their peaks of early March, but up 4.2 percent on end-2011. Emerging market sovereign bond yields have also drifted higher as investors have retreated to safer assets, such as US, German and Japanese sovereign debt.
Figure 3: Equity market movements continue to be affected by developments in the Euro zone (USD equity index, 2 July 2008=100)
Figure 4: Global commodity prices have come down, but remain relatively high by historical levels (USD international commodity price indices Jan 2005=100)
Sources: MSCI and World Bank staff calculations Source: World Bank
25
50
75
100
125
25
50
75
100
125
Jul-08 Jul-09 Jul-10 Jul-11 Jul-12
Emerging market equity (USD)
Euro area equity (USD)
Developed market equity (USD)
Index (2 July 2008=100) Index (2 July 2008=100)
50
100
150
200
250
300
350
50
100
150
200
250
300
350
Jun-06 Jun-08 Jun-10 Jun-12
Metals and minerals
Agriculture
Energy
Index (Jan 2005=100) Index (Jan 2005=100)
I n d o n e s i a E c o n o m i c Q u a r t e r l y R i s i n g t o p r e s e n t a n d f u t u r e c h a l l e n g e s
THE WORLD BANK | BANK DUNIA July 20122
Leading indicators also point to a slowing in global activity…
Financial sector and policy developments in Europe have occurred against the backdrop of contracting or flat leading and partial indicators in the Euro area, the US, Japan and China, which point to a slowing down in global activity. Global trade is also expected to remain subdued, with the World Bank projecting global trade volumes to grow by 5.3 percent in 2012, down from 6.1 percent in 2011, before recovering to 7.0 percent in 2013.
… and international commodity prices – including oil – have come down
In line with the renewed concerns on the economic outlook, international commodity prices have retreated in recent months, but remain at relatively high levels by historical standards (Figure 4). Energy prices dropped 21.5 percent from March to June while non-energy prices fell by 6.3 percent. Average crude oil prices (Brent) in June (USD 96 per barrel) were 23.5 percent below their March average, due to slowing global demand and improving production prospects. Metal and mineral prices fell 11.2 percent over the same period, on softening demand from Europe and China. The falls affected prices of some of Indonesia’s key commodity exports such as coal and rubber (down by almost 20 percent from March to June), palm oil (by 13 percent) and copper (by 12 percent).
Although there have been moves to ease policy to support growth, this support is likely to be more constrained this time round
The risk of a further weakening in the global economy and renewed financial market strains have prompted further monetary easing by, for example, the central banks in the UK and Euro zone. Authorities in Asia, such as in China, have also cut rates or easedreserve requirements to support growth. However, as for developed economies, many emerging economies have become more constrained in their ability to loosen monetary and fiscal policy further in the event of another major economic shock. Some emerging economies are also running up against capacity constraints. Added to this, ongoing processes of fiscal consolidation and deleveraging in developed economies will continueto hold back growth over the near and medium term.
Overall, the baseline growth outlook in 2012 and 2013 for Indonesia’s major trading partners remains relatively weak
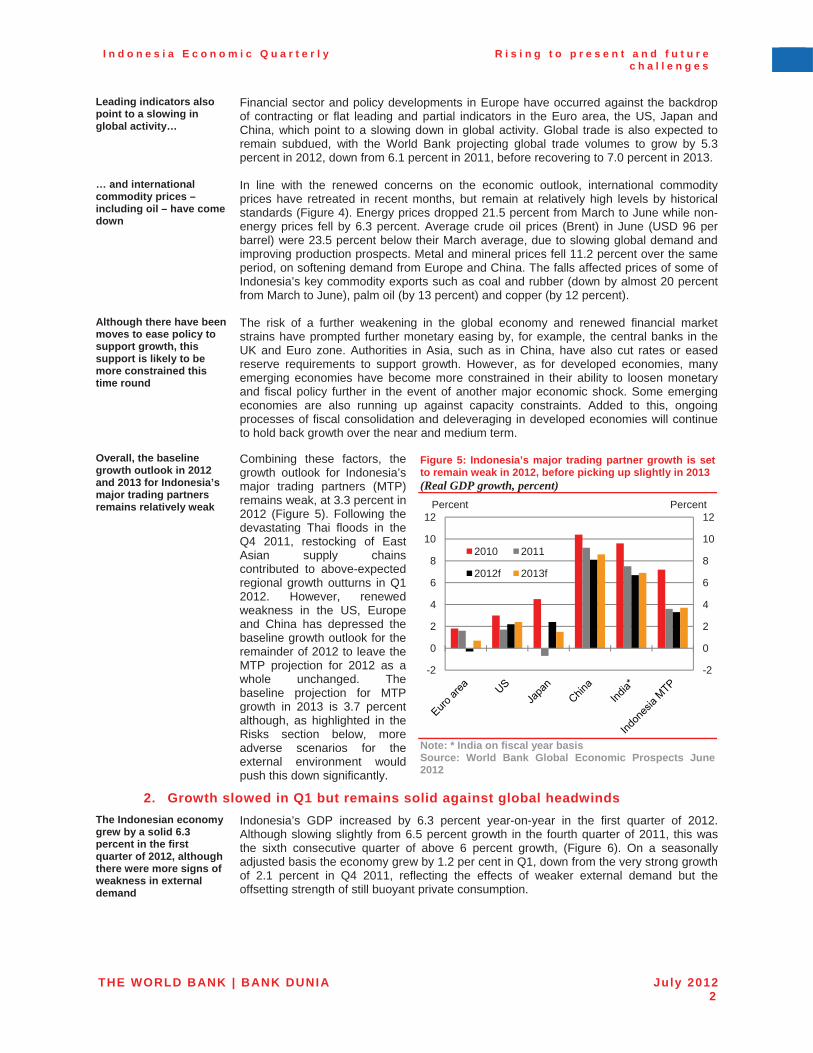
Combining these factors, the growth outlook for Indonesia’s major trading partners (MTP) remains weak, at 3.3 percent in 2012 (Figure 5). Following the devastating Thai floods in the Q4 2011, restocking of East Asian supply chains contributed to above-expected regional growth outturns in Q1 2012. However, renewed weakness in the US, Europe and China has depressed the baseline growth outlook for the remainder of 2012 to leave the MTP projection for 2012 as a whole unchanged. The baseline projection for MTP growth in 2013 is 3.7 percent although, as highlighted in the Risks section below, more adverse scenarios for the external environment would push this down significantly.
Figure 5: Indonesia’s major trading partner growth is set to remain weak in 2012, before picking up slightly in 2013 (Real GDP growth, percent)
Note: * India on fiscal year basis Source: World Bank Global Economic Prospects June 2012
2. Growth slowed in Q1 but remains solid against global headwinds The Indonesian economy grew by a solid 6.3 percent in the first quarter of 2012, although there were more signs of weakness in external demand
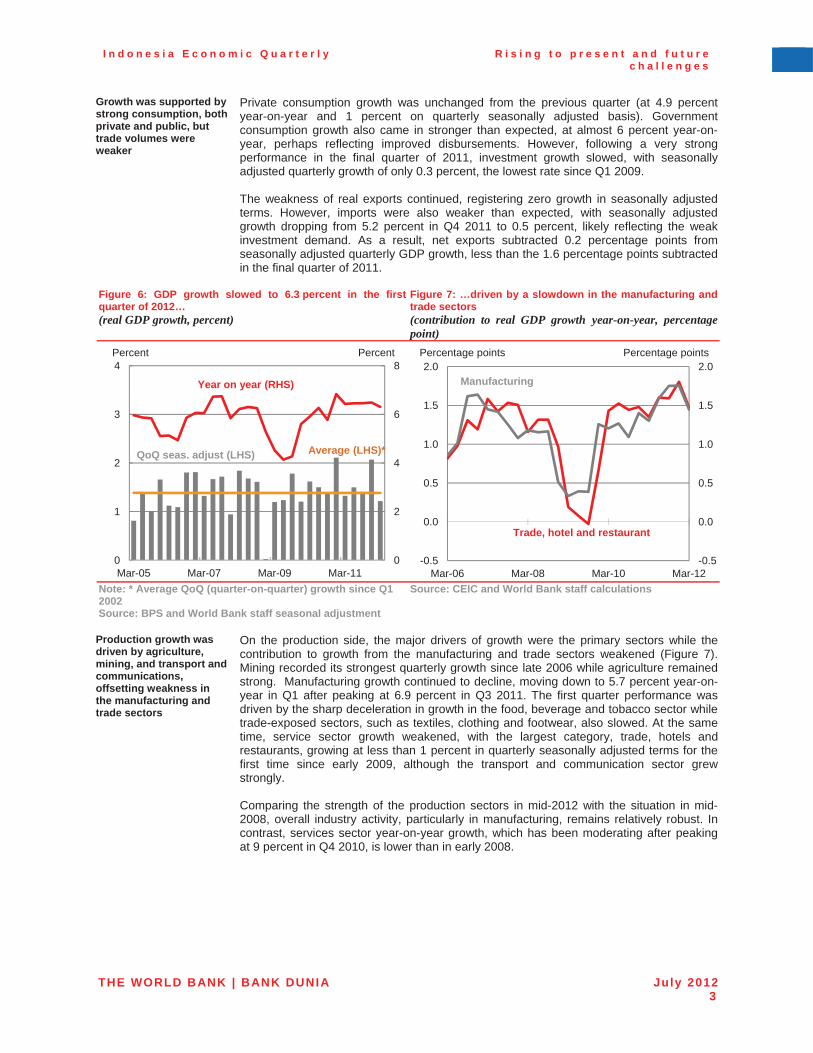
Indonesia’s GDP increased by 6.3 percent year-on-year in the first quarter of 2012. Although slowing slightly from 6.5 percent growth in the fourth quarter of 2011, this was the sixth consecutive quarter of above 6 percent growth, (Figure 6). On a seasonally adjusted basis the economy grew by 1.2 per cent in Q1, down from the very strong growth of 2.1 percent in Q4 2011, reflecting the effects of weaker external demand but the offsetting strength of still buoyant private consumption.
-2
0
2
4
6
8
10
12
-2
0
2
4
6
8
10
12
2010 2011
2012f 2013f
Percent Percent
I n d o n e s i a E c o n o m i c Q u a r t e r l y R i s i n g t o p r e s e n t a n d f u t u r e c h a l l e n g e s
THE WORLD BANK | BANK DUNIA July 20123
Growth was supported by strong consumption, both private and public, but trade volumes were weaker
Private consumption growth was unchanged from the previous quarter (at 4.9 percent year-on-year and 1 percent on quarterly seasonally adjusted basis). Government consumption growth also came in stronger than expected, at almost 6 percent year-on-year, perhaps reflecting improved disbursements. However, following a very strong performance in the final quarter of 2011, investment growth slowed, with seasonally adjusted quarterly growth of only 0.3 percent, the lowest rate since Q1 2009.
The weakness of real exports continued, registering zero growth in seasonally adjusted terms. However, imports were also weaker than expected, with seasonally adjusted growth dropping from 5.2 percent in Q4 2011 to 0.5 percent, likely reflecting the weak investment demand. As a result, net exports subtracted 0.2 percentage points from seasonally adjusted quarterly GDP growth, less than the 1.6 percentage points subtracted in the final quarter of 2011.
Figure 6: GDP growth slowed to 6.3 percent in the first quarter of 2012… (real GDP growth, percent)
Figure 7: …driven by a slowdown in the manufacturing and trade sectors (contribution to real GDP growth year-on-year, percentagepoint)
Note: * Average QoQ (quarter-on-quarter) growth since Q1 2002 Source: BPS and World Bank staff seasonal adjustment
Source: CEIC and World Bank staff calculations
Production growth was driven by agriculture, mining, and transport and communications, offsetting weakness in the manufacturing and trade sectors
On the production side, the major drivers of growth were the primary sectors while the contribution to growth from the manufacturing and trade sectors weakened (Figure 7). Mining recorded its strongest quarterly growth since late 2006 while agriculture remained strong. Manufacturing growth continued to decline, moving down to 5.7 percent year-on-year in Q1 after peaking at 6.9 percent in Q3 2011. The first quarter performance was driven by the sharp deceleration in growth in the food, beverage and tobacco sector while trade-exposed sectors, such as textiles, clothing and footwear, also slowed. At the same time, service sector growth weakened, with the largest category, trade, hotels and restaurants, growing at less than 1 percent in quarterly seasonally adjusted terms for the first time since early 2009, although the transport and communication sector grew strongly.
Comparing the strength of the production sectors in mid-2012 with the situation in mid-2008, overall industry activity, particularly in manufacturing, remains relatively robust. In contrast, services sector year-on-year growth, which has been moderating after peaking at 9 percent in Q4 2010, is lower than in early 2008.
0
2
4
6
8
0
1
2
3
4
Mar-05 Mar-07 Mar-09 Mar-11
Percent Percent
QoQ seas. adjust (LHS)
Year on year (RHS)
Average (LHS)*
-0.5
0.0
0.5
1.0
1.5
2.0
-0.5
0.0
0.5
1.0
1.5
2.0
Mar-06 Mar-08 Mar-10 Mar-12
Trade, hotel and restaurant
Manufacturing
Percentage points Percentage points
I n d o n e s i a E c o n o m i c Q u a r t e r l y R i s i n g t o p r e s e n t a n d f u t u r e c h a l l e n g e s
THE WORLD BANK | BANK DUNIA July 20124
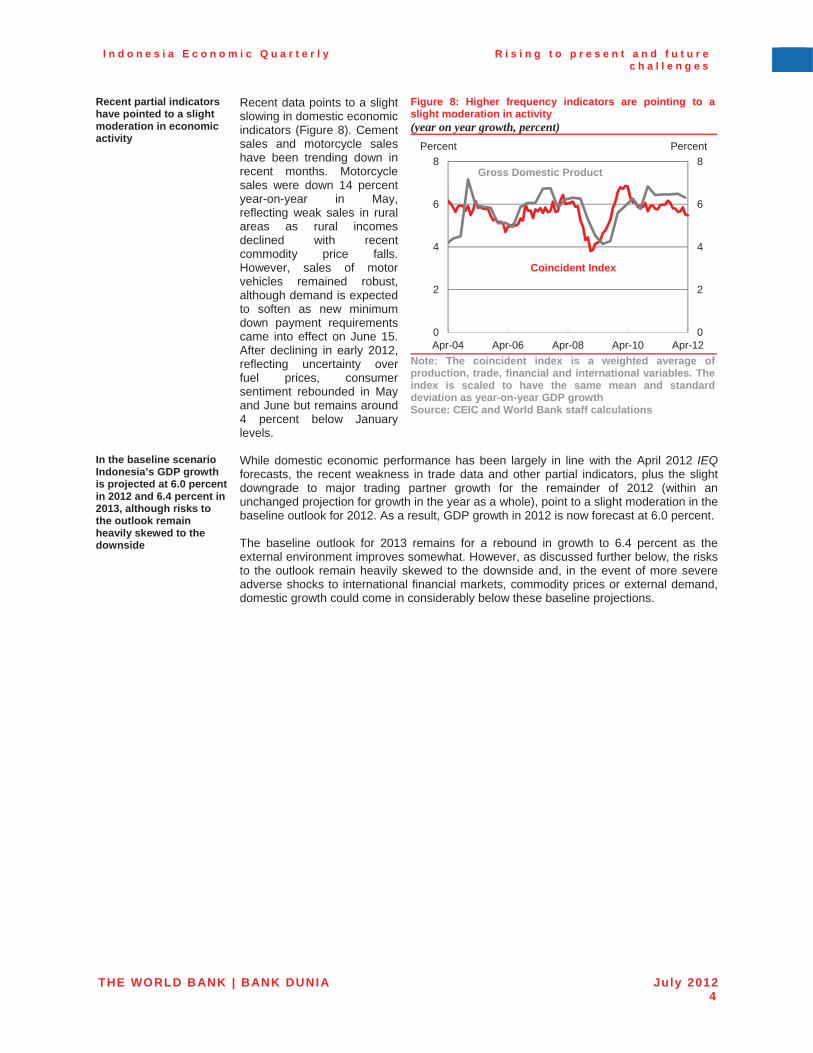
Recent partial indicators have pointed to a slight moderation in economic activity
Recent data points to a slight slowing in domestic economic indicators (Figure 8). Cement sales and motorcycle sales have been trending down in recent months. Motorcycle sales were down 14 percent year-on-year in May, reflecting weak sales in rural areas as rural incomes declined with recent commodity price falls. However, sales of motor vehicles remained robust, although demand is expected to soften as new minimum down payment requirements came into effect on June 15. After declining in early 2012, reflecting uncertainty over fuel prices, consumer sentiment rebounded in May and June but remains around 4 percent below January levels.
Figure 8: Higher frequency indicators are pointing to a slight moderation in activity (year on year growth, percent)
Note: The coincident index is a weighted average of production, trade, financial and international variables. The index is scaled to have the same mean and standard deviation as year-on-year GDP growth Source: CEIC and World Bank staff calculations
In the baseline scenario Indonesia’s GDP growth is projected at 6.0 percent in 2012 and 6.4 percent in 2013, although risks to the outlook remain heavily skewed to the downside
While domestic economic performance has been largely in line with the April 2012 IEQ forecasts, the recent weakness in trade data and other partial indicators, plus the slight downgrade to major trading partner growth for the remainder of 2012 (within an unchanged projection for growth in the year as a whole), point to a slight moderation in the baseline outlook for 2012. As a result, GDP growth in 2012 is now forecast at 6.0 percent.
The baseline outlook for 2013 remains for a rebound in growth to 6.4 percent as the external environment improves somewhat. However, as discussed further below, the risks to the outlook remain heavily skewed to the downside and, in the event of more severe adverse shocks to international financial markets, commodity prices or external demand, domestic growth could come in considerably below these baseline projections.
0
2
4
6
8
0
2
4
6
8
Apr-04 Apr-06 Apr-08 Apr-10 Apr-12
Coincident Index
Gross Domestic Product
Percent Percent
I n d o n e s i a E c o n o m i c Q u a r t e r l y R i s i n g t o p r e s e n t a n d f u t u r e c h a l l e n g e s
THE WORLD BANK | BANK DUNIA July 20125
Table 4: Under the baseline scenario GDP growth of 6.0 percent is projected for 2012, rising to 6.4 percent in 2013 (percentage change, unless otherwise indicated)
Annual Year to December quarter Revisions to
annual
2011 2012 2013 2011 2012 2013 2012 2013
1. Main economic indicators
Total Consumption expenditure 4.5 4.8 5.0 4.6 4.8 5.0 -0.1 0.0
Private consumption expenditure 4.7 4.5 4.8 4.9 4.3 4.9 -0.1 0.0
Government consumption 3.2 6.8 6.0 2.8 6.9 5.9 0.0 0.0
Gross fixed capital formation 8.8 9.6 10.0 11.5 9.5 10.1 -0.1 0.0
Exports of goods and services 13.6 6.3 7.6 7.9 6.8 6.9 -1.1 -1.9
Imports of goods and services 13.3 7.7 8.1 10.1 6.1 8.2 -1.5 -1.5
Gross Domestic Product 6.5 6.0 6.4 6.5 5.8 6.5 -0.1 0.0
Agriculture 3.0 3.4 3.4 4.1 2.8 3.6 0.0 0.0
Industry 5.3 4.9 5.3 5.3 4.7 5.4 0.0 0.0
Services 8.5 7.8 8.2 9.0 7.9 7.7 -0.2 0.0
2. External indicators
Balance of payments (USD bn) 11.9 3.0 10.8 n/a n/a n/a -4.8 -1.8
Current account balance (USD bn) 1.7 -7.9 -4.6 n/a n/a n/a -3.8 -2.9
Trade balance (USD bn) 23.3 11.3 15.7 n/a n/a n/a -4.2 -2.9
Financial account balance (USD bn) 14.0 11.3 15.4 n/a n/a n/a -0.7 1.1
3. Other economic measures
Consumer price index 5.4 4.4 5.1 4.1 5.0 5.1 -0.3 -0.1
Poverty basket Index 8.2 7.0 7.5 6.3 7.0 7.6 -0.1 -0.5
GDP Deflator 8.4 7.2 8.1 7.5 8.1 8.1 -1.5 -1.5
Nominal GDP 15.4 13.7 15.1 14.5 14.4 15.1 -1.6 -1.6
4. Economic assumptions
Exchange rate (IDR/USD) 8773 9300 9100 9024 9400 9100 300 100
Indonesian crude price (USD/bl) 112 110 100 111 100 100 -10 -15
Major trading partner growth 3.6 3.3 3.7 2.5 3.5 3.9 0.0 -0.2 Note: Projected trade flows relate to the national accounts, which may overstate the true movement in trade volumes and understate the movement in prices due to differences in price series. Revisions are relative to projections in April 2012 IEQ. The annual revisions under ‘3. Other economic measures’ are based on the no-fuel subsidy reform projections of the World Bank in April 2012 and not the published April 2012 IEQ projections which were based on fuel-subsidy reform Source: MoF, BPS, BI, CEIC and World Bank projections
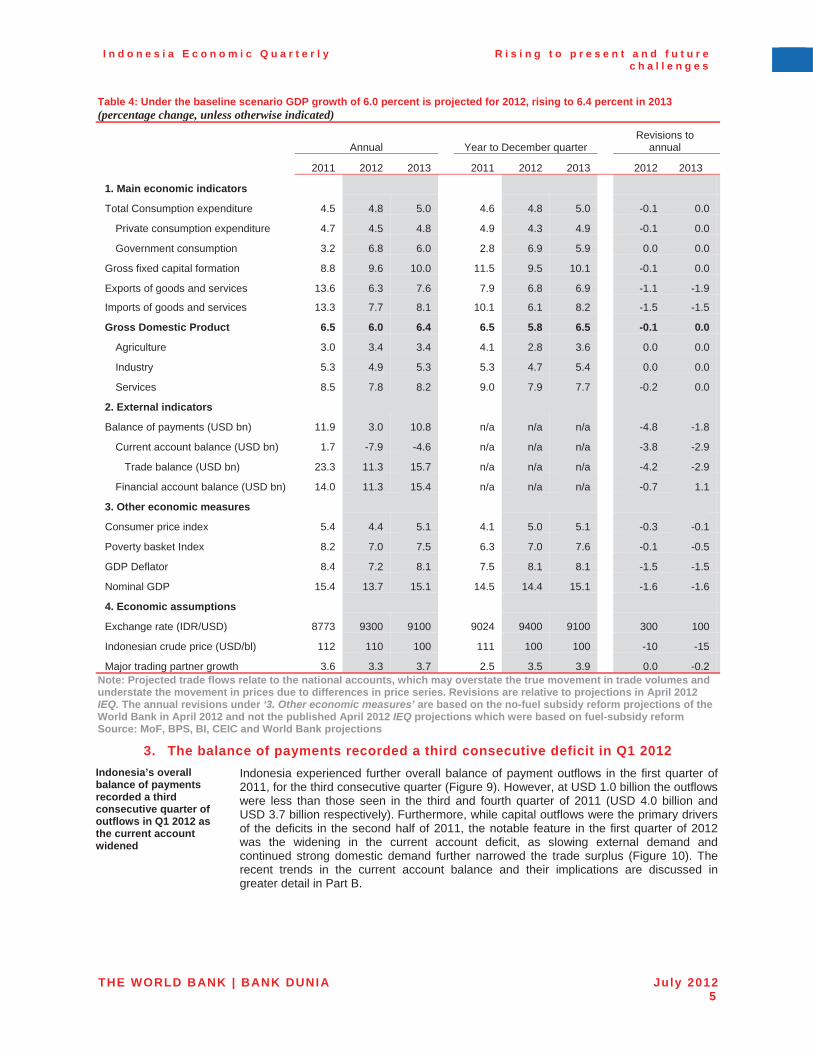
3. The balance of payments recorded a third consecutive deficit in Q1 2012 Indonesia’s overall balance of payments recorded a third consecutive quarter of outflows in Q1 2012 as the current account widened
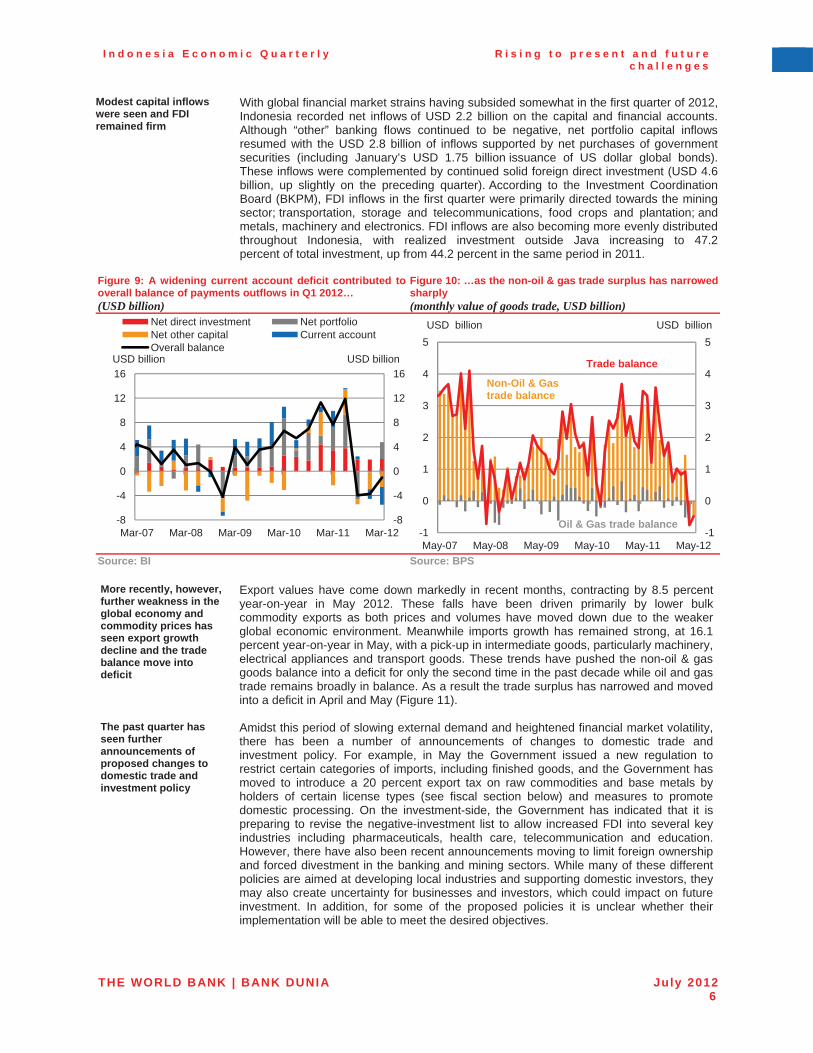
Indonesia experienced further overall balance of payment outflows in the first quarter of 2011, for the third consecutive quarter (Figure 9). However, at USD 1.0 billion the outflows were less than those seen in the third and fourth quarter of 2011 (USD 4.0 billion and USD 3.7 billion respectively). Furthermore, while capital outflows were the primary drivers of the deficits in the second half of 2011, the notable feature in the first quarter of 2012 was the widening in the current account deficit, as slowing external demand and continued strong domestic demand further narrowed the trade surplus (Figure 10). The recent trends in the current account balance and their implications are discussed in greater detail in Part B.
I n d o n e s i a E c o n o m i c Q u a r t e r l y R i s i n g t o p r e s e n t a n d f u t u r e c h a l l e n g e s
THE WORLD BANK | BANK DUNIA July 20126
Modest capital inflows were seen and FDI remained firm
With global financial market strains having subsided somewhat in the first quarter of 2012, Indonesia recorded net inflows of USD 2.2 billion on the capital and financial accounts. Although “other” banking flows continued to be negative, net portfolio capital inflows resumed with the USD 2.8 billion of inflows supported by net purchases of government securities (including January’s USD 1.75 billion issuance of US dollar global bonds). These inflows were complemented by continued solid foreign direct investment (USD 4.6 billion, up slightly on the preceding quarter). According to the Investment Coordination Board (BKPM), FDI inflows in the first quarter were primarily directed towards the mining sector; transportation, storage and telecommunications, food crops and plantation; and metals, machinery and electronics. FDI inflows are also becoming more evenly distributed throughout Indonesia, with realized investment outside Java increasing to 47.2 percent of total investment, up from 44.2 percent in the same period in 2011.
Figure 9: A widening current account deficit contributed to overall balance of payments outflows in Q1 2012… (USD billion)
Figure 10: …as the non-oil & gas trade surplus has narrowed sharply (monthly value of goods trade, USD billion)
Source: BI Source: BPS
More recently, however, further weakness in the global economy and commodity prices has seen export growth decline and the trade balance move into deficit
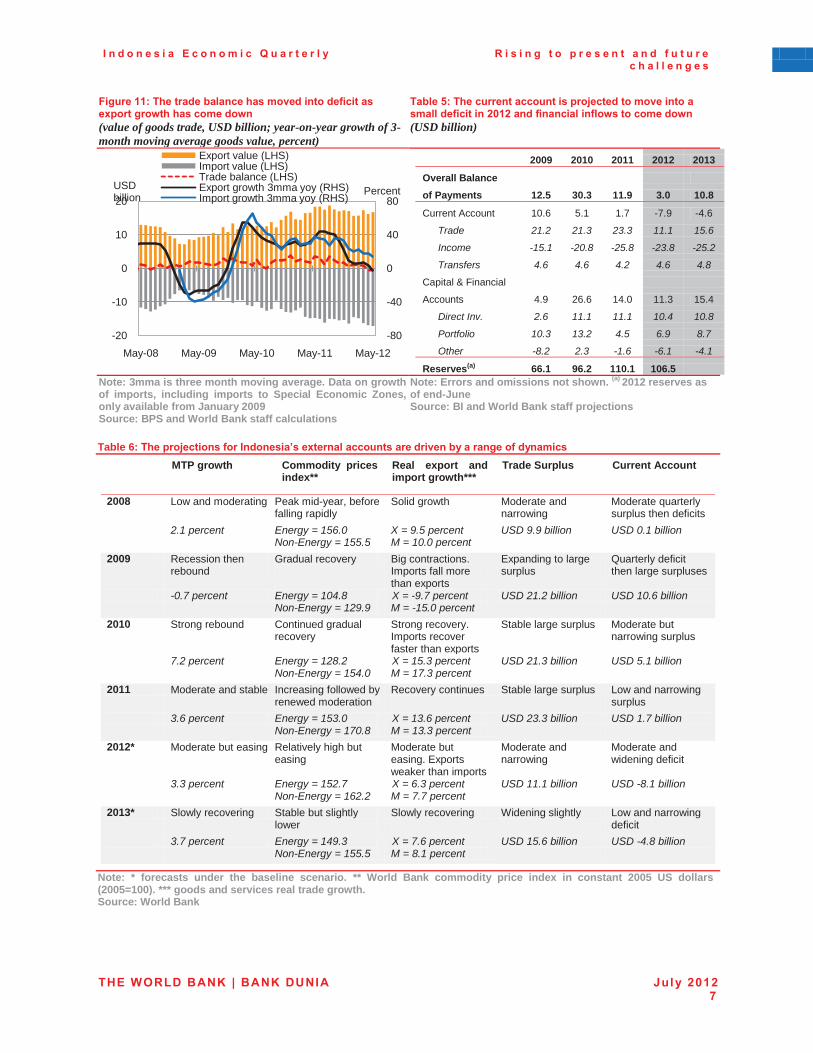
Export values have come down markedly in recent months, contracting by 8.5 percent year-on-year in May 2012. These falls have been driven primarily by lower bulk commodity exports as both prices and volumes have moved down due to the weaker global economic environment. Meanwhile imports growth has remained strong, at 16.1 percent year-on-year in May, with a pick-up in intermediate goods, particularly machinery, electrical appliances and transport goods. These trends have pushed the non-oil & gas goods balance into a deficit for only the second time in the past decade while oil and gas trade remains broadly in balance. As a result the trade surplus has narrowed and moved into a deficit in April and May (Figure 11).
The past quarter has seen further announcements of proposed changes to domestic trade and investment policy
Amidst this period of slowing external demand and heightened financial market volatility, there has been a number of announcements of changes to domestic trade and investment policy. For example, in May the Government issued a new regulation to restrict certain categories of imports, including finished goods, and the Government has moved to introduce a 20 percent export tax on raw commodities and base metals by holders of certain license types (see fiscal section below) and measures to promote domestic processing. On the investment-side, the Government has indicated that it is preparing to revise the negative-investment list to allow increased FDI into several key industries including pharmaceuticals, health care, telecommunication and education. However, there have also been recent announcements moving to limit foreign ownership and forced divestment in the banking and mining sectors. While many of these different policies are aimed at developing local industries and supporting domestic investors, they may also create uncertainty for businesses and investors, which could impact on future investment. In addition, for some of the proposed policies it is unclear whether their implementation will be able to meet the desired objectives.
-8
-4
0
4
8
12
16
-8
-4
0
4
8
12
16
Mar-07 Mar-08 Mar-09 Mar-10 Mar-11 Mar-12
Net direct investment Net portfolioNet other capital Current accountOverall balance
USD billion USD billion
-1
0
1
2
3
4
5
-1
0
1
2
3
4
5
May-07 May-08 May-09 May-10 May-11 May-12
Trade balance
Non-Oil & Gas trade balance
USD billion
Oil & Gas trade balance
USD billion
I n d o n e s i a E c o n o m i c Q u a r t e r l y R i s i n g t o p r e s e n t a n d f u t u r e c h a l l e n g e s
THE WORLD BANK | BANK DUNIA July 2012 7
Figure 11: The trade balance has moved into deficit as export growth has come down (value of goods trade, USD billion; year-on-year growth of 3-month moving average goods value, percent)
Table 5: The current account is projected to move into a small deficit in 2012 and financial inflows to come down (USD billion)
2009 2010 2011 2012 2013
Overall Balance of Payments 12.5 30.3 11.9 3.0 10.8
Current Account 10.6 5.1 1.7 -7.9 -4.6
Trade 21.2 21.3 23.3 11.1 15.6
Income -15.1 -20.8 -25.8 -23.8 -25.2
Transfers 4.6 4.6 4.2 4.6 4.8
Capital & Financial
Accounts 4.9 26.6 14.0 11.3 15.4
Direct Inv. 2.6 11.1 11.1 10.4 10.8
Portfolio 10.3 13.2 4.5 6.9 8.7
Other -8.2 2.3 -1.6 -6.1 -4.1
Reserves(a) 66.1 96.2 110.1 106.5Note: 3mma is three month moving average. Data on growth of imports, including imports to Special Economic Zones, only available from January 2009Source: BPS and World Bank staff calculations
Note: Errors and omissions not shown. (a) 2012 reserves as of end-JuneSource: BI and World Bank staff projections
Table 6: The projections for Indonesia’s external accounts are driven by a range of dynamicsMTP growth Commodity prices
index**Real export and import growth***
Trade Surplus Current Account
2008 Low and moderating Peak mid-year, before falling rapidly
Solid growth Moderate and narrowing
Moderate quarterly surplus then deficits
2.1 percent Energy = 156.0Non-Energy = 155.5
X = 9.5 percentM = 10.0 percent
USD 9.9 billion USD 0.1 billion
2009 Recession then rebound
Gradual recovery Big contractions. Imports fall more than exports
Expanding to large surplus
Quarterly deficit then large surpluses
-0.7 percent Energy = 104.8Non-Energy = 129.9
X = -9.7 percentM = -15.0 percent
USD 21.2 billion USD 10.6 billion
2010 Strong rebound Continued gradual recovery
Strong recovery. Imports recover faster than exports
Stable large surplus Moderate but narrowing surplus
7.2 percent Energy = 128.2Non-Energy = 154.0
X = 15.3 percentM = 17.3 percent
USD 21.3 billion USD 5.1 billion
2011 Moderate and stable Increasing followed by renewed moderation
Recovery continues Stable large surplus Low and narrowing surplus
3.6 percent Energy = 153.0Non-Energy = 170.8
X = 13.6 percentM = 13.3 percent
USD 23.3 billion USD 1.7 billion
2012* Moderate but easing Relatively high but easing
Moderate but easing. Exports weaker than imports
Moderate and narrowing
Moderate and widening deficit
3.3 percent Energy = 152.7Non-Energy = 162.2
X = 6.3 percentM = 7.7 percent
USD 11.1 billion USD -8.1 billion
2013* Slowly recovering Stable but slightly lower
Slowly recovering Widening slightly Low and narrowing deficit
3.7 percent Energy = 149.3Non-Energy = 155.5
X = 7.6 percentM = 8.1 percent
USD 15.6 billion USD -4.8 billion
Note: * forecasts under the baseline scenario. ** World Bank commodity price index in constant 2005 US dollars (2005=100). *** goods and services real trade growth. Source: World Bank
-80
-40
0
40
80
-20
-10
0
10
20
May-08 May-09 May-10 May-11 May-12
Export value (LHS)Import value (LHS)Trade balance (LHS)Export growth 3mma yoy (RHS)Import growth 3mma yoy (RHS)
USDbillion Percent
I n d o n e s i a E c o n o m i c Q u a r t e r l y R i s i n g t o p r e s e n t a n d f u t u r e c h a l l e n g e s
THE WORLD BANK | BANK DUNIA July 20128
Baseline projections for the overall balance of payments inflows have come down reflecting the weaker global outlook, while financial flows will continue to be sensitive to global market conditions
The near-term outlook for Indonesia’s external accounts will depend critically on developments in Indonesia’s export markets and international commodity prices, and on investor sentiment. In the baseline scenario the trade surplus is projected to narrow in 2012 to roughly half its 2011 value but to improve in 2013, in line with the international environment, reducing the current account deficit slightly (Table 5 and Table 6). On the financial account side, net direct investment is expected to remain firm. Portfolio and other capital flows for 2012 have been downgraded in light of the outflows in the year-to-date but should gradually improve through 2013 in the baseline scenario as volatility in international financial markets recedes. Should global conditions deteriorate further, theset of dynamics driving the balance of payment would clearly play out differently for both trade and, in particular, financial flows.
4. Spillovers from global financial market turbulence were seen again in May Indonesia’s financial markets were again affected by a deterioration in international investor sentiment in the second quarter of 2012
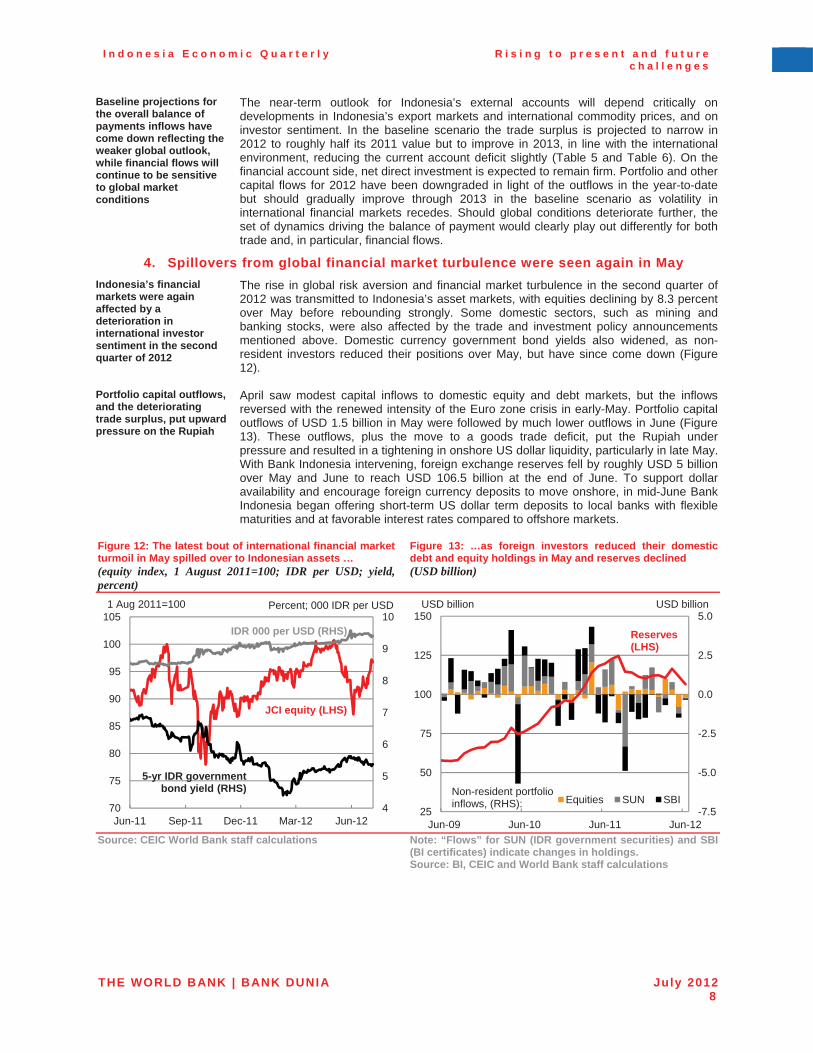
The rise in global risk aversion and financial market turbulence in the second quarter of 2012 was transmitted to Indonesia’s asset markets, with equities declining by 8.3 percent over May before rebounding strongly. Some domestic sectors, such as mining and banking stocks, were also affected by the trade and investment policy announcements mentioned above. Domestic currency government bond yields also widened, as non-resident investors reduced their positions over May, but have since come down (Figure 12).
Portfolio capital outflows, and the deteriorating trade surplus, put upward pressure on the Rupiah
April saw modest capital inflows to domestic equity and debt markets, but the inflows reversed with the renewed intensity of the Euro zone crisis in early-May. Portfolio capital outflows of USD 1.5 billion in May were followed by much lower outflows in June (Figure 13). These outflows, plus the move to a goods trade deficit, put the Rupiah under pressure and resulted in a tightening in onshore US dollar liquidity, particularly in late May. With Bank Indonesia intervening, foreign exchange reserves fell by roughly USD 5 billion over May and June to reach USD 106.5 billion at the end of June. To support dollar availability and encourage foreign currency deposits to move onshore, in mid-June Bank Indonesia began offering short-term US dollar term deposits to local banks with flexible maturities and at favorable interest rates compared to offshore markets.
Figure 12: The latest bout of international financial market turmoil in May spilled over to Indonesian assets … (equity index, 1 August 2011=100; IDR per USD; yield, percent)
Figure 13: …as foreign investors reduced their domestic debt and equity holdings in May and reserves declined (USD billion)
Source: CEIC World Bank staff calculations Note: “Flows” for SUN (IDR government securities) and SBI(BI certificates) indicate changes in holdings. Source: BI, CEIC and World Bank staff calculations
4
5
6
7
8
9
10
70
75
80
85
90
95
100
105
Jun-11 Sep-11 Dec-11 Mar-12 Jun-12
JCI equity (LHS)
IDR 000 per USD (RHS)
5-yr IDR government bond yield (RHS)
1 Aug 2011=100 Percent; 000 IDR per USD
-7.5
-5.0
-2.5
0.0
2.5
5.0
25
50
75
100
125
150
Jun-09 Jun-10 Jun-11 Jun-12
Equities SUN SBI
USD billion
Non-resident portfolio inflows, (RHS):
Reserves (LHS)
USD billion
I n d o n e s i a E c o n o m i c Q u a r t e r l y R i s i n g t o p r e s e n t a n d f u t u r e c h a l l e n g e s
THE WORLD BANK | BANK DUNIA July 20129
With inflation concerns receding, Bank Indonesia is focusing on exchange rate stabilization and managing inflation expectations
With inflation set to remain within its target of 4.5 percent +/- 1 percent for 2012, Bank Indonesia has turned its focus to providing “support for Rupiah stabilization” and managing inflation expectations through monetary operations and macro-prudential policies. The latter include the maximum loan-to-value regulations for housing and vehicle loans that were outlined in the April 2012 IEQ. The challenge for the central bank is to continue to utilize its various policy instruments to support growth during this next period of softening global conditions, whilst ensuring that short-term inflation pressures – such as the upcoming Ramadan price spikes – do not translate into sustained rises in inflation and inflation expectations.
Box 1: Commercial property prices have been increasing strongly, while residential price growth has come down
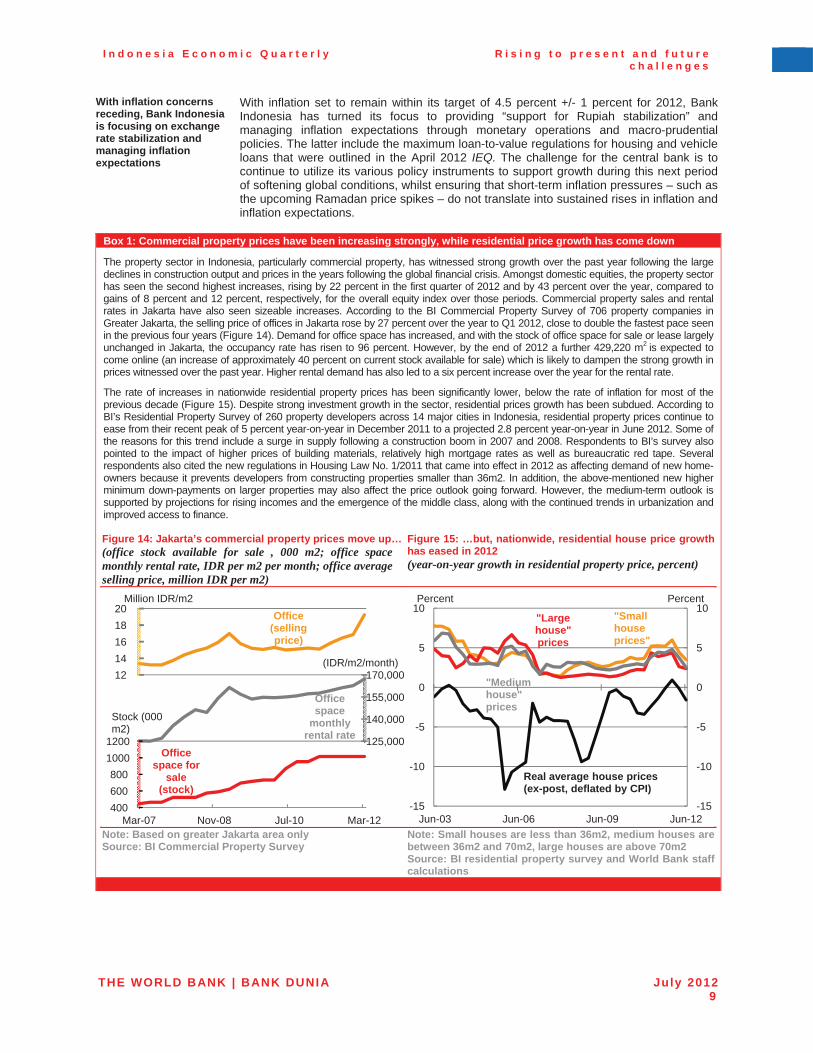
The property sector in Indonesia, particularly commercial property, has witnessed strong growth over the past year following the large declines in construction output and prices in the years following the global financial crisis. Amongst domestic equities, the property sector has seen the second highest increases, rising by 22 percent in the first quarter of 2012 and by 43 percent over the year, compared to gains of 8 percent and 12 percent, respectively, for the overall equity index over those periods. Commercial property sales and rental rates in Jakarta have also seen sizeable increases. According to the BI Commercial Property Survey of 706 property companies inGreater Jakarta, the selling price of offices in Jakarta rose by 27 percent over the year to Q1 2012, close to double the fastest pace seen in the previous four years (Figure 14). Demand for office space has increased, and with the stock of office space for sale or lease largely unchanged in Jakarta, the occupancy rate has risen to 96 percent. However, by the end of 2012 a further 429,220 m2 is expected to come online (an increase of approximately 40 percent on current stock available for sale) which is likely to dampen the strong growth in prices witnessed over the past year. Higher rental demand has also led to a six percent increase over the year for the rental rate.
The rate of increases in nationwide residential property prices has been significantly lower, below the rate of inflation for most of the previous decade (Figure 15). Despite strong investment growth in the sector, residential prices growth has been subdued. According to BI’s Residential Property Survey of 260 property developers across 14 major cities in Indonesia, residential property prices continue to ease from their recent peak of 5 percent year-on-year in December 2011 to a projected 2.8 percent year-on-year in June 2012. Some of the reasons for this trend include a surge in supply following a construction boom in 2007 and 2008. Respondents to BI’s survey also pointed to the impact of higher prices of building materials, relatively high mortgage rates as well as bureaucratic red tape. Several respondents also cited the new regulations in Housing Law No. 1/2011 that came into effect in 2012 as affecting demand of new home-owners because it prevents developers from constructing properties smaller than 36m2. In addition, the above-mentioned new higherminimum down-payments on larger properties may also affect the price outlook going forward. However, the medium-term outlook issupported by projections for rising incomes and the emergence of the middle class, along with the continued trends in urbanization and improved access to finance.
Figure 14: Jakarta’s commercial property prices move up…(office stock available for sale , 000 m2; office space monthly rental rate, IDR per m2 per month; office average selling price, million IDR per m2)
Figure 15: …but, nationwide, residential house price growth has eased in 2012 (year-on-year growth in residential property price, percent)
Note: Based on greater Jakarta area only Source: BI Commercial Property Survey
Note: Small houses are less than 36m2, medium houses are between 36m2 and 70m2, large houses are above 70m2 Source: BI residential property survey and World Bank staff calculations
Officespace for
sale(stock)
Officespace
monthly rental rate
Office(sellingprice)
400600800
10001200 125,000
140,000
155,000
170,0001214161820
0.00
0.33
0.67
1.00
Mar-07 Nov-08 Jul-10 Mar-12
Million IDR/m2
Stock (000 m2)
(IDR/m2/month)
"Smallhouseprices"
"Largehouse"prices
"Mediumhouse"prices
-15
-10
-5
0
5
10
-15
-10
-5
0
5
10
Jun-03 Jun-06 Jun-09 Jun-12
Percent Percent
Real average house prices (ex-post, deflated by CPI)
I n d o n e s i a E c o n o m i c Q u a r t e r l y R i s i n g t o p r e s e n t a n d f u t u r e c h a l l e n g e s
THE WORLD BANK | BANK DUNIA July 201210
Overall banking sector performance continues to be robust
As of April 2012, overall banking sector indicators remained solid. The capital adequacy ratio, while down slightly, remains at 18 percent. Non-performing loans were down half a percentage point over the year to 2.3 percent. With lending rates coming down close to 1percentage point in the first quarter, net-interest margins also came down to 5.4 percent. Credit growth accelerated to 25.7 percent year-on-year in April 2012 led by investment credit (up by 28.8 percent), capital credit (up by 27.7 percent), and then consumer credit (up by 20.5 percent). The new regulations on housing and vehicle loans may dampen credit growth directed to these sectors. As discussed in Box 1 residential property prices has eased recently, although commercial property sales and rental prices have seen strong growth.
Loan growth has contributed to the gradual rise in the loan-to-deposit ratio to 81.6 percent at April 2012. There are, however, reports that banks are lending more cautiously to industries which are most sensitive to current global economic and commodity price volatility such as natural resources, minerals, plantations and shipping firms. At the same time, the US dollar liquidity tightness mentioned above is reportedly affecting the ability of some local corporates to obtain dollars and dollar credit facilities.
There has been progress on some important financial sector institutional developments
In a welcome development to enhance crisis preparedness, the Ministry of Finance, the Indonesian Deposit Insurance Corporation, and BI have signed a Memorandum of Understanding (MoU) to coordinate efforts in order to prevent and address issues of financial system stability. The MoU provides guidelines for coordination in the event of a financial crisis and identifies mechanisms for sharing data and information. It also supports the creation of an integrated crisis management protocol (CMP) based on the agencies’ authority under existing laws and regulations. While the National CMP helps improve crisis prevention and the handling of a potential financial crisis in the short-term, it does not fully address the gaps in the current legal framework and, in the long term, the authorities will need to design and put in place permanent arrangements for systemic monitoring and impact assessment, crisis preparedness, and crisis management, oncethe Financial Services Authority (OJK) is fully operational. As discussed in the December 2011 IEQ, the OJK is due to take over supervision and regulation of non bank financial institutions and capital markets by January 1, 2013 and of the banking industry by January 1, 2014, while Commission XI of the House of Representatives recently voted to select seven Commissioners of the OJK. Finally, in another regulatory development, Bank Indonesia signed two MoUs on cross border banking supervision with the Australian Prudential Regulation Authority and the Financial Services Commission of Korea.
5. Fuel subsidy spending remains high but a price hike in 2012 is now unlikely Indonesia’s fiscal position in the first half of 2012 remained solid with revenue performance strong against relatively weak expenditures
The central government budget balance recorded a deficit of IDR 36.1 trillion in the first half of the year, well below the full-year government target of IDR 190.1 trillion deficit or 2.1 percent of GDP (Figure 16). The primary balance was also in a surplus, reflecting strong revenue collection along with relatively weak expenditure performance, particularly for capital and material expenditures. However, it is worth noting that the deficit tends to be back loaded with expenditures towards the end of the year – in both 2010 and 2011, despite full-year deficits, the central government balance was in surplus from February to November. The government’s financing plans were well on-track. By end of June, 61.8 percent of the government’s total gross securities issuance target of IDR 270.7 trillion had been realized.
Figure 16: The budget deficit in the first half of 2012 was less than a fifth of the full-year target under the revised Budget (percent of GDP by in the first half of year)
Source: MoF and World Bank staff calculations
-2.0
-1.0
0.0
1.0
2.0
3.0
-2.0
-1.0
0.0
1.0
2.0
3.0
RevisedBudget
Realizationfull-year
Realization1st half
RevisedBudget
Realization1st half
2011 2012
Overall deficit Primary deficit Net financing
Percent of GDP Percent of GDP(+) indicates deficit(-) indicates surplus
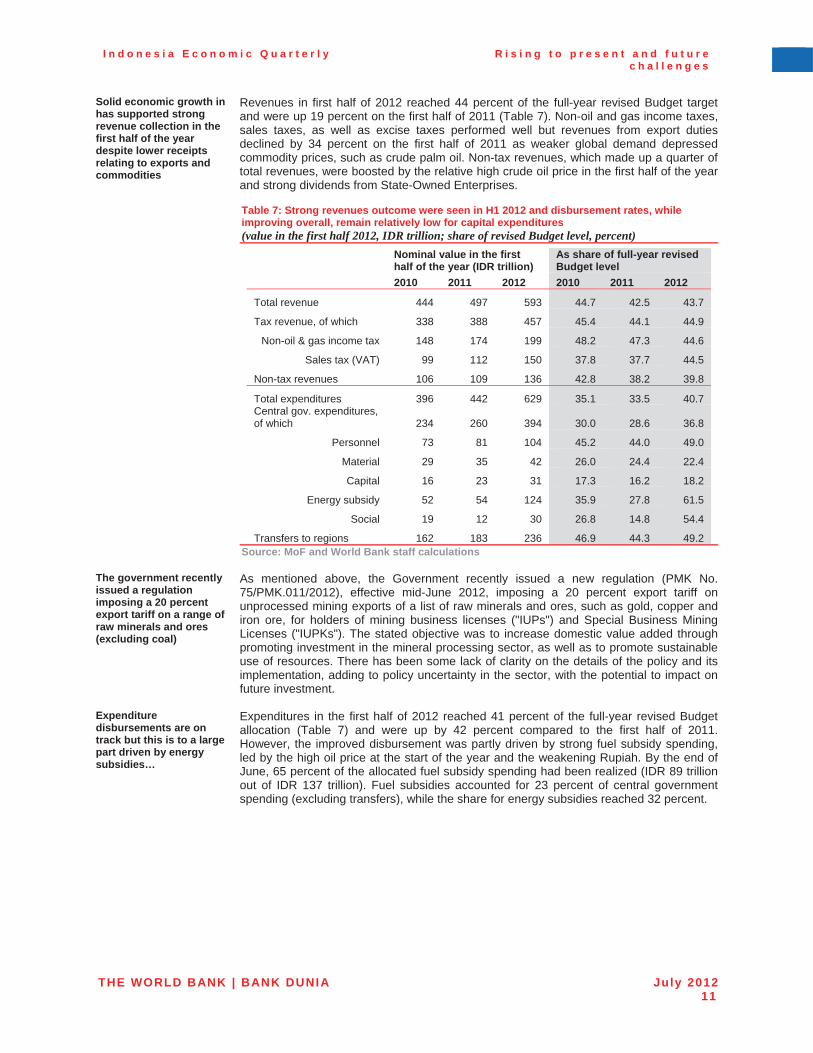
I n d o n e s i a E c o n o m i c Q u a r t e r l y R i s i n g t o p r e s e n t a n d f u t u r e c h a l l e n g e s
THE WORLD BANK | BANK DUNIA July 201211
Solid economic growth in has supported strong revenue collection in the first half of the year despite lower receipts relating to exports and commodities
Revenues in first half of 2012 reached 44 percent of the full-year revised Budget target and were up 19 percent on the first half of 2011 (Table 7). Non-oil and gas income taxes, sales taxes, as well as excise taxes performed well but revenues from export duties declined by 34 percent on the first half of 2011 as weaker global demand depressed commodity prices, such as crude palm oil. Non-tax revenues, which made up a quarter of total revenues, were boosted by the relative high crude oil price in the first half of the year and strong dividends from State-Owned Enterprises.
Table 7: Strong revenues outcome were seen in H1 2012 and disbursement rates, while improving overall, remain relatively low for capital expenditures (value in the first half 2012, IDR trillion; share of revised Budget level, percent)
Nominal value in the first half of the year (IDR trillion)
As share of full-year revised Budget level
2010 2011 2012 2010 2011 2012
Total revenue 444 497 593 44.7 42.5 43.7
Tax revenue, of which 338 388 457 45.4 44.1 44.9
Non-oil & gas income tax 148 174 199 48.2 47.3 44.6
Sales tax (VAT) 99 112 150 37.8 37.7 44.5
Non-tax revenues 106 109 136 42.8 38.2 39.8
Total expenditures 396 442 629 35.1 33.5 40.7Central gov. expenditures, of which 234 260 394 30.0 28.6 36.8
Personnel 73 81 104 45.2 44.0 49.0
Material 29 35 42 26.0 24.4 22.4
Capital 16 23 31 17.3 16.2 18.2
Energy subsidy 52 54 124 35.9 27.8 61.5
Social 19 12 30 26.8 14.8 54.4
Transfers to regions 162 183 236 46.9 44.3 49.2Source: MoF and World Bank staff calculations
The government recently issued a regulation imposing a 20 percent export tariff on a range of raw minerals and ores (excluding coal)
As mentioned above, the Government recently issued a new regulation (PMK No. 75/PMK.011/2012), effective mid-June 2012, imposing a 20 percent export tariff on unprocessed mining exports of a list of raw minerals and ores, such as gold, copper and iron ore, for holders of mining business licenses ("IUPs") and Special Business Mining Licenses ("IUPKs"). The stated objective was to increase domestic value added through promoting investment in the mineral processing sector, as well as to promote sustainable use of resources. There has been some lack of clarity on the details of the policy and its implementation, adding to policy uncertainty in the sector, with the potential to impact on future investment.
Expenditure disbursements are on track but this is to a large part driven by energy subsidies…
Expenditures in the first half of 2012 reached 41 percent of the full-year revised Budget allocation (Table 7) and were up by 42 percent compared to the first half of 2011. However, the improved disbursement was partly driven by strong fuel subsidy spending, led by the high oil price at the start of the year and the weakening Rupiah. By the end of June, 65 percent of the allocated fuel subsidy spending had been realized (IDR 89 trillion out of IDR 137 trillion). Fuel subsidies accounted for 23 percent of central government spending (excluding transfers), while the share for energy subsidies reached 32 percent.
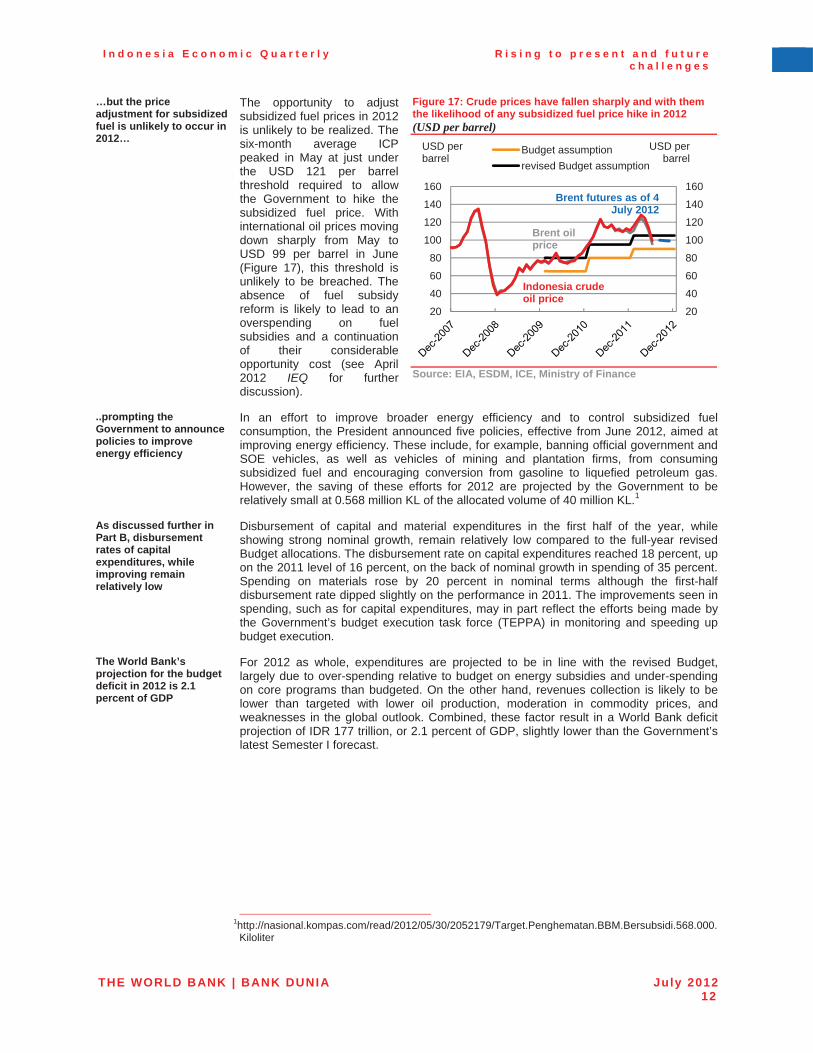
I n d o n e s i a E c o n o m i c Q u a r t e r l y R i s i n g t o p r e s e n t a n d f u t u r e c h a l l e n g e s
THE WORLD BANK | BANK DUNIA July 201212
…but the price adjustment for subsidized fuel is unlikely to occur in 2012…
The opportunity to adjust subsidized fuel prices in 2012 is unlikely to be realized. The six-month average ICP peaked in May at just under the USD 121 per barrel threshold required to allow the Government to hike the subsidized fuel price. With international oil prices moving down sharply from May to USD 99 per barrel in June (Figure 17), this threshold is unlikely to be breached. The absence of fuel subsidy reform is likely to lead to an overspending on fuel subsidies and a continuation of their considerable opportunity cost (see April 2012 IEQ for further discussion).
Figure 17: Crude prices have fallen sharply and with them the likelihood of any subsidized fuel price hike in 2012 (USD per barrel)
Source: EIA, ESDM, ICE, Ministry of Finance
..prompting the Government to announce policies to improve energy efficiency
In an effort to improve broader energy efficiency and to control subsidized fuel consumption, the President announced five policies, effective from June 2012, aimed at improving energy efficiency. These include, for example, banning official government and SOE vehicles, as well as vehicles of mining and plantation firms, from consuming subsidized fuel and encouraging conversion from gasoline to liquefied petroleum gas. However, the saving of these efforts for 2012 are projected by the Government to be relatively small at 0.568 million KL of the allocated volume of 40 million KL.1
As discussed further in Part B, disbursement rates of capital expenditures, while improving remain relatively low
Disbursement of capital and material expenditures in the first half of the year, while showing strong nominal growth, remain relatively low compared to the full-year revised Budget allocations. The disbursement rate on capital expenditures reached 18 percent, up on the 2011 level of 16 percent, on the back of nominal growth in spending of 35 percent. Spending on materials rose by 20 percent in nominal terms although the first-half disbursement rate dipped slightly on the performance in 2011. The improvements seen in spending, such as for capital expenditures, may in part reflect the efforts being made by the Government’s budget execution task force (TEPPA) in monitoring and speeding up budget execution.
The World Bank’s projection for the budget deficit in 2012 is 2.1 percent of GDP
For 2012 as whole, expenditures are projected to be in line with the revised Budget, largely due to over-spending relative to budget on energy subsidies and under-spending on core programs than budgeted. On the other hand, revenues collection is likely to be lower than targeted with lower oil production, moderation in commodity prices, and weaknesses in the global outlook. Combined, these factor result in a World Bank deficit projection of IDR 177 trillion, or 2.1 percent of GDP, slightly lower than the Government’s latest Semester I forecast.
1http://nasional.kompas.com/read/2012/05/30/2052179/Target.Penghematan.BBM.Bersubsidi.568.000.
Kiloliter
20
40
60
80
100
120
140
160
20
40
60
80
100
120
140
160
Budget assumptionrevised Budget assumption
Brent oil price
Indonesia crudeoil price
USD per barrel
USD per barrel
Brent futures as of 4July 2012
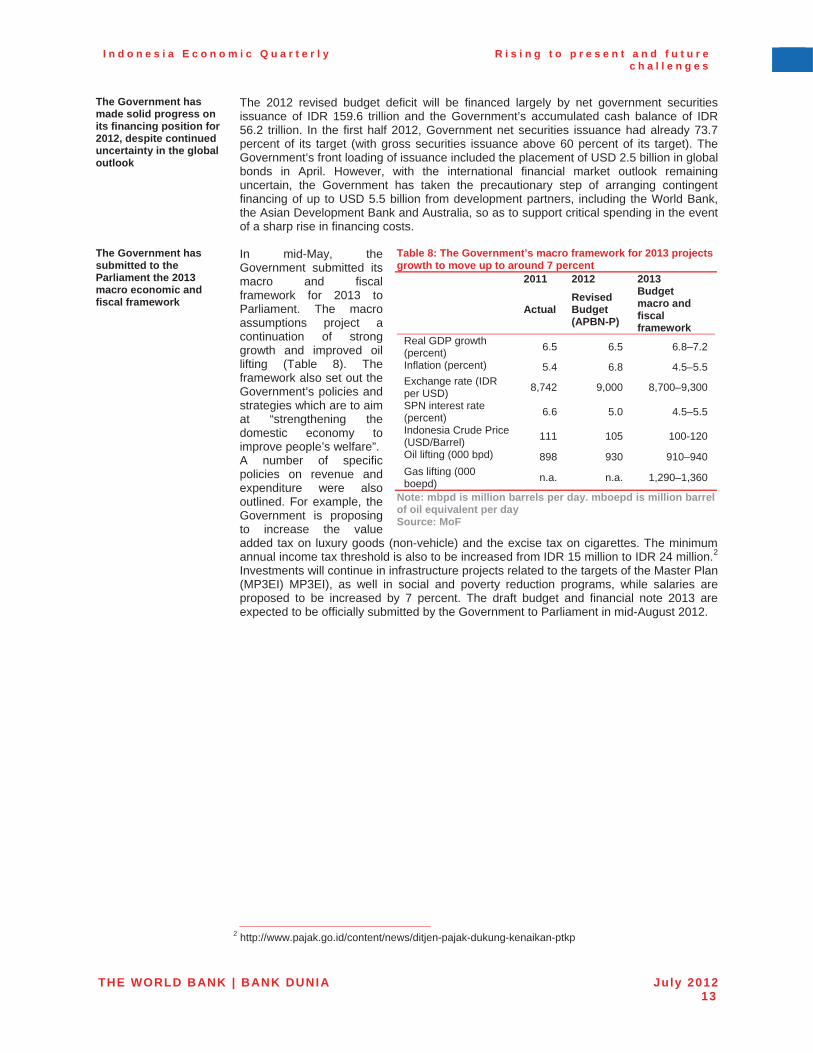
I n d o n e s i a E c o n o m i c Q u a r t e r l y R i s i n g t o p r e s e n t a n d f u t u r e c h a l l e n g e s
THE WORLD BANK | BANK DUNIA July 201213
The Government has made solid progress on its financing position for 2012, despite continued uncertainty in the global outlook
The 2012 revised budget deficit will be financed largely by net government securities issuance of IDR 159.6 trillion and the Government’s accumulated cash balance of IDR 56.2 trillion. In the first half 2012, Government net securities issuance had already 73.7 percent of its target (with gross securities issuance above 60 percent of its target). The Government’s front loading of issuance included the placement of USD 2.5 billion in global bonds in April. However, with the international financial market outlook remaining uncertain, the Government has taken the precautionary step of arranging contingent financing of up to USD 5.5 billion from development partners, including the World Bank, the Asian Development Bank and Australia, so as to support critical spending in the event of a sharp rise in financing costs.
The Government has submitted to the Parliament the 2013 macro economic and fiscal framework
In mid-May, the Government submitted its macro and fiscal framework for 2013 to Parliament. The macro assumptions project a continuation of strong growth and improved oil lifting (Table 8). The framework also set out the Government’s policies and strategies which are to aim at “strengthening the domestic economy to improve people’s welfare”. A number of specific policies on revenue and expenditure were also outlined. For example, the Government is proposing to increase the value added tax on luxury goods (non-vehicle) and the excise tax on cigarettes. The minimum annual income tax threshold is also to be increased from IDR 15 million to IDR 24 million.2Investments will continue in infrastructure projects related to the targets of the Master Plan (MP3EI) MP3EI), as well in social and poverty reduction programs, while salaries are proposed to be increased by 7 percent. The draft budget and financial note 2013 areexpected to be officially submitted by the Government to Parliament in mid-August 2012.
Table 8: The Government’s macro framework for 2013 projects growth to move up to around 7 percent
2011 2012 2013
Actual Revised Budget (APBN-P)
Budget macro and fiscalframework
Real GDP growth (percent) 6.5 6.5 6.8–7.2
Inflation (percent) 5.4 6.8 4.5–5.5 Exchange rate (IDR per USD) 8,742 9,000 8,700–9,300
SPN interest rate (percent) 6.6 5.0 4.5–5.5
Indonesia Crude Price (USD/Barrel) 111 105 100-120
Oil lifting (000 bpd) 898 930 910–940 Gas lifting (000 boepd) n.a. n.a. 1,290–1,360
Note: mbpd is million barrels per day. mboepd is million barrel of oil equivalent per day Source: MoF
2 http://www.pajak.go.id/content/news/ditjen-pajak-dukung-kenaikan-ptkp
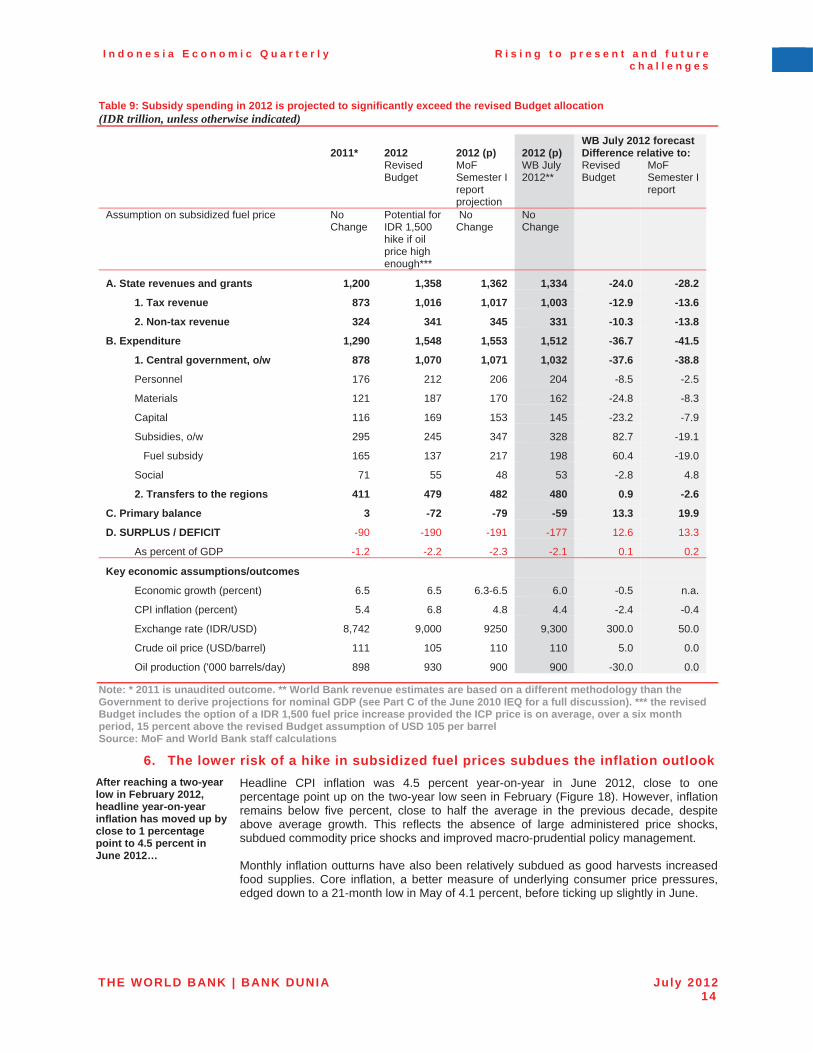
I n d o n e s i a E c o n o m i c Q u a r t e r l y R i s i n g t o p r e s e n t a n d f u t u r e c h a l l e n g e s
THE WORLD BANK | BANK DUNIA July 201214
Table 9: Subsidy spending in 2012 is projected to significantly exceed the revised Budget allocation (IDR trillion, unless otherwise indicated)
2011* 2012 2012 (p) 2012 (p) WB July 2012 forecast Difference relative to:
RevisedBudget
MoFSemester I reportprojection
WB July 2012**
RevisedBudget
MoFSemester I report
Assumption on subsidized fuel price NoChange
Potential for IDR 1,500 hike if oil price high enough***
No Change
NoChange
A. State revenues and grants 1,200 1,358 1,362 1,334 -24.0 -28.2
1. Tax revenue 873 1,016 1,017 1,003 -12.9 -13.6
2. Non-tax revenue 324 341 345 331 -10.3 -13.8
B. Expenditure 1,290 1,548 1,553 1,512 -36.7 -41.5
1. Central government, o/w 878 1,070 1,071 1,032 -37.6 -38.8
Personnel 176 212 206 204 -8.5 -2.5
Materials 121 187 170 162 -24.8 -8.3
Capital 116 169 153 145 -23.2 -7.9
Subsidies, o/w 295 245 347 328 82.7 -19.1
Fuel subsidy 165 137 217 198 60.4 -19.0
Social 71 55 48 53 -2.8 4.8
2. Transfers to the regions 411 479 482 480 0.9 -2.6
C. Primary balance 3 -72 -79 -59 13.3 19.9
D. SURPLUS / DEFICIT -90 -190 -191 -177 12.6 13.3
As percent of GDP -1.2 -2.2 -2.3 -2.1 0.1 0.2
Key economic assumptions/outcomes ��Economic growth (percent) 6.5 6.5 6.3-6.5 6.0 -0.5 n.a.
CPI inflation (percent) 5.4 6.8 4.8 4.4 -2.4 -0.4
Exchange rate (IDR/USD) 8,742 9,000 9250 9,300 300.0 50.0
Crude oil price (USD/barrel) 111 105 110 110 5.0 0.0
Oil production ('000 barrels/day) 898 930 900 900 -30.0 0.0
Note: * 2011 is unaudited outcome. ** World Bank revenue estimates are based on a different methodology than the Government to derive projections for nominal GDP (see Part C of the June 2010 IEQ for a full discussion). *** the revised Budget includes the option of a IDR 1,500 fuel price increase provided the ICP price is on average, over a six month period, 15 percent above the revised Budget assumption of USD 105 per barrel Source: MoF and World Bank staff calculations
6. The lower risk of a hike in subsidized fuel prices subdues the inflation outlook After reaching a two-year low in February 2012, headline year-on-year inflation has moved up by close to 1 percentage point to 4.5 percent in June 2012…
Headline CPI inflation was 4.5 percent year-on-year in June 2012, close to one percentage point up on the two-year low seen in February (Figure 18). However, inflation remains below five percent, close to half the average in the previous decade, despite above average growth. This reflects the absence of large administered price shocks, subdued commodity price shocks and improved macro-prudential policy management.
Monthly inflation outturns have also been relatively subdued as good harvests increased food supplies. Core inflation, a better measure of underlying consumer price pressures, edged down to a 21-month low in May of 4.1 percent, before ticking up slightly in June.
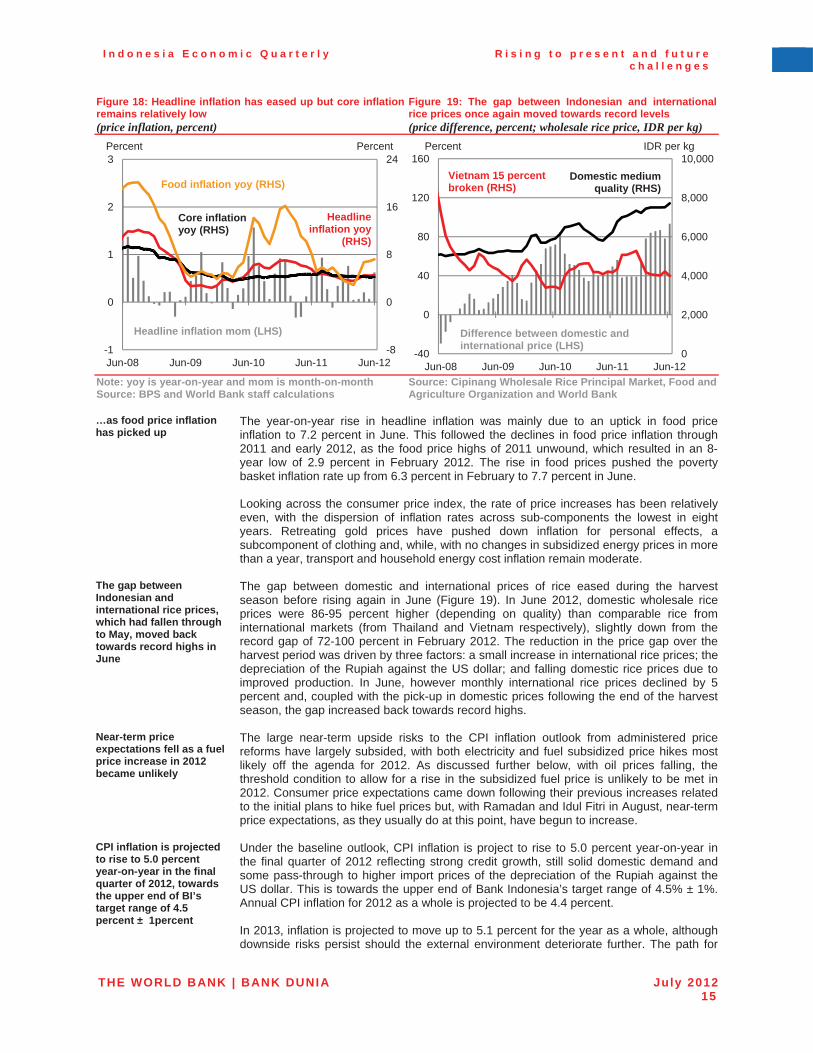
I n d o n e s i a E c o n o m i c Q u a r t e r l y R i s i n g t o p r e s e n t a n d f u t u r e c h a l l e n g e s
THE WORLD BANK | BANK DUNIA July 201215
Figure 18: Headline inflation has eased up but core inflation remains relatively low (price inflation, percent)
Figure 19: The gap between Indonesian and international rice prices once again moved towards record levels (price difference, percent; wholesale rice price, IDR per kg)
Note: yoy is year-on-year and mom is month-on-month Source: BPS and World Bank staff calculations
Source: Cipinang Wholesale Rice Principal Market, Food and Agriculture Organization and World Bank
…as food price inflation has picked up
The year-on-year rise in headline inflation was mainly due to an uptick in food price inflation to 7.2 percent in June. This followed the declines in food price inflation through 2011 and early 2012, as the food price highs of 2011 unwound, which resulted in an 8-year low of 2.9 percent in February 2012. The rise in food prices pushed the poverty basket inflation rate up from 6.3 percent in February to 7.7 percent in June.
Looking across the consumer price index, the rate of price increases has been relatively even, with the dispersion of inflation rates across sub-components the lowest in eight years. Retreating gold prices have pushed down inflation for personal effects, a subcomponent of clothing and, while, with no changes in subsidized energy prices in more than a year, transport and household energy cost inflation remain moderate.
The gap between Indonesian and international rice prices, which had fallen through to May, moved back towards record highs in June
The gap between domestic and international prices of rice eased during the harvest season before rising again in June (Figure 19). In June 2012, domestic wholesale rice prices were 86-95 percent higher (depending on quality) than comparable rice from international markets (from Thailand and Vietnam respectively), slightly down from the record gap of 72-100 percent in February 2012. The reduction in the price gap over the harvest period was driven by three factors: a small increase in international rice prices; the depreciation of the Rupiah against the US dollar; and falling domestic rice prices due to improved production. In June, however monthly international rice prices declined by 5 percent and, coupled with the pick-up in domestic prices following the end of the harvest season, the gap increased back towards record highs.
Near-term price expectations fell as a fuel price increase in 2012 became unlikely
The large near-term upside risks to the CPI inflation outlook from administered price reforms have largely subsided, with both electricity and fuel subsidized price hikes most likely off the agenda for 2012. As discussed further below, with oil prices falling, the threshold condition to allow for a rise in the subsidized fuel price is unlikely to be met in 2012. Consumer price expectations came down following their previous increases related to the initial plans to hike fuel prices but, with Ramadan and Idul Fitri in August, near-term price expectations, as they usually do at this point, have begun to increase.
CPI inflation is projected to rise to 5.0 percent year-on-year in the final quarter of 2012, towards the upper end of BI’s target range of 4.5 percent ± 1percent
Under the baseline outlook, CPI inflation is project to rise to 5.0 percent year-on-year in the final quarter of 2012 reflecting strong credit growth, still solid domestic demand and some pass-through to higher import prices of the depreciation of the Rupiah against the US dollar. This is towards the upper end of Bank Indonesia’s target range of 4.5% ± 1%. Annual CPI inflation for 2012 as a whole is projected to be 4.4 percent.
In 2013, inflation is projected to move up to 5.1 percent for the year as a whole, although downside risks persist should the external environment deteriorate further. The path for
-8
0
8
16
24
-1
0
1
2
3
Jun-08 Jun-09 Jun-10 Jun-11 Jun-12
Core inflation yoy (RHS)
Headlineinflation yoy
(RHS)
Headline inflation mom (LHS)
Percent Percent
Food inflation yoy (RHS)
0
2,000
4,000
6,000
8,000
10,000
-40
0
40
80
120
160
Jun-08 Jun-09 Jun-10 Jun-11 Jun-12
Difference between domestic and international price (LHS)
Vietnam 15 percent broken (RHS)
Domestic medium quality (RHS)
Percent IDR per kg
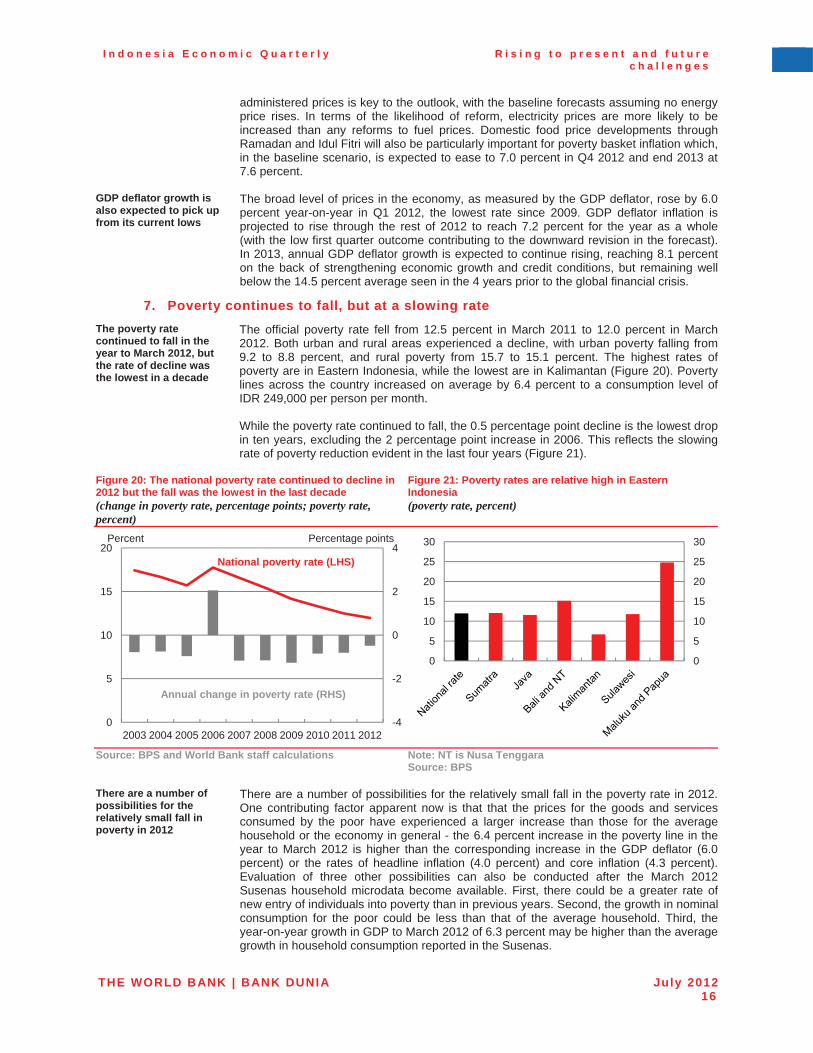
I n d o n e s i a E c o n o m i c Q u a r t e r l y R i s i n g t o p r e s e n t a n d f u t u r e c h a l l e n g e s
THE WORLD BANK | BANK DUNIA July 201216
administered prices is key to the outlook, with the baseline forecasts assuming no energy price rises. In terms of the likelihood of reform, electricity prices are more likely to be increased than any reforms to fuel prices. Domestic food price developments through Ramadan and Idul Fitri will also be particularly important for poverty basket inflation which, in the baseline scenario, is expected to ease to 7.0 percent in Q4 2012 and end 2013 at 7.6 percent.
GDP deflator growth is also expected to pick up from its current lows
The broad level of prices in the economy, as measured by the GDP deflator, rose by 6.0 percent year-on-year in Q1 2012, the lowest rate since 2009. GDP deflator inflation is projected to rise through the rest of 2012 to reach 7.2 percent for the year as a whole (with the low first quarter outcome contributing to the downward revision in the forecast). In 2013, annual GDP deflator growth is expected to continue rising, reaching 8.1 percent on the back of strengthening economic growth and credit conditions, but remaining well below the 14.5 percent average seen in the 4 years prior to the global financial crisis.
7. Poverty continues to fall, but at a slowing rate The poverty rate continued to fall in the year to March 2012, but the rate of decline was the lowest in a decade
The official poverty rate fell from 12.5 percent in March 2011 to 12.0 percent in March 2012. Both urban and rural areas experienced a decline, with urban poverty falling from 9.2 to 8.8 percent, and rural poverty from 15.7 to 15.1 percent. The highest rates of poverty are in Eastern Indonesia, while the lowest are in Kalimantan (Figure 20). Poverty lines across the country increased on average by 6.4 percent to a consumption level of IDR 249,000 per person per month.
While the poverty rate continued to fall, the 0.5 percentage point decline is the lowest drop in ten years, excluding the 2 percentage point increase in 2006. This reflects the slowing rate of poverty reduction evident in the last four years (Figure 21).
Figure 20: The national poverty rate continued to decline in 2012 but the fall was the lowest in the last decade (change in poverty rate, percentage points; poverty rate, percent)
Figure 21: Poverty rates are relative high in Eastern Indonesia (poverty rate, percent)
Source: BPS and World Bank staff calculations Note: NT is Nusa Tenggara Source: BPS
There are a number of possibilities for the relatively small fall in poverty in 2012
There are a number of possibilities for the relatively small fall in the poverty rate in 2012. One contributing factor apparent now is that that the prices for the goods and services consumed by the poor have experienced a larger increase than those for the average household or the economy in general - the 6.4 percent increase in the poverty line in the year to March 2012 is higher than the corresponding increase in the GDP deflator (6.0 percent) or the rates of headline inflation (4.0 percent) and core inflation (4.3 percent). Evaluation of three other possibilities can also be conducted after the March 2012 Susenas household microdata become available. First, there could be a greater rate of new entry of individuals into poverty than in previous years. Second, the growth in nominal consumption for the poor could be less than that of the average household. Third, the year-on-year growth in GDP to March 2012 of 6.3 percent may be higher than the average growth in household consumption reported in the Susenas.
-4
-2
0
2
4
0
5
10
15
20
2003 2004 2005 2006 2007 2008 2009 2010 2011 2012
National poverty rate (LHS)
Annual change in poverty rate (RHS)
Percent Percentage points
0
5
10
15
20
25
30
0
5
10
15
20
25
30

I n d o n e s i a E c o n o m i c Q u a r t e r l y R i s i n g t o p r e s e n t a n d f u t u r e c h a l l e n g e s
THE WORLD BANK | BANK DUNIA July 201217
Slower poverty reduction may also reflect the entrenched nature of the remaining poor, as well as the large number of households vulnerable to falling into poverty
The changing nature of the poor is also a factor. As the poverty rate nears 10 percent, poverty reduction is becoming more difficult. When poverty was 20 or 30 percent of the population, there were many people living just under the poverty line, so moderate increases in income brought a large number out of poverty. However, in recent times, there are fewer people just below the poverty line, with many of the remaining poor being much further below (Figure 22). As a consequence, greater increases in their income are required to achieve the same rate of poverty reduction as in previous years.
At the same time as the remaining poor are increasingly far below the poverty line, the many people who have moved out of poverty in the last three decades still live close to the poverty line and remain vulnerable to falling back into poverty (Figure 23); over half of the poor in each year were not poor the year before.
Figure 22: The remaining poor live increasingly far below the poverty line… (average per capita consumption by percentile for bottom 20 percent of population, as percentage of poverty line)
Figure 23: …while a large number of Indonesians just above the poverty line remain vulnerable to falls back into poverty (2011 monthly per capita consumption, 000 Rupiah)
Source: Susenas 2011 and World Bank staff calculations Source: Susenas 2011 and World Bank staff calculations
Addressing these problems of poverty and vulnerability requires more effective government programs
These two related phenomena of chronic poverty and widespread vulnerability mean poverty reduction policies in Indonesia should focus on two objectives. First, social promotion programs are required to help the remaining poor out of poverty through income support and investment in their human capital. This includes programs in Indonesia such as Scholarships for Poor Children (Beasiswa Siswa Miskin, or BSM) which allows poor families to meet the cost of education, and the conditional cash transfer program (Program Keluarga Harapan, or PKH) which provides cash transfers to the mothers of very poor households while promoting maternal and child health and school enrolment. However, coverage of these programs remains very low and needs to be increased to include the many poor who currently miss out.
Second, social protection programs are required to protect the many more vulnerable households in Indonesia from falling into poverty.3 Some such programs exist, such as Rice for the Poor (Raskin) and Health Insurance for the Poor (Jamkesmas), but they experience problems of implementation and do not reach all of the poor and vulnerable. These programs need to be improved and expanded to cover all vulnerable households.At the same time, new programs are needed protect especially vulnerable groups, such as the destitute elderly and the disabled, or to provide work for the temporary unemployed.
3 For more details see the Part C of the April 2012 IEQ and the recently released World Bank (2012)
report on Protecting Poor and Vulnerable Households in Indonesia, available at http://go.worldbank.org/5BWH4ZCQM0.
0
20
40
60
80
100
120
0
20
40
60
80
100
120
1 3 5 7 9 11 13 15 17 19
Consumption relative to poverty line
Per capita consumption percentile
Percent Percent
Poverty line
02
46
810
0 100 200 300 400 500 600 700 800
Poverty Line (PL) (12.5 percent below)
1.2 X PL (24 percent below)
1.5 X PL (38 percent below)
Monthly Household Per Capita Consumption (IDR 000)
Million of individuals

I n d o n e s i a E c o n o m i c Q u a r t e r l y R i s i n g t o p r e s e n t a n d f u t u r e c h a l l e n g e s
THE WORLD BANK | BANK DUNIA July 201218
Employment growth in the year to February 2012 was led by the industrial and services sectors…
Turning to labor market developments, total employment in February 2012 rose by 1.4 percent year-on-year, pushing the open unemployment rate down by 0.5 percentage points to 6.3 percent (Figure 24). Based on GDP data for Q1 2012, each 1 percentage point of GDP growth was associated with an increase in employment of around 216,000, somewhat lower than the average of around 400,000 in the past six years (although further analysis is required to look into these trends in more detail).
The services and industrial sectors were broadly equal drivers of this employment growth with the former increasing by 3 percent, boosted by the financial sector. Employment in industry increased by 6.4 percent and had the highest elasticity to GDP growth amongst the various sectors.
Figure 24: Unemployment continued decline in year to February 2012… (year-on-year growth, percent; unemployment rate, percent)
Note: Data for February. BPS changed the labor force survey weighting in February 2011. *Formal employment includes employers with, permanent workers and salaried workers Source: BPS and World Bank staff calculation
…as jobs continue to move away from agriculture and towards more formal employment
The decline in agricultural employment in the year to February 2012 is consistent with the longer-term trends. Over the past six years the share of total employees in non-agricultural sectors increased from 56 percent to 63 percent. This transition to the non-agriculture sector is one major factor why formal employment has picked up in recent years, although even within the formal sector the vast majority of workers do not have a contract. Interestingly, in line with increased demand for skilled labor, it was higher educated employees who contributed the most to employment growth over the past year and who also achieved the largest falls in unemployment rates.
8. External uncertainty remains the greatest near-term risk to the economyRisks in the international environment remain high and are expected to persist…
With the resolution of the Euro zone crisis still unclear, and the ongoing potential for other downside shocks to hit the global outlook, such as from developments in China or other major emerging economies, there continues to be a risk of more adverse scenarios for Indonesia’s near-term external environment. The domestic real impact of such scenarios,even if they occur in the second half of 2012, would probably be felt most strongly in 2013(although the financial market impacts would be more immediate). Indeed, it is likely that risks during 2013 will remain high given the likely continuation of problems in the Euro zone plus the ongoing fiscal challenges also faced in economies such as the US.
…and, if realized in a severe global slowdown, could push Indonesia’s growth in 2013 below 4 percent
The October 2011 IEQ outlined a number of alternative scenarios for the international environment. Assumptions were made for the likely path of trading partner growth, terms of trade (primarily commodity prices) and domestic investment in each scenario which then flow through to projected growth to provide some guide to the downside risks that the Indonesian economy might face.
In the baseline scenario of continued financial market turbulence, as outlined above, growth is expected to moderate to 6.0 percent in 2012 before recovering slightly to 6.4 percent in 2013. In the event of a major freezing of international financial markets which contributes to a drop in trading partner growth, a fall in global commodity prices and reduced domestic investor confidence leading to a scenario similar to in 2009, it is projected that growth could slow to 4.7 percent in 2013 (Scenario 2 in Table 10). In a third scenario in which such a crisis was accompanied by, or indeed precipitated, a severe, prolonged global downturn encompassing the major emerging economies, growth in Indonesia could drop to 3.8 percent, with the impact of the slowdown felt more sharply in domestic activity as commodity price falls reduce incomes and investment. Developments
25
35
45
55
65
0
3
6
9
12
2006 2007 2008 2009 2010 2011 2012
Unemployment rate (LHS)Real GDP growth (LHS)Non-agri employment rate (RHS)Formal employment rate* (RHS)
PercentPercent
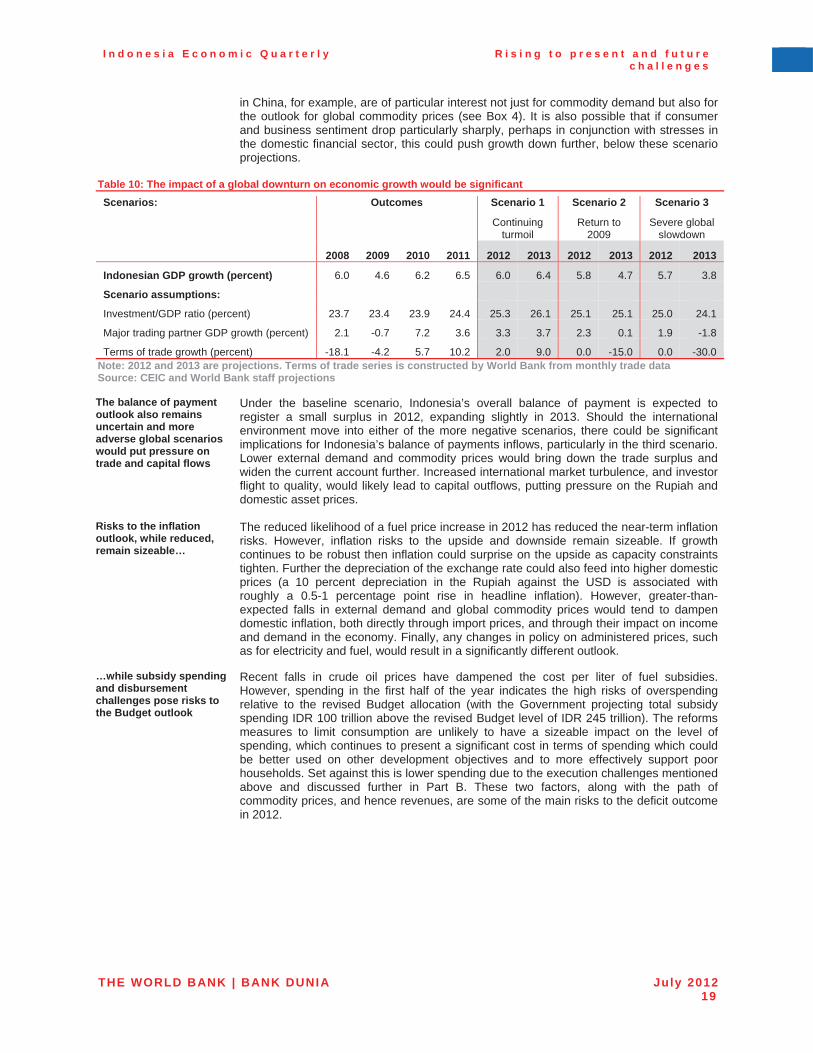
I n d o n e s i a E c o n o m i c Q u a r t e r l y R i s i n g t o p r e s e n t a n d f u t u r e c h a l l e n g e s
THE WORLD BANK | BANK DUNIA July 201219
in China, for example, are of particular interest not just for commodity demand but also for the outlook for global commodity prices (see Box 4). It is also possible that if consumer and business sentiment drop particularly sharply, perhaps in conjunction with stresses in the domestic financial sector, this could push growth down further, below these scenario projections.
Table 10: The impact of a global downturn on economic growth would be significant Scenarios: Outcomes Scenario 1 Scenario 2 Scenario 3
Continuing turmoil
Return to 2009
Severe global slowdown
�� 2008 2009 2010 2011 2012 2013 2012 2013 2012 2013
Indonesian GDP growth (percent) 6.0 4.6 6.2 6.5 6.0 6.4 5.8 4.7 5.7 3.8
Scenario assumptions: �� � �� �� � �Investment/GDP ratio (percent) 23.7 23.4 23.9 24.4 25.3 26.1 25.1 25.1 25.0 24.1
Major trading partner GDP growth (percent) 2.1 -0.7 7.2 3.6 3.3 3.7 2.3 0.1 1.9 -1.8
Terms of trade growth (percent) -18.1 -4.2 5.7 10.2 2.0 9.0 0.0 -15.0 0.0 -30.0 Note: 2012 and 2013 are projections. Terms of trade series is constructed by World Bank from monthly trade data Source: CEIC and World Bank staff projections
The balance of payment outlook also remains uncertain and more adverse global scenarios would put pressure on trade and capital flows
Under the baseline scenario, Indonesia’s overall balance of payment is expected to register a small surplus in 2012, expanding slightly in 2013. Should the international environment move into either of the more negative scenarios, there could be significant implications for Indonesia’s balance of payments inflows, particularly in the third scenario. Lower external demand and commodity prices would bring down the trade surplus and widen the current account further. Increased international market turbulence, and investor flight to quality, would likely lead to capital outflows, putting pressure on the Rupiah and domestic asset prices.
Risks to the inflation outlook, while reduced, remain sizeable…
The reduced likelihood of a fuel price increase in 2012 has reduced the near-term inflation risks. However, inflation risks to the upside and downside remain sizeable. If growth continues to be robust then inflation could surprise on the upside as capacity constraints tighten. Further the depreciation of the exchange rate could also feed into higher domestic prices (a 10 percent depreciation in the Rupiah against the USD is associated with roughly a 0.5-1 percentage point rise in headline inflation). However, greater-than-expected falls in external demand and global commodity prices would tend to dampen domestic inflation, both directly through import prices, and through their impact on income and demand in the economy. Finally, any changes in policy on administered prices, such as for electricity and fuel, would result in a significantly different outlook.
…while subsidy spending and disbursement challenges pose risks to the Budget outlook
Recent falls in crude oil prices have dampened the cost per liter of fuel subsidies. However, spending in the first half of the year indicates the high risks of overspending relative to the revised Budget allocation (with the Government projecting total subsidy spending IDR 100 trillion above the revised Budget level of IDR 245 trillion). The reforms measures to limit consumption are unlikely to have a sizeable impact on the level of spending, which continues to present a significant cost in terms of spending which could be better used on other development objectives and to more effectively support poor households. Set against this is lower spending due to the execution challenges mentioned above and discussed further in Part B. These two factors, along with the path of commodity prices, and hence revenues, are some of the main risks to the deficit outcome in 2012.
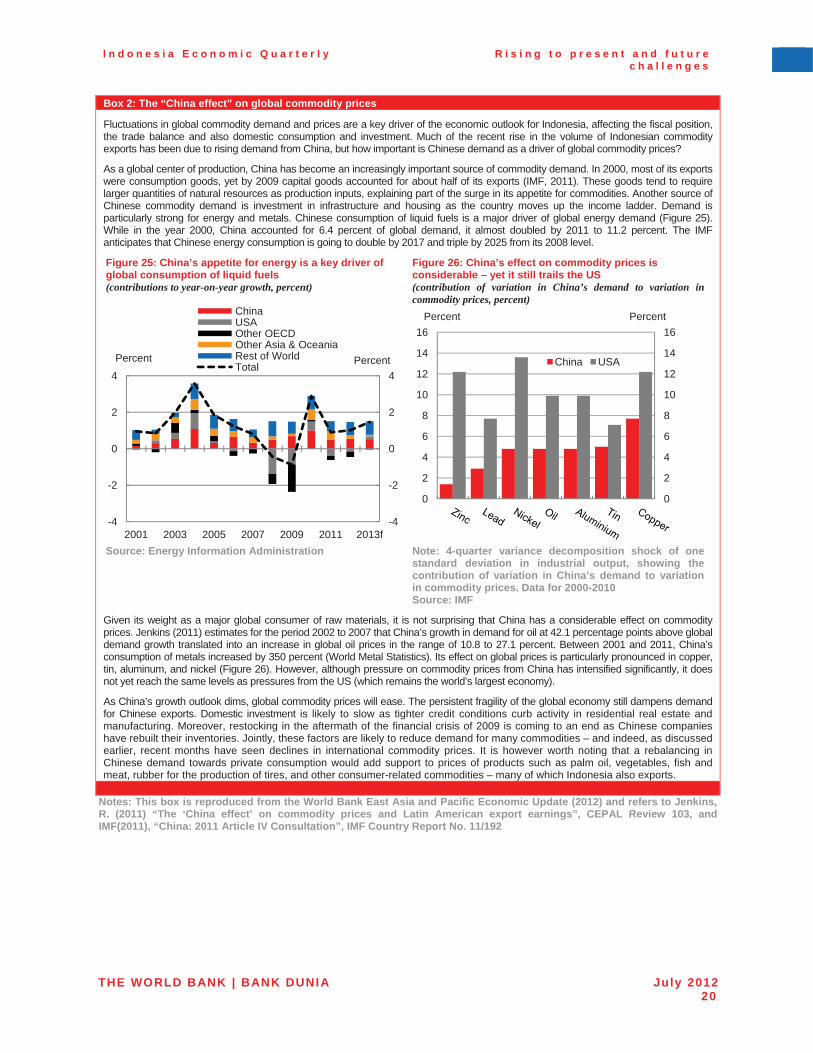
I n d o n e s i a E c o n o m i c Q u a r t e r l y R i s i n g t o p r e s e n t a n d f u t u r e c h a l l e n g e s
THE WORLD BANK | BANK DUNIA July 201220
Box 2: The “China effect” on global commodity prices
Fluctuations in global commodity demand and prices are a key driver of the economic outlook for Indonesia, affecting the fiscal position, the trade balance and also domestic consumption and investment. Much of the recent rise in the volume of Indonesian commodity exports has been due to rising demand from China, but how important is Chinese demand as a driver of global commodity prices?
As a global center of production, China has become an increasingly important source of commodity demand. In 2000, most of its exportswere consumption goods, yet by 2009 capital goods accounted for about half of its exports (IMF, 2011). These goods tend to require larger quantities of natural resources as production inputs, explaining part of the surge in its appetite for commodities. Another source of Chinese commodity demand is investment in infrastructure and housing as the country moves up the income ladder. Demand is particularly strong for energy and metals. Chinese consumption of liquid fuels is a major driver of global energy demand (Figure 25). While in the year 2000, China accounted for 6.4 percent of global demand, it almost doubled by 2011 to 11.2 percent. The IMF anticipates that Chinese energy consumption is going to double by 2017 and triple by 2025 from its 2008 level.
Figure 25: China’s appetite for energy is a key driver of global consumption of liquid fuels (contributions to year-on-year growth, percent)
Figure 26: China’s effect on commodity prices is considerable – yet it still trails the US (contribution of variation in China’s demand to variation in commodity prices, percent)
Source: Energy Information Administration Note: 4-quarter variance decomposition shock of one standard deviation in industrial output, showing the contribution of variation in China’s demand to variation in commodity prices. Data for 2000-2010 Source: IMF
Given its weight as a major global consumer of raw materials, it is not surprising that China has a considerable effect on commodity prices. Jenkins (2011) estimates for the period 2002 to 2007 that China’s growth in demand for oil at 42.1 percentage points above global demand growth translated into an increase in global oil prices in the range of 10.8 to 27.1 percent. Between 2001 and 2011, China’sconsumption of metals increased by 350 percent (World Metal Statistics). Its effect on global prices is particularly pronounced in copper, tin, aluminum, and nickel (Figure 26). However, although pressure on commodity prices from China has intensified significantly, it does not yet reach the same levels as pressures from the US (which remains the world’s largest economy).
As China’s growth outlook dims, global commodity prices will ease. The persistent fragility of the global economy still dampens demand for Chinese exports. Domestic investment is likely to slow as tighter credit conditions curb activity in residential real estate and manufacturing. Moreover, restocking in the aftermath of the financial crisis of 2009 is coming to an end as Chinese companies have rebuilt their inventories. Jointly, these factors are likely to reduce demand for many commodities – and indeed, as discussed earlier, recent months have seen declines in international commodity prices. It is however worth noting that a rebalancing in Chinese demand towards private consumption would add support to prices of products such as palm oil, vegetables, fish and meat, rubber for the production of tires, and other consumer-related commodities – many of which Indonesia also exports.
Notes: This box is reproduced from the World Bank East Asia and Pacific Economic Update (2012) and refers to Jenkins, R. (2011) “The ‘China effect’ on commodity prices and Latin American export earnings”, CEPAL Review 103, and IMF(2011), “China: 2011 Article IV Consultation”, IMF Country Report No. 11/192
-4
-2
0
2
4
-4
-2
0
2
4
2001 2003 2005 2007 2009 2011 2013f
ChinaUSAOther OECDOther Asia & OceaniaRest of WorldTotal PercentPercent
0
2
4
6
8
10
12
14
16
0
2
4
6
8
10
12
14
16
China USA
PercentPercent

THE WORLD BANK | BANK DUNIA July 201221
B. SOME�RECENT�DEVELOPMENTS�IN�
INDONESIA’S�ECONOMY�
1. Drivers and implications of recent trends in Indonesia’s current account
Indonesia’s current account balance has been narrowing and is projected to move into an annual deficit in 2012 for the first time since the Asian financial crisis
Rapid domestic growth and weak external demand have seen Indonesia’s current account surplus (CAS) narrow substantially in recent years. The World Bank projects that Indonesia will record an annual current account deficit (CAD) in 2012 for the first timesince before the Asian financial crisis. While the recent weakening of the trade balance, as described in Part A, has accelerated the movement of the current account into deficit, this is also a medium-term trend. This section analyzes the drivers that underlie these recent dynamics in Indonesia’s current account, and discusses related issues of the sustainability of the deficit and its implications for Indonesia’s external financing position.
a. Recent dynamics in Indonesia’s current account After maintaining a current account deficit through the 1980s and 1990s, the fundamentals of Indonesia’s external accounts changed during the Asian financial crisis
Prior to the Asian crisis, Indonesia experienced almost three decades of strong economic expansion, driven by industrialization, urbanization and the reduction of trade barriers,which saw the economy became more globally integrated.4 As in many other countries, this rapid ‘catch-up’ phase of economic development required a significant increase in the investment rate, with investment-to-GDP rising from 28.5 percent in 1980 to 37.2 percent in 1997. Given low domestic savings, this investment was financed by borrowing from overseas with the current account deficit averaging around 3 percent of GDP annually(see Box 3 for a description of the current account). Current account outflows were financed by short-term loans and portfolio capital inflows. The sudden withdrawal of external financing during the Asian financial crisis saw Indonesia’s current account swing to a surplus as the currency depreciated heavily, followed by policy reforms aimed at reducing external debt and building domestic buffers against sudden stops in foreign capital flows.
In recent years, Indonesia has maintained a current account surplus, contributing to the build-up of foreign reserves
Since 1998 Indonesia’s current account has generally remained in surplus, with export earnings more than offsetting imports and income payments to foreign investors. This reflects an increase in savings relative to investment compared to before the Asian financial crisis, reflecting more conservative investment practices and lending regulations. The persistent current account surplus has also helped to provide a source of external financing in recent years, lowering vulnerabilities to sudden capital stops, and has contributed to the four-fold increase in foreign reserves over the past decade.
Yet, the current account has been trending down since the 2008 global financial crisis…
However, since the 2008 global financial crisis, strong domestic conditions combined with ongoing weakness in the global economy have resulted in a narrowing of the current account surplus, as imports and income outflows related to increasing FDI (particularly in the mining & minerals sector) have grown faster than exports earnings.
4 Elias & Noone (2011), “The Growth and Development of the Indonesian Economy”, Reserve Bank of
Australia Bulletin, December.
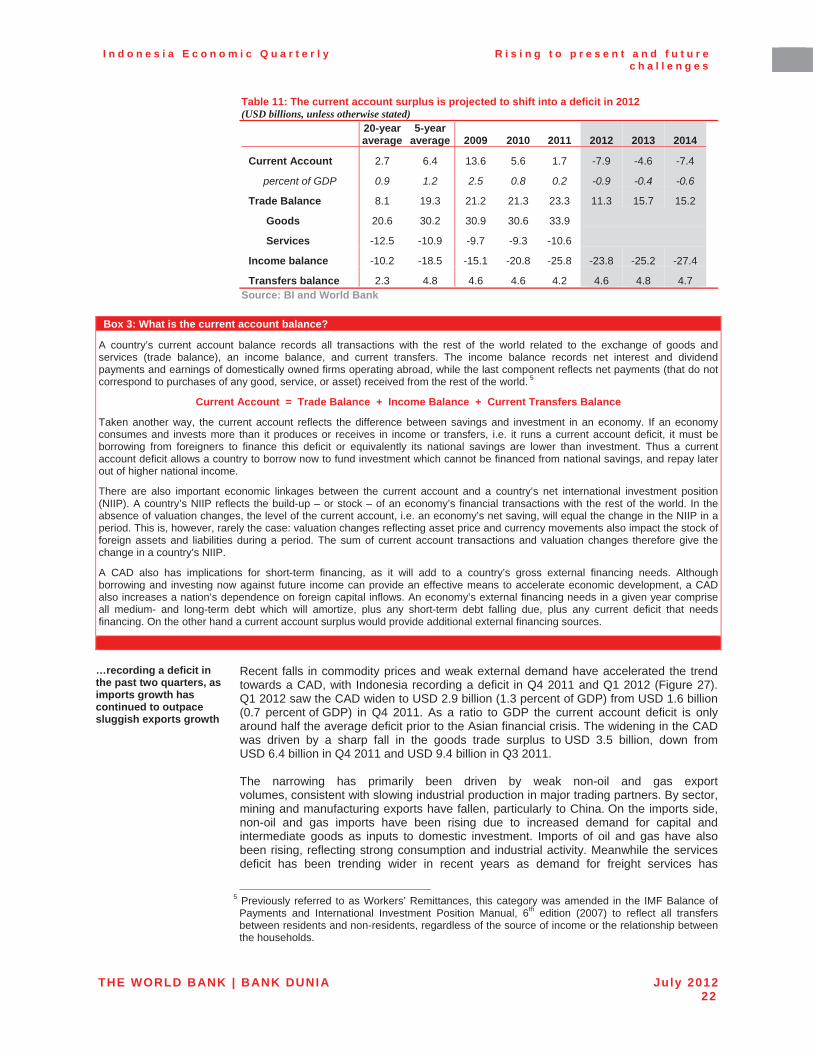
I n d o n e s i a E c o n o m i c Q u a r t e r l y R i s i n g t o p r e s e n t a n d f u t u r e c h a l l e n g e s
THE WORLD BANK | BANK DUNIA July 201222
Table 11: The current account surplus is projected to shift into a deficit in 2012 (USD billions, unless otherwise stated)
20-year average
5-year average 2009 2010 2011 2012 2013 2014
Current Account 2.7 6.4 13.6 5.6 1.7 -7.9 -4.6 -7.4
percent of GDP 0.9 1.2 2.5 0.8 0.2 -0.9 -0.4 -0.6
Trade Balance 8.1 19.3 21.2 21.3 23.3 11.3 15.7 15.2
Goods 20.6 30.2 30.9 30.6 33.9
Services -12.5 -10.9 -9.7 -9.3 -10.6
Income balance -10.2 -18.5 -15.1 -20.8 -25.8 -23.8 -25.2 -27.4
Transfers balance 2.3 4.8 4.6 4.6 4.2 4.6 4.8 4.7Source: BI and World Bank
Box 3: What is the current account balance?
A country’s current account balance records all transactions with the rest of the world related to the exchange of goods and services (trade balance), an income balance, and current transfers. The income balance records net interest and dividend payments and earnings of domestically owned firms operating abroad, while the last component reflects net payments (that do notcorrespond to purchases of any good, service, or asset) received from the rest of the world. 5
Current Account = Trade Balance + Income Balance + Current Transfers Balance
Taken another way, the current account reflects the difference between savings and investment in an economy. If an economy consumes and invests more than it produces or receives in income or transfers, i.e. it runs a current account deficit, it must beborrowing from foreigners to finance this deficit or equivalently its national savings are lower than investment. Thus a currentaccount deficit allows a country to borrow now to fund investment which cannot be financed from national savings, and repay later out of higher national income.
There are also important economic linkages between the current account and a country’s net international investment position (NIIP). A country’s NIIP reflects the build-up – or stock – of an economy’s financial transactions with the rest of the world. In the absence of valuation changes, the level of the current account, i.e. an economy’s net saving, will equal the change in the NIIP in a period. This is, however, rarely the case: valuation changes reflecting asset price and currency movements also impact the stock of foreign assets and liabilities during a period. The sum of current account transactions and valuation changes therefore give thechange in a country’s NIIP.
A CAD also has implications for short-term financing, as it will add to a country’s gross external financing needs. Although borrowing and investing now against future income can provide an effective means to accelerate economic development, a CADalso increases a nation’s dependence on foreign capital inflows. An economy’s external financing needs in a given year compriseall medium- and long-term debt which will amortize, plus any short-term debt falling due, plus any current deficit that needs financing. On the other hand a current account surplus would provide additional external financing sources.
…recording a deficit in the past two quarters, as imports growth has continued to outpace sluggish exports growth
Recent falls in commodity prices and weak external demand have accelerated the trend towards a CAD, with Indonesia recording a deficit in Q4 2011 and Q1 2012 (Figure 27). Q1 2012 saw the CAD widen to USD 2.9 billion (1.3 percent of GDP) from USD 1.6 billion (0.7 percent of GDP) in Q4 2011. As a ratio to GDP the current account deficit is only around half the average deficit prior to the Asian financial crisis. The widening in the CAD was driven by a sharp fall in the goods trade surplus to USD 3.5 billion, down from USD 6.4 billion in Q4 2011 and USD 9.4 billion in Q3 2011.
The narrowing has primarily been driven by weak non-oil and gas export volumes, consistent with slowing industrial production in major trading partners. By sector, mining and manufacturing exports have fallen, particularly to China. On the imports side, non-oil and gas imports have been rising due to increased demand for capital and intermediate goods as inputs to domestic investment. Imports of oil and gas have also been rising, reflecting strong consumption and industrial activity. Meanwhile the services deficit has been trending wider in recent years as demand for freight services has
5 Previously referred to as Workers’ Remittances, this category was amended in the IMF Balance of
Payments and International Investment Position Manual, 6th edition (2007) to reflect all transfers between residents and non-residents, regardless of the source of income or the relationship between the households.
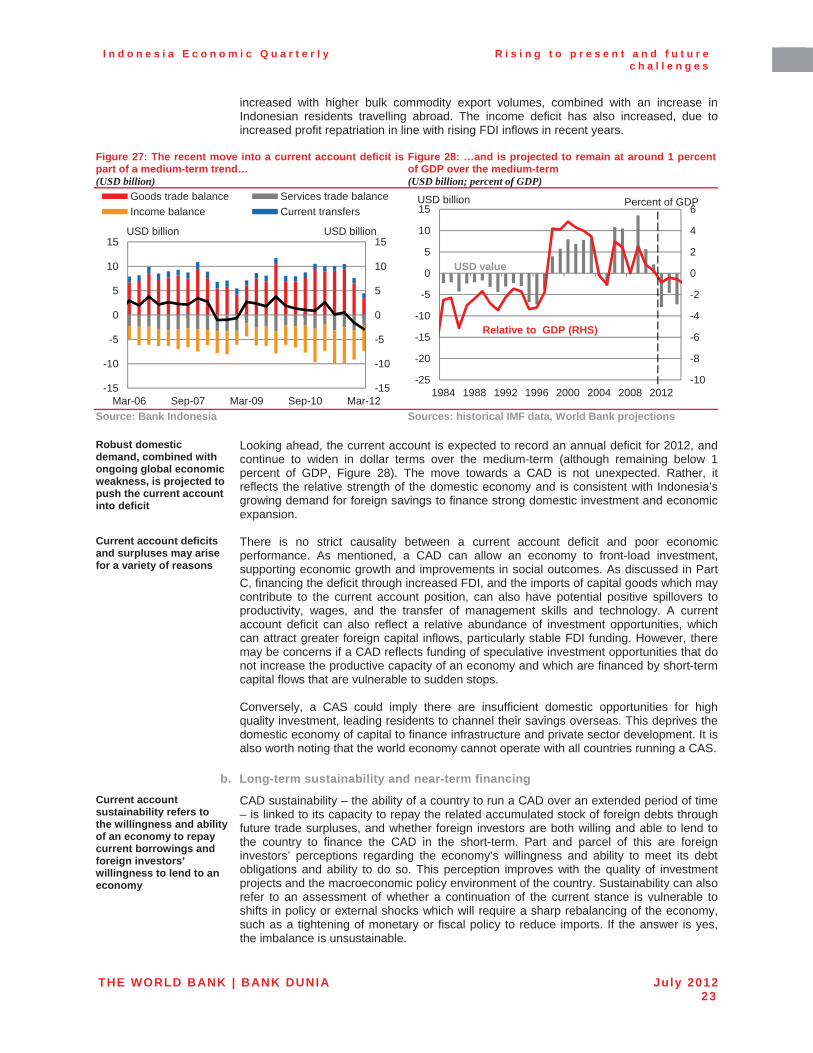
I n d o n e s i a E c o n o m i c Q u a r t e r l y R i s i n g t o p r e s e n t a n d f u t u r e c h a l l e n g e s
THE WORLD BANK | BANK DUNIA July 201223
increased with higher bulk commodity export volumes, combined with an increase in Indonesian residents travelling abroad. The income deficit has also increased, due to increased profit repatriation in line with rising FDI inflows in recent years.
Figure 27: The recent move into a current account deficit is part of a medium-term trend… (USD billion)
Figure 28: …and is projected to remain at around 1 percent of GDP over the medium-term (USD billion; percent of GDP)
Source: Bank Indonesia Sources: historical IMF data, World Bank projections
Robust domestic demand, combined with ongoing global economic weakness, is projected to push the current account into deficit
Looking ahead, the current account is expected to record an annual deficit for 2012, and continue to widen in dollar terms over the medium-term (although remaining below 1 percent of GDP, Figure 28). The move towards a CAD is not unexpected. Rather, it reflects the relative strength of the domestic economy and is consistent with Indonesia’s growing demand for foreign savings to finance strong domestic investment and economic expansion.
Current account deficits and surpluses may arise for a variety of reasons
There is no strict causality between a current account deficit and poor economic performance. As mentioned, a CAD can allow an economy to front-load investment, supporting economic growth and improvements in social outcomes. As discussed in Part C, financing the deficit through increased FDI, and the imports of capital goods which may contribute to the current account position, can also have potential positive spillovers to productivity, wages, and the transfer of management skills and technology. A current account deficit can also reflect a relative abundance of investment opportunities, which can attract greater foreign capital inflows, particularly stable FDI funding. However, there may be concerns if a CAD reflects funding of speculative investment opportunities that do not increase the productive capacity of an economy and which are financed by short-term capital flows that are vulnerable to sudden stops.
Conversely, a CAS could imply there are insufficient domestic opportunities for high quality investment, leading residents to channel their savings overseas. This deprives the domestic economy of capital to finance infrastructure and private sector development. It is also worth noting that the world economy cannot operate with all countries running a CAS.
b. Long-term sustainability and near-term financing Current account sustainability refers to the willingness and ability of an economy to repay current borrowings and foreign investors’ willingness to lend to an economy
CAD sustainability – the ability of a country to run a CAD over an extended period of time – is linked to its capacity to repay the related accumulated stock of foreign debts through future trade surpluses, and whether foreign investors are both willing and able to lend to the country to finance the CAD in the short-term. Part and parcel of this are foreign investors’ perceptions regarding the economy’s willingness and ability to meet its debt obligations and ability to do so. This perception improves with the quality of investment projects and the macroeconomic policy environment of the country. Sustainability can also refer to an assessment of whether a continuation of the current stance is vulnerable to shifts in policy or external shocks which will require a sharp rebalancing of the economy, such as a tightening of monetary or fiscal policy to reduce imports. If the answer is yes, the imbalance is unsustainable.
-15
-10
-5
0
5
10
15
-15
-10
-5
0
5
10
15
Mar-06 Sep-07 Mar-09 Sep-10 Mar-12
Goods trade balance Services trade balanceIncome balance Current transfers
USD billion USD billion
-10
-8
-6
-4
-2
0
2
4
6
-25
-20
-15
-10
-5
0
5
10
15
1984 1988 1992 1996 2000 2004 2008 2012
USD value
Relative to GDP (RHS)
USD billion Percent of GDP
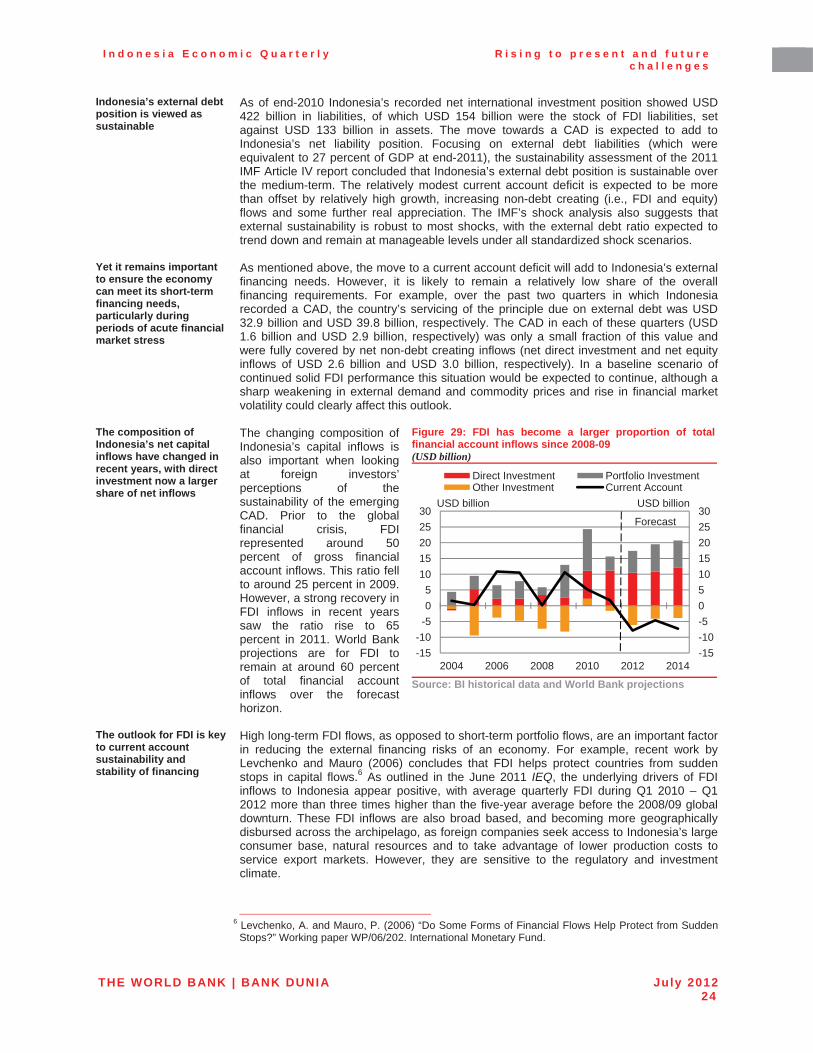
I n d o n e s i a E c o n o m i c Q u a r t e r l y R i s i n g t o p r e s e n t a n d f u t u r e c h a l l e n g e s
THE WORLD BANK | BANK DUNIA July 201224
Indonesia’s external debt position is viewed as sustainable
As of end-2010 Indonesia’s recorded net international investment position showed USD 422 billion in liabilities, of which USD 154 billion were the stock of FDI liabilities, set against USD 133 billion in assets. The move towards a CAD is expected to add to Indonesia’s net liability position. Focusing on external debt liabilities (which were equivalent to 27 percent of GDP at end-2011), the sustainability assessment of the 2011 IMF Article IV report concluded that Indonesia’s external debt position is sustainable over the medium-term. The relatively modest current account deficit is expected to be more than offset by relatively high growth, increasing non-debt creating (i.e., FDI and equity) flows and some further real appreciation. The IMF’s shock analysis also suggests that external sustainability is robust to most shocks, with the external debt ratio expected totrend down and remain at manageable levels under all standardized shock scenarios.
Yet it remains important to ensure the economy can meet its short-term financing needs, particularly during periods of acute financial market stress
As mentioned above, the move to a current account deficit will add to Indonesia’s external financing needs. However, it is likely to remain a relatively low share of the overall financing requirements. For example, over the past two quarters in which Indonesia recorded a CAD, the country’s servicing of the principle due on external debt was USD 32.9 billion and USD 39.8 billion, respectively. The CAD in each of these quarters (USD 1.6 billion and USD 2.9 billion, respectively) was only a small fraction of this value and were fully covered by net non-debt creating inflows (net direct investment and net equity inflows of USD 2.6 billion and USD 3.0 billion, respectively). In a baseline scenario of continued solid FDI performance this situation would be expected to continue, although a sharp weakening in external demand and commodity prices and rise in financial market volatility could clearly affect this outlook.
The composition of Indonesia’s net capital inflows have changed in recent years, with direct investment now a larger share of net inflows
The changing composition of Indonesia’s capital inflows is also important when looking at foreign investors’ perceptions of the sustainability of the emerging CAD. Prior to the global financial crisis, FDI represented around 50 percent of gross financial account inflows. This ratio fell to around 25 percent in 2009. However, a strong recovery in FDI inflows in recent years saw the ratio rise to 65 percent in 2011. World Bank projections are for FDI to remain at around 60 percent of total financial account inflows over the forecast horizon.
Figure 29: FDI has become a larger proportion of total financial account inflows since 2008-09 (USD billion)
Source: BI historical data and World Bank projections
The outlook for FDI is key to current account sustainability and stability of financing
High long-term FDI flows, as opposed to short-term portfolio flows, are an important factor in reducing the external financing risks of an economy. For example, recent work by Levchenko and Mauro (2006) concludes that FDI helps protect countries from sudden stops in capital flows.6 As outlined in the June 2011 IEQ, the underlying drivers of FDI inflows to Indonesia appear positive, with average quarterly FDI during Q1 2010 – Q1 2012 more than three times higher than the five-year average before the 2008/09 global downturn. These FDI inflows are also broad based, and becoming more geographically disbursed across the archipelago, as foreign companies seek access to Indonesia’s large consumer base, natural resources and to take advantage of lower production costs to service export markets. However, they are sensitive to the regulatory and investment climate.
6 Levchenko, A. and Mauro, P. (2006) “Do Some Forms of Financial Flows Help Protect from Sudden
Stops?” Working paper WP/06/202. International Monetary Fund.
-15-10-5051015202530
-15-10-505
1015202530
2004 2006 2008 2010 2012 2014
Direct Investment Portfolio InvestmentOther Investment Current Account
USD billion USD billion
Forecast
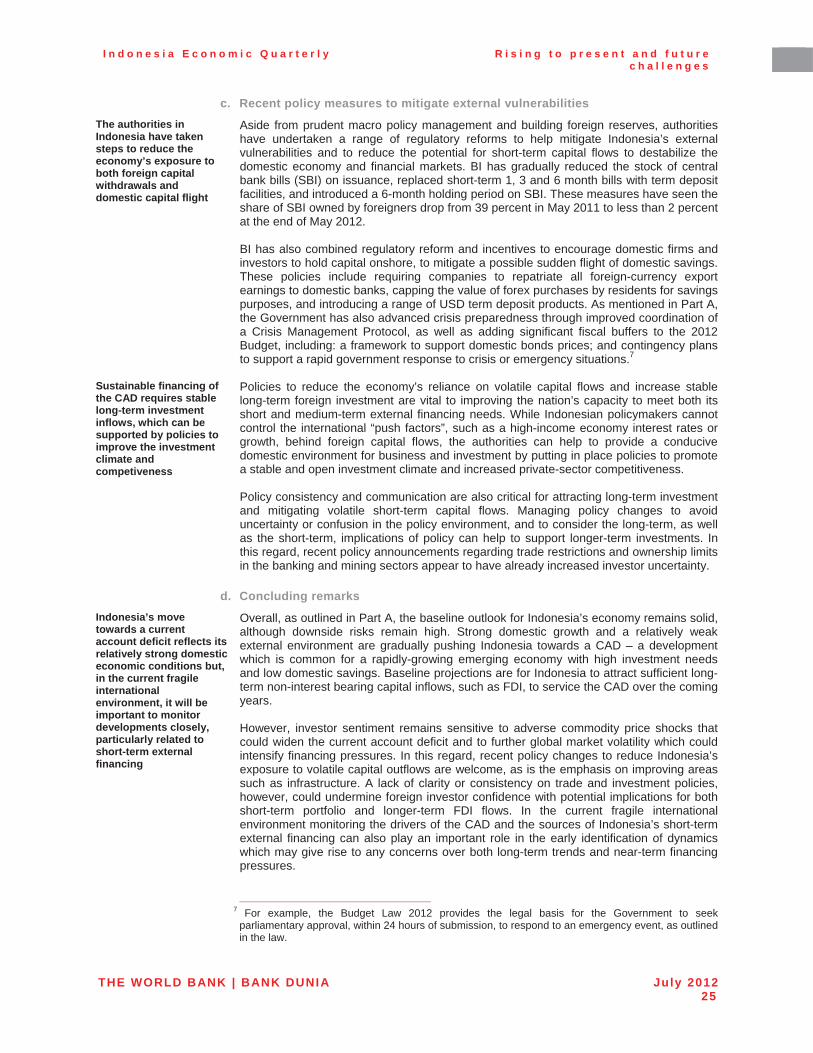
I n d o n e s i a E c o n o m i c Q u a r t e r l y R i s i n g t o p r e s e n t a n d f u t u r e c h a l l e n g e s
THE WORLD BANK | BANK DUNIA July 201225
c. Recent policy measures to mitigate external vulnerabilities The authorities in Indonesia have taken steps to reduce the economy’s exposure to both foreign capital withdrawals and domestic capital flight
Aside from prudent macro policy management and building foreign reserves, authorities have undertaken a range of regulatory reforms to help mitigate Indonesia’s external vulnerabilities and to reduce the potential for short-term capital flows to destabilize the domestic economy and financial markets. BI has gradually reduced the stock of central bank bills (SBI) on issuance, replaced short-term 1, 3 and 6 month bills with term deposit facilities, and introduced a 6-month holding period on SBI. These measures have seen the share of SBI owned by foreigners drop from 39 percent in May 2011 to less than 2 percent at the end of May 2012.
BI has also combined regulatory reform and incentives to encourage domestic firms and investors to hold capital onshore, to mitigate a possible sudden flight of domestic savings. These policies include requiring companies to repatriate all foreign-currency export earnings to domestic banks, capping the value of forex purchases by residents for savings purposes, and introducing a range of USD term deposit products. As mentioned in Part A, the Government has also advanced crisis preparedness through improved coordination of a Crisis Management Protocol, as well as adding significant fiscal buffers to the 2012 Budget, including: a framework to support domestic bonds prices; and contingency plans to support a rapid government response to crisis or emergency situations.7
Sustainable financing of the CAD requires stable long-term investment inflows, which can be supported by policies to improve the investment climate and competiveness
Policies to reduce the economy’s reliance on volatile capital flows and increase stable long-term foreign investment are vital to improving the nation’s capacity to meet both its short and medium-term external financing needs. While Indonesian policymakers cannot control the international “push factors”, such as a high-income economy interest rates or growth, behind foreign capital flows, the authorities can help to provide a conducive domestic environment for business and investment by putting in place policies to promotea stable and open investment climate and increased private-sector competitiveness.
Policy consistency and communication are also critical for attracting long-term investment and mitigating volatile short-term capital flows. Managing policy changes to avoid uncertainty or confusion in the policy environment, and to consider the long-term, as well as the short-term, implications of policy can help to support longer-term investments. In this regard, recent policy announcements regarding trade restrictions and ownership limits in the banking and mining sectors appear to have already increased investor uncertainty.
d. Concluding remarks Indonesia’s move towards a current account deficit reflects its relatively strong domestic economic conditions but, in the current fragile international environment, it will be important to monitor developments closely, particularly related to short-term external financing
Overall, as outlined in Part A, the baseline outlook for Indonesia’s economy remains solid, although downside risks remain high. Strong domestic growth and a relatively weak external environment are gradually pushing Indonesia towards a CAD – a development which is common for a rapidly-growing emerging economy with high investment needs and low domestic savings. Baseline projections are for Indonesia to attract sufficient long-term non-interest bearing capital inflows, such as FDI, to service the CAD over the coming years.
However, investor sentiment remains sensitive to adverse commodity price shocks that could widen the current account deficit and to further global market volatility which could intensify financing pressures. In this regard, recent policy changes to reduce Indonesia’s exposure to volatile capital outflows are welcome, as is the emphasis on improving areas such as infrastructure. A lack of clarity or consistency on trade and investment policies, however, could undermine foreign investor confidence with potential implications for both short-term portfolio and longer-term FDI flows. In the current fragile international environment monitoring the drivers of the CAD and the sources of Indonesia’s short-term external financing can also play an important role in the early identification of dynamics which may give rise to any concerns over both long-term trends and near-term financing pressures.
7 For example, the Budget Law 2012 provides the legal basis for the Government to seek
parliamentary approval, within 24 hours of submission, to respond to an emergency event, as outlined in the law.
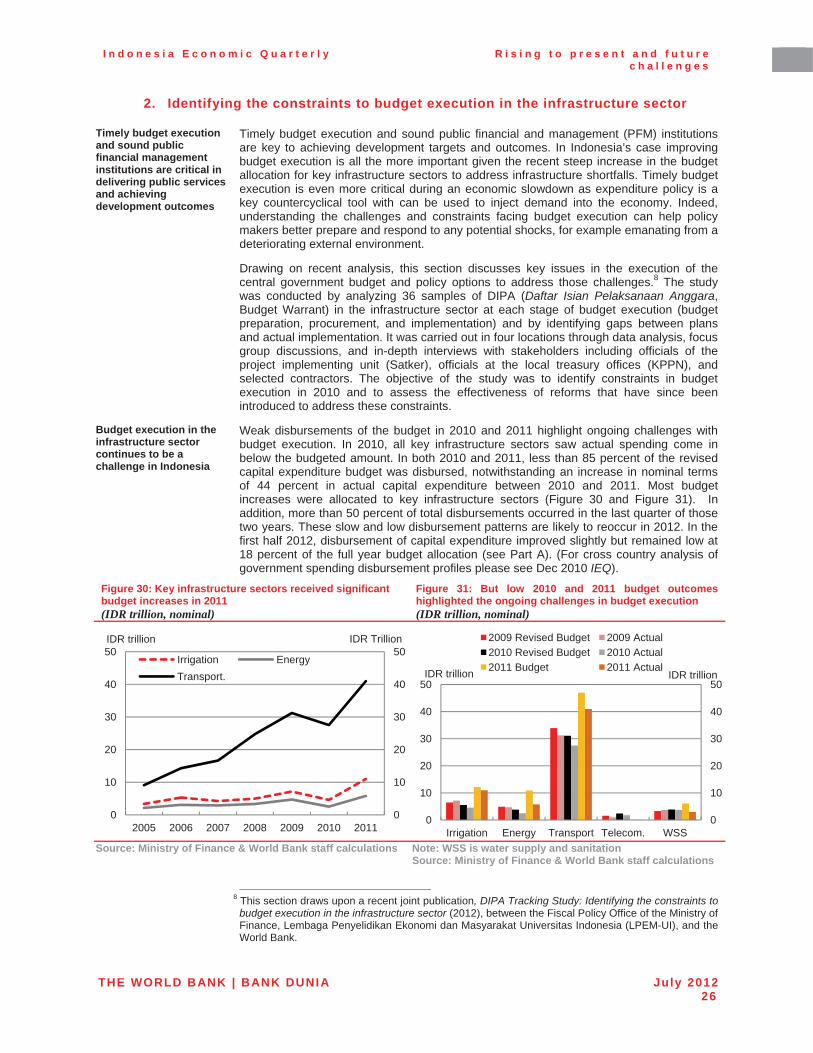
I n d o n e s i a E c o n o m i c Q u a r t e r l y R i s i n g t o p r e s e n t a n d f u t u r e c h a l l e n g e s
THE WORLD BANK | BANK DUNIA July 201226
2. Identifying the constraints to budget execution in the infrastructure sector
Timely budget execution and sound public financial management institutions are critical in delivering public services and achieving development outcomes
Timely budget execution and sound public financial and management (PFM) institutions are key to achieving development targets and outcomes. In Indonesia’s case improving budget execution is all the more important given the recent steep increase in the budget allocation for key infrastructure sectors to address infrastructure shortfalls. Timely budget execution is even more critical during an economic slowdown as expenditure policy is a key countercyclical tool with can be used to inject demand into the economy. Indeed, understanding the challenges and constraints facing budget execution can help policy makers better prepare and respond to any potential shocks, for example emanating from a deteriorating external environment.
Drawing on recent analysis, this section discusses key issues in the execution of the central government budget and policy options to address those challenges.8 The study was conducted by analyzing 36 samples of DIPA (Daftar Isian Pelaksanaan Anggara,Budget Warrant) in the infrastructure sector at each stage of budget execution (budget preparation, procurement, and implementation) and by identifying gaps between plans and actual implementation. It was carried out in four locations through data analysis, focus group discussions, and in-depth interviews with stakeholders including officials of the project implementing unit (Satker), officials at the local treasury offices (KPPN), and selected contractors. The objective of the study was to identify constraints in budget execution in 2010 and to assess the effectiveness of reforms that have since been introduced to address these constraints.
Budget execution in the infrastructure sector continues to be a challenge in Indonesia
Weak disbursements of the budget in 2010 and 2011 highlight ongoing challenges with budget execution. In 2010, all key infrastructure sectors saw actual spending come in below the budgeted amount. In both 2010 and 2011, less than 85 percent of the revised capital expenditure budget was disbursed, notwithstanding an increase in nominal terms of 44 percent in actual capital expenditure between 2010 and 2011. Most budget increases were allocated to key infrastructure sectors (Figure 30 and Figure 31). In addition, more than 50 percent of total disbursements occurred in the last quarter of those two years. These slow and low disbursement patterns are likely to reoccur in 2012. In the first half 2012, disbursement of capital expenditure improved slightly but remained low at 18 percent of the full year budget allocation (see Part A). (For cross country analysis of government spending disbursement profiles please see Dec 2010 IEQ).
Figure 30: Key infrastructure sectors received significant budget increases in 2011 (IDR trillion, nominal)
Figure 31: But low 2010 and 2011 budget outcomes highlighted the ongoing challenges in budget execution(IDR trillion, nominal)
Source: Ministry of Finance & World Bank staff calculations Note: WSS is water supply and sanitation Source: Ministry of Finance & World Bank staff calculations
8 This section draws upon a recent joint publication, DIPA Tracking Study: Identifying the constraints to
budget execution in the infrastructure sector (2012), between the Fiscal Policy Office of the Ministry of Finance, Lembaga Penyelidikan Ekonomi dan Masyarakat Universitas Indonesia (LPEM-UI), and the World Bank.
0
10
20
30
40
50
0
10
20
30
40
50
2005 2006 2007 2008 2009 2010 2011
IDR TrillionIDR trillion
Irrigation EnergyTransport.
0
10
20
30
40
50
0
10
20
30
40
50
Irrigation Energy Transport Telecom. WSS
IDR trillionIDR trillion
2009 Revised Budget 2009 Actual2010 Revised Budget 2010 Actual2011 Budget 2011 Actual
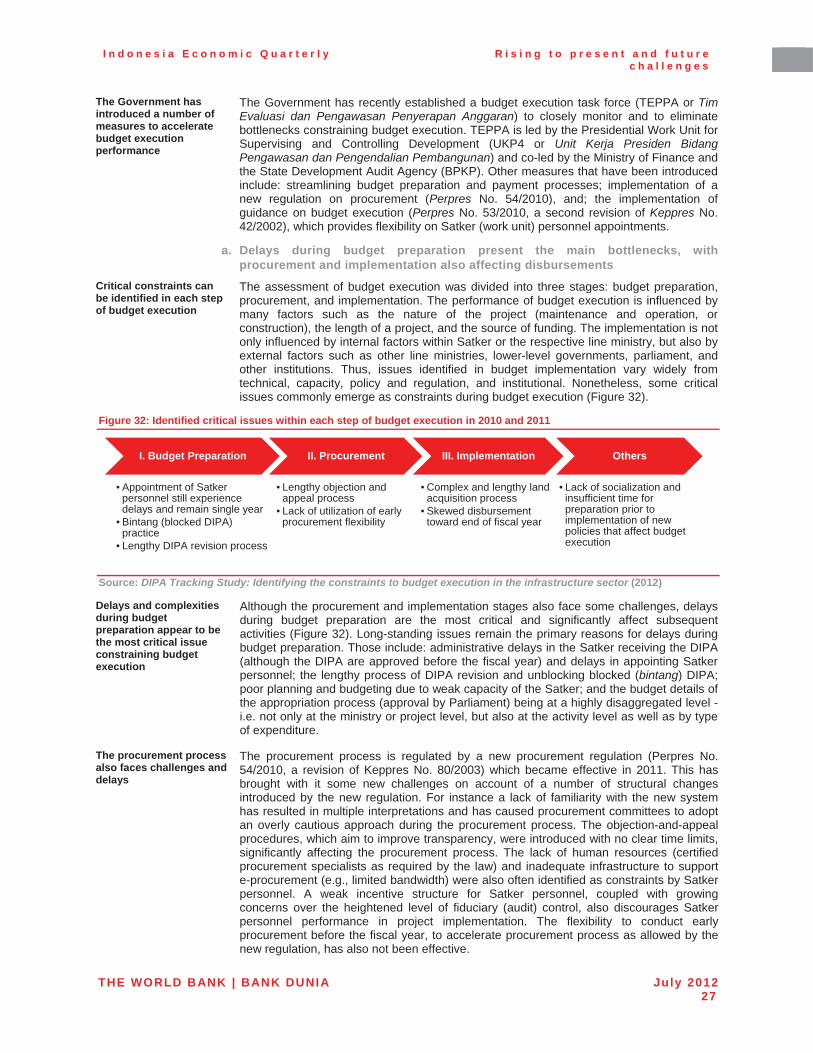
I n d o n e s i a E c o n o m i c Q u a r t e r l y R i s i n g t o p r e s e n t a n d f u t u r e c h a l l e n g e s
THE WORLD BANK | BANK DUNIA July 201227
The Government has introduced a number of measures to accelerate budget execution performance
The Government has recently established a budget execution task force (TEPPA or Tim Evaluasi dan Pengawasan Penyerapan Anggaran) to closely monitor and to eliminate bottlenecks constraining budget execution. TEPPA is led by the Presidential Work Unit for Supervising and Controlling Development (UKP4 or Unit Kerja Presiden Bidang Pengawasan dan Pengendalian Pembangunan) and co-led by the Ministry of Finance and the State Development Audit Agency (BPKP). Other measures that have been introduced include: streamlining budget preparation and payment processes; implementation of a new regulation on procurement (Perpres No. 54/2010), and; the implementation of guidance on budget execution (Perpres No. 53/2010, a second revision of Keppres No. 42/2002), which provides flexibility on Satker (work unit) personnel appointments.
a. Delays during budget preparation present the main bottlenecks, with procurement and implementation also affecting disbursements
Critical constraints can be identified in each step of budget execution
The assessment of budget execution was divided into three stages: budget preparation, procurement, and implementation. The performance of budget execution is influenced by many factors such as the nature of the project (maintenance and operation, or construction), the length of a project, and the source of funding. The implementation is not only influenced by internal factors within Satker or the respective line ministry, but also by external factors such as other line ministries, lower-level governments, parliament, and other institutions. Thus, issues identified in budget implementation vary widely from technical, capacity, policy and regulation, and institutional. Nonetheless, some critical issues commonly emerge as constraints during budget execution (Figure 32).
Figure 32: Identified critical issues within each step of budget execution in 2010 and 2011
Source: DIPA Tracking Study: Identifying the constraints to budget execution in the infrastructure sector (2012)
Delays and complexities during budget preparation appear to be the most critical issue constraining budget execution
Although the procurement and implementation stages also face some challenges, delays during budget preparation are the most critical and significantly affect subsequent activities (Figure 32). Long-standing issues remain the primary reasons for delays during budget preparation. Those include: administrative delays in the Satker receiving the DIPA (although the DIPA are approved before the fiscal year) and delays in appointing Satker personnel; the lengthy process of DIPA revision and unblocking blocked (bintang) DIPA; poor planning and budgeting due to weak capacity of the Satker; and the budget details of the appropriation process (approval by Parliament) being at a highly disaggregated level -i.e. not only at the ministry or project level, but also at the activity level as well as by type of expenditure.
The procurement process also faces challenges and delays
The procurement process is regulated by a new procurement regulation (Perpres No. 54/2010, a revision of Keppres No. 80/2003) which became effective in 2011. This has brought with it some new challenges on account of a number of structural changes introduced by the new regulation. For instance a lack of familiarity with the new system has resulted in multiple interpretations and has caused procurement committees to adopt an overly cautious approach during the procurement process. The objection-and-appeal procedures, which aim to improve transparency, were introduced with no clear time limits, significantly affecting the procurement process. The lack of human resources (certified procurement specialists as required by the law) and inadequate infrastructure to support e-procurement (e.g., limited bandwidth) were also often identified as constraints by Satker personnel. A weak incentive structure for Satker personnel, coupled with growing concerns over the heightened level of fiduciary (audit) control, also discourages Satker personnel performance in project implementation. The flexibility to conduct early procurement before the fiscal year, to accelerate procurement process as allowed by the new regulation, has also not been effective.
I. Budget Preparation
• Appointment of Satker personnel still experience delays and remain single year
• Bintang (blocked DIPA) practice
• Lengthy DIPA revision process
II. Procurement
• Lengthy objection and appeal process
• Lack of utilization of early procurement flexibility
III. Implementation
• Complex and lengthy land acquisition process
• Skewed disbursement toward end of fiscal year
Others
• Lack of socialization and insufficient time for preparation prior to implementation of new policies that affect budget execution
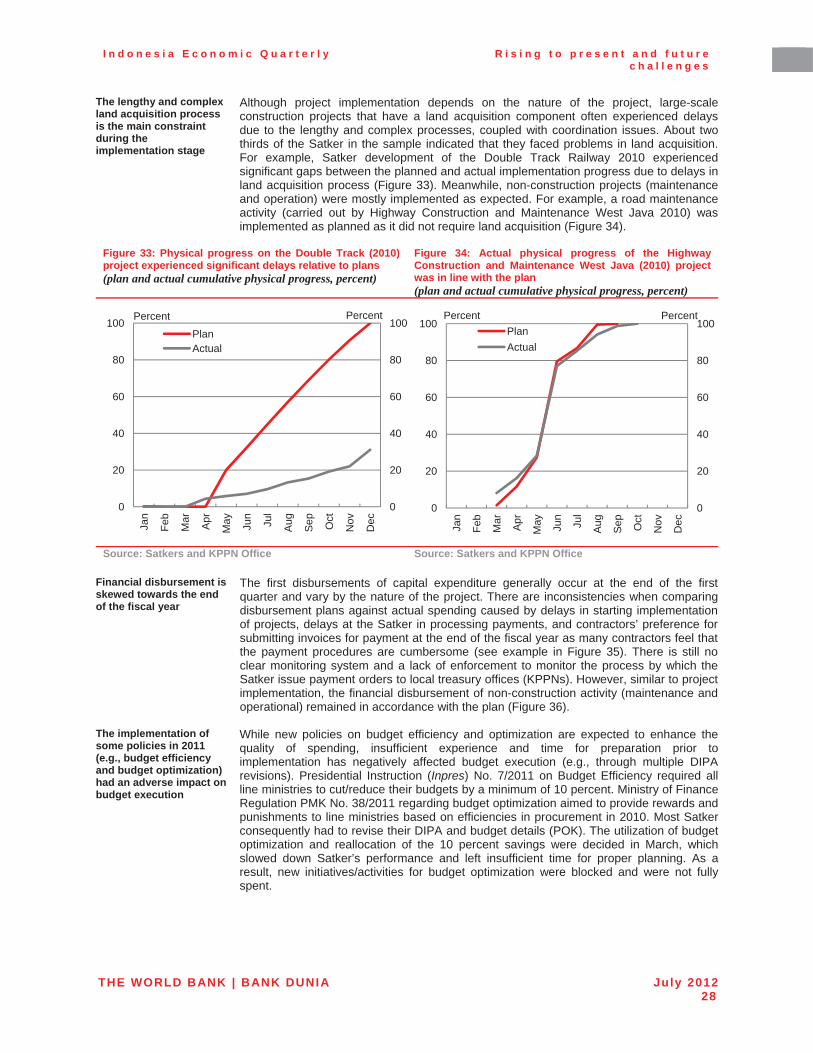
I n d o n e s i a E c o n o m i c Q u a r t e r l y R i s i n g t o p r e s e n t a n d f u t u r e c h a l l e n g e s
THE WORLD BANK | BANK DUNIA July 201228
The lengthy and complex land acquisition process is the main constraint during the implementation stage
Although project implementation depends on the nature of the project, large-scale construction projects that have a land acquisition component often experienced delays due to the lengthy and complex processes, coupled with coordination issues. About two thirds of the Satker in the sample indicated that they faced problems in land acquisition. For example, Satker development of the Double Track Railway 2010 experienced significant gaps between the planned and actual implementation progress due to delays in land acquisition process (Figure 33). Meanwhile, non-construction projects (maintenance and operation) were mostly implemented as expected. For example, a road maintenance activity (carried out by Highway Construction and Maintenance West Java 2010) was implemented as planned as it did not require land acquisition (Figure 34).
Figure 33: Physical progress on the Double Track (2010) project experienced significant delays relative to plans(plan and actual cumulative physical progress, percent)
Figure 34: Actual physical progress of the Highway Construction and Maintenance West Java (2010) project was in line with the plan (plan and actual cumulative physical progress, percent)
Source: Satkers and KPPN Office Source: Satkers and KPPN Office
Financial disbursement is skewed towards the end of the fiscal year
The first disbursements of capital expenditure generally occur at the end of the first quarter and vary by the nature of the project. There are inconsistencies when comparing disbursement plans against actual spending caused by delays in starting implementationof projects, delays at the Satker in processing payments, and contractors’ preference for submitting invoices for payment at the end of the fiscal year as many contractors feel that the payment procedures are cumbersome (see example in Figure 35). There is still no clear monitoring system and a lack of enforcement to monitor the process by which the Satker issue payment orders to local treasury offices (KPPNs). However, similar to project implementation, the financial disbursement of non-construction activity (maintenance and operational) remained in accordance with the plan (Figure 36).
The implementation of some policies in 2011 (e.g., budget efficiency and budget optimization) had an adverse impact on budget execution
While new policies on budget efficiency and optimization are expected to enhance the quality of spending, insufficient experience and time for preparation prior to implementation has negatively affected budget execution (e.g., through multiple DIPA revisions). Presidential Instruction (Inpres) No. 7/2011 on Budget Efficiency required all line ministries to cut/reduce their budgets by a minimum of 10 percent. Ministry of Finance Regulation PMK No. 38/2011 regarding budget optimization aimed to provide rewards and punishments to line ministries based on efficiencies in procurement in 2010. Most Satker consequently had to revise their DIPA and budget details (POK). The utilization of budget optimization and reallocation of the 10 percent savings were decided in March, which slowed down Satker’s performance and left insufficient time for proper planning. As a result, new initiatives/activities for budget optimization were blocked and were not fully spent.
0
20
40
60
80
100
0
20
40
60
80
100
Jan
Feb
Mar
Apr
May Jun
Jul
Aug
Sep Oct
Nov
Dec
PercentPercent
PlanActual
0
20
40
60
80
100
0
20
40
60
80
100
Jan
Feb
Mar
Apr
May Jun
Jul
Aug
Sep Oct
Nov
Dec
PercentPercentPlanActual
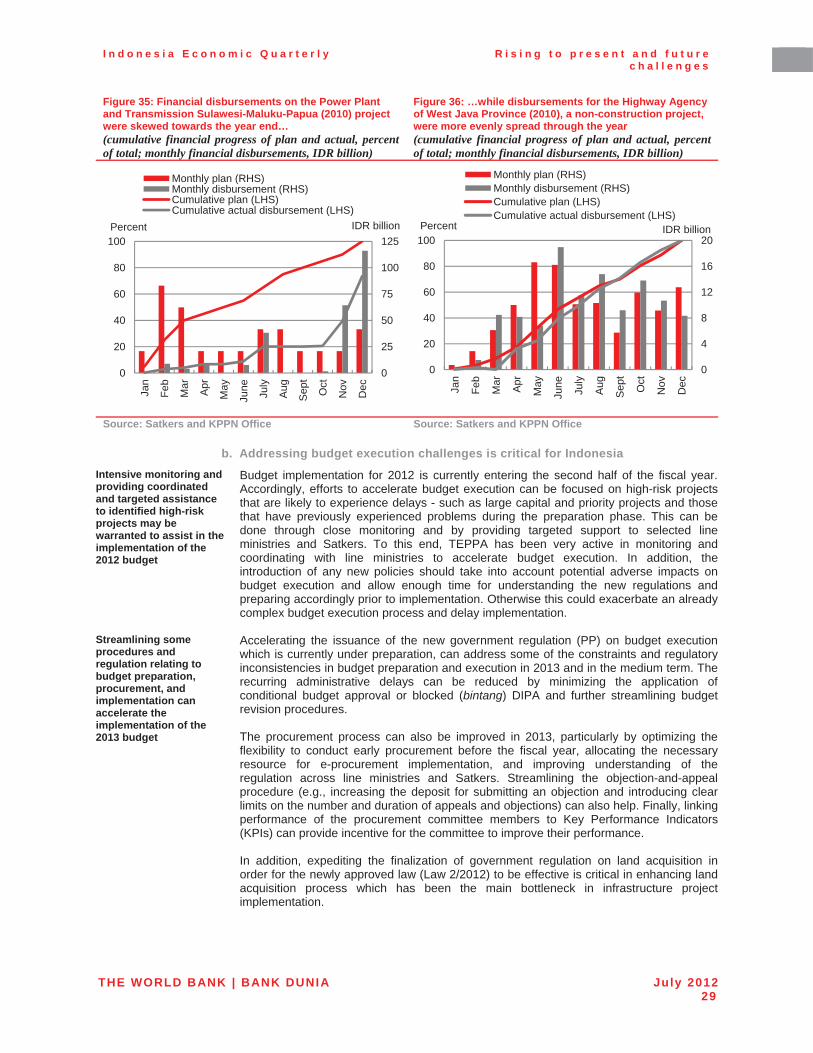
I n d o n e s i a E c o n o m i c Q u a r t e r l y R i s i n g t o p r e s e n t a n d f u t u r e c h a l l e n g e s
THE WORLD BANK | BANK DUNIA July 201229
Figure 35: Financial disbursements on the Power Plant and Transmission Sulawesi-Maluku-Papua (2010) project were skewed towards the year end… (cumulative financial progress of plan and actual, percent of total; monthly financial disbursements, IDR billion)
Figure 36: …while disbursements for the Highway Agency of West Java Province (2010), a non-construction project, were more evenly spread through the year (cumulative financial progress of plan and actual, percent of total; monthly financial disbursements, IDR billion)
Source: Satkers and KPPN Office Source: Satkers and KPPN Office
b. Addressing budget execution challenges is critical for Indonesia Intensive monitoring and providing coordinated and targeted assistance to identified high-risk projects may be warranted to assist in the implementation of the 2012 budget
Budget implementation for 2012 is currently entering the second half of the fiscal year. Accordingly, efforts to accelerate budget execution can be focused on high-risk projects that are likely to experience delays - such as large capital and priority projects and those that have previously experienced problems during the preparation phase. This can be done through close monitoring and by providing targeted support to selected line ministries and Satkers. To this end, TEPPA has been very active in monitoring and coordinating with line ministries to accelerate budget execution. In addition, the introduction of any new policies should take into account potential adverse impacts on budget execution and allow enough time for understanding the new regulations and preparing accordingly prior to implementation. Otherwise this could exacerbate an already complex budget execution process and delay implementation.
Streamlining some procedures and regulation relating to budget preparation, procurement, and implementation can accelerate the implementation of the 2013 budget
Accelerating the issuance of the new government regulation (PP) on budget execution which is currently under preparation, can address some of the constraints and regulatory inconsistencies in budget preparation and execution in 2013 and in the medium term. The recurring administrative delays can be reduced by minimizing the application of conditional budget approval or blocked (bintang) DIPA and further streamlining budget revision procedures.
The procurement process can also be improved in 2013, particularly by optimizing the flexibility to conduct early procurement before the fiscal year, allocating the necessary resource for e-procurement implementation, and improving understanding of the regulation across line ministries and Satkers. Streamlining the objection-and-appeal procedure (e.g., increasing the deposit for submitting an objection and introducing clear limits on the number and duration of appeals and objections) can also help. Finally, linking performance of the procurement committee members to Key Performance Indicators(KPIs) can provide incentive for the committee to improve their performance.
In addition, expediting the finalization of government regulation on land acquisition in order for the newly approved law (Law 2/2012) to be effective is critical in enhancing land acquisition process which has been the main bottleneck in infrastructure project implementation.
0
25
50
75
100
125
0
20
40
60
80
100
Jan
Feb
Mar
Apr
May
June July
Aug
Sep
t
Oct
Nov
Dec
IDR billionPercent
Monthly plan (RHS)Monthly disbursement (RHS)Cumulative plan (LHS)Cumulative actual disbursement (LHS)
0
4
8
12
16
20
0
20
40
60
80
100
Jan
Feb
Mar Apr
May
June July
Aug
Sep
t
Oct
Nov
Dec
IDR billionPercent
Monthly plan (RHS)Monthly disbursement (RHS)Cumulative plan (LHS)Cumulative actual disbursement (LHS)

I n d o n e s i a E c o n o m i c Q u a r t e r l y R i s i n g t o p r e s e n t a n d f u t u r e c h a l l e n g e s
THE WORLD BANK | BANK DUNIA July 201230
In the medium term, efforts to accelerate budget execution should be part of broader Public Financial Management (PFM) reforms
In the medium term, efforts to improve budget execution should be closely aligned with the ongoing broader PFM reforms including the implementation of Performance Based Budget (PBB) and Medium Term Expenditure Framework (MTEF). To this end, one of the important elements is providing increasing authority to line ministries (Echelon 1 officials) to deal with DIPA revisions within the activity level. This can speed up budget preparationand implementation through strengthened ex-post control and audit. Therefore, current detailed input-based budget appropriation by Parliament is no longer in line with the current reforms towards performance-based budgeting, suggesting that budget appropriation (approval by parliament) should be at a more aggregated level. In addition, efforts should be made to gradually discontinue the practice of using blocked DIPA (bintang) or conditional budget approval.
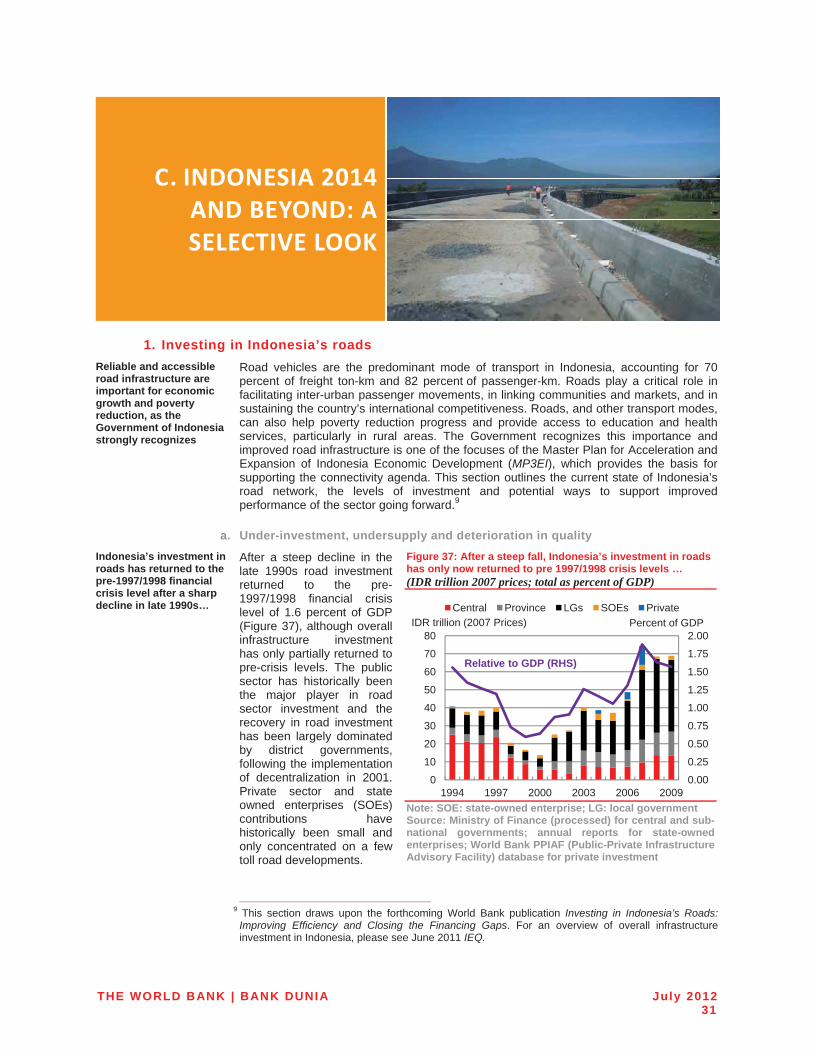
THE WORLD BANK | BANK DUNIA July 201231
C. INDONESIA�2014�AND�BEYOND:�A�SELECTIVE�LOOK�
1. Investing in Indonesia’s roads Reliable and accessible road infrastructure are important for economic growth and poverty reduction, as the Government of Indonesia strongly recognizes
Road vehicles are the predominant mode of transport in Indonesia, accounting for 70 percent of freight ton-km and 82 percent of passenger-km. Roads play a critical role in facilitating inter-urban passenger movements, in linking communities and markets, and in sustaining the country’s international competitiveness. Roads, and other transport modes, can also help poverty reduction progress and provide access to education and health services, particularly in rural areas. The Government recognizes this importance and improved road infrastructure is one of the focuses of the Master Plan for Acceleration and Expansion of Indonesia Economic Development (MP3EI), which provides the basis for supporting the connectivity agenda. This section outlines the current state of Indonesia’s road network, the levels of investment and potential ways to support improved performance of the sector going forward.9
a. Under-investment, undersupply and deterioration in quality Indonesia’s investment in roads has returned to the pre-1997/1998 financial crisis level after a sharp decline in late 1990s…
After a steep decline in the late 1990s road investment returned to the pre-1997/1998 financial crisis level of 1.6 percent of GDP (Figure 37), although overall infrastructure investment has only partially returned to pre-crisis levels. The public sector has historically been the major player in road sector investment and the recovery in road investment has been largely dominated by district governments, following the implementation of decentralization in 2001. Private sector and state owned enterprises (SOEs) contributions have historically been small and only concentrated on a few toll road developments.
Figure 37: After a steep fall, Indonesia’s investment in roads has only now returned to pre 1997/1998 crisis levels … (IDR trillion 2007 prices; total as percent of GDP)
Note: SOE: state-owned enterprise; LG: local government Source: Ministry of Finance (processed) for central and sub-national governments; annual reports for state-owned enterprises; World Bank PPIAF (Public-Private Infrastructure Advisory Facility) database for private investment
9 This section draws upon the forthcoming World Bank publication Investing in Indonesia’s Roads:
Improving Efficiency and Closing the Financing Gaps. For an overview of overall infrastructure investment in Indonesia, please see June 2011 IEQ.
0.00
0.25
0.50
0.75
1.00
1.25
1.50
1.75
2.00
0
10
20
30
40
50
60
70
80
1994 1997 2000 2003 2006 2009
IDR trillion (2007 Prices)Central Province LGs SOEs Private
Relative to GDP (RHS)
Percent of GDP
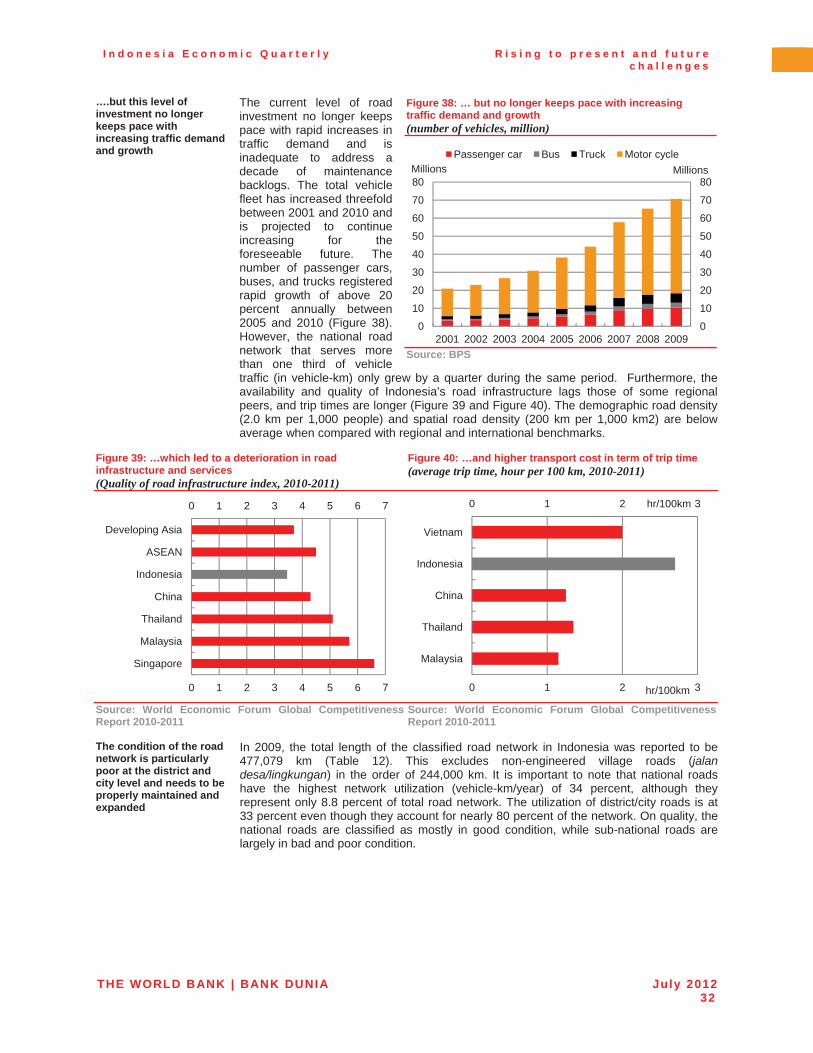
I n d o n e s i a E c o n o m i c Q u a r t e r l y R i s i n g t o p r e s e n t a n d f u t u r e c h a l l e n g e s
THE WORLD BANK | BANK DUNIA July 201232
….but this level of investment no longer keeps pace with increasing traffic demand and growth
The current level of road investment no longer keeps pace with rapid increases in traffic demand and is inadequate to address a decade of maintenance backlogs. The total vehicle fleet has increased threefold between 2001 and 2010 and is projected to continue increasing for the foreseeable future. The number of passenger cars, buses, and trucks registered rapid growth of above 20 percent annually between 2005 and 2010 (Figure 38). However, the national road network that serves more than one third of vehicle traffic (in vehicle-km) only grew by a quarter during the same period. Furthermore, the availability and quality of Indonesia’s road infrastructure lags those of some regional peers, and trip times are longer (Figure 39 and Figure 40). The demographic road density (2.0 km per 1,000 people) and spatial road density (200 km per 1,000 km2) are below average when compared with regional and international benchmarks.
Figure 38: … but no longer keeps pace with increasing traffic demand and growth (number of vehicles, million)
Source: BPS
Figure 39: …which led to a deterioration in road infrastructure and services (Quality of road infrastructure index, 2010-2011)
Figure 40: …and higher transport cost in term of trip time (average trip time, hour per 100 km, 2010-2011)
Source: World Economic Forum Global Competitiveness Report 2010-2011
Source: World Economic Forum Global Competitiveness Report 2010-2011
The condition of the road network is particularly poor at the district and city level and needs to be properly maintained and expanded
In 2009, the total length of the classified road network in Indonesia was reported to be 477,079 km (Table 12). This excludes non-engineered village roads (jalan desa/lingkungan) in the order of 244,000 km. It is important to note that national roads have the highest network utilization (vehicle-km/year) of 34 percent, although they represent only 8.8 percent of total road network. The utilization of district/city roads is at 33 percent even though they account for nearly 80 percent of the network. On quality, the national roads are classified as mostly in good condition, while sub-national roads are largely in bad and poor condition.
0 1 2 3 4 5 6 7
0 1 2 3 4 5 6 7
Singapore
Malaysia
Thailand
China
Indonesia
ASEAN
Developing Asia
0 1 2 3
0 1 2 3
Malaysia
Thailand
China
Indonesia
Vietnam
hr/100km
hr/100km
0
10
20
30
40
50
60
70
80
0
10
20
30
40
50
60
70
80
2001 2002 2003 2004 2005 2006 2007 2008 2009
MillionsMillionsPassenger car Bus Truck Motor cycle
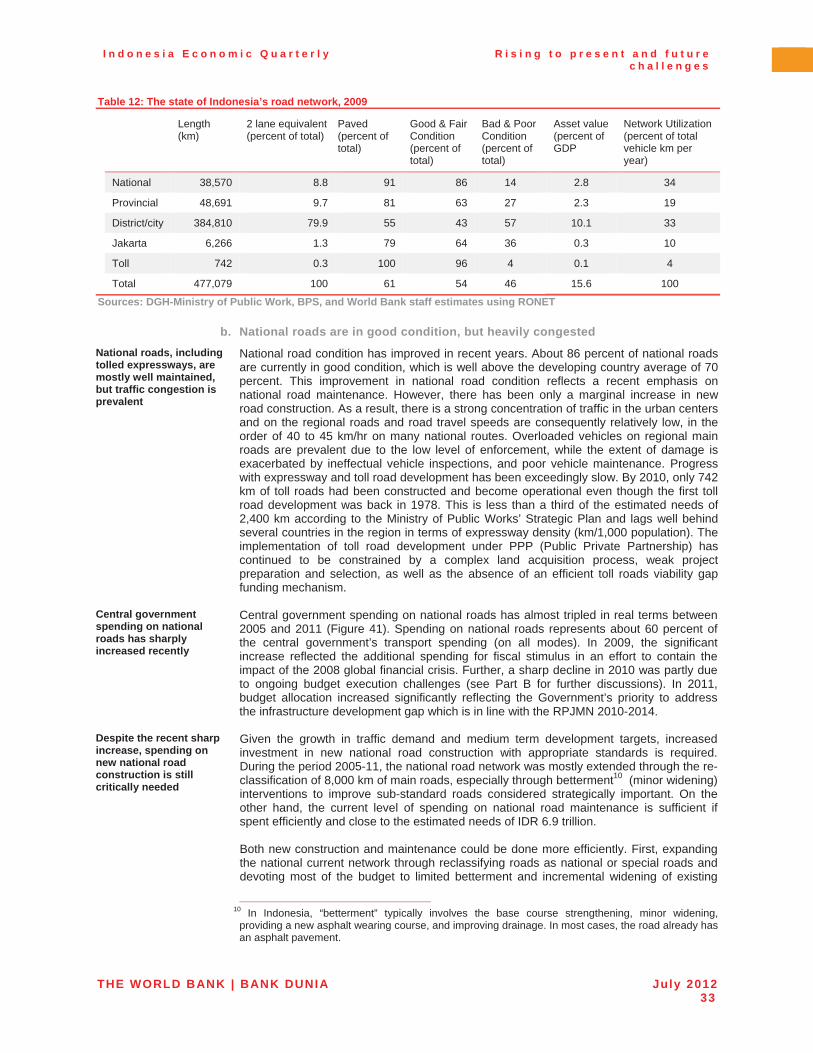
I n d o n e s i a E c o n o m i c Q u a r t e r l y R i s i n g t o p r e s e n t a n d f u t u r e c h a l l e n g e s
THE WORLD BANK | BANK DUNIA July 201233
Table 12: The state of Indonesia’s road network, 2009
Length(km)
2 lane equivalent (percent of total)
Paved(percent of total)
Good & Fair Condition(percent of total)
Bad & Poor Condition(percent of total)
Asset value (percent of GDP
Network Utilization (percent of total vehicle km per year)
National 38,570 8.8 91 86 14 2.8 34
Provincial 48,691 9.7 81 63 27 2.3 19
District/city 384,810 79.9 55 43 57 10.1 33
Jakarta 6,266 1.3 79 64 36 0.3 10
Toll 742 0.3 100 96 4 0.1 4
Total 477,079 100 61 54 46 15.6 100
Sources: DGH-Ministry of Public Work, BPS, and World Bank staff estimates using RONET
b. National roads are in good condition, but heavily congested National roads, including tolled expressways, are mostly well maintained, but traffic congestion is prevalent
National road condition has improved in recent years. About 86 percent of national roads are currently in good condition, which is well above the developing country average of 70 percent. This improvement in national road condition reflects a recent emphasis on national road maintenance. However, there has been only a marginal increase in new road construction. As a result, there is a strong concentration of traffic in the urban centers and on the regional roads and road travel speeds are consequently relatively low, in the order of 40 to 45 km/hr on many national routes. Overloaded vehicles on regional main roads are prevalent due to the low level of enforcement, while the extent of damage is exacerbated by ineffectual vehicle inspections, and poor vehicle maintenance. Progress with expressway and toll road development has been exceedingly slow. By 2010, only 742 km of toll roads had been constructed and become operational even though the first toll road development was back in 1978. This is less than a third of the estimated needs of 2,400 km according to the Ministry of Public Works’ Strategic Plan and lags well behind several countries in the region in terms of expressway density (km/1,000 population). Theimplementation of toll road development under PPP (Public Private Partnership) has continued to be constrained by a complex land acquisition process, weak project preparation and selection, as well as the absence of an efficient toll roads viability gap funding mechanism.
Central government spending on national roads has sharply increased recently
Central government spending on national roads has almost tripled in real terms between 2005 and 2011 (Figure 41). Spending on national roads represents about 60 percent of the central government’s transport spending (on all modes). In 2009, the significant increase reflected the additional spending for fiscal stimulus in an effort to contain the impact of the 2008 global financial crisis. Further, a sharp decline in 2010 was partly due to ongoing budget execution challenges (see Part B for further discussions). In 2011, budget allocation increased significantly reflecting the Government’s priority to address the infrastructure development gap which is in line with the RPJMN 2010-2014.
Despite the recent sharp increase, spending on new national road construction is still critically needed
Given the growth in traffic demand and medium term development targets, increased investment in new national road construction with appropriate standards is required.During the period 2005-11, the national road network was mostly extended through the re-classification of 8,000 km of main roads, especially through betterment10 (minor widening) interventions to improve sub-standard roads considered strategically important. On the other hand, the current level of spending on national road maintenance is sufficient if spent efficiently and close to the estimated needs of IDR 6.9 trillion.
Both new construction and maintenance could be done more efficiently. First, expanding the national current network through reclassifying roads as national or special roads and devoting most of the budget to limited betterment and incremental widening of existing
10 In Indonesia, “betterment” typically involves the base course strengthening, minor widening,
providing a new asphalt wearing course, and improving drainage. In most cases, the road already has an asphalt pavement.
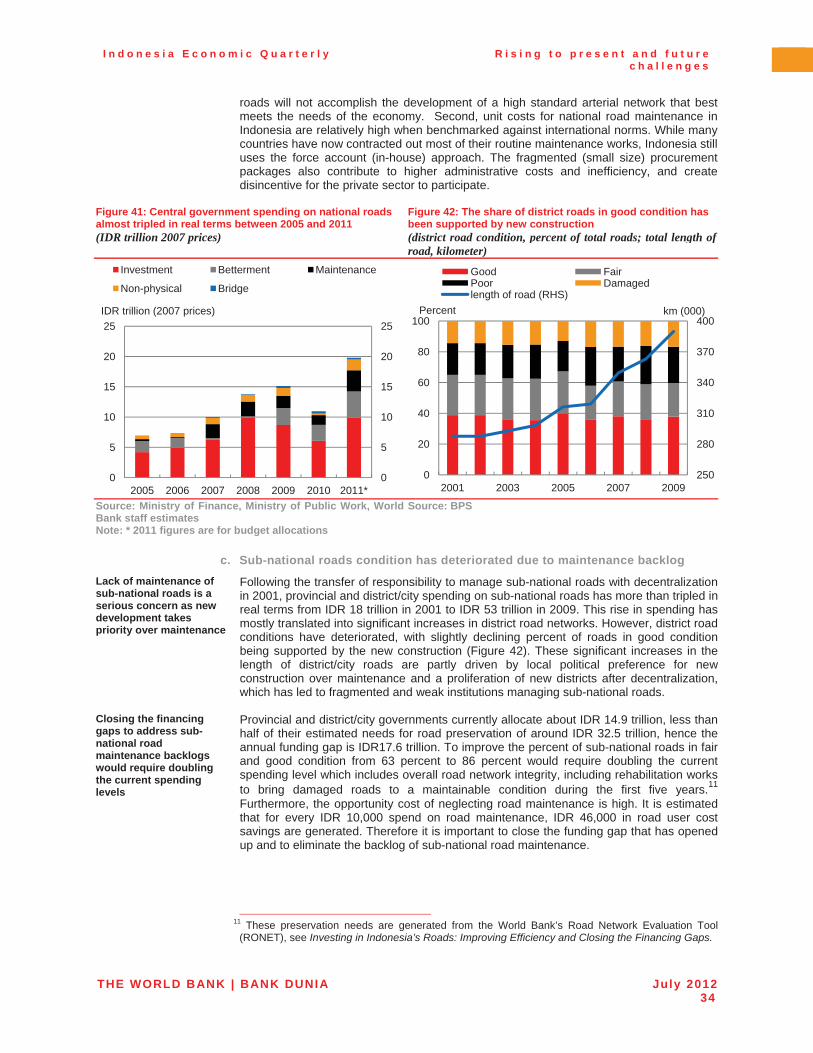
I n d o n e s i a E c o n o m i c Q u a r t e r l y R i s i n g t o p r e s e n t a n d f u t u r e c h a l l e n g e s
THE WORLD BANK | BANK DUNIA July 201234
roads will not accomplish the development of a high standard arterial network that best meets the needs of the economy. Second, unit costs for national road maintenance in Indonesia are relatively high when benchmarked against international norms. While many countries have now contracted out most of their routine maintenance works, Indonesia still uses the force account (in-house) approach. The fragmented (small size) procurement packages also contribute to higher administrative costs and inefficiency, and create disincentive for the private sector to participate.
Figure 41: Central government spending on national roads almost tripled in real terms between 2005 and 2011 (IDR trillion 2007 prices)
Figure 42: The share of district roads in good condition has been supported by new construction (district road condition, percent of total roads; total length ofroad, kilometer)
Source: Ministry of Finance, Ministry of Public Work, World Bank staff estimates Note: * 2011 figures are for budget allocations
Source: BPS
c. Sub-national roads condition has deteriorated due to maintenance backlog Lack of maintenance of sub-national roads is a serious concern as new development takes priority over maintenance
Following the transfer of responsibility to manage sub-national roads with decentralization in 2001, provincial and district/city spending on sub-national roads has more than tripled in real terms from IDR 18 trillion in 2001 to IDR 53 trillion in 2009. This rise in spending has mostly translated into significant increases in district road networks. However, district road conditions have deteriorated, with slightly declining percent of roads in good condition being supported by the new construction (Figure 42). These significant increases in the length of district/city roads are partly driven by local political preference for new construction over maintenance and a proliferation of new districts after decentralization, which has led to fragmented and weak institutions managing sub-national roads.
Closing the financing gaps to address sub-national road maintenance backlogs would require doubling the current spending levels
Provincial and district/city governments currently allocate about IDR 14.9 trillion, less than half of their estimated needs for road preservation of around IDR 32.5 trillion, hence the annual funding gap is IDR17.6 trillion. To improve the percent of sub-national roads in fair and good condition from 63 percent to 86 percent would require doubling the current spending level which includes overall road network integrity, including rehabilitation works to bring damaged roads to a maintainable condition during the first five years.11
Furthermore, the opportunity cost of neglecting road maintenance is high. It is estimated that for every IDR 10,000 spend on road maintenance, IDR 46,000 in road user cost savings are generated. Therefore it is important to close the funding gap that has opened up and to eliminate the backlog of sub-national road maintenance.
11 These preservation needs are generated from the World Bank’s Road Network Evaluation Tool
(RONET), see Investing in Indonesia’s Roads: Improving Efficiency and Closing the Financing Gaps.
0
5
10
15
20
25
0
5
10
15
20
25
2005 2006 2007 2008 2009 2010 2011*
IDR trillion (2007 prices)
Investment Betterment Maintenance
Non-physical Bridge
250
280
310
340
370
400
0
20
40
60
80
100
2001 2003 2005 2007 2009
km (000)Percent
Good FairPoor Damagedlength of road (RHS)
I n d o n e s i a E c o n o m i c Q u a r t e r l y R i s i n g t o p r e s e n t a n d f u t u r e c h a l l e n g e s
THE WORLD BANK | BANK DUNIA July 201235
d. Towards improved roads infrastructure performance The capacity of the national road network should be expanded only by following appropriate road capacity standards
The current policy of expanding the national network through reclassifying provincial roads as national or special roads and devoting most of the budget to limited betterment and incremental widening of existing roads is not optimal and will not accomplish the development of a high standard arterial network that will best meet the needs of the economy. The long term need for national road development is road expansion to 4-lane divided standard and a separate integral expressway network where appropriate.
The efficiency of national road maintenance can be improved by phasing out force accounts and gradually moving towards performance based contacts, and increasing the average size of procurement packages,
Phasing out force account and moving towards performance-based contracts (PBC), could further improve efficiency through competition. 12 A successful approach in other countries has been to encourage force account units to become small contracting firms. Initially such firms are given special support and are guaranteed work for the first few years, but eventually they have to become fully competitive contractors. Some of these firms continue to expand and eventually can handle large-scale projects. Extending road preservation activities from annual to multi-year programs and increasing the average size of road maintenance procurement packages could reduce administrative cost and improve efficiency as well as create incentives for the private sector to participate.
Given the urgency to address congestion and the slow progress with Public Private Partnerships (PPPs) implementation, the Government may need to step up public investment while addressing constraints to PPPs
To accelerate highways development as outlined in the Ministry of Public Works’ strategic plan, the Government may need to step in and increase public investment in highways, particularly in low traffic volume sections and outside Java routes. At the same time, addressing factors that constrain PPP implementation is also critical. Improving PPP project selection and preparation by involving key related institutions (such as the Ministry of Finance) and providing adequate fiscal support through a viability gap assessment is critical for successful implementation. Focusing on the most strategic and viable PPP projects and getting them transacted can be a powerful way to demonstrate government commitment to PPP implementation (for a further discussion on PPPs please see the October 2011 IEQ).
To address district/city road maintenance backlogs, a new institutional and funding mechanism is proposed
Higher priority should be given to resolving the district/city roads maintenance backlog and fragmented and weak institutional capacity. One possible option is to integratedistrict/city road planning and management at the provincial level to increase regional coordination and benefits from economies of scale, and to address the technical and managerial capacity issue without undermining local decision-making authority. Districts could delegate the management of all or part of their road networks using a contract management approach. The funding for this maintenance could potentially be secured through earmarking of the road-related user charges (RUCs), which include the annual vehicle license fees (PKB), vehicle transaction/transfer fees (BBNKB) and the fuel levy (PBBKB). Should these RUCs be allocated entirely to maintenance, it is estimated that about 90 percent of the maintenance needs can be met. Earmarking may have its own challenges such as reducing budget flexibility, but in this case, there is an argument to be made that the benefit incidence principle applies more and those who benefit from the roads should pay more for its maintenance.
12 In a traditional contract, the contractors are paid for the amount of work completed. Under a
performance-based contract, the contractor works on a lump sum basis, usually receiving annual payments for meeting contractually binding performance requirements. International experience shows that PBCs can deliver higher quality results, often for a lower price.
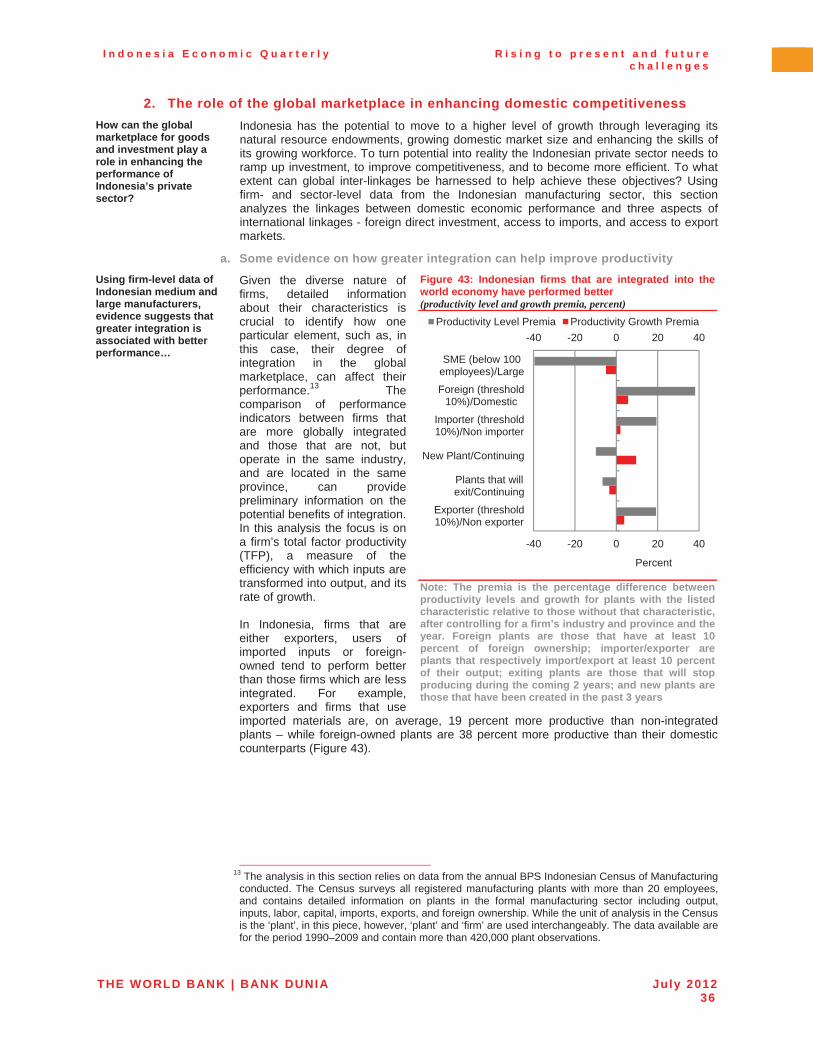
I n d o n e s i a E c o n o m i c Q u a r t e r l y R i s i n g t o p r e s e n t a n d f u t u r e c h a l l e n g e s
THE WORLD BANK | BANK DUNIA July 201236
2. The role of the global marketplace in enhancing domestic competitiveness How can the global marketplace for goods and investment play a role in enhancing the performance of Indonesia’s private sector?
Indonesia has the potential to move to a higher level of growth through leveraging its natural resource endowments, growing domestic market size and enhancing the skills of its growing workforce. To turn potential into reality the Indonesian private sector needs to ramp up investment, to improve competitiveness, and to become more efficient. To what extent can global inter-linkages be harnessed to help achieve these objectives? Using firm- and sector-level data from the Indonesian manufacturing sector, this section analyzes the linkages between domestic economic performance and three aspects of international linkages - foreign direct investment, access to imports, and access to export markets.
a. Some evidence on how greater integration can help improve productivity Using firm-level data of Indonesian medium and large manufacturers, evidence suggests that greater integration is associated with better performance…
Given the diverse nature of firms, detailed information about their characteristics is crucial to identify how one particular element, such as, in this case, their degree of integration in the global marketplace, can affect their performance.13 The comparison of performance indicators between firms that are more globally integrated and those that are not, but operate in the same industry, and are located in the same province, can provide preliminary information on the potential benefits of integration. In this analysis the focus is on a firm’s total factor productivity (TFP), a measure of the efficiency with which inputs are transformed into output, and its rate of growth.
In Indonesia, firms that are either exporters, users of imported inputs or foreign-owned tend to perform better than those firms which are less integrated. For example, exporters and firms that use imported materials are, on average, 19 percent more productive than non-integrated plants – while foreign-owned plants are 38 percent more productive than their domestic counterparts (Figure 43).
Figure 43: Indonesian firms that are integrated into the world economy have performed better (productivity level and growth premia, percent)
Note: The premia is the percentage difference between productivity levels and growth for plants with the listedcharacteristic relative to those without that characteristic, after controlling for a firm’s industry and province and the year. Foreign plants are those that have at least 10 percent of foreign ownership; importer/exporter are plants that respectively import/export at least 10 percent of their output; exiting plants are those that will stop producing during the coming 2 years; and new plants are those that have been created in the past 3 years
13 The analysis in this section relies on data from the annual BPS Indonesian Census of Manufacturing
conducted. The Census surveys all registered manufacturing plants with more than 20 employees, and contains detailed information on plants in the formal manufacturing sector including output, inputs, labor, capital, imports, exports, and foreign ownership. While the unit of analysis in the Census is the ‘plant’, in this piece, however, ‘plant’ and ‘firm’ are used interchangeably. The data available are for the period 1990–2009 and contain more than 420,000 plant observations.
-40 -20 0 20 40
-40 -20 0 20 40
Exporter (threshold 10%)/Non exporter
Plants that will exit/Continuing
New Plant/Continuing
Importer (threshold 10%)/Non importer
Foreign (threshold 10%)/Domestic
SME (below 100 employees)/Large
Productivity Level Premia Productivity Growth Premia
Percent
I n d o n e s i a E c o n o m i c Q u a r t e r l y R i s i n g t o p r e s e n t a n d f u t u r e c h a l l e n g e s
THE WORLD BANK | BANK DUNIA July 201237
…and improving performance over time
The relative out-performance of more integrated firms is also seen in their performance over time. For example, productivity growth for exporters has been on average 3 percentage points faster than for non-exporters over 1990 to 2009; for firms with foreign owners it has been about 6 percentage points higher than for domestic firms; and for users of imported inputs it has been 2 percentage points higher than for those that rely only on domestic inputs. These premia suggest an association between integration and performance, but they cannot determine the direction of causality. It is likely that firms that performed better in the first place were the ones that succeed in entering export markets, that ventured into using imported inputs, or that attracted foreign investors. However, as outlined below, there is substantial evidence pointing to greater integration as an important force affecting productivity in Indonesia (see Box 4 for some case study evidence).
Box 4: Do local manufacturing firms benefit from greater integration? Some case studies from Jakarta and Surabaya
Local firms can benefit from the presence of foreign-owned firms through business interactions which transfer knowledge, skills and practices. Indeed, anecdotal evidence provides examples of such interactions which have contributed to increased knowledge capacity, improvement in product quality, and increase in sales volume.
For example, a domestic producer of metal components for Japanese automotive firms highlighted the substantial benefits received from the interaction with its foreign-owned clients. The Japanese firms operating in Indonesia provided support during several free consultations, as well as auditing activities, which were conducive to improvements in product design and quality. More importantly, the producer claimed that the new knowledge acquired by the local firm improved the quality of inputs sold to other customers (both local and foreign). In addition, the new knowledge gained by the local firm helped it to gain market shares and enter new markets.
Other examples point to improvements in product quality and standards by some Indonesian manufacturing firms due to their interaction with foreign clients as well as with suppliers of imported inputs. For example, two resource-based manufacturers (one in the coffee processing sector, another in the fish industry) claim that their interactions with foreign clients involved in exporting helped them to introduce better quality and sanitary standards. The fish producers, for example, pushed by strict sanitary standards abroad, and encouraged by free training provided by their foreign clients improved the standards in all their production processes. For the coffee producer, suppliers provided training on how to operate a sophisticated imported coffee processor, which led to an improvement in the quality of the final product.
Meanwhile, increased competition from foreign products can also motivate local firms to innovate to produce better products forcustomers. For example, a large local household and electrical appliances producer based in Surabaya reported that competition withChinese producers encouraged them to be more creative, which led to the development of a customer service unit, providing quality after-sales services. This proved to be effective in maintaining market share, by differentiating their product from competitors.
b. The importance of FDI for enhancing Indonesia’s productive capacity The importance of FDI in the Indonesian economy has increased over the past two decades,..
Foreign-owned plants accounted for 41 percent of total output in 2005-9, up from 23 percent in 1990-94. Over the same period, their share of exports rose from just above 25 percent to 50 percent. In some industries it is even higher. For example, in 2009, plants with foreign equity accounted for over 75 percent of exports in 8 of 21 manufacturing industries and over 50 percent of exports in a further 5 industries.
…is likely continue to rise…
Recent BKPM data suggest that in the first quarter of 2012, foreign investment realization in manufacturing reached USD 5.7 billion, a 30 percent increase year on year. As outlined in the June 2011 IEQ, these increased FDI inflows have been driven by relatively low labor costs, the availability of key natural resources and a large and growing domestic market, reflecting favorable demographics, high GDP per capita growth, and a rapidly growing middle class. However, the attractiveness of Indonesia for FDI inflows could be further enhanced by addressing weaknesses in terms of infrastructure and skills, and by improvements in the business environment, which are also necessary, if the full benefits of the FDI are to be gained.
…and can potentially bring a number of important benefits to the domestic economy
FDI can play three crucial roles in supporting Indonesia’s development in terms of financing of investment, facilitating the opening up of export markets, and boosting productivity, helping the country move up the value chain. Foreign sources of financing are likely to be crucial to help meet the targeted increases in physical capital investmentthat Indonesia needs. Although it is possible to design policies to stimulate higher saving rates domestically, these could have the unintended consequence of choking off domestic demand. Within foreign financing, FDI is regarded as the most attractive source of longer-term funding given its relative stability and the other potential benefits it may bring.
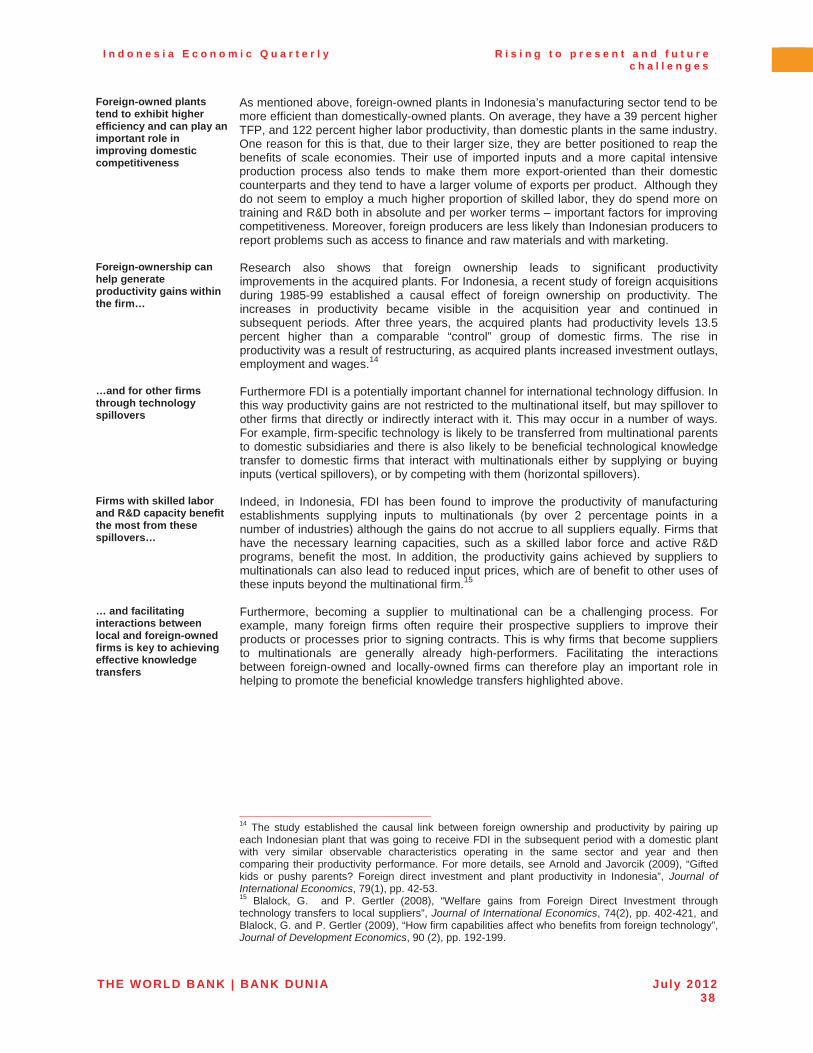
I n d o n e s i a E c o n o m i c Q u a r t e r l y R i s i n g t o p r e s e n t a n d f u t u r e c h a l l e n g e s
THE WORLD BANK | BANK DUNIA July 201238
Foreign-owned plants tend to exhibit higher efficiency and can play an important role in improving domestic competitiveness
As mentioned above, foreign-owned plants in Indonesia’s manufacturing sector tend to be more efficient than domestically-owned plants. On average, they have a 39 percent higher TFP, and 122 percent higher labor productivity, than domestic plants in the same industry. One reason for this is that, due to their larger size, they are better positioned to reap the benefits of scale economies. Their use of imported inputs and a more capital intensive production process also tends to make them more export-oriented than their domestic counterparts and they tend to have a larger volume of exports per product. Although they do not seem to employ a much higher proportion of skilled labor, they do spend more on training and R&D both in absolute and per worker terms – important factors for improving competitiveness. Moreover, foreign producers are less likely than Indonesian producers to report problems such as access to finance and raw materials and with marketing.
Foreign-ownership can help generate productivity gains within the firm…
Research also shows that foreign ownership leads to significant productivity improvements in the acquired plants. For Indonesia, a recent study of foreign acquisitions during 1985-99 established a causal effect of foreign ownership on productivity. The increases in productivity became visible in the acquisition year and continued in subsequent periods. After three years, the acquired plants had productivity levels 13.5 percent higher than a comparable “control” group of domestic firms. The rise in productivity was a result of restructuring, as acquired plants increased investment outlays, employment and wages.14
…and for other firms through technology spillovers
Furthermore FDI is a potentially important channel for international technology diffusion. In this way productivity gains are not restricted to the multinational itself, but may spillover to other firms that directly or indirectly interact with it. This may occur in a number of ways. For example, firm-specific technology is likely to be transferred from multinational parents to domestic subsidiaries and there is also likely to be beneficial technological knowledgetransfer to domestic firms that interact with multinationals either by supplying or buying inputs (vertical spillovers), or by competing with them (horizontal spillovers).
Firms with skilled labor and R&D capacity benefit the most from these spillovers…
Indeed, in Indonesia, FDI has been found to improve the productivity of manufacturing establishments supplying inputs to multinationals (by over 2 percentage points in a number of industries) although the gains do not accrue to all suppliers equally. Firms that have the necessary learning capacities, such as a skilled labor force and active R&D programs, benefit the most. In addition, the productivity gains achieved by suppliers to multinationals can also lead to reduced input prices, which are of benefit to other uses of these inputs beyond the multinational firm.15
… and facilitating interactions between local and foreign-owned firms is key to achieving effective knowledge transfers
Furthermore, becoming a supplier to multinational can be a challenging process. For example, many foreign firms often require their prospective suppliers to improve their products or processes prior to signing contracts. This is why firms that become suppliers to multinationals are generally already high-performers. Facilitating the interactions between foreign-owned and locally-owned firms can therefore play an important role in helping to promote the beneficial knowledge transfers highlighted above.
14 The study established the causal link between foreign ownership and productivity by pairing up each Indonesian plant that was going to receive FDI in the subsequent period with a domestic plant with very similar observable characteristics operating in the same sector and year and then comparing their productivity performance. For more details, see Arnold and Javorcik (2009), “Gifted kids or pushy parents? Foreign direct investment and plant productivity in Indonesia”, Journal of International Economics, 79(1), pp. 42-53.15 Blalock, G. and P. Gertler (2008), “Welfare gains from Foreign Direct Investment through technology transfers to local suppliers”, Journal of International Economics, 74(2), pp. 402-421, and Blalock, G. and P. Gertler (2009), “How firm capabilities affect who benefits from foreign technology”, Journal of Development Economics, 90 (2), pp. 192-199.
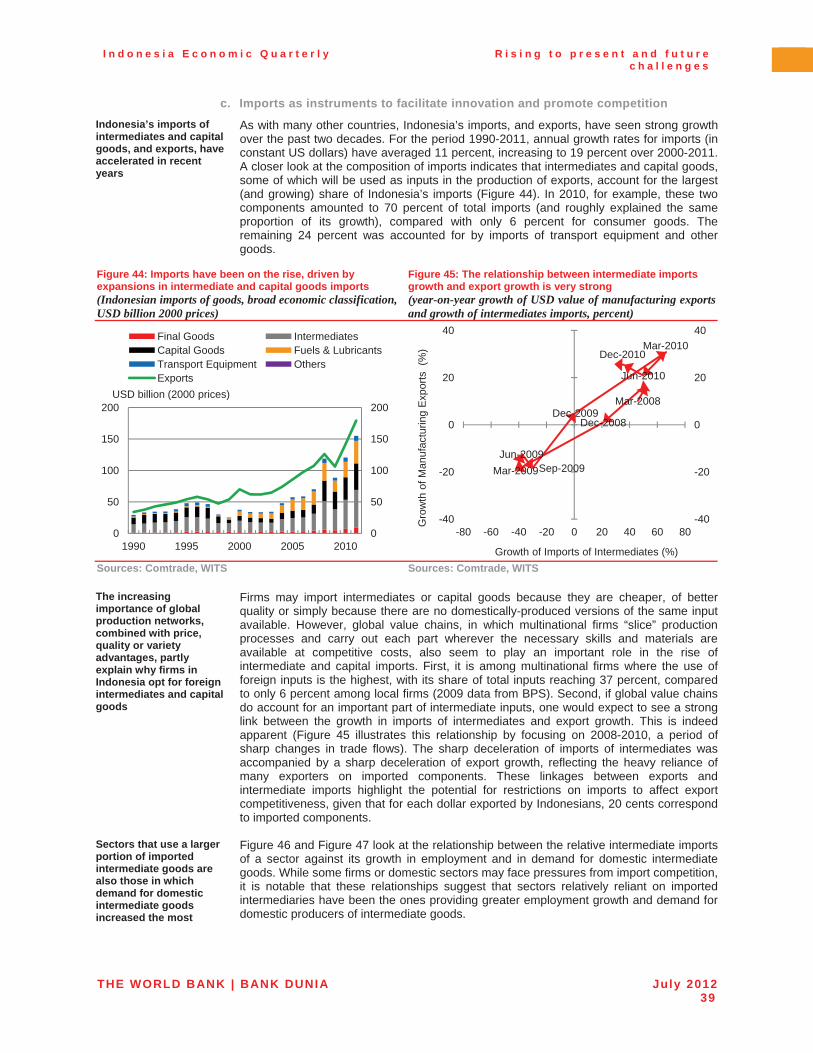
I n d o n e s i a E c o n o m i c Q u a r t e r l y R i s i n g t o p r e s e n t a n d f u t u r e c h a l l e n g e s
THE WORLD BANK | BANK DUNIA July 201239
c. Imports as instruments to facilitate innovation and promote competition Indonesia’s imports of intermediates and capital goods, and exports, have accelerated in recent years
As with many other countries, Indonesia’s imports, and exports, have seen strong growth over the past two decades. For the period 1990-2011, annual growth rates for imports (in constant US dollars) have averaged 11 percent, increasing to 19 percent over 2000-2011.A closer look at the composition of imports indicates that intermediates and capital goods, some of which will be used as inputs in the production of exports, account for the largest (and growing) share of Indonesia’s imports (Figure 44). In 2010, for example, these two components amounted to 70 percent of total imports (and roughly explained the same proportion of its growth), compared with only 6 percent for consumer goods. The remaining 24 percent was accounted for by imports of transport equipment and other goods.
Figure 44: Imports have been on the rise, driven by expansions in intermediate and capital goods imports (Indonesian imports of goods, broad economic classification, USD billion 2000 prices)
Figure 45: The relationship between intermediate imports growth and export growth is very strong (year-on-year growth of USD value of manufacturing exportsand growth of intermediates imports, percent)
Sources: Comtrade, WITS Sources: Comtrade, WITS
The increasing importance of global production networks, combined with price, quality or variety advantages, partly explain why firms in Indonesia opt for foreign intermediates and capital goods
Firms may import intermediates or capital goods because they are cheaper, of better quality or simply because there are no domestically-produced versions of the same input available. However, global value chains, in which multinational firms “slice” production processes and carry out each part wherever the necessary skills and materials are available at competitive costs, also seem to play an important role in the rise of intermediate and capital imports. First, it is among multinational firms where the use of foreign inputs is the highest, with its share of total inputs reaching 37 percent, compared to only 6 percent among local firms (2009 data from BPS). Second, if global value chains do account for an important part of intermediate inputs, one would expect to see a strong link between the growth in imports of intermediates and export growth. This is indeed apparent (Figure 45 illustrates this relationship by focusing on 2008-2010, a period of sharp changes in trade flows). The sharp deceleration of imports of intermediates was accompanied by a sharp deceleration of export growth, reflecting the heavy reliance of many exporters on imported components. These linkages between exports and intermediate imports highlight the potential for restrictions on imports to affect export competitiveness, given that for each dollar exported by Indonesians, 20 cents correspond to imported components.
Sectors that use a larger portion of imported intermediate goods are also those in which demand for domestic intermediate goods increased the most
Figure 46 and Figure 47 look at the relationship between the relative intermediate imports of a sector against its growth in employment and in demand for domestic intermediate goods. While some firms or domestic sectors may face pressures from import competition, it is notable that these relationships suggest that sectors relatively reliant on imported intermediaries have been the ones providing greater employment growth and demand for domestic producers of intermediate goods.
0
50
100
150
200
0
50
100
150
200
1990 1995 2000 2005 2010
Final Goods IntermediatesCapital Goods Fuels & LubricantsTransport Equipment OthersExports
USD billion (2000 prices) Mar-2008
Dec-2008
Mar-2009Jun-2009
Sep-2009
Dec-2009
Mar-2010
Jun-2010
Dec-2010
-40
-20
0
20
40
-40
-20
0
20
40
-80 -60 -40 -20 0 20 40 60 80
Gro
wth
of M
anuf
actu
ring
Exp
orts
(%
)
Growth of Imports of Intermediates (%)
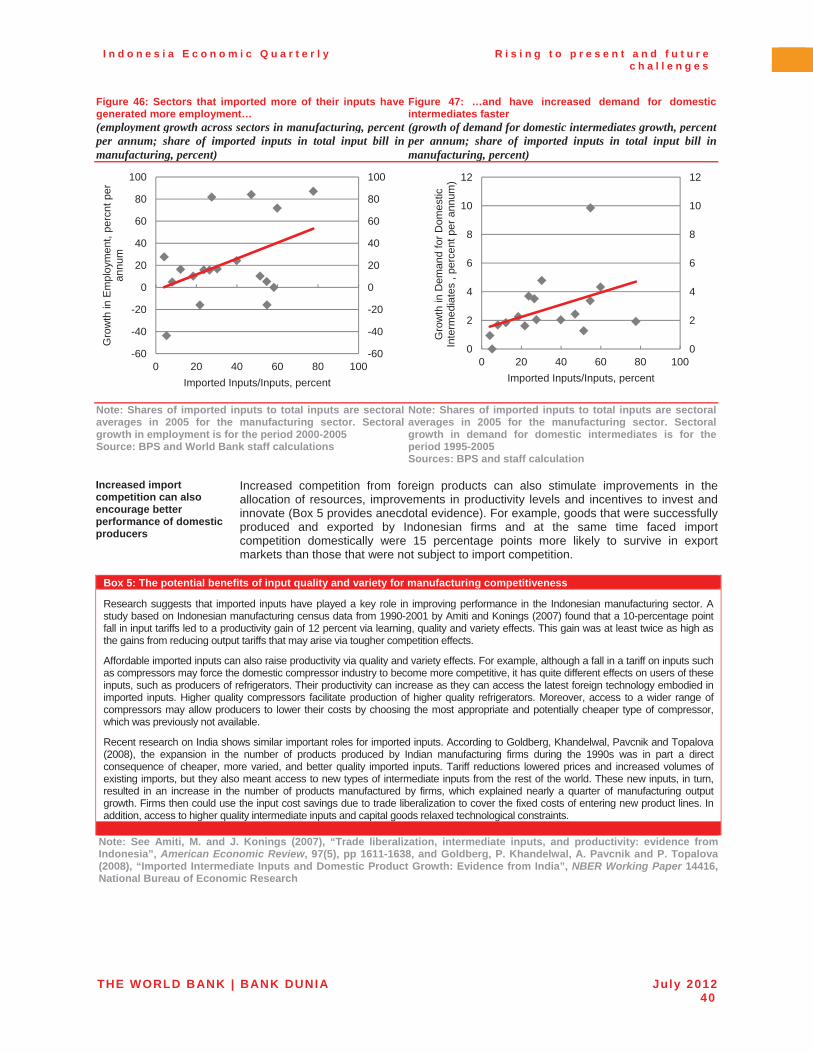
I n d o n e s i a E c o n o m i c Q u a r t e r l y R i s i n g t o p r e s e n t a n d f u t u r e c h a l l e n g e s
THE WORLD BANK | BANK DUNIA July 201240
Figure 46: Sectors that imported more of their inputs have generated more employment… (employment growth across sectors in manufacturing, percent per annum; share of imported inputs in total input bill in manufacturing, percent)
Figure 47: …and have increased demand for domestic intermediates faster (growth of demand for domestic intermediates growth, percent per annum; share of imported inputs in total input bill in manufacturing, percent)
Note: Shares of imported inputs to total inputs are sectoral averages in 2005 for the manufacturing sector. Sectoral growth in employment is for the period 2000-2005 Source: BPS and World Bank staff calculations
Note: Shares of imported inputs to total inputs are sectoral averages in 2005 for the manufacturing sector. Sectoral growth in demand for domestic intermediates is for the period 1995-2005 Sources: BPS and staff calculation
Increased import competition can also encourage better performance of domestic producers
Increased competition from foreign products can also stimulate improvements in the allocation of resources, improvements in productivity levels and incentives to invest and innovate (Box 5 provides anecdotal evidence). For example, goods that were successfully produced and exported by Indonesian firms and at the same time faced import competition domestically were 15 percentage points more likely to survive in export markets than those that were not subject to import competition.
Box 5: The potential benefits of input quality and variety for manufacturing competitiveness
Research suggests that imported inputs have played a key role in improving performance in the Indonesian manufacturing sector. Astudy based on Indonesian manufacturing census data from 1990-2001 by Amiti and Konings (2007) found that a 10-percentage pointfall in input tariffs led to a productivity gain of 12 percent via learning, quality and variety effects. This gain was at least twice as high as the gains from reducing output tariffs that may arise via tougher competition effects.
Affordable imported inputs can also raise productivity via quality and variety effects. For example, although a fall in a tariff on inputs such as compressors may force the domestic compressor industry to become more competitive, it has quite different effects on users of these inputs, such as producers of refrigerators. Their productivity can increase as they can access the latest foreign technology embodied in imported inputs. Higher quality compressors facilitate production of higher quality refrigerators. Moreover, access to a wider range of compressors may allow producers to lower their costs by choosing the most appropriate and potentially cheaper type of compressor,which was previously not available.
Recent research on India shows similar important roles for imported inputs. According to Goldberg, Khandelwal, Pavcnik and Topalova (2008), the expansion in the number of products produced by Indian manufacturing firms during the 1990s was in part a direct consequence of cheaper, more varied, and better quality imported inputs. Tariff reductions lowered prices and increased volumes of existing imports, but they also meant access to new types of intermediate inputs from the rest of the world. These new inputs, in turn, resulted in an increase in the number of products manufactured by firms, which explained nearly a quarter of manufacturing output growth. Firms then could use the input cost savings due to trade liberalization to cover the fixed costs of entering new product lines. In addition, access to higher quality intermediate inputs and capital goods relaxed technological constraints.
Note: See Amiti, M. and J. Konings (2007), “Trade liberalization, intermediate inputs, and productivity: evidence from Indonesia”, American Economic Review, 97(5), pp 1611-1638, and Goldberg, P. Khandelwal, A. Pavcnik and P. Topalova (2008), “Imported Intermediate Inputs and Domestic Product Growth: Evidence from India”, NBER Working Paper 14416, National Bureau of Economic Research
-60
-40
-20
0
20
40
60
80
100
-60
-40
-20
0
20
40
60
80
100
0 20 40 60 80 100
Gro
wth
in E
mpl
oym
ent,
perc
nt p
er
annu
m
Imported Inputs/Inputs, percent
0
2
4
6
8
10
12
0
2
4
6
8
10
12
0 20 40 60 80 100
Gro
wth
in D
eman
d fo
r Dom
estic
In
term
edia
tes
, per
cent
per
ann
um)
Imported Inputs/Inputs, percent
I n d o n e s i a E c o n o m i c Q u a r t e r l y R i s i n g t o p r e s e n t a n d f u t u r e c h a l l e n g e s
THE WORLD BANK | BANK DUNIA July 201241
d. Exporting as a means to drive productivity and growth Exporting allows Indonesian firms to learn and innovate
Export markets can generate dynamic gains associated with faster productivity growth and innovation capacity. For example, tougher competition in export markets increases the costs of not innovating. Local firms tend to find foreign customers more sophisticated and discriminating, and to satisfy them, exporters may need to improve production processes, upgrade capital and standards, as well as train their workers. In addition, export markets can be a powerful force for product diversification.
The more trade there is with a particular market, the more information is available for new exporters, and therefore the easier it is to enter that market
Firms in developing countries face considerable fixed costs in order to enter export markets.16 Firms need to search for market information, comply with foreign standards, and understand foreign clients. Recent research shows that the overall level of trade between two countries is important in allowing new entrants to enter and survive in the export market. The expansion of exports of existing products is therefore helpful for future export growth and diversification, including for new firms to enter the existing export market. This is because the higher the export flows with a particular destination, the larger the stock of available information there is about that market, lowering the information related costs a firm faces when entering a new export market.17
As well as the potential supply-side productivity benefits of exports, they can of course support demand for domestic production
As well as providing an engine for learning and innovation, export markets have of course played a key role in increasing demand for the goods and services produced by Indonesian firms. For example, over the period 1990-2010, export growth was equivalent to 52 percent of the total growth in demand for Indonesia’s goods and services (although import growth must subtracted from this to get the contribution of net external demand to growth).
As seen in the growth performance of many of Indonesia’s regional peers during the global financial crisis of 2008 to 2009, greater trade openness can also bring with it the potential for growth volatility. However, recent work suggests that greater trade openness tends to reduce volatility in economies that show relatively high levels of export diversification, while the opposite happens in poorly diversified economies. In particular, it is product diversification that plays the most important role in shielding an economy from the detrimental impact of foreign shocks.18
16 Brenton, P., Newfarmer, R. and P. Walkenhorst (2007), “Avenues for Export Diversification: Issues
for Low-Income Countries”, MPRA Paper 22758, University Library of Munich, Germany. 17 Ibid.18 Haddad, M., Lim, J., Munro, L., Saborowski, C. and B. Shepherd (2011), “Volatility, Export Diversification and Policy”, Chapter 11 in Managing Openness, Ed. Haddad, M. and B. Shepherd, The World Bank.
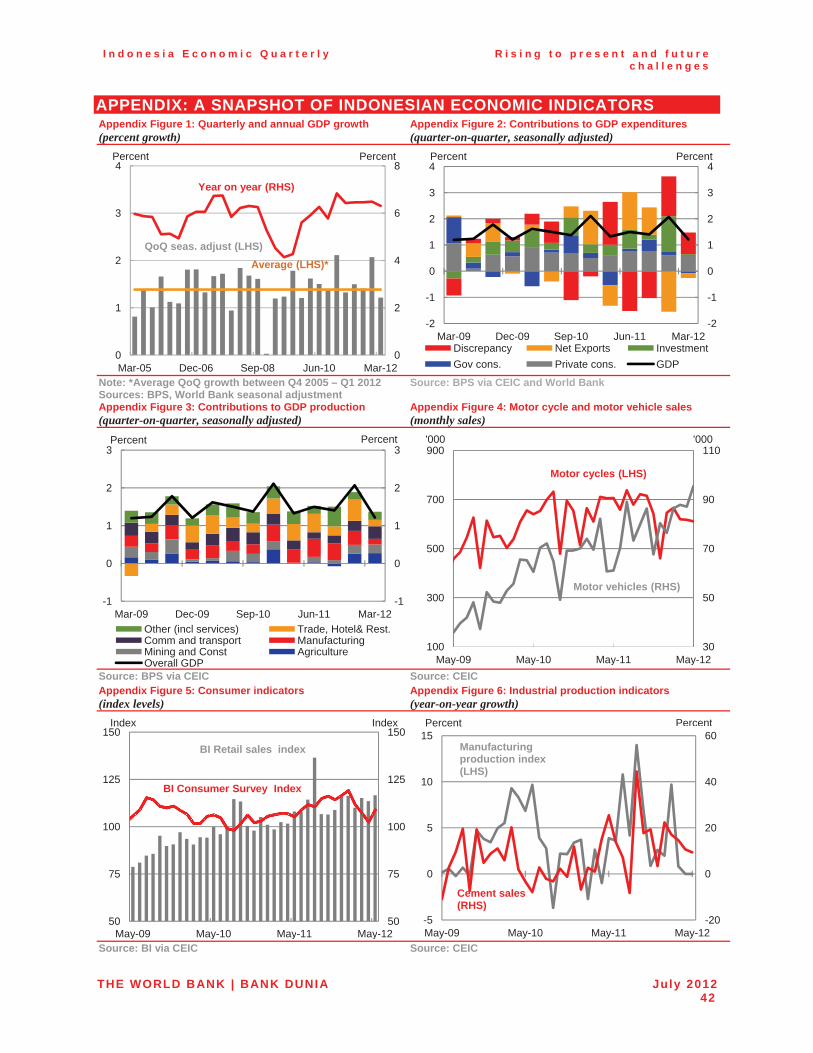
I n d o n e s i a E c o n o m i c Q u a r t e r l y R i s i n g t o p r e s e n t a n d f u t u r e c h a l l e n g e s
THE WORLD BANK | BANK DUNIA July 201242
APPENDIX: A SNAPSHOT OF INDONESIAN ECONOMIC INDICATORS Appendix Figure 1: Quarterly and annual GDP growth (percent growth)
Appendix Figure 2: Contributions to GDP expenditures (quarter-on-quarter, seasonally adjusted)
Note: *Average QoQ growth between Q4 2005 – Q1 2012 Sources: BPS, World Bank seasonal adjustment
Source: BPS via CEIC and World Bank
Appendix Figure 3: Contributions to GDP production (quarter-on-quarter, seasonally adjusted)
Appendix Figure 4: Motor cycle and motor vehicle sales (monthly sales)
Source: BPS via CEIC Source: CEIC Appendix Figure 5: Consumer indicators (index levels)
Appendix Figure 6: Industrial production indicators (year-on-year growth)
Source: BI via CEIC Source: CEIC
0
2
4
6
8
0
1
2
3
4
Mar-05 Dec-06 Sep-08 Jun-10 Mar-12
Percent Percent
QoQ seas. adjust (LHS)
Year on year (RHS)
Average (LHS)*
-2
-1
0
1
2
3
4
-2
-1
0
1
2
3
4
Mar-09 Dec-09 Sep-10 Jun-11 Mar-12Discrepancy Net Exports InvestmentGov cons. Private cons. GDP
Percent Percent
-1
0
1
2
3
-1
0
1
2
3
Mar-09 Dec-09 Sep-10 Jun-11 Mar-12Other (incl services) Trade, Hotel& Rest.Comm and transport ManufacturingMining and Const AgricultureOverall GDP
Percent Percent
30
50
70
90
110
100
300
500
700
900
May-09 May-10 May-11 May-12
'000
Motor cycles (LHS)
'000
Motor vehicles (RHS)
50
75
100
125
150
50
75
100
125
150
May-09 May-10 May-11 May-12
Index Index
BI Retail sales index
BI Consumer Survey Index
-20
0
20
40
60
-5
0
5
10
15
May-09 May-10 May-11 May-12
Percent Percent
Cement sales (RHS)
Manufacturingproduction index (LHS)
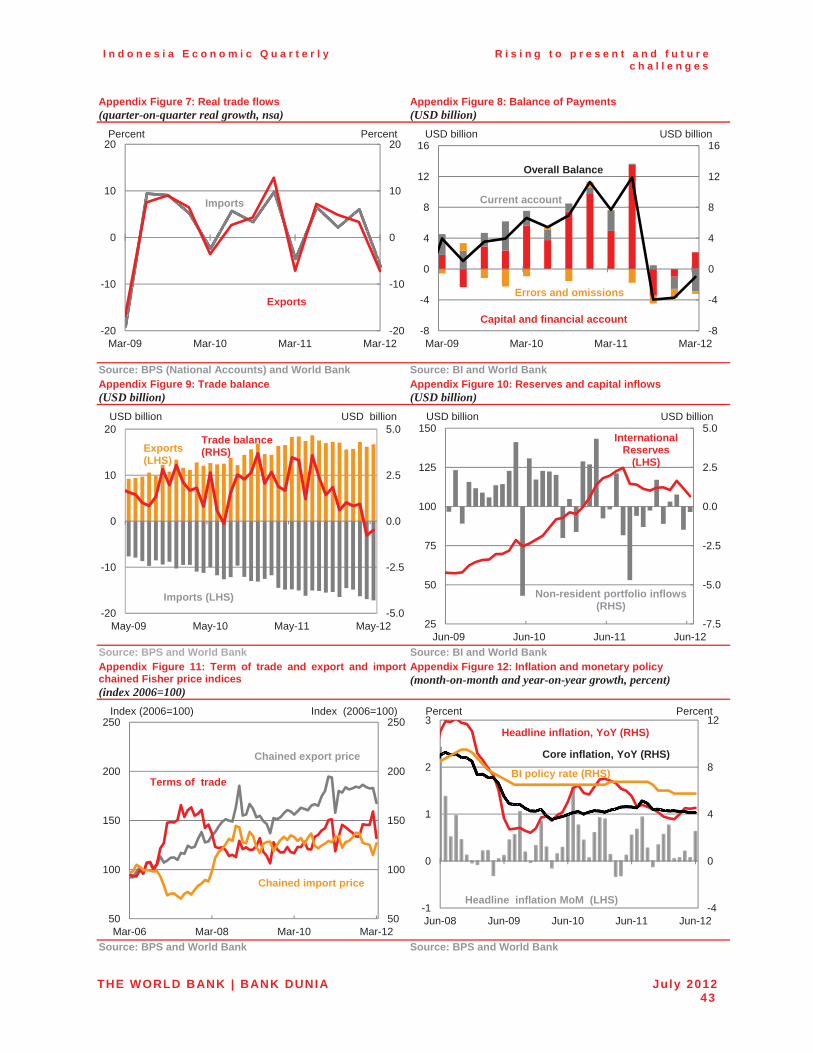
I n d o n e s i a E c o n o m i c Q u a r t e r l y R i s i n g t o p r e s e n t a n d f u t u r e c h a l l e n g e s
THE WORLD BANK | BANK DUNIA July 201243
Appendix Figure 7: Real trade flows (quarter-on-quarter real growth, nsa)
Appendix Figure 8: Balance of Payments (USD billion)
Source: BPS (National Accounts) and World Bank Source: BI and World Bank Appendix Figure 9: Trade balance (USD billion)
Appendix Figure 10: Reserves and capital inflows (USD billion)
Source: BPS and World Bank Source: BI and World Bank Appendix Figure 11: Term of trade and export and import chained Fisher price indices (index 2006=100)
Appendix Figure 12: Inflation and monetary policy (month-on-month and year-on-year growth, percent)
Source: BPS and World Bank Source: BPS and World Bank
-20
-10
0
10
20
-20
-10
0
10
20
Mar-09 Mar-10 Mar-11 Mar-12
Exports
Imports
Percent Percent
-8
-4
0
4
8
12
16
-8
-4
0
4
8
12
16
Mar-09 Mar-10 Mar-11 Mar-12
USD billion USD billion
Capital and financial account
Current account
Overall Balance
Errors and omissions
-5.0
-2.5
0.0
2.5
5.0
-20
-10
0
10
20
May-09 May-10 May-11 May-12
Trade balance (RHS)Exports
(LHS)
Imports (LHS)
USD billion USD billion
-7.5
-5.0
-2.5
0.0
2.5
5.0
25
50
75
100
125
150
Jun-09 Jun-10 Jun-11 Jun-12
InternationalReserves
(LHS)
USD billion USD billion
Non-resident portfolio inflows (RHS)
50
100
150
200
250
50
100
150
200
250
Mar-06 Mar-08 Mar-10 Mar-12
Index (2006=100) Index (2006=100)
Terms of trade
Chained import price
Chained export price
-4
0
4
8
12
-1
0
1
2
3
Jun-08 Jun-09 Jun-10 Jun-11 Jun-12
Core inflation, YoY (RHS)
Headline inflation, YoY (RHS)
Headline inflation MoM (LHS)
Percent Percent
BI policy rate (RHS)
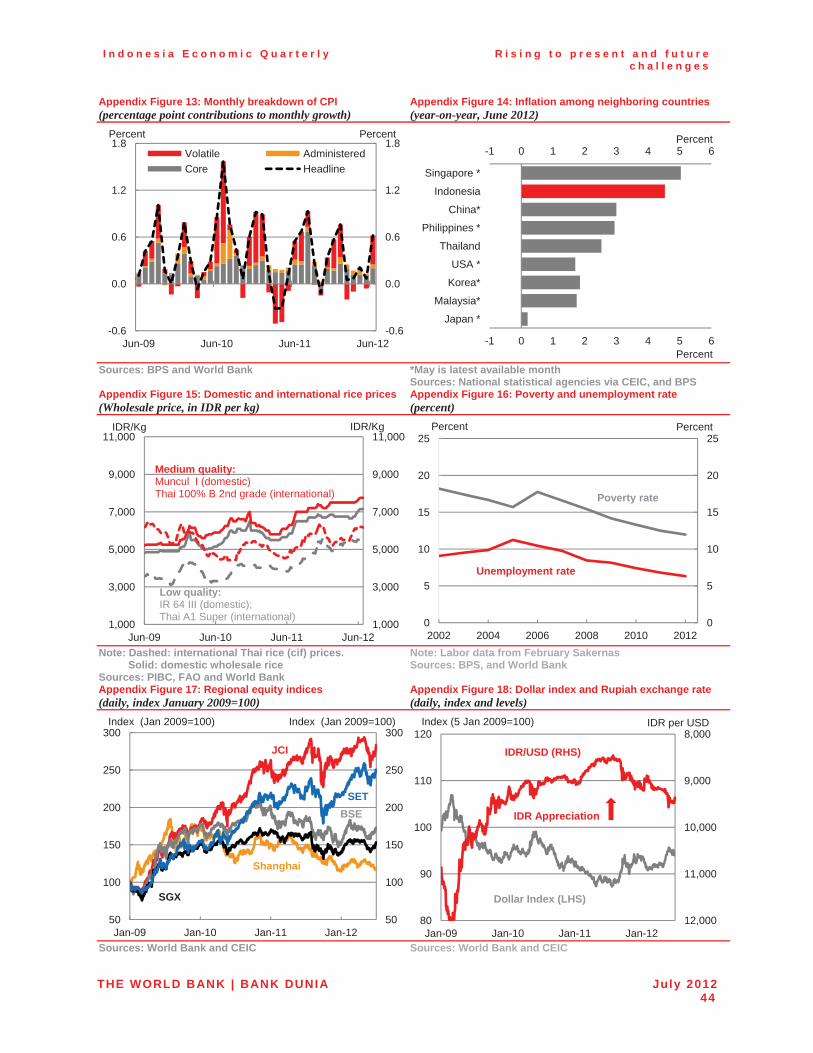
I n d o n e s i a E c o n o m i c Q u a r t e r l y R i s i n g t o p r e s e n t a n d f u t u r e c h a l l e n g e s
THE WORLD BANK | BANK DUNIA July 201244
Appendix Figure 13: Monthly breakdown of CPI (percentage point contributions to monthly growth)
Appendix Figure 14: Inflation among neighboring countries (year-on-year, June 2012)
Sources: BPS and World Bank *May is latest available month Sources: National statistical agencies via CEIC, and BPS
Appendix Figure 15: Domestic and international rice prices (Wholesale price, in IDR per kg)
Appendix Figure 16: Poverty and unemployment rate (percent)
Note: Dashed: international Thai rice (cif) prices. Solid: domestic wholesale rice Sources: PIBC, FAO and World Bank
Note: Labor data from February Sakernas Sources: BPS, and World Bank
Appendix Figure 17: Regional equity indices (daily, index January 2009=100)
Appendix Figure 18: Dollar index and Rupiah exchange rate (daily, index and levels)
Sources: World Bank and CEIC Sources: World Bank and CEIC
-0.6
0.0
0.6
1.2
1.8
-0.6
0.0
0.6
1.2
1.8
Jun-09 Jun-10 Jun-11 Jun-12
Volatile AdministeredCore Headline
Percent Percent-1 0 1 2 3 4 5 6
-1 0 1 2 3 4 5 6
Japan *
Malaysia*
Korea*
USA *
Thailand
Philippines *
China*
Indonesia
Singapore *
Percent
Percent
1,000
3,000
5,000
7,000
9,000
11,000
1,000
3,000
5,000
7,000
9,000
11,000
Jun-09 Jun-10 Jun-11 Jun-12
Low quality:IR 64 III (domestic);Thai A1 Super (international)
IDR/Kg
Medium quality: Muncul I (domestic)Thai 100% B 2nd grade (international)
IDR/Kg
0
5
10
15
20
25
0
5
10
15
20
25
2002 2004 2006 2008 2010 2012
Percent Percent
Poverty rate
Unemployment rate
50
100
150
200
250
300
50
100
150
200
250
300
Jan-09 Jan-10 Jan-11 Jan-12
Index (Jan 2009=100)
SGX
JCI
SET
Shanghai
BSE
Index (Jan 2009=100)8,000
9,000
10,000
11,000
12,00080
90
100
110
120
Jan-09 Jan-10 Jan-11 Jan-12
Index (5 Jan 2009=100)
IDR/USD (RHS)
Dollar Index (LHS)
IDR Appreciation
IDR per USD
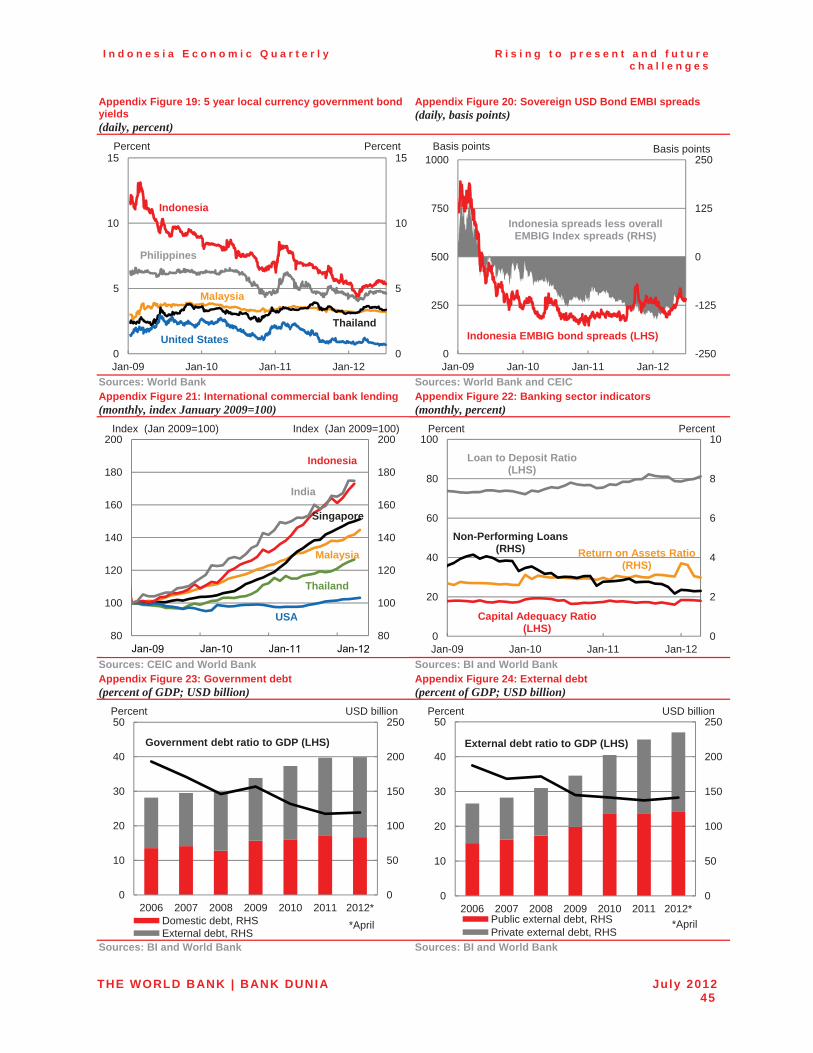
I n d o n e s i a E c o n o m i c Q u a r t e r l y R i s i n g t o p r e s e n t a n d f u t u r e c h a l l e n g e s
THE WORLD BANK | BANK DUNIA July 201245
Appendix Figure 19: 5 year local currency government bond yields (daily, percent)
Appendix Figure 20: Sovereign USD Bond EMBI spreads (daily, basis points)
Sources: World Bank Sources: World Bank and CEIC Appendix Figure 21: International commercial bank lending (monthly, index January 2009=100)
Appendix Figure 22: Banking sector indicators (monthly, percent)
Sources: CEIC and World Bank Sources: BI and World Bank Appendix Figure 23: Government debt (percent of GDP; USD billion)
Appendix Figure 24: External debt (percent of GDP; USD billion)
Sources: BI and World Bank Sources: BI and World Bank
0
5
10
15
0
5
10
15
Jan-09 Jan-10 Jan-11 Jan-12
Percent
Philippines
United StatesThailand
Malaysia
Indonesia
Percent
-250
-125
0
125
250
0
250
500
750
1000
Jan-09 Jan-10 Jan-11 Jan-12
Basis points
Indonesia EMBIG bond spreads (LHS)
Indonesia spreads less overall EMBIG Index spreads (RHS)
Basis points
80
100
120
140
160
180
200
80
100
120
140
160
180
200Index (Jan 2009=100)
USA
Thailand
Singapore
Indonesia
India
Malaysia
Index (Jan 2009=100)
0
2
4
6
8
10
0
20
40
60
80
100
Jan-09 Jan-10 Jan-11 Jan-12
Capital Adequacy Ratio (LHS)
Return on Assets Ratio (RHS)
Loan to Deposit Ratio (LHS)
Percent Percent
Non-Performing Loans (RHS)
0
50
100
150
200
250
0
10
20
30
40
50
2006 2007 2008 2009 2010 2011 2012*Domestic debt, RHSExternal debt, RHS
Percent USD billion
Government debt ratio to GDP (LHS)
*April
0
50
100
150
200
250
0
10
20
30
40
50
2006 2007 2008 2009 2010 2011 2012*Public external debt, RHSPrivate external debt, RHS
External debt ratio to GDP (LHS)
Percent USD billion
*April
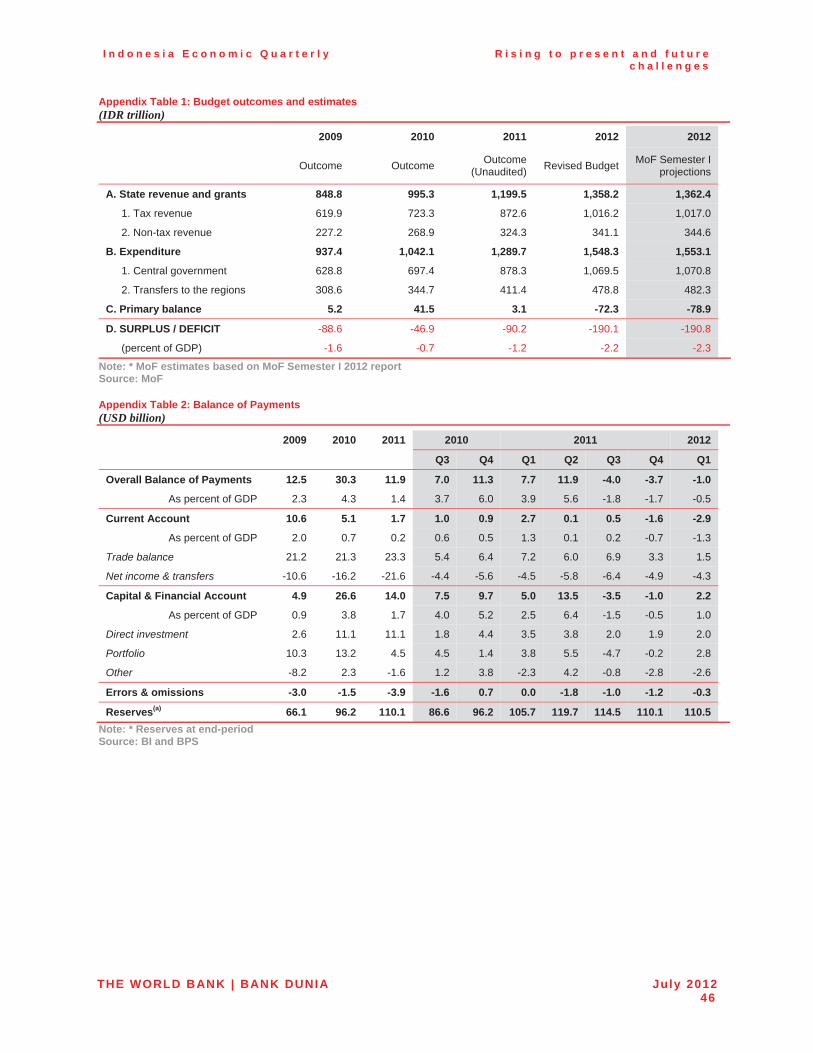
I n d o n e s i a E c o n o m i c Q u a r t e r l y R i s i n g t o p r e s e n t a n d f u t u r e c h a l l e n g e s
THE WORLD BANK | BANK DUNIA July 201246
Appendix Table 1: Budget outcomes and estimates (IDR trillion)
2009 2010 2011 2012 2012
Outcome Outcome Outcome(Unaudited) Revised Budget MoF Semester I
projections
A. State revenue and grants 848.8 995.3 1,199.5 1,358.2 1,362.4
1. Tax revenue 619.9 723.3 872.6 1,016.2 1,017.0
2. Non-tax revenue 227.2 268.9 324.3 341.1 344.6
B. Expenditure 937.4 1,042.1 1,289.7 1,548.3 1,553.1
1. Central government 628.8 697.4 878.3 1,069.5 1,070.8
2. Transfers to the regions 308.6 344.7 411.4 478.8 482.3
C. Primary balance 5.2 41.5 3.1 -72.3 -78.9
D. SURPLUS / DEFICIT -88.6 -46.9 -90.2 -190.1 -190.8
(percent of GDP) -1.6 -0.7 -1.2 -2.2 -2.3
Note: * MoF estimates based on MoF Semester I 2012 report Source: MoF
Appendix Table 2: Balance of Payments (USD billion)
�� 2009 2010 2011 2010 2011 2012
�� �� �� �� Q3 Q4 Q1 Q2 Q3 Q4 Q1
Overall Balance of Payments 12.5 30.3 11.9 7.0 11.3 7.7 11.9 -4.0 -3.7 -1.0
As percent of GDP 2.3 4.3 1.4 3.7 6.0 3.9 5.6 -1.8 -1.7 -0.5
Current Account 10.6 5.1 1.7 1.0 0.9 2.7 0.1 0.5 -1.6 -2.9
As percent of GDP 2.0 0.7 0.2 0.6 0.5 1.3 0.1 0.2 -0.7 -1.3
Trade balance 21.2 21.3 23.3 5.4 6.4 7.2 6.0 6.9 3.3 1.5
Net income & transfers -10.6 -16.2 -21.6 -4.4 -5.6 -4.5 -5.8 -6.4 -4.9 -4.3
Capital & Financial Account 4.9 26.6 14.0 7.5 9.7 5.0 13.5 -3.5 -1.0 2.2
As percent of GDP 0.9 3.8 1.7 4.0 5.2 2.5 6.4 -1.5 -0.5 1.0
Direct investment 2.6 11.1 11.1 1.8 4.4 3.5 3.8 2.0 1.9 2.0
Portfolio 10.3 13.2 4.5 4.5 1.4 3.8 5.5 -4.7 -0.2 2.8
Other -8.2 2.3 -1.6 1.2 3.8 -2.3 4.2 -0.8 -2.8 -2.6
Errors & omissions -3.0 -1.5 -3.9 -1.6 0.7 0.0 -1.8 -1.0 -1.2 -0.3
Reserves(a) 66.1 96.2 110.1 86.6 96.2 105.7 119.7 114.5 110.1 110.5 Note: * Reserves at end-period Source: BI and BPS
Investing in Indonesia’s Institutionsfor Inclusive and Sustainable Development
October 2012
Maintaining resilience
INDONESIA ECONOMIC QUARTERLY
����
INDONESIA ECONOMIC QUARTERLY ����������������� ��
October 2012 �������������������������������
� �� �

��
� �
Preface �
� � ������������ �����������������������������������������������������������������������������������������������������������������������������������������!������������������������"������������������������������������������"����������� "�� ��������� ������� ���� ����� #��"����� ��� �������� ������ "��� ����������������"���������������������������"�������#��"����������������������������������"����#������������!����������������������!�������������!�"���������������������������!� ���� ���� ��������� "� ������� ���� ��"������ �������� ��� �������������������������
� � ���� �������� ����������������#�������������������������� ������������� "������������������"� ����$����%�����&�������""���!��������������������"� '�����(�����������)���� �����!�&���%�����!� ������*���������)���� �����!�+������-������� /������ �����!� *����� ������� ���� ����� ��������� (����� *������� 0�������������1!� *���� '�������� 0������������� ����������!� ��������� ����!� "��������� ������� �������������� ������1!� 2������ 2������� 0����"�������� ������ ���� ��������� ����1!� 2����3������ 0������ ���� ����� ����1� ���� *���� ����� 0"����� ���� 4567� %�����1�� *��������������������#�������������"���-#�� �����*�����������0"���������4567�%�����1!�+����)������0�������1!�����2���(����0������������1!�/���������'���������'�#����-������+������ 03������ �������� )�#1!� '��""��� '��������!� �#��� *���������� ���� ����8�������0�������������������������1!�����(�����#�$���9��0������1��*����'�������!�*������!�2����3�����!�����*�������������������������������������������(����*����!�&���%�����!�+������-��!�*����-����8�!� :���(���)��!� '�����*��'�������!���������� ���� '������ $�������� �������� ��������� ������� ���� ������� -���� '����-;����!�2�������*���!�����������#��!�&�����<�����#��!�+����!�(����������$����������=�����'��������������������������������������*����!�'������+;�������;!�����+����3���#����������������������������������������������� ������ �� �� ������� "� ���� ��""� "� ���� ������������� %���� "�� =����������� ����-���������� >�����$����%���!������������"�������"�������*���������8��������� ��*�*�-� ������ ���� '������ "�� �������� (���������� ���� 2����� 9����� *������0' ( 29*1��������������"������!��������������!���������������������������������������������������"����� �������#�"� ���� ���������-�������"�����$����%������ �������������� �������������!�*�*�-�������*���������8��������������$����%���������������������������������"� ��������� ��������� ��� ����#����������������!� ���!� ����������!� �����������"��������#�������������������#������������������;�������������������"����� $���� %���� ���������� ���� ������ ����� "� ���� ��������� �� ���� ���������� �������������"����������������/���� ���� �������� ��������� ���� ��������� 9��� ?�������!� 9�� ������� ������ ���� ����$����%�����*���������������������������������� ��� ���������� � ���������� �����
� � 2�� ��"������� ����� ���� $���� %���� ���� ��� ���������� ��� �������!� ������ �����###�#����������>������������ ����� �������������������� ����������� ���� "�� �������������� ��������� ������������������!� ������ ������� ��������@#������������ 2�� A������ ���� ��������������������������������!����������������������@#���������������
Table of contents
���������������������� ��� � �������� ��� ��
�! �"#$#��"��$%����"�&�'(%�)�� *
*! )+����,����� ����+���-���� ��� ��+�������������� ������� * .! %��/��������� ��-��� ���0�� � ���������� ����+�������������- ���,����� 1 1! )+������� ������� ���������-�� ���������� ��+������ �2����������.3*.� 4 5! � ����� �������������+��������� ���������� 6 7! �2������������� ��+���+���2�������� ���/�����������-�+��� �� ���� *3 4! )+��������/������ ������ ������,���������+�������� � *1 8! ����� ���������,�� 0�,�� �� ����������/��������/� ����� ��������� *4
�! �#���9�"�$)�%�;�&#(��$)���$��$%#$��������"#$#�<� *=
*! � � ��������� �����������/������ ���>������ ������� �� ���>�������� �� *= a. Recent dynamics in Indonesia’s manufactured exports ............................................................ 18 b. Manufactured exports and imports of intermediate and capital goods .................................... 21 c. Reviving the growth in Indonesia’s manufacturing sector and exports ................................... 22
.! )+��.3*1�/��/����������� ��+��������� �����/� � �� .1 a. Strengthening the domestic economy while advancing crisis preparedness ......................... 23 b. Despite a solid aggregate fiscal position, effective space for key development expenditures
is constrained by rising energy subsidy spending .................................................................... 25 c. The Medium-Term Budget Framework projects a surplus by 2016 .......................................... 28
"! �$%#$�����.3*5��$%���<#$%������&�")�;��&##?� 13
*! %�������,�+� ��+����/�����-�+��������� �� ��/���� ����/� ������� 13 a. The main drivers of rising personnel spending in Indonesia .................................................... 30 b. Offsetting policies or mechanisms are currently lacking .......................................................... 33
.! )+��@��+���������� �&�-���������� ����+�����,����������������������+��� 15 a. The potential benefits of institutional autonomy and enhanced accountability ...................... 34 b. Enhanced autonomy during Indonesia’s New Paradigm era and in the 2012 Law .................. 35 c. Proposed innovations under the new Law .................................................................................. 36 d. Next steps and future challenges ................................................................................................ 39
�((�$%�A�����$�(�@#)�#���$%#$����$��"#$#��"��$%�"�)#9� � 53
�� �
LIST OF FIGURES
�������*��� � ����������� �����-�+�+���,�� ������� ��������-����������� ����� �!!!!!!!!!!!!!!�� Figure 2: A deterioration in current account balances has been seen in regional peers, as well
as in Indonesia�!!!!!!!!!!!!!!!!!!!!!!!!!!!!!!!!!!!!!!!!!!!!!!!!!!!!!!!!!!!!!!!!!!!!!!!!!!!!!!!!!!!!!!!!!!!!!!!!!!!!!!!!!!!!!!��� �������1����,������� �/���� ���������� �� ����������� ��������������+��������/� � ��!!!����� �������5���2������������������������� ������������ ��+���+���2�������� �'���2��������������
��� �C�!!!!!!!!!!!!!!!!!!!!!!!!!!!!!!!!!!!!!!!!!!!!!!!!!!!!!!!!!!!!!!!!!!!!!!!!!!!!!!!!!!!!!!!!!!!!!!!!!!!!!!!!!!!!!!!!!!!!!!!�. �������7��C-+��������� ����������������� ������� � ��������������������/����������
�- �!!!!!!!!!!!!!!!!!!!!!!!!!!!!!!!!!!!!!!!!!!!!!!!!!!!!!!!!!!!!!!!!!!!!!!!!!!!!!!!!!!!!!!!!!!!!!!!!!!!!!!!!!!!!!!!!!!!!!!!!!!!!!!!!�. �������4��D%(����-�+�� ����������4!5�/���� ��� ��+������ �2����������.3*.C�!!!!!!!!!!!!!!!!!!!!!!!!!!!�5 �������8��C���� �,��� ����������� �� �� ������ �����-�+�-+��� �����/�����-���������������
� ����-�+�!!!!!!!!!!!!!!!!!!!!!!!!!!!!!!!!!!!!!!!!!!!!!!!!!!!!!!!!!!!!!!!!!!!!!!!!!!!!!!!!!!!!!!!!!!!!!!!!!!!!!!!!!!!!!!!!!!!!!!!!�5 �������=�������+��+����2�� ������������� ���������+�-���� ������������ ��!!!!!!!!!!!!!!!!!!!!!!!!!!!!!!!�5 Figure 9: Balance of payment outflows were again dominated by a rise in the current account
deficit�!!!!!!!!!!!!!!!!!!!!!!!!!!!!!!!!!!!!!!!!!!!!!!!!!!!!!!!!!!!!!!!!!!!!!!!!!!!!!!!!!!!!!!!!!!!!!!!!!!!!!!!!!!!!!!!!!!!!!!!!!!!!!!!�4 Figure 10: The narrowing in the trade surplus contributed to the rise in the current account
deficit…�!!!!!!!!!!!!!!!!!!!!!!!!!!!!!!!!!!!!!!!!!!!!!!!!!!!!!!!!!!!!!!!!!!!!!!!!!!!!!!!!!!!!!!!!!!!!!!!!!!!!!!!!!!!!!!!!!!!!!!!!!!!�8 Figure 11: …with current account deteriorations also seen in a number of regional peers�!!!!!!!!!!�8 �������*.������� ���/�������-�+�+����,�� ����-��,����� ���������/�����!!!!!!!!!!!!!!!!!!!!!!!!!!!!!!!�= �������*1��@��� ��� ������� ����� ������ ����+�����������-������!!!!!!!!!!!!!!!!!!!!!!!!!!!!!!!!!!!!!!!!!!�6 �������*5��)+����/�,��-�� �� � ���� �� �� ��� ���� �������/������+���������- ������
������������������� �.3*.�!!!!!!!!!!!!!!!!!!!!!!!!!!!!!!!!!!!!!!!!!!!!!!!!!!!!!!!!!!!!!!!!!!!!!!!!!!!!!!!!!!!!!!!!!!�6 Figure 15: Indonesian equities showed strong gains in the third quarter but the weakness in the
Rupiah persisted…�!!!!!!!!!!!!!!!!!!!!!!!!!!!!!!!!!!!!!!!!!!!!!!!!!!!!!!!!!!!!!!!!!!!!!!!!!!!!!!!!!!!!!!!!!!!!!!!!!!!!!!!�** Figure 16: …although net foreign purchases of equities and bonds picked up strongly in
September�!!!!!!!!!!!!!!!!!!!!!!!!!!!!!!!!!!!!!!!!!!!!!!!!!!!!!!!!!!!!!!!!!!!!!!!!!!!!!!!!!!!!!!!!!!!!!!!!!!!!!!!!!!!!!!!!!!!!!�** �������*8��"��������-�+������ ����/�0���,��� ������ ��� �-���� ����/������ �C�!!!!!!!!!!!!�*. �������*=��C-��+�����������������������-�+����� �/��������+��+��!!!!!!!!!!!!!!!!!!!!!!!!!!!!!!!!!!!!!!!!!�*. �������*6��&�-����+� �/��E��������/������� �+����� ���,��������-��� � >�������� ���!!!!!!!!�*1 �������.3��9�������>,������/�����+������� ��+��/�0�,���� � ��������� �����������/�����
+��������-���� �C�!!!!!!!!!!!!!!!!!!!!!!!!!!!!!!!!!!!!!!!!!!!!!!!!!!!!!!!!!!!!!!!!!!!!!!!!!!!!!!!!!!!!!!!!!!!!!!!!!�*6 �������.*��C� ������������������� �� ��� �����������/����������+���,�� ���� �����
����� ��/�����!!!!!!!!!!!!!!!!!!!!!!!!!!!!!!!!!!!!!!!!!!!!!!!!!!!!!!!!!!!!!!!!!!!!!!!!!!!!!!!!!!!!!!!!!!!!!!!!!!!!!!!!!!!!!!!�*6 �������..��(���������+����/����- ���������� � ���������������>,������ ���������
��/�����!!!!!!!!!!!!!!!!!!!!!!!!!!!!!!!!!!!!!!!!!!!!!!!!!!!!!!!!!!!!!!!!!!!!!!!!!!!!!!!!!!!!!!!!!!!!!!!!!!!!!!!!!!!!!!!!!!!!!!!!!!�*6 �������.1��� � ���������/�����+�����+�������-������-������������� ���������>,����
/�������!!!!!!!!!!!!!!!!!!!!!!!!!!!!!!!!!!!!!!!!!!!!!!!!!!!!!!!!!!!!!!!!!!!!!!!!!!!!!!!!!!!!!!!!!!!!!!!!!!!!!!!!!!!!!!!!!!!!!!!!�.3 �������.5��� ������������/�������-�+�+���������- �-��+��+����� ��������� ���������
��/�����!!!!!!!!!!!!!!!!!!!!!!!!!!!!!!!!!!!!!!!!!!!!!!!!!!!!!!!!!!!!!!!!!!!!!!!!!!!!!!!!!!!!!!!!!!!!!!!!!!!!!!!!!!!!!!!!!!!!!!!!!!�.. �������.7����/����/������+�����+��/� ���������������/�����!!!!!!!!!!!!!!!!!!!!!!!!!!!!!!!!!!!!!!!!!!!!!!!!!!!!!!!!!�.. �������.4��)+��.3*1�/��/������������� ��� ��������������������/������ C�!!!!!!!!!!!!!!!!!!!!!!!�.7 �������.8��C,��������������/� � ��� ����������/�� ��/��������+������� ����������+�������
D%(�!!!!!!!!!!!!!!!!!!!!!!!!!!!!!!!!!!!!!!!!!!!!!!!!!!!!!!!!!!!!!!!!!!!!!!!!!!!!!!!!!!!!!!!!!!!!!!!!!!!!!!!!!!!!!!!!!!!!!!!!!!!!!!!�.7 �������.=��9��� ��� �������,�������-�������/� � ��� ���/����� �������/��������!!!!!!!!!!!�.8 �������.6������������ ��������� �.3*.0�� �.3*1������� ����������/��� �� ��� �������������
/�������������-���������� ��!!!!!!!!!!!!!!!!!!!!!!!!!!!!!!!!!!!!!!!!!!!!!!!!!!!!!!!!!!!!!!!!!!!!!!!!!!!!!!!!!!�.8 �������13��� ��������� ������������������� �����/���� ���/� � ��+�������/�����+�������
��/�����/� � �C�!!!!!!!!!!!!!!!!!!!!!!!!!!!!!!!!!!!!!!!!!!!!!!!!!!!!!!!!!!!!!!!!!!!!!!!!!!!!!!!!!!!!!!!!!!!!!!!!!!!!!!!�13 �������1*��C� ������ ������������+�+��+����+������� ���� ��� ���,> ���� ���������!!!!!!!!�13 �������1.��@� ���������/���������� ��������+��+��+��������+�������+����/���������������� ���!�1. �������11��)+���+����������� ���� �+��+���������� ����� �������/������+����+�������� ��
������-�!!!!!!!!!!!!!!!!!!!!!!!!!!!!!!!!!!!!!!!!!!!!!!!!!!!!!!!!!!!!!!!!!!!!!!!!!!!!!!!!!!!!!!!!!!!!!!!!!!!!!!!!!!!!!!!!!!!!!!!!!�1= �
LIST OF APPENDIX FIGURES
�//� ����������*��G��������� �� ���D%(����-�+�!!!!!!!!!!!!!!!!!!!!!!!!!!!!!!!!!!!!!!!!!!!!!!!!!!!!!!!!!!!!!!!!!!!�53 �//� ����������.��"� ���,���� �����D%(���/� �������!!!!!!!!!!!!!!!!!!!!!!!!!!!!!!!!!!!!!!!!!!!!!!!!!!!!!!!!!!!!!!!!!�53 �//� ����������1��"� ���,���� �����D%(�/������� �!!!!!!!!!!!!!!!!!!!!!!!!!!!!!!!!!!!!!!!!!!!!!!!!!!!!!!!!!!!!!!!!!!!!!�53 �//� ����������5�������������� ���������+���������!!!!!!!!!!!!!!!!!!!!!!!!!!!!!!!!!!!!!!!!!!!!!!!!!!!!!!!!!!!!!!!�53 �//� ����������7��"� ������� ��������!!!!!!!!!!!!!!!!!!!!!!!!!!!!!!!!!!!!!!!!!!!!!!!!!!!!!!!!!!!!!!!!!!!!!!!!!!!!!!!!!!!!!!!!!�53 �//� ����������4��� �������/������� �� ��������!!!!!!!!!!!!!!!!!!!!!!!!!!!!!!!!!!!!!!!!!!!!!!!!!!!!!!!!!!!!!!!!!!!!!!!�53 �//� ����������8��9����������-��!!!!!!!!!!!!!!!!!!!!!!!!!!!!!!!!!!!!!!!!!!!!!!!!!!!!!!!!!!!!!!!!!!!!!!!!!!!!!!!!!!!!!!!!!!!!!!!!!�5* �//� ����������=����� ������(���� ���!!!!!!!!!!!!!!!!!!!!!!!!!!!!!!!!!!!!!!!!!!!!!!!!!!!!!!!!!!!!!!!!!!!!!!!!!!!!!!!!!!!!!!!!!�5* �//� ����������6��D���������,�� ���!!!!!!!!!!!!!!!!!!!!!!!!!!!!!!!!!!!!!!!!!!!!!!!!!!!!!!!!!!!!!!!!!!!!!!!!!!!!!!!!!!!!!!!!!�5* �//� ����������*3��9��������� ���/����� ��-��!!!!!!!!!!!!!!!!!!!!!!!!!!!!!!!!!!!!!!!!!!!!!!!!!!!!!!!!!!!!!!!!!!!!!!!!!!�5* �//� ����������**��)������������� ���/����� ���/�����+�� �>���+���/������ �����!!!!!!!!!!!!�5* �//� ����������*.��� ����� �� ��� ������/�����!!!!!!!!!!!!!!!!!!!!!!!!!!!!!!!!!!!!!!!!!!!!!!!!!!!!!!!!!!!!!!!!!!!!!!!!!�5* �//� ����������*1���� �+��,�����- ����"(��!!!!!!!!!!!!!!!!!!!!!!!!!!!!!!!!!!!!!!!!!!!!!!!!!!!!!!!!!!!!!!!!!!!!!!!!!!!!!!�5. �//� ����������*5��� ����� ���� �� ���+,��� ����� ������!!!!!!!!!!!!!!!!!!!!!!!!!!!!!!!!!!!!!!!!!!!!!!!!!!!!!!!!!�5. �//� ����������*7��%��������� �� ��� ���� �������/������!!!!!!!!!!!!!!!!!!!!!!!!!!!!!!!!!!!!!!!!!!!!!!!!!!!!!!!!!!�5. �//� ����������*4��(�������� �� ��/���� �������!!!!!!!!!!!!!!!!!!!!!!!!!!!!!!!!!!!!!!!!!!!!!!!!!!!!!!!!!!!!!!!!!!!!�5. �//� ����������*8��9���� ���2������ �����!!!!!!!!!!!!!!!!!!!!!!!!!!!!!!!!!!!!!!!!!!!!!!!!!!!!!!!!!!!!!!!!!!!!!!!!!!!!!!!!!!!�5. �//� ����������*=��%����� ���� �9�/��+����+� ��������!!!!!!!!!!!!!!!!!!!!!!!!!!!!!!!!!!!!!!!!!!!!!!!!!!!!!!!!!�5. �//� ����������*6��7>�������������� �������� �� ��,� ������!!!!!!!!!!!!!!!!!!!!!!!!!!!!!!!!!!!!!!!!!!!!!�51 �//� ����������.3���������� �'�%��� �������/�����!!!!!!!!!!!!!!!!!!!!!!!!!!!!!!!!!!!!!!!!!!!!!!!!!!!!!!!!!!!!!!�51 �//� ����������.*��� ��� ���� ������������,� ��� � ��!!!!!!!!!!!!!!!!!!!!!!!!!!!!!!!!!!!!!!!!!!!!!!!!!!!!!!!!!�51 �//� ����������..���� �� ���������� ��������!!!!!!!!!!!!!!!!!!!!!!!!!!!!!!!!!!!!!!!!!!!!!!!!!!!!!!!!!!!!!!!!!!!!!!!!!!!!!!!�51 �//� ����������.1��D���� �� ���,��!!!!!!!!!!!!!!!!!!!!!!!!!!!!!!!!!!!!!!!!!!!!!!!!!!!!!!!!!!!!!!!!!!!!!!!!!!!!!!!!!!!!!!!!!!!!!�51 �//� ����������.5������� ���,��!!!!!!!!!!!!!!!!!!!!!!!!!!!!!!!!!!!!!!!!!!!!!!!!!!!!!!!!!!!!!!!!!!!!!!!!!!!!!!!!!!!!!!!!!!!!!!!!!!!!�51
LIST OF TABLES
)�,��*��' ����+��,���� ����� ������ � ����������-�+����/��E��������4!1�/���� ��� �.3*1�!!!!���� )�,��.��"��������/����������� �+����������+��+�� � ��� ��������,������� ��/������� ���
-��������!!!!!!!!!!!!!!!!!!!!!!!!!!!!!!!!!!!!!!!!!!!!!!!!!!!!!!!!!!!!!!!!!!!!!!!!!!!!!!!!!!!!!!!!!!!!!!!!!!!!!!!!!!!!!!!!!!!!!!!�. )�,��1��' ����+��,���� ����� �����D%(����-�+����4!*�/���� �����/��E���������.3*.0����� �����
4!1�/���� ��� �.3*1�!!!!!!!!!!!!!!!!!!!!!!!!!!!!!!!!!!!!!!!!!!!!!!!!!!!!!!!!!!!!!!!!!!!!!!!!!!!!!!!!!!!!!!!!!!!!!!!!!!!!!!!!!�7 )�,��5���� ����-� ��� ��+����������/���-��������+������� ������� ��� ��������������.3*.������
-+���!!!!!!!!!!!!!!!!!!!!!!!!!!!!!!!!!!!!!!!!!!!!!!!!!!!!!!!!!!!!!!!!!!!!!!!!!!!!!!!!!!!!!!!!!!!!!!!!!!!!!!!!!!!!!!!!!!!!!!!!!!!!!!!�= )�,��7��)+�����������������������0��+���+������ �� ���� � �� ��/� ������-��� �������!!!!!!!!!!!!�*1 )�,��4����������,������ ���������+����+��+��� �����������+������/�����!!!!!!!!!!!!!!!!!!!!!!!!!�*5 )�,��8��@��+���� �������,�����/� � ��� ��������� �� ����� ���������� ������������/��+�
�/��+���������� �.3*.�!!!!!!!!!!!!!!!!!!!!!!!!!!!!!!!!!!!!!!!!!!!!!!!!!!!!!!!!!!!!!!!!!!!!!!!!!!!!!!!!!!!!!!!!!!!!!!!!!!!!�*7 )�,��=��9��� ���/� � ���� �"+� ��� �+��+����+����������������,������/�����!!!!!!!!!!!!!!!!!!!�.3 )�,��6�������������/��� ��� ������,����D%(����-�+����4!=�/���� ��!!!!!!!!!!!!!!!!!!!!!!!!!!!!!!!!!!!!!�.1 )�,��*3��(�������� �� ��/���� ������������/��E����������� ��� �.3*1�!!!!!!!!!!!!!!!!!!!!!!!!!!!!!!!�.5 )�,��**��)+��.3*1�/��/����������/��E�����������������*!4����D%(�!!!!!!!!!!!!!!!!!!!!!!!!!!!!!!!!!!!!!!!!!!!�.4 )�,��*.��D%(����-�+����/��E��������,���,����8�/���� ��� �.3*5�!!!!!!!!!!!!!!!!!!!!!!!!!!!!!!!!!!!!!!!!!!!!!!!!!�.6 )�,��*1��)+�������>)���������������-�����������������������/���,��.3*4!!!!!!!!!!!!!!!!!!!!!!!!�.6
�
LIST OF APPENDIX TABLES
�//� ���)�,��*������������������ �/��E����� ��!!!!!!!!!!!!!!!!!!!!!!!!!!!!!!!!!!!!!!!!!!!!!!!!!!!!!!!!!!!!!!!!!!!!!�55 �//� ���)�,��.����� ������(���� ���!!!!!!!!!!!!!!!!!!!!!!!!!!!!!!!!!!!!!!!!!!!!!!!!!!!!!!!!!!!!!!!!!!!!!!!!!!!!!!!!!!!!!!!!!!�55
�
LIST OF BOXES
����*��)+��' �����%���,���H��-����,��������������������������� ���/��������!!!!!!!!!!!!!!!!!!!!�*4 ����.�������>�������� ��� �� � ��������� �����������/�����!!!!!!!!!!!!!!!!!!!!!!!!!!!!!!!!!!!!!!!!!!!!!!!!!!!!!�.3

��
Executive summary: Maintaining resilience
�)+���+�� ��������� ��� � �������� ��C�
� ������������������#�������"���������������������������#�������������������������� *����� �� ����� ���������� ����!� �������� #���� ����� �� �������� ����"� "�� ����������������A������"�/�������#�#����������������"��������������������!�����"�� �������������"�����#�����������������"�����������������������������/�������������������������������"����#����������#���������������������������������������������������������������A�������"�����������������������������������������#������������������������!��������������"������!������������������������#������"��������9������#���������������������������������456C�������������������������
C� ��+��������������,����� ����-+��+�+�����-�0�/���/�� ���� �-���� ��������/� ��� �
� ������������������������ ���*���!�����#����?'��������!������#�#�������;����������� ������!� ���������� /����!� ����� ����������� �� ������� ������ ��#���� ���'��������!� ���� ?'� 2�������=������ ���� ���� %���� "� &����� �������� ��� ����������"���� �������� ������!� #����� ���� ������� /������� %���� ��"������ ��� #��������� �������� ��� *���� �������� ���� �������� ����� ������!� #����� #���� #�����������������!��������������������������������"���������������!�����"����������"�������������������������������������!������������������������A�������/�������������������������!� #���� ��� ������ ��� �""������ ��� ������ �������� ���� ������ �������� "�����������������;���������������������������������"���� ���� ������ "���� "� �����������������&����4564!�#�����������������������������&���������������������������������"�������"������
������-��������� ����� �� ����������/�����0�� � ����������-�+�/������� ���� ��+��������+������.3*.�-������� �C�
� ��������� ������ �������������� ����� ����� "� ��#��� ��� ��������� A������� "� 4564!��������������D�C��������������������!� ��� �������� "��� D�7� ����������� ���� "���� A������� 02������ 61��%������ �������� ����������������������"���������������!����� ���������� �������� ������������ �������� -������ ���������� ����� "� ������� ��������!�������� ������ ��"������ ������������ �������� �� ������3��������/9�� ��"������ "��������� ��C�7� �������� ������������ ���'����������"���� ���������� ��C�D��������� ��� *����!� #���� ��� #��������� ������� ����������� ��� ��������� 2����� �������� /��� ��"�����������������������!�;��������C����������
Figure 1: Indonesia’s recent growth has been resilient amidst weaker external demand ���������������� �������������
�$�������E������� ��/��� ������-�+����-���+���,��� � ���������/�������������������(�0�"��"0������� ���������������� ��
�� �
�D
�7
5
7
D
F
�D
�7
5
7
D
F
&���5G '���5H &���65 *���66
� � ����
� � ����J� ��E������� ��/��� ���
9������ 9������

vi
C,����+����/�������-���� � ����,����� �� ����������/������+���,�� ���� �� ����� ��+��+����2�� ���� ���������+�-��������� ��������������� �� ������������ �
� ��������������"������������#������"������!�������!�������������������������#��������������������3#����!� ���� ���������� "��������������K�� �����������!� ��������������#��������������M��� �������������!��������� "��A������ ��������!����������!��������������������������������������""� ����������3#����!� ��� �� ��������#�"�����������"���������������������������"����#��#���������������������#��!���#������� ���� ��"����� ���� �""���� "� ���� ����� 2����� ������� ��� ������!� ���� ����"�������#�#����������������������#��������������#����������������������������������������������������������������A������!�����������#����������"�������������8-9���#��!� ���� ������� ������ ����� ������ ����� ������ �������� ��������� �� �������� ��� ����������A�������"�4564����
)+����� ��������� � ������� ������� ��,�� ������������ � ������������������-�+�� �� ������ �� ���C�
� ��������� �������� ������������ "������� ���� ��"����� ������� ����� A������� "� 4564��'�����������!� ���� �������#���� � �������� ���������"����� ��"����� ��������������� ������� ������������������� �� ���� ������ "�������� ������� �����#�#�� ��� ������ ����4564!� �������� ��������������� ������ ������!� ������� ���� ������ ��� �������������� ������� "� ������������ ����#� ���� ���!�������� #���� �������� ������"�#� ��� ���� ������ ����������� ���������!������ ���� ������� ��������������� ���� �� ��"����� "� 7�6��������� "� 8-9� ��� ��������� A������� "� 4564�� *������������#���� �����������������������������������������������������������!��������������(��������������������#��������������������������"��������������������������������02������41���������������������������������"�������������������������������������������������� �������������������������������"���������������������������������� �������� ����������������� N� ��������� "���� ��� ������ ���� ���*�������������������������������""���!���#��������������������""�����
Figure 2: A deterioration in current account balances has been seen in regional peers, as well as in Indonesia � ����� ���������� ��� �����������
��������@������ ������0����� ������� ���������������� ��
�C,�������+��+��+���+����/���� �������� �� �� ������������������%��� ��-��
� $���������#��������������������"������������������������������������������������� �� �������� ����� "� ��������� ������� ����������� ����!� ���� ����� �� "���� �������"����� ��� ���������� ���� ���������� "� ������������ ����� "������ ������� ������������"�#!� ��� ����� �� ������ ��������� �� ����������� �������� ���"��� ���������� "�#��(����������� ������ �#���� ���������� ��"��� �� ��"�� ���� ������������� "� ���������������� ����� ��� ��� ����������!� ��������� ��� ���� ���� ������ �������� ���� ������������������������;�����������'�������������������������������������������������������������""�����������������!����"���!��������������������������A�����!���� ����������� �������� ���� ���� ������� ����� �� �"� ����� ��������� �""���� ����������������� ��"������!� �������� ��������� �������� ���� ������� �� ��������� ���������*��#���� "������������#���������"� �����������������!�����������������������!� �������"�����������������������������������������������
)+��,����������������� ��������,���+��+�� �������,����������+�����������������������//����
� 3�������������������������������������������������������������������������������#�����������$����%�������"�������;������"��4564���4�C���������"�8-9!� ������������� 4�4� �������� ��� ���� 8���������� ������� %������� -�"����� "��������!� �#����!� ����"������� �� ������� 3���� ���� ������������ ���� 8���������� ��������� �������� ������������ ���������� "��������� "�� ��� ��� ���� ������ "� ������� ��������� ����� ������������� ����������� ��� ����������"����� "������� �������������������� ����������������8���������� ������ %������ "�� 4567!� ���������� ������ ������� #���� 9���������!����������"���������������6�D���������"�8-9!�#��������(�����������%������2����#�������������������������������������"�5�7���������"�8-9����456D���� �
�O
5
O
65
6O
�O
5
O
65
6O4566��74566��C4564��64564��4
9�������"�8-9 9�������"�8-9
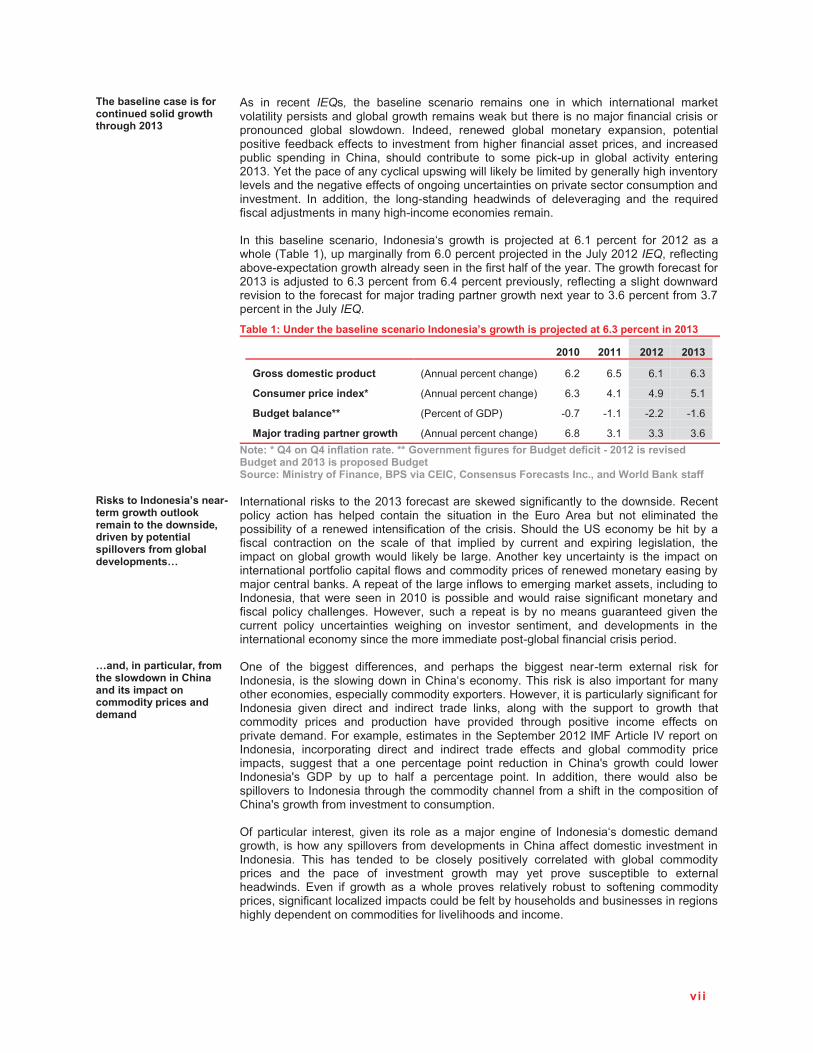
vi i
)+��,���� ���������������� �� ����������-�+��+����+�.3*1��
� *� ��� ������� ����� ���� �������� ������� ������� ��� ��� #����� ������������� �����������������������������������#����������#��������������������;��"������������������������� ������ �#�#��� ������!� ����#��� ������ �������� �������!� ����������������"���������""���� �� ���������� "���������� "������������������!����� ���������������� �������� ��� /����!� ����� ���������� �� ��� �������� ��� ������ ��������� ���������4567��:������������"����������������#����#�������������������������������������������������������������������������""����"����������������������������������������������������������� ��� �������!� ���� ������������ ����#���� "� ������������� ���� ���� ��A������"�������;��������������������������������������������� ���� �������� ������!� ��������� ��#��� �� ��;������ ��� D�6� �������� "�� 4564� �� ��#����0������61!���������������"���D�5�����������;�������������&����4564����!���"��������������������������#����������������������"�������"�"�����������������#���"������"��4567�����;�������D�7���������"���D�C�����������������!���"�����������������#�#�����������������"������"����;��������������������#���������������7�D���������"���7�G����������������&�����������
Table 1: Under the baseline scenario Indonesia’s growth is projected at 6.3 percent in 2013 �
�� .3*3� .3**� .3*.� .3*1�
D�������������/������ 0*��������������������1� D�4� D�O� D�6� D�7�
"� ������/������ ��K� 0*��������������������1� D�7� C�6� C�F� �O�6�
������,�� ��KK� 09�������"�8-91� �5�G� �6�6� �4�4� �6�D�
��E������� ��/��� ������-�+� 0*��������������������1� D�H� 7�6� 7�7� 7�D���
$�����K�G5�� �G5�� ����� �����!�KK�D���� �� ���������������������������>�.3*.������������������ �.3*1����/��/�������������������� ����������� � ��0��(������"��"0�"� �� ��������������� �!0�� ������� ���������
9��������� � ������� ���>��������-�+������������� �����+���- ���0����� �,��/��� �����/��������������,������/�� ��C��
� �����������������������4567�"������������#�������"�������� �������#������=������������ ������ ��� ������� ������� ���� �������� ��� ���� ��� *���� ���� ��� ����������� �������������"��� ����#��� ������"�������"� ����������'����� ����?'����������������� ��"����� ���������� �� ���� ����� "� ����� �������� ��� �������� ���� ��������� ���������!� ���������������������#���#���� ���������� �������*���������������������� �� ���� �������������������������"�����������"�#�������������������"�����#����������������������;����������������*��������"�������������"�#����������������������!��������������������!� �����#�������� ���4565� ������������#���� ���������"������������������"����� ������ ����������� 3#����!� ���� �� ������� �� ��� �� ����� ����������� ������ ������������ ������ ������������� #�������� �� ������� ��������!� ���� ����������� ��� �������������������������������������������������������"����������������������
C� 0�� �/��������0�������+����-�- �� �"+� ��� �������/����� ����������/������� ���� �
� K��� "� ���� ������� ��""������!� ���� ������� ���� ������� ���������� ��������� ���� "���������!� �� �����#�����#�����/��������������������� ����� ��������� "������������������!����������������������������3#����!�����������������������"������"���������� ������ ������� ���� ��������� ������ ����!� ����� #���� ���� ������ �� ��#��� ������������� ������ ���� ��������� ����� �������� ������� ������� ������ �""���� ������������������2���������!��������� �������'���������4564��(2�*��������P����������������!� ������������ ������� ���� ��������� ������ �""���� ���� ������ �������� ������������!� ������ ����� �� ��� ����������� ����� ��������� ��� /����R� ��#��� ����� �#����������R� 8-9� ��� ��� �� ���"� �� ����������� ������ ��� �������!� ������ #���� ��� ������������������������������������������������ "�������"�� ��� ������������"�/����R���#���"���������������������������K"� ����������� �������!� ������ ��� ������ ����;�� ������� "� �������������������������#��!� ���#�������������"�������������� ���/������""����������� ���������� ������������ ���� ��� ������� �� ��� ������ ��������� ���������� #���� ������ �������������� ���� ���� ����� "� ���������� ��#��� ���� ���� ����� ���������� �� �������������#����� ���� �"� ��#��� �� �� #���� ����� ����������� ����� �� "������� �������������!�����"������������������������������"��������������������������������������������������������������"����������������������
�� �
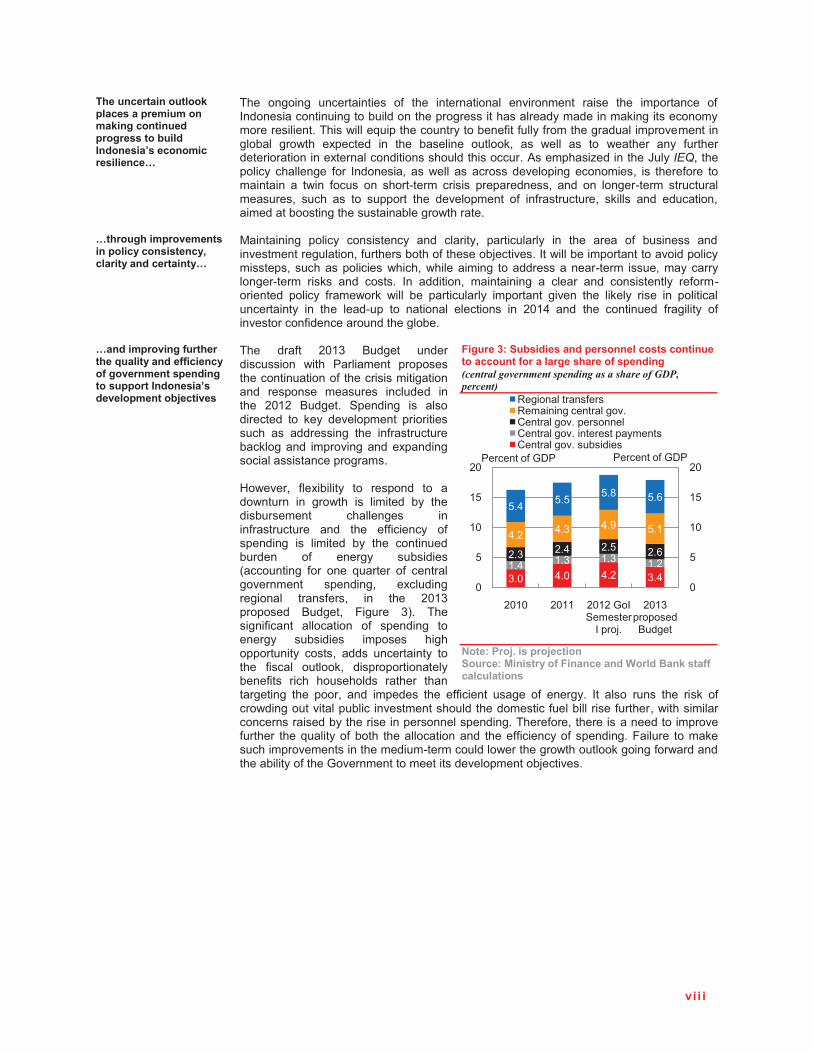
vi i i
)+��� ������ ��������/�������/�������� ����� ���� �� ���/�����������,���� � ���������� ����������� ��C��
� ���� ������ ������������� "� ���� ������������� ����������� ����� ���� ���������� "�����������������������������������������������������������������������������������������������#�����A���������������������"���"�����"����������������������������������� ��#��� ��������� ��� ���� �������� ����!� �� #���� �� �� #������� ���� "������������������������������������������������������*������������������&�������!����������� ���������� "�� �������!� �� #���� �� ���� ���������� ������!� �� �����"��� ����������� �� �#��� "��� �� ��������� ����� ����������!� ���� �� ����������� ����������������!� ���� �� �� ������ ���� ����������� "� ��"����������!� ����� ���� ��������!��������������������������������#�����������
C�+����+���/������ ���� �/������� ����� ��0��������� ������� ��C��
� (����������� ������ ��������� ���� �������!� ������������� ��� ���� ����� "� ������ �����������������������!�"�����������"�������;�����������#����������������������������������!��������������#����!�#������������ �������������������� ���!���������������������� ���� ���� ���� ��� �������!� ������������ �� ������ ���� ���������� ��"����������� ������ "����#��� #���� ��� ������������� ��������� ������ ���� ������� ���� ��� ��������������������� ��� ���� �������� �� �������� �������� ��� 456C� ���� ���� ��������� "��������� "����������"�������������������������
C� ���/���� ������+����+��2������� �������� ����������� �� ���/� � �������//����� � �����������/�� ���,E��������
� ���� ���"�� 4567� %������ ������������� #���� 9���������� ��������������������"������������������������ ������ ������� ��������� ������� 4564� %������� '�������� �� ������������ �� ���� ����������� ������������� �� ��������� ���� ��"���������������������� ���������������������������������������������3#����!� "����������� �� ������ �� ���#������ ��� ��#��� �� �������� ��� ��������������� ���������� �����"����������� ���� ���� �""�������� "��������� �� �������� ��� ���� ���������������� "� ������� �������0���������� "�� ��� A������� "� ������������������ �������!� ������������������ ����"��!� ��� ���� 4567������� %�����!� 2������ 71�� ��������"������ ��������� "� �������� ��������� ������� ����� ��������������� ��!� ���� ������������ ������ "����� ����!� �������������������"��� ����� ������� ������� ��������������� ���� ��!� ���� ������� ���� �""������� ����� "� �������� ��� ��� ���� ���� ���� "���#�����������������������������������������������"�������������"������!�#������������������������������������������������������������"��!�������������������������"������� ����A�������"� ���� ����������������� �����""��������"����������2������� �����������������������������������������������#���������#�������������"�#��������������������"�����8�������������������������������;��������
Figure 3: Subsidies and personnel costs continue to account for a large share of spending � ��������������������������������������� ����
�$�����(��E!����/��E����� ����������� ����������� � ���� ������� ���������������� ��
�� �
7�5 C�5 C�4 7�C6�C 6�7 6�7 6�44�7 4�C 4�O 4�DC�4 C�7 C�F O�6
O�C O�O O�H O�D
5
O
65
6O
45
5
O
65
6O
45
4565 4566 4564�8��'�������
����;�
4567�������%�����
=�����������"��=��������������������/������������������/��������������������������/�����������������
9�������"�8-99�������"�8-9

ix
���
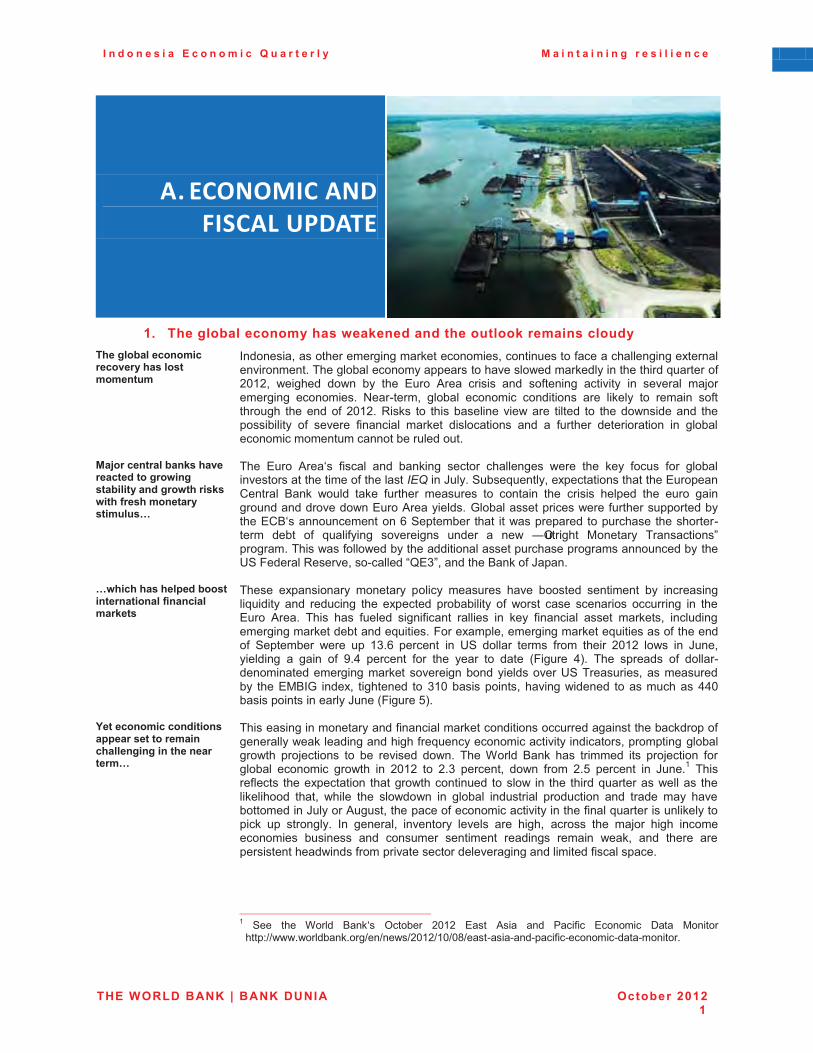
I n d o n e s i a E c o n o m i c Q u a r t e r l y M a i n t a i n i n g r e s i l i e n c e
THE WORLD BANK | BANK DUNIA October 2012 1
A.�ECONOMIC AND FISCAL UPDATE
�*!� The global economy has weakened and the outlook remains cloudy
)+����,����� ��������������+����������� ����
� �������!������������������������������!�����������"����������������������������������������������������������������������#�������������������������A�������"�4564!� #������� �#�� ��� ���� ��� *���� ����� ���� "������� ��������� ��� ������� ��;����������� �������� +��������!� ������ ������� �������� ���� ������� �� ������� "��������� ��������"� 4564�� =��� �� ������������ ���#����� ������� �� �����#��������� ������������� "� ������ "��������� ������� ��������� ���� �� "������� ������������ ��� �����������������������������������������
��E����� ����,� ���+�����������������-� �����,������ ����-�+�������-��+�����+��� �������������C�
� ���� ��� *����� "����� ���� �������� ����� ���������� #���� ���� ���� "��� "�� �������������������������"����������������&�����'���A������!��������������������� �������/������� %���� #���� ����� "������� ������� �� ������� ���� ����� ������� ���� ���� ���������������������#�� ���*�����������8���������������#����"���������������������� /%����������������D�'�������������� ���#������������������������������������ ����� "� A����"����� �������� ������ �� ��#� SK�������� (������� ���������”�������������#��"��#�������������������������������������������������������?'�2�������=�����!�������� “QE3”,���������%����"�&�������
C-+��+�+���+�/��,������ ��� ���� ���� � ������������
� ����� ����������� �������� ������ ������� ����� ����� ��������� ��� ������������A������� ���� ��������� ���� ��������� ����������� "� #��� ���� ������� ��������� ��� ���� ��� *����� ���� ��� "������ ����"������ ������� ��� ���� "��������� ���� ������!� ������������������������������������A�������2���������!������������������A��������"���������"� '��������� #���� ��� 67�D� �������� ��� ?'� ������ ����� "��� ������ 4564� �#� ��� &���!���������� �� ����� "� F�C� �������� "�� ���� ����� �� ����� 02������ C1�� ���� ������ "� �������������������������������������������������������?'���������!�������������� ���� (%�8� �����!� ���������� �� 765���������!��������#������� ����������� CC5�������������������&����02������O1���
<������ ������� ���� ���//���������������� ��+�� �� ��� ��+�� ��������C�
� �������������������������"���������������������������������������������������"�����������#���������������������"��A������������������������������!������������������#��� ��;������ �� ��� ������� �#��� ���� $���� %���� ��� �������� ��� ��;������ "�������� ������� ��#��� ��� 4564� �� 4�7� �������!� �#�� "��� 4�O� �������� ��� &����6� ������"����� ��������������� �������#������������ ���#� ��� ���� ������A���������#������ ������������� ����!� #����� ���� �#�#�� ��� ������ ���������� ��������� ���� ������ ���� ���������������&������*����!����������"������������������������"�����A������������������������� ��� �������� ��� �������!� ��������� ������ ���� ����!� ���� ���� ��;�� ����� ������������� ������ ���� ������� ��������� �������� ������� #���!� ���� ������ �����������������#����"�����������������������������������������"������������� �
�����������������������������������������������������������������6� '��� ���� $���� %����� K������ 4564� ��� *��� ���� 9���"��� ������ -���� (�����
����V>>###�#����������>��>��#>4564>65>5H>����������������"����������������������
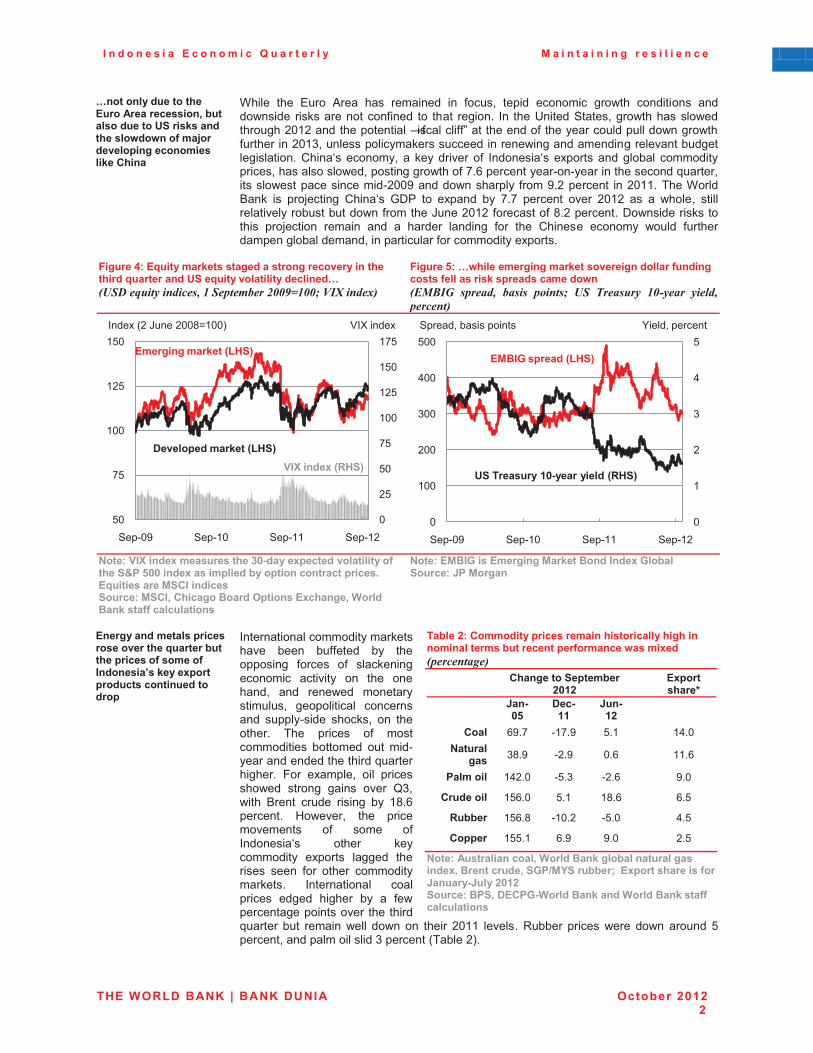
I n d o n e s i a E c o n o m i c Q u a r t e r l y M a i n t a i n i n g r e s i l i e n c e
THE WORLD BANK | BANK DUNIA October 2012 2
C ���� ���������+�������������������� 0�,�������������'��������� ��+����-�- ������E�������/� ����� ����������"+� ��
� $����� ���� ��� *���� ��� ��������� ��� "��!� ������ ������� ��#��� �������� �����#����� �������������"����� �� ����� ������� ��� ����?������'����!���#�������#����������4564������������������S"��������""”������������"���������������������#����#���"����������4567!�������������������������������#��������������������������������������������/�����������!��� ����������� "� ������������������������� �������������!��������#��!���������#���"�G�D���������������������������������A������!�����#�����������������455F������#��������� "���F�4��������� ���4566������$����%���� �� ��;������� /������ 8-9� �� ������� ��� G�G� �������� ���� 4564� �� �� #���!� ��������������������������#��"�������&����4564�"������"�H�4����������-#��������������� ��;������ ������� ���� �� ������� �������� "�� ���� /������ ������ #���� "��������������������������!���������������"������������������
Figure 4: Equity markets staged a strong recovery in the third quarter and US equity volatility declined… � !��"��������� ���#�!�����$%%&'#%%(�)*+����,��
Figure 5: …while emerging market sovereign dollar funding costs fell as risk spreads came down �-�.*�� ������ ������ ������(� !� /����� #%���� ������� ����
� �$�����;�A�� �������������+��13>�����/������������������+���L(�733�� ��������/���,���/��� ��� ������/�����!��2�������������"��� ���������������"�0�"+�����������#/��� �����+� ��0������� ���������������� ��
$���������D���������� ����������� �� ���D�,����������M(������ �
�� ������ �������/�����������������+��2�������,����+��/������������������ � �������������/����/��������� �� ��������/�
� ��������������������������������� ����� ��""����� ��� ���������� "���� "� ����������������� ��������� �� ���� �������!� ���� ����#��� ��������������!� ����������� ����������� ���������� ���!� �� ���������� ���� ������ "� ������������ ������� ��� �����������������������������A��������������� 2�� �������!� ��� �������#��� ����� ����� ���� �7!�#���� %����� ������ ������ ��� 6H�D���������� 3#����!� ���� �������������� "� ��� "���������� ����� ������������ ������ ������� �������� ���� "�� ����� ���������������� ������������� ���������� ������ ������� ��� �� "�#��������������������� ����������A������� ���� ������� #���� �#�� �� ������ 4566� ������� =������ ������ #���� �#�� ������ O��������!�����������������7���������0������41���
Table 2: Commodity prices remain historically high in nominal terms but recent performance was mixed �� ������
"+� ��������/���,���.3*.��
� ��/�����+���K�
M� >37�
%��>**�
M� >*.�
� �
"��� DF�G� �6G�F� O�6� � 6C�5�$������
���� 7H�F� �4�F� 5�D� � 66�D�
(������ 6C4�5� �O�7� �4�D� � F�5�
"������� 6OD�5� O�6� 6H�D� � D�O�
9�,,��� 6OD�H� �65�4� �O�5� � C�O�
"�//���� 6OO�6� D�F� F�5� � 4�O��
$������������� ����0������� ����,�� ����������� ��0���� ������0��D(N�<����,,��O����/�����+�����������M� ����>M���.3*.�����������(�0�%�"(D>������ ��� ������� ���������������� ��
5
4O
O5
GO
655
64O
6O5
6GO
O5
GO
655
64O
6O5
'���5F '���65 '���66 '���64
������ ���������P&@�Q
%����/���������P&@�Q�
������04�&����455HX6551 P�Y �����
;�A � ���P9@�Q�
5
6
4
7
C
O
5
655
455
755
C55
O55
'���5F '���65 '���66 '���64
����D��/����P&@�Q
'��)��������*3>���������P9@�Q
'�����! �������� :����!��������
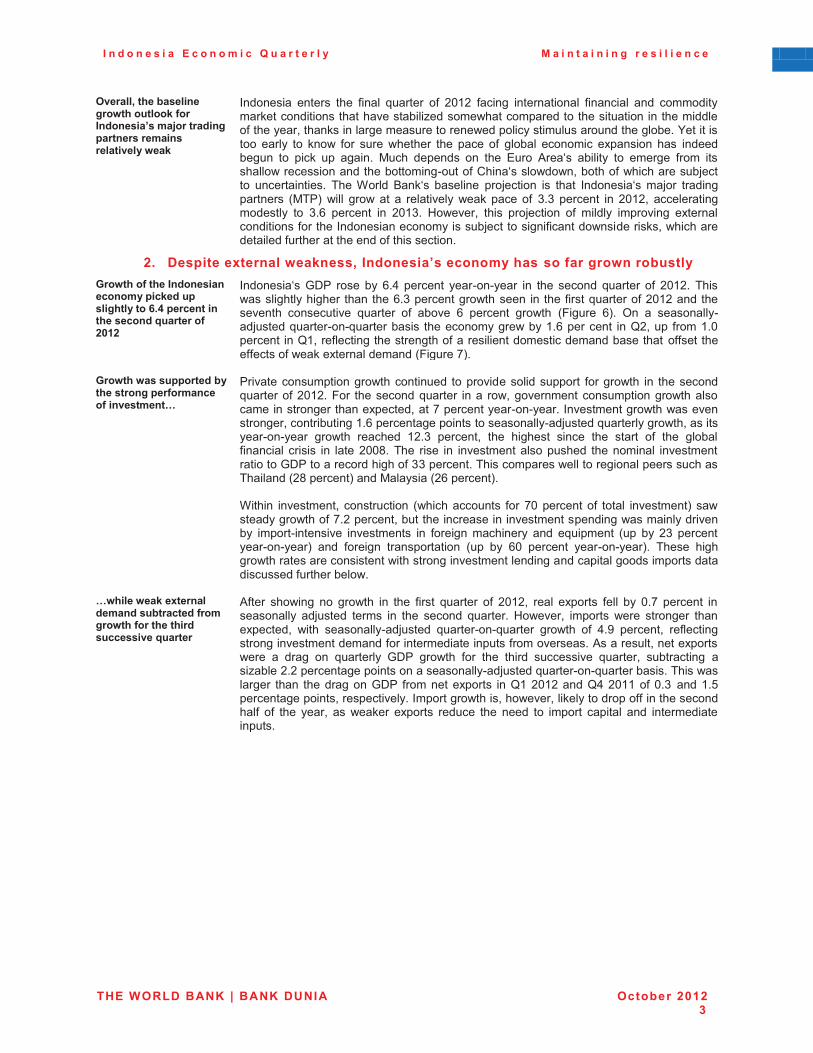
I n d o n e s i a E c o n o m i c Q u a r t e r l y M a i n t a i n i n g r e s i l i e n c e
THE WORLD BANK | BANK DUNIA October 2012 3
#����0��+��,���� �����-�+������������� � ���������E������� ��/��� ��������� �����������-����
� �������� ������ ���� "����� A������� "� 4564� "������ ������������� "��������� ���� ���������������������������������������������#����������������������������������������"���������!�����������������������������#��������������������������������:���������� ������ �� ��#� "�� ���� #������� ���� ����� "� ������ ������� �������� ��� ������������� �� ����� ��� ������� (���� ������� �� ���� ��� *����� �������� �� ������� "��� �������#���������������������������"�/�������#�#�!�����"�#�����������;������ �������������� ����$���� %����� �������� ��;������ �� ����� ��������� ��;�� ���������������� 0(�91� #���� ��#� ��� �� ����������� #���������"� 7�7��������� ���4564!� �������������������� �� 7�D� �������� ��� 4567�� 3#����!� ���� ��;������ "� ������� ��������� �����������������"�������������������������;����������"�������#��������!�#������������������"������������������"������������
.!� Despite external weakness, Indonesia’s economy has so far grown robustly D��-�+�����+��� � ���� ���� ����/������/����+������4!5�/���� ��� ��+������ �2����������.3*.�
� ��������� 8-9� ��� ��� D�C� �������� ������������ ��� ���� ����� A������� "� 4564�� ����#����������������� ���������D�7�����������#������� �������"����A�������"�4564���������������� ���������� A������� "� ����� D� �������� ��#��� 02������ D1�� K�� �� ����������;�����A���������A����������� �������������#����6�D���������� ����4!���� "���6�5�������������6!���"��������������������"�����������������������������������""��������""����"�#��������������������02������G1���
D��-�+�-�����//�����,���+������ ��/������� ������� ������ �C�
� 9������������������#������������ ������������������� "����#��� ��� ���������A�������"�4564��2�� ���������A������� ����� �#!����������������������#����������������������������������!����G����������������������������������#���#�������������!�������������6�D�����������������������������;�����A�����������#��!������������������ ��#��� �������� 64�7� �������!� ���� ������� ����� ���� ����� "� ���� ������"�������������� ��� �����455H������ ���� ��� ������������������� ����������� �����������������8-9����������������"�77���������������������#����������������������������������04H��������1�����(�������04D��������1���$������ ���������!� ���������� 0#������������ "�� G5���������"� ����� ���������1� �#���������#���"�G�4��������!��������������������������������������#������������������� ��������������� ���������� ��� "������ ���������� ���� �A�������� 0��� ��� 47� �������������������1� ���� "������ ������������ 0��� ��� D5� �������� �����������1�� ����� �������#��������������������#������������������������������������������������������������"����������#���
C-+���-��������� ����� ���,���������������-�+������+���+��������������2�������
� *"���� �#���� �� ��#��� ��� ���� "���� A������� "� 4564!� ����� ������ "���� ��� 5�G� �������� ����������� ��;����� ����� ��� ���� ����� A�������� 3#����!� ������ #���� ������� �������������!� #���� ����������;����� A���������A������� ��#��� "� C�F� �������!� ��"������������������������������"���������������������"����������*��������!�����������#���� �� ����� �� A��������� 8-9� ��#��� "�� ���� ������ �������� A������!� ����������� ���������4�4�������������������������������;�����A���������A����������������#��������� ����� �����������8-9� "������������� ����6�4564������C�4566�"�5�7�����6�O����������������!����������������������#����!��#����!��������������""����������������"� "� ���� ����!� �� #������ ������ ������� ���� ����� �� ������ �������� ���� ��������������������
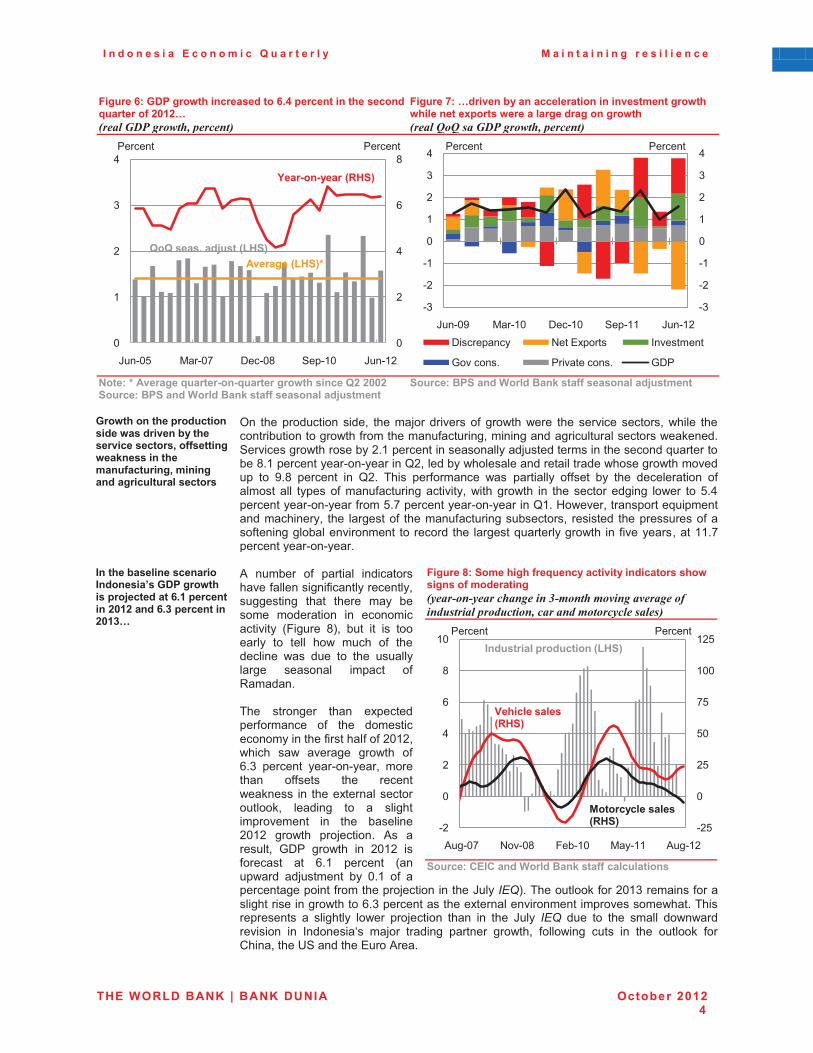
I n d o n e s i a E c o n o m i c Q u a r t e r l y M a i n t a i n i n g r e s i l i e n c e
THE WORLD BANK | BANK DUNIA October 2012 4
Figure 6: GDP growth increased to 6.4 percent in the second quarter of 2012… ���������������� ���
Figure 7: …driven by an acceleration in investment growth while net exports were a large drag on growth ����0�0���������������� ���
�
$�����K���������2������>� >2����������-�+��� ���G.�.33.����������(��� ������� ������������� ���E����� ��
���������(��� ������� ������������� ���E����� ��
�D��-�+�� ��+��/������� �����-������� �,���+�����������������0��������� ��-��� ����� ��+���� �������� �0��� � ��� ��������������������
� K�� ������������� ���!� ������;���������"� ��#���#���� ���� ������� ����!�#����� �������������������#���"�����������"��������!������������������������������#���������'���������#���������4�6����������������������;����������������������A������������H�6�������������������������4!��������#������������������������#�����#����������� �� F�H� �������� ��� �4�� ���� ���"������� #�� ���������� ""��� ��� ���� ������������ "������ ���� �����"�����"�����������������!�#������#��� ��� ���� ����� ������� �#��� ��O�C���������������������"���O�G�������������������������6��3#����!����������A���������������������!� ���� �������"� ��������"���������������!� ������� �����������"���"������������������������ ������������ �������A�����������#��� ���"��������!����66�G�����������������������
� ��+��,���� ����� ������ � �������D%(����-�+����/��E��������4!*�/���� ��� �.3*.�� �4!1�/���� ��� �.3*1C�
� *� ������� "� �������� ��������������"����������"����������������!����������� ����� ������ ���� ������ ��������� ��� ���������������� 02������ H1!� ���� ��� �� �������� �� ����� �#� ����� "� ������������ #�� ���� �� ���� ������������� ������ ������� "�=������������� ������� ����� ������������"������� "� ���� ��������������������"�������"�"�4564!�#����� �#� �������� ��#��� "�D�7� �������� �����������!� ��������� ""��� ���� �������#������ ��� ����������������������!� �������� �� �� ����������������� ��� ���� ��������4564� ��#��� ��;������� *� �������!� 8-9� ��#��� ��� 4564� ��"������ ��� D�6� �������� 0�����#���� ��;������� ��� 5�6� "� ������������������"���������;�������������&�������1�����������"��4567��������"�������������������#�����D�7��������������������������������������������#������������������ �� �������� �#��� ��;������ ����� ��� ���� &���� ���� ���� �� ���� ����� �#�#����������� ��� ��������� ��;�� �������� �������� ��#��!� "��#���� ���� ��� ���� ����� "��/����!�����?'��������� ���*�����
Figure 8: Some high frequency activity indicators show signs of moderating ���������� ��������1������������������������������������ ������ ���������� � ��������
��������"��"�� ������� ���������������� ��
5
4
C
D
H
5
6
4
7
C
&���5O (���5G -���5H '���65 &���64
9������ 9������
G�G ����!��E����P&@�Q
<���>� >�����P9@�Q
��������P&@�QK
�7
�4
�6
5
6
4
7
C
�7
�4
�6
5
6
4
7
C
&���5F (���65 -���65 '���66 &���64-��������� +��� ���� ���������
8����� 9���������� 8-9
9������ 9������
�4O
5
4O
O5
GO
655
64O
�4
5
4
C
D
H
65
*���5G +��5H 2���65 (���66 *���64
� �������/������� �P&@�Q
;�+���������P9@�Q
���������������P9@�Q
9������ 9������
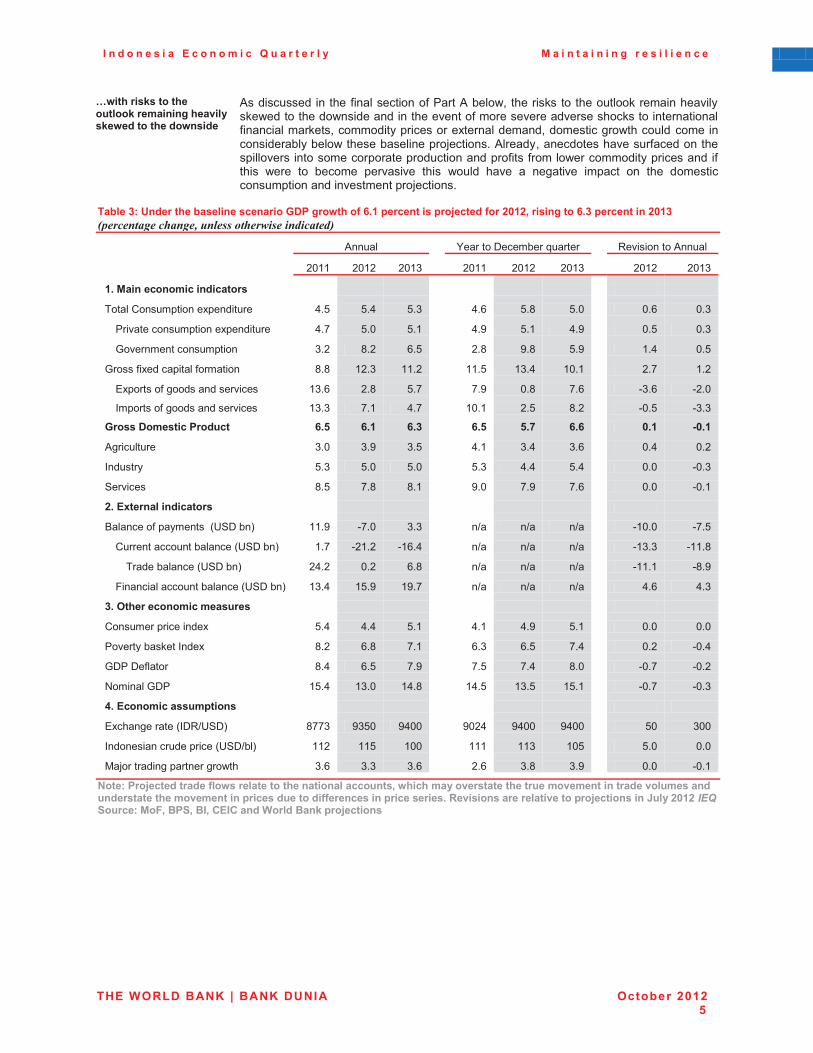
I n d o n e s i a E c o n o m i c Q u a r t e r l y M a i n t a i n i n g r e s i l i e n c e
THE WORLD BANK | BANK DUNIA October 2012 5
C-��+�����������+�������������� � ��+���������-������+���- ����
� *���������������"�����������"�9����*����#!� ������������������������������������#����������#����������������������"�������������������������������������"���������������!��������������������������������!����������#�����������������������������#����������������;�������*������!����������������"�������������������������������������������������"���"����#����������������������"����� #���� �� ������ ��������� ���� #���� ����� �� ��������� ������� �� ���� ��������������������������������;������ �
Table 3: Under the baseline scenario GDP growth of 6.1 percent is projected for 2012, rising to 6.3 percent in 2013 �� ����� ����������������������� �����
�� *������ �� :������-��������A������� �� =��������*������
�� 4566� 4564� 4567� �� 4566� 4564� 4567� �� 4564� 4567�
*!���� ���� ������ �������� �� �� �� �� �� �� �� �� �� ��
�����/�������������������� C�O� O�C� O�7� �� C�D� O�H� O�5� �� 5�D� 5�7�
9���������������������������� C�G� O�5� O�6� �� C�F� O�6� C�F� �� 5�O� 5�7�
8������������������ 7�4� H�4� D�O� �� 4�H� F�H� O�F� �� 6�C� 5�O�
8��"�������������"������� H�H� 64�7� 66�4� �� 66�O� 67�C� 65�6� �� 4�G� 6�4�
�����"��������������� 67�D� 4�H� O�G� �� G�F� 5�H� G�D� �� �7�D� �4�5�
������"��������������� 67�7� G�6� C�G� �� 65�6� 4�O� H�4� �� �5�O� �7�7�
D�����%��������(������ 4!7� 4!*� 4!1� �� 4!7� 7!8� 4!4� �� 3!*� >3!*�
*����������� 7�5� 7�F� 7�O� �� C�6� 7�C� 7�D� �� 5�C� 5�4�
�������� O�7� O�5� O�5� �� O�7� C�C� O�C� �� 5�5� �5�7�
'������� H�O� G�H� H�6� �� F�5� G�F� G�D� �� 5�5� �5�6�
.!������ ��� �������� �� �� �� �� �� �� �� �� �� ��
%�������"����������0?'-���1� 66�F� �G�5� 7�7� �� �>�� �>�� �>�� �� �65�5� �G�O�
/����������������������0?'-���1� 6�G� �46�4� �6D�C� �� �>�� �>�� �>�� �� �67�7� �66�H�
��������������0?'-���1� 4C�4� 5�4� D�H� �� �>�� �>�� �>�� �� �66�6� �H�F�
2������������������������0?'-���1� 67�C� 6O�F� 6F�G� �� �>�� �>�� �>�� �� C�D� C�7�
1!�#�+������ �������������� �� �� �� �� �� �� �� �� �� ��
/������������������ O�C� C�C� O�6� �� C�6� C�F� O�6� �� 5�5� 5�5�
9������������������ H�4� D�H� G�6� �� D�7� D�O� G�C� �� 5�4� �5�C�
8-9�-�"����� H�C� D�O� G�F� �� G�O� G�C� H�5� �� �5�G� �5�4�
+������8-9� 6O�C� 67�5� 6C�H� �� 6C�O� 67�O� 6O�6� �� �5�G� �5�7�
5!���� ����������/��� �� �� �� �� �� �� �� �� �� �� ��
�������������0�-=>?'-1� HGG7� F7O5� FC55� �� F54C� FC55� FC55� �� O5� 755�
���������������������0?'->��1� 664� 66O� 655� �� 666� 667� 65O� �� O�5� 5�5�
(�;��������������������#��� 7�D� 7�7� 7�D� �� 4�D� 7�H� 7�F� �� 5�5� �5�6��
�
$�����(��E������������-������������+�� ���� ������� ��0�-+��+����������������+������������� ��� �������������� �� ���������+�������� ��� �/������������������ ����� �/�����������!�9������ �����������������/��E����� ��� �M���.3*.�����������������0��(�0���0�"��"�� ������� ��/��E����� ��
�� �
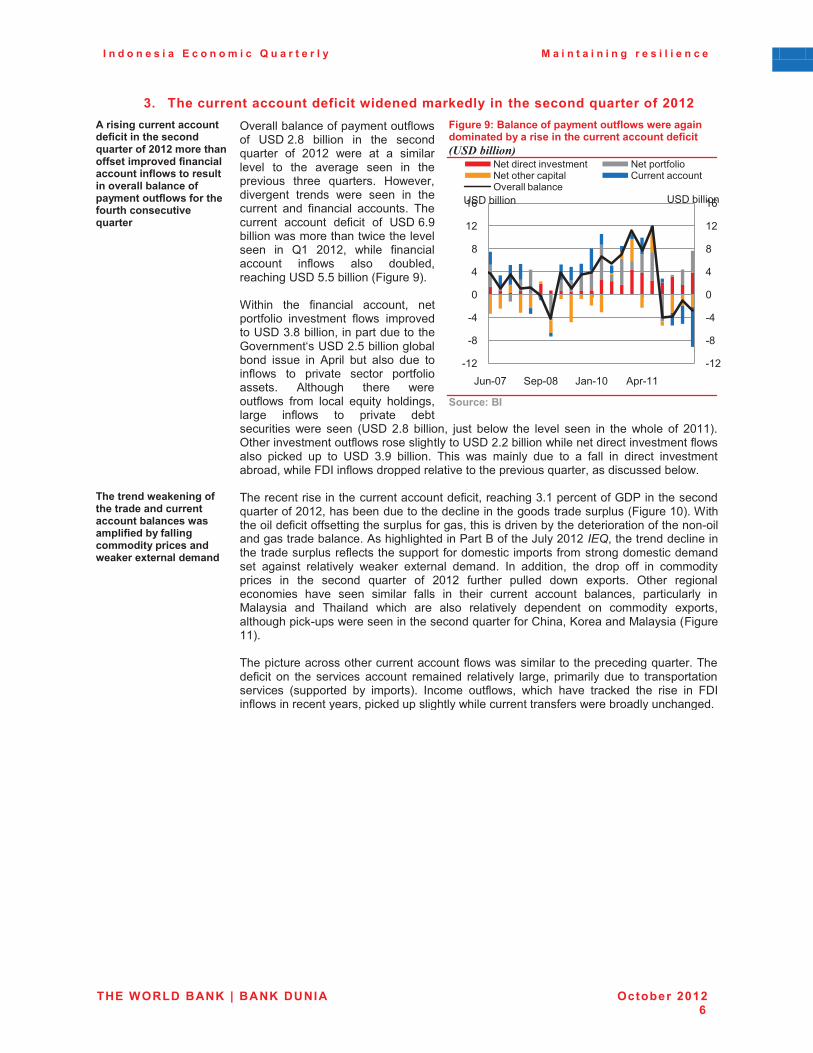
I n d o n e s i a E c o n o m i c Q u a r t e r l y M a i n t a i n i n g r e s i l i e n c e
THE WORLD BANK | BANK DUNIA October 2012 6
1!� The current account deficit widened markedly in the second quarter of 2012 ������ ������� ������� ���������� ��+������ �2����������.3*.�������+� ����������/������� � ��������� ��� ��-������������ �������,�� ������/���� �������-�������+�������+��� ���������2�������
� K���������������"�����������"�#�"� ?'-�4�H� ������� ��� ���� �����A������� "� 4564� #���� ��� �� ������������� �� ���� �������� ���� ��� ����������� ������ A�������� 3#����!����������� ������ #���� ���� ��� ������������ ���� "��������� �������� ������������ ������� ��"����� "� ?'-�D�F��������#������������#������������������ ��� �6� 4564!� #����� "���������������� ��"�#� ��� ������!����������?'-�O�O��������02������F1���$������ ���� "��������� ������!� �������"��� ���������� "�#� ����������?'-�7�H�������!�������������������8����������?'-�4�O������������������ ���� ��� *����� ���� ��� ���� ����"�#� �� �������� ����� ���"�������� *������� ������ #������"�#� "��� ����� �A����� ������!������� ��"�#� �� �������� �������������� #���� ���� 0?'-� 4�H� ������!� ;��� ���#� ���� ������ ���� ��� ���� #���� "� 45661��K�����������������"�#��������������?'-�4�4��������#��������������������������"�#���� ������� ��� �� ?'-� 7�F� �������� ���� #�� ������� ���� �� �� "���� ��� ������� ���������������!�#�����2-����"�#������������������������������A������!�������������#��
Figure 9: Balance of payment outflows were again dominated by a rise in the current account deficit � !�����������
�����������
�)+����� �-���� � ������+�������� ������ ������� ��,�� ����-�����/�����,����� �����������/������� �-����������� ����� �
� ���������������������������������������"����!����������7�6���������"�8-9�������������A�������"�4564!�������������������������������������������������02������651��$�������������"�����""�����������������"����!���������������������������������"���������������������������������*����������������9����%�"�����&����4564����!����������������������������������������"���������������"���������������"������������������������� ������� ����������� #������ ��������� �������� ��� �������!� ���� ���� ""� ��� �������������� ��� ���� ����� A������� "� 4564� "������� ������� �#�� ������� K����� ��������������� ����� ���� ������� "���� ��� ������ �������� ������� �������!� ������������� ���(������� ���� ��������� #����� ���� ��� ����������� ���������� �� �������� �����!�����������������#��������������������A�������"��/����!�<��������(�������02������661����������������������������������������"�#�#�������������������������A��������������"����� �� ���� ������� ������� ��������� ����������� �����!� ���������� ���� �� ������������������� 0�������� ��� �����1�� ������ ��"�#!� #����� ����� �������� ���� ���� ��� 2-����"�#���������������!�������������������#�����������������"���#������������������������� �
�64
�H
�C
5
C
H
64
6D
�64
�H
�C
5
C
H
64
6D
&���5G '���5H &���65 *���66
+������������������� +������"��+��������������� /�������������K��������������
?'-������� ?'-�������
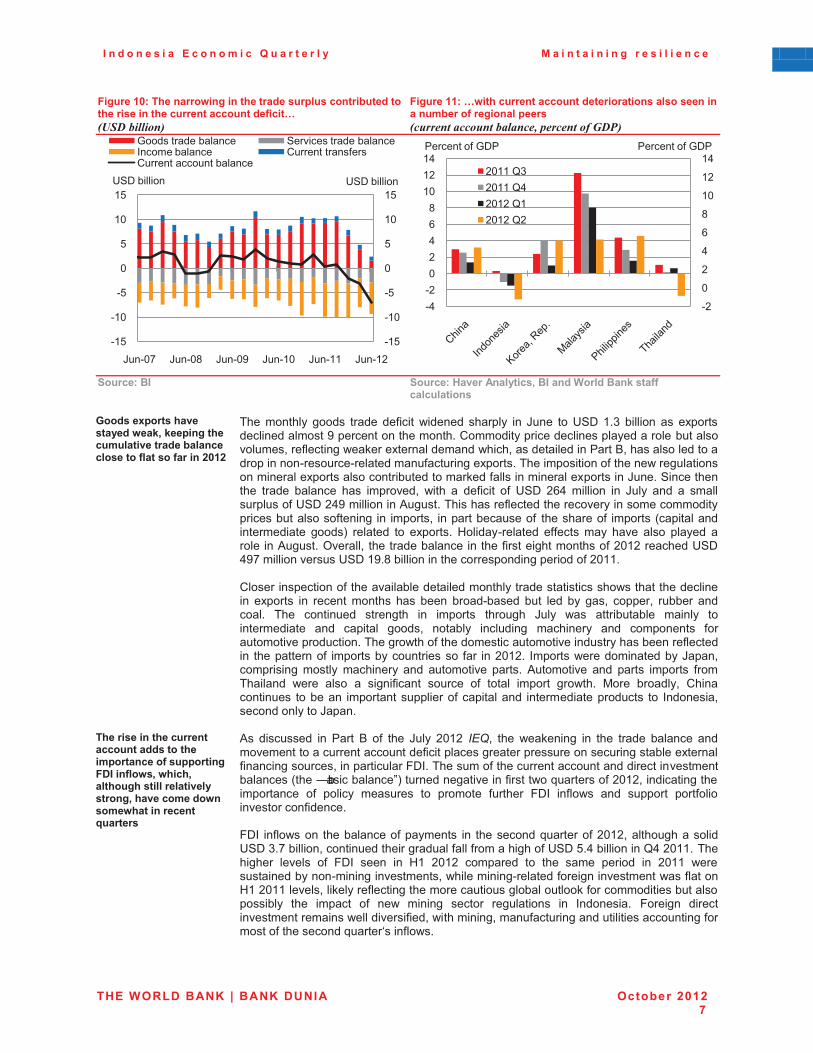
I n d o n e s i a E c o n o m i c Q u a r t e r l y M a i n t a i n i n g r e s i l i e n c e
THE WORLD BANK | BANK DUNIA October 2012 7
Figure 10: The narrowing in the trade surplus contributed to the rise in the current account deficit… � !�����������
Figure 11: …with current account deteriorations also seen in a number of regional peers � ����� ���������� ��� �����������
������������ ��������@������ ������0����� ������� ��������
�������� ���
D������/�����+����������-���0����/� ���+�����������������,�� ����������������������� �.3*.�
� ���� ������� ��� ������ ��"����� #�������������� ��� &���� �� ?'-� 6�7� ������� �� ��������������������F���������������������/����������������������������������������������!���"��������#����������������������#����!���������������9����%!��������������������������������������������"����������������������������"�������#��������������������������������������������������"������������������������&�����'�������������� ������ �������� ��� �������!� #���� �� ��"����� "� ?'-� 4DC� ������� ��� &���� ���� �� �����������"�?'-�4CF�����������*���������������"����������������������������������������������"������� ��� �����!� ���������������"� ���������"� ������0������������������������� ��1� �������� �� ������� 3�������������� �""���� ���� ����� ��� ������� ���������*������K������!� �������������������������"���������������"�4564���������?'-�CFG�������������?'-�6F�H��������������������������������"�4566���/�������������"����������������������������������������������#��������������������� ������ ��� ������� ����� ��� ����� ���������� ���� ���� ��� ��!� �����!� ������� ��������� ���� ��������� �������� ��� ������ ������� &���� #�� ������������� ������� ��������������� ���� �������� ��!� ������� ���������� ���������� ���� �������� "���������������������������#���"���������������������������������������"���������� ������������"� ������������������ "��� ���4564�� ������#����������������&����!���������� ����� ���������� ���� ��������� ������ *�������� ���� ����� ������ "������������ #���� ��� �� ����"������ ����� "� ����� ������ ��#���� (��� ������!� /������������� �������� �����������������"������������� �������������������� �� �������!������������&�������
)+�������� ��+������� ������� ���������+����/���� ��������//���� ���%��� ��-�0�-+��+0���+���+������������������ �0�+����������- �����-+���� ����� ��2��������
� *� ������� ��� 9���� %� "� ���� &���� 4564� ���!� ���� #��������� ��� ���� ������ �������� ���������������������������������"���������������������������������������������������"�������������!���������������2-����������"�������������������������������������������������0����S������������”)��������������������"�����#�A�������"�4564!�������������������������� "� ������ ������� �� ������ "������� 2-�� ��"�#� ���� ������ ���"������������"����������2-�� ��"�#��� ������������"��������� ��� ���������A�������"�4564!���������������?'-�7�G�������!������������������������"����"����������"�?'-�O�C������������C�4566������������� ������ "� 2-�� ���� ��� 36� 4564� �������� �� ���� ���� ������ ��� 4566� #����������������������������������!�#��������������������"����������������#��"������36�4566������!����������"����������������������������������"������������������������ ���� ������� "� ��#� ������� ����� ���������� ��� ��������� 2������ ������������������������#����������"���!�#����������!�����"��������������������������������"�����"����������A����������"�#����
�6O
�65
�O
5
O
65
6O
�6O
�65
�O
5
O
65
6O
&���5G &���5H &���5F &���65 &���66 &���64
8��������������� '��������������������������������� /�����������"��/���������������������
?'-������� ?'-�������
�4
5
4
C
D
H
65
64
6C
�C�454CDH
65646C
4566��74566��C4564��64564��4
9�������"�8-9 9�������"�8-9
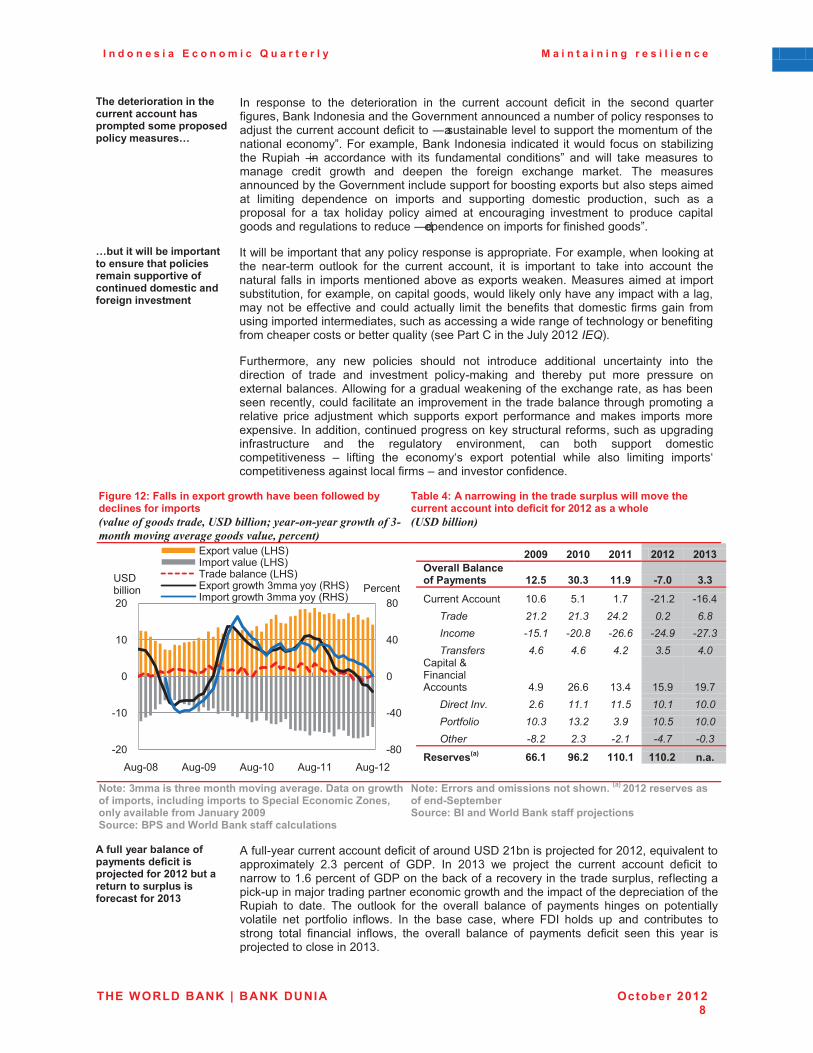
I n d o n e s i a E c o n o m i c Q u a r t e r l y M a i n t a i n i n g r e s i l i e n c e
THE WORLD BANK | BANK DUNIA October 2012 8
)+������������� �� ��+������� ������� ��+���/���/��������/��/����/�������������C�
� ��� ������ �� ���� ������������ ��� ���� �������� ������� ��"����� ��� ���� ����� A�������"�����!�%��������������������8���������������������������"�����������������;������������������������"�������S��������������������������������������"������������������”.�2���������!�%���� �������� ���������� ���#���� "�������������������� =������ S��� ���������� #���� ��� "����������� �������”� ���� #���� ����� ������� ��������� ������� ��#��� ���� ������� ���� "������ ��������� �������� ���� �����������������������8�����������������������"���������������������������������� ��������� ����������� �� ������ ���� ��������� ������� ��������!� ���� �� �������� "�� �� ���� ������� ������ ������ ��� ����������� ���������� �� ������� ����������������������������������S�������������������"��"���������”����
C,������-��,����/���� ������ ������+���/������������ ���//������������ �� ������������ ������� �� ������ ��
� ���#���������������������������������������������������2���������!�#����������������� ���������� ����� "�� ���� �������� ������!� ��� �� ��������� �� ����� ���� ������� ������������ "���� ��� ����������������������������#�������(��������������� ���������������!�"���������!�������������!�#�������������������������������#���������!������������""������������������������� ������ ��������"��� ������������ "��������� "����������������������������!�����������������#����������"����������������"������"�����������������������A�������0���9����/��������&����4564����1���
2���������!� ���� ��#� ������� ����� ��� ��������� ���������� ������������ ���� ������������� "� ������ ���� ���������� ������������� ���� �������� ���� ���� ������� ��������������������*��#����"������������#���������"������������������!�����������������������!������"����������������������������������������������������������������������� ������ ��;������� #����� ������ ������ ���"������� ���� ����� ������ �������������� ����������!����������������������������������"��!�������������������"����������� ���� ���� ���������� ����������!� ���� ���� ������ �������������������� N� ��"����� ���� ������� ������ ��������� #����� ��� ��������� ��������������������������������"����N��������������"����������
Figure 12: Falls in export growth have been followed by declines for imports �������������������� !���������(�������������������1�������������������������������� ����
Table 4: A narrowing in the trade surplus will move the current account into deficit for 2012 as a whole � !�����������
�� .336� .3*3� .3**� .3*.� .3*1�#�������� ������(���� ���� *.!7� 13!1� **!6� >8!3� 1!1�
/�������*������� 65�D� O�6� 6�G� �46�4� �6D�C����� � ��� � ��� ����� ���� ����������� � �� � ������ ������ ������ ��������������� ���� ���� ���� ���� ����
/�������[�2���������*������ C�F� 4D�D� 67�C� 6O�F� 6F�G�
����� ���!�� ���� � � ��� �� � ����"�� ��#��� ���� ���� ���� ���� ����$ %��� ����� ���� ��� � ����� �����
9�������P�Q� 44!*� 64!.� **3!*� **3!.� !�!��
$�����1��������+������ �+����� ���������!�%����� ����-�+������/����0�� ��� ����/���������/�������� �����R� ��0�� �������,�������M� �����.336����������(��� ������� ���������������� ��
$������������� �������� �� ����+�- !�P�Q�.3*.����������������� >��/���,��������������� ������� ��������/��E����� ��
�����������,�� ������/���� �������������/��E���������.3*.�,���������� �������/�������������������.3*1��
� *�"��������������������������"�����"�������?'-�46�������;������"��4564!��A������������������������ 4�7� �������� "� 8-9�� ��� 4567� #�� ��;���� ���� �������� ������� ��"����� ������#���6�D���������"�8-9������������"�����������������������������!���"�����������������������;���������������������������#������������������"�����������������"�����=������ �� ������ ���� ����� "�� ���� ������� �������� "� �������� ������ �� ������������������� ���� ���"��� ��"�#�� ��� ���� ���� ���!� #����� 2-�� ���� ��� ���� ���������� ������� ����� "��������� ��"�#!� ���� ������� �������� "� �������� ��"����� ���� ���� ����� ����;���������������4567���
�H5
�C5
5
C5
H5
�45
�65
5
65
45
*���5H *���5F *���65 *���66 *���64
�����������0)3'1������������0)3'1��������������0)3'1 �������#���7�������0=3'1��������#���7�������0=3'1
?'-������ 9������
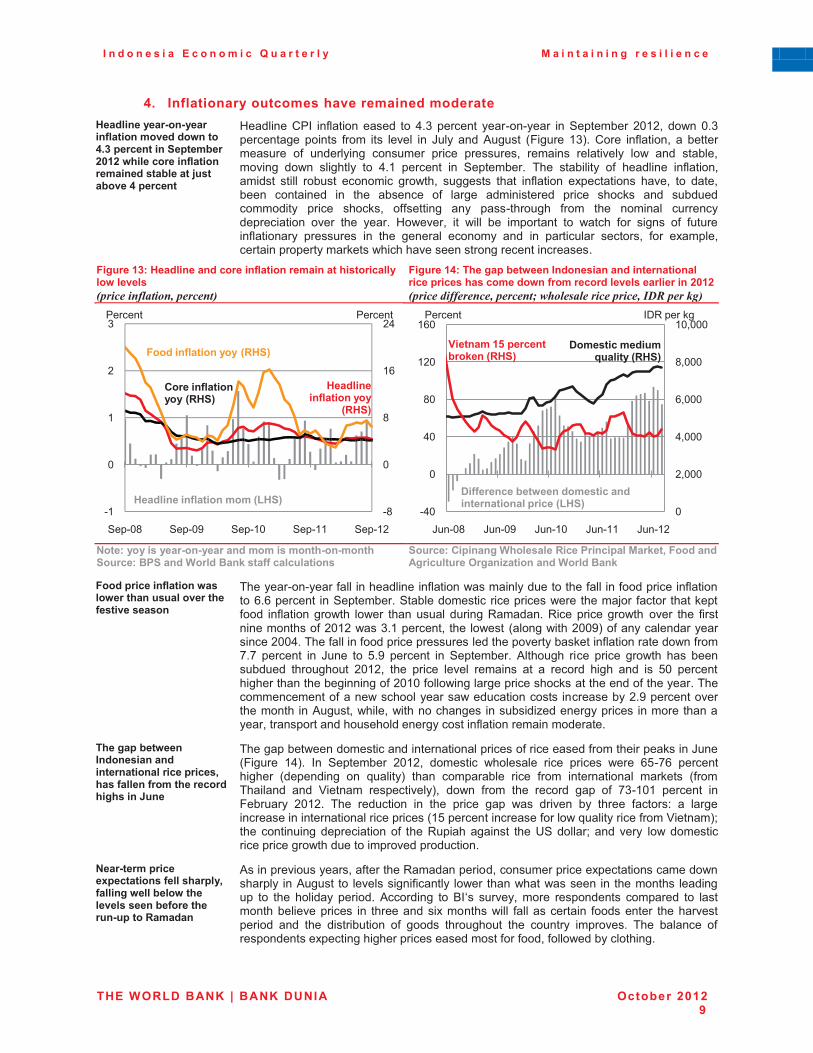
I n d o n e s i a E c o n o m i c Q u a r t e r l y M a i n t a i n i n g r e s i l i e n c e
THE WORLD BANK | BANK DUNIA October 2012 9
5!� Inflationary outcomes have remained moderate @��� ������>� >������ ����� �������- ����5!1�/���� ��� ���/���,���.3*.�-+��������� ����� ������ �����,�����E�����,����5�/���� ���
� 3��������/9�� ��"����������� ��C�7��������� ������������ ���'���������4564!� �#��5�7������������ ����� "��� ��� ������ ��� &���� ���� *����� 02������ 671�� /��� ��"�����!� �� �������������� "� ����������� ������� ������ ������!� ������� ����������� �#� ���� �����!������� �#�� �������� �� C�6� �������� ��� '���������� ���� ��������� "� ��������� ��"�����!������� ����� ����� ������� ��#��!� ������ ����� ��"������ ����������� ����!� �� ����!������ ��������� ��� ���� ������� "� ������ ������������ ������ ���� ���� ��������������� ������ ���!� ""������� ���� ���������� "��� ���� ������� ��������������������� ���� ���� ������ 3#����!� ��� #���� ��� ��������� �� #����� "�� ���� "� "��������"��������� ������� ��� ���� �������� ������ ���� ��� ����������� ����!� "�� �������!������������������������#������������������������������������
Figure 13: Headline and core inflation remain at historically low levels ��� ������������� ���
Figure 14: The gap between Indonesian and international rice prices has come down from record levels earlier in 2012 ��� ������ ��� ��(���������� ��� ��*�2���3��
� �$����������������>� >������ ���������� �+>� >�� �+����������(��� ������� ���������������� ��
��������"�/� � ���+������9����(�� ��/��������0������ ������������#��� �S���� �� ������� ���
�����/������ ����� �-����-����+� ������������+��������������� �
� ����������������"������������������"������#�������������������"�������"����������"��������D�D������������'����������'������������������������#����������;�� "���������������"�� ��"��������#��� �#��� ���������� �������=��������=������������#������� ���� "��������������"�4564�#��7�6��������!������#��� 0�����#����455F1�"������������������������455C������"�������"��������������������������������������"������������#��"���G�G� �������� ��� &���� �� O�F� �������� ��� '���������� *������� ����� ������ ��#��� ��� ������������ ��������� 4564!� ���� ������ ������ ������� ��� �� ������ ����� ���� �� O5� ����������������������������������"�4565�"��#�������������������������������"���������������������������"�����#�����������#������������������������4�F�������������������������*����!�#����!�#������������� ������������������������� ������������������!��������������������������������"�����������������������
)+����/�,��-�� �� � ���� �� �� ��� ���� �������/�����0�+������ �������+��������+��+��� �M� ��
� �����������#����������������������������������"�����������"�����������������&����02������ 6C1�� ��� '��������� 4564!� ������� #������� ����� ������ #���� DO�GD� ��������������� 0���������� �� A������1� ����� ���������� ����� "��� ������������� ������� 0"������������ ���� P������� �����������1!� �#�� "��� ���� ������ ���� "� G7�656� �������� ���2�������� 4564�� ���� ��������� ��� ���� ������ ���� #�� ������� ��� ������ "����V� �� �����������������������������������������06O�����������������"���#�A������������"���P������1M����� ����������������������"� ����=������������� ����?'������M���������� �#���������������������#����������������������������
$���>�����/�������/������� ������+��/�0���� ��-��,��-��+���������� �,�������+���� >�/����9���� �
� *���������������!��"��������=������������!�������������������������������#��������� ���*����� �� ����������"�������� �#��������#����#������������������ ����������� �� ���� ������� ������� *�������� �� %��� �����!� ���� ��������� �������� �� ����������������������� ��� ������������������#���� "�������������� "�������� ����������������� ���� ���� ����������� "� ��� ��������� ���� ������� �������� ���� �������� "�����������������������������������������"��"�!�"��#���������������� �
�H
5
H
6D
4C
�6
5
6
4
7
'���5H '���5F '���65 '���66 '���64
"����� ����� �����P9@�Q
@��� ��� ����� �����
P9@�Q
@��� � � ����� ����P&@�Q
9������ 9������
����� ����� �����P9@�Q
5
4!555
C!555
D!555
H!555
65!555
�C5
5
C5
H5
645
6D5
&���5H &���5F &���65 &���66 &���64
%������ ���,��-�� ���������� �� ��� ���� ��/���� P&@�Q
;��� �� *7�/���� ��,���� �P9@�Q
%��������������2������P9@�Q�
9������ �-= ������
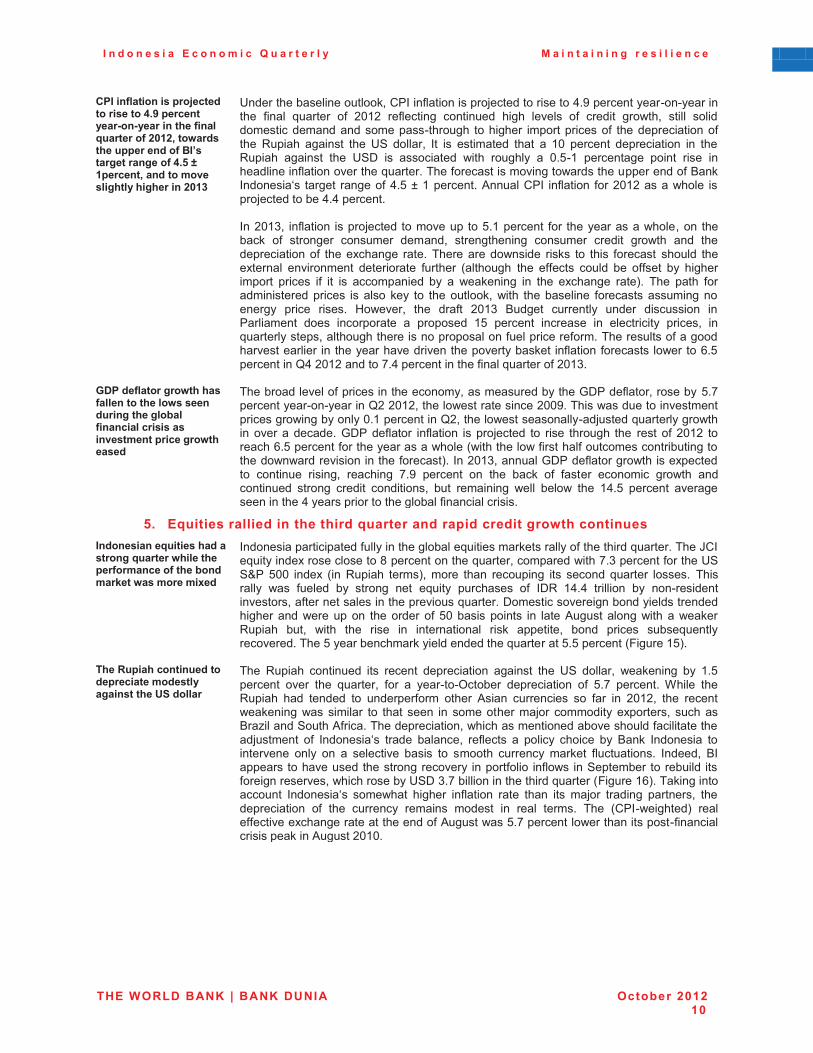
I n d o n e s i a E c o n o m i c Q u a r t e r l y M a i n t a i n i n g r e s i l i e n c e
THE WORLD BANK | BANK DUNIA October 2012 10
"(��� ����� ����/��E����������������5!6�/���� ������>� >������ ��+���� ��2����������.3*.0���-�����+���//���� ������������������ ������5!7�U�*/���� �0�� ������������+���+��+���� �.3*1�
� ?���������������������!�/9����"����������;��������������C�F���������������������������� "����� A������� "� 4564� ��"�������� ��������� ����� ������ "� ������� ��#��!� ����� ����������������������������������� ��������� ������������"� ����������������"����� =������ ������� ���� ?'� �����!� ��� �� ��������� ����� �� 65� �������� ������������ ��� ����=������ ������� ���� ?'-� �� �������� #���� ������� �� 5�O�6� ����������� ����� ���� ��������������"��������������A������������"���������������#������������������"�%������������� ������� ������"�C�O�\�6����������*������/9�� ��"������ "��4564�����#���� ����;�����������C�C���������������4567!� ��"������ ����;��������������� ��O�6��������� "�� �������������#���!��� ��������� "� ������� ������� ������!� ������������� ������� ������� ��#��� ���� ����������������"� ������������� �����������������#����� ���� �� ���� "����������� ������������� ����������� ����������� "������� 0�������� ���� �""���� ����� ��� ""��� ��� ������������� ������ �"� ��� �� ����������� ��� �� #��������� ��� ���� ��������� ����1�� ���� ����� "�������������������� ����� ���� �� ��������!�#���� ������������ "���������������������� ������ ����� 3#����!� ���� ���"�� 4567� %������ ���������� ������ ������� ���9���������� ��� ���������� �� ������ 6O� �������� �������� ��� ������������ �����!� ���A������������!���������������������������"������������"��������������"������������������������ �������������������������������������� ��"������"�������#�����D�O�������������C�4564�������G�C����������������"�����A�������"�4567���
D%(�����������-�+�+������ �����+���-����� ���� ���+����,���� � ��������������� ������ ��/��������-�+��������
� ���������������"�������������������!������������������8-9���"����!�������O�G�������������������������4�4564!������#�������������455F������#��������������������������#�����������5�6�������������4!������#�������������;�����A�����������#��������������������8-9���"����� ��"������ ����;������ �� ���� ������� ���� ���� "� 4564� ��������D�O���������"���������������#����0#���������#�"�������"��������������������������#�#������������������"�����1�����4567!��������8-9���"�������#���������������� �������� �����!� ��������� G�F� �������� �� ���� ����� "� "����� ������� ��#��� ������������� ����� ������� �������!� ���� ���������� #���� ���#� ���� 6C�O� �������� �������������������C�����������������������"���������������
7!� Equities rallied in the third quarter and rapid credit growth continues � � ���� ��2�������+�������� ��2�������-+����+��/������� �������+��,� ��������-�������������
� ���������������������"�������������������A�������������������"�����������A������������&/���A��������������������H���������������A������!���������#����G�7���������"������?'�'[9� O55� ������ 0��� =������ ����1!� ���� ����� ��������� ��� ����� A������� ���� ���������� #�� "������ ��� ����� ���� �A����� �������� "� �-=� 6C�C� �������� ��� �����������������!��"��������������������������A��������-�������������������������������������������#��������� ���������"� O5���������� ��� �����*����������#������#������=������ ���!� #���� ���� ���� ��� ������������� ���� ��������!� ���� ������ ���A���������������������O��������������������������������A����������O�O���������02������6O1���
)+��9�/��+��� �� �������/������������������� ����+��'�������
� ���� =������ ��������� ��� ������� ������������ ������� ���� ?'� �����!� #��������� ��� 6�O��������� ���� ���� A������!� "�� �� �������K������ ������������ "� O�G� ��������� $����� ����=������ ���� ������� �� ��������"��� ����� *���� ���������� � "��� ��� 4564!� ���� �������#���������#��������� �� ����� ���� ��� ����������;�� ���������������!� ������%����������'����*"���������������������!�#��������������������������"����������������;������� "� ��������� ������ �������!� ��"����� �� ������ ������ ��� %���� �������� ������������ ���� �� �� ��������� ���� �� ���� ��������� ������� "����������� ������!� %������������������������������������� ������"��� ��"�#����'����������������������"������������!�#�����������?'-�7�G���������������������A�������02������6D1�������������������� ��������� ��#���� ������� ��"������ ����� ����� ��� ��;�� �������� �������!� ���������������� "� ���� ��������� ������� ����� ��� ����� ������ ���� 0/9��#�������1� ������""��������������������������������"�*�����#��O�G����������#��������������"����������������������*�����4565���� �
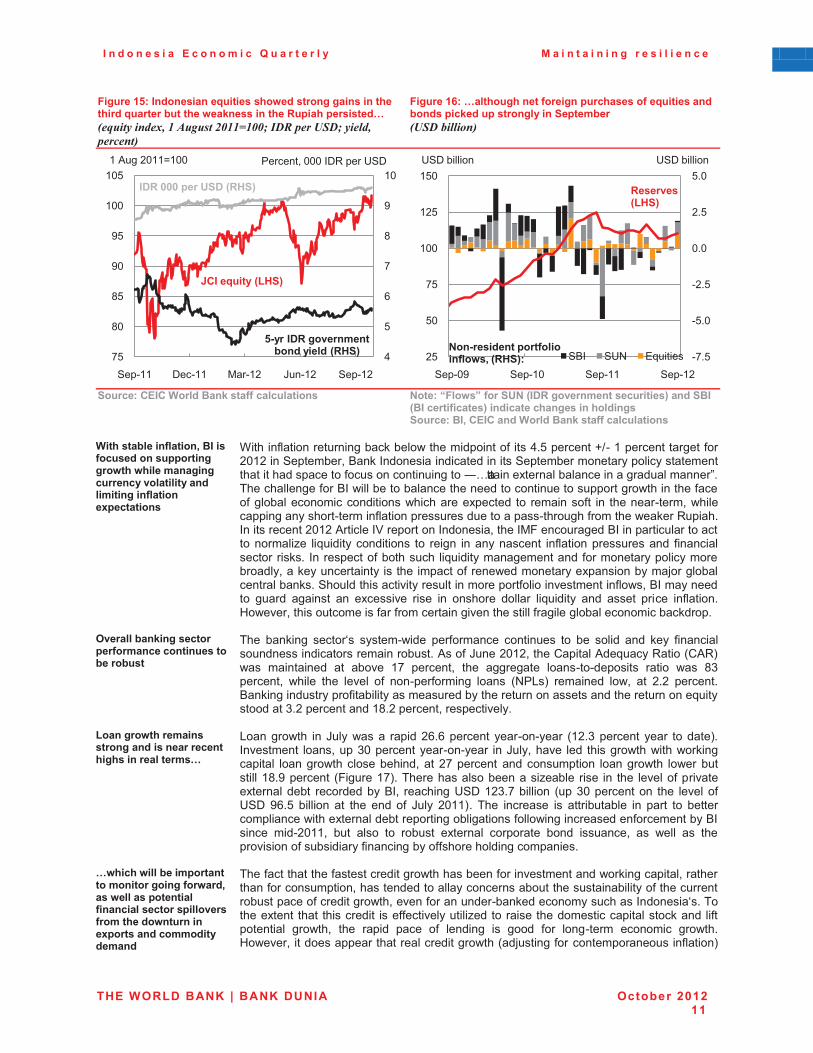
I n d o n e s i a E c o n o m i c Q u a r t e r l y M a i n t a i n i n g r e s i l i e n c e
THE WORLD BANK | BANK DUNIA October 2012 11
Figure 15: Indonesian equities showed strong gains in the third quarter but the weakness in the Rupiah persisted… �"��������,��#�4������$%##'#%%(�*�2��� !�(�������� ����
Figure 16: …although net foreign purchases of equities and bonds picked up strongly in September � !�������������
� ���������"��"������� ���������������� �� $�����V��-�X������'$�P�%9������ �� ������������Q�� �����
P���������������Q�� �������+� ����� �+�� �������������0�"��"�� ������� ���������������� ��
����+����,��� ����� 0��������������� ���//���� �����-�+�-+����� ��� ������� ������������� ������ ��� ����� ���/������� ��
� $������"������������������������#�������������"����C�O���������]>��6����������������"��4564����'��������!�%����������������������������'���������������������������������������������������"�����������������S^������������������������������������������r”����������������"��%��#����������������������������������������������#����������"����"����������������������#������������������ �� �������"�� ��� �������������!�#����������������������������"�������������������������������"�������#������=��������������������4564�*��������P����������������!������(2�����������%��������������������������������� ��A��������������� �� ������ �������������� ��"����������������� "������������������� ����������"��������� ��A����������������������"��������������������������!��������������������������������"�����#������������������������;����������������������'����������������������������������"���������������"�#!�%������������� ������ ������� ��� �������� ���� ��� ����� ������ ��A������� ���� ���� ������ ��"�������3#����!�������������"���"��������������������������"������������������������������
#�����,� �� ���������/������� ����� �� �������,����,�����
� ���� �������� ������ �����#���� ���"������� �������� �� ��� ���� ���� ���� "�������������������������������������*�"�&����4564!�����/�������*��A�����=����0/*=1�#�� ����������� ��� ����� 6G� �������!� ���� ���������� ������������ ����� #�� H7��������!� #����� ���� ������ "� ������"������ ���� 0+9)1� ��������� �#!� ��� 4�4� ���������%�����������������"����������������������������������������������������������A�����������7�4�������������6H�4��������!���������������
&�� ����-�+������ ������ ��� ���� �������� ��+��+��� ����������C�
� )�����#��� ��� &����#���� ������4D�D��������� ������������ 064�7��������� ����� ������1������������ ���!����75��������������������� ���&���!������ ���� ������#���#����#�������������� ������#�������������!����4G���������������������� ������#��� �#������������6H�F��������� 02������6G1����������������������������� ���� ��� ���� ������"����������������������� �����������%�!� ���������?'-�647�G�������� 0���75����������� ���� ������"�?'-� FD�O� ������� ��� ���� ���� "� &���� 45661�� ���� �������� �� ������������� ��� ����� �� �����������������#������������������������������������"��#���������������"�����������%������� ����4566!� ���� ��� �� ����� ��������� �������� ���� ������!� �� #���� �� �����������"����������"������������""���������������������
�C-+��+�-��,����/���� ������� �������� �����-��0����-�����/��� ������ � ������������/�������������+���- ��� �� ���/������ ������������� �
����"�������������"��������������#�����������"����������������#�������������!�������������"����������!������������������������������������������������"�����������������������"����������#��!������"����������������������������������������������������� ����� ����������� ���""������������������������������������������������������"����������� ��#��!� ���� ������ ����� "� �������� �� ��� "�� ��������� ������� ��#����3#����!���������������������������������#���0��;������"����������������"�����1�
C
O
D
G
H
F
65
GO
H5
HO
F5
FO
655
65O
'���66 -���66 (���64 &���64 '���64
6�*���4566X655 9������!�555��-=�����?'-
�%9�333�/���'�%�P9@�Q
M"���2���� P&@�Q
7>����%9������ �� ��,� �����P9@�Q �G�O
�O�5
�4�O
5�5
4�O
O�5
4O
O5
GO
655
64O
6O5
'���5F '���65 '���66 '���64
'%� '?+ A�����
?'- ������
$� >����� ��/��������� ��-�0�P9@�Q��
9��������P&@�Q
?'- ������

I n d o n e s i a E c o n o m i c Q u a r t e r l y M a i n t a i n i n g r e s i l i e n c e
THE WORLD BANK | BANK DUNIA October 2012 12
������� �� ��������� �������� ���455C� 02������ 6H1!����� ���������"� �������!� �����������A������������!�����������"����������������������������"��������������������������!������ #����� ���� �������� ��������� ����� ���� ������� �#� ���� ��������� ����� ��������������������� ���� ������!� �������� ��������� ���#���� ��� ����� ���������� ���� �#� ���������������������������������#���������� ��������� ��#����� "������ "�����������"��������� "��������#������ ��������� �� ���� �������� "� ���� ���"�#� ���� �������� ����� "� ��������� "������������������� ���� ��������� 2�� �������!� ������ ������ ��������� ����� ��� ������ �������������������������������!�����"�#����������������""���������#���������������������������������������!�������������������������"���������������!�"���������!�������������������������������#�������������������������������"�������������!����������������#��������������������"���������������������������A��������"�����������������������������������������������������������������
Figure 17: Credit growth remains rapid, led by investment and working capital loans… ������������������������������ ����
Figure 18: …with estimated real credit growth around previous highs ���������� ������������ ����
������������� ������� ���������������� �� $�����9���������/����������,��"(��
����������0�"��"�� ������� ��������/��E����� ���
)+����� ����� �/�����������+�� �-��� � ������������0��+��#M?0��� �� ����
� ���� ����� ����������� ����� ������ #������ ���� ��������� ������ �� ���� ��#� ��������2��������� '������� *�������� 0$ ��� �� &�� '�(�)�!� �� K&<1�� � *� �������� ��� ����K������4566� ���!� ����K&<�#���� ���������� ����������������������������������������"������!�������������������������%�������)<!�#������������������������������������"������� ���������� ���"����� ��� %���� ��������� ���� �������� ������� ���� ��������"��������� ���������� ��������� #���� ����"��� �� K&<� ��� &������� 4567!� ���� ���������������������������������&�������456C����������������!�����8���������"���������������������������"�������"������������������"��� ������������ "� K&<!� ���������� ��������� �""��� �� ��������� ����������������� ��������� ������� ���� ��������� ����� ���� ���#���� �� ������������������������ ��� ���������� ��"���� ��� �������!� ��� &���� 4564� ���� K&<� %���� "�/��������#����������� �������������#���� ���� ������������ "���� ��� ����K&<� ��#���������%�������������������������������������������������%�������������������������������������������������������"������K&<��9����������������"������������������"� K&<� #���� �������� ���������� ���� ������� "� 3=� ������� ���� ����������� "� �������������� "���������� �������������������� ������/����������!� ����K&<����������"��������� ����� ���������� �������� �� #��� �� ������������� �������R� ������������"�������������� ��"���������!� ���������������������� ���� ��������������"� ����������������������������!����������"��������������������"������!�������������"�����������������"������������������
�45
5
45
C5
D5
�45
5
45
C5
D5
&���54 &���5C &���5D &���5H &���65 &���64
$������/���������������/�������
9������ 9������
$��� ��
9��
�65
5
65
45
75
C5
�65
5
65
45
75
C59������9�������
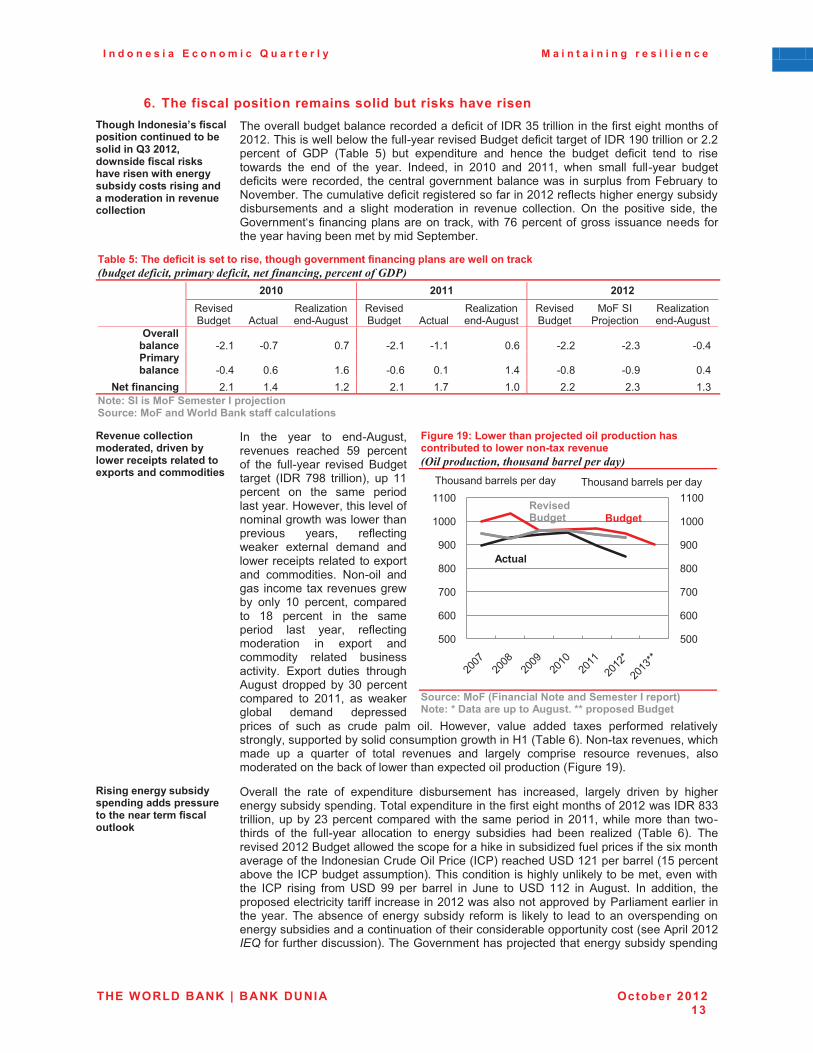
I n d o n e s i a E c o n o m i c Q u a r t e r l y M a i n t a i n i n g r e s i l i e n c e
THE WORLD BANK | BANK DUNIA October 2012 13
4!�The fiscal position remains solid but risks have risen )+���+�� � �������������/������ ��� �� ������,������� �G1�.3*.0��- ����������������+�������� �-��+�� �������,�������������� ��� ����������� �� ����� ���������� �
� ��������������������������������������"�����"��-=�7O����������������"���������������"�4564��������#�������#�����"����������������%��������"������������"��-=�6F5�����������4�4��������� "� 8-9� 0������ O1� ���� ������������ ���� ������ ���� ������� ��"����� ����� �� �����#���� ���� ���� "� ���� ������ ������!� ��� 4565� ���� 4566!� #���� ����� "��������� ���������"�����#�����������!� ������������������������������#�� ��������� "���2�������� ��+�������������������������"����������������"������4564���"������������������������������������ ���� �� ������ ��������� ��� �������� ���������� K�� ���� ������� ���!� ����8���������� "�������������������� �����!�#����GD���������"���� ������������ "����������������������������������'������������
Table 5: The deficit is set to rise, though government financing plans are well on track ���������� ������������� ������������ ������ ������������
�� .3*3� .3**� .3*.�
��=������%������ *������
=��������������*�����
=������%������ *������
=��������������*�����
=������%������
(2�'���9�;������
=��������������*�����
#�����,�� ��� �4�6� �5�G� 5�G� �4�6� �6�6� 5�D� �4�4� �4�7� �5�C�(�������,�� ��� �5�C� 5�D� 6�D� �5�D� 5�6� 6�C� �5�H� �5�F� 5�C�
$����� � �� �� 4�6� 6�C� 6�4� 4�6� 6�G� 6�5� 4�4� 4�7� 6�7��
$��������������������������/��E����� �������������� ������� ���������������� ��
�9��� ���������� ��������0����� �,���-��������/��������������/������ ������������
� ��� ���� ����� �� ����*����!��������� �������� OF� ��������"� ���� "��������� ������� %������������� 0�-=� GFH� �������1!� ��� 66��������� �� ���� ���� ����������������3#����!�����������"����������#���#���#��������������� ����!� ��"��������#������ ��������� ������� �����#������������������������������� ���������� +����� ������� ���������������������#���� ���� 65� �������!� ���������� 6H� �������� ��� ���� ���������� ���� ����!� ��"����������������� ��� ������ ������������ �������� ���������������� ����� ������ �������*����� ����������75����������������� �� 4566!� �� #������������ ������� �������������� "� ���� �� ������ ����� ���� 3#����!� ������ ������ ����� ���"����� �����������������!���������������������������#������36�0������D1��+�������������!�#���������� ��� �� A������� "� ����� �������� ���� �������� ������� ������� �������!� �����������������������"��#�����������������������������02������6F1���
Figure 19: Lower than projected oil production has contributed to lower non-tax revenue �5������� ��������������������������
�������������P�� � ����$����� ��������������/���Q�$�����K�%���������/����������!�KK�/��/����������
�9��� ��� �������,�����/� � �����/������������+�� ����������������������
� K������� ���� ����� "� ������������ ����������� ��� ��������!� �������� ������� ��� �����������������������������������������������������"���������������"�4564�#���-=�H77��������!�������47�����������������#���� �������������� ���4566!�#��������� ����� �#������� "� ���� "��������� ��������� �� ������� ������� ���� ����� ��������� 0������ D1�� �����������4564�%���������#�����������"���������������������"�����������"���������������������"��������������/�����K���9�����0�/91���������?'-�646������������06O�������������������/9���������������1����������������������������������������!������#�������� �/9� ������ "��� ?'-� FF� ���� ������� ��� &���� �� ?'-� 664� ��� *������ ��� �������!� ��������������������������""������������4564�#�������������������9������������������������������������������"�������������� ��"��� �� ������� �� ����� �������������������������������������������������"�������������������������������0���*�����4564�����"��"�������������1������8��������������;��������������������������������
O55
D55
G55
H55
F55
6555
6655
O55
D55
G55
H55
F55
6555
6655��������������������� ���������������������
�����9�����������
�����
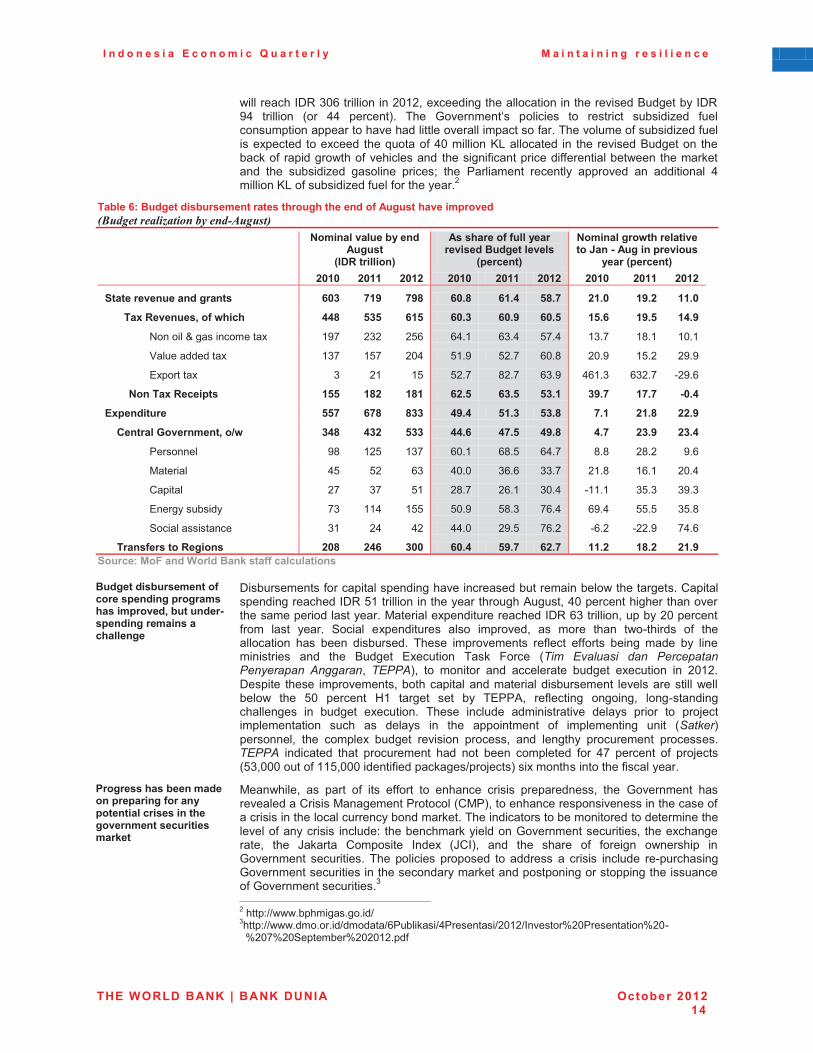
I n d o n e s i a E c o n o m i c Q u a r t e r l y M a i n t a i n i n g r e s i l i e n c e
THE WORLD BANK | BANK DUNIA October 2012 14
#�����������-=�75D������������4564!��������������������������������������%����������-=�FC� �������� 0�� CC� �������1�� ���� 8���������� ������� �� �������� ��������� "�����������������������������������������������������"��������������"����������"��������������� ��������� ����A����"�C5��������<)���������� ��� ���� �������%�������� ���������"���������#���"���������������������"��������������""������������#������������������� ���� ��������� ������� �����M� ���� 9���������� ��������� �������� ��� ���������� C��������<)�"����������"����"�����������4��
Table 6: Budget disbursement rates through the end of August have improved �.��������6������������4��������
�
$��� �������,��� ���������
P�%9������ Q�
����+���������������������������������
P/���� �Q��
$��� �����-�+������������M� �>������ �/��������
�����P/���� �Q��� .3*3� .3**� .3*.� .3*3� .3**� .3*.� .3*3� .3**� .3*.�
���������� ���� ���� ���� 431� 8*6� 86=� 43!=� 4*!5� 7=!8� .*!3� *6!.� **!3�
)���9��� ���0����-+��+� 55=� 717� 4*7� 43!1� 43!6� 43!7� *7!4� *6!7� *5!6�
+�����[�������������� 6FG� 474� 4OD� DC�6� D7�C� OG�C� 67�G� 6H�6� 65�6�
P���������������� 67G� 6OG� 45C� O6�F� O4�G� D5�H� 45�F� 6O�4� 4F�F�
��������� 7� 46� 6O� O4�G� H4�G� D7�F� CD6�7� D74�G� �4F�D�
$� �)���9����/���� *77� *=.� *=*� 4.!7� 41!7� 71!*� 16!8� *8!8� >3!5�
��/� ������ 778� 48=� =11� 56!5� 7*!1� 71!=� 8!*� .*!=� ..!6�
"� ����D���� �� �0��N-� 15=� 51.� 711� 55!4� 58!7� 56!=� 5!8� .1!6� .1!5�
9�������� FH� 64O� 67G� D5�6� DH�O� DC�G� H�H� 4H�4� F�D�
(��������� CO� O4� D7� C5�5� 7D�D� 77�G� 46�H� 6D�6� 45�C�
/������� 4G� 7G� O6� 4H�G� 4D�6� 75�C� �66�6� 7O�7� 7F�7�
������������ G7� 66C� 6OO� O5�F� OH�7� GD�C� DF�C� OO�O� 7O�H�
'������������� 76� 4C� C4� CC�5� 4F�O� GD�4� �D�4� �44�F� GC�D�
)�� ���������9���� �� .3=� .54� 133� 43!5� 76!8� 4.!8� **!.� *=!.� .*!6��
������������� ������� ���������������� ���
��������,������ �����������/� � ��/��������+�����/����0�,���� ��>�/� � ������� �����+�� ���
� -����������"����������������������������������������������#�������������/������������������������-=�O6����������������������������*����!�C5�������������������������������������������������(�����������������������������-=�D7��������!�������45���������"��� ���� ������ '����� ������������ ��� �������!� �� ���� ����� �#������� "� ������������� ��� ����� ��������� ����� ����������� ��"����� �""��� ������ ����� ��� �������������� ���� ���� %������ �������� ���� 2���� 0���� �!#(��� �� "����* ��"��+��*�� ,�))��!� ��"",1!� �� ������ ���� ����������� ������� ��������� ��� 4564��-������ ����� ����������!������������������������������������� ���������������#�������#� ���� O5� �������� 36� ������� ��� ��� � 99*!� ��"�������� �����!� ���������������������� ��� ������� ���������� ����� �������� �������������� ������ ����� �� ��;������������������ ���� �� ������ ��� ���� ����������� "� ������������� ����� 0- .��1��������!� ���� ������� ������� ������� ����!� ���� �������� ����������� ���������"",� ���������� ����� ����������� ���� ��� ����� ��������� "�� CG� �������� "� ��;����0O7!555����"�66O!555�������"�����������>��;���1�����������������"������������
(��������+���,�� ������ �/��/��� ������� ��/��� ������������ ��+������� �� ����������������������
� (���#����!� �� ����� "� ��� �""��� �� �������� ����� ����������!� ���� 8��������� ��������������/����(����������9�����0/(91!��������������������������������"�����������������������������������������������������������������������������������������"���������� �������V� ����������������������8�����������������!� �����������������!� ���� &������� /������ ������ 0&/�1!� ���� ���� ����� "� "������ #������� ���8��������� ���������� ���� ������� ������ �������� �� ����� �������� �������������8������������������������������������������������������������������������"�8������������������7������������������������������������������������������������������4�����V>>###�������������>�7����V>>###��������>������>D9�������>C9�������>4564>������_459���������_45�
_45G_45'��������_454564���"�
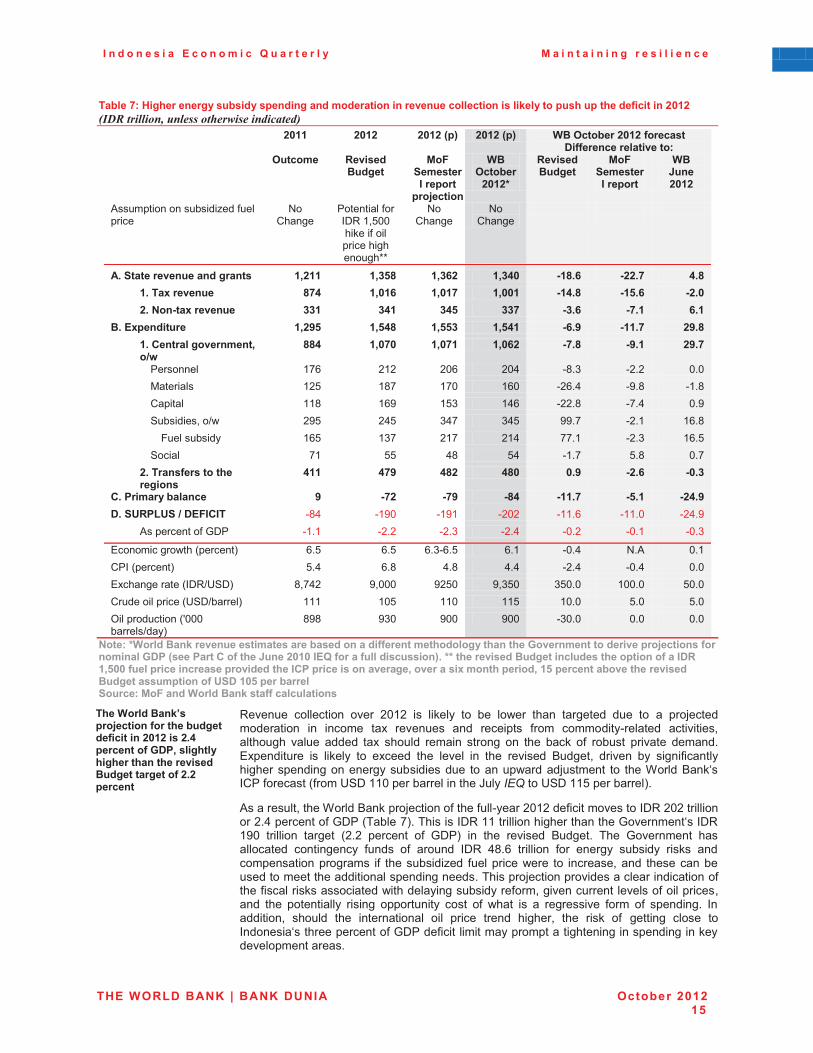
I n d o n e s i a E c o n o m i c Q u a r t e r l y M a i n t a i n i n g r e s i l i e n c e
THE WORLD BANK | BANK DUNIA October 2012 15
Table 7: Higher energy subsidy spending and moderation in revenue collection is likely to push up the deficit in 2012 �*�2��������������������������� �����
��
.3**� .3*.� .3*.�P/Q� .3*.�P/Q� ���#���,���.3*.����������%������ ���������������
�� ��
#�������� 9������������
������������������/����
/��E����� �
���#���,���
.3*.K�
9������������
�����������������/����
���M� ��.3*.�
*������������������"����������
+�/������
9��������"���-=�6!O55�������"��������������������``�
+�/������
+�/������
�� ����
��
�� �� �� �� �� �� �� �� ��
�!����������� ���� ���� ��� *0.**� *017=� *014.� *0153� >*=!4� >..!8� 5!=��� *!�)������� ��� =85� *03*4� *03*8� *033*� >*5!=� >*7!4� >.!3��� .!�$� >�������� ��� 11*� 15*� 157� 118� >1!4� >8!*� 4!*��!���/� ������ *0.67� *075=� *0771� *075*� >4!6� >**!8� .6!=��� *!�"� ��������� �� �0�
�N-�==5� *0383� *038*� *034.� >8!=� >6!*� .6!8�
�� 9������� 6GD� 464� 45D� 45C� �H�7� �4�4� 5�5��� (�������� 64O� 6HG� 6G5� 6D5� �4D�C� �F�H� �6�H��� /������� 66H� 6DF� 6O7� 6CD� �44�H� �G�C� 5�F��� '������!�>#� 4FO� 4CO� 7CG� 7CO� FF�G� �4�6� 6D�H��� 2���������� 6DO� 67G� 46G� 46C� GG�6� �4�7� 6D�O��� '����� G6� OO� CH� OC� �6�G� O�H� 5�G��� .!�)�� ����������+��
����� ��5**� 586� 5=.� 5=3� 3!6� >.!4� >3!1�
"!�(�������,�� ��� 6� >8.� >86� >=5� >**!8� >7!*� >.5!6�%!��'9(&'��N�%���"�)�� �HC� �6F5� �6F6� �454� �66�D� �66�5� �4C�F��� *���������"�8-9� �6�6� �4�4� �4�7� �4�C� �5�4� �5�6� �5�7�
��������#���0�������1� D�O� D�O� D�7�D�O� D�6� �5�C� +�*� 5�6�/9��0�������1� O�C� D�H� C�H� C�C� �4�C� �5�C� 5�5� �������������0�-=>?'-1� H!GC4� F!555� F4O5� F!7O5� 7O5�5� 655�5� O5�5�/��������������0?'->������1� 666� 65O� 665� 66O� 65�5� O�5� O�5�K������������0R555�������>���1�
HFH� F75� F55� F55� �75�5� 5�5� 5�5��
$�����K������ ������ �����������������,����� ��������� �����+�������+� ��+��D���� �� �����������/��E����� ������ ��� ��D%(�P����(����"�����+��M� ��.3*3���G������������������ Q!�KK��+���������������� ������+���/��� �������%9�*0733�����/������ �������/�������+���"(�/��������� ��������0�������������� �+�/����0�*7�/���� ���,�����+��������������������/��� ����'�%�*37�/���,������������������ ������� ���������������� ��
�����
)+�������� ����/��E����� ������+��,������������� �.3*.����.!5�/���� �����D%(0����+���+��+����+� ��+�������������������������.!.�/���� ��
� =������� ��������� ���� 4564� �� ������� �� ��� �#��� ����� ��������� ���� �� �� ��;��������������� ��� ������ ���� �������� ���� �������� "��� ���������������� ���������!��������� ������ ������ ���� ����� ������� ����� �� ���� ����� "� ����� �������� �������� ����������� �� ������� �� ������� ���� ������ ��� ���� ������� %�����!� ������� ��� ����"������������������������������������������� �������#������;������� �� ����$����%������/9�"������0"���?'-�665�������������������&����������?'-�66O�����������1����*��������!�����$����%������;������"�����"���������4564���"������������-=�454�����������4�C���������"�8-9�0������G1���������-=�66�������������������������8�����������-=�6F5� �������� ������� 04�4� �������� "� 8-91� ��� ���� ������� %������� ���� 8��������� ������������ ����������� "���� "� ������ �-=� CH�D� �������� "�� ������� ������ ���� ��������������������� �"� ������������� "����������#���� �� �������!����� ���������������������������������������������������������;�������������������������������"�����"�����������������#���������������������"��!���������������������"���������!����� ���� ����������� ������ ���������� ��� "� #���� �� �� ��������� "��� "� ��������� ����������!� ����� ���� ������������� ��� ������ ������ ������!� ���� ���� "� �������� ���� �������������������������"�8-9���"����������������������������������������������������������������������
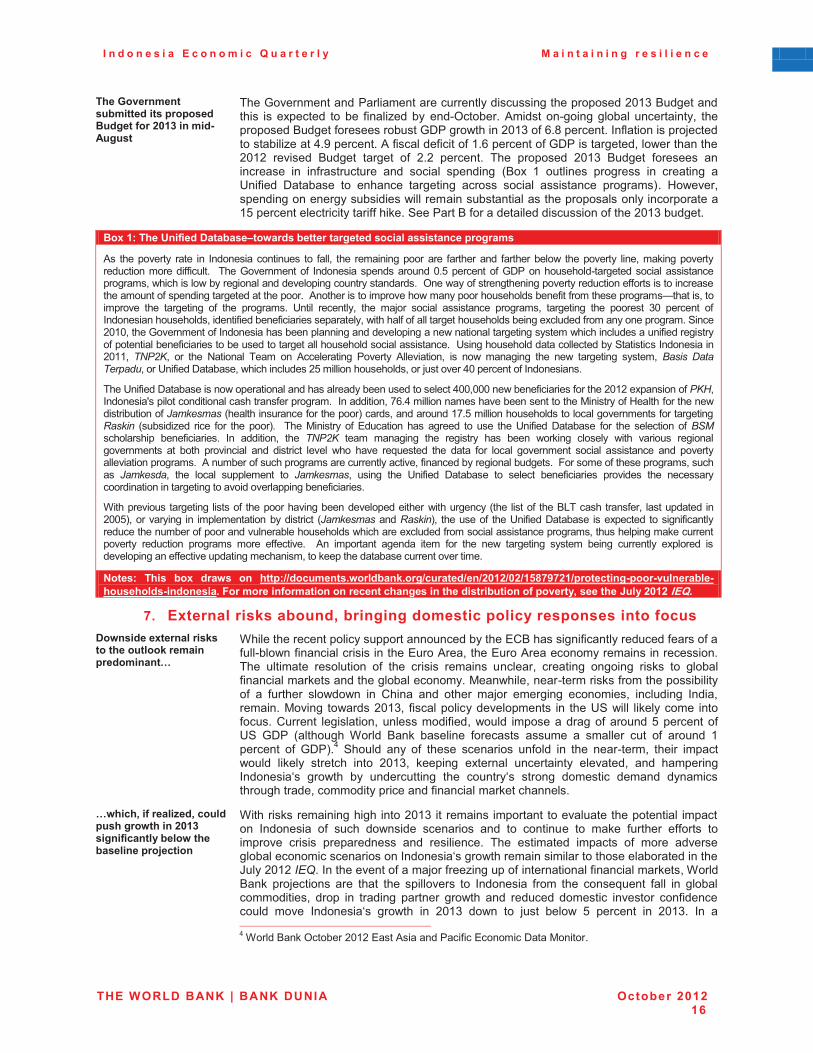
I n d o n e s i a E c o n o m i c Q u a r t e r l y M a i n t a i n i n g r e s i l i e n c e
THE WORLD BANK | BANK DUNIA October 2012 16
)+��D���� �� ����,����������/��/��������������.3*1�� ���>�������
� ����8�������������9������������������������������������������4567�%�������������� ����������� ����� "������������ ����K�������*����� ������������� �����������!� ����������%������"����������8-9���#������4567�"�D�H������������"����������;��������������������C�F����������*�"�������"�����"�6�D���������"�8-9�����������!��#������������4564� ������� %������ ������� "� 4�4� ��������� ���� ������ 4567� %������ "����� ����������� ��� ��"����������� ���� ����� �������� 0%�� 6� ������� ������ ��� ��������� ��?��"���� -������� �� �������� ���������� ���� ����� �������� ������1�� 3#����!�������������������������#�������������������������������������������������6O�������������������������""�������'���9����%�"��������������������"�����4567�����������
Box 1: The Unified Database–towards better targeted social assistance programs
*� ����������� ����� ��� ���������������� �� "���!� ���� ������������� ���� "������� ���� "������� ���#� ����������� ����!������������������������������""������� �����8���������"� �������������������5�O��������� "�8-9������������������������ ��������������!�#��������#�������������������������������������������K���#���"�������������������������������""�������������������������"������������������������������*������������������#��������������������"���"��������������b������!���������� ���� ���������� "� ���� �������� ?����� ��������!� ���� ��;�� ����� �������� ������!� ���������� ���� ����� 75� �������� "����������������!�������"��������"�����������������!�#�������"�"����������������������������������"������������������'�����4565!�����8���������"��������������������������������������������#������������������������#������������������"������������"��������������"����������������������������������������������������?����������������������������'�������������������4566!� �/"�'!� �� ���� +������� ����� �� *������������ 9������ *���������!� �� �#� ��������� ���� ��#� ���������� ����!� 0���� � ����*(!���?��"����-������!�#�������������4O��������������!���;�������C5���������"�����������
����?��"����-����������#�������������������������������������������C55!555���#�����"��������"������4564���������"�"'1!��������R������������������������"����������������������!�GD�C���������������������������������(�������"�3������"��������#������������"�&�.�����0����������������"��������1�����!�����������6G�O��������������������������������"������������2�.��� 0��������� ����� "�� ���� ��1�� � ����(������� "� �������� ��� ������� �� ��� ����?��"���� -������� "�� ���� ��������"� 0-3���������� ����"��������� ��� �������!� ���� �/"�'� ����� ��������� ���� �������� ��� ����� #������ ������ #���� ������ ������������������ ��� ���� ���������� ���� �������� ������ #�� ����� ��A������ ���� ����� "�� ����� ���������� ����� �������� ���� ���������������������������*��������"��������������������������������!�"����������������������������2�����"������������!������� &�.��!� ���� ����� ���������� �� &�.����!� ����� ���� ?��"���� -������� �� ������ ����"�������� ������� ���� �����������������������������������������������������"���������
$��������������������� ����"� �����������������������������������#������������0���� ����"� ����%)����������"��!� ������������ ���455O1!����������� ��� ������������������������� 0&�.���������2�.��1!� �������"� ����?��"����-������� ����������� ������"��������������������������"��������������������������#������������������"����������������������!��������������������������������� ��������� ������� ���� �""�������� � *�� ��������� ������� ����� "�� ���� ��#� ���������� ����� ������ ���������� �������� ����������������""������������������������!��������������������������������������
Notes: This box draws on http://documents.worldbank.org/curated/en/2012/02/15879721/protecting-poor-vulnerable-households-indonesia. For more information on recent changes in the distribution of poverty, see the July 2012 IEQ.
�
8!� External risks abound, bringing domestic policy responses into focus %�- ��������� ������������+�������������� �/����� � �C�
� $�������������������������������������������� /%��������"����������������"����"���"������#��"��������������������� ���*���!����� ���*�������������������������������� ��������� �������� "� ���� ����� ������� �������!� ��������� ������ ���� �� ������"�������������������������������������(���#����!���������������"����������������"� �� "������� �#�#�� ��� /����� ���� ����� ��;�� ��������� ������!� ���������� �����!���������(����� �#����4567!� "���������������������� ��� ����?'�#���� ����������� ����"����/������� ���������!���������"���!�#���� ������������"�������O���������"�?'� 8-9� 0�������� $���� %���� �������� "������ ����� �� ������� ���� "� ������ 6��������� "� 8-91�C� '����� ���� "� ����� ������� ��"��� ��� ���� ���������!� ������ �������#���� ������� ������� ���� 4567!� �������� ��������� ������������ ��������!� ���� ������������������� ��#��� ��� ������������� ���� �������� ����� ������� ������� ��������������������!�������������������"���������������������������
C-+��+0��������S�0�����/��+����-�+�� �.3*1���� ����� ���,��-��+��,���� ��/��E����� �
� $���������������������������4567���� ������� ��������� ������������������������ ��������� �������� "� ���� �#����� ������� ���� �� �������� �� ����� "������� �""��� ��������� ����� ����������� ���� ����������� ���� ��������� ������� "� ���� ����������������������������������������#����������������������������������������&����4564�������������������"�����;��"�����������"��������������"���������������!�$����%���� ��;������ ���� ����� ���� �������� �� �������� "��� ���� ���A����� "���� ��� ��������������!� ���� ��� �������� �������� ��#��� ���� �������� ������� ������� ��"������������ ���� ��������� ��#��� ��� 4567� �#�� �� ;��� ���#� O� �������� ��� 4567�� ��� �������������������������������������������������������������������C�$����%����K������4564� ���*�������9���"��� ������-����(������
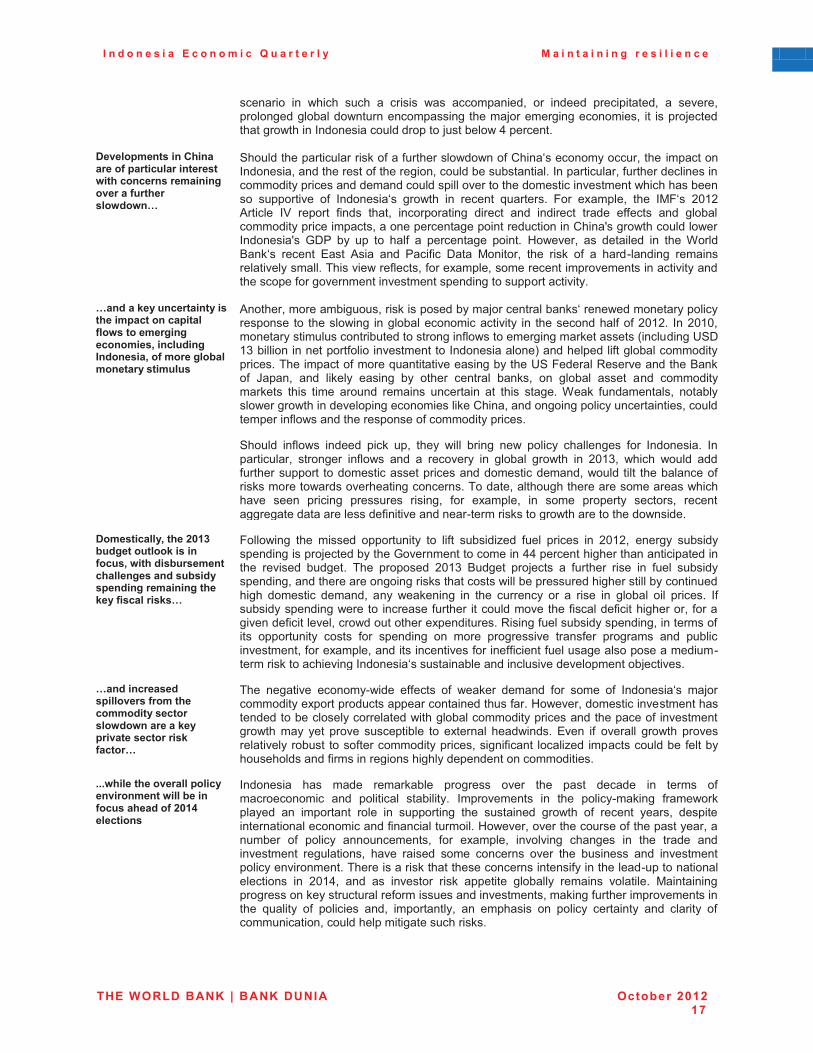
I n d o n e s i a E c o n o m i c Q u a r t e r l y M a i n t a i n i n g r e s i l i e n c e
THE WORLD BANK | BANK DUNIA October 2012 17
������� ��� #����� ���� �� ����� #�� ����������!� �� ������� ������������!� �� �����!����������������#����������������������;�����������������!� ��� ����;�������������#�������������������������;������#�C�����������
%����/�� ���� �"+� ���������/���������� �������-��+��� ��� ������� � �������������+�����-�- C�
� '������������������������"���"��������#�#��"�/����������������!���������������������!�������������"����������!���������������������������������!�"��������������������������������������������������������������������������������#�������������� ��������� "� ��������� ��#��� ��� ������� A�������� 2�� �������!� ���� �(2�� 4564�*������� �P� ������ "���� ����!� ������������ ������� ���� ��������� ������ �""���� ���� ��������������������������!����������������������������������/����R���#���������#����������R� 8-9� ��� ��� �� ���"� �� ����������� ������ 3#����!� �� ��������� ��� ���� $����%����� ������� ��� *��� ���� 9���"��� -���� (����!� ���� ���� "� �� ������������� �������������������������������#���"����!�"���������!����������������������������������������������"��������������������������������������������������
C� �������� ������ �������+����/����� ���/������-����������� ����� �����0�� ��� ��� � ����0�����������,���� ��������������
� *�����!������������!����������������;��������������������#����������������������� �� �����#���� ������������������������� ��� ������������"�"�4564�� ���4565!������������������������������������"�#�����������������������0����������?'-�67������������������"���������������������������1��������������"����������������������������������"�����A�������������������������?'�2�������=��������������%����"� &����!� ���� ������� ������ ��� ����� �������� ����!� �� ������ ���� ���� ��������������� ���� ����� ������ ������� ���������� ��� ���� ������ $���� "����������!� ��������#�����#����������������������������/����!�����������������������������!���������������"�#���������������"������������������'����� ��"�#� ������� ����� ��!� ����� #���� ������ ��#� ������ ���������� "�� ��������� �������������!� ������� ��"�#� ���� �� �������� ��� ������ ��#��� ��� 4567!� #����� #���� ����"������������� ������������������������������������!�#��������� ������������"����������#�����������������������������!���������������������������#���������� ���� �������� ������� �����!� "�� �������!� ��� ��� �������� ����!� �������������������������������"������������������������������#��������������#��������
%���������0��+��.3*1�,���������������� ������0�-��+���,������ ���+�� ����� ���,�����/� � ������� � ���+�����������������C�
� 2��#���� ���� ����� ���������� �� ��"�� ��������� "���� ������ ��� 4564!� ������� ������������������;�������������8������������������CC���������������������������������������� ������� �������� ���� ������ 4567� %������ ��;���� �� "������� ���� ��� "���� �������������!���������������������������������#�������������������������������������������� ������� ������!� ���� #��������� ��� ���� ��������� �� �� ���� ��� ������ ��� ������� �"���������������#������ ��������"������� ����������������"�������"�������������!�"������������"����������!���#�����������������������=�����"�����������������!���������"���� ���������� ��� "�� �������� �� ���� ��������� ����"��� ������� ���� ����������������!�"���������!������������������"�����""�������"�����������������������������������������������������������������������������������������;���������
C� �� ��������/�������������+��������������������-�- �����������/�������������������������C�
� ���� ��������� ������#���� �""���� "� #������ ������� "�� ��� "� ��������� ��;�������������������������������������������"����3#����!�������������������������������������������������#�������������������������������������"� ������������#��� ���� ���� ��������������� �� ��������� ����#����� ���� �"� ������� ��#��� ��������������������� ��"�����������������!�����"��������������� ���������������"������������������"�������������������������������������������
!!!-+����+��������/������ ���� �� ��-��,��� ��������+������.3*5������� ��
� �������� ��� ����� ����������� ������ ���� ���� ���� ������� ��� ����� "������������ ���� ��������� ���������� ����������� ��� ���� ������������� "����#���������� ��� ��������� ���� ��� ��������� ���� �������� ��#��� "� ������� ����!� �������������������������������"�����������������3#����!��������������"�������������!���������� "� ������ �����������!� "�� �������!� ��������� ������� ��� ���� ������ �������������� ���������!� ����� ������ ��� ������� ���� ���� ������ ���� �����������������������������������������������������������������"����������������������������������� ��� 456C!� ���� �� ������� ���� ��������� �������� ������� ��������� (�����������������������������������"��������������������!��������"������������������������� A������� "� ������� ���!� ����������!� ��� ������� �� ������ ���������� ���� �������� "������������!�����������������������������

I n d o n e s i a E c o n o m i c Q u a r t e r l y M a i n t a i n i n g r e s i l i e n c e
THE WORLD BANK | BANK DUNIA October 2012 18
B.�SOME RECENT DEVELOPMENTS IN
INDONESIA’S ECONOMY
*!� Indonesia’s manufactured exports: near-term dynamics and longer-term trends
���+�� � ���������������/�����-���� � �0�+�-�+������ �����������/�����/�������0�-+��������+����/������ �������+�������,�� ���� �+�-��� ��+��� �>�����/������� �������+���������,��� +� ������ �����-��Y��
� ���� ������� "� ���� #������ ��� ������ ������� ��� ����� �������� ���� ��� ���� ����������"�������"� �������������������4564��$����� �������������������������������������������������!��������������������#����������������"���������������*������������� ���9����*!� ������������������������������������!�#��������������� ���������������������������"��/������������A�������"������������������������������������������������������#�"��������������������������!������������������������������ �������"������������������ ������ ��������#����������� "�� �������������������������������������������������������������������#�����������������������"��������� �������� "� ��������� ������ ���� �������� #���� �� ����"� ������� "� �������������"����������"�������������!��������������������������"��������!�����������������������������"������������#���������������"�A�������;��������#��"�����
a.� Recent dynamics in Indonesia’s manufactured exports �+�����������>,������/�����+������� �/�������������������+��/���������� �+�0��+�����-�+����������� �����������/�����+���������//��
� ������#��� �����"� ��������� ����������������� "������� ��� ������������"�"�4566��������!������������������������������������������������#��"���������������*��������!���������������������#�������������������#�������������"����������������#������������#���������������������������������!�����������������������������������������������������455H�����������455F�02������451��2���������!����*�����4564!�����������!���������������������������������!� "�������6D�4��������������������!������ 65�D� �������� ��� &����� -������������ ����!� ���������� ������� &���!� ��������� ������������ ������ "���� ����� "������!� �#�� ��� 6O�F� �������!� #����� ���� �������� �������"�������� ������ #�� ���� �������� ��� O�O� ��������� $������ ���� �����!� �� �������������"� �#��������"�������� ������ ��#�������������!�#���� ��������������������������������"�������������������"�����"��!���������������������������#����������������������������02������461���
�� ��,������/������� �>,������/������������+�������� �������-�+�����+���+����,������������ ��������� ������ ����//���+�� ��
� $����������������������!��������������"�����"���������������� ���������?'*����������������""�����������������������������"�������"������������������������0�����(�����������&����1�����������������������������������������������������"�������������������������#��� "��������������� "�#���� 0���H�F��������������������� ������� "���� ����������"� 45641!� ������������������� 0���O�H� �������1!����������� 0G�H��������1!� ���� �������� �A�������� ���� ����� 06C�H� �������1�� �������� ����� ��������������"��67�C���������"�����������!�����4O�7���������"�����"�����������������������������"�����"����������������)�����*������!�=���!���������?������*���� �������0�������� ���������� "�� 6C�6� �������� "� ����� "�#���� ��� 45641� ���� ���� ��������� ����������"�������"���/���������������������������������#���"�"�#���������"������������������� ���� ������ ������ ��������������"� ����������� ��� �������!��������������������������������"������������������������������������������������
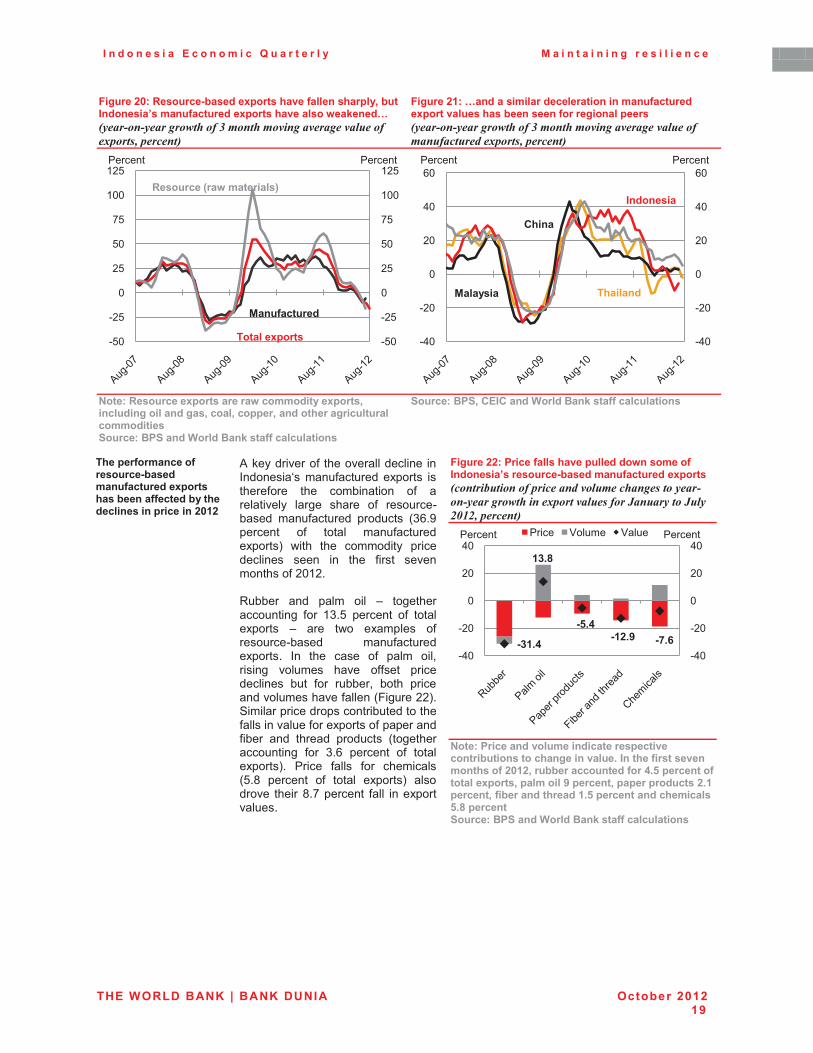
I n d o n e s i a E c o n o m i c Q u a r t e r l y M a i n t a i n i n g r e s i l i e n c e
THE WORLD BANK | BANK DUNIA October 2012 19
Figure 20: Resource-based exports have fallen sharply, but Indonesia’s manufactured exports have also weakened… �������������������1���������������������������,������� ����
Figure 21: …and a similar deceleration in manufactured export values has been seen for regional peers �������������������1��������������������������������� ����,������� ����
� �$�����9����������/�����������-������������/����0�� ��� ������ ����0����0���//��0�� ���+����������������������������������(��� ������� ���������������� ��
���������(�0�"��"�� ������� ���������������� ��
�)+��/������� ��������������>,������ �����������/�����+���,�� ���������,���+����� ���� �/������ �.3*.�
� *������������"� ������������������� ������������ ����"�������������� �������"��� ���� ���������� "� ������������� ������ ����� "� ������������ ����"�������� ������� 07D�F��������� "� ����� ����"�������������1� #���� ���� �������� �������������� ���� ��� ���� "���� ����������"�4564����=������ ���� ����� ��� N� ������������������ "�� 67�O� �������� "� ����������� N� ���� �#� �������� "������������� ����"��������������� ��� ���� ���� "� ����� ��!������� ������ ����� ""��� �������������� ���� "�� ������!� ���� ���������������������"������02������441��'����������������������������������"�������������"��������"�����������"����� ���� ������� ������� 0������������������ "�� 7�D� �������� "� ����������1�� 9����� "���� "�� ���������0O�H� �������� "� ����� �����1� �������� ������ H�G��������� "���� ����������������
Figure 22: Price falls have pulled down some of Indonesia’s resource-based manufactured exports � ���������������� ����������� ���������������������������,�������������7���������7����$%#$��� ����
�$�����(������ �������� ���������/��������� ���,���� ������+� ���� �����!�� ��+������������ ��� �+�����.3*.0���,,�������� �������5!7�/���� ������������/����0�/������6�/���� �0�/�/���/�������.!*�/���� �0���,���� ��+����*!7�/���� ��� ��+�������7!=�/���� �����������(��� ������� ���������������� ��
�O5
�4O
5
4O
O5
GO
655
64O
�O5
�4O
5
4O
O5
GO
655
64O9������� 9�������
)������/����
9��������P��-���������Q
�� ��������
)+��� �������
� � ����
"+� �
�C5
�45
5
45
C5
D5
�C5
�45
5
45
C5
D59������� 9�������
>1*!5
*1!=
>7!5>*.!6 >8!4
�C5
�45
5
45
C5
�C5
�45
5
45
C59���� P���� P����9������ 9������
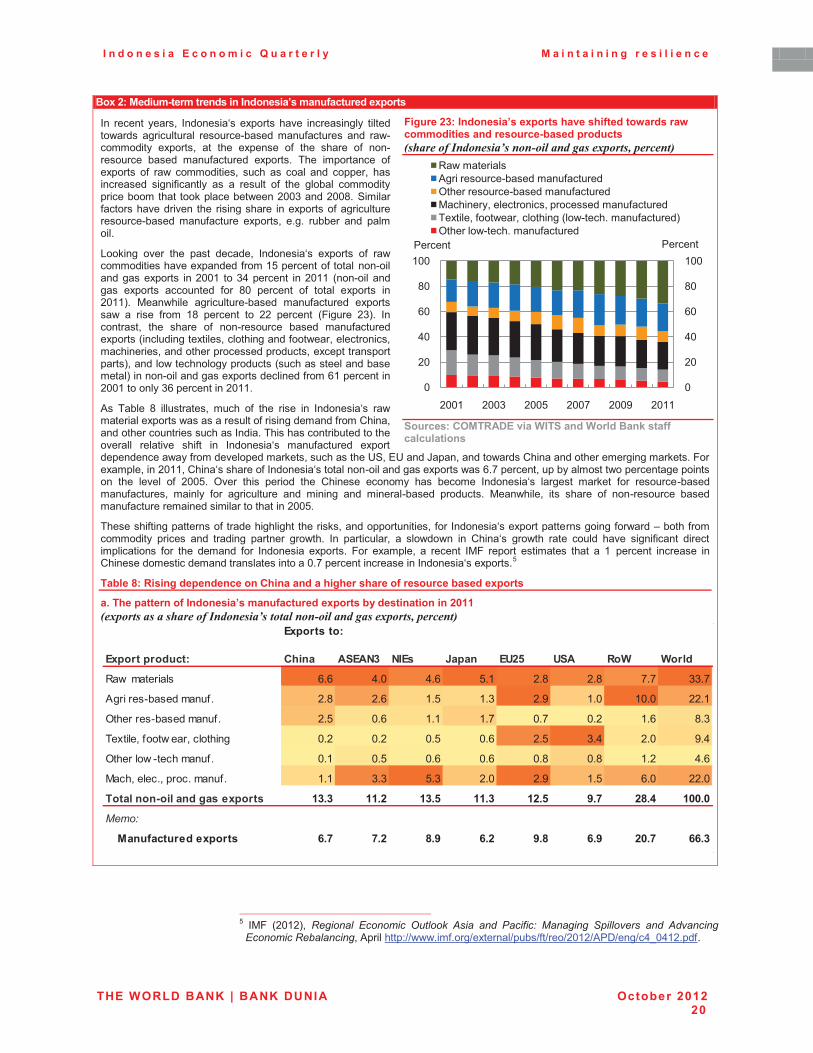
I n d o n e s i a E c o n o m i c Q u a r t e r l y M a i n t a i n i n g r e s i l i e n c e
THE WORLD BANK | BANK DUNIA October 2012 20
Box 2: Medium-term trends in Indonesia’s manufactured exports
��� ������� ����!� ��������� ������ ����� ������������ ��������#���� ������������� ������������ ����"������� ���� ��#��������� �����!� ��� ���� ������� "� ���� ����� "� ���������� ����� ����"�������� ������� ���� ���������� "������� "� ��#� ��������!� ���� �� ���� ���� �����!� ������������ ����"�������� �� �� ������ "� ���� ������ ����������������������������������#����4557�����455H��'�������"����������������� ���� ����������� ���������"������������������������� ����"������� �����!� ����� ������� ���� ����������
)����� ���� ���� ���� ������!� ��������� ������ "� ��#������������������������"���6O���������"������������������������� ���4556� ��7C��������� ���4566� 0������������� ������ ��������� "�� H5� �������� "� ����� ������ ���45661�� (���#����� ����������������� ����"�������� �������#� �� ���� "��� 6H� �������� �� 44� �������� 02������ 471�� ���������!� ���� ����� "� ���������� ����� ����"��������������0�����������������!�������������"�#���!����������!�����������!�����������������������!��������������������1!������#�����������������0������������������������1��������������������������������"���D6������������4556�������7D������������4566��
*� ������ H� ���������!� ����� "� ���� ���� ��� ��������� ��#����������������#������������"��������������"���/����!�������������������������������������������������������������� ��������� ��"�� ��� ��������� ����"�������� ������������������#���"������������������!�����������?'!� ?�����&����!������#����/�������������������������������2���������!����4566!�/�����������"����������������������������������#��D�G��������!�������������#������������������� ���� ������ "� 455O�� K���� ���� ������ ���� /������ ������ ��� ������ ��������� ������� ������� "�� ����������������"������!� ������� "�� ������������ ���� ������� ���� ������������� �������� (���#����!� ��� ����� "� ���������� ���������"���������������������������������455O��
�������"�������������"������������������������!���������������!�"������������������������������"�#����N�����"����������� ������ ���� �������� �������� ��#���� ��� ����������!� �� �#�#�� ��� /������ ��#��� ����� ����� ����� ����"������ ������������������ "�� ���� ������� "�� �������� ������� 2�� �������!� �� ������� �(2� ������ �������� ����� �� 6� �������� �������� ���/�����������������������������������5�G�����������������������������������O�
Table 8: Rising dependence on China and a higher share of resource based exports
a. The pattern of Indonesia’s manufactured exports by destination in 2011 �,�����������������*�������8������������������������,������� ����
��
Figure 23: Indonesia’s exports have shifted towards raw commodities and resource-based products ��������*�������8������������������,������� ����
����������"#�)9�%��������)��� ������� ���������������� ���
�
�����������������������������������������������������������������O� �(2� 045641!� 2�)���#� ��������� $( #��.� ,��� �� "�����4� 3�)��)� -*�##�!���� �� ,!����)�
���������2�5#����)!�*���������V>>###���"���>��������>���>"�>��>4564>*9->���>�Cj5C64���"���
��/��������
��/����/������ "+� � ����$1 $��� M�/� �'.7 '�� 9�� ���
=�# ��������� D�D C�5 C�D O�6 4�H 4�H G�G 77�G
*����������������"� 4�H 4�D 6�O 6�7 4�F 6�5 65�5 44�6
K�����������������"� 4�O 5�D 6�6 6�G 5�G 5�4 6�D H�7
�������!�"�# ���!�������� 5�4 5�4 5�O 5�D 4�O 7�C 4�5 F�C
K������# ����������"� 5�6 5�O 5�D 5�D 5�H 5�H 6�4 C�D
(���!������!����������"� 6�6 7�7 O�7 4�5 4�F 6�O D�5 44�5
)���� � >���� �������/���� *1!1 **!. *1!7 **!1 *.!7 6!8 .=!5 *33!3
3���4
�� �����������/���� 4!8 8!. =!6 4!. 6!= 4!6 .3!8 44!1
5
45
C5
D5
H5
655
5
45
C5
D5
H5
655
4556 4557 455O 455G 455F 4566
=�#���������*��������������������"�������K���������������������"�������(��������!����������!������������"��������������!�"�#���!���������0�#�����������"�������1K������#�����������"�������
9������� 9�������
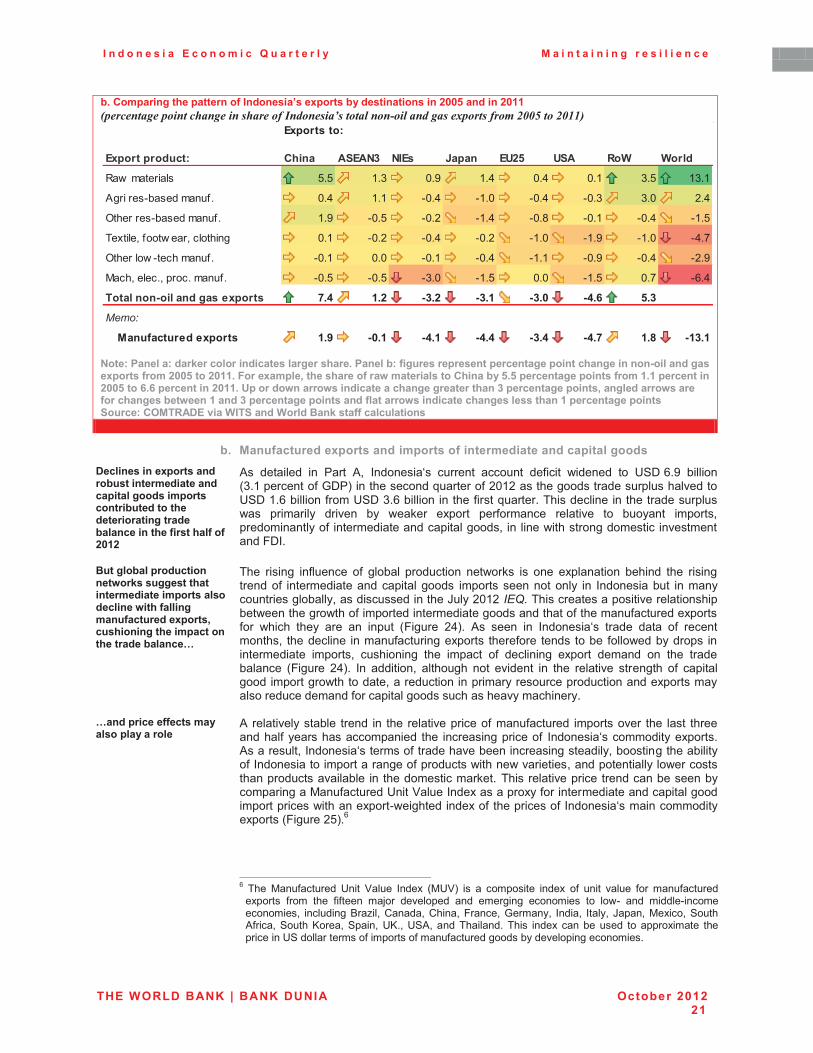
I n d o n e s i a E c o n o m i c Q u a r t e r l y M a i n t a i n i n g r e s i l i e n c e
THE WORLD BANK | BANK DUNIA October 2012 21
b. Comparing the pattern of Indonesia’s exports by destinations in 2005 and in 2011 �� ����������� ���������������*�������8������������������������,���������$%%9����$%##��
$�����(� ����������������� ��������������+���!�(� ��,������������/���� ��/���� �����/�� ���+� ���� � � >���� �������/����������.337����.3**!���������/�0��+���+���������-�������������"+� ��,��7!7�/���� �����/�� ��������*!*�/���� ��� �.337����4!4�/���� ��� �.3**!�'/�����- �����-��� ���������+� ������������+� �1�/���� �����/�� ��0�� �������-�����������+� ����,��-�� �*�� �1�/���� �����/�� ���� ���������-��� �������+� ���������+� �*�/���� �����/�� �����������"#�)9�%��������)��� ������� ���������������� ��
b.� Manufactured exports and imports of intermediate and capital goods %��� ���� ���/������ ���,����� ����������� ���/�����������/������� ���,��������+������������ �������,�� ���� ��+��������+������.3*.�
� *� ��������� ��� 9���� *!� ��������� �������� ������� ��"����� #������� �� ?'-�D�F� �������07�6���������"�8-91�������������A�������"�4564�������������������������������?'-�6�D��������"���?'-�7�D���������������"����A���������������������������������������#�� ���������� ������� ��� #������ ������ ���"������� ��������� �� ������� �����!��������������"� ���������������������������!���������#������������������������������2-�����
������,��/������� � ��-��������������+���� ������������/������������ ��-��+���� ���� �����������/����0����+�� � ���+����/����� ��+�������,�� ��C�
� ���� ������ ��"������� "� ������ ��������� ���#��� �� ��� ����������� ������� ���� ������������"� ���������������������������� ����������������� ��� ������������ �����������������������!�����������������&����4564����������������������������������������#����������#���"����������������������������������"���������"��������������"�� #����� ����� ���� ��� ������ 02������ 4C1�� *� ���� ��� ��������� ������ ����� "� �����������!� ������������ �������"��������������� �����"��� ����� ����� "��#���������� ���������������� �����!� ��������� ���� ������� "� ���������� ������ ������� �� ���� �������������� 02������ 4C1�� ��� �������!� �������� ��� �������� ��� ���� ��������� �������� "� �������������������#���������!����������������������������������������������������������������������"�������������������������������������
C� �/���������������������/���������
� *� ����������������� ������ ��� �������������������"�����"�������� ���������� ���� ���� �������������"�������������������� ���� ����������������"� ������������������������*��������!���������������"����������������������������������!�������������������"�������������������������"��������#������#���������!�����������������#���������������������������� ������������������������������������������������������������������������(���"��������?����P��������������������"������������������������������������������#�������������#��������������"� ����������"�����������������������������02������4O1�D���� �
�����������������������������������������������������������������D� ���� (���"�������� ?���� P����� ������ 0(?P1� �� �� ������� ������ "� ����� ������ "�� ����"��������
������ "��� ���� "�"����� ��;�� ��������� ���� ��������� ������� �� �#�� ���� �������������������!� ����������%�����!�/�����!�/����!�2�����!�8������!� �����!� �����!� &����!�(����!�'����*"����!�'����<���!�'����!�?<�!�?'*!� ������������������ ������ ������� ���� �� ����������� �������������?'������������"�������"�����"��������������������������������
��/��������
��/����/������ "+� � ����$1 $��� M�/� �'.7 '�� 9�� ���
=�# ��������� O�O 6�7 5�F 6�C 5�C 5�6 7�O 67�6
*����������������"� 5�C 6�6 �5�C �6�5 �5�C �5�7 7�5 4�C
K�����������������"� 6�F �5�O �5�4 �6�C �5�H �5�6 �5�C �6�O
�������!�"�# ���!�������� 5�6 �5�4 �5�C �5�4 �6�5 �6�F �6�5 �C�G
K������# ����������"� �5�6 5�5 �5�6 �5�C �6�6 �5�F �5�C �4�F
(���!������!����������"� �5�O �5�O �7�5 �6�O 5�5 �6�O 5�G �D�C
)���� � >���� �������/���� 8!5 *!. >1!. >1!* >1!3 >5!4 7!1
3���4
�� �����������/���� *!6 >3!* >5!* >5!5 >1!5 >5!8 *!= >*1!*
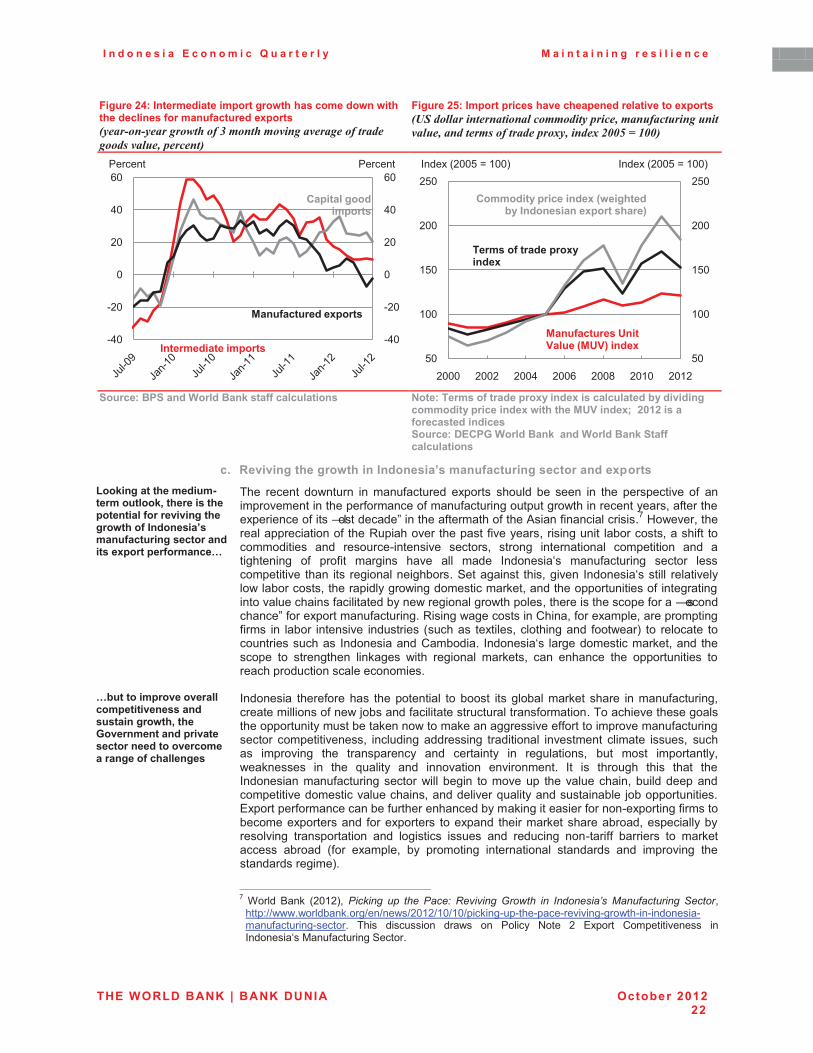
I n d o n e s i a E c o n o m i c Q u a r t e r l y M a i n t a i n i n g r e s i l i e n c e
THE WORLD BANK | BANK DUNIA October 2012 22
Figure 24: Intermediate import growth has come down with the declines for manufactured exports �������������������1��������������������������������������� ����
Figure 25: Import prices have cheapened relative to exports � !������������������� ����������� �������� ����������������������������������,������,�$%%9�'�#%%��
� �����������(��� ������� ���������������� �� $�����)�������������/������ ��������������,������ ��
���������/������ ���-��+��+���';�� ��O��.3*.����������������� ��������������%�"(D������� ���� ������� ���������������� ��
c.� Reviving the growth in Indonesia’s manufacturing sector and exports &���� ������+�������>�����������0��+��������+��/��� �������������� ���+�����-�+����� � ��������� �������� ���������� �������/����/������� ��C�
� ���� ������� �#������ ��� ����"�������� ������ ����� ��� ���� ��� ���� ����������� "� ������������������������"�������"�����"�����������������#�����������������!��"�������������������"����S���������”���������"��������"�����*����"��������������G�3#����!����������������������"�����=������������������"��������!������������ �������!�����"������������� ���� ���������������� ����!� ����� ������������� ���������� ���� ������������� "� ��"��� ������� ����� ���� ����� ��������� ����"��������� ����� �������������� ����� ��� �����������������'���������� ���!������� �������������� ������������#��������!���������������#�����������������!��������������������"�����������������������������"����������������#�����������#������!�����������������"����S�����������” "������������"����������=�����#����������/����!�"���������!��������������"���� ��� ����� ��������� ��������� 0������ �������!������������� "�#���1� �� �������� ���������������� ������������/�������� ��������� �������������������!����� �������� �� ���������� �������� #���� �������� ������!� ���� �������� ���� ����������� ��������������������������������
C,��������/��������������/������� ����� ������� ����-�+0��+��D���� �� ��� �/�������������� ������������������� �������+�� �����
� �������� �����"������ ������������� ����� ��������������������� �������"��������!���������������"���#�;������"������������������������"�������������������������������������������������������#���������������������""����������������"�������������� ������������!� ������������������� ����������� ���������� �������� ���!������� ��������� ���� ������������ ���� ���������� ��� ���������!� ���� ��� ����������!�#������� ��� ���� A������� ���� ��������� ������������ ��� �� ������� ���� ����� �����������������"��������� �����#���������� ��������� ���������������!���������������������������������������������!�������������A��������������������� ;�������������� ��������"��������������"�����������������������������������"��������������"������������������������ "���������� ��������� �����������������������!���������������������� ������������ ���� ������� ���� ���� ��������� �������""� �������� �� ������������ ������ 0"�� �������!� ��� �������� ������������� �������� ���� ��������� ������������������1���� ������������������������������������������������������������������G� $���� %���� 045641!� "��.��)� (*� %�� "��4� 2�!�!��)� 6��7 %� ��� �������8�� 3�(�� (���)� -�� ��!�
����V>>###�#����������>��>��#>4564>65>65>�������������������������������#������������������"��������������� ���� ������� ���#� �� 9����� +��� 4� ����� /������������ ������������(���"���������'������
�C5
�45
5
45
C5
D5
�C5
�45
5
45
C5
D59������ 9������
� ������������/����
"�/����������/����
�� �����������/����
O5
655
6O5
455
4O5
O5
655
6O5
455
4O5
4555 4554 455C 455D 455H 4565 4564
������0455O�X�6551 ������0455O�X�6551
"��������/������ ���P-���+���,��� � ���� ���/�����+���Q
�� ����������' ���;����P�';Q�� ��
)�������������/������ ��
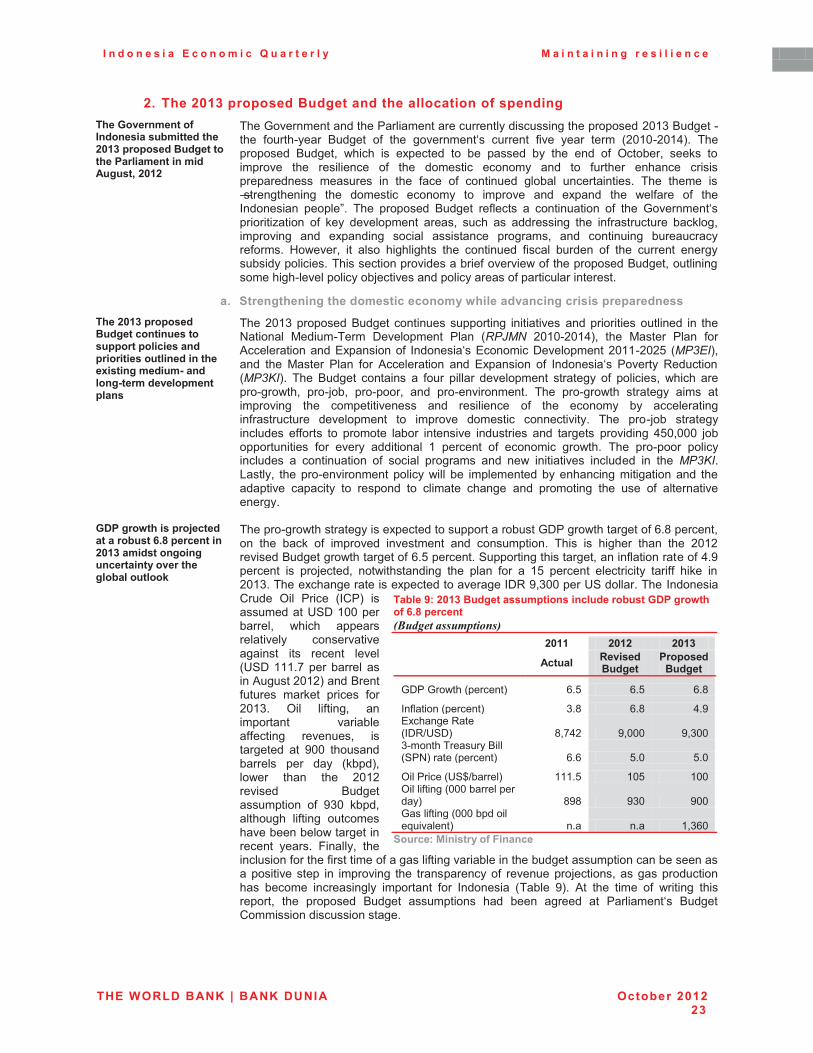
I n d o n e s i a E c o n o m i c Q u a r t e r l y M a i n t a i n i n g r e s i l i e n c e
THE WORLD BANK | BANK DUNIA October 2012 23
.!�The 2013 proposed Budget and the allocation of spending )+��D���� �� ������ � �������,�������+��.3*1�/��/��������������+��(������ ��� ����������0�.3*.�
� ����8�����������������9������������������������������������������4567�%������������ "���������� %������ "� ���� ����������� �������� "���� ����� ����� 04565�456C1�� ���������� %�����!� #����� �� ��������� �� ��� ����� ��� ���� ���� "� K�����!� ���� ��������� ���� ���������� "� ���� ������� ������ ���� �� "������� �������� ���������������� ������� ��� ���� "���� "� ��������� ������ �������������� ���� ������ ��S������������� ���� ������� ������ �� ������� ���� ������� ���� #��"���� "� ������������� �����”. ���� ������ %������ ��"����� �� ����������� "� ���� 8����������������������� "� ���� ����������� ����!� ���� �� ��������� ���� ��"����������� ������!���������� ���� ���������� ����� �������� ������!� ���� ���������� ��������������"���� 3#����!� ��� ��� ���������� ���� ��������� "����� ������� "� ���� �������� ��������������������������������������������"�������#�"�����������%�����!�������������������������������;����������������������"���������������������
a.� Strengthening the domestic economy while advancing crisis preparedness )+��.3*1�/��/������������ �� ���������//����/�������� �/�������������� ��� ��+�������� �������>�� �� �>���������/�� ��/� ��
� ����4567�������%����������������������� ����������� ������������� �������� ��� ����+������� (����������� -���������� 9���� 02"&3/� 4565�456C1!� ���� (����� 9���� "��*��������������� �������"� ��������� ������-����������4566�454O� 03"���1!����� ���� (����� 9���� "�� *����������� ���� ������� "� ��������� 9������ =��������03"�'�1�� ���� %������ ������� �� "��� ������� ����������� �������� "� ������!� #����� ���������#��!� ���;�!� �����!� ���� ��������������� ���� �����#��� �������� ���� ������������ ���� ������������� ���� ���������� "� ���� ������ ��� ���������������"����������� ����������� �� ������� ������� ������������� ���� ���;�� ���������������� �""��� �� ������ ����� ��������� ��������� ���� ������� ��������� CO5!555� ;������������� "�� ������ ���������� 6� �������� "� ������� ��#���� ���� ������ �������������� �� ����������� "� ����� ������� ���� ��#� ����������� ��������� ��� ���� 3"�'���)����!� ������������������������#���� ��� ��������������������������������������� ������������� ��������� �� ������ �� �������� ������� ���� �������� ���� ��� "� ���������������������
D%(����-�+����/��E������������,����4!=�/���� ��� �.3*1�������� ��� ��� ������ ���������+����,���������
� ���������#�������������������������������������8-9���#����������"�D�H��������!��� ���� ����� "� �������� ���������� ���� ���������� ���� �� ������� ����� ���� 4564��������%��������#����������"�D�O����������'�������������������!������"�����������"�C�F��������� �� ��;�����!� ��#����������� ���� ����� "�� �� 6O� �������� ������������ ����""� ����� ���4567������������������������������������������-=�F!755�����?'��������������������/����� K��� 9����� 0�/91� �����������?'-�655�����������!� #����� ������������������ ������������������ ��� ������� ������0?'-�666�G������������ �����*�����45641�����%�����"������ ������� ������ "��4567�� K��� ��"����!� ������������ ����������""������� �������!� ����������� ��� F55� �������������� ���� ���� 0����1!��#��� ����� ���� 4564�������� %�������������� "� F75� ����!����������� ��"����� �������������������#������������������ ������ 2������!� ������������"������"���������"��������"�������������������������������������������������������������� ��� ��������� ���� ������������"� ����������;�����!������������������ ������ ������������ ��������� "�� �������� 0������ F1�� *�� ���� ����� "� #������� ���������!� ���� ������ %������ �������� ���� ����� ������� ��� 9����������� %������/�������������������
Table 9: 2013 Budget assumptions include robust GDP growth of 6.8 percent �.������������������
.3**� .3*.� .3*1�
� ������ 9������������
(��/����������
8-9�8�#���0�������1� D�O� D�O� D�H�
��"������0�������1� 7�H� D�H� C�F� ��������=����0�-=>?'-1� H!GC4� F!555� F!755�7��������������%����0'9+1������0�������1� D�D� O�5� O�5�
K���9�����0?'q>������1� 666�O� 65O� 655�K�����"�����0555���������������1� HFH� F75� F55�8����"�����0555���������A��������1� ���� ���� 6!7D5�
�
���������� ����������� � ���
�
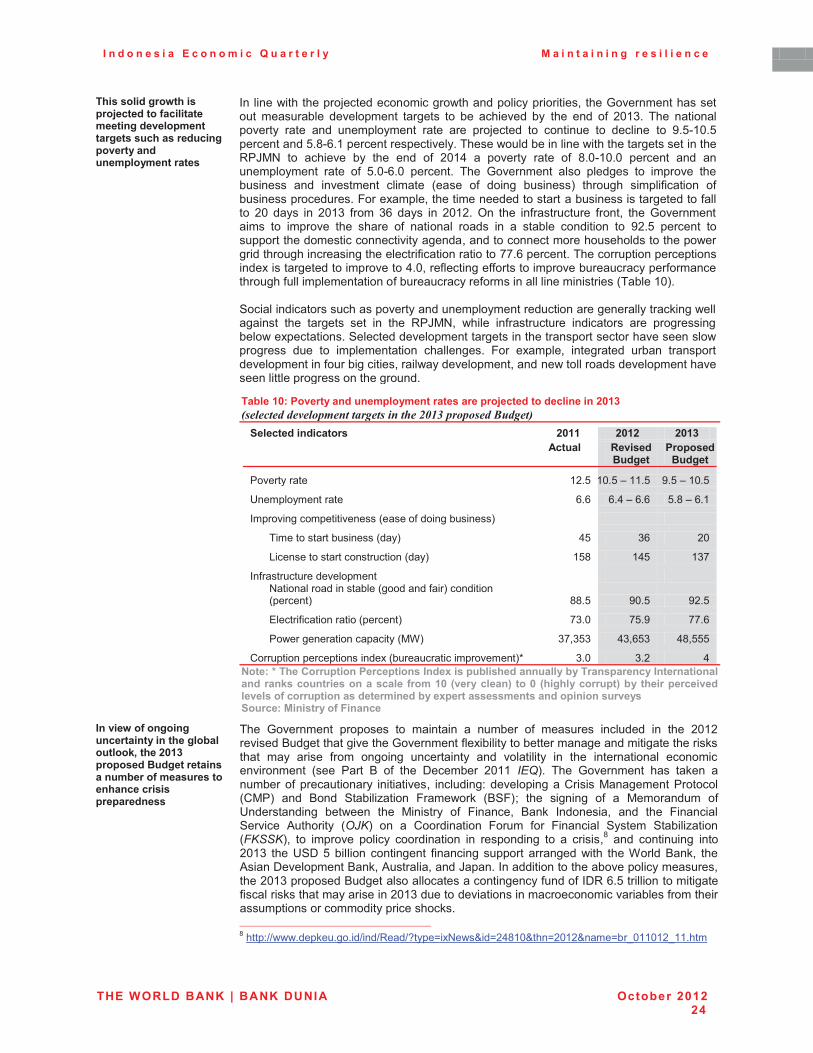
I n d o n e s i a E c o n o m i c Q u a r t e r l y M a i n t a i n i n g r e s i l i e n c e
THE WORLD BANK | BANK DUNIA October 2012 24
)+����������-�+����/��E����������������������� ������/�� �������������+��������� ��/�������� �� ��/���� ���������
��������#����������;���������������#���������������������!�����8������������������ ���������� ����������� ������� �� ��� ��������� ��� ���� ���� "� 4567�� ���� ��������������� ����� ���� ������������ ����� ���� ��;������ �� �������� �� �������� �� F�O�65�O�������������O�H�D�6���������������������������#���������������#�������������������������=9&(+� �� �������� ��� ���� ���� "� 456C� �� ������� ����� "� H�5�65�5� �������� ���� ��������������� ����� "� O�5�D�5� ��������� ���� 8��������� ��� ������� �� ������� ���������� ���� ���������� �������� 0���� "� ����� �����1� ������� �����"������� "�����������������2���������!���������������������������������������������"������ 45� ���� ��� 4567� "��� 7D� ���� ��� 4564�� K�� ���� ��"����������� "���!� ���� 8������������� �� ������� ���� ����� "� �������� ���� ��� �� ������ �������� �� F4�O� �������� �������������������������������������!��������������������������������#������������������������������������"��������������GG�D�������������������������������������������������������������C�5!���"���������""���������������������������"��������������"������������������"���������������"������������������������0������651����'���������������������������������������������������������������������������#����������� ���� ������� ��� ��� ���� =9&(+!� #����� ��"����������� ��������� ���� ������������#�������������'��������������������������������������������������������#������� ���� �� �������������� ����������� 2�� �������!� ����������� ������ ����������������������"������������!�����#�������������!�������#������������������������������������������������������ �Table 10: Poverty and unemployment rates are projected to decline in 2013 ��� ������������������������$%#1��������.������
�������� �������� .3**� .3*.� .3*1�� ������ 9������
������(��/����
������
9������������ 64�O� 65�O�N�66�O�� F�O�N�65�O��
?����������������� D�D� D�C�N�D�D�� O�H�N�D�6��
����������������������0����"�����������1��� �� �� ��
������������������0���1� CO� 7D� 45�
)�����������������������0���1�� 6OH� 6CO� 67G�
��"����������������������� �� �� ��+��������������������0�������"���1���������0�������1� HH�O� F5�O� F4�O�
������"������������0�������1�� G7�5� GO�F� GG�D�
9#����������������������0($1�� 7G!7O7� C7!DO7� CH!OOO�
/������������������������0�����������������������1`�� 7�5� 7�4� C��
$�����K�)+��"����/��� �(����/��� ��� ������/�,��+��� ����,��)�� �/��� ���� ��� ���� ��� ��� ������ ������� �������� �����*3�P�������� Q� ���3� P+��+�������/�Q�,�� �+����/���������������������/��� ���������� ��,����/������������ ���� ��/� �� ������������������� ����������� � ���
�
� ����-����� ��� ��� ������ ���� ��+����,��������0��+��.3*1�/��/��������������� ���� ��,������������������� +� ����������/��/��� �����
� ���� 8��������� ����� �� ��������� �� ������� "� ������� ��������� ��� ���� 4564��������%��������������������8���������"����������������������������������������������������� ���� ����� "��� ������ ������������ ���� ���������� ��� ���� ������������� ������������������ 0��� 9���� %� "� ���� -�������� 4566� ���1�� ���� 8��������� ��� ������ ���������"�������������� ����������!� ���������V�������������/����(����������9�����0/(91� ���� %��� '������������ 2����#��� 0%'21M� ���� ������� "� �� (��������� "�?������������ ���#���� ���� (������� "� 2������!� %���� �������!� ���� ���� 2���������'������� *�������� 0$&'1� �� �� /��������� 2���� "�� 2��������� '����� '������������09'--'1!� �� ������� ������ ���������� ��� ��������� �� �� ����!H� ���� ���������� ����4567� ����?'-�O�������� ���������� "��������������� ���������#���� ����$����%���!� ����*����-����������%���!�*�������!�����&����������������������������������������!�����4567�������%������������������������������"����"��-=�D�O��������������������"��������������������������4567���������������������������������������"�������������������������������������������������������������������������������������������������������H�����V>>###������������>���>=���>x����X��+�#[��X4CH65[���X4564[����X��j566564j66������
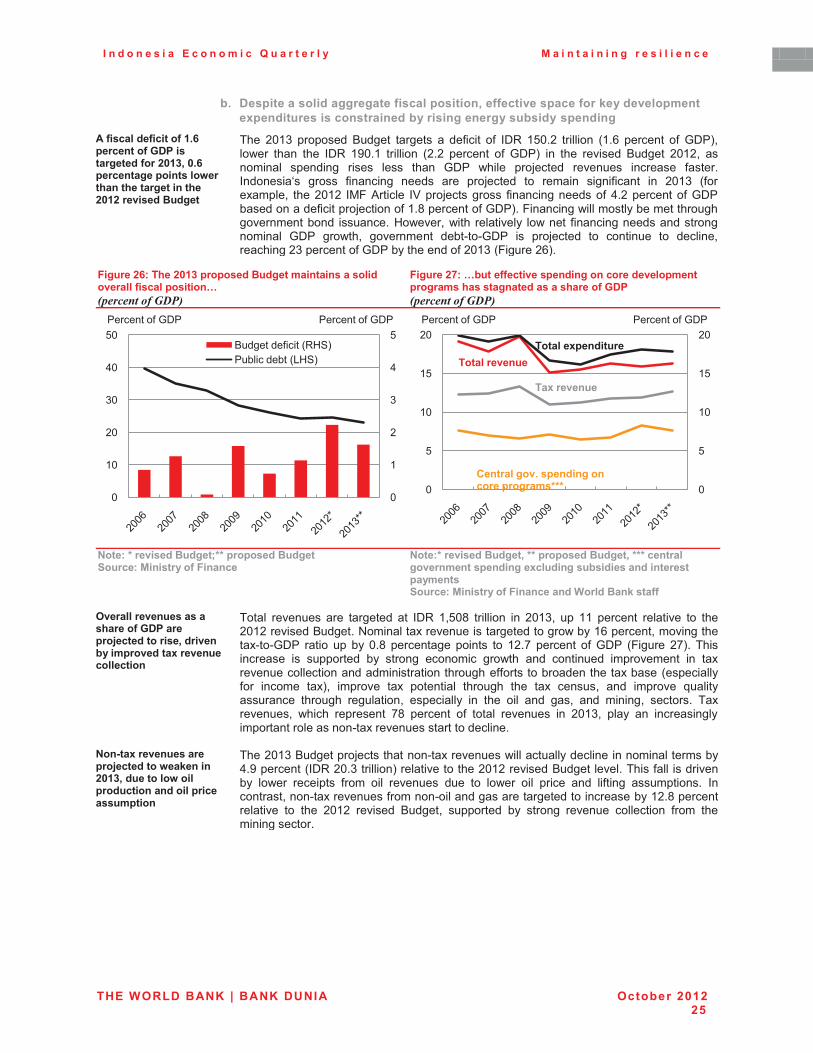
I n d o n e s i a E c o n o m i c Q u a r t e r l y M a i n t a i n i n g r e s i l i e n c e
THE WORLD BANK | BANK DUNIA October 2012 25
b.� Despite a solid aggregate fiscal position, effective space for key development expenditures is constrained by rising energy subsidy spending
������������������*!4�/���� �����D%(����������������.3*10�3!4�/���� �����/�� ����-����+� ��+���������� ��+��.3*.��������������
� ���� 4567� ������ %������ ������� �� ��"����� "� �-=� 6O5�4� �������� 06�D� �������� "� 8-91!��#��� ����� ���� �-=� 6F5�6� �������� 04�4� �������� "� 8-91� ��� ���� ������� %������ 4564!� ��������� �������� ���� ��� ����� 8-9� #����� ��;������ �������� �������� "��������������� ��� "��������� ����� ���� ��;������ �� ������� ����"������ ��� 4567� 0"���������!� ����4564� �(2�*������� �P���;������� "��������������"�C�4���������"�8-9������������"�������;������"�6�H���������"�8-91��2���������#������������������������������������� ��������3#����!�#���� ����������� �#����� "������������������������������ 8-9� ��#��!� ���������� �������8-9� �� ��;������ �� �������� �� �������!����������47���������"�8-9������������"�4567�02������4D1���
Figure 26: The 2013 proposed Budget maintains a solid overall fiscal position… �� �����������
Figure 27: …but effective spending on core development programs has stagnated as a share of GDP �� �����������
� �$�����K�������������OKK�/��/��������������������� ����������� � ���
$����K�������������0�KK�/��/���������0�KKK��� ��������� �� ���/� � ������� ����,������� �� �������/���� ������������� ����������� � ���� ������� ��������
�#��������� ����������+�������D%(�����/��E������������0����� �,����/������������� ���������� ��
� ����� �������� ���� ��������� ��� �-=� 6!O5H� �������� ��� 4567!� ��� 66� �������� ��������� �� ����4564��������%�������+���������������������������������#����6D��������!�����������������8-9� ����� ��� ���5�H� ����������� ����� �� 64�G� �������� "� 8-9� 02������ 4G1�������������� �� �������� ��� ����� ������� ��#��� ���� ��������� ����������� ��� ����������������������������������������������""������������������������0����������"�� ������ ���1!� ������� ���� ��������� ������� ���� ���� ����!� ���� ������� A��������������� ������� ���������!� ���������� ��� ���� ��� ���� ��!� ���� ������!� ������ �����������!� #����� ��������� GH� �������� "� ����� �������� ��� 4567!� ����� ��� �����������������������������������������������������������
$� >�������� ��������/��E��������-���� �� �.3*10��������-����/������� �� ����/����������/��� ��
� ����4567�%��������;������������������������#���������������������������������������C�F���������0�-=�45�7��������1����������������4564��������%�����������������"���������������� �#��� �������� "��� ��� �������� ���� �� �#��� ��� ������ ���� ��"����� ��������� ���������!����������������"������������������������������������������64�H������������������ �� ���� 4564� ������� %�����!� �������� ��� ����� �������� ��������� "��� �������������������� �
5
6
4
7
C
O
5
65
45
75
C5
O5%��������"�����0=3'19�����������0)3'1
9������ "�8-99������ "�8-9
5
O
65
6O
45
5
O
65
6O
459������ "�8-99������ "�8-9
)�������� ���
)������� ���
)������/� �����
"� �������!��/� � ��� ������/�������KKK

I n d o n e s i a E c o n o m i c Q u a r t e r l y M a i n t a i n i n g r e s i l i e n c e
THE WORLD BANK | BANK DUNIA October 2012 26
#�����,�������/� ������0�-+����/�� � ��� �������0�����/��E��������������+��������������D%(�� �.3*1�
� �������������������������������-=�6!DOH��������!����G�6������������������������4564��������%�����!��������������#�����������"�8-9���6G�F���������"���6H�4������������4564��K"�������������!�DF���������#��������������������������������������������#�����76� �������� #���� ��� ����"������ �� ���������� ���� ����� ����������� $������ ������������������ �������!� ���� ��������� �� ������� ������!� ��� 4C� �������!� �� ���� �����������!� "��#�������������������������� 046��������1!��������������������� 06G��������1!���������� ������������ 06C� �������1!� ��������� ������������ 0D� �������1�� -������ ���� ����������� "����� �����!� �""������� ����� "�� �������� �� ���� ����������� ������������ ������������#�������������������������������������������������"�"�������������������������������02������4G1����
Table 11: The 2013 proposed Budget projects a deficit of 1.6 of GDP �*�2������������������� �����
� �-=��������� 9�������"�8-9�
� .3*3� .3**� .3*.� .3*1� .3*3� .3**� .3*.� .3*1�
� *������ *������ =������%������
9�����%������
*������ *������ =������%������
9�����%������
�!����������� ���� ���� ��� 667� *0.**� *017=� *073=� *7!7� *4!1� *7!6� *4!1�
6�������������� 8.1� =85� *03*4� *0*86� **!1� **!=� **!6� *.!8�
4��+�������������� .46� 11*� 15*� 1.5� 5!.� 5!7� 5!3� 1!7�
�!���/� ������ *035.� *0.67� *075=� *047=� *4!.� *8!5� *=!.� *8!6�
6��/����������������!�>#� DFG� HHC� 6!5G5� 6!67F� 65�F� 66�F� 64�O� 64�7�
9������� 6CH� 6GD� 464� 4C6� 4�7� 4�C� 4�O� 4�D�
(�������� FH� 64O� 6HG� 6OF� 6�O� 6�G� 4�4� 6�G�
/������� H5� 66H� 6DF� 6FC� 6�7� 6�D� 4�5� 4�6�
���������������� HH� F7� 66H� 667� 6�C� 6�7� 6�C� 6�4�
'������!�>#� 6F7� 4FO� 4CO� 76D� 7�5� C�5� 4�F� 7�C�
������������� 6C5� 4OD� 454� 4GO� 4�4� 7�C� 4�C� 7�5�
'����� DF� G6� OO� OF� 6�6� 6�5� 5�D� 5�D�
K����������������� 44� O� H4� O7� 5�7� 5�6� 6�5� 5�D�
4������"������������ 7CO� C66� CGF� O6F� O�C� O�O� O�D� O�D�
"!�(�������,�� ��� 5.� 6� >8.� >18� 3!4� 3!*� >3!=� >3!5�
%!��'9(&'��N�%���"�)�� >58� >=5� >*63� >*73� >3!8� >*!*� >.!.� >*!4�
�!�$����� � �� �� F4� 676� 6F5� 6O5� 6�C� 6�H� 4�4� 6�D�
6��-������"��������� FD� 6CF� 6FO� 6G5� 6�O� 4�5� 4�7� 6�H�
4��2������"��������� �O� �6H� �C� �45� �5�6� �5�4� �5�6� �5�4��
���������� ����������� � ���� ������� ���������������� ���
�/� � ��� �� �������,����������� ����,��� ���0� ��-��+��� � ����/��/����*7�/���� ��+����� �������������������C�
� '������������������������ ����� �� ����������������� ���4567����7���������"�8-9�0�-=�4GO��������1!��������������������������������������4564��������%���������������02������4H1�F��������������������������������������������������������������������������������������������������"������������������!�#�������������G5���������"����� ����� ������� ������ ��!� �� �-=� 6FC� �������!� ��� C6� �������� "��� ���� 4564� �������%�����������8�������������������������������� "����������"�CD������������ ������0<)1!� D�������� <)� ������� ����� ���� ��������� ��� ���� 4564� ������� %������� ���� ��"��������������� ��������� ���� �� ���� ������ ���� ��� ���� ������� "� �������!� �� #���� �� ���������������������#�����������������������������!� ����� ����� ����������� �������������8���������� ������������� �� �������� ��������� "������������� ����������� ������""����������� ����"������������������������������!� ��#�������� �����"������������"������������ (���#����!� ���� ������������ ������ �� ��������� �-=� H5�F� �������!� ��� 4O��������� "��� 4564�� ���� 8��������� �� ������� �� 6O� �������� �������� ������������ ����""�
�����������������������������������������������������������������F�2��"���������������������������������������"������������������*�����4566�������

I n d o n e s i a E c o n o m i c Q u a r t e r l y M a i n t a i n i n g r e s i l i e n c e
THE WORLD BANK | BANK DUNIA October 2012 27
�������� ���4567� "���������#������������������F55�P����������0P*1��*���������������������������������������/������������������!����������������������������;������9�����������"�����%�����������������
Figure 28: Rising energy subsidy relative to spending on capital and social programs �*�2����������
Figure 29: After strong rises in 2012, in 2013 key ministries implementing infrastructure programs see lower allocations �*�2����������
� �$����� ��� �����-�+�� �.3*1����/��/���������������������.3*.������������������������ ����������� � ���
$����� ��� �����-�+�� �.3*1����/��/���������������������.3*.������������������������ ����������� � ���
�C����� ���+������0�-��+� ������� ������������/� � �����0�����������������������������/� �����������������+��� �������������,�����C�
� /������������������!��������"���������"���������������������!����������������-=�6FC������������4567!����6O��������������������4564��=����������8-9�����������"����������������������������!���4�6������������4567�"���4�5������������4564!�����������������������������"������������������������������������8���������#��������������������4566�05�O��������� "� 8-91�� $����� ���� ������� �������� ��� ���� ������� "�� �������� �������� �����������������!������������������������"�����������������������������������3"���!� �������������� ���� ���� �������� �� ��� ���� �������� ��������� �� ��������������� (�������� ������������ ��� �� 6C�G� �������� "���� ��� ������� �������� ��������� �� ����4564� ������� %������ �� �-=� 6OF� �������� ��� 4567� ��"�������� ���� 8���������� �""�����������������������������������������������������������������4567���
C� ���/� ��� ����������/�������� �/�����������/��������+���� ���,��
� '������������������������������������������������"�G������������������������4564� �������%�����!������������#��������� �� ��������������������� ����������������������������������'��������������������� �������������� �-=�OF� ����������������������� ����� ���� ������������ ��� ����� ��������� ������ ���� ���������� ��������00$-1����������������(�������"�=�������*""���!����������"������������00-31!�������� ��������� "�� ���� ��� 0&�.����1!� ���������� ����"��� "�� ��� �������0"'11!� ���� ���� ��������� ����� ����������� ������� 0"/"31�� ��� �������� ����� ���������������!�#������������������������������#���������������������������������������!� ������ ����� "�� ������� 02�.��1!� ���� ������� ����"��� �� ���� ������ 00$-������������������������������������1���������������#�����"����������������4567����������������4564��������%��������
(���� ����/� �����������/��E��������� ������������������������/� � �0������//�����+����� ���������,������������������������� ���� ��������
� 9����������������������4567�������;����������-=�4C6�6���������04�D���������"�8-91!����67�D���������"�������4564��������%�������K"������������!�CD�����������"���������������������� ���� ���#����!� 74� �������� "�� �����!� ���� 46� �������� "�� �������� ����������������������������������������������"���������8����������������"�G����������������������������������������������������������������!������������"���������������"��!��������������������������������������������"����#�����������������������������������4567���������������������������������������������������������������������������������������������������������������������9����/���
?���� ���� ���������+���������� �������������
� ����� ����� �������� �������� ������� "���� ��� ������� ����� ��������� �� ���� 4564� �������%�������-����������������������������"����������!������"������������������������4564�
*1!4Z*5!6Z
17!8Z
4!7Z
=!5Z
5
455
C55
D55
5
455
C55
D55
4565�*����� 4566�*�����4564�=������%����� 4567�9�����%�����
>*5!8Z
$��� �����-�+�� �.3*1�
�-=�������� �-=��������
4!4Z
1!4Z 4!3Z3!3Z
**!5Z
5
45
C5
D5
H5
655
5
45
C5
D5
H5
655
4565�*����� 4566�*�����4564�=������%����� 4567�9�����%�����
>8!=Z >*5!7Z
>*8!=Z
�-=�������� �-=��������$��� �����-�+�� �.3*1�
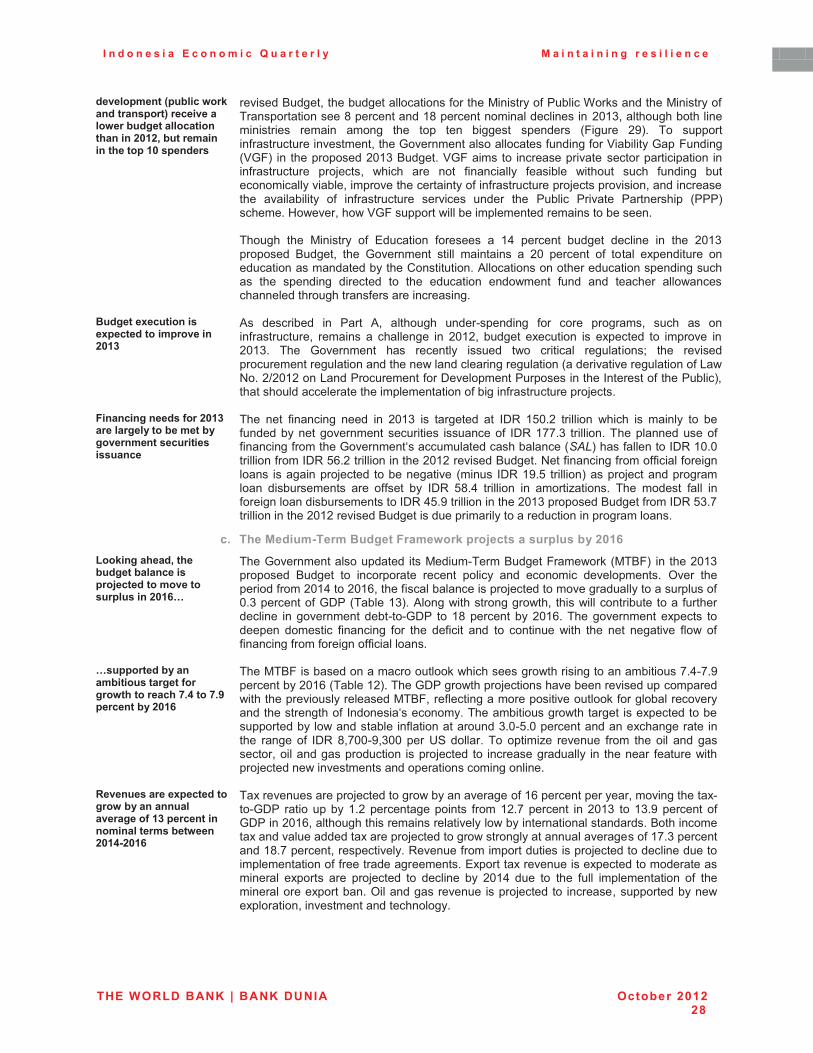
I n d o n e s i a E c o n o m i c Q u a r t e r l y M a i n t a i n i n g r e s i l i e n c e
THE WORLD BANK | BANK DUNIA October 2012 28
����/�� ��P/�,���-����� ���� �/���Q������������-���,������������ ��+� �� �.3*.0�,�������� �� ��+����/�*3��/� ����
�������%�����!���������������������"������(�������"�9������$�����������(�������"����������������H�������������6H���������������������������4567!��������������������������� ������� ����� ���� ��� ���� ������� ������� 02������ 4F1�� �� ��������"��������������������!�����8��������������������"�������"��P���������8���2�������0P821� �������������4567�%�������P82������� ���������������� ������������������ �����"����������� ��;���!� #����� ���� ��� "����������� "������� #������ ���� "������� ���������������������!����������������������"���"�������������;����������!����������������� ������������� "� ��"����������� ������� ������ ���� 9������ 9������� 9���������� 09991��������3#����!��#�P82�������#������������������������������������������� ���� (������� "� �������� "����� �� 6C� �������� ������� �������� ��� ���� 4567������� %�����!� ���� 8��������� ����� ��������� �� 45� �������� "� ����� ������������ �����������������������������/����������*�������������������������������������� ���� �������� ��������� �� ���� ��������� ���#����� "���� ���� �������� ���#��������������������������"�������������������
�������������� ������/����������/������ �.3*1�
� *� ��������� ��� 9���� *!� �������� �������������� "�� ���� ������!� ���� �� ����"����������!� ������� �� ���������� ��� 4564!� ������� ��������� �� ��������� �� ������� ���4567�� ���� 8��������� ��� ��������� ����� �#� ��������� ���������M� ���� ��������������������������������������#�������������������������0�����������������������"�)�#�+��4>4564���)����9����������"��-����������9��������������������"�����9�����1!����������������������������������������"�������"�������������;������
�� � �� �� ��������.3*1��������������,������,������� �� ������������������ ���
� ���� ���� "��������� ����� ��� 4567� �� ��������� ��� �-=� 6O5�4� �������� #����� �� ������� �� ���"�������������������������������� �������"� �-=�6GG�7� ������������������������"�"���������"�������8����������������������������������0-,:1����"���������-=�65�5���������"����-=�OD�4����������������4564��������%�������+���"���������"���""������"���������� ����������;������ �������������� 0����� �-=�6F�O� �������1�����;������������������� ����������� ���� ""��� ��� �-=� OH�C� �������� ��� ������������ ���� ����� "���� ���"������������������������-=�CO�F����������������4567�������%������"����-=�O7�G����������������4564��������%��������������������������������������������������
c.� The Medium-Term Budget Framework projects a surplus by 2016 &���� ���+��0��+��,�����,�� ������/��E�������������������/���� �.3*4C�
� ����8�������������������� ���(�����������%������2����#���0(�%21� �������4567������� %������ �� ���������� ������� ������ ���� ������� ������������ K���� ����������"���456C���456D!�����"�����������������;��������������������������������"�5�7���������"�8-9�0������671��*����#�����������#��!� ����#������������������"��������������� ��������������������8-9� ��6H��������� ���456D����������������������� ��������� ������� "��������� "�� ���� ��"����� ���� �� �������� #���� ���� ���� ��������� "�#� "�"���������"���"������""������������
C��//�����,��� ���,���������������������-�+��������+�8!5����8!6�/���� ��,��.3*4�
� ����(�%2����������������������#����������#����������������������G�C�G�F������������456D�0������641������8-9���#�����;����������������������������������#�������������������������(�%2!���"��������������������������"��������������������������������"�������������������������������#��������������������������������������#�������������"���������������7�5�O�5������������������������������ ������� ������ "� �-=� H!G55�F!755� ���� ?'� ������� �� �������� �������� "��� ���� ��� �����������!�������������������� ����;������ �� ������������������ ��� ��������� "�������#������;��������#�������������������������������������
9��� ����������/�����������-�,��� �� ��������������*1�/���� ��� � ��� ��������,��-�� �.3*5>.3*4�
� ������������������;����������#���������������"�6D�����������������!�����������������8-9� ����������� 6�4����������������� "���64�G��������� ���4567� ��67�F��������� "�8-9����456D!��������������������������������#��������������������������%���������������������������������������;����������#��������������������������"�6G�7�������������6H�G��������!��������������=�������"�������������������;������������������������������������"�"��������������������� ������������������������������������������������ ������ ���� ��;������ �� �������� ��� 456C� ���� �� ���� "���� �������������� "� ��������������������������K����������������������;�������� �������!��������������#����������!��������������������������� �
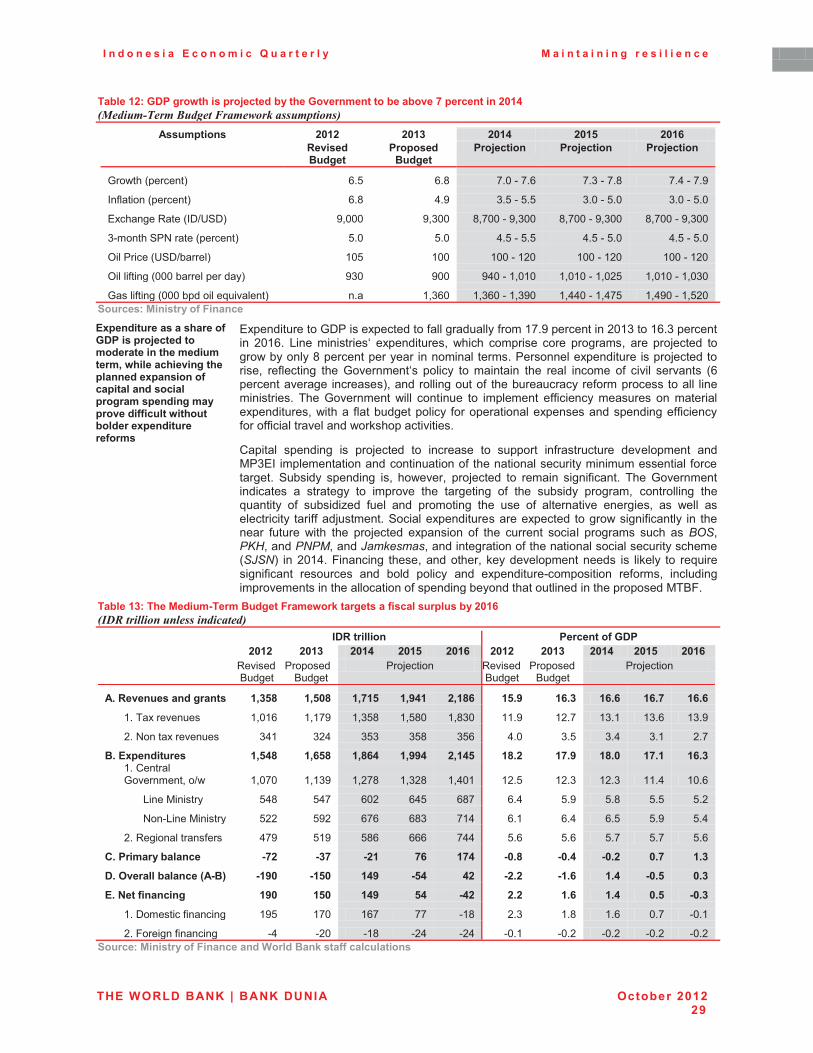
I n d o n e s i a E c o n o m i c Q u a r t e r l y M a i n t a i n i n g r e s i l i e n c e
THE WORLD BANK | BANK DUNIA October 2012 29
Table 12: GDP growth is projected by the Government to be above 7 percent in 2014 �������/��.�����:����3��������������
�����/��� �� .3*.� .3*1� .3*5� .3*7� .3*4�
�� 9������������
(��/����������
(��E����� � (��E����� � (��E����� �
8�#���0�������1� D�O� D�H� G�5���G�D� G�7���G�H� G�C���G�F�
��"������0�������1� D�H� C�F� 7�O���O�O� 7�5���O�5� 7�5���O�5�
��������=����0�->?'-1� F!555� F!755� H!G55���F!755� H!G55���F!755� H!G55���F!755�
7������'9+������0�������1� O�5� O�5� C�O���O�O� C�O���O�5� C�O���O�5�
K���9�����0?'->������1� 65O� 655� 655���645� 655���645� 655���645�
K�����"�����0555���������������1� F75� F55� FC5���6!565� 6!565���6!54O� 6!565���6!575�
8����"�����0555���������A��������1� ���� 6!7D5� 6!7D5���6!7F5� 6!CC5���6!CGO� 6!CF5���6!O45��
����������� ����������� � ����
��/� ������������+�������D%(����/��E����������������� ��+������������0�-+�����+���� ���+��/� ����/� ��� ������/����� �������/��������/� � ������/�������������-��+����,������/� ��������������
� �������������8-9��������������"��������������"���6G�F������������4567���6D�7������������ 456D�� )���� ���������� �����������!� #����� ������� ���� ������!� ���� ��;������ ����#��������H����������������������������������9�����������������������;�����������!� ��"�������� ���� 8���������� ������ �� ��������� ���� ����� ������ "� ������ ������� 0D������������������������1!���������������"� ������������������"�������������� ��������������� ���� 8��������� #���� �������� �� ���������� �""�������� ������� �� ��������������������!�#������ "����������������� "��������������������������������""��������"��""�����������������#�����������������/������� �������� �� ��;������ �� �������� �� ������ ��"����������� ����������� ����(97 �������������������������������"�������������������������������������"������������ '������ �������� �!� �#����!� ��;������ �� ������� ����"������� ���� 8������������������ �� �������� �� ������� ���� ���������� "� ���� ������ ������!� ���������� ����A�������� "� ��������� "���� ���� �������� ���� ��� "� ������������ �������!� �� #���� �������������� ����""���;��������'������������������������������ ����#�����"�������� ��� ��������� "������ #���� ���� ��;������ �������� "� ���� �������� ����� ������� ���� �� 0$-!�"'1!�����"/"3!�����&�.����!����������������"��������������������������������0-&-/1� ���456C��2��������� ����!���������!��������������������� �� ������� �� ��A���������"������ ������� ���� ���� ������ ���� �������������������� ��"��!� �������������������������������������"�����������������������������������������(�%2���
)�,��*1��)+�������>)���������������-�����������������������/���,��.3*4��*�2������������������� ������
� �%9������ � (���� �����D%(�� .3*.� .3*1� .3*5� .3*7� .3*4� .3*.� .3*1� .3*5� .3*7� .3*4�� =������
%������9�����
%������9�;������ =������
%������9�����
%������9�;������
�!�9��� ����� ���� ��� *017=� *073=� *08*7� *065*� .0*=4� *7!6� *4!1� *4!4� *4!8� *4!4�
6�������������� 6!56D� 6!6GF� 6!7OH� 6!OH5� 6!H75� 66�F� 64�G� 67�6� 67�D� 67�F�
4��+�������������� 7C6� 74C� 7O7� 7OH� 7OD� C�5� 7�O� 7�C� 7�6� 4�G�
�!���/� ������� *075=� *047=� *0=45� *0665� .0*57� *=!.� *8!6� *=!3� *8!*� *4!1�6��/�������8��������!�>#� 6!5G5� 6!67F� 6!4GH� 6!74H� 6!C56� 64�O� 64�7� 64�7� 66�C� 65�D�
)����(������� OCH� OCG� D54� DCO� DHG� D�C� O�F� O�H� O�O� O�4�
+��)����(������� O44� OF4� DGD� DH7� G6C� D�6� D�C� D�O� O�F� O�C�
4��=�����������"��� CGF� O6F� OHD� DDD� GCC� O�D� O�D� O�G� O�G� O�D�
"!�(�������,�� ��� >8.� >18� >.*� 84� *85� >3!=� >3!5� >3!.� 3!8� *!1�
%!�#�����,�� ���P�>�Q� >*63� >*73� *56� >75� 5.� >.!.� >*!4� *!5� >3!7� 3!1�
�!�$����� � �� �� *63� *73� *56� 75� >5.� .!.� *!4� *!5� 3!7� >3!1�
6��-������"��������� 6FO� 6G5� 6DG� GG� �6H� 4�7� 6�H� 6�D� 5�G� �5�6�
4��2������"��������� �C� �45� �6H� �4C� �4C� �5�6� �5�4� �5�4� �5�4� �5�4��
���������� ����������� � ���� ������� ���������������� ��
I n d o n e s i a E c o n o m i c Q u a r t e r l y M a i n t a i n i n g r e s i l i e n c e
THE WORLD BANK | BANK DUNIA October 2012 30
�
C.�INDONESIA 2014 AND BEYOND: A SELECTIVE LOOK
*!� Drivers behind the rapid growth of government personnel expenditures D���� �� ��������������� �������/� � ��� �/���� ��+�������- ��������/����+� ��������+����/� � �������������
� ��������� �#��������8-9���������������� "�������"����������������������� ����"��������������������������������������������������������������!��������������������������������������������������������������"������������3#����!������������� ���� ������� �����!� ������� ������ �#� ������� ������� �������� "�� ������ �������������������������"����������������������2���������!�������������������������������������������!� ���������������������������� �� ������������������������������� ���� "����������������#������� "����� ����� "������������������02������751!�#���������������������#��������"�6C�������������H������������������������������"���455H� ��4564��*��� �����!� ���������� ����!� ���� ���������������%��������������� "���������� ������������ �� ������ �#�������������� ����� "���������� �����������!�#����� �����������"�����������02������761��8�������������������"�������������������������������������������������������������������!� �����������������������"�������#�"��������������������������������������������������������������
Figure 30: Increases in total Budget allocations to personnel spending have outpaced those to capital spending… ���������������� �������� ������������������������������.��������� ��������*�2����������
Figure 31: …and personnel accounts for a much higher share of national and sub-national Budget allocations �*�2��������(�� ������������ ������������������������������.��������� ��������
������������� ������� ���������������� �� ������������� ������� ���������������� ��
a.� The main drivers of rising personnel spending in Indonesia �������� ����� �������������� �������/�������/� �������� ����� ��+��2����������/� � �C�
� (���� "� ���� ������� ��"��� �� ���� ������� ����!� #����� ���� ������ ��� ��������� ���������� ���!� �""�������!� ���� A������� "� ������� �������!� ����� ����� �������� ���������������� ��� ���� (������� "� 2������� ���� ���� ��������� ������!� 0**����� =�"����������� �������� ������ ���� ����� ���� ���� ����������M� ���� ���"������� "� ��������������� ���� �������� ������M� ���� ����������� "� �� ������������ ������������"����#��M����"����������������������09%%1M�������������������������
�C5
�45
5
45
C5
D5
H5
�C5
�45
5
45
C5
D5
H5
455F 4565 4566 4564
9�������%�����
/�������%�����
�-=�������� �-=��������
5
65
45
75
C5
5
6O5
755
CO5
D55
455H 455F 4565 4566 4564
9�������%������0�-=!�)3'1/�������%������0�-=!�)3'19�������%������0�����"������%�����!�=3'1/�������%������0�����"������%�����!�=3'1
�-=�������� 9������
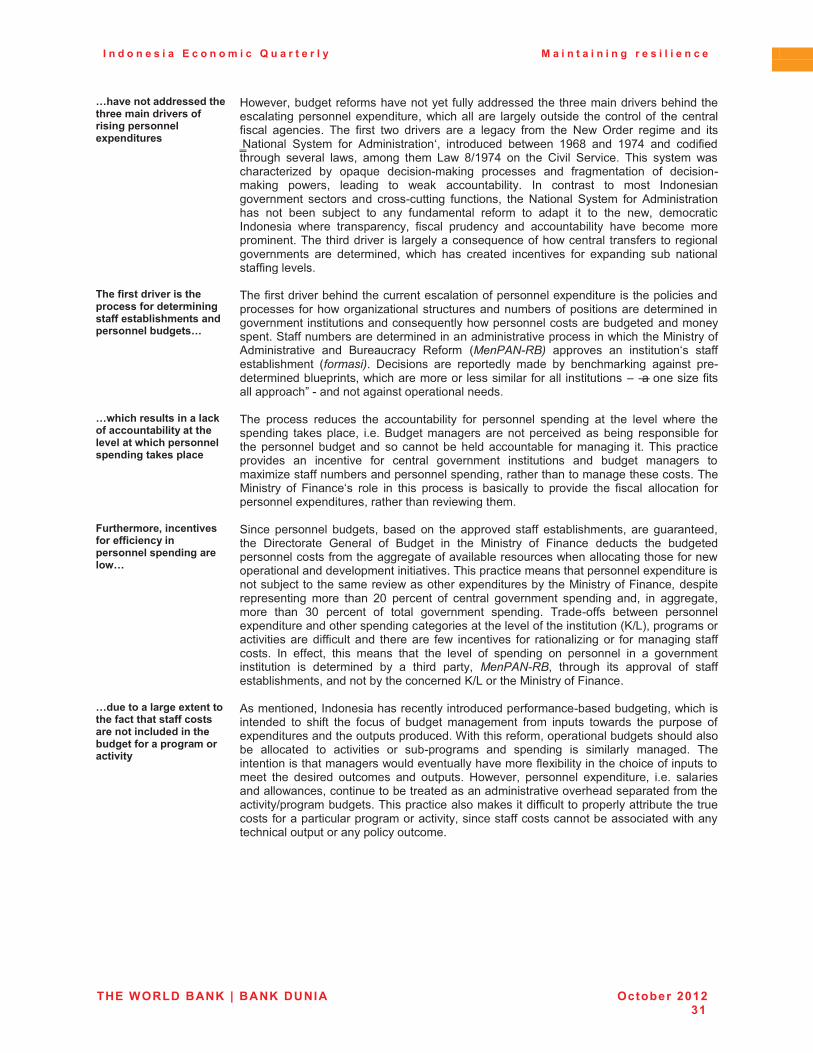
I n d o n e s i a E c o n o m i c Q u a r t e r l y M a i n t a i n i n g r e s i l i e n c e
THE WORLD BANK | BANK DUNIA October 2012 31
C+���� �����������+���+������� ��������������� ��/���� ����/� �������
� 3#����!����������"���������������"���������������������������������������������������������������������������!�#������������� �������������� ����������"� ������������"����� ��������� ���� "���� �#� ������� ���� �� ������� "��� ���� +�#� K����� ������� ���� ���{+������� '����� "�� *������������!� ���������� ���#���� 6FDH� ���� 6FGC� ���� ���"����������� ������� ��#!� ����� ����� )�#� H>6FGC� �� ���� /����� '�������� ���� ����� #���������������� ��� ��A��� �������������� ������ ���� "������������ "� �������������� �#��!� �������� �� #���� ��������������� ��� ������� �� ��� ������������������� ����� ���� ����������� "������!� ���� +������� '����� "�� *��������������� ��� ����� ��;���� �� ���� "����������� ��"��� �� ������ ��� �� ���� ��#!� ������������������ #����� �����������!� "����� ��������� ���� �������������� ����� ������ ������������������������������� �� �������������A������"��#��������� ����"����������������������� ���� ����������!� #����� ��� �������� ���������� "�� ���������� ��� ����������""������������
)+������������������+��/����������������� � ������������,��+�� ���� �/���� ��,�������
� ����"���������������������������������������"��������������������������������������������"���#����������������������������������"���������������������� ������������������������������A��������#����������������������������������������'��""���������������������������������������������������#���������(�������"�*������������� ���� %����������� =�"��� 03��",/�20;� ������� ��� ����������� ��""������������� 0������;�� -������ ���� ���������� ����� ��� ������������� ������� ������������������������!�#�������������������������"������ ����������N�S���������"��������������” ����������������������������������
C-+��+��������� ��������������� ��,���������+���������-+��+�/���� ���/� � ��������/����
� ���� ����� ������� ���� �������������� "�� �������� �������� ��� ���� ������ #����� ������������ ����������!� �����%��������������������� ������������ ������ ��������� "������������������������� �������������������������� "����������� ������������������������ ��� ���������� "�� �������� ���������� ���������� ���� ������� �������� �������������""���������������������������!�����������������������������������(������� "� 2�������� ���� ��� ���� ����� �� ��������� �� ������� ���� "����� ��������� "���������������������!������������������#������������
����+������0�� �� ����������������� ���� �/���� ���/� � �������-C�
� '����� �������� ������!� ����� �� ��������������""� �����������!� ��������������!����� -���������� 8������� "� %������ ��� ���� (������� "� 2������� ������� ���� ��������������������"�����������������"������������������#������������������"����#����������������������������������������������������������������������������������������;�������������������#���������������������������(�������"�2������!�������������������� ���� ����� 45� �������� "� �������� ���������� �������� ���!� ��� ���������!����� ����� 75� �������� "� ����� ���������� ��������� ������""� ���#���� �����������������������������������������������������������"���������������0<>)1!������������������������ ��""���������� ���������� "�#� ���������� "�� ��������������� "�������������""����� ��� �""���!� ���� ����� ����� ���� ������ "� �������� �� �������� ��� �� �������������������� �� ����������� ��� �� ������ �����!� 3��",/�20!� ������� ��� �������� "� ��""������������!������������������������<>)�������(�������"�2���������
C����������������� ������+��������+������������������� ���� ����� ��+��,�����������/�������������������
� *���������!����������������������������������"���������������������!�#���������������� �� ��"�� ���� "��� "� ������� ����������� "��� ������ �#���� ���� ������ "������������������������������������$����������"��!����������������������������� ��������� �� ���������� �� ���������� ���� �������� �� ��������� ��������� ����������������������������#������������������������"������������������������"�������������� ���� ������� ������ ���� ������� 3#����!� �������� �����������!� ����� ��������������#����!����������������������������������������������������������"���������������>�����������������������������������������""��������������������������������������"��������������������������������!��������""���������������������#���������������������������������������������
� �
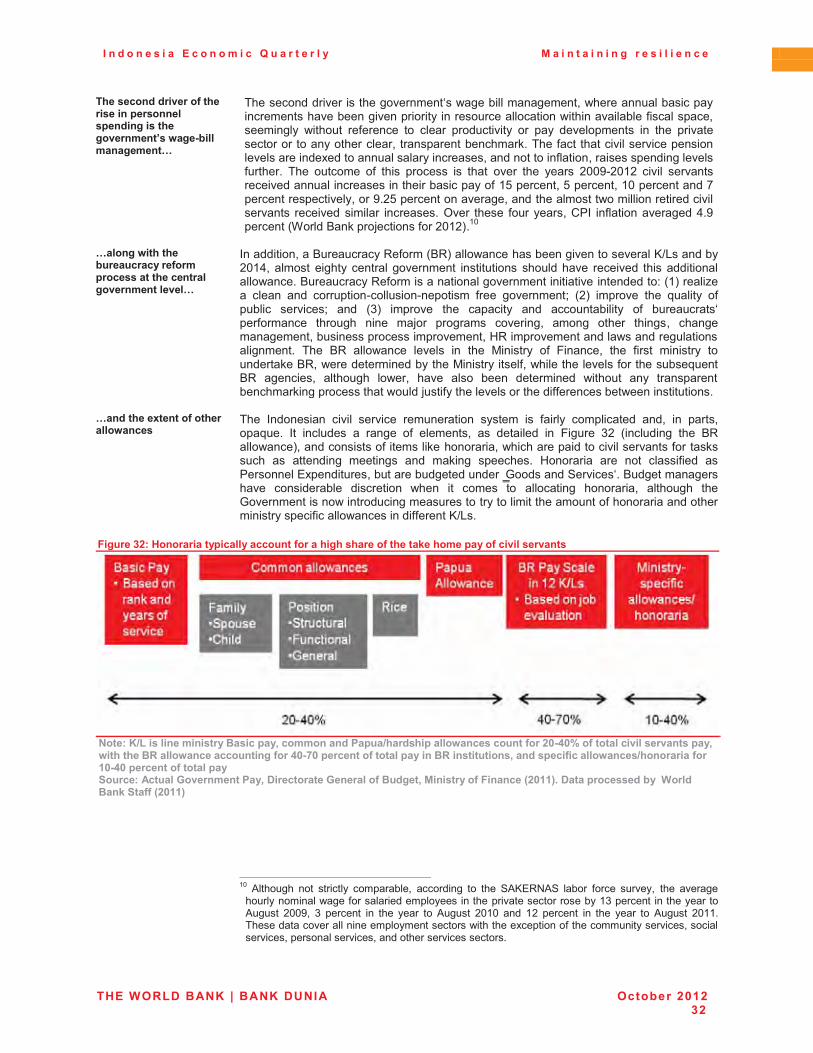
I n d o n e s i a E c o n o m i c Q u a r t e r l y M a i n t a i n i n g r e s i l i e n c e
THE WORLD BANK | BANK DUNIA October 2012 32
)+������ �����������+�������� �/���� ���/� � ������+������� �� ����-���>,���� ����� �C�
� ���������������������������������#�������������������!�#��������������������������������������������������������������������������#����������������"���������!���������� #������ ��"������� �� ������ ������������ �� ���� ����������� ��� ���� �������������������������������!���������������������������"��������������������������������������������������������������������!������������"�����!��������������������"�������� ���� ������ "� ���� ����� �� ����� ���� ���� ����� 455F�4564� ������ �������������������������������������������������"�6O��������!�O��������!�65�������������G��������������������!���F�4O������������������!���������������#����������������������������� ��������� ������� ���������K���� ����� "�������!�/9�� ��"���������������C�F���������0$����%������;������"��45641�65�
�C�� ��-��+��+��,������������������/�����������+���� ��������� �� �����C�
� ����������!���%�����������=�"���0%=1����#����������������������������<>)��������456C!������ ������������������������� ���������� ���������� ��������� �����������������#������%�����������=�"����������������������������������������������V�061����������� ������ ���� ����������������������� "���� ���������M� 041� ������� ���� A������� "�������� ������M� ���� 071� ������� ���� ��������� ���� �������������� "� ���������������"������� ������� ����� ��;�� ������� �������!� ����� ����� �����!� �����������������!����������������������!�3=������������������#�������������������������� ���� %=� ���#����� ������ ��� ���� (������� "� 2������!� ���� "���� �������� ������������%=!�#����������������������(�����������"!�#���������������"���������A�����%=� �������!� �������� �#��!� ����� ��� ����� ����������� #������ ���� ����������������������������������#����;���"��������������������""����������#�����������������
C� ��+������ �������+�����-� �����
� ���� ��������� ������ ������� ������������ ����� �� "������ ����������� ���!� ��� ����!���A���� ��� �������� �� ������ "� �������!� �� ��������� ��� 2������ 74� 0���������� ���� %=����#����1!����������"������������������!�#�����������������������������"���������� �� ���������� �������� ���� ������� �������� 3������� ���� ��� ����"���� ��9������� ����������!������������������������{8������'���������%������������������� ����������� ��������� #���� ��� ���� �� ���������� �������!� �������� ����8������������#�������������������������������������������"������������������������������"������#����������""������<>)���
Figure 32: Honoraria typically account for a high share of the take home pay of civil servants �
��
�
$�����?N&����� ���� ������������/��0������ �� �(�/��N+���+�/���-� ������� ������.3>53Z������������������� ���/��0�-��+��+���9���-� �������� �� ������53>83�/���� ����������/���� ��9�� �������� �0�� ��/���������-� ���N+� �����������*3>53�/���� ����������/�����������������D���� �� ��(��0�%�����������D� ������������0��� ����������� � ���P.3**Q!�%����/��������,��������� ��������P.3**Q�
�� �
�����������������������������������������������������������������65� *������� ��� �������� ���������!� ��������� �� ���� '*< =+*'� ����� "���� �����!� ���� ��������
�������������#����"��������������������������������������������67�����������������������*����� 455F!� 7� �������� ��� ���� ����� �� *����� 4565� ���� 64� �������� ��� ���� ����� �� *����� 4566�����������������������������������������#�����������������"��������������������!������������!��������������!�����������������������
I n d o n e s i a E c o n o m i c Q u a r t e r l y M a i n t a i n i n g r e s i l i e n c e
THE WORLD BANK | BANK DUNIA October 2012 33
)+���+�������������+������������������� � ���+����S������+��%�'������ ����������� ��� ��
� ���� ������������� "� �������������� �������� �� ����#��� ���� "������ "�� ������������ ������������ ����� ������ "�� �������� ���������� 0��� ,#�.��� <�(�!� �,<!� �� 8�������*��������2���1����������!�#�������������"��������������������������#��������������"�����������������������������������"�������������������������������������������"�������������������� ������������������������������ �������� ����#��������� �������������������������������������������������������!���������������"����������������""��������������������#����������������������������������������������������������� ���������� ����!� �������� ���������� ����� "���� ����� ����� �� �������� ������������������ �������� "�� ��� �������� "� ������ #��"����� ���� ������ "� ����������������������������������#���"������������"������������������������������������2���� ����� ��!� ������ #���� ������ 4�H� ������� �������� ������ ������!� ����� ������ ����������7�F����������������������!��#����!�������������������������������������������� �� ����� ������� "� ��������>��������� ��""� ���� ���������� ������ ������� ���455G�����455H���
b.� Offsetting policies or mechanisms are currently lacking �������������������������+����������/��������+����������C�
� �������������������������������������������"���������������������#���������������� ��""��� ���� "����� �������"� ����� �������������� ����������!��������������������� "�#� ����������� �� ��"������� �������� �������� ���� ������ �����"��� ��� �������������� "�� ���� ��������� 2������!� ���������� ���������� ���� ������� �������������������������"�����"����"���������������������������������""��������������0����������� ��� ���!� "�� �������!� �� ������ ��� ��������� ��""� ��������� �� ��#������� ��������"����1!�����������������������������"������������������"������������������������������������� 2������!� ������ �� �� ����� "� ��������� "�� �����������!� ���� #�����������������������������"������������������"����������������������""������������������������������������������������������������������������������������������
C-+��0�� ������ ���/� � ��� �/���� ���������->�����/� � ��� �/�������/����������
� ������������!��������������������� ������������� �����75���������"������������������������� ���������� ������������� � *� ����� ����!� ���������� �������� �����������!��#����!� ��������������#�����#����� ���������������"������ ���������� "������������� �������� �������� ����� �� ��#���� ����� ����� ���� �� ���� ������ ������� �������������!��������#���������������������"��������������������������������������������� ""���� ���� �������� ���������� ���� K��� ���������� ���������� �� �� ������ ���������������������������������������#��������������������������������!���������"��������������
D�� �����-��0���/���� ���+��� ��,��-�� �/���� ��������� �/�,����������/������� ��������/���� ��
� ���� #��� "�#���� �� �� �������� #���� ���� ������ "� ��"��� "����� �� ��������� �������"������� ���������� "� ���� ������� ���� ���� ����������� "� ������� ��������� ������������ ���"������� ����� ���������!� ������ #����� �������� ������������ ����� ������������ ��� ���� ��������� ������� �������� ��� ���� ������� ��������� 9������ �����������������������������������������!������������������������!�"���#���������������� ���������� ������� �����#������� ������� ��A��������������"� 3��",/�20�� ����"���������� ���� ��������� ������������������ ��""� �������������������!� ���� �� ���� "��������������������������"����""���!�#�����������������������#������������������#�������������"�������������������������������������������������������#������������������������#��������������������������������!����������������>�""���������;�������#�����������������(��������"�������������#������������A��������� �
I n d o n e s i a E c o n o m i c Q u a r t e r l y M a i n t a i n i n g r e s i l i e n c e
THE WORLD BANK | BANK DUNIA October 2012 34
.!� The Higher Education Law: a milestone achieved but still a difficult road ahead � � ������� �-�&�-�� �@��+���������� ������������ ����� �������� ��� ��+��������-���������������� ����� ������ ��,��������+��+���������� �� �������� ��� �� � ����0�,�����//������� ���� �������
� *� ��#� )�#� �� 3������ �������� 0??64>45641� #�� �������� ��� ���� ���������9������������ &����67!�4564����������� ���� ��#���� ����9����������*����� 65!� 4564������ )�#� ����� #���� ��� ���� ��������� �� ��� �� ����"������ �������� �� ���� ���� �����#�����������������������������������������������"�������������������������������������03 �1!� ����������������������������������!���������!�-�.�#%����))��0������1!���������!�����������!����� ����������������������������������������������� ��#����� ���� ��������� #���� ��� ��������� #���� ����� ����� �� ��M� ��� ������� "������ ������������� "� ���� ���������� "����#��� #����� #���� ������ ���� �������� "� ���� ��#� ������������ ���� �����������������������������"� ���� ���������������������*�!� ������"�� ���� ��#� ��#� �� ��� ��������!� #���� ������� ������ ��� ������� ����� ��� ������ ������������� �����!� ����� ����� ���� *������� "� ��������� 9������� ?����������0*9��'�1!�#�������������������������������������������������������������������"�������#���#�66��
��/� ������ ����-��+�� ������������ ��,�����+����+��/��� ����������� �S���+��+��+���������� ��������� ������+����+�� ���,������� �������� ��/������� ��0���/����������� ������� �����-�+�
� $�����������������������#������������������������������������������������"������������������ ���� ���"������� "� ������� ��������� ���������!� ��������� ���������������������!� ����� ���� ����������� ������������ ��#���� *� ������� $���� %���� �����������������������S���������������������������"������������#�������#������������������ ���*��”���������S��"���������������������������������V��������������������������������������� ��� ���� ����� ������� �� ���������� ���������!� ���������!� ��������!� ������!���������!������������������������������ |���}� ���������������������� ����� ���������������"�����������������#��”�64�*����������"�����������������������������������"��� K /-� �������� ���� ����� "������� �� ����� S|�}�� �������� #����� ���� "����������� ����� �������!� ���������� "� ������� ��������� ����� ������ �� ���� ��� �� �������������������� "����!� ������ ������ ������� �� �� �������� ������� #���� ���� ������� "���������������������������!������������""������������������������������.”67��
� � 8����� ���� ������� �������� ����� ���� ������� �� ������� ��� ���������!� ���� "��#����������"��������������������#�"����������������������������������������������������������������!������������������������������������������������������*�����"��������"����������"������!���������������������������#�)�#�������������������������������!�"��#����������"�����������������������������������!����������
a.� The potential benefits of institutional autonomy and enhanced accountability ��/������������0���� �������+��#�"%0�+������� �� +� ���� �������� ������ �������,��� ������������/����������/������ �����������������0�� ���������������/������� �� �� +� ����������+�/����������C��
� $������������� �� �������� �����������������"���"�������������������������������������������"�������"��������������������������x�*��������"������������"������������������� �������� ���"������� �� ��������� ���������� #���� ������������ �������6C�'��������� ����� ��� �#�� ����� ������������ ��"��� �� �������� "����������� ������������������ ����� ����� ������� �������� ������� "� ��������� ���������� ����� ���"��������� ���������������������������������������������3 ������������������������������������������6O��
�� �
�����������������������������������������������������������������66�'��!�"���������!�
����V>>��������������>����>4564>5F>4O>6F7F774F>8�������??�9��-��;��������(<��64�$����%���� 045661!�"( ��)�1�)%����(� ���� ��=��.� �� -.�##�� ��2�����%� ����6��7 %� ����� �
,��!�����V>>��#����������>&�2K�~9DG5��67�'���������!�)������(��(������#����*���8�����!�-�!�%��#��!�/������&��=���#���045641!�-.�##���
/� �&(� ���*#���4�3�)��)��(� ��������2��(# ������� �����(��*����>�� �#�,��!�-�����������-����������'����!�$����%���!�����V>>��#����������> 7*CK79-75��
6C�'��!�"���������!�<���!�&��3������*��*��9�����0455C1!�S�����������"���������������������������������������������"�������"������������������V�*������"��������������������������.”�&������"�9�����*����������(����������47061V�67�75�����*����!�9�!�-�#�������!�(�!�3���!�/�� (��/����!� *�� ���� *�� '����� 0455F1!� S���� 8��������� ���� 9��"������� "� =�������?���������V� ��������"��� �������������?�'�”�+% =�$������9�����'�����+��6CHO6��
6O�'��!������������!�(�����!�&�!�%�����!�=�!�'����!�3��������(���������/�!�����/��'�����0455G1!�S���� 9����� -����������� "� ���������� ��� ��������� �������”!� K /-� ������ -����������$������9�����+��OGD�����K /-�0455H1!���� ��+��(� �������� %��'��7#�)��-���� +�P���6��

I n d o n e s i a E c o n o m i c Q u a r t e r l y M a i n t a i n i n g r e s i l i e n c e
THE WORLD BANK | BANK DUNIA October 2012 35
� � K"����������������������������������������"���������������&��������455C!�����������HF�����������������������������������������"������(�������"� �������!������������"��������� ������� ���� ��������� ������� ����� "� ��""!� #���� �� ��� "� ������������������������������������������������������������������������������������*���������������#�������������4565��������������������������������������������������������������������!������������������������� ��#����������������������"���!���������������������� ���������#����������6D��
C!+�-����0��+��,� ���������� ����������� ��������� ��������,������S����������,��� ���������� ��,��������������������/����� ��� � ������ ��2�����
� ���� ��������� ����"��� "��� ��������� ������� ���� ��!� �#����!� ���������� 2���������!�����������������#�"�����������������������������"������������������������"������������ ��������������6FF5!�����������������������������!��������������������������� ������� ���� �� ������� ������� �� ���� ������ "� ���"������!� ���� ����� ������� ����������� ����� ��� �������� "������� ������������ ������� �� ������� ������#�� ��������� ���� ��������!� ������������� ������ #�� ��������� ���������� ��������!��������������������������������6G�%��!�����������������������#�#��������2���!����� ������� "� ������������ ������� ���� ��� ������ ��� ��� �������� ����������������A����������'����!��������#���������A�����"���������������������������������������������������������
b.� Enhanced autonomy during Indonesia’s New Paradigm era and in the 2012 Law � � �����,��� ������������ �������� ������ ����� �*666�� ������+�����-� �������/��������� �������������� ����+�������� ��������
� *� ��� ����� �������!� ���������� �� �������� ���#���� ������������ ������� ������������������������������������������������������������������������������������6FF5��*�������������������������������������������������������������������������������6FH5�����6FF5!�����-����������8�������"�3������ ��������0-83 1�#���������� (������� "� �������� ����� �� �������� ��� ������ "��� �������� ����������� ����������� ���� ��������� #���� �� "��� �� ������� 3 �� ����������� "�� ���������������� ��� �����!� ��������� 3 �� ������� "�� �������� ������!� �������� ����� ���������� ��� ��� ����� ����������� �"� ����� ���� ��� ����� ���� ������������ "�� ������ #�������������� *� �� �����!� ��� 6FFF!� �� 8��������� =��������� 099>D61� ����������������� "��� ������� ����������� �� ������� "� ������� �� �� ����� ���� ��� �������������� ����� �� 8���������K#���� )����� ������� 0�� 013/;�� ���� � ������� ��� #����#���������"����������������������������������/�7�"��)������6H��
%��� ���+���/������ � �����-�����/�� ����� �� +� �� ������ �����+����+����/���������� � �0�,����+�������� ��������� ����/����-��+������� ���� �� ��-�
� ������#����������"�����������������""�������������""������������3 ����������������� ���� A������� ���� ���������� "� ����������� ������� ��� ����������� ����� �""������������� ��������� S#������” #���� �� ��� �������� "��� �������� ��������� ���� ����� ��������#���������������������������������#������!������������"����������#�"����������� O� �������� "� ���� -83 � ����������� ������� ��� ���� ������ 6FF5� �� ���� ����� 75������������455O��-���������������!� ��������#����������������� �������������3 ��������� ������� ����������#��� ����������� ������ ���� �� ����� "� ���� "������������ �������������������������������������� ���'���)��������� �����������������(�����A����%��!�����/�7�"��)����������������������#������"�������������#���
�������/������������+�������� ����,��� �,����������� ������ ��-����������S��� ��-0�,����+���-����+���>����
� ��� ���������"���������������������""���������������������������������#���������������������"��������+�#�9���������������������������455F�3������ ��������)�#�0??>F>455F1�#�� ����"���!� ��������� �� "����� ���� ��� ��#� "�� ���� ������� �������� ������ ���� �����������#����99>D6��3#����!�;����������������"����������������������455F�)�#�#������������������/�����������/�������� �
�����������������������������������������������������������������6D� &������� (������� "� �������!� /������!� '���!� '������� ���� ��������� 045651!� - (�� �����(���9�##�7��)������*�� �������/ ���#�<��!���� ���4��� �����2�*�� �0���������&������1��6G�/������ "��3������ ��������9�����'�����!� �������������/������ "��3������ ��������=������!�
0455H1!�"��)��������1�)%����(� ����2������,�������(��*�4�6�!�������2�������6H�����"��������������#������%�0%����������������"���������1!��9%�0%���*��������������������1!�
?�� 0?���������"� �������1����� ?8(�08��;���(����?��������1�� ��� ���� "��#���� "��������� ������"������������������#������������%3(+�����!��������?'?�0?���������"�+����'�������1!�?+*�=�0*���������?��������1�����?9��0���������+������� ��������?��������1��
I n d o n e s i a E c o n o m i c Q u a r t e r l y M a i n t a i n i n g r e s i l i e n c e
THE WORLD BANK | BANK DUNIA October 2012 36
���+� ������+� ���������+��.336�&�-�-�����/���0��+�� ���� ��+��,������+������� ����-����2����� ���������������S���� ����+��+���������� C!�
� 2������������!� ���� ���������� �� ���� 455F� )�#� #�� �#�������M� "�����!� ���� �������������!� #�� ���� �������� ����� ������������ ������� �A������ �� ��������������������"����������������!����������%3(+�����������������������#�������������������������"���������������������������������������"���������������""�������������� "��� ���� ���� ��� %3(+� ���������� �"���� 6FFF� ���� "��� �� ����� �#� ���� ���� ������#� ���#� ����� ���� �������� "���� #�� ������ ���� ���������� "� ������������������������������������"������������A�����������������������6F���
C� ��+���� ������ ����������,��������� �������� ����������������� �����+��&�-�����������+��-������������� ���/��������� ����� � �������@���
� '������!� ������� ������� ����!� ��� ������� �� ���������� "�� ���� 3 �� �� ���� �� ������������������� �� "����������� ������������ �������!� ���� 455F� )�#� "������ �� ����� ������� ��������������������������������������������������������������"����������3 �������������������� �� ����� �������� �������� ���� �������� �#���� ��������� �������������������#������������������#��� ������������ ����(�������"�2����������""������ ����!����������� ���2�����:����455F!� �����������"� "���������������������������#��������� ����� �""����� ��� ���� "����������� "� ����������� ����� ������ "������� #�� #������#�!���A��������������3 ��"������������������������������������������������#���������-�9*���
)+��.3*.�&�-������������ ������� ����/�����������/� � ���+��/����,��������� �������� ������ ���C��
� ���� ��#� ��#� ��� ��� ���� ���� "�� 3 �� ����������� ���� ���� ��������� �� ������������������!� ������������S�����"����r” ������ "�������������#���������������"������������������/�7�"��)������� ������!������"� ����"���"� ��������������� ����������������������������#���#������������#������������������#����������������������"����� 3 �� #������������ ������� ������������ ���������������� #���� ���� �� �� ��#����������'�����K#����3������ ��������)����� ������0"��)(�(�����))��/�)��0��1(.(��"�/011�#���������������������������#���������������������������������A�������� "��#������������������ "�� ���� "��������������������"�'�����'�������?���� 00:<1��������������������8���������=������������������45�����������������%3(+����������������#����#����#���������������#��������9�+%3����
C!,���-��+���/���� ����������
� 2�� ���� 3 �� ��� ������� ��� ���� �����"������ �����!� ���� ������� ���� ��� *������� D4�#������������������������������������������������������#�������������������������"� ���� ���������!� ����� ���� ���� ���� ��������� "� ���� 3 �� #���� ��� ���������� ��� ����������������������������������0�������������������1����������S"�������������” ���������!�����������������������������������#���������������������(����������=����������$���������"��������������������"��������������"������������*�������D7����#������������������������������������M��������������M������������M������"��M�A��������������M������""��������������""�������M�����������#���������������������"��#������������������������������������������������������#�����������#����������"��������
c.� Proposed innovations under the new Law )+��.3*.�&�-�/��/������� ��,��������/���� ��� ������ ��
� *�������������;��"��!�������#�����������������������������������������������#��������������� ������!� #������ ��� ���� �� ����������� ������!� �������� #���� A��������������!�����������A����!� ���������� �������������"� ����������������"� "����������������!������������������������������#��!�"������������������������������!��������� ����������� "� ��#� ����������� ���� ��#� ����� ���� ������� ���� ���������� ��������������� ��������!� �������� �������� ������� ��������� 09�'1� �������� ����������� �������������� ��� ���� �����"� ���� ��#��9��������������������#����� ���������� ��� ����� ����"�#� ��"������� ���� "��������� �� ���� �������� "� 9�'M� ���������� ���� 8����������������������������������"����������#�������9�'�������������""������������������������������������������������������������������������������
' ����+�� �-��-�+��+���������� ������������+����+��+�����������O��������0�/�������� ��� �������� ��
� ����6FHF�)�#�����������������������"���������������������#����������!����������� ����������!�������������� ����������!����������� ���������*���������#!���������������������������������������������������������9�����������?�����������#���#!�������"������� ���� ������� "� ���� ��������� ����#��� ���� ���������!� ���� ��� �������� ������"������ ������ �� ��� �������� ������������ ��������� �#���� ���������� �������A����� �� ����"��� A����"������!� ���� ��������� �� !�� ���#� ������ �� ������� ������������������������������������������"���������������������"���"�������
� �
�����������������������������������������������������������������6F��$����%����045651!��������V�3������ ��������2��������!�'������4�4!������44�N�4D��45��-83 ��������������#�����������������������������"��������"��"������"���������=���������
����������"�������������-��������4564��

I n d o n e s i a E c o n o m i c Q u a r t e r l y M a i n t a i n i n g r e s i l i e n c e
THE WORLD BANK | BANK DUNIA October 2012 37
)+��������� �����������//������+��������� ����"���� ����"����������� �-���/�����@���� ����� �������������D���� �� ��-��,������ ������+�������,��+�� �������� >���� 0����� ��� ������� ��+������� ����-+����+��� ��0����+����+� ����� �������� ��������� ��� �������� ��-+����+����� ���//��
� ���� ��#� ��������� ������� ��������� ������ ������ #���� ���� ���������� ������ �����������������������������������!�����������������������������������8����������������������������������������������������������������������������OO5��������456O��/��������/����������������������������"����������V�������������#������������ 3 �M� ��� ��������� #���� ���� ����� ��������M� ��� ��;������� #���� ��������������M� ��� ��������� #���� ����� ���� �������� �������M� ������� ���������� �����������"����� ��������� �����"������ ����� ���� ��� ���"����� ����� �������� ����������������M������������������#�����������#��������������������������������"���������� ������� ����������� "� ����������� ��������� ������� ����� ��� ���������M� #����-83 � ���������� ���������� ���� ����������� ��� "� ����������� �� ���������/��������/���������-=�O5��������0?'-�O�7�������146!����#����������;���������������"�����������!����������������"�"�"���������!��"���������!�#�����������"����"�"���"������������ -83 � �������� �������� ���� ��;����� "� /������ ���� ��������� �� ��� "�������� ������������������������!������!�#��������S45�������t” �����"��������������������"����������������������������������������!��������"� ��������������������#������A������������������#������������������"�����"������������������������������������S����”��44��
)+����+�����+��&�-������� ��������������+������ ����V �������/�����X� ���������+��+���������� C�
� �����������������������������455F�3������ ��������)�#�������������������������������#����������������������������������������������� ��������� �������"�����"� ������#���#������������������������#�����"�����������"���������������������"�������������������������!��������� ��������������������������������!� �� ����� ����������S��� "����"�t”.��
C� ��/������ ����//�������� �������������/� �����/�,���@��������-���������� �����0�� ��-�������� ������������0���� ����� ���� ������ ������� �� ����,���������+��+���������� ��� � ��
� '�������������������"���������������������"����������������#�������������������"�����������������������������������3 ��"���#������������"������������9������3 ���������������������"��������������"����#��������"�������������������������������� 0������������� �� ������ "� �����1� ���� ���������� ��������� �� ���� �����0�������������D5��������1�#����������������������"���"���"������������������������������ �������������)�#������ ����� ����8���������#������������������������������������������������������������������"�����������������������������3 ����������"��"��������������������������#�������������������������������"���������3 �������������"������� ��� ������������ ���� ������ "� ������� "��� �������� ��� ������� ���� ����8���������#���� �������� ������������ ������� �������3 �� �#��� ����������"� ������������"����������"��M�����-=�6�O������������4567������-=�7�5������������456C�0?'-�6DG������������67�D���������������������4567!�����?'-�77C������������4G���������������������456C1������8���������#�������������������������3 ��"��������������������"���������� "��� ������� ��� ���������� �������� "���� 00� (�� $*������#� "����.�����))��/�)�����%K9�+1����
)+��D���� �� ���������+���+�� �������+�� ������,�� �����/������� �������,���S��+��+���������� �-��+�,������� ����� ���-+���� ���� ����2������������� ��
� ����#����������������������������������������������������� )�#!������������"��������������������������������"�������������������������������������*��������������������������#����!�#�����������������������������������8�������������������������� "��� �����3 ������������������� ���������� ������������������!�������������������������������������������������������������������������������������������������8�������������������"������������������#���� ������ ��������� ����������V� ��������� ����������� "� ��������� ����������������#�����#�������������������������"��!������������������"��������"���������������������!��������������������������"���������3 �����������"����������������������������A����������������47�/�������� ������������ ������������#������� ���������������"�������������"���������������� ������������������������������������������������������������������46�<���!�����V>>���������������4564>5F>5F>6C5DC6G4>*�������<��������44�2��"�������������������������������S45��������”���������9����/�"�����*�����4564������47�?���������������#������������������������������"������������������"��-=�6�������������������������������������������������������A�������������������-=�45����������������!�����%K9�+�����8��������� #���� ����� �� ����� ���������� #���� ��� ��� ������� "������ ����������� �-=� OG� ��������0?'-�D45���������A��������1!���"������#���������������GH������������������4564�-83 ����������������������������'���$����%���!�4565!�����!�%��4�4!������7D��
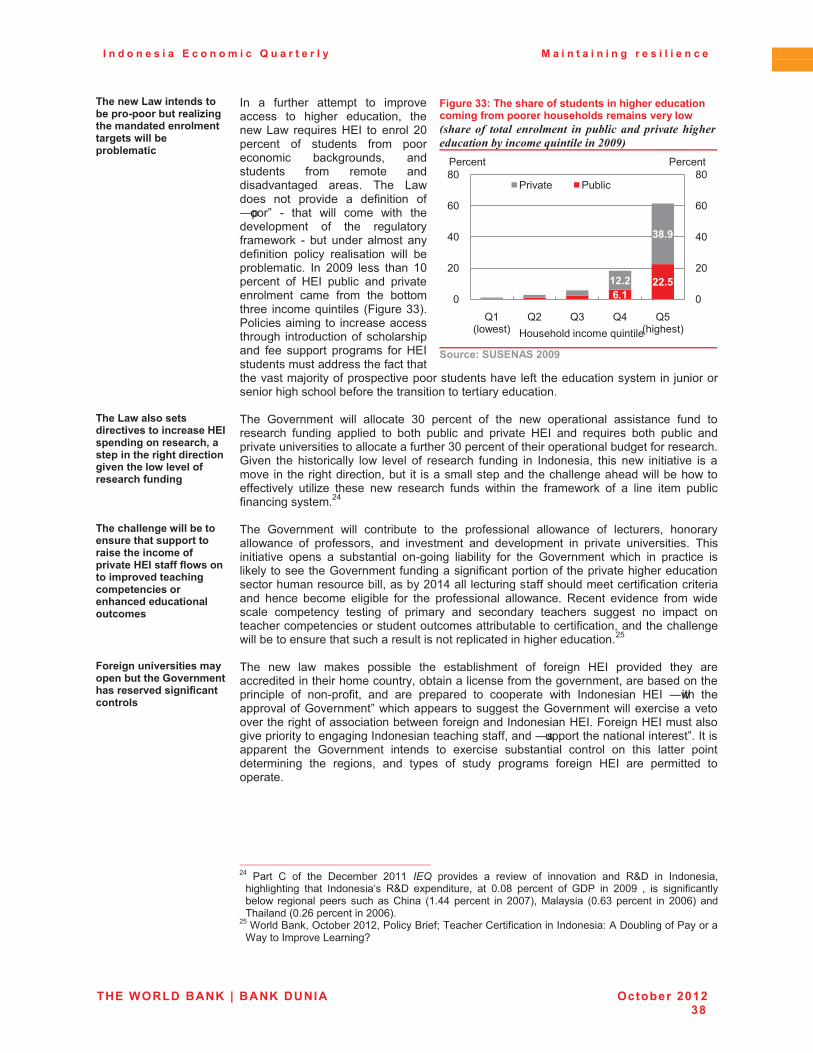
I n d o n e s i a E c o n o m i c Q u a r t e r l y M a i n t a i n i n g r e s i l i e n c e
THE WORLD BANK | BANK DUNIA October 2012 38
)+�� �-�&�-�� �� �����,��/��>/����,�������S� ���+���� ����� ���� ����������-��,��/��,�������
� ��� �� "������� �������� �� ������������ �� ������� ��������!� ������#�)�#� ��A�����3 �� �� ����� 45��������� "� ������� "��� ���������� ���������!� ����������� "��� ������ ����������������� ������ ���� )�#���� ��� ������� �� ��"������� "�S�r” �� ����� #���� ���� #���� ��������������� "� ���� ����������"����#��� �� ���� ������ ����� ������"������� ������ ���������� #���� ��������������� ��� 455F� ��� ����� 65��������� "� 3 �� ������� ���� ����������������� ����� "��� ���� ����������� ������A�������� 02������771��9��������������� �������������������� �����������"�������������� "��� ������ ������� "�� 3 �����������������������"�������������������;�����"����������������������������"�����������������������;�����������������������"�������������������������������������
Figure 33: The share of students in higher education coming from poorer households remains very low �������� ������ ������� �������� ������������������ ����������� ���"����������$%%&��
����������'��$���.336�
�)+��&�-������������������������ �������@����/� � ��� ��������+0������/�� ��+�����+��������� ����� ��+���-���������������+��� � ���
� ���� 8��������� #���� �������� 75� �������� "� ���� ��#� ���������� �������� "���� ���������� "������� �������� �� ���� ������� ���� �������� 3 �� ���� ��A����� ���� ������� �����������������������������������"�������75���������"������������������������"�����������8����� ���� ����������� �#� ������ "� �������� "������� ��� �������!� ���� ��#� ����������� �����������������������������!����� ��� �������������������������������������#��������#����""��������� �������� ����� ��#� �������� "���� #������ ���� "����#��� "� �� ����� ����� �������"��������������4C��
)+���+�� ���-��,������ ������+�����//��������������+��� ��������/�������@�����������-��� ������/���������+� �����/��� ��������� +� ���������� �����������
� ���� 8��������� #���� ���������� �� ���� ��"������ ���#����� "� ��������!� ����������#����� "� ��"��!� ���� ���������� ���� ����������� ��� �������� ������������ ��������������� ���� �� ���������� ������� ���������� "�� ���� 8��������� #����� ��� ��������� ������������������8���������"�������������"������������"���������������������������������������������������!������456C�����������������""����������������"�������������������� ������ ������ ��������� "�� ���� ��"������ ���#������ =������ ��������� "��� #��������� ���������� ������� "� �������� ���� �������� �������� ������ �� ������� ��������������������������������������������������������"������!�������������������#�������������������������������������������������������������������4O���
������ �� ����������������/� �,����+��D���� �� ��+�������������� ����� ���� �����
� ���� ��#� ��#� ����� ������ ���� ������������ "� "������ 3 �� �������� ����� ����������������������������������!����������������"����������������!�������������������������� "� �����"��!� ���� ���� ��������� �� �������� #���� ��������� 3 �� S#���� ������������"�8�������t” #�������������������� ����8���������#��������������������������������"������������#����"�������������������3 ���2������3 �����������������������������������������������������""!�����S������������������������t”.��������������� ���� 8��������� ������� �� �������� ���������� ������ �� ���� ������� ����������������� ���� �����!� ���� ����� "� ����� ������� "������ 3 �� ���� ���������� ������������� �
�����������������������������������������������������������������4C� 9���� /� "� ���� -�������� 4566� ���� ������� �� �����#� "� ��������� ���� =[-� ��� �������!�
������������� ����� ��������� =[-� �����������!� ��� 5�5H� �������� "� 8-9� ��� 455F� !� �� ����"�����������#� �������� ����� ������/����� 06�CC��������� ��� 455G1!�(������� 05�D7��������� ��� 455D1� �������������05�4D������������455D1��
4O�$����%���!�K������4564!�9�����%���"M���������/����"�����������������V�*�-�������"�9�������$������������)�������x�
4!*..!7*.!.
1=!6
5
45
C5
D5
H5
5
45
C5
D5
H5
�6�0�#��1
�4 �7 �C �O�0������1
9������ 9�����
9������ 9������
3������������A�������
I n d o n e s i a E c o n o m i c Q u a r t e r l y M a i n t a i n i n g r e s i l i e n c e
THE WORLD BANK | BANK DUNIA October 2012 39
d.� Next steps and future challenges ���2�� ��������� ������+��&�-�� ������,������/��������� �+������������ ����� ����� � ����� ������ ��/��� ��-+��+� ������,���������������������������� ���� ��� �� ����,���� ���//��������+����2�������/��� �� ���������� ���
� -���������������������"������������������������������������������������������������ ������� ���"�� "� ���� )�#�� ���� ���������� ���������� ���� 8��������� ���� -83 ��#�"�������#����������������������"������������������������������"�����)�#!��� ������ ���� ����������� ���� ������ ������� ���� ��#� ����"� ������"��� ��� 76�(����������-������ 0"�����1�����66�8���������=��������� 0991� �����#������������������#���������������������#����������"����#������������������4557�'�����2�������)�#!�����455C�'�������������)�#!�����6FGC�����6FFF�/�����'�������)�#!������������������������������"����������������#��������������4D�����������������#���������������8��������������������"����#��!����������(�������"� �������!�����-83 ��������������!������������������������� �����������������������������������"��������"����������������������"�����������������A������-����������=�����������
�����������������������������������������������������������������4D�2����������9975>6FF5����#���3 ��������������������������"���"���������������"���������
#���� ���� ��������� ���� �������!� ���� ��� #�� ���A������� �������� ��� ���� ���� ����� ��� �������"�������"���(�������"�2��������
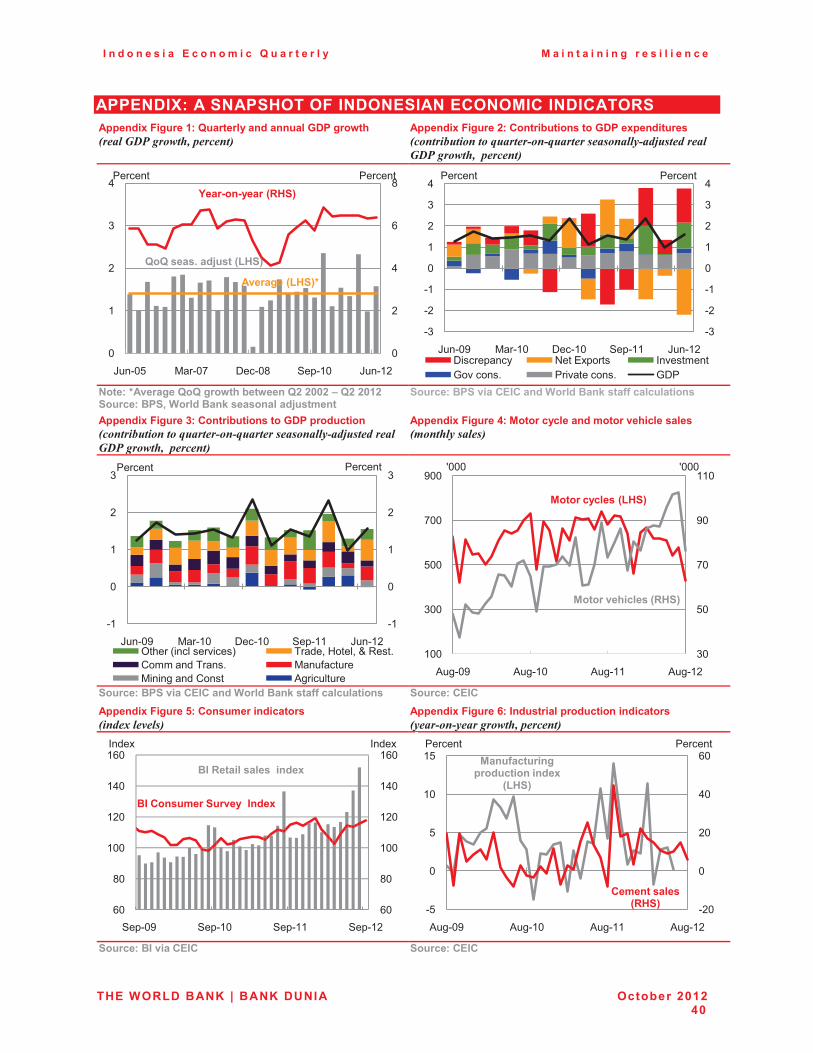
I n d o n e s i a E c o n o m i c Q u a r t e r l y M a i n t a i n i n g r e s i l i e n c e
THE WORLD BANK | BANK DUNIA October 2012 40
APPENDIX: A SNAPSHOT OF INDONESIAN ECONOMIC INDICATORS Appendix Figure 1: Quarterly and annual GDP growth ���������������� ����
�
Appendix Figure 2: Contributions to GDP expenditures � ��������������"�������"����������������;��������������������� ����
� �$�����K��������G�G����-�+�,��-�� �G.�.33.�H�G.�.3*.����������(�0������� ������� ���E����� ��
���������(������"��"�� ������� ���������������� ��
Appendix Figure 3: Contributions to GDP production � ��������������"�������"����������������;��������������������� ����
Appendix Figure 4: Motor cycle and motor vehicle sales ���������������
� ����������(������"��"�� ������� ���������������� �� ��������"��"�Appendix Figure 5: Consumer indicators ����,�������
Appendix Figure 6: Industrial production indicators ������������������ ����
� ����������������"��"� ��������"��"�
5
4
C
D
H
5
6
4
7
C
&���5O (���5G -���5H '���65 &���64
9������ 9������
G�G ����!��E����P&@�Q
<���>� >�����P9@�Q
��������P&@�QK
�7
�4
�6
5
6
4
7
C
�7
�4
�6
5
6
4
7
C
&���5F (���65 -���65 '���66 &���64-��������� +��� ���� ���������8����� 9���������� 8-9
9������ 9������
�6
5
6
4
7
�6
5
6
4
7
&���5F (���65 -���65 '���66 &���64K�����0�����������1 �����!�3���!�[�=���/������������ (���"������(����������/�� *����������
9������ 9������
75
O5
G5
F5
665
655
755
O55
G55
F55
*���5F *���65 *���66 *���64
R555
������������P&@�Q
R555
��������+�����P9@�Q
D5
H5
655
645
6C5
6D5
D5
H5
655
645
6C5
6D5
'���5F '���65 '���66 '���64
����� �����
���9������������ ��
���"� ������������ � ���
�45
5
45
C5
D5
�O
5
O
65
6O
*���5F *���65 *���66 *���64
9������ 9������
"��� �������P9@�Q
�� �������� �/������� � ���
P&@�Q
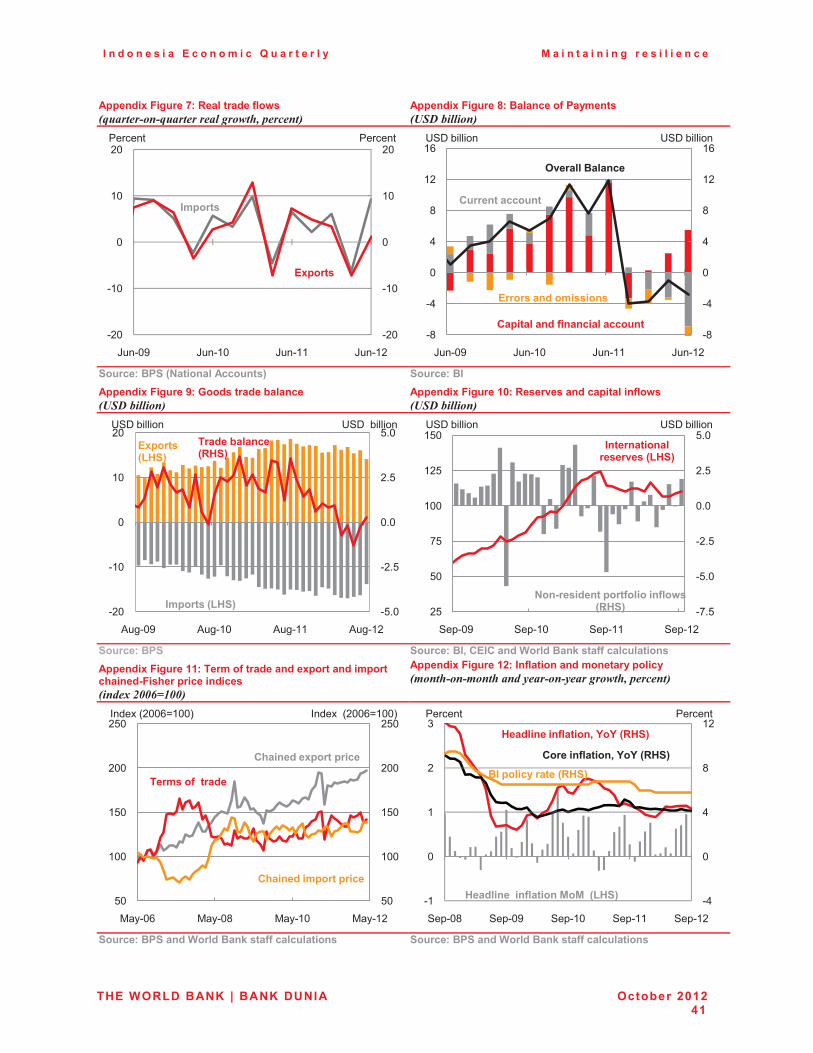
I n d o n e s i a E c o n o m i c Q u a r t e r l y M a i n t a i n i n g r e s i l i e n c e
THE WORLD BANK | BANK DUNIA October 2012 41
Appendix Figure 7: Real trade flows �"�������"��������������� ����
Appendix Figure 8: Balance of Payments � !�����������
� ����������(��P$���� ������� ��Q�� ������������Appendix Figure 9: Goods trade balance � !�����������
Appendix Figure 10: Reserves and capital inflows � !�����������
� ����������(�� ����������0�"��"�� ������� ���������������� ��Appendix Figure 11: Term of trade and export and import chained-Fisher price indices ����,�$%%<'#%%��
Appendix Figure 12: Inflation and monetary policy ������������������������������������� ����
� ����������(��� ������� ���������������� �� ���������(��� ������� ���������������� ��
�45
�65
5
65
45
�45
�65
5
65
45
&���5F &���65 &���66 &���64
��/����
��/����
9������ 9������
�H
�C
5
C
H
64
6D
�H
�C
5
C
H
64
6D
&���5F &���65 &���66 &���64
?'-������� ?'-�������
"�/����� ��� � ��������� �
"���� ������� �
#�������� ��
�������� �������� �
�O�5
�4�O
5�5
4�O
O�5
�45
�65
5
65
45
*���5F *���65 *���66 *���64
)����,�� ���P9@�Q
��/����P&@�Q
��/���� P&@�Q
?'- ������ ?'- ������
�G�O
�O�5
�4�O
5�5
4�O
O�5
4O
O5
GO
655
64O
6O5
'���5F '���65 '���66 '���64
� ��� ���� �����������P&@�Q
?'- ������ ?'-��������
$� >����� ��/��������� ��-��P9@�Q
O5
655
6O5
455
4O5
O5
655
6O5
455
4O5
(���5D (���5H (���65 (���64
������0455DX6551�� �������0455DX6551
)�������� �����
"+�� � ��/����/����
"+�� � ��/����/����
�C
5
C
H
64
�6
5
6
4
7
'���5H '���5F '���65 '���66 '���64
"����� ����� 0�<�<�P9@�Q
@��� ��� ����� 0 <�< P9@�Q
@��� �� � ����� �����P&@�Q
9������ 9������
���/��������� P9@�Q
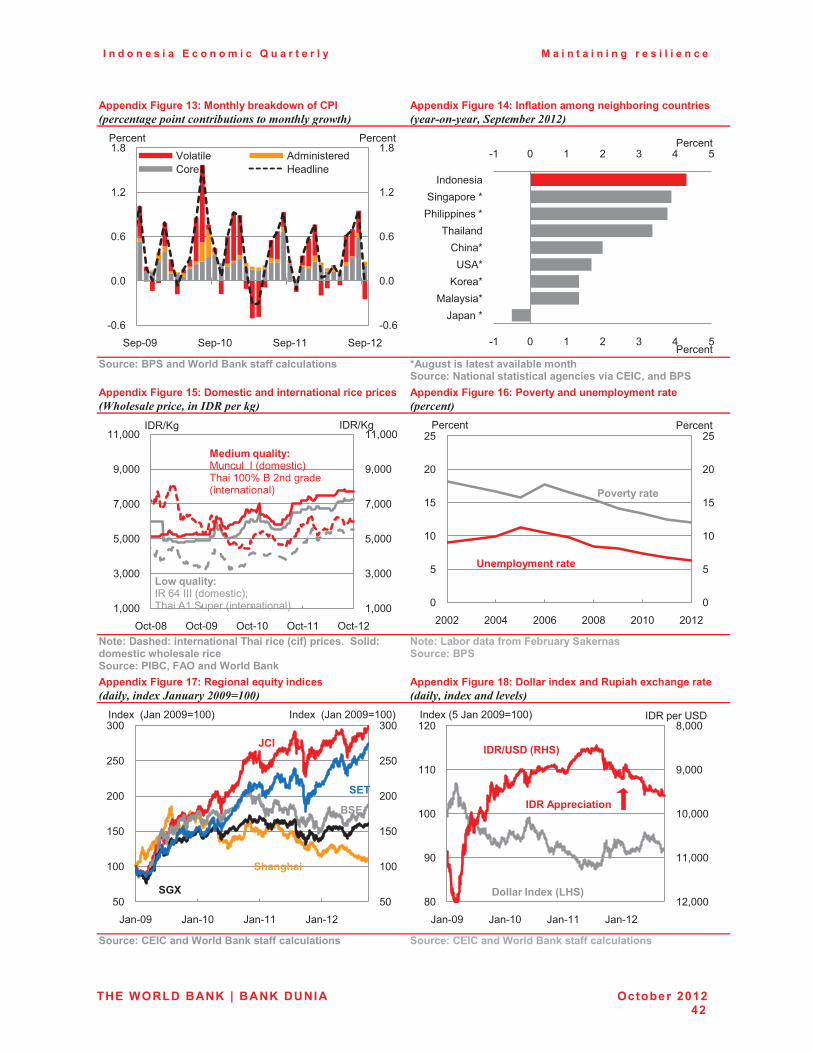
I n d o n e s i a E c o n o m i c Q u a r t e r l y M a i n t a i n i n g r e s i l i e n c e
THE WORLD BANK | BANK DUNIA October 2012 42
Appendix Figure 13: Monthly breakdown of CPI �� ����������� ������������������������������
Appendix Figure 14: Inflation among neighboring countries �����������!�����$%#$��
� ����������(��� ������� ���������������� �� K���������������������,���� �+�
��������$���� ���������������� ���������"��"0�� ��(��Appendix Figure 15: Domestic and international rice prices �=��������� �����*�2���3���
Appendix Figure 16: Poverty and unemployment rate �� ����
� �$�����%��+���� ��� ���� ��)+��������P���Q�/�����!���������������-+�������������������(��"0���#�� ������� ��
$�����&�,��������������,����������� �������������(��
Appendix Figure 17: Regional equity indices �����������,�7������$%%&'#%%��
Appendix Figure 18: Dollar index and Rupiah exchange rate �����������,�����������
� ���������"��"�� ������� ���������������� �� ��������"��"�� ������� ���������������� ��
�5�D
5�5
5�D
6�4
6�H
�5�D
5�5
5�D
6�4
6�H
'���5F '���65 '���66 '���64
P������ *����������/�� 3��������
9������ 9�������6 5 6 4 7 C O
�6 5 6 4 7 C O
&�����`(������`
<���`?'*`
/����`��������
9����������`'��������`
�������
9������
9������
6!555
7!555
O!555
G!555
F!555
66!555
6!555
7!555
O!555
G!555
F!555
66!555
K���5H K���5F K���65 K���66 K���64
&�-�2�������=�DC�����0������1M�����*6�'�����0������������1
�-=><�
������2�������(���������0������1�����655_�%�4���������0������������1
�-=><�
5
O
65
6O
45
4O
5
O
65
6O
45
4O
4554 455C 455D 455H 4565 4564
9������ 9������
(�����������
' ��/���� ������
O5
655
6O5
455
4O5
755
O5
655
6O5
455
4O5
755
&���5F &���65 &���66 &���64
����� 0&���455FX6551
�DA
M"�
��)
�+� �+��
���
����� 0&���455FX6551H!555
F!555
65!555
66!555
64!555H5
F5
655
665
645
&���5F &���65 &���66 &���64
������0O�&���455FX6551
�%9N'�%�P9@�Q
%����� ���P&@�Q
�%9��//��������
�-=�����?'-
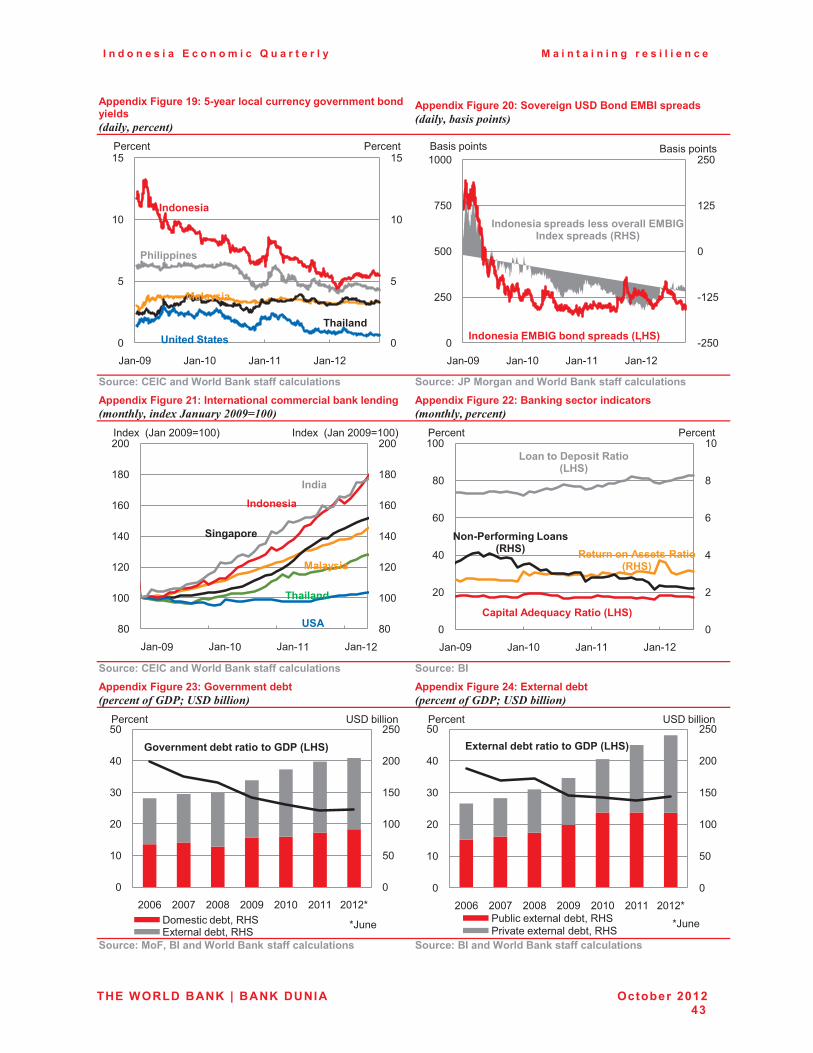
I n d o n e s i a E c o n o m i c Q u a r t e r l y M a i n t a i n i n g r e s i l i e n c e
THE WORLD BANK | BANK DUNIA October 2012 43
Appendix Figure 19: 5-year local currency government bond yields ��������� ����
Appendix Figure 20: Sovereign USD Bond EMBI spreads ����������������������
� ���������"��"�� ������� ���������������� �� ��������M(������ �� ������� ���������������� ��Appendix Figure 21: International commercial bank lending �������������,�7������$%%&'#%%��
Appendix Figure 22: Banking sector indicators ����������� ����
� ���������"��"�� ������� ���������������� �� �����������Appendix Figure 23: Government debt �� ���������(� !�����������
Appendix Figure 24: External debt �� ���������(� !�����������
� ������������0����� ������� ���������������� �� ������������ ������� ���������������� ��
5
O
65
6O
5
O
65
6O
&���5F &���65 &���66 &���64
9������
(+��//� ��
' ����������)+���
�������
� � ����
9������
�4O5
�64O
5
64O
4O5
5
4O5
O55
GO5
6555
&���5F &���65 &���66 &���64
%�������
� � ���� ����D ,� ��/�����P&@�Q
� � ������/���� ��������������D�� ����/�����P9@�Q
%�������
H5
655
645
6C5
6D5
6H5
455
H5
655
645
6C5
6D5
6H5
455�������0&���455FX6551
'��
)+���
�� ��/���
� � ����
� ��
�������
�������0&���455FX6551
5
4
C
D
H
65
5
45
C5
D5
H5
655
&���5F &���65 &���66 &���64
"�/������2�����9�����P&@�Q
9���� �� ��������9�����P9@�Q
&�� ����%�/�����9�����P&@�Q
9������ 9������
$� >(������� ��&�� ��P9@�Q
5
O5
655
6O5
455
4O5
5
65
45
75
C5
O5
455D 455G 455H 455F 4565 4566 4564`-����������!�=3' ������������!�=3'
9������ ?'-�������
D���� �� � �,�����������D%(�P&@�Q
`&���
5
O5
655
6O5
455
4O5
5
65
45
75
C5
O5
455D 455G 455H 455F 4565 4566 4564`9�������������������!�=3'9��������������������!�=3'
����� ���,������� ���D%(�P&@�Q
9������ ?'-�������
`&���
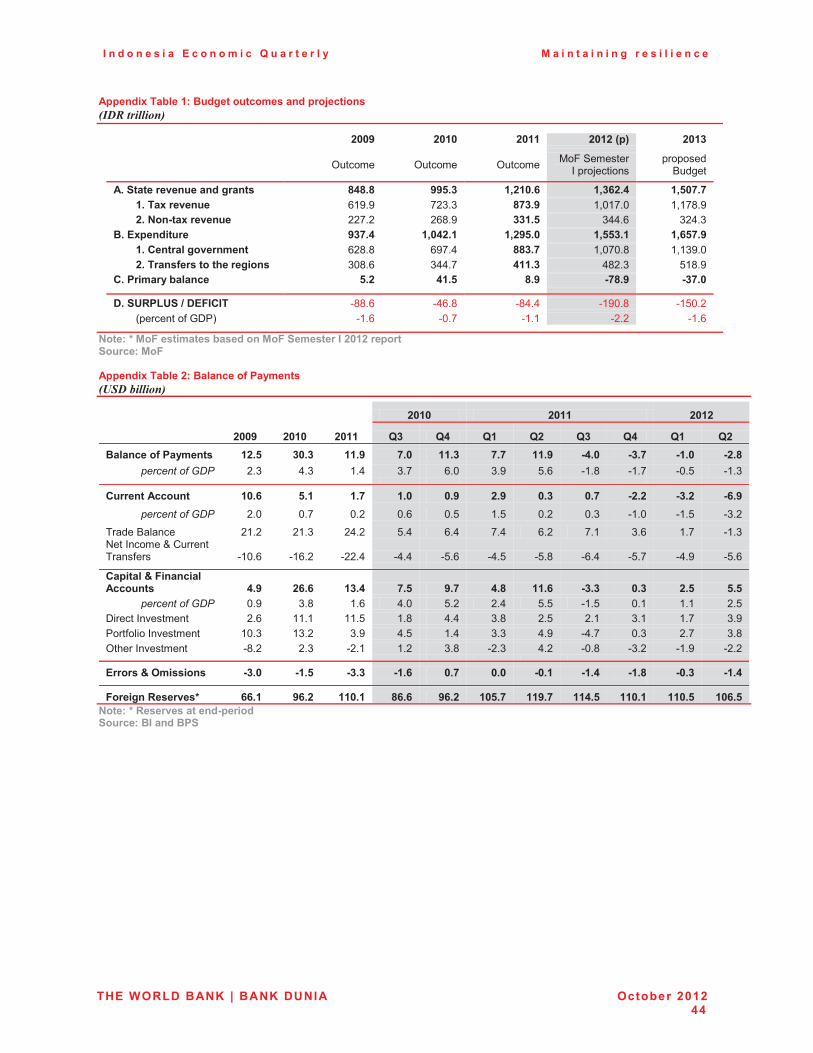
I n d o n e s i a E c o n o m i c Q u a r t e r l y M a i n t a i n i n g r e s i l i e n c e
THE WORLD BANK | BANK DUNIA October 2012 44
Appendix Table 1: Budget outcomes and projections �*�2�����������
�� �� �� �� �� �� ��
�� �� �� .336� .3*3� .3**� .3*.�P/Q� .3*1�
�� �� ��K������ K������ K������� (2�'�������
����;������������
%������
�!����������� ���� ���� ��� �� =5=!=� 667!1� *0.*3!4� *014.!5� *0738!8��� *!�)������� ��� �� D6F�F� G47�7� =81!6� 6!56G�5� 6!6GH�F��� .!�$� >�������� ��� �� 44G�4� 4DH�F� 11*!7� 7CC�D� 74C�7��!���/� ������ �� 618!5� *035.!*� *0.67!3� *0771!*� *0478!6��� *!�"� ��������� �� �� �� D4H�H� DFG�C� ==1!8� 6!5G5�H� 6!67F�5��� .!�)�� ����������+������� �� �� 75H�D� 7CC�G� 5**!1� CH4�7� O6H�F�"!�(�������,�� ��� �� 7!.� 5*!7� =!6� >8=!6� >18!3��� �� �� �� �� �� �� ��
%!��'9(&'��N�%���"�)�� �� �HH�D� �CD�H� �HC�C� �6F5�H� �6O5�4��� 0��������"�8-91� �� �6�D� �5�G� �6�6� �4�4� �6�D�
�
$�����K���������������,����� ����������������.3*.���/����������������
�Appendix Table 2: Balance of Payments � !������������
�� .3*3� .3**� .3*.�
�� .336� .3*3� .3**� G1� G5� G*� G.� G1� G5� G*� G.���� ������(���� ��� *.!7� 13!1� **!6� 8!3� **!1� 8!8� **!6� >5!3� >1!8� >*!3� >.!=�
*����� ����6�"� 4�7� C�7� 6�C� 7�G� D�5� 7�F� O�D� �6�H� �6�G� �5�O� �6�7��� �� �� �� �� �� �� �� �� �� �� ��
"���� ������� �� *3!4� 7!*� *!8� *!3� 3!6� .!6� 3!1� 3!8� >.!.� >1!.� >4!6�*����� ����6�"� 4�5� 5�G� 5�4� 5�D� 5�O� 6�O� 5�4� 5�7� �6�5� �6�O� �7�4�
������%������� 46�4� 46�7� 4C�4� O�C� D�C� G�C� D�4� G�6� 7�D� 6�G� �6�7�+���������[�/�����������"��� �65�D� �6D�4� �44�C� �C�C� �O�D� �C�O� �O�H� �D�C� �O�G� �C�F� �O�D��� �� �� �� �� �� �� �� �� �� �� ��
"�/����L��� � ��������� ��� 5!6� .4!4� *1!5� 8!7� 6!8� 5!=� **!4� >1!1� 3!1� .!7� 7!7�
*����� ����6�"� 5�F� 7�H� 6�D� C�5� O�4� 4�C� O�O� �6�O� 5�6� 6�6� 4�O�-���������������� 4�D� 66�6� 66�O� 6�H� C�C� 7�H� 4�O� 4�6� 7�6� 6�G� 7�F�9��"������������� 65�7� 67�4� 7�F� C�O� 6�C� 7�7� C�F� �C�G� 5�7� 4�G� 7�H�K��������������� �H�4� 4�7� �4�6� 6�4� 7�H� �4�7� C�4� �5�H� �7�4� �6�F� �4�4��� �� �� �� �� �� �� �� �� �� �� ��
�������L�#������ �� >1!3� >*!7� >1!1� >*!4� 3!8� 3!3� >3!*� >*!5� >*!=� >3!1� >*!5��� �� �� �� �� �� �� �� �� �� �� ��
������ �9�������K� 44!*� 64!.� **3!*� =4!4� 64!.� *37!8� **6!8� **5!7� **3!*� **3!7� *34!7��
$�����K�9������������ >/����������������� ��(��
�

December 2012
Policies in focus
INDONESIA ECONOMIC QUARTERLY
INDONESIA ECONOMIC QUARTERLY Policies in focus
December 2012

Preface
The Indonesia Economic Quarterly reports on and synthesizes the past three months’ key developments in Indonesia’s economy. It places them in a longer-term and global context, and assesses the implications of these developments and other changes in policy for the outlook for Indonesia’s economic and social welfare. Its coverage ranges from the macroeconomy to financial markets to indicators of human welfare and development. It is intended for a wide audience, including policy makers, business leaders, financial market participants, and the community of analysts and professionals engaged in Indonesia’s evolving economy.
This Indonesia Economic Quarterly was prepared and compiled by the macro and fiscal policy cluster of the World Bank’s Jakarta office, under the guidance of Sector Manager and Lead Economist, Jim Brumby, Economic Advisor and Lead Economist, Ndiame Diop and Senior Economist, Ashley Taylor. The team included Magda Adriani (commodity prices), Shakira Jones (real sector), Fitria Fitrani (trade), Faya Hayati (prices), Brendan Coates (capital account and financial sector), Ahya Ihsan (fiscal) and Alex Sienaert. Additional contributions were received from Kiyoshi Taniguchi (Food Law), Moez Miaouiand Stefan Handoyo (corporate governance), Edgar Janz, Vivi Alatas and Astrid Savitri(minimum wages), Fook Chuan Eng and Iwan Gunawan (Jakarta flood mitigation), Jon Jellema (village infrastructure survey), David Lawrence (disaster recovery), Djauhari Sitorus, Neni Lestari (banking) and The Fei Ming (Corporate sector). Alex Sienaert, Arsianti, and Ashley Taylor shared the editing and production. Yue Man Lee, Soekarno Wirokartono, Chris Manning, Sjamsu Rahardja, Bill Wallace, Arlan Rahman, Anita Kendrick, Shamima Khan, Sudarno Sumarto and Mark Vothknecht provided detailed comments and input. Dini Sari Djalal, Farhana Asnap, Indra Irnawan, Jerry Kurniawan, Nugroho, Marcellinus Winata and Randy Salim organized the dissemination and Titi Ananto, Sylvia Njotomihardjo, and Nina Herawati provided valuable administrative support.
This report is a product of the staff of the International Bank for Reconstruction and Development / The World Bank, supported by funding from the Australian Government -AusAID under the Support for Enhanced Macroeconomic and Fiscal Policy Analysis (SEMEFPA) program.
The findings, interpretations, and conclusions expressed in this report do not necessarily reflect the views of the Executive Directors of The World Bank or the governments they represent, AusAID or the Australian Government. The World Bank does not guarantee the accuracy of the data included in this work. The boundaries, colors, denominations, and other information shown on any map in this work do not imply any judgment on the part of The World Bank concerning the legal status of any territory or the endorsement or acceptance of such boundaries.
Cover and chapter photographs are copyright PT. Unilever. All rights reserved.
For more World Bank analysis of Indonesia’s economy: For information about the World Bank and its activities in Indonesia, please visit
www.worldbank.org/id
In order to be included on an email distribution list for this Quarterly series and related publications, please contact [email protected]. For questions and comments relating to this publication, please contact [email protected].
Table of contents
�
Executive Summary: Policies in focus iv
A. � ECONOMIC AND FISCAL UPDATE 1 �1.� Global economic growth remains weak, likely improving only modestly in 2013 1�2.� Indonesia’s economy continues to grow robustly, moderating slightly in Q3 2�3.� Exports are still under pressure but capital inflows have been strong 6�4.� Inflation softness continues but cost-push pressures emerge for 2013 8�5.� Foreign investor portfolio flows return while credit growth moderates 11�6.� Fiscal deficit widens on rising subsidy spending and subdued revenue growth 14�7.� Policymakers face an array of external and domestic risks in 2013 19�
B. � SOME RECENT DEVELOPMENTS IN INDONESIA’S ECONOMY 21 �1.� Will rising minimum wages affect job creation in Indonesia 21�
a.� Minimum wage level and employment protection legislation in Indonesia.............................. 22�b.� Effects of minimum wage increases on job creation ................................................................. 24�c.� Changes in the process for setting minimum wages ................................................................. 25�d.� Adopting a long-term view on job creation and worker protection .......................................... 25�
2.� Building Jakarta’s resilience to frequent flooding 27�a.� The severity of flooding has increased, imposing significant costs ........................................ 27�b.� Weather patterns, urbanization, subsidence and climate change all play a role… ................. 28�c.� …but actions can be taken to improve Jakarta’s resilience to floods ...................................... 30�
C. � INDONESIA 2014 AND BEYOND: A SELECTIVE LOOK 32 �1.� Indonesia’s successes in disaster reconstruction and preparedness 32�
a.� The challenges posed by the Aceh, Nias and Java disasters were unprecedented ................ 32�b.� Multi-donor funds supported Government-led relief and reconstruction efforts .................... 33�c.� Applying the lessons that Indonesia has learned on disaster recovery ....................................... 35�
2.� Village infrastructure for basic service delivery 37�a.� What is the Village Infrastructure Census and why is it necessary? ........................................ 37�b.� The VIC combines a range of indicators to provide Supply Readiness Indices ...................... 37�c.� Health Service Supply Readiness is highest in Java and Bali .................................................. 39�d.� …with similar spatial patterns for Education Supply Readiness… .......................................... 40�e.� …and both are highly correlated with Transportation Supply Readiness ............................... 41�f.� Extensions and policy applications ............................................................................................. 43�
APPENDIX: A SNAPSHOT OF INDONESIAN ECONOMIC INDICATORS 44 �
LIST OF FIGURES
Figure 1: Investment growth has so far remained resilient to the downturn in commodity prices and exports .................................................................................................................... vi�
Figure 2: Increases for 2013 may well push minimum wages higher relative to regional neighbors ..................................................................................................................... viii�
Figure 3: Improved conditions in the US and a bottoming-out in China but no upturn yet for the Euro Area or Japan ........................................................................................................ 2�
Figure 4: Commodities remain well off their highs, though some have gained in recent months 2�Figure 5: Real GDP growth moderated to 6.2 percent year-on-year in the third quarter of 2012… 2�Figure 6: …while nominal GDP growth dipped to its lowest level since September 2009 as GDP
deflator growth slowed .................................................................................................. 2�Figure 7: Private consumption and investment continue to be the key drivers of growth ............. 4�Figure 8: Manufacturing continued to perform strongly in the third quarter while services
growth moderated .......................................................................................................... 4�Figure 9: Inventory levels appear elevated ......................................................................................... 4�Figure 10: The balance of payments returned to a small surplus in the third quarter of 2012 ...... 6�Figure 11: Exports remain under pressure… ..................................................................................... 7�Figure 12: …while portfolio inflows have picked up again ................................................................ 7�Figure 13: Headline and core inflation remain at historically low levels .......................................... 8�Figure 14: The Rupiah has weakened considerably, though less so on a trade-weighted basis 11�Figure 15: The bond market rallied strongly this quarter while equities have fluctuated since
mid-October… .............................................................................................................. 12�Figure 16: …and Rupiah depreciation has been moderate in real terms and compared with other
commodity exporters ................................................................................................... 12�Figure 17: Credit growth has slowed since May............................................................................... 12�Figure 18: The Budget deficit through October expanded on higher energy subsidy spending . 14�Figure 19: Revenue collection has moderated on the back of continued weaker income tax and
non-tax revenue receipts ............................................................................................. 14�Figure 20: The volume of subsidized fuel continues to rise in the absence of fuel subsidy
reform ............................................................................................................................ 16�Figure 21: Excess subsidized fuel use relative to quota is centered in densely populated cities,
mining, and border areas ............................................................................................. 16�Figure 22: After 10 months of 2012, some of the budget allocations remaining to be spent are
significant ..................................................................................................................... 17�Figure 23: Capital and subsidies spending set to increase in 2013 ............................................... 18�Figure 24: Increases for 2013 will likely push Indonesia’s minimum wages above regional
neighbors ...................................................................................................................... 21�Figure 25: Indonesia’s workforce is highly informal… .................................................................... 23�Figure 26: …but for those in the formal sector, minimum wages signal increases for all ........... 23�Figure 27: Non-compliance tends to increase with rising minimum wages… ............................... 24�Figure 28: …and small-sized firms tend to be less compliant ........................................................ 24�Figure 29: The 2007 flood caused sizeable financial damage but much greater economic
losses… ......................................................................................................................... 28�Figure 30: …and these economic losses were focused on larger industrial firms ....................... 28�Figure 31: Densely-populated slum areas were heavily affected by the 2007 flood ..................... 29�Figure 32: The 2007 flood would have been less severe if existing facilities were fully
functioning .................................................................................................................... 30�Figure 33: A strategic framework for effective disaster reconstruction ......................................... 34�Figure 34: Health Supply Readiness is higher in Java and Bali and falls in eastern Indonesia ... 39�Figure 35: The spatial pattern of Education Supply Readiness is similar to that for health ........ 40�Figure 36: Areas with poor supply of health or education services tend to also have poor
accessibility by public transport ................................................................................. 42�Figure 37: Half of the sub-districts in the Papuan provinces do not have any mobile phone
signal ............................................................................................................................. 42�Figure 38: The quality of primary school teachers can vary markedly even within sub-districts 42�

LIST OF APPENDIX FIGURES
Appendix Figure 1: Quarterly and annual GDP growth ................................................................... 44�Appendix Figure 2: Contributions to GDP expenditures ................................................................. 44�Appendix Figure 3: Contributions to GDP production ..................................................................... 44�Appendix Figure 4: Motor cycle and motor vehicle sales ............................................................... 44�Appendix Figure 5: Consumer indicators ......................................................................................... 44�Appendix Figure 6: Industrial production indicators ....................................................................... 44�Appendix Figure 7: Real trade flows ................................................................................................. 45�Appendix Figure 8: Balance of Payments ......................................................................................... 45�Appendix Figure 9: Goods trade balance ......................................................................................... 45�Appendix Figure 10: Reserves and capital inflows .......................................................................... 45�Appendix Figure 11: Indonesia’s major term of trade indices and other commodities ............... 45�Appendix Figure 12: Inflation and monetary policy ......................................................................... 45�Appendix Figure 13: Monthly breakdown of CPI .............................................................................. 46�Appendix Figure 14: Inflation among neighboring countries ......................................................... 46�Appendix Figure 15: Domestic and international rice prices .......................................................... 46�Appendix Figure 16: Poverty and unemployment rate .................................................................... 46�Appendix Figure 17: Regional equity indices ................................................................................... 46�Appendix Figure 18: Dollar index and Rupiah exchange rate ......................................................... 46�Appendix Figure 19: 5-year local currency government bond yields ............................................. 47�Appendix Figure 20: Sovereign USD Bond EMBI spreads .............................................................. 47�Appendix Figure 21: International commercial bank lending ......................................................... 47�Appendix Figure 22: Banking sector indicators ............................................................................... 47�Appendix Figure 23: Government debt ............................................................................................. 47�Appendix Figure 24: External debt .................................................................................................... 47�
LIST OF TABLES
Table 1: Commodity prices remain historically high in nominal terms but recent performance has been mixed .............................................................................................................. v�
Table 2: Under the baseline scenario Indonesia’s growth is projected at 6.3 percent in 2013 .... vii�Table 3: Under the baseline scenario GDP growth of 6.1 percent is projected for 2012, rising to
6.3 percent in 2013 ......................................................................................................... 5�Table 4: Budget disbursement rates through end-October remain relatively low......................... 15�Table 5: The fiscal deficit will expand in 2012 on higher energy subsidy spending and a
moderation in revenue collection ............................................................................... 19�Table 6: Worker productivity lags behind ......................................................................................... 21�Table 7: The composite Supply Readiness Indices include a range of indicators for health,
education and transportation ...................................................................................... 38�Table 8: Some of the gaps in Health Service Supply Readiness are striking, such as access to
secondary health care.................................................................................................. 40�Table 9: The Education Supply Readiness Gaps indicates the need for to improve physical
quality of supply ........................................................................................................... 41�
LIST OF APPENDIX TABLES Appendix Table 1: Budget outcomes and projections ..................................................................... 48�Appendix Table 2: Balance of Payments .......................................................................................... 48�Appendix Table 3: Indonesia’s development indicators at a glance .............................................. 49�
LIST OF BOXES Box 1: Indonesia’s new Food Law ....................................................................................................... 8�Box 2: Why has the depreciating Rupiah not had a greater impact on inflation? ........................ 11�Box 3: Developments in Indonesia’s corporate governance framework ....................................... 13�Box 4: Labor regulations: a “plateau” effect .................................................................................... 24�Box 5: The impact of the major 2007 flood on Jakarta .................................................................... 28�Box 6: Rekompak – community-led reconstruction of settlements after disaster ........................ 34�Box 7: A note on reliability in the Supply Readiness Rankings ...................................................... 38�

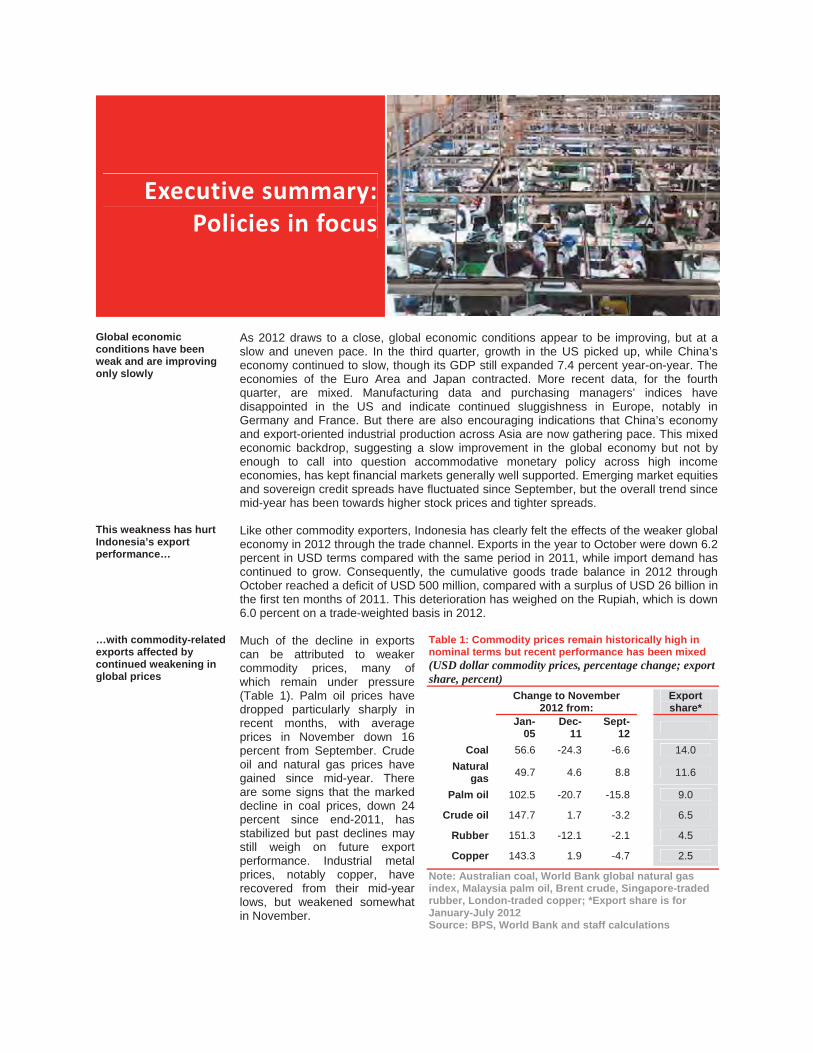
Executive�summary:�Policies�in�focus�
Global economic conditions have been weak and are improving only slowly
As 2012 draws to a close, global economic conditions appear to be improving, but at a slow and uneven pace. In the third quarter, growth in the US picked up, while China’s economy continued to slow, though its GDP still expanded 7.4 percent year-on-year. The economies of the Euro Area and Japan contracted. More recent data, for the fourth quarter, are mixed. Manufacturing data and purchasing managers’ indices have disappointed in the US and indicate continued sluggishness in Europe, notably in Germany and France. But there are also encouraging indications that China’s economy and export-oriented industrial production across Asia are now gathering pace. This mixed economic backdrop, suggesting a slow improvement in the global economy but not by enough to call into question accommodative monetary policy across high income economies, has kept financial markets generally well supported. Emerging market equities and sovereign credit spreads have fluctuated since September, but the overall trend since mid-year has been towards higher stock prices and tighter spreads.
This weakness has hurt Indonesia’s export performance…
Like other commodity exporters, Indonesia has clearly felt the effects of the weaker global economy in 2012 through the trade channel. Exports in the year to October were down 6.2 percent in USD terms compared with the same period in 2011, while import demand has continued to grow. Consequently, the cumulative goods trade balance in 2012 through October reached a deficit of USD 500 million, compared with a surplus of USD 26 billion in the first ten months of 2011. This deterioration has weighed on the Rupiah, which is down 6.0 percent on a trade-weighted basis in 2012.
…with commodity-related exports affected by continued weakening in global prices
Much of the decline in exports can be attributed to weaker commodity prices, many of which remain under pressure (Table 1). Palm oil prices have dropped particularly sharply in recent months, with average prices in November down 16 percent from September. Crude oil and natural gas prices have gained since mid-year. There are some signs that the marked decline in coal prices, down 24 percent since end-2011, has stabilized but past declines may still weigh on future export performance. Industrial metal prices, notably copper, have recovered from their mid-year lows, but weakened somewhat in November.
Table 1: Commodity prices remain historically high in nominal terms but recent performance has been mixed (USD dollar commodity prices, percentage change; export share, percent)
Change to November 2012 from:
Exportshare*
Jan-05
Dec-11
Sept-12
Coal 56.6 -24.3 -6.6 14.0Natural
gas 49.7 4.6 8.8 11.6
Palm oil 102.5 -20.7 -15.8 9.0
Crude oil 147.7 1.7 -3.2 6.5
Rubber 151.3 -12.1 -2.1 4.5
Copper 143.3 1.9 -4.7 2.5
Note: Australian coal, World Bank global natural gas index, Malaysia palm oil, Brent crude, Singapore-traded rubber, London-traded copper; *Export share is for January-July 2012Source: BPS, World Bank and staff calculations
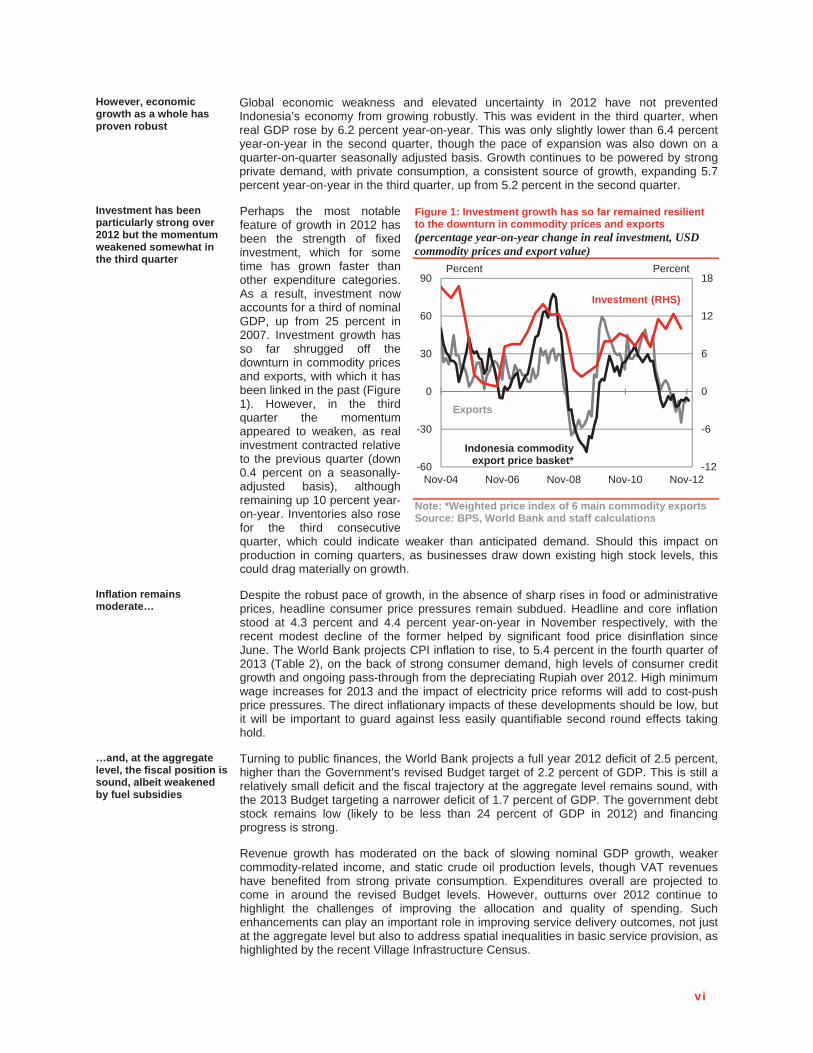
vi
However, economic growth as a whole has proven robust
Global economic weakness and elevated uncertainty in 2012 have not prevented Indonesia’s economy from growing robustly. This was evident in the third quarter, when real GDP rose by 6.2 percent year-on-year. This was only slightly lower than 6.4 percent year-on-year in the second quarter, though the pace of expansion was also down on a quarter-on-quarter seasonally adjusted basis. Growth continues to be powered by strong private demand, with private consumption, a consistent source of growth, expanding 5.7 percent year-on-year in the third quarter, up from 5.2 percent in the second quarter.
Investment has been particularly strong over 2012 but the momentum weakened somewhat in the third quarter
Perhaps the most notable feature of growth in 2012 has been the strength of fixed investment, which for some time has grown faster than other expenditure categories. As a result, investment now accounts for a third of nominal GDP, up from 25 percent in 2007. Investment growth has so far shrugged off the downturn in commodity prices and exports, with which it has been linked in the past (Figure 1). However, in the third quarter the momentum appeared to weaken, as real investment contracted relative to the previous quarter (down 0.4 percent on a seasonally-adjusted basis), although remaining up 10 percent year-on-year. Inventories also rose for the third consecutive quarter, which could indicate weaker than anticipated demand. Should this impact on production in coming quarters, as businesses draw down existing high stock levels, this could drag materially on growth.
Figure 1: Investment growth has so far remained resilient to the downturn in commodity prices and exports (percentage year-on-year change in real investment, USD commodity prices and export value)
Note: *Weighted price index of 6 main commodity exports Source: BPS, World Bank and staff calculations
Inflation remains moderate…
Despite the robust pace of growth, in the absence of sharp rises in food or administrative prices, headline consumer price pressures remain subdued. Headline and core inflation stood at 4.3 percent and 4.4 percent year-on-year in November respectively, with the recent modest decline of the former helped by significant food price disinflation since June. The World Bank projects CPI inflation to rise, to 5.4 percent in the fourth quarter of 2013 (Table 2), on the back of strong consumer demand, high levels of consumer credit growth and ongoing pass-through from the depreciating Rupiah over 2012. High minimum wage increases for 2013 and the impact of electricity price reforms will add to cost-push price pressures. The direct inflationary impacts of these developments should be low, but it will be important to guard against less easily quantifiable second round effects taking hold.
…and, at the aggregate level, the fiscal position is sound, albeit weakened by fuel subsidies
Turning to public finances, the World Bank projects a full year 2012 deficit of 2.5 percent, higher than the Government’s revised Budget target of 2.2 percent of GDP. This is still a relatively small deficit and the fiscal trajectory at the aggregate level remains sound, with the 2013 Budget targeting a narrower deficit of 1.7 percent of GDP. The government debt stock remains low (likely to be less than 24 percent of GDP in 2012) and financing progress is strong.
Revenue growth has moderated on the back of slowing nominal GDP growth, weaker commodity-related income, and static crude oil production levels, though VAT revenues have benefited from strong private consumption. Expenditures overall are projected to come in around the revised Budget levels. However, outturns over 2012 continue to highlight the challenges of improving the allocation and quality of spending. Such enhancements can play an important role in improving service delivery outcomes, not just at the aggregate level but also to address spatial inequalities in basic service provision, as highlighted by the recent Village Infrastructure Census.
-12
-6
0
6
12
18
-60
-30
0
30
60
90
Nov-04 Nov-06 Nov-08 Nov-10 Nov-12
PercentPercent
Investment (RHS)
Exports
Indonesia commodity export price basket*
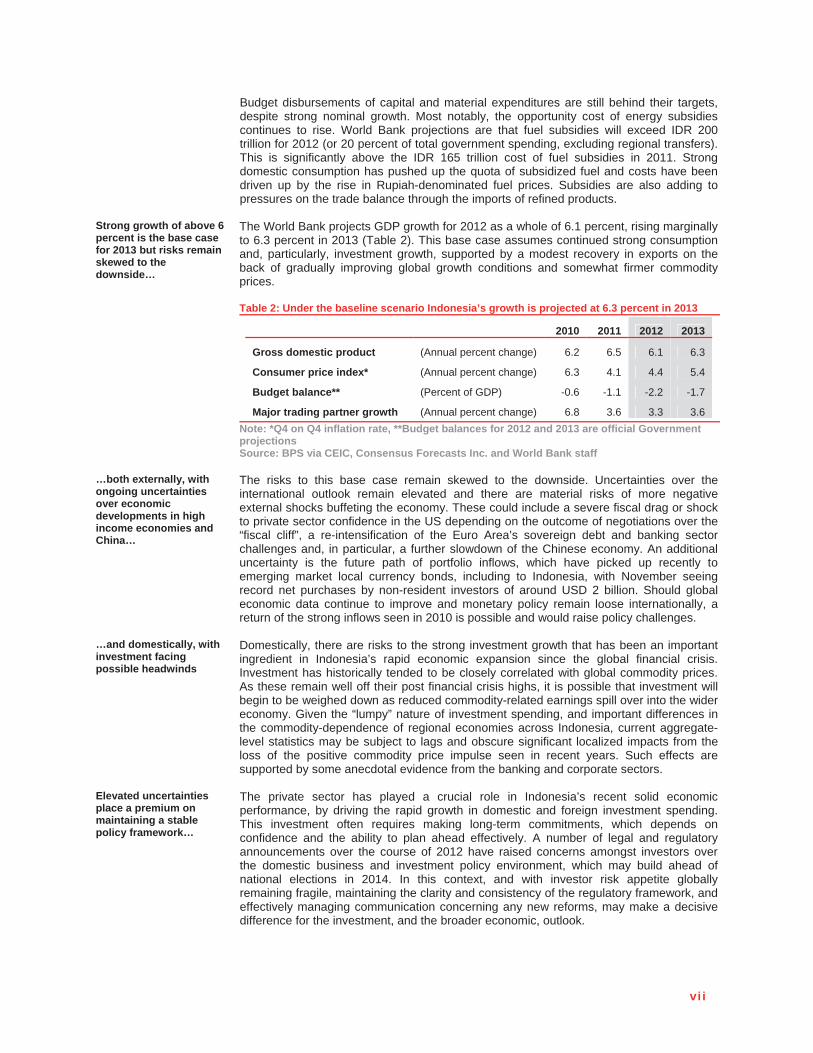
vi i
Budget disbursements of capital and material expenditures are still behind their targets, despite strong nominal growth. Most notably, the opportunity cost of energy subsidies continues to rise. World Bank projections are that fuel subsidies will exceed IDR 200 trillion for 2012 (or 20 percent of total government spending, excluding regional transfers). This is significantly above the IDR 165 trillion cost of fuel subsidies in 2011. Strong domestic consumption has pushed up the quota of subsidized fuel and costs have been driven up by the rise in Rupiah-denominated fuel prices. Subsidies are also adding to pressures on the trade balance through the imports of refined products.
Strong growth of above 6 percent is the base case for 2013 but risks remain skewed to the downside…
The World Bank projects GDP growth for 2012 as a whole of 6.1 percent, rising marginally to 6.3 percent in 2013 (Table 2). This base case assumes continued strong consumption and, particularly, investment growth, supported by a modest recovery in exports on the back of gradually improving global growth conditions and somewhat firmer commodity prices.
Table 2: Under the baseline scenario Indonesia’s growth is projected at 6.3 percent in 2013
2010 2011 2012 2013
Gross domestic product (Annual percent change) 6.2 6.5 6.1 6.3
Consumer price index* (Annual percent change) 6.3 4.1 4.4 5.4
Budget balance** (Percent of GDP) -0.6 -1.1 -2.2 -1.7
Major trading partner growth (Annual percent change) 6.8 3.6 3.3 3.6Note: *Q4 on Q4 inflation rate, **Budget balances for 2012 and 2013 are official Government projections Source: BPS via CEIC, Consensus Forecasts Inc. and World Bank staff
…both externally, with ongoing uncertainties over economic developments in high income economies and China…
The risks to this base case remain skewed to the downside. Uncertainties over the international outlook remain elevated and there are material risks of more negative external shocks buffeting the economy. These could include a severe fiscal drag or shock to private sector confidence in the US depending on the outcome of negotiations over the “fiscal cliff”, a re-intensification of the Euro Area’s sovereign debt and banking sector challenges and, in particular, a further slowdown of the Chinese economy. An additional uncertainty is the future path of portfolio inflows, which have picked up recently to emerging market local currency bonds, including to Indonesia, with November seeing record net purchases by non-resident investors of around USD 2 billion. Should global economic data continue to improve and monetary policy remain loose internationally, a return of the strong inflows seen in 2010 is possible and would raise policy challenges.
…and domestically, with investment facing possible headwinds
Domestically, there are risks to the strong investment growth that has been an important ingredient in Indonesia’s rapid economic expansion since the global financial crisis. Investment has historically tended to be closely correlated with global commodity prices. As these remain well off their post financial crisis highs, it is possible that investment will begin to be weighed down as reduced commodity-related earnings spill over into the wider economy. Given the “lumpy” nature of investment spending, and important differences in the commodity-dependence of regional economies across Indonesia, current aggregate-level statistics may be subject to lags and obscure significant localized impacts from the loss of the positive commodity price impulse seen in recent years. Such effects are supported by some anecdotal evidence from the banking and corporate sectors.
Elevated uncertainties place a premium on maintaining a stable policy framework…
The private sector has played a crucial role in Indonesia’s recent solid economic performance, by driving the rapid growth in domestic and foreign investment spending. This investment often requires making long-term commitments, which depends on confidence and the ability to plan ahead effectively. A number of legal and regulatory announcements over the course of 2012 have raised concerns amongst investors over the domestic business and investment policy environment, which may build ahead ofnational elections in 2014. In this context, and with investor risk appetite globally remaining fragile, maintaining the clarity and consistency of the regulatory framework, and effectively managing communication concerning any new reforms, may make a decisive difference for the investment, and the broader economic, outlook.
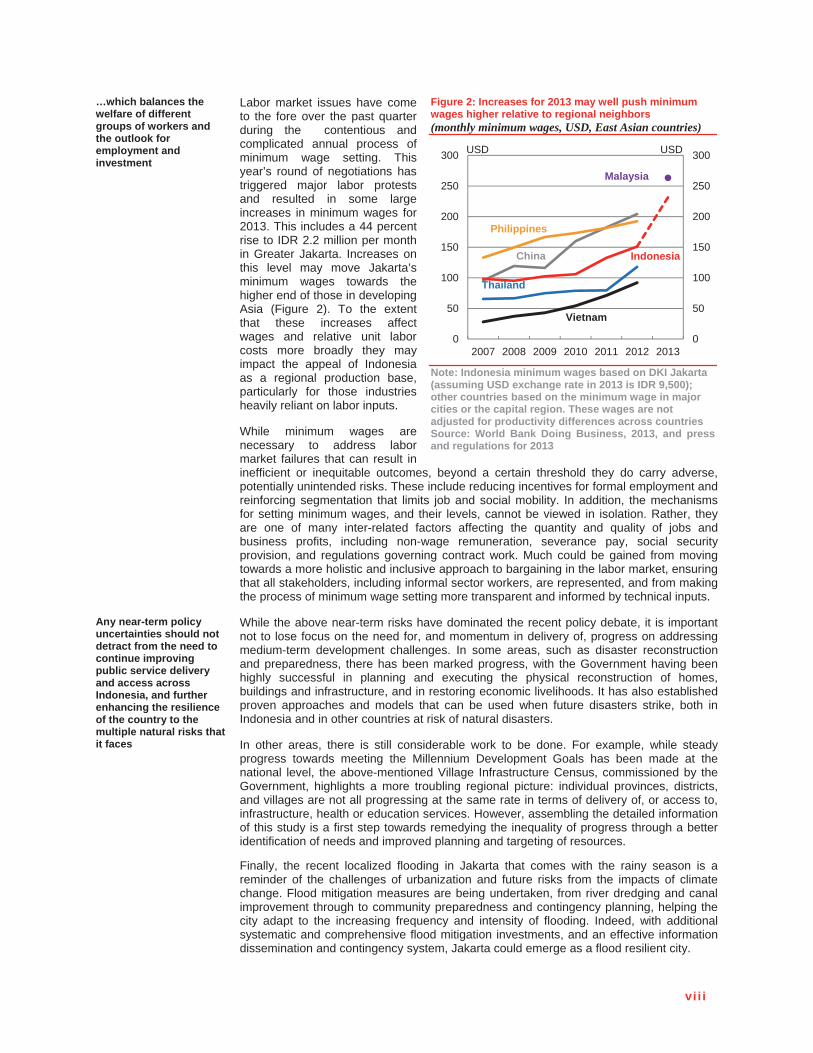
vi i i
…which balances the welfare of different groups of workers and the outlook for employment and investment
Labor market issues have come to the fore over the past quarter during the contentious and complicated annual process of minimum wage setting. This year’s round of negotiations has triggered major labor protests and resulted in some large increases in minimum wages for 2013. This includes a 44 percent rise to IDR 2.2 million per month in Greater Jakarta. Increases on this level may move Jakarta’s minimum wages towards the higher end of those in developing Asia (Figure 2). To the extent that these increases affect wages and relative unit labor costs more broadly they may impact the appeal of Indonesia as a regional production base, particularly for those industries heavily reliant on labor inputs.
While minimum wages are necessary to address labor market failures that can result in inefficient or inequitable outcomes, beyond a certain threshold they do carry adverse, potentially unintended risks. These include reducing incentives for formal employment and reinforcing segmentation that limits job and social mobility. In addition, the mechanisms for setting minimum wages, and their levels, cannot be viewed in isolation. Rather, they are one of many inter-related factors affecting the quantity and quality of jobs and business profits, including non-wage remuneration, severance pay, social security provision, and regulations governing contract work. Much could be gained from moving towards a more holistic and inclusive approach to bargaining in the labor market, ensuring that all stakeholders, including informal sector workers, are represented, and from making the process of minimum wage setting more transparent and informed by technical inputs.
Figure 2: Increases for 2013 may well push minimum wages higher relative to regional neighbors (monthly minimum wages, USD, East Asian countries)
Note: Indonesia minimum wages based on DKI Jakarta (assuming USD exchange rate in 2013 is IDR 9,500); other countries based on the minimum wage in major cities or the capital region. These wages are not adjusted for productivity differences across countries Source: World Bank Doing Business, 2013, and press and regulations for 2013
Any near-term policy uncertainties should not detract from the need to continue improving public service delivery and access across Indonesia, and further enhancing the resilience of the country to the multiple natural risks that it faces
While the above near-term risks have dominated the recent policy debate, it is important not to lose focus on the need for, and momentum in delivery of, progress on addressing medium-term development challenges. In some areas, such as disaster reconstruction and preparedness, there has been marked progress, with the Government having been highly successful in planning and executing the physical reconstruction of homes, buildings and infrastructure, and in restoring economic livelihoods. It has also established proven approaches and models that can be used when future disasters strike, both in Indonesia and in other countries at risk of natural disasters.
In other areas, there is still considerable work to be done. For example, while steady progress towards meeting the Millennium Development Goals has been made at the national level, the above-mentioned Village Infrastructure Census, commissioned by the Government, highlights a more troubling regional picture: individual provinces, districts, and villages are not all progressing at the same rate in terms of delivery of, or access to, infrastructure, health or education services. However, assembling the detailed information of this study is a first step towards remedying the inequality of progress through a better identification of needs and improved planning and targeting of resources.
Finally, the recent localized flooding in Jakarta that comes with the rainy season is a reminder of the challenges of urbanization and future risks from the impacts of climate change. Flood mitigation measures are being undertaken, from river dredging and canal improvement through to community preparedness and contingency planning, helping the city adapt to the increasing frequency and intensity of flooding. Indeed, with additional systematic and comprehensive flood mitigation investments, and an effective information dissemination and contingency system, Jakarta could emerge as a flood resilient city.
0
50
100
150
200
250
300
0
50
100
150
200
250
300
2007 2008 2009 2010 2011 2012 2013
USDUSD
China Indonesia
Malaysia
Philippines
Thailand
Vietnam

I n d o n e s i a E c o n o m i c Q u a r t e r l y P o l i c i e s i n f o c u s
THE WORLD BANK | BANK DUNIA December 20121
A. ECONOMIC�AND�FISCAL�UPDATE
1. Global economic growth remains weak, likely improving only modestly in 2013
Global economic momentum is improving, but slowly and unevenly
As the end of 2012 approaches, the modest firming in global economic conditions anticipated in the October IEQ appears to be underway, but the improvement continues to be slow and uneven. In the US, third quarter GDP growth rose to 2.7 percent at a seasonally adjusted annualized rate (saar), sharply higher than 1.3 percent (saar) in the second quarter and a significant upward revision from the initial estimate of 2 percent. In contrast, China’s economy continued to slow in the third quarter on a year-on-year basis, but still grew by 7.4 percent year-on-year, and there are encouraging signs, such as from industrial output, that some acceleration in growth is underway. Less positively, however, the Euro Area is still struggling to emerge from its shallow but protracted recession, with third quarter GDP flat-lining at -0.2 percent (saar) amidst concerns that both Germany, the regional growth engine, and France, are slowing. Japan’s economy also shrank by 3.5 percent (saar) in the third quarter of 2012.
Coupled with accommodative policies, this has been enough to support financial markets
Economic data have been mixed since the October IEQ and are certainly not pointing to a strong enough near-term pickup in global growth to call accommodative monetary policy into question (Figure 3). Meanwhile, the debt crisis in the Euro Area lingers on but fears over an imminent sovereign funding and banking crisis have abated since August, following policy action by the European Central Bank. This mix has capped most developed-market bond yields at historically low levels, stabilized financial conditions in the Euro Area, and been quite supportive for risk appetite, triggering significant inflows to emerging market debt and equities. Consequently, while financial markets have fluctuated since the October IEQ, equity prices remain well above their mid-year lows and sovereign credit spreads have tightened back to levels last seen in mid-2011.
Commodity price movements have been mixed
In line with the hesitant nature of the global growth recovery, the recent performance of international commodity prices has been mixed, and the prices of many of Indonesia’s key exports remain under pressure (Figure 4). Palm oil prices have dropped particularly sharply, with average prices in November down 16 percent from September, to bring the decline for 2012 through November to 21 percent. Crude oil and natural gas prices have gained since mid-year and there are some signs that the marked decline in coal prices has stabilized, though prices remain on the order of 20 percent lower in 2012. Industrial metal prices, notably copper, have recovered somewhat from their mid-year lows, but tended to give up some gains in November.
2013 should be a better year for global growth, but perhaps not by much, and downside risks remain
Looking ahead to 2013, the outlook remains for a gradual improvement in the global economy, with the World Bank expecting growth in Indonesia’s major trading partners to rise by 0.3 percent from 2012, to 3.6 percent. The pace of the recovery from the financial crisis in high income economies, many of which are still weighed down by high debt burdens, resulting in private sector deleveraging and fiscal consolidation, is expected to remain slow. Much therefore depends on China, where the risk of a further slowdown, while not the base case, remains. In both the US and the Euro Area there is also a clear chance of more adverse scenarios unfolding, as negotiations continue in the US over avoiding the tax increases and spending cuts imposed by current legislation (the “fiscal cliff”), and Europe treads a difficult path towards debt sustainability in the periphery. The
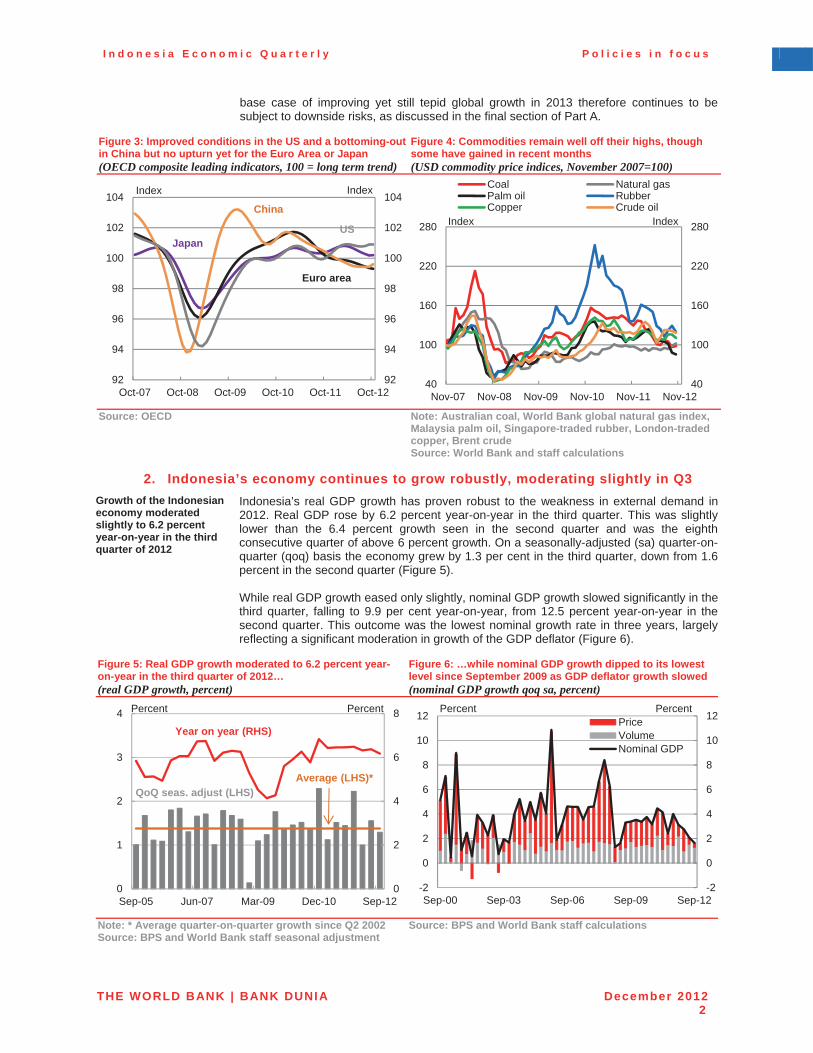
I n d o n e s i a E c o n o m i c Q u a r t e r l y P o l i c i e s i n f o c u s
THE WORLD BANK | BANK DUNIA December 20122
base case of improving yet still tepid global growth in 2013 therefore continues to be subject to downside risks, as discussed in the final section of Part A.
Figure 3: Improved conditions in the US and a bottoming-out in China but no upturn yet for the Euro Area or Japan (OECD composite leading indicators, 100 = long term trend)
Figure 4: Commodities remain well off their highs, though some have gained in recent months (USD commodity price indices, November 2007=100)
Source: OECD Note: Australian coal, World Bank global natural gas index, Malaysia palm oil, Singapore-traded rubber, London-traded copper, Brent crude Source: World Bank and staff calculations
2. Indonesia’s economy continues to grow robustly, moderating slightly in Q3 Growth of the Indonesian economy moderated slightly to 6.2 percent year-on-year in the third quarter of 2012
Indonesia’s real GDP growth has proven robust to the weakness in external demand in 2012. Real GDP rose by 6.2 percent year-on-year in the third quarter. This was slightly lower than the 6.4 percent growth seen in the second quarter and was the eighth consecutive quarter of above 6 percent growth. On a seasonally-adjusted (sa) quarter-on-quarter (qoq) basis the economy grew by 1.3 per cent in the third quarter, down from 1.6 percent in the second quarter (Figure 5).
While real GDP growth eased only slightly, nominal GDP growth slowed significantly in the third quarter, falling to 9.9 per cent year-on-year, from 12.5 percent year-on-year in the second quarter. This outcome was the lowest nominal growth rate in three years, largely reflecting a significant moderation in growth of the GDP deflator (Figure 6).
Figure 5: Real GDP growth moderated to 6.2 percent year-on-year in the third quarter of 2012… (real GDP growth, percent)
Figure 6: …while nominal GDP growth dipped to its lowest level since September 2009 as GDP deflator growth slowed (nominal GDP growth qoq sa, percent)
Note: * Average quarter-on-quarter growth since Q2 2002 Source: BPS and World Bank staff seasonal adjustment
Source: BPS and World Bank staff calculations
92
94
96
98
100
102
104
92
94
96
98
100
102
104
Oct-07 Oct-08 Oct-09 Oct-10 Oct-11 Oct-12
IndexIndex
JapanUS
Euro area
China
40
100
160
220
280
40
100
160
220
280
Nov-07 Nov-08 Nov-09 Nov-10 Nov-11 Nov-12
IndexIndex
Coal Natural gasPalm oil RubberCopper Crude oil
0
2
4
6
8
0
1
2
3
4
Sep-05 Jun-07 Mar-09 Dec-10 Sep-12
Percent Percent
QoQ seas. adjust (LHS)
Year on year (RHS)
Average (LHS)*
-2
0
2
4
6
8
10
12
-2
0
2
4
6
8
10
12
Sep-00 Sep-03 Sep-06 Sep-09 Sep-12
PriceVolumeNominal GDP
Percent Percent
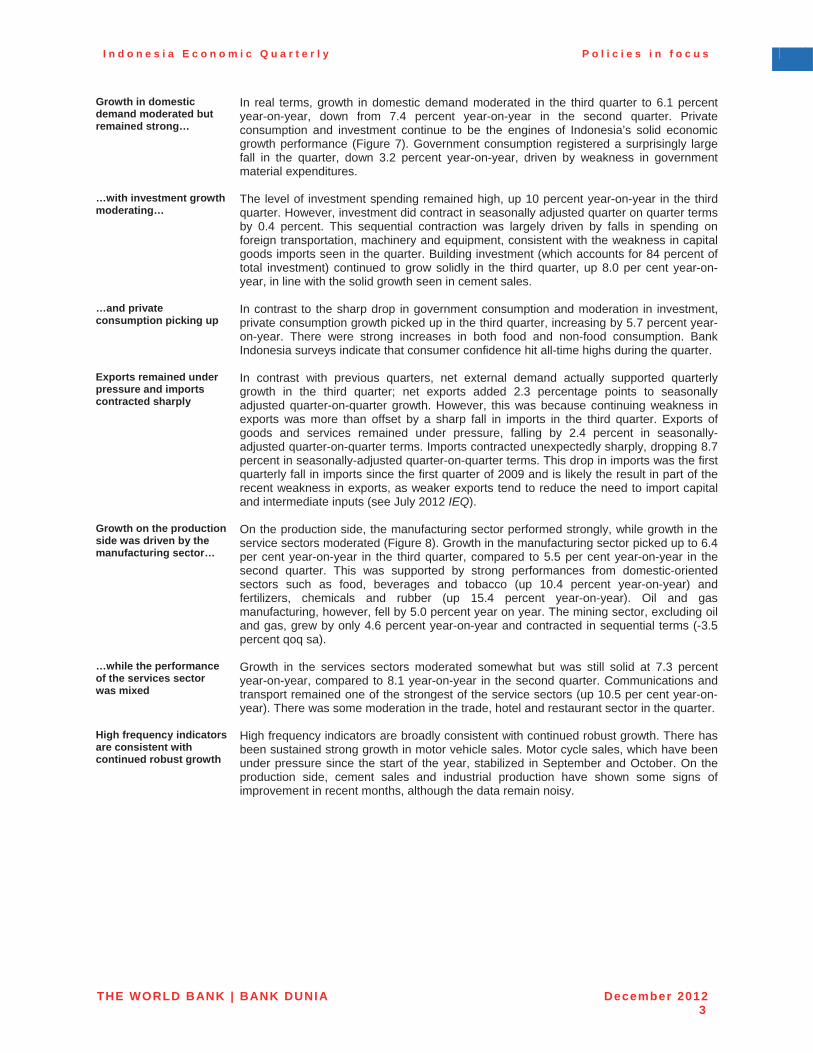
I n d o n e s i a E c o n o m i c Q u a r t e r l y P o l i c i e s i n f o c u s
THE WORLD BANK | BANK DUNIA December 20123
Growth in domestic demand moderated but remained strong…
In real terms, growth in domestic demand moderated in the third quarter to 6.1 percent year-on-year, down from 7.4 percent year-on-year in the second quarter. Private consumption and investment continue to be the engines of Indonesia’s solid economic growth performance (Figure 7). Government consumption registered a surprisingly large fall in the quarter, down 3.2 percent year-on-year, driven by weakness in government material expenditures.
…with investment growth moderating…
The level of investment spending remained high, up 10 percent year-on-year in the third quarter. However, investment did contract in seasonally adjusted quarter on quarter terms by 0.4 percent. This sequential contraction was largely driven by falls in spending on foreign transportation, machinery and equipment, consistent with the weakness in capital goods imports seen in the quarter. Building investment (which accounts for 84 percent of total investment) continued to grow solidly in the third quarter, up 8.0 per cent year-on-year, in line with the solid growth seen in cement sales.
…and private consumption picking up
In contrast to the sharp drop in government consumption and moderation in investment, private consumption growth picked up in the third quarter, increasing by 5.7 percent year-on-year. There were strong increases in both food and non-food consumption. Bank Indonesia surveys indicate that consumer confidence hit all-time highs during the quarter.
Exports remained under pressure and imports contracted sharply
In contrast with previous quarters, net external demand actually supported quarterly growth in the third quarter; net exports added 2.3 percentage points to seasonally adjusted quarter-on-quarter growth. However, this was because continuing weakness in exports was more than offset by a sharp fall in imports in the third quarter. Exports of goods and services remained under pressure, falling by 2.4 percent in seasonally-adjusted quarter-on-quarter terms. Imports contracted unexpectedly sharply, dropping 8.7 percent in seasonally-adjusted quarter-on-quarter terms. This drop in imports was the first quarterly fall in imports since the first quarter of 2009 and is likely the result in part of therecent weakness in exports, as weaker exports tend to reduce the need to import capital and intermediate inputs (see July 2012 IEQ).
Growth on the production side was driven by the manufacturing sector…
On the production side, the manufacturing sector performed strongly, while growth in the service sectors moderated (Figure 8). Growth in the manufacturing sector picked up to 6.4 per cent year-on-year in the third quarter, compared to 5.5 per cent year-on-year in the second quarter. This was supported by strong performances from domestic-oriented sectors such as food, beverages and tobacco (up 10.4 percent year-on-year) and fertilizers, chemicals and rubber (up 15.4 percent year-on-year). Oil and gas manufacturing, however, fell by 5.0 percent year on year. The mining sector, excluding oil and gas, grew by only 4.6 percent year-on-year and contracted in sequential terms (-3.5 percent qoq sa).
…while the performance of the services sector was mixed
Growth in the services sectors moderated somewhat but was still solid at 7.3 percent year-on-year, compared to 8.1 year-on-year in the second quarter. Communications andtransport remained one of the strongest of the service sectors (up 10.5 per cent year-on-year). There was some moderation in the trade, hotel and restaurant sector in the quarter.
High frequency indicators are consistent with continued robust growth
High frequency indicators are broadly consistent with continued robust growth. There has been sustained strong growth in motor vehicle sales. Motor cycle sales, which have been under pressure since the start of the year, stabilized in September and October. On the production side, cement sales and industrial production have shown some signs of improvement in recent months, although the data remain noisy.
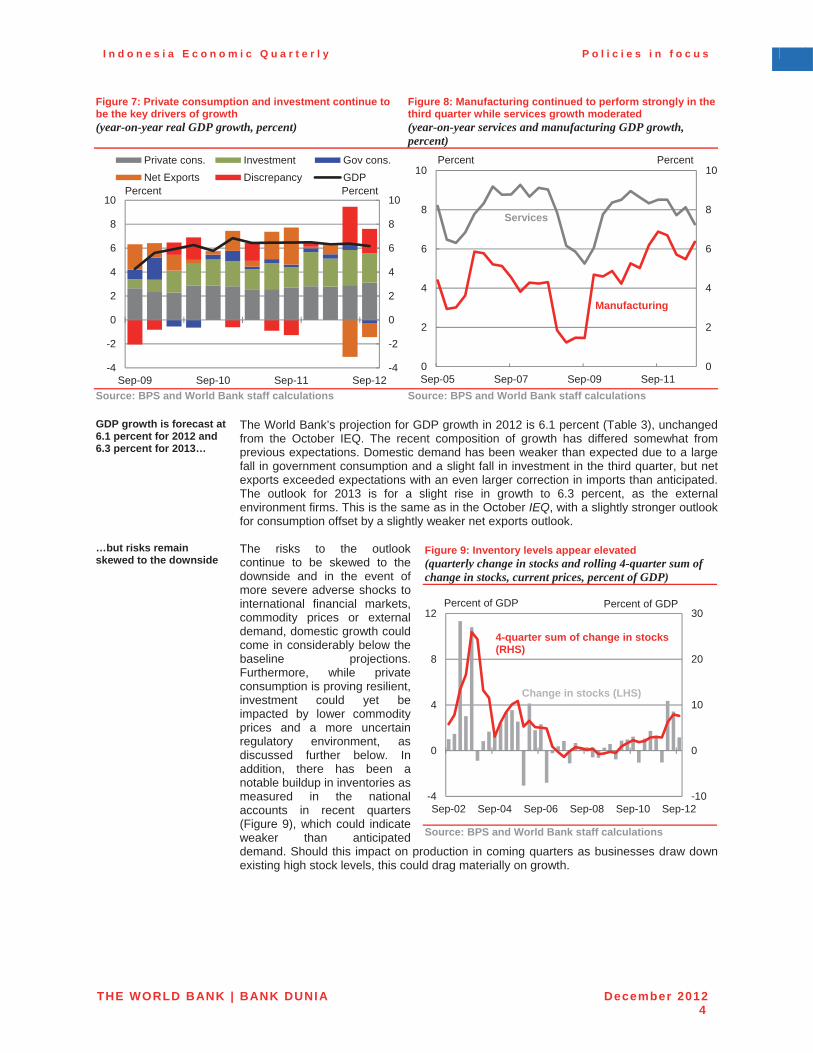
I n d o n e s i a E c o n o m i c Q u a r t e r l y P o l i c i e s i n f o c u s
THE WORLD BANK | BANK DUNIA December 20124
Figure 7: Private consumption and investment continue to be the key drivers of growth (year-on-year real GDP growth, percent)
Figure 8: Manufacturing continued to perform strongly in the third quarter while services growth moderated (year-on-year services and manufacturing GDP growth, percent)
Source: BPS and World Bank staff calculations Source: BPS and World Bank staff calculations
GDP growth is forecast at 6.1 percent for 2012 and 6.3 percent for 2013…
The World Bank’s projection for GDP growth in 2012 is 6.1 percent (Table 3), unchangedfrom the October IEQ. The recent composition of growth has differed somewhat from previous expectations. Domestic demand has been weaker than expected due to a large fall in government consumption and a slight fall in investment in the third quarter, but net exports exceeded expectations with an even larger correction in imports than anticipated. The outlook for 2013 is for a slight rise in growth to 6.3 percent, as the external environment firms. This is the same as in the October IEQ, with a slightly stronger outlook for consumption offset by a slightly weaker net exports outlook.
…but risks remain skewed to the downside
The risks to the outlook continue to be skewed to the downside and in the event of more severe adverse shocks to international financial markets, commodity prices or external demand, domestic growth could come in considerably below the baseline projections. Furthermore, while private consumption is proving resilient, investment could yet be impacted by lower commodity prices and a more uncertain regulatory environment, as discussed further below. In addition, there has been a notable buildup in inventories as measured in the national accounts in recent quarters (Figure 9), which could indicate weaker than anticipated demand. Should this impact on production in coming quarters as businesses draw down existing high stock levels, this could drag materially on growth.
Figure 9: Inventory levels appear elevated(quarterly change in stocks and rolling 4-quarter sum of change in stocks, current prices, percent of GDP)
Source: BPS and World Bank staff calculations
-4
-2
0
2
4
6
8
10
-4
-2
0
2
4
6
8
10
Sep-09 Sep-10 Sep-11 Sep-12
Private cons. Investment Gov cons.Net Exports Discrepancy GDP
Percent Percent
0
2
4
6
8
10
0
2
4
6
8
10
Sep-05 Sep-07 Sep-09 Sep-11
Manufacturing
Percent
Services
Percent
-10
0
10
20
30
-4
0
4
8
12
Sep-02 Sep-04 Sep-06 Sep-08 Sep-10 Sep-12
4-quarter sum of change in stocks (RHS)
Change in stocks (LHS)
Percent of GDP Percent of GDP
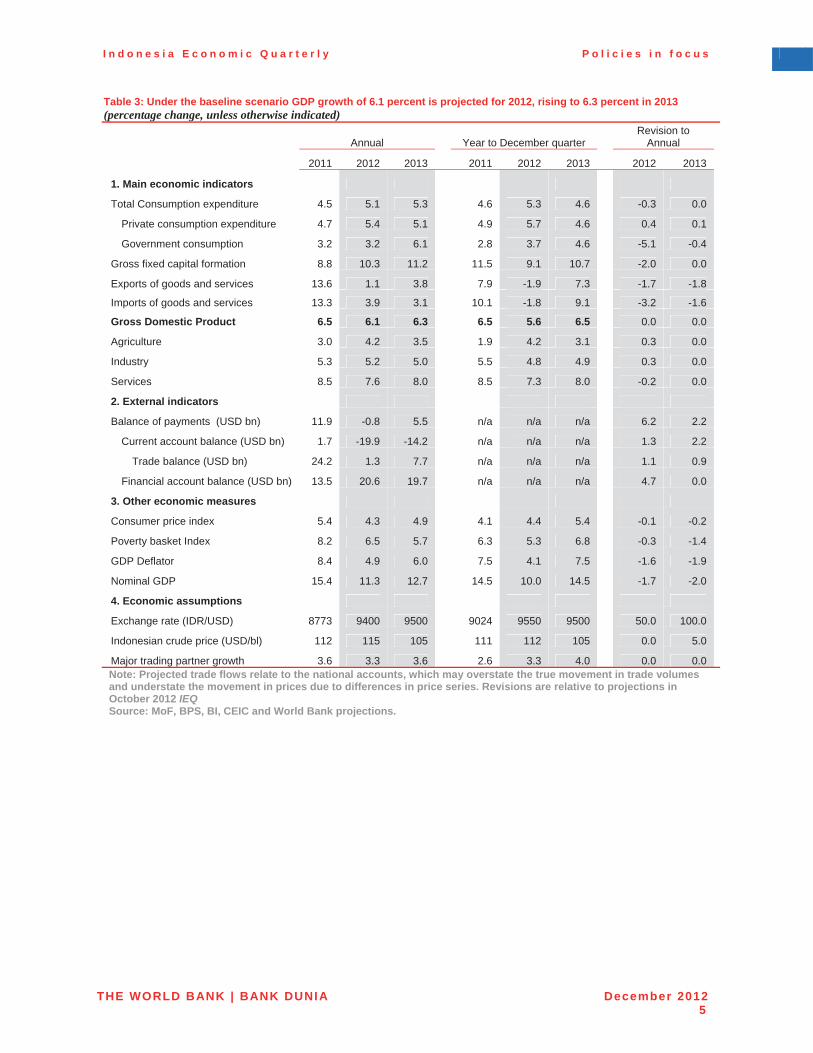
I n d o n e s i a E c o n o m i c Q u a r t e r l y P o l i c i e s i n f o c u s
THE WORLD BANK | BANK DUNIA December 20125
Table 3: Under the baseline scenario GDP growth of 6.1 percent is projected for 2012, rising to 6.3 percent in 2013 (percentage change, unless otherwise indicated)
Annual Year to December quarter Revision to
Annual
2011 2012 2013 2011 2012 2013 2012 2013
1. Main economic indicators
Total Consumption expenditure 4.5 5.1 5.3 4.6 5.3 4.6 -0.3 0.0
Private consumption expenditure 4.7 5.4 5.1 4.9 5.7 4.6 0.4 0.1
Government consumption 3.2 3.2 6.1 2.8 3.7 4.6 -5.1 -0.4
Gross fixed capital formation 8.8 10.3 11.2 11.5 9.1 10.7 -2.0 0.0
Exports of goods and services 13.6 1.1 3.8 7.9 -1.9 7.3 -1.7 -1.8
Imports of goods and services 13.3 3.9 3.1 10.1 -1.8 9.1 -3.2 -1.6
Gross Domestic Product 6.5 6.1 6.3 6.5 5.6 6.5 0.0 0.0
Agriculture 3.0 4.2 3.5 1.9 4.2 3.1 0.3 0.0
Industry 5.3 5.2 5.0 5.5 4.8 4.9 0.3 0.0
Services 8.5 7.6 8.0 8.5 7.3 8.0 -0.2 0.0
2. External indicators
Balance of payments (USD bn) 11.9 -0.8 5.5 n/a n/a n/a 6.2 2.2
Current account balance (USD bn) 1.7 -19.9 -14.2 n/a n/a n/a 1.3 2.2
Trade balance (USD bn) 24.2 1.3 7.7 n/a n/a n/a 1.1 0.9
Financial account balance (USD bn) 13.5 20.6 19.7 n/a n/a n/a 4.7 0.0
3. Other economic measures
Consumer price index 5.4 4.3 4.9 4.1 4.4 5.4 -0.1 -0.2
Poverty basket Index 8.2 6.5 5.7 6.3 5.3 6.8 -0.3 -1.4
GDP Deflator 8.4 4.9 6.0 7.5 4.1 7.5 -1.6 -1.9
Nominal GDP 15.4 11.3 12.7 14.5 10.0 14.5 -1.7 -2.0
4. Economic assumptions
Exchange rate (IDR/USD) 8773 9400 9500 9024 9550 9500 50.0 100.0
Indonesian crude price (USD/bl) 112 115 105 111 112 105 0.0 5.0
Major trading partner growth 3.6 3.3 3.6 2.6 3.3 4.0 0.0 0.0Note: Projected trade flows relate to the national accounts, which may overstate the true movement in trade volumes and understate the movement in prices due to differences in price series. Revisions are relative to projections in October 2012 IEQ Source: MoF, BPS, BI, CEIC and World Bank projections.

I n d o n e s i a E c o n o m i c Q u a r t e r l y P o l i c i e s i n f o c u s
THE WORLD BANK | BANK DUNIA December 20126
3. Exports are still under pressure but capital inflows have been strong The overall balance of payments returned to surplus in Q3 2012
Indonesia’s relatively rapid pace of economic growth and continued weaker demand for its exports have taken a toll on the external accounts. Nevertheless, the quarterly overall balance of payments returned to surplus in the third quarter for the first time since mid-2011, albeit to a modest USD 800 million. This was helped by a sharp reduction in imports and in turn a smaller current account deficit, as well as by the ongoing strength of capital inflows (Figure 10).
However, the basic balance remains in deficit, as the FDI surplus was more than offset by the current account deficit. Indonesia thus remains exposed to a reduction in shorter-term capital flows in the event of heightened uncertainty on global financial markets. With the current account deficit expected to shrink further, but not to return to surplus, as the economy continues to expand faster than that of Indonesia’s major trading partners, and with domestic investment needs remaining high, it will be important to sustain and increase hitherto strong levels of FDI.
Figure 10: The balance of payments returned to a small surplus in the third quarter of 2012 (USD billion)
Note: Basic balance = current account balance + net direct investment Source: BPS and World Bank staff calculations
Exports remained weak in Q3
Weak external demand and lower prices, particularly for commodities, have continued to weigh on Indonesia’s exports. Exports were USD 46 billion in the third quarter, their lowest level in the last eight quarters and down by 5 percent compared with the second quarter. The decline was broad-based but was particularly pronounced for mining and minerals, and oil and gas, exports. This weakness persisted in October, when exports declined slightly further from September and were 7.6 percent lower year-on-year.
Imports fell sharply… Having grown robustly in the first half of 2012, imports contracted sharply in the third quarter to USD 45.5 billion, down over USD 5 billion from the second quarter and by 2 percent in nominal USD terms compared with 3Q 2011 (Figure 11). This was the first quarterly drop in imports in three years. In October, however, imports bounced back strongly, rising 12 percent on September on the back of rising energy and raw material imports.
…reflecting reduced production over the Ramadhan period and a fall in demand for export-related input products
The reduced import demand seen in the third quarter likely reflects in part the impact of Ramadhan and Lebaran in July and August. The 10.6 percent qoq drop in imports of raw and intermediate materials was the biggest contributor to the overall decline in imports, accounting for 7.8 percent of the 10.2 percent quarter-on-quarter fall in total imports. More disaggregated data available through August suggest that the declines in imported raw and intermediate good demand were broad-based.
The continued decline of exports has also dented demand for capital imports. Total capital goods imports fell by 10.9 percent quarter-on-quarter in the third quarter, driving about a quarter of the total quarterly reduction seen in imports. Heavy machinery and transportation imports, which are important for activity in the plantation and mining sectors, have slowed. October trade data show capital imports did pick up and this may be an encouraging sign for exports going forward, but given the volatile nature of monthly trade data it is too soon to draw firm conclusions.
Capital inflows remained robust and FDI is well-diversified…
In contrast to the trade balance, which remains under pressure, Indonesia continues to record sizable financial surpluses, of USD 6.0 billion in the third quarter. The surplus was driven by continued strong net inward direct investment (USD 3.6 billion), as well as netportfolio investment (USD 3.8 billion). The net other investment deficit shrank to USD 1.5
-12
-8
-4
0
4
8
12
16
-12
-8
-4
0
4
8
12
16
Sep-09 Sep-10 Sep-11 Sep-12
Current account Net other capitalNet portfolio Net direct investmentOverall balance Basic balance
USD billion USD billion
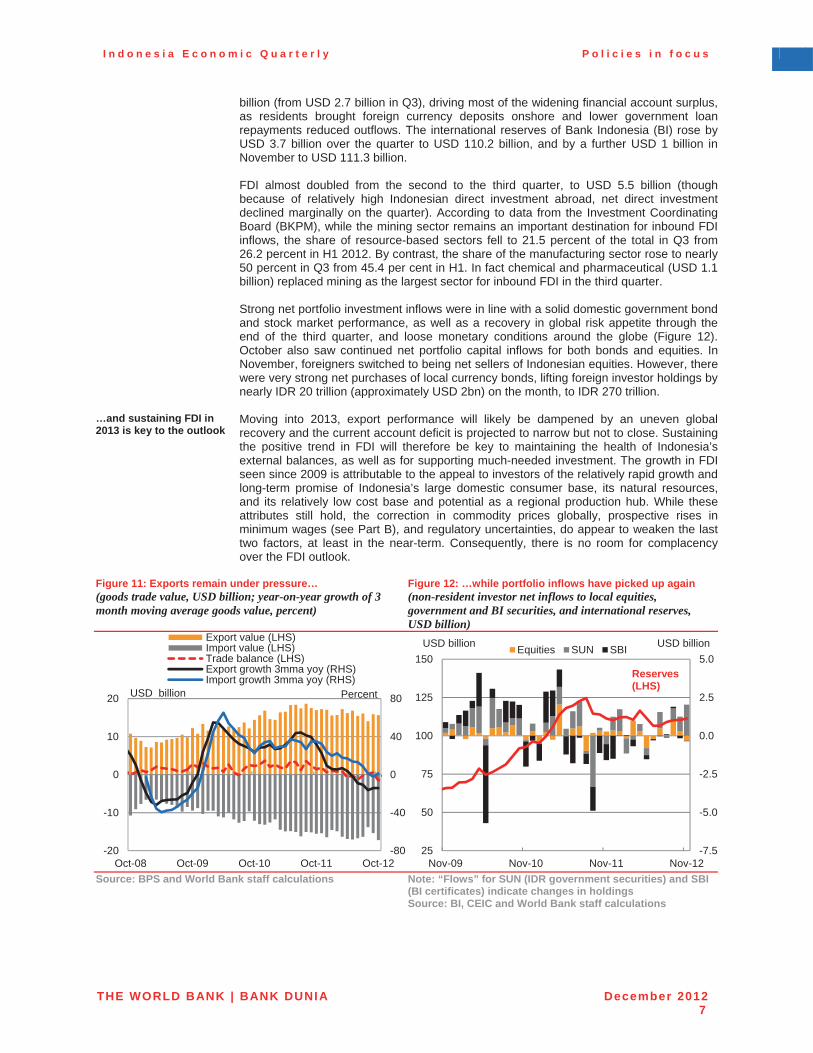
I n d o n e s i a E c o n o m i c Q u a r t e r l y P o l i c i e s i n f o c u s
THE WORLD BANK | BANK DUNIA December 20127
billion (from USD 2.7 billion in Q3), driving most of the widening financial account surplus, as residents brought foreign currency deposits onshore and lower government loan repayments reduced outflows. The international reserves of Bank Indonesia (BI) rose by USD 3.7 billion over the quarter to USD 110.2 billion, and by a further USD 1 billion in November to USD 111.3 billion.
FDI almost doubled from the second to the third quarter, to USD 5.5 billion (though because of relatively high Indonesian direct investment abroad, net direct investment declined marginally on the quarter). According to data from the Investment Coordinating Board (BKPM), while the mining sector remains an important destination for inbound FDI inflows, the share of resource-based sectors fell to 21.5 percent of the total in Q3 from 26.2 percent in H1 2012. By contrast, the share of the manufacturing sector rose to nearly 50 percent in Q3 from 45.4 per cent in H1. In fact chemical and pharmaceutical (USD 1.1 billion) replaced mining as the largest sector for inbound FDI in the third quarter.
Strong net portfolio investment inflows were in line with a solid domestic government bond and stock market performance, as well as a recovery in global risk appetite through the end of the third quarter, and loose monetary conditions around the globe (Figure 12). October also saw continued net portfolio capital inflows for both bonds and equities. In November, foreigners switched to being net sellers of Indonesian equities. However, there were very strong net purchases of local currency bonds, lifting foreign investor holdings by nearly IDR 20 trillion (approximately USD 2bn) on the month, to IDR 270 trillion.
…and sustaining FDI in 2013 is key to the outlook
Moving into 2013, export performance will likely be dampened by an uneven global recovery and the current account deficit is projected to narrow but not to close. Sustaining the positive trend in FDI will therefore be key to maintaining the health of Indonesia’s external balances, as well as for supporting much-needed investment. The growth in FDI seen since 2009 is attributable to the appeal to investors of the relatively rapid growth and long-term promise of Indonesia’s large domestic consumer base, its natural resources, and its relatively low cost base and potential as a regional production hub. While these attributes still hold, the correction in commodity prices globally, prospective rises in minimum wages (see Part B), and regulatory uncertainties, do appear to weaken the last two factors, at least in the near-term. Consequently, there is no room for complacency over the FDI outlook.
Figure 11: Exports remain under pressure… (goods trade value, USD billion; year-on-year growth of 3 month moving average goods value, percent)
Figure 12: …while portfolio inflows have picked up again (non-resident investor net inflows to local equities, government and BI securities, and international reserves, USD billion)
Source: BPS and World Bank staff calculations Note: “Flows” for SUN (IDR government securities) and SBI (BI certificates) indicate changes in holdings Source: BI, CEIC and World Bank staff calculations
-80
-40
0
40
80
-20
-10
0
10
20
Oct-08 Oct-09 Oct-10 Oct-11 Oct-12
Export value (LHS)Import value (LHS)Trade balance (LHS)Export growth 3mma yoy (RHS)Import growth 3mma yoy (RHS)
USD billion Percent
-7.5
-5.0
-2.5
0.0
2.5
5.0
25
50
75
100
125
150
Nov-09 Nov-10 Nov-11 Nov-12
Equities SUN SBIUSD billion
Reserves (LHS)
USD billion
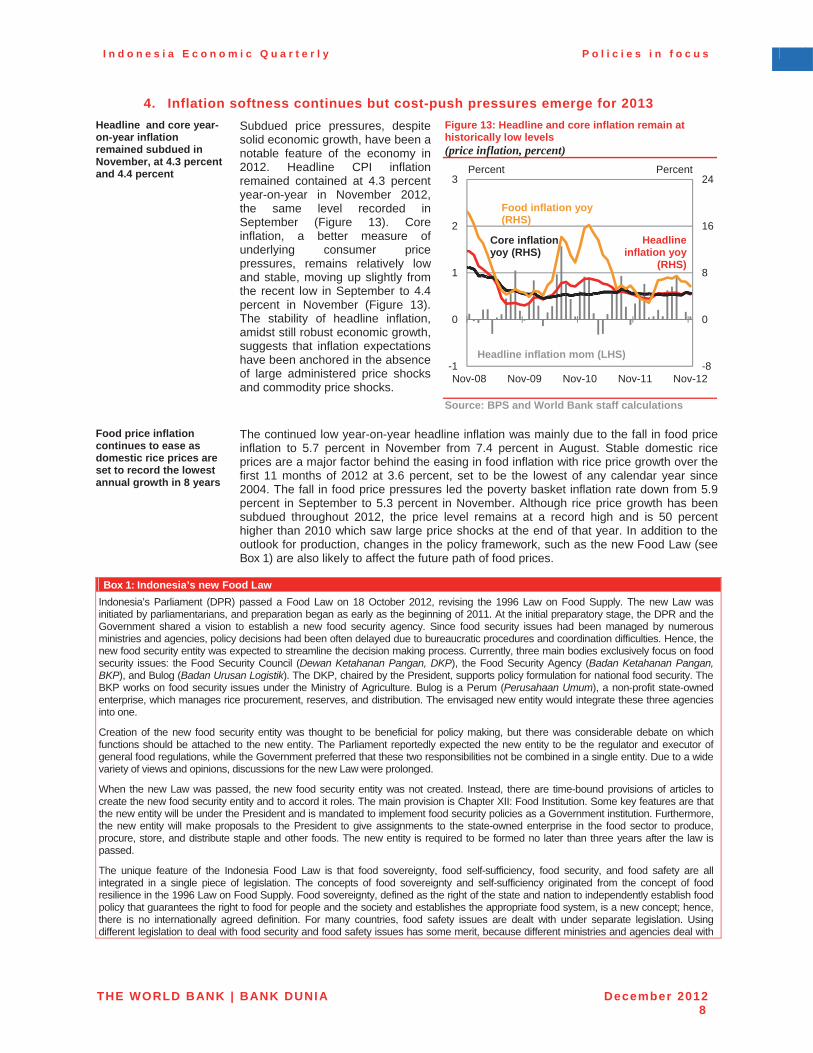
I n d o n e s i a E c o n o m i c Q u a r t e r l y P o l i c i e s i n f o c u s
THE WORLD BANK | BANK DUNIA December 20128
4. Inflation softness continues but cost-push pressures emerge for 2013 Headline and core year-on-year inflation remained subdued in November, at 4.3 percent and 4.4 percent
Subdued price pressures, despite solid economic growth, have been a notable feature of the economy in 2012. Headline CPI inflation remained contained at 4.3 percent year-on-year in November 2012, the same level recorded in September (Figure 13). Core inflation, a better measure of underlying consumer price pressures, remains relatively low and stable, moving up slightly from the recent low in September to 4.4 percent in November (Figure 13). The stability of headline inflation, amidst still robust economic growth, suggests that inflation expectations have been anchored in the absence of large administered price shocks and commodity price shocks.
Figure 13: Headline and core inflation remain at historically low levels (price inflation, percent)
Source: BPS and World Bank staff calculations
Food price inflation continues to ease as domestic rice prices are set to record the lowest annual growth in 8 years
The continued low year-on-year headline inflation was mainly due to the fall in food price inflation to 5.7 percent in November from 7.4 percent in August. Stable domestic rice prices are a major factor behind the easing in food inflation with rice price growth over the first 11 months of 2012 at 3.6 percent, set to be the lowest of any calendar year since 2004. The fall in food price pressures led the poverty basket inflation rate down from 5.9 percent in September to 5.3 percent in November. Although rice price growth has been subdued throughout 2012, the price level remains at a record high and is 50 percent higher than 2010 which saw large price shocks at the end of that year. In addition to the outlook for production, changes in the policy framework, such as the new Food Law (seeBox 1) are also likely to affect the future path of food prices.
Box 1: Indonesia’s new Food Law Indonesia’s Parliament (DPR) passed a Food Law on 18 October 2012, revising the 1996 Law on Food Supply. The new Law was initiated by parliamentarians, and preparation began as early as the beginning of 2011. At the initial preparatory stage, the DPR and the Government shared a vision to establish a new food security agency. Since food security issues had been managed by numerous ministries and agencies, policy decisions had been often delayed due to bureaucratic procedures and coordination difficulties. Hence, the new food security entity was expected to streamline the decision making process. Currently, three main bodies exclusively focus on food security issues: the Food Security Council (Dewan Ketahanan Pangan, DKP), the Food Security Agency (Badan Ketahanan Pangan, BKP), and Bulog (Badan Urusan Logistik). The DKP, chaired by the President, supports policy formulation for national food security. The BKP works on food security issues under the Ministry of Agriculture. Bulog is a Perum (Perusahaan Umum), a non-profit state-owned enterprise, which manages rice procurement, reserves, and distribution. The envisaged new entity would integrate these three agencies into one.
Creation of the new food security entity was thought to be beneficial for policy making, but there was considerable debate on which functions should be attached to the new entity. The Parliament reportedly expected the new entity to be the regulator and executor of general food regulations, while the Government preferred that these two responsibilities not be combined in a single entity. Due to a wide variety of views and opinions, discussions for the new Law were prolonged.
When the new Law was passed, the new food security entity was not created. Instead, there are time-bound provisions of articles to create the new food security entity and to accord it roles. The main provision is Chapter XII: Food Institution. Some key features are that the new entity will be under the President and is mandated to implement food security policies as a Government institution. Furthermore, the new entity will make proposals to the President to give assignments to the state-owned enterprise in the food sector to produce, procure, store, and distribute staple and other foods. The new entity is required to be formed no later than three years after the law is passed.
The unique feature of the Indonesia Food Law is that food sovereignty, food self-sufficiency, food security, and food safety are all integrated in a single piece of legislation. The concepts of food sovereignty and self-sufficiency originated from the concept of food resilience in the 1996 Law on Food Supply. Food sovereignty, defined as the right of the state and nation to independently establish food policy that guarantees the right to food for people and the society and establishes the appropriate food system, is a new concept; hence, there is no internationally agreed definition. For many countries, food safety issues are dealt with under separate legislation. Using different legislation to deal with food security and food safety issues has some merit, because different ministries and agencies deal with
-8
0
8
16
24
-1
0
1
2
3
Nov-08 Nov-09 Nov-10 Nov-11 Nov-12
Core inflation yoy (RHS)
Headlineinflation yoy
(RHS)
Headline inflation mom (LHS)
Percent Percent
Food inflation yoy (RHS)

I n d o n e s i a E c o n o m i c Q u a r t e r l y P o l i c i e s i n f o c u s
THE WORLD BANK | BANK DUNIA December 20129
food security and food safety. The new Law’s strong focus on food safety is inherited from the 1996 Law on Food Supply.
The new Law mandates the Government to intervene significantly in the food market and food sector to achieve self-sufficiency and food security. For example, Article 23 stipulates the Government to manage national food reserves. Article 51 obliges the government to regulate food trading to stabilize staple food supply and prices. Article 55 further mandates the Government to stabilize supply and prices of staple food at the producer and consumer level. This contrasts with the 1996 Law, in which the Government’s involvement for food trade, particularly food imports, is mostly limited to food safety issues.
While it remains to be seen how the legislation will be implemented, these are roles associated with potentially sizable government interventions in the food market for the sake of food security. Consumers’ welfare could be undermined due to higher food prices if there was an attempt to achieve food security and food self-sufficiency through government intervention to limit food trade and increase reserves. In fact, the international experience suggests that increasing agricultural productivity and investment are the keys to achieving sustainable food security. Note: For more information, see OECD Review of Agricultural Policies: Indonesia 2012 (October 2012)
Near-term price expectations have risen following the decision of the government to increase electricity tariffs in 2013
Consumer price expectations measured in October 2012 have edged up since recent lows in August. According to BI’s survey, more respondents compared to last month believe prices in three and six months will rise, largely due to the Government’s decision to increase electricity prices in 2013. Meanwhile retailers reported milder inflationary pressures following the festive season, with their index of expectations for prices 3-months ahead in September falling to the lowest point since late 2011. Given the recent announcements on minimum wage increases (see below and Part B), upcoming survey results for November and December are likely to reflect a pick-up in price expectations.
The planned increase in electricity tariffs in 2013 is expected to have a modest impact on inflation as the majority of households are not affected, similar to the increase in 2010
The welcome move in the 2013 budget to increase subsidized electricity tariffs by an average of 15 percent is expected to have a temporary, one-off impact on CPI inflation. The precise details are yet to be announced but Parliament has mandated that the increase apply only to household users on connection types not typically used by poor or even middle class households (i.e. excluding 450V and 900V connection types). The affected households account for 15 percent of household users but 35 percent of household electricity consumption.
The direct impact of such a reform on the CPI is likely to be limited. Household electricity expenses make up 2.8 percent of households’ consumption bundle according to the CPI consumption weights, so even a full 15 percent increase for all households would directly raise CPI inflation by only 0.42 percentage points. The actual direct impact will be lower as the reform will exclude the 85 percent of the population with unaffected connection types. The indirect impact will be limited too by the relatively small share of electricity in firms’ costs. Electricity bills make up about 5 percent of most medium and large manufacturing firms’ total costs (according to the 2006 Industry Survey). A 15 percent higher electricity bill thus increases typical total costs by less than 1 percent. The bigger, less easily quantifiable, risk for inflation is if firms use the reforms to reset their prices.
Large increases in minimum wages across Indonesia’s provinces are being awarded for 2013…
As discussed in more detail in Part B, provinces across Indonesia have commenced announcing increases to the minimum wage for 2013 with increases of up to 50 percent in some provinces such as East Kalimantan and 44 percent in Jakarta (the biggest increase in a decade). These increases across Indonesia are likely to have a larger impact on broader cost-push pressures than their immediate, direct effect on the CPI.
Direct impacts are limited by the fact that the CPI only includes the wages for some labor (such as housekeeping services) which are categorized as being in the informal sector, and to which the minimum wage therefore does not apply. The proportion of products within the CPI that may directly be exposed to formal sector minimum wage rises is likely to be small, and even for the firms producing these products, the share of total costs attributable to laborers on minimum wages is likely to be limited. According to the 2006 Industry Survey of Manufacturing Firms in Indonesia, about 76% of all firms have the minimum wage as less than 10% of the firm’s average wage. Consequently, the direct impact of the minimum wage rise on total costs will generally be small, although the impact may be more sizable in certain sectors. Finally, any pass-through to consumers of the impact on their operating costs will also be affected by the degree of competition in the market, their exposure to imports and their profit margins.
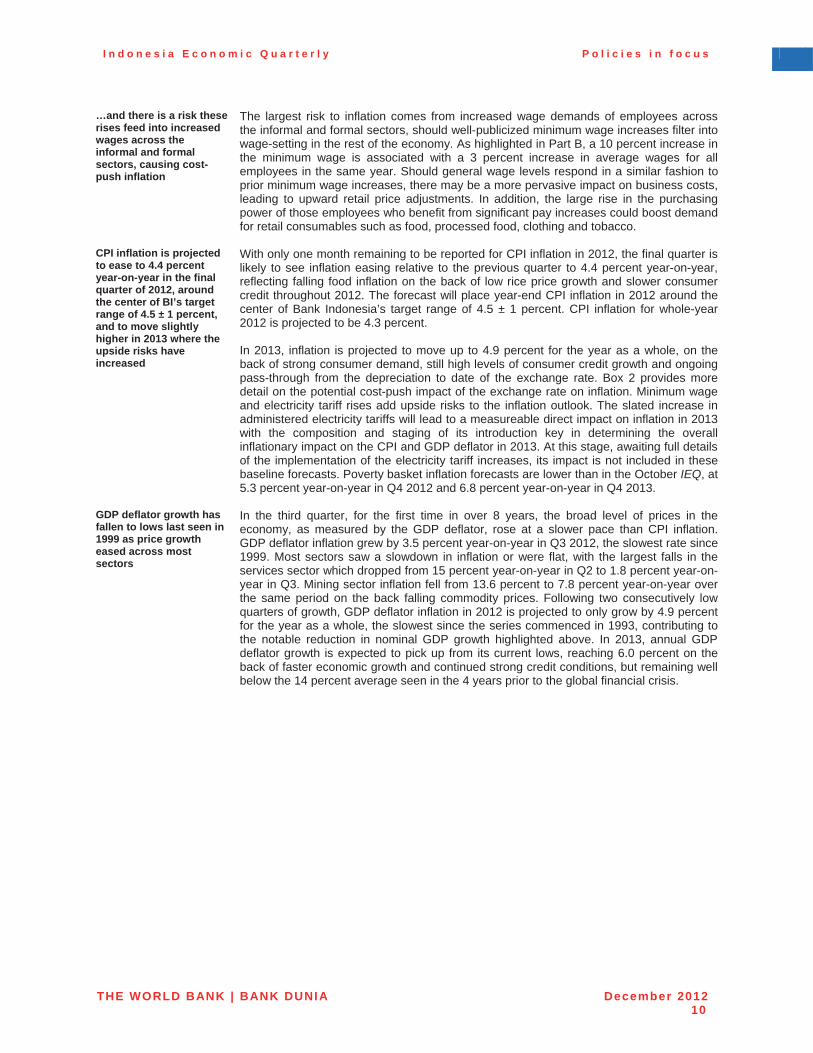
I n d o n e s i a E c o n o m i c Q u a r t e r l y P o l i c i e s i n f o c u s
THE WORLD BANK | BANK DUNIA December 201210
…and there is a risk these rises feed into increased wages across the informal and formal sectors, causing cost-push inflation
The largest risk to inflation comes from increased wage demands of employees across the informal and formal sectors, should well-publicized minimum wage increases filter into wage-setting in the rest of the economy. As highlighted in Part B, a 10 percent increase in the minimum wage is associated with a 3 percent increase in average wages for all employees in the same year. Should general wage levels respond in a similar fashion to prior minimum wage increases, there may be a more pervasive impact on business costs, leading to upward retail price adjustments. In addition, the large rise in the purchasing power of those employees who benefit from significant pay increases could boost demand for retail consumables such as food, processed food, clothing and tobacco.
CPI inflation is projected to ease to 4.4 percent year-on-year in the final quarter of 2012, around the center of BI’s target range of 4.5 ± 1 percent, and to move slightly higher in 2013 where the upside risks have increased
With only one month remaining to be reported for CPI inflation in 2012, the final quarter is likely to see inflation easing relative to the previous quarter to 4.4 percent year-on-year, reflecting falling food inflation on the back of low rice price growth and slower consumer credit throughout 2012. The forecast will place year-end CPI inflation in 2012 around the center of Bank Indonesia’s target range of 4.5 ± 1 percent. CPI inflation for whole-year 2012 is projected to be 4.3 percent.
In 2013, inflation is projected to move up to 4.9 percent for the year as a whole, on the back of strong consumer demand, still high levels of consumer credit growth and ongoing pass-through from the depreciation to date of the exchange rate. Box 2 provides more detail on the potential cost-push impact of the exchange rate on inflation. Minimum wage and electricity tariff rises add upside risks to the inflation outlook. The slated increase in administered electricity tariffs will lead to a measureable direct impact on inflation in 2013 with the composition and staging of its introduction key in determining the overall inflationary impact on the CPI and GDP deflator in 2013. At this stage, awaiting full details of the implementation of the electricity tariff increases, its impact is not included in these baseline forecasts. Poverty basket inflation forecasts are lower than in the October IEQ, at5.3 percent year-on-year in Q4 2012 and 6.8 percent year-on-year in Q4 2013.
GDP deflator growth has fallen to lows last seen in 1999 as price growth eased across most sectors
In the third quarter, for the first time in over 8 years, the broad level of prices in the economy, as measured by the GDP deflator, rose at a slower pace than CPI inflation. GDP deflator inflation grew by 3.5 percent year-on-year in Q3 2012, the slowest rate since 1999. Most sectors saw a slowdown in inflation or were flat, with the largest falls in the services sector which dropped from 15 percent year-on-year in Q2 to 1.8 percent year-on-year in Q3. Mining sector inflation fell from 13.6 percent to 7.8 percent year-on-year overthe same period on the back falling commodity prices. Following two consecutively low quarters of growth, GDP deflator inflation in 2012 is projected to only grow by 4.9 percent for the year as a whole, the slowest since the series commenced in 1993, contributing to the notable reduction in nominal GDP growth highlighted above. In 2013, annual GDP deflator growth is expected to pick up from its current lows, reaching 6.0 percent on the back of faster economic growth and continued strong credit conditions, but remaining well below the 14 percent average seen in the 4 years prior to the global financial crisis.
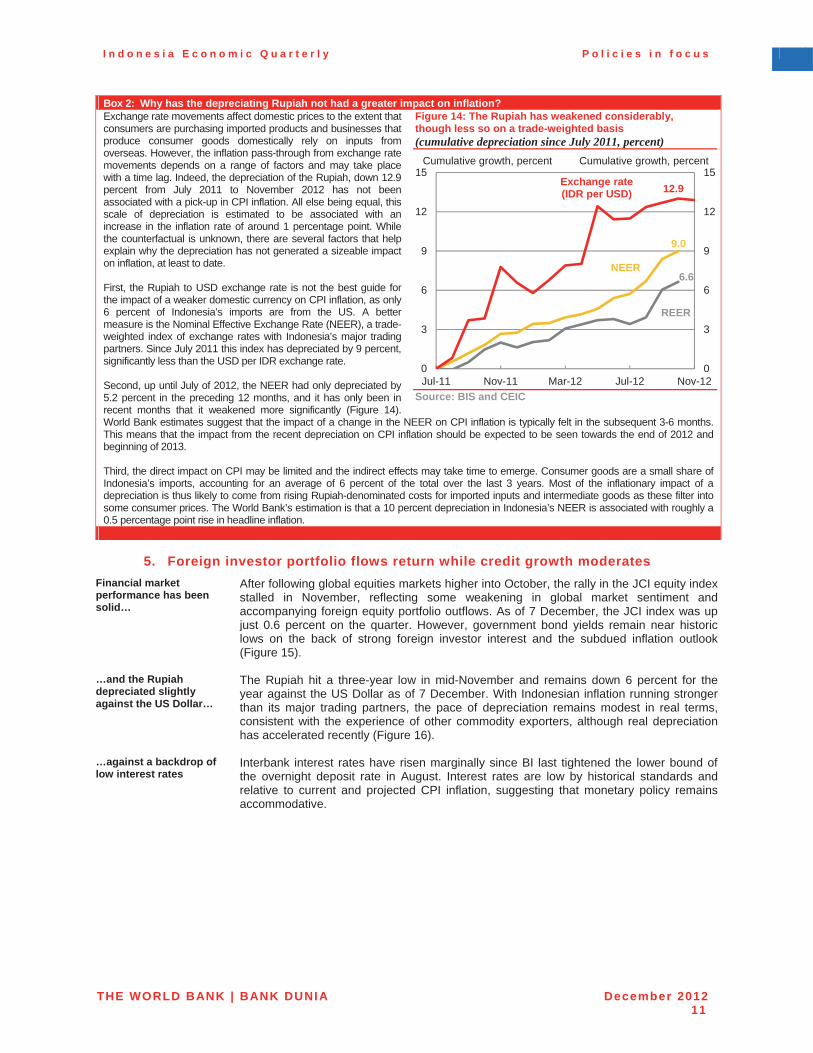
I n d o n e s i a E c o n o m i c Q u a r t e r l y P o l i c i e s i n f o c u s
THE WORLD BANK | BANK DUNIA December 201211
Box 2: Why has the depreciating Rupiah not had a greater impact on inflation?Exchange rate movements affect domestic prices to the extent that consumers are purchasing imported products and businesses that produce consumer goods domestically rely on inputs from overseas. However, the inflation pass-through from exchange rate movements depends on a range of factors and may take place with a time lag. Indeed, the depreciation of the Rupiah, down 12.9 percent from July 2011 to November 2012 has not been associated with a pick-up in CPI inflation. All else being equal, this scale of depreciation is estimated to be associated with an increase in the inflation rate of around 1 percentage point. While the counterfactual is unknown, there are several factors that help explain why the depreciation has not generated a sizeable impact on inflation, at least to date.
First, the Rupiah to USD exchange rate is not the best guide for the impact of a weaker domestic currency on CPI inflation, as only 6 percent of Indonesia’s imports are from the US. A better measure is the Nominal Effective Exchange Rate (NEER), a trade-weighted index of exchange rates with Indonesia’s major trading partners. Since July 2011 this index has depreciated by 9 percent, significantly less than the USD per IDR exchange rate.
Second, up until July of 2012, the NEER had only depreciated by 5.2 percent in the preceding 12 months, and it has only been in recent months that it weakened more significantly (Figure 14). World Bank estimates suggest that the impact of a change in the NEER on CPI inflation is typically felt in the subsequent 3-6 months. This means that the impact from the recent depreciation on CPI inflation should be expected to be seen towards the end of 2012 and beginning of 2013.
Third, the direct impact on CPI may be limited and the indirect effects may take time to emerge. Consumer goods are a small share of Indonesia’s imports, accounting for an average of 6 percent of the total over the last 3 years. Most of the inflationary impact of a depreciation is thus likely to come from rising Rupiah-denominated costs for imported inputs and intermediate goods as these filter into some consumer prices. The World Bank’s estimation is that a 10 percent depreciation in Indonesia’s NEER is associated with roughly a 0.5 percentage point rise in headline inflation.
Figure 14: The Rupiah has weakened considerably, though less so on a trade-weighted basis (cumulative depreciation since July 2011, percent)
Source: BIS and CEIC
5. Foreign investor portfolio flows return while credit growth moderates Financial market performance has been solid…
After following global equities markets higher into October, the rally in the JCI equity index stalled in November, reflecting some weakening in global market sentiment and accompanying foreign equity portfolio outflows. As of 7 December, the JCI index was up just 0.6 percent on the quarter. However, government bond yields remain near historic lows on the back of strong foreign investor interest and the subdued inflation outlook(Figure 15).
…and the Rupiah depreciated slightly against the US Dollar…
The Rupiah hit a three-year low in mid-November and remains down 6 percent for the year against the US Dollar as of 7 December. With Indonesian inflation running stronger than its major trading partners, the pace of depreciation remains modest in real terms, consistent with the experience of other commodity exporters, although real depreciation has accelerated recently (Figure 16).
…against a backdrop of low interest rates
Interbank interest rates have risen marginally since BI last tightened the lower bound of the overnight deposit rate in August. Interest rates are low by historical standards and relative to current and projected CPI inflation, suggesting that monetary policy remains accommodative.
9.0
6.6
12.9
0
3
6
9
12
15
0
3
6
9
12
15
Jul-11 Nov-11 Mar-12 Jul-12 Nov-12
Cumulative growth, percent Cumulative growth, percent
Exchange rate (IDR per USD)
NEER
REER
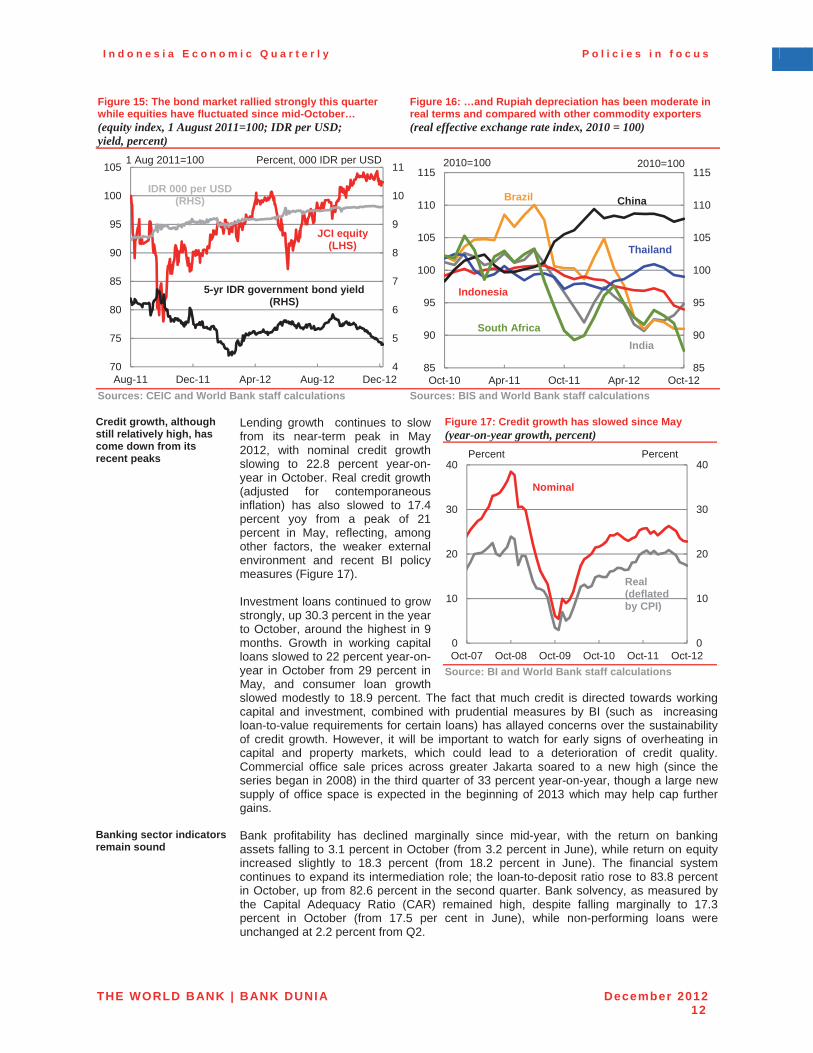
I n d o n e s i a E c o n o m i c Q u a r t e r l y P o l i c i e s i n f o c u s
THE WORLD BANK | BANK DUNIA December 201212
Figure 15: The bond market rallied strongly this quarter while equities have fluctuated since mid-October… (equity index, 1 August 2011=100; IDR per USD; yield, percent)
Figure 16: …and Rupiah depreciation has been moderate in real terms and compared with other commodity exporters (real effective exchange rate index, 2010 = 100)
Sources: CEIC and World Bank staff calculations Sources: BIS and World Bank staff calculations
Credit growth, although still relatively high, has come down from its recent peaks
Lending growth continues to slow from its near-term peak in May 2012, with nominal credit growth slowing to 22.8 percent year-on-year in October. Real credit growth (adjusted for contemporaneous inflation) has also slowed to 17.4 percent yoy from a peak of 21 percent in May, reflecting, among other factors, the weaker external environment and recent BI policy measures (Figure 17).
Investment loans continued to grow strongly, up 30.3 percent in the year to October, around the highest in 9 months. Growth in working capital loans slowed to 22 percent year-on-year in October from 29 percent in May, and consumer loan growth slowed modestly to 18.9 percent. The fact that much credit is directed towards working capital and investment, combined with prudential measures by BI (such as increasing loan-to-value requirements for certain loans) has allayed concerns over the sustainability of credit growth. However, it will be important to watch for early signs of overheating in capital and property markets, which could lead to a deterioration of credit quality.Commercial office sale prices across greater Jakarta soared to a new high (since the series began in 2008) in the third quarter of 33 percent year-on-year, though a large new supply of office space is expected in the beginning of 2013 which may help cap further gains.
Figure 17: Credit growth has slowed since May (year-on-year growth, percent)
Source: BI and World Bank staff calculations
Banking sector indicators remain sound
Bank profitability has declined marginally since mid-year, with the return on banking assets falling to 3.1 percent in October (from 3.2 percent in June), while return on equity increased slightly to 18.3 percent (from 18.2 percent in June). The financial system continues to expand its intermediation role; the loan-to-deposit ratio rose to 83.8 percentin October, up from 82.6 percent in the second quarter. Bank solvency, as measured by the Capital Adequacy Ratio (CAR) remained high, despite falling marginally to 17.3 percent in October (from 17.5 per cent in June), while non-performing loans were unchanged at 2.2 percent from Q2.
4
5
6
7
8
9
10
11
70
75
80
85
90
95
100
105
Aug-11 Dec-11 Apr-12 Aug-12 Dec-12
1 Aug 2011=100 Percent, 000 IDR per USD
IDR 000 per USD (RHS)
JCI equity(LHS)
5-yr IDR government bond yield (RHS)
85
90
95
100
105
110
115
85
90
95
100
105
110
115
Oct-10 Apr-11 Oct-11 Apr-12 Oct-12
China
India
Indonesia
Thailand
2010=100 2010=100
South Africa
Brazil
0
10
20
30
40
0
10
20
30
40
Oct-07 Oct-08 Oct-09 Oct-10 Oct-11 Oct-12
Percent Percent
Nominal
Real(deflatedby CPI)
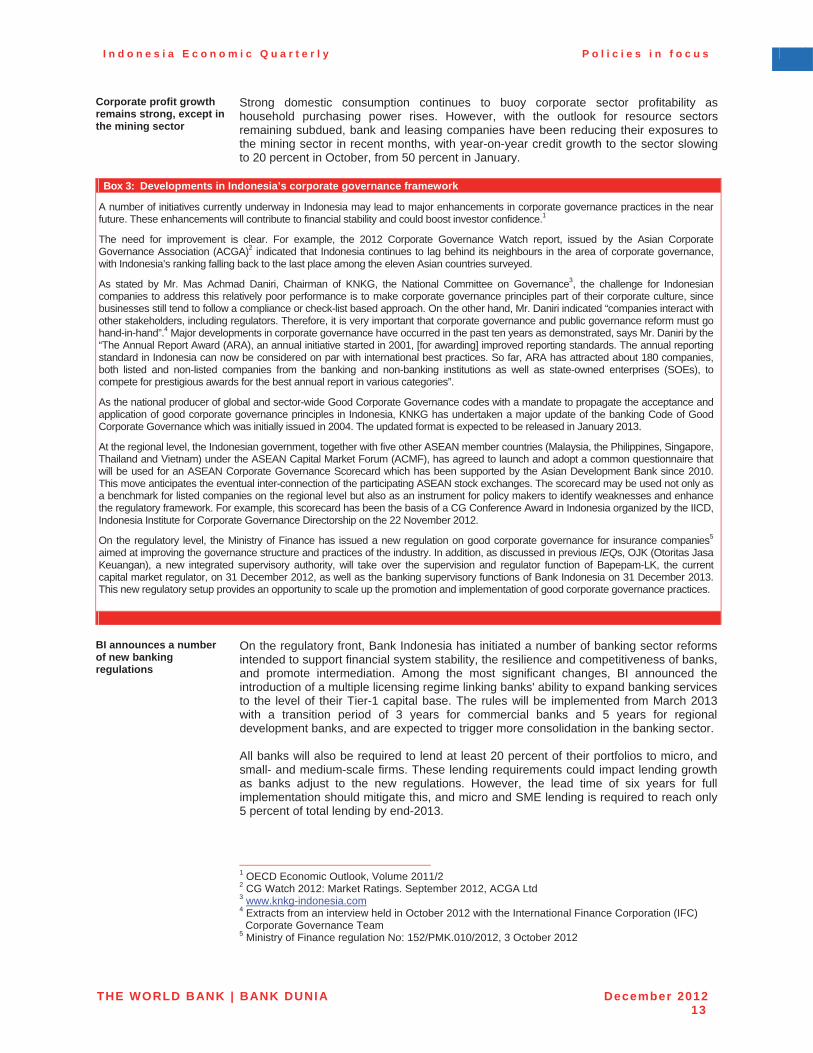
I n d o n e s i a E c o n o m i c Q u a r t e r l y P o l i c i e s i n f o c u s
THE WORLD BANK | BANK DUNIA December 201213
Corporate profit growth remains strong, except in the mining sector
Strong domestic consumption continues to buoy corporate sector profitability as household purchasing power rises. However, with the outlook for resource sectors remaining subdued, bank and leasing companies have been reducing their exposures to the mining sector in recent months, with year-on-year credit growth to the sector slowing to 20 percent in October, from 50 percent in January.
Box 3: Developments in Indonesia’s corporate governance framework
A number of initiatives currently underway in Indonesia may lead to major enhancements in corporate governance practices in the near future. These enhancements will contribute to financial stability and could boost investor confidence.1
The need for improvement is clear. For example, the 2012 Corporate Governance Watch report, issued by the Asian Corporate Governance Association (ACGA)2 indicated that Indonesia continues to lag behind its neighbours in the area of corporate governance, with Indonesia’s ranking falling back to the last place among the eleven Asian countries surveyed.
As stated by Mr. Mas Achmad Daniri, Chairman of KNKG, the National Committee on Governance3, the challenge for Indonesian companies to address this relatively poor performance is to make corporate governance principles part of their corporate culture, since businesses still tend to follow a compliance or check-list based approach. On the other hand, Mr. Daniri indicated “companies interact with other stakeholders, including regulators. Therefore, it is very important that corporate governance and public governance reform must go hand-in-hand”.4 Major developments in corporate governance have occurred in the past ten years as demonstrated, says Mr. Daniri by the “The Annual Report Award (ARA), an annual initiative started in 2001, [for awarding] improved reporting standards. The annual reporting standard in Indonesia can now be considered on par with international best practices. So far, ARA has attracted about 180 companies, both listed and non-listed companies from the banking and non-banking institutions as well as state-owned enterprises (SOEs), tocompete for prestigious awards for the best annual report in various categories”.
As the national producer of global and sector-wide Good Corporate Governance codes with a mandate to propagate the acceptance andapplication of good corporate governance principles in Indonesia, KNKG has undertaken a major update of the banking Code of GoodCorporate Governance which was initially issued in 2004. The updated format is expected to be released in January 2013.
At the regional level, the Indonesian government, together with five other ASEAN member countries (Malaysia, the Philippines, Singapore, Thailand and Vietnam) under the ASEAN Capital Market Forum (ACMF), has agreed to launch and adopt a common questionnaire that will be used for an ASEAN Corporate Governance Scorecard which has been supported by the Asian Development Bank since 2010. This move anticipates the eventual inter-connection of the participating ASEAN stock exchanges. The scorecard may be used not only as a benchmark for listed companies on the regional level but also as an instrument for policy makers to identify weaknesses and enhance the regulatory framework. For example, this scorecard has been the basis of a CG Conference Award in Indonesia organized by the IICD, Indonesia Institute for Corporate Governance Directorship on the 22 November 2012.
On the regulatory level, the Ministry of Finance has issued a new regulation on good corporate governance for insurance companies5
aimed at improving the governance structure and practices of the industry. In addition, as discussed in previous IEQs, OJK (Otoritas Jasa Keuangan), a new integrated supervisory authority, will take over the supervision and regulator function of Bapepam-LK, the current capital market regulator, on 31 December 2012, as well as the banking supervisory functions of Bank Indonesia on 31 December 2013.This new regulatory setup provides an opportunity to scale up the promotion and implementation of good corporate governance practices.
BI announces a number of new banking regulations
On the regulatory front, Bank Indonesia has initiated a number of banking sector reforms intended to support financial system stability, the resilience and competitiveness of banks, and promote intermediation. Among the most significant changes, BI announced the introduction of a multiple licensing regime linking banks' ability to expand banking services to the level of their Tier-1 capital base. The rules will be implemented from March 2013 with a transition period of 3 years for commercial banks and 5 years for regional development banks, and are expected to trigger more consolidation in the banking sector.
All banks will also be required to lend at least 20 percent of their portfolios to micro, and small- and medium-scale firms. These lending requirements could impact lending growth as banks adjust to the new regulations. However, the lead time of six years for full implementation should mitigate this, and micro and SME lending is required to reach only 5 percent of total lending by end-2013.
1 OECD Economic Outlook, Volume 2011/2 2 CG Watch 2012: Market Ratings. September 2012, ACGA Ltd 3 www.knkg-indonesia.com4 Extracts from an interview held in October 2012 with the International Finance Corporation (IFC)
Corporate Governance Team 5 Ministry of Finance regulation No: 152/PMK.010/2012, 3 October 2012
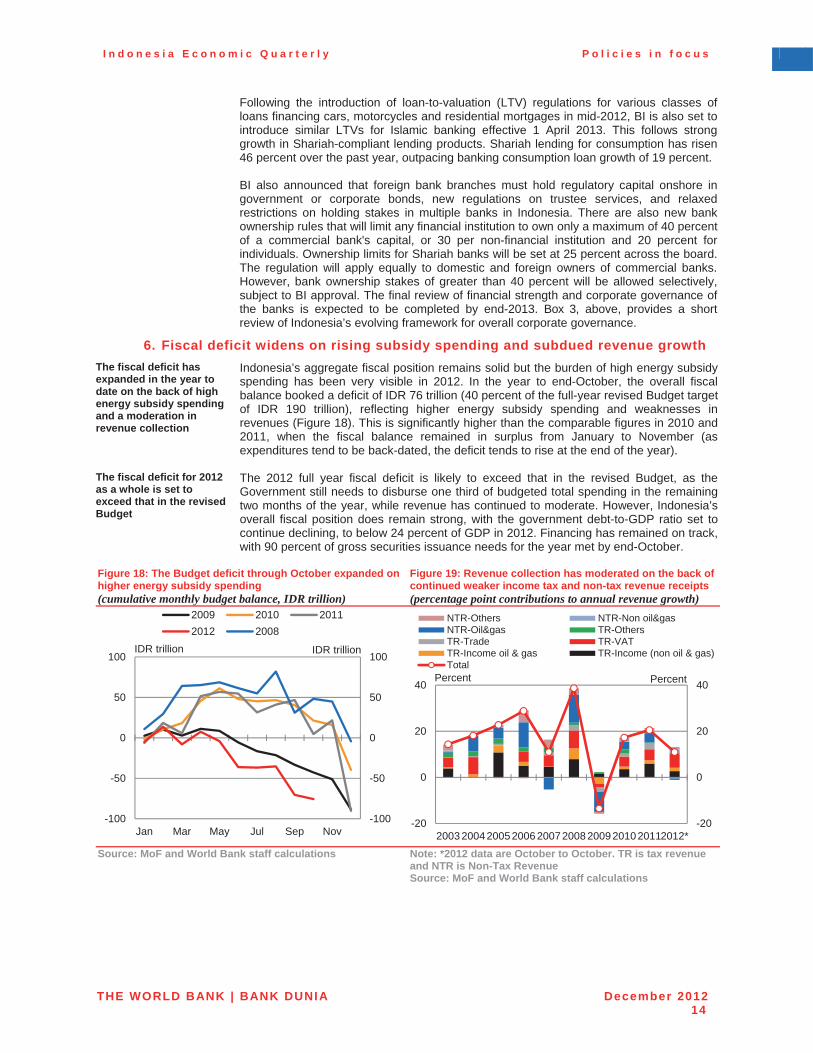
I n d o n e s i a E c o n o m i c Q u a r t e r l y P o l i c i e s i n f o c u s
THE WORLD BANK | BANK DUNIA December 201214
Following the introduction of loan-to-valuation (LTV) regulations for various classes of loans financing cars, motorcycles and residential mortgages in mid-2012, BI is also set to introduce similar LTVs for Islamic banking effective 1 April 2013. This follows strong growth in Shariah-compliant lending products. Shariah lending for consumption has risen 46 percent over the past year, outpacing banking consumption loan growth of 19 percent.
BI also announced that foreign bank branches must hold regulatory capital onshore in government or corporate bonds, new regulations on trustee services, and relaxed restrictions on holding stakes in multiple banks in Indonesia. There are also new bank ownership rules that will limit any financial institution to own only a maximum of 40 percentof a commercial bank's capital, or 30 per non-financial institution and 20 percent for individuals. Ownership limits for Shariah banks will be set at 25 percent across the board. The regulation will apply equally to domestic and foreign owners of commercial banks. However, bank ownership stakes of greater than 40 percent will be allowed selectively, subject to BI approval. The final review of financial strength and corporate governance of the banks is expected to be completed by end-2013. Box 3, above, provides a short review of Indonesia’s evolving framework for overall corporate governance.
6. Fiscal deficit widens on rising subsidy spending and subdued revenue growth The fiscal deficit has expanded in the year to date on the back of high energy subsidy spending and a moderation in revenue collection
Indonesia’s aggregate fiscal position remains solid but the burden of high energy subsidy spending has been very visible in 2012. In the year to end-October, the overall fiscal balance booked a deficit of IDR 76 trillion (40 percent of the full-year revised Budget target of IDR 190 trillion), reflecting higher energy subsidy spending and weaknesses in revenues (Figure 18). This is significantly higher than the comparable figures in 2010 and 2011, when the fiscal balance remained in surplus from January to November (as expenditures tend to be back-dated, the deficit tends to rise at the end of the year).
The fiscal deficit for 2012 as a whole is set to exceed that in the revised Budget
The 2012 full year fiscal deficit is likely to exceed that in the revised Budget, as the Government still needs to disburse one third of budgeted total spending in the remainingtwo months of the year, while revenue has continued to moderate. However, Indonesia’s overall fiscal position does remain strong, with the government debt-to-GDP ratio set to continue declining, to below 24 percent of GDP in 2012. Financing has remained on track, with 90 percent of gross securities issuance needs for the year met by end-October.
Figure 18: The Budget deficit through October expanded on higher energy subsidy spending (cumulative monthly budget balance, IDR trillion)
Figure 19: Revenue collection has moderated on the back of continued weaker income tax and non-tax revenue receipts (percentage point contributions to annual revenue growth)
Source: MoF and World Bank staff calculations Note: *2012 data are October to October. TR is tax revenue and NTR is Non-Tax Revenue Source: MoF and World Bank staff calculations
-100
-50
0
50
100
-100
-50
0
50
100
Jan Mar May Jul Sep Nov
IDR trillion
2009 2010 20112012 2008
IDR trillion
-20
0
20
40
-20
0
20
40
2003 200420052006 20072008 2009201020112012*
PercentPercent
NTR-Others NTR-Non oil&gasNTR-Oil&gas TR-OthersTR-Trade TR-VATTR-Income oil & gas TR-Income (non oil & gas)Total
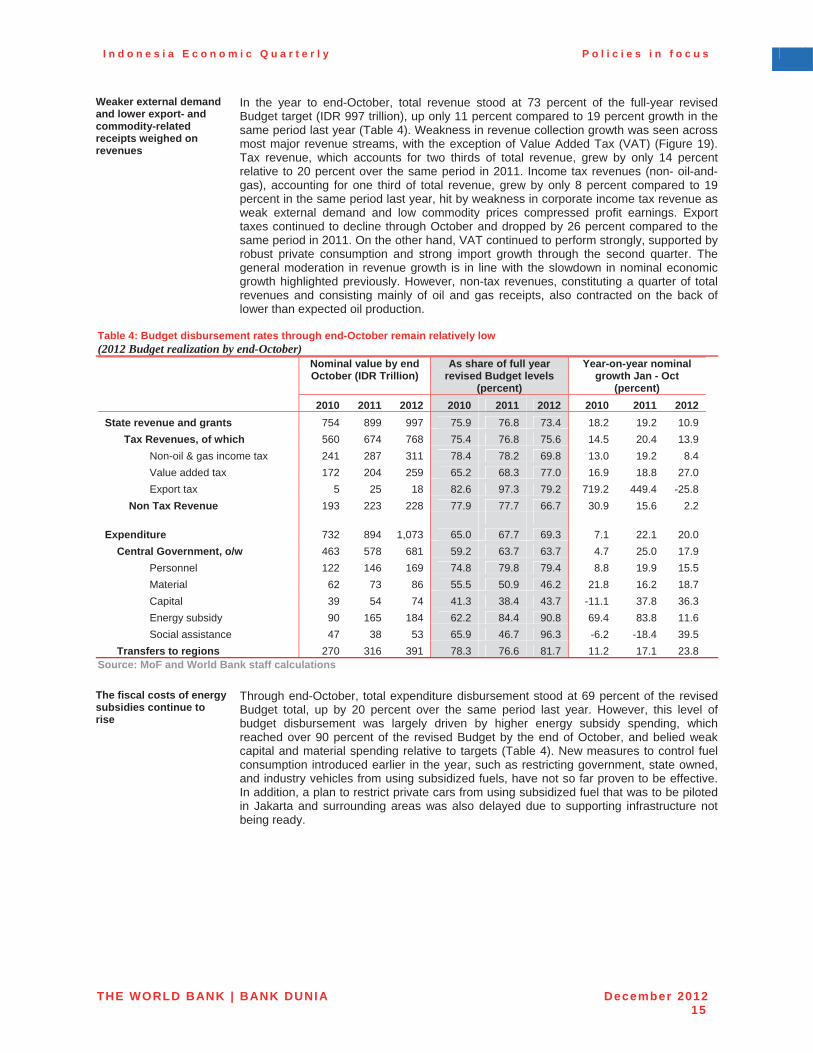
I n d o n e s i a E c o n o m i c Q u a r t e r l y P o l i c i e s i n f o c u s
THE WORLD BANK | BANK DUNIA December 201215
Weaker external demand and lower export- and commodity-related receipts weighed on revenues
In the year to end-October, total revenue stood at 73 percent of the full-year revised Budget target (IDR 997 trillion), up only 11 percent compared to 19 percent growth in the same period last year (Table 4). Weakness in revenue collection growth was seen across most major revenue streams, with the exception of Value Added Tax (VAT) (Figure 19). Tax revenue, which accounts for two thirds of total revenue, grew by only 14 percent relative to 20 percent over the same period in 2011. Income tax revenues (non- oil-and-gas), accounting for one third of total revenue, grew by only 8 percent compared to 19 percent in the same period last year, hit by weakness in corporate income tax revenue as weak external demand and low commodity prices compressed profit earnings. Export taxes continued to decline through October and dropped by 26 percent compared to the same period in 2011. On the other hand, VAT continued to perform strongly, supported by robust private consumption and strong import growth through the second quarter. The general moderation in revenue growth is in line with the slowdown in nominal economic growth highlighted previously. However, non-tax revenues, constituting a quarter of total revenues and consisting mainly of oil and gas receipts, also contracted on the back of lower than expected oil production.
Table 4: Budget disbursement rates through end-October remain relatively low (2012 Budget realization by end-October)
Nominal value by end October (IDR Trillion)
As share of full year revised Budget levels
(percent)
Year-on-year nominal growth Jan - Oct
(percent) 2010 2011 2012 2010 2011 2012 2010 2011 2012
State revenue and grants 754 899 997 75.9 76.8 73.4 18.2 19.2 10.9Tax Revenues, of which 560 674 768 75.4 76.8 75.6 14.5 20.4 13.9
Non-oil & gas income tax 241 287 311 78.4 78.2 69.8 13.0 19.2 8.4Value added tax 172 204 259 65.2 68.3 77.0 16.9 18.8 27.0Export tax 5 25 18 82.6 97.3 79.2 719.2 449.4 -25.8
Non Tax Revenue 193 223 228 77.9 77.7 66.7 30.9 15.6 2.2
Expenditure 732 894 1,073 65.0 67.7 69.3 7.1 22.1 20.0Central Government, o/w 463 578 681 59.2 63.7 63.7 4.7 25.0 17.9
Personnel 122 146 169 74.8 79.8 79.4 8.8 19.9 15.5Material 62 73 86 55.5 50.9 46.2 21.8 16.2 18.7Capital 39 54 74 41.3 38.4 43.7 -11.1 37.8 36.3Energy subsidy 90 165 184 62.2 84.4 90.8 69.4 83.8 11.6Social assistance 47 38 53 65.9 46.7 96.3 -6.2 -18.4 39.5
Transfers to regions 270 316 391 78.3 76.6 81.7 11.2 17.1 23.8Source: MoF and World Bank staff calculations
The fiscal costs of energy subsidies continue to rise
Through end-October, total expenditure disbursement stood at 69 percent of the revised Budget total, up by 20 percent over the same period last year. However, this level of budget disbursement was largely driven by higher energy subsidy spending, which reached over 90 percent of the revised Budget by the end of October, and belied weak capital and material spending relative to targets (Table 4). New measures to control fuel consumption introduced earlier in the year, such as restricting government, state owned, and industry vehicles from using subsidized fuels, have not so far proven to be effective. In addition, a plan to restrict private cars from using subsidized fuel that was to be piloted in Jakarta and surrounding areas was also delayed due to supporting infrastructure not being ready.
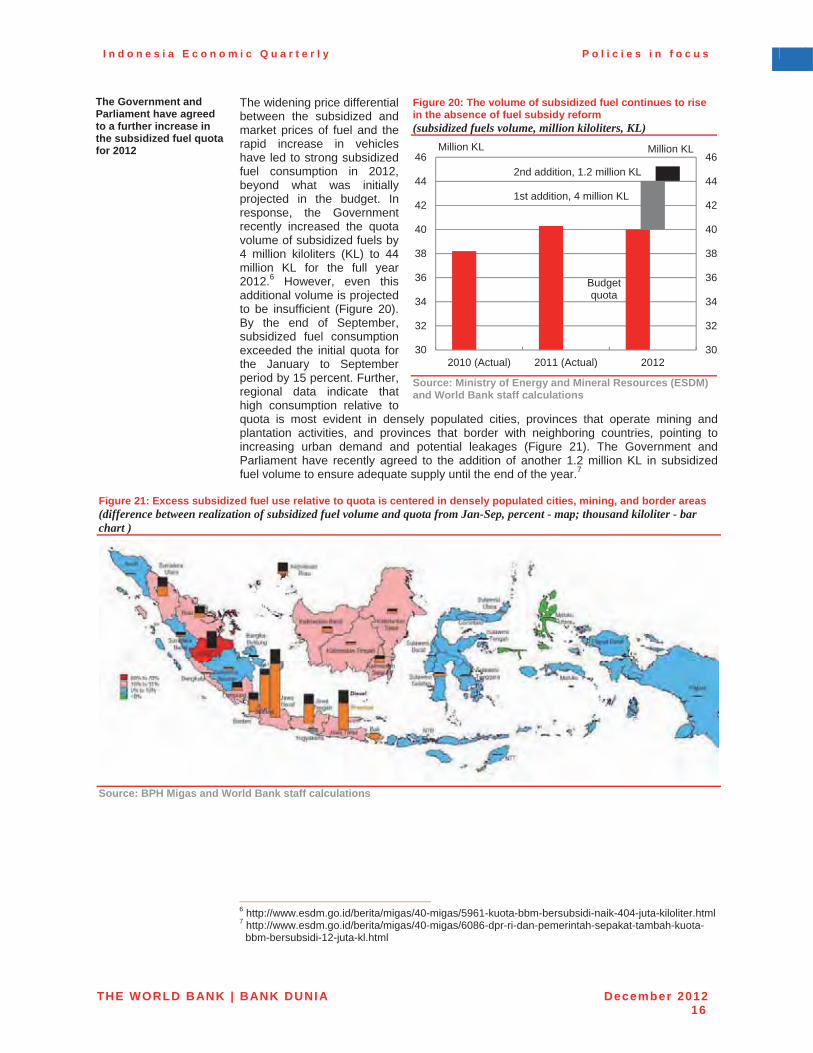
I n d o n e s i a E c o n o m i c Q u a r t e r l y P o l i c i e s i n f o c u s
THE WORLD BANK | BANK DUNIA December 201216
The Government and Parliament have agreed to a further increase in the subsidized fuel quota for 2012
The widening price differential between the subsidized and market prices of fuel and the rapid increase in vehicles have led to strong subsidized fuel consumption in 2012, beyond what was initially projected in the budget. In response, the Government recently increased the quota volume of subsidized fuels by 4 million kiloliters (KL) to 44 million KL for the full year 2012.6 However, even this additional volume is projected to be insufficient (Figure 20). By the end of September, subsidized fuel consumption exceeded the initial quota for the January to September period by 15 percent. Further, regional data indicate that high consumption relative to quota is most evident in densely populated cities, provinces that operate mining and plantation activities, and provinces that border with neighboring countries, pointing to increasing urban demand and potential leakages (Figure 21). The Government and Parliament have recently agreed to the addition of another 1.2 million KL in subsidized fuel volume to ensure adequate supply until the end of the year.7
Figure 20: The volume of subsidized fuel continues to rise in the absence of fuel subsidy reform (subsidized fuels volume, million kiloliters, KL)
Source: Ministry of Energy and Mineral Resources (ESDM) and World Bank staff calculations
Figure 21: Excess subsidized fuel use relative to quota is centered in densely populated cities, mining, and border areas (difference between realization of subsidized fuel volume and quota from Jan-Sep, percent - map; thousand kiloliter - bar chart )
Source: BPH Migas and World Bank staff calculations
6 http://www.esdm.go.id/berita/migas/40-migas/5961-kuota-bbm-bersubsidi-naik-404-juta-kiloliter.html7 http://www.esdm.go.id/berita/migas/40-migas/6086-dpr-ri-dan-pemerintah-sepakat-tambah-kuota-
bbm-bersubsidi-12-juta-kl.html
Budgetquota
30
32
34
36
38
40
42
44
46
30
32
34
36
38
40
42
44
46
2010 (Actual) 2011 (Actual) 2012
Million KLMillion KL
2nd addition, 1.2 million KL
1st addition, 4 million KL
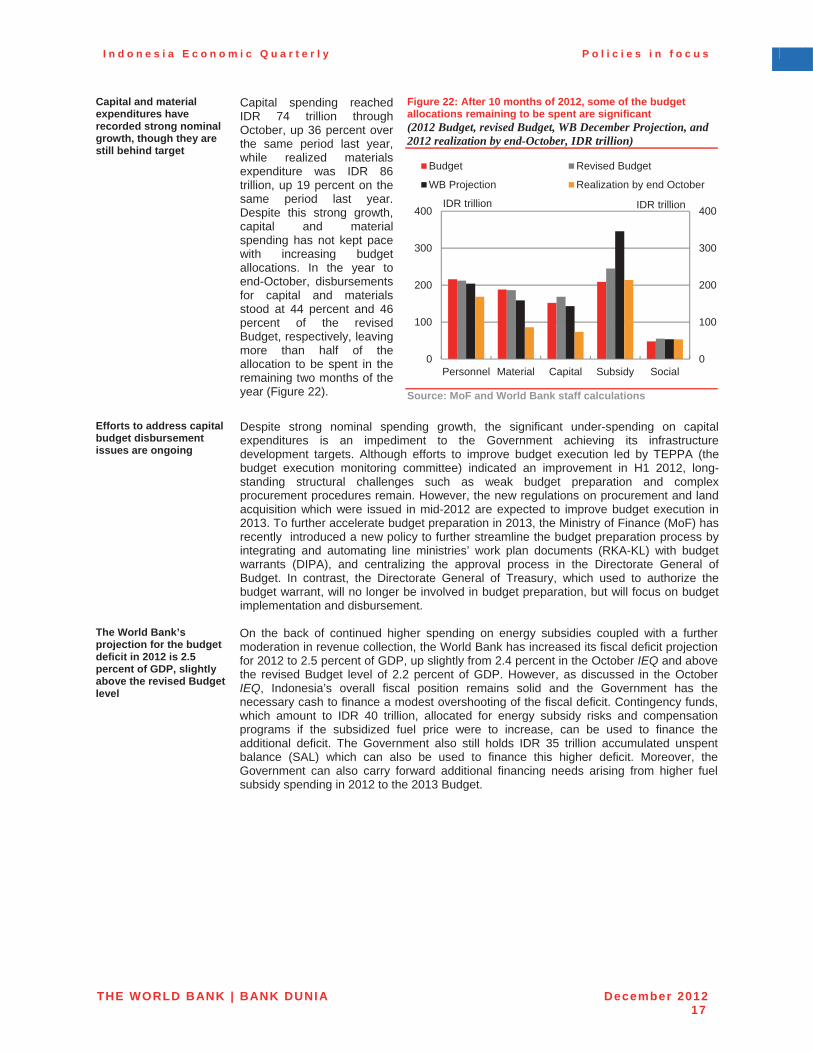
I n d o n e s i a E c o n o m i c Q u a r t e r l y P o l i c i e s i n f o c u s
THE WORLD BANK | BANK DUNIA December 201217
Capital and material expenditures have recorded strong nominal growth, though they are still behind target
Capital spending reached IDR 74 trillion through October, up 36 percent over the same period last year, while realized materials expenditure was IDR 86 trillion, up 19 percent on the same period last year. Despite this strong growth, capital and material spending has not kept pace with increasing budget allocations. In the year to end-October, disbursements for capital and materials stood at 44 percent and 46 percent of the revised Budget, respectively, leaving more than half of the allocation to be spent in the remaining two months of the year (Figure 22).
Figure 22: After 10 months of 2012, some of the budget allocations remaining to be spent are significant (2012 Budget, revised Budget, WB December Projection, and 2012 realization by end-October, IDR trillion)
Source: MoF and World Bank staff calculations
Efforts to address capital budget disbursement issues are ongoing
Despite strong nominal spending growth, the significant under-spending on capital expenditures is an impediment to the Government achieving its infrastructure development targets. Although efforts to improve budget execution led by TEPPA (the budget execution monitoring committee) indicated an improvement in H1 2012, long-standing structural challenges such as weak budget preparation and complex procurement procedures remain. However, the new regulations on procurement and land acquisition which were issued in mid-2012 are expected to improve budget execution in 2013. To further accelerate budget preparation in 2013, the Ministry of Finance (MoF) has recently introduced a new policy to further streamline the budget preparation process by integrating and automating line ministries’ work plan documents (RKA-KL) with budget warrants (DIPA), and centralizing the approval process in the Directorate General of Budget. In contrast, the Directorate General of Treasury, which used to authorize the budget warrant, will no longer be involved in budget preparation, but will focus on budget implementation and disbursement.
The World Bank’s projection for the budget deficit in 2012 is 2.5 percent of GDP, slightly above the revised Budget level
On the back of continued higher spending on energy subsidies coupled with a further moderation in revenue collection, the World Bank has increased its fiscal deficit projection for 2012 to 2.5 percent of GDP, up slightly from 2.4 percent in the October IEQ and abovethe revised Budget level of 2.2 percent of GDP. However, as discussed in the October IEQ, Indonesia’s overall fiscal position remains solid and the Government has the necessary cash to finance a modest overshooting of the fiscal deficit. Contingency funds, which amount to IDR 40 trillion, allocated for energy subsidy risks and compensation programs if the subsidized fuel price were to increase, can be used to finance the additional deficit. The Government also still holds IDR 35 trillion accumulated unspent balance (SAL) which can also be used to finance this higher deficit. Moreover, the Government can also carry forward additional financing needs arising from higher fuel subsidy spending in 2012 to the 2013 Budget.
0
100
200
300
400
0
100
200
300
400
Personnel Material Capital Subsidy Social
IDR trillionIDR trillion
Budget Revised Budget
WB Projection Realization by end October
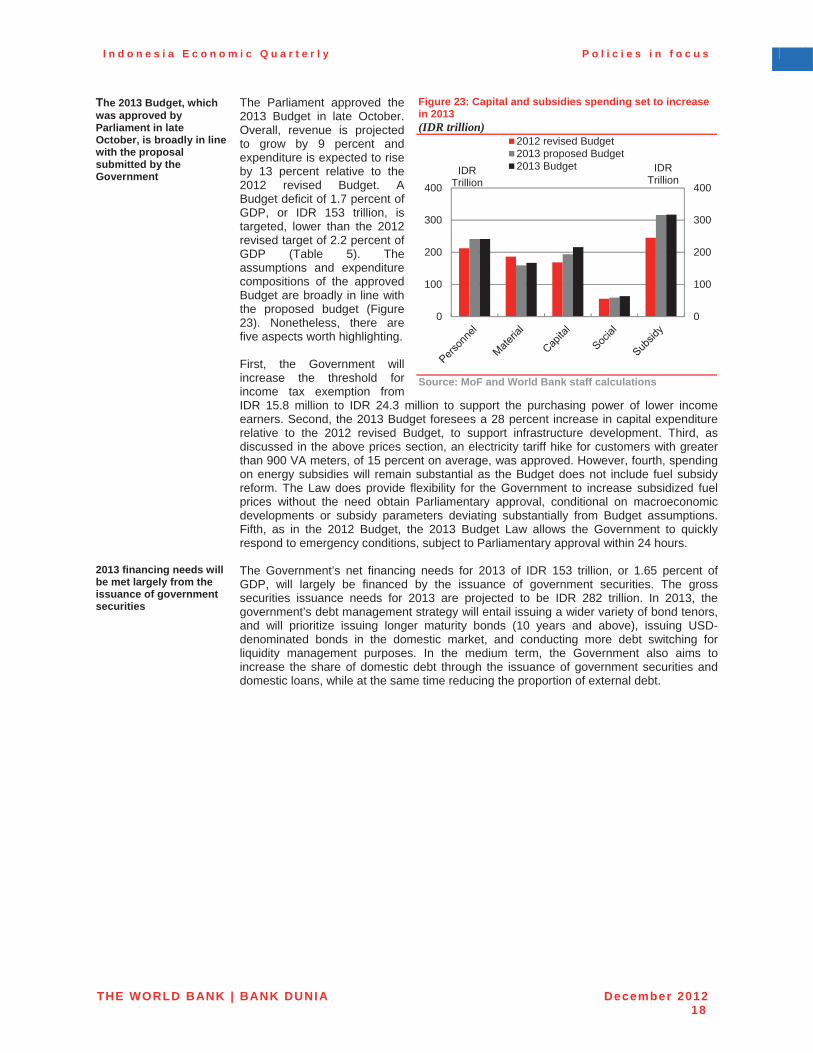
I n d o n e s i a E c o n o m i c Q u a r t e r l y P o l i c i e s i n f o c u s
THE WORLD BANK | BANK DUNIA December 201218
The 2013 Budget, which was approved by Parliament in late October, is broadly in line with the proposal submitted by the Government
The Parliament approved the 2013 Budget in late October. Overall, revenue is projected to grow by 9 percent and expenditure is expected to rise by 13 percent relative to the 2012 revised Budget. A Budget deficit of 1.7 percent of GDP, or IDR 153 trillion, is targeted, lower than the 2012 revised target of 2.2 percent of GDP (Table 5). The assumptions and expenditure compositions of the approved Budget are broadly in line with the proposed budget (Figure 23). Nonetheless, there are five aspects worth highlighting.
First, the Government will increase the threshold for income tax exemption from IDR 15.8 million to IDR 24.3 million to support the purchasing power of lower income earners. Second, the 2013 Budget foresees a 28 percent increase in capital expenditure relative to the 2012 revised Budget, to support infrastructure development. Third, as discussed in the above prices section, an electricity tariff hike for customers with greater than 900 VA meters, of 15 percent on average, was approved. However, fourth, spending on energy subsidies will remain substantial as the Budget does not include fuel subsidy reform. The Law does provide flexibility for the Government to increase subsidized fuel prices without the need obtain Parliamentary approval, conditional on macroeconomic developments or subsidy parameters deviating substantially from Budget assumptions. Fifth, as in the 2012 Budget, the 2013 Budget Law allows the Government to quickly respond to emergency conditions, subject to Parliamentary approval within 24 hours.
Figure 23: Capital and subsidies spending set to increase in 2013 (IDR trillion)
Source: MoF and World Bank staff calculations
2013 financing needs will be met largely from the issuance of government securities
The Government’s net financing needs for 2013 of IDR 153 trillion, or 1.65 percent of GDP, will largely be financed by the issuance of government securities. The gross securities issuance needs for 2013 are projected to be IDR 282 trillion. In 2013, the government’s debt management strategy will entail issuing a wider variety of bond tenors, and will prioritize issuing longer maturity bonds (10 years and above), issuing USD-denominated bonds in the domestic market, and conducting more debt switching for liquidity management purposes. In the medium term, the Government also aims to increase the share of domestic debt through the issuance of government securities and domestic loans, while at the same time reducing the proportion of external debt.
0
100
200
300
400
0
100
200
300
400
IDRTrillion
IDRTrillion
2012 revised Budget2013 proposed Budget2013 Budget
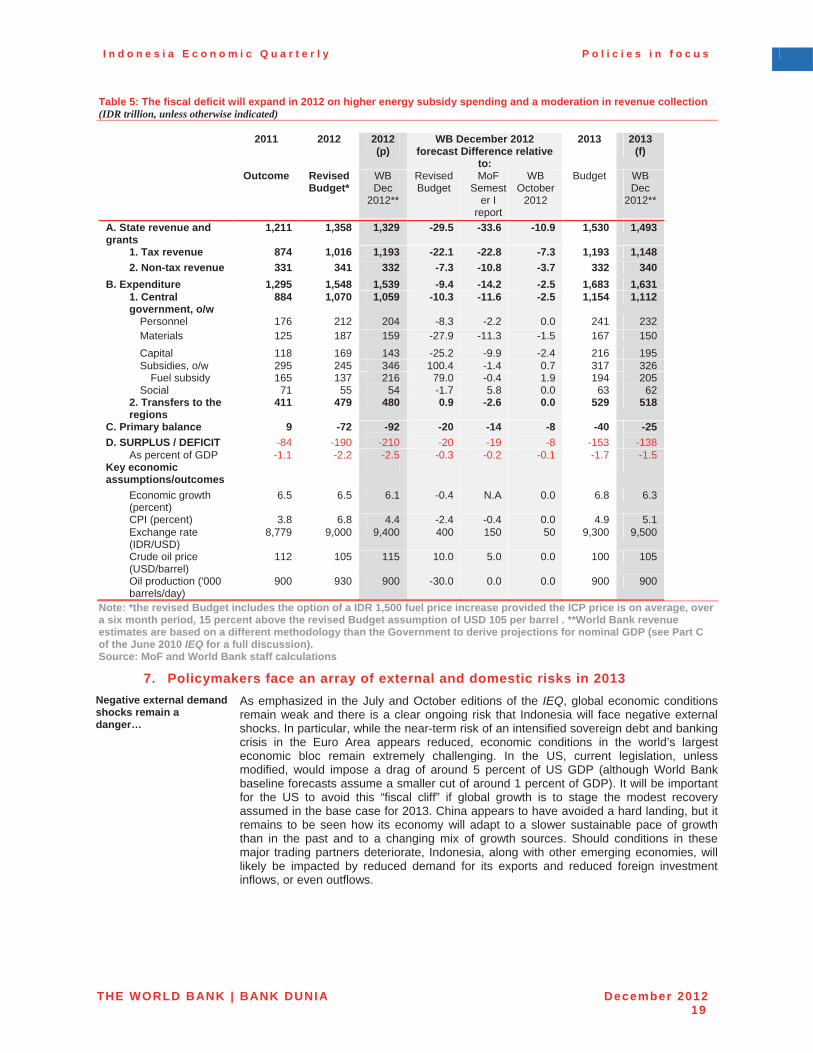
I n d o n e s i a E c o n o m i c Q u a r t e r l y P o l i c i e s i n f o c u s
THE WORLD BANK | BANK DUNIA December 201219
Table 5: The fiscal deficit will expand in 2012 on higher energy subsidy spending and a moderation in revenue collection (IDR trillion, unless otherwise indicated)
2011 2012 2012(p)
WB December 2012 forecast Difference relative
to:
2013 2013(f)
Outcome Revised Budget*
WBDec
2012**
RevisedBudget
MoFSemest
er I report
WBOctober
2012
Budget WBDec
2012**
A. State revenue and grants
1,211 1,358 1,329 -29.5 -33.6 -10.9 1,530 1,493
1. Tax revenue 874 1,016 1,193 -22.1 -22.8 -7.3 1,193 1,148 2. Non-tax revenue 331 341 332 -7.3 -10.8 -3.7 332 340
B. Expenditure 1,295 1,548 1,539 -9.4 -14.2 -2.5 1,683 1,631 1. Central government, o/w
884 1,070 1,059 -10.3 -11.6 -2.5 1,154 1,112
Personnel 176 212 204 -8.3 -2.2 0.0 241 232Materials 125 187 159 -27.9 -11.3 -1.5 167 150Capital 118 169 143 -25.2 -9.9 -2.4 216 195Subsidies, o/w 295 245 346 100.4 -1.4 0.7 317 326
Fuel subsidy 165 137 216 79.0 -0.4 1.9 194 205Social 71 55 54 -1.7 5.8 0.0 63 62
2. Transfers to the regions
411 479 480 0.9 -2.6 0.0 529 518
C. Primary balance 9 -72 -92 -20 -14 -8 -40 -25 D. SURPLUS / DEFICIT -84 -190 -210 -20 -19 -8 -153 -138
As percent of GDP -1.1 -2.2 -2.5 -0.3 -0.2 -0.1 -1.7 -1.5 Key economic assumptions/outcomes
Economic growth (percent)
6.5 6.5 6.1 -0.4 N.A 0.0 6.8 6.3
CPI (percent) 3.8 6.8 4.4 -2.4 -0.4 0.0 4.9 5.1Exchange rate (IDR/USD)
8,779 9,000 9,400 400 150 50 9,300 9,500
Crude oil price (USD/barrel)
112 105 115 10.0 5.0 0.0 100 105
Oil production ('000 barrels/day)
900 930 900 -30.0 0.0 0.0 900 900
Note: *the revised Budget includes the option of a IDR 1,500 fuel price increase provided the ICP price is on average, over a six month period, 15 percent above the revised Budget assumption of USD 105 per barrel . **World Bank revenue estimates are based on a different methodology than the Government to derive projections for nominal GDP (see Part C of the June 2010 IEQ for a full discussion). Source: MoF and World Bank staff calculations
7. Policymakers face an array of external and domestic risks in 2013 Negative external demand shocks remain a danger…
As emphasized in the July and October editions of the IEQ, global economic conditions remain weak and there is a clear ongoing risk that Indonesia will face negative external shocks. In particular, while the near-term risk of an intensified sovereign debt and banking crisis in the Euro Area appears reduced, economic conditions in the world’s largest economic bloc remain extremely challenging. In the US, current legislation, unless modified, would impose a drag of around 5 percent of US GDP (although World Bank baseline forecasts assume a smaller cut of around 1 percent of GDP). It will be importantfor the US to avoid this “fiscal cliff” if global growth is to stage the modest recovery assumed in the base case for 2013. China appears to have avoided a hard landing, but it remains to be seen how its economy will adapt to a slower sustainable pace of growth than in the past and to a changing mix of growth sources. Should conditions in these major trading partners deteriorate, Indonesia, along with other emerging economies, will likely be impacted by reduced demand for its exports and reduced foreign investment inflows, or even outflows.
I n d o n e s i a E c o n o m i c Q u a r t e r l y P o l i c i e s i n f o c u s
THE WORLD BANK | BANK DUNIA December 201220
…and there are also homegrown risks to demand
Domestically, investment spending has been a potent source of growth. It is not yet clear whether the moderation in investment in the third quarter marks the start of a cooling trend, as investment tends to be a volatile component of GDP and capital imports did pick up slightly in October. However, there are risks to the currently high rate of investment spending. First, investment has historically tended to be closely correlated with global commodity prices and, as these remain well off their post financial crisis highs, it is possible that investment will begin to be weighed down as reduced commodity-related earnings spill over into the wider economy. Second, a number of policy announcements over the course of 2012 have raised some concerns over the domestic business and investment policy environment. These concerns may intensify in the lead-up to national elections in 2014, particularly since investor risk appetite globally remains fragile.
Policy could be tested even if the growth environment remains supportive
Even if these negative risks to domestic demand do not materialize, economic developments in 2013 may still test policymakers. In particular, should strong growth continue in 2013, it will be important to watch for signs that the economy is overheating. As with the negative risks to demand, the catalysts for an excess of demand may be external or local. Strong portfolio investment inflows, which have picked up towards the close of 2012, may continue to increase on the back of loose monetary policy in major economies and the global search for yield. Domestically, some increased cost-push inflationary pressures can be foreseen, including from high minimum wage increases, ongoing pass-through from the Rupiah depreciation which has occurred in 2012, and the temporary impact of electricity subsidy reform. Given the ongoing strength of domestic demand, which in the past has received an additional impulse from pre-election spending, it will be important to respond proactively to nascent inflation risks or to signs that the investment needed to expand the economy’s productive capacity is not keeping pace.
International and domestic uncertainties remain elevated, placing the focus on the quality of policy making…
The base case sees solid GDP growth in Indonesia in 2013, as global economic conditions turn mildly more supportive. Yet uncertainties over the international outlook remain elevated and there are material risks of more negative external shocks buffeting the economy. In light of the continued downside risks to the outlook, and scope for more political noise in the run-up to the 2014 elections, there is a need for continued efforts to support improvements in the quality of policy making. This includes a continued focus on crisis mitigation policies, building on the considerable progress Indonesia has already made in securing sources of contingent financing and formulating crisis response protocols for use in times of acute market stress. It is also raises the importance of continuing to tackle the more structural constraints to growth, notably by working to close the large infrastructure gap and improve the efficiency of public spending, thus raising the resilience and sustainable growth rate of the economy.
…especially with regard to the investment climate
Supporting the private sector is also crucial, since rapid growth in investment spending has been a major driver of the recent robust pace of growth, which is lifting living standards in Indonesia. Investment requires making long-term, irreversible commitments, and doing this requires confidence and the ability to effectively plan ahead. Maintaining the clarity and consistency of the regulatory framework, and effectively managing communication concerning any new reforms, may make a decisive difference forinvestment, and hence for the overall economic outlook.
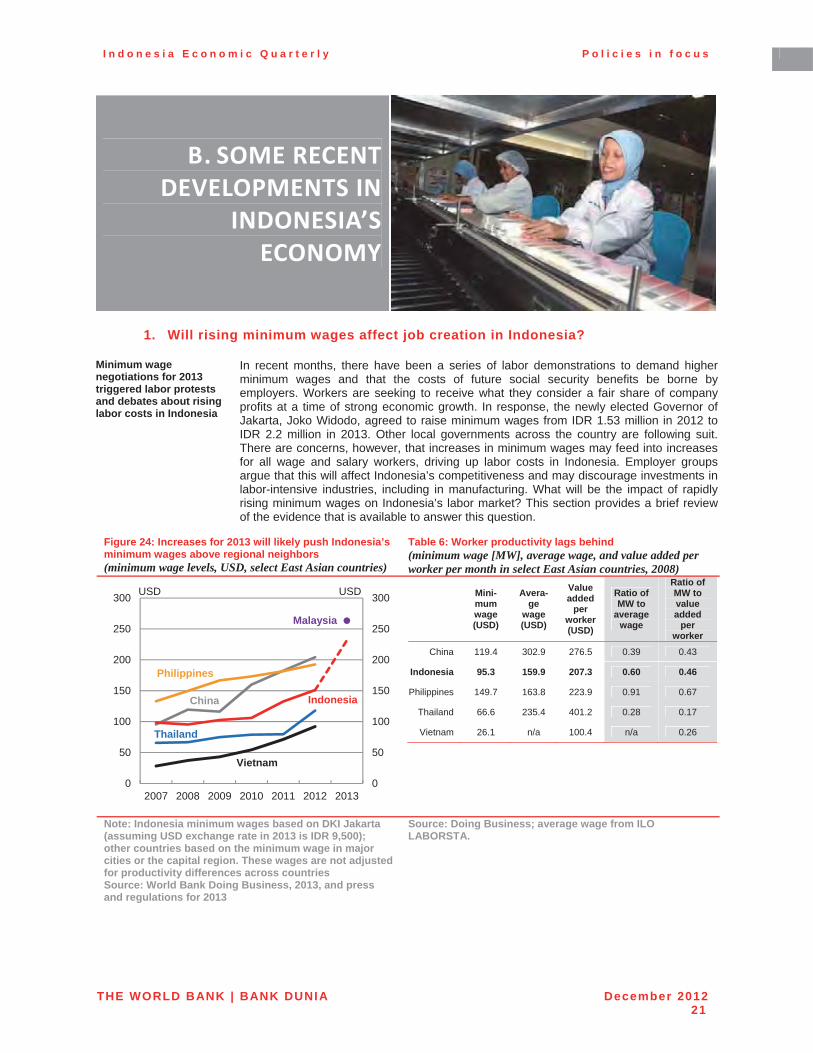
I n d o n e s i a E c o n o m i c Q u a r t e r l y P o l i c i e s i n f o c u s
THE WORLD BANK | BANK DUNIA December 201221
B. SOME�RECENT�DEVELOPMENTS�IN�
INDONESIA’S�ECONOMY�
1. Will rising minimum wages affect job creation in Indonesia?
Minimum wage negotiations for 2013 triggered labor protests and debates about rising labor costs in Indonesia
In recent months, there have been a series of labor demonstrations to demand higher minimum wages and that the costs of future social security benefits be borne by employers. Workers are seeking to receive what they consider a fair share of company profits at a time of strong economic growth. In response, the newly elected Governor of Jakarta, Joko Widodo, agreed to raise minimum wages from IDR 1.53 million in 2012 to IDR 2.2 million in 2013. Other local governments across the country are following suit. There are concerns, however, that increases in minimum wages may feed into increases for all wage and salary workers, driving up labor costs in Indonesia. Employer groups argue that this will affect Indonesia’s competitiveness and may discourage investments in labor-intensive industries, including in manufacturing. What will be the impact of rapidly rising minimum wages on Indonesia’s labor market? This section provides a brief review of the evidence that is available to answer this question.
Figure 24: Increases for 2013 will likely push Indonesia’s minimum wages above regional neighbors (minimum wage levels, USD, select East Asian countries)
Table 6: Worker productivity lags behind (minimum wage [MW], average wage, and value added per worker per month in select East Asian countries, 2008)
Mini- mumwage (USD)
Avera-ge
wage (USD)
Valueadded
per worker (USD)
Ratio of MW to
average wage
Ratio of MW to value added
per worker
China 119.4 302.9 276.5 0.39 0.43
Indonesia 95.3 159.9 207.3 0.60 0.46
Philippines 149.7 163.8 223.9 0.91 0.67
Thailand 66.6 235.4 401.2 0.28 0.17
Vietnam 26.1 n/a 100.4 n/a 0.26
Note: Indonesia minimum wages based on DKI Jakarta (assuming USD exchange rate in 2013 is IDR 9,500); other countries based on the minimum wage in major cities or the capital region. These wages are not adjusted for productivity differences across countries Source: World Bank Doing Business, 2013, and press and regulations for 2013
Source: Doing Business; average wage from ILO LABORSTA.
0
50
100
150
200
250
300
0
50
100
150
200
250
300
2007 2008 2009 2010 2011 2012 2013
USDUSD
China Indonesia
Malaysia
Philippines
Thailand
Vietnam
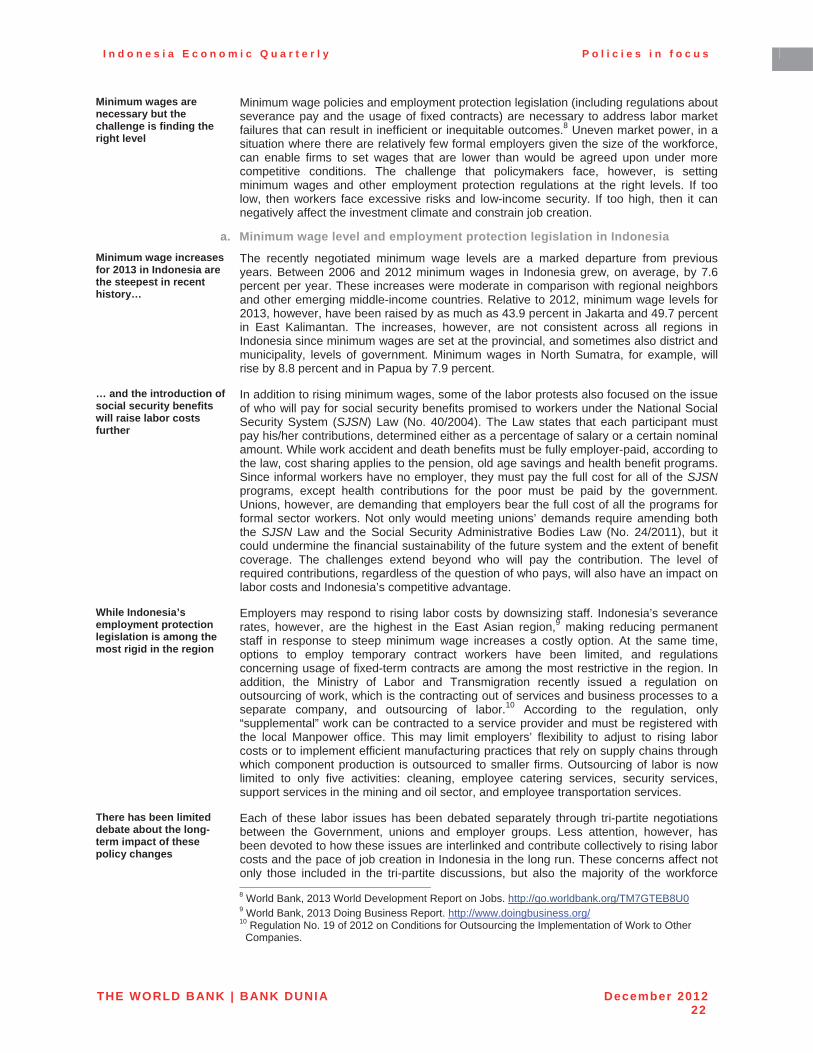
I n d o n e s i a E c o n o m i c Q u a r t e r l y P o l i c i e s i n f o c u s
THE WORLD BANK | BANK DUNIA December 201222
Minimum wages are necessary but the challenge is finding the right level
Minimum wage policies and employment protection legislation (including regulations about severance pay and the usage of fixed contracts) are necessary to address labor market failures that can result in inefficient or inequitable outcomes.8 Uneven market power, in a situation where there are relatively few formal employers given the size of the workforce, can enable firms to set wages that are lower than would be agreed upon under more competitive conditions. The challenge that policymakers face, however, is setting minimum wages and other employment protection regulations at the right levels. If too low, then workers face excessive risks and low-income security. If too high, then it can negatively affect the investment climate and constrain job creation.
a. Minimum wage level and employment protection legislation in Indonesia Minimum wage increases for 2013 in Indonesia are the steepest in recent history…
The recently negotiated minimum wage levels are a marked departure from previous years. Between 2006 and 2012 minimum wages in Indonesia grew, on average, by 7.6 percent per year. These increases were moderate in comparison with regional neighbors and other emerging middle-income countries. Relative to 2012, minimum wage levels for 2013, however, have been raised by as much as 43.9 percent in Jakarta and 49.7 percent in East Kalimantan. The increases, however, are not consistent across all regions in Indonesia since minimum wages are set at the provincial, and sometimes also district and municipality, levels of government. Minimum wages in North Sumatra, for example, will rise by 8.8 percent and in Papua by 7.9 percent.
… and the introduction of social security benefits will raise labor costs further
In addition to rising minimum wages, some of the labor protests also focused on the issue of who will pay for social security benefits promised to workers under the National Social Security System (SJSN) Law (No. 40/2004). The Law states that each participant must pay his/her contributions, determined either as a percentage of salary or a certain nominal amount. While work accident and death benefits must be fully employer-paid, according to the law, cost sharing applies to the pension, old age savings and health benefit programs. Since informal workers have no employer, they must pay the full cost for all of the SJSNprograms, except health contributions for the poor must be paid by the government. Unions, however, are demanding that employers bear the full cost of all the programs for formal sector workers. Not only would meeting unions’ demands require amending both the SJSN Law and the Social Security Administrative Bodies Law (No. 24/2011), but it could undermine the financial sustainability of the future system and the extent of benefit coverage. The challenges extend beyond who will pay the contribution. The level of required contributions, regardless of the question of who pays, will also have an impact on labor costs and Indonesia’s competitive advantage.
While Indonesia’s employment protection legislation is among the most rigid in the region
Employers may respond to rising labor costs by downsizing staff. Indonesia’s severance rates, however, are the highest in the East Asian region,9 making reducing permanent staff in response to steep minimum wage increases a costly option. At the same time, options to employ temporary contract workers have been limited, and regulations concerning usage of fixed-term contracts are among the most restrictive in the region. In addition, the Ministry of Labor and Transmigration recently issued a regulation on outsourcing of work, which is the contracting out of services and business processes to a separate company, and outsourcing of labor.10 According to the regulation, only “supplemental” work can be contracted to a service provider and must be registered with the local Manpower office. This may limit employers’ flexibility to adjust to rising labor costs or to implement efficient manufacturing practices that rely on supply chains through which component production is outsourced to smaller firms. Outsourcing of labor is now limited to only five activities: cleaning, employee catering services, security services, support services in the mining and oil sector, and employee transportation services.
There has been limited debate about the long-term impact of these policy changes
Each of these labor issues has been debated separately through tri-partite negotiations between the Government, unions and employer groups. Less attention, however, has been devoted to how these issues are interlinked and contribute collectively to rising labor costs and the pace of job creation in Indonesia in the long run. These concerns affect not only those included in the tri-partite discussions, but also the majority of the workforce 8 World Bank, 2013 World Development Report on Jobs. http://go.worldbank.org/TM7GTEB8U09 World Bank, 2013 Doing Business Report. http://www.doingbusiness.org/10 Regulation No. 19 of 2012 on Conditions for Outsourcing the Implementation of Work to Other
Companies.
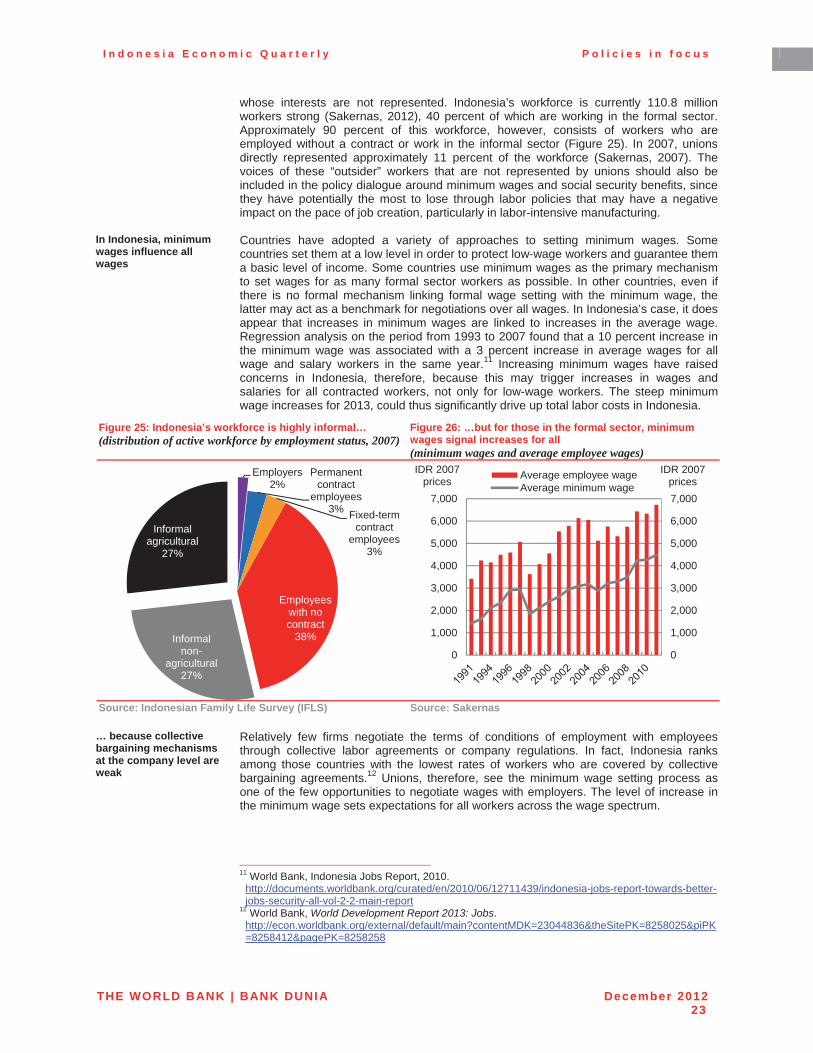
I n d o n e s i a E c o n o m i c Q u a r t e r l y P o l i c i e s i n f o c u s
THE WORLD BANK | BANK DUNIA December 201223
whose interests are not represented. Indonesia’s workforce is currently 110.8 million workers strong (Sakernas, 2012), 40 percent of which are working in the formal sector. Approximately 90 percent of this workforce, however, consists of workers who are employed without a contract or work in the informal sector (Figure 25). In 2007, unions directly represented approximately 11 percent of the workforce (Sakernas, 2007). The voices of these “outsider” workers that are not represented by unions should also be included in the policy dialogue around minimum wages and social security benefits, since they have potentially the most to lose through labor policies that may have a negative impact on the pace of job creation, particularly in labor-intensive manufacturing.
In Indonesia, minimum wages influence all wages
Countries have adopted a variety of approaches to setting minimum wages. Some countries set them at a low level in order to protect low-wage workers and guarantee them a basic level of income. Some countries use minimum wages as the primary mechanism to set wages for as many formal sector workers as possible. In other countries, even if there is no formal mechanism linking formal wage setting with the minimum wage, the latter may act as a benchmark for negotiations over all wages. In Indonesia’s case, it does appear that increases in minimum wages are linked to increases in the average wage. Regression analysis on the period from 1993 to 2007 found that a 10 percent increase in the minimum wage was associated with a 3 percent increase in average wages for all wage and salary workers in the same year.11 Increasing minimum wages have raised concerns in Indonesia, therefore, because this may trigger increases in wages and salaries for all contracted workers, not only for low-wage workers. The steep minimum wage increases for 2013, could thus significantly drive up total labor costs in Indonesia.
Figure 25: Indonesia’s workforce is highly informal… (distribution of active workforce by employment status, 2007)
Figure 26: …but for those in the formal sector, minimum wages signal increases for all (minimum wages and average employee wages)
Source: Indonesian Family Life Survey (IFLS) Source: Sakernas
… because collective bargaining mechanisms at the company level are weak
Relatively few firms negotiate the terms of conditions of employment with employees through collective labor agreements or company regulations. In fact, Indonesia ranks among those countries with the lowest rates of workers who are covered by collective bargaining agreements.12 Unions, therefore, see the minimum wage setting process as one of the few opportunities to negotiate wages with employers. The level of increase in the minimum wage sets expectations for all workers across the wage spectrum.
11 World Bank, Indonesia Jobs Report, 2010.
http://documents.worldbank.org/curated/en/2010/06/12711439/indonesia-jobs-report-towards-better-jobs-security-all-vol-2-2-main-report
12 World Bank, World Development Report 2013: Jobs.http://econ.worldbank.org/external/default/main?contentMDK=23044836&theSitePK=8258025&piPK=8258412&pagePK=8258258
Employers2%
Permanentcontract
employees3% Fixed-term
contractemployees
3%
Employees with no contract
38%Informalnon-
agricultural27%
Informalagricultural
27%
0
1,000
2,000
3,000
4,000
5,000
6,000
7,000
0
1,000
2,000
3,000
4,000
5,000
6,000
7,000
IDR 2007 prices
IDR 2007 pricesAverage employee wage
Average minimum wage
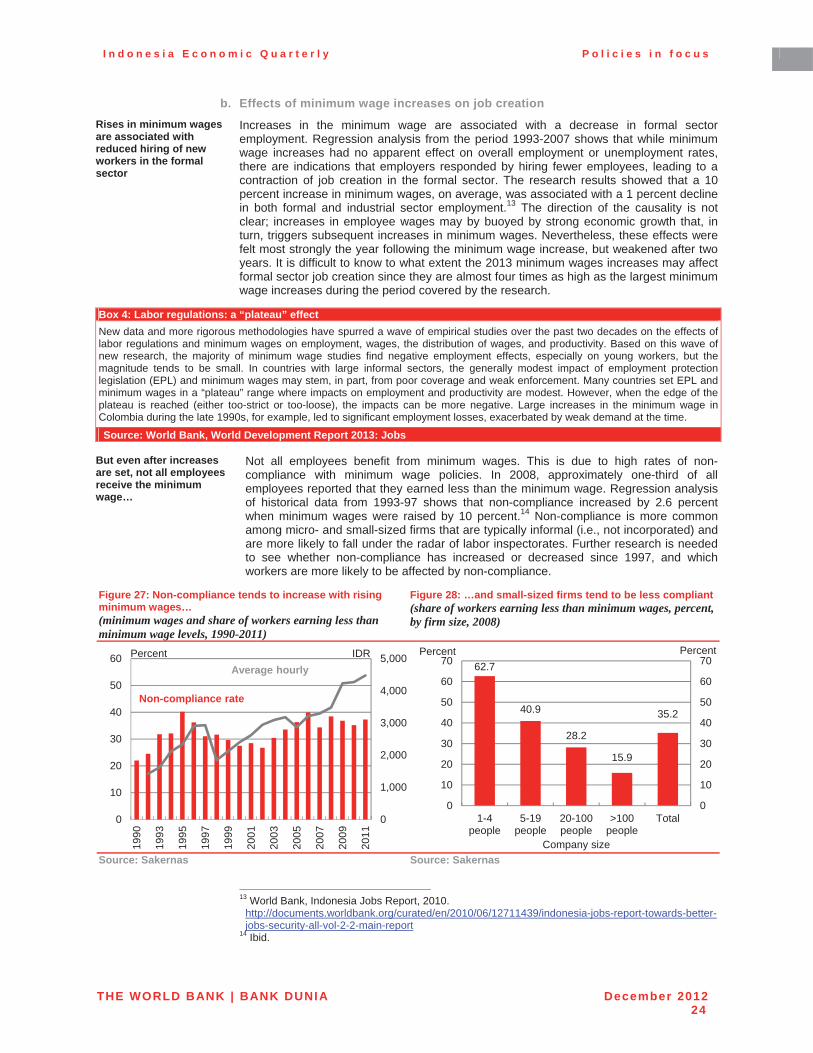
I n d o n e s i a E c o n o m i c Q u a r t e r l y P o l i c i e s i n f o c u s
THE WORLD BANK | BANK DUNIA December 201224
b. Effects of minimum wage increases on job creation Rises in minimum wages are associated with reduced hiring of new workers in the formal sector
Increases in the minimum wage are associated with a decrease in formal sector employment. Regression analysis from the period 1993-2007 shows that while minimum wage increases had no apparent effect on overall employment or unemployment rates, there are indications that employers responded by hiring fewer employees, leading to a contraction of job creation in the formal sector. The research results showed that a 10 percent increase in minimum wages, on average, was associated with a 1 percent decline in both formal and industrial sector employment.13 The direction of the causality is not clear; increases in employee wages may by buoyed by strong economic growth that, in turn, triggers subsequent increases in minimum wages. Nevertheless, these effects were felt most strongly the year following the minimum wage increase, but weakened after two years. It is difficult to know to what extent the 2013 minimum wages increases may affect formal sector job creation since they are almost four times as high as the largest minimum wage increases during the period covered by the research.
Box 4: Labor regulations: a “plateau” effect New data and more rigorous methodologies have spurred a wave of empirical studies over the past two decades on the effects oflabor regulations and minimum wages on employment, wages, the distribution of wages, and productivity. Based on this wave of new research, the majority of minimum wage studies find negative employment effects, especially on young workers, but the magnitude tends to be small. In countries with large informal sectors, the generally modest impact of employment protection legislation (EPL) and minimum wages may stem, in part, from poor coverage and weak enforcement. Many countries set EPL and minimum wages in a “plateau” range where impacts on employment and productivity are modest. However, when the edge of the plateau is reached (either too-strict or too-loose), the impacts can be more negative. Large increases in the minimum wage in Colombia during the late 1990s, for example, led to significant employment losses, exacerbated by weak demand at the time.
Source: World Bank, World Development Report 2013: Jobs
But even after increases are set, not all employees receive the minimum wage…
Not all employees benefit from minimum wages. This is due to high rates of non-compliance with minimum wage policies. In 2008, approximately one-third of all employees reported that they earned less than the minimum wage. Regression analysis of historical data from 1993-97 shows that non-compliance increased by 2.6 percent when minimum wages were raised by 10 percent.14 Non-compliance is more common among micro- and small-sized firms that are typically informal (i.e., not incorporated) and are more likely to fall under the radar of labor inspectorates. Further research is needed to see whether non-compliance has increased or decreased since 1997, and which workers are more likely to be affected by non-compliance.
Figure 27: Non-compliance tends to increase with rising minimum wages… (minimum wages and share of workers earning less than minimum wage levels, 1990-2011)
Figure 28: …and small-sized firms tend to be less compliant(share of workers earning less than minimum wages, percent, by firm size, 2008)
Source: Sakernas Source: Sakernas
13 World Bank, Indonesia Jobs Report, 2010.
http://documents.worldbank.org/curated/en/2010/06/12711439/indonesia-jobs-report-towards-better-jobs-security-all-vol-2-2-main-report
14 Ibid.
0
1,000
2,000
3,000
4,000
5,000
0
10
20
30
40
50
60
1990
1993
1995
1997
1999
2001
2003
2005
2007
2009
2011
IDRPercent
Non-compliance rate
Average hourly 62.7
40.9
28.2
15.9
35.2
0
10
20
30
40
50
60
70
0
10
20
30
40
50
60
70
1-4people
5-19people
20-100people
>100people
Total
PercentPercent
Company size

I n d o n e s i a E c o n o m i c Q u a r t e r l y P o l i c i e s i n f o c u s
THE WORLD BANK | BANK DUNIA December 201225
…which tends to affect low-wage workers more
Poor households benefit less from minimum wage increases. First, many of the poor do not work in the formal sector and do not earn regular wages. Second, the majority (55 percent in 2006) of poor workers with salaried jobs report that they earn less than the minimum wage.15 This is mostly likely because they tend to work in micro-firms that are more likely to be non-compliant in paying minimum wages.
c. Changes in the process for setting minimum wages Indonesia revised the process for setting minimum wages in 2006…
The current process for setting minimum wages was first laid out in the 2003 Manpower Law in which local tripartite wage councils prepared a proposed level that was based on a decent standard of living for workers. Governors (for provinces) and heads of districts and mayors (for district and municipalities) finalize the level and set the new minimum wage. In 2005, the Minister of Manpower and Transmigration decreed that local wage councils were required to use a new standard for calculating the cost of living for workers (Kebutuhan Hidup Minimal, KHL), which was to be used as an input for determining minimum wages. The KHL, calculated from a basket of 47 basic commodities and services, was on average 38 percent higher than the previous living standards measure.16
… but the process needs to become less political and more technically driven
In 2007, the authority for calculating the KHL shifted from Statistics Indonesia (BPS) to the tripartite local wage councils (Dewan Pengupahan). Unions and employer groups conduct separate surveys to calculate the KHL, which is then negotiated and a compromise figure is agreed upon. Recent research indicates that this method overstates the real increase in prices; during 2007-2011 KHL increases were almost double the estimated increase in the rate of inflation.17 Nevertheless, the influence of the KHL on minimum wages – although positive – is relatively small. The other factors considered by the wage councils are not publicly released. The shift from a technical to negotiated approach partly explains the large variation in minimum wage increases across regions.
Revisions to the minimum wage setting process are needed to reduce the risk of future labor unrest
Since the process of determining minimum wages is mostly based on negotiations, and only weakly linked to technical assessments of cost of living increases, the process has become highly contentious. A more technical approach to setting minimum wages can improve the transparency and perceived fairness of the process while, at the same time, minimizing business uncertainty and output losses. The appropriateness of the KHL bundle should be re-assessed, and a single transparent process to re-calculate the annual KHL should be agreed to in advance. This revised KHL should become the primary determinant for proposing minimum wage increases; other factors that contribute to the calculation should be standardized and made available for public scrutiny. Shifting towards such a transparent, technically-driven approach will help to ensure that the minimum wage setting process will not be subject to interference by local politics or the interests of employers or unions. This will also improve the transparency and predictability of future minimum wages, which will help boost investor confidence in Indonesia by facilitating business planning and potentially reducing the risk of labor unrest.
d. Adopting a long-term view on job creation and worker protection Broader dialogue is also needed on a long-term reform strategy that works for all workers…
Minimum wage policies are closely linked to other employment protection measures: severance pay, restrictions on fixed-term contracts and outsourcing, and the introduction of social security benefits such as pensions and accident insurance. There has been strong and vigorous debate on each of these issues, but workers and employers remain trapped in a “lose-lose” situation. Little effort has been made to consider how the policies and regulations work in tandem to protect workers, or their effect on job creation. There is a need for the Government, workers (represented not only by unions but also considering the interests of the large population of informal workers) and employers to shift towards a long-term view of labor policy reform in Indonesia and find “win-win” solutions that work for all. Together, these stakeholders should consider what blend of policies and instruments can be applied to provide real protection for workers without compromising investment in labor-intensive industries and the pace of quality job creation in Indonesia. Such a discussion will also require addressing and resolving some of the issues related to establishing the national social security systems. This will include how to expand 15 Ibid. 16 Chris Manning and Raden Muhamad Purnagunawan, 2012. 17 Ibid.
I n d o n e s i a E c o n o m i c Q u a r t e r l y P o l i c i e s i n f o c u s
THE WORLD BANK | BANK DUNIA December 201226
coverage, designing the right benefit package, ensuring that the future system will be financially sustainable in the long-run, transforming the institutions responsible for the delivery and oversight of the social security system, and synergizing the labor law with the introduction of the social security employment programs.
…and is driven more by research-based evidence than short-term politics
This section has briefly reviewed the evidence to inform the discussion on minimum wages, drawing on the findings of the 2010 World Bank Jobs Report, which reviewedIndonesia’s labor market over the last two decades. However, further work is required by all stakeholders to build the body of knowledge needed for evidence-based policy making. To this end, in early 2013 the World Bank will release an update of the report, which will expand on some of the most pressing issues, notably social security benefits for workers and skills development. At the same time, the World Bank’s 2013 World Development Report is focusing on the issue of jobs and will provide global learning on how to provide more jobs and improve effective protection for all workers.
I n d o n e s i a E c o n o m i c Q u a r t e r l y P o l i c i e s i n f o c u s
THE WORLD BANK | BANK DUNIA December 201227
2. Building Jakarta’s resilience to frequent flooding Jakarta is Indonesia’s preeminent urban center, one of the largest metropolitan areas in the world, and the source of almost one sixth of the country’s GDP…
As the main commercial hub of Indonesia, the capital city of Jakarta contributes about 13percent, or USD 112 billion, of the country’s total GDP.18 As the economic and political center of Indonesia, regional urbanization has also contributed to making Jakarta one of the largest metropolitan areas in the world. The Special Capital District of Jakarta (DKI)covers an area of approximately 650 km2 with a population of about 10 million (2010). The population of Greater Jakarta (covering about 7,300 km2) stands at just under 30 million.Population growth rates are far above the national average and the population is projected to exceed 35 million people by 2020. Up to 250,000 rural-urban migrants are estimated to move to Jakarta every year, contributing to the increase in informal settlements where people live without the benefit of public services (e.g., transportation, water supply, sanitation and waste management).
…but it suffers from a perennial flood problem
Due to its location and rapid population growth, coupled with under-development of public services, the city has become known for a range of problems, the most severe of which are manifested in disastrous perennial flooding. Jakarta was built on a low lying coastal area. It sits on fluvial sediments on the lowest lying areas of a basin that is surrounded by several dormant volcanoes whose slopes form the upstream catchment areas of the 13 major rivers that flow through the basin on their way to the Java Sea. Today, about 40percent of the city (including most of north Jakarta) lies at, or below, sea level. Perennial floods have been a fact of life in Jakarta since its foundation. Major and destructive incidences have been recorded as far back as 1621, 1654, and 1918.19
As the current rainy season has brought localized flooding to parts of the city, this section provide a timely overview of the severe economic and human impact of such flooding and its determinants. While recognizing the policy challenges, it then outlines some immediate actions that can help to alleviate flood impacts and improve the city’s resilience in the near and medium term.
a. The severity of flooding has increased, imposing significant costs Flood incidences have been increasing in severity in recent times…
Flood incidences have been increasing in severity during the past decades, with especially devastating floods recorded in January 1996, February 2002, and February 2007. The 2007 event alone inundated 235 km2 (about 36 percent) of the city, by up to seven meters in some areas. It affected more than 2.6 million people and forced 340,000 people to flee their homes. Over 70 people died and outbreaks of disease affected over 200,000 people. In 2008 a flood event closed the airport toll road, cancelling over 1,000 flights and causing serious disruptions for the city. Floods in 2009 also occurred at high intensity and continued into 2010. The actual and perceived risk of flooding results inhuman suffering, direct financial and economic damage, and affects the incentives of businesses and investors to make investments in affected areas.
…inflicting a severe economic, financial and human toll…
The estimated financial and economic losses from a 10-day flood event in 2002 were over USD 1 billion, whereas the 6-day 2007 flood cost about USD 900 million. The consequences of severe flooding to Jakarta are even more alarming if assessed by their sectoral impacts. Unlike rapid onset disasters, like earthquakes or tsunamis (the impact and reconstruction from which are discussed in the following section), the direct damage caused by inundation is relatively small compared to the economic losses caused by interruptions in city services and mobility, and hence productive economic activities (see Box 5 on the 2007 flood).
18 Calculations based on 2011 GDP and regional GDP figures from CEIC. 19 Laporan Perkiraan Kerusakan dan Kerugian Pasca Bencana Banjir Awal Februari 2007 di Wilayah
JABODETABEK (Damage and Losses Estimate of February 2007 Flood), http://www.bappenas.go.id/node/111/995/laporan-perkiraan-kerusakan-dan-kerugian-pasca-bencana-banjir-awal-februari-2007-di-jabodetabek/

I n d o n e s i a E c o n o m i c Q u a r t e r l y P o l i c i e s i n f o c u s
THE WORLD BANK | BANK DUNIA December 201228
Box 5: The impact of the major 2007 flood on Jakarta The 2007 flood, which inundated nearly 36 percent of the city, blocked many major access roads, disrupting supplies of goods and production materials from, into or through the city. The same flood inundated 2,465 electricity distribution transformers which had to be shut down. Similarly five water treatment plants were affected, while damages to mains distribution from upstream sources in Bogor reduced clean water supply of 400 liters/second for more than one week.The Indonesian Association of General Insurance estimated that the claims that had to be paid to private individuals amounted to USD 400 million.
The impact of the flood was relatively well documented. A damage and loss assessment was immediately carried out by BAPPENAS. This provided a breakdown of the sectoral effects of the disaster in the form of direct damage to assets and economic losses from disruption to economic activities. While direct damage to private homes and public infrastructure reached more than USD 160 million, the economic impact caused by loss of opportunity for trade and commerce was much larger at USD 680 million.
Figure 29: The 2007 flood caused sizeable financial damage but much greater economic losses…
Figure 30: …and these economic losses were focused on larger industrial firms
Source: Bappenas 2007 Source: Bappenas 2007A closer look at the economic losses also reveals that large industry, such as major factories, was impacted the most, since supplies for their production were disrupted and factories had to be shut down as workers could not come to work. The second largest impact was for Small and Medium Enterprises (SMEs), which typically employ more people. With major industrial cities like Jakarta increasingly playing an important role as regional production bases for ASEAN, flood occurrences such as these raise major concerns of supply disruptions for regional economic players such as car and part manufacturers (with similar concerns raised following the major floods in Thailand in 2011).
…affecting the poor disproportionately
While major flood events such as in 2007 impact both the richer and the poorer populations of Jakarta, the poor, who tend to live in low lying areas or along waterways, are disproportionately impacted (Figure 30). As a large metropolitan area, Jakarta offers many economic opportunities and attracts in-migration from surrounding areas. In the absence of adequate affordable housing for day laborers and people working in the informal sectors which help provide the city with much needed workers, informal settlements typically occupying public spaces in hazard-prone areas have grown. This trend not only increases the vulnerability of the community, but also creates the burden on already aging and often not properly maintained infrastructure such as canal and river embankments.
b. Weather patterns, urbanization, subsidence and climate change all play a role… Climate and weather patterns contribute to make Jakarta prone to floods...
The Jakarta region experiences high annual average rainfall. The climate and weather in Indonesia is influenced by the convergence of tropical and continental influences, and the monsoon seasons, that determine distinct weather patterns such as the rainy and dry seasons. Around Jakarta, the complex land and mountain range formation creates an ascent of humid air masses that result in powerful cloudbursts affecting regional weather systems. Annual rainfall typically ranges between 1,500 to 2,500 mm per year, but reaches up to 4,000 mm per year in the higher elevation upstream areas, leading to high intensity, high volume water runoff flows through the Jakarta basin area.
1
10
100
1,000
1
10
100
1,000
MillionUSD
MillionUSD Damage Losses
210.53
76.74
4.846.45 3.28
Large Industry SMEsInformal Sector Trade (traditional markets)Agriculture/Fishery

I n d o n e s i a E c o n o m i c Q u a r t e r l y P o l i c i e s i n f o c u s
THE WORLD BANK | BANK DUNIA December 201229
…but this is exacerbated by massive urbanization and the inability of infrastructure to cope
Overall urbanization trends are central to the causes of Jakarta flooding. The population of Greater Jakarta has more than tripled over the last four decades, recording the levels of 8.4 m in 1971, 11.5 million in 1980, 17.1 million in 1990, 20.4 million in 2000, and 27.9 million in 2010. The net population density of Jakarta city is about 140 persons per hectare, with central Jakarta by far the most densely populated area in Indonesia. (Figure 31)
Figure 31: Densely-populated slum areas were heavily affected by the 2007 flood
Source: Jakarta Urban Challenges in a Changing Climate. Mayors’ Task Force On Climate Change, Disaster Risk and The Urban Poor (2010)
Urbanization has led to a reduced capacity for rainfall absorption and retention, overwhelming the flood control system design
The intensification of urbanization is linked to the increasing severity of flooding events.There has been encroachment and development on critical catchment areas and increased solid waste generation and sedimentation. As urbanization spreads upstream, land-use patterns change and competition for water resources increases, which severely affect downstream areas. Peak water flows have increased (increased flow volumes and flow velocity), an outcome of the reduced rainfall absorption and retention capacity, overwhelming flood control system design. The flow capacities of flood control designs have also decreased due to the lack of adequate operations and maintenance and the existence of bottlenecks (e.g., low-clearance bridges, pipes, and other obstacles) resulting in sedimentation. About 17.9 percent of all solid waste ends up in the drainage system, amounting to about 1,067 m3/day, of which about 921 m3/day is generated from within DKI Jakarta, while the remaining 146 m3/day travels from upstream areas.
Land subsidence and climate change compound the problem, with some parts of Jakarta are sinking by up to 25 cm per year…
In the meantime, continuing land subsidence threatens the overall functioning of the flood control system and increases risks of tidal floods, and climate change is expected to cause higher intensity rainfall conditions and rising sea-levels. Recent studies of land subsidence have found typical subsidence rates of 7.5 to 10 cm per year particularly affecting areas of north Jakarta. However, in localized areas of north Jakarta subsidence in the range of 15 to 25 cm per year have been observed, which if sustained, would result in them sinking to 4 to 5 m below sea level by 2025. Land subsidence results in increased vulnerability to flooding due to the reduced gravitational capacity to channel storm flows to the sea, and the increased risk of tidal flooding. Land subsidence also increases the necessity for pumping, dikes and sea defenses. The most prominent cause of land subsidence in Jakarta is intensive deep groundwater abstraction – a common source of water supply for individual households and businesses in the city. The deep wells drill into the aquifer and extract high volumes of water, collapsing the aquifer structure and allowing sea water intrusion.
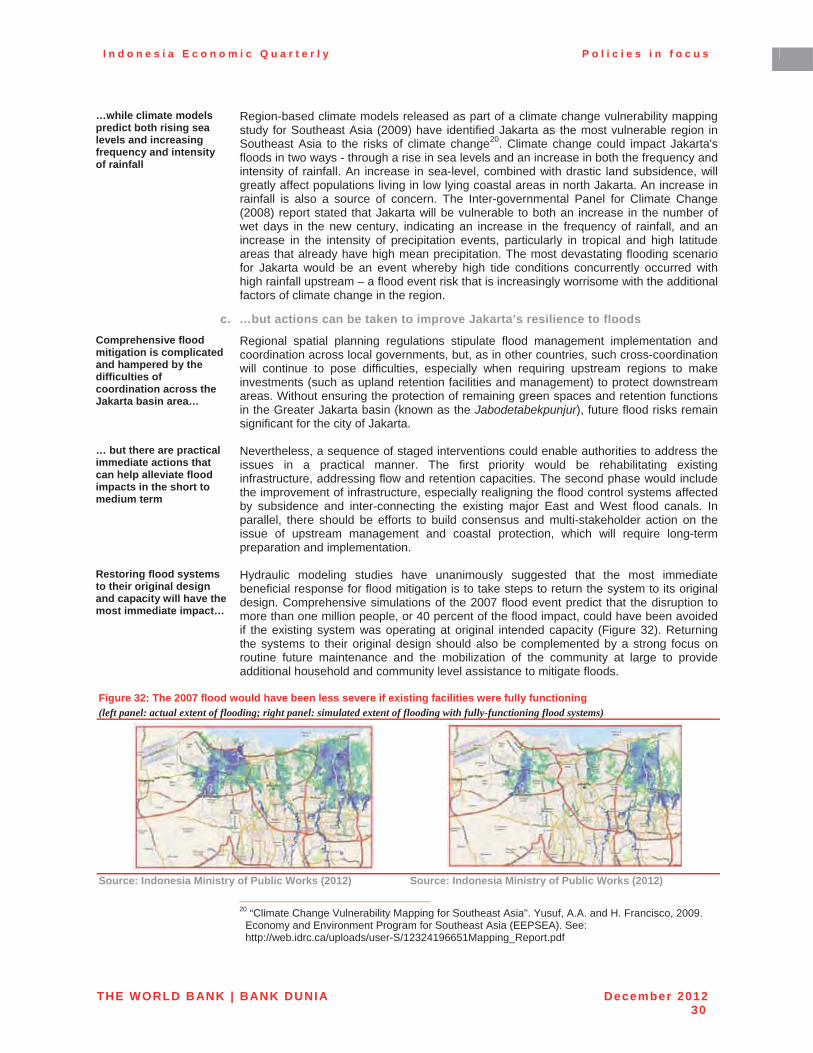
I n d o n e s i a E c o n o m i c Q u a r t e r l y P o l i c i e s i n f o c u s
THE WORLD BANK | BANK DUNIA December 201230
…while climate models predict both rising sea levels and increasing frequency and intensity of rainfall
Region-based climate models released as part of a climate change vulnerability mapping study for Southeast Asia (2009) have identified Jakarta as the most vulnerable region in Southeast Asia to the risks of climate change20. Climate change could impact Jakarta's floods in two ways - through a rise in sea levels and an increase in both the frequency and intensity of rainfall. An increase in sea-level, combined with drastic land subsidence, will greatly affect populations living in low lying coastal areas in north Jakarta. An increase in rainfall is also a source of concern. The Inter-governmental Panel for Climate Change (2008) report stated that Jakarta will be vulnerable to both an increase in the number of wet days in the new century, indicating an increase in the frequency of rainfall, and an increase in the intensity of precipitation events, particularly in tropical and high latitude areas that already have high mean precipitation. The most devastating flooding scenario for Jakarta would be an event whereby high tide conditions concurrently occurred with high rainfall upstream – a flood event risk that is increasingly worrisome with the additional factors of climate change in the region.
c. …but actions can be taken to improve Jakarta’s resilience to floods Comprehensive flood mitigation is complicated and hampered by the difficulties of coordination across the Jakarta basin area…
Regional spatial planning regulations stipulate flood management implementation and coordination across local governments, but, as in other countries, such cross-coordination will continue to pose difficulties, especially when requiring upstream regions to make investments (such as upland retention facilities and management) to protect downstream areas. Without ensuring the protection of remaining green spaces and retention functions in the Greater Jakarta basin (known as the Jabodetabekpunjur), future flood risks remain significant for the city of Jakarta.
… but there are practical immediate actions that can help alleviate flood impacts in the short to medium term
Nevertheless, a sequence of staged interventions could enable authorities to address the issues in a practical manner. The first priority would be rehabilitating existing infrastructure, addressing flow and retention capacities. The second phase would include the improvement of infrastructure, especially realigning the flood control systems affected by subsidence and inter-connecting the existing major East and West flood canals. In parallel, there should be efforts to build consensus and multi-stakeholder action on the issue of upstream management and coastal protection, which will require long-term preparation and implementation.
Restoring flood systems to their original design and capacity will have the most immediate impact…
Hydraulic modeling studies have unanimously suggested that the most immediate beneficial response for flood mitigation is to take steps to return the system to its original design. Comprehensive simulations of the 2007 flood event predict that the disruption to more than one million people, or 40 percent of the flood impact, could have been avoided if the existing system was operating at original intended capacity (Figure 32). Returning the systems to their original design should also be complemented by a strong focus on routine future maintenance and the mobilization of the community at large to provide additional household and community level assistance to mitigate floods.
Figure 32: The 2007 flood would have been less severe if existing facilities were fully functioning (left panel: actual extent of flooding; right panel: simulated extent of flooding with fully-functioning flood systems)
Source: Indonesia Ministry of Public Works (2012) Source: Indonesia Ministry of Public Works (2012)
20 “Climate Change Vulnerability Mapping for Southeast Asia". Yusuf, A.A. and H. Francisco, 2009.
Economy and Environment Program for Southeast Asia (EEPSEA). See: http://web.idrc.ca/uploads/user-S/12324196651Mapping_Report.pdf
I n d o n e s i a E c o n o m i c Q u a r t e r l y P o l i c i e s i n f o c u s
THE WORLD BANK | BANK DUNIA December 201231
…while reconfiguring key canal networks at strategic locations strengthens the system to cope with recent urban and physical changes
The recently completed East flood canal offers the possibility to divert excess flows of the main Ciliwung river. The building of a diversion system for the Ciliwung river at the existing main control gate in south Jakarta or further upstream, connecting both the East and West flood canals, and improvements to adjoining canals, would provide further safeguards to the heavily populated city center. Coupled with the normalization of the existing system to original design, an additional 600,000 people could have escaped the direct effects of the 2007 flood event.
In the meantime, better preparation and systematic contingency planning can help improve resilience
Despite the various ongoing and planned efforts to mitigate flood risks in Jakarta, theserisks will continue to threaten the city for the foreseeable future. Contingency planning and investing in flood preparedness are critical to increase the resilience of the city and its population to cope with, adapt to and prepare for the recurring flood events, thereby reducing their vulnerability to these risks.
Sophisticated contingency planning tools are being developed and introduced to help city managers and planners…
In recent months, a more sophisticated contingency planning tool has been introduced through an initiative led by the Indonesian National Agency for Disaster Management (BNPB) to develop a practical tool to support sub-national disaster management agencies (BPBDs) during emergency contingency planning. A partnership between the BNPB, the Australia-Indonesia Facility for Disaster Reduction (AIFDR), and the Global Facility for Disaster Reduction and Recovery (GFDRR) has developed a contingency planning tool based on hazard impact modeling. This tool is aimed at providing planners with prior knowledge of who will be impacted and what will be damaged in the event of a particular natural disaster event. This tool – named the Indonesia Scenario Assessment for Emergencies (InaSAFE)21 – was officially launched at the 5th Asian Ministerial Conference on Disaster Risk Reduction (AMCDRR) in October 2012.
…which would significantly increase resilience and reduce vulnerability, if they are mainstreamed and constantly augmented on with ever improving and accurate data
Through answering a series of questions about a potential disaster scenario, the InaSAFE hazard impact modeling tool can be used to produce maps and reports to estimate potential damage, along with recommended actions for emergency managers. This tool was tested during the 2011-2012 Jakarta flood season and proved effective in providing an understanding of hazard impacts and communicating them to support disaster risk management decisions. Participatory mapping tools (e.g., OpenStreetMap) have been used to collect high resolution baseline data of critical infrastructure in Jakarta through collaboration between the Jakarta Provincial Disaster Management Agency (BPBD), theHumanitarian OpenStreet Team (HOT) and University of Indonesia, supported by several international development organizations. These, together with hazard data from technical agencies and demographic data from the national census, were used to produce visualizations of the impact of different flood scenarios on critical infrastructure (e.g., roads, schools or hospitals) and populations in flood prone areas across Jakarta. The tool calculates the number of structures or areas that could be flooded under different scenarios, giving the exact location of the affected areas and infrastructure to support contingency planning. The tool can also be used to support risk-based land-use planning, determining priorities for infrastructure retrofitting, real-time impact forecasts, or for a Post Disaster Needs Assessment (PDNA).
Through a combination of these different measures Jakarta can be made more resilient to flood risks, supporting the economic development of the city and the livelihoods of its population
As Jakarta continues to undertake flood mitigation both through structural measures, such as river dredging, canal improvement or construction of retention basins, and non-structural measures such as catchment rehabilitation, community preparedness and contingency planning, the city will better adapt to the increasing frequency and intensity of flooding. While the poor have always been disproportionately affected, they also show the most resilience, mainly out of necessity and the lack of choices that they can make. But, through increased awareness of flood risk, early warning and prediction, as well as real-time flood information dissemination including through the social media, all inhabitants of Jakarta, be they individuals, corporations or public agencies, can adapt their lives and make their respective contingency planning to ensure safety, business continuity andsecured livelihood. Jakartans have shown extreme patience in dealing and coping with problems on a daily basis. With a few more systematic and comprehensive flood mitigation investments, and an effective information dissemination and contingency system, Jakarta could emerge as a flood resilient city.
21 For more detail information, please visit : www.inasafe.org
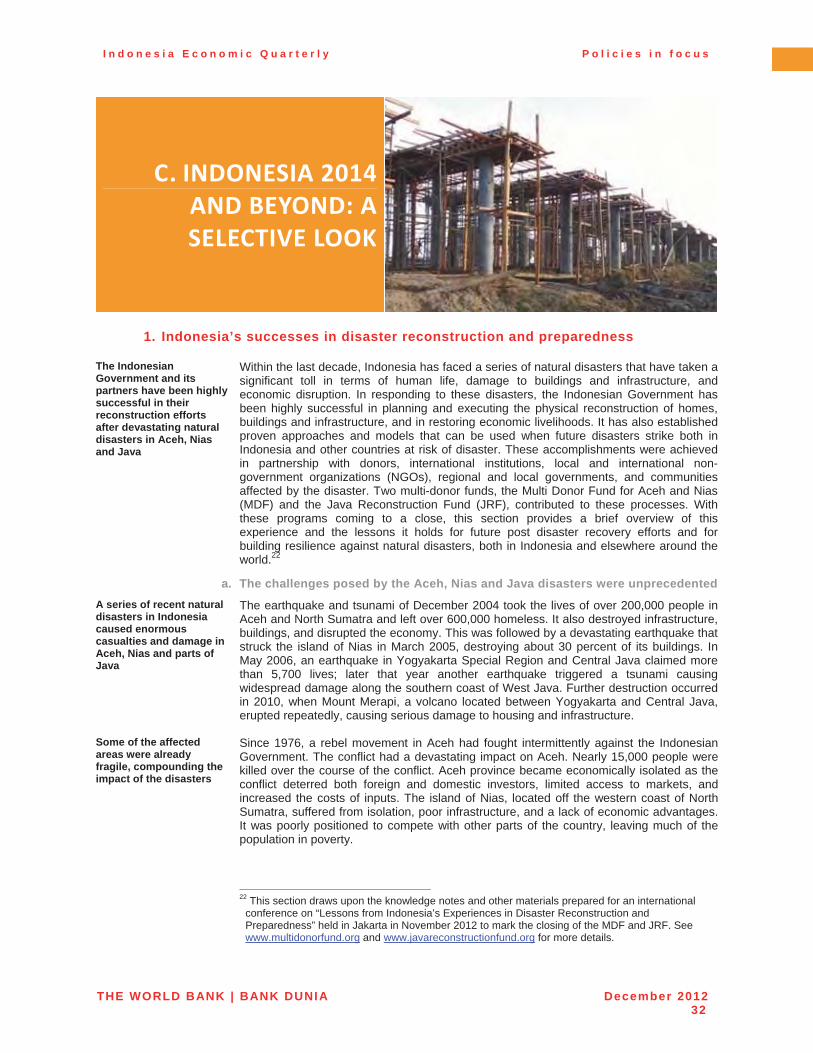
I n d o n e s i a E c o n o m i c Q u a r t e r l y P o l i c i e s i n f o c u s
THE WORLD BANK | BANK DUNIA December 201232
C. INDONESIA�2014�AND�BEYOND:�A�SELECTIVE�LOOK�
1. Indonesia’s successes in disaster reconstruction and preparedness
The Indonesian Government and its partners have been highly successful in their reconstruction efforts after devastating natural disasters in Aceh, Nias and Java
Within the last decade, Indonesia has faced a series of natural disasters that have taken a significant toll in terms of human life, damage to buildings and infrastructure, and economic disruption. In responding to these disasters, the Indonesian Government has been highly successful in planning and executing the physical reconstruction of homes, buildings and infrastructure, and in restoring economic livelihoods. It has also established proven approaches and models that can be used when future disasters strike both in Indonesia and other countries at risk of disaster. These accomplishments were achieved in partnership with donors, international institutions, local and international non-government organizations (NGOs), regional and local governments, and communities affected by the disaster. Two multi-donor funds, the Multi Donor Fund for Aceh and Nias (MDF) and the Java Reconstruction Fund (JRF), contributed to these processes. With these programs coming to a close, this section provides a brief overview of this experience and the lessons it holds for future post disaster recovery efforts and for building resilience against natural disasters, both in Indonesia and elsewhere around the world.22
a. The challenges posed by the Aceh, Nias and Java disasters were unprecedented A series of recent natural disasters in Indonesia caused enormous casualties and damage in Aceh, Nias and parts of Java
The earthquake and tsunami of December 2004 took the lives of over 200,000 people in Aceh and North Sumatra and left over 600,000 homeless. It also destroyed infrastructure, buildings, and disrupted the economy. This was followed by a devastating earthquake that struck the island of Nias in March 2005, destroying about 30 percent of its buildings. In May 2006, an earthquake in Yogyakarta Special Region and Central Java claimed more than 5,700 lives; later that year another earthquake triggered a tsunami causing widespread damage along the southern coast of West Java. Further destruction occurred in 2010, when Mount Merapi, a volcano located between Yogyakarta and Central Java, erupted repeatedly, causing serious damage to housing and infrastructure.
Some of the affected areas were already fragile, compounding the impact of the disasters
Since 1976, a rebel movement in Aceh had fought intermittently against the Indonesian Government. The conflict had a devastating impact on Aceh. Nearly 15,000 people were killed over the course of the conflict. Aceh province became economically isolated as the conflict deterred both foreign and domestic investors, limited access to markets, and increased the costs of inputs. The island of Nias, located off the western coast of North Sumatra, suffered from isolation, poor infrastructure, and a lack of economic advantages. It was poorly positioned to compete with other parts of the country, leaving much of the population in poverty.
22 This section draws upon the knowledge notes and other materials prepared for an international
conference on “Lessons from Indonesia’s Experiences in Disaster Reconstruction and Preparedness” held in Jakarta in November 2012 to mark the closing of the MDF and JRF. See www.multidonorfund.org and www.javareconstructionfund.org for more details.
I n d o n e s i a E c o n o m i c Q u a r t e r l y P o l i c i e s i n f o c u s
THE WORLD BANK | BANK DUNIA December 201233
Managing the generous contributions in aid presented challenges in the recovery process
Both Indonesia and the international community were generous in providing aid in response to the disasters. Supplies, funding, and expertise were mobilized to support relief and reconstruction efforts. Total contributions from the Indonesian Government and international donors reached USD 6.7 billion for the reconstruction of Aceh and Nias. Hundreds of organizations established themselves in Aceh and Nias. While this assistance was both needed and welcomed, managing such huge resources presented major challenges for government, which led the reconstruction effort. Defining a clear reconstruction strategy, directing resources to support it, and managing funds in an efficient, transparent way was critical for the success of the overall reconstruction effort. Coordination of the many players on the ground was also essential to avoid duplication of effort and ensure an efficient usage of resources.
b. Multi-donor funds supported Government-led relief and reconstruction efforts The Indonesian Government led and coordinated the relief and reconstruction process in Aceh and Nias with support from the MDF
The Government of Indonesia managed each stage of the relief and recovery process. Given the scale of the disaster in Aceh and Nias, it established the Agency for the Rehabilitation and Reconstruction of Aceh and Nias (BRR) to coordinate and manage the process until its closure in 2009. It also requested the establishment of a multi-donor fund with the World Bank acting as trustee to support the overall reconstruction effort. This led to the formation of the MDF, which pooled USD 655 million in contributions from 15 donors, representing nearly 10 percent of total reconstruction funds.23 This approach was designed to simplify the management of funds, focus resources where they were most needed in line with government strategy, and ensure funds would be used in a transparent, cost-efficient way. As such, it was in line with the Paris Declaration on Aid Effectiveness of 2005, which calls for national governments to develop their own development strategies which are then supported by donors towards well-defined goals.
The MDF model was successfully replicated in Java
In response to the 2006 earthquakes in Java a National Transition Team was established for initial coordination until 2008. Later, this role was assumed by the National Development Planning Agency (Bappenas) in coordination with provincial governments and line agencies. Seven donors set up the JRF using the same inclusive governance structure as the MDF, pooling USD 94.1 million.24 The program was expanded in 2010 to address reconstruction efforts following the Merapi eruptions. With the MDF in operation for over a year by the time the Java earthquakes struck, the value of the model as a vehicle for managing aid to support reconstruction had been demonstrated.
The multi donor funds contributed to the reconstruction efforts by providing a framework for government-led partnerships…
The MDF and JRF contributed to the reconstruction efforts by providing an inclusive governance mechanism that provided government, donors, and other key players a platform for discussing issues and making decisions quickly. A Steering Committee consisting of representatives from the Indonesian Government, the World Bank as trustee,donors and civil society coordinated stakeholders, formulated a strategy, developed procedures, and allocated funds to proposed projects.
…adopting a phased approach…
In support of the Government’s reconstruction agenda, the MDF program implemented a strategy using a phased approach to meet the evolving needs of survivors throughout the reconstruction process. After their immediate needs were addressed by the Government, reconstruction support focused on rebuilding homes and communities. As rebuilding progressed, the focus was on major infrastructure to restore transportation links, ensure availability of safe water, provide sanitation, and manage waste. The third phase of the MDF laid the groundwork for long-term development by strengthening key economic sectors, such as coffee, cacao, fisheries and rubber. This approach reflected and reinforced the government’s strategy. The reconstruction efforts in Java also took this approach, starting with housing reconstruction before working on restoring livelihoods.
23 The MDF’s donors were the European Commission, the Netherlands, the United Kingdom, the
World Bank, Sweden, Denmark, Norway, Germany, Canada, Belgium, Finland, the Asian Development Bank, the United States, New Zealand and Ireland.
24 The JRF’s donors were the European Commission, the Netherlands, the United Kingdom, Canada, Finland and Denmark.
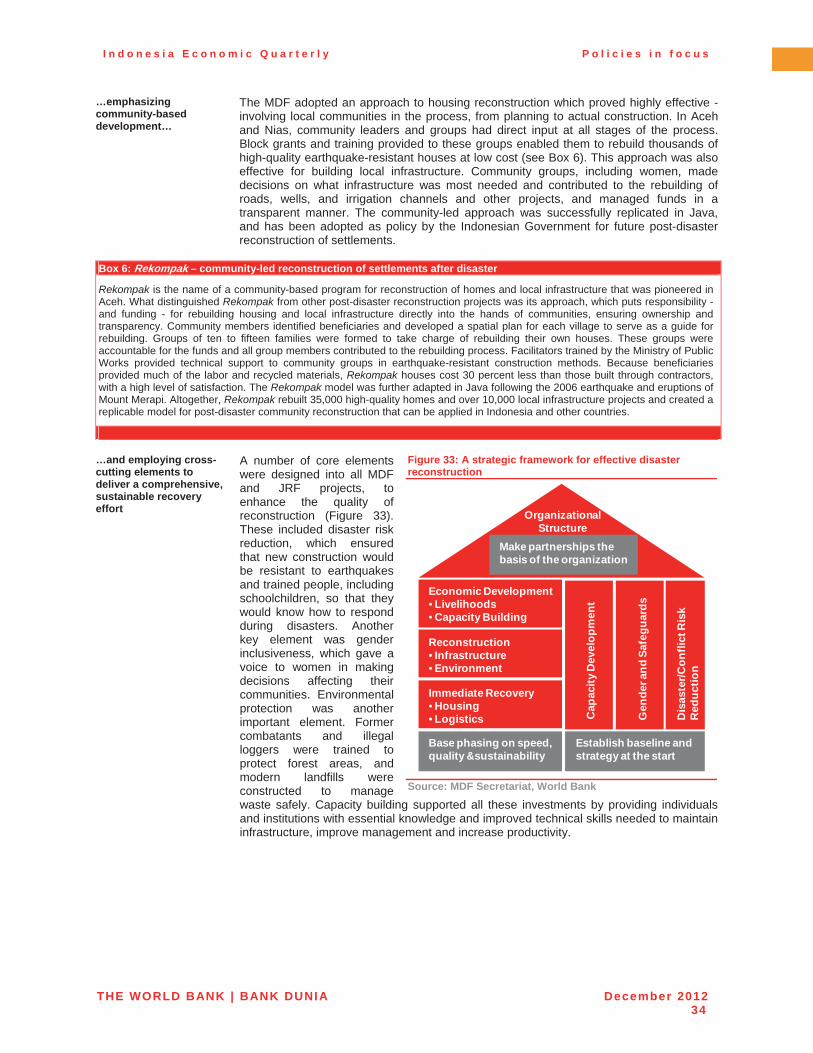
I n d o n e s i a E c o n o m i c Q u a r t e r l y P o l i c i e s i n f o c u s
THE WORLD BANK | BANK DUNIA December 201234
…emphasizing community-based development…
The MDF adopted an approach to housing reconstruction which proved highly effective -involving local communities in the process, from planning to actual construction. In Aceh and Nias, community leaders and groups had direct input at all stages of the process. Block grants and training provided to these groups enabled them to rebuild thousands of high-quality earthquake-resistant houses at low cost (see Box 6). This approach was also effective for building local infrastructure. Community groups, including women, made decisions on what infrastructure was most needed and contributed to the rebuilding of roads, wells, and irrigation channels and other projects, and managed funds in a transparent manner. The community-led approach was successfully replicated in Java, and has been adopted as policy by the Indonesian Government for future post-disaster reconstruction of settlements.
Box 6: Rekompak – community-led reconstruction of settlements after disaster
Rekompak is the name of a community-based program for reconstruction of homes and local infrastructure that was pioneered in Aceh. What distinguished Rekompak from other post-disaster reconstruction projects was its approach, which puts responsibility - and funding - for rebuilding housing and local infrastructure directly into the hands of communities, ensuring ownership and transparency. Community members identified beneficiaries and developed a spatial plan for each village to serve as a guide for rebuilding. Groups of ten to fifteen families were formed to take charge of rebuilding their own houses. These groups were accountable for the funds and all group members contributed to the rebuilding process. Facilitators trained by the Ministry of PublicWorks provided technical support to community groups in earthquake-resistant construction methods. Because beneficiaries provided much of the labor and recycled materials, Rekompak houses cost 30 percent less than those built through contractors, with a high level of satisfaction. The Rekompak model was further adapted in Java following the 2006 earthquake and eruptions of Mount Merapi. Altogether, Rekompak rebuilt 35,000 high-quality homes and over 10,000 local infrastructure projects and created a replicable model for post-disaster community reconstruction that can be applied in Indonesia and other countries.
…and employing cross-cutting elements to deliver a comprehensive, sustainable recovery effort
A number of core elements were designed into all MDF and JRF projects, to enhance the quality of reconstruction (Figure 33). These included disaster risk reduction, which ensured that new construction would be resistant to earthquakes and trained people, including schoolchildren, so that they would know how to respond during disasters. Another key element was gender inclusiveness, which gave a voice to women in making decisions affecting their communities. Environmental protection was another important element. Former combatants and illegal loggers were trained to protect forest areas, and modern landfills were constructed to manage waste safely. Capacity building supported all these investments by providing individuals and institutions with essential knowledge and improved technical skills needed to maintain infrastructure, improve management and increase productivity.
Figure 33: A strategic framework for effective disaster reconstruction
Source: MDF Secretariat, World Bank
Reconstruction• Infrastructure• Environment
Immediate Recovery• Housing• Logistics
Economic Development• Livelihoods• Capacity Building
Base phasing on speed, quality &sustainability
Establish baseline and strategy at the start
Cap
acity
Dev
elop
men
t
Gen
der a
nd S
afeg
uard
s
Dis
aste
r/Con
flict
Ris
k R
educ
tion
Make partnerships the basis of the organization
Organizational Structure
I n d o n e s i a E c o n o m i c Q u a r t e r l y P o l i c i e s i n f o c u s
THE WORLD BANK | BANK DUNIA December 201235
c. Applying the lessons that Indonesia has learned on disaster recovery Indonesia’s experience over the past decade has generated a body of critical knowledge on disaster recovery
Over an eight-year period from 2004, the Indonesian Government responded to a series of natural disasters including, for example, earthquakes and tsunamis, landslides and volcanic eruptions. It was able to apply freshly-learned lessons from one disaster to the next. In this way, it built up a body of knowledge related to disaster response and preparedness. Its experience with the MDF and JRF enabled it to replicate and improve models and approaches to disaster response and preparedness. In the process, Indonesia is now well-positioned to contribute to the global body of knowledge on these issues, so that others can benefit from these lessons and experience to better manage future disasters and reduce their impact.
The experience also prompted the Government of Indonesia to make policy changes in disaster planning and response, including the establishment of the National Disaster Management Agency…
Following the experience of the disasters in Aceh, Nias and Java, the Indonesian Government has put in place a number of new policies to improve disaster management, preparedness and response. In 2008 the National Disaster Management Agency (BNPB)was established. Its role includes formulating disaster management policy, coordinating the government’s response to disasters, disaster preparedness, and providing information relevant to disasters. It operates at both national and regional levels. The BNPBcoordinated the development of the National Disaster Management Plan for 2010-2014, which includes a number of components drawn from the MDF and JRF. These include the integration of disaster risk reduction in development programs, capacity building, community-based disaster management, and enhancing the role of government partners.25
…and the Indonesia Disaster Fund
In 2010, the Government also established the Indonesia Disaster Fund (IDF). The IDF was established to fund and coordinate disaster recovery efforts and disaster preparedness with international support. This donor trust fund operates through two windows, one administered by the World Bank and the other by the United Nations. The IDF also incorporates a number of features successfully employed by the MDF and JRF, including alignment with government strategy, a steering committee, technical committee, and focus areas including housing, livelihoods, and capacity building.
Some of the key lessons include the fact that reconstruction efforts benefit from an over-arching strategic framework…
A number of important lessons for reconstruction efforts can also be drawn out from Indonesia’s experience. In terms of overall strategies, a framework for reconstruction based on three interrelated strategies of strong partnerships, effective implementation, and cross-cutting elements was found to be successful. Overarching organizational structures, such as those provided by the MDF and JRF, enable a government and its partners to make effective program decisions, design appropriate projects and execute them efficiently. In addition, a mix of partners and implementers brought together core competencies and comparative advantages to address a wide range of needs. For donor-funded support it is important to have solid monitoring and evaluation, regular reporting, clear communications, and good funds management to ensure that each project supports the Government’s reconstruction strategy.
...community-led development delivers…
The evidence from Indonesia shows that community-driven approaches can be adaptedeffectively for post-disaster reconstruction to deliver cost-effective, equitable and sustainable local level recovery. As discussed in Box 6 on the Rekompak program, the experiences of community recovery projects implemented under the MDF and JRFdemonstrate that disaster-affected communities are able to manage reconstruction resources and projects to high-levels of quality and satisfaction while benefitting from increased confidence and capacities brought by the consultative and participatoryapproaches. At the same time, the community driven approach encourages faster social recovery and builds capacities that will last well beyond the reconstruction.
…building capacity should be an integral feature for sustainable results…
Capacity building proved to be crucial in the sustainability of investments made in serviceprovision and economic development. Capacity-building strategies ranged fromempowering communities to participate in the rebuilding of housing and community infrastructure to strengthening skills and systems for local governments to managereconstruction assets, to organizational development for local government to better
25 Indonesia National Agency for Disaster Management. Disaster Management Plan / 2010-2014, pp.
80-83. http://www.bnpb.go.id/website/file/pubnew/99.pdf
I n d o n e s i a E c o n o m i c Q u a r t e r l y P o l i c i e s i n f o c u s
THE WORLD BANK | BANK DUNIA December 201236
address public sector management. Capacity building was found to be most effective when woven into each project and program initiative at entry, with its design and intensity reflecting the challenges of sustainability and the exit strategy of the supporting actors.
…post-disaster reconstruction of infrastructure can benefit from a sequenced approach…
The experiences in Aceh and Nias demonstrate that a sequenced approach to infrastructure investments, and, indeed, to overall reconstruction, based on balancing the need for urgency with the need for quality and ownership, can be highly effective inmanaging short-term expectations while delivering long lasting results. For example, the MDF’s initial infrastructure investments focused on immediate logistics needs to restorevital transport links and provide access to affected areas. Once these were established, the MDF redirected attention to large scale infrastructure reconstruction. Investments in large infrastructure have critical quality and ownership requirements that may supersede speed considerations, and care needed to be taken to balance the cost of speed againstthe cost of delay. Later, the scope of this work expanded to provide training to agencies responsible for managing the newly created assets.
…and gender equality and women’s empowerment improves results
Another important lesson that can be drawn from the experiences of the MDF and JRF was that supporting gender equality and women’s empowerment in reconstruction efforts led to better results and increased resilience. Women’s participation improved quality, cost efficiency and increased satisfaction, and sped up economic recovery. Women benefited from stronger legal and land ownership rights, which in turn gave women entrepreneurs better access to credit. Their active participation in local decision-making processesincreased social cohesion and improved outcomes, such as an increase in the provision of public goods such as water, sanitation and health clinics.
Valuable knowledge generated through Indonesia’s experience on disaster reconstruction and preparedness has been delivered back to the global community…
As mentioned, the experience over nearly eight years of responding to a series of disasters, and applying lessons learned, have given the Indonesian government extensive experience and knowledge in disaster management. Much of this has been embedded in its policies and newly-formed government bodies, such as the BNPB, and in educational institutions such as the Gadjah Mada University in Yogyakarta and the Tsunami Research Center in Banda Aceh. Other countries, including Haiti and Pakistan, have studied Indonesia’s disaster response methods in designing their own post-disaster strategies. Indonesia, which has benefitted from international support in the wake of disasters, is now able to give back to the global community lessons for the future.
…including through knowledge-sharing events across disaster-prone countries…
In November 2012, the closing of the MDF and JRF were marked by an international conference in Jakarta on “Lessons from Indonesia’s Experiences in Disaster Reconstruction and Preparedness” which shared global experiences in post-disaster reconstruction and preparedness. The conference drew over 500 participants including dignitaries from disaster prone countries including Japan, Pakistan, and Haiti. It coveredmany aspects of post-disaster reconstruction and preparedness, including the community-led approach to housing reconstruction, post-disaster livelihoods recovery, gender and capacity development, mainstreaming disaster risk reduction, and knowledge sharing.
…with the aim of delivering a legacy of further improvements in disaster response, resilience and preparedness into the future
Indonesia has set a new standard for disaster response through its experiences in Aceh, Nias and Java. This is critical in a country which, by virtue of geography, will face natural disasters again. But the Indonesia government’s successful approach to natural disaster response and preparedness will save countless lives in the future. Its approach is proven and has been successfully replicated to address different kinds of disasters and contexts. As a significant contributor to the reconstruction results, the MDF and JRF programs have been documenting their models, approaches, and experiences. The lessons Indonesia has learned through its massive recovery efforts will ensure that a legacy of improved response, resilience and preparedness will endure into the future.
I n d o n e s i a E c o n o m i c Q u a r t e r l y P o l i c i e s i n f o c u s
THE WORLD BANK | BANK DUNIA December 201237
2. Village infrastructure for basic service delivery Positive trends in Indonesia’s socioeconomic development over the past decade hide significant region-by-region inequality which is in part due to a lack of human and physical capital for basic services
Since the turn of the millennium, Indonesian real incomes have grown rapidly and reliably while steady progress towards meeting the Millennium Development Goals has been made. However, robust national averages and trends hide a more troubling regional picture: individual provinces, districts, and villages are not all progressing at the same high rate. While there are many likely factors behind this unequal distribution, an impossible-to-ignore constraint to better performance in all Indonesian regions lies in the availability of the human and physical capital necessary for basic service provision. Using the findings of the recent Village Infrastructure Census this section highlights some of the key spatial divergences in health, education and infrastructure service delivery across the country and discusses how this new highly disaggregated data may be used to inform future policies to address this inequality of progress.
a. What is the Village Infrastructure Census and why is it necessary? The VIC provides insights into a more equitable, targeted and potentially more rational system of resource transfers from the central government to local governments…
A recent Village Infrastructure Census (VIC), commissioned by the Vice President’s Office for the Acceleration of Poverty Reduction (TNP2K), developed in collaboration with the PNPM Support Facility (PSF),26 and undertaken by the Central Statistics Agency (BPS), demonstrates the size and shape of the deficiencies in the ability to provide basic health, education, and transportation services across different villages. The VIC is regarded by TNP2K and the Government as the first step toward remedying the inequality of progress. The insights from the VIC can be used to inform the development of a plan for spending resources more equitably; for improving the targeting of development spending priorities, and potentially for pointing the way towards a more rational system of resource transfers (from central to local governments) to better match needs and capacities. The portrait of basic service supply readiness in Indonesian regions drawn from the VIC can also be used to quantify the remaining gaps in health, education, and transportation, i.e. the investments required to meet basic service standards, and estimate the cost of filling those gaps.
…by collecting detailed facility-level information...
The VIC provides detailed facility-level information on public health and education facilities, covering a total of 166,506 health facilities and 164,561 schools across the country. The 2011 PODES (Potensi Desa) core survey (also a village-by-village census) is used to complement the VIC data by providing observations on the quantity and quality of intra- and inter-village transportation and the quantity of health and education providers. The resulting combined database provides in-depth information on the quantity, quality, and accessibility of existing basic, public service-oriented infrastructure.
…and assesses supply-side weaknesses to quantify the cost of remedying them
Combined with further analyses and reports, commissioned jointly by TNP2K and PSF, this information provides a comprehensive assessment of the local-level availability of basic facilities and services in health, education, and transport. The database is rich enough to generate a nuanced picture of “supply readiness” through the construction of indices combining several different indicators of the human and physical capital necessary for the provision of services. The indicators entering the supply readiness indices are available at the village level, which provides a very high resolution picture and will enable policy recommendations to be tailored to any level of regional disaggregation.
b. The VIC combines a range of indicators to provide Supply Readiness Indices The VIC provides information on three rough categories of basic service supply quantity and quality…
Indicators entering the VIC-based supply readiness indices can be grouped into roughly three categories, according to the type of information they provide, namely on the availability and accessibility of facilities, on the presence and qualification of personnel, and on the physical characteristics of facilities. Table 7 provides more detail on the selected indicators for health , education, and transportation services, respectively. As a general rule, the selected indicators of supply readiness take a value between 0 and 1, reflecting the share of the population, facility or geographic area that meet a supply readiness norm or threshold. 26 The PNPM Support Facility (PSF) was established by the Government of Indonesia and supported
by multi-donor grants provided by the Governments of Australia, Denmark, the Netherlands, United Kingdom, United States, and the European Union. The grants are administered by the World Bank. The VIC final report will be made available on both the TNP2K and PSF websites beginning February 2013. For more details see http://pnpm-support.org/.
I n d o n e s i a E c o n o m i c Q u a r t e r l y P o l i c i e s i n f o c u s
THE WORLD BANK | BANK DUNIA December 201238
Table 7: The composite Supply Readiness Indices include a range of indicators for health, education and transportation (indicators included in composite index)
a. Health Supply Readiness Indicators Indicator Description
Access to primary care Share of population that can easily reach a polyclinic, Puskesmas, Puskesmas Pembantu, or physician’s practice
Access to secondary care Share of population that can easily reach a hospital
Access to delivery facility Share of population that can easily reach a hospital, maternity hospital, Puskesmas,Polindes or midwife’s practice
Physician at Puskesmas Share of Puskesmas with at least one physician present
Midwife in the village Share of population living in villages with a midwife present
Water supply Puskesmas Share of Puskesmas with water installation within facility or 10 min walk
Electrification Share of health facilities with electricity (excluding Posyandu)b. Education Supply Readiness Indicators
Indicator Description
Access to early childhood education Share of population in villages with early childhood education post (PAUD) in village or kindergarten within 1 km of village
Access to junior secondary school (SMP) Share of population in villages with SMP within 6 (3) km
Teacher qualification, primary school (SD) Share of SD with at least 2 teachers holding advanced S1 degrees
Teacher qualification SMP Average share of SMP teachers holding advanced S1 degrees
Laboratory in SMP Share of SMP with laboratory
Water Supply Share of schools with water in student bathroom
Electrification Share of schools with electricity
c. Transportation Supply Readiness Indicators
Indicator Description
Surface of main road Share of villages with main road surface being either asphalt/concrete or gravel/stone etc.
Condition of main road Share of villages with main road with no or minor damages
Condition of bridges Share of villages with bridges with no or minor damages
Need for new bridges Share of villages that report no need for new bridge(s)
Public trans. to Camat Share of villages with public transport with fixed route to the office of the sub-district head
Public trans. to regent/mayor Share of villages with public transport with fixed route to the office of the regent/major
…while composite indices combine this information to create “at a glance” readability
The indices constructed from these indicators manage to absorb the immense amount of information contained in the VIC – within which individual variables provide a breakdown of various aspects of service delivery – and combine it into summary indicators allowingfor an easy grasp of the overall situation (see Box 7 below for more detail on the index construction). Index construction in the VIC report also preserves the very high resolution of the VIC and PODES data and therefore the indices can provide the “at a glance” summary capability all the way down to subdistrict-level for policy makers.
Box 7: A note on reliability in the Supply Readiness Rankings
In the construction of any indicator that combines a number of separate, but not necessarily independent, observations on variables that are themselves proxies and are often measured in different units, there is always a worry that the system of implicit or explicit weights – or the share any one variable has in the determination of the final index score – that accompany such a combination will unfairly disadvantage one region or another and misrepresent the true distribution of performance.
In the analysis accompanying the VIC, six different weighting schemes are suggested to combine the underlying variables into a composite index. Three of these weighting schemes are chosen formulaically to represent (1) a focus on access, (2) equal weights for each of three categories (availability and accessibility of facilities; presence and qualification of personnel; andphysical characteristics of facilities), and (3) equal weights for each indicator. Another three weighting schemes were derivedempirically through (4) a principal components analysis, (5) an OLS regression of utilization on all seven indicators, and (6) a
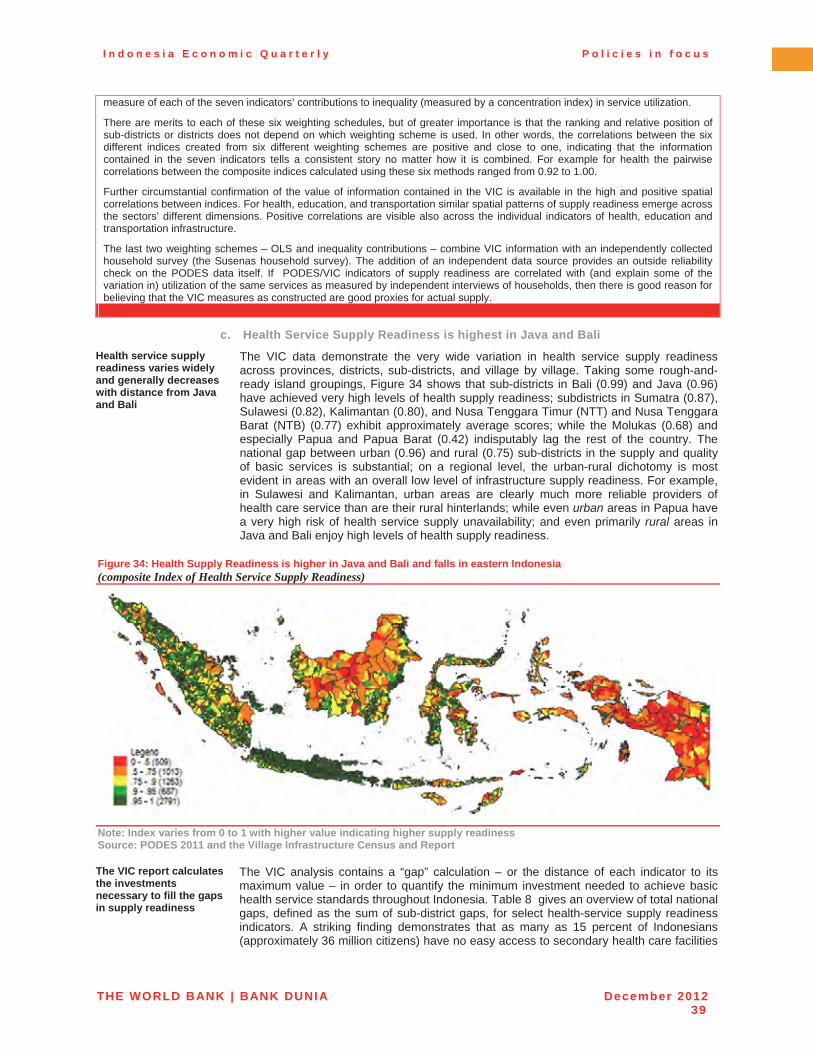
I n d o n e s i a E c o n o m i c Q u a r t e r l y P o l i c i e s i n f o c u s
THE WORLD BANK | BANK DUNIA December 201239
measure of each of the seven indicators’ contributions to inequality (measured by a concentration index) in service utilization.
There are merits to each of these six weighting schedules, but of greater importance is that the ranking and relative position ofsub-districts or districts does not depend on which weighting scheme is used. In other words, the correlations between the six different indices created from six different weighting schemes are positive and close to one, indicating that the information contained in the seven indicators tells a consistent story no matter how it is combined. For example for health the pairwise correlations between the composite indices calculated using these six methods ranged from 0.92 to 1.00.
Further circumstantial confirmation of the value of information contained in the VIC is available in the high and positive spatial correlations between indices. For health, education, and transportation similar spatial patterns of supply readiness emerge acrossthe sectors’ different dimensions. Positive correlations are visible also across the individual indicators of health, education and transportation infrastructure.
The last two weighting schemes – OLS and inequality contributions – combine VIC information with an independently collected household survey (the Susenas household survey). The addition of an independent data source provides an outside reliability check on the PODES data itself. If PODES/VIC indicators of supply readiness are correlated with (and explain some of the variation in) utilization of the same services as measured by independent interviews of households, then there is good reason forbelieving that the VIC measures as constructed are good proxies for actual supply.
c. Health Service Supply Readiness is highest in Java and Bali Health service supply readiness varies widely and generally decreases with distance from Java and Bali
The VIC data demonstrate the very wide variation in health service supply readiness across provinces, districts, sub-districts, and village by village. Taking some rough-and-ready island groupings, Figure 34 shows that sub-districts in Bali (0.99) and Java (0.96) have achieved very high levels of health supply readiness; subdistricts in Sumatra (0.87), Sulawesi (0.82), Kalimantan (0.80), and Nusa Tenggara Timur (NTT) and Nusa Tenggara Barat (NTB) (0.77) exhibit approximately average scores; while the Molukas (0.68) and especially Papua and Papua Barat (0.42) indisputably lag the rest of the country. Thenational gap between urban (0.96) and rural (0.75) sub-districts in the supply and quality of basic services is substantial; on a regional level, the urban-rural dichotomy is most evident in areas with an overall low level of infrastructure supply readiness. For example, in Sulawesi and Kalimantan, urban areas are clearly much more reliable providers of health care service than are their rural hinterlands; while even urban areas in Papua have a very high risk of health service supply unavailability; and even primarily rural areas in Java and Bali enjoy high levels of health supply readiness.
Figure 34: Health Supply Readiness is higher in Java and Bali and falls in eastern Indonesia (composite Index of Health Service Supply Readiness)
Note: Index varies from 0 to 1 with higher value indicating higher supply readiness Source: PODES 2011 and the Village Infrastructure Census and Report
The VIC report calculates the investments necessary to fill the gaps in supply readiness
The VIC analysis contains a “gap” calculation – or the distance of each indicator to its maximum value – in order to quantify the minimum investment needed to achieve basic health service standards throughout Indonesia. Table 8 gives an overview of total national gaps, defined as the sum of sub-district gaps, for select health-service supply readiness indicators. A striking finding demonstrates that as many as 15 percent of Indonesians (approximately 36 million citizens) have no easy access to secondary health care facilities
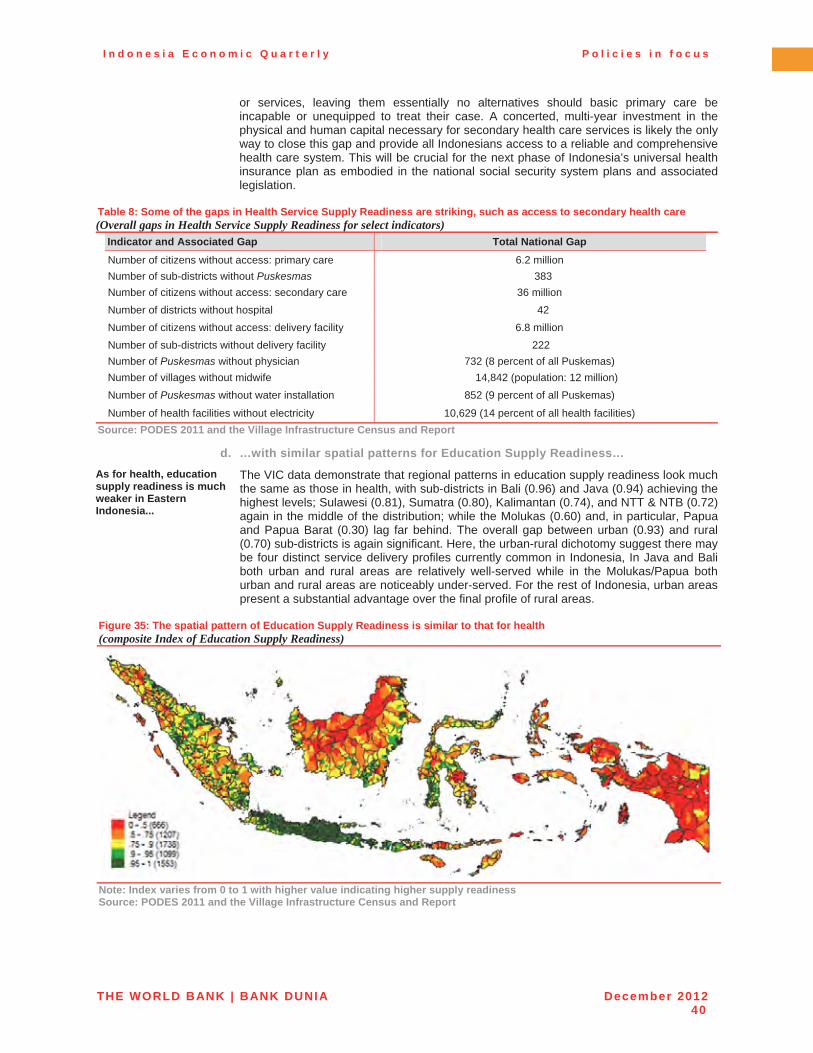
I n d o n e s i a E c o n o m i c Q u a r t e r l y P o l i c i e s i n f o c u s
THE WORLD BANK | BANK DUNIA December 201240
or services, leaving them essentially no alternatives should basic primary care be incapable or unequipped to treat their case. A concerted, multi-year investment in the physical and human capital necessary for secondary health care services is likely the only way to close this gap and provide all Indonesians access to a reliable and comprehensive health care system. This will be crucial for the next phase of Indonesia’s universal health insurance plan as embodied in the national social security system plans and associated legislation.
Table 8: Some of the gaps in Health Service Supply Readiness are striking, such as access to secondary health care(Overall gaps in Health Service Supply Readiness for select indicators)
Indicator and Associated Gap Total National Gap Number of citizens without access: primary care 6.2 million Number of sub-districts without Puskesmas 383 Number of citizens without access: secondary care 36 million Number of districts without hospital 42Number of citizens without access: delivery facility 6.8 million Number of sub-districts without delivery facility 222 Number of Puskesmas without physician 732 (8 percent of all Puskemas) Number of villages without midwife 14,842 (population: 12 million) Number of Puskesmas without water installation 852 (9 percent of all Puskemas)
Number of health facilities without electricity 10,629 (14 percent of all health facilities) Source: PODES 2011 and the Village Infrastructure Census and Report
d. …with similar spatial patterns for Education Supply Readiness… As for health, education supply readiness is much weaker in Eastern Indonesia...
The VIC data demonstrate that regional patterns in education supply readiness look much the same as those in health, with sub-districts in Bali (0.96) and Java (0.94) achieving the highest levels; Sulawesi (0.81), Sumatra (0.80), Kalimantan (0.74), and NTT & NTB (0.72)again in the middle of the distribution; while the Molukas (0.60) and, in particular, Papua and Papua Barat (0.30) lag far behind. The overall gap between urban (0.93) and rural (0.70) sub-districts is again significant. Here, the urban-rural dichotomy suggest there may be four distinct service delivery profiles currently common in Indonesia, In Java and Bali both urban and rural areas are relatively well-served while in the Molukas/Papua both urban and rural areas are noticeably under-served. For the rest of Indonesia, urban areas present a substantial advantage over the final profile of rural areas.
Figure 35: The spatial pattern of Education Supply Readiness is similar to that for health (composite Index of Education Supply Readiness)
Note: Index varies from 0 to 1 with higher value indicating higher supply readiness Source: PODES 2011 and the Village Infrastructure Census and Report
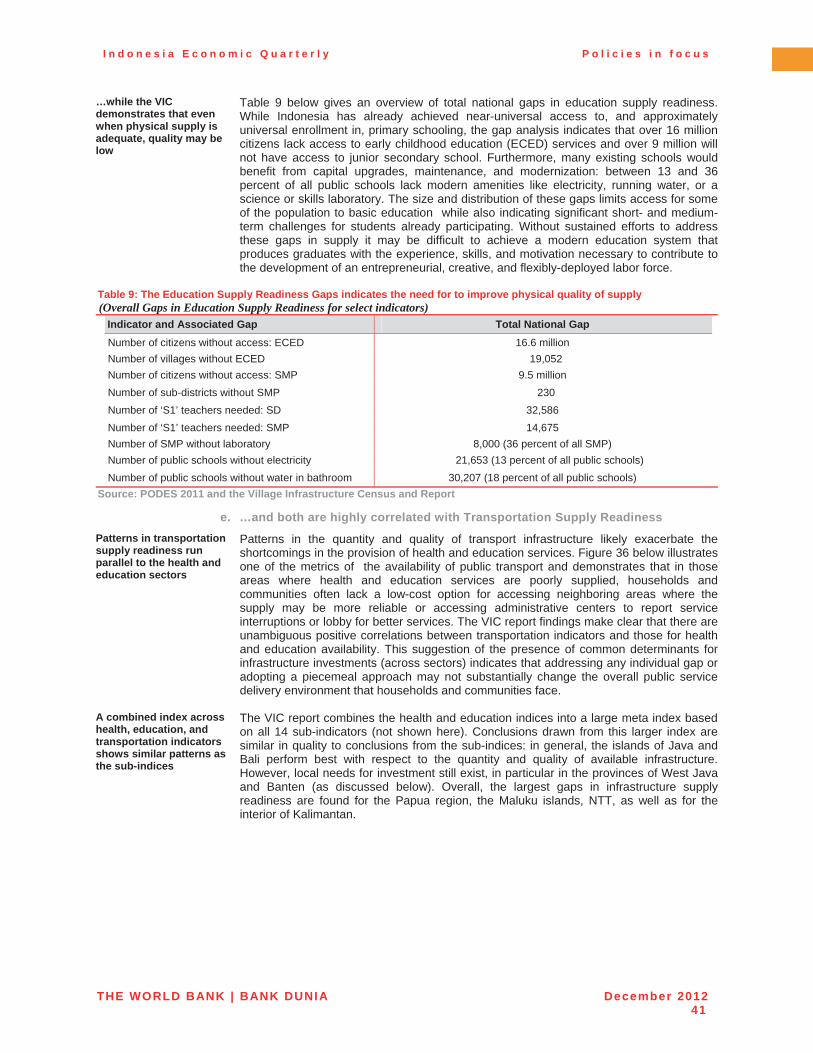
I n d o n e s i a E c o n o m i c Q u a r t e r l y P o l i c i e s i n f o c u s
THE WORLD BANK | BANK DUNIA December 201241
…while the VIC demonstrates that even when physical supply is adequate, quality may be low
Table 9 below gives an overview of total national gaps in education supply readiness. While Indonesia has already achieved near-universal access to, and approximately universal enrollment in, primary schooling, the gap analysis indicates that over 16 million citizens lack access to early childhood education (ECED) services and over 9 million will not have access to junior secondary school. Furthermore, many existing schools would benefit from capital upgrades, maintenance, and modernization: between 13 and 36 percent of all public schools lack modern amenities like electricity, running water, or a science or skills laboratory. The size and distribution of these gaps limits access for some of the population to basic education while also indicating significant short- and medium-term challenges for students already participating. Without sustained efforts to address these gaps in supply it may be difficult to achieve a modern education system that produces graduates with the experience, skills, and motivation necessary to contribute to the development of an entrepreneurial, creative, and flexibly-deployed labor force.
Table 9: The Education Supply Readiness Gaps indicates the need for to improve physical quality of supply (Overall Gaps in Education Supply Readiness for select indicators)
Indicator and Associated Gap Total National Gap Number of citizens without access: ECED 16.6 million Number of villages without ECED 19,052 Number of citizens without access: SMP 9.5 million Number of sub-districts without SMP 230Number of ‘S1’ teachers needed: SD 32,586 Number of ‘S1’ teachers needed: SMP 14,675 Number of SMP without laboratory 8,000 (36 percent of all SMP) Number of public schools without electricity 21,653 (13 percent of all public schools) Number of public schools without water in bathroom 30,207 (18 percent of all public schools)
Source: PODES 2011 and the Village Infrastructure Census and Report
e. …and both are highly correlated with Transportation Supply Readiness Patterns in transportation supply readiness run parallel to the health and education sectors
Patterns in the quantity and quality of transport infrastructure likely exacerbate the shortcomings in the provision of health and education services. Figure 36 below illustrates one of the metrics of the availability of public transport and demonstrates that in those areas where health and education services are poorly supplied, households and communities often lack a low-cost option for accessing neighboring areas where the supply may be more reliable or accessing administrative centers to report service interruptions or lobby for better services. The VIC report findings make clear that there are unambiguous positive correlations between transportation indicators and those for health and education availability. This suggestion of the presence of common determinants for infrastructure investments (across sectors) indicates that addressing any individual gap or adopting a piecemeal approach may not substantially change the overall public service delivery environment that households and communities face.
A combined index across health, education, and transportation indicators shows similar patterns as the sub-indices
The VIC report combines the health and education indices into a large meta index based on all 14 sub-indicators (not shown here). Conclusions drawn from this larger index are similar in quality to conclusions from the sub-indices: in general, the islands of Java and Bali perform best with respect to the quantity and quality of available infrastructure. However, local needs for investment still exist, in particular in the provinces of West Java and Banten (as discussed below). Overall, the largest gaps in infrastructure supply readiness are found for the Papua region, the Maluku islands, NTT, as well as for the interior of Kalimantan.
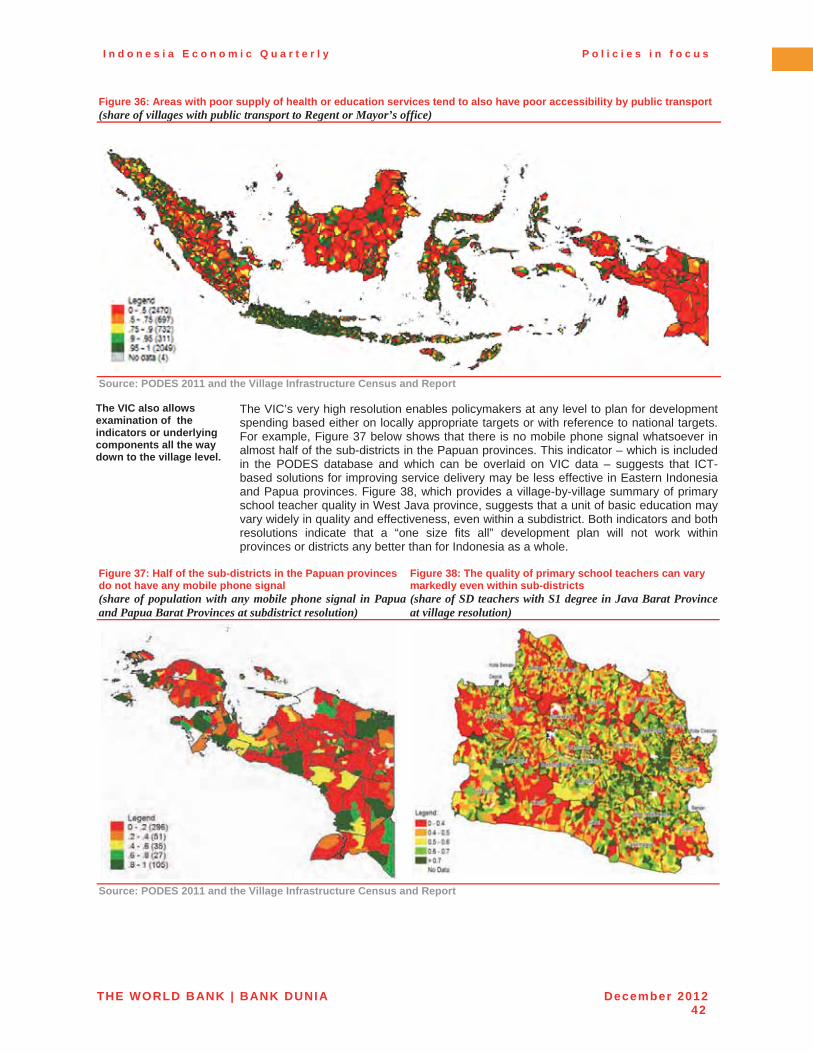
I n d o n e s i a E c o n o m i c Q u a r t e r l y P o l i c i e s i n f o c u s
THE WORLD BANK | BANK DUNIA December 201242
Figure 36: Areas with poor supply of health or education services tend to also have poor accessibility by public transport (share of villages with public transport to Regent or Mayor’s office)
Source: PODES 2011 and the Village Infrastructure Census and Report
The VIC also allows examination of the indicators or underlying components all the way down to the village level.
The VIC’s very high resolution enables policymakers at any level to plan for development spending based either on locally appropriate targets or with reference to national targets. For example, Figure 37 below shows that there is no mobile phone signal whatsoever in almost half of the sub-districts in the Papuan provinces. This indicator – which is included in the PODES database and which can be overlaid on VIC data – suggests that ICT-based solutions for improving service delivery may be less effective in Eastern Indonesia and Papua provinces. Figure 38, which provides a village-by-village summary of primary school teacher quality in West Java province, suggests that a unit of basic education may vary widely in quality and effectiveness, even within a subdistrict. Both indicators and both resolutions indicate that a “one size fits all” development plan will not work within provinces or districts any better than for Indonesia as a whole.
Figure 37: Half of the sub-districts in the Papuan provinces do not have any mobile phone signal (share of population with any mobile phone signal in Papua and Papua Barat Provinces at subdistrict resolution)
Figure 38: The quality of primary school teachers can vary markedly even within sub-districts (share of SD teachers with S1 degree in Java Barat Province at village resolution)
Source: PODES 2011 and the Village Infrastructure Census and Report
I n d o n e s i a E c o n o m i c Q u a r t e r l y P o l i c i e s i n f o c u s
THE WORLD BANK | BANK DUNIA December 201243
f. Extensions and policy applications The village-level resolution of the VIC combined with its generality make it useful for pro-poor development planning in all sectors and at all levels…
The primary impetus behind the VIC (and associated report) was the need for more and better evidence-based strategies for financing, management, and targeting in the Government of Indonesia’s “Cluster 2” or community-driven development programs (of which the National Community Empowerment Program or PNPM Mandiri is perhaps the best-known). For example, for the competitively-awarded and community-managed block grants that are delivered through the PNPM program, the VIC data can be used to find and prioritize regions that would benefit from larger block grants or from eligibility for and receipt of more than one type of PNPM block grant. As PNPM block grants are most frequently used by communities to increase the infrastructure asset base – roads, irrigation and drainage structures, clean water facilities, etc – providing extra financing through PNPM for areas that face large supply readiness gaps could produce a substantial impact, even in the short-term. Policy planners involved with the PNPM-Generasi initiative – a PNPM variant targeted to the poorest regions where block grants are tied to spending on health and education services – are taking advantage of the VIC database to decide which regions will receive Generasi block grants over its 2013-2015 scale-up phase.
…and its public availability means that it can be used by any user to benchmark regional performance
The VIC’s native resolution means that any of the potential applications – for example, using the VIC to revise public resource spending to better match needs and capacities or to improve the targeting of priority development initiatives in any sector – can be pursued at any regional level and by any motivated politician or authority no matter his or her location. The VIC as developed also supports this evidence-based analysis with regard to local, regional, or even national comparisons, so any user will be able to determine his region’s performance against all relevant benchmarks and standards. By supporting the development of a database and tool that is applicable throughout Indonesia, TNP2K and the Government have provided a significant public service; by continuing to support the VIC’s dissemination and adoption outside of its own walls, TNP2K will be responsible for bringing one of the first widely-applicable, easy-to-use, and up-to-date methodologies for pro-poor policy planning to all regions and all sectors interested in evidence-based processes and outputs.
Extensions of the VIC, to link it to measures of isolation and multi-dimensional poverty, are in process to inform further future policy making
A number of ongoing extensions of the VIC analysis, which are being developed by the Monitoring and Evaluation (M&E) team in the PNPM Support Facility (PSF), can provide additional insights into other dimensions of service provision. The first extension aims to indicate relative levels of isolation in order to provide another Indonesia-wide layer of relevant information for evidence-based targeting strategies for all government development spending. As the maps above indicate, many supply-deficient regions are either surrounded by poor-performing regions or are situated a considerable distance away from the next-closest region with good performance. This type of isolation can impede progress on its own as there may be no best practices to learn from or high-performing neighbors to absorb internal migrants.
A second extension is to link the VIC with data on multi-dimensional poverty (MDP). As the VIC data was collected by BPS as an add-on to one of its regularly produced products (the PODES village census, which is produced every 3 years), the VIC database is easy to merge with other BPS-produced datasets such as the 2010 Population Census and the quarterly Susenas household socioeconomic welfare survey. Data on MDP captures expenditures and outcomes within households and so provides a good demand-side counterpart to the supply-side information that the VIC contains. Combining the two databases should allow researchers and policymakers to see the entire economy of basic services in one place, facilitating analysis to discover areas where demand-side outcomes exceed expectations despite supply-side impediments, and their determinants.
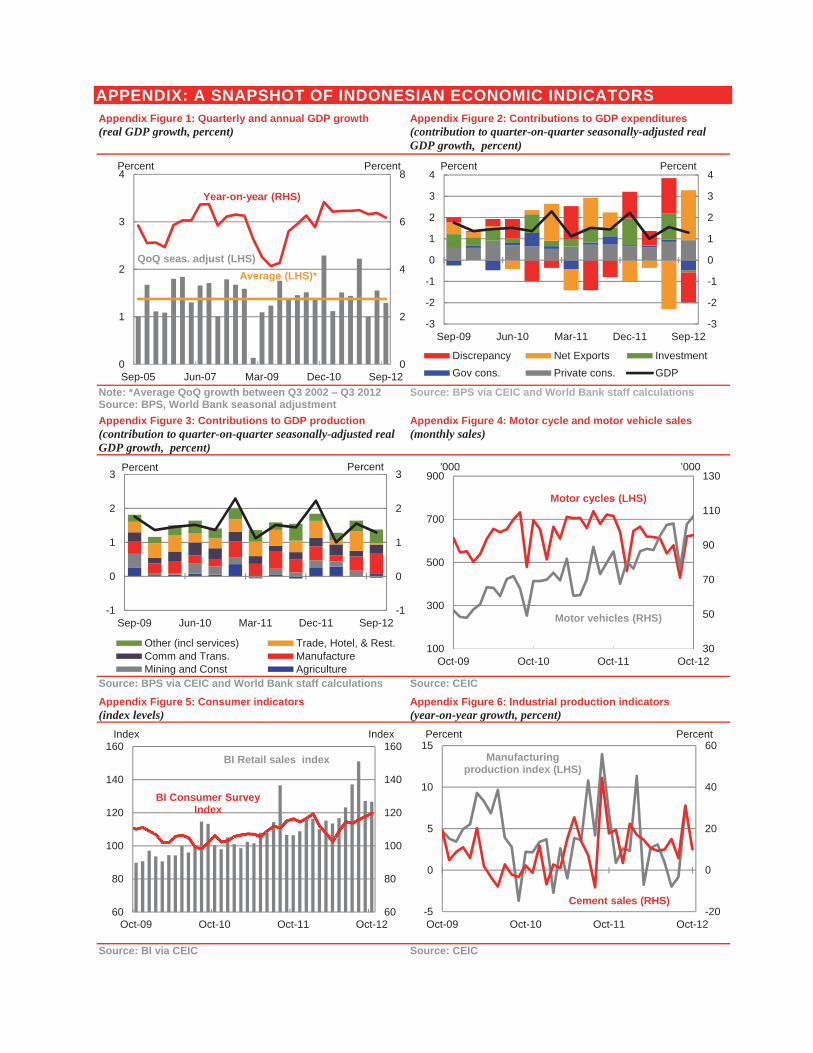
APPENDIX: A SNAPSHOT OF INDONESIAN ECONOMIC INDICATORS Appendix Figure 1: Quarterly and annual GDP growth (real GDP growth, percent)
Appendix Figure 2: Contributions to GDP expenditures (contribution to quarter-on-quarter seasonally-adjusted real GDP growth, percent)
Note: *Average QoQ growth between Q3 2002 – Q3 2012 Source: BPS, World Bank seasonal adjustment
Source: BPS via CEIC and World Bank staff calculations
Appendix Figure 3: Contributions to GDP production (contribution to quarter-on-quarter seasonally-adjusted real GDP growth, percent)
Appendix Figure 4: Motor cycle and motor vehicle sales (monthly sales)
Source: BPS via CEIC and World Bank staff calculations Source: CEIC Appendix Figure 5: Consumer indicators (index levels)
Appendix Figure 6: Industrial production indicators (year-on-year growth, percent)
Source: BI via CEIC Source: CEIC
0
2
4
6
8
0
1
2
3
4
Sep-05 Jun-07 Mar-09 Dec-10 Sep-12
Percent Percent
QoQ seas. adjust (LHS)
Year-on-year (RHS)
Average (LHS)*
-3
-2
-1
0
1
2
3
4
-3
-2
-1
0
1
2
3
4
Sep-09 Jun-10 Mar-11 Dec-11 Sep-12
Discrepancy Net Exports InvestmentGov cons. Private cons. GDP
Percent Percent
-1
0
1
2
3
-1
0
1
2
3
Sep-09 Jun-10 Mar-11 Dec-11 Sep-12
Other (incl services) Trade, Hotel, & Rest.Comm and Trans. ManufactureMining and Const Agriculture
Percent Percent
30
50
70
90
110
130
100
300
500
700
900
Oct-09 Oct-10 Oct-11 Oct-12
'000
Motor cycles (LHS)
'000
Motor vehicles (RHS)
60
80
100
120
140
160
60
80
100
120
140
160
Oct-09 Oct-10 Oct-11 Oct-12
Index Index
BI Retail sales index
BI Consumer SurveyIndex
-20
0
20
40
60
-5
0
5
10
15
Oct-09 Oct-10 Oct-11 Oct-12
Percent Percent
Cement sales (RHS)
Manufacturingproduction index (LHS)
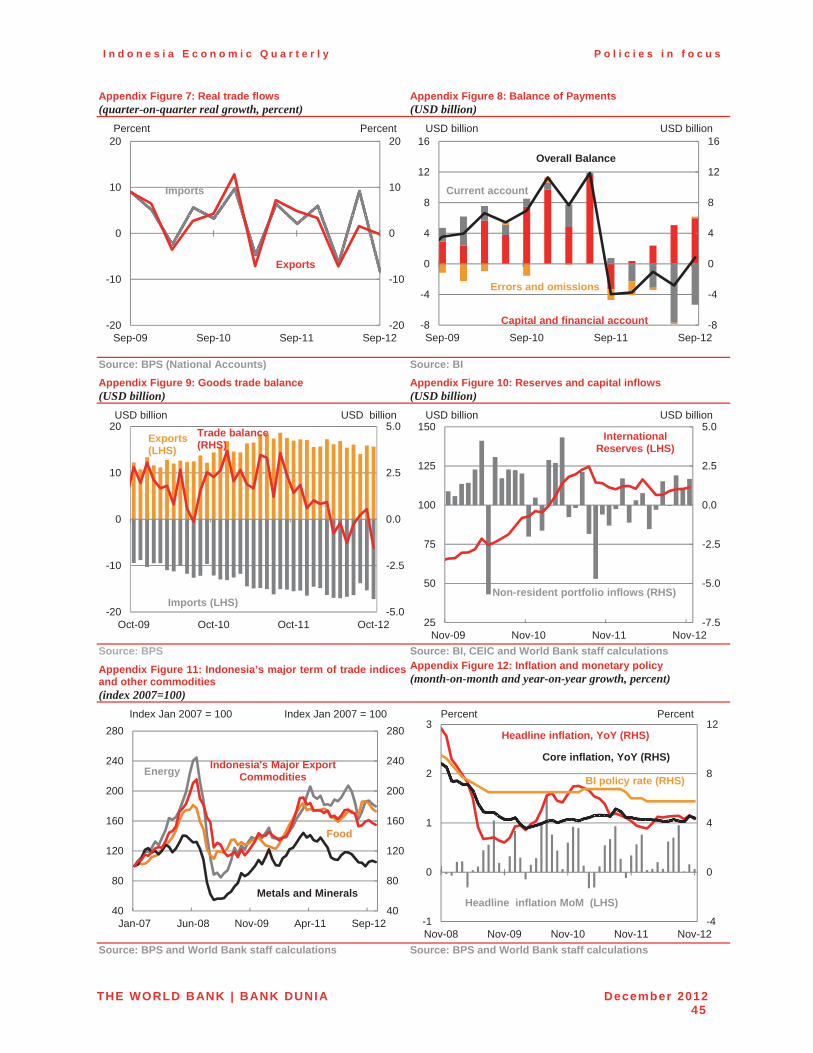
I n d o n e s i a E c o n o m i c Q u a r t e r l y P o l i c i e s i n f o c u s
THE WORLD BANK | BANK DUNIA December 201245
Appendix Figure 7: Real trade flows (quarter-on-quarter real growth, percent)
Appendix Figure 8: Balance of Payments (USD billion)
Source: BPS (National Accounts) Source: BIAppendix Figure 9: Goods trade balance (USD billion)
Appendix Figure 10: Reserves and capital inflows (USD billion)
Source: BPS Source: BI, CEIC and World Bank staff calculations Appendix Figure 11: Indonesia’s major term of trade indices and other commodities (index 2007=100)
Appendix Figure 12: Inflation and monetary policy (month-on-month and year-on-year growth, percent)
Source: BPS and World Bank staff calculations Source: BPS and World Bank staff calculations
-20
-10
0
10
20
-20
-10
0
10
20
Sep-09 Sep-10 Sep-11 Sep-12
Exports
Imports
Percent Percent
-8
-4
0
4
8
12
16
-8
-4
0
4
8
12
16
Sep-09 Sep-10 Sep-11 Sep-12
USD billion USD billion
Capital and financial account
Current account
Overall Balance
Errors and omissions
-5.0
-2.5
0.0
2.5
5.0
-20
-10
0
10
20
Oct-09 Oct-10 Oct-11 Oct-12
Trade balance (RHS)Exports
(LHS)
Imports (LHS)
USD billion USD billion
-7.5
-5.0
-2.5
0.0
2.5
5.0
25
50
75
100
125
150
Nov-09 Nov-10 Nov-11 Nov-12
InternationalReserves (LHS)
USD billion USD billion
Non-resident portfolio inflows (RHS)
40
80
120
160
200
240
280
40
80
120
160
200
240
280
Jan-07 Jun-08 Nov-09 Apr-11 Sep-12
Index Jan 2007 = 100 Index Jan 2007 = 100
Indonesia's Major Export Commodities
Food
Metals and Minerals
Energy
-4
0
4
8
12
-1
0
1
2
3
Nov-08 Nov-09 Nov-10 Nov-11 Nov-12
Core inflation, YoY (RHS)
Headline inflation, YoY (RHS)
Headline inflation MoM (LHS)
Percent Percent
BI policy rate (RHS)
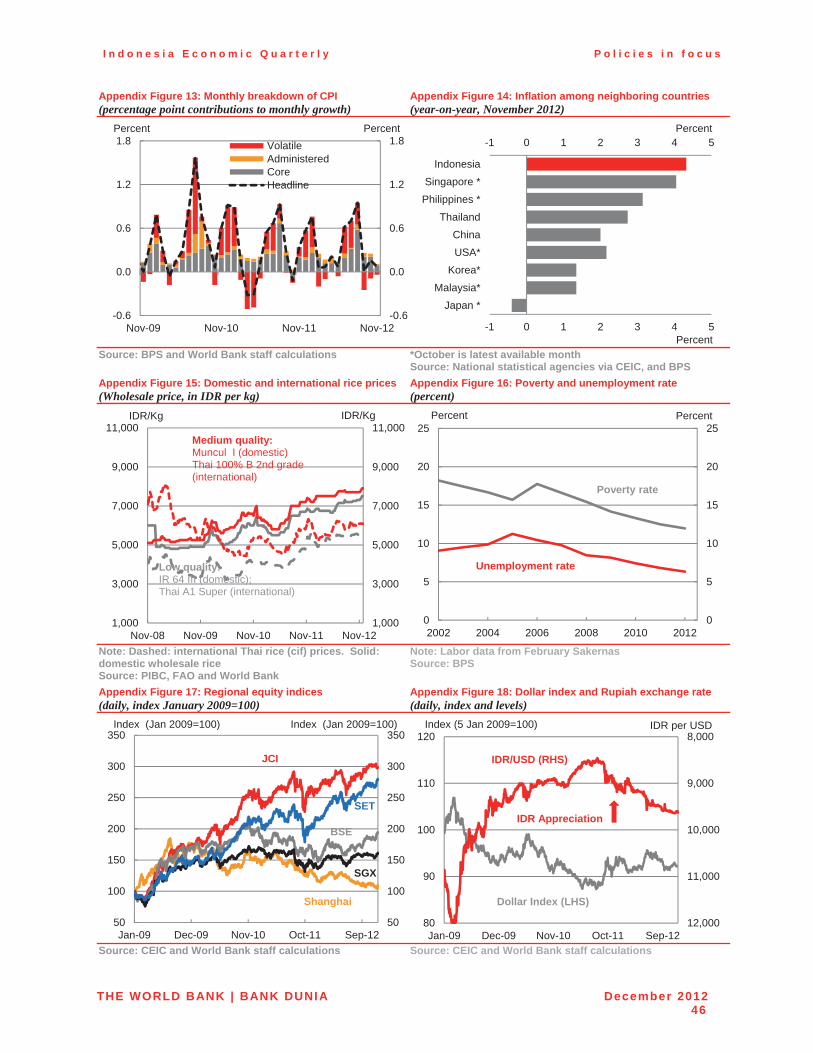
I n d o n e s i a E c o n o m i c Q u a r t e r l y P o l i c i e s i n f o c u s
THE WORLD BANK | BANK DUNIA December 201246
Appendix Figure 13: Monthly breakdown of CPI (percentage point contributions to monthly growth)
Appendix Figure 14: Inflation among neighboring countries (year-on-year, November 2012)
Source: BPS and World Bank staff calculations *October is latest available month Source: National statistical agencies via CEIC, and BPS
Appendix Figure 15: Domestic and international rice prices (Wholesale price, in IDR per kg)
Appendix Figure 16: Poverty and unemployment rate (percent)
Note: Dashed: international Thai rice (cif) prices. Solid: domestic wholesale rice Source: PIBC, FAO and World Bank
Note: Labor data from February Sakernas Source: BPS
Appendix Figure 17: Regional equity indices (daily, index January 2009=100)
Appendix Figure 18: Dollar index and Rupiah exchange rate (daily, index and levels)
Source: CEIC and World Bank staff calculations Source: CEIC and World Bank staff calculations
-0.6
0.0
0.6
1.2
1.8
-0.6
0.0
0.6
1.2
1.8
Nov-09 Nov-10 Nov-11 Nov-12
VolatileAdministeredCoreHeadline
Percent Percent-1 0 1 2 3 4 5
-1 0 1 2 3 4 5
Japan *Malaysia*
Korea*USA*China
Thailand
Philippines *Singapore *
Indonesia
Percent
Percent
1,000
3,000
5,000
7,000
9,000
11,000
1,000
3,000
5,000
7,000
9,000
11,000
Nov-08 Nov-09 Nov-10 Nov-11 Nov-12
Low quality:IR 64 III (domestic);Thai A1 Super (international)
IDR/Kg
Medium quality: Muncul I (domestic)Thai 100% B 2nd grade (international)
IDR/Kg
0
5
10
15
20
25
0
5
10
15
20
25
2002 2004 2006 2008 2010 2012
Percent Percent
Poverty rate
Unemployment rate
50
100
150
200
250
300
350
50
100
150
200
250
300
350
Jan-09 Dec-09 Nov-10 Oct-11 Sep-12
Index (Jan 2009=100)
SGX
JCI
SET
Shanghai
BSE
Index (Jan 2009=100)8,000
9,000
10,000
11,000
12,00080
90
100
110
120
Jan-09 Dec-09 Nov-10 Oct-11 Sep-12
Index (5 Jan 2009=100)
IDR/USD (RHS)
Dollar Index (LHS)
IDR Appreciation
IDR per USD
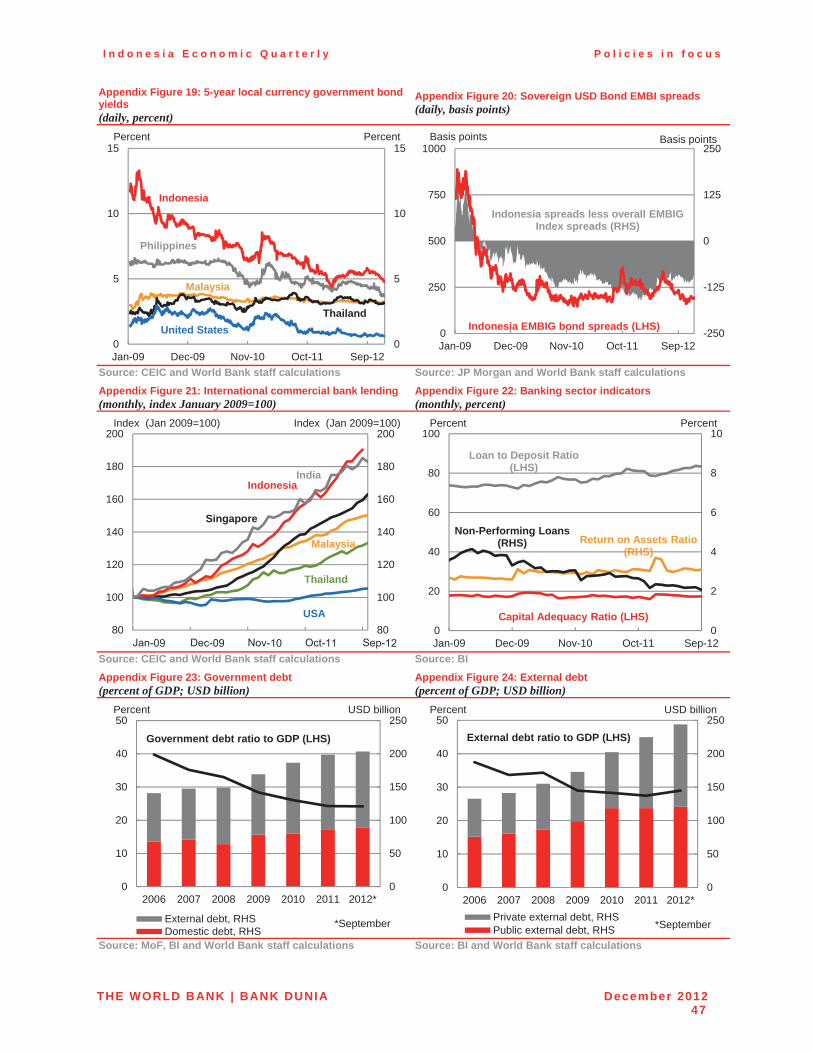
I n d o n e s i a E c o n o m i c Q u a r t e r l y P o l i c i e s i n f o c u s
THE WORLD BANK | BANK DUNIA December 201247
Appendix Figure 19: 5-year local currency government bond yields (daily, percent)
Appendix Figure 20: Sovereign USD Bond EMBI spreads (daily, basis points)
Source: CEIC and World Bank staff calculations Source: JP Morgan and World Bank staff calculations Appendix Figure 21: International commercial bank lending (monthly, index January 2009=100)
Appendix Figure 22: Banking sector indicators (monthly, percent)
Source: CEIC and World Bank staff calculations Source: BI Appendix Figure 23: Government debt (percent of GDP; USD billion)
Appendix Figure 24: External debt (percent of GDP; USD billion)
Source: MoF, BI and World Bank staff calculations Source: BI and World Bank staff calculations
0
5
10
15
0
5
10
15
Jan-09 Dec-09 Nov-10 Oct-11 Sep-12
Percent
Philippines
United StatesThailand
Malaysia
Indonesia
Percent
-250
-125
0
125
250
0
250
500
750
1000
Jan-09 Dec-09 Nov-10 Oct-11 Sep-12
Basis points
Indonesia EMBIG bond spreads (LHS)
Indonesia spreads less overall EMBIG Index spreads (RHS)
Basis points
80
100
120
140
160
180
200
80
100
120
140
160
180
200Index (Jan 2009=100)
USA
Thailand
Singapore
IndonesiaIndia
Malaysia
Index (Jan 2009=100)
0
2
4
6
8
10
0
20
40
60
80
100
Jan-09 Dec-09 Nov-10 Oct-11 Sep-12
Capital Adequacy Ratio (LHS)
Return on Assets Ratio (RHS)
Loan to Deposit Ratio (LHS)
Percent Percent
Non-Performing Loans (RHS)
0
50
100
150
200
250
0
10
20
30
40
50
2006 2007 2008 2009 2010 2011 2012*
External debt, RHSDomestic debt, RHS
Percent USD billion
Government debt ratio to GDP (LHS)
*September
0
50
100
150
200
250
0
10
20
30
40
50
2006 2007 2008 2009 2010 2011 2012*Private external debt, RHSPublic external debt, RHS
External debt ratio to GDP (LHS)
Percent USD billion
*September
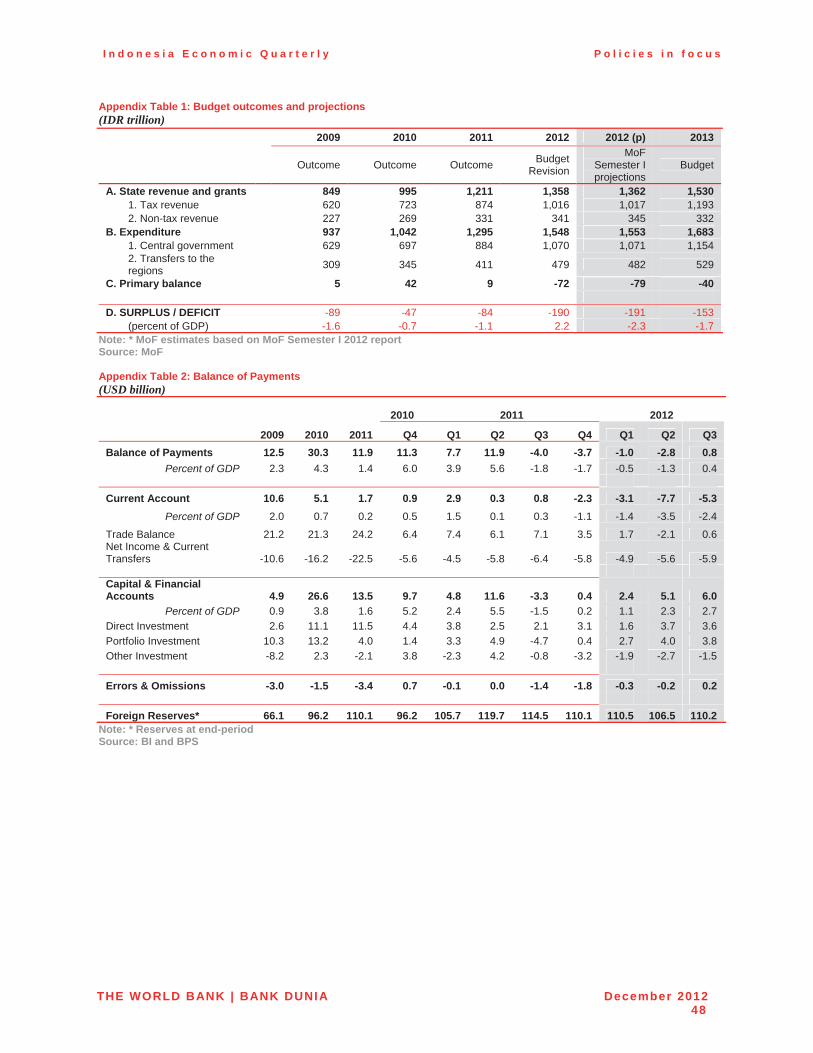
I n d o n e s i a E c o n o m i c Q u a r t e r l y P o l i c i e s i n f o c u s
THE WORLD BANK | BANK DUNIA December 201248
Appendix Table 1: Budget outcomes and projections (IDR trillion)
2009 2010 2011 2012 2012 (p) 2013
Outcome Outcome Outcome BudgetRevision
MoFSemester I projections
Budget
A. State revenue and grants 849 995 1,211 1,358 1,362 1,530 1. Tax revenue 620 723 874 1,016 1,017 1,193 2. Non-tax revenue 227 269 331 341 345 332
B. Expenditure 937 1,042 1,295 1,548 1,553 1,683 1. Central government 629 697 884 1,070 1,071 1,154 2. Transfers to the regions 309 345 411 479 482 529
C. Primary balance 5 42 9 -72 -79 -40
D. SURPLUS / DEFICIT -89 -47 -84 -190 -191 -153 (percent of GDP) -1.6 -0.7 -1.1 2.2 -2.3 -1.7
Note: * MoF estimates based on MoF Semester I 2012 report Source: MoF
Appendix Table 2: Balance of Payments (USD billion)
2010 2011 2012
2009 2010 2011 Q4 Q1 Q2 Q3 Q4 Q1 Q2 Q3 Balance of Payments 12.5 30.3 11.9 11.3 7.7 11.9 -4.0 -3.7 -1.0 -2.8 0.8
Percent of GDP 2.3 4.3 1.4 6.0 3.9 5.6 -1.8 -1.7 -0.5 -1.3 0.4
Current Account 10.6 5.1 1.7 0.9 2.9 0.3 0.8 -2.3 -3.1 -7.7 -5.3 Percent of GDP 2.0 0.7 0.2 0.5 1.5 0.1 0.3 -1.1 -1.4 -3.5 -2.4
Trade Balance 21.2 21.3 24.2 6.4 7.4 6.1 7.1 3.5 1.7 -2.1 0.6Net Income & Current Transfers -10.6 -16.2 -22.5 -5.6 -4.5 -5.8 -6.4 -5.8 -4.9 -5.6 -5.9
Capital & Financial Accounts 4.9 26.6 13.5 9.7 4.8 11.6 -3.3 0.4 2.4 5.1 6.0
Percent of GDP 0.9 3.8 1.6 5.2 2.4 5.5 -1.5 0.2 1.1 2.3 2.7Direct Investment 2.6 11.1 11.5 4.4 3.8 2.5 2.1 3.1 1.6 3.7 3.6Portfolio Investment 10.3 13.2 4.0 1.4 3.3 4.9 -4.7 0.4 2.7 4.0 3.8Other Investment -8.2 2.3 -2.1 3.8 -2.3 4.2 -0.8 -3.2 -1.9 -2.7 -1.5
Errors & Omissions -3.0 -1.5 -3.4 0.7 -0.1 0.0 -1.4 -1.8 -0.3 -0.2 0.2
Foreign Reserves* 66.1 96.2 110.1 96.2 105.7 119.7 114.5 110.1 110.5 106.5 110.2
Note: * Reserves at end-period Source: BI and BPS
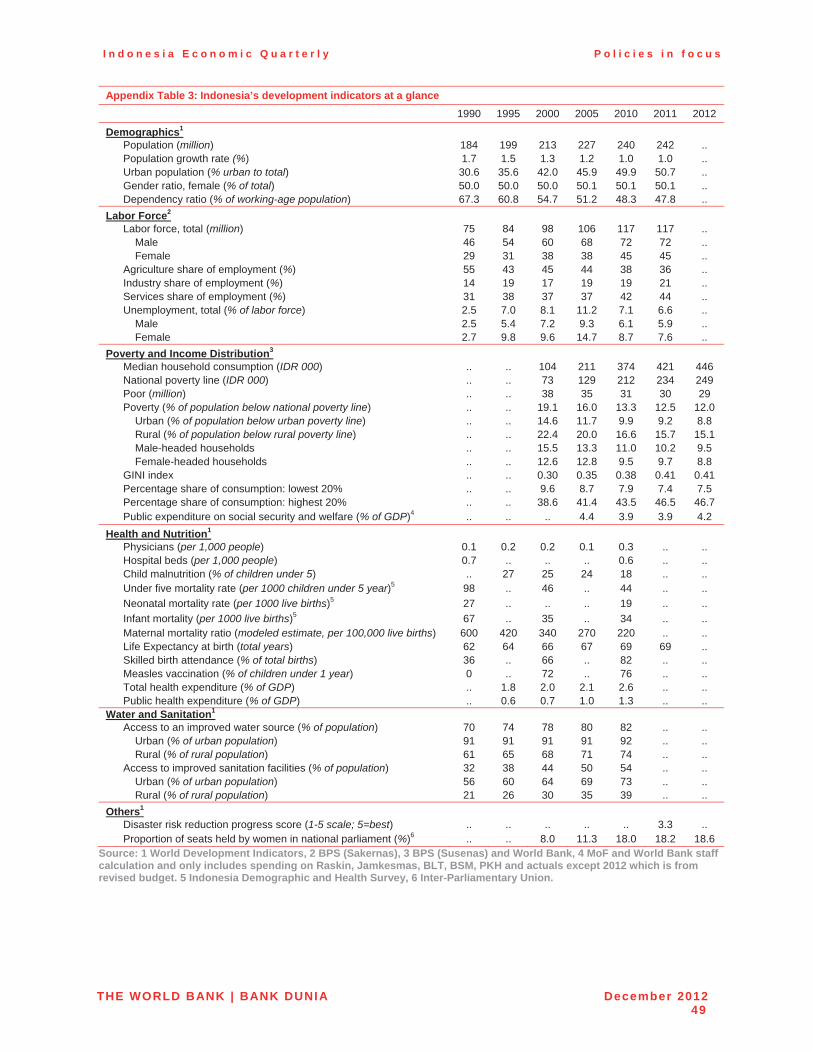
I n d o n e s i a E c o n o m i c Q u a r t e r l y P o l i c i e s i n f o c u s
THE WORLD BANK | BANK DUNIA December 201249
Appendix Table 3: Indonesia’s development indicators at a glance1990 1995 2000 2005 2010 2011 2012
Demographics1
Population (million) 184 199 213 227 240 242 ..Population growth rate (%) 1.7 1.5 1.3 1.2 1.0 1.0 ..Urban population (% urban to total) 30.6 35.6 42.0 45.9 49.9 50.7 ..Gender ratio, female (% of total) 50.0 50.0 50.0 50.1 50.1 50.1 ..Dependency ratio (% of working-age population) 67.3 60.8 54.7 51.2 48.3 47.8 ..
Labor Force2
Labor force, total (million) 75 84 98 106 117 117 .. Male 46 54 60 68 72 72 .. Female 29 31 38 38 45 45 ..Agriculture share of employment (%) 55 43 45 44 38 36 ..Industry share of employment (%) 14 19 17 19 19 21 ..Services share of employment (%) 31 38 37 37 42 44 ..Unemployment, total (% of labor force) 2.5 7.0 8.1 11.2 7.1 6.6 .. Male 2.5 5.4 7.2 9.3 6.1 5.9 .. Female 2.7 9.8 9.6 14.7 8.7 7.6 ..
Poverty and Income Distribution3
Median household consumption (IDR 000) .. .. 104 211 374 421 446National poverty line (IDR 000) .. .. 73 129 212 234 249Poor (million) .. .. 38 35 31 30 29Poverty (% of population below national poverty line) .. .. 19.1 16.0 13.3 12.5 12.0 Urban (% of population below urban poverty line) .. .. 14.6 11.7 9.9 9.2 8.8 Rural (% of population below rural poverty line) .. .. 22.4 20.0 16.6 15.7 15.1 Male-headed households .. .. 15.5 13.3 11.0 10.2 9.5 Female-headed households .. .. 12.6 12.8 9.5 9.7 8.8GINI index .. .. 0.30 0.35 0.38 0.41 0.41Percentage share of consumption: lowest 20% .. .. 9.6 8.7 7.9 7.4 7.5Percentage share of consumption: highest 20% .. .. 38.6 41.4 43.5 46.5 46.7Public expenditure on social security and welfare (% of GDP)4 .. .. .. 4.4 3.9 3.9 4.2
Health and Nutrition1
Physicians (per 1,000 people) 0.1 0.2 0.2 0.1 0.3 .. ..Hospital beds (per 1,000 people) 0.7 .. .. .. 0.6 .. ..Child malnutrition (% of children under 5) .. 27 25 24 18 .. ..Under five mortality rate (per 1000 children under 5 year)5 98 .. 46 .. 44 .. ..Neonatal mortality rate (per 1000 live births)5 27 .. .. .. 19 .. ..Infant mortality (per 1000 live births)5 67 .. 35 .. 34 .. ..Maternal mortality ratio (modeled estimate, per 100,000 live births) 600 420 340 270 220 .. ..Life Expectancy at birth (total years) 62 64 66 67 69 69 ..Skilled birth attendance (% of total births) 36 .. 66 .. 82 .. ..Measles vaccination (% of children under 1 year) 0 .. 72 .. 76 .. ..Total health expenditure (% of GDP) .. 1.8 2.0 2.1 2.6 .. ..Public health expenditure (% of GDP) .. 0.6 0.7 1.0 1.3 .. ..
Water and Sanitation1
Access to an improved water source (% of population) 70 74 78 80 82 .. .. Urban (% of urban population) 91 91 91 91 92 .. .. Rural (% of rural population) 61 65 68 71 74 .. ..Access to improved sanitation facilities (% of population) 32 38 44 50 54 .. .. Urban (% of urban population) 56 60 64 69 73 .. .. Rural (% of rural population) 21 26 30 35 39 .. ..
Others1
Disaster risk reduction progress score (1-5 scale; 5=best) .. .. .. .. .. 3.3 ..Proportion of seats held by women in national parliament (%)6 .. .. 8.0 11.3 18.0 18.2 18.6
Source: 1 World Development Indicators, 2 BPS (Sakernas), 3 BPS (Susenas) and World Bank, 4 MoF and World Bank staff calculation and only includes spending on Raskin, Jamkesmas, BLT, BSM, PKH and actuals except 2012 which is from revised budget. 5 Indonesia Demographic and Health Survey, 6 Inter-Parliamentary Union.

March 2013
Pressures mounting
INDONESIA ECONOMIC QUARTERLY
INDONESIA ECONOMIC QUARTERLY Pressures mounting
March 2013

Preface
The Indonesia Economic Quarterly (IEQ) has two main aims. First, it reports on the key developments over the past three months in Indonesia’s economy, and places these in a longer-term and global context. Based on these developments, and on policy changes over the period, the IEQ regularly updates the outlook for Indonesia’s economy and social welfare. Second, the IEQ provides a more in-depth examination of selected economic and policy issues, and analysis of Indonesia’s medium-term development challenges. It is intended for a wide audience, including policymakers, business leaders, financial market participants, and the community of analysts and professionals engaged in Indonesia’s evolving economy.
The IEQ is a product of the World Bank’s Jakarta office. The report is compiled by the Macro and Fiscal Policy Cluster, Poverty Reduction and Economic Management (PREM) Network, under the guidance of Sector Manager and Lead Economist, Jim Brumby, Economic Advisor and Lead Economist, Ndiame Diop, and Senior Economist, Ashley Taylor. The core project team, with responsibility for Part A (economic update), editing and production, comprises Arsianti, Magda Adriani, Fitria Fitrani, Brendan Coates, Faya Hayati, Ahya Ihsan, Shakira Jones, Alex Sienaert and Ashley Taylor, with invaluableadministrative support provided by Titi Ananto and Sylvia Njotomihardjo. Dissemination is organized by Dini Sari Djalal, Farhana Asnap, Indra Irnawan, Jerry Kurniawan, Nugroho, Marcellinus Winata and Randy Salim.
This edition of the IEQ also includes contributions from Ahya Ihsan (Section B.1 on the 2012 Budget outturn), Fitria Fitrani and Brendan Coates (Section B.2 on trade), Taimur Samad, Renata Simatupang and Chandan Deuskar (Section C.1 on urbanization) and Bill Wallace and Ahya Ihsan (Section C.2. on infrastructure investment, with support from Jonathan Sariaatmadja and Yus Pakpahan). Key input was also received from Kiyoshi Taniguchi (box on beef prices), Djauhari Sitorus, Neni Lestari and The Fei Ming (banking sector, credit and corporate sector update), and Cindy Paladines and Matthew Wai-Poi (poverty update). Mark Ahern, Bert Hoffman, Yue Man Lee, Hari Purnomo, Sjamsu Rahardja, Theo Thomas and Soekarno Wirokartono provided in-depth comments.
This report is a product of the staff of the International Bank for Reconstruction and Development / The World Bank, supported by funding from the Australian Government ––AusAID, under the Support for Enhanced Macroeconomic and Fiscal Policy Analysis (SEMEFPA) program.
The findings, interpretations, and conclusions expressed in this report do not necessarily reflect the views of the Executive Directors of The World Bank or the governments they represent, AusAID or the Australian Government. The World Bank does not guarantee the accuracy of the data included in this work. The boundaries, colors, denominations, and other information shown on any map in this work do not imply any judgment on the part of The World Bank concerning the legal status of any territory or the endorsement oracceptance of such boundaries.
Cover and chapter photographs are copyright Juferdy, SECO and Sri Probo. All rights reserved.
For more World Bank analysis of Indonesia’s economy: For information about the World Bank and its activities in Indonesia, please visit
www.worldbank.org/id.
In order to be included on an email distribution list for this Quarterly series and related publications, please contact [email protected]. For questions and comments relating to this publication, please contact [email protected].

Table of contents
Preface iii �
Executive summary: Pressures mounting viii �
A. � ECONOMIC AND FISCAL UPDATE 1 �
1.� Global economic conditions have improved modestly 1�2.� Indonesia’s economy continued to grow steadily through the end of 2012 2�3.� Current account deficit places focus on external financing needs and sources 6�4.� Credit extension and asset price growth remain strong in early 2013 9�5.� Low economy-wide inflation in 2012 but the CPI has recently accelerated 12�6.� The fiscal deficit is likely to expand in 2013 on higher fuel subsidy spending 16�7.� The official poverty rate continues to decline slowly 19�8.� Risks to the outlook are being heightened by domestic factors 21�
B. � SOME RECENT DEVELOPMENTS IN INDONESIA’S ECONOMY 23 �
1.� A closer look at the preliminary 2012 Budget outturn 23�a.� The preliminary figure for the overall deficit was 1.8 percent of GDP… .................................. 24�b.� …as falling revenue growth was offset by underspends on core expenditures ...................... 24�
2.� Understanding the value-added in Indonesia’s trade 27�a.� What can be learnt from looking at trade in value added? ........................................................ 27�b.� Commodities have driven the patterns of Indonesia’s value added in exports ....................... 27�c.� Imported intermediates are increasingly going towards domestic production ....................... 28�d.� Integration into international supply chains could help export diversification ....................... 29�
C. � INDONESIA 2014 AND BEYOND: A SELECTIVE LOOK 31 �
1.� Preparing for Indonesia’s urban future: harnessing agglomeration economies 31�a.� Cities as the future of Indonesia .................................................................................................. 31�b.� Urban agglomeration brings both benefits and challenges ...................................................... 32�c.� The way forward: making the most of urbanization and agglomeration in Indonesia ............ 36�
2.� Piecing together the picture of Indonesia's infrastructure investment trends 37�a.� Infrastructure investment has not recovered to pre-Asian crisis levels .................................. 38�b.� What has been driving the recent trends in infrastructure investment? .................................. 39�c.� Linking infrastructure, growth and development outcomes ..................................................... 42�
APPENDIX: A SNAPSHOT OF INDONESIAN ECONOMIC INDICATORS 43 �
LIST OF FIGURES
Figure 1: Real GDP growth has stayed steady but nominal GDP and real final sales growth have slowed ............................................................................................................................. x�
Figure 2: Infrastructure investment in real terms and as a share of GDP remains below pre-Asian crisis levels ......................................................................................................... xi�
Figure 3: US Treasury yields remain close to historic lows and emerging market sovereign credit spreads are tight… .............................................................................................. 2�
Figure 4: …while the prices of some of Indonesia’s key commodity exports show signs of stabilization and recovery ............................................................................................. 2�
Figure 5: Private consumption and investment continue to be the key drivers of growth, offsetting net export weakness ..................................................................................... 4�
Figure 6: Services and Industry performed robustly ......................................................................... 4�Figure 7: Weak capital goods imports suggest further possible moderation in investment
growth ............................................................................................................................. 4�Figure 8: A wider current account deficit has kept the basic balance of payments in deficit… .... 6�Figure 9: … as a combination of weak prices and export volumes weighed on most commodity
exports ............................................................................................................................ 6�Figure 10: A sizable oil and gas trade deficit has recently weighed on the external accounts ..... 7�Figure 11: Despite strong growth, FDI inflows into Indonesia remain modest compared to its
peers ................................................................................................................................ 8�Figure 12: Reserves declined in January and February despite the return of portfolio investment
inflows ............................................................................................................................. 8�Figure 13: Gross external financing needs have trended higher ...................................................... 9�Figure 14: …although foreign currency lending has been decelerating, to below the pace of
domestic lending ............................................................................................................ 9�Figure 15: Bond yields remain low and the Rupiah has depreciated ............................................. 10�Figure 16: The recent dip in credit growth appears to have bottomed out for now ...................... 10�Figure 17: Indonesia’s banking system assets as a share of GDP remains small compared with
its peers… ..................................................................................................................... 10�Figure 18: …despite comparatively rapid nominal credit growth in recent years ......................... 10�Figure 19: Residential house price growth has been modest, especially in real terms, but is now
accelerating… ............................................................................................................... 11�Figure 20: …while property sector lending accelerated to mid-2012 but has since slowed as
LTVs have taken effect................................................................................................. 11�Figure 21: Inflation in 2012 was the lowest in 12 years… ................................................................ 12�Figure 22: …helped by food price disinflation over the second half of 2012 before this
accelerated in early 2013 ............................................................................................. 12�Figure 23: CPI weights of the food items affected by recent restrictive trade policies influence
their CPI impact… ........................................................................................................ 12�Figure 24: …with some prices recently soaring ............................................................................... 12�Figure 25: The domestic beef price has risen sharply ..................................................................... 13�Figure 26: Large variation in regulated minimum wage increases across provinces ................... 14�Figure 27: Food prices increased due to floods ............................................................................... 15�Figure 28: Prudent fiscal policy set to continue in 2013 .................................................................. 16�Figure 29: Spending on fuel subsidies is likely to overshoot the Budget in 2013… ..................... 17�Figure 30: …and, along with budget execution challenges, continue to constrain the quality of
spending ....................................................................................................................... 17�Figure 31: Revenue collection is expected to improve in 2013....................................................... 17�Figure 32: Poverty continues to decline, but is lagging the pace required to meet the
Government’s RPJM targets ....................................................................................... 20�Figure 33: Much of the population remains close to the official poverty line, indicating high
vulnerability to poverty ................................................................................................ 20�Figure 34: The 2012 deficit came in lower than in the revised Budget ........................................... 24�Figure 35: Revenue collection came in near target but performance varied across categories .. 25�Figure 36: Budget execution challenges remain for core spending, energy subsidy spending
rose markedly ............................................................................................................... 25�Figure 37: As in previous years, a significant share of annual spending was disbursed in
December ...................................................................................................................... 25�Figure 38: Value-added exports accounted for only 8 percent of Indonesia’s growth in the
decade to 2011.............................................................................................................. 28�

Figure 39: Indonesia’s gross merchandise exports show a high domestic value-added, and low services, content .......................................................................................................... 28�
Figure 40: The share of foreign value-added in some of Indonesia’s manufactured product exports is sizable… ...................................................................................................... 28�
Figure 41: ...while China’s exports embody more imported inputs than Indonesia’s, except for machinery and TCF ...................................................................................................... 28�
Figure 42: Indonesia’s intermediate merchandise imports support both domestic and export-oriented production… .................................................................................................. 29�
Figure 43: …while in China, a larger share of imported intermediate products are re-exported . 29�Figure 44: Capital goods have risen as a share of Indonesia’s total imports ............................... 30�Figure 45: Indonesia has one of the fastest urbanization rates in Asia ......................................... 31�Figure 46: Important agglomeration and densely populated areas exist across Indonesia ......... 33�Figure 47: Megacities and smaller agglomeration centers perform well, but mid-sized
agglomerations less so ................................................................................................ 33�Figure 48: Per capita spending on infrastructure varies widely across agglomeration sizes ..... 34�Figure 49: Urban areas of Jakarta have expanded rapidly between 2000 and 2010...................... 35�Figure 50: Despite the strong increase seen over 2007 to 2009, infrastructure investment fell
again in 2010 and 2011................................................................................................. 39�Figure 51: Unlike infrastructure investment, the overall fixed investment ratio has surpassed
pre-1997/1998 crisis levels .......................................................................................... 39�Figure 52: Private sector infrastructure investment-to-GDP has fallen markedly… ..................... 40�Figure 53: …while the share of sub-national governments has increased with the process of
decentralization ............................................................................................................ 40�Figure 54: Private sector infrastructure investment in Indonesia has fallen off since 2008 ........ 40�Figure 55: After recovering over 2007 to 2009 energy sector infrastructure has fallen off, as has
that in telecoms,… ....................................................................................................... 41�Figure 56: …but investment in transport infrastructure has risen, recently accounting for one
half of total investment ................................................................................................ 41�
LIST OF APPENDIX FIGURES
Appendix Figure 1: Quarterly and annual GDP growth ................................................................... 43�Appendix Figure 2: Contributions to GDP expenditures ................................................................. 43�Appendix Figure 3: Contributions to GDP production ..................................................................... 43�Appendix Figure 4: Motor cycle and motor vehicle sales ............................................................... 43�Appendix Figure 5: Consumer indicators ......................................................................................... 43�Appendix Figure 6: Industrial production indicators ....................................................................... 43�Appendix Figure 7: Real trade flows ................................................................................................. 44�Appendix Figure 8: Balance of payments ......................................................................................... 44�Appendix Figure 9: Goods trade balance ......................................................................................... 44�Appendix Figure 10: Reserves and capital inflows .......................................................................... 44�Appendix Figure 11: Terms of trade and export and import chained-Fisher price indices .......... 44�Appendix Figure 12: Inflation and monetary policy ......................................................................... 44�Appendix Figure 13: Monthly breakdown of CPI .............................................................................. 45�Appendix Figure 14: Inflation comparison across countries .......................................................... 45�Appendix Figure 15: Domestic and international rice prices .......................................................... 45�Appendix Figure 16: Poverty and unemployment rate .................................................................... 45�Appendix Figure 17: Regional equity indices ................................................................................... 45�Appendix Figure 18: Dollar index and Rupiah exchange rate ......................................................... 45�Appendix Figure 19: 5-year local currency government bond yields ............................................. 46�Appendix Figure 20: Sovereign USD Bond EMBI spreads .............................................................. 46�Appendix Figure 21: International commercial bank lending ......................................................... 46�Appendix Figure 22: Banking sector indicators ............................................................................... 46�Appendix Figure 23: Government debt ............................................................................................. 46�Appendix Figure 24: External debt .................................................................................................... 46�
LIST OF TABLES
Table 1: Under the baseline scenario Indonesia’s growth is projected at 6.2 percent in 2013 ..... ix�Table 2: Under the baseline scenario GDP growth of 6.2 percent is projected for 2013, rising to
6.5 percent in 2014 ......................................................................................................... 5�Table 3: The World Bank projects a fiscal deficit of 1.9 percent of GDP in 2013, slightly higher
than that in the Budget ................................................................................................ 19�Table 4: Actual macro outcomes were mixed relative to the 2012 Budget assumptions ............. 23�Table 5: Capital goods and the rising role of China and the NIEs in Indonesia’s imports ........... 30�
LIST OF APPENDIX TABLES
Appendix Table 1: Budget outcomes and projections ..................................................................... 47�Appendix Table 2: Balance of Payments .......................................................................................... 47�Appendix Table 3: Indonesia’s historical macro-economic indicators at a glance ....................... 48�Appendix Table 4: Indonesia’s development indicators at a glance .............................................. 49�
LIST OF BOXES
Box 1: Property prices, lending growth and risks to financial stability ......................................... 11�Box 2: A look at the drivers of increasing beef prices in Indonesia ............................................... 13�Box 3: Serious floods in Jakarta caused tragic loss of life, and also serious economic
disruption and price increases ................................................................................... 15�Box 4: Indonesia’s changing import mix: the growth of capital goods imports and the growing
role of Asia .................................................................................................................... 30�Box 5: Methodological note on infrastructure investment data in Indonesia ................................ 38�
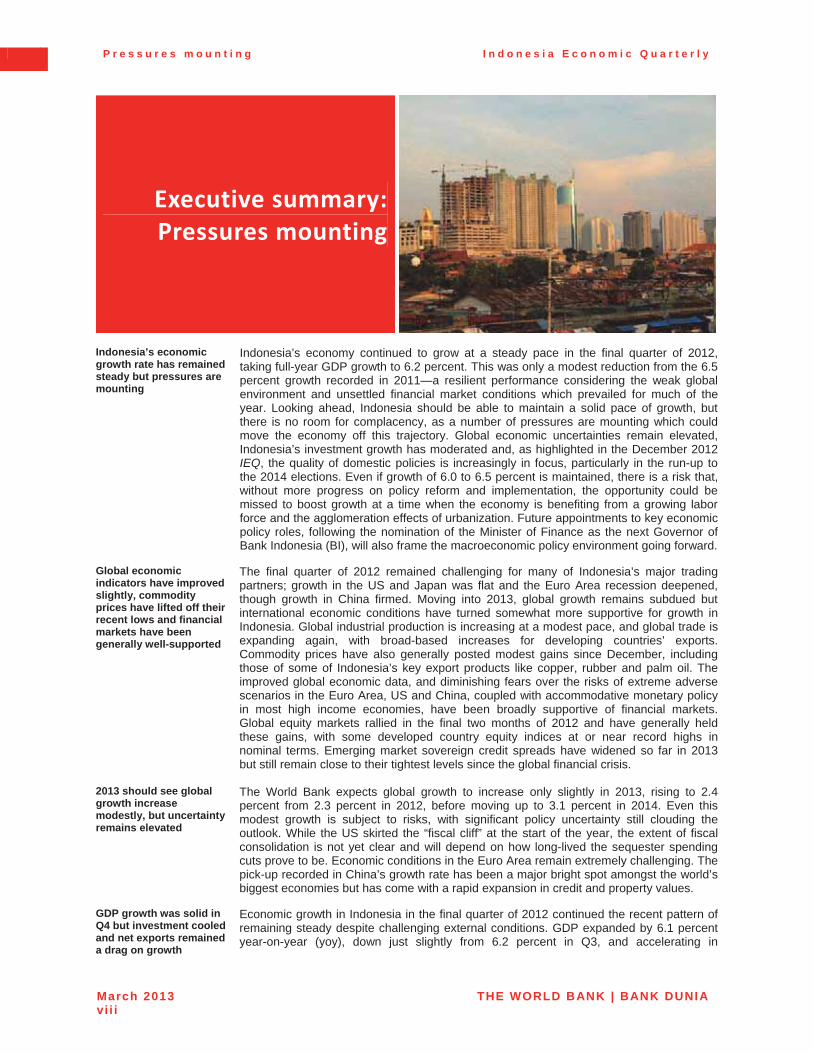
P r e s s u r e s m o u n t i n g I n d o n e s i a E c o n o m i c Q u a r t e r l y
March 2013 THE WORLD BANK | BANK DUNIAvi i i
Executive�summary:�Pressures�mounting
Indonesia’s economic growth rate has remained steady but pressures are mounting
Indonesia’s economy continued to grow at a steady pace in the final quarter of 2012, taking full-year GDP growth to 6.2 percent. This was only a modest reduction from the 6.5 percent growth recorded in 2011—a resilient performance considering the weak global environment and unsettled financial market conditions which prevailed for much of the year. Looking ahead, Indonesia should be able to maintain a solid pace of growth, butthere is no room for complacency, as a number of pressures are mounting which could move the economy off this trajectory. Global economic uncertainties remain elevated, Indonesia’s investment growth has moderated and, as highlighted in the December 2012 IEQ, the quality of domestic policies is increasingly in focus, particularly in the run-up tothe 2014 elections. Even if growth of 6.0 to 6.5 percent is maintained, there is a risk that, without more progress on policy reform and implementation, the opportunity could be missed to boost growth at a time when the economy is benefiting from a growing labor force and the agglomeration effects of urbanization. Future appointments to key economic policy roles, following the nomination of the Minister of Finance as the next Governor of Bank Indonesia (BI), will also frame the macroeconomic policy environment going forward.
Global economic indicators have improved slightly, commodity prices have lifted off their recent lows and financial markets have been generally well-supported
The final quarter of 2012 remained challenging for many of Indonesia’s major trading partners; growth in the US and Japan was flat and the Euro Area recession deepened, though growth in China firmed. Moving into 2013, global growth remains subdued but international economic conditions have turned somewhat more supportive for growth in Indonesia. Global industrial production is increasing at a modest pace, and global trade is expanding again, with broad-based increases for developing countries’ exports. Commodity prices have also generally posted modest gains since December, including those of some of Indonesia’s key export products like copper, rubber and palm oil. The improved global economic data, and diminishing fears over the risks of extreme adverse scenarios in the Euro Area, US and China, coupled with accommodative monetary policy in most high income economies, have been broadly supportive of financial markets. Global equity markets rallied in the final two months of 2012 and have generally held these gains, with some developed country equity indices at or near record highs in nominal terms. Emerging market sovereign credit spreads have widened so far in 2013 but still remain close to their tightest levels since the global financial crisis.
2013 should see global growth increase modestly, but uncertainty remains elevated
The World Bank expects global growth to increase only slightly in 2013, rising to 2.4 percent from 2.3 percent in 2012, before moving up to 3.1 percent in 2014. Even this modest growth is subject to risks, with significant policy uncertainty still clouding the outlook. While the US skirted the “fiscal cliff” at the start of the year, the extent of fiscal consolidation is not yet clear and will depend on how long-lived the sequester spending cuts prove to be. Economic conditions in the Euro Area remain extremely challenging. The pick-up recorded in China’s growth rate has been a major bright spot amongst the world’s biggest economies but has come with a rapid expansion in credit and property values.
GDP growth was solid in Q4 but investment cooled and net exports remained a drag on growth
Economic growth in Indonesia in the final quarter of 2012 continued the recent pattern of remaining steady despite challenging external conditions. GDP expanded by 6.1 percent year-on-year (yoy), down just slightly from 6.2 percent in Q3, and accelerating in
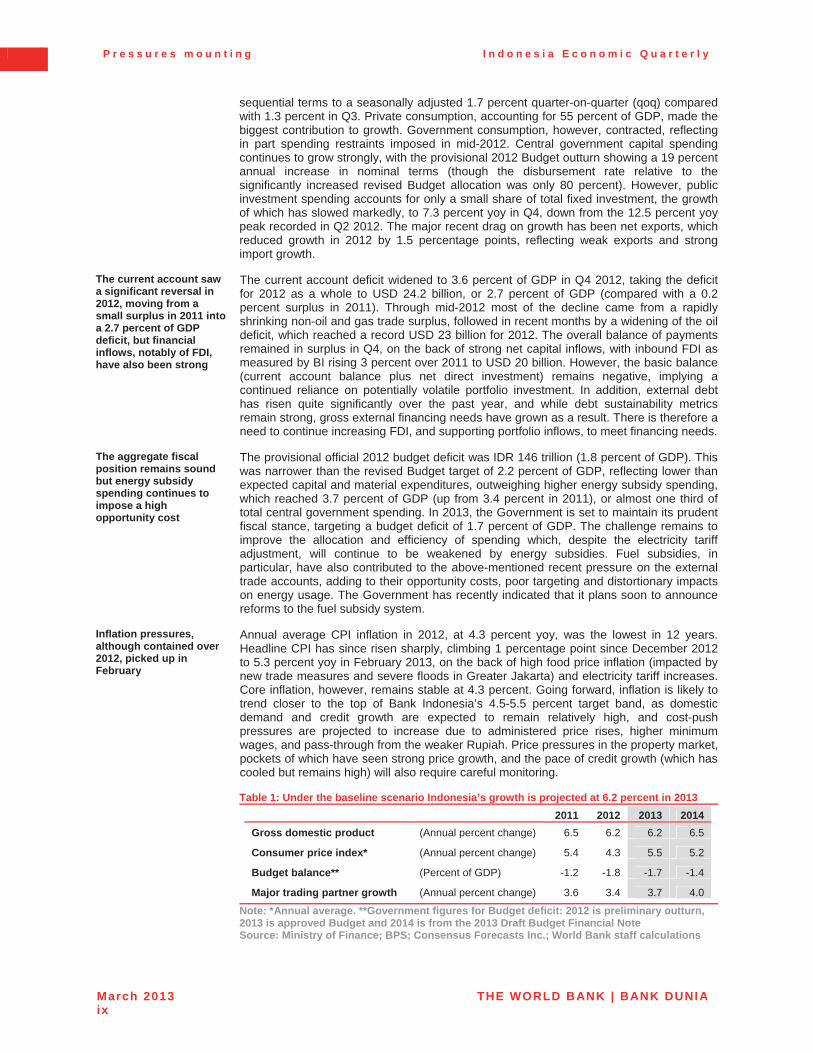
P r e s s u r e s m o u n t i n g I n d o n e s i a E c o n o m i c Q u a r t e r l y
March 2013 THE WORLD BANK | BANK DUNIAix
sequential terms to a seasonally adjusted 1.7 percent quarter-on-quarter (qoq) compared with 1.3 percent in Q3. Private consumption, accounting for 55 percent of GDP, made the biggest contribution to growth. Government consumption, however, contracted, reflecting in part spending restraints imposed in mid-2012. Central government capital spending continues to grow strongly, with the provisional 2012 Budget outturn showing a 19 percent annual increase in nominal terms (though the disbursement rate relative to the significantly increased revised Budget allocation was only 80 percent). However, public investment spending accounts for only a small share of total fixed investment, the growth of which has slowed markedly, to 7.3 percent yoy in Q4, down from the 12.5 percent yoy peak recorded in Q2 2012. The major recent drag on growth has been net exports, which reduced growth in 2012 by 1.5 percentage points, reflecting weak exports and strong import growth.
The current account saw a significant reversal in 2012, moving from a small surplus in 2011 into a 2.7 percent of GDP deficit, but financial inflows, notably of FDI, have also been strong
The current account deficit widened to 3.6 percent of GDP in Q4 2012, taking the deficit for 2012 as a whole to USD 24.2 billion, or 2.7 percent of GDP (compared with a 0.2 percent surplus in 2011). Through mid-2012 most of the decline came from a rapidly shrinking non-oil and gas trade surplus, followed in recent months by a widening of the oil deficit, which reached a record USD 23 billion for 2012. The overall balance of payments remained in surplus in Q4, on the back of strong net capital inflows, with inbound FDI as measured by BI rising 3 percent over 2011 to USD 20 billion. However, the basic balance (current account balance plus net direct investment) remains negative, implying a continued reliance on potentially volatile portfolio investment. In addition, external debt has risen quite significantly over the past year, and while debt sustainability metrics remain strong, gross external financing needs have grown as a result. There is therefore a need to continue increasing FDI, and supporting portfolio inflows, to meet financing needs.
The aggregate fiscal position remains sound but energy subsidy spending continues to impose a high opportunity cost
The provisional official 2012 budget deficit was IDR 146 trillion (1.8 percent of GDP). This was narrower than the revised Budget target of 2.2 percent of GDP, reflecting lower than expected capital and material expenditures, outweighing higher energy subsidy spending,which reached 3.7 percent of GDP (up from 3.4 percent in 2011), or almost one third of total central government spending. In 2013, the Government is set to maintain its prudentfiscal stance, targeting a budget deficit of 1.7 percent of GDP. The challenge remains to improve the allocation and efficiency of spending which, despite the electricity tariff adjustment, will continue to be weakened by energy subsidies. Fuel subsidies, in particular, have also contributed to the above-mentioned recent pressure on the external trade accounts, adding to their opportunity costs, poor targeting and distortionary impacts on energy usage. The Government has recently indicated that it plans soon to announce reforms to the fuel subsidy system.
Inflation pressures, although contained over 2012, picked up in February
Annual average CPI inflation in 2012, at 4.3 percent yoy, was the lowest in 12 years. Headline CPI has since risen sharply, climbing 1 percentage point since December 2012 to 5.3 percent yoy in February 2013, on the back of high food price inflation (impacted by new trade measures and severe floods in Greater Jakarta) and electricity tariff increases. Core inflation, however, remains stable at 4.3 percent. Going forward, inflation is likely to trend closer to the top of Bank Indonesia’s 4.5-5.5 percent target band, as domestic demand and credit growth are expected to remain relatively high, and cost-push pressures are projected to increase due to administered price rises, higher minimum wages, and pass-through from the weaker Rupiah. Price pressures in the property market, pockets of which have seen strong price growth, and the pace of credit growth (which has cooled but remains high) will also require careful monitoring.
Table 1: Under the baseline scenario Indonesia’s growth is projected at 6.2 percent in 2013 2011 2012 2013 2014
Gross domestic product (Annual percent change) 6.5 6.2 6.2 6.5
Consumer price index* (Annual percent change) 5.4 4.3 5.5 5.2
Budget balance** (Percent of GDP) -1.2 -1.8 -1.7 -1.4
Major trading partner growth (Annual percent change) 3.6 3.4 3.7 4.0
Note: *Annual average. **Government figures for Budget deficit: 2012 is preliminary outturn, 2013 is approved Budget and 2014 is from the 2013 Draft Budget Financial Note Source: Ministry of Finance; BPS; Consensus Forecasts Inc.; World Bank staff calculations
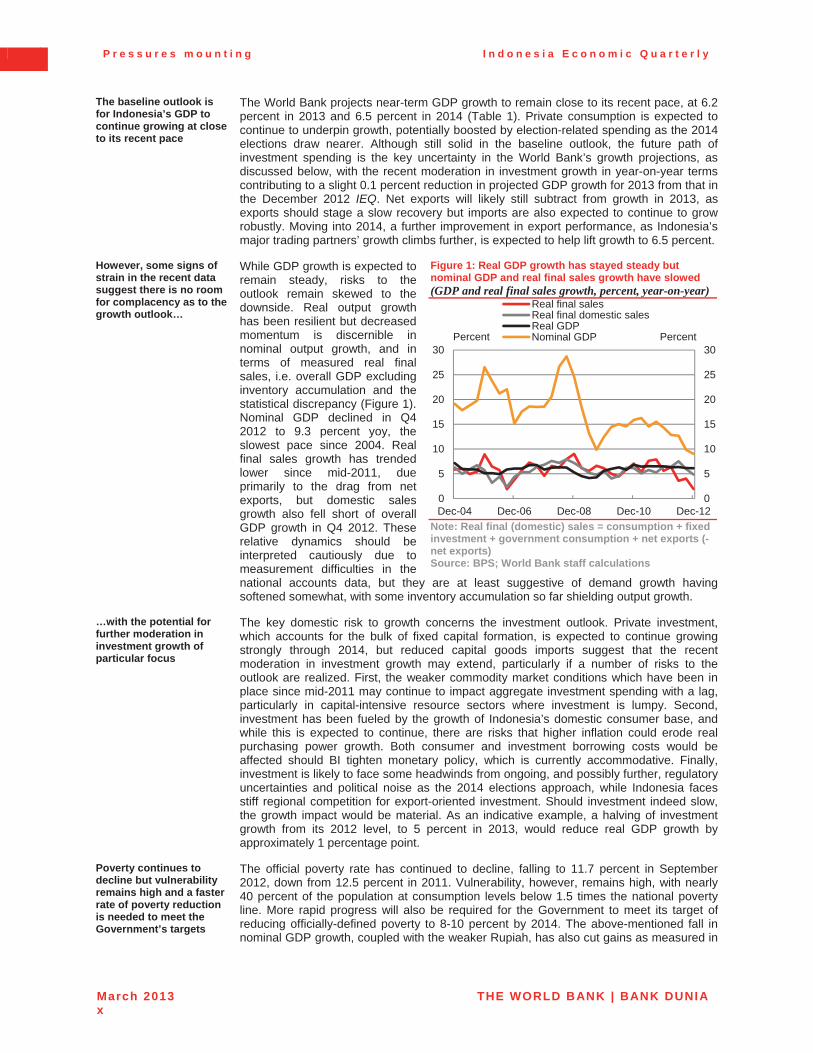
P r e s s u r e s m o u n t i n g I n d o n e s i a E c o n o m i c Q u a r t e r l y
March 2013 THE WORLD BANK | BANK DUNIAx
The baseline outlook is for Indonesia’s GDP to continue growing at close to its recent pace
The World Bank projects near-term GDP growth to remain close to its recent pace, at 6.2 percent in 2013 and 6.5 percent in 2014 (Table 1). Private consumption is expected to continue to underpin growth, potentially boosted by election-related spending as the 2014 elections draw nearer. Although still solid in the baseline outlook, the future path of investment spending is the key uncertainty in the World Bank’s growth projections, as discussed below, with the recent moderation in investment growth in year-on-year terms contributing to a slight 0.1 percent reduction in projected GDP growth for 2013 from that in the December 2012 IEQ. Net exports will likely still subtract from growth in 2013, as exports should stage a slow recovery but imports are also expected to continue to grow robustly. Moving into 2014, a further improvement in export performance, as Indonesia’s major trading partners’ growth climbs further, is expected to help lift growth to 6.5 percent.
However, some signs of strain in the recent data suggest there is no room for complacency as to the growth outlook…
While GDP growth is expected to remain steady, risks to the outlook remain skewed to the downside. Real output growth has been resilient but decreased momentum is discernible in nominal output growth, and in terms of measured real final sales, i.e. overall GDP excluding inventory accumulation and the statistical discrepancy (Figure 1). Nominal GDP declined in Q4 2012 to 9.3 percent yoy, the slowest pace since 2004. Real final sales growth has trended lower since mid-2011, due primarily to the drag from net exports, but domestic sales growth also fell short of overall GDP growth in Q4 2012. These relative dynamics should be interpreted cautiously due to measurement difficulties in the national accounts data, but they are at least suggestive of demand growth having softened somewhat, with some inventory accumulation so far shielding output growth.
Figure 1: Real GDP growth has stayed steady but nominal GDP and real final sales growth have slowed (GDP and real final sales growth, percent, year-on-year)
Note: Real final (domestic) sales = consumption + fixed investment + government consumption + net exports (-net exports) Source: BPS; World Bank staff calculations
…with the potential for further moderation in investment growth of particular focus
The key domestic risk to growth concerns the investment outlook. Private investment, which accounts for the bulk of fixed capital formation, is expected to continue growing strongly through 2014, but reduced capital goods imports suggest that the recent moderation in investment growth may extend, particularly if a number of risks to the outlook are realized. First, the weaker commodity market conditions which have been in place since mid-2011 may continue to impact aggregate investment spending with a lag, particularly in capital-intensive resource sectors where investment is lumpy. Second, investment has been fueled by the growth of Indonesia’s domestic consumer base, and while this is expected to continue, there are risks that higher inflation could erode real purchasing power growth. Both consumer and investment borrowing costs would be affected should BI tighten monetary policy, which is currently accommodative. Finally, investment is likely to face some headwinds from ongoing, and possibly further, regulatory uncertainties and political noise as the 2014 elections approach, while Indonesia faces stiff regional competition for export-oriented investment. Should investment indeed slow, the growth impact would be material. As an indicative example, a halving of investment growth from its 2012 level, to 5 percent in 2013, would reduce real GDP growth by approximately 1 percentage point.
Poverty continues to decline but vulnerability remains high and a faster rate of poverty reduction is needed to meet the Government’s targets
The official poverty rate has continued to decline, falling to 11.7 percent in September 2012, down from 12.5 percent in 2011. Vulnerability, however, remains high, with nearly 40 percent of the population at consumption levels below 1.5 times the national poverty line. More rapid progress will also be required for the Government to meet its target of reducing officially-defined poverty to 8-10 percent by 2014. The above-mentioned fall in nominal GDP growth, coupled with the weaker Rupiah, has also cut gains as measured in
0
5
10
15
20
25
30
0
5
10
15
20
25
30
Dec-04 Dec-06 Dec-08 Dec-10 Dec-12
PercentPercent
Real final salesReal final domestic salesReal GDPNominal GDP
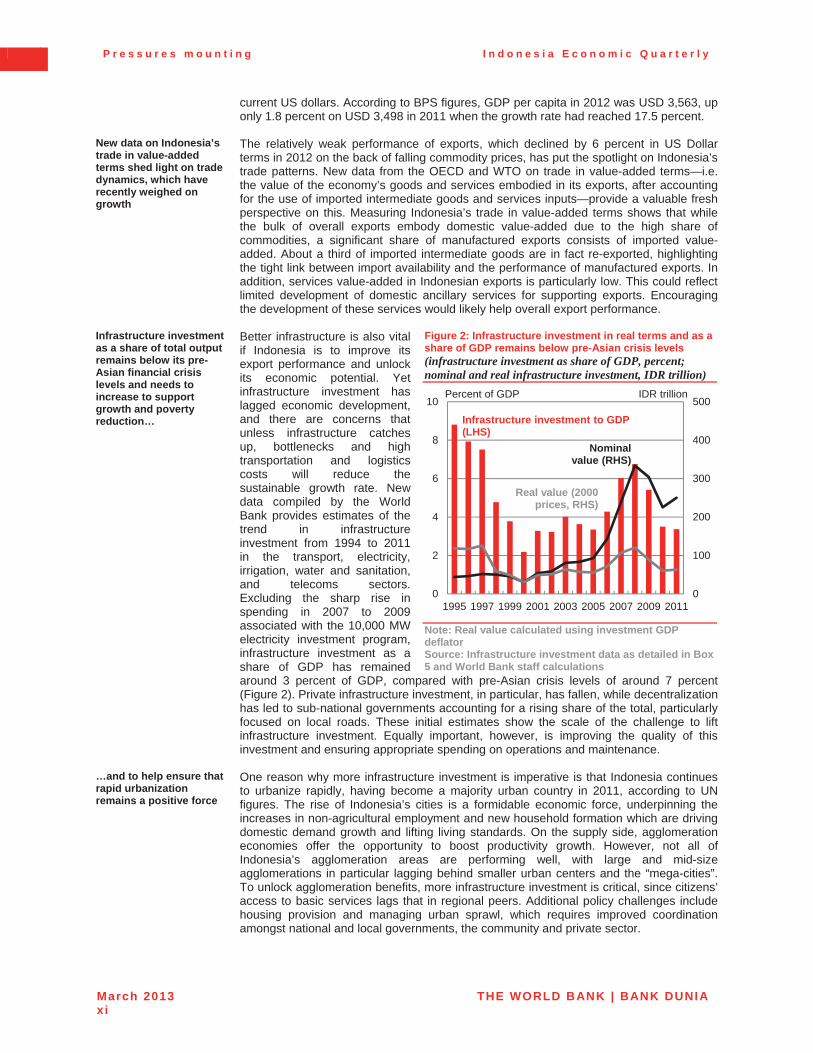
P r e s s u r e s m o u n t i n g I n d o n e s i a E c o n o m i c Q u a r t e r l y
March 2013 THE WORLD BANK | BANK DUNIAxi
current US dollars. According to BPS figures, GDP per capita in 2012 was USD 3,563, up only 1.8 percent on USD 3,498 in 2011 when the growth rate had reached 17.5 percent.
New data on Indonesia’s trade in value-added terms shed light on trade dynamics, which have recently weighed on growth
The relatively weak performance of exports, which declined by 6 percent in US Dollarterms in 2012 on the back of falling commodity prices, has put the spotlight on Indonesia’s trade patterns. New data from the OECD and WTO on trade in value-added terms—i.e. the value of the economy’s goods and services embodied in its exports, after accounting for the use of imported intermediate goods and services inputs—provide a valuable fresh perspective on this. Measuring Indonesia’s trade in value-added terms shows that while the bulk of overall exports embody domestic value-added due to the high share of commodities, a significant share of manufactured exports consists of imported value-added. About a third of imported intermediate goods are in fact re-exported, highlighting the tight link between import availability and the performance of manufactured exports. In addition, services value-added in Indonesian exports is particularly low. This could reflect limited development of domestic ancillary services for supporting exports. Encouraging the development of these services would likely help overall export performance.
Infrastructure investment as a share of total output remains below its pre-Asian financial crisis levels and needs to increase to support growth and poverty reduction…
Better infrastructure is also vital if Indonesia is to improve its export performance and unlock its economic potential. Yet infrastructure investment has lagged economic development, and there are concerns that unless infrastructure catches up, bottlenecks and high transportation and logistics costs will reduce the sustainable growth rate. New data compiled by the World Bank provides estimates of the trend in infrastructure investment from 1994 to 2011 in the transport, electricity, irrigation, water and sanitation, and telecoms sectors. Excluding the sharp rise in spending in 2007 to 2009 associated with the 10,000 MW electricity investment program, infrastructure investment as a share of GDP has remained around 3 percent of GDP, compared with pre-Asian crisis levels of around 7 percent(Figure 2). Private infrastructure investment, in particular, has fallen, while decentralization has led to sub-national governments accounting for a rising share of the total, particularly focused on local roads. These initial estimates show the scale of the challenge to lift infrastructure investment. Equally important, however, is improving the quality of this investment and ensuring appropriate spending on operations and maintenance.
Figure 2: Infrastructure investment in real terms and as a share of GDP remains below pre-Asian crisis levels (infrastructure investment as share of GDP, percent; nominal and real infrastructure investment, IDR trillion)
Note: Real value calculated using investment GDP deflator Source: Infrastructure investment data as detailed in Box 5 and World Bank staff calculations
…and to help ensure that rapid urbanization remains a positive force
One reason why more infrastructure investment is imperative is that Indonesia continues to urbanize rapidly, having become a majority urban country in 2011, according to UN figures. The rise of Indonesia’s cities is a formidable economic force, underpinning the increases in non-agricultural employment and new household formation which are driving domestic demand growth and lifting living standards. On the supply side, agglomeration economies offer the opportunity to boost productivity growth. However, not all of Indonesia’s agglomeration areas are performing well, with large and mid-size agglomerations in particular lagging behind smaller urban centers and the “mega-cities”. To unlock agglomeration benefits, more infrastructure investment is critical, since citizens’ access to basic services lags that in regional peers. Additional policy challenges include housing provision and managing urban sprawl, which requires improved coordination amongst national and local governments, the community and private sector.
0
100
200
300
400
500
0
2
4
6
8
10
1995 1997 1999 2001 2003 2005 2007 2009 2011
Percent of GDP IDR trillion
Nominalvalue (RHS)
Real value (2000 prices, RHS)
Infrastructure investment to GDP (LHS)
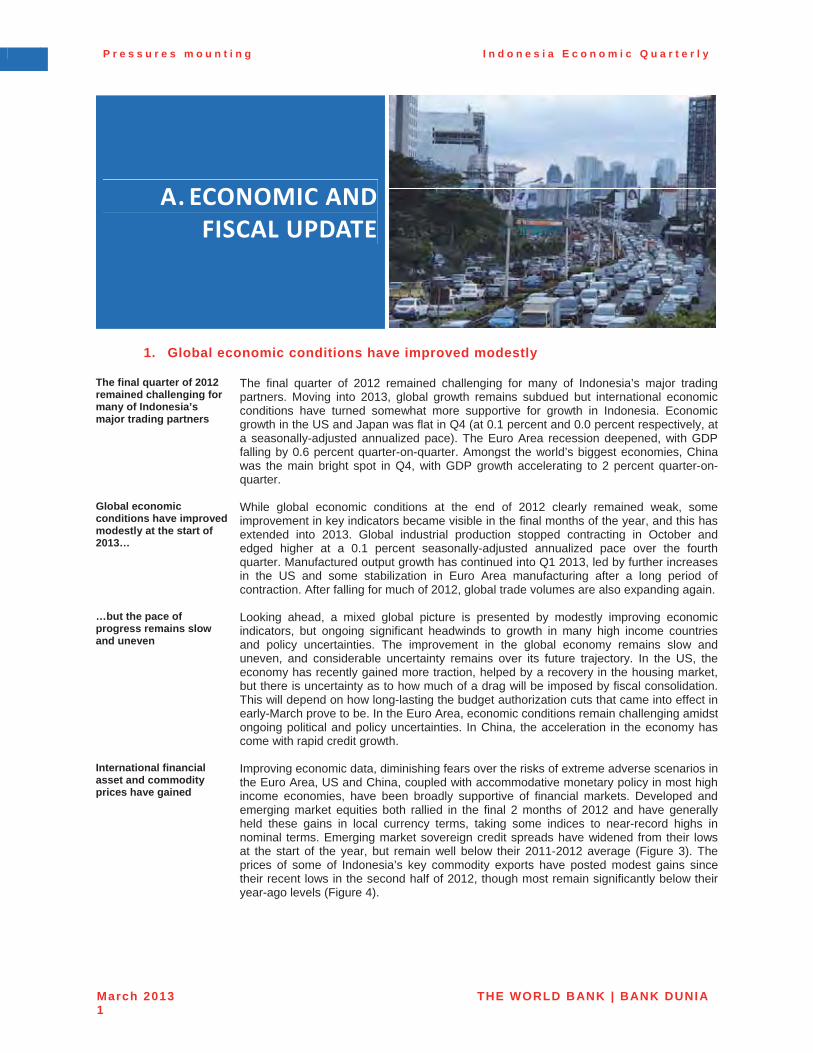
P r e s s u r e s m o u n t i n g I n d o n e s i a E c o n o m i c Q u a r t e r l y
March 2013 THE WORLD BANK | BANK DUNIA1
A. ECONOMIC�AND�FISCAL�UPDATE
1. Global economic conditions have improved modestly
The final quarter of 2012 remained challenging for many of Indonesia’s major trading partners
The final quarter of 2012 remained challenging for many of Indonesia’s major trading partners. Moving into 2013, global growth remains subdued but international economic conditions have turned somewhat more supportive for growth in Indonesia. Economic growth in the US and Japan was flat in Q4 (at 0.1 percent and 0.0 percent respectively, at a seasonally-adjusted annualized pace). The Euro Area recession deepened, with GDP falling by 0.6 percent quarter-on-quarter. Amongst the world’s biggest economies, China was the main bright spot in Q4, with GDP growth accelerating to 2 percent quarter-on-quarter.
Global economic conditions have improved modestly at the start of 2013…
While global economic conditions at the end of 2012 clearly remained weak, some improvement in key indicators became visible in the final months of the year, and this has extended into 2013. Global industrial production stopped contracting in October and edged higher at a 0.1 percent seasonally-adjusted annualized pace over the fourth quarter. Manufactured output growth has continued into Q1 2013, led by further increases in the US and some stabilization in Euro Area manufacturing after a long period of contraction. After falling for much of 2012, global trade volumes are also expanding again.
…but the pace of progress remains slow and uneven
Looking ahead, a mixed global picture is presented by modestly improving economic indicators, but ongoing significant headwinds to growth in many high income countries and policy uncertainties. The improvement in the global economy remains slow and uneven, and considerable uncertainty remains over its future trajectory. In the US, the economy has recently gained more traction, helped by a recovery in the housing market, but there is uncertainty as to how much of a drag will be imposed by fiscal consolidation. This will depend on how long-lasting the budget authorization cuts that came into effect in early-March prove to be. In the Euro Area, economic conditions remain challenging amidst ongoing political and policy uncertainties. In China, the acceleration in the economy hascome with rapid credit growth.
International financial asset and commodity prices have gained
Improving economic data, diminishing fears over the risks of extreme adverse scenarios in the Euro Area, US and China, coupled with accommodative monetary policy in most high income economies, have been broadly supportive of financial markets. Developed and emerging market equities both rallied in the final 2 months of 2012 and have generally held these gains in local currency terms, taking some indices to near-record highs in nominal terms. Emerging market sovereign credit spreads have widened from their lows at the start of the year, but remain well below their 2011-2012 average (Figure 3). The prices of some of Indonesia’s key commodity exports have posted modest gains since their recent lows in the second half of 2012, though most remain significantly below their year-ago levels (Figure 4).
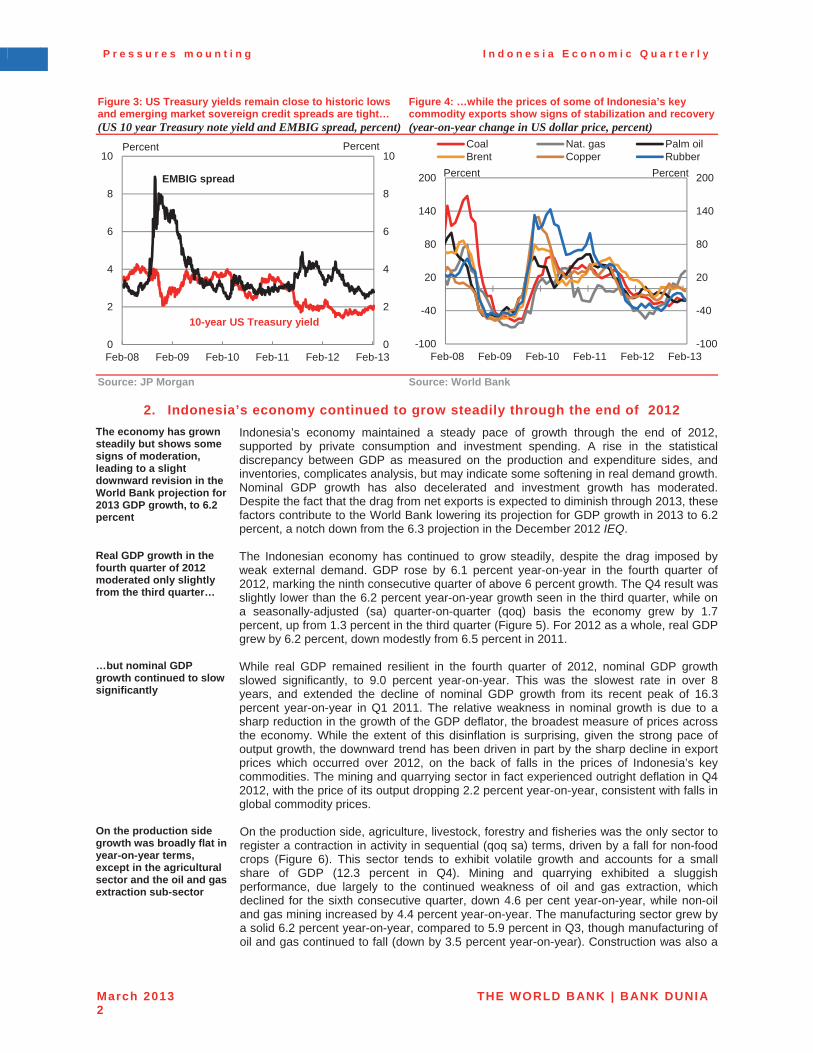
P r e s s u r e s m o u n t i n g I n d o n e s i a E c o n o m i c Q u a r t e r l y
March 2013 THE WORLD BANK | BANK DUNIA2
Figure 3: US Treasury yields remain close to historic lows and emerging market sovereign credit spreads are tight… (US 10 year Treasury note yield and EMBIG spread, percent)
Figure 4: …while the prices of some of Indonesia’s key commodity exports show signs of stabilization and recovery(year-on-year change in US dollar price, percent)
Source: JP Morgan Source: World Bank
2. Indonesia’s economy continued to grow steadily through the end of 2012 The economy has grown steadily but shows some signs of moderation, leading to a slight downward revision in the World Bank projection for 2013 GDP growth, to 6.2 percent
Indonesia’s economy maintained a steady pace of growth through the end of 2012, supported by private consumption and investment spending. A rise in the statistical discrepancy between GDP as measured on the production and expenditure sides, and inventories, complicates analysis, but may indicate some softening in real demand growth. Nominal GDP growth has also decelerated and investment growth has moderated. Despite the fact that the drag from net exports is expected to diminish through 2013, these factors contribute to the World Bank lowering its projection for GDP growth in 2013 to 6.2 percent, a notch down from the 6.3 projection in the December 2012 IEQ.
Real GDP growth in the fourth quarter of 2012 moderated only slightly from the third quarter…
The Indonesian economy has continued to grow steadily, despite the drag imposed by weak external demand. GDP rose by 6.1 percent year-on-year in the fourth quarter of 2012, marking the ninth consecutive quarter of above 6 percent growth. The Q4 result was slightly lower than the 6.2 percent year-on-year growth seen in the third quarter, while on a seasonally-adjusted (sa) quarter-on-quarter (qoq) basis the economy grew by 1.7 percent, up from 1.3 percent in the third quarter (Figure 5). For 2012 as a whole, real GDP grew by 6.2 percent, down modestly from 6.5 percent in 2011.
…but nominal GDP growth continued to slow significantly
While real GDP remained resilient in the fourth quarter of 2012, nominal GDP growth slowed significantly, to 9.0 percent year-on-year. This was the slowest rate in over 8 years, and extended the decline of nominal GDP growth from its recent peak of 16.3 percent year-on-year in Q1 2011. The relative weakness in nominal growth is due to a sharp reduction in the growth of the GDP deflator, the broadest measure of prices across the economy. While the extent of this disinflation is surprising, given the strong pace of output growth, the downward trend has been driven in part by the sharp decline in export prices which occurred over 2012, on the back of falls in the prices of Indonesia’s key commodities. The mining and quarrying sector in fact experienced outright deflation in Q4 2012, with the price of its output dropping 2.2 percent year-on-year, consistent with falls in global commodity prices.
On the production side growth was broadly flat in year-on-year terms, except in the agricultural sector and the oil and gas extraction sub-sector
On the production side, agriculture, livestock, forestry and fisheries was the only sector to register a contraction in activity in sequential (qoq sa) terms, driven by a fall for non-food crops (Figure 6). This sector tends to exhibit volatile growth and accounts for a small share of GDP (12.3 percent in Q4). Mining and quarrying exhibited a sluggish performance, due largely to the continued weakness of oil and gas extraction, whichdeclined for the sixth consecutive quarter, down 4.6 per cent year-on-year, while non-oil and gas mining increased by 4.4 percent year-on-year. The manufacturing sector grew by a solid 6.2 percent year-on-year, compared to 5.9 percent in Q3, though manufacturing of oil and gas continued to fall (down by 3.5 percent year-on-year). Construction was also a
0
2
4
6
8
10
0
2
4
6
8
10
Feb-08 Feb-09 Feb-10 Feb-11 Feb-12 Feb-13
PercentPercent
10-year US Treasury yield
EMBIG spread
-100
-40
20
80
140
200
-100
-40
20
80
140
200
Feb-08 Feb-09 Feb-10 Feb-11 Feb-12 Feb-13
PercentPercent
Coal Nat. gas Palm oilBrent Copper Rubber
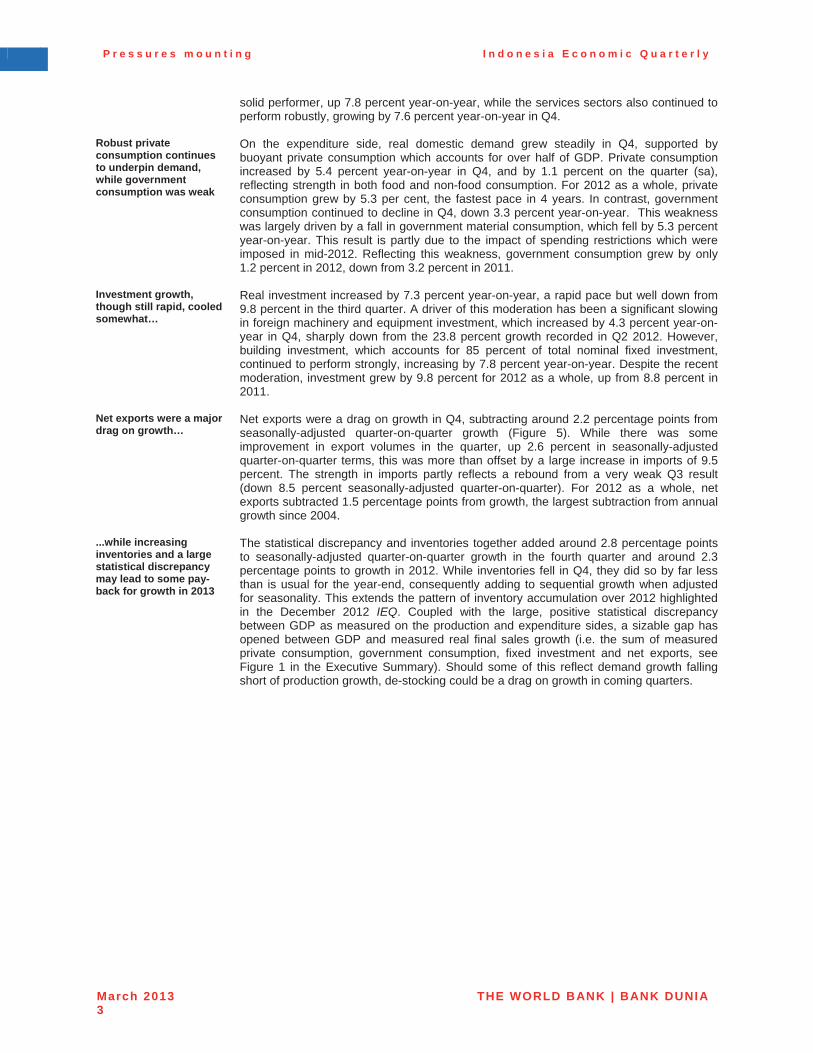
P r e s s u r e s m o u n t i n g I n d o n e s i a E c o n o m i c Q u a r t e r l y
March 2013 THE WORLD BANK | BANK DUNIA3
solid performer, up 7.8 percent year-on-year, while the services sectors also continued to perform robustly, growing by 7.6 percent year-on-year in Q4.
Robust private consumption continues to underpin demand, while government consumption was weak
On the expenditure side, real domestic demand grew steadily in Q4, supported by buoyant private consumption which accounts for over half of GDP. Private consumption increased by 5.4 percent year-on-year in Q4, and by 1.1 percent on the quarter (sa), reflecting strength in both food and non-food consumption. For 2012 as a whole, private consumption grew by 5.3 per cent, the fastest pace in 4 years. In contrast, government consumption continued to decline in Q4, down 3.3 percent year-on-year. This weakness was largely driven by a fall in government material consumption, which fell by 5.3 percent year-on-year. This result is partly due to the impact of spending restrictions which were imposed in mid-2012. Reflecting this weakness, government consumption grew by only 1.2 percent in 2012, down from 3.2 percent in 2011.
Investment growth, though still rapid, cooled somewhat…
Real investment increased by 7.3 percent year-on-year, a rapid pace but well down from 9.8 percent in the third quarter. A driver of this moderation has been a significant slowing in foreign machinery and equipment investment, which increased by 4.3 percent year-on-year in Q4, sharply down from the 23.8 percent growth recorded in Q2 2012. However, building investment, which accounts for 85 percent of total nominal fixed investment, continued to perform strongly, increasing by 7.8 percent year-on-year. Despite the recent moderation, investment grew by 9.8 percent for 2012 as a whole, up from 8.8 percent in 2011.
Net exports were a major drag on growth…
Net exports were a drag on growth in Q4, subtracting around 2.2 percentage points from seasonally-adjusted quarter-on-quarter growth (Figure 5). While there was some improvement in export volumes in the quarter, up 2.6 percent in seasonally-adjusted quarter-on-quarter terms, this was more than offset by a large increase in imports of 9.5 percent. The strength in imports partly reflects a rebound from a very weak Q3 result (down 8.5 percent seasonally-adjusted quarter-on-quarter). For 2012 as a whole, net exports subtracted 1.5 percentage points from growth, the largest subtraction from annual growth since 2004.
...while increasing inventories and a large statistical discrepancy may lead to some pay-back for growth in 2013
The statistical discrepancy and inventories together added around 2.8 percentage points to seasonally-adjusted quarter-on-quarter growth in the fourth quarter and around 2.3 percentage points to growth in 2012. While inventories fell in Q4, they did so by far less than is usual for the year-end, consequently adding to sequential growth when adjusted for seasonality. This extends the pattern of inventory accumulation over 2012 highlighted in the December 2012 IEQ. Coupled with the large, positive statistical discrepancy between GDP as measured on the production and expenditure sides, a sizable gap has opened between GDP and measured real final sales growth (i.e. the sum of measured private consumption, government consumption, fixed investment and net exports, see Figure 1 in the Executive Summary). Should some of this reflect demand growth falling short of production growth, de-stocking could be a drag on growth in coming quarters.

P r e s s u r e s m o u n t i n g I n d o n e s i a E c o n o m i c Q u a r t e r l y
March 2013 THE WORLD BANK | BANK DUNIA4
Figure 5: Private consumption and investment continue to be the key drivers of growth, offsetting net export weakness(year-on-year real GDP growth, percent)
Figure 6: Services and Industry performed robustly (year-on-year Services, Industry and Agriculture GDP growth, percent)
Source: BPS; World Bank staff calculations Source: BPS; World Bank staff calculations
Most high frequency indicators remain firm, with some moderation on the retail side…
High frequency indicators are generally firm. On the production side, cement sales and industrial production have continued to improve in recent months, with cement sales up 20.6 percent year-on-year in February, consistent with the strong performance of building investment in Q4. On the consumption side, motorcycle sales, which fell during much of 2012, have stabilized, increasing in year-on-year terms for the first time in 10 months in December 2012. Vehicle sales in February were also up a strong 19.4 percent yoy. Other demand-side indicators show some evidence of moderation, with consumer sentiment still at high levels but slightly off the Q3 2012 highs as measured by Bank Indonesia, while retail sales growth fell to 7.1 percent yoy in January, down from 15.1 percent in December.
…and with the notable exception of softening capital goods spending
The key uncertainty for the near-term domestic demand growth outlook is the future path of investment. With a large proportion of machinery and equipment for investment purposes imported, capital imports are a good high frequency indicator of investment. This indicator suggests that there is likely to be a further moderation in machinery and equipment investment in coming months (Figure 7). Growth in capital imports has been declining since early 2012, with capital imports falling by 12.1 percent year-on-year in January 2013. This is consistent with the historical link between capital spending and commodity prices, as highlighted in the December 2012 IEQ, with the weakness in commodity prices and exports over 2012 now filtering with a lag into somewhat weaker investment growth.
Figure 7: Weak capital goods imports suggest further possible moderation in investment growth (real fixed investment and 3-month moving average of capital goods imports in USD, percent year-on-year)
Source: BPS; World Bank staff calculations
-4
-2
0
2
4
6
8
10
-4
-2
0
2
4
6
8
10
Dec-09 Sep-10 Jun-11 Mar-12 Dec-12
Private cons. Gov cons.Investment Net ExportsDiscrepancy GDP
Percent Percent
-4
-2
0
2
4
6
8
10
-4
-2
0
2
4
6
8
10
Dec-05 Sep-07 Jun-09 Mar-11 Dec-12
Industry
Percent
Services
Percent
Agriculture
0
2
4
6
8
10
12
14
-40
-20
0
20
40
60
80
Mar-09 Jan-10 Oct-10 Jul-11 Apr-12 Jan-13
Percent Percent
Capital goods imports
Real fixed investment (RHS)

P r e s s u r e s m o u n t i n g I n d o n e s i a E c o n o m i c Q u a r t e r l y
March 2013 THE WORLD BANK | BANK DUNIA5
GDP growth is forecast at 6.2 percent for 2013 and 6.5 percent for 2014…
The World Bank’s projection for GDP growth in 2013 is 6.2 percent (Table 2), down slightly from 6.3 percent in the December 2012 IEQ. Private consumption is expected to remain the main driver of growth, potentially boosted by pre-election spending in the second half of the year. Investment will also continue to be a key source of growth but is expected to moderate somewhat from its rate of increase in 2012, as indicated by the slower pace of imported capital goods spending described above. Net exports will likely continue to subtract from growth in 2013, though to a lesser extent than in 2012. This is because while exports are expected to stage a slow recovery, imports are also expected to continue to grow robustly in line with solid growth in domestic demand. For 2014, growth is expected to pick up to 6.5 percent, supported by a further lift in exports.
Table 2: Under the baseline scenario GDP growth of 6.2 percent is projected for 2013, rising to 6.5 percent in 2014 (percentage change, unless otherwise indicated)
Annual Year to December quarter Revision to
Annual2012 2013 2014 2012 2013 2014 2013 2014
1. Main economic indicators
Total Consumption expenditure 4.8 5.0 5.8 3.9 5.9 5.1 -0.2 n/a
Private consumption expenditure 5.3 5.5 5.8 5.4 5.8 5.1 0.4 n/a
Government consumption 1.2 1.7 5.7 -3.3 6.6 5.3 -4.4 n/a
Gross fixed capital formation 9.8 8.0 9.6 7.3 8.8 10.0 -3.3 n/a
Exports of goods and services 2.0 5.8 11.3 0.5 8.7 12.9 2.0 n/a
Imports of goods and services 6.6 8.6 9.5 6.8 8.1 10.0 5.5 n/a
Gross Domestic Product 6.2 6.2 6.5 6.1 6.2 6.7 -0.1 n/a
Agriculture 4.0 2.8 3.2 . 2.0 4.5 3.2 -0.7 n/a
Industry 5.2 5.1 5.4 5.4 4.7 5.8 0.0 n/a
Services 7.7 8.0 8.1 7.6 7.9 8.2 -0.1 n/a
2. External indicators
Balance of payments (USD bn) 0.2 2.0 4.3 n/a n/a n/a -3.5 n/a
Current account balance (USD bn) -24.2 -23.7 -22.4 n/a n/a n/a -9.5 n/a
Trade balance (USD bn) -2.4 0.3 4.6 n/a n/a n/a -7.4 n/a
Financial account balance (USD bn) 24.9 25.7 26.7 n/a n/a n/a 6.0 n/a
3. Other economic measures
Consumer price index 4.3 5.5 5.2 4.4 5.8 5.4 0.5 n/a
Poverty basket Index 6.5 6.1 6.8 5.4 6.9 7.0 0.4 n/a
GDP Deflator 4.6 4.9 5.9 2.7 6.9 5.5 -1.1 n/a
Nominal GDP 11.0 11.4 12.7 9.0 13.6 12.6 -1.3 n/a
4. Economic assumptions
Exchange rate (IDR/USD) 9419 9600 9500 9630 9600 9500 100.0 n/a
Indonesian crude price (USD/bl) 113 110 105 108 110 105 5.0 n/a
Major trading partner growth 3.4 3.7 4.0 3.1 4.4 3.4 0.1 n/aNote: Projected trade flows relate to the national accounts, which may overstate the true movement in trade volumes and understate the movement in prices due to differences in price series. Revisions are relative to projections in December 2012 IEQSource: MoF; BPS; BI; CEIC; World Bank projections

P r e s s u r e s m o u n t i n g I n d o n e s i a E c o n o m i c Q u a r t e r l y
March 2013 THE WORLD BANK | BANK DUNIA6
3. Current account deficit places focus on external financing needs and sources Indonesia recorded its first annual current account deficit in 15 years in 2012…
Indonesia’s current account deficit widened in Q4 2012 to USD 7.8 billion, or 3.6 percent of GDP (Figure 8). This reflected the combination of ongoing subdued demand for exports and relatively weak commodity prices, and strong import demand, fueled by sustained domestic demand growth. For 2012 as a whole, the current account deficit stood at USD 24.2 billion (2.7 percent of GDP). This was the first full-year deficit in 15 years, reflecting the narrowing goods trade surplus which fell from USD 34.8 billion in 2011 to USD 8.4 billion in 2012. Through to mid-2012 the bulk of the decline came from a rapidly deteriorating surplus in the non-energy trade balance, followed in recent months by a widening of the oil and gas trade deficit.
…but the overall balance of payments returned to surplus in the second half of 2012
Despite the deficit on the current account, the overall balance of payments remained in surplus in Q4 2012, as in Q3, at USD 3.2 billion on the back of strong capital inflows. However, the basic balance (current account balance plus net direct investment) remains in deficit, with direct investment flows financing less than 60 per cent of the current account deficit in Q4, down from 80 per cent in Q3. As a result, Indonesia’s ability to sustain strong FDI inflows and keep policies supportive of potentially volatile portfolio investment will be monitored closely by markets.
Figure 8: A wider current account deficit has kept the basic balance of payments in deficit… (balance of payments flows, USD billion)
Figure 9: … as a combination of weak prices and export volumes weighed on most commodity exports (contribution of price and volume changes to year-on-year growth in export values, percent)
Note: Basic balance = current account balance + net direct investment Source: Bank Indonesia; World Bank staff calculations
Note: growth rates from January to November; x-axis label brackets denote export share, Jan-Nov 2012 Source: CEIC; World Bank staff calculations
The goods trade surplus narrowed further in Q4 on strong import demand coupled with weak exports
Turning to a more detailed view of recent trade dynamics, in the final quarter of 2012 the goods trade balance fell to USD 0.6 billion, its lowest level since at least 1993. Exports saw a very modest recovery to USD 46.7 billion (up from USD 45.6 billion in Q3), but this was more than offset by stronger imports of USD 46.1 billion (up from USD 42.4 billion in Q3). Strengthening goods trade volumes also led to a widening of the services trade deficit to USD 3.3 billion in Q4, reflecting demand for associated transport services. Overall exports of goods and services for 2012 were down 6.3 percent on 2011, while imports rose 8.3 percent, in nominal USD terms.
-12
-8
-4
0
4
8
12
16
-12
-8
-4
0
4
8
12
16
Dec-09 Dec-10 Dec-11 Dec-12
Net direct investment Net portfolioNet other capital Current accountOverall balance Basic balance
USD billion USD billion
-10.0-10.1
-34.0
3.2
-47.7
-2.1
-11.1-12.1
-60
-40
-20
0
20
-60
-40
-20
0
20price volume valuePercent Percent
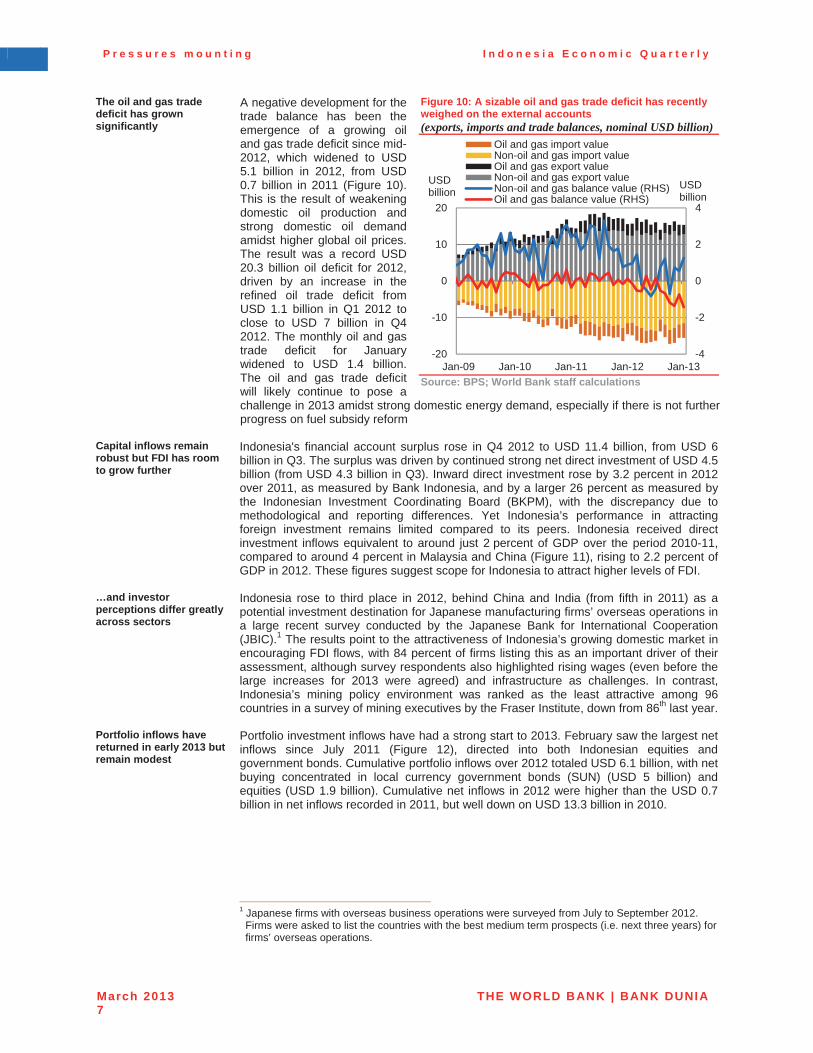
P r e s s u r e s m o u n t i n g I n d o n e s i a E c o n o m i c Q u a r t e r l y
March 2013 THE WORLD BANK | BANK DUNIA7
The oil and gas trade deficit has grown significantly
A negative development for the trade balance has been the emergence of a growing oil and gas trade deficit since mid-2012, which widened to USD 5.1 billion in 2012, from USD 0.7 billion in 2011 (Figure 10). This is the result of weakening domestic oil production and strong domestic oil demand amidst higher global oil prices. The result was a record USD 20.3 billion oil deficit for 2012, driven by an increase in the refined oil trade deficit from USD 1.1 billion in Q1 2012 to close to USD 7 billion in Q4 2012. The monthly oil and gas trade deficit for January widened to USD 1.4 billion. The oil and gas trade deficit will likely continue to pose a challenge in 2013 amidst strong domestic energy demand, especially if there is not further progress on fuel subsidy reform
Figure 10: A sizable oil and gas trade deficit has recently weighed on the external accounts (exports, imports and trade balances, nominal USD billion)
Source: BPS; World Bank staff calculations
Capital inflows remain robust but FDI has room to grow further
Indonesia's financial account surplus rose in Q4 2012 to USD 11.4 billion, from USD 6 billion in Q3. The surplus was driven by continued strong net direct investment of USD 4.5 billion (from USD 4.3 billion in Q3). Inward direct investment rose by 3.2 percent in 2012 over 2011, as measured by Bank Indonesia, and by a larger 26 percent as measured by the Indonesian Investment Coordinating Board (BKPM), with the discrepancy due to methodological and reporting differences. Yet Indonesia’s performance in attracting foreign investment remains limited compared to its peers. Indonesia received direct investment inflows equivalent to around just 2 percent of GDP over the period 2010-11, compared to around 4 percent in Malaysia and China (Figure 11), rising to 2.2 percent of GDP in 2012. These figures suggest scope for Indonesia to attract higher levels of FDI.
…and investor perceptions differ greatly across sectors
Indonesia rose to third place in 2012, behind China and India (from fifth in 2011) as a potential investment destination for Japanese manufacturing firms’ overseas operations in a large recent survey conducted by the Japanese Bank for International Cooperation (JBIC).1 The results point to the attractiveness of Indonesia’s growing domestic market in encouraging FDI flows, with 84 percent of firms listing this as an important driver of their assessment, although survey respondents also highlighted rising wages (even before the large increases for 2013 were agreed) and infrastructure as challenges. In contrast, Indonesia’s mining policy environment was ranked as the least attractive among 96 countries in a survey of mining executives by the Fraser Institute, down from 86th last year.
Portfolio inflows have returned in early 2013 but remain modest
Portfolio investment inflows have had a strong start to 2013. February saw the largest net inflows since July 2011 (Figure 12), directed into both Indonesian equities and government bonds. Cumulative portfolio inflows over 2012 totaled USD 6.1 billion, with net buying concentrated in local currency government bonds (SUN) (USD 5 billion) and equities (USD 1.9 billion). Cumulative net inflows in 2012 were higher than the USD 0.7 billion in net inflows recorded in 2011, but well down on USD 13.3 billion in 2010.
1 Japanese firms with overseas business operations were surveyed from July to September 2012.
Firms were asked to list the countries with the best medium term prospects (i.e. next three years) for firms’ overseas operations.
-4
-2
0
2
4
-20
-10
0
10
20
Jan-09 Jan-10 Jan-11 Jan-12 Jan-13
Oil and gas import valueNon-oil and gas import valueOil and gas export valueNon-oil and gas export valueNon-oil and gas balance value (RHS)Oil and gas balance value (RHS)
USDbillion
USDbillion
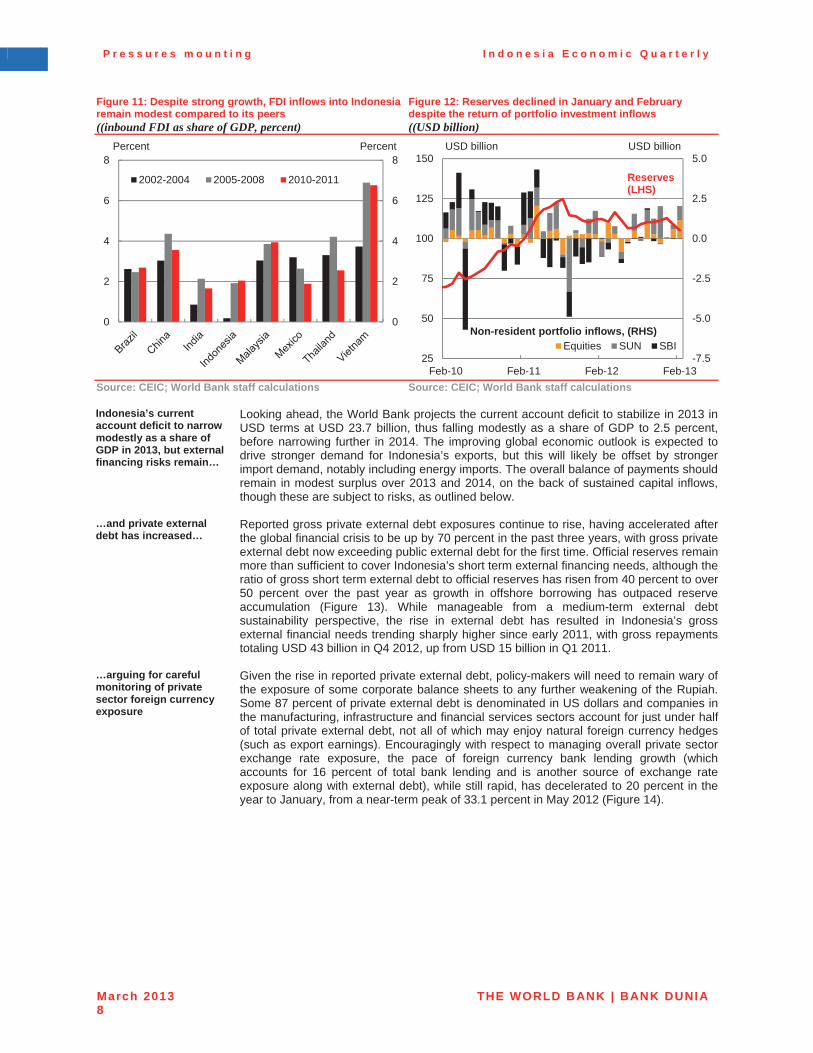
P r e s s u r e s m o u n t i n g I n d o n e s i a E c o n o m i c Q u a r t e r l y
March 2013 THE WORLD BANK | BANK DUNIA8
Figure 11: Despite strong growth, FDI inflows into Indonesia remain modest compared to its peers ((inbound FDI as share of GDP, percent)
Figure 12: Reserves declined in January and February despite the return of portfolio investment inflows ((USD billion)
Source: CEIC; World Bank staff calculations Source: CEIC; World Bank staff calculations
Indonesia’s current account deficit to narrow modestly as a share of GDP in 2013, but external financing risks remain…
Looking ahead, the World Bank projects the current account deficit to stabilize in 2013 in USD terms at USD 23.7 billion, thus falling modestly as a share of GDP to 2.5 percent, before narrowing further in 2014. The improving global economic outlook is expected to drive stronger demand for Indonesia’s exports, but this will likely be offset by stronger import demand, notably including energy imports. The overall balance of payments should remain in modest surplus over 2013 and 2014, on the back of sustained capital inflows, though these are subject to risks, as outlined below.
…and private external debt has increased…
Reported gross private external debt exposures continue to rise, having accelerated after the global financial crisis to be up by 70 percent in the past three years, with gross private external debt now exceeding public external debt for the first time. Official reserves remain more than sufficient to cover Indonesia’s short term external financing needs, although the ratio of gross short term external debt to official reserves has risen from 40 percent to over 50 percent over the past year as growth in offshore borrowing has outpaced reserve accumulation (Figure 13). While manageable from a medium-term external debt sustainability perspective, the rise in external debt has resulted in Indonesia’s gross external financial needs trending sharply higher since early 2011, with gross repayments totaling USD 43 billion in Q4 2012, up from USD 15 billion in Q1 2011.
…arguing for careful monitoring of private sector foreign currency exposure
Given the rise in reported private external debt, policy-makers will need to remain wary of the exposure of some corporate balance sheets to any further weakening of the Rupiah. Some 87 percent of private external debt is denominated in US dollars and companies in the manufacturing, infrastructure and financial services sectors account for just under half of total private external debt, not all of which may enjoy natural foreign currency hedges (such as export earnings). Encouragingly with respect to managing overall private sector exchange rate exposure, the pace of foreign currency bank lending growth (which accounts for 16 percent of total bank lending and is another source of exchange rate exposure along with external debt), while still rapid, has decelerated to 20 percent in the year to January, from a near-term peak of 33.1 percent in May 2012 (Figure 14).
0
2
4
6
8
0
2
4
6
8
2002-2004 2005-2008 2010-2011
Percent Percent
-7.5
-5.0
-2.5
0.0
2.5
5.0
25
50
75
100
125
150
Feb-10 Feb-11 Feb-12 Feb-13
Equities SUN SBI
USD billion
Non-resident portfolio inflows, (RHS)
Reserves (LHS)
USD billion

P r e s s u r e s m o u n t i n g I n d o n e s i a E c o n o m i c Q u a r t e r l y
March 2013 THE WORLD BANK | BANK DUNIA9
Figure 13: Gross external financing needs have trended higher (USD billion per quarter, percent)
Figure 14: …although foreign currency lending has been decelerating, to below the pace of domestic lending (percent)
Source: CEIC; World Bank staff calculations Source: CEIC; World Bank staff calculations
4. Credit extension and asset price growth remain strong in early 2013 Indonesian equity prices have risen and bond prices have been well-supported, while the Rupiah has weakened…
After rising 12 percent over 2012, Indonesian equities have continued to follow global equities markets higher into 2013. The JCI equity index is up 13 per cent in 2013 to March 8, driven by strong performances by the finance and especially the property sector. Government bond yields have crept up from their historic lows but interest rates remain low by historical standards and relative to current and projected CPI inflation. The Rupiah fell to a new three-year low against the US dollar in January, though the depreciation has been more modest on a trade-weighted basis and in real terms, reflecting Indonesia’s higher inflation rate and recent currency depreciation among major trading partners, particularly Japan. After recovering through the second half of 2012, official reserves also fell by USD 4 billion in January to USD 108.8 billion, amidst tightening onshore US dollar liquidity, and by a further USD 3.6 billion in February to USD 105.2 billion, likely on valuation effects and as Bank Indonesia (BI) intervened to limit Rupiah volatility. In early February, Bank Indonesia reiterated its prohibition on local banks from participating in the offshore non-deliverable forwards (NDF) market, and has begun supplying foreign exchange directly to state-owned energy companies.
The recent slowdown in credit growth has stabilized for now…
The recent slowdown in domestic lending growth since May 2012 appears to have stabilized for now, with nominal credit growth edging higher to 23 percent year-on-year in January, up from 22 percent in November. Real credit growth (adjusted for contemporaneous inflation) also picked up to 18 percent yoy (Figure 16). Growth of investment loans continue to ease to 25 percent in the year to January, from 30 percent in October. Growth in working capital loans slowed to 24 percent year-on-year in January, while consumer loan growth rebounded in year-on year terms to 20 percent in January, from 12 percent in November, reflecting both strong recent monthly credit growth and favorable base effects.
…and credit growth remains high, reflecting catch-up from still low levels of bank intermediation…
Strong lending growth continues to generate some concerns over possible risks to credit quality. While reflecting strong domestic demand, especially for investment, the rapid expansion of bank balance sheets in recent years (which account for 80 percent of financial system assets) likely also reflects catch-up by Indonesia’s financial system from a relatively low base (Figure 17). Despite strong recent lending growth, total banking system assets remained equivalent to just 41 percent of GDP in 2012, compared to 52 percent in the Philippines, 74 percent in India, and 121 percent in Vietnam (2011 figures)(Figure 18).
…and necessitating a strong ongoing focus on prudential regulation and credit quality monitoring
As highlighted in the December 2012 IEQ, Bank Indonesia has also implemented prudential limits to dampen lending, including increasing loan-to-value (LTV) requirements for residential mortgages, leading to a slowing in the growth rate of property-related credit
20
30
40
50
60
-15
0
15
30
45
Dec-08 Dec-09 Dec-10 Dec-11 Dec-12
External debt repayments (LHS)Current Account financing needs (LHS)
USD billion Percent of FX reserves
Short term external debt ratio to FX reserves (RHS)
-40
-20
0
20
40
60
-40
-20
0
20
40
60
Jan-08 Jan-09 Jan-10 Jan-11 Jan-12 Jan-13
Percent Percent
Foreign currencyloans (USD terms)
Local currency loans (IDR terms)
Foreign currency loans (IDR terms)

P r e s s u r e s m o u n t i n g I n d o n e s i a E c o n o m i c Q u a r t e r l y
March 2013 THE WORLD BANK | BANK DUNIA10
since mid-2012. Mortgage lending rates are also up slightly (see Box 1). Banking sector indicators remained stable to end-2012 and credit quality remains sound despite strong recent lending growth. Bank solvency, as measured by the Capital Adequacy Ratio (CAR) remained high at 19.3 percent, while the level of non-performing loans continued to decline, to below 2 percent in December for the first time.
Figure 15: Bond yields remain low and the Rupiah has depreciated (IDR per USD; yield, percent)
Figure 16: The recent dip in credit growth appears to have bottomed out for now (year-on-year growth, percent)
Note: 2013 figures to March 8 Source: CEIC; World Bank staff calculations
Source: CEIC; World Bank staff calculations
Figure 17: Indonesia’s banking system assets as a share of GDP remains small compared with its peers… (share of nominal GDP, percent)
Figure 18: …despite comparatively rapid nominal credit growth in recent years (year-on-year growth, percent)
Note: 2011 figures, except for China and Indonesia (2012) Source: CEIC; World Bank staff calculations
Note: all figures to Jan 2013 except Indonesia (Dec 2012) Source: CEIC; World Bank staff calculations
8.0
8.5
9.0
9.5
10.0
4
5
6
7
8
Sep-11 Mar-12 Sep-12 Mar-13
IDR '000 per USD (RHS)
5-year bond yield (LHS)
Percent '000 IDR per USD
-10
-5
0
5
10
0
10
20
30
40
Jan-09 Jan-10 Jan-11 Jan-12 Jan-13
Percent Percent
Nominal (LHS)
Real (LHS)
Monthly nominal lending growth (RHS)
0
50
100
150
200
0
50
100
150
200Percent of GDP Percent of GDP
80
100
120
140
160
180
200
220
80
100
120
140
160
180
200
220Index (Jan 2009=100)
USA
Thailand
Singapore
Indonesia
India
Malaysia
Index (Jan 2009=100)
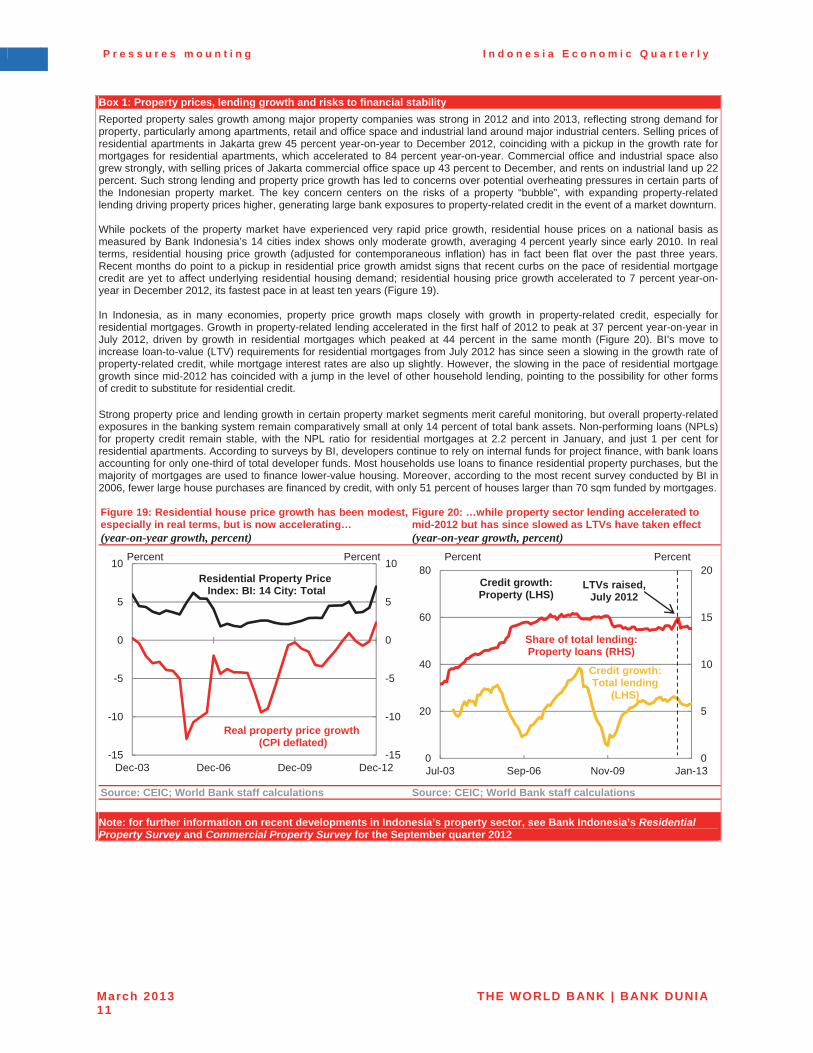
P r e s s u r e s m o u n t i n g I n d o n e s i a E c o n o m i c Q u a r t e r l y
March 2013 THE WORLD BANK | BANK DUNIA11
Box 1: Property prices, lending growth and risks to financial stabilityReported property sales growth among major property companies was strong in 2012 and into 2013, reflecting strong demand for property, particularly among apartments, retail and office space and industrial land around major industrial centers. Selling prices of residential apartments in Jakarta grew 45 percent year-on-year to December 2012, coinciding with a pickup in the growth rate formortgages for residential apartments, which accelerated to 84 percent year-on-year. Commercial office and industrial space alsogrew strongly, with selling prices of Jakarta commercial office space up 43 percent to December, and rents on industrial land up 22 percent. Such strong lending and property price growth has led to concerns over potential overheating pressures in certain parts of the Indonesian property market. The key concern centers on the risks of a property “bubble”, with expanding property-related lending driving property prices higher, generating large bank exposures to property-related credit in the event of a market downturn.
While pockets of the property market have experienced very rapid price growth, residential house prices on a national basis as measured by Bank Indonesia’s 14 cities index shows only moderate growth, averaging 4 percent yearly since early 2010. In real terms, residential housing price growth (adjusted for contemporaneous inflation) has in fact been flat over the past three years.Recent months do point to a pickup in residential price growth amidst signs that recent curbs on the pace of residential mortgagecredit are yet to affect underlying residential housing demand; residential housing price growth accelerated to 7 percent year-on-year in December 2012, its fastest pace in at least ten years (Figure 19).
In Indonesia, as in many economies, property price growth maps closely with growth in property-related credit, especially for residential mortgages. Growth in property-related lending accelerated in the first half of 2012 to peak at 37 percent year-on-year in July 2012, driven by growth in residential mortgages which peaked at 44 percent in the same month (Figure 20). BI’s move to increase loan-to-value (LTV) requirements for residential mortgages from July 2012 has since seen a slowing in the growth rate ofproperty-related credit, while mortgage interest rates are also up slightly. However, the slowing in the pace of residential mortgagegrowth since mid-2012 has coincided with a jump in the level of other household lending, pointing to the possibility for other forms of credit to substitute for residential credit.
Strong property price and lending growth in certain property market segments merit careful monitoring, but overall property-related exposures in the banking system remain comparatively small at only 14 percent of total bank assets. Non-performing loans (NPLs)for property credit remain stable, with the NPL ratio for residential mortgages at 2.2 percent in January, and just 1 per cent forresidential apartments. According to surveys by BI, developers continue to rely on internal funds for project finance, with bank loans accounting for only one-third of total developer funds. Most households use loans to finance residential property purchases, but the majority of mortgages are used to finance lower-value housing. Moreover, according to the most recent survey conducted by BI in2006, fewer large house purchases are financed by credit, with only 51 percent of houses larger than 70 sqm funded by mortgages.
Figure 19: Residential house price growth has been modest, especially in real terms, but is now accelerating… (year-on-year growth, percent)
Figure 20: …while property sector lending accelerated to mid-2012 but has since slowed as LTVs have taken effect (year-on-year growth, percent)
Source: CEIC; World Bank staff calculations Source: CEIC; World Bank staff calculations
Note: for further information on recent developments in Indonesia’s property sector, see Bank Indonesia’s Residential Property Survey and Commercial Property Survey for the September quarter 2012
-15
-10
-5
0
5
10
-15
-10
-5
0
5
10
Dec-03 Dec-06 Dec-09 Dec-12
Percent Percent
Real property price growth (CPI deflated)
Residential Property Price Index: BI: 14 City: Total
0
5
10
15
20
0
20
40
60
80
Jul-03 Sep-06 Nov-09 Jan-13
Percent Percent
Share of total lending: Property loans (RHS)
Credit growth: Total lending
(LHS)
Credit growth: Property (LHS)
LTVs raised, July 2012
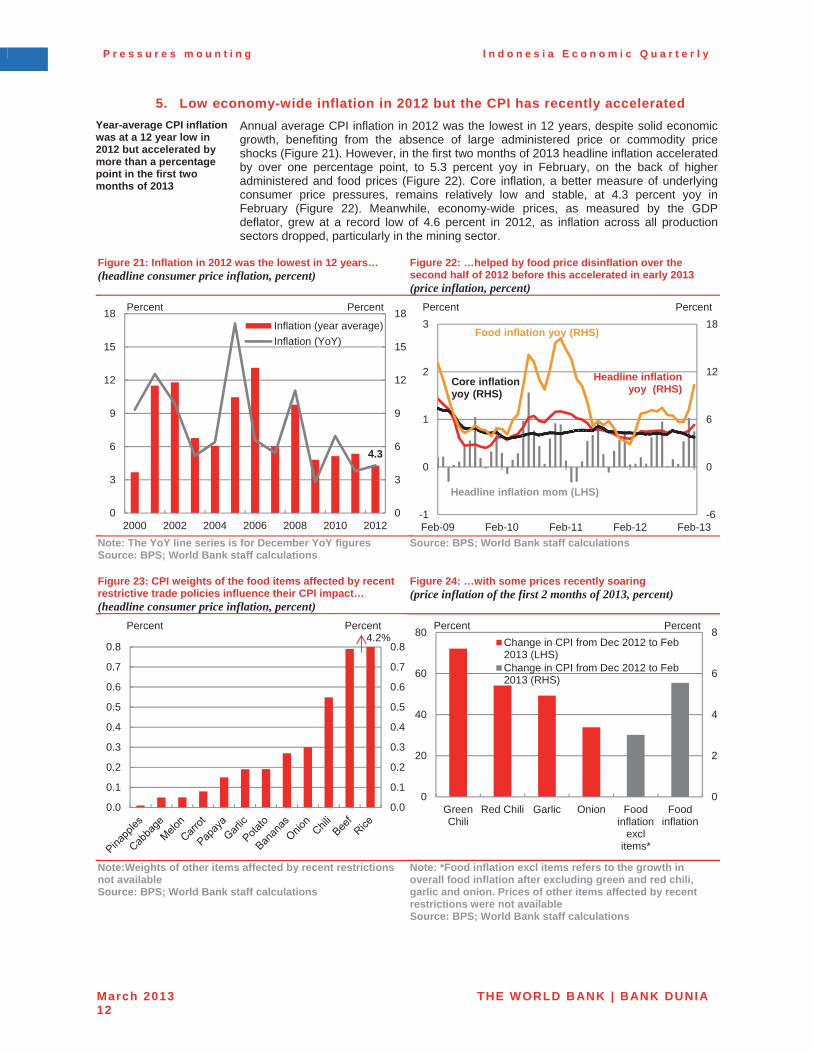
P r e s s u r e s m o u n t i n g I n d o n e s i a E c o n o m i c Q u a r t e r l y
March 2013 THE WORLD BANK | BANK DUNIA12
5. Low economy-wide inflation in 2012 but the CPI has recently accelerated Year-average CPI inflation was at a 12 year low in 2012 but accelerated by more than a percentage point in the first two months of 2013
Annual average CPI inflation in 2012 was the lowest in 12 years, despite solid economic growth, benefiting from the absence of large administered price or commodity price shocks (Figure 21). However, in the first two months of 2013 headline inflation acceleratedby over one percentage point, to 5.3 percent yoy in February, on the back of higher administered and food prices (Figure 22). Core inflation, a better measure of underlying consumer price pressures, remains relatively low and stable, at 4.3 percent yoy in February (Figure 22). Meanwhile, economy-wide prices, as measured by the GDP deflator, grew at a record low of 4.6 percent in 2012, as inflation across all production sectors dropped, particularly in the mining sector.
Figure 21: Inflation in 2012 was the lowest in 12 years… (headline consumer price inflation, percent)
Figure 22: …helped by food price disinflation over the second half of 2012 before this accelerated in early 2013 (price inflation, percent)
Note: The YoY line series is for December YoY figures Source: BPS; World Bank staff calculations
Source: BPS; World Bank staff calculations
Figure 23: CPI weights of the food items affected by recent restrictive trade policies influence their CPI impact… (headline consumer price inflation, percent)
Figure 24: …with some prices recently soaring (price inflation of the first 2 months of 2013, percent)
Note:Weights of other items affected by recent restrictions not available Source: BPS; World Bank staff calculations
Note: *Food inflation excl items refers to the growth in overall food inflation after excluding green and red chili, garlic and onion. Prices of other items affected by recent restrictions were not available Source: BPS; World Bank staff calculations
4.3
0
3
6
9
12
15
18
0
3
6
9
12
15
18
2000 2002 2004 2006 2008 2010 2012
Inflation (year average)Inflation (YoY)
Percent Percent
-6
0
6
12
18
-1
0
1
2
3
Feb-09 Feb-10 Feb-11 Feb-12 Feb-13
Core inflation yoy (RHS)
Headline inflationyoy (RHS)
Headline inflation mom (LHS)
Percent Percent
Food inflation yoy (RHS)
4.2%
0.0
0.1
0.2
0.3
0.4
0.5
0.6
0.7
0.8
0.0
0.1
0.2
0.3
0.4
0.5
0.6
0.7
0.8
Percent Percent
0
2
4
6
8
0
20
40
60
80
GreenChili
Red Chili Garlic Onion Foodinflation
exclitems*
Foodinflation
Change in CPI from Dec 2012 to Feb2013 (LHS)Change in CPI from Dec 2012 to Feb2013 (RHS)
Percent Percent
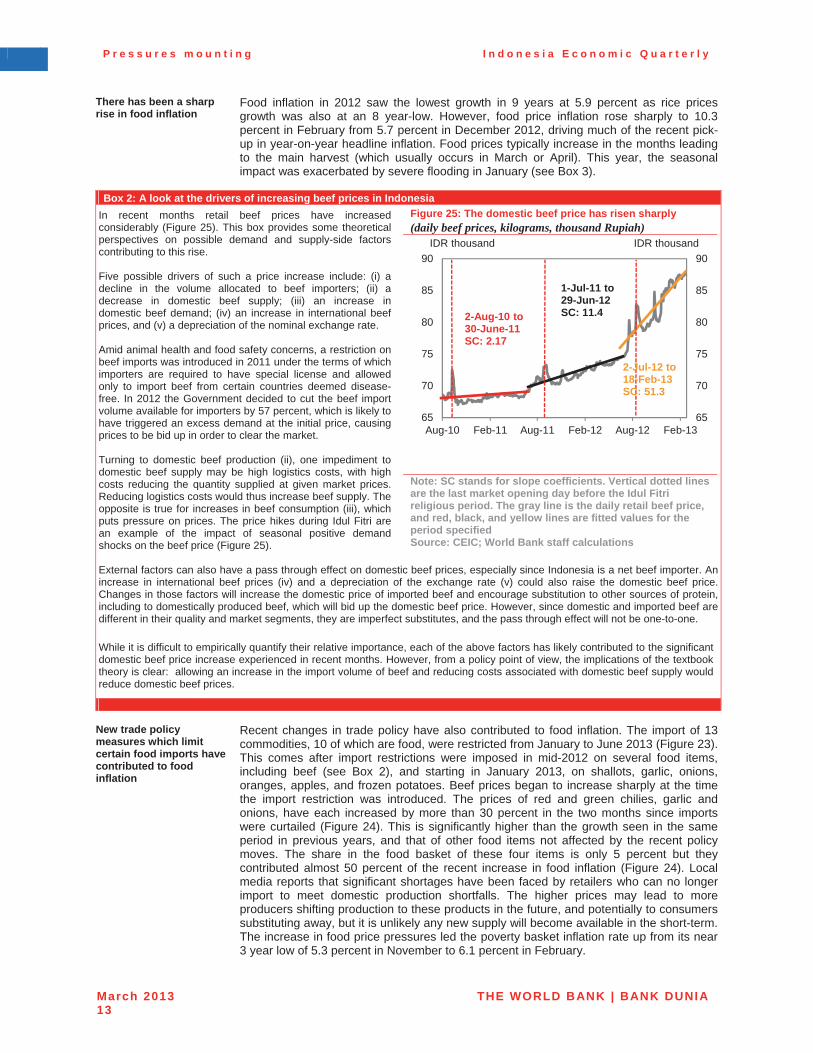
P r e s s u r e s m o u n t i n g I n d o n e s i a E c o n o m i c Q u a r t e r l y
March 2013 THE WORLD BANK | BANK DUNIA13
There has been a sharp rise in food inflation
Food inflation in 2012 saw the lowest growth in 9 years at 5.9 percent as rice prices growth was also at an 8 year-low. However, food price inflation rose sharply to 10.3 percent in February from 5.7 percent in December 2012, driving much of the recent pick-up in year-on-year headline inflation. Food prices typically increase in the months leading to the main harvest (which usually occurs in March or April). This year, the seasonalimpact was exacerbated by severe flooding in January (see Box 3).
Box 2: A look at the drivers of increasing beef prices in Indonesia In recent months retail beef prices have increased considerably (Figure 25). This box provides some theoretical perspectives on possible demand and supply-side factors contributing to this rise.
Five possible drivers of such a price increase include: (i) a decline in the volume allocated to beef importers; (ii) a decrease in domestic beef supply; (iii) an increase in domestic beef demand; (iv) an increase in international beef prices, and (v) a depreciation of the nominal exchange rate.
Amid animal health and food safety concerns, a restriction on beef imports was introduced in 2011 under the terms of which importers are required to have special license and allowed only to import beef from certain countries deemed disease-free. In 2012 the Government decided to cut the beef import volume available for importers by 57 percent, which is likely to have triggered an excess demand at the initial price, causing prices to be bid up in order to clear the market.
Turning to domestic beef production (ii), one impediment to domestic beef supply may be high logistics costs, with high costs reducing the quantity supplied at given market prices. Reducing logistics costs would thus increase beef supply. The opposite is true for increases in beef consumption (iii), which puts pressure on prices. The price hikes during Idul Fitri are an example of the impact of seasonal positive demand shocks on the beef price (Figure 25).
External factors can also have a pass through effect on domestic beef prices, especially since Indonesia is a net beef importer. Anincrease in international beef prices (iv) and a depreciation of the exchange rate (v) could also raise the domestic beef price.Changes in those factors will increase the domestic price of imported beef and encourage substitution to other sources of protein,including to domestically produced beef, which will bid up the domestic beef price. However, since domestic and imported beef aredifferent in their quality and market segments, they are imperfect substitutes, and the pass through effect will not be one-to-one.
While it is difficult to empirically quantify their relative importance, each of the above factors has likely contributed to the significant domestic beef price increase experienced in recent months. However, from a policy point of view, the implications of the textbook theory is clear: allowing an increase in the import volume of beef and reducing costs associated with domestic beef supply wouldreduce domestic beef prices.
Figure 25: The domestic beef price has risen sharply (daily beef prices, kilograms, thousand Rupiah)
Note: SC stands for slope coefficients. Vertical dotted lines are the last market opening day before the Idul Fitri religious period. The gray line is the daily retail beef price, and red, black, and yellow lines are fitted values for the period specified Source: CEIC; World Bank staff calculations
New trade policy measures which limit certain food imports have contributed to food inflation
Recent changes in trade policy have also contributed to food inflation. The import of 13 commodities, 10 of which are food, were restricted from January to June 2013 (Figure 23). This comes after import restrictions were imposed in mid-2012 on several food items,including beef (see Box 2), and starting in January 2013, on shallots, garlic, onions, oranges, apples, and frozen potatoes. Beef prices began to increase sharply at the time the import restriction was introduced. The prices of red and green chilies, garlic and onions, have each increased by more than 30 percent in the two months since imports were curtailed (Figure 24). This is significantly higher than the growth seen in the same period in previous years, and that of other food items not affected by the recent policy moves. The share in the food basket of these four items is only 5 percent but they contributed almost 50 percent of the recent increase in food inflation (Figure 24). Local media reports that significant shortages have been faced by retailers who can no longer import to meet domestic production shortfalls. The higher prices may lead to more producers shifting production to these products in the future, and potentially to consumers substituting away, but it is unlikely any new supply will become available in the short-term.The increase in food price pressures led the poverty basket inflation rate up from its near 3 year low of 5.3 percent in November to 6.1 percent in February.
65
70
75
80
85
90
65
70
75
80
85
90
Aug-10 Feb-11 Aug-11 Feb-12 Aug-12 Feb-13
IDR thousandIDR thousand
2-Aug-10 to 30-June-11SC: 2.17
1-Jul-11 to29-Jun-12SC: 11.4
2-Jul-12 to18-Feb-13SC: 51.3
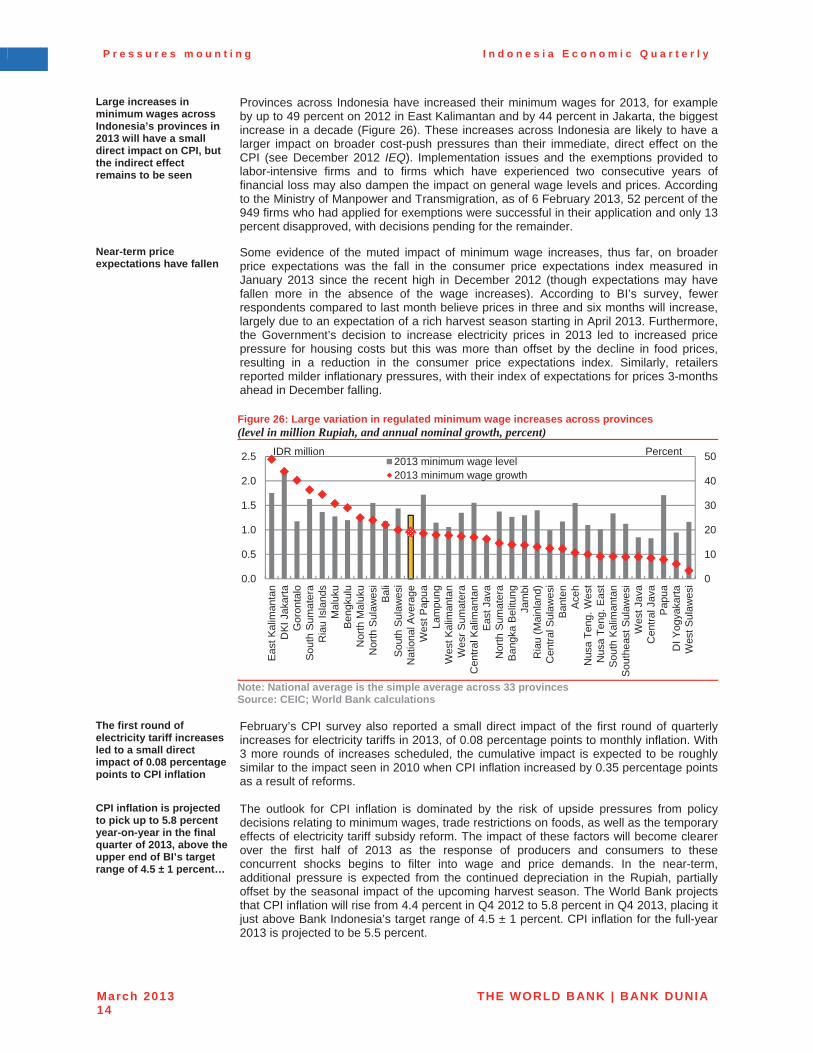
P r e s s u r e s m o u n t i n g I n d o n e s i a E c o n o m i c Q u a r t e r l y
March 2013 THE WORLD BANK | BANK DUNIA14
Large increases in minimum wages across Indonesia’s provinces in 2013 will have a small direct impact on CPI, but the indirect effect remains to be seen
Provinces across Indonesia have increased their minimum wages for 2013, for exampleby up to 49 percent on 2012 in East Kalimantan and by 44 percent in Jakarta, the biggest increase in a decade (Figure 26). These increases across Indonesia are likely to have a larger impact on broader cost-push pressures than their immediate, direct effect on the CPI (see December 2012 IEQ). Implementation issues and the exemptions provided to labor-intensive firms and to firms which have experienced two consecutive years of financial loss may also dampen the impact on general wage levels and prices. According to the Ministry of Manpower and Transmigration, as of 6 February 2013, 52 percent of the 949 firms who had applied for exemptions were successful in their application and only 13 percent disapproved, with decisions pending for the remainder.
Near-term price expectations have fallen
Some evidence of the muted impact of minimum wage increases, thus far, on broader price expectations was the fall in the consumer price expectations index measured in January 2013 since the recent high in December 2012 (though expectations may have fallen more in the absence of the wage increases). According to BI’s survey, fewerrespondents compared to last month believe prices in three and six months will increase, largely due to an expectation of a rich harvest season starting in April 2013. Furthermore, the Government’s decision to increase electricity prices in 2013 led to increased price pressure for housing costs but this was more than offset by the decline in food prices, resulting in a reduction in the consumer price expectations index. Similarly, retailers reported milder inflationary pressures, with their index of expectations for prices 3-months ahead in December falling.
Figure 26: Large variation in regulated minimum wage increases across provinces (level in million Rupiah, and annual nominal growth, percent)
Note: National average is the simple average across 33 provinces Source: CEIC; World Bank calculations
The first round of electricity tariff increases led to a small direct impact of 0.08 percentage points to CPI inflation
February’s CPI survey also reported a small direct impact of the first round of quarterlyincreases for electricity tariffs in 2013, of 0.08 percentage points to monthly inflation. With 3 more rounds of increases scheduled, the cumulative impact is expected to be roughlysimilar to the impact seen in 2010 when CPI inflation increased by 0.35 percentage pointsas a result of reforms.
CPI inflation is projected to pick up to 5.8 percent year-on-year in the final quarter of 2013, above the upper end of BI’s target range of 4.5 ± 1 percent…
The outlook for CPI inflation is dominated by the risk of upside pressures from policy decisions relating to minimum wages, trade restrictions on foods, as well as the temporary effects of electricity tariff subsidy reform. The impact of these factors will become clearer over the first half of 2013 as the response of producers and consumers to these concurrent shocks begins to filter into wage and price demands. In the near-term, additional pressure is expected from the continued depreciation in the Rupiah, partially offset by the seasonal impact of the upcoming harvest season. The World Bank projects that CPI inflation will rise from 4.4 percent in Q4 2012 to 5.8 percent in Q4 2013, placing it just above Bank Indonesia’s target range of 4.5 ± 1 percent. CPI inflation for the full-year 2013 is projected to be 5.5 percent.
0
10
20
30
40
50
0.0
0.5
1.0
1.5
2.0
2.5
Eas
t Kal
iman
tan
DKI
Jak
arta
Gor
onta
loS
outh
Sum
ater
aR
iau
Isla
nds
Mal
uku
Ben
gkul
uN
orth
Mal
uku
Nor
th S
ulaw
esi
Bal
iS
outh
Sul
awes
iN
atio
nal A
vera
geW
est P
apua
Lam
pung
Wes
t Kal
iman
tan
Wes
r Sum
ater
aC
entra
l Kal
iman
tan
East
Jav
aN
orth
Sum
ater
aB
angk
a B
elitu
ngJa
mbi
Ria
u (M
ainl
and)
Cen
tral S
ulaw
esi
Ban
ten
Ace
hN
usa
Teng
. Wes
tN
usa
Teng
. Eas
tS
outh
Kal
iman
tan
Sou
thea
st S
ulaw
esi
Wes
t Jav
aC
entra
l Jav
aP
apua
DI Y
ogya
karta
Wes
t Sul
awes
i
2013 minimum wage level2013 minimum wage growth
IDR million Percent

P r e s s u r e s m o u n t i n g I n d o n e s i a E c o n o m i c Q u a r t e r l y
March 2013 THE WORLD BANK | BANK DUNIA15
…and to move slightly lower in 2014
In 2014, inflation is projected to ease to 5.2 percent for the year as a whole, on the back of a stronger Rupiah, the unwinding of food inflation and the end of incremental electricity price increases scheduled throughout 2013. Poverty basket inflation forecasts are slightly higher than in the December 2012 IEQ, at 6.9 percent year-on-year in Q4 2013 and 7.0percent year-on-year in Q4 2014.
GDP deflator growth has fallen to lows last seen in 1999 as price growth eased across most sectors
As discussed in Section 1, the broader level of prices growth in the economy, as measured by the GDP deflator, ended 2012 at 2.7 percent year-on-year, the lowest growth in 13 years. Over 2012 as a whole, GDP deflator growth was 4.6 percent, the lowest annual rate on record. The rapid deceleration of GDP deflator growth from 9.2 percent year-on-year in early 2011 to its current low of 2.7 percent was seen across all 9 sectors of the economy, with the largest decline in deflator growth occurring in the miningsector which fell by 22 percentage points to record a fall of 2.2 percent year-on-year in December 2012, the lowest growth rate in a decade. Accordingly, the projection for GDP deflator inflation growth for 2013 is revised lower to 4.9 percent. In 2014, GDP deflator growth is expected to rise to 5.9 percent on the back of strengthening economic growth and credit conditions, but remaining less than half the 14 percent average seen prior to the impact of the global financial crisis.
Box 3: Serious floods in Jakarta caused tragic loss of life, and also serious economic disruption and price increasesSerious flooding inundated several areas in the greater Jakarta area on January 16-17, following heavy monsoon rains and the collapse of a 30-meter-long section of the West flood canal dike. The flood, the worst since 2007, directly affected 25 percent of the city, requiring 40,000 people to be evacuated and tragically causing the loss of 21 lives. In terms of the economic impact, several main businesses areas including the Mangga Dua and Tanah Abang markets were affected, and the industrial zones of Pulogadung and Kawasan Berikat Nusantara were inundated, halting their activities for up to 7 days, as well as hampering trade by limiting transportation access to ports. The Jakarta Chamber of Commerce and Industry estimated the economic cost of the flood at IDR 20 trillion (USD 2.06 billion), much higher than Government’s estimate of the cost of the previous severe floods in 2007, of IDR 3.3 trillion. The regional governments of flood-impacted regions are now conducting post-disaster needs assessments (PDNA) and implementing recovery plans. Aside from costing the impact of the recent floods, the analytical results of these exercises will provide valuable insights into the economic vulnerabilities to, and impacts of, future flooding.
The inundations and resultant disruption to supply networks in and around Jakarta led to a pick-up in consumer prices in January, especially for raw food prices such as spices, chilies, fish, fruits, and vegetables. Jakarta and Greater Jakarta (Bogor, Depok, Tangerang and Bekasi) accounts for 38 percent of national inflation.In January 2013, food inflation for Jakarta was 3.3 percent month-on-month, the highest increase in four years, while Bekasi (5.0percent) and Depok (3.8 percent) also saw strong increases. Tangerang and Bogor, which were less affected, recorded monthly food price rises of 2.0 percent and 1.4 percent. These increases contributed significantly to a surge in monthly national food inflation to 3.4 percent.
Figure 27: Food prices increased due to floods (month on month change in food CPI, percent)
Source: BPS; World Bank staff calculations
Note: For more information on Jakarta’s vulnerability to floods and mitigation measures, see Part B of the December 2012 IEQ
-4
-3
-2
-1
0
1
2
3
4
5
-4
-3
-2
-1
0
1
2
3
4
5
Jan-09 Jan-10 Jan-11 Jan-12 Jan-13
PercentPercentDKI National
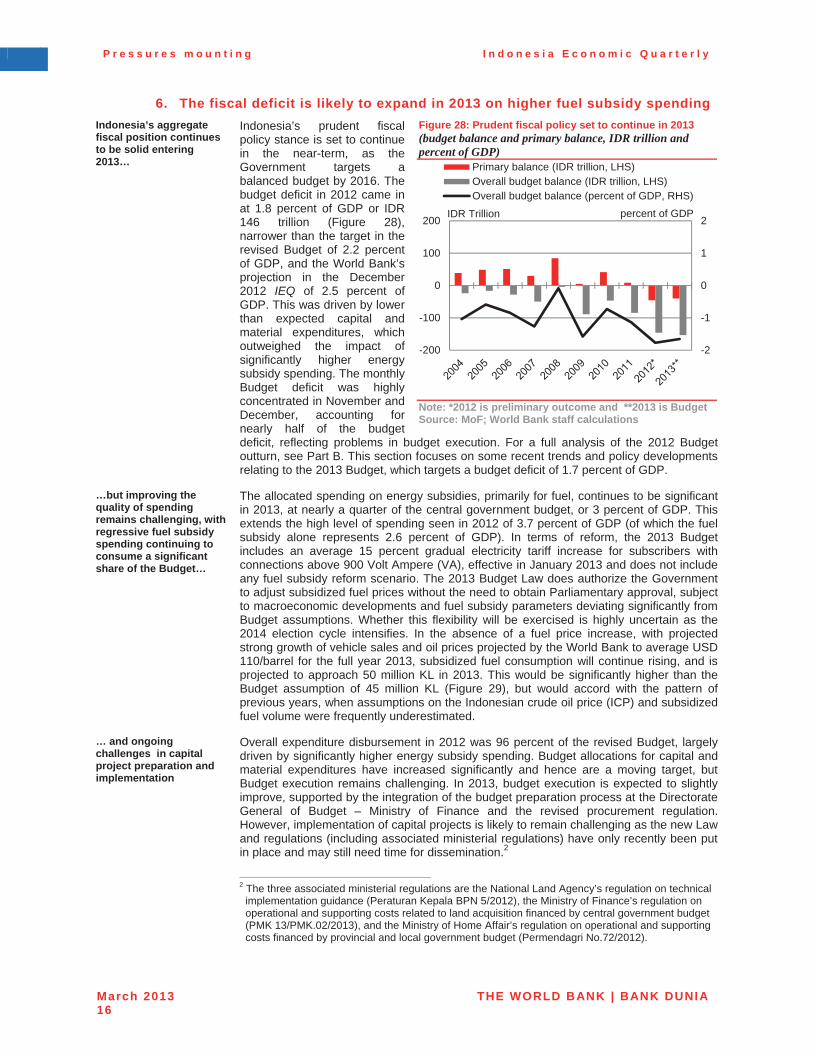
P r e s s u r e s m o u n t i n g I n d o n e s i a E c o n o m i c Q u a r t e r l y
March 2013 THE WORLD BANK | BANK DUNIA16
6. The fiscal deficit is likely to expand in 2013 on higher fuel subsidy spending Indonesia’s aggregate fiscal position continues to be solid entering 2013…
Indonesia’s prudent fiscal policy stance is set to continue in the near-term, as the Government targets a balanced budget by 2016. The budget deficit in 2012 came in at 1.8 percent of GDP or IDR 146 trillion (Figure 28), narrower than the target in the revised Budget of 2.2 percent of GDP, and the World Bank’s projection in the December 2012 IEQ of 2.5 percent of GDP. This was driven by lower than expected capital and material expenditures, which outweighed the impact of significantly higher energy subsidy spending. The monthly Budget deficit was highly concentrated in November and December, accounting for nearly half of the budget deficit, reflecting problems in budget execution. For a full analysis of the 2012 Budget outturn, see Part B. This section focuses on some recent trends and policy developments relating to the 2013 Budget, which targets a budget deficit of 1.7 percent of GDP.
Figure 28: Prudent fiscal policy set to continue in 2013 (budget balance and primary balance, IDR trillion and percent of GDP)
Note: *2012 is preliminary outcome and **2013 is Budget Source: MoF; World Bank staff calculations
…but improving the quality of spending remains challenging, with regressive fuel subsidy spending continuing to consume a significant share of the Budget…
The allocated spending on energy subsidies, primarily for fuel, continues to be significant in 2013, at nearly a quarter of the central government budget, or 3 percent of GDP. Thisextends the high level of spending seen in 2012 of 3.7 percent of GDP (of which the fuel subsidy alone represents 2.6 percent of GDP). In terms of reform, the 2013 Budget includes an average 15 percent gradual electricity tariff increase for subscribers with connections above 900 Volt Ampere (VA), effective in January 2013 and does not include any fuel subsidy reform scenario. The 2013 Budget Law does authorize the Government to adjust subsidized fuel prices without the need to obtain Parliamentary approval, subject to macroeconomic developments and fuel subsidy parameters deviating significantly from Budget assumptions. Whether this flexibility will be exercised is highly uncertain as the 2014 election cycle intensifies. In the absence of a fuel price increase, with projected strong growth of vehicle sales and oil prices projected by the World Bank to average USD 110/barrel for the full year 2013, subsidized fuel consumption will continue rising, and is projected to approach 50 million KL in 2013. This would be significantly higher than the Budget assumption of 45 million KL (Figure 29), but would accord with the pattern of previous years, when assumptions on the Indonesian crude oil price (ICP) and subsidized fuel volume were frequently underestimated.
… and ongoing challenges in capital project preparation and implementation
Overall expenditure disbursement in 2012 was 96 percent of the revised Budget, largely driven by significantly higher energy subsidy spending. Budget allocations for capital and material expenditures have increased significantly and hence are a moving target, but Budget execution remains challenging. In 2013, budget execution is expected to slightly improve, supported by the integration of the budget preparation process at the Directorate General of Budget – Ministry of Finance and the revised procurement regulation. However, implementation of capital projects is likely to remain challenging as the new Law and regulations (including associated ministerial regulations) have only recently been put in place and may still need time for dissemination.2
2 The three associated ministerial regulations are the National Land Agency’s regulation on technical
implementation guidance (Peraturan Kepala BPN 5/2012), the Ministry of Finance’s regulation on operational and supporting costs related to land acquisition financed by central government budget (PMK 13/PMK.02/2013), and the Ministry of Home Affair’s regulation on operational and supporting costs financed by provincial and local government budget (Permendagri No.72/2012).
-2
-1
0
1
2
-200
-100
0
100
200
Primary balance (IDR trillion, LHS)Overall budget balance (IDR trillion, LHS)Overall budget balance (percent of GDP, RHS)
IDR Trillion percent of GDP
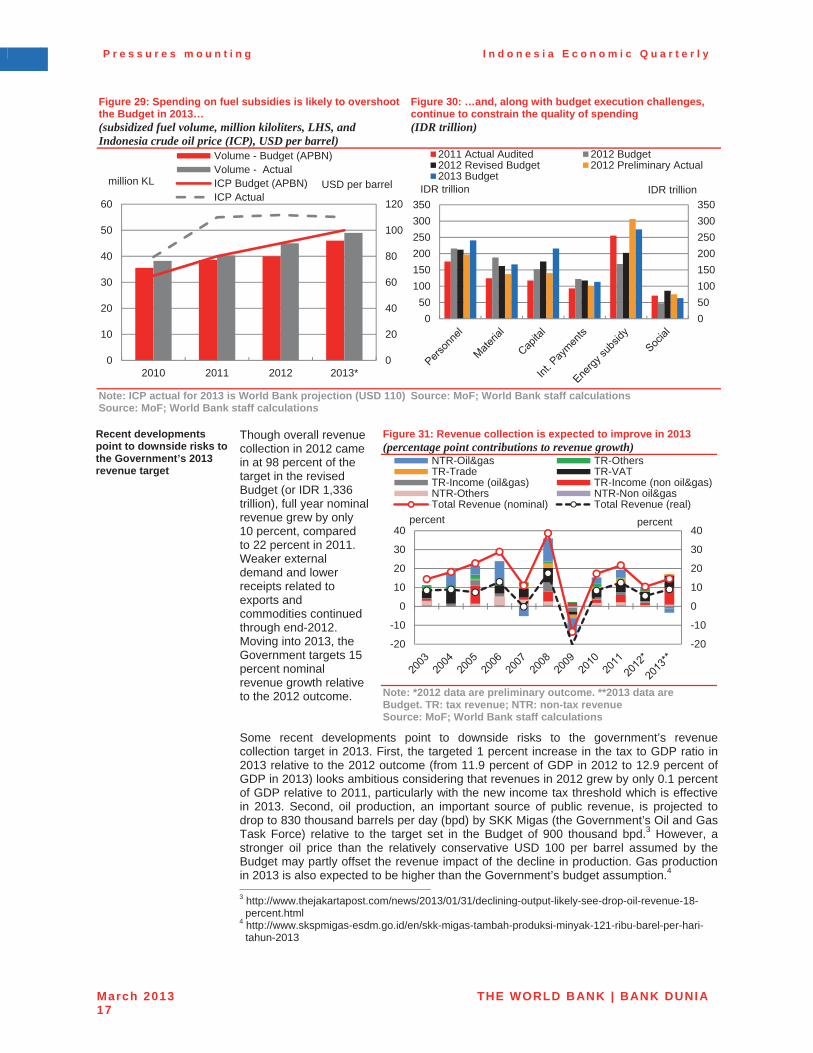
P r e s s u r e s m o u n t i n g I n d o n e s i a E c o n o m i c Q u a r t e r l y
March 2013 THE WORLD BANK | BANK DUNIA17
Figure 29: Spending on fuel subsidies is likely to overshoot the Budget in 2013… (subsidized fuel volume, million kiloliters, LHS, and Indonesia crude oil price (ICP), USD per barrel)
Figure 30: …and, along with budget execution challenges, continue to constrain the quality of spending (IDR trillion)
Note: ICP actual for 2013 is World Bank projection (USD 110)Source: MoF; World Bank staff calculations
Source: MoF; World Bank staff calculations
Recent developments point to downside risks to the Government’s 2013 revenue target
Though overall revenue collection in 2012 came in at 98 percent of the target in the revised Budget (or IDR 1,336 trillion), full year nominal revenue grew by only 10 percent, compared to 22 percent in 2011. Weaker external demand and lower receipts related to exports and commodities continued through end-2012. Moving into 2013, the Government targets 15 percent nominal revenue growth relative to the 2012 outcome.
Some recent developments point to downside risks to the government’s revenue collection target in 2013. First, the targeted 1 percent increase in the tax to GDP ratio in 2013 relative to the 2012 outcome (from 11.9 percent of GDP in 2012 to 12.9 percent of GDP in 2013) looks ambitious considering that revenues in 2012 grew by only 0.1 percent of GDP relative to 2011, particularly with the new income tax threshold which is effective in 2013. Second, oil production, an important source of public revenue, is projected to drop to 830 thousand barrels per day (bpd) by SKK Migas (the Government’s Oil and Gas Task Force) relative to the target set in the Budget of 900 thousand bpd.3 However, a stronger oil price than the relatively conservative USD 100 per barrel assumed by the Budget may partly offset the revenue impact of the decline in production. Gas production in 2013 is also expected to be higher than the Government’s budget assumption.4
Figure 31: Revenue collection is expected to improve in 2013 (percentage point contributions to revenue growth)
Note: *2012 data are preliminary outcome. **2013 data are Budget. TR: tax revenue; NTR: non-tax revenue Source: MoF; World Bank staff calculations
3 http://www.thejakartapost.com/news/2013/01/31/declining-output-likely-see-drop-oil-revenue-18-
percent.html 4 http://www.skspmigas-esdm.go.id/en/skk-migas-tambah-produksi-minyak-121-ribu-barel-per-hari-
tahun-2013
0
20
40
60
80
100
120
0
10
20
30
40
50
60
2010 2011 2012 2013*
Volume - Budget (APBN)Volume - ActualICP Budget (APBN)ICP Actual
million KL USD per barrel
050100150200250300350
050
100150200250300350
2011 Actual Audited 2012 Budget2012 Revised Budget 2012 Preliminary Actual2013 Budget
IDR trillion IDR trillion
-20
-10
0
10
20
30
40
-20
-10
0
10
20
30
40percent
NTR-Oil&gas TR-OthersTR-Trade TR-VATTR-Income (oil&gas) TR-Income (non oil&gas)NTR-Others NTR-Non oil&gasTotal Revenue (nominal) Total Revenue (real)
percent
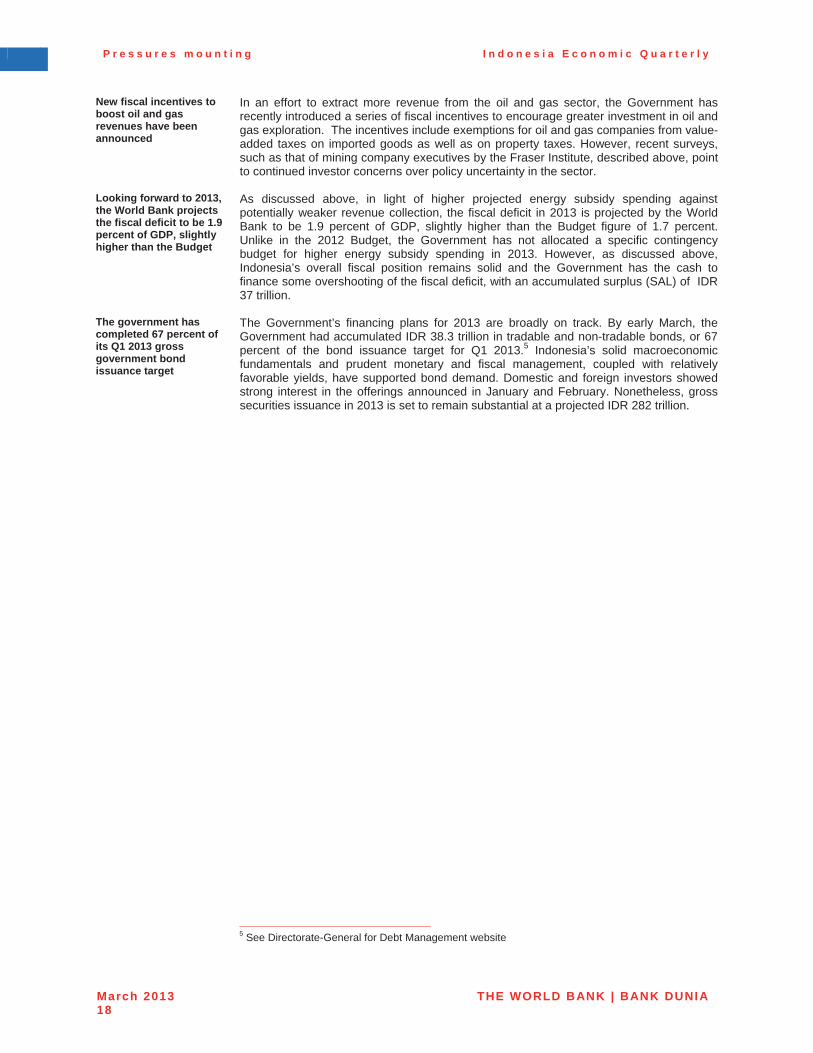
P r e s s u r e s m o u n t i n g I n d o n e s i a E c o n o m i c Q u a r t e r l y
March 2013 THE WORLD BANK | BANK DUNIA18
New fiscal incentives to boost oil and gas revenues have been announced
In an effort to extract more revenue from the oil and gas sector, the Government has recently introduced a series of fiscal incentives to encourage greater investment in oil and gas exploration. The incentives include exemptions for oil and gas companies from value-added taxes on imported goods as well as on property taxes. However, recent surveys, such as that of mining company executives by the Fraser Institute, described above, point to continued investor concerns over policy uncertainty in the sector.
Looking forward to 2013, the World Bank projects the fiscal deficit to be 1.9 percent of GDP, slightly higher than the Budget
As discussed above, in light of higher projected energy subsidy spending against potentially weaker revenue collection, the fiscal deficit in 2013 is projected by the World Bank to be 1.9 percent of GDP, slightly higher than the Budget figure of 1.7 percent. Unlike in the 2012 Budget, the Government has not allocated a specific contingency budget for higher energy subsidy spending in 2013. However, as discussed above, Indonesia’s overall fiscal position remains solid and the Government has the cash to finance some overshooting of the fiscal deficit, with an accumulated surplus (SAL) of IDR 37 trillion.
The government has completed 67 percent of its Q1 2013 gross government bond issuance target
The Government’s financing plans for 2013 are broadly on track. By early March, the Government had accumulated IDR 38.3 trillion in tradable and non-tradable bonds, or 67percent of the bond issuance target for Q1 2013.5 Indonesia’s solid macroeconomic fundamentals and prudent monetary and fiscal management, coupled with relatively favorable yields, have supported bond demand. Domestic and foreign investors showed strong interest in the offerings announced in January and February. Nonetheless, gross securities issuance in 2013 is set to remain substantial at a projected IDR 282 trillion.
5 See Directorate-General for Debt Management website
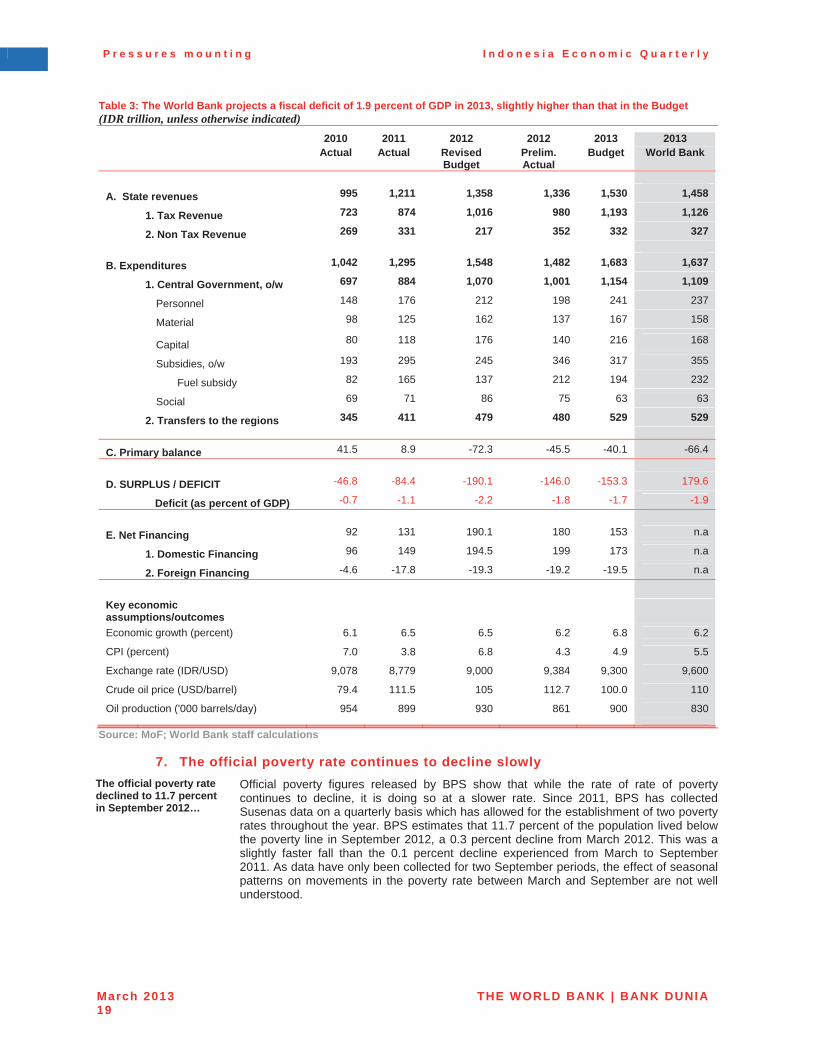
P r e s s u r e s m o u n t i n g I n d o n e s i a E c o n o m i c Q u a r t e r l y
March 2013 THE WORLD BANK | BANK DUNIA19
Table 3: The World Bank projects a fiscal deficit of 1.9 percent of GDP in 2013, slightly higher than that in the Budget (IDR trillion, unless otherwise indicated)
2010 2011 2012 2012 2013 2013 Actual Actual Revised
Budget Prelim.Actual
Budget World Bank
A. State revenues 995 1,211 1,358 1,336 1,530 1,458
1. Tax Revenue 723 874 1,016 980 1,193 1,126
2. Non Tax Revenue 269 331 217 352 332 327
B. Expenditures 1,042 1,295 1,548 1,482 1,683 1,637
1. Central Government, o/w 697 884 1,070 1,001 1,154 1,109
Personnel 148 176 212 198 241 237
Material 98 125 162 137 167 158
Capital 80 118 176 140 216 168
Subsidies, o/w 193 295 245 346 317 355
Fuel subsidy 82 165 137 212 194 232
Social 69 71 86 75 63 63
2. Transfers to the regions 345 411 479 480 529 529
C. Primary balance 41.5 8.9 -72.3 -45.5 -40.1 -66.4
D. SURPLUS / DEFICIT -46.8 -84.4 -190.1 -146.0 -153.3 179.6
Deficit (as percent of GDP) -0.7 -1.1 -2.2 -1.8 -1.7 -1.9
E. Net Financing 92 131 190.1 180 153 n.a
1. Domestic Financing 96 149 194.5 199 173 n.a
2. Foreign Financing -4.6 -17.8 -19.3 -19.2 -19.5 n.a
Key economic assumptions/outcomes Economic growth (percent) 6.1 6.5 6.5 6.2 6.8 6.2
CPI (percent) 7.0 3.8 6.8 4.3 4.9 5.5
Exchange rate (IDR/USD) 9,078 8,779 9,000 9,384 9,300 9,600
Crude oil price (USD/barrel) 79.4 111.5 105 112.7 100.0 110
Oil production ('000 barrels/day) 954 899 930 861 900 830
Source: MoF; World Bank staff calculations
7. The official poverty rate continues to decline slowly The official poverty rate declined to 11.7 percent in September 2012…
Official poverty figures released by BPS show that while the rate of rate of poverty continues to decline, it is doing so at a slower rate. Since 2011, BPS has collected Susenas data on a quarterly basis which has allowed for the establishment of two poverty rates throughout the year. BPS estimates that 11.7 percent of the population lived below the poverty line in September 2012, a 0.3 percent decline from March 2012. This was a slightly faster fall than the 0.1 percent decline experienced from March to September 2011. As data have only been collected for two September periods, the effect of seasonal patterns on movements in the poverty rate between March and September are not well understood.
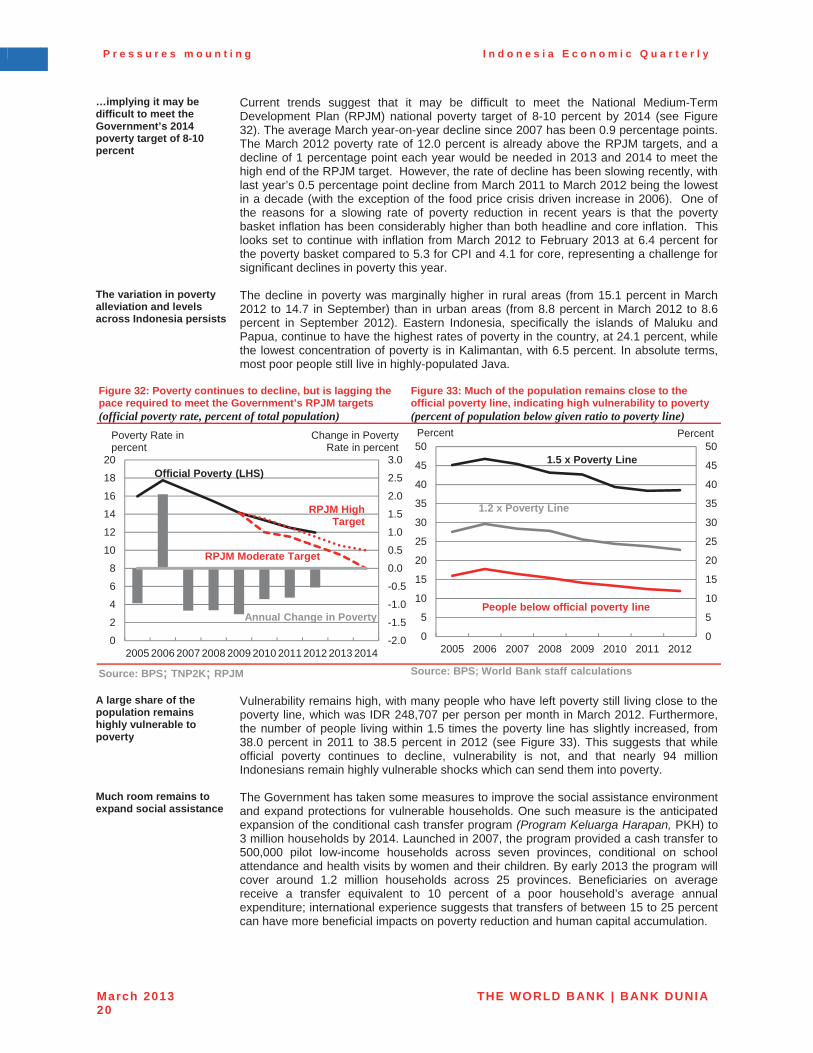
P r e s s u r e s m o u n t i n g I n d o n e s i a E c o n o m i c Q u a r t e r l y
March 2013 THE WORLD BANK | BANK DUNIA20
…implying it may be difficult to meet the Government’s 2014 poverty target of 8-10 percent
Current trends suggest that it may be difficult to meet the National Medium-Term Development Plan (RPJM) national poverty target of 8-10 percent by 2014 (see Figure 32). The average March year-on-year decline since 2007 has been 0.9 percentage points. The March 2012 poverty rate of 12.0 percent is already above the RPJM targets, and a decline of 1 percentage point each year would be needed in 2013 and 2014 to meet the high end of the RPJM target. However, the rate of decline has been slowing recently, with last year’s 0.5 percentage point decline from March 2011 to March 2012 being the lowest in a decade (with the exception of the food price crisis driven increase in 2006). One of the reasons for a slowing rate of poverty reduction in recent years is that the poverty basket inflation has been considerably higher than both headline and core inflation. This looks set to continue with inflation from March 2012 to February 2013 at 6.4 percent for the poverty basket compared to 5.3 for CPI and 4.1 for core, representing a challenge for significant declines in poverty this year.
The variation in poverty alleviation and levels across Indonesia persists
The decline in poverty was marginally higher in rural areas (from 15.1 percent in March 2012 to 14.7 in September) than in urban areas (from 8.8 percent in March 2012 to 8.6 percent in September 2012). Eastern Indonesia, specifically the islands of Maluku and Papua, continue to have the highest rates of poverty in the country, at 24.1 percent, while the lowest concentration of poverty is in Kalimantan, with 6.5 percent. In absolute terms, most poor people still live in highly-populated Java.
Figure 32: Poverty continues to decline, but is lagging the pace required to meet the Government’s RPJM targets (official poverty rate, percent of total population)
Figure 33: Much of the population remains close to the official poverty line, indicating high vulnerability to poverty (percent of population below given ratio to poverty line)
Source: BPS; TNP2K; RPJM Source: BPS; World Bank staff calculations
A large share of the population remains highly vulnerable to poverty
Vulnerability remains high, with many people who have left poverty still living close to the poverty line, which was IDR 248,707 per person per month in March 2012. Furthermore, the number of people living within 1.5 times the poverty line has slightly increased, from 38.0 percent in 2011 to 38.5 percent in 2012 (see Figure 33). This suggests that while official poverty continues to decline, vulnerability is not, and that nearly 94 million Indonesians remain highly vulnerable shocks which can send them into poverty.
Much room remains to expand social assistance
The Government has taken some measures to improve the social assistance environment and expand protections for vulnerable households. One such measure is the anticipated expansion of the conditional cash transfer program (Program Keluarga Harapan, PKH) to 3 million households by 2014. Launched in 2007, the program provided a cash transfer to 500,000 pilot low-income households across seven provinces, conditional on school attendance and health visits by women and their children. By early 2013 the program will cover around 1.2 million households across 25 provinces. Beneficiaries on average receive a transfer equivalent to 10 percent of a poor household’s average annual expenditure; international experience suggests that transfers of between 15 to 25 percent can have more beneficial impacts on poverty reduction and human capital accumulation.
-2.0
-1.5
-1.0
-0.5
0.0
0.5
1.0
1.5
2.0
2.5
3.0
0
2
4
6
8
10
12
14
16
18
20
2005 2006 2007 2008 2009 2010 2011 2012 2013 2014
Official Poverty (LHS)
RPJM High Target
RPJM Moderate Target
Annual Change in Poverty
Change in Poverty Rate in percent
Poverty Rate in percent
0
5
10
15
20
25
30
35
40
45
50
0
5
10
15
20
25
30
35
40
45
50
2005 2006 2007 2008 2009 2010 2011 2012
PercentPercent
People below official poverty line
1.2 x Poverty Line
1.5 x Poverty Line
P r e s s u r e s m o u n t i n g I n d o n e s i a E c o n o m i c Q u a r t e r l y
March 2013 THE WORLD BANK | BANK DUNIA21
8. Risks to the outlook are being heightened by domestic factors The growth outlook faces risks…
The World Bank base case is for the Indonesian economy to continue to grow steadily through 2013. Uncertainty over the global economic outlook still remains elevated, but firmer global economic activity and better financial market conditions since late 2012 suggest somewhat reduced risks to Indonesia’s economy from negative external shocks. However, a number of domestic developments have come to the fore which may weaken growth.
…from lower fixed investment growth…
The key threat to growth surrounds the investment outlook, the risks to which are broadly three-fold.
First, weaker commodity prices since mid-2011 appear to have begun weighing on investment through the end of 2012. This is in line with the historical link between commodity prices and investment growth, and stems from the importance of commodities for exports, company profits, and for household incomes in parts of the country where the resources sector is important for labor income, such as oil palm growing regions. The latter labor income channel is at the intersection between investment and consumption, and this is a second area where investment growth faces risks. Investment has been increasingly geared towards meeting the demands of Indonesia’s rapidly growing consumer market. While consumption is expected to continue to rise strongly, underpinned by favorable structural forces, growth could be blunted should higher inflation due to rising cost-push pressures erode purchasing power, and if high consumer confidence is dampened by associated higher borrowing costs.
Third, investment is likely to face some headwinds from the ongoing failure to address regulatory issues, some policy missteps, and general uncertainty surrounding the electoral process and outcome as the 2014 elections draw nearer. Indonesia also continues to face stiff competition from other economies in the region for export-oriented investment at a time when labor costs, at least for minimum wage workers, have risen significantly.
These risks make sustaining the pace of private investment spending and FDI paramount to the GDP growth outlook. As an indicative example, a halving in investment growth, to 5 percent in 2013 (against close to 10 percent in 2012 and the World Bank base case of 8.0 percent in 2013), would reduce real GDP growth by approximately 1 percentage point.
…rising cost-push inflation pressures…
Inflation risks are skewed upwards. Pass-through from the weaker nominal Rupiah exchange rate was limited in 2012 but will likely continue to feed through into consumer prices with a lag, and sustained currency weakness would compound this. The upward adjustment of subsidized electricity prices by an average of 15 percent, while welcome on efficiency and fiscal grounds, will have a temporary inflationary effect, as would any additional administered price increases through 2014. More pressures come from potential second round price effects from the minimum wage increases granted for 2013, although it remains to be seen how the generally large increases will affect the overall wage distribution and employment. Finally, existing measures restricting trade in products such as foods and electronic equipment will tend to raise prices. Bank Indonesia will need to gauge the risk of these supply-side factors feeding through into higher generalized inflation, which may necessitate tightening monetary policy. This challenge will coincide with the term of the new central bank Governor, which will begin in May 2013 following the announcement that incumbent Governor Darmin Nasution is to retire.
…and management of the external balance
Measures restricting trade and an increase in protectionist rhetoric have coincided with policymakers’ concerns over the move into quarterly current account deficits and the depreciation of the Rupiah, which has been a focus for investors. Going forward, it will be important to ensure that policy responses to Indonesia’s external account dynamics avoid counter-productive and unintended consequences, such as raising investor risk perceptions at a time when gross external debt financing needs are significant, or reducing competitiveness by increasing domestic prices or hampering exports which rely on imported inputs. In addition, there have been episodes when foreign exchange market liquidity has been tight, and it will be important for policy to help avoid such episodes going forward.
P r e s s u r e s m o u n t i n g I n d o n e s i a E c o n o m i c Q u a r t e r l y
March 2013 THE WORLD BANK | BANK DUNIA22
While sustaining growth will require minimizing policy-related uncertainties
In addition to navigating the short-term challenges posed by domestic and international economic conditions, continuing to address Indonesia’s medium-term development challenges will require making more progress on economic policy reform and implementation. Notable challenges include ensuring that the communication and implementation of regulatory policies encourage continued private investment growth, while also continuing to raise the level and efficiency of public investment, particularly on infrastructure. An intensification of the political cycle in the build-up to elections in 2014 is likely to make this more difficult. Consequently, over this period it will be important to minimize uncertainties over the policy stance and to emphasize clear communication over potential policy reforms. Future appointments to key economic policy roles, following the nomination of the Minister of Finance as the next Governor of Bank Indonesia, will also frame the macroeconomic policy environment going forward.
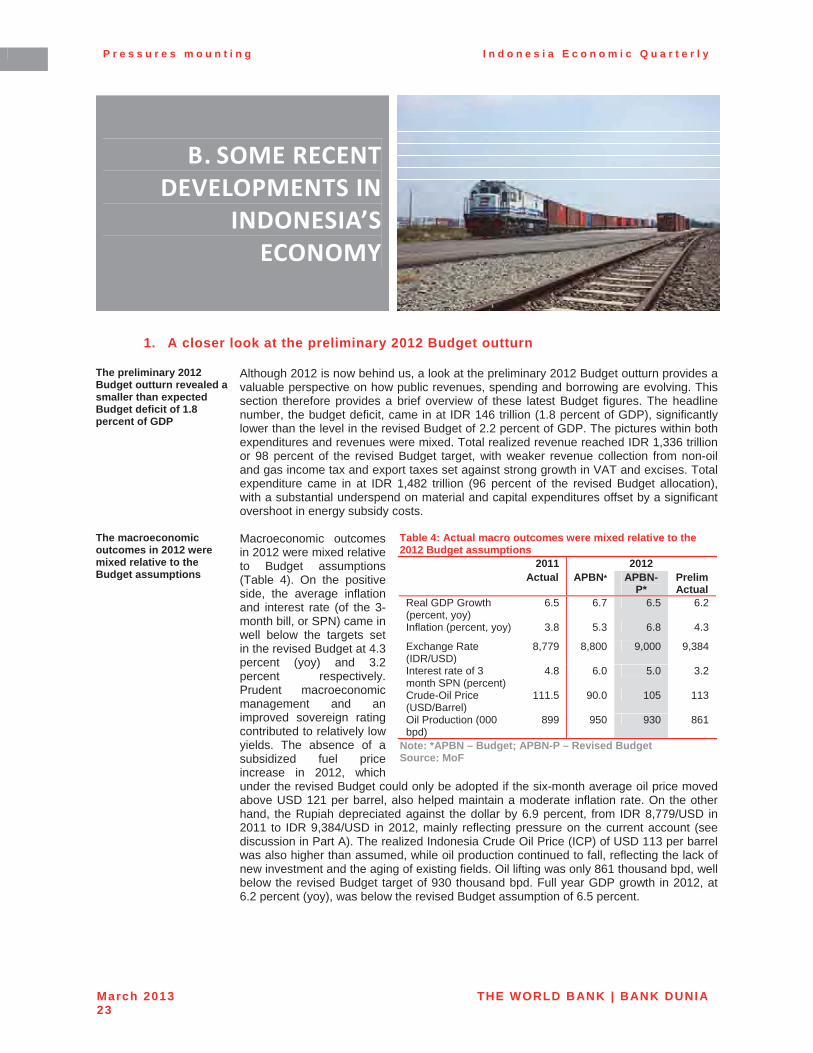
P r e s s u r e s m o u n t i n g I n d o n e s i a E c o n o m i c Q u a r t e r l y
March 2013 THE WORLD BANK | BANK DUNIA23
B. SOME�RECENT�DEVELOPMENTS�IN�
INDONESIA’S�ECONOMY�
1. A closer look at the preliminary 2012 Budget outturn
The preliminary 2012 Budget outturn revealed a smaller than expected Budget deficit of 1.8 percent of GDP
Although 2012 is now behind us, a look at the preliminary 2012 Budget outturn provides a valuable perspective on how public revenues, spending and borrowing are evolving. This section therefore provides a brief overview of these latest Budget figures. The headline number, the budget deficit, came in at IDR 146 trillion (1.8 percent of GDP), significantly lower than the level in the revised Budget of 2.2 percent of GDP. The pictures within both expenditures and revenues were mixed. Total realized revenue reached IDR 1,336 trillion or 98 percent of the revised Budget target, with weaker revenue collection from non-oil and gas income tax and export taxes set against strong growth in VAT and excises. Total expenditure came in at IDR 1,482 trillion (96 percent of the revised Budget allocation), with a substantial underspend on material and capital expenditures offset by a significant overshoot in energy subsidy costs.
The macroeconomic outcomes in 2012 were mixed relative to the Budget assumptions
Macroeconomic outcomes in 2012 were mixed relative to Budget assumptions (Table 4). On the positive side, the average inflation and interest rate (of the 3-month bill, or SPN) came in well below the targets set in the revised Budget at 4.3 percent (yoy) and 3.2 percent respectively. Prudent macroeconomic management and an improved sovereign rating contributed to relatively low yields. The absence of a subsidized fuel price increase in 2012, which under the revised Budget could only be adopted if the six-month average oil price moved above USD 121 per barrel, also helped maintain a moderate inflation rate. On the other hand, the Rupiah depreciated against the dollar by 6.9 percent, from IDR 8,779/USD in 2011 to IDR 9,384/USD in 2012, mainly reflecting pressure on the current account (see discussion in Part A). The realized Indonesia Crude Oil Price (ICP) of USD 113 per barrel was also higher than assumed, while oil production continued to fall, reflecting the lack of new investment and the aging of existing fields. Oil lifting was only 861 thousand bpd, well below the revised Budget target of 930 thousand bpd. Full year GDP growth in 2012, at 6.2 percent (yoy), was below the revised Budget assumption of 6.5 percent.
Table 4: Actual macro outcomes were mixed relative to the 2012 Budget assumptions
2011 2012 Actual APBN* APBN-
P*PrelimActual
Real GDP Growth (percent, yoy)
6.5 6.7 6.5 6.2
Inflation (percent, yoy) 3.8 5.3 6.8 4.3
Exchange Rate (IDR/USD)
8,779 8,800 9,000 9,384
Interest rate of 3 month SPN (percent)
4.8 6.0 5.0 3.2
Crude-Oil Price (USD/Barrel)
111.5 90.0 105 113
Oil Production (000 bpd)
899 950 930 861
Note: *APBN – Budget; APBN-P – Revised Budget Source: MoF
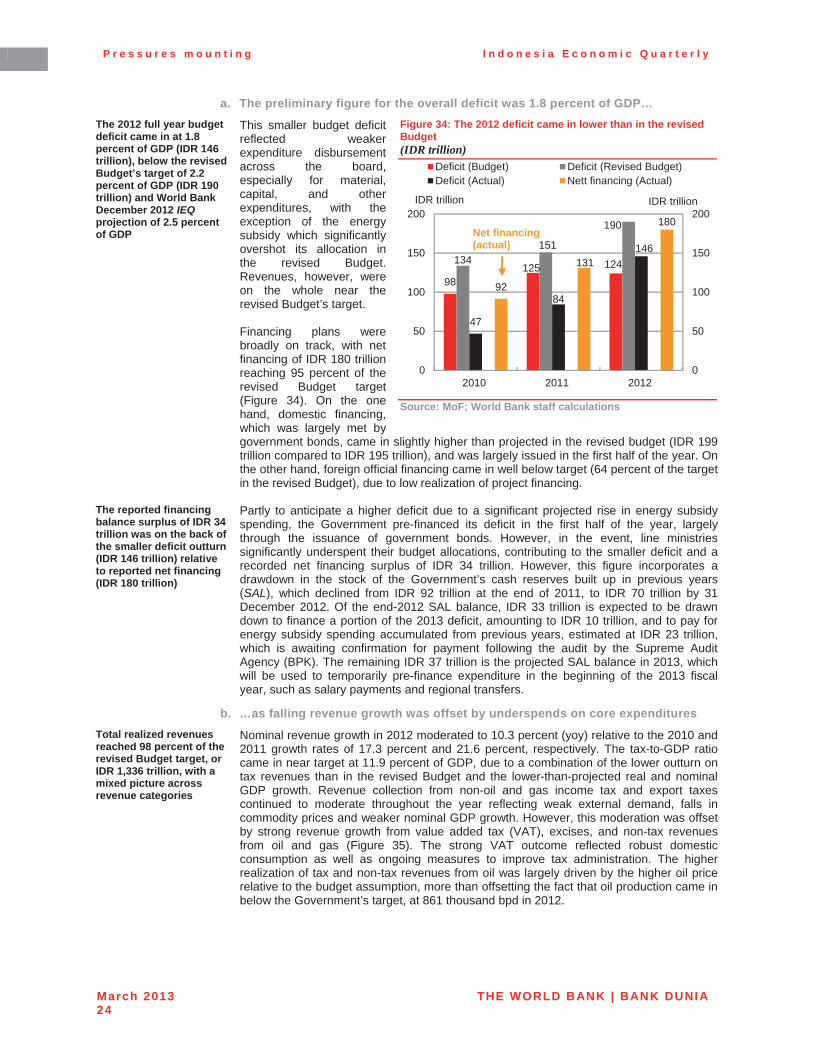
P r e s s u r e s m o u n t i n g I n d o n e s i a E c o n o m i c Q u a r t e r l y
March 2013 THE WORLD BANK | BANK DUNIA24
a. The preliminary figure for the overall deficit was 1.8 percent of GDP… The 2012 full year budget deficit came in at 1.8 percent of GDP (IDR 146 trillion), below the revised Budget’s target of 2.2 percent of GDP (IDR 190 trillion) and World Bank December 2012 IEQprojection of 2.5 percent of GDP
This smaller budget deficit reflected weaker expenditure disbursement across the board, especially for material, capital, and other expenditures, with the exception of the energy subsidy which significantly overshot its allocation in the revised Budget. Revenues, however, were on the whole near the revised Budget’s target.
Financing plans were broadly on track, with net financing of IDR 180 trillion reaching 95 percent of the revised Budget target (Figure 34). On the one hand, domestic financing, which was largely met by government bonds, came in slightly higher than projected in the revised budget (IDR 199 trillion compared to IDR 195 trillion), and was largely issued in the first half of the year. On the other hand, foreign official financing came in well below target (64 percent of the target in the revised Budget), due to low realization of project financing.
Figure 34: The 2012 deficit came in lower than in the revised Budget (IDR trillion)
Source: MoF; World Bank staff calculations
The reported financing balance surplus of IDR 34 trillion was on the back of the smaller deficit outturn (IDR 146 trillion) relative to reported net financing (IDR 180 trillion)
Partly to anticipate a higher deficit due to a significant projected rise in energy subsidy spending, the Government pre-financed its deficit in the first half of the year, largely through the issuance of government bonds. However, in the event, line ministries significantly underspent their budget allocations, contributing to the smaller deficit and a recorded net financing surplus of IDR 34 trillion. However, this figure incorporates a drawdown in the stock of the Government’s cash reserves built up in previous years(SAL), which declined from IDR 92 trillion at the end of 2011, to IDR 70 trillion by 31 December 2012. Of the end-2012 SAL balance, IDR 33 trillion is expected to be drawndown to finance a portion of the 2013 deficit, amounting to IDR 10 trillion, and to pay for energy subsidy spending accumulated from previous years, estimated at IDR 23 trillion, which is awaiting confirmation for payment following the audit by the Supreme Audit Agency (BPK). The remaining IDR 37 trillion is the projected SAL balance in 2013, which will be used to temporarily pre-finance expenditure in the beginning of the 2013 fiscal year, such as salary payments and regional transfers.
b. …as falling revenue growth was offset by underspends on core expenditures Total realized revenues reached 98 percent of the revised Budget target, or IDR 1,336 trillion, with a mixed picture across revenue categories
Nominal revenue growth in 2012 moderated to 10.3 percent (yoy) relative to the 2010 and 2011 growth rates of 17.3 percent and 21.6 percent, respectively. The tax-to-GDP ratio came in near target at 11.9 percent of GDP, due to a combination of the lower outturn on tax revenues than in the revised Budget and the lower-than-projected real and nominal GDP growth. Revenue collection from non-oil and gas income tax and export taxes continued to moderate throughout the year reflecting weak external demand, falls in commodity prices and weaker nominal GDP growth. However, this moderation was offset by strong revenue growth from value added tax (VAT), excises, and non-tax revenues from oil and gas (Figure 35). The strong VAT outcome reflected robust domestic consumption as well as ongoing measures to improve tax administration. The higher realization of tax and non-tax revenues from oil was largely driven by the higher oil price relative to the budget assumption, more than offsetting the fact that oil production came in below the Government’s target, at 861 thousand bpd in 2012.
98125 124134
151
190
47
84
146
92
131
180
0
50
100
150
200
0
50
100
150
200
2010 2011 2012
IDR trillion
Deficit (Budget) Deficit (Revised Budget)Deficit (Actual) Nett financing (Actual)
IDR trillion
Net financing (actual)
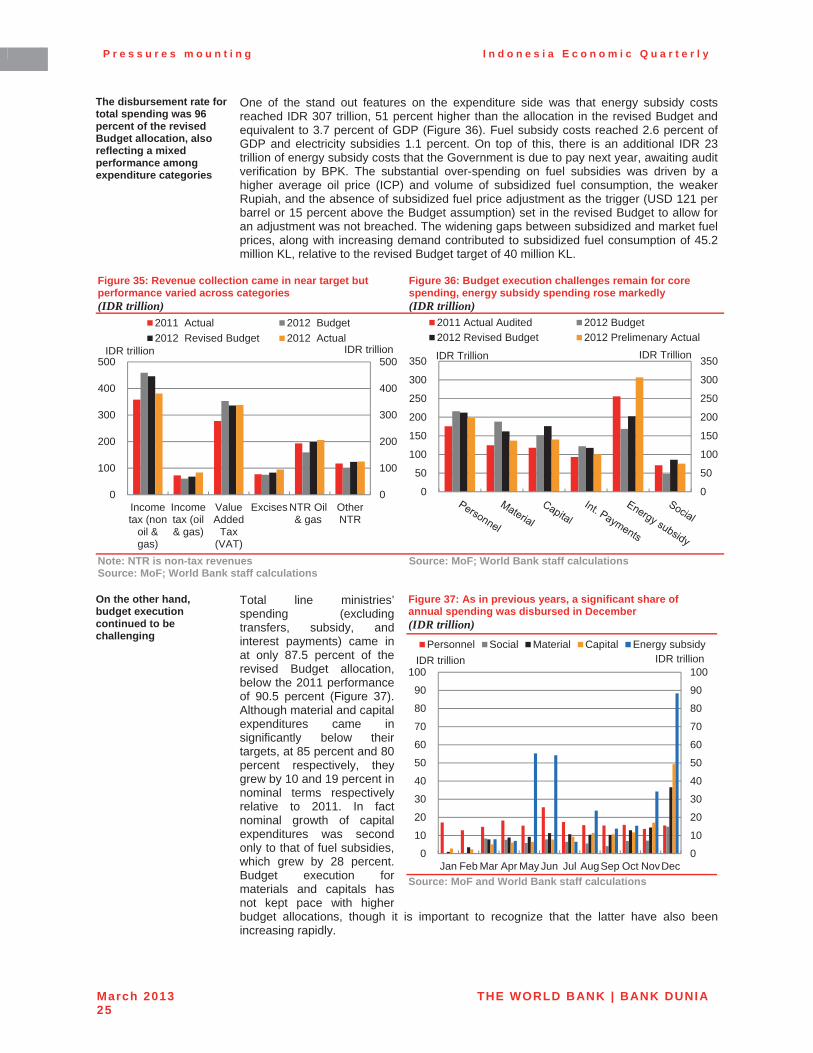
P r e s s u r e s m o u n t i n g I n d o n e s i a E c o n o m i c Q u a r t e r l y
March 2013 THE WORLD BANK | BANK DUNIA25
The disbursement rate for total spending was 96 percent of the revised Budget allocation, also reflecting a mixed performance among expenditure categories
One of the stand out features on the expenditure side was that energy subsidy costs reached IDR 307 trillion, 51 percent higher than the allocation in the revised Budget and equivalent to 3.7 percent of GDP (Figure 36). Fuel subsidy costs reached 2.6 percent of GDP and electricity subsidies 1.1 percent. On top of this, there is an additional IDR 23 trillion of energy subsidy costs that the Government is due to pay next year, awaiting audit verification by BPK. The substantial over-spending on fuel subsidies was driven by a higher average oil price (ICP) and volume of subsidized fuel consumption, the weaker Rupiah, and the absence of subsidized fuel price adjustment as the trigger (USD 121 per barrel or 15 percent above the Budget assumption) set in the revised Budget to allow for an adjustment was not breached. The widening gaps between subsidized and market fuel prices, along with increasing demand contributed to subsidized fuel consumption of 45.2 million KL, relative to the revised Budget target of 40 million KL.
Figure 35: Revenue collection came in near target but performance varied across categories (IDR trillion)
Figure 36: Budget execution challenges remain for core spending, energy subsidy spending rose markedly (IDR trillion)
Note: NTR is non-tax revenues Source: MoF; World Bank staff calculations
Source: MoF; World Bank staff calculations
On the other hand, budget execution continued to be challenging
Total line ministries’ spending (excluding transfers, subsidy, and interest payments) came in at only 87.5 percent of the revised Budget allocation,below the 2011 performance of 90.5 percent (Figure 37). Although material and capital expenditures came in significantly below their targets, at 85 percent and 80 percent respectively, they grew by 10 and 19 percent in nominal terms respectively relative to 2011. In fact nominal growth of capital expenditures was second only to that of fuel subsidies, which grew by 28 percent. Budget execution for materials and capitals has not kept pace with higher budget allocations, though it is important to recognize that the latter have also been increasing rapidly.
Figure 37: As in previous years, a significant share of annual spending was disbursed in December (IDR trillion)
Source: MoF and World Bank staff calculations
0
100
200
300
400
500
0
100
200
300
400
500
Incometax (non
oil &gas)
Incometax (oil& gas)
ValueAdded
Tax(VAT)
Excises NTR Oil& gas
OtherNTR
IDR trillion
2011 Actual 2012 Budget2012 Revised Budget 2012 Actual
IDR trillion
0
50
100
150
200
250
300
350
0
50
100
150
200
250
300
350 IDR Trillion
2011 Actual Audited 2012 Budget2012 Revised Budget 2012 Prelimenary Actual
IDR Trillion
0
10
20
30
40
50
60
70
80
90
100
0
10
20
30
40
50
60
70
80
90
100
Jan Feb Mar Apr May Jun Jul AugSep Oct NovDec
IDR trillionPersonnel Social Material Capital Energy subsidy
IDR trillion
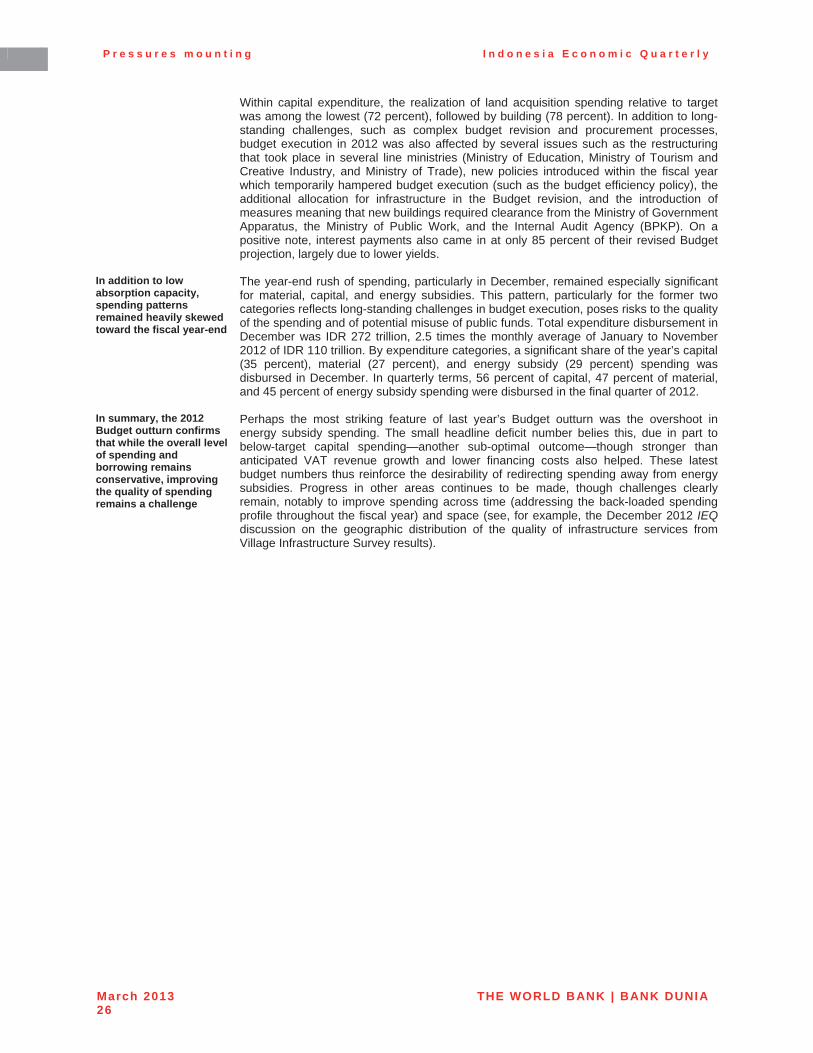
P r e s s u r e s m o u n t i n g I n d o n e s i a E c o n o m i c Q u a r t e r l y
March 2013 THE WORLD BANK | BANK DUNIA26
Within capital expenditure, the realization of land acquisition spending relative to target was among the lowest (72 percent), followed by building (78 percent). In addition to long-standing challenges, such as complex budget revision and procurement processes, budget execution in 2012 was also affected by several issues such as the restructuring that took place in several line ministries (Ministry of Education, Ministry of Tourism and Creative Industry, and Ministry of Trade), new policies introduced within the fiscal year which temporarily hampered budget execution (such as the budget efficiency policy), the additional allocation for infrastructure in the Budget revision, and the introduction of measures meaning that new buildings required clearance from the Ministry of Government Apparatus, the Ministry of Public Work, and the Internal Audit Agency (BPKP). On a positive note, interest payments also came in at only 85 percent of their revised Budget projection, largely due to lower yields.
In addition to low absorption capacity, spending patterns remained heavily skewed toward the fiscal year-end
The year-end rush of spending, particularly in December, remained especially significant for material, capital, and energy subsidies. This pattern, particularly for the former two categories reflects long-standing challenges in budget execution, poses risks to the quality of the spending and of potential misuse of public funds. Total expenditure disbursement in December was IDR 272 trillion, 2.5 times the monthly average of January to November 2012 of IDR 110 trillion. By expenditure categories, a significant share of the year’s capital (35 percent), material (27 percent), and energy subsidy (29 percent) spending was disbursed in December. In quarterly terms, 56 percent of capital, 47 percent of material, and 45 percent of energy subsidy spending were disbursed in the final quarter of 2012.
In summary, the 2012 Budget outturn confirms that while the overall level of spending and borrowing remains conservative, improving the quality of spending remains a challenge
Perhaps the most striking feature of last year’s Budget outturn was the overshoot in energy subsidy spending. The small headline deficit number belies this, due in part to below-target capital spending—another sub-optimal outcome—though stronger than anticipated VAT revenue growth and lower financing costs also helped. These latest budget numbers thus reinforce the desirability of redirecting spending away from energy subsidies. Progress in other areas continues to be made, though challenges clearly remain, notably to improve spending across time (addressing the back-loaded spending profile throughout the fiscal year) and space (see, for example, the December 2012 IEQ discussion on the geographic distribution of the quality of infrastructure services from Village Infrastructure Survey results).
P r e s s u r e s m o u n t i n g I n d o n e s i a E c o n o m i c Q u a r t e r l y
March 2013 THE WORLD BANK | BANK DUNIA27
2. Understanding the value-added in Indonesia’s trade New value-added data offer a fresh perspective on Indonesia’s trade in goods and services
Following the deterioration in the current account balance since mid-2011, Indonesia’s trade patterns have been under particular scrutiny. New data from the OECD and the WTO provide a valuable new perspective on Indonesia’s trade, by measuring trade in value-added rather than in conventional gross terms. This section provides an overview of this new value-added perspective of trade, highlighting the scope to boost the contribution of exports to the economy, the importance of Indonesia’s integration into global supply chains, and the strong link between export and import performance.
a. What can be learnt from looking at trade in value added? The new OECD-WTO data in trade provide valuable new insights on Indonesia’s trade patterns…
New OECD-WTO statistics on trade in value-added (TiVA) provide important new insights into foreign trade.6 The TiVA dataset traces the contribution to a country’s gross exports from inputs from abroad, generating estimates of exports in value-added terms; that is, the value of the economy’s goods and services that are embodied in its exports, after accounting for the use of imported intermediate goods and services inputs.
…by revealing the hidden importance of exports and imports
Measuring trade flows in value-added terms using the TiVA dataset helps to capture an economy’s role in global supply chains, since it eliminates the over-counting of trade values found in gross trade statistics when the same good is reported several times in national trade statistics as it crosses borders. For example, one estimate suggests that only USD 6.50 (about 3.6 percent) of the total manufacturing cost of an Apple iPhone in 2009 could be attributed to production activities inside China, with the bulk of the value in fact accounted for by the cost of components imported from elsewhere, such as Japan (34 percent), Germany (16 percent), and South Korea (13 percent).7 Yet it is the full (gross) shipping price of goods which is reported in gross exports—in this example, the full USD 178.96 value of the Apple iPhone in China’s exports. Measuring trade in value added, instead of such gross terms, thus clarifies the links between exports and imports, and the availability of high quality intermediate inputs as a factor in export performance.
b. Commodities have driven the patterns of Indonesia’s value added in exports The contribution of exports in value-added terms to Indonesia’s GDP growth remains modest
Growth in domestic value-added of exports is estimated to account for only 8 percent of Indonesia’s real GDP growth in the decade to 2011, reflecting the modest growth in Indonesia’s exports despite the structural uplift in many commodity prices over the past decade (Figure 38). Estimates using the TiVA data also suggest that domestic value-added of exports as a share of GDP declined to 21.9 percent in 2011, from 28 percent in 2005, a similar fall to that seen in gross exports as a share of GDP (Figure 38).
In aggregate, Indonesia’s exports contain only a small share of foreign value-added content
The TiVA data show that of Indonesia’s total gross merchandise exports in 2009,8 only 14.3 percent comprised foreign inputs, resulting from the inclusion of foreign parts in the production of merchandise exports (Figure 39). This means that 85.7 percent of the total of gross merchandise exports consisted of domestic value-added content, higher than China (71 percent), but lower than Brazil (97 percent) (Figure 39).
This is due to the large share of natural resources exports, while in manufacturing exports Indonesia appears relatively well-integrated in global value chains
The relatively high share of domestic value-added in exports is the result of the dominance of natural resource-based products in Indonesia’s exports (accounting for about two-thirds of total gross exports). Considered separately, however, the manufacturing sector can actually be seen to be relatively well connected to global value chains (Figure 40). For example, almost 40 percent of the value of Indonesia’s gross machinery exports consists of foreign value-added, reflecting Indonesia’s participation in global production networks, especially with Japan and Korea. Foreign content also comprises a large share of electronics, and textile, clothing, and footwear (TCF) exports (25 percent). In fact, for certain industries, the foreign components of Indonesia’s gross exports are even larger than for China, notably in machinery (29.7 percent) and in TCF (14.8 percent) (Figure 41).
6http://www.oecd.org/industry/industryandglobalisation/measuringtradeinvalue-addedanoecd-
wtojointinitiative.htm 7Xing, Y, and Detert, N 2010, “How the iPhone widens the United States trade deficit with the
People's Republic of China”, ADBI Working Paper No. 257, December 8The publicly accessible TiVA dataset provides estimates of value added trade flows for 2005, 2008,
and 2009 only, with the lag in the data reflecting the challenges in deriving the estimates
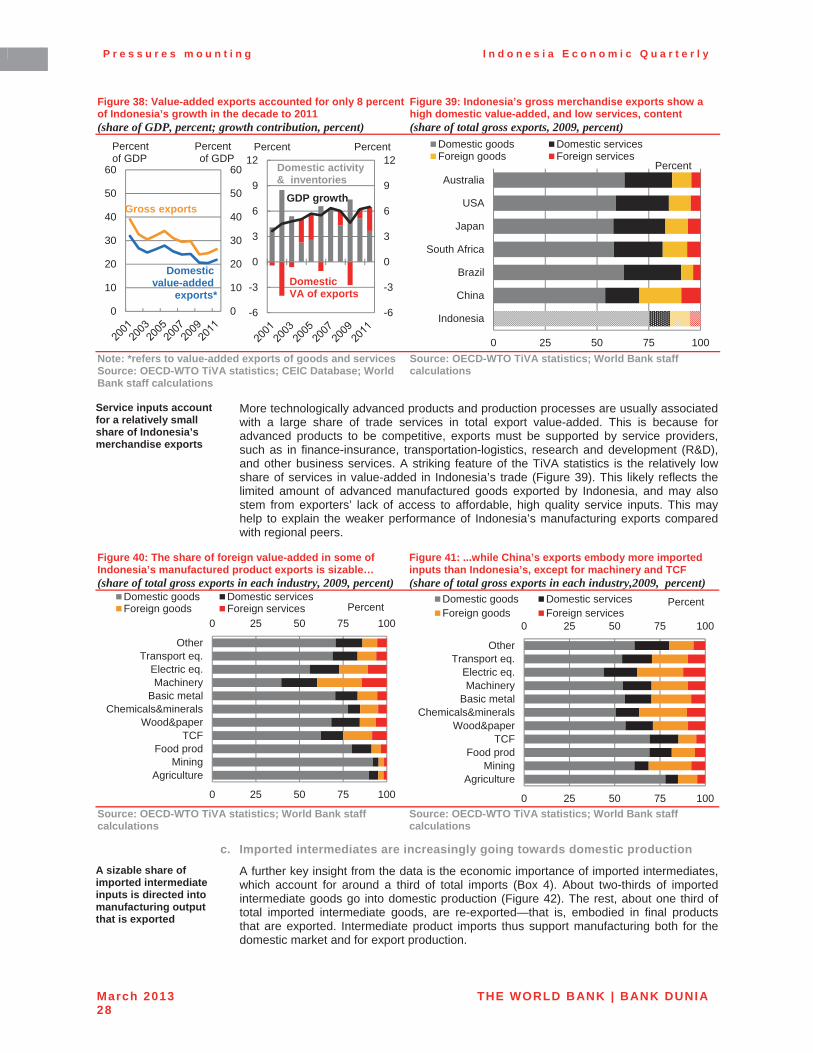
P r e s s u r e s m o u n t i n g I n d o n e s i a E c o n o m i c Q u a r t e r l y
March 2013 THE WORLD BANK | BANK DUNIA28
Figure 38: Value-added exports accounted for only 8 percent of Indonesia’s growth in the decade to 2011 (share of GDP, percent; growth contribution, percent)
Figure 39: Indonesia’s gross merchandise exports show a high domestic value-added, and low services, content (share of total gross exports, 2009, percent)
Note: *refers to value-added exports of goods and services Source: OECD-WTO TiVA statistics; CEIC Database; World Bank staff calculations
Source: OECD-WTO TiVA statistics; World Bank staff calculations
Service inputs account for a relatively small share of Indonesia’s merchandise exports
More technologically advanced products and production processes are usually associated with a large share of trade services in total export value-added. This is because for advanced products to be competitive, exports must be supported by service providers, such as in finance-insurance, transportation-logistics, research and development (R&D), and other business services. A striking feature of the TiVA statistics is the relatively low share of services in value-added in Indonesia’s trade (Figure 39). This likely reflects the limited amount of advanced manufactured goods exported by Indonesia, and may also stem from exporters’ lack of access to affordable, high quality service inputs. This may help to explain the weaker performance of Indonesia’s manufacturing exports compared with regional peers.
Figure 40: The share of foreign value-added in some of Indonesia’s manufactured product exports is sizable… (share of total gross exports in each industry, 2009, percent)
Figure 41: ...while China’s exports embody more imported inputs than Indonesia’s, except for machinery and TCF (share of total gross exports in each industry,2009, percent)
Source: OECD-WTO TiVA statistics; World Bank staff calculations
Source: OECD-WTO TiVA statistics; World Bank staff calculations
c. Imported intermediates are increasingly going towards domestic production A sizable share of imported intermediate inputs is directed into manufacturing output that is exported
A further key insight from the data is the economic importance of imported intermediates, which account for around a third of total imports (Box 4). About two-thirds of imported intermediate goods go into domestic production (Figure 42). The rest, about one third of total imported intermediate goods, are re-exported—that is, embodied in final products that are exported. Intermediate product imports thus support manufacturing both for the domestic market and for export production.
0
10
20
30
40
50
60
0
10
20
30
40
50
60
Percentof GDP
Percentof GDP
Domesticvalue-added
exports*
Gross exports
-6
-3
0
3
6
9
12
-6
-3
0
3
6
9
12Percent
GDP growth
Domestic activity& inventories
DomesticVA of exports
Percent
0 25 50 75 100
Indonesia
China
Brazil
South Africa
Japan
USA
Australia
Domestic goods Domestic servicesForeign goods Foreign services
Percent
0 25 50 75 100
0 25 50 75 100
AgricultureMining
Food prodTCF
Wood&paperChemicals&minerals
Basic metalMachinery
Electric eq.Transport eq.
Other
Domestic goods Domestic servicesForeign goods Foreign services Percent
0 25 50 75 100
0 25 50 75 100
AgricultureMining
Food prodTCF
Wood&paperChemicals&minerals
Basic metalMachinery
Electric eq.Transport eq.
Other
Domestic goods Domestic servicesForeign goods Foreign services
Percent

P r e s s u r e s m o u n t i n g I n d o n e s i a E c o n o m i c Q u a r t e r l y
March 2013 THE WORLD BANK | BANK DUNIA29
The share of imported intermediate inputs that went into manufactured exports was lower in 2009 than in 2005
Comparing the TiVA statistics for 2005 and 2009 reveals an interesting change. In Indonesia, the proportion of intermediate goods imports directed towards exports, while significant as reported above, was lower in 2009 than in 2005 (Figure 42, compare solid gray bars for re-exported imports in 2005 with black bars for 2009). For comparison, the share of imported intermediate goods going into production for domestic and export use declined only slightly between 2005 and 2009 in China (Figure 43). This may reflect the temporary impact of the global financial crisis. However, it may also indicate a trend of imports of intermediate goods as inputs to manufacturing for the domestic market growing more quickly than the growth of intermediate goods imports as inputs for export-oriented manufacturing. More recent data are required to better understand the trends in where imported intermediate goods are being directed.
Figure 42: Indonesia’s intermediate merchandise imports support both domestic and export-oriented production… (allocation of intermediate imports, percent, 2005 and 2009)
Figure 43: …while in China, a larger share of imported intermediate products are re-exported (allocation of intermediate imports, percent, 2005 and 2009)
Source: OECD-WTO TiVA statistics; World Bank staff calculations
Source: OECD-WTO TiVA statistics; World Bank staff calculations
d. Integration into international supply chains could help export diversification Imports contribute significantly to the value-added of Indonesia’s exports, and there is significant scope to expand the contribution of services
Trade in value-added data offer a useful fresh perspective on Indonesia’s trade patterns. The data show that, overall, the share of domestic value-added in Indonesia’s total exports is high, reflecting a high share of locally-extracted commodities in exports. On inspection, foreign value-added is revealed to account for a significant share of certain export segments, notably in TCF, machinery and electrical equipment. The importance of imported inputs for export production is such that about a third of imported intermediates go into export value-added. These features of Indonesia’s trade demonstrate the importance of Indonesia’s integration into global supply chains, and the strong link between export and import performance. This means that limiting imports can have the unintended consequence of also hampering exports. The data also show that there is scope for Indonesia to deepen its linkages to international supply chains by drawing more on foreign value-added in the goods and services that Indonesia exports. This is exemplified by China’s value-added trade patterns, which show a higher reliance on imported inputs than Indonesia’s. Services value-added in Indonesian exports is particularly low, both for domestic and foreign services. This could reflect limited development of domestic ancillary services for supporting exports, and also low usage by Indonesian exporters of foreign-supplied export services. Encouraging the development of these services would likely help overall export performance and help to diversify exports away from commodities.
0 25 50 75 100
0 25 50 75 100
AgricultureMining
Food prodTCF
Wood&paperChemicals&minerals
Basic metalMachinery
Electric eq.Transport eq.Other goods
Aggregate
export production 05 domestic production 05export production 09 domestic production 09 PercentPercent
0 25 50 75 100
0 25 50 75 100
AgricultureMining
Food prodTCF
Wood&paperChemicals&minerals
Basic metalMachinery
Electric eq.Transport eq.Other goods
Aggregate
export production 05 domestic production 05export production 09 domestic production 09 PercentPercent
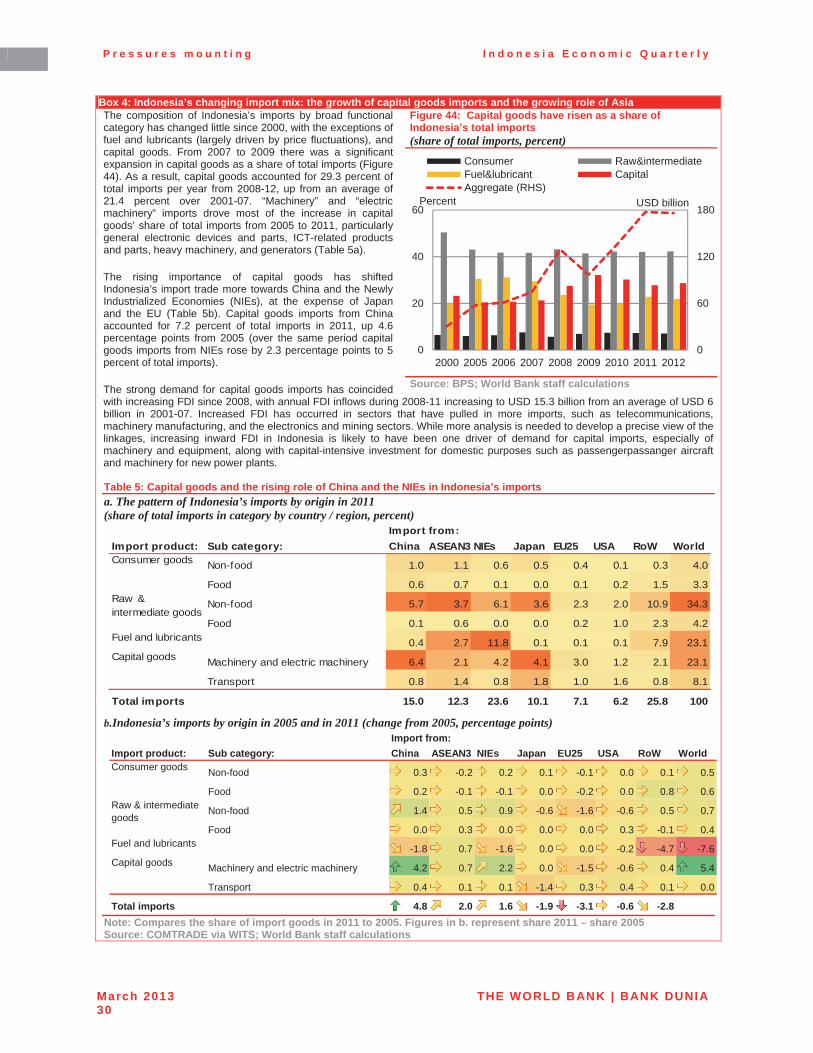
P r e s s u r e s m o u n t i n g I n d o n e s i a E c o n o m i c Q u a r t e r l y
March 2013 THE WORLD BANK | BANK DUNIA30
Box 4: Indonesia’s changing import mix: the growth of capital goods imports and the growing role of AsiaFigure 44: Capital goods have risen as a share of Indonesia’s total imports (share of total imports, percent)
Source: BPS; World Bank staff calculations
The composition of Indonesia’s imports by broad functional category has changed little since 2000, with the exceptions of fuel and lubricants (largely driven by price fluctuations), and capital goods. From 2007 to 2009 there was a significant expansion in capital goods as a share of total imports (Figure 44). As a result, capital goods accounted for 29.3 percent of total imports per year from 2008-12, up from an average of 21.4 percent over 2001-07. “Machinery” and “electric machinery” imports drove most of the increase in capital goods’ share of total imports from 2005 to 2011, particularly general electronic devices and parts, ICT-related products and parts, heavy machinery, and generators (Table 5a).
The rising importance of capital goods has shifted Indonesia’s import trade more towards China and the Newly Industrialized Economies (NIEs), at the expense of Japan and the EU (Table 5b). Capital goods imports from China accounted for 7.2 percent of total imports in 2011, up 4.6 percentage points from 2005 (over the same period capital goods imports from NIEs rose by 2.3 percentage points to 5 percent of total imports).
The strong demand for capital goods imports has coincided with increasing FDI since 2008, with annual FDI inflows during 2008-11 increasing to USD 15.3 billion from an average of USD 6 billion in 2001-07. Increased FDI has occurred in sectors that have pulled in more imports, such as telecommunications, machinery manufacturing, and the electronics and mining sectors. While more analysis is needed to develop a precise view of thelinkages, increasing inward FDI in Indonesia is likely to have been one driver of demand for capital imports, especially of machinery and equipment, along with capital-intensive investment for domestic purposes such as passengerpassanger aircraft and machinery for new power plants.
Table 5: Capital goods and the rising role of China and the NIEs in Indonesia’s imports a. The pattern of Indonesia’s imports by origin in 2011 (share of total imports in category by country / region, percent)
b.Indonesia’s imports by origin in 2005 and in 2011 (change from 2005, percentage points)
Note: Compares the share of import goods in 2011 to 2005. Figures in b. represent share 2011 – share 2005 Source: COMTRADE via WITS; World Bank staff calculations
0
60
120
180
0
20
40
60
2000 2005 2006 2007 2008 2009 2010 2011 2012
Consumer Raw&intermediateFuel&lubricant CapitalAggregate (RHS)
Percent USD billion
Import from:Import product: Sub category: China ASEAN3 NIEs Japan EU25 USA RoW World
Non-food 1.0 1.1 0.6 0.5 0.4 0.1 0.3 4.0
Food 0.6 0.7 0.1 0.0 0.1 0.2 1.5 3.3
Non-food 5.7 3.7 6.1 3.6 2.3 2.0 10.9 34.3
Food 0.1 0.6 0.0 0.0 0.2 1.0 2.3 4.2Fuel and lubricants 0.4 2.7 11.8 0.1 0.1 0.1 7.9 23.1
Machinery and electric machinery 6.4 2.1 4.2 4.1 3.0 1.2 2.1 23.1
Transport 0.8 1.4 0.8 1.8 1.0 1.6 0.8 8.1
Total imports 15.0 12.3 23.6 10.1 7.1 6.2 25.8 100
Consumer goods
Raw & intermediate goods
Capital goods
Import from:Import product: Sub category: China ASEAN3 NIEs Japan EU25 USA RoW World
Non-food 0.3 -0.2 0.2 0.1 -0.1 0.0 0.1 0.5
Food 0.2 -0.1 -0.1 0.0 -0.2 0.0 0.8 0.6
Non-food 1.4 0.5 0.9 -0.6 -1.6 -0.6 0.5 0.7
Food 0.0 0.3 0.0 0.0 0.0 0.3 -0.1 0.4Fuel and lubricants -1.8 0.7 -1.6 0.0 0.0 -0.2 -4.7 -7.6
Machinery and electric machinery 4.2 0.7 2.2 0.0 -1.5 -0.6 0.4 5.4
Transport 0.4 0.1 0.1 -1.4 0.3 0.4 0.1 0.0
Total imports 4.8 2.0 1.6 -1.9 -3.1 -0.6 -2.8
Consumer goods
Raw & intermediate goods
Capital goods
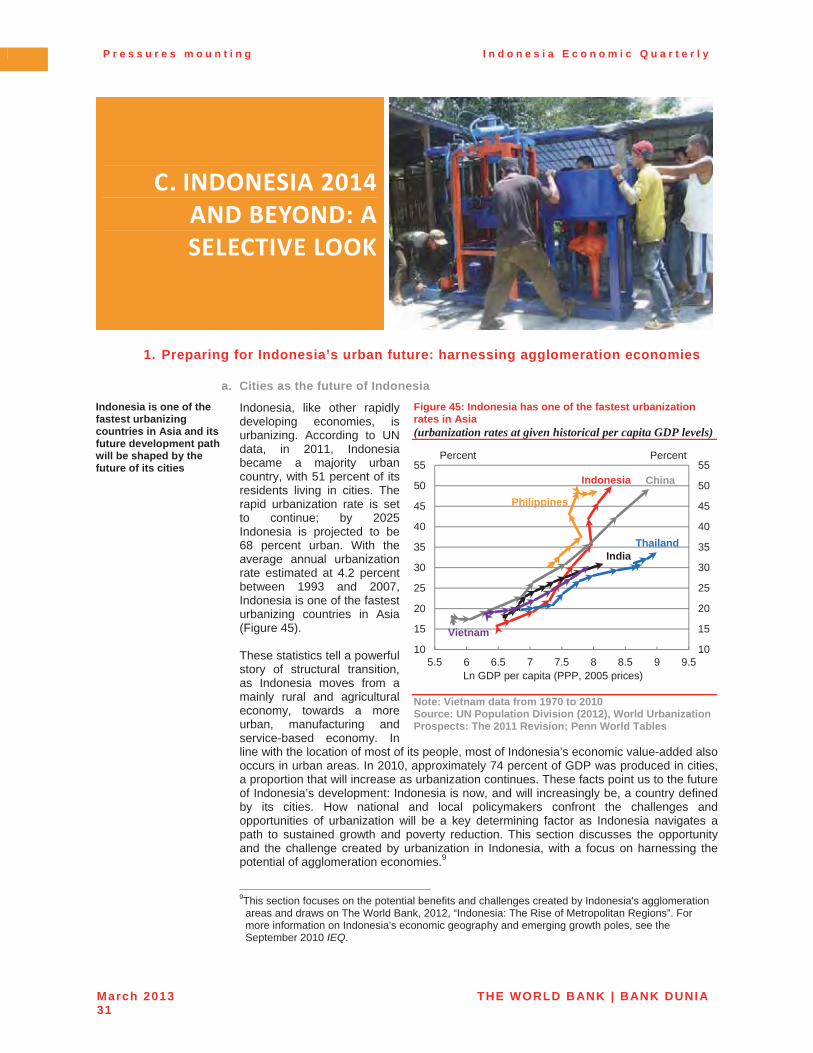
P r e s s u r e s m o u n t i n g I n d o n e s i a E c o n o m i c Q u a r t e r l y
March 2013 THE WORLD BANK | BANK DUNIA31
C. INDONESIA�2014�AND�BEYOND:�A�SELECTIVE�LOOK�
1. Preparing for Indonesia’s urban future: harnessing agglomeration economies
a. Cities as the future of Indonesia Indonesia is one of the fastest urbanizing countries in Asia and its future development path will be shaped by the future of its cities
Indonesia, like other rapidly developing economies, is urbanizing. According to UN data, in 2011, Indonesia became a majority urban country, with 51 percent of its residents living in cities. The rapid urbanization rate is set to continue; by 2025 Indonesia is projected to be 68 percent urban. With the average annual urbanization rate estimated at 4.2 percent between 1993 and 2007, Indonesia is one of the fastest urbanizing countries in Asia (Figure 45).
These statistics tell a powerful story of structural transition, as Indonesia moves from a mainly rural and agricultural economy, towards a more urban, manufacturing and service-based economy. In line with the location of most of its people, most of Indonesia’s economic value-added also occurs in urban areas. In 2010, approximately 74 percent of GDP was produced in cities,a proportion that will increase as urbanization continues. These facts point us to the future of Indonesia’s development: Indonesia is now, and will increasingly be, a country defined by its cities. How national and local policymakers confront the challenges and opportunities of urbanization will be a key determining factor as Indonesia navigates a path to sustained growth and poverty reduction. This section discusses the opportunity and the challenge created by urbanization in Indonesia, with a focus on harnessing the potential of agglomeration economies.9
Figure 45: Indonesia has one of the fastest urbanization rates in Asia (urbanization rates at given historical per capita GDP levels)
Note: Vietnam data from 1970 to 2010 Source: UN Population Division (2012), World Urbanization Prospects: The 2011 Revision; Penn World Tables
9This section focuses on the potential benefits and challenges created by Indonesia's agglomeration
areas and draws on The World Bank, 2012, “Indonesia: The Rise of Metropolitan Regions”. For more information on Indonesia's economic geography and emerging growth poles, see the September 2010 IEQ.
10
15
20
25
30
35
40
45
50
55
10
15
20
25
30
35
40
45
50
55
5.5 6 6.5 7 7.5 8 8.5 9 9.5
Percent
Ln GDP per capita (PPP, 2005 prices)
Indonesia China
India
Philippines
Thailand
Vietnam
Percent
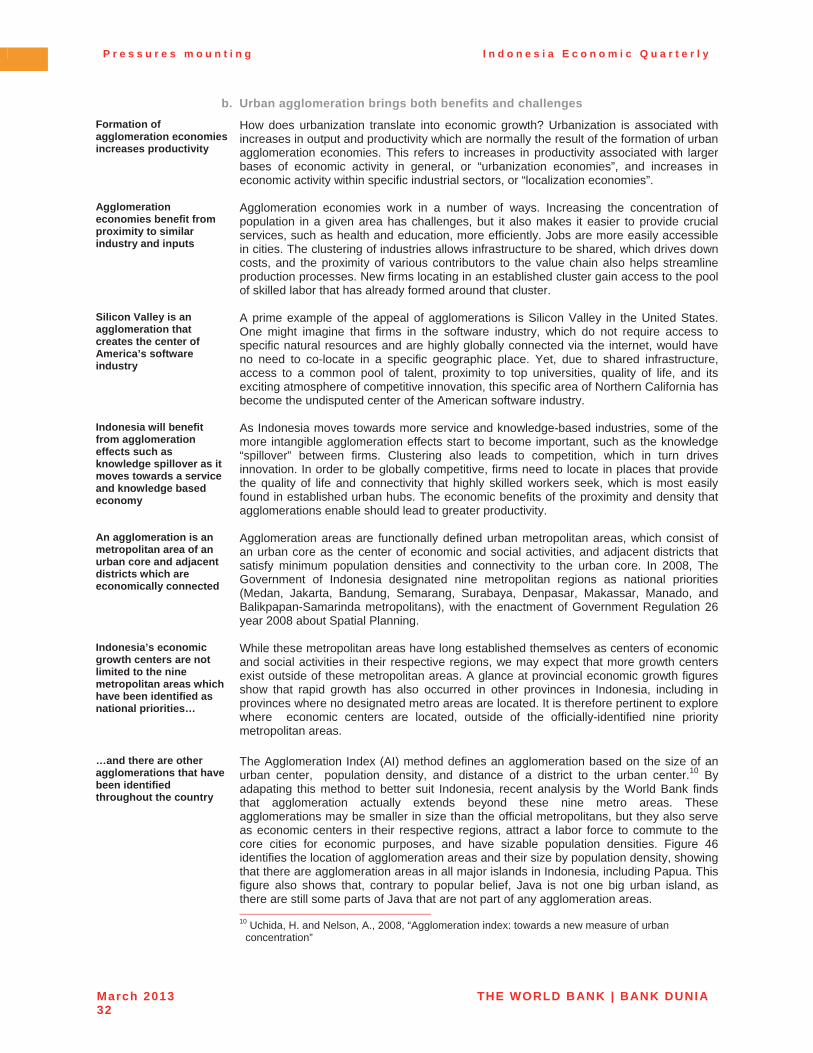
P r e s s u r e s m o u n t i n g I n d o n e s i a E c o n o m i c Q u a r t e r l y
March 2013 THE WORLD BANK | BANK DUNIA32
b. Urban agglomeration brings both benefits and challengesFormation of agglomeration economies increases productivity
How does urbanization translate into economic growth? Urbanization is associated with increases in output and productivity which are normally the result of the formation of urban agglomeration economies. This refers to increases in productivity associated with larger bases of economic activity in general, or “urbanization economies”, and increases in economic activity within specific industrial sectors, or “localization economies”.
Agglomeration economies benefit from proximity to similar industry and inputs
Agglomeration economies work in a number of ways. Increasing the concentration of population in a given area has challenges, but it also makes it easier to provide crucial services, such as health and education, more efficiently. Jobs are more easily accessible in cities. The clustering of industries allows infrastructure to be shared, which drives down costs, and the proximity of various contributors to the value chain also helps streamline production processes. New firms locating in an established cluster gain access to the pool of skilled labor that has already formed around that cluster.
Silicon Valley is an agglomeration that creates the center of America’s software industry
A prime example of the appeal of agglomerations is Silicon Valley in the United States. One might imagine that firms in the software industry, which do not require access to specific natural resources and are highly globally connected via the internet, would have no need to co-locate in a specific geographic place. Yet, due to shared infrastructure, access to a common pool of talent, proximity to top universities, quality of life, and its exciting atmosphere of competitive innovation, this specific area of Northern California has become the undisputed center of the American software industry.
Indonesia will benefit from agglomeration effects such as knowledge spillover as it moves towards a service and knowledge based economy
As Indonesia moves towards more service and knowledge-based industries, some of the more intangible agglomeration effects start to become important, such as the knowledge “spillover” between firms. Clustering also leads to competition, which in turn drives innovation. In order to be globally competitive, firms need to locate in places that provide the quality of life and connectivity that highly skilled workers seek, which is most easily found in established urban hubs. The economic benefits of the proximity and density that agglomerations enable should lead to greater productivity.
An agglomeration is an metropolitan area of an urban core and adjacent districts which are economically connected
Agglomeration areas are functionally defined urban metropolitan areas, which consist of an urban core as the center of economic and social activities, and adjacent districts that satisfy minimum population densities and connectivity to the urban core. In 2008, The Government of Indonesia designated nine metropolitan regions as national priorities(Medan, Jakarta, Bandung, Semarang, Surabaya, Denpasar, Makassar, Manado, and Balikpapan-Samarinda metropolitans), with the enactment of Government Regulation 26 year 2008 about Spatial Planning.
Indonesia’s economic growth centers are not limited to the nine metropolitan areas which have been identified as national priorities…
While these metropolitan areas have long established themselves as centers of economic and social activities in their respective regions, we may expect that more growth centers exist outside of these metropolitan areas. A glance at provincial economic growth figures show that rapid growth has also occurred in other provinces in Indonesia, including inprovinces where no designated metro areas are located. It is therefore pertinent to explorewhere economic centers are located, outside of the officially-identified nine priority metropolitan areas.
…and there are other agglomerations that have been identified throughout the country
The Agglomeration Index (AI) method defines an agglomeration based on the size of an urban center, population density, and distance of a district to the urban center.10 By adapating this method to better suit Indonesia, recent analysis by the World Bank finds that agglomeration actually extends beyond these nine metro areas. These agglomerations may be smaller in size than the official metropolitans, but they also serve as economic centers in their respective regions, attract a labor force to commute to the core cities for economic purposes, and have sizable population densities. Figure 46identifies the location of agglomeration areas and their size by population density, showing that there are agglomeration areas in all major islands in Indonesia, including Papua. This figure also shows that, contrary to popular belief, Java is not one big urban island, as there are still some parts of Java that are not part of any agglomeration areas. 10 Uchida, H. and Nelson, A., 2008, “Agglomeration index: towards a new measure of urban
concentration”
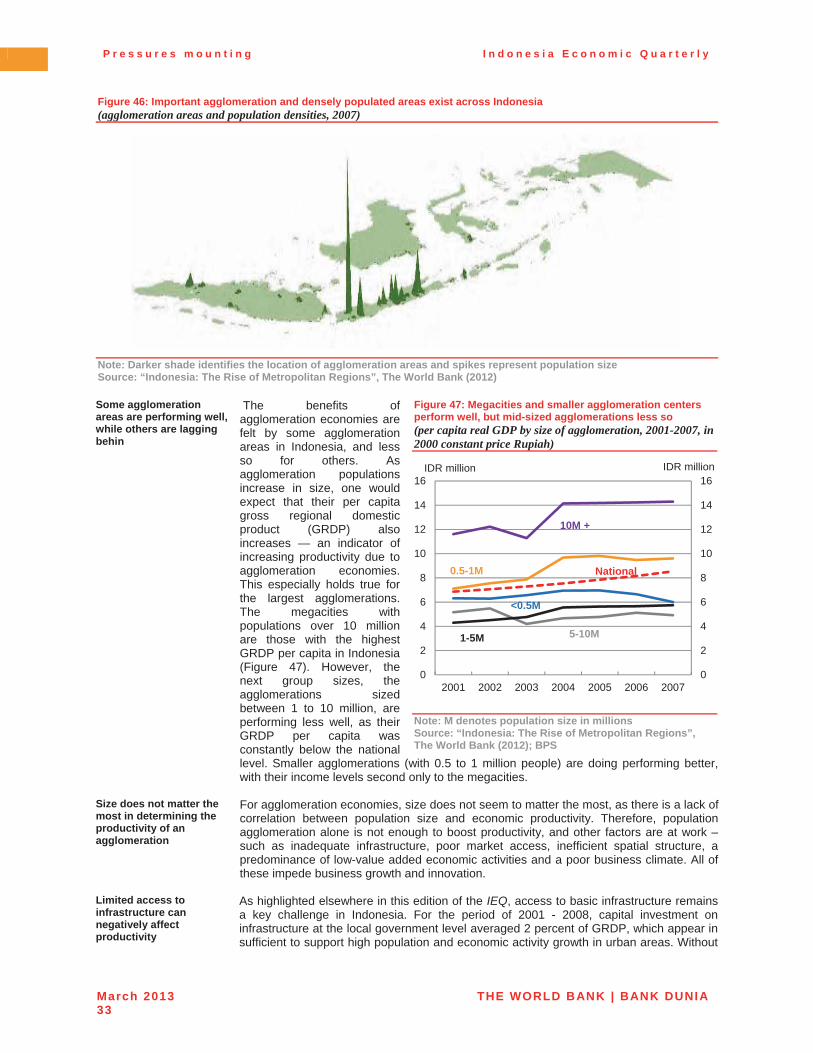
P r e s s u r e s m o u n t i n g I n d o n e s i a E c o n o m i c Q u a r t e r l y
March 2013 THE WORLD BANK | BANK DUNIA33
Figure 46: Important agglomeration and densely populated areas exist across Indonesia (agglomeration areas and population densities, 2007)
Note: Darker shade identifies the location of agglomeration areas and spikes represent population size Source: “Indonesia: The Rise of Metropolitan Regions”, The World Bank (2012)
Some agglomeration areas are performing well, while others are lagging behin
The benefits of agglomeration economies are felt by some agglomeration areas in Indonesia, and less so for others. As agglomeration populations increase in size, one would expect that their per capita gross regional domestic product (GRDP) also increases — an indicator of increasing productivity due to agglomeration economies. This especially holds true for the largest agglomerations. The megacities with populations over 10 million are those with the highest GRDP per capita in Indonesia (Figure 47). However, the next group sizes, the agglomerations sized between 1 to 10 million, are performing less well, as their GRDP per capita was constantly below the national level. Smaller agglomerations (with 0.5 to 1 million people) are doing performing better, with their income levels second only to the megacities.
Figure 47: Megacities and smaller agglomeration centers perform well, but mid-sized agglomerations less so (per capita real GDP by size of agglomeration, 2001-2007, in 2000 constant price Rupiah)
Note: M denotes population size in millions Source: “Indonesia: The Rise of Metropolitan Regions”, The World Bank (2012); BPS
Size does not matter the most in determining the productivity of an agglomeration
For agglomeration economies, size does not seem to matter the most, as there is a lack of correlation between population size and economic productivity. Therefore, population agglomeration alone is not enough to boost productivity, and other factors are at work –such as inadequate infrastructure, poor market access, inefficient spatial structure, a predominance of low-value added economic activities and a poor business climate. All of these impede business growth and innovation.
Limited access to infrastructure can negatively affect productivity
As highlighted elsewhere in this edition of the IEQ, access to basic infrastructure remains a key challenge in Indonesia. For the period of 2001 - 2008, capital investment on infrastructure at the local government level averaged 2 percent of GRDP, which appear insufficient to support high population and economic activity growth in urban areas. Without
0
2
4
6
8
10
12
14
16
0
2
4
6
8
10
12
14
16
2001 2002 2003 2004 2005 2006 2007
IDR millionIDR million
10M +
5-10M1-5M
0.5-1M
<0.5M
National
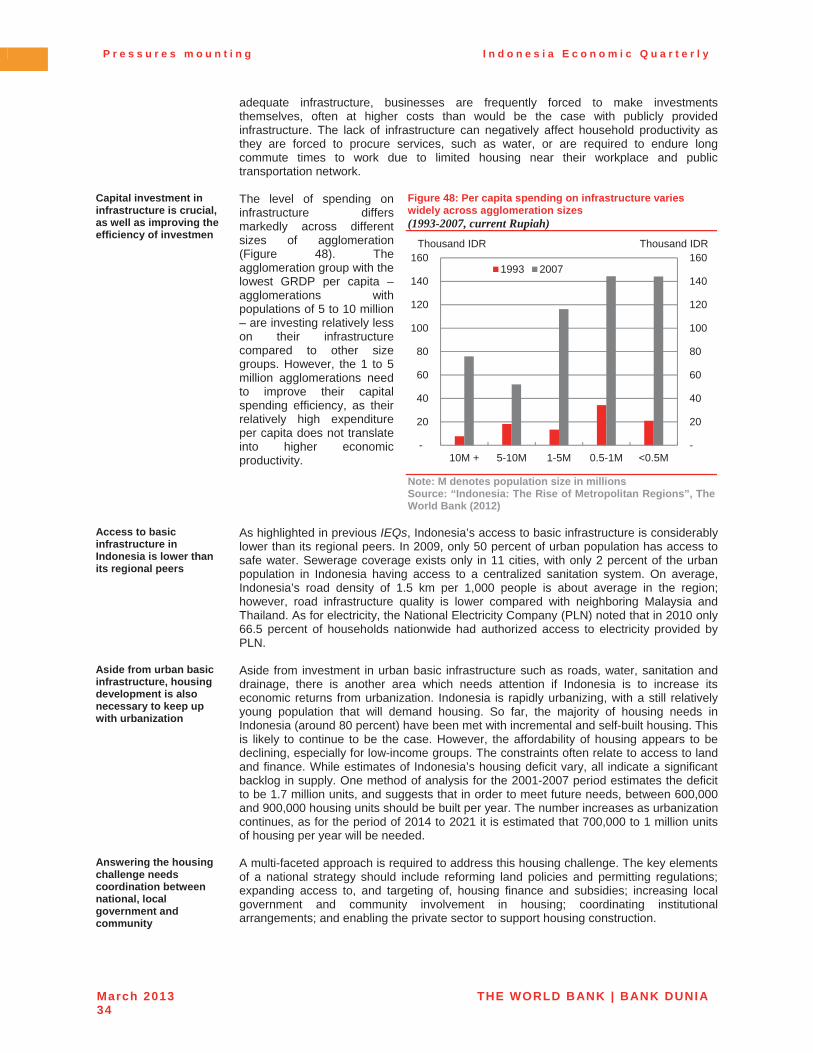
P r e s s u r e s m o u n t i n g I n d o n e s i a E c o n o m i c Q u a r t e r l y
March 2013 THE WORLD BANK | BANK DUNIA34
adequate infrastructure, businesses are frequently forced to make investments themselves, often at higher costs than would be the case with publicly providedinfrastructure. The lack of infrastructure can negatively affect household productivity as they are forced to procure services, such as water, or are required to endure long commute times to work due to limited housing near their workplace and public transportation network.
Capital investment in infrastructure is crucial, as well as improving the efficiency of investmen
The level of spending on infrastructure differs markedly across different sizes of agglomeration (Figure 48). The agglomeration group with the lowest GRDP per capita – agglomerations with populations of 5 to 10 million – are investing relatively less on their infrastructure compared to other size groups. However, the 1 to 5 million agglomerations need to improve their capital spending efficiency, as their relatively high expenditure per capita does not translate into higher economic productivity.
Figure 48: Per capita spending on infrastructure varies widely across agglomeration sizes (1993-2007, current Rupiah)
Note: M denotes population size in millions Source: “Indonesia: The Rise of Metropolitan Regions”, The World Bank (2012)
Access to basic infrastructure in Indonesia is lower than its regional peers
As highlighted in previous IEQs, Indonesia’s access to basic infrastructure is considerably lower than its regional peers. In 2009, only 50 percent of urban population has access to safe water. Sewerage coverage exists only in 11 cities, with only 2 percent of the urban population in Indonesia having access to a centralized sanitation system. On average, Indonesia’s road density of 1.5 km per 1,000 people is about average in the region; however, road infrastructure quality is lower compared with neighboring Malaysia and Thailand. As for electricity, the National Electricity Company (PLN) noted that in 2010 only 66.5 percent of households nationwide had authorized access to electricity provided by PLN.
Aside from urban basic infrastructure, housing development is also necessary to keep up with urbanization
Aside from investment in urban basic infrastructure such as roads, water, sanitation and drainage, there is another area which needs attention if Indonesia is to increase its economic returns from urbanization. Indonesia is rapidly urbanizing, with a still relatively young population that will demand housing. So far, the majority of housing needs in Indonesia (around 80 percent) have been met with incremental and self-built housing. This is likely to continue to be the case. However, the affordability of housing appears to be declining, especially for low-income groups. The constraints often relate to access to landand finance. While estimates of Indonesia’s housing deficit vary, all indicate a significant backlog in supply. One method of analysis for the 2001-2007 period estimates the deficit to be 1.7 million units, and suggests that in order to meet future needs, between 600,000 and 900,000 housing units should be built per year. The number increases as urbanization continues, as for the period of 2014 to 2021 it is estimated that 700,000 to 1 million units of housing per year will be needed.
Answering the housing challenge needs coordination between national, local government and community
A multi-faceted approach is required to address this housing challenge. The key elements of a national strategy should include reforming land policies and permitting regulations; expanding access to, and targeting of, housing finance and subsidies; increasing local government and community involvement in housing; coordinating institutional arrangements; and enabling the private sector to support housing construction.
-
20
40
60
80
100
120
140
160
-
20
40
60
80
100
120
140
160
10M + 5-10M 1-5M 0.5-1M <0.5M
Thousand IDRThousand IDR
1993 2007
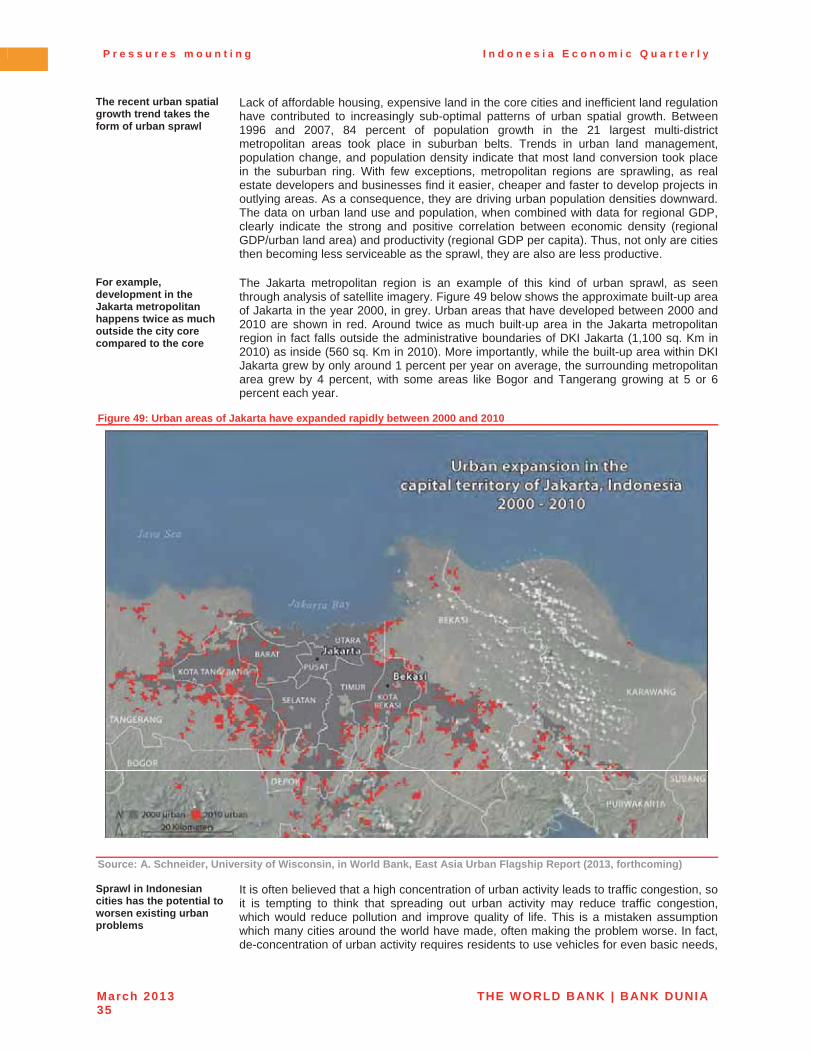
P r e s s u r e s m o u n t i n g I n d o n e s i a E c o n o m i c Q u a r t e r l y
March 2013 THE WORLD BANK | BANK DUNIA35
The recent urban spatial growth trend takes the form of urban sprawl
Lack of affordable housing, expensive land in the core cities and inefficient land regulation have contributed to increasingly sub-optimal patterns of urban spatial growth. Between 1996 and 2007, 84 percent of population growth in the 21 largest multi-district metropolitan areas took place in suburban belts. Trends in urban land management, population change, and population density indicate that most land conversion took place in the suburban ring. With few exceptions, metropolitan regions are sprawling, as real estate developers and businesses find it easier, cheaper and faster to develop projects in outlying areas. As a consequence, they are driving urban population densities downward. The data on urban land use and population, when combined with data for regional GDP, clearly indicate the strong and positive correlation between economic density (regional GDP/urban land area) and productivity (regional GDP per capita). Thus, not only are cities then becoming less serviceable as the sprawl, they are also are less productive.
For example, development in the Jakarta metropolitan happens twice as much outside the city core compared to the core
The Jakarta metropolitan region is an example of this kind of urban sprawl, as seen through analysis of satellite imagery. Figure 49 below shows the approximate built-up area of Jakarta in the year 2000, in grey. Urban areas that have developed between 2000 and 2010 are shown in red. Around twice as much built-up area in the Jakarta metropolitan region in fact falls outside the administrative boundaries of DKI Jakarta (1,100 sq. Km in 2010) as inside (560 sq. Km in 2010). More importantly, while the built-up area within DKI Jakarta grew by only around 1 percent per year on average, the surrounding metropolitan area grew by 4 percent, with some areas like Bogor and Tangerang growing at 5 or 6 percent each year.
Figure 49: Urban areas of Jakarta have expanded rapidly between 2000 and 2010
Source: A. Schneider, University of Wisconsin, in World Bank, East Asia Urban Flagship Report (2013, forthcoming)
Sprawl in Indonesian cities has the potential to worsen existing urban problems
It is often believed that a high concentration of urban activity leads to traffic congestion, so it is tempting to think that spreading out urban activity may reduce traffic congestion, which would reduce pollution and improve quality of life. This is a mistaken assumption which many cities around the world have made, often making the problem worse. In fact, de-concentration of urban activity requires residents to use vehicles for even basic needs,
P r e s s u r e s m o u n t i n g I n d o n e s i a E c o n o m i c Q u a r t e r l y
March 2013 THE WORLD BANK | BANK DUNIA36
such as buying groceries or going to school, and the further apart the destinations are the longer the trips need to be. A sprawling urban form therefore leads to more vehicles on the road for longer durations per trip, which adds to traffic congestion and carbon emissions. In contrast, a compact urban form, coupled with walkable urban design, allows more trips to be made on foot, and vehicular trips to be shorter, which reduces congestion. Thus, urban density can in fact reduce traffic congestion.
c. The way forward: making the most of urbanization and agglomeration in Indonesia
Indonesia needs a multi-faceted strategy to manage urbanization and leverage growth
Indonesia needs to leverage urbanization to foster socio-economic development to a much greater extent than it has done so far. A multi-faceted and differentiated strategy is required, in order to manage urbanization to better leverage growth. The possible portfolio of actions and interventions might include a set of coordinated policy actions at the national and subnational levels. In thinking of coordinated urban policy, it is critically important to acknowledge how cities and their surrounding agglomeration areas perform as centers of economic activities, and to differentiate these agglomerations by different population sizes.
Metropolitan coordination that extends beyond administrative boundaries is the key to empower large metropolitan regions
In large metropolitan regions, coordination on strategic infrastructure investment and regional economic development is critical. Current administrative boundaries of metropolitan areas have not adequately reflected the spatial limits of economic activities or the dynamics of regional markets. Issues that affect these activities and markets need to be coordinated across administrative boundaries. Most of Indonesia’s large cities are experiencing a shift in spatial structure, moving from a spatial structure of single city center (mono-centric) to polycentric structures. In most cases, the development of new centers of economic activity is poorly planned and poorly integrated with investments in transit, residential development and urban services. This shifting in city spatial structure should be responded to with better city planning, to facilitate the creation of more efficient structures and promote better connectivity between the city and other cities and local governments within the metropolitan area. Large cities need to consider revitalization and repurposing of older central city and suburban areas, requiring advanced planning skills and, more importantly, new mechanisms to foster land consolidation.
The future of Indonesia’s urban development lies in small to medium cities
In the next decade most of Indonesia’s urban population growth is projected to take place in small to medium size cities with populations of less than 5 million. These cities will need considerable technical and financial support to accommodate their expected growth. However, many small cities are not growing and need assistance to increase prosperity for their residents. Smaller cities would greatly benefit from improving the business environment, investing in basic services and improved connectivity to regional centers.
Indonesia has a chance to realize the potential benefits of urbanization with the right policies and investments
The transformation of Indonesia from a rural to a mostly urban country, already well underway, is one of its most critical challenges today, with far-reaching impacts on the economy, society and environment. At this stage, Indonesia has a valuable chance to get urbanization right before it is locked into spatial structures that will be costly to undo. Considering the potential benefits that can be realized with the right policies and investments, Indonesia has reason to be cautiously optimistic about its urban future.
P r e s s u r e s m o u n t i n g I n d o n e s i a E c o n o m i c Q u a r t e r l y
March 2013 THE WORLD BANK | BANK DUNIA37
2. Piecing together the picture of Indonesia's infrastructure investment trends
Infrastructure weaknesses are holding back Indonesia’s growth potential…
After falling off sharply following the 1997/1998 Asian financial crisis, Indonesia’s infrastructure investment has struggled to return to the levels seen prior to the crisis of above 7 percent of GDP. This is in sharp contrast to the strong increase in total investment rates, which are now well above pre-1997/98 levels. Despite numerous attempts to overcome infrastructure bottlenecks, the level and quality of infrastructure lag rising needs, driven by increases in income, modern production processes and rapid urbanization (discussed in the previous section). As long-suffering residents of Jakarta can attest, traffic in the capital is regularly gridlocked, and serious traffic congestion is now a problem in many cities. Meanwhile trade movements through Tanjung Priok, Indonesia’s main port of entry and exit, are seriously delayed, the country’s airports are overcrowded, electricity supplies are often problematic, and water and sanitation services are, in many areas, failing to keep up with demand.
…which has triggered an increasing policy focus on infrastructure investment
Indonesia’s infrastructure challenges are well-recognized and the Government has committed to address them through, for example, the Medium-Term Development Plan and the 2011-2025 Master Plan for the Acceleration and Expansion of Economic Development.11 A range of policies and institutional frameworks have been introduced to accelerate infrastructure development and there has been a marked increase in Budget allocations to capital expenditure in recent years.
However, consistent and reliable information on infrastructure investment in Indonesia is scarce and difficult to obtain
However, despite the importance of infrastructure and the need for good data to make good policy, consistent data and information on the level of infrastructure investment in Indonesia, and on the stock of infrastructure capital, are scarce and difficult to obtain. To fill this gap, the World Bank has compiled a dataset of infrastructure investment, by sectorand by source—central and regional government, state-owned enterprises (SOEs) and private—from the mid-1990s.12 In compiling this data many difficulties were encountered, particularly in trying to ensure consistency over time (see Box 5). The data should therefore be viewed as preliminary and subject to further refinement and are also silent on the quality or efficiency of the investment. With these caveats, this section presents the initial findings on the recent trends of the level of infrastructure investment in Indonesia and highlights areas for potential future work, such as understanding the links between Indonesia’s infrastructure investment, and infrastructure capital stock and growthperformance.13
11 For related analysis see the June 2012 IEQ for an overview of Indonesia’s infrastructure challenges
and of the Master Plan. See also the December 2012 IEQ for a review of the 2013 Budget and disaggregated analysis of access to infrastructure services from the Village Infrastructure Census.
12 The data collection builds upon previous analysis in World Bank (2005), “Averting Infrastructure Crisis: A Framework for Policy and Action” and in World Bank (2007), “Spending for Development: Making the Most of Indonesia’s New Opportunities”
13 This section draws on forthcoming World Bank analysis on “The State of Indonesia’s Infrastructure: How it is and how it might have been” by Ahya Ihsan, Paul Lemaistre, Jon Saariatmadja and William Wallace
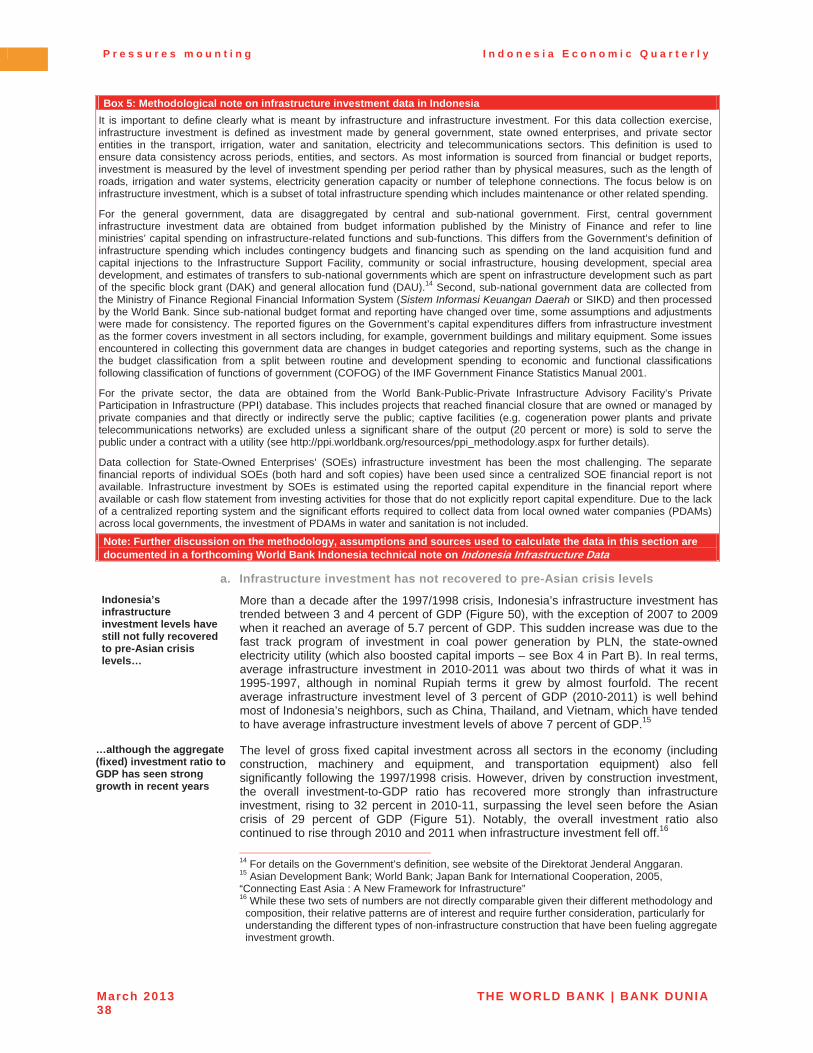
P r e s s u r e s m o u n t i n g I n d o n e s i a E c o n o m i c Q u a r t e r l y
March 2013 THE WORLD BANK | BANK DUNIA38
Box 5: Methodological note on infrastructure investment data in Indonesia It is important to define clearly what is meant by infrastructure and infrastructure investment. For this data collection exercise,infrastructure investment is defined as investment made by general government, state owned enterprises, and private sector entities in the transport, irrigation, water and sanitation, electricity and telecommunications sectors. This definition is used to ensure data consistency across periods, entities, and sectors. As most information is sourced from financial or budget reports,investment is measured by the level of investment spending per period rather than by physical measures, such as the length of roads, irrigation and water systems, electricity generation capacity or number of telephone connections. The focus below is on infrastructure investment, which is a subset of total infrastructure spending which includes maintenance or other related spending.
For the general government, data are disaggregated by central and sub-national government. First, central government infrastructure investment data are obtained from budget information published by the Ministry of Finance and refer to line ministries’ capital spending on infrastructure-related functions and sub-functions. This differs from the Government’s definition of infrastructure spending which includes contingency budgets and financing such as spending on the land acquisition fund and capital injections to the Infrastructure Support Facility, community or social infrastructure, housing development, special areadevelopment, and estimates of transfers to sub-national governments which are spent on infrastructure development such as part of the specific block grant (DAK) and general allocation fund (DAU).14 Second, sub-national government data are collected from the Ministry of Finance Regional Financial Information System (Sistem Informasi Keuangan Daerah or SIKD) and then processed by the World Bank. Since sub-national budget format and reporting have changed over time, some assumptions and adjustments were made for consistency. The reported figures on the Government’s capital expenditures differs from infrastructure investmentas the former covers investment in all sectors including, for example, government buildings and military equipment. Some issuesencountered in collecting this government data are changes in budget categories and reporting systems, such as the change in the budget classification from a split between routine and development spending to economic and functional classifications following classification of functions of government (COFOG) of the IMF Government Finance Statistics Manual 2001.
For the private sector, the data are obtained from the World Bank-Public-Private Infrastructure Advisory Facility’s Private Participation in Infrastructure (PPI) database. This includes projects that reached financial closure that are owned or managed by private companies and that directly or indirectly serve the public; captive facilities (e.g. cogeneration power plants and private telecommunications networks) are excluded unless a significant share of the output (20 percent or more) is sold to serve the public under a contract with a utility (see http://ppi.worldbank.org/resources/ppi_methodology.aspx for further details).
Data collection for State-Owned Enterprises’ (SOEs) infrastructure investment has been the most challenging. The separate financial reports of individual SOEs (both hard and soft copies) have been used since a centralized SOE financial report is notavailable. Infrastructure investment by SOEs is estimated using the reported capital expenditure in the financial report where available or cash flow statement from investing activities for those that do not explicitly report capital expenditure. Due to the lack of a centralized reporting system and the significant efforts required to collect data from local owned water companies (PDAMs)across local governments, the investment of PDAMs in water and sanitation is not included.
Note: Further discussion on the methodology, assumptions and sources used to calculate the data in this section are documented in a forthcoming World Bank Indonesia technical note on Indonesia Infrastructure Data
a. Infrastructure investment has not recovered to pre-Asian crisis levels Indonesia’s infrastructure investment levels have still not fully recovered to pre-Asian crisis levels…
More than a decade after the 1997/1998 crisis, Indonesia’s infrastructure investment has trended between 3 and 4 percent of GDP (Figure 50), with the exception of 2007 to 2009 when it reached an average of 5.7 percent of GDP. This sudden increase was due to the fast track program of investment in coal power generation by PLN, the state-owned electricity utility (which also boosted capital imports – see Box 4 in Part B). In real terms, average infrastructure investment in 2010-2011 was about two thirds of what it was in 1995-1997, although in nominal Rupiah terms it grew by almost fourfold. The recent average infrastructure investment level of 3 percent of GDP (2010-2011) is well behind most of Indonesia’s neighbors, such as China, Thailand, and Vietnam, which have tended to have average infrastructure investment levels of above 7 percent of GDP.15
…although the aggregate (fixed) investment ratio to GDP has seen strong growth in recent years
The level of gross fixed capital investment across all sectors in the economy (including construction, machinery and equipment, and transportation equipment) also fell significantly following the 1997/1998 crisis. However, driven by construction investment, the overall investment-to-GDP ratio has recovered more strongly than infrastructure investment, rising to 32 percent in 2010-11, surpassing the level seen before the Asian crisis of 29 percent of GDP (Figure 51). Notably, the overall investment ratio also continued to rise through 2010 and 2011 when infrastructure investment fell off.16
14 For details on the Government’s definition, see website of the Direktorat Jenderal Anggaran. 15 Asian Development Bank; World Bank; Japan Bank for International Cooperation, 2005, “Connecting East Asia : A New Framework for Infrastructure” 16 While these two sets of numbers are not directly comparable given their different methodology and
composition, their relative patterns are of interest and require further consideration, particularly for understanding the different types of non-infrastructure construction that have been fueling aggregate investment growth.
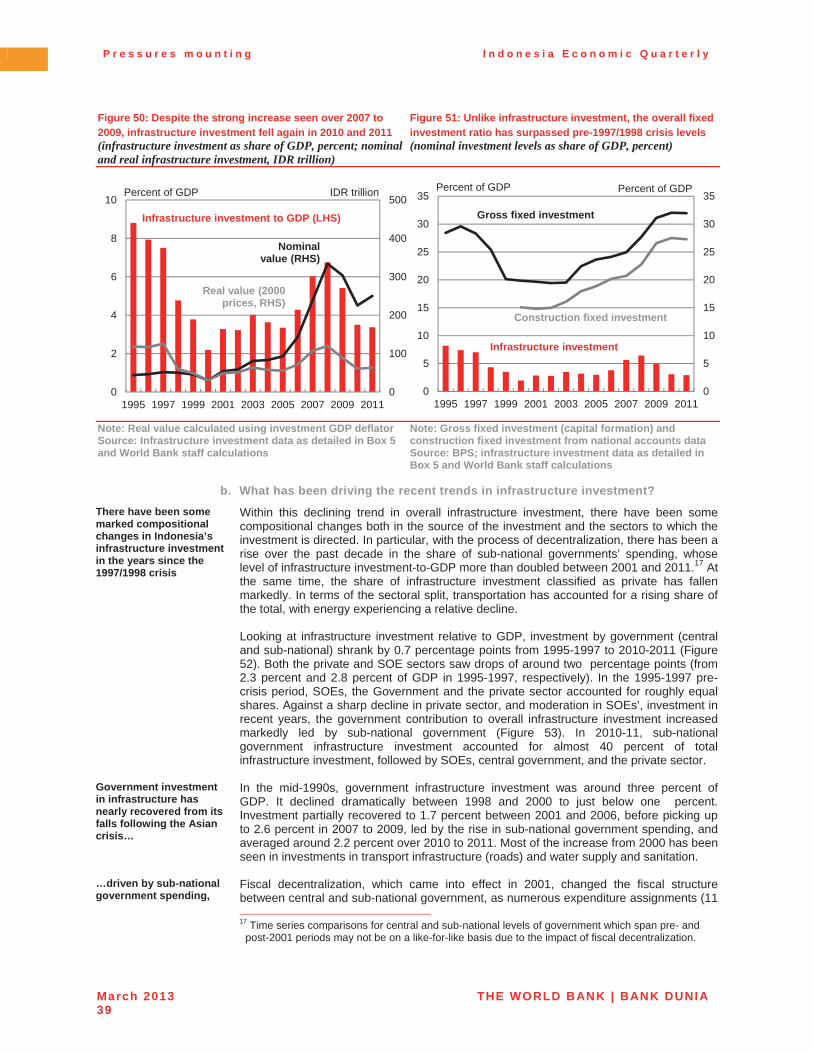
P r e s s u r e s m o u n t i n g I n d o n e s i a E c o n o m i c Q u a r t e r l y
March 2013 THE WORLD BANK | BANK DUNIA39
Figure 50: Despite the strong increase seen over 2007 to 2009, infrastructure investment fell again in 2010 and 2011 (infrastructure investment as share of GDP, percent; nominal and real infrastructure investment, IDR trillion)
Figure 51: Unlike infrastructure investment, the overall fixed investment ratio has surpassed pre-1997/1998 crisis levels (nominal investment levels as share of GDP, percent)
Note: Real value calculated using investment GDP deflator Source: Infrastructure investment data as detailed in Box 5 and World Bank staff calculations
Note: Gross fixed investment (capital formation) and construction fixed investment from national accounts data Source: BPS; infrastructure investment data as detailed in Box 5 and World Bank staff calculations
b. What has been driving the recent trends in infrastructure investment? There have been some marked compositional changes in Indonesia’s infrastructure investment in the years since the 1997/1998 crisis
Within this declining trend in overall infrastructure investment, there have been some compositional changes both in the source of the investment and the sectors to which the investment is directed. In particular, with the process of decentralization, there has been a rise over the past decade in the share of sub-national governments’ spending, whose level of infrastructure investment-to-GDP more than doubled between 2001 and 2011.17 At the same time, the share of infrastructure investment classified as private has fallen markedly. In terms of the sectoral split, transportation has accounted for a rising share of the total, with energy experiencing a relative decline.
Looking at infrastructure investment relative to GDP, investment by government (central and sub-national) shrank by 0.7 percentage points from 1995-1997 to 2010-2011 (Figure 52). Both the private and SOE sectors saw drops of around two percentage points (from 2.3 percent and 2.8 percent of GDP in 1995-1997, respectively). In the 1995-1997 pre-crisis period, SOEs, the Government and the private sector accounted for roughly equal shares. Against a sharp decline in private sector, and moderation in SOEs’, investment in recent years, the government contribution to overall infrastructure investment increased markedly led by sub-national government (Figure 53). In 2010-11, sub-national government infrastructure investment accounted for almost 40 percent of total infrastructure investment, followed by SOEs, central government, and the private sector.
Government investment in infrastructure has nearly recovered from its falls following the Asian crisis…
In the mid-1990s, government infrastructure investment was around three percent of GDP. It declined dramatically between 1998 and 2000 to just below one percent. Investment partially recovered to 1.7 percent between 2001 and 2006, before picking up to 2.6 percent in 2007 to 2009, led by the rise in sub-national government spending, and averaged around 2.2 percent over 2010 to 2011. Most of the increase from 2000 has been seen in investments in transport infrastructure (roads) and water supply and sanitation.
…driven by sub-national government spending,
Fiscal decentralization, which came into effect in 2001, changed the fiscal structure between central and sub-national government, as numerous expenditure assignments (11 17 Time series comparisons for central and sub-national levels of government which span pre- and
post-2001 periods may not be on a like-for-like basis due to the impact of fiscal decentralization.
0
100
200
300
400
500
0
2
4
6
8
10
1995 1997 1999 2001 2003 2005 2007 2009 2011
Percent of GDP IDR trillion
Nominalvalue (RHS)
Real value (2000 prices, RHS)
Infrastructure investment to GDP (LHS)
0
5
10
15
20
25
30
35
0
5
10
15
20
25
30
35
1995 1997 1999 2001 2003 2005 2007 2009 2011
Percent of GDP
Gross fixed investment
Construction fixed investment
Infrastructure investment
Percent of GDP
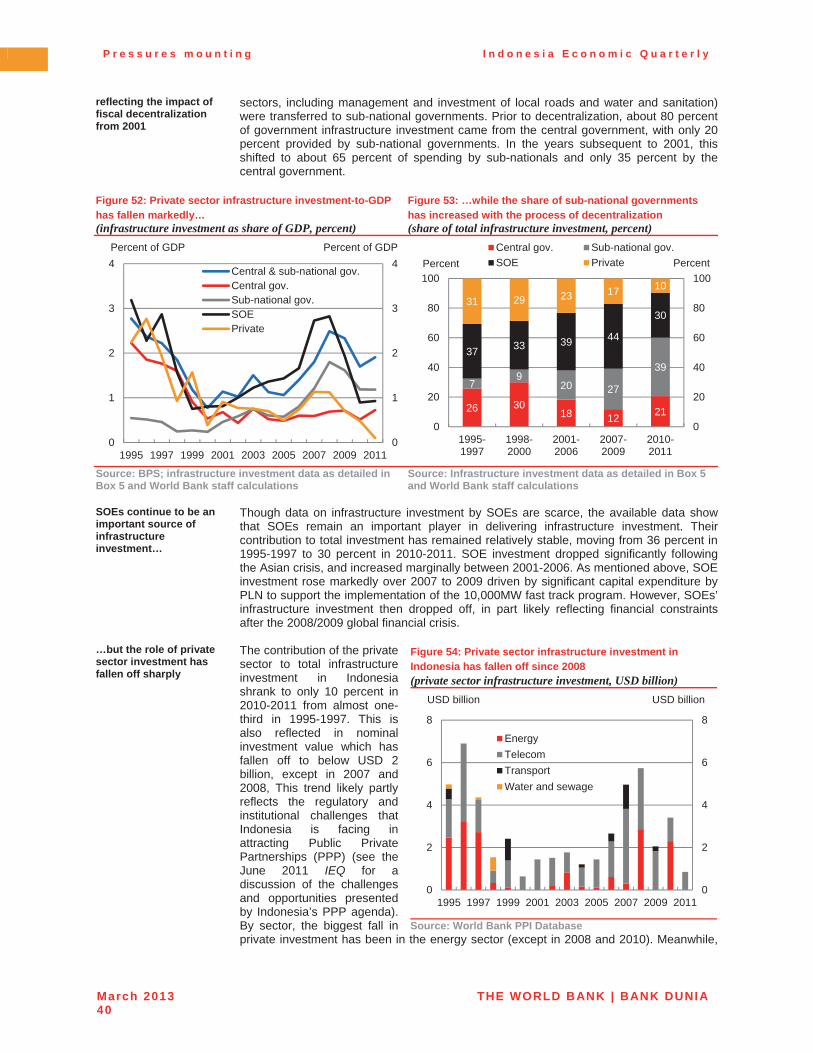
P r e s s u r e s m o u n t i n g I n d o n e s i a E c o n o m i c Q u a r t e r l y
March 2013 THE WORLD BANK | BANK DUNIA40
reflecting the impact of fiscal decentralization from 2001
sectors, including management and investment of local roads and water and sanitation)were transferred to sub-national governments. Prior to decentralization, about 80 percent of government infrastructure investment came from the central government, with only 20 percent provided by sub-national governments. In the years subsequent to 2001, this shifted to about 65 percent of spending by sub-nationals and only 35 percent by the central government.
Figure 52: Private sector infrastructure investment-to-GDP has fallen markedly… (infrastructure investment as share of GDP, percent)
Figure 53: …while the share of sub-national governments has increased with the process of decentralization (share of total infrastructure investment, percent)
Source: BPS; infrastructure investment data as detailed in Box 5 and World Bank staff calculations
Source: Infrastructure investment data as detailed in Box 5 and World Bank staff calculations
SOEs continue to be an important source of infrastructure investment…
Though data on infrastructure investment by SOEs are scarce, the available data show that SOEs remain an important player in delivering infrastructure investment. Their contribution to total investment has remained relatively stable, moving from 36 percent in 1995-1997 to 30 percent in 2010-2011. SOE investment dropped significantly following the Asian crisis, and increased marginally between 2001-2006. As mentioned above, SOE investment rose markedly over 2007 to 2009 driven by significant capital expenditure by PLN to support the implementation of the 10,000MW fast track program. However, SOEs’ infrastructure investment then dropped off, in part likely reflecting financial constraints after the 2008/2009 global financial crisis.
…but the role of private sector investment has fallen off sharply
The contribution of the private sector to total infrastructure investment in Indonesia shrank to only 10 percent in 2010-2011 from almost one-third in 1995-1997. This is also reflected in nominal investment value which has fallen off to below USD 2 billion, except in 2007 and 2008, This trend likely partly reflects the regulatory and institutional challenges that Indonesia is facing in attracting Public Private Partnerships (PPP) (see the June 2011 IEQ for a discussion of the challenges and opportunities presented by Indonesia’s PPP agenda). By sector, the biggest fall in private investment has been in the energy sector (except in 2008 and 2010). Meanwhile,
Figure 54: Private sector infrastructure investment in Indonesia has fallen off since 2008 (private sector infrastructure investment, USD billion)
Source: World Bank PPI Database
0
1
2
3
4
0
1
2
3
4
1995 1997 1999 2001 2003 2005 2007 2009 2011
Central & sub-national gov.Central gov.Sub-national gov.SOEPrivate
Percent of GDP Percent of GDP
26 3018 12 21
79
20 27
3937 33 39 44
3031 29 23 17 10
0
20
40
60
80
100
0
20
40
60
80
100
1995-1997
1998-2000
2001-2006
2007-2009
2010-2011
Central gov. Sub-national gov.SOE PrivatePercent Percent
0
2
4
6
8
0
2
4
6
8
1995 1997 1999 2001 2003 2005 2007 2009 2011
ThdEnergy
TelecomTransportWater and sewage
USD billion USD billion
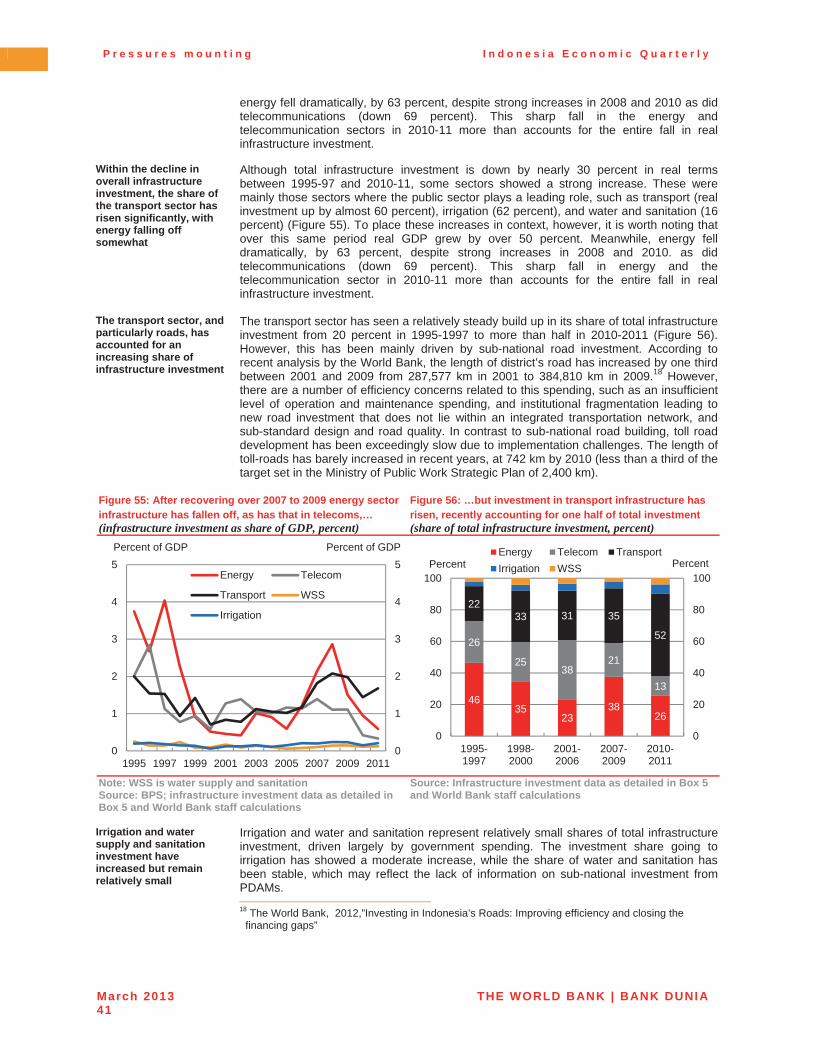
P r e s s u r e s m o u n t i n g I n d o n e s i a E c o n o m i c Q u a r t e r l y
March 2013 THE WORLD BANK | BANK DUNIA41
energy fell dramatically, by 63 percent, despite strong increases in 2008 and 2010 as did telecommunications (down 69 percent). This sharp fall in the energy and telecommunication sectors in 2010-11 more than accounts for the entire fall in real infrastructure investment.
Within the decline in overall infrastructure investment, the share of the transport sector has risen significantly, with energy falling off somewhat
Although total infrastructure investment is down by nearly 30 percent in real termsbetween 1995-97 and 2010-11, some sectors showed a strong increase. These were mainly those sectors where the public sector plays a leading role, such as transport (real investment up by almost 60 percent), irrigation (62 percent), and water and sanitation (16 percent) (Figure 55). To place these increases in context, however, it is worth noting thatover this same period real GDP grew by over 50 percent. Meanwhile, energy fell dramatically, by 63 percent, despite strong increases in 2008 and 2010. as did telecommunications (down 69 percent). This sharp fall in energy and the telecommunication sector in 2010-11 more than accounts for the entire fall in real infrastructure investment.
The transport sector, and particularly roads, has accounted for an increasing share of infrastructure investment
The transport sector has seen a relatively steady build up in its share of total infrastructure investment from 20 percent in 1995-1997 to more than half in 2010-2011 (Figure 56). However, this has been mainly driven by sub-national road investment. According to recent analysis by the World Bank, the length of district’s road has increased by one third between 2001 and 2009 from 287,577 km in 2001 to 384,810 km in 2009.18 However, there are a number of efficiency concerns related to this spending, such as an insufficient level of operation and maintenance spending, and institutional fragmentation leading to new road investment that does not lie within an integrated transportation network, and sub-standard design and road quality. In contrast to sub-national road building, toll road development has been exceedingly slow due to implementation challenges. The length of toll-roads has barely increased in recent years, at 742 km by 2010 (less than a third of the target set in the Ministry of Public Work Strategic Plan of 2,400 km).
Figure 55: After recovering over 2007 to 2009 energy sector infrastructure has fallen off, as has that in telecoms,… (infrastructure investment as share of GDP, percent)
Figure 56: …but investment in transport infrastructure has risen, recently accounting for one half of total investment (share of total infrastructure investment, percent)
Note: WSS is water supply and sanitation Source: BPS; infrastructure investment data as detailed in Box 5 and World Bank staff calculations
Source: Infrastructure investment data as detailed in Box 5 and World Bank staff calculations
Irrigation and water supply and sanitation investment have increased but remain relatively small
Irrigation and water and sanitation represent relatively small shares of total infrastructure investment, driven largely by government spending. The investment share going to irrigation has showed a moderate increase, while the share of water and sanitation has been stable, which may reflect the lack of information on sub-national investment from PDAMs. 18 The World Bank, 2012,”Investing in Indonesia’s Roads: Improving efficiency and closing the
financing gaps”
0
1
2
3
4
5
0
1
2
3
4
5
1995 1997 1999 2001 2003 2005 2007 2009 2011
Energy Telecom
Transport WSS
Irrigation
Percent of GDP Percent of GDP
4635
2338
26
26
2538
21
13
2233 31 35
52
0
20
40
60
80
100
0
20
40
60
80
100
1995-1997
1998-2000
2001-2006
2007-2009
2010-2011
Energy Telecom TransportIrrigation WSSPercent Percent
P r e s s u r e s m o u n t i n g I n d o n e s i a E c o n o m i c Q u a r t e r l y
March 2013 THE WORLD BANK | BANK DUNIA42
c. Linking infrastructure, growth and development outcomes The failure to keep up with infrastructure investment is likely already impacting Indonesia’s growth and development outcomes
Extensive research finds that infrastructure investment has a significantly positive impact on long-term economic growth. Infrastructure increases productivity and attracts business activity by lowering transport and production costs and facilitating market access. Well-functioning infrastructure enables the population to better access key services and economic opportunities, enhances firms’ productivity and competitiveness, stimulates domestic and foreign investment, integrates domestic markets and connects them at low cost to markets in other countries. The failure to sustain an appropriate level of infrastructure investment can be a significant drag on growth and development outcomes.
Infrastructure investment needs are substantial, even simply for maintaining the existing infrastructure stock
How much have the trends in Indonesia’s infrastructure investment impacted economic growth over the past and future decade? This complex question is beyond the scope of this section but there are some key points that are worth highlighting in the context of these new data. First, the growth pay-offs to more infrastructure investment can be sizeable. Recent OECD empirical research which examines the link between infrastructure investment (including repairs and maintenance) and GDP performance reveals that physical infrastructure investment can boost long-term economic output more than other kinds of physical investment.19 As an example, the estimated infrastructureelasticity of output in China is in the range of 0.20 to 0.41—that is, a 10 percent increase in the infrastructure stock is associated with a two to 4.1 percent increase in GDP growth.20 Second, while much of the focus is on the level of infrastructure investment, there should also be an emphasis on the quality and efficiency of this investment, including the allocation of spending across different types of infrastructure. Third, it is not just new investment that counts but how existing infrastructure assets are maintained to extend their life and quality. Otherwise, a substantial level of gross investment is needed just to cover depreciation of, let alone increase, the infrastructure capital stock.
19 D. Sutherland, S. Araújo, B. Égert and T. Kozluk, 2009, “Infrastructure investment: links to growth
and the role of public policies”, OECD Working Paper No. 686 20 Sahoo and Nataraj, 2010, “Infrastructure development and economic growth in China”, Institute of
Developing Economies
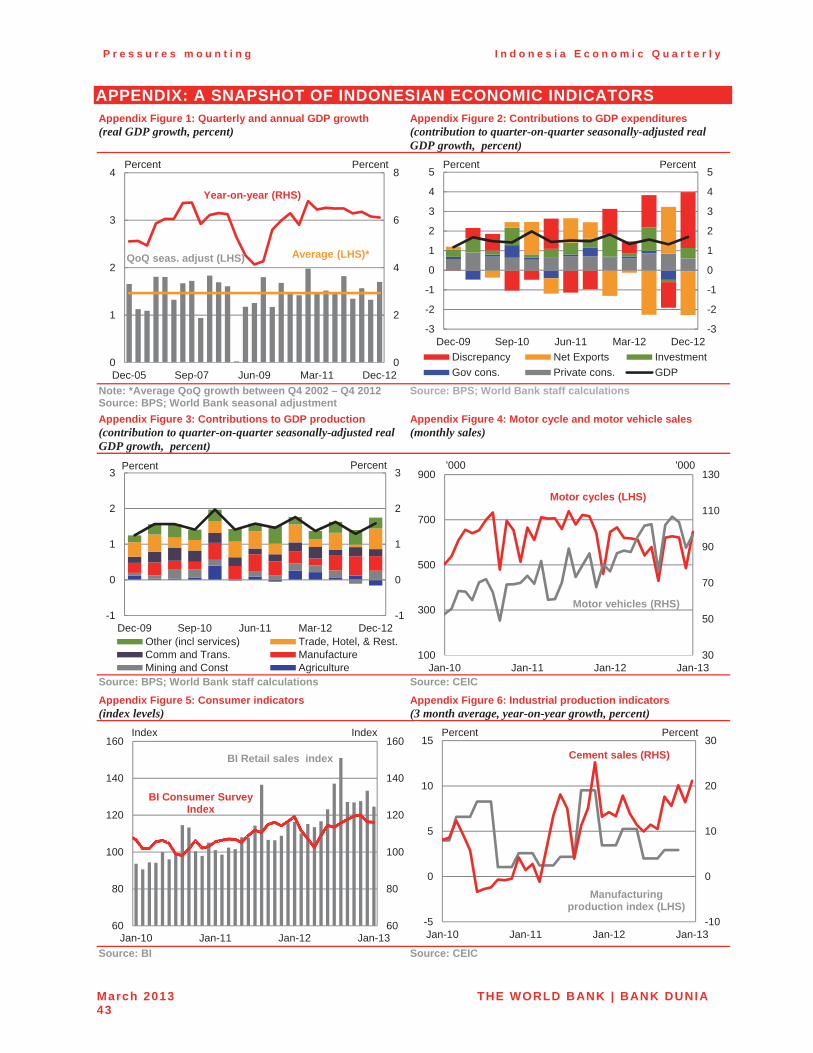
P r e s s u r e s m o u n t i n g I n d o n e s i a E c o n o m i c Q u a r t e r l y
March 2013 THE WORLD BANK | BANK DUNIA43
APPENDIX: A SNAPSHOT OF INDONESIAN ECONOMIC INDICATORS Appendix Figure 1: Quarterly and annual GDP growth (real GDP growth, percent)
Appendix Figure 2: Contributions to GDP expenditures (contribution to quarter-on-quarter seasonally-adjusted real GDP growth, percent)
Note: *Average QoQ growth between Q4 2002 – Q4 2012 Source: BPS; World Bank seasonal adjustment
Source: BPS; World Bank staff calculations
Appendix Figure 3: Contributions to GDP production (contribution to quarter-on-quarter seasonally-adjusted real GDP growth, percent)
Appendix Figure 4: Motor cycle and motor vehicle sales (monthly sales)
Source: BPS; World Bank staff calculations Source: CEIC Appendix Figure 5: Consumer indicators (index levels)
Appendix Figure 6: Industrial production indicators (3 month average, year-on-year growth, percent)
Source: BI Source: CEIC
0
2
4
6
8
0
1
2
3
4
Dec-05 Sep-07 Jun-09 Mar-11 Dec-12
Percent Percent
QoQ seas. adjust (LHS)
Year-on-year (RHS)
Average (LHS)*
-3
-2
-1
0
1
2
3
4
5
-3
-2
-1
0
1
2
3
4
5
Dec-09 Sep-10 Jun-11 Mar-12 Dec-12Discrepancy Net Exports InvestmentGov cons. Private cons. GDP
Percent Percent
-1
0
1
2
3
-1
0
1
2
3
Dec-09 Sep-10 Jun-11 Mar-12 Dec-12Other (incl services) Trade, Hotel, & Rest.Comm and Trans. ManufactureMining and Const Agriculture
Percent Percent
30
50
70
90
110
130
100
300
500
700
900
Jan-10 Jan-11 Jan-12 Jan-13
'000
Motor cycles (LHS)
'000
Motor vehicles (RHS)
60
80
100
120
140
160
60
80
100
120
140
160
Jan-10 Jan-11 Jan-12 Jan-13
Index Index
BI Retail sales index
BI Consumer SurveyIndex
-10
0
10
20
30
-5
0
5
10
15
Jan-10 Jan-11 Jan-12 Jan-13
Percent Percent
Cement sales (RHS)
Manufacturingproduction index (LHS)
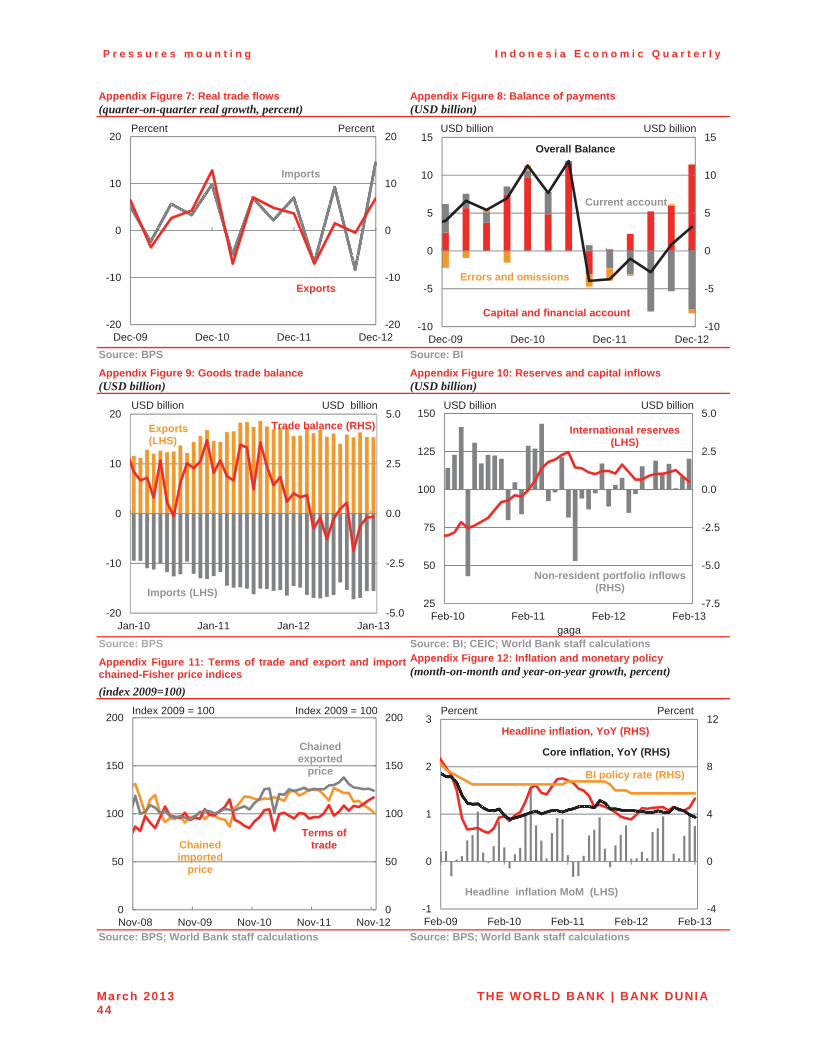
P r e s s u r e s m o u n t i n g I n d o n e s i a E c o n o m i c Q u a r t e r l y
March 2013 THE WORLD BANK | BANK DUNIA44
Appendix Figure 7: Real trade flows (quarter-on-quarter real growth, percent)
Appendix Figure 8: Balance of payments (USD billion)
Source: BPS Source: BIAppendix Figure 9: Goods trade balance (USD billion)
Appendix Figure 10: Reserves and capital inflows (USD billion)
gaga Source: BPS Source: BI; CEIC; World Bank staff calculations Appendix Figure 11: Terms of trade and export and import chained-Fisher price indices (index 2009=100)
Appendix Figure 12: Inflation and monetary policy (month-on-month and year-on-year growth, percent)
Source: BPS; World Bank staff calculations Source: BPS; World Bank staff calculations
-20
-10
0
10
20
-20
-10
0
10
20
Dec-09 Dec-10 Dec-11 Dec-12
Exports
Imports
Percent Percent
-10
-5
0
5
10
15
-10
-5
0
5
10
15
Dec-09 Dec-10 Dec-11 Dec-12
USD billion USD billion
Capital and financial account
Current account
Overall Balance
Errors and omissions
-5.0
-2.5
0.0
2.5
5.0
-20
-10
0
10
20
Jan-10 Jan-11 Jan-12 Jan-13
Trade balance (RHS)Exports(LHS)
Imports (LHS)
USD billion USD billion
-7.5
-5.0
-2.5
0.0
2.5
5.0
25
50
75
100
125
150
Feb-10 Feb-11 Feb-12 Feb-13
International reserves (LHS)
USD billion USD billion
Non-resident portfolio inflows (RHS)
Chainedimported
price
Terms of trade
Chainedexported
price
0
50
100
150
200
0
50
100
150
200
Nov-08 Nov-09 Nov-10 Nov-11 Nov-12
Index 2009 = 100 Index 2009 = 100
-4
0
4
8
12
-1
0
1
2
3
Feb-09 Feb-10 Feb-11 Feb-12 Feb-13
Core inflation, YoY (RHS)
Headline inflation, YoY (RHS)
Headline inflation MoM (LHS)
Percent Percent
BI policy rate (RHS)
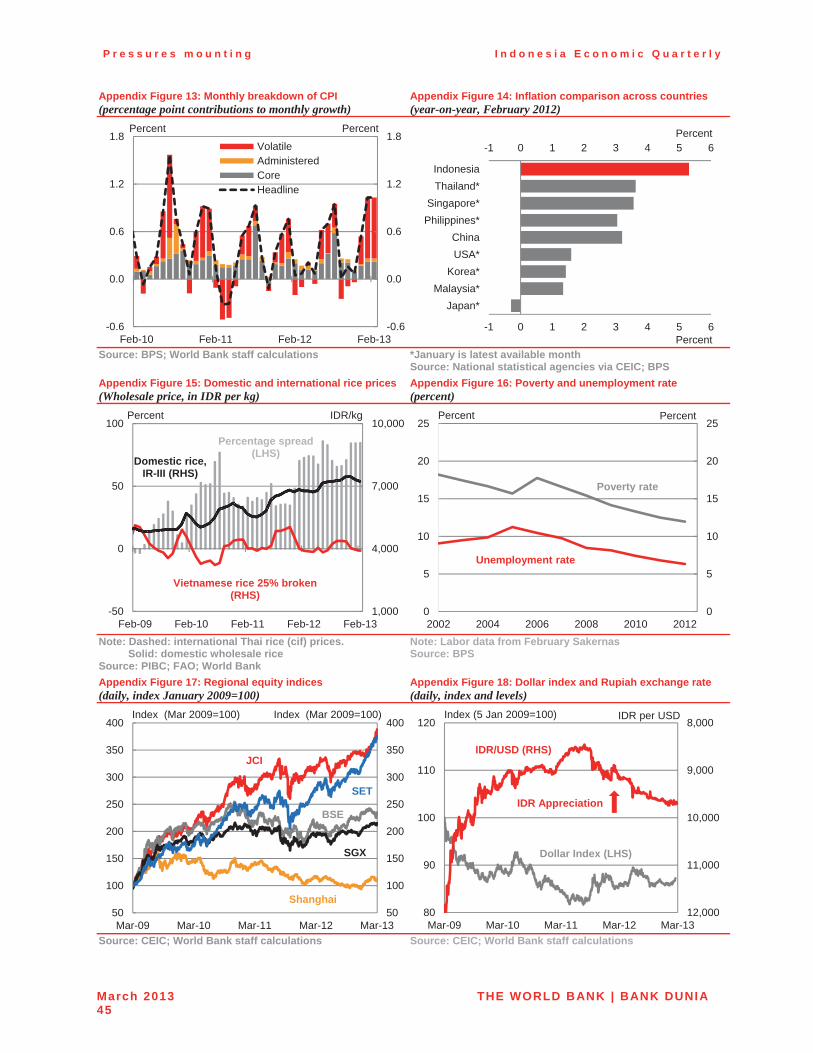
P r e s s u r e s m o u n t i n g I n d o n e s i a E c o n o m i c Q u a r t e r l y
March 2013 THE WORLD BANK | BANK DUNIA45
Appendix Figure 13: Monthly breakdown of CPI (percentage point contributions to monthly growth)
Appendix Figure 14: Inflation comparison across countries (year-on-year, February 2012)
Source: BPS; World Bank staff calculations *January is latest available month Source: National statistical agencies via CEIC; BPS
Appendix Figure 15: Domestic and international rice prices (Wholesale price, in IDR per kg)
Appendix Figure 16: Poverty and unemployment rate (percent)
Note: Dashed: international Thai rice (cif) prices. Solid: domestic wholesale rice Source: PIBC; FAO; World Bank
Note: Labor data from February Sakernas Source: BPS
Appendix Figure 17: Regional equity indices (daily, index January 2009=100)
Appendix Figure 18: Dollar index and Rupiah exchange rate (daily, index and levels)
Source: CEIC; World Bank staff calculations Source: CEIC; World Bank staff calculations
-0.6
0.0
0.6
1.2
1.8
-0.6
0.0
0.6
1.2
1.8
Feb-10 Feb-11 Feb-12 Feb-13
VolatileAdministeredCoreHeadline
Percent Percent
-1 0 1 2 3 4 5 6
-1 0 1 2 3 4 5 6
Japan*Malaysia*
Korea*USA*China
Philippines*Singapore*
Thailand*Indonesia
Percent
Percent
1,000
4,000
7,000
10,000
-50
0
50
100
Feb-09 Feb-10 Feb-11 Feb-12 Feb-13
Domestic rice, IR-III (RHS)
Vietnamese rice 25% broken (RHS)
Percentage spread(LHS)
Percent IDR/kg
0
5
10
15
20
25
0
5
10
15
20
25
2002 2004 2006 2008 2010 2012
Percent Percent
Poverty rate
Unemployment rate
50
100
150
200
250
300
350
400
50
100
150
200
250
300
350
400
Mar-09 Mar-10 Mar-11 Mar-12 Mar-13
Index (Mar 2009=100)
SGX
JCI
SET
Shanghai
BSE
Index (Mar 2009=100)8,000
9,000
10,000
11,000
12,00080
90
100
110
120
Mar-09 Mar-10 Mar-11 Mar-12 Mar-13
Index (5 Jan 2009=100)
IDR/USD (RHS)
Dollar Index (LHS)
IDR Appreciation
IDR per USD
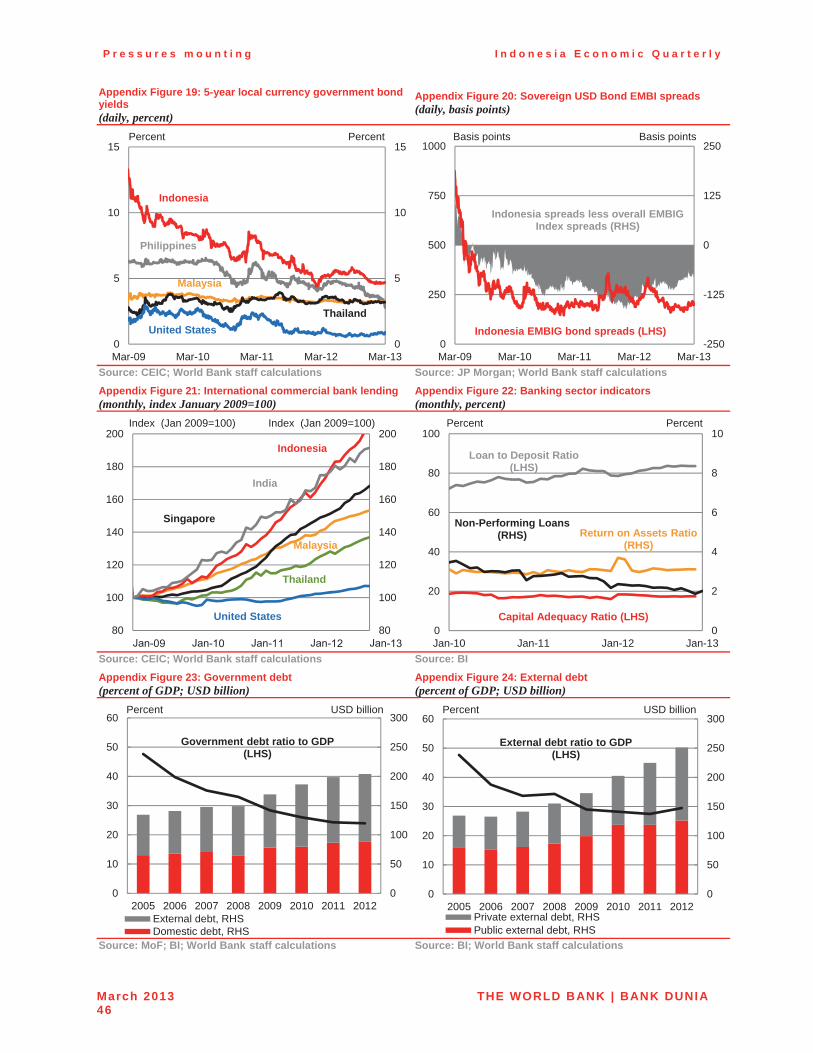
P r e s s u r e s m o u n t i n g I n d o n e s i a E c o n o m i c Q u a r t e r l y
March 2013 THE WORLD BANK | BANK DUNIA46
Appendix Figure 19: 5-year local currency government bond yields (daily, percent)
Appendix Figure 20: Sovereign USD Bond EMBI spreads (daily, basis points)
Source: CEIC; World Bank staff calculations Source: JP Morgan; World Bank staff calculations Appendix Figure 21: International commercial bank lending (monthly, index January 2009=100)
Appendix Figure 22: Banking sector indicators (monthly, percent)
Source: CEIC; World Bank staff calculations Source: BI Appendix Figure 23: Government debt (percent of GDP; USD billion)
Appendix Figure 24: External debt (percent of GDP; USD billion)
Source: MoF; BI; World Bank staff calculations Source: BI; World Bank staff calculations
0
5
10
15
0
5
10
15
Mar-09 Mar-10 Mar-11 Mar-12 Mar-13
Percent
Philippines
United StatesThailand
Malaysia
Indonesia
Percent
-250
-125
0
125
250
0
250
500
750
1000
Mar-09 Mar-10 Mar-11 Mar-12 Mar-13
Basis points
Indonesia EMBIG bond spreads (LHS)
Indonesia spreads less overall EMBIG Index spreads (RHS)
Basis points
80
100
120
140
160
180
200
80
100
120
140
160
180
200Index (Jan 2009=100)
Thailand
Singapore
Indonesia
India
Malaysia
Index (Jan 2009=100)
United States0
2
4
6
8
10
0
20
40
60
80
100
Jan-10 Jan-11 Jan-12 Jan-13
Capital Adequacy Ratio (LHS)
Return on Assets Ratio (RHS)
Loan to Deposit Ratio (LHS)
Percent Percent
Non-Performing Loans (RHS)
0
50
100
150
200
250
300
0
10
20
30
40
50
60
2005 2006 2007 2008 2009 2010 2011 2012External debt, RHSDomestic debt, RHS
Percent USD billion
Government debt ratio to GDP (LHS)
*December
0
50
100
150
200
250
300
0
10
20
30
40
50
60
2005 2006 2007 2008 2009 2010 2011 2012Private external debt, RHSPublic external debt, RHS
External debt ratio to GDP (LHS)
Percent USD billion
*December
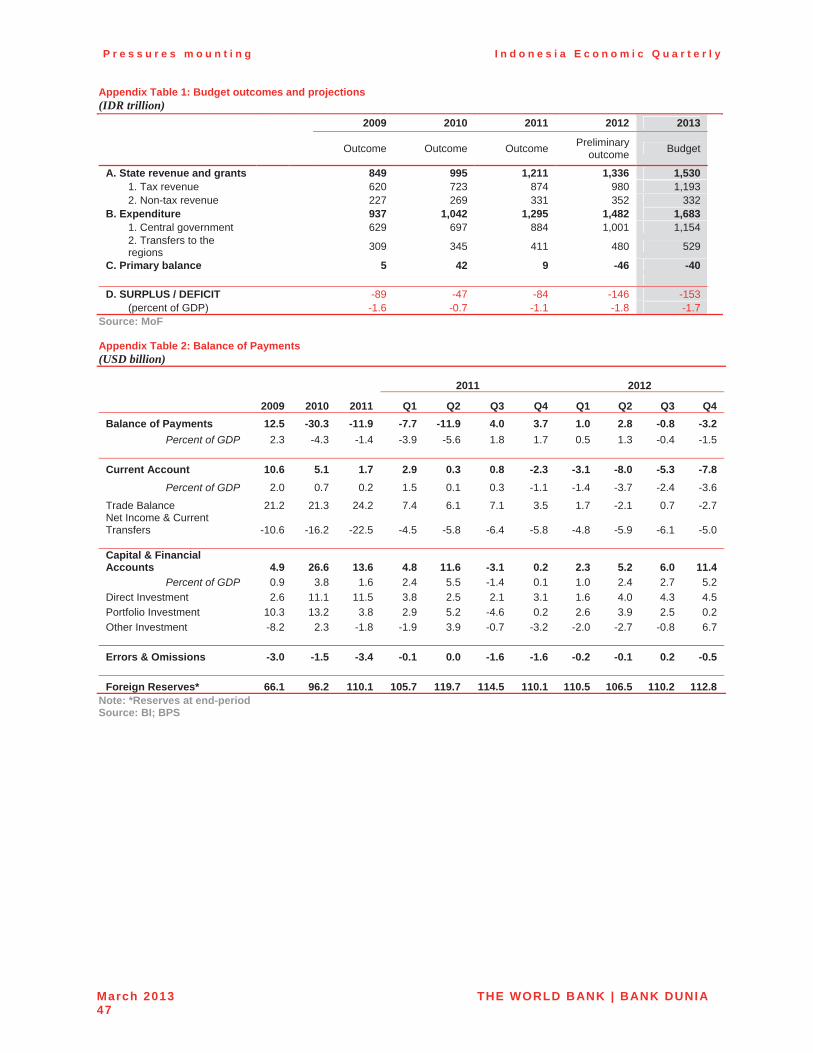
P r e s s u r e s m o u n t i n g I n d o n e s i a E c o n o m i c Q u a r t e r l y
March 2013 THE WORLD BANK | BANK DUNIA47
Appendix Table 1: Budget outcomes and projections (IDR trillion)
2009 2010 2011 2012 2013
Outcome Outcome Outcome Preliminary outcome Budget
A. State revenue and grants 849 995 1,211 1,336 1,530 1. Tax revenue 620 723 874 980 1,193 2. Non-tax revenue 227 269 331 352 332
B. Expenditure 937 1,042 1,295 1,482 1,683 1. Central government 629 697 884 1,001 1,154 2. Transfers to the regions 309 345 411 480 529
C. Primary balance 5 42 9 -46 -40
D. SURPLUS / DEFICIT -89 -47 -84 -146 -153 (percent of GDP) -1.6 -0.7 -1.1 -1.8 -1.7
Source: MoF
Appendix Table 2: Balance of Payments (USD billion)
2011 2012
2009 2010 2011 Q1 Q2 Q3 Q4 Q1 Q2 Q3 Q4 Balance of Payments 12.5 -30.3 -11.9 -7.7 -11.9 4.0 3.7 1.0 2.8 -0.8 -3.2
Percent of GDP 2.3 -4.3 -1.4 -3.9 -5.6 1.8 1.7 0.5 1.3 -0.4 -1.5
Current Account 10.6 5.1 1.7 2.9 0.3 0.8 -2.3 -3.1 -8.0 -5.3 -7.8 Percent of GDP 2.0 0.7 0.2 1.5 0.1 0.3 -1.1 -1.4 -3.7 -2.4 -3.6
Trade Balance 21.2 21.3 24.2 7.4 6.1 7.1 3.5 1.7 -2.1 0.7 -2.7 Net Income & Current Transfers -10.6 -16.2 -22.5 -4.5 -5.8 -6.4 -5.8 -4.8 -5.9 -6.1 -5.0
Capital & Financial Accounts 4.9 26.6 13.6 4.8 11.6 -3.1 0.2 2.3 5.2 6.0 11.4
Percent of GDP 0.9 3.8 1.6 2.4 5.5 -1.4 0.1 1.0 2.4 2.7 5.2 Direct Investment 2.6 11.1 11.5 3.8 2.5 2.1 3.1 1.6 4.0 4.3 4.5 Portfolio Investment 10.3 13.2 3.8 2.9 5.2 -4.6 0.2 2.6 3.9 2.5 0.2 Other Investment -8.2 2.3 -1.8 -1.9 3.9 -0.7 -3.2 -2.0 -2.7 -0.8 6.7
Errors & Omissions -3.0 -1.5 -3.4 -0.1 0.0 -1.6 -1.6 -0.2 -0.1 0.2 -0.5
Foreign Reserves* 66.1 96.2 110.1 105.7 119.7 114.5 110.1 110.5 106.5 110.2 112.8
Note: *Reserves at end-period Source: BI; BPS
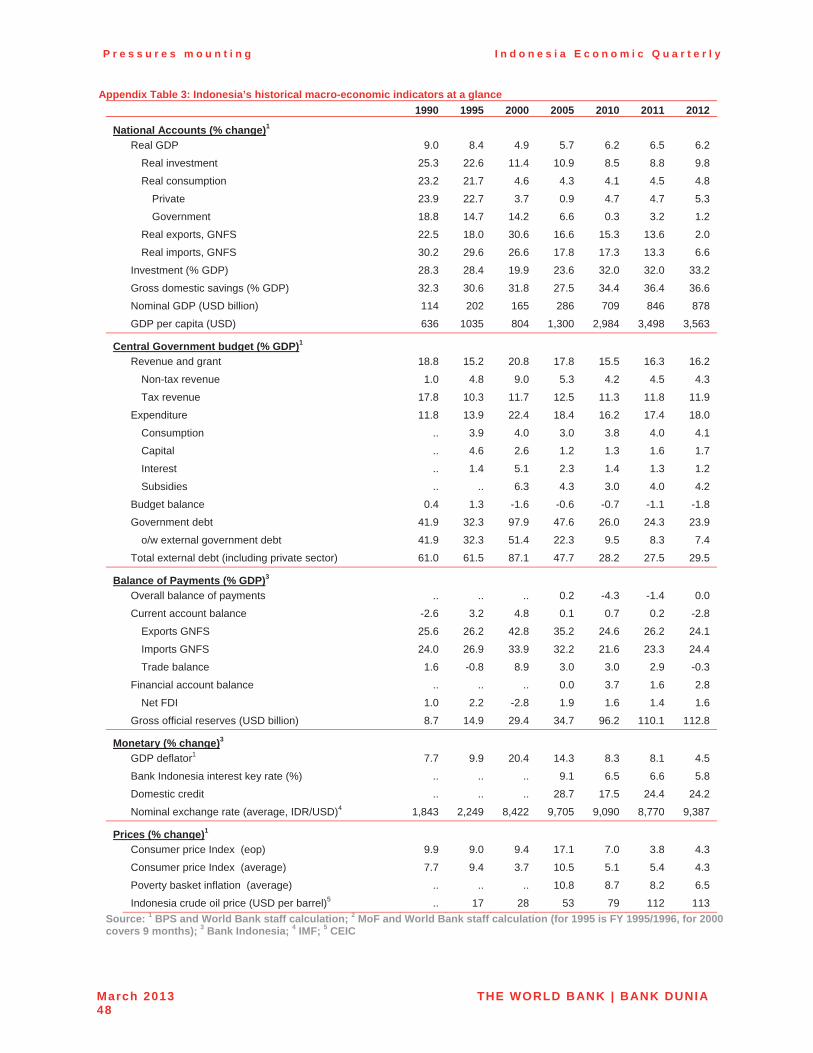
P r e s s u r e s m o u n t i n g I n d o n e s i a E c o n o m i c Q u a r t e r l y
March 2013 THE WORLD BANK | BANK DUNIA48
Appendix Table 3: Indonesia’s historical macro-economic indicators at a glance 1990 1995 2000 2005 2010 2011 2012
National Accounts (% change)1
�� Real GDP 9.0 8.4 4.9 5.7 6.2 6.5 6.2
�� Real investment 25.3 22.6 11.4 10.9 8.5 8.8 9.8
�� Real consumption 23.2 21.7 4.6 4.3 4.1 4.5 4.8
�� Private 23.9 22.7 3.7 0.9 4.7 4.7 5.3
�� Government 18.8 14.7 14.2 6.6 0.3 3.2 1.2
�� Real exports, GNFS 22.5 18.0 30.6 16.6 15.3 13.6 2.0
�� Real imports, GNFS 30.2 29.6 26.6 17.8 17.3 13.3 6.6
�� Investment (% GDP) 28.3 28.4 19.9 23.6 32.0 32.0 33.2
�� Gross domestic savings (% GDP) 32.3 30.6 31.8 27.5 34.4 36.4 36.6
�� Nominal GDP (USD billion) 114 202 165 286 709 846 878
�� GDP per capita (USD) 636 1035 804 1,300 2,984 3,498 3,563
Central Government budget (% GDP)1
�� Revenue and grant 18.8 15.2 20.8 17.8 15.5 16.3 16.2
�� Non-tax revenue 1.0 4.8 9.0 5.3 4.2 4.5 4.3
�� Tax revenue 17.8 10.3 11.7 12.5 11.3 11.8 11.9
�� Expenditure 11.8 13.9 22.4 18.4 16.2 17.4 18.0
�� Consumption .. 3.9 4.0 3.0 3.8 4.0 4.1
�� Capital .. 4.6 2.6 1.2 1.3 1.6 1.7
�� Interest .. 1.4 5.1 2.3 1.4 1.3 1.2
�� Subsidies .. .. 6.3 4.3 3.0 4.0 4.2
�� Budget balance 0.4 1.3 -1.6 -0.6 -0.7 -1.1 -1.8
�� Government debt 41.9 32.3 97.9 47.6 26.0 24.3 23.9
�� o/w external government debt 41.9 32.3 51.4 22.3 9.5 8.3 7.4
�� Total external debt (including private sector) 61.0 61.5 87.1 47.7 28.2 27.5 29.5
Balance of Payments (% GDP)3
�� Overall balance of payments .. .. .. 0.2 -4.3 -1.4 0.0
�� Current account balance -2.6 3.2 4.8 0.1 0.7 0.2 -2.8
�� Exports GNFS 25.6 26.2 42.8 35.2 24.6 26.2 24.1
�� Imports GNFS 24.0 26.9 33.9 32.2 21.6 23.3 24.4
�� Trade balance 1.6 -0.8 8.9 3.0 3.0 2.9 -0.3
�� Financial account balance .. .. .. 0.0 3.7 1.6 2.8
�� Net FDI 1.0 2.2 -2.8 1.9 1.6 1.4 1.6
�� Gross official reserves (USD billion) 8.7 14.9 29.4 34.7 96.2 110.1 112.8
Monetary (% change)3
�� GDP deflator1 7.7 9.9 20.4 14.3 8.3 8.1 4.5
�� Bank Indonesia interest key rate (%) .. .. .. 9.1 6.5 6.6 5.8
�� Domestic credit .. .. .. 28.7 17.5 24.4 24.2
�� Nominal exchange rate (average, IDR/USD)4 1,843 2,249 8,422 9,705 9,090 8,770 9,387
Prices (% change)1
�� Consumer price Index (eop) 9.9 9.0 9.4 17.1 7.0 3.8 4.3
�� Consumer price Index (average) 7.7 9.4 3.7 10.5 5.1 5.4 4.3
�� Poverty basket inflation (average) .. .. .. 10.8 8.7 8.2 6.5
�� Indonesia crude oil price (USD per barrel)5 .. 17 28 53 79 112 113Source: 1 BPS and World Bank staff calculation; 2 MoF and World Bank staff calculation (for 1995 is FY 1995/1996, for 2000 covers 9 months); 3 Bank Indonesia; 4 IMF; 5 CEIC
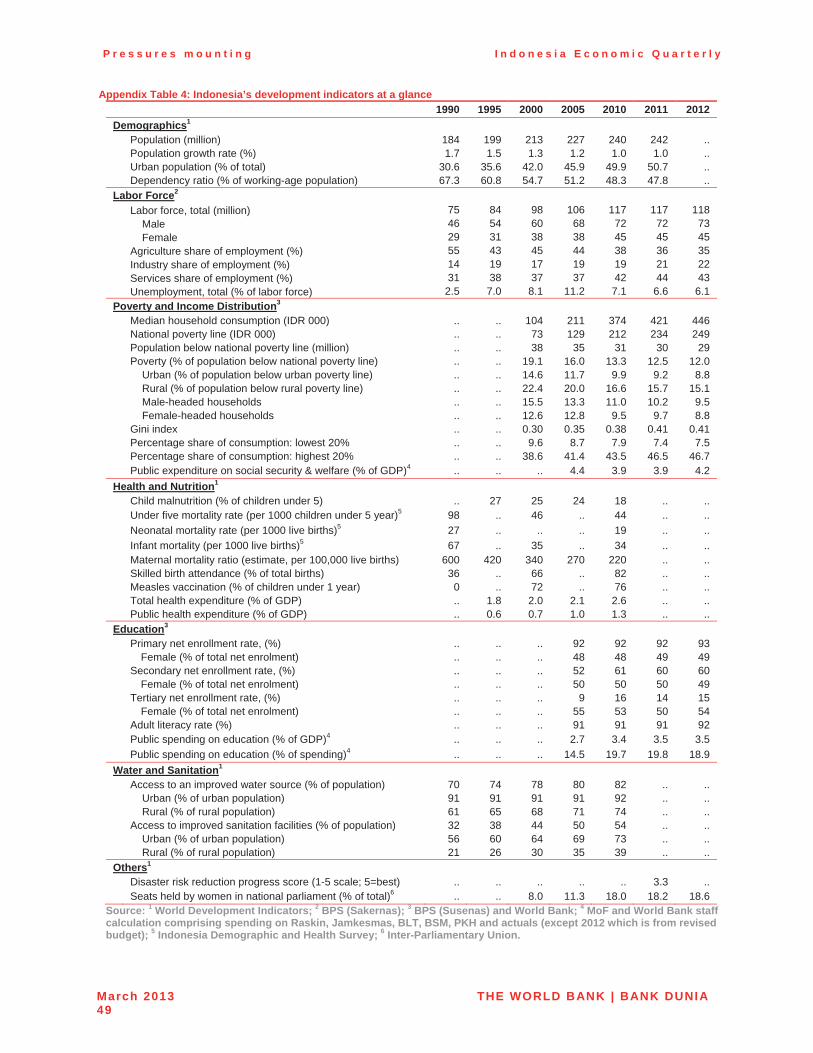
P r e s s u r e s m o u n t i n g I n d o n e s i a E c o n o m i c Q u a r t e r l y
March 2013 THE WORLD BANK | BANK DUNIA49
Appendix Table 4: Indonesia’s development indicators at a glance 1990 1995 2000 2005 2010 2011 2012
Demographics1
Population (million) 184 199 213 227 240 242 ..Population growth rate (%) 1.7 1.5 1.3 1.2 1.0 1.0 ..Urban population (% of total) 30.6 35.6 42.0 45.9 49.9 50.7 ..Dependency ratio (% of working-age population) 67.3 60.8 54.7 51.2 48.3 47.8 ..
Labor Force2
Labor force, total (million) 75 84 98 106 117 117 118 Male 46 54 60 68 72 72 73 Female 29 31 38 38 45 45 45Agriculture share of employment (%) 55 43 45 44 38 36 35Industry share of employment (%) 14 19 17 19 19 21 22Services share of employment (%) 31 38 37 37 42 44 43Unemployment, total (% of labor force) 2.5 7.0 8.1 11.2 7.1 6.6 6.1
Poverty and Income Distribution3
Median household consumption (IDR 000) .. .. 104 211 374 421 446National poverty line (IDR 000) .. .. 73 129 212 234 249Population below national poverty line (million) .. .. 38 35 31 30 29Poverty (% of population below national poverty line) .. .. 19.1 16.0 13.3 12.5 12.0 Urban (% of population below urban poverty line) .. .. 14.6 11.7 9.9 9.2 8.8 Rural (% of population below rural poverty line) .. .. 22.4 20.0 16.6 15.7 15.1 Male-headed households .. .. 15.5 13.3 11.0 10.2 9.5 Female-headed households .. .. 12.6 12.8 9.5 9.7 8.8Gini index .. .. 0.30 0.35 0.38 0.41 0.41Percentage share of consumption: lowest 20% .. .. 9.6 8.7 7.9 7.4 7.5Percentage share of consumption: highest 20% .. .. 38.6 41.4 43.5 46.5 46.7Public expenditure on social security & welfare (% of GDP)4 .. .. .. 4.4 3.9 3.9 4.2
Health and Nutrition1
Child malnutrition (% of children under 5) .. 27 25 24 18 .. ..Under five mortality rate (per 1000 children under 5 year)5 98 .. 46 .. 44 .. ..Neonatal mortality rate (per 1000 live births)5 27 .. .. .. 19 .. ..Infant mortality (per 1000 live births)5 67 .. 35 .. 34 .. ..Maternal mortality ratio (estimate, per 100,000 live births) 600 420 340 270 220 .. ..Skilled birth attendance (% of total births) 36 .. 66 .. 82 .. ..Measles vaccination (% of children under 1 year) 0 .. 72 .. 76 .. ..Total health expenditure (% of GDP) .. 1.8 2.0 2.1 2.6 .. ..Public health expenditure (% of GDP) .. 0.6 0.7 1.0 1.3 .. ..
Education3
Primary net enrollment rate, (%) .. .. .. 92 92 92 93Female (% of total net enrolment) .. .. .. 48 48 49 49
Secondary net enrollment rate, (%) .. .. .. 52 61 60 60Female (% of total net enrolment) .. .. .. 50 50 50 49
Tertiary net enrollment rate, (%) .. .. .. 9 16 14 15Female (% of total net enrolment) .. .. .. 55 53 50 54
Adult literacy rate (%) .. .. .. 91 91 91 92Public spending on education (% of GDP)4 .. .. .. 2.7 3.4 3.5 3.5Public spending on education (% of spending)4 .. .. .. 14.5 19.7 19.8 18.9
Water and Sanitation1
Access to an improved water source (% of population) 70 74 78 80 82 .. .. Urban (% of urban population) 91 91 91 91 92 .. .. Rural (% of rural population) 61 65 68 71 74 .. ..Access to improved sanitation facilities (% of population) 32 38 44 50 54 .. .. Urban (% of urban population) 56 60 64 69 73 .. .. Rural (% of rural population) 21 26 30 35 39 .. ..
Others1
Disaster risk reduction progress score (1-5 scale; 5=best) .. .. .. .. .. 3.3 ..Seats held by women in national parliament (% of total)6 .. .. 8.0 11.3 18.0 18.2 18.6
Source: 1 World Development Indicators; 2 BPS (Sakernas); 3 BPS (Susenas) and World Bank; 4 MoF and World Bank staff calculation comprising spending on Raskin, Jamkesmas, BLT, BSM, PKH and actuals (except 2012 which is from revised budget); 5 Indonesia Demographic and Health Survey; 6 Inter-Parliamentary Union.

Compilation of the Indonesia Economic Quarterly (IEQ) FY 2013 Reports – Indonesian language versions • Mengatasi tantangan saat ini dan ke depan, Juli 2012
• Menjaga ketahanan, Oktober 2012
• Menyoroti kebijakan, Desember 2012
• Tekanan meningkat, Maret 2013
Juli 2012
Mengatasi tantangan saat ini dan ke depan
PERKEMBANGAN TRIWULANANPEREKONOMIAN INDONESIA
PERKEMBANGAN TRIWULANAN PEREKONOMIAN INDONESIA Mengatasi tantangan saat ini dan ke depan Juli 2012


Kata Pengantar
Perkembangan Triwulanan Perekonomian Indonesia menyajikan perkembangan utama ekonomi Indonesia dalam tiga bulan terakhir. Laporan ini menempatkan perkembangan tersebut dalam konteks jangka panjang dan global, serta memberikan penilaian terhadap prospek ekonomi dan kesejahteraan sosial Indonesia. Laporan ini ditujukan untuk khalayak termasuk pembuat kebijakan, pemimpin bisnis, pelaku pasar keuangan, serta komunitas analis dan professional yang terlibat dalam ekonomi Indonesia.
Laporan ini disiapkan dan disusun oleh cluster kebijakan makro dan fiskal Bank Dunia Jakarta di bawah bimbingan Shubham Chaudhuri sebagai Lead Economist dan Enrique Blanco Armas sebagai Senior Country Economist. Tim penyusun dipimpin oleh Ashley Taylor, termasuk Magda Adriani (harga komoditas), Andrew Blackman (lingkungan internasional, sektor eksternal, pasar keuangan dan tranksaksi berjalan), Fitria Fitrani (pasar tenaga kerja), Faya Hayati (harga dan pasar properti), Ahya Ihsan (fiskal dan pelaksanaan APBN dan Analisa belanja publik sektor jalan), David Stephan (sektor riil dan resiko). Kontribusi tambahan diterima dari Neni Lestari (perbankan), The Fei Ming (sektor korporasi), Gonzalo Varela dan Victor Duggan (Keterkaitan global dan kinerja ekonomi) dan Matthew Wai-Poi (Kemiskinan). Pengeditan dan produksi dilakukan oleh Arsianti, Faya Hayati, Yus Medina Pakpahan dan Ashley Taylor. Komentar serta masukan yang cukup detail diberikan oleh Enrique Blanco Armas, Mustapha Benmaamar, Shubham Chaudhuri, Dini Sari Djalal, Anna Gueorguieva, Bert Hofman, Tehmina Khan, Sjamsu Rahardja dan Samer Al-Samarrai. Diseminasi diorganisir oleh Dini Sari Djalal, Farhana Asnap, Indra Irnawan, Jerry Kurniawan, Nugroho, Marcellinus Winata dan Randy Salim. Akhirnya, dukungan administratif yang sangat berharga diberikan oleh Titi Ananto, Nayu Ramadhaningsih dan Nina Herawati. Dokumen ini diterjemahkan ke bahasa Indonesia oleh Nicolas Novianto dan diedit oleh Dwi Endah Abriningrum, Magda Adriani, Fitria Fitrani, Ahya Ihsan, Arsianti, Yus Medina Pakpahan dan Wahyoe Soedarmono. Laporan ini disusun oleh para staf International Bank for Reconstruction and Development /Bank Dunia, dengan dukungan pendanaan dari Pemerintah Australia - AusAID melalui program Support for Enhanced Macroeconomic and Fiscal Policy Analysis (SEMEFPA). Temuan-temuan, interpretasi dan kesimpulan-kesimpulan yang dinyatakan di dalam laporan ini tidak selalu mencerminkan pandangan AusAID dan Pemerintah Australia, para Direktur Pelaksana Bank Dunia atau pemerintah yang diwakilinya. Bank Dunia tidak menjamin ketepatan data-data yang termuat dalam laporan ini. Batas-batas, warna, denominasi dan informasi-informasi lain yang digambarkan pada setiap peta di dalam laporan ini tidak mencerminkan pendapat Bank Dunia mengenai status hukum dari wilayah atau dukungan atau penerimaan dari batas-batas tersebut. Untuk mendapatkan lebih banyak analisa Bank Dunia terhadap ekonomi Indonesia:
Untuk informasi mengenai Bank Dunia serta kegiatannya di Indonesia, silakan berkunjung ke website ini www.worldbank.org/id Untuk mendapatkan publikasi terkait melalui e-mail, silakan menghubungi [email protected]. Untuk pertanyaan dan saran berkaitan dengan publikasi ini, silakan menghubungi [email protected].

Daftar isi KATA PENGANTAR iii
Ringkasan Eksekutif: Mengatasi tantangan saat ini dan ke depan viii
A. PERKEMBANGAN EKONOMI DAN FISKAL TERKINI 1
1. Prospek ekonomi dunia tetap lemah dan pasar keuangan tetap bergejolak 1 2. Pertumbuhan melambat pada kuartal pertama tetapi masih tetap kokoh menghadapi kelesuan
dunia 3 3. Neraca pembayaran mencatat defisit ketiga secara berurutan di kuartal 1 2012 5 4. Pengaruh dari gejolak pasar keuangan dunia terlihat kembali pada bulan Mei 8 5. Belanja untuk subsidi BBM masih tetap tinggi tetapi peningkatan harga tampaknya tidak akan
terjadi untuk tahun 2012 11 6. Turunnya risiko lonjakan harga BBM bersubsidi melemahkan proyeksi inflasi 15 7. Tingkat kemiskinan terus menurun, tetapi dengan laju yang lebih lambat 16 8. Ketidakpastian luar negeri masih menjadi risiko jangka pendek terbesar terhadap ekonomi 20
B. BEBERAPA PERKEMBANGAN TERBARU PEREKONOMIAN INDONESIA 23
1. Pendorong dan implikasi tren-tren terakhir pada neraca berjalan Indonesia 23 a. Dinamika neraca berjalan Indonesia akhir-akhir ini .................................................................. 23 b. Keberlanjutan jangka panjang dan pendanaan dalam waktu singkat ...................................... 26 c. Upaya kebijakan yang dilakukan baru-baru ini untuk memitigasi kerentanan eksternal ........ 27 d. Komentar penutup ......................................................................................................................... 28
2. Identifikasi hambatan dalam pelaksanaan anggaran di sektor infrastruktur 29 a. Keterlambatan dalam proses persiapan anggaran merupakan faktor penghambat utama,
walaupun masalah-masalah dalam proses pengadaan dan pelaksanaan juga mempengaruhi pencairan anggaran ...................................................................................................................... 30
b. Mengatasi hambatan-hambatan dalam pelaksanaan anggaran adalah hal yang sangat penting bagi Indonesia ................................................................................................................. 32
C. INDONESIA TAHUN 2014 DAN SELANJUTNYA: TINJAUAN TERPILIH 34
1. Investasi di sektor jalan di Indonesia 34 a. Rendahnya investasi, kurangnya pasokan, dan memburuknya kualitas ................................. 34 b. Jalan-jalan nasional dalam kondisi baik tetapi sangat padat .................................................... 36 c. Kondisi jalan-jalan daerah telah menurun karena lambatnya pemeliharaan ........................... 37 d. Menuju kinerja infrastruktur jalan yang lebih baik ..................................................................... 38
2. Peranan pasar dunia dalam meningkatkan daya saing dalam negeri 39 a. Beberapa bukti tentang bagaimana integrasi yang lebih besar dapat membantu
meningkatkan produktivitas ......................................................................................................... 39 b. Pentingnya peran FDI untuk meningkatkan kapasitas produktif Indonesia............................. 40 c. Impor sebagai instrumen untuk mendukung inovasi dan mendorong persaingan ................. 42 d. Ekspor sebagai cara untuk mendorong produktivitas dan pertumbuhan ................................ 44
LAMPIRAN: INDIKATOR GAMBARAN EKONOMI INDONESIA 46
DAFTAR GRAFIK Gambar 1: Rupiah secara bertahap terus melemah di tengah gejolak pasar ekuitas .................... ix Gambar 2: Belanja modal, walaupun meningkat secara nominal, realisasi terus berada jauh di
bawah alokasi ................................................................................................................ xi Gambar 3: Pergerakan pasar ekuitas terus terpengaruh oleh perkembangan pada zona Euro .... 1 Gambar 4: Harga komoditas dunia telah turun, tetapi masih tetap tinggi secara tingkat historis. 1 Gambar 5: Pertumbuhan mitra perdagangan utama Indonesia tetap lemah di tahun 2012,
sebelum sedikit meningkat pada tahun 2013 ............................................................... 2 Gambar 6: Pertumbuhan PDB melambat menjadi 6,3 persen pada kuartal pertama tahun 2012…3 Gambar 7: …didorong oleh perlambatan pada sektor perdagangan dan manufaktur .................... 3 Gambar 8: Indikator bulanan menunjukkan sedikit moderasi dalam kegiatan ................................ 4 Gambar 9: Melebarnya defisit neraca berjalan berkontribusi dalam aliran keluar neraca
pembayaran secara keseluruhan pada kuartal 1, 2012… ........................................... 6 Gambar 10: …dengan surplus non-migas juga menurun dengan tajam .......................................... 6 Gambar 11: Neraca perdagangan bergerak menjadi defisit seiring dengan menurunnya
pertumbuhan ekspor ...................................................................................................... 7 Gambar 12: Gejolak pasar keuangan yang terakhir mendorong pelebaran yield obligasi,
penurunan indeks ekuitas dan perlemahan Rupiah… ................................................ 8 Gambar 13: …dengan penurunan kepemilikan obligasi dan ekuitas oleh investor asing pada
bulan Mei, dan cadangan devisa menurun .................................................................. 8 Gambar 14: Harga properti komersial di Jakarta telah meningkat… ................................................ 9 Gambar 15: …tetapi secara nasional, pertumbuhan harga perumahan telah menurun pada
tahun 2012 ....................................................................................................................... 9 Gambar 16: Defisit APBN pada paruh pertama 2012 kurang dari seperlima target setahun sesuai
dengan APBN-P ............................................................................................................ 11 Gambar 17: Harga minyak mentah telah menurun dengan tajam dan juga kemungkinan
peningkatan harga BBM bersubsidi pada tahun 2012 .............................................. 12 Gambar 18: Inflasi IHK sedikit meningkat tetapi inflasi inti tetap bertahan rendah ...................... 15 Gambar 19: Perbedaan antara harga beras internasional dan Indonesia sekali lagi bergerak ke
nilai tertinggi ................................................................................................................. 15 Gambar 20: Tingkat kemiskinan nasional relatif terus menyusut di 2012 namun tingkat
menurunnya yang paling rendah di dekade terakhir ini .......................................... 17 Gambar 21: Tingkat kemiskinan nasional relatif tinggi di Indonesia Timur ................................... 17 Gambar 22: Kaum miskin yang tersisa hidup semakin jauh di bawah garis kemiskinan… ......... 18 Gambar 23: …sementara sejumlah besar penduduk Indonesia yang hidup hanya sedikit di atas
garis kemiskinan tetap rentan jatuh kembali ke kemiskinan .................................... 18 Gambar 24: Pengangguran terus menurun dalam setahun hingga Februari 2012… .................... 19 Gambar 25: Permintaan energi China merupakan pendorong utama konsumsi bahan bakar cair
dunia .............................................................................................................................. 22 Gambar 26: Pengaruh China terhadap harga komoditas cukup besar – tetapi masih berada di
belakang AS .................................................................................................................. 22 Gambar 27: Pergeseran ke CAD belakangan ini adalah bagian dari tren jangka menengah… .... 25 Gambar 28: …dan diproyeksikan akan bertahan pada kisaran 1 persen dari PDB pada jangka
menengah ..................................................................................................................... 25 Gambar 29: FDI telah menjadi bagian yang lebih besar dari jumlah aliran masuk neraca
keuangan sejak tahun 2008-09 .................................................................................... 27 Gambar 30: Sektor infrastruktur utama menerima kenaikan anggaran yang signifikan di tahun
2011 ............................................................................................................................... 30 Gambar 31: Tetapi rendahnya realisasi APBN 2010 dan 2011 memperlihatkan tantangan
pelaksanaan anggaran masih berlanjut ..................................................................... 30 Gambar 32: Masalah-masalah kritis yang teridentifikasi pada setiap tahapan pelaksanaan
anggaran pada tahun 2010 dan 2011 .......................................................................... 30 Gambar 33: Rencana vs realisasi kemajuan fisik: Pembangunan Jalur Rel KA Ganda (2010) .... 31 Gambar 34: Rencana vs realisasi kemajuan fisik: Tugas Bantuan (SKPD-TP) Pembangunan dan
Pemeliharaan Jalan Tol Jawa Barat (2010) ................................................................ 31 Gambar 35: Rencana vs realisasi kemajuan keuangan: Pembangkit Listrik dan Transmisi
Sulawesi-Maluku-Papua- Tahun Fiskal 2010, proyek ini terpola ke akhir tahun ..... 32 Gambar 36: Rencana vs realisasi kemajuan keuangan: SKPD-TP Dinas Bina Marga Provinsi
Jawa Barat (2010), sebuah proyek non-konstruksi lebih terbagi rata ke sepanjang tahun.............................................................................................................................. 32
Gambar 37: Setelah turun tajam, investasi dalam bidang jalan di Indonesia baru kembali ke tingkat pra-krisis tahun 1997/1998… .......................................................................... 35
Gambar 38: …yang tidak sebanding dengan laju peningkatan permintaan dan pertumbuhan lalu lintas .............................................................................................................................. 35
Gambar 39: …yang menyebabkan penurunan pada infrastruktur dan layanan jalan ................... 35 Gambar 40: …dan biaya transportasi yang lebih tinggi per waktu perjalanan .............................. 35 Gambar 41: Belanja pemerintah pusat untuk jalan meningkat hampir tiga kali lipat secara riil
antara tahun 2005 dan 2011 ......................................................................................... 37 Gambar 42: Bagian dari jalan daerah dalam kondisi baik didukung oleh pembangunan baru .... 37 Gambar 43: Lebih baiknya kinerja perusahaan Indonesia yang terintegrasi dengan ekonomi
dunia .............................................................................................................................. 39 Gambar 44: Impor telah meningkat, didorong oleh peningkatan impor barang modal dan
setengah jadi ................................................................................................................ 43 Gambar 45: Hubungan antara pertumbuhan impor barang setengah jadi dan pertumbuhan
ekspor sangatlah kuat.................................................................................................. 43 Gambar 46: Sektor yang mengimpor lebih banyak input-nya menyerap lebih banyak tenaga
kerja… ........................................................................................................................... 43 Gambar 47: …dan telah meningkatkan permintaan bagi barang setengah jadi domestik secara
lebih cepat ..................................................................................................................... 43
DAFTAR GRAFIK LAMPIRAN Lampiran gambar 1: Pertumbuhan PDB ........................................................................................... 46 Lampiran gambar 2: Kontribusi pengeluaran terhadap PDB .......................................................... 46 Lampiran gambar 3: Kontribusi sektor terhadap PDB ..................................................................... 46 Lampiran gambar 4: Penjualan sepeda motor dan mobil ................................................................ 46 Lampiran gambar 5: Indikator konsumen ......................................................................................... 46 Lampiran gambar 6: Indikator kegiatan industri .............................................................................. 46 Lampiran gambar 7: Aliran perdagangan riil .................................................................................... 47 Lampiran gambar 8: Neraca pembayaran ......................................................................................... 47 Lampiran gambar 9: Neraca perdagangan ........................................................................................ 47 Lampiran gambar 10: Cadangan devisa dan modal asing .............................................................. 47 Lampiran gambar 11: Term of trade dan implisit ekspor- impor berdasarkan chained Fisher-
Price indices ................................................................................................................. 47 Lampiran gambar 12: Inflasi dan kebijakan moneter ....................................................................... 47 Lampiran gambar 13: Rincian tingkat harga konsumen .................................................................. 48 Lampiran gambar 14: Tingkat inflasi negara tetangga .................................................................... 48 Lampiran gambar 15: Harga beras kulakan di pasar domestik dan internasional ........................ 48 Lampiran gambar 16: Tingkat kemiskinan dan pengangguran ....................................................... 48 Lampiran gambar 17: Indeks saham regional .................................................................................. 48 Lampiran gambar 18: Indeks spot dolar dan rupiah ........................................................................ 48 Lampiran gambar 19: Yield obligasi pemerintah 5 tahunan mata uang lokal ................................ 49 Lampiran gambar 20: Spread EMBI obligasi pemerintah dengan obligasi dollar amerika ........... 49 Lampiran gambar 21: Tingkat kredit bank umum............................................................................. 49 Lampiran gambar 22: Indikator keuangan sektor perbankan ......................................................... 49 Lampiran gambar 23: Utang pemerintah ........................................................................................... 49 Lampiran gambar 24: Utang luar negeri ............................................................................................ 49
DAFTAR TABEL Tabel 1: Harga beberapa komoditas ekspor utama Indonesia telah turun pada beberapa bulan
terakhir ......................................................................................................................... viii Tabel 2: Berdsarkan skenario dasar (baseline) pertumbuhan diperkirakan 6,0 persen pada
tahun 2012 ...................................................................................................................... ix Tabel 3: Dampak penurunan perekonomian global terhadap pertumbuhan ekonomi pada tahun
2013 akan cukup besar .................................................................................................. x Tabel 4: Menurut skenario baseline pertumbuhan PDB untuk tahun 2012 diproyeksikan sebesar
6.0 persen dan meningkat ke 6,4 persen pada tahun 2013 ......................................... 5 Tabel 5: Neraca berjalan diproyeksikan mencatat defisit yang kecil pada tahun 2012 dan aliran
masuk keuangan akan menurun ................................................................................... 7 Tabel 6: Proyeksi neraca eksternal Indonesia di pengaruhi oleh faktor dinamis yang beragam .. 7 Tabel 7: Kuatnya hasil penerimaan tercatat pada semester 1/2012 dan tingkat pencairan, walau
meningkat secara keseluruhan, tetap relatif rendah khususnya belanja modal .... 12 Tabel 8: Kerangka makro 2013 Pemerintah memproyeksikan pertumbuhan meningkat sekitar 7
persen............................................................................................................................ 13 Tabel 9: Tanpa reformasi subsidi BBM pada tahun 2012, dan revisi turun harga minyak mentah,
defisit APBN dapat mencapai 2,6 persen dari PDB ................................................... 14 Tabel 10: Dampak penurunan global terhadap pertumbuhan ekonomi akan menjadi signifikan 20 Tabel 11: Surplus neraca berjalan diproyeksikan akan berubah menjadi defisit pada tahun
2012 ............................................................................................................................... 24 Tabel 12: Keadaan jaringan jalan Indonesia, tahun 2009 ................................................................ 35
DAFTAR TABEL LAMPIRAN Lampiran Tabel 1: Realisasi dan anggaran belanja pemerintah ..................................................... 50 Lampiran Tabel 2: Neraca Pembayaran ............................................................................................ 50
DAFTAR KOTAK Kotak 1: Harga properti komersial telah meningkat dengan kuat, sementara pertumbuhan harga
perumahan telah menurun ............................................................................................ 9 Kotak 2: “Pengaruh China” terhadap harga-harga komoditas dunia ............................................. 22 Kotak 3: Apa itu Neraca Berjalan? ..................................................................................................... 24 Kotak 4: Apakah perusahaan manufaktur lokal menerima manfaat dari integrasi yang lebih
besar? Beberapa studi kasus dari Jakarta dan Surabaya ........................................ 40 Kotak 5: Potensi manfaat dari kualitas dan keragaman input bagi daya saing manufaktur ........ 44
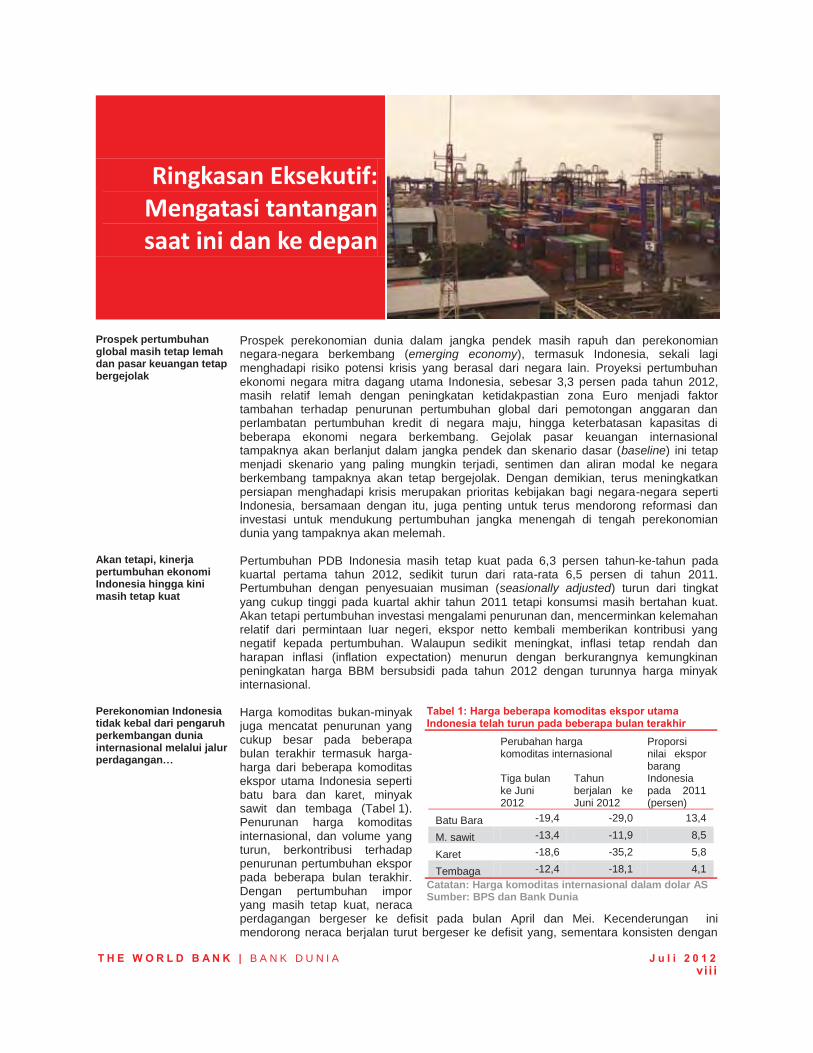
T H E W O R L D B A N K | B A N K D U N I A J u l i 2 0 1 2
vi i i
Ringkasan Eksekutif: Mengatasi tantangan saat ini dan ke depan
Prospek pertumbuhan global masih tetap lemah dan pasar keuangan tetap bergejolak
Prospek perekonomian dunia dalam jangka pendek masih rapuh dan perekonomian negara-negara berkembang (emerging economy), termasuk Indonesia, sekali lagi menghadapi risiko potensi krisis yang berasal dari negara lain. Proyeksi pertumbuhan ekonomi negara mitra dagang utama Indonesia, sebesar 3,3 persen pada tahun 2012, masih relatif lemah dengan peningkatan ketidakpastian zona Euro menjadi faktor tambahan terhadap penurunan pertumbuhan global dari pemotongan anggaran dan perlambatan pertumbuhan kredit di negara maju, hingga keterbatasan kapasitas di beberapa ekonomi negara berkembang. Gejolak pasar keuangan internasional tampaknya akan berlanjut dalam jangka pendek dan skenario dasar (baseline) ini tetap menjadi skenario yang paling mungkin terjadi, sentimen dan aliran modal ke negara berkembang tampaknya akan tetap bergejolak. Dengan demikian, terus meningkatkan persiapan menghadapi krisis merupakan prioritas kebijakan bagi negara-negara seperti Indonesia, bersamaan dengan itu, juga penting untuk terus mendorong reformasi dan investasi untuk mendukung pertumbuhan jangka menengah di tengah perekonomian dunia yang tampaknya akan melemah.
Akan tetapi, kinerja pertumbuhan ekonomi Indonesia hingga kini masih tetap kuat
Pertumbuhan PDB Indonesia masih tetap kuat pada 6,3 persen tahun-ke-tahun pada kuartal pertama tahun 2012, sedikit turun dari rata-rata 6,5 persen di tahun 2011. Pertumbuhan dengan penyesuaian musiman (seasionally adjusted) turun dari tingkat yang cukup tinggi pada kuartal akhir tahun 2011 tetapi konsumsi masih bertahan kuat. Akan tetapi pertumbuhan investasi mengalami penurunan dan, mencerminkan kelemahan relatif dari permintaan luar negeri, ekspor netto kembali memberikan kontribusi yang negatif kepada pertumbuhan. Walaupun sedikit meningkat, inflasi tetap rendah dan harapan inflasi (inflation expectation) menurun dengan berkurangnya kemungkinan peningkatan harga BBM bersubsidi pada tahun 2012 dengan turunnya harga minyak internasional.
Perekonomian Indonesia tidak kebal dari pengaruh perkembangan dunia internasional melalui jalur perdagangan…
Harga komoditas bukan-minyak juga mencatat penurunan yang cukup besar pada beberapa bulan terakhir termasuk harga-harga dari beberapa komoditas ekspor utama Indonesia seperti batu bara dan karet, minyak sawit dan tembaga (Tabel 1). Penurunan harga komoditas internasional, dan volume yang turun, berkontribusi terhadap penurunan pertumbuhan ekspor pada beberapa bulan terakhir. Dengan pertumbuhan impor yang masih tetap kuat, neraca perdagangan bergeser ke defisit pada bulan April dan Mei. Kecenderungan ini mendorong neraca berjalan turut bergeser ke defisit yang, sementara konsisten dengan
Tabel 1: Harga beberapa komoditas ekspor utama Indonesia telah turun pada beberapa bulan terakhir
Perubahan harga komoditas internasional
Proporsi nilai ekspor barang Indonesia pada 2011 (persen)
Tiga bulan ke Juni 2012
Tahun berjalan ke Juni 2012
Batu Bara -19,4 -29,0 13,4
M. sawit -13,4 -11,9 8,5
Karet -18,6 -35,2 5,8
Tembaga -12,4 -18,1 4,1
Catatan: Harga komoditas internasional dalam dolar AS Sumber: BPS dan Bank Dunia
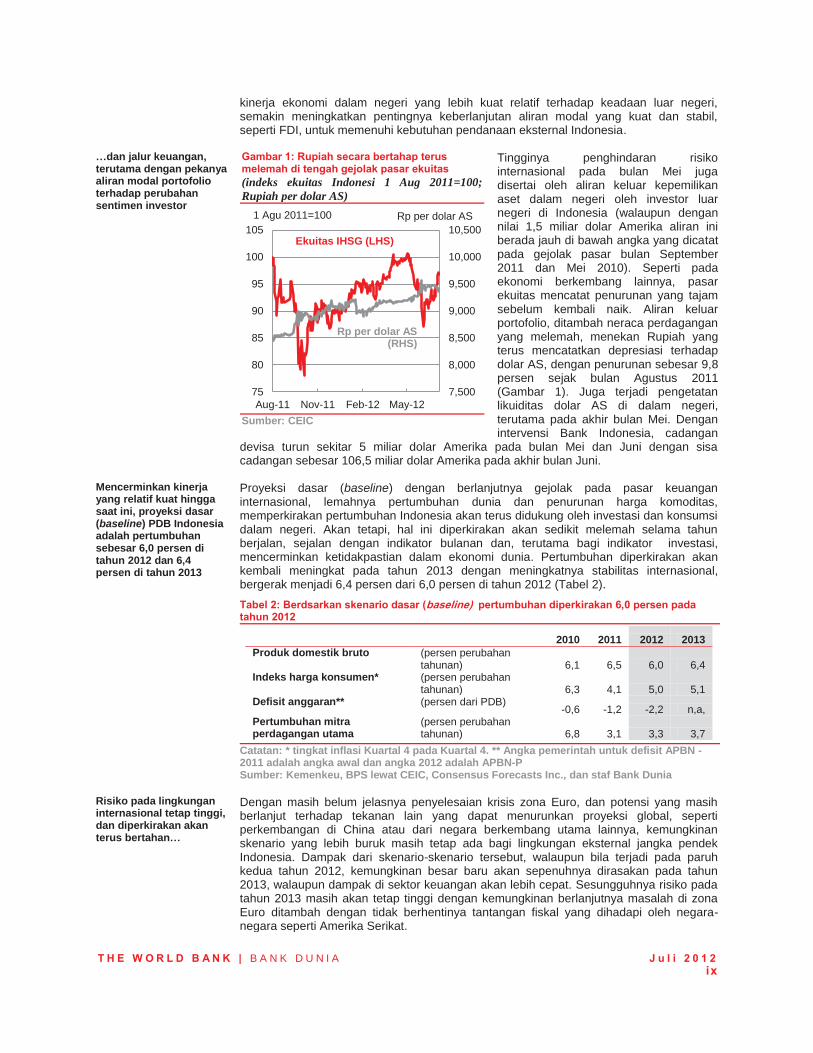
T H E W O R L D B A N K | B A N K D U N I A J u l i 2 0 1 2
ix
kinerja ekonomi dalam negeri yang lebih kuat relatif terhadap keadaan luar negeri, semakin meningkatkan pentingnya keberlanjutan aliran modal yang kuat dan stabil, seperti FDI, untuk memenuhi kebutuhan pendanaan eksternal Indonesia.
…dan jalur keuangan, terutama dengan pekanya aliran modal portofolio terhadap perubahan sentimen investor
Tingginya penghindaran risiko internasional pada bulan Mei juga disertai oleh aliran keluar kepemilikan aset dalam negeri oleh investor luar negeri di Indonesia (walaupun dengan nilai 1,5 miliar dolar Amerika aliran ini berada jauh di bawah angka yang dicatat pada gejolak pasar bulan September 2011 dan Mei 2010). Seperti pada ekonomi berkembang lainnya, pasar ekuitas mencatat penurunan yang tajam sebelum kembali naik. Aliran keluar portofolio, ditambah neraca perdagangan yang melemah, menekan Rupiah yang terus mencatatkan depresiasi terhadap dolar AS, dengan penurunan sebesar 9,8 persen sejak bulan Agustus 2011 (Gambar 1). Juga terjadi pengetatan likuiditas dolar AS di dalam negeri, terutama pada akhir bulan Mei. Dengan intervensi Bank Indonesia, cadangan
devisa turun sekitar 5 miliar dolar Amerika pada bulan Mei dan Juni dengan sisa cadangan sebesar 106,5 miliar dolar Amerika pada akhir bulan Juni.
Gambar 1: Rupiah secara bertahap terus melemah di tengah gejolak pasar ekuitas (indeks ekuitas Indonesi 1 Aug 2011=100; Rupiah per dolar AS)
Sumber: CEIC
Mencerminkan kinerja yang relatif kuat hingga saat ini, proyeksi dasar (baseline) PDB Indonesia adalah pertumbuhan sebesar 6,0 persen di tahun 2012 dan 6,4 persen di tahun 2013
Proyeksi dasar (baseline) dengan berlanjutnya gejolak pada pasar keuangan internasional, lemahnya pertumbuhan dunia dan penurunan harga komoditas, memperkirakan pertumbuhan Indonesia akan terus didukung oleh investasi dan konsumsi dalam negeri. Akan tetapi, hal ini diperkirakan akan sedikit melemah selama tahun berjalan, sejalan dengan indikator bulanan dan, terutama bagi indikator investasi, mencerminkan ketidakpastian dalam ekonomi dunia. Pertumbuhan diperkirakan akan kembali meningkat pada tahun 2013 dengan meningkatnya stabilitas internasional, bergerak menjadi 6,4 persen dari 6,0 persen di tahun 2012 (Tabel 2).
Tabel 2: Berdsarkan skenario dasar (baseline) pertumbuhan diperkirakan 6,0 persen pada tahun 2012
2010 2011 2012 2013 Produk domestik bruto (persen perubahan
tahunan) 6,1 6,5 6,0 6,4 Indeks harga konsumen* (persen perubahan
tahunan) 6,3 4,1 5,0 5,1 Defisit anggaran** (persen dari PDB)
-0,6 -1,2 -2,2 n,a, Pertumbuhan mitra perdagangan utama
(persen perubahan tahunan) 6,8 3,1 3,3 3,7
Catatan: * tingkat inflasi Kuartal 4 pada Kuartal 4. ** Angka pemerintah untuk defisit APBN - 2011 adalah angka awal dan angka 2012 adalah APBN-P Sumber: Kemenkeu, BPS lewat CEIC, Consensus Forecasts Inc., dan staf Bank Dunia
Risiko pada lingkungan internasional tetap tinggi, dan diperkirakan akan terus bertahan…
Dengan masih belum jelasnya penyelesaian krisis zona Euro, dan potensi yang masih berlanjut terhadap tekanan lain yang dapat menurunkan proyeksi global, seperti perkembangan di China atau dari negara berkembang utama lainnya, kemungkinan skenario yang lebih buruk masih tetap ada bagi lingkungan eksternal jangka pendek Indonesia. Dampak dari skenario-skenario tersebut, walaupun bila terjadi pada paruh kedua tahun 2012, kemungkinan besar baru akan sepenuhnya dirasakan pada tahun 2013, walaupun dampak di sektor keuangan akan lebih cepat. Sesungguhnya risiko pada tahun 2013 masih akan tetap tinggi dengan kemungkinan berlanjutnya masalah di zona Euro ditambah dengan tidak berhentinya tantangan fiskal yang dihadapi oleh negara-negara seperti Amerika Serikat.
7,500
8,000
8,500
9,000
9,500
10,000
10,500
75
80
85
90
95
100
105
Aug-11 Nov-11 Feb-12 May-12
Ekuitas IHSG (LHS)
Rp per dolar AS (RHS)
1 Agu 2011=100 Rp per dolar AS
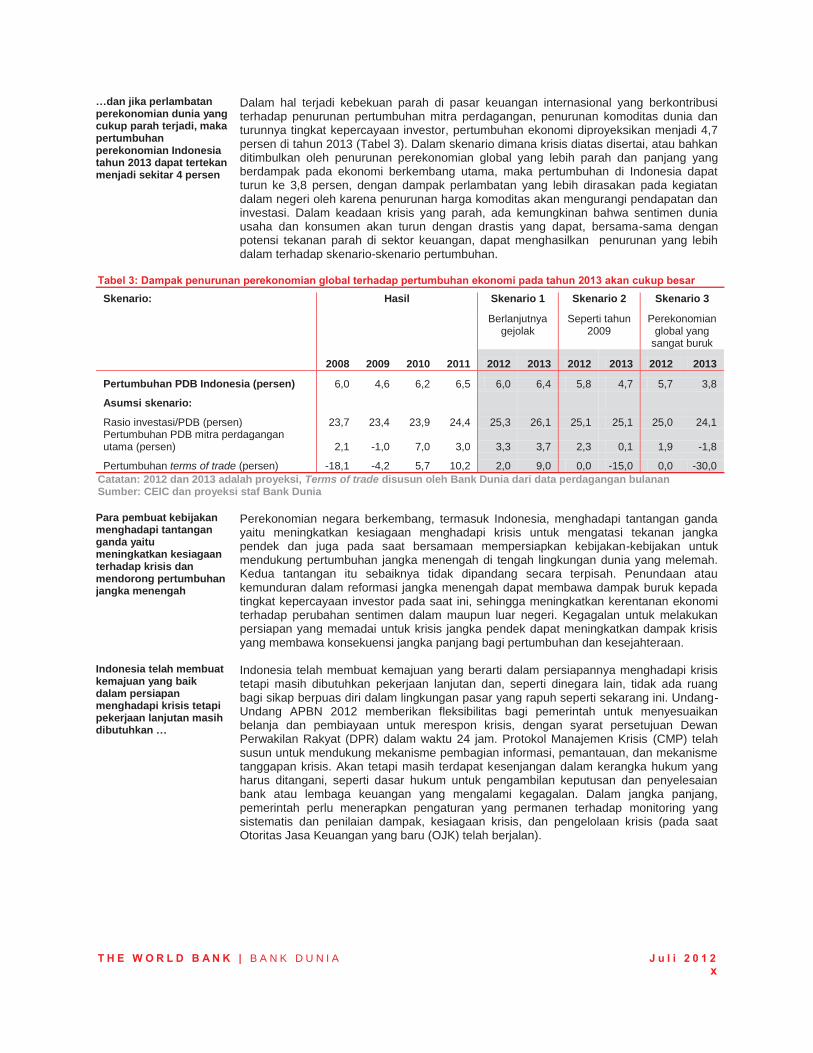
T H E W O R L D B A N K | B A N K D U N I A J u l i 2 0 1 2
x
…dan jika perlambatan perekonomian dunia yang cukup parah terjadi, maka pertumbuhan perekonomian Indonesia tahun 2013 dapat tertekan menjadi sekitar 4 persen
Dalam hal terjadi kebekuan parah di pasar keuangan internasional yang berkontribusi terhadap penurunan pertumbuhan mitra perdagangan, penurunan komoditas dunia dan turunnya tingkat kepercayaan investor, pertumbuhan ekonomi diproyeksikan menjadi 4,7 persen di tahun 2013 (Tabel 3). Dalam skenario dimana krisis diatas disertai, atau bahkan ditimbulkan oleh penurunan perekonomian global yang lebih parah dan panjang yang berdampak pada ekonomi berkembang utama, maka pertumbuhan di Indonesia dapat turun ke 3,8 persen, dengan dampak perlambatan yang lebih dirasakan pada kegiatan dalam negeri oleh karena penurunan harga komoditas akan mengurangi pendapatan dan investasi. Dalam keadaan krisis yang parah, ada kemungkinan bahwa sentimen dunia usaha dan konsumen akan turun dengan drastis yang dapat, bersama-sama dengan potensi tekanan parah di sektor keuangan, dapat menghasilkan penurunan yang lebih dalam terhadap skenario-skenario pertumbuhan.
Tabel 3: Dampak penurunan perekonomian global terhadap pertumbuhan ekonomi pada tahun 2013 akan cukup besar
Skenario: Hasil Skenario 1 Skenario 2 Skenario 3
Berlanjutnya gejolak
Seperti tahun 2009
Perekonomian global yang
sangat buruk 2008 2009 2010 2011 2012 2013 2012 2013 2012 2013
Pertumbuhan PDB Indonesia (persen) 6,0 4,6 6,2 6,5 6,0 6,4 5,8 4,7 5,7 3,8
Asumsi skenario: Rasio investasi/PDB (persen) 23,7 23,4 23,9 24,4 25,3 26,1 25,1 25,1 25,0 24,1 Pertumbuhan PDB mitra perdagangan utama (persen) 2,1 -1,0 7,0 3,0 3,3 3,7 2,3 0,1 1,9 -1,8
Pertumbuhan terms of trade (persen) -18,1 -4,2 5,7 10,2 2,0 9,0 0,0 -15,0 0,0 -30,0
Catatan: 2012 dan 2013 adalah proyeksi, Terms of trade disusun oleh Bank Dunia dari data perdagangan bulanan Sumber: CEIC dan proyeksi staf Bank Dunia
Para pembuat kebijakan menghadapi tantangan ganda yaitu meningkatkan kesiagaan terhadap krisis dan mendorong pertumbuhan jangka menengah
Perekonomian negara berkembang, termasuk Indonesia, menghadapi tantangan ganda yaitu meningkatkan kesiagaan menghadapi krisis untuk mengatasi tekanan jangka pendek dan juga pada saat bersamaan mempersiapkan kebijakan-kebijakan untuk mendukung pertumbuhan jangka menengah di tengah lingkungan dunia yang melemah. Kedua tantangan itu sebaiknya tidak dipandang secara terpisah. Penundaan atau kemunduran dalam reformasi jangka menengah dapat membawa dampak buruk kepada tingkat kepercayaan investor pada saat ini, sehingga meningkatkan kerentanan ekonomi terhadap perubahan sentimen dalam maupun luar negeri. Kegagalan untuk melakukan persiapan yang memadai untuk krisis jangka pendek dapat meningkatkan dampak krisis yang membawa konsekuensi jangka panjang bagi pertumbuhan dan kesejahteraan.
Indonesia telah membuat kemajuan yang baik dalam persiapan menghadapi krisis tetapi pekerjaan lanjutan masih dibutuhkan …
Indonesia telah membuat kemajuan yang berarti dalam persiapannya menghadapi krisis tetapi masih dibutuhkan pekerjaan lanjutan dan, seperti dinegara lain, tidak ada ruang bagi sikap berpuas diri dalam lingkungan pasar yang rapuh seperti sekarang ini. Undang-Undang APBN 2012 memberikan fleksibilitas bagi pemerintah untuk menyesuaikan belanja dan pembiayaan untuk merespon krisis, dengan syarat persetujuan Dewan Perwakilan Rakyat (DPR) dalam waktu 24 jam. Protokol Manajemen Krisis (CMP) telah susun untuk mendukung mekanisme pembagian informasi, pemantauan, dan mekanisme tanggapan krisis. Akan tetapi masih terdapat kesenjangan dalam kerangka hukum yang harus ditangani, seperti dasar hukum untuk pengambilan keputusan dan penyelesaian bank atau lembaga keuangan yang mengalami kegagalan. Dalam jangka panjang, pemerintah perlu menerapkan pengaturan yang permanen terhadap monitoring yang sistematis dan penilaian dampak, kesiagaan krisis, dan pengelolaan krisis (pada saat Otoritas Jasa Keuangan yang baru (OJK) telah berjalan).
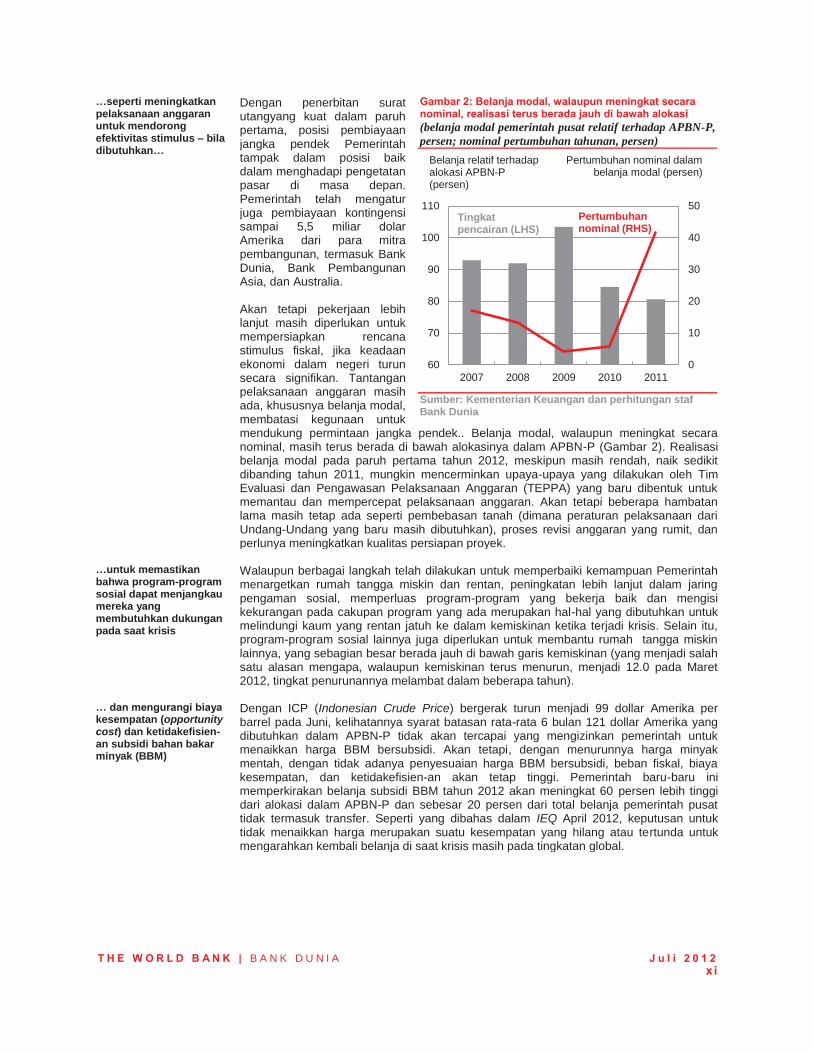
T H E W O R L D B A N K | B A N K D U N I A J u l i 2 0 1 2
x i
…seperti meningkatkan pelaksanaan anggaran untuk mendorong efektivitas stimulus – bila dibutuhkan…
Dengan penerbitan surat utangyang kuat dalam paruh pertama, posisi pembiayaan jangka pendek Pemerintah tampak dalam posisi baik dalam menghadapi pengetatan pasar di masa depan. Pemerintah telah mengatur juga pembiayaan kontingensi sampai 5,5 miliar dolar Amerika dari para mitra pembangunan, termasuk Bank Dunia, Bank Pembangunan Asia, dan Australia. Akan tetapi pekerjaan lebih lanjut masih diperlukan untuk mempersiapkan rencana stimulus fiskal, jika keadaan ekonomi dalam negeri turun secara signifikan. Tantangan pelaksanaan anggaran masih ada, khususnya belanja modal, membatasi kegunaan untuk mendukung permintaan jangka pendek.. Belanja modal, walaupun meningkat secara nominal, masih terus berada di bawah alokasinya dalam APBN-P (Gambar 2). Realisasi belanja modal pada paruh pertama tahun 2012, meskipun masih rendah, naik sedikit dibanding tahun 2011, mungkin mencerminkan upaya-upaya yang dilakukan oleh Tim Evaluasi dan Pengawasan Pelaksanaan Anggaran (TEPPA) yang baru dibentuk untuk memantau dan mempercepat pelaksanaan anggaran. Akan tetapi beberapa hambatan lama masih tetap ada seperti pembebasan tanah (dimana peraturan pelaksanaan dari Undang-Undang yang baru masih dibutuhkan), proses revisi anggaran yang rumit, dan perlunya meningkatkan kualitas persiapan proyek.
Gambar 2: Belanja modal, walaupun meningkat secara nominal, realisasi terus berada jauh di bawah alokasi (belanja modal pemerintah pusat relatif terhadap APBN-P, persen; nominal pertumbuhan tahunan, persen)
Sumber: Kementerian Keuangan dan perhitungan staf Bank Dunia
…untuk memastikan bahwa program-program sosial dapat menjangkau mereka yang membutuhkan dukungan pada saat krisis
Walaupun berbagai langkah telah dilakukan untuk memperbaiki kemampuan Pemerintah menargetkan rumah tangga miskin dan rentan, peningkatan lebih lanjut dalam jaring pengaman sosial, memperluas program-program yang bekerja baik dan mengisi kekurangan pada cakupan program yang ada merupakan hal-hal yang dibutuhkan untuk melindungi kaum yang rentan jatuh ke dalam kemiskinan ketika terjadi krisis. Selain itu, program-program sosial lainnya juga diperlukan untuk membantu rumah tangga miskin lainnya, yang sebagian besar berada jauh di bawah garis kemiskinan (yang menjadi salah satu alasan mengapa, walaupun kemiskinan terus menurun, menjadi 12.0 pada Maret 2012, tingkat penurunannya melambat dalam beberapa tahun).
… dan mengurangi biaya kesempatan (opportunity cost) dan ketidakefisien-an subsidi bahan bakar minyak (BBM)
Dengan ICP (Indonesian Crude Price) bergerak turun menjadi 99 dollar Amerika per barrel pada Juni, kelihatannya syarat batasan rata-rata 6 bulan 121 dollar Amerika yang dibutuhkan dalam APBN-P tidak akan tercapai yang mengizinkan pemerintah untuk menaikkan harga BBM bersubsidi. Akan tetapi, dengan menurunnya harga minyak mentah, dengan tidak adanya penyesuaian harga BBM bersubsidi, beban fiskal, biaya kesempatan, dan ketidakefisien-an akan tetap tinggi. Pemerintah baru-baru ini memperkirakan belanja subsidi BBM tahun 2012 akan meningkat 60 persen lebih tinggi dari alokasi dalam APBN-P dan sebesar 20 persen dari total belanja pemerintah pusat tidak termasuk transfer. Seperti yang dibahas dalam IEQ April 2012, keputusan untuk tidak menaikkan harga merupakan suatu kesempatan yang hilang atau tertunda untuk mengarahkan kembali belanja di saat krisis masih pada tingkatan global.
0
10
20
30
40
50
60
70
80
90
100
110
2007 2008 2009 2010 2011
Tingkat pencairan (LHS)
Pertumbuhan nominal (RHS)
Belanja relatif terhadap alokasi APBN-P (persen)
Pertumbuhan nominal dalam belanja modal (persen)
T H E W O R L D B A N K | B A N K D U N I A J u l i 2 0 1 2
x i i
Juga diperlukan fokus perhatian pada kebijakan dan investasi yang dapat mendorong pertumbuhan jangka menengah melalui peningkatan produktivitas dan mengatasi hambatan utama infrastruktur
Indonesia, dan negara-negara ekonomi berkembang lainnya, harus mempersiapkan diri untuk menghadapi kemungkinan terjadinya gejolak ekonomi dunia dengan jangka waktu yang panjang dan lemahnya permintaan dengan menekankan kembali strategi pembangunan jangka menengah. Hal ini termasuk reformasi yang meningkatkan produktivitas dan meningkatkan investasi, dari investor dalam dan luar negeri, sebagai syarat dasar untuk mendorong pertumbuhan di Indonesia hingga 7 persen atau lebih dan untuk menciptakan lapangan pekerjaan yang berkualitas bagi sekitar dua juta orang yang masuk ke angkatan kerja setiap tahun. Koordinasi, kejelasan dan konsistensi kebijakan peraturan sangatlah penting untuk mendukung investasi ini, bersamaan dengan penanganan lemahnya infrastruktur Indonesia. Sebagai gambaran atas tantangan infrastruktur yang dihadapi, sementara jumlah kendaraan telah meningkat tiga kali lipat dari tahun 2001 hingga 2010, jaringan jalan nasional, yang melayani hingga sepertiga dari lalu-lintas kendaraan (dalam kendaraan per km), hanya meningkat seperempatnya. Sementara pemerintah telah menetapkan target yang ambisius untuk pendanaan Kemitraan Pemerintah Swasta (KPS) bagi proyek-proyek infrastruktur, sebagian besar investasi infrastruktur masih harus didanai oleh sektor publik dengan lambatnya kemajuan KPS selama ini.
Akses yang lebih besar ke pasar dalam dan luar negeri berpotensi memainkan peranan penting dalam meningkatkan kinerja ekonomi domestik …
Memfasilitasi perdagangan dalam dan luar negeri juga memiliki peran yang penting bagi Indonesia untuk mendukung kekuatan pasar domestiknya dan memanfaatkan semakin pentingnya wilayah Asia Timur di dalam permintaan dunia. Jika disertai dengan investasi pendukung dalam keahlian dan infrastruktur, sebagai contoh, maka akses kepada jaringan perdagangan dan investasi internasional juga dapat membantu mendorong peningkatan produktivitas dan daya saing perusahaan-perusahaan dalam negeri, seperti yang terlihat dari kinerja yang lebih baik dari perusahaan-perusahaan manufaktur yang memiliki keterpaduan internasional yang lebih besar. Sebagai contoh, pada industri dan propinsi yang sama, perusahaan manufaktur yang merupakan eksportir atau menggunakan bahan impor secara rata-rata mencatatkan tingkat produktivitas 19 persen lebih tinggi dari pabrik-pabrik yang tidak terpadu secara internasional – sementara pabrik yang dimiliki oleh asing memiliki tingkat produktivitas 38 persen lebih tinggi dari perusahaan yang setara di dalam negeri.
…tetapi pengumuman kebijakan baru-baru ini telah menimbulkan sejumlah kekhawatiran tentang arah pengambilan kebijakan dan sulitnya komunikasi dan koordinasi kebijakan
Pengumuman kebijakan baru-baru ini telah menimbulkan sejumlah pertanyaan tentang arah pengambilan kebijakan dalam perdagangan dan investasi. Kebijakan-kebijakan tersebut termasuk, sebagai contoh, pembatasan impor produk hortikultura, peraturan divestasi yang baru, dan persyaratan pemrosesan pada sektor pertambangan. Walaupun tujuan dari kebijakan-kebijakan tersebut dapat berasal dari upaya untuk mendorong produktivitas, menciptakan lapangan pekerjaan dan pertumbuhan domestik, penyajiannya, yang seringkali berubah, memperlihatkan adanya kesulitan koordinasi dan komunikasi. Dan juga ketidakpastian efektivitas dalam pencapiaan tujuan-tujuan tersebut dan resiko konsekuensi negatif jangka panjang, terdapat kekhawatiran bahwa perluasan kebijakan seperti itu dapat melemahkan tingkat kepercayaan investor terhadap prospek ekonomi domestik, pada saat hal itu sangat dibutuhkan.
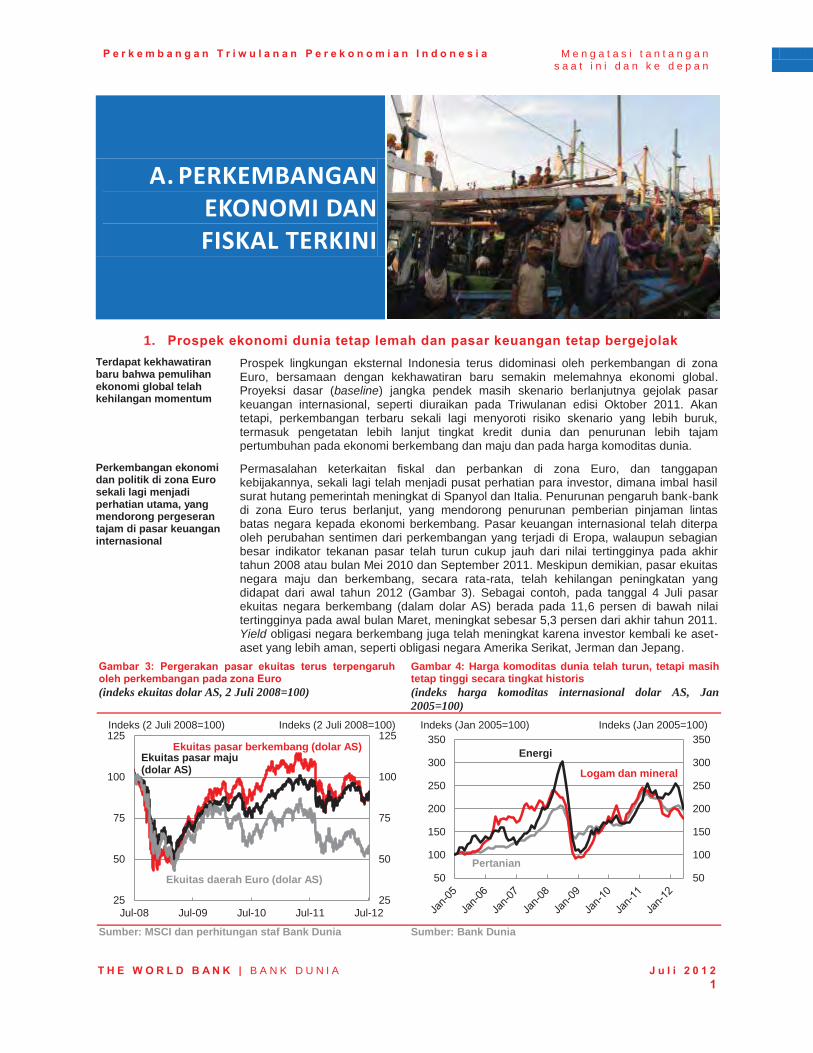
P e r k e m b a n g a n T r i w u l a n a n P e r e k o n o m i a n I n d o n e s i a M e n g a t a s i t a n t a n g a n s a a t i n i d a n k e d e p a n
T H E W O R L D B A N K | B A N K D U N I A J u l i 2 0 1 2 1
A. PERKEMBANGAN EKONOMI DAN FISKAL TERKINI
1. Prospek ekonomi dunia tetap lemah dan pasar keuangan tetap bergejolak Terdapat kekhawatiran baru bahwa pemulihan ekonomi global telah kehilangan momentum
Prospek lingkungan eksternal Indonesia terus didominasi oleh perkembangan di zona Euro, bersamaan dengan kekhawatiran baru semakin melemahnya ekonomi global. Proyeksi dasar (baseline) jangka pendek masih skenario berlanjutnya gejolak pasar keuangan internasional, seperti diuraikan pada Triwulanan edisi Oktober 2011. Akan tetapi, perkembangan terbaru sekali lagi menyoroti risiko skenario yang lebih buruk, termasuk pengetatan lebih lanjut tingkat kredit dunia dan penurunan lebih tajam pertumbuhan pada ekonomi berkembang dan maju dan pada harga komoditas dunia.
Perkembangan ekonomi dan politik di zona Euro sekali lagi menjadi perhatian utama, yang mendorong pergeseran tajam di pasar keuangan internasional
Permasalahan keterkaitan fiskal dan perbankan di zona Euro, dan tanggapan kebijakannya, sekali lagi telah menjadi pusat perhatian para investor, dimana imbal hasil surat hutang pemerintah meningkat di Spanyol dan Italia. Penurunan pengaruh bank-bank di zona Euro terus berlanjut, yang mendorong penurunan pemberian pinjaman lintas batas negara kepada ekonomi berkembang. Pasar keuangan internasional telah diterpa oleh perubahan sentimen dari perkembangan yang terjadi di Eropa, walaupun sebagian besar indikator tekanan pasar telah turun cukup jauh dari nilai tertingginya pada akhir tahun 2008 atau bulan Mei 2010 dan September 2011. Meskipun demikian, pasar ekuitas negara maju dan berkembang, secara rata-rata, telah kehilangan peningkatan yang didapat dari awal tahun 2012 (Gambar 3). Sebagai contoh, pada tanggal 4 Juli pasar ekuitas negara berkembang (dalam dolar AS) berada pada 11,6 persen di bawah nilai tertingginya pada awal bulan Maret, meningkat sebesar 5,3 persen dari akhir tahun 2011. Yield obligasi negara berkembang juga telah meningkat karena investor kembali ke aset-aset yang lebih aman, seperti obligasi negara Amerika Serikat, Jerman dan Jepang.
Gambar 3: Pergerakan pasar ekuitas terus terpengaruh oleh perkembangan pada zona Euro (indeks ekuitas dolar AS, 2 Juli 2008=100)
Gambar 4: Harga komoditas dunia telah turun, tetapi masih tetap tinggi secara tingkat historis (indeks harga komoditas internasional dolar AS, Jan 2005=100)
Sumber: MSCI dan perhitungan staf Bank Dunia Sumber: Bank Dunia
25
50
75
100
125
25
50
75
100
125
Jul-08 Jul-09 Jul-10 Jul-11 Jul-12
Ekuitas pasar berkembang (dolar AS)
Ekuitas daerah Euro (dolar AS)
Ekuitas pasar maju (dolar AS)
Indeks (2 Juli 2008=100) Indeks (2 Juli 2008=100)
50
100
150
200
250
300
350
50
100
150
200
250
300
350
Logam dan mineral
Pertanian
Energi
Indeks (Jan 2005=100) Indeks (Jan 2005=100)
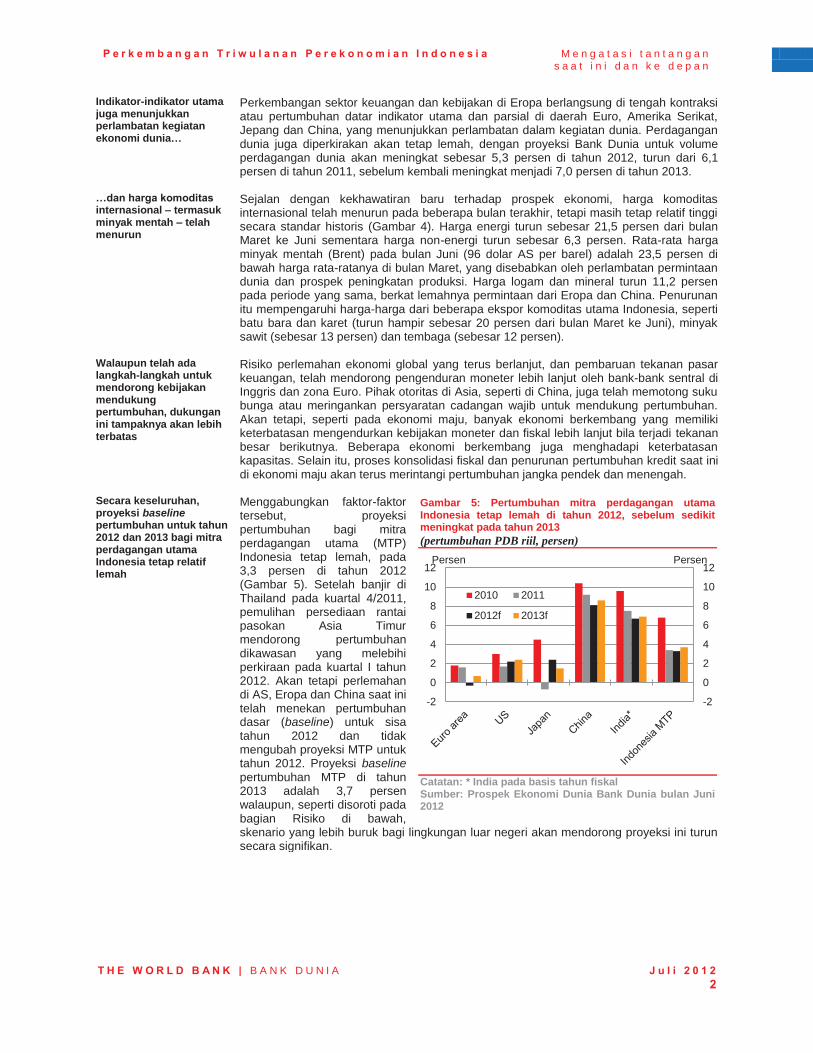
P e r k e m b a n g a n T r i w u l a n a n P e r e k o n o m i a n I n d o n e s i a M e n g a t a s i t a n t a n g a n s a a t i n i d a n k e d e p a n
T H E W O R L D B A N K | B A N K D U N I A J u l i 2 0 1 2 2
Indikator-indikator utama juga menunjukkan perlambatan kegiatan ekonomi dunia…
Perkembangan sektor keuangan dan kebijakan di Eropa berlangsung di tengah kontraksi atau pertumbuhan datar indikator utama dan parsial di daerah Euro, Amerika Serikat, Jepang dan China, yang menunjukkan perlambatan dalam kegiatan dunia. Perdagangan dunia juga diperkirakan akan tetap lemah, dengan proyeksi Bank Dunia untuk volume perdagangan dunia akan meningkat sebesar 5,3 persen di tahun 2012, turun dari 6,1 persen di tahun 2011, sebelum kembali meningkat menjadi 7,0 persen di tahun 2013.
…dan harga komoditas internasional – termasuk minyak mentah – telah menurun
Sejalan dengan kekhawatiran baru terhadap prospek ekonomi, harga komoditas internasional telah menurun pada beberapa bulan terakhir, tetapi masih tetap relatif tinggi secara standar historis (Gambar 4). Harga energi turun sebesar 21,5 persen dari bulan Maret ke Juni sementara harga non-energi turun sebesar 6,3 persen. Rata-rata harga minyak mentah (Brent) pada bulan Juni (96 dolar AS per barel) adalah 23,5 persen di bawah harga rata-ratanya di bulan Maret, yang disebabkan oleh perlambatan permintaan dunia dan prospek peningkatan produksi. Harga logam dan mineral turun 11,2 persen pada periode yang sama, berkat lemahnya permintaan dari Eropa dan China. Penurunan itu mempengaruhi harga-harga dari beberapa ekspor komoditas utama Indonesia, seperti batu bara dan karet (turun hampir sebesar 20 persen dari bulan Maret ke Juni), minyak sawit (sebesar 13 persen) dan tembaga (sebesar 12 persen).
Walaupun telah ada langkah-langkah untuk mendorong kebijakan mendukung pertumbuhan, dukungan ini tampaknya akan lebih terbatas
Risiko perlemahan ekonomi global yang terus berlanjut, dan pembaruan tekanan pasar keuangan, telah mendorong pengenduran moneter lebih lanjut oleh bank-bank sentral di Inggris dan zona Euro. Pihak otoritas di Asia, seperti di China, juga telah memotong suku bunga atau meringankan persyaratan cadangan wajib untuk mendukung pertumbuhan. Akan tetapi, seperti pada ekonomi maju, banyak ekonomi berkembang yang memiliki keterbatasan mengendurkan kebijakan moneter dan fiskal lebih lanjut bila terjadi tekanan besar berikutnya. Beberapa ekonomi berkembang juga menghadapi keterbatasan kapasitas. Selain itu, proses konsolidasi fiskal dan penurunan pertumbuhan kredit saat ini di ekonomi maju akan terus merintangi pertumbuhan jangka pendek dan menengah.
Secara keseluruhan, proyeksi baseline pertumbuhan untuk tahun 2012 dan 2013 bagi mitra perdagangan utama Indonesia tetap relatif lemah
Menggabungkan faktor-faktor tersebut, proyeksi pertumbuhan bagi mitra perdagangan utama (MTP) Indonesia tetap lemah, pada 3,3 persen di tahun 2012 (Gambar 5). Setelah banjir di Thailand pada kuartal 4/2011, pemulihan persediaan rantai pasokan Asia Timur mendorong pertumbuhan dikawasan yang melebihi perkiraan pada kuartal I tahun 2012. Akan tetapi perlemahan di AS, Eropa dan China saat ini telah menekan pertumbuhan dasar (baseline) untuk sisa tahun 2012 dan tidak mengubah proyeksi MTP untuk tahun 2012. Proyeksi baseline pertumbuhan MTP di tahun 2013 adalah 3,7 persen walaupun, seperti disoroti pada bagian Risiko di bawah, skenario yang lebih buruk bagi lingkungan luar negeri akan mendorong proyeksi ini turun secara signifikan.
Gambar 5: Pertumbuhan mitra perdagangan utama Indonesia tetap lemah di tahun 2012, sebelum sedikit meningkat pada tahun 2013 (pertumbuhan PDB riil, persen)
Catatan: * India pada basis tahun fiskal Sumber: Prospek Ekonomi Dunia Bank Dunia bulan Juni 2012
-2
0
2
4
6
8
10
12
-2
0
2
4
6
8
10
12
2010 2011
2012f 2013f
Persen Persen
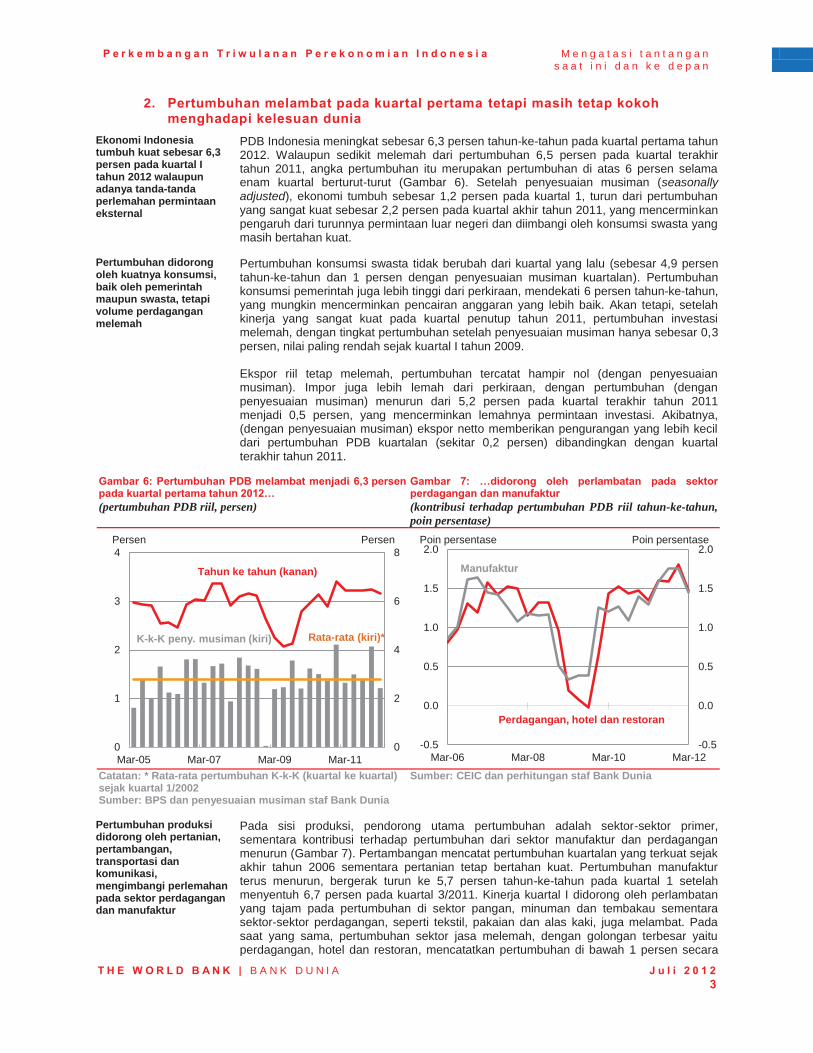
P e r k e m b a n g a n T r i w u l a n a n P e r e k o n o m i a n I n d o n e s i a M e n g a t a s i t a n t a n g a n s a a t i n i d a n k e d e p a n
T H E W O R L D B A N K | B A N K D U N I A J u l i 2 0 1 2 3
2. Pertumbuhan melambat pada kuartal pertama tetapi masih tetap kokoh menghadapi kelesuan dunia
Ekonomi Indonesia tumbuh kuat sebesar 6,3 persen pada kuartal I tahun 2012 walaupun adanya tanda-tanda perlemahan permintaan eksternal
PDB Indonesia meningkat sebesar 6,3 persen tahun-ke-tahun pada kuartal pertama tahun 2012. Walaupun sedikit melemah dari pertumbuhan 6,5 persen pada kuartal terakhir tahun 2011, angka pertumbuhan itu merupakan pertumbuhan di atas 6 persen selama enam kuartal berturut-turut (Gambar 6). Setelah penyesuaian musiman (seasonally adjusted), ekonomi tumbuh sebesar 1,2 persen pada kuartal 1, turun dari pertumbuhan yang sangat kuat sebesar 2,2 persen pada kuartal akhir tahun 2011, yang mencerminkan pengaruh dari turunnya permintaan luar negeri dan diimbangi oleh konsumsi swasta yang masih bertahan kuat.
Pertumbuhan didorong oleh kuatnya konsumsi, baik oleh pemerintah maupun swasta, tetapi volume perdagangan melemah
Pertumbuhan konsumsi swasta tidak berubah dari kuartal yang lalu (sebesar 4,9 persen tahun-ke-tahun dan 1 persen dengan penyesuaian musiman kuartalan). Pertumbuhan konsumsi pemerintah juga lebih tinggi dari perkiraan, mendekati 6 persen tahun-ke-tahun, yang mungkin mencerminkan pencairan anggaran yang lebih baik. Akan tetapi, setelah kinerja yang sangat kuat pada kuartal penutup tahun 2011, pertumbuhan investasi melemah, dengan tingkat pertumbuhan setelah penyesuaian musiman hanya sebesar 0,3 persen, nilai paling rendah sejak kuartal I tahun 2009. Ekspor riil tetap melemah, pertumbuhan tercatat hampir nol (dengan penyesuaian musiman). Impor juga lebih lemah dari perkiraan, dengan pertumbuhan (dengan penyesuaian musiman) menurun dari 5,2 persen pada kuartal terakhir tahun 2011 menjadi 0,5 persen, yang mencerminkan lemahnya permintaan investasi. Akibatnya, (dengan penyesuaian musiman) ekspor netto memberikan pengurangan yang lebih kecil dari pertumbuhan PDB kuartalan (sekitar 0,2 persen) dibandingkan dengan kuartal terakhir tahun 2011.
Gambar 6: Pertumbuhan PDB melambat menjadi 6,3 persen pada kuartal pertama tahun 2012… (pertumbuhan PDB riil, persen)
Gambar 7: …didorong oleh perlambatan pada sektor perdagangan dan manufaktur (kontribusi terhadap pertumbuhan PDB riil tahun-ke-tahun, poin persentase)
Catatan: * Rata-rata pertumbuhan K-k-K (kuartal ke kuartal) sejak kuartal 1/2002 Sumber: BPS dan penyesuaian musiman staf Bank Dunia
Sumber: CEIC dan perhitungan staf Bank Dunia
Pertumbuhan produksi didorong oleh pertanian, pertambangan, transportasi dan komunikasi, mengimbangi perlemahan pada sektor perdagangan dan manufaktur
Pada sisi produksi, pendorong utama pertumbuhan adalah sektor-sektor primer, sementara kontribusi terhadap pertumbuhan dari sektor manufaktur dan perdagangan menurun (Gambar 7). Pertambangan mencatat pertumbuhan kuartalan yang terkuat sejak akhir tahun 2006 sementara pertanian tetap bertahan kuat. Pertumbuhan manufaktur terus menurun, bergerak turun ke 5,7 persen tahun-ke-tahun pada kuartal 1 setelah menyentuh 6,7 persen pada kuartal 3/2011. Kinerja kuartal I didorong oleh perlambatan yang tajam pada pertumbuhan di sektor pangan, minuman dan tembakau sementara sektor-sektor perdagangan, seperti tekstil, pakaian dan alas kaki, juga melambat. Pada saat yang sama, pertumbuhan sektor jasa melemah, dengan golongan terbesar yaitu perdagangan, hotel dan restoran, mencatatkan pertumbuhan di bawah 1 persen secara
0
2
4
6
8
0
1
2
3
4
Mar-05 Mar-07 Mar-09 Mar-11
Persen Persen
K-k-K peny. musiman (kiri)
Tahun ke tahun (kanan)
Rata-rata (kiri)*
-0.5
0.0
0.5
1.0
1.5
2.0
-0.5
0.0
0.5
1.0
1.5
2.0
Mar-06 Mar-08 Mar-10 Mar-12
Perdagangan, hotel dan restoran
Manufaktur
Poin persentase Poin persentase
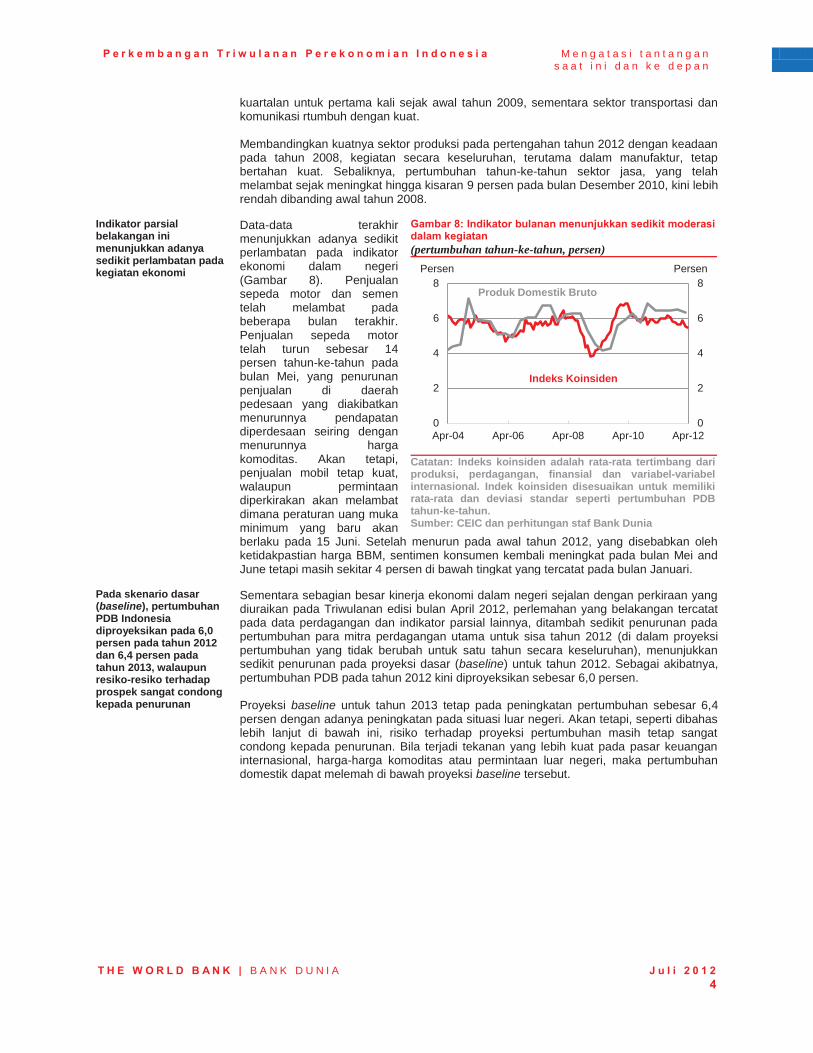
P e r k e m b a n g a n T r i w u l a n a n P e r e k o n o m i a n I n d o n e s i a M e n g a t a s i t a n t a n g a n s a a t i n i d a n k e d e p a n
T H E W O R L D B A N K | B A N K D U N I A J u l i 2 0 1 2 4
kuartalan untuk pertama kali sejak awal tahun 2009, sementara sektor transportasi dan komunikasi rtumbuh dengan kuat. Membandingkan kuatnya sektor produksi pada pertengahan tahun 2012 dengan keadaan pada tahun 2008, kegiatan secara keseluruhan, terutama dalam manufaktur, tetap bertahan kuat. Sebaliknya, pertumbuhan tahun-ke-tahun sektor jasa, yang telah melambat sejak meningkat hingga kisaran 9 persen pada bulan Desember 2010, kini lebih rendah dibanding awal tahun 2008.
Indikator parsial belakangan ini menunjukkan adanya sedikit perlambatan pada kegiatan ekonomi
Data-data terakhir menunjukkan adanya sedikit perlambatan pada indikator ekonomi dalam negeri (Gambar 8). Penjualan sepeda motor dan semen telah melambat pada beberapa bulan terakhir. Penjualan sepeda motor telah turun sebesar 14 persen tahun-ke-tahun pada bulan Mei, yang penurunan penjualan di daerah pedesaan yang diakibatkan menurunnya pendapatan diperdesaan seiring dengan menurunnya harga komoditas. Akan tetapi, penjualan mobil tetap kuat, walaupun permintaan diperkirakan akan melambat dimana peraturan uang muka minimum yang baru akan berlaku pada 15 Juni. Setelah menurun pada awal tahun 2012, yang disebabkan oleh ketidakpastian harga BBM, sentimen konsumen kembali meningkat pada bulan Mei and June tetapi masih sekitar 4 persen di bawah tingkat yang tercatat pada bulan Januari.
Gambar 8: Indikator bulanan menunjukkan sedikit moderasi dalam kegiatan (pertumbuhan tahun-ke-tahun, persen)
Catatan: Indeks koinsiden adalah rata-rata tertimbang dari produksi, perdagangan, finansial dan variabel-variabel internasional. Indek koinsiden disesuaikan untuk memiliki rata-rata dan deviasi standar seperti pertumbuhan PDB tahun-ke-tahun. Sumber: CEIC dan perhitungan staf Bank Dunia
Pada skenario dasar (baseline), pertumbuhan PDB Indonesia diproyeksikan pada 6,0 persen pada tahun 2012 dan 6,4 persen pada tahun 2013, walaupun resiko-resiko terhadap prospek sangat condong kepada penurunan
Sementara sebagian besar kinerja ekonomi dalam negeri sejalan dengan perkiraan yang diuraikan pada Triwulanan edisi bulan April 2012, perlemahan yang belakangan tercatat pada data perdagangan dan indikator parsial lainnya, ditambah sedikit penurunan pada pertumbuhan para mitra perdagangan utama untuk sisa tahun 2012 (di dalam proyeksi pertumbuhan yang tidak berubah untuk satu tahun secara keseluruhan), menunjukkan sedikit penurunan pada proyeksi dasar (baseline) untuk tahun 2012. Sebagai akibatnya, pertumbuhan PDB pada tahun 2012 kini diproyeksikan sebesar 6,0 persen. Proyeksi baseline untuk tahun 2013 tetap pada peningkatan pertumbuhan sebesar 6,4 persen dengan adanya peningkatan pada situasi luar negeri. Akan tetapi, seperti dibahas lebih lanjut di bawah ini, risiko terhadap proyeksi pertumbuhan masih tetap sangat condong kepada penurunan. Bila terjadi tekanan yang lebih kuat pada pasar keuangan internasional, harga-harga komoditas atau permintaan luar negeri, maka pertumbuhan domestik dapat melemah di bawah proyeksi baseline tersebut.
0
2
4
6
8
0
2
4
6
8
Apr-04 Apr-06 Apr-08 Apr-10 Apr-12
Indeks Koinsiden
Produk Domestik Bruto
Persen Persen
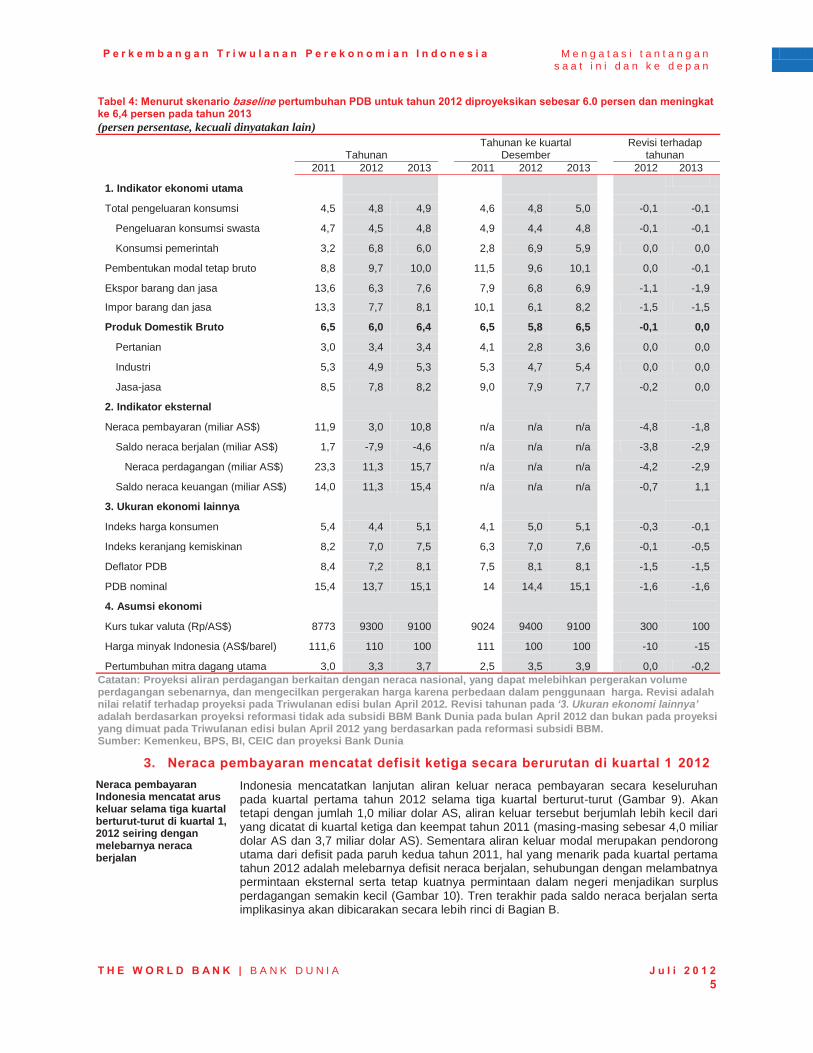
P e r k e m b a n g a n T r i w u l a n a n P e r e k o n o m i a n I n d o n e s i a M e n g a t a s i t a n t a n g a n s a a t i n i d a n k e d e p a n
T H E W O R L D B A N K | B A N K D U N I A J u l i 2 0 1 2 5
Tabel 4: Menurut skenario baseline pertumbuhan PDB untuk tahun 2012 diproyeksikan sebesar 6.0 persen dan meningkat ke 6,4 persen pada tahun 2013 (persen persentase, kecuali dinyatakan lain)
Tahunan
Tahunan ke kuartal Desember
Revisi terhadap tahunan
2011 2012 2013 2011 2012 2013 2012 2013
1. Indikator ekonomi utama
Total pengeluaran konsumsi 4,5 4,8 4,9 4,6 4,8 5,0 -0,1 -0,1
Pengeluaran konsumsi swasta 4,7 4,5 4,8 4,9 4,4 4,8 -0,1 -0,1
Konsumsi pemerintah 3,2 6,8 6,0 2,8 6,9 5,9 0,0 0,0
Pembentukan modal tetap bruto 8,8 9,7 10,0 11,5 9,6 10,1 0,0 -0,1
Ekspor barang dan jasa 13,6 6,3 7,6 7,9 6,8 6,9 -1,1 -1,9
Impor barang dan jasa 13,3 7,7 8,1 10,1 6,1 8,2 -1,5 -1,5
Produk Domestik Bruto 6,5 6,0 6,4 6,5 5,8 6,5 -0,1 0,0
Pertanian 3,0 3,4 3,4 4,1 2,8 3,6 0,0 0,0
Industri 5,3 4,9 5,3 5,3 4,7 5,4 0,0 0,0
Jasa-jasa 8,5 7,8 8,2 9,0 7,9 7,7 -0,2 0,0
2. Indikator eksternal
Neraca pembayaran (miliar AS$) 11,9 3,0 10,8 n/a n/a n/a -4,8 -1,8
Saldo neraca berjalan (miliar AS$) 1,7 -7,9 -4,6 n/a n/a n/a -3,8 -2,9
Neraca perdagangan (miliar AS$) 23,3 11,3 15,7 n/a n/a n/a -4,2 -2,9
Saldo neraca keuangan (miliar AS$) 14,0 11,3 15,4 n/a n/a n/a -0,7 1,1
3. Ukuran ekonomi lainnya
Indeks harga konsumen 5,4 4,4 5,1 4,1 5,0 5,1 -0,3 -0,1
Indeks keranjang kemiskinan 8,2 7,0 7,5 6,3 7,0 7,6 -0,1 -0,5
Deflator PDB 8,4 7,2 8,1 7,5 8,1 8,1 -1,5 -1,5
PDB nominal 15,4 13,7 15,1 14 14,4 15,1 -1,6 -1,6
4. Asumsi ekonomi
Kurs tukar valuta (Rp/AS$) 8773 9300 9100 9024 9400 9100 300 100
Harga minyak Indonesia (AS$/barel) 111,6 110 100 111 100 100 -10 -15
Pertumbuhan mitra dagang utama 3,0 3,3 3,7 2,5 3,5 3,9 0,0 -0,2
Catatan: Proyeksi aliran perdagangan berkaitan dengan neraca nasional, yang dapat melebihkan pergerakan volume perdagangan sebenarnya, dan mengecilkan pergerakan harga karena perbedaan dalam penggunaan harga. Revisi adalah nilai relatif terhadap proyeksi pada Triwulanan edisi bulan April 2012. Revisi tahunan pada ‘3. Ukuran ekonomi lainnya’ adalah berdasarkan proyeksi reformasi tidak ada subsidi BBM Bank Dunia pada bulan April 2012 dan bukan pada proyeksi yang dimuat pada Triwulanan edisi bulan April 2012 yang berdasarkan pada reformasi subsidi BBM. Sumber: Kemenkeu, BPS, BI, CEIC dan proyeksi Bank Dunia
3. Neraca pembayaran mencatat defisit ketiga secara berurutan di kuartal 1 2012 Neraca pembayaran Indonesia mencatat arus keluar selama tiga kuartal berturut-turut di kuartal 1, 2012 seiring dengan melebarnya neraca berjalan
Indonesia mencatatkan lanjutan aliran keluar neraca pembayaran secara keseluruhan pada kuartal pertama tahun 2012 selama tiga kuartal berturut-turut (Gambar 9). Akan tetapi dengan jumlah 1,0 miliar dolar AS, aliran keluar tersebut berjumlah lebih kecil dari yang dicatat di kuartal ketiga dan keempat tahun 2011 (masing-masing sebesar 4,0 miliar dolar AS dan 3,7 miliar dolar AS). Sementara aliran keluar modal merupakan pendorong utama dari defisit pada paruh kedua tahun 2011, hal yang menarik pada kuartal pertama tahun 2012 adalah melebarnya defisit neraca berjalan, sehubungan dengan melambatnya permintaan eksternal serta tetap kuatnya permintaan dalam negeri menjadikan surplus perdagangan semakin kecil (Gambar 10). Tren terakhir pada saldo neraca berjalan serta implikasinya akan dibicarakan secara lebih rinci di Bagian B.
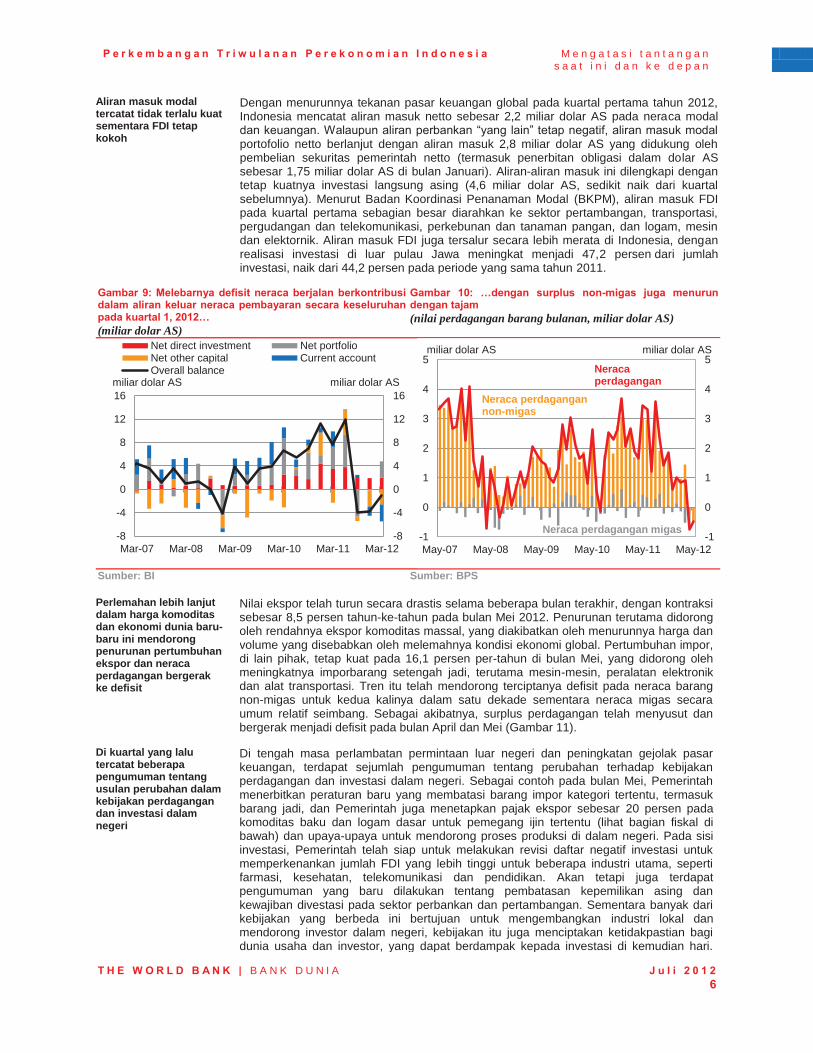
P e r k e m b a n g a n T r i w u l a n a n P e r e k o n o m i a n I n d o n e s i a M e n g a t a s i t a n t a n g a n s a a t i n i d a n k e d e p a n
T H E W O R L D B A N K | B A N K D U N I A J u l i 2 0 1 2 6
Aliran masuk modal tercatat tidak terlalu kuat sementara FDI tetap kokoh
Dengan menurunnya tekanan pasar keuangan global pada kuartal pertama tahun 2012, Indonesia mencatat aliran masuk netto sebesar 2,2 miliar dolar AS pada neraca modal dan keuangan. Walaupun aliran perbankan “yang lain” tetap negatif, aliran masuk modal portofolio netto berlanjut dengan aliran masuk 2,8 miliar dolar AS yang didukung oleh pembelian sekuritas pemerintah netto (termasuk penerbitan obligasi dalam dolar AS sebesar 1,75 miliar dolar AS di bulan Januari). Aliran-aliran masuk ini dilengkapi dengan tetap kuatnya investasi langsung asing (4,6 miliar dolar AS, sedikit naik dari kuartal sebelumnya). Menurut Badan Koordinasi Penanaman Modal (BKPM), aliran masuk FDI pada kuartal pertama sebagian besar diarahkan ke sektor pertambangan, transportasi, pergudangan dan telekomunikasi, perkebunan dan tanaman pangan, dan logam, mesin dan elektornik. Aliran masuk FDI juga tersalur secara lebih merata di Indonesia, dengan realisasi investasi di luar pulau Jawa meningkat menjadi 47,2 persen dari jumlah investasi, naik dari 44,2 persen pada periode yang sama tahun 2011.
Gambar 9: Melebarnya defisit neraca berjalan berkontribusi dalam aliran keluar neraca pembayaran secara keseluruhan pada kuartal 1, 2012… (miliar dolar AS)
Gambar 10: …dengan surplus non-migas juga menurun dengan tajam (nilai perdagangan barang bulanan, miliar dolar AS)
Sumber: BI Sumber: BPS
Perlemahan lebih lanjut dalam harga komoditas dan ekonomi dunia baru-baru ini mendorong penurunan pertumbuhan ekspor dan neraca perdagangan bergerak ke defisit
Nilai ekspor telah turun secara drastis selama beberapa bulan terakhir, dengan kontraksi sebesar 8,5 persen tahun-ke-tahun pada bulan Mei 2012. Penurunan terutama didorong oleh rendahnya ekspor komoditas massal, yang diakibatkan oleh menurunnya harga dan volume yang disebabkan oleh melemahnya kondisi ekonomi global. Pertumbuhan impor, di lain pihak, tetap kuat pada 16,1 persen per-tahun di bulan Mei, yang didorong oleh meningkatnya imporbarang setengah jadi, terutama mesin-mesin, peralatan elektronik dan alat transportasi. Tren itu telah mendorong terciptanya defisit pada neraca barang non-migas untuk kedua kalinya dalam satu dekade sementara neraca migas secara umum relatif seimbang. Sebagai akibatnya, surplus perdagangan telah menyusut dan bergerak menjadi defisit pada bulan April dan Mei (Gambar 11).
Di kuartal yang lalu tercatat beberapa pengumuman tentang usulan perubahan dalam kebijakan perdagangan dan investasi dalam negeri
Di tengah masa perlambatan permintaan luar negeri dan peningkatan gejolak pasar keuangan, terdapat sejumlah pengumuman tentang perubahan terhadap kebijakan perdagangan dan investasi dalam negeri. Sebagai contoh pada bulan Mei, Pemerintah menerbitkan peraturan baru yang membatasi barang impor kategori tertentu, termasuk barang jadi, dan Pemerintah juga menetapkan pajak ekspor sebesar 20 persen pada komoditas baku dan logam dasar untuk pemegang ijin tertentu (lihat bagian fiskal di bawah) dan upaya-upaya untuk mendorong proses produksi di dalam negeri. Pada sisi investasi, Pemerintah telah siap untuk melakukan revisi daftar negatif investasi untuk memperkenankan jumlah FDI yang lebih tinggi untuk beberapa industri utama, seperti farmasi, kesehatan, telekomunikasi dan pendidikan. Akan tetapi juga terdapat pengumuman yang baru dilakukan tentang pembatasan kepemilikan asing dan kewajiban divestasi pada sektor perbankan dan pertambangan. Sementara banyak dari kebijakan yang berbeda ini bertujuan untuk mengembangkan industri lokal dan mendorong investor dalam negeri, kebijakan itu juga menciptakan ketidakpastian bagi dunia usaha dan investor, yang dapat berdampak kepada investasi di kemudian hari.
-8
-4
0
4
8
12
16
-8
-4
0
4
8
12
16
Mar-07 Mar-08 Mar-09 Mar-10 Mar-11 Mar-12
Net direct investment Net portfolioNet other capital Current accountOverall balance
miliar dolar AS miliar dolar AS
-1
0
1
2
3
4
5
-1
0
1
2
3
4
5
May-07 May-08 May-09 May-10 May-11 May-12
Neraca perdagangan
Neraca perdagangan non-migas
miliar dolar AS
Neraca perdagangan migas
miliar dolar AS
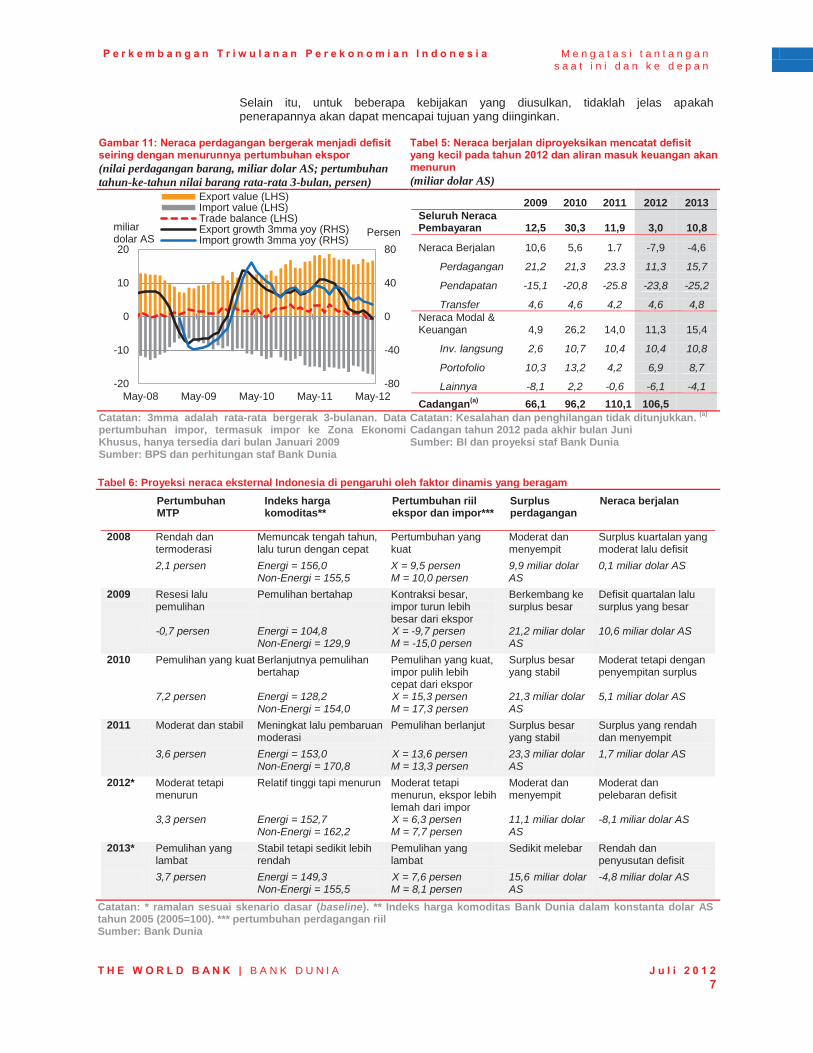
P e r k e m b a n g a n T r i w u l a n a n P e r e k o n o m i a n I n d o n e s i a M e n g a t a s i t a n t a n g a n s a a t i n i d a n k e d e p a n
T H E W O R L D B A N K | B A N K D U N I A J u l i 2 0 1 2 7
Selain itu, untuk beberapa kebijakan yang diusulkan, tidaklah jelas apakah penerapannya akan dapat mencapai tujuan yang diinginkan.
Gambar 11: Neraca perdagangan bergerak menjadi defisit seiring dengan menurunnya pertumbuhan ekspor (nilai perdagangan barang, miliar dolar AS; pertumbuhan tahun-ke-tahun nilai barang rata-rata 3-bulan, persen)
Tabel 5: Neraca berjalan diproyeksikan mencatat defisit yang kecil pada tahun 2012 dan aliran masuk keuangan akan menurun (miliar dolar AS)
2009 2010 2011 2012 2013 Seluruh Neraca Pembayaran 12,5 30,3 11,9 3,0 10,8
Neraca Berjalan 10,6 5,6 1.7 -7,9 -4,6
Perdagangan 21,2 21,3 23.3 11,3 15,7
Pendapatan -15,1 -20,8 -25.8 -23,8 -25,2
Transfer 4,6 4,6 4,2 4,6 4,8 Neraca Modal & Keuangan 4,9 26,2 14,0 11,3 15,4
Inv. langsung 2,6 10,7 10,4 10,4 10,8
Portofolio 10,3 13,2 4,2 6,9 8,7
Lainnya -8,1 2,2 -0,6 -6,1 -4,1 Cadangan(a) 66,1 96,2 110,1 106,5
Catatan: 3mma adalah rata-rata bergerak 3-bulanan. Data pertumbuhan impor, termasuk impor ke Zona Ekonomi Khusus, hanya tersedia dari bulan Januari 2009 Sumber: BPS dan perhitungan staf Bank Dunia
Catatan: Kesalahan dan penghilangan tidak ditunjukkan. (a)
Cadangan tahun 2012 pada akhir bulan Juni Sumber: BI dan proyeksi staf Bank Dunia
Tabel 6: Proyeksi neraca eksternal Indonesia di pengaruhi oleh faktor dinamis yang beragam
Pertumbuhan MTP
Indeks harga komoditas**
Pertumbuhan riil ekspor dan impor***
Surplus perdagangan
Neraca berjalan
2008 Rendah dan termoderasi
Memuncak tengah tahun, lalu turun dengan cepat
Pertumbuhan yang kuat
Moderat dan menyempit
Surplus kuartalan yang moderat lalu defisit
2,1 persen Energi = 156,0 Non-Energi = 155,5
X = 9,5 persen M = 10,0 persen
9,9 miliar dolar AS
0,1 miliar dolar AS
2009 Resesi lalu pemulihan
Pemulihan bertahap Kontraksi besar, impor turun lebih besar dari ekspor
Berkembang ke surplus besar
Defisit quartalan lalu surplus yang besar
-0,7 persen Energi = 104,8 Non-Energi = 129,9
X = -9,7 persen M = -15,0 persen
21,2 miliar dolar AS
10,6 miliar dolar AS
2010 Pemulihan yang kuat Berlanjutnya pemulihan bertahap
Pemulihan yang kuat, impor pulih lebih cepat dari ekspor
Surplus besar yang stabil
Moderat tetapi dengan penyempitan surplus
7,2 persen Energi = 128,2 Non-Energi = 154,0
X = 15,3 persen M = 17,3 persen
21,3 miliar dolar AS
5,1 miliar dolar AS
2011 Moderat dan stabil Meningkat lalu pembaruan moderasi
Pemulihan berlanjut Surplus besar yang stabil
Surplus yang rendah dan menyempit
3,6 persen Energi = 153,0 Non-Energi = 170,8
X = 13,6 persen M = 13,3 persen
23,3 miliar dolar AS
1,7 miliar dolar AS
2012* Moderat tetapi menurun
Relatif tinggi tapi menurun Moderat tetapi menurun, ekspor lebih lemah dari impor
Moderat dan menyempit
Moderat dan pelebaran defisit
3,3 persen Energi = 152,7 Non-Energi = 162,2
X = 6,3 persen M = 7,7 persen
11,1 miliar dolar AS
-8,1 miliar dolar AS
2013* Pemulihan yang lambat
Stabil tetapi sedikit lebih rendah
Pemulihan yang lambat
Sedikit melebar Rendah dan penyusutan defisit
3,7 persen Energi = 149,3 Non-Energi = 155,5
X = 7,6 persen M = 8,1 persen
15,6 miliar dolar AS
-4,8 miliar dolar AS
Catatan: * ramalan sesuai skenario dasar (baseline). ** Indeks harga komoditas Bank Dunia dalam konstanta dolar AS tahun 2005 (2005=100). *** pertumbuhan perdagangan riil Sumber: Bank Dunia
-80
-40
0
40
80
-20
-10
0
10
20
May-08 May-09 May-10 May-11 May-12
Export value (LHS)Import value (LHS)Trade balance (LHS)Export growth 3mma yoy (RHS)Import growth 3mma yoy (RHS)
miliar dolar AS Persen
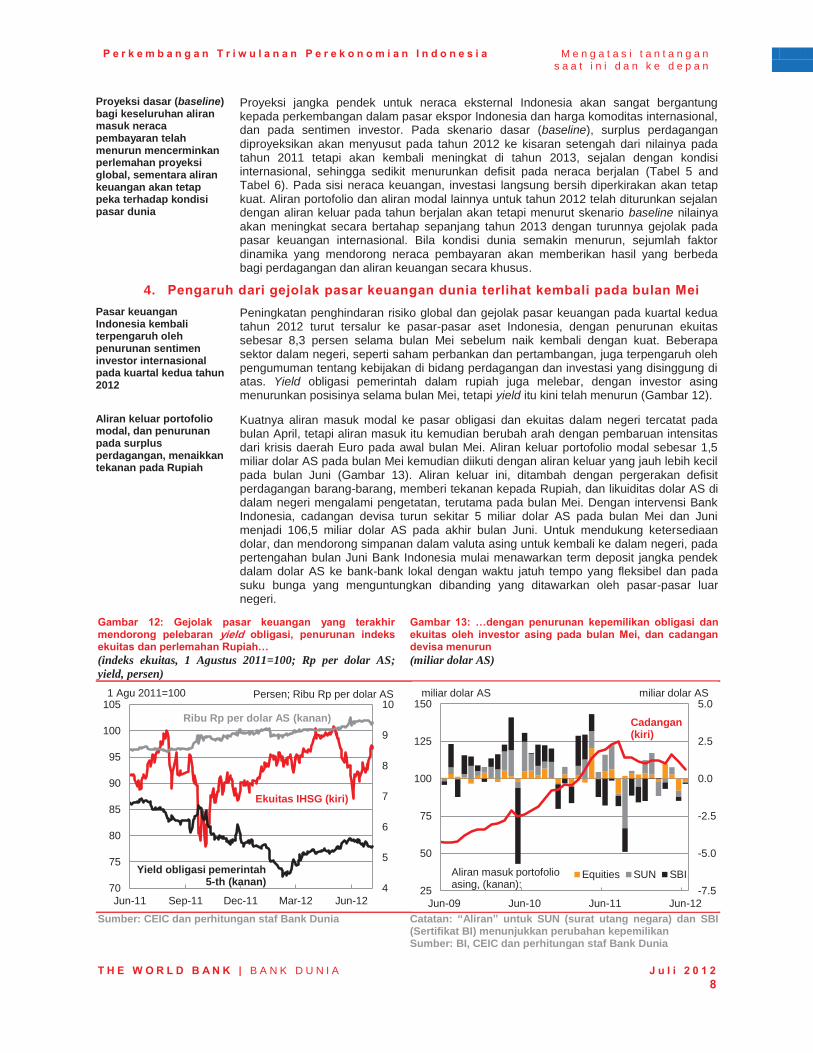
P e r k e m b a n g a n T r i w u l a n a n P e r e k o n o m i a n I n d o n e s i a M e n g a t a s i t a n t a n g a n s a a t i n i d a n k e d e p a n
T H E W O R L D B A N K | B A N K D U N I A J u l i 2 0 1 2 8
Proyeksi dasar (baseline) bagi keseluruhan aliran masuk neraca pembayaran telah menurun mencerminkan perlemahan proyeksi global, sementara aliran keuangan akan tetap peka terhadap kondisi pasar dunia
Proyeksi jangka pendek untuk neraca eksternal Indonesia akan sangat bergantung kepada perkembangan dalam pasar ekspor Indonesia dan harga komoditas internasional, dan pada sentimen investor. Pada skenario dasar (baseline), surplus perdagangan diproyeksikan akan menyusut pada tahun 2012 ke kisaran setengah dari nilainya pada tahun 2011 tetapi akan kembali meningkat di tahun 2013, sejalan dengan kondisi internasional, sehingga sedikit menurunkan defisit pada neraca berjalan (Tabel 5 and Tabel 6). Pada sisi neraca keuangan, investasi langsung bersih diperkirakan akan tetap kuat. Aliran portofolio dan aliran modal lainnya untuk tahun 2012 telah diturunkan sejalan dengan aliran keluar pada tahun berjalan akan tetapi menurut skenario baseline nilainya akan meningkat secara bertahap sepanjang tahun 2013 dengan turunnya gejolak pada pasar keuangan internasional. Bila kondisi dunia semakin menurun, sejumlah faktor dinamika yang mendorong neraca pembayaran akan memberikan hasil yang berbeda bagi perdagangan dan aliran keuangan secara khusus.
4. Pengaruh dari gejolak pasar keuangan dunia terlihat kembali pada bulan Mei Pasar keuangan Indonesia kembali terpengaruh oleh penurunan sentimen investor internasional pada kuartal kedua tahun 2012
Peningkatan penghindaran risiko global dan gejolak pasar keuangan pada kuartal kedua tahun 2012 turut tersalur ke pasar-pasar aset Indonesia, dengan penurunan ekuitas sebesar 8,3 persen selama bulan Mei sebelum naik kembali dengan kuat. Beberapa sektor dalam negeri, seperti saham perbankan dan pertambangan, juga terpengaruh oleh pengumuman tentang kebijakan di bidang perdagangan dan investasi yang disinggung di atas. Yield obligasi pemerintah dalam rupiah juga melebar, dengan investor asing menurunkan posisinya selama bulan Mei, tetapi yield itu kini telah menurun (Gambar 12).
Aliran keluar portofolio modal, dan penurunan pada surplus perdagangan, menaikkan tekanan pada Rupiah
Kuatnya aliran masuk modal ke pasar obligasi dan ekuitas dalam negeri tercatat pada bulan April, tetapi aliran masuk itu kemudian berubah arah dengan pembaruan intensitas dari krisis daerah Euro pada awal bulan Mei. Aliran keluar portofolio modal sebesar 1,5 miliar dolar AS pada bulan Mei kemudian diikuti dengan aliran keluar yang jauh lebih kecil pada bulan Juni (Gambar 13). Aliran keluar ini, ditambah dengan pergerakan defisit perdagangan barang-barang, memberi tekanan kepada Rupiah, dan likuiditas dolar AS di dalam negeri mengalami pengetatan, terutama pada bulan Mei. Dengan intervensi Bank Indonesia, cadangan devisa turun sekitar 5 miliar dolar AS pada bulan Mei dan Juni menjadi 106,5 miliar dolar AS pada akhir bulan Juni. Untuk mendukung ketersediaan dolar, dan mendorong simpanan dalam valuta asing untuk kembali ke dalam negeri, pada pertengahan bulan Juni Bank Indonesia mulai menawarkan term deposit jangka pendek dalam dolar AS ke bank-bank lokal dengan waktu jatuh tempo yang fleksibel dan pada suku bunga yang menguntungkan dibanding yang ditawarkan oleh pasar-pasar luar negeri.
Gambar 12: Gejolak pasar keuangan yang terakhir mendorong pelebaran yield obligasi, penurunan indeks ekuitas dan perlemahan Rupiah… (indeks ekuitas, 1 Agustus 2011=100; Rp per dolar AS; yield, persen)
Gambar 13: …dengan penurunan kepemilikan obligasi dan ekuitas oleh investor asing pada bulan Mei, dan cadangan devisa menurun (miliar dolar AS)
Sumber: CEIC dan perhitungan staf Bank Dunia Catatan: “Aliran” untuk SUN (surat utang negara) dan SBI
(Sertifikat BI) menunjukkan perubahan kepemilikan Sumber: BI, CEIC dan perhitungan staf Bank Dunia
4
5
6
7
8
9
10
70
75
80
85
90
95
100
105
Jun-11 Sep-11 Dec-11 Mar-12 Jun-12
Ekuitas IHSG (kiri)
Ribu Rp per dolar AS (kanan)
Yield obligasi pemerintah 5-th (kanan)
1 Agu 2011=100 Persen; Ribu Rp per dolar AS
-7.5
-5.0
-2.5
0.0
2.5
5.0
25
50
75
100
125
150
Jun-09 Jun-10 Jun-11 Jun-12
Equities SUN SBI
miliar dolar AS
Aliran masuk portofolio asing, (kanan):
Cadangan (kiri)
miliar dolar AS
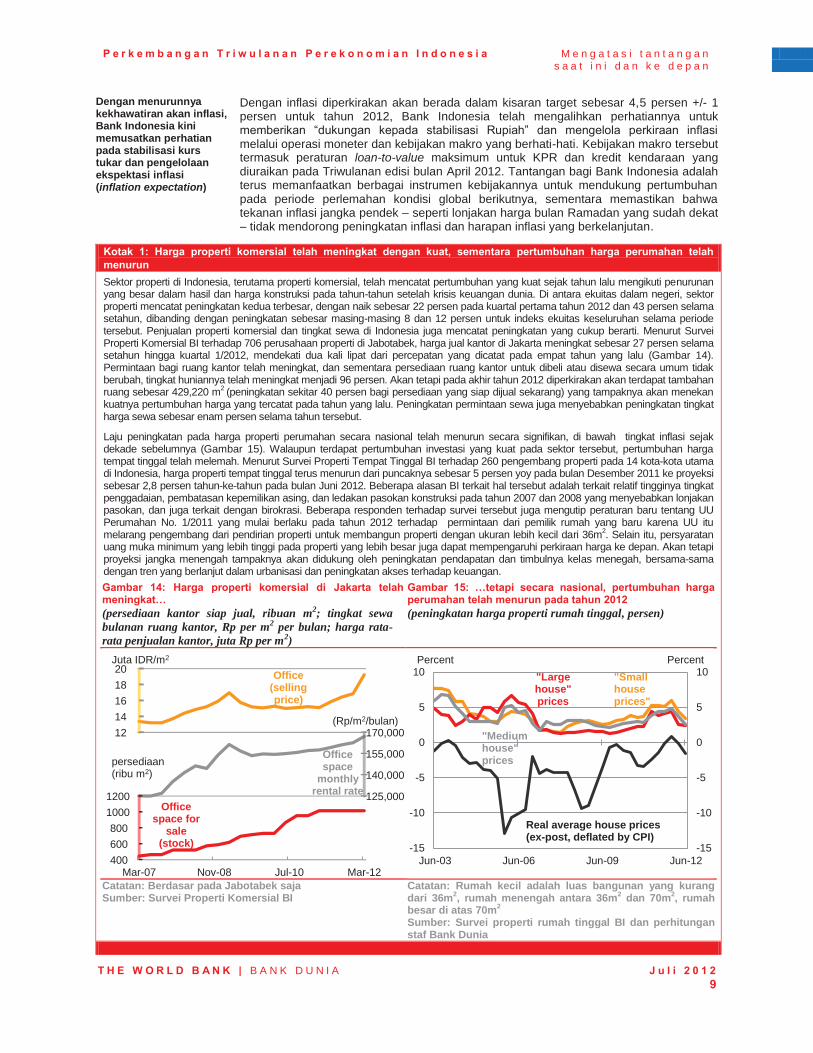
P e r k e m b a n g a n T r i w u l a n a n P e r e k o n o m i a n I n d o n e s i a M e n g a t a s i t a n t a n g a n s a a t i n i d a n k e d e p a n
T H E W O R L D B A N K | B A N K D U N I A J u l i 2 0 1 2 9
Dengan menurunnya kekhawatiran akan inflasi, Bank Indonesia kini memusatkan perhatian pada stabilisasi kurs tukar dan pengelolaan ekspektasi inflasi (inflation expectation)
Dengan inflasi diperkirakan akan berada dalam kisaran target sebesar 4,5 persen +/- 1 persen untuk tahun 2012, Bank Indonesia telah mengalihkan perhatiannya untuk memberikan “dukungan kepada stabilisasi Rupiah” dan mengelola perkiraan inflasi melalui operasi moneter dan kebijakan makro yang berhati-hati. Kebijakan makro tersebut termasuk peraturan loan-to-value maksimum untuk KPR dan kredit kendaraan yang diuraikan pada Triwulanan edisi bulan April 2012. Tantangan bagi Bank Indonesia adalah terus memanfaatkan berbagai instrumen kebijakannya untuk mendukung pertumbuhan pada periode perlemahan kondisi global berikutnya, sementara memastikan bahwa tekanan inflasi jangka pendek – seperti lonjakan harga bulan Ramadan yang sudah dekat – tidak mendorong peningkatan inflasi dan harapan inflasi yang berkelanjutan.
Kotak 1: Harga properti komersial telah meningkat dengan kuat, sementara pertumbuhan harga perumahan telah menurun Sektor properti di Indonesia, terutama properti komersial, telah mencatat pertumbuhan yang kuat sejak tahun lalu mengikuti penurunan yang besar dalam hasil dan harga konstruksi pada tahun-tahun setelah krisis keuangan dunia. Di antara ekuitas dalam negeri, sektor properti mencatat peningkatan kedua terbesar, dengan naik sebesar 22 persen pada kuartal pertama tahun 2012 dan 43 persen selama setahun, dibanding dengan peningkatan sebesar masing-masing 8 dan 12 persen untuk indeks ekuitas keseluruhan selama periode tersebut. Penjualan properti komersial dan tingkat sewa di Indonesia juga mencatat peningkatan yang cukup berarti. Menurut Survei Properti Komersial BI terhadap 706 perusahaan properti di Jabotabek, harga jual kantor di Jakarta meningkat sebesar 27 persen selama setahun hingga kuartal 1/2012, mendekati dua kali lipat dari percepatan yang dicatat pada empat tahun yang lalu (Gambar 14). Permintaan bagi ruang kantor telah meningkat, dan sementara persediaan ruang kantor untuk dibeli atau disewa secara umum tidak berubah, tingkat huniannya telah meningkat menjadi 96 persen. Akan tetapi pada akhir tahun 2012 diperkirakan akan terdapat tambahan ruang sebesar 429,220 m2 (peningkatan sekitar 40 persen bagi persediaan yang siap dijual sekarang) yang tampaknya akan menekan kuatnya pertumbuhan harga yang tercatat pada tahun yang lalu. Peningkatan permintaan sewa juga menyebabkan peningkatan tingkat harga sewa sebesar enam persen selama tahun tersebut.
Laju peningkatan pada harga properti perumahan secara nasional telah menurun secara signifikan, di bawah tingkat inflasi sejak dekade sebelumnya (Gambar 15). Walaupun terdapat pertumbuhan investasi yang kuat pada sektor tersebut, pertumbuhan harga tempat tinggal telah melemah. Menurut Survei Properti Tempat Tinggal BI terhadap 260 pengembang properti pada 14 kota-kota utama di Indonesia, harga properti tempat tinggal terus menurun dari puncaknya sebesar 5 persen yoy pada bulan Desember 2011 ke proyeksi sebesar 2,8 persen tahun-ke-tahun pada bulan Juni 2012. Beberapa alasan BI terkait hal tersebut adalah terkait relatif tingginya tingkat penggadaian, pembatasan kepemilikan asing, dan ledakan pasokan konstruksi pada tahun 2007 dan 2008 yang menyebabkan lonjakan pasokan, dan juga terkait dengan birokrasi. Beberapa responden terhadap survei tersebut juga mengutip peraturan baru tentang UU Perumahan No. 1/2011 yang mulai berlaku pada tahun 2012 terhadap permintaan dari pemilik rumah yang baru karena UU itu melarang pengembang dari pendirian properti untuk membangun properti dengan ukuran lebih kecil dari 36m2. Selain itu, persyaratan uang muka minimum yang lebih tinggi pada properti yang lebih besar juga dapat mempengaruhi perkiraan harga ke depan. Akan tetapi proyeksi jangka menengah tampaknya akan didukung oleh peningkatan pendapatan dan timbulnya kelas menegah, bersama-sama dengan tren yang berlanjut dalam urbanisasi dan peningkatan akses terhadap keuangan. Gambar 14: Harga properti komersial di Jakarta telah meningkat… (persediaan kantor siap jual, ribuan m2; tingkat sewa bulanan ruang kantor, Rp per m2 per bulan; harga rata-rata penjualan kantor, juta Rp per m2)
Gambar 15: …tetapi secara nasional, pertumbuhan harga perumahan telah menurun pada tahun 2012 (peningkatan harga properti rumah tinggal, persen)
Catatan: Berdasar pada Jabotabek saja Sumber: Survei Properti Komersial BI
Catatan: Rumah kecil adalah luas bangunan yang kurang dari 36m2, rumah menengah antara 36m2 dan 70m2, rumah besar di atas 70m2 Sumber: Survei properti rumah tinggal BI dan perhitungan staf Bank Dunia
Office space for
sale (stock)
Office space
monthly rental rate
Office (selling price)
400 600 800
1000 1200 125,000
140,000
155,000
170,000 12 14 16 18 20
0.00
0.33
0.67
1.00
Mar-07 Nov-08 Jul-10 Mar-12
Juta IDR/m2
persediaan (ribu m2)
(Rp/m2/bulan)
"Small house prices"
"Large house" prices
"Medium house" prices
-15
-10
-5
0
5
10
-15
-10
-5
0
5
10
Jun-03 Jun-06 Jun-09 Jun-12
Percent Percent
Real average house prices (ex-post, deflated by CPI)
P e r k e m b a n g a n T r i w u l a n a n P e r e k o n o m i a n I n d o n e s i a M e n g a t a s i t a n t a n g a n s a a t i n i d a n k e d e p a n
T H E W O R L D B A N K | B A N K D U N I A J u l i 2 0 1 2 10
Kinerja seseluruhan sektor perbankan tetap kuat
Per bulan April 2012, seluruh indikator sektor perbankan tetap kokoh. Rasio kecukupan modal, walau sedikit menurun, tetap berada pada 18 persen. Kredit macet turun setengah poin persentase sepanjang tahun ke 2,3 persen. Dengan suku bunga pinjaman turun mendekati satu poin persentase pada kuartal pertama, marjin bunga bersih (net-interest margin) juga telah turun menjadi 5,4 persen. Pertumbuhan kredit meningkat menjadi 25,7 persen tahun-ke-tahun pada bulan April 2012, dimulai dari kredit investasi (naik sebesar 28,8 persen), kredit modal kerja (naik sebesar 27,7 persen) dan kredit konsumsi (naik sebesar 20,5 persen). Peraturan baru dalam pinjaman perumahan dan kendaraan dapat menghambat pertumbuhan kredit yang diarahkan ke sektor-sektor tersebut. Seperti disinggung pada Kotak 1, harga properti perumahan baru-baru ini telah menurun, walaupun harga sewa dan penjualan properti komersial mencatatkan pertumbuhan yang kuat. Pertumbuhan kredit ini memberi kontribusi kepada peningkatan bertahap dalam rasio pinjaman terhadap simpanan (loan-to-deposit) menjadi 81,6 persen pada bulan April 2012. Akan tetapi terdapat laporan bahwa bank-bank memberikan kredit secara lebih berhati-hati kepada industri yang sangat sensitif terhadap gejolak harga komoditas dan ekonomi dunia seperti perusahaan dalam bidang sumber daya alam, mineral, perkebunan dan pengiriman. Pada saat yang bersamaan, ketatnya likuiditas dolar AS yang disinggung di atas dilaporkan telah mempengaruhi kemampuan sejumlah perusahaan lokal untuk memperoleh dolar dan fasilitas kredit dalam dolar.
Terdapat kemajuan dalam penguatan kelembagaan yang penting bagi sektor keuangan
Dalam perkembangan yang disambut baik untuk meningkatkan persiapan menghadapi krisis, Kementerian Keuangan, Lembaga Penjamin Simpanan dan Bank Indonesia telah menandatangani nota kesepahaman untuk mengkoordinasi upaya-upaya untuk mencegah dan menangani masalah-masalah stabilitas sistem keuangan. Nota itu memberikan pedoman bagi koordinasi dalam hal terjadi krisis keuangan dan mengidentifikasi mekanisme untuk berbagi data dan informasi. Nota itu juga mendukung pembentukan protokol manajemen krisis (CMP) berdasarkan atas kewenangan badan-badan tersebut menurut peraturan perundangan yang berlaku. Sementara CMP Nasional membantu pencegahan krisis dan penanganan krisis keuangan potensial dalam jangka pendek, ia tidak sepenuhnya menangani celah-celah dalam kerangka hukum yang ada sekarang, dan dalam jangka panjang, pihak otoritas harus merancangan dan menetapkan pengaturan yang tetap bagi pemantauan dan penilaian dampak yang sistemis, persiapan krisis dan manajemen krisis, setelah Otoritas Jasa Keuangan (OJK) beroperasi sepenuhnya. Seperti dibicarakan pada Triwulanan edisi bulan Desember 2011, OJK akan mengambil alih pengawasan dan pengaturan lembaga-lembaga keuangan non bank dan pasar modal pada tanggal 1 January 2013 dan industri perbankan pada tanggal 1 January 2014 dan Komisi XI DPR baru-baru ini telah memilih tujuh Komisaris OJK. Akhirnya, pada perkembangan peraturan yang lain, Bank Indonesia menandatangani 2 nota kesepahaman tentang pengawasan perbankan lintas batas dengan Otoritas Peraturan Kehati-hatian Australia dan Komisi Jasa Keuangan Korea.
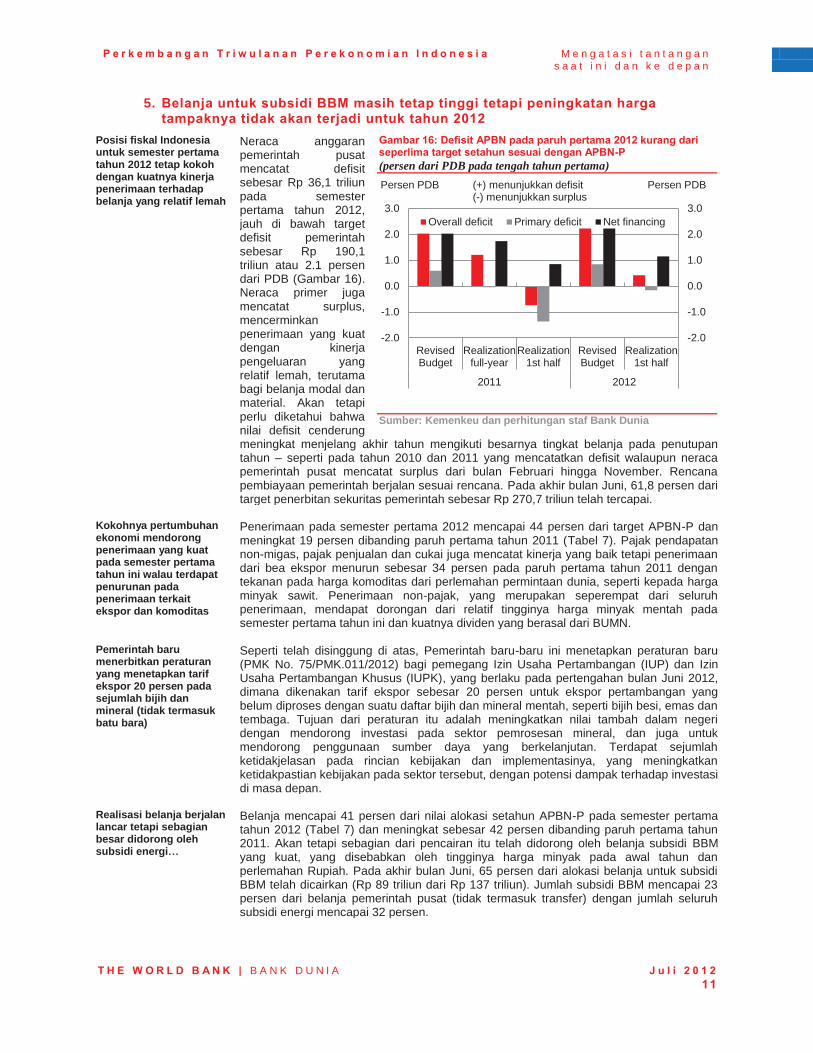
P e r k e m b a n g a n T r i w u l a n a n P e r e k o n o m i a n I n d o n e s i a M e n g a t a s i t a n t a n g a n s a a t i n i d a n k e d e p a n
T H E W O R L D B A N K | B A N K D U N I A J u l i 2 0 1 2 11
5. Belanja untuk subsidi BBM masih tetap tinggi tetapi peningkatan harga tampaknya tidak akan terjadi untuk tahun 2012
Posisi fiskal Indonesia untuk semester pertama tahun 2012 tetap kokoh dengan kuatnya kinerja penerimaan terhadap belanja yang relatif lemah
Neraca anggaran pemerintah pusat mencatat defisit sebesar Rp 36,1 triliun pada semester pertama tahun 2012, jauh di bawah target defisit pemerintah sebesar Rp 190,1 triliun atau 2.1 persen dari PDB (Gambar 16). Neraca primer juga mencatat surplus, mencerminkan penerimaan yang kuat dengan kinerja pengeluaran yang relatif lemah, terutama bagi belanja modal dan material. Akan tetapi perlu diketahui bahwa nilai defisit cenderung meningkat menjelang akhir tahun mengikuti besarnya tingkat belanja pada penutupan tahun – seperti pada tahun 2010 dan 2011 yang mencatatkan defisit walaupun neraca pemerintah pusat mencatat surplus dari bulan Februari hingga November. Rencana pembiayaan pemerintah berjalan sesuai rencana. Pada akhir bulan Juni, 61,8 persen dari target penerbitan sekuritas pemerintah sebesar Rp 270,7 triliun telah tercapai.
Gambar 16: Defisit APBN pada paruh pertama 2012 kurang dari seperlima target setahun sesuai dengan APBN-P (persen dari PDB pada tengah tahun pertama)
Sumber: Kemenkeu dan perhitungan staf Bank Dunia
Kokohnya pertumbuhan ekonomi mendorong penerimaan yang kuat pada semester pertama tahun ini walau terdapat penurunan pada penerimaan terkait ekspor dan komoditas
Penerimaan pada semester pertama 2012 mencapai 44 persen dari target APBN-P dan meningkat 19 persen dibanding paruh pertama tahun 2011 (Tabel 7). Pajak pendapatan non-migas, pajak penjualan dan cukai juga mencatat kinerja yang baik tetapi penerimaan dari bea ekspor menurun sebesar 34 persen pada paruh pertama tahun 2011 dengan tekanan pada harga komoditas dari perlemahan permintaan dunia, seperti kepada harga minyak sawit. Penerimaan non-pajak, yang merupakan seperempat dari seluruh penerimaan, mendapat dorongan dari relatif tingginya harga minyak mentah pada semester pertama tahun ini dan kuatnya dividen yang berasal dari BUMN.
Pemerintah baru menerbitkan peraturan yang menetapkan tarif ekspor 20 persen pada sejumlah bijih dan mineral (tidak termasuk batu bara)
Seperti telah disinggung di atas, Pemerintah baru-baru ini menetapkan peraturan baru (PMK No. 75/PMK.011/2012) bagi pemegang Izin Usaha Pertambangan (IUP) dan Izin Usaha Pertambangan Khusus (IUPK), yang berlaku pada pertengahan bulan Juni 2012, dimana dikenakan tarif ekspor sebesar 20 persen untuk ekspor pertambangan yang belum diproses dengan suatu daftar bijih dan mineral mentah, seperti bijih besi, emas dan tembaga. Tujuan dari peraturan itu adalah meningkatkan nilai tambah dalam negeri dengan mendorong investasi pada sektor pemrosesan mineral, dan juga untuk mendorong penggunaan sumber daya yang berkelanjutan. Terdapat sejumlah ketidakjelasan pada rincian kebijakan dan implementasinya, yang meningkatkan ketidakpastian kebijakan pada sektor tersebut, dengan potensi dampak terhadap investasi di masa depan.
Realisasi belanja berjalan lancar tetapi sebagian besar didorong oleh subsidi energi…
Belanja mencapai 41 persen dari nilai alokasi setahun APBN-P pada semester pertama tahun 2012 (Tabel 7) dan meningkat sebesar 42 persen dibanding paruh pertama tahun 2011. Akan tetapi sebagian dari pencairan itu telah didorong oleh belanja subsidi BBM yang kuat, yang disebabkan oleh tingginya harga minyak pada awal tahun dan perlemahan Rupiah. Pada akhir bulan Juni, 65 persen dari alokasi belanja untuk subsidi BBM telah dicairkan (Rp 89 triliun dari Rp 137 triliun). Jumlah subsidi BBM mencapai 23 persen dari belanja pemerintah pusat (tidak termasuk transfer) dengan jumlah seluruh subsidi energi mencapai 32 persen.
-2.0
-1.0
0.0
1.0
2.0
3.0
-2.0
-1.0
0.0
1.0
2.0
3.0
RevisedBudget
Realizationfull-year
Realization1st half
RevisedBudget
Realization1st half
2011 2012
Overall deficit Primary deficit Net financing
Persen PDB Persen PDB (+) menunjukkan defisit (-) menunjukkan surplus
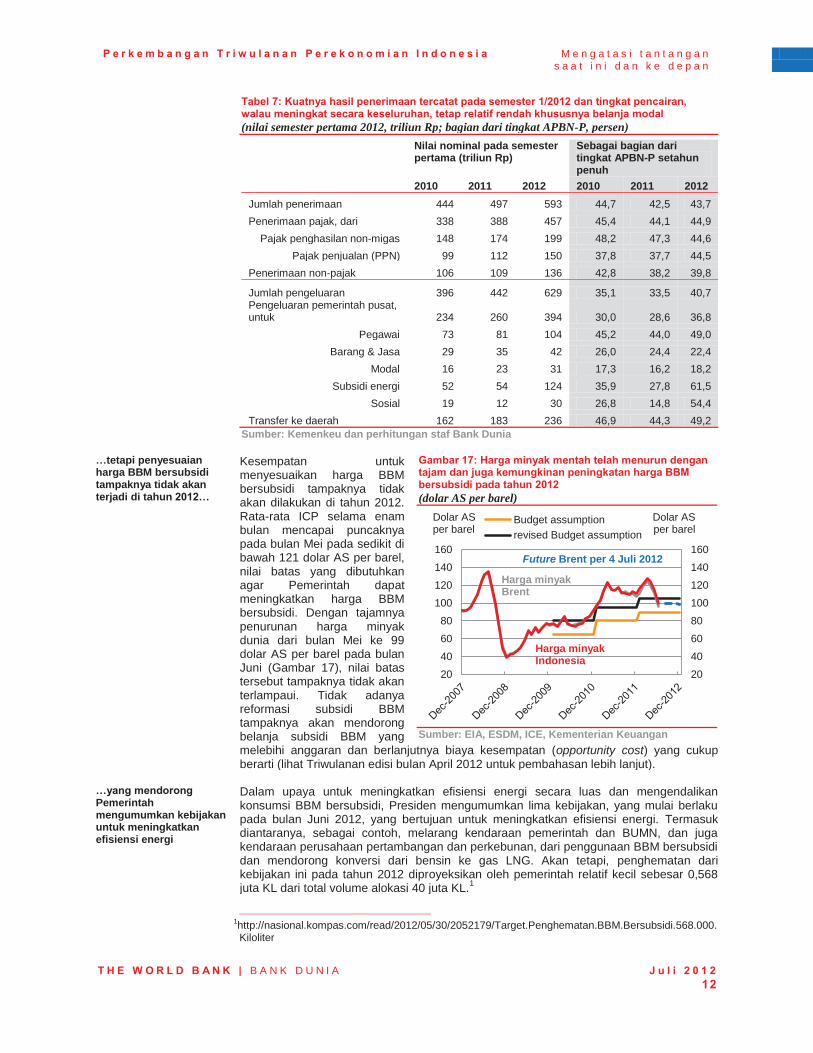
P e r k e m b a n g a n T r i w u l a n a n P e r e k o n o m i a n I n d o n e s i a M e n g a t a s i t a n t a n g a n s a a t i n i d a n k e d e p a n
T H E W O R L D B A N K | B A N K D U N I A J u l i 2 0 1 2 12
Tabel 7: Kuatnya hasil penerimaan tercatat pada semester 1/2012 dan tingkat pencairan, walau meningkat secara keseluruhan, tetap relatif rendah khususnya belanja modal (nilai semester pertama 2012, triliun Rp; bagian dari tingkat APBN-P, persen)
Nilai nominal pada semester pertama (triliun Rp)
Sebagai bagian dari tingkat APBN-P setahun penuh
2010 2011 2012 2010 2011 2012 Jumlah penerimaan 444 497 593 44,7 42,5 43,7 Penerimaan pajak, dari 338 388 457 45,4 44,1 44,9
Pajak penghasilan non-migas 148 174 199 48,2 47,3 44,6 Pajak penjualan (PPN) 99 112 150 37,8 37,7 44,5
Penerimaan non-pajak 106 109 136 42,8 38,2 39,8
Jumlah pengeluaran 396 442 629 35,1 33,5 40,7 Pengeluaran pemerintah pusat, untuk 234 260 394 30,0 28,6 36,8
Pegawai 73 81 104 45,2 44,0 49,0 Barang & Jasa 29 35 42 26,0 24,4 22,4
Modal 16 23 31 17,3 16,2 18,2 Subsidi energi 52 54 124 35,9 27,8 61,5
Sosial 19 12 30 26,8 14,8 54,4 Transfer ke daerah 162 183 236 46,9 44,3 49,2
Sumber: Kemenkeu dan perhitungan staf Bank Dunia
…tetapi penyesuaian harga BBM bersubsidi tampaknya tidak akan terjadi di tahun 2012…
Kesempatan untuk menyesuaikan harga BBM bersubsidi tampaknya tidak akan dilakukan di tahun 2012. Rata-rata ICP selama enam bulan mencapai puncaknya pada bulan Mei pada sedikit di bawah 121 dolar AS per barel, nilai batas yang dibutuhkan agar Pemerintah dapat meningkatkan harga BBM bersubsidi. Dengan tajamnya penurunan harga minyak dunia dari bulan Mei ke 99 dolar AS per barel pada bulan Juni (Gambar 17), nilai batas tersebut tampaknya tidak akan terlampaui. Tidak adanya reformasi subsidi BBM tampaknya akan mendorong belanja subsidi BBM yang melebihi anggaran dan berlanjutnya biaya kesempatan (opportunity cost) yang cukup berarti (lihat Triwulanan edisi bulan April 2012 untuk pembahasan lebih lanjut).
Gambar 17: Harga minyak mentah telah menurun dengan tajam dan juga kemungkinan peningkatan harga BBM bersubsidi pada tahun 2012 (dolar AS per barel)
Sumber: EIA, ESDM, ICE, Kementerian Keuangan
…yang mendorong Pemerintah mengumumkan kebijakan untuk meningkatkan efisiensi energi
Dalam upaya untuk meningkatkan efisiensi energi secara luas dan mengendalikan konsumsi BBM bersubsidi, Presiden mengumumkan lima kebijakan, yang mulai berlaku pada bulan Juni 2012, yang bertujuan untuk meningkatkan efisiensi energi. Termasuk diantaranya, sebagai contoh, melarang kendaraan pemerintah dan BUMN, dan juga kendaraan perusahaan pertambangan dan perkebunan, dari penggunaan BBM bersubsidi dan mendorong konversi dari bensin ke gas LNG. Akan tetapi, penghematan dari kebijakan ini pada tahun 2012 diproyeksikan oleh pemerintah relatif kecil sebesar 0,568 juta KL dari total volume alokasi 40 juta KL.1
1http://nasional.kompas.com/read/2012/05/30/2052179/Target.Penghematan.BBM.Bersubsidi.568.000.Kiloliter
20
40
60
80
100
120
140
160
20
40
60
80
100
120
140
160
Budget assumptionrevised Budget assumption
Harga minyak Brent
Harga minyak Indonesia
Dolar AS per barel
Dolar AS per barel
Future Brent per 4 Juli 2012
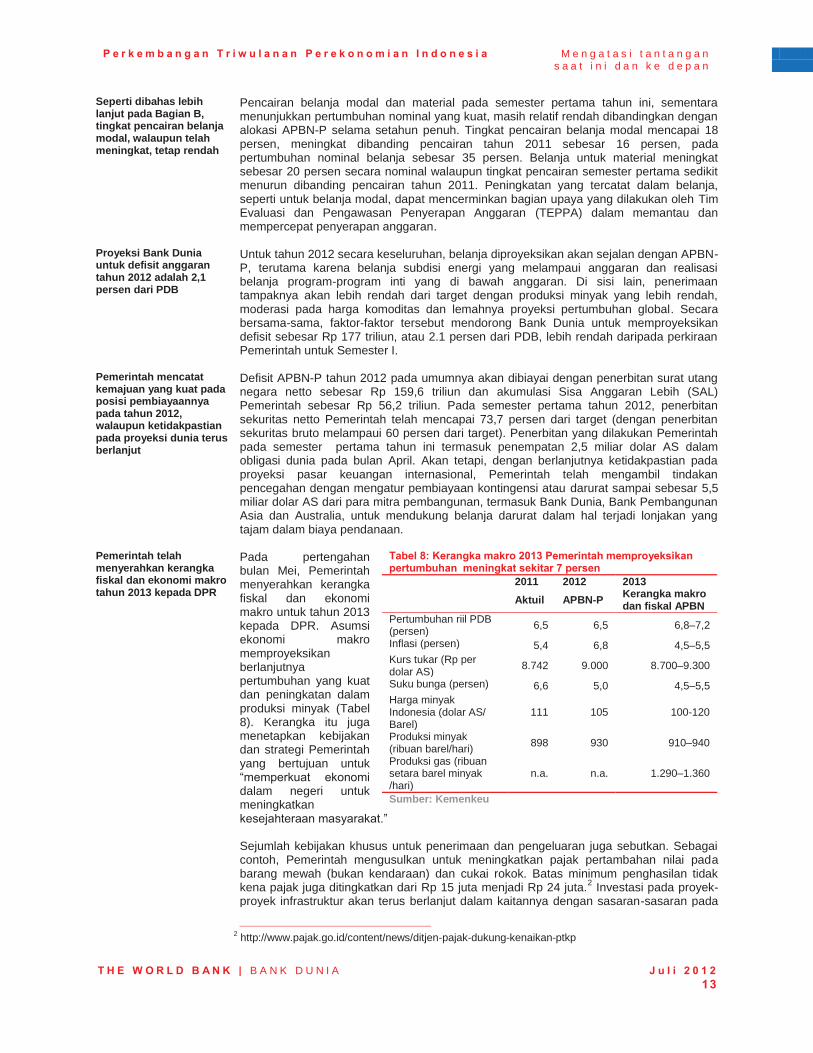
P e r k e m b a n g a n T r i w u l a n a n P e r e k o n o m i a n I n d o n e s i a M e n g a t a s i t a n t a n g a n s a a t i n i d a n k e d e p a n
T H E W O R L D B A N K | B A N K D U N I A J u l i 2 0 1 2 13
Seperti dibahas lebih lanjut pada Bagian B, tingkat pencairan belanja modal, walaupun telah meningkat, tetap rendah
Pencairan belanja modal dan material pada semester pertama tahun ini, sementara menunjukkan pertumbuhan nominal yang kuat, masih relatif rendah dibandingkan dengan alokasi APBN-P selama setahun penuh. Tingkat pencairan belanja modal mencapai 18 persen, meningkat dibanding pencairan tahun 2011 sebesar 16 persen, pada pertumbuhan nominal belanja sebesar 35 persen. Belanja untuk material meningkat sebesar 20 persen secara nominal walaupun tingkat pencairan semester pertama sedikit menurun dibanding pencairan tahun 2011. Peningkatan yang tercatat dalam belanja, seperti untuk belanja modal, dapat mencerminkan bagian upaya yang dilakukan oleh Tim Evaluasi dan Pengawasan Penyerapan Anggaran (TEPPA) dalam memantau dan mempercepat penyerapan anggaran.
Proyeksi Bank Dunia untuk defisit anggaran tahun 2012 adalah 2,1 persen dari PDB
Untuk tahun 2012 secara keseluruhan, belanja diproyeksikan akan sejalan dengan APBN-P, terutama karena belanja subdisi energi yang melampaui anggaran dan realisasi belanja program-program inti yang di bawah anggaran. Di sisi lain, penerimaan tampaknya akan lebih rendah dari target dengan produksi minyak yang lebih rendah, moderasi pada harga komoditas dan lemahnya proyeksi pertumbuhan global. Secara bersama-sama, faktor-faktor tersebut mendorong Bank Dunia untuk memproyeksikan defisit sebesar Rp 177 triliun, atau 2.1 persen dari PDB, lebih rendah daripada perkiraan Pemerintah untuk Semester I.
Pemerintah mencatat kemajuan yang kuat pada posisi pembiayaannya pada tahun 2012, walaupun ketidakpastian pada proyeksi dunia terus berlanjut
Defisit APBN-P tahun 2012 pada umumnya akan dibiayai dengan penerbitan surat utang negara netto sebesar Rp 159,6 triliun dan akumulasi Sisa Anggaran Lebih (SAL) Pemerintah sebesar Rp 56,2 triliun. Pada semester pertama tahun 2012, penerbitan sekuritas netto Pemerintah telah mencapai 73,7 persen dari target (dengan penerbitan sekuritas bruto melampaui 60 persen dari target). Penerbitan yang dilakukan Pemerintah pada semester pertama tahun ini termasuk penempatan 2,5 miliar dolar AS dalam obligasi dunia pada bulan April. Akan tetapi, dengan berlanjutnya ketidakpastian pada proyeksi pasar keuangan internasional, Pemerintah telah mengambil tindakan pencegahan dengan mengatur pembiayaan kontingensi atau darurat sampai sebesar 5,5 miliar dolar AS dari para mitra pembangunan, termasuk Bank Dunia, Bank Pembangunan Asia dan Australia, untuk mendukung belanja darurat dalam hal terjadi lonjakan yang tajam dalam biaya pendanaan.
Pemerintah telah menyerahkan kerangka fiskal dan ekonomi makro tahun 2013 kepada DPR
Pada pertengahan bulan Mei, Pemerintah menyerahkan kerangka fiskal dan ekonomi makro untuk tahun 2013 kepada DPR. Asumsi ekonomi makro memproyeksikan berlanjutnya pertumbuhan yang kuat dan peningkatan dalam produksi minyak (Tabel 8). Kerangka itu juga menetapkan kebijakan dan strategi Pemerintah yang bertujuan untuk “memperkuat ekonomi dalam negeri untuk meningkatkan kesejahteraan masyarakat.” Sejumlah kebijakan khusus untuk penerimaan dan pengeluaran juga sebutkan. Sebagai contoh, Pemerintah mengusulkan untuk meningkatkan pajak pertambahan nilai pada barang mewah (bukan kendaraan) dan cukai rokok. Batas minimum penghasilan tidak kena pajak juga ditingkatkan dari Rp 15 juta menjadi Rp 24 juta.2 Investasi pada proyek-proyek infrastruktur akan terus berlanjut dalam kaitannya dengan sasaran-sasaran pada
Tabel 8: Kerangka makro 2013 Pemerintah memproyeksikan pertumbuhan meningkat sekitar 7 persen 2011 2012 2013 Aktuil APBN-P Kerangka makro
dan fiskal APBN Pertumbuhan riil PDB (persen) 6,5 6,5 6,8–7,2
Inflasi (persen) 5,4 6,8 4,5–5,5 Kurs tukar (Rp per dolar AS) 8.742 9.000 8.700–9.300
Suku bunga (persen) 6,6 5,0 4,5–5,5 Harga minyak Indonesia (dolar AS/ Barel)
111 105 100-120
Produksi minyak (ribuan barel/hari) 898 930 910–940
Produksi gas (ribuan setara barel minyak /hari)
n.a. n.a. 1.290–1.360
Sumber: Kemenkeu
2 http://www.pajak.go.id/content/news/ditjen-pajak-dukung-kenaikan-ptkp
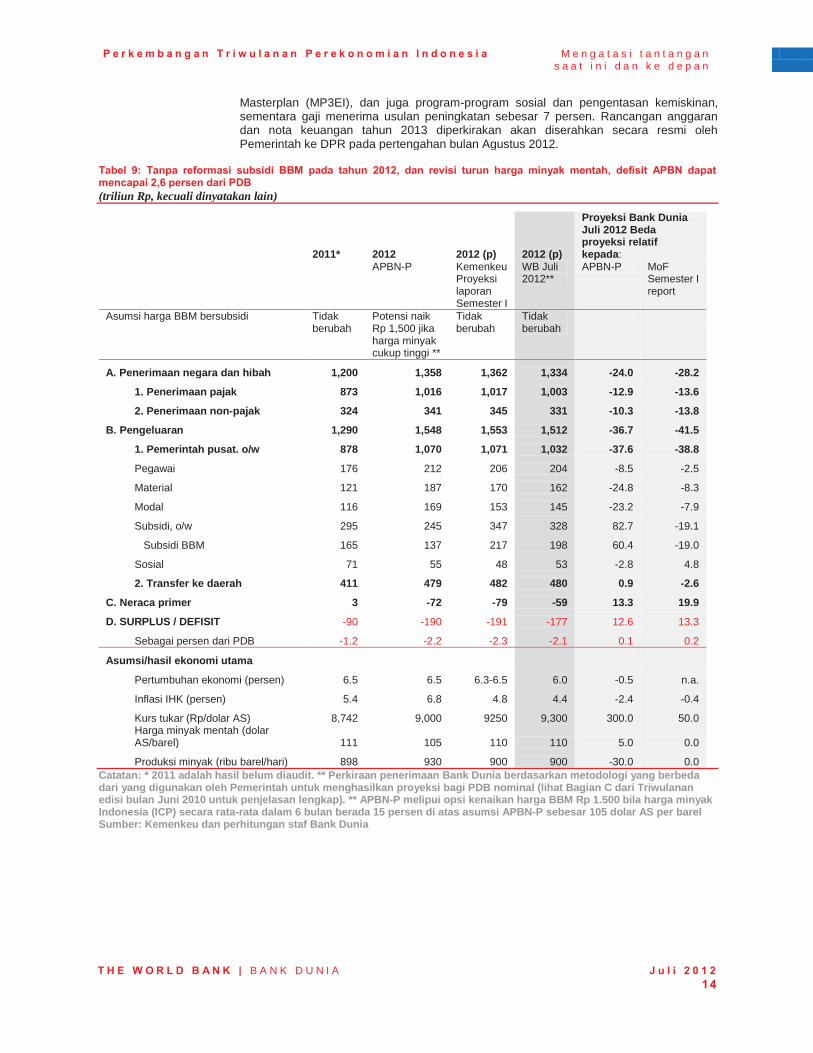
P e r k e m b a n g a n T r i w u l a n a n P e r e k o n o m i a n I n d o n e s i a M e n g a t a s i t a n t a n g a n s a a t i n i d a n k e d e p a n
T H E W O R L D B A N K | B A N K D U N I A J u l i 2 0 1 2 14
Masterplan (MP3EI), dan juga program-program sosial dan pengentasan kemiskinan, sementara gaji menerima usulan peningkatan sebesar 7 persen. Rancangan anggaran dan nota keuangan tahun 2013 diperkirakan akan diserahkan secara resmi oleh Pemerintah ke DPR pada pertengahan bulan Agustus 2012.
Tabel 9: Tanpa reformasi subsidi BBM pada tahun 2012, dan revisi turun harga minyak mentah, defisit APBN dapat mencapai 2,6 persen dari PDB (triliun Rp, kecuali dinyatakan lain)
2011* 2012 2012 (p) 2012 (p)
Proyeksi Bank Dunia Juli 2012 Beda proyeksi relatif kepada:
APBN-P Kemenkeu Proyeksi laporan Semester I
WB Juli 2012**
APBN-P MoF Semester I report
Asumsi harga BBM bersubsidi Tidak berubah
Potensi naik Rp 1,500 jika harga minyak cukup tinggi **
Tidak berubah
Tidak berubah
A. Penerimaan negara dan hibah 1,200 1,358 1,362 1,334 -24.0 -28.2
1. Penerimaan pajak 873 1,016 1,017 1,003 -12.9 -13.6
2. Penerimaan non-pajak 324 341 345 331 -10.3 -13.8
B. Pengeluaran 1,290 1,548 1,553 1,512 -36.7 -41.5
1. Pemerintah pusat. o/w 878 1,070 1,071 1,032 -37.6 -38.8
Pegawai 176 212 206 204 -8.5 -2.5
Material 121 187 170 162 -24.8 -8.3
Modal 116 169 153 145 -23.2 -7.9
Subsidi, o/w 295 245 347 328 82.7 -19.1
Subsidi BBM 165 137 217 198 60.4 -19.0
Sosial 71 55 48 53 -2.8 4.8
2. Transfer ke daerah 411 479 482 480 0.9 -2.6
C. Neraca primer 3 -72 -79 -59 13.3 19.9
D. SURPLUS / DEFISIT -90 -190 -191 -177 12.6 13.3
Sebagai persen dari PDB -1.2 -2.2 -2.3 -2.1 0.1 0.2
Asumsi/hasil ekonomi utama
Pertumbuhan ekonomi (persen) 6.5 6.5 6.3-6.5 6.0 -0.5 n.a.
Inflasi IHK (persen) 5.4 6.8 4.8 4.4 -2.4 -0.4
Kurs tukar (Rp/dolar AS) 8,742 9,000 9250 9,300 300.0 50.0
Harga minyak mentah (dolar AS/barel) 111 105 110 110 5.0 0.0
Produksi minyak (ribu barel/hari) 898 930 900 900 -30.0 0.0
Catatan: * 2011 adalah hasil belum diaudit. ** Perkiraan penerimaan Bank Dunia berdasarkan metodologi yang berbeda dari yang digunakan oleh Pemerintah untuk menghasilkan proyeksi bagi PDB nominal (lihat Bagian C dari Triwulanan edisi bulan Juni 2010 untuk penjelasan lengkap). ** APBN-P melipui opsi kenaikan harga BBM Rp 1.500 bila harga minyak Indonesia (ICP) secara rata-rata dalam 6 bulan berada 15 persen di atas asumsi APBN-P sebesar 105 dolar AS per barel Sumber: Kemenkeu dan perhitungan staf Bank Dunia

P e r k e m b a n g a n T r i w u l a n a n P e r e k o n o m i a n I n d o n e s i a M e n g a t a s i t a n t a n g a n s a a t i n i d a n k e d e p a n
T H E W O R L D B A N K | B A N K D U N I A J u l i 2 0 1 2 15
6. Turunnya risiko lonjakan harga BBM bersubsidi melemahkan proyeksi inflasi Setelah mencapai nilai terendah dalam dua tahun pada bulan Februari 2012, inflasi IHK (headline) tahun-ke-tahun meningkat hampir 1 poin persentase ke 4,5 persen pada bulan Juni 2012…
Inflasi IHK (headline) mencapai 4,5 persen tahun-ke-tahun pada bulan Juni 2012, mendekati peningkatan sebesar satu poin persentase dari angka paling rendah selama dua tahun terakhir yang dicatat pada bulan Februari (Gambar 18). Akan tetapi tingkat inflasi masih bertahan di bawah angka lima persen, mendekati setengah dari nilai rata-rata pada dekade yang lalu, masih di atas pertumbuhan rata-rata. Hal ini mencerminkan absennya kejutan harga yang diatur oleh pemerintah, penurunan kejutan harga komoditas dan peningkatan dalam kehati-hatian manajemen kebijakan makro. Catatan inflasi bulanan juga relatif menurun dengan keberhasilan panen yang meningkatkan persediaan bahan pangan. Inflasi inti, alat ukur yang lebih baik untuk melihat faktor pendorong tekanan harga konsumen, menyusut ke tingkat paling rendah dalam 21 bulan terakhir sebesar 4,1 persen di bulan Mei, sebelum sedikit meningkat pada bulan Juni.
Gambar 18: Inflasi IHK sedikit meningkat tetapi inflasi inti tetap bertahan rendah (inflasi harga, persen)
Gambar 19: Perbedaan antara harga beras internasional dan Indonesia sekali lagi bergerak ke nilai tertinggi (perbedaan harga, persen; harga beras kulakan, Rp per kg)
Catatan: T-k-t adalah tahun-ke-tahun Sumber: BPS dan perhitungan staf Bank Dunia
Sumber: Pasar Induk Beras Cipinang, Food and Agriculture Organization dan Bank Dunia
…dengan meningkatnya inflasi harga bahan pangan
Peningkatan inflasi IHK tahun-ke-tahun menjadi 7.2 persen di bulan Juni terutama disebabkan peningkatan inflasi harga bahan pangan. Hal ini mengikuti penurunan inflasi harga bahan pangan selama tahun 2011 dan awal tahun 2012, dengan berakhirnya periode tingginya harga bahan pangan pada tahun 2011. Penurunan inflasi harga pangan sempat menyentuh angka paling rendah dalam 8 tahun pada 2,9 persen di bulan Februari 2012. Peningkatan harga bahan pangan mendorong tingkat inflasi keranjang kemiskinan naik dari 6,3 persen di bulan Februari menjadi 7,7 persen di bulan Juni. Melihat pada indeks harga konsumen, laju peningkatan harga relatif merata, dengan penyebaran tingkat inflasi pada sub-sub komponen berada pada nilai paling rendah dalam delapan tahun. Penurunan harga emas telah mendorong turun inflasi perhiasan pribadi, yang merupakan sub-komponen dari pakaian. Dengan tidak adanya perubahan harga bahan bakar bersubsidi selama lebih dari satu tahun, inflasi biaya energi transportasi dan rumah tangga tetap bertahan pada nilai yang moderat.
Perbedaan antara harga beras dalam dan luar negeri, yang telah menurun hingga bulan Mei, kembali meningkat ke nilai tertinggi pada bulan Juni
Perbedaan antara harga beras dalam dan luar negeri menurun selama masa panen sebelum kembali meningkat pada bulan Juni (Gambar 19). Pada bulan Juni 2012, harga beras kulakan dalam negeri berada pada kisaran 86-95 persen lebih tinggi (bergantung pada kualitas) dari beras dengan kualitas yang sebanding dari pasar luar negeri (masing-masing dari Thailand dan Vietnam), sedikit lebih rendah dari perbedaan harga sebesar 72-100 persen yang tercatat pada bulan Februari 2012. Turunnya perbedaan harga selama masa panen didorong oleh tiga faktor: peningkatan tipis pada harga beras internasional; depresiasi Rupiah terhadap dolar AS; dan turunnya harga beras dalam negeri karena peningkatan produksi. Sedangkan, pada bulan Juni, walaupun harga beras
-8
0
8
16
24
-1
0
1
2
3
Jun-08 Jun-09 Jun-10 Jun-11 Jun-12
Inflasi inti t-k-t (kanan) Inflasi IHK t-
k-t (kanan)
Inflasi IHK bulan-ke-bulan (kiri)
Persen Persen
Inflasi pangan tahun-ke-tahun (kanan)
0
2,000
4,000
6,000
8,000
10,000
-40
0
40
80
120
160
Jun-08 Jun-09 Jun-10 Jun-11 Jun-12
Perbedaan harga domestik dan internasional (kiri)
Vietnam beras pecah 15 persen (kanan)
Beras kualitas menengah domestik
(kanan)
Persen Rp per kg
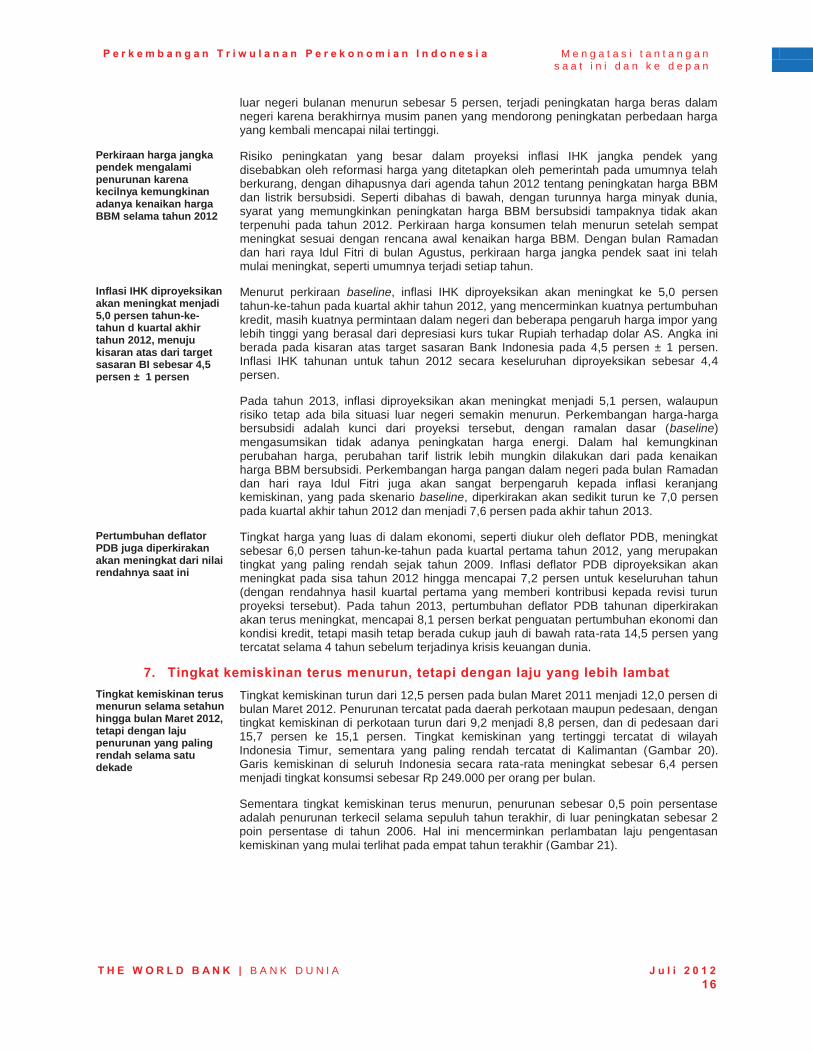
P e r k e m b a n g a n T r i w u l a n a n P e r e k o n o m i a n I n d o n e s i a M e n g a t a s i t a n t a n g a n s a a t i n i d a n k e d e p a n
T H E W O R L D B A N K | B A N K D U N I A J u l i 2 0 1 2 16
luar negeri bulanan menurun sebesar 5 persen, terjadi peningkatan harga beras dalam negeri karena berakhirnya musim panen yang mendorong peningkatan perbedaan harga yang kembali mencapai nilai tertinggi.
Perkiraan harga jangka pendek mengalami penurunan karena kecilnya kemungkinan adanya kenaikan harga BBM selama tahun 2012
Risiko peningkatan yang besar dalam proyeksi inflasi IHK jangka pendek yang disebabkan oleh reformasi harga yang ditetapkan oleh pemerintah pada umumnya telah berkurang, dengan dihapusnya dari agenda tahun 2012 tentang peningkatan harga BBM dan listrik bersubsidi. Seperti dibahas di bawah, dengan turunnya harga minyak dunia, syarat yang memungkinkan peningkatan harga BBM bersubsidi tampaknya tidak akan terpenuhi pada tahun 2012. Perkiraan harga konsumen telah menurun setelah sempat meningkat sesuai dengan rencana awal kenaikan harga BBM. Dengan bulan Ramadan dan hari raya Idul Fitri di bulan Agustus, perkiraan harga jangka pendek saat ini telah mulai meningkat, seperti umumnya terjadi setiap tahun.
Inflasi IHK diproyeksikan akan meningkat menjadi 5,0 persen tahun-ke-tahun d kuartal akhir tahun 2012, menuju kisaran atas dari target sasaran BI sebesar 4,5 persen ± 1 persen
Menurut perkiraan baseline, inflasi IHK diproyeksikan akan meningkat ke 5,0 persen tahun-ke-tahun pada kuartal akhir tahun 2012, yang mencerminkan kuatnya pertumbuhan kredit, masih kuatnya permintaan dalam negeri dan beberapa pengaruh harga impor yang lebih tinggi yang berasal dari depresiasi kurs tukar Rupiah terhadap dolar AS. Angka ini berada pada kisaran atas target sasaran Bank Indonesia pada 4,5 persen ± 1 persen. Inflasi IHK tahunan untuk tahun 2012 secara keseluruhan diproyeksikan sebesar 4,4 persen. Pada tahun 2013, inflasi diproyeksikan akan meningkat menjadi 5,1 persen, walaupun risiko tetap ada bila situasi luar negeri semakin menurun. Perkembangan harga-harga bersubsidi adalah kunci dari proyeksi tersebut, dengan ramalan dasar (baseline) mengasumsikan tidak adanya peningkatan harga energi. Dalam hal kemungkinan perubahan harga, perubahan tarif listrik lebih mungkin dilakukan dari pada kenaikan harga BBM bersubsidi. Perkembangan harga pangan dalam negeri pada bulan Ramadan dan hari raya Idul Fitri juga akan sangat berpengaruh kepada inflasi keranjang kemiskinan, yang pada skenario baseline, diperkirakan akan sedikit turun ke 7,0 persen pada kuartal akhir tahun 2012 dan menjadi 7,6 persen pada akhir tahun 2013.
Pertumbuhan deflator PDB juga diperkirakan akan meningkat dari nilai rendahnya saat ini
Tingkat harga yang luas di dalam ekonomi, seperti diukur oleh deflator PDB, meningkat sebesar 6,0 persen tahun-ke-tahun pada kuartal pertama tahun 2012, yang merupakan tingkat yang paling rendah sejak tahun 2009. Inflasi deflator PDB diproyeksikan akan meningkat pada sisa tahun 2012 hingga mencapai 7,2 persen untuk keseluruhan tahun (dengan rendahnya hasil kuartal pertama yang memberi kontribusi kepada revisi turun proyeksi tersebut). Pada tahun 2013, pertumbuhan deflator PDB tahunan diperkirakan akan terus meningkat, mencapai 8,1 persen berkat penguatan pertumbuhan ekonomi dan kondisi kredit, tetapi masih tetap berada cukup jauh di bawah rata-rata 14,5 persen yang tercatat selama 4 tahun sebelum terjadinya krisis keuangan dunia.
7. Tingkat kemiskinan terus menurun, tetapi dengan laju yang lebih lambat Tingkat kemiskinan terus menurun selama setahun hingga bulan Maret 2012, tetapi dengan laju penurunan yang paling rendah selama satu dekade
Tingkat kemiskinan turun dari 12,5 persen pada bulan Maret 2011 menjadi 12,0 persen di bulan Maret 2012. Penurunan tercatat pada daerah perkotaan maupun pedesaan, dengan tingkat kemiskinan di perkotaan turun dari 9,2 menjadi 8,8 persen, dan di pedesaan dari 15,7 persen ke 15,1 persen. Tingkat kemiskinan yang tertinggi tercatat di wilayah Indonesia Timur, sementara yang paling rendah tercatat di Kalimantan (Gambar 20). Garis kemiskinan di seluruh Indonesia secara rata-rata meningkat sebesar 6,4 persen menjadi tingkat konsumsi sebesar Rp 249.000 per orang per bulan.
Sementara tingkat kemiskinan terus menurun, penurunan sebesar 0,5 poin persentase adalah penurunan terkecil selama sepuluh tahun terakhir, di luar peningkatan sebesar 2 poin persentase di tahun 2006. Hal ini mencerminkan perlambatan laju pengentasan kemiskinan yang mulai terlihat pada empat tahun terakhir (Gambar 21).
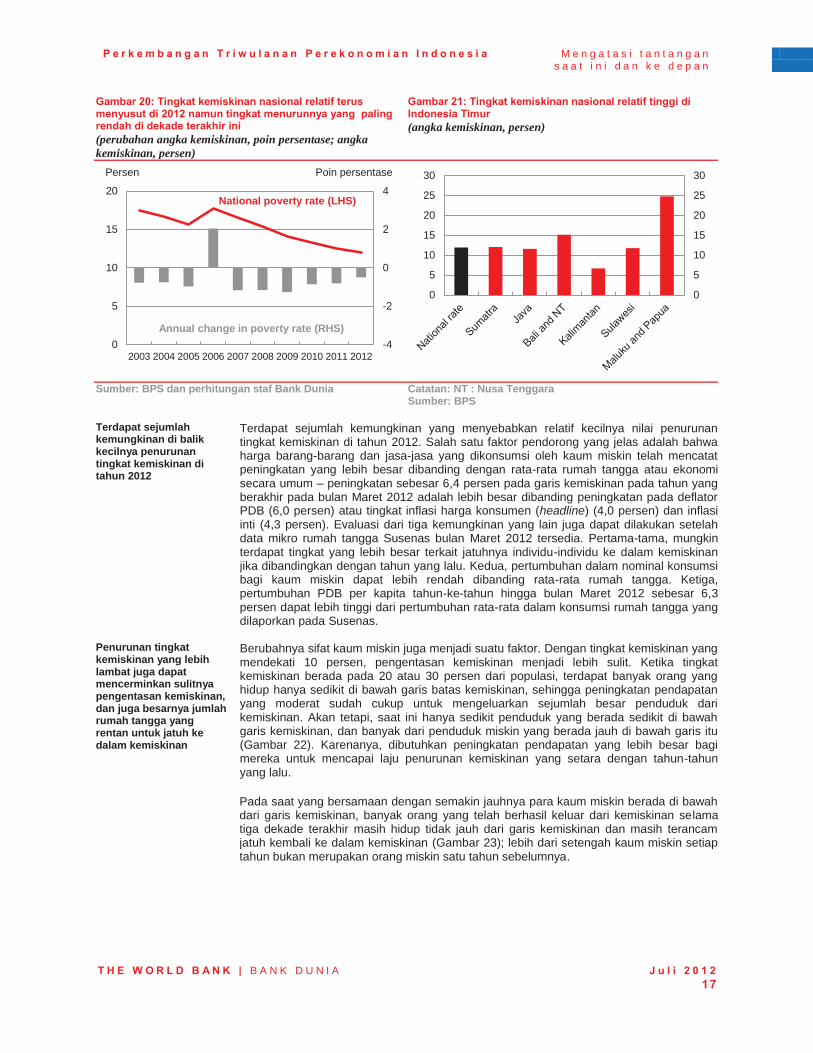
P e r k e m b a n g a n T r i w u l a n a n P e r e k o n o m i a n I n d o n e s i a M e n g a t a s i t a n t a n g a n s a a t i n i d a n k e d e p a n
T H E W O R L D B A N K | B A N K D U N I A J u l i 2 0 1 2 17
Gambar 20: Tingkat kemiskinan nasional relatif terus menyusut di 2012 namun tingkat menurunnya yang paling rendah di dekade terakhir ini (perubahan angka kemiskinan, poin persentase; angka kemiskinan, persen)
Gambar 21: Tingkat kemiskinan nasional relatif tinggi di Indonesia Timur (angka kemiskinan, persen)
Sumber: BPS dan perhitungan staf Bank Dunia Catatan: NT : Nusa Tenggara
Sumber: BPS
Terdapat sejumlah kemungkinan di balik kecilnya penurunan tingkat kemiskinan di tahun 2012
Terdapat sejumlah kemungkinan yang menyebabkan relatif kecilnya nilai penurunan tingkat kemiskinan di tahun 2012. Salah satu faktor pendorong yang jelas adalah bahwa harga barang-barang dan jasa-jasa yang dikonsumsi oleh kaum miskin telah mencatat peningkatan yang lebih besar dibanding dengan rata-rata rumah tangga atau ekonomi secara umum – peningkatan sebesar 6,4 persen pada garis kemiskinan pada tahun yang berakhir pada bulan Maret 2012 adalah lebih besar dibanding peningkatan pada deflator PDB (6,0 persen) atau tingkat inflasi harga konsumen (headline) (4,0 persen) dan inflasi inti (4,3 persen). Evaluasi dari tiga kemungkinan yang lain juga dapat dilakukan setelah data mikro rumah tangga Susenas bulan Maret 2012 tersedia. Pertama-tama, mungkin terdapat tingkat yang lebih besar terkait jatuhnya individu-individu ke dalam kemiskinan jika dibandingkan dengan tahun yang lalu. Kedua, pertumbuhan dalam nominal konsumsi bagi kaum miskin dapat lebih rendah dibanding rata-rata rumah tangga. Ketiga, pertumbuhan PDB per kapita tahun-ke-tahun hingga bulan Maret 2012 sebesar 6,3 persen dapat lebih tinggi dari pertumbuhan rata-rata dalam konsumsi rumah tangga yang dilaporkan pada Susenas.
Penurunan tingkat kemiskinan yang lebih lambat juga dapat mencerminkan sulitnya pengentasan kemiskinan, dan juga besarnya jumlah rumah tangga yang rentan untuk jatuh ke dalam kemiskinan
Berubahnya sifat kaum miskin juga menjadi suatu faktor. Dengan tingkat kemiskinan yang mendekati 10 persen, pengentasan kemiskinan menjadi lebih sulit. Ketika tingkat kemiskinan berada pada 20 atau 30 persen dari populasi, terdapat banyak orang yang hidup hanya sedikit di bawah garis batas kemiskinan, sehingga peningkatan pendapatan yang moderat sudah cukup untuk mengeluarkan sejumlah besar penduduk dari kemiskinan. Akan tetapi, saat ini hanya sedikit penduduk yang berada sedikit di bawah garis kemiskinan, dan banyak dari penduduk miskin yang berada jauh di bawah garis itu (Gambar 22). Karenanya, dibutuhkan peningkatan pendapatan yang lebih besar bagi mereka untuk mencapai laju penurunan kemiskinan yang setara dengan tahun-tahun yang lalu.
Pada saat yang bersamaan dengan semakin jauhnya para kaum miskin berada di bawah dari garis kemiskinan, banyak orang yang telah berhasil keluar dari kemiskinan selama tiga dekade terakhir masih hidup tidak jauh dari garis kemiskinan dan masih terancam jatuh kembali ke dalam kemiskinan (Gambar 23); lebih dari setengah kaum miskin setiap tahun bukan merupakan orang miskin satu tahun sebelumnya.
-4
-2
0
2
4
0
5
10
15
20
2003 2004 2005 2006 2007 2008 2009 2010 2011 2012
National poverty rate (LHS)
Annual change in poverty rate (RHS)
Persen Poin persentase
0
5
10
15
20
25
30
0
5
10
15
20
25
30

P e r k e m b a n g a n T r i w u l a n a n P e r e k o n o m i a n I n d o n e s i a M e n g a t a s i t a n t a n g a n s a a t i n i d a n k e d e p a n
T H E W O R L D B A N K | B A N K D U N I A J u l i 2 0 1 2 18
Gambar 22: Kaum miskin yang tersisa hidup semakin jauh di bawah garis kemiskinan… (rata-rata konsumsi per kapita per persentil untuk 20% populasi terendah, persentase garis kemiskinan)
Gambar 23: …sementara sejumlah besar penduduk Indonesia yang hidup hanya sedikit di atas garis kemiskinan tetap rentan jatuh kembali ke kemiskinan (konsumsi bulanan per kapita tahun 2011, ribu rupiah)
Sumber: Susenas 2011 dan perhitungan staf Bank Dunia Sumber: Susenas 2011 dan perhitungan staf Bank Dunia
Penanganan masalah kemiskinan dan kerentanan tersebut membutuhkan program pemerintah yang lebih efektif
Kedua fenomena yang berkaitan tersebut, kemiskinan yang kronis dan kerentanan yang luas berarti bahwa kebijakan pengentasan kemiskinan di Indonesia harus terpusat kepada dua tujuan. Pertama, dibutuhkan program peningkatan sosial untuk membantu kaum miskin untuk keluar dari kemiskinan melalui dukungan penghasilan dan investasi dalam mendorong peningkatan sumber daya manusia mereka. Yang termasuk program ini adalah program-program Beasiswa Siswa Miskin (BSM) yang memungkinkan keluarga miskin untuk menjangkau biaya pendidikan, dan Program Keluarga Harapan (PKH) yang memberikan bantuan uang tunai kepada para ibu dari keluarga yang sangat miskin, di samping mendorong kesehatan persalinan dan anak-anak dan belajar di sekolah. Akan tetapi cakupan dari program-program itu masih tetap sangat rendah dan harus ditingkatkan untuk menyertakan banyak kaum miskin yang belum disertakan.
Kedua, program-program perlindungan sosial diperlukan untuk melindungi banyak keluarga yang rentan di Indonesia terhadap risiko jatuhnya ke dalam kemiskinan.3 Terdapat sejumlah program, seperti Beras untuk rakyat miskin (Raskin) dan Jaminan Kesehatan Masyarakat (Jamkesmas), tetapi mereka menghadapi masalah dalam penerapan dan tidak menjangkau seluruh kaum rentan dan miskin. Program-program itu harus ditingkatkan dan diperluas untuk mencakup seluruh keluarga yang rentan. Pada saat yang bersamaan, dibutuhkan program-program baru untuk melindungi kelompok-kelompok yang sangat rentan, seperti mereka yang cacat dan tua dan sangat miskin, atau untuk memberikan pekerjaan kepada mereka yang tidak bekerja secara sementara.
3 Untuk rincian lebih lanjut lihat Bagian C dari Triwulanan edisi bulan April 2012 dan laporan Bank Dunia yang baru diluncurkan (tahun 2012) tentang Protecting Poor and Vulnerable Households in Indonesia, tersedia pada http://go.worldbank.org/5BWH4ZCQM0.
0
20
40
60
80
100
120
0
20
40
60
80
100
120
1 3 5 7 9 11 13 15 17 19
Consumption relative to poverty line
Per capita consumption percentile
Persen Persen
Poverty line
02
46
810
0 100 200 300 400 500 600 700 800
Poverty Line (PL) (12.5percent below)
1.2 X PL (24 percentbelow)
1.5 X PL (38 percentbelow)
Monthly Household Per Capita Consumption (IDR 000)
juta orang
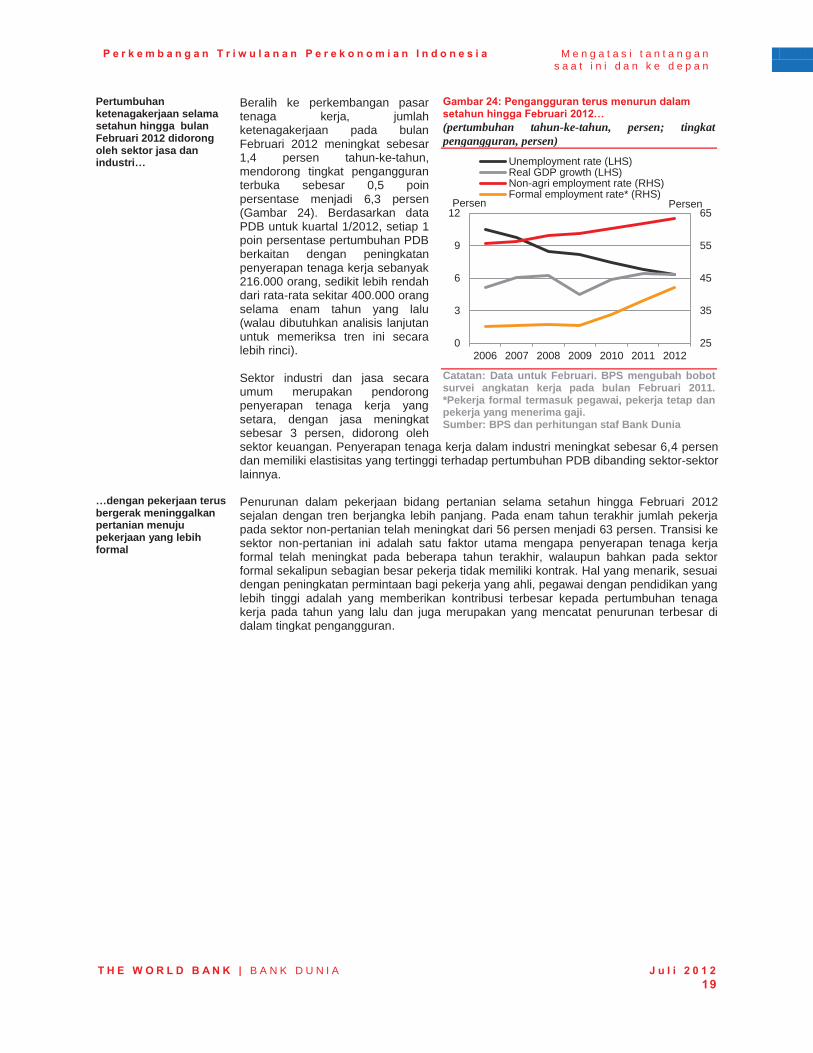
P e r k e m b a n g a n T r i w u l a n a n P e r e k o n o m i a n I n d o n e s i a M e n g a t a s i t a n t a n g a n s a a t i n i d a n k e d e p a n
T H E W O R L D B A N K | B A N K D U N I A J u l i 2 0 1 2 19
Pertumbuhan ketenagakerjaan selama setahun hingga bulan Februari 2012 didorong oleh sektor jasa dan industri…
Beralih ke perkembangan pasar tenaga kerja, jumlah ketenagakerjaan pada bulan Februari 2012 meningkat sebesar 1,4 persen tahun-ke-tahun, mendorong tingkat pengangguran terbuka sebesar 0,5 poin persentase menjadi 6,3 persen (Gambar 24). Berdasarkan data PDB untuk kuartal 1/2012, setiap 1 poin persentase pertumbuhan PDB berkaitan dengan peningkatan penyerapan tenaga kerja sebanyak 216.000 orang, sedikit lebih rendah dari rata-rata sekitar 400.000 orang selama enam tahun yang lalu (walau dibutuhkan analisis lanjutan untuk memeriksa tren ini secara lebih rinci). Sektor industri dan jasa secara umum merupakan pendorong penyerapan tenaga kerja yang setara, dengan jasa meningkat sebesar 3 persen, didorong oleh sektor keuangan. Penyerapan tenaga kerja dalam industri meningkat sebesar 6,4 persen dan memiliki elastisitas yang tertinggi terhadap pertumbuhan PDB dibanding sektor-sektor lainnya.
Gambar 24: Pengangguran terus menurun dalam setahun hingga Februari 2012… (pertumbuhan tahun-ke-tahun, persen; tingkat pengangguran, persen)
Catatan: Data untuk Februari. BPS mengubah bobot survei angkatan kerja pada bulan Februari 2011. *Pekerja formal termasuk pegawai, pekerja tetap dan pekerja yang menerima gaji. Sumber: BPS dan perhitungan staf Bank Dunia
…dengan pekerjaan terus bergerak meninggalkan pertanian menuju pekerjaan yang lebih formal
Penurunan dalam pekerjaan bidang pertanian selama setahun hingga Februari 2012 sejalan dengan tren berjangka lebih panjang. Pada enam tahun terakhir jumlah pekerja pada sektor non-pertanian telah meningkat dari 56 persen menjadi 63 persen. Transisi ke sektor non-pertanian ini adalah satu faktor utama mengapa penyerapan tenaga kerja formal telah meningkat pada beberapa tahun terakhir, walaupun bahkan pada sektor formal sekalipun sebagian besar pekerja tidak memiliki kontrak. Hal yang menarik, sesuai dengan peningkatan permintaan bagi pekerja yang ahli, pegawai dengan pendidikan yang lebih tinggi adalah yang memberikan kontribusi terbesar kepada pertumbuhan tenaga kerja pada tahun yang lalu dan juga merupakan yang mencatat penurunan terbesar di dalam tingkat pengangguran.
25
35
45
55
65
0
3
6
9
12
2006 2007 2008 2009 2010 2011 2012
Unemployment rate (LHS)Real GDP growth (LHS)Non-agri employment rate (RHS)Formal employment rate* (RHS)
Persen Persen
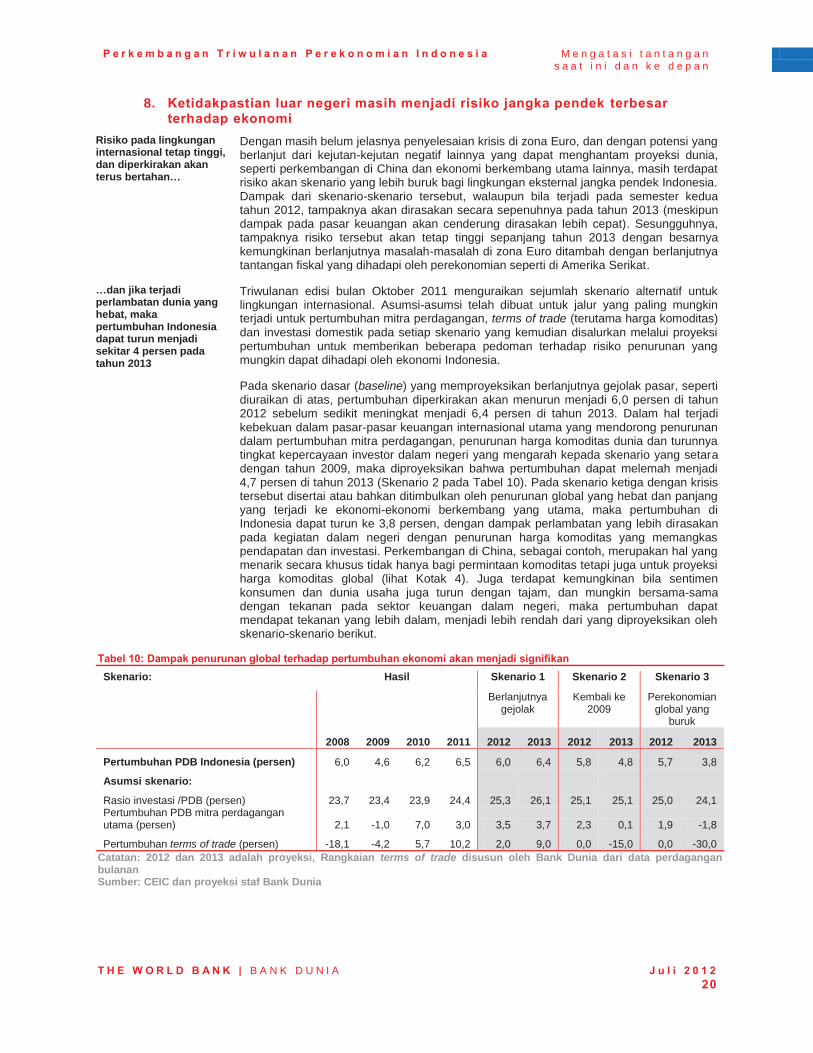
P e r k e m b a n g a n T r i w u l a n a n P e r e k o n o m i a n I n d o n e s i a M e n g a t a s i t a n t a n g a n s a a t i n i d a n k e d e p a n
T H E W O R L D B A N K | B A N K D U N I A J u l i 2 0 1 2 20
8. Ketidakpastian luar negeri masih menjadi risiko jangka pendek terbesar terhadap ekonomi
Risiko pada lingkungan internasional tetap tinggi, dan diperkirakan akan terus bertahan…
Dengan masih belum jelasnya penyelesaian krisis di zona Euro, dan dengan potensi yang berlanjut dari kejutan-kejutan negatif lainnya yang dapat menghantam proyeksi dunia, seperti perkembangan di China dan ekonomi berkembang utama lainnya, masih terdapat risiko akan skenario yang lebih buruk bagi lingkungan eksternal jangka pendek Indonesia. Dampak dari skenario-skenario tersebut, walaupun bila terjadi pada semester kedua tahun 2012, tampaknya akan dirasakan secara sepenuhnya pada tahun 2013 (meskipun dampak pada pasar keuangan akan cenderung dirasakan lebih cepat). Sesungguhnya, tampaknya risiko tersebut akan tetap tinggi sepanjang tahun 2013 dengan besarnya kemungkinan berlanjutnya masalah-masalah di zona Euro ditambah dengan berlanjutnya tantangan fiskal yang dihadapi oleh perekonomian seperti di Amerika Serikat.
…dan jika terjadi perlambatan dunia yang hebat, maka pertumbuhan Indonesia dapat turun menjadi sekitar 4 persen pada tahun 2013
Triwulanan edisi bulan Oktober 2011 menguraikan sejumlah skenario alternatif untuk lingkungan internasional. Asumsi-asumsi telah dibuat untuk jalur yang paling mungkin terjadi untuk pertumbuhan mitra perdagangan, terms of trade (terutama harga komoditas) dan investasi domestik pada setiap skenario yang kemudian disalurkan melalui proyeksi pertumbuhan untuk memberikan beberapa pedoman terhadap risiko penurunan yang mungkin dapat dihadapi oleh ekonomi Indonesia. Pada skenario dasar (baseline) yang memproyeksikan berlanjutnya gejolak pasar, seperti diuraikan di atas, pertumbuhan diperkirakan akan menurun menjadi 6,0 persen di tahun 2012 sebelum sedikit meningkat menjadi 6,4 persen di tahun 2013. Dalam hal terjadi kebekuan dalam pasar-pasar keuangan internasional utama yang mendorong penurunan dalam pertumbuhan mitra perdagangan, penurunan harga komoditas dunia dan turunnya tingkat kepercayaan investor dalam negeri yang mengarah kepada skenario yang setara dengan tahun 2009, maka diproyeksikan bahwa pertumbuhan dapat melemah menjadi 4,7 persen di tahun 2013 (Skenario 2 pada Tabel 10). Pada skenario ketiga dengan krisis tersebut disertai atau bahkan ditimbulkan oleh penurunan global yang hebat dan panjang yang terjadi ke ekonomi-ekonomi berkembang yang utama, maka pertumbuhan di Indonesia dapat turun ke 3,8 persen, dengan dampak perlambatan yang lebih dirasakan pada kegiatan dalam negeri dengan penurunan harga komoditas yang memangkas pendapatan dan investasi. Perkembangan di China, sebagai contoh, merupakan hal yang menarik secara khusus tidak hanya bagi permintaan komoditas tetapi juga untuk proyeksi harga komoditas global (lihat Kotak 4). Juga terdapat kemungkinan bila sentimen konsumen dan dunia usaha juga turun dengan tajam, dan mungkin bersama-sama dengan tekanan pada sektor keuangan dalam negeri, maka pertumbuhan dapat mendapat tekanan yang lebih dalam, menjadi lebih rendah dari yang diproyeksikan oleh skenario-skenario berikut.
Tabel 10: Dampak penurunan global terhadap pertumbuhan ekonomi akan menjadi signifikan
Skenario: Hasil Skenario 1 Skenario 2 Skenario 3
Berlanjutnya gejolak
Kembali ke 2009
Perekonomian global yang
buruk 2008 2009 2010 2011 2012 2013 2012 2013 2012 2013
Pertumbuhan PDB Indonesia (persen) 6,0 4,6 6,2 6,5 6,0 6,4 5,8 4,8 5,7 3,8
Asumsi skenario: Rasio investasi /PDB (persen) 23,7 23,4 23,9 24,4 25,3 26,1 25,1 25,1 25,0 24,1 Pertumbuhan PDB mitra perdagangan utama (persen) 2,1 -1,0 7,0 3,0 3,5 3,7 2,3 0,1 1,9 -1,8
Pertumbuhan terms of trade (persen) -18,1 -4,2 5,7 10,2 2,0 9,0 0,0 -15,0 0,0 -30,0
Catatan: 2012 dan 2013 adalah proyeksi, Rangkaian terms of trade disusun oleh Bank Dunia dari data perdagangan bulanan Sumber: CEIC dan proyeksi staf Bank Dunia
P e r k e m b a n g a n T r i w u l a n a n P e r e k o n o m i a n I n d o n e s i a M e n g a t a s i t a n t a n g a n s a a t i n i d a n k e d e p a n
T H E W O R L D B A N K | B A N K D U N I A J u l i 2 0 1 2 21
Proyeksi neraca pembayaran juga tetap tidak pasti dan skenario dunia yang lebih negatif akan memberi tekanan kepada aliran modal dan perdagangan
Menurut skenario dasar (baseline), keseluruhan neraca pembayaran Indonesia diperkirakan akan mencatat sedikit surplus pada tahun 2012, dan meningkat tipis di tahun 2013. Bila lingkungan internasional bergerak ke skenario yang lebih negatif, maka dapat terjadi implikasi yang lebih signifikan terhadap arus masuk neraca pembayaran Indonesia, terutama pada Skenario ketiga. Permintaan eksternal dan harga komoditas yang lebih rendah akan menurunkan surplus perdagangan dan semakin memperlebar neraca berjalan. Peningkatan gejolak pasar internasional dan pelarian aset investor ke risiko yang lebih rendah, tampaknya akan mendorong aliran keluar modal, yang memberikan tekanan kepada Rupiah dan harga aset-aset dalam negeri.
Risiko kepada proyeksi inflasi, walaupun telah menurun, tetap besar
Penurunan kemungkinan untuk peningkatan harga BBM di tahun 2012 telah menyusutkan risiko inflasi jangka pendek. Akan tetapi, risiko kenaikan dan penurunan inflasi masih tetap besar. Jika pertumbuhan tetap berlanjut dengan kuat maka inflasi dapat meningkat dengan terjadinya pengetatan pada keterbatasan kapasitas. Lebih jauh lagi depresiasi kurs tukar juga dapat mempengaruhi harga domestik yang lebih tinggi (depresiasi Rupiah sebesar 10 persen terhadap dolar AS berkaitan dengan peningkatan sekitar 0,5-1 poin persentase dalam inflasi headline). Akan tetapi penurunan yang lebih besar dari perkiraan pada permintaan eksternal dan harga komoditas global akan cenderung menurunkan inflasi dalam negeri, baik secara langsung melalui harga-harga impor, dan melalui dampaknya terhadap pendapatan dan permintaan di dalam ekonomi. Akhirnya, perubahan apapun dalam kebijakan pengelolaan subsidi harga, seperti untuk listrik dan BBM, akan menghasilkan proyeksi yang sangat berbeda di tahun 2013.
…sementara tantangan belanja subsidi dan pencairan menjadi risiko kepada proyeksi APBN
Turunnya harga minyak mentah yang terjadi belakangan ini telah menurunkan biaya subsidi BBM per liter. Akan tetapi, belanja pada semester pertama tahun ini menunjukkan tingginya risiko untuk belanja yang melampaui alokasi APBN-P (dengan proyeksi Pemerintah untuk jumlah belanja subsidi sebesar Rp 100 triliun di atas alokasi pada APBN-P sebesar Rp 245 triliun). Langkah-langkah kebijakan untuk membatasi konsumsi tidak akan memberi dampak yang berarti terhadap tingkat belanja, yang merupakan biaya yang tinggi yang dapat dialokasikan untuk belanja pembangunan lainnya dan mendukung rumah tangga miskin. Sebaliknya, juga terdapat masalah belanja yang lebih rendah karena tantangan pencairan yang telah disinggung di atas dan dibahas lebih lanjut pada Bagian B. Kedua faktor ini, bersama-sama dengan jalur harga komoditas, dan penerimaan, adalah beberapa dari risiko-risiko utama terhadap hasil defisit di tahun 2012.
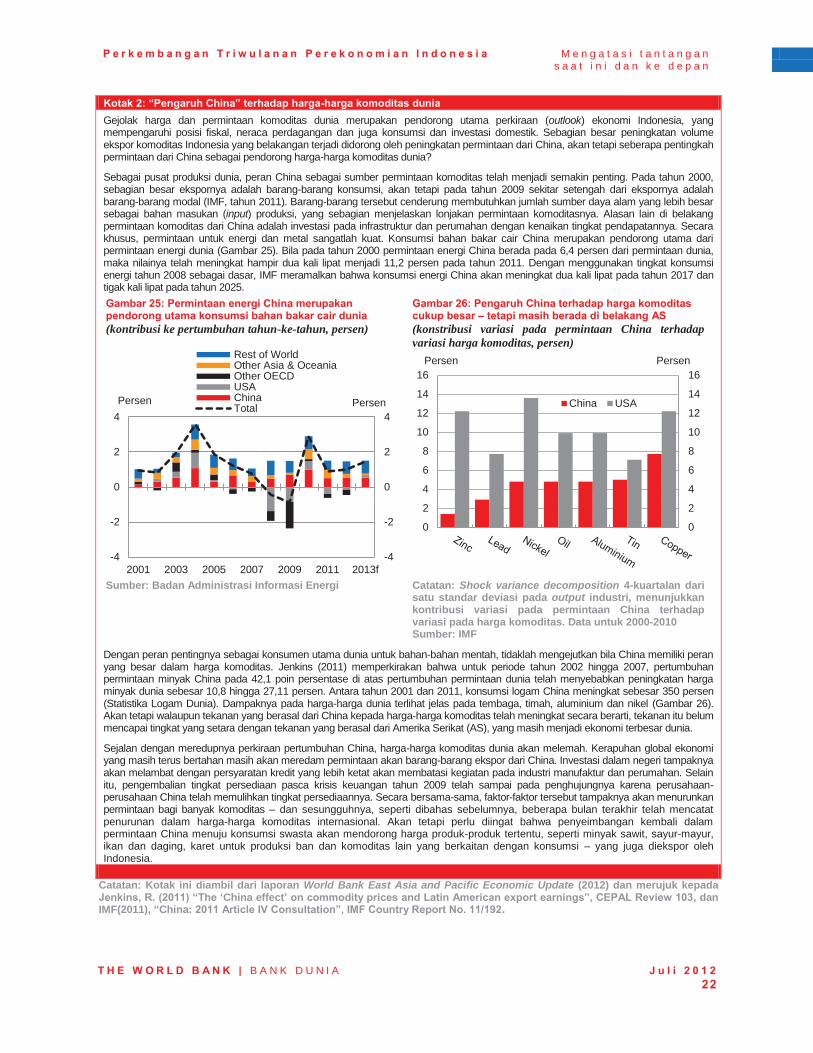
P e r k e m b a n g a n T r i w u l a n a n P e r e k o n o m i a n I n d o n e s i a M e n g a t a s i t a n t a n g a n s a a t i n i d a n k e d e p a n
T H E W O R L D B A N K | B A N K D U N I A J u l i 2 0 1 2 22
Kotak 2: “Pengaruh China” terhadap harga-harga komoditas dunia Gejolak harga dan permintaan komoditas dunia merupakan pendorong utama perkiraan (outlook) ekonomi Indonesia, yang mempengaruhi posisi fiskal, neraca perdagangan dan juga konsumsi dan investasi domestik. Sebagian besar peningkatan volume ekspor komoditas Indonesia yang belakangan terjadi didorong oleh peningkatan permintaan dari China, akan tetapi seberapa pentingkah permintaan dari China sebagai pendorong harga-harga komoditas dunia?
Sebagai pusat produksi dunia, peran China sebagai sumber permintaan komoditas telah menjadi semakin penting. Pada tahun 2000, sebagian besar ekspornya adalah barang-barang konsumsi, akan tetapi pada tahun 2009 sekitar setengah dari ekspornya adalah barang-barang modal (IMF, tahun 2011). Barang-barang tersebut cenderung membutuhkan jumlah sumber daya alam yang lebih besar sebagai bahan masukan (input) produksi, yang sebagian menjelaskan lonjakan permintaan komoditasnya. Alasan lain di belakang permintaan komoditas dari China adalah investasi pada infrastruktur dan perumahan dengan kenaikan tingkat pendapatannya. Secara khusus, permintaan untuk energi dan metal sangatlah kuat. Konsumsi bahan bakar cair China merupakan pendorong utama dari permintaan energi dunia (Gambar 25). Bila pada tahun 2000 permintaan energi China berada pada 6,4 persen dari permintaan dunia, maka nilainya telah meningkat hampir dua kali lipat menjadi 11,2 persen pada tahun 2011. Dengan menggunakan tingkat konsumsi energi tahun 2008 sebagai dasar, IMF meramalkan bahwa konsumsi energi China akan meningkat dua kali lipat pada tahun 2017 dan tigak kali lipat pada tahun 2025. Gambar 25: Permintaan energi China merupakan pendorong utama konsumsi bahan bakar cair dunia (kontribusi ke pertumbuhan tahun-ke-tahun, persen)
Gambar 26: Pengaruh China terhadap harga komoditas cukup besar – tetapi masih berada di belakang AS (konstribusi variasi pada permintaan China terhadap variasi harga komoditas, persen)
Sumber: Badan Administrasi Informasi Energi Catatan: Shock variance decomposition 4-kuartalan dari
satu standar deviasi pada output industri, menunjukkan kontribusi variasi pada permintaan China terhadap variasi pada harga komoditas. Data untuk 2000-2010 Sumber: IMF
Dengan peran pentingnya sebagai konsumen utama dunia untuk bahan-bahan mentah, tidaklah mengejutkan bila China memiliki peran yang besar dalam harga komoditas. Jenkins (2011) memperkirakan bahwa untuk periode tahun 2002 hingga 2007, pertumbuhan permintaan minyak China pada 42,1 poin persentase di atas pertumbuhan permintaan dunia telah menyebabkan peningkatan harga minyak dunia sebesar 10,8 hingga 27,11 persen. Antara tahun 2001 dan 2011, konsumsi logam China meningkat sebesar 350 persen (Statistika Logam Dunia). Dampaknya pada harga-harga dunia terlihat jelas pada tembaga, timah, aluminium dan nikel (Gambar 26). Akan tetapi walaupun tekanan yang berasal dari China kepada harga-harga komoditas telah meningkat secara berarti, tekanan itu belum mencapai tingkat yang setara dengan tekanan yang berasal dari Amerika Serikat (AS), yang masih menjadi ekonomi terbesar dunia.
Sejalan dengan meredupnya perkiraan pertumbuhan China, harga-harga komoditas dunia akan melemah. Kerapuhan global ekonomi yang masih terus bertahan masih akan meredam permintaan akan barang-barang ekspor dari China. Investasi dalam negeri tampaknya akan melambat dengan persyaratan kredit yang lebih ketat akan membatasi kegiatan pada industri manufaktur dan perumahan. Selain itu, pengembalian tingkat persediaan pasca krisis keuangan tahun 2009 telah sampai pada penghujungnya karena perusahaan-perusahaan China telah memulihkan tingkat persediaannya. Secara bersama-sama, faktor-faktor tersebut tampaknya akan menurunkan permintaan bagi banyak komoditas – dan sesungguhnya, seperti dibahas sebelumnya, beberapa bulan terakhir telah mencatat penurunan dalam harga-harga komoditas internasional. Akan tetapi perlu diingat bahwa penyeimbangan kembali dalam permintaan China menuju konsumsi swasta akan mendorong harga produk-produk tertentu, seperti minyak sawit, sayur-mayur, ikan dan daging, karet untuk produksi ban dan komoditas lain yang berkaitan dengan konsumsi – yang juga diekspor oleh Indonesia.
Catatan: Kotak ini diambil dari laporan World Bank East Asia and Pacific Economic Update (2012) dan merujuk kepada Jenkins, R. (2011) “The ‘China effect’ on commodity prices and Latin American export earnings”, CEPAL Review 103, dan IMF(2011), “China: 2011 Article IV Consultation”, IMF Country Report No. 11/192.
-4
-2
0
2
4
-4
-2
0
2
4
2001 2003 2005 2007 2009 2011 2013f
Rest of WorldOther Asia & OceaniaOther OECDUSAChinaTotal Persen Persen
0
2
4
6
8
10
12
14
16
0
2
4
6
8
10
12
14
16
China USA
Persen Persen
P e r k e m b a n g a n T r i w u l a n a n P e r e k o n o m i a n I n d o n e s i a M e n g a t a s i t a n t a n g a n s a a t i n i d a n k e d e p a n
T H E W O R L D B A N K | B A N K D U N I A J u l i 2 0 1 2 23
B. BEBERAPA PERKEMBANGAN
TERBARU PEREKONOMIAN
INDONESIA
1. Pendorong dan implikasi tren-tren terakhir pada neraca berjalan Indonesia
Saldo neraca berjalan Indonesia telah menyusut dan diproyeksikan akan menjadi defisit tahunan pada tahun 2012 untuk pertama kali sejak krisis keuangan Asia
Cepatnya laju pertumbuhan domestik dan lemahnya permintaan luar negeri membuat surplus neraca berjalan (CAS) Indonesia menurun secara berarti pada beberapa tahun terakhir. Bank Dunia memproyeksikan bahwa Indonesia akan mulai mencatat defisit neraca berjalan (CAD) tahunan pada tahun 2012, untuk pertama kali terjadi sejak krisis keuangan Asia. Perlemahan yang belakangan terjadi pada neraca pembayaran, seperti dijelaskan pada Bagian A, telah mempercepat pergeseran neraca berjalan menjadi defisit, hal ini juga merupakan bagian dari tren jangka menengah. Bagian ini menganalisis faktor-faktor pendorong yang mendasari pergerakan akhir-akhir ini pada neraca berjalan Indonesia, dan membahas masalah-masalah yang terkait dengan keberlanjutan dari defisit tersebut dan implikasinya terhadap posisi pendanaan luar negeri Indonesia.
a. Dinamika neraca berjalan Indonesia akhir-akhir ini Setelah mencatatkan defisit neraca berjalan (CAD) pada tahun 80an hingga 90an, pokok-pokok neraca luar negeri Indonesia berubah pada krisis keuangan Asia
Sebelum krisis Asia, Indonesia mengalami pertumbuhan ekonomi yang kuat selama hampir tiga dekade, dengan didorong oleh industrialisasi, urbanisasi dan penurunan hambatan perdagangan, yang menghasilkan ekonomi yang lebih terpadu secara global.4 Seperti dengan banyak negara-negara lain, tahap ‘mengejar ketinggalan’ pembangunan ekonomi ini membutuhkan peningkatan yang signifikan dalam tingkat investasi, dengan tingat investasi terhadap PDB meningkat dari 28.5 persen tahun 1980 menjadi 37.2 persen pada tahun 1997. Dengan rendahnya tingkat simpanan dalam negeri, maka investasi tersebut didanai dengan pinjaman luar negeri dengan rata-rata defisit neraca berjalan berada pada kisaran 3 persen dari PDB tahunan (lihat Kotak 3 untuk deskripsi neraca berjalan). Aliran keluar neraca berjalan didanai oleh pinjaman jangka pendek dan aliran masuk modal portofolio. Penarikan pendanaan luar negeri secara tiba-tiba pada masa krisis keuangan Asia menyebabkan neraca berjalan Indonesia berpindah menjadi surplus karena terdepresiasinya mata uang yang cukup tinggi, diikuti dengan reformasi kebijakan yang ditujukan kepada pengurangan hutang luar negeri dan membangun penyangga-penyangga domestik terhadap penghentian aliran masuk modal asing secara tiba-tiba.
Pada beberapa tahun terakhir, Indonesia telah mencatat surplus neraca berjalan, yang mendorong peningkatan jumlah cadangan devisa
Sejak tahun 1998 neraca berjalan Indonesia pada umumnya terus bertahan dalam posisi surplus, dengan penerimaan ekspor yang lebih dari cukup untuk mengimbangi impor dan pembayaran pendapatan kepada investor asing. Hal ini menggambarkan suatu peningkatan dalam simpanan secara relatif terhadap investasi dibandingkan dengan periode-periode sebelum krisis keuangan Asia, yang menunjukan terdapat pelaksanaan yang lebih konservatif terhadap praktik-praktik investasi dan peraturan pemberian pinjaman. Surplus neraca berjalan yang terus terjadi juga membantu menyediakan pendanaan bagi luar negeri pada beberapa tahun terakhir, menurunkan kerentanan
4 Elias & Noone (2011), “The Growth and Development of the Indonesian Economy”, Reserve Bank of Australia Bulletin, Desember.
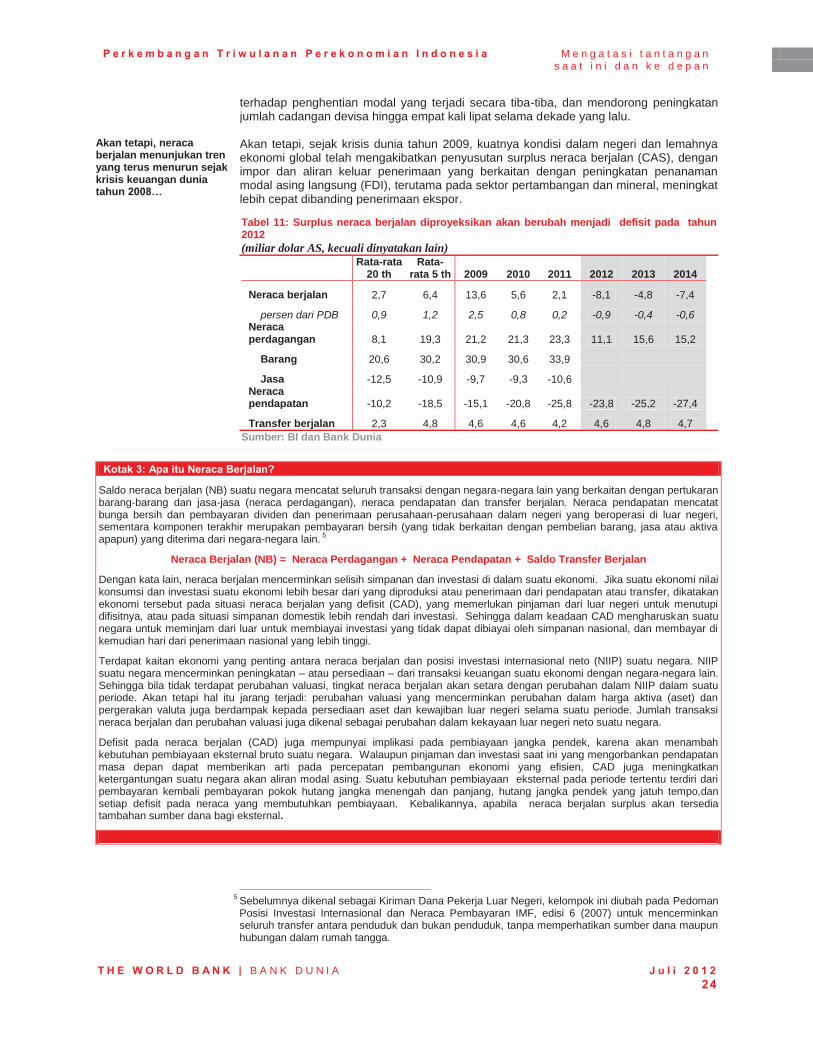
P e r k e m b a n g a n T r i w u l a n a n P e r e k o n o m i a n I n d o n e s i a M e n g a t a s i t a n t a n g a n s a a t i n i d a n k e d e p a n
T H E W O R L D B A N K | B A N K D U N I A J u l i 2 0 1 2 24
terhadap penghentian modal yang terjadi secara tiba-tiba, dan mendorong peningkatan jumlah cadangan devisa hingga empat kali lipat selama dekade yang lalu.
Akan tetapi, neraca berjalan menunjukan tren yang terus menurun sejak krisis keuangan dunia tahun 2008…
Akan tetapi, sejak krisis dunia tahun 2009, kuatnya kondisi dalam negeri dan lemahnya ekonomi global telah mengakibatkan penyusutan surplus neraca berjalan (CAS), dengan impor dan aliran keluar penerimaan yang berkaitan dengan peningkatan penanaman modal asing langsung (FDI), terutama pada sektor pertambangan dan mineral, meningkat lebih cepat dibanding penerimaan ekspor. Tabel 11: Surplus neraca berjalan diproyeksikan akan berubah menjadi defisit pada tahun 2012 (miliar dolar AS, kecuali dinyatakan lain)
Rata-rata
20 th Rata-
rata 5 th 2009 2010 2011 2012 2013 2014
Neraca berjalan 2,7 6,4 13,6 5,6 2,1 -8,1 -4,8 -7,4
persen dari PDB 0,9 1,2 2,5 0,8 0,2 -0,9 -0,4 -0,6 Neraca perdagangan 8,1 19,3 21,2 21,3 23,3 11,1 15,6 15,2
Barang 20,6 30,2 30,9 30,6 33,9
Jasa -12,5 -10,9 -9,7 -9,3 -10,6 Neraca pendapatan -10,2 -18,5 -15,1 -20,8 -25,8 -23,8 -25,2 -27,4
Transfer berjalan 2,3 4,8 4,6 4,6 4,2 4,6 4,8 4,7
Sumber: BI dan Bank Dunia
Kotak 3: Apa itu Neraca Berjalan?
Saldo neraca berjalan (NB) suatu negara mencatat seluruh transaksi dengan negara-negara lain yang berkaitan dengan pertukaran barang-barang dan jasa-jasa (neraca perdagangan), neraca pendapatan dan transfer berjalan. Neraca pendapatan mencatat bunga bersih dan pembayaran dividen dan penerimaan perusahaan-perusahaan dalam negeri yang beroperasi di luar negeri, sementara komponen terakhir merupakan pembayaran bersih (yang tidak berkaitan dengan pembelian barang, jasa atau aktiva apapun) yang diterima dari negara-negara lain. 5
Neraca Berjalan (NB) = Neraca Perdagangan + Neraca Pendapatan + Saldo Transfer Berjalan
Dengan kata lain, neraca berjalan mencerminkan selisih simpanan dan investasi di dalam suatu ekonomi. Jika suatu ekonomi nilai konsumsi dan investasi suatu ekonomi lebih besar dari yang diproduksi atau penerimaan dari pendapatan atau transfer, dikatakan ekonomi tersebut pada situasi neraca berjalan yang defisit (CAD), yang memerlukan pinjaman dari luar negeri untuk menutupi difisitnya, atau pada situasi simpanan domestik lebih rendah dari investasi. Sehingga dalam keadaan CAD mengharuskan suatu negara untuk meminjam dari luar untuk membiayai investasi yang tidak dapat dibiayai oleh simpanan nasional, dan membayar di kemudian hari dari penerimaan nasional yang lebih tinggi.
Terdapat kaitan ekonomi yang penting antara neraca berjalan dan posisi investasi internasional neto (NIIP) suatu negara. NIIP suatu negara mencerminkan peningkatan – atau persediaan – dari transaksi keuangan suatu ekonomi dengan negara-negara lain. Sehingga bila tidak terdapat perubahan valuasi, tingkat neraca berjalan akan setara dengan perubahan dalam NIIP dalam suatu periode. Akan tetapi hal itu jarang terjadi: perubahan valuasi yang mencerminkan perubahan dalam harga aktiva (aset) dan pergerakan valuta juga berdampak kepada persediaan aset dan kewajiban luar negeri selama suatu periode. Jumlah transaksi neraca berjalan dan perubahan valuasi juga dikenal sebagai perubahan dalam kekayaan luar negeri neto suatu negara.
Defisit pada neraca berjalan (CAD) juga mempunyai implikasi pada pembiayaan jangka pendek, karena akan menambah kebutuhan pembiayaan eksternal bruto suatu negara. Walaupun pinjaman dan investasi saat ini yang mengorbankan pendapatan masa depan dapat memberikan arti pada percepatan pembangunan ekonomi yang efisien, CAD juga meningkatkan ketergantungan suatu negara akan aliran modal asing. Suatu kebutuhan pembiayaan eksternal pada periode tertentu terdiri dari pembayaran kembali pembayaran pokok hutang jangka menengah dan panjang, hutang jangka pendek yang jatuh tempo,dan setiap defisit pada neraca yang membutuhkan pembiayaan. Kebalikannya, apabila neraca berjalan surplus akan tersedia tambahan sumber dana bagi eksternal.
5 Sebelumnya dikenal sebagai Kiriman Dana Pekerja Luar Negeri, kelompok ini diubah pada Pedoman Posisi Investasi Internasional dan Neraca Pembayaran IMF, edisi 6 (2007) untuk mencerminkan seluruh transfer antara penduduk dan bukan penduduk, tanpa memperhatikan sumber dana maupun hubungan dalam rumah tangga.
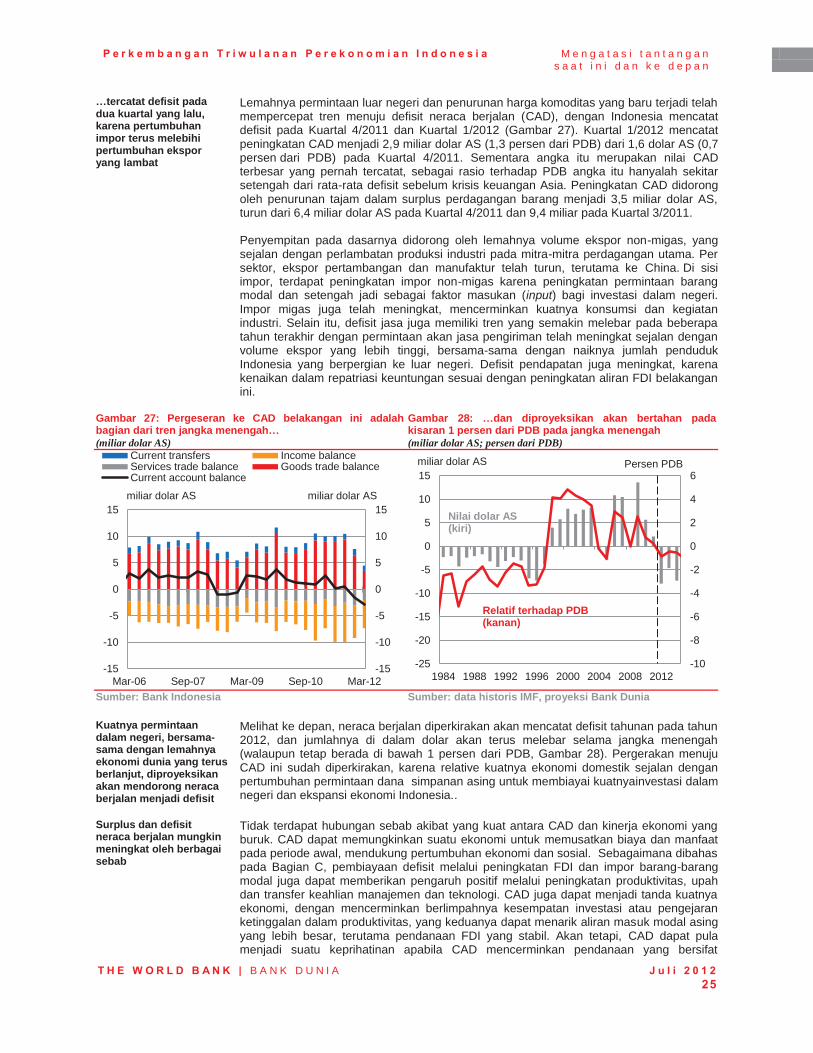
P e r k e m b a n g a n T r i w u l a n a n P e r e k o n o m i a n I n d o n e s i a M e n g a t a s i t a n t a n g a n s a a t i n i d a n k e d e p a n
T H E W O R L D B A N K | B A N K D U N I A J u l i 2 0 1 2 25
…tercatat defisit pada dua kuartal yang lalu, karena pertumbuhan impor terus melebihi pertumbuhan ekspor yang lambat
Lemahnya permintaan luar negeri dan penurunan harga komoditas yang baru terjadi telah mempercepat tren menuju defisit neraca berjalan (CAD), dengan Indonesia mencatat defisit pada Kuartal 4/2011 dan Kuartal 1/2012 (Gambar 27). Kuartal 1/2012 mencatat peningkatan CAD menjadi 2,9 miliar dolar AS (1,3 persen dari PDB) dari 1,6 dolar AS (0,7 persen dari PDB) pada Kuartal 4/2011. Sementara angka itu merupakan nilai CAD terbesar yang pernah tercatat, sebagai rasio terhadap PDB angka itu hanyalah sekitar setengah dari rata-rata defisit sebelum krisis keuangan Asia. Peningkatan CAD didorong oleh penurunan tajam dalam surplus perdagangan barang menjadi 3,5 miliar dolar AS, turun dari 6,4 miliar dolar AS pada Kuartal 4/2011 dan 9,4 miliar pada Kuartal 3/2011. Penyempitan pada dasarnya didorong oleh lemahnya volume ekspor non-migas, yang sejalan dengan perlambatan produksi industri pada mitra-mitra perdagangan utama. Per sektor, ekspor pertambangan dan manufaktur telah turun, terutama ke China. Di sisi impor, terdapat peningkatan impor non-migas karena peningkatan permintaan barang modal dan setengah jadi sebagai faktor masukan (input) bagi investasi dalam negeri. Impor migas juga telah meningkat, mencerminkan kuatnya konsumsi dan kegiatan industri. Selain itu, defisit jasa juga memiliki tren yang semakin melebar pada beberapa tahun terakhir dengan permintaan akan jasa pengiriman telah meningkat sejalan dengan volume ekspor yang lebih tinggi, bersama-sama dengan naiknya jumlah penduduk Indonesia yang berpergian ke luar negeri. Defisit pendapatan juga meningkat, karena kenaikan dalam repatriasi keuntungan sesuai dengan peningkatan aliran FDI belakangan ini.
Gambar 27: Pergeseran ke CAD belakangan ini adalah bagian dari tren jangka menengah… (miliar dolar AS)
Gambar 28: …dan diproyeksikan akan bertahan pada kisaran 1 persen dari PDB pada jangka menengah (miliar dolar AS; persen dari PDB)
Sumber: Bank Indonesia Sumber: data historis IMF, proyeksi Bank Dunia
Kuatnya permintaan dalam negeri, bersama-sama dengan lemahnya ekonomi dunia yang terus berlanjut, diproyeksikan akan mendorong neraca berjalan menjadi defisit
Melihat ke depan, neraca berjalan diperkirakan akan mencatat defisit tahunan pada tahun 2012, dan jumlahnya di dalam dolar akan terus melebar selama jangka menengah (walaupun tetap berada di bawah 1 persen dari PDB, Gambar 28). Pergerakan menuju CAD ini sudah diperkirakan, karena relative kuatnya ekonomi domestik sejalan dengan pertumbuhan permintaan dana simpanan asing untuk membiayai kuatnyainvestasi dalam negeri dan ekspansi ekonomi Indonesia..
Surplus dan defisit neraca berjalan mungkin meningkat oleh berbagai sebab
Tidak terdapat hubungan sebab akibat yang kuat antara CAD dan kinerja ekonomi yang buruk. CAD dapat memungkinkan suatu ekonomi untuk memusatkan biaya dan manfaat pada periode awal, mendukung pertumbuhan ekonomi dan sosial. Sebagaimana dibahas pada Bagian C, pembiayaan defisit melalui peningkatan FDI dan impor barang-barang modal juga dapat memberikan pengaruh positif melalui peningkatan produktivitas, upah dan transfer keahlian manajemen dan teknologi. CAD juga dapat menjadi tanda kuatnya ekonomi, dengan mencerminkan berlimpahnya kesempatan investasi atau pengejaran ketinggalan dalam produktivitas, yang keduanya dapat menarik aliran masuk modal asing yang lebih besar, terutama pendanaan FDI yang stabil. Akan tetapi, CAD dapat pula menjadi suatu keprihatinan apabila CAD mencerminkan pendanaan yang bersifat
-15
-10
-5
0
5
10
15
-15
-10
-5
0
5
10
15
Mar-06 Sep-07 Mar-09 Sep-10 Mar-12
Current transfers Income balanceServices trade balance Goods trade balanceCurrent account balance
miliar dolar AS miliar dolar AS
-10
-8
-6
-4
-2
0
2
4
6
-25
-20
-15
-10
-5
0
5
10
15
1984 1988 1992 1996 2000 2004 2008 2012
Nilai dolar AS (kiri)
Relatif terhadap PDB (kanan)
miliar dolar AS Persen PDB
P e r k e m b a n g a n T r i w u l a n a n P e r e k o n o m i a n I n d o n e s i a M e n g a t a s i t a n t a n g a n s a a t i n i d a n k e d e p a n
T H E W O R L D B A N K | B A N K D U N I A J u l i 2 0 1 2 26
investasi spekulatif yang tidak meningkatkan produktifitas suatu ekonomi dan yang didanai oleh aliran modal jangka pendek yang dapat berhenti secara tiba-tiba. Kebalikannya, surplus neraca berjalan (CAS) dapat menandakan kurangnya kesempatan domestik untuk melakukan investasi yang berkualitas tinggi, yang mendorong penduduknya untuk mengalihkan simpanan mereka ke luar negeri. Hal ini dapat menghilangkan modal ekonomi domestik untuk mendanai pembangunan infrastruktur dan sektor swasta di dalam negeri. Juga perlu dicatat bahwa ekonomi dunia tidak dapat bekerja bila seluruh negara berada pada posisi CAS..
b. Keberlanjutan jangka panjang dan pendanaan dalam waktu singkat CAD yang berkelanjutan merujuk kepada keinginan dan kemampuan suatu ekonomi untuk membayar kembali pinjaman yang ada dan keinginan investor asing untuk memberi pinjaman pada suatu ekonomi…
CAD yang berkelanjutan – kemampuan suatu negara untuk menjalankan kondisi CAD untuk suatu jangka waktu yang lama – memiliki kaitan yang erat dengan kemampuannya untuk membayarkan kembali hutang-hutang luar negerinya melalui surplus perdagangan masa depannya, dan apakah investor asing mau dan dapat memberi pinjaman kepada negara itu untuk mendanai CAD secara jangka pendek. Bagian yang tidak dapat dipisahkan termasuk persepsi investor asing mengenai keinginan dan kemampuan ekonomi tersebut untuk memenuhi dan menyanggupi tanggung jawab hutangnya. Persepsi ini meningkat sesuai dengan kualitas proyek-proyek investasi yang dihasilkan dan lingkup kebijakan ekonomi makro dari negara tersebut. Berkelanjutan juga dapat merujuk pada suatu pengamatan apakah kelanjutan kondisi saat ini menjadi rentan terhadap perubahan kebijakan atau pengaruh gejolak dari eksternal yang akan memerlukan kebijakan penyeimbangan seperti pengetatan moneter atau kebijakan fiskal untuk mengurangi impor. Jika jawabannya adalah ya, maka ketidakseimbangan tersebut adalah tidak berkelanjutan.
Posisi utang luar negeri Indonesia dipandang sebagai berkelanjutan.
Pada akhir tahun 2010, tercatat jumlah investasi internasional Indonesia mencapai USD 422 milyar (dalam bentuk kewajiban), dimana USD 154 milyar adalah saham dari pemodal asing, yang diantaranya USD 133 milar dalam bentuk aset. Pergerakan ke arah CAD diperkirakan akan meningkatkan posisi kewajiban neto Indonesia. Memfokuskan pada kewajiban terhadap utang luar negeri (yang mencapai 27 persen terhadap PDB pada akhir tahun 2011), penilaian berkelanjutan dari laporan IMF Article IV tahun 2011 menyimpulkan bahwa posisi utang luar negeri Indonesia dinilai berkelanjutan untuk jangka menengah. CAD yang relatif melambat diharapkan dapat lebih menyeimbangi keadaan dengan pertumbuhan ekonomi yang relatif tinggi, peningkatan aliran dana yang bersumber dari non-utang (misalnya FDI dan saham) dan dari apresiasi riil lanjutan. Analisa kejutan dari IMF juga menyebutkan bahwa berkelanjutan eksternal berpengaruh kuat dari sebagian besar kejutan-kejutan yang diberikan, dengan ratio utang luar negeri yang diperkirakan menurun dan tetap pada tingkat terkendali di bawah seluruh skenario kejutan standar.
Akan tetapi tetaplah penting untuk memastikan bahwa ekonomi dapat memenuhi kebutuhan pendanaan jangka pendeknya, terutama pada masa-masa tekanan pasar keuangan yang berat
Sebagaimana disebutkan diatas, pergerakan ke arah defisit neraca berjalan (CAD) akan meningkatkan kebutuhan finansial eksternal Indonesia. Akan tetapi, kecenderungannya tetap memiliki kontribusi relatif rendah dari keseluruhan kebutuhan keuangan. Misalnya, selama dua kuartal terakhir dimana Indonesia memiliki CAD, negara menjalankan kewajibannya membayar pokok utang luar negeri yang telah jatuh tempo sebesar USD 32.9 miliar dan USD 39.8 miliar. CAD pada tiap kuartal (USD 1.6 miliar dan USD 2.9 miliar) merupakan bagian kecil dan terbayar oleh aliran masuk neto dana dari non-utang (investasi langsung neto dan aliran masuk saham sejumlah USD 2.6 milyar dan USD 3.0 milyar). Pada skenario dasar (baseline) dengan tetap kuatnya kinerja FDI, situasi ini diharapkan akan berlanjut, walau terjadi pelemahan tajam pada permintaan eksternal dan harga-harga komoditi dan meningkatnya gejolak pasar finansial dapat jelas terlihat akibat outlook ini.
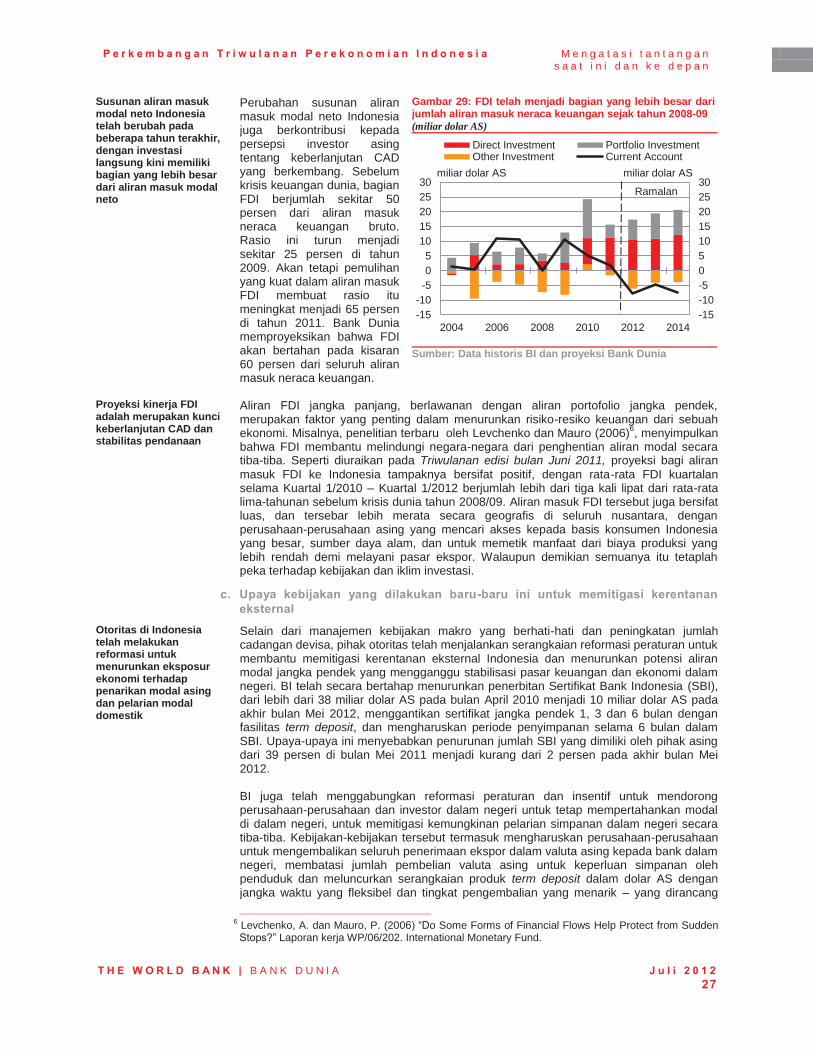
P e r k e m b a n g a n T r i w u l a n a n P e r e k o n o m i a n I n d o n e s i a M e n g a t a s i t a n t a n g a n s a a t i n i d a n k e d e p a n
T H E W O R L D B A N K | B A N K D U N I A J u l i 2 0 1 2 27
Susunan aliran masuk modal neto Indonesia telah berubah pada beberapa tahun terakhir, dengan investasi langsung kini memiliki bagian yang lebih besar dari aliran masuk modal neto
Perubahan susunan aliran masuk modal neto Indonesia juga berkontribusi kepada persepsi investor asing tentang keberlanjutan CAD yang berkembang. Sebelum krisis keuangan dunia, bagian FDI berjumlah sekitar 50 persen dari aliran masuk neraca keuangan bruto. Rasio ini turun menjadi sekitar 25 persen di tahun 2009. Akan tetapi pemulihan yang kuat dalam aliran masuk FDI membuat rasio itu meningkat menjadi 65 persen di tahun 2011. Bank Dunia memproyeksikan bahwa FDI akan bertahan pada kisaran 60 persen dari seluruh aliran masuk neraca keuangan.
Gambar 29: FDI telah menjadi bagian yang lebih besar dari jumlah aliran masuk neraca keuangan sejak tahun 2008-09 (miliar dolar AS)
Sumber: Data historis BI dan proyeksi Bank Dunia
Proyeksi kinerja FDI adalah merupakan kunci keberlanjutan CAD dan stabilitas pendanaan
Aliran FDI jangka panjang, berlawanan dengan aliran portofolio jangka pendek, merupakan faktor yang penting dalam menurunkan risiko-resiko keuangan dari sebuah ekonomi. Misalnya, penelitian terbaru oleh Levchenko dan Mauro (2006)6, menyimpulkan bahwa FDI membantu melindungi negara-negara dari penghentian aliran modal secara tiba-tiba. Seperti diuraikan pada Triwulanan edisi bulan Juni 2011, proyeksi bagi aliran masuk FDI ke Indonesia tampaknya bersifat positif, dengan rata-rata FDI kuartalan selama Kuartal 1/2010 – Kuartal 1/2012 berjumlah lebih dari tiga kali lipat dari rata-rata lima-tahunan sebelum krisis dunia tahun 2008/09. Aliran masuk FDI tersebut juga bersifat luas, dan tersebar lebih merata secara geografis di seluruh nusantara, dengan perusahaan-perusahaan asing yang mencari akses kepada basis konsumen Indonesia yang besar, sumber daya alam, dan untuk memetik manfaat dari biaya produksi yang lebih rendah demi melayani pasar ekspor. Walaupun demikian semuanya itu tetaplah peka terhadap kebijakan dan iklim investasi.
c. Upaya kebijakan yang dilakukan baru-baru ini untuk memitigasi kerentanan eksternal
Otoritas di Indonesia telah melakukan reformasi untuk menurunkan eksposur ekonomi terhadap penarikan modal asing dan pelarian modal domestik
Selain dari manajemen kebijakan makro yang berhati-hati dan peningkatan jumlah cadangan devisa, pihak otoritas telah menjalankan serangkaian reformasi peraturan untuk membantu memitigasi kerentanan eksternal Indonesia dan menurunkan potensi aliran modal jangka pendek yang mengganggu stabilisasi pasar keuangan dan ekonomi dalam negeri. BI telah secara bertahap menurunkan penerbitan Sertifikat Bank Indonesia (SBI), dari lebih dari 38 miliar dolar AS pada bulan April 2010 menjadi 10 miliar dolar AS pada akhir bulan Mei 2012, menggantikan sertifikat jangka pendek 1, 3 dan 6 bulan dengan fasilitas term deposit, dan mengharuskan periode penyimpanan selama 6 bulan dalam SBI. Upaya-upaya ini menyebabkan penurunan jumlah SBI yang dimiliki oleh pihak asing dari 39 persen di bulan Mei 2011 menjadi kurang dari 2 persen pada akhir bulan Mei 2012. BI juga telah menggabungkan reformasi peraturan dan insentif untuk mendorong perusahaan-perusahaan dan investor dalam negeri untuk tetap mempertahankan modal di dalam negeri, untuk memitigasi kemungkinan pelarian simpanan dalam negeri secara tiba-tiba. Kebijakan-kebijakan tersebut termasuk mengharuskan perusahaan-perusahaan untuk mengembalikan seluruh penerimaan ekspor dalam valuta asing kepada bank dalam negeri, membatasi jumlah pembelian valuta asing untuk keperluan simpanan oleh penduduk dan meluncurkan serangkaian produk term deposit dalam dolar AS dengan jangka waktu yang fleksibel dan tingkat pengembalian yang menarik – yang dirancang
6 Levchenko, A. dan Mauro, P. (2006) “Do Some Forms of Financial Flows Help Protect from Sudden Stops?” Laporan kerja WP/06/202. International Monetary Fund.
-15-10-5051015202530
-15-10-505
1015202530
2004 2006 2008 2010 2012 2014
Direct Investment Portfolio InvestmentOther Investment Current Account
miliar dolar AS miliar dolar AS
Ramalan
P e r k e m b a n g a n T r i w u l a n a n P e r e k o n o m i a n I n d o n e s i a M e n g a t a s i t a n t a n g a n s a a t i n i d a n k e d e p a n
T H E W O R L D B A N K | B A N K D U N I A J u l i 2 0 1 2 28
untuk memperdalam pasar dolar AS di dalam negeri, menurunkan gejolak aliran modal jangka pendek dan menambah simpanan cadangan devisa Indonesia. Pada sisi fiskal, Pemerintah telah meningkatkan persiapan menghadapi krisis dengan peningkatan koordinasi melalui Protokol Pengelolaan Krisis, dan juga menambah penyangga fiskal secara signifikan pada APBN tahun 2012, yang termasuk: kerangka untuk mendukung harga obligasi dalam negeri; dan rencana kontingensi untuk mendukung tanggapan pemerintah yang cepat terhadap keadaan krisis atau darurat.7
Pendanaan CAD yang berkelanjutan membutuhkan aliran masuk investasi jangka panjang yang stabil, yang dapat didukung oleh kebijakan untuk meningkatkan iklim investasi dan mendorong daya saing
Kebijakan-kebijakan untuk menurunkan kebergantungan ekonomi terhadap aliran modal yang mudah berubah arah dan meningkatkan investasi asing jangka panjang yang stabil merupakan hal yang penting untuk meningkatkan kapasitas negara untuk memenuhi kebutuhan pendanaan eksternal jangka pendek dan menengah. Sementara penyusun kebijakan di Indonesia tidak dapat mengendalikan ‘faktor-faktor” internasional, seperti tingkat bunga dan pertumbuhan pada negara maju, dibalik aliran dana asing, pihak otoritas dapat membantu memberikan lingkungan dalam negeri yang kondusif bagi dunia usaha dan investasi dengan menempatkan kebijakan-kebijakan untuk mendorong iklim investasi yang stabil dan terbuka dan meningkatkan daya saing sektor swasta.
Kebijakan yang konsistensi dan komunikasi juga merupakan hal yang sangat penting dalam menarik investasi asing berjangka panjang dan untuk mengurangi gejolak aliran dana jangka pendek.Sangatlah penting bagi Pemerintah untuk mengelola perubahan kebijakan untuk menghindari ketidakpastian atau kerancuan dalam lingkungan kebijakan, dan melakukan pertimbangan untuk implikasi jangka panjang dan jangka pendek dari suatu kebijakan. Dalam hal ini, pengumuman kebijakan yang baru dilakukan tentang pembatasan perdagangan, tarif ekspor dan batas kepemilikan pada sektor perbankan dan tambang telah meningkatkan ketidakpastian dan mempengaruhi tingkat kepercayaan investor.
d. Komentar penutup Perpindahan Indonesia ke CAD mencerminkan secara relatif kuatnya kondisi ekonomi di dalam negeri di tengah ketidakpastian lingkungkan internasional. Untuk itu sangat penting terus memonitor perkembanganya dengan seksama, khususnya yang berkaitan dengan pembiayaan eksternal jangka pendek
Secara keseluruhan, seperti telah dibahas pada bagian A, proyeksi dasar (baseline) ekonomi Indonesia masih tetap kokoh, walaupun risiko penurunan tetap tinggi. Kuatnya pertumbuhan dalam negeri dan lemahnya pengaruh luar negeri secara bertahap mendorong Indonesia menuju CAD – suatu perkembangan yang umum dialami oleh ekonomi berkembang yang bertumbuh dengan pesat dengan kebutuhan investasi yang tinggi dan simpanan dalam negeri yang rendah. Proyeksi-proyeksi dasar bagi Indonesia adalah penarikan aliran masuk modal jangka panjang yang tidak dibebani bunga, seperti FDI, untuk mendukung CAD pada tahun-tahun ke depan. Walaupun sentimen investor tetaplah sensitif terhadap kejutan berbaliknya harga komoditi yang dapat memperlebar CAD dan gejolak pasar dunia lanjutan yang dapat menambah tekanan keuangan. Dalam hal ini, perubahan kebijakan yang baru dilakukan untuk menurunkan eksposur Indonesia terhadap aliran keluar modal yang mudah berubah arah disambut dengan baik, sebagaimana kebijakan diarahkan untuk meningkatkan bidang-bidang seperti infrastruktur. Kurang jelas atau tidak konsistennya peraturan perdagangan dan investasi, dapat mengurangi kepercayaan investor yang berpotensial memberikan dampak pada aliran FDI portfolio jangka pendek dan panjang. Pada situasi lingkungan internasional yang rentan tersebut memonitor faktor pendorong CAD dan sumber-sumber pendanaan eksternal jangka pendek Indonesia dapat berperanan penting pada identifikasi awal pada dinamika yang mungkin timbul akibat tekanan pembiayaan pada kedua pembiayaan jangka panjang dan jangka pendek
7 Sebagai contoh, UU APBN tahun 2012 memberikan dasar hukum kepada Pemerintah untuk meminta persetujuan DPR dalam waktu 24 jam setelah penyerahan, demi menanggapi suatu peristiwa darurat, seperti yang diuraikan di dalam UU tersebut.
P e r k e m b a n g a n T r i w u l a n a n P e r e k o n o m i a n I n d o n e s i a M e n g a t a s i t a n t a n g a n s a a t i n i d a n k e d e p a n
T H E W O R L D B A N K | B A N K D U N I A J u l i 2 0 1 2 29
2. Identifikasi hambatan dalam pelaksanaan anggaran di sektor infrastruktur
Pelaksanaan anggaran yang tepat waktu serta Manajemen Keuangan Publik yang lebih baik adalah hal penting dalam penyediaan layanan publik dan pencapaian hasil pembangunan
Pelaksanaan anggaran yang tepat waktu serta Manajemen Keuangan Publik yang lebih baik adalah kunci penting dalam mewujudkan target dan hasil pembangunan. Dalam halnya Indonesia, memperbaiki pelaksanaan anggaran adalah salah satu hal yang sangat penting mengingat bahwa peningkatan alokasi anggaran yang cukup signifikan telah terjadi pada sektor utama infrastruktur dalam menjawab permasalahan infrastruktur. Pelaksanaan anggaran yang tepat waktu juga salah satu hal yang penting selama terjadinya kelesuan ekonomi karena kebijakan pengeluaran keuangan merupakan salah satu alat countercyclical yang dapat digunakan sebagai suntikan bagi perekonomian dari sisi permintaan. Oleh karena itu, dengan memahami berbagai tantangan dan hambatan yang dihadapi dalam pelaksanaan anggaran maka akan dapat membantu para pengambil keputusan untuk menjadi lebih baik dalam menyiapkan dan menanggapi berbagai guncangan yang mungkin terjadi, seperti faktor lingkungan eksternal yang memburuk. Berdasarkan analisis terkini, bagian ini akan membahas isu-isu utama dalam pelaksanaan anggaran oleh pemerintah pusat serta pilihan-pilihan kebijakan untuk mengatasi permasalahan tersebut8. Studi ini dilaksanakan melalui analisis terhadap tiga puluh enam DIPA (Daftar Isian Pelaksanaan Anggaran) yang dipilih sebagai sampel dari sektor infrastruktur dalam setiap tahapan pelaksanaan anggaran (persiapan anggaran, pengadaan, dan pelaksanaan). Selain itu, studi ini mengidentifikasi faktor-faktor yang mengakibatkan adanya celah antara perencanaan dan pelaksanaan. Untuk itu, studi ini dilakukan di empat provinsi sampel melalui pengumpulan data dan informasi, wawancara yang mendalam, dan diskusi kelompok terfokus (FGD) kepada para pemangku kepentingan diantaranya Satker, KPPN, dan para kontraktor. Tujuan studi ini adalah untuk mengidentifikasi faktor-faktor yang menghambat pelaksanaan anggaran di tahun 2010 serta menilai keefektivan reformasi yang telah berjalan dalam mengatasi permasalahan tersebut.
Pelaksanaan anggaran di sektor infrastruktur masih menjadi tantangan bagi pembangunan di Indonesia
Rendahnya pencairan anggaran di tahun 2010 dan 2011 menunjukkan masih adanya hambatan pelaksanaan anggaran. Pada tahun 2010, seluruh sector utama infrastruktur menunjukkan realisasi pengeluaran yang lebih rendah dari yang telah dianggarkan. Di tahun 2010 dan 2011, realisasi belanja modal APBN-P lebih rendah dari 85 persen, walaupun terdapat peningkatan belanja modal secara nominal sebesar 44 persen antara tahun 2010 dan 2011. Sebagaian besar kenaikan anggaran dialokasian kepada sektor-sektor utama infrastruktur (Gambar 30 dan Gambar 31). Selain itu, lebih dari 50 persen dari keseluruhan pencairan terjadi pada triwulan terakhir dari kedua tahun tersebut. Lambatnya dan rendahnya pola pencairan ini ada kemungkinan akan terjadi lagi pada tahun 2012. Pada paruh pertama 2012, pencairan pengeluaran modal hanya sedikit lebih baik tetapi masih rendah sebesar 18 persen dari total alokasi anggaran keseluruhan (lihat IEQ Bagian A). (Untuk analisis profil pencairan pengeluaran pemerintah Negara-negara lain dapat dilihat pada publikasi IEQ Desember 2011).
Pemerintah telah meluncurkan sejumlah upaya untuk mempercepat kinerja pelaksanaan APBN
Pemerintah baru-baru ini telah membentuk suatu satuan tugas yang dikenal sebagai TEPPA (Tim Evaluasi dan Pengawasan Penyerapan Anggaran) untuk memantau dan membuka simpul-simpul (de-bottlenecking) masalah yang menghambat penyerapan anggaran tahun ini. TEPPA dipimpin oleh UKP4, dengan Wakil Ketua Wakil Menteri Keuangan dan Ketua BPKP. Pemerintah juga telah melaksanakan beberapa upaya kebijakan, termasuk menyederhanakan proses penyusunan dan pembayaran anggaran, penerapan peraturan pengadaan yang baru (Perpres No. 54/2010), dan penerapan pedoman pelaksanaan anggaran (Perpres No. 53/2010, amandemen kedua dari Keppres No. 42/2002), yang memberikan keleluasaan bagi pengangkatan pejabat Satker (satuan kerja).
8 Bagian ini diambil dari publikasi bersama antara Badan Kebijakan Fiskal, Kementerian Keaungan, LPEM-UI, dan Bank Dunia, Studi Penelusuran DIPA: Identifiaksi Hambatan dalam Pelaksanaan Anggaran di Sektor Infrastruktur
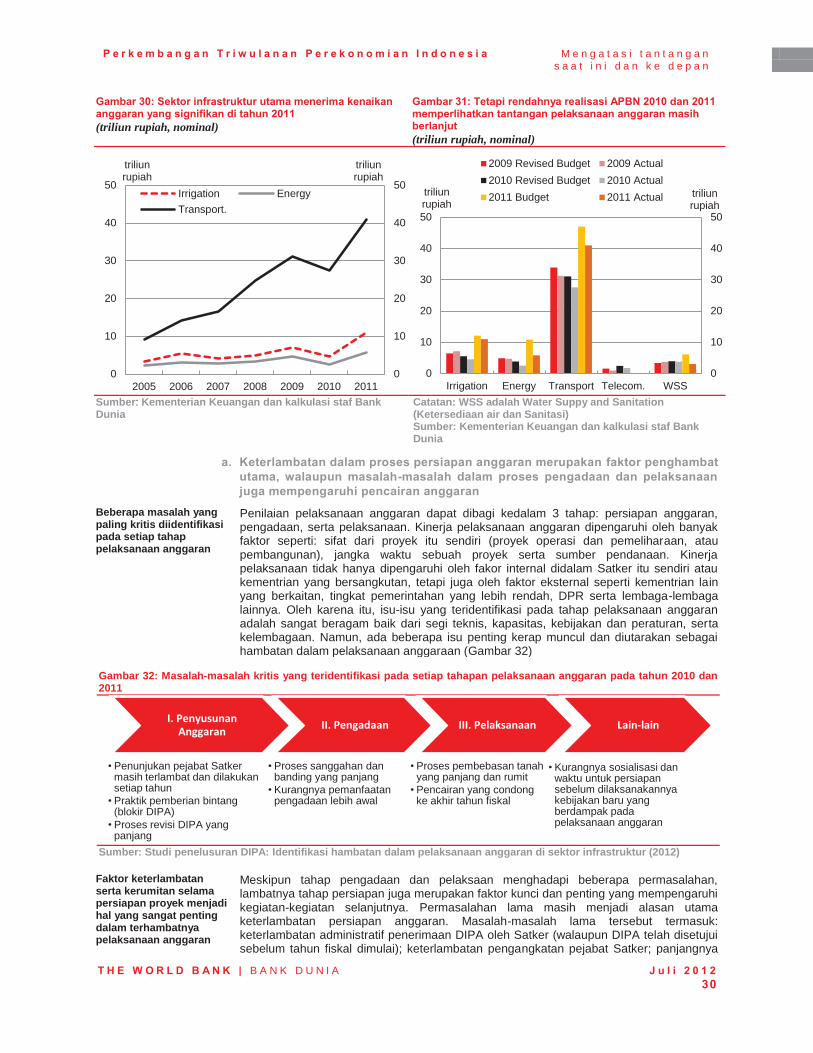
P e r k e m b a n g a n T r i w u l a n a n P e r e k o n o m i a n I n d o n e s i a M e n g a t a s i t a n t a n g a n s a a t i n i d a n k e d e p a n
T H E W O R L D B A N K | B A N K D U N I A J u l i 2 0 1 2 30
Gambar 30: Sektor infrastruktur utama menerima kenaikan anggaran yang signifikan di tahun 2011 (triliun rupiah, nominal)
Gambar 31: Tetapi rendahnya realisasi APBN 2010 dan 2011 memperlihatkan tantangan pelaksanaan anggaran masih berlanjut (triliun rupiah, nominal)
Sumber: Kementerian Keuangan dan kalkulasi staf Bank Dunia
Catatan: WSS adalah Water Suppy and Sanitation (Ketersediaan air dan Sanitasi) Sumber: Kementerian Keuangan dan kalkulasi staf Bank Dunia
a. Keterlambatan dalam proses persiapan anggaran merupakan faktor penghambat utama, walaupun masalah-masalah dalam proses pengadaan dan pelaksanaan juga mempengaruhi pencairan anggaran
Beberapa masalah yang paling kritis diidentifikasi pada setiap tahap pelaksanaan anggaran
Penilaian pelaksanaan anggaran dapat dibagi kedalam 3 tahap: persiapan anggaran, pengadaan, serta pelaksanaan. Kinerja pelaksanaan anggaran dipengaruhi oleh banyak faktor seperti: sifat dari proyek itu sendiri (proyek operasi dan pemeliharaan, atau pembangunan), jangka waktu sebuah proyek serta sumber pendanaan. Kinerja pelaksanaan tidak hanya dipengaruhi oleh fakor internal didalam Satker itu sendiri atau kementrian yang bersangkutan, tetapi juga oleh faktor eksternal seperti kementrian lain yang berkaitan, tingkat pemerintahan yang lebih rendah, DPR serta lembaga-lembaga lainnya. Oleh karena itu, isu-isu yang teridentifikasi pada tahap pelaksanaan anggaran adalah sangat beragam baik dari segi teknis, kapasitas, kebijakan dan peraturan, serta kelembagaan. Namun, ada beberapa isu penting kerap muncul dan diutarakan sebagai hambatan dalam pelaksanaan anggaraan (Gambar 32)
Gambar 32: Masalah-masalah kritis yang teridentifikasi pada setiap tahapan pelaksanaan anggaran pada tahun 2010 dan 2011
Sumber: Studi penelusuran DIPA: Identifikasi hambatan dalam pelaksanaan anggaran di sektor infrastruktur (2012)
Faktor keterlambatan serta kerumitan selama persiapan proyek menjadi hal yang sangat penting dalam terhambatnya pelaksanaan anggaran
Meskipun tahap pengadaan dan pelaksaan menghadapi beberapa permasalahan, lambatnya tahap persiapan juga merupakan faktor kunci dan penting yang mempengaruhi kegiatan-kegiatan selanjutnya. Permasalahan lama masih menjadi alasan utama keterlambatan persiapan anggaran. Masalah-masalah lama tersebut termasuk: keterlambatan administratif penerimaan DIPA oleh Satker (walaupun DIPA telah disetujui sebelum tahun fiskal dimulai); keterlambatan pengangkatan pejabat Satker; panjangnya
0
10
20
30
40
50
0
10
20
30
40
50
2005 2006 2007 2008 2009 2010 2011
triliun rupiah
triliun rupiah
Irrigation EnergyTransport.
0
10
20
30
40
50
0
10
20
30
40
50
Irrigation Energy Transport Telecom. WSS
triliun rupiah
triliun rupiah
2009 Revised Budget 2009 Actual2010 Revised Budget 2010 Actual2011 Budget 2011 Actual
I. Penyusunan Anggaran
• Penunjukan pejabat Satker masih terlambat dan dilakukan setiap tahun
• Praktik pemberian bintang (blokir DIPA)
• Proses revisi DIPA yang panjang
II. Pengadaan
• Proses sanggahan dan banding yang panjang
• Kurangnya pemanfaatan pengadaan lebih awal
III. Pelaksanaan
• Proses pembebasan tanah yang panjang dan rumit
• Pencairan yang condong ke akhir tahun fiskal
Lain-lain
• Kurangnya sosialisasi dan waktu untuk persiapan sebelum dilaksanakannya kebijakan baru yang berdampak pada pelaksanaan anggaran
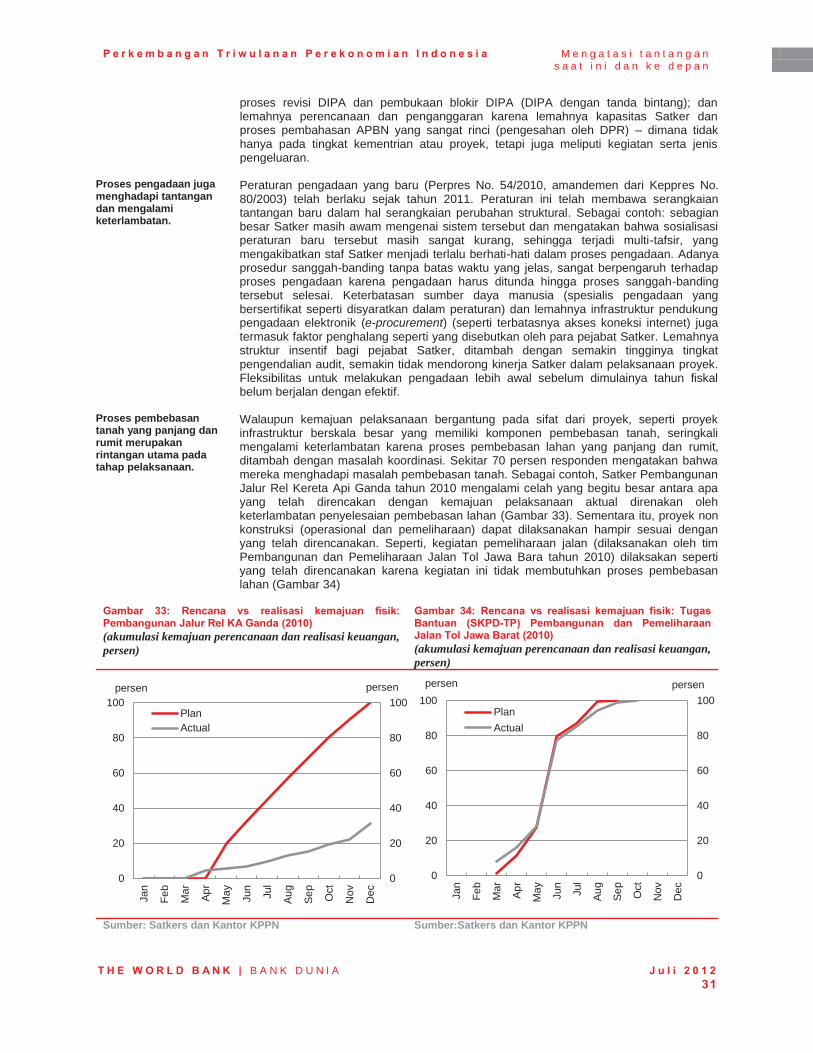
P e r k e m b a n g a n T r i w u l a n a n P e r e k o n o m i a n I n d o n e s i a M e n g a t a s i t a n t a n g a n s a a t i n i d a n k e d e p a n
T H E W O R L D B A N K | B A N K D U N I A J u l i 2 0 1 2 31
proses revisi DIPA dan pembukaan blokir DIPA (DIPA dengan tanda bintang); dan lemahnya perencanaan dan penganggaran karena lemahnya kapasitas Satker dan proses pembahasan APBN yang sangat rinci (pengesahan oleh DPR) – dimana tidak hanya pada tingkat kementrian atau proyek, tetapi juga meliputi kegiatan serta jenis pengeluaran.
Proses pengadaan juga menghadapi tantangan dan mengalami keterlambatan.
Peraturan pengadaan yang baru (Perpres No. 54/2010, amandemen dari Keppres No. 80/2003) telah berlaku sejak tahun 2011. Peraturan ini telah membawa serangkaian tantangan baru dalam hal serangkaian perubahan struktural. Sebagai contoh: sebagian besar Satker masih awam mengenai sistem tersebut dan mengatakan bahwa sosialisasi peraturan baru tersebut masih sangat kurang, sehingga terjadi multi-tafsir, yang mengakibatkan staf Satker menjadi terlalu berhati-hati dalam proses pengadaan. Adanya prosedur sanggah-banding tanpa batas waktu yang jelas, sangat berpengaruh terhadap proses pengadaan karena pengadaan harus ditunda hingga proses sanggah-banding tersebut selesai. Keterbatasan sumber daya manusia (spesialis pengadaan yang bersertifikat seperti disyaratkan dalam peraturan) dan lemahnya infrastruktur pendukung pengadaan elektronik (e-procurement) (seperti terbatasnya akses koneksi internet) juga termasuk faktor penghalang seperti yang disebutkan oleh para pejabat Satker. Lemahnya struktur insentif bagi pejabat Satker, ditambah dengan semakin tingginya tingkat pengendalian audit, semakin tidak mendorong kinerja Satker dalam pelaksanaan proyek. Fleksibilitas untuk melakukan pengadaan lebih awal sebelum dimulainya tahun fiskal belum berjalan dengan efektif.
Proses pembebasan tanah yang panjang dan rumit merupakan rintangan utama pada tahap pelaksanaan.
Walaupun kemajuan pelaksanaan bergantung pada sifat dari proyek, seperti proyek infrastruktur berskala besar yang memiliki komponen pembebasan tanah, seringkali mengalami keterlambatan karena proses pembebasan lahan yang panjang dan rumit, ditambah dengan masalah koordinasi. Sekitar 70 persen responden mengatakan bahwa mereka menghadapi masalah pembebasan tanah. Sebagai contoh, Satker Pembangunan Jalur Rel Kereta Api Ganda tahun 2010 mengalami celah yang begitu besar antara apa yang telah direncakan dengan kemajuan pelaksanaan aktual direnakan oleh keterlambatan penyelesaian pembebasan lahan (Gambar 33). Sementara itu, proyek non konstruksi (operasional dan pemeliharaan) dapat dilaksanakan hampir sesuai dengan yang telah direncanakan. Seperti, kegiatan pemeliharaan jalan (dilaksanakan oleh tim Pembangunan dan Pemeliharaan Jalan Tol Jawa Bara tahun 2010) dilaksakan seperti yang telah direncanakan karena kegiatan ini tidak membutuhkan proses pembebasan lahan (Gambar 34)
Gambar 33: Rencana vs realisasi kemajuan fisik: Pembangunan Jalur Rel KA Ganda (2010) (akumulasi kemajuan perencanaan dan realisasi keuangan, persen)
Gambar 34: Rencana vs realisasi kemajuan fisik: Tugas Bantuan (SKPD-TP) Pembangunan dan Pemeliharaan Jalan Tol Jawa Barat (2010) (akumulasi kemajuan perencanaan dan realisasi keuangan, persen)
Sumber: Satkers dan Kantor KPPN Sumber:Satkers dan Kantor KPPN
0
20
40
60
80
100
0
20
40
60
80
100
Jan
Feb
Mar Ap
r
May Jun
Jul
Aug
Sep
Oct
Nov
Dec
persen persen
PlanActual
0
20
40
60
80
100
0
20
40
60
80
100
Jan
Feb
Mar
Apr
May Jun
Jul
Aug
Sep
Oct
Nov
Dec
persen persen
PlanActual
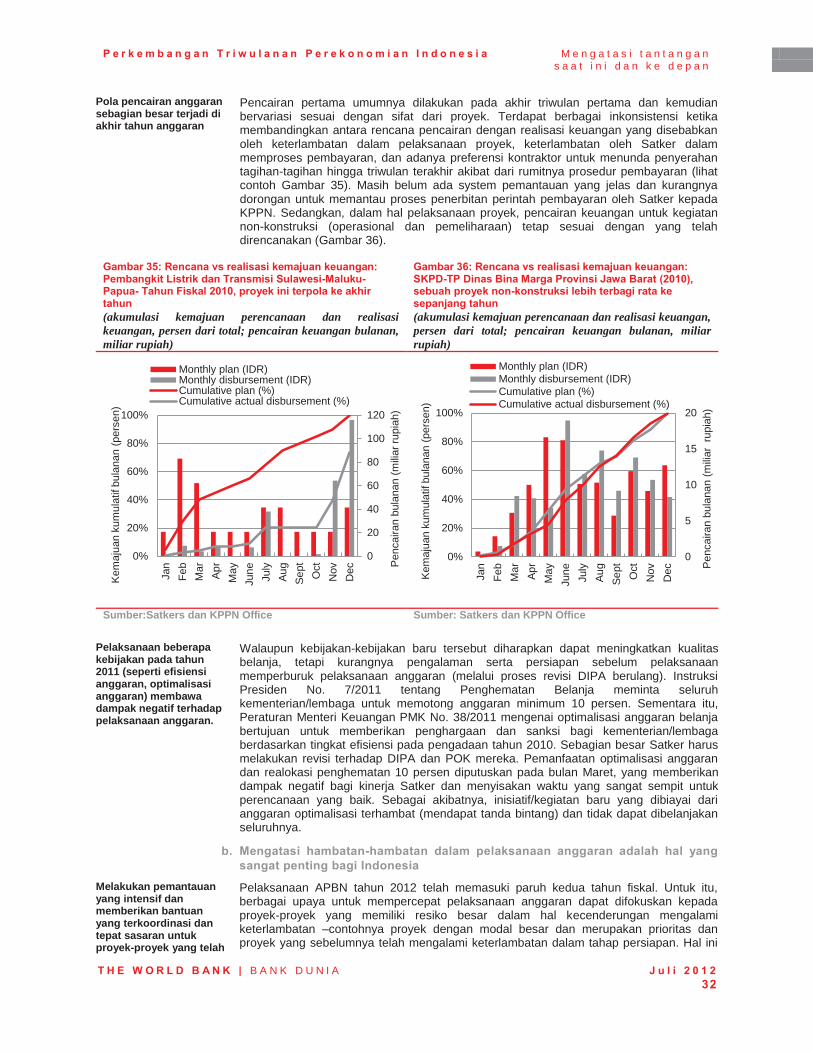
P e r k e m b a n g a n T r i w u l a n a n P e r e k o n o m i a n I n d o n e s i a M e n g a t a s i t a n t a n g a n s a a t i n i d a n k e d e p a n
T H E W O R L D B A N K | B A N K D U N I A J u l i 2 0 1 2 32
Pola pencairan anggaran sebagian besar terjadi di akhir tahun anggaran
Pencairan pertama umumnya dilakukan pada akhir triwulan pertama dan kemudian bervariasi sesuai dengan sifat dari proyek. Terdapat berbagai inkonsistensi ketika membandingkan antara rencana pencairan dengan realisasi keuangan yang disebabkan oleh keterlambatan dalam pelaksanaan proyek, keterlambatan oleh Satker dalam memproses pembayaran, dan adanya preferensi kontraktor untuk menunda penyerahan tagihan-tagihan hingga triwulan terakhir akibat dari rumitnya prosedur pembayaran (lihat contoh Gambar 35). Masih belum ada system pemantauan yang jelas dan kurangnya dorongan untuk memantau proses penerbitan perintah pembayaran oleh Satker kepada KPPN. Sedangkan, dalam hal pelaksanaan proyek, pencairan keuangan untuk kegiatan non-konstruksi (operasional dan pemeliharaan) tetap sesuai dengan yang telah direncanakan (Gambar 36).
Gambar 35: Rencana vs realisasi kemajuan keuangan: Pembangkit Listrik dan Transmisi Sulawesi-Maluku-Papua- Tahun Fiskal 2010, proyek ini terpola ke akhir tahun (akumulasi kemajuan perencanaan dan realisasi keuangan, persen dari total; pencairan keuangan bulanan, miliar rupiah)
Gambar 36: Rencana vs realisasi kemajuan keuangan: SKPD-TP Dinas Bina Marga Provinsi Jawa Barat (2010), sebuah proyek non-konstruksi lebih terbagi rata ke sepanjang tahun (akumulasi kemajuan perencanaan dan realisasi keuangan, persen dari total; pencairan keuangan bulanan, miliar rupiah)
Sumber:Satkers dan KPPN Office Sumber: Satkers dan KPPN Office
Pelaksanaan beberapa kebijakan pada tahun 2011 (seperti efisiensi anggaran, optimalisasi anggaran) membawa dampak negatif terhadap pelaksanaan anggaran.
Walaupun kebijakan-kebijakan baru tersebut diharapkan dapat meningkatkan kualitas belanja, tetapi kurangnya pengalaman serta persiapan sebelum pelaksanaan memperburuk pelaksanaan anggaran (melalui proses revisi DIPA berulang). Instruksi Presiden No. 7/2011 tentang Penghematan Belanja meminta seluruh kementerian/lembaga untuk memotong anggaran minimum 10 persen. Sementara itu, Peraturan Menteri Keuangan PMK No. 38/2011 mengenai optimalisasi anggaran belanja bertujuan untuk memberikan penghargaan dan sanksi bagi kementerian/lembaga berdasarkan tingkat efisiensi pada pengadaan tahun 2010. Sebagian besar Satker harus melakukan revisi terhadap DIPA dan POK mereka. Pemanfaatan optimalisasi anggaran dan realokasi penghematan 10 persen diputuskan pada bulan Maret, yang memberikan dampak negatif bagi kinerja Satker dan menyisakan waktu yang sangat sempit untuk perencanaan yang baik. Sebagai akibatnya, inisiatif/kegiatan baru yang dibiayai dari anggaran optimalisasi terhambat (mendapat tanda bintang) dan tidak dapat dibelanjakan seluruhnya.
b. Mengatasi hambatan-hambatan dalam pelaksanaan anggaran adalah hal yang sangat penting bagi Indonesia
Melakukan pemantauan yang intensif dan memberikan bantuan yang terkoordinasi dan tepat sasaran untuk proyek-proyek yang telah
Pelaksanaan APBN tahun 2012 telah memasuki paruh kedua tahun fiskal. Untuk itu, berbagai upaya untuk mempercepat pelaksanaan anggaran dapat difokuskan kepada proyek-proyek yang memiliki resiko besar dalam hal kecenderungan mengalami keterlambatan –contohnya proyek dengan modal besar dan merupakan prioritas dan proyek yang sebelumnya telah mengalami keterlambatan dalam tahap persiapan. Hal ini
0
20
40
60
80
100
120
0%
20%
40%
60%
80%
100%
Jan
Feb
Mar
Apr
May
June July
Aug
Sept
Oct
Nov
Dec Pe
ncai
ran
bula
nan
(milia
r rup
iah)
Kem
ajua
n ku
mul
atif
bula
nan
(per
sen)
Monthly plan (IDR)Monthly disbursement (IDR)Cumulative plan (%)Cumulative actual disbursement (%)
0
5
10
15
20
0%
20%
40%
60%
80%
100%
Jan
Feb
Mar
Apr
May
June July
Aug
Sept
Oct
Nov
Dec P
enca
iran
bula
nan
(milia
r ru
piah
)
Kem
ajua
n ku
mul
atif
bula
nan
(per
sen)
Monthly plan (IDR)Monthly disbursement (IDR)Cumulative plan (%)Cumulative actual disbursement (%)
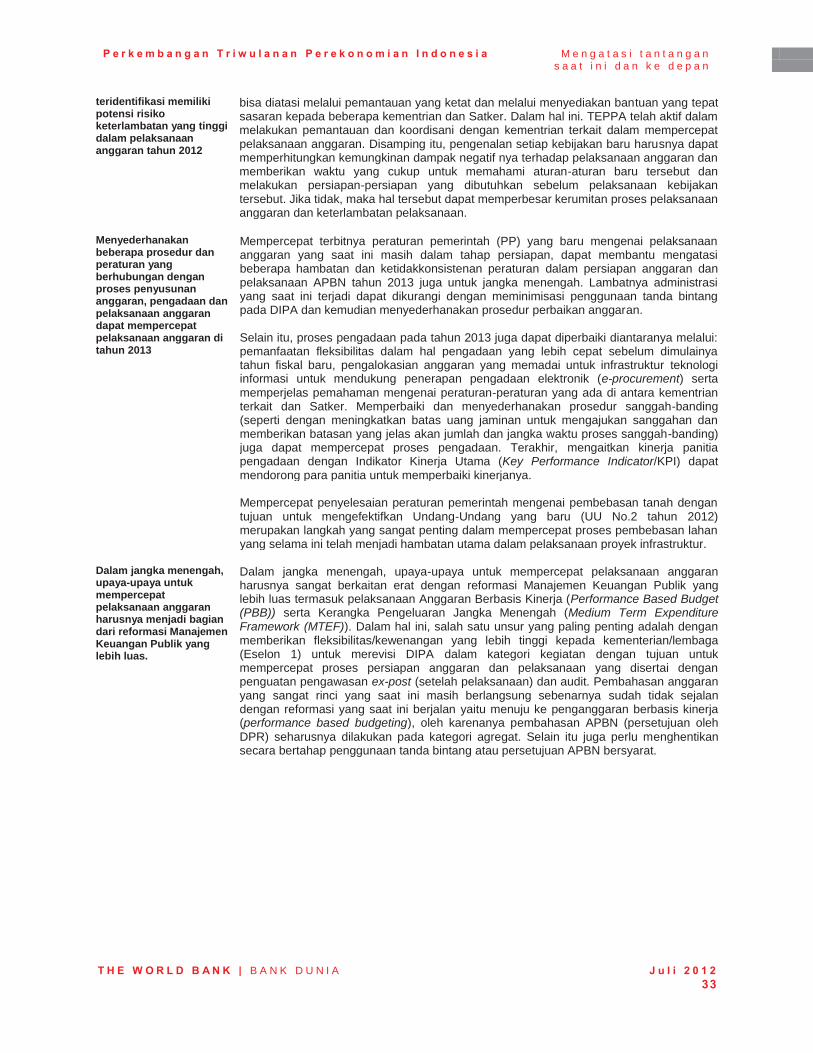
P e r k e m b a n g a n T r i w u l a n a n P e r e k o n o m i a n I n d o n e s i a M e n g a t a s i t a n t a n g a n s a a t i n i d a n k e d e p a n
T H E W O R L D B A N K | B A N K D U N I A J u l i 2 0 1 2 33
teridentifikasi memiliki potensi risiko keterlambatan yang tinggi dalam pelaksanaan anggaran tahun 2012
bisa diatasi melalui pemantauan yang ketat dan melalui menyediakan bantuan yang tepat sasaran kepada beberapa kementrian dan Satker. Dalam hal ini. TEPPA telah aktif dalam melakukan pemantauan dan koordisani dengan kementrian terkait dalam mempercepat pelaksanaan anggaran. Disamping itu, pengenalan setiap kebijakan baru harusnya dapat memperhitungkan kemungkinan dampak negatif nya terhadap pelaksanaan anggaran dan memberikan waktu yang cukup untuk memahami aturan-aturan baru tersebut dan melakukan persiapan-persiapan yang dibutuhkan sebelum pelaksanaan kebijakan tersebut. Jika tidak, maka hal tersebut dapat memperbesar kerumitan proses pelaksanaan anggaran dan keterlambatan pelaksanaan.
Menyederhanakan beberapa prosedur dan peraturan yang berhubungan dengan proses penyusunan anggaran, pengadaan dan pelaksanaan anggaran dapat mempercepat pelaksanaan anggaran di tahun 2013
Mempercepat terbitnya peraturan pemerintah (PP) yang baru mengenai pelaksanaan anggaran yang saat ini masih dalam tahap persiapan, dapat membantu mengatasi beberapa hambatan dan ketidakkonsistenan peraturan dalam persiapan anggaran dan pelaksanaan APBN tahun 2013 juga untuk jangka menengah. Lambatnya administrasi yang saat ini terjadi dapat dikurangi dengan meminimisasi penggunaan tanda bintang pada DIPA dan kemudian menyederhanakan prosedur perbaikan anggaran. Selain itu, proses pengadaan pada tahun 2013 juga dapat diperbaiki diantaranya melalui: pemanfaatan fleksibilitas dalam hal pengadaan yang lebih cepat sebelum dimulainya tahun fiskal baru, pengalokasian anggaran yang memadai untuk infrastruktur teknologi informasi untuk mendukung penerapan pengadaan elektronik (e-procurement) serta memperjelas pemahaman mengenai peraturan-peraturan yang ada di antara kementrian terkait dan Satker. Memperbaiki dan menyederhanakan prosedur sanggah-banding (seperti dengan meningkatkan batas uang jaminan untuk mengajukan sanggahan dan memberikan batasan yang jelas akan jumlah dan jangka waktu proses sanggah-banding) juga dapat mempercepat proses pengadaan. Terakhir, mengaitkan kinerja panitia pengadaan dengan Indikator Kinerja Utama (Key Performance Indicator/KPI) dapat mendorong para panitia untuk memperbaiki kinerjanya.
Mempercepat penyelesaian peraturan pemerintah mengenai pembebasan tanah dengan tujuan untuk mengefektifkan Undang-Undang yang baru (UU No.2 tahun 2012) merupakan langkah yang sangat penting dalam mempercepat proses pembebasan lahan yang selama ini telah menjadi hambatan utama dalam pelaksanaan proyek infrastruktur.
Dalam jangka menengah, upaya-upaya untuk mempercepat pelaksanaan anggaran harusnya menjadi bagian dari reformasi Manajemen Keuangan Publik yang lebih luas.
Dalam jangka menengah, upaya-upaya untuk mempercepat pelaksanaan anggaran harusnya sangat berkaitan erat dengan reformasi Manajemen Keuangan Publik yang lebih luas termasuk pelaksanaan Anggaran Berbasis Kinerja (Performance Based Budget (PBB)) serta Kerangka Pengeluaran Jangka Menengah (Medium Term Expenditure Framework (MTEF)). Dalam hal ini, salah satu unsur yang paling penting adalah dengan memberikan fleksibilitas/kewenangan yang lebih tinggi kepada kementerian/lembaga (Eselon 1) untuk merevisi DIPA dalam kategori kegiatan dengan tujuan untuk mempercepat proses persiapan anggaran dan pelaksanaan yang disertai dengan penguatan pengawasan ex-post (setelah pelaksanaan) dan audit. Pembahasan anggaran yang sangat rinci yang saat ini masih berlangsung sebenarnya sudah tidak sejalan dengan reformasi yang saat ini berjalan yaitu menuju ke penganggaran berbasis kinerja (performance based budgeting), oleh karenanya pembahasan APBN (persetujuan oleh DPR) seharusnya dilakukan pada kategori agregat. Selain itu juga perlu menghentikan secara bertahap penggunaan tanda bintang atau persetujuan APBN bersyarat.
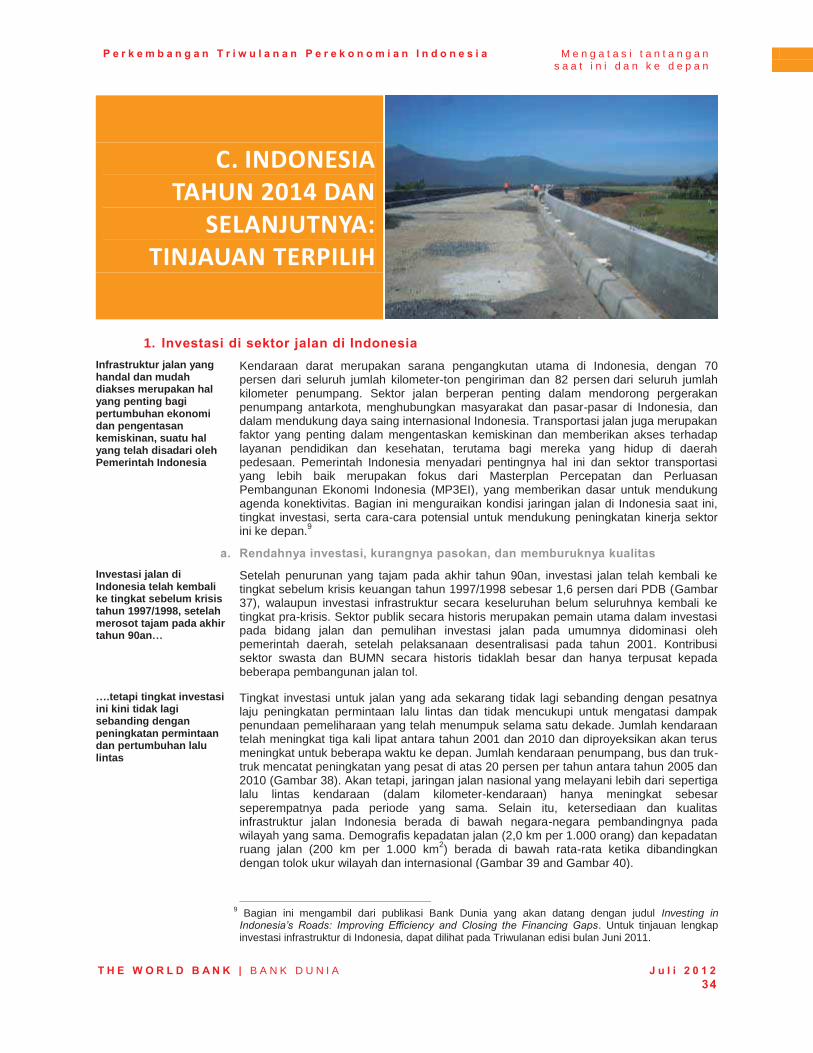
P e r k e m b a n g a n T r i w u l a n a n P e r e k o n o m i a n I n d o n e s i a M e n g a t a s i t a n t a n g a n s a a t i n i d a n k e d e p a n
T H E W O R L D B A N K | B A N K D U N I A J u l i 2 0 1 2 34
C. INDONESIA TAHUN 2014 DAN
SELANJUTNYA: TINJAUAN TERPILIH
1. Investasi di sektor jalan di Indonesia Infrastruktur jalan yang handal dan mudah diakses merupakan hal yang penting bagi pertumbuhan ekonomi dan pengentasan kemiskinan, suatu hal yang telah disadari oleh Pemerintah Indonesia
Kendaraan darat merupakan sarana pengangkutan utama di Indonesia, dengan 70 persen dari seluruh jumlah kilometer-ton pengiriman dan 82 persen dari seluruh jumlah kilometer penumpang. Sektor jalan berperan penting dalam mendorong pergerakan penumpang antarkota, menghubungkan masyarakat dan pasar-pasar di Indonesia, dan dalam mendukung daya saing internasional Indonesia. Transportasi jalan juga merupakan faktor yang penting dalam mengentaskan kemiskinan dan memberikan akses terhadap layanan pendidikan dan kesehatan, terutama bagi mereka yang hidup di daerah pedesaan. Pemerintah Indonesia menyadari pentingnya hal ini dan sektor transportasi yang lebih baik merupakan fokus dari Masterplan Percepatan dan Perluasan Pembangunan Ekonomi Indonesia (MP3EI), yang memberikan dasar untuk mendukung agenda konektivitas. Bagian ini menguraikan kondisi jaringan jalan di Indonesia saat ini, tingkat investasi, serta cara-cara potensial untuk mendukung peningkatan kinerja sektor ini ke depan.9
a. Rendahnya investasi, kurangnya pasokan, dan memburuknya kualitas Investasi jalan di Indonesia telah kembali ke tingkat sebelum krisis tahun 1997/1998, setelah merosot tajam pada akhir tahun 90an…
Setelah penurunan yang tajam pada akhir tahun 90an, investasi jalan telah kembali ke tingkat sebelum krisis keuangan tahun 1997/1998 sebesar 1,6 persen dari PDB (Gambar 37), walaupun investasi infrastruktur secara keseluruhan belum seluruhnya kembali ke tingkat pra-krisis. Sektor publik secara historis merupakan pemain utama dalam investasi pada bidang jalan dan pemulihan investasi jalan pada umumnya didominasi oleh pemerintah daerah, setelah pelaksanaan desentralisasi pada tahun 2001. Kontribusi sektor swasta dan BUMN secara historis tidaklah besar dan hanya terpusat kepada beberapa pembangunan jalan tol.
….tetapi tingkat investasi ini kini tidak lagi sebanding dengan peningkatan permintaan dan pertumbuhan lalu lintas
Tingkat investasi untuk jalan yang ada sekarang tidak lagi sebanding dengan pesatnya laju peningkatan permintaan lalu lintas dan tidak mencukupi untuk mengatasi dampak penundaan pemeliharaan yang telah menumpuk selama satu dekade. Jumlah kendaraan telah meningkat tiga kali lipat antara tahun 2001 dan 2010 dan diproyeksikan akan terus meningkat untuk beberapa waktu ke depan. Jumlah kendaraan penumpang, bus dan truk-truk mencatat peningkatan yang pesat di atas 20 persen per tahun antara tahun 2005 dan 2010 (Gambar 38). Akan tetapi, jaringan jalan nasional yang melayani lebih dari sepertiga lalu lintas kendaraan (dalam kilometer-kendaraan) hanya meningkat sebesar seperempatnya pada periode yang sama. Selain itu, ketersediaan dan kualitas infrastruktur jalan Indonesia berada di bawah negara-negara pembandingnya pada wilayah yang sama. Demografis kepadatan jalan (2,0 km per 1.000 orang) dan kepadatan ruang jalan (200 km per 1.000 km2) berada di bawah rata-rata ketika dibandingkan dengan tolok ukur wilayah dan internasional (Gambar 39 and Gambar 40).
9 Bagian ini mengambil dari publikasi Bank Dunia yang akan datang dengan judul Investing in Indonesia’s Roads: Improving Efficiency and Closing the Financing Gaps. Untuk tinjauan lengkap investasi infrastruktur di Indonesia, dapat dilihat pada Triwulanan edisi bulan Juni 2011.

P e r k e m b a n g a n T r i w u l a n a n P e r e k o n o m i a n I n d o n e s i a M e n g a t a s i t a n t a n g a n s a a t i n i d a n k e d e p a n
T H E W O R L D B A N K | B A N K D U N I A J u l i 2 0 1 2 35
Gambar 37: Setelah turun tajam, investasi dalam bidang jalan di Indonesia baru kembali ke tingkat pra-krisis tahun 1997/1998… (triliun Rp pada harga tahun 2007; persentase dari PDB)
Gambar 38: …yang tidak sebanding dengan laju peningkatan permintaan dan pertumbuhan lalu lintas (jumlah kendaraan, juta)
Catatan: SOE:BUMN, LG: Pemda Sumber: Kementerian Keuangan (diproses) bagi pemerintah pusat dan daerah; Laporan tahunan untuk BUMN; basis data PPI Bank Dunia untuk investasi swasta
Sumber: BPS
Gambar 39: …yang menyebabkan penurunan pada infrastruktur dan layanan jalan (indeks kualitas infrastruktur jalan, tahun 2010-2011)
Gambar 40: …dan biaya transportasi yang lebih tinggi per waktu perjalanan (rata-rata waktu perjalanan, jam per 100 km, 2010-2011)
Sumber: World Economic Forum Global Competitiveness Report tahun 2010-2011
Sumber: World Economic Forum Global Competitiveness Report tahun 2010-2011
Tabel 12: Keadaan jaringan jalan Indonesia, tahun 2009
Panjang (km)
Ekivalen 2 jalur (persentase dari total)
Diaspal (persentase dari total)
Kondisi baik & sedang (persentase dari total)
Kondisi buruk & rusak (persentase dari total)
Nilai aset (persen PDB)
Penggunaan jaringan jalan (persentase dari total kendaraan-km per tahun)
Nasional 38,570 8.8 91 86 14 2.8 34
Propinsi 48,691 9.7 81 63 27 2.3 19
Kota/kabupaten 384,810 79.9 55 43 57 10.1 33
Jakarta 6,266 1.3 79 64 36 0.3 10
Tol 742 0.3 100 96 4 0.1 4
Jumlah 477,079 100 61 54 46 15.6 100
Sumber: Ditjen Perhubungan Darat-Kementerian Pekerjaan Umum, BPS, dan perkiraan staf Bank Dunia menggunakan RONET
0.00
0.25
0.50
0.75
1.00
1.25
1.50
1.75
2.00
0
10
20
30
40
50
60
70
80
1994 1997 2000 2003 2006 2009
Triliun rupiah (tahun dasar 2007) Central Province LGs SOEs Private
Relative to GDP (RHS)
Persen PDB
0
10
20
30
40
50
60
70
80
0
10
20
30
40
50
60
70
80
2001 2002 2003 2004 2005 2006 2007 2008 2009
Juta Juta Passenger car Bus Truck Motor cycle
0 1 2 3 4 5 6 7
0 1 2 3 4 5 6 7
Singapore
Malaysia
Thailand
China
Indonesia
ASEAN
Developing Asia
0 1 2 3
0 1 2 3
Malaysia
Thailand
China
Indonesia
Vietnam
hr/100km
hr/100km
P e r k e m b a n g a n T r i w u l a n a n P e r e k o n o m i a n I n d o n e s i a M e n g a t a s i t a n t a n g a n s a a t i n i d a n k e d e p a n
T H E W O R L D B A N K | B A N K D U N I A J u l i 2 0 1 2 36
Kondisi jaringan jalan yang memburuk khususnya di tingkat kabupaten/kota dan perlu diperbaiki dan diperlebar dengan baik.
Di tahun 2009, laporan panjang jaringan jalan raya di Indonesia mencapai 477.079 km (Tabel 12). Angka itu tidak termasuk jalan desa/lingkungan yang mencapai 244.000 km. Penting untuk dicatat bahwa jalan-jalan nasional mencatat tingkat penggunaan jaringan yang paling tinggi sebesar 34 persen (kendaraan per km/tahun), walaupun panjangnya hanya mencakup 8,8 persen dari seluruh jaringan jalan. Tingkat penggunaan jalan kota/daerah hanyalah 33 persen walaupun jumlahnya hampir mencapai 80 persen dari seluruh jaringan jalan. Secara kualitas, jalan-jalan nasional pada umumnya digolongkan sebagai dalam keadaan baik, sementara jalan-jalan yang bukan jalan nasional umumnya berada dalam kondisi buruk dan kurang.
b. Jalan-jalan nasional dalam kondisi baik tetapi sangat padat Jalan-jalan nasional, termasuk jalan tol, umumnya dipelihara dengan baik, tetapi sering mengalami kemacetan lalu-lintas
Kondisi jalan nasional telah meningkat pada beberapa tahun terakhir. Sekitar 86 persen jalan-jalan nasional berada pada kondisi yang baik, suatu angka yang cukup jauh berada di atas nilai rata-rata negara berkembang pada 70 persen. Peningkatan kondisi jalan nasional ini mencerminkan penekanan baru yang dilakukan untuk pemeliharaan jalan nasional. Akan tetapi, hanya terdapat sedikit peningkatan pembangunan jalan baru. Sebagai akibatnya, terdapat kepadatan lalu lintas pada pusat-pusat kota dan jalan-jalan daerah, dan kecepatan perjalanan darat sangatlah rendah, berkisar pada 40 hingga 45 km/jam pada sebagian besar rute nasional. Kelebihan beban kendaraan pada jalan-jalan utama di daerah biasa terjadi disebabkan oleh rendahnya tingkat penegakan hukum, sementara kondisi tingkat kerusakan jalan diperburuk oleh pemeriksaan kendaraan yang tidak efektif, serta buruknya pemeliharaan kendaraan. Kemajuan pembangunan jalan bebas hambatan dan jalan tol sangatlah lambat. Pada tahun 2010, hanya 742 km jalan tol telah dibangun dan telah beroperasi walaupun pembangunan jalan tol dilakukan pertama kali pada tahun 1978. Jumlah ini kurang dari sepertiga dari perkiraan kebutuhan sebesar 2.400 km menurut Rencana Strategis Kementerian Perhubungan dan tertinggal di belakang beberapa negara di wilayah yang sama dalam hal kepadatan jalan bebas hambatan (km/1.000 populasi). Pelaksanaan pembangunan jalan tol dengan pola Kemitraan Pemerintah Swasta (Public Private Partnership/ PPP) masih terhalang oleh proses pembebasan lahan yang kompleks, persiapan proyek dan seleksi yang lemah, serta tidak tersedianya mekanisme pembiayaan kesenjangan kelayakan jalan tol yang efisien.
Belanja pemerintah pusat untuk jalan-jalan nasional telah meningkat tajam belakangan ini
Belanja untuk jalan-jalan nasional telah meningkat tiga kali lipat secara riil antara tahun 2005 dan 2011 (Gambar 41). Belanja untuk jalan-jalan nasional merupakan sekitar 60 persen dari belanja perhubungan pemerintah pusat (untuk seluruh sarana transportasi). Pada tahun 2009, peningkatan yang signifikan itu mencerminkan tambahan belanja untuk stimulus fiskal dalam upaya untuk membatasi dampak krisis keuangan dunia tahun 2008. Selain itu, penurunan yang tajam pada tahun 2010 sebagian disebabkan oleh tantangan pelaksanaan anggaran (untuk pembahasan lebih lanjut atas pelaksanaan anggaran di Indonesia dapat dilihat pada Bagian B). Pada tahun 2011, alokasi anggaran meningkat secara signifikan yang mencerminkan prioritas pemerintah untuk memperkecil kesenjangan pembangunan infrastruktur yang sejalan dengan RPJMN 2010-2014.
Walaupun terjadi peningkatan yang tajam belakangan ini, belanja untuk pembangunan jalan nasional yang baru masih sangat dibutuhkan
Dengan peningkatan dalam permintaan lalu lintas dan sasaran pembangunan jangka menengah, dibutuhkan peningkatan investasi dalam pembangunan jalan nasional baru dengan standar yang memadai. Selama periode tahun 2005-11, jaringan jalan nasional pada umumnya diperluas dengan penggolongan kembali 8.000 km jalan utama, terutama melalui pelaksanaan perbaikan10 (sedikit pelebaran) untuk meningkatkan jalan-jalan yang di bawah standar yang dianggap penting secara strategis. Di sisi lain, tingkat belanja untuk pemeliharaan jalan nasional sudah mencukupi bila dibelanjakan dengan efisien dan mendekati tingkat kebutuhan yang diperkirakan sebesar Rp 6,9 trilliun. Pembangunan jalan baru dan pemeliharaan dapat dilakukan secara lebih efisien. Pertama, memperluas jaringan nasional yang ada melalui penggolongan kembali jalan-jalan sebagai jalan nasional atau jalan khusus dan menempatkan sebagian besar
10 Di Indonesia, “peningkatan” (bettermen) umumnya melibatkan penguatan dasar jalan, sedikit pelebaran, pemberian lapisan aspal jalan yang baru dan memperbaiki saluran air. Pada umumnya jalan-jalan tersebut telah memiliki lapisan aspal.
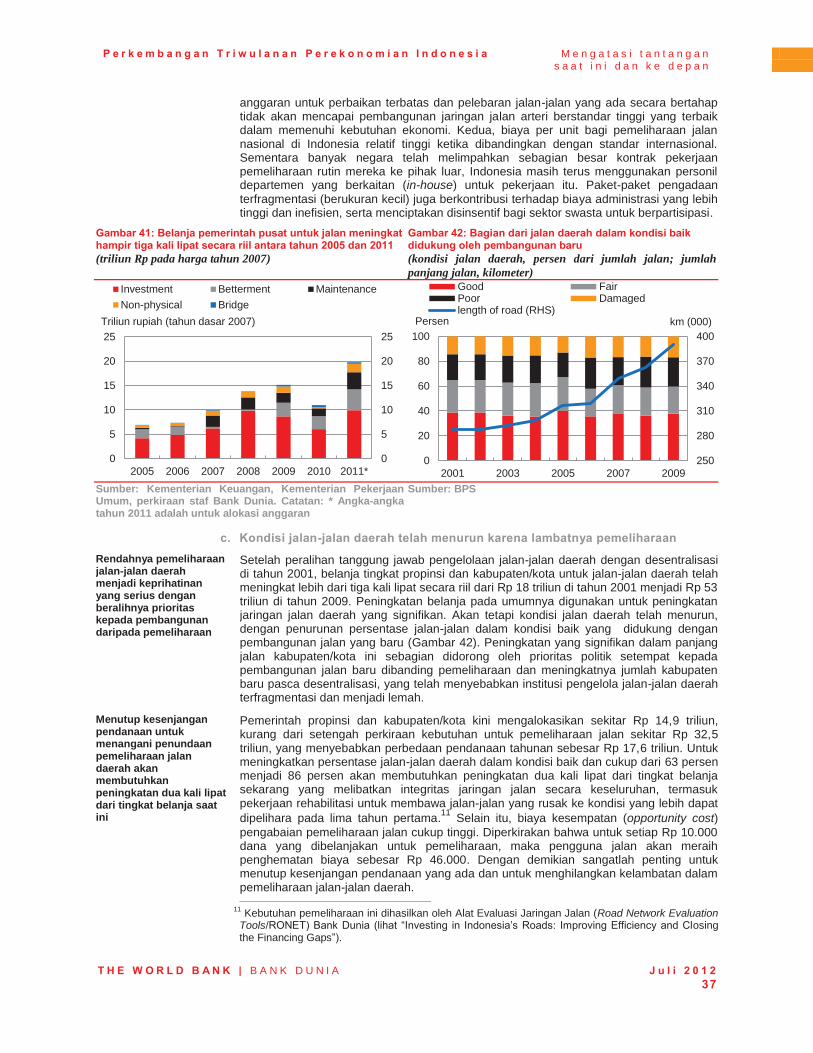
P e r k e m b a n g a n T r i w u l a n a n P e r e k o n o m i a n I n d o n e s i a M e n g a t a s i t a n t a n g a n s a a t i n i d a n k e d e p a n
T H E W O R L D B A N K | B A N K D U N I A J u l i 2 0 1 2 37
anggaran untuk perbaikan terbatas dan pelebaran jalan-jalan yang ada secara bertahap tidak akan mencapai pembangunan jaringan jalan arteri berstandar tinggi yang terbaik dalam memenuhi kebutuhan ekonomi. Kedua, biaya per unit bagi pemeliharaan jalan nasional di Indonesia relatif tinggi ketika dibandingkan dengan standar internasional. Sementara banyak negara telah melimpahkan sebagian besar kontrak pekerjaan pemeliharaan rutin mereka ke pihak luar, Indonesia masih terus menggunakan personil departemen yang berkaitan (in-house) untuk pekerjaan itu. Paket-paket pengadaan terfragmentasi (berukuran kecil) juga berkontribusi terhadap biaya administrasi yang lebih tinggi dan inefisien, serta menciptakan disinsentif bagi sektor swasta untuk berpartisipasi.
Gambar 41: Belanja pemerintah pusat untuk jalan meningkat hampir tiga kali lipat secara riil antara tahun 2005 dan 2011 (triliun Rp pada harga tahun 2007)
Gambar 42: Bagian dari jalan daerah dalam kondisi baik didukung oleh pembangunan baru (kondisi jalan daerah, persen dari jumlah jalan; jumlah panjang jalan, kilometer)
Sumber: Kementerian Keuangan, Kementerian Pekerjaan Umum, perkiraan staf Bank Dunia. Catatan: * Angka-angka tahun 2011 adalah untuk alokasi anggaran
Sumber: BPS
c. Kondisi jalan-jalan daerah telah menurun karena lambatnya pemeliharaan Rendahnya pemeliharaan jalan-jalan daerah menjadi keprihatinan yang serius dengan beralihnya prioritas kepada pembangunan daripada pemeliharaan
Setelah peralihan tanggung jawab pengelolaan jalan-jalan daerah dengan desentralisasi di tahun 2001, belanja tingkat propinsi dan kabupaten/kota untuk jalan-jalan daerah telah meningkat lebih dari tiga kali lipat secara riil dari Rp 18 triliun di tahun 2001 menjadi Rp 53 triliun di tahun 2009. Peningkatan belanja pada umumnya digunakan untuk peningkatan jaringan jalan daerah yang signifikan. Akan tetapi kondisi jalan daerah telah menurun, dengan penurunan persentase jalan-jalan dalam kondisi baik yang didukung dengan pembangunan jalan yang baru (Gambar 42). Peningkatan yang signifikan dalam panjang jalan kabupaten/kota ini sebagian didorong oleh prioritas politik setempat kepada pembangunan jalan baru dibanding pemeliharaan dan meningkatnya jumlah kabupaten baru pasca desentralisasi, yang telah menyebabkan institusi pengelola jalan-jalan daerah terfragmentasi dan menjadi lemah.
Menutup kesenjangan pendanaan untuk menangani penundaan pemeliharaan jalan daerah akan membutuhkan peningkatan dua kali lipat dari tingkat belanja saat ini
Pemerintah propinsi dan kabupaten/kota kini mengalokasikan sekitar Rp 14,9 triliun, kurang dari setengah perkiraan kebutuhan untuk pemeliharaan jalan sekitar Rp 32,5 triliun, yang menyebabkan perbedaan pendanaan tahunan sebesar Rp 17,6 triliun. Untuk meningkatkan persentase jalan-jalan daerah dalam kondisi baik dan cukup dari 63 persen menjadi 86 persen akan membutuhkan peningkatan dua kali lipat dari tingkat belanja sekarang yang melibatkan integritas jaringan jalan secara keseluruhan, termasuk pekerjaan rehabilitasi untuk membawa jalan-jalan yang rusak ke kondisi yang lebih dapat dipelihara pada lima tahun pertama.11 Selain itu, biaya kesempatan (opportunity cost) pengabaian pemeliharaan jalan cukup tinggi. Diperkirakan bahwa untuk setiap Rp 10.000 dana yang dibelanjakan untuk pemeliharaan, maka pengguna jalan akan meraih penghematan biaya sebesar Rp 46.000. Dengan demikian sangatlah penting untuk menutup kesenjangan pendanaan yang ada dan untuk menghilangkan kelambatan dalam pemeliharaan jalan-jalan daerah.
11 Kebutuhan pemeliharaan ini dihasilkan oleh Alat Evaluasi Jaringan Jalan (Road Network Evaluation Tools/RONET) Bank Dunia (lihat “Investing in Indonesia’s Roads: Improving Efficiency and Closing the Financing Gaps”).
0
5
10
15
20
25
0
5
10
15
20
25
2005 2006 2007 2008 2009 2010 2011*
Triliun rupiah (tahun dasar 2007)
Investment Betterment MaintenanceNon-physical Bridge
250
280
310
340
370
400
0
20
40
60
80
100
2001 2003 2005 2007 2009
km (000) Persen
Good FairPoor Damagedlength of road (RHS)
P e r k e m b a n g a n T r i w u l a n a n P e r e k o n o m i a n I n d o n e s i a M e n g a t a s i t a n t a n g a n s a a t i n i d a n k e d e p a n
T H E W O R L D B A N K | B A N K D U N I A J u l i 2 0 1 2 38
d. Menuju kinerja infrastruktur jalan yang lebih baik Kapasitas jaringan jalan nasional sebaiknya hanya diperluas dengan mengikuti standar kapasitas jalan yang sesuai
Kebijakan yang sekarang dilakukan untuk memperluas jaringan jalan nasional dengan penggolongan kembali jalan-jalan propinsi sebagai jalan nasional atau jalan khusus dan menempatkan sebagian besar anggaran bagi perbaikan terbatas dan sedikit pelebaran jalan-jalan yang telah ada tidaklah optimal dan tidak akan menghasilkan pembangunan jaringan jalan arteri dengan standar yang tinggi yang sangat dibutuhkan untuk perkembangan ekonomi. Kebutuhan jangka panjang bagi pembangunan jalan nasional adalah perluasan jalan menjadi 4 jalur dengan pembagian standar dan jaringan jalur cepat terpadu yang terpisah bila mungkin dilakukan.
Efisiensi pemeliharaan jalan nasional dapat ditingkatkan secara bertahap dengan beralih dari penggunaan personil departemen dan kepada kontrak berbasis kinerja, dan meningkatkan ukuran rata-rata paket pengadaan
Secara bertahap beralih dari penggunaan personil departemen dan beralih kepada kontrak berbasis kinerja (performance-based contracts/PBC) dapat lebih meningkatkan efisiensi melalui kompetisi.12 Pendekatan yang telah meraih keberhasilan di negara-negara lain adalah mendorong unit-unit personil departemen yang bertugas untuk pembangunan/pemeliharaan jalan untuk menjadi perusahaan kecil yang menerima kontrak. Pada awalnya perusahaan-perusahaan itu diberikan dukungan khusus dan jaminan pekerjaan pada beberapa tahun pertama, tetapi pada akhirnya mereka harus menjadi kontraktor yang sepenuhnya bersaing dengan kontraktor lainnya. Beberapa perusahaan tersebut berhasil mengembangkan dirinya dan kemudian dapat menangani proyek-proyek berskala besar. Memperpanjang kegiatan pemeliharaan jalan dari program satu tahunan menjadi tahun jamak (multi-year) dan meningkatkan rata-rata ukuran paket pengadaan pemeliharaan jalan dapat menurunkan biaya administrasi dan meningkatkan efisensi serta menciptakan insentif bagi partisipasi sektor swasta.
Dengan mendesaknya penanganan kemacetan dan kerumitan Kemitraan Pemerintah Swasta (KPS), pemerintah tampaknya harus meningkatkan investasi publik dan menangani rintangan-rintangan terhadap KPS
Untuk mempercepat pembangunan jalan bebas hambatan seperti diuraikan pada rencana strategis Kementerian PU, Pemerintah mungkin harus lebih terlibat dan meningkatkan investasi publik dalam jalan bebas hambatan, terutama pada bagian-bagian dengan kepadatan lalu-lintas yang rendah dan rute-rute di luar pulau Jawa. Secara bersamaan, penanganan faktor-faktor yang merintangi penerapan KPS juga sangatlah penting. Peningkatan dalam pemilihan dan penyiapan proyek KPS dengan melibatkan lembaga-lembaga terkait utama (Kemenkeu) dan memberikan dukungan fiskal yang memadai melalui penilaian kesenjangan kelayakan adalah hal yang penting bagi keberhasilan penerapan. Penekanan kepada proyek-proyek KPS yang paling strategis dan layak, dan membawa proyek-proyek itu hingga tahap transaksi dapat membawa pengaruh yang besar dalam menunjukkan komitmen pemerintah terhadap penerapan KPS (untuk uraian yang lebih mendalam tentang KPS dapat dilihat pada Triwulanan edisi bulan Oktober 2011).
Untuk menangani penundaan pemeliharaan jalan kabupaten/kota, diusulkan suatu mekanisme pendanaan dan kelembagaan yang baru
Prioritas yang lebih tinggi harus diberikan untuk penyelesaian penundaan pemeliharaan jalan kabupatan/kota yang menumpuk dan kapasitas kelembagaan yang lemah dan terpecah-pecah. Salah satu pilihan adalah memadukan perencanaan dan pengelolaan jalan kabupaten/kota pada tingkat provinsi untuk meningkatkan koordinasi antar wilayah, memetik manfaat dari skala ekonomi, dan menangani masalah kapasitas teknis dan manajerial tanpa mengganggu kewenangan pengambilan keputusan daerah setempat. Kabupaten-kabupaten dapat mendelegasikan pengelolaan seluruh atau sebagian jaringan jalan-jalan mereka dengan menggunakan pendekatan pengelolaan kontrak. Pendanaan untuk upaya pemeliharaan ini dapat ditetapkan dengan biaya penggunaan yang berkaitan dengan jalan (road-related users charges/RUCs), yang termasuk Pajak Kendaraan Bermotor (PKB), Bea Balik Nama Kendaraan Bermotor (BBNKB) dan Pajak Bahan Bakar Kendaraan Bermotor (PBBKB). Bila seluruh biaya itu dialokasikan bagi pemeliharaan, maka sekitar 90% dari kebutuhan pemeliharaan dapat dipenuhi. Penetapan tersebut juga akan membawa tantangan tersendiri, seperti penurunan fleksibilitas anggaran, tetapi dalam hal ini berlaku prinsip manfaat yang lebih banyak dan mereka yang menerima manfaat dari jalan harus membayar lebih banyak untuk pemeliharaannya.
12 Pada kontrak tradisional, para kontraktor dibayar untuk jumlah pekerjaan yang telah selesai. Pada kontrak berbasis kinerja, kontraktor bekerja secara sekaligus, umumnya menerima pembayaran tahunan untuk memenuhi persyaratan kinerja yang diikat dalam kontrak. Pengalaman internasional menunjukkan bahwa kontrak berbasis kinerja dapat memberikan hasil dengan kualitas yang lebih tinggi, dan seringkali pada tingkat harga yang lebih rendah.
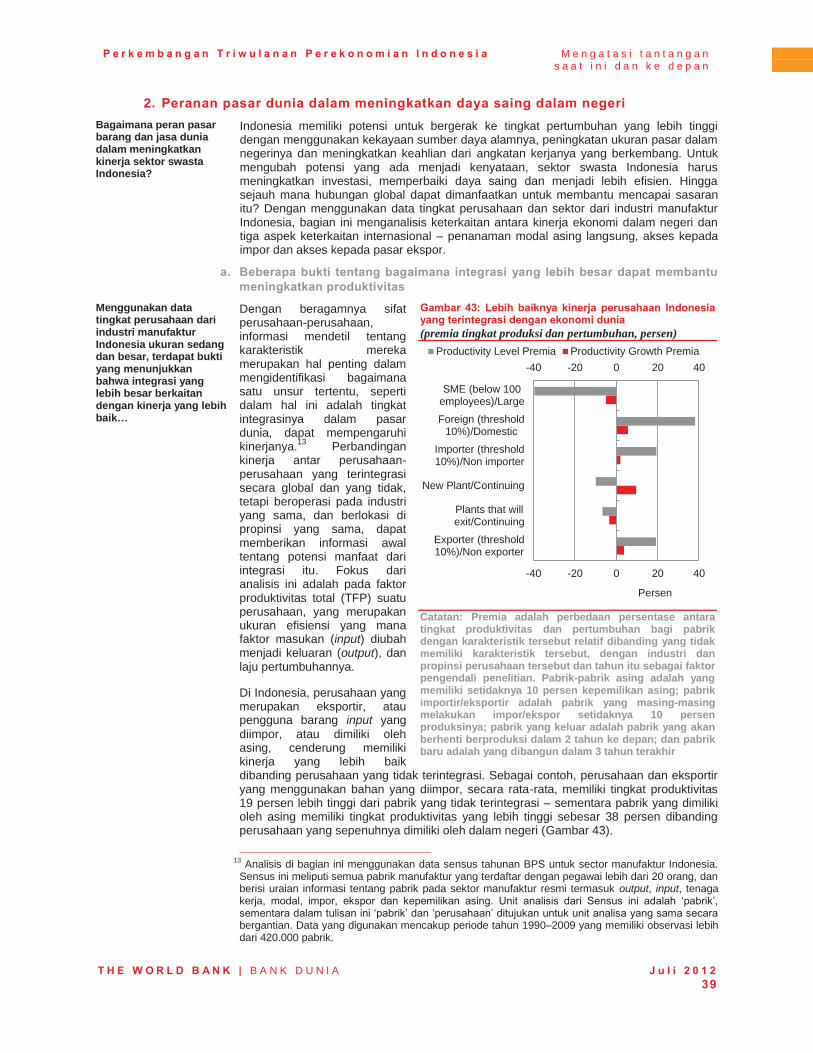
P e r k e m b a n g a n T r i w u l a n a n P e r e k o n o m i a n I n d o n e s i a M e n g a t a s i t a n t a n g a n s a a t i n i d a n k e d e p a n
T H E W O R L D B A N K | B A N K D U N I A J u l i 2 0 1 2 39
2. Peranan pasar dunia dalam meningkatkan daya saing dalam negeri Bagaimana peran pasar barang dan jasa dunia dalam meningkatkan kinerja sektor swasta Indonesia?
Indonesia memiliki potensi untuk bergerak ke tingkat pertumbuhan yang lebih tinggi dengan menggunakan kekayaan sumber daya alamnya, peningkatan ukuran pasar dalam negerinya dan meningkatkan keahlian dari angkatan kerjanya yang berkembang. Untuk mengubah potensi yang ada menjadi kenyataan, sektor swasta Indonesia harus meningkatkan investasi, memperbaiki daya saing dan menjadi lebih efisien. Hingga sejauh mana hubungan global dapat dimanfaatkan untuk membantu mencapai sasaran itu? Dengan menggunakan data tingkat perusahaan dan sektor dari industri manufaktur Indonesia, bagian ini menganalisis keterkaitan antara kinerja ekonomi dalam negeri dan tiga aspek keterkaitan internasional – penanaman modal asing langsung, akses kepada impor dan akses kepada pasar ekspor.
a. Beberapa bukti tentang bagaimana integrasi yang lebih besar dapat membantu meningkatkan produktivitas
Menggunakan data tingkat perusahaan dari industri manufaktur Indonesia ukuran sedang dan besar, terdapat bukti yang menunjukkan bahwa integrasi yang lebih besar berkaitan dengan kinerja yang lebih baik…
Dengan beragamnya sifat perusahaan-perusahaan, informasi mendetil tentang karakteristik mereka merupakan hal penting dalam mengidentifikasi bagaimana satu unsur tertentu, seperti dalam hal ini adalah tingkat integrasinya dalam pasar dunia, dapat mempengaruhi kinerjanya.13 Perbandingan kinerja antar perusahaan-perusahaan yang terintegrasi secara global dan yang tidak, tetapi beroperasi pada industri yang sama, dan berlokasi di propinsi yang sama, dapat memberikan informasi awal tentang potensi manfaat dari integrasi itu. Fokus dari analisis ini adalah pada faktor produktivitas total (TFP) suatu perusahaan, yang merupakan ukuran efisiensi yang mana faktor masukan (input) diubah menjadi keluaran (output), dan laju pertumbuhannya. Di Indonesia, perusahaan yang merupakan eksportir, atau pengguna barang input yang diimpor, atau dimiliki oleh asing, cenderung memiliki kinerja yang lebih baik dibanding perusahaan yang tidak terintegrasi. Sebagai contoh, perusahaan dan eksportir yang menggunakan bahan yang diimpor, secara rata-rata, memiliki tingkat produktivitas 19 persen lebih tinggi dari pabrik yang tidak terintegrasi – sementara pabrik yang dimiliki oleh asing memiliki tingkat produktivitas yang lebih tinggi sebesar 38 persen dibanding perusahaan yang sepenuhnya dimiliki oleh dalam negeri (Gambar 43).
Gambar 43: Lebih baiknya kinerja perusahaan Indonesia yang terintegrasi dengan ekonomi dunia (premia tingkat produksi dan pertumbuhan, persen)
Catatan: Premia adalah perbedaan persentase antara tingkat produktivitas dan pertumbuhan bagi pabrik dengan karakteristik tersebut relatif dibanding yang tidak memiliki karakteristik tersebut, dengan industri dan propinsi perusahaan tersebut dan tahun itu sebagai faktor pengendali penelitian. Pabrik-pabrik asing adalah yang memiliki setidaknya 10 persen kepemilikan asing; pabrik importir/eksportir adalah pabrik yang masing-masing melakukan impor/ekspor setidaknya 10 persen produksinya; pabrik yang keluar adalah pabrik yang akan berhenti berproduksi dalam 2 tahun ke depan; dan pabrik baru adalah yang dibangun dalam 3 tahun terakhir
13 Analisis di bagian ini menggunakan data sensus tahunan BPS untuk sector manufaktur Indonesia. Sensus ini meliputi semua pabrik manufaktur yang terdaftar dengan pegawai lebih dari 20 orang, dan berisi uraian informasi tentang pabrik pada sektor manufaktur resmi termasuk output, input, tenaga kerja, modal, impor, ekspor dan kepemilikan asing. Unit analisis dari Sensus ini adalah ‘pabrik’, sementara dalam tulisan ini ‘pabrik’ dan ‘perusahaan’ ditujukan untuk unit analisa yang sama secara bergantian. Data yang digunakan mencakup periode tahun 1990–2009 yang memiliki observasi lebih dari 420.000 pabrik.
-40 -20 0 20 40
-40 -20 0 20 40
Exporter (threshold10%)/Non exporter
Plants that willexit/Continuing
New Plant/Continuing
Importer (threshold10%)/Non importer
Foreign (threshold10%)/Domestic
SME (below 100employees)/Large
Productivity Level Premia Productivity Growth Premia
Persen
P e r k e m b a n g a n T r i w u l a n a n P e r e k o n o m i a n I n d o n e s i a M e n g a t a s i t a n t a n g a n s a a t i n i d a n k e d e p a n
T H E W O R L D B A N K | B A N K D U N I A J u l i 2 0 1 2 40
…dan peningkatan kinerja seiring berjalannya waktu
Lebih tingginya kinerja perusahaan yang lebih terintegrasi juga dapat dilihat pada kinerjanya sesuai dengan berjalannya waktu. Sebagai contoh, pertumbuhan produktivitas bagi perusahaan eksportir lebih tinggi 3 poin persentase secara rata-rata dibanding non-eksportir selama tahun 1990 hingga 2009; dan sekitar 6 poin persentase lebih tinggi bagi perusahaan-perusahaan dengan kepemilikan asing dibanding dengan perusahaan dalam negeri; dan 2 poin persentase lebih besar bagi pengguna bahan input yang diimpor dibanding perusahaan yang bergantung pada input domestik. Premia tersebut menunjukkan adanya keterkaitan antara integrasi dan kinerja, tetapi mereka tidak dapat menentukan arah hubungan sebab-akibatnya. Tampaknya perusahaan yang berprestasi lebih baik adalah mereka yang berhasil masuk ke pasar ekspor, yang mencoba menggunakan bahan impor sebagai input, atau yang menarik investor asing. Akan tetapi, seperti diuraikan di bawah, terdapat bukti yang cukup yang menunjuk kepada integrasi yang lebih besar sebagai kekuatan yang penting yang mempengaruhi produktivitas di Indonesia (lihat Kotak 4 untuk beberapa bukti studi kasus).
Kotak 4: Apakah perusahaan manufaktur lokal menerima manfaat dari integrasi yang lebih besar? Beberapa studi kasus dari Jakarta dan Surabaya Perusahaan-perusahaan lokal dapat mengambil manfaat dari keberadaan perusahaan yang dimiliki asing melalui interaksi usaha yang melibatkan transfer pengetahuan, keahlian dan praktik. Sesungguhnya, bukti-bukti memberikan contoh bahwa interaksi tersebut mendorong peningkatan kapasitas pengetahuan, peningkatan kualitas produk dan kenaikan volume penjualan.
Sebagai contoh, sebuah produsen komponen logam dalam negeri untuk perusahaan otomatif Jepang menyebutkan manfaat yang cukup besar yang diterima dari interaksi dengan kliennya yang dimiliki oleh asing. Perusahaan-perusahaan Jepang yang beroperasi di Indonesia memberikan dukungan lewat sejumlah konsultasi tanpa biaya, dan juga kegiatan audit, yang bersifat kondusif terhadap peningkatan dalam kualitas dan rancangan produk. Lebih penting lagi, produsen tersebut mengatakan bahwa pengetahuan baru yang didapat oleh perusahaan lokal itu membantu meningkatkan kualitas input yang kemudian dijual ke pelanggan lainnya (baik di dalam maupun luar negeri). Selain itu, pengetahuan baru yang didapat oleh perusahaan lokal itu membantu meningkatkan pangsa pasar dan masuk ke pasar-pasar baru.
Contoh-contoh lain menunjuk kepada perbaikan dalam standar dan kualitas produk oleh sejumlah perusahaan manufaktur Indonesia melalui interaksinya dengan klien asing dan juga dengan pemasok dari bahan input yang diimpor. Sebagai contoh, dua perusahaan manufaktur sumber daya alam (satu dalam sektor proses kopi dan yang lain dalam industri perikanan) mengatakan bahwa interaksi mereka dengan klien asing yang terlibat dalam ekspor membantu mereka dalam menggunakan standar sanitasi dan kualitas yang lebih baik. Produsen ikan tersebut, sebagai contoh, mendorong standar sanitasi yang ketat secara luas, dan pelatihan tanpa biaya yang diberikan oleh klien asing mereka telah mendorong peningkatan standar pada seluruh proses produksi mereka. Sang produsen kopi menerima pelatihan yang diberikan oleh pemasok tentang bagaimana mengoperasikan mesin pemroses kopi yang canggih yang diimpor, yang memberikan peningkatan kualitas pada produk akhirnya.
Sementara itu, peningkatan persaingan dengan produk-produk asing juga dapat mendorong perusahaan-perusahaan lokal untuk berinovasi untuk menghasilkan produk yang lebih baik bagi konsumen. Sebagai contoh, produsen peralatan rumah tangga dan elektronik berukuran besar di Surabaya melaporkan bahwa persaingan dengan para produsen dari China mendorong mereka untuk menjadi lebih kreatif, yang mendasari pembentukan suatu unit layanan pelanggan, yang memberikan layanan purna jual yang berkualitas. Langkah itu terbukti efektif dalam menjaga pangsa pasar, dengan membedakan produk mereka dari para kompetitor.
b. Pentingnya peran FDI untuk meningkatkan kapasitas produktif Indonesia Pentingnya peran FDI bagi ekonomi Indonesia telah meningkat selama dua dekade yang lalu..
Pabrik-pabrik yang dimiliki asing berkontribusi sebanyak 41 persen dari seluruhtotal output pada tahun 2005-9, naik dari 23 persen pada tahun 1990-94. Selama periode yang sama, jumlah ekspornya meningkat dari sedikit di atas 25 persen menjadi 50 persen. Beberapa industri bahkan mencatat angka yang lebih besar. Sebagai contoh, di tahun 2009, pabrik-pabrik dengan kepemilikan asing berada di belakang 75 persen ekspor pada 8 dari 21 industri manufaktur dan lebih dari 50 persen ekspor pada 5 industri berikutnya.
…dan tampaknya akan terus meningkat…
Data terbaru dari BKPM menunjukkan bahwa pada kuartal pertama tahun 2012, realisasi investasi asing dalam industri manufaktur mencapai 5,7 miliar dolar AS, peningkatan sebesar 30 persen tahun-ke-tahun. Seperti diuraikan pada Triwulanan edisi bulan Juni 2011, peningkatan aliran masuk FDI ini telah didorong oleh biaya buruh yang relatif rendah, ketersediaan sumber daya alam utama dan pasar dalam negeri yang besar dan berkembang, yang mencerminkan demografis yang mendukung, tingginya pertumbuhan PDB per kapita, dan pertumbuhan kelas menengah yang pesat. Akan tetapi, daya tarik Indonesia untuk aliran masuk FDI dapat semakin ditingkatkan dengan menangani kelemahan-kelemahan dalam bidang infrastruktur dan keahlian, dan dengan perbaikan dalam lingkungan dunia usaha, yang memang juga dibutuhkan untuk sepenuhnya meraup manfaat yang dibawa oleh FDI.
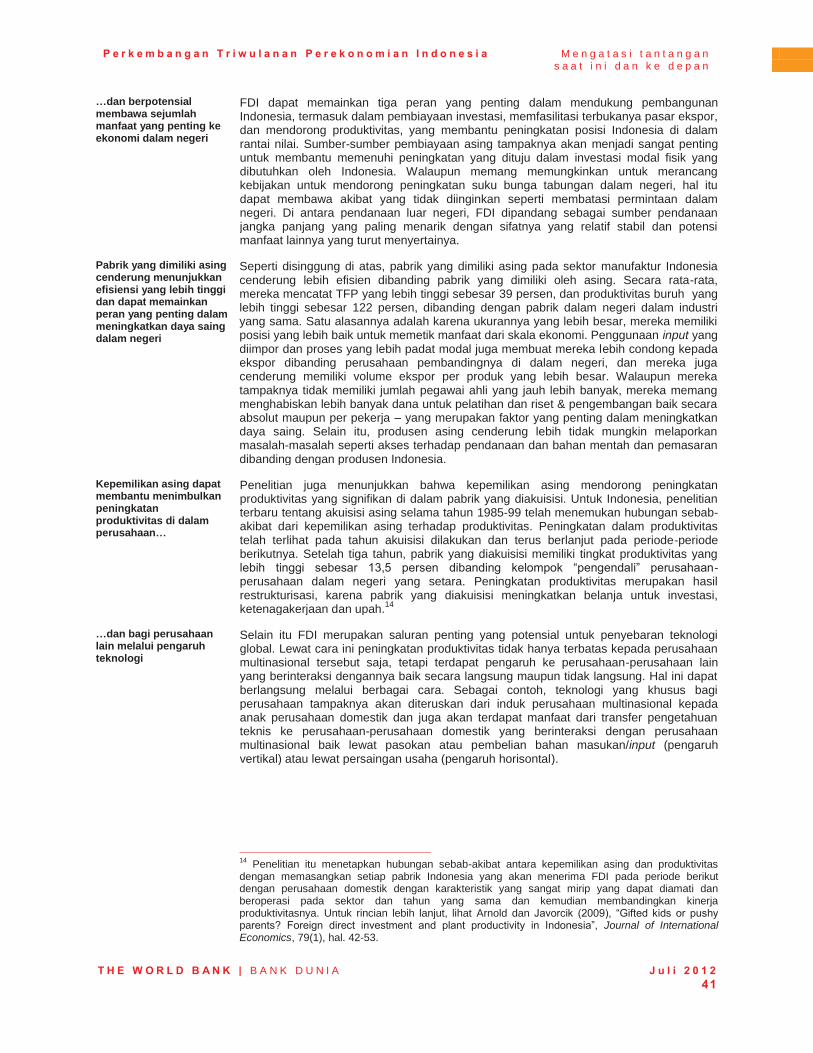
P e r k e m b a n g a n T r i w u l a n a n P e r e k o n o m i a n I n d o n e s i a M e n g a t a s i t a n t a n g a n s a a t i n i d a n k e d e p a n
T H E W O R L D B A N K | B A N K D U N I A J u l i 2 0 1 2 41
…dan berpotensial membawa sejumlah manfaat yang penting ke ekonomi dalam negeri
FDI dapat memainkan tiga peran yang penting dalam mendukung pembangunan Indonesia, termasuk dalam pembiayaan investasi, memfasilitasi terbukanya pasar ekspor, dan mendorong produktivitas, yang membantu peningkatan posisi Indonesia di dalam rantai nilai. Sumber-sumber pembiayaan asing tampaknya akan menjadi sangat penting untuk membantu memenuhi peningkatan yang dituju dalam investasi modal fisik yang dibutuhkan oleh Indonesia. Walaupun memang memungkinkan untuk merancang kebijakan untuk mendorong peningkatan suku bunga tabungan dalam negeri, hal itu dapat membawa akibat yang tidak diinginkan seperti membatasi permintaan dalam negeri. Di antara pendanaan luar negeri, FDI dipandang sebagai sumber pendanaan jangka panjang yang paling menarik dengan sifatnya yang relatif stabil dan potensi manfaat lainnya yang turut menyertainya.
Pabrik yang dimiliki asing cenderung menunjukkan efisiensi yang lebih tinggi dan dapat memainkan peran yang penting dalam meningkatkan daya saing dalam negeri
Seperti disinggung di atas, pabrik yang dimiliki asing pada sektor manufaktur Indonesia cenderung lebih efisien dibanding pabrik yang dimiliki oleh asing. Secara rata-rata, mereka mencatat TFP yang lebih tinggi sebesar 39 persen, dan produktivitas buruh yang lebih tinggi sebesar 122 persen, dibanding dengan pabrik dalam negeri dalam industri yang sama. Satu alasannya adalah karena ukurannya yang lebih besar, mereka memiliki posisi yang lebih baik untuk memetik manfaat dari skala ekonomi. Penggunaan input yang diimpor dan proses yang lebih padat modal juga membuat mereka lebih condong kepada ekspor dibanding perusahaan pembandingnya di dalam negeri, dan mereka juga cenderung memiliki volume ekspor per produk yang lebih besar. Walaupun mereka tampaknya tidak memiliki jumlah pegawai ahli yang jauh lebih banyak, mereka memang menghabiskan lebih banyak dana untuk pelatihan dan riset & pengembangan baik secara absolut maupun per pekerja – yang merupakan faktor yang penting dalam meningkatkan daya saing. Selain itu, produsen asing cenderung lebih tidak mungkin melaporkan masalah-masalah seperti akses terhadap pendanaan dan bahan mentah dan pemasaran dibanding dengan produsen Indonesia.
Kepemilikan asing dapat membantu menimbulkan peningkatan produktivitas di dalam perusahaan…
Penelitian juga menunjukkan bahwa kepemilikan asing mendorong peningkatan produktivitas yang signifikan di dalam pabrik yang diakuisisi. Untuk Indonesia, penelitian terbaru tentang akuisisi asing selama tahun 1985-99 telah menemukan hubungan sebab-akibat dari kepemilikan asing terhadap produktivitas. Peningkatan dalam produktivitas telah terlihat pada tahun akuisisi dilakukan dan terus berlanjut pada periode-periode berikutnya. Setelah tiga tahun, pabrik yang diakuisisi memiliki tingkat produktivitas yang lebih tinggi sebesar 13,5 persen dibanding kelompok “pengendali” perusahaan-perusahaan dalam negeri yang setara. Peningkatan produktivitas merupakan hasil restrukturisasi, karena pabrik yang diakuisisi meningkatkan belanja untuk investasi, ketenagakerjaan dan upah.14
…dan bagi perusahaan lain melalui pengaruh teknologi
Selain itu FDI merupakan saluran penting yang potensial untuk penyebaran teknologi global. Lewat cara ini peningkatan produktivitas tidak hanya terbatas kepada perusahaan multinasional tersebut saja, tetapi terdapat pengaruh ke perusahaan-perusahaan lain yang berinteraksi dengannya baik secara langsung maupun tidak langsung. Hal ini dapat berlangsung melalui berbagai cara. Sebagai contoh, teknologi yang khusus bagi perusahaan tampaknya akan diteruskan dari induk perusahaan multinasional kepada anak perusahaan domestik dan juga akan terdapat manfaat dari transfer pengetahuan teknis ke perusahaan-perusahaan domestik yang berinteraksi dengan perusahaan multinasional baik lewat pasokan atau pembelian bahan masukan/input (pengaruh vertikal) atau lewat persaingan usaha (pengaruh horisontal).
14 Penelitian itu menetapkan hubungan sebab-akibat antara kepemilikan asing dan produktivitas dengan memasangkan setiap pabrik Indonesia yang akan menerima FDI pada periode berikut dengan perusahaan domestik dengan karakteristik yang sangat mirip yang dapat diamati dan beroperasi pada sektor dan tahun yang sama dan kemudian membandingkan kinerja produktivitasnya. Untuk rincian lebih lanjut, lihat Arnold dan Javorcik (2009), “Gifted kids or pushy parents? Foreign direct investment and plant productivity in Indonesia”, Journal of International Economics, 79(1), hal. 42-53.
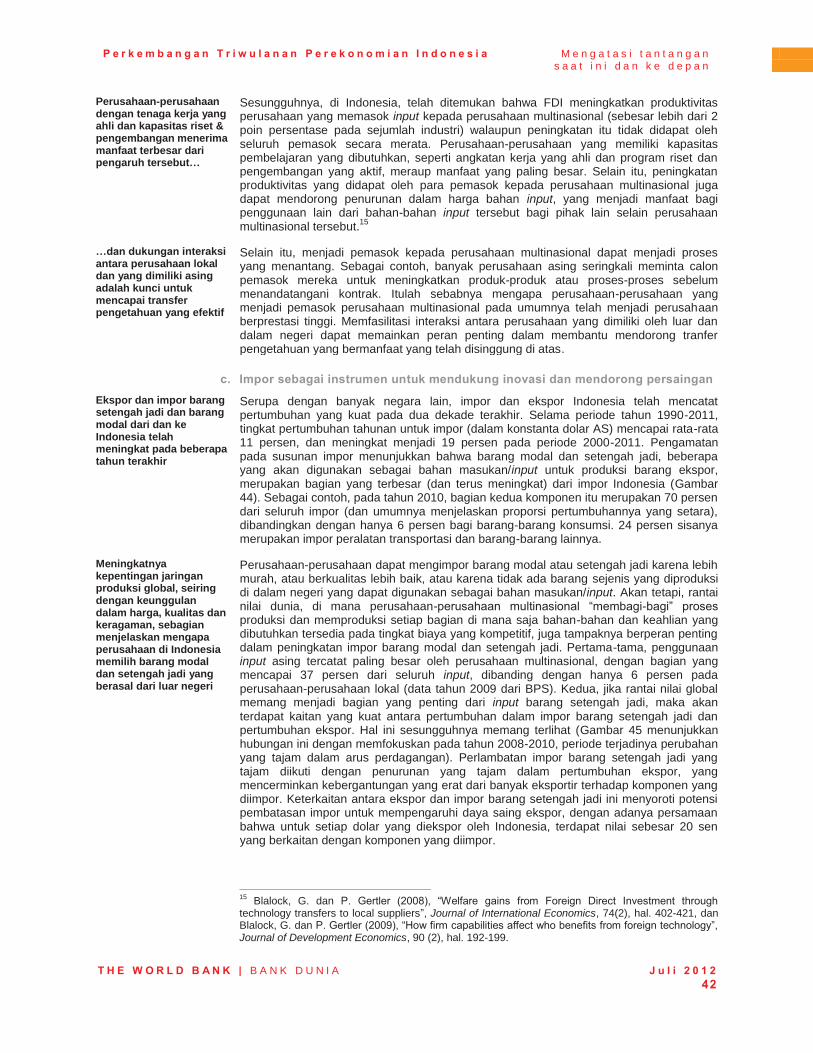
P e r k e m b a n g a n T r i w u l a n a n P e r e k o n o m i a n I n d o n e s i a M e n g a t a s i t a n t a n g a n s a a t i n i d a n k e d e p a n
T H E W O R L D B A N K | B A N K D U N I A J u l i 2 0 1 2 42
Perusahaan-perusahaan dengan tenaga kerja yang ahli dan kapasitas riset & pengembangan menerima manfaat terbesar dari pengaruh tersebut…
Sesungguhnya, di Indonesia, telah ditemukan bahwa FDI meningkatkan produktivitas perusahaan yang memasok input kepada perusahaan multinasional (sebesar lebih dari 2 poin persentase pada sejumlah industri) walaupun peningkatan itu tidak didapat oleh seluruh pemasok secara merata. Perusahaan-perusahaan yang memiliki kapasitas pembelajaran yang dibutuhkan, seperti angkatan kerja yang ahli dan program riset dan pengembangan yang aktif, meraup manfaat yang paling besar. Selain itu, peningkatan produktivitas yang didapat oleh para pemasok kepada perusahaan multinasional juga dapat mendorong penurunan dalam harga bahan input, yang menjadi manfaat bagi penggunaan lain dari bahan-bahan input tersebut bagi pihak lain selain perusahaan multinasional tersebut.15
…dan dukungan interaksi antara perusahaan lokal dan yang dimiliki asing adalah kunci untuk mencapai transfer pengetahuan yang efektif
Selain itu, menjadi pemasok kepada perusahaan multinasional dapat menjadi proses yang menantang. Sebagai contoh, banyak perusahaan asing seringkali meminta calon pemasok mereka untuk meningkatkan produk-produk atau proses-proses sebelum menandatangani kontrak. Itulah sebabnya mengapa perusahaan-perusahaan yang menjadi pemasok perusahaan multinasional pada umumnya telah menjadi perusahaan berprestasi tinggi. Memfasilitasi interaksi antara perusahaan yang dimiliki oleh luar dan dalam negeri dapat memainkan peran penting dalam membantu mendorong tranfer pengetahuan yang bermanfaat yang telah disinggung di atas.
c. Impor sebagai instrumen untuk mendukung inovasi dan mendorong persaingan Ekspor dan impor barang setengah jadi dan barang modal dari dan ke Indonesia telah meningkat pada beberapa tahun terakhir
Serupa dengan banyak negara lain, impor dan ekspor Indonesia telah mencatat pertumbuhan yang kuat pada dua dekade terakhir. Selama periode tahun 1990-2011, tingkat pertumbuhan tahunan untuk impor (dalam konstanta dolar AS) mencapai rata-rata 11 persen, dan meningkat menjadi 19 persen pada periode 2000-2011. Pengamatan pada susunan impor menunjukkan bahwa barang modal dan setengah jadi, beberapa yang akan digunakan sebagai bahan masukan/input untuk produksi barang ekspor, merupakan bagian yang terbesar (dan terus meningkat) dari impor Indonesia (Gambar 44). Sebagai contoh, pada tahun 2010, bagian kedua komponen itu merupakan 70 persen dari seluruh impor (dan umumnya menjelaskan proporsi pertumbuhannya yang setara), dibandingkan dengan hanya 6 persen bagi barang-barang konsumsi. 24 persen sisanya merupakan impor peralatan transportasi dan barang-barang lainnya.
Meningkatnya kepentingan jaringan produksi global, seiring dengan keunggulan dalam harga, kualitas dan keragaman, sebagian menjelaskan mengapa perusahaan di Indonesia memilih barang modal dan setengah jadi yang berasal dari luar negeri
Perusahaan-perusahaan dapat mengimpor barang modal atau setengah jadi karena lebih murah, atau berkualitas lebih baik, atau karena tidak ada barang sejenis yang diproduksi di dalam negeri yang dapat digunakan sebagai bahan masukan/input. Akan tetapi, rantai nilai dunia, di mana perusahaan-perusahaan multinasional “membagi-bagi” proses produksi dan memproduksi setiap bagian di mana saja bahan-bahan dan keahlian yang dibutuhkan tersedia pada tingkat biaya yang kompetitif, juga tampaknya berperan penting dalam peningkatan impor barang modal dan setengah jadi. Pertama-tama, penggunaan input asing tercatat paling besar oleh perusahaan multinasional, dengan bagian yang mencapai 37 persen dari seluruh input, dibanding dengan hanya 6 persen pada perusahaan-perusahaan lokal (data tahun 2009 dari BPS). Kedua, jika rantai nilai global memang menjadi bagian yang penting dari input barang setengah jadi, maka akan terdapat kaitan yang kuat antara pertumbuhan dalam impor barang setengah jadi dan pertumbuhan ekspor. Hal ini sesungguhnya memang terlihat (Gambar 45 menunjukkan hubungan ini dengan memfokuskan pada tahun 2008-2010, periode terjadinya perubahan yang tajam dalam arus perdagangan). Perlambatan impor barang setengah jadi yang tajam diikuti dengan penurunan yang tajam dalam pertumbuhan ekspor, yang mencerminkan kebergantungan yang erat dari banyak eksportir terhadap komponen yang diimpor. Keterkaitan antara ekspor dan impor barang setengah jadi ini menyoroti potensi pembatasan impor untuk mempengaruhi daya saing ekspor, dengan adanya persamaan bahwa untuk setiap dolar yang diekspor oleh Indonesia, terdapat nilai sebesar 20 sen yang berkaitan dengan komponen yang diimpor.
15 Blalock, G. dan P. Gertler (2008), “Welfare gains from Foreign Direct Investment through technology transfers to local suppliers”, Journal of International Economics, 74(2), hal. 402-421, dan Blalock, G. dan P. Gertler (2009), “How firm capabilities affect who benefits from foreign technology”, Journal of Development Economics, 90 (2), hal. 192-199.
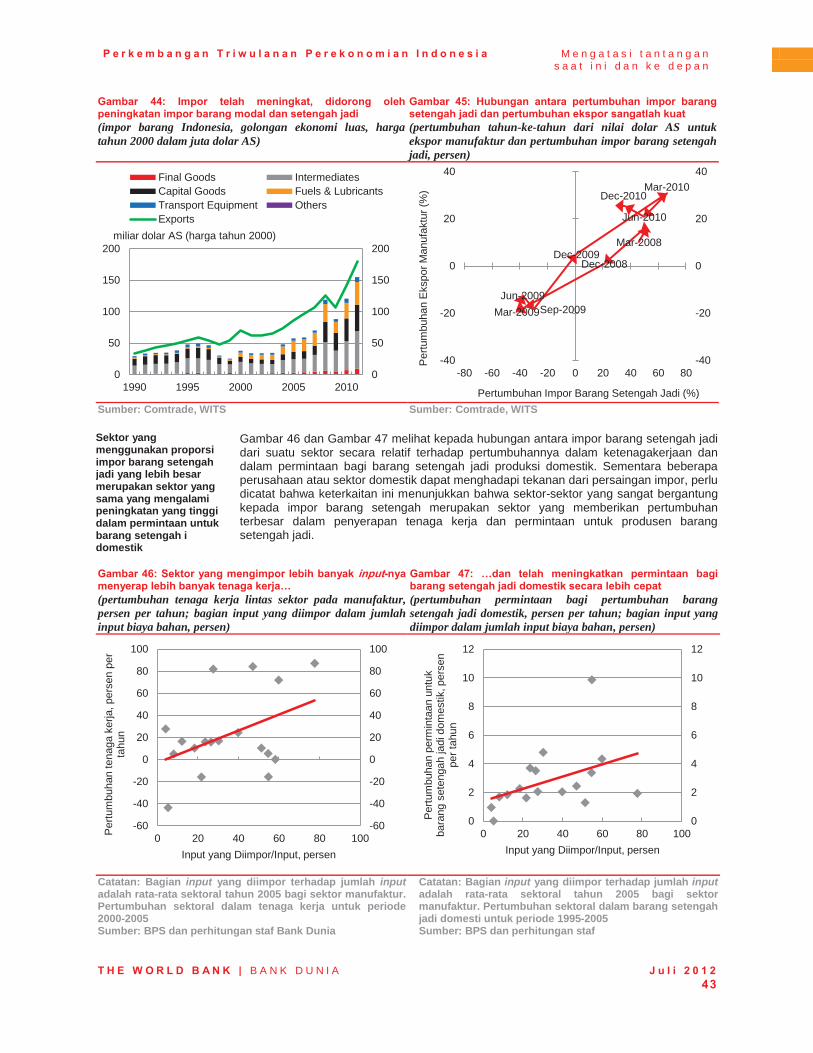
P e r k e m b a n g a n T r i w u l a n a n P e r e k o n o m i a n I n d o n e s i a M e n g a t a s i t a n t a n g a n s a a t i n i d a n k e d e p a n
T H E W O R L D B A N K | B A N K D U N I A J u l i 2 0 1 2 43
Gambar 44: Impor telah meningkat, didorong oleh peningkatan impor barang modal dan setengah jadi (impor barang Indonesia, golongan ekonomi luas, harga tahun 2000 dalam juta dolar AS)
Gambar 45: Hubungan antara pertumbuhan impor barang setengah jadi dan pertumbuhan ekspor sangatlah kuat (pertumbuhan tahun-ke-tahun dari nilai dolar AS untuk ekspor manufaktur dan pertumbuhan impor barang setengah jadi, persen)
Sumber: Comtrade, WITS Sumber: Comtrade, WITS
Sektor yang menggunakan proporsi impor barang setengah jadi yang lebih besar merupakan sektor yang sama yang mengalami peningkatan yang tinggi dalam permintaan untuk barang setengah i domestik
Gambar 46 dan Gambar 47 melihat kepada hubungan antara impor barang setengah jadi dari suatu sektor secara relatif terhadap pertumbuhannya dalam ketenagakerjaan dan dalam permintaan bagi barang setengah jadi produksi domestik. Sementara beberapa perusahaan atau sektor domestik dapat menghadapi tekanan dari persaingan impor, perlu dicatat bahwa keterkaitan ini menunjukkan bahwa sektor-sektor yang sangat bergantung kepada impor barang setengah merupakan sektor yang memberikan pertumbuhan terbesar dalam penyerapan tenaga kerja dan permintaan untuk produsen barang setengah jadi.
Gambar 46: Sektor yang mengimpor lebih banyak input-nya menyerap lebih banyak tenaga kerja… (pertumbuhan tenaga kerja lintas sektor pada manufaktur, persen per tahun; bagian input yang diimpor dalam jumlah input biaya bahan, persen)
Gambar 47: …dan telah meningkatkan permintaan bagi barang setengah jadi domestik secara lebih cepat (pertumbuhan permintaan bagi pertumbuhan barang setengah jadi domestik, persen per tahun; bagian input yang diimpor dalam jumlah input biaya bahan, persen)
Catatan: Bagian input yang diimpor terhadap jumlah input adalah rata-rata sektoral tahun 2005 bagi sektor manufaktur. Pertumbuhan sektoral dalam tenaga kerja untuk periode 2000-2005 Sumber: BPS dan perhitungan staf Bank Dunia
Catatan: Bagian input yang diimpor terhadap jumlah input adalah rata-rata sektoral tahun 2005 bagi sektor manufaktur. Pertumbuhan sektoral dalam barang setengah jadi domesti untuk periode 1995-2005 Sumber: BPS dan perhitungan staf
0
50
100
150
200
0
50
100
150
200
1990 1995 2000 2005 2010
Final Goods IntermediatesCapital Goods Fuels & LubricantsTransport Equipment OthersExports
miliar dolar AS (harga tahun 2000) Mar-2008
Dec-2008
Mar-2009 Jun-2009
Sep-2009
Dec-2009
Mar-2010
Jun-2010
Dec-2010
-40
-20
0
20
40
-40
-20
0
20
40
-80 -60 -40 -20 0 20 40 60 80
Per
tum
buha
n E
kspo
r Man
ufak
tur (
%)
Pertumbuhan Impor Barang Setengah Jadi (%)
-60
-40
-20
0
20
40
60
80
100
-60
-40
-20
0
20
40
60
80
100
0 20 40 60 80 100Per
tum
buha
n te
naga
ker
ja, p
erse
n pe
r ta
hun
Input yang Diimpor/Input, persen
0
2
4
6
8
10
12
0
2
4
6
8
10
12
0 20 40 60 80 100
Per
tum
buha
n pe
rmin
taan
unt
uk
bara
ng s
eten
gah
jadi
dom
estik
, per
sen
per t
ahun
Input yang Diimpor/Input, persen
P e r k e m b a n g a n T r i w u l a n a n P e r e k o n o m i a n I n d o n e s i a M e n g a t a s i t a n t a n g a n s a a t i n i d a n k e d e p a n
T H E W O R L D B A N K | B A N K D U N I A J u l i 2 0 1 2 44
Meningkatnya persaingan impor juga mendorong kinerja yang lebih baik bagi produsen domestik
Peningkatan persaingan dari produk-produk asing juga dapat mendorong peningkatan dalam alokasi sumber daya, perbaikan dalam tingkat produktivitas dan insentif untuk melakukan investasi dan inovasi (Kotak 5 memberikan contoh di lapangan). Sebagai contoh, barang-barang yang berhasil diproduksi dan diekspor oleh perusahaan-perusahaan Indonesia dan pada saat yang bersamaan menghadapi persaingan impor di dalam negeri memiliki tingkat keberhasilan yang lebih tinggi sebesar 15 poin persentase pada pasar ekspor dibanding mereka yang tidak menghadapi persaingan impor.
Kotak 5: Potensi manfaat dari kualitas dan keragaman input bagi daya saing manufaktur
Penelitian menunjukkan bahwa barang input yang diimpor memainkan peran utama dalam meningkatkan kinerja pada sektor manufaktur Indonesia. Suatu penelitian pada data sensus manufaktur Indonesia dari periode 1990-2001 oleh Amiti dan Konings (2007) menemukan bahwa penurunan sebesar 10 poin persentase dalam tarif impor barang input akan memberikan peningkatan produktivitas sebesar 12 persen melalui pengaruh pembelajaran, kualitas dan keragaman. Peningkatan ini setidaknya dua kali lipat lebih tinggi dari peningkatan yang berasal dari penurunan tarif output yang dapat timbul dari pengaruh persaingan yang lebih keras.
Terjangkaunya harga barang input yang impor juga dapat meningkatkan produktivitas melalui pengaruh kualitas dan keragaman. Sebagai contoh, walau penurunan tarif impor input pada barang seperti kompresor dapat menekan industri kompresor dalam negeri untuk menjadi lebih kompetitif, pengaruhnya akan berbeda kepada pengguna barang input tersebut, seperti produsen lemari pendingin. Produktivitasnya dapat meningkat karena mereka dapat mengakses teknologi asing terbaru yang terkandung di dalam barang input yang diimpor itu. Kompresor berkualitas lebih tinggi mendorong produksi lemari pendingin dengan kualitas yang lebih tinggi. Selain itu, akses terhadap pilihan kompresor yang lebih banyak dapat memungkinkan produsen untuk menurunkan biaya mereka dengan memilih jenis kompresor yang paling tepat dan mungkin lebih murah, yang sebelumnya tidak tersedia.
Penelitian terakhir di India menunjukkan peran penting yang serupa untuk barang input yang diimpor. Menurut Goldberg, Khandelwal, Pavcnik dan Topalova (2008), perluasan jumlah produk yang dihasilkan oleh perusahaan-perusahaan manufaktur India selama tahun 90an sebagian disebabkan oleh harga barang input impor yang lebih murah, lebih bervariasi dan berkualitas lebih tinggi. Penurunan tarif menurunkan harga dan meningkatkan volume impor yang ada, tetapi mereka juga berarti akses kepada jenis-jenis barang input setengah jadi yang baru dari luar negeri. Barang-barang input yang baru tersebut, pada gilirannya, akan meningkatkan jumlah produk yang dihasilkan oleh perusahaan, yang menjelaskan sekitar seperempat dari pertumbuhan output manufaktur. Perusahaan-perusahaan lalu dapat menggunakan penghematan biaya input tersebut dari liberalisasi perdagangan untuk membayar biaya tetap untuk membuka lini produk yang baru. Selain itu, akses terhadap barang modal dan barang input setengah jadi dengan kualitas yang lebih tinggi akan menurunkan rintangan teknologi.
Catatan: Lihat Amiti, M. dan J. Konings (2007), “Trade liberalization, intermediate inputs, and productivity: evidence from Indonesia”, American Economic Review, 97(5), hal. 1611-1638, dan Goldberg, P. Khandelwal, A. Pavcnik dan P. Topalova (2008), “Imported Intermediate Inputs and Domestic Product Growth: Evidence from India”, NBER Working Paper 14416, National Bureau of Economic Research
d. Ekspor sebagai cara untuk mendorong produktivitas dan pertumbuhan Ekspor memungkinkan perusahaan Indonesia untuk belajar dan berinovasi
Pasar ekspor dapat menghasilkan peningkatan-peningkatan dinamis yang berkaitan dengan pertumbuhan produktivitas dan kapasitas inovasi yang lebih cepat. Sebagai contoh, persaingan yang lebih ketat pada pasar ekspor meningkatkan biaya yang terjadi bila tidak berinovasi. Perusahaan-perusahaan lokal cenderung menemukan bahwa pelanggan asing memiliki sifat yang lebih canggih dan membedakan, dan untuk melayani mereka, para eksportir mungkin harus meningkatkan proses produksi, memperbarui modal dan standar, dan juga melatih para pekerja mereka. Selain itu, pasar ekspor dapat menjadi pendorong yang kuat bagi diversifikasi produk.
Semakin banyak perdagangan dengan pasar tertentu, semakin banyak pula tersedia informasi bagi eksportir baru, sehingga lebih mudah pula memasuki pasar itu
Perusahaan-perusahaan pada negara membangun menghadapi biaya tetap yang cukup besar untuk masuk ke pasar ekspor.16 Perusahaan-perusahaan harus mencari informasi pasar, memenuhi standar internasional, dan memahami klien asing. Riset terbaru menunjukkan bahwa keseluruhan tingkat perdagangan antara dua negara adalah hal yang penting untuk memungkinkan pemain baru untuk masuk dan bertahan di dalam pasar ekspor. Dengan demikian perluasan ekspor dari produk yang ada adalah bermanfaat bagi pertumbuhan dan diversifikasi ekspor yang akan datang, termasuk bagi perusahaan-perusahaan baru untuk masuk ke pasar ekspor yang telah ada. Hal ini karena semakin tinggi aliran ekspor dengan tujuan tertentu, semakin besar pula informasi yang tersedia tentang pasar tersebut, yang menurunkan biaya yang berkaitan dengan informasi yang dihadapi oleh suatu perusahaan ketika memasuki suatu pasar ekspor yang baru.17
16 Brenton, P., Newfarmer, R. dan P. Walkenhorst (2007), “Avenues for Export Diversification: Issues for Low-Income Countries”, MPRA Paper 22758, University Library of Munich, Jerman. 17 Ibid.
P e r k e m b a n g a n T r i w u l a n a n P e r e k o n o m i a n I n d o n e s i a M e n g a t a s i t a n t a n g a n s a a t i n i d a n k e d e p a n
T H E W O R L D B A N K | B A N K D U N I A J u l i 2 0 1 2 45
Dan juga manfaat potensial produktivitas sisi penawaran, yang dapat mendorong permintaan bagi produksi domestik
Dan juga memberikan sarana untuk belajar dan berinovasi, pasar ekspor memainkan peran utama dalam meningkatkan permintaan bagi barang-barang dan jasa yang dihasilkan oleh perusahaan-perusahaan Indonesia. Sebagai contoh, pada periode tahun 1990-2010, pertumbuhan ekspor setara dengan 52 persen dari jumlah pertumbuhan dalam permintaan bagi barang-barang dan jasa Indonesia (walaupun pertumbuhan impor harus dikurangkan dari angka ini untuk mendapatkan kontribusi dari permintaan eksternal netto terhadap pertumbuhan). Seperti terlihat pada kinerja pertumbuhan dari banyak negara pembanding Indonesia di wilayah yang sama selama krisis keuangan global pada tahun 2008 hingga 2009, keterbukaan perdagangan yang lebih besar juga dapat membawa potensi gejolak pertumbuhan. Akan tetapi penelitian terakhir menunjukkan bahwa keterbukaan perdagangan yang lebih besar cenderung menurunkan gejolak dalam ekonomi-ekonomi yang menunjukkan tingkat diversifikasi ekspor yang tinggi, sementara hal yang sebaliknya terjadi pada ekonomi dengan diversifikasi yang rendah. Secara khusus, diversifikasi produk memiliki peran yang paling penting dalam melindungi suatu ekonomi dari dampak kejutan luar negeri yang merugikan.18
18 Haddad, M., Lim, J., Munro, L., Saborowski, C. dan B. Shepherd (2011), “Volatility, Export Diversification and Policy”, Bab 11 dalam Managing Openness, Ed. Haddad, M. and B. Shepherd, The World Bank.

P e r k e m b a n g a n T r i w u l a n a n P e r e k o n o m i a n I n d o n e s i a M e n g a t a s i t a n t a n g a n s a a t i n i d a n k e d e p a n
T H E W O R L D B A N K | B A N K D U N I A J u l i 2 0 1 2 46
LAMPIRAN: INDIKATOR GAMBARAN EKONOMI INDONESIA Lampiran gambar 1: Pertumbuhan PDB (persen pertumbuhan, triwulanan dan tahunan)
Lampiran gambar 2: Kontribusi pengeluaran terhadap PDB (pertumbuhan trimulan-ke-triwulan, penyesuaian musiman)
Catatan: *Rata-rata pertumbuhan Tw-k-Tw sejak Q1 2005-Q1 2012. Sumber: BPS dan perhitungan staf Bank Dunia
Sumber: BPS dan perhitungan staf Bank Dunia
Lampiran gambar 3: Kontribusi sektor terhadap PDB (pertumbuhan trimulan-ke-triwulan, penyesuaian musiman
Lampiran gambar 4: Penjualan sepeda motor dan mobil (bulanan, unit)
Sumber: BPS melalui CEIC Sumber: CEIC Lampiran gambar 5: Indikator konsumen (indeks)
Lampiran gambar 6: Indikator kegiatan industri (pertumbuhan tahun-ke-tahun)
Sumber: BI via CEIC Sumber: CEIC
0
2
4
6
8
0
1
2
3
4
Mar-05 Dec-06 Sep-08 Jun-10 Mar-12
Persen Persen
Tw-k-Tw, penyesuaian musiman (kiri)
Tahun-ke-tahun (kanan)
Rata-rata (kiri)*
-2
-1
0
1
2
3
4
-2
-1
0
1
2
3
4
Mar-09 Dec-09 Sep-10 Jun-11 Mar-12Discrepancy Net Exports InvestmentGov cons. Private cons. GDP
Persen Persen
-1
0
1
2
3
-1
0
1
2
3
Mar-09 Dec-09 Sep-10 Jun-11 Mar-12Other (incl services) Trade, Hotel& Rest.Comm and transport ManufacturingMining and Const AgricultureOverall GDP
Persen Persen
30
50
70
90
110
100
300
500
700
900
May-09 May-10 May-11 May-12
'000
Sepeda motor (kiri)
'000
Mobil (kanan)
50
75
100
125
150
50
75
100
125
150
May-09 May-10 May-11 May-12
Indeks Indeks
Indeks penjualan ritel BI
Indeks survey konsumen BI
-20
0
20
40
60
-5
0
5
10
15
May-09 May-10 May-11 May-12
Persen Persen
Penjualan semen (kanan)
Indeks produksi manufaktur (kiri)
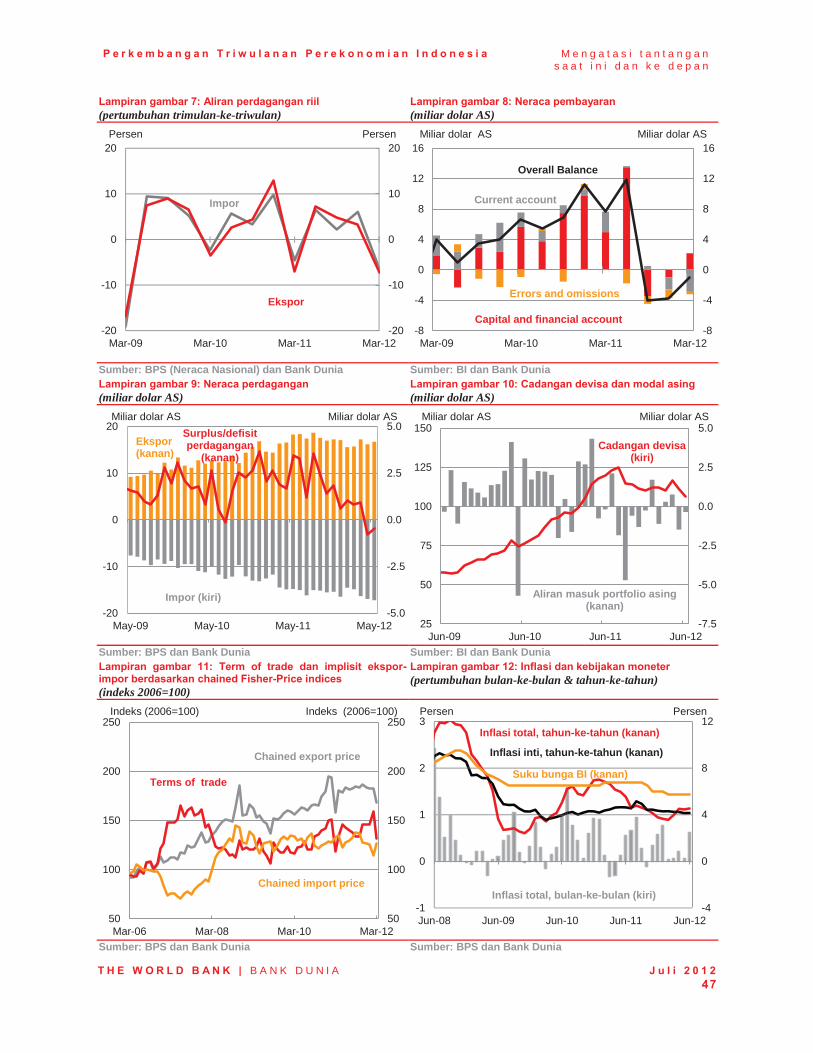
P e r k e m b a n g a n T r i w u l a n a n P e r e k o n o m i a n I n d o n e s i a M e n g a t a s i t a n t a n g a n s a a t i n i d a n k e d e p a n
T H E W O R L D B A N K | B A N K D U N I A J u l i 2 0 1 2 47
Lampiran gambar 7: Aliran perdagangan riil (pertumbuhan trimulan-ke-triwulan)
Lampiran gambar 8: Neraca pembayaran (miliar dolar AS)
Sumber: BPS (Neraca Nasional) dan Bank Dunia Sumber: BI dan Bank Dunia Lampiran gambar 9: Neraca perdagangan (miliar dolar AS)
Lampiran gambar 10: Cadangan devisa dan modal asing (miliar dolar AS)
Sumber: BPS dan Bank Dunia Sumber: BI dan Bank Dunia Lampiran gambar 11: Term of trade dan implisit ekspor- impor berdasarkan chained Fisher-Price indices (indeks 2006=100)
Lampiran gambar 12: Inflasi dan kebijakan moneter (pertumbuhan bulan-ke-bulan & tahun-ke-tahun)
Sumber: BPS dan Bank Dunia Sumber: BPS dan Bank Dunia
-20
-10
0
10
20
-20
-10
0
10
20
Mar-09 Mar-10 Mar-11 Mar-12
Ekspor
Impor
Persen Persen
-8
-4
0
4
8
12
16
-8
-4
0
4
8
12
16
Mar-09 Mar-10 Mar-11 Mar-12
Miliar dolar AS Miliar dolar AS
Capital and financial account
Current account
Overall Balance
Errors and omissions
-5.0
-2.5
0.0
2.5
5.0
-20
-10
0
10
20
May-09 May-10 May-11 May-12
Surplus/defisit perdagangan
(kanan) Ekspor (kanan)
Impor (kiri)
Miliar dolar AS Miliar dolar AS
-7.5
-5.0
-2.5
0.0
2.5
5.0
25
50
75
100
125
150
Jun-09 Jun-10 Jun-11 Jun-12
Cadangan devisa (kiri)
Miliar dolar AS Miliar dolar AS
Aliran masuk portfolio asing (kanan)
50
100
150
200
250
50
100
150
200
250
Mar-06 Mar-08 Mar-10 Mar-12
Indeks (2006=100) Indeks (2006=100)
Terms of trade
Chained import price
Chained export price
-4
0
4
8
12
-1
0
1
2
3
Jun-08 Jun-09 Jun-10 Jun-11 Jun-12
Inflasi inti, tahun-ke-tahun (kanan)
Inflasi total, tahun-ke-tahun (kanan)
Inflasi total, bulan-ke-bulan (kiri)
Persen Persen
Suku bunga BI (kanan)

P e r k e m b a n g a n T r i w u l a n a n P e r e k o n o m i a n I n d o n e s i a M e n g a t a s i t a n t a n g a n s a a t i n i d a n k e d e p a n
T H E W O R L D B A N K | B A N K D U N I A J u l i 2 0 1 2 48
Lampiran gambar 13: Rincian tingkat harga konsumen (persentasi dari kontribusi inflasi bulanan)
Lampiran gambar 14: Tingkat inflasi negara tetangga (pertumbuhan tahun-ke-tahun, Juni 2012
Sumber: BPS dan Bank Dunia Catatan: *Mei merupakan data terkini
Sumber: Nasional statistik melalui CEIC, dan BPS Lampiran gambar 15: Harga beras kulakan di pasar domestik dan internasional (Rupiah per kg)
Lampiran gambar 16: Tingkat kemiskinan dan pengangguran (data tahunan, persen)
Catatan: Titik-titik adalah harga beras Thailand (cif) Garis adalah harga beras domestic tingkat grosir Sumber: PIBC, FAO dan Bank Dunia
Catatan: Data tenaga kerja dari Sakernas Agustus Sumber: BPS, dan Bank Dunia
Lampiran gambar 17: Indeks saham regional (indeks harian)
Lampiran gambar 18: Indeks spot dolar dan rupiah (indeks dan tingkat harga harian)
Sumber: Bank Dunia dan CEIC Sumber: Bank Dunia dan CEIC
-0.6
0.0
0.6
1.2
1.8
-0.6
0.0
0.6
1.2
1.8
Jun-09 Jun-10 Jun-11 Jun-12
Volatile AdministeredCore Headline
Persen Persen -1 0 1 2 3 4 5 6
-1 0 1 2 3 4 5 6
Japan *Malaysia*
Korea*USA *
ThailandPhilippines *
China*Indonesia
Singapore *
Persen
Persen
1,000
3,000
5,000
7,000
9,000
11,000
1,000
3,000
5,000
7,000
9,000
11,000
Jun-09 Jun-10 Jun-11 Jun-12
Kualitas rendah: IR 64 III (domestic); Thai A1 Super (international)
Rp/Kg
Kualitas medium Muncul I (domestic) Thai 100% B 2nd grade (internasional)
Rp/Kg
0
5
10
15
20
25
0
5
10
15
20
25
2002 2004 2006 2008 2010 2012
Persen Persen
Tingkatan kemiskinan
Tingkat pengangguran
50
100
150
200
250
300
50
100
150
200
250
300
Jan-09 Jan-10 Jan-11 Jan-12
Indeks (Jan 2009=100)
SGX
JCI
SET
Shanghai
BSE
Indeks (Jan 2009=100) 8,000
9,000
10,000
11,000
12,00080
90
100
110
120
Jan-09 Jan-10 Jan-11 Jan-12
Indeks (5 Jan 2009=100)
IDR/USD (kanan)
Indeks Dollar (kiri)
Appresiasi IDR
Rp per dolar AS

P e r k e m b a n g a n T r i w u l a n a n P e r e k o n o m i a n I n d o n e s i a M e n g a t a s i t a n t a n g a n s a a t i n i d a n k e d e p a n
T H E W O R L D B A N K | B A N K D U N I A J u l i 2 0 1 2 49
Lampiran gambar 19: Yield obligasi pemerintah 5 tahunan mata uang lokal (persen, harian)
Lampiran gambar 20: Spread EMBI obligasi pemerintah dengan obligasi dollar amerika (basis poin, harian)
Sumber: CEIC dan Bank Dunia Sumber: BI dan Bank Dunia Lampiran gambar 21: Tingkat kredit bank umum (indeks, bulan Januari 2008=100)
Lampiran gambar 22: Indikator keuangan sektor perbankan (bulanan, persen)
Sumber: CEIC dan Bank Dunia Sumber: BI dan Bank Dunia Lampiran gambar 23: Utang pemerintah (persentasi dari PDB; miliar dolar)
Lampiran gambar 24: Utang luar negeri (persentasi dari PDB; miliar dolar)
Sumber: BI dan Bank Dunia Sumber: BI dan Bank Dunia
0
5
10
15
0
5
10
15
Jan-09 Jan-10 Jan-11 Jan-12
Persen
Philippines
United States Thailand
Malaysia
Indonesia
Persen
-250
-125
0
125
250
0
250
500
750
1000
Jan-09 Jan-10 Jan-11 Jan-12
Basis poin
Indonesia EMBIG bond spreads (LHS)
Indonesia spreads less overall EMBIG Index spreads (kanan)
Basis poin
80
100
120
140
160
180
200
80
100
120
140
160
180
200Index (Jan 2009=100)
USA
Thailand
Singapore
Indonesia
India
Malaysia
Index (Jan 2009=100)
0
2
4
6
8
10
0
20
40
60
80
100
Jan-09 Jan-10 Jan-11 Jan-12
Capital Adequacy Ratio (LHS)
Return on Assets Ratio (RHS)
Loan to Deposit Ratio (LHS)
Persen Persen
Non-Performing Loans (RHS)
0
50
100
150
200
250
0
10
20
30
40
50
2006 2007 2008 2009 2010 2011 2012*
External debt, RHSDomestic debt, RHS
Persen Miliar USD
Rasio utang pemerintah terhadap PDB
*April
0
50
100
150
200
250
0
10
20
30
40
50
2006 2007 2008 2009 2010 2011 2012*
Private external debt, RHSPublic external debt, RHS
Rasio utang luar negeri terhadap PDB (kiri)
Persen Miliar USD
*April

P e r k e m b a n g a n T r i w u l a n a n P e r e k o n o m i a n I n d o n e s i a M e n g a t a s i t a n t a n g a n s a a t i n i d a n k e d e p a n
T H E W O R L D B A N K | B A N K D U N I A J u l i 2 0 1 2 50
Lampiran Tabel 1: Realisasi dan anggaran belanja pemerintah (triliun rupiah)
2009 2010 2011 2012 2012
Realisasi Realisasi Realisasi (sementara) APBN-P
Perkiraan semester I
DepKeu* A. State revenue and grants 848.8 995.3 1,199.5 1,358.2 1,362.4
1. Tax revenue 619.9 723.3 872.6 1,016.2 1,017.0
2. Non-tax revenue 227.2 268.9 324.3 341.1 344.6
B. Expenditure 937.4 1,042.1 1,289.7 1,548.3 1,553.1
1. Central government 628.8 697.4 878.3 1,069.5 1,070.8
2. Transfers to the regions 308.6 344.7 411.4 478.8 482.3
C. Primary balance 5.2 41.5 3.1 -72.3 -78.9
D. SURPLUS / DEFICIT -88.6 -46.9 -90.2 -190.1 -190.8
(percent of GDP) -1.6 -0.7 -1.2 -2.2 -2.3
Catatan: * Perkiraan Depkeu berdasarkan laporan keuangan DepKue Semester I 2012 Sumber: Depkeu
Lampiran Tabel 2: Neraca Pembayaran (miliar dolar AS)
2009 2010 2011 2010 2011 2012
Q3 Q4 Q1 Q2 Q3 Q4 Q1
Overall Balance of Payments 12.5 30.3 11.9 7.0 11.3 7.7 11.9 -4.0 -3.7 -1.0 As percent of GDP 2.3 4.3 1.4 3.7 6.0 3.9 5.6 -1.8 -1.7 -0.5
Current Account 10.6 5.1 1.7 1.0 0.9 2.7 0.1 0.5 -1.6 -2.9 As percent of GDP 2.0 0.7 0.2 0.6 0.5 1.3 0.1 0.2 -0.7 -1.3
Trade balance 21.2 21.3 23.3 5.4 6.4 7.2 6.0 6.9 3.3 1.5
Net income & transfers -10.6 -16.2 -21.6 -4.4 -5.6 -4.5 -5.8 -6.4 -4.9 -4.3
Capital & Financial Account 4.9 26.6 14.0 7.5 9.7 5.0 13.5 -3.5 -1.0 2.2 As percent of GDP 0.9 3.8 1.7 4.0 5.2 2.5 6.4 -1.5 -0.5 1.0
Direct investment 2.6 11.1 11.1 1.8 4.4 3.5 3.8 2.0 1.9 2.0 Portfolio 10.3 13.2 4.5 4.5 1.4 3.8 5.5 -4.7 -0.2 2.8 Other -8.2 2.3 -1.6 1.2 3.8 -2.3 4.2 -0.8 -2.8 -2.6 Errors & omissions -3.0 -1.5 -3.9 -1.6 0.7 0.0 -1.8 -1.0 -1.2 -0.3 Reserves(a) 66.1 96.2 110.1 86.6 96.2 105.7 119.7 114.5 110.1 110.5
Catatan: * Cadangan devisa pada akhir periode Sumber: BI danBPS

Investing in Indonesia’s Institutionsfor Inclusive and Sustainable Development

Oktober 2012
Menjaga ketahanan
PERKEMBANGAN TRIWULANANPEREKONOMIAN INDONESIA

PERKEMBANGAN TRIWULANAN PEREKONOMIAN INDONESIA Menjaga ketahanan
Oktober 2012

Kata Pengantar
Perkembangan Triwulanan Perekonomian Indonesia menyajikan perkembangan utama ekonomi Indonesia dalam tiga bulan terakhir. Laporan ini menempatkan perkembangan tersebut dalam konteks jangka panjang dan global, serta memberikan penilaian terhadap prospek ekonomi dan kesejahteraan sosial Indonesia. Laporan ini ditujukan untuk khalayak termasuk pembuat kebijakan, pemimpin bisnis, pelaku pasar keuangan, serta komunitas analis dan professional yang terlibat dalam ekonomi Indonesia.
Laporan ini disiapkan dan disusun oleh tim kebijakan makro dan fiskal Bank Dunia Jakarta di bawah bimbingan Jim Brumby sebagai Lead Economist dan Sector Manager, Ndiame Diop sebagai Economic Adviser dan Lead Economist dan Ashley Taylor sebagai Country Economist. Tim penyusun terdiri dari Magda Adriani (harga komoditas), Alex Sienaert (lingkungan internasional, sektor eksternal, pasar keuangan dan ringkasan eksekutif), Fitria Fitrani (ekspor manufaktur dan sektor eksternal), Faya Hayati (harga dan sektor riil), dan Ahya Ihsan (fiskal dan RAPBN 2013). Kontribusi tambahan diterima dari Dwi Endah Abriningrum (fiskal dan RAPBN 2013), Neni Lestari (perbankan), The Fei Ming (sektor korporasi), Christopher Smith dan Siwage Dharma Negara (UU pendidikan tinggi), Staffan Synnerstorm, Erwin Ariadharma dan Enda Ginting (belanja untuk pegawai negeri). Pengeditan dan produksi dilakukan oleh Alex Sienaert, Arsianti, Faya Hayati dan Ashley Taylor. Komentar serta masukan yang cukup detail diberikan oleh Mark Ahern, Jim Brumby, Ndiame Diop, Alex Drees-Gross, Yue Man Lee, Samar Al-Samarrai, Theo Thomas dan Soekarno Wirokartono. Diseminasi diorganisir oleh Dini Sari Djalal, Farhana Asnap, Indra Irnawan, Jerry Kurniawan, Nugroho, Marcellinus Winata dan Randy Salim. Akhirnya, dukungan administratif yang sangat berharga diberikan oleh Titi Ananto, Sylvia Njotomihardjo dan Nina Herawati. Dokumen ini diterjemahkan ke bahasa Indonesia oleh Nicolas Novianto dan diedit oleh Magda Adriani, Fitria Fitrani, Ahya Ihsan, Arsianti, Soekarno Wirokartono, Wahyoe Soedarmono, Enda Ginting and Siwage Dharma Negara. Laporan ini disusun oleh para staf International Bank for Reconstruction and Development /Bank Dunia, dengan dukungan pendanaan dari Pemerintah Australia - AusAID melalui program Support for Enhanced Macroeconomic and Fiscal Policy Analysis (SEMEFPA). Temuan-temuan, interpretasi dan kesimpulan-kesimpulan yang dinyatakan di dalam laporan ini tidak selalu mencerminkan pandangan AusAID dan Pemerintah Australia, para Direktur Pelaksana Bank Dunia atau pemerintah yang diwakilinya. Bank Dunia tidak menjamin ketepatan data-data yang termuat dalam laporan ini. Batas-batas, warna, denominasi dan informasi-informasi lain yang digambarkan pada setiap peta di dalam laporan ini tidak mencerminkan pendapat Bank Dunia mengenai status hukum dari wilayah atau dukungan atau penerimaan dari batas-batas tersebut. Foto sampul depan dan bagian dalam merupakan Hak Cipta @ PT. Unilever, PT Indika Energy dan Bank Dunia. Semua Hak Cipta dilindungi. Untuk mendapatkan lebih banyak analisa Bank Dunia terhadap ekonomi Indonesia:
Untuk informasi mengenai Bank Dunia serta kegiatannya di Indonesia, silakan berkunjung ke website ini www.worldbank.org/id Untuk mendapatkan publikasi terkait melalui e-mail, silakan menghubungi [email protected]. Untuk pertanyaan dan saran berkaitan dengan publikasi ini, silakan menghubungi [email protected].
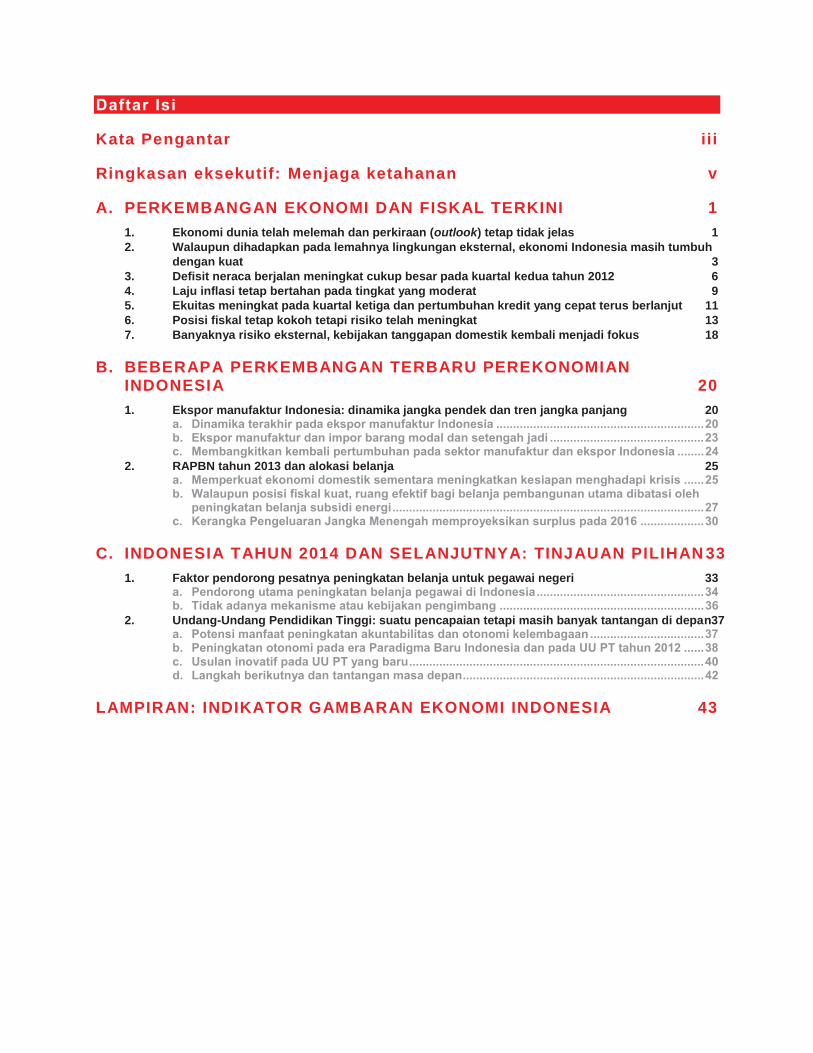
Daftar Isi
Kata Pengantar iii
Ringkasan eksekutif: Menjaga ketahanan v
A. PERKEMBANGAN EKONOMI DAN FISKAL TERKINI 1
1. Ekonomi dunia telah melemah dan perkiraan (outlook) tetap tidak jelas 1 2. Walaupun dihadapkan pada lemahnya lingkungan eksternal, ekonomi Indonesia masih tumbuh
dengan kuat 3 3. Defisit neraca berjalan meningkat cukup besar pada kuartal kedua tahun 2012 6 4. Laju inflasi tetap bertahan pada tingkat yang moderat 9 5. Ekuitas meningkat pada kuartal ketiga dan pertumbuhan kredit yang cepat terus berlanjut 11 6. Posisi fiskal tetap kokoh tetapi risiko telah meningkat 13 7. Banyaknya risiko eksternal, kebijakan tanggapan domestik kembali menjadi fokus 18
B. BEBERAPA PERKEMBANGAN TERBARU PEREKONOMIAN INDONESIA 20
1. Ekspor manufaktur Indonesia: dinamika jangka pendek dan tren jangka panjang 20 a. Dinamika terakhir pada ekspor manufaktur Indonesia .............................................................. 20 b. Ekspor manufaktur dan impor barang modal dan setengah jadi .............................................. 23 c. Membangkitkan kembali pertumbuhan pada sektor manufaktur dan ekspor Indonesia ........ 24
2. RAPBN tahun 2013 dan alokasi belanja 25 a. Memperkuat ekonomi domestik sementara meningkatkan kesiapan menghadapi krisis ...... 25 b. Walaupun posisi fiskal kuat, ruang efektif bagi belanja pembangunan utama dibatasi oleh
peningkatan belanja subsidi energi ............................................................................................. 27 c. Kerangka Pengeluaran Jangka Menengah memproyeksikan surplus pada 2016 ................... 30
C. INDONESIA TAHUN 2014 DAN SELANJUTNYA: TINJAUAN PILIHAN 33
1. Faktor pendorong pesatnya peningkatan belanja untuk pegawai negeri 33 a. Pendorong utama peningkatan belanja pegawai di Indonesia .................................................. 34 b. Tidak adanya mekanisme atau kebijakan pengimbang ............................................................. 36
2. Undang-Undang Pendidikan Tinggi: suatu pencapaian tetapi masih banyak tantangan di depan37 a. Potensi manfaat peningkatan akuntabilitas dan otonomi kelembagaan .................................. 37 b. Peningkatan otonomi pada era Paradigma Baru Indonesia dan pada UU PT tahun 2012 ...... 38 c. Usulan inovatif pada UU PT yang baru ........................................................................................ 40 d. Langkah berikutnya dan tantangan masa depan ........................................................................ 42
LAMPIRAN: INDIKATOR GAMBARAN EKONOMI INDONESIA 43
DAFTAR GRAFIK
Gambar 1: Pertumbuhan Indonesia masih tetap kuat di tengah perlemahan permintaan eksternal .......................................................................................................................... v
Gambar 2: Penurunan keseimbangan neraca berjalan telah terlihat di negara-negara di kawasan dan juga di Indonesia .................................................................................................... vi
Gambar 3: Belanja subsidi dan pegawai terus mengambil bagian besar dari total belanja .......... ix Gambar 4: Pasar ekuitas menunjukkan pemulihan yang kuat pada kuartal ketiga dan volatilitas
ekuitas AS menurun… ................................................................................................... 2 Gambar 5: …sementara biaya pendanaan dolar negara pasar berkembang turun dengan
merosotnya spread risiko .............................................................................................. 2 Gambar 6: Pertumbuhan PDB meningkat menjadi 6,4 persen pada kuartal kedua tahun 2012… . 4 Gambar 7: …didorong oleh percepatan pertumbuhan investasi sementara ekspor bersih sangat
membebani pertumbuhan .............................................................................................. 4 Gambar 8: Sejumlah indikator kegiatan ekonomi frekuensi tinggi menunjukkan tanda-tanda
perlambatan .................................................................................................................... 4 Gambar 9: Aliran keluar neraca pembayaran sekali lagi didominasi oleh peningkatan defisit
neraca berjalan ............................................................................................................... 6 Gambar 10: Penyempitan surplus perdagangan mendorong peningkatan defisit neraca
berjalan… ........................................................................................................................ 7 Gambar 11: …dengan penurunan neraca berjalan juga terlihat pada sejumlah negara tetangga . 7 Gambar 12: Turunnya pertumbuhan ekspor diikuti penurunan impor ............................................. 9 Gambar 13: Inflasi headline dan inti tetap berada pada tingkat yang rendah ................................. 9 Gambar 14: Perbedaan harga beras dalam dan luar negeri telah turun dari tingkat tertinggi pada
awal 2012 ......................................................................................................................... 9 Gambar 15: Ekuitas Indonesia mencatat pertumbuhan yang kuat pada kuartal tiga tapi Rupiah
tetap melemah… ........................................................................................................... 11 Gambar 16: …walau pembelian oleh asing untuk ekuitas dan obligasi meningkat dengan kuat
pada bulan September ................................................................................................. 11 Gambar 17: Pertumbuhan kredit masih tinggi, terutama kredit investasi dan modal kerja… ...... 13 Gambar 18: …dengan perkiraan pertumbuhan kredit riil pada nilai tertinggi yang lalu ............... 13 Gambar 19: Produksi minyak yang dibawah proyeksi telah berkontribusi kepada penerimaan
bukan pajak yang lebih rendah ................................................................................... 14 Gambar 20: Ekspor berbasis sumber daya alam turun dengan tajam, dan ekspor manufaktur
Indonesia juga melemah… .......................................................................................... 21 Gambar 21: …dan perlambatan serupa pada nilai ekspor manufaktur juga tercatat pada negara
sewilayah ...................................................................................................................... 21 Gambar 22: Penurunan harga turut menarik turun sejumlah ekspor manufaktur berbasis
sumber daya alam Indonesia ...................................................................................... 21 Gambar 23: Ekspor Indonesia telah bergeser ke komoditas mentah dan produk berbasis
sumber daya alam ........................................................................................................ 22 Gambar 24: Pertumbuhan ekspor barang setengah jadi merosot dengan penurunan ekspor
manufaktur .................................................................................................................... 24 Gambar 25: Harga impor telah menurun dibanding ekspor ............................................................ 24 Gambar 26: RAPBN 2013 menjaga kuatnya posisi fiskal secara keseluruhan… .......................... 27 Gambar 27: …tetapi belanja program-program pembangunan inti yang efektif tetap stagnan
terhadap PDB ................................................................................................................ 27 Gambar 28: Peningkatan subsidi energi membatasi peningkatan alokasi untuk belanja modal
dan program sosial ...................................................................................................... 29 Gambar 29: Setelah peningkatan pesat pada 2012, kementerian utama yang melaksanakan
program infrastruktur menerima alokasi yang lebih rendah pada 2013 .................. 29 Gambar 30: Laju peningkatan alokasi APBN untuk belanja pegawai telah mengalahkan laju
belanja modal… ............................................................................................................ 33 Gambar 31: …dan belanja pegawai mengambil bagian yang jauh lebih besar pada alokasi
Anggaran pemerintah pusat dan daerah .................................................................... 33 Gambar 32: Honorarium umumnya merupakan bagian yang besar dari jumlah penghasilan
pegawai negeri ............................................................................................................. 36 Gambar 33: Persentase siswa pendidikan tinggi yang berasal dari keluarga miskin sangatlah
rendah ........................................................................................................................... 41

DAFTAR GRAFIK LAMPIRAN
Lampiran gambar 1: Pertumbuhan PDB triwulanan dan tahunan .................................................. 43 Lampiran gambar 2: Kontribusi pengeluaran terhadap PDB .......................................................... 43 Lampiran gambar 3: Kontribusi sektor terhadap PDB ..................................................................... 43 Lampiran gambar 4: Penjualan sepeda motor dan mobil ................................................................ 43 Lampiran gambar 5: Indikator konsumen ......................................................................................... 43 Lampiran gambar 6: Indikator kegiatan industri .............................................................................. 43 Lampiran gambar 7: Aliran perdagangan riil .................................................................................... 44 Lampiran gambar 8: Neraca pembayaran ......................................................................................... 44 Lampiran gambar 9: Neraca perdagangan ........................................................................................ 44 Lampiran gambar 10: Cadangan devisa dan modal asing .............................................................. 44 Lampiran gambar 11: Term of trade dan implisit ekspor- impor berdasarkan chained Fisher-
Price indices ................................................................................................................. 44 Lampiran gambar 12: Inflasi dan kebijakan moneter ....................................................................... 44 Lampiran gambar 13: Rincian tingkat harga konsumen .................................................................. 45 Lampiran gambar 14: Tingkat inflasi negara tetangga .................................................................... 45 Lampiran gambar 15: Harga beras kulakan di pasar domestik dan internasional ........................ 45 Lampiran gambar 16: Tingkat kemiskinan dan pengangguran ....................................................... 45 Lampiran gambar 17: Indeks saham regional .................................................................................. 45 Lampiran gambar 18: Indeks spot dolar dan rupiah ........................................................................ 45 Lampiran gambar 19: Yield obligasi pemerintah 5 tahunan mata uang lokal ................................ 46 Lampiran gambar 20: Spread EMBI obligasi pemerintah dengan obligasi dollar amerika ........... 46 Lampiran gambar 21: Tingkat kredit bank umum............................................................................. 46 Lampiran gambar 22: Indikator keuangan sektor perbankan ......................................................... 46 Lampiran gambar 23: Utang pemerintah ........................................................................................... 46 Lampiran gambar 24: Utang luar negeri ............................................................................................ 46
DAFTAR TABEL
Tabel 1: Menurut skenario baseline pertumbuhan Indonesia diproyeksikan sebesar 6,3 persen pada tahun 2013 ........................................................................................................... vii
Tabel 2: Harga nominal komoditas tetap tinggi secara historis tetapi hasil terakhir merupakan campuran ........................................................................................................................ 2
Tabel 3: Menurut skenario baseline pertumbuhan PDB diproyeksikan sebesar 6,1 persen untuk tahun 2012, meningkat menjadi 6,3 persen pada 2013 ............................................... 5
Tabel 4: Menyempitnya surplus perdagangan akan menggerakkan neraca berjalan ke defisit untuk tahun 2012 secara keseluruhan.......................................................................... 9
Tabel 5: Defisit kemungkinan meningkat, walau rencana pembiayaan pemerintah berada pada jalur yang tepat ............................................................................................................. 14
Tabel 6: Laju pencairan APBN hingga akhir bulan Agustus mencatat peningkatan ..................... 15 Tabel 7: Belanja subsidi energi yang lebih tinggi dan moderasi pada pengumpulan penerimaan
tampaknya akan meningkatkan defisit pada tahun 2012 .......................................... 16 Tabel 8: Peningkatan kebergantungan kepada China dan kenaikan bagian ekspor berbasis
sumber daya alam ........................................................................................................ 22 Tabel 9: Asumsi APBN termasuk pertumbuhan PDB yang kuat sebesar 6,8 persen .................... 25 Tabel 10: Tingkat kemiskinan dan pengangguran diproyeksikan akan menurun pada 2013 ....... 26 Tabel 11: RAPBN 2013 memproyeksikan defisit sebesar 1.6% dari PDB ....................................... 28 Tabel 12: Pertumbuhan PDB diproyeksikan berada di atas 7 persen pada tahun 2014 ............... 31 Tabel 13: Kerangka Pengeluaran Jangka Menengah menargetkan surplus fiskal pada tahun
2016 ............................................................................................................................... 32
DAFTAR TABEL LAMPIRAN Lampiran tabel 1: Realisasi dan proyeksi anggaran belanja pemerintah ...................................... 47 Lampiran tabel 2: Neraca Pembayaran ............................................................................................. 47
DAFTAR KOTAK
Kotak 1: Basis Data Terpadu–untuk penargetan program-program bantuan sosial yang lebih baik ................................................................................................................................ 17
Kotak 2: Tren jangka menengah dalam ekspor manufaktur Indonesia ............................................... 22

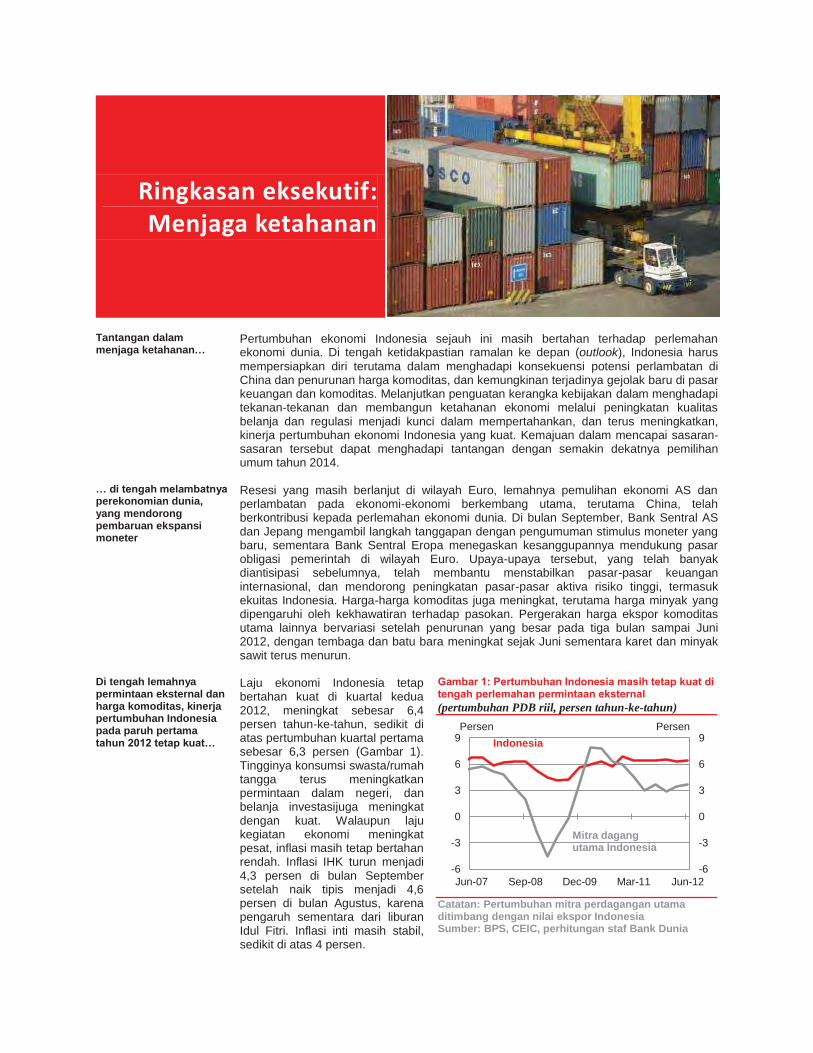
Ringkasan eksekutif: Menjaga ketahanan
Tantangan dalam menjaga ketahanan…
Pertumbuhan ekonomi Indonesia sejauh ini masih bertahan terhadap perlemahan ekonomi dunia. Di tengah ketidakpastian ramalan ke depan (outlook), Indonesia harus mempersiapkan diri terutama dalam menghadapi konsekuensi potensi perlambatan di China dan penurunan harga komoditas, dan kemungkinan terjadinya gejolak baru di pasar keuangan dan komoditas. Melanjutkan penguatan kerangka kebijakan dalam menghadapi tekanan-tekanan dan membangun ketahanan ekonomi melalui peningkatan kualitas belanja dan regulasi menjadi kunci dalam mempertahankan, dan terus meningkatkan, kinerja pertumbuhan ekonomi Indonesia yang kuat. Kemajuan dalam mencapai sasaran-sasaran tersebut dapat menghadapi tantangan dengan semakin dekatnya pemilihan umum tahun 2014.
… di tengah melambatnya perekonomian dunia, yang mendorong pembaruan ekspansi moneter
Resesi yang masih berlanjut di wilayah Euro, lemahnya pemulihan ekonomi AS dan perlambatan pada ekonomi-ekonomi berkembang utama, terutama China, telah berkontribusi kepada perlemahan ekonomi dunia. Di bulan September, Bank Sentral AS dan Jepang mengambil langkah tanggapan dengan pengumuman stimulus moneter yang baru, sementara Bank Sentral Eropa menegaskan kesanggupannya mendukung pasar obligasi pemerintah di wilayah Euro. Upaya-upaya tersebut, yang telah banyak diantisipasi sebelumnya, telah membantu menstabilkan pasar-pasar keuangan internasional, dan mendorong peningkatan pasar-pasar aktiva risiko tinggi, termasuk ekuitas Indonesia. Harga-harga komoditas juga meningkat, terutama harga minyak yang dipengaruhi oleh kekhawatiran terhadap pasokan. Pergerakan harga ekspor komoditas utama lainnya bervariasi setelah penurunan yang besar pada tiga bulan sampai Juni 2012, dengan tembaga dan batu bara meningkat sejak Juni sementara karet dan minyak sawit terus menurun.
Di tengah lemahnya permintaan eksternal dan harga komoditas, kinerja pertumbuhan Indonesia pada paruh pertama tahun 2012 tetap kuat…
Laju ekonomi Indonesia tetap bertahan kuat di kuartal kedua 2012, meningkat sebesar 6,4 persen tahun-ke-tahun, sedikit di atas pertumbuhan kuartal pertama sebesar 6,3 persen (Gambar 1). Tingginya konsumsi swasta/rumah tangga terus meningkatkan permintaan dalam negeri, dan belanja investasijuga meningkat dengan kuat. Walaupun laju kegiatan ekonomi meningkat pesat, inflasi masih tetap bertahan rendah. Inflasi IHK turun menjadi 4,3 persen di bulan September setelah naik tipis menjadi 4,6 persen di bulan Agustus, karena pengaruh sementara dari liburan Idul Fitri. Inflasi inti masih stabil, sedikit di atas 4 persen.
Gambar 1: Pertumbuhan Indonesia masih tetap kuat di tengah perlemahan permintaan eksternal (pertumbuhan PDB riil, persen tahun-ke-tahun)
Catatan: Pertumbuhan mitra perdagangan utama ditimbang dengan nilai ekspor Indonesia Sumber: BPS, CEIC, perhitungan staf Bank Dunia
-6
-3
0
3
6
9
-6
-3
0
3
6
9
Jun-07 Sep-08 Dec-09 Mar-11 Jun-12
Indonesia
Mitra dagang utama Indonesia
Persen Persen
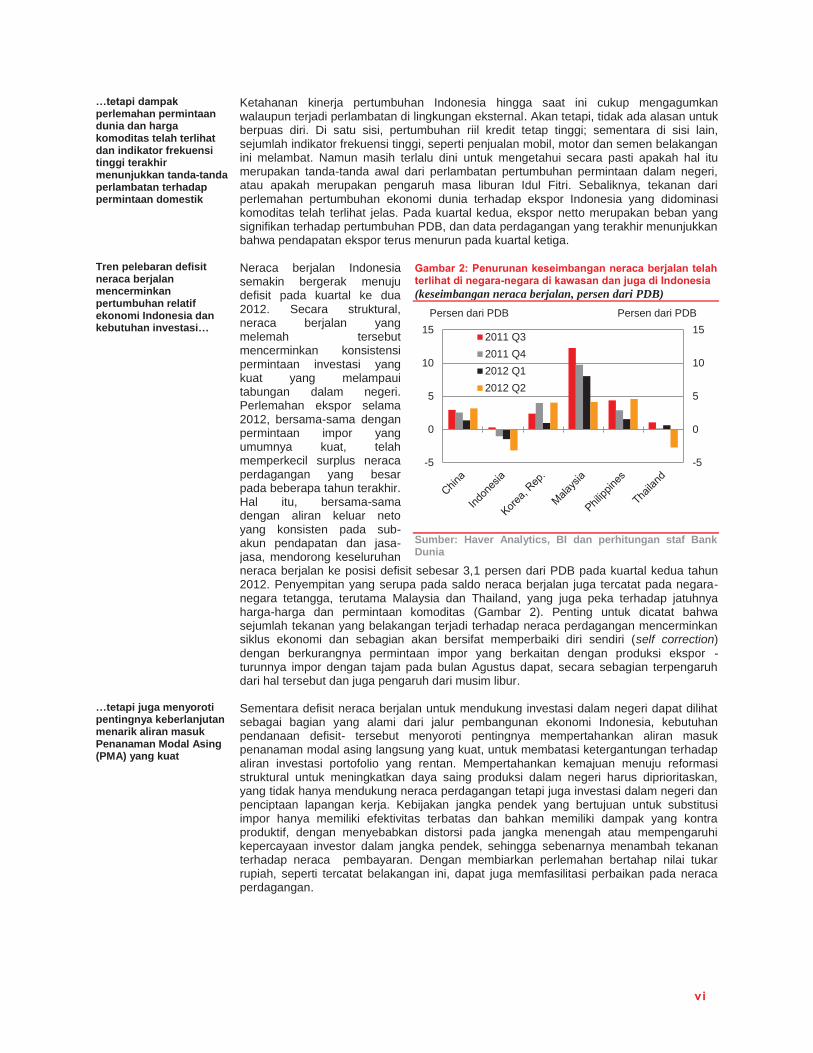
vi
…tetapi dampak perlemahan permintaan dunia dan harga komoditas telah terlihat dan indikator frekuensi tinggi terakhir menunjukkan tanda-tanda perlambatan terhadap permintaan domestik
Ketahanan kinerja pertumbuhan Indonesia hingga saat ini cukup mengagumkan walaupun terjadi perlambatan di lingkungan eksternal. Akan tetapi, tidak ada alasan untuk berpuas diri. Di satu sisi, pertumbuhan riil kredit tetap tinggi; sementara di sisi lain, sejumlah indikator frekuensi tinggi, seperti penjualan mobil, motor dan semen belakangan ini melambat. Namun masih terlalu dini untuk mengetahui secara pasti apakah hal itu merupakan tanda-tanda awal dari perlambatan pertumbuhan permintaan dalam negeri, atau apakah merupakan pengaruh masa liburan Idul Fitri. Sebaliknya, tekanan dari perlemahan pertumbuhan ekonomi dunia terhadap ekspor Indonesia yang didominasi komoditas telah terlihat jelas. Pada kuartal kedua, ekspor netto merupakan beban yang signifikan terhadap pertumbuhan PDB, dan data perdagangan yang terakhir menunjukkan bahwa pendapatan ekspor terus menurun pada kuartal ketiga.
Tren pelebaran defisit neraca berjalan mencerminkan pertumbuhan relatif ekonomi Indonesia dan kebutuhan investasi…
Neraca berjalan Indonesia semakin bergerak menuju defisit pada kuartal ke dua 2012. Secara struktural, neraca berjalan yang melemah tersebut mencerminkan konsistensi permintaan investasi yang kuat yang melampaui tabungan dalam negeri. Perlemahan ekspor selama 2012, bersama-sama dengan permintaan impor yang umumnya kuat, telah memperkecil surplus neraca perdagangan yang besar pada beberapa tahun terakhir. Hal itu, bersama-sama dengan aliran keluar neto yang konsisten pada sub-akun pendapatan dan jasa-jasa, mendorong keseluruhan neraca berjalan ke posisi defisit sebesar 3,1 persen dari PDB pada kuartal kedua tahun 2012. Penyempitan yang serupa pada saldo neraca berjalan juga tercatat pada negara-negara tetangga, terutama Malaysia dan Thailand, yang juga peka terhadap jatuhnya harga-harga dan permintaan komoditas (Gambar 2). Penting untuk dicatat bahwa sejumlah tekanan yang belakangan terjadi terhadap neraca perdagangan mencerminkan siklus ekonomi dan sebagian akan bersifat memperbaiki diri sendiri (self correction) dengan berkurangnya permintaan impor yang berkaitan dengan produksi ekspor - turunnya impor dengan tajam pada bulan Agustus dapat, secara sebagian terpengaruh dari hal tersebut dan juga pengaruh dari musim libur.
Gambar 2: Penurunan keseimbangan neraca berjalan telah terlihat di negara-negara di kawasan dan juga di Indonesia (keseimbangan neraca berjalan, persen dari PDB)
Sumber: Haver Analytics, BI dan perhitungan staf Bank Dunia
…tetapi juga menyoroti pentingnya keberlanjutan menarik aliran masuk Penanaman Modal Asing (PMA) yang kuat
Sementara defisit neraca berjalan untuk mendukung investasi dalam negeri dapat dilihat sebagai bagian yang alami dari jalur pembangunan ekonomi Indonesia, kebutuhan pendanaan defisit- tersebut menyoroti pentingnya mempertahankan aliran masuk penanaman modal asing langsung yang kuat, untuk membatasi ketergantungan terhadap aliran investasi portofolio yang rentan. Mempertahankan kemajuan menuju reformasi struktural untuk meningkatkan daya saing produksi dalam negeri harus diprioritaskan, yang tidak hanya mendukung neraca perdagangan tetapi juga investasi dalam negeri dan penciptaan lapangan kerja. Kebijakan jangka pendek yang bertujuan untuk substitusi impor hanya memiliki efektivitas terbatas dan bahkan memiliki dampak yang kontra produktif, dengan menyebabkan distorsi pada jangka menengah atau mempengaruhi kepercayaan investor dalam jangka pendek, sehingga sebenarnya menambah tekanan terhadap neraca pembayaran. Dengan membiarkan perlemahan bertahap nilai tukar rupiah, seperti tercatat belakangan ini, dapat juga memfasilitasi perbaikan pada neraca perdagangan.
-5
0
5
10
15
-5
0
5
10
152011 Q32011 Q42012 Q12012 Q2
Persen dari PDB Persen dari PDB
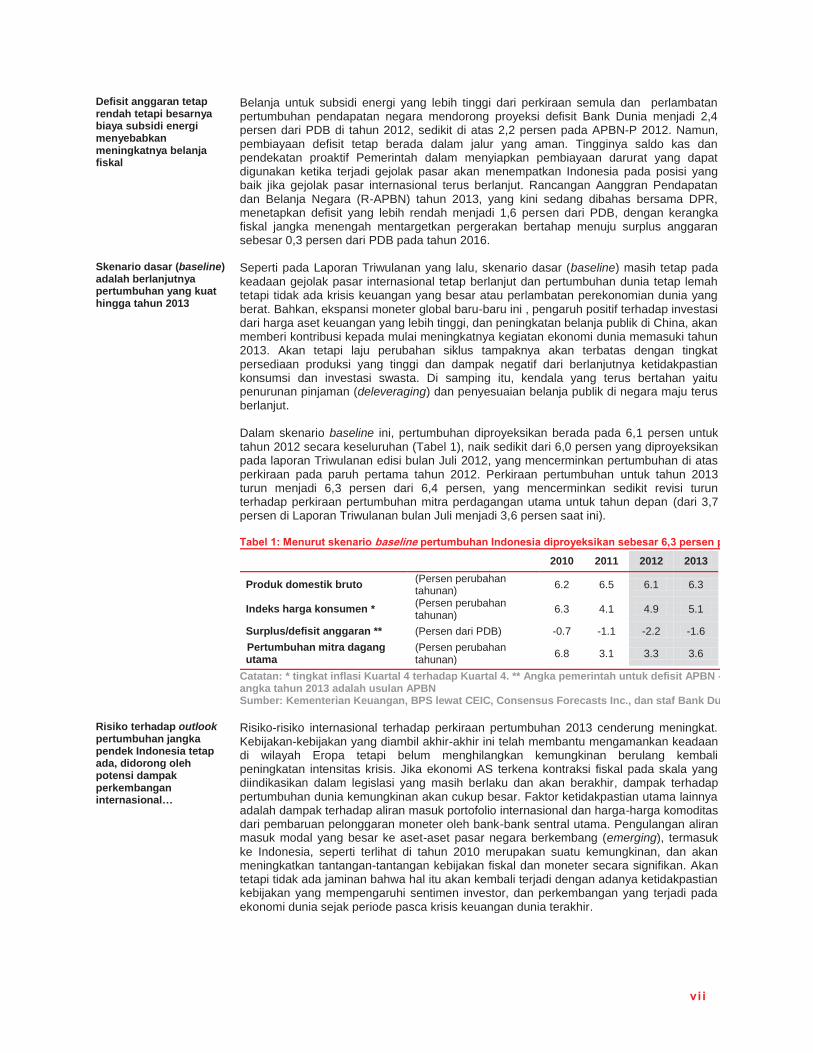
vi i
Defisit anggaran tetap rendah tetapi besarnya biaya subsidi energi menyebabkan meningkatnya belanja fiskal
Belanja untuk subsidi energi yang lebih tinggi dari perkiraan semula dan perlambatan pertumbuhan pendapatan negara mendorong proyeksi defisit Bank Dunia menjadi 2,4 persen dari PDB di tahun 2012, sedikit di atas 2,2 persen pada APBN-P 2012. Namun, pembiayaan defisit tetap berada dalam jalur yang aman. Tingginya saldo kas dan pendekatan proaktif Pemerintah dalam menyiapkan pembiayaan darurat yang dapat digunakan ketika terjadi gejolak pasar akan menempatkan Indonesia pada posisi yang baik jika gejolak pasar internasional terus berlanjut. Rancangan Aanggran Pendapatan dan Belanja Negara (R-APBN) tahun 2013, yang kini sedang dibahas bersama DPR, menetapkan defisit yang lebih rendah menjadi 1,6 persen dari PDB, dengan kerangka fiskal jangka menengah mentargetkan pergerakan bertahap menuju surplus anggaran sebesar 0,3 persen dari PDB pada tahun 2016.
Skenario dasar (baseline) adalah berlanjutnya pertumbuhan yang kuat hingga tahun 2013
Seperti pada Laporan Triwulanan yang lalu, skenario dasar (baseline) masih tetap pada keadaan gejolak pasar internasional tetap berlanjut dan pertumbuhan dunia tetap lemah tetapi tidak ada krisis keuangan yang besar atau perlambatan perekonomian dunia yang berat. Bahkan, ekspansi moneter global baru-baru ini , pengaruh positif terhadap investasi dari harga aset keuangan yang lebih tinggi, dan peningkatan belanja publik di China, akan memberi kontribusi kepada mulai meningkatnya kegiatan ekonomi dunia memasuki tahun 2013. Akan tetapi laju perubahan siklus tampaknya akan terbatas dengan tingkat persediaan produksi yang tinggi dan dampak negatif dari berlanjutnya ketidakpastian konsumsi dan investasi swasta. Di samping itu, kendala yang terus bertahan yaitu penurunan pinjaman (deleveraging) dan penyesuaian belanja publik di negara maju terus berlanjut. Dalam skenario baseline ini, pertumbuhan diproyeksikan berada pada 6,1 persen untuk tahun 2012 secara keseluruhan (Tabel 1), naik sedikit dari 6,0 persen yang diproyeksikan pada laporan Triwulanan edisi bulan Juli 2012, yang mencerminkan pertumbuhan di atas perkiraan pada paruh pertama tahun 2012. Perkiraan pertumbuhan untuk tahun 2013 turun menjadi 6,3 persen dari 6,4 persen, yang mencerminkan sedikit revisi turun terhadap perkiraan pertumbuhan mitra perdagangan utama untuk tahun depan (dari 3,7 persen di Laporan Triwulanan bulan Juli menjadi 3,6 persen saat ini). Tabel 1: Menurut skenario baseline pertumbuhan Indonesia diproyeksikan sebesar 6,3 persen p
2010 2011 2012 2013
Produk domestik bruto (Persen perubahan tahunan) 6.2 6.5 6.1 6.3
Indeks harga konsumen * (Persen perubahan tahunan) 6.3 4.1 4.9 5.1
Surplus/defisit anggaran ** (Persen dari PDB) -0.7 -1.1 -2.2 -1.6 Pertumbuhan mitra dagang utama
(Persen perubahan tahunan) 6.8 3.1 3.3 3.6
Catatan: * tingkat inflasi Kuartal 4 terhadap Kuartal 4. ** Angka pemerintah untuk defisit APBN -angka tahun 2013 adalah usulan APBN Sumber: Kementerian Keuangan, BPS lewat CEIC, Consensus Forecasts Inc., dan staf Bank Du
Risiko terhadap outlook pertumbuhan jangka pendek Indonesia tetap ada, didorong oleh potensi dampak perkembangan internasional…
Risiko-risiko internasional terhadap perkiraan pertumbuhan 2013 cenderung meningkat. Kebijakan-kebijakan yang diambil akhir-akhir ini telah membantu mengamankan keadaan di wilayah Eropa tetapi belum menghilangkan kemungkinan berulang kembali peningkatan intensitas krisis. Jika ekonomi AS terkena kontraksi fiskal pada skala yang diindikasikan dalam legislasi yang masih berlaku dan akan berakhir, dampak terhadap pertumbuhan dunia kemungkinan akan cukup besar. Faktor ketidakpastian utama lainnya adalah dampak terhadap aliran masuk portofolio internasional dan harga-harga komoditas dari pembaruan pelonggaran moneter oleh bank-bank sentral utama. Pengulangan aliran masuk modal yang besar ke aset-aset pasar negara berkembang (emerging), termasuk ke Indonesia, seperti terlihat di tahun 2010 merupakan suatu kemungkinan, dan akan meningkatkan tantangan-tantangan kebijakan fiskal dan moneter secara signifikan. Akan tetapi tidak ada jaminan bahwa hal itu akan kembali terjadi dengan adanya ketidakpastian kebijakan yang mempengaruhi sentimen investor, dan perkembangan yang terjadi pada ekonomi dunia sejak periode pasca krisis keuangan dunia terakhir.
vi i i
…dan khususnya dari perlambatan di China, dan dampaknya terhadap permintaan dan harga-harga komoditas
Salah satu perbedaan terbesar, dan mungkin risiko luar negeri terbesar yang dihadapi oleh Indonesia, adalah perlambatan yang terjadi pada ekonomi China. Risiko ini juga penting bagi beberapa negara lainnya, utamanya negara eksportir komoditi. Namun pengaruhnya terhadap Indonesia sangat penting mengingat hubungan dagang langsung dan tidak langsung, bersamaan dengan dukungan terhadap pertumbuhan yang diberikan oleh harga komiditi dan produksi melalui efek pendapatan terhadap permintaan swasta. Misalnya, perkiraan dalam laporan IMF Artikel IV bulan September 2012 tentang Indonesia, dengan memasukkan pengaruh perdagangan langsung maupun tidak langsung dan dampak harga komoditas dunia, menunjukkan penurunan satu poin persentase pada pertumbuhan China dapat menurunkan PDB Indonesia hingga setengah poin persentase. Selain itu, terdapat pula kemungkinan pengaruh kepada Indonesia melalui jalur komoditas, yang berasal dari pergeseran komposisi pertumbuhan China dari investasi ke konsumsi. Secara khususnya, karena peranannya sebagai mesin utama pertumbuhan permintaan domestik Indonesia, adalah bagaimana pengaruh dari perkembangan di China terhadap investasi domestik di Indonesia. Hal ini cenderung memiliki hubungan positif dengan harga komiditas dunia dan laju pertumbuhan investasi mungkin belum membuktikan kerentanan terhadap pengaruh eksternal. Walaupun pertumbuhan secara keseluruhan masih bertahan kuat dari melambatnya harga komoditas, dampak lokal telah dapat dirasakan oleh rumah tangga dan usaha di daerah yang sangat tergantung terhadap komoditas untuk mata pencaharian dan pendapatan.
Ketidakpastian outlook semakin meningkatkan pentingnya membuat kemajuan dalam membangun ketahanan ekonomi Indonesia…
Ketidakpastian yang terus berlanjut di lingkungan internasional meningkatkan pentingnya melanjutkan kemajuan yang telah dibuat oleh Indonesia untuk meningkatkan ketahanan ekonomi. Hal ini akan memperkuat Indonesia untuk sepenuhnya memetik manfaat dari peningkatan pertumbuhan dunia secara bertahap seperti diperkirakan pada perkiraan (outlook) dasar (baseline), dan juga untuk menghadapi penurunan lanjutan kondisi luar negeri jika terjadi. Seperti ditekankan pada Laporan Triwulanan edisi bulan Juli, tantangan kebijakan untuk Indonesia dan juga ekonomi-ekonomi berkembang adalah mempertahankan fokus ganda pada kesiagaan krisis jangka pendek, dan upaya-upaya struktural jangka yang lebih panjang, seperti dukungan pembangunan infrastruktur, ketrampilan dan pendidikan, yang bertujuan untuk mendorong pertumbuhan yang berkelanjutan.
…melalui perbaikan pada konsistensi, kejelasan, dan kepastian kebijakan…
Menjaga kejelasan dan konsistensi kebijakan, terutama di bidang regulasi bisnis dan investasi, akan semakin mendorong tujuan-tujuan tersebut. Akan sangat penting untuk menghindari pengambilan kebijakan yang keliru, seperti kebijakan yang dimaksudkan untuk mengatasi permasalahan jangka pendek, dapat membawa risiko dan biaya jangka panjang. Selain itu, menjaga kerangka kebijakan berorientasi kepada reformasi yang jelas dan konsisten akan sangat penting mengingat potensi ketidakpastian politik menjelang pemilu nasional di tahun 2014 dan masih rapuhnya kepercayaan investor di seluruh dunia.
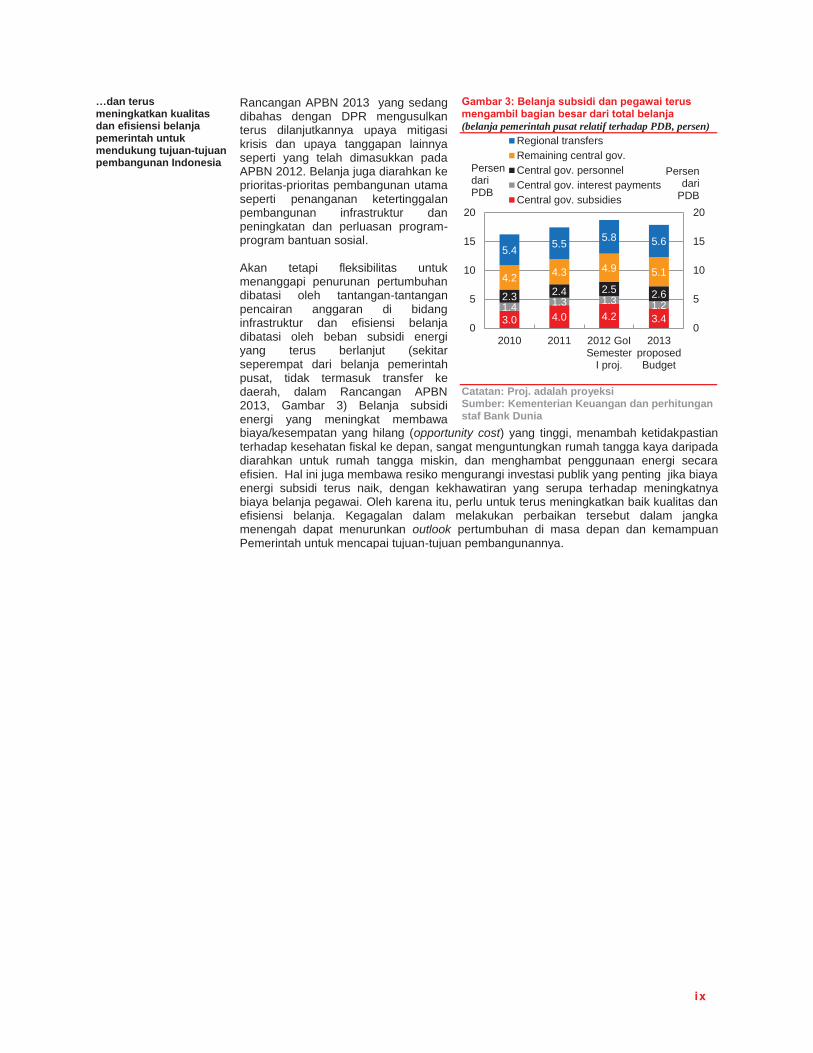
ix
…dan terus meningkatkan kualitas dan efisiensi belanja pemerintah untuk mendukung tujuan-tujuan pembangunan Indonesia
Rancangan APBN 2013 yang sedang dibahas dengan DPR mengusulkan terus dilanjutkannya upaya mitigasi krisis dan upaya tanggapan lainnya seperti yang telah dimasukkan pada APBN 2012. Belanja juga diarahkan ke prioritas-prioritas pembangunan utama seperti penanganan ketertinggalan pembangunan infrastruktur dan peningkatan dan perluasan program-program bantuan sosial. Akan tetapi fleksibilitas untuk menanggapi penurunan pertumbuhan dibatasi oleh tantangan-tantangan pencairan anggaran di bidang infrastruktur dan efisiensi belanja dibatasi oleh beban subsidi energi yang terus berlanjut (sekitar seperempat dari belanja pemerintah pusat, tidak termasuk transfer ke daerah, dalam Rancangan APBN 2013, Gambar 3) Belanja subsidi energi yang meningkat membawa biaya/kesempatan yang hilang (opportunity cost) yang tinggi, menambah ketidakpastian terhadap kesehatan fiskal ke depan, sangat menguntungkan rumah tangga kaya daripada diarahkan untuk rumah tangga miskin, dan menghambat penggunaan energi secara efisien. Hal ini juga membawa resiko mengurangi investasi publik yang penting jika biaya energi subsidi terus naik, dengan kekhawatiran yang serupa terhadap meningkatnya biaya belanja pegawai. Oleh karena itu, perlu untuk terus meningkatkan baik kualitas dan efisiensi belanja. Kegagalan dalam melakukan perbaikan tersebut dalam jangka menengah dapat menurunkan outlook pertumbuhan di masa depan dan kemampuan Pemerintah untuk mencapai tujuan-tujuan pembangunannya.
Gambar 3: Belanja subsidi dan pegawai terus mengambil bagian besar dari total belanja (belanja pemerintah pusat relatif terhadap PDB, persen)
Catatan: Proj. adalah proyeksi Sumber: Kementerian Keuangan dan perhitungan staf Bank Dunia
3.0 4.0 4.2 3.4 1.4 1.3 1.3 1.2 2.3 2.4 2.5 2.6 4.2 4.3 4.9 5.1
5.4 5.5 5.8 5.6
0
5
10
15
20
0
5
10
15
20
2010 2011 2012 GoISemester
I proj.
2013proposedBudget
Regional transfersRemaining central gov.Central gov. personnelCentral gov. interest paymentsCentral gov. subsidies
Persen dari
PDB
Persen dari PDB
A. PERKEMBANGAN EKONOMI DAN FISKAL
TERKINI
1. Ekonomi dunia telah melemah dan perkiraan (outlook) tetap tidak jelas
Pemulihan ekonomi dunia telah kehilangan momentumnya
Indonesia, seperti pasar ekonomi berkembang lainnya, masih menghadapi lingkungan eksternal yang menantang. Ekonomi dunia tampaknya telah melemah secara signifikan pada kuartal ketiga tahun 2012, dibebani oleh krisis zona Euro dan perlemahan kegiatan pada sejumlah ekonomi berkembang utama. Pada jangka pendek, kondisi ekonomi dunia tampaknya akan tetap lemah hingga akhir tahun 2012. Risiko turun terhadap perkiraan dasar (baseline) cenderung meningkat dan kemungkinan dislokasi pasar keuangan yang parah dan perlemahan lanjutan dari momentum ekonomi global tidak dapat diabaikan.
Bank-bank sentral utama bereaksi terhadap peningkatan risiko stabilitas dan pertumbuhan dengan stimulus moneter yang baru…
Tantangan terhadap sektor perbankan dan fiskal zona Euro menjadi perhatian utama bagi investor dunia pada saat Triwulanan terakhir pada bulan Juli. Sejalan dengan itu, harapan bahwa Bank Sentral Eropa (ECB) akan mengambil langkah-langkah lanjutan untuk membatasi krisis membantu mendukung euro dan menurunkan yield zona Euro. Harga aset dunia semakin didorong oleh pengumuman ECB pada tanggal 6 September bahwa ECB telah siap untuk membeli hutang jangka pendek negara menurut program baru “Outright Monetary Transactions”. Hal ini kemudian diikuti dengan program pembelian aset tambahan yang diumumkan oleh Bank Sentral AS (US Federal Reserve), yang umum disebut sebagai “QE3”, dan Bank Sentral Jepang.
…yang telah membantu memperkuat pasar keuangan internasional
Upaya kebijakan ekspansif tersebut telah memperkuat sentimen dengan meningkatkan likuiditas dan menurunkan kemungkinan perkiraan skenario terburuk pada zona Euro. Kebijakan itu juga telah memperkuat peningkatan pada pasar-pasar aset finansial utama, termasuk pasar hutang dan ekuitas berkembang. Sebagai contoh, ekuitas pasar berkembang pada akhir bulan September meningkat sebesar 13,6 persen dalam nilai dolar AS dari nilai rendahnya selama tahun 2012 pada bulan Juni, yang memberikan peningkatan sebesar 9,4 persen untuk tahun berjalan (Gambar 4). Perbedaan (spread) dari yield obligasi negara pasar berkembang dengan denominasi dolar dengan surat utang AS, seperti diukur oleh indeks EMBIG, menyempit menjadi 310 basis poin, setelah sebelumnya melebar hingga 440 basis poin pada awal bulan Juni (Gambar 5).
Tetapi kondisi ekonomi tampaknya tetap akan menantang dalam jangka pendek…
Pelonggaran kondisi pasar keuangan dan moneter ini terjadi di tengah melemahnya indikator ekonomi utama dan frekuensi tinggi, yang mendorong revisi turun proyeksi pertumbuhan dunia. Bank Dunia telah memangkas proyeksinya bagi pertumbuhan ekonomi global pada tahun 2012 menjadi 2,3 persen dari 2,5 persen pada bulan Juni.1 Hal ini mencerminkan perkiraan bahwa pertumbuhan akan terus melambat pada kuartal ketiga dan juga kemungkinan bahwa laju kegiatan ekonomi pada kuartal akhir tampaknya tidak akan meningkat dengan kuat, walau perlambatan pada produksi industri dan perdagangan dunia tampaknya sudah tidak akan turun lebih jauh lagi pada bulan Juli atau Agustus. Secara umum, tingkat persediaan tetap tinggi pada dunia usaha ekonomi
1 Lihat Bank Dunia Oktober 2012 East Asia and Pacific Economic Data Monitor
http://www.worldbank.org/en/news/2012/10/08/east-asia-and-pacific-economic-data-monitor.
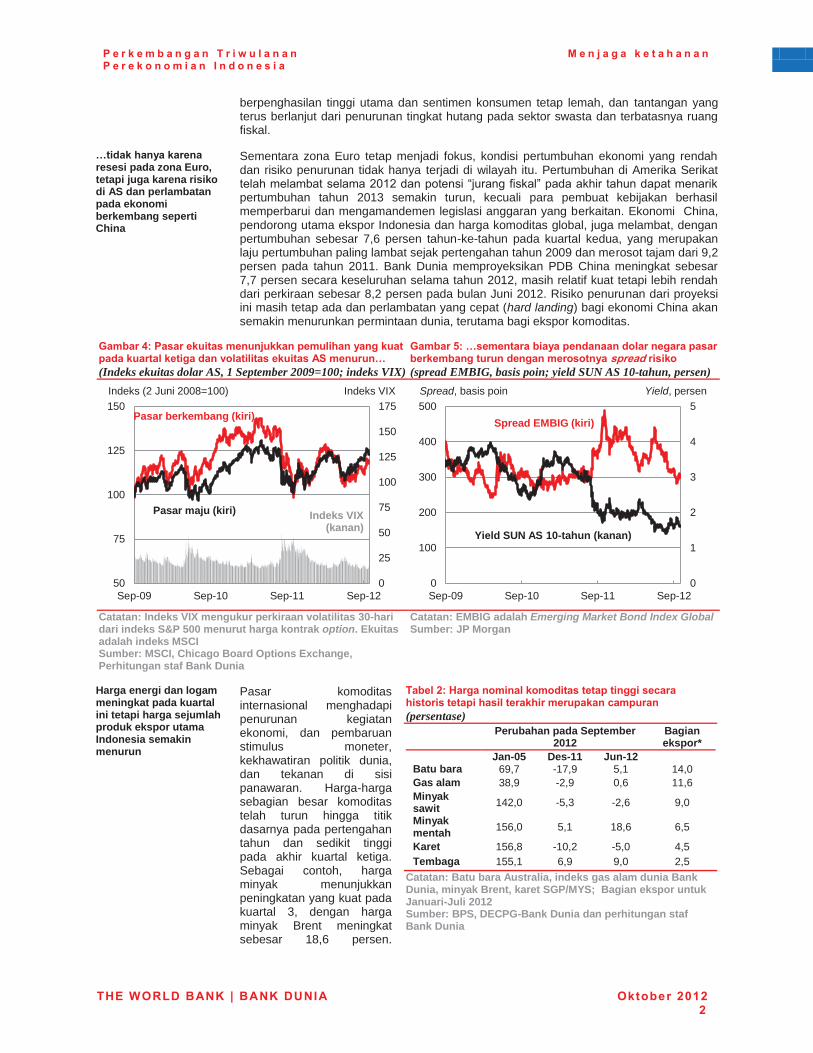
P e r k e m b a n g a n T r i w u l a n a n P e r e k o n o m i a n I n d o n e s i a
M e n j a g a k e t a h a n a n
THE WORLD BANK | BANK DUNIA Oktober 2012 2
berpenghasilan tinggi utama dan sentimen konsumen tetap lemah, dan tantangan yang terus berlanjut dari penurunan tingkat hutang pada sektor swasta dan terbatasnya ruang fiskal.
…tidak hanya karena resesi pada zona Euro, tetapi juga karena risiko di AS dan perlambatan pada ekonomi berkembang seperti China
Sementara zona Euro tetap menjadi fokus, kondisi pertumbuhan ekonomi yang rendah dan risiko penurunan tidak hanya terjadi di wilayah itu. Pertumbuhan di Amerika Serikat telah melambat selama 2012 dan potensi “jurang fiskal” pada akhir tahun dapat menarik pertumbuhan tahun 2013 semakin turun, kecuali para pembuat kebijakan berhasil memperbarui dan mengamandemen legislasi anggaran yang berkaitan. Ekonomi China, pendorong utama ekspor Indonesia dan harga komoditas global, juga melambat, dengan pertumbuhan sebesar 7,6 persen tahun-ke-tahun pada kuartal kedua, yang merupakan laju pertumbuhan paling lambat sejak pertengahan tahun 2009 dan merosot tajam dari 9,2 persen pada tahun 2011. Bank Dunia memproyeksikan PDB China meningkat sebesar 7,7 persen secara keseluruhan selama tahun 2012, masih relatif kuat tetapi lebih rendah dari perkiraan sebesar 8,2 persen pada bulan Juni 2012. Risiko penurunan dari proyeksi ini masih tetap ada dan perlambatan yang cepat (hard landing) bagi ekonomi China akan semakin menurunkan permintaan dunia, terutama bagi ekspor komoditas.
Gambar 4: Pasar ekuitas menunjukkan pemulihan yang kuat pada kuartal ketiga dan volatilitas ekuitas AS menurun… (Indeks ekuitas dolar AS, 1 September 2009=100; indeks VIX)
Gambar 5: …sementara biaya pendanaan dolar negara pasar berkembang turun dengan merosotnya spread risiko (spread EMBIG, basis poin; yield SUN AS 10-tahun, persen)
Catatan: Indeks VIX mengukur perkiraan volatilitas 30-hari dari indeks S&P 500 menurut harga kontrak option. Ekuitas adalah indeks MSCI Sumber: MSCI, Chicago Board Options Exchange, Perhitungan staf Bank Dunia
Catatan: EMBIG adalah Emerging Market Bond Index Global Sumber: JP Morgan
Harga energi dan logam meningkat pada kuartal ini tetapi harga sejumlah produk ekspor utama Indonesia semakin menurun
Pasar komoditas internasional menghadapi penurunan kegiatan ekonomi, dan pembaruan stimulus moneter, kekhawatiran politik dunia, dan tekanan di sisi panawaran. Harga-harga sebagian besar komoditas telah turun hingga titik dasarnya pada pertengahan tahun dan sedikit tinggi pada akhir kuartal ketiga. Sebagai contoh, harga minyak menunjukkan peningkatan yang kuat pada kuartal 3, dengan harga minyak Brent meningkat sebesar 18,6 persen.
Tabel 2: Harga nominal komoditas tetap tinggi secara historis tetapi hasil terakhir merupakan campuran (persentase)
Perubahan pada September 2012
Bagian ekspor*
Jan-05 Des-11 Jun-12 Batu bara 69,7 -17,9 5,1 14,0 Gas alam 38,9 -2,9 0,6 11,6 Minyak sawit 142,0 -5,3 -2,6 9,0
Minyak mentah 156,0 5,1 18,6 6,5
Karet 156,8 -10,2 -5,0 4,5 Tembaga 155,1 6,9 9,0 2,5
Catatan: Batu bara Australia, indeks gas alam dunia Bank Dunia, minyak Brent, karet SGP/MYS; Bagian ekspor untuk Januari-Juli 2012 Sumber: BPS, DECPG-Bank Dunia dan perhitungan staf Bank Dunia
0
25
50
75
100
125
150
175
50
75
100
125
150
Sep-09 Sep-10 Sep-11 Sep-12
Pasar berkembang (kiri)
Pasar maju (kiri)
Indeks (2 Juni 2008=100) Indeks VIX
Indeks VIX (kanan)
0
1
2
3
4
5
0
100
200
300
400
500
Sep-09 Sep-10 Sep-11 Sep-12
Spread EMBIG (kiri)
Yield SUN AS 10-tahun (kanan)
Spread, basis poin Yield, persen

P e r k e m b a n g a n T r i w u l a n a n P e r e k o n o m i a n I n d o n e s i a
M e n j a g a k e t a h a n a n
THE WORLD BANK | BANK DUNIA Oktober 2012 3
Namun pergerakan harga sejumlah komoditas ekspor utama Indonesia yang lain mencatat peningkatan yang lebih lambat dibanding yang dicatat oleh pasar komoditas lainnya. Harga batu bara internasional meningkat beberapa persentase pada kuartal 3 tetapi masih di bawah tingkat harga yang tercatat pada tahun 2011. Harga karet turun pada kisaran 5 persen, dan minyak sawit merosot 3 persen (Tabel 2).
Secara keseluruhan, perkiraan (outlook) dasar (baseline) pertumbuhan mitra perdagangan utama Indonesia tetap relatif lemah
Indonesia memasuki kuartal terakhir tahun 2012 dengan kondisi pasar komoditas dan keuangan internasional yang sudah agak stabil dibanding keadaan pada pertengahan tahun, yang disebabkan oleh upaya pembaruan kebijakan stimulus di seluruh dunia. Namun masih terlalu dini untuk mengetahui secara pasti apakah laju peningkatan ekonomi dunia memang telah dimulai. Banyak hal bergantung kepada kemampuan zona Euro untuk bangkit dari resesi dangkalnya dan berakhirnya perlambatan di China, dua hal yang masih diselimuti ketidakpastian. Proyeksi dasar (baseline) Bank Dunia adalah bahwa mitra perdagangan utama (MTP) Indonesia akan tumbuh pada laju yang relatif rendah sebesar 3,3 persen pada tahun 2012, sedikit meningkat ke 3,6 persen pada tahun 2013. Namun proyeksi peningkatan kecil bagi kondisi eksternal ekonomi Indonesia ini ditentukan oleh risiko penurunan yang signifikan, yang dirinci lebih lanjut pada akhir bagian ini.
2. Walaupun dihadapkan pada lemahnya lingkungan eksternal, ekonomi Indonesia masih tumbuh dengan kuat
Pertumbuhan ekonomi Indonesia sedikit meningkat menjadi 6,4 persen pada kuartal kedua tahun 2012
PDB Indonesia meningkat sebesar 6,4 persen tahun-ke-tahun pada kuartal kedua tahun 2012. Pertumbuhan ini sedikit lebih tinggi dari 6,3 persen yang tercatat pada kuartal pertama tahun 2012 dan merupakan kuartal ketujuh dengan pertumbuhan di atas 6 persen secara berturut-turut (Gambar 6). Berdasarkan triwulan-ke-triwulan dengan penyesuaian musiman, ekonomi tumbuh sebesar 1,6 persen pada kuartal 2, naik dari 1,0 persen pada kuartal 1, yang mencerminkan kekuatan dari basis permintaan dalam negeri yang kokoh yang mengimbangi pengaruh dari lemahnya permintaan dari luar negeri (Gambar 7).
Pertumbuhan didukung oleh kuatnya kinerja investasi…
Pertumbuhan investasi swasta terus memberikan dukungan yang kuat bagi pertumbuhan pada kuartal kedua tahun 2012. Selama dua kuartal berturut-turut, pertumbuhan konsumsi pemerintah juga meningkat melampaui perkiraan, pada 7 persen tahun-ke-tahun. Investasi bahkan mencatat pertumbuhan yang lebih kuat, memberikan kontribusi sebesar 1,6 poin persentase kepada pertumbuhan dengan penyesuaian musiman, dengan pertumbuhan tahun-ke-tahun mencapai 12,3 persen, angka tertinggi sejak mulainya krisis keuangan dunia pada akhir tahun 2008. Peningkatan investasi ini juga mendorong rasio nominal investasi terhadap PDB ke nilai tertinggi yang pernah tercatat sebesar 33 persen, yang sebanding dengan negara tetangga seperti Thailand (28 persen) dan Malaysia (26 persen). Di dalam investasi, konstruksi (yang merupakan 70 persen dari jumlah investasi) mencatat pertumbuhan yang kuat sebesar 7,2 persen, tetapi peningkatan dalam belanja investasi umumnya didorong oleh investasi padat impor dalam mesin dan peralatan asing (meningkat sebesar 23 persen tahun-ke-tahun) dan transportasi asing (naik sebesar 60 persen tahun-ke-tahun). Tingginya laju pertumbuhan ini sejalan dengan kuatnya pinjaman investasi dan impor barang modal yang dibahas lebih lanjut di bawah ini.
…sementara permintaan eksternal yang lemah membebani pertumbuhan selama tiga kuartal berturut-turut
Setelah tidak menunjukkan pertumbuhan pada kuartal pertama tahun 2012, ekspor riil turun sebesar 0,7 persen menurut penyesuaian musiman pada kuartal kedua. Namun impor meningkat lebih tinggi dari perkiraan, dengan pertumbuhan triwulan-ke-triwulan dengan penyesuaian musiman sebesar 4,9 persen, yang mencerminkan kuatnya permintaan investasi bagi barang input setengah jadi dari luar negeri. Sebagai akibatnya, ekspor bersih menjadi beban pada pertumbuhan PDB secara kuartalan untuk tiga kuartal berturut-turut, mengurangi 2,2 poin persentase secara triwulan-ke-triwulan dengan penyesuaian musiman. Beban itu lebih besar dari beban ekspor bersih terhadap PDB pada kuartal 1/2012 dan kuartal 4/2011 masing-masing sebesar 0,3 dan 1,5 poin persentase. Namun pertumbuhan impor tampaknya akan menurun pada paruh kedua tahun 2012, karena perlemahan ekspor akan menurunkan kebutuhan untuk melakukan impor barang modal dan barang input setengah jadi.

P e r k e m b a n g a n T r i w u l a n a n P e r e k o n o m i a n I n d o n e s i a
M e n j a g a k e t a h a n a n
THE WORLD BANK | BANK DUNIA Oktober 2012 4
Gambar 6: Pertumbuhan PDB meningkat menjadi 6,4 persen pada kuartal kedua tahun 2012… (pertumbuhan PDB riil, persen)
Gambar 7: …didorong oleh percepatan pertumbuhan investasi sementara ekspor bersih sangat membebani pertumbuhan (pertumbuhan PDB Tw-ke-Tw riil, persen)
Catatan: * Rata-rata pertumbuhan triwulan-ke-triwulan sejak kuartal 2/2002 Sumber: BPS dan penyesuaian musiman staf Bank Dunia
Sumber: BPS dan penyesuaian musiman staf Bank Dunia
Pertumbuhan pada sisi produksi didorong oleh sektor jasa, mengimbangi perlemahan pada sektor manufaktur, pertambangan dan pertanian
Pada sisi produksi, sektor jasa menjadi pendorong utama pertumbuhan, sementara kontribusi kepada pertumbuhan yang berasal dari sektor manufaktur, pertambangan dan pertanian melemah. Jasa tumbuh sebesar 2,1 persen dengan penyesuaian musiman pada kuartal 2, dipimpin oleh perdagangan eceran dan kulakan yang naik hingga 9,8 persen pada kuartal 2. Kinerja ini mengimbangi sebagian perlemahan pada hampir seluruh jenis kegiatan manufaktur, dengan pertumbuhan pada sektor tersebut menurun menjadi 5,4 persen tahun-ke-tahun dari 5,7 persen tahun-ke-tahun pada kuartal 1. Namun peralatan transportasi dan mesin, sub-sektor manufaktur terbesar, mampu menahan tekanan perlemahan dunia dan mencatatkan pertumbuhan kuartalan terbesar dalam lima tahun terakhir, sebesar 11,7 persen tahun-ke-tahun.
Pada skenario dasar (baseline), PDB Indonesia diproyeksikan mencapai 6,1 persen pada tahun 2012 dan 6,3 persen pada 2013…
Sejumlah indikator parsial telah menurun secara signifikan akhir-akhir ini, yang menunjukkan kemungkinan perlambatan dalam kegiatan ekonomi (Gambar 8), tetapi masih terlalu dini untuk mengetahui seberapa besar penurunan itu disebabkan oleh dampak musiman yang besar dari bulan Ramadan. Kinerja ekonomi dalam negeri yang lebih kuat dari perkiraan pada paruh pertama tahun 2012, dengan rata-rata pertumbuhan sebesar 6,3 persen tahun-ke-tahun, lebih dari cukup untuk mengimbangi perlemahan yang belakangan terjadi pada perkiraan (outlook) eksternal, sehingga menyebabkan peningkatan tipis pada proyeksi pertumbuhan dasar (baseline) tahun 2012. Sebagai akibatnya, pertumbuhan PDB pada tahun 2012 diperkirakan akan mencapai 6,1 persen (peningkatan tipis sebesar 0,1 poin persentase dari proyeksi pada Triwulanan edisi bulan Juli). Perkiraan (outlook) untuk tahun 2013 tetap bertahan pada sedikit peningkatan menjadi
Gambar 8: Sejumlah indikator kegiatan ekonomi frekuensi tinggi menunjukkan tanda-tanda perlambatan (perubahan tahun-ke-tahun dalam rata-rata bergerak 3-bulanan untuk produksi industri, penjualan mobil dan motor)
Sumber: CEIC dan perhitungan staf Bank Dunia
0
2
4
6
8
0
1
2
3
4
Jun-05 Mar-07 Dec-08 Sep-10 Jun-12
Persen Persen
T-k-T peny. musiman (kiri)
Tahun-ke-tahun (kanan)
Rata-rata (kiri)*
-3
-2
-1
0
1
2
3
4
-3
-2
-1
0
1
2
3
4
Jun-09 Mar-10 Dec-10 Sep-11 Jun-12
Discrepancy Net Exports Investment
Gov cons. Private cons. GDP
Persen Persen
-25
0
25
50
75
100
125
-2
0
2
4
6
8
10
Aug-07 Nov-08 Feb-10 May-11 Aug-12
Produksi industri (kiri)
Penjualan kendaraan
Penjualan motor (kanan)
Persen Persen
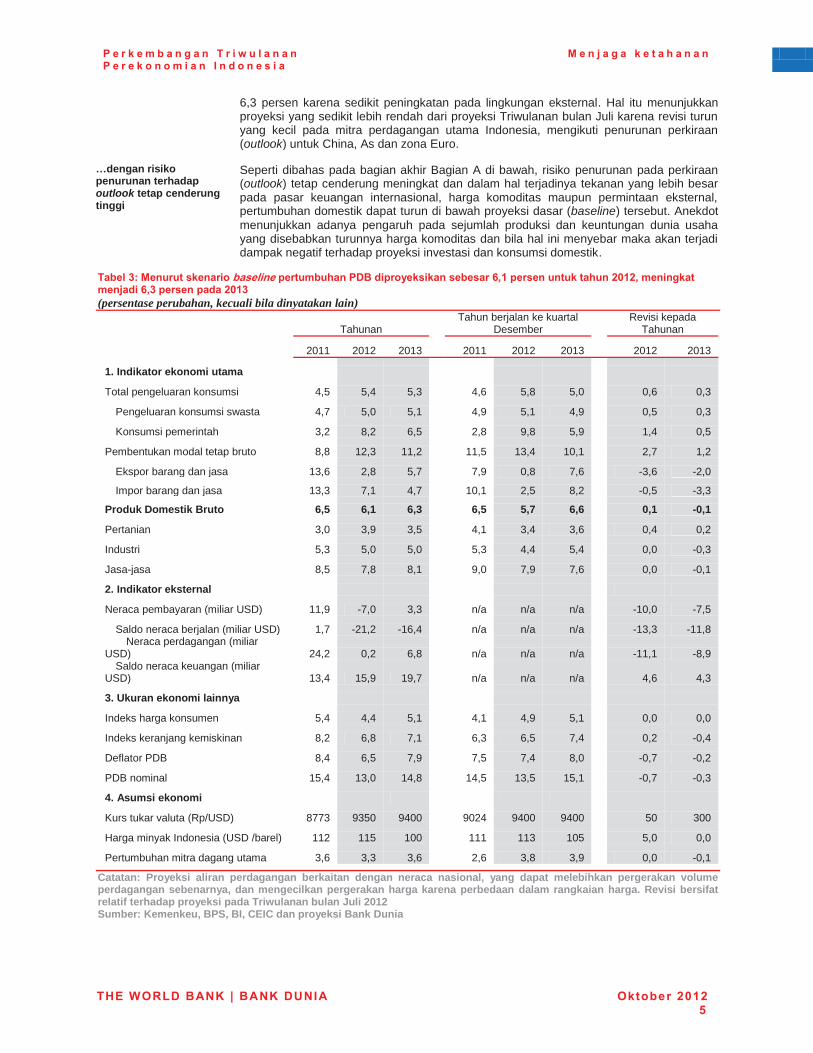
P e r k e m b a n g a n T r i w u l a n a n P e r e k o n o m i a n I n d o n e s i a
M e n j a g a k e t a h a n a n
THE WORLD BANK | BANK DUNIA Oktober 2012 5
6,3 persen karena sedikit peningkatan pada lingkungan eksternal. Hal itu menunjukkan proyeksi yang sedikit lebih rendah dari proyeksi Triwulanan bulan Juli karena revisi turun yang kecil pada mitra perdagangan utama Indonesia, mengikuti penurunan perkiraan (outlook) untuk China, As dan zona Euro.
…dengan risiko penurunan terhadap outlook tetap cenderung tinggi
Seperti dibahas pada bagian akhir Bagian A di bawah, risiko penurunan pada perkiraan (outlook) tetap cenderung meningkat dan dalam hal terjadinya tekanan yang lebih besar pada pasar keuangan internasional, harga komoditas maupun permintaan eksternal, pertumbuhan domestik dapat turun di bawah proyeksi dasar (baseline) tersebut. Anekdot menunjukkan adanya pengaruh pada sejumlah produksi dan keuntungan dunia usaha yang disebabkan turunnya harga komoditas dan bila hal ini menyebar maka akan terjadi dampak negatif terhadap proyeksi investasi dan konsumsi domestik.
Tabel 3: Menurut skenario baseline pertumbuhan PDB diproyeksikan sebesar 6,1 persen untuk tahun 2012, meningkat menjadi 6,3 persen pada 2013 (persentase perubahan, kecuali bila dinyatakan lain)
Tahunan Tahun berjalan ke kuartal
Desember Revisi kepada
Tahunan
2011 2012 2013 2011 2012 2013 2012 2013
1. Indikator ekonomi utama
Total pengeluaran konsumsi 4,5 5,4 5,3 4,6 5,8 5,0 0,6 0,3
Pengeluaran konsumsi swasta 4,7 5,0 5,1 4,9 5,1 4,9 0,5 0,3
Konsumsi pemerintah 3,2 8,2 6,5 2,8 9,8 5,9 1,4 0,5
Pembentukan modal tetap bruto 8,8 12,3 11,2 11,5 13,4 10,1 2,7 1,2
Ekspor barang dan jasa 13,6 2,8 5,7 7,9 0,8 7,6 -3,6 -2,0
Impor barang dan jasa 13,3 7,1 4,7 10,1 2,5 8,2 -0,5 -3,3
Produk Domestik Bruto 6,5 6,1 6,3 6,5 5,7 6,6 0,1 -0,1
Pertanian 3,0 3,9 3,5 4,1 3,4 3,6 0,4 0,2
Industri 5,3 5,0 5,0 5,3 4,4 5,4 0,0 -0,3
Jasa-jasa 8,5 7,8 8,1 9,0 7,9 7,6 0,0 -0,1
2. Indikator eksternal
Neraca pembayaran (miliar USD) 11,9 -7,0 3,3 n/a n/a n/a -10,0 -7,5
Saldo neraca berjalan (miliar USD) 1,7 -21,2 -16,4 n/a n/a n/a -13,3 -11,8 Neraca perdagangan (miliar
USD) 24,2 0,2 6,8 n/a n/a n/a -11,1 -8,9 Saldo neraca keuangan (miliar
USD) 13,4 15,9 19,7 n/a n/a n/a 4,6 4,3
3. Ukuran ekonomi lainnya
Indeks harga konsumen 5,4 4,4 5,1 4,1 4,9 5,1 0,0 0,0
Indeks keranjang kemiskinan 8,2 6,8 7,1 6,3 6,5 7,4 0,2 -0,4
Deflator PDB 8,4 6,5 7,9 7,5 7,4 8,0 -0,7 -0,2
PDB nominal 15,4 13,0 14,8 14,5 13,5 15,1 -0,7 -0,3
4. Asumsi ekonomi
Kurs tukar valuta (Rp/USD) 8773 9350 9400 9024 9400 9400 50 300
Harga minyak Indonesia (USD /barel) 112 115 100 111 113 105 5,0 0,0
Pertumbuhan mitra dagang utama 3,6 3,3 3,6 2,6 3,8 3,9 0,0 -0,1
Catatan: Proyeksi aliran perdagangan berkaitan dengan neraca nasional, yang dapat melebihkan pergerakan volume perdagangan sebenarnya, dan mengecilkan pergerakan harga karena perbedaan dalam rangkaian harga. Revisi bersifat relatif terhadap proyeksi pada Triwulanan bulan Juli 2012 Sumber: Kemenkeu, BPS, BI, CEIC dan proyeksi Bank Dunia

P e r k e m b a n g a n T r i w u l a n a n P e r e k o n o m i a n I n d o n e s i a
M e n j a g a k e t a h a n a n
THE WORLD BANK | BANK DUNIA Oktober 2012 6
3. Defisit neraca berjalan meningkat cukup besar pada kuartal kedua tahun 2012 Peningkatan defisit neraca berjalan pada kuartal kedua tahun 2012 melebihi peningkatan aliran masuk neraca keuangan yang secara keseluruhan menghasilkan aliran keluar neraca pembayaran untuk empat kuartal berturut-turut
Aliran keluar neraca pembayaran secara keseluruhan sebesar 2,8 miliar dolar AS pada kuartal kedua tahun 2012 berada pada tingkat yang sama dengan nilai rata-rata yang tercatat pada tiga kuartal yang lalu. Akan tetapi, tren yang berbeda terlihat pada neraca berjalan dan keuangan. Defisit neraca berjalan sebesar 6,9 miliar dolar AS adalah lebih dari dua kali lipat tingkat yang dicatat pada kuartal 1/2012, sementara aliran masuk neraca keuangan juga meningkat dua kali lipat, hingga mencapai 5,5 miliar dolar AS (Gambar 9). Di dalam neraca keuangan itu, aliran investasi portofolio bersih meningkat menjadi 3,8 miliar dolar AS, sebagian disebabkan oleh penerbitan obligasi pemerintah global sebesar 2,5 miliar dolar AS pada bulan April tapi juga karena aliran masuk ke aset-aset portofolio sektor swasta. Walaupun terdapat aliran keluar dari kepemilikan ekuitas lokal, tercatat adanya aliran berskala besar yang masuk ke sekuritas hutang swasta (sebesar 2,8 miliar dolar AS, hanya sedikit di bawah jumlah yang tercatat pada sepanjang 2011). Aliran keluar investasi lainnya sedikit meningkat menjadi 2,2 miliar dolar AS sementara aliran investasi langsung bersih juga meningkat menjadi 3,9 miliar dolar AS. Hal ini terutama karena penurunan dalam investasi langsung di luar negeri, sementara aliran masuk FDI menurun relatif dibanding kuartal yang lalu, seperti dibicarakan di bawah ini.
Gambar 9: Aliran keluar neraca pembayaran sekali lagi didominasi oleh peningkatan defisit neraca berjalan (miliar dolar AS)
Sumber: BI
Tren perlemahan neraca berjalan dan perdagangan diperparah oleh penurunan harga komoditas dan penurunan permintaan eksternal
Peningkatan defisit neraca berjalan belakangan ini, yang mencapai 3,1 persen dari PDB pada kuartal kedua tahun 2012, disebabkan oleh berkurangnya surplus perdagangan barang (Gambar 10). Dengan defisit minyak mengimbangi surplus dari gas, hal ini didorong oleh penurunan pada neraca perdagangan non-migas. Seperti disoroti pada Bagian B dari Triwulanan bulan Juli 2012, tren penurunan pada surplus perdagangan mencerminkan dukungan bagi impor domestik dari kuatnya permintaan dalam negeri dibanding permintaan luar negeri yang relatif lebih lemah. Selain itu, penurunan dalam harga komoditas pada kuartal kedua tahun 2012 semakin menurunkan ekspor. Ekonomi regional lainnya juga mencatat kemerosotan serupa pada saldo neraca berjalan mereka, terutama Malaysia dan Thailand yang juga relatif bergantung kepada ekspor komoditas, walaupun peningkatan telah mulai terlihat pada kuartal kedua untuk China, Korea dan Malaysia (Gambar 11). Gambaran pada aliran neraca perdagangan lainnya juga serupa dengan kuartal yang lalu. Defisit pada neraca jasa tetap relatif besar, terutama karena jasa transportasi (didukung oleh impor). Aliran keluar pendapatan, yang mengikuti peningkatan aliran masuk FDI pada beberapa tahun terakhir, sedikit meningkat sementara transfer berjalan secara umum tidak berubah.
-12
-8
-4
0
4
8
12
16
-12
-8
-4
0
4
8
12
16
Jun-07 Sep-08 Dec-09 Mar-11 Jun-12
Current accountNet other capitalNet portfolioNet direct investmentOverall balance
Miliar USD
Miliar USD
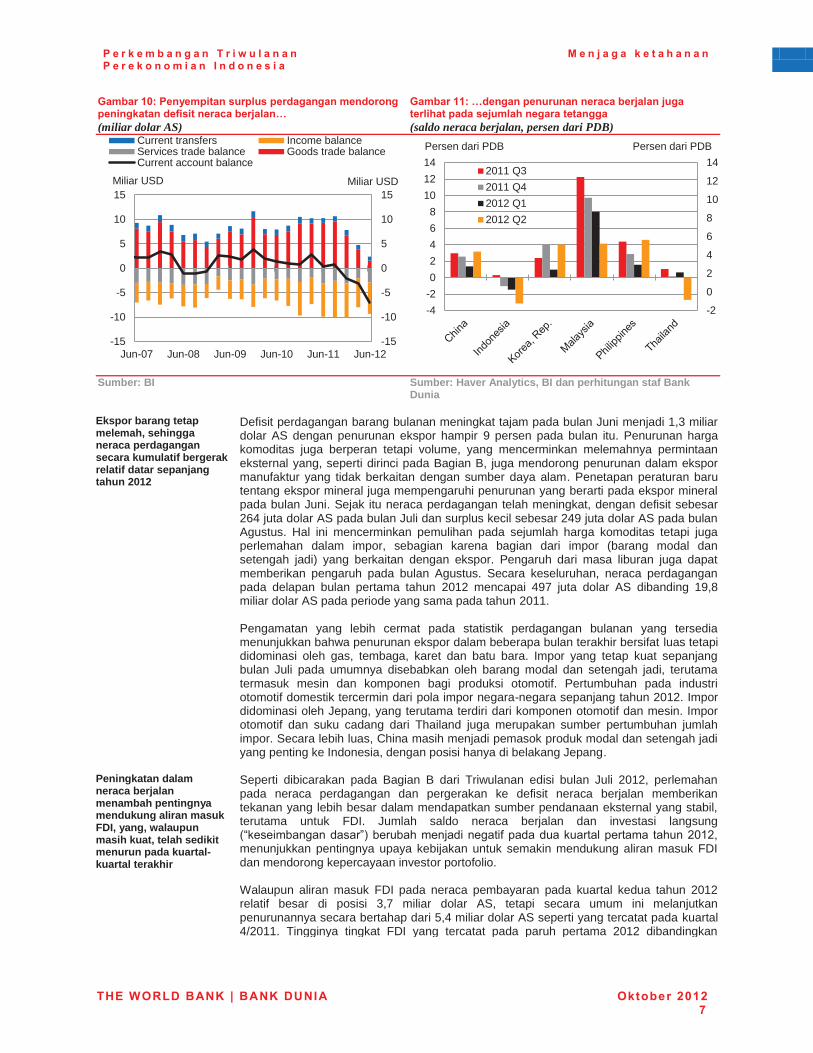
P e r k e m b a n g a n T r i w u l a n a n P e r e k o n o m i a n I n d o n e s i a
M e n j a g a k e t a h a n a n
THE WORLD BANK | BANK DUNIA Oktober 2012 7
Gambar 10: Penyempitan surplus perdagangan mendorong peningkatan defisit neraca berjalan… (miliar dolar AS)
Gambar 11: …dengan penurunan neraca berjalan juga terlihat pada sejumlah negara tetangga (saldo neraca berjalan, persen dari PDB)
Sumber: BI Sumber: Haver Analytics, BI dan perhitungan staf Bank
Dunia
Ekspor barang tetap melemah, sehingga neraca perdagangan secara kumulatif bergerak relatif datar sepanjang tahun 2012
Defisit perdagangan barang bulanan meningkat tajam pada bulan Juni menjadi 1,3 miliar dolar AS dengan penurunan ekspor hampir 9 persen pada bulan itu. Penurunan harga komoditas juga berperan tetapi volume, yang mencerminkan melemahnya permintaan eksternal yang, seperti dirinci pada Bagian B, juga mendorong penurunan dalam ekspor manufaktur yang tidak berkaitan dengan sumber daya alam. Penetapan peraturan baru tentang ekspor mineral juga mempengaruhi penurunan yang berarti pada ekspor mineral pada bulan Juni. Sejak itu neraca perdagangan telah meningkat, dengan defisit sebesar 264 juta dolar AS pada bulan Juli dan surplus kecil sebesar 249 juta dolar AS pada bulan Agustus. Hal ini mencerminkan pemulihan pada sejumlah harga komoditas tetapi juga perlemahan dalam impor, sebagian karena bagian dari impor (barang modal dan setengah jadi) yang berkaitan dengan ekspor. Pengaruh dari masa liburan juga dapat memberikan pengaruh pada bulan Agustus. Secara keseluruhan, neraca perdagangan pada delapan bulan pertama tahun 2012 mencapai 497 juta dolar AS dibanding 19,8 miliar dolar AS pada periode yang sama pada tahun 2011. Pengamatan yang lebih cermat pada statistik perdagangan bulanan yang tersedia menunjukkan bahwa penurunan ekspor dalam beberapa bulan terakhir bersifat luas tetapi didominasi oleh gas, tembaga, karet dan batu bara. Impor yang tetap kuat sepanjang bulan Juli pada umumnya disebabkan oleh barang modal dan setengah jadi, terutama termasuk mesin dan komponen bagi produksi otomotif. Pertumbuhan pada industri otomotif domestik tercermin dari pola impor negara-negara sepanjang tahun 2012. Impor didominasi oleh Jepang, yang terutama terdiri dari komponen otomotif dan mesin. Impor otomotif dan suku cadang dari Thailand juga merupakan sumber pertumbuhan jumlah impor. Secara lebih luas, China masih menjadi pemasok produk modal dan setengah jadi yang penting ke Indonesia, dengan posisi hanya di belakang Jepang.
Peningkatan dalam neraca berjalan menambah pentingnya mendukung aliran masuk FDI, yang, walaupun masih kuat, telah sedikit menurun pada kuartal-kuartal terakhir
Seperti dibicarakan pada Bagian B dari Triwulanan edisi bulan Juli 2012, perlemahan pada neraca perdagangan dan pergerakan ke defisit neraca berjalan memberikan tekanan yang lebih besar dalam mendapatkan sumber pendanaan eksternal yang stabil, terutama untuk FDI. Jumlah saldo neraca berjalan dan investasi langsung (“keseimbangan dasar”) berubah menjadi negatif pada dua kuartal pertama tahun 2012, menunjukkan pentingnya upaya kebijakan untuk semakin mendukung aliran masuk FDI dan mendorong kepercayaan investor portofolio. Walaupun aliran masuk FDI pada neraca pembayaran pada kuartal kedua tahun 2012 relatif besar di posisi 3,7 miliar dolar AS, tetapi secara umum ini melanjutkan penurunannya secara bertahap dari 5,4 miliar dolar AS seperti yang tercatat pada kuartal 4/2011. Tingginya tingkat FDI yang tercatat pada paruh pertama 2012 dibandingkan
-15
-10
-5
0
5
10
15
-15
-10
-5
0
5
10
15
Jun-07 Jun-08 Jun-09 Jun-10 Jun-11 Jun-12
Current transfers Income balanceServices trade balance Goods trade balanceCurrent account balance
Miliar USD Miliar USD
-2
0
2
4
6
8
10
12
14
-4-202468
101214
2011 Q32011 Q42012 Q12012 Q2
Persen dari PDB Persen dari PDB
P e r k e m b a n g a n T r i w u l a n a n P e r e k o n o m i a n I n d o n e s i a
M e n j a g a k e t a h a n a n
THE WORLD BANK | BANK DUNIA Oktober 2012 8
dengan periode yang sama tahun 2011 didukung oleh investasi bukan pertambangan, sementara investasi asing yang berkaitan dengan pertambangan mencatat perkembangan yang mendatar pada paruh pertama tahun 2011, yang mencerminkan perkiraan global yang lebih berhati-hati bagi komoditas tetapi juga mungkin disebabkan oleh dampak peraturan baru pada sektor pertambangan di Indonesia. FDI tetap memiliki diversifikasi yang baik, dengan aliran masuk dari pertambangan, manufaktur dan utilitas yang mendominasi pada kuartal kedua.
Penurunan pada neraca berjalan telah mendorong sejumlah usulan kebijakan…
Sebagai tanggapan dari penurunan yang terjadi dalam kaitannya dengan defisit neraca berjalan pada angka-angka kuartal kedua, Bank Indonesia dan Pemerintah telah mengumumkan sejumlah kebijakan sebagai tanggapan untuk menyesuaikan defisit neraca berjalan ke “tingkat yang berkelanjutan untuk mendukung momentum ekonomi nasional.” Sebagai contoh, Bank Indonesia menyatakan bahwa ia akan menetapkan fokus pada stabilisasi Rupiah “sesuai dengan kondisi fundamental” dan akan mengambil langkah-langkah untuk mengelola pertumbuhan kredit dan memperdalam pasar valuta asing. Langkah-langkah yang diumumkan oleh Pemerintah termasuk dukungan untuk mendorong ekspor dan juga langkah-langkah yang bertujuan untuk membatasi kebergantungan kepada impor dan mendukung produksi dalam negeri, seperti usulan bagi kebijakan keringanan pajak yang bertujuan untuk mendorong investasi untuk menghasilkan barang-barang modal dan peraturan untuk menurunkan “kebergantungan terhadap impor barang-barang jadi”.
…tetapi juga penting untuk memastikan bahwa kebijakan tetap mendukung keberlanjutan investasi dalam dan luar negeri
Merupakan hal penting bahwa kebijakan tanggapan tetap tepat. Sebagai contoh, ketika melihat perkiraan (outlook) jangka pendek neraca berjalan, patut untuk dicatat penurunan alami impor seperti yang disinggung di atas dengan menurunnya ekspor. Langkah-langkah yang ditujukan pada substitusi impor, misalnya pada barang modal, tampaknya hanya akan membawa dampak yang perlambatan, kemungkinan adanya ketidak efektifan dan bahkan dapat membatasi manfaat yang diperoleh perusahaan-perusahaan di dalam negeri dengan penggunaan barang impor setengah jadi, seperti akses kepada rangkaian teknologi yang lebih luas atau manfaat dari biaya yang lebih rendah maupun kualitas yang lebih baik (lihat Bagian C dari Triwulan edisi bulan Juli 2012).
Selain itu, kebijakan baru apapun harus tidak membawa ketidakpastian baru kepada arah penyusunan kebijakan perdagangan dan investasi yang akan semakin menekan neraca eksternal. Memperkenankan perlemahan bertahap kepada kurs tukar valuta, seperti yang terjadi belakangan ini, dapat mendukung peningkatan pada neraca perdagangan melalui dorongan penyesuaian harga relatif yang dapat mendukung kinerja ekspor dan membuat impor menjadi lebih mahal. Selain itu, kemajuan yang berkelanjutan pada reformasi struktural utama, seperti peningkatan infrastruktur dan lingkungan peraturan perundangan, dapat mendukung daya saing dalam negeri – mengangkat potensi ekonomi ekspor sementara juga membatasi daya saing impor terhadap perusahaan-perusahaan lokal – dan kepercayaan investor.
Neraca pembayaran diproyeksikan defisit di tahun 2012 secara total, dan diperkiraan kembali ke surplus pada tahun 2013
Neraca berjalan setahun penuh diproyeksikan defisit sekitar 21 miliar dolar AS untuk tahun 2012, setara dengan sekitar 2,3 persen dari PDB. Pada tahun 2013 defisit neraca berjalan diperkirakan akan turun menjadi 1,6 persen dari PDB dengan pemulihan pada surplus perdagangan, yang mencerminkan peningkatan yang mulai tercatat pada pertumbuhan ekonomi mitra perdagangan utama dan dampak depresiasi Rupiah yang berjalan. Perkiraan (outlook) bagi neraca pembayaran secara keseluruhan akan bergantung pada potensi volatilitas aliran masuk portofolio bersih. Pada keadaan dasar, dengan bertahannya FDI dan berkontribusi kepada aliran masuk keuangan yang kuat, keseluruhan defisit neraca pembayaran yang tercatat untuk tahun ini diproyeksikan akan berakhir pada tahun 2013.
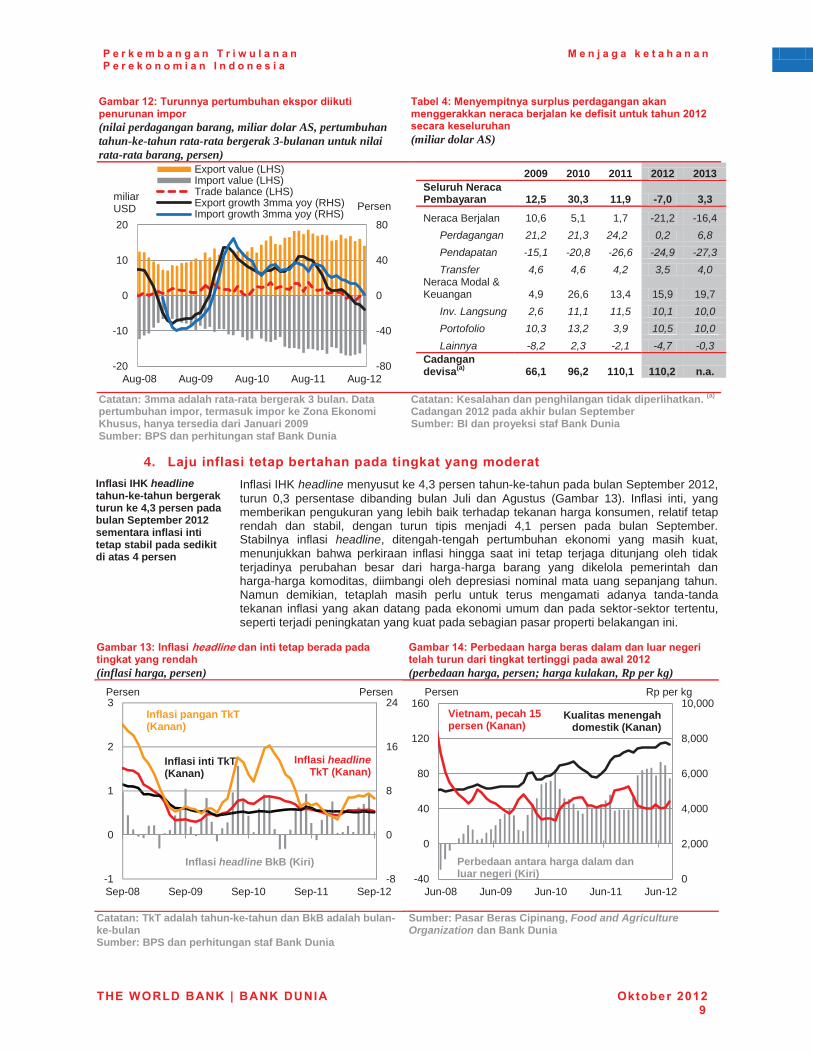
P e r k e m b a n g a n T r i w u l a n a n P e r e k o n o m i a n I n d o n e s i a
M e n j a g a k e t a h a n a n
THE WORLD BANK | BANK DUNIA Oktober 2012 9
Gambar 12: Turunnya pertumbuhan ekspor diikuti penurunan impor (nilai perdagangan barang, miliar dolar AS, pertumbuhan tahun-ke-tahun rata-rata bergerak 3-bulanan untuk nilai rata-rata barang, persen)
Tabel 4: Menyempitnya surplus perdagangan akan menggerakkan neraca berjalan ke defisit untuk tahun 2012 secara keseluruhan (miliar dolar AS)
2009 2010 2011 2012 2013 Seluruh Neraca Pembayaran 12,5 30,3 11,9 -7,0 3,3
Neraca Berjalan 10,6 5,1 1,7 -21,2 -16,4 Perdagangan 21,2 21,3 24,2 0,2 6,8 Pendapatan -15,1 -20,8 -26,6 -24,9 -27,3 Transfer 4,6 4,6 4,2 3,5 4,0
Neraca Modal & Keuangan 4,9 26,6 13,4 15,9 19,7
Inv. Langsung 2,6 11,1 11,5 10,1 10,0 Portofolio 10,3 13,2 3,9 10,5 10,0 Lainnya -8,2 2,3 -2,1 -4,7 -0,3
Cadangan devisa(a) 66,1 96,2 110,1 110,2 n.a.
Catatan: 3mma adalah rata-rata bergerak 3 bulan. Data pertumbuhan impor, termasuk impor ke Zona Ekonomi Khusus, hanya tersedia dari Januari 2009 Sumber: BPS dan perhitungan staf Bank Dunia
Catatan: Kesalahan dan penghilangan tidak diperlihatkan. (a)
Cadangan 2012 pada akhir bulan September Sumber: BI dan proyeksi staf Bank Dunia
4. Laju inflasi tetap bertahan pada tingkat yang moderat Inflasi IHK headline tahun-ke-tahun bergerak turun ke 4,3 persen pada bulan September 2012 sementara inflasi inti tetap stabil pada sedikit di atas 4 persen
Inflasi IHK headline menyusut ke 4,3 persen tahun-ke-tahun pada bulan September 2012, turun 0,3 persentase dibanding bulan Juli dan Agustus (Gambar 13). Inflasi inti, yang memberikan pengukuran yang lebih baik terhadap tekanan harga konsumen, relatif tetap rendah dan stabil, dengan turun tipis menjadi 4,1 persen pada bulan September. Stabilnya inflasi headline, ditengah-tengah pertumbuhan ekonomi yang masih kuat, menunjukkan bahwa perkiraan inflasi hingga saat ini tetap terjaga ditunjang oleh tidak terjadinya perubahan besar dari harga-harga barang yang dikelola pemerintah dan harga-harga komoditas, diimbangi oleh depresiasi nominal mata uang sepanjang tahun. Namun demikian, tetaplah masih perlu untuk terus mengamati adanya tanda-tanda tekanan inflasi yang akan datang pada ekonomi umum dan pada sektor-sektor tertentu, seperti terjadi peningkatan yang kuat pada sebagian pasar properti belakangan ini.
Gambar 13: Inflasi headline dan inti tetap berada pada tingkat yang rendah (inflasi harga, persen)
Gambar 14: Perbedaan harga beras dalam dan luar negeri telah turun dari tingkat tertinggi pada awal 2012 (perbedaan harga, persen; harga kulakan, Rp per kg)
Catatan: TkT adalah tahun-ke-tahun dan BkB adalah bulan-ke-bulan Sumber: BPS dan perhitungan staf Bank Dunia
Sumber: Pasar Beras Cipinang, Food and Agriculture Organization dan Bank Dunia
-80
-40
0
40
80
-20
-10
0
10
20
Aug-08 Aug-09 Aug-10 Aug-11 Aug-12
Export value (LHS)Import value (LHS)Trade balance (LHS)Export growth 3mma yoy (RHS)Import growth 3mma yoy (RHS)
miliar USD Persen
-8
0
8
16
24
-1
0
1
2
3
Sep-08 Sep-09 Sep-10 Sep-11 Sep-12
Inflasi inti TkT (Kanan)
Inflasi headline TkT (Kanan)
Inflasi headline BkB (Kiri)
Persen Persen
Inflasi pangan TkT (Kanan)
0
2,000
4,000
6,000
8,000
10,000
-40
0
40
80
120
160
Jun-08 Jun-09 Jun-10 Jun-11 Jun-12
Perbedaan antara harga dalam dan luar negeri (Kiri)
Vietnam, pecah 15 persen (Kanan)
Kualitas menengah domestik (Kanan)
Persen Rp per kg
P e r k e m b a n g a n T r i w u l a n a n P e r e k o n o m i a n I n d o n e s i a
M e n j a g a k e t a h a n a n
THE WORLD BANK | BANK DUNIA Oktober 2012 10
Inflasi harga bahan pangan lebih rendah dari biasanya
Penurunan tahun-ke-tahun inflasi headline pada bulan September terutama disebabkan oleh penurunan harga bahan pangan menjadi 6,6 persen. Harga beras dalam negeri yang stabil selama bulan Ramadan adalah faktor utama yang menjaga pertumbuhan inflasi bahan pangan lebih rendah dari biasanya. Pertumbuhan harga beras pada sembilan bulan pertama tahun 2012 mencapai 3,1 persen, tingkat paling rendah (juga terjadi pada tahun 2009) dari tahun kalender manapun sejak tahun 2004. Melemahnya tekanan harga bahan pangan mendorong turunnya laju inflasi keranjang kemiskinan dari 7,7 persen pada bulan Juni menjadi 5,9 persen pada bulan September. Walaupun harga beras hanya mencatat pertumbuhan yang rendah sepanjang tahun 2012, tingkat harganya tetap tinggi dan masih berada 50 persen lebih tinggi dibanding harga pada awal tahun 2010 setelah terjadi lonjakan harga yang besar pada akhir tahun. Dimulainya tahun ajaran baru mendorong peningkatan biaya pendidikan sebesar 2,9 persen sepanjang bulan Agustus, sementara dengan tidak adanya perubahan harga energi bersubsidi selama lebih dari satu tahun, laju inflasi biaya transportasi dan energi rumah tangga tetap moderat.
Perbedaan antara harga beras dalam dan luar negeri menyusut dari nilai tertinggi pada bulan Juni
Perbedaan antara harga beras dalam dan luar negeri menyusut dari nilai tertingginya yang tercatat pada bulan Juni (Gambar 14). Pada bulan September 2012, harga beras kulakan dalam negeri lebih tinggi sebesar 65-76 persen (sesuai kualitas) dari beras yang sebanding di pasar internasional (masing-masing dari Thailand dan Vietnam), turun dari perbedaan harga tertinggi sebesar 73-101 persen pada bulan Februari 2012. Penyusutan perbedaan harga itu didorong oleh tiga faktor: peningkatan yang besar dalam harga beras internasional (peningkatan harga beras berkualitas rendah Vietnam sebesar 15 persen); berlanjutnya depresiasi Rupiah terhadap dolar AS; dan melemahnya peningkatan harga beras dalam negeri karena peningkatan produksi.
Perkiraan harga jangka pendek turun dengan tajam, merosot di bawah tingkat yang tercatat sebelum peningkatan menjelang bulan Ramadan
Seperti pada tahun-tahun yang lalu, setelah berakhirnya bulan Ramadan, perkiraan harga konsumen turun dengan tajam pada bulan Agustus ke tingkat yang lebih rendah secara signifikan dari yang tercatat pada bulan-bulan menjelang masa liburan. Menurut survei BI, lebih banyak responden yang membandingkan ke bulan yang lalu melihat bahwa harga-harga dalam tiga dan enam bulan akan turun karena sejumlah bahan pangan memasuki masa panen dan peningkatan pada distribusi barang-barang di seluruh negeri. Proporsi responden terbanyak memperkirakan penurunan harga terbesar akan terjadi pada bahan pangan, diikuti dengan sandang.
Inflasi IHK diproyeksikan akan meningkat menjadi 4,9 persen tahun-ke-tahun pada kuartal akhir tahun 2012, menuju batas atas target BI sebesar 4,5 ± 1 persen, dan akan naik sedikit lebih tinggi pada tahun 2013
Menurut perkiraan dasar (baseline outlook), inflasi IHK diproyeksikan akan meningkat menjadi 4,9 persen tahun-ke-tahun pada kuartal terakhir tahun 2012, yang mencerminkan berlanjutnya tingkat pertumbuhan kredit yang tinggi, permintaan dalam negeri yang masih kokoh dan pengaruh dari harga impor yang lebih tinggi karena depresiasi nilai Rupiah terhadap dolar AS. Diperkirakan bahwa depresiasi Rupiah sebesar 10 persen terhadap dolar AS akan secara kasar berkaitan dengan peningkatan sebesar 0,5-1 poin persentase pada inflasi headline pada kuartal tersebut. Perkiraan inflasi bergerak menuju batas sasaran atas Bank Indonesia sebesar 4,5 ± 1 persen. Inflasi IHK tahunan untuk tahun 2012 secara keseluruhan diproyeksikan sebesar 4,4 persen. Pada tahun 2013, inflasi diproyeksikan akan meningkat menjadi 5,1 persen untuk keseluruhan tahun, sesuai pengaruh kuatnya permintaan konsumen, peningkatan kredit konsumen dan depresiasi nilai tukar valuta. Terdapat risiko penurunan pada perkiraan ini bila situasi luar negeri semakin tidak menentu (walaupun pengaruhnya dapat diimbangi dengan harga impor yang lebih tinggi jika diikuti dengan depresiasi nilai tukar valuta). Jalur bagi harga-harga yang dikelola pemerintah juga menjadi kunci perkiraan (outlook) itu, dengan perkiraan dasar (baseline) mengasumsikan tidak adanya peningkatan harga energi. Namun, RAPBN 2013 yang sedang dibahas di DPR turut menyertakan usulan peningkatan tarif listrik sebesar 15 persen, secara bertahap tiap kuartal, walaupun sementara ini tidak ada usulan untuk reformasi harga BBM. Hasil panen yang baik pada awal tahun telah mendorong turun perkiraan inflasi keranjang kemiskinan menjadi 6,5 persen pada kuartal 4/2012 dan 7,4 persen pada kuartal akhir tahun 2013.
Pertumbuhan deflator PDB telah menyusut ke tingkat rendah yang tercatat pada waktu krisis keuangan dunia dengan
Luasnya tingkat harga pada ekonomi, yang diukur oleh deflator PDB, meningkat sebesar 5,7 persen tahun-ke-tahun pada kuartal 2/2012, tingkat paling rendah sejak tahun 2009. Hal ini disebabkan oleh harga investasi yang hanya bertumbuh sebesar 0,1 persen pada kuartal kedua, pertumbuhan kuartalan paling rendah dengan penyesuaian musiman selama satu dekade. Inflasi deflator PDB diproyeksikan akan meningkat pada sisa tahun
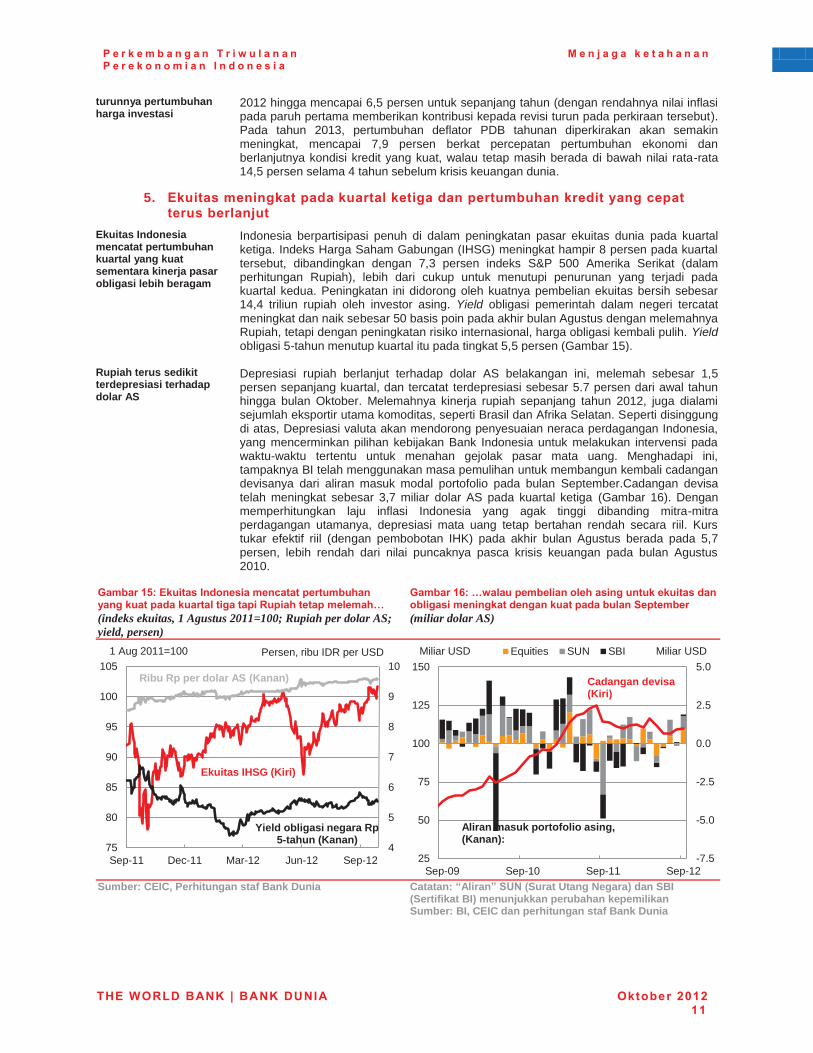
P e r k e m b a n g a n T r i w u l a n a n P e r e k o n o m i a n I n d o n e s i a
M e n j a g a k e t a h a n a n
THE WORLD BANK | BANK DUNIA Oktober 2012 11
turunnya pertumbuhan harga investasi
2012 hingga mencapai 6,5 persen untuk sepanjang tahun (dengan rendahnya nilai inflasi pada paruh pertama memberikan kontribusi kepada revisi turun pada perkiraan tersebut). Pada tahun 2013, pertumbuhan deflator PDB tahunan diperkirakan akan semakin meningkat, mencapai 7,9 persen berkat percepatan pertumbuhan ekonomi dan berlanjutnya kondisi kredit yang kuat, walau tetap masih berada di bawah nilai rata-rata 14,5 persen selama 4 tahun sebelum krisis keuangan dunia.
5. Ekuitas meningkat pada kuartal ketiga dan pertumbuhan kredit yang cepat terus berlanjut
Ekuitas Indonesia mencatat pertumbuhan kuartal yang kuat sementara kinerja pasar obligasi lebih beragam
Indonesia berpartisipasi penuh di dalam peningkatan pasar ekuitas dunia pada kuartal ketiga. Indeks Harga Saham Gabungan (IHSG) meningkat hampir 8 persen pada kuartal tersebut, dibandingkan dengan 7,3 persen indeks S&P 500 Amerika Serikat (dalam perhitungan Rupiah), lebih dari cukup untuk menutupi penurunan yang terjadi pada kuartal kedua. Peningkatan ini didorong oleh kuatnya pembelian ekuitas bersih sebesar 14,4 triliun rupiah oleh investor asing. Yield obligasi pemerintah dalam negeri tercatat meningkat dan naik sebesar 50 basis poin pada akhir bulan Agustus dengan melemahnya Rupiah, tetapi dengan peningkatan risiko internasional, harga obligasi kembali pulih. Yield obligasi 5-tahun menutup kuartal itu pada tingkat 5,5 persen (Gambar 15).
Rupiah terus sedikit terdepresiasi terhadap dolar AS
Depresiasi rupiah berlanjut terhadap dolar AS belakangan ini, melemah sebesar 1,5 persen sepanjang kuartal, dan tercatat terdepresiasi sebesar 5.7 persen dari awal tahun hingga bulan Oktober. Melemahnya kinerja rupiah sepanjang tahun 2012, juga dialami sejumlah eksportir utama komoditas, seperti Brasil dan Afrika Selatan. Seperti disinggung di atas, Depresiasi valuta akan mendorong penyesuaian neraca perdagangan Indonesia, yang mencerminkan pilihan kebijakan Bank Indonesia untuk melakukan intervensi pada waktu-waktu tertentu untuk menahan gejolak pasar mata uang. Menghadapi ini, tampaknya BI telah menggunakan masa pemulihan untuk membangun kembali cadangan devisanya dari aliran masuk modal portofolio pada bulan September.Cadangan devisa telah meningkat sebesar 3,7 miliar dolar AS pada kuartal ketiga (Gambar 16). Dengan memperhitungkan laju inflasi Indonesia yang agak tinggi dibanding mitra-mitra perdagangan utamanya, depresiasi mata uang tetap bertahan rendah secara riil. Kurs tukar efektif riil (dengan pembobotan IHK) pada akhir bulan Agustus berada pada 5,7 persen, lebih rendah dari nilai puncaknya pasca krisis keuangan pada bulan Agustus 2010.
Gambar 15: Ekuitas Indonesia mencatat pertumbuhan yang kuat pada kuartal tiga tapi Rupiah tetap melemah… (indeks ekuitas, 1 Agustus 2011=100; Rupiah per dolar AS; yield, persen)
Gambar 16: …walau pembelian oleh asing untuk ekuitas dan obligasi meningkat dengan kuat pada bulan September (miliar dolar AS)
Sumber: CEIC, Perhitungan staf Bank Dunia Catatan: “Aliran” SUN (Surat Utang Negara) dan SBI
(Sertifikat BI) menunjukkan perubahan kepemilikan Sumber: BI, CEIC dan perhitungan staf Bank Dunia
4
5
6
7
8
9
10
75
80
85
90
95
100
105
Sep-11 Dec-11 Mar-12 Jun-12 Sep-12
1 Aug 2011=100 Persen, ribu IDR per USD
Ribu Rp per dolar AS (Kanan)
Ekuitas IHSG (Kiri)
Yield obligasi negara Rp 5-tahun (Kanan)
-7.5
-5.0
-2.5
0.0
2.5
5.0
25
50
75
100
125
150
Sep-09 Sep-10 Sep-11 Sep-12
Equities SUN SBIMiliar USD
Aliran masuk portofolio asing, (Kanan):
Cadangan devisa (Kiri)
Miliar USD
P e r k e m b a n g a n T r i w u l a n a n P e r e k o n o m i a n I n d o n e s i a
M e n j a g a k e t a h a n a n
THE WORLD BANK | BANK DUNIA Oktober 2012 12
Dengan inflasi yang stabil, BI memfokuskan pada dukungan pertumbuhan sambil mengelola gejolak valuta dan membatasi perkiraan inflasi
Dengan inflasi kembali dibawah kisaran target 4,5 persen +/- 1 persen pada bulan September, Bank Indonesia mengidentifikan kebijakannya yang dinyatakan pada kebijakan moneter bulan September bahwa ia memiliki ruang untuk melanjutkan “…pencapaian keseimbangan eksternal secara bertahap”. Tantangan yang akan dihadapi Bank Indonesia adalah menyeimbangkan antara pemberian dukungan terhadap pertumbuhan, disaat kondisi ekonomi dunia yang diperkirakan akan tetap lemah selama jangka pendek, dan mengurangi tekanan inflasi akibat depresiasi Rupiah. Pada laporan Pasal IV 2012 tentang Indonesia, IMF secara khusus mendorong BI untuk mengambil tindakan untuk menormalkan kondisi likuiditas untuk mengendalikan tekanan inflasi dan risiko sektor keuangan apapun yang baru timbul. Dalam kaitannya dengan manajemen likuiditas dan kebijakan moneter yang lebih luas, faktor ketidakpastian utama adalah dampak dari pembaruan ekspansi moneter oleh bank-bank sentral utama dunia. Bila kegiatan ini menyebabkan peningkatan aliran masuk investasi portofolio, BI mungkin perlu menyiapkan diri menghadapi peningkatan likuiditas dolar dalam negeri dan inflasi harga aset yang berlebihan. Namun kemungkinan terjadinya tidaklah besar dengan masih rapuhnya keadaan ekonomi dunia.
Kinerja sektor perbankan secara keseluruhan tetap kuat
Kinerja sektor perbankan secara keseluruhan tetap kuat dan indikator kesehatan keuangan utama tetap kokoh. Hingga bulan Juni 2012, Rasio Kecukupan Modal (Capital Adequacy Ratio/CAR) terjaga di atas 17 persen, rasio agregat hutang terhadap simpanan (LDR) sebesar 83 persen, sementara tingkat kredit macet (non-performing loan/NPL) tetap rendah pada 2,2 persen. Profitabilitas industri perbankan seperti diukur dengan tingkat pengembalian aktiva dan ekuitas (return on assets dan return on equity) masing-masing sebesar 3,2 persen dan 18,2 persen.
Pertumbuhan kredit tetap kuat , dan mendekati nilai tertinggi akhir-akhir ini secara ril…
Pertumbuhan kredit pada bulan Juli tercatat cepat sebesar 26,6 persen tahun-ke-tahun (12,3 persen tahun berjalan). Kredit investasi, yang naik 30 persen tahun-ke-tahun pada bulan Juli, telah memimpin pertumbuhan ini dan diikuti dengan kredit modal kerja tidak jauh di belakangnya, pada 27 persen, dan pertumbuhan kredit konsumsi yang lebih rendah tapi tetap besar pada 18,9 persen (Gambar 17). Juga terdapat peningkatan yang cukup besar pada tingkat hutang swasta dari luar negeri yang dicatat oleh BI, yang mencapai 123,7 miliar dolar AS (naik 30 persen dari 96,5 miliar dolar AS pada akhir bulan Juli 2011). Peningkatan ini sebagian disebabkan oleh ketaatan yang lebih baik terhadap kewajiban pelaporan hutang luar negeri dengan peningkatan penegakkan peraturan oleh BI sejak pertengahan tahun 2011, dan juga karena kuatnya penerbitan obligasi perusahaan luar negeri, dan juga pemberian pendanaan anak perusahaan oleh perusahaan induk di luar negeri.
…yang akan penting untuk dipantau di masa depan, serta potensi pengaruh sektor keuangan dari penurunan ekspor dan permintaan komoditas
Kenyataan bahwa pertumbuhan kredit yang paling cepat adalah kredit investasi modal kerja, dan bukan kredit konsumen, merupakan berita yang menenangkan di tengah keprihatinan tentang keberlanjutan laju pertumbuhan kredit yang saat ini sedang tinggi, khususnya pada sektor perbankan yang masih rendah seperti di Indonesia. Sejauh kredit itu digunakan secara efektif untuk meningkatkan modal dalam negeri dan mendorong potensi pertumbuhan, laju kredit yang cepat merupakan hal yang baik bagi pertumbuhan ekonomi jangka panjang. Namun, tampaknya pertumbuhan kredit riil (yang disesuaikan dengan inflasi yang terjadi) kembali ke nilai-nilai tertingginya pada tahun 2004 (Gambar 18), dan laju pemberian kredit, dan pengendalian kualitas kredit, harus dipantau secara hati-hati. Hal yang sama juga berlaku bagi pergerakan utang luar negeri swasta, karena pada saat jumlah total utang luar negeri swasta rendah dan ukuran kerentanan hutang luar negeri tidak mengancam, kredit luar negeri swasta menjadi makin naik dan kini telah melampaui jumlah utang luar negeri pemerintah. Yang juga penting untuk diperhatikan adalah tanda-tanda pengaruh lanjutan dari penurunan ekspor dan kuatnya aliran dana, serta neraca keuangan dunia usaha dan lembaga-lembaga di Indonesia. Sebagai contoh, laporan media menunjukkan bahwa sejumlah produsen batu bara dan perusahaan pengapalan berskala besar telah terpengaruh oleh perlemahan permintaan luar negeri dan harga komoditas, dan kedua jenis perusahaan itu kini menghadapi tekanan keuangan, misalnya melakukan rencana restrukturisasi dengan bank mereka. Pada sektor keuangan non-bank, perusahaan-perusahaan sewa guna usaha (leasing) yang memberikan belanja modal seperti alat-alat berat untuk sektor pertambangan dapat juga terkena dampak dari penurunan permintaan.

P e r k e m b a n g a n T r i w u l a n a n P e r e k o n o m i a n I n d o n e s i a
M e n j a g a k e t a h a n a n
THE WORLD BANK | BANK DUNIA Oktober 2012 13
Gambar 17: Pertumbuhan kredit masih tinggi, terutama kredit investasi dan modal kerja… (pertumbuhan kredit tahun-ke-tahun sesuai jenisnya, persen)
Gambar 18: …dengan perkiraan pertumbuhan kredit riil pada nilai tertinggi yang lalu (pertumbuhan kredit tahun-ke-tahun, persen)
Sumber: BI dan perhitungan staf Bank Dunia Catatan: Nilai riil adalah nilai setelah dideflasi dengan IHK
Sumber: BI, CEIC dan proyeksi staf Bank Dunia
Proses transisi ke Otoritas Jasa Keuangan, OJK, terus berlanjut
Perkembangan-perkembangan di atas terjadi pada masa transisi ke Otoritas Jasa Keuangan (OJK) Indonesia yang baru. Seperti diuraikan pada Triwulanan edisi bulan Oktober 2011, OJK akan menggabungkan fungsi pemantauan pasar modal dan non-bank, yang kini dilaksanakan oleh Bapepam-LK, dengan pemantauan dan pengaturan fungsi yang kini dilakukan oleh Bank Indonesia. Pemantauan pasar saham dan lembaga keuangan non-bank akan dipindahkan kepada OJK pada bulan Januari 2013, dan tanggung jawab pemantauan perbankan pada bulan Januari 2014. Dalam persiapannya, Pemerintah Indonesia telah mengambil sejumlah langkah untuk mendukung keberhasilan pembentukan OJK, termasuk dukungan upaya untuk mengelola kapasitas pemantauan yang ada sekarang pada proses transisi dan mengambil dari pengalaman internasional untuk reformasi peraturan. Selain itu, pada bulan Juli 2012 Dewan Komisaris OJK telah diangkat sesuai dengan jadwal waktu yang tercantum pada UU OJK dan para anggota Dewan telah mulai melakukan tanggung jawabnya. Dewan itu juga telah menerima rencana struktur organisasi awal untuk OJK. Prioritas langkah berikut untuk pendirian OJK termasuk peyelesaian penggunaan kebijakan SDM dan pengangkatan untuk posisi-posisi utama dan finalisasi sistem manajemen internal. Akibatnya, OJK dan otoritas sektor keuangan lainnya melanjutkan upaya mereka untuk menerapkan agenda reformasi sektor finansial jangka menengah Indonesia, termasuk memberikan prioritas pada penerapan protokol manajemen krisis yang telah diamandemen, mendukung diversifikasi sektor finansial, dan mendorong keterlibatan keuangan bagi mereka yang kurang diperhitungkan.
6. Posisi fiskal tetap kokoh tetapi risiko telah meningkat Walau posisi fiskal Indonesia tetap kokoh pada kuartal 3/2012, risiko fiskal telah meningkat dengan naiknya biaya subsidi energi dan perlambatan pengumpulan penerimaan
Neraca anggaran secara keseluruhan mencatat defisit sebesar 35 triliun rupiah pada delapan bulan pertama tahun 2012. Defisit ini cukup jauh di bawah sasaran defisit pada APBN-P sebesar 190 triliun rupiah atau 2,2 persen dari PDB (Tabel 5) tetapi belanja dan kemudian defisit anggaran cenderung meningkat menjelang akhir tahun. Sesungguhnya, pada tahun 2010 dan 2011, ketika defisit setahun penuh mencatat defisit yang rendah, neraca pemerintah pusat berada dalam keadaan surplus dari bulan Februari hingga November. Kumulatif defisit yang tercatat sejauh ini pada tahun 2012 mencerminkan pencairan subsidi energi yang lebih tinggi dan sedikit penurunan pada pengumpulan penerimaan. Perkembangan positif bahwa rencana pembiayaan Pemerintah berada pada jalur yang tepat, dengan 76 persen dari penerbitan bruto yang direncanakan untuk tahun 2012 telah tercapai pada pertengahan bulan September.
-20
0
20
40
60
-20
0
20
40
60
Jul-02 Jul-04 Jul-06 Jul-08 Jul-10 Jul-12
Working CapitalInvestmentConsumption
Persen Persen
Nominal
Riil
-10
0
10
20
30
40
-10
0
10
20
30
40Persen Persen
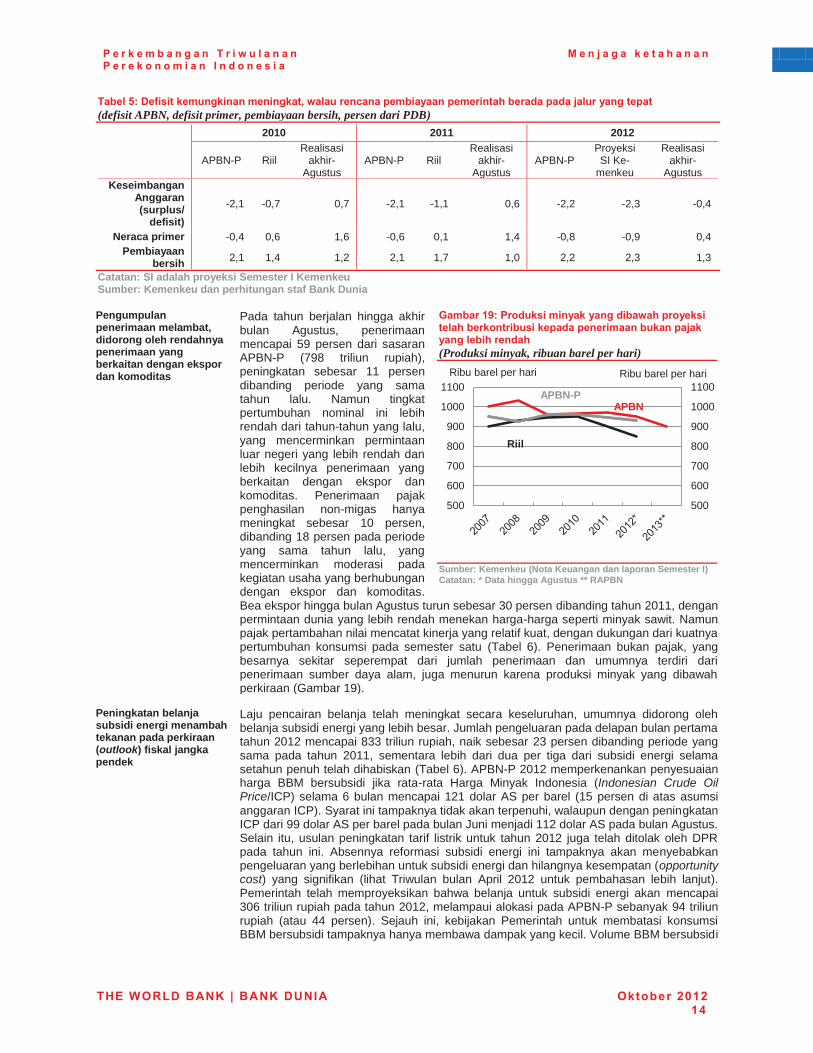
P e r k e m b a n g a n T r i w u l a n a n P e r e k o n o m i a n I n d o n e s i a
M e n j a g a k e t a h a n a n
THE WORLD BANK | BANK DUNIA Oktober 2012 14
Tabel 5: Defisit kemungkinan meningkat, walau rencana pembiayaan pemerintah berada pada jalur yang tepat (defisit APBN, defisit primer, pembiayaan bersih, persen dari PDB)
2010 2011 2012
APBN-P Riil
Realisasi akhir-
Agustus APBN-P Riil
Realisasi akhir-
Agustus APBN-P
Proyeksi SI Ke-
menkeu
Realisasi akhir-
Agustus Keseimbangan
Anggaran (surplus/
defisit) -2,1 -0,7 0,7 -2,1 -1,1 0,6 -2,2 -2,3 -0,4
Neraca primer -0,4 0,6 1,6 -0,6 0,1 1,4 -0,8 -0,9 0,4 Pembiayaan
bersih 2,1 1,4 1,2 2,1 1,7 1,0 2,2 2,3 1,3
Catatan: SI adalah proyeksi Semester I Kemenkeu Sumber: Kemenkeu dan perhitungan staf Bank Dunia
Pengumpulan penerimaan melambat, didorong oleh rendahnya penerimaan yang berkaitan dengan ekspor dan komoditas
Pada tahun berjalan hingga akhir bulan Agustus, penerimaan mencapai 59 persen dari sasaran APBN-P (798 triliun rupiah), peningkatan sebesar 11 persen dibanding periode yang sama tahun lalu. Namun tingkat pertumbuhan nominal ini lebih rendah dari tahun-tahun yang lalu, yang mencerminkan permintaan luar negeri yang lebih rendah dan lebih kecilnya penerimaan yang berkaitan dengan ekspor dan komoditas. Penerimaan pajak penghasilan non-migas hanya meningkat sebesar 10 persen, dibanding 18 persen pada periode yang sama tahun lalu, yang mencerminkan moderasi pada kegiatan usaha yang berhubungan dengan ekspor dan komoditas. Bea ekspor hingga bulan Agustus turun sebesar 30 persen dibanding tahun 2011, dengan permintaan dunia yang lebih rendah menekan harga-harga seperti minyak sawit. Namun pajak pertambahan nilai mencatat kinerja yang relatif kuat, dengan dukungan dari kuatnya pertumbuhan konsumsi pada semester satu (Tabel 6). Penerimaan bukan pajak, yang besarnya sekitar seperempat dari jumlah penerimaan dan umumnya terdiri dari penerimaan sumber daya alam, juga menurun karena produksi minyak yang dibawah perkiraan (Gambar 19).
Gambar 19: Produksi minyak yang dibawah proyeksi telah berkontribusi kepada penerimaan bukan pajak yang lebih rendah (Produksi minyak, ribuan barel per hari)
Sumber: Kemenkeu (Nota Keuangan dan laporan Semester I) Catatan: * Data hingga Agustus ** RAPBN
Peningkatan belanja subsidi energi menambah tekanan pada perkiraan (outlook) fiskal jangka pendek
Laju pencairan belanja telah meningkat secara keseluruhan, umumnya didorong oleh belanja subsidi energi yang lebih besar. Jumlah pengeluaran pada delapan bulan pertama tahun 2012 mencapai 833 triliun rupiah, naik sebesar 23 persen dibanding periode yang sama pada tahun 2011, sementara lebih dari dua per tiga dari subsidi energi selama setahun penuh telah dihabiskan (Tabel 6). APBN-P 2012 memperkenankan penyesuaian harga BBM bersubsidi jika rata-rata Harga Minyak Indonesia (Indonesian Crude Oil Price/ICP) selama 6 bulan mencapai 121 dolar AS per barel (15 persen di atas asumsi anggaran ICP). Syarat ini tampaknya tidak akan terpenuhi, walaupun dengan peningkatan ICP dari 99 dolar AS per barel pada bulan Juni menjadi 112 dolar AS pada bulan Agustus. Selain itu, usulan peningkatan tarif listrik untuk tahun 2012 juga telah ditolak oleh DPR pada tahun ini. Absennya reformasi subsidi energi ini tampaknya akan menyebabkan pengeluaran yang berlebihan untuk subsidi energi dan hilangnya kesempatan (opportunity cost) yang signifikan (lihat Triwulan bulan April 2012 untuk pembahasan lebih lanjut). Pemerintah telah memproyeksikan bahwa belanja untuk subsidi energi akan mencapai 306 triliun rupiah pada tahun 2012, melampaui alokasi pada APBN-P sebanyak 94 triliun rupiah (atau 44 persen). Sejauh ini, kebijakan Pemerintah untuk membatasi konsumsi BBM bersubsidi tampaknya hanya membawa dampak yang kecil. Volume BBM bersubsidi
500
600
700
800
900
1000
1100
500
600
700
800
900
1000
1100Ribu barel per hari Ribu barel per hari
APBN APBN-P
Riil
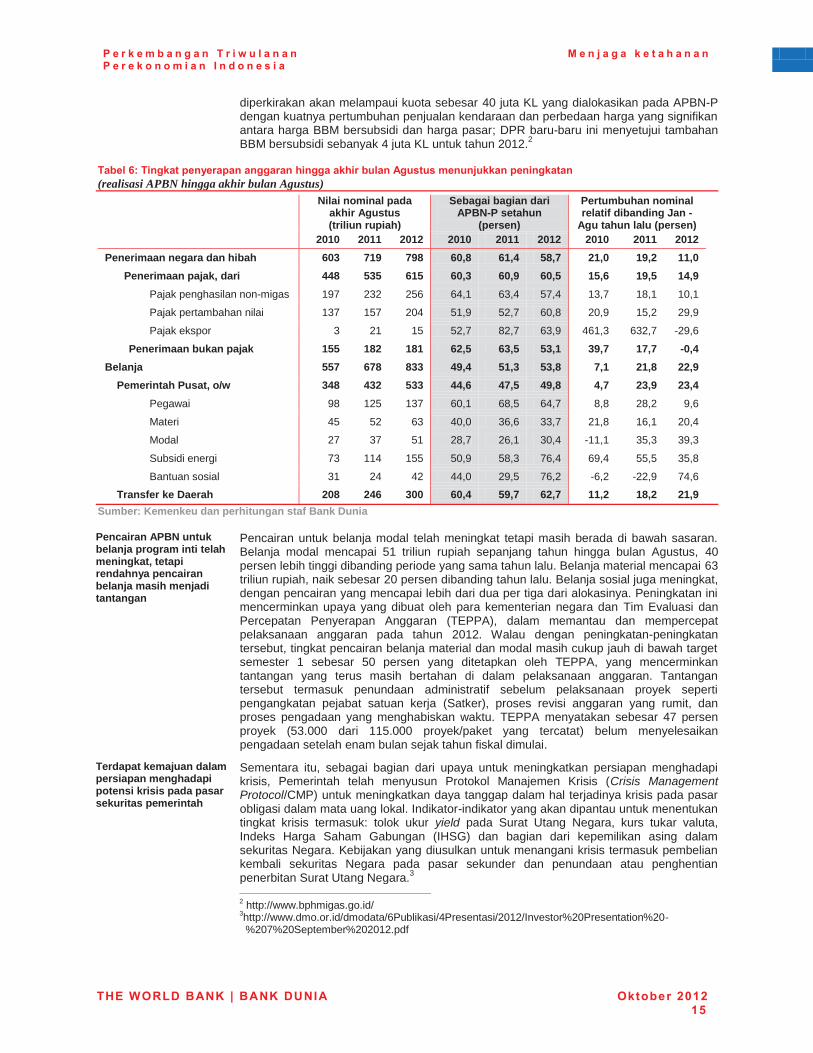
P e r k e m b a n g a n T r i w u l a n a n P e r e k o n o m i a n I n d o n e s i a
M e n j a g a k e t a h a n a n
THE WORLD BANK | BANK DUNIA Oktober 2012 15
diperkirakan akan melampaui kuota sebesar 40 juta KL yang dialokasikan pada APBN-P dengan kuatnya pertumbuhan penjualan kendaraan dan perbedaan harga yang signifikan antara harga BBM bersubsidi dan harga pasar; DPR baru-baru ini menyetujui tambahan BBM bersubsidi sebanyak 4 juta KL untuk tahun 2012.2
Tabel 6: Tingkat penyerapan anggaran hingga akhir bulan Agustus menunjukkan peningkatan (realisasi APBN hingga akhir bulan Agustus)
Nilai nominal pada akhir Agustus (triliun rupiah)
Sebagai bagian dari APBN-P setahun
(persen)
Pertumbuhan nominal relatif dibanding Jan -
Agu tahun lalu (persen) 2010 2011 2012 2010 2011 2012 2010 2011 2012 Penerimaan negara dan hibah 603 719 798 60,8 61,4 58,7 21,0 19,2 11,0
Penerimaan pajak, dari 448 535 615 60,3 60,9 60,5 15,6 19,5 14,9 Pajak penghasilan non-migas 197 232 256 64,1 63,4 57,4 13,7 18,1 10,1
Pajak pertambahan nilai 137 157 204 51,9 52,7 60,8 20,9 15,2 29,9
Pajak ekspor 3 21 15 52,7 82,7 63,9 461,3 632,7 -29,6
Penerimaan bukan pajak 155 182 181 62,5 63,5 53,1 39,7 17,7 -0,4 Belanja 557 678 833 49,4 51,3 53,8 7,1 21,8 22,9
Pemerintah Pusat, o/w 348 432 533 44,6 47,5 49,8 4,7 23,9 23,4 Pegawai 98 125 137 60,1 68,5 64,7 8,8 28,2 9,6
Materi 45 52 63 40,0 36,6 33,7 21,8 16,1 20,4
Modal 27 37 51 28,7 26,1 30,4 -11,1 35,3 39,3
Subsidi energi 73 114 155 50,9 58,3 76,4 69,4 55,5 35,8
Bantuan sosial 31 24 42 44,0 29,5 76,2 -6,2 -22,9 74,6
Transfer ke Daerah 208 246 300 60,4 59,7 62,7 11,2 18,2 21,9
Sumber: Kemenkeu dan perhitungan staf Bank Dunia
Pencairan APBN untuk belanja program inti telah meningkat, tetapi rendahnya pencairan belanja masih menjadi tantangan
Pencairan untuk belanja modal telah meningkat tetapi masih berada di bawah sasaran. Belanja modal mencapai 51 triliun rupiah sepanjang tahun hingga bulan Agustus, 40 persen lebih tinggi dibanding periode yang sama tahun lalu. Belanja material mencapai 63 triliun rupiah, naik sebesar 20 persen dibanding tahun lalu. Belanja sosial juga meningkat, dengan pencairan yang mencapai lebih dari dua per tiga dari alokasinya. Peningkatan ini mencerminkan upaya yang dibuat oleh para kementerian negara dan Tim Evaluasi dan Percepatan Penyerapan Anggaran (TEPPA), dalam memantau dan mempercepat pelaksanaan anggaran pada tahun 2012. Walau dengan peningkatan-peningkatan tersebut, tingkat pencairan belanja material dan modal masih cukup jauh di bawah target semester 1 sebesar 50 persen yang ditetapkan oleh TEPPA, yang mencerminkan tantangan yang terus masih bertahan di dalam pelaksanaan anggaran. Tantangan tersebut termasuk penundaan administratif sebelum pelaksanaan proyek seperti pengangkatan pejabat satuan kerja (Satker), proses revisi anggaran yang rumit, dan proses pengadaan yang menghabiskan waktu. TEPPA menyatakan sebesar 47 persen proyek (53.000 dari 115.000 proyek/paket yang tercatat) belum menyelesaikan pengadaan setelah enam bulan sejak tahun fiskal dimulai.
Terdapat kemajuan dalam persiapan menghadapi potensi krisis pada pasar sekuritas pemerintah
Sementara itu, sebagai bagian dari upaya untuk meningkatkan persiapan menghadapi krisis, Pemerintah telah menyusun Protokol Manajemen Krisis (Crisis Management Protocol/CMP) untuk meningkatkan daya tanggap dalam hal terjadinya krisis pada pasar obligasi dalam mata uang lokal. Indikator-indikator yang akan dipantau untuk menentukan tingkat krisis termasuk: tolok ukur yield pada Surat Utang Negara, kurs tukar valuta, Indeks Harga Saham Gabungan (IHSG) dan bagian dari kepemilikan asing dalam sekuritas Negara. Kebijakan yang diusulkan untuk menangani krisis termasuk pembelian kembali sekuritas Negara pada pasar sekunder dan penundaan atau penghentian penerbitan Surat Utang Negara.3 2 http://www.bphmigas.go.id/ 3http://www.dmo.or.id/dmodata/6Publikasi/4Presentasi/2012/Investor%20Presentation%20-
%207%20September%202012.pdf
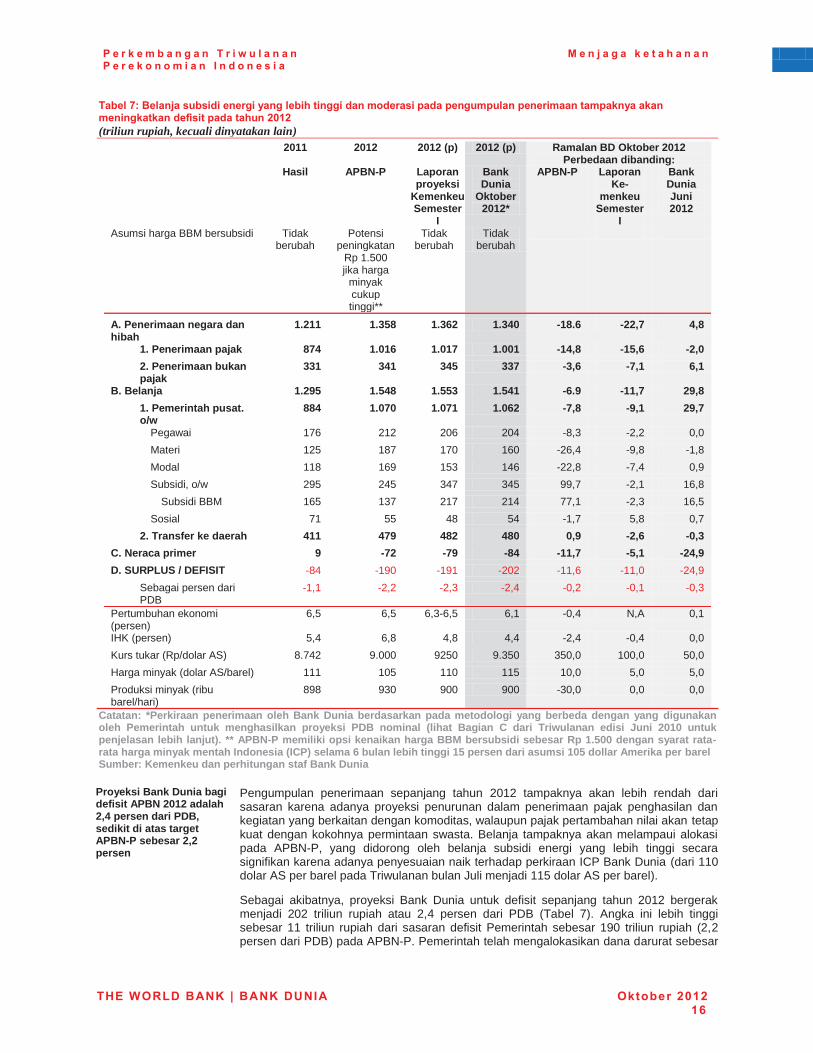
P e r k e m b a n g a n T r i w u l a n a n P e r e k o n o m i a n I n d o n e s i a
M e n j a g a k e t a h a n a n
THE WORLD BANK | BANK DUNIA Oktober 2012 16
Tabel 7: Belanja subsidi energi yang lebih tinggi dan moderasi pada pengumpulan penerimaan tampaknya akan meningkatkan defisit pada tahun 2012 (triliun rupiah, kecuali dinyatakan lain)
2011 2012 2012 (p) 2012 (p) Ramalan BD Oktober 2012 Perbedaan dibanding:
Hasil APBN-P Laporan proyeksi
Kemenkeu Semester
I
Bank Dunia
Oktober 2012*
APBN-P Laporan Ke-
menkeu Semester
I
Bank Dunia Juni 2012
Asumsi harga BBM bersubsidi Tidak berubah
Potensi peningkatan
Rp 1.500 jika harga
minyak cukup tinggi**
Tidak berubah
Tidak berubah
A. Penerimaan negara dan hibah
1.211 1.358 1.362 1.340 -18.6 -22,7 4,8
1. Penerimaan pajak 874 1.016 1.017 1.001 -14,8 -15,6 -2,0 2. Penerimaan bukan
pajak 331 341 345 337 -3,6 -7,1 6,1
B. Belanja 1.295 1.548 1.553 1.541 -6.9 -11,7 29,8 1. Pemerintah pusat.
o/w 884 1.070 1.071 1.062 -7,8 -9,1 29,7
Pegawai 176 212 206 204 -8,3 -2,2 0,0 Materi 125 187 170 160 -26,4 -9,8 -1,8 Modal 118 169 153 146 -22,8 -7,4 0,9 Subsidi, o/w 295 245 347 345 99,7 -2,1 16,8 Subsidi BBM 165 137 217 214 77,1 -2,3 16,5 Sosial 71 55 48 54 -1,7 5,8 0,7 2. Transfer ke daerah 411 479 482 480 0,9 -2,6 -0,3 C. Neraca primer 9 -72 -79 -84 -11,7 -5,1 -24,9 D. SURPLUS / DEFISIT -84 -190 -191 -202 -11,6 -11,0 -24,9 Sebagai persen dari
PDB -1,1 -2,2 -2,3 -2,4 -0,2 -0,1 -0,3
Pertumbuhan ekonomi (persen)
6,5 6,5 6,3-6,5 6,1 -0,4 N,A 0,1
IHK (persen) 5,4 6,8 4,8 4,4 -2,4 -0,4 0,0 Kurs tukar (Rp/dolar AS) 8.742 9.000 9250 9.350 350,0 100,0 50,0 Harga minyak (dolar AS/barel) 111 105 110 115 10,0 5,0 5,0 Produksi minyak (ribu barel/hari)
898 930 900 900 -30,0 0,0 0,0
Catatan: *Perkiraan penerimaan oleh Bank Dunia berdasarkan pada metodologi yang berbeda dengan yang digunakan oleh Pemerintah untuk menghasilkan proyeksi PDB nominal (lihat Bagian C dari Triwulanan edisi Juni 2010 untuk penjelasan lebih lanjut). ** APBN-P memiliki opsi kenaikan harga BBM bersubsidi sebesar Rp 1.500 dengan syarat rata-rata harga minyak mentah Indonesia (ICP) selama 6 bulan lebih tinggi 15 persen dari asumsi 105 dollar Amerika per barel Sumber: Kemenkeu dan perhitungan staf Bank Dunia
Proyeksi Bank Dunia bagi defisit APBN 2012 adalah 2,4 persen dari PDB, sedikit di atas target APBN-P sebesar 2,2 persen
Pengumpulan penerimaan sepanjang tahun 2012 tampaknya akan lebih rendah dari sasaran karena adanya proyeksi penurunan dalam penerimaan pajak penghasilan dan kegiatan yang berkaitan dengan komoditas, walaupun pajak pertambahan nilai akan tetap kuat dengan kokohnya permintaan swasta. Belanja tampaknya akan melampaui alokasi pada APBN-P, yang didorong oleh belanja subsidi energi yang lebih tinggi secara signifikan karena adanya penyesuaian naik terhadap perkiraan ICP Bank Dunia (dari 110 dolar AS per barel pada Triwulanan bulan Juli menjadi 115 dolar AS per barel). Sebagai akibatnya, proyeksi Bank Dunia untuk defisit sepanjang tahun 2012 bergerak menjadi 202 triliun rupiah atau 2,4 persen dari PDB (Tabel 7). Angka ini lebih tinggi sebesar 11 triliun rupiah dari sasaran defisit Pemerintah sebesar 190 triliun rupiah (2,2 persen dari PDB) pada APBN-P. Pemerintah telah mengalokasikan dana darurat sebesar
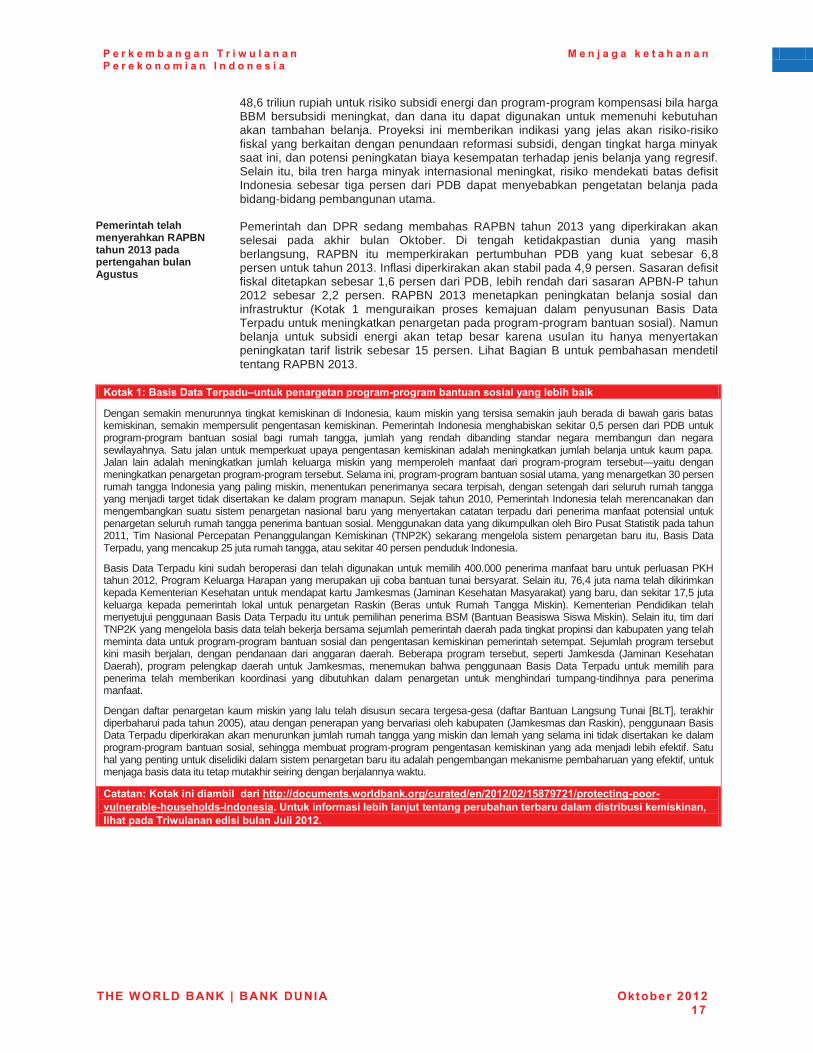
P e r k e m b a n g a n T r i w u l a n a n P e r e k o n o m i a n I n d o n e s i a
M e n j a g a k e t a h a n a n
THE WORLD BANK | BANK DUNIA Oktober 2012 17
48,6 triliun rupiah untuk risiko subsidi energi dan program-program kompensasi bila harga BBM bersubsidi meningkat, dan dana itu dapat digunakan untuk memenuhi kebutuhan akan tambahan belanja. Proyeksi ini memberikan indikasi yang jelas akan risiko-risiko fiskal yang berkaitan dengan penundaan reformasi subsidi, dengan tingkat harga minyak saat ini, dan potensi peningkatan biaya kesempatan terhadap jenis belanja yang regresif. Selain itu, bila tren harga minyak internasional meningkat, risiko mendekati batas defisit Indonesia sebesar tiga persen dari PDB dapat menyebabkan pengetatan belanja pada bidang-bidang pembangunan utama.
Pemerintah telah menyerahkan RAPBN tahun 2013 pada pertengahan bulan Agustus
Pemerintah dan DPR sedang membahas RAPBN tahun 2013 yang diperkirakan akan selesai pada akhir bulan Oktober. Di tengah ketidakpastian dunia yang masih berlangsung, RAPBN itu memperkirakan pertumbuhan PDB yang kuat sebesar 6,8 persen untuk tahun 2013. Inflasi diperkirakan akan stabil pada 4,9 persen. Sasaran defisit fiskal ditetapkan sebesar 1,6 persen dari PDB, lebih rendah dari sasaran APBN-P tahun 2012 sebesar 2,2 persen. RAPBN 2013 menetapkan peningkatan belanja sosial dan infrastruktur (Kotak 1 menguraikan proses kemajuan dalam penyusunan Basis Data Terpadu untuk meningkatkan penargetan pada program-program bantuan sosial). Namun belanja untuk subsidi energi akan tetap besar karena usulan itu hanya menyertakan peningkatan tarif listrik sebesar 15 persen. Lihat Bagian B untuk pembahasan mendetil tentang RAPBN 2013.
Kotak 1: Basis Data Terpadu–untuk penargetan program-program bantuan sosial yang lebih baik
Dengan semakin menurunnya tingkat kemiskinan di Indonesia, kaum miskin yang tersisa semakin jauh berada di bawah garis batas kemiskinan, semakin mempersulit pengentasan kemiskinan. Pemerintah Indonesia menghabiskan sekitar 0,5 persen dari PDB untuk program-program bantuan sosial bagi rumah tangga, jumlah yang rendah dibanding standar negara membangun dan negara sewilayahnya. Satu jalan untuk memperkuat upaya pengentasan kemiskinan adalah meningkatkan jumlah belanja untuk kaum papa. Jalan lain adalah meningkatkan jumlah keluarga miskin yang memperoleh manfaat dari program-program tersebut—yaitu dengan meningkatkan penargetan program-program tersebut. Selama ini, program-program bantuan sosial utama, yang menargetkan 30 persen rumah tangga Indonesia yang paling miskin, menentukan penerimanya secara terpisah, dengan setengah dari seluruh rumah tangga yang menjadi target tidak disertakan ke dalam program manapun. Sejak tahun 2010, Pemerintah Indonesia telah merencanakan dan mengembangkan suatu sistem penargetan nasional baru yang menyertakan catatan terpadu dari penerima manfaat potensial untuk penargetan seluruh rumah tangga penerima bantuan sosial. Menggunakan data yang dikumpulkan oleh Biro Pusat Statistik pada tahun 2011, Tim Nasional Percepatan Penanggulangan Kemiskinan (TNP2K) sekarang mengelola sistem penargetan baru itu, Basis Data Terpadu, yang mencakup 25 juta rumah tangga, atau sekitar 40 persen penduduk Indonesia.
Basis Data Terpadu kini sudah beroperasi dan telah digunakan untuk memilih 400.000 penerima manfaat baru untuk perluasan PKH tahun 2012, Program Keluarga Harapan yang merupakan uji coba bantuan tunai bersyarat. Selain itu, 76,4 juta nama telah dikirimkan kepada Kementerian Kesehatan untuk mendapat kartu Jamkesmas (Jaminan Kesehatan Masyarakat) yang baru, dan sekitar 17,5 juta keluarga kepada pemerintah lokal untuk penargetan Raskin (Beras untuk Rumah Tangga Miskin). Kementerian Pendidikan telah menyetujui penggunaan Basis Data Terpadu itu untuk pemilihan penerima BSM (Bantuan Beasiswa Siswa Miskin). Selain itu, tim dari TNP2K yang mengelola basis data telah bekerja bersama sejumlah pemerintah daerah pada tingkat propinsi dan kabupaten yang telah meminta data untuk program-program bantuan sosial dan pengentasan kemiskinan pemerintah setempat. Sejumlah program tersebut kini masih berjalan, dengan pendanaan dari anggaran daerah. Beberapa program tersebut, seperti Jamkesda (Jaminan Kesehatan Daerah), program pelengkap daerah untuk Jamkesmas, menemukan bahwa penggunaan Basis Data Terpadu untuk memilih para penerima telah memberikan koordinasi yang dibutuhkan dalam penargetan untuk menghindari tumpang-tindihnya para penerima manfaat.
Dengan daftar penargetan kaum miskin yang lalu telah disusun secara tergesa-gesa (daftar Bantuan Langsung Tunai [BLT], terakhir diperbaharui pada tahun 2005), atau dengan penerapan yang bervariasi oleh kabupaten (Jamkesmas dan Raskin), penggunaan Basis Data Terpadu diperkirakan akan menurunkan jumlah rumah tangga yang miskin dan lemah yang selama ini tidak disertakan ke dalam program-program bantuan sosial, sehingga membuat program-program pengentasan kemiskinan yang ada menjadi lebih efektif. Satu hal yang penting untuk diselidiki dalam sistem penargetan baru itu adalah pengembangan mekanisme pembaharuan yang efektif, untuk menjaga basis data itu tetap mutakhir seiring dengan berjalannya waktu.
Catatan: Kotak ini diambil dari http://documents.worldbank.org/curated/en/2012/02/15879721/protecting-poor-vulnerable-households-indonesia. Untuk informasi lebih lanjut tentang perubahan terbaru dalam distribusi kemiskinan, lihat pada Triwulanan edisi bulan Juli 2012.
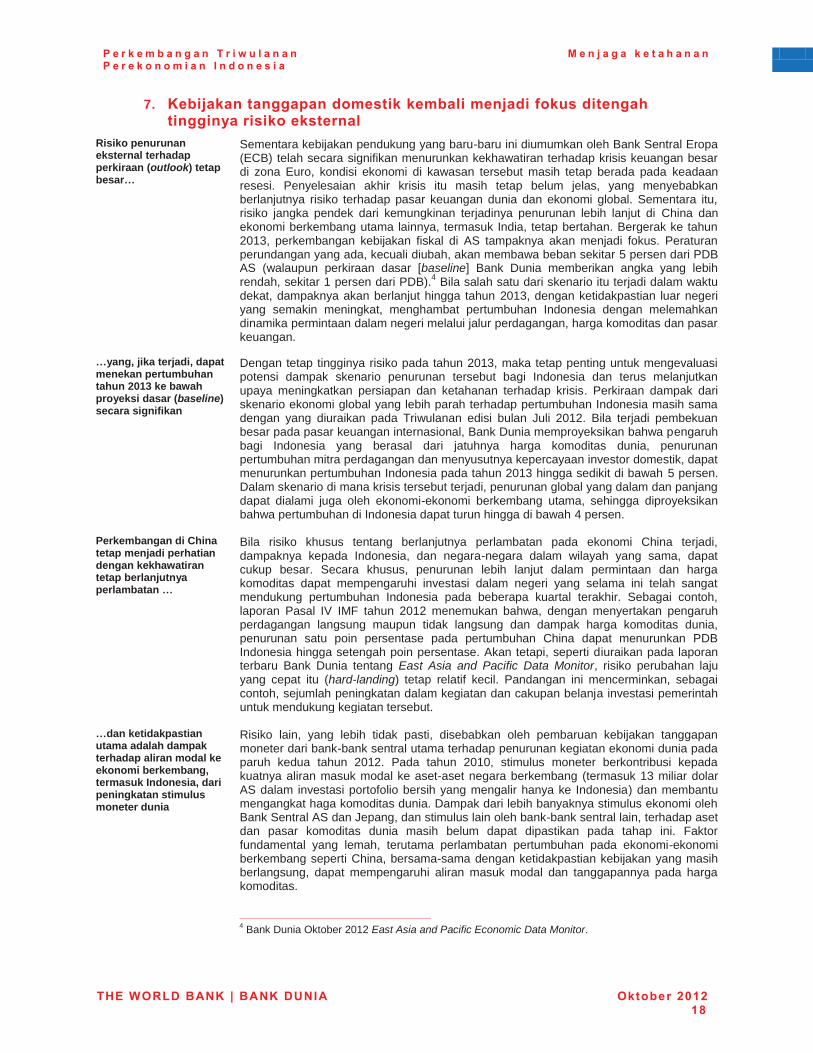
P e r k e m b a n g a n T r i w u l a n a n P e r e k o n o m i a n I n d o n e s i a
M e n j a g a k e t a h a n a n
THE WORLD BANK | BANK DUNIA Oktober 2012 18
7. Kebijakan tanggapan domestik kembali menjadi fokus ditengah tingginya risiko eksternal
Risiko penurunan eksternal terhadap perkiraan (outlook) tetap besar…
Sementara kebijakan pendukung yang baru-baru ini diumumkan oleh Bank Sentral Eropa (ECB) telah secara signifikan menurunkan kekhawatiran terhadap krisis keuangan besar di zona Euro, kondisi ekonomi di kawasan tersebut masih tetap berada pada keadaan resesi. Penyelesaian akhir krisis itu masih tetap belum jelas, yang menyebabkan berlanjutnya risiko terhadap pasar keuangan dunia dan ekonomi global. Sementara itu, risiko jangka pendek dari kemungkinan terjadinya penurunan lebih lanjut di China dan ekonomi berkembang utama lainnya, termasuk India, tetap bertahan. Bergerak ke tahun 2013, perkembangan kebijakan fiskal di AS tampaknya akan menjadi fokus. Peraturan perundangan yang ada, kecuali diubah, akan membawa beban sekitar 5 persen dari PDB AS (walaupun perkiraan dasar [baseline] Bank Dunia memberikan angka yang lebih rendah, sekitar 1 persen dari PDB).4 Bila salah satu dari skenario itu terjadi dalam waktu dekat, dampaknya akan berlanjut hingga tahun 2013, dengan ketidakpastian luar negeri yang semakin meningkat, menghambat pertumbuhan Indonesia dengan melemahkan dinamika permintaan dalam negeri melalui jalur perdagangan, harga komoditas dan pasar keuangan.
…yang, jika terjadi, dapat menekan pertumbuhan tahun 2013 ke bawah proyeksi dasar (baseline) secara signifikan
Dengan tetap tingginya risiko pada tahun 2013, maka tetap penting untuk mengevaluasi potensi dampak skenario penurunan tersebut bagi Indonesia dan terus melanjutkan upaya meningkatkan persiapan dan ketahanan terhadap krisis. Perkiraan dampak dari skenario ekonomi global yang lebih parah terhadap pertumbuhan Indonesia masih sama dengan yang diuraikan pada Triwulanan edisi bulan Juli 2012. Bila terjadi pembekuan besar pada pasar keuangan internasional, Bank Dunia memproyeksikan bahwa pengaruh bagi Indonesia yang berasal dari jatuhnya harga komoditas dunia, penurunan pertumbuhan mitra perdagangan dan menyusutnya kepercayaan investor domestik, dapat menurunkan pertumbuhan Indonesia pada tahun 2013 hingga sedikit di bawah 5 persen. Dalam skenario di mana krisis tersebut terjadi, penurunan global yang dalam dan panjang dapat dialami juga oleh ekonomi-ekonomi berkembang utama, sehingga diproyeksikan bahwa pertumbuhan di Indonesia dapat turun hingga di bawah 4 persen.
Perkembangan di China tetap menjadi perhatian dengan kekhawatiran tetap berlanjutnya perlambatan …
Bila risiko khusus tentang berlanjutnya perlambatan pada ekonomi China terjadi, dampaknya kepada Indonesia, dan negara-negara dalam wilayah yang sama, dapat cukup besar. Secara khusus, penurunan lebih lanjut dalam permintaan dan harga komoditas dapat mempengaruhi investasi dalam negeri yang selama ini telah sangat mendukung pertumbuhan Indonesia pada beberapa kuartal terakhir. Sebagai contoh, laporan Pasal IV IMF tahun 2012 menemukan bahwa, dengan menyertakan pengaruh perdagangan langsung maupun tidak langsung dan dampak harga komoditas dunia, penurunan satu poin persentase pada pertumbuhan China dapat menurunkan PDB Indonesia hingga setengah poin persentase. Akan tetapi, seperti diuraikan pada laporan terbaru Bank Dunia tentang East Asia and Pacific Data Monitor, risiko perubahan laju yang cepat itu (hard-landing) tetap relatif kecil. Pandangan ini mencerminkan, sebagai contoh, sejumlah peningkatan dalam kegiatan dan cakupan belanja investasi pemerintah untuk mendukung kegiatan tersebut.
…dan ketidakpastian utama adalah dampak terhadap aliran modal ke ekonomi berkembang, termasuk Indonesia, dari peningkatan stimulus moneter dunia
Risiko lain, yang lebih tidak pasti, disebabkan oleh pembaruan kebijakan tanggapan moneter dari bank-bank sentral utama terhadap penurunan kegiatan ekonomi dunia pada paruh kedua tahun 2012. Pada tahun 2010, stimulus moneter berkontribusi kepada kuatnya aliran masuk modal ke aset-aset negara berkembang (termasuk 13 miliar dolar AS dalam investasi portofolio bersih yang mengalir hanya ke Indonesia) dan membantu mengangkat haga komoditas dunia. Dampak dari lebih banyaknya stimulus ekonomi oleh Bank Sentral AS dan Jepang, dan stimulus lain oleh bank-bank sentral lain, terhadap aset dan pasar komoditas dunia masih belum dapat dipastikan pada tahap ini. Faktor fundamental yang lemah, terutama perlambatan pertumbuhan pada ekonomi-ekonomi berkembang seperti China, bersama-sama dengan ketidakpastian kebijakan yang masih berlangsung, dapat mempengaruhi aliran masuk modal dan tanggapannya pada harga komoditas.
4 Bank Dunia Oktober 2012 East Asia and Pacific Economic Data Monitor.
P e r k e m b a n g a n T r i w u l a n a n P e r e k o n o m i a n I n d o n e s i a
M e n j a g a k e t a h a n a n
THE WORLD BANK | BANK DUNIA Oktober 2012 19
Jika aliran masuk modal meningkat, maka hal ini akan membawa tantangan kebijakan baru bagi Indonesia. Khususnya, aliran modal masuk yang lebih kuat dan pemulihan pertumbuhan dunia pada tahun 2013, yang akan mengangkat harga aset dalam negeri dan permintaan domestik, akan mendorong risiko keseimbangan menuju situasi ekonomi terlalu panas (overheating). Hingga saat ini, ada beberapa sektor yang mencatat peningkatan tekanan harga, misalnya di sektor properti, data agregat terakhir semakin tidak jelas dan risiko penurunan pertumbuhan dalam jangka pendek semakin tinggi.
Secara domestik, perkiraan (outlook) anggaran 2013 menjadi perhatian, dengan tantangan pencairan dan belanja subsidi tetap menjadi risiko fiskal utama…
Mengikuti hilangnya kesempatan untuk meningkatkan harga BBM bersubsidi pada tahun 2012, belanja subsidi energi diproyeksikan oleh Pemerintah akan mencapai 44 persen lebih tinggi dari perkiraan pada APBN-P. RAPBN 2013 memproyeksikan peningkatan yang semakin tinggi untuk belanja subsidi BBM, dan terdapat risiko berkelanjutan bahwa biaya akan mengalami tekanan yang lebih tinggi dengan berlanjutnya permintaan domestik yang tinggi, perlemahan apapun dalam mata uang atau peningkatan dalam harga minyak dunia. Jika subsidi meningkat lebih tinggi lagi maka ia akan dapat meningkatkan defisit fiskal atau, dengan tingkat defisit yang ada, membatasi belanja untuk hal yang lain. Peningkatan belanja subsidi BBM, dalam hal biaya kesempatan (opportunity cost) bagi, sebagai contoh, belanja untuk program bantuan yang lebih progresif dan investasi pemerintah, dan insentif-nya bagi penggunaan bahan bakar yang tidak efisien, juga menjadi risiko jangka menengah terhadap pencapaian tujuan pembangunan Indonesia yang berkelanjutan dan inklusif.
…dan peningkatan pengaruh dari perlambatan sektor komoditas merupakan faktor risiko utama bagi sektor swasta…
Pengaruh negatif pada ekonomi yang berasal dari perlemahan permintaan sejumlah produk ekspor komoditas utama Indonesia tampaknya masih berlanjut sejauh ini. Akan tetapi, investasi dalam negeri cenderung memiliki keterkaitan yang erat dengan harga komoditas dunia, dan laju pertumbuhan investasi dapat terbukti rentan terhadap hambatan eksternal. Meskipun, bila pertumbuhan secara keseluruhan tetap relatif kuat terhadap harga komoditas yang lebih lemah, dampak dalam negeri dalam ukuran yang lebih kecil dapat dirasakan secara signifikan oleh rumah tangga dan perusahaan-perusahaan pada daerah-daerah yang sangat bergantung kepada komoditas.
...sementara lingkungan kebijakan secara keseluruhan akan menjadi lebih terfokus menjelang pemilu tahun 2014
Indonesia telah membuat kemajuan yang mengagumkan selama dekade yang lalu dalam hal stabilitas politik dan ekonomi makro. Peningkatan dalam kerangka penyusunan kebijakan memainkan peran penting dalam mendukung pertumbuhan berkelanjutan pada beberapa tahun terakhir, walau menghadapi gejolak ekonomi dan keuangan internasional. Akan tetapi, sepanjang tahun lalu, sejumlah pengumuman kebijakan, sebagai contoh yang melibatkan perubahan di dalam peraturan perundangan perdagangan dan investasi, telah menyebabkan sejumlah tantangan akan lingkungan kebijakan dunia usaha dan investasi. Terdapat risiko bahwa tantangan-tantangan itu dapat meningkat menjelang pemilu nasional tahun 2014, di tengah tetap bergejolaknya selera risiko investor dunia. Mempertahankan kemajuan pada masalah-masalah investasi dan reformasi struktural, membuat peningkatan lanjutan pada kualitas kebijakan, dan yang penting, penekanan pada kepastian kebijakan dan kejelasan komunikasi, dapat membantu memitigasi risiko-risiko tersebut.
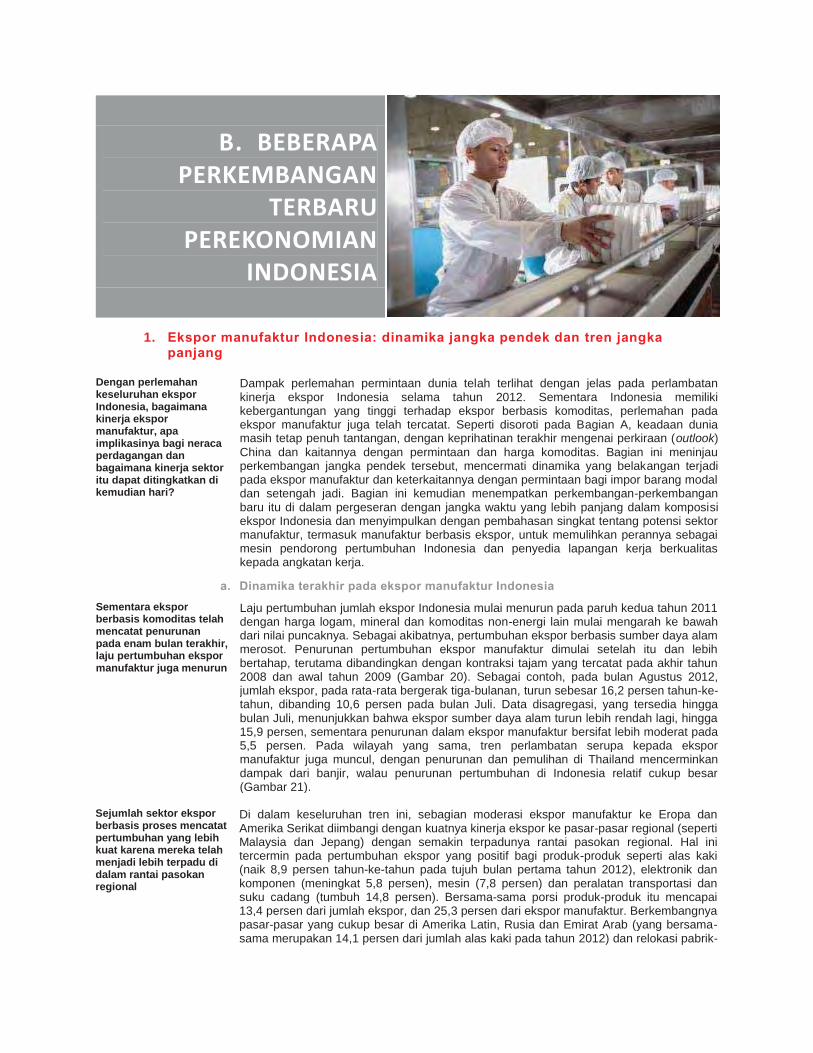
B. BEBERAPA PERKEMBANGAN
TERBARU PEREKONOMIAN
INDONESIA
1. Ekspor manufaktur Indonesia: dinamika jangka pendek dan tren jangka panjang
Dengan perlemahan keseluruhan ekspor Indonesia, bagaimana kinerja ekspor manufaktur, apa implikasinya bagi neraca perdagangan dan bagaimana kinerja sektor itu dapat ditingkatkan di kemudian hari?
Dampak perlemahan permintaan dunia telah terlihat dengan jelas pada perlambatan kinerja ekspor Indonesia selama tahun 2012. Sementara Indonesia memiliki kebergantungan yang tinggi terhadap ekspor berbasis komoditas, perlemahan pada ekspor manufaktur juga telah tercatat. Seperti disoroti pada Bagian A, keadaan dunia masih tetap penuh tantangan, dengan keprihatinan terakhir mengenai perkiraan (outlook) China dan kaitannya dengan permintaan dan harga komoditas. Bagian ini meninjau perkembangan jangka pendek tersebut, mencermati dinamika yang belakangan terjadi pada ekspor manufaktur dan keterkaitannya dengan permintaan bagi impor barang modal dan setengah jadi. Bagian ini kemudian menempatkan perkembangan-perkembangan baru itu di dalam pergeseran dengan jangka waktu yang lebih panjang dalam komposisi ekspor Indonesia dan menyimpulkan dengan pembahasan singkat tentang potensi sektor manufaktur, termasuk manufaktur berbasis ekspor, untuk memulihkan perannya sebagai mesin pendorong pertumbuhan Indonesia dan penyedia lapangan kerja berkualitas kepada angkatan kerja.
a. Dinamika terakhir pada ekspor manufaktur Indonesia Sementara ekspor berbasis komoditas telah mencatat penurunan pada enam bulan terakhir, laju pertumbuhan ekspor manufaktur juga menurun
Laju pertumbuhan jumlah ekspor Indonesia mulai menurun pada paruh kedua tahun 2011 dengan harga logam, mineral dan komoditas non-energi lain mulai mengarah ke bawah dari nilai puncaknya. Sebagai akibatnya, pertumbuhan ekspor berbasis sumber daya alam merosot. Penurunan pertumbuhan ekspor manufaktur dimulai setelah itu dan lebih bertahap, terutama dibandingkan dengan kontraksi tajam yang tercatat pada akhir tahun 2008 dan awal tahun 2009 (Gambar 20). Sebagai contoh, pada bulan Agustus 2012, jumlah ekspor, pada rata-rata bergerak tiga-bulanan, turun sebesar 16,2 persen tahun-ke-tahun, dibanding 10,6 persen pada bulan Juli. Data disagregasi, yang tersedia hingga bulan Juli, menunjukkan bahwa ekspor sumber daya alam turun lebih rendah lagi, hingga 15,9 persen, sementara penurunan dalam ekspor manufaktur bersifat lebih moderat pada 5,5 persen. Pada wilayah yang sama, tren perlambatan serupa kepada ekspor manufaktur juga muncul, dengan penurunan dan pemulihan di Thailand mencerminkan dampak dari banjir, walau penurunan pertumbuhan di Indonesia relatif cukup besar (Gambar 21).
Sejumlah sektor ekspor berbasis proses mencatat pertumbuhan yang lebih kuat karena mereka telah menjadi lebih terpadu di dalam rantai pasokan regional
Di dalam keseluruhan tren ini, sebagian moderasi ekspor manufaktur ke Eropa dan Amerika Serikat diimbangi dengan kuatnya kinerja ekspor ke pasar-pasar regional (seperti Malaysia dan Jepang) dengan semakin terpadunya rantai pasokan regional. Hal ini tercermin pada pertumbuhan ekspor yang positif bagi produk-produk seperti alas kaki (naik 8,9 persen tahun-ke-tahun pada tujuh bulan pertama tahun 2012), elektronik dan komponen (meningkat 5,8 persen), mesin (7,8 persen) dan peralatan transportasi dan suku cadang (tumbuh 14,8 persen). Bersama-sama porsi produk-produk itu mencapai 13,4 persen dari jumlah ekspor, dan 25,3 persen dari ekspor manufaktur. Berkembangnya pasar-pasar yang cukup besar di Amerika Latin, Rusia dan Emirat Arab (yang bersama-sama merupakan 14,1 persen dari jumlah alas kaki pada tahun 2012) dan relokasi pabrik-

P e r k e m b a n g a n T r i w u l a n a n P e r e k o n o m i a n I n d o n e s i a
M e n j a g a k e t a h a n a n
THE WORLD BANK | BANK DUNIA Oktober 2012 21
pabrik dari China ke Indonesia tampaknya merupakan alasan dari pertumbuhan positif alas kaki ini. Banjir di Thailand dan pertumbuhan tingkat pendapatan dan besarnya permintaan pasar di Indonesia, telah membantu mendorong Indonesia sebagai salah satu pemain utama dalam produksi otomotif untuk tingkat regional.
Gambar 20: Ekspor berbasis sumber daya alam turun dengan tajam, dan ekspor manufaktur Indonesia juga melemah… (pertumbuhan tahun-ke-tahun nilai rata-rata bergerak ekspor 3-bulanan, persen)
Gambar 21: …dan perlambatan serupa pada nilai ekspor manufaktur juga tercatat pada negara sewilayah (pertumbuhan tahun-ke-tahun nilai rata-rata bergerak ekspor manufaktur 3-bulanan, persen)
Catatan: Ekspor sumber daya alam adalah ekspor komoditas mentah, seperti minyak dan gas, batu bara, tembaga dan komoditas pertanian lainnya Sumber: BPS dan perhitungan staf Bank Dunia
Sumber: BPS, CEIC dan perhitungan staf Bank Dunia
Kinerja ekspor manufaktur berbasis sumber daya alam terpengaruh oleh penurunan harga pada tahun 2012
Pendorong utama penurunan ekspor manufaktur Indonesia secara keseluruhan adalah gabungan dari bagian produk manufaktur berbasis sumber daya alam yang relatif besar (36,9 persen dari jumlah ekspor manufaktur) dan penurunan harga komoditas yang tercatat pada tujuh bulan pertama tahun 2012. Karet dan minyak sawit – yang merupakan 13,5 persen dari jumlah ekspor – adalah dua contoh dari ekspor manufaktur berbasis sumber daya alam. Dalam hal minyak sawit, peningkatan volume telah mengimbangi penurunan harga, tetapi untuk karet, harga dan volume bersama-sama mencatatkan penurunan (Gambar 22). Penurunan harga yang serupa berkontribusi kepada penurunan nilai ekspor produk kertas dan serat dan benang (yang bersama-sama merupakan 3,6 persen dari jumlah ekspor). Turunnya harga untuk barang kimia (5,8 persen dari jumlah ekspor) juga mendorong penurunan nilai ekspornya sebesar 8,7 persen.
Gambar 22: Penurunan harga turut menarik turun sejumlah ekspor manufaktur berbasis sumber daya alam Indonesia (kontribusi perubahan harga dan volume kepada pertumbuhan nilai ekspor tahun-ke-tahun untuk bulan Januari hingga Juli 2012, persen)
Catatan: Harga dan volume menunjukkan masing-masing kontribusi kepada perubahan nilai. Pada tujuh bulan pertama tahun 2012, karet merupakan 4,5 persen dari jumlah ekspor, minyak sawit 9 persen, produk kertas 2,1 persen, serat dan benang 1,5 persen dan kimia 5,8 persen Sumber: BPS dan perhitungan staf Bank Dunia
-50
-25
0
25
50
75
100
125
-50
-25
0
25
50
75
100
125Persen Persen
Ekspor total
Sumber daya alam (bahan mentah)
Manufaktur Thailand Malaysia
Indonesia
China
-40
-20
0
20
40
60
-40
-20
0
20
40
60Persen Persen
-31.4
13.8
-5.4 -12.9 -7.6
-40
-20
0
20
40
-40
-20
0
20
40
Karet Minyakkelapasawit
produkkertas
seratdan
benang
kimia
Harga Volume NilaiPersen Persen
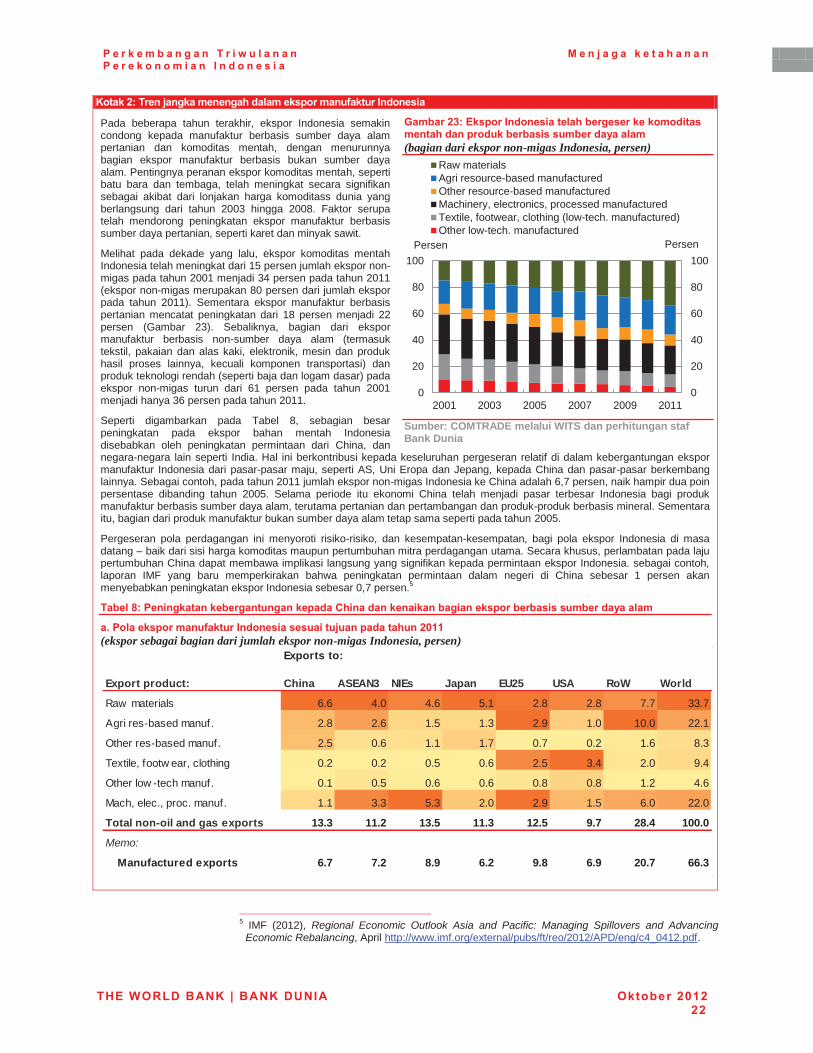
P e r k e m b a n g a n T r i w u l a n a n P e r e k o n o m i a n I n d o n e s i a
M e n j a g a k e t a h a n a n
THE WORLD BANK | BANK DUNIA Oktober 2012 22
Kotak 2: Tren jangka menengah dalam ekspor manufaktur Indonesia
Pada beberapa tahun terakhir, ekspor Indonesia semakin condong kepada manufaktur berbasis sumber daya alam pertanian dan komoditas mentah, dengan menurunnya bagian ekspor manufaktur berbasis bukan sumber daya alam. Pentingnya peranan ekspor komoditas mentah, seperti batu bara dan tembaga, telah meningkat secara signifikan sebagai akibat dari lonjakan harga komoditass dunia yang berlangsung dari tahun 2003 hingga 2008. Faktor serupa telah mendorong peningkatan ekspor manufaktur berbasis sumber daya pertanian, seperti karet dan minyak sawit.
Melihat pada dekade yang lalu, ekspor komoditas mentah Indonesia telah meningkat dari 15 persen jumlah ekspor non-migas pada tahun 2001 menjadi 34 persen pada tahun 2011 (ekspor non-migas merupakan 80 persen dari jumlah ekspor pada tahun 2011). Sementara ekspor manufaktur berbasis pertanian mencatat peningkatan dari 18 persen menjadi 22 persen (Gambar 23). Sebaliknya, bagian dari ekspor manufaktur berbasis non-sumber daya alam (termasuk tekstil, pakaian dan alas kaki, elektronik, mesin dan produk hasil proses lainnya, kecuali komponen transportasi) dan produk teknologi rendah (seperti baja dan logam dasar) pada ekspor non-migas turun dari 61 persen pada tahun 2001 menjadi hanya 36 persen pada tahun 2011.
Seperti digambarkan pada Tabel 8, sebagian besar peningkatan pada ekspor bahan mentah Indonesia disebabkan oleh peningkatan permintaan dari China, dan negara-negara lain seperti India. Hal ini berkontribusi kepada keseluruhan pergeseran relatif di dalam kebergantungan ekspor manufaktur Indonesia dari pasar-pasar maju, seperti AS, Uni Eropa dan Jepang, kepada China dan pasar-pasar berkembang lainnya. Sebagai contoh, pada tahun 2011 jumlah ekspor non-migas Indonesia ke China adalah 6,7 persen, naik hampir dua poin persentase dibanding tahun 2005. Selama periode itu ekonomi China telah menjadi pasar terbesar Indonesia bagi produk manufaktur berbasis sumber daya alam, terutama pertanian dan pertambangan dan produk-produk berbasis mineral. Sementara itu, bagian dari produk manufaktur bukan sumber daya alam tetap sama seperti pada tahun 2005.
Pergeseran pola perdagangan ini menyoroti risiko-risiko, dan kesempatan-kesempatan, bagi pola ekspor Indonesia di masa datang – baik dari sisi harga komoditas maupun pertumbuhan mitra perdagangan utama. Secara khusus, perlambatan pada laju pertumbuhan China dapat membawa implikasi langsung yang signifikan kepada permintaan ekspor Indonesia. sebagai contoh, laporan IMF yang baru memperkirakan bahwa peningkatan permintaan dalam negeri di China sebesar 1 persen akan menyebabkan peningkatan ekspor Indonesia sebesar 0,7 persen.5
Tabel 8: Peningkatan kebergantungan kepada China dan kenaikan bagian ekspor berbasis sumber daya alam
a. Pola ekspor manufaktur Indonesia sesuai tujuan pada tahun 2011 (ekspor sebagai bagian dari jumlah ekspor non-migas Indonesia, persen)
Gambar 23: Ekspor Indonesia telah bergeser ke komoditas mentah dan produk berbasis sumber daya alam (bagian dari ekspor non-migas Indonesia, persen)
Sumber: COMTRADE melalui WITS dan perhitungan staf Bank Dunia
5 IMF (2012), Regional Economic Outlook Asia and Pacific: Managing Spillovers and Advancing
Economic Rebalancing, April http://www.imf.org/external/pubs/ft/reo/2012/APD/eng/c4_0412.pdf.
Exports to:
Export product: China ASEAN3 NIEs Japan EU25 USA RoW World
Raw materials 6.6 4.0 4.6 5.1 2.8 2.8 7.7 33.7
Agri res-based manuf. 2.8 2.6 1.5 1.3 2.9 1.0 10.0 22.1
Other res-based manuf. 2.5 0.6 1.1 1.7 0.7 0.2 1.6 8.3
Textile, footw ear, clothing 0.2 0.2 0.5 0.6 2.5 3.4 2.0 9.4
Other low -tech manuf. 0.1 0.5 0.6 0.6 0.8 0.8 1.2 4.6
Mach, elec., proc. manuf. 1.1 3.3 5.3 2.0 2.9 1.5 6.0 22.0
Total non-oil and gas exports 13.3 11.2 13.5 11.3 12.5 9.7 28.4 100.0
Memo:
Manufactured exports 6.7 7.2 8.9 6.2 9.8 6.9 20.7 66.3
0
20
40
60
80
100
0
20
40
60
80
100
2001 2003 2005 2007 2009 2011
Raw materialsAgri resource-based manufacturedOther resource-based manufacturedMachinery, electronics, processed manufacturedTextile, footwear, clothing (low-tech. manufactured)Other low-tech. manufactured
Persen Persen
P e r k e m b a n g a n T r i w u l a n a n P e r e k o n o m i a n I n d o n e s i a
M e n j a g a k e t a h a n a n
THE WORLD BANK | BANK DUNIA Oktober 2012 23
b. Membandingkan pola ekspor Indonesia sesuai tujuan pada tahun 2005 dan tahun 2011 (perubahan poin persentase dalam bagian jumlah ekspor non-migas Indonesia dari tahun 2005 hingga 2011)
Catatan: Panil a: warna yang lebih gelap menunjukkan bagian yang lebih besar. Panil b: angka-angka mewakili perubahan poin persentase dalam ekspor non-migas dari 2005 hingga 2011. Sebagai contoh, bagian bahan mentah ke China sebesar 5,5 poin persentase dari 1,1 persen pada tahun 2005 menjadi 6,6 persen pada tahun 2011. Panah naik atau turun menunjukkan perubahan lebih besar dari 3 poin persentase, panah miring menunjukkan perubahan antara 1 hingga 3 poin persentase dan panah datar menunjukkan perubahan kurang dari 1 poin persentase Sumber: COMTRADE lewat WITS dan perhitungan staf Bank Dunia
b. Ekspor manufaktur dan impor barang modal dan setengah jadi Penurunan dalam ekspor dan kuatnya impor barang modal dan setengah jadi berkontribusi kepada penurunan neraca perdagangan pada paruh pertama tahun 2012
Seperti telah dirinci pada Bagian A, defisit neraca berjalan Indonesia meningkat menjadi 6,9 miliar dolar AS (3,1 persen dari PDB) pada kuartal kedua tahun 2012 karena surplus perdagangan barang berkurang separuh menjadi 1,6 miliar dolar AS dari 3,6 miliar dolar AS pada triwulan pertama. Penurunan surplus perdagangan ini terutama didorong oleh perlemahan kinerja ekspor relatif terhadap tingginya impor, terutama untuk barang modal dan setengah jadi, sejalan dengan kuatnya FDI dan investasi dalam negeri.
Tetapi jaringan produksi global menunjukkan bahwa impor barang setengah jadi turut menurun dengan berkurangnya ekspor manufaktur, membatasi dampaknya terhadap neraca perdagangan…
Peningkatan pengaruh jaringan produksi global adalah satu penjelasan di belakang peningkatan tren impor barang modal dan setengah jadi yang terlihat tidak hanya di Indonesia tetapi juga di banyak negara di seluruh dunia, seperti dibicarakan pada Triwulanan edisi bulan Juli 2012. Hal ini menciptakan hubungan positif antara pertumbuhan impor barang setengah jadi dan ekspor manufaktur yang menggunakannya sebagai barang masukan/input (Gambar 24). Seperti terlihat pada data perdagangan Indonesia selama beberapa bulan terakhir, penurunan dalam ekspor manufaktur cenderung diikuti dengan penurunan pada impor barang setengah jadi, yang membatasi dampak penurunan permintaan ekspor terhadap neraca perdagangan (Gambar 24). Selain itu, walau tidak terlihat jelas pada kekuatan relatif pertumbuhan impor barang modal hingga saat ini, penurunan dalam ekspor dan produksi sumber daya primer dapat turut mengurangi permintaan untuk barang modal seperti alat-alat berat.
…dan pengaruh harga juga dapat berperan
Tren yang relatif stabil di dalam harga relatif ekspor manufaktur pada tiga setengah tahun terakhir telah mengikuti peningkatan harga ekspor komoditas Indonesia. sebagai akibatnya, nilai tukar perdagangan (terms of trade) Indonesia semakin meningkat, mendorong kemampuan Indonesia untuk mengimpor serangkaian jenis produk yang baru, dan berpotensi menurunkan biaya dari produk yang tersedia pada pasar dalam negeri. Tren harga relatif ini dapat terlihat dengan membandingkan Indeks Nilai Unit Manufaktur sebagai wakil untuk harga impor barang modal dan setengah jadi dan indeks yang diboboti ekspor untuk harga-harga komoditas ekspor utama Indonesia (Gambar 25).6 6 Indeks Nilai Unit Manufaktur (MUV) adalah indeks gabungan nilai unit bagi ekspor manufaktur dari
lima belas ekonomi maju dan berkembang utama bagi ekonomi berpenghasilan rendah dan menengah, termasuk Brasil, Kanada, China, Prancis, Jerman, India, Italia, Jepang, Meksiko, Afrika Selatan, Korea Selatan, Spanyol, Inggris, Amerika Serikat dan Thailand. Indeks ini dapat digunakan untuk memperkirakan harga impor barang manufaktur oleh ekonomi berkembang dalam dolar AS.
Exports to:
Export product: China ASEAN3 NIEs Japan EU25 USA RoW World
Raw materials 5.5 1.3 0.9 1.4 0.4 0.1 3.5 13.1
Agri res-based manuf. 0.4 1.1 -0.4 -1.0 -0.4 -0.3 3.0 2.4
Other res-based manuf. 1.9 -0.5 -0.2 -1.4 -0.8 -0.1 -0.4 -1.5
Textile, footw ear, clothing 0.1 -0.2 -0.4 -0.2 -1.0 -1.9 -1.0 -4.7
Other low -tech manuf. -0.1 0.0 -0.1 -0.4 -1.1 -0.9 -0.4 -2.9
Mach, elec., proc. manuf. -0.5 -0.5 -3.0 -1.5 0.0 -1.5 0.7 -6.4
Total non-oil and gas exports 7.4 1.2 -3.2 -3.1 -3.0 -4.6 5.3
Memo:
Manufactured exports 1.9 -0.1 -4.1 -4.4 -3.4 -4.7 1.8 -13.1
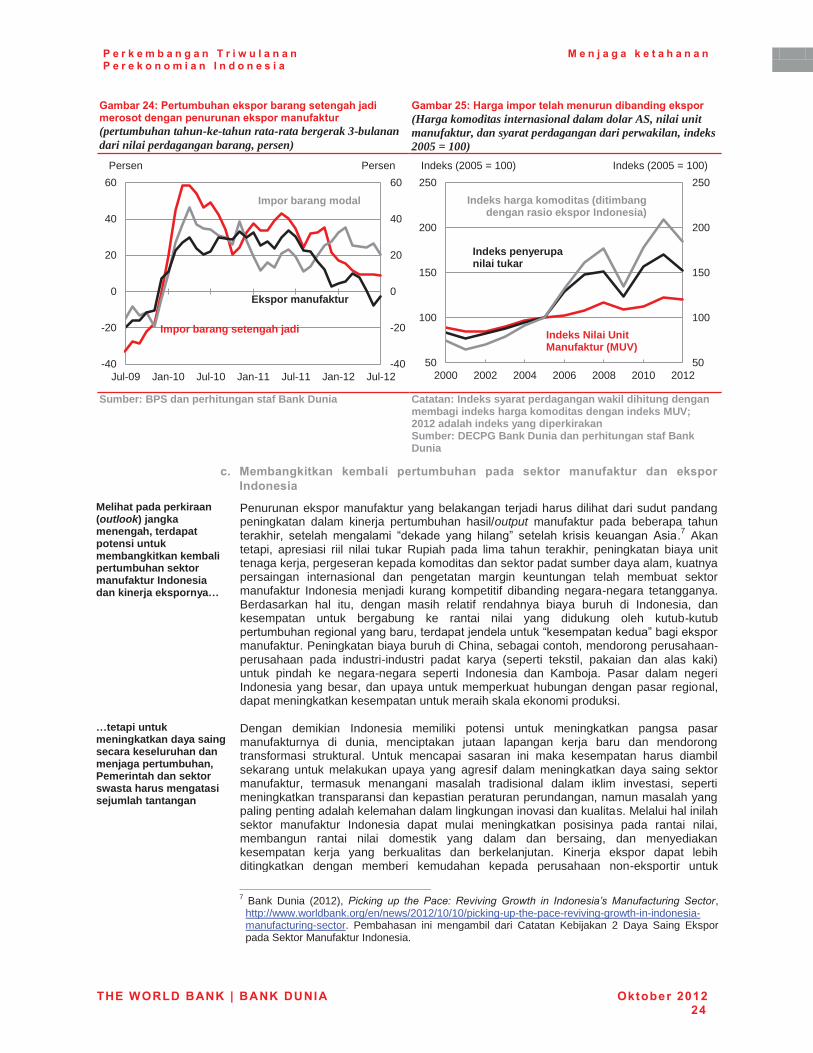
P e r k e m b a n g a n T r i w u l a n a n P e r e k o n o m i a n I n d o n e s i a
M e n j a g a k e t a h a n a n
THE WORLD BANK | BANK DUNIA Oktober 2012 24
Gambar 24: Pertumbuhan ekspor barang setengah jadi merosot dengan penurunan ekspor manufaktur (pertumbuhan tahun-ke-tahun rata-rata bergerak 3-bulanan dari nilai perdagangan barang, persen)
Gambar 25: Harga impor telah menurun dibanding ekspor (Harga komoditas internasional dalam dolar AS, nilai unit manufaktur, dan syarat perdagangan dari perwakilan, indeks 2005 = 100)
Sumber: BPS dan perhitungan staf Bank Dunia Catatan: Indeks syarat perdagangan wakil dihitung dengan
membagi indeks harga komoditas dengan indeks MUV; 2012 adalah indeks yang diperkirakan Sumber: DECPG Bank Dunia dan perhitungan staf Bank Dunia
c. Membangkitkan kembali pertumbuhan pada sektor manufaktur dan ekspor Indonesia
Melihat pada perkiraan (outlook) jangka menengah, terdapat potensi untuk membangkitkan kembali pertumbuhan sektor manufaktur Indonesia dan kinerja ekspornya…
Penurunan ekspor manufaktur yang belakangan terjadi harus dilihat dari sudut pandang peningkatan dalam kinerja pertumbuhan hasil/output manufaktur pada beberapa tahun terakhir, setelah mengalami “dekade yang hilang” setelah krisis keuangan Asia.7 Akan tetapi, apresiasi riil nilai tukar Rupiah pada lima tahun terakhir, peningkatan biaya unit tenaga kerja, pergeseran kepada komoditas dan sektor padat sumber daya alam, kuatnya persaingan internasional dan pengetatan margin keuntungan telah membuat sektor manufaktur Indonesia menjadi kurang kompetitif dibanding negara-negara tetangganya. Berdasarkan hal itu, dengan masih relatif rendahnya biaya buruh di Indonesia, dan kesempatan untuk bergabung ke rantai nilai yang didukung oleh kutub-kutub pertumbuhan regional yang baru, terdapat jendela untuk “kesempatan kedua” bagi ekspor manufaktur. Peningkatan biaya buruh di China, sebagai contoh, mendorong perusahaan-perusahaan pada industri-industri padat karya (seperti tekstil, pakaian dan alas kaki) untuk pindah ke negara-negara seperti Indonesia dan Kamboja. Pasar dalam negeri Indonesia yang besar, dan upaya untuk memperkuat hubungan dengan pasar regional, dapat meningkatkan kesempatan untuk meraih skala ekonomi produksi.
…tetapi untuk meningkatkan daya saing secara keseluruhan dan menjaga pertumbuhan, Pemerintah dan sektor swasta harus mengatasi sejumlah tantangan
Dengan demikian Indonesia memiliki potensi untuk meningkatkan pangsa pasar manufakturnya di dunia, menciptakan jutaan lapangan kerja baru dan mendorong transformasi struktural. Untuk mencapai sasaran ini maka kesempatan harus diambil sekarang untuk melakukan upaya yang agresif dalam meningkatkan daya saing sektor manufaktur, termasuk menangani masalah tradisional dalam iklim investasi, seperti meningkatkan transparansi dan kepastian peraturan perundangan, namun masalah yang paling penting adalah kelemahan dalam lingkungan inovasi dan kualitas. Melalui hal inilah sektor manufaktur Indonesia dapat mulai meningkatkan posisinya pada rantai nilai, membangun rantai nilai domestik yang dalam dan bersaing, dan menyediakan kesempatan kerja yang berkualitas dan berkelanjutan. Kinerja ekspor dapat lebih ditingkatkan dengan memberi kemudahan kepada perusahaan non-eksportir untuk
7 Bank Dunia (2012), Picking up the Pace: Reviving Growth in Indonesia’s Manufacturing Sector,
http://www.worldbank.org/en/news/2012/10/10/picking-up-the-pace-reviving-growth-in-indonesia-manufacturing-sector. Pembahasan ini mengambil dari Catatan Kebijakan 2 Daya Saing Ekspor pada Sektor Manufaktur Indonesia.
-40
-20
0
20
40
60
-40
-20
0
20
40
60
Jul-09 Jan-10 Jul-10 Jan-11 Jul-11 Jan-12 Jul-12
Persen Persen
Impor barang setengah jadi
Impor barang modal
Ekspor manufaktur
50
100
150
200
250
50
100
150
200
250
2000 2002 2004 2006 2008 2010 2012
Indeks (2005 = 100) Indeks (2005 = 100)
Indeks harga komoditas (ditimbang dengan rasio ekspor Indonesia)
Indeks Nilai Unit Manufaktur (MUV)
Indeks penyerupa nilai tukar
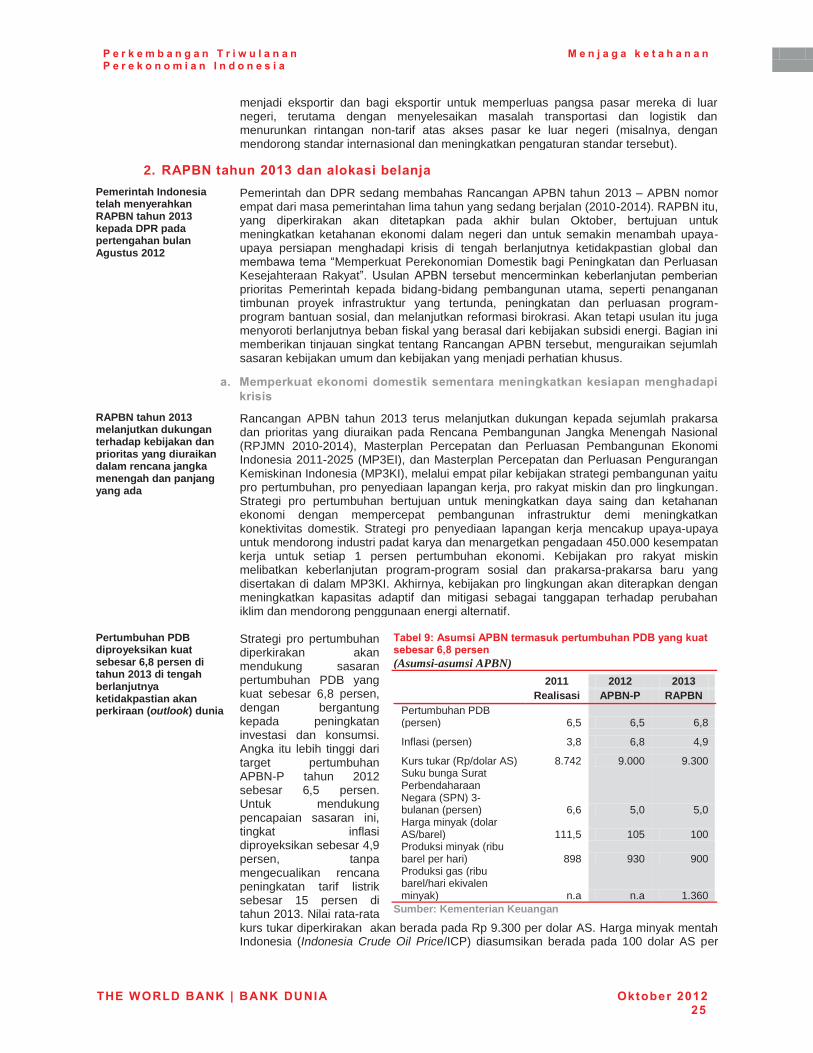
P e r k e m b a n g a n T r i w u l a n a n P e r e k o n o m i a n I n d o n e s i a
M e n j a g a k e t a h a n a n
THE WORLD BANK | BANK DUNIA Oktober 2012 25
menjadi eksportir dan bagi eksportir untuk memperluas pangsa pasar mereka di luar negeri, terutama dengan menyelesaikan masalah transportasi dan logistik dan menurunkan rintangan non-tarif atas akses pasar ke luar negeri (misalnya, dengan mendorong standar internasional dan meningkatkan pengaturan standar tersebut).
2. RAPBN tahun 2013 dan alokasi belanja Pemerintah Indonesia telah menyerahkan RAPBN tahun 2013 kepada DPR pada pertengahan bulan Agustus 2012
Pemerintah dan DPR sedang membahas Rancangan APBN tahun 2013 – APBN nomor empat dari masa pemerintahan lima tahun yang sedang berjalan (2010-2014). RAPBN itu, yang diperkirakan akan ditetapkan pada akhir bulan Oktober, bertujuan untuk meningkatkan ketahanan ekonomi dalam negeri dan untuk semakin menambah upaya-upaya persiapan menghadapi krisis di tengah berlanjutnya ketidakpastian global dan membawa tema “Memperkuat Perekonomian Domestik bagi Peningkatan dan Perluasan Kesejahteraan Rakyat”. Usulan APBN tersebut mencerminkan keberlanjutan pemberian prioritas Pemerintah kepada bidang-bidang pembangunan utama, seperti penanganan timbunan proyek infrastruktur yang tertunda, peningkatan dan perluasan program-program bantuan sosial, dan melanjutkan reformasi birokrasi. Akan tetapi usulan itu juga menyoroti berlanjutnya beban fiskal yang berasal dari kebijakan subsidi energi. Bagian ini memberikan tinjauan singkat tentang Rancangan APBN tersebut, menguraikan sejumlah sasaran kebijakan umum dan kebijakan yang menjadi perhatian khusus.
a. Memperkuat ekonomi domestik sementara meningkatkan kesiapan menghadapi krisis
RAPBN tahun 2013 melanjutkan dukungan terhadap kebijakan dan prioritas yang diuraikan dalam rencana jangka menengah dan panjang yang ada
Rancangan APBN tahun 2013 terus melanjutkan dukungan kepada sejumlah prakarsa dan prioritas yang diuraikan pada Rencana Pembangunan Jangka Menengah Nasional (RPJMN 2010-2014), Masterplan Percepatan dan Perluasan Pembangunan Ekonomi Indonesia 2011-2025 (MP3EI), dan Masterplan Percepatan dan Perluasan Pengurangan Kemiskinan Indonesia (MP3KI), melalui empat pilar kebijakan strategi pembangunan yaitu pro pertumbuhan, pro penyediaan lapangan kerja, pro rakyat miskin dan pro lingkungan. Strategi pro pertumbuhan bertujuan untuk meningkatkan daya saing dan ketahanan ekonomi dengan mempercepat pembangunan infrastruktur demi meningkatkan konektivitas domestik. Strategi pro penyediaan lapangan kerja mencakup upaya-upaya untuk mendorong industri padat karya dan menargetkan pengadaan 450.000 kesempatan kerja untuk setiap 1 persen pertumbuhan ekonomi. Kebijakan pro rakyat miskin melibatkan keberlanjutan program-program sosial dan prakarsa-prakarsa baru yang disertakan di dalam MP3KI. Akhirnya, kebijakan pro lingkungan akan diterapkan dengan meningkatkan kapasitas adaptif dan mitigasi sebagai tanggapan terhadap perubahan iklim dan mendorong penggunaan energi alternatif.
Pertumbuhan PDB diproyeksikan kuat sebesar 6,8 persen di tahun 2013 di tengah berlanjutnya ketidakpastian akan perkiraan (outlook) dunia
Strategi pro pertumbuhan diperkirakan akan mendukung sasaran pertumbuhan PDB yang kuat sebesar 6,8 persen, dengan bergantung kepada peningkatan investasi dan konsumsi. Angka itu lebih tinggi dari target pertumbuhan APBN-P tahun 2012 sebesar 6,5 persen. Untuk mendukung pencapaian sasaran ini, tingkat inflasi diproyeksikan sebesar 4,9 persen, tanpa mengecualikan rencana peningkatan tarif listrik sebesar 15 persen di tahun 2013. Nilai rata-rata kurs tukar diperkirakan akan berada pada Rp 9.300 per dolar AS. Harga minyak mentah Indonesia (Indonesia Crude Oil Price/ICP) diasumsikan berada pada 100 dolar AS per
Tabel 9: Asumsi APBN termasuk pertumbuhan PDB yang kuat sebesar 6,8 persen (Asumsi-asumsi APBN)
2011 2012 2013 Realisasi APBN-P RAPBN
Pertumbuhan PDB (persen) 6,5 6,5 6,8
Inflasi (persen) 3,8 6,8 4,9
Kurs tukar (Rp/dolar AS) 8.742 9.000 9.300 Suku bunga Surat Perbendaharaan Negara (SPN) 3-bulanan (persen) 6,6 5,0 5,0 Harga minyak (dolar AS/barel) 111,5 105 100 Produksi minyak (ribu barel per hari) 898 930 900 Produksi gas (ribu barel/hari ekivalen minyak) n.a n.a 1.360
Sumber: Kementerian Keuangan
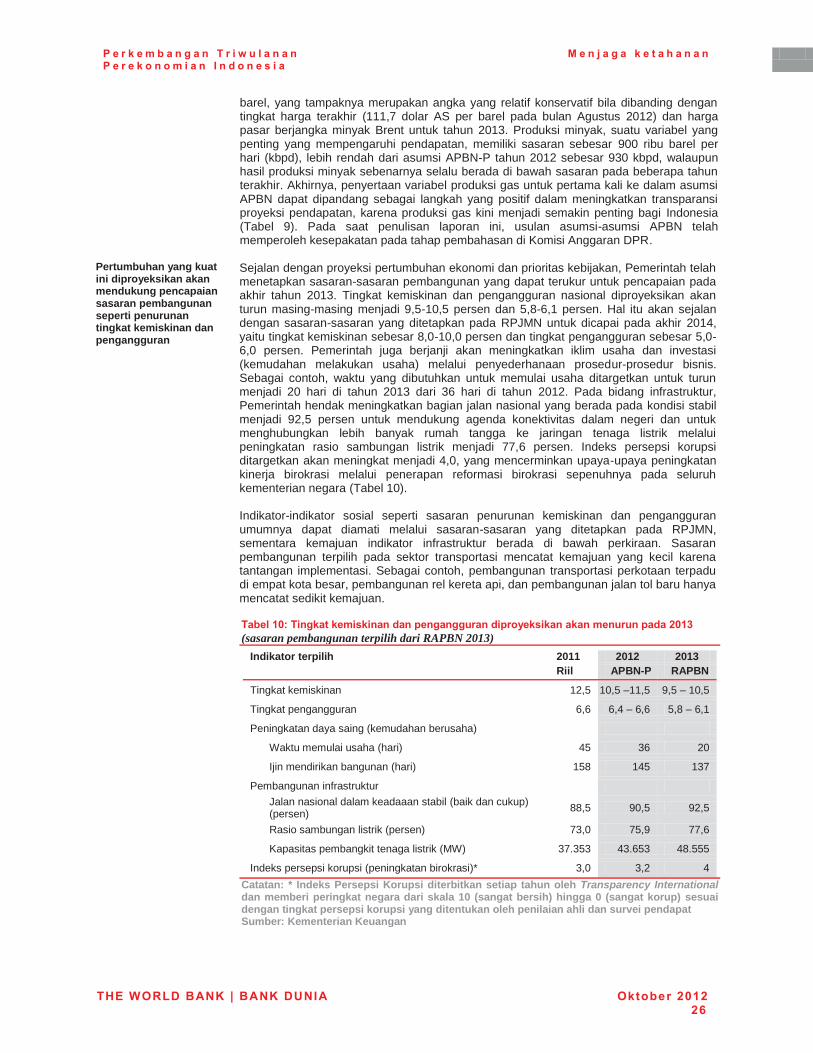
P e r k e m b a n g a n T r i w u l a n a n P e r e k o n o m i a n I n d o n e s i a
M e n j a g a k e t a h a n a n
THE WORLD BANK | BANK DUNIA Oktober 2012 26
barel, yang tampaknya merupakan angka yang relatif konservatif bila dibanding dengan tingkat harga terakhir (111,7 dolar AS per barel pada bulan Agustus 2012) dan harga pasar berjangka minyak Brent untuk tahun 2013. Produksi minyak, suatu variabel yang penting yang mempengaruhi pendapatan, memiliki sasaran sebesar 900 ribu barel per hari (kbpd), lebih rendah dari asumsi APBN-P tahun 2012 sebesar 930 kbpd, walaupun hasil produksi minyak sebenarnya selalu berada di bawah sasaran pada beberapa tahun terakhir. Akhirnya, penyertaan variabel produksi gas untuk pertama kali ke dalam asumsi APBN dapat dipandang sebagai langkah yang positif dalam meningkatkan transparansi proyeksi pendapatan, karena produksi gas kini menjadi semakin penting bagi Indonesia (Tabel 9). Pada saat penulisan laporan ini, usulan asumsi-asumsi APBN telah memperoleh kesepakatan pada tahap pembahasan di Komisi Anggaran DPR.
Pertumbuhan yang kuat ini diproyeksikan akan mendukung pencapaian sasaran pembangunan seperti penurunan tingkat kemiskinan dan pengangguran
Sejalan dengan proyeksi pertumbuhan ekonomi dan prioritas kebijakan, Pemerintah telah menetapkan sasaran-sasaran pembangunan yang dapat terukur untuk pencapaian pada akhir tahun 2013. Tingkat kemiskinan dan pengangguran nasional diproyeksikan akan turun masing-masing menjadi 9,5-10,5 persen dan 5,8-6,1 persen. Hal itu akan sejalan dengan sasaran-sasaran yang ditetapkan pada RPJMN untuk dicapai pada akhir 2014, yaitu tingkat kemiskinan sebesar 8,0-10,0 persen dan tingkat pengangguran sebesar 5,0-6,0 persen. Pemerintah juga berjanji akan meningkatkan iklim usaha dan investasi (kemudahan melakukan usaha) melalui penyederhanaan prosedur-prosedur bisnis. Sebagai contoh, waktu yang dibutuhkan untuk memulai usaha ditargetkan untuk turun menjadi 20 hari di tahun 2013 dari 36 hari di tahun 2012. Pada bidang infrastruktur, Pemerintah hendak meningkatkan bagian jalan nasional yang berada pada kondisi stabil menjadi 92,5 persen untuk mendukung agenda konektivitas dalam negeri dan untuk menghubungkan lebih banyak rumah tangga ke jaringan tenaga listrik melalui peningkatan rasio sambungan listrik menjadi 77,6 persen. Indeks persepsi korupsi ditargetkan akan meningkat menjadi 4,0, yang mencerminkan upaya-upaya peningkatan kinerja birokrasi melalui penerapan reformasi birokrasi sepenuhnya pada seluruh kementerian negara (Tabel 10). Indikator-indikator sosial seperti sasaran penurunan kemiskinan dan pengangguran umumnya dapat diamati melalui sasaran-sasaran yang ditetapkan pada RPJMN, sementara kemajuan indikator infrastruktur berada di bawah perkiraan. Sasaran pembangunan terpilih pada sektor transportasi mencatat kemajuan yang kecil karena tantangan implementasi. Sebagai contoh, pembangunan transportasi perkotaan terpadu di empat kota besar, pembangunan rel kereta api, dan pembangunan jalan tol baru hanya mencatat sedikit kemajuan. Tabel 10: Tingkat kemiskinan dan pengangguran diproyeksikan akan menurun pada 2013 (sasaran pembangunan terpilih dari RAPBN 2013)
Indikator terpilih 2011 2012 2013 Riil APBN-P RAPBN
Tingkat kemiskinan 12,5 10,5 –11,5 9,5 – 10,5
Tingkat pengangguran 6,6 6,4 – 6,6 5,8 – 6,1
Peningkatan daya saing (kemudahan berusaha)
Waktu memulai usaha (hari) 45 36 20
Ijin mendirikan bangunan (hari) 158 145 137
Pembangunan infrastruktur Jalan nasional dalam keadaaan stabil (baik dan cukup) (persen) 88,5 90,5 92,5
Rasio sambungan listrik (persen) 73,0 75,9 77,6
Kapasitas pembangkit tenaga listrik (MW) 37.353 43.653 48.555
Indeks persepsi korupsi (peningkatan birokrasi)* 3,0 3,2 4
Catatan: * Indeks Persepsi Korupsi diterbitkan setiap tahun oleh Transparency International dan memberi peringkat negara dari skala 10 (sangat bersih) hingga 0 (sangat korup) sesuai dengan tingkat persepsi korupsi yang ditentukan oleh penilaian ahli dan survei pendapat Sumber: Kementerian Keuangan
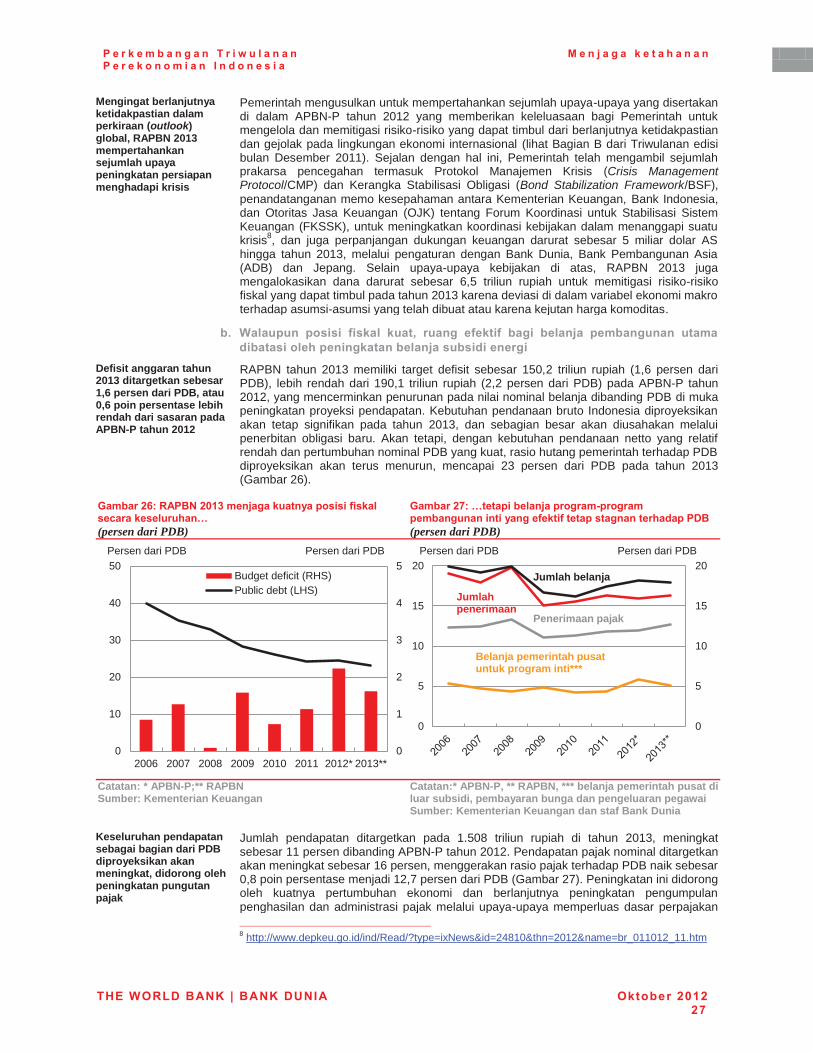
P e r k e m b a n g a n T r i w u l a n a n P e r e k o n o m i a n I n d o n e s i a
M e n j a g a k e t a h a n a n
THE WORLD BANK | BANK DUNIA Oktober 2012 27
Mengingat berlanjutnya ketidakpastian dalam perkiraan (outlook) global, RAPBN 2013 mempertahankan sejumlah upaya peningkatan persiapan menghadapi krisis
Pemerintah mengusulkan untuk mempertahankan sejumlah upaya-upaya yang disertakan di dalam APBN-P tahun 2012 yang memberikan keleluasaan bagi Pemerintah untuk mengelola dan memitigasi risiko-risiko yang dapat timbul dari berlanjutnya ketidakpastian dan gejolak pada lingkungan ekonomi internasional (lihat Bagian B dari Triwulanan edisi bulan Desember 2011). Sejalan dengan hal ini, Pemerintah telah mengambil sejumlah prakarsa pencegahan termasuk Protokol Manajemen Krisis (Crisis Management Protocol/CMP) dan Kerangka Stabilisasi Obligasi (Bond Stabilization Framework/BSF), penandatanganan memo kesepahaman antara Kementerian Keuangan, Bank Indonesia, dan Otoritas Jasa Keuangan (OJK) tentang Forum Koordinasi untuk Stabilisasi Sistem Keuangan (FKSSK), untuk meningkatkan koordinasi kebijakan dalam menanggapi suatu krisis8, dan juga perpanjangan dukungan keuangan darurat sebesar 5 miliar dolar AS hingga tahun 2013, melalui pengaturan dengan Bank Dunia, Bank Pembangunan Asia (ADB) dan Jepang. Selain upaya-upaya kebijakan di atas, RAPBN 2013 juga mengalokasikan dana darurat sebesar 6,5 triliun rupiah untuk memitigasi risiko-risiko fiskal yang dapat timbul pada tahun 2013 karena deviasi di dalam variabel ekonomi makro terhadap asumsi-asumsi yang telah dibuat atau karena kejutan harga komoditas.
b. Walaupun posisi fiskal kuat, ruang efektif bagi belanja pembangunan utama dibatasi oleh peningkatan belanja subsidi energi
Defisit anggaran tahun 2013 ditargetkan sebesar 1,6 persen dari PDB, atau 0,6 poin persentase lebih rendah dari sasaran pada APBN-P tahun 2012
RAPBN tahun 2013 memiliki target defisit sebesar 150,2 triliun rupiah (1,6 persen dari PDB), lebih rendah dari 190,1 triliun rupiah (2,2 persen dari PDB) pada APBN-P tahun 2012, yang mencerminkan penurunan pada nilai nominal belanja dibanding PDB di muka peningkatan proyeksi pendapatan. Kebutuhan pendanaan bruto Indonesia diproyeksikan akan tetap signifikan pada tahun 2013, dan sebagian besar akan diusahakan melalui penerbitan obligasi baru. Akan tetapi, dengan kebutuhan pendanaan netto yang relatif rendah dan pertumbuhan nominal PDB yang kuat, rasio hutang pemerintah terhadap PDB diproyeksikan akan terus menurun, mencapai 23 persen dari PDB pada tahun 2013 (Gambar 26).
Gambar 26: RAPBN 2013 menjaga kuatnya posisi fiskal secara keseluruhan… (persen dari PDB)
Gambar 27: …tetapi belanja program-program pembangunan inti yang efektif tetap stagnan terhadap PDB (persen dari PDB)
Catatan: * APBN-P;** RAPBN Sumber: Kementerian Keuangan
Catatan:* APBN-P, ** RAPBN, *** belanja pemerintah pusat di luar subsidi, pembayaran bunga dan pengeluaran pegawai Sumber: Kementerian Keuangan dan staf Bank Dunia
Keseluruhan pendapatan sebagai bagian dari PDB diproyeksikan akan meningkat, didorong oleh peningkatan pungutan pajak
Jumlah pendapatan ditargetkan pada 1.508 triliun rupiah di tahun 2013, meningkat sebesar 11 persen dibanding APBN-P tahun 2012. Pendapatan pajak nominal ditargetkan akan meningkat sebesar 16 persen, menggerakan rasio pajak terhadap PDB naik sebesar 0,8 poin persentase menjadi 12,7 persen dari PDB (Gambar 27). Peningkatan ini didorong oleh kuatnya pertumbuhan ekonomi dan berlanjutnya peningkatan pengumpulan penghasilan dan administrasi pajak melalui upaya-upaya memperluas dasar perpajakan 8 http://www.depkeu.go.id/ind/Read/?type=ixNews&id=24810&thn=2012&name=br_011012_11.htm
0
1
2
3
4
5
0
10
20
30
40
50
2006 2007 2008 2009 2010 2011 2012* 2013**
Budget deficit (RHS)Public debt (LHS)
Persen dari PDB Persen dari PDB
0
5
10
15
20
0
5
10
15
20Persen dari PDB Persen dari PDB
Jumlah penerimaan
Penerimaan pajak
Jumlah belanja
Belanja pemerintah pusat untuk program inti***
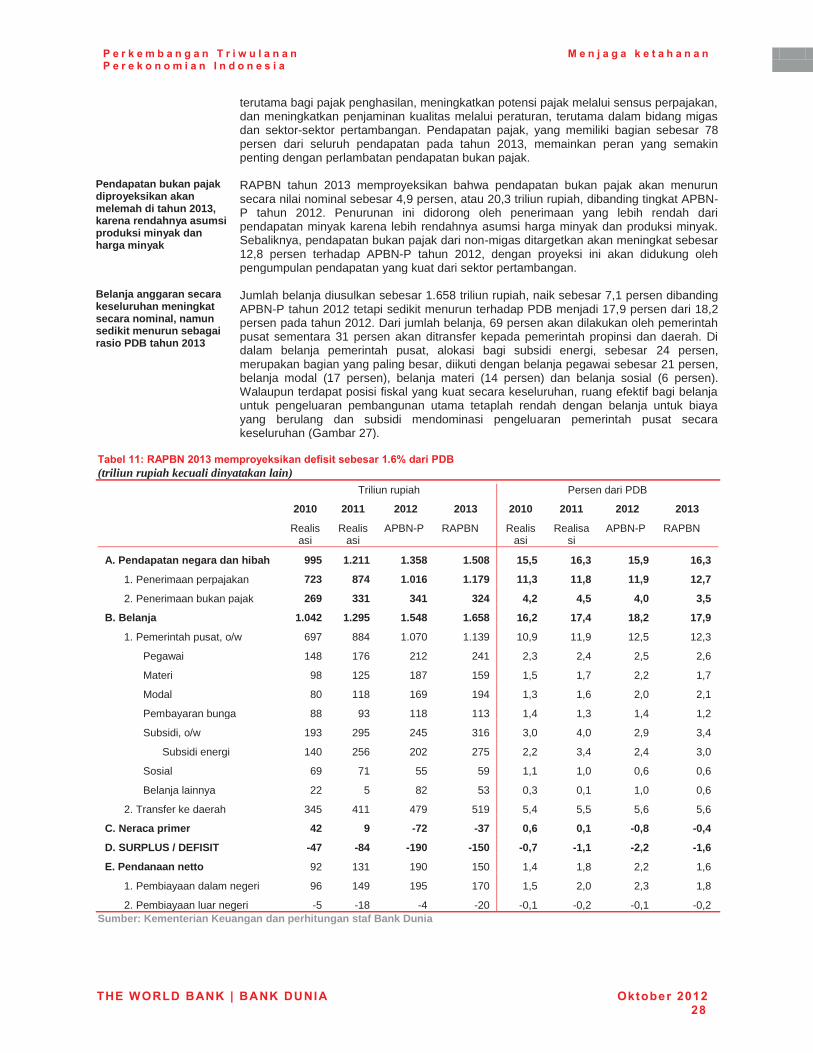
P e r k e m b a n g a n T r i w u l a n a n P e r e k o n o m i a n I n d o n e s i a
M e n j a g a k e t a h a n a n
THE WORLD BANK | BANK DUNIA Oktober 2012 28
terutama bagi pajak penghasilan, meningkatkan potensi pajak melalui sensus perpajakan, dan meningkatkan penjaminan kualitas melalui peraturan, terutama dalam bidang migas dan sektor-sektor pertambangan. Pendapatan pajak, yang memiliki bagian sebesar 78 persen dari seluruh pendapatan pada tahun 2013, memainkan peran yang semakin penting dengan perlambatan pendapatan bukan pajak.
Pendapatan bukan pajak diproyeksikan akan melemah di tahun 2013, karena rendahnya asumsi produksi minyak dan harga minyak
RAPBN tahun 2013 memproyeksikan bahwa pendapatan bukan pajak akan menurun secara nilai nominal sebesar 4,9 persen, atau 20,3 triliun rupiah, dibanding tingkat APBN-P tahun 2012. Penurunan ini didorong oleh penerimaan yang lebih rendah dari pendapatan minyak karena lebih rendahnya asumsi harga minyak dan produksi minyak. Sebaliknya, pendapatan bukan pajak dari non-migas ditargetkan akan meningkat sebesar 12,8 persen terhadap APBN-P tahun 2012, dengan proyeksi ini akan didukung oleh pengumpulan pendapatan yang kuat dari sektor pertambangan.
Belanja anggaran secara keseluruhan meningkat secara nominal, namun sedikit menurun sebagai rasio PDB tahun 2013
Jumlah belanja diusulkan sebesar 1.658 triliun rupiah, naik sebesar 7,1 persen dibanding APBN-P tahun 2012 tetapi sedikit menurun terhadap PDB menjadi 17,9 persen dari 18,2 persen pada tahun 2012. Dari jumlah belanja, 69 persen akan dilakukan oleh pemerintah pusat sementara 31 persen akan ditransfer kepada pemerintah propinsi dan daerah. Di dalam belanja pemerintah pusat, alokasi bagi subsidi energi, sebesar 24 persen, merupakan bagian yang paling besar, diikuti dengan belanja pegawai sebesar 21 persen, belanja modal (17 persen), belanja materi (14 persen) dan belanja sosial (6 persen). Walaupun terdapat posisi fiskal yang kuat secara keseluruhan, ruang efektif bagi belanja untuk pengeluaran pembangunan utama tetaplah rendah dengan belanja untuk biaya yang berulang dan subsidi mendominasi pengeluaran pemerintah pusat secara keseluruhan (Gambar 27).
Tabel 11: RAPBN 2013 memproyeksikan defisit sebesar 1.6% dari PDB (triliun rupiah kecuali dinyatakan lain)
Triliun rupiah Persen dari PDB
2010 2011 2012 2013 2010 2011 2012 2013
Realisasi
Realisasi
APBN-P RAPBN Realisasi
Realisasi
APBN-P RAPBN
A. Pendapatan negara dan hibah 995 1.211 1.358 1.508 15,5 16,3 15,9 16,3
1. Penerimaan perpajakan 723 874 1.016 1.179 11,3 11,8 11,9 12,7
2. Penerimaan bukan pajak 269 331 341 324 4,2 4,5 4,0 3,5
B. Belanja 1.042 1.295 1.548 1.658 16,2 17,4 18,2 17,9
1. Pemerintah pusat, o/w 697 884 1.070 1.139 10,9 11,9 12,5 12,3
Pegawai 148 176 212 241 2,3 2,4 2,5 2,6
Materi 98 125 187 159 1,5 1,7 2,2 1,7
Modal 80 118 169 194 1,3 1,6 2,0 2,1
Pembayaran bunga 88 93 118 113 1,4 1,3 1,4 1,2
Subsidi, o/w 193 295 245 316 3,0 4,0 2,9 3,4
Subsidi energi 140 256 202 275 2,2 3,4 2,4 3,0
Sosial 69 71 55 59 1,1 1,0 0,6 0,6
Belanja lainnya 22 5 82 53 0,3 0,1 1,0 0,6
2. Transfer ke daerah 345 411 479 519 5,4 5,5 5,6 5,6
C. Neraca primer 42 9 -72 -37 0,6 0,1 -0,8 -0,4
D. SURPLUS / DEFISIT -47 -84 -190 -150 -0,7 -1,1 -2,2 -1,6
E. Pendanaan netto 92 131 190 150 1,4 1,8 2,2 1,6
1. Pembiayaan dalam negeri 96 149 195 170 1,5 2,0 2,3 1,8
2. Pembiayaan luar negeri -5 -18 -4 -20 -0,1 -0,2 -0,1 -0,2
Sumber: Kementerian Keuangan dan perhitungan staf Bank Dunia
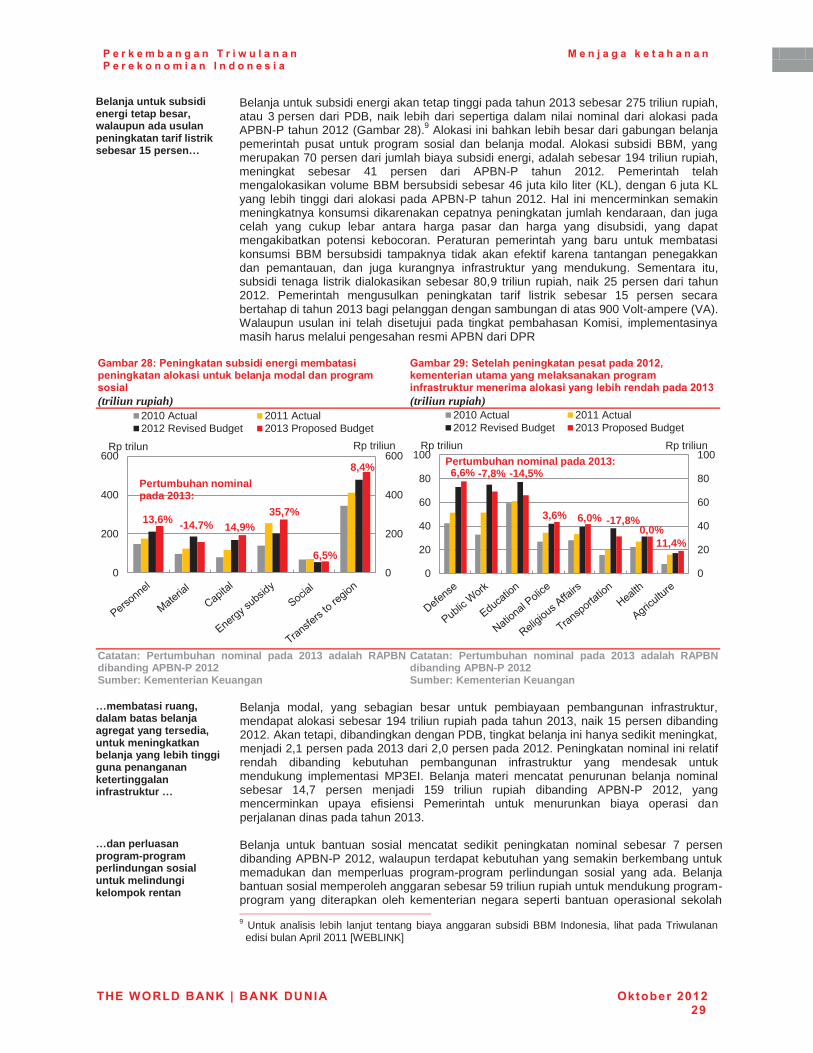
P e r k e m b a n g a n T r i w u l a n a n P e r e k o n o m i a n I n d o n e s i a
M e n j a g a k e t a h a n a n
THE WORLD BANK | BANK DUNIA Oktober 2012 29
Belanja untuk subsidi energi tetap besar, walaupun ada usulan peningkatan tarif listrik sebesar 15 persen…
Belanja untuk subsidi energi akan tetap tinggi pada tahun 2013 sebesar 275 triliun rupiah, atau 3 persen dari PDB, naik lebih dari sepertiga dalam nilai nominal dari alokasi pada APBN-P tahun 2012 (Gambar 28).9 Alokasi ini bahkan lebih besar dari gabungan belanja pemerintah pusat untuk program sosial dan belanja modal. Alokasi subsidi BBM, yang merupakan 70 persen dari jumlah biaya subsidi energi, adalah sebesar 194 triliun rupiah, meningkat sebesar 41 persen dari APBN-P tahun 2012. Pemerintah telah mengalokasikan volume BBM bersubsidi sebesar 46 juta kilo liter (KL), dengan 6 juta KL yang lebih tinggi dari alokasi pada APBN-P tahun 2012. Hal ini mencerminkan semakin meningkatnya konsumsi dikarenakan cepatnya peningkatan jumlah kendaraan, dan juga celah yang cukup lebar antara harga pasar dan harga yang disubsidi, yang dapat mengakibatkan potensi kebocoran. Peraturan pemerintah yang baru untuk membatasi konsumsi BBM bersubsidi tampaknya tidak akan efektif karena tantangan penegakkan dan pemantauan, dan juga kurangnya infrastruktur yang mendukung. Sementara itu, subsidi tenaga listrik dialokasikan sebesar 80,9 triliun rupiah, naik 25 persen dari tahun 2012. Pemerintah mengusulkan peningkatan tarif listrik sebesar 15 persen secara bertahap di tahun 2013 bagi pelanggan dengan sambungan di atas 900 Volt-ampere (VA). Walaupun usulan ini telah disetujui pada tingkat pembahasan Komisi, implementasinya masih harus melalui pengesahan resmi APBN dari DPR
Gambar 28: Peningkatan subsidi energi membatasi peningkatan alokasi untuk belanja modal dan program sosial (triliun rupiah)
Gambar 29: Setelah peningkatan pesat pada 2012, kementerian utama yang melaksanakan program infrastruktur menerima alokasi yang lebih rendah pada 2013 (triliun rupiah)
Catatan: Pertumbuhan nominal pada 2013 adalah RAPBN dibanding APBN-P 2012 Sumber: Kementerian Keuangan
Catatan: Pertumbuhan nominal pada 2013 adalah RAPBN dibanding APBN-P 2012 Sumber: Kementerian Keuangan
…membatasi ruang, dalam batas belanja agregat yang tersedia, untuk meningkatkan belanja yang lebih tinggi guna penanganan ketertinggalan infrastruktur …
Belanja modal, yang sebagian besar untuk pembiayaan pembangunan infrastruktur, mendapat alokasi sebesar 194 triliun rupiah pada tahun 2013, naik 15 persen dibanding 2012. Akan tetapi, dibandingkan dengan PDB, tingkat belanja ini hanya sedikit meningkat, menjadi 2,1 persen pada 2013 dari 2,0 persen pada 2012. Peningkatan nominal ini relatif rendah dibanding kebutuhan pembangunan infrastruktur yang mendesak untuk mendukung implementasi MP3EI. Belanja materi mencatat penurunan belanja nominal sebesar 14,7 persen menjadi 159 triliun rupiah dibanding APBN-P 2012, yang mencerminkan upaya efisiensi Pemerintah untuk menurunkan biaya operasi dan perjalanan dinas pada tahun 2013.
…dan perluasan program-program perlindungan sosial untuk melindungi kelompok rentan
Belanja untuk bantuan sosial mencatat sedikit peningkatan nominal sebesar 7 persen dibanding APBN-P 2012, walaupun terdapat kebutuhan yang semakin berkembang untuk memadukan dan memperluas program-program perlindungan sosial yang ada. Belanja bantuan sosial memperoleh anggaran sebesar 59 triliun rupiah untuk mendukung program-program yang diterapkan oleh kementerian negara seperti bantuan operasional sekolah 9 Untuk analisis lebih lanjut tentang biaya anggaran subsidi BBM Indonesia, lihat pada Triwulanan
edisi bulan April 2011 [WEBLINK]
13,6% 14,9%
35,7%
6,5%
8,4%
0
200
400
600
0
200
400
600
2010 Actual 2011 Actual2012 Revised Budget 2013 Proposed Budget
-14,7%
Pertumbuhan nominal pada 2013:
Rp trilun Rp triliun
6,6%
3,6% 6,0% 0,0%
11,4%
0
20
40
60
80
100
0
20
40
60
80
100
2010 Actual 2011 Actual2012 Revised Budget 2013 Proposed Budget
-7,8% -14,5%
-17,8%
Rp triliun Rp triliun Pertumbuhan nominal pada 2013:
P e r k e m b a n g a n T r i w u l a n a n P e r e k o n o m i a n I n d o n e s i a
M e n j a g a k e t a h a n a n
THE WORLD BANK | BANK DUNIA Oktober 2012 30
(BOS) yang dikelola oleh Kementerian Agama, bantuan beasiswa siswa miskin (BSM), jaminan kesehatan bagi masyarakat miskin (Jamkesmas), bantuan rumah tangga miskin program keluarga harapan (PKH), dan program nasional pemberdayaan masyarakat (PNPM). Selain itu terdapat program-program sosial inti lain yang tidak disebut di atas yang disalurkan melalui belanja subsidi, seperti beras untuk rakyat miskin atau Raskin, dan melalui transfer ke daerah (program BOS yang mendukung pendidikan dasar) juga menerima alokasi yang sama atau lebih rendah di tahun 2013 dibandingkan dengan APBN-P 2012.
Belanja pegawai diproyeksikan meningkat terhadap belanja total, dalam rangka mendukung pelaksanaan reformasi birokrasi pada seluruh kementerian negara
Belanja pegawai pada tahun 2013 diproyeksikan mencapai 241,1 triliun rupiah (2,6 persen dari PDB), naik sebesar 13,6 persen dibanding APBN-P 2012. Dari jumlah belanja itu, 46 persen adalah untuk gaji dan tunjangan pegawai negeri, 32 persen untuk pensiun dan 21 persen untuk honorarium dan uang lembur. Peningkatan pada belanja pegawai mencerminkan kebijakan Pemerintah untuk peningkatan gaji dan pensiun pegawai negeri sebesar 7 persen per tahun, berlanjutnya reformasi birokrasi dan cadangan untuk tambahan biaya gaji bagi pegawai baru pada lembaga-lembaga pemerintahan pada tahun 2013. Faktor pendorong peningkatan belanja pegawai di tingkat pusat dan daerah diuraikan pada Bagian C.
Kementerian utama yang melaksanakan pembangunan infrastruktur (pekerjaan umum dan transportasi) menerima alokasi anggaran yang lebih rendah dibanding tahun 2012, tetapi tetap dalam 10 besar pelaku belanja
Jumlah belanja kementerian negara tetap stagnan secara nominal dibanding APBN-P 2012. Meskipun terdapat pernyataan akan pemberian prioritas kepada infrastruktur, setelah peningkatan yang kuat pada APBN-P 2012, alokasi anggaran untuk Kementerian Pekerjaan Umum dan Kementerian Perhubungan mencatat penurunan nominal masing-masing sebesar 8 persen dan 18 persen pada tahun 2013, walau kedua kementerian itu masih tercatat di dalam daftar 10 penerima alokasi anggaran terbesar (Gambar 29). Untuk mendukung investasi infrastruktur, Pemerintah juga mengalokasikan dana dukungan kelayakan (Viability Gap Funding/VGF) pada RAPBN 2013. VGF bertujuan untuk meningkatkan partisipasi sektor swasta di dalam proyek-proyek infrastruktur yang tidak layak secara finansial tetapi layak secara ekonomi, meningkatkan kepastian pemberian proyek infrastruktur dan meningkatkan ketersediaan layanan infrastruktur menurut skema Kemitraan Pemerintah Swasta (KPS). Namun, bagaimana perkembangan penerapan dukungan VGF masih harus diamati. Walau Kementerian Pendidikan menerima penurunan anggaran sebesar 14 persen pada RAPBN 2013, Pemerintah masih memenuhi aturan 20 persen dari jumlah belanja untuk pendidikan seperti dimandatkan oleh undang-undang. Alokasi untuk belanja pendidikan yang lain seperti belanja untuk dana abadi dan tunjangan guru yang disalurkan melalui transfer mengalami peningkatan.
Pencairan anggaran diperkirakan akan meningkat pada tahun 2013
Seperti diuraikan pada Bagian A, walaupun rendahnya pencairan belanja untuk program-program inti, seperti untuk infrastruktur, masih merupakan suatu tantangan di tahun 2012, pencairan anggaran diperkirakan akan meningkat di tahun 2013. Pemerintah baru-baru ini menetapkan dua peraturan yang penting; amandemen peraturan pengadaan dan peraturan pembebasan tanah yang baru (peraturan pelaksanaan dari UU No. 2/2012 tentang Pengadaan Tanah Bagi Pembangunan Untuk Kepentingan Umum), yang dapat mempercepat implementasi proyek-proyek infrastruktur berukuran besar.
Sebagian besar kebutuhan pendanaan untuk tahun 2013 dipenuhi dengan penerbitan SUN
Kebutuhan pembiayaan netto untuk tahun 2013 ditargetkan mencapai 150,2 triliun rupiah yang umumnya didanai melalui penerbitan surat utang negara netto sebesar 177,3 triliun rupiah. Perencanaan penggunaan pembiayaan dari saldo anggaran lebih (SAL) telah turun menjadi 10,0 triliun rupiah dari 56,2 triliun rupiah pada APBN-P 2012. Pendanaan netto dari pinjaman luar negeri yang resmi kembali diproyeksikan pada angka negatif (minus 19,5 triliun rupiah) karena pencairan proyek dan program diimbangi dengan amortisasi sebesar 58,4 triliun rupiah. Penurunan tipis pada pencairan hutang luar negeri menjadi 45,9 triliun rupiah pada RAPBN 2013 dari 53,7 triliun rupiah pada APBN-P 2012 umumnya disebabkan oleh penurunan pada pinjaman-pinjaman program.
c. Kerangka Pengeluaran Jangka Menengah memproyeksikan surplus pada 2016 Melihat ke depan, neraca anggaran diproyeksikan menjadi surplus pada tahun 2016…
Pemerintah juga menguraikan pembaruan Kerangka Pengeluaran Jangka Menengah-nya (KPJM) pada RAPBN 2013 untuk menyertakan perkembangan kebijakan dan ekonomi terbaru. Pada periode dari 2014 hingga 2016, saldo fiskal diproyeksikan akan bergerak secara bertahap menjadi surplus sebesar 0,3 persen dari PDB (Tabel 13). Bersama-sama
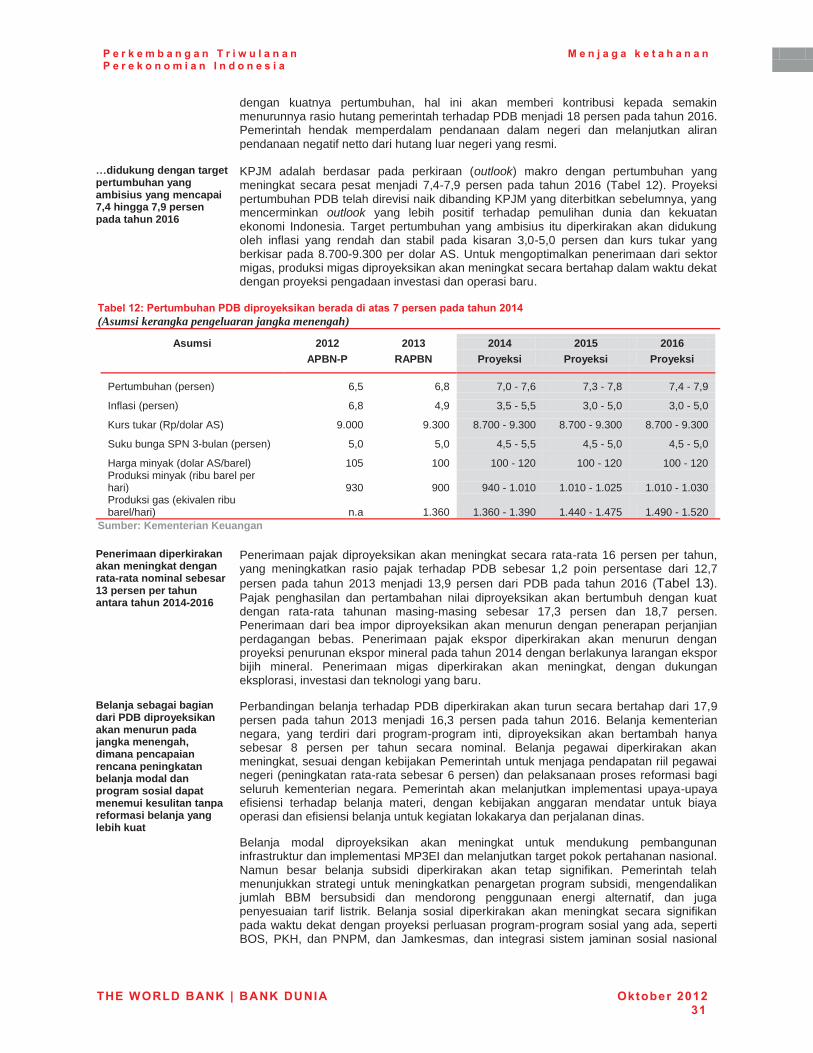
P e r k e m b a n g a n T r i w u l a n a n P e r e k o n o m i a n I n d o n e s i a
M e n j a g a k e t a h a n a n
THE WORLD BANK | BANK DUNIA Oktober 2012 31
dengan kuatnya pertumbuhan, hal ini akan memberi kontribusi kepada semakin menurunnya rasio hutang pemerintah terhadap PDB menjadi 18 persen pada tahun 2016. Pemerintah hendak memperdalam pendanaan dalam negeri dan melanjutkan aliran pendanaan negatif netto dari hutang luar negeri yang resmi.
…didukung dengan target pertumbuhan yang ambisius yang mencapai 7,4 hingga 7,9 persen pada tahun 2016
KPJM adalah berdasar pada perkiraan (outlook) makro dengan pertumbuhan yang meningkat secara pesat menjadi 7,4-7,9 persen pada tahun 2016 (Tabel 12). Proyeksi pertumbuhan PDB telah direvisi naik dibanding KPJM yang diterbitkan sebelumnya, yang mencerminkan outlook yang lebih positif terhadap pemulihan dunia dan kekuatan ekonomi Indonesia. Target pertumbuhan yang ambisius itu diperkirakan akan didukung oleh inflasi yang rendah dan stabil pada kisaran 3,0-5,0 persen dan kurs tukar yang berkisar pada 8.700-9.300 per dolar AS. Untuk mengoptimalkan penerimaan dari sektor migas, produksi migas diproyeksikan akan meningkat secara bertahap dalam waktu dekat dengan proyeksi pengadaan investasi dan operasi baru.
Tabel 12: Pertumbuhan PDB diproyeksikan berada di atas 7 persen pada tahun 2014 (Asumsi kerangka pengeluaran jangka menengah)
Asumsi 2012 2013 2014 2015 2016
APBN-P RAPBN Proyeksi Proyeksi Proyeksi
Pertumbuhan (persen) 6,5 6,8 7,0 - 7,6 7,3 - 7,8 7,4 - 7,9
Inflasi (persen) 6,8 4,9 3,5 - 5,5 3,0 - 5,0 3,0 - 5,0
Kurs tukar (Rp/dolar AS) 9.000 9.300 8.700 - 9.300 8.700 - 9.300 8.700 - 9.300
Suku bunga SPN 3-bulan (persen) 5,0 5,0 4,5 - 5,5 4,5 - 5,0 4,5 - 5,0
Harga minyak (dolar AS/barel) 105 100 100 - 120 100 - 120 100 - 120 Produksi minyak (ribu barel per hari) 930 900 940 - 1.010 1.010 - 1.025 1.010 - 1.030 Produksi gas (ekivalen ribu barel/hari) n.a 1.360 1.360 - 1.390 1.440 - 1.475 1.490 - 1.520
Sumber: Kementerian Keuangan
Penerimaan diperkirakan akan meningkat dengan rata-rata nominal sebesar 13 persen per tahun antara tahun 2014-2016
Penerimaan pajak diproyeksikan akan meningkat secara rata-rata 16 persen per tahun, yang meningkatkan rasio pajak terhadap PDB sebesar 1,2 poin persentase dari 12,7 persen pada tahun 2013 menjadi 13,9 persen dari PDB pada tahun 2016 (Tabel 13). Pajak penghasilan dan pertambahan nilai diproyeksikan akan bertumbuh dengan kuat dengan rata-rata tahunan masing-masing sebesar 17,3 persen dan 18,7 persen. Penerimaan dari bea impor diproyeksikan akan menurun dengan penerapan perjanjian perdagangan bebas. Penerimaan pajak ekspor diperkirakan akan menurun dengan proyeksi penurunan ekspor mineral pada tahun 2014 dengan berlakunya larangan ekspor bijih mineral. Penerimaan migas diperkirakan akan meningkat, dengan dukungan eksplorasi, investasi dan teknologi yang baru.
Belanja sebagai bagian dari PDB diproyeksikan akan menurun pada jangka menengah, dimana pencapaian rencana peningkatan belanja modal dan program sosial dapat menemui kesulitan tanpa reformasi belanja yang lebih kuat
Perbandingan belanja terhadap PDB diperkirakan akan turun secara bertahap dari 17,9 persen pada tahun 2013 menjadi 16,3 persen pada tahun 2016. Belanja kementerian negara, yang terdiri dari program-program inti, diproyeksikan akan bertambah hanya sebesar 8 persen per tahun secara nominal. Belanja pegawai diperkirakan akan meningkat, sesuai dengan kebijakan Pemerintah untuk menjaga pendapatan riil pegawai negeri (peningkatan rata-rata sebesar 6 persen) dan pelaksanaan proses reformasi bagi seluruh kementerian negara. Pemerintah akan melanjutkan implementasi upaya-upaya efisiensi terhadap belanja materi, dengan kebijakan anggaran mendatar untuk biaya operasi dan efisiensi belanja untuk kegiatan lokakarya dan perjalanan dinas. Belanja modal diproyeksikan akan meningkat untuk mendukung pembangunan infrastruktur dan implementasi MP3EI dan melanjutkan target pokok pertahanan nasional. Namun besar belanja subsidi diperkirakan akan tetap signifikan. Pemerintah telah menunjukkan strategi untuk meningkatkan penargetan program subsidi, mengendalikan jumlah BBM bersubsidi dan mendorong penggunaan energi alternatif, dan juga penyesuaian tarif listrik. Belanja sosial diperkirakan akan meningkat secara signifikan pada waktu dekat dengan proyeksi perluasan program-program sosial yang ada, seperti BOS, PKH, dan PNPM, dan Jamkesmas, dan integrasi sistem jaminan sosial nasional
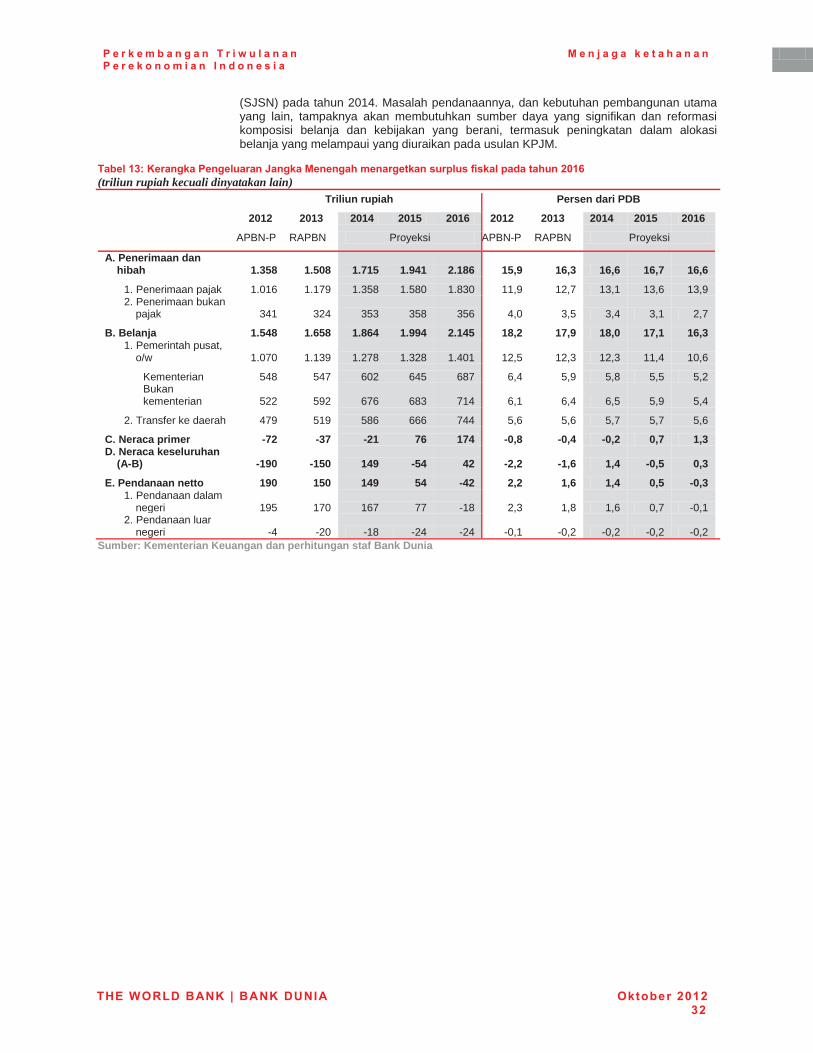
P e r k e m b a n g a n T r i w u l a n a n P e r e k o n o m i a n I n d o n e s i a
M e n j a g a k e t a h a n a n
THE WORLD BANK | BANK DUNIA Oktober 2012 32
(SJSN) pada tahun 2014. Masalah pendanaannya, dan kebutuhan pembangunan utama yang lain, tampaknya akan membutuhkan sumber daya yang signifikan dan reformasi komposisi belanja dan kebijakan yang berani, termasuk peningkatan dalam alokasi belanja yang melampaui yang diuraikan pada usulan KPJM.
Tabel 13: Kerangka Pengeluaran Jangka Menengah menargetkan surplus fiskal pada tahun 2016 (triliun rupiah kecuali dinyatakan lain)
Triliun rupiah Persen dari PDB
2012 2013 2014 2015 2016 2012 2013 2014 2015 2016
APBN-P RAPBN Proyeksi APBN-P RAPBN Proyeksi
A. Penerimaan dan hibah 1.358 1.508 1.715 1.941 2.186 15,9 16,3 16,6 16,7 16,6
1. Penerimaan pajak 1.016 1.179 1.358 1.580 1.830 11,9 12,7 13,1 13,6 13,9 2. Penerimaan bukan
pajak 341 324 353 358 356 4,0 3,5 3,4 3,1 2,7
B. Belanja 1.548 1.658 1.864 1.994 2.145 18,2 17,9 18,0 17,1 16,3 1. Pemerintah pusat,
o/w 1.070 1.139 1.278 1.328 1.401 12,5 12,3 12,3 11,4 10,6
Kementerian 548 547 602 645 687 6,4 5,9 5,8 5,5 5,2 Bukan kementerian 522 592 676 683 714 6,1 6,4 6,5 5,9 5,4
2. Transfer ke daerah 479 519 586 666 744 5,6 5,6 5,7 5,7 5,6
C. Neraca primer -72 -37 -21 76 174 -0,8 -0,4 -0,2 0,7 1,3 D. Neraca keseluruhan
(A-B) -190 -150 149 -54 42 -2,2 -1,6 1,4 -0,5 0,3
E. Pendanaan netto 190 150 149 54 -42 2,2 1,6 1,4 0,5 -0,3 1. Pendanaan dalam
negeri 195 170 167 77 -18 2,3 1,8 1,6 0,7 -0,1 2. Pendanaan luar
negeri -4 -20 -18 -24 -24 -0,1 -0,2 -0,2 -0,2 -0,2
Sumber: Kementerian Keuangan dan perhitungan staf Bank Dunia
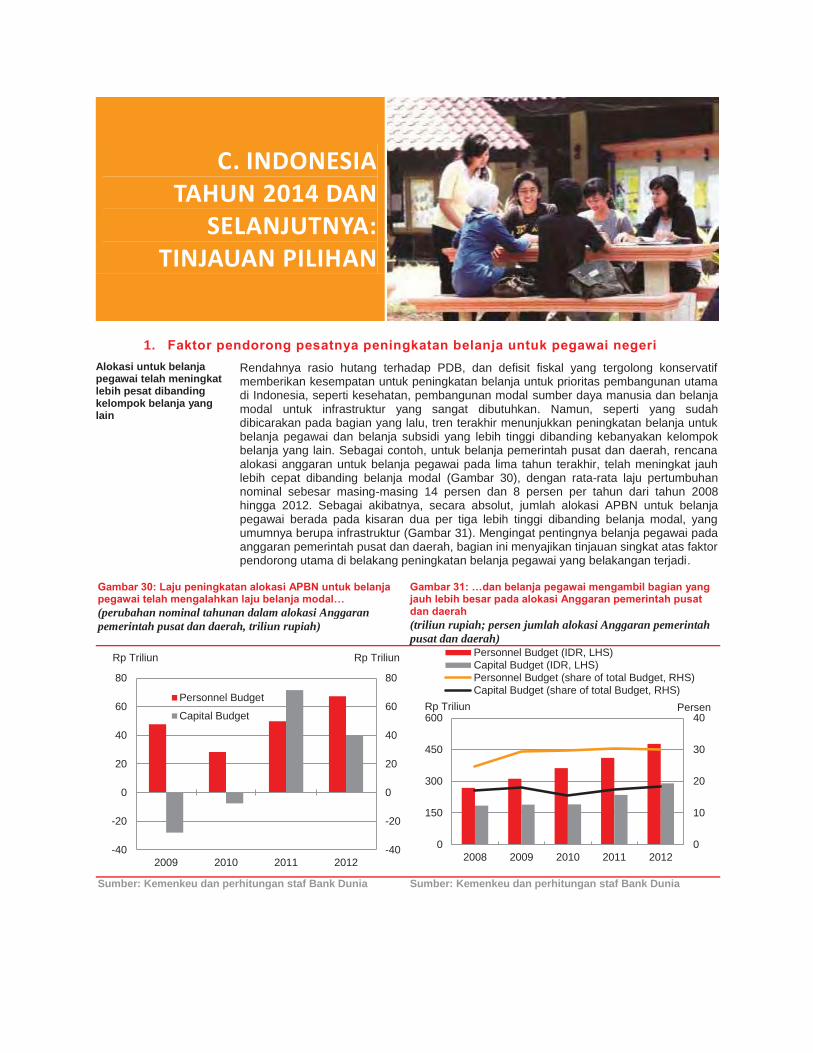
C. INDONESIA TAHUN 2014 DAN
SELANJUTNYA: TINJAUAN PILIHAN
1. Faktor pendorong pesatnya peningkatan belanja untuk pegawai negeri Alokasi untuk belanja pegawai telah meningkat lebih pesat dibanding kelompok belanja yang lain
Rendahnya rasio hutang terhadap PDB, dan defisit fiskal yang tergolong konservatif memberikan kesempatan untuk peningkatan belanja untuk prioritas pembangunan utama di Indonesia, seperti kesehatan, pembangunan modal sumber daya manusia dan belanja modal untuk infrastruktur yang sangat dibutuhkan. Namun, seperti yang sudah dibicarakan pada bagian yang lalu, tren terakhir menunjukkan peningkatan belanja untuk belanja pegawai dan belanja subsidi yang lebih tinggi dibanding kebanyakan kelompok belanja yang lain. Sebagai contoh, untuk belanja pemerintah pusat dan daerah, rencana alokasi anggaran untuk belanja pegawai pada lima tahun terakhir, telah meningkat jauh lebih cepat dibanding belanja modal (Gambar 30), dengan rata-rata laju pertumbuhan nominal sebesar masing-masing 14 persen dan 8 persen per tahun dari tahun 2008 hingga 2012. Sebagai akibatnya, secara absolut, jumlah alokasi APBN untuk belanja pegawai berada pada kisaran dua per tiga lebih tinggi dibanding belanja modal, yang umumnya berupa infrastruktur (Gambar 31). Mengingat pentingnya belanja pegawai pada anggaran pemerintah pusat dan daerah, bagian ini menyajikan tinjauan singkat atas faktor pendorong utama di belakang peningkatan belanja pegawai yang belakangan terjadi.
Gambar 30: Laju peningkatan alokasi APBN untuk belanja pegawai telah mengalahkan laju belanja modal… (perubahan nominal tahunan dalam alokasi Anggaran pemerintah pusat dan daerah, triliun rupiah)
Gambar 31: …dan belanja pegawai mengambil bagian yang jauh lebih besar pada alokasi Anggaran pemerintah pusat dan daerah (triliun rupiah; persen jumlah alokasi Anggaran pemerintah pusat dan daerah)
Sumber: Kemenkeu dan perhitungan staf Bank Dunia Sumber: Kemenkeu dan perhitungan staf Bank Dunia
-40
-20
0
20
40
60
80
-40
-20
0
20
40
60
80
2009 2010 2011 2012
Personnel Budget
Capital Budget
Rp Triliun Rp Triliun
0
10
20
30
40
0
150
300
450
600
2008 2009 2010 2011 2012
Personnel Budget (IDR, LHS)Capital Budget (IDR, LHS)Personnel Budget (share of total Budget, RHS)Capital Budget (share of total Budget, RHS)
Rp Triliun Persen

P e r k e m b a n g a n T r i w u l a n a n P e r e k o n o m i a n I n d o n e s i a
M e n j a g a K e t a h a n a n
THE WORLD BANK | BANK DUNIA Oktober 2012 34
a. Pendorong utama peningkatan belanja pegawai di Indonesia Reformasi pengelolaan anggaran dirancang bertujuan untuk meningkatkan kendali pengeluaran dan kualitas belanja…
Sebagian besar reformasi sistem penganggaran yang belakangan ini dilakukan, yang bertujuan untuk meningkatkan pengendalian, efisiensi dan kualitas belanja pemerintah, telah dirancang dan diterapkan oleh Kementerian Keuangan dan Bappenas. Reformasi termasuk peningkatan pengendalian atas hutang dan manajemen kas; penyatuan belanja pembangunan dan belanja modal; pengenalan kerangka pengeluaran jangka menengah; penganggaran berbasis kinerja (PBB); dan akuntansi berbasis akrual.
…belum menangani tiga pendorong utama peningkatan belanja pegawai
Namun reformasi penganggaran belum sepenuhnya mencakup tiga faktor pendorong utama di belakang peningkatan belanja pegawai, yang semuanya cenderung berada di luar pengendalian badan-badan fiskal pusat. Dua pendorong pertama adalah warisan dari masa Orde Baru dan merupakan ‘Sistem Administrasi Nasional’ yang berlaku antara tahun 1968 dan 1974 dan diundangkan dalam sejumlah UU, termasuk UU 8/1974 tentang Pokok-Pokok Kepegawaian. Ciri-ciri dari sistem tersebut termasuk proses pengambilan keputusan yang tidak jelas, dan terpecahnya kewenangan pengambilan keputusan, yang berakibat pada akuntabilitas/pertanggungjawaban yang tergolong lemah. Berbeda dengan sebagian besar sektor dan fungsi pemerintah, Sistem Administrasi Nasional belum tersentuh oleh reformasi mendasar apapun, untuk penyesuaian dengan negara demokratis Indonesia yang baru, di mana transparansi, kehati-hatian fiskal dan akuntabilitas telah menjadi semakin penting. Pendorong ketiga adalah akibat dari penentuan transfer pusat kepada pemerintah daerah, yang menciptakan insentif untuk menaikkan jumlah pegawai di daerah.
Pendorong pertama adalah proses penentuan formasi staf dan anggaran pegawai…
Pendorong pertama melatarbelakangi peningkatan belanja pegawai adalah kebijakan-kebijakan dan proses-proses atas bagaimana struktur organisasi dan jumlah jabatan ditentukan di lembaga pemerintah, dan sejalan itu bagaimana biaya pegawai dianggarkan dan bagaimana membelanjakan anggaran. Jumlah staf ditentukan melalui proses administratif, dimana Kementerian Pendayagunaan Aparatur Negara dan Reformasi Birokrasi (MenPAN-RB) bertugas mengesahkan formasi kepegawaian suatu lembaga. Keputusan kemudian dibuat dengan melakukan tolok ukur terhadap cetak biru yang telah ditentukan sebelumnya, yang rata-rata sama untuk seluruh lembaga – “pendekatan satu ukuran untuk semua” – dan bukan menurut kebutuhan operasional
…yang menyebabkan kurangnya akuntabilitas pada tingkat terjadinya belanja pegawai
Proses itu memangkas sisi akuntabilitas belanja pegawai pada tingkat di mana pengeluaran berlangsung, yaitu para pengguna anggaran tidak dianggap bertanggung jawab atas anggaran pegawainya, sehingga tidak dapat dimintai pertanggungjawaban atas pengelolaannya. Tindakan ini memberikan insentif bagi lembaga pemerintah pusat dan pengguna anggaran untuk memaksimalkan jumlah staf dan belanja pegawai, dan bukan kepada pengelolaan atas pengeluaran-pengeluaran dimaksud. Peran Kementerian Keuangan di dalam proses ini pada dasarnya adalah memberikan alokasi fiskal bagi belanja pegawai, dan bukan melakukan tinjauan padanya.
Selain itu, insentif untuk melakukan efisiensi pada belanja pegawai rendah …
Karena anggaran pegawai, yang disusun berdasarkan formasi pegawai yang telah disetujui, bersifat sebagai pengeluaran yang telah terjamin, Direktur Jendral Anggaran pada Kementerian Keuangan memotong biaya pegawai yang telah dianggarkan dari jumlah sumber daya yang tersedia, ketika membuat alokasi untuk program pembangunan dan kegiatan operasional yang baru. Tindakan ini berarti bahwa belanja pegawai tidak memperoleh tinjauan yang sama seperti belanja yang lain oleh Kementerian Keuangan, walaupun jumlahnya melampaui 20 persen dari belanja pemerintah pusat dan, secara agregat, lebih dari 30 persen dari jumlah belanja pemerintah. Pertukaran antara belanja pegawai dan kelompok pengeluaran lainnya pada tingkat kelembagaan (Kementerian/Lembaga, K/L), program atau kegiatan tidaklah mudah, dan hanya tersedia insentif yang minim untuk melakukan rasionalisasi atau untuk mengelola belanja pegawai. Hal ini berarti bahwa tingkat belanja untuk pegawai pada lembaga pemerintahan ditentukan oleh pihak ketiga, MenPAN-RB, melalui persetujuannya atas formasi pegawai, dan bukan oleh K/L terkait atau oleh Kementerian Keuangan.
…karena belanja pegawai tidak disertakan di dalam anggaran suatu program atau kegiatan
Seperti telah disebut, Indonesia baru-baru ini meluncurkan penganggaran berbasis kinerja, yang bertujuan untuk menggeser pendekatan manajemen anggaran dari segi masukan/input menuju tujuan pengeluaran dan hasil/output yang didapatkan. Dengan reformasi ini, anggaran operasional harus dialokasikan kepada kegiatan atau sub-

P e r k e m b a n g a n T r i w u l a n a n P e r e k o n o m i a n I n d o n e s i a
M e n j a g a K e t a h a n a n
THE WORLD BANK | BANK DUNIA Oktober 2012 35
program, dan sama halnya pengeluaran juga dikelola dengan cara yang sama. Tujuannya adalah agar para manajer pada akhirnya akan memiliki lebih banyak keleluasaan dalam pemilihan jenis masukan untuk memberikan hasil dan output yang diharapkan. Namun belanja pegawai, seperti gaji dan tunjangan, masih terus diperlakukan sebagai pengeluaran tambahan (overhead) administratif yang terpisah dari anggaran kegiatan/program. Tindakan ini mempersulit upaya untuk dengan tepat menentukan biaya sebenarnya dari suatu program atau kegiatan, karena biaya pegawai tidak dapat dikaitkan dengan output teknis apapun atau hasil kebijakan manapun.
Pendorong kedua dari peningkatan belanja pegawai adalah manajemen pemerintah atas tagihan gaji …
Pendorong kedua adalah manajemen pemerintah atas tagihan gaji, di mana peningkatan gaji pokok tahunan mendapat prioritas dalam alokasi sumber daya sesuai dengan ruang fiskal yang tersedia, yang sepertinya dilakukan tanpa adanya rujukan terhadap produktivitas yang jelas, atau perkembangan gaji pada sektor swasta atau terhadap tolok ukur lain manapun yang jelas dan transparan. Fakta bahwa tingkat pensiun pegawai negeri di lekatkan dengan indeksasi kepada peningkatan gaji tahunan, dan bukan kepada inflasi, semakin meningkatkan tingkat belanja. Hasil dari proses ini adalah bahwa sepanjang periode tahun 2009-2012 pegawai negeri menerima peningkatan gaji pokok tahunan masing-masing sebesar 15 persen, 5 persen, 10 persen dan 7 persen, atau rata-rata sebesar 9,25 persen, dan hampir dua juta pegawai negeri yang telah pensiun juga menerima peningkatan yang serupa. Selama empat tahun itu, rata-rata inflasi IHK tercatat sebesar 4,9 persen (proyeksi Bank Dunia untuk tahun 2012).10
…bersama-sama dengan proses reformasi birokrasi pada tingkat pemerintah pusat…
Selain itu, tunjangan Reformasi Birokrasi (BR) sudah diberikan kepada sejumlah K/L, dan pada tahun 2014, hampir delapan puluh lembaga pemerintah pusat akan menerima tunjangan tambahan ini. Reformasi Birokrasi adalah prakarsa pemerintah nasional yang bertujuan untuk: (1) mengadakan pemerintahan yang bersih dan bebas korupsi-kolusi dan nepotisme (KKN); (2) meningkatkan kualitas pelayanan masyarakat; dan (3) meningkatkan kapasitas dan akuntabilitas kinerja birokrat melalui sembilan program utama yang mencakup, antara lain, manajemen perubahan, peningkatan proses usaha, peningkatan SDM dan penyamaan UU dan peraturan. Tingkat tunjangan BR pada Kementerian Keuangan, yang merupakan kementerian pertama yang menjalankan BR, ditentukan oleh Kementerian itu sendiri, sementara tingkatan untuk lembaga-lembaga BR berikutnya, walau lebih rendah, juga telah ditentukan tanpa proses tolok ukur yang transparan yang dapat membenarkan besarnya tingkatan itu atau besarnya perbedaan antar lembaga.
…dan tingkat tunjangan yang lain
Sistem remunerasi pegawai negeri Indonesia cukup rumit, dan pada beberapa bagian tidak jelas. Sistem itu menyertakan sejumlah unsur, seperti terlihat pada Gambar 32 (termasuk tunjangan BR), dan terdiri dari bagian-bagian seperti honorarium, yang dibayarkan kepada pegawai negeri untuk tugas-tugas seperti menghadiri rapat dan membuat pidato. Honorarium tidak digolongkan sebagai Biaya Pegawai, tetapi dianggarkan di bawah ‘barang dan jasa’. Para pengguna anggaran memiliki kebebasan yang cukup besar dalam mengalokasikan belanja honorarium, walaupun Pemerintah kini menerbitkan berbagai upaya untuk membatasi jumlah honorarium ini dan tunjangan khusus kementerian lainnya pada berbagai K/L.
Pendorong ketiga adalah rumus untuk menentukan besarnya dana alokasi umum (DAU)
Pendorong ketiga dari peningkatan belanja pegawai adalah tata cara perumusan Dana Alokasi Umum (DAU) bagi pemerintah daerah, dimana ukuran tagihan gaji pegawai negeri daerah menjadi satu penentu untuk menentukan ukuran alokasinya. Hal ini menciptakan insentif yang kuat bagi pemerintah daerah untuk memaksimalkan jumlah pegawainya dan meningkatkan tagihan gaji dan bukannya mengelola atau menurunkan belanja tersebut. Selain itu, karena proses untuk menentukan formasi pegawai tidak selalu jelas, dan berdasarkan kepada tolok ukur terhadap rencana cetak biru dan bukan terhadap kebutuhan operasional, pemerintah daerah telah dapat menerima persetujuan pemerintah pusat bagi peningkatan angkatan kerjanya. Pengaturan ini mengakibatkan 10 Walaupun tidak dapat dibandingkan secara langsung, menurut survei angkatan kerja SAKERNAS,
rata-rata upah nominal per jam bagi pegawai di sektor swasta meningkat sebesar 13 persen pada tahun hingga bulan Agustus 2009, 3 persen pada tahun hingga Agustus 2010 dan 12 persen pada tahun hingga bulan Agustus 2011. Data ini mencakup sembilan sektor pekerjaan dengan pengecualian layanan masyarakat, layanan sosial, layanan pribadi dan sektor pelayanan lainnya.
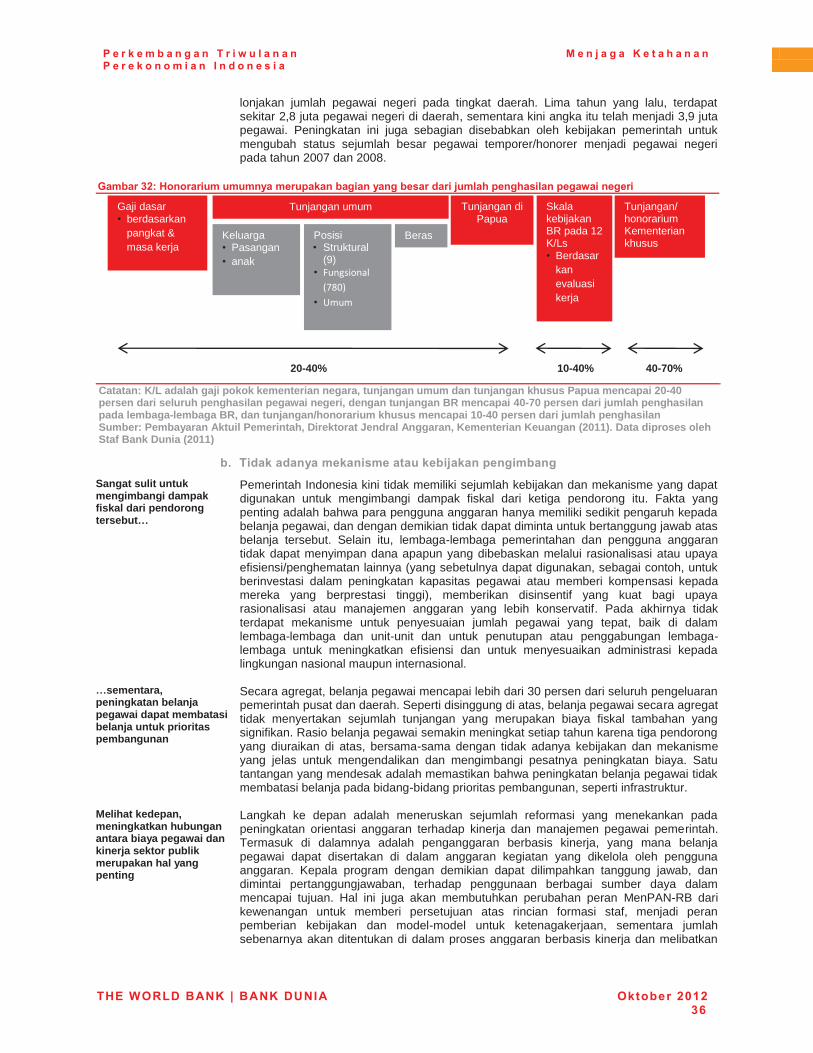
P e r k e m b a n g a n T r i w u l a n a n P e r e k o n o m i a n I n d o n e s i a
M e n j a g a K e t a h a n a n
THE WORLD BANK | BANK DUNIA Oktober 2012 36
lonjakan jumlah pegawai negeri pada tingkat daerah. Lima tahun yang lalu, terdapat sekitar 2,8 juta pegawai negeri di daerah, sementara kini angka itu telah menjadi 3,9 juta pegawai. Peningkatan ini juga sebagian disebabkan oleh kebijakan pemerintah untuk mengubah status sejumlah besar pegawai temporer/honorer menjadi pegawai negeri pada tahun 2007 dan 2008.
Gambar 32: Honorarium umumnya merupakan bagian yang besar dari jumlah penghasilan pegawai negeri
Catatan: K/L adalah gaji pokok kementerian negara, tunjangan umum dan tunjangan khusus Papua mencapai 20-40 persen dari seluruh penghasilan pegawai negeri, dengan tunjangan BR mencapai 40-70 persen dari jumlah penghasilan pada lembaga-lembaga BR, dan tunjangan/honorarium khusus mencapai 10-40 persen dari jumlah penghasilan Sumber: Pembayaran Aktuil Pemerintah, Direktorat Jendral Anggaran, Kementerian Keuangan (2011). Data diproses oleh Staf Bank Dunia (2011)
b. Tidak adanya mekanisme atau kebijakan pengimbang Sangat sulit untuk mengimbangi dampak fiskal dari pendorong tersebut…
Pemerintah Indonesia kini tidak memiliki sejumlah kebijakan dan mekanisme yang dapat digunakan untuk mengimbangi dampak fiskal dari ketiga pendorong itu. Fakta yang penting adalah bahwa para pengguna anggaran hanya memiliki sedikit pengaruh kepada belanja pegawai, dan dengan demikian tidak dapat diminta untuk bertanggung jawab atas belanja tersebut. Selain itu, lembaga-lembaga pemerintahan dan pengguna anggaran tidak dapat menyimpan dana apapun yang dibebaskan melalui rasionalisasi atau upaya efisiensi/penghematan lainnya (yang sebetulnya dapat digunakan, sebagai contoh, untuk berinvestasi dalam peningkatan kapasitas pegawai atau memberi kompensasi kepada mereka yang berprestasi tinggi), memberikan disinsentif yang kuat bagi upaya rasionalisasi atau manajemen anggaran yang lebih konservatif. Pada akhirnya tidak terdapat mekanisme untuk penyesuaian jumlah pegawai yang tepat, baik di dalam lembaga-lembaga dan unit-unit dan untuk penutupan atau penggabungan lembaga-lembaga untuk meningkatkan efisiensi dan untuk menyesuaikan administrasi kepada lingkungan nasional maupun internasional.
…sementara, peningkatan belanja pegawai dapat membatasi belanja untuk prioritas pembangunan
Secara agregat, belanja pegawai mencapai lebih dari 30 persen dari seluruh pengeluaran pemerintah pusat dan daerah. Seperti disinggung di atas, belanja pegawai secara agregat tidak menyertakan sejumlah tunjangan yang merupakan biaya fiskal tambahan yang signifikan. Rasio belanja pegawai semakin meningkat setiap tahun karena tiga pendorong yang diuraikan di atas, bersama-sama dengan tidak adanya kebijakan dan mekanisme yang jelas untuk mengendalikan dan mengimbangi pesatnya peningkatan biaya. Satu tantangan yang mendesak adalah memastikan bahwa peningkatan belanja pegawai tidak membatasi belanja pada bidang-bidang prioritas pembangunan, seperti infrastruktur.
Melihat kedepan, meningkatkan hubungan antara biaya pegawai dan kinerja sektor publik merupakan hal yang penting
Langkah ke depan adalah meneruskan sejumlah reformasi yang menekankan pada peningkatan orientasi anggaran terhadap kinerja dan manajemen pegawai pemerintah. Termasuk di dalamnya adalah penganggaran berbasis kinerja, yang mana belanja pegawai dapat disertakan di dalam anggaran kegiatan yang dikelola oleh pengguna anggaran. Kepala program dengan demikian dapat dilimpahkan tanggung jawab, dan dimintai pertanggungjawaban, terhadap penggunaan berbagai sumber daya dalam mencapai tujuan. Hal ini juga akan membutuhkan perubahan peran MenPAN-RB dari kewenangan untuk memberi persetujuan atas rincian formasi staf, menjadi peran pemberian kebijakan dan model-model untuk ketenagakerjaan, sementara jumlah sebenarnya akan ditentukan di dalam proses anggaran berbasis kinerja dan melibatkan
Gaji dasar • berdasarkan
pangkat & masa kerja
Tunjangan umum Tunjangan di Papua
Keluarga • Pasangan • anak
Posisi • Struktural
(9) • Fungsional
(780) • Umum
Beras
Skala kebijakan BR pada 12 K/Ls • Berdasar
kan evaluasi kerja
Tunjangan/ honorarium Kementerian khusus
20-40% 40-70% 10-40%
P e r k e m b a n g a n T r i w u l a n a n P e r e k o n o m i a n I n d o n e s i a
M e n j a g a K e t a h a n a n
THE WORLD BANK | BANK DUNIA Oktober 2012 37
pembahasan tentang bagaimana suatu lembaga dapat mengelola seluruh sumber dayanya dengan lebih baik, termasuk tujuan-tujuan penghematan/efisiensi bila dapat dicapai. Mekanisme untuk penyesuaian jumlah pegawai juga akan dibutuhkan.
2. Undang-Undang Pendidikan Tinggi: suatu pencapaian tetapi masih banyak tantangan di depan
UU Pendidikan Tinggi merupakan titik pencapaian yang signifikan menuju otonomi dan akuntabilitas lembaga-lembaga pendidikan di Indonesia, tetapi UU ini belum mendapat dukungan yang universal
Undang-Undang tentang Pendidikan Tinggi (UU 12/2012) akhirnya diluluskan oleh DPR pada tanggal 13 Juli 2012 dan penetapannya ditandatangani oleh Presiden pada tanggal 10 Agustus 2012. UU PT ini memiliki potensi untuk menjadi pencapaian yang signifikan menuju perluasan otonomi dan peningkatan akuntabilitas dari lembaga pendidikan tinggi (LPT) Indonesia, yaitu universitas, institut, sekolah tinggi, akademi, politeknik negeri dan swasta, dan akademi komunitas yang akan segera didirikan dalam jumlah besar di Indonesia. Sejauh mana potensi itu dapat direalisasikan perlu dinilai seiring berjalannya waktu; pada awalnya akan bergantung pada perkembangan kerangka peraturan yang akan mengarahkan jalannya UU dan kemudian pada implementasi dan penerapan prinsip-prinsip peraturan tersebut. Dukungan kepada UU PT yang baru juga belum bersifat universal, misalnya keprihatinan yang diangkat oleh sejumlah kelompok dari kalangan akademis dan masyarakat, termasuk Asosiasi Perguruan Tinggi Swasta Indonesia (APTISI), dimana media melaporkan bahwa mereka sedang mempertimbangkan untuk mengajukan uji materi atas aspek-aspek dari UU baru tersebut.11
Perluasan otonomi dengan peningkatan akuntabilitas berpotensi memodernisasi sektor pendidikan tinggi dan mendorong kinerja kelembagaan yang lebih baik, peningkatan keterampilan dan keberlanjutan pertumbuhan
Ketika otonomi yang lebih besar juga diikuti dengan akuntabilitas yang lebih tinggi maka hal itu dapat menjadi faktor penting dalam meningkatkan kinerja dari lembaga pendidikan, meningkatkan pencapaian pendidikan, ketrampilan dan pada akhirnya pertumbuhan produktivitas. Laporan Bank Dunia yang baru diterbitkan menyoroti bahwa “pendidikan yang lebih tinggi merupakan hal yang sangat penting bagi keberlanjutan pertumbuhan di negara-negara berpenghasilan rendah dan menengah di Asia Timur” dan dapat “meningkatkan produktivitas dan daya saing dengan: memberikan keterampilan tingkat tinggi yang dibutuhkan oleh pasar tenaga kerja – termasuk keterampilan teknis, perilaku, pemikiran, sains, teknologi, teknik dan matematika... [dan] memulai atau memperluas penelitian yang kuat yang dibutuhkan untuk inovasi dan pertumbuhan”.12 Walaupun sebagian besar penelitian empiris berasal dari negara-negara OECD, temuan umumnya adalah “[P]ada negara-negara yang memberikan kebebasan yang lebih besar, lembaga-lembaga pendidikan tinggi mampu berkarya dengan lebih mendorong kewirausahaan, menyesuaikan program-program mereka dengan permintaan siswa dan pasar tenaga kerja, dan memberikan respon yang efisien terhadap insentif-insentif pemerintah.”13
Dengan tingginya perhatian akan perdebatan tentang otonomi pendidikan tinggi, bagian berikut dari laporan ini meninjau bukti-bukti tentang akuntabilitas dan otonomi kelembagaan pendidikan tinggi di negara-negara lain, sebagai latar belakang dan konteks terhadap perkembangan di Indonesia. Selanjutnya diberikan ringkasan tentang aspek-aspek utama, inovasi dan perubahan yang terdapat pada UU PT yang baru, diikuti dengan kesimpulan penutup tentang langkah selanjutnya yang mungkin diambil, dan masalah-masalah yang berkaitan.
a. Potensi manfaat peningkatan akuntabilitas dan otonomi kelembagaan Penelitian-penelitian empiris, terutama untuk OECD, menunjukkan bahwa peningkatan
Apakah terdapat bukti tentang potensi manfaat dari otonomi dan akuntabilitas yang lebih besar terhadap kinerja lembaga pendidikan tinggi? Sejumlah penelitian menemukan bahwa kinerja penelitian universitas memiliki korelasi yang positif dengan otonomi lembaga pendidikan.14 Hasil simulasi juga menunjukkan bahwa reformasi kelembagaan 11 Lihat, sebagai contoh,
http://edukasi.kompas.com/read/2012/09/25/19393329/Gugatan.UU.PT.Diajukan.ke.MK. 12 World Bank (2011), Putting Higher Education to Work - Skills and Research for Growth in East
Asia, http://go.worldbank.org/JTFOQZP670. 13 Sondergaard, L. dan M. Murthi dengan Abu-Ghaida, D., Bodewig, C. dan J. Rutkowski (2012),
Skills, Not Just Diplomas: Managing Education for Results in Eastern Europe and Central Asia, Directions in Development Series, Bank Dunia, http://go.worldbank.org/E3A4O3PD30.
14 Lihat, sebagai contoh, Knott, J. H. dan A. A. Payne (2004), “The impact of state governance structures on management and performance of public organizations: A study of higher education
(footnote continued)
P e r k e m b a n g a n T r i w u l a n a n P e r e k o n o m i a n I n d o n e s i a
M e n j a g a K e t a h a n a n
THE WORLD BANK | BANK DUNIA Oktober 2012 38
otonomi kelembagaan berkaitan dengan dampak positif secara keseluruhan terhadap kegiatan akademis, peningkatan jumlah kelulusan dan produktivitas penelitian…
untuk meningkatkan fleksibilitas dan akuntabilitas dapat mendorong jumlah kelulusan yang jauh lebih besar dan penelitian juga menemukan bahwa otonomi dan kepemimpinan lembaga pendidikan dapat meningkatkan kemampuan LPT untuk turut serta di dalam pembangunan regional.15 Salah satu contoh yang menarik adalah reformasi hukum besar-besaran yang dilakukan di Jepang pada tahun 2004, yang memberikan status hukum kepada 89 universitas nasional terpisah dari Kementerian Pendidikan, serta memberikan otonomi keuangan dan status pegawai bukan pegawai negeri, dengan sejumlah pengaturan akuntabilitas seperti evaluasi eksternal dan struktur pengelolaan internal. Kajian sementara yang dilakukan pada tahun 2010 menunjukkan dampak yang positif secara umum, tidak hanya pada kegiatan pendidikan, tetapi juga pada kemampuan untuk memenangkan persaingan mencari dana penelitian, dan dalam kemampuan mereka untuk melibatkan masyarakat.16
….akan tetapi manfaat peningkatan otonomi tampaknya tidak akan dapat dipetik bila diterapkan aturan akuntabilitas yang terlalu berlebihan dan pendanaan tidak mencukupi
Namun potensi manfaat dari peningkatan otonomi tidaklah muncul secara otomatis. Sebagai contoh, kajian yang rinci tentang reformasi pengelolaan pendidikan tinggi yang dilakukan pada sejumlah negara di Eropa sejak tahun 90an, termasuk pada ekonomi-ekonomi transisi, menyimpulkan bahwa otonomi kelembagaan membawa dampak positif terhadap seluruh aspek kinerja, dan bahwa universitas-universitas Eropa harus diberikan otonomi kelembagaan lebih lanjut untuk mengembangkan strategi dan struktur, anggaran dan kebijakan sumber daya manusia mereka sendiri.17 Tetapi laporan itu juga memberikan dua peringatan. Pertama, dampak otonomi kelembagaan dapat dengan mudah hilang dengan persyaratan akuntabilitas yang berlebihan. Kedua, otonomi tanpa investasi pendanaan yang memadai juga akan mengalami kesulitan dalam membawa perubahan yang diharapkan.
b. Peningkatan otonomi pada era Paradigma Baru Indonesia dan pada UU PT tahun 2012
Indonesia mulai bergerak menuju otonomi kelembagaan pada tahun 1999 dan selama dekade berikutnya melakukan uji coba berbagai upaya otonomi sesuai Paradigma Baru
Seperti negara-negara lain, pencapaian keseimbangan antara otonomi kelembagaan dan akuntabilitasnya merupakan tantangan pada sistem pendidikan tinggi Indonesia sejak pertengahan tahun 90an. Dengan berkembangnya sektor pendidikan tinggi menjadi lebih kompleks dan beragam pada tahun 80an dan 90an, Direktorat Jenderal Pendidikan Tinggi (Dikti) di dalam Kementerian Pendidikan telah berusaha menyesuaikan posisinya dari pusat pengelolaan menjadi pemantau dan pengatur dengan penekanan pada akuntabilitas LPT atas hasil-hasil pendidikan. Sebagai tanggapan, LPT Indonesia meminta otonomi yang lebih besar, dengan mengatakan bahwa mereka tidak dapat diminta untuk bertanggung jawab jika mereka tidak dapat mengelola diri sendiri. Sebagai akibatnya, pada tahun 1999, Peraturan Pemerintah 61 memberikan sejumlah uji coba otonomi kepada empat universitas terbesar di Indonesia dengan memberikan status sebagai Badan Hukum Milik Negara (BHMN), dan dengan demikian memulai era yang kemudian disebut sebagai masa Paradigma Baru pada dekade berikutnya.18
Pada masa tersebut Indonesia merupakan pelopor dalam meningkatkan otonomi melalui pendanaan kompetitif, tetapi era Paradigma Baru hanya menjadi uji coba tanpa
Paradigma baru ini menekankan kepada peningkatan efisiensi dan efektivitas manajemen LPT dan kualitas dan relevansi hasil-hasil pendidikan. Karena memahami bahwa efisiensi dan peningkatan “kepemilikan” akan berasal dari perencanaan dari bawah ke atas dan bahwa pengguna akhir berada pada posisi terbaik untuk menentukan kebutuhan mereka sendiri, pendanaan kompetitif meningkat dari di bawah 5 persen dari anggaran pembangunan Dikti pada awal tahun 90an menjadi lebih dari 30 persen pada tahun 2005. Pada masa itu Indonesia dipandang sebagai pelopor dalam peningkatan otonomi LPT
institutions.” Journal of Policy Analysis and Management 23(1): 13-30 dan Aghion, P., Dewatripont, M., Hoxby, C. Mas-Colell, A. dan A. Sapir (2009), “The Governance and Performance of Research Universities: Evidence from Europe and the U.S.” NBER Working Paper Series No. 14851.
15 Lihat, masing-masing, Martins, J., Boarini, R., Strauss, H. de la Maisonneuve C., dan C. Saadi (2007), “The Policy Determinants of Investment in Tertiary Education”, OECD Economic Department Working Paper No. 576 and OECD (2008), Tertiary Education for the Knowledge Society Vol. 1.
16 Japanese Ministry of Education, Culture, Sports, Science and Technology (2010), Status and Issues Following Incorporation of National Universities: Interim Report (laporan bahasa Jepang). 17 Center for Higher Education Policy Studies, International Centre for Higher Education Research,
(2008), Progress in Higher Education Reform Across Europe: Governance Reform. 18 Empat universitas adalah ITB, IPB, UI dan UGM. Lima tahun berikutnya tiga universitas lain
mendapat status BHMN, yaitu USU, UNAIR dan UPI.
P e r k e m b a n g a n T r i w u l a n a n P e r e k o n o m i a n I n d o n e s i a
M e n j a g a K e t a h a n a n
THE WORLD BANK | BANK DUNIA Oktober 2012 39
landasan hukum melalui pemberian dana hibah bersaing dengan kajian sejawat dan Indonesia menjadi acuan bagi sistem pendidikan tinggi di negara-negara berkembang lainnya seperti Sri Lanka dan kemudian Tunisia dan Mozambik. Akan tetapi masa Paradigma Baru tetap menjadi suatu uji coba tanpa landasan hukum.
Dibutuhkan satu dekade sejak dimulainya era Paradigma Baru sebelum inovasi ini akhirnya diformalisasi secara hukum, tetapi produk hukum ini hanya berumur pendek
Rumit dan sulitnya pencapaian kemufakatan, menyebabkan tidak kurang dari sepuluh tahun setelah masa Paradigma Baru dimulai barulah UU Badan Hukum Pendidikan (BHP) tahun 2009 (UU 9/2009) diratifikasi sebagai peresmian otonomi yang diberikan pada uji coba yang dimulai dengan PP 61. Akan tetapi hanya sebelas bulan sejak penetapannya, UU BHP dibatalkan oleh Mahkamah Konstitusi.
Dalam kurang dari satu tahun UU 9/2009 dibatalkan, didasarkan pada anggapan bahwa otonomi sama dengan komersialisasi pendidikan tinggi….
Secara mendasar kritik terhadap UU 9/2009 memiliki dua sisi; pertama, dan yang paling menyulitkan, adalah tudingan bahwa otonomi kelembagaan adalah sama dengan komersialisasi pendidikan tinggi, pengalaman BHMN menunjukkan bahwa langkah itu mendorong peningkatan biaya pendidikan sehingga menyulitkan akses bagi kaum miskin menuju pendidikan tinggi. Biaya pendidikan memang meningkat pada lembaga-lembaga BHMN sejak tahun 1999 tetapi kenaikan ini diukur dari basis yang sangat rendah dan pandangan yang sangat sempit mengatakan bahwa pendorongnya hanya karena peningkatan komersialisasi tanpa memperhatikan kebutuhan biaya sebenarnya dalam memberikan pendidikan tinggi yang berkualitas19
…dan dalam menetapkan jangka waktu bagi seluruh lembaga untuk mendapat otonomi, UU itu mengabaikan keberagaman kapasitas yang ada pada berbagai LPT di Indonesia
Kedua, kritikus mengatakan bahwa dengan menetapkan jangka waktu bagi seluruh LPT untuk mendapat otonomi kelembagaan sebagai kesatuan yang independen secara finansial, UU 9/2009 telah lalai memperhitungkan perbedaan yang sangat besar di dalam perkembangan dan kapasitas kelembagaan LPT Indonesia dan kesiapan mereka untuk menerima otonomi yang lebih besar. Pergerakan menuju otonomi kelembagaan yang lebih besar menerima dua pukulan karena secara bersamaan Kementerian Keuangan menegaskan bahwa, dimulai pada Tahun Fiskal 2009, taraf otonomi manajemen keuangan yang selama ini memiliki keleluasaan pendanaan lewat hibah akan ditarik, dan mengharuskan pendanaan untuk LPT negeri melalui jalur Daftar Isian Pelaksanaan Anggaran (DIPA).
UU 12/2012 membuka kemungkinan bagi otonomi kelembagaan…
UU PT yang baru meletakkan dasar bagi manajemen LPT dan transisi menuju otonomi kelembagaan, termasuk klausa “pokok” untuk universitas-universitas dengan pengalaman otonomi pada masa Paradigma Baru. Sesungguhnya, sebagian besar debat tentang otonomi kelembagaan pada UU PT yang baru berkisar pada bagaimana menangani status LPT-LPT yang telah memiliki pengalaman otonomi. Universitas-universitas tersebut akan mendapat status baru sebagai Perguruan Tinggi Negara Badan Hukum (PTNBH) untuk waktu yang tidak melampaui dua tahun. Sementara itu mereka harus mengikuti prosedur yang ada bagi manajemen keuangan Badan Layanan Umum (BLU) sampai Peraturan Pemerintah pelaksananya ditetapkan20 dan mengubah status BHMN mereka sesuai dengan status baru mereka sebagai PTNBH.
….tetapi dengan persyaratan khusus
Untuk LPT yang tidak tercakup oleh klausa pokok tersebut, terdapat persyaratan khusus pada Pasal 62 yang menyatakan bahwa otonomi harus dilakukan sesuai dengan tujuan dan kapasitas lembaga tersebut, bahwa tujuan dan kapasitas LPT akan dievaluasi oleh lembaga independen (yang belum ditentukan) dan “aturan selanjutnya” tentang dasar, tujuan dan kapasitas untuk melaksanakan otonomi akan dirinci dalam suatu Peraturan Menteri. Sementara lima prinsip yang dinyatakan sebagai dasar otonomi pada Pasal 63 memang menggunakan praktik terbaik internasional; akuntabilitas; transparansi; nirlaba; jaminan kualitas; dan efektivitas dan efisiensi; masalahnya akan terletak pada rincian bagaimana lembaga-lembaga pendidikan dievaluasi sesuai dengan prinsip-prinsip dan oleh siapa dan untuk jangka waktu berapa lama.
19 Bank Dunia (2010), Indonesia: Higher Education Financing, Bagian 2.2, halaman 22 – 26. 20 Dikti telah membentuk kelompok kerja dan memperkirakan bahwa rancangan akhir peraturan
pendanaan akan siap disahkan pada bulan Desember 2012.
P e r k e m b a n g a n T r i w u l a n a n P e r e k o n o m i a n I n d o n e s i a
M e n j a g a K e t a h a n a n
THE WORLD BANK | BANK DUNIA Oktober 2012 40
c. Usulan inovatif pada UU PT yang baru UU 12/2012 mengusulkan sejumlah inovasi yang penting…
Walaupun memang merupakan penekanan utama, UU PT yang baru tidak hanya merupakan UU untuk otonomi kelembagaan, karena cakupannya juga melibatkan jaminan kualitas, akses dan pemerataan, yang membuka kemungkinan pendirian universitas asing, perluasan jalur pendidikan tinggi, prioritas dan modalitas pendanaan, dan pengembangan lembaga-lembaga baru. UU ini mencakup pendidikan tinggi pemerintah dan swasta, walaupun perguruan tinggi swasta (PTS) hanya mendapat perhatian yang minim. Namun pemberi layanan swasta dapat merasa lega karena segelintir rujukan yang ada memberikan dukungan kepada operasi PTS; memperluas komitmen Pemerintah untuk membayar tunjangan sertifikasi bagi para dosen PTS dan menyertakan lembaga-lembaga swasta di dalam program insentif untuk mendorong kegiatan penelitian.
Menurut UU PT yang baru,pendidikan tinggi diberikan melalui tiga jalur: akademik, profesi dan kejuruan
UU tahun 1989 menetapkan sistem pendidikan tinggi dengan jalur ganda – akademik, yaitu pendidikan tradisional, yang lebih banyak berdasarkan teori, melalui jalur universitas, dan profesi, dijelaskan sebagai pendidikan berorientasi kejuruan yang disampaikan melalui politeknik. Dengan UU PT yang baru, definisi dan rincian jalur akademik tidak berubah tetapi jalur profesi merupakan pendidikan tingkat sarjana ke atas untuk lapangan kerja yang membutuhkan kualifikasi khusus, dan memperkenalkan jalur kejuruan/vokasi sebagai pendidikan praktik tingkat diploma yang menyiapkan para mahasiswa untuk bekerja pada bidang yang spesifik.
Jalur kejuruan mendukung pembentukan Akademi Komunitas sebagai jenis LPT yang baru dan tugas utama Pemerintah adalah memastikan bahwa pendiriannya didorong oleh permintaan industri dan masyarakat akan kebutuhan mereka, dan bukan persepsi lembaga pendidikan akan apa yang dapat mereka berikan
Jalur pendidikan tinggi kejuruan yang baru menyesuaikan dengan usulan pemerintah untuk menciptakan akademi komunitas di kabupaten, kotamadya dan daerah-daerah terpencil. Pemerintah telah memutuskan untuk memulai secepat mungkin dan hendak memiliki 550 akademi komunitas pada akhir tahun 2015. Akademi komunitas ini diperkirakan akan dibangun melalui enam cara: bekerja sama dengan LPT yang ada; bekerja sama dengan masyarakat setempat; berkerja sama dengan pemerintah setempat; bekerja sama dengan industri lokal dan regional; melalui peningkatan kursus pendidikan non-formal yang telah ada yang dijalankan oleh pemberi pelatihan swasta non-formal; dan sebagai lembaga baru yang berdiri sendiri di mana terdapat permintaan yang belum terpenuhi. Implikasi anggaran untuk pendirian akademi komunitas akan cukup besar; laporan Dikti memperkirakan biaya pembangunan suatu Akademi Komunitas yang berdiri sendiri memerlukan biaya sebesar 50 miliar rupiah (5,3 juta dolar AS)21. Pembangunan lima puluh Akademi Komunitas, yang hanya merupakan sepuluh persen dari sasaran, akan menghabiskan seperlima dari anggaran modal tahunan Dikti. Mayoritas Akademi Komunitas tersebut diperkirakan akan memperoleh pendanaan dengan kerja sama usaha, namun dengan adanya aturan “20 persen” bagi pendidikan sebagai bagian dari jumlah belanja pemerintah, biaya pelaksanaan sasaran tersebut akan membutuhkan alokasi ulang di dalam kerangka belanja pendidikan yang ada dan bukan sebagai “tambahan”. 22
UU itu banyak berisi rujukan tentang sifat “nirlaba” dari pendidikan tinggi…
Kritik terhadap UU Pendidikan Tinggi tahun 2009 bahwa pendidikan tinggi Indonesia menjadi lebih komersil membawa dampak yang kuat terhadap penyusunan UU PT yang baru . Sejumlah bagian dari UU PT yang baru menekankan prinsip dasar dunia pendidikan Indonesia, bagi pemberi layanan pemerintah dan swasta, bahwa “tidak untuk mencari keuntungan”.
…dan dukungan operasional diperkenalkan untuk memberikan kompensasi kepada LPT negeri atas penurunan biaya pendidikan dan penurunan penerimaan dari mahasiswa, yang
Kepekaan terhadap tingginya biaya pendidikan bagi para siswa terlihat nyata dengan peluncuran dukungan operasional untuk memberikan kompensasi bagi LPT negeri atas penurunan penerimaan dari biaya pendidikan. LPT negeri di Indonesia pada umumnya menerima dana dari dua sumber – biaya yang dibayar oleh mahasiswa pada satu sisi (sekitar sepertiga dari pendapatan) dan alokasi pemerintah pada sisi yang lain (sekitar 60 persen) dengan keseimbangan yang datang dari biaya layanan kepada masyarakat dan atau industri. UU PT yang baru menyatakan bahwa Pemerintah akan menentukan dan menerapkan biaya unit standar untuk operasi pendidikan tinggi untuk setiap program studi 21 Kompas, http://edukasi.kompas.com 2012/09/09/14064172/Akademi.Komunitas. 22 Untuk rincian dan analisis lebih lanjut tentang aturan “20 persen”, lihat Bagian C dari Laporan
Triwulanan edisi bulan April 2012.
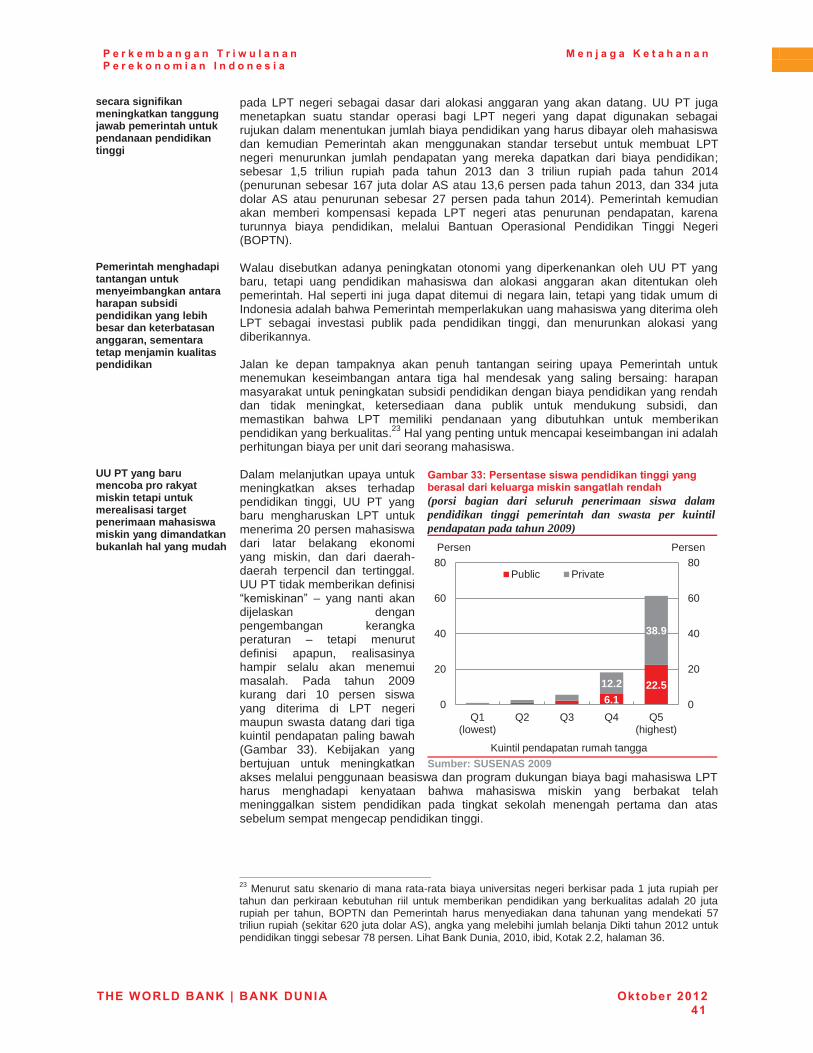
P e r k e m b a n g a n T r i w u l a n a n P e r e k o n o m i a n I n d o n e s i a
M e n j a g a K e t a h a n a n
THE WORLD BANK | BANK DUNIA Oktober 2012 41
secara signifikan meningkatkan tanggung jawab pemerintah untuk pendanaan pendidikan tinggi
pada LPT negeri sebagai dasar dari alokasi anggaran yang akan datang. UU PT juga menetapkan suatu standar operasi bagi LPT negeri yang dapat digunakan sebagai rujukan dalam menentukan jumlah biaya pendidikan yang harus dibayar oleh mahasiswa dan kemudian Pemerintah akan menggunakan standar tersebut untuk membuat LPT negeri menurunkan jumlah pendapatan yang mereka dapatkan dari biaya pendidikan; sebesar 1,5 triliun rupiah pada tahun 2013 dan 3 triliun rupiah pada tahun 2014 (penurunan sebesar 167 juta dolar AS atau 13,6 persen pada tahun 2013, dan 334 juta dolar AS atau penurunan sebesar 27 persen pada tahun 2014). Pemerintah kemudian akan memberi kompensasi kepada LPT negeri atas penurunan pendapatan, karena turunnya biaya pendidikan, melalui Bantuan Operasional Pendidikan Tinggi Negeri (BOPTN).
Pemerintah menghadapi tantangan untuk menyeimbangkan antara harapan subsidi pendidikan yang lebih besar dan keterbatasan anggaran, sementara tetap menjamin kualitas pendidikan
Walau disebutkan adanya peningkatan otonomi yang diperkenankan oleh UU PT yang baru, tetapi uang pendidikan mahasiswa dan alokasi anggaran akan ditentukan oleh pemerintah. Hal seperti ini juga dapat ditemui di negara lain, tetapi yang tidak umum di Indonesia adalah bahwa Pemerintah memperlakukan uang mahasiswa yang diterima oleh LPT sebagai investasi publik pada pendidikan tinggi, dan menurunkan alokasi yang diberikannya. Jalan ke depan tampaknya akan penuh tantangan seiring upaya Pemerintah untuk menemukan keseimbangan antara tiga hal mendesak yang saling bersaing: harapan masyarakat untuk peningkatan subsidi pendidikan dengan biaya pendidikan yang rendah dan tidak meningkat, ketersediaan dana publik untuk mendukung subsidi, dan memastikan bahwa LPT memiliki pendanaan yang dibutuhkan untuk memberikan pendidikan yang berkualitas.23 Hal yang penting untuk mencapai keseimbangan ini adalah perhitungan biaya per unit dari seorang mahasiswa.
UU PT yang baru mencoba pro rakyat miskin tetapi untuk merealisasi target penerimaan mahasiswa miskin yang dimandatkan bukanlah hal yang mudah
Dalam melanjutkan upaya untuk meningkatkan akses terhadap pendidikan tinggi, UU PT yang baru mengharuskan LPT untuk menerima 20 persen mahasiswa dari latar belakang ekonomi yang miskin, dan dari daerah-daerah terpencil dan tertinggal. UU PT tidak memberikan definisi “kemiskinan” – yang nanti akan dijelaskan dengan pengembangan kerangka peraturan – tetapi menurut definisi apapun, realisasinya hampir selalu akan menemui masalah. Pada tahun 2009 kurang dari 10 persen siswa yang diterima di LPT negeri maupun swasta datang dari tiga kuintil pendapatan paling bawah (Gambar 33). Kebijakan yang bertujuan untuk meningkatkan akses melalui penggunaan beasiswa dan program dukungan biaya bagi mahasiswa LPT harus menghadapi kenyataan bahwa mahasiswa miskin yang berbakat telah meninggalkan sistem pendidikan pada tingkat sekolah menengah pertama dan atas sebelum sempat mengecap pendidikan tinggi.
Gambar 33: Persentase siswa pendidikan tinggi yang berasal dari keluarga miskin sangatlah rendah (porsi bagian dari seluruh penerimaan siswa dalam pendidikan tinggi pemerintah dan swasta per kuintil pendapatan pada tahun 2009)
Sumber: SUSENAS 2009
23 Menurut satu skenario di mana rata-rata biaya universitas negeri berkisar pada 1 juta rupiah per tahun dan perkiraan kebutuhan riil untuk memberikan pendidikan yang berkualitas adalah 20 juta rupiah per tahun, BOPTN dan Pemerintah harus menyediakan dana tahunan yang mendekati 57 triliun rupiah (sekitar 620 juta dolar AS), angka yang melebihi jumlah belanja Dikti tahun 2012 untuk pendidikan tinggi sebesar 78 persen. Lihat Bank Dunia, 2010, ibid, Kotak 2.2, halaman 36.
6.1 22.5 12.2
38.9
0
20
40
60
80
0
20
40
60
80
Q1(lowest)
Q2 Q3 Q4 Q5(highest)
Public Private
Persen Persen
Kuintil pendapatan rumah tangga
P e r k e m b a n g a n T r i w u l a n a n P e r e k o n o m i a n I n d o n e s i a
M e n j a g a K e t a h a n a n
THE WORLD BANK | BANK DUNIA Oktober 2012 42
UU PT yang baru juga mengarahkan LPT untuk meningkatkan belanja untuk penelitian, langkah yang tepat untuk merespon rendahnya anggaran penelitian
Pemerintah akan mengalokasikan 30 persen dari dana bantuan operasional yang baru untuk mendanai penelitian dan pendanaan itu terbuka untuk LPT negeri maupun swasta, dan mengharuskan universitas negeri maupun swasta untuk mengalokasikan tambahan 30 persen dari anggaran operasi mereka untuk penelitian. Ditengah rendahnya tingkat pendanaan untuk penelitian di Indonesia, prakarsa baru ini merupakan langkah ke arah yang tepat, tetapi langkah itu hanyalah langkah kecil dan masih akan menghadapi tantangan akan bagaimana memanfaatkan dana penelitian baru tersebut secara efektif di dalam kerangka sistem pendanaan publik.24
Tantangannya adalah memastikan bahwa dukungan untuk meningkatkan pendapatan staf LPT swasta dapat meningkatkan kompetensi pengajaran atau hasil-hasil pendidikan
Pemerintah akan memberi kontribusi berupa tunjangan profesi pengajar, tunjangan honor profesor, dan investasi dan pembangunan di universitas-universitas swasta. Prakarsa ini membuka kewajiban berjalan yang cukup besar bagi Pemerintah yang dalam praktiknya tampaknya Pemerintah akan mendanai bagian yang signifikan dari sektor sumber daya manusia pada pendidikan tinggi, karena pada tahun 2014 seluruh pengajar harus memenuhi kriteria sertifikasi dan dengan demikian berhak menerima tunjangan profesi. Bukti-bukti terakhir dari hasil uji kompetensi guru-guru sekolah dasar dan menengah dalam skala nasional menunjukkan bahwa tidak ada dampak terhadap kompetensi guru atau hasil-hasil siswa yang berkaitan dengan sertifikasi, dan tantangannya adalah untuk memastikan bahwa hasil tersebut tidak akan terulang pada pendidikan tinggi.25
Universitas asing dapat membuka cabang tetapi Pemerintah memegang kendali yang signifikan
UU PT yang baru membuka kemungkinan bagi pendirian LPT asing dengan syarat bahwa mereka telah memiliki akreditasi di negara asalnya, mendapat ijin dari pemerintah, mengusung prinsip nirlaba, dan bersedia bekerja sama dengan LPT Indonesia “dengan persetujuan Pemerintah” yang artinya bahwa Pemerintah memiliki hak veto atas hubungan antara LPT asing dan Indonesia. LPT asing juga harus memberikan prioritas untuk menggunakan staf pengajar dari Indonesia, dan “mendukung kepentingan nasional”. Tampaknya Pemerintah ingin memegang kendali yang besar pada hal terakhir ini dengan menentukan wilayah, dan jurusan pendidikan yang diperkenankan bagi LPT asing.
d. Langkah berikutnya dan tantangan masa depan Banyaknya revisi terhadap draft UU ini sebelum penetapan telah menyebabkan kesalahpahaman dan salah pengertian yang harus ditangani secepat mungkin dan disertai dengan pembangunan konsensus untuk mendukung peraturan pelaksanaan yang dibutuhkan
Debat dan upaya mencapai kesepakatan antar para pemangku kepentingan pada tahun yang lalu telah menyebabkan banyaknya revisi rancangan UU PT tersebut. Tantangan yang paling dekat yang dihadapi oleh Pemerintah dan Dikti adalah bagaimana menyebarkan informasi tentang isi sebenarnya dari UU PT yang baru, untuk menjelaskan kesalahpahaman apapun dan membangun dukungan. UU PT yang baru menyebut 31 Peraturan Menteri dan 11 Peraturan Pemerintah yang dibutuhkan dan harus disusun sesuai dengan aturan yang ditetapkan oleh UU Keuangan Negara tahun 2003, UU Perbendaharaan Negara tahun 2004, UU Pegawai Negeri tahun 1974 dan 1999, dan yang lain. Terdapat contoh-contoh dari UU dan peraturan pendidikan yang lalu26 yang tidak sejalan dengan kerangka legislatif Pemerintahan yang lebih luas, sehingga Kementerian Pendidikan, khususnya Dikti, harus membangun konsensus antar pemangku kepentingan untuk membentuk landasan yang kuat bagi langkah berikut yang mendesak untuk mengembangkan Peraturan yang dibutuhkan.
24 Bagian C dari Laporan Triwulanan edisi Desember 2011 meninjau inovasi dan litbang di Indonesia,
menyoroti belanja litbang Indonesia, pada 0,08 persen dari PDB di tahun 2009, sangat rendah dibanding negara pembanding satu wilayah seperti China (1,44 persen pada 2007), Malaysia (0,63 persen pada 2006) dan Thailand (0,26 persen pada 2006).
25 Bank Dunia, Oktober 2012, Policy Brief; Teacher Certification in Indonesia: A Doubling of Pay or a Way to Improve Learning?
26 Sebagai contoh PP 30/1990 memungkinkan LPT untuk mengumpulkan dan menyimpan pendapatan dari pembayaran dan kontrak untuk layanan kepada masyarakat dan industri, tetapi hal itu kemudian dibatalkan pada tahun yang sama dengan klarifikasi dari Kementerian Keuangan.
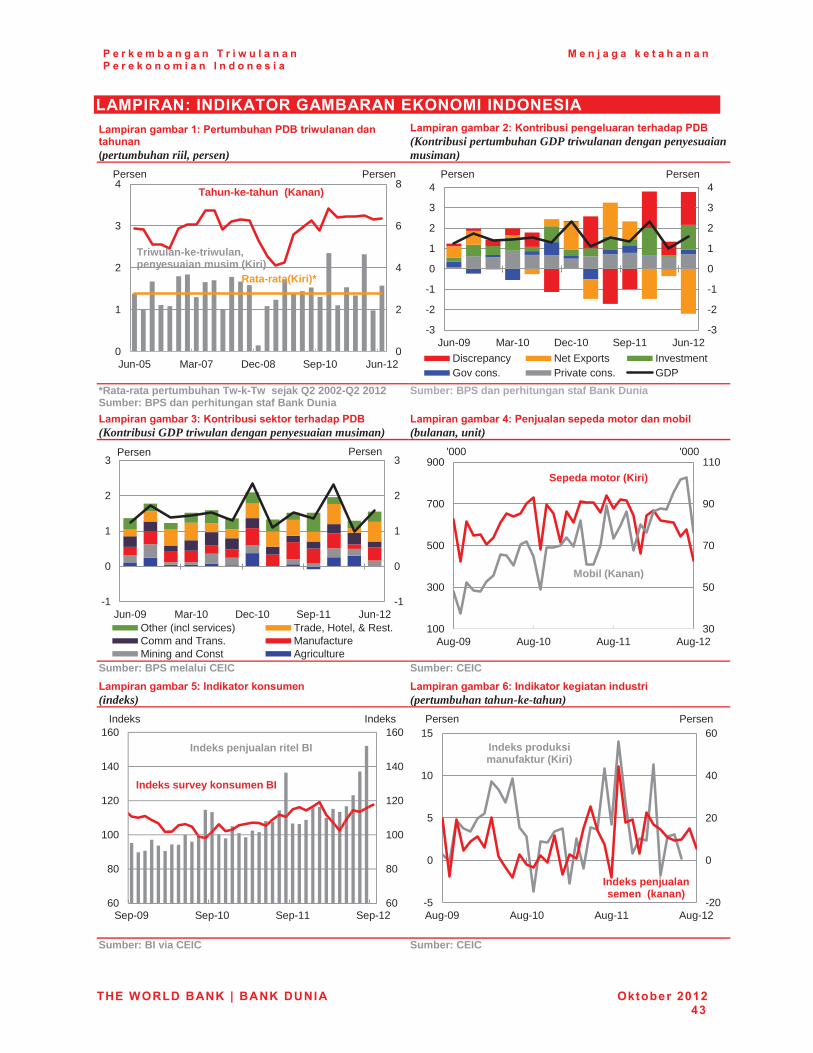
P e r k e m b a n g a n T r i w u l a n a n P e r e k o n o m i a n I n d o n e s i a
M e n j a g a k e t a h a n a n
THE WORLD BANK | BANK DUNIA Oktober 2012 43
LAMPIRAN: INDIKATOR GAMBARAN EKONOMI INDONESIA Lampiran gambar 1: Pertumbuhan PDB triwulanan dan tahunan (pertumbuhan riil, persen)
Lampiran gambar 2: Kontribusi pengeluaran terhadap PDB (Kontribusi pertumbuhan GDP triwulanan dengan penyesuaian musiman)
*Rata-rata pertumbuhan Tw-k-Tw sejak Q2 2002-Q2 2012 Sumber: BPS dan perhitungan staf Bank Dunia
Sumber: BPS dan perhitungan staf Bank Dunia
Lampiran gambar 3: Kontribusi sektor terhadap PDB (Kontribusi GDP triwulan dengan penyesuaian musiman)
Lampiran gambar 4: Penjualan sepeda motor dan mobil (bulanan, unit)
Sumber: BPS melalui CEIC Sumber: CEIC Lampiran gambar 5: Indikator konsumen (indeks)
Lampiran gambar 6: Indikator kegiatan industri (pertumbuhan tahun-ke-tahun)
Sumber: BI via CEIC Sumber: CEIC
0
2
4
6
8
0
1
2
3
4
Jun-05 Mar-07 Dec-08 Sep-10 Jun-12
Persen Persen
Triwulan-ke-triwulan, penyesuaian musim (Kiri)
Tahun-ke-tahun (Kanan)
Rata-rata(Kiri)*
-3
-2
-1
0
1
2
3
4
-3
-2
-1
0
1
2
3
4
Jun-09 Mar-10 Dec-10 Sep-11 Jun-12Discrepancy Net Exports InvestmentGov cons. Private cons. GDP
Persen Persen
-1
0
1
2
3
-1
0
1
2
3
Jun-09 Mar-10 Dec-10 Sep-11 Jun-12Other (incl services) Trade, Hotel, & Rest.Comm and Trans. ManufactureMining and Const Agriculture
Persen Persen
30
50
70
90
110
100
300
500
700
900
Aug-09 Aug-10 Aug-11 Aug-12
'000
Sepeda motor (Kiri)
'000
Mobil (Kanan)
60
80
100
120
140
160
60
80
100
120
140
160
Sep-09 Sep-10 Sep-11 Sep-12
Indeks Indeks
Indeks penjualan ritel BI
Indeks survey konsumen BI
-20
0
20
40
60
-5
0
5
10
15
Aug-09 Aug-10 Aug-11 Aug-12
Persen Persen
Indeks penjualan semen (kanan)
Indeks produksi manufaktur (Kiri)
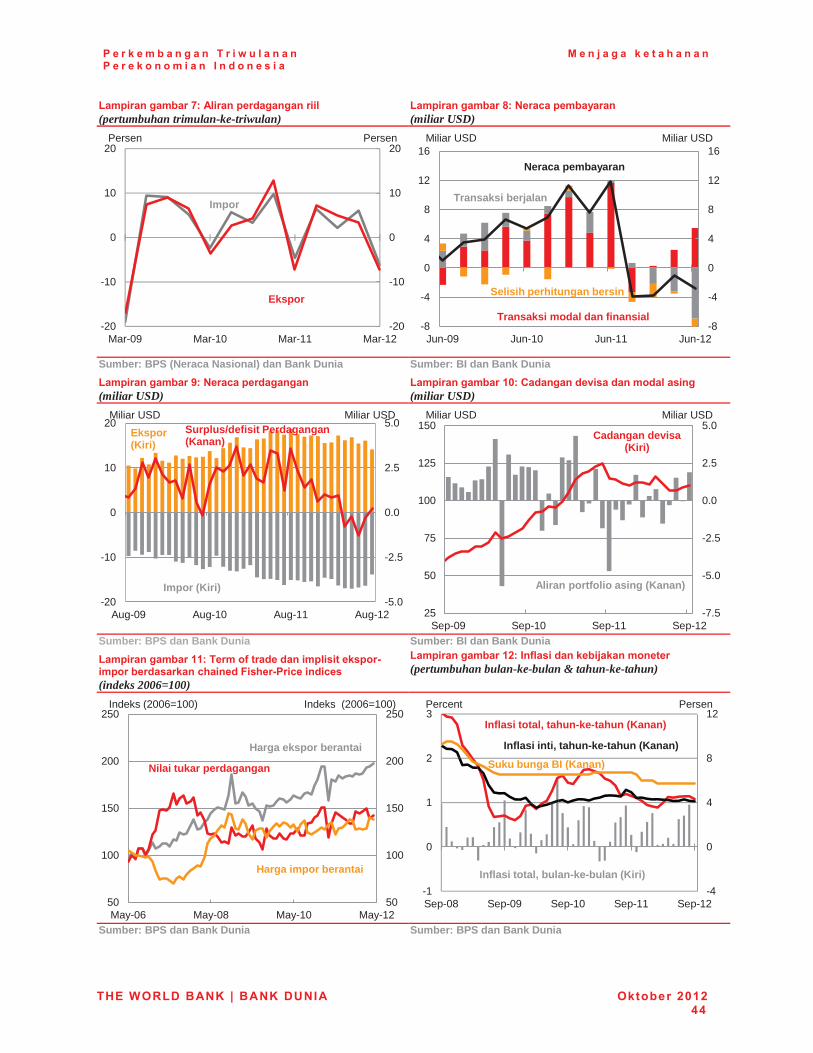
P e r k e m b a n g a n T r i w u l a n a n P e r e k o n o m i a n I n d o n e s i a
M e n j a g a k e t a h a n a n
THE WORLD BANK | BANK DUNIA Oktober 2012 44
Lampiran gambar 7: Aliran perdagangan riil (pertumbuhan trimulan-ke-triwulan)
Lampiran gambar 8: Neraca pembayaran (miliar USD)
Sumber: BPS (Neraca Nasional) dan Bank Dunia Sumber: BI dan Bank Dunia Lampiran gambar 9: Neraca perdagangan (miliar USD)
Lampiran gambar 10: Cadangan devisa dan modal asing (miliar USD)
Sumber: BPS dan Bank Dunia Sumber: BI dan Bank Dunia Lampiran gambar 11: Term of trade dan implisit ekspor- impor berdasarkan chained Fisher-Price indices (indeks 2006=100)
Lampiran gambar 12: Inflasi dan kebijakan moneter (pertumbuhan bulan-ke-bulan & tahun-ke-tahun)
Sumber: BPS dan Bank Dunia Sumber: BPS dan Bank Dunia
-20
-10
0
10
20
-20
-10
0
10
20
Mar-09 Mar-10 Mar-11 Mar-12
Ekspor
Impor
Persen Persen
-8
-4
0
4
8
12
16
-8
-4
0
4
8
12
16
Jun-09 Jun-10 Jun-11 Jun-12
Miliar USD Miliar USD
Transaksi modal dan finansial
Transaksi berjalan
Neraca pembayaran
Selisih perhitungan bersin
-5.0
-2.5
0.0
2.5
5.0
-20
-10
0
10
20
Aug-09 Aug-10 Aug-11 Aug-12
Surplus/defisit Perdagangan (Kanan)
Ekspor (Kiri)
Impor (Kiri)
Miliar USD Miliar USD
-7.5
-5.0
-2.5
0.0
2.5
5.0
25
50
75
100
125
150
Sep-09 Sep-10 Sep-11 Sep-12
Cadangan devisa (Kiri)
Miliar USD Miliar USD
Aliran portfolio asing (Kanan)
50
100
150
200
250
50
100
150
200
250
May-06 May-08 May-10 May-12
Indeks (2006=100) Indeks (2006=100)
Nilai tukar perdagangan
Harga impor berantai
Harga ekspor berantai
-4
0
4
8
12
-1
0
1
2
3
Sep-08 Sep-09 Sep-10 Sep-11 Sep-12
Inflasi inti, tahun-ke-tahun (Kanan)
Inflasi total, tahun-ke-tahun (Kanan)
Inflasi total, bulan-ke-bulan (Kiri)
Percent Persen
Suku bunga BI (Kanan)
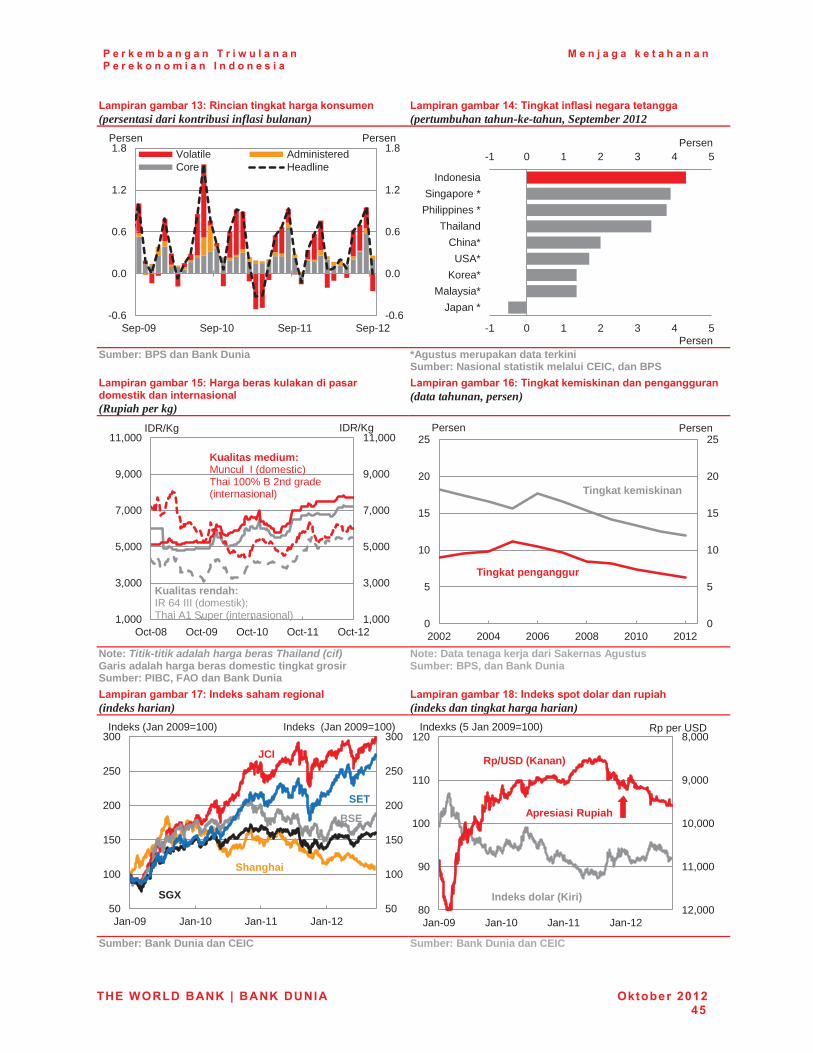
P e r k e m b a n g a n T r i w u l a n a n P e r e k o n o m i a n I n d o n e s i a
M e n j a g a k e t a h a n a n
THE WORLD BANK | BANK DUNIA Oktober 2012 45
Lampiran gambar 13: Rincian tingkat harga konsumen (persentasi dari kontribusi inflasi bulanan)
Lampiran gambar 14: Tingkat inflasi negara tetangga (pertumbuhan tahun-ke-tahun, September 2012
Sumber: BPS dan Bank Dunia *Agustus merupakan data terkini
Sumber: Nasional statistik melalui CEIC, dan BPS Lampiran gambar 15: Harga beras kulakan di pasar domestik dan internasional (Rupiah per kg)
Lampiran gambar 16: Tingkat kemiskinan dan pengangguran (data tahunan, persen)
Note: Titik-titik adalah harga beras Thailand (cif) Garis adalah harga beras domestic tingkat grosir Sumber: PIBC, FAO dan Bank Dunia
Note: Data tenaga kerja dari Sakernas Agustus Sumber: BPS, dan Bank Dunia
Lampiran gambar 17: Indeks saham regional (indeks harian)
Lampiran gambar 18: Indeks spot dolar dan rupiah (indeks dan tingkat harga harian)
Sumber: Bank Dunia dan CEIC Sumber: Bank Dunia dan CEIC
-0.6
0.0
0.6
1.2
1.8
-0.6
0.0
0.6
1.2
1.8
Sep-09 Sep-10 Sep-11 Sep-12
Volatile AdministeredCore Headline
Persen Persen
-1 0 1 2 3 4 5
-1 0 1 2 3 4 5
Japan *Malaysia*
Korea*USA*
China*Thailand
Philippines *Singapore *
Indonesia
Persen
Persen
1,000
3,000
5,000
7,000
9,000
11,000
1,000
3,000
5,000
7,000
9,000
11,000
Oct-08 Oct-09 Oct-10 Oct-11 Oct-12
Kualitas rendah: IR 64 III (domestik); Thai A1 Super (internasional)
IDR/Kg
Kualitas medium: Muncul I (domestic) Thai 100% B 2nd grade (internasional)
IDR/Kg
0
5
10
15
20
25
0
5
10
15
20
25
2002 2004 2006 2008 2010 2012
Persen Persen
Tingkat kemiskinan
Tingkat penganggur
50
100
150
200
250
300
50
100
150
200
250
300
Jan-09 Jan-10 Jan-11 Jan-12
Indeks (Jan 2009=100)
SGX
JCI
SET
Shanghai
BSE
Indeks (Jan 2009=100) 8,000
9,000
10,000
11,000
12,00080
90
100
110
120
Jan-09 Jan-10 Jan-11 Jan-12
Indexks (5 Jan 2009=100)
Rp/USD (Kanan)
Indeks dolar (Kiri)
Apresiasi Rupiah
Rp per USD
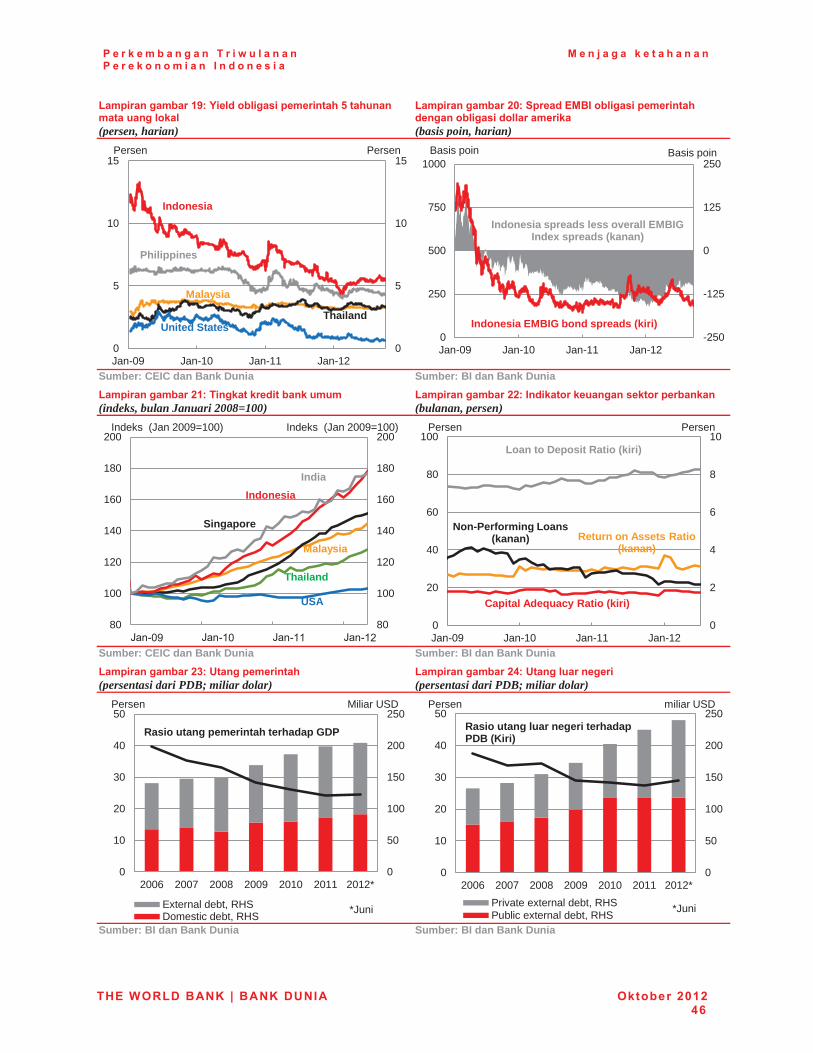
P e r k e m b a n g a n T r i w u l a n a n P e r e k o n o m i a n I n d o n e s i a
M e n j a g a k e t a h a n a n
THE WORLD BANK | BANK DUNIA Oktober 2012 46
Lampiran gambar 19: Yield obligasi pemerintah 5 tahunan mata uang lokal (persen, harian)
Lampiran gambar 20: Spread EMBI obligasi pemerintah dengan obligasi dollar amerika (basis poin, harian)
Sumber: CEIC dan Bank Dunia Sumber: BI dan Bank Dunia Lampiran gambar 21: Tingkat kredit bank umum (indeks, bulan Januari 2008=100)
Lampiran gambar 22: Indikator keuangan sektor perbankan (bulanan, persen)
Sumber: CEIC dan Bank Dunia Sumber: BI dan Bank Dunia Lampiran gambar 23: Utang pemerintah (persentasi dari PDB; miliar dolar)
Lampiran gambar 24: Utang luar negeri (persentasi dari PDB; miliar dolar)
Sumber: BI dan Bank Dunia Sumber: BI dan Bank Dunia
0
5
10
15
0
5
10
15
Jan-09 Jan-10 Jan-11 Jan-12
Persen
Philippines
United States Thailand
Malaysia
Indonesia
Persen
-250
-125
0
125
250
0
250
500
750
1000
Jan-09 Jan-10 Jan-11 Jan-12
Basis poin
Indonesia EMBIG bond spreads (kiri)
Indonesia spreads less overall EMBIG Index spreads (kanan)
Basis poin
80
100
120
140
160
180
200
80
100
120
140
160
180
200Indeks (Jan 2009=100)
USA
Thailand
Singapore
Indonesia India
Malaysia
Indeks (Jan 2009=100)
0
2
4
6
8
10
0
20
40
60
80
100
Jan-09 Jan-10 Jan-11 Jan-12
Capital Adequacy Ratio (kiri)
Return on Assets Ratio (kanan)
Loan to Deposit Ratio (kiri)
Persen Persen
Non-Performing Loans (kanan)
0
50
100
150
200
250
0
10
20
30
40
50
2006 2007 2008 2009 2010 2011 2012*
External debt, RHSDomestic debt, RHS
Persen Miliar USD
Rasio utang pemerintah terhadap GDP
*Juni
0
50
100
150
200
250
0
10
20
30
40
50
2006 2007 2008 2009 2010 2011 2012*Private external debt, RHSPublic external debt, RHS
Rasio utang luar negeri terhadap PDB (Kiri)
Persen miliar USD
*Juni
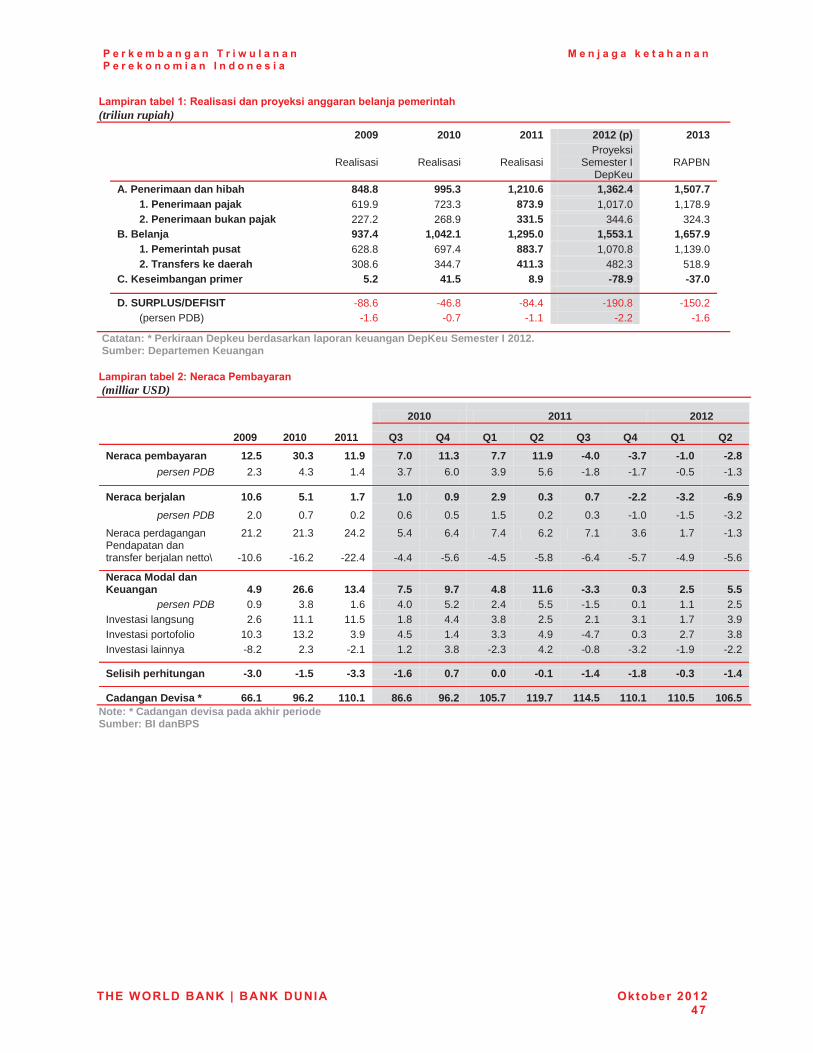
P e r k e m b a n g a n T r i w u l a n a n P e r e k o n o m i a n I n d o n e s i a
M e n j a g a k e t a h a n a n
THE WORLD BANK | BANK DUNIA Oktober 2012 47
Lampiran tabel 1: Realisasi dan proyeksi anggaran belanja pemerintah (triliun rupiah)
2009 2010 2011 2012 (p) 2013
Realisasi Realisasi Realisasi
Proyeksi Semester I
DepKeu RAPBN
A. Penerimaan dan hibah 848.8 995.3 1,210.6 1,362.4 1,507.7 1. Penerimaan pajak 619.9 723.3 873.9 1,017.0 1,178.9 2. Penerimaan bukan pajak 227.2 268.9 331.5 344.6 324.3 B. Belanja 937.4 1,042.1 1,295.0 1,553.1 1,657.9 1. Pemerintah pusat 628.8 697.4 883.7 1,070.8 1,139.0 2. Transfers ke daerah 308.6 344.7 411.3 482.3 518.9 C. Keseimbangan primer 5.2 41.5 8.9 -78.9 -37.0
D. SURPLUS/DEFISIT -88.6 -46.8 -84.4 -190.8 -150.2 (persen PDB) -1.6 -0.7 -1.1 -2.2 -1.6
Catatan: * Perkiraan Depkeu berdasarkan laporan keuangan DepKeu Semester I 2012. Sumber: Departemen Keuangan
Lampiran tabel 2: Neraca Pembayaran (milliar USD)
2010 2011 2012
2009 2010 2011 Q3 Q4 Q1 Q2 Q3 Q4 Q1 Q2 Neraca pembayaran 12.5 30.3 11.9 7.0 11.3 7.7 11.9 -4.0 -3.7 -1.0 -2.8
persen PDB 2.3 4.3 1.4 3.7 6.0 3.9 5.6 -1.8 -1.7 -0.5 -1.3
Neraca berjalan 10.6 5.1 1.7 1.0 0.9 2.9 0.3 0.7 -2.2 -3.2 -6.9 persen PDB 2.0 0.7 0.2 0.6 0.5 1.5 0.2 0.3 -1.0 -1.5 -3.2
Neraca perdagangan 21.2 21.3 24.2 5.4 6.4 7.4 6.2 7.1 3.6 1.7 -1.3 Pendapatan dan transfer berjalan netto\ -10.6 -16.2 -22.4 -4.4 -5.6 -4.5 -5.8 -6.4 -5.7 -4.9 -5.6
Neraca Modal dan Keuangan 4.9 26.6 13.4 7.5 9.7 4.8 11.6 -3.3 0.3 2.5 5.5
persen PDB 0.9 3.8 1.6 4.0 5.2 2.4 5.5 -1.5 0.1 1.1 2.5 Investasi langsung 2.6 11.1 11.5 1.8 4.4 3.8 2.5 2.1 3.1 1.7 3.9 Investasi portofolio 10.3 13.2 3.9 4.5 1.4 3.3 4.9 -4.7 0.3 2.7 3.8 Investasi lainnya -8.2 2.3 -2.1 1.2 3.8 -2.3 4.2 -0.8 -3.2 -1.9 -2.2
Selisih perhitungan -3.0 -1.5 -3.3 -1.6 0.7 0.0 -0.1 -1.4 -1.8 -0.3 -1.4
Cadangan Devisa * 66.1 96.2 110.1 86.6 96.2 105.7 119.7 114.5 110.1 110.5 106.5
Note: * Cadangan devisa pada akhir periode Sumber: BI danBPS


Desember 2012
Menyoroti kebijakan
PERKEMBANGAN TRIWULANANPEREKONOMIAN INDONESIA

Desember 2012
Menyoroti kebijakan
PERKEMBANGAN TRIWULANANPEREKONOMIAN INDONESIA
PERKEMBANGAN TRIWULANAN PEREKONOMIAN INDONESIA Menyoroti kebijakan
Desember 2012

Kata Pengantar
Perkembangan Triwulanan Perekonomian Indonesia menyajikan perkembangan utama ekonomi Indonesia dalam tiga bulan terakhir. Laporan ini menempatkan perkembangan tersebut dalam konteks jangka panjang dan global, serta memberikan penilaian terhadap prospek ekonomi dan kesejahteraan sosial Indonesia. Laporan ini ditujukan untuk khalayak termasuk pembuat kebijakan, pemimpin bisnis, pelaku pasar keuangan, serta komunitas analis dan professional yang terlibat dalam ekonomi Indonesia.
Laporan ini disiapkan dan disusun oleh tim kebijakan makro dan fiskal Bank Dunia Jakarta di bawah bimbingan Jim Brumby sebagai Lead Economist dan Sector Manager,Ndiame Diop sebagai Economic Adviser dan Lead Economist dan Ashley Taylor sebagai Country Economist. Tim penyusun terdiri dari Magda Adriani (harga komoditas), Shakira Jones (sektor riil), Fitria Fitrani (perdagangan), Faya Hayati (harga), Brendan Coates (neraca modal dan sektor keuangan), Ahya Ihsan (fiskal) dan Alex Sienaert. Kontribusi tambahan diterima dari Kiyoshi Taniguchi (peraturan pangan), Moez Miaoui dan Stefan Handoyo (corporate governance), Edgar Janz dan Astrid Rengganis Savitri (upah minimum), Fook Chuan Eng dan Iwan Gunawan (pencegahan banjir Jakarta), Jon Jellema (survei infrastruktur pedesaan), David Lawrence (pemulihan dari bencana), Djauhari Sitorus, Neni Lestari (perbankan) and The Fei Ming (sektor korporasi).Pengeditan dan produksi dilakukan oleh Alex Sienaert, Arsianti dan Ashley Taylor. Komentar serta masukan terperinci diberikan oleh Jim Brumby, Ndiame Diop, Soekarno Wirokartono, Vivi Alatas, Chris Manning, Sjamsu Rahardja, Bill Wallace, Arian Rahman, Anita Kendrick, Shamima Khan, Sudarno Sumarto dan Mark Vothknecht. Diseminasi diorganisir oleh Dini Sari Djalal, Farhana Asnap, Indra Irnawan, Jerry Kurniawan, Nugroho, Marcellinus Winata dan Randy Salim. Akhirnya, dukungan administratif yang sangat berharga diberikan oleh Titi Ananto, Sylvia Njotomihardjo dan Nina Herawati.
Dokumen ini diterjemahkan ke dalam Bahasa Indonesia oleh Nicolas Novianto dan diedit oleh Magda Adriani, Fitria Fitrani, Ahya Ihsan, Arsianti, Soekarno Wirokartono, Wahyoe Soedarmono, Safriza Sofyan, Astrid Rengganis Savitri dan Suryani Amin.
Laporan ini disusun oleh para staf International Bank for Reconstruction and Development /Bank Dunia, dengan dukungan pendanaan dari Pemerintah Australia - AusAID melalui program Support for Enhanced Macroeconomic and Fiscal Policy Analysis (SEMEFPA).
Temuan-temuan, interpretasi dan kesimpulan-kesimpulan yang dinyatakan di dalam laporan ini tidak selalu mencerminkan pandangan AusAID dan Pemerintah Australia, para Direktur Pelaksana Bank Dunia atau pemerintah yang diwakilinya. Bank Dunia tidak menjamin ketepatan data-data yang termuat dalam laporan ini. Batas-batas, warna, denominasi dan informasi-informasi lain yang digambarkan pada setiap peta di dalam laporan ini tidak mencerminkan pendapat Bank Dunia mengenai status hukum dari wilayah atau dukungan atau penerimaan dari batas-batas tersebut.
Foto sampul depan dan bagian dalam merupakan Hak Cipta @ PT Unilever dan Bank Dunia. Semua Hak Cipta dilindungi.
Untuk mendapatkan lebih banyak analisa Bank Dunia terhadap ekonomi Indonesia:
Untuk informasi mengenai Bank Dunia serta kegiatannya di Indonesia, silakan berkunjung ke website ini www.worldbank.org/id
Untuk mendapatkan publikasi terkait melalui e-mail, silakan menghubungi [email protected]. Untuk pertanyaan dan saran berkaitan dengan publikasi ini, silakan menghubungi [email protected].
Daftar Isi
Kata Pengantar iii �
Ringkasan eksekutif: Menyoroti kebijakan v �
A. � PERKEMBANGAN EKONOMI DAN FISKAL TERKINI 1 �
1.� Pertumbuhan ekonomi global masih tetap lemah, diperkirakan hanya sedikit membaik di tahun 2013 1�
2.� Pertumbuhan ekonomi Indonesia tetap kuat, sedikit melambat di kuartal ketiga 2�3.� Ekspor masih tertekan tetapi aliran masuk modal tetap kuat 7�4.� Penurunan inflasi terus berlanjut tetapi tekanan dorongan biaya (cost-push) muncul pada tahun
2013 9�5.� Aliran masuk portofolio investasi asing kembali meningkat sementara pertumbuhan kredit
melambat 13�6.� Defisit fiskal melebar karena naiknya belanja subsidi dan lemahnya pertumbuhan penerimaan16�7.� Pengambil kebijakan menghadapi serangkaian risiko dari dalam dan luar negeri pada tahun
2013 22�
B. � BEBERAPA PERKEMBANGAN TERKINI PEREKONOMIAN INDONESIA 24 �
1.� Apakah kenaikan upah minimum akan mempengaruhi penciptaan lapangan kerja di Indonesia24�a.� Tingkat upah minimum dan peraturan perlindungan pekerja di Indonesia .............................. 25�b.� Pengaruh kenaikan upah minimum terhadap penciptaan lapangan kerja ............................... 27�c.� Perubahan dalam proses penetapan upah minimum ................................................................. 29�d.� Menggunakan visi jangka panjang terhadap penciptaan lapangan kerja dan perlindungan
pekerja ............................................................................................................................................ 29�2.� Membangun ketahanan Jakarta terhadap banjir 31�
a.� Tingkat keparahan banjir semakin meningkat, membebankan biaya yang signifikan ............ 31�b.� Pola cuaca, urbanisasi, penurunan permukaan tanah dan iklim semuanya memainkan
peran… ........................................................................................................................................... 33�c.� …tetapi berbagai tindakan dapat dilakukan untuk meningkatkan ketahanan Jakarta terhadap
banjir ............................................................................................................................................... 34�
C. � INDONESIA TAHUN 2014 DAN SELANJUTNYA: TINJAUAN PILIHAN37 �
1.� Keberhasilan Indonesia dalam rekonstruksi pasca bencana dan kesiagaan menghadapi bencana 37�a.� Tantangan yang dihadapi oleh bencana di Aceh, Nias dan Jawa belum pernah terjadi
sebelumnya .................................................................................................................................... 37�b.� Multi Donor Fund mendukung upaya pemulihan & rekonstruksi yang dipimpin Pemerintah 38�c.� Menerapkan pelajaran yang dipetik Indonesia dalam pemulihan pasca bencana ........................ 40�
2.� Infrastruktur desa untukpenyediaan layanan dasar 43�a.� Apakah Sensus Infrastruktur Desa dan Mengapa Diperlukan? ................................................. 43�b.� SID menggabungkan beragam indikator untuk menghasilkan indeks kesiapan sisi
penawaran (supply readiness indices) ........................................................................................ 44�c.� Kesiapan Pelayanan Kesehatan yang tertinggi berada di Jawa dan Bali ................................. 45�d.� …pola yang sama nampak pada Kesiapan Pelayanan di bidang Pendidikan.......................... 47�e.� …dan keduanya berkorelasi kuat dengan Kesiapan Pelayanan di bidang Transportasi ........ 48�f.� Perluasan dan Aplikasi Kebijakan ............................................................................................... 50�
LAMPIRAN: INDIKATOR GAMBARAN EKONOMI INDONESIA 51 �
DAFTAR GRAFIK
Gambar 1: Pertumbuhan investasi sejauh ini tetap bertahan terhadap penurunan harga komoditas dan ekspor .................................................................................................. vi�
Gambar 2: Peningkatan tahun 2013 dapat mendorong upah minimum lebih tinggi relatif dibanding negara tetangga… ..................................................................................... viii�
Gambar 3: Membaiknya kondisi di AS dan China telah mencapai titik terendah dan kembali bangkit, tetapi belum ada perubahan di zona Eropa atau Jepang ............................. 2�
Gambar 4: Komoditas tetap berada di bawah harga tertingginya, walau sebagian telah meningkat di beberapa bulan terakhir .......................................................................... 2�
Gambar 5: Pertumbuhan PDB riil turun menjadi 6,2 persen (tahun ke tahun) pada kuartal ketiga tahun 2012… ................................................................................................................... 3�
Gambar 6: …sementara pertumbuhan PDB nominal jatuh ke tingkat terendah sejak September 2009 karena perlambatan pertumbuhan PDB deflator ................................................ 3�
Gambar 7: Investasi dan konsumsi swasta tetap menjadi pendorong utama pertumbuhan ......... 4�Gambar 8: Manufaktur tetap kuat pada kuartal ketiga sementara pertumbuhan jasa melambat ... 4�Gambar 9: Tingkat inventori menunjukan peningkatan ..................................................................... 5�Gambar 10: Neraca pembayaran kembali mencatatkan sedikit surplus di kuartal ketiga 2012 ..... 7�Gambar 11: Exports masih terus tertekan… ....................................................................................... 9�Gambar 12: …sementara aliran masuk portofolio telah kembali meningkat ................................... 9�Gambar 13: Inflasi IHK dan inti tetap bertahan pada tingkat yang rendah secara historis ............ 9�Gambar 14: Nilai tukar Rupiah melemah cukup besar, tapi lebih rendah dibandingkan dengan
kurs rupiah yang dibobot dengan nilai perdagangannya (trade-weighted)…......... 13�Gambar 15: Pasar obligasi meningkat kuat kuartal ini sementara ekuitas bergejolak sejak
pertengahan Oktober… ................................................................................................ 14�Gambar 16: …dan depresiasi Rupiah melambat secara riil dan bila dibanding dengan eksportir
komoditas lainnya ........................................................................................................ 14�Gambar 17: Pertumbuhan kredit melambat sejak Mei ..................................................................... 14�Gambar 18: Defisit anggaran hingga bulan Oktober meningkat karena tingginya belanja subsidi
energi............................................................................................................................. 17�Gambar 19: Penerimaan mengalami moderasi karena berlanjutnya perlemahan penerimaan
pajak penghasilan dan penerimaan bukan pajak ...................................................... 17�Gambar 20: Volume BBM bersubsidi terus meningkat di tahun 2012 karena tidak adanya
reformasi subsidi BBM ................................................................................................ 18�Gambar 21: Konsumsi BBM yang melebihi Kuota terpusat di kota-kota yang padat, daerah-
daerah pertambangan dan perbatasan ....................................................................... 19�Gambar 22: Sisa anggaran tahun 2012 sampai akhir bulan Oktober masih besar........................ 19�Gambar 23: Belanja modal dan subsidi akan meningkat pada tahun 2013 ................................... 20�Gambar 24: Kenaikan ditahun 2013 dapat mendorong upah minimum di atas negara tetangga 24�Gambar 25: Sebagian besar angkatan kerja di Indonesia adalah pekerja informal… ................... 27�Gambar 26: Tetapi bagi pekerja di sektor formal, upah minimum mengindikasikan kenaikan bagi
semua. ........................................................................................................................... 27�Gambar 27: Ketidakpatuhan cenderung meningkat dengan naiknya upah minimum .................. 28�Gambar 28: …dan perusahaan kecil cenderung lebih tidak patuh ................................................. 28�Gambar 29: Banjir tahun 2007 menyebabkan kerusakan finansial yang cukup besar dan
kerugian ekonomi yang jauh lebih tinggi… ............................................................... 32�Gambar 30: …dan kerugian ekonomi itu terfokus kepada perusahaan-perusahaan industri yang
lebih besar .................................................................................................................... 32�Gambar 31: Daerah-daerah perumahan kumuh yang terkena banjir .............................................. 33�Gambar 32: Banjir tahun 2007 akan lebih ringan bila sarana yang ada berfungsi sepenuhnya .. 35�Gambar 33: Kerangka strategis bagi rekonstruksi bencana yang efektif ...................................... 40�Gambar 34: Kesiapan Pelayanan Kesehatan lebih tinggi di Jawa dan Bali dan rendah di bagian
timur Indonesia............................................................................................................. 46�Gambar 35: Pola spasial untuk Kesiapan Pelayanan di bidang Pendidikan sama dengan bidang
Kesehatan ..................................................................................................................... 47�Gambar 36: Daerah dengan Kesiapan Pelayanan yang rendah untuk Kesehatan dan Pendidikan
cenderung mempunyai akses transportasi umum yang buruk ................................ 49�Gambar 37: Setengah kecamatan di Papua tidak memiliki sinyal ponsel ...................................... 49�Gambar 38: Kualitas guru SD dapat bervariasi cukup besar bahkan didalam kecamatan ........... 49�
DAFTAR GRAFIK LAMPIRAN
Lampiran gambar 1: Pertumbuhan PDB triwulanan dan tahunan .................................................. 51�Lampiran gambar 2: Kontribusi pengeluaran terhadap PDB .......................................................... 51�Lampiran gambar 3: Kontribusi sektor terhadap PDB ..................................................................... 51�Lampiran gambar 4: Penjualan sepeda motor dan mobil ................................................................ 51�Lampiran gambar 5: Indikator konsumen ......................................................................................... 51�Lampiran gambar 6: Indikator kegiatan industri .............................................................................. 51�Lampiran gambar 7: Aliran perdagangan riil .................................................................................... 52�Lampiran gambar 8: Neraca pembayaran ......................................................................................... 52�Lampiran gambar 9: Neraca perdagangan ........................................................................................ 52�Lampiran gambar 10: Cadangan devisa dan modal asing .............................................................. 52�Lampiran gambar 11: Indeks harga komoditas terpilih ................................................................... 52�Lampiran gambar 12: Inflasi dan kebijakan moneter ....................................................................... 52�Lampiran gambar 13: Rincian tingkat harga konsumen .................................................................. 53�Lampiran gambar 14: Tingkat inflasi negara tetangga .................................................................... 53�Lampiran gambar 15: Harga beras kulakan di pasar domestik dan internasional ........................ 53�Lampiran gambar 16: Tingkat kemiskinan dan pengangguran ....................................................... 53�Lampiran gambar 17: Indeks saham regional .................................................................................. 53�Lampiran gambar 18: Indeks spot dolar Amerika dan rupiah ......................................................... 53�Lampiran gambar 19: Yield obligasi pemerintah 5 tahunan mata uang lokal ................................ 54�Lampiran gambar 20: Spread EMBI obligasi pemerintah dengan obligasi dollar amerika ........... 54�Lampiran gambar 21: Tingkat kredit bank umum ............................................................................. 54�Lampiran gambar 22: Indikator keuangan sektor perbankan ......................................................... 54�Lampiran gambar 23: Utang pemerintah ........................................................................................... 54�Lampiran gambar 24: Utang luar negeri ............................................................................................ 54�
DAFTAR TABEL
Tabel 1: Secara historis harga nominal komoditas masih bertahan tinggi tetapi tren terakhir beragam .......................................................................................................................... v�
Tabel 2: Dalam skenario baseline pertumbuhan Indonesia diproyeksikan mencapai 6,3 persen untuk tahun 2013 .......................................................................................................... vii�
Tabel 3: Berdasarkan scenario dasar pertumbuhan PDB 2012 diproyeksikan sebesar 6,1 persen di 2012, dan meningkat menjadi 6,3 persen di 2013.................................................... 6�
Tabel 4: Tingkat pencairan anggaran hingga akhir bulan Oktober masih rendah ........................ 18�Tabel 5: Defisit fiskal akan meningkat pada tahun 2012 karena peningkatan belanja subsidi
energi dan perlemahan pada penerimaan .................................................................. 21�Tabel 6: …sementara produktivitas pekerja masih tertinggal ......................................................... 24�Tabel 7: Indeks gabungan Kesiapan Sisi Penawaran termasuk beragam indikator Kesehatan,
Pendidikan, dan Transportasi ..................................................................................... 44�Tabel 8: Beberapa Kesenjangan pada Kesiapan Pelayanan Kesehatan sangat mengejutkan,
seperti akses terhadap pelayanan kesehatan sekunder ........................................... 46�Tabel 9: Kesenjangan Kesiapan Pelayanan Pendidikan indeks menunjukkan kebutuhan untuk
perbaikan kualitas fisik layanan .................................................................................. 48�
DAFTAR TABEL LAMPIRAN Lampiran tabel 1: Realisasi dan anggaran belanja pemerintah ...................................................... 55�Lampiran tabel 2: Neraca Pembayaran ............................................................................................. 55�Lampiran tabel 3: Sekilas tentang indikator sosial Indonesia ........................................................ 56�
DAFTAR KOTAK
Kotak 1: Undang-Undang Pangan yang baru di Indonesia .................................................................. 10�Kotak 2: Mengapa depresiasi Rupiah tidak membawa dampak yang lebih besar kepada inflasi 12�Kotak 3: Perkembangan pada kerangka pengelolaan perusahaan di Indonesia .......................... 15�Kotak 4: Peraturan Tenaga Kerja: Pengaruh “taraf tanpa kemajuan” ................................................. 28�Kotak 5: Dampak banjir besar tahun 2007 terhadap Jakarta ........................................................... 32�Kotak 6: Rekompak – Rehabilitasi dan Rekonstruksi Masyarakat dan Permukiman Berbasis
Komunitas pasca bencana .......................................................................................... 39�Kotak 7: Catatan tentang keandalan Peringkat Kesiapan Sisi Penawaran .................................... 45�

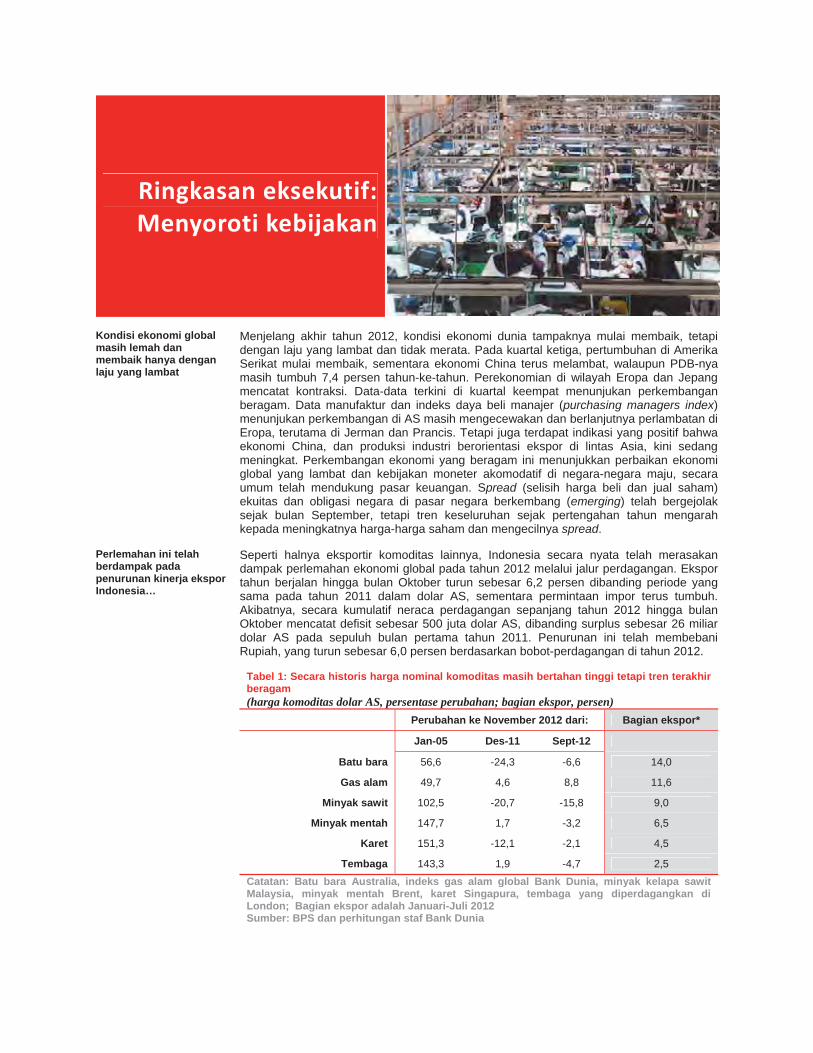
Ringkasan�eksekutif:�Menyoroti�kebijakan
Kondisi ekonomi global masih lemah dan membaik hanya dengan laju yang lambat
Menjelang akhir tahun 2012, kondisi ekonomi dunia tampaknya mulai membaik, tetapi dengan laju yang lambat dan tidak merata. Pada kuartal ketiga, pertumbuhan di Amerika Serikat mulai membaik, sementara ekonomi China terus melambat, walaupun PDB-nya masih tumbuh 7,4 persen tahun-ke-tahun. Perekonomian di wilayah Eropa dan Jepang mencatat kontraksi. Data-data terkini di kuartal keempat menunjukan perkembangan beragam. Data manufaktur dan indeks daya beli manajer (purchasing managers index)menunjukan perkembangan di AS masih mengecewakan dan berlanjutnya perlambatan di Eropa, terutama di Jerman dan Prancis. Tetapi juga terdapat indikasi yang positif bahwa ekonomi China, dan produksi industri berorientasi ekspor di lintas Asia, kini sedang meningkat. Perkembangan ekonomi yang beragam ini menunjukkan perbaikan ekonomi global yang lambat dan kebijakan moneter akomodatif di negara-negara maju, secara umum telah mendukung pasar keuangan. Spread (selisih harga beli dan jual saham) ekuitas dan obligasi negara di pasar negara berkembang (emerging) telah bergejolak sejak bulan September, tetapi tren keseluruhan sejak pertengahan tahun mengarah kepada meningkatnya harga-harga saham dan mengecilnya spread.
Perlemahan ini telah berdampak pada penurunan kinerja ekspor Indonesia…
Seperti halnya eksportir komoditas lainnya, Indonesia secara nyata telah merasakan dampak perlemahan ekonomi global pada tahun 2012 melalui jalur perdagangan. Ekspor tahun berjalan hingga bulan Oktober turun sebesar 6,2 persen dibanding periode yang sama pada tahun 2011 dalam dolar AS, sementara permintaan impor terus tumbuh.Akibatnya, secara kumulatif neraca perdagangan sepanjang tahun 2012 hingga bulan Oktober mencatat defisit sebesar 500 juta dolar AS, dibanding surplus sebesar 26 miliardolar AS pada sepuluh bulan pertama tahun 2011. Penurunan ini telah membebani Rupiah, yang turun sebesar 6,0 persen berdasarkan bobot-perdagangan di tahun 2012.
Tabel 1: Secara historis harga nominal komoditas masih bertahan tinggi tetapi tren terakhir beragam (harga komoditas dolar AS, persentase perubahan; bagian ekspor, persen)
Perubahan ke November 2012 dari: Bagian ekspor*
Jan-05 Des-11 Sept-12
Batu bara 56,6 -24,3 -6,6 14,0
Gas alam 49,7 4,6 8,8 11,6
Minyak sawit 102,5 -20,7 -15,8 9,0
Minyak mentah 147,7 1,7 -3,2 6,5
Karet 151,3 -12,1 -2,1 4,5
Tembaga 143,3 1,9 -4,7 2,5Catatan: Batu bara Australia, indeks gas alam global Bank Dunia, minyak kelapa sawit Malaysia, minyak mentah Brent, karet Singapura, tembaga yang diperdagangkan di London; Bagian ekspor adalah Januari-Juli 2012 Sumber: BPS dan perhitungan staf Bank Dunia
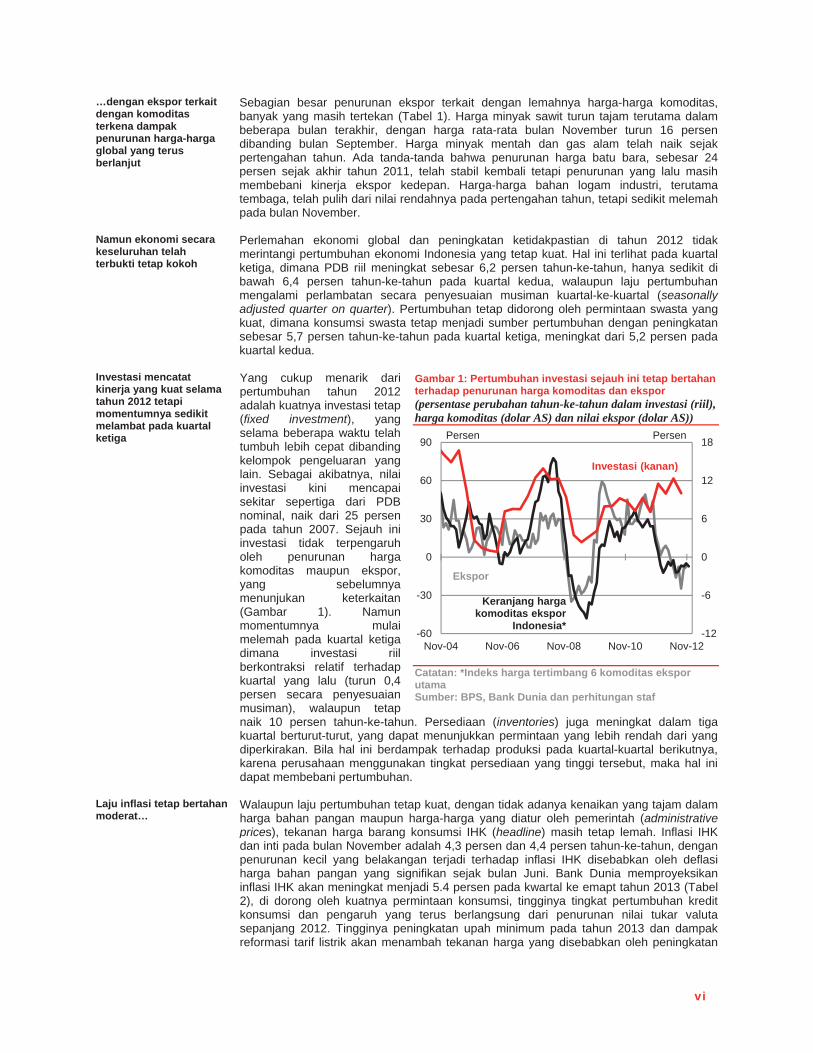
vi
…dengan ekspor terkait dengan komoditas terkena dampak penurunan harga-harga global yang terus berlanjut
Sebagian besar penurunan ekspor terkait dengan lemahnya harga-harga komoditas, banyak yang masih tertekan (Tabel 1). Harga minyak sawit turun tajam terutama dalam beberapa bulan terakhir, dengan harga rata-rata bulan November turun 16 persen dibanding bulan September. Harga minyak mentah dan gas alam telah naik sejak pertengahan tahun. Ada tanda-tanda bahwa penurunan harga batu bara, sebesar 24 persen sejak akhir tahun 2011, telah stabil kembali tetapi penurunan yang lalu masih membebani kinerja ekspor kedepan. Harga-harga bahan logam industri, terutama tembaga, telah pulih dari nilai rendahnya pada pertengahan tahun, tetapi sedikit melemah pada bulan November.
Namun ekonomi secara keseluruhan telah terbukti tetap kokoh
Perlemahan ekonomi global dan peningkatan ketidakpastian di tahun 2012 tidak merintangi pertumbuhan ekonomi Indonesia yang tetap kuat. Hal ini terlihat pada kuartal ketiga, dimana PDB riil meningkat sebesar 6,2 persen tahun-ke-tahun, hanya sedikit di bawah 6,4 persen tahun-ke-tahun pada kuartal kedua, walaupun laju pertumbuhan mengalami perlambatan secara penyesuaian musiman kuartal-ke-kuartal (seasonally adjusted quarter on quarter). Pertumbuhan tetap didorong oleh permintaan swasta yang kuat, dimana konsumsi swasta tetap menjadi sumber pertumbuhan dengan peningkatan sebesar 5,7 persen tahun-ke-tahun pada kuartal ketiga, meningkat dari 5,2 persen pada kuartal kedua.
Investasi mencatat kinerja yang kuat selama tahun 2012 tetapi momentumnya sedikit melambat pada kuartal ketiga
Yang cukup menarik dari pertumbuhan tahun 2012 adalah kuatnya investasi tetap (fixed investment), yang selama beberapa waktu telah tumbuh lebih cepat dibanding kelompok pengeluaran yang lain. Sebagai akibatnya, nilai investasi kini mencapai sekitar sepertiga dari PDB nominal, naik dari 25 persen pada tahun 2007. Sejauh ini investasi tidak terpengaruh oleh penurunan harga komoditas maupun ekspor, yang sebelumnya menunjukan keterkaitan (Gambar 1). Namun momentumnya mulai melemah pada kuartal ketiga dimana investasi riil berkontraksi relatif terhadap kuartal yang lalu (turun 0,4 persen secara penyesuaian musiman), walaupun tetap naik 10 persen tahun-ke-tahun. Persediaan (inventories) juga meningkat dalam tiga kuartal berturut-turut, yang dapat menunjukkan permintaan yang lebih rendah dari yang diperkirakan. Bila hal ini berdampak terhadap produksi pada kuartal-kuartal berikutnya,karena perusahaan menggunakan tingkat persediaan yang tinggi tersebut, maka hal ini dapat membebani pertumbuhan.
Gambar 1: Pertumbuhan investasi sejauh ini tetap bertahan terhadap penurunan harga komoditas dan ekspor (persentase perubahan tahun-ke-tahun dalam investasi (riil), harga komoditas (dolar AS) dan nilai ekspor (dolar AS))
Catatan: *Indeks harga tertimbang 6 komoditas ekspor utama Sumber: BPS, Bank Dunia dan perhitungan staf
Laju inflasi tetap bertahan moderat…
Walaupun laju pertumbuhan tetap kuat, dengan tidak adanya kenaikan yang tajam dalam harga bahan pangan maupun harga-harga yang diatur oleh pemerintah (administrative prices), tekanan harga barang konsumsi IHK (headline) masih tetap lemah. Inflasi IHK dan inti pada bulan November adalah 4,3 persen dan 4,4 persen tahun-ke-tahun, dengan penurunan kecil yang belakangan terjadi terhadap inflasi IHK disebabkan oleh deflasi harga bahan pangan yang signifikan sejak bulan Juni. Bank Dunia memproyeksikan inflasi IHK akan meningkat menjadi 5.4 persen pada kwartal ke emapt tahun 2013 (Tabel2), di dorong oleh kuatnya permintaan konsumsi, tingginya tingkat pertumbuhan kredit konsumsi dan pengaruh yang terus berlangsung dari penurunan nilai tukar valuta sepanjang 2012. Tingginya peningkatan upah minimum pada tahun 2013 dan dampak reformasi tarif listrik akan menambah tekanan harga yang disebabkan oleh peningkatan
-12
-6
0
6
12
18
-60
-30
0
30
60
90
Nov-04 Nov-06 Nov-08 Nov-10 Nov-12
PersenPersen
Investasi (kanan)
Ekspor
Keranjang hargakomoditas ekspor
Indonesia*
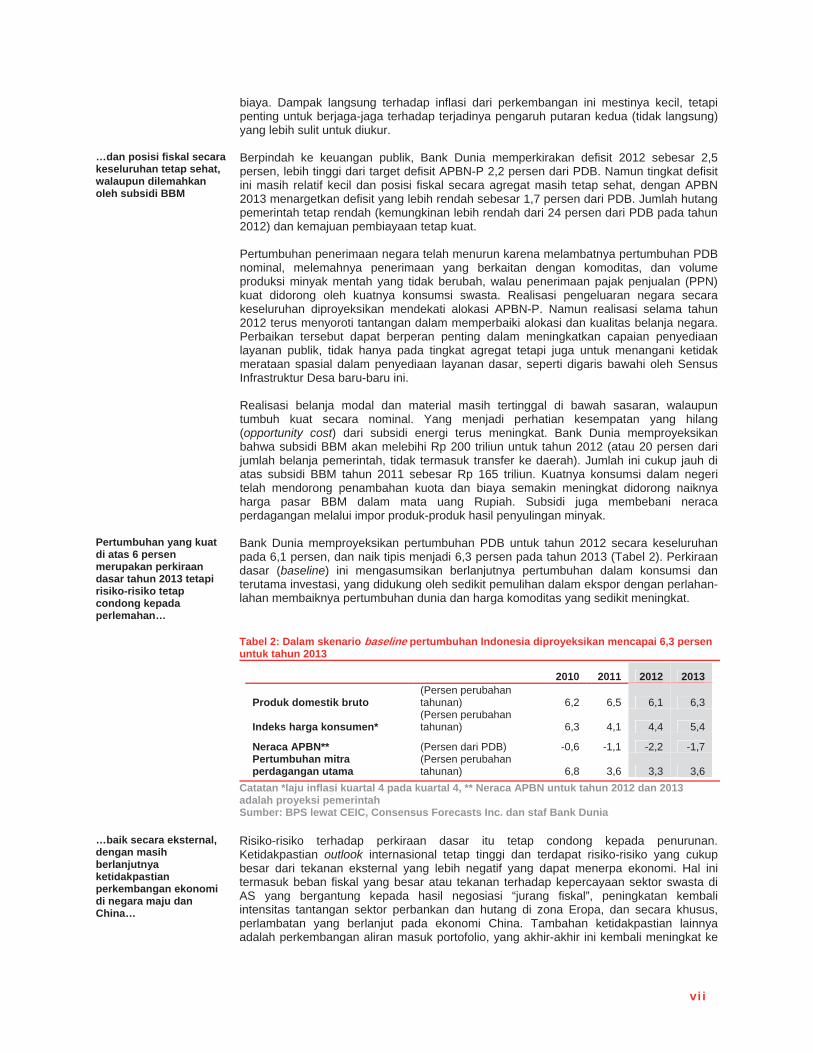
vi i
biaya. Dampak langsung terhadap inflasi dari perkembangan ini mestinya kecil, tetapi penting untuk berjaga-jaga terhadap terjadinya pengaruh putaran kedua (tidak langsung) yang lebih sulit untuk diukur.
…dan posisi fiskal secara keseluruhan tetap sehat, walaupun dilemahkan oleh subsidi BBM
Berpindah ke keuangan publik, Bank Dunia memperkirakan defisit 2012 sebesar 2,5 persen, lebih tinggi dari target defisit APBN-P 2,2 persen dari PDB. Namun tingkat defisit ini masih relatif kecil dan posisi fiskal secara agregat masih tetap sehat, dengan APBN 2013 menargetkan defisit yang lebih rendah sebesar 1,7 persen dari PDB. Jumlah hutang pemerintah tetap rendah (kemungkinan lebih rendah dari 24 persen dari PDB pada tahun 2012) dan kemajuan pembiayaan tetap kuat.
Pertumbuhan penerimaan negara telah menurun karena melambatnya pertumbuhan PDB nominal, melemahnya penerimaan yang berkaitan dengan komoditas, dan volume produksi minyak mentah yang tidak berubah, walau penerimaan pajak penjualan (PPN)kuat didorong oleh kuatnya konsumsi swasta. Realisasi pengeluaran negara secara keseluruhan diproyeksikan mendekati alokasi APBN-P. Namun realisasi selama tahun 2012 terus menyoroti tantangan dalam memperbaiki alokasi dan kualitas belanja negara. Perbaikan tersebut dapat berperan penting dalam meningkatkan capaian penyediaan layanan publik, tidak hanya pada tingkat agregat tetapi juga untuk menangani ketidak merataan spasial dalam penyediaan layanan dasar, seperti digaris bawahi oleh Sensus Infrastruktur Desa baru-baru ini.
Realisasi belanja modal dan material masih tertinggal di bawah sasaran, walaupun tumbuh kuat secara nominal. Yang menjadi perhatian kesempatan yang hilang (opportunity cost) dari subsidi energi terus meningkat. Bank Dunia memproyeksikan bahwa subsidi BBM akan melebihi Rp 200 triliun untuk tahun 2012 (atau 20 persen dari jumlah belanja pemerintah, tidak termasuk transfer ke daerah). Jumlah ini cukup jauh di atas subsidi BBM tahun 2011 sebesar Rp 165 triliun. Kuatnya konsumsi dalam negeri telah mendorong penambahan kuota dan biaya semakin meningkat didorong naiknya harga pasar BBM dalam mata uang Rupiah. Subsidi juga membebani neraca perdagangan melalui impor produk-produk hasil penyulingan minyak.
Pertumbuhan yang kuat di atas 6 persen merupakan perkiraan dasar tahun 2013 tetapi risiko-risiko tetap condong kepada perlemahan…
Bank Dunia memproyeksikan pertumbuhan PDB untuk tahun 2012 secara keseluruhan pada 6,1 persen, dan naik tipis menjadi 6,3 persen pada tahun 2013 (Tabel 2). Perkiraan dasar (baseline) ini mengasumsikan berlanjutnya pertumbuhan dalam konsumsi dan terutama investasi, yang didukung oleh sedikit pemulihan dalam ekspor dengan perlahan-lahan membaiknya pertumbuhan dunia dan harga komoditas yang sedikit meningkat.
Tabel 2: Dalam skenario baseline pertumbuhan Indonesia diproyeksikan mencapai 6,3 persen untuk tahun 2013
2010 2011 2012 2013
Produk domestik bruto (Persen perubahan tahunan) 6,2 6,5 6,1 6,3
Indeks harga konsumen* (Persen perubahan tahunan) 6,3 4,1 4,4 5,4
Neraca APBN** (Persen dari PDB) -0,6 -1,1 -2,2 -1,7 Pertumbuhan mitra perdagangan utama
(Persen perubahan tahunan) 6,8 3,6 3,3 3,6
Catatan *laju inflasi kuartal 4 pada kuartal 4, ** Neraca APBN untuk tahun 2012 dan 2013 adalah proyeksi pemerintah Sumber: BPS lewat CEIC, Consensus Forecasts Inc. dan staf Bank Dunia
…baik secara eksternal, dengan masih berlanjutnya ketidakpastian perkembangan ekonomi di negara maju dan China…
Risiko-risiko terhadap perkiraan dasar itu tetap condong kepada penurunan. Ketidakpastian outlook internasional tetap tinggi dan terdapat risiko-risiko yang cukup besar dari tekanan eksternal yang lebih negatif yang dapat menerpa ekonomi. Hal ini termasuk beban fiskal yang besar atau tekanan terhadap kepercayaan sektor swasta di AS yang bergantung kepada hasil negosiasi “jurang fiskal”, peningkatan kembali intensitas tantangan sektor perbankan dan hutang di zona Eropa, dan secara khusus, perlambatan yang berlanjut pada ekonomi China. Tambahan ketidakpastian lainnya adalah perkembangan aliran masuk portofolio, yang akhir-akhir ini kembali meningkat ke
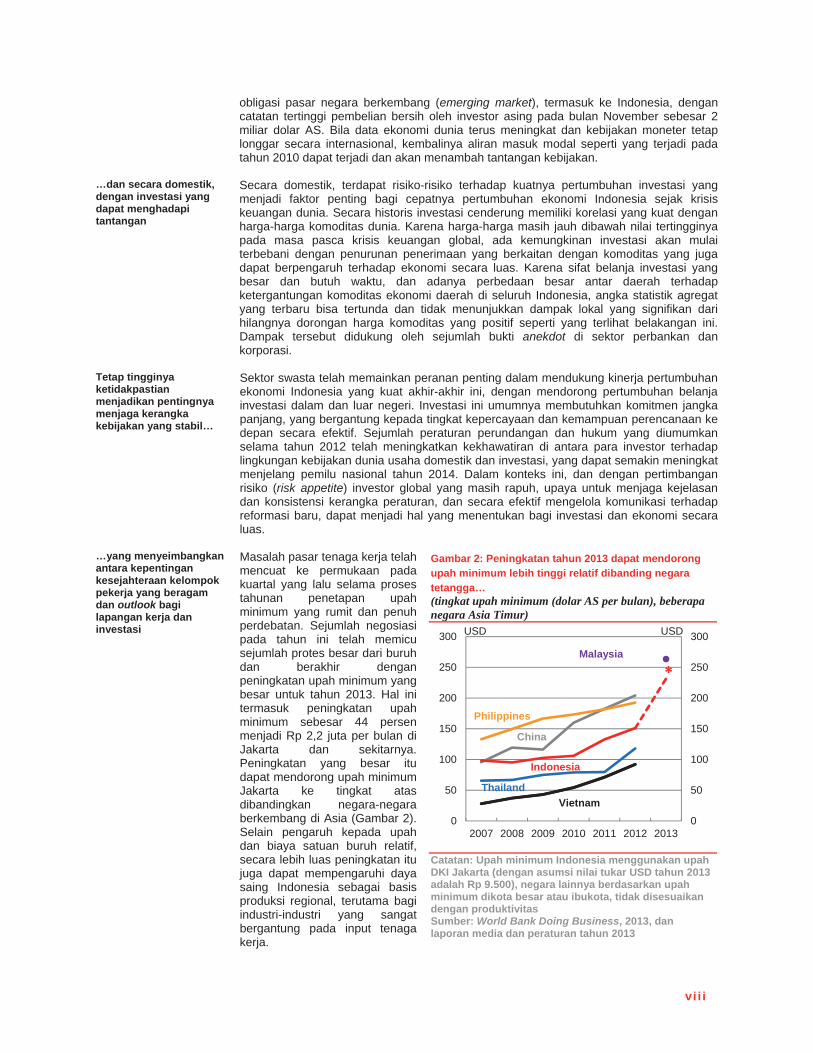
vi i i
obligasi pasar negara berkembang (emerging market), termasuk ke Indonesia, dengan catatan tertinggi pembelian bersih oleh investor asing pada bulan November sebesar 2 miliar dolar AS. Bila data ekonomi dunia terus meningkat dan kebijakan moneter tetap longgar secara internasional, kembalinya aliran masuk modal seperti yang terjadi pada tahun 2010 dapat terjadi dan akan menambah tantangan kebijakan.
…dan secara domestik, dengan investasi yang dapat menghadapi tantangan
Secara domestik, terdapat risiko-risiko terhadap kuatnya pertumbuhan investasi yang menjadi faktor penting bagi cepatnya pertumbuhan ekonomi Indonesia sejak krisis keuangan dunia. Secara historis investasi cenderung memiliki korelasi yang kuat dengan harga-harga komoditas dunia. Karena harga-harga masih jauh dibawah nilai tertingginya pada masa pasca krisis keuangan global, ada kemungkinan investasi akan mulai terbebani dengan penurunan penerimaan yang berkaitan dengan komoditas yang juga dapat berpengaruh terhadap ekonomi secara luas. Karena sifat belanja investasi yang besar dan butuh waktu, dan adanya perbedaan besar antar daerah terhadap ketergantungan komoditas ekonomi daerah di seluruh Indonesia, angka statistik agregat yang terbaru bisa tertunda dan tidak menunjukkan dampak lokal yang signifikan dari hilangnya dorongan harga komoditas yang positif seperti yang terlihat belakangan ini. Dampak tersebut didukung oleh sejumlah bukti anekdot di sektor perbankan dan korporasi.
Tetap tingginya ketidakpastian menjadikan pentingnya menjaga kerangka kebijakan yang stabil…
Sektor swasta telah memainkan peranan penting dalam mendukung kinerja pertumbuhan ekonomi Indonesia yang kuat akhir-akhir ini, dengan mendorong pertumbuhan belanja investasi dalam dan luar negeri. Investasi ini umumnya membutuhkan komitmen jangka panjang, yang bergantung kepada tingkat kepercayaan dan kemampuan perencanaan ke depan secara efektif. Sejumlah peraturan perundangan dan hukum yang diumumkan selama tahun 2012 telah meningkatkan kekhawatiran di antara para investor terhadap lingkungan kebijakan dunia usaha domestik dan investasi, yang dapat semakin meningkat menjelang pemilu nasional tahun 2014. Dalam konteks ini, dan dengan pertimbangan risiko (risk appetite) investor global yang masih rapuh, upaya untuk menjaga kejelasan dan konsistensi kerangka peraturan, dan secara efektif mengelola komunikasi terhadap reformasi baru, dapat menjadi hal yang menentukan bagi investasi dan ekonomi secara luas.
…yang menyeimbangkan antara kepentingan kesejahteraan kelompok pekerja yang beragam dan outlook bagi lapangan kerja dan investasi
Masalah pasar tenaga kerja telah mencuat ke permukaan pada kuartal yang lalu selama proses tahunan penetapan upah minimum yang rumit dan penuh perdebatan. Sejumlah negosiasi pada tahun ini telah memicu sejumlah protes besar dari buruh dan berakhir dengan peningkatan upah minimum yang besar untuk tahun 2013. Hal ini termasuk peningkatan upah minimum sebesar 44 persen menjadi Rp 2,2 juta per bulan di Jakarta dan sekitarnya. Peningkatan yang besar itu dapat mendorong upah minimum Jakarta ke tingkat atas dibandingkan negara-negara berkembang di Asia (Gambar 2). Selain pengaruh kepada upah dan biaya satuan buruh relatif, secara lebih luas peningkatan itu juga dapat mempengaruhi daya saing Indonesia sebagai basis produksi regional, terutama bagi industri-industri yang sangat bergantung pada input tenaga kerja.
Gambar 2: Peningkatan tahun 2013 dapat mendorong upah minimum lebih tinggi relatif dibanding negara tetangga…(tingkat upah minimum (dolar AS per bulan), beberapa negara Asia Timur)
Catatan: Upah minimum Indonesia menggunakan upah DKI Jakarta (dengan asumsi nilai tukar USD tahun 2013 adalah Rp 9.500), negara lainnya berdasarkan upah minimum dikota besar atau ibukota, tidak disesuaikan dengan produktivitas Sumber: World Bank Doing Business, 2013, dan laporan media dan peraturan tahun 2013
0
50
100
150
200
250
300
0
50
100
150
200
250
300
2007 2008 2009 2010 2011 2012 2013
USDUSD
China
Indonesia
Malaysia
Philippines
ThailandVietnam
*
ix
Walaupun upah minimum penting untuk mengatasi kegagalan pasar tenaga kerja yang dapat menghasilkan dampak yang kurang efisien dan tidak adil, melewati batas tertentu dapat membawa risiko-risiko negatif dan tidak diinginkan. Hal ini termasuk menurunkan insentif bagi penciptaan lapangan pekerjaan di sektor formal dan mendorong segmentasi yang membatasi pekerjaan dan mobilitas sosial. Selain itu, mekanisme penetapan upah minimum, dan besarannya, tidak dapat dipandang secara terpisah. Hal tersebutsesungguhnya sebagai bagian dari banyak faktor yang mempengaruhi kuantitas dan kualitas lapangan kerja dan keuntungan usaha, termasuk remunerasi non-upah, uang pesangon, jaminan sosial dan peraturan pemerintah yang mengatur tentang pekerjaan kontrak. Banyak hal yang dapat diperoleh dengan menggunakan pendekatan yang lebih holistik dan inklusif terhadap tawar-menawar di pasar tenaga kerja, dengan memastikan bahwa seluruh pemangku kepentingan, termasuk pekerja sektor informal, telah diwakili, dan dengan membuat proses penetapan upah minimum lebih transparan dan mendapat masukan secara teknis.
Ketidakpastian kebijakan jangka pendek apapun sebaiknya tidak mempengaruhi kebutuhan untuk terus melanjutkan kemajuan dalam peningkatan layanan publik dan akses di seluruh Indonesia, dan terus meningkatkan ketahanan negara terhadap berbagai risiko bencana alam yang dihadapinya
Sementara risiko-risiko jangka pendek seperti disinggung di atas telah mendominasi debat kebijakan yang belakangan terjadi, sangat penting untuk tidak mengalihkan fokus terhadap kebutuhan dan momentum dalam mencapai kemajuan penanganan tantangan pembangunan jangka menengah. Dalam sejumlah bidang, seperti dalam kesiapan dan rekonstruksi pasca-bencana, telah mencatat kemajuan yang berarti, dengan keberhasilan Pemerintah dalam perencanaan dan pelaksanaan pembangunan fisik perumahan, gedung-gedung dan infrastruktur, dan dalam memulihkan nafkah ekonomi. Indonesia juga telah mengembangkan pendekatan-pendekatan dan model-model yang telah terbukti yang dapat digunakan kembali untuk menghadapi bencana berikutnya, baik di Indonesia maupun negara-negara lain yang rawan akan bencana.
Di bidang lain, masih terdapat banyak hal yang harus dilakukan. Sebagai contoh, sementara kemajuan telah dicapai dalam memenuhi Millennium Development Goal pada tingkat nasional, Sensus Infrastruktur Desa (SID) terakhir yang dilakukan oleh Pemerintah menyoroti gambaran daerah yang lebih meresahkan: masing-masing propinsi, kabupaten/kota, dan desa-desa tidak mencatat tingkat kemajuan yang merata dalam hal penyediaan atau akses terhadap layanan kesehatan, pendidikan dan infrastruktur. Akan tetapi pengumpulan informasi yang rinci dari penelitian tersebut merupakan langkah awal untuk memperbaiki ketimpangan kemajuan melalui identifikasi kebutuhan yang lebih baik dan peningkatan perencanaan dan penargetan sumber daya.
Akhirnya, peristiwa banjir yang melanda Jakarta bersamaan dengan datangnya musim hujan adalah peringatan tepat waktu tentang tantangan-tanganan urbanisasi dan risiko yang akan datang dari dampak perubahan iklim. Upaya mitigasi banjir sedang dilaksanakan, dari pengerukan sungai dan perbaikan kanal melalui persiapan komunitas dan perencanaan kontingensi, yang membantu kota Jakarta untuk menyesuaikan diri dalam menghadapi peningkatan frekuensi dan intensitas banjir. Dengan sedikit tambahan investasi untuk mitigasi banjir yang sistematis dan menyeluruh, dan suatu sistem kontingensi dan sosialisasi informasi, Jakarta dapat menjadi sebuah kota yang tahanterhadap banjir.
A. PERKEMBANGAN�EKONOMI�DAN�FISKAL�
TERKINI
1. Pertumbuhan ekonomi global masih tetap lemah, diperkirakan hanya sedikit membaik di tahun 2013
Momentum ekonomi global membaik, tetapi berjalan lambat dan tidak merata
Seiring dengan mendekatnya akhir tahun 2012, kondisi ekonomi global sedikit membaik seperti diantisipasi pada Triwulanan edisi bulan Oktober, walau penguatan yang terjadi berjalan sangat lambat dan tidak merata. PDB AS di kuartal ketiga meningkat menjadi 2,7 persen dengan penyesuaian musiman yang disetahunkan (seasonally adjustedannualized rate, saar), naik cukup tajam dari 1,3 persen (saar) pada kuartal kedua dengan revisi naik yang signifikan dari perkiraan awal sebesar 2 persen. Sebaliknya, ekonomi China terus melambat di kuartal ketiga (tahun-ke-tahun), walau masih tumbuh sebesar 7,4 persen tahun-ke-tahun, dan terdapat beberapa perkembangan positif, seperti dari output industri yang menunjukkan sejumlah percepatan dalam pertumbuhan sedang berlangsung. Sementara faktor yang kurang positif, Zona Eropa masih terus berjuanguntuk keluar dari resesinya yang berkepanjangan, dan dengan PDB di kuartal ketiga relatif datar sebesar -0,2 persen (saar) ditengah kekhawatiran melambatnya pertumbuhan baik di Jerman - sebagai mesin pertumbuhan wilayah itu - dan Prancis. Ekonomi Jepang juga mengalami kontraksi sebesar 3,5 persen (saar) di kuartal ketiga 2012.
Didukung oleh kebijakan yang akomodatif, hal ini telah mendukung pasar keuangan
Pergerakan data ekonomi beragam sejak Triwulanan edisi bulan Oktober dan belum menunjukkan akan adanya pemulihan pertumbuhan global dalam waktu dekat yang mengindikasikan masih diperlukan kebijakan moneter yang akomodatif (Gambar 3). Sementara itu, krisis hutang di zona Eropa terus berlangsung namun kekhawatiran terhadap pembiayaan hutang dan krisis di sektor perbankan telah mereda sejak bulan Agustus, seiring dengan beberapa kebijakan yang diambil oleh Bank Sentral Eropa. Perpaduan kondisi ini telah membuat tingkat imbal hasil obligasi negara-negara maju ke tingkat terendah secara historis, menstabilkan kondisi keuangan di zona Eropa, dan memberikan dukungan terhadap pengambilan resiko untuk berinvestasi, memicu aliran masuk modal yang signifikan ke pasar hutang dan ekuitas negara-negara berkembang(emerging). Karenanya, walau pergerakan di pasar keuangan cukup begejolak sejak Triwulanan bulan Oktober, harga-harga ekuitas terus bertahan di level yang cukup jauh di atas harga terendahnya di pertengahan tahun dan spread obligasi negara telah mengecil kembali ke tingkat yang pernah dicapai di pertengahan tahun 2011.
Pergerakan-pergerakan harga komoditas beragam
Sejalan dengan masih lemahnya pemulihan pertumbuhan dunia, pergerakan harga-harga komoditas internasional akhir-akhir ini beragam, dan harga-harga sebagian besar ekspor utama Indonesia terus mengalami tekanan (Gambar 4). Harga minyak sawit khususnya turun tajam, dengan harga rata-ratanya di bulan November turun 16 persen dibandingkan September, membawa penurunan keseluruhan hingga November menjadi 21 persen. Harga minyak mentah dan gas alam telah meningkat sejak pertengahan tahun dan ada tanda-tanda penurunan harga batu bara yang sebelumnya cukup besar telah stabil, walau harga masih lebih rendah 20 persen selama tahun 2012. Harga bahan logam industri, terutama tembaga, sedikit membaik dari harga terendahnya di pertengahan tahun walau ada kecenderungan menurun di bulan November.
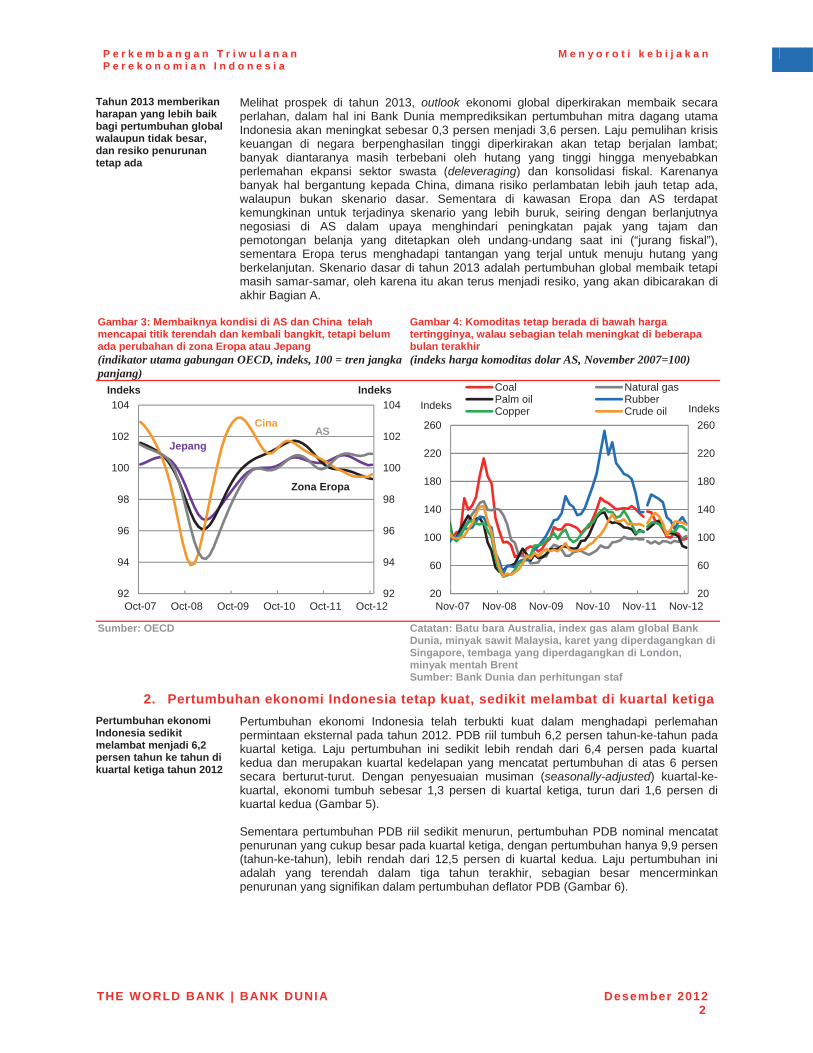
P e r k e m b a n g a n T r i w u l a n a n P e r e k o n o m i a n I n d o n e s i a
M e n y o r o t i k e b i j a k a n
THE WORLD BANK | BANK DUNIA Desember 20122
Tahun 2013 memberikan harapan yang lebih baik bagi pertumbuhan global walaupun tidak besar, dan resiko penurunan tetap ada
Melihat prospek di tahun 2013, outlook ekonomi global diperkirakan membaik secara perlahan, dalam hal ini Bank Dunia memprediksikan pertumbuhan mitra dagang utama Indonesia akan meningkat sebesar 0,3 persen menjadi 3,6 persen. Laju pemulihan krisis keuangan di negara berpenghasilan tinggi diperkirakan akan tetap berjalan lambat; banyak diantaranya masih terbebani oleh hutang yang tinggi hingga menyebabkan perlemahan ekpansi sektor swasta (deleveraging) dan konsolidasi fiskal. Karenanya banyak hal bergantung kepada China, dimana risiko perlambatan lebih jauh tetap ada, walaupun bukan skenario dasar. Sementara di kawasan Eropa dan AS terdapat kemungkinan untuk terjadinya skenario yang lebih buruk, seiring dengan berlanjutnya negosiasi di AS dalam upaya menghindari peningkatan pajak yang tajam dan pemotongan belanja yang ditetapkan oleh undang-undang saat ini (“jurang fiskal”), sementara Eropa terus menghadapi tantangan yang terjal untuk menuju hutang yang berkelanjutan. Skenario dasar di tahun 2013 adalah pertumbuhan global membaik tetapi masih samar-samar, oleh karena itu akan terus menjadi resiko, yang akan dibicarakan di akhir Bagian A.
Gambar 3: Membaiknya kondisi di AS dan China telah mencapai titik terendah dan kembali bangkit, tetapi belum ada perubahan di zona Eropa atau Jepang (indikator utama gabungan OECD, indeks, 100 = tren jangka panjang)
Gambar 4: Komoditas tetap berada di bawah harga tertingginya, walau sebagian telah meningkat di beberapa bulan terakhir (indeks harga komoditas dolar AS, November 2007=100)
Sumber: OECD Catatan: Batu bara Australia, index gas alam global Bank Dunia, minyak sawit Malaysia, karet yang diperdagangkan di Singapore, tembaga yang diperdagangkan di London, minyak mentah Brent Sumber: Bank Dunia dan perhitungan staf
2. Pertumbuhan ekonomi Indonesia tetap kuat, sedikit melambat di kuartal ketiga Pertumbuhan ekonomi Indonesia sedikit melambat menjadi 6,2 persen tahun ke tahun di kuartal ketiga tahun 2012
Pertumbuhan ekonomi Indonesia telah terbukti kuat dalam menghadapi perlemahan permintaan eksternal pada tahun 2012. PDB riil tumbuh 6,2 persen tahun-ke-tahun pada kuartal ketiga. Laju pertumbuhan ini sedikit lebih rendah dari 6,4 persen pada kuartal kedua dan merupakan kuartal kedelapan yang mencatat pertumbuhan di atas 6 persen secara berturut-turut. Dengan penyesuaian musiman (seasonally-adjusted) kuartal-ke-kuartal, ekonomi tumbuh sebesar 1,3 persen di kuartal ketiga, turun dari 1,6 persen di kuartal kedua (Gambar 5).
Sementara pertumbuhan PDB riil sedikit menurun, pertumbuhan PDB nominal mencatat penurunan yang cukup besar pada kuartal ketiga, dengan pertumbuhan hanya 9,9 persen (tahun-ke-tahun), lebih rendah dari 12,5 persen di kuartal kedua. Laju pertumbuhan ini adalah yang terendah dalam tiga tahun terakhir, sebagian besar mencerminkan penurunan yang signifikan dalam pertumbuhan deflator PDB (Gambar 6).
92
94
96
98
100
102
104
92
94
96
98
100
102
104
Oct-07 Oct-08 Oct-09 Oct-10 Oct-11 Oct-12
IndeksIndeks
JepangAS
Zona Eropa
Cina
20
60
100
140
180
220
260
20
60
100
140
180
220
260
Nov-07 Nov-08 Nov-09 Nov-10 Nov-11 Nov-12
IndeksIndeks
Coal Natural gasPalm oil RubberCopper Crude oil

P e r k e m b a n g a n T r i w u l a n a n P e r e k o n o m i a n I n d o n e s i a
M e n y o r o t i k e b i j a k a n
THE WORLD BANK | BANK DUNIA Desember 20123
Gambar 5: Pertumbuhan PDB riil turun menjadi 6,2 persen (tahun ke tahun) pada kuartal ketiga tahun 2012… (pertumbuhan PDB riil, persen)
Gambar 6: …sementara pertumbuhan PDB nominal jatuh ke tingkat terendah sejak September 2009 karena perlambatan pertumbuhan PDB deflator (pertumbuhan PDB nominal kuartal-ke-kuartal penyesuaian musiman, persen)
Catatan: * Rata-rata pertumbuhan kuartal-ke-kuartal sejak kuartal dua tahun 2002 Sumber: BPS dan penyesuaian musiman staf Bank Dunia
Sumber: BPS dan perhitungan staf Bank Dunia
Pertumbuhan permintaan dalam negeri melambat tetapi tetap kuat…
Secara riil, pertumbuhan permintaan dalam negeri mengalami pelemahan di kuartal ketiga menjadi 6,1 persen tahun-ke-tahun, turun dari 7,4 persen tahun-ke-tahun pada kuartal kedua. Konsumsi swasta dan investasi terus menjadi motor pertumbuhan ekonomi yang mantap (Gambar 7). Sementara konsumsi pemerintah mencatat penurunan yang mengejutkan, turun sebesar 3,2 persen dari tahun-ke-tahun, disebabkan oleh rendahnya realisasi belanja barang pemerintah.
… dengan pertumbuhan investasi melambat
Tingkat pengeluaran investasi masih cukup tinggi, meningkat sebesar 10 persen tahun-ke-tahun di kuartal ketiga. Akan tetapi investasi sesungguhnya mengalami kontraksi apabila dilihat berdasarkan penyesuaian musiman kuartal-ke-kuartal sebesar 0,4 persen di kuartal ketiga. Kontraksi yang berurutan ini sebagian besar didorong oleh penurunan dalam belanja transportasi luar negri, permesinan dan peralatan, yang konsisten dengan melemahnya impor barang modal yang terlihat dalam kuartal ini. Investasi gedung (yang merupakan 84 persen dari seluruh investasi) terus tumbuh dengan kuat di kuartal ketiga, meningkat sebesar 8,0 persen tahun-ke-tahun, sejalan dengan kuatnya pertumbuhan yang tercatat pada penjualan semen.
… dan konsumsi swasta yang meningkat
Berbeda dari penurunan yang tajam yang terjadi dalam konsumsi pemerintah dan perlambatan dalam investasi, pertumbuhan konsumsi swasta meningkat di kuartal ketiga, naik sebesar 5,7 persen tahun-ke-tahun. Tercatat peningkatan yang kuat pada konsumsi bahan pangan dan non-pangan. Survei Bank Indonesia menunjukan bahwa kepercayaan konsumen mencapai tingkat tertinggi di kuartal ini.
Ekspor masih terus tertekan dan impor mengalami kontraksi tajam
Tidak seperti kuartal sebelumnya, faktor permintaan eksternal netto kali ini memberikan dukungan positif terhadap pertumbuhan yang terjadi di kuartal ini; ekspor netto naik 2,3 persen terhadap penyesuaian musiman kuartal-ke-kuartal. Akan tetapi, hal ini disebabkan oleh tajamnya penurunan impor yang menetralisir berlanjutnya penurun yang terjadi pada ekspor di kuartal ketiga. Ekspor barang-barang dan jasa tetap mengalami tekanan turun sebesar 2,4 persen (penyesuaian musiman kuartal-ke-kuartal). Impor secara mengejutkan berkontraksi dengan tajam, turun sebanyak 8,7 persen (penyesuaian musiman kuartal-ke-kuartal). Penurunan import ini merupakan yang pertama sejak kuartal pertama tahun 2009 dan sepertinya disebabkan oleh melemahnya ekspor, dimana lemahnya ekspor cenderung mengurangi kebutuhan untuk mengimpor barang modal dan setengah jadi untuk bahan input (lihat Triwulanan edisi bulan Juli 2012).
0
2
4
6
8
0
1
2
3
4
Sep-05 Jun-07 Mar-09 Dec-10 Sep-12
Persen Persen
Kuartal-ke-kuartal peny. musiman (LHS)
Tahun-ke-tahun (kanan)
Rata-rata (kiri)*
-2
0
2
4
6
8
10
12
-2
0
2
4
6
8
10
12
Sep-00 Sep-03 Sep-06 Sep-09 Sep-12
PriceVolumeNominal GDP
Persen Persen
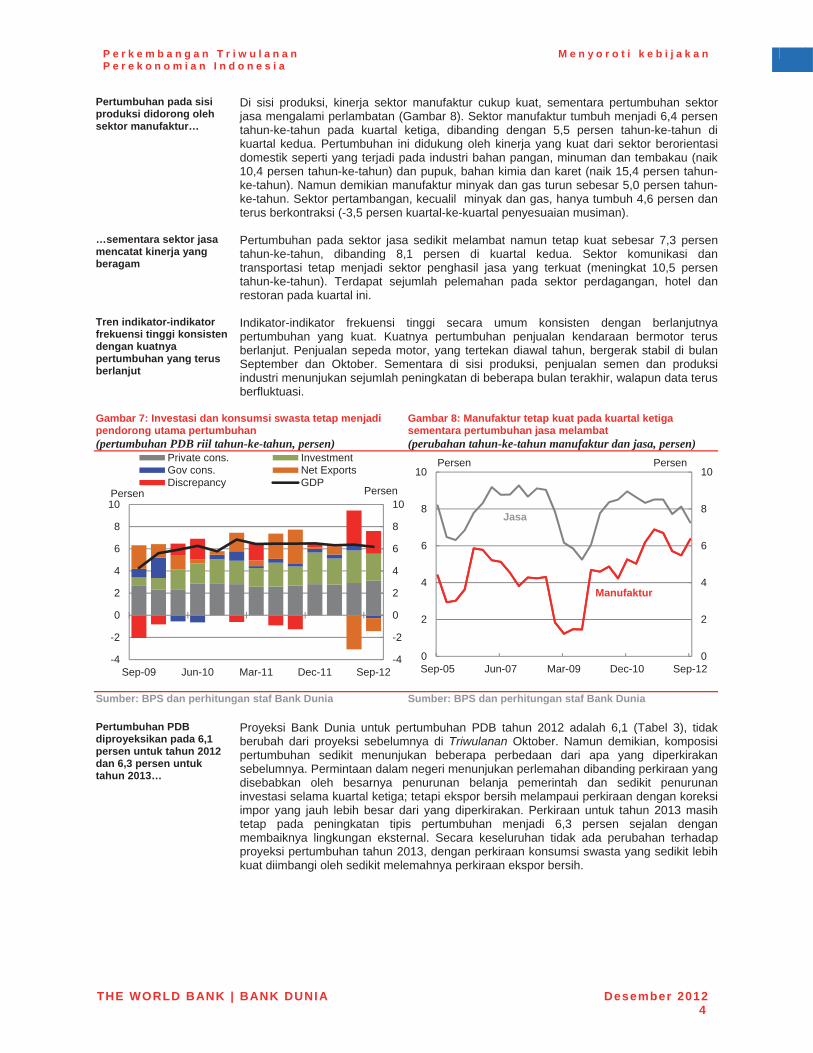
P e r k e m b a n g a n T r i w u l a n a n P e r e k o n o m i a n I n d o n e s i a
M e n y o r o t i k e b i j a k a n
THE WORLD BANK | BANK DUNIA Desember 20124
Pertumbuhan pada sisi produksi didorong oleh sektor manufaktur…
Di sisi produksi, kinerja sektor manufaktur cukup kuat, sementara pertumbuhan sektor jasa mengalami perlambatan (Gambar 8). Sektor manufaktur tumbuh menjadi 6,4 persentahun-ke-tahun pada kuartal ketiga, dibanding dengan 5,5 persen tahun-ke-tahun di kuartal kedua. Pertumbuhan ini didukung oleh kinerja yang kuat dari sektor berorientasi domestik seperti yang terjadi pada industri bahan pangan, minuman dan tembakau (naik 10,4 persen tahun-ke-tahun) dan pupuk, bahan kimia dan karet (naik 15,4 persen tahun-ke-tahun). Namun demikian manufaktur minyak dan gas turun sebesar 5,0 persen tahun-ke-tahun. Sektor pertambangan, kecualil minyak dan gas, hanya tumbuh 4,6 persen dan terus berkontraksi (-3,5 persen kuartal-ke-kuartal penyesuaian musiman).
…sementara sektor jasa mencatat kinerja yang beragam
Pertumbuhan pada sektor jasa sedikit melambat namun tetap kuat sebesar 7,3 persentahun-ke-tahun, dibanding 8,1 persen di kuartal kedua. Sektor komunikasi dan transportasi tetap menjadi sektor penghasil jasa yang terkuat (meningkat 10,5 persen tahun-ke-tahun). Terdapat sejumlah pelemahan pada sektor perdagangan, hotel dan restoran pada kuartal ini.
Tren indikator-indikator frekuensi tinggi konsisten dengan kuatnya pertumbuhan yang terus berlanjut
Indikator-indikator frekuensi tinggi secara umum konsisten dengan berlanjutnya pertumbuhan yang kuat. Kuatnya pertumbuhan penjualan kendaraan bermotor terus berlanjut. Penjualan sepeda motor, yang tertekan diawal tahun, bergerak stabil di bulan September dan Oktober. Sementara di sisi produksi, penjualan semen dan produksi industri menunjukan sejumlah peningkatan di beberapa bulan terakhir, walapun data terus berfluktuasi.
Gambar 7: Investasi dan konsumsi swasta tetap menjadi pendorong utama pertumbuhan (pertumbuhan PDB riil tahun-ke-tahun, persen)
Gambar 8: Manufaktur tetap kuat pada kuartal ketiga sementara pertumbuhan jasa melambat (perubahan tahun-ke-tahun manufaktur dan jasa, persen)
Sumber: BPS dan perhitungan staf Bank Dunia Sumber: BPS dan perhitungan staf Bank Dunia
Pertumbuhan PDB diproyeksikan pada 6,1 persen untuk tahun 2012 dan 6,3 persen untuk tahun 2013…
Proyeksi Bank Dunia untuk pertumbuhan PDB tahun 2012 adalah 6,1 (Tabel 3), tidak berubah dari proyeksi sebelumnya di Triwulanan Oktober. Namun demikian, komposisi pertumbuhan sedikit menunjukan beberapa perbedaan dari apa yang diperkirakan sebelumnya. Permintaan dalam negeri menunjukan perlemahan dibanding perkiraan yang disebabkan oleh besarnya penurunan belanja pemerintah dan sedikit penurunan investasi selama kuartal ketiga; tetapi ekspor bersih melampaui perkiraan dengan koreksi impor yang jauh lebih besar dari yang diperkirakan. Perkiraan untuk tahun 2013 masih tetap pada peningkatan tipis pertumbuhan menjadi 6,3 persen sejalan dengan membaiknya lingkungan eksternal. Secara keseluruhan tidak ada perubahan terhadap proyeksi pertumbuhan tahun 2013, dengan perkiraan konsumsi swasta yang sedikit lebih kuat diimbangi oleh sedikit melemahnya perkiraan ekspor bersih.
-4
-2
0
2
4
6
8
10
-4
-2
0
2
4
6
8
10
Sep-09 Jun-10 Mar-11 Dec-11 Sep-12
Private cons. InvestmentGov cons. Net ExportsDiscrepancy GDP
Persen Persen
0
2
4
6
8
10
0
2
4
6
8
10
Sep-05 Jun-07 Mar-09 Dec-10 Sep-12
Manufaktur
Persen
Jasa
Persen
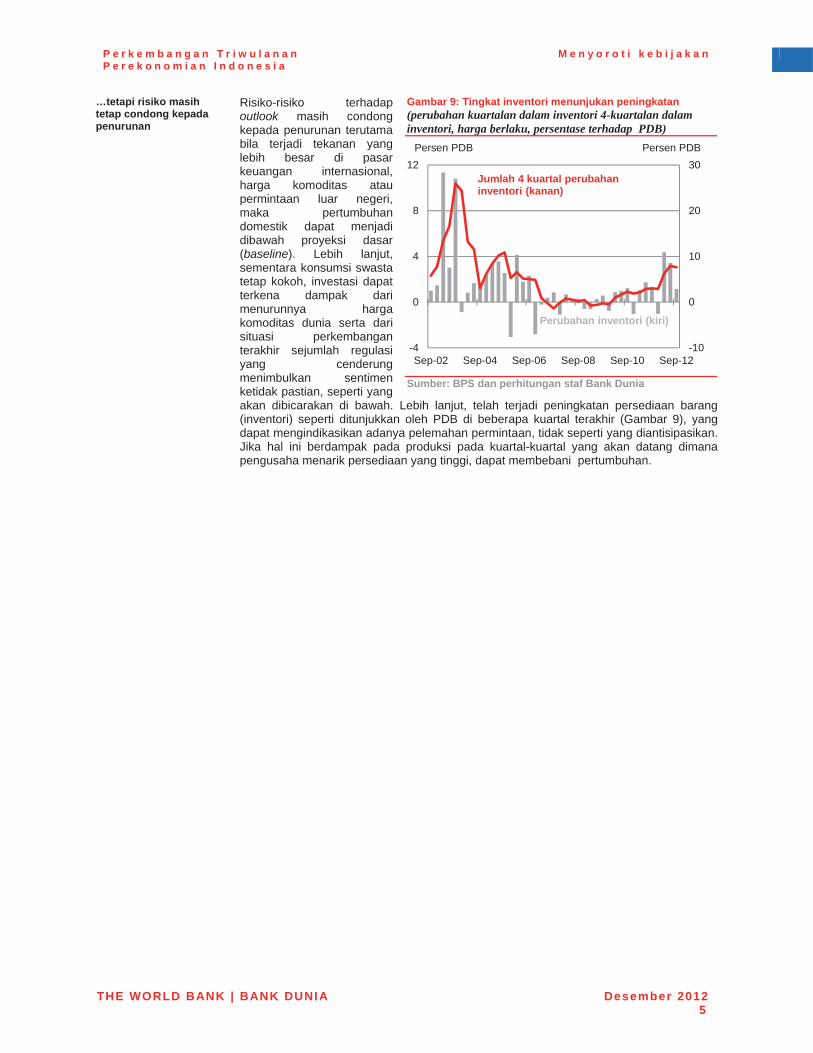
P e r k e m b a n g a n T r i w u l a n a n P e r e k o n o m i a n I n d o n e s i a
M e n y o r o t i k e b i j a k a n
THE WORLD BANK | BANK DUNIA Desember 20125
…tetapi risiko masih tetap condong kepada penurunan
Risiko-risiko terhadap outlook masih condong kepada penurunan terutama bila terjadi tekanan yang lebih besar di pasar keuangan internasional, harga komoditas atau permintaan luar negeri, maka pertumbuhan domestik dapat menjadi dibawah proyeksi dasar (baseline). Lebih lanjut, sementara konsumsi swasta tetap kokoh, investasi dapat terkena dampak dari menurunnya harga komoditas dunia serta dari situasi perkembangan terakhir sejumlah regulasi yang cenderung menimbulkan sentimen ketidak pastian, seperti yang akan dibicarakan di bawah. Lebih lanjut, telah terjadi peningkatan persediaan barang (inventori) seperti ditunjukkan oleh PDB di beberapa kuartal terakhir (Gambar 9), yang dapat mengindikasikan adanya pelemahan permintaan, tidak seperti yang diantisipasikan. Jika hal ini berdampak pada produksi pada kuartal-kuartal yang akan datang dimana pengusaha menarik persediaan yang tinggi, dapat membebani pertumbuhan.
Gambar 9: Tingkat inventori menunjukan peningkatan (perubahan kuartalan dalam inventori 4-kuartalan dalam inventori, harga berlaku, persentase terhadap PDB)
Sumber: BPS dan perhitungan staf Bank Dunia
-10
0
10
20
30
-4
0
4
8
12
Sep-02 Sep-04 Sep-06 Sep-08 Sep-10 Sep-12
Jumlah 4 kuartal perubahan inventori (kanan)
Perubahan inventori (kiri)
Persen PDB Persen PDB
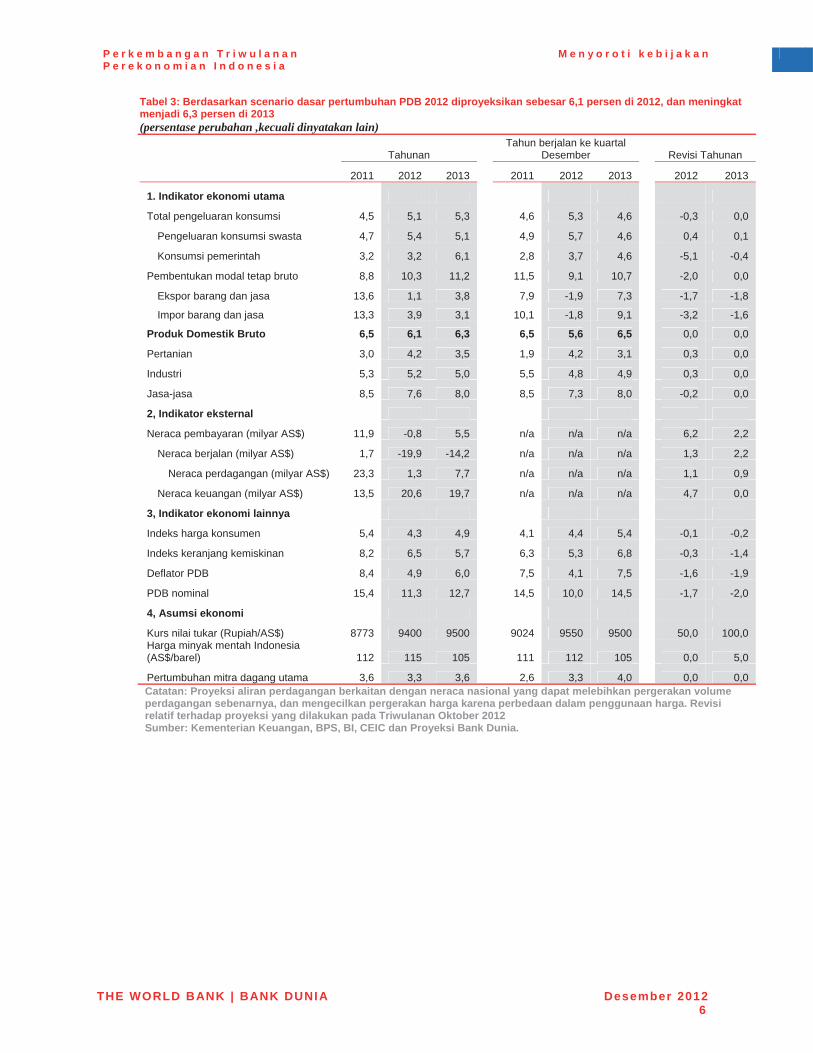
P e r k e m b a n g a n T r i w u l a n a n P e r e k o n o m i a n I n d o n e s i a
M e n y o r o t i k e b i j a k a n
THE WORLD BANK | BANK DUNIA Desember 20126
Tabel 3: Berdasarkan scenario dasar pertumbuhan PDB 2012 diproyeksikan sebesar 6,1 persen di 2012, dan meningkat menjadi 6,3 persen di 2013 (persentase perubahan ,kecuali dinyatakan lain)
Tahunan Tahun berjalan ke kuartal
Desember Revisi Tahunan
2011 2012 2013 2011 2012 2013 2012 2013
1. Indikator ekonomi utama
Total pengeluaran konsumsi 4,5 5,1 5,3 4,6 5,3 4,6 -0,3 0,0
Pengeluaran konsumsi swasta 4,7 5,4 5,1 4,9 5,7 4,6 0,4 0,1
Konsumsi pemerintah 3,2 3,2 6,1 2,8 3,7 4,6 -5,1 -0,4
Pembentukan modal tetap bruto 8,8 10,3 11,2 11,5 9,1 10,7 -2,0 0,0
Ekspor barang dan jasa 13,6 1,1 3,8 7,9 -1,9 7,3 -1,7 -1,8
Impor barang dan jasa 13,3 3,9 3,1 10,1 -1,8 9,1 -3,2 -1,6
Produk Domestik Bruto 6,5 6,1 6,3 6,5 5,6 6,5 0,0 0,0
Pertanian 3,0 4,2 3,5 1,9 4,2 3,1 0,3 0,0
Industri 5,3 5,2 5,0 5,5 4,8 4,9 0,3 0,0
Jasa-jasa 8,5 7,6 8,0 8,5 7,3 8,0 -0,2 0,0
2, Indikator eksternal
Neraca pembayaran (milyar AS$) 11,9 -0,8 5,5 n/a n/a n/a 6,2 2,2
Neraca berjalan (milyar AS$) 1,7 -19,9 -14,2 n/a n/a n/a 1,3 2,2
Neraca perdagangan (milyar AS$) 23,3 1,3 7,7 n/a n/a n/a 1,1 0,9
Neraca keuangan (milyar AS$) 13,5 20,6 19,7 n/a n/a n/a 4,7 0,0
3, Indikator ekonomi lainnya
Indeks harga konsumen 5,4 4,3 4,9 4,1 4,4 5,4 -0,1 -0,2
Indeks keranjang kemiskinan 8,2 6,5 5,7 6,3 5,3 6,8 -0,3 -1,4
Deflator PDB 8,4 4,9 6,0 7,5 4,1 7,5 -1,6 -1,9
PDB nominal 15,4 11,3 12,7 14,5 10,0 14,5 -1,7 -2,0
4, Asumsi ekonomi
Kurs nilai tukar (Rupiah/AS$) 8773 9400 9500 9024 9550 9500 50,0 100,0 Harga minyak mentah Indonesia (AS$/barel) 112 115 105 111 112 105 0,0 5,0
Pertumbuhan mitra dagang utama 3,6 3,3 3,6 2,6 3,3 4,0 0,0 0,0Catatan: Proyeksi aliran perdagangan berkaitan dengan neraca nasional yang dapat melebihkan pergerakan volume perdagangan sebenarnya, dan mengecilkan pergerakan harga karena perbedaan dalam penggunaan harga. Revisi relatif terhadap proyeksi yang dilakukan pada Triwulanan Oktober 2012Sumber: Kementerian Keuangan, BPS, BI, CEIC dan Proyeksi Bank Dunia.
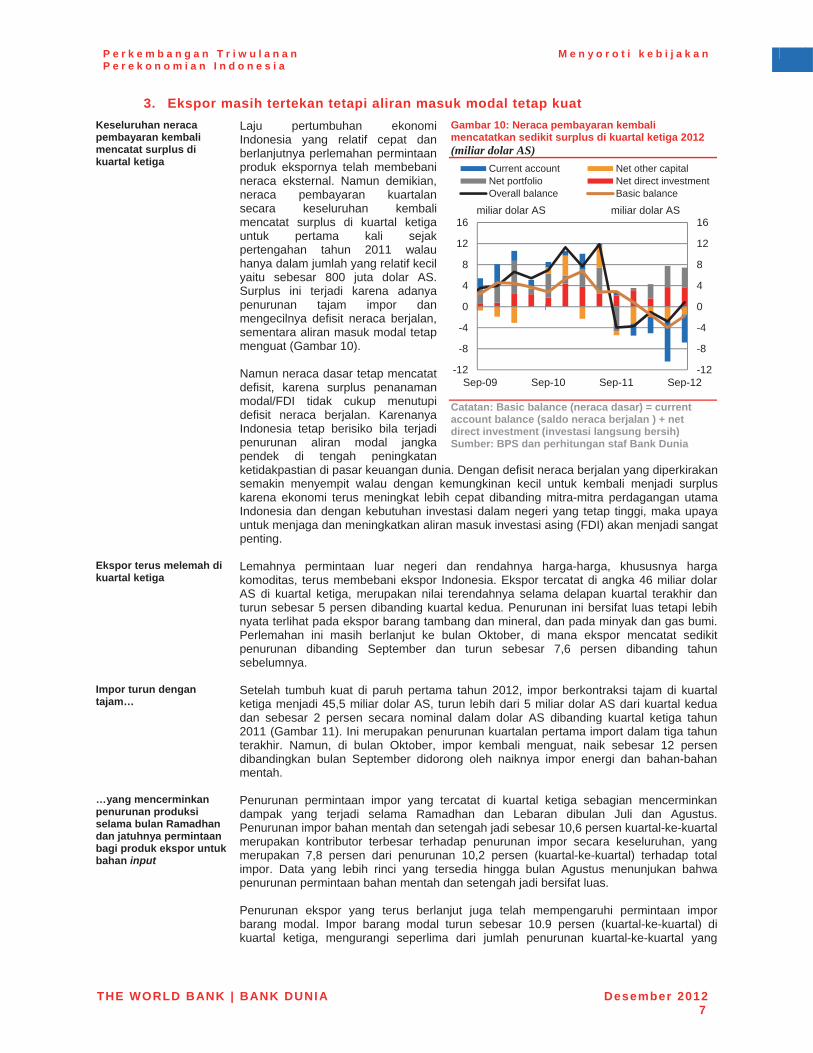
P e r k e m b a n g a n T r i w u l a n a n P e r e k o n o m i a n I n d o n e s i a
M e n y o r o t i k e b i j a k a n
THE WORLD BANK | BANK DUNIA Desember 20127
3. Ekspor masih tertekan tetapi aliran masuk modal tetap kuat Keseluruhan neraca pembayaran kembali mencatat surplus di kuartal ketiga
Laju pertumbuhan ekonomi Indonesia yang relatif cepat dan berlanjutnya perlemahan permintaan produk ekspornya telah membebani neraca eksternal. Namun demikian, neraca pembayaran kuartalan secara keseluruhan kembali mencatat surplus di kuartal ketiga untuk pertama kali sejak pertengahan tahun 2011 walau hanya dalam jumlah yang relatif kecil yaitu sebesar 800 juta dolar AS. Surplus ini terjadi karena adanya penurunan tajam impor dan mengecilnya defisit neraca berjalan, sementara aliran masuk modal tetap menguat (Gambar 10).
Namun neraca dasar tetap mencatat defisit, karena surplus penanaman modal/FDI tidak cukup menutupi defisit neraca berjalan. Karenanya Indonesia tetap berisiko bila terjadi penurunan aliran modal jangka pendek di tengah peningkatan ketidakpastian di pasar keuangan dunia. Dengan defisit neraca berjalan yang diperkirakan semakin menyempit walau dengan kemungkinan kecil untuk kembali menjadi surpluskarena ekonomi terus meningkat lebih cepat dibanding mitra-mitra perdagangan utama Indonesia dan dengan kebutuhan investasi dalam negeri yang tetap tinggi, maka upaya untuk menjaga dan meningkatkan aliran masuk investasi asing (FDI) akan menjadi sangat penting.
Gambar 10: Neraca pembayaran kembali mencatatkan sedikit surplus di kuartal ketiga 2012 (miliar dolar AS)
Catatan: Basic balance (neraca dasar) = current account balance (saldo neraca berjalan ) + net direct investment (investasi langsung bersih) Sumber: BPS dan perhitungan staf Bank Dunia
Ekspor terus melemah di kuartal ketiga
Lemahnya permintaan luar negeri dan rendahnya harga-harga, khususnya harga komoditas, terus membebani ekspor Indonesia. Ekspor tercatat di angka 46 miliar dolar AS di kuartal ketiga, merupakan nilai terendahnya selama delapan kuartal terakhir dan turun sebesar 5 persen dibanding kuartal kedua. Penurunan ini bersifat luas tetapi lebih nyata terlihat pada ekspor barang tambang dan mineral, dan pada minyak dan gas bumi. Perlemahan ini masih berlanjut ke bulan Oktober, di mana ekspor mencatat sedikit penurunan dibanding September dan turun sebesar 7,6 persen dibanding tahun sebelumnya.
Impor turun dengan tajam…
Setelah tumbuh kuat di paruh pertama tahun 2012, impor berkontraksi tajam di kuartal ketiga menjadi 45,5 miliar dolar AS, turun lebih dari 5 miliar dolar AS dari kuartal kedua dan sebesar 2 persen secara nominal dalam dolar AS dibanding kuartal ketiga tahun 2011 (Gambar 11). Ini merupakan penurunan kuartalan pertama import dalam tiga tahun terakhir. Namun, di bulan Oktober, impor kembali menguat, naik sebesar 12 persendibandingkan bulan September didorong oleh naiknya impor energi dan bahan-bahan mentah.
…yang mencerminkan penurunan produksi selama bulan Ramadhan dan jatuhnya permintaan bagi produk ekspor untuk bahan input
Penurunan permintaan impor yang tercatat di kuartal ketiga sebagian mencerminkan dampak yang terjadi selama Ramadhan dan Lebaran dibulan Juli dan Agustus. Penurunan impor bahan mentah dan setengah jadi sebesar 10,6 persen kuartal-ke-kuartal merupakan kontributor terbesar terhadap penurunan impor secara keseluruhan, yang merupakan 7,8 persen dari penurunan 10,2 persen (kuartal-ke-kuartal) terhadap total impor. Data yang lebih rinci yang tersedia hingga bulan Agustus menunjukan bahwa penurunan permintaan bahan mentah dan setengah jadi bersifat luas.
Penurunan ekspor yang terus berlanjut juga telah mempengaruhi permintaan impor barang modal. Impor barang modal turun sebesar 10.9 persen (kuartal-ke-kuartal) di kuartal ketiga, mengurangi seperlima dari jumlah penurunan kuartal-ke-kuartal yang
-12
-8
-4
0
4
8
12
16
-12
-8
-4
0
4
8
12
16
Sep-09 Sep-10 Sep-11 Sep-12
Current account Net other capitalNet portfolio Net direct investmentOverall balance Basic balance
miliar dolar AS miliar dolar AS
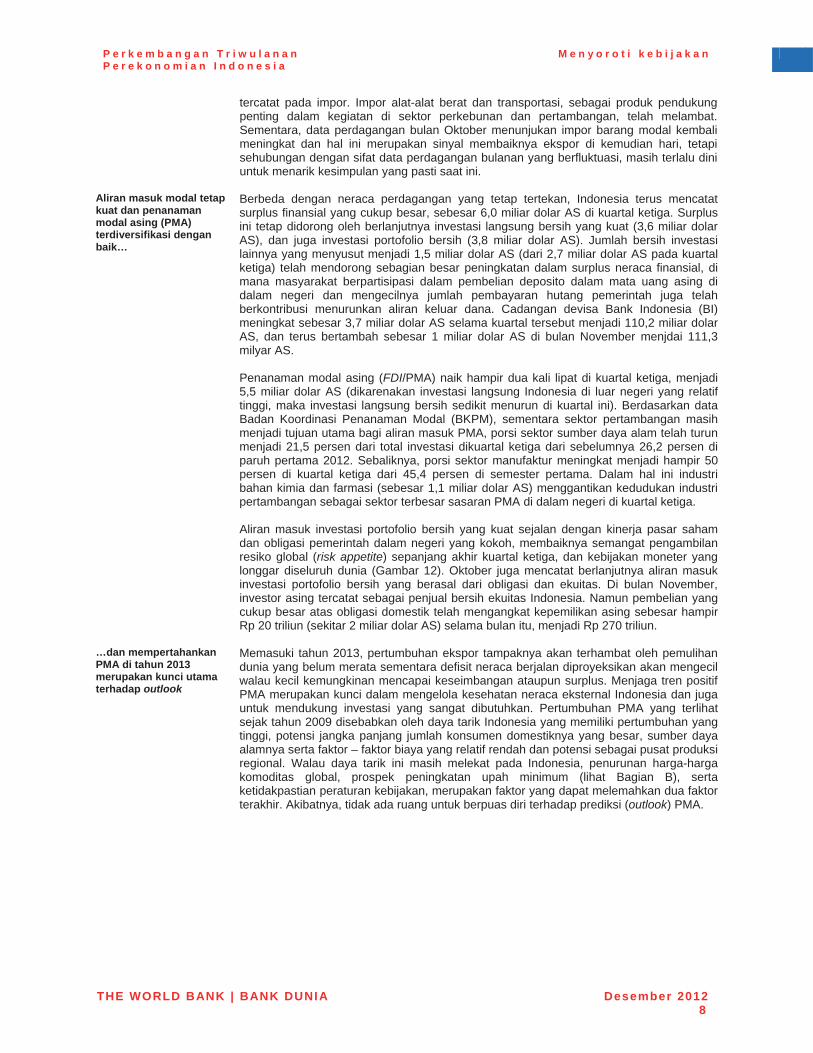
P e r k e m b a n g a n T r i w u l a n a n P e r e k o n o m i a n I n d o n e s i a
M e n y o r o t i k e b i j a k a n
THE WORLD BANK | BANK DUNIA Desember 20128
tercatat pada impor. Impor alat-alat berat dan transportasi, sebagai produk pendukung penting dalam kegiatan di sektor perkebunan dan pertambangan, telah melambat. Sementara, data perdagangan bulan Oktober menunjukan impor barang modal kembali meningkat dan hal ini merupakan sinyal membaiknya ekspor di kemudian hari, tetapi sehubungan dengan sifat data perdagangan bulanan yang berfluktuasi, masih terlalu dini untuk menarik kesimpulan yang pasti saat ini.
Aliran masuk modal tetap kuat dan penanaman modal asing (PMA) terdiversifikasi dengan baik…
Berbeda dengan neraca perdagangan yang tetap tertekan, Indonesia terus mencatat surplus finansial yang cukup besar, sebesar 6,0 miliar dolar AS di kuartal ketiga. Surplus ini tetap didorong oleh berlanjutnya investasi langsung bersih yang kuat (3,6 miliar dolar AS), dan juga investasi portofolio bersih (3,8 miliar dolar AS). Jumlah bersih investasi lainnya yang menyusut menjadi 1,5 miliar dolar AS (dari 2,7 miliar dolar AS pada kuartal ketiga) telah mendorong sebagian besar peningkatan dalam surplus neraca finansial, di mana masyarakat berpartisipasi dalam pembelian deposito dalam mata uang asing di dalam negeri dan mengecilnya jumlah pembayaran hutang pemerintah juga telah berkontribusi menurunkan aliran keluar dana. Cadangan devisa Bank Indonesia (BI) meningkat sebesar 3,7 miliar dolar AS selama kuartal tersebut menjadi 110,2 miliar dolar AS, dan terus bertambah sebesar 1 miliar dolar AS di bulan November menjdai 111,3 milyar AS.
Penanaman modal asing (FDI/PMA) naik hampir dua kali lipat di kuartal ketiga, menjadi 5,5 miliar dolar AS (dikarenakan investasi langsung Indonesia di luar negeri yang relatif tinggi, maka investasi langsung bersih sedikit menurun di kuartal ini). Berdasarkan data Badan Koordinasi Penanaman Modal (BKPM), sementara sektor pertambangan masih menjadi tujuan utama bagi aliran masuk PMA, porsi sektor sumber daya alam telah turun menjadi 21,5 persen dari total investasi dikuartal ketiga dari sebelumnya 26,2 persen di paruh pertama 2012. Sebaliknya, porsi sektor manufaktur meningkat menjadi hampir 50 persen di kuartal ketiga dari 45,4 persen di semester pertama. Dalam hal ini industri bahan kimia dan farmasi (sebesar 1,1 miliar dolar AS) menggantikan kedudukan industri pertambangan sebagai sektor terbesar sasaran PMA di dalam negeri di kuartal ketiga.
Aliran masuk investasi portofolio bersih yang kuat sejalan dengan kinerja pasar saham dan obligasi pemerintah dalam negeri yang kokoh, membaiknya semangat pengambilan resiko global (risk appetite) sepanjang akhir kuartal ketiga, dan kebijakan moneter yang longgar diseluruh dunia (Gambar 12). Oktober juga mencatat berlanjutnya aliran masuk investasi portofolio bersih yang berasal dari obligasi dan ekuitas. Di bulan November, investor asing tercatat sebagai penjual bersih ekuitas Indonesia. Namun pembelian yang cukup besar atas obligasi domestik telah mengangkat kepemilikan asing sebesar hampir Rp 20 triliun (sekitar 2 miliar dolar AS) selama bulan itu, menjadi Rp 270 triliun.
…dan mempertahankan PMA di tahun 2013 merupakan kunci utama terhadap outlook
Memasuki tahun 2013, pertumbuhan ekspor tampaknya akan terhambat oleh pemulihan dunia yang belum merata sementara defisit neraca berjalan diproyeksikan akan mengecil walau kecil kemungkinan mencapai keseimbangan ataupun surplus. Menjaga tren positif PMA merupakan kunci dalam mengelola kesehatan neraca eksternal Indonesia dan juga untuk mendukung investasi yang sangat dibutuhkan. Pertumbuhan PMA yang terlihat sejak tahun 2009 disebabkan oleh daya tarik Indonesia yang memiliki pertumbuhan yang tinggi, potensi jangka panjang jumlah konsumen domestiknya yang besar, sumber daya alamnya serta faktor – faktor biaya yang relatif rendah dan potensi sebagai pusat produksi regional. Walau daya tarik ini masih melekat pada Indonesia, penurunan harga-harga komoditas global, prospek peningkatan upah minimum (lihat Bagian B), serta ketidakpastian peraturan kebijakan, merupakan faktor yang dapat melemahkan dua faktor terakhir. Akibatnya, tidak ada ruang untuk berpuas diri terhadap prediksi (outlook) PMA.
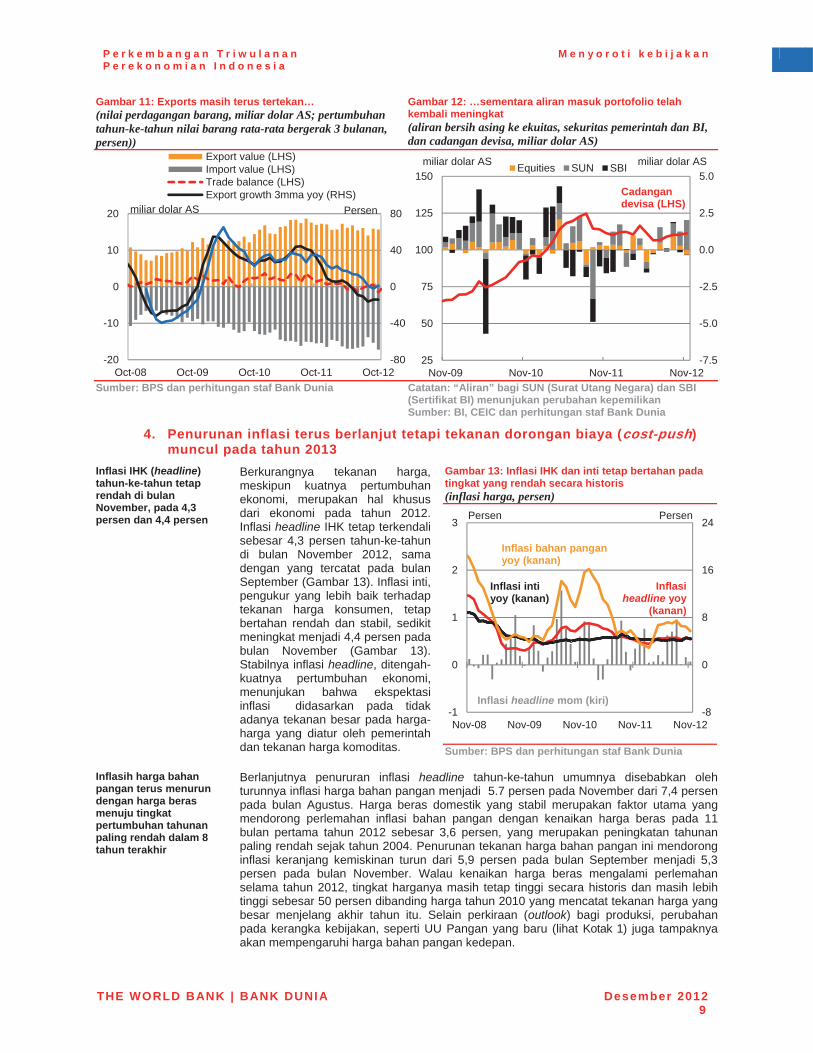
P e r k e m b a n g a n T r i w u l a n a n P e r e k o n o m i a n I n d o n e s i a
M e n y o r o t i k e b i j a k a n
THE WORLD BANK | BANK DUNIA Desember 20129
Gambar 11: Exports masih terus tertekan… (nilai perdagangan barang, miliar dolar AS; pertumbuhan tahun-ke-tahun nilai barang rata-rata bergerak 3 bulanan, persen))
Gambar 12: …sementara aliran masuk portofolio telah kembali meningkat (aliran bersih asing ke ekuitas, sekuritas pemerintah dan BI, dan cadangan devisa, miliar dolar AS)
Sumber: BPS dan perhitungan staf Bank Dunia Catatan: “Aliran” bagi SUN (Surat Utang Negara) dan SBI (Sertifikat BI) menunjukan perubahan kepemilikan Sumber: BI, CEIC dan perhitungan staf Bank Dunia
4. Penurunan inflasi terus berlanjut tetapi tekanan dorongan biaya (cost-push)muncul pada tahun 2013
Inflasi IHK (headline)tahun-ke-tahun tetap rendah di bulan November, pada 4,3 persen dan 4,4 persen
Berkurangnya tekanan harga, meskipun kuatnya pertumbuhan ekonomi, merupakan hal khusus dari ekonomi pada tahun 2012. Inflasi headline IHK tetap terkendali sebesar 4,3 persen tahun-ke-tahun di bulan November 2012, sama dengan yang tercatat pada bulan September (Gambar 13). Inflasi inti, pengukur yang lebih baik terhadap tekanan harga konsumen, tetap bertahan rendah dan stabil, sedikit meningkat menjadi 4,4 persen pada bulan November (Gambar 13). Stabilnya inflasi headline, ditengah- kuatnya pertumbuhan ekonomi, menunjukan bahwa ekspektasi inflasi didasarkan pada tidak adanya tekanan besar pada harga-harga yang diatur oleh pemerintah dan tekanan harga komoditas.
Gambar 13: Inflasi IHK dan inti tetap bertahan pada tingkat yang rendah secara historis (inflasi harga, persen)
Sumber: BPS dan perhitungan staf Bank Dunia
Inflasih harga bahan pangan terus menurun dengan harga beras menuju tingkat pertumbuhan tahunan paling rendah dalam 8 tahun terakhir
Berlanjutnya penururan inflasi headline tahun-ke-tahun umumnya disebabkan oleh turunnya inflasi harga bahan pangan menjadi 5.7 persen pada November dari 7,4 persenpada bulan Agustus. Harga beras domestik yang stabil merupakan faktor utama yang mendorong perlemahan inflasi bahan pangan dengan kenaikan harga beras pada 11 bulan pertama tahun 2012 sebesar 3,6 persen, yang merupakan peningkatan tahunan paling rendah sejak tahun 2004. Penurunan tekanan harga bahan pangan ini mendorong inflasi keranjang kemiskinan turun dari 5,9 persen pada bulan September menjadi 5,3 persen pada bulan November. Walau kenaikan harga beras mengalami perlemahan selama tahun 2012, tingkat harganya masih tetap tinggi secara historis dan masih lebih tinggi sebesar 50 persen dibanding harga tahun 2010 yang mencatat tekanan harga yang besar menjelang akhir tahun itu. Selain perkiraan (outlook) bagi produksi, perubahan pada kerangka kebijakan, seperti UU Pangan yang baru (lihat Kotak 1) juga tampaknya akan mempengaruhi harga bahan pangan kedepan.
-80
-40
0
40
80
-20
-10
0
10
20
Oct-08 Oct-09 Oct-10 Oct-11 Oct-12
Export value (LHS)Import value (LHS)Trade balance (LHS)Export growth 3mma yoy (RHS)
miliar dolar AS Persen
-7.5
-5.0
-2.5
0.0
2.5
5.0
25
50
75
100
125
150
Nov-09 Nov-10 Nov-11 Nov-12
Equities SUN SBImiliar dolar AS
Cadangandevisa (LHS)
miliar dolar AS
-8
0
8
16
24
-1
0
1
2
3
Nov-08 Nov-09 Nov-10 Nov-11 Nov-12
Inflasi inti yoy (kanan)
Inflasiheadline yoy
(kanan)
Inflasi headline mom (kiri)
Persen Persen
Inflasi bahan pangan yoy (kanan)
P e r k e m b a n g a n T r i w u l a n a n P e r e k o n o m i a n I n d o n e s i a
M e n y o r o t i k e b i j a k a n
THE WORLD BANK | BANK DUNIA Desember 201210
Kotak 1: Undang-Undang Pangan yang baru di Indonesia Dewan Perwakilan Rakyat (DPR) Indonesia mengesahkan Undang-Undang (UU) Pangan pada tanggal 18 Oktober 2012, mengganti UU Pangan tahun 1996. UU baru itu diprakarsai oleh anggota dewan, dan persiapan telah dilakukan sejak awal tahun 2011. Pada tahap persiapan awal, DPR dan Pemerintah menyamakan pandangan dalam menetapkan suatu badan ketahanan pangan baru. Karena masalah pangan dikelola oleh berbagai kementerian dan lembaga, keputusan kebijakan seringkali tertunda karena prosedur birokrasi dan kesulitan koordinasi. Sehingga, badan ketahanan pangan yang baru diharapkan dapat mempercepat proses pengambilan keputusan. Saat ini terdapat tiga badan yang khusus menangani masalah ketahanan pangan: Dewan Ketahanan Pangan (DKP), Badan Ketahanan Pangan (BKP) dan Bulog (Badan Urusan Logistik). DKP, yang dipimpin oleh Presiden, menangani perumusan kebijakan bagi ketahanan pangan nasional. BKP menangani masalah ketahanan pangan di bawah Kementerian Pertanian. Bulog adalah suatu Perum (Perusahaan Umum), badan usaha milik negara nirlaba, yang mengelola pengadaan, cadangan dan distribusi beras. Nampaknya suatu badan baru direncanakan akan memadukan ketiga badan tersebut menjadi satu.
Penetapan badan ketahanan pangan yang baru itu diperkirakan akan mendukung pengambilan keputusan, namun terdapat sejumlah debat tentang fungsi-fungsi apa yang harus diberikan kepada badan yang baru tersebut. DPR tampaknya menginginkan badan baru ituuntuk menjadi pengatur dan pelaksana peraturan bahan pangan umum, sementara Pemerintah menghendaki agar kedua tanggung jawab itu tidak digabungkan ke satu entitas. Karena pandangan dan pendapat yang berbeda, pembahasan UU baru itu menjadi berlarut-larut.
Ketika UU baru itu disahkan, badan ketahanan pangan yang baru itu tidak dibentuk. Namun terdapat pasal-pasal yang mengatur bataswaktu pembentukan badan ketahanan pangan baru dan penjelasan akan peranannya. Peraturan utamanya adalah pada Bab XII: Kelembagaan Pangan. Beberapa hal-hal utama adalah bahwa lembaga baru itu akan berada di bawah Presiden dan menerima mandat untuk menerapkan kebijakan ketahanan pangan sebagai lembaga Pemerintah. Selain itu lembaga baru itu akan membuat usulan kepada Presiden untuk menugaskan para badan usaha milik negara di bidang pangan untuk menghasilkan, mengadakan, menyimpan, dan mendistribusikan bahan pangan pokok dan bahan pangan lainnya. Entitas baru itu harus dibentuk dalam waktu tiga tahun setelah pengesahan UU itu.
Hal yang berbeda dari UU Pangan Indonesia ini adalah bahwa kedaulatan pangan, swasembada pangan, ketahanan pangan dan keamanan pangan seluruhnya terpadu di dalam satu UU. Konsep kedaulatan dan swasembada pangan berasal dari konsep ketahanan pangan pada UU Pangan tahun 1996. Kedaulatan pangan, yang didefinisikan sebagai hak setiap bangsa dan setiap rakyat untuk secaraindependen menetapkan kebijakan pangan yang menjamin hak pangan bagi penduduk dan masyarakat dan menetapkan sistem bahan pangan yang sesuai, adalah suatu konsep yang baru; karena tidak terdapat definisi yang telah disepakati oleh dunia internasional. Untuk banyak negara, masalah keamanan pangan ditangani dengan UU yang terpisah. Penggunaan UU yang berbeda untuk ketahanan pangan dan keamanan pangan memiliki beberapa manfaat, karena kementerian dan lembaga yang menangani ketahanan pangan dan keamanan pangan juga berbeda-beda. Penekanan UU yang baru itu kepada keamanan pangan diwariskan dari UU tahun 1996 tentang Pangan.
UU baru itu memberi mandat kepada Pemerintah untuk melakukan intervensi yang signifikan ke pasar dan sektor bahan pangan untuk mencapai swasembada pangan dan ketahanan pangan. Sebagai contoh, Pasal 23 menyatakan bahwa Pemerintah mengelola cadangan bahan pangan nasional. Pasal 51 menugaskan pemerintah untuk mengelola perdagangan bahan pangan untuk menstabilkan pasokan dan harga bahan pangan. Pasal 55 memberikan mandat kepada pemerintah untuk menstabilkan pasokan dan harga bahan pangan pokok pada tingkat produsen dan konsumen. Hal ini berlawanan dengan UU tahun 1996, yang mana keterlibatan Pemerintah dalam perdagangan bahan pangan, terutama impor bahan pangan, umumnya terbatas kepada masalah keamanan bahan pangan.
Sementara penerapan UU itu masih harus dilihat, terdapat peran-peran yang berkaitan dengan potensi intervensi pemerintah yang besar ke pasar bahan pangan demi ketahanan pangan. Kesejahteraan konsumen dapat terganggu karena lebih tingginya harga bahan pangan jika terdapat upaya untuk mencapai ketahanan pangan dan swasembada pangan melalui intervensi Pemerintah untuk membatasi perdagangan bahan pangan dan meningkatkan cadangan. Sesungguhnya, pengalaman internasional menunjukan bahwa peningkatan produktivitas dan investasi pertanian merupakan kunci untuk mencapai ketahanan pangan yang berkelanjutan. Catatan: Untuk informasi lebih lanjut, lihat OECD Review of Agricultural Policies: Indonesia 2012 (Oktober 2012)
Ekspektasi harga jangka pendek telah meningkat mengikuti keputusan pemerintah untuk meningkatkan tarif listrik pada tahun 2013
Ekspektasi harga konsumen yang diukur pada bulan Oktober 2012 telah naik dari tingkat rendahnya pada bulan Agustus. Menurut survei BI, lebih banyak responden dibanding bulan yang lalu mengatakan bahwa harga-harga akan naik pada tiga hingga enam bulan ke depan, terutama karena keputusan Pemerintah untuk meningkatkan tarif listrik pada tahun 2013. Sementara itu para penjual eceran melaporkan tekanan inflasi yang lebih lunak selama masa hari raya, dengan indeks harapan untuk harga-harga selama 3 bulan di depan pada bulan September turun ke tingkat yang paling rendah sejak akhir 2011. Dengan peningkatan upah minimum yang baru diumumkan (lihat di bawah dan Bagian B), hasil penelitian berikut untuk bulan November dan Desember tampaknya akan mencerminkan peningkatan ekspektasi harga.
Rencana peningkatan tarif listrik pada tahun 2013 diperkirakan akan berdampak terbatas karena sebagian besar rumah tangga tidak akan terpengaruh, sama seperti peningkatan pada
Keputusan yang disambut baik dalam APBN 2013 untuk meningkatkan tarif listrik bersubsidi dengan besar rata-rata 15 persen yang diperkirakan akan membawa dampak sementara dan satu kali saja terhadap inflasi IHK. Rinciannya belum diumumkan tetapi DPR telah memandatkan bahwa peningkatan itu hanya berlaku kepada pelanggan rumah tangga atau sambungan listrik yang umumnya tidak digunakan oleh kaum miskin dan bahkan kelompok menengah sekalipun (yaitu tidak termasuk sambungan listrik dengan daya 450V dan 900V). Rumah tangga yang terpengaruh hanyalah merupakan 15 persen
P e r k e m b a n g a n T r i w u l a n a n P e r e k o n o m i a n I n d o n e s i a
M e n y o r o t i k e b i j a k a n
THE WORLD BANK | BANK DUNIA Desember 201211
tahun 2010 dari pelanggan rumah tangga tetapi mereka mengkonsumsi 35 persen dari seluruh konsumsi listrik rumah tangga.
Dampak langsung dari reformasi tersebut terhadap IHK tampaknya akan terbatas. Biaya tarif listrik rumah tangga merupakan 2,8 persen dari seluruh konsumsi menurut bobot konsumsi IHK, jadi bahkan bila peningkatan 15 persen itu diterapkan kepada seluruh rumah tangga sekalipun, inflasi IHK hanya akan meningkat sebesar 0,42 poin persentase. Realisasinya akan lebih rendah karena reformasi itu tidak menyertakan 85 persen dari penduduk yang menggunakan jenis sambungan listrik yang tidak mengalami peningkatan tarif. Dampak tidak langsung juga akan terbatas dengan relatif rendahnya bagian biaya listrik pada biaya perusahaan. Biaya listrik hanya sekitar 5 persen dari total biaya bagi sebagian besar perusahaan manufaktur berukuran menengah dan besar (menurut Survei Industri 2006). Kenaikan biaya listrik sebesar 15 persen akan secara umum meningkatkan jumlah biaya sebesar kurang dari 1 persen. Risiko terhadap inflasi yang lebih besar dan lebih sulit untuk dihitung adalah bila para perusahaan menggunakan kenaikan tarif listrik itu sebagai alasan untuk meningkatkan harga jual mereka.
Peningkatan upah minimum yang besar pada seluruh propinsi di Indonesia akan berlaku pada tahun 2013…
Seperti dibahas dengan lebih mendetil pada Bagian B, propinsi-propinsi di seluruh Indonesia telah mengumumkan peningkatan upah minimum untuk tahun 2013 dengan jumlah yang mencapai 50 persen pada beberapa propinsi seperti Kalimantan Timur dan 44 persen di Jakarta (peningkatan terbesar selama satu dekade). Peningkatan di seluruh Indonesia ini tampaknya akan membawa dampak yang lebih besar terhadap tekanan biaya yang lebih besar dibanding pengaruh langsungnya yang cepat terhadap IHK.
Dampak langsung terbatas karena IHK hanya menyertakan upah bagi sejumlah kegiatan buruh (seperti jasa rumah tangga) yang digolongkan sebagai sektor informal, dan upah minimum tersebut karenanya tidak berlaku. Proporsi produk-produk di dalam IHK yang dapat berkaitan langsung dengan kenaikan upah minimum sektor formal tampaknya hanya berjumlah kecil, dan bahkan bagi perusahaan-perusahaan yang menghasilkan produk-produk tersebut, bagian dari jumlah biaya yang berkaitan dengan para buruh dan upah minimum tampaknya akan terbatas. Menurut Survei Industri Perusahaan Manufaktur di Indonesia 2006, sekitar 76 persen dari seluruh perusahaan mengatakan bahwa mereka yang menerima upah minimum jumlahnya tidak sampai 10 persen dari rata-rata upah perusahaan itu. Karenanya, dampak peningkatan upah minimum terhadap jumlah biaya umumnya hanyalah berukuran kecil. Akhirnya, pengaruh apapun terhadap konsumen akan dampaknya terhadap biaya operasi juga akan terbatas dengan tingkat persaingan di pasar, keterkaitannya dengan impor dan tingkat margin keuntungan mereka.
…dan terdapat risiko bahwa keputusan tersebut akan meningkatkan upah lebih luas pada sektor formal dan informal, menyebabkan inflasi yang didorong biaya
Risiko terbesar kepada inflasi datang dari peningkatan permintaan upah yang lebih besar dari para pegawai dari sektor informal maupun formal, jika peningkatan upah minimum yang diumumkan secara luas itu juga mempengaruhi penetapan upah di seluruh ekonomi negara. Seperti disinggung pada Bagian B, peningkatan sebesar 10 persen dalam upah minimum berkaitan dengan peningkatan rata-rata upah bagi seluruh pegawai sebesar 3 persen pada tahun yang sama. Bila tingkat upah umum turut meningkat seperti yang terjadi pada peningkatan upah minimum yang lalu, mungkin terjadi dampak yang lebih luas terhadap biaya usaha, yang dapat menjalar hingga penyesuaian harga jual eceran. Selain itu, peningkatan yang besar pada daya beli para pegawai yang menerima manfaat dari penghasilan yang lebih tinggi secara signifikan dapat meningkatkan permintaan bagi barang-barang konsumsi eceran seperti bahan pangan, makanan hasil proses, pakaian dan rokok.
Inflasi IHK diproyeksikan akan menurun menjadi 4,4 persen tahun-ke-tahun pada kuartal terakhir tahun 2012, sekitar pertengahan angka sasaran BI sebesar 4,5 ± 1 persen, dan sedikit peningkatan pada tahun 2013 dengan naiknya risiko peningkatan inflasi
Dengan hanya satu bulan tersisa untuk pelaporan inflasi IHK tahun 2012, kuartal terakhir tampaknya akan mencatat penurunan inflasi menjadi 4,4 persen tahun-ke-tahun, yang mencerminkan penurunan inflasi bahan pangan yang disebabkan oleh rendahnya peningkatan harga beras dan perlambatan kredit konsumen selama tahun 2012. Perkiraan itu akan menempatkan inflasi IHK akhir tahun pada tengah-tengah angka sasaran inflasi Bank Indonesia sebesar 4,5 ± 1 persen. Inflasi IHK untuk sepanjang tahun 2012 diproyeksikan sebesar 4,3 persen.
Pada tahun 2013, inflasi diproyeksikan akan meningkat menjadi 4,9 persen selama setahun, didorong oleh kuatnya permintaan konsumen, masih tingginya tingkat pertumbuhan kredit konsumen dan pengaruh dari perlemahan kurs tukar rupiah yang
P e r k e m b a n g a n T r i w u l a n a n P e r e k o n o m i a n I n d o n e s i a
M e n y o r o t i k e b i j a k a n
THE WORLD BANK | BANK DUNIA Desember 201212
masih terus berlangsung. Kotak 2 memberikan lebih banyak rincian tentang dampak tekanan biaya dari kurs tukar terhadap inflasi. Peningkatan upah minimum dan tarif listrik menambah risiko peningkatan terhadap perkiraan (outlook) inflasi. Peningkatan tarif listrik bersubsidi yang dijadwalkan tersebut akan membawa dampak langsung yang dapat diukur terhadap inflasi pada tahun 2013 dengan komposisi dan penetapan peluncurannya menjadi kunci dalam menentukan keseluruhan dampak inflasi terhadap IHK dan deflator PDB pada tahun 2013. Pada tahap ini, dampak peningkatan tarif listrik tidak disertakan ke dalam perkiraan standar (baseline) Bank Dunia karena tidak adanya rincian mengenai peningkatan tarif tersebut. Perkiraan inflasi keranjang kemiskinan lebih rendah pada 5,3 persen pada kuartal keempat tahun 2012 dan 6,8 persen pada kuartal keempat tahun 2013.
Pertumbuhan deflator PDB telah turun ke nilai rendahnya sejak tahun 1999 karena penurunan pertumbuhan harga di hampir semua sektor
Pada kuartal ketiga, untuk pertama kali lebih dari 8 tahun, tingkat harga-harga secara umum di dalam ekonomi, seperti diukur oleh deflator PDB, meningkat dengan laju yang lebih lambat dari inflasi IHK. Inflasi deflator PDB tumbuh sebesar 3,5 persen tahun-ke-tahun pada kuartal ketiga tahun 2012, laju yang paling rendah sejak tahun 1999. Sebagian besar sektor mencatat perlambatan inflasi atau bergerak datar, dengan penurunan terbesar pada jasa-jasa yang turun dari 15 persen tahun-ke-tahun pada kuartal kedua menjadi 1,8 persen tahun-ke-tahun pada kuartal ketiga. Inflasi sektor pertambangan turun dari 13,6 persen menjadi 7,8 persen tahun-ke-tahun pada periode yang sama karena turunnya harga-harga komoditas. Setelah dua kuartal pertumbuhan yang rendah secara berturut-turut, deflator PDB pada tahun 2012 diproyeksikan untuk bertumbuh hanya sebesar 4,9 persen selama setahun penuh, laju yang paling lambat sejak data dimulai pada tahun 1993, berkontribusi kepada penurunan yang nyata pada pertumbuhan PDB nominal seperti disinggung di atas. Pada tahun 2013 pertumbuhan deflator PDB tahunan diperkirakan akan meningkat dari nilainya yang kini rendah, mencapai 6,0 persen dengan didorong oleh pertumbuhan ekonomi yang lebih cepat dan berlanjutnya kondisi kredit yang kuat, tetapi masih tetap cukup jauh di bawah rata-rata 14 persen yang tercatat pada 4 tahun sebelum krisis keuangan dunia.
Kotak 2: Mengapa depresiasi Rupiah tidak membawa dampak yang lebih besar kepada inflasiPergerakan nilai tukar mempengaruhi harga dalam negeri sebagai akibat dari konsumen membeli produk impor dan melakukan usaha memproduksi barang-barang konsumsi di dalam negeri yang bergantung kepada barang input dari luar negeri. Namun, pengaruh inflasi dari pegerakan nilai tukar bergantung kepada sejumlah faktor dan pengaruhnya dapat terjadi setelah beberapa waktu. Sesungguhnya,depresiasi Rupiah, dengan penurunan nilai sebesar 12,9 persen dari bulan Juli 2011 ke November 2012, tidak dikaitkan dengan peningkatan inflasi IHK. Dengan semua hal lain dianggap tidak berubah, Bank Dunia memperkirakan bahwa skala depresiasi itu akanberkaitan dengan peningkatan laju inflasi sekitar 1 poin persentase. Sementara kontrafaktual tidak diketahui, terdapat sejumlah faktor yang dapat membantu menjelaskan mengapa depresiasi tidak menyebabkan dampak yang besar terhadap inflasi, setidaknya hingga saat ini.
Pertama, kurs tukar Rupiah terhadap dolar AS bukanlah merupakan pedoman terbaik atas dampak melemahnya mata uang dalam negeri terhadap inflasi IHK, karena hanya 6 persen dari impor Indonesia berasal dari AS. Pengukuran yang lebih baik adalah Kurs Tukar Nominal Efektif (Nominal Effective Exchange Rate/NEER), indeks kurs tukar dengan pembobotan perdagangan dengan para mitra perdagangan utama Indonesia. Sejak bulan Juli 2011 indeks ini telah mengalami depresiasi sebesar 9 persen, lebih kecil secara signifikan dibanding kurs tukar dolar AS per Rupiah.
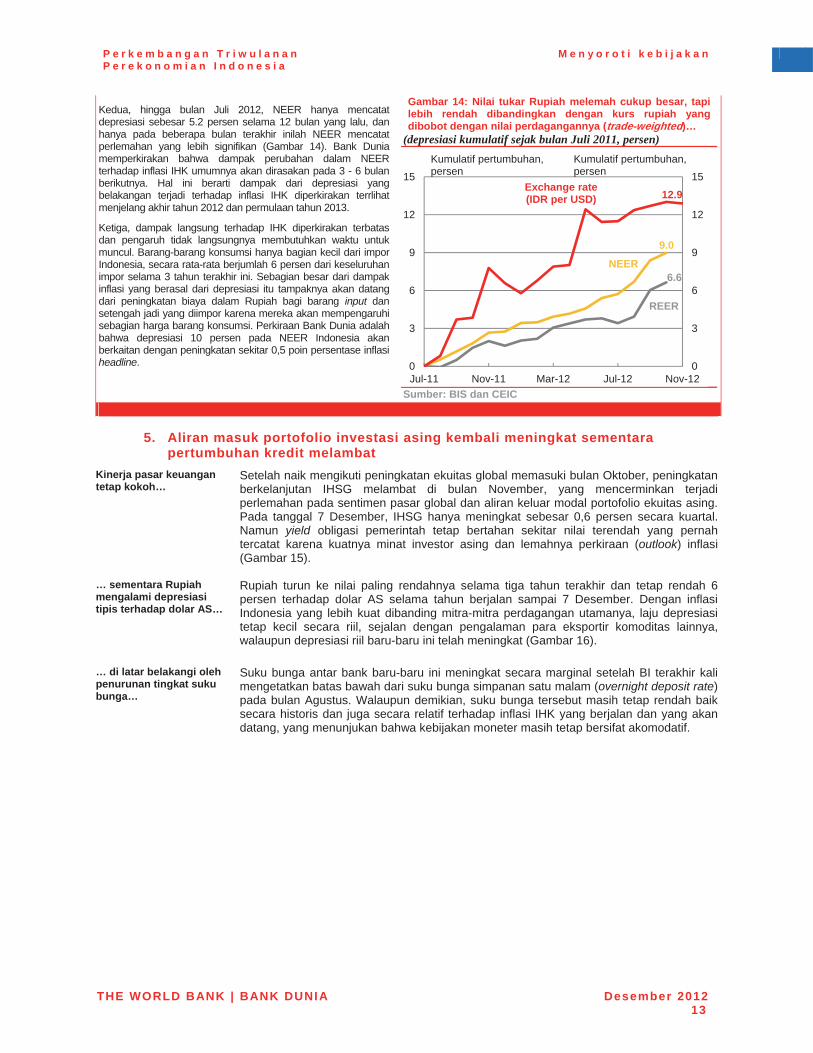
P e r k e m b a n g a n T r i w u l a n a n P e r e k o n o m i a n I n d o n e s i a
M e n y o r o t i k e b i j a k a n
THE WORLD BANK | BANK DUNIA Desember 201213
Kedua, hingga bulan Juli 2012, NEER hanya mencatat depresiasi sebesar 5.2 persen selama 12 bulan yang lalu, dan hanya pada beberapa bulan terakhir inilah NEER mencatat perlemahan yang lebih signifikan (Gambar 14). Bank Dunia memperkirakan bahwa dampak perubahan dalam NEER terhadap inflasi IHK umumnya akan dirasakan pada 3 - 6 bulan berikutnya. Hal ini berarti dampak dari depresiasi yang belakangan terjadi terhadap inflasi IHK diperkirakan terrlihat menjelang akhir tahun 2012 dan permulaan tahun 2013.
Ketiga, dampak langsung terhadap IHK diperkirakan terbatas dan pengaruh tidak langsungnya membutuhkan waktu untuk muncul. Barang-barang konsumsi hanya bagian kecil dari impor Indonesia, secara rata-rata berjumlah 6 persen dari keseluruhan impor selama 3 tahun terakhir ini. Sebagian besar dari dampak inflasi yang berasal dari depresiasi itu tampaknya akan datang dari peningkatan biaya dalam Rupiah bagi barang input dan setengah jadi yang diimpor karena mereka akan mempengaruhi sebagian harga barang konsumsi. Perkiraan Bank Dunia adalah bahwa depresiasi 10 persen pada NEER Indonesia akan berkaitan dengan peningkatan sekitar 0,5 poin persentase inflasi headline.
Gambar 14: Nilai tukar Rupiah melemah cukup besar, tapi lebih rendah dibandingkan dengan kurs rupiah yang dibobot dengan nilai perdagangannya (trade-weighted)…
(depresiasi kumulatif sejak bulan Juli 2011, persen)
Sumber: BIS dan CEIC
5. Aliran masuk portofolio investasi asing kembali meningkat sementara pertumbuhan kredit melambat
Kinerja pasar keuangan tetap kokoh…
Setelah naik mengikuti peningkatan ekuitas global memasuki bulan Oktober, peningkatan berkelanjutan IHSG melambat di bulan November, yang mencerminkan terjadi perlemahan pada sentimen pasar global dan aliran keluar modal portofolio ekuitas asing. Pada tanggal 7 Desember, IHSG hanya meningkat sebesar 0,6 persen secara kuartal. Namun yield obligasi pemerintah tetap bertahan sekitar nilai terendah yang pernah tercatat karena kuatnya minat investor asing dan lemahnya perkiraan (outlook) inflasi(Gambar 15).
… sementara Rupiah mengalami depresiasi tipis terhadap dolar AS…
Rupiah turun ke nilai paling rendahnya selama tiga tahun terakhir dan tetap rendah 6 persen terhadap dolar AS selama tahun berjalan sampai 7 Desember. Dengan inflasi Indonesia yang lebih kuat dibanding mitra-mitra perdagangan utamanya, laju depresiasi tetap kecil secara riil, sejalan dengan pengalaman para eksportir komoditas lainnya, walaupun depresiasi riil baru-baru ini telah meningkat (Gambar 16).
… di latar belakangi oleh penurunan tingkat suku bunga…
Suku bunga antar bank baru-baru ini meningkat secara marginal setelah BI terakhir kali mengetatkan batas bawah dari suku bunga simpanan satu malam (overnight deposit rate)pada bulan Agustus. Walaupun demikian, suku bunga tersebut masih tetap rendah baik secara historis dan juga secara relatif terhadap inflasi IHK yang berjalan dan yang akan datang, yang menunjukan bahwa kebijakan moneter masih tetap bersifat akomodatif.
9.0
6.6
12.9
0
3
6
9
12
15
0
3
6
9
12
15
Jul-11 Nov-11 Mar-12 Jul-12 Nov-12
Kumulatif pertumbuhan, persen
Kumulatif pertumbuhan, persen
Exchange rate (IDR per USD)
NEER
REER
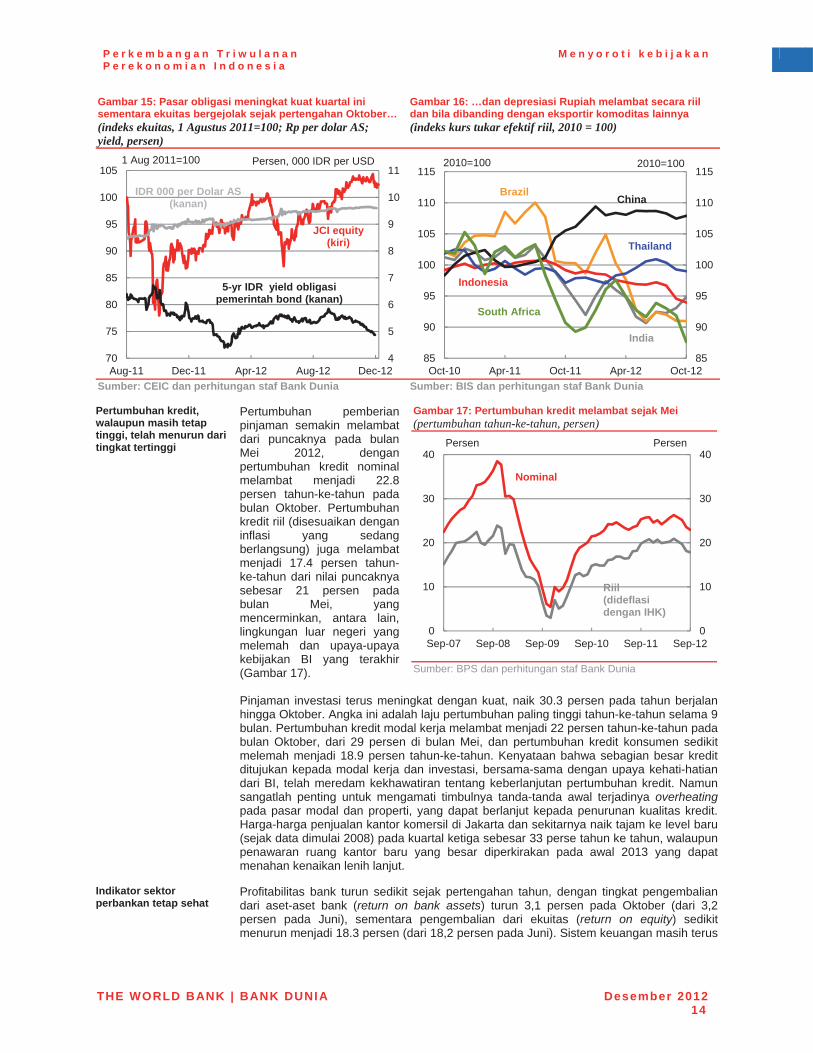
P e r k e m b a n g a n T r i w u l a n a n P e r e k o n o m i a n I n d o n e s i a
M e n y o r o t i k e b i j a k a n
THE WORLD BANK | BANK DUNIA Desember 201214
Gambar 15: Pasar obligasi meningkat kuat kuartal ini sementara ekuitas bergejolak sejak pertengahan Oktober… (indeks ekuitas, 1 Agustus 2011=100; Rp per dolar AS; yield, persen)
Gambar 16: …dan depresiasi Rupiah melambat secara riil dan bila dibanding dengan eksportir komoditas lainnya (indeks kurs tukar efektif riil, 2010 = 100)
Sumber: CEIC dan perhitungan staf Bank Dunia Sumber: BIS dan perhitungan staf Bank Dunia
Pertumbuhan kredit, walaupun masih tetap tinggi, telah menurun dari tingkat tertinggi
Pertumbuhan pemberian pinjaman semakin melambat dari puncaknya pada bulan Mei 2012, dengan pertumbuhan kredit nominal melambat menjadi 22.8 persen tahun-ke-tahun pada bulan Oktober. Pertumbuhan kredit riil (disesuaikan dengan inflasi yang sedang berlangsung) juga melambat menjadi 17.4 persen tahun-ke-tahun dari nilai puncaknya sebesar 21 persen pada bulan Mei, yang mencerminkan, antara lain, lingkungan luar negeri yang melemah dan upaya-upaya kebijakan BI yang terakhir (Gambar 17).
Pinjaman investasi terus meningkat dengan kuat, naik 30.3 persen pada tahun berjalan hingga Oktober. Angka ini adalah laju pertumbuhan paling tinggi tahun-ke-tahun selama 9 bulan. Pertumbuhan kredit modal kerja melambat menjadi 22 persen tahun-ke-tahun pada bulan Oktober, dari 29 persen di bulan Mei, dan pertumbuhan kredit konsumen sedikit melemah menjadi 18.9 persen tahun-ke-tahun. Kenyataan bahwa sebagian besar kredit ditujukan kepada modal kerja dan investasi, bersama-sama dengan upaya kehati-hatian dari BI, telah meredam kekhawatiran tentang keberlanjutan pertumbuhan kredit. Namun sangatlah penting untuk mengamati timbulnya tanda-tanda awal terjadinya overheatingpada pasar modal dan properti, yang dapat berlanjut kepada penurunan kualitas kredit.Harga-harga penjualan kantor komersil di Jakarta dan sekitarnya naik tajam ke level baru (sejak data dimulai 2008) pada kuartal ketiga sebesar 33 perse tahun ke tahun, walaupun penawaran ruang kantor baru yang besar diperkirakan pada awal 2013 yang dapat menahan kenaikan lenih lanjut.
Gambar 17: Pertumbuhan kredit melambat sejak Mei (pertumbuhan tahun-ke-tahun, persen)
Sumber: BPS dan perhitungan staf Bank Dunia
Indikator sektor perbankan tetap sehat
Profitabilitas bank turun sedikit sejak pertengahan tahun, dengan tingkat pengembalian dari aset-aset bank (return on bank assets) turun 3,1 persen pada Oktober (dari 3,2 persen pada Juni), sementara pengembalian dari ekuitas (return on equity) sedikit menurun menjadi 18.3 persen (dari 18,2 persen pada Juni). Sistem keuangan masih terus
4
5
6
7
8
9
10
11
70
75
80
85
90
95
100
105
Aug-11 Dec-11 Apr-12 Aug-12 Dec-12
1 Aug 2011=100 Persen, 000 IDR per USD
IDR 000 per Dolar AS(kanan)
JCI equity(kiri)
5-yr IDR yield obligasipemerintah bond (kanan)
85
90
95
100
105
110
115
85
90
95
100
105
110
115
Oct-10 Apr-11 Oct-11 Apr-12 Oct-12
China
India
Indonesia
Thailand
2010=100 2010=100
South Africa
Brazil
0
10
20
30
40
0
10
20
30
40
Sep-07 Sep-08 Sep-09 Sep-10 Sep-11 Sep-12
Persen Persen
Nominal
Riil(dideflasidengan IHK)
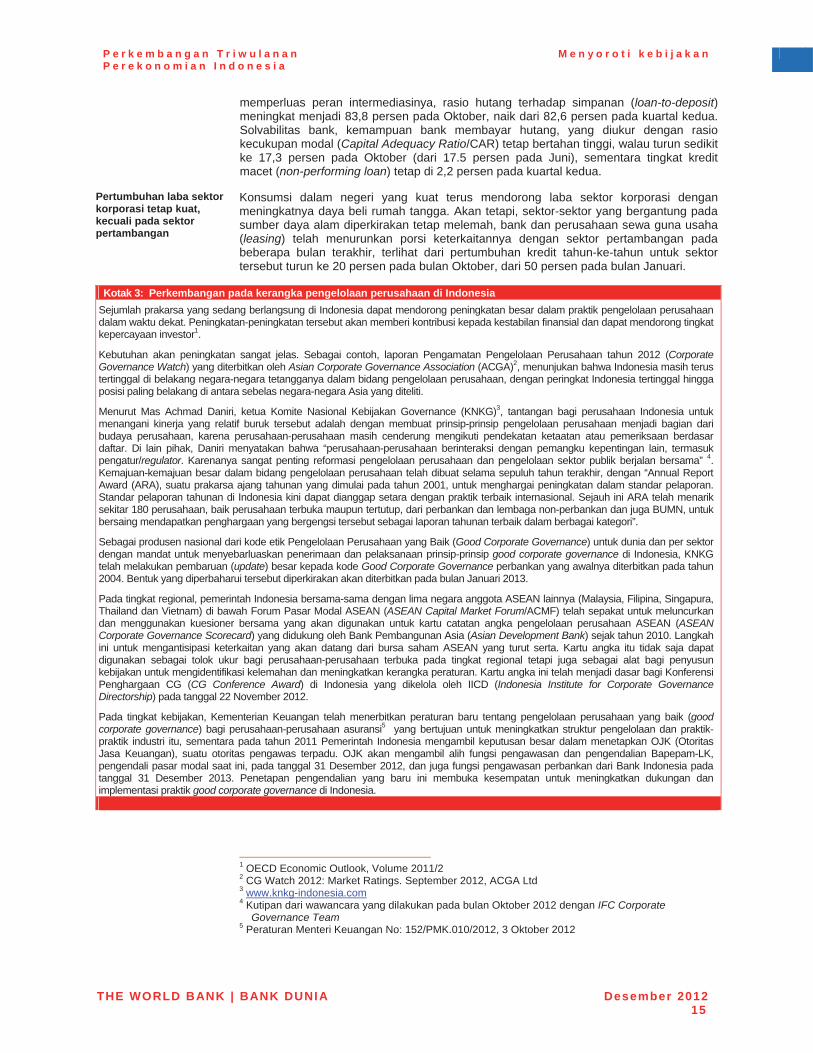
P e r k e m b a n g a n T r i w u l a n a n P e r e k o n o m i a n I n d o n e s i a
M e n y o r o t i k e b i j a k a n
THE WORLD BANK | BANK DUNIA Desember 201215
memperluas peran intermediasinya, rasio hutang terhadap simpanan (loan-to-deposit)meningkat menjadi 83,8 persen pada Oktober, naik dari 82,6 persen pada kuartal kedua. Solvabilitas bank, kemampuan bank membayar hutang, yang diukur dengan rasio kecukupan modal (Capital Adequacy Ratio/CAR) tetap bertahan tinggi, walau turun sedikit ke 17,3 persen pada Oktober (dari 17.5 persen pada Juni), sementara tingkat kredit macet (non-performing loan) tetap di 2,2 persen pada kuartal kedua.
Pertumbuhan laba sektor korporasi tetap kuat, kecuali pada sektor pertambangan
Konsumsi dalam negeri yang kuat terus mendorong laba sektor korporasi dengan meningkatnya daya beli rumah tangga. Akan tetapi, sektor-sektor yang bergantung pada sumber daya alam diperkirakan tetap melemah, bank dan perusahaan sewa guna usaha (leasing) telah menurunkan porsi keterkaitannya dengan sektor pertambangan pada beberapa bulan terakhir, terlihat dari pertumbuhan kredit tahun-ke-tahun untuk sektor tersebut turun ke 20 persen pada bulan Oktober, dari 50 persen pada bulan Januari.
Kotak 3: Perkembangan pada kerangka pengelolaan perusahaan di Indonesia Sejumlah prakarsa yang sedang berlangsung di Indonesia dapat mendorong peningkatan besar dalam praktik pengelolaan perusahaan dalam waktu dekat. Peningkatan-peningkatan tersebut akan memberi kontribusi kepada kestabilan finansial dan dapat mendorong tingkatkepercayaan investor1.
Kebutuhan akan peningkatan sangat jelas. Sebagai contoh, laporan Pengamatan Pengelolaan Perusahaan tahun 2012 (Corporate Governance Watch) yang diterbitkan oleh Asian Corporate Governance Association (ACGA)2, menunjukan bahwa Indonesia masih terus tertinggal di belakang negara-negara tetangganya dalam bidang pengelolaan perusahaan, dengan peringkat Indonesia tertinggal hingga posisi paling belakang di antara sebelas negara-negara Asia yang diteliti.
Menurut Mas Achmad Daniri, ketua Komite Nasional Kebijakan Governance (KNKG)3, tantangan bagi perusahaan Indonesia untuk menangani kinerja yang relatif buruk tersebut adalah dengan membuat prinsip-prinsip pengelolaan perusahaan menjadi bagian dari budaya perusahaan, karena perusahaan-perusahaan masih cenderung mengikuti pendekatan ketaatan atau pemeriksaan berdasar daftar. Di lain pihak, Daniri menyatakan bahwa “perusahaan-perusahaan berinteraksi dengan pemangku kepentingan lain, termasuk pengatur/regulator. Karenanya sangat penting reformasi pengelolaan perusahaan dan pengelolaan sektor publik berjalan bersama” 4.Kemajuan-kemajuan besar dalam bidang pengelolaan perusahaan telah dibuat selama sepuluh tahun terakhir, dengan “Annual Report Award (ARA), suatu prakarsa ajang tahunan yang dimulai pada tahun 2001, untuk menghargai peningkatan dalam standar pelaporan. Standar pelaporan tahunan di Indonesia kini dapat dianggap setara dengan praktik terbaik internasional. Sejauh ini ARA telah menarik sekitar 180 perusahaan, baik perusahaan terbuka maupun tertutup, dari perbankan dan lembaga non-perbankan dan juga BUMN, untuk bersaing mendapatkan penghargaan yang bergengsi tersebut sebagai laporan tahunan terbaik dalam berbagai kategori”.
Sebagai produsen nasional dari kode etik Pengelolaan Perusahaan yang Baik (Good Corporate Governance) untuk dunia dan per sektor dengan mandat untuk menyebarluaskan penerimaan dan pelaksanaan prinsip-prinsip good corporate governance di Indonesia, KNKG telah melakukan pembaruan (update) besar kepada kode Good Corporate Governance perbankan yang awalnya diterbitkan pada tahun 2004. Bentuk yang diperbaharui tersebut diperkirakan akan diterbitkan pada bulan Januari 2013.
Pada tingkat regional, pemerintah Indonesia bersama-sama dengan lima negara anggota ASEAN lainnya (Malaysia, Filipina, Singapura, Thailand dan Vietnam) di bawah Forum Pasar Modal ASEAN (ASEAN Capital Market Forum/ACMF) telah sepakat untuk meluncurkan dan menggunakan kuesioner bersama yang akan digunakan untuk kartu catatan angka pengelolaan perusahaan ASEAN (ASEAN Corporate Governance Scorecard) yang didukung oleh Bank Pembangunan Asia (Asian Development Bank) sejak tahun 2010. Langkah ini untuk mengantisipasi keterkaitan yang akan datang dari bursa saham ASEAN yang turut serta. Kartu angka itu tidak saja dapatdigunakan sebagai tolok ukur bagi perusahaan-perusahaan terbuka pada tingkat regional tetapi juga sebagai alat bagi penyusun kebijakan untuk mengidentifikasi kelemahan dan meningkatkan kerangka peraturan. Kartu angka ini telah menjadi dasar bagi Konferensi Penghargaan CG (CG Conference Award) di Indonesia yang dikelola oleh IICD (Indonesia Institute for Corporate Governance Directorship) pada tanggal 22 November 2012.
Pada tingkat kebijakan, Kementerian Keuangan telah menerbitkan peraturan baru tentang pengelolaan perusahaan yang baik (good corporate governance) bagi perusahaan-perusahaan asuransi5 yang bertujuan untuk meningkatkan struktur pengelolaan dan praktik-praktik industri itu, sementara pada tahun 2011 Pemerintah Indonesia mengambil keputusan besar dalam menetapkan OJK (Otoritas Jasa Keuangan), suatu otoritas pengawas terpadu. OJK akan mengambil alih fungsi pengawasan dan pengendalian Bapepam-LK, pengendali pasar modal saat ini, pada tanggal 31 Desember 2012, dan juga fungsi pengawasan perbankan dari Bank Indonesia pada tanggal 31 Desember 2013. Penetapan pengendalian yang baru ini membuka kesempatan untuk meningkatkan dukungan dan implementasi praktik good corporate governance di Indonesia.
1 OECD Economic Outlook, Volume 2011/2 2 CG Watch 2012: Market Ratings. September 2012, ACGA Ltd 3 www.knkg-indonesia.com4 Kutipan dari wawancara yang dilakukan pada bulan Oktober 2012 dengan IFC Corporate
Governance Team5 Peraturan Menteri Keuangan No: 152/PMK.010/2012, 3 Oktober 2012
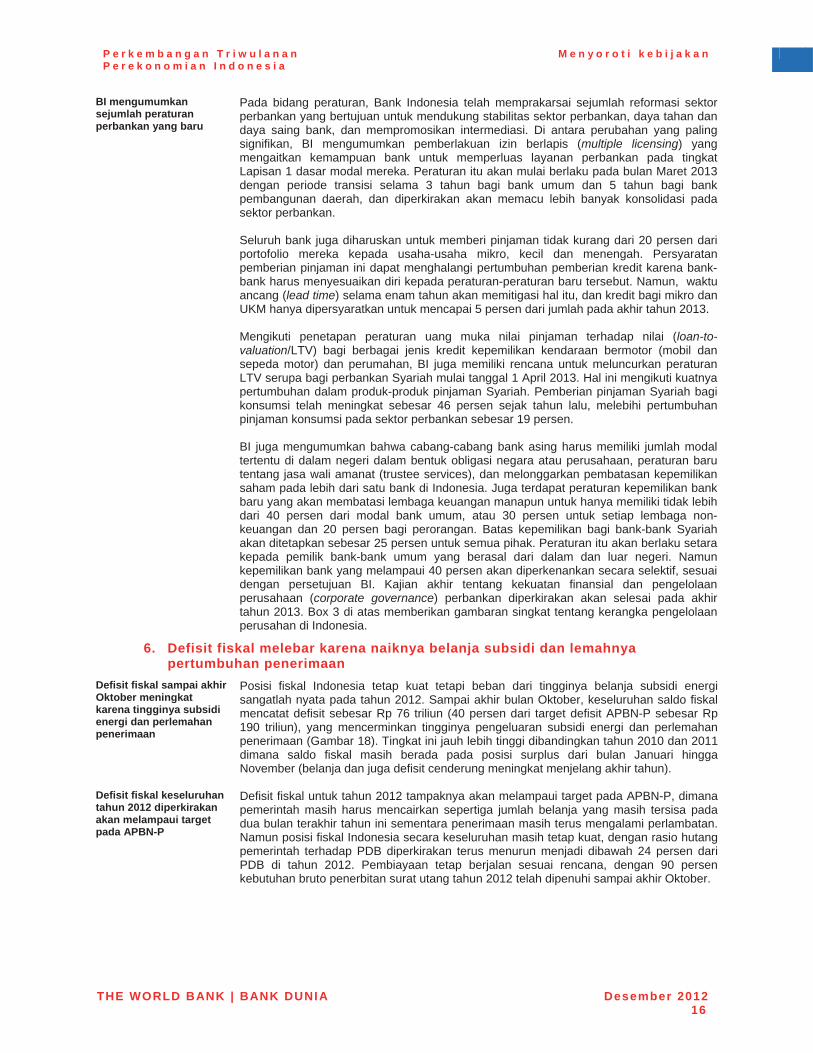
P e r k e m b a n g a n T r i w u l a n a n P e r e k o n o m i a n I n d o n e s i a
M e n y o r o t i k e b i j a k a n
THE WORLD BANK | BANK DUNIA Desember 201216
BI mengumumkan sejumlah peraturan perbankan yang baru
Pada bidang peraturan, Bank Indonesia telah memprakarsai sejumlah reformasi sektor perbankan yang bertujuan untuk mendukung stabilitas sektor perbankan, daya tahan dan daya saing bank, dan mempromosikan intermediasi. Di antara perubahan yang paling signifikan, BI mengumumkan pemberlakuan izin berlapis (multiple licensing) yang mengaitkan kemampuan bank untuk memperluas layanan perbankan pada tingkat Lapisan 1 dasar modal mereka. Peraturan itu akan mulai berlaku pada bulan Maret 2013 dengan periode transisi selama 3 tahun bagi bank umum dan 5 tahun bagi bank pembangunan daerah, dan diperkirakan akan memacu lebih banyak konsolidasi pada sektor perbankan.
Seluruh bank juga diharuskan untuk memberi pinjaman tidak kurang dari 20 persen dari portofolio mereka kepada usaha-usaha mikro, kecil dan menengah. Persyaratan pemberian pinjaman ini dapat menghalangi pertumbuhan pemberian kredit karena bank-bank harus menyesuaikan diri kepada peraturan-peraturan baru tersebut. Namun, waktu ancang (lead time) selama enam tahun akan memitigasi hal itu, dan kredit bagi mikro dan UKM hanya dipersyaratkan untuk mencapai 5 persen dari jumlah pada akhir tahun 2013.
Mengikuti penetapan peraturan uang muka nilai pinjaman terhadap nilai (loan-to-valuation/LTV) bagi berbagai jenis kredit kepemilikan kendaraan bermotor (mobil dan sepeda motor) dan perumahan, BI juga memiliki rencana untuk meluncurkan peraturan LTV serupa bagi perbankan Syariah mulai tanggal 1 April 2013. Hal ini mengikuti kuatnya pertumbuhan dalam produk-produk pinjaman Syariah. Pemberian pinjaman Syariah bagi konsumsi telah meningkat sebesar 46 persen sejak tahun lalu, melebihi pertumbuhan pinjaman konsumsi pada sektor perbankan sebesar 19 persen.
BI juga mengumumkan bahwa cabang-cabang bank asing harus memiliki jumlah modal tertentu di dalam negeri dalam bentuk obligasi negara atau perusahaan, peraturan baru tentang jasa wali amanat (trustee services), dan melonggarkan pembatasan kepemilikan saham pada lebih dari satu bank di Indonesia. Juga terdapat peraturan kepemilikan bank baru yang akan membatasi lembaga keuangan manapun untuk hanya memiliki tidak lebih dari 40 persen dari modal bank umum, atau 30 persen untuk setiap lembaga non-keuangan dan 20 persen bagi perorangan. Batas kepemilikan bagi bank-bank Syariah akan ditetapkan sebesar 25 persen untuk semua pihak. Peraturan itu akan berlaku setara kepada pemilik bank-bank umum yang berasal dari dalam dan luar negeri. Namun kepemilikan bank yang melampaui 40 persen akan diperkenankan secara selektif, sesuai dengan persetujuan BI. Kajian akhir tentang kekuatan finansial dan pengelolaan perusahaan (corporate governance) perbankan diperkirakan akan selesai pada akhir tahun 2013. Box 3 di atas memberikan gambaran singkat tentang kerangka pengelolaan perusahan di Indonesia.
6. Defisit fiskal melebar karena naiknya belanja subsidi dan lemahnya pertumbuhan penerimaan
Defisit fiskal sampai akhir Oktober meningkat karena tingginya subsidi energi dan perlemahan penerimaan
Posisi fiskal Indonesia tetap kuat tetapi beban dari tingginya belanja subsidi energi sangatlah nyata pada tahun 2012. Sampai akhir bulan Oktober, keseluruhan saldo fiskal mencatat defisit sebesar Rp 76 triliun (40 persen dari target defisit APBN-P sebesar Rp 190 triliun), yang mencerminkan tingginya pengeluaran subsidi energi dan perlemahan penerimaan (Gambar 18). Tingkat ini jauh lebih tinggi dibandingkan tahun 2010 dan 2011 dimana saldo fiskal masih berada pada posisi surplus dari bulan Januari hingga November (belanja dan juga defisit cenderung meningkat menjelang akhir tahun).
Defisit fiskal keseluruhan tahun 2012 diperkirakan akan melampaui target pada APBN-P
Defisit fiskal untuk tahun 2012 tampaknya akan melampaui target pada APBN-P, dimana pemerintah masih harus mencairkan sepertiga jumlah belanja yang masih tersisa pada dua bulan terakhir tahun ini sementara penerimaan masih terus mengalami perlambatan. Namun posisi fiskal Indonesia secara keseluruhan masih tetap kuat, dengan rasio hutang pemerintah terhadap PDB diperkirakan terus menurun menjadi dibawah 24 persen dari PDB di tahun 2012. Pembiayaan tetap berjalan sesuai rencana, dengan 90 persen kebutuhan bruto penerbitan surat utang tahun 2012 telah dipenuhi sampai akhir Oktober.
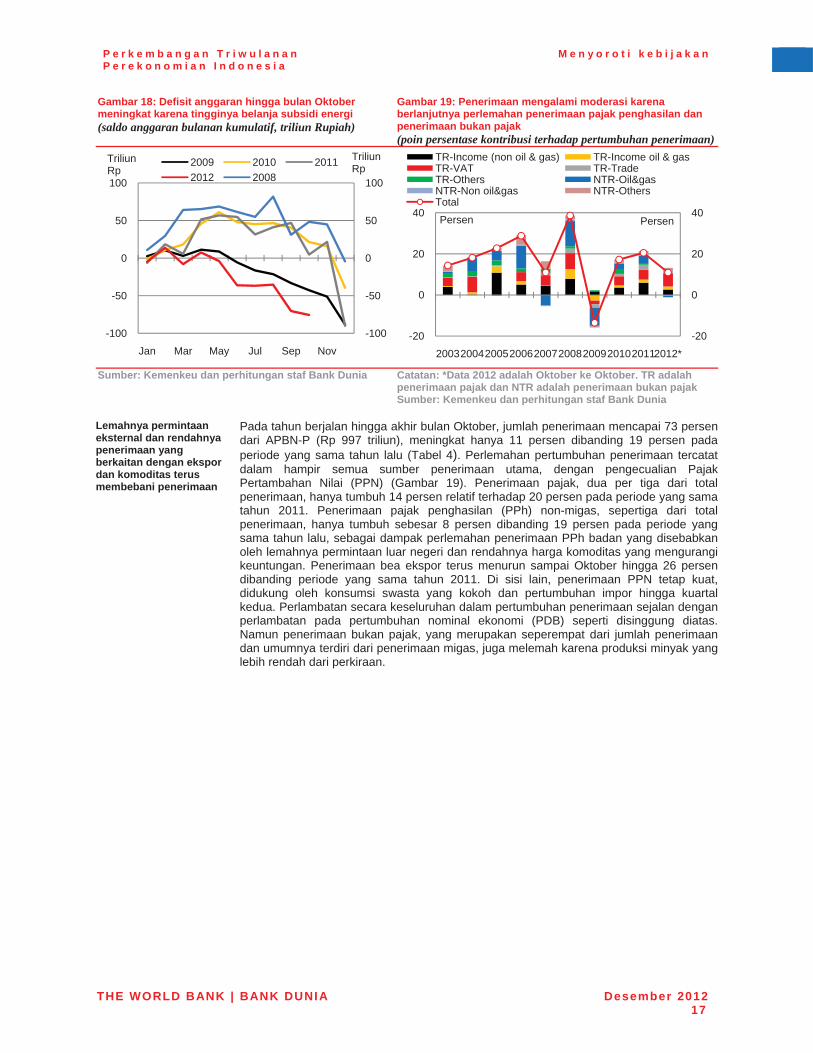
P e r k e m b a n g a n T r i w u l a n a n P e r e k o n o m i a n I n d o n e s i a
M e n y o r o t i k e b i j a k a n
THE WORLD BANK | BANK DUNIA Desember 201217
Gambar 18: Defisit anggaran hingga bulan Oktober meningkat karena tingginya belanja subsidi energi (saldo anggaran bulanan kumulatif, triliun Rupiah)
Gambar 19: Penerimaan mengalami moderasi karena berlanjutnya perlemahan penerimaan pajak penghasilan dan penerimaan bukan pajak (poin persentase kontribusi terhadap pertumbuhan penerimaan)
Sumber: Kemenkeu dan perhitungan staf Bank Dunia Catatan: *Data 2012 adalah Oktober ke Oktober. TR adalah penerimaan pajak dan NTR adalah penerimaan bukan pajak Sumber: Kemenkeu dan perhitungan staf Bank Dunia
Lemahnya permintaan eksternal dan rendahnya penerimaan yang berkaitan dengan ekspor dan komoditas terus membebani penerimaan
Pada tahun berjalan hingga akhir bulan Oktober, jumlah penerimaan mencapai 73 persendari APBN-P (Rp 997 triliun), meningkat hanya 11 persen dibanding 19 persen pada periode yang sama tahun lalu (Tabel 4). Perlemahan pertumbuhan penerimaan tercatat dalam hampir semua sumber penerimaan utama, dengan pengecualian Pajak Pertambahan Nilai (PPN) (Gambar 19). Penerimaan pajak, dua per tiga dari total penerimaan, hanya tumbuh 14 persen relatif terhadap 20 persen pada periode yang sama tahun 2011. Penerimaan pajak penghasilan (PPh) non-migas, sepertiga dari total penerimaan, hanya tumbuh sebesar 8 persen dibanding 19 persen pada periode yang sama tahun lalu, sebagai dampak perlemahan penerimaan PPh badan yang disebabkan oleh lemahnya permintaan luar negeri dan rendahnya harga komoditas yang mengurangi keuntungan. Penerimaan bea ekspor terus menurun sampai Oktober hingga 26 persendibanding periode yang sama tahun 2011. Di sisi lain, penerimaan PPN tetap kuat, didukung oleh konsumsi swasta yang kokoh dan pertumbuhan impor hingga kuartal kedua. Perlambatan secara keseluruhan dalam pertumbuhan penerimaan sejalan dengan perlambatan pada pertumbuhan nominal ekonomi (PDB) seperti disinggung diatas. Namun penerimaan bukan pajak, yang merupakan seperempat dari jumlah penerimaan dan umumnya terdiri dari penerimaan migas, juga melemah karena produksi minyak yang lebih rendah dari perkiraan.
-100
-50
0
50
100
-100
-50
0
50
100
Jan Mar May Jul Sep Nov
TriliunRp2009 2010 2011
2012 2008
TriliunRp
-20
0
20
40
-20
0
20
40
2003200420052006200720082009201020112012*
PersenPersen
TR-Income (non oil & gas) TR-Income oil & gasTR-VAT TR-TradeTR-Others NTR-Oil&gasNTR-Non oil&gas NTR-OthersTotal

P e r k e m b a n g a n T r i w u l a n a n P e r e k o n o m i a n I n d o n e s i a
M e n y o r o t i k e b i j a k a n
THE WORLD BANK | BANK DUNIA Desember 201218
Tabel 4: Tingkat pencairan anggaran hingga akhir bulan Oktober masih rendah (realisasi anggaran tahun 2012 sampai akhir bulan Oktober)
Nilai nominal akhir Oktober (Triliun Rp)
Persentase terhadap APBN-P (persen)
Pertumbuhan nominal YoY Jan - Okt (persen)
2010 2011 2012 2010 2011 2012 2010 2011 2012 Penerimaan negara dan hibah 754 899 997 75,9 76,8 73,4 18,2 19,2 10,9
Penerimaan pajak, dari 560 674 768 75,4 76,8 75,6 14,5 20,4 13,9Pajak penghasilan non-migas 241 287 311 78,4 78,2 69,8 13,0 19,2 8,4Pajak pertambahan nilai 172 204 259 65,2 68,3 77,0 16,9 18,8 27,0Pajak ekspor 5 25 18 82,6 97,3 79,2 719,2 449,4 -25,8
Penerimaan bukan pajak 193 223 228 77,9 77,7 66,7 30,9 15,6 2,2
Pengeluaran 732 894 1,073 65,0 67,7 69,3 7,1 22,1 20,0Pemerintah Pusat 463 578 681 59,2 63,7 63,7 4,7 25,0 17,9
Belanja pegawai 122 146 169 74,8 79,8 79,4 8,8 19,9 15,5Belanja barang 62 73 86 55,5 50,9 46,2 21,8 16,2 18,7Belanja modal 39 54 74 41,3 38,4 43,7 -11,1 37,8 36,3Subsidi energi 90 165 184 62,2 84,4 90,8 69,4 83,8 11,6Bantuan sosial 47 38 53 65,9 46,7 96,3 -6,2 -18,4 39,5
Transfer ke daerah 270 316 391 78,3 76,6 81,7 11,2 17,1 23,8Sumber: Kemenkeu dan perhitungan staf Bank Dunia
Beban fiskal dari subsidi energi terus meningkat
Sampai akhir bulan Oktober, tingkat realisasi pengeluaran adalah sebesar 69 persen dari APBN-P, tumbuh sebesar 20 persen dibanding periode yang sama tahun lalu. Namun tingkat pencairan anggaran ini sebagian besar didorong oleh besarnya belanja subsidi energi, yang mencapai lebih dari 90 persen dari APBN-P pada akhir bulan Oktober, dan menutupi lemahnya realisasi belanja modal dan barang (Tabel 4). Upaya-upaya baru untuk mengendalikan konsumsi BBM yang telah diluncurkan pada awal tahun, seperti larangan penggunaan BBM bersubsidi oleh kendaraan pemerintah, BUMN dan industri, belum terbukti efektif. Selain itu, rencana untuk membatasi kendaraan pribadi dari penggunaan BBM bersubsidi yang rencananya akan diuji-cobakan di Jakarta dan sekitarnya juga mengalami penundaan karena tidak siapnya infrastruktur pendukung.
Pemerintah dan DPR telah menyepakati penambahan selanjutnya volume BBM bersubsidi untuk tahun 2012
Melebarnya perbedaan harga antara harga BBM bersubsidi dan harga pasar, dan pesatnya peningkatan jumlah kendaraan bermotor, telah mendorong kuatnya konsumsi BBM bersubsidi pada tahun 2012, melebihi yang sebelumnya diproyeksikan dalam APBN. Menanggapi hal tersebut, Pemerintah kemudian meningkatkan kuota volume BBM bersubsidi sebesar 4 juta kiloliter (KL) menjadi 44 juta KL untuk setahun penuh di akhir September 20126.Walaupun adanya penambahan itu, volume diperkirakan masih tidak akan mencukupi hingga akhir tahun 2012 (Gambar 20).
Gambar 20: Volume BBM bersubsidi terus meningkat di tahun 2012 karena tidak adanya reformasi subsidi BBM (volume BBM bersubsidi, juta kilo liter (KL))
Sumber: Kementerian Energi dan Sumber Daya Mineral (ESDM) dan perhitungan staf Bank Dunia
6 http://www.esdm.go.id/berita/migas/40-migas/5961-kuota-bbm-bersubsidi-naik-404-juta-kiloliter.html
KuotaAPBN
30
32
34
36
38
40
42
44
46
30
32
34
36
38
40
42
44
46
2010 (Actual) 2011 (Actual) 2012
juta KLjuta KL
Penambahan kedua, 1,2 juta KL
Penambahan pertama 4 juta KL

P e r k e m b a n g a n T r i w u l a n a n P e r e k o n o m i a n I n d o n e s i a
M e n y o r o t i k e b i j a k a n
THE WORLD BANK | BANK DUNIA Desember 201219
Menjelang akhir bulan September, konsumsi BBM bersubsidi telah melampaui kuota awal untuk periode bulan Januari-September sebesar 15 persen. Selanjutnya, data regional menunjukan bahwa pola konsumsi yang melebihi kuota ini sangat jelas terlihat di kota-kota dengan penduduk yang padat, propinsi-propinsi yang memiliki kegiatan pertambangan dan perkebunan, dan propinsi-propinsi yang berbatasan dengan negara tetangga, yang menunjukan peningkatan permintaan dan kemungkinan kebocoran(Gambar 21). Pada awal Desember, Pemerintah dan DPR telah menyetujui kuota tambahan sebesar 1,2 juta KL untuk memastikan bahwa pasokan BBM bersubsidi akan mencukupi hingga akhir tahun7.
Gambar 21: Konsumsi BBM yang melebihi Kuota terpusat di kota-kota yang padat, daerah-daerah pertambangan dan perbatasan (perbedaan volume BBM bersubsidi antara realisasi Jan-Sep dan kuota Jan-Sep, persen – peta, ribuan kilo liter-bar chart )
Sumber: BPH Migas dan perhitungan staf Bank Dunia.
Tingkat realisasi belanja modal dan barang mencatatkan pertumbuhan nominal yang kuat, namun masih dibawah target
Belanja modal mencapai Rp 74 triliun sampai dengan Oktober, meningkat 36 persen dari periode yang sama tahun lalu sementara realisasi belanja barang mencapai Rp 86 triliun, naik sebesar 19 persen dibanding periode yang sama tahun lalu. Meskipun tumbuh cukup kuat secara nominal, realisasi belanja barang dan modal tidak mampu mengimbangi kenaikan alokasi anggaran. Sampai akhir Oktober, tingkat realisasi belanja modal dan barang hanya 44 persen dan 46 persen dari APBN-P, menyisakan lebih dari separuh anggaran harus dibelanjakan di dua bulan terakhir (Gambar 22).
Gambar 22: Sisa anggaran tahun 2012 sampai akhir bulan Oktober masih besar (APBN 2012, APBN-P, Proyeksi Desember Bank Dunia, dan realisasi 2012 sampai akhir Oktober, triliun Rp)
Sumber: Kemenkeu dan perhitungan staf Bank Dunia
Upaya untuk menangani rendahnya realisasi
Walaupun tumbuh kuat secara nominal, rendahnya pencairan belanja modal ini merintangi upaya Pemerintah dalam mencapai sasaran-sasaran pembangunan 7http://www.esdm.go.id/berita/migas/40-migas/6086-dpr-ri-dan-pemerintah-sepakat-tambah-kuota-
bbm-bersubsidi-12-juta-kl.html
0
100
200
300
400
0
100
200
300
400
Personnel Material Capital Subsidy Social
Triliun RpTriliun Rp
Budget Revised Budget
WB Projection Realization by end October
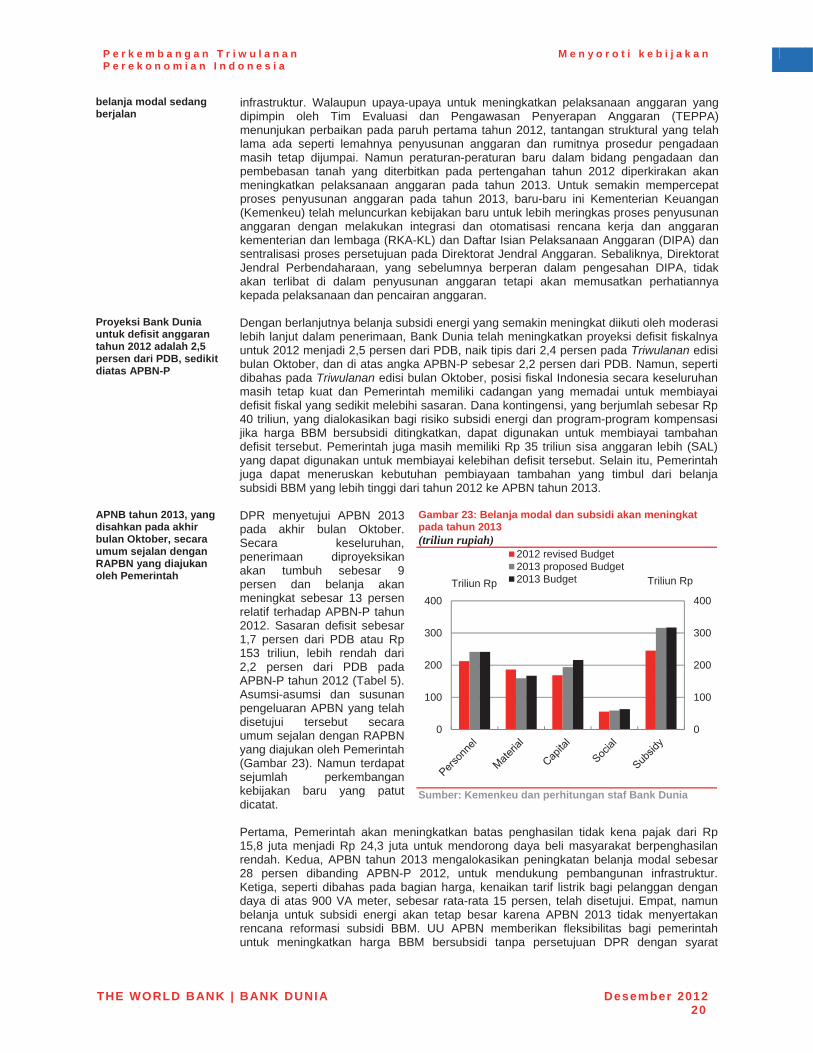
P e r k e m b a n g a n T r i w u l a n a n P e r e k o n o m i a n I n d o n e s i a
M e n y o r o t i k e b i j a k a n
THE WORLD BANK | BANK DUNIA Desember 201220
belanja modal sedang berjalan
infrastruktur. Walaupun upaya-upaya untuk meningkatkan pelaksanaan anggaran yang dipimpin oleh Tim Evaluasi dan Pengawasan Penyerapan Anggaran (TEPPA) menunjukan perbaikan pada paruh pertama tahun 2012, tantangan struktural yang telah lama ada seperti lemahnya penyusunan anggaran dan rumitnya prosedur pengadaan masih tetap dijumpai. Namun peraturan-peraturan baru dalam bidang pengadaan dan pembebasan tanah yang diterbitkan pada pertengahan tahun 2012 diperkirakan akan meningkatkan pelaksanaan anggaran pada tahun 2013. Untuk semakin mempercepat proses penyusunan anggaran pada tahun 2013, baru-baru ini Kementerian Keuangan (Kemenkeu) telah meluncurkan kebijakan baru untuk lebih meringkas proses penyusunan anggaran dengan melakukan integrasi dan otomatisasi rencana kerja dan anggaran kementerian dan lembaga (RKA-KL) dan Daftar Isian Pelaksanaan Anggaran (DIPA) dan sentralisasi proses persetujuan pada Direktorat Jendral Anggaran. Sebaliknya, Direktorat Jendral Perbendaharaan, yang sebelumnya berperan dalam pengesahan DIPA, tidak akan terlibat di dalam penyusunan anggaran tetapi akan memusatkan perhatiannya kepada pelaksanaan dan pencairan anggaran.
Proyeksi Bank Dunia untuk defisit anggaran tahun 2012 adalah 2,5 persen dari PDB, sedikit diatas APBN-P
Dengan berlanjutnya belanja subsidi energi yang semakin meningkat diikuti oleh moderasi lebih lanjut dalam penerimaan, Bank Dunia telah meningkatkan proyeksi defisit fiskalnya untuk 2012 menjadi 2,5 persen dari PDB, naik tipis dari 2,4 persen pada Triwulanan edisi bulan Oktober, dan di atas angka APBN-P sebesar 2,2 persen dari PDB. Namun, seperti dibahas pada Triwulanan edisi bulan Oktober, posisi fiskal Indonesia secara keseluruhan masih tetap kuat dan Pemerintah memiliki cadangan yang memadai untuk membiayai defisit fiskal yang sedikit melebihi sasaran. Dana kontingensi, yang berjumlah sebesar Rp40 triliun, yang dialokasikan bagi risiko subsidi energi dan program-program kompensasi jika harga BBM bersubsidi ditingkatkan, dapat digunakan untuk membiayai tambahan defisit tersebut. Pemerintah juga masih memiliki Rp 35 triliun sisa anggaran lebih (SAL) yang dapat digunakan untuk membiayai kelebihan defisit tersebut. Selain itu, Pemerintah juga dapat meneruskan kebutuhan pembiayaan tambahan yang timbul dari belanja subsidi BBM yang lebih tinggi dari tahun 2012 ke APBN tahun 2013.
APNB tahun 2013, yang disahkan pada akhir bulan Oktober, secara umum sejalan dengan RAPBN yang diajukan oleh Pemerintah
DPR menyetujui APBN 2013 pada akhir bulan Oktober. Secara keseluruhan, penerimaan diproyeksikan akan tumbuh sebesar 9 persen dan belanja akan meningkat sebesar 13 persen relatif terhadap APBN-P tahun 2012. Sasaran defisit sebesar 1,7 persen dari PDB atau Rp 153 triliun, lebih rendah dari 2,2 persen dari PDB pada APBN-P tahun 2012 (Tabel 5). Asumsi-asumsi dan susunan pengeluaran APBN yang telah disetujui tersebut secara umum sejalan dengan RAPBN yang diajukan oleh Pemerintah (Gambar 23). Namun terdapat sejumlah perkembangan kebijakan baru yang patut dicatat.
Pertama, Pemerintah akan meningkatkan batas penghasilan tidak kena pajak dari Rp 15,8 juta menjadi Rp 24,3 juta untuk mendorong daya beli masyarakat berpenghasilan rendah. Kedua, APBN tahun 2013 mengalokasikan peningkatan belanja modal sebesar 28 persen dibanding APBN-P 2012, untuk mendukung pembangunan infrastruktur. Ketiga, seperti dibahas pada bagian harga, kenaikan tarif listrik bagi pelanggan dengan daya di atas 900 VA meter, sebesar rata-rata 15 persen, telah disetujui. Empat, namun belanja untuk subsidi energi akan tetap besar karena APBN 2013 tidak menyertakan rencana reformasi subsidi BBM. UU APBN memberikan fleksibilitas bagi pemerintah untuk meningkatkan harga BBM bersubsidi tanpa persetujuan DPR dengan syarat
Gambar 23: Belanja modal dan subsidi akan meningkat pada tahun 2013 (triliun rupiah)
Sumber: Kemenkeu dan perhitungan staf Bank Dunia
0
100
200
300
400
0
100
200
300
400
Triliun RpTriliun Rp
2012 revised Budget2013 proposed Budget2013 Budget
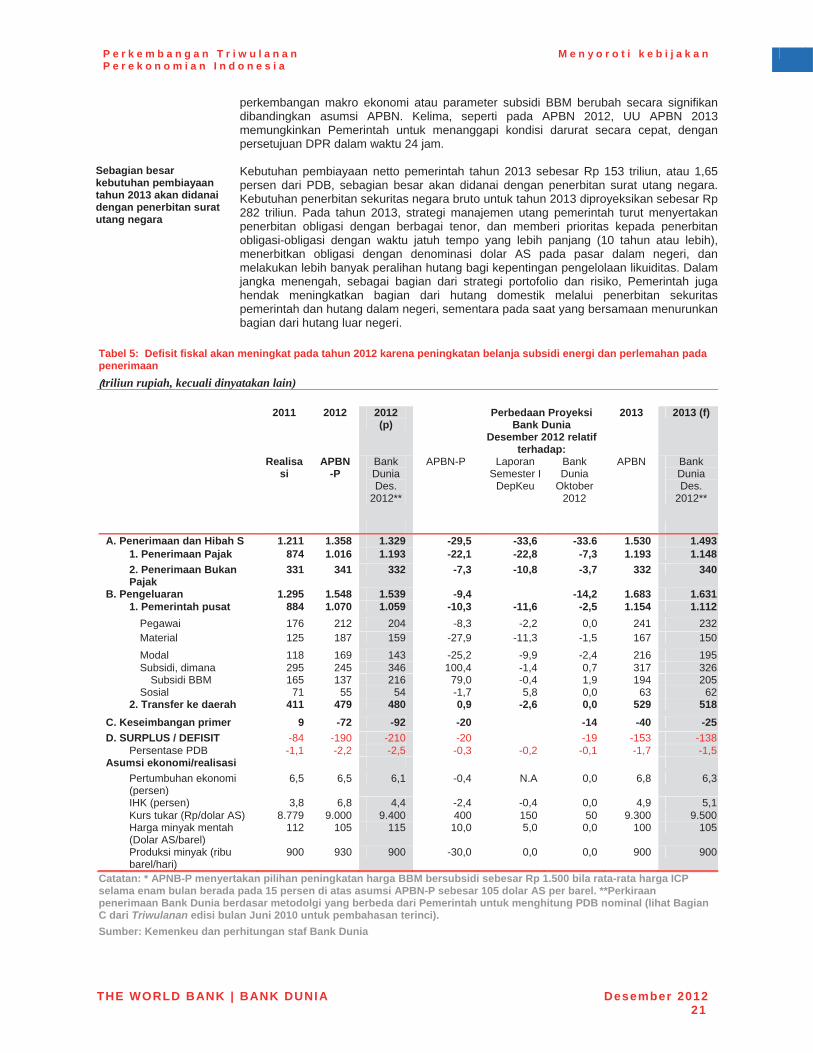
P e r k e m b a n g a n T r i w u l a n a n P e r e k o n o m i a n I n d o n e s i a
M e n y o r o t i k e b i j a k a n
THE WORLD BANK | BANK DUNIA Desember 201221
perkembangan makro ekonomi atau parameter subsidi BBM berubah secara signifikan dibandingkan asumsi APBN. Kelima, seperti pada APBN 2012, UU APBN 2013 memungkinkan Pemerintah untuk menanggapi kondisi darurat secara cepat, dengan persetujuan DPR dalam waktu 24 jam.
Sebagian besar kebutuhan pembiayaan tahun 2013 akan didanai dengan penerbitan surat utang negara
Kebutuhan pembiayaan netto pemerintah tahun 2013 sebesar Rp 153 triliun, atau 1,65 persen dari PDB, sebagian besar akan didanai dengan penerbitan surat utang negara. Kebutuhan penerbitan sekuritas negara bruto untuk tahun 2013 diproyeksikan sebesar Rp 282 triliun. Pada tahun 2013, strategi manajemen utang pemerintah turut menyertakan penerbitan obligasi dengan berbagai tenor, dan memberi prioritas kepada penerbitan obligasi-obligasi dengan waktu jatuh tempo yang lebih panjang (10 tahun atau lebih), menerbitkan obligasi dengan denominasi dolar AS pada pasar dalam negeri, dan melakukan lebih banyak peralihan hutang bagi kepentingan pengelolaan likuiditas. Dalam jangka menengah, sebagai bagian dari strategi portofolio dan risiko, Pemerintah juga hendak meningkatkan bagian dari hutang domestik melalui penerbitan sekuritas pemerintah dan hutang dalam negeri, sementara pada saat yang bersamaan menurunkan bagian dari hutang luar negeri.
Tabel 5: Defisit fiskal akan meningkat pada tahun 2012 karena peningkatan belanja subsidi energi dan perlemahan pada penerimaan (triliun rupiah, kecuali dinyatakan lain)
2011 2012 2012(p)
Perbedaan Proyeksi Bank Dunia
Desember 2012 relatif terhadap:
2013 2013 (f)
Realisasi
APBN-P
BankDuniaDes.
2012**
APBN-P LaporanSemester I
DepKeu
BankDunia
Oktober2012
APBN BankDuniaDes.
2012**
A. Penerimaan dan Hibah S 1.211 1.358 1.329 -29,5 -33,6 -33.6 1.530 1.4931. Penerimaan Pajak 874 1.016 1.193 -22,1 -22,8 -7,3 1.193 1.1482. Penerimaan Bukan Pajak
331 341 332 -7,3 -10,8 -3,7 332 340
B. Pengeluaran 1.295 1.548 1.539 -9,4 -14,2 1.683 1.6311. Pemerintah pusat 884 1.070 1.059 -10,3 -11,6 -2,5 1.154 1.112
Pegawai 176 212 204 -8,3 -2,2 0,0 241 232Material 125 187 159 -27,9 -11,3 -1,5 167 150Modal 118 169 143 -25,2 -9,9 -2,4 216 195Subsidi, dimana 295 245 346 100,4 -1,4 0,7 317 326
Subsidi BBM 165 137 216 79,0 -0,4 1,9 194 205Sosial 71 55 54 -1,7 5,8 0,0 63 62
2. Transfer ke daerah 411 479 480 0,9 -2,6 0,0 529 518C. Keseimbangan primer 9 -72 -92 -20 -14 -40 -25D. SURPLUS / DEFISIT -84 -190 -210 -20 -19 -153 -138
Persentase PDB -1,1 -2,2 -2,5 -0,3 -0,2 -0,1 -1,7 -1,5Asumsi ekonomi/realisasi
Pertumbuhan ekonomi (persen)
6,5 6,5 6,1 -0,4 N.A 0,0 6,8 6,3
IHK (persen) 3,8 6,8 4,4 -2,4 -0,4 0,0 4,9 5,1Kurs tukar (Rp/dolar AS) 8.779 9.000 9.400 400 150 50 9.300 9.500Harga minyak mentah (Dolar AS/barel)
112 105 115 10,0 5,0 0,0 100 105
Produksi minyak (ribu barel/hari)
900 930 900 -30,0 0,0 0,0 900 900
Catatan: * APNB-P menyertakan pilihan peningkatan harga BBM bersubsidi sebesar Rp 1.500 bila rata-rata harga ICP selama enam bulan berada pada 15 persen di atas asumsi APBN-P sebesar 105 dolar AS per barel. **Perkiraan penerimaan Bank Dunia berdasar metodolgi yang berbeda dari Pemerintah untuk menghitung PDB nominal (lihat Bagian C dari Triwulanan edisi bulan Juni 2010 untuk pembahasan terinci). Sumber: Kemenkeu dan perhitungan staf Bank Dunia
P e r k e m b a n g a n T r i w u l a n a n P e r e k o n o m i a n I n d o n e s i a
M e n y o r o t i k e b i j a k a n
THE WORLD BANK | BANK DUNIA Desember 201222
7. Pengambil kebijakan menghadapi serangkaian risiko dari dalam dan luar negeri pada tahun 2013
Tekanan negatif permintaan luar negeri masih menjadi ancaman…
Seperti ditekankan pada Triwulanan edisi bulan Juli dan Oktober, kondisi ekonomi global masih tetap lemah dan terdapat risiko yang nyata bahwa Indonesia akan menghadapi tekanan eksternal yang negatif. Secara khusus, walaupun resiko-resiko jangka pendek krisis hutang dan perbankan di zona Euro kelihatannya berkurang, kondisi ekonomi di blok ekonomi terbesar dunia tetap masih sangat menantang. Di Amerika Serikat, menurut Undang-Undang saat ini dan kecuali diamandemen, akan mengakibatkan penurunan sekitar 5 persen dari PDB AS (walau perkiraan dasar/baseline Bank Dunia mengasumsikan pemotongan yang lebih kecil sekitar 1 persen dari PDB). Akan sangat penting bagi AS untuk menghindari “jurang fiskal” ini bila pertumbuhan global pulih pada tingkat moderat seperti pada asumsi skenario dasar untuk tahun 2013. China tampaknya berhasil menghindari penurunan pertumbuhan yang drastis, tetapi masih harus dilihat bagaimana ekonominya beradaptasi menuju laju pertumbuhan berkelanjutan yang lebih lambat dibanding masa lalu dan ke perubahan sumber-sumber pertumbuhan yang berbeda. Bila kondisi para mitra perdagangan Indonesia itu menurun, maka Indonesia, bersama-sama dengan ekonomi berkembang (emerging) lainnya, akan menerima dampak berupa penurunan permintaan ekspor, berkurangnya aliran masuk investasi asing, atau bahkan aliran keluar modal.
…dan juga terdapat risiko-resiko dari dalam negeri terhadap permintaan
Secara domestik, belanja investasi telah menjadi sumber pertumbuhan yang kuat. Namun belum jelas apakah perlambatan dalam investasi di kwartal ketiga merupakan tanda dimulainya tren perlambatan, karena investasi cenderung menjadi komponen PDB yang bersifat naik-turun dan impor modal memang sedikit meningkat pada bulan Oktober. Namun ada sejumlah risiko terhadap belanja investasi yang kini berada pada tingkat yang tinggi. Pertama, investasi secara historis cenderung berkaitan erat dengan harga komoditas global, dan dengan harga-harga itu kini berada jauh di bawah harga-harga tertingginya pada waktu krisis keuangan, terdapat kemungkinan investasi akan mulai menurun karena penurunan keuntungan yang berkaitan dengan komoditas mempengaruhi ekonomi yang lebih luas. Kedua, sejumlah pengumuman kebijakan selama tahun 2012 telah mendorong sejumlah kekhawatiran terhadap lingkungan kebijakan investasi dan usaha dalam negeri. Kekhawatiran-kekhawatiran tersebut dapat semakin meningkat menjelang pemilu tahun 2014, terutama karena minat risiko (riskappetite) investor global masih rapuh.
Kebijakan dapat diuji walaupun lingkungan pertumbuhan tetap mendukung
Walaupun risiko-risiko negatif terhadap permintaan dalam negeri ini tidak terealisasi, perkembangan ekonomi di tahun 2013 masih dapat menguji para pembuat kebijakan. Khususnya, bila pertumbuhan yang kuat berlanjut pada tahun 2013, maka sangatlah penting untuk selalu waspada untuk mengamati tanda-tanda bila ekonomi menjadi terlalu panas (overheating). Seperti pada risiko negatif terhadap permintaan, pendorong/katalis bagi kelebihan permintaan dapat berasal dari dalam atau luar negeri. Risiko eksternal utama adalah kembalinya aliran masuk modal investasi portofolio yang kuat. Hal ini telah meningkat menjelang akhir tahun 2012 dan dapat semakin meningkat karena kebijakan moneter yang longgar di ekonomi-ekonomi utama dan upaya pencarian yield secara global. Dari dalam negeri, diperkirakan ada sejumlah peningkatan tekanan inflasi cost-push (didorong biaya), termasuk dari tingginya peningkatan upah minimum, pengaruh berkelanjutan dari depresiasi Rupiah yang berlangsung selama tahun 2012, dan dampak sementara dari kenaikan tarif listrik. Dengan kuatnya permintaan dalam negeri saat ini, dimana di masa lalu mendapat dorongan tambahan dari belanja pra-pemilu, menjadi penting untuk ditanggapi secara pro-aktif terhadap risiko-risiko inflasi yang baru muncul atau terhadap tanda-tanda bahwa laju peningkatan investasi untuk meningkatkan kapasitas produktif ekonomi telah tertinggal.
Ketidakpastian dalam dan luar negeri tetap tinggi, menjadikan fokus pada kualitas pembuat kebijakan…
Skenario dasar Bank Dunia melihat pertumbuhan PDB yang kuat di Indonesia untuk tahun 2013 dengan kondisi ekonomi global menjadi lebih mendukung. Namun ketidakpastian pada perkiraan (outlook) luar negeri masih tetap tinggi dan masih terdapat risiko-risiko kejutan eksternal yang lebih negatif yang menerpa ekonomi. Dengan terus berlanjutnya resiko outlook global dan kemungkinan adanya guncangan-guncangan politik menuju Pemilu 2014, dibutuhkan dukungan berkelanjutan terhadap peningkatan kualitas pengambilan kebijakan. Hal ini termasuk melanjutkan penekanan pada kebijakan mitigasi krisis, membangun kemajuan yang telah dibuat Indonesia dalam menjamin sumber-
P e r k e m b a n g a n T r i w u l a n a n P e r e k o n o m i a n I n d o n e s i a
M e n y o r o t i k e b i j a k a n
THE WORLD BANK | BANK DUNIA Desember 201223
sumber pendanaan kontingensi dan merumuskan protokol tanggapan pengelolaan krisis untuk digunakan bila terjadi tekanan yang besar terhadap pasar. Hal itu juga meningkatkan pentingnya penanganan hambatan pertumbuhan yang bersifat lebih struktural, terutama upaya untuk menutup kesenjangan infrastruktur yang besar dan meningkatkan efisiensi belanja pemerintah, sehingga akan meningkatkan ketahanan dan keberlanjutan laju pertumbuhan ekonomi.
…terutama berkaitan dengan iklim investasi
Peran sektor swasta yang sangat penting juga harus diakui, karena cepatnya pertumbuhan belanja investasi merupakan pendorong utama kuatnya laju pertumbuhan yang tercatat belakangan ini, yang meningkatkan standar kehidupan di Indonesia. Investasi membutuhkan komitmen jangka panjang yang tidak dapat berubah-ubah, dan untuk melakukannya dibutuhkan keyakinan dan kemampuan perencanaan ke depan. Menjaga kejelasan dan konsistensi kerangka peraturan, dan secara efektif mengelola komunikasi tentang reformasi baru apapun, dapat menjadi perbedaan yang menentukan bagi investasi, dan juga bagi ekonomi secara keseluruhan.
B. BEBERAPA�PERKEMBANGAN�
TERKINI�PEREKONOMIAN�
INDONESIA�
1. Apakah kenaikan upah minimum akan mempengaruhi penciptaan lapangan kerja di Indonesia
Negosiasi upah minimum tahun 2013 memicu protes buruh dan perdebatan mengenai kenaikan biaya tenaga kerja di Indonesia.
Ribuan buruh turun ke jalan pada beberapa bulan terakhir untuk menuntut kenaikan upah minimum dan agar biaya-biaya untuk tunjangan jaminan sosial yang sedang dirancang dibebankan kepada perusahaan. Para pekerja meminta apa yang mereka anggap sebagai bagian yang adil dari keuntungan perusahaan selama berlangsungnya pertumbuhan ekonomi yang pesat. Menanggapi hal ini, Gubernur Jakarta yang baru terpilih, Joko Widodo, sepakat untuk menaikkan upah minimum dari Rp 1,53 juta di tahun 2012 menjadi Rp 2,2 juta untuk tahun 2013. Pemerintah daerah lainnya juga mengikuti langkah tersebut. Ada kekhawatiran bahwa kenaikan upah minimum digunakan sebagai acuan bagi kenaikan gaji dan upah secara keseluruhan, yang akan meningkatkan biaya tenaga kerja di Indonesia. Pihak perusahaan menganggap bahwa hal ini akan mempengaruhi daya saing Indonesia dan dapat menghalangi investasi pada industri-industri padat tenaga kerja, seperti manufaktur. Apa dampak dari cepatnya laju kenaikan upah minimum terhadap pasar tenaga kerja di Indonesia? Bagian ini mengkaji fakta-fakta yang ada untuk menjawab pertanyaan tersebut.
Gambar 24: Kenaikan ditahun 2013 dapat mendorong upah minimum di atas negara tetangga(tingkat upah minimum (dolar AS), di beberapa negara Asia Timur)
Tabel 6: Sementara produktivitas pekerja masih tertinggal (upah minimum, rata-rata upah & nilai tambah per pegawai di beberapa negara Asia Timur, 2008)
Upah mini-mum(dolarAS)
Rata-rata upah(dolarAS)
Nilaitambah
perpekerja (dolarAS)
Rasio MW ke rata-rata
upah
Rasio MW ke nilai
tambah per pekerja
Cina 119,4 302,9 276,5 0,39 0,43
Indonesia 95,3 159,9 207,3 0,60 0,46
Filipina 149,7 163,8 223,9 0,91 0,67
Thailand 66,6 235,4 401,2 0,28 0,17
Vietnam 26,1 n/a 100,4 n/a 0,26
Catatan: Upah minimum Indonesia menggunakan upah DKI Jakarta (dengan asumsi nilai tukar USD tahun 2013 adalah Rp 9.500), negara lainnya berdasarkan upah minimum dikota besar atau ibukota, tidak disesuaikan dengan produktivitas Sumber: Doing Business, 2013, dan pers dan peraturan 2013
Sumber: Doing Business; rata-rata upah dari ILO LABORSTA.
0
50
100
150
200
250
300
0
50
100
150
200
250
300
2007 2008 2009 2010 2011 2012 2013
USDUSD
Cina Indonesia
Malaysia
Filipina
Thailand
Vietnam
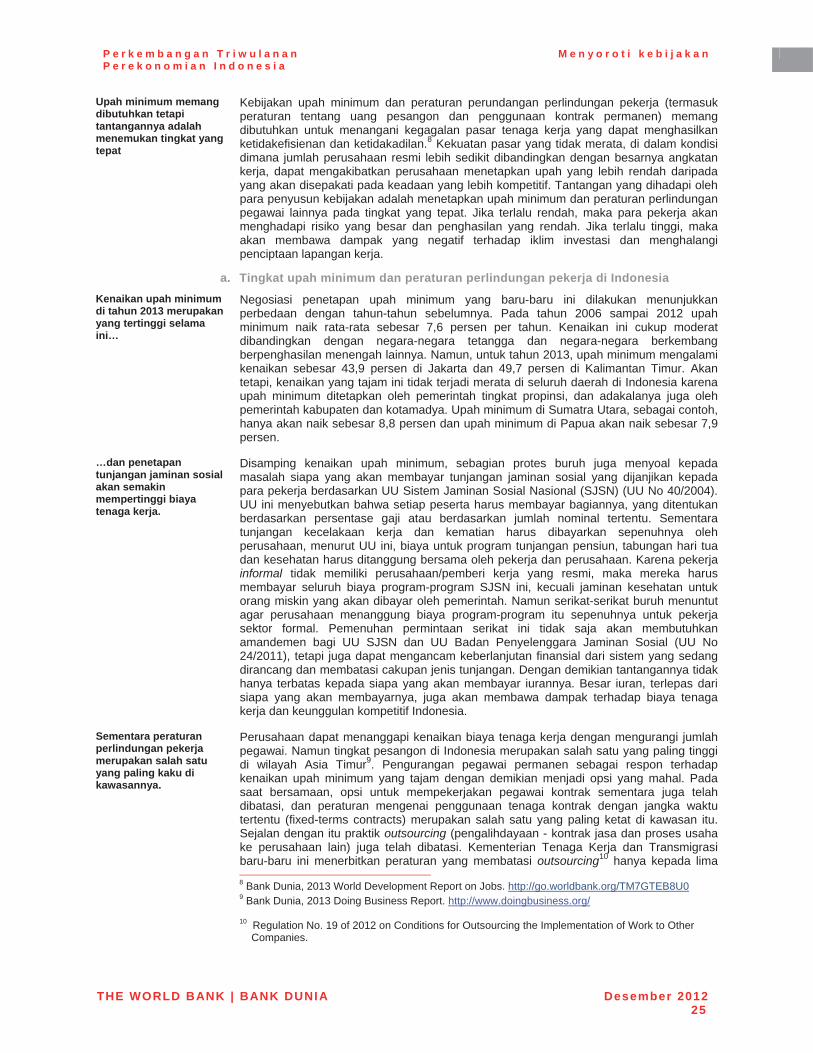
P e r k e m b a n g a n T r i w u l a n a n P e r e k o n o m i a n I n d o n e s i a
M e n y o r o t i k e b i j a k a n
THE WORLD BANK | BANK DUNIA Desember 201225
Upah minimum memang dibutuhkan tetapi tantangannya adalah menemukan tingkat yang tepat
Kebijakan upah minimum dan peraturan perundangan perlindungan pekerja (termasuk peraturan tentang uang pesangon dan penggunaan kontrak permanen) memang dibutuhkan untuk menangani kegagalan pasar tenaga kerja yang dapat menghasilkan ketidakefisienan dan ketidakadilan.8 Kekuatan pasar yang tidak merata, di dalam kondisi dimana jumlah perusahaan resmi lebih sedikit dibandingkan dengan besarnya angkatan kerja, dapat mengakibatkan perusahaan menetapkan upah yang lebih rendah daripada yang akan disepakati pada keadaan yang lebih kompetitif. Tantangan yang dihadapi oleh para penyusun kebijakan adalah menetapkan upah minimum dan peraturan perlindungan pegawai lainnya pada tingkat yang tepat. Jika terlalu rendah, maka para pekerja akan menghadapi risiko yang besar dan penghasilan yang rendah. Jika terlalu tinggi, maka akan membawa dampak yang negatif terhadap iklim investasi dan menghalangi penciptaan lapangan kerja.
a. Tingkat upah minimum dan peraturan perlindungan pekerja di Indonesia Kenaikan upah minimum di tahun 2013 merupakan yang tertinggi selama ini…
Negosiasi penetapan upah minimum yang baru-baru ini dilakukan menunjukkan perbedaan dengan tahun-tahun sebelumnya. Pada tahun 2006 sampai 2012 upah minimum naik rata-rata sebesar 7,6 persen per tahun. Kenaikan ini cukup moderat dibandingkan dengan negara-negara tetangga dan negara-negara berkembang berpenghasilan menengah lainnya. Namun, untuk tahun 2013, upah minimum mengalami kenaikan sebesar 43,9 persen di Jakarta dan 49,7 persen di Kalimantan Timur. Akan tetapi, kenaikan yang tajam ini tidak terjadi merata di seluruh daerah di Indonesia karena upah minimum ditetapkan oleh pemerintah tingkat propinsi, dan adakalanya juga oleh pemerintah kabupaten dan kotamadya. Upah minimum di Sumatra Utara, sebagai contoh, hanya akan naik sebesar 8,8 persen dan upah minimum di Papua akan naik sebesar 7,9 persen.
…dan penetapan tunjangan jaminan sosial akan semakin mempertinggi biaya tenaga kerja.
Disamping kenaikan upah minimum, sebagian protes buruh juga menyoal kepada masalah siapa yang akan membayar tunjangan jaminan sosial yang dijanjikan kepada para pekerja berdasarkan UU Sistem Jaminan Sosial Nasional (SJSN) (UU No 40/2004). UU ini menyebutkan bahwa setiap peserta harus membayar bagiannya, yang ditentukan berdasarkan persentase gaji atau berdasarkan jumlah nominal tertentu. Sementara tunjangan kecelakaan kerja dan kematian harus dibayarkan sepenuhnya oleh perusahaan, menurut UU ini, biaya untuk program tunjangan pensiun, tabungan hari tua dan kesehatan harus ditanggung bersama oleh pekerja dan perusahaan. Karena pekerja informal tidak memiliki perusahaan/pemberi kerja yang resmi, maka mereka harus membayar seluruh biaya program-program SJSN ini, kecuali jaminan kesehatan untuk orang miskin yang akan dibayar oleh pemerintah. Namun serikat-serikat buruh menuntut agar perusahaan menanggung biaya program-program itu sepenuhnya untuk pekerja sektor formal. Pemenuhan permintaan serikat ini tidak saja akan membutuhkan amandemen bagi UU SJSN dan UU Badan Penyelenggara Jaminan Sosial (UU No24/2011), tetapi juga dapat mengancam keberlanjutan finansial dari sistem yang sedang dirancang dan membatasi cakupan jenis tunjangan. Dengan demikian tantangannya tidak hanya terbatas kepada siapa yang akan membayar iurannya. Besar iuran, terlepas dari siapa yang akan membayarnya, juga akan membawa dampak terhadap biaya tenaga kerja dan keunggulan kompetitif Indonesia.
Sementara peraturan perlindungan pekerja merupakan salah satu yang paling kaku di kawasannya.
Perusahaan dapat menanggapi kenaikan biaya tenaga kerja dengan mengurangi jumlah pegawai. Namun tingkat pesangon di Indonesia merupakan salah satu yang paling tinggi di wilayah Asia Timur9. Pengurangan pegawai permanen sebagai respon terhadap kenaikan upah minimum yang tajam dengan demikian menjadi opsi yang mahal. Pada saat bersamaan, opsi untuk mempekerjakan pegawai kontrak sementara juga telah dibatasi, dan peraturan mengenai penggunaan tenaga kontrak dengan jangka waktu tertentu (fixed-terms contracts) merupakan salah satu yang paling ketat di kawasan itu. Sejalan dengan itu praktik outsourcing (pengalihdayaan - kontrak jasa dan proses usaha ke perusahaan lain) juga telah dibatasi. Kementerian Tenaga Kerja dan Transmigrasi baru-baru ini menerbitkan peraturan yang membatasi outsourcing10 hanya kepada lima 8 Bank Dunia, 2013 World Development Report on Jobs. http://go.worldbank.org/TM7GTEB8U09 Bank Dunia, 2013 Doing Business Report. http://www.doingbusiness.org/
10 Regulation No. 19 of 2012 on Conditions for Outsourcing the Implementation of Work to Other Companies.
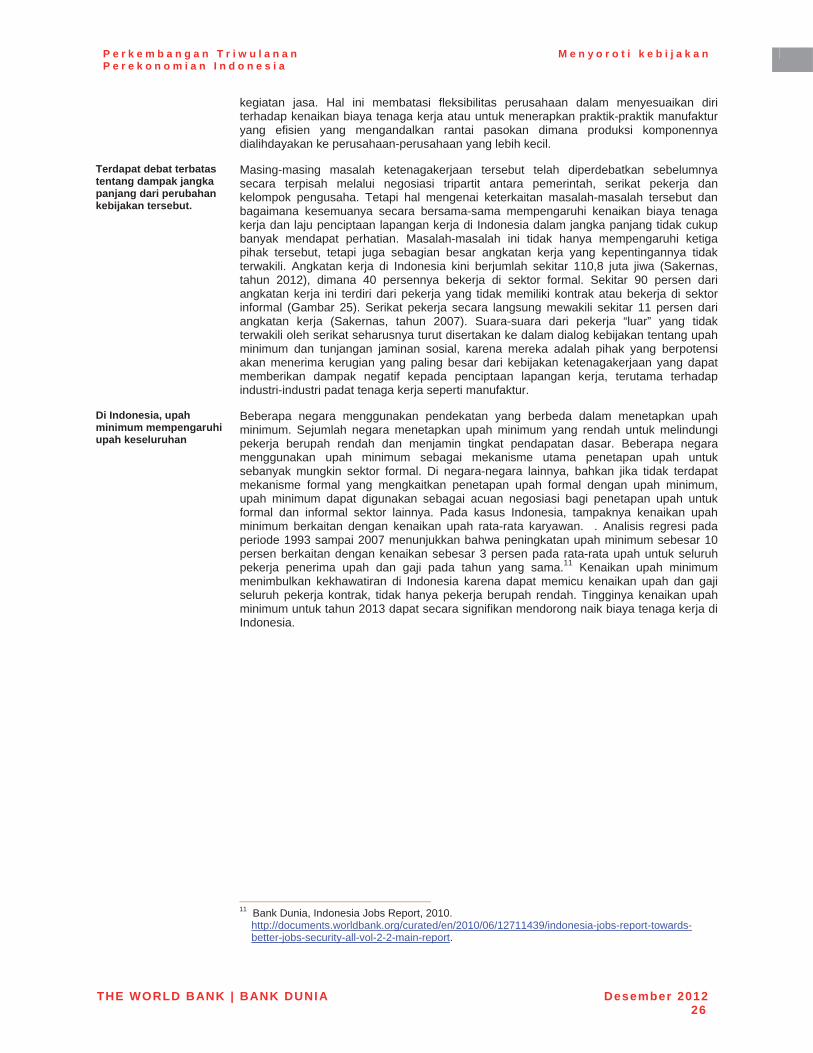
P e r k e m b a n g a n T r i w u l a n a n P e r e k o n o m i a n I n d o n e s i a
M e n y o r o t i k e b i j a k a n
THE WORLD BANK | BANK DUNIA Desember 201226
kegiatan jasa. Hal ini membatasi fleksibilitas perusahaan dalam menyesuaikan diri terhadap kenaikan biaya tenaga kerja atau untuk menerapkan praktik-praktik manufaktur yang efisien yang mengandalkan rantai pasokan dimana produksi komponennya dialihdayakan ke perusahaan-perusahaan yang lebih kecil.
Terdapat debat terbatas tentang dampak jangka panjang dari perubahan kebijakan tersebut.
Masing-masing masalah ketenagakerjaan tersebut telah diperdebatkan sebelumnya secara terpisah melalui negosiasi tripartit antara pemerintah, serikat pekerja dan kelompok pengusaha. Tetapi hal mengenai keterkaitan masalah-masalah tersebut dan bagaimana kesemuanya secara bersama-sama mempengaruhi kenaikan biaya tenaga kerja dan laju penciptaan lapangan kerja di Indonesia dalam jangka panjang tidak cukup banyak mendapat perhatian. Masalah-masalah ini tidak hanya mempengaruhi ketiga pihak tersebut, tetapi juga sebagian besar angkatan kerja yang kepentingannya tidak terwakili. Angkatan kerja di Indonesia kini berjumlah sekitar 110,8 juta jiwa (Sakernas, tahun 2012), dimana 40 persennya bekerja di sektor formal. Sekitar 90 persen dari angkatan kerja ini terdiri dari pekerja yang tidak memiliki kontrak atau bekerja di sektor informal (Gambar 25). Serikat pekerja secara langsung mewakili sekitar 11 persen dari angkatan kerja (Sakernas, tahun 2007). Suara-suara dari pekerja “luar” yang tidak terwakili oleh serikat seharusnya turut disertakan ke dalam dialog kebijakan tentang upah minimum dan tunjangan jaminan sosial, karena mereka adalah pihak yang berpotensi akan menerima kerugian yang paling besar dari kebijakan ketenagakerjaan yang dapat memberikan dampak negatif kepada penciptaan lapangan kerja, terutama terhadap industri-industri padat tenaga kerja seperti manufaktur.
Di Indonesia, upah minimum mempengaruhi upah keseluruhan
Beberapa negara menggunakan pendekatan yang berbeda dalam menetapkan upah minimum. Sejumlah negara menetapkan upah minimum yang rendah untuk melindungi pekerja berupah rendah dan menjamin tingkat pendapatan dasar. Beberapa negara menggunakan upah minimum sebagai mekanisme utama penetapan upah untuk sebanyak mungkin sektor formal. Di negara-negara lainnya, bahkan jika tidak terdapat mekanisme formal yang mengkaitkan penetapan upah formal dengan upah minimum, upah minimum dapat digunakan sebagai acuan negosiasi bagi penetapan upah untuk formal dan informal sektor lainnya. Pada kasus Indonesia, tampaknya kenaikan upah minimum berkaitan dengan kenaikan upah rata-rata karyawan. . Analisis regresi pada periode 1993 sampai 2007 menunjukkan bahwa peningkatan upah minimum sebesar 10 persen berkaitan dengan kenaikan sebesar 3 persen pada rata-rata upah untuk seluruh pekerja penerima upah dan gaji pada tahun yang sama.11 Kenaikan upah minimum menimbulkan kekhawatiran di Indonesia karena dapat memicu kenaikan upah dan gaji seluruh pekerja kontrak, tidak hanya pekerja berupah rendah. Tingginya kenaikan upah minimum untuk tahun 2013 dapat secara signifikan mendorong naik biaya tenaga kerja di Indonesia.
11 Bank Dunia, Indonesia Jobs Report, 2010.
http://documents.worldbank.org/curated/en/2010/06/12711439/indonesia-jobs-report-towards-better-jobs-security-all-vol-2-2-main-report.
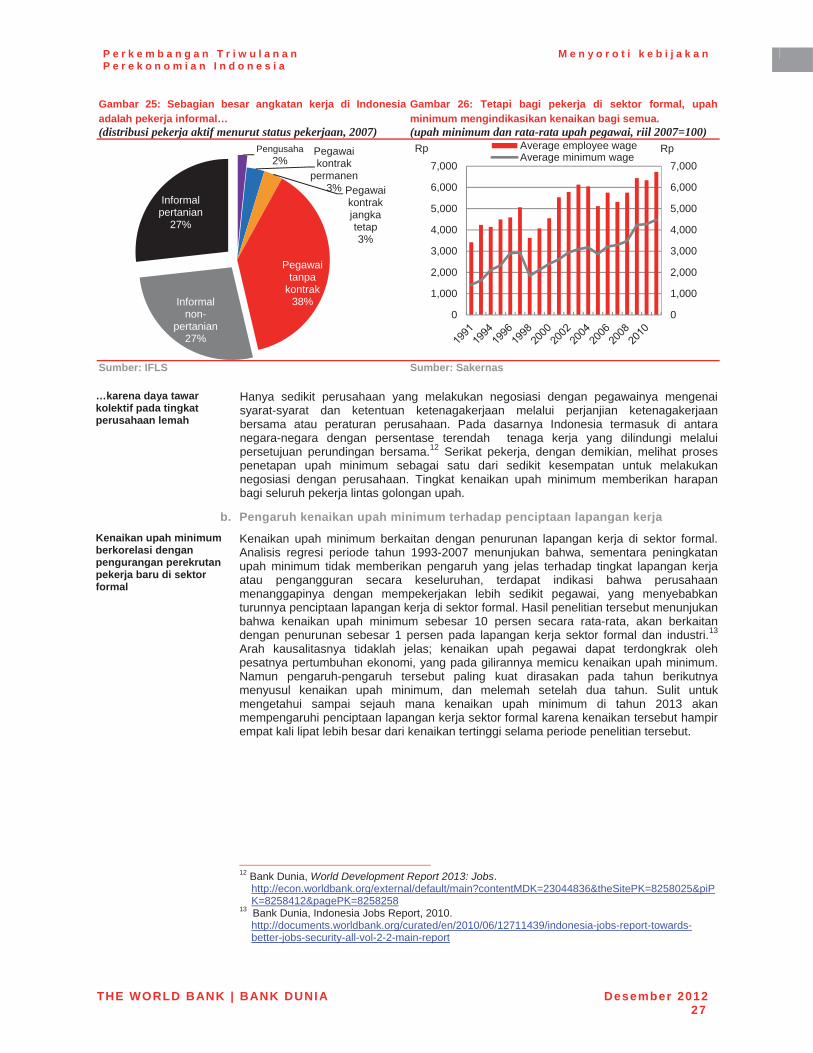
P e r k e m b a n g a n T r i w u l a n a n P e r e k o n o m i a n I n d o n e s i a
M e n y o r o t i k e b i j a k a n
THE WORLD BANK | BANK DUNIA Desember 201227
Gambar 25: Sebagian besar angkatan kerja di Indonesia adalah pekerja informal… (distribusi pekerja aktif menurut status pekerjaan, 2007)
Gambar 26: Tetapi bagi pekerja di sektor formal, upah minimum mengindikasikan kenaikan bagi semua. (upah minimum dan rata-rata upah pegawai, riil 2007=100)
Sumber: IFLS Sumber: Sakernas
…karena daya tawar kolektif pada tingkat perusahaan lemah
Hanya sedikit perusahaan yang melakukan negosiasi dengan pegawainya mengenai syarat-syarat dan ketentuan ketenagakerjaan melalui perjanjian ketenagakerjaan bersama atau peraturan perusahaan. Pada dasarnya Indonesia termasuk di antara negara-negara dengan persentase terendah tenaga kerja yang dilindungi melalui persetujuan perundingan bersama.12 Serikat pekerja, dengan demikian, melihat proses penetapan upah minimum sebagai satu dari sedikit kesempatan untuk melakukan negosiasi dengan perusahaan. Tingkat kenaikan upah minimum memberikan harapan bagi seluruh pekerja lintas golongan upah.
b. Pengaruh kenaikan upah minimum terhadap penciptaan lapangan kerja Kenaikan upah minimum berkorelasi dengan pengurangan perekrutan pekerja baru di sektor formal
Kenaikan upah minimum berkaitan dengan penurunan lapangan kerja di sektor formal. Analisis regresi periode tahun 1993-2007 menunjukan bahwa, sementara peningkatan upah minimum tidak memberikan pengaruh yang jelas terhadap tingkat lapangan kerja atau pengangguran secara keseluruhan, terdapat indikasi bahwa perusahaan menanggapinya dengan mempekerjakan lebih sedikit pegawai, yang menyebabkan turunnya penciptaan lapangan kerja di sektor formal. Hasil penelitian tersebut menunjukan bahwa kenaikan upah minimum sebesar 10 persen secara rata-rata, akan berkaitan dengan penurunan sebesar 1 persen pada lapangan kerja sektor formal dan industri.13
Arah kausalitasnya tidaklah jelas; kenaikan upah pegawai dapat terdongkrak oleh pesatnya pertumbuhan ekonomi, yang pada gilirannya memicu kenaikan upah minimum. Namun pengaruh-pengaruh tersebut paling kuat dirasakan pada tahun berikutnya menyusul kenaikan upah minimum, dan melemah setelah dua tahun. Sulit untuk mengetahui sampai sejauh mana kenaikan upah minimum di tahun 2013 akan mempengaruhi penciptaan lapangan kerja sektor formal karena kenaikan tersebut hampir empat kali lipat lebih besar dari kenaikan tertinggi selama periode penelitian tersebut.
12 Bank Dunia, World Development Report 2013: Jobs.
http://econ.worldbank.org/external/default/main?contentMDK=23044836&theSitePK=8258025&piPK=8258412&pagePK=8258258
13 Bank Dunia, Indonesia Jobs Report, 2010. http://documents.worldbank.org/curated/en/2010/06/12711439/indonesia-jobs-report-towards-better-jobs-security-all-vol-2-2-main-report
Pengusaha2%
Pegawai kontrak
permanen3% Pegawai
kontrakjangkatetap3%
Pegawai tanpa
kontrak38%Informal
non-pertanian
27%
Informalpertanian
27%
0
1,000
2,000
3,000
4,000
5,000
6,000
7,000
0
1,000
2,000
3,000
4,000
5,000
6,000
7,000Rp RpAverage employee wage
Average minimum wage
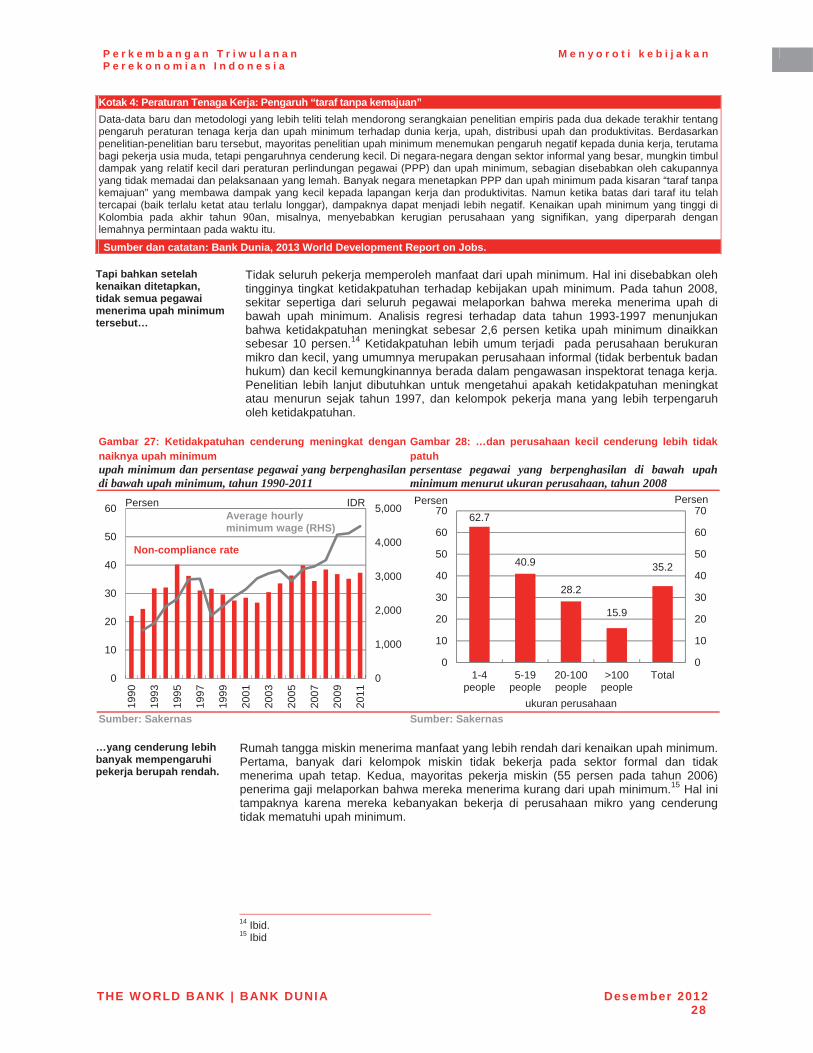
P e r k e m b a n g a n T r i w u l a n a n P e r e k o n o m i a n I n d o n e s i a
M e n y o r o t i k e b i j a k a n
THE WORLD BANK | BANK DUNIA Desember 201228
Kotak 4: Peraturan Tenaga Kerja: Pengaruh “taraf tanpa kemajuan” Data-data baru dan metodologi yang lebih teliti telah mendorong serangkaian penelitian empiris pada dua dekade terakhir tentangpengaruh peraturan tenaga kerja dan upah minimum terhadap dunia kerja, upah, distribusi upah dan produktivitas. Berdasarkan penelitian-penelitian baru tersebut, mayoritas penelitian upah minimum menemukan pengaruh negatif kepada dunia kerja, terutama bagi pekerja usia muda, tetapi pengaruhnya cenderung kecil. Di negara-negara dengan sektor informal yang besar, mungkin timbul dampak yang relatif kecil dari peraturan perlindungan pegawai (PPP) dan upah minimum, sebagian disebabkan oleh cakupannya yang tidak memadai dan pelaksanaan yang lemah. Banyak negara menetapkan PPP dan upah minimum pada kisaran “taraf tanpa kemajuan” yang membawa dampak yang kecil kepada lapangan kerja dan produktivitas. Namun ketika batas dari taraf itu telah tercapai (baik terlalu ketat atau terlalu longgar), dampaknya dapat menjadi lebih negatif. Kenaikan upah minimum yang tinggi diKolombia pada akhir tahun 90an, misalnya, menyebabkan kerugian perusahaan yang signifikan, yang diperparah dengan lemahnya permintaan pada waktu itu.
Sumber dan catatan: Bank Dunia, 2013 World Development Report on Jobs.
Tapi bahkan setelah kenaikan ditetapkan, tidak semua pegawai menerima upah minimum tersebut…
Tidak seluruh pekerja memperoleh manfaat dari upah minimum. Hal ini disebabkan oleh tingginya tingkat ketidakpatuhan terhadap kebijakan upah minimum. Pada tahun 2008, sekitar sepertiga dari seluruh pegawai melaporkan bahwa mereka menerima upah di bawah upah minimum. Analisis regresi terhadap data tahun 1993-1997 menunjukan bahwa ketidakpatuhan meningkat sebesar 2,6 persen ketika upah minimum dinaikkan sebesar 10 persen.14 Ketidakpatuhan lebih umum terjadi pada perusahaan berukuran mikro dan kecil, yang umumnya merupakan perusahaan informal (tidak berbentuk badan hukum) dan kecil kemungkinannya berada dalam pengawasan inspektorat tenaga kerja. Penelitian lebih lanjut dibutuhkan untuk mengetahui apakah ketidakpatuhan meningkat atau menurun sejak tahun 1997, dan kelompok pekerja mana yang lebih terpengaruh oleh ketidakpatuhan.
Gambar 27: Ketidakpatuhan cenderung meningkat dengan naiknya upah minimum upah minimum dan persentase pegawai yang berpenghasilandi bawah upah minimum, tahun 1990-2011
Gambar 28: …dan perusahaan kecil cenderung lebih tidak patuh persentase pegawai yang berpenghasilan di bawah upahminimum menurut ukuran perusahaan, tahun 2008
Sumber: Sakernas Sumber: Sakernas
…yang cenderung lebih banyak mempengaruhi pekerja berupah rendah.
Rumah tangga miskin menerima manfaat yang lebih rendah dari kenaikan upah minimum. Pertama, banyak dari kelompok miskin tidak bekerja pada sektor formal dan tidak menerima upah tetap. Kedua, mayoritas pekerja miskin (55 persen pada tahun 2006) penerima gaji melaporkan bahwa mereka menerima kurang dari upah minimum.15 Hal ini tampaknya karena mereka kebanyakan bekerja di perusahaan mikro yang cenderung tidak mematuhi upah minimum.
14 Ibid. 15 Ibid
0
1,000
2,000
3,000
4,000
5,000
0
10
20
30
40
50
60
1990
1993
1995
1997
1999
2001
2003
2005
2007
2009
2011
IDRPersen
Non-compliance rate
Average hourly minimum wage (RHS)
62.7
40.9
28.2
15.9
35.2
0
10
20
30
40
50
60
70
0
10
20
30
40
50
60
70
1-4people
5-19people
20-100people
>100people
Total
PersenPersen
ukuran perusahaan
P e r k e m b a n g a n T r i w u l a n a n P e r e k o n o m i a n I n d o n e s i a
M e n y o r o t i k e b i j a k a n
THE WORLD BANK | BANK DUNIA Desember 201229
c. Perubahan dalam proses penetapan upah minimum Indonesia merevisi proses penetapan upah minimum pada tahun 2006
Proses penetapan upah minimum yang kini berlaku pertama kali ditetapkan melalui UU Ketenagakerjaan tahun 2003 dimana disebutkan bahwa dewan pengupahan tripartit lokal memberikan usulan tingkat upah minimum yang didasarkan pada standar hidup layak bagi pekerja. Gubernur (di tingkat provinsi) dan bupati dan walikota (di tingkat kabupaten dan kotamadya) melakukan finalisasi dan menetapkan upah minimum yang baru. Pada tahun 2005 Kementerian Tenaga Kerja dan Transmigrasi menetapkan bahwa dewan pengupahan lokal diharuskan menggunakan standar yang baru dalam menghitung Kebutuhan Hidup Layak (KHL), yang akan digunakan sebagai masukan dalam menetapkan upah minimum. KHL, yang dihitung dari harga kelompok 46 barang dan jasa pokok, rata-rata lebih tinggi sebesar 38 persen dibandingkan dengan KHL sebelumnya.16
…tetapi prosesnya seharusnya lebih tidak politis dan lebih didasari oleh hal-hal teknis.
Pada tahun 2007, kewenangan menghitung KHL berpindah dari Badan Pusat Statstik (BPS) ke Dewan Pengupahan tripartit lokal. Kelompok serikat pekerja dan perusahaan melakukan survei sendiri untuk menghitung KHL, yang kemudian dinegosiasikan dan angka kompromi disepakati. Penelitian terakhir menunjukan bahwa metode ini menghasilkan kenaikan riil harga yang lebih besar ; pada tahun 2007-2011 kenaikan KHL hampir mencapai dua kali lipat dari perkiraan kenaikan berdasarkan laju inflasi.17
Pengaruh KHL terhadap upah minimum – walaupun positif –relatif kecil. Faktor-faktor lain yang menjadi pertimbangan Dewan Pengupahan tidak diumumkan kepada publik. Pergeseran dari pendekatan teknis ke negosiasi dapat menjelaskan besarnya variasi upah minimum di berbagai wilayah di Indonesia.
Dibutuhkan revisi terhadap proses penetapan upah minimum untuk mencegah kerusuhan buruh.
Karena proses penetapan upah minimum pada dasarnya dilakukan melalui negosiasi, dan hanya memiliki kaitan yang lemah dengan penilaian teknis terhadap kenaikan biaya hidup, proses tersebut menjadi sangat kontroversial. Pendekatan yang lebih teknis dan profesional dalam menetapkan upah minimum dapat meningkatkan transparansi dan keadilan dari proses tersebut dan, pada saat yang bersamaan, meminimalkan ketidakpastian bisnis dan kerugian . Ketepatan pengukuran KHL harus ditinjau ulang, dan proses transparanuntuk menghitung kembali KHL tahunan harus disepakati sejak awal. KHL yang telah direvisi ini harus menjadi penentu utama dalam mengusulkan kenaikan upah minimum; faktor-faktor lain yang memberi kontribusi kepada perhitungan harus dibakukan dan terbuka untuk diperiksa oleh masyarakat. Pergeseran menuju pendekatan yang transparan dan didasari oleh faktor teknis, yang disinggung sebelumnya, akan membantu menjamin bahwa proses penetapan upah minimum tidak akan dipengaruhi oleh politik lokal atau kepentingan perusahaan dan/atau serikat pekerja. Hal ini juga akan meningkatkan transparansi dan kepastian perkiraan tingkat upah minimum selanjutnya, yang akan membantu meningkatkan kepercayaan investor terhadap Indonesia dengan membantu perencanaan usaha dan menurunkan risiko kerusuhan buruh.
d. Menggunakan visi jangka panjang terhadap penciptaan lapangan kerja dan perlindungan pekerja
Dibutuhkan dialog yang lebih mendalam tentang strategi reformasi jangka panjang yang bermanfaat untuk seluruh pekerja…
Kebijakan upah minimum terkait erat dengan upaya-upaya perlindungan pekerja lainnya: uang pesangon, pembatasan kontrak jangka waktu tertentu dan outsourcing, dan pemberlakuan tunjangan jaminan sosial seperti pensiun dan asuransi kecelakaan kerja. Terjadi perdebatan yang sengit mengenai hal-hal di atas, tetapi para pekerja dan pengusaha tetap terjebak dalam keadaan “sama-sama rugi.” Hanya sedikit upaya yang dilakukan untuk mengkaji bagaimana kebijakan dan peraturan dapat bekerja bersama-sama untuk melindungi pekerja, atau pengaruhnya terhadap penciptaan lapangan kerja. Ada kebutuhan bagi pemerintah, pekerja (diwakili tidak hanya oleh serikat tetapi juga mempertimbangkan kepentingan pekerja informal yang jumlahnya besar) dan perusahaan untuk bergerak menuju visi jangka panjang reformasi kebijakan tenaga kerja di Indonesia dan menemukan solusi “sama-sama untung” yang diterima oleh semua pihak. Secara bersama-sama, para pemangku kepentingan ini harus mempertimbangkan perpaduan kebijakan dan instrumen yang dapat diterapkan untuk memberikan perlindungan yang sesungguhnya kepada para pekerja tanpa mengorbankan investasi pada industri-industri padat tenaga kerja dan laju penciptaan lapangan kerja di Indonesia.
16 Manning, Chris dan Raden Muhamad Purnagunawan, 2012. 17 Ibid.
P e r k e m b a n g a n T r i w u l a n a n P e r e k o n o m i a n I n d o n e s i a
M e n y o r o t i k e b i j a k a n
THE WORLD BANK | BANK DUNIA Desember 201230
Diskusi mengenai sejumlah masalah yang berkaitan dengan penetapan sistem jaminan sosial nasional dan penanganannya juga diperlukan. Termasuk di dalamnya adalah bagaimana memperluas cakupan, merancang paket tunjangan yang tepat, memastikan bahwa sistem yang akan datang akan berkelanjutan secara finansial untuk jangka panjang, mengubah lembaga-lembaga yang bertanggung jawab atas pelaksanaan dan pengawasan sistem jaminan sosial, dan mensinergikan UU ketenagakerjaan dengan pemberlakuan program-program jaminan sosial bagi pekerja..
…dan lebih didasari oleh penelitian berbasis bukti daripada politik jangka pendek.
Penelitian empiris yang kuat dapat memberikan masukan terhadap perdebatan di seputar reformasi ketenagakerjaan. Pada tahun 2010, Bank Dunia menerbitkan Laporan Ketenagakerjaan di Indonesia (Indonesia Jobs Report), suatu kajian lengkap tentang pasar tenaga kerja di Indonesia selama dua dekade terakhir. Pada awal tahun 2013, Bank Dunia akan memperbarui laporan ini, yang akan meliputi perluasan dari sejumlah masalah yang paling mendesak, seperti tunjangan jaminan sosial bagi pekerja dan pendekatan-pendekatan baru untuk peningkatan keterampilan. Pada saat yang bersamaan, Laporan Perkembangan Dunia (World Development Report) Bank Dunia tahun 2013 memfokuskan kepada masalah ketenagakerjaan dan akan memberikan pemahaman global tentang bagaimana menyediakan lebih banyak pekerjaan dan memperbaiki perlindungan yang efektif bagi seluruh pekerja.

P e r k e m b a n g a n T r i w u l a n a n P e r e k o n o m i a n I n d o n e s i a
M e n y o r o t i k e b i j a k a n
THE WORLD BANK | BANK DUNIA Desember 201231
2. Membangun ketahanan Jakarta terhadap banjir Jakarta adalah pusat perkotaan Indonesia, salah satu daerah metropolitan terbesar di dunia, dan sumber dari hampir seperlima PDB Indonesia…
Sebagai pusat niaga utama di Indonesia, ibukota Jakarta memiliki kontribusi sekitar 13 persen, atau 112 miliar dolar AS, terhadap jumlah PDB Indonesia.18 Sebagai pusat ekonomi dan politik di Indonesia, urbanisasi dari daerah juga memberi kontribusi menjadikan Jakarta sebagai salah satu daerah metropolitan terbesar di dunia. Daerah Khusus Ibukota (DKI) Jakarta mencakup daerah dengan luas sekitar 650 km2 dengan jumlah penduduk sekitar 10 juta jiwa (2010). Jumlah penduduk Jakarta dan sekitarnya (mencakup daerah seluas 7.300 km2) mencapai hampir 30 juta jiwa. Tingkat pertumbuhan penduduk berada jauh di atas rata-rata nasional dan jumlah penduduknya diperkirakan akan melampaui 35 juta jiwa pada tahun 2020. Diperkirakan sebanyak 250.000 pendatang dari desa pindah ke Jakarta setiap tahun, yang berkontribusi pada peningkatan jumlah pemukiman liar di mana penduduk hidup tanpa dukungan pelayanan umum (seperti transportasi, pasokan air, sanitasi dan pengelolaan limbah).
…tetapi Jakarta mengalami masalah banjir yang menahun
Disebabkan oleh lokasi dan cepatnya pertumbuhan penduduk, ditambah buruknya tingkat pelayanan masyarakat, kota Jakarta telah dikenal karena sejumlah masalahnya, dan yang paling parah timbul dalam bentuk banjir yang terus berlangsung selama bertahun-tahun. Jakarta dibangun di atas daerah dataran rendah pantai. Kota Jakarta terletak di atas daerah endapan aliran sungai pada bagian paling rendah dari cekungan yang dikelilingi oleh sejumlah gunung berapi yang tidak aktif yang lereng-lerengnya membentuk daerah penampung bagian hulu dari 13 sungai besar yang melalui cekungan itu menuju ke Laut Jawa. Saat ini, sekitar 40 persen dari kota Jakarta (termasuk sebagian besar daerah utara) berada pada, atau di bawah, permukaan air laut. Banjir tahunan sudah menjadi hal yang umum di Jakarta sejak pendiriannya. Banjir besar dan merusak telah tercatat sampai sejauh tahun 1621, 1654 dan 1918.19
Dengan musim penghujan yang sedang berlangsung yang telah membawa banjir ke daerah-daerah tertentu di kota Jakarta, bagian ini memberikan tinjauan terbaru mengenai dampak ekonomi dan kemanusiaan yang berat dari banjir tersebut dan faktor-faktor penyebabnya. Sementara mengenali tantangan-tantangan kebijakan, bagian ini menguraikan sejumlah tindakan yang dapat segera dilakukan untuk membantu meringankan dampak banjir dan meningkatkan ketahanan kota untuk jangka pendek dan menengah.
a. Tingkat keparahan banjir semakin meningkat, membebankan biaya yang signifikan
Tingkat keparahan kejadian banjir semakin meningkat belakangan ini…
Tingkat keparahan dari kejadian banjir meningkat selama dekade-dekade terakhir, terutama banjir besar yang terjadi pada bulan Januari 1996, Februari 2002 dan Februari2007. Banjir pada tahun 2007 saja menggenangi daerah seluas 235 km2 (sekitar 36 persen) dari kota Jakarta, dengan kedalaman yang mencapai tujuh meter di beberapa wilayah. Banjir tersebut berdampak pada lebih dari 2,6 juta orang dan memaksa 340,000 penduduk untuk mengungsi dari rumah mereka. Lebih dari 70 jiwa menjadi korban dan wabah penyakit menjangkiti lebih dari 200.000 orang. Pada tahun 2008 banjir menyerang jalan tol bandara, membatalkan 1.000 penerbangan dan menyebabkan gangguan yang berat bagi Jakarta. Banjir tahun 2009 juga terjadi dengan intensitas yang tinggi dan berlanjut hingga tahun 2010. Risiko banjir yang dirasakan dan yang sebenarnya menyebabkan penderitaan penduduk, kerusakan langsung pada bidang ekonomi dan keuangan, dan mempengaruhi pertimbangan usaha dan investor dalam penentuan keputusan investasi pada daerah-daerah yang berdampak banjir.
…menimbulkan kerugian ekonomi, keuangan dan kemanusiaan…
Kerugian ekonomi dan keuangan dari kejadian banjir selama 10 hari di tahun 2002 melampaui 1 miliar dolar AS, sementara banjir 6 hari pada tahun 2007 menyebabkan kerugian sekitar 900 juta dolar AS. Akibat dari parahnya banjir di Jakarta lebih menakutkan bila diukur menurut dampak sektoralnya. Tidak seperti bencana alam yang terjadi dengan cepat seperti gempa bumi atau tsunami (yang dampak dan rekonstruksinya dibahas pada bagian berikut), kerusakan langsung yang disebabkan oleh 18 Perhitungan berdasarkan Angka PDB tahun 2011 dan PDB daerah dari CEIC 19 Laporan Perkiraan Kerusakan dan Kerugian Pasca Bencana Banjir Awal Februari 2007 di Wilayah
JABODETABEK, http://www.bappenas.go.id/node/111/995/laporan-perkiraan-kerusakan-dan-kerugian-pasca-bencana-banjir-awal-februari-2007-di-jabodetabek/
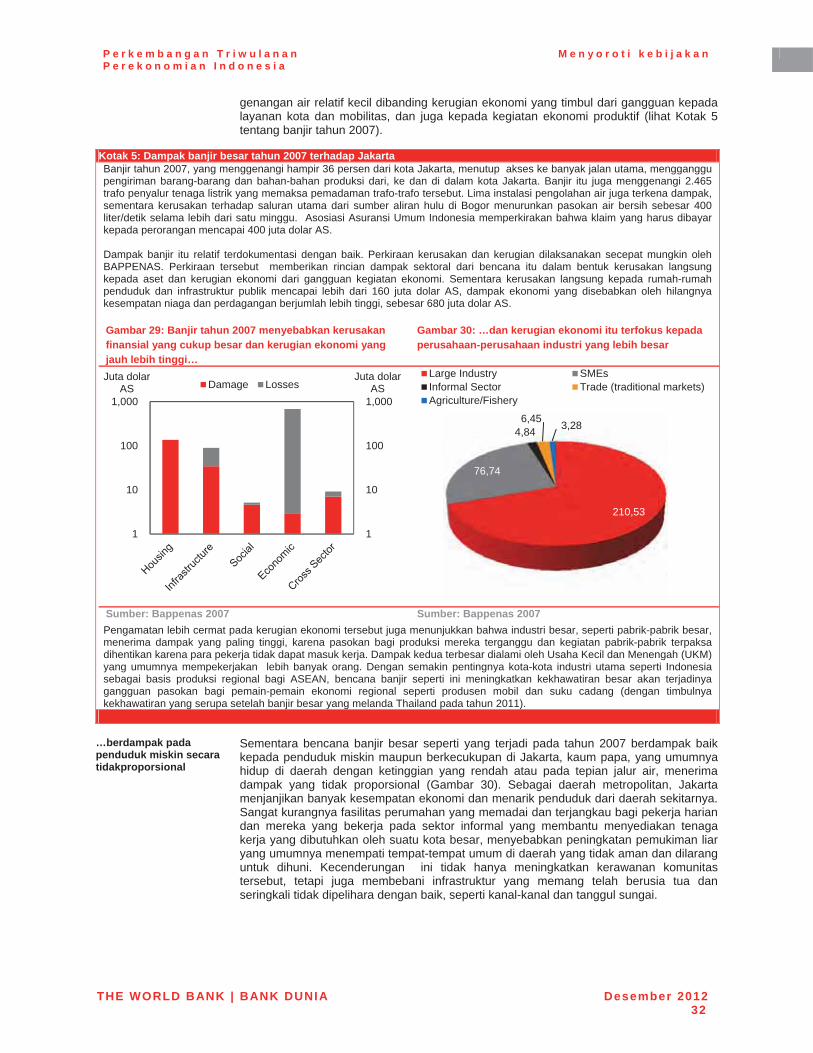
P e r k e m b a n g a n T r i w u l a n a n P e r e k o n o m i a n I n d o n e s i a
M e n y o r o t i k e b i j a k a n
THE WORLD BANK | BANK DUNIA Desember 201232
genangan air relatif kecil dibanding kerugian ekonomi yang timbul dari gangguan kepada layanan kota dan mobilitas, dan juga kepada kegiatan ekonomi produktif (lihat Kotak 5tentang banjir tahun 2007).
Kotak 5: Dampak banjir besar tahun 2007 terhadap Jakarta Banjir tahun 2007, yang menggenangi hampir 36 persen dari kota Jakarta, menutup akses ke banyak jalan utama, mengganggu pengiriman barang-barang dan bahan-bahan produksi dari, ke dan di dalam kota Jakarta. Banjir itu juga menggenangi 2.465 trafo penyalur tenaga listrik yang memaksa pemadaman trafo-trafo tersebut. Lima instalasi pengolahan air juga terkena dampak, sementara kerusakan terhadap saluran utama dari sumber aliran hulu di Bogor menurunkan pasokan air bersih sebesar 400 liter/detik selama lebih dari satu minggu. Asosiasi Asuransi Umum Indonesia memperkirakan bahwa klaim yang harus dibayar kepada perorangan mencapai 400 juta dolar AS.
Dampak banjir itu relatif terdokumentasi dengan baik. Perkiraan kerusakan dan kerugian dilaksanakan secepat mungkin oleh BAPPENAS. Perkiraan tersebut memberikan rincian dampak sektoral dari bencana itu dalam bentuk kerusakan langsung kepada aset dan kerugian ekonomi dari gangguan kegiatan ekonomi. Sementara kerusakan langsung kepada rumah-rumah penduduk dan infrastruktur publik mencapai lebih dari 160 juta dolar AS, dampak ekonomi yang disebabkan oleh hilangnya kesempatan niaga dan perdagangan berjumlah lebih tinggi, sebesar 680 juta dolar AS.
Gambar 29: Banjir tahun 2007 menyebabkan kerusakan finansial yang cukup besar dan kerugian ekonomi yang jauh lebih tinggi…
Gambar 30: …dan kerugian ekonomi itu terfokus kepada perusahaan-perusahaan industri yang lebih besar
Sumber: Bappenas 2007 Sumber: Bappenas 2007Pengamatan lebih cermat pada kerugian ekonomi tersebut juga menunjukkan bahwa industri besar, seperti pabrik-pabrik besar, menerima dampak yang paling tinggi, karena pasokan bagi produksi mereka terganggu dan kegiatan pabrik-pabrik terpaksa dihentikan karena para pekerja tidak dapat masuk kerja. Dampak kedua terbesar dialami oleh Usaha Kecil dan Menengah (UKM) yang umumnya mempekerjakan lebih banyak orang. Dengan semakin pentingnya kota-kota industri utama seperti Indonesia sebagai basis produksi regional bagi ASEAN, bencana banjir seperti ini meningkatkan kekhawatiran besar akan terjadinya gangguan pasokan bagi pemain-pemain ekonomi regional seperti produsen mobil dan suku cadang (dengan timbulnya kekhawatiran yang serupa setelah banjir besar yang melanda Thailand pada tahun 2011).
…berdampak pada penduduk miskin secara tidakproporsional
Sementara bencana banjir besar seperti yang terjadi pada tahun 2007 berdampak baik kepada penduduk miskin maupun berkecukupan di Jakarta, kaum papa, yang umumnya hidup di daerah dengan ketinggian yang rendah atau pada tepian jalur air, menerima dampak yang tidak proporsional (Gambar 30). Sebagai daerah metropolitan, Jakarta menjanjikan banyak kesempatan ekonomi dan menarik penduduk dari daerah sekitarnya. Sangat kurangnya fasilitas perumahan yang memadai dan terjangkau bagi pekerja harian dan mereka yang bekerja pada sektor informal yang membantu menyediakan tenaga kerja yang dibutuhkan oleh suatu kota besar, menyebabkan peningkatan pemukiman liar yang umumnya menempati tempat-tempat umum di daerah yang tidak aman dan dilarang untuk dihuni. Kecenderungan ini tidak hanya meningkatkan kerawanan komunitas tersebut, tetapi juga membebani infrastruktur yang memang telah berusia tua dan seringkali tidak dipelihara dengan baik, seperti kanal-kanal dan tanggul sungai.
1
10
100
1,000
1
10
100
1,000
Juta dolar AS
Juta dolar AS Damage Losses
210,53
76,74
4,846,45 3,28
Large Industry SMEsInformal Sector Trade (traditional markets)Agriculture/Fishery
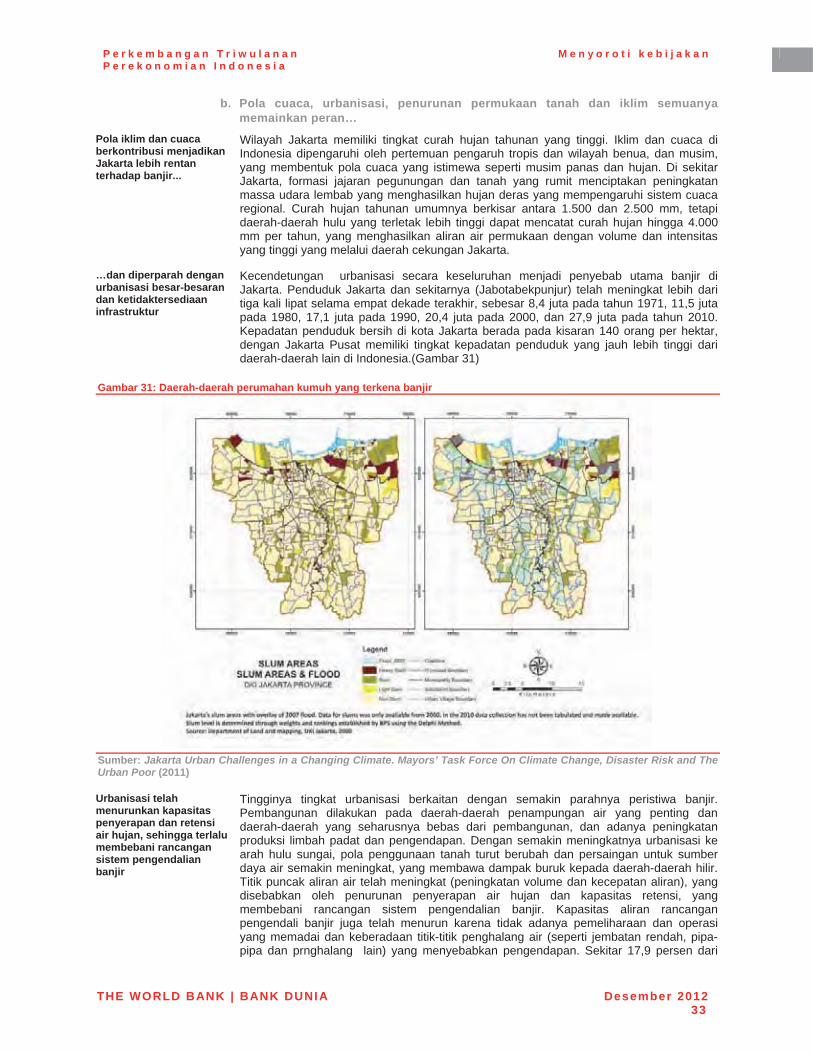
P e r k e m b a n g a n T r i w u l a n a n P e r e k o n o m i a n I n d o n e s i a
M e n y o r o t i k e b i j a k a n
THE WORLD BANK | BANK DUNIA Desember 201233
b. Pola cuaca, urbanisasi, penurunan permukaan tanah dan iklim semuanya memainkan peran…
Pola iklim dan cuaca berkontribusi menjadikan Jakarta lebih rentan terhadap banjir...
Wilayah Jakarta memiliki tingkat curah hujan tahunan yang tinggi. Iklim dan cuaca di Indonesia dipengaruhi oleh pertemuan pengaruh tropis dan wilayah benua, dan musim, yang membentuk pola cuaca yang istimewa seperti musim panas dan hujan. Di sekitar Jakarta, formasi jajaran pegunungan dan tanah yang rumit menciptakan peningkatan massa udara lembab yang menghasilkan hujan deras yang mempengaruhi sistem cuaca regional. Curah hujan tahunan umumnya berkisar antara 1.500 dan 2.500 mm, tetapi daerah-daerah hulu yang terletak lebih tinggi dapat mencatat curah hujan hingga 4.000 mm per tahun, yang menghasilkan aliran air permukaan dengan volume dan intensitas yang tinggi yang melalui daerah cekungan Jakarta.
…dan diperparah dengan urbanisasi besar-besaran dan ketidaktersediaan infrastruktur
Kecendetungan urbanisasi secara keseluruhan menjadi penyebab utama banjir di Jakarta. Penduduk Jakarta dan sekitarnya (Jabotabekpunjur) telah meningkat lebih dari tiga kali lipat selama empat dekade terakhir, sebesar 8,4 juta pada tahun 1971, 11,5 juta pada 1980, 17,1 juta pada 1990, 20,4 juta pada 2000, dan 27,9 juta pada tahun 2010. Kepadatan penduduk bersih di kota Jakarta berada pada kisaran 140 orang per hektar, dengan Jakarta Pusat memiliki tingkat kepadatan penduduk yang jauh lebih tinggi dari daerah-daerah lain di Indonesia.(Gambar 31)
Gambar 31: Daerah-daerah perumahan kumuh yang terkena banjir
Sumber: Jakarta Urban Challenges in a Changing Climate. Mayors’ Task Force On Climate Change, Disaster Risk and The Urban Poor (2011)
Urbanisasi telah menurunkan kapasitas penyerapan dan retensi air hujan, sehingga terlalu membebani rancangan sistem pengendalian banjir
Tingginya tingkat urbanisasi berkaitan dengan semakin parahnya peristiwa banjir. Pembangunan dilakukan pada daerah-daerah penampungan air yang penting dan daerah-daerah yang seharusnya bebas dari pembangunan, dan adanya peningkatan produksi limbah padat dan pengendapan. Dengan semakin meningkatnya urbanisasi ke arah hulu sungai, pola penggunaan tanah turut berubah dan persaingan untuk sumber daya air semakin meningkat, yang membawa dampak buruk kepada daerah-daerah hilir.Titik puncak aliran air telah meningkat (peningkatan volume dan kecepatan aliran), yang disebabkan oleh penurunan penyerapan air hujan dan kapasitas retensi, yang membebani rancangan sistem pengendalian banjir. Kapasitas aliran rancangan pengendali banjir juga telah menurun karena tidak adanya pemeliharaan dan operasi yang memadai dan keberadaan titik-titik penghalang air (seperti jembatan rendah, pipa-pipa dan prnghalang lain) yang menyebabkan pengendapan. Sekitar 17,9 persen dari
P e r k e m b a n g a n T r i w u l a n a n P e r e k o n o m i a n I n d o n e s i a
M e n y o r o t i k e b i j a k a n
THE WORLD BANK | BANK DUNIA Desember 201234
seluruh limbah padat berakhir pada sistem drainase, dengan volume sekitar 1.067 m3/hari, yang mana sekitar 921 m3/hari dihasilkan oleh DKI Jakarta sendiri, sementara 146 m3/hari sisanya datang dari daerah hulu.
Penurunan permukaan tanah dan perubahan iklim menambah masalah, dengan sejumlah daerah di Jakarta mengalami penurunan permukaan hingga 25 cm per tahun…
Sementara itu, terus menurunnya permukaan tanah semakin mengancam fungsi sistem pengendalian banjir secara keseluruhan dan meningkatkan risiko banjir air pasang, dan perubahan iklim diperkirakan akan mendorong semakin tingginya intensitas curah hujan dan kenaikan ketinggian permukaan laut. Penelitian terakhir tentang penurunan permukaan tanah menemukan bahwa tingkat penurunan yang umumnya berada pada kisaran 7,5 hinga 10 cm per tahun yang terutama mempengaruhi daerah-daerah di bagian utara Jakarta. Akan tetapi, pada daerah-daerah tertentu di sebelah utara Jakarta, penurunan permukaan tanah yang mencapai kisaran 15 hingga 25 cm per tahun juga telah tercatat, yang bila terus berlangsung, akan menyebabkan ketinggian tanah mereka turun ke 4 hingga 5 m di bawah permukaan air laut pada tahun 2025. Penurunan permukaan tanah meningkatkan kerawanan terhadap banjir karena perlemahan daya gravitasi dalam menyalurkan aliran air ke laut, dan juga meningkatkan risiko banjir yang disebabkan oleh air laut yang pasang. Penurunan permukaan tanah juga meningkatkan kebutuhan untuk pompa, tanggul dan pertahanan laut. Penyebab utama penurunan permukaan tanah di Jakarta adalah penggunaan air tanah melalui penggalian yang dalam – sebagai sumber utama air bersih bagi rumah tangga dan perusahaan di dalam kota. Pengeboran sumur yang dalam ke akuifer dan tingginya penggunaan air meruntuhkan struktur akuifer dan membuka jalan bagi intrusi air laut.
…sementara model iklim meramalkan peningkatan ketinggian air laut dan tingginya frekuensi dan intensitas curah hujan
Model iklim wilayah yang diterbitkan sebagai bagian dari penelitian pemetaan kerawanan perubahan iklim bagi Asia Tenggara (2009) menyebutkan bahwa Jakarta merupakan wilayah yang paling rawan di Asia Tenggara terhadap risiko perubahan iklim20. Perubahan iklim dapat membawa dua dampak terhadap banjir di Jakarta – melalui peningkatan ketinggian air laut dan melalui peningkatan frekuensi dan intensitas curah hujan. Peningkatan permukaan air laut yang disertai dengan penurunan permukaan tanah yang drastis, akan membawa pengaruh yang sangat buruk bagi penduduk yang hidup pada daerah-daerah pantai yang rendah di bagian utara kota Jakarta. Peningkatan curah hujan juga menjadi sumber keprihatinan. Laporan dari Dewan Perubahan Iklim Antar Pemerintahan di tahun 2008 menyatakan bahwa Jakarta akan menjadi semakin rawan terhadap peningkatan jumlah hari-hari basah pada abad yang baru, ditandai dengan peningkatan frekuensi hujan dan intensitasnya, terutama pada daerah-daerah tropis dan garis lintang yang tinggi yang memang telah memiliki angka rata-rata curah hujan secara statistika yang tinggi. Skenario bencana banjir yang paling dahsyat untuk kota Jakarta adalah ketika kondisi air pasang terjadi pada saat yang sama dengan tingginya curah hujan pada bagian hulu – risiko peristiwa banjir yang semakin memprihatinkan dengan adanya tambahan faktor perubahan iklim di wilayah tersebut.
c. …tetapi berbagai tindakan dapat dilakukan untuk meningkatkan ketahanan Jakarta terhadap banjir
Upaya mitigasi banjir yang komprehensif merupakan hal yang rumit dan terkendala oleh sulitnya koordinasi lintas daerah cekungan…
Peraturan tata ruang wilayah mengatur implementasi pengelolaan dan koordinasi banjir lintas pemerintahan daerah, tetapi, seperti dijumpai pada negara-negara lain, koordinasi silang demikian akan selalu menemui kesulitan, terutama bila meminta daerah-daerah hulu untuk melakukan investasi (seperti sarana retensi dataran tinggi dan pengelolaannya) untuk melindungi daerah-daerah hilir. Tanpa jaminan akan perlindungan ruang terbuka hijau yang masih tersisa dan fungsi retensi pada daerah cekungan Jabotabekpunjur, maka Jakarta masih akan terus menghadapi risiko banjir yang besar.
… tetapi terdapat tindakan praktis yang dapat segera diambil untuk membantu meringankan dampak banjir untuk jangka pendek dan menengah
Namun, suatu urutan intervensi yang teratur dapat mendukung pihak yang berwenang untuk mengambil tindakan dalam menangani masalah-masalah tersebut. Prioritas pertama adalah memulihkan kembali infrastruktur yang ada, menangani kapasitas aliran dan retensi. Tahap kedua akan melibatkan peningkatan infrastruktur, terutama menyusun kembali sistem pengendalian banjir yang telah terpengaruh oleh penurunan permukaan air tanah dan penghubungan kanal-kanal banjir Timur dan Barat yang utama. Secara
20 “Climate Change Vulnerability Mapping for Southeast Asia". Yusuf, A.A. dan H. Francisco, 2009.
Economy and Environment Program for Southeast Asia (EEPSEA). lihat: http://web.idrc.ca/uploads/user-S/12324196651Mapping_Report.pdf

P e r k e m b a n g a n T r i w u l a n a n P e r e k o n o m i a n I n d o n e s i a
M e n y o r o t i k e b i j a k a n
THE WORLD BANK | BANK DUNIA Desember 201235
bersama-sama, harus dilakukan upaya untuk membangun kemufakatan dan tindakan multi-pemangku kepentingan mengenai masalah pengelolaan daerah hulu dan perlindungan daerah pantai, yang akan membutuhkan persiapan dan implementasi jangka panjang.
Pengembalian sistem banjir ke rancangan dan kapasitas awalnya akan membawa dampak yang paling cepat dapat dirasakan…
Berbagai penelitian model hidrolik secara bulat menyarankan bahwa upaya yang paling cepat membawa dampak mitigasi banjir adalah mengambil langkah-langkah untuk mengembalikan sistem ke rancangan awalnya. Simulasi yang menyeluruh atas banjir tahun 2007 meramalkan bahwa gangguan terhadap lebih dari satu juta jiwa, atau 40 persen dari dampak banjir tersebut, dapat dihindari bila sistem yang ada dapat bekerja sesuai dengan kapasitas yang dirancang sebelumnya (Gambar 32). Pengembalian sistem ke rancangan awalnya juga harus dilengkapi dengan penekanan yang kuat pada pemeliharaan rutin di masa depan dan mobilisasi masyarakat luas untuk memberikan bantuan tingkat rumah tangga dan komunitas untuk mitigasi bencana banjir.
…sementara rekonfigurasi jaringan kanal utama pada lokasi-lokasi strategis memperkuat sistem untuk menanggung perubahan fisik dan urbanisasi
Kanal banjir Timur yang baru diselesaikan menawarkan kemungkinan untuk mengalihkan kelebihan aliran air dari sungai utama Ciliwung. Pembangunan sistem pengalih untuksungai Ciliwung pada pintu air pengendali utama di bagian selatan Jakarta dan lebih tinggi ke arah hulu, yang menghubungkan kanal banjir Timur dan Barat, dan peningkatan pada kanal-kanal yang berdampingan akan memberikan perlindungan tambahan kepada pusat kota yang padat penduduknya. Ditambah dengan normalisasi sistem yang ada ke rancangan awalnya, jumlah penduduk yang lolos dari pengaruh langsung peristiwa banjir tahun 2007 akan bertambah sebesar 600.000 orang lagi.
Gambar 32: Banjir tahun 2007 akan lebih ringan bila sarana yang ada berfungsi sepenuhnya (panil kiri: tingkat banjir sebenarnya. Panil kanan: simulasi tingkat banjir dengan sistem penanggulangan banjir yang beroperasi sepenuhnya)
Sumber: Kementerian Pekerjaan Umum (2012) Sumber: Kementerian Pekerjaan Umum (2012)
Sementara itu, persiapan dan perencanaan kontinjensi secara sistematis dapat membantu meningkatkan ketahanan
Walau dengan berbagai upaya yang direncanakan dan sedang dilakukan untuk memitigasi risiko banjir di Jakarta, risiko-risiko tersebut akan tetap mengancam kota Jakarta hingga waktu yang belum dapat diperkirakan. Perencanaan dan investasi kontinjensi untuk kesiapan menghadapi banjir merupakan hal penting untuk meningkatkan ketahanan kota dan penduduknya untuk mengatasi, menyesuaikan dan menyiapkan diri untuk menghadapi peristiwa banjir yang berulang, sehingga menurunkan kerawanan dari risiko-risiko tersebut.
Alat-alat perencanaan kontinjensi yang mutakhir sedang disusun dan diluncurkan untuk membantu para perencana dan pengelola kota…
Pada beberapa bulan terakhir alat perencanaan kontinjensi yang lebih mutakhir telah diluncurkan melalui prakarsa yang dipimpin oleh Badan Nasional Penanggulangan Bencana (BNPB) untuk menyusun alat praktis untuk mendukung perencanaan kontinjensi darurat dari Badan-Badan Penanggulangan Bencana Daerah (BPBD). Suatu kemitraan antara BNPB, Badan Australia-Indonesia untuk Pengurangan Bencana (Australia-Indonesia Facility for Disaster Reduction/AIFDR) dan Badan Dunia untuk Pengurangan dan Pemulihan Bencana (Global Facility for Disaster Reduction and Recovery/GFDRR) telah mengembangkan suatu alat perencanaan kontinjensi yang didasarkan pada pemodelan dampak ancaman . Alat ini bertujuan untuk memberikan pengetahuan lebih awal kepada para perencana tentang siapa yang akan terkena dampak dan apa yang akan mengalami kerusakan dalam hal terjadinya suatu peristiwa bencana alam tertentu. Alat ini, yang dinamai Penilaian Skenario Indonesia untuk Keadaan Darurat (Indonesia

P e r k e m b a n g a n T r i w u l a n a n P e r e k o n o m i a n I n d o n e s i a
M e n y o r o t i k e b i j a k a n
THE WORLD BANK | BANK DUNIA Desember 201236
Scenario Assessment for Emergencies/InaSAFE)21 – secara resmi diluncurkan pada Konferensi Kementerian Asia tentang Pengurangan Risiko Bencana ke-5 (5th Asian Ministerial Conference on Disaster Risk Reduction/AMCDRR) pada bulan Oktober 2012.
…yang akan secara signifikan meningkatkan ketahanan dan menurunkan kerawanan, jika diarusutamakan dan terus-menerus diperkaya dengan data yang akurat dan diperbaiki
Dengan menjawab serangkaian pertanyaan tentang skenario potensi bencana, alat penyusunan pemodelan dampak ancaman InaSAFE dapat digunakan untuk membuat peta-peta dan laporan-laporan untuk memperkirakan potensi kerusakan yang menimpa penduduk maupun infrastruktur dan tindakan yang diusulkan bagi para pengelola keadaan darurat. Alat ini diuji pada musim banjir tahun 2011-2012 di Jakarta dan telah terbukti efektif dalam memberikan pemahaman atas dampak bahaya dan mengkomunikasikannya untuk mendukung pengambilan keputusan manajemen risiko bencana yang efektif. Alat-alat pemetaan partisipatif (seperti OpenStreetMap) juga telah digunakan untuk mengumpulkan data dasar (baseline) dengan tingkat rincian yang tinggi tentang infrastruktur-infrastruktur kritis di Jakarta melalui kolaborasi antara the BadanPenanggulangan Bencana Daerah Jakarta (BPBD), Tim Humanitarian OpenStreet (HOT) dan Universitas Indonesia, dengan dukungan dari sejumlah organisasi pembangunan internasional. Bersama-sama dengan data ancaman dari badan-badan teknis dan data demografis dari sensus nasional, digunakan untuk menghasilkan visualisasi dampak dari skenario-skenario banjir yang berbeda-beda terhadap infrastruktur yang kritis (seperti jalan, sekolah atau rumah sakit) dan penduduk pada daerah-daerah rawan banjir di seluruh Jakarta. Untuk skenario-skenario yang berbeda, alat ini menghitung jumlah bangunan atau daerah yang dapat mengalami kebanjiran , memberikan lokasi yang tepat dari daerah-daerah yang terdampak dan infrastruktur untuk mendukung perencanaan kontinjensi bencana. Juga dapat digunakan untuk mendukung perencanaan penggunaan lahan berbasis risiko, menentukan prioritas untuk penguatan infrastruktur, ramalan dampak secara waktu nyata (real-time), atau untuk Penilaian Kebutuhan Pasca Bencana (PDNA).
Melalui kombinasi berbagai upaya yang berbeda tersebut ketahanan Jakarta terhadap risiko banjir dapat ditingkatkan, mendukung pembangunan ekonomi kota dan mata pencaharian penduduknya
Dengan berlanjutnya upaya Jakarta dalam menangani mitigasi banjir melalui upaya struktural, seperti pengerukan sungai, perbaikan kanal dan pembangunan cekungan retensi, dan upaya non-struktural seperti rehabilitasi daerah resapan, persiapan komunitas dan rencana kontinjensi, maka kota Jakarta akan beradaptasi dengan lebih baik terhadap peningkatan frekuensi dan intensitas banjir. Sementara kaum miskin akan selalu menerima pengaruh secara tidak proporsional, mereka juga menunjukan tingkat ketahanan yang paling tinggi, yang terutama karena keterpaksaan dan terbatasnya pilihan yang dapat diambil. Namun dengan semakin meningkatnya kesadaran akan risiko banjir, peringatan dini dan perkiraan, dan juga sosialisasi informasi banjir secara real-timetermasuk melalui media sosial, seluruh penduduk Jakarta, baik secara perorangan, perusahaan atau badan pemerintahan, dapat menyesuaikan kehidupan mereka dan membuat perencanaan kontinjensi yang sesuai untuk menjamin keselamatan, kelangsungan usaha dan mengamankan mata pencaharian. Penduduk Jakarta telah menunjukan kesabaran yang sangat tinggi dalam menangani dan mengatasi berbagai masalah setiap hari. Dengan sedikit tambahan investasi untuk mitigasi banjir yang sistematis dan menyeluruh, dan suatu sistem kontinjensi dan sosialisasi informasi, Jakarta dapat tampil menjadi sebuah kota yang memiliki ketahanan terhadap banjir.
21 Untuk informasi lebih lanjut, kunjungi: www.inasafe.org
C. INDONESIA�TAHUN�2014�DAN�
SELANJUTNYA:�TINJAUAN�PILIHAN
1. Keberhasilan Indonesia dalam rekonstruksi pasca bencana dan kesiagaan menghadapi bencana
Pemerintah Indonesia dan mitranya mencatat keberhasilan besar dalam upaya rekonstruksi pasca-bencana alam di Aceh, Nias dan Jawa
Dalam beberapa dekade terakhir, Indonesia menghadapi serangkaian bencana alam dengan korban dan kerugian yang besar baik nyawa, kerusakan bangunan dan infrastruktur, dan gangguan ekonomi. Pemerintah Indonesia telah mencatat keberhasilan yang besar dalam penanganan bencana-bencana tersebut, terutama dalam perencanaan dan pelaksanaan pembangunan kembali rumah-rumah, bangunan dan infrastruktur fisik, dan pemulihan mata pencaharian ekonomi. Pemerintah juga telah mengembangkan pendekatan-pendekatan dan model-model yang telah teruji yang dapat digunakan bila bencana alam terjadi kembali di masa depan, baik di Indonesia maupun negara-negara lain yang menghadapi risiko bencana alam. Pencapaian tersebut diraih bersama-sama dengan para donor, lembaga internasional, lembaga swadaya masyarakat (LSM), pemerintah propinsi dan lokal, dan komunitas yang terkena dampak bencana. Dua program multi-donor funds, Multi Donor Fund for Aceh and Nias (MDF) dan Java Reconstruction Fund (JRF), berkontribusi terhadap proses-proses tersebut. Menjelang berakhirnya program-program tersebut, bagian ini memberikan tinjauan singkat tentang pengalaman dan pelajaran yang dapat dipetik bagi upaya pemulihan pasca-bencana dan untuk membangun ketahanan terhadap bencana alam, baik di Indonesia maupun negara lainnya di dunia.22
a. Tantangan yang dihadapi oleh bencana di Aceh, Nias dan Jawa belum pernah terjadi sebelumnya
Serangkaian bencana alam akhir-akhir ini di Indonesia menyebabkan kerugian dan kerusakan besar di Aceh, Nias dan sebagian Jawa
Gempa bumi dan tsunami yg terjadi pada bulan Desember 2004 menelan lebih dari 200.000 jiwa di Aceh dan Sumatra Utara dan menyebabkan 600.000 jiwa kehilangan tempat tinggalnya. Bencana itu juga menghancurkan infrastruktur, bangunan dan mengganggu jalannya ekonomi. Bencana ini diikuti dengan gempa bumi yang menghantam pulau Nias pada bulan Maret 2005, menghancurkan sekitar 30 persen dari seluruh bangunannya. Pada bulan Mei 2006, gempa bumi yang terjadi di DI Yogyakarta dan Jawa Tengah menelan lebih dari 5.700 jiwa; dan beberapa bulan kemudian terjadi gempa bumi yang lain yang menyebabkan tsunami yang menyebabkan kerusakan luas pada daerah pantai bagian selatan di Jawa Barat. Bencana berikutnya terjadi pada tahun 2010, ketika Gunung Merapi, gunung api yang terletak di antara Yogyakarta dan Jawa Tengah, meletus berkali-kali dan merusak perumahan dan infrastruktur.
Sejumlah daerah yang terkena dampak memang sudah rapuh,
Sejak tahun 1976, gerakan pemberontakan di Aceh telah melakukan perlawananterhadap Pemerintah Indonesia. Konflik itu membawa dampak yang sangat besar diAceh. Jumlah
22 Bagian ini disusun berdasarkan tulisan dan materi-materi lain yang disusun untuk konferensi
internasional tentang “Lessons from Indonesia’s Experiences in Disaster Reconstruction and Preparedness” yang diadakan di Jakarta pada bulan November 2012 untuk menandai penutupan MDF dan JRF. Lihat www.multidonorfund.org dan www.javareconstructionfund.org untuk informasi lebih lanjut.
P e r k e m b a n g a n T r i w u l a n a n P e r e k o n o m i a n I n d o n e s i a
M e n y o r o t i k e b i j a k a n
THE WORLD BANK | BANK DUNIA Desember 201238
memperbesar dampak dari bencana-bencana tersebut
korban mendekati 15.000 jiwa selama konflik. Propinsi Aceh menjadi terisolasi secara ekonomi karena konflik itu merintangi investor dalam dan luar negeri, membatasi akses ke pasar dan meningkatkan biaya input. Pulau Nias yang terletak pada bagian pantai barat Sumatra Utara, juga terisolasi dengan infrastruktur yang buruk dan lemahnya keunggulan ekonomi. Letak pulau itu membuatnya tidak mampu bersaing dengan daerah-daerah lain di Indonesia, yang menyebabkan sebagian besar penduduknya hidup dalam kemiskinan.
Mengelola bantuan yang berlimpah menjadi tantangan dalam proses pemulihan
Bantuan yang berlimpah datang dari dalam maupun luar negeri sebagai tanggapan dari bencana-bencana tersebut. Barang-barang kebutuhan, dana dan tenaga ahlidikerahkan untuk mendukung upaya pemulihan dan rekonstruksi. Jumlah bantuan dari Pemerintah Indonesia dan donor-donor internasional mencapai 6,7 miliar dolar AS bagi rekonstruksi Aceh dan Nias. Ratusan organisasi ikut serta di Aceh dan Nias. Sementara bantuan tersebut memang dibutuhkan dan disambut baik, mengelola sumber daya yang cukup besar membawa tantangan yang besar bagi pemerintah, yang memimpin upaya rekonstruksi. Penetapan strategi rekonstruksi yang jelas, mengarahkan sumber-sumber daya untuk mendukung proses rekonstruksi dan mengelola dana secara efisien dan transparan adalah hal-hal yang vital bagi upaya rekonstruksi secara keseluruhan. Mengkoordinasi para pelaku dalam jumlah besar di lapangan juga sangat penting untuk mencegah duplikasi dan menjamin penggunaan sumber daya yang efisien.
b. Multi Donor Fund mendukung upaya pemulihan dan rekonstruksi yang dipimpin Pemerintah
Pemerintah Indonesia memimpin dan mengkoordinasikan proses pemulihan dan rekonstruksi di Aceh dan Nias dengan dukungan dari MDF
Pemerintah Indonesia mengelola setiap tahapan proses pemberian bantuan dan pemulihan kembali. Menimbang besarnya skala bencana di Aceh dan Nias, Pemerintah membentuk Badan Rehabilitasi dan Rekonstruksi (BRR) Aceh dan Nias untuk mengelola dan mengkoordinasi proses tersebut sampai penutupannya di tahun 2009. Pemerintah juga meminta pembentukan suatu lembaga pengatur dana multi donor dengan Bank Dunia sebagai wali amanat untuk mendukung upaya rekonstruksi secara keseluruhan. Hal ini mendorong pembentukan MDF, yang mengumpulkan sumbangan hingga 655 jutadolar AS dari 15 donor, yang besarnya hampir mencapai 10 persen dari seluruh jumlah dana rekonstruksi.23 Pendekatan ini dirancang untuk menyederhanakan pengelolaan dana, memfokuskan sumber daya ke bagian yang paling membutuhkan sesuai dengan strategi pemerintah, dan memastikan bahwa dana akan digunakan secara transparan dan hemat biaya. Hal itu juga sejalan dengan Deklarasi Paris tentang Efektivitas Bantuan tahun 2005, yang meminta para pemerintah nasional untuk menyusun strategi pembangunan mereka sendiri yang kemudian didukung oleh para donor bagi sasaran-sasaran yang telah ditetapkan dengan jelas.
Model MDF tersebut direplikasi dengan sukses di Jawa
Sebagai tanggapan terhadap gempa bumi tahun 2006 di Pulau Jawa, dibentuk suatu Tim Koordinasi Rehabilitasi dan Rekonstruksi untuk melakukan koordinasi awal hingga tahun 2008. Peran ini kemudian diambil alih oleh Badan Perencanaan dan Pembangunan Nasional (Bappenas) dengan koordinasi bersama-sama pemerintah propinsi dan Kementrian/Lembaga. Tujuh donor membentuk JRF dengan menggunakan susunan pengelolaan inklusif seperti MDF, dan mengumpulkan dana sebesar 94,1 juta dolar AS.24
Program tersebut diperluas pada tahun 2010 untuk menangani upaya rekonstruksi pasca meletusnya Merapi. Dengan telah beroperasinya MDF selama lebih dari satu tahun pada waktu terjadinya gempa bumi di Jawa, nilai model tersebut sebagai alat untuk mengelola bantuan untuk mendukung rekonstruksi telah terlihat dengan jelas.
Multi Donor Fund membantu upaya rekonstruksi dengan memberikan kerangka bagi kemitraan yang dipimpin pemerintah…
MDF dan JRF memberi kontribusi bagi upaya rekonstruksi dengan memberikan mekanisme pengaturan inklusif yang memberikan suatu landasan bagi pemerintah, para donor dan pemain-pemain utama lain untuk membicarakan berbagai masalah dan mengambil keputusan dengan cepat. Komite Pengarah yang berisi wakil-wakil dari Pemerintah Indonesia, Bank Dunia sebagai wali amanat, para donor dan pemangku kepentingan dari komunitas, menyusun suatu strategi, mengembangkan berbagai prosedur dan menetapkan dana bagi proyek-proyek yang diusulkan.
23 Para donor MDF adalah Komisi Eropa, Belanda, Inggris, Bank Dunia, Swedia, Denmark, Norwegia,
Jerman, Kanada, Belgia, Finlandia, Asian Development Bank, Amerika Serikat, Selandia Baru dan Irlandia.
24 Para donor JRF adalah Komisi Eropa, Belanda, Inggris, Kanada, Finlandia dan Denmark.
P e r k e m b a n g a n T r i w u l a n a n P e r e k o n o m i a n I n d o n e s i a
M e n y o r o t i k e b i j a k a n
THE WORLD BANK | BANK DUNIA Desember 201239
…dengan menggunakan pendekatan bertahap…
Untuk mendukung agenda rekonstruksi Pemerintah, program MDF menerapkan strategi dengan pendekatan bertahap untuk memenuhi kebutuhan penduduk yang selamat yang terus berkembang selama proses rekonstruksi. Setelah kebutuhan-kebutuhan utama yang mendesak telah ditangani oleh Pemerintah, dukungan rekonstruksi difokuskan pada pembangunan rumah-rumah dan masyarakat. Selanjutnya fokusnya adalah pada infrastruktur utama untuk memulihkan jaringan transportasi, menjamin ketersediaan air bersih, keberadaan sanitasi dan pengelolaan limbah. Tahap ketiga MDF meletakkan dasar-dasar bagi pembangunan jangka panjang dengan memperkuat sektor-sektor ekonomi utama, seperti kopi, kakao, perikanan dan karet. Pendekatan ini mencerminkan dan memperkuat strategi pemerintah. Upaya rekonstruksi di Jawa juga menggunakan pendekatan ini, dengan memulai dari rekonstruksi perumahan sebelum memulihkan mata pencaharian.
…menekankan pada pembangunan berbasis masyarakat…
MDF menggunakan pendekatan rekonstruksi perumahan yang terbukti sangat efektif –yang melibatkan masyarakat setempat di dalam prosesnya, sejak perencanaan hingga pembangunan yang sesungguhnya. Di Aceh dan Nias, para pemimpin masyarakat dan kelompok memberikan masukan langsung pada seluruh tahapan proses. Dana hibah dan pelatihan yang diberikan kepada kelompok-kelompok tersebut memungkinkan mereka untuk membangun kembali ribuan rumah anti-gempa yang berkualitas tinggi dengan biaya yang rendah (lihat Kotak 6). Pendekatan ini juga terbukti efektif dalam membangun infrastruktur lokal. Kelompok-kelompok masyarakat, termasuk para perempuan, membuat keputusan akan infrastruktur yang paling dibutuhkan dan membantu pembangunan kembali jalan-jalan, sumur dan jalur irigasi dan proyek-proyek lainnya, dan mengelola dana secara transparan. Pendekatan yang dipimpin oleh masyarakat ini secara sukses diulangi di Jawa, dan telah ditetapkan sebagai suatu kebijakan oleh Pemerintah Indonesia bagi upaya rekonstruksi pemukiman pasca-bencana di masa depan.
Kotak 6: Rekompak – Rehabilitasi dan Rekonstruksi Masyarakat dan Permukiman Berbasis Komunitas pasca bencana
Rekompak (Rehabilitasi dan Rekonstruksi Masyarakat dan Permukiman Berbasis Komunitas) adalah nama dari program berbasis komunitas bagi rekonstruksi perumahan dan infrastruktur lokal yang dipelopori di Aceh. Yang membedakan Rekompak dari proyek rekonstruksi pasca-bencana lainnya adalah pendekatannya, yang menempatkan tanggung jawab – dan pendanaan – untuk pembangunan kembali perumahan dan infrastruktur setempat secara langsung di tangan komunitas, sehingga menjamin kepemilikan dan transparansi. Para anggota komunitas mengidentifikasi para penerima bantuan dan mengembangkan rencana tata ruang bagi setiap desa sebagai pedoman pembangunan kembali. Kelompok-kelompok beranggotakan sepuluh hingga 15 keluarga dibentuk untuk bertanggung jawab atas pembangunan kembali rumah mereka masing-masing. Kelompok-kelompok itu bertanggung jawab atas dana yang diberikan dan seluruh anggota kelompok memiliki peran dalam proses pembangunan kembali. Para fasilitator yang dilatih oleh Kementerian Pekerjaan Umum memberikan dukungan teknis kepada kelompok komunitas tentang metode pembangunan tahan gempa. Karena para penerima bantuan memberikan sebagian besar tenaga dan bahan-bahan yang didaur kembali, rumah-rumah Rekompak dapat menghemat biaya 30 persen lebih rendah dibanding bila dibangun oleh kontraktor, dan juga memberikan rasa puas yang tinggi. Model Rekompak itu kemudian juga digunakan di Pulau Jawa pasca gempa bumi tahun 2006 dan meletusnya Gunung Merapi. Secara bersama-sama, Rekompak membangun 35.000 rumah berkualitas tinggi dan lebih dari 10.000 proyek infrastruktur lokal dan menciptakan model rekonstruksi komunitas pasca-bencana yang dapat digunakan kembali yang dapat diterapkan di dalam maupun luar negeri.
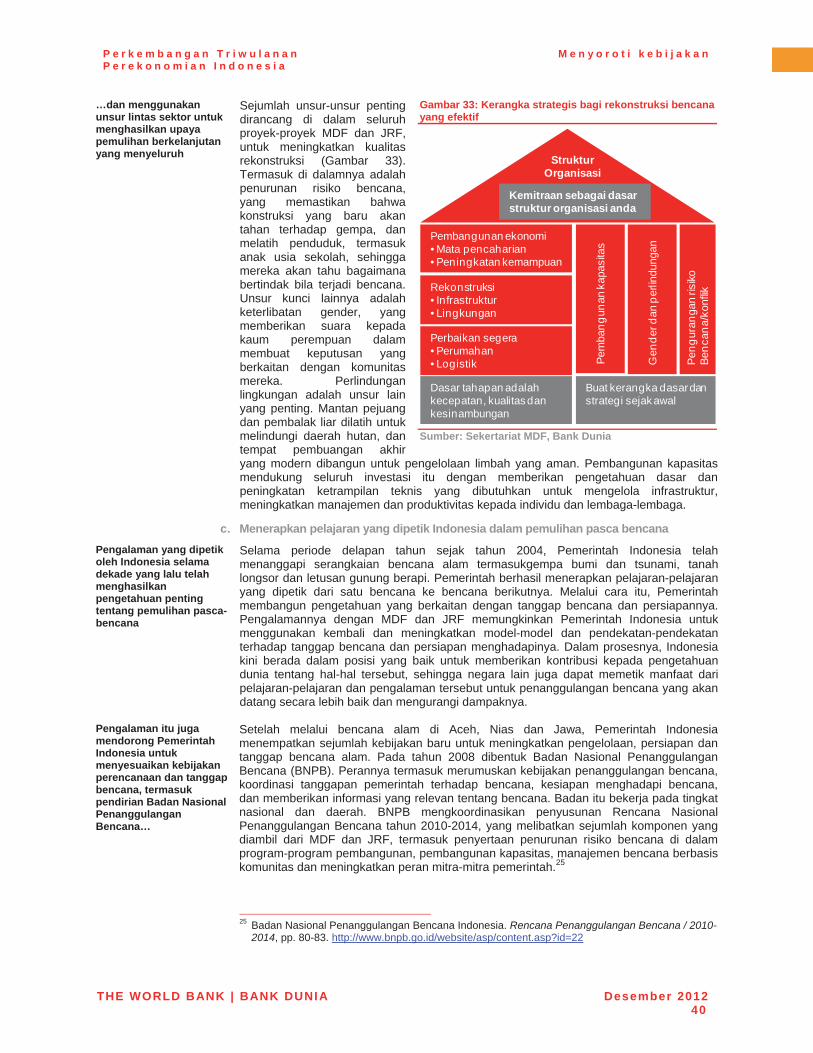
P e r k e m b a n g a n T r i w u l a n a n P e r e k o n o m i a n I n d o n e s i a
M e n y o r o t i k e b i j a k a n
THE WORLD BANK | BANK DUNIA Desember 201240
…dan menggunakan unsur lintas sektor untuk menghasilkan upaya pemulihan berkelanjutan yang menyeluruh
Sejumlah unsur-unsur penting dirancang di dalam seluruh proyek-proyek MDF dan JRF, untuk meningkatkan kualitas rekonstruksi (Gambar 33). Termasuk di dalamnya adalah penurunan risiko bencana, yang memastikan bahwa konstruksi yang baru akan tahan terhadap gempa, dan melatih penduduk, termasuk anak usia sekolah, sehingga mereka akan tahu bagaimana bertindak bila terjadi bencana. Unsur kunci lainnya adalah keterlibatan gender, yang memberikan suara kepada kaum perempuan dalam membuat keputusan yang berkaitan dengan komunitas mereka. Perlindungan lingkungan adalah unsur lain yang penting. Mantan pejuang dan pembalak liar dilatih untuk melindungi daerah hutan, dan tempat pembuangan akhir yang modern dibangun untuk pengelolaan limbah yang aman. Pembangunan kapasitas mendukung seluruh investasi itu dengan memberikan pengetahuan dasar dan peningkatan ketrampilan teknis yang dibutuhkan untuk mengelola infrastruktur, meningkatkan manajemen dan produktivitas kepada individu dan lembaga-lembaga.
Gambar 33: Kerangka strategis bagi rekonstruksi bencana yang efektif
Sumber: Sekertariat MDF, Bank Dunia
c. Menerapkan pelajaran yang dipetik Indonesia dalam pemulihan pasca bencana Pengalaman yang dipetik oleh Indonesia selama dekade yang lalu telah menghasilkan pengetahuan penting tentang pemulihan pasca-bencana
Selama periode delapan tahun sejak tahun 2004, Pemerintah Indonesia telah menanggapi serangkaian bencana alam termasukgempa bumi dan tsunami, tanah longsor dan letusan gunung berapi. Pemerintah berhasil menerapkan pelajaran-pelajaran yang dipetik dari satu bencana ke bencana berikutnya. Melalui cara itu, Pemerintah membangun pengetahuan yang berkaitan dengan tanggap bencana dan persiapannya. Pengalamannya dengan MDF dan JRF memungkinkan Pemerintah Indonesia untuk menggunakan kembali dan meningkatkan model-model dan pendekatan-pendekatan terhadap tanggap bencana dan persiapan menghadapinya. Dalam prosesnya, Indonesia kini berada dalam posisi yang baik untuk memberikan kontribusi kepada pengetahuan dunia tentang hal-hal tersebut, sehingga negara lain juga dapat memetik manfaat dari pelajaran-pelajaran dan pengalaman tersebut untuk penanggulangan bencana yang akan datang secara lebih baik dan mengurangi dampaknya.
Pengalaman itu juga mendorong Pemerintah Indonesia untuk menyesuaikan kebijakan perencanaan dan tanggap bencana, termasuk pendirian Badan Nasional Penanggulangan Bencana…
Setelah melalui bencana alam di Aceh, Nias dan Jawa, Pemerintah Indonesia menempatkan sejumlah kebijakan baru untuk meningkatkan pengelolaan, persiapan dan tanggap bencana alam. Pada tahun 2008 dibentuk Badan Nasional Penanggulangan Bencana (BNPB). Perannya termasuk merumuskan kebijakan penanggulangan bencana, koordinasi tanggapan pemerintah terhadap bencana, kesiapan menghadapi bencana, dan memberikan informasi yang relevan tentang bencana. Badan itu bekerja pada tingkat nasional dan daerah. BNPB mengkoordinasikan penyusunan Rencana Nasional Penanggulangan Bencana tahun 2010-2014, yang melibatkan sejumlah komponen yang diambil dari MDF dan JRF, termasuk penyertaan penurunan risiko bencana di dalam program-program pembangunan, pembangunan kapasitas, manajemen bencana berbasis komunitas dan meningkatkan peran mitra-mitra pemerintah.25
25 Badan Nasional Penanggulangan Bencana Indonesia. Rencana Penanggulangan Bencana / 2010-
2014, pp. 80-83. http://www.bnpb.go.id/website/asp/content.asp?id=22
Rekonstruksi• Infrastruktur• Lingkungan
Perbaikan segera• Perumahan• Logistik
Pembangunan ekonomi• Mata pencaharian• Peningkatan kemampuan
Dasar tahapan adalahkecepatan, kualitasdankesinambungan
Buat kerangka dasardanstrategi sejak awal
Pem
bang
unan
kap
asita
s
Gen
der d
anpe
rlind
unga
n
Peng
uran
gan
risiko
Benc
ana/
konf
lik
Kemitraan sebagai dasarstruktur organisasi anda
StrukturOrganisasi
P e r k e m b a n g a n T r i w u l a n a n P e r e k o n o m i a n I n d o n e s i a
M e n y o r o t i k e b i j a k a n
THE WORLD BANK | BANK DUNIA Desember 201241
…dan Dana Penanggulangan Bencana Indonesia
Pada tahun 2010, Pemerintah juga menetapkan Dana Penanggulangan Bencana (DPB) Indonesia. DPB dibentuk untuk mendanai dan mengkoordinasikan upaya pemulihan dan persiapan bencana dengan dukungan dunia internasional. Dana perwalian donor ini bekerja melalui dua jendela, satu yang dikelola oleh Bank Dunia dan yang lain oleh Persatuan Bangsa-Bangsa. DPB juga menyertakan sejumlah fasilitas yang sebelumnya mencatat keberhasilan melalui MDF dan JRF, termasuk penyesuaian dengan strategi pemerintah, komite pengarah, komite teknis, dan bidang-bidang fokus, yang termasuk perumahan, mata pencaharian dan pembangunan kapasitas.
Sejumlah pelajaran utama termasuk bahwa upaya-upaya rekonstruksi akan memperoleh manfaat dari kerangka strategi yang menyeluruh…
Sejumlah pelajaran penting untuk upaya rekonstruksi juga dapat dipetik dari pengalaman Indonesia. dalam hal strategi secara keseluruhan, suatu kerangka rekonstruksi yang berdasar kepada tiga strategi yang saling berkaitan, yaitu kemitraan yang kuat, implementasi yang efektif dan unsur-unsur lintas sektoral, telah menunjukkan keberhasilannya. Struktur organisasi yang menyeluruh, seperti yang diberikan oleh MDF dan JRF, memungkinkan pemerintah dan para mitranya untuk mengambil keputusan program yang efektif, merancang proyek yang sesuai dan pelaksanaan proyek tersebut secara efisien. Selain itu, gabungan antara mitra dan pelaksana memberikan kompetensi inti dan keunggulan komparatif dalam menghadapi kebutuhan yang sangat bervariasi. Bagi dukungan donor, sangatlah penting untuk memiliki monitoring dan evaluasi yang kuat, pelaporan yang teratur, komunikasi yang jelas dan manajemen dana yang baik untuk memastikan bahwa setiap proyek telah mendukung strategi rekonstruksi Pemerintah.
... pembangunan yang dipimpin oleh komunitas berhasil…
Bukti-bukti dari Indonesia menunjukan bahwa pendekatan yang didorong oleh komunitas dapat disesuaikan secara efektif bagi rekonstruksi pasca-bencana untuk memberikan pemulihan tingkat lokal yang hemat biaya, adil merata dan berkelanjutan. Seperti dibahas pada Kotak 6 tentang program Rekompak, pengalaman proyek-proyek pemulihan komunitas yang diterapkan menurut MDF dan JRF menunjukan bahwa komunitas yang terkena bencana mampu untuk mengelola sumber daya rekonstruksi dan proyek-proyek dengan kualitas dan tingkat kepuasan yang tinggi dan memetik manfaat dari peningkatan rasa percaya diri dan kapasitas yang berasal dari pendekatan konsultatif dan partisipatif.Pada saat yang bersamaan, pendekatan yang didorong oleh komunitas mendorong pemulihan sosial yang lebih cepat dan membangun kapasitas yang bertahan lama, jauh melampaui masa rekonstruksi.
…pembangunan kapasitas harus menjadi bagian integral bagi hasil-hasil yang berkelanjutan…
Pembangunan kapasitas terbukti menjadi hal yang sangat penting di dalam keberlanjutan investasi yang dibuat dalam pemberian layanan dan pembangunan ekonomi. Strategi-strategi pembangunan kapasitas mulai dari pemberdayaan komunitas untuk turut serta di dalam pembangunan kembali perumahan dan infrastruktur komunitas demi penguatan ketrampilan dan sistem pemerintah daerah untuk mengelola aset-aset rekonstruksi, hingga pengembangan organisasi untuk pemerintah daerah untuk penanganan manajemen sektor publik yang lebih baik. Pembangunan kapasitas terbukti menjadi paling efektif ketika disertakan ke setiap prakarsa program dan proyek sejak awal, dengan rancangan dan intensitas yang mencerminkan tantangan keberlanjutan dan strategi akhir dari para pelaku yang memberikan dukungan.
…rekonstruksi infrastruktur pasca-bencana akan lebih baik melalui pendekatan yang bertahap…
Pengalaman di Aceh dan Nias menunjukan bahwa pendekatan pentahapan terhadap investasi infrastruktur, dan bagi keseluruhan rekonstruksi, berdasarkan pada penyeimbangan antara kebutuhan yang mendesak dan permintaan akan kualitas dan kepemilikan, dapat menjadi sangat efektif dalam mengelola harapan jangka pendek sementara memberikan hasil yang bertahan lama. Sebagai contoh, investasi infrastruktur awal MDF memfokuskan kepada kebutuhan logistik yang mendesak untuk memulihkan jaringan transportasi dan memberikan akses kepada daerah-daerah yang terkena dampak. Setelah hal itu dilakukan, MDF mengalihkan perhatiannya kepada rekonstruksi infrastruktur berskala besar. Investasi pada infrastruktur yang besar memiliki persyaratan kepemilikan dan kualitas yang sangat penting yang dapat mengalahkan pertimbangan kecepatan, dan kebutuhan akan tingkat kecermatan yang harus digunakan untuk mengimbangi faktor biaya kecepatan dibanding biaya penundaan. Setelah itu, cakupan pekerjaan diperluas untuk memberikan pelatihan kepada badan-badan yang bertanggung jawab untuk mengelola aset-aset yang baru dibentuk.
P e r k e m b a n g a n T r i w u l a n a n P e r e k o n o m i a n I n d o n e s i a
M e n y o r o t i k e b i j a k a n
THE WORLD BANK | BANK DUNIA Desember 201242
…dan kesetaraan gender dan pemberdayaan perempuan meningkatkan hasil-hasil
Pelajaran penting lain yang dapat dipetik dari pengalaman MDF dan JRF adalah bahwa dukungan kepada kesetaraan gender dan pemberdayaan perempuan di dalam upaya rekonstruksi mendorong hasil-hasil yang lebih baik dan ketahanan yang lebih tinggi. Partisipasi perempuan meningkatkan kualitas, efisiensi biaya dan rasa kepuasan, dan mempercepat pemulihan ekonomi. Perempuan memperoleh manfaat dari hak kepemilikan tanah dan hukum yang lebih kuat, yang pada gilirannya memberikan akses kredit yang lebih baik kepada para usahawati. Keterlibatan mereka yang aktif di dalam proses pengambilan keputusan setempat meningkatkan kohesi sosial dan hasil-hasil, seperti peningkatan dalam pemberian barang-barang publik seperti air, sanitasi dan klinik kesehatan.
Pengetahuan yang berharga yang dipetik dari pengalaman Indonesia dalam rekonstruksi dan persiapan bencana menjadi sumbangan kepada komunitas global…
Seperti disinggung sebelumnya, pengalaman dari hampir delapan tahun menanggapi serangkaian bencana, dan menerapkan pelajaran-pelajaran yang dipetik, telah memberikan pengalaman dan pemahaman yang ekstensif kepada pemerintah Indonesia di dalam penanggulangan bencana. Sebagian besar darinya telah disertakan di dalam kebijakan-kebijakan dan badan-badan pemerintahan yang baru dibentuk, seperti BNPB, dan di dalam lembaga-lembaga pendidikan seperti Universitas Gadjah Mada di Yogyakarta dan Pusat Penelitian Tsunami di Banda Aceh. Negara-negara lain, termasuk Haiti dan Pakistan, telah mempelajari metode tanggap bencana Indonesia dalam merancang strategi-strategi pasca-bencana mereka. Indonesia, yang menerima banyak bantuan dan dukungan internasional setelah tertimpa bencana, kini dapat memberikan imbal balik kepada komunitas global dalam bentuk pelajaran untuk masa yang akan datang.
…termasuk melalui acara berbagi pengalaman lintas negara-negara yang rawan bencana…
Pada bulan November 2012, penutupan MDF dan JRF ditandai dengan konferensi internasional di Jakarta tentang “Mengangkat Pembelajaran dari Pengalaman Indonesia dalam Persiapan dan Pemulihan Bencana” yang saling membagikan pengalaman dunia dalam persiapan dan rekonstruksi pasca-bencana. Konferensi itu dihadiri oleh lebih dari 500 peserta termasuk tokoh-tokoh penting dari negara-negara rawan bencana seperti Jepang, Pakistan dan Haiti. Konferensi itu mencakup banyak aspek tentang persiapan dan rekonstruksi pasca-bencana, termasuk pendekatan yang dipimpin oleh komunitas dalam rekonstruksi perumahan, pemulihan mata pencaharian pasca-bencana, pembangunan gender dan kapasitas, pengarusutamaan penurunan risiko bencana, dan saling berbagi pengetahuan.
…dengan maksud untuk memberikan warisan bagi peningkatan lebih lanjut dalam penanggulangan, ketahanan dan kesiapan menghadapi bencana yang akan datang
Indonesia telah menetapkan standar baru untuk penanggulangan bencana lewat pengalamannya di Aceh, Nias dan Jawa. Hal ini sangatlah penting bagi negara yang secara geografis, akan kembali menghadapi bencana alam. Namun keberhasilan pendekatan Pemerintah Indonesia terhadap kesiapan dan penanggulangan bencana alam akan menyelamatkan jumlah jiwa yang tidak terhitung di masa depan. Pendekatannya telah terbukti dan telah berhasil dilakukan kembali untuk menangani jenis bencana alam yang berlainan dan konteks yang berbeda. Sebagai kontributor yang signifikan terhadap hasil rekonstruksi, program-program MDF dan JRF telah mendokumentasikan model-model, pendekatan dan pengalaman-pengalamannya. Pelajaran yang dipetik oleh Indonesia melalui upaya pemulihan pasca-bencanaskala besar akan memastikan bahwa warisan akan peningkatan kesiapan, penanggulangan dan ketahanan akan terus berlanjut ke masa yang akan datang.
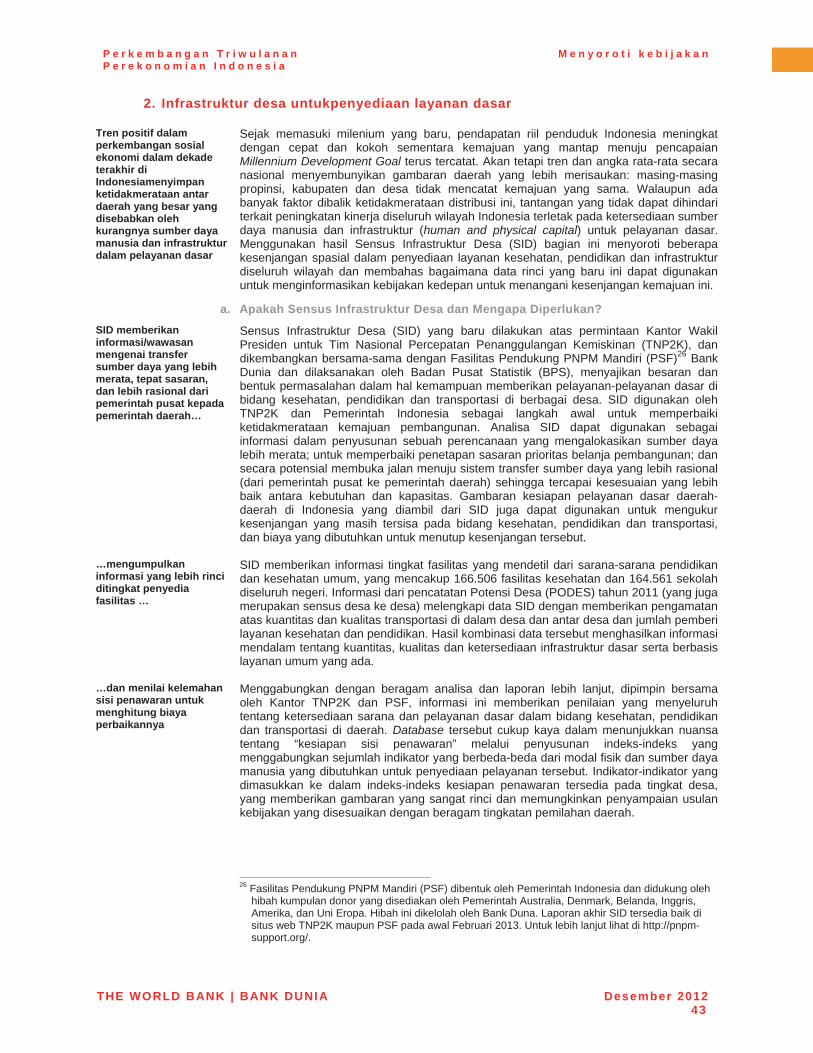
P e r k e m b a n g a n T r i w u l a n a n P e r e k o n o m i a n I n d o n e s i a
M e n y o r o t i k e b i j a k a n
THE WORLD BANK | BANK DUNIA Desember 201243
2. Infrastruktur desa untukpenyediaan layanan dasar
Tren positif dalam perkembangan sosial ekonomi dalam dekade terakhir di Indonesiamenyimpan ketidakmerataan antar daerah yang besar yang disebabkan oleh kurangnya sumber daya manusia dan infrastruktur dalam pelayanan dasar
Sejak memasuki milenium yang baru, pendapatan riil penduduk Indonesia meningkat dengan cepat dan kokoh sementara kemajuan yang mantap menuju pencapaian Millennium Development Goal terus tercatat. Akan tetapi tren dan angka rata-rata secara nasional menyembunyikan gambaran daerah yang lebih merisaukan: masing-masing propinsi, kabupaten dan desa tidak mencatat kemajuan yang sama. Walaupun ada banyak faktor dibalik ketidakmerataan distribusi ini, tantangan yang tidak dapat dihindari terkait peningkatan kinerja diseluruh wilayah Indonesia terletak pada ketersediaan sumber daya manusia dan infrastruktur (human and physical capital) untuk pelayanan dasar. Menggunakan hasil Sensus Infrastruktur Desa (SID) bagian ini menyoroti beberapa kesenjangan spasial dalam penyediaan layanan kesehatan, pendidikan dan infrastruktur diseluruh wilayah dan membahas bagaimana data rinci yang baru ini dapat digunakan untuk menginformasikan kebijakan kedepan untuk menangani kesenjangan kemajuan ini.
a. Apakah Sensus Infrastruktur Desa dan Mengapa Diperlukan? SID memberikan informasi/wawasan mengenai transfer sumber daya yang lebih merata, tepat sasaran, dan lebih rasional dari pemerintah pusat kepada pemerintah daerah…
Sensus Infrastruktur Desa (SID) yang baru dilakukan atas permintaan Kantor Wakil Presiden untuk Tim Nasional Percepatan Penanggulangan Kemiskinan (TNP2K), dan dikembangkan bersama-sama dengan Fasilitas Pendukung PNPM Mandiri (PSF)26 Bank Dunia dan dilaksanakan oleh Badan Pusat Statistik (BPS), menyajikan besaran dan bentuk permasalahan dalam hal kemampuan memberikan pelayanan-pelayanan dasar di bidang kesehatan, pendidikan dan transportasi di berbagai desa. SID digunakan oleh TNP2K dan Pemerintah Indonesia sebagai langkah awal untuk memperbaiki ketidakmerataan kemajuan pembangunan. Analisa SID dapat digunakan sebagai informasi dalam penyusunan sebuah perencanaan yang mengalokasikan sumber daya lebih merata; untuk memperbaiki penetapan sasaran prioritas belanja pembangunan; dan secara potensial membuka jalan menuju sistem transfer sumber daya yang lebih rasional(dari pemerintah pusat ke pemerintah daerah) sehingga tercapai kesesuaian yang lebih baik antara kebutuhan dan kapasitas. Gambaran kesiapan pelayanan dasar daerah-daerah di Indonesia yang diambil dari SID juga dapat digunakan untuk mengukur kesenjangan yang masih tersisa pada bidang kesehatan, pendidikan dan transportasi, dan biaya yang dibutuhkan untuk menutup kesenjangan tersebut.
…mengumpulkan informasi yang lebih rinci ditingkat penyedia fasilitas …
SID memberikan informasi tingkat fasilitas yang mendetil dari sarana-sarana pendidikan dan kesehatan umum, yang mencakup 166.506 fasilitas kesehatan dan 164.561 sekolah diseluruh negeri. Informasi dari pencatatan Potensi Desa (PODES) tahun 2011 (yang juga merupakan sensus desa ke desa) melengkapi data SID dengan memberikan pengamatan atas kuantitas dan kualitas transportasi di dalam desa dan antar desa dan jumlah pemberi layanan kesehatan dan pendidikan. Hasil kombinasi data tersebut menghasilkan informasi mendalam tentang kuantitas, kualitas dan ketersediaan infrastruktur dasar serta berbasis layanan umum yang ada.
…dan menilai kelemahan sisi penawaran untuk menghitung biaya perbaikannya
Menggabungkan dengan beragam analisa dan laporan lebih lanjut, dipimpin bersama oleh Kantor TNP2K dan PSF, informasi ini memberikan penilaian yang menyeluruh tentang ketersediaan sarana dan pelayanan dasar dalam bidang kesehatan, pendidikan dan transportasi di daerah. Database tersebut cukup kaya dalam menunjukkan nuansa tentang “kesiapan sisi penawaran” melalui penyusunan indeks-indeks yang menggabungkan sejumlah indikator yang berbeda-beda dari modal fisik dan sumber daya manusia yang dibutuhkan untuk penyediaan pelayanan tersebut. Indikator-indikator yang dimasukkan ke dalam indeks-indeks kesiapan penawaran tersedia pada tingkat desa, yang memberikan gambaran yang sangat rinci dan memungkinkan penyampaian usulan kebijakan yang disesuaikan dengan beragam tingkatan pemilahan daerah.
26 Fasilitas Pendukung PNPM Mandiri (PSF) dibentuk oleh Pemerintah Indonesia dan didukung oleh
hibah kumpulan donor yang disediakan oleh Pemerintah Australia, Denmark, Belanda, Inggris, Amerika, dan Uni Eropa. Hibah ini dikelolah oleh Bank Duna. Laporan akhir SID tersedia baik di situs web TNP2K maupun PSF pada awal Februari 2013. Untuk lebih lanjut lihat di http://pnpm-support.org/.

P e r k e m b a n g a n T r i w u l a n a n P e r e k o n o m i a n I n d o n e s i a
M e n y o r o t i k e b i j a k a n
THE WORLD BANK | BANK DUNIA Desember 201244
b. SID menggabungkan beragam indikator untuk menghasilkan indeks kesiapan sisi penawaran (supply readiness indices)
SID memberikan informasi tentang kuantitas dan kualitas tiga kelompok layanan dasar…
Indikator-indikator yang disertakan dalam indeks-indeks kesiapan sisi penawaran berdasarkan SID tersebut secara umum dapat dikelompokkan menjadi tiga golongan, menurut informasi yang diberikan yaitu mengenai ketersediaan dan kemudahan mendapatkan fasilitas pelayanan, keberadaan dan kualifikasi personil, dan karakteristik fisik dari fasilitas yang ada. Error! Reference source not found. memberikan rincian lebih lanjut tentang beberapa indikator di sektor kesehatan, pendidikan dan transportasi. Sebagai aturan umum, indikator-indikator kesiapan pelayanan yang terpilih memiliki nilai antara 0 dan 1, yang mencerminkan proporsi penduduk, fasilitas atau daerah geografis yang memenuhi batas atau standar kesiapan pelayanan.
Tabel 7: Indeks gabungan Kesiapan Sisi Penawaran termasuk beragam indikator Kesehatan, Pendidikan, dan Transportasi(indikator-indikator yang disertakan di dalam indeks gabungan)
a. Indikator Kesiapan Sisi Penawaran untuk Kesehatan Indikator Uraian
Akses ke Kesehatan Dasar Proporsi penduduk yang dengan mudah dapat mengunjungi poliklinik, Puskesmas, Puskesmas Pembantu atau praktik dokter
Akses ke Kesehatan Sekunder Proporsi penduduk yang dengan mudah dapat mengunjungi rumah sakit
Akses ke Fasiltas Persalinan Proporsi penduduk yang dengan mudah dapat mengunjungi rumah sakit, rumah sakit bersalin, Puskesmas, Polindes atau praktik bidan
Dokter di Puskesmas Proporsi Puskesmas yang memiliki sekurangnya satu orang dokter Bidan di Desa Proporsi penduduk yang tinggal di desa yang memiliki bidan
Pasokan air Puskesmas Proporsi Puskesmas dengan instalasi air di dalam kompleks atau dalam jangkauan berjalan kaki selama 10 menit
Tenaga listrik Proporsi sarana kesehatan yang menggunakan tenaga listrik (tidak termasuk Posyandu) b. Indikator Kesiapan Faktor Penawaran untuk Pendidikan
Indikator Uraian
Akses ke PAUD Proporsi penduduk yang tinggal di desa dengan fasilitas pendidikan anak usia dini (PAUD) atau taman kanak-kanak dalam jarak 1 km dari desa
Akses ke SMP Proporsi penduduk di desa dengan SMP dalam jarak 6 (3) km Kualifikasi Guru SD Proporsi SD dengan setidaknya 2 guru dengan gelar S1 Kualifikasi Guru SMP Rata-rata proporsi guru SMP dengan gelar S1 Laboratorium di SMP Proporsi SMP yang memiliki laboratorium Pasokan Air Proporsi sekolah dimana air tersedia di kamar mandi murid Tenaga listrik Proporsi sekolah yang mempunyai akses terhadap listrik
c. Indikator Kesiapan Faktor Penawaran untuk Transportasi Indikator Uraian
Permukaan Jalan Utama Proporsi desa yang mempunyai jalan utama dengan permukaan aspal/beton atau batu/kerikil dll.
Kondisi: Jalan Utama Proporsi desa dengan jalan utama tanpa atau sedikit kerusakan Kondisi Jembatan Proporsi desa dengan jembatan tanpa atau sedikit kerusakan Kebutuhan Jembatan Baru Proporsi desa yang melaporkan tidak adanya permintaan jembatan (baru)
Transportasi Umum ke Camat Proporsi desa yang mempunyai transportasi umum dengan trayek tetap ke kantor kecamatan
Transportasi Umum ke Bupati/ Walikota
Proporsi desa yang mempunyai transportasi umum dengan trayek tetap ke kantor kabupaten/kotamadya
…dan indeks gabungan menyatukan informasi tersebut untuk memberikan gambaran “sekilas” ketersediaan
Indeks-indeks yang disusun dari indikator-indikator tersebut mampu menyerap sejumlah besar informasi yang terkandung di dalam SID – di dalam tiap-tiap variabel terdapat rincian dari berbagai aspek pelayanan – dan menyatukannya ke dalam ringkasan indikator yang memudahkan pemahaman terhadap keadaan secara keseluruhan (lihat Kotak 7) untuk rincian lebih lanjut akan penyusunan indeks). Penyusunan indeks di dalam laporan SID juga mempertahankan rincian data SID dan PODES dan dengan demikian, indeks-indeks tersebut dapat memberikan ringkasan “singkat” sampai ke tingkat kecamatan bagi penyusun kebijakan pada tingkat kabupaten.

P e r k e m b a n g a n T r i w u l a n a n P e r e k o n o m i a n I n d o n e s i a
M e n y o r o t i k e b i j a k a n
THE WORLD BANK | BANK DUNIA Desember 201245
Kotak 7: Catatan tentang keandalan Peringkat Kesiapan Sisi Penawaran Dalam penyusunan indikator-indikator yang menggabungkan sejumlah pengamatan yang terpisah, namun tidak sepenuhnya independen, variabel-variabel yang terbentuk seringkali merupakan nilai pendekatan (proxy) dan tidak jarang diukur dalam satuan yang berbeda sering terdapat keraguan bahwa sistem dengan bobot eksplisit maupun implisit – atau proporsi dari sebuah variabel yang menentukan nilai akhir indeks – yang mendampingi kombinasi tersebut dapat merugikan di satu atau daerah lainnya dan keliru dalam menunjukkan distribusi kinerja yang sesungguhnya.
Di dalam analisis yang mendampingi SID, diusulkan enam skema pembobotan yang berbeda untuk menggabungkan variabel-variabel yang menjadi dasar pembentukan suatu indeks gabungan. Tiga skema pembobotan dipilih untuk mewakili (1) penekanan pada akses, (2) bobot yang setara untuk masing-masing tiga kelompok (ketersediaan dan aksesibilitas sarana; keberadaan dan kualifikasi personil; dan karakteristik fisik fasilitas/sarana), dan (3) bobot yang setara untuk setiap indikator.Tiga skema pembobotan yang lain, diturunkan secara empiris melalui (4) analisis komponen utama, (5) regresi OLS dari pemanfaatan seluruh tujuh indikator, dan (6) pengukuran kontribusi dari masing-masing tujuh indikator terhadap ketidakmerataan (diukur oleh suatu indeks konsentrasi) di dalam pemanfaatan layanan.
Masing-masing dari enam aturan pembobotan itu memiliki manfaat tersendiri, tetapi yang lebih penting adalah bahwa peringkat dan posisi relatif dari kecamatan atau kabupaten tidak bergantung kepada jenis skema pembobotan yang digunakan. Dengan kata lain, korelasi antara enam indeks yang berbeda yang berasal dari enam skema pembobotan bersifat positif dan mendekati angka satu, yang menunjukan bahwa informasi yang terkandung pada tujuh indikator tersebut menyampaikan cerita yang konsisten tanpa bergantung kepada bagaimana mereka dikombinasikan. Sebagai contoh, untuk sektor kesehatan korelasi pairwise antara indeks gabungan yang dihitung dengan menggunakan ke enam metode tersebut berkisar 0.92 sampai 1.00.
Selanjutnya, hasil terperinci tentang nilai informasi yang terkandung di dalam SID tersedia dalam korelasi spasial yang tinggi danpositif antar indeks. Bagi kesehatan, pendidikan dan transportasi, terdapat pola spasial pada tingkat kesiapan penyampaian layanan di dalam dimensi-dimensi sektoral yang berbeda. Korelasi positif juga terlihat lintas indikator infrastruktur kesehatan,pendidikan dan transportasi.
Dua skema pembobotan terakhir– kontribusi ketidakmerataan dan OLS – menggabungkan informasi SID dengan survei rumah tangga yang dilaksanakan secara independen (Survei Sosial Ekonomi Nasional/ Susenas). Penambahan sumber data independen ini memberikan pemeriksaan keandalan terhadap kualitas data PODES itu sendiri. Karena indikator-indikator kesiapan pelayanan PODES/SID berkorelasi dengan (dan menjelasikan sejumlah variasi di dalam) pemanfaatan layanan yang serupa seperti yang diukur oleh wawancara rumah tangga yang independen, maka terdapat dasar yang kuat untuk menganggap bahwa pengukuran SID seperti yang disusun merupakan representasi yang memadai bagi pelayanan yang sesungguhnya.
c. Kesiapan Pelayanan Kesehatan yang tertinggi berada di Jawa dan Bali Kesiapan pelayanan kesehatan mencatat keberagaman yang sangat besar dan umumnya menurun sesuai besarnya jarak dari Jawa dan Bali
Data SID menunjukan sangat besarnya variasi di dalam pelayanan kesehatan lintas propinsi, kabupaten, kecamatan dan desa ke desa. Dengan menggunakan pengelompokan kepulauan yang umum dan siap digunakan, Gambar 34 menunjukan bahwa kecamatan-kecamatan di Bali (0,99 dari 1,0) dan Jawa (0,96) mencatat taraf kesiapan pelayanan kesehatan yang sangat tinggi; kecamatan-kecamatan di Sumatra (0,87), Sulawesi (0,82), Kalimantan (0,80) dan NTT & NTB (0,77) mencatat angka rata-rata; sementara Molukas (0,68) dan terutama Papua dan Papua Barat (0,42) nyata-nyata tertinggal dari daerah lain di Indonesia. Kesenjangan nasional antara kecamatan kota (0,96) dan desa (0,75) dalam hal penyampaian dan kualitas layanan dasar berjumlah cukup besar; pada tingkat wilayah, dikotomi perkotaan-pedesaan terlihat paling jelas pada daerah-daerah dengan kesiapan penyampaian infrastruktur yang rendah secara keseluruhan. Sebagai contoh, di Sulawesi dan Kalimantan, daerah-daerah perkotaan secara jelas merupakan pemberi pelayanan yang jauh lebih dapat diandalkan dibanding daerah pedesaan pedalaman; dan bahkan daerah perkotaan sekalipun di Papua memiliki risiko yang sangat tinggi tidak tersedianya layanan kesehatan; sementara daerah-daerah pedesaan utama saja di Jawa dan Bali menikmati tingkat kesiapan pelayanan kesehatan yang sangat tinggi.
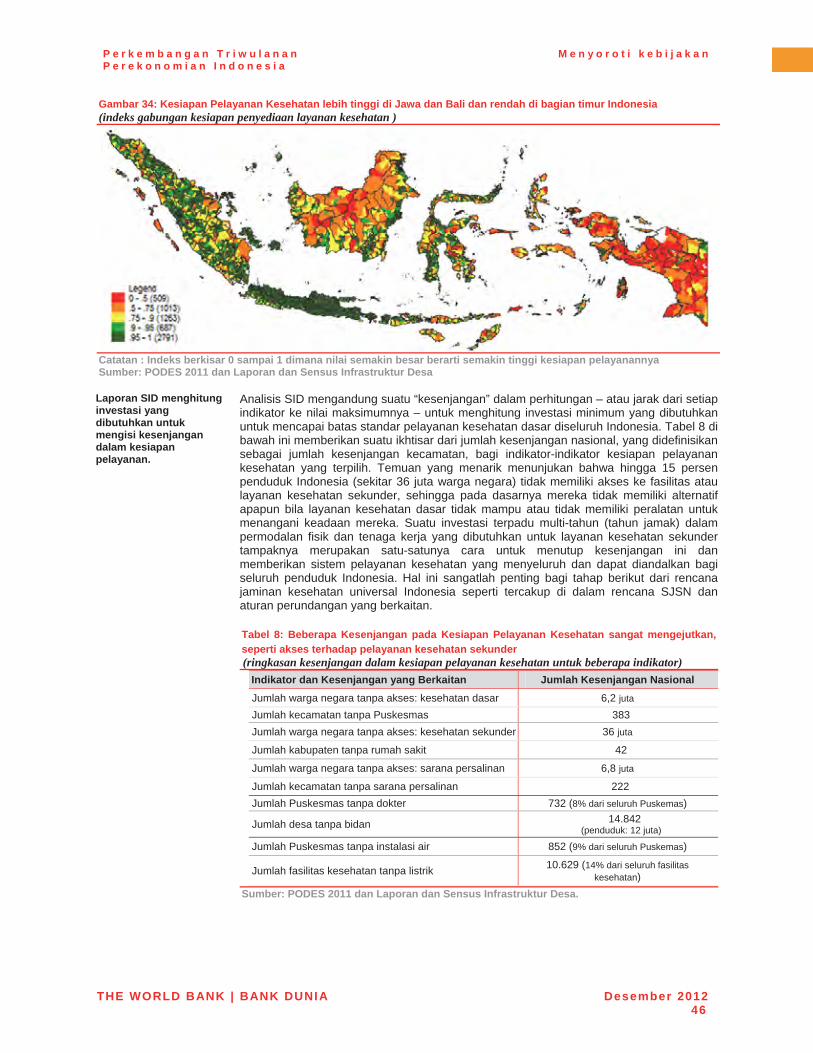
P e r k e m b a n g a n T r i w u l a n a n P e r e k o n o m i a n I n d o n e s i a
M e n y o r o t i k e b i j a k a n
THE WORLD BANK | BANK DUNIA Desember 201246
Gambar 34: Kesiapan Pelayanan Kesehatan lebih tinggi di Jawa dan Bali dan rendah di bagian timur Indonesia (indeks gabungan kesiapan penyediaan layanan kesehatan )
Catatan : Indeks berkisar 0 sampai 1 dimana nilai semakin besar berarti semakin tinggi kesiapan pelayanannya Sumber: PODES 2011 dan Laporan dan Sensus Infrastruktur Desa
Laporan SID menghitung investasi yang dibutuhkan untuk mengisi kesenjangan dalam kesiapan pelayanan.
Analisis SID mengandung suatu “kesenjangan” dalam perhitungan – atau jarak dari setiap indikator ke nilai maksimumnya – untuk menghitung investasi minimum yang dibutuhkan untuk mencapai batas standar pelayanan kesehatan dasar diseluruh Indonesia. Tabel 8 di bawah ini memberikan suatu ikhtisar dari jumlah kesenjangan nasional, yang didefinisikan sebagai jumlah kesenjangan kecamatan, bagi indikator-indikator kesiapan pelayanan kesehatan yang terpilih. Temuan yang menarik menunjukan bahwa hingga 15 persenpenduduk Indonesia (sekitar 36 juta warga negara) tidak memiliki akses ke fasilitas atau layanan kesehatan sekunder, sehingga pada dasarnya mereka tidak memiliki alternatif apapun bila layanan kesehatan dasar tidak mampu atau tidak memiliki peralatan untuk menangani keadaan mereka. Suatu investasi terpadu multi-tahun (tahun jamak) dalam permodalan fisik dan tenaga kerja yang dibutuhkan untuk layanan kesehatan sekunder tampaknya merupakan satu-satunya cara untuk menutup kesenjangan ini dan memberikan sistem pelayanan kesehatan yang menyeluruh dan dapat diandalkan bagi seluruh penduduk Indonesia. Hal ini sangatlah penting bagi tahap berikut dari rencana jaminan kesehatan universal Indonesia seperti tercakup di dalam rencana SJSN dan aturan perundangan yang berkaitan.
Tabel 8: Beberapa Kesenjangan pada Kesiapan Pelayanan Kesehatan sangat mengejutkan, seperti akses terhadap pelayanan kesehatan sekunder (ringkasan kesenjangan dalam kesiapan pelayanan kesehatan untuk beberapa indikator)
Indikator dan Kesenjangan yang Berkaitan Jumlah Kesenjangan Nasional Jumlah warga negara tanpa akses: kesehatan dasar 6,2 juta
Jumlah kecamatan tanpa Puskesmas 383Jumlah warga negara tanpa akses: kesehatan sekunder 36 juta
Jumlah kabupaten tanpa rumah sakit 42
Jumlah warga negara tanpa akses: sarana persalinan 6,8 juta
Jumlah kecamatan tanpa sarana persalinan 222 Jumlah Puskesmas tanpa dokter 732 (8% dari seluruh Puskemas)
Jumlah desa tanpa bidan 14.842(penduduk: 12 juta)
Jumlah Puskesmas tanpa instalasi air 852 (9% dari seluruh Puskemas)
Jumlah fasilitas kesehatan tanpa listrik 10.629 (14% dari seluruh fasilitas kesehatan)
Sumber: PODES 2011 dan Laporan dan Sensus Infrastruktur Desa.

P e r k e m b a n g a n T r i w u l a n a n P e r e k o n o m i a n I n d o n e s i a
M e n y o r o t i k e b i j a k a n
THE WORLD BANK | BANK DUNIA Desember 201247
d. …pola yang sama nampak pada Kesiapan Pelayanan di bidang Pendidikan Seperti pada kesehatan, kesiapan pelayanan pendidikan jauh lebih rendah di Indonesia Timur...
Data SID menunjukan bahwa pola wilayah dalam kesiapan pelayanan pendidikan mirip seperti pada bidang kesehatan, dengan kecamatan-kecamatan di Bali (0,96) dan Jawa (0,94) menunjukan tingkatan yang tertinggi; Sulawesi (0,81), Sumatra (0,80), Kalimantan (0,74), dan NTT & NTB (0,72) berada di tengah-tengah distribusi; sementara Molukas (0,60) dan terutama Papua dan Papua Barat (0,30) tertinggal jauh di belakang. Kesenjangan secara keseluruhan antara kecamatan yang berada di perkotaan (0,93) dan pedesaan (0,70) sekali lagi berjumlah cukup besar. Di sini, dikotomi perkotaan-pedesaan menunjukan terdapat empat profil pelayanan yang berbeda yang umum dijumpai di Indonesia: profil Jawa/Bali, dengan pelayanan yang relatif baik untuk daerah perkotaan maupun pedesaan; profil Molukas/Papua, dengan pelayanan yang jelas kurang bagi daerah perkotaan maupun pedesaan, dan daerah-daerah lain di Indonesia, dengan daerah perkotaan memiliki keunggulan yang relatif lebih besar dibanding daerah pedesaan.
Gambar 35: Pola spasial untuk Kesiapan Pelayanan di bidang Pendidikan sama dengan bidang Kesehatan indeks gabungan kesiapan pelayanan pendidikan)
Catatan : Indeks berkisar 0 sampai 1 dimana nilai semakin besar berarti semakin tinggi kesiapan pelayanannya Sumber: PODES 2011 dan Laporan dan Sensus Infrastruktur Desa.
… sementara SID menujukkan walaupun ketersediaan secara fisik sudah memadai, kualitasnya masih rendah.
Tabel 9 di bawah merupakan ikhtisar dari jumlah kesenjangan nasional dalam kesiapan pelayanan pendidikan. Walaupun Indonesia telah mencapai akses yang hampir menyeluruh kepada, dan diperkirakan telah menyeluruh dalam hal partisipasi sekolahbagi, pendidikan dasar, analisis kesenjangan menunjukan bahwa terdapat lebih dari 16 juta warga negara yang tidak memiliki akses kepada layanan pendidikan anak usia dini (PAUD) dan lebih dari 9 juta tidak akan mendapatkan akses kepada sekolah menengah pertama. Selain itu, banyak sekolah akan memperoleh manfaat dari peningkatan modal, pemeliharaan dan modernisasi: antara 13 dan 36 persen dari seluruh sekolah umum tidak memiliki fasilitas modern seperti tenaga listrik, air atau laboratorium ilmu pengetahuan atau ketrampilan. Ukuran dan distribusi kesenjangan tampaknya menghambat pemenuhan hak seluruh warga negara Indonesia untuk pendidikan dasar seperti yang tercantum di dalam UUD, sementara juga menunjukan tantangan jangka pendek dan menengah yang signifikan bagi para murid yang telah turut serta: sistem pendidikan modern yang menghasilkan lulusan dengan pengalaman, ketrampilan dan motivasi yang dibutuhkan untuk menjadi angkatan kerja yang memiliki sifat kewirausahaan, kreatif dan mudah ditempatkan tampaknya akan sulit dicapai tanpa upaya-upaya berkelanjutan.
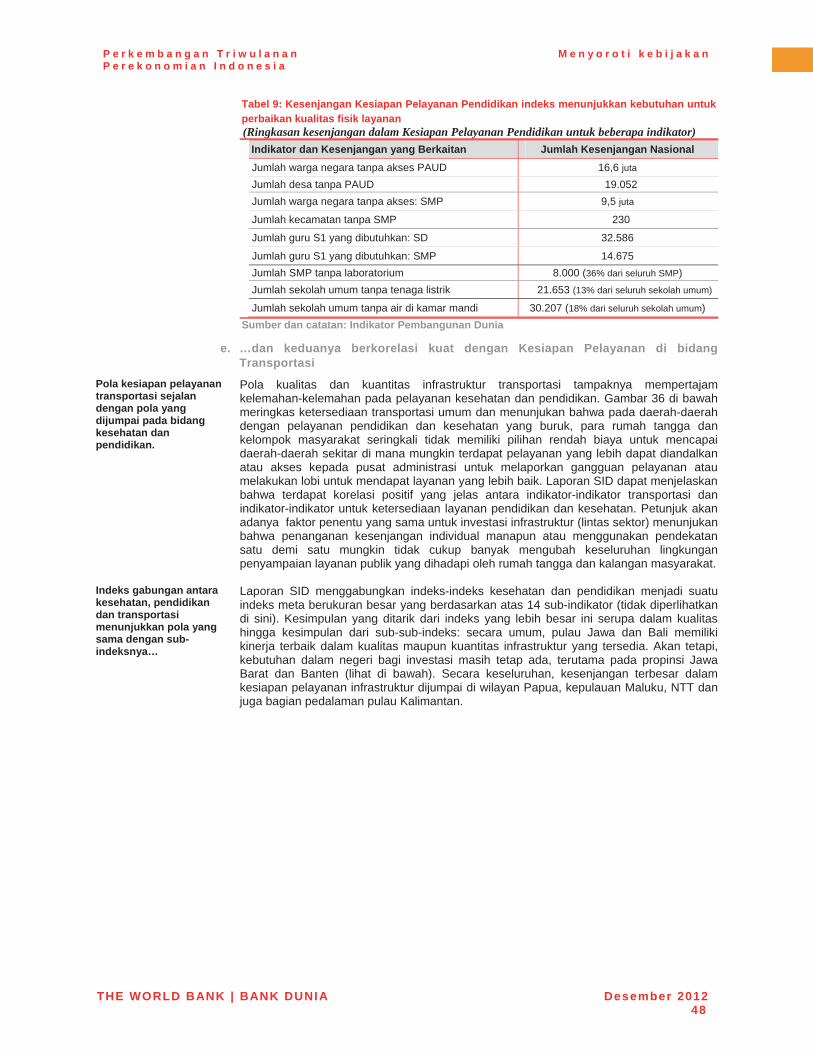
P e r k e m b a n g a n T r i w u l a n a n P e r e k o n o m i a n I n d o n e s i a
M e n y o r o t i k e b i j a k a n
THE WORLD BANK | BANK DUNIA Desember 201248
Tabel 9: Kesenjangan Kesiapan Pelayanan Pendidikan indeks menunjukkan kebutuhan untuk perbaikan kualitas fisik layanan (Ringkasan kesenjangan dalam Kesiapan Pelayanan Pendidikan untuk beberapa indikator)
Indikator dan Kesenjangan yang Berkaitan Jumlah Kesenjangan Nasional Jumlah warga negara tanpa akses PAUD 16,6 juta
Jumlah desa tanpa PAUD 19.052 Jumlah warga negara tanpa akses: SMP 9,5 juta
Jumlah kecamatan tanpa SMP 230
Jumlah guru S1 yang dibutuhkan: SD 32.586
Jumlah guru S1 yang dibutuhkan: SMP 14.675 Jumlah SMP tanpa laboratorium 8.000 (36% dari seluruh SMP)Jumlah sekolah umum tanpa tenaga listrik 21.653 (13% dari seluruh sekolah umum)
Jumlah sekolah umum tanpa air di kamar mandi 30.207 (18% dari seluruh sekolah umum)Sumber dan catatan: Indikator Pembangunan Dunia
e. …dan keduanya berkorelasi kuat dengan Kesiapan Pelayanan di bidang Transportasi
Pola kesiapan pelayanan transportasi sejalan dengan pola yang dijumpai pada bidang kesehatan dan pendidikan.
Pola kualitas dan kuantitas infrastruktur transportasi tampaknya mempertajam kelemahan-kelemahan pada pelayanan kesehatan dan pendidikan. Gambar 36 di bawah meringkas ketersediaan transportasi umum dan menunjukan bahwa pada daerah-daerah dengan pelayanan pendidikan dan kesehatan yang buruk, para rumah tangga dan kelompok masyarakat seringkali tidak memiliki pilihan rendah biaya untuk mencapai daerah-daerah sekitar di mana mungkin terdapat pelayanan yang lebih dapat diandalkan atau akses kepada pusat administrasi untuk melaporkan gangguan pelayanan atau melakukan lobi untuk mendapat layanan yang lebih baik. Laporan SID dapat menjelaskan bahwa terdapat korelasi positif yang jelas antara indikator-indikator transportasi dan indikator-indikator untuk ketersediaan layanan pendidikan dan kesehatan. Petunjuk akan adanya faktor penentu yang sama untuk investasi infrastruktur (lintas sektor) menunjukan bahwa penanganan kesenjangan individual manapun atau menggunakan pendekatan satu demi satu mungkin tidak cukup banyak mengubah keseluruhan lingkungan penyampaian layanan publik yang dihadapi oleh rumah tangga dan kalangan masyarakat.
Indeks gabungan antara kesehatan, pendidikan dan transportasi menunjukkan pola yang sama dengan sub-indeksnya…
Laporan SID menggabungkan indeks-indeks kesehatan dan pendidikan menjadi suatu indeks meta berukuran besar yang berdasarkan atas 14 sub-indikator (tidak diperlihatkan di sini). Kesimpulan yang ditarik dari indeks yang lebih besar ini serupa dalam kualitas hingga kesimpulan dari sub-sub-indeks: secara umum, pulau Jawa dan Bali memiliki kinerja terbaik dalam kualitas maupun kuantitas infrastruktur yang tersedia. Akan tetapi, kebutuhan dalam negeri bagi investasi masih tetap ada, terutama pada propinsi Jawa Barat dan Banten (lihat di bawah). Secara keseluruhan, kesenjangan terbesar dalam kesiapan pelayanan infrastruktur dijumpai di wilayan Papua, kepulauan Maluku, NTT dan juga bagian pedalaman pulau Kalimantan.
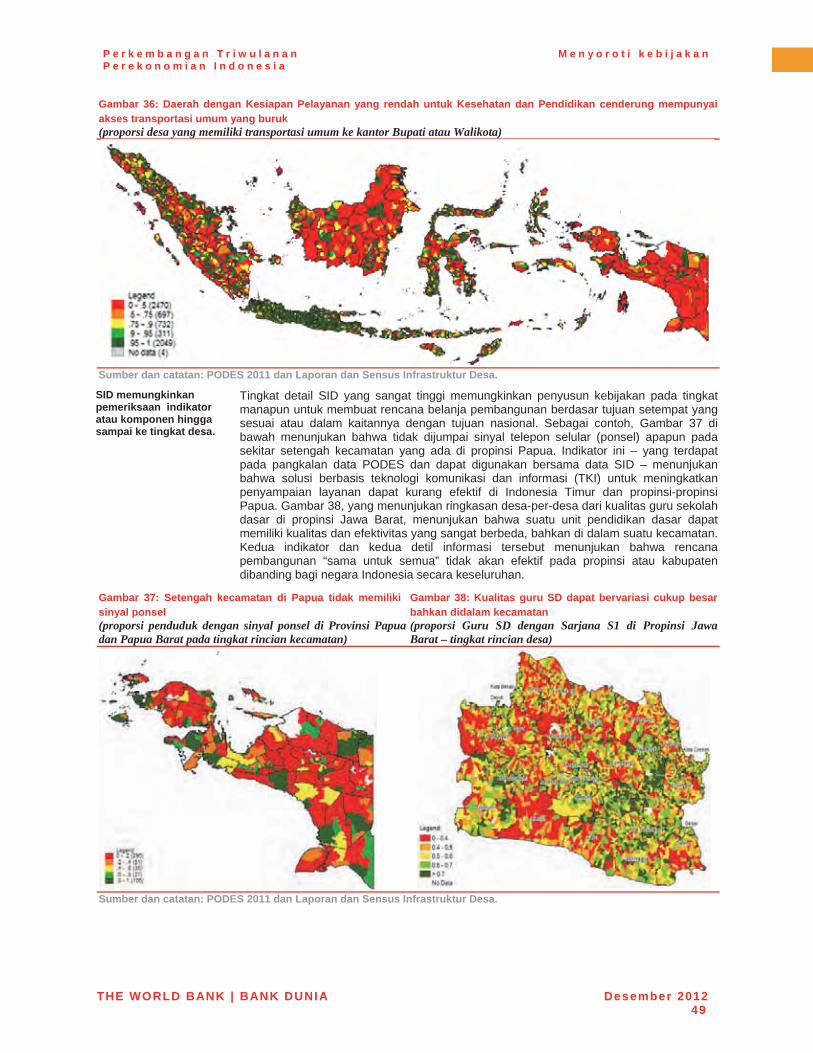
P e r k e m b a n g a n T r i w u l a n a n P e r e k o n o m i a n I n d o n e s i a
M e n y o r o t i k e b i j a k a n
THE WORLD BANK | BANK DUNIA Desember 201249
Gambar 36: Daerah dengan Kesiapan Pelayanan yang rendah untuk Kesehatan dan Pendidikan cenderung mempunyai akses transportasi umum yang buruk (proporsi desa yang memiliki transportasi umum ke kantor Bupati atau Walikota)
Sumber dan catatan: PODES 2011 dan Laporan dan Sensus Infrastruktur Desa.
SID memungkinkan pemeriksaan indikator atau komponen hingga sampai ke tingkat desa.
Tingkat detail SID yang sangat tinggi memungkinkan penyusun kebijakan pada tingkat manapun untuk membuat rencana belanja pembangunan berdasar tujuan setempat yang sesuai atau dalam kaitannya dengan tujuan nasional. Sebagai contoh, Gambar 37 di bawah menunjukan bahwa tidak dijumpai sinyal telepon selular (ponsel) apapun pada sekitar setengah kecamatan yang ada di propinsi Papua. Indikator ini – yang terdapat pada pangkalan data PODES dan dapat digunakan bersama data SID – menunjukan bahwa solusi berbasis teknologi komunikasi dan informasi (TKI) untuk meningkatkan penyampaian layanan dapat kurang efektif di Indonesia Timur dan propinsi-propinsi Papua. Gambar 38, yang menunjukan ringkasan desa-per-desa dari kualitas guru sekolah dasar di propinsi Jawa Barat, menunjukan bahwa suatu unit pendidikan dasar dapat memiliki kualitas dan efektivitas yang sangat berbeda, bahkan di dalam suatu kecamatan. Kedua indikator dan kedua detil informasi tersebut menunjukan bahwa rencana pembangunan “sama untuk semua” tidak akan efektif pada propinsi atau kabupaten dibanding bagi negara Indonesia secara keseluruhan.
Gambar 37: Setengah kecamatan di Papua tidak memiliki sinyal ponsel (proporsi penduduk dengan sinyal ponsel di Provinsi Papuadan Papua Barat pada tingkat rincian kecamatan)
Gambar 38: Kualitas guru SD dapat bervariasi cukup besar bahkan didalam kecamatan (proporsi Guru SD dengan Sarjana S1 di Propinsi Jawa Barat – tingkat rincian desa)
Sumber dan catatan: PODES 2011 dan Laporan dan Sensus Infrastruktur Desa.
P e r k e m b a n g a n T r i w u l a n a n P e r e k o n o m i a n I n d o n e s i a
M e n y o r o t i k e b i j a k a n
THE WORLD BANK | BANK DUNIA Desember 201250
f. Perluasan dan Aplikasi Kebijakan Rincian SID tingkat desa yang digabungkan dengan tingkat agregat berguna bagi perencanaan pembangunan pro-miskin di seluruh sektor dan pada semua tingkatan...
Penggerak utama di belakang SID (dan laporan yang berkaitan) adalah kebutuhan bagi strategi yang lebih banyak dan lebih baik untuk pendanaan, pengelolaan dan penetapan sasaran pada program “Klaster 2” Pemerintah Indonesia atau program-program pembangunan yang didorong oleh masyarakat (yang lebih banyak dikenal sebagai Program Nasional Pemberdayaan Masyarakat atau PNPM Mandiri). Sebagai contoh, untuk dana hibah yang diberikan melalui persaingan dan dikelola oleh masyarakat yang disampaikan melalui program PNPM, data SID dapat digunakan untuk menemukan dan memprioritaskan daerah-daerah yang akan memperoleh manfaat dari bagian dana hibah yang lebih besar atau dari kelayakan dan penerima dari lebih dari satu dana hibah PNPM. Karena dana hibah PNPM memiliki tingkat penggunaan paling tinggi oleh masyarakat untuk meningkatkan dasar aset infrastruktur – jalan, irigasi, bangunan drainase, sarana air bersih dll. – pemberian pendanaan ekstra melalui PNPM bagi daerah-daerah yang menghadapi kesenjangan ketersediaan pelayanan dapat memberikan dampak yang cukup berarti, walau mungkin hanya bersifat sementara. Penyusun kebijakan yang terlibat di dalam Prakarsa PNPM-Generasi – sejenis PNPM yang memiliki sasaran daerah-daerah paling miskin dengan dana hibah yang terkait dengan layanan kesehatan dan pendidikan – memanfaatkan pangkalan data SID untuk menentukan daerah-daerah yang akan menerima dana hibah Generasi pada tahap peningkatannya pada tahun 2013-2015.
…dan ketersediannya di publik berarti bahwa SID dapat digunakan oleh siapapun untuk menentukan tolok ukur kinerja daerah
Tingkat rincian SID berarti bahwa dengan potensi penggunaan apapun – seperti menggunakan SID untuk melakukan revisi belanja sumber daya masyarakat agar lebih sesuai dengan kebutuhan dan kapasitas atau meningkatkan penetapan sasaran prakarsa pembangunan yang diprioritaskan pada sektor manapun – dapat dilakukan pada tingkat daerah manapun dan oleh otoritas maupun politisi manapun yang memiliki motivasi dimanapun ia berada. Pengembangan SID juga mendukung analisis berbasis bukti tersebut dengan kaitannya kepada perbandingan lokal, wilayah atau bahkan tingkat nasional, sehingga pengguna manapun akan dapat menentukan kinerja wilayahnya dibanding seluruh tolok ukur dan standar yang relevan. Dengan mendukung penyusunan pangkalan data dan alat yang berlaku di seluruh Indonesia, TNP2K dan Pemerintah Indonesia telah memberikan layanan umum yang signifikan; dengan terus mendukung penyampaian SID dan penggunaannya di luar dindingnya sendiri, TNP2K akan bertanggung jawab untuk memberikan salah satu dari metodologi-metodologi terkini, mudah digunakan dan tersedia secara luas yang pertama bagi kebijakan pro-kemiskinan bagi seluruh wilayah dan seluruh sektor yang tertarik kepada proses-proses dan outputyang berdasarkan bukti.
Perluasan dari SID, untuk menghubungkannya dengan hambatan isolasi daerah dan faktor multi-dimensi kemiskinan, sedang dalam proses pengerjaan yang selanjutnya memberikan informasi bagi pembuatan kebijakan di masa mendatang
Beberapa perluasan analisis SID, yang sedang dikembangkan oleh tim Monitoring danEvaluasi (M&E) dalam PNPM Support Facility (PSF), dapat memberikan wawasantambahan ke dalam dimensi lain dari penyediaan layanan. Perluasan pertama bertujuanuntuk menunjukkan tingkat isolasi relatif untuk memberikan berbagai informasi yang relevan untuk strategi pecapaian target belanja publik yang lebih baik berbasis buktiempiris. Seperti peta di atas menunjukkan, banyak pasokan-kekurangan daerah yangbaik dikelilingi oleh daerah miskin atau terletak cukup jauh dari wilayah terdekatberikutnya dengan kinerja yang baik. Isolasi tersebut dapat menghambat kemajuandaerah sendiri karena tidak mungkin ada contoh untuk belajar dari daerah tetanggaberkinerja tinggi dalam menyerap migran internal.
Perluasan kedua adalah untuk menghubungkan SID dengan data multi-dimensi kemiskinan (MDP). Karena data SID dikumpulkan oleh BPS yang secara teraturdihasilkan (PODES desa sensus, yang diproduksi setiap 3 tahun), database SID mudahuntuk digabungkan dengan dataset BPS lainnya seperti Sensus Penduduk 2010 dansurvei rumah tangga Susenas kuartalan untuk melihat kesejahteraan sosial ekonomi. Data MDP menangkap pengeluaran dan hasil dalam rumah tangga dan sehingga, iamenyediakan data dari sisi permintaan untuk informasi sisi penawaran yang terkandung dalam SID. Menggabungkan dua database tersebut memungkinkan para peneliti dan pembuat kebijakan untuk melihat perekonomian dan seluruh pelayanan dasar di satu tempat, memfasilitasi analisis untuk menemukan daerah di mana sisi permintaan melebihi harapan meskipun ada hambatan di sisi penawaran, serta faktor penentunya.
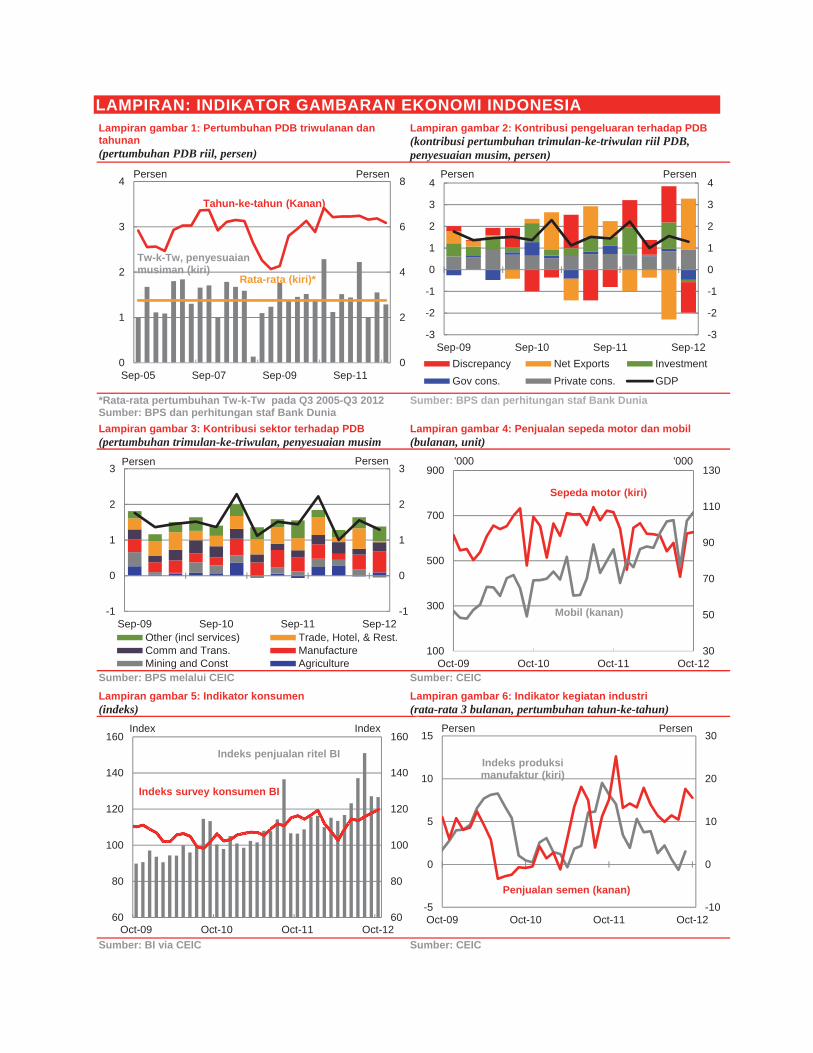
LAMPIRAN: INDIKATOR GAMBARAN EKONOMI INDONESIALampiran gambar 1: Pertumbuhan PDB triwulanan dan tahunan (pertumbuhan PDB riil, persen)
Lampiran gambar 2: Kontribusi pengeluaran terhadap PDB (kontribusi pertumbuhan trimulan-ke-triwulan riil PDB, penyesuaian musim, persen)
*Rata-rata pertumbuhan Tw-k-Tw pada Q3 2005-Q3 2012 Sumber: BPS dan perhitungan staf Bank Dunia
Sumber: BPS dan perhitungan staf Bank Dunia
Lampiran gambar 3: Kontribusi sektor terhadap PDB (pertumbuhan trimulan-ke-triwulan, penyesuaian musim
Lampiran gambar 4: Penjualan sepeda motor dan mobil (bulanan, unit)
Sumber: BPS melalui CEIC Sumber: CEIC Lampiran gambar 5: Indikator konsumen (indeks)
Lampiran gambar 6: Indikator kegiatan industri (rata-rata 3 bulanan, pertumbuhan tahun-ke-tahun)
Sumber: BI via CEIC Sumber: CEIC
0
2
4
6
8
0
1
2
3
4
Sep-05 Sep-07 Sep-09 Sep-11
Persen Persen
Tw-k-Tw, penyesuaianmusiman (kiri)
Tahun-ke-tahun (Kanan)
Rata-rata (kiri)*
-3
-2
-1
0
1
2
3
4
-3
-2
-1
0
1
2
3
4
Sep-09 Sep-10 Sep-11 Sep-12Discrepancy Net Exports InvestmentGov cons. Private cons. GDP
Persen Persen
-1
0
1
2
3
-1
0
1
2
3
Sep-09 Sep-10 Sep-11 Sep-12Other (incl services) Trade, Hotel, & Rest.Comm and Trans. ManufactureMining and Const Agriculture
Persen Persen
30
50
70
90
110
130
100
300
500
700
900
Oct-09 Oct-10 Oct-11 Oct-12
'000
Sepeda motor (kiri)
'000
Mobil (kanan)
60
80
100
120
140
160
60
80
100
120
140
160
Oct-09 Oct-10 Oct-11 Oct-12
Index Index
Indeks penjualan ritel BI
Indeks survey konsumen BI
-10
0
10
20
30
-5
0
5
10
15
Oct-09 Oct-10 Oct-11 Oct-12
Persen Persen
Penjualan semen (kanan)
Indeks produksi manufaktur (kiri)

P e r k e m b a n g a n T r i w u l a n a n P e r e k o n o m i a n I n d o n e s i a
M e n y o r o t i k e b i j a k a n
THE WORLD BANK | BANK DUNIA Desember 201252
Lampiran gambar 7: Aliran perdagangan riil (pertumbuhan trimulan-ke-triwulan)
Lampiran gambar 8: Neraca pembayaran (miliar USD)
Sumber: BPS (Neraca Nasional) dan Bank Dunia Sumber: BI dan Bank Dunia Lampiran gambar 9: Neraca perdagangan (miliar USD)
Lampiran gambar 10: Cadangan devisa dan modal asing (miliar USD)
Sumber: BPS dan Bank Dunia Sumber: BI dan Bank Dunia Lampiran gambar 11: Indeks harga komoditas terpilih (indeks 2007=100)
Lampiran gambar 12: Inflasi dan kebijakan moneter (pertumbuhan bulan-ke-bulan & tahun-ke-tahun)
Sumber: BPS dan Bank Dunia Sumber: BPS dan Bank Dunia
-20
-10
0
10
20
-20
-10
0
10
20
Sep-09 Sep-10 Sep-11 Sep-12
Ekspor
Impor
Persen Persen
-8
-4
0
4
8
12
16
-8
-4
0
4
8
12
16
Sep-09 Sep-10 Sep-11 Sep-12
miliar USD miliar USD
Neraca modal dan keuangan
Neraca berjalan
Neraca keseluruhan
Selisih dan pembulatan
-5.0
-2.5
0.0
2.5
5.0
-18
-8
2
12
22
Oct-09 Oct-10 Oct-11 Oct-12
Surplus/defisit perdagangan (kanan)Ekspor (kiri)
Imports (LHS)
miliar USD miliar USD
-7.5
-5.0
-2.5
0.0
2.5
5.0
25
50
75
100
125
150
Nov-09 Nov-10 Nov-11 Nov-12
Cadangan devisa (kiri)
miliar USD miliar USD
Aliran masuk portfolio asing (kanan)
50
100
150
200
250
50
100
150
200
250
Jan-07 Jun-08 Nov-09 Apr-11 Sep-12
Index Jan 2007 = 100 Index Jan 2007 = 100
Komoditi ekspor utamaIndonesia
Makanan
Metal dan mineral
Energi
-4
0
4
8
12
-1
0
1
2
3
Nov-08 Nov-09 Nov-10 Nov-11 Nov-12
Inflasi inti, tahun-ketahun (kanan)
Inflasi headline, tahun-ke-tahun (kanan)
Inflasi Headline bulan-ke-bulan (kiri)
Persen Persen
Tingkat bungan BI (kanan)

P e r k e m b a n g a n T r i w u l a n a n P e r e k o n o m i a n I n d o n e s i a
M e n y o r o t i k e b i j a k a n
THE WORLD BANK | BANK DUNIA Desember 201253
Lampiran gambar 13: Rincian tingkat harga konsumen (persentasi dari kontribusi inflasi bulanan)
Lampiran gambar 14: Tingkat inflasi negara tetangga (pertumbuhan tahun-ke-tahun, Juni 2012
Sumber: BPS dan Bank Dunia *Oktober merupakan data terkini Sumber: Nasional statistik melalui CEIC, dan BPS
Lampiran gambar 15: Harga beras kulakan di pasar domestik dan internasional (Rupiah per kg)
Lampiran gambar 16: Tingkat kemiskinan dan pengangguran (data tahunan, persen)
Note: Titik-titik adalah harga beras Thailand (cif) Garis adalah harga beras domestic tingkat grosir Sumber: PIBC, FAO dan Bank Dunia
Note: Data tenaga kerja dari Sakernas Agustus Sumber: BPS, dan Bank Dunia
Lampiran gambar 17: Indeks saham regional (indeks harian)
Lampiran gambar 18: Indeks spot dolar Amerika dan rupiah (indeks dan tingkat harga harian)
Sumber: Bank Dunia dan CEIC Sumber: Bank Dunia dan CEIC
-0.6
0.0
0.6
1.2
1.8
-0.6
0.0
0.6
1.2
1.8
Nov-09 Nov-10 Nov-11 Nov-12
VolatileAdministeredCoreHeadline
Persen Persen-1 0 1 2 3 4 5
-1 0 1 2 3 4 5
Japan *Malaysia*
Korea*USA*China
ThailandPhilippines *Singapore *
Indonesia
Persen
Persen
1,000
3,000
5,000
7,000
9,000
11,000
1,000
3,000
5,000
7,000
9,000
11,000
Nov-08 Nov-09 Nov-10 Nov-11 Nov-12
Kualitas rendah:IR 64 III (domestic);Thai A1 Super (international)
Rupiah/Kg
Kualitas mediumMuncul I (domestic)Thai 100% B 2nd grade (internasional)
Rupiah/Kg
0
5
10
15
20
25
0
5
10
15
20
25
2002 2004 2006 2008 2010 2012
Persen Persen
Tingkat kemiskinan
Tingkat pengangguran
50
100
150
200
250
300
350
50
100
150
200
250
300
350
Jan-09 Dec-09 Nov-10 Oct-11 Sep-12
Index (Jan 2009=100)
SGX
JCI
SET
Shanghai
BSE
Index (Jan 2009=100)8,000
9,000
10,000
11,000
12,00080
90
100
110
120
Jan-09 Dec-09 Nov-10 Oct-11 Sep-12
Index (5 Jan 2009=100)
IDR/USD (kanan)
Indeks Dolar Amerika
Apresiasi Rupiah
Rupiah per USD
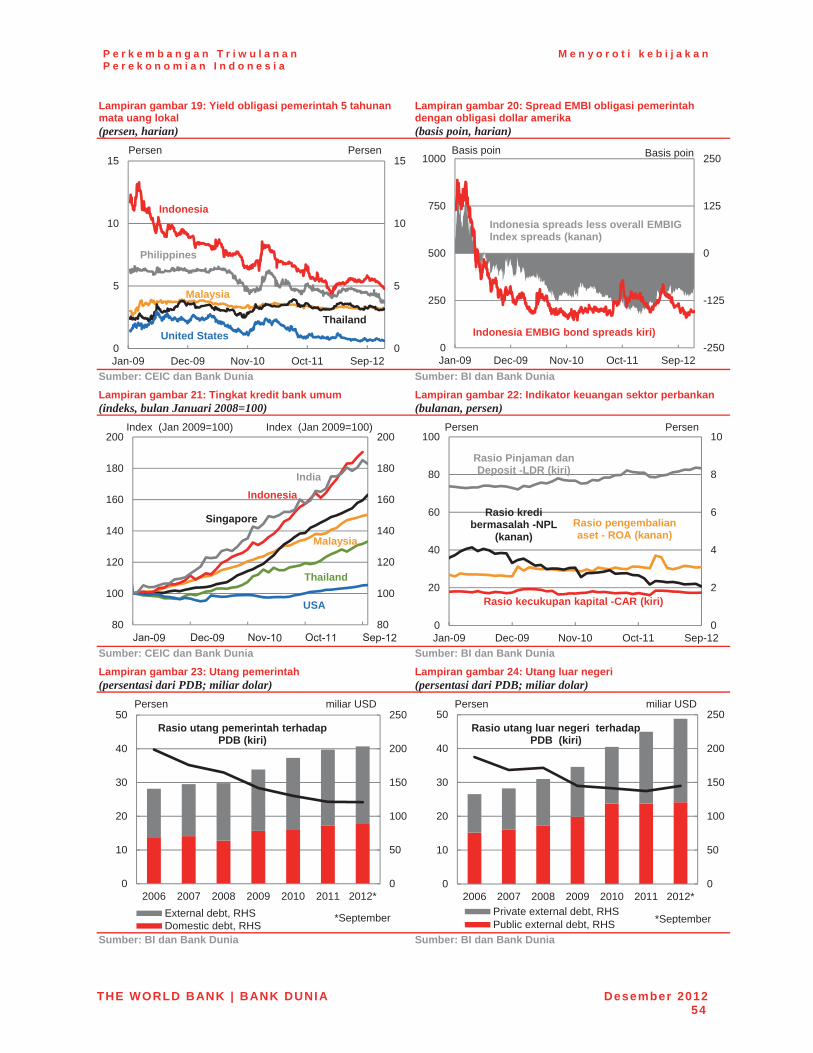
P e r k e m b a n g a n T r i w u l a n a n P e r e k o n o m i a n I n d o n e s i a
M e n y o r o t i k e b i j a k a n
THE WORLD BANK | BANK DUNIA Desember 201254
Lampiran gambar 19: Yield obligasi pemerintah 5 tahunan mata uang lokal (persen, harian)
Lampiran gambar 20: Spread EMBI obligasi pemerintah dengan obligasi dollar amerika (basis poin, harian)
Sumber: CEIC dan Bank Dunia Sumber: BI dan Bank Dunia Lampiran gambar 21: Tingkat kredit bank umum (indeks, bulan Januari 2008=100)
Lampiran gambar 22: Indikator keuangan sektor perbankan (bulanan, persen)
Sumber: CEIC dan Bank Dunia Sumber: BI dan Bank Dunia Lampiran gambar 23: Utang pemerintah (persentasi dari PDB; miliar dolar)
Lampiran gambar 24: Utang luar negeri (persentasi dari PDB; miliar dolar)
Sumber: BI dan Bank Dunia Sumber: BI dan Bank Dunia
0
5
10
15
0
5
10
15
Jan-09 Dec-09 Nov-10 Oct-11 Sep-12
Persen
Philippines
United StatesThailand
Malaysia
Indonesia
Persen
-250
-125
0
125
250
0
250
500
750
1000
Jan-09 Dec-09 Nov-10 Oct-11 Sep-12
Basis poin
Indonesia EMBIG bond spreads kiri)
Indonesia spreads less overall EMBIG Index spreads (kanan)
Basis poin
80
100
120
140
160
180
200
80
100
120
140
160
180
200Index (Jan 2009=100)
USA
Thailand
Singapore
IndonesiaIndia
Malaysia
Index (Jan 2009=100)
0
2
4
6
8
10
0
20
40
60
80
100
Jan-09 Dec-09 Nov-10 Oct-11 Sep-12
Rasio kecukupan kapital -CAR (kiri)
Rasio pengembalian aset - ROA (kanan)
Rasio Pinjaman dan Deposit -LDR (kiri)
Persen Persen
Rasio kredi bermasalah -NPL
(kanan)
0
50
100
150
200
250
0
10
20
30
40
50
2006 2007 2008 2009 2010 2011 2012*External debt, RHSDomestic debt, RHS
Persen miliar USD
Rasio utang pemerintah terhadap PDB (kiri)
*September
0
50
100
150
200
250
0
10
20
30
40
50
2006 2007 2008 2009 2010 2011 2012*Private external debt, RHSPublic external debt, RHS
Rasio utang luar negeri terhadap PDB (kiri)
Persen miliar USD
*September
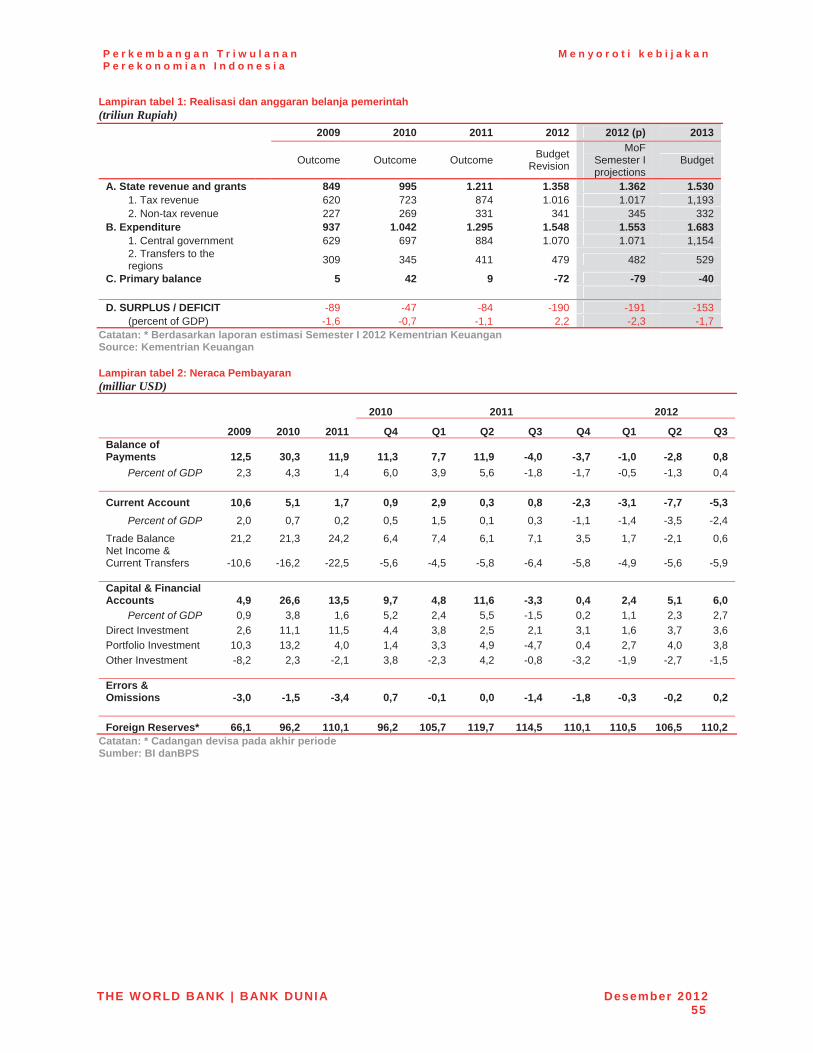
P e r k e m b a n g a n T r i w u l a n a n P e r e k o n o m i a n I n d o n e s i a
M e n y o r o t i k e b i j a k a n
THE WORLD BANK | BANK DUNIA Desember 201255
Lampiran tabel 1: Realisasi dan anggaran belanja pemerintah (triliun Rupiah)
2009 2010 2011 2012 2012 (p) 2013
Outcome Outcome Outcome BudgetRevision
MoFSemester I projections
Budget
A. State revenue and grants 849 995 1.211 1.358 1.362 1.530 1. Tax revenue 620 723 874 1.016 1.017 1,193 2. Non-tax revenue 227 269 331 341 345 332
B. Expenditure 937 1.042 1.295 1.548 1.553 1.683 1. Central government 629 697 884 1.070 1.071 1,154 2. Transfers to the regions 309 345 411 479 482 529
C. Primary balance 5 42 9 -72 -79 -40
D. SURPLUS / DEFICIT -89 -47 -84 -190 -191 -153 (percent of GDP) -1,6 -0,7 -1,1 2,2 -2,3 -1,7
Catatan: * Berdasarkan laporan estimasi Semester I 2012 Kementrian Keuangan Source: Kementrian Keuangan
Lampiran tabel 2: Neraca Pembayaran (milliar USD)
2010 2011 2012
2009 2010 2011 Q4 Q1 Q2 Q3 Q4 Q1 Q2 Q3 Balance of Payments 12,5 30,3 11,9 11,3 7,7 11,9 -4,0 -3,7 -1,0 -2,8 0,8
Percent of GDP 2,3 4,3 1,4 6,0 3,9 5,6 -1,8 -1,7 -0,5 -1,3 0,4
Current Account 10,6 5,1 1,7 0,9 2,9 0,3 0,8 -2,3 -3,1 -7,7 -5,3 Percent of GDP 2,0 0,7 0,2 0,5 1,5 0,1 0,3 -1,1 -1,4 -3,5 -2,4
Trade Balance 21,2 21,3 24,2 6,4 7,4 6,1 7,1 3,5 1,7 -2,1 0,6 Net Income & Current Transfers -10,6 -16,2 -22,5 -5,6 -4,5 -5,8 -6,4 -5,8 -4,9 -5,6 -5,9
Capital & Financial Accounts 4,9 26,6 13,5 9,7 4,8 11,6 -3,3 0,4 2,4 5,1 6,0
Percent of GDP 0,9 3,8 1,6 5,2 2,4 5,5 -1,5 0,2 1,1 2,3 2,7 Direct Investment 2,6 11,1 11,5 4,4 3,8 2,5 2,1 3,1 1,6 3,7 3,6 Portfolio Investment 10,3 13,2 4,0 1,4 3,3 4,9 -4,7 0,4 2,7 4,0 3,8 Other Investment -8,2 2,3 -2,1 3,8 -2,3 4,2 -0,8 -3,2 -1,9 -2,7 -1,5
Errors & Omissions -3,0 -1,5 -3,4 0,7 -0,1 0,0 -1,4 -1,8 -0,3 -0,2 0,2
Foreign Reserves* 66,1 96,2 110,1 96,2 105,7 119,7 114,5 110,1 110,5 106,5 110,2
Catatan: * Cadangan devisa pada akhir periode Sumber: BI danBPS
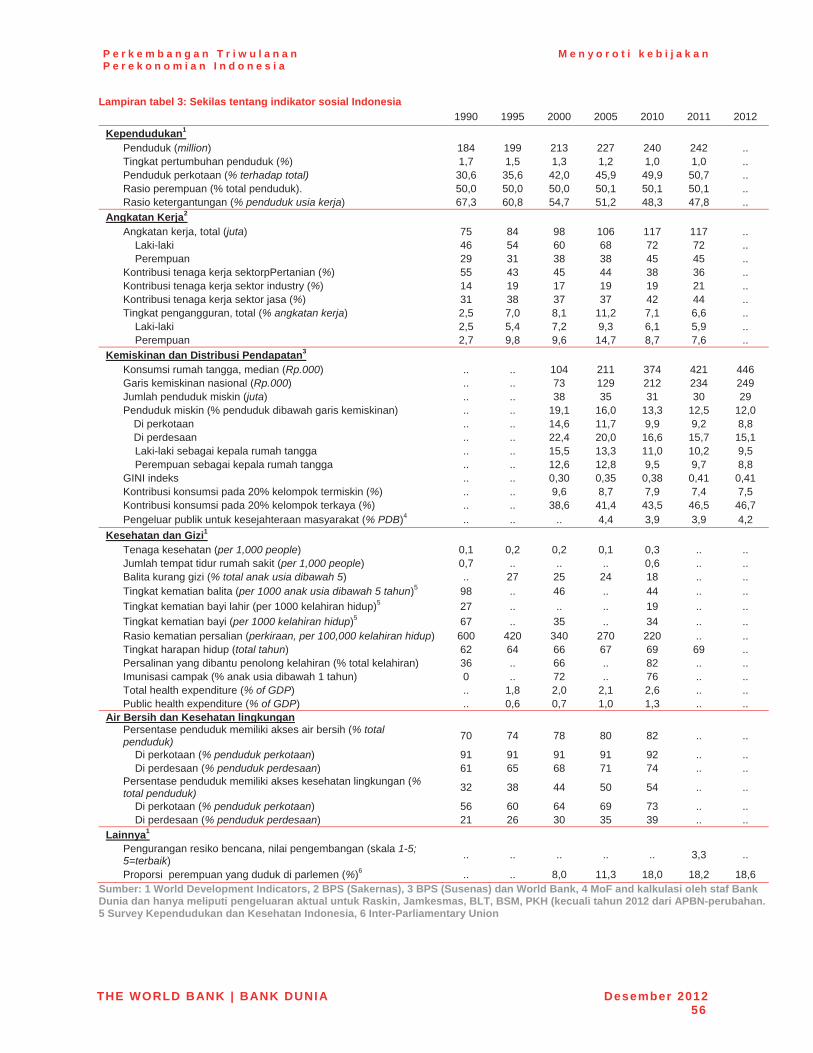
P e r k e m b a n g a n T r i w u l a n a n P e r e k o n o m i a n I n d o n e s i a
M e n y o r o t i k e b i j a k a n
THE WORLD BANK | BANK DUNIA Desember 201256
Lampiran tabel 3: Sekilas tentang indikator sosial Indonesia 1990 1995 2000 2005 2010 2011 2012
Kependudukan1
Penduduk (million) 184 199 213 227 240 242 ..Tingkat pertumbuhan penduduk (%) 1,7 1,5 1,3 1,2 1,0 1,0 ..Penduduk perkotaan (% terhadap total) 30,6 35,6 42,0 45,9 49,9 50,7 ..Rasio perempuan (% total penduduk). 50,0 50,0 50,0 50,1 50,1 50,1 ..Rasio ketergantungan (% penduduk usia kerja) 67,3 60,8 54,7 51,2 48,3 47,8 ..
Angkatan Kerja2
Angkatan kerja, total (juta) 75 84 98 106 117 117 .. Laki-laki 46 54 60 68 72 72 .. Perempuan 29 31 38 38 45 45 ..Kontribusi tenaga kerja sektorpPertanian (%) 55 43 45 44 38 36 ..Kontribusi tenaga kerja sektor industry (%) 14 19 17 19 19 21 ..Kontribusi tenaga kerja sektor jasa (%) 31 38 37 37 42 44 ..Tingkat pengangguran, total (% angkatan kerja) 2,5 7,0 8,1 11,2 7,1 6,6 .. Laki-laki 2,5 5,4 7,2 9,3 6,1 5,9 .. Perempuan 2,7 9,8 9,6 14,7 8,7 7,6 ..
Kemiskinan dan Distribusi Pendapatan3
Konsumsi rumah tangga, median (Rp.000) .. .. 104 211 374 421 446Garis kemiskinan nasional (Rp.000) .. .. 73 129 212 234 249Jumlah penduduk miskin (juta) .. .. 38 35 31 30 29Penduduk miskin (% penduduk dibawah garis kemiskinan) .. .. 19,1 16,0 13,3 12,5 12,0
Di perkotaan .. .. 14,6 11,7 9,9 9,2 8,8Di perdesaan .. .. 22,4 20,0 16,6 15,7 15,1
Laki-laki sebagai kepala rumah tangga .. .. 15,5 13,3 11,0 10,2 9,5 Perempuan sebagai kepala rumah tangga .. .. 12,6 12,8 9,5 9,7 8,8GINI indeks .. .. 0,30 0,35 0,38 0,41 0,41Kontribusi konsumsi pada 20% kelompok termiskin (%) .. .. 9,6 8,7 7,9 7,4 7,5Kontribusi konsumsi pada 20% kelompok terkaya (%) .. .. 38,6 41,4 43,5 46,5 46,7Pengeluar publik untuk kesejahteraan masyarakat (% PDB)4 .. .. .. 4,4 3,9 3,9 4,2
Kesehatan dan Gizi1
Tenaga kesehatan (per 1,000 people) 0,1 0,2 0,2 0,1 0,3 .. ..Jumlah tempat tidur rumah sakit (per 1,000 people) 0,7 .. .. .. 0,6 .. ..Balita kurang gizi (% total anak usia dibawah 5) .. 27 25 24 18 .. ..Tingkat kematian balita (per 1000 anak usia dibawah 5 tahun)5 98 .. 46 .. 44 .. ..Tingkat kematian bayi lahir (per 1000 kelahiran hidup)5 27 .. .. .. 19 .. ..Tingkat kematian bayi (per 1000 kelahiran hidup)5 67 .. 35 .. 34 .. ..Rasio kematian persalian (perkiraan, per 100,000 kelahiran hidup) 600 420 340 270 220 .. ..Tingkat harapan hidup (total tahun) 62 64 66 67 69 69 ..Persalinan yang dibantu penolong kelahiran (% total kelahiran) 36 .. 66 .. 82 .. ..Imunisasi campak (% anak usia dibawah 1 tahun) 0 .. 72 .. 76 .. ..Total health expenditure (% of GDP) .. 1,8 2,0 2,1 2,6 .. ..Public health expenditure (% of GDP) .. 0,6 0,7 1,0 1,3 .. ..
Air Bersih dan Kesehatan lingkungan Persentase penduduk memiliki akses air bersih (% total penduduk) 70 74 78 80 82 .. ..
Di perkotaan (% penduduk perkotaan) 91 91 91 91 92 .. .. Di perdesaan (% penduduk perdesaan) 61 65 68 71 74 .. ..Persentase penduduk memiliki akses kesehatan lingkungan (%total penduduk) 32 38 44 50 54 .. ..
Di perkotaan (% penduduk perkotaan) 56 60 64 69 73 .. .. Di perdesaan (% penduduk perdesaan) 21 26 30 35 39 .. ..
Lainnya1
Pengurangan resiko bencana, nilai pengembangan (skala 1-5;5=terbaik) .. .. .. .. .. 3,3 ..
Proporsi perempuan yang duduk di parlemen (%)6 .. .. 8,0 11,3 18,0 18,2 18,6Sumber: 1 World Development Indicators, 2 BPS (Sakernas), 3 BPS (Susenas) dan World Bank, 4 MoF and kalkulasi oleh staf Bank Dunia dan hanya meliputi pengeluaran aktual untuk Raskin, Jamkesmas, BLT, BSM, PKH (kecuali tahun 2012 dari APBN-perubahan. 5 Survey Kependudukan dan Kesehatan Indonesia, 6 Inter-Parliamentary Union


Maret 2013
Tekanan meningkat
PERKEMBANGAN TRIWULANANPEREKONOMIAN INDONESIA
����
PERKEMBANGAN TRIWULANAN PEREKONOMIAN INDONESIA �����������������
Maret 2013 �������������������������������
� �� �

� �
Kata Pengantar � � ����������� ������������ ������ ��Indonesia Economic Quarterly/IEQ)
������ �������������������������� ����������������������� ������ � ���� � �� ���� ����� ��� �� �������� ���� ������� ���� ������ ������� �������� ��������� �� ����� ������� ��� ��� ���� ��� �������������� ����� � ����� �� ��������� ���� � ����� ��� � ����� ���������������� ���������������� �� ����� ������������� IEQ � ������� ���� � � ������ ������� ��! ��� ����� � �� ��� ��� ��������� �� � � ��������� ���� ������� ���� ������ ����� �� "���� � � ����������� ������ ���� �������� ������� ��� ���� ��� �� � � � ��� ������ ���������� ����� ���� ��� � �� �� ���#�� ��� ��� ���� ��� �� ��� ��� ��������������� ������ ���
� � IEQ ���������������$� �� �%������� ����������� ����� ����������# ����� � �� ������� ��� �� � �� '����� *���� � �Poverty Reduction and Economic Management/PREM+�� ��� $� � %���� � � ���� � �� �� % �� ����������� �Sector Manager ��Lead Economist��-� ���$ ������� �Economic Adviser � Lead Economist���4���������������� �Senior Economist��� ������������������ � ���� ������ ���� � � �� � 4� ���������� ����� � ���� +������� ����������� �����4�� � ��'���4�� ��; �� �; �� �������<������;��=�� ��4��������>�� ��%�����4��@�> �������4���������������������� � �� � �� ���� � � ��� �� ����� � � � 4��� �� >��K � -����� ������� $ ��� � �� ����������$ �>� �$�����;���4�������������%�������� ���-��������'����� ���X ����Y���>� ����
� � *� � � ���������������� ��� ��� �4���������� ���Z��������� �� �����\^Z\+�� ; �� � ; �� � �� ����� <����� ��� � ��\� ����� ������+�� � ����>����Y���> ��������<���$������ ��� �<�Z��������� �� +���� ���X�������4��� ������� �<�\� ����� K���� � #����������������������� �%����>� �������_�������+��'������������� ��� ���� �� ���� �� ���� � ������ ����������� �+��$���� �> �������-� � "���� � ������;� � ' �� ���������� ������� ������� ���� �� �� ������� +� �� < ��� ��� �����'������X !�� ������������������� �� +�������=�##���_���'�"����>�����Y������������������'���4�����=� ����������>������X ������������������ ������������������ ���$������ �� �������������������� ����� � ����� - ����� -�K ��� �� � �� �� ����� '��� 4�� �� 4�� � �� ; �� �; �� ��4��������Y���> �������X�����>����������
� � "���� �� ���������������# International Bank for Reconstruction and Development���� $� �� ���� ������ ���� �� � ����� ��� 4����� � !� 4��4�$� ����� ��������Support for Enhanced Macroeconomic and Fiscal Policy Analysis��>*'*;�4+�������!������ �������� � �� ��� ����!��� ����� ��� � ���� � � ��������� � � ��� ������ �� ���� 4��4�$� �� ����� ��� 4����� �� ���$ ������� ������ ��� $� � ��� ����� ��� ��� � �� � ��� ��� $� � � ������� � ������� ��!��� ��� ������� ���� ����� �� ���!����� �������� � � �� #���� ! #���� � � � ��� � ������ ��� ��� �� ���� � � ��������� � � ��� ������ �� ������ ��� $� � ���� � ������ ������ �� �� �������������������� ���� ����!���������������;������������������ ������������ =��< ���`�%�#������>*<q���>� �������>�������>����=��< ���� � ��� ���
���������������� �������������� ��������������������������������������
� � z���� #���� ����� ����$� ��������� ���� ������ ��� ������������������� ��� �����������������{ ���z���� ������� ���� �� � � ����� � �!� ��� � ��� �������� ���� `������������� z���� ������ �� ��� ���� �� ���� ���� �� � ��� ����������� �� ����`���������������

Daftar Isi
�������������� ���
���������������������������������� � �
!" �#��#$�!%&!%�#�'%'$���!%�*�+�!-��#���%� � ;
;" ��������������� ��� �� ������������������ ; <" #���������������������������������������������<=;<� < >" ����������?��������������@� �����@���������������������������������������� �
��������������� O Q" ������������������������������������������W� �<=;>� X Y" ��� ������������?���� ���������������<=;<��������Z���� ������������� ������������ ;> O" ������������ ���������������������������<=;>������� ������������� ��@�����������$�;[ \" ���������������������������������������� ������ <; [" �����������������������]outlook^������������������ ��������_�������������� <>
�" �#�#�!�!��#��#$�!%&!%��#���%���#�#�'%'$�!%��%�'%#+�!� <Y
;" ���@�������������� ��������������!��%�<=;<� <Y a. Angka sementara defisit anggaran adalah 1.8 percent dari PDB… .......................................... 26 b. … penurunan pertumbuhan penerimaan diimbangi oleh rendahnya realisasi belanja utama26
<" $��������������� ����������� ����������������������� <X a. Apa yang dapat dipelajari dari perdagangan berdasarkan konsep nilai tambah? .................. 29 b. Produk komoditas menjadi faktor pendorong nilai tambah ekspor Indonesia ........................ 29 c. Bahan baku impor semakin banyak digunakan untuk produksi dalam negeri ........................ 31 d. Integrasi dengan rantai pasokan internasional dapat membantu diversifikasi ekspor .......... 32
`" �%�'%#+�!��!Z�%�<=;Q��!%�+#-!%q��%{!����%q!�!%���-�Z!% >Q
;" $����������������������������������������� � ����������������������� >Q a. Kota sebagai masa depan Indonesia ........................................................................................... 34 b. !� ��������������������W���������������������� ........................................................ 35 c. -������������������������������������������ ���������������� .......................... 40
<" $��������������������������������������������������� Q; a. Investasi infrastruktur belum pulih ke tingkatan pra-krisis Asia .............................................. 42 b. Apa yang mendorong tren terakhir dalam investasi infrastruktur? .......................................... 43 e. Menghubungkan infrastruktur, pertumbuhan dan hasil pembangunan ................................... 46
-!$���!%���%���!�'��&!$�!�!%�#�'%'$���%�'%#+�!� Q[
�� �
DAFTAR GRAFIK
&������;�������������������� �������������������������������������� ������@�� ������������ �� ���� ������""""""""""""""""""""""""""""""""""""""""""""""""""""""""""""""""""""""""""""""""""""""""""""""����
&������<��������������������������?������� �����������������������������������W��������������_�������!����""""""""""""""""""""""""""""""""""""""""""""""""""""""""""""""""""""""""""""""""""""""""""""""""""""""""""""""""��|
&������>��Yield��� ������!+��������������� �����������������������spread��������������#$�� ���������}�""""""""""""""""""""""""""""""""""""""""""""""""""""""""""""""""""""""""""""""""""""""""""""""""""""""""""""�<
&������Q��}���������������@�� ���������������������������������� ����� ��������� ������������� ������������""""""""""""""""""""""""""""""""""""""""""""""""""""""""""""""""""""""""""""""""""�<
&������Y������������������������W������������@���������������������������~�� ������� �����������������""""""""""""""""""""""""""""""""""""""""""""""""""""""""""""""""""""""""""""""""�Q
&������O�������������q������?���������@������������"""""""""""""""""""""""""""""""""""""""""""""""""""""""""""""""""�Q &������\��-����������������������� �����@������������������� ��@������
�� ����������������������������""""""""""""""""""""""""""""""""""""""""""""""""""""""""""""""""""""""""""""�Q &������[��$ ����������������?����@� �������������?�����������������������
���� ���������}�"""""""""""""""""""""""""""""""""""""""""""""""""""""""""""""""""""""""""""""""""""""""""""""""""""""""�O &������X��}���������������������� ������������������ ����������������������
����������������������������""""""""""""""""""""""""""""""""""""""""""""""""""""""""""""""""""""""""""""""""�O &������;=������������������������������������ ��������������?�������� �"""""""""""""""�\ &������;;���� ��������������~�*������������ ������������������� �����������������
�����_������������������""""""""""""""""""""""""""""""""""""""""""""""""""""""""""""""""""""""""""""""""""""�[ &������;<��`������������������������ ���q����������*�������W� ���� �����������
���������������� ���� ������� ��"""""""""""""""""""""""""""""""""""""""""""""""""""""""""""""""""""""""""""""""""�[ &������;>��������������������������� �������?���������������""""""""""""""""""""""""""""""""""�X &������;Q��}W� ������@������ ����� ����������� ���� �����~���@�������W��� �@��
���@������ �������"""""""""""""""""""""""""""""""""""""""""""""""""""""""""""""""""""""""""""""""""""""""""""""""""""�X &������;Y������ ����� ��������������������������������"""""""""""""""""""""""""""""""""""""""""""""""""""�;= &������;O��������������������������������� ����������@���� ������� �����������
���������������""""""""""""""""""""""""""""""""""""""""""""""""""""""""""""""""""""""""""""""""""""""""""""""""""""""""""""""""�;= &������;\��!��_��������������������������������������������������������������
�����������������}�""""""""""""""""""""""""""""""""""""""""""""""""""""""""""""""""""""""""""""""""""""""""""""�;; &������;[��}W� ����?���������������?������������������������ �����������������
��������������"""""""""""""""""""""""""""""""""""""""""""""""""""""""""""""""""""""""""""""""""""""""""""""""""""""""""""""""�;; &������;X������������������������������� �����������~����������?������� ~�����������
�� �����������}�"""""""""""""""""""""""""""""""""""""""""""""""""""""""""""""""""""""""""""""""""""""""""""""""""""""""�;< &������<=��}���������������������������� �@�������������������<=;<~�������� ���
� ��������������������������������������]loan to value ratio^}�"""""""""""""""�;< &������<;����� ����������<=;<�������� ���;<��������������}�"""""""""""""""""""""""""""""""""""""""""""""""�;> &������<<��}����@����� ������� �������������������������������<=;<��� ���
��������������W� �<=;>�""""""""""""""""""""""""""""""""""""""""""""""""""""""""""""""""""""""""""""""""""""""""""�;> &������<>����������������Z����������������������������������� �����@�����
�����������������������������������Z��""""""""""""""""""""""""""""""""""""""""""""""""""""�;Q &������<Q��}�����������������������W������� ����������@�����������������"""""""""""""""�;Q &������<Y��Z����������������� ��������� ��������������@���"""""""""""""""""""""""""""""""""""""""""""""�;Y &������<O����������������������������?�����������������������������������������""""""""�;O &������<\�����������������������������������������@���"""""""""""""""""""""""""""""""""""""""""""""""""""""""""�;\ &������<[�����@����������_������������ �������� ��@�������������<=;>�"""""""""""""""""""""""""""""""""�;[ &������<X��� ��@�����������������$������������������ �������!��%�������<=;>}�""""""�;X &������>=��}���������_��������������������� �����������������~��������������
��� ������ ��@��"""""""""""""""""""""""""""""""""""""""""""""""""""""""""""""""""""""""""""""""""""""""""""""""""""""""""""""�;X &������>;��������� �����������������������������������������������<=;>�""""""""""""""�;X &������><�����������������������~������� �@����� ���� �������������������������������
�����������������q$���������""""""""""""""""""""""""""""""""""""""""""""""""""""""""""""""""""""""""�<< &������>>��+����������������������������������������������������������~�
����@��������������������������������������������""""""""""""""""""""""""""""""""""""�<< &������>Q���� ���������������������������<=;<� ���������������������!��%_��"""""""""""""""�<O &������>Y��������������������?����������������������@���������������������@����
���������"""""""""""""""""""""""""""""""""""""""""""""""""""""""""""""""""""""""""""""""""""""""""""""""""""""""""""""""""""�<\ &������>O��������������?������!��%���������������� ��@������~�� ��@��������������
��������������"""""""""""""""""""""""""""""""""""""""""""""""""""""""""""""""""""""""""""""""""""""""""""""""""""""""""""�<\
&������>\��+������������� �����~�����������������������<=;<��?������������� ���������""""""""""""""""""""""""""""""""""""""""""""""""""""""""""""""""""""""""""""""""""""""""""""""""""""""""""""""""""""""�<\
&������>[��#������������������ ��_������������������������������[������������������������������ ���������������������������<=;;�""""""""""""""""""""""""�>=
&������>X��#���������������������������������������@����������������� ����������� �����������������������@��������������""""""""""""""""""""""""""""""""""""""""""""""""""""""""�>=
&������Q=���������� ����������������� ����@�� ����������������������������������?���������}�"""""""""""""""""""""""""""""""""""""""""""""""""""""""""""""""""""""""""""""""""""""""""""""""""""""""""""""""�>;
&������Q;��"""��������������`������������� ����������������������������������������~��?�� ���������������������`*�"""""""""""""""""""""""""""""""""""""""""""""""""""""""""�>;
&������Q<����������������������������@�����������������������������������������@���������}�"""""""""""""""""""""""""""""""""""""""""""""""""""""""""""""""""""""""""""""""""""""""""""""""""""""""�><
&������Q>��""����������`���~���������������������������@������������������� ����@�� ��� ���������""""""""""""""""""""""""""""""""""""""""""""""""""""""""""""""""""""""""""""""""""""""""""""""""""�><
&������QQ��������������_���������� ���������������������������� ���������������"""""""�>> &������QY������������ ����� ����������������������� ����������������������?������
!����""""""""""""""""""""""""""""""""""""""""""""""""""""""""""""""""""""""""""""""""""""""""""""""""""""""""""""""""""""""""""""""""�>Q &������QO�������������_������� ��������������������������������� �����
��������"""""""""""""""""""""""""""""""""""""""""""""""""""""""""""""""""""""""""""""""""""""""""""""""""""""""""""""""""""""""�>O &������Q\������_��������������������� ������������ �����?� ��������������~������
�������� �����������������������""""""""""""""""""""""""""""""""""""""""""""""""""""""""""""""""""�>\ &������Q[��� ��@������������������������������������_��� ��������������� �������""""""�>[ &������QX�����������������q�������� ������������������������������<===����<=;=�""""""""�>X &������Y=���� ���������������������������<==\��������<==X~���������������������������� ��
����������������<=;=����<=;;�"""""""""""""""""""""""""""""""""""""""""""""""""""""""""""""""""""""""""""""""""�Q> &������Y;�����������������������������������~����������������������?������ �������� ���
� ������������������_�������������;XX\�;XX[�""""""""""""""""""""""""""""""""""""""""""""""""""""""""""�Q> &������Y<�������������������������������������������W������������������������@��}�""�QQ &������Y>��}����������������������������� �����������������������
����� ������"""""""""""""""""""""""""""""""""""""""""""""""""""""""""""""""""""""""""""""""""""""""""""""""""""""""""""""""�QQ &������YQ��������������������������������W�����������������������@���������<==[�""""""""�QY &������YY��+� ����������������������<==\��������<==X���������������������� ���
������~����@��������� ����������}�""""""""""""""""""""""""""""""""""""""""""""""""""""""""""""""""�QO &������YO��}���������������� ������������������������~���������������������@�� ���
���������""""""""""""""""""""""""""""""""""""""""""""""""""""""""""""""""""""""""""""""""""""""""""""""""""""""""""""""""""""""""�QO
DAFTAR GRAFIK LAMPIRAN -���������������;��������������������W� ����������������""""""""""""""""""""""""""""""""""""""""""""""""""�Q[ -���������������<��������������������������� ������""""""""""""""""""""""""""""""""""""""""""""""""""""""""""�Q[ -���������������>��������������������������������""""""""""""""""""""""""""""""""""""""""""""""""""""""""""""""""�Q[ -���������������Q����@�� �������������������� �""""""""""""""""""""""""""""""""""""""""""""""""""""""""""""""""�Q[ -���������������Y�������������������"""""""""""""""""""""""""""""""""""""""""""""""""""""""""""""""""""""""""""""""""""""""""�Q[ -���������������O���������������������������""""""""""""""""""""""""""""""""""""""""""""""""""""""""""""""""""""""""""""""�Q[ -���������������\��! ������������������ �""""""""""""""""""""""""""""""""""""""""""""""""""""""""""""""""""""""""""""""""""""�QX -���������������[��%��?������������"""""""""""""""""""""""""""""""""""""""""""""""""""""""""""""""""""""""""""""""""""""""""�QX -���������������X��%��?������������""""""""""""""""""""""""""""""""""""""""""""""""""""""""""""""""""""""""""""""""""""""""�QX -���������������;=��`������������������ �������""""""""""""""""""""""""""""""""""""""""""""""""""""""""""""""�QX -���������������;;������������������� ����������_����������������?�����*����_
���?��"""""""""""""""""""""""""""""""""""""""""""""""""""""""""""""""""""""""""""""""""""""""""""""""""""""""""""""""""""""""""""�QX -���������������;<������ ����������@�����������""""""""""""""""""""""""""""""""""""""""""""""""""""""""""""""""""""""�QX -���������������;>�����?������ ���������������������������"""""""""""""""""""""""""""""""""""""""""""""""""""�Y= -���������������;Q������������������������ ������������������������"""""""""""""""""""""""""""""""""""�Y= -���������������;Y��Z������������ ���������������������������������� �""""""""""""""""""""""""�Y= -���������������;O�����������������������������������"""""""""""""""""""""""""""""""""""""""""""""""""""""""�Y= -���������������;\������������������� �""""""""""""""""""""""""""""""""""""""""""""""""""""""""""""""""""""""""""""""""""�Y= -���������������;[������������� ���!���������������"""""""""""""""""""""""""""""""""""""""""""""""""""""""""""""�Y= -���������������;X��{� ��� ���������������Y������������������� ��� �""""""""""""""""""""""""""""""""�Y; -���������������<=��+����#$����� ���������������������� ������� ����������"""""""""""�Y; -���������������<;������������������������"""""""""""""""""""""""""""""""""""""""""""""""""""""""""""""""""""""""""""""�Y; -���������������<<����������������������������������"""""""""""""""""""""""""""""""""""""""""""""""""""""""""�Y; -���������������<>�����������������"""""""""""""""""""""""""""""""""""""""""""""""""""""""""""""""""""""""""""""""""""""""""""�Y; -���������������<Q�������� ���������""""""""""""""""""""""""""""""""""""""""""""""""""""""""""""""""""""""""""""""""""""""""""""�Y;
DAFTAR TABEL
��� �;��$�������������������]baseline^��������������������������������������O~<����������������<=;>"""""""""""""""""""""""""""""""""""""""""""""""""""""""""""""""""""""""""""""""""""""""""""""""����
��� �<��$�������������������]baseline^~�����������������������������?�����O~<������������������<=;>~���������������@���O~Y������������������<=;Q�""""�Y
��� �>������������������������������������� �������;~X������������������������<=;>~���������������������!��%�"""""""""""""""""""""""""""""""""""""""""""""""""""""""""""""""""""""""""""""�<;
��� �Q���� ����������������������������������<=;<�����������������������������!��%<Y ��� �Y������������ ��������������������`�������%�#���� �����������������"""""""""""""�>>
DAFTAR TABEL LAMPIRAN
-����������� �;���� ������������������� ��@�����������""""""""""""""""""""""""""""""""""""""""""""""""""""""�Y< -����������� �<��%��?������������"""""""""""""""""""""""""""""""""""""""""""""""""""""""""""""""""""""""""""""""""""""""""""""�Y< -����������� �>��+�� ���������������������������������������������������""""""""""""""�Y> Lampiran tabel 4: Sekilas tentang perkembangan indikator sosial Indonesia�""""""""""""""""""""""""""""""�YQ
DAFTAR KOTAK
������;��Z������������~��������������������������������������� �������������"""""""""""""""�;< ������<�����@���������������������������������������������������"""""""""""""""""""""""""""""""""�;Y ������>�����@����������q������������������������@�W�������������~����@�������������
�������������������������������������"""""""""""""""""""""""""""""""""""""""""""""""""""""""""""""�;\ ������Q��������������������������������������������������������������� ����
����������������!����"""""""""""""""""""""""""""""""""""""""""""""""""""""""""""""""""""""""""""""""""""""""""""""""�>> ������Y��`����������� ������������������������������������������������"""""""""""""""""""""""""""�Q<
�
�
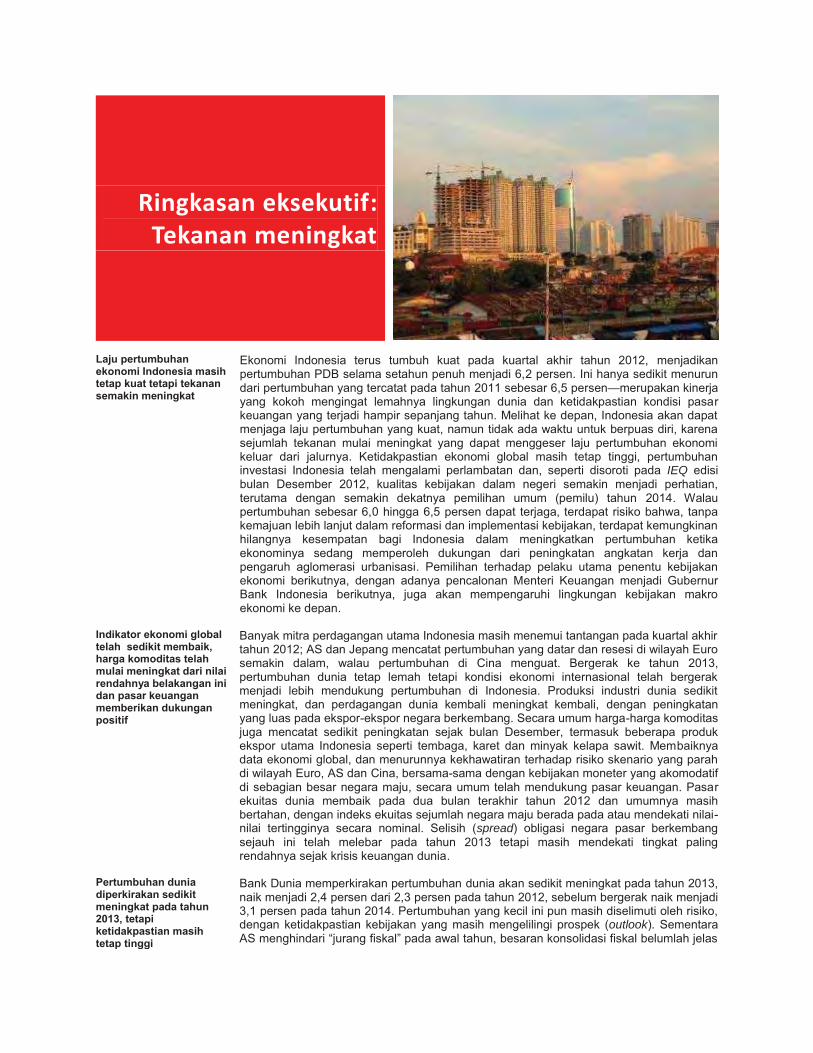
Ringkasan eksekutif: Tekanan meningkat
�
-�@�������������������������������������������������������������������������
� *���� � ����� � ������ ������� ���� ��� ������ �� �� ���� \^Z\�� ���� �������������$���������������������� �|�\��������� ������� � ���������� ����������������������������\^ZZ��������|�}������~�������� ������� ������ ��� ��� ������ � ����� �� � �� ��� ����� � ��� � � ����������������� ���� �������������'�� ���������������� �������������������������������������� ����������������������� � �������������� ���� ��� � �� ���� ��� ���� ��������� ���� ���������� ����� ������� �� � ������� ��� ����� � ����� � ������ �� �� ����� � �� �� ���������� K���� � ����� � ����� ����� � �������� ��� ������ � � ����� � ��� IEQ� �� � ����� $�������� \^Z\�� ��� ��� ��� ��� ���� ���� � ���� � ���� � ����� ��������� ���� ���� � ������ ��� � �� ����� ���� ��+� ���� \^Z��� X��������������������|�^�� ���|�}����������� ������� �������� � �������� ������������ �������������#���� ��� �������� ���� ����������������� �� ���� �������� �� � ����� � ���� �� ����� ���������� ��� ������� �� ����� ����������� ������ �� � �� ���� ���� ����� ��������� ������� � ��� �� �� ��� � �� ������� ������ ���� ������ ��� �������� � ��� ������ ���� ��� ������ '���� � ����� ���� � ����������� ����� � ��� ������ ���� �� ��������� � � ����� ��� ��� ���������� ����������
����������������� ��� �� ����������������~����������������� ����� ������������������ ������������ ������������������������������������������������������
� ����� ������������������� ��� ������� ���������������� ������\^Z\��4>���%���������������������������������� �� �� ����*�������� � ����� ���� ���������� � � < � ������� �������� ��� ���� \^Z������������� �� � ����� ����� ���� � ��� � � ����� � ���� ��� ����� ������������ � ��� �� �������� ���������� � � ����� �� ������� � ����� � �� � ��� � ���� ����� �� ������� �� � ����� � �� ���� ����� �� ���� �� ��������������������!���������������������>������������!��������� ������� ������ ��� � �� �� ���� ����� ���� $��������� �������� ������� �������������� ���� ����� � ������ � ������� ����� �� � ��� ����� �� ��� '��� ����������� ����������������������� ���������� � ������� ���������� �� ����*�����4>���< �������!���������� ������������������� #�� ����� ������������������������������������������������������� ��� �� � ���� �� ��� ��� ���� ����� �� ���� \^Z\� �� ������ �� ������������� �������� ������������������������������������ � � ! � � ���� �� �� ����� �� ��� >�� � �� �spread+� ��� �� � ���� ���� ��������������� � ����� ������� ��� ���� \^Z�� ���� � �� �� ������ � � ���� �� ��������������� � ��������� ���
����������������������������������������������������<=;>~��������������������������������������
� ���$� �������� ��������������� ������ � ���� �����������\^Z��� ������ �\����������� �\����������������\^Z\������������������ ������ ���Z��������������\^Z������������������� �� ������ ��� ��� ��� ������� � ����������� ����� ���� �������� ������� � � ��������� �outlook+��>������4>����� �� �������# �������������������������� �� �# �����������������
P e r k e m b a n g a n T r i w u l a n a n P e r e k o n o m i a n I n d o n e s i a
T e k a n a n m e n i n g k a t
THE WORLD BANK | BANK DUNIA Maret 2013 vi
��������������������������������������������� ��������������� ��� � � ����� � � � � ���� *���� �� �� ���� ������ '��� ������������� ����� � < � ������� � � �� ����� ���� � � ��� ����� !����� ����������� ����� ������ ��� �������������������� ���� � �������� ����
����������?���������������������������������������� �Q�<=;<~��������������������������������������������������������@��������������������������
� ���������� ����� � ����� � ��� ������ �� �� ���� \^Z\� �������� ����� ������������� � ���������������������$���� �����������|�Z����������!��!�������� � �� ������� � |�\���������������� ������� ���� ����������������� � Z��� ������ �����!��!������ ���� ������ � ��� ��� � �� �� Z��������������������������� ���������������+������������}}��������� ��$��� ������ ���� ��� � �������� ������� ����������� -��� ������������� ��� ������ ������ �� ��� ����� ���� � ������ �� ���������������� ���������������������\^Z\����������������� �������������� �� ���� ����� ���� ��� �� � ������� 4��-!�� \^Z\� ���������� ���� ���� ������� Z�� ������ ����� �� �� ����� � ���� ��� ��� �� ������ �4��-!���������� ��� �������� � # ��������� ��^������+��-�������� K���� ������ ��������������� ������� ���� ������ K���� ������������# @��� K������+��� ��� ���������������������������� ������ ���!��!���� ��� ������ ��� ����� �� � ������ ������� Z\�}� ���������!��!���� ��� � ���� ��� ������ \� ���� \^Z\�� ���� ��� ����� ����������������� ������ � ���� ������� ���� ��� ��� ������� �����������������Z�}��������������\^Z\����������� ���������������������������������� ���� �������
%��?����@� �����?��������� ������������������������������������<=;<~���������������� ����?� ���������������<~\�������������~�������� �������������� ������~���������*��~��������������������
� $�# � �� ���� ������ �� ���� ���� � ��|� ������ �� � �$�� ��� ������ �� ����\^Z\�� ��� ������ ��# � �� ���� \^Z\� ����� ���������� ���� � \��\� � � �� �����4>�� ��� \��� ������ �� � �$�� �� �� ��� �������� ������� ^�\� ������ ��� ����\^ZZ+��>����������������\^Z\����� ������������������ �����������������������������������!� �������� ��� ��������������# � ��� ��� ��� ������� ���� ����� ��� ��� ���� � � � ���� �� � ������� \�� � � ������� 4>� ����� ���� \^Z\�� ���������� ���� ������� �� �� ������ ����������������� ��� ������ ����� � �� ����� ����� � ��� �������� ���������� �� ������ �;$�+� ��� � ���� ��� ����� � �� �� ������ ��� ���� \^ZZ�������� \^� � � �� ����� 4>�� -��� ���� ���� ������ ���� ������ � ����� K���� � ���������� �+��������� #������������������������������������� K���� � �����#�� �� ��� ����� ����������� >�� � ���� ����� ���� ���� � ������� ���� ���� ������ � � # �� ����� ���� ����� �� ������� ���� ������������� ����� �debt sustainability+� �� �� ����� ����� � ���� ������������������������������ ��� �����$������ � ���������� ������������� �� ����� ;$��� �� �������� � �� ����� ����� �����#�� �� � ��� ��� ������� ���������������
������������ ��?���������������������������� ��@������������������������������������������������������
� 4������ �� ����������# � ��4��-�\^Z\�����Y��Z�|��� � ���Z����������� ��$�+��$�# � �� � ��� �� ����� �� � ���� 4��-!�� ������� \�\� ������ �� � �$��� ��������� ������������������������ ��������� ����� ����������� � ���������� � ����� ������� ��� �� �������� ������������� ��$��� ���� ����������� ��� ���� \^ZZ+�� ��� ��� �� ������ �� �� � ������ ����� ����� ������������ ���� \^Z��� ����� ��� �� �������� ���� !�� � # ������ �������������# � �������������Z����������� ��$��������� �� ����������������� ��������� ����# � �� ��������������������� ��� #�� ��� ������������ ��������������� � ����� ��>��� � ������������������������������ ��� ����������������������������� �!�� �� ����������������� ������������ ��������������������� ����� ��������������� ������� ������!���� ������� �������������������������� ��������� � ������������
���������� ������������~�W� ����������� ��� ����������<=;<~��� �������������� ���*�������
� Y�!��� #�� � �=�� ���� ��� ���� \^Z\�� ������� ���� ������ ���!��!������������ ��� ������� ����� Z\� ���� ����� ��� >������ ��� �=�� �� ���� ����� ��Z����������������$��������\^Z\����� �}������������!��!�����������;����� �\^Z������� �� ����� �� �� �� #�� ���������������� �������� � ��� ��� ������� ������� �� �� �� ���� � � %���� �� ��� ���+� �� ��� �� #� � ��� ��� -��� #�� � � � �� �� ����� ��� �� ��� ���� ������� '�� ��� ���

P e r k e m b a n g a n T r i w u l a n a n P e r e k o n o m i a n I n d o n e s i a
T e k a n a n m e n i n g k a t
THE WORLD BANK | BANK DUNIA Maret 2013 vi i
����� #�� � ������ �� �������� ������ � ���� ��� ���� #�� � �������� � ������� ��}!}�}� ������� ���� ���������� ���� �� �� ���� �� �������� � � ���� ��� �� ����� � �� �� �� ���� �������� � �� �cost-push+�� ������� �� �� �� ���� ���� ��� ���� ���� � �� ��� �� � �� �� ����� ���������������� ���������Y�� ������������������������� ������������ ����������������������������������� ������������������ ���������������������� ������� �� +����������������������������������Tabel 1: Menurut skenario dasar (baseline) pertumbuhan Indonesia diproyeksikan sebesar 6,2 persen pada tahun 2013 �
�� � <=;;� <=;<� <=;>� <=;Q�������������������� ��������������
���+�|�}� |�\� |�\� |�}�
��������������������� �����������������+�
}��� ���� �}�}� }�\�
+��� ��������������������� ��������� ��$�+� !Z�\� !Z��� !Z��� !Z���
���������������������������������
�����������������+�
��|� ���� ���� ��^����
`�������������_���������������!������������������������������������<=;<��� ����� �������������~�<=;>��� ���!��%����<=;Q�����%�������������!��%�<=;>�+������ ��������� �������~� ��+~� `�������� *��?����� ��?"~� ����������� ����� ������������
�������]outlook^������]baseline^��� ��������������������� ��@������������������������ �@����������_����������
� ��� $� � ���������� �� ���������� �$�� ���� ������ ����� ������ � ���������� � ��� �� �������|�\���������� ���� \^Z����|�}���������� ����\^Z�������� Z+�� ������ � ����� � ���� ��� �� ������ �������� ����������� ��������� ����������������������� ���������������� ��������� ������� ���� � ������ ��� � �� ����� ���� \^Z��� X����� �������� �outlook+����� �baseline+� ����� ����� ��� ����� K���� � ������ ������� #�������� ����� � ���� ���� ������� � ��� $� �� ������ � � ���� � � ����� ������������ ���������� K���� � ���!��!���� �� �� �� �� � ��������������� � ���������^�Z������������������ ������������$�����������\^Z���� � ������� � ��� �������� ��� IEQ� �� � � ���� $�������� \^Z\�� *������ ���� ������������ �������� ������������������\^Z������������������� ����� � ����� �� ����� ���� � ����� �� ������ �� ���� ����� '����� ����� \^Z��� � ���� ������� � ���� ��� �� ���� ��� �� ����� ���� �� �������������� � ��� ������� ���� ����� � ��� ������� �� ����������������$������ �|�}���������
%�������������@�� �������_�������������������_�������������������������������W����������������������������������������������}�
� >������ ���������� �$��� ���� ��������������������� � � ��!� � ��� ��������������� �outlook+� ����� ����������� ����������������� output� � �� ����������� ���� ���� � �������������� ���� ���� ��� ������������� output� �� ����� ����� �������������� �� �� � ��� � ��������������$��� ����������������� � ������ � ��������� ��� �� �� ������ Z+����$�� �� �� ������ ���������������\^Z\����� ��������������!��!�������������� �� ����� ����� ���� \^^������������� ������ �� �� � ������� �������� ���� ������ �� ����� ����� ������������ \^ZZ�� ������� �������� �� � ������� ���� ��� ���� �
Gambar 1: Pertumbuhan PDB riil tetap kuat tetapi pertumbuhan PDB nominal dan penjualan akhir riil telah melambat � ������������������� ������������������� �����������������������
�`����������@�� ������������ �]� �������^��������������������������������������������������������������]_�����������^�+��������+�����������������������������
^
Z^
\^
�^
^
Z^
\^
�^
$��!^� $��!^| $��!^� $��!Z^ $��!Z\
�������� ��� ��������� �������� ��� ��$��� ��$���� ������� ������
P e r k e m b a n g a n T r i w u l a n a n P e r e k o n o m i a n I n d o n e s i a
T e k a n a n m e n i n g k a t
THE WORLD BANK | BANK DUNIA Maret 2013 vi i i
���������� ������ ���� ���� � ���� ����� �� � ���������� ���������� �$������������� ������\^Z\��$ � �!� � ����������������� �#� ���������� !�� �������� �������������������� ���!�������� �������� ���� ���������� ���� �������� ���� ���������� ���� �� ����� ��� � �� ������������ �������� ������ � ������ � ��� �� ����� � ��� ��� � ����������output��
�}�������������� �������� ���� ��@���� �������������������������@��������������������
� Y � ��� ���� ���� ���� � ������� ���������� ���� �������� K���� �� �K���� ������� ��� ������� ��� � ������� ���� � ����� ��������� ����� ������� ���� ��� �� ������ �� ���� ���� ����� � ��� ���� \^Z��� ���� � ������ ������������������������������������ �!�� �� ��������������� K���� � ���� ��������� ������� � �� �������� � � ��� ������� �������� ���� ������� ������� K���� � ���� ���� � � ��� � ����� �������� ��� � � ��������� ������� ����� ����� �������������� ����\^ZZ��������������������� ������� ��������������� K���� ������������� ����������������!������������������������������ ��� K���� � � ��������������� K���� ������� ������������������������������������������ �������������� �� ���� �������������������� �������� � ��!� � ������� #�� ������� ��� �� ����������� ����������������� � � ���>�� � ����� ��� ������������ K���� � �� ���������� � �� ��� ����� � ��������� ����� ���������� ������������������ ������ ������� #��4�� ���� K���� � �������� ������ � �������� � ��� �� � ��� ����� � ������ � � ��� �� �������� ���������������������� � ���������� ������������ �������\^Z�� � � ��� ��� ������� ����� � ���� ������ � ���� �� ��� ��� �������� ����� K���� � ����� ��� � �������� % �� K���� � ���!���� �������������� ������� ���������� �� ���� #�� ���� >��� � ������ � �� #������������������ K���� ������������� �� ������������\^Z\������ �}���������� ����\^Z�����������������������$��� �� � �!� ���������Z��� �����������
��������������������������������������������������������������� �@��������������������������� ����?����������������������������������
� � ������� �� ����� ��������������������������� �ZZ����������������>��������� \^Z\�� ����� �� � Z\�}� ������ ��� ���� \^ZZ�� -��� � ���� �������� �� ����� � �� �� ���� ��� �� �^� ������ �� � �������� � ���� ���� � ���������� � � � ���� Z�}� �� � �� �� ��� �� � � ���� � ���� ��� �� � ������ ������ ����� ��� �� ����� ��� ����� ��� ���� ���� � ���� ���������� �� �� ����� � ��# � ���� ������ ��+����� � �!Z^���������� ���� \^Z����������� ���� ���������� �$�� �� �� ������ � � � ����� � � ���� ������������������Y�� ��������������������� ����� ��� �������������������4>��������'��������!�����>���$�������� ���������\^Z\�������}|�� ����� 4>�� �� ���� ��� ������� Z��� ������ �� � ������ ����� 4>� ��� ����\^ZZ���� �������������������� �Z��}�������
���������������������������������������?������ ��������������@�����������������������~������� �������������������������������
� � ������������������ #����������������������|�������������� �������4>���� ���� \^Z\� ���� ������ ���� ����� ���� ��� �� ����� � ������� ����������� ����� �� $�!��� ���� �� � q*<$� �� X�q� ����� ������������ � ������������ �K���!����������+~� ��� � ����!��������!�������� ����� � ��� �������� � � ���� ��������� ������� ������� ����������� ���� ���� ���� ������� �� � ��� � ����� �� ��~������ ������ ��� ���� ���� ��� �� �������� ������� ����� � ������� � ������� �������� ���� ������� ���� � ����� �� � ���������� �������������� � ������������ �������������� ������ ���� ��������� ���� � � # �� �� � ������� ���� ��#����� ��� ������� � � ����� �� ����� ����� ��� ����� �������� � � ������ >�� ��� ������ �� �� � ���� ������������� ����� ������������ ������������ ����� ���������� ��������������� �� ��� �������� � ����� �� � ���� �� � ������� ��#������ >�� � ��������� � � �� � ��� ���� ������� ����� � ���� ������ =�� � ���������� �� �������� ��������� ��� ������ �� ����� �������� ��������$����� ����� � ������� ��!��� ��������� ������ ���� ������� � ���������������������������
�

P e r k e m b a n g a n T r i w u l a n a n P e r e k o n o m i a n I n d o n e s i a
T e k a n a n m e n i n g k a t
THE WORLD BANK | BANK DUNIA Maret 2013 ix
������������������������������������������������������������W������������� ������������������!��������� �������������������������������������������������������������}�
� �#���������� ��� ��� �� � ������ ���� ��� �� � ������� � ������� ����� � ���� ��������� ����� �� �� ����� ������ ��� -��� K���� � #������������������� ������ �������� ����� �� ���� ������ �� ��������� � ������� #���������� ���� ���������� ������ ��� ���������� �bottleneck+� ��� �� �������� � �� ��� �� ���� ������� �������������� ������������� � � ����� ��$�!��� ���� ��� � � ��������� ��� $� � ������������ �� ���� K���� � #���������� �� � ���� Z����� ��� \^ZZ� ���� � ����������� �� � ��� ��� � �� �� ������ �� �� � �� � ���������� �� ��� ��� ���������� ���� ���� ��� ���� \^^�� � ��� \^^�� ��� ���� �� ���� ������� K���� � ������ �� � ��� �� Z^�^^^� 'X�� K���� � #���������� ����� ����� ��� ��� �������� �� � �$��� � �� �� � ���� ��!�� � �� ��� ��� �� ������ �� � �$�� ������ \+���������� K���� � #���������� ����� ����� ������ ������� ������� �� � ������������� ������� � ����� ��� ����� ������� ����� K���� � ���� � �� ����������������#������������������������� ����� ������������������� ����� �� ����� K���� � #����������� >�� ��� ��� ������ ���� ��� ��� K���� � �� ����� �� �������� ��� ���� � ���������� ���������� ����
Gambar 2: Investasi infrastruktur secara riil dan sebagai bagian dari PDB tetap di bawah tingkat pra-krisis Asia ������������������������������������������ ������������������������������������������������� ��
`��������%� ����� �������������������� ����������� ������"�+��������������������������������������������������������������Y�������������������������������
�}������������������������������W��?������� �@���������������@������������������������
� >����������������� ���� K���� � #������������������� ����������� ���� ����� � ������ ������ ������� ��� �� � ��� ������ ���� ������������� ��������������� ����� � ��������������� ����\^ZZ��������� ���� ���� ����� ��� ��� ���!���� � � ����� � ������� ����������� ����������������������� ������������������!���� ������������ ����� ������������������������������������� ������ ���� � �� ������� ��#� � ����� ��� � � � ������ ������� � ����� ������������������������������� ����������� K ����-���� ������������� ������� � � � ����� � ������ � ���� ��� � ��� ���� ������� �������������������������� ������ ��������������������������� ����� ���� ���!���� ��� �������� ���� ����� �mega-city+�� z���� ����� �� �#�� �� �������� ������� K���� � #������������� ��� �� � �� ��� ��� ���# � ������������ ��� ���� ��� ��� ���� ����� �������� ����� � ����� ��!������� ���� ����� �� ������!���� ��������������� ��� � ���������� ����� ����� �� ���� ������� ����� �������� ������������� �� ���� ����� � � ��� ����� ��� ����� �� ������ ������������������������ �
^
Z^^
\^^
�^^
�^^
}^^
^
\
�
|
�
Z^
Z��} Z��� Z��� \^^Z \^^� \^^} \^^� \^^� \^ZZ
�������� ��$�� �� � ��Y��
%� ��������� �]�����^�
%� ������ �]������������<===~������^�
����������������������������������]����^�
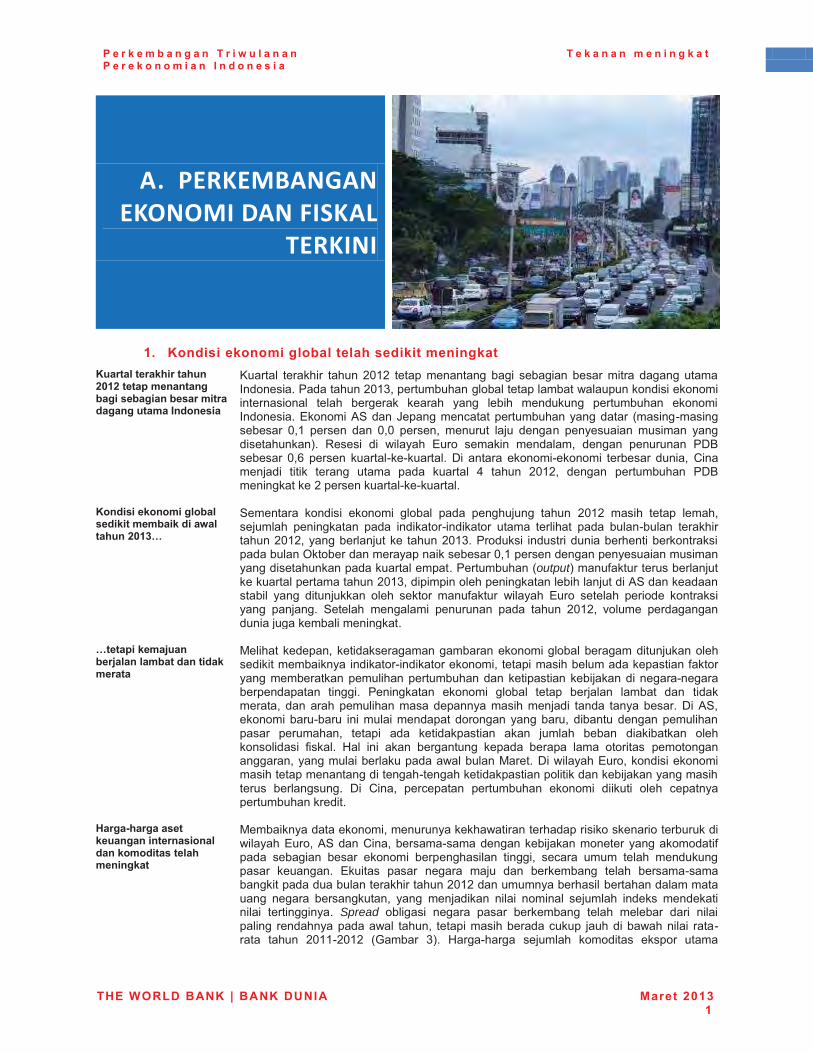
P e r k e m b a n g a n T r i w u l a n a n P e r e k o n o m i a n I n d o n e s i a
T e k a n a n m e n i n g k a t
THE WORLD BANK | BANK DUNIA Maret 2013 1
A.� PERKEMBANGAN EKONOMI DAN FISKAL
TERKINI
�
;"� Kondisi ekonomi global telah sedikit meningkat ������ ���������������<=;<������������������������������������������������������������
� ������ ����� �� ����\^Z\� ����� ����� �� � ���� � ����� � ��� ������������� ���������\^Z�������������������������������������� � ������ � ���� ��� ����� �������� ����� ��� ��� �� �������� ���������� ����� ������ ��*���� �4>���%��������������������������� ��� �!�� ��������� ^�Z� ������ �� ^�^� ������� ������� ���� ���� ������ � ��� �� ���� ������+�� Y���� � � � � ���� *���� ���� � ������� ���� ������ �$���������^�|� ������ �����!��!������� $ � ��� ����� !����� � �������� �� �� < ����� � � � �� ����� ���� ��� ������ �� ���� \^Z\�� ���� ���������� �$���� �������\������������!��!���������
��������������� ��� �����������������W� �������<=;>}�
� >������ ��� � � ����� � ������ ��� ��������� ���� \^Z\� �� �� ����� �������������� �� ���� ��� � ����! � ����� ���� ���� ��� ��� ���!���� ����� ������\^Z\���������������� ����\^Z���������� � ����� ��� ������� ���������� ��������q��������������� ���������^�Z����������������� ���� ������ ���������������������������������output+���#��������������������������������������\^Z���� � �� �������� ������� �������� �4>���������� �� ��� � ������� ����� ������� ��#����� � ���� *���� ������� ��� ���� ������ ���� ����� >������ ����� � ������ ��� ���� \^Z\�� K������ ��������� ���������� ��� ������
}���������@������@� ��� ��������������������
� '�� ������������� ������������������ �������������� �������������� � ������ ��� � ����! � ���������� ������ ��� ��������������� �#���������������������� ����������������� ��� ���� ���� ����!������������� � �� �� �� ���� ����� � ������ ����� ������ ����� �� � ��������� �� �������� ������������ ������ � ��� ���������$ �4>������� ����!���� ���� ��������������������� � ������������� ������ �������� ���� � �� ��� ����� � �� ������ ���� � � ���� ���������� �� � # ����� =�� � �� �������� ����� ����� ��� ���� ��� ������������������� ������������������'�����$ �� ����*�������� � ������ ��� ������������� �����!�������� ����� ���� � ������� �������� �������� ���������� $ � < �� �������� ���������� ����� � � ��� � ����� �������������������� ����
Z����_����������������������������� �������������� ������������
� '��� ����������� ��������������� ���������� � ������� ������������ �� ����*�����4>���< �������!���������� ������������������� #���� ���� � ����� ����� � �������� �� � �� �� ����� ����� ����� ������������ ������ *�� ��� ���� ���� ���� �� ��������� ����� �����!������ ����������������� ������\^Z\�������������� ������������������ ���� ���������� ��� ���� �� � � �� �� �������� ����� ������ � � � ���� �� ��� Spread ��� �� � ���� ���� ��������� ����� ������� �� � � ��� �� ������������ ����� ���� ��� ������������� ����� ����� � � ��!��� ���� \^ZZ!\^Z\� ������ �+�� =��!���� �������� ����� ��� ������� ����

P e r k e m b a n g a n T r i w u l a n a n P e r e k o n o m i a n I n d o n e s i a
T e k a n a n m e n i n g k a t
THE WORLD BANK | BANK DUNIA Maret 2013 2
����� � ��� � �� �� ���� �� � � � ������ ��� ����� ����� ���� \^Z\�� �������� �������� ������������ �� ������������������������+���
Gambar 3: Yield obligasi AS tetap mendekati nilai rendah historisnya dan spread hutang negara EM relatif ketat… � ������������������� ������
Gambar 4: …sementara harga sejumlah ekspor komoditas utama Indonesia mulai pulih dari nilai terendahnya belakangan ini � �����������������������������������������!"�� ������
+������q��$������ +�����������������
<"� Ekonomi Indonesia terus tumbuh kuat hingga akhir 2012 ���������������������������������������@���������_������� ������������������������~�������������������������������������������<=;>~���@���O~<��������
� *���� � ����� � ����� ���� ��� � ��� ������ �� �� ���� \^Z\�� � ����� ��������������������� �������� K���� �� �'� ������ ������� ���� �� ������$������ ������� �� � �������� ���� � ��������������� ���� ������� �������� � �� �� �������� ���� ���������� ���� �� � ��� ���������� �$���� �� ���� ����� ����� �� ���������� � K���� � �������� � X����� ����� ������� ������� ����� � ����� ������ ��������� �� �������� ��� ����\^Z��� � � #����!#����� ��������� ������� ��� � ��� ������ ������� � ��� $� � ����������������$�� ����\^Z������ � |�\�������� ��� � �� ��� �� ������� � |������������� ������� �����IEQ�$��������\^Z\����
������������������ ����������� �Q�<=;<�������������� ��������������������� �>�
� *���� � ����� � ����� ������� ����� ������ � ��� � ����� ������������ �� ��������� �$�� ������� |�Z� ������ ���!��!���� � � ������ �� ���� \^Z\������ �� ������ � ������� ������ ��!�� ��������!������ ��� ����� ������������ ��� |�������� � ���������������� ��!�� ��� � �� ��� �� ����� � �� � |�\������� ���!��!���� ��� ������ ��� ������ ���� ���� ���� ���������� �� �������!�������+������ � �������Z��������������!��!��������� ������ � Z��� ������ ��� ������ �� ������ }+�� >���� ����������� ����� ���� \^Z\������������ �$�� � �� ������� |�\� ������� ��� � �� ������� � �� ��� ������������������\^ZZ��������|�}����������
}��������������������������� ����������������?���������������
� >������ �$�� � �� �� �� ����� ������ ��� ������ �� �� ���� \^Z\�� �����������$�� �� �� ������� ����� � � # �� ���� � ��^� ������ ���!��!����� "������������ ������� ��� �� �� ����� ���� �� ���� ����� ��� �� �������������������������$���� �� �� � � ��������������Z|��������� ���!��!������������������� ����\^ZZ���������� �� ��������������������� ���������� ��#����� �$��� �������� ���!���� ��� �� �� ���� � �������� �� >������ � ���� � � #�� � � ���������� �� ���� ����� ��������������output�� ���������� ����� �� ����������������� ��������������� ��� ������� ����� ���� \^Z\�� ��� � ������ ����� ������ ��������� ��� ���� ����� �� >������ �������� �� ����� � ���� ��������#�� � ��������������� �� ����\^Z\����������output!��������������\�\����������!��!�������������������������������� ����� ����
� �
^
\
�
|
�
Z^
^
\
�
|
�
Z^
;��!^� ;��!^� ;��!Z^ ;��!ZZ ;��!Z\ ;��!Z�
������������
;=_�����+����������� �
#$��&������
!Z^^
!�^
\^
�^
Z�^
\^^
!Z^^
!�^
\^
�^
Z�^
\^^
;��!^� ;��!^� ;��!Z^ ;��!ZZ ;��!Z\ ;��!Z�
������������
<�� -����� ����� ����� <����� Y�����
P e r k e m b a n g a n T r i w u l a n a n P e r e k o n o m i a n I n d o n e s i a
T e k a n a n m e n i n g k a t
THE WORLD BANK | BANK DUNIA Maret 2013 3
������������������������������������������?�����������������~��?�� �������������������������_���������������������
� ��� � � � ������� �� ��� ������� ���� �� �������� ������ �� ��� �� ������ ������ ������ ����� �������� ������!��!������ ���� ������ ���� �+�� ��� � ������ ����� ������ ��� ��� ���� ��� ������ |+��>������ �������������������������������������������������������� � ��� �� �� � �$�� �Z\��� ������ ��� ������ �+�� �������� �� ����� ��� �����������^�}������� ���!��!������������������������������������^��������� ���!��!���������������� ���� ������� ����� �� �������������������� �������� ��� ������� � � ���� ��� ������ ����� ��� ��������������!������� ���� � ��|� ������ ���!��!����� ���� ���� �������� �!� ����� ������������������������!��!�����>��������#���������������������������|�\����������!��!������ �� ��}���������������������������������������#������ ��������������������������������}����������!��!���+���������� ������������ �������������� ������������������������!��!������������������� �������������� ��������� ����������������|����������!��!�����������������
������������������W���������������������������~���������������������������� ����
� ��� � � � ��������� ���� �� � �� ���� ���� � ������� ���� ��� ������ ��� ���� ������ ����� ������ � ����� ��� ������� ��� �� �� � ������� ���� ������� ������� ������ � ����� �� ���� ������� }��� ������ ���!��!���� ��������� ��� �� ������� Z�Z� ������ ����� � ����� �����!��!������ ������� ���� �+�� ��� ������ �� ����� ������ � ��� ��� �� ���� �������z��������\^Z\����������������������� �������� �����������}������������������� ��� �� ����������������� ���>��� ���������� ������ �������� ����� ��� ������ ��� ������ ���� ������ ���!��!����� ������ �� ������ ����� ������� �������� ��� � �������� ��� �������� \^Z\��4� ����� �������� �������� ������ ������ �������Z�\���������� ����\^Z\����������� ���\�������� �����\^ZZ���
�������������������~�W� ���������������~�����@��������������}��
� �K���� � � �� �� ���� ������� ���� ������ ���!��!����� ���� ��� ����� �� � �� ������� ������ ���� �� ���� ������ ��� ������� ��� ������ ��� ��� ��������������� � ���� ������ ��� � � # �� ���� K���� � ������ � ��������� �������� ���������������������������!��!���������������� ����� �� � ���������� ������� \���� ������ ��� � ���� ��� ������ ����� ����\^Z\��$ �� � �� �� K���� �������������������}������������� K���� ������� ������ ���������������� �������������� ������������������������!��!�����X����������������������� �� K���� ����������������������� ����������������������������\^Z\�� ���� ������������������\^ZZ�������� ������������ ����^������������������$����������������������
#��������������@����������������������������}�
� *������ ���� �� ������ � ���������� ��� ������ ��� ������ � ��� ��� \�\� �� ������������ ����������������!��!���������������� ���� �� ������}+�� >������ ������� �������� �� ���� � � ���� K������ ������� ��� ���������������� �� ���� ������� \�|� ������ ����� �����!��!������ ���� ������ ���� ������� ���� �� ������� ������� �� ������������ ��������������}�������� ������ ����� � ���� � ������ �� ������ ����� � �� � �� �������� �� ��� ���� ����� ������ ������� ��}� ������ ���!��!���+�� z���� ����\^Z\� ����� ����������� ������� ���� �� ������ � Z�}� �� � ��������� �� ������������$��� � ���������� ��������� ������������������������\^^�����
"""�������������������������������������������������������������������������W���@�� ��������������������������������������<=;>�
� ������� ��� �� �� �� ������ � ���� �����!��� ������ ��� ��� \��� �� ���������� ����� ���������� �����!��!������ ���� ������ � ��� �� � ������� ����� �� ��� ��� \��� �� � ��������� ����� ���������� ���� \^Z\��>������������ ����������������������� ������� ��������� �� �������� � � ���� ������ ���������� ����� �������� � �� � ���� �� �������� ��� =�� � ���������� ���� ������ � ������ � ���� ����� ���� \^Z\���� � ���� ��� IEQ �� � � ���� $��������\^Z\. ������ � � ���������� �� ����� � #� ��� �$�� ��� � ����� �� � � � � ������� � �� � � � ��������� ���� � � �������� ������ ����� ��� �������� ���������� �$�� �� ������ # �� � �� �� �������� Z� � � � ���� ������� #+�� =�� � ������ �� ��� �� ������ �������������� �� � �� �� ���������� ������� �� ��� ������ ������ � ���� �de-stocking+��������� ������������������������������!��������� �����
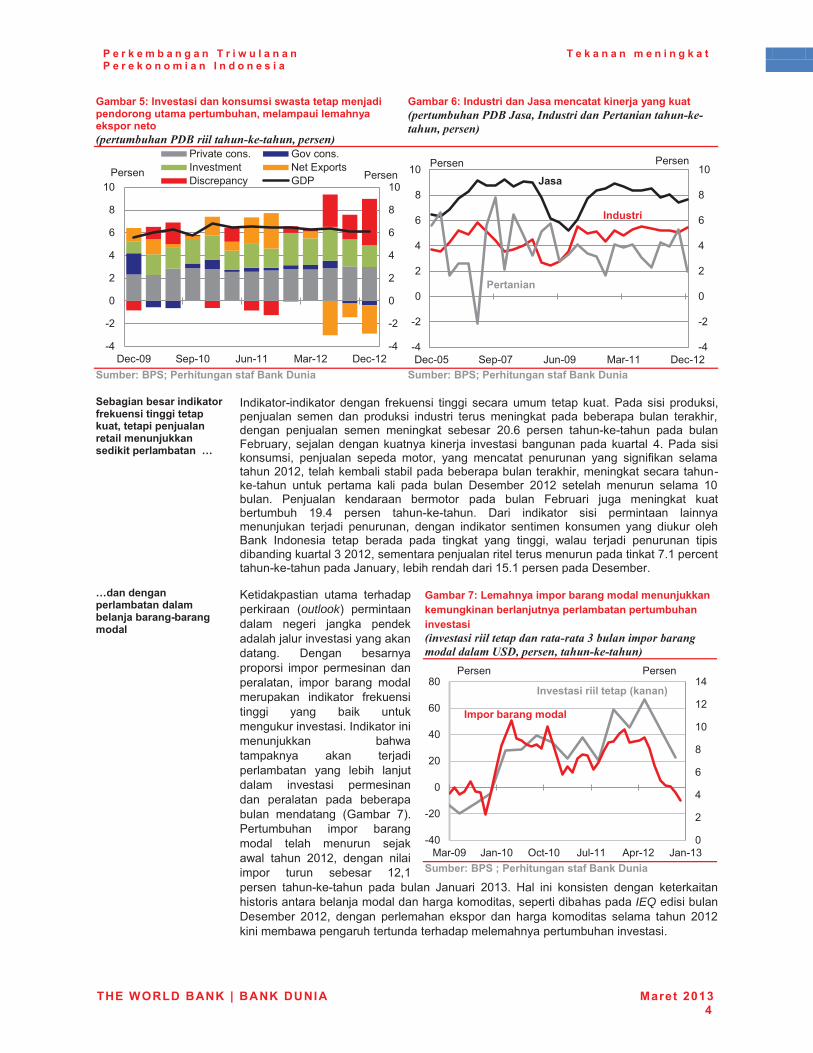
P e r k e m b a n g a n T r i w u l a n a n P e r e k o n o m i a n I n d o n e s i a
T e k a n a n m e n i n g k a t
THE WORLD BANK | BANK DUNIA Maret 2013 4
Gambar 5: Investasi dan konsumsi swasta tetap menjadi pendorong utama pertumbuhan, melampaui lemahnya ekspor neto � ���������������������������������� ������
Gambar 6: Industri dan Jasa mencatat kinerja yang kuat � ���������������#�����$������������������������������������ ������
�
+��������+����������������������������� +��������+������������������������������
+���������������������������������������������~���������@�� ������� �����@�������������� ���������}��
� �� ����! � ����� ���� #������ � � �� � ����� ����� ����� ����� ���� � � ������� �������� ����� �� ������� � ����� � ������ �� ���� ��� ������� ���� ����� ������� ������ ����� �� ���� ������� \^�|� ������ ���!��!���� ��� ����;����������������������� ���� K���� � ������������� ������� � ������� �� ������ ������ ������� ��� ������ ������ ��� � � # �� ���������\^Z\������������ ���� ��������������������� ����� ������������!��!���� ����� ������ �� � ��� ���� $�������� \^Z\� ������� ������ ����� Z^������ ������ ����� ��������� ��� ���� ;����� � ���� �� ���� �������������� Z���� ������ ���!��!����� $� � � ����� � � � ���� �� � ��������� ����� � ������� ���� � ����� ��� ��� ������� ��� � ����� �������� ����� � ����� ����� ��� � ���� ��� � �� �� ���� ����� � ������ � � ��� �� ����������\^Z\���������������� �������������������� �����Z�����������!��!�������%�������� ��������� �Z}�Z����������$����������
}���������� ��������� ���� ��@��������_���������� �
� ��� ����� � ���� ����������� �� �outlook+� ���� ������ ���� � ���� ��������������� K���� ����������� $��� ������������� � ����� ������ � ��������� ����� ���� ������������ � ����� #������ �� �� � ��� � �� ������������� K���� ���� ����� ��������� ���������� �� ����� ��������� ��� ��� �� ��������� K���� � ������ ��� ������ ��� ����������� ������ ������ �+������������ ����� ��������� ����� ������ �������� ���� \^Z\�� ���� � � ����� ����� ������� Z\�Z������� ���!��!���� ��� ���� %�� � \^Z��� =�� � ��� ���� ���� ������ ��� ���� �������������������������� ���������� �� �������IEQ �� � �����$�������� \^Z\�� ���� �������� ������� �� ���� ����� ��� ����� ���� \^Z\�� ���������������������������������������������� K���� �
Gambar 7: Lemahnya impor barang modal menunjukkan kemungkinan berlanjutnya perlambatan pertumbuhan investasi ���������������� ���������������%�������� ���������������������&"��� ����������������������
�+��������+������������������������������
!�
!\
^
\
�
|
�
Z^
!�
!\
^
\
�
|
�
Z^
$��!^� >��!Z^ %�!ZZ '�!Z\ $��!Z\
�� K������� ��K������K������ -���*@�����$ ������� �$�
������ ������
!�
!\
^
\
�
|
�
Z^
!�
!\
^
\
�
|
�
Z^
$��!^} >��!^� %�!^� '�!ZZ $��!Z\
��������
������
q����
������
���������
^
\
�
|
�
Z^
Z\
Z�
!�^
!\^
^
\^
�^
|^
�^
'�!^� %!Z^ q��!Z^ %��!ZZ 4��!Z\ %!Z�
������ ������
���������������� �
������������ ������]�����^�
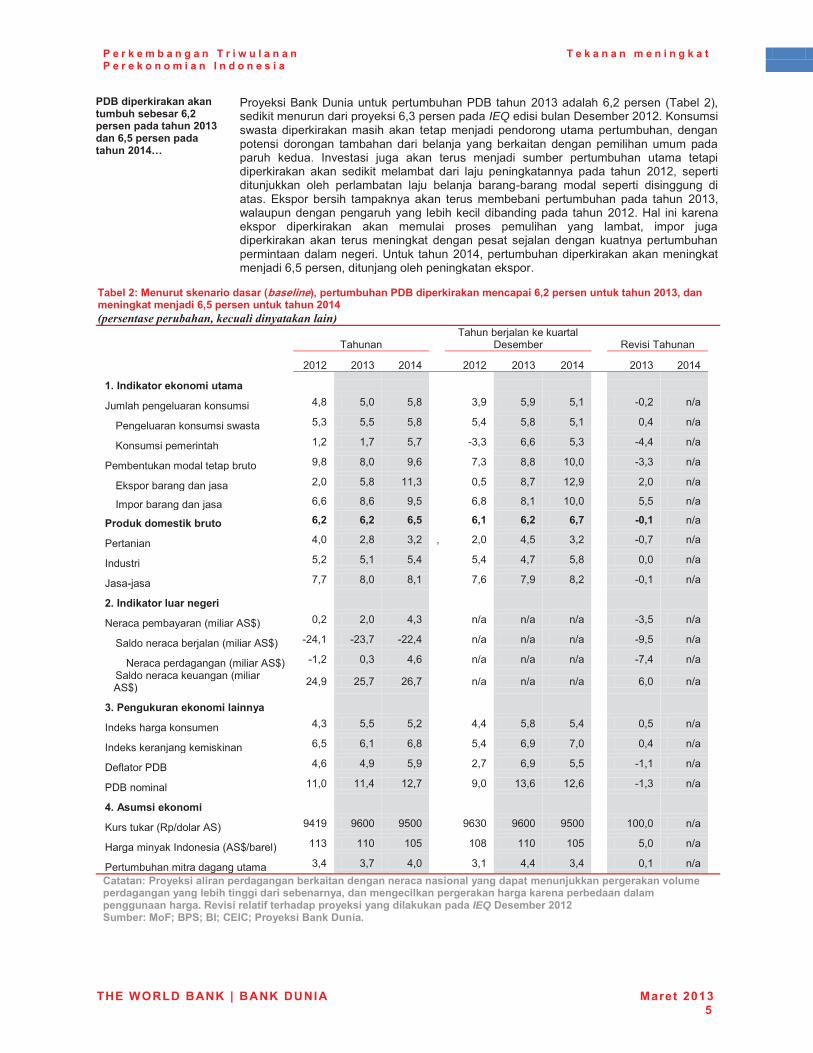
P e r k e m b a n g a n T r i w u l a n a n P e r e k o n o m i a n I n d o n e s i a
T e k a n a n m e n i n g k a t
THE WORLD BANK | BANK DUNIA Maret 2013 5
���������������������������������O~<����������������<=;>����O~Y����������������<=;Q}�
� ������� ����$� �����������������$������\^Z������|�\�������������\+����� � ���������� �������� �|������������IEQ �� � �����$��������\^Z\�������� ������� ���� ����� ���� ��������� � ����������������������� ��������� � ������ ������� � ����� ������� �� ������� � ������� �������� ������ �K���� � ���� �� ������ ���� � ������� ���������� ���� ���� �� ���� ��� �� ��� � �� ������� �� � ���� �� ����� ��� ���� \^Z\�� ������ �� ������� ����� �������� ���� ����� ���!���� ����� ������ � � � ����� � ����� *������ ���� �� ������ �� ������ ������ � ���������� ��� ���� \^Z����������������������� ��� ����� ��� �� ����� ���� \^Z\��=�� ������������ � ���� ��� �� ����� � ������� ����� �� ��� ������ ����� ����� ���� ��� �� ������ �� ���� ���� ����� ��������� ������������������� ���������� ��z���� ����\^Z�������������� ���� ������� �������� �|�}��������� ������������ ��������������
Tabel 2: Menurut skenario dasar (baseline), pertumbuhan PDB diperkirakan mencapai 6,2 persen untuk tahun 2013, dan meningkat menjadi 6,5 persen untuk tahun 2014 � ���������� ������������'������(�������������
�� ���� ���������������������
$�������� �� Y�K � �����
�� \^Z\� \^Z�� \^Z�� �� \^Z\� \^Z�� \^Z�� �� \^Z�� \^Z��
;"����������������������� �� �� �� �� �� �� �� �� �� ��
%������������������� � ���� }�^� }��� � ���� }��� }�Z� � !^�\� {�
�������������� ������ }��� }�}� }��� � }��� }��� }�Z� � ^��� {�
������ ������ ��� Z�\� Z��� }��� � !���� |�|� }��� � !���� {�
������������������������� ���� ��^� ��|� � ���� ���� Z^�^� � !���� {�
*��������������� \�^� }��� ZZ��� � ^�}� ���� Z\��� � \�^� {�
��������������� |�|� ��|� ��}� |��� ��Z� Z^�^� }�}� {�
������������������� O~<� O~<� O~Y� O~;� O~<� O~\� _=~;� {�
���� � ��^� \��� ��\� �� \�^� ��}� ��\� � !^��� {�
������ � }�\� }�Z� }��� � }��� ���� }��� � ^�^� {�
%�!��� ���� ��^� ��Z� � ��|� ���� ��\� � !^�Z� {�
<"���������� ��������� �� �� �� �� �� �� �� �� �� ��
-������������� � ��4>�+� ^�\� \�^� ���� � {� {� {� � !��}� {�
>���������������� � ��4>�+� !\��Z� !\���� !\\��� � {� {� {� � !��}� {�
-������������� � ��4>�+� !Z�\� ^��� ��|� � {� {� {� � !���� {�>��������������� � ��4>�+� \���� \}��� \|��� � {� {� {� � |�^� {�
>"������������������ ������� � � � � � � � � � ������������������ ���� }�}� }�\� � ���� }��� }��� � ^�}� {�
��������������� �� � |�}� |�Z� |��� � }��� |��� ��^� � ^��� {�
$�#������$�� ��|� ���� }��� � \��� |��� }�}� � !Z�Z� {�
�$���� �� ZZ�^� ZZ��� Z\��� � ��^� Z��|� Z\�|� � !Z��� {�
Q"�!������������� � � � � � � � � � ������������Y�{�����4>+� ��Z�� �|^^� �}^^� � �|�^� �|^^� �}^^� � Z^^�^� {�
=���� �������� ��4>�{����+� ZZ�� ZZ^� Z^}� � Z^�� ZZ^� Z^}� � }�^� {�
����������� ����������� ���� ���� ��^� � ��Z� ���� ���� � ^�Z� {�`����������������� ��������������������������������?��������� ���������������@����������������� ������������������ �����������������������~�������?� ��������������������������������� ������������������"�������� �������������������������� �����������IEQ�������<=;<��+������$�*����+������`#�`��������������������"�
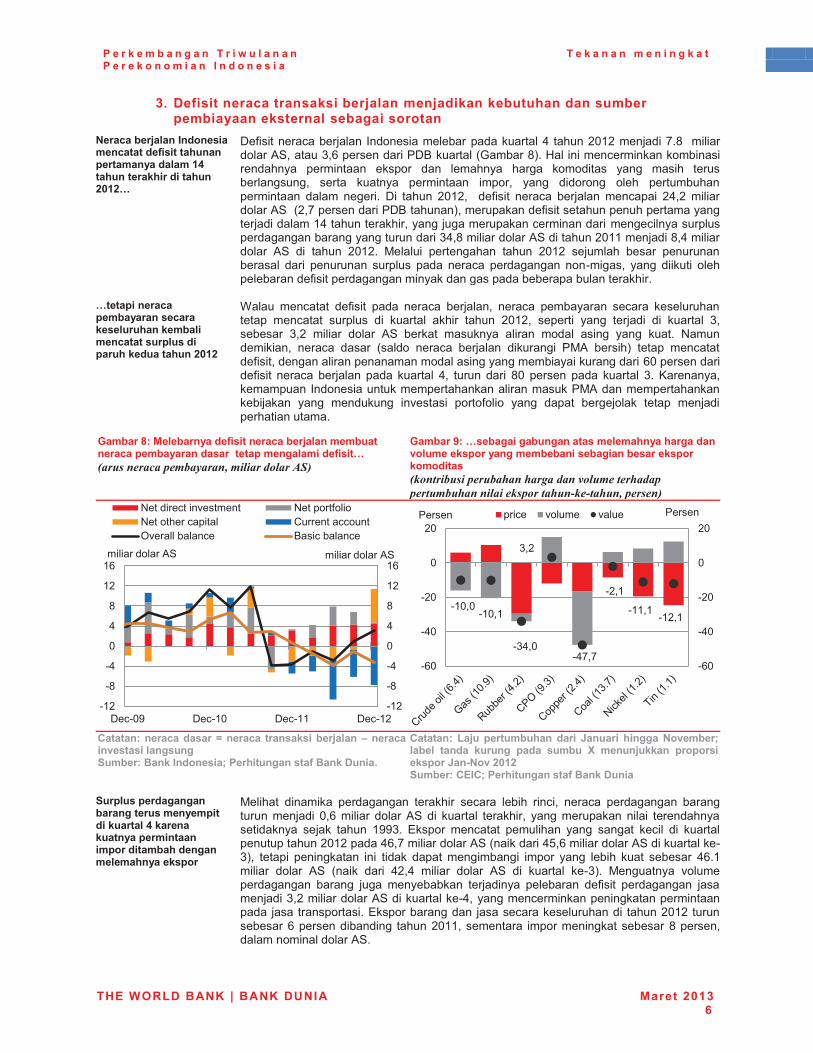
P e r k e m b a n g a n T r i w u l a n a n P e r e k o n o m i a n I n d o n e s i a
T e k a n a n m e n i n g k a t
THE WORLD BANK | BANK DUNIA Maret 2013 6
3.�Defisit neraca transaksi berjalan menjadikan kebutuhan dan sumber pembiayaan eksternal sebagai sorotan
%��?����@� �������������?������������������������������ ���;Q�����������������������<=;<}�
� $�# � ������������ ����� ������������������� ����\^Z\����� ����� �� � �������4>�������|��������� ��$���������������+��=�� ������� ������ � ������� ���� �� ������� �� ������ ���� ����� ��� ��� �� �� ���������������� ����� ����� ���� �� ������ ��� � ������ ����� �������������� �� ���� ���� �� $ � ���� \^Z\�� � ��# � �� ���� ������ ���� � \��\� � � �������4>���\����������� ��$�����+�����������# � ��������������������������� �����Z����������� ��������������������� ��� ������ �������������������������������� ������� � �������4>�� �����\^ZZ����� ������ � ������� 4>� � � ���� \^Z\�� '���� � �������� ���� \^Z\� �������� ����� ������������ �� � ������ �������� ��� ���� ������� �!� ���� ��� � ��� � ��������������# � ���������� ��������������������������� ����
}���������?�������������?������ ����������� ����?��������� ���������������������<=;<�
� X��� ������ ��# � �� ��� ���� ������� ���� ������� ����� ��������������� ������ �������� � � ������ �� �� ���� \^Z\�� ������ � ��� ����� � � � ������ ���������� ��\� � � �� ����� 4>� ������ ������ � �� ����� � �� ��� ����� -������ � �� ���� ���� ������ ���� ������ � ���� � �'4� ���� �+� ����� ��������# � �������� ������������ ��������� � �������� �|^��������� ���# � �� ���� ������ ��������� ��� ����� �� � �^� ������ ��� ������ ��� ������������������ ����������������� ��������'4���������������� ��� ��� �������� K���� � �����#�� �� ��� ���� ���������� ����� ���� ������ �������
Gambar 8: Melebarnya defisit neraca berjalan membuat neraca pembayaran dasar tetap mengalami defisit… ����������'�� ����(�����������������!"��
Gambar 9: …sebagai gabungan atas melemahnya harga dan volume ekspor yang membebani sebagian besar ekspor komoditas ���������� �������������������������������� � ������������������ ������������������� �������
� �`�����������?������������?�� ������������@� ��� �����?����������� ��������+����������������������������������������������"�
`�������� -�@�� ����������� ���� q������� ������� %������� �� � ����� ������� ���� ������ �� ����@������ ���������������q��_%���<=;<�+������`#�`�����������������������������
�+��� ������������������������������������������ �Q��������������������������������������������� ��������������
� '�� ��� � � �� ������� ����� �� ����� ��� �� � � �� ���� ������� ������������� � ^�|�� � �� ����� 4>� � � ������ ����� ��� ���������� � � ����������� ���� ����� ���� Z����� *������ ������ ����� �� ��� ���� ��� �� � � �����������������\^Z\�����|���� � �������4>�� ���� ��}�|�� � �������4>�� ���������!�+�� ���� � �� ���� � � ��� ���� ��� ��� � ����� ��� ��� �� ���� ������� �|�Z�� � �� ����� 4>� � �� �� � �\��� � � �� ����� 4>� � � ������ ��!�+�� '������ K������������� ���� ���� �������� ����� �� ������� ��# � �� ������� ������� ���\�� � �������4>�� ���������!������������ ���� �������� ���������������� ��*������������������������������� � ����\^Z\�������������|�������� �� �� ����\^ZZ��������� ������� �������������������������� �������4>��
!Z\
!�
!�
^
�
�
Z\
Z|
!Z\
!�
!�
^
�
�
Z\
Z|
$��!^� $��!Z^ $��!ZZ $��!Z\
-���� ����� K������ -�������#�� �-����������� �� <�����������qK��������� �� ������
� � �������4>� � � �������4>�
!Z^�^�!Z^�Z�
!���^�
��\�
!�����
!\�Z�
!ZZ�Z�!Z\�Z�
!|^
!�^
!\^
^
\^
!|^
!�^
!\^
^
\^�� �� K����� K��������� ������
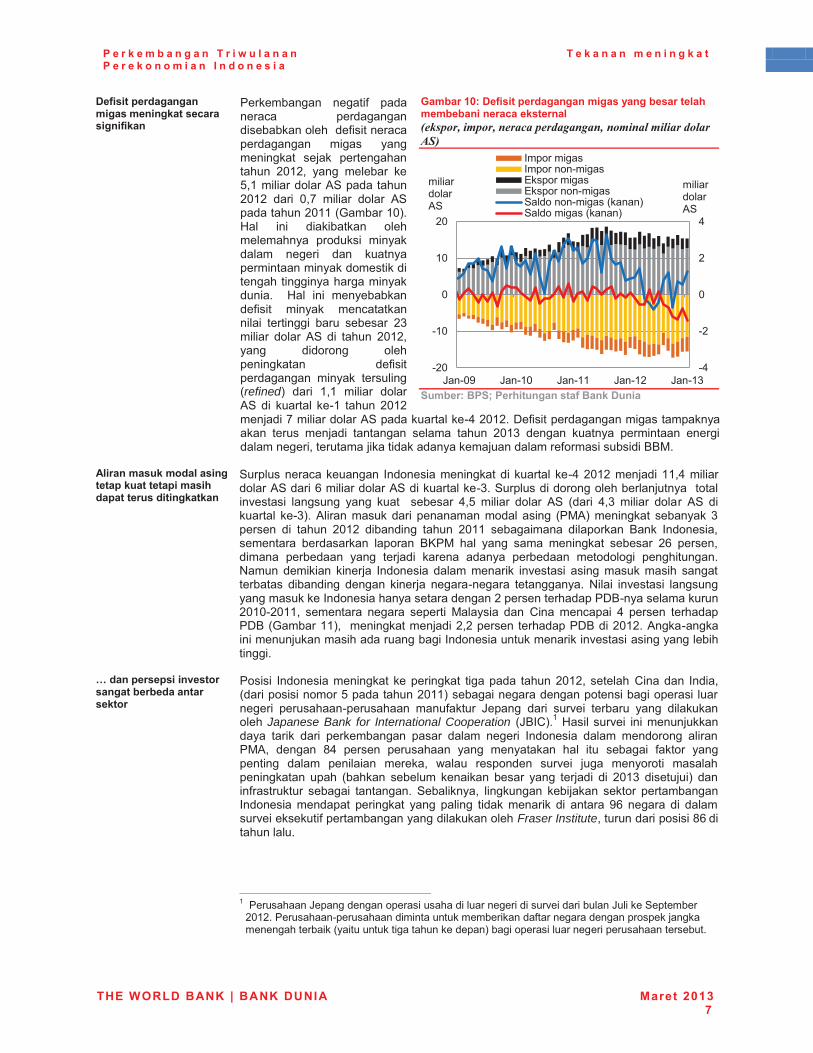
P e r k e m b a n g a n T r i w u l a n a n P e r e k o n o m i a n I n d o n e s i a
T e k a n a n m e n i n g k a t
THE WORLD BANK | BANK DUNIA Maret 2013 7
���������������������������������?���������������
� ��������� ��� #� ������� �������� ��������������# � ������������� � ��� ����� ���� ����� ������������ \^Z\�� ��� ������� ���}�Z�� � �������4>��������\^Z\� �� � ^��� � � �� ����� 4>��������\^ZZ�������Z^+��=�� � � � ���� ������������� ������� � � ������� ���� � �� ��������� ��� ��������� ��� ������� �� ������� ����� �� � =�� � ����������# � �� � ��� ������� � � ���� �� � ���� ������� \��� � �� ����� 4>� � � ���� \^Z\����� � ������ ������� ���� ��# � ��������� � ��� ������ ���refined+� �� � Z�Z� � � �� �����4>� � � ������ ��!Z� ���� \^Z\����� ���� � �������4>������������!��\^Z\��$�# � ���������� ����������� ������ ���� � ���� ����� ���� \^Z�� ���� ����� ���� �� ���� ��������� ���������� ��� ������������������#���� ����� � ���'��
Gambar 10: Defisit perdagangan migas yang besar telah membebani neraca eksternal ���� ����� ��������'�� ����������������������������!"�
+��������+�����������������������������
�! �������������� ���������������������������������������������������
� >���������������� ����� ��� ����� ������� ��!��\^Z\����� �ZZ���� � �������4>��� �|�� � �������4>�� ���������!���>�������� ��������������������������� K���� � ������ ��� ���� � ������� ��}� � � �� ����� 4>� ��� � ���� � � �� ����� 4>� � ������� ��!�+��4� ��������� � ��������� � �� ��'4+��� ���� �������������� � � ���� \^Z\� � �� �� ���� \^ZZ� ���� �� � ������ ��� ����� ��������� �������� ����� ���'� ��� ��� ��� �� ���� ������� \|� �������� �� ������� ��� ����� � ���� ��� ������� ��������� � ���� �����-��� ��� � � � ���� ����� � ���� ��� �� K���� � � �� ������� �� ����������� � �� �� ���� � ���� ���!���� �������� - � � K���� � ���������������������� �������������\���������������$�!������������\^Z^!\^ZZ�� ������� ���� ������ � '��� � �� < � ���� � �� ������ ��������$��������ZZ+�� ��� �������� �\�\���������������$��� �\^Z\��4��!��� ���������� ���������� ������ ��������� �� K���� �� �������� ��� �� ����
}��������������������������������������������
� ��� � � ����� ��� ���������� ���� � ����� ����\^Z\��������� < ��� �� ����� ���� � ������}��������\^ZZ+����� �������������� ��� ������ ��������� � ������!������� ��#����� %���� �� � ���K� � ������� ��� � ����������Japanese Bank for International Cooperation �%��<+�Z�=� �����K� � ������������ �� �� �� � ��������� ���� ���� ���� � ����� � ���� �������� � ���'4�� ���� ��� ������ ������� ��� ������ ��� ��� ���� � #����� ������ �� ���� �� � � ������� ���� �������� ���K� � ���� ������� � ������� ���� ���� ����� �������� �� �� ����� ��� ����� � � � \^Z�� � ������ +� �� #���������� ���� � ����� >��� ���� � ����� ��� ��� ������� ������������� � ������ ��� ���� ��� �� �� � ��� ��� �� � � ��� �|� ���� � � �������K� �������� #������������� ����������Fraser Institute��������� ���� � ��|�� ������������ �
�����������������������������������������������������������������Z���������%������������� ������ ��������� �� ����K� ��� �����%�� ����>���������
\^Z\��������!�������� � ������������� ���#��������������������������������� ���� ��������� ������������+��� ������ ��������� ������������������
!�
!\
^
\
�
!\^
!Z^
^
Z^
\^
%!^� %!Z^ %!ZZ %!Z\ %!Z�
������� ���������!� ��*������� ��*�������!� ��>�����!� �����+>����� �����+
� � �������4>�
� � �������4>�
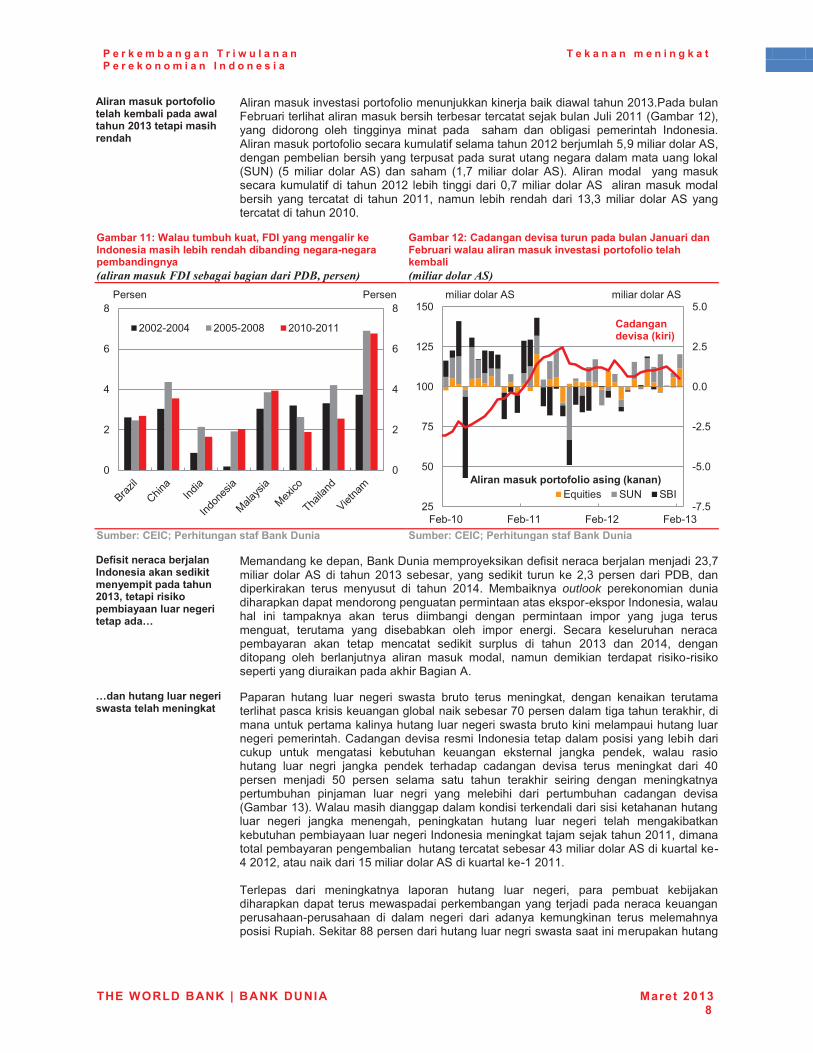
P e r k e m b a n g a n T r i w u l a n a n P e r e k o n o m i a n I n d o n e s i a
T e k a n a n m e n i n g k a t
THE WORLD BANK | BANK DUNIA Maret 2013 8
! ������������������ ���� ������� �������W� �������<=;>������������������
� 4� ������� K���� ������#�� ����������� ����� ��� �������\^Z���������;����� ����� ���� ����������� ��������������������������%�� �\^ZZ�������Z\+����� � ������ ����� � �� �� � �� ��� � ���� �� ��� �� � ����� ��� ����� ��4� ������������#�� ������������� #����������\^Z\����������}���� � �������4>������������ ����� ���������������������������������������������>z-+� �}� � � �� ����� 4>+� �� ���� �Z��� � � �� ����� 4>+�� 4� �� ����� � ��� ���������������� #�� � ����\^Z\� ��� �� � �� ��� �^���� � �������4>� �� ���������������� �� ��� ������� � � ���� \^ZZ�� ��� ��� �� ����� �� � Z���� � � �� ����� 4>� ����������� �����\^Z^���
Gambar 11: Walau tumbuh kuat, FDI yang mengalir ke Indonesia masih lebih rendah dibanding negara-negara pembandingnya �������������)�$��������������������� ������
Gambar 12: Cadangan devisa turun pada bulan Januari dan Februari walau aliran masuk investasi portofolio telah kembali ������������!"�
�+������`#�`����������������������������� +������`#�`�����������������������������
�����������?����@� ����������������������������������������<=;>~������������������������ ����������������}�
� '����������������$� ����������� ����# � ���������������� �\����� � �� �����4>� � � ���� \^Z���������� ������ � �� ��������\����������� ��$��� ��� ���� ��� ������ �������� � � ���� \^Z��� '��� ��� outlook� �������� � �� �� ��������������������������� �����������!������������ ��������� � ������ �� ������ � ��� � ���� ���� �� ����� ��� ���� ������������� ������� ��� � ������ ����� ����� ���� �� >���� ���������� ����������� �� ����� ������ ��� � �� �������� � � ���� \^Z�� �� \^Z��� ����� ����� ����� ��������� � �� ����� ������ ��� ��� � � ������� � � ��!� � ��������� ����� �� ������� ���� �4���
}���������� ����������W������ ������������
� ���� ����� ���� ���� � ����� ������ ������ �� ����� ���� �� �� ����������� ��������� � ������������� ����������^������������ ����������� ���� ���������������� ��������������� ������������� ������� �������������� ������ ����<�����K ������ ������ ������������� � ������� ���� ������� ����� ����� � �������� ����� �������� ���� ������� ���� �� ������� ���� ��� � ���� ������ ������� ���� ��K �� ������ �� ���� �� � �^������� ���� � }^� ������ ����� ���� ���� ����� �� �� � �� ���� �� ��������������� � ��� ���� ��� � ��� ����� � � �� � ���������� ���� ��K ��������Z�+��X����� ��� ����������� � �������� ��� �� � ��������������� ���� � ���� ������� �� ���� ����� ���� ���� � ����� ���� ���������������� ���������� ������ ��� �����������������\^ZZ��� ��������������������� ������������������������� � �������4>�� ���������!��\^Z\����� ���� �Z}�� � �������4>�� ���������!Z�\^ZZ����������� �� � �� ����� ����� ����� ���� ���� �� ��� ������� ��� ���� ��������� ������������ ������������� ����� �������������������!������� � � ���� ���� � �� � ��� ������ � ������ ����������� � �Y�� ���>�� �������������� ������������� ��������� �������������
^
\
�
|
�
^
\
�
|
�
\^^\!\^^� \^^}!\^^� \^Z^!\^ZZ
������ ������
!��}
!}�^
!\�}
^�^
\�}
}�^
\}
}^
�}
Z^^
Z\}
Z}^
;��!Z^ ;��!ZZ ;��!Z\ ;��!Z�
*�� � �� >z- >��
� � �������4>�
! ������������������ ���������]�����^�
`������������]����^�
� � �������4>�
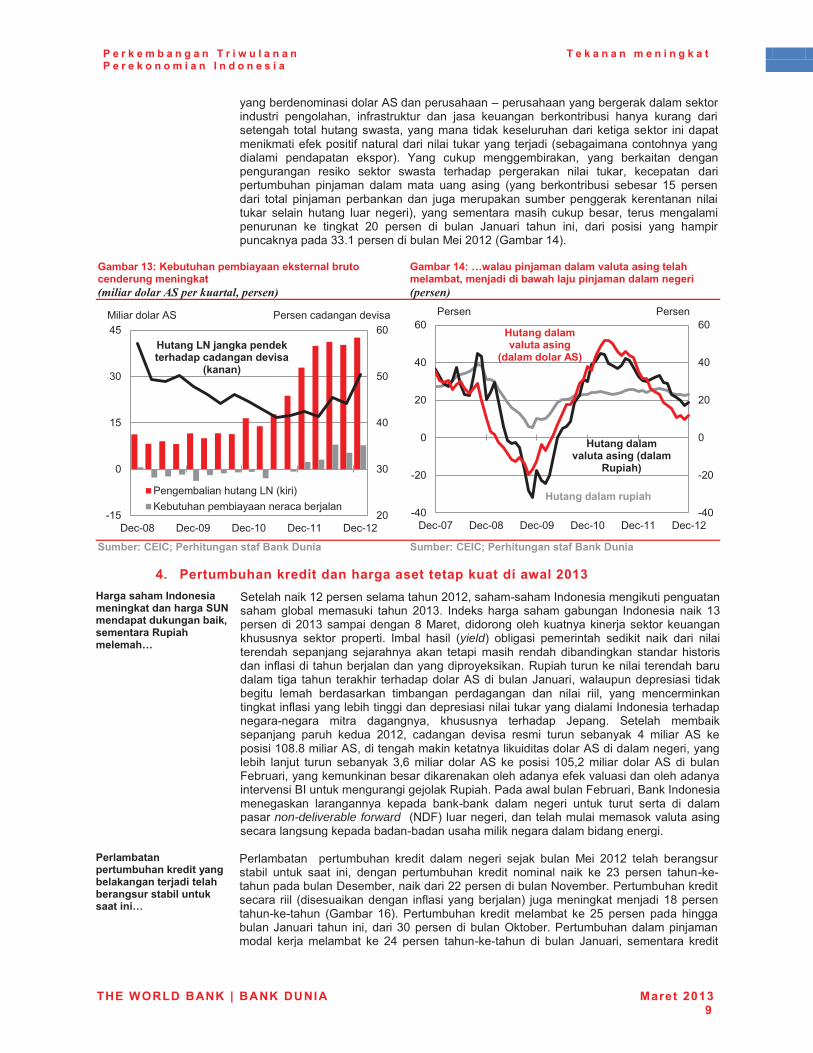
P e r k e m b a n g a n T r i w u l a n a n P e r e k o n o m i a n I n d o n e s i a
T e k a n a n m e n i n g k a t
THE WORLD BANK | BANK DUNIA Maret 2013 9
���������� � ������4>����������������������������������������� ����� � �������� #���������� �� ��� ����� ������� ��� � ��� ����� �� �������� ��������������������� � ��������������� ���� ��������� ������� ��� ��#������ � #�������� � � � ������������� ������ ������������� �� � ������ ������+�� _�� ������ ������� ���� ��� ���� �� ����������� ��� ��� ������� ����� ������� �������� � � ������ ������� �� ����������� � ��� ���� ��� ��� � �� ���� ������� ��� � ������� Z}� �������� � ����� � ��� ������ �� ������������������ �������� ������ � ������ ��� � ����� ���� ���� +�� ��� ������� �� �� ������ ������ ������ ����� ������� ��� � ���� \^� ������ � � ���� %�� � ���� �� �� � ��� � � ��� ��� ��������������Z�������� �����'� �\^Z\�������Z�+������
Gambar 13: Kebutuhan pembiayaan eksternal bruto cenderung meningkat ������������!"� ������������ �������
Gambar 14: …walau pinjaman dalam valuta asing telah melambat, menjadi di bawah laju pinjaman dalam negeri � �������
� �+������`#�`����������������������������� +������`#�`�����������������������������
4.� Pertumbuhan kredit dan harga aset tetap kuat di awal 2013 Z�������������������������������������+�%��������������������~����������������� ���}��
� >������ ��Z\����������������\^Z\�����!��������� ���� ��� ����������� ������ ������ � ���� \^Z��� ������������������� ����� � ��Z��������� �\^Z����� �������'������ ����������������� ������������������������ ������� ������� �� ����� �� �� �yield+� ��� �� � ����� ��� ��� � �� �� �� � � �������������� ������� �� ���� � �� �� ������ �� ��� ������ ���� ���� #�� �� ����������������� ������� ���Y�� ���������� � ����������������� �� ���� ����� �� ������������4>�� �����%�� �������������� � � � ������ ��� ����� �������� � ���� ������� �� � � � ��� ��� ������ ��� ���� #�� ������� ��� �� ��������� � � � ���������� �� ������ �����������!���� � ��� ������ �������� ������� %����� >������ ���� �������� ����� ����� \^Z\�� ���� ��K �� ���� � ����� ������ �� � � �� 4>� ������ � �Z^����� � ��4>��� �������� �������� �� � ��������4>�� ��������� �������� �� ����� �������������|� � � �� ����� 4>���� ��� � � Z^}�\�� � �� ����� 4>� � � ����;����� ���������� ������� ��������������#���K��� ����������� ���K�� ��������������� ��������Y�� �������������;����� ���������� �������� ����� ����� ��!��� ���� ���� � ����� ������ ����� � � ��������non-deliverable forward���-$;+��������� ������������ ��������K����� ��������������������!�������� � ����������� ������� ���
�� ������������������������������ ����������@���� ����������������� ���������������}�
� �������� � ���������� ���� �� ���� ���� � ����� ���� '� � \^Z\� ����� ����������� �� ����� ��� �� ���� ���������� ���� �� �� �� �� ��� \�� ������ ���!��!�����������$��������� ���� �\\�������� �����-�K��������������������� ������� � �� �� ���� ������ #�� ���������+� ������ �������� � Z�����������!��!���� ������ Z|+�� �������������� �� ������� ��� \}� ������ ��� � �������%�� � ���� ���� ��^�������� �����q����������������������� �������� ����� ������� ��� \�� ������ ���!��!���� � � ���� %�� �� ������� ���� ��
\^
�^
�^
}^
|^
!Z}
^
Z}
�^
�}
$��!^� $��!^� $��!Z^ $��!ZZ $��!Z\
������� ������"-��� � +������������ �����������
' � �������4>� ������������K ��
Z������-%�@�����������������?������������
]�����^�
!�^
!\^
^
\^
�^
|^
!�^
!\^
^
\^
�^
|^
$��!^� $��!^� $��!^� $��!Z^ $��!ZZ $��!Z\
������ ������
Z������� ����� ����������
]� ���� ���!+^�
Z������� ����������
Z������� ����� ����������]� ���
������^�
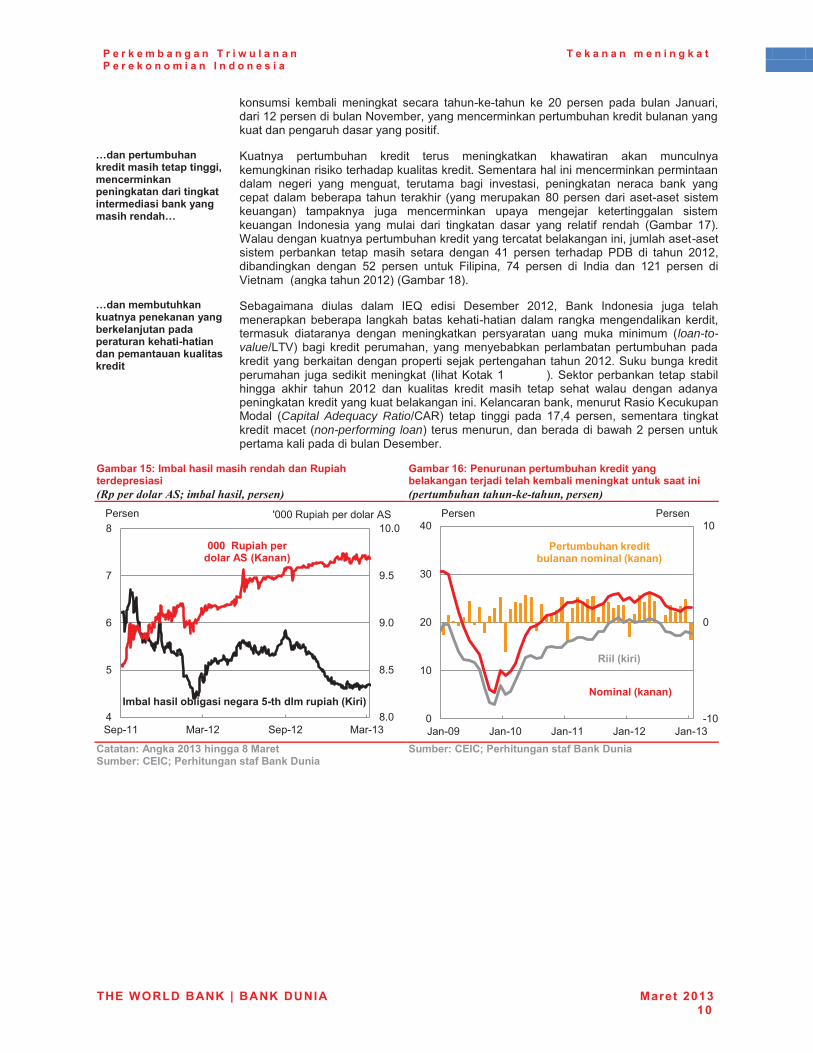
P e r k e m b a n g a n T r i w u l a n a n P e r e k o n o m i a n I n d o n e s i a
T e k a n a n m e n i n g k a t
THE WORLD BANK | BANK DUNIA Maret 2013 10
������ � ����� � �� ���� ����� ���!��!���� ��� \^� ������ ��� ���� %�� ���� �Z\�������� �����-�K���������������� ���������������� �������������������������������� � #���
}������������������������������������~���?�������������������������������������������������������������}�
� ����� ���������� ���� �� ������ �� ����� ���� �� �� ������������� �� � ������������� ������� ���>��������� ������� ������ ������ ���� � ��� ������� ������� �� � K���� �� �� ���� ���� ��� ������������������� ���� ����� �� ����������� �^��������� ����!����� ���������+� ������ ���� ������ �� ���� ������� ������ ���� � ���������� ����� � ��� ��� � �� � � ���� ���� ��� ���� #� ����� ������ Z�+��X�������������������������� ������������������ �����������!����� ����� ������ ����� �� �� ����� ���� �Z� ������ ������� �$�� � � ���� \^Z\��� �� ��� ���� }\� ������ ����� ; � � �� ��� ������ � � �� � �� Z\Z� ������ � �� �������������\^Z\+�������Z�+����
}�������������������������������������� ��@�����������������������_����������������������� ����������
� >��� �� � ���� ���� �*�� �� � � $�������� \^Z\�� ��� ����� � ���� ������������������� ������������� !�� ����� ���������� ������ ����������� � ���� ���� �� ����� �������� ��� ���� � ���� �loan-to-value{"��+��� � ���� �� �������� ������������������������������������ ��������� ������������� ������������������\^Z\��>������������ ��������� ������� � ���� ���� �� ��������Z�����Z+��>������������ �������� ��� ��� �� �� ���� \^Z\� �� ��� ��� ���� �� �� �� ����� ����� ���� ���� ����� �������� ��������������� �������������������Y� ����������'���� �Capital Adequacy Ratio{<4Y+� ����� � �� � ��� Z���� ������� ������� � �������� ��������non-performing loan+� ��������������������� �����\�������������������� ����� �����$����������
Gambar 15: Imbal hasil masih rendah dan Rupiah terdepresiasi � � ���������!"������������� ������
Gambar 16: Penurunan pertumbuhan kredit yang belakangan terjadi telah kembali meningkat untuk saat ini � ��������������������������� ������
�`��������!�����<=;>��������[�$����+������`#�`������������������������������
+������`#�`�����������������������������
�� �
��^
��}
��^
��}
Z^�^
�
}
|
�
�
>��!ZZ '�!Z\ >��!Z\ '�!Z�
===�������������� ���!+�]�����^�
���� ����� ��� ������������Y_��� ���������]����^�
������ �^^^�Y�� �����������4>�
!Z^
^
Z^
^
Z^
\^
�^
�^
%!^� %!Z^ %!ZZ %!Z\ %!Z�
������ ������
%����� �]�����^�
��� �]����^�
������������������ ����������� �]�����^�
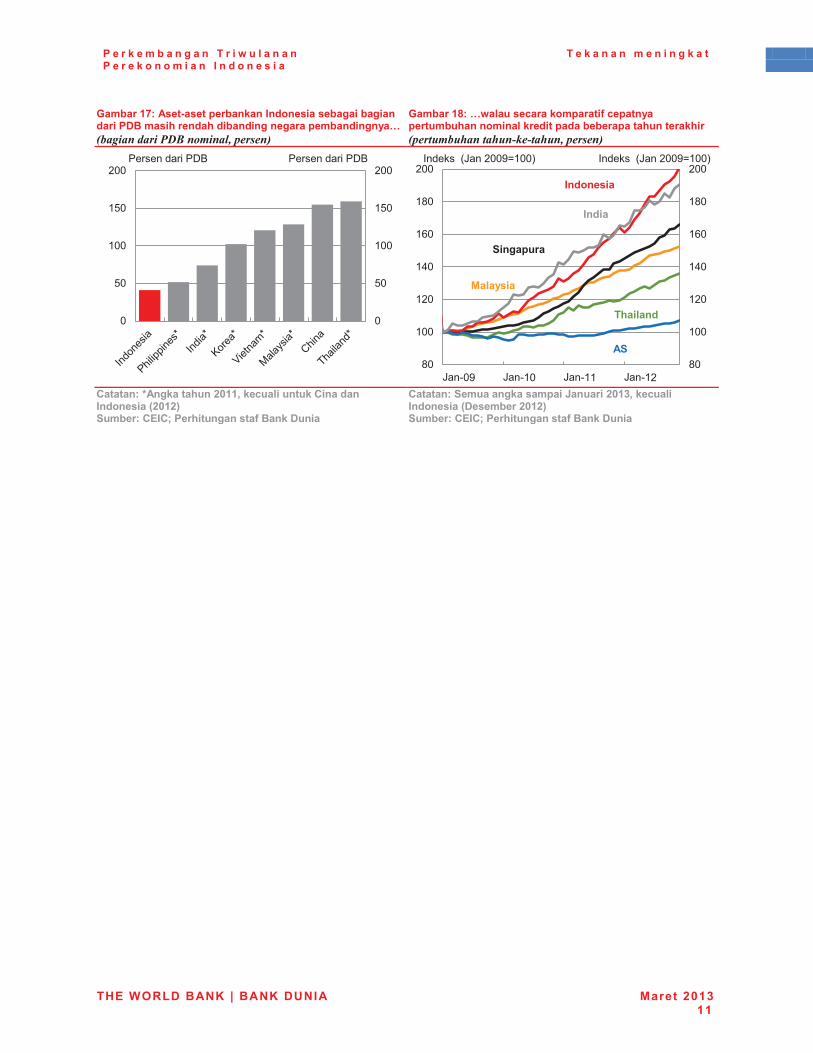
P e r k e m b a n g a n T r i w u l a n a n P e r e k o n o m i a n I n d o n e s i a
T e k a n a n m e n i n g k a t
THE WORLD BANK | BANK DUNIA Maret 2013 11
�Gambar 17: Aset-aset perbankan Indonesia sebagai bagian dari PDB masih rendah dibanding negara pembandingnya… ���������������������� ������
Gambar 18: …walau secara komparatif cepatnya pertumbuhan nominal kredit pada beberapa tahun terakhir � ��������������������������� ������
�`���������!�����������<=;;~��?�� ��������`���������������]<=;<^�+������`#�`�����������������������������
`��������+�����������������q�������<=;>~��?�� ����������]������<=;<^�+������`#�`�����������������������������
�
�� �
^
}^
Z^^
Z}^
\^^
^
}^
Z^^
Z}^
\^^�������� ��$�� �������� ��$��
�^
Z^^
Z\^
Z�^
Z|^
Z�^
\^^
�^
Z^^
Z\^
Z�^
Z|^
Z�^
\^^��������%�\^^��Z^^+�
!+�
���� ���
+���������
��������
�����
$� ������
��������%�\^^��Z^^+�
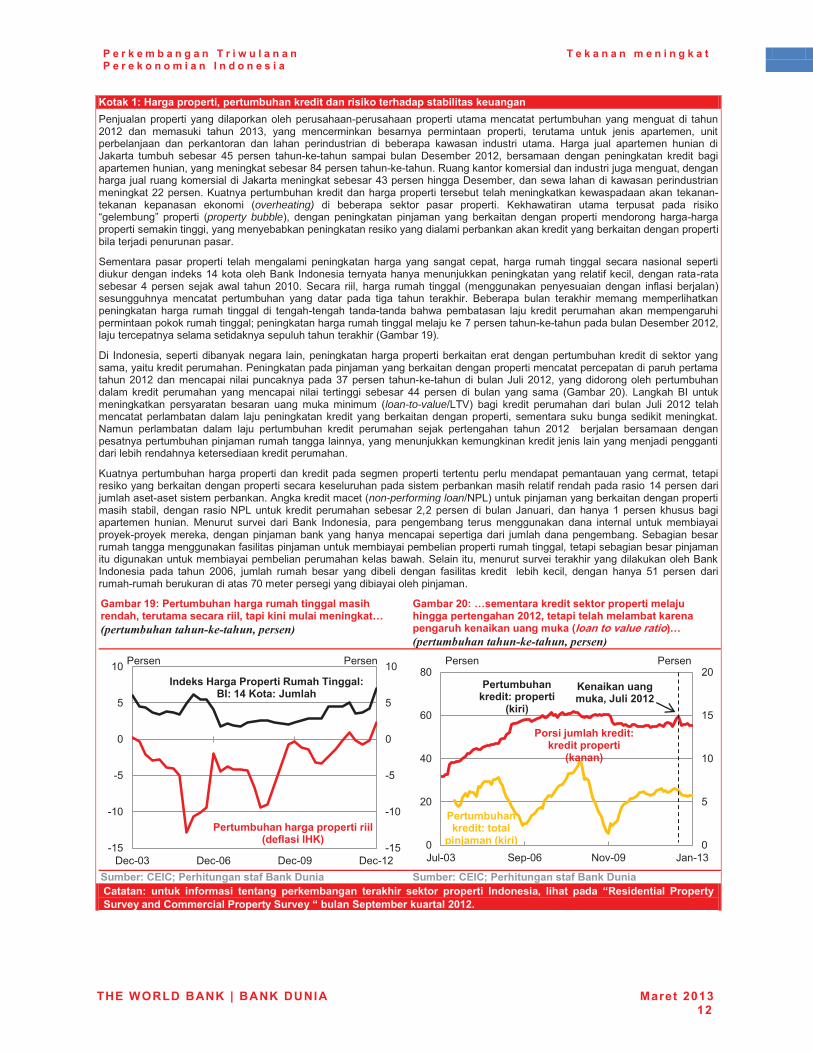
P e r k e m b a n g a n T r i w u l a n a n P e r e k o n o m i a n I n d o n e s i a
T e k a n a n m e n i n g k a t
THE WORLD BANK | BANK DUNIA Maret 2013 12
Kotak 1: Harga properti, pertumbuhan kredit dan risiko terhadap stabilitas keuangan ������������� � ���� �����������������!�������������� � ������������������������������ � ����\^Z\� �� ������ � ���� \^Z��� ��� ������ �� ������ ���� �� ������� �� ������� ����� �� �� �������� � ���������� �� �������� �� ��� ��� ����� � � � ������� ���� ����� � ����� =��� ���� ������� �� � � �%���� ������� ������� �}� ������ ���!��!���� ��� � ���� $�������� \^Z\�� ������ ���� �� ���� ���� �� �� ���������� ������� �����������������������!��!�����Y�������������� ���� ����� ���������������������������������� ��� �%������ ��������������������� ���$������������������� �������� ����� ��� ����\\��������������������������� ��������������� � ��������� ������� �������������� ���!���� ����� ����� � �overheating)� � � ������� ������� ���� ������� �� ������ �� ���� �������� ��� � � �������������� ������� � �property bubble+�� ���� �� ���� � ��� ��� ���� �� ���� ������� � �������� ���!����������� ����� �� �� ��������������� ������� ������� �� ������������� ��������� ������������� �� ������� ������������
>������ ���� ������� � ����� ����� � �� ���� ���� ��� ���� ������ ���� ����� � ���� ����� � ��� ������ �� ��������� �����Z������������������� �������������������� ����������� #���� ���������!���������� �� ������ ����� ��� ���� \^Z^�� >���� � ��� ���� ����� � ���� �������� ������ ����� #�� � �����+����������� ������ ���������� ��� ���� ��� � �� ���� ����� ��� ������� ���� ����� �� ����� ������� ������ �������� ����� � ���� � � ����!����� ��!��� ���� ������� �������� �� ������������������ ����� �������������� ������� �������������� ������������������������!��!�����������$��������\^Z\����������������������� ��������������������� ��������Z�+��
$ � ����� �������� �� �������� � ���� ��������������� ����� ������������������������ ��� ���������������� ������� ������������ �������� ���������� ������������� ���������������� ����������������\^Z\������� � � ������������������� ���!��!����� �����%�� �\^Z\������ ������������������������� ���� �� ������� ��� ���� � � � ���� �� � ������� ��� ������ � � ���� ��� ��� ������ \^+�� "���� ��� ������� ����� �������� ����� ��� ���� � ���� �loan-to-value{"��+� �� � ���� �� ������� �� � ���� %�� � \^Z\� ����������������������� ������ �������� �� ������� ������������� �� ������������������� � ���� �����-��� �������� ���� ���� ���������� ���� �� ������� ����� �������� ���� \^Z\� � ������ ������ ��������������������� ������������� �������������������� ����� ���� ��� �������� ������ ��� ���� ���������������� ����� ����������
�������������������������� ������� ������������������ � ������������������������������������ ���� ���� ���������� ������������� �������������������� ������������� ������ #����������� �� Z���������� ����������!����� ������������4������� ��������non-performing loan{-�"+������� ���������� ������������� ��� ����� ������� �� ��-�"���������� ����������������\�\�������� �����%�� �������Z���������������� �������� �� �� '������ ���K� � �� � ��� ����� �� ��� �������� ������������� �� ����� ��������� � �������!������������������� ���������������� � ������ ���� � �����������������>��� ����������������������#� � ���� ������������ � ������� �������� ������� ��������� ����� ������� ��� ���� ������������� � ������� ������������������>�� � ��������������K� ������ ������ ������������������ � ��� ���� \^^|�� ������ ����� ����� ��� � ��� � ���� #� � ��� ���� �� � ��� �� ��� ��� ���� ��� }Z� ������ �� �����!�������������� �����^������������� ����� � � ������� �����
Gambar 19: Pertumbuhan harga rumah tinggal masih rendah, terutama secara riil, tapi kini mulai meningkat… � ��������������������������� ������
Gambar 20: …sementara kredit sektor properti melaju hingga pertengahan 2012, tetapi telah melambat karena pengaruh kenaikan uang muka (loan to value ratio)… � ��������������������������� ������
� �+������`#�`����������������������������� +������`#�`�����������������������������
�
Catatan: untuk informasi tentang perkembangan terakhir sektor properti Indonesia, lihat pada “Residential Property Survey and Commercial Property Survey “ bulan September kuartal 2012.
!Z}
!Z^
!}
^
}
Z^
!Z}
!Z^
!}
^
}
Z^
$��!^� $��!^| $��!^� $��!Z\
������ ������
���������������������������� �]� �����Z�^�
�
�����Z������������������������� ������;Q�������q�� ���
�
^
}
Z^
Z}
\^
^
\^
�^
|^
�^
%��!^� >��!^| -�K!^� %!Z�
������ ������
������@�� ����������������������
]�����^�
��������������������� �
���@�����]����^�
�������������������������
]����^�
�����������������~�q� ��<=;<�
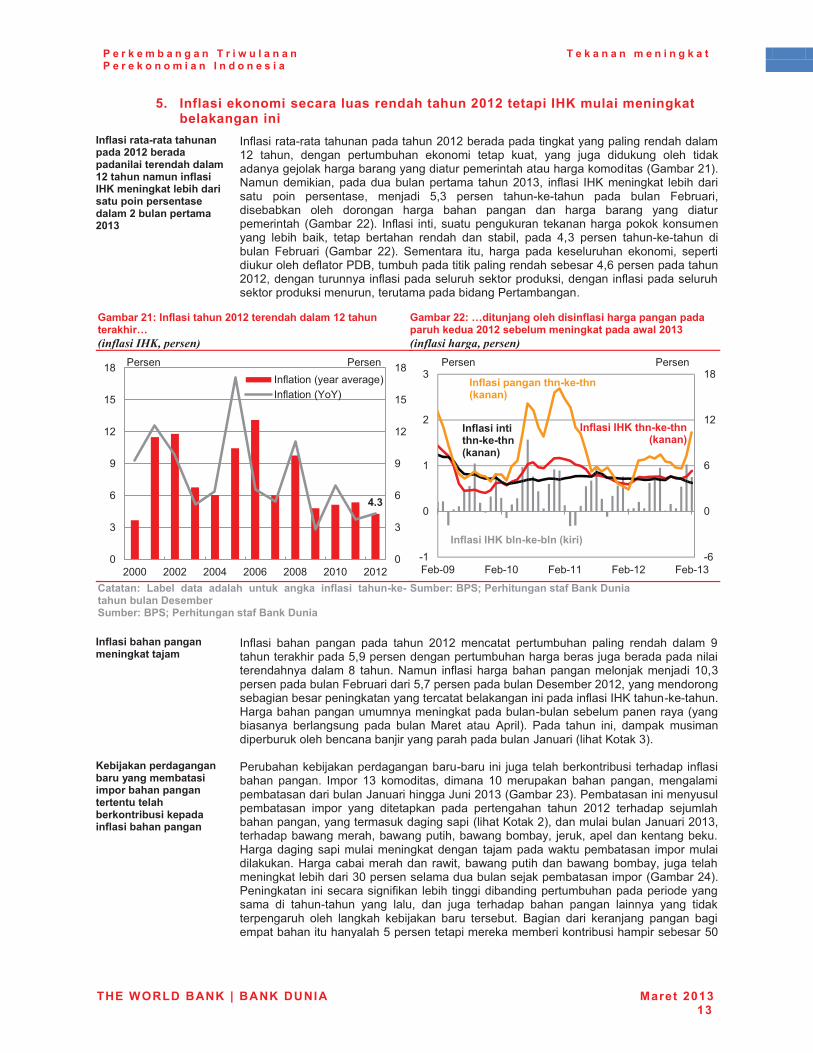
P e r k e m b a n g a n T r i w u l a n a n P e r e k o n o m i a n I n d o n e s i a
T e k a n a n m e n i n g k a t
THE WORLD BANK | BANK DUNIA Maret 2013 13
5.� Inflasi ekonomi secara luas rendah tahun 2012 tetapi IHK mulai meningkat belakangan ini
��� ��������_�����������������<=;<����������� ���������� ���;<���������������� �����Z����������� ��������������������������� ���<��� ����������<=;>��
� �#�� ���!��������������\^Z\���������� ��������� �����������Z\� ����� ���� ���������� ����� � ����� ����� ��� ���� � ������ ����� � ������������������������� ��������� ��������������� ���������\Z+��-������ � �� ���������������� ����\^Z��� #�� � �=���� ���� ��� ���� ����� �� � ���������� ���� � }��� ������ ���!��!���� ��� ���� ;����� ��� ������ ����� ������ ���� ��� ��� �� ���� ���� ��� � ��������� ��� ������\\+�� �#�� � � �� ������������� ������������������������ ��� �� � ��� ����� ������ ����� �� ��� ��� ��� ���� ������ ���!��!���� � ����� ;����� � ������ \\+�� >������ ���� ���� ��� ���������� ����� �� ������ �� ������������#������$�������������� � ���� ����������������|��������������\^Z\������������ #�� �������������������������� ������ #�� �������������������������� ������������������� �������������
Gambar 21: Inflasi tahun 2012 terendah dalam 12 tahun terakhir… �������$*+�� �������
Gambar 22: …ditunjang oleh disinflasi harga pangan pada paruh kedua 2012 sebelum meningkat pada awal 2013 ������������� �������
`�������� -�� � ���� �� ��� ������ ������ ��� ���� �����_�_�������� �����������+��������+�����������������������������
+��������+�����������������������������
�
���� ����������������������������@���
� �#�� � ��� ��� ��� ���� \^Z\� ������ ���������� �� �� ����� ���� ����������� �����}�������������������������������������������� � ��������������� �����-��� #�� ���������������������� �Z^����������������;����� ��� �}����������������$��������\^Z\����������������� �������� �������������������� ���� #�� ��=�����!��!�����=����������������� ����������!����������������������� ��� ��������� ��� ���� '���� ��� 4�� �+�� ��� ���� �� ����� ��� ��� �������������������� ����������������%�� ��� ���������+�������
���@������������������������������������������������������������� ������������������������ �����������������
� ���������� �������������!���� � ���������������� ��� � ������� #�� ���� ���� ������ Z�� ����� ���� � �� Z^� ������� ��� ���� ����� ���������� �����%�� �� ���%� �\^Z��������\�+��������� ���������������� ����� ��� � ������ ��� �������� ���� \^Z\� ������� ���������������������������� ���� ��� ��������\+������� �����%�� �\^Z��������������������������� �������������� ������������������������=����� ���� ���� ��� �������� ������������������� �������� �� ������=����� ���������� ���������� ��������������� ���� ������� ������� ���� ��^������������������������������� �����������\�+���� ���� ������� � # �� ��� ��� �� �� �� ������������������ ���������� � � ���!���� ��� ����� �� ���� ������� ��� ��� � �� ��� � ������������� ����� ����� ��� ��� ���� ���������� �� � �� � ������ ��� �� ��������� ��������}����������� ������������� ����� ��� ���� ���������}^�
Q">�
^
�
|
�
Z\
Z}
Z�
^
�
|
�
Z\
Z}
Z�
\^^^ \^^\ \^^� \^^| \^^� \^Z^ \^Z\
�#�� �������K����+�#�� ���_�_+
������ ������
!|
^
|
Z\
Z�
!Z
^
Z
\
�
;��!^� ;��!Z^ ;��!ZZ ;��!Z\ ;��!Z�
��� ������������_�_����]�����^�
��� �����Z�����_�_����]�����^�
��� �����Z��� �_�_� ��]����^�
������ �����������
��� ��������������_�_����]�����^�
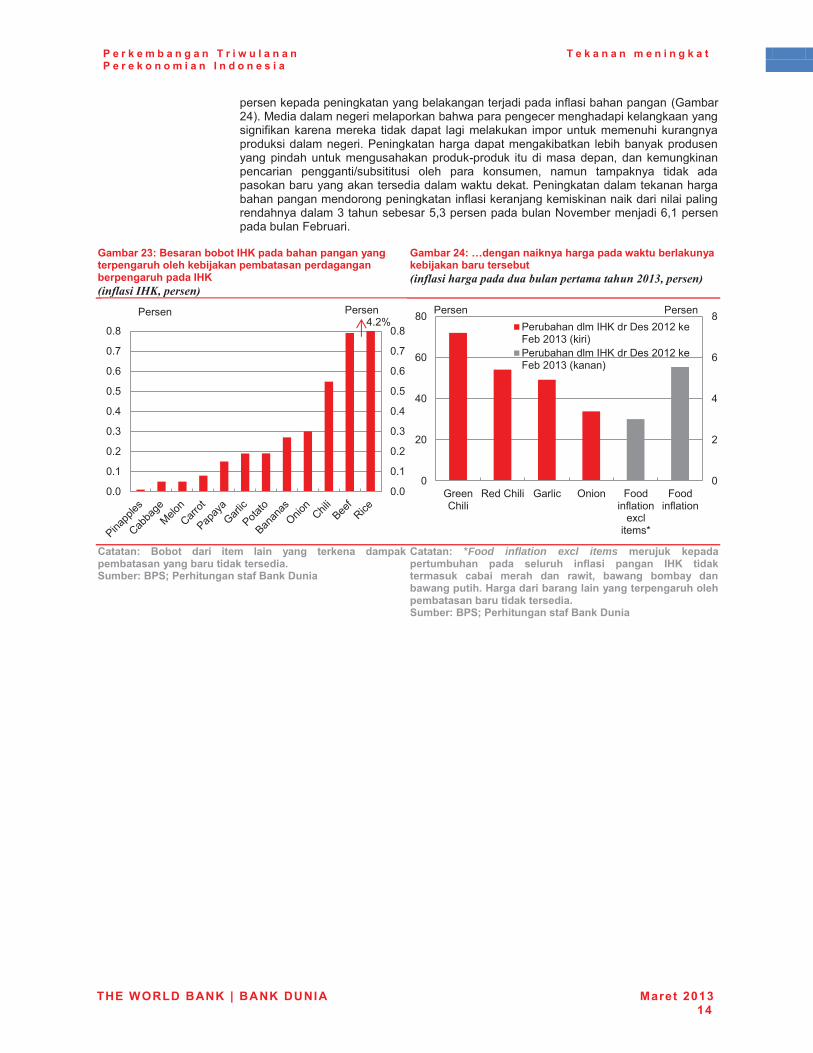
P e r k e m b a n g a n T r i w u l a n a n P e r e k o n o m i a n I n d o n e s i a
T e k a n a n m e n i n g k a t
THE WORLD BANK | BANK DUNIA Maret 2013 14
������������� ������������������ ���� #�� �������������\�+��'�� ��������� ������������������������������ ����������� � # �� ���������� � ������� �� �������� ���������������� �������������� ��������� ���� ���������������� ���� ��� ������������������ ����������������������!������� ���� ��������� �������� ����� � ����� {���� � ��� � ����� ��� �������� ��� ������ � ��� ���������������������� ������������������ �������������������������������� ���� #�� ���������� �� � ���� � � ��� �������������������������}����������������-�K���������� �|�Z��������������;����� ����
Gambar 23: Besaran bobot IHK pada bahan pangan yang terpengaruh oleh kebijakan pembatasan perdagangan berpengaruh pada IHK �������$*+�� �������
Gambar 24: …dengan naiknya harga pada waktu berlakunya kebijakan baru tersebut ������������ �������������� �������������,-.%�� �������
�`�������� ������ ���� ���� ���� ����� ������ ������������������������������������"��+��������+�����������������������������
`�������� �Food inflation excl items� ���@��� ���������������� ���� � ����� ��� ���� ������� �Z�� ������������� ?����� ����� ��� ��W��~� ��W���� ������� �����W���������"�Z���������������� �������������������� ���������������������������"�+��������+�����������������������������
�
� �
��\��
^�^
^�Z
^�\
^��
^��
^�}
^�|
^��
^��
^�^
^�Z
^�\
^��
^��
^�}
^�|
^��
^��
������ ������
^
\
�
|
�
^
\^
�^
|^
�^
����<� �
Y���<� � ��� � q � ;��� #�� �
�@�� �����
;��� #�� �
������������=�����$���\^Z\���;���\^Z���� � +������������=�����$���\^Z\���;���\^Z����+
������ ������
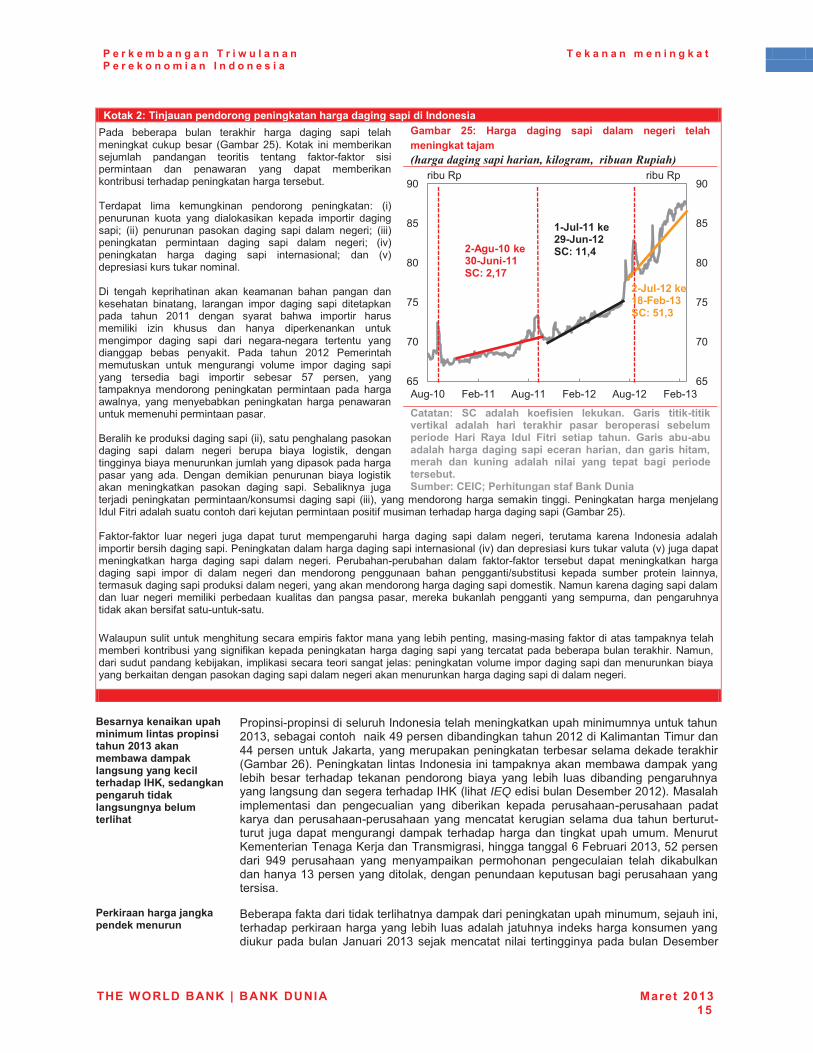
P e r k e m b a n g a n T r i w u l a n a n P e r e k o n o m i a n I n d o n e s i a
T e k a n a n m e n i n g k a t
THE WORLD BANK | BANK DUNIA Maret 2013 15
��
Kotak 2: Tinjauan pendorong peningkatan harga daging sapi di Indonesia ��� ������� ���� ����� �� ���� �� �� �� � ������� ���������� ����� ������ \}+�� ����� ������� ���������� ���� ���� � �� ����� #����!#����� � � ����� �� �� ����� ��� ���� ������ ������ ��� ���������� �������������������������� � �� ������ � �������� �� ����� � +������� ����� ��� � ���� �� ����� ����� �� �� ���� �� � +� ������ ����� �� �� �� � ���� ���� �� � +��� ���� ���� �� �� �� �� � ���� ���� �� � K+��� ���� ���� �� �� �� � ���� ���� �� �K+������� � ������������� ����$ � ����� ���� �� � �� ���� ��� ��� ��������� � ���� ���� ����� �� �� �� � � ��������� ���� \^ZZ� ���� ����� ���� ����� �� �������� � � � � � ������� �� ��� � ������� �������� ����� �� �� �� � �� � ���!���� �������� ���� ���� ����� ���� ��� ��� ���� \^Z\� ����� ������������ ����� ������ � K������ ����� �� �� �� ���� ������ � �� � ����� �� ������� }�� ������� ��������� �������� �� ���� ���� �� ��� ��������� ��� �������� �� ���� ���� ���������������� ����� ������������ ������������ ��� ���� �� +�������������������� �� �� � ���� ���� � ������ � �� ��� �� ��� ����� �� ��� ������������������� ���������������� ��� ��� $��� ��� � � ������ � �� ��� �� ���� �� ����� ����� �� �� �� �� >��� ��� ��������� ��� �������� �{������ ��� ���� � � +�� ������������������� � � �� ���� ��������������������; �� ������������������ ����������� ����� � #���� ��������������� ���� �������\}+���;����!#����� ���� ���� � ���� ���� ������ ��������� � ���� �� �� �� � ���� ���� �� ������� ���� ����� � ���� ����� ������ ���� ���� ���� �������������� ���� � ���� ���� K+��������� � �����������K�����K+����������� ����� ���� �� �� �� � ���� ���� �� ������!������� ���� #����!#����� ��������� ���� �� ����� ������ �� �� � ����� � � ���� ���� � �� �������� ������ ��� ����� {����� ��� � ����� ������� ����� � � ������������� ���� �������� ��������� ��������������������� ���� ������� ���-��������� ���� ������� ���� ���� � ��� � � � ������� ��� ��� �� ���� ����� ������ ������ ����� � ��� �������� �� ��������� ��������� #�����!����!������X�������� ����������� ������������ � ��#������������� ����� ����� �!�� ��#������ ��������������������� ����� ��� ����� � # ��������� ���������� ���� ������������������������������ ���-������ �������������� ���� ��� �� ���������� ������������� ����K������ ������� ���� ����������� ��������� ������������� ���� ��������� ���������������� ���� �� ��������� ��
Gambar 25: Harga daging sapi dalam negeri telah meningkat tajam ������������ ����������������������� � ����
�`�������� +`� �� ��� �������� �����"� &����� �����_������������ � �� ��� ����� �������� ������ ��������� �� �������� Z���� ����� �� � *����� ������ �����"� &����� ���_������ ��������������� ����� ?���� ������~���������������~������ ��� ������� �� ��� �� ��� ����� ����� ����� �����������"�+������`#�`�����������������������������
��
����������������������������� ����������������������<=;>����������W�������� ��������������?� ���������Z�~���������������������� ������������ ������� �����
� ���� � !���� � �� �������������� �������� ���������� ��������������\^Z������� �������� ������������ �� �������\^Z\�� ��� ���� ��������������������%����������������� ���������������������������� ��������\|+���� ����� �������� � �������������������������� �� ����� ������� ���� �������� � �� ��� ��� �� ���� � �� �� ���������������������������������=���� ���IEQ��� � �����$��������\^Z\+��'���� �������� � �� ������� � ��� � ��� �� ����� ������!������� ����������������!��������������������� ��������� ������������!������ ���� ���������� � ����� ������� ���� �� � ���� ���� ������ '������������� ���������������� ��� ��� ��������|�;����� �\^Z���}\��������� � ���� ������� ��� ����� �� �������� ������� � ����� � �����������Z������������ ������������������������� ��������������� ����
���������������@�����������������
� �������#����� �� ������� ����������� ��� ��������� ������������ ������������� ������������ �� �������� ������ �������������������� ������������ %�� �\^Z������������� � � ���� �� ���������$��������
|}
�^
�}
�^
�}
�^
|}
�^
�}
�^
�}
�^
4��!Z^ ;��!ZZ 4��!ZZ ;��!Z\ 4��!Z\ ;��!Z�
� ���Y��� ���Y��
<_!��_;=���>=_q���_;;�+`��<~;\�
;_q� _;;���<X_q��_;<�+`��;;~Q��
<_q� _;<���;[_*�_;>�+`��Y;~>�
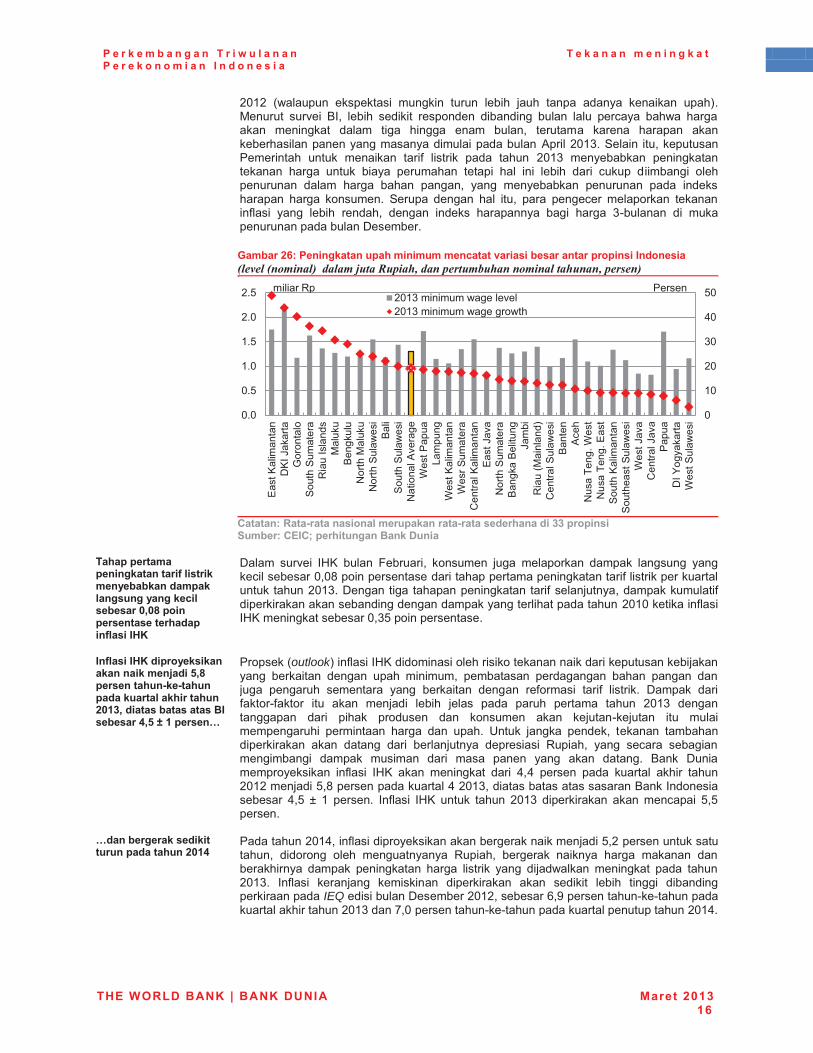
P e r k e m b a n g a n T r i w u l a n a n P e r e k o n o m i a n I n d o n e s i a
T e k a n a n m e n i n g k a t
THE WORLD BANK | BANK DUNIA Maret 2013 16
\^Z\� ������� �������� � ���� � ����� ��� �� ���� ��� ��� �� �� ���+��'������ ���K� � ���� ��� �� ��� � �� �������� � �� �� ���� ���� ������ ���� ������ �� ���� ���� � �� � ��� ��� ����� ������� ���� ���� ��������� ������������� ��� �������� 4�� ��\^Z���>�� � ����������������� ��� ����� �� �� �� #� � ��� �� ��� ���� \^Z�� �������� �� �������� ���� ����� � �� ������� ���� � ��� � ��� �� �� � ������ � ��� � ����������� ���� ���� ��� ���� ��� �������� ������ ��� ��������� ���� �������� >����� ���� ��� ���� ��� �������� �������� ���� #�� � ��� ��� �� ������ ���� ����� ����� �� � ���� �!���� � � �����������������$����������Gambar 26: Peningkatan upah minimum mencatat variasi besar antar propinsi Indonesia ���������������������������� � �������� ��������������������������� �������
�`������������_������������ ��������������_��������������>>����������+������`#�`�������������������������
������������������������������ ����������������������� ��������������?� �������=~=[������������������������ �����Z��
� $��� ���K� � �=�� ���� ;����� �� ������� ���� �������� ����� ������ ������ ���������^�^���� ������������ ������������� ������ #�� ��� ���������������������\^Z���$���� �� ������ ������ #��������������������� #�� ���� ��������� ������������������ ����������\^Z^���� �� #�� ��=���� �����������^��}��� �����������
���� �����Z��������������������������@���Y~[�����������_�_���������������� �������������<=;>~���������������������������Q~Y���;�����}�
� ���������outlook+� #�� ��=��� ��� � ������� � ������� ���� ������������ ������ ���� �� ���� ���� � ����� ������� ������� ��� ��� ������ ������� ������� ��� ���� �� ���� ��#���� � �� #� � ��� ��� $���� �� �#����!#����� ��� �� ���� � ��� �� ����� ��� ����� ������ ���� \^Z�� ��������� �� � � ��� �������� �� ������� �� �����!������ ��� ��� ���������� � ���� �� ���� �� ����� z���� ���� ������� ���� ������ ���� ��� �� ���� �� � ��������� ������ � � Y�� ��� ��� ����� ���� ���� ��� � ����� ��� �� �� � ��� ��� ��� �� ����� ��� $� ����������� �� #�� � �=�� �� �� ���� �� � ���� ������ ��� ������ �� �� ����\^Z\����� �}��������������������\^Z���� ���������������������� �������� ��}� �� Z� ������� �#�� � �=�� ����� ���� \^Z�� � ���� ��� �� ���� � }�}���������
}��������������������������������<=;Q�
� �������\^Z��� #�� �� ������� ������������ ������ �}�\��������������������� � ������ ����� �������� Y�� ��� �������� ��� ���� ��� ������� ��� ����� �� ���� ���� � ��� �� ��� � ������ �� ���� ��� ����\^Z��� �#�� � ������ ��� �� � � ���� ��� �� ��� � �� ��� �� � �� � � �� ������ �����IEQ��� � �����$��������\^Z\���������|������������!��!��������������� ������\^Z������^����������!��!������������������������\^Z����� �
^
Z^
\^
�^
�^
}^
^�^
^�}
Z�^
Z�}
\�^
\�}
*�
����
�
�
$�
��%�
��
���
��
��>
����
�>��
���
Y
��
���
��
'�
���
��
����
�-
����
�'�
���
-��
���>
���
��
��
>
����
�>��
���
-
� �
��4
K��
��X
�����
��
"�
���
X��
����
�
�
X��
��>��
���
<
���
����
�
�
*�
��%K
-
����
�>��
���
�
��
��
�� ��
�%
��
Y
���'
�
�+
<�
����>
���
��
�
��
�4��
�-
���
���
��X��
�-
���
���
��*�
�>
����
���
�
�
>��
���
���>
���
��
X��
��%K
<
���
��%K
�
��
$��_
���
���
X��
��>��
���
\^Z��� ����������K��\^Z��� ��������������
� � ��Y�� ������
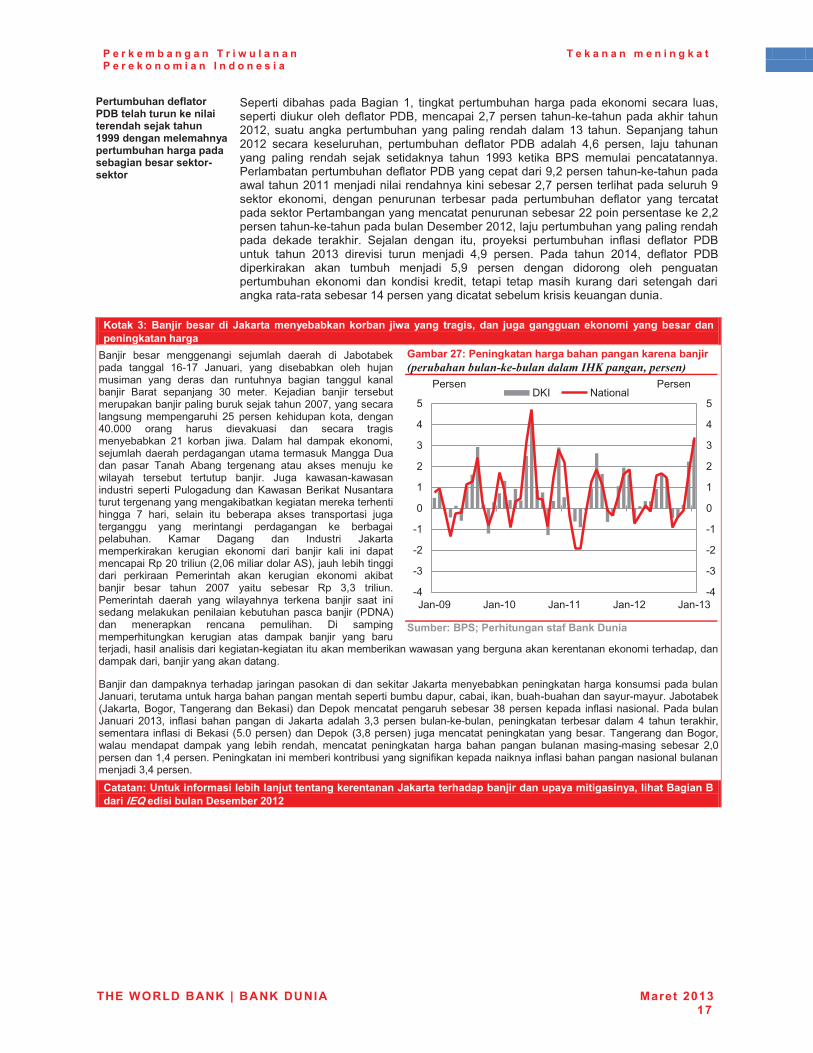
P e r k e m b a n g a n T r i w u l a n a n P e r e k o n o m i a n I n d o n e s i a
T e k a n a n m e n i n g k a t
THE WORLD BANK | BANK DUNIA Maret 2013 17
������������ ���������� ������������� ����������@���������;XXX������� ����������������������������������������������_������
� >����� � � ��������� � Z�� � ���� ���������������������� � ����� ����������� �� ������������#������$������� �\��������� ���!��!��������� �� ����\^Z\������������������������� �� ��������� Z�� �����>����� ����\^Z\� ����� ����������� ���������� ��#����� �$�� ���� ��|� ������� ���� ������� �� �� ����� ����� ��� ���� ���� Z���� ��� �� ��>� ����� � ����������������������������#������$������������ ���\����������!��!��������������\^ZZ����� � � �������� ��������\������������� ����������������������� ����� �� ���� ������ �������� ��� ���������� ��#����� ��� �����������������������������������������������\\��� �������������\�\����������!��!�����������$��������\^Z\��������������������� ���������� ������ ����� ��� >���� ���� ���� ������� � ���������� #�� � ��#����� �$������� ���� \^Z�� � ��K � � ����� ���� � ���� ������� ��� ���� \^Z��� ��#����� �$��� ���� ��� �� ������� ���� � }��� ������ ���� � ������ ����� ���������������� ����� � �� ��� � � ���� ��� ���� � ����� �� �� ����� �� � ������� �� ������!����������Z������������ �������������� � ��������� ���
Kotak 3: Banjir besar di Jakarta menyebabkan korban jiwa yang tragis, dan juga gangguan ekonomi yang besar dan peningkatan harga
�� �� ����� ������ � �������� ����� � � %���������� ����� Z|!Z�� %�� �� ��� � ������ ����� ������� �� ��� ����� �� ������� �� � ������ ����� �� ���� ������ �^� ������� ���� � �� �� ������������������� ���� �����������������\^^����������������� ��������� � \}� ������ ��� ���� ����� �����^�^^^� ���� ����� � �K��� � �� ����� ��� ���������� \Z� ����� � ��� $��� ��� ����� ����� �����������������������������������'���$���� ���� ��� 4��� ������� ��� ����� ������ ���� ���� ��������� ��������� �� ��� %��� ���!���� ����� � ������ � ��������� �� ���� ��� ��� -������������������������� ������� �������������� �� ��� �� �� �� ��� � ��� ������� ����� �������� � ������������ ��� ��� �� � ������� ��� ����� ��������� ���� $��� �� ������ � %����������� ��� ����� � ����� � �� � �� �� �� � � �������� �Y��\^��� � ���\�^|�� � �������4>+��������� ��� �� ��� � ���� �� ����� ��� �� ����� � ����� � � ����� �� ����� ���� \^^�� � ��� ������� Y�� ���� �� � �������� ��� ����� ��� � ����� ������ �� �� ��� ��������������� � ��������������� �� ��$-4+��� ������� ���� ����� ��� $ � ��� ��������� ����� ����� � ��� ����� �� �� ��� ��������� ���� ��� � ���� ���� �!��� �� ����������� ���������������������������� ������������������ ���� ���������������� ������������������� �������� ������ ���%�������������� �������������� ��������%�� ����������������������������������� ��������������� �� ������!����������!������%��������%������������������������ +���$��������������������������������������� #�� �� �����������%�� � \^Z��� #�� � ��� ��� � � %���� ���� ���� ������ ���!��!����� �� ���� �������� ���� �� ���� ����� ���������� #�� �� ����� � �}�^������+���$���������������+� ������������ �������������������������������� ������ ����� ��� ��� �� ������ ������ �� ���� ���� ��� ��� ���� �� �!�� �� ������� \�^���������Z������������ ���� ������� ����� ��� ����� � # ������� ��� #�� �������� ����������� ������������
Gambar 27: Peningkatan harga bahan pangan karena banjir � ������������������������������$*+� ������ �������
+��������+�����������������������������
Catatan: Untuk informasi lebih lanjut tentang kerentanan Jakarta terhadap banjir dan upaya mitigasinya, lihat Bagian B dari IEQ edisi bulan Desember 2012
�� �
!�
!�
!\
!Z
^
Z
\
�
�
}
!�
!�
!\
!Z
^
Z
\
�
�
}
%!^� %!Z^ %!ZZ %!Z\ %!Z�
������������$�� -� ��
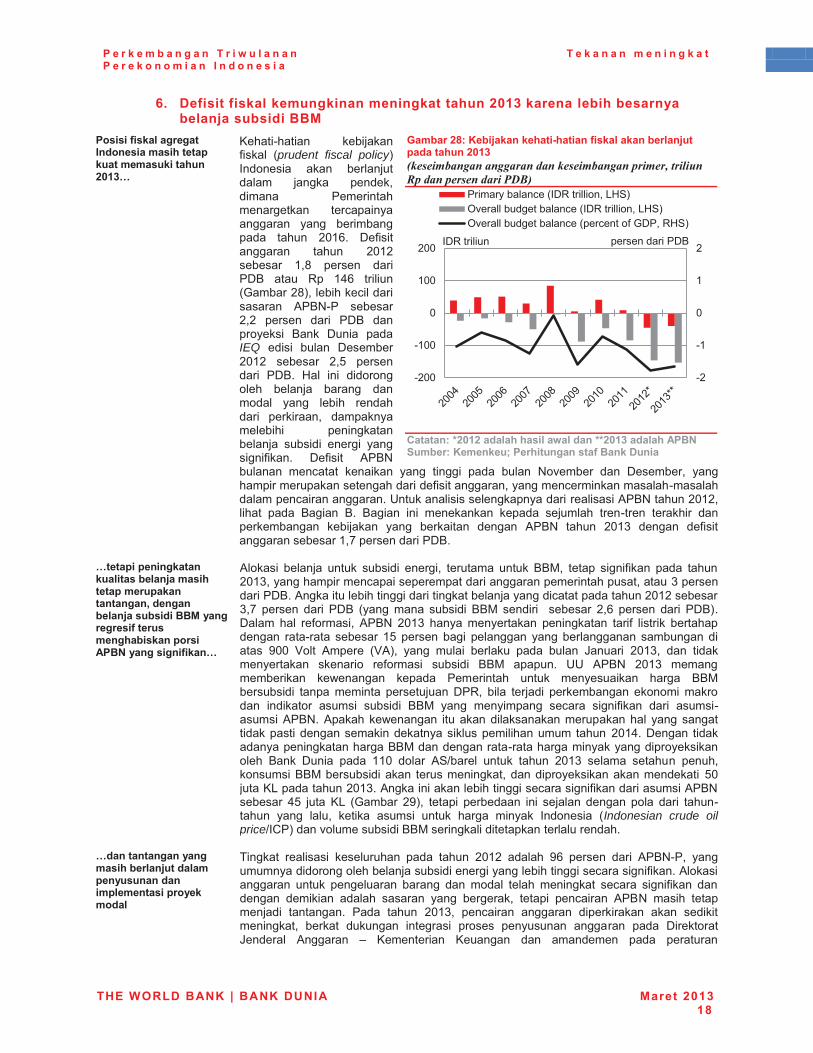
P e r k e m b a n g a n T r i w u l a n a n P e r e k o n o m i a n I n d o n e s i a
T e k a n a n m e n i n g k a t
THE WORLD BANK | BANK DUNIA Maret 2013 18
6.� Defisit fiskal kemungkinan meningkat tahun 2013 karena lebih besarnya belanja subsidi BBM
������������ ����������������������������������������������<=;>}�
� ���� !�� � � ��� ���# ���� �prudent fiscal policy+������ � �� ������������ ���� �������� �� ����� ����������� ����� ������ ��� ��� ������� ���� \^Z|�� $�# � ������ ���� \^Z\�������� Z��� ������ �� ��$�� ��� Y�� Z�|� �� � ��������\�+����� ����� ���� ����� 4��-!�� �������\�\� ������ �� � �$�� ��������� � ��� $� � ���IEQ �� � � ���� $��������\^Z\� ������� \�}� �������� � �$��� =�� � � ����������� ����� ���� ������� ��� ��� �� ������� � ���� ��� ����������� � � �� ��������� ���� � � ���� � ���� � # ��� $�# � �� 4��-����� ������ �� �� ��� � �� � ��� ���� -�K������ �� $��������� ������ ������������������ ���# � ���������������� ������!������������ �������z����� � ������������� ���� �� �4��-�����\^Z\��� ��� ��� �� � ��� �� � � ������ ����� �������� ���!���� ����� �� ����������� ��� ��� ��� ���� �� ���� 4��-� ���� \^Z�� ���� ��# � �������������Z����������� ��$����
Gambar 28: Kebijakan kehati-hatian fiskal akan berlanjut pada tahun 2013 ���������������������������������� ������������ ����� ���������������
`���������<=;<��� ������� ��W� ������<=;>��� ���!��%�+����������������������������������������
�}�������������������� ������ ��@�������������������������������~������� ��@�����������$������������������������������������!��%����������������}�
� 4���� � ����� ����� ���� � � ���� �� ������� ����� ��'�� ����� � � # �� ��� ����\^Z��������� ������ ������������� ���������� ���������������������� ��$���4��� ������ ��� �� ��� �� ������������� �����������\^Z\������������ ������ �� � �$�� ���� �� ���� � � ��'� ��� � � � ������� \�|� ������ �� � �$�+��$��� ��� ��#���� �� 4��-� \^Z�� ��� �������� �� ���� �� #� � ��� �� ����������� ��!��� ������� Z}������� �� � ������ ����������������� ���� �^^� ����� 4������ ��4+�� ��� ��� � ������� ��� ���� %�� � \^Z��� �� � ����������� ���� �� ��#���� � ���� � � ��'� ����� zz� 4��-� \^Z�� ����������� �� ������ ����� ����� ��� ����� ������ �� ���� ��'�������� � � ��� ��� �� ���������� $�Y�� � �� ����� � ��������� ����� � ������� � ����� ���� � ���� � � ��'� ��� ��� ���� ����� � � # �� �� � ���� !���� �4��-��4���������� ������ ��������������� �������� ������ ��������� �������� �������� � ������� ���� \^Z���$��� � �������� ����������'���������!�������� ������� ������� ������� ��� $� � ��� ZZ^� ����� 4>{����� ����� ���� \^Z�� ����� ������ ������������ ���'�������� � ��� �������� �������� ������� ���������� � }^������"��������\^Z���4��� ������ ��� �� ������� � # ���� ����� �4��-�������� �}� ���� �"� ������ \�+�� ���� � ������� � ����� ���� ���� �� � ���!���� ��� ����� ��� �� ���� � ����� ���� � ��� ����� � �Indonesian crude oil price{�<�+���K���������� � ���'���� ��� �� ��������������������
}�������������������������� ��@���� ������������������� ���������������� �
� � ���� ��� �� � ���������� ��� ���� \^Z\� ���� �|� ������ �� � 4��-!��� ���������� �������������������� � ����� ������� ��� �� ������� � # ���4���� ����� ����� �������� ���� �� ����� ����� �� ���� ����� � � # �� ������ ��� � � ���� ���� ��� ��������� ���� � ��� �� 4��-� �� �� ��������� � ����� ��� ���� \^Z��� ��� �� ���� � ���� ��� �� ��� � ���� ����� ������ ������ ����� � ������� ������� ���� ��� $ ��������%������ 4���� �� ������� � ����� �� ������ ��� �������
!\
!Z
^
Z
\
!\^^
!Z^^
^
Z^^
\^^
�� �����������$Y��� �� ���"=>+qK�������������������$Y��� �� ���"=>+qK��������������������������#��$���Y=>+
�$Y��� � �� �������� ��$��
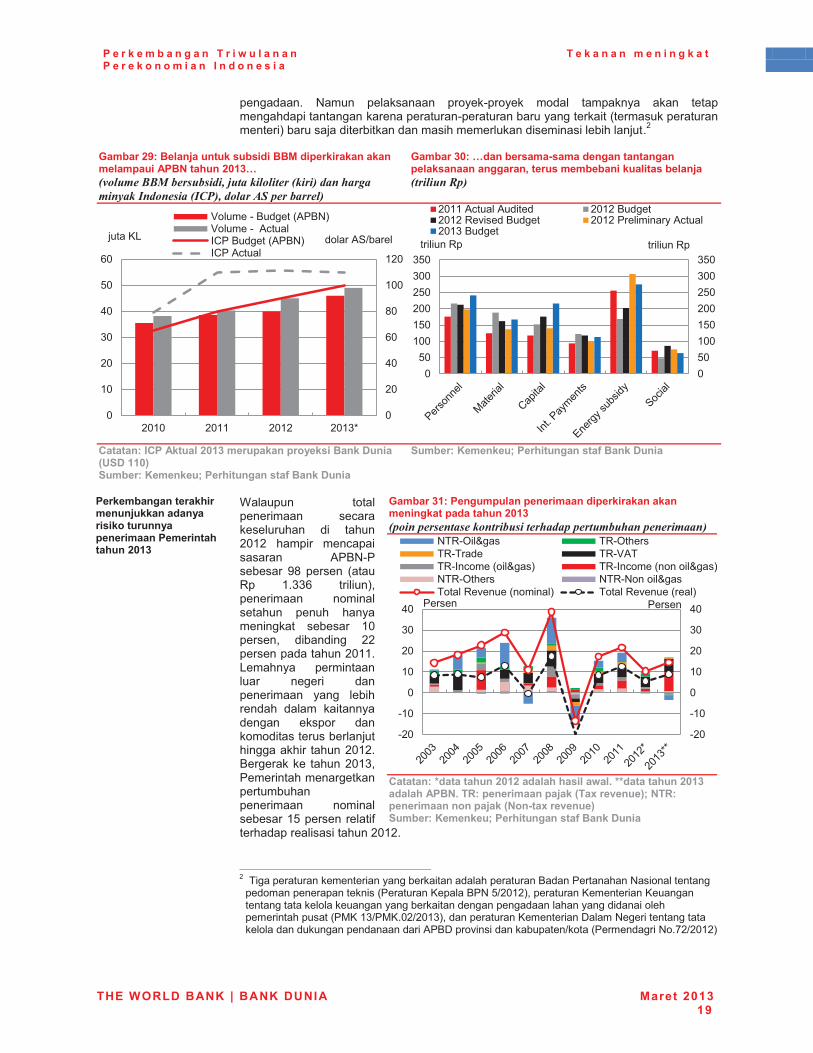
P e r k e m b a n g a n T r i w u l a n a n P e r e k o n o m i a n I n d o n e s i a
T e k a n a n m e n i n g k a t
THE WORLD BANK | BANK DUNIA Maret 2013 19
������ -��� ������ ������!������� ����� ������ �� ����������� ���������������!������������������ ����������������������� +��������� ���� ������� ������������ ��� � ���� �������\���
Gambar 29: Belanja untuk subsidi BBM diperkirakan akan melampaui APBN tahun 2013… ����������/����������������������������������������(���$���������$0����������!"� �����������
Gambar 30: …dan bersama-sama dengan tantangan pelaksanaan anggaran, terus membebani kualitas belanja ������� ��
`���������`��!���� �<=;>�����������������������������]�+��;;=^�+����������������������������������������
+����������������������������������������
������������������������@����������������������������������������������������<=;>�
� X����� ��������� �� ��������������� � � ����\^Z\� ��� �� ���� ����� 4��-!��������� ��� ������ ����Y�� Z���|� �� � �+������ �� �� �������� ����� ����� ���� ������� Z^�������� � �� �� \\��������������\^ZZ��"����� ���� ������ ���� � ������ �� ��� ��� ������� ���� � ������� ������� ������� ������������������ ����� �� ����\^Z\������������� ����\^Z�������� ������������������������� �� �� ���������Z}����������� #����������� �� �����\^Z\���
Gambar 31: Pengumpulan penerimaan diperkirakan akan meningkat pada tahun 2013 � ��� �������������������������� � ����������� �����������
`�������������������<=;<��� ������� ��W� "�������������<=;>��� ���!��%"����������������@���]��|�����^��%�������������������@���]%��_��|�����^�+����������������������������������������
�����������������������������������������������������������������\��� ���������������� �������� ����������������������-� ��������
��������������� �����������������-�}{\^Z\+���������������� �������������������������������� ������������������ � ����������� ����������'��Z�{�'��^\{\^Z�+������������������ �$���-���� ����������������������������� �4��$����K � ���������{������������� �-���\{\^Z\+�
^
\^
�^
|^
�^
Z^^
Z\^
^
Z^
\^
�^
�^
}^
|^
\^Z^ \^ZZ \^Z\ \^Z��
�������!���������4��-+�������!��4�����<����������4��-+�<��4����
�����"� �����4>{�����
^}^Z^^Z}^\^^\}^�^^�}^
^}^
Z^^Z}^\^^\}^�^^�}^
\^ZZ�4�����4�� ��� \^Z\�������\^Z\�Y�K ���������� \^Z\����� � ���4����\^Z��������
�� � ��Y�� �� � ��Y��
!\^
!Z^
^
Z^
\^
�^
�^
!\^
!Z^
^
Z^
\^
�^
�^ ������������
-�Y!q ���� �Y!q������Y!���� �Y!�4��Y!�������� ����+ �Y!���������� ����+-�Y!q����� -�Y!-��� ���������Y�K������� �+ �����Y�K��������+
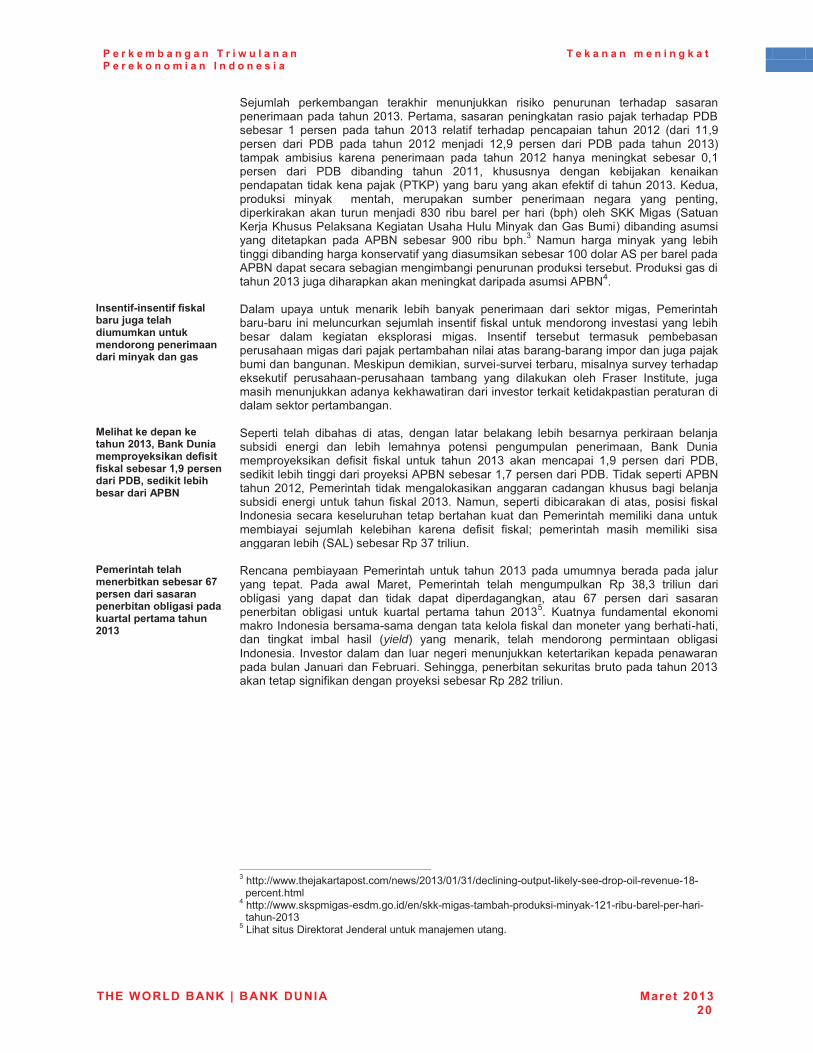
P e r k e m b a n g a n T r i w u l a n a n P e r e k o n o m i a n I n d o n e s i a
T e k a n a n m e n i n g k a t
THE WORLD BANK | BANK DUNIA Maret 2013 20
>������� ��������� ����� �� �������� � � ��� ������ ������� �������� ����� ����\^Z���������������� ������ ������ ��������$��������� Z� ������ ��� ���� \^Z�� ���� #� ������� ���� � ���� \^Z\� ��� � ZZ��������� �� � �$�� ��� ���� \^Z\� ���� � Z\��� ������ �� � �$�� ��� ���� \^Z�+������ �� � ��� ���� ���� �� ��� ���� \^Z\� ��� �� ���� ������� ^�Z������� �� � �$�� � �� �� ���� \^ZZ�� �������� ���� ��� ��� �� ��������� ���������������+��������������#��� #�� �����\^Z���������������� � � ��� � ������ ������� ������� ���� �� ���� ��� ��� ���� ���� ��� �� ����� ���� � ��^� � ��� ����� ���� �� � ����+� ����� >��� ' ��� �>������������������������ ��z���=����' ����������� +�� �� ������ ���� � ������ ��� 4��-� ������� �^^� � ��� ������ -��� ���� � ��� ��� ��� ��� �� �� �� �����������K� #����� ���� ���������Z^^������4>�������������4��-�������������� ���� ��� �������������� ������������������ ����� �����\^Z������� ��������� ������ ������� �4��-����
�������_������������� ������@����� �����������������������������������������������������
� $��� ���� ����� ��� �� ��� �� ���� ���� �� �� � ������� � ���� ����� ������!���� ������������������ ��� #� # ����������������� K���� ������� ������� ���� ��� �� �������� � � ���� ���� #� ��������� �������� ���������������� ����� ������������� � �������!���� ������������������ ��������'��� ������ � �����K� !���K� ���������� �������K����������������� #� ������!������� ����� ��� � ����� ����� ;����� ��� ������ ������ ������������������� ���� � K���������� ����� ����� ��������� ����������������������
$ �������������������<=;>~������������������������������������ �������;~X�������������~������� �������������!��%�
� >����� � ����� � ���� � � ���� ���� ���� ������ ��� �� ������ ���� �� ��������� � � ���� � �� ��� �� ������ ����� � ��������� ���� ��� ��� $� ����������� �� ��# � �� # ���� ����� ���� \^Z�� �� ���� � Z��� ������ �� � �$������ � ����� ��� �� ��� �������� �4��-��������Z����������� ��$���� ��������� �4��-�����\^Z\������� ��� � ���������� ������������������� ���������� � � ���� ������ ���� # ���� \^Z��� -���������� �� � ����� � ���� ��� � � # ��������� ���������������� ���������������������� ������ � � ������������ � � �������� ����� �� ���� ��# � �� # ����� ����� ��� �� �� ��� � � � � ��������� ���>4"+��������Y������� � ����
���������� �������������������O\����������������������������� ���������������� ��������������<=;>�
� Y��� ���� �� ����� ��� ����� ���� \^Z�� ��� ������ ����� ��� �������� ������ ��� ��� '����� ����� ��� ����� ���������� Y�� ����� �� � �� �� ���� �� � ��� ���� �� � ��� ���� � ��������� ��� |�� ������ �� � ��������� �� ��� �� � ����� ������ ������ ���� \^Z�}�� ����� #������� ����� ����������� ������!����������������# ��������������������� !�� ���� � ���� ���� �� �� �yield+� ��� ��� ��� ����� �������� ���� �� ��� �� ������ �� �K������������ �������� ���������������� �������������������%�� ���;����� ��>�� ��������� ������� ����������������\^Z���������� � # ������������� ��������Y��\�\��� � ����� �
������������������������������������������������������������������������{{�������������������{���{\^Z�{^Z{�Z{���� �!������!� ����!���!����!� �!��K���!Z�!
�������������������{{��������� ��!�������� �{�{���!� ��!����!������� !� ��!Z\Z!� ��!����!���!�� !
���!\^Z����}�" ���� ����$ ��������%�����������������������
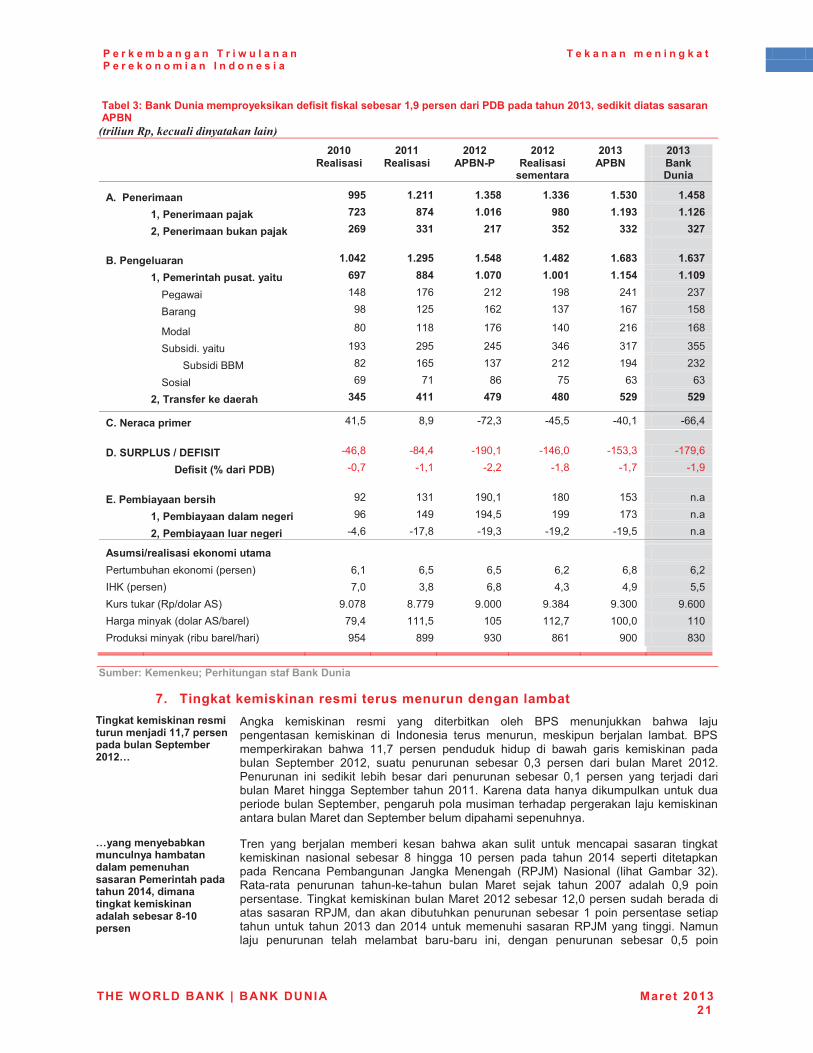
P e r k e m b a n g a n T r i w u l a n a n P e r e k o n o m i a n I n d o n e s i a
T e k a n a n m e n i n g k a t
THE WORLD BANK | BANK DUNIA Maret 2013 21
Tabel 3: Bank Dunia memproyeksikan defisit fiskal sebesar 1,9 persen dari PDB pada tahun 2013, sedikit diatas sasaran APBN ������� ����'������(������������
��
�� �� <=;=� <=;;� <=;<� <=;<� <=;>� <=;>�
�� ���� ������ �� ������ !��%_�� �� ������
��������!��%� �����
�������� �� �� � �� � �� ��
!"����������� XXY� ;"<;;� ;">Y[� ;">>O� ;"Y>=� ;"QY[�
�� ;~������������@��� \<>� [\Q� ;"=;O� X[=� ;";X>� ;";<O�
�� <~������������������@��� <OX� >>;� <;\� >Y<� >><� ><\��� �� �� �� � �� ���"���� ������ ;"=Q<� ;"<XY� ;"YQ[� ;"Q[<� ;"O[>� ;"O>\�
�� ;~���������������"������� OX\� [[Q� ;"=\=� ;"==;� ;";YQ� ;";=X�
�� ���� � Z��� Z�|� \Z\� Z��� \�Z� \���
�� ���� ��� Z\}� Z|\� Z��� Z|�� Z}��
�� '���� �^� ZZ�� Z�|� Z�^� \Z|� Z|��
�� >��� � ��� ��� Z��� \�}� \�}� ��|� �Z�� �}}�
�� >��� � ���'� �\� Z|}� Z��� \Z\� Z��� \�\�
�� >�� �� |�� �Z� �|� �}� |�� |��
�� <~���������������� >QY� Q;;� Q\X� Q[=� Y<X� Y<X��� �� �� � �� � �� ��
`"�%��?�������� �Z�}� ���� !�\��� !�}�}� !�^�Z� !||����� �� �� �� �� � �� ���"�+���-�+����#*�+���� !�|��� !����� !Z�^�Z� !Z�|�^� !Z}���� !Z���|�
�� �������]���������^� !^��� !Z�Z� !\�\� !Z��� !Z��� !Z����� �� �� �� � �� ��#"����������������� �\� Z�Z� Z�^�Z� Z�^� Z}�� ��
�� ;~������������ �������� �|� Z��� Z���}� Z��� Z��� ��
�� <~����������� ��������� !��|� !Z���� !Z���� !Z��\� !Z��}� ���� �� �� �� �� � �� ��
!�������� ������������������� �� �� �� � �� ����������������� �������+� |�Z� |�}� |�}� |�\� |��� |�\��=��������+� ��^� ���� |��� ���� ���� }�}������������Y�{�����4>+� ��^��� ������ ��^^^� ������ ���^^� ��|^^�=���� ���������4>{����+� ����� ZZZ�}� Z^}� ZZ\��� Z^^�^� ZZ^�������� �� ����� �������{�� +� �}�� ���� ��^� �|Z� �^^� ��^��� �� �� �� ��
�
�� ��
�
�
+����������������������������������������
7.� Tingkat kemiskinan resmi terus menurun dengan lambat �������������������������������@���;;~\������������ ���+������<=;<}�
� 4��� ��� �� � ���� � ��� � ���� ��� ����� ��>� �������� ���� ����������� ��� �� � � � ����� � ������ ������� ���� ��� ������ ������ ��>�������� ��� ���� ZZ��� ������ �������� � ���� � � ���� �� �� ��� �� � ������� >��������� \^Z\�� ����� ������ ������� ^��� ������ �� � ���� '���� \^Z\�������� � ��� � �� ��� �� ����� �� � ������ ������� ^�Z� ������ ��� ����� � �� �����'����� ��� >��������� ����\^ZZ������������� ������������������� ��������>������������������������ ������������������������ �� ��������'������>���������������� ��� ����������
}������������������?� �������������� ��������������������������������������<=;Q~��������������������������� ���������[_;=��������
� ���� ��� ������ ������ � ���� ���� �� ��� �� ����� ���� � ���� � ������� �� � � ��� ������� �� � ��� Z^� ������ ��� ���� \^Z�� ������ � � ��������� Y��� ������� %��� '����� �Y�%'+� -� ��� �� ��� ����� �\+��Y�!��� ������ ���!��!���� ���� '���� ����� ���� \^^�� ���� ^��� �� ������������ ������� �� �����'����\^Z\��������Z\�^������������������ ��������Y�%'������� �������������������� Z��� ������������� ����������� ���� \^Z����\^Z������������� � ���� Y�%'���� � �� ��-������� ������ ����� ������� ���!���� �� ���� ������ ������� ^�}� �� �
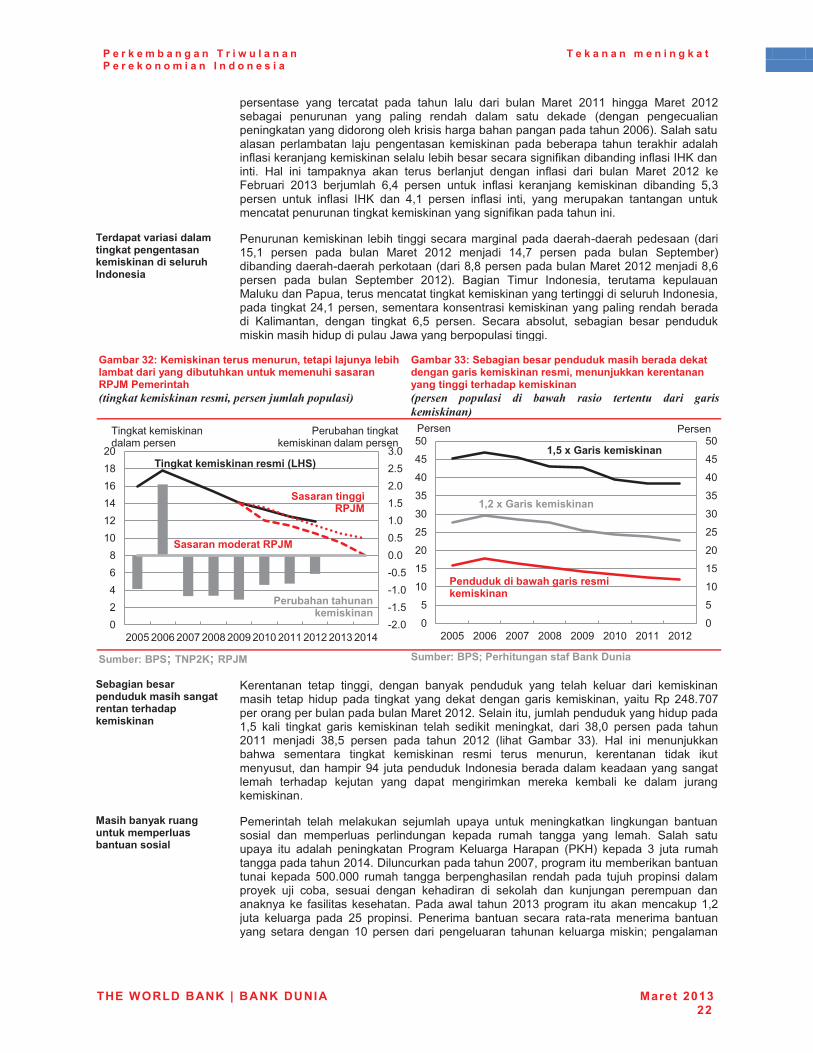
P e r k e m b a n g a n T r i w u l a n a n P e r e k o n o m i a n I n d o n e s i a
T e k a n a n m e n i n g k a t
THE WORLD BANK | BANK DUNIA Maret 2013 22
��������� ��� ������� ��� ���� ���� �� � ���� '���� \^ZZ� � ��� '���� \^Z\����� � ������ ��� �� �� ����� ���� ���� ������ ����� ������� ��� �������� ������������� � �������������������\^^|+��>���������� �������� ���� ���������� �� ���� ������� ���� ����� �� ���� #�� ���������� �� ���������� ������������� � # ��� �� �� #�� ��=���� � �� =�� � ������ �� ������ �������� ���� #�� � �� � ���� '���� \^Z\� ���;����� � \^Z�� ��������� |��� ������ ����� #�� � ������ ��� �� � � �� �� }��������� ����� #�� � �=�� �� ��Z� ������ #�� � � �� ��� ������� ���� ������������������ ������� �� ����� � # ��������� ��
���������������� ���������������������������������� �������������
� ��������� �� � ��� �� � �� ��������� ���������!����������� ��� �Z}�Z� ������ ��� ���� '���� \^Z\� ���� � Z���� ������ ��� ���� >��������+�� �� ������!��������������� ������������������'����\^Z\����� ���|������� ��� ���� >��������� \^Z\+�� �� � � ���� ����� �� ������� �������'������������������������� ������� �� �������� �� �� �������������� ������ ����\��Z���������������������� ���� �� ������ ������������� � �� ���� ���� � ���� |�}� ������� >���� �������� ���� � ����� ��������� �� ��� ��� ����� ������%�������������� �� �� ���
Gambar 32: Kemiskinan terus menurun, tetapi lajunya lebih lambat dari yang dibutuhkan untuk memenuhi sasaran RPJM Pemerintah ���������������������� ������������� � ������
Gambar 33: Sebagian besar penduduk masih berada dekat dengan garis kemiskinan resmi, menunjukkan kerentanan yang tinggi terhadap kemiskinan � ������ � ����� �� ��1��� ����� ��������� ���� ��������������
+��������+���%�<�����q$� +��������+�����������������������������
+������������������������������������������������������
� ������ ����� � �� �� ���� ���� �������� ��� ����� ������ �� � ��� �� ��� �� ����� � ���� ��� � ���� ��� ����� ���� �� �� ��� �� �� � ��� Y�� \����^�������������������������'����\^Z\��>�� � ���������������������� �������Z�}� �� � � ���� �� �� ��� �� � ����� ��� � �� �� ����� �� � ���^� ������ ��� ����\^ZZ� ���� � ���}� ������ ��� ���� \^Z\� �� ��� ����� ��+�� =�� � ������������ ������� � ���� ��� �� � ���� � ������ ������� ������ � ��� ������������������ ����� ������������ ����� �������������������������� ������� ������ ��� ���� ��� � ��� ������ ����� � ��� ���� �������� �� ��
$���������������������������� ����������������� �
� ����� ��� ����� ������� �������� ���� ����� �� ����� � ����� ������� �� �� ���������� ���� ���� ����� ����� ���� ��� ������ >��� �������� ��� ���� �� ���� ������� ������� =�� ���=+� ����� �� ���� ����������������\^Z���$ ��������������\^^���������� ��������� �������� � ����� }^^�^^^� ����� ���� �������� �� ����� ��� ������ ���� � � ����������� �� � ����� ���� � ���� ���� �� � � ������� �� ������ �������� �������� #� � ����������������� ���� \^Z��������� ������������Z�\����� ������� ��� \}� ���� � �� ���� �� ���� ����� ��!��� ���� �� ������� ����� ���� Z^� ������ �� � �������� ���� �������� �� �� ������
!\�^!Z�}!Z�^!^�}^�^^�}Z�^Z�}\�^\�}��^
^\�|�
Z^Z\Z�Z|Z�\^
\^^} \^^| \^^� \^^� \^^� \^Z^ \^ZZ \^Z\ \^Z� \^Z�
�����������������������]-Z+^�
+����������������q$�
+���������������q$�
���������������������������
�������� ������� �� �����������
� ������� �� �����������
^
}
Z^
Z}
\^
\}
�^
�}
�^
�}
}^
^
}
Z^
Z}
\^
\}
�^
�}
�^
�}
}^
\^^} \^^| \^^� \^^� \^^� \^Z^ \^ZZ \^Z\
������������
����������W������������������������
;~<�|�&���������������
;~Y�|�&���������������
P e r k e m b a n g a n T r i w u l a n a n P e r e k o n o m i a n I n d o n e s i a
T e k a n a n m e n i n g k a t
THE WORLD BANK | BANK DUNIA Maret 2013 23
���� ��� �������� ���� ���#��� ���� ������ ��� Z}� � ��� \}� �������� ������ ����� ��� ��� �� ����#�� ����� ������� ��� �� � ������ ����� ���������������� ��
8.� Risiko terhadap perkiraan (outlook) menguat disebabkan oleh faktor-faktor domestik
�������]outlook^���������������������������}�
� ���� ���������$� ������������������ ������ �������������������������� ��������������\^Z������ ����� ���������������outlook+������ ��� ��� �� ����� � �� �� ���� ���� ������� ���������� ��� ������������� � � ���� ����� ��� ��� �� � �� ����� �� �� ���� \^Z\� ������� ����� � ��� ��� ������ �� � #����� ���� ���� � ����� ������ ������� ����� � ����� ��-��� ������� �������� ��������� ���� ���� � ��� ���� ��������������������
}���������� ������������������������������������������������ ������������]�$��^����� ��������}�
� Y � �������������������������������� ��������� K���� ������� ����� ����������������������������� ��� ������������� ����\^ZZ� ������ �������� � ������ � K���� � ������ �� �� ���� \^Z\�� =�� � ����� ���� � ��� ���� �� ��� ���� ����� ��� �� ���������� K���� �� � ����� ��� �������� ��� ����� �������� ��� ������� �� ������ ����� ���� � � ����������������������� ������� ���� ������ ���������������������� ��������!����� �������� ����� �� ��� >���� ������ ������ ��������� �������� ���� ���� ��� K���� � �� ������ �� �� � ���� ��� ����� � � ������������ K���� � ������ � � � ���� �K���� � ����� ���� � ������ ����������� �� ���� ������� ����� � ��� �� ���� ���� ������ >������������ � � ���� ��� �� ������ �� ���� ���� ����� � ������ ����� ���������������� ��� �������� ���������� ������������������� � � ��� � �� #�� � �� ���� ���� ��� ���� �������� � �� ��� ������ � ��� ��� ����� ������������������������������������ ��� ���������� ������� ��� K���� � ������ �� ������ � �������� � ��� �� � ��� ����� ����������������� � ���������� ���������� �������\^Z�������� ����������� � ���� �� ��� ����� �� � ���!���� ������ ���� K���� � �������� ��� � ������� ��� ����� � � �� � �� ���� ������ ��� ��� ���� ����� ������������������� ���������� � # ����Y � ��!� � ��� ������������������� K���� ��������;$������ �������������� �� �� � �������� ���������� �$��� >��� � ������ � �� #�� ���������������� K���� � � ��� ��������� � ��� ���� � }� ������ ��� ���� \^Z���� �� �� ������ � Z^� ������ ��� ���� \^Z\� �� ���� �� ���� ��� $� ����������^��������������\^Z�+����������������������$��� ������������ ���Z��� �������������
}���������������������� ������������������]cost-push^}�
� Y � ��� #�� � ���������� �������������� � ����������� ������� ��Y�� ����� ���� #�� ������� ��� ���� \^Z\� ���� � ������ �� ������ ��������� ����� ������� ���� ����� ���� ������ �� �������� ��� �� ����� ����� K���������� ���������������������� � ���� #� � ��� ��������� � ����������!���Z}�������������������� ����������# � �� ���# ����������� � ��� �� ������ ������� #�� � �������� ������ � ���� ����� �� ���� ������� ������ ���� � � ���� � ��� ���� \^Z��� ���� ��� ��� �� ����� �������� ������ ������������������������ ��� ��������� �������� ���������������\^Z����������� ��������� � ����� ���� ������������ ��� �� ��������� � ���������� � ��� ��� � ���� �� ���� ����� ����������� 4�� ���� ���!���� ��� �� ��� ������ � ������� ������� ������ ���������������������� ���������������������� ������������ ����� � ����� �������� � � ��� #����� � � � ����� � ��� ��������� ��� ���� #�� � ������ ��� ���� ��������� ������� ��� ��� ������������ ���������������������������������������� ����������������� ����������������'� �\^Z�������������������� ���� �������������������$�� �-��� ���
�� �

P e r k e m b a n g a n T r i w u l a n a n P e r e k o n o m i a n I n d o n e s i a
T e k a n a n m e n i n g k a t
THE WORLD BANK | BANK DUNIA Maret 2013 24
}������ � �������?�������� �
� z��!���� ��� ������ � ������� �� �� ���� ����� �� ������� � ����������� ������ �� �� � ��� ������� ��� ��� ������� � ������ ��# � ������ ������ ������ �� ������ � � Y�� ��� ��� ���� ���� � #����� �� � ��� K������� '����� ��� ����� �� ���� ��� �� ����� ����� �� ���� ��� �������������� � �������������� ������ ������� �� ��������� �����!������� #� ��� � ��� � � ��� ������ � �� ���� ������� � � � ��� ��� ������������ �������� ���� �� ����� ���� ���� � ������ ��� � � # ��� �������������� �������� ����������������� ������ �� ����������� �������� ����� ����� ���� ������ >�� � ���� ������� �� ����!�� ������ �� � �� � ��� ���� K���� � �� ����� � �������� �� ���� ��� � ����� �� �� � ����� �� ��� ��� ����� ����� �� ����� ��� ��� ��������� � �������������
+���������@����������������������� �������������������������� ���������������������������������������@�����
� >�� ����� �� ����!������������������ ������� ���� � ������ ����� �� ���� ���� �� ���������� ���� ���� ������� ���������� ����� � �� ���������� ��� �� ���� ������ ���� ��#���� � �� �������� ���� �������� �����!������������������������� ���������� �� ��� �������� ���� ��������������������� K���� ��������� ����������� ������� ���� �� ����� �# � �� � K���� � ����� ���������������� ��� #��������������� # �� ���� � ������������ � �������������� \^Z�� ������ �� ��������� �� ��� ���������� ������ ����� ��� ���� ������� ��� �� ����� ������ � ��� ����� � ��� ��� �� ��������� ��� ���� �� � ��� ����� ���� �� ����� � ��#���� � ��� ���� ������� � ���������������� � !��� � ���� ����� ���������� ������������ � �'���� ������ ���� � �������� ��� ����� �� ���� �� ������ ���� � � �������� ������������� �����������
P e r k e m b a n g a n T r i w u l a n a n P e r e k o n o m i a n I n d o n e s i a
T e k a n a n m e n i n g k a t
THE WORLD BANK | BANK DUNIA Maret 2013 25
B.� BEBERAPA PERKEMBANGAN
TERKINI PEREKONOMIAN
INDONESIA
;"� Tinjauan terhadap realisasi sementara APBN 2012 �� ��������������!��%�<=;<�����@������������!������������� �����������������������������;~[��������������
� X����� ���� \^Z\� ����� ������ ����� � ��� ��� ������� ��� �� � 4��-� ������ ������ �� ���� ��� ������� ����� �� �� ������������� ��� ����� �� � ��� ����� ���� �� � � ������ �� � ��� � ��������� ��!��� 4��-� ��� ����� ��� 4��� headline�� ��# � �� ����� ���� �Y�� Z�|� �� � �� �Z��� ������ �� � �$�+�� ��� �� ����� ����� � � # �� � �� �� ���� ���� 4��-!�� ������� \�\� ������ �� � �$��� ����� ���� �������� ������ �� ������� %����� ��� �� � ���� �� ���� � Y�� Z���|� �� � �� ��� ��������� �� � ���� 4��-!��� ���� ���� �� ��� ��� �� ����� �� � ���� ������ �� ������� �!� ��� � �� �� ����� ���������� ��-� �� ��� �� %������������� ���� � Y�� Z���\� �� � �� ��|� ������ �� � ���� � 4��-!�+�� ���� ��� �������� ��� �� � ����� ���� �� ����� � ��� � ���� ��� �� ������ � ������ � ����� ������� � # ����
�� �������������������������<=;<��������������������������������_�������!��%��
� Y�� �� � � ����� ����� ����������\^Z\����K� � �� �� ��� ����������� � 4��-� ������ �+��$� � � � � ��� � #�� ��!��� #�� �������������>�-��!���+� ����� ���� � ����� ���� ���� ������ ��� 4��-!���� �!�� �� ������� ��������������+�����\�����������+�� �������� ����� �������������� !�� ����� ���� ��� ��������� ���� ����� �������������������� ������ �� �yield+�� � ��� ����� �� ���� ��'�������� � ��������\^Z\����� ������� 4��-!���������� ������ ����!�������� ��������������������� ����Z\Z������4>����������� ��������������������� #�� � ��������� ������$ � � � �� ��Y�� ������� ������� � ��������|������������������������ �Y����������������� 4>� ��� ���� \^ZZ� ���� � Y�� ������ ���� ����� 4>� ��� ���� \^Z\�� ��������� ������ �� ���� ������� ���� ������ �� ��� ������� ����� � 4+�� Y�� �� � =��� ' ��� ����� � �Indonesia Crude Oil Price{�<�+� �������ZZ�� ����� 4>� ���� ����� ���� ��� �� � �� � �� � ���� �� ������� ������� � � ��� ������������� ��� ������ �� ������ K���� � ���� �� ���� � ���� ����� ���������������� �� ���������� ��|Z�� �������������� �����+������������� �� ������ �4��-!�����������^�� �������������������$������ �|�\�����������+��������\^Z\�������� ��������� �4��-!���������|�}���������
Tabel 4: Realisasi indikator ekonomi makro tahun 2012 bervariasi dibandingkan asumsi APBN
� <=;;�� <=;<��
� �� �_�����
!��%� !��%_��� �� �_�����
���_�����
�����������$��� ���������+�
|�}�� |���� |�}�� |�\��
�#�� ��������+� ����� }���� |���� ����������������Y�{z>$+�
������� ���^^�� ��^^^�� �������
>��������>�-��!������+�
����� |�^�� }�^�� ��\��
=���� ��������������4>{����+�
�ZZZ�}�� �^�^�� Z^}�� ZZ���
������� �� ����^^^����+�
����� �}^�� ��^�� �|Z��
+������������
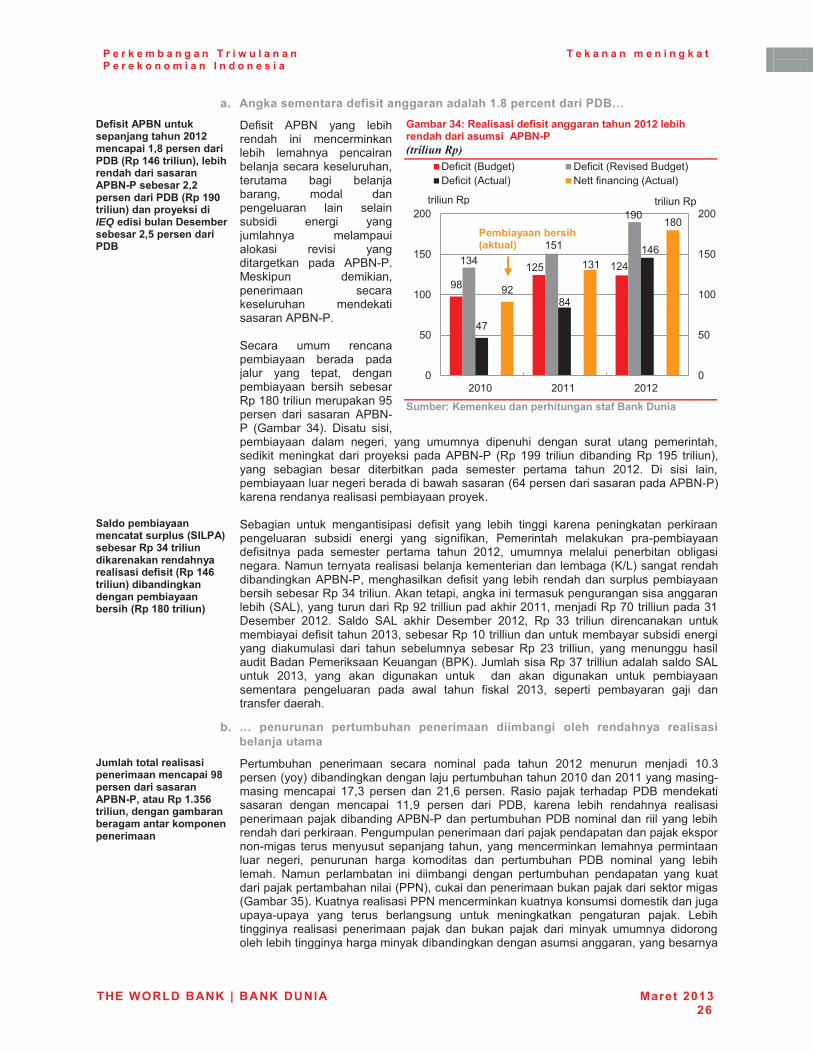
P e r k e m b a n g a n T r i w u l a n a n P e r e k o n o m i a n I n d o n e s i a
T e k a n a n m e n i n g k a t
THE WORLD BANK | BANK DUNIA Maret 2013 26
a.� Angka sementara defisit anggaran adalah 1.8 percent dari PDB… �������!��%�����������@����������<=;<���?�����;~[��������������]���;QO���� ���^~� ���������������������!��%_��������<~<��������������]���;X=���� ���^��������������IEQ������� ���������������<~Y��������������
� $�# � �� 4��-� ��� ��� ������� � ������ ����� �� ������ ��� ������������������������������ �� � ���������� ����� ���������� � � ��� ����� � � ���� � ���������� ������ ����� � ��K � � ���� ������� ��� 4��-!���'��� ��� ��� � ������ �� ��������������� ������ �����4��-!����>���� ����� �������� �� ����� �������� ��� ������ �������� �� ���� �� �������Y��Z�^��� � ����������}������� �� � ���� 4��-!�� ������ ��+�� $ ���� � � ������ �� ���� ���� �� ��� ������ � ���� � ���� ����� ���� ����� ������� � �� �� ���� �� � ������� � ��� 4��-!�� �Y�� Z��� �� � �� � �� �� Y�� Z�}� �� � �+����� ���� � ����� � ���� ��� ��� ��������� ������ ���� \^Z\�� $ � � � � � ������ ���������� ������� ����������|���������� ��������4��-!�+������������� �� ����� ����������
Gambar 34: Realisasi defisit anggaran tahun 2012 lebih rendah dari asumsi APBN-P ������� ��
+������������������������������������������
�+� ��������������?��������� ���]+�-�!^����������>Q���� ������������������������ ������������]���;QO���� ���^���������������������������������]���;[=���� ���^�
� >��� � ����� ���� � �� � ��# � �� ��� ��� �� � �� � ���� �� ���� ���� ���������� ���� � � ���� � ��� � � # ��� ����� ��� ������� ��!���� ����# � ��� ��� ��������� ������ ���� \^Z\�� ������ ����� � ����� �� ��� �� ������-������������ �� ������������� �����������{"+����������� �� ���4��-!�������� �����# � ����� ��� �� ������������������� ������ ���������Y������� � ���4������ ����� ����������������� ��������� ���>4"+������������ �Y���\��� �� ������� ��\^ZZ������ �Y���^��� �� ������Z�$�������� \^Z\�� >���� >4"� �� �� $�������� \^Z\�� Y�� ��� �� � �� � ����� ��������� � ���# � ������\^Z����������Y��Z^��� �� �������������������� � ����� ���� � ������ � �� � ���� ��������� ������� Y�� \�� �� �� ��� ��� ������� �� ���� ���������� ������������+��%������ ��Y������� �� �����������>4"������ \^Z��� ��� �� � ���� ����� � �� �� � ���� ����� ���� ��������� �������� ��� ��� ���� # ���� \^Z��� ������ � ������� �� � �����#���������
b.� … penurunan pertumbuhan penerimaan diimbangi oleh rendahnya realisasi belanja utama
q�� ������� ��� �����������������?�����X[������������������!��%_�~���������;">YO���� ���~����������������������������������������������
� ���������� ���� �� ����� �� �� ��� ���� \^Z\� ������ ���� � Z^�������������+�� �� �������������������������\^Z^���\^ZZ������ �!�� �� ���� � Z���� ������ �� \Z�|� ������� Y� �� ���� ������� �$�� ������ ����� ���� ���� � ZZ��� ������ �� � �$��� ���� ��� �� ������ ��� �� ����� ������� �� ��4��-!���������������$���� ����� �������� ��������� ����� ���������������� ���� �������������������������!� ��� �������������� ������ ����� ��������� �� ���������� ������ ���� �� ������ ���� ����� ��� �� ���������� �$�� �� �� ��� ��� �������� -��� �������� � � ��� � ���� ���������� ������ ��� ������ ������������� � ����-+����� ������� ������������ ��������� ����������}+���������� �� ���-������� ������������� ������� �����������!���� ��� ������ ��������� ����� �� ����� ������� ����� "�� ��� �� �� ��� �� � ���� �� ���� �� ���� ���� �� � � ��� ������ � �������������� ��� �� ������� ���� �� ����������� ���������������
���Z\}� Z\��Z���
Z}Z�
Z�^�
���
���
Z�|�
�\�
Z�Z�
Z�^�
^
}^
Z^^
Z}^
\^^
^
}^
Z^^
Z}^
\^^
\^Z^ \^ZZ \^Z\
�� � ��Y��
$�# � ���������+ $�# � ���Y�K ����������+$�# � ���4����+ -����# � ���4����+
�� � ��Y��
����������������]����� ^�

P e r k e m b a n g a n T r i w u l a n a n P e r e k o n o m i a n I n d o n e s i a
T e k a n a n m e n i n g k a t
THE WORLD BANK | BANK DUNIA Maret 2013 27
��� ���� ��������������� ��� ����������������� �� ��������� �����������������|Z�� ���������
��?������� ��@���?������ ��������� ���XO����������� ������!��%_�~�@�����������������@����������������������������� ��@��
� >��� ���� ��� ��� ���� � ����� � � � � � � �������� ���� � �� ���� � � ���� ����� �Y�� �^�� �� � ��� ��� �� � �� � ������� }Z��������� � ���� � ���4��-!������������������������� ��$���������|+��>��� � ���'����� �\�|��������� ��$�������� � �� ��� ������ �Z�Z��������>�� � ����������������� ������ � ����� ��������Y��\���� � ����������� �������������� ������������� ��������� ������� ����� ��� ����� ����� %����� ����� ������ �� ��� ������ ����� �� �����������������!���� �����<�+������� ��� �� ���K������������ ���'�������� � �� ������� Y�� ��� �� � ��� ��� ������ � ���� ��'� ������� � ����������������� �� ���������4��-!��� �������� ��Z\Z������4>�������������Z}�������� �������� �4��-+��<����������� ������������������'�������� � �����������������!����������� ��� ��������� ����������� ������ � ��'� ������� � � ��� ���� � �}�\� ���� �"�� � �� �� ����4��-!����������^������"���
Gambar 35: Penerimaan hampir mencapai sasaran tapi kinerjanya bervariasi antar jenis penerimaan ������� � ���
Gambar 36: Tantangan pencairan APBN tetap ada untuk belanja inti, belanja subsidi energi meningkat pesat ������� � ���
� �
`��������%����� ������������������@���]���_��|�����^�+������������������������������������������
+������������������������������������������
��������� ������������������������������������� ��@���
� %����� ����� ������� ��� ������ ���� �� ����������� ����������#���� ���� � � �� ���+�������� ����}��������� � � ���� 4��-!��� � ����� � ���� ���� \^ZZ���� ���� � �^�}� ��������������+��X������������ �� ����� ����������� � � # �� � � ��������� �� �!�� ��������� �}� ������ �� �^�������� ����� �� �������� ������ �� ������ �!�� �� ������� Z^��� Z�� ������ � �� ������ \^ZZ�� >������������������� �� ������� ����� ��� � ����������������� ��
Gambar 37: Seperti tahun sebelumnya, sebagian besar anggaran 2012 dicairkan pada bulan Desember ������� � �����
+������������������������������������������
^
Z^^
\^^
�^^
�^^
}^^
^
Z^^
\^^
�^^
�^^
}^^
������@���
� �����+
������@��� �����+
����4����
�@��4�+
*@� ��� -�Y�q �����
q����-�Y
�� � ��Y��
\^ZZ��4���� \^Z\��������\^Z\��Y�K ���������� \^Z\��4����
�� � ��Y��
^
}^
Z^^
Z}^
\^^
\}^
�^^
�}^
^
}^
Z^^
Z}^
\^^
\}^
�^^
�}^
������� '��� � <� �� ���������
*�������� ��
>�� �
\^ZZ�4�����4�� ��� \^Z\�������\^Z\�Y�K ���������� \^Z\����� �����4����
�� � ��Y�� �� �� � ��Y�� ��
^
Z^
\^
�^
�^
}^
|^
�^
�^
�^
Z^^
^
Z^
\^
�^
�^
}^
|^
�^
�^
�^
Z^^
% ;�� '� 4�� '� %� %�� 4��>�� q�� -�K$��
������� >�� � '��� � <� �� *��������� ���� � ��Y�� �� �� � ��Y�� ��
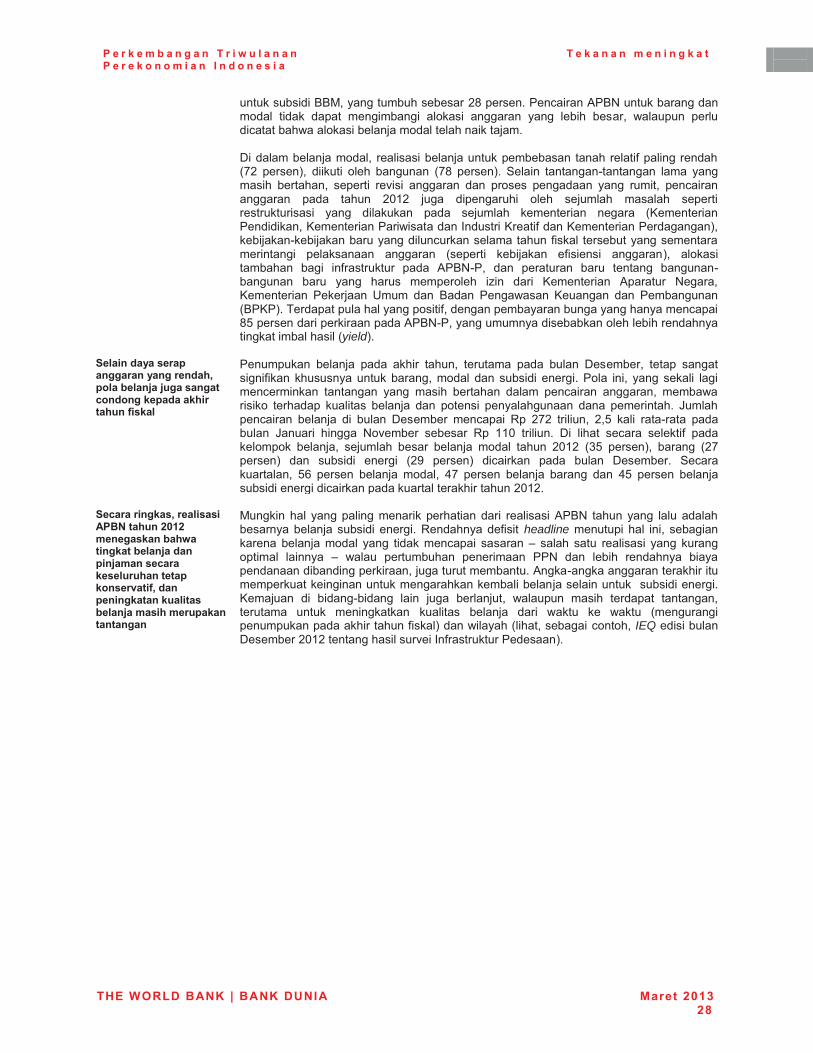
P e r k e m b a n g a n T r i w u l a n a n P e r e k o n o m i a n I n d o n e s i a
T e k a n a n m e n i n g k a t
THE WORLD BANK | BANK DUNIA Maret 2013 28
��������� � ���'�������������������\������������ ��4��-����������������� � ��� ���� ��� ��� � ���� � ���� ��� ��� �� ������ ������ ������� ������������ ���������������� ���������$ ���������������� ��� �� ������������������� ������� #��� ���������\� �����+�� � ��� � ����� ���� ���� �����+�� >�� � ���!���� ��� ����� �� ������� ������ � ��K � � ���� �� ������� ����� ��� ��� ��� ��� ������ ��� ���� \^Z\� ���� � ������ � ����� �������� ����� ������ ����������� �� � ��� � ����� ��� �������� ������� � ���� �������� ���� � ���������� ��� � ����������� ����� #���������� �������+����� ��!��� ����������� ����������������# ���� ���������������������� �� � ������ ���� ������� � ��� ��� �# � �� � ���+�� ���� ������ �� � #���������� ��� 4��-!��� �� ������� ���� ����� ���!���� ���� ��� ����� ����������� � � �� � ������� � 4������ -������������ � ������� z���� �� ��� ������ ����� �� ������������+���������������������� � #��������������������������� ��}��������� ����� �����4��-!������������� �������������� ��������� ���� ������ ���yield+���
+ �������������������������������~��� ��� ��@��@�����������?���������������������������� �
� �������� ����� ��� �� �� ����� ������� ��� ���� $��������� ����� ����� � # �� �������� ����� ����� ����� ������ � � ���� �� ���� �� ������� � �� ������� �� ���� ��� �� �� ������ ���� ��� �� ����� ������� � ��� ������� ��� ��� ����� �� ����� � �������� �� ����� ���� %�������� �� ����� � � ���� $�������� ���� � Y�� \�\� �� � ��� \�}� �� � ��!��� ������� %�� � � ��� -�K������ ������� Y�� ZZ^� �� � ��� $ � � ��� ����� ������ #� ������������ ������ �������� ����� ����� ����� ���� \^Z\� ��}� �����+�� ���� �\�������+� �� ���� � � ���� � �\�� �����+� � � ��� ��� ���� $��������� >����������� }|� ������ ����� ������ ��� ������ ����� ���� �� �}� ������ ��������� � ����� �� � ����������������� ������\^Z\����
+?�����������~��� ������!��%�������<=;<�������������W����������� ��@��������@������?������ ����������������������~������������������ ������ ��@���������������������������
� '��� ���� ����� ����� ������� ��� � ��� �� �4��-� ������� ����������������������� � � ���� ��Y�������# � �� headline������� � ��� �� ���� ����� ����� ����� ��� � ��� ���� � ������ ���� ���� ��� �� � ��� �������� ��� � �� �� ���� ���������� ���� �� ��-� �� ��� �� ������ � ������� �� ������ ���������������������4��!������������ �� ��������������� � ������������������ ��������� ����������� � ����� �������� � � � ��!� ��� � � ���� ��������� ������ �� �� ������� ������������ ����� �� ����� ��� ��� ����� �� � ����� ��� ����� ������� �������������� ������# ���+���� ������ �������� ��������IEQ��� � �����$��������\^Z\�������� �����K� ��#���������������+���� �
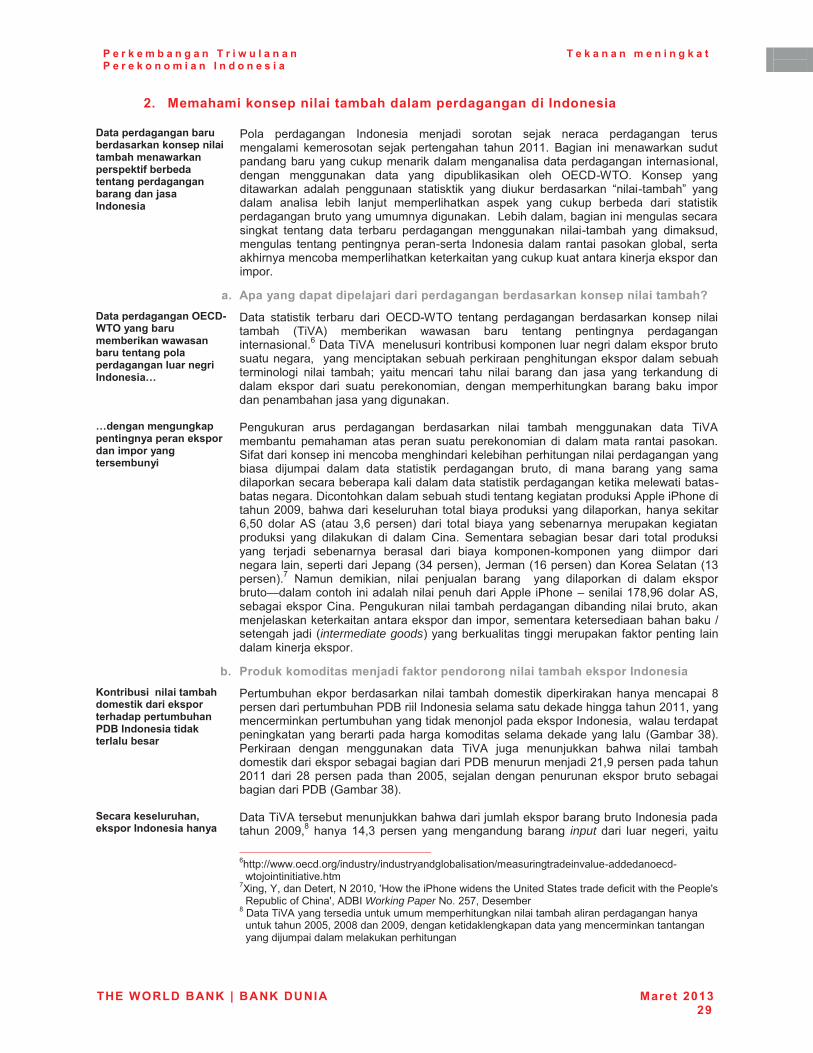
P e r k e m b a n g a n T r i w u l a n a n P e r e k o n o m i a n I n d o n e s i a
T e k a n a n m e n i n g k a t
THE WORLD BANK | BANK DUNIA Maret 2013 29
<"� Memahami konsep nilai tambah dalam perdagangan di Indonesia
�������������������������������������� �������������W�����������������������������������������������@������������
� ���� ������� ����� � ���� � ������ ����� ���� ������� ����������� � ���������� ����� �������� ���� \^ZZ�� �� � � ������ �������������������������� ���������� ������������ ���� �������� ������� ��� ��� � ���� �� �� ����� q*<$!X�q�� ������ ���� ����� ���� ������ ��� ��� �� ��� � ����� �������� � � !������ ������� � �� ��� �� ����� ������� ���� ����� ��� ������ ������� �� � ��� �� ������������������������� ������"�� ��������� � �������������� ���� ����� ��� ������� ������� ������� � !����� ��� � �������������� �������� ������!����� ����� ����� �� � ������������ ������� ���������������� ���������� ������������������� ������������� ������
a.� Apa yang dapat dipelajari dari perdagangan berdasarkan konsep nilai tambah? ���������������'#`�_��'��������������������W�W������������������� ������������ ����������������}�
� $�� ��� �� �� ������� �� � q*<$!X�q� ����� ������� �������� ������ � ������ �� �4+� ������ �� ���� ���� ����� ��� ��� ������� ���� ���|�$��� �4���������� ����� ��� ��������������� ���������������������������� ������� �������������� ������ ������������������������� ���� � � � ������ � ��� ���� � ���� � � ���� �� ��� ��� �������� � ����� ������� �� � ����� �������� �� ���� ������� ����� ���� ���� �������������������� �������
}������������������������������������������������������������
� �������� ���� ������� �������� � � ����� ������� ��� � �4�������� ������ ������� ����� �������� � � � ���� ��� �� � ������> #���� ������� ����������� �� ������ ������ ���� � ������������ �� � ���� � ���� ��� ��� �� �� ������� ������� � � �� ���� ��� ���� �������������������� ����������� �� ������������ �������� ����!���������$ ��������������������� ��������� ��������� �4����� ������ �����\^^��������� ����������������� ��������� ����� ������� ������ ���|�}^� ����� 4>� ���� ��|� �����+� �� � ����� � �� ��� ������� ������� ��� ��������� � ��� � ����� � � ���� < �� >������ ���� � ����� �� � ����� ������� ���� ����� � ������� ������ �� � � �� ������!������� ��� � ����� �� ������ �������� ��� �%�������������+��%�����Z|������+��������>�����Z�������+��� -��� ��� � �� � � ������ ���� � ��� � ������ � � ���� ������������~���������� ����� � �������� �4����� ��������� � �Z����|������4>������ ��������< ���������� � � ������������� �� �� � ������������������������ �������������� ��������������������� ��������{���������� ��intermediate goods+���������� ���� �� �������� #�������� �� � ������ ������������
b.� Produk komoditas menjadi faktor pendorong nilai tambah ekspor Indonesia �������������� ���������������������������������������������������������������� � �������
� ������������������������ � � ����������� ��� ���� ���������� � ���������� ������������$��� ������� ����������������� �������\^ZZ����������� ���������������� ������������������������� ���������������� ������������ ������������� ����������������� ���� ��������+������ �� ���� ������� ��� � �4� ���� �������� ���� � � ����������� ���� ������������ ��� ��� ��$������������ �\Z����������������\^ZZ� �� � \�� ������ ��� ��� \^^}�� ����� ���� ������ ������� ������ ���� ��� ��� ��$����������+���
�+?������ ������~���������������������
� $��� �4������������������������ ����������������������������� �������� \^^���� ��� Z���� ������ �������������� input� �� � ���� ���� �� � ���
�����������������������������������������������������������������|�����{{������������{ ������{ ������������ �� �{����� ����� K���!��������!
����� � � � K�������� ���_����$�������-�\^Z^���=������� ������ ��������z ����>������������# � ��� ����������������
Y����� ���#�<� ���4$���Working Paper�-���\}���$����������$��� �4���������� ������������������ ����� � ������� ������������
���������\^^}��\^^����\^^���������� �������������������� ���������� ���� ���������������� ����
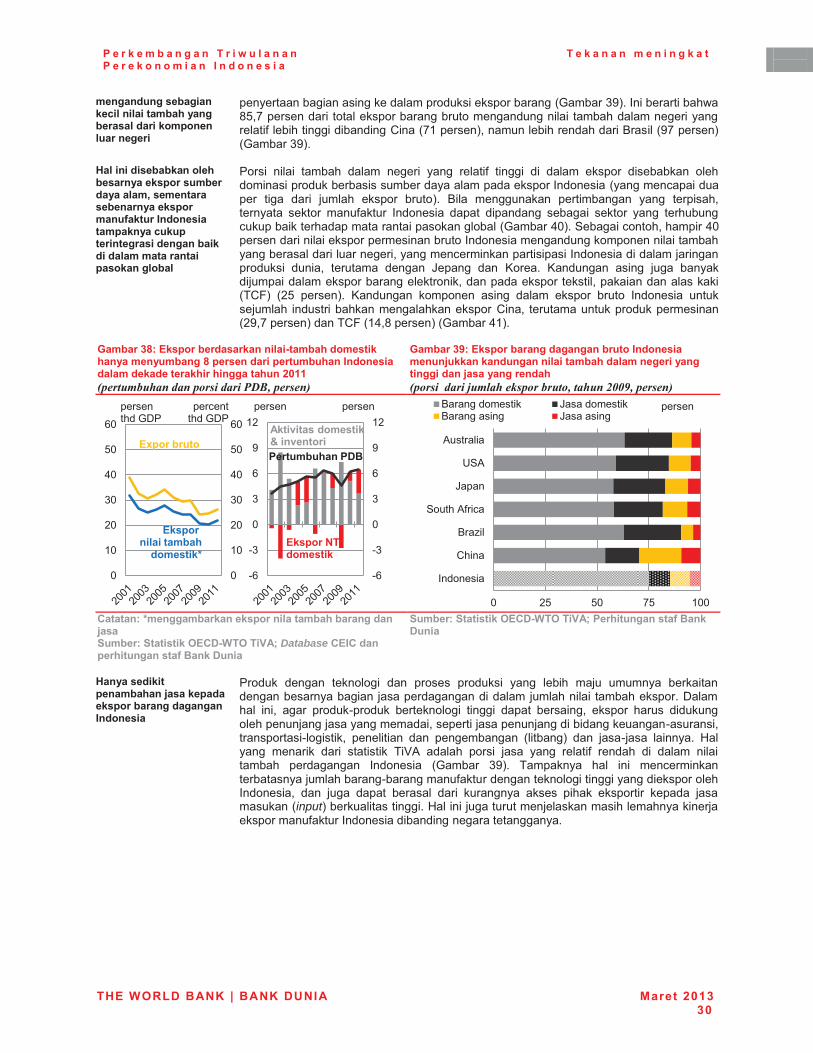
P e r k e m b a n g a n T r i w u l a n a n P e r e k o n o m i a n I n d o n e s i a
T e k a n a n m e n i n g k a t
THE WORLD BANK | BANK DUNIA Maret 2013 30
������������������?� ��� �������������������� ������������� ���������
��������� �� ���������������� ��������������������+��� ������ ������}����������� � ����������������������������� � � ������������� �������� #���� ��� �� �� �� ��< ���Z������+�������� ��������� ���� �����������+���������+�����
Z� ��������������� ��������������������������� ��~�����������������������������������������������������?����������������������������� ������������������������ ��� �
� ���� � � � ����� ���� ���� � ��� ���� #� � �� � � � ���� ������� � ������ �������� � ������������� ������������������������������ ��������� �������� � �� �� � ������ ������� �����+�� � �� ������� ���� ���� ��� ���� ���������� ������� ��#����� ����� � ���� � ���� ���� � ������� ��� ���������������� �������������� �������������������^+��>��� ����������� ���^��������� � � �������������� ������������ ��������������� � ����������������� ��������� ����������� ����� � �� ������ �� ������� ��������� � �� �� ������� ���� %���� �� ������ ����� � �� ���� ����� ���� ����������������������� �������������������� ����� �������� ���<;+� �\}� �����+�� ����� ������� � �� ���� ������� ������ ����� � ������������� ����� ������������������� < �� ������������������������� ��\���������+����<;��Z���������+��������Z+���
Gambar 38: Ekspor berdasarkan nilai-tambah domestik hanya menyumbang 8 persen dari pertumbuhan Indonesia dalam dekade terakhir hingga tahun 2011 � ��������������� ������������� ������
Gambar 39: Ekspor barang dagangan bruto Indonesia menunjukkan kandungan nilai tambah dalam negeri yang tinggi dan jasa yang rendah � ������������������� ����������������,--2�� �������
`������������������������������ �������������������@����+������+���������'#`�_��'����!��Database�`#�`�������������������������������
+������+���������'#`�_��'����!�����������������������������
�Z���������������������@��������������������������������������
� ������� ���� ������� � �� ������� ������� � ��� ��� �� ���� ������ ���� �������������� ������������ ����������� � � �������������$������ �� ��� ������!������� ���������� � � �� � ���� ���� ��� ������� ����� � ��������������������������� �������� ����������� �� �������!���� ���������� !��� �� ��� ���� � � �� �������� �� ���+� �� ��!��� � ��� =����� ��� �� �� � ��� �� �� � �4� ���� ���� � ��� ��� ���� #� ����� � � ���� � ������ ������� ����� � ������ ��+�� ������ ��� � ������ �������������������!������#���������������� �� �� ����� ����������������� �� �� ���� ���� ������ �� � ������ ����� � ��� ������� �� ����� ���������input+������� ���� �� ��=�� ��������������������� ��������� �������������#���������� �� �� ��������������
�
^
Z^
\^
�^
�^
}^
|^
^
Z^
\^
�^
�^
}^
|^
������������$��
#��������� ����������
��������
#|����������
�����������$��
!|
!�
^
�
|
�
Z\
!|
!�
^
�
|
�
Z\������
���������������
!����������������������������
#������%����������
������
^ \} }^ �} Z^^
�����
<�
��� �
>�����4#� �
%�
z>4
4�����
���������� � %�������� ������ � %��� �
������

P e r k e m b a n g a n T r i w u l a n a n P e r e k o n o m i a n I n d o n e s i a
T e k a n a n m e n i n g k a t
THE WORLD BANK | BANK DUNIA Maret 2013 31
Gambar 40: Porsi nilai tambah asing dalam sejumlah ekspor produk manufaktur Indonesia cukup besar… � ����������� ���������� ������������� ��������������,--2�� �������
Gambar 41: ...sementara ekspor Cina mengandung lebih banyak masukan impor dibanding Indonesia, kecuali untuk permesinan dan TCF � ������������ ���������� ������������� ���������������,--2��� �������
+������+���������'#`�_��'����!�����������������������������
+������+���������'#`�_��'����!�����������������������������
c.� Bahan baku impor semakin banyak digunakan untuk produksi dalam negeri q�� �������������������������?�������������@�������������� ������������������������������������� ��
� =�� � ������� �������� �� ��� ���� ������������ ���� � ������������{������������������������������ ���� ������ ������������+��>�� ����������� ���� � ������������� ���������������� ��������� ��������\+��>������ � ���� ��� ��� ������ �� �� � ����� ����� ��� ���� �� � ���� ������ ������������ ~������� �������������������������������������# ���������� �� ��������$������ � � ��������������������� �����������#����� � �� ����� � ���� � � ���� ���� ���� � ����� ����� ������� � �������������������
��������������������@�����������������������������������������?����� �������������������<==X���������������<==Y�
� ������������� ������ ������������ ������� �4�����\^^}�����\^^��� �� � ����� �� ������� � ����� ��� ���� ��� � ������ ����� �������� ������������� � � # �� ������ � � ������ � � ���� ������ ��� �� ����� � � ���� \^^��� �� ������\^^}��������\���� �����# ��������!�������� ��������� ������������ ���� ����\^^}�������# ���������� �������� ����\^^�+��>��� ������ �������< ��� ����� � ����������������� ���������������� ��� ��������������� ���������������� � ���������������\^^}���\^^����������+��=�� ������� ���������������� ��� � ������� �� �� -��� ��� ��� ���� ���� �������� ���� �������� ����� ������������ ����� � �����������#������ ������������� ������ ������� �������� �� ��������������������� ��������������$ ���������!��������� �������������� ������� ����������������� �������������
�
^ \} }^ �} Z^^
^ \} }^ �} Z^^
4�� �������' �
;���������<;
X��������<��� ����� ����
�� ������'�� ���
*����� ����������������
q����
���������� � %�������� ������ � %��� � ������
^ \} }^ �} Z^^
^ \} }^ �} Z^^
4�� �������' �
;���������<;
X��������<��� ����� ����
�� ������'�� ���
*����� ����������������
q����
���������� � %�������� ������ � %��� �
������
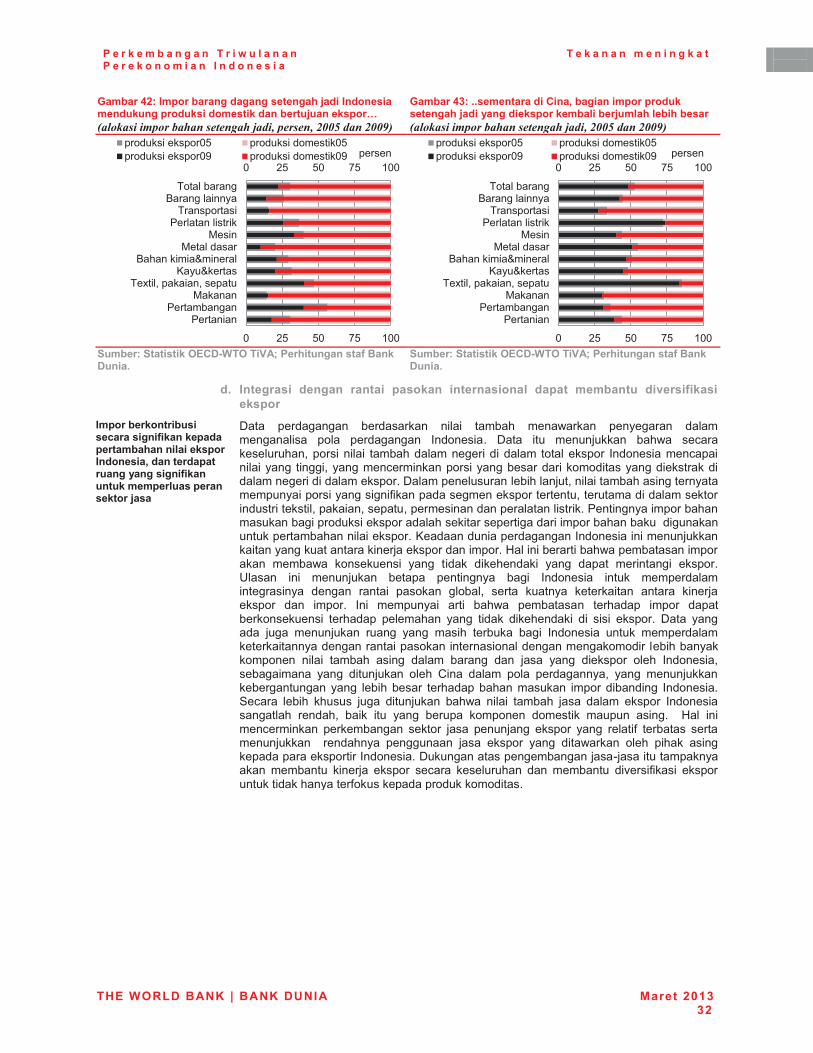
P e r k e m b a n g a n T r i w u l a n a n P e r e k o n o m i a n I n d o n e s i a
T e k a n a n m e n i n g k a t
THE WORLD BANK | BANK DUNIA Maret 2013 32
Gambar 42: Impor barang dagang setengah jadi Indonesia mendukung produksi domestik dan bertujuan ekspor… ��������� ���������������������� �������,--3�����,--2��
Gambar 43: ..sementara di Cina, bagian impor produk setengah jadi yang diekspor kembali berjumlah lebih besar ��������� ����������������������,--3�����,--2��
+������+���������'#`�_��'����!����������������������������"�
+������+���������'#`�_��'����!����������������������������"��
d.� Integrasi dengan rantai pasokan internasional dapat membantu diversifikasi ekspor
��������������������?��������������������������������� ����������������~������������������������������������������� ���������������@�����
� $�� ������� �������� � � ����� ������ ������� �������� �� ���� ������� ����� �� $�� ��� �������� ���� �������������������� � � � ������������� �� ����������������� ����� ����� � � ���� � �� ����������� ������ ����������� ������ ������� �������� ��������� �� �������������$��������������� �������� � ������� �������������� ����� ����� � # ����������������������������������� ������������ ����� ������ ����� ��������������� ���������� ��� ������ ��� ��������������� �������� ��������������� ��������� ���� � �������������� ����������������� � ��������������� ������������� � ���������� ������������� ������������� ������=�� ������ ������������ ������� ������ �������� � ��� � ��� � ������ � ��� ���� ��� �� � ��������z��� � ������� ����� ��� ��� �� � ����� � ���� ���������� ����� �� ���� �� � ����� ������� ����� ����� ������ �� ��� � ����������� �� ������ � � ������ � �� � ���� ������� ������� ����� ��������������� � ������� ������� ��� � ��� � ������ � � � � � � �������� $�� ����� ���� ������� ���� ��� �� �� ������� �� � ����� � ����� ���������������� ��������� ������ ���� ��������������� ����� ������������� � � ����� � �� ���� ���� �� ��� ��� � ������� ����� ����� ������ �� ��� � ������ ����� < � ���� ���� �������� ��� ��������������������� ��� ������� ��������������� ������ �� �� ����� ��>���� ��� �� ������� ���� � ������ ���� � � ����� ��� ���� ������� ����� ������� ������ � �� ��� ��� ������ ������� ������ �� ����� � ��� � =�� ������� �� ��������� ������� ��� ������ ������� ��� ���� #� ������� ������������� � ������ ������ ��� ������� ��� � ����� ����� � ��� � ����������������� ������� ��$������������������!��� ����������� ������� � ���� ������� ����� ���������� �� ������� � K��� # �� � ������������� ���������#���������������������� ����� �
^ \} }^ �} Z^^
^ \} }^ �} Z^^
���� �������
'���@� ����� �������
������������� � �� ���
'�������'��
������� ��� ���������
����� ���������
������� �������^} ������� ������� �^}������� �������^� ������� ������� �^� ������
^ \} }^ �} Z^^
^ \} }^ �} Z^^
���� �������
'���@� ����� �������
������������� � �� ���
'�������'��
������� ��� ���������
����� ���������
������� �������^} ������� ������� �^}������� �������^� ������� ������� �^� ������
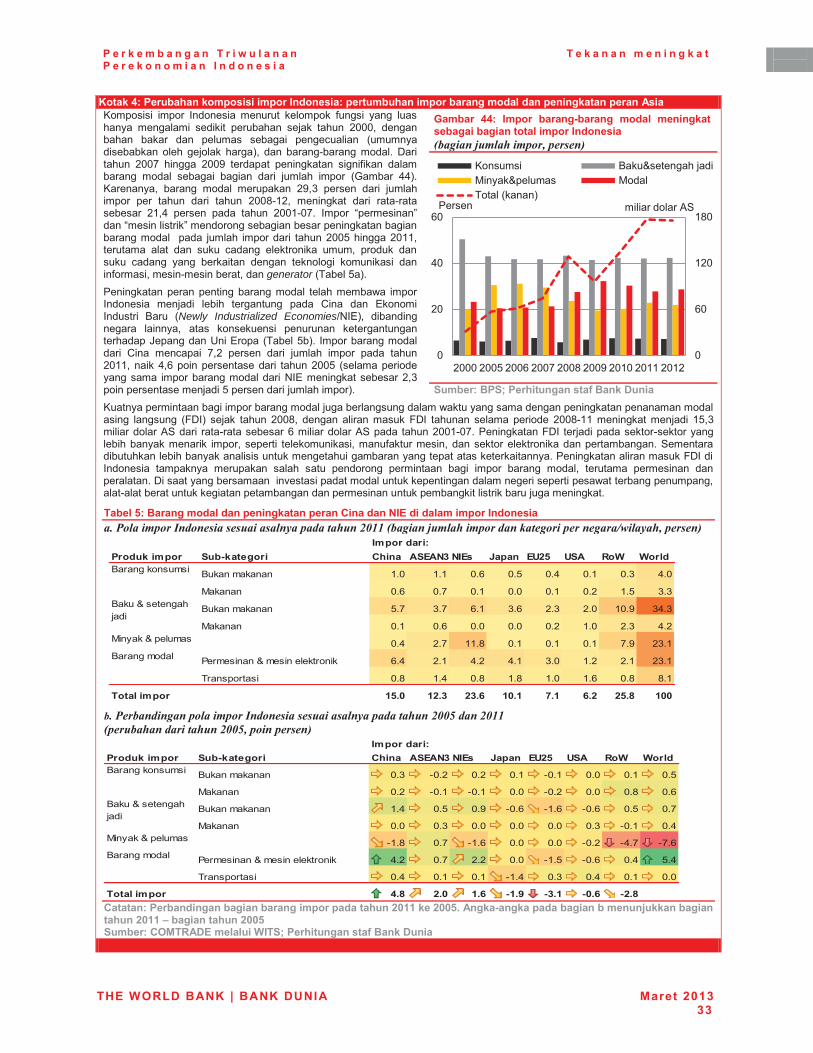
P e r k e m b a n g a n T r i w u l a n a n P e r e k o n o m i a n I n d o n e s i a
T e k a n a n m e n i n g k a t
THE WORLD BANK | BANK DUNIA Maret 2013 33
Kotak 4: Perubahan komposisi impor Indonesia: pertumbuhan impor barang modal dan peningkatan peran Asia ������ � � ����� ����� � ������� ��������� #��� � ��� ������� ����� � ��� � �� ������� ����� ���� \^^^�� ������� ���� �� ������� ���� � ������� � �������� ������ ����� ������� ���+�� �� ���!���� ������ $� ����� \^^�� � ��� \^^�� ������� �� ���� � � # �� �������� ����� ���� � �� � �� � ������ ����� ������ ��+�������� ���� ����� ������� \���� ������ �� � ������ ����� ���� ���� �� � ���� \^^�!Z\�� �� ���� �� � ��!���������� \Z��� ������ ��� ���� \^^Z!^��� ������ ������� �������� �� ��� ��������������� �������� ������ ���������� ���� ������ ������� � ����\^^}�� ���\^ZZ��������� ��� �� ����� ���� ������� �� ������ ������� ������� ���� ��� ���� �� ���� ������� � ���� �� � �� #���� ����� !��� ���������generator�������}+���� ����������� ����������� ����������� ���������� � ���� � ��� �� �������� ��� < � �� *���� ������� � ���� �Newly Industrialized Economies{-�*+�� � �� ������ � ��� ��� �������� � ������ �����������������%������z �*���� ������}�+�� ����������������� � < � ���� � ��\� ������ �� � ������ ����� ��� ����\^ZZ�� ����|��� ������������ � ����\^^}� ��������� ���������� ���������������� �-�*��� �����������\����� �������������� �}��������� ������� ����+����������� ���� � ������������������������������������������������ �������������� �� ������ �;$�+� ����� ���� \^^��� ���� � �� ����� ;$�� ���� ����� ��� ���� \^^�!ZZ� �� �������� � Z}���� � �������4>��� � ��!����������|�� � �������4>���� ����\^^Z!^����� ����;$�� ����� ����������!������������� ��������� �� ������������ � �������� �� ����#�������� ������������������ �������������>������� ���������� ������� � �������������� ����������������������� ������ ����� �������;$��� ������ � ������ ������� ���� ���� �������� ���� �� �� � ����� ���� ������ ������� ������ � ���������$ �������������� K���� �������������������� ���������� ������� �����������������������!���������������� ����������������� ������������ ��� ��� ������������ �����
Tabel 5: Barang modal dan peningkatan peran Cina dan NIE di dalam impor Indonesia �4������� ���$�������������������(�� ����������,-..��������������� �������������� ��������51��(���� �������
�4������������ ����� ���$�������������������(�� ����������,--3�����,-..��� �������������������,--3�� ��� �������
�`�������������������������������������������������<=;;���<==Y"�!����_�����������������������@�������������������<=;;����������������<==Y��+������`'$��!�#�� � ������+�����������������������������
�
&������ QQ�� ������ ������_������� ��� � ��������������������������� ����������������������������� ���� �������
+��������+������������������������������
�
��������������������� +��_������� `���� !+#!%> %�#� q���� #�<Y �+! ��� ���
������ Z�^ Z�Z ^�| ^�} ^�� ^�Z ^�� ��^
'� ^�| ^�� ^�Z ^�^ ^�Z ^�\ Z�} ���
������ }�� ��� |�Z ��| \�� \�^ Z^�� ����
'� ^�Z ^�| ^�^ ^�^ ^�\ Z�^ \�� ��\' ����������� ^�� \�� ZZ�� ^�Z ^�Z ^�Z ��� \��Z
������ ������ �������� � |�� \�Z ��\ ��Z ��^ Z�\ \�Z \��Z
�������� ^�� Z�� ^�� Z�� Z�^ Z�| ^�� ��Z
���� ������� ;Y"= ;<"> <>"O ;="; \"; O"< <Y"[ ;==
����������
���������������
��������
��������������������� +��_������� `���� !+#!%> %�#� q���� #�<Y �+! ��� ���
������ ^�� !^�\ ^�\ ^�Z !^�Z ^�^ ^�Z ^�}
'� ^�\ !^�Z !^�Z ^�^ !^�\ ^�^ ^�� ^�|
������ Z�� ^�} ^�� !^�| !Z�| !^�| ^�} ^��
'� ^�^ ^�� ^�^ ^�^ ^�^ ^�� !^�Z ^��' ����������� !Z�� ^�� !Z�| ^�^ ^�^ !^�\ !��� !��|
������ ������ �������� � ��\ ^�� \�\ ^�^ !Z�} !^�| ^�� }��
�������� ^�� ^�Z ^�Z !Z�� ^�� ^�� ^�Z ^�^
���� ������� Q"[ <"= ;"O _;"X _>"; _="O _<"[
����������
���������������
��������
^
|^
Z\^
Z�^
^
\^
�^
|^
\^^^ \^^} \^^| \^^� \^^� \^^� \^Z^ \^ZZ \^Z\
������ ������������� ' ��������� '����������+
������ � � �������4>�

P e r k e m b a n g a n T r i w u l a n a n P e r e k o n o m i a n I n d o n e s i a
T e k a n a n m e n i n g k a t
THE WORLD BANK | BANK DUNIA Maret 2013 34
�
C.�INDONESIA TAHUN 2014 DAN
SELANJUTNYA: TINJAUAN PILIHAN
��
;"�Mempersiapkan masa depan perkotaan Indonesia: mengelola dan mengarahkan ekonomi
a.� Kota sebagai masa depan Indonesia ���������� ����� ���������������������?�����������������������������?������!��������������������������������� �������������������_��������
� >����� � ����� !����� �� ������������������������ � ���� ����� ���� �� �� ��� ����\^ZZ�� ����� � ���� ����� ���� ���� ������������ �}Z� �����+�� ���� � � ����� ��������"��� ��� �� � ��� ����� ��� ������ ��������� ������� \^\}� � ���� ��� |�������� �������� ����� ��� � ���� � � ������������� $��� ��!������� ��� �� � ����� ���� ��� ���� � ��\������� ��� ���� Z������ \^^��� ����� � �������� ���� ���� �������� � ���������� �� ������ �������� �4� ��������}+����$�� ��� �� �� ����������� ��� �� ��� �������� ����� ��� � � ����������� ���� �������������� � �� � ���� ���� ��� � � ����� � ���� � �� ������ ���� ������ � ������� ��� �������� ����� ��#����� �� ���� >���� ������������� ������ � ���� ���� � ����� ��������� ��� ����� �������������� � � ����� ����� � � � ����� � ���� ��������� � � ����!���������������� ����\^Z^�� ��� ��� ����������� ��$��� �� ���� � ���!����� ������������ � ��� �� ���� � �� ���� ��� ��� � ������ ��� �� �� ����� �������������������������������� ������� ������� �������� �� ���� � ���� �� ���� ��� � ������ ����� ���!������ �� ��������� ��� ��� ����� �� ����� ������ � ���!���� ���������!������������ � ������������ �� � ������ � #����������������� ������ �������������������������������������������������� �� �� �� � � ������� �������� �� ���� ��� � ����� ����
Gambar 45: Indonesia adalah salah satu negara yang mengalami urbanisasi yang tercepat di Asia ������������������� ����� ���� �������
`������������������������;X\=���<=;=�+�������%����� ���������������]<=;<^~���� �������������������?�������<=;;����������������� ���� ��
Z^
Z}
\^
\}
�^
�}
�^
�}
}^
}}
Z^
Z}
\^
\}
�^
�}
�^
�}
}^
}}
}�} | |�} � ��} � ��} � ��}
������
"��$�������� ��������\^^}��� ���+�
�������� `����
�����
*� ������
���� ���
�������
������
P e r k e m b a n g a n T r i w u l a n a n P e r e k o n o m i a n I n d o n e s i a
T e k a n a n m e n i n g k a t
THE WORLD BANK | BANK DUNIA Maret 2013 35
��� �� �� � ����� �����������������#������� �������� �������������������� ���
b.� !� ��������������������W�����������������������
������������� ����������������������������������������
� �� ����������� �� ������������������� ��z�� �� � � � ��������� ���� ��� output� �� ������� K ��� ��� ����� ����� ������� �� �� �� ���������� ����������� ����� � �������� =�� � �������� ����� �� ����������� K ���������� ��������� ����������������� ����������~��������� ���������� ������� ���� �� ��~����� ����������� ������� �� � ���� ������!������� ����� � �������~������ � ���� ���� � ������ �������� �� ����
��� �������������������� �������������������������������������������������@����
� ���������������� �������������������������� ����������� ������� ������ ������ ����� ���� � ��� ��� ���� �������� ������ � ��!��������� ��������� ���� � ������������������� ���# � ���"�������� ��� �� ����� � ���� � � ���!����� ����������� ����� � ������ ������ � #��������������������!��������������� ����������������� ����� �������� � � ��������������� ������������������ ��������!��������������������������������������������������������������������������������� �������������������� ��� �������������������
-�����+� ������� ������ �������������������������������������������� �����!������
� <����� ��� ����� �� ������ ����������� ������� ����� "����� > � ����> � ��� �����+� � � 4��� �� >�� ���� >���� ����� ���� ��� �� ���� ������!������������������� �� ���������� ��������� ����������������������� ��� ������� �� ��������� ����� ������ ����� � internet�� � ��� ������ ����� � ������ ������ ������� ��� ���� -��� ���� #���������� ��� ���� � ������������������������������������� ������� �������������� ��������� ���� � K��� ��!� K��� ��� ���� ��� ��� ��� � ����� �� ���� ����������� ���� �� ��� ������ � #�� ����� � � <� #�� � �� � ���� � ������������������ ������ ����� �����������4��� ������ �������������
������������������������������������������ �������������� �����������������@� �������������������@�����������������@�����������������
� $��� ���������� ����� � ������ ����� � ��� �� ��������� ��������������� ����������� ��� ��� �� � ��� ��������� �� ���� � ��� ��� ������ ������� �������� ��� �������� ����������� ���������� ���� ������ ��� � � ��� ������ �K� �� z���� ���� � ������ � #� ����� �������������!�������������������������������������� ����� ���� ����������� K ������� �� ��������������������� ����������� ������ �� ������� �������� ���� ��������!���������������������'#������� ��� �������� ����� �� ������ ��� � ��� �� ����� ����������� �� ��������������� K ��������� ��������
�!� ��������� �������������� ���������������������������_���������������������������?�����������
� $���!������������ ���������!������������� ���������� #��� ������� ���� � � �� � ������ ������� ���� � ����� ��� �� ����� � �� ��� �� ������!����� ����� � ��� ��� ������ � �� ��� � � ���� ������ ������ � ������� K ��� � ���� ���� ������� ������� ����� ������� ���������� ������� \^^��� ����� ��� ����� � ������� ���� �� ����� �������� �� ���� ��� �� ���� ��� �������������� ��'����%�����������>������>������$������'������'������� ���!>�� �+������ ������������� ���-��\|�����\^^�������Y������Y���X ����-� ����
�� �
��������������������������������������������������������������������� � �������� ��#������������� ��� ����� ������������� �� ������ �
������� ���� ���������$� ��\^Z\+�������� ������Y ����#�'������� ��Y�� �����z���� #���� ���� ������������������# ������� ������ ���� ����������������������� ���������*���� � �>���������\^Z^��
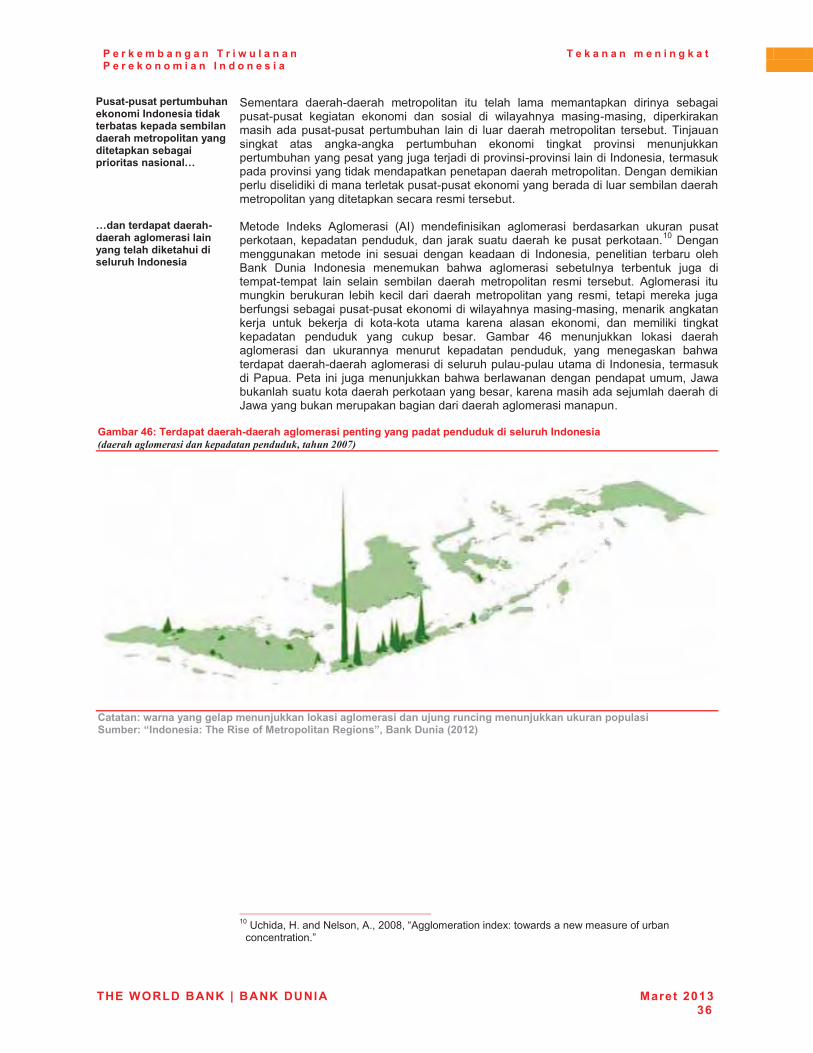
P e r k e m b a n g a n T r i w u l a n a n P e r e k o n o m i a n I n d o n e s i a
T e k a n a n m e n i n g k a t
THE WORLD BANK | BANK DUNIA Maret 2013 36
�����_������������������������������������������������������ �������������� ������������������������������������������� }�
� >������ ����!����� �������� �� ��� ����� ��� ������� � � �� ���� �����!����� ��� �� ����� � �� ��� �� � � � ����� �� �!�� ��� � ���� ����� ��������!����� ���������� � �� � ����������������� �� ����������� ���� ���� ��� ��!��� ���������� ����� � � ���� ���K � � �������������������������������������� �� ����K � !���K � �� �� ������ ����������������K � ����� ����������������������������� ���$������ � �������� ��� � � �� ���������������!���������� ���������� ��������� ��������������� ������ ��������������� �����������
�}��������������_������� ������� ���������� �������������� �������������
� '������ ������ 4������� � �4�+� ����# � �� ������� � �������� ����� ������������������������������ �����������������������������Z^�$���������� ������� � ���� � ���� ���� � � ����� �� ���� � � ������� �������� $� � ����� � ������� ���� ������� � ��������� ��������� ���� � ������!������ � � ��� � ���� �� ����� �������� �� ���� � ���������� 4������� � ������� � �������� ��� �� ��� �� �� � ����� �������� �� ��� ���� �� ���� � ������ �������#��� ����� �����!���������� �� �� ������� �!�� ������ ����������� ����� ������� � � ���!���� ���� ���� ��� ����� �� �� ��� � � � � ���������� �������� ��� ������ ������ ����� �|� �������� ���� � ������������ � �� ������ ������� ������ ��������� ��� ������� ���������������!������������ �� �������������!���������� ������ �� ��������� ���������� � ��������������������������������������%�������������������������������������������� ������������������ �%������������������ ��� ������������� �������
Gambar 46: Terdapat daerah-daerah aglomerasi penting yang padat penduduk di seluruh Indonesia ����������������������� ������� ���������������,--6�
`��������W����������� �������@������ �������� �����������@�������?��������@����������������� ����+��������������������������$����� ������������~������������]<=;<^�
�� �
�����������������������������������������������������������������Z^�z�� ���=����-������4���\^^����4�������� �� ��@���������������������#�����
������� ����
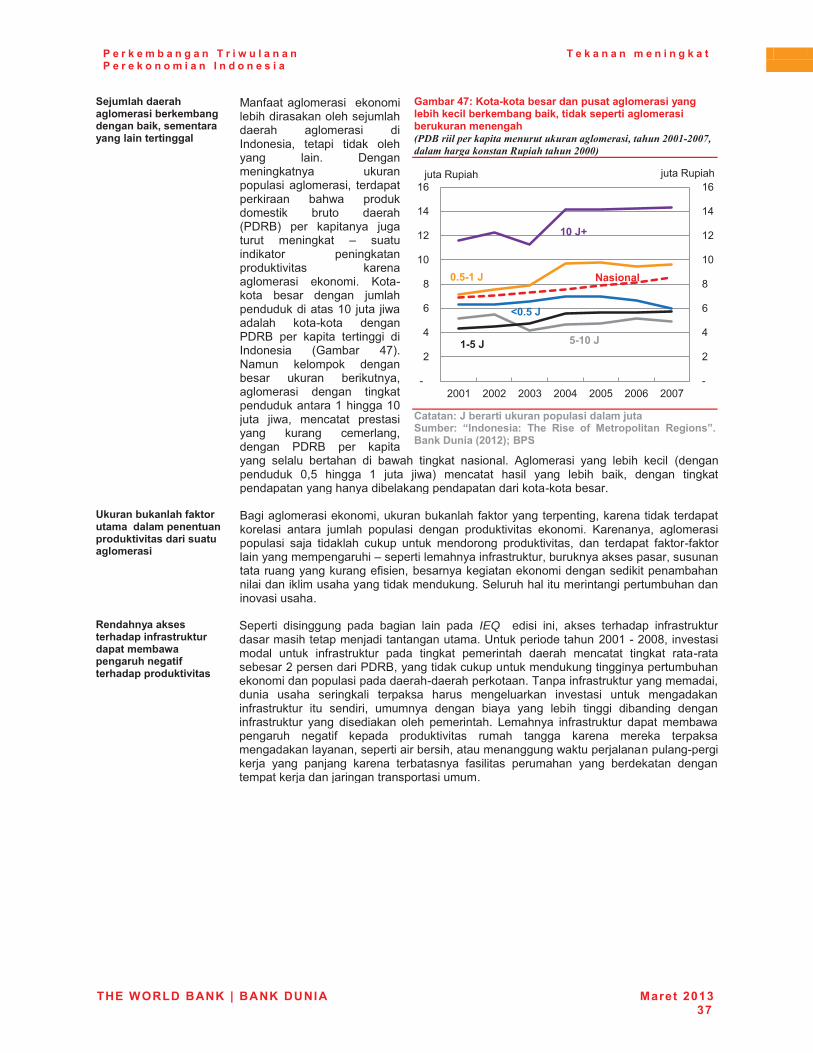
P e r k e m b a n g a n T r i w u l a n a n P e r e k o n o m i a n I n d o n e s i a
T e k a n a n m e n i n g k a t
THE WORLD BANK | BANK DUNIA Maret 2013 37
+@�� ���������� �������������������������~�������������� ������������ �
� '#��������� � ������ ���� ��� ���������������������� ������� � � ������ �� ���� � � ��� �������� � �� $����� ����� ����������� � ������� �� ����������� �� ���� ������������� �� ������ �������$Y�+� ���� �� ��� ���������� �� ���� �� ����� � ����� �� ����������� K ��� ����������� � ����� �� ���!���� ����� ���� ��������������� ����Z^� ���� � ������ ���!���� �����$Y�� ���� �� �� ���� �� � � ������ � ������ ��+��-��� ��������� ��������� ����� ��� ������������� � ���� � ���������������Z�� ���Z^����� � ��� ������ ������ ���� ����� ������������� �$Y�� ���� �� ����� ������ ������ � � ���� � ���� � ���� 4������� � ��� ��� �� ��� �� ������������� ^�}� � ��� Z� ���� � �+� ������ �� �� ��� ��� �� � ��� ���� � ����������������� �������������� ����!����������
Gambar 47: Kota-kota besar dan pusat aglomerasi yang lebih kecil berkembang baik, tidak seperti aglomerasi berukuran menengah �������� ����� ����������������������������������,--.�,--6��������������������� � ���������,---��
`��������q������������������� ����� ���@����+������ ���������� ��� ���� ��� $����� ����� �������"������������]<=;<^����+�
������������� ������������������ ������������������������������������ �������
� �� �������� ������ �������������#�������������� �������� ���������������� � ��� ������ ������ � ���� ������� K ��� ����� �� ������ ������� ������� � ��� � ����� ������ ����� �������� ������� K ���� �� ������� #����!#������ ������������� ��������� ������� #�������������������������������������������������# � ������������ ������� �������� � �������� � ��� �� ���������� ������������>���������� ������ �� ������������� �K� �������
�������������������������������������������W�������������������������������������
� >����� � � � ����� ��� �� � � � ��� IEQ � �� � � �� ����� ������� #���������������� ����������� ����������z������� ��������\^^Z�!�\^^��� K���� ������ ����� #���������� ��� � ���� ����� ��� ����� ������ � ���� ��!����������\��������� ��$Y������� ����������������������� �� ����������������� ��������� ��������!���������������� #����������������� ���� � ���� ��� ��� � ������� ����� ��������� K���� � ����� ������ #���������� ��� ��� � �� ������ ���� � �� ��� ��� �� � �� � � �� �� ���� #���������� ��� � ��� �� ����� ����� ���� "����� #���������� ���� ������������� ��� #� ����� ������� K ��� ����� ���� ���� ������ ����������������������� � ������ ����������������������������!���� ������ ��� ���� ���� �������� #� � ��� ������� ��� �������� ������������������� ���������� ��������� �
�!
�\
��
�|
��
�Z^
�Z\
�Z�
�Z|
�!
�\
��
�|
��
�Z^
�Z\
�Z�
�Z|
\^^Z \^^\ \^^� \^^� \^^} \^^| \^^�
����Y�� ������Y�� ��
;=�q��
Y_;=�q�;_Y�q�
="Y_;�q�
�="Y�q�
%������ �
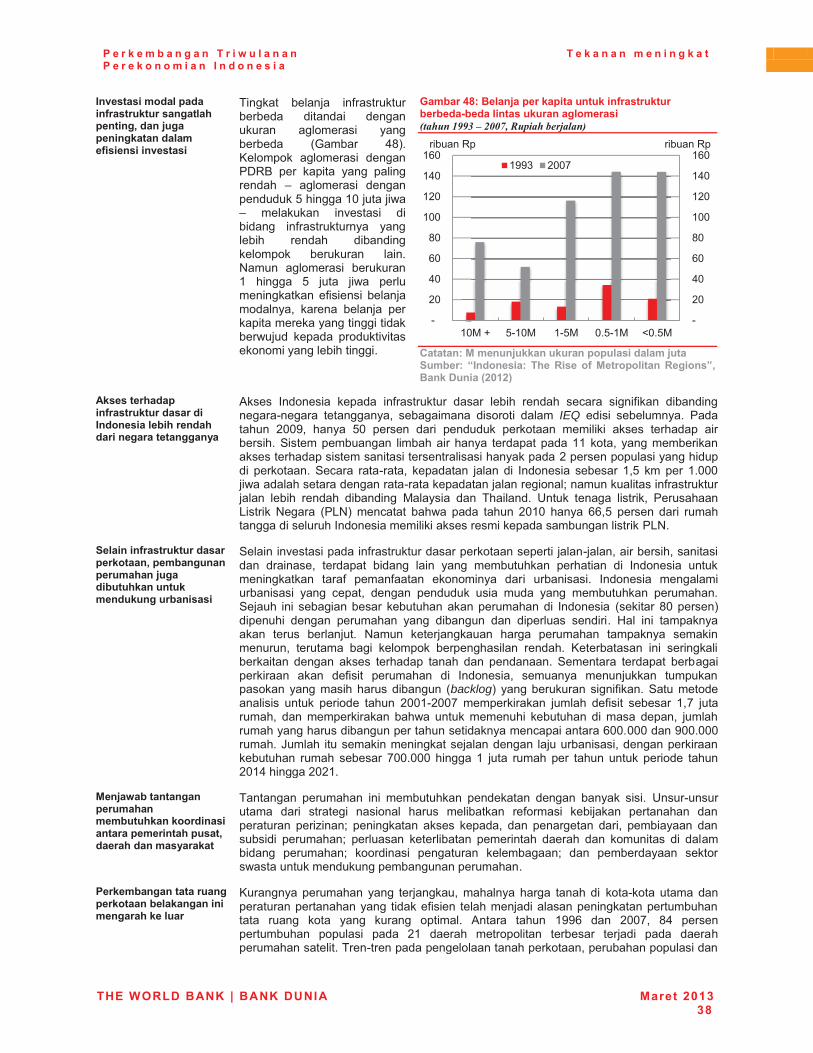
P e r k e m b a n g a n T r i w u l a n a n P e r e k o n o m i a n I n d o n e s i a
T e k a n a n m e n i n g k a t
THE WORLD BANK | BANK DUNIA Maret 2013 38
������������ ������������������������� ���������~����@���������������� ���������������������
� � ���� ����� #����������������� � �� � ��������� ������� � ���������� ������ ��+������������ ������� � �����$Y�� ���� �� �� ��� �� ������� �� ������� � ������������}�� ���Z^������ ���� ������� K���� � � �� ��� #����������� ������ �� ����� � �� ����������� �������� � ��-��� ������� � ��������Z� � ��� }� ���� � �� �������� ����� �# � �� � ������������ ���� ����� ������ ������������ �� �� ������������ ����� ������� K �������� ������� ��� �� ��
Gambar 48: Belanja per kapita untuk infrastruktur berbeda-beda lintas ukuran aglomerasi �������.22%�7�,--6�� � �������������
`��������$�����@����������������� ����� ���@����+������ ���������� ��� ���� ��� $����� ����� �������~������������]<=;<^�
�!����������������������������������������� ������������������������������
� 4����� ����� � ����� #���������� ���� ��� �� ����� ����� � � # �� � �� �����!���� �������� ���� �� � ����� � ���� IEQ� �� � � ���������� ������� \^^��� ��� }^� ������ �� � �������� ������� ��� � � � ����� ������� ������ ���> ������������ � ���� �� ��� ����������ZZ������ ��������� ��������������� ������ �� ��������� �� ��������\������������� ����� ����� � �������� >���� ��!���� ������ ��� � � ����� � ������� Z�}� ��� ���� Z�^^^�� �����������������!��������������� ���������� ��� #������������� ��� �� ����� � �� �� '��� � �� �� ���� z���� ���� � ��� ��� �������" ��� �� -���� ��"-+� ������ ���� ��� ���� \^Z^� ��� ||�}� ������ �� � ���������� �������������� ���� � � ���������� ������������� ��� ���"-���
+ �������������������������������~���������������������@���������������������������������������
� >�� � K���� ���� #��������������������������� � ��!���� ������ ���� �� ��� �� ���� ������� � ��� � � ��� ���������� ����� � � � ����� � ������� ����� ��#� ���#�� ����� �� �� � ��� �� �� ����� � ����� ���� �� � ��� ������ ���� �������� �� � ���� ��� ���������� ��������>����� � ���� ������ ������������������ � ����� � ���� ��� �^������+�� ���� � ���� ������� ��� � ���� �� � ������� ��� � �� =�� � �������� ������ ��������� -��� ���������� ���� ������� ������ ���� �������� ������� �� � ��������� �������� �� ������ ��������� � ��� ��� ����� �� ���� ����� ������� ��� �� ����� >������ ������� ����� ����� �� �� ��# � �� ������� � � ����� �� ������ �������� ����������������� �������� ���� �backlog+� ������������ � # ���>����������� � �� ����� ��� ���� ���� \^^Z!\^^�� ������� ��� ������ ��# � �� ������� Z��� ���������� �� ������� ��� ���� ����� ������ � �������� � � ��� ����� �������������������� ��������������� �������� ����|^^�^^^����^^�^^^�������%����� ������� ��� �������������������� �� ���������� ���������� ����� ������� �^^�^^^� � ��� Z� ���� ����� ���� ���� ����� ��� ���� ����\^Z��� ���\^\Z���
$�@�W����������������������������������������������������������������~��������������������
� ���� ������� � ���������� ������� ���� ���� � � �� z���!��������� �� � ������ � � ��� ����� ��� ���� ��#���� � ��� ��� ������ ��������� ��� � �� �� ���� ����� ������ �� ������� �� �� ���� �� ������ � � �������� ������� ������ ��� ����� ��� ����� �� ���� ��� � � ����� ��� �������� ����� � � ������� ��������� �� ��������� �����������������������������������������
�������������������������������� ���������������������� ����
� ������������� ��� ��������� ����� ���� ���� � ���!���� ���� ������������������ � ����# � �� ��������� ������ ����������������� ���� ���� ��� ����� ��� ���� 4��� ���� Z��|� �� \^^��� ��� ���������������� ������ � ��� \Z� ����� �������� �� �������� ����� � ��� ���������������� ������!��������������������������������������� ���
�!
�\^
��^
�|^
��^
�Z^^
�Z\^
�Z�^
�Z|^
�!
�\^
��^
�|^
��^
�Z^^
�Z\^
�Z�^
�Z|^
Z^'�� }!Z^' Z!}' ^�}!Z' ^�}'
� ���Y��� ���Y��
Z��� \^^�
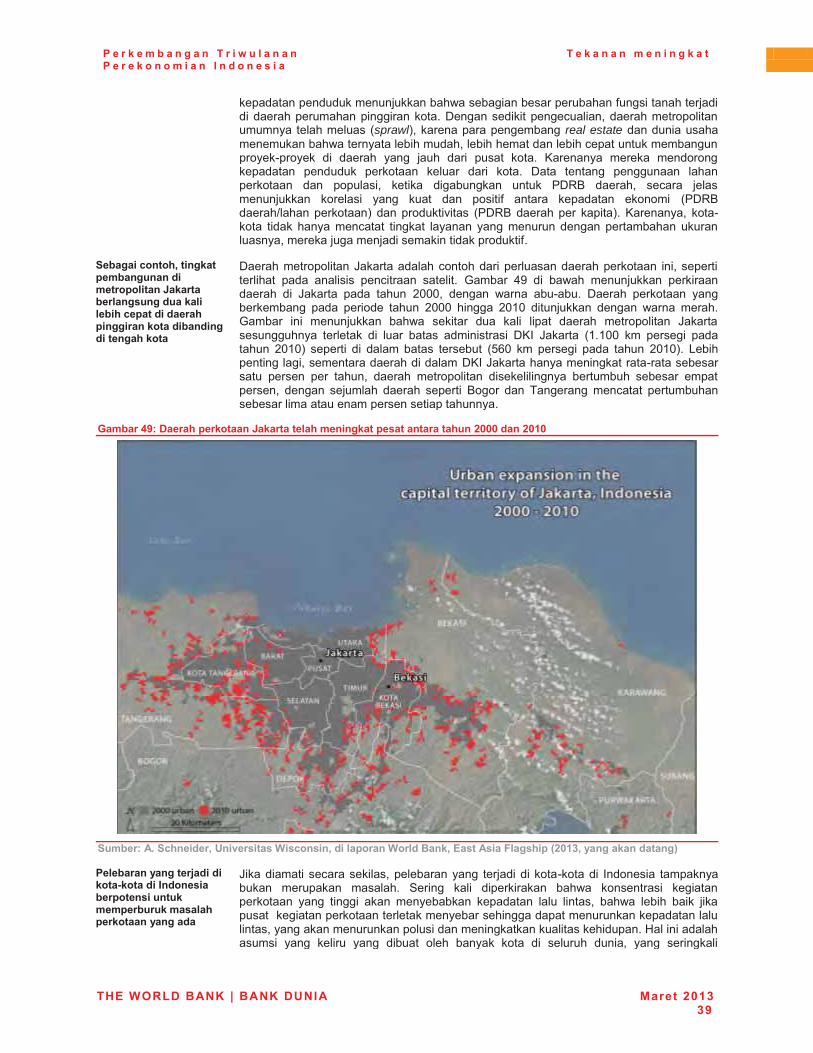
P e r k e m b a n g a n T r i w u l a n a n P e r e k o n o m i a n I n d o n e s i a
T e k a n a n m e n i n g k a t
THE WORLD BANK | BANK DUNIA Maret 2013 39
������������������������������ �������������#��� ��������� �� �������������� �� �������$������ � ��������� ��������������� �������� ������������sprawl+����������������� real estate����� ������������������������� ����������� ������������ �������������������������!������� � � ����� ��� ���� �� � ����� ����� ����� ������ �������������� �������� ������� ������ �� � ����� $�� ����� ������ ���������� �� ������ �� ��� �� � ������ ����� �$Y�� ������ ����� ������������� ������ � ��� ���� �� ��� � #� ��� ������ ����� � ��$Y������{���������+� ��������� K ��� ��$Y�� ��������� �� �+�� ������ ���!���� � ��� ��� ������ � ���� ��� ��� ���������� �������� ������������������������� ����� �� ���������� #���
+������?�����~���������������������������� �����q��������� ������������� �� ����?�����������������������������������������������
� $������������ ��%���������������� �������������������� �������� ����� ��� ��� � � �� ��� ��� ���� ��� ����� ��� � � ���� �������� ���� ������� � � %���� ��� ���� \^^^�� ���� ��� ��!���� $���� ������� ������������ ��� ��� ���� ���� \^^^� � ��� \^Z^� � ������� ���� ��� ����������� � �������� ���� ��� ��� ��� �� � � ��� ����� �������� �� %�������������� �������� � � ���� ���� �� ���� � $��� %���� �Z�Z^^� ��� ������ � ������� \^Z^+� ������ � � � ���� ���� ��������� �}|^� ��� ������ � ��� ���� \^Z^+�� "�� ����� ���� ��������������� �����$���%��������� ������!�������������� ������ ���� ����� ����� �������� �� � ����� � ��� ���������� ������� ������������ ���� �������� ����� ������ � ������ �� ������ ������ ������������������ ����������������� ���������
Gambar 49: Daerah perkotaan Jakarta telah meningkat pesat antara tahun 2000 dan 2010
+������!"�+?����~���������������?�����~��� ���������� �����~�#����!����* �������]<=;>~����������������^��
� �������������@���������_�������������������������������������������� ��������������������
� % ��� �� � �������� �������������� ����� �� ����!����� � ����� � ���������� ������� ������ >�� �� �� � � ���� ��� ���� ������� � ��� ��������� ��� � �� � �� �������� ������ ���� � ���� ���� ��� �� � �� � ����������� ��������������������������� ������������������������� ��������������������� ����� �������� ������ �����=�� ��������� � ��� ��� ��� ��� � ���� ����� ���� ���� � � �������� �� �� ��� ��� ��� �

P e r k e m b a n g a n T r i w u l a n a n P e r e k o n o m i a n I n d o n e s i a
T e k a n a n m e n i n g k a t
THE WORLD BANK | BANK DUNIA Maret 2013 40
���� � ������������ ������ ������� ������ ������� � ��� ����������������������������������������������� �������������� ���������� ���������� ������� �������������� ������������������ ����������������������� ������������� �����������>�� ��������������������������������������� �� �� �� ������������ ���� ���� ����� ������ ��� ���� ���� � ��������� ��� �� ����������� ���� � ��� �� �� � � ������ ��� � � � � �� ������ ����� ������� �������� ���� ����������������� �������� ��������������������� �� �� �� �������� ��� �� ���� ������ ���� ������ �� �� �������� ����� �� ��������� ��� �� � ����� ��� ����� � �������������������� ����>�� ����������������� ����������������������������������������������������������� ����
c.� -������������������������������������������ �����������������
������������������������������������������������������ � ��������������������������������������
� ����� � ����� ���������� ��� �� � ����� �������� ������� ��� ������� ���� � ������� ���� ��� �� � �� ��� � ��� ������ �� ������ ��$ ������������� � ��������������� � � � ����� � �� ���������������� �� ������������������������������������ ��� ���� ������� ����� ���K�� �������� �� �������������� ��������� �� ������ ����������� � ����� ���� � ��� �� ������ '��� � ��� ��� ����� ������� �������� � ����������� �������������� ��� �����!������������� �� ����� � ���������� ���� � ����� ��� �� ����� �� �� ����� �������� ��� ��!��� �������������� ���������������� !������� ����� ���������������� �������������
���������������� ����������� ������������_��������������������� ������?�����������������������_����������� �����������������
� �������!������������� ������������� � �������� K���� � #������������������� �� �� �������� ����� � ����� ������� ��� ��� ���� ��� ������!������ ���� #�������������� �������� ��������� ������� ������ ��� ������� ������� ����� � ������������'���!����������������� � ���� �� ��� �!��� �� ��������� ����� � ����� � �� � ��� ������ ���� #�� >��� � ����� ���!���� � � ����� � ����� ����� � �������������������������������� �������������������������������������� �+������������ ���� ���������� �������������������������!�������� ������� � ���� ��� � � � ���� ��� ������ ���� ������ ��������� ��� K���� � ��� ����� ������� ������� ����� ������� �� ����������� ��������� ���� ����� ��� ���� ���� � ����� � ���� � ���������� ���� ��� ��� �� � ��� ����� �������� ��� ��� ����� ��� ��� ���# � ����������������� K ��������� ��� ��������� � ���������������� � � � ���� ���� ����� �������� ��� ���!���� ����� ����� ������� �������K �� �� � �� ������� ����!����� ���� �� ����� ������� ��� � ��� �� ����� �� ��� ���������� ������� �� ������ ��� �� ��� �� ��� ��� ����� ������ ����������������������������� �� ������
$��������������������������������������������� ������������_���������������?� ���������������
� ��� ������ ��� �� ���� ���� � ����� ���������� ������ � ������������ � � ���� ��� �� ��������� ��� ���!���� �������� ��� �� � ������������������� ����������� �}������ ������!���� ������������������� ���� �� �� ��� �� ����� ������� ���������� ���� � ���� ���-��� ���� ���!���� ��� �� ��� � ��� ���������� ������������ ���� ������� �����������������������������!������������������� ����� ���� ���� ������� ���� �� ���� � ����� ����� K���� � ��� �������������� K ��������� ��� ���������!�������� �����
����������� ���������������������� ������������������������ ��������������������@���������������������������
� ���#���� � ����� � �� � ���� ������ ��� ���� ��� ������� ������������������������������ ����������������� ���� � ��� ���� �� ������� ���� ����� ���� ����� �� � ����� �� ������� ��� ������ ��� ���� �� ����� � ��� � � � �������� ��� ������� ��������������� �� ����� ��������������������� ��������������������� �������������� ��������� ������������-��������������#������� �� ��� ���� � �� � ���� ��� ��� �� K���� � ��� ������ ����� ���� � � � ��� ����� ���� ��� ��� � �� ����� � ��� ���� ����������������
�
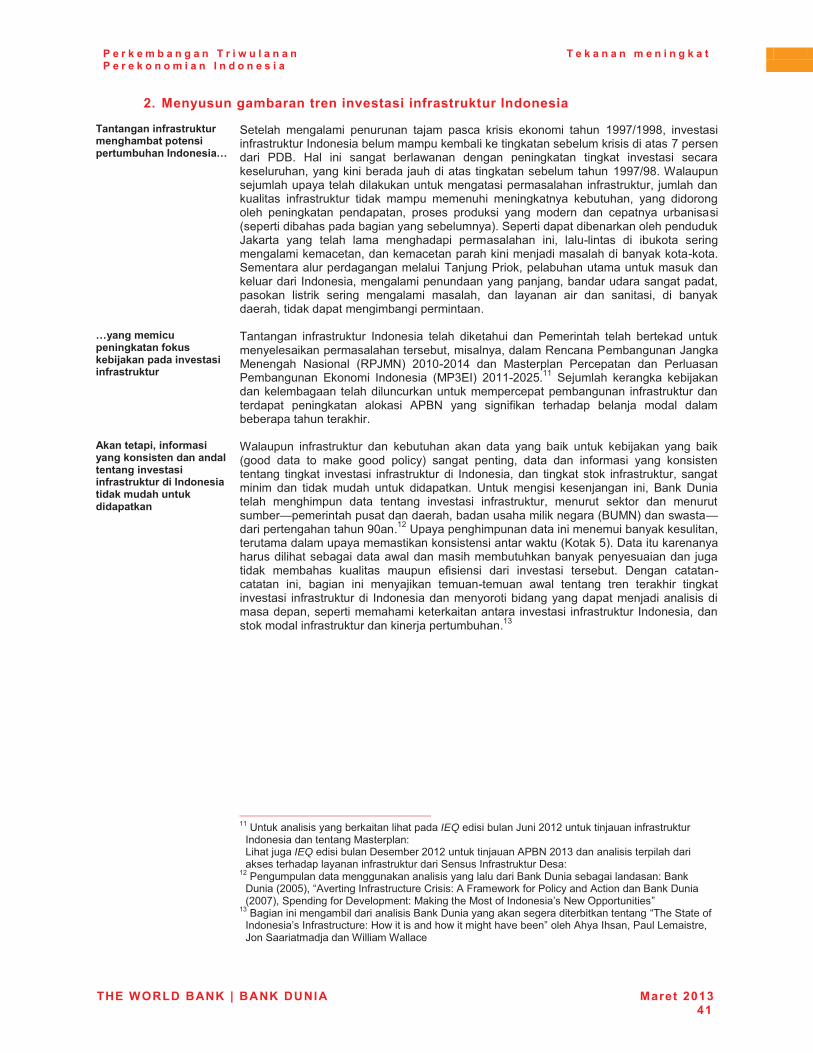
P e r k e m b a n g a n T r i w u l a n a n P e r e k o n o m i a n I n d o n e s i a
T e k a n a n m e n i n g k a t
THE WORLD BANK | BANK DUNIA Maret 2013 41
<"�Menyusun gambaran tren investasi infrastruktur Indonesia
�����������������������������������������������������������}�
� >������ ����� � ������ ���� ���� �� � �� ����� � ���� Z���{Z����� K���� � #��������������� ����������������� ����� �������������� � ��� �������������� � �$��� =�� � ���� ������ ���� �� ���� � ���� K���� � �������������������� ����������� ����� ���������������� Z���{����X����������������������� ��������������� ��������� #����������� ����������� ��� #���������� � ��� ����� ������ � �� ����� ��������� ��� � ����������� �� ���� ������� ������� ������� � ��� ������ �� ������ ��� �� �������� �� ��������� ������������+��>����� ������ ������������������%���� ��� ����� ��� ������ � �������� �� ���!� ��� � � ������ ��� ������� ����������������������� ����� ������� ��������!�����>���������������������� �������� ����������������������������������� � ����� ������� ������������������������������������ � ��� �� ��� �� ����� � ������ �� ��� �� �� � �� �� � � ����������� ���������� ��� ����� ����
}��������?����������������������@��������������������������������
� ���� #���������� ����� � ����� � ����� � �� ����� ��� ����� �������� ������������ ��������������������� ���������Y����������%���'����� -� ��� �Y�%'-+� \^Z^!\^Z�� �� '������� �������� �� �������������� *���� � ����� � �'��*�+� \^ZZ!\^\}�ZZ� >������� ������ ��� ������������������� ������������������������������ #������������������� �� ���� ���� � 4��-� ��� � � # �� ������� ����� ����� �������������������� ����
!���������~������������������������������� ������������������������������������������������������������������
� X����� #���������� �� �������� �� ��� ��� � �� ����� ��� ��� ��� � �������� ��� ��� ���� ����� ��� ��+� ���� ��� ��� ��� �� #���� � ��� ��� ��������� � ���� K���� � #���������� � � ����� �� �� � ��������� #����������� ����� �� �� � ��� ����� ����� � ������ z���� ��� � � ������� �� ��� $� ������ ���� ���� ��� ����� K���� � #����������� ������� ������� �� �������������~����� ������������������������ � ��������z'-+�������~�� ��������������^�Z\�z������� ������� ������ ���������� ����������������������� ����� ���� ���������������}+��$�� �������������� � ������� ����������� ���������������������� �������� ��� ������� ��� ��� ����� �# � �� � �� � K���� � ���������� $��� ���!���� �� �� � � ���� �� ����!����� ��� ����� ���� ����� �� � ���� K���� � #����������� � ����� ���������� �� �������������� �� � ��� ��������������� ������ ������� ����� K���� � #���������� ����� �������������� #������������� ��������������Z���� �
�����������������������������������������������������������������ZZ�z����� � ��������� ��� ������IEQ��� � �����%� �\^Z\������� ��� #����������
����� ��������'������� ���" �������IEQ��� � �����$��������\^Z\������� ���4��-�\^Z����� � ������ ����� �
��������������� #������������ �>������#����������$�����Z\��������������������� � ����������� ����$� ����� ���������
$� ��\^^}+���4K��� ���#�����������<� � ���4�;��������#������ �����4�� �������$� ��\^^�+��>��� ��#���$�K���������'� ������'�����#������ ¡��-���q������ � ����
Z���� � ������ ���� �� � �����$� ������������� ���� �������������>�����#������ ¡���#������������=��� �� �������� ��� �����K������������4������������"�� ������%��>� �������X �� ��X�����
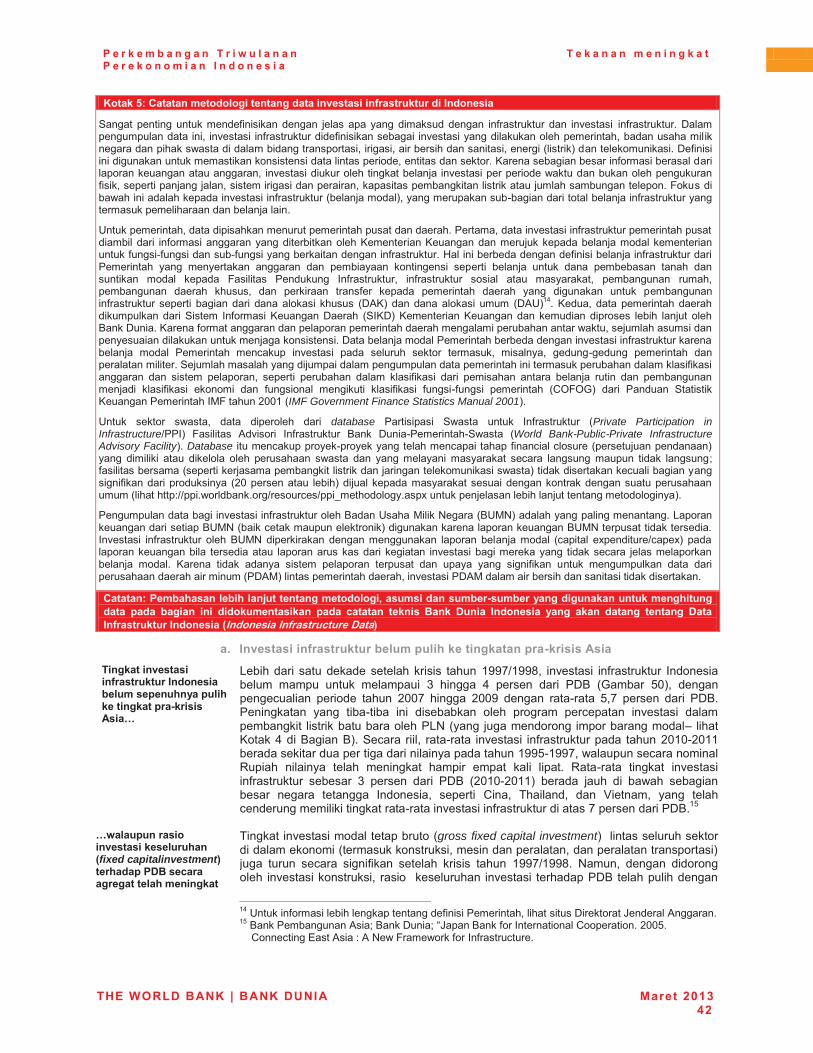
P e r k e m b a n g a n T r i w u l a n a n P e r e k o n o m i a n I n d o n e s i a
T e k a n a n m e n i n g k a t
THE WORLD BANK | BANK DUNIA Maret 2013 42
Kotak 5: Catatan metodologi tentang data investasi infrastruktur di Indonesia
>��� ��� �����������# � ������ ������� ��� � ���������� #���������� �� K���� � #�����������$��������������� �� K���� � #����������� ��# � ������ � K���� ����� ��������������� ������������ � ��������� ��������� ������ ����������� �� � �� �� ������ ����� �� ������ ��� ��� �+����������� �� ��$�# � � �� �������������� ����� ���� ����� ������ ������� ��������������������� ������ #���� ��������� ������������������� K���� �� ����������� ��������� K���� �������� ����������������������������# � ��������� ���������� ����� � �� ������ ������ ��������� ��� ��� �������������������������;������ ����� ���������� K���� � #��������������������+���������������!�� ��� ����������� #�������������������������� ����������� ��
z��������� �������� � ���������������� �������������������������� K���� � #��������������� ��������� �� ���� � #���� ��������� ���� ��������������� �������������������������������������� ������#��� !#��� ������!#��� �������� ������ #�����������=�� ��������������# � ������ #������������ ������ ��� ��� �������� ���� �� ���� �� ��� ��� � ������ � ����� ����� �� �������� ��� ����� �� ����� ����� ;� � ��� �������� �#����������� #���������� ��� �� ��� �������� ������� ������������� ����� �������� �� ���� �� ���#��� ����� ����� ��� ����� ��� � ���� ����� ������� #���������������� � �� � �� � �� ���� � ������� �$4�+� �� �� ���� � ����� �$4z+Z��� ������ ��� ����� ��� ������ ���������� � > ����� �#���� � �����$���� �>��$+� ������� �������� ����� � � ������� ��� �� ����� ��������$� ������#����������������������� ������������� ����������������������������� ��������� �� ������������������ ���� ��$����������������� �������������� K���� � #������������������� ����� ����� ��� ������� K���� � ��� �������� ������� ��������� � ����� �����!������ ����� ��� ��������� � �����>���������������� ���� ���������������������� ��� ����������������������� # �� ����� �� � ����� �������� ������ � ������� ���� ��� # �� � �� � ��� ��� ��� ����� ��� � �� ����������� � ��� # �� � ����� � �� #��� ��� ��� ��� � ��� # �� � #��� !#��� � ����� ��� �<q;q�+� �� � ���� >�� �� ������������ ����';�����\^^Z��IMF Government Finance Statistics Manual 2001+��
z���� ������� ������ ��� � �������� �� � database� ��� � �� � >���� ����� �#���������� �Private Participation in Infrastructure{���+� ;� � ��� 4�K ��� � �#���������� ��� $� !����� ��!>���� �World Bank-Public-Private Infrastructure Advisory Facility+��Database� ����������������!������������������� �����# � ������������������������+���� � � � � � ��� � ������ ����� ������� ����� �� ��� ���� � ������� ����� ������ ����� � ��� �������#� � ���������������� �������������� ��� ��� ������ ���������� �� �����+�� ���� ����������� ��� ����� � # ���� �������� �� �\^���������� ��� �+�� ���� ����� ����������� ���������������������������������� ��������{{�� ������������{���������{�� ¢��������������@���������������� ��������������������� �+��
�������������� � K���� � #������������������z���' � ��-������z'-+���������� ��������"����������� ���� ���z'-��� ������������������� �+�� �������������������z'-���������� ��������� ���K���� � #���������� ����� �z'-� � ���� ��� ����������� ����� ����� ����� ��� ��� �@��� ����{���@+� �������������� �� ������ ���� �������������� � ��� �� K���� ��� ���������� � �������� ������������������ ������ ���� � ��� ��� � ����� ������� �������� �� ���� ��� � � # �� ����� ���������� ��� �� ������������� ��� �����$4'+�� �������� ��������� K���� ��$4'����� ������ ����� �� �� ���� �������
Catatan: Pembahasan lebih lanjut tentang metodologi, asumsi dan sumber-sumber yang digunakan untuk menghitung data pada bagian ini didokumentasikan pada catatan teknis Bank Dunia Indonesia yang akan datang tentang Data Infrastruktur Indonesia (Indonesia Infrastructure Data)
a.� Investasi infrastruktur belum pulih ke tingkatan pra-krisis Asia ���������������������������������������� �������������� ����������������_�������!���}�
� "�� ���� � ����������������� �� � �� ���� Z���{Z����� K���� � #���������� ����� ������� ����� ����� ������ � �� � ��� �� ������ �� � �$�� ������ }^+�� ����������� � ��� ���� ���� \^^�� � ��� \^^�� ���� ��!��� }��� ������ �� � �$����� ���� ��� � �!� �� � � ������ ����� ������� �������� K���� � ���������� �� � ��� ���������������"-����������������� ��������������� � ����������� ��� ��+��>���� � ��� ��!��� K���� � #������������� ����\^Z^!\^ZZ��������� ����������� ���� � � ���������Z��}!Z������������������ ��Y�� �� � �� ����� �� ���� ��� �� ����� �� � � ���� Y�!��� � ���� K���� � #���������� ������� �� ������ �� � �$�� �\^Z^!\^ZZ+� ����� ���� � � ���� ���� ������ ���� ������ ����� �� ������ � < �� �� ���� �� � ����� ��� ���������������� � � �� ������!��� K���� � #����������� �������������� ��$��Z}���
}W� ����������������������� �������]fixed capitalinvestment^�������������?������������ ������������
� � ���� K���� ������������������gross fixed capital investment+�� � ������������������� ���������� ������������������ ����� �������������������������� +����� ����� ����� � � # �� ������� �� � �� ���� Z���{Z����� -���� ���� � ����������� K���� ��������� �� �� �� ����������� K���� � ��������$���������� ������
�����������������������������������������������������������������Z��z���� #���� ���� ���������������# � ������ ����� ���� ����$ ��������%������4������Z}�����������4� �����$� ���%�����#�������� ���<������ ���\^^}���
<���� ��*���4� ���4�-���;��������#����#�������������
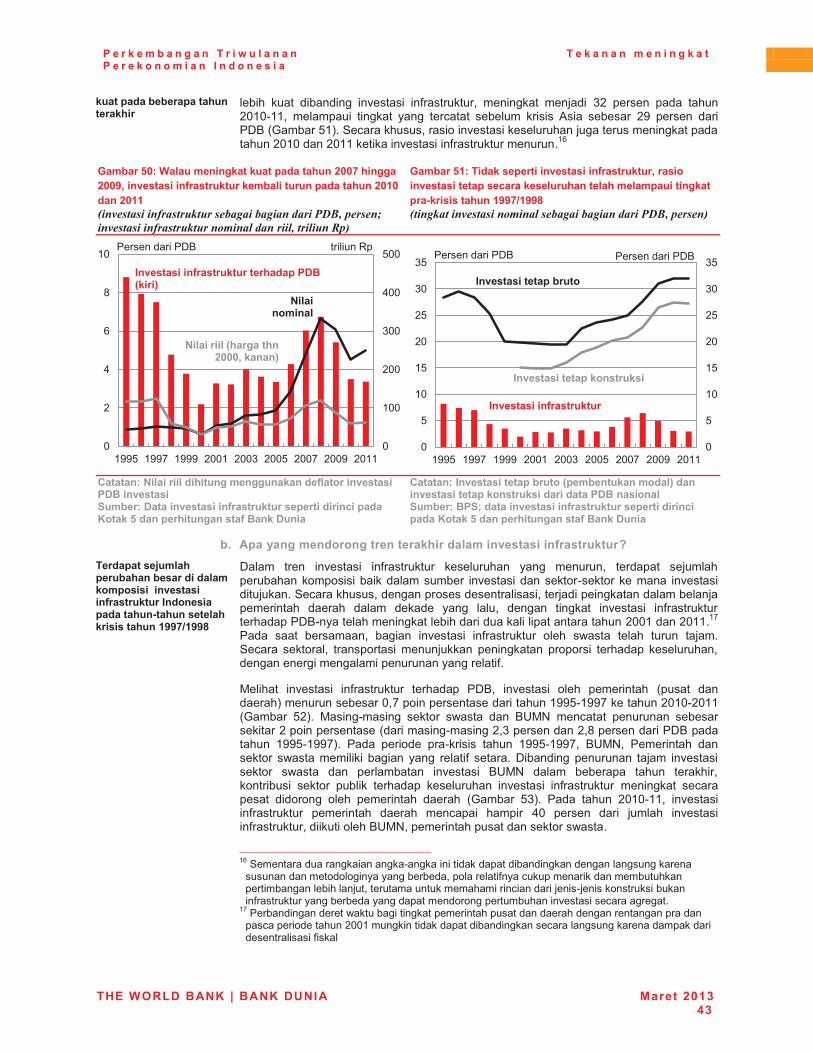
P e r k e m b a n g a n T r i w u l a n a n P e r e k o n o m i a n I n d o n e s i a
T e k a n a n m e n i n g k a t
THE WORLD BANK | BANK DUNIA Maret 2013 43
������������������������������
��� �� ���� � �� �� K���� � #����������� �� ���� ���� � �\� ������ ��� ����\^Z^!ZZ�� ������ � � ���� ��� ������� �������� �� � �� 4� � ������� \�� ������ �� ��$��������}Z+��>�������������� �� K���� ����������������������� �����������\^Z^���\^ZZ���� �� K���� � #����������������Z|���
Gambar 50: Walau meningkat kuat pada tahun 2007 hingga 2009, investasi infrastruktur kembali turun pada tahun 2010 dan 2011 ������������������������������������������ ������������������������������������������������� ��
Gambar 51: Tidak seperti investasi infrastruktur, rasio investasi tetap secara keseluruhan telah melampaui tingkat pra-krisis tahun 1997/1998 ������������������������������������������ �������
�`��������%� ������ ��������������������� ���������������������������+��������������������������������������������?������������Y��������������������������������
`����������������������������]������������� ^������������������������������������������������ �+��������+���������������������������������������?������������Y�������������������������������
b.� Apa yang mendorong tren terakhir dalam investasi infrastruktur? ��������@�� �������������������� ������������������������������������������������������_�������� ����������������;XX\�;XX[�
� $��� ���� K���� � #���������� ���������� ��� ������� ������� ��������������������� � �� ������������� K���� ���������!������������ K���� �� �������>������������������������������ �� ������� ��� ������������������ ��� ����� ���� ������ ��� ����� ���� � ���� K���� � #������������������$�!��������� ������� ���� ������ �� ����������\^^Z���\^ZZ�Z����� ��� ������� �� � K���� � #���������� ����� ����� ����� ����� �����>���� ��������� �������� � �������� �� ���� ������� � ������� ������������������� ������ �������������� #���'�� ��� K���� � #���������� ������� �$��� K���� � ����� ����� ��� ������ ������+��������������^����� ������������ �����Z��}!Z�����������\^Z^!\^ZZ������� }\+�� '� �!�� �� ������� ����� �� �z'-� ������ ������ ���������� ���\��� ������������� ��� �!�� ��\�����������\����������� ��$��������� Z��}!Z���+�� ��� ��� ���� ��!�� � �� ���� Z��}!Z����� �z'-�� ����� ��� ��������� �������� � � � �� � ��� ���� #� ������ $ �� �� ������ ���� K���� �������� ����� �� �������� K���� � �z'-� ���� ������� ���� ����� ������� ��� � ������� ���� �� ������� ���������� K���� � #���������� �� ���� ���������� � ������ ����� ����� ��� ����� ������ }�+�� ��� ���� \^Z^!ZZ�� K���� � #���������� ����� ��� ����� ���� � ��� �� �^� ������ �� � ������ K���� � #������������ ��� �������z'-������� �������������������������
�����������������������������������������������������������������Z|�>������������ ���!��� �� �������� �� �����������������
���������������� ��������������������� #����������� ������������������ ������� ������������������������� �� � ��� ��� �!�� ���������� ����� #��������������������������������������������� K���� �������������
Z������� ��������������� �� ��������� ������������������������������������ ��������\^^Z����� �� �������� �� ������������������������� �������� �� �# ����
^
Z^^
\^^
�^^
�^^
}^^
^
\
�
|
�
Z^
Z��} Z��� Z��� \^^Z \^^� \^^} \^^� \^^� \^ZZ
�������� ��$�� �� � ��Y��
%� ��������� �
%� ������ �]����������<===~������^�
����������������������������������]����^�
^
}
Z^
Z}
\^
\}
�^
�}
^
}
Z^
Z}
\^
\}
�^
�}
Z��} Z��� Z��� \^^Z \^^� \^^} \^^� \^^� \^ZZ
�������� ��$��
��������������������
�������������������������
�����������������������
�������� ��$��
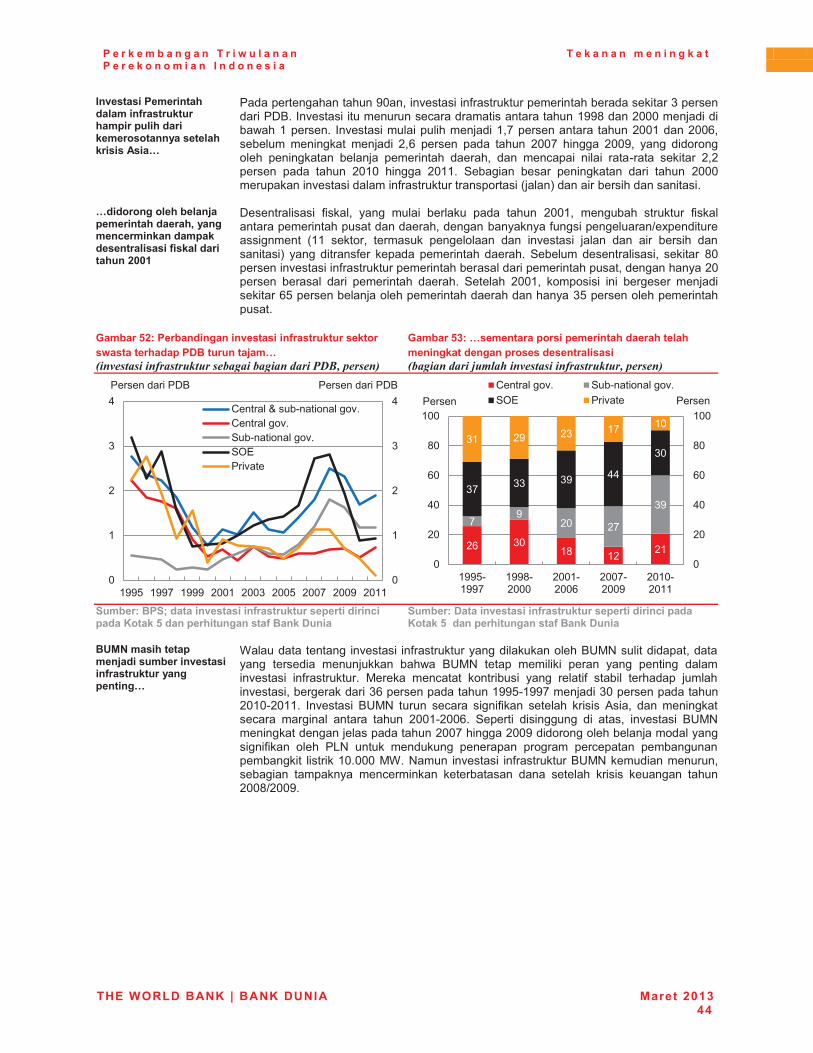
P e r k e m b a n g a n T r i w u l a n a n P e r e k o n o m i a n I n d o n e s i a
T e k a n a n m e n i n g k a t
THE WORLD BANK | BANK DUNIA Maret 2013 44
������������������� �������������������������� ���������������������� ����������!���}�
� ����������������^�� K���� � #��������������� ����������� ������������� ��$����K���� � ������������������ ���������Z������\^^^����� �� �����Z�������� �K���� ���� ���� ������ �Z������������ ����\^^Z���\^^|���������� �� ���� ���� � \�|� ������ ��� ���� \^^�� � ��� \^^��� ��� � ����������� �� ���� ����� ����� ��� ������ �� ���� � � � ��!��� ��� ��� \�\������� ��� ���� \^Z^� � ��� \^ZZ�� >��� � ����� �� ���� �� � ���� \^^^�������� K���� ����� #������������������ ����+��� ������ ����� �� ���
}�������� ��� ��@���������������~��������?������������������� ����������� �����������<==;�
� $������ �� � # ����� ��� ��� � ������� ��� ���� \^^Z�� ������� ��������� # ������������ �������������������������#��� ��������{�@��� ������� ����� �ZZ� �������� �������� �������� �� K���� � ��� �� �� ���� �� ��� �� +� ���� ���#��� ����� ����� ��� ������ >������� ������� �� �� ��� ��� �^������� K���� � #��������������� ����������� ������ ����������������\^������� ������ �� � ����� ��� ������ >������ \^^Z�� ������ � � � ��������� ���� ���� ���|}���������������������� ��������������}����������������� ����������
Gambar 52: Perbandingan investasi infrastruktur sektor swasta terhadap PDB turun tajam… ������������������������������������������ �������
Gambar 53: …sementara porsi pemerintah daerah telah meningkat dengan proses desentralisasi ��������������������������������������� �������
+��������+���������������������������������������?������������Y�������������������������������
+��������������������������������������������?������������Y��������������������������������
���$%��������������@�������������������������������������������}�
� X����������� K���� � #�������������� �����������z'-���� ��� ����������� ������ � �������� ���� �z'-� ����� ��� � � � ���� ��� ��� �� ���� K���� � #����������� '����� ������ ���� ��� � ��� ���� #� ��� �� ������� ������ K���� ������������ ��|��������������Z��}!Z�������� ��^��������������\^Z^!\^ZZ�� �K���� � �z'-� ����� ����� � � # �� ������� �� � �� 4� �� �� �� ��������� ��� �� ��� ���� \^^Z!\^^|�� >����� � � � ����� � � ���� K���� � �z'-��� ��������������������\^^��� ���\^^��� ������������������������� � # �� ����� �"-� ����� �������� ������ ������� �������� ������������� �� � ��� ��Z^�^^^�'X��-��� K���� � #�����������z'-������ ������������ � ������ ������ �� ��������� �� ������� �� � �� ����� ����\^^�{\^^����� �
^
Z
\
�
�
^
Z
\
�
�
Z��} Z��� Z��� \^^Z \^^� \^^} \^^� \^^� \^ZZ
<����������!� �����K�<�������K�>��!� �����K�>q*�� K��
�������� ��$�� �������� ��$��
\|� �^�Z�� Z\� \Z�
����
\^� \��
������ ��� ��� ���
�^��Z� \�� \�� Z�� Z^�
^
\^
�^
|^
�^
Z^^
^
\^
�^
|^
�^
Z^^
Z��}!Z���
Z���!\^^^
\^^Z!\^^|
\^^�!\^^�
\^Z^!\^ZZ
<�������K� >��!� �����K�>q* �� K�������� ������
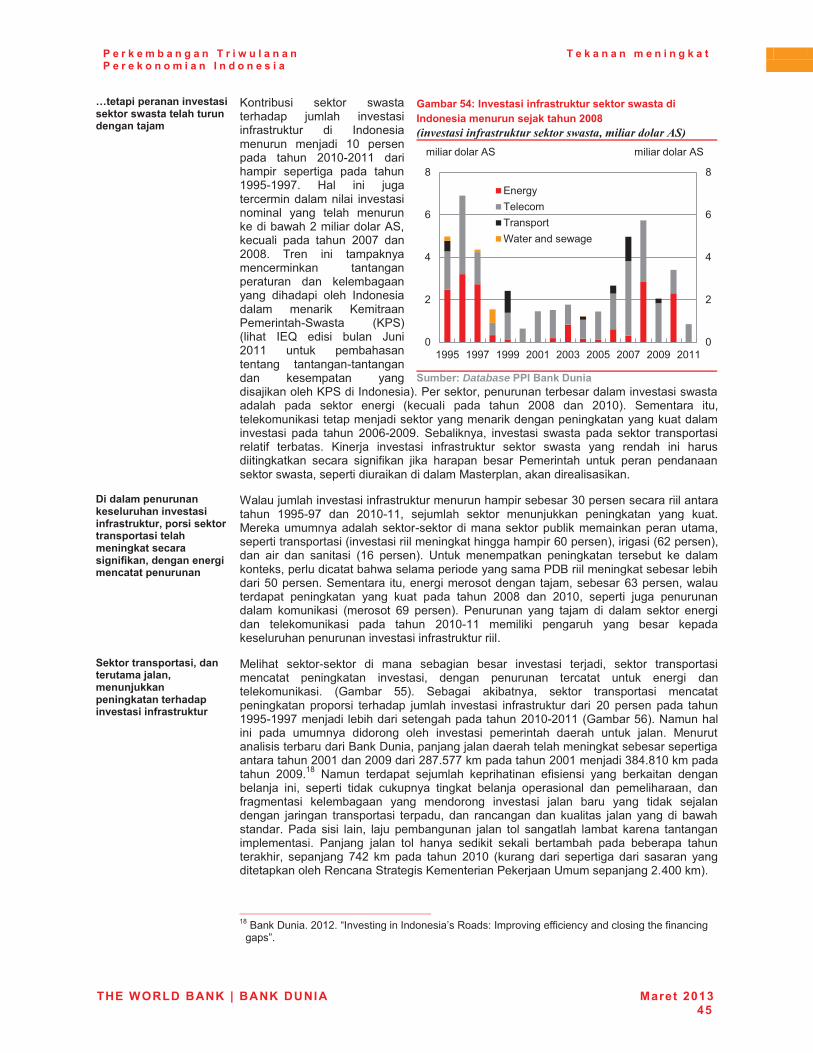
P e r k e m b a n g a n T r i w u l a n a n P e r e k o n o m i a n I n d o n e s i a
T e k a n a n m e n i n g k a t
THE WORLD BANK | BANK DUNIA Maret 2013 45
}�����������������������������W������ ����������������@���
� ���� ��� � ������� ������������ ������ K���� � #���������� � � ����� ������� ���� � Z^� ��������� ���� \^Z^!\^ZZ� �� ���� �� ������ �� ��� ����Z��}!Z����� =�� � ����������� ����� � � K���� ��� �� ��� ����� ���������� �����\�� � �������4>������� � ��� ���� \^^�� ��\^^��� ���� � ������������ �� ����������� �� ����������� � ��� � ����� ����� ����� ��� �� ��� �������� ��!>���� ���>+��� ��� �*�� �� � � ���� %� �\^ZZ� ����� ������������ ���!������ �������� ���� �� ���������>�� ������ +�������������������������������� K���� ���������� ��� ������� ���� � ������ � ��� ���� \^^�� �� \^Z^+�� >������ ������������ �� ���������� �������������� �������� ��������������� K���� � ��� ���� \^^|!\^^��� >��� ���� K���� � ����� ��� ������� �������� ����� #� �������� � ���� K���� � #���������� ������� ����� ��� ����� � ������ � ����� ����� � � # �� � �� ���� ����� ����� ��� ����� ���� ����������������������� �� �� ��� �����'����������� ��� �� ���
Gambar 54: Investasi infrastruktur sektor swasta di Indonesia menurun sejak tahun 2008 ������������������������������1�����������������!"�
�+������Database����������������
����� �������������� �����������������������������~��������������������������� �������������?��������������~�������������?��������������
� X��������� K���� � #������������������� ����������^������������� ��������� Z��}!��� �� \^Z^!ZZ�� �������� ������� �������� �� ���� ��� �����'���������������������!�������� �������������� ����� ����������������� ��������� �� K���� �� ���� ����� ������ ��|^������+�� � �� ��|\������+���� �� �� � �� � �Z|� �����+�� z���� �������� �� ���� ��������� ��� ������������������� ���������������� �����������$��� ���� �������������� ���� �}^��������>������ �������� �������������������������|�������������������� �� ���� ��� ���� ��� ���� \^^�� �� \^Z^�� ������ � ���� ���������� ���� �� � ��������� |�� �����+�� ������ ��� ���� � � ���� ������� ���� ��� �������� �� � ��� ���� \^Z^!ZZ� ��� � � � ������� ��� ����� ��������������������� K���� � #����������� ����
+�����������������~������������@� ��~�����@������������������������������������������������
� '�� ��� ������!������� � � �� ���� � ����� K���� � ����� �� ������� �������� ������� �� ���� K���� �� ���� ������ ������� ����� ���� � ���������� �� �� ������ }}+�� >��� � � ����� ������� �������� � �������� ����������� � ������� ������ K���� � #���������� �� � \^� ������ ��� ����Z��}!Z�������� � ��� ���� ���������������\^Z^!\^ZZ�������}|+��-������ � ��� ������ � ������ ����� K���� � ����� ��� ����� ����� ���� '������� � ����������� ����$� ��������������������� ����������������� ���������\^^Z���\^^���� �\���}�������������\^^Z����� ������Z^����������� \^^��Z�� -��� ������� �������� ���� �� � �# � �� � ��� ���� �� ��������� �� ������ � � ��� ������� � ���� ����� ����� ��� �� ����� ���� ��#������ � �������� ��� �������� K���� � ��� ���� ��� � ��� ��������� �� �� �������� � �������� �� ���� ����� ��� ��� ���� � ���������� ��� � � � � �� ���� ������� ��� ���� ������ ����� ���� ���� �������� �� ���� ��� ���� ��� ��� � �� ���� � �������� ��� ������� ��������� ��� ������ ��\� ��� ��� ���� \^Z^� ������ �� � ������ �� �� � ���� ���� �����������Y���>����� ��������� ��������z����������\��^^���+���� �
�����������������������������������������������������������������Z�����$� ��\^Z\����K��� �� ������ ¡��Y����������K ���## � ���������� ������# � ��
������
^
\
�
|
�
^
\
�
|
�
Z��} Z��� Z��� \^^Z \^^� \^^} \^^� \^^� \^ZZ
*������������������X�����������
� � �������4>� � � �������4>�
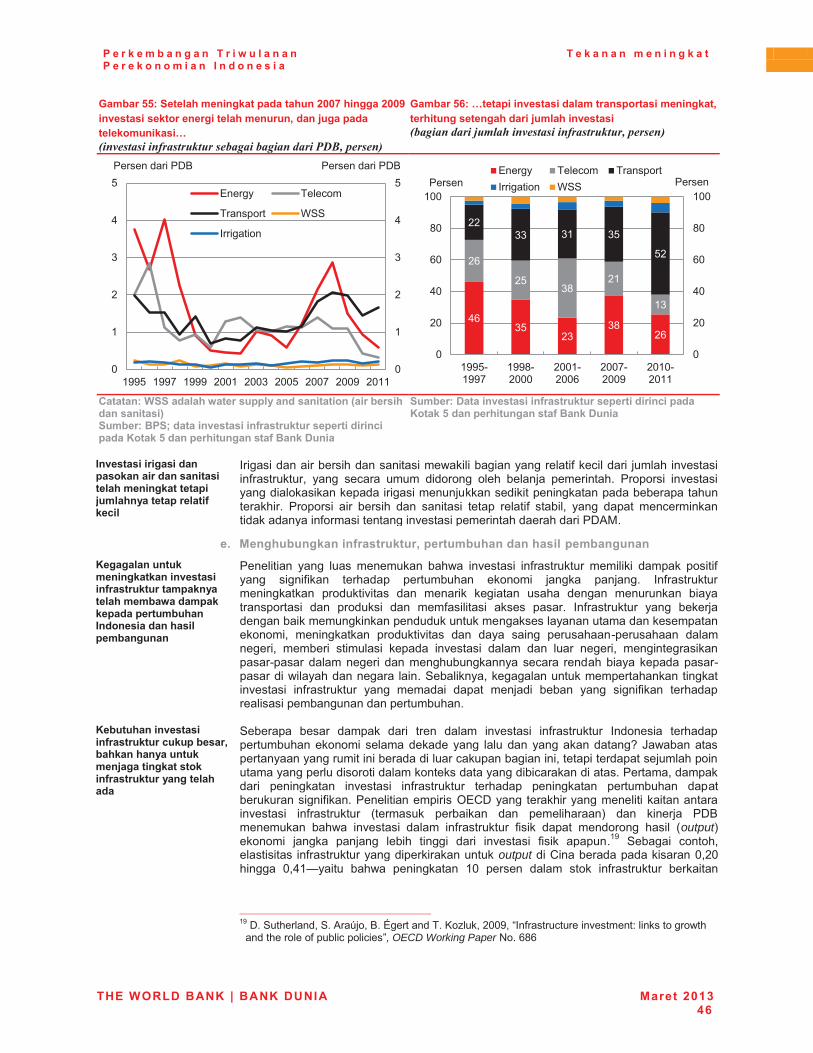
P e r k e m b a n g a n T r i w u l a n a n P e r e k o n o m i a n I n d o n e s i a
T e k a n a n m e n i n g k a t
THE WORLD BANK | BANK DUNIA Maret 2013 46
Gambar 55: Setelah meningkat pada tahun 2007 hingga 2009 investasi sektor energi telah menurun, dan juga pada telekomunikasi… ������������������������������������������ �������
Gambar 56: …tetapi investasi dalam transportasi meningkat, terhitung setengah dari jumlah investasi ��������������������������������������� �������
�`���������++��� ���W�������� ����������������]���������������������^�+��������+���������������������������������������?������������Y�������������������������������
+��������������������������������������������?������������Y�������������������������������
���������������������������������������������� ������������������@�� ������������ ������?� �
� �� �� ��� ������ ����� �� ����� � ��� �������� #���� ���� � ������ K���� � #����������� ��� ����� ����� � ������ ����� ����� ����� ���� ������� � K���� ����� ���� ������� � �� ������������ � ���� ����������������������� ��� ������� � �� ���� �� �� � �� � ����� ���� #� ��� ��� ��� ���� ������ ��� ������ #���� ������ K���� ������ ���������� ��$4'��
e.� Menghubungkan infrastruktur, pertumbuhan dan hasil pembangunan ����� ������������������������������������������������������� �������W��������������������������������������� ������������
� ���� � � ��� ���� ������� ���� K���� � #���������� ��� � � � ����� ��� � #���� � � # �� ������� ���������� ����� � ���� ����� �#������������ ����� ������� K ��� �� ��� �� ��� �� ���� ���� ������� � ���������� � �� ������� � �� ���#� � �� � ����� ����� �#���������� ��� ������������ �������� ��������������������������������������������� �� �� ����� ������� K ��� �� ��� � �� ������!������� �������� �� ������ � �� ���� � ����� K���� � ���� �� ���� ���� �� ��� ����� �����!������������ � ������������������ ������ ����������!����� �� ���������� � ��>��� �������������������������� ���� K���� � #���������� ��� ���� � ���� ���� � ���� ��� � � # �� ���������� �� ����������������������
��������������������������������?���������~����������������������@������������������������������������� ������
� >������ ����� ����� �� � ���� ���� K���� � #���������� ����� � ���������������������� � �������������� ����������������%������������������ �� ������� ������������ � ������ ������������������ ��������������� ����� ������������������� � ����� ������������������� � �� ���� K���� � #���������� ������� �� ���� ���������� ������������� � # ������� � ���� � ��q*<$���� ����� ��������� � �� ����� K���� � #���������� ��������� ���� �� �� ����� ��+� �� � ���� �$��������� ���� K���� � ���� #���������� # � �� ���� �������� �� �� �output+������ � ���� ���� ��� �� � �� � �� � K���� � # � �� ����Z�� >��� � ����������� � ��� #�������������� ���� ��������output�� �< ���������� ���^�\^�� ��� ^��Z~� ��� ���� �� ���� Z^� ������ ���� ����� #���������� ���� ��
�����������������������������������������������������������������Z��$��>���������>��4�£�������¤������������������\^^�����#����������� K��������� �������������
������������#����� ����� � ���, OECD Working Paper�-���|�|�
^
Z
\
�
�
}
^
Z
\
�
�
}
Z��} Z��� Z��� \^^Z \^^� \^^} \^^� \^^� \^ZZ
*���� �������
������� X>>
��� �� �
�������� ��$�� �������� ��$��
�|��}�
\�����
\|�
\|�
\}����
\Z�
Z��
\\���� �Z� �}�
}\�
^
\^
�^
|^
�^
Z^^
^
\^
�^
|^
�^
Z^^
Z��}!Z���
Z���!\^^^
\^^Z!\^^|
\^^�!\^^�
\^Z^!\^ZZ
*���� ������� ���������� �� � X>>������ ������
P e r k e m b a n g a n T r i w u l a n a n P e r e k o n o m i a n I n d o n e s i a
T e k a n a n m e n i n g k a t
THE WORLD BANK | BANK DUNIA Maret 2013 47
������ ���������������$���������\�� �����Z�������\^����������������� � ����� ����� �������� ��� � ���� K���� � #����������� ������ ���������� ����� ��� ��� ��� �� �# � �� � K���� �� �������� ���� � ������ ��� ����� � �� �� #����������� ��� ��� K���� � ���� ���� ���!����� ��� ��������� � ����� �� ���� � �� �� ���!���� #���������� ��� �� � ��� ��� ��������������� ��� ������ �� ��� ����� % �� � ���� � ������� � ���� K���� � ������ ��� ������ ����� ��� ����� ������ � ������ � � �� �� ��� ��� ������������ ������ #������������
�����������������������������������������������������������������\^�>������-�����\^Z^����#�������������K��������������� ��������� �<� ����� ������#�
$�K���� ��*���� ����

THE WORLD BANK | BANK DUNIA Maret 2013 48
LAMPIRAN: INDIKATOR GAMBARAN EKONOMI INDONESIA Lampiran gambar 1: Pertumbuhan PDB triwulanan dan tahunan (pertumbuhan PDB riil, persen)
Lampiran gambar 2: Kontribusi terhadap PDB pengeluaran (kontribusi pertumbuhan trimulan-ke-triwulan riil PDB,penyesuaian musim, persen)�
� ������_�����������������W_�_�W�������Q�<==Y_�Q�<=;<�+��������+~��� �� ��������������������
+��������+������ �� ����������������������
Lampiran gambar 3: Kontribusi produksi terhadap PDB (Kontribusi GDP triwulan dengan penyesuaian musiman)
Lampiran gambar 4: Penjualan sepeda motor dan mobil (bulanan, unit)
� �+��������+���� �� �������������������� +������`#�`�Lampiran gambar 5: Indikator konsumen ��������
Lampiran gambar 6: Indikator kegiatan industri �����������%���������� ���������������������������
� �+����������� +������`#�`�
^
\
�
|
�
^
Z
\
�
�
$��!^} >��!^� %�!^� '�!ZZ $��!Z\
������ ������
�W_�_�W~�������������������]����^�
^�
�����_�_������]�����^�
����_�����]����^��
!�
!\
!Z
^
Z
\
�
�
}
!�
!\
!Z
^
Z
\
�
�
}
$��!^� >��!Z^ %�!ZZ '�!Z\ $��!Z\$ ������� -���*@����� �K��������K����� �� K������� �$�
������ ������
!Z
^
Z
\
�
!Z
^
Z
\
�
$��!^� >��!Z^ %�!ZZ '�!Z\ $��!Z\q������ ������K ���+ ������=��������Y����<���������� '�#�����' ����<��� 4�� �������
������ �����
�^
}^
�^
�^
ZZ^
Z�^
Z^^
�^^
}^^
�^^
�^^
%!Z^ %!ZZ %!Z\ %!Z�
�^^^
+���������]����^�
�^^^
$��� �]�����^�
|^
�^
Z^^
Z\^
Z�^
Z|^
|^
�^
Z^^
Z\^
Z�^
Z|^
%!Z^ %!ZZ %!Z\ %!Z�
������ ������
��������@�� ������ ����
����������������������
�
!Z^
^
Z^
\^
�^
!}
^
}
Z^
Z}
%!Z^ %!ZZ %!Z\ %!Z�
������ ��������
��@�� �������]�����^�
������������������������]����^�
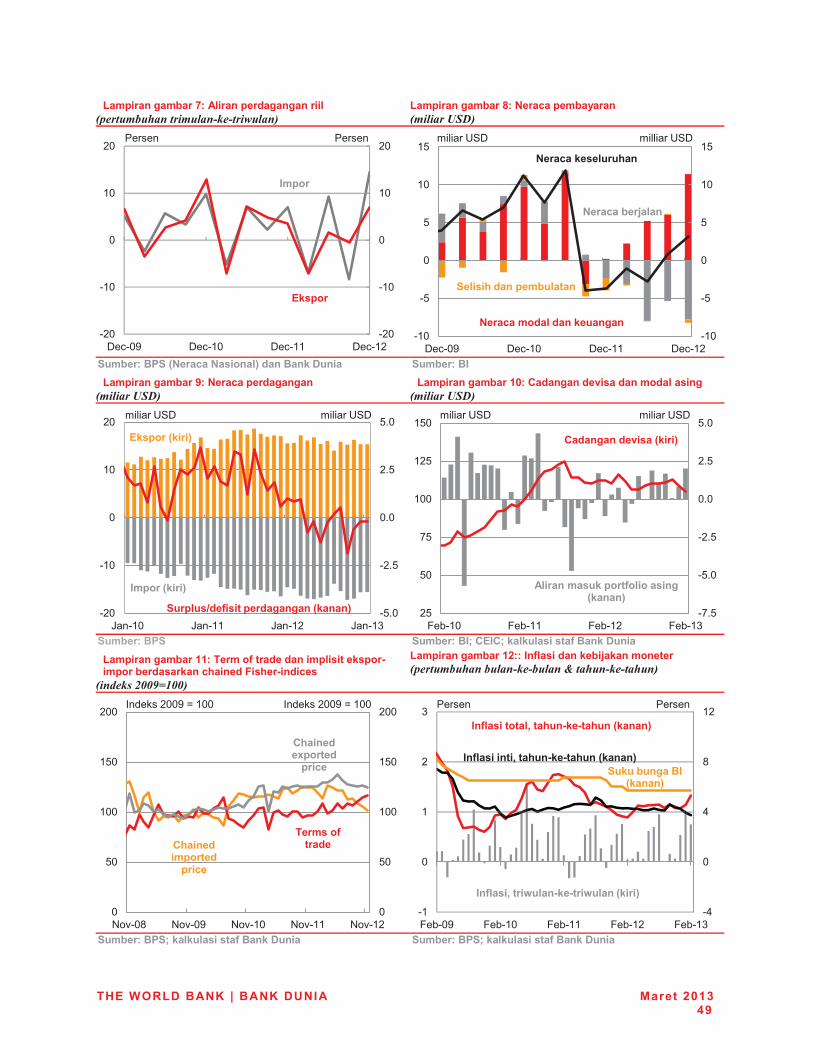
THE WORLD BANK | BANK DUNIA Maret 2013 49
Lampiran gambar 7: Aliran perdagangan riil � ������������������������1������
Lampiran gambar 8: Neraca pembayaran ������&"���
� �+��������+�]%��?��%������ ^��������������� +����������Lampiran gambar 9: Neraca perdagangan ������&"���
Lampiran gambar 10: Cadangan devisa dan modal asing ������&"���
� �+��������+�� +����������`#�`���� �� ��������������������Lampiran gambar 11: Term of trade dan implisit ekspor-impor berdasarkan chained Fisher-indices �������,--28.--��
Lampiran gambar 12:: Inflasi dan kebijakan moneter � ��������������������������9�����������������
� �+��������+���� �� �������������������� +��������+���� �� ��������������������
!\^
!Z^
^
Z^
\^
!\^
!Z^
^
Z^
\^
$��!^� $��!Z^ $��!ZZ $��!Z\
#������
������
������ ��������
!Z^
!}
^
}
Z^
Z}
!Z^
!}
^
}
Z^
Z}
$��!^� $��!Z^ $��!ZZ $��!Z\
� � ��z>$� � �� ��z>$�
%��?����� ������������
%��?����@� ���
%��?���� �������
+ ������������ �����
!}�^
!\�}
^�^
\�}
}�^
!\^
!Z^
^
Z^
\^
%!Z^ %!ZZ %!Z\ %!Z�+��� �������������������]�����^�
#������]����^�
������]����^�
� � � z>$ � � ��z>$
!��}
!}�^
!\�}
^�^
\�}
}�^
\}
}^
�}
Z^^
Z\}
Z}^
;��!Z^ ;��!ZZ ;��!Z\ ;��!Z�
`������������]����^�
� � ��z>$ � � ��z>$
! ����������������� ���������]�����^�
`������������
���?�
������������
`�����|�����
���?�
^
}^
Z^^
Z}^
\^^
^
}^
Z^^
Z}^
\^^
-�K!^� -�K!^� -�K!Z^ -�K!ZZ -�K!Z\
������\^^����Z^^� ������\^^����Z^^�
!�
^
�
�
Z\
!Z
^
Z
\
�
;��!^� ;��!Z^ ;��!ZZ ;��!Z\ ;��!Z�
��� ��������~������_�_������]�����^�
��� �������� ~������_�_������]�����^�
��� ���~����W� ��_�_���W� ���]����^�
������ �����������
+�������������]�����^�
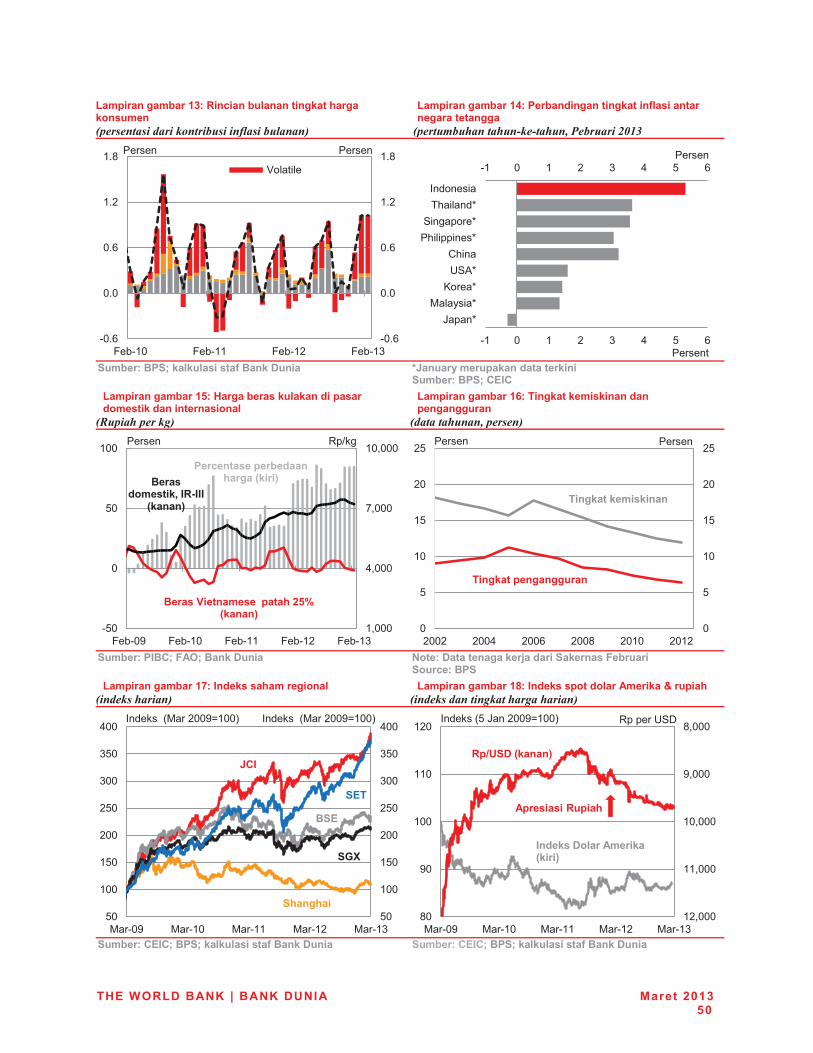
THE WORLD BANK | BANK DUNIA Maret 2013 50
Lampiran gambar 13: Rincian bulanan tingkat harga konsumen � �������������������������������������
Lampiran gambar 14: Perbandingan tingkat inflasi antar negara tetangga � �����������������������������������,-.%�
� �+��������+���� �� �������������������� �q���������������������������
+��������+��`#�`�Lampiran gambar 15: Harga beras kulakan di pasar domestik dan internasional � � ��� ������
Lampiran gambar 16: Tingkat kemiskinan dan pengangguran ��������������� �������
� �+���������`��*!'������������� %�����������������@������+�������*�������
+���?����+�Lampiran gambar 17: Indeks saham regional ��������������
Lampiran gambar 18: Indeks spot dolar Amerika & rupiah �����������������������������
� �+������`#�`����+���� �� �������������������� +������`#�`����+���� �� ��������������������
!^�|
^�^
^�|
Z�\
Z��
!^�|
^�^
^�|
Z�\
Z��
;��!Z^ ;��!ZZ ;��!Z\ ;��!Z�
���� ��
������ ������!Z ^ Z \ � � } |
!Z ^ Z \ � � } |
%��'��� �
�����z>4�<�
�� � �� ���> ������
�� ��������
������
�������
Z�^^^
��^^^
��^^^
Z^�^^^
!}^
^
}^
Z^^
;��!^� ;��!Z^ ;��!ZZ ;��!Z\ ;��!Z�
�����������~���_����
]�����^�
��������������������<Y��]�����^�
��?������������������]����^�
�������� Y�{���
^
}
Z^
Z}
\^
\}
^
}
Z^
Z}
\^
\}
\^^\ \^^� \^^| \^^� \^Z^ \^Z\
�������� ������
������������������
��������������������
}^
Z^^
Z}^
\^^
\}^
�^^
�}^
�^^
}^
Z^^
Z}^
\^^
\}^
�^^
�}^
�^^
'�!^� '�!Z^ '�!ZZ '�!Z\ '�!Z�
��������'��\^^��Z^^+�
+&��
q`��
+#��
+��������
�+#�
��������'��\^^��Z^^+� ��^^^
��^^^
Z^�^^^
ZZ�^^^
Z\�^^^�^
�^
Z^^
ZZ^
Z\^
'�!^� '�!Z^ '�!ZZ '�!Z\ '�!Z�
�������}�%�\^^��Z^^+
����+��]�����^�
������� ���!������]����^��
!���������������
Y������z>$�
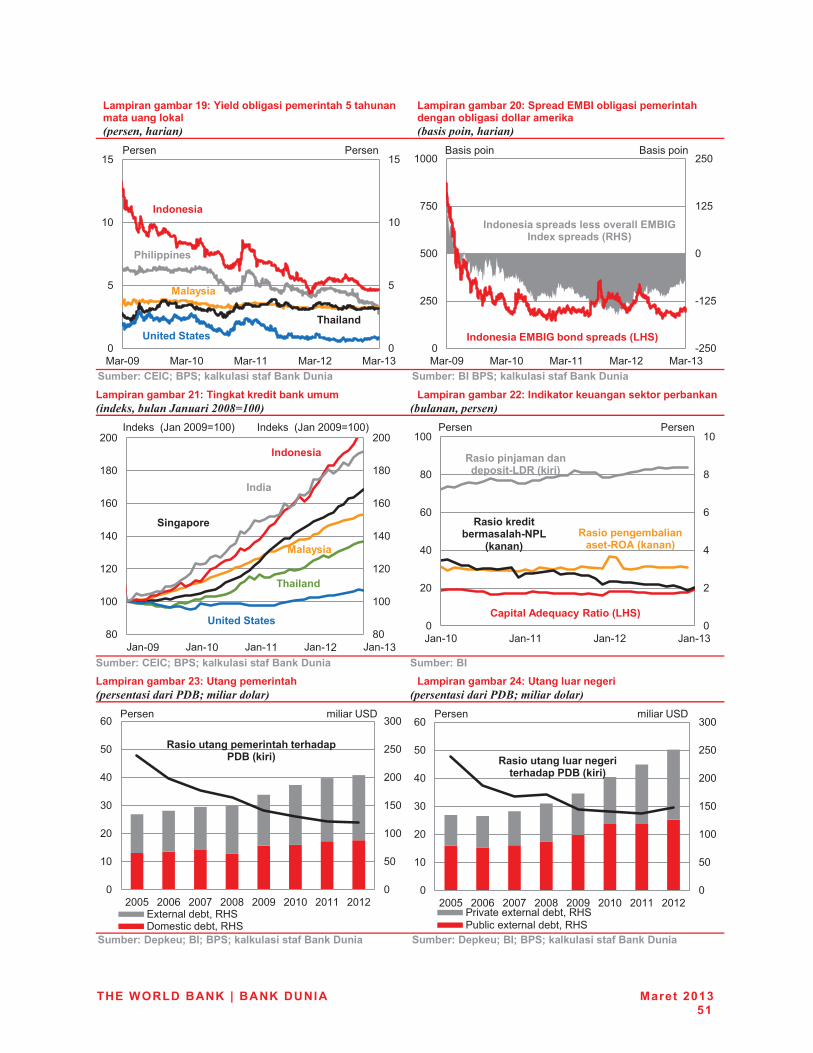
THE WORLD BANK | BANK DUNIA Maret 2013 51
Lampiran gambar 19: Yield obligasi pemerintah 5 tahunan mata uang lokal � ��������������
Lampiran gambar 20: Spread EMBI obligasi pemerintah dengan obligasi dollar amerika ������ �����������
� �+������`#�`����+���� �� �������������������� +�����������+���� �� ��������������������Lampiran gambar 21: Tingkat kredit bank umum ��������������#������,--:8.--��
Lampiran gambar 22: Indikator keuangan sektor perbankan ���������� �������
��
+������`#�`����+���� �� �������������������� +���������Lampiran gambar 23: Utang pemerintah � ������������������������������
Lampiran gambar 24: Utang luar negeri � ������������������������������
� �+������������������+���� �� �������������������� +������������������+���� �� ��������������������
�� �
^
}
Z^
Z}
^
}
Z^
Z}
'�!^� '�!Z^ '�!ZZ '�!Z\ '�!Z�
������
��� �������
�����+��������� ���
$� ������
��������
��������
!\}^
!Z\}
^
Z\}
\}^
^
\}^
}^^
�}^
Z^^^
'�!^� '�!Z^ '�!ZZ '�!Z\ '�!Z�
�� ���� �
��������#$��&�����������]-Z+^�
�������������� ������� �#$��&���|�������]�Z+^�
�� ���� �
�^
Z^^
Z\^
Z�^
Z|^
Z�^
\^^
�^
Z^^
Z\^
Z�^
Z|^
Z�^
\^^��������%�\^^��Z^^+�
���� ���
+�������
��������
�����
$� ������
��������%�\^^��Z^^+�
�����+����� ^
\
�
|
�
Z^
^
\^
�^
|^
�^
Z^^
%!Z^ %!ZZ %!Z\ %!Z�
`����� �!���?��������]-Z+^�
������������ �������_�'!�]�����^�
���������@�������������_-���]����^�
������ ������
����������������� ��_%�-�
]�����^�
^
}^
Z^^
Z}^
\^^
\}^
�^^
^
Z^
\^
�^
�^
}^
|^
\^^} \^^| \^^� \^^� \^^� \^Z^ \^ZZ \^Z\*@�����������Y=>$����� ��������Y=>
������ � � ��z>$�
��������������������������������]����^�
��$��������
^
}^
Z^^
Z}^
\^^
\}^
�^^
^
Z^
\^
�^
�^
}^
|^
\^^} \^^| \^^� \^^� \^^� \^Z^ \^ZZ \^Z\�� K����@�����������Y=>���� ���@�����������Y=>
������������ ��������������������]����^�
������ � � ��z>$�
�$��������
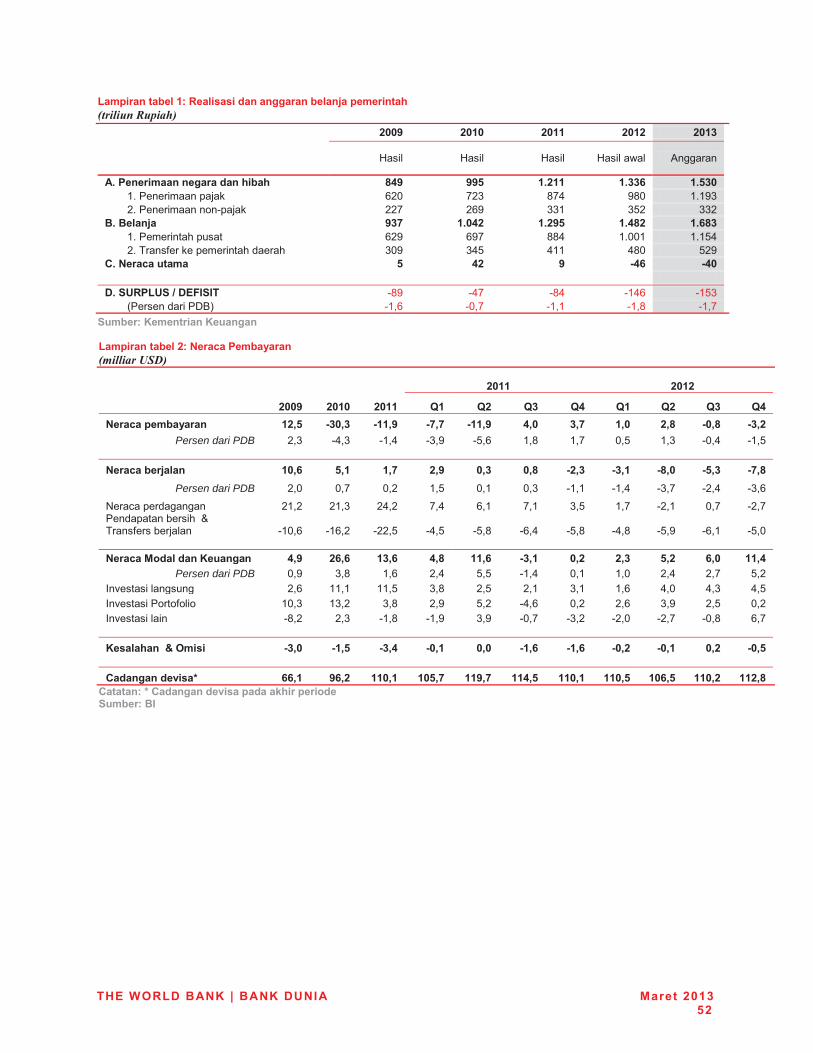
THE WORLD BANK | BANK DUNIA Maret 2013 52
Lampiran tabel 1: Realisasi dan anggaran belanja pemerintah ������� � ����
�� �� <==X� <=;=� <=;;� <=;<� <=;>�
�� ��=� �� =� �� =� ��� =� ����� 4����
!"������������������������� [QX� XXY� ;"<;;� ;">>O� ;"Y>=��� Z������ ������ |\^� �\�� ���� ��^� Z�Z����� \������ ���!���� \\�� \|�� ��Z� �}\� ��\��"�� ��@�� X>\� ;"=Q<� ;"<XY� ;"Q[<� ;"O[>��� Z������� �������� |\�� |��� ���� Z�^^Z� Z�Z}���� \�����#����������� �������� �^�� ��}� �ZZ� ��^� }\��`"�%��?�������� Y� Q<� X� _QO� _Q=��� �� �� �� �� �� ���"�+���-�+����#*�+���� !��� !��� !��� !Z�|� !Z}���� ��������� ��$�+� !Z�|� !^��� !Z�Z� !Z��� !Z���
�
+������������������������
Lampiran tabel 2: Neraca Pembayaran �������&"����
�� �� �� �� <=;;� <=;<�
�� <==X� <=;=� <=;;� �;� �<� �>� �Q� �;� �<� �>� �Q�%��?������������ ;<~Y� _>=~>� _;;~X� _\~\� _;;~X� Q~=� >~\� ;~=� <~[� _=~[� _>~<�
Persen dari PDB \��� !���� !Z��� !���� !}�|� Z��� Z��� ^�}� Z��� !^��� !Z�}��� �� �� �� �� �� �� �� �� �� �� ��%��?����@� ��� ;=~O� Y~;� ;~\� <~X� =~>� =~[� _<~>� _>~;� _[~=� _Y~>� _\~[�
Persen dari PDB \�^� ^��� ^�\� Z�}� ^�Z� ^��� !Z�Z� !Z��� !���� !\��� !��|�
-����������� \Z�\� \Z��� \��\� ���� |�Z� ��Z� ��}� Z��� !\�Z� ^��� !\������������� ��������#���������� !Z^�|� !Z|�\� !\\�}� !��}� !}��� !|��� !}��� !���� !}��� !|�Z� !}�^��� �� �� �� �� �� �� �� �� �� �� ��%��?��$�� ������������� Q~X� <O~O� ;>~O� Q~[� ;;~O� _>~;� =~<� <~>� Y~<� O~=� ;;~Q�
Persen dari PDB ^��� ���� Z�|� \��� }�}� !Z��� ^�Z� Z�^� \��� \��� }�\��K���� �������� \�|� ZZ�Z� ZZ�}� ���� \�}� \�Z� ��Z� Z�|� ��^� ���� ��}��K���� ������#�� �� Z^��� Z��\� ���� \��� }�\� !��|� ^�\� \�|� ���� \�}� ^�\��K���� �� � !��\� \��� !Z��� !Z��� ���� !^��� !��\� !\�^� !\��� !^��� |����� �� �� �� �� �� �� �� �� �� �� ����� ��������'����� _>~=� _;~Y� _>~Q� _=~;� =~=� _;~O� _;~O� _=~<� _=~;� =~<� _=~Y��� �� �� �� �� �� �� �� �� �� �� ��`������������� OO~;� XO~<� ;;=~;� ;=Y~\� ;;X~\� ;;Q~Y� ;;=~;� ;;=~Y� ;=O~Y� ;;=~<� ;;<~[�
�
`����������`���������������������������+����������
�� �
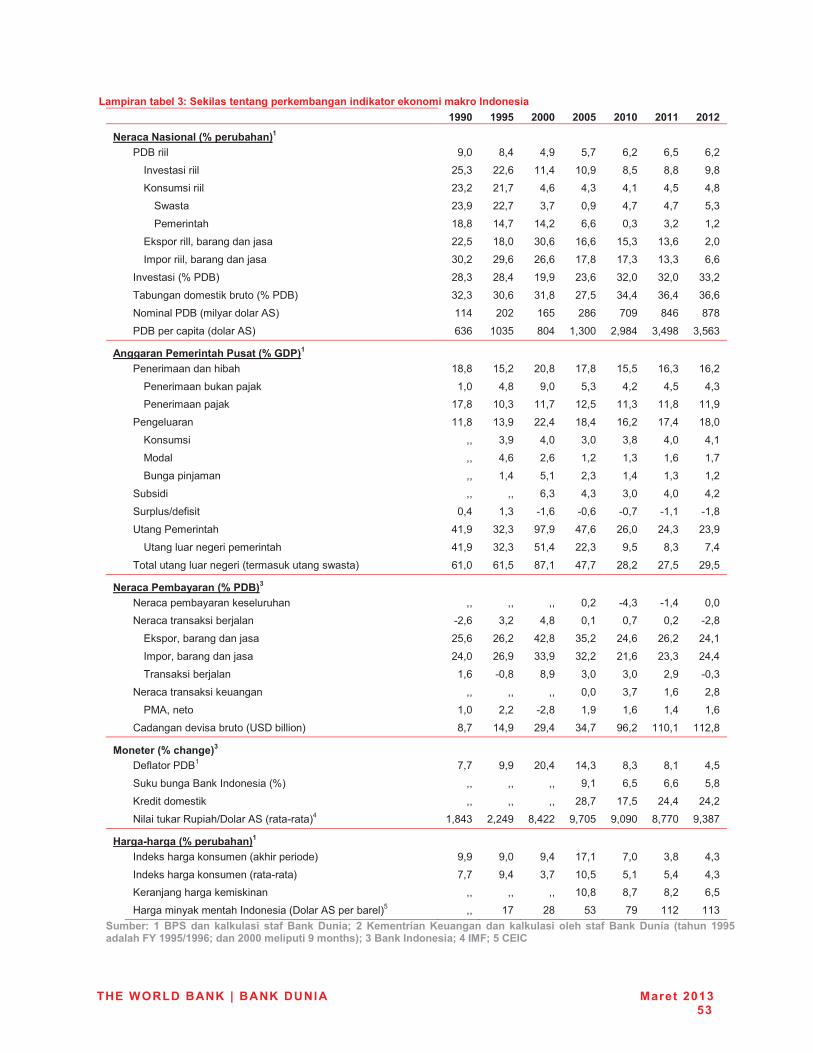
THE WORLD BANK | BANK DUNIA Maret 2013 53
Lampiran tabel 3: Sekilas tentang perkembangan indikator ekonomi makro Indonesia �� �� ;XX=� ;XXY� <===� <==Y� <=;=� <=;;� <=;<�
%��?��%������ �]����������^;� �� �� �� �� �� �� �$��� ���� ��^� ���� ���� }��� |�\� |�}� |�\�
�K���� �� �� \}��� \\�|� ZZ��� Z^��� ��}� ���� ����
������ �� �� \��\� \Z��� ��|� ���� ��Z� ��}� ����
>���� \���� \\��� ���� ^��� ���� ���� }���
����� ��� Z���� Z���� Z��\� |�|� ^��� ��\� Z�\�
*������� ������������� \\�}� Z��^� �^�|� Z|�|� Z}��� Z��|� \�^�
������� ������������ �^�\� \��|� \|�|� Z���� Z���� Z���� |�|�
�K���� �����$�+� \���� \���� Z���� \��|� �\�^� �\�^� ���\�
����������� ������������$�+� �\��� �^�|� �Z��� \��}� ����� �|��� �|�|�
-�� ���$���� ���������4>+� ZZ�� \^\� Z|}� \�|� �^�� ��|� ����
�$�������� ��������4>+� |�|� Z^�}� �^�� Z��^^� \����� ������ ��}|��
!�����������������������]��&��^;� �� �� �� �� �� �� ���� ����� ��� Z���� Z}�\� \^��� Z���� Z}�}� Z|��� Z|�\�
���� ���������� Z�^� ���� ��^� }��� ��\� ��}� ����
���� ������ Z���� Z^��� ZZ��� Z\�}� ZZ��� ZZ��� ZZ���
�������� ZZ��� Z���� \\��� Z���� Z|�\� Z���� Z��^�
������ ��� ��� ���� ��^� ��^� ���� ��^� ��Z�
'���� ��� ��|� \�|� Z�\� Z��� Z�|� Z���
����� ��� ��� Z��� }�Z� \��� Z��� Z��� Z�\�
>��� � � ��� ��� |��� ���� ��^� ��^� ��\�
>������{��# � �� ^��� Z��� !Z�|� !^�|� !^��� !Z�Z� !Z���
z�������� ��� �Z��� �\��� ����� ���|� \|�^� \���� \����
z����������� ������ ��� �Z��� �\��� }Z��� \\��� ��}� ���� ����
����������������� ������������������+� |Z�^� |Z�}� ���Z� ����� \��\� \��}� \��}�
%��?������������]�����^>� �� �� �� �� �� �� -���������������������� ��� ��� ��� ^�\� !���� !Z��� ^�^�
-��������� ������� !\�|� ��\� ���� ^�Z� ^��� ^�\� !\���
*���������������� \}�|� \|�\� �\��� �}�\� \��|� \|�\� \��Z�
���������������� \��^� \|��� ����� �\�\� \Z�|� \���� \����
����� ������� Z�|� !^��� ���� ��^� ��^� \��� !^���
-��������� ������ ��� ��� ��� ^�^� ���� Z�|� \���
�'4������ Z�^� \�\� !\��� Z��� Z�|� Z��� Z�|�
<�����K ���������z>$�� �� �+� ���� Z���� \���� ����� �|�\� ZZ^�Z� ZZ\���
$�����]��?����^>� �� �� �� �� �� �� $�#������$�Z�� ���� ���� \^��� Z���� ���� ��Z� ��}�
>���������������� ���+� ��� ��� ��� ��Z� |�}� |�|� }���
���� �������� �� ��� ��� ��� \���� Z��}� \���� \��\�
- � ������Y�� �{$����4>����!��+�� Z����� \�\��� ���\\� ���^}� ��^�^� ����^� ������
Z����_������]����������^;� �� �� �� �� �� �� �������������������� ����� ���+� ���� ��^� ���� Z��Z� ��^� ���� ����
��������������������!��+� ���� ���� ���� Z^�}� }�Z� }��� ����
������������� �� � ��� ��� ��� Z^��� ���� ��\� |�}�
=���� ������������� ��$����4>���������+}� ��� Z�� \�� }�� ��� ZZ\� ZZ���
+������ ;� ��+� ��� �� �� ���� ����� ����� ������� <� ��������� �������� ��� �� �� ���� � �� ����� ����� ������ ]������ ;XXY��� ���*{�;XXY�;XXO�����<===�� ������X�������^��>���������������Q��$*��Y�`#�`�
�
�� �
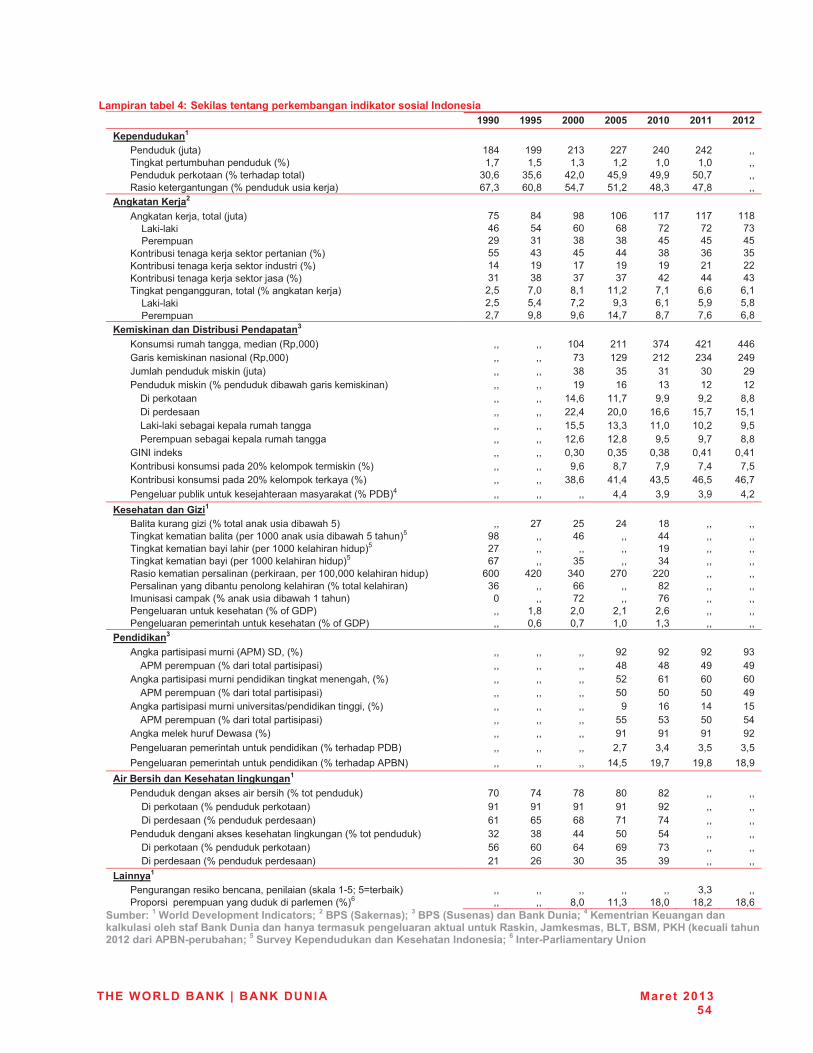
THE WORLD BANK | BANK DUNIA Maret 2013 54
��
Lampiran tabel 4: Sekilas tentang perkembangan indikator sosial Indonesia �� �� ;XX=� ;XXY� <===� <==Y� <=;=� <=;;� <=;<���������;� �� �� �� �� �� �� ���� ������������+� Z��� Z��� \Z�� \\�� \�^� \�\� ����� � ������������������������+� Z��� Z�}� Z��� Z�\� Z�^� Z�^� ����� �����������������������������+� �^�|� �}�|� �\�^� �}��� ����� }^��� ����� Y� ������������������������� �����+� |���� |^��� }���� }Z�\� ����� ����� ���!����������@�<� �� �� �� �� �� �� ���� 4�������������������+� �}� ��� ��� Z^|� ZZ�� ZZ�� ZZ���� ����"� !�� � �|� }�� |^� |�� �\� �\� ����� ������������ \�� �Z� ��� ��� �}� �}� �}��� ���� ��� ��������������������� ���+� }}� ��� �}� ��� ��� �|� �}��� ���� ��� ����������������� ����� ���+� Z�� Z�� Z�� Z�� Z�� \Z� \\��� ���� ��� ����������������������+� �Z� ��� ��� ��� �\� ��� ����� � �����������������������������+� \�}� ��^� ��Z� ZZ�\� ��Z� |�|� |�Z��� ����"� !�� � \�}� }��� ��\� ���� |�Z� }��� }����� ������������ \��� ���� ��|� Z���� ���� ��|� |�����������������������������������>� �� �� �� �� �� �� ���� ������ �������������� ��Y��^^^+� ��� ��� Z^�� \ZZ� ���� �\Z� ��|��� �� ����� �� �� ����Y��^^^+� ��� ��� ��� Z\�� \Z\� \��� \����� %�������������� �� �����+� ��� ��� ��� �}� �Z� �^� \���� ��������� �� ������������� ������ ����� �� +� ��� ��� Z�� Z|� Z�� Z\� Z\��� $ ��������� ��� ��� Z��|� ZZ��� ���� ��\� ������ $ �������� ��� ��� \\��� \^�^� Z|�|� Z}��� Z}�Z��� "� !�� ����� ���������������� ��� ��� Z}�}� Z���� ZZ�^� Z^�\� ��}��� ������������ ���������������� ��� ��� Z\�|� Z\��� ��}� ���� ������ ��-�� ����� ��� ��� ^��^� ^��}� ^���� ^��Z� ^��Z��� ���� ��� ������� ����\^��������������� �� ���+� ��� ��� ��|� ���� ���� ���� ��}��� ���� ��� ������� ����\^�������������������+� ��� ��� ���|� �Z��� ���}� �|�}� �|����� ������������ ����������������������������$�+�� ��� ��� ��� ���� ���� ���� ��\������������&���;� �� �� �� �� �� �� ���� �� �������� � ������������� �� ����}+� ��� \�� \}� \�� Z�� ��� ����� � �������� ��� �������Z^^^����� �� ����}����+}� ��� ��� �|� ��� ��� ��� ����� � �������� ��� ��� �������Z^^^����� ��� ���+}� \�� ��� ��� ��� Z�� ��� ����� � �������� ��� ������Z^^^����� ��� ���+}� |�� ��� �}� ��� ��� ��� ����� Y� ������ ������ ������ �������Z^^�^^^����� ��� ���+� |^^� �\^� ��^� \�^� \\^� ��� ����� ����� ����� ��������������� �������������� �+� �|� ��� ||� ��� �\� ��� ����� ��� �� ������������� �� ����Z����+� ^� ��� �\� ��� �|� ��� ����� ������������������������#��$�+� ��� Z��� \�^� \�Z� \�|� ��� ����� ������������� �������������������#��$�+� ��� ^�|� ^��� Z�^� Z��� ��� ����������>� �� �� �� �� �� �� ���� 4������ � �� ���� ��4�'+�>$����+� ��� ��� ��� �\� �\� �\� ����� 4�'�������������� ��������� � �� +� ��� ��� ��� ��� ��� ��� ����� 4������ � �� ���� ���� � ��� �������������+� ��� ��� ��� }\� |Z� |^� |^��� 4�'�������������� ��������� � �� +� ��� ��� ��� }^� }^� }^� ����� 4������ � �� ���� �� K��� ��{��� � ��� �� ����+� ��� ��� ��� �� Z|� Z�� Z}��� 4�'�������������� ��������� � �� +� ��� ��� ��� }}� }�� }^� }���� 4�������������#�$������+� ��� ��� ��� �Z� �Z� �Z� �\��� ������������� ����������� � �������������$�+� ��� ��� ��� \��� ���� ��}� ��}��� ������������� ����������� � ������������4��-+� ��� ��� ��� Z��}� Z���� Z���� Z����!�������������������� ���������;� �� �� �� �� �� �� ���� ����������������� ������ ����������������+� �^� ��� ��� �^� �\� ��� ����� ����$ �������������������������+� �Z� �Z� �Z� �Z� �\� ��� ����� ����$ �������������������������+� |Z� |}� |�� �Z� ��� ��� ����� ����������� �������������� �������������������+� �\� ��� ��� }^� }�� ��� ����� ����$ �������������������������+� }|� |^� |�� |�� ��� ��� ����� ����$ �������������������������+� \Z� \|� �^� �}� ��� ��� ���-������;� �� �� �� �� �� �� ���� ���������� ���������� � ������Z!}��}����� �+� ��� ��� ��� ��� ��� ���� ����� ������� �������������������� ����������+|� ��� ��� ��^� ZZ��� Z��^� Z��\� Z��|�
�
+������;���� ��� ���������?�������<���+�]+������^��>���+�]+�����^����������������Q����������������������� �� ����� �������������������������������������� ����������� �������������~�q�������~��-�~��+$~���Z�]�?�� ��������<=;<�����!��%_����������Y�+����������������������������������O�����_��� ���������������
�
��