CHAPTER 4 FISCAL POLICY AND FISCAL MANAGEMENT
12
37 CHAPTER 4 FISCAL POLICY AND FISCAL MANAGEMENT [Government continues to pursue a prudent fiscal policy stance with a view to ensuring macroeconomic stability and conducive environment for sustained higher level of growth. The trend of revenue mobilisation shows that the revenue-GDP ratio is on the rise, albeit the pace of growth is slow. In FY 2014-15, the total revenue mobilisation by NBR stood at Tk.1,36,724 crore against the revised target of Tk.1,35,028 crore which is 13.16 percent higher than the outturn of the previous fiscal year. The mobilisation against income tax witnessed 12.31 percent growth compared to that of previous fiscal year reflecting progress in direct tax collection. Government expenditure as percentage of GDP has been on the increase. The utilisation of ADP stood at 91 percent in FY 2014-15. Currently, the larger portion of ADP is financed from domestic sources. Aid flow witnessed significant improvement in FY 2014-15. Though the Government expenditure has increased, budget deficit remained below 5 percent of GDP in FY 2014-15.] The overall management of Government’s revenue and expenditure is fundamentally guided by the fiscal policy. A well balanced fiscal policy plays a very important role in meeting spending priorities with available resources, creating congenial environment for achieving faster economic growth and maintaining macroeconomic stability of the country. Currently, the Government is implementing a wide range of reforms to streamline both revenue and expenditure management. These reforms have a direct bearing on creation of employment opportunities, increasing productivity and poverty reduction. Government Revenues Tax revenue is the principal source of Government revenue. The rest of the revenue comes from non-tax sources like fees, charges, tolls etc. The trends of revenue mobilisation and tax/revenue- GDP ratio for the period from FY 2006-07 to FY 2014-15 is presented in Table 4.1. Table 4.1: Revenue Receipts (In Crore Tk.) Particulars 2006-07 2007-08 2008-09 2009-10 2010-11 2011-12 2012-13 2013-14 2014-15 Total Revenue 49472 60539 69180 79484 95188 114885 139670 156671 163371 Tax Revenue 39247 48012 55526 63956 79052 94754 116824 130178 140676 Non-tax Revenue 10225 12527 13654 15528 16135 22279 22846 26493 22695 As percent of GDP (GDP base year:2005-06) Total Revenue 9.00 9.63 9.81 9.97 10.39 10.89 11.65 11.66 10.79 Tax Revenue 7.14 7.64 7.88 8.02 8.63 9.12 9.74 9.69 9.29 Non-tax Revenue 1.86 1.99 1.94 1.95 1.76 1.76 1.91 1.97 1.50 Source: Various issues of Budget in Brief, Finance Division. Figures are based on revised budget.
-
Upload
khangminh22 -
Category
Documents
-
view
0 -
download
0
Transcript of CHAPTER 4 FISCAL POLICY AND FISCAL MANAGEMENT

37
CHAPTER 4
FISCAL POLICY AND FISCAL MANAGEMENT
[Government continues to pursue a prudent fiscal policy stance with a view to ensuring
macroeconomic stability and conducive environment for sustained higher level of growth. The
trend of revenue mobilisation shows that the revenue-GDP ratio is on the rise, albeit the pace
of growth is slow. In FY 2014-15, the total revenue mobilisation by NBR stood at Tk.1,36,724
crore against the revised target of Tk.1,35,028 crore which is 13.16 percent higher than the
outturn of the previous fiscal year. The mobilisation against income tax witnessed 12.31
percent growth compared to that of previous fiscal year reflecting progress in direct tax
collection. Government expenditure as percentage of GDP has been on the increase. The
utilisation of ADP stood at 91 percent in FY 2014-15. Currently, the larger portion of ADP is
financed from domestic sources. Aid flow witnessed significant improvement in FY 2014-15.
Though the Government expenditure has increased, budget deficit remained below 5 percent of
GDP in FY 2014-15.]
The overall management of Government’s revenue and expenditure is fundamentally guided by
the fiscal policy. A well balanced fiscal policy plays a very important role in meeting spending
priorities with available resources, creating congenial environment for achieving faster economic
growth and maintaining macroeconomic stability of the country. Currently, the Government is
implementing a wide range of reforms to streamline both revenue and expenditure management.
These reforms have a direct bearing on creation of employment opportunities, increasing
productivity and poverty reduction.
Government Revenues
Tax revenue is the principal source of Government revenue. The rest of the revenue comes from
non-tax sources like fees, charges, tolls etc. The trends of revenue mobilisation and tax/revenue-
GDP ratio for the period from FY 2006-07 to FY 2014-15 is presented in Table 4.1.
Table 4.1: Revenue Receipts
(In Crore Tk.)
Particulars 2006-07 2007-08 2008-09 2009-10 2010-11 2011-12 2012-13 2013-14 2014-15
Total Revenue 49472 60539 69180 79484 95188 114885 139670 156671 163371
Tax Revenue 39247 48012 55526 63956 79052 94754 116824 130178 140676
Non-tax Revenue 10225 12527 13654 15528 16135 22279 22846 26493 22695
As percent of GDP (GDP base year:2005-06)
Total Revenue 9.00 9.63 9.81 9.97 10.39 10.89 11.65 11.66 10.79
Tax Revenue 7.14 7.64 7.88 8.02 8.63 9.12 9.74 9.69 9.29
Non-tax Revenue 1.86 1.99 1.94 1.95 1.76 1.76 1.91 1.97 1.50 Source: Various issues of Budget in Brief, Finance Division. Figures are based on revised budget.

38
The tax-GDP ratio is one of the recognised criteria for judging the level of development of a
country. Table 4.1 shows that in FY 2006-07, revenue-GDP ratio was 9.00 percent, which rose to
11.66 percent in FY 2013-14. But in FY 2014-15 the revenue-GDP ratio came down to 10.79
percent due to political stress and strain in the third quarter of the fiscal year.
Revenue Management
Formulation of tax policy and its execution responsibilities are performed by the National Board
of Revenue (NBR) under the Internal Resource Division. The major steps taken by the
Government during FY 2014-15 for enhancing collection of direct and indirect taxes with a view
to achieving the social and economic goal at a faster pace is shown in the Box 4.1.
Box 4.1: Measures under Direct and Indirect Tax System for FY 2014-15
Measures under Direct Tax System
Tax exemption limit for individual tax payer has been maintained at the previous year's level of Tk 2,20,000.
The exemption limit for female taxpayers and senior citizens of 65 years and above has been enhanced to Tk
2,75,000 from Tk. 2,50,000 and for the retarded persons it has been enhanced to Tk.3,50,000 from Tk.
3,00,000.
Corporate tax rate has been reduced from 37.5 percent to 35 percent for non-publicly traded company and
private limited company.
For ensuring equitable distribution of resources and for reducing economic disparity between the rich and
poor, highest tax rate of the high income earning taxpayers having annual income of more than Tk. 44.20
lakh has been increased from 25 percent to 30 percent. In addition to this, surcharge has been imposed at an
increased rate from 10 percent to 25 percent on the basis of net wealth.
For streamlining the taxation of house rent income and to ensure the collection of proper amount of tax
revenue from the income from house property, legal provisions have been made requiring the mandatory
deposit of house rents receipts into the bank accounts.
For encouraging women and vocational education, donations to girl’s school or girl’s college and or to
vocational and technical institutions have been given tax exemption. Considering the importance of
agriculture in our economy, and as part of fiscal incentive to agricultural sector, tax exemption limit for
the income from agriculture has been increased from Tk.50 thousand to Tk.2 lakh.
For creating large-scale employment opportunities in the less developed areas, the industrial
undertakings set up and transferred to that areas have been given the benefits of tax rebate at the rate of
20 percent for 10 years.
For conserving environment and ecology, tax holiday facilities has been extended to pollution free Hybrid
Hoffman Kiln (HHK) brickfields.
For maintaining the stability of the capital market as well as ensuring its continual expansion and
strengthening, Demutualised Stock Exchanges have been granted tax exemption facilities.
For ensuring welfare of pensioners’ and the wage earners, income from investment on pensioner savings
certificate and wage earners development bond amounting up to Tk.5 lakh has been given tax exemption.
For stimulating export sector, the rate of tax deduction at source on Cash Incentive has been reduced
from 5 percent to 3 percent.
The rate of tax deduction at source on local LC and deemed commission has been reduced from 5 percent
to 3 percent.
All donations through banking channel to national level research institutions engaged in research work in

39
the field of agriculture, industry, science and technology have been given the benefits of tax exemption.
For encouraging the discharge of corporate social responsibility, the limit of tax debatable spending has
been increased from Tk.8 crore to Tk.12 crore.
For facilitating the provision of essential services to the people, the tax rate for autonomous bodies has
been reduced.
For ensuring the proper collection of revenue, and at the same time ensuring equity and fairness in the
distribution of income, advance tax has been imposed on the income from the sale of land property
situated in the commercially important areas and posh residential areas to be collected on the basis of
land area (per katha) irrespective of their registration value.
Measures under Indirect Tax System
Customs duty System
Four tiers/slabs of import duty structure (0%, 5%, 10% & 25%) have been kept unchanged. Moreover the
highest rate of import duty has been kept 25 percent as before while keeping the import duty 2 percent for
capital machinery and ICT sector.
Twelve tiers of supplementary duty structure (10%, 15%, 20%, 30%, 45%, 60%, 100%, 150%, 200%,
250%, 350%, 500%) have been enacted creating two new tiers like 15% and 200%. Among these 200%,
250%, 350% and 500% are imposed to discourage the importation of cigarette, liquor, motor vehicle
having more than 2000 cc engine capacity as they are luxurious in nature and injurious to public health.
Existing Specific Duty on raw and refined sugar has been increased and fixed at Tk.2,000/MT and
Tk.4,500/MT respectively.
Specific duty on MS billet/ingot has been increased from tk.3500/MT to tk.5000/MT keeping that of meltable
scrap Tk.1,500/MT unchanged. At the same way specific duty on 11.664 grams of gold bullion has been
fixed at Tk.3000 keeping that of silver bullion unchanged.
Regulatory Duty (RD) at a rate of 5 percent on finished and luxurious items will continue for the next one
year. Besides that, RD has been imposed on some items of 10 percent import duty for the protection of the
local industries.
The SRO regarding capital machinery has been rationalized and updated.
Rules relating to ascertainment of minimum value of new and reconditioned motor vehicles have been kept
unchanged.
Import duty has been reduced on more than 50 items including ceramic, steel melting, printing, baby
diaper, poultry, raw materials for plastic and many other industries.
Supplementary duty on more than 700 items has been reduced and rationalized to combat false declaration
and smuggling.
Value Added Tax (VAT)
01. Liberalisation of Value Added Tax (VAT) System:
Discretionary powers of the VAT Officials have been curtailed. Provision relating to imposition of fine
penalty by the adjudicating officer in the VAT system has been reduced. The penalty threshold has been
changed to maximum half of the evaded amount to minimum one fourth of the evaded amount
Some services have been inserted in the Second Schedule of the Value Added Tax Act, 1991 in order to
provide VAT exemption against those services .
Time limit for submitting VAT Challan (invoice) has been increased to 5 days from 72 hours.
Provisions have been made for such situation when the amount of export of a manufacturing entity is less
than that of its domestic supply, the local producers can take drawback or can adjust through the Vat
Current Account (Musuk-18); and
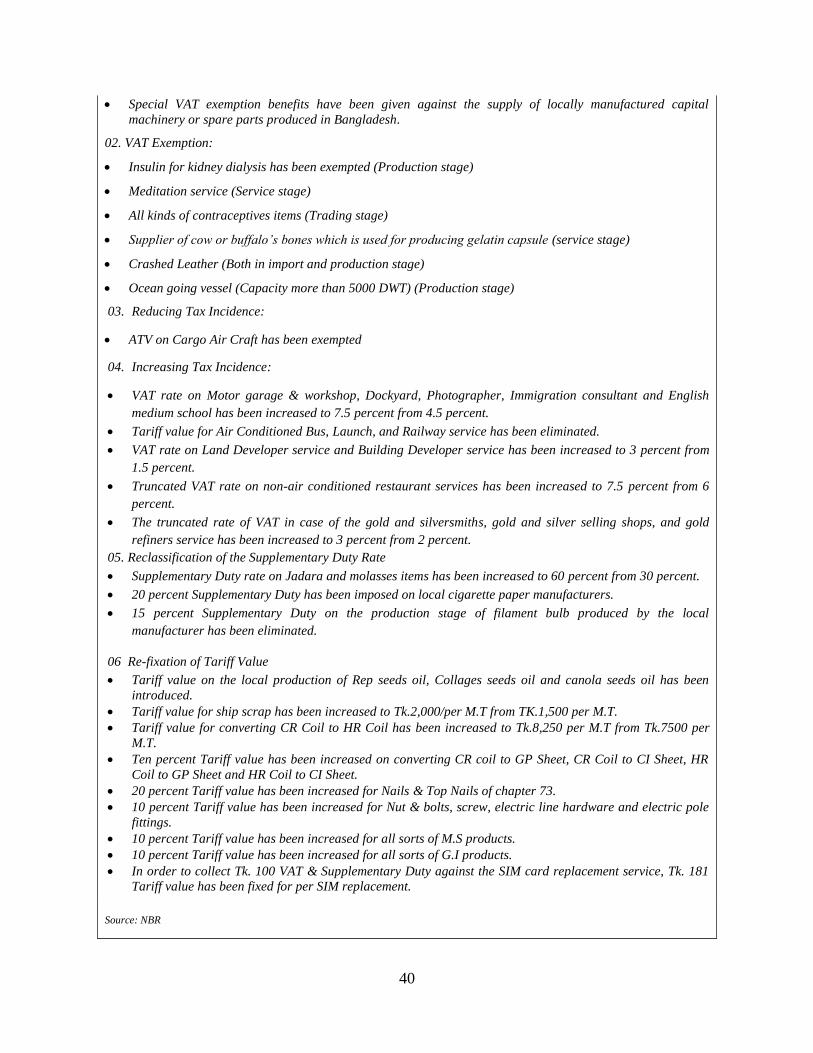
40
Special VAT exemption benefits have been given against the supply of locally manufactured capital
machinery or spare parts produced in Bangladesh.
02. VAT Exemption:
Insulin for kidney dialysis has been exempted (Production stage)
Meditation service (Service stage)
All kinds of contraceptives items (Trading stage)
Supplier of cow or buffalo’s bones which is used for producing gelatin capsule (service stage)
Crashed Leather (Both in import and production stage)
Ocean going vessel (Capacity more than 5000 DWT) (Production stage)
03. Reducing Tax Incidence:
ATV on Cargo Air Craft has been exempted
04. Increasing Tax Incidence:
VAT rate on Motor garage & workshop, Dockyard, Photographer, Immigration consultant and English
medium school has been increased to 7.5 percent from 4.5 percent.
Tariff value for Air Conditioned Bus, Launch, and Railway service has been eliminated.
VAT rate on Land Developer service and Building Developer service has been increased to 3 percent from
1.5 percent.
Truncated VAT rate on non-air conditioned restaurant services has been increased to 7.5 percent from 6
percent.
The truncated rate of VAT in case of the gold and silversmiths, gold and silver selling shops, and gold
refiners service has been increased to 3 percent from 2 percent.
05. Reclassification of the Supplementary Duty Rate
Supplementary Duty rate on Jadara and molasses items has been increased to 60 percent from 30 percent.
20 percent Supplementary Duty has been imposed on local cigarette paper manufacturers.
15 percent Supplementary Duty on the production stage of filament bulb produced by the local
manufacturer has been eliminated.
06 Re-fixation of Tariff Value
Tariff value on the local production of Rep seeds oil, Collages seeds oil and canola seeds oil has been
introduced.
Tariff value for ship scrap has been increased to Tk.2,000/per M.T from TK.1,500 per M.T.
Tariff value for converting CR Coil to HR Coil has been increased to Tk.8,250 per M.T from Tk.7500 per
M.T.
Ten percent Tariff value has been increased on converting CR coil to GP Sheet, CR Coil to CI Sheet, HR
Coil to GP Sheet and HR Coil to CI Sheet.
20 percent Tariff value has been increased for Nails & Top Nails of chapter 73.
10 percent Tariff value has been increased for Nut & bolts, screw, electric line hardware and electric pole
fittings.
10 percent Tariff value has been increased for all sorts of M.S products.
10 percent Tariff value has been increased for all sorts of G.I products.
In order to collect Tk. 100 VAT & Supplementary Duty against the SIM card replacement service, Tk. 181
Tariff value has been fixed for per SIM replacement.
Source: NBR
41
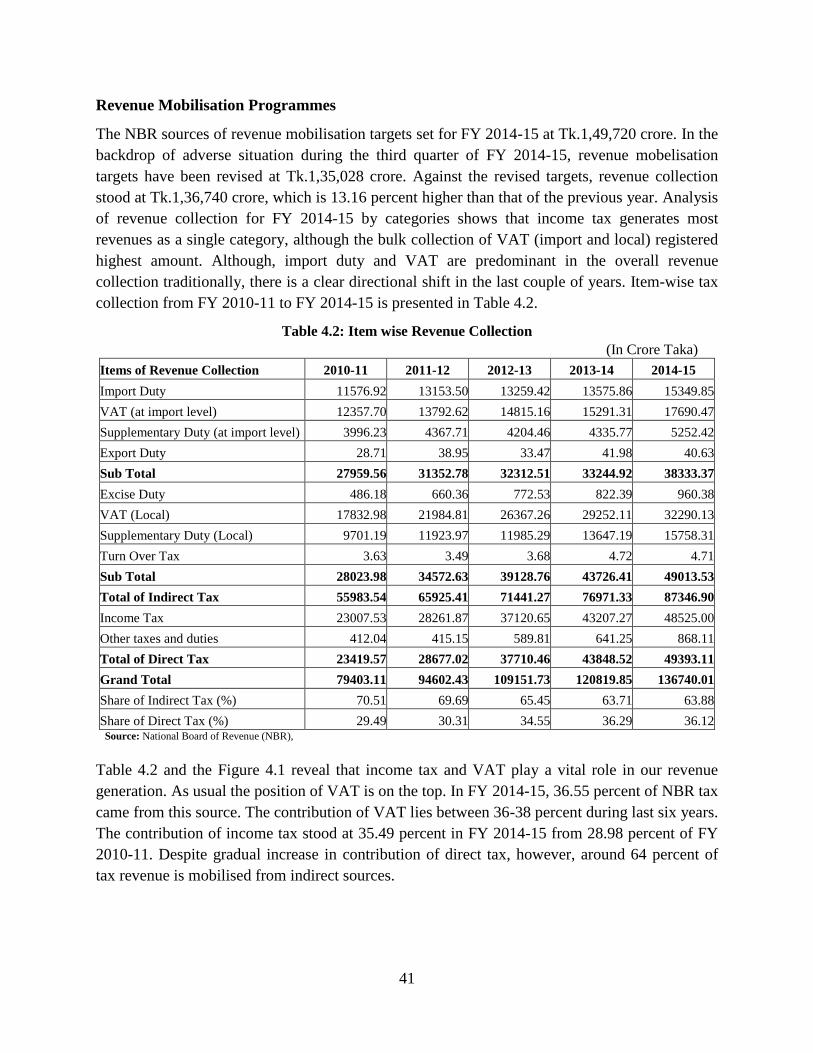
Revenue Mobilisation Programmes
The NBR sources of revenue mobilisation targets set for FY 2014-15 at Tk.1,49,720 crore. In the
backdrop of adverse situation during the third quarter of FY 2014-15, revenue mobelisation
targets have been revised at Tk.1,35,028 crore. Against the revised targets, revenue collection
stood at Tk.1,36,740 crore, which is 13.16 percent higher than that of the previous year. Analysis
of revenue collection for FY 2014-15 by categories shows that income tax generates most
revenues as a single category, although the bulk collection of VAT (import and local) registered
highest amount. Although, import duty and VAT are predominant in the overall revenue
collection traditionally, there is a clear directional shift in the last couple of years. Item-wise tax
collection from FY 2010-11 to FY 2014-15 is presented in Table 4.2.
Table 4.2: Item wise Revenue Collection
(In Crore Taka)
Items of Revenue Collection 2010-11 2011-12 2012-13 2013-14 2014-15
Import Duty 11576.92 13153.50 13259.42 13575.86 15349.85
VAT (at import level) 12357.70 13792.62 14815.16 15291.31 17690.47
Supplementary Duty (at import level) 3996.23 4367.71 4204.46 4335.77 5252.42
Export Duty 28.71 38.95 33.47 41.98 40.63
Sub Total 27959.56 31352.78 32312.51 33244.92 38333.37
Excise Duty 486.18 660.36 772.53 822.39 960.38
VAT (Local) 17832.98 21984.81 26367.26 29252.11 32290.13
Supplementary Duty (Local) 9701.19 11923.97 11985.29 13647.19 15758.31
Turn Over Tax 3.63 3.49 3.68 4.72 4.71
Sub Total 28023.98 34572.63 39128.76 43726.41 49013.53
Total of Indirect Tax 55983.54 65925.41 71441.27 76971.33 87346.90
Income Tax 23007.53 28261.87 37120.65 43207.27 48525.00
Other taxes and duties 412.04 415.15 589.81 641.25 868.11
Total of Direct Tax 23419.57 28677.02 37710.46 43848.52 49393.11
Grand Total 79403.11 94602.43 109151.73 120819.85 136740.01
Share of Indirect Tax (%) 70.51 69.69 65.45 63.71 63.88
Share of Direct Tax (%) 29.49 30.31 34.55 36.29 36.12 Source: National Board of Revenue (NBR),
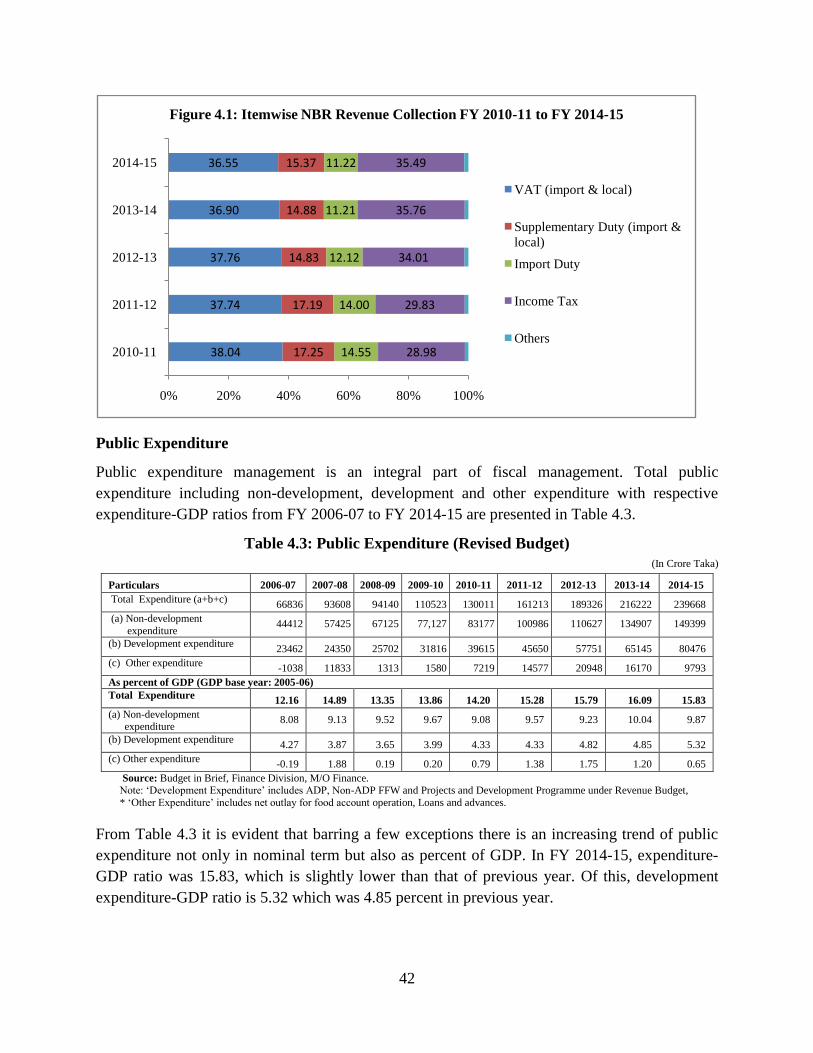
Table 4.2 and the Figure 4.1 reveal that income tax and VAT play a vital role in our revenue
generation. As usual the position of VAT is on the top. In FY 2014-15, 36.55 percent of NBR tax
came from this source. The contribution of VAT lies between 36-38 percent during last six years.
The contribution of income tax stood at 35.49 percent in FY 2014-15 from 28.98 percent of FY
2010-11. Despite gradual increase in contribution of direct tax, however, around 64 percent of
tax revenue is mobilised from indirect sources.
42
Public Expenditure
Public expenditure management is an integral part of fiscal management. Total public
expenditure including non-development, development and other expenditure with respective
expenditure-GDP ratios from FY 2006-07 to FY 2014-15 are presented in Table 4.3.
Table 4.3: Public Expenditure (Revised Budget)
(In Crore Taka)
Source: Budget in Brief, Finance Division, M/O Finance. Note: ‘Development Expenditure’ includes ADP, Non-ADP FFW and Projects and Development Programme under Revenue Budget,
* ‘Other Expenditure’ includes net outlay for food account operation, Loans and advances.
From Table 4.3 it is evident that barring a few exceptions there is an increasing trend of public
expenditure not only in nominal term but also as percent of GDP. In FY 2014-15, expenditure-
GDP ratio was 15.83, which is slightly lower than that of previous year. Of this, development
expenditure-GDP ratio is 5.32 which was 4.85 percent in previous year.
38.04
37.74
37.76
36.90
36.55
17.25
17.19
14.83
14.88
15.37
14.55
14.00
12.12
11.21
11.22
28.98
29.83
34.01
35.76
35.49
0% 20% 40% 60% 80% 100%
2010-11
2011-12
2012-13
2013-14
2014-15
Figure 4.1: Itemwise NBR Revenue Collection FY 2010-11 to FY 2014-15
VAT (import & local)
Supplementary Duty (import &
local)
Import Duty
Income Tax
Others
Particulars 2006-07 2007-08 2008-09 2009-10 2010-11 2011-12 2012-13 2013-14 2014-15
Total Expenditure (a+b+c) 66836 93608 94140 110523 130011 161213 189326 216222 239668
(a) Non-development
expenditure 44412 57425 67125 77,127 83177 100986 110627 134907 149399
(b) Development expenditure 23462 24350 25702 31816 39615 45650 57751 65145 80476
(c) Other expenditure -1038 11833 1313 1580 7219 14577 20948 16170 9793
As percent of GDP (GDP base year: 2005-06)
Total Expenditure 12.16 14.89 13.35 13.86 14.20 15.28 15.79 16.09 15.83
(a) Non-development expenditure
8.08 9.13 9.52 9.67 9.08 9.57 9.23 10.04 9.87
(b) Development expenditure 4.27 3.87 3.65 3.99 4.33 4.33 4.82 4.85 5.32
(c) Other expenditure -0.19 1.88 0.19 0.20 0.79 1.38 1.75 1.20 0.65
43
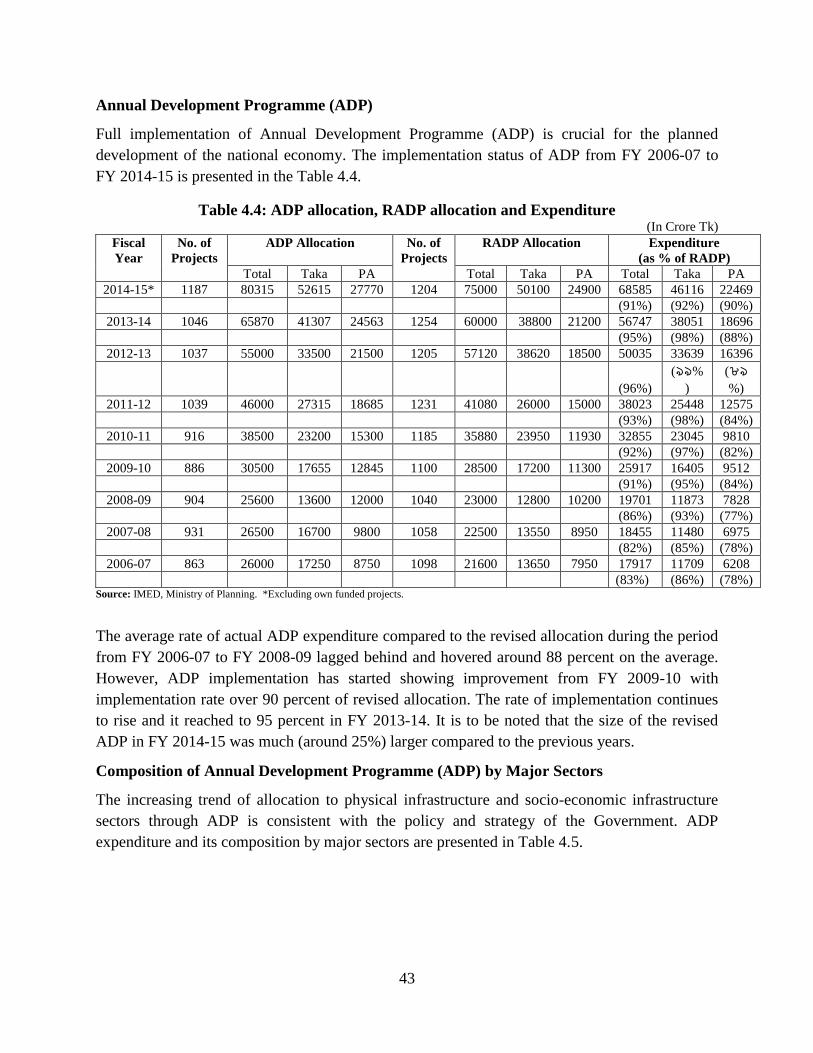
Annual Development Programme (ADP)
Full implementation of Annual Development Programme (ADP) is crucial for the planned
development of the national economy. The implementation status of ADP from FY 2006-07 to
FY 2014-15 is presented in the Table 4.4.
Table 4.4: ADP allocation, RADP allocation and Expenditure (In Crore Tk)
Fiscal
Year
No. of
Projects
ADP Allocation No. of
Projects
RADP Allocation Expenditure
(as % of RADP)
Total Taka PA Total Taka PA Total Taka PA
2014-15* 1187 80315 52615 27770 1204 75000 50100 24900 68585 46116 22469
(91%) (92%) (90%)
2013-14 1046 65870 41307 24563 1254 60000 38800 21200 56747 38051 18696
(95%) (98%) (88%)
2012-13 1037 55000 33500 21500 1205 57120 38620 18500 50035 33639 16396
(96%)
(৯৯%
)
(৮৯%)
2011-12 1039 46000 27315 18685 1231 41080 26000 15000 38023 25448 12575
(93%) (98%) (84%)
2010-11 916 38500 23200 15300 1185 35880 23950 11930 32855 23045 9810
(92%) (97%) (82%)
2009-10 886 30500 17655 12845 1100 28500 17200 11300 25917 16405 9512
(91%) (95%) (84%)
2008-09 904 25600 13600 12000 1040 23000 12800 10200 19701 11873 7828
(86%) (93%) (77%)
2007-08 931 26500 16700 9800 1058 22500 13550 8950 18455 11480 6975
(82%) (85%) (78%)
2006-07 863 26000 17250 8750 1098 21600 13650 7950 17917 11709 6208
(83%) (86%) (78%) Source: IMED, Ministry of Planning. *Excluding own funded projects.
The average rate of actual ADP expenditure compared to the revised allocation during the period
from FY 2006-07 to FY 2008-09 lagged behind and hovered around 88 percent on the average.
However, ADP implementation has started showing improvement from FY 2009-10 with
implementation rate over 90 percent of revised allocation. The rate of implementation continues
to rise and it reached to 95 percent in FY 2013-14. It is to be noted that the size of the revised
ADP in FY 2014-15 was much (around 25%) larger compared to the previous years.
Composition of Annual Development Programme (ADP) by Major Sectors
The increasing trend of allocation to physical infrastructure and socio-economic infrastructure
sectors through ADP is consistent with the policy and strategy of the Government. ADP
expenditure and its composition by major sectors are presented in Table 4.5.

44
Table 4.5: ADP Allocation and its Composition by Major Sectors (In Crore Taka)
FY 2010-11 2011-12 2012-13 2013-14 2014-15
Sector Allocation % Allocation % Allocation % Allocation % Allocation %
1. Agriculture 2246.35 6.26 2536.23 6.17 2845.41 5.43 3511.76 5.85 4028.88 5.18
2.RD&RI 4565.26 12.72 5097.31 12.41 6824.49 13.03 6977.15 11.63 8422.01 10.82
3. Water Resources 1311.09 3.65 1439.90 3.51 1676.81 3.20 1889.38 3.15 2080.29 2.67
4.Industry 374.68 1.04 968.88 2.36 1836.40 3.51 2727.14 4.55 1791.71 2.30
5. Power 5981.88 16.67 7208.10 17.55 8803.04 16.81 8066.11 13.44 8301.45 10.67
6. Gas, Oil &
Natural Resources.
1054.86 2.94 726.09 1.77 1377.58 2.63 1912.66 3.19 2162.43 2.78
7. Transport 5355.40 14.93 6381.81 15.54 8457.06 16.15 10295.13 17.16 14365.97 18.46
8.Cmmunication 276.17 0.77 877.96 2.14 905.65 1.73 786.67 1.31 1198.83 1.54
9. Physical Planning
& Housing
3293.54 9.18 4230.53 10.30 5043.58 9.63 5383.35 8.97 8575.91 11.02
10. Education &
Religion
5047.65 14.07 4821.32 11.74 6639.17 12.68 7994.74 13.32 9025.91 11.60
11.Sports & Culture 366.79 1.02 140.92 0.34 177.85 0.34 265.92 0.44 166.92 0.21
12. Health &
Population
3162.08 8.81 3386.67 8.24 3995.54 7.63 4219.79 7.03 4989.69 6.41
13. Mass
Communication
92.10 0.26 62.41 0.15 50.20 0.10 111.90 0.19 112.95 0.15
14. Social Welfare,
Women Affairs &
Youth Dev.
317.42 0.88 321.28 0.78 399.36 0.76 451.31 0.75 368.33 0.47
15. Public
Administration
1003.81 2.80 972.57 2.37 1035.27 1.98 1371.27 2.29 1709.35 2.20
16.SICT 147.37 0.41 135.04 0.33 288.85 0.55 1559.03 2.60 4594.76 5.90
17. Labour &
Employment
39.38 0.11 125.97 0.31 282.75 0.54 354.40 0.59 511.44 0.66
Block/Others 1244.17 3.47 1647.00 4.01 1727.00 3.30 2122.29 3.54 5429.22 6.98
Grand Total 35880.00 99.99 41079.99 100.02 52366.01 100.00 60000.00 100.00 77836.05 100.00
Source: IMED, Ministry of Planning.
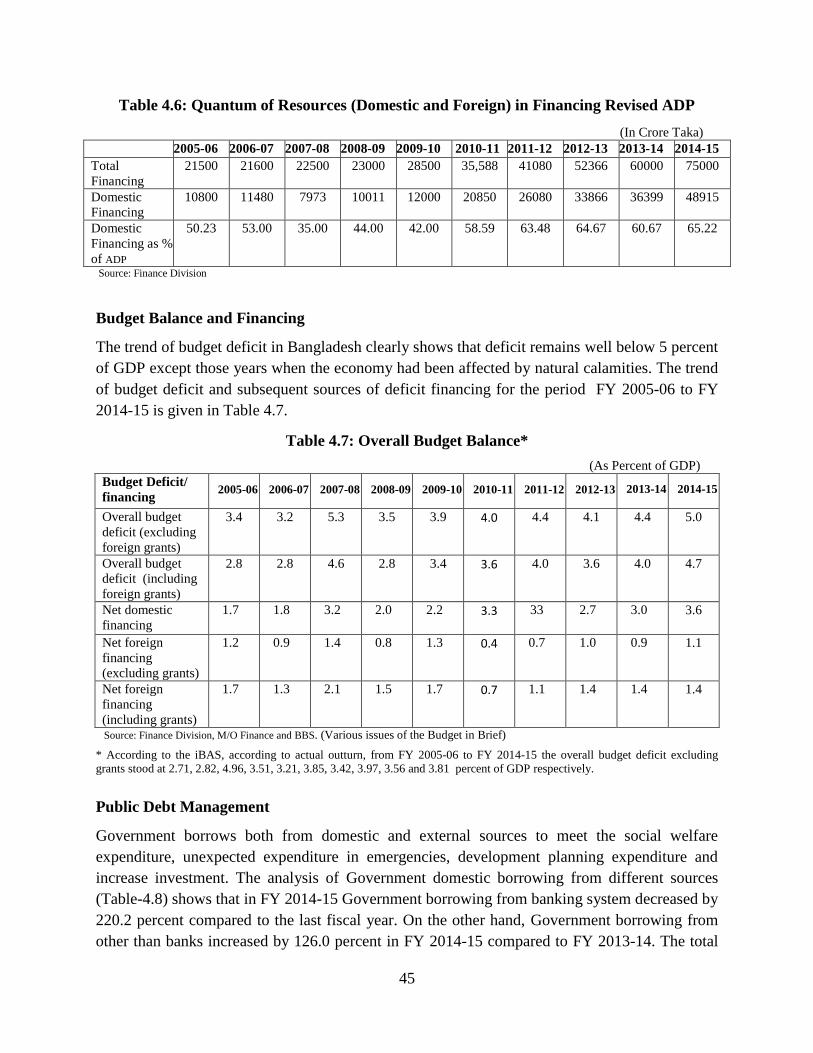
Domestic Resources for ADP
The contribution of domestic resources towards financing of ADP shows an upward trend and
accounted for on average over 60 percent from FY 2011-12. During FY 2005-06 to FY 2014-15,
the average contribution of domestic resources towards ADP stood at around 56 percent despite
an exception in FY 2007-08 where it stood around 35 percent. It is to be noted that during FY
2007-08, there was an increased flow of external resources to carry out rehabilitation work
following recurrent floods and devastation of the cyclone Sidr. In FY 2014-15 the share of
domestic resources went up to 65.22 percent for financing a larger ADP compared to that of the
previous year. Table 4.6 shows the financing of revised ADP from domestic sources during the
period from FY 2005-06 to FY 2014-15.
45
Table 4.6: Quantum of Resources (Domestic and Foreign) in Financing Revised ADP
(In Crore Taka)
2005-06 2006-07 2007-08 2008-09 2009-10 2010-11 2011-12 2012-13 2013-14 2014-15
Total
Financing
21500 21600 22500 23000 28500 35,588 41080 52366 60000 75000
Domestic
Financing
10800 11480 7973 10011 12000 20850 26080 33866 36399 48915
Domestic
Financing as %
of ADP
50.23 53.00 35.00 44.00 42.00 58.59 63.48 64.67 60.67 65.22
Source: Finance Division
Budget Balance and Financing
The trend of budget deficit in Bangladesh clearly shows that deficit remains well below 5 percent
of GDP except those years when the economy had been affected by natural calamities. The trend
of budget deficit and subsequent sources of deficit financing for the period FY 2005-06 to FY
2014-15 is given in Table 4.7.
Table 4.7: Overall Budget Balance*
(As Percent of GDP)
Budget Deficit/
financing 2005-06 2006-07 2007-08 2008-09 2009-10 2010-11 2011-12 2012-13 2013-14 2014-15
Overall budget
deficit (excluding
foreign grants)
3.4 3.2 5.3 3.5 3.9 4.0 4.4 4.1 4.4 5.0
Overall budget
deficit (including
foreign grants)
2.8 2.8 4.6 2.8 3.4 3.6 4.0 3.6 4.0 4.7
Net domestic
financing
1.7 1.8 3.2 2.0 2.2 3.3 33 2.7 3.0 3.6
Net foreign
financing
(excluding grants)
1.2 0.9 1.4 0.8 1.3 0.4 0.7 1.0 0.9 1.1
Net foreign
financing
(including grants)
1.7 1.3 2.1 1.5 1.7 0.7 1.1 1.4 1.4
1.4
Source: Finance Division, M/O Finance and BBS. (Various issues of the Budget in Brief)
* According to the iBAS, according to actual outturn, from FY 2005-06 to FY 2014-15 the overall budget deficit excluding
grants stood at 2.71, 2.82, 4.96, 3.51, 3.21, 3.85, 3.42, 3.97, 3.56 and 3.81 percent of GDP respectively.
Public Debt Management
Government borrows both from domestic and external sources to meet the social welfare
expenditure, unexpected expenditure in emergencies, development planning expenditure and
increase investment. The analysis of Government domestic borrowing from different sources
(Table-4.8) shows that in FY 2014-15 Government borrowing from banking system decreased by
220.2 percent compared to the last fiscal year. On the other hand, Government borrowing from
other than banks increased by 126.0 percent in FY 2014-15 compared to FY 2013-14. The total
46
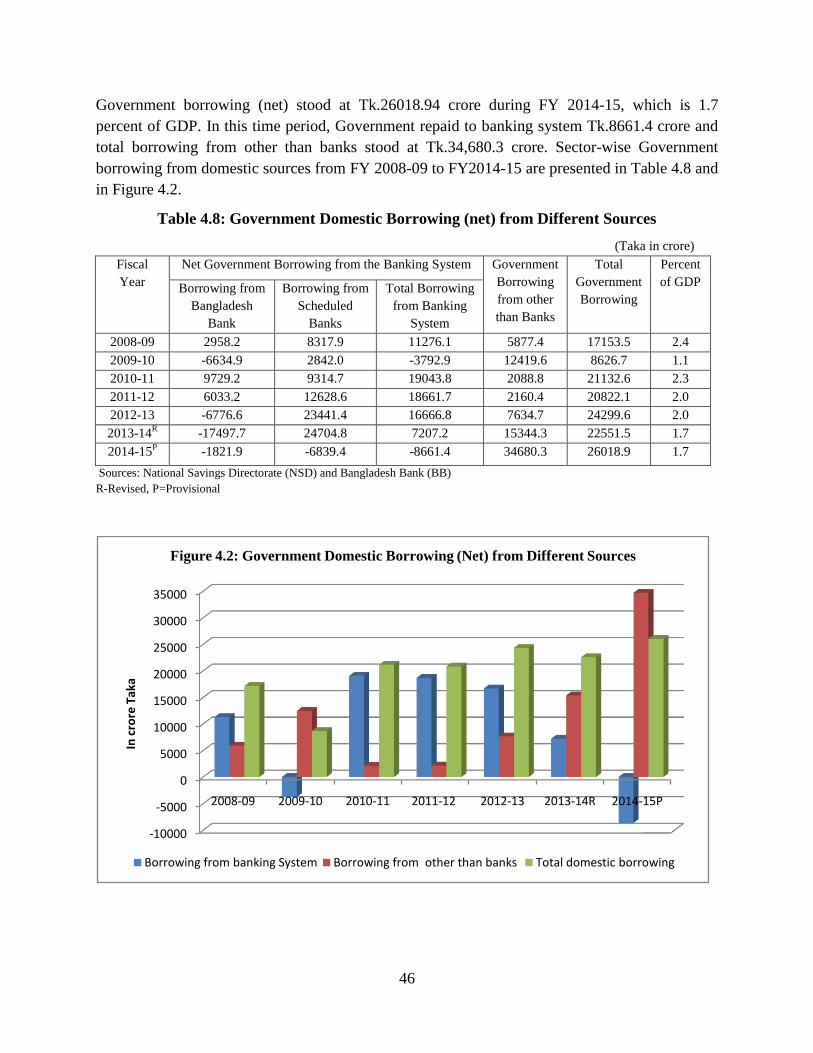
Government borrowing (net) stood at Tk.26018.94 crore during FY 2014-15, which is 1.7
percent of GDP. In this time period, Government repaid to banking system Tk.8661.4 crore and
total borrowing from other than banks stood at Tk.34,680.3 crore. Sector-wise Government
borrowing from domestic sources from FY 2008-09 to FY2014-15 are presented in Table 4.8 and
in Figure 4.2.
Table 4.8: Government Domestic Borrowing (net) from Different Sources
(Taka in crore)
Fiscal
Year
Net Government Borrowing from the Banking System Government
Borrowing
from other
than Banks
Total
Government
Borrowing
Percent
of GDP Borrowing from
Bangladesh
Bank
Borrowing from
Scheduled
Banks
Total Borrowing
from Banking
System
2008-09 2958.2 8317.9 11276.1 5877.4 17153.5 2.4
2009-10 -6634.9 2842.0 -3792.9 12419.6 8626.7 1.1
2010-11 9729.2 9314.7 19043.8 2088.8 21132.6 2.3
2011-12 6033.2 12628.6 18661.7 2160.4 20822.1 2.0
2012-13 -6776.6 23441.4 16666.8 7634.7 24299.6 2.0
2013-14R -17497.7 24704.8 7207.2 15344.3 22551.5 1.7
2014-15P -1821.9 -6839.4 -8661.4 34680.3 26018.9 1.7
Sources: National Savings Directorate (NSD) and Bangladesh Bank (BB)
R-Revised, P=Provisional
-10000
-5000
0
5000
10000
15000
20000
25000
30000
35000
2008-09 2009-10 2010-11 2011-12 2012-13 2013-14R 2014-15P
In c
rore
Tak
a
Figure 4.2: Government Domestic Borrowing (Net) from Different Sources
Borrowing from banking System Borrowing from other than banks Total domestic borrowing

47
Government Borrowing from External Sources
The external assistance shows a trend of steady decline in the flow of grants overtaken by the
increasing share of loans. As a result, outflow of budgetary resources in the form of amortisation
is increasing which in fact reduces the net flow of external resources to Bangladesh. In FY 2013-
14 net foreign assistance (after principal and interest payment) flow reached to a record U$ 1790
million, which is the highest in recent times. Table 4.9 shows the Government borrowing from
external sources and its repayment during FY 2005-06 to FY 2014-15. The foreign aid flow
situation is shown in Figure 4.3.
Table 4.9: Government Borrowing from Foreign Sources
(In million US$)
Fiscal
Year
Disbursement of Loans
and Grants
Principal and Interest
Payment
Net Foreign Aid Flow
Grant Loans Sub-Total Interest Principal Sub-
Total
After Principal
Payment
After Principal &
Interest Payment
1 2 3 4=(2+3) 5 6 7=(5+6) 8=(4-6) 9=(4-7)
2005-06 501 1067 1568 176 502 678 1066 890
2006-07 590 1040 1630 182 540 722 1090 908
2007-08 658 1403 2061 184 586 770 1475 1291
2008-09 658 1189 1847 200 655 855 1192 992
2009-10 634 1588 2222 190 685 875 1537 1347
2010-11 745 1032 1777 200 729 929 1048 848
2011-12 588 1538 2126 197 770 957 1357 1160
2012-13 726 2084 2811 195 895 1091 1915 1719
2013-14 681 2404 3084 206 1089 1294 1996 1790
2014-15* 557 2472 3029 188 910 1097 2120 1632
Source: Economic Relations Division (ERD). * provisional
Currently, the debt obligation of the Government is at a tolerable level. Financing through grant
and loan from external sources is gradually narrowing due to shift in the policies of development
partners. This prompted the Government to adopt measures to mobilise resources from domestic
sources alongside those from external sources.
0
500
1000
1500
2000
2500
3000
3500
2005-06 2006-07 2007-08 2008-09 2009-10 2010-11 2011-12 2012-13 2013-14 2014-15
In m
illio
n U
S$
Figure 4.3: Foreign Aid Disbursement and Payments, Net Flows
Disbursment Principal and Interest Payments Net Foreign Aid
48
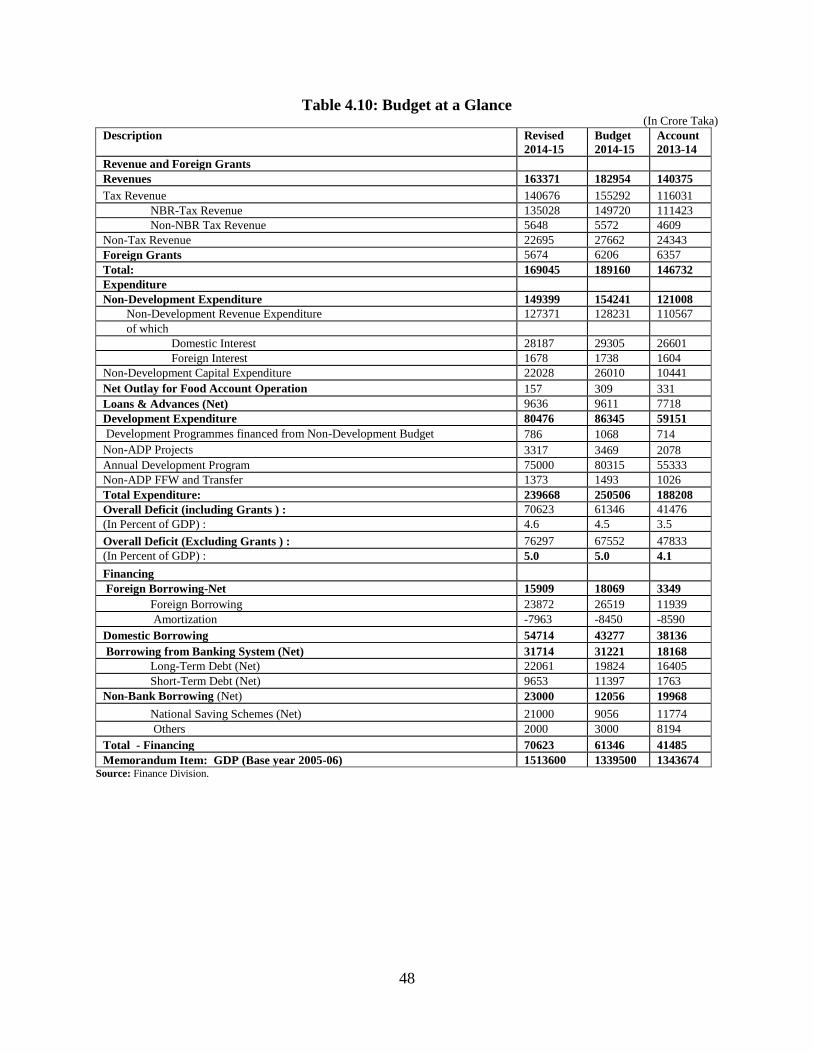
Table 4.10: Budget at a Glance (In Crore Taka)
Description Revised
2014-15
Budget
2014-15
Account
2013-14
Revenue and Foreign Grants
Revenues 163371 182954 140375
Tax Revenue 140676 155292 116031
NBR-Tax Revenue 135028 149720 111423
Non-NBR Tax Revenue 5648 5572 4609
Non-Tax Revenue 22695 27662 24343
Foreign Grants 5674 6206 6357
Total: 169045 189160 146732
Expenditure
Non-Development Expenditure 149399 154241 121008
Non-Development Revenue Expenditure 127371 128231 110567
of which
Domestic Interest 28187 29305 26601
Foreign Interest 1678 1738 1604
Non-Development Capital Expenditure 22028 26010 10441
Net Outlay for Food Account Operation 157 309 331
Loans & Advances (Net) 9636 9611 7718
Development Expenditure 80476 86345 59151
Development Programmes financed from Non-Development Budget 786 1068 714
Non-ADP Projects 3317 3469 2078
Annual Development Program 75000 80315 55333
Non-ADP FFW and Transfer 1373 1493 1026
Total Expenditure: 239668 250506 188208
Overall Deficit (including Grants ) : 70623 61346 41476
(In Percent of GDP) : 4.6 4.5 3.5
Overall Deficit (Excluding Grants ) : 76297 67552 47833
(In Percent of GDP) : 5.0 5.0 4.1
Financing
Foreign Borrowing-Net 15909 18069 3349
Foreign Borrowing 23872 26519 11939
Amortization -7963 -8450 -8590
Domestic Borrowing 54714 43277 38136
Borrowing from Banking System (Net) 31714 31221 18168
Long-Term Debt (Net) 22061 19824 16405
Short-Term Debt (Net) 9653 11397 1763
Non-Bank Borrowing (Net) 23000 12056 19968
National Saving Schemes (Net) 21000 9056 11774
Others 2000 3000 8194
Total - Financing 70623 61346 41485
Memorandum Item: GDP (Base year 2005-06) 1513600 1339500 1343674 Source: Finance Division.