THE ALLSTATE CORPORATION
265
UNITED STATES SECURITIES AND EXCHANGE COMMISSION Washington, D.C. 20549 FORM 10-K For the transition period from to Commission file number 1-11840 THE ALLSTATE CORPORATION (Exact name of registrant as specified in its charter) Delaware 36-3871531 (State or Other Jurisdiction of Incorporation or Organization) (I.R.S. Employer Identification No.) 2775 Sanders Road, Northbrook, Illinois 60062 (Address of principal executive offices) (Zip Code) Registrant's telephone number, including area code: (847) 402-5000 Securities registered pursuant to Section 12(b) of the Act: Securities registered pursuant to Section 12(g) of the Act: None Indicate by check mark if the registrant is a well-known seasoned issuer, as defined in Rule 405 of the Securities Act. Yes X No Indicate by check mark if the registrant is not required to file reports pursuant to Section 13 or Section 15(d) of the Act. Yes No X Indicate by check mark whether the registrant (1) has filed all reports required to be filed by Section 13 or 15(d) of the Securities Exchange Act of 1934 during the preceding 12 months (or for such shorter period that the registrant was required to file such reports), and (2) has been subject to such filing requirements for the past 90 days. Yes X No Indicate by check mark whether the registrant has submitted electronically and posted on its corporate Web site, if any, every Interactive Data File required to be submitted and posted pursuant to Rule 405 of Regulation S-T (§ 232.405 of this chapter) during the preceding 12 months (or for such shorter period that the registrant was required to submit and post such files). Yes X No Indicate by check mark if disclosure of delinquent filers pursuant to Item 405 of Regulation S-K (§ 229.405 of this chapter) is not contained herein, and will not be contained, to the best of registrant's knowledge in definitive proxy or information statements incorporated by reference in Part III of this Form 10-K or any amendment to this Form 10-K. X Indicate by check mark whether the registrant is a large accelerated filer, an accelerated filer, a non-accelerated filer, or a smaller reporting company. See the definitions of "large accelerated filer," "accelerated filer" and "smaller reporting company" in Rule 12b-2 of the Exchange Act. Indicate by check mark whether the registrant is a shell company (as defined in Rule 12b-2 of the Exchange Act). Yes No X ☒ ANNUAL REPORT PURSUANT TO SECTION 13 OR 15(d) OF THE SECURITIES EXCHANGE ACT OF 1934 For the fiscal year ended December 31, 2010 OR o TRANSITION REPORT PURSUANT TO SECTION 13 OR 15(d) OF THE SECURITIES EXCHANGE ACT OF 1934 Title of each class Name of each exchange on which registered Common Stock, par value $0.01 per share New York Stock Exchange Chicago Stock Exchange Large accelerated filer X Accelerated filer Non-accelerated filer (Do not check if a smaller reporting company) Smaller reporting company
-
Upload
khangminh22 -
Category
Documents
-
view
0 -
download
0
Transcript of THE ALLSTATE CORPORATION

UNITED STATESSECURITIES AND EXCHANGE COMMISSION
Washington, D.C. 20549
FORM 10-K
For the transition period from to
Commission file number 1-11840
THE ALLSTATE CORPORATION(Exact name of registrant as specified in its charter)
Delaware 36-3871531(State or Other Jurisdiction ofIncorporation or Organization)
(I.R.S. EmployerIdentification No.)
2775 Sanders Road, Northbrook, Illinois 60062(Address of principal executive offices) (Zip Code)
Registrant's telephone number, including area code: (847) 402-5000
Securities registered pursuant to Section 12(b) of the Act:
Securities registered pursuant to Section 12(g) of the Act: None
Indicate by check mark if the registrant is a well-known seasoned issuer, as defined in Rule 405 of the Securities Act.
Yes X No
Indicate by check mark if the registrant is not required to file reports pursuant to Section 13 or Section 15(d) of the Act.
Yes No X
Indicate by check mark whether the registrant (1) has filed all reports required to be filed by Section 13 or 15(d) of the Securities Exchange Act of1934 during the preceding 12 months (or for such shorter period that the registrant was required to file such reports), and (2) has been subject to suchfiling requirements for the past 90 days.
Yes X No
Indicate by check mark whether the registrant has submitted electronically and posted on its corporate Web site, if any, every Interactive Data Filerequired to be submitted and posted pursuant to Rule 405 of Regulation S-T (§ 232.405 of this chapter) during the preceding 12 months (or for suchshorter period that the registrant was required to submit and post such files).
Yes X No
Indicate by check mark if disclosure of delinquent filers pursuant to Item 405 of Regulation S-K (§ 229.405 of this chapter) is not contained herein,and will not be contained, to the best of registrant's knowledge in definitive proxy or information statements incorporated by reference in Part III of thisForm 10-K or any amendment to this Form 10-K. X
Indicate by check mark whether the registrant is a large accelerated filer, an accelerated filer, a non-accelerated filer, or a smaller reportingcompany. See the definitions of "large accelerated filer," "accelerated filer" and "smaller reporting company" in Rule 12b-2 of the Exchange Act.
Indicate by check mark whether the registrant is a shell company (as defined in Rule 12b-2 of the Exchange Act).
Yes No X
☒ ANNUAL REPORT PURSUANT TO SECTION 13 OR 15(d) OF THESECURITIES EXCHANGE ACT OF 1934
For the fiscal year ended December 31, 2010
OR
o TRANSITION REPORT PURSUANT TO SECTION 13 OR 15(d) OF THESECURITIES EXCHANGE ACT OF 1934
Title of each class Name of each exchangeon which registered
Common Stock, par value $0.01 per share New York Stock ExchangeChicago Stock Exchange
Large accelerated filer X Accelerated filer
Non-accelerated filer (Do not check if a smaller reporting company) Smaller reporting company

The aggregate market value of the common stock held by non-affiliates of the registrant, computed by reference to the closing price as of the lastbusiness day of the registrant's most recently completed second fiscal quarter, June 30, 2010, was approximately $15.36 billion.
As of February 1, 2011, the registrant had 529,770,022 shares of common stock outstanding.
Documents Incorporated By Reference
Portions of the following documents are incorporated herein by reference as follows:
Part III of this Form 10-K incorporates by reference certain information from the registrant's definitive proxy statement for its annual stockholdersmeeting to be held on May 17, 2011 (the "Proxy Statement") to be filed not later than 120 days after the end of the fiscal year covered by this Form 10-K.

TABLE OF CONTENTS
PagePART I Item 1. Business 1
Priorities 1 Allstate Protection Segment 1 Allstate Financial Segment 3 Other Business Segments 5 Reserve for Property-Liability Claims and Claims Expense 5 Regulation 9 Internet Website 12 Other Information about Allstate 12 Executive Officers 13
Item 1A. Risk Factors 14Item 1B. Unresolved Staff Comments 23Item 2. Properties 23Item 3. Legal Proceedings 23Item 4. (Removed and Reserved) 23
PART II
Item 5. Market for Registrant's Common Equity, Related Stockholders Matters and Issuer Purchases of
Equity Securities
24Item 6. Selected Financial Data 25Item 7. Management's Discussion and Analysis of Financial Condition and Results of Operations 26Item 7A. Quantitative and Qualitative Disclosures About Market Risk 122Item 8. Financial Statements and Supplementary Data 122Item 9. Changes in and Disagreements with Accountants on Accounting and Financial Disclosure 208Item 9A. Controls and Procedures 208Item 9B. Other Information 208
PART III
Item 10. Directors, Executive Officers and Corporate Governance 209Item 11. Executive Compensation 209Item 12. Security Ownership of Certain Beneficial Owners and Management and Related Stockholder Matters 210Item 13. Certain Relationships and Related Transactions, and Director Independence 210Item 14. Principal Accounting Fees and Services 210
PART IV
Item 15. Exhibits and Financial Statement Schedules 211Signatures 214Financial Statement Schedules S-1

Part I
Item 1. Business
The Allstate Corporation was incorporated under the laws of the State of Delaware on November 5, 1992 to serve as the holding company forAllstate Insurance Company. Its business is conducted principally through Allstate Insurance Company, Allstate Life Insurance Company and theiraffiliates (collectively, including The Allstate Corporation, "Allstate"). Allstate is primarily engaged in the personal property and casualty insurancebusiness and the life insurance, retirement and investment products business. It conducts its business primarily in the United States.
The Allstate Corporation is the largest publicly held personal lines insurer in the United States. Widely known through the "You're In Good HandsWith Allstate®" slogan, Allstate is reinventing protection and retirement to help individuals in approximately 16 million households protect what theyhave today and better prepare for tomorrow. Customers can access Allstate products and services such as auto insurance and homeowners insurancethrough more than 13,000 exclusive Allstate agencies and financial representatives in the United States and Canada. Allstate is the 2nd largestpersonal property and casualty insurer in the United States on the basis of 2009 statutory direct premiums earned. In addition, according to A.M. Best,it is the nation's 16th largest issuer of life insurance business on the basis of 2009 ordinary life insurance in force and 21st largest on the basis of 2009statutory admitted assets.
Allstate has four business segments:
To achieve its goals in 2011, Allstate is focused on three priorities:
• improve our operating results;• grow our businesses profitably; and• differentiate ourselves from the competition by reinventing our business.
In this annual report on Form 10-K, we occasionally refer to statutory financial information. All domestic United States insurance companies arerequired to prepare statutory-basis financial statements. As a result, industry data is available that enables comparisons between insurancecompanies, including competitors that are not subject to the requirement to prepare financial statements in conformity with accounting principlesgenerally accepted in the United States of America ("GAAP"). We frequently use industry publications containing statutory financial information toassess our competitive position.
ALLSTATE PROTECTION SEGMENT
Products and Distribution
Our Allstate Protection segment accounted for 92% of Allstate's 2010 consolidated insurance premiums and contract charges. In this segment, wesell principally private passenger auto and homeowners insurance, primarily through agencies. These products are marketed under the Allstate andEncompass® brand names. The Allstate Protection segment also includes a separate organization called Emerging Businesses which comprisesBusiness Insurance (commercial products for small business owners), Consumer Household (specialty products including motorcycle, boat, rentersand condominium insurance policies), Allstate Dealer Services (insurance and non-insurance products sold primarily to auto dealers), AllstateRoadside Services (retail and wholesale roadside assistance products) and Ivantage (insurance agency). We also participate in the involuntary orshared private passenger auto insurance business in order to maintain our licenses to do business in many states. In some states, Allstate exclusiveagencies offer non-proprietary property insurance products.
Allstate brand auto and homeowners insurance products are sold primarily through Allstate exclusive agencies and, to a lesser extent, throughindependent agencies in areas not served by exclusive agencies. Encompass brand auto and homeowners insurance products are sold throughindependent agencies.
In most states, consumers can also purchase certain Allstate brand personal insurance products, and obtain service, through our direct channelthat includes call centers and the internet.
Total Allstate Protection premiums written were $25.91 billion in 2010. Our broad-based network of approximately 11,500 Allstate exclusiveagencies in approximately 10,850 locations in the U.S. produced approximately 87% of the Allstate Protection segment's written premiums in 2010.The direct channel accounted for 3% of this total. The rest was generated primarily by approximately 4,500 independent agencies. We are among theseven largest providers of
1
• Allstate Protection • Discontinued Lines and Coverages• Allstate Financial • Corporate and Other

personal property and casualty insurance products through independent agencies in the United States, based on statutory written premium informationprovided by A.M. Best for 2009.
Competition
The markets for personal private passenger auto and homeowners insurance are highly competitive. The following charts provide the marketshares of our principal competitors in the U.S. by direct written premium for the year ended December 31, 2009 (the most recent date such competitiveinformation is available) according to A.M. Best.
In the personal property and casualty insurance market, we compete principally on the basis of the recognition of our brands, the scope of ourdistribution system, price, the breadth of our product offerings, product features, customer service, claim handling, and use of technology. In addition,our proprietary database of underwriting and pricing experience enables Allstate to use pricing sophistication to more accurately price risks and tocross sell products within our customer base.
Pricing sophistication and related underwriting and marketing programs use a number of risk evaluation factors. For auto insurance, these factorscan include but are not limited to vehicle make, model and year; driver age and marital status; territory; years licensed; loss history; years insured withprior carrier; prior liability limits; prior lapse in coverage; and insurance scoring based on credit report information. For property insurance, these factorscan include but are not limited to amount of insurance purchased; geographic location of the property; loss history; age and constructioncharacteristics of the property; and insurance scoring based on credit report information.
Our primary focus in using pricing sophistication methods has been on acquiring and retaining new business. The aim has been to enhanceAllstate's competitive position with respect to "target" market segments while maintaining or improving profitability. "Target customers" generally refersto consumers who want to purchase multiple products from one insurance provider including auto, homeowners and financial products, who havebetter retention and potentially present more favorable prospects for profitability over the course of their relationships with us. We provide and continueto enhance a range of discounts to attract more target customers. For example, we implemented an auto discount designed to attract and retain targetcustomers. In many states, we also increased the discount our homeowners customers receive if they insure their automobiles with Allstate.
Allstate Your Choice Auto® insurance allows qualified customers to choose from a variety of optional auto insurance packages at various prices.We believe that Allstate Your Choice Auto differentiates Allstate from its competitors and allows for increased growth and increased retention. AllstateYour Choice Home® allows qualified customers to choose from options such as a claim-free bonus and greater ability to tailor their own homeinsurance protection coverage. Allstate Blue® is our non-standard auto insurance product which offers features such as a loyalty bonus and roadsideassistance coverage.
Geographic Markets
The principal geographic markets for our auto, homeowners, and other personal property and casualty products are in the United States. Throughvarious subsidiaries, we are authorized to sell various types of personal property and casualty insurance products in all 50 states, the District ofColumbia and Puerto Rico. We also sell personal property and casualty insurance products in Canada through a distribution system similar to thatused in the United States.
2
Private Passenger Auto Insurance Homeowners Insurance
Insurer Market Share Insurer Market Share State Farm 18.1% State Farm 20.8%Allstate 10.7% Allstate 9.8%GEICO 8.4% Farmers 7.1%Progressive 7.6% Liberty Mutual 5.1%Farmers 6.5% Travelers 4.6%Nationwide 4.6% Nationwide 4.5%Liberty Mutual 4.4% USAA 4.2%USAA 4.1%

The following table reflects, in percentages, the principal geographic distribution of premiums earned for the Allstate Protection segment for theyear ended December 31, 2010, based on information contained in statements filed with state insurance departments. No other jurisdiction accountedfor more than 5 percent of the premiums earned for the segment.
New York 10.7%California 9.9%Texas 9.4%Florida 8.3%Pennsylvania 5.3%
We continue to take actions to support earning an acceptable return on the risks assumed in our property business and to reduce variability in ourearnings, while providing quality protection to our customers. Accordingly, we expect to continue to adjust underwriting practices with respect to ourproperty business in markets with significant catastrophe risk exposure.
Additional Information
Information regarding the last three years' revenues and income from operations attributable to the Allstate Protection segment is contained inNote 18 of the consolidated financial statements. Note 18 also includes information regarding the last three years' identifiable assets attributable to ourproperty-liability operations, which includes our Allstate Protection segment and our Discontinued Lines and Coverages segment. Note 18 isincorporated in this Part I, Item 1 by reference.
Information regarding the amount of premium earned for Allstate Protection segment products for the last three years is set forth in Part II,Item 7 – Management's Discussion and Analysis of Financial Condition and Results of Operations, in the table regarding premiums earned by brand.That table is incorporated in this Part I, Item 1 by reference.
ALLSTATE FINANCIAL SEGMENT
Products and Distribution
Our Allstate Financial segment provides life insurance, retirement and investment products, and voluntary accident and health insurance products.Our principal products are interest-sensitive, traditional and variable life insurance; fixed annuities including deferred and immediate; and voluntaryaccident and health insurance. Our institutional products, which we offer on an opportunistic basis, consist primarily of funding agreements sold tounaffiliated trusts that use them to back medium-term notes issued to institutional and individual investors. Banking products and services have beenoffered to customers through the Allstate Bank. The table on page 4 lists our major distribution channels for this segment, with the associated productsand targeted customers.
As the table indicates, we sell Allstate Financial products to individuals through multiple intermediary distribution channels, including Allstateexclusive agencies and exclusive financial specialists, independent agents, and specialized structured settlement brokers. Through March 31, 2010,we also sold products through banks and broker-dealers. Although we continue to service in force contracts sold through these distribution channels,we no longer solicit new sales through direct relationships with banks or broker-dealers. Certain of our master brokerage agencies and independentagents may continue to wholesale our products to banks and broker-dealers through their relationships. On February 8, 2011, we announced that wehad reached an agreement to sell substantially all of the deposits of Allstate Bank to Discover Bank and our plans to enter into a multi-year distributionand marketing agreement whereby Discover Bank will provide banking products and services to Allstate customers in the future. Allstate Financialdoes not intend to originate banking products or services after the transaction closes, which is expected to be by mid-year 2011, pending regulatoryapproval.
We sell products through independent agents affiliated with approximately 150 master brokerage agencies. Independent workplace enrollingagents and Allstate exclusive agencies also sell our voluntary accident and health insurance products primarily to employees of unaffiliatedbusinesses. On an opportunistic basis, we sell funding agreements to unaffiliated trusts used to back medium-term notes.
3

Allstate Financial Distribution Channels, Products and Target Customers
Allstate exclusive agencies and exclusive financial specialists also sell the following non-proprietary products in addition to Allstate Financialproducts: mutual funds, fixed and variable annuities, disability insurance, and long-term care insurance.
Competition
We compete on a wide variety of factors, including the scope of our distribution systems, the type of our product offerings, the recognition of ourbrands, our financial strength and ratings, our differentiated product features and prices, and the level of customer service that we provide. With regardto funding agreements, we compete principally on the basis of our financial strength and ratings.
The market for life insurance, retirement, and investment products continues to be highly fragmented and competitive. As of December 31, 2010,there were approximately 470 groups of life insurance companies in the United States, most of which offered one or more similar products. Accordingto A.M. Best, as of December 31, 2009, the Allstate Financial segment is the nation's 16th largest issuer of life insurance and related business on thebasis of 2009 ordinary life insurance in force and 21st largest on the basis of 2009 statutory admitted assets. In addition, because many of theseproducts include a savings or investment component, our competition includes domestic and foreign securities firms, investment advisors, mutualfunds, banks and other financial institutions. Competitive pressure continues to grow
4
Distribution Channel Proprietary Products Target CustomersAllstate exclusive
agencies(Allstate Exclusive
Agents andAllstate Exclusive
Financial Specialists)
Term life insuranceWhole life insuranceInterest-sensitive life insuranceVariable life insuranceDeferred fixed annuities (including indexed andmarket value adjusted "MVA")Immediate fixed annuitiesBank products (Certificates of deposit, money marketaccounts, savings accounts, checking accounts and AllstateAgency loans)Workplace life and voluntary accident and healthinsurance(4)
Middle market(1), emerging affluent(2) and mass affluentconsumers(3) with retirement and family financial protection needs
Independent agents(through master
brokerage agencies)
Term life insuranceWhole life insuranceInterest-sensitive life insuranceVariable life insuranceDeferred fixed annuities (including indexed andMVA)Immediate fixed annuities
Emerging affluent and mass affluent consumers with retirement andfamily financial protection needs
Independent agents(as workplace enrolling
agents)
Workplace life and voluntary accident and healthinsurance(4)
Middle market consumers with family financial protection needsemployed by small, medium, and large size firms
Structured settlementannuity brokers
Structured settlement annuities Typically used to fund or annuitize large claims or litigation settlements
Broker-dealers(Funding agreements)
Funding agreements backing medium-termnotes
Institutional and individual investors
Consumers with $35,000-$75,000 in household income
Consumers with $75,000-$150,000 in household income
Consumers with greater than $150,000 in household income
Interest-sensitive and term life insurance; disability income insurance; cancer, accident, critical illness and heart/stroke insurance; hospital indemnity; limited benefit medicalinsurance; and dental insurance
(1)
(2)
(3)
(4)

due to several factors, including cross marketing alliances between unaffiliated businesses, as well as consolidation activity in the financial servicesindustry.
Geographic Markets
We sell life insurance, retirement and investment products, and voluntary accident and health insurance throughout the United States. Throughsubsidiaries, we are authorized to sell various types of these products in all 50 states, the District of Columbia, Puerto Rico, the U.S. Virgin Islands andGuam. We also sell funding agreements in the United States.
The following table reflects, in percentages, the principal geographic distribution of statutory premiums and annuity considerations for the AllstateFinancial segment for the year ended December 31, 2010, based on information contained in statements filed with state insurance departments. Noother jurisdiction accounted for more than 5 percent of the statutory premiums and annuity considerations.
California 11.6%Florida 8.3%Texas 7.7%New York 5.4%Nebraska 5.1%
Additional Information
Information regarding the last three years' revenues and income from operations attributable to the Allstate Financial segment is contained inNote 18 of the Consolidated Financial Statements. Note 18 also includes information regarding the last three years' identifiable assets attributable tothe Allstate Financial segment. Note 18 is incorporated in this Part I, Item 1 by reference.
Information regarding premiums and contract charges for Allstate Financial segment products for the last three years is set forth in Part II, Item 7 –Management's Discussion and Analysis of Financial Condition and Results of Operations, in the table that summarizes premiums and contract chargesby product. That table is incorporated in this Part I, Item 1 by reference.
OTHER BUSINESS SEGMENTS
Our Corporate and Other segment is comprised of holding company activities and certain non-insurance operations. Note 18 of the ConsolidatedFinancial Statements contains information regarding the revenues, income from operations, and identifiable assets attributable to our Corporate andOther segment over the last three years.
Our Discontinued Lines and Coverages segment includes results from insurance coverage that we no longer write and results for certaincommercial and other businesses in run-off. Our exposure to asbestos, environmental and other discontinued lines claims arises in this segment.Note 18 of the Consolidated Financial Statements contains information for the last three years regarding revenues, income from operations, andidentifiable assets attributable to our property-liability operations, which includes both our Allstate Protection segment and our Discontinued Lines andCoverages segment. Note 18 is incorporated in this Part I, Item 1 by reference.
RESERVE FOR PROPERTY-LIABILITY CLAIMS AND CLAIMS EXPENSE
The following information regarding reserves applies to all of our property-liability operations, encompassing both the Allstate Protection segmentand the Discontinued Lines and Coverages segment.
Reconciliation of Claims Reserves
The following tables are summary reconciliations of the beginning and ending property-liability insurance claims and claims expense reserves,displayed individually for each of the last three years. The first table presents reserves on a gross (before reinsurance) basis. The end of year grossreserve balances are reflected in the Consolidated Statements
5

of Financial Position. The second table presents reserves on a net (after reinsurance) basis. The total net property-liability insurance claims and claimsexpense amounts are reflected in the Consolidated Statements of Operations.
The year-end 2010 gross reserves of $19.47 billion for property-liability insurance claims and claims expense, as determined under GAAP, were$3.33 billion more than the net reserve balance of $16.14 billion recorded on the basis of statutory accounting practices for reports provided to stateregulatory authorities. The principal differences are reinsurance recoverables from third parties totaling $2.07 billion that reduce reserves for statutoryreporting but are recorded as assets for GAAP reporting, and a liability for the reserves of the Canadian subsidiaries for $0.96 billion. Remainingdifferences are due to variations in requirements between GAAP and statutory reporting.
As the tables above illustrate, Allstate's net reserve for property-liability insurance claims and claims expense at the end of 2009 decreased in2010 by $159 million, compared to reestimates of the gross reserves of a decrease of $105 million. Net reserve reestimates in 2010, 2009 and 2008were more favorable than the gross reserve reestimates due to reinsurance cessions.
6
Gross($ in millions) Year ended December 31, 2010 2009 2008 Gross reserve for property-liability claims and claims expense, beginning of year $ 19,167 $ 19,456 $ 18,865
Incurred claims and claims expense Provision attributable to the current year 19,327 19,111 20,381 Change in provision attributable to prior years (105) 50 303
Total claims and claims expense 19,222 19,161 20,684
Claim payments Claims and claims expense attributable to current year 12,087 12,002 12,941 Claims and claims expense attributable to prior years 6,834 7,448 7,152
Total payments 18,921 19,450 20,093
Gross reserve for property-liability claims and claims expense, end of year asshown on the Loss Reserve Reestimates table $ 19,468 $ 19,167 $ 19,456
Net Year ended December 31, 2010 2009 2008 Net reserve for property-liability claims and claims expense, beginning of year $ 17,028 $ 17,182 $ 16,660
Incurred claims and claims expense Provision attributable to the current year 19,110 18,858 19,894 Change in provision attributable to prior years (159) (112) 170
Total claims and claims expense 18,951 18,746 20,064
Claim payments Claims and claims expense attributable to current year 12,012 11,905 12,658 Claims and claims expense attributable to prior years 6,571 6,995 6,884
Total payments 18,583 18,900 19,542
Net reserve for property-liability claims and claims expense, end of year as shownon the Loss Reserve Reestimates table(1) $ 17,396 $ 17,028 $ 17,182
Reserves for claims and claims expense are net of reinsurance of $2.07 billion, $2.14 billion and $2.27 billion as of December 31, 2010, 2009 and 2008,respectively.
(1)

Loss Reserve Reestimates
The following Loss Reserve Reestimates table illustrates the change over time of the net reserves established for property-liability insuranceclaims and claims expense at the end of the last eleven calendar years. The first section shows the reserves as originally reported at the end of thestated year. The second section, reading down, shows the cumulative amounts paid as of the end of successive years with respect to that reserveliability. The third section, reading down, shows retroactive reestimates of the original recorded reserve as of the end of each successive year which isthe result of Allstate's expanded awareness of additional facts and circumstances that pertain to the unsettled claims. The last section compares thelatest reestimated reserve to the reserve originally established, and indicates whether the original reserve was adequate to cover the estimated costsof unsettled claims. The table also presents the gross reestimated liability as of the end of the latest reestimation period, with separate disclosure ofthe related reestimated reinsurance recoverable. The Loss Reserve Reestimates table is cumulative and, therefore, ending balances should not beadded since the amount at the end of each calendar year includes activity for both the current and prior years. Unfavorable reserve reestimates areshown in this table in parentheses.
7
($ in millions) Loss Reserve Reestimates
December 31,
2000
& prior 2001 2002 2003 2004 2005 2006 2007 2008 2009 2010 Gross reserves for
unpaid claimsand claimsExpense $ 16,859 $ 16,500 $ 16,690 $ 17,714 $ 19,338 $ 22,117 $ 18,866 $ 18,865 $ 19,456 $ 19,167 $ 19,468
Reinsurancerecoverable 1,634 1,667 1,672 1,734 2,577 3,186 2,256 2,205 2,274 2,139 2,072
Reserve forunpaid claimsand claimsexpense 15,225 14,833 15,018 15,980 16,761 18,931 16,610 16,660 17,182 17,028 17,396
Paid (cumulative)as of:
One year later 6,748 6,874 6,275 6,073 6,665 7,952 6,684 6,884 6,995 6,571 Two years later 10,066 9,931 9,241 9,098 9,587 11,293 9,957 9,852 10,069 Three years later 11,889 11,730 11,165 10,936 11,455 13,431 11,837 11,761 Four years later 12,967 12,949 12,304 12,088 12,678 14,608 12,990 Five years later 13,768 13,648 13,032 12,866 13,374 15,325 Six years later 14,255 14,135 13,583 13,326 13,866
Seven years
later 14,617 14,558 13,928 13,703 Eight years later 14,945 14,829 14,243 Nine years later 15,157 15,099 Ten years later 15,402
Reservereestimated asof:
End of year 15,225 14,833 15,018 15,980 16,761 18,931 16,610 16,660 17,182 17,028 17,396 One year later 15,567 15,518 15,419 15,750 16,293 17,960 16,438 16,830 17,070 16,869 Two years later 15,900 16,175 15,757 15,677 16,033 17,876 16,633 17,174 17,035 Three years later 16,625 16,696 15,949 15,721 16,213 18,162 17,135 17,185 Four years later 17,249 16,937 16,051 15,915 16,337 18,805 17,238 Five years later 17,501 17,041 16,234 16,027 16,895 19,014 Six years later 17,633 17,207 16,351 16,496 17,149
Seven years
later 17,804 17,321 16,778 16,763 Eight years later 17,885 17,701 17,062 Nine years later 18,205 17,991 Ten years later 18,495 Initial reserve in
excess of (lessthan)reestimatedreserve:
Amount of
reestimate (3,270) (3,158) (2,044) (783) (388) (83) (628) (525) 147 159 Percent (21.5)% (21.3)% (13.6)% (4.9)% (2.3)% (0.4)% (3.8)% (3.2)% 0.9% 0.9%
Gross reestimatedliability-latest 21,861 21,334 20,391 19,910 20,542 22,838 19,963 19,756 19,526 19,062
Reestimatedrecoverable-latest 3,366 3,343 3,329 3,147 3,393 3,824 2,725 2,571 2,491 2,193
Net reestimatedliability-latest 18,495 17,991 17,062 16,763 17,149 19,014 17,238 17,185 17,035 16,869
Gross cumulativereestimate(increase)decrease $ (5,002) $ (4,834) $ (3,701) $ (2,196) $ (1,204) $ (721) $ (1,097) $ (891) $ (70) $ 105

As shown in the above table, the subsequent cumulative increase in the net reserves established up to December 31, 2004, in general, reflectadditions to reserves in the Discontinued Lines and Coverages Segment, primarily for asbestos and environmental liabilities, which offset the effects offavorable severity trends experienced by Allstate Protection, as discussed more fully below. The cumulative increases in reserves established as ofDecember 31, 2006 and 2007 are due to the shift of reserves to older accident years attributable to a reallocation of reserves related to employeepostretirement benefits to more accident years, and a reclassification of injury and 2008 non-injury reserves to older years which occurred in 2009 asdiscussed below.
The following table is derived from the Loss Reserve Reestimates table and summarizes the effect of reserve reestimates, net of reinsurance, oncalendar year operations for the ten-year period ended December 31, 2010. The total of each column details the amount of reserve reestimates madein the indicated calendar year and shows the accident years to which the reestimates are applicable. The amounts in the total accident year column onthe far right represent the cumulative reserve reestimates for the indicated accident year(s). Favorable reserve reestimates are shown in this table inparentheses. Since December 31, 2003, the changes in total have generally been favorable other than 2008 which was adversely impacted due tolitigation filed in conjunction with a Louisiana deadline for filing suits related to Hurricane Katrina, as shown and discussed more fully below.
In 2010, favorable prior year reserve reestimates were primarily due to Allstate Protection catastrophe losses and auto severity development thatwere less than anticipated in previous estimates, partially offset by litigation settlements. The increased reserves in accident years 2000 & prior is dueto the litigation settlements of $100 million, a reclassification of injury reserves to older years and reserve strengthening.
In 2009, favorable prior year reserve reestimates were primarily due to Allstate Protection catastrophe losses that were less than anticipated inprevious estimates. The shift of reserves to older accident years is attributable to a reallocation of reserves related to employee postretirement benefitsto more accident years, and a reclassification of injury and 2008 non-injury reserves to older years.
In 2008, unfavorable prior year reserve reestimates were primarily due to Allstate Protection catastrophe losses that were more than anticipated inprevious estimates.
In 2007, favorable prior year reserve reestimates were primarily due to Allstate Protection auto severity development that was less than what wasanticipated in previous estimates. Decreased reserve reestimates for Allstate Protection more than offset increased reestimates of losses primarilyrelated to environmental liabilities reported by the Discontinued Lines and Coverages segment.
8
($ in millions)
Amount of reestimates for each segmentDecember 31,
2000
& prior 2001 2002 2003 2004 2005 2006 2007 2008 2009 Net Discontinued Lines and Coverages reestimate $ (1,882) $ (1,856) $ (1,625) $ (1,051) $ (416) $ (249) $ (117) $ (70) $ (52) $ (28)Net Allstate Protection reestimate (1,388) (1,302) (419) 268 28 166 (511) (455) 199 187
Amount of reestimate (net) $ (3,270) $ (3,158) $ (2,044) $ (783) $ (388) $ (83) $ (628) $ (525) $ 147 $ 159
($ in millions)
Effect of net reserve reestimates oncalendar year operations
2001 2002 2003 2004 2005 2006 2007 2008 2009 2010 Total BY ACCIDENT YEAR 2000 & prior $ 342 $ 333 $ 725 $ 624 $ 252 $ 132 $ 171 $ 80 $ 320 $ 291 $3,270 2001 352 (68) (103) (11) (28) (5) 33 59 (1) 228 2002 (256) (183) (49) (2) 18 3 47 (6) (428)2003 (568) (265) (58) 11 (4) 43 (17) (858)2004 (395) (304) (14) 12 90 (13) (624)2005 (711) (264) 162 84 (45) (774)2006 (89) (91) (141) (106) (427)2007 (25) (158) (92) (275)2008 (456) (46) (502)2009 (124) (124)
TOTAL $ 342 $ 685 $ 401 $ (230) $ (468) $ (971) $ (172) $ 170 $ (112) $ (159) $ (514)

In 2006, 2005 and 2004, favorable prior year reserve reestimates were primarily due to Allstate Protection auto injury severity and late reportedloss development that was less than what was anticipated in previous reserve estimates and in 2006, also by catastrophe losses that were less thananticipated in previous estimates. Decreased reserve reestimates for Allstate Protection more than offset increased reestimates of losses primarilyrelated to asbestos liabilities reported by the Discontinued Lines and Coverages segment.
In 2003, unfavorable prior year reserve reestimates were due to increases primarily related to asbestos and other discontinued lines, partiallyoffset by favorable Allstate Protection auto injury severity and late reported loss development that was better than previous estimates.
In 2002, unfavorable prior year reserve reestimates were due to claim severity and late reported losses for Allstate Protection that were greaterthan what was anticipated in previous reserve estimates and to increased estimates of losses primarily related to asbestos and environmental liabilitiesin the Discontinued Lines and Coverages segment.
In 2001, unfavorable prior year reserve reestimates were due to greater volume of late reported weather related losses than expected from theend of the year 2000 which were reported in the year 2001, additional incurred losses on the 1994 Northridge earthquake, adverse results of classaction and other litigation, upward reestimates of property losses and upward reestimates of losses in the Encompass and Canadian businesses.
For additional information regarding reserves, see "Management's Discussion and Analysis of Financial Condition and Results of Operations –Property-Liability Claims and Claims Expense Reserves."
REGULATION
Allstate is subject to extensive regulation, primarily at the state level. The method, extent, and substance of such regulation varies by state butgenerally has its source in statutes that establish standards and requirements for conducting the business of insurance and that delegate regulatoryauthority to a state regulatory agency. In general, such regulation is intended for the protection of those who purchase or use insurance productsissued by our subsidiaries, not the holders of securities issued by The Allstate Corporation. These rules have a substantial effect on our business andrelate to a wide variety of matters, including insurance company licensing and examination, agent and adjuster licensing, price setting, trade practices,policy forms, statutory accounting methods, corporate governance, the nature and amount of investments, claims practices, participation in sharedmarkets and guaranty funds, reserve adequacy, insurer solvency, transactions with affiliates, the payment of dividends, and underwriting standards.Some of these matters are discussed in more detail below. For a discussion of statutory financial information, see Note 15 of the ConsolidatedFinancial Statements. For a discussion of regulatory contingencies, see Note 13 of the Consolidated Financial Statements. Notes 13 and 15 areincorporated in this Part I, Item 1 by reference.
In recent years, the state insurance regulatory framework has come under increased federal scrutiny. Legislation that would provide for increasedfederal regulation of insurance, including the federal chartering of insurance companies, has been proposed. Moreover, as part of an effort tostrengthen the regulation of the financial services market, the Dodd-Frank Wall Street Reform and Consumer Protection Act was enacted. Hundreds ofregulations must be promulgated and implemented pursuant to this new law, and we cannot predict what the final regulations will require but do notexpect a material impact on Allstate's operations. The new law also creates the Federal Office of Insurance ("FIO") within the Treasury Department.The FIO will monitor the insurance industry, provide advice to the new Financial Stability Oversight Council, represent the U.S. on internationalinsurance matters and study the current regulatory system and submit a report to Congress in 2012. In addition, state legislators and insuranceregulators continue to examine the appropriate nature and scope of state insurance regulation. We cannot predict whether any specific state or federalmeasures will be adopted to change the nature or scope of the regulation of insurance or what effect any such measures would have on Allstate. Weare working for changes in the regulatory environment, including recognizing the need for and improving appropriate risk based pricing and promotingthe creation of government sponsored, privately funded solutions for mega-catastrophes. While the actions that we take will be primarily focused onreducing the catastrophe exposure in our property business, we also consider their impact on our ability to market our auto lines.
Agent and Broker Compensation. In recent years, several states considered new legislation or regulations regarding the compensation of agentsand brokers by insurance companies. The proposals ranged in nature from new disclosure requirements to new duties on insurance agents andbrokers in dealing with customers. New disclosure requirements have been imposed in certain circumstances upon some agents and brokers inseveral states.
Limitations on Dividends By Insurance Subsidiaries. As a holding company with no significant business operations of its own, The AllstateCorporation relies on dividends from Allstate Insurance Company as one of the principal sources
9
of cash to pay dividends and to meet its obligations, including the payment of principal and interest on debt. Allstate Insurance Company is regulatedas an insurance company in Illinois and its ability to pay dividends is restricted by Illinois law. For additional information regarding those restrictions,see Part II, Item 5 of this report. The laws of the other jurisdictions that generally govern our other insurance subsidiaries contain similar limitations onthe payment of dividends and in some jurisdictions the laws may be more restrictive.
Insurance Holding Company Regulation. The Allstate Corporation and Allstate Insurance Company are insurance holding companies subject toregulation in the jurisdictions in which their insurance subsidiaries do business. In the U.S., these subsidiaries are organized under the insurancecodes of Florida, Illinois, Massachusetts, Nebraska, New York, and Texas, and some of these subsidiaries are considered commercially domiciled inCalifornia, Florida, and Utah. Generally, the insurance codes in these states provide that the acquisition or change of "control" of a domestic orcommercially domiciled insurer or of any person that controls such an insurer cannot be consummated without the prior approval of the relevantinsurance regulator. In general, a presumption of "control" arises from the ownership, control, possession with the power to vote, or possession ofproxies with respect to, ten percent or more of the voting securities of an insurer or of a person that controls an insurer. In addition, certain stateinsurance laws require pre-acquisition notification to state agencies of a change in control with respect to a non-domestic insurance company licensedto do business in that state. While such pre-acquisition notification statutes do not authorize the state agency to disapprove the change of control, suchstatutes do authorize certain remedies, including the issuance of a cease and desist order with respect to the non-domestic insurer if certain conditionsexist, such as undue market concentration. Thus, any transaction involving the acquisition of ten percent or more of The Allstate Corporation'scommon stock would generally require prior approval by the state insurance departments in California, Illinois, Massachusetts, Nebraska, New York,Texas, and Utah. The prior approval of the Florida insurance department would be necessary for the acquisition of five percent or more. Moreover,notification would be required in those other states that have adopted pre-acquisition notification provisions and where the insurance subsidiaries areadmitted to transact business. Such approval requirements may deter, delay, or prevent certain transactions affecting the ownership of The AllstateCorporation's common stock.
Price Regulation. Nearly all states have insurance laws requiring personal property and casualty insurers to file price schedules, policy orcoverage forms, and other information with the state's regulatory authority. In many cases, such price schedules, policy forms, or both must beapproved prior to use. While they vary from state to state, the objectives of the pricing laws are generally the same: a price cannot be excessive,inadequate, or unfairly discriminatory.
The speed with which an insurer can change prices in response to competition or in response to increasing costs depends, in part, on whether thepricing laws are (i) prior approval, (ii) file-and-use, or (iii) use-and-file laws. In states having prior approval laws, the regulator must approve a pricebefore the insurer may use it. In states having file-and-use laws, the insurer does not have to wait for the regulator's approval to use a price, but theprice must be filed with the regulatory authority prior to being used. A use-and-file law requires an insurer to file prices within a certain period of timeafter the insurer begins using them. Eighteen states, including California and New York, have prior approval laws. Under all three types of pricing laws,the regulator has the authority to disapprove a price subsequent to its filing.
An insurer's ability to adjust its prices in response to competition or to increasing costs is often dependent on an insurer's ability to demonstrate tothe regulator that its pricing or proposed pricing meets the requirements of the pricing laws. In those states that significantly restrict an insurer'sdiscretion in selecting the business that it wants to underwrite, an insurer can manage its risk of loss by charging a price that reflects the cost andexpense of providing the insurance. In those states that significantly restrict an insurer's ability to charge a price that reflects the cost and expense ofproviding the insurance, the insurer can manage its risk of loss by being more selective in the type of business it underwrites. When a statesignificantly restricts both underwriting and pricing, it becomes more difficult for an insurer to maintain its profitability.
Changes in Allstate's claim settlement process may require Allstate to actuarially adjust loss information used in its pricing process. Some stateinsurance regulatory authorities may not approve price increases that give full effect to these adjustments.
From time to time, the private passenger auto insurance industry comes under pressure from state regulators, legislators, and special interestgroups to reduce, freeze, or set prices at levels that do not correspond with our analysis of underlying costs and expenses. Homeowners insurancecomes under similar pressure, particularly as regulators in states subject to high levels of catastrophe losses struggle to identify an acceptablemethodology to price for catastrophe exposure. We expect this kind of pressure to persist. In addition, our use of insurance scoring based on creditreport information for underwriting and pricing has been the subject of challenges and investigations by
10

regulators, legislators, and special interest groups. The result could be legislation or regulation that adversely affects the profitability of the AllstateProtection segment. We cannot predict the impact on our business of possible future legislative and regulatory measures regarding pricing.
Involuntary Markets. As a condition of maintaining our licenses to write personal property and casualty insurance in various states, we arerequired to participate in assigned risk plans, reinsurance facilities, and joint underwriting associations that provide various types of insurancecoverage to individuals or entities that otherwise are unable to purchase such coverage from private insurers. Underwriting results related to thesearrangements, which tend to be adverse, have been immaterial to our results of operations.
Guaranty Funds. Under state insurance guaranty fund laws, insurers doing business in a state can be assessed, up to prescribed limits, in orderto cover certain obligations of insolvent insurance companies.
National Flood Insurance Program. We voluntarily participate as a Write Your Own carrier in the National Flood Insurance Program ("NFIP"). TheNFIP is administered and regulated by the Federal Emergency Management Agency. We operate as a fiscal agent of the federal government in theselling and administering of the Standard Flood Insurance Policy. This involves the collection of premiums belonging to the federal government and thepaying of covered claims by directly drawing on funds of the United States Treasury. We receive expense allowances from the NFIP for underwritingadministration, claims management, commissions and adjuster fees.
Investment Regulation. Our insurance subsidiaries are subject to regulations that require investment portfolio diversification and that limit theamount of investment in certain categories. Failure to comply with these rules leads to the treatment of non-conforming investments as non-admittedassets for purposes of measuring statutory surplus. Further, in some instances, these rules require divestiture of non-conforming investments.
Exiting Geographic Markets; Canceling and Non-Renewing Policies. Most states regulate an insurer's ability to exit a market. For example,states limit, to varying degrees, an insurer's ability to cancel and non-renew policies. Some states prohibit an insurer from withdrawing one or moretypes of insurance business from the state, except pursuant to a plan that is approved by the state insurance department. Regulations that limitcancellation and non-renewal and that subject withdrawal plans to prior approval requirements may restrict an insurer's ability to exit unprofitablemarkets.
Variable Life Insurance and Registered Fixed Annuities. The sale and administration of variable life insurance and registered fixed annuities withmarket value adjustment features are subject to extensive regulatory oversight at the federal and state level, including regulation and supervision bythe Securities and Exchange Commission and the Financial Industry Regulatory Authority ("FINRA").
Broker-Dealers, Investment Advisors, and Investment Companies. The Allstate entities that operate as broker-dealers, registered investmentadvisors, and investment companies are subject to regulation and supervision by the Securities and Exchange Commission, FINRA and/or, in somecases, state securities administrators.
Banking. The Allstate Corporation is a diversified unitary savings and loan holding company for Allstate Bank, a federal stock savings bank anda member of the Federal Deposit Insurance Corporation ("FDIC"). The principal supervisory authority for the diversified savings and loan holdingcompany activities and the bank is the Office of Thrift Supervision ("OTS"). We are subject to OTS regulation, examination, supervision, and reportingrequirements and its enforcement authority. Among other things, this permits the OTS to restrict or prohibit activities that are determined to be aserious risk to the financial safety, soundness, and stability of Allstate Bank. The bank is also subject to the authority of the FDIC and other federalfinancial regulators implementing various laws applicable to banking. The Dodd-Frank Wall Street Reform and Consumer Protection Act ("Dodd-FrankAct") provides for the regulation and supervision of federal savings banks like Allstate Bank to be transferred to the Office of the Comptroller of theCurrency ("OCC"), the agency that regulates national banks. The OCC will assume primary responsibility for implementing and enforcing many of thelaws and regulations applicable to federal savings banks. The transfer will occur over a transition period of up to one year, subject to a possible sixmonth extension. At the same time, the responsibility for supervising savings and loan holding companies will be transferred to the Federal ReserveBoard, which is the agency that regulates bank holding companies. The Dodd-Frank Act also provides for the creation of a new agency, the ConsumerFinancial Protection Bureau, as an independent bureau of the Federal Reserve Board, to take over the implementation of federal consumer financialprotection and fair lending laws from the depository institution regulators. However, institutions of $10 billion or less in assets will continue to beexamined for compliance with such laws and regulations by, and subject to the enforcement authority of, the applicable regulator rather than theConsumer Financial Protection Bureau.
Privacy Regulation. Federal law and the laws of many states require financial institutions to protect the security and confidentiality of customerinformation and to notify customers about their policies and practices relating to
11

collection and disclosure of customer information and their policies relating to protecting the security and confidentiality of that information. Federal lawand the laws of many states also regulate disclosures and disposal of customer information. Congress, state legislatures, and regulatory authoritiesare expected to consider additional regulation relating to privacy and other aspects of customer information.
Asbestos. Congress has considered legislation to address asbestos claims and litigation in the past, but unified support among variousdefendant and insurer groups considered essential to any possible reform has been lacking. We cannot predict the impact on our business of possiblefuture legislative measures regarding asbestos.
Environmental. Environmental pollution and clean-up of polluted waste sites is the subject of both federal and state regulation. TheComprehensive Environmental Response Compensation and Liability Act of 1980 ("Superfund") and comparable state statutes ("mini-Superfund")govern the clean-up and restoration of waste sites by Potentially Responsible Parties ("PRPs"). Superfund and the mini-Superfunds (EnvironmentalClean-up Laws or "ECLs") establish a mechanism to assign liability to PRPs or to fund the clean-up of waste sites if PRPs fail to do so. The extent ofliability to be allocated to a PRP is dependent on a variety of factors. By some estimates, there are thousands of potential waste sites subject to clean-up, but the exact number is unknown. The extent of clean-up necessary and the process of assigning liability remain in dispute. The insurance industryis involved in extensive litigation regarding coverage issues arising out of the clean-up of waste sites by insured PRPs and the insured parties' allegedliability to third parties responsible for the clean-up. The insurance industry, including Allstate, has disputed and is disputing many such claims. Keycoverage issues include whether Superfund response, investigation, and clean-up costs are considered damages under the policies; trigger ofcoverage; the applicability of several types of pollution exclusions; proper notice of claims; whether administrative liability triggers the duty to defend;appropriate allocation of liability among triggered insurers; and whether the liability in question falls within the definition of an "occurrence." Identicalcoverage issues exist for clean-up and waste sites not covered under Superfund. To date, courts have been inconsistent in their rulings on theseissues. Allstate's exposure to liability with regard to its insureds that have been, or may be, named as PRPs is uncertain. While comprehensiveSuperfund reform proposals have been introduced in Congress, only modest reform measures have been enacted.
INTERNET WEBSITE
Our Internet website address is allstate.com. The Allstate Corporation's annual reports on Form 10-K, quarterly reports on Form 10-Q, currentreports on Form 8-K, and any amendments to such reports that we file or furnish pursuant to Section 13(a) of the Securities Exchange Act of 1934 areavailable through our Internet website, free of charge, as soon as reasonably practicable after they are electronically filed or furnished to the Securitiesand Exchange Commission. In addition, our corporate governance guidelines, our code of ethics, and the charters of our Audit Committee,Compensation and Succession Committee, and Nominating and Governance Committee are available on our website and in print to any stockholderwho requests copies by contacting Investor Relations, The Allstate Corporation, 2775 Sanders Road, Northbrook, Illinois 60062-6127, 1-800-416-8803.
OTHER INFORMATION ABOUT ALLSTATE
As of December 31, 2010, Allstate had approximately 35,000 full-time employees and 700 part-time employees.
Information regarding revenues generated outside of the United States is incorporated in this Part I, Item 1 by reference to Note 18 of theConsolidated Financial Statements.
Allstate's four business segments use shared services, including human resources, investment, finance, information technology and legalservices, provided by Allstate Insurance Company and other affiliates.
Although the insurance business generally is not seasonal, claims and claims expense for the Allstate Protection segment tend to be higher forperiods of severe or inclement weather.
"Allstate" is one of the most recognized brand names in the United States. We use the names "Allstate," "Encompass," and "Lincoln Benefit Life"extensively in our business, along with related service marks, logos, and slogans, such as "Good Hands." Our rights in the United States to thesenames, service marks, logos, and slogans continue so long as we continue to use them in commerce. These service marks and many others used byAllstate are the subject of renewable U.S. and/or foreign service mark registrations. We believe that these service marks are important to our businessand we intend to maintain our rights to them through continued use.
12

Executive Officers
The following table sets forth the names of our executive officers, their ages as of February 1, 2011, their positions, and the years of their firstelection as officers. "AIC" refers to Allstate Insurance Company.
Each of the officers named above may be removed from office at any time, with or without cause, by the board of directors of the relevantcompany.
With the exception of Messrs. Civgin, DeVries, Lacher, LaNeve, and Winter, and Ms. Mayes, these officers have held the listed positions for atleast the last five years or have served Allstate in various executive or administrative capacities for at least five years.
Prior to joining Allstate in 2008, Mr. Civgin was Executive Vice President and Chief Financial Officer of OfficeMax, Incorporated and served in thatposition since 2005.
Prior to joining Allstate in 2008, Mr. DeVries served as Senior Vice President of Human Resources at Principal Financial Group since 2000.
Prior to joining Allstate in 2009, Mr. Lacher served in various executive officer positions for The Travelers Companies, Inc. since 2002.
Prior to joining Allstate in 2009, Mr. LaNeve served as Vice President of Sales, Service and Marketing of General Motors Corporation since 2004.
Prior to joining Allstate in 2009, Mr. Winter served as Vice Chairman of American International Group ("AIG") in 2009, President and ChiefExecutive Officer of AIG American General Domestic Life Companies since 2006, and Executive Vice President of Massachusetts Mutual LifeInsurance Company since 1996.
Prior to joining Allstate in 2007, Ms. Mayes served as Senior Vice President and General Counsel of Pitney Bowes since 2003.
13
Name Age Position/Offices
Year FirstElectedOfficer
Thomas J. Wilson 53 Chairman of the Board, President, and Chief Executive Officer of The Allstate Corporation;Chairman of the Board, President, and Chief Executive Officer of AIC.
1995
Catherine S. Brune
57
Senior Vice President of AIC (Chief Information Officer).
1999
Don Civgin
49
Senior Vice President and Chief Financial Officer of The Allstate Corporation; Senior Vice Presidentand Chief Financial Officer of AIC.
2008
James D. DeVries
47
Senior Vice President of AIC (Human Resources).
2008
Judith P. Greffin
50
Senior Vice President and Chief Investment Officer of AIC.
2002
Joseph P. Lacher, Jr.
41
President Allstate Protection – Senior Vice President of AIC.
2009
Mark R. LaNeve
51
Senior Vice President and Chief Marketing Officer of AIC.
2009
Michele C. Mayes
61
Senior Vice President and General Counsel of The Allstate Corporation; Senior Vice President andGeneral Counsel of AIC (Chief Legal Officer).
2007
Samuel H. Pilch
64
Controller of The Allstate Corporation; Group Vice President and Controller of AIC.
1995
Michael J. Roche
59
Senior Vice President of AIC (Claims).
2003
Steven P. Sorenson
46
Senior Vice President of AIC (Allstate Protection Product Operations).
2000
Joan H. Walker
63
Senior Vice President of AIC (Corporate Relations).
2005
Matthew E. Winter
54
President and Chief Executive Officer Allstate Financial – Senior Vice President of AIC.
2009

Item 1A. Risk Factors
This document contains "forward-looking statements" that anticipate results based on our estimates, assumptions and plans that are subject touncertainty. These statements are made subject to the safe-harbor provisions of the Private Securities Litigation Reform Act of 1995. We assume noobligation to update any forward-looking statements as a result of new information or future events or developments.
These forward-looking statements do not relate strictly to historical or current facts and may be identified by their use of words like "plans,""seeks," "expects," "will," "should," "anticipates," "estimates," "intends," "believes," "likely," "targets" and other words with similar meanings. Thesestatements may address, among other things, our strategy for growth, catastrophe exposure management, product development, investment results,regulatory approvals, market position, expenses, financial results, litigation and reserves. We believe that these statements are based on reasonableestimates, assumptions and plans. However, if the estimates, assumptions or plans underlying the forward-looking statements prove inaccurate or ifother risks or uncertainties arise, actual results could differ materially from those communicated in these forward-looking statements.
In addition to the normal risks of business, we are subject to significant risks and uncertainties, including those listed below, which apply to us asan insurer and a provider of other financial services. These risks constitute our cautionary statements under the Private Securities Litigation ReformAct of 1995 and readers should carefully review such cautionary statements as they identify certain important factors that could cause actual results todiffer materially from those in the forward-looking statements and historical trends. These cautionary statements are not exclusive and are in additionto other factors discussed elsewhere in this document, in our filings with the Securities and Exchange Commission ("SEC") or in materials incorporatedtherein by reference.
Risks Relating to the Property-Liability business
As a property and casualty insurer, we may face significant losses from catastrophes and severe weather events
Because of the exposure of our property and casualty business to catastrophic events, our operating results and financial condition may varysignificantly from one period to the next. Catastrophes can be caused by various natural and man-made disasters, including earthquakes, volcanoes,wildfires, tornadoes, hurricanes, tropical storms and certain types of terrorism. We may incur catastrophe losses in our auto and property business inexcess of: (1) those experienced in prior years, (2) those that we project would be incurred based on hurricane and earthquake losses which have aone percent probability of occurring on an annual aggregate countrywide basis, (3) those that external modeling firms estimate would be incurredbased on other levels of probability, (4) the average expected level used in pricing or (5) our current reinsurance coverage limits. Despite ourcatastrophe management programs, we are exposed to catastrophes that could have a material adverse effect on operating results and financialcondition. For example, our historical catastrophe experience includes losses relating to Hurricane Katrina in 2005 totaling $3.6 billion, the Northridgeearthquake of 1994 totaling $2.1 billion and Hurricane Andrew in 1992 totaling $2.3 billion. We are also exposed to assessments from the CaliforniaEarthquake Authority and various state-created catastrophe insurance facilities, and to losses that could surpass the capitalization of these facilities.Our liquidity could be constrained by a catastrophe, or multiple catastrophes, which result in extraordinary losses or a downgrade of our debt orfinancial strength ratings.
In addition, we are subject to claims arising from weather events such as winter storms, rain, hail and high winds. The incidence and severity ofweather conditions are largely unpredictable. There is generally an increase in the frequency and severity of auto and property claims when severeweather conditions occur.
The nature and level of catastrophes in any period cannot be predicted and could be material to our operating results and financialcondition
Along with others in the industry, we use models developed by third party vendors in assessing our property exposure to catastrophe losses.These models assume various conditions and probability scenarios. Such models do not necessarily accurately predict future losses or accuratelymeasure losses currently incurred. Catastrophe models, which have been evolving since the early 1990s, use historical information about hurricanesand earthquakes and also utilize detailed information about our in-force business. While we use this information in connection with our pricing and riskmanagement activities, there are limitations with respect to its usefulness in predicting losses in any reporting period. These limitations are evident insignificant variations in estimates between models and modelers, material increases and decreases in model results due to changes and refinementsof the underlying data elements, assumptions which lead to questionable predictive capability, and actual event conditions that have not been wellunderstood previously
14

and not incorporated into the models. In addition, the models are not necessarily reflective of actual demand surge, loss adjustment expenses and theoccurrence of mold losses, which are subject to wide variation by event or location.
Impacts of catastrophes and our catastrophe management strategy may adversely affect premium growth
Due to our catastrophe risk management efforts, the size of our homeowners business has been negatively impacted and may continue to benegatively impacted if we take further actions. Homeowners premium growth rates and retention could be more adversely impacted than we expect byadjustments to our business structure, size and underwriting practices in markets with significant catastrophe risk exposure. In addition, due to thediminished potential for cross-selling opportunities, new business growth in our auto lines could be lower than expected.
Unanticipated increases in the severity or frequency of claims may adversely affect our operating results and financial condition
Changes in the severity or frequency of claims may affect the profitability of our Allstate Protection segment. Changes in bodily injury claimseverity are driven primarily by inflation in the medical sector of the economy and litigation. Changes in auto physical damage claim severity are drivenprimarily by inflation in auto repair costs, auto parts prices and used car prices. Changes in homeowners claim severity are driven by inflation in theconstruction industry, in building materials and in home furnishings, and by other economic and environmental factors, including increased demand forservices and supplies in areas affected by catastrophes. However, changes in the level of the severity of claims are not limited to the effects of inflationand demand surge in these various sectors of the economy. Increases in claim severity can arise from unexpected events that are inherently difficult topredict. Examples of such events include a decision in 2001 by the Georgia Supreme Court which held that diminished value coverage was included inauto policies under Georgia law and the emergence of mold-related homeowners losses in the state of Texas during 2002. Although we pursue variousloss management initiatives in the Allstate Protection segment in order to mitigate future increases in claim severity, there can be no assurances thatthese initiatives will successfully identify or reduce the effect of future increases in claim severity.
Our Allstate Protection segment may experience volatility in claim frequency from time to time, and short-term trends may not continue over thelonger term. A spike in gas prices and a significant decline in miles driven, both of which occurred in 2008, are examples of factors contributing to ashort-term frequency change. A significant increase in claim frequency could have an adverse effect on our operating results and financial condition.
Actual claims incurred may exceed current reserves established for claims and may adversely affect our operating results and financialcondition
Recorded claim reserves in the Property-Liability business are based on our best estimates of losses, both reported and incurred but not reported("IBNR"), after considering known facts and interpretations of circumstances. Internal factors are considered including our experience with similarcases, actual claims paid, historical trends involving claim payment patterns, pending levels of unpaid claims, loss management programs, product mixand contractual terms. External factors are also considered which include, but are not limited to, law changes, court decisions, changes to regulatoryrequirements and economic conditions. Because reserves are estimates of the unpaid portion of losses that have occurred, including IBNR losses, theestablishment of appropriate reserves, including reserves for catastrophes, is an inherently uncertain and complex process. The ultimate cost of lossesmay vary materially from recorded reserves and such variance may adversely affect our operating results and financial condition.
Predicting claim expense relating to asbestos, environmental and other discontinued lines is inherently uncertain and may have a materialadverse effect on our operating results and financial condition
The process of estimating asbestos, environmental and other discontinued lines liabilities is complicated by complex legal issues concerning,among other things, the interpretation of various insurance policy provisions and whether those losses are covered, or were ever intended to becovered, and whether losses could be recoverable through retrospectively determined premium, reinsurance or other contractual agreements.Asbestos-related bankruptcies and other asbestos litigation are complex, lengthy proceedings that involve substantial uncertainty for insurers.Actuarial techniques and databases used in estimating asbestos, environmental and other discontinued lines net loss reserves may prove to beinadequate indicators of the extent of probable loss. Ultimate net losses from these discontinued lines could materially exceed established lossreserves and expected recoveries and have a material adverse effect on our operating results and financial condition.
15
Regulation limiting rate increases and requiring us to underwrite business and participate in loss sharing arrangements may adverselyaffect our operating results and financial condition
From time to time, political events and positions affect the insurance market, including efforts to suppress rates to a level that may not allow us toreach targeted levels of profitability. For example, if Allstate Protection's loss ratio compares favorably to that of the industry, state regulatoryauthorities may impose rate rollbacks, require us to pay premium refunds to policyholders, or resist or delay our efforts to raise rates even if theproperty and casualty industry generally is not experiencing regulatory resistance to rate increases. Such resistance affects our ability, in all productlines, to obtain approval for rate changes that may be required to achieve targeted levels of profitability and returns on equity. Our ability to affordreinsurance required to reduce our catastrophe risk in designated areas may be dependent upon the ability to adjust rates for its cost.
In addition to regulating rates, certain states have enacted laws that require a property-liability insurer conducting business in that state toparticipate in assigned risk plans, reinsurance facilities and joint underwriting associations or require the insurer to offer coverage to all consumers,often restricting an insurer's ability to charge the price it might otherwise charge. In these markets, we may be compelled to underwrite significantamounts of business at lower than desired rates, possibly leading to an unacceptable return on equity, or as the facilities recognize a financial deficit,they may in turn have the ability to assess participating insurers, adversely affecting our results of operations and financial condition. Laws andregulations of many states also limit an insurer's ability to withdraw from one or more lines of insurance in the state, except pursuant to a plan that isapproved by the state insurance department. Additionally, certain states require insurers to participate in guaranty funds for impaired or insolventinsurance companies. These funds periodically assess losses against all insurance companies doing business in the state. Our operating results andfinancial condition could be adversely affected by any of these factors.
The potential benefits of our sophisticated risk segmentation process may not be fully realized
We believe that pricing sophistication and underwriting (including Strategic Risk Management which, in some situations, considers information thatis obtained from credit reports among other factors) has allowed us to be more competitive and operate more profitably. However, because many ofour competitors have adopted underwriting criteria and sophisticated pricing models similar to those we use and because other competitors may followsuit, our competitive advantage could decline or be lost. Further, the use of insurance scoring from information that is obtained from credit reports as afactor in underwriting and pricing has at times been challenged by regulators, legislators, litigants and special interest groups in various states.Competitive pressures could also force us to modify our pricing sophistication model. Furthermore, we cannot be assured that these pricingsophistication models will accurately reflect the level of losses that we will ultimately incur.
Allstate Protection's operating results and financial condition may be adversely affected by the cyclical nature of the property and casualtybusiness
The property and casualty market is cyclical and has experienced periods characterized by relatively high levels of price competition, lessrestrictive underwriting standards and relatively low premium rates, followed by periods of relatively lower levels of competition, more selectiveunderwriting standards and relatively high premium rates. A downturn in the profitability cycle of the property and casualty business could have amaterial adverse effect on our operating results and financial condition.
Risks Relating to the Allstate Financial Segment
Changes in underwriting and actual experience could materially affect profitability and financial condition
Our product pricing includes long-term assumptions regarding investment returns, mortality, morbidity, persistency and operating costs andexpenses of the business. We establish target returns for each product based upon these factors and the average amount of capital that we must holdto support in-force contracts taking into account rating agencies and regulatory requirements. We monitor and manage our pricing and overall salesmix to achieve target new business returns on a portfolio basis, which could result in the discontinuation or de-emphasis of products or distributionrelationships and a decline in sales. Profitability from new business emerges over a period of years depending on the nature and life of the product andis subject to variability as actual results may differ from pricing assumptions. Additionally, many of our products have fixed or guaranteed terms thatlimit our ability to increase revenues or reduce benefits, including credited interest, once the product has been issued.
Our profitability in this segment depends on the adequacy of investment spreads, the management of market and credit risks associated withinvestments, the sufficiency of premiums and contract charges to cover mortality and morbidity benefits, the persistency of policies to ensure recoveryof acquisition expenses, and the management of
16

operating costs and expenses within anticipated pricing allowances. Legislation and regulation of the insurance marketplace and products could alsoaffect our profitability and financial condition.
Changes in reserve estimates may adversely affect our operating results
The reserve for life-contingent contract benefits is computed on the basis of long-term actuarial assumptions of future investment yields, mortality,morbidity, persistency and expenses. We periodically review the adequacy of these reserves on an aggregate basis and if future experience differssignificantly from assumptions, adjustments to reserves and amortization of deferred policy acquisition costs ("DAC") may be required which couldhave a material adverse effect on our operating results.
Changes in market interest rates may lead to a significant decrease in the sales and profitability of spread-based products
Our ability to manage the Allstate Financial spread-based products, such as fixed annuities and institutional products, is dependent uponmaintaining profitable spreads between investment yields and interest crediting rates. When market interest rates decrease or remain at relatively lowlevels, proceeds from investments that have matured or have been prepaid or sold may be reinvested at lower yields, reducing investment spread.Lowering interest crediting rates on some products in such an environment can partially offset decreases in investment yield. However, these changescould be limited by market conditions, regulatory minimum rates or contractual minimum rate guarantees on many contracts and may not match thetiming or magnitude of changes in investment yields. Decreases in the interest crediting rates offered on products in the Allstate Financial segmentcould make those products less attractive, leading to lower sales and/or changes in the level of policy loans, surrenders and withdrawals. Non-parallelshifts in interest rates, such as increases in short-term rates without accompanying increases in medium- and long-term rates, can influence customerdemand for fixed annuities, which could impact the level and profitability of new customer deposits. Increases in market interest rates can also havenegative effects on Allstate Financial, for example by increasing the attractiveness of other investments to our customers, which can lead to highersurrenders at a time when the segment's fixed income investment asset values are lower as a result of the increase in interest rates. This could lead tothe sale of fixed income securities at a loss. For certain products, principally fixed annuity and interest-sensitive life products, the earned rate on assetscould lag behind rising market yields. We may react to market conditions by increasing crediting rates, which could narrow spreads and reduceprofitability. Unanticipated surrenders could result in accelerated amortization of DAC or affect the recoverability of DAC and thereby increaseexpenses and reduce profitability.
Changes in estimates of profitability on interest-sensitive life, fixed annuities and other investment products may adversely affect ourprofitability and financial condition through the amortization of DAC
DAC related to interest-sensitive life, fixed annuities and other investment contracts is amortized in proportion to actual historical gross profits andestimated future gross profits ("EGP") over the estimated lives of the contracts. The principal assumptions for determining the amount of EGP areinvestment returns, including capital gains and losses on assets supporting contract liabilities, interest crediting rates to contractholders, and theeffects of persistency, mortality, expenses, and hedges if applicable. Updates to these assumptions (commonly referred to as "DAC unlocking") couldadversely affect our profitability and financial condition.
Reducing our concentration in fixed annuities and funding agreements may adversely affect reported results
We have been pursuing strategies to reduce our concentration in fixed annuities and funding agreements. Lower new sales of these products, aswell as our ongoing risk mitigation and return optimization programs, could negatively impact investment portfolio levels, complicate settlement ofexpiring contracts including forced sales of assets with unrealized capital losses, and affect goodwill impairment testing and insurance reservesdeficiency testing.
A loss of key product distribution relationships could materially affect sales, results of operations or cash flows
Certain products in the Allstate Financial segment are distributed under agreements with other members of the financial services industry that arenot affiliated with us. Termination of one or more of these agreements due to, for example, a change in control of one of these distributors or marketconditions that make it difficult to achieve our target return on certain products, resulting in relatively uncompetitive pricing, or a decision by us todiscontinue selling products through a distribution channel, could have a detrimental effect on the sales, results of operations or cash flows if it were toresult in an elevated level of surrenders of in-force contracts sold through terminated distribution relationships.
17

Changes in tax laws may decrease sales and profitability of products and adversely affect our financial condition
Under current federal and state income tax law, certain products we offer, primarily life insurance and annuities, receive favorable tax treatment.This favorable treatment may give certain of our products a competitive advantage over noninsurance products. Congress from time to time considerslegislation that would reduce or eliminate the favorable policyholder tax treatment currently applicable to life insurance and annuities. Congress alsoconsiders proposals to reduce the taxation of certain products or investments that may compete with life insurance or annuities. Legislation thatincreases the taxation on insurance products or reduces the taxation on competing products could lessen the advantage or create a disadvantage forcertain of our products making them less competitive. Such proposals, if adopted, could have a material adverse effect on our profitability and financialcondition or ability to sell such products and could result in the surrender of some existing contracts and policies. In addition, changes in the federalestate tax laws could negatively affect the demand for the types of life insurance used in estate planning.
Risks Relating to Investments
We are subject to market risk and declines in credit quality which may adversely affect investment income, cause additional realized losses,and cause increased unrealized losses
Although we continually reevaluate our risk mitigation and return optimization programs, we remain subject to the risk that we will incur losses dueto adverse changes in interest rates, credit spreads, equity prices, commodity prices or foreign currency exchange rates. Adverse changes to theserates, spreads and prices may occur due to changes in the liquidity of a market or market segment, insolvency or financial distress of key marketmakers or participants, or changes in market perceptions of credit worthiness and/or risk tolerance.
We are subject to risks associated with potential declines in credit quality related to specific issuers or specific industries and a general weakeningin the economy, which are typically reflected through credit spreads. Credit spread is the additional yield on fixed income securities above the risk-freerate (typically defined as the yield on U.S. Treasury securities) that market participants require to compensate them for assuming credit, liquidity and/orprepayment risks. Credit spreads vary (i.e. increase or decrease) in response to the market's perception of risk and liquidity in a specific issuer orspecific sector and are influenced by the credit ratings, and the reliability of those ratings, published by external rating agencies. Although we usederivative financial instruments to manage these risks, the effectiveness of such instruments is subject to the same risks.
A decline in market interest rates or credit spreads could have an adverse effect on our investment income as we invest cash in new investmentsthat may earn less than the portfolio's average yield. In a declining interest rate environment, borrowers may prepay or redeem securities more quicklythan expected as they seek to refinance at lower rates. A decline could also lead us to purchase longer-term or riskier assets in order to obtainadequate investment yields resulting in a duration gap when compared to the duration of liabilities. An increase in market interest rates or creditspreads could have an adverse effect on the value of our investment portfolio by decreasing the fair values of the fixed income securities that comprisea substantial majority of our investment portfolio. A declining equity market could also cause the investments in our pension plans to decrease ordecreasing interest rates could cause the funding target and the projected benefit obligation of our pension plans or the accumulated benefit obligationof our other postretirement benefit plans to increase, either or both resulting in a decrease in the funded status of the pension plans and a reduction ofshareholders' equity, increases in pension and other postretirement benefit expense and increases in required contributions to the pension plans. Adecline in the quality of our investment portfolio as a result of adverse economic conditions or otherwise could cause additional realized losses onsecurities, including realized losses relating to equity and derivative strategies.
Deteriorating financial performance impacting securities collateralized by residential and commercial mortgage loans, collateralizedcorporate loans, and commercial mortgage loans may lead to write-downs and impact our results of operations and financial condition
Changes in residential or commercial mortgage delinquencies, loss severities or recovery rates, declining residential or commercial real estateprices, corporate loan delinquencies or recovery rates, changes in credit or bond insurer strength ratings and the quality of service provided by serviceproviders on securities in our portfolios could lead us to determine that write-downs are necessary in the future.
The impact of our investment strategies may be adversely affected by developments in the financial markets
The impact of our investment portfolio risk mitigation and return optimization programs may be adversely affected by unexpected developments inthe financial markets. For example, derivative contracts may result in coverage that is
18

not as effective as intended thereby leading to the recognition of losses without the recognition of gains expected to mitigate the losses.
Concentration of our investment portfolios in any particular segment of the economy may have adverse effects on our operating results andfinancial condition
The concentration of our investment portfolios in any particular industry, collateral type, group of related industries or geographic sector could havean adverse effect on our investment portfolios and consequently on our results of operations and financial condition. Events or developments that havea negative impact on any particular industry, group of related industries or geographic region may have a greater adverse effect on the investmentportfolios to the extent that the portfolios are concentrated rather than diversified.
The determination of the amount of realized capital losses recorded for impairments of our investments is highly subjective and couldmaterially impact our operating results and financial condition
The determination of the amount of realized capital losses recorded for impairments vary by investment type and is based upon our periodicevaluation and assessment of known and inherent risks associated with the respective asset class. Such evaluations and assessments are revised asconditions change and new information becomes available. We update our evaluations regularly and reflect changes in other-than-temporaryimpairments in our results of operations. The assessment of whether other-than-temporary impairments have occurred is based on our case-by-caseevaluation of the underlying reasons for the decline in fair value. There can be no assurance that we have accurately assessed the level of or amountsrecorded for other-than-temporary impairments taken in our financial statements. Furthermore, historical trends may not be indicative of futureimpairments and additional impairments may need to be recorded in the future.
The determination of the fair value of our fixed income and equity securities is highly subjective and could materially impact our operatingresults and financial condition
In determining fair values we generally utilize market transaction data for the same or similar instruments. The degree of management judgmentinvolved in determining fair values is inversely related to the availability of market observable information. The fair value of assets may differ from theactual amount received upon sale of an asset in an orderly transaction between market participants at the measurement date. Moreover, the use ofdifferent valuation assumptions may have a material effect on the assets' fair values. The difference between amortized cost or cost and fair value, netof deferred income taxes, certain life and annuity DAC, certain deferred sales inducement costs ("DSI"), and certain reserves for life-contingentcontract benefits, is reflected as a component of accumulated other comprehensive income in shareholders' equity. Changing market conditions couldmaterially affect the determination of the fair value of securities and unrealized net capital gains and losses could vary significantly. Determining fairvalue is highly subjective and could materially impact our operating results and financial condition.
Risks Relating to the Insurance Industry
Our future results are dependent in part on our ability to successfully operate in an insurance industry that is highly competitive
The insurance industry is highly competitive. Our competitors include other insurers and, because some of our products include a savings orinvestment component, securities firms, investment advisers, mutual funds, banks and other financial institutions. Many of our competitors have well-established national reputations and market similar products. Because of the competitive nature of the insurance industry, including competition forproducers such as exclusive and independent agents, there can be no assurance that we will continue to effectively compete with our industry rivals,or that competitive pressures will not have a material adverse effect on our business, operating results or financial condition. Furthermore, certaincompetitors operate using a mutual insurance company structure and therefore may have dissimilar profitability and return targets. Our ability tosuccessfully operate may also be impaired if we are not effective in filling critical leadership positions, in developing the talent and skills of our humanresources, in assimilating new executive talent into our organization, or in deploying human resource talent consistently with our business goals.
Difficult conditions in the economy generally could adversely affect our business and operating results
As with most businesses, we believe difficult conditions in the economy, such as significant negative macroeconomic trends, including relativelyhigh and sustained unemployment, reduced consumer spending, lower home prices, substantial increases in delinquencies on consumer debt,including defaults on home mortgages, and the relatively low availability of credit could have an adverse effect on our business and operating results.
19

General economic conditions could adversely affect us in the form of consumer behavior and pressure investment results. Consumer behaviorchanges could include decreased demand for our products. For example, as consumers purchase fewer automobiles, our sales of auto insurance maydecline. Also, as consumers become more cost conscious, they may choose lower levels of auto and homeowners insurance. In addition, holders ofsome of our interest-sensitive life insurance and annuity products may engage in an elevated level of discretionary withdrawals of contractholderfunds. Our investment results could be adversely affected as deteriorating financial and business conditions affect the issuers of the securities in ourinvestment portfolio.
There can be no assurance that actions of the U.S. federal government, Federal Reserve and other governmental and regulatory bodies forthe purpose of stabilizing the financial markets and stimulating the economy will achieve the intended effect
In response to the financial crises affecting the banking system, the financial markets and the broader economy in recent years, the U.S. federalgovernment, the Federal Reserve and other governmental and regulatory bodies have taken actions such as purchasing mortgage-backed and othersecurities from financial institutions, investing directly in banks, thrifts and bank and savings and loan holding companies and increasing federalspending to stimulate the economy. There can be no assurance as to the long term impact such actions will have on the financial markets or oneconomic conditions, including potential inflationary affects. Continued volatility and any further economic deterioration could materially and adverselyaffect our business, financial condition and results of operations.
Losses from litigation may be material to our operating results or cash flows and financial condition
As is typical for a large company, we are involved in various legal actions, including class action litigation challenging a range of companypractices and coverage provided by our insurance products. In the event of an unfavorable outcome in one or more of these matters, the ultimateliability may be in excess of amounts currently reserved and may be material to our operating results or cash flows for a particular quarter or annualperiod and to our financial condition.
We are subject to extensive regulation and potential further restrictive regulation may increase our operating costs and limit our growth
As insurance companies, broker-dealers, investment advisers, a federal stock savings bank and/or investment companies, many of oursubsidiaries are subject to extensive laws and regulations. These laws and regulations are complex and subject to change. Moreover, they areadministered and enforced by a number of different governmental authorities, including state insurance regulators, state securities administrators, theSEC, the FINRA, the Office of Thrift Supervision, the U.S. Department of Justice, and state attorneys general, each of which exercises a degree ofinterpretive latitude. Consequently, we are subject to the risk that compliance with any particular regulator's or enforcement authority's interpretation ofa legal issue may not result in compliance with another's interpretation of the same issue, particularly when compliance is judged in hindsight. Inaddition, there is risk that any particular regulator's or enforcement authority's interpretation of a legal issue may change over time to our detriment, orthat changes in the overall legal environment may, even absent any particular regulator's or enforcement authority's interpretation of a legal issuechanging, cause us to change our views regarding the actions we need to take from a legal risk management perspective, thus necessitating changesto our practices that may, in some cases, limit our ability to grow and improve the profitability of our business. Furthermore, in some cases, these lawsand regulations are designed to protect or benefit the interests of a specific constituency rather than a range of constituencies. For example, stateinsurance laws and regulations are generally intended to protect or benefit purchasers or users of insurance products, not holders of securities issuedby The Allstate Corporation. In many respects, these laws and regulations limit our ability to grow and improve the profitability of our business.
In recent years, the state insurance regulatory framework has come under public scrutiny and members of Congress have discussed proposals toprovide for federal chartering of insurance companies. We can make no assurances regarding the potential impact of state or federal measures thatmay change the nature or scope of insurance regulation.
Regulatory reforms, and the more stringent application of existing regulations, may make it more expensive for us to conduct our business
The federal government has enacted comprehensive regulatory reforms for financial services entities. As part of a larger effort to strengthen theregulation of the financial services market, certain reforms are applicable to the insurance industry, including the establishment of a Federal InsuranceOffice within the Department of Treasury.
20

We are a diversified unitary savings and loan holding company for Allstate Bank, a federal stock savings bank and a member of the FDIC. Theprincipal supervisory authority for the diversified unitary savings and loan holding company activities and the bank is the OTS. We are subject to OTSregulation, examination, supervision and reporting requirements and its enforcement authority. Among other things, this permits the OTS to restrict orprohibit activities that are determined to be a serious risk to the financial safety, soundness and stability of Allstate Bank. The reforms will abolish theOTS and transfer those responsibilities to the OCC and the Federal Reserve Board within an established time period.
These regulatory reforms and any additional legislation or regulatory requirements imposed upon us in connection with the federal government'sregulatory reform of the financial services industry or arising from reform related to the international regulatory capital framework for banking firms, andany more stringent enforcement of existing regulations by federal authorities, may make it more expensive for us to conduct our business.
Reinsurance may be unavailable at current levels and prices, which may limit our ability to write new business
Our personal lines catastrophe reinsurance program was designed, utilizing our risk management methodology, to address our exposure tocatastrophes nationwide. Market conditions beyond our control impact the availability and cost of the reinsurance we purchase. No assurances can bemade that reinsurance will remain continuously available to us to the same extent and on the same terms and rates as is currently available. Forexample, our ability to afford reinsurance to reduce our catastrophe risk in designated areas may be dependent upon our ability to adjust premiumrates for its cost, and there are no assurances that the terms and rates for our current reinsurance program will continue to be available next year. Ifwe were unable to maintain our current level of reinsurance or purchase new reinsurance protection in amounts that we consider sufficient and atprices that we consider acceptable, we would have to either accept an increase in our exposure risk, reduce our insurance writings, or develop or seekother alternatives.
Reinsurance subjects us to the credit risk of our reinsurers and may not be adequate to protect us against losses arising from cededinsurance, which could have a material adverse effect on our operating results and financial condition
The collectability of reinsurance recoverables is subject to uncertainty arising from a number of factors, including changes in market conditions,whether insured losses meet the qualifying conditions of the reinsurance contract and whether reinsurers, or their affiliates, have the financial capacityand willingness to make payments under the terms of a reinsurance treaty or contract. Our inability to collect a material recovery from a reinsurer couldhave a material adverse effect on our operating results and financial condition.
A large scale pandemic, the continued threat of terrorism or ongoing military actions may have an adverse effect on the level of claimlosses we incur, the value of our investment portfolio, our competitive position, marketability of product offerings, liquidity and operatingresults
A large scale pandemic, the continued threat of terrorism, within the United States and abroad, or ongoing military and other actions, andheightened security measures in response to these types of threats, may cause significant volatility and losses in our investment portfolio fromdeclines in the equity markets and from interest rate changes in the United States, Europe and elsewhere, and result in loss of life, property damage,disruptions to commerce and reduced economic activity. Some of the assets in our investment portfolio may be adversely affected by declines in theequity markets and reduced economic activity caused by a large scale pandemic or the continued threat of terrorism. Additionally, in the AllstateProtection and Allstate Financial business segments, a large scale pandemic or terrorist act could have a material adverse effect on the sales,profitability, competitiveness, marketability of product offerings, liquidity, and operating results.
A downgrade in our financial strength ratings may have an adverse effect on our competitive position, the marketability of our productofferings, and our liquidity, operating results and financial condition
Financial strength ratings are important factors in establishing the competitive position of insurance companies and generally have an effect on aninsurance company's business. On an ongoing basis, rating agencies review the financial performance and condition of insurers and could downgradeor change the outlook on an insurer's ratings due to, for example, a change in an insurer's statutory capital; a change in a rating agency'sdetermination of the amount of risk-adjusted capital required to maintain a particular rating; an increase in the perceived risk of an insurer's investmentportfolio; a reduced confidence in management or a host of other considerations that may or may not be under the insurer's control. The insurancefinancial strength ratings of Allstate Insurance Company and Allstate Life Insurance Company and The Allstate Corporation's senior debt ratingsfrom A.M. Best, Standard & Poor's and Moody's are subject
21

to continuous review, and the retention of current ratings cannot be assured. A downgrade in any of these ratings could have a material adverse effecton our sales, our competitiveness, the marketability of our product offerings, and our liquidity, operating results and financial condition.
Adverse capital and credit market conditions may significantly affect our ability to meet liquidity needs or our ability to obtain credit onacceptable terms
In periods of extreme volatility and disruption in the capital and credit markets, liquidity and credit capacity may be severely restricted. In suchcircumstances, our ability to obtain capital to fund operating expenses, financing costs, capital expenditures or acquisitions may be limited, and thecost of any such capital may be significant. Our access to additional financing will depend on a variety of factors such as market conditions, thegeneral availability of credit, the overall availability of credit to our industry, our credit ratings and credit capacity, as well as lenders' perception of ourlong- or short-term financial prospects. Similarly, our access to funds may be impaired if regulatory authorities or rating agencies take negative actionsagainst us. If a combination of these factors were to occur, our internal sources of liquidity may prove to be insufficient and in such case, we may notbe able to successfully obtain additional financing on favorable terms.
Changes in accounting standards issued by the Financial Accounting Standards Board ("FASB") or other standard-setting bodies mayadversely affect our results of operations and financial condition
Our financial statements are subject to the application of generally accepted accounting principles, which are periodically revised, interpretedand/or expanded. Accordingly, we are required to adopt new guidance or interpretations, or could be subject to existing guidance as we enter into newtransactions, which may have a material adverse effect on our results of operations and financial condition that is either unexpected or has a greaterimpact than expected. For a description of changes in accounting standards that are currently pending and, if known, our estimates of their expectedimpact, see Note 2 of the consolidated financial statements.
The change in our unrecognized tax benefit during the next 12 months is subject to uncertainty
We have disclosed our estimate of net unrecognized tax benefits and the reasonably possible increase or decrease in its balance during the next12 months in Note 14 of the consolidated financial statements. However, actual results may differ from our estimate for reasons such as changes inour position on specific issues, developments with respect to the governments' interpretations of income tax laws or changes in judgment resultingfrom new information obtained in audits or the appeals process.
The realization of deferred tax assets is subject to uncertainty
The realization of our deferred tax assets, net of valuation allowance, is based on our assumption that we will be able to fully utilize the deductionsthat are ultimately recognized for tax purposes. However, actual results may differ from our assumptions if adequate levels of taxable income are notattained.
The ability of our subsidiaries to pay dividends may affect our liquidity and ability to meet our obligations
The Allstate Corporation is a holding company with no significant operations. The principal asset is the stock of its subsidiaries. State insuranceregulatory authorities limit the payment of dividends by insurance subsidiaries, as described in Note 15 of the consolidated financial statements. Inaddition, competitive pressures generally require the subsidiaries to maintain insurance financial strength ratings. These restrictions and otherregulatory requirements affect the ability of the subsidiaries to make dividend payments. Limits on the ability of the subsidiaries to pay dividends couldadversely affect holding company liquidity, including our ability to pay dividends to shareholders, service our debt, or complete share repurchaseprograms in the timeframe expected.
The occurrence of events unanticipated in our disaster recovery systems and management continuity planning or a support failure fromexternal providers during a disaster could impair our ability to conduct business effectively
The occurrence of a disaster such as a natural catastrophe, an industrial accident, a terrorist attack or war, events unanticipated in our disasterrecovery systems, or a support failure from external providers, could have an adverse effect on our ability to conduct business and on our results ofoperations and financial condition, particularly if those events affect our computer-based data processing, transmission, storage, and retrieval systems.In the event that a significant number of our managers could be unavailable in the event of a disaster, our ability to effectively conduct our businesscould be severely compromised.
22
Changing climate conditions may adversely affect our financial condition, profitability or cash flows
Allstate recognizes the scientific view that the world is getting warmer. Climate change, to the extent it produces rising temperatures and changesin weather patterns, could impact the frequency or severity of weather events and wildfires, the affordability and availability of homeowners insurance,and the results for our Allstate Protection segment.
Loss of key vendor relationships or failure of a vendor to protect personal information of our customers, claimants or employees couldaffect our operations
We rely on services and products provided by many vendors in the United States and abroad. These include, for example, vendors of computerhardware and software and vendors of services such as claim adjustment services and human resource benefits management services. In the eventthat one or more of our vendors suffers a bankruptcy or otherwise becomes unable to continue to provide products or services, or fails to protectpersonal information of our customers, claimants or employees, we may suffer operational impairments and financial losses.
Item 1B. Unresolved Staff Comments
None.
Item 2. Properties
Our home office complex is located in Northbrook, Illinois. As of December 31, 2010, the Home Office complex consists of several buildingstotaling 2.3 million square feet of office space on a 278-acre site.
We also operate from approximately 1,400 administrative, data processing, claims handling and other support facilities in North America. Inaddition to our home office facilities, 2.3 million square feet are owned and 6.1 million square feet are leased. Outside North America, we lease threeproperties in Northern Ireland comprising 130,550 square feet. We also have one lease in London for 3,650 square feet. Generally, only major Allstatefacilities are owned. In a majority of cases, new lease terms and renewals are for five years or less.
The locations out of which the Allstate exclusive agencies operate in the U.S. are normally leased by the agencies as lessees.
Item 3. Legal Proceedings
Information required for Item 3 is incorporated by reference to the discussion under the heading "Regulation and Compliance" and under theheading "Legal and regulatory proceedings and inquiries" in Note 13 of the consolidated financial statements.
Item 4. (Removed and Reserved)
23

Part II
Item 5. Market for Registrant's Common Equity, Related Stockholder Matters and Issuer Purchases of Equity Securities
As of February 1, 2011, there were 108,052 record holders of The Allstate Corporation's common stock. The principal market for the commonstock is the New York Stock Exchange but it is also listed on the Chicago Stock Exchange. Set forth below are the high and low New York StockExchange Composite listing prices of, and cash dividends declared for, the common stock during 2010 and 2009.
The payment of dividends by Allstate Insurance Company ("AIC") to The Allstate Corporation is limited by Illinois insurance law to formulaamounts based on statutory net income and statutory surplus, as well as the timing and amount of dividends paid in the preceding twelve months. Inthe twelve-month period ending December 31, 2010, AIC paid dividends of $1.30 billion. Based on the greater of 2010 statutory net income or 10% ofstatutory surplus, the maximum amount of dividends that AIC will be able to pay without prior Illinois Department of Insurance approval at a given pointin time in 2011 is $1.54 billion, less dividends paid during the preceding twelve months measured at that point in time. Notification and approval ofintercompany lending activities is also required by the Illinois Department of Insurance for those transactions that exceed formula amounts based onstatutory admitted assets and statutory surplus.
Issuer Purchases of Equity Securities
24
High Low Close DividendsDeclared
2010 First quarter 32.48 28.13 32.31 .20 Second quarter 35.51 28.41 28.73 .20 Third quarter 32.36 26.86 31.55 .20 Fourth quarter 33.29 29.00 31.88 .20
2009 First quarter 33.50 13.77 19.15 .20 Second quarter 28.73 18.50 24.40 .20 Third quarter 31.74 22.82 30.62 .20 Fourth quarter 32.23 27.52 30.04 .20
Period
Total number ofshares
(or units)purchased (1)
Average pricepaid per share
(or unit)
Total numberof shares(or units)
purchased as partof publicly
announced plansor
programs (2)
Maximum number(or approximatedollar value) of
shares(or units) that mayyet be purchasedunder the plans or
programs (3) October 1, 2010 -
October 31, 2010 1,069 $ 31.5700 — $ — November 1, 2010 -
November 30, 2010 1,991,801 $ 29.7716 1,991,801 $ 941 million December 1, 2010 -
December 31, 2010 3,246,304 $ 31.0674 3,246,304 $ 840 million Total 5,239,174 $ 30.5749 5,238,105 —
In accordance with the terms of its equity compensation plans, Allstate acquired the following shares in connection with stock option exercises by employeesand/or directors. The stock was received in payment of the exercise price of the options and in satisfaction of withholding taxes due upon exercise or vesting.
October: 1,069 November: none December: none
Repurchases under our programs are, from time to time, executed under the terms of a pre-set trading plan meeting the requirements of Rule 10b5-1(c) ofthe Securities Exchange Act of 1934.
None
On November 9, 2010, we announced the approval of a new share repurchase program for $1.00 billion. This program is expected to be completed byMarch 31, 2012.
(1)
(2)
(3)

Item 6. Selected Financial Data
5-YEAR SUMMARY OF SELECTED FINANCIAL DATA
25
($ in millions, except per share data and ratios) 2010 2009 2008 2007 2006 Consolidated Operating Results Insurance premiums and contract charges $ 28,125 $ 28,152 $ 28,862 $ 29,099 $ 29,333 Net investment income 4,102 4,444 5,622 6,435 6,177 Realized capital gains and losses (827) (583) (5,090) 1,235 286 Total revenues 31,400 32,013 29,394 36,769 35,796 Net income (loss) 928 854 (1,679) 4,636 4,993 Net income (loss) per share: Net income (loss) per share — basic 1.72 1.58 (3.06) 7.80 7.88 Net income (loss) per share — diluted 1.71 1.58 (3.06) 7.76 7.83 Cash dividends declared per share 0.80 0.80 1.64 1.52 1.40
Consolidated Financial Position Investments $100,483 $ 99,833 $ 95,998 $118,980 $119,757 Total assets 130,874 132,652 134,798 156,408 157,554 Reserves for claims and claims expense, life-contingent
contract benefits and contractholder funds 81,145 84,659 90,750 94,052 93,683 Short-term debt — — — — 12 Long-term debt 5,908 5,910 5,659 5,640 4,650 Shareholders' equity 19,016 16,692 12,641 21,851 21,846 Shareholders' equity per diluted share 35.32 30.84 23.47 38.54 34.80 Equity 19,044 16,721 12,673 21,902 21,937
Property-Liability Operations Premiums earned $ 25,957 $ 26,194 $ 26,967 $ 27,233 $ 27,369 Net investment income 1,189 1,328 1,674 1,972 1,854 Net income 1,054 1,543 228 4,258 4,614 Operating ratios (1) Claims and claims expense ("loss") ratio 73.0 71.6 74.4 64.9 58.5 Expense ratio 25.1 24.6 25.0 24.9 25.1 Combined ratio 98.1 96.2 99.4 89.8 83.6
Allstate Financial Operations Premiums and contract charges $ 2,168 $ 1,958 $ 1,895 $ 1,866 $ 1,964 Net investment income 2,853 3,064 3,811 4,297 4,173 Net income (loss) 58 (483) (1,721) 465 464 Investments 61,582 62,216 61,449 74,256 75,951
We use operating ratios to measure the profitability of our Property-Liability results. We believe that they enhance an investor's understanding of ourprofitability. They are calculated as follows: Claims and claims expense ("loss") ratio is the ratio of claims and claims expense to premiums earned. Lossratios include the impact of catastrophe losses. Expense ratio is the ratio of amortization of deferred policy acquisition costs, operating costs and expensesand restructuring and related charges to premiums earned. Combined ratio is the ratio of claims and claims expense, amortization of deferred policyacquisition costs, operating costs and expenses and restructuring and related charges to premiums earned. The combined ratio is the sum of the loss ratioand the expense ratio. The difference between 100% and the combined ratio represents underwriting income as a percentage of premiums earned, orunderwriting margin.
(1)

Item 7. Management's Discussion and Analysis of Financial Condition and Results of Operations
26
PageOverview 272010 Highlights 27Consolidated Net Income (Loss) 28Application of Critical Accounting Estimates 28Property-Liability 2010 Highlights 41Property-Liability Operations 42Allstate Protection Segment 44Discontinued Lines and Coverages Segment 56Property-Liability Investment Results 57Property-Liability Claims and Claims Expense Reserves 58Allstate Financial 2010 Highlights 69Allstate Financial Segment 69Investments 2010 Highlights 79Investments 79Market Risk 109Pension Plans 112Deferred Taxes 114Capital Resources and Liquidity 2010 Highlights 114Capital Resources and Liquidity 115Enterprise Risk and Return Management 121Regulation and Legal Proceedings 122Pending Accounting Standards 122

OVERVIEW
The following discussion highlights significant factors influencing the consolidated financial position and results of operations of The AllstateCorporation (referred to in this document as "we", "our", "us", the "Company" or "Allstate"). It should be read in conjunction with the 5-year summary ofselected financial data, consolidated financial statements and related notes found under Part II, Item 6 and Item 8 contained herein. Further analysis ofour insurance segments is provided in the Property-Liability Operations (which includes the Allstate Protection and the Discontinued Lines andCoverages segments) and in the Allstate Financial Segment sections of Management's Discussion and Analysis ("MD&A"). The segments areconsistent with the way in which we use financial information to evaluate business performance and to determine the allocation of resources.
Allstate is focused on three priorities in 2011:
• improve our operating results;• grow our businesses profitably; and• differentiate ourselves from the competition by reinventing our business.
The most important factors we monitor to evaluate the financial condition and performance of our company include:
• For Allstate Protection: premium written, the number of policies in force ("PIF"), retention, price changes, claim frequency (rate of claimoccurrence per policy in force) and severity (average cost per claim), catastrophes, loss ratio, expenses, underwriting results, and salesof all products and services;
• For Allstate Financial: benefit and investment spread, amortization of deferred policy acquisition costs ("DAC"), expenses, operatingincome, net income, invested assets, and premiums and contract charges;
• For Investments: credit quality/experience, realized capital gains and losses, investment income, unrealized capital gains and losses,stability of long-term returns, total returns, cash flows, and asset and liability duration; and
• For financial condition: liquidity, parent holding company level of deployable invested assets, financial strength ratings, operatingleverage, debt leverage, book value per share, and return on equity.
2010 HIGHLIGHTS
• Consolidated net income was $928 million in 2010 compared to $854 million in 2009. Net income per diluted share was $1.71 in 2010compared to $1.58 in 2009.
• Property-Liability net income was $1.05 billion in 2010 compared to $1.54 billion in 2009.• The Property-Liability combined ratio was 98.1 in 2010 compared to 96.2 in 2009.• Allstate Financial had net income of $58 million in 2010 compared to a net loss of $483 million in 2009.• Total revenues were $31.40 billion in 2010 compared to $32.01 billion in 2009.• Property-Liability premiums earned in 2010 totaled $25.96 billion, a decrease of 0.9% from $26.19 billion in 2009.• Net realized capital losses were $827 million in 2010 compared to $583 million in 2009.• Investments as of December 31, 2010 totaled $100.48 billion, an increase of 0.7% from $99.83 billion as of December 31, 2009. Net investment
income in 2010 was $4.10 billion, a decrease of 7.7% from $4.44 billion in 2009.• Book value per diluted share (ratio of shareholders' equity to total shares outstanding and dilutive potential shares outstanding) was $35.32 as
of December 31, 2010, an increase of 14.5% from $30.84 as of December 31, 2009.• For the twelve months ended December 31, 2010, return on the average of beginning and ending period shareholders' equity was 5.2%, a
decrease of 0.6 points from 5.8% for the twelve months ended December 31, 2009.• As of December 31, 2010, we had $19.02 billion in capital. This total included $3.84 billion in deployable invested assets at the parent holding
company level.
27

CONSOLIDATED NET INCOME (LOSS)
APPLICATION OF CRITICAL ACCOUNTING ESTIMATES
The preparation of financial statements in conformity with accounting principles generally accepted in the United States of America ("GAAP")requires management to adopt accounting policies and make estimates and assumptions that affect amounts reported in the consolidated financialstatements. The most critical estimates include those used in determining:
• Fair value of financial assets• Impairment of fixed income and equity securities• Deferred policy acquisition costs amortization• Reserve for property-liability insurance claims and claims expense estimation• Reserve for life-contingent contract benefits estimation
In making these determinations, management makes subjective and complex judgments that frequently require estimates about matters that areinherently uncertain. Many of these policies, estimates and related judgments are common in the insurance and financial services industries; othersare specific to our businesses and operations. It is reasonably likely that changes in these estimates could occur from period to period and result in amaterial impact on our consolidated financial statements.
A brief summary of each of these critical accounting estimates follows. For a more detailed discussion of the effect of these estimates on ourconsolidated financial statements, and the judgments and assumptions related to these
28
($ in millions) For the years ended December 31, 2010 2009 2008 Revenues Property-liability insurance premiums $ 25,957 $ 26,194 $ 26,967 Life and annuity premiums and contract charges 2,168 1,958 1,895 Net investment income 4,102 4,444 5,622 Realized capital gains and losses: Total other-than-temporary impairment losses (937) (2,376) (3,735)
Portion of loss recognized in other comprehensiveincome (64) 457 —
Net other-than-temporary impairment lossesrecognized in earnings (1,001) (1,919) (3,735)
Sales and other realized capital gains and losses 174 1,336 (1,355)
Total realized capital gains and losses (827) (583) (5,090)
Total revenues 31,400 32,013 29,394
Costs and expenses Property-liability insurance claims and claims expense (18,951) (18,746) (20,064)Life and annuity contract benefits (1,815) (1,617) (1,612)Interest credited to contractholder funds (1,807) (2,126) (2,411)Amortization of deferred policy acquisition costs (4,034) (4,754) (4,679)Operating costs and expenses (3,281) (3,007) (3,273)Restructuring and related charges (30) (130) (23)Interest expense (367) (392) (351)
Total costs and expenses (30,285) (30,772) (32,413)Gain (loss) on disposition of operations 11 7 (6)Income tax (expense) benefit (198) (394) 1,346
Net income (loss) $ 928 $ 854 $ (1,679)
Property-Liability $ 1,054 $ 1,543 $ 228 Allstate Financial 58 (483) (1,721)Corporate and Other (184) (206) (186)
Net income (loss) $ 928 $ 854 $ (1,679)
estimates, see the referenced sections of this document. For a complete summary of our significant accounting policies, see Note 2 of theconsolidated financial statements.
Fair value of financial assets Fair value is defined as the price that would be received to sell an asset or paid to transfer a liability in an orderlytransaction between market participants at the measurement date. We categorize our financial assets measured at fair value into a three-levelhierarchy based on the observability of inputs to the valuation techniques as follows:
Observable inputs are inputs that reflect the assumptions market participants would use in valuing financial assets that are developed based onmarket data obtained from independent sources. In the absence of sufficient observable inputs, unobservable inputs reflect our estimates of theassumptions market participants would use in valuing financial assets and are developed based on the best information available in the circumstances.The degree of management judgment involved in determining fair values is inversely related to the availability of market observable information.
We are responsible for the determination of fair value of financial assets and the supporting assumptions and methodologies. We gain assuranceon the overall reasonableness and consistent application of valuation input assumptions, valuation methodologies and compliance with accountingstandards for fair value determination through the execution of various processes and controls designed to ensure that our financial assets areappropriately valued. We monitor fair values received from third parties and those derived internally on an ongoing basis.
We employ independent third-party valuation service providers, broker quotes and internal pricing methods to determine fair values. We obtain orcalculate only one single quote or price for each financial instrument.
Valuation service providers typically obtain data about market transactions and other key valuation model inputs from multiple sources and,through the use of proprietary models, produce valuation information in the form of a single fair value for individual securities for which a fair value hasbeen requested under the terms of our agreements. For certain equity securities, valuation service providers provide market quotations for completedtransactions on the measurement date. For other security types, fair values are derived from the valuation service providers' proprietary valuationmodels. The inputs used by the valuation service providers include, but are not limited to, market prices from recently completed transactions andtransactions of comparable securities, interest rate yield curves, credit spreads, liquidity spreads, currency rates, and other information, as applicable.Credit and liquidity spreads are typically implied from completed transactions and transactions of comparable securities. Valuation service providersalso use proprietary discounted cash flow models that are widely accepted in the financial services industry and similar to those used by other marketparticipants to value the same financial instruments. The valuation models take into account, among other things, market observable information as ofthe measurement date, as described above, as well as the specific attributes of the security being valued including its term, interest rate, credit rating,industry sector, and where applicable, collateral quality and other issue or issuer specific information. Executing valuation models effectively requiresseasoned professional judgment and experience. In cases where market transactions or other market observable data is limited, the extent to whichjudgment is applied varies inversely with the availability of market observable information.
For certain of our financial assets measured at fair value, where our valuation service providers cannot provide fair value determinations, weobtain a single non-binding price quote from a broker familiar with the security who, similar to our valuation service providers, may considertransactions or activity in similar securities among other information. The brokers providing price quotes are generally from the brokerage divisions ofleading financial institutions with market making, underwriting and distribution expertise regarding the security subject to valuation.
The fair value of certain financial assets, including privately placed corporate fixed income securities, auction rate securities ("ARS") backed bystudent loans, equity-indexed notes, and certain free-standing derivatives, for which our valuation service providers or brokers do not provide fair valuedeterminations, is determined using valuation methods
29
Level 1: Financial asset values are based on unadjusted quoted prices for identical assets in an active market that we can access.
Level 2: Financial asset values are based on the following: (a) Quoted prices for similar assets in active markets; (b) Quoted prices for identical or similar assets in markets that are not active; or (c) Valuation models whose inputs are observable, directly or indirectly, for substantially the full term of the asset.
Level 3: Financial asset values are based on prices or valuation techniques that require inputs that are both unobservable and significant to theoverall fair value measurement. Unobservable inputs reflect our estimates of the assumptions that market participants would use in valuingthe financial assets.

and models widely accepted in the financial services industry. Internally developed valuation models, which include inputs that may not be marketobservable and as such involve some degree of judgment, are considered appropriate for each class of security to which they are applied.
Our internal pricing methods are primarily based on models using discounted cash flow methodologies that develop a single best estimate of fairvalue. Our models generally incorporate inputs that we believe are representative of inputs other market participants would use to determine fair valueof the same instruments, including yield curves, quoted market prices of comparable securities, published credit spreads, and other applicable marketdata. Additional inputs that are used include internally-derived assumptions such as liquidity premium and credit ratings, as well as instrument-specificcharacteristics that include, but are not limited to, coupon rate, expected cash flows, sector of the issuer, and call provisions. Our internally assignedcredit ratings are developed at a more detailed level than externally published ratings and allow for a more precise match of these ratings to othermarket observable valuation inputs, such as credit and sector spreads, when performing these valuations. Due to the existence of non-marketobservable inputs, such as liquidity premiums, judgment is required in developing these fair values. As a result, the fair value of these financial assetsmay differ from the amount actually received to sell an asset in an orderly transaction between market participants at the measurement date.Moreover, the use of different valuation assumptions may have a material effect on the financial assets' fair values.
For the majority of our financial assets measured at fair value, all significant inputs are based on market observable data and significantmanagement judgment does not affect the periodic determination of fair value. The determination of fair value using discounted cash flow modelsinvolves management judgment when significant model inputs are not based on market observable data. However, where market observable data isavailable, it takes precedence, and as a result, no range of reasonably likely inputs exists from which the basis of a sensitivity analysis could beconstructed.
There is one primary situation where a discounted cash flow model utilizes a significant input that is not market observable, and it relates to thedetermination of fair value for our ARS backed by student loans. The significant input utilized is the anticipated date liquidity will return to this market(that is, when auction failures will cease). Determination of this assumption allows for matching to market observable inputs when performing thesevaluations.
The following table displays the sensitivity of reasonably likely changes in the anticipated date liquidity will return to the student loan ARS marketas of December 31, 2010. The selection of these hypothetical scenarios represents an illustration of the estimated potential proportional effect ofalternate assumptions and should not be construed as either a prediction of future events or an indication that it would be reasonably likely that allsecurities would be similarly affected.
We believe our most significant exposure to changes in fair value is due to market risk. Our exposure to changes in market conditions is discussedfully in the Market Risk section of the MD&A.
We employ specific control processes to determine the reasonableness of the fair value of our financial assets. Our processes are designed toensure that the values received or internally estimated are accurately recorded and that the data inputs and the valuation techniques utilized areappropriate, consistently applied, and that the assumptions are reasonable and consistent with the objective of determining fair value. For example, ona continuing basis, we assess the reasonableness of individual security values received from valuation service providers and those derived frominternal models that exceed certain thresholds as compared to previous values received from those valuation service providers or derived from internalmodels. In addition, we may validate the reasonableness of fair value by comparing information obtained from our valuation service providers to otherthird party valuation sources for selected securities. We perform ongoing price validation procedures such as back-testing of actual sales, whichcorroborate the various inputs used in internal pricing models to market observable data. When fair value determinations are expected to be morevariable, we validate them through reviews by members of management who have relevant expertise and who are independent of those charged withexecuting investment transactions.
30
($ in millions) ARS backed by student loans at fair value $ 1,230
Percentage change in fair value resulting from:
Decrease in the anticipated date liquidity will return tothis market by six months 1.1%
Increase in the anticipated date liquidity will return tothis market by six months (1.1)%

We also perform an analysis to determine whether there has been a significant decrease in the volume and level of activity for the asset whencompared to normal market activity, and if so, whether transactions may not be orderly. Among the indicators we consider in determining whether asignificant decrease in the volume and level of market activity for a specific asset has occurred include the level of new issuances in the primarymarket, trading volume in the secondary market, level of credit spreads over historical levels, bid-ask spread, and price consensuses among marketparticipants and sources. If evidence indicates that prices are based on transactions that are not orderly, we place little, if any, weight on thetransaction price and will estimate fair value using an internal pricing model. As of December 31, 2010 and 2009, we did not alter fair values providedby our valuation service providers or brokers or substitute them with an internal pricing model.
The following table identifies fixed income and equity securities and short-term investments as of December 31, 2010 by source of fair valuedetermination:
For more detailed information on our accounting policy for the fair value of financial assets and the financial assets by level in the fair valuehierarchy, see Notes 2 and 5 of the consolidated financial statements.
Impairment of fixed income and equity securities For investments classified as available for sale, the difference between fair value andamortized cost for fixed income securities and cost for equity securities, net of certain other items and deferred income taxes (as disclosed in Note 4),is reported as a component of accumulated other comprehensive income on the Consolidated Statements of Financial Position and is not reflected inthe operating results of any period until reclassified to net income upon the consummation of a transaction with an unrelated third party or when awrite-down is recorded due to an other-than-temporary decline in fair value. We have a comprehensive portfolio monitoring process to identify andevaluate each fixed income and equity security whose carrying value may be other-than-temporarily impaired.
For each fixed income security in an unrealized loss position, we assess whether management with the appropriate authority has made thedecision to sell or whether it is more likely than not we will be required to sell the security before recovery of the amortized cost basis for reasons suchas liquidity, contractual or regulatory purposes. If a security meets either of these criteria, the security's decline in fair value is considered other thantemporary and is recorded in earnings.
If we have not made the decision to sell the fixed income security and it is not more likely than not we will be required to sell the fixed incomesecurity before recovery of its amortized cost basis, we evaluate whether we expect to receive cash flows sufficient to recover the entire amortized costbasis of the security. We use our best estimate of future cash flows expected to be collected from the fixed income security discounted at the security'soriginal or current effective rate, as appropriate, to calculate a recovery value and determine whether a credit loss exists. The determination of cashflow estimates is inherently subjective and methodologies may vary depending on facts and circumstances specific to the security. All reasonablyavailable information relevant to the collectability of the security, including past events, current conditions, and reasonable and supportableassumptions and forecasts, are considered when developing the estimate of cash flows expected to be collected. That information generally includes,but is not limited to, the remaining payment terms of the security, prepayment speeds, foreign exchange rates, the financial condition and futureearnings potential of the issue or issuer, expected defaults, expected recoveries, the value of underlying collateral, vintage, geographic concentration,available reserves or escrows, current subordination levels, third party guarantees and other credit enhancements. Other information, such as industryanalyst reports and forecasts, sector credit ratings, financial condition of the bond insurer for insured fixed income securities, and other market datarelevant to the realizability of contractual cash flows, may also be considered. The estimated fair value of collateral will be used to estimate recoveryvalue if we determine that the security is dependent on the liquidation of collateral for ultimate settlement. If the estimated recovery value is less thanthe amortized cost of the security, a credit loss exists and an other-than-temporary impairment for the difference between the estimated recovery valueand amortized cost is recorded in earnings. The portion of the unrealized loss related to factors other than credit remains classified in accumulatedother comprehensive income. If we determine that the fixed income security does not have sufficient cash
31
($ in millions) Fair
value Percentto total
Fair value based on internal sources $ 7,971 9.1%Fair value based on external sources (1) 79,731 90.9
Total $ 87,702 100.0%
Includes $4.20 billion that are valued using broker quotes.(1)

flow or other information to estimate a recovery value for the security, we may conclude that the entire decline in fair value is deemed to be creditrelated and the loss is recorded in earnings.
There are a number of assumptions and estimates inherent in evaluating impairments of equity securities and determining if they are other thantemporary, including: 1) our ability and intent to hold the investment for a period of time sufficient to allow for an anticipated recovery in value; 2) thelength of time and extent to which the fair value has been less than cost; 3) the financial condition, near-term and long-term prospects of the issue orissuer, including relevant industry specific market conditions and trends, geographic location and implications of rating agency actions and offeringprices; and 4) the specific reasons that a security is in an unrealized loss position, including overall market conditions which could affect liquidity.
Once assumptions and estimates are made, any number of changes in facts and circumstances could cause us to subsequently determine that afixed income or equity security is other-than-temporarily impaired, including: 1) general economic conditions that are worse than previously forecastedor that have a greater adverse effect on a particular issuer or industry sector than originally estimated; 2) changes in the facts and circumstancesrelated to a particular issue or issuer's ability to meet all of its contractual obligations; and 3) changes in facts and circumstances that result in changesto management's intent to sell or result in our assessment that it is more likely than not we will be required to sell before recovery of the amortized costbasis of a fixed income security or causes a change in our ability or intent to hold an equity security until it recovers in value. Changes in assumptions,facts and circumstances could result in additional charges to earnings in future periods to the extent that losses are realized. The charge to earnings,while potentially significant to net income, would not have a significant effect on shareholders' equity, since our securities are designated as availablefor sale and carried at fair value and as a result, any related unrealized loss, net of deferred income taxes and related DAC, deferred sales inducementcosts ("DSI") and reserves for life-contingent contract benefits, would already be reflected as a component of accumulated other comprehensiveincome in shareholders' equity.
The determination of the amount of other-than-temporary impairment is an inherently subjective process based on periodic evaluation of thefactors described above. Such evaluations and assessments are revised as conditions change and new information becomes available. We update ourevaluations regularly and reflect changes in other-than-temporary impairments in results of operations as such evaluations are revised. The use ofdifferent methodologies and assumptions in the determination of the amount of other-than-temporary impairments may have a material effect on theamounts presented within the consolidated financial statements.
For additional detail on investment impairments, see Note 4 of the consolidated financial statements.
Deferred policy acquisition costs amortization We incur significant costs in connection with acquiring insurance policies and investmentcontracts. In accordance with GAAP, costs that vary with and are primarily related to acquiring insurance policies and investment contracts aredeferred and recorded as an asset on the Consolidated Statements of Financial Position.
DAC related to property-liability contracts is amortized into income as premiums are earned, typically over periods of six or twelve months. Theamortization methodology for DAC related to Allstate Financial policies and contracts includes significant assumptions and estimates.
DAC related to traditional life insurance is amortized over the premium paying period of the related policies in proportion to the estimated revenueson such business. Significant assumptions relating to estimated premiums, investment returns, as well as mortality, persistency and expenses toadminister the business are established at the time the policy is issued and are generally not revised during the life of the policy. The assumptions fordetermining the timing and amount of DAC amortization are consistent with the assumptions used to calculate the reserve for life-contingent contractbenefits. Any deviations from projected business in force resulting from actual policy terminations differing from expected levels and any estimatedpremium deficiencies may result in a change to the rate of amortization in the period such events occur. Generally, the amortization periods for thesepolicies approximates the estimated lives of the policies. The recovery of DAC is dependent upon the future profitability of the business. Weperiodically review the adequacy of reserves and recoverability of DAC for these policies on an aggregate basis using actual experience. Weaggregate all traditional life insurance products and immediate annuities with life contingencies in the analysis. In the event actual experience issignificantly adverse compared to the original assumptions and a premium deficiency is determined to exist, any remaining unamortized DAC balancemust be expensed to the extent not recoverable and a premium deficiency reserve may be required if the remaining DAC balance is insufficient toabsorb the deficiency. In 2010 and 2009, our reviews concluded that no premium deficiency adjustments were necessary, primarily due to projectedprofit from traditional life insurance more than offsetting the projected losses in immediate
32

annuities with life contingencies. In 2008, for traditional life insurance and immediate annuities with life contingencies, an aggregate premiumdeficiency of $336 million pre-tax ($219 million after-tax) resulted primarily from a study indicating that the annuitants on certain life-contingentcontracts are projected to live longer than we anticipated when the contracts were issued and, to a lesser degree, a reduction in the related investmentportfolio yield. The deficiency was recorded through a reduction in DAC.
DAC related to interest-sensitive life, fixed annuities and other investment contracts is amortized in proportion to the incidence of the total presentvalue of gross profits, which includes both actual historical gross profits ("AGP") and estimated future gross profits ("EGP") expected to be earned overthe estimated lives of the contracts. The amortization is net of interest on the prior period DAC balance using rates established at the inception of thecontracts. Actual amortization periods generally range from 15-30 years; however, incorporating estimates of the rate of customer surrenders, partialwithdrawals and deaths generally results in the majority of the DAC being amortized during the surrender charge period, which is typically 10-20 yearsfor interest-sensitive life and 5-10 years for fixed annuities. The cumulative DAC amortization is reestimated and adjusted by a cumulative charge orcredit to results of operations when there is a difference between the incidence of actual versus expected gross profits in a reporting period or whenthere is a change in total EGP.
AGP and EGP consist primarily of the following components: contract charges for the cost of insurance less mortality costs and other benefits(benefit margin); investment income and realized capital gains and losses less interest credited (investment margin); and surrender and other contractcharges less maintenance expenses (expense margin). The principal assumptions for determining the amount of EGP are investment returns,including capital gains and losses on assets supporting contract liabilities, interest crediting rates to contractholders, and the effects of persistency,mortality, expenses, and hedges if applicable, and these assumptions are reasonably likely to have the greatest impact on the amount of DACamortization. Changes in these assumptions can be offsetting and we are unable to reasonably predict their future movements or offsetting impactsover time.
Each reporting period, DAC amortization is recognized in proportion to AGP for that period adjusted for interest on the prior period DAC balance.This amortization process includes an assessment of AGP compared to EGP, the actual amount of business remaining in force and realized capitalgains and losses on investments supporting the product liability. The impact of realized capital gains and losses on amortization of DAC depends uponwhich product liability is supported by the assets that give rise to the gain or loss. If the AGP is greater than EGP in the period, but the total EGP isunchanged, the amount of DAC amortization will generally increase, resulting in a current period decrease to earnings. The opposite result generallyoccurs when the AGP is less than the EGP in the period, but the total EGP is unchanged. However, when DAC amortization or a component of grossprofits for a quarterly period is potentially negative (which would result in an increase of the DAC balance) as a result of negative AGP, the specificfacts and circumstances surrounding the potential negative amortization are considered to determine whether it is appropriate for recognition in theconsolidated financial statements. Negative amortization is only recorded when the increased DAC balance is determined to be recoverable based onfacts and circumstances. Negative amortization was not recorded for certain fixed annuities during 2010, 2009 and 2008 periods in which significantcapital losses were realized on their related investment portfolio. For products whose supporting investments are exposed to capital losses in excessof our expectations which may cause periodic AGP to become temporarily negative, EGP and AGP utilized in DAC amortization may be modified toexclude the excess capital losses.
Annually, we review and update all assumptions underlying the projections of EGP, including investment returns, comprising investment incomeand realized capital gains and losses, interest crediting rates, persistency, mortality, expenses and the effect of any hedges. At each reporting period,we assess whether any revisions to assumptions used to determine DAC amortization are required. These reviews and updates may result inamortization acceleration or deceleration, which are commonly referred to as "DAC unlocking". If the update of assumptions causes total EGP toincrease, the rate of DAC amortization will generally decrease, resulting in a current period increase to earnings. A decrease to earnings generallyoccurs when the assumption update causes the total EGP to decrease.
Over the past three years, our most significant DAC assumption updates that resulted in a change to EGP and the amortization of DAC have beenrevisions to expected future investment returns, primarily realized capital losses, mortality, expenses and the number of contracts in force orpersistency. The following table provides the effect on DAC
33

amortization of changes in assumptions relating to the gross profit components of investment margin, benefit margin and expense margin during theyears ended December 31.
In 2010, DAC amortization deceleration related to changes in the investment margin component of EGP primarily related to interest-sensitive lifeinsurance and was due to higher than previously projected investment income and lower interest credited, partially offset by higher projected realizedcapital losses. The acceleration related to benefit margin was primarily due to lower projected renewal premium (which is also expected to reducepersistency) on interest-sensitive life insurance, partially offset by higher than previously projected revenues associated with variable life insurance dueto appreciation in the underlying separate account valuations. The deceleration related to expense margin resulted from current and expected expenselevels lower than previously projected. DAC amortization acceleration related to changes in the investment margin component of EGP in the firstquarter of 2009 was primarily due to an increase in the level of expected realized capital losses in 2009 and 2010. The deceleration related to benefitmargin was due to more favorable projected life insurance mortality. The acceleration related to expense margin resulted from current and expectedexpense levels higher than previously projected. DAC amortization acceleration related to changes in the investment margin component of EGP in2008 was primarily due to the level of realized capital losses impacting actual gross profits in 2008 and the impact of realized capital losses onexpected gross profits in 2009. The deceleration related to benefit margin was due to more favorable projected life insurance mortality. Theacceleration related to expense margin resulted from current and expected expense levels higher than previously projected.
The following table displays the sensitivity of reasonably likely changes in assumptions included in the gross profit components of investmentmargin or benefit margin to amortization of the DAC balance as of December 31, 2010.
Any potential changes in assumptions discussed above are measured without consideration of correlation among assumptions. Therefore, it wouldbe inappropriate to add them together in an attempt to estimate overall variability in amortization.
For additional detail related to DAC, see the Allstate Financial Segment section of this document.
Reserve for property-liability insurance claims and claims expense estimation Reserves are established to provide for the estimated costsof paying claims and claims expenses under insurance policies we have issued. Property-Liability underwriting results are significantly influenced byestimates of property-liability insurance claims and claims expense reserves. These reserves are an estimate of amounts necessary to settle alloutstanding claims, including claims that have been incurred but not reported ("IBNR"), as of the financial statement date.
Characteristics of reserves Reserves are established independently of business segment management for each business segment and line ofbusiness based on estimates of the ultimate cost to settle claims, less losses that have been paid. The significant lines of business are auto,homeowners, and other lines for Allstate Protection, and asbestos, environmental, and other discontinued lines for Discontinued Lines and Coverages.Allstate Protection's claims are typically reported promptly with relatively little reporting lag between the date of occurrence and the date the loss isreported. Auto and homeowners liability losses generally take an average of about two years to settle, while auto physical damage, homeownersproperty and other personal lines have an average settlement time of less than one year. Discontinued Lines and Coverages involve long-tail losses,such as those related to asbestos and environmental claims, which often involve substantial reporting lags and extended times to settle.
34
($ in millions) 2010 2009 2008 Investment margin $ 15 $ (399) $ (303)Benefit margin (45) 129 35 Expense margin 42 (7) (59)
Net deceleration (acceleration) $ 12 $ (277) $ (327)
($ in millions) December 31, 2010
Increase/(reduction) in DAC Increase in future investment margins of 25 basis points $ 70 Decrease in future investment margins of 25 basis points $ (78)
Decrease in future life mortality by 1% $ 19 Increase in future life mortality by 1% $ (20)

Reserves are the difference between the estimated ultimate cost of losses incurred and the amount of paid losses as of the reporting date.Reserves are estimated for both reported and unreported claims, and include estimates of all expenses associated with processing and settling allincurred claims. We update most of our reserve estimates quarterly and as new information becomes available or as events emerge that may affectthe resolution of unsettled claims. Changes in prior year reserve estimates (reserve reestimates), which may be material, are determined by comparingupdated estimates of ultimate losses to prior estimates, and the differences are recorded as property-liability insurance claims and claims expense inthe Consolidated Statements of Operations in the period such changes are determined. Estimating the ultimate cost of claims and claims expenses isan inherently uncertain and complex process involving a high degree of judgment and is subject to the evaluation of numerous variables.
The actuarial methods used to develop reserve estimates Reserve estimates are derived by using several different actuarial estimation methodsthat are variations on one primary actuarial technique. The actuarial technique is known as a "chain ladder" estimation process in which historical losspatterns are applied to actual paid losses and reported losses (paid losses plus individual case reserves established by claim adjusters) for anaccident year or a report year to create an estimate of how losses are likely to develop over time. An accident year refers to classifying claims basedon the year in which the claims occurred. A report year refers to classifying claims based on the year in which the claims are reported. Bothclassifications are used to prepare estimates of required reserves for payments to be made in the future. The key assumptions affecting our reserveestimates comprise data elements including claim counts, paid losses, case reserves, and development factors calculated with this data.
In the chain ladder estimation technique, a ratio (development factor) is calculated which compares current period results to results in the priorperiod for each accident year. A three-year or two-year average development factor, based on historical results, is usually multiplied by the currentperiod experience to estimate the development of losses of each accident year into the next time period. The development factors for the future timeperiods for each accident year are compounded over the remaining future periods to calculate an estimate of ultimate losses for each accident year.The implicit assumption of this technique is that an average of historical development factors is predictive of future loss development, as the significantsize of our experience data base achieves a high degree of statistical credibility in actuarial projections of this type. The effects of inflation are implicitlyconsidered in the reserving process, the implicit assumption being that a multi-year average development factor includes an adequate provision.Occasionally, unusual aberrations in loss patterns are caused by external and internal factors such as changes in claim reporting, settlement patterns,unusually large losses, process changes, legal or regulatory changes, and other influences. In these instances, analyses of alternate developmentfactor selections are performed to evaluate the effect of these factors and actuarial judgment is applied to make appropriate development factorassumptions needed to develop a best estimate of ultimate losses.
How reserve estimates are established and updated Reserve estimates are developed at a very detailed level, and the results of thesenumerous micro-level best estimates are aggregated to form a consolidated reserve estimate. For example, over one thousand actuarial estimates ofthe types described above are prepared each quarter to estimate losses for each line of insurance, major components of losses (such as coveragesand perils), major states or groups of states and for reported losses and IBNR. The actuarial methods described above are used to analyze thesettlement patterns of claims by determining the development factors for specific data elements that are necessary components of a reserveestimation process. Development factors are calculated quarterly for data elements such as claim counts reported and settled, paid losses, and paidlosses combined with case reserves. The calculation of development factors from changes in these data elements also impacts claim severity trends,which is a common industry reference used to explain changes in reserve estimates. The historical development patterns for these data elements areused as the assumptions to calculate reserve estimates.
Often, several different estimates are prepared for each detailed component, incorporating alternative analyses of changing claim settlementpatterns and other influences on losses, from which we select our best estimate for each component, occasionally incorporating additional analysesand actuarial judgment, as described above. These micro-level estimates are not based on a single set of assumptions. Actuarial judgments that maybe applied to these components of certain micro-level estimates generally do not have a material impact on the consolidated level of reserves.Moreover, this detailed micro-level process does not permit or result in a compilation of a company-wide roll up to generate a range of needed lossreserves that would be meaningful. Based on our review of these estimates, our best estimate of required reserves for each state/line/coveragecomponent is recorded for each accident year, and the required reserves for each component are summed to create the reserve balance carried onour Consolidated Statements of Financial Position.
35

Reserves are reestimated quarterly, by combining historical results with current actual results to calculate new development factors. This processincorporates the historic and latest actual trends, and other underlying changes in the data elements used to calculate reserve estimates. Newdevelopment factors are likely to differ from previous development factors used in prior reserve estimates because actual results (claims reported orsettled, losses paid, or changes to case reserves) occur differently than the implied assumptions contained in the previous development factorcalculations. If claims reported, paid losses, or case reserve changes are greater or less than the levels estimated by previous development factors,reserve reestimates increase or decrease. When actual development of these data elements is different than the historical development pattern usedin a prior period reserve estimate, a new reserve is determined. The difference between indicated reserves based on new reserve estimates andrecorded reserves (the previous estimate) is the amount of reserve reestimate and is recognized as an increase or decrease in property-liabilityinsurance claims and claims expense in the Consolidated Statements of Operations. Total Property-liability reserve reestimates, after-tax, as a percentof net income in 2010, 2009 and 2008 were 11.1%, 8.5%, and (6.6)%, respectively. For Property-Liability, the 3-year average of reserve reestimates asa percentage of total reserves was a favorable 0.2%, for Allstate Protection, the 3-year average of reserve estimates was a favorable 0.4% and forDiscontinued Lines and Coverages, the 3-year average of reserve reestimates was an unfavorable 1.2%, each of these results being consistent withina reasonable actuarial tolerance for our respective businesses. A more detailed discussion of reserve reestimates is presented in the Property-LiabilityClaims and Claims Expense Reserves section of this document.
The following table shows net claims and claims expense reserves by operating segment and line of business as of December 31:
Allstate Protection reserve estimates
Factors affecting reserve estimates Reserve estimates are developed based on the processes and historical development trends as previouslydescribed. These estimates are considered in conjunction with known facts and interpretations of circumstances and factors including our experiencewith similar cases, actual claims paid, differing payment patterns and pending levels of unpaid claims, loss management programs, product mix andcontractual terms, changes in law and regulation, judicial decisions, and economic conditions. When we experience changes of the type previouslymentioned, we may need to apply actuarial judgment in the determination and selection of development factors considered more reflective of the newtrends, such as combining shorter or longer periods of historical results with current actual results to produce development factors based on two-year,three-year, or longer development periods to reestimate our reserves. For example, if a legal change is expected to have a significant impact on thedevelopment of claim severity for a coverage which is part of a particular line of insurance in a specific state, actuarial judgment is applied to determineappropriate development factors that will most accurately reflect the expected impact on that specific estimate. Another example would be when achange in economic conditions is expected to affect the cost of repairs to damaged autos or property for a particular line, coverage, or state, actuarialjudgment is applied to determine appropriate development factors to use in the reserve estimate that will most accurately reflect the expected impactson severity development.
As claims are reported, for certain liability claims of sufficient size and complexity, the field adjusting staff establishes case reserve estimates ofultimate cost, based on their assessment of facts and circumstances related to each individual claim. For other claims which occur in large volumesand settle in a relatively short time frame, it is not practical or efficient to set case reserves for each claim, and a statistical case reserve is set for theseclaims based on estimation techniques previously described. In the normal course of business, we may also supplement our claims
36
($ in millions) 2010 2009 2008 Allstate Protection Auto $ 11,034 $ 10,606 $ 10,220 Homeowners 2,442 2,399 2,824 Other lines 2,141 2,145 2,207
Total Allstate Protection 15,617 15,150 15,251 Discontinued Lines and Coverages Asbestos 1,100 1,180 1,228 Environmental 201 198 195 Other discontinued lines 478 500 508
Total Discontinued Lines and Coverages 1,779 1,878 1,931
Total Property-Liability $ 17,396 $ 17,028 $ 17,182

processes by utilizing third party adjusters, appraisers, engineers, inspectors, and other professionals and information sources to assess and settlecatastrophe and non-catastrophe related claims.
Historically, the case reserves set by the field adjusting staff have not proven to be an entirely accurate estimate of the ultimate cost of claims. Toprovide for this, a development reserve is estimated using previously described processes, and allocated to pending claims as a supplement to casereserves. Typically, the case and supplemental development reserves comprise about 90% of total reserves.
Another major component of reserves is IBNR. Typically, IBNR comprises about 10% of total reserves.
Generally, the initial reserves for a new accident year are established based on severity assumptions for different business segments, lines andcoverages based on historical relationships to relevant inflation indicators, and reserves for prior accident years are statistically determined usingprocesses previously described. Changes in auto current year claim severity are generally influenced by inflation in the medical and auto repair sectorsof the economy. We mitigate these effects through various loss management programs. Injury claims are affected largely by medical cost inflation whilephysical damage claims are affected largely by auto repair cost inflation and used car prices. For auto physical damage coverages, we monitor ourrate of increase in average cost per claim against a weighted average of the Maintenance and Repair price index and the Parts and Equipment priceindex. We believe our claim settlement initiatives, such as improvements to the claim review and settlement process, the use of special investigativeunits to detect fraud and handle suspect claims, litigation management and defense strategies, as well as various other loss management initiativesunderway, contribute to the mitigation of injury and physical damage severity trends.
Changes in homeowners current year claim severity are generally influenced by inflation in the cost of building materials, the cost of constructionand property repair services, the cost of replacing home furnishings and other contents, the types of claims that qualify for coverage, deductibles andother economic and environmental factors. We employ various loss management programs to mitigate the effect of these factors.
As loss experience for the current year develops for each type of loss, it is monitored relative to initial assumptions until it is judged to havesufficient statistical credibility. From that point in time and forward, reserves are reestimated using statistical actuarial processes to reflect the impactactual loss trends have on development factors incorporated into the actuarial estimation processes. Statistical credibility is usually achieved by theend of the first calendar year; however, when trends for the current accident year exceed initial assumptions sooner, they are usually determined to becredible, and reserves are increased accordingly.
The very detailed processes for developing reserve estimates, and the lack of a need and existence of a common set of assumptions ordevelopment factors, limits aggregate reserve level testing for variability of data elements. However, by applying standard actuarial methods toconsolidated historic accident year loss data for major loss types, comprising auto injury losses, auto physical damage losses and homeowner losses,we develop variability analyses consistent with the way we develop reserves by measuring the potential variability of development factors, asdescribed in the section titled "Potential Reserve Estimate Variability" below.
Causes of reserve estimate uncertainty Since reserves are estimates of unpaid portions of claims and claims expenses that have occurred,including IBNR losses, the establishment of appropriate reserves, including reserves for catastrophes, requires regular reevaluation and refinement ofestimates to determine our ultimate loss estimate.
At each reporting date, the highest degree of uncertainty in estimates of losses arises from claims remaining to be settled for the current accidentyear and the most recent preceding accident year. The greatest degree of uncertainty exists in the current accident year because the current accidentyear contains the greatest proportion of losses that have not been reported or settled but must be estimated as of the current reporting date. Most ofthese losses relate to damaged property such as automobiles and homes, and medical care for injuries from accidents. During the first year after theend of an accident year, a large portion of the total losses for that accident year are settled. When accident year losses paid through the end of the firstyear following the initial accident year are incorporated into updated actuarial estimates, the trends inherent in the settlement of claims emerge moreclearly. Consequently, this is the point in time at which we tend to make our largest reestimates of losses for an accident year. After the second year,the losses that we pay for an accident year typically relate to claims that are more difficult to settle, such as those involving serious injuries or litigation.Private passenger auto insurance provides a good illustration of the uncertainty of future loss estimates: our typical annual percentage payout ofreserves for an accident year is approximately 45% in the first year after the end of the accident year, 20% in the second year, 15% in the third year,10% in the fourth year, and the remaining 10% thereafter.
37

Reserves for catastrophe losses Property-Liability claims and claims expense reserves also include reserves for catastrophe losses.Catastrophe losses are an inherent risk of the property-liability insurance industry that have contributed, and will continue to contribute, to potentiallymaterial year-to-year fluctuations in our results of operations and financial position. We define a "catastrophe" as an event that produces pre-tax lossesbefore reinsurance in excess of $1 million and involves multiple first party policyholders, or an event that produces a number of claims in excess of apreset, per-event threshold of average claims in a specific area, occurring within a certain amount of time following the event. Catastrophes are causedby various natural events including high winds, winter storms, tornadoes, hailstorms, wildfires, tropical storms, hurricanes, earthquakes and volcanoes.We are also exposed to man-made catastrophic events, such as certain acts of terrorism or industrial accidents. The nature and level of catastrophesin any period cannot be predicted.
The estimation of claims and claims expense reserves for catastrophes also comprises estimates of losses from reported claims and IBNR,primarily for damage to property. In general, our estimates for catastrophe reserves are based on claim adjuster inspections and the application ofhistorical loss development factors as described previously. However, depending on the nature of the catastrophe, as noted above, the estimationprocess can be further complicated. For example, for hurricanes, complications could include the inability of insureds to promptly report losses,limitations placed on claims adjusting staff affecting their ability to inspect losses, determining whether losses are covered by our homeowners policy(generally for damage caused by wind or wind driven rain) or specifically excluded coverage caused by flood, estimating additional living expenses,and assessing the impact of demand surge, exposure to mold damage, and the effects of numerous other considerations, including the timing of acatastrophe in relation to other events, such as at or near the end of a financial reporting period, which can affect the availability of information neededto estimate reserves for that reporting period. In these situations, we may need to adapt our practices to accommodate these circumstances in order todetermine a best estimate of our losses from a catastrophe. As an example, in 2005 to complete an estimate for certain areas affected by HurricaneKatrina and not yet inspected by our claims adjusting staff, or where we believed our historical loss development factors were not predictive, we reliedon analysis of actual claim notices received compared to total PIF, as well as visual, governmental and third party information, including aerial photos,area observations, and data on wind speed and flood depth to the extent available.
Potential reserve estimate variability The aggregation of numerous micro-level estimates for each business segment, line of insurance, majorcomponents of losses (such as coverages and perils), and major states or groups of states for reported losses and IBNR forms the reserve liabilityrecorded in the Consolidated Statements of Financial Position. Because of this detailed approach to developing our reserve estimates, there is not asingle set of assumptions that determine our reserve estimates at the consolidated level. Given the numerous micro-level estimates for reported lossesand IBNR, management does not believe the processes that we follow will produce a statistically credible or reliable actuarial reserve range that wouldbe meaningful. Reserve estimates, by their very nature, are very complex to determine and subject to significant judgment, and do not represent anexact determination for each outstanding claim. Accordingly, as actual claims, and/or paid losses, and/or case reserve results emerge, our estimate ofthe ultimate cost to settle will be different than previously estimated.
To develop a statistical indication of potential reserve variability within reasonably likely possible outcomes, an actuarial technique (stochasticmodeling) is applied to the countrywide consolidated data elements for paid losses and paid losses combined with case reserves separately for injurylosses, auto physical damage losses, and homeowners losses excluding catastrophe losses. Based on the combined historical variability of thedevelopment factors calculated for these data elements, an estimate of the standard error or standard deviation around these reserve estimates iscalculated within each accident year for the last eleven years for each type of loss. The variability of these reserve estimates within one standarddeviation of the mean (a measure of frequency of dispersion often viewed to be an acceptable level of accuracy) is believed by management torepresent a reasonable and statistically probable measure of potential variability. Based on our products and coverages, historical experience, thestatistical credibility of our extensive data and stochastic modeling of actuarial chain ladder methodologies used to develop reserve estimates, weestimate that the potential variability of our Allstate Protection reserves, excluding reserves for catastrophe losses, within a reasonable probability ofother possible outcomes, may be approximately plus or minus 4%, or plus or minus $425 million in net income. A lower level of variability exists forauto injury losses, which comprise approximately 75% of reserves, due to their relatively stable development patterns over a longer duration of timerequired to settle claims. Other types of losses, such as auto physical damage, homeowners losses and other losses, which comprise about 25% ofreserves, tend to have greater variability but are settled in a much shorter period of time. Although this evaluation reflects most reasonably likelyoutcomes, it is possible the final outcome may fall below or above these amounts. Historical variability of reserve estimates is reported in the Property-Liability Claims and Claims Expense Reserves section of this document.
38

Adequacy of reserve estimates We believe our net claims and claims expense reserves are appropriately established based on availablemethodology, facts, technology, laws and regulations. We calculate and record a single best reserve estimate, in conformance with generally acceptedactuarial standards, for each line of insurance, its components (coverages and perils) and state, for reported losses and for IBNR losses, and as aresult we believe that no other estimate is better than our recorded amount. Due to the uncertainties involved, the ultimate cost of losses may varymaterially from recorded amounts, which are based on our best estimates.
Discontinued Lines and Coverages reserve estimates
Characteristics of Discontinued Lines exposure We continue to receive asbestos and environmental claims. Asbestos claims relate primarily tobodily injuries asserted by people who were exposed to asbestos or products containing asbestos. Environmental claims relate primarily to pollutionand related clean-up costs.
Our exposure to asbestos, environmental and other discontinued lines claims arises principally from assumed reinsurance coverage written duringthe 1960s through the mid-1980s, including reinsurance on primary insurance written on large U.S. companies, and from direct excess insurancewritten from 1972 through 1985, including substantial excess general liability coverages on large U.S. companies. Additional exposure stems fromdirect primary commercial insurance written during the 1960s through the mid-1980s. Other discontinued lines exposures primarily relate to generalliability and product liability mass tort claims, such as those for medical devices and other products.
In 1986, the general liability policy form used by us and others in the property-liability industry was amended to introduce an "absolute pollutionexclusion," which excluded coverage for environmental damage claims, and to add an asbestos exclusion. Most general liability policies issued prior to1987 contain annual aggregate limits for product liability coverage. General liability policies issued in 1987 and thereafter contain annual aggregatelimits for product liability coverage and annual aggregate limits for all coverages. Our experience to date is that these policy form changes have limitedthe extent of our exposure to environmental and asbestos claim risks.
Our exposure to liability for asbestos, environmental and other discontinued lines losses manifests differently depending on whether it arises fromassumed reinsurance coverage, direct excess insurance or direct primary commercial insurance. The direct insurance coverage we provided thatcovered asbestos, environmental and other discontinued lines was substantially "excess" in nature.
Direct excess insurance and reinsurance involve coverage written by us for specific layers of protection above retentions and other insuranceplans. The nature of excess coverage and reinsurance provided to other insurers limits our exposure to loss to specific layers of protection in excess ofpolicyholder retention on primary insurance plans. Our exposure is further limited by the significant reinsurance that we had purchased on our directexcess business.
Our assumed reinsurance business involved writing generally small participations in other insurers' reinsurance programs. The reinsured losses inwhich we participate may be a proportion of all eligible losses or eligible losses in excess of defined retentions. The majority of our assumedreinsurance exposure, approximately 85%, is for excess of loss coverage, while the remaining 15% is for pro-rata coverage.
Our direct primary commercial insurance business did not include coverage to large asbestos manufacturers. This business comprises a crosssection of policyholders engaged in many diverse business sectors located throughout the country.
How reserve estimates are established and updated We conduct an annual review in the third quarter to evaluate and establish asbestos,environmental and other discontinued lines reserves. Changes to reserves are recorded in the reporting period in which they are determined. Usingestablished industry and actuarial best practices and assuming no change in the regulatory or economic environment, this detailed and comprehensivemethodology determines asbestos reserves based on assessments of the characteristics of exposure (i.e. claim activity, potential liability, jurisdiction,products versus non-products exposure) presented by individual policyholders, and determines environmental reserves based on assessments of thecharacteristics of exposure (i.e. environmental damages, respective shares of liability of potentially responsible parties, appropriateness and cost ofremediation) to pollution and related clean-up costs. The number and cost of these claims is affected by intense advertising by trial lawyers seekingasbestos plaintiffs, and entities with asbestos exposure seeking bankruptcy protection as a result of asbestos liabilities, initially causing a delay in thereporting of claims, often followed by an acceleration and an increase in claims and claims expenses as settlements occur.
After evaluating our insureds' probable liabilities for asbestos and/or environmental claims, we evaluate our insureds' coverage programs for suchclaims. We consider our insureds' total available insurance coverage, including
39

the coverage we issued. We also consider relevant judicial interpretations of policy language and applicable coverage defenses or determinations, ifany.
Evaluation of both the insureds' estimated liabilities and our exposure to the insureds depends heavily on an analysis of the relevant legal issuesand litigation environment. This analysis is conducted by our specialized claims adjusting staff and legal counsel. Based on these evaluations, casereserves are established by claims adjusting staff and actuarial analysis is employed to develop an IBNR reserve, which includes estimated potentialreserve development and claims that have occurred but have not been reported. As of December 31, 2010 and 2009, IBNR was 60.1% and 62.3%,respectively, of combined asbestos and environmental reserves.
For both asbestos and environmental reserves, we also evaluate our historical direct net loss and expense paid and incurred experience to assessany emerging trends, fluctuations or characteristics suggested by the aggregate paid and incurred activity.
Other Discontinued Lines and Coverages The following table shows reserves for other discontinued lines which provide for remaining loss andloss expense liabilities related to business no longer written by us, other than asbestos and environmental, as of December 31.
Other mass torts describes direct excess and reinsurance general liability coverage provided for cumulative injury losses other than asbestos andenvironmental. Workers' compensation and commercial and other include run-off from discontinued direct primary, direct excess and reinsurancecommercial insurance operations of various coverage exposures other than asbestos and environmental. Reserves are based on considerationssimilar to those previously described, as they relate to the characteristics of specific individual coverage exposures.
Potential reserve estimate variability Establishing Discontinued Lines and Coverages net loss reserves for asbestos, environmental and otherdiscontinued lines claims is subject to uncertainties that are much greater than those presented by other types of claims. Among the complications arelack of historical data, long reporting delays, uncertainty as to the number and identity of insureds with potential exposure and unresolved legal issuesregarding policy coverage; unresolved legal issues regarding the determination, availability and timing of exhaustion of policy limits; plaintiffs' evolvingand expanding theories of liability; availability and collectability of recoveries from reinsurance; retrospectively determined premiums and othercontractual agreements; estimates of the extent and timing of any contractual liability; the impact of bankruptcy protection sought by various asbestosproducers and other asbestos defendants; and other uncertainties. There are also complex legal issues concerning the interpretation of variousinsurance policy provisions and whether those losses are covered, or were ever intended to be covered, and could be recoverable throughretrospectively determined premium, reinsurance or other contractual agreements. Courts have reached different and sometimes inconsistentconclusions as to when losses are deemed to have occurred and which policies provide coverage; what types of losses are covered; whether there isan insurer obligation to defend; how policy limits are determined; how policy exclusions and conditions are applied and interpreted; and whether clean-up costs represent insured property damage. Our reserves for asbestos and environmental exposures could be affected by tort reform, class actionlitigation, and other potential legislation and judicial decisions. Environmental exposures could also be affected by a change in the existing federalSuperfund law and similar state statutes. There can be no assurance that any reform legislation will be enacted or that any such legislation will providefor a fair, effective and cost-efficient system for settlement of asbestos or environmental claims. We believe these issues are not likely to be resolved inthe near future, and the ultimate costs may vary materially from the amounts currently recorded resulting in material changes in loss reserves.Historical variability of reserve estimates is demonstrated in the Property-Liability Claims and Claims Expense Reserves section of this document.
Adequacy of reserve estimates Management believes its net loss reserves for environmental, asbestos and other discontinued lines exposuresare appropriately established based on available facts, technology, laws, regulations, and assessments of other pertinent factors and characteristics ofexposure (i.e. claim activity, potential liability, jurisdiction, products versus non-products exposure) presented by individual policyholders, assuming nochange in the legal, legislative or economic environment. Due to the uncertainties and factors described above, management believes it is notpracticable to develop a meaningful range for any such additional net loss reserves that may be required.
40
($ in millions) 2010 2009 2008 Other mass torts $ 188 $ 201 $ 177 Workers' compensation 116 122 130 Commercial and other 174 177 201
Other discontinued lines $ 478 $ 500 $ 508

Further discussion of reserve estimates For further discussion of these estimates and quantification of the impact of reserve estimates, reservereestimates and assumptions, see Notes 7 and 13 to the consolidated financial statements and the Property-Liability Claims and Claims ExpenseReserves section of this document.
Reserve for life-contingent contract benefits estimation Due to the long term nature of traditional life insurance, life-contingent immediateannuities and voluntary health products, benefits are payable over many years; accordingly, the reserves are calculated as the present value of futureexpected benefits to be paid, reduced by the present value of future expected net premiums. Long-term actuarial assumptions of future investmentyields, mortality, morbidity, policy terminations and expenses are used when establishing the reserve for life-contingent contract benefits payable underthese insurance policies. These assumptions, which for traditional life insurance are applied using the net level premium method, include provisions foradverse deviation and generally vary by characteristics such as type of coverage, year of issue and policy duration. Future investment yieldassumptions are determined based upon prevailing investment yields as well as estimated reinvestment yields. Mortality, morbidity and policytermination assumptions are based on our experience and industry experience. Expense assumptions include the estimated effects of inflation andexpenses to be incurred beyond the premium-paying period. These assumptions are established at the time the policy is issued, are consistent withassumptions for determining DAC amortization for these policies, and are generally not changed during the policy coverage period. However, if actualexperience emerges in a manner that is significantly adverse relative to the original assumptions, adjustments to DAC or reserves may be requiredresulting in a charge to earnings which could have a material adverse effect on our operating results and financial condition. We periodically review theadequacy of reserves and recoverability of DAC for these policies on an aggregate basis using actual experience. In the event actual experience issignificantly adverse compared to the original assumptions and a premium deficiency is determined to exist, any remaining unamortized DAC balancemust be expensed to the extent not recoverable and the establishment of a premium deficiency reserve may be required. In 2010 and 2009, ourreviews concluded that no premium deficiency adjustments were necessary, primarily due to profit from traditional life insurance more than offsettingthe projected losses in immediate annuities with life contingencies. In 2008, for traditional life insurance and immediate annuities with lifecontingencies, an aggregate premium deficiency of $336 million pre-tax ($219 million after-tax) resulted primarily from a study indicating that theannuitants on certain life-contingent contracts are projected to live longer than we anticipated when the contracts were issued and, to a lesser degree,a reduction in the related investment portfolio yield. The deficiency was recorded through a reduction in DAC. We will continue to monitor theexperience of our traditional life insurance and immediate annuities. We anticipate that mortality, investment and reinvestment yields, and policyterminations are the factors that would be most likely to require premium deficiency adjustments to these reserves or related DAC.
For further detail on the reserve for life-contingent contract benefits, see Note 8 of the consolidated financial statements.
PROPERTY-LIABILITY 2010 HIGHLIGHTS
• Premiums written, an operating measure that is defined and reconciled to premiums earned in the Property-Liability Operations section of theMD&A, decreased 0.2% to $25.91 billion in 2010 from $25.97 billion in 2009.
– Allstate brand standard auto premiums written increased 0.5% to $15.84 billion in 2010 from $15.76 billion in 2009.– Allstate brand homeowners premiums written increased 2.1% to $5.75 billion in 2010 from $5.64 billion in 2009.– Encompass brand premiums written decreased 17.5% to $1.10 billion in 2010 from $1.33 billion in 2009.
• Premium operating measures and statistics contributing to overall Allstate brand standard auto premiums written increase were the following:
– 1.5% decrease in PIF as of December 31, 2010 compared to December 31, 2009– 2.1% increase in the six month policy term average gross premium before reinsurance to $443 in 2010 from $434 in 2009– 0.2 point decrease in the six month renewal ratio to 88.7% in 2010 compared to 88.9% in 2009– 0.2% decrease in new issued applications in 2010 compared to 2009
• Premium operating measures and statistics contributing to overall Allstate brand homeowners premiums written increase were the following:
– 4.1% decrease in PIF as of December 31, 2010 compared to December 31, 2009– 6.8% increase in the twelve month policy term average gross premium before reinsurance to $943 in 2010 from $883 in 2009– 0.3 point increase in the twelve month renewal ratio to 88.4% in 2010 compared to 88.1% in 2009– 3.6% decrease in new issued applications in 2010 compared to 2009– $27 million decrease in catastrophe reinsurance costs to $534 million in 2010 from $561 million in 2009
41

• Factors comprising the Allstate brand standard auto loss ratio increase of 1.4 points to 70.7 in 2010 from 69.3 in 2009 were the following:
– 2.0% increase in standard auto claim frequency for property damage in 2010 compared to 2009– 6.2% increase in standard auto claim frequency for bodily injury in 2010 compared to 2009– 0.5% decrease in auto paid claim severities for property damage in 2010 compared to 2009– 0.3% decrease in auto paid claim severities for bodily injury in 2010 compared to 2009
• Factors comprising the Allstate brand homeowners loss ratio, which includes catastrophes, increase of 2.5 points to 82.1 in 2010 from 79.6 in2009 were the following:
– 2.3 point increase in the effect of catastrophe losses to 31.3 points in 2010 compared to 29.0 points in 2009– 1.1% decrease in homeowner claim frequency, excluding catastrophes, in 2010 compared to 2009– 1.6% increase in paid claim severity, excluding catastrophes, in 2010 compared to 2009
• Factors comprising the $138 million increase in catastrophe losses to $2.21 billion in 2010 compared to $2.07 billion in 2009 were the following:
– 90 events with losses of $2.37 billion in 2010 compared to 82 events with losses of $2.24 billion in 2009– $163 million favorable prior year reserve reestimates in 2010 compared to $169 million favorable reserve reestimates in 2009
• Factors comprising prior year reserve reestimates of $159 million favorable in 2010 compared to $112 million favorable in 2009 included:
– prior year reserve reestimates related to auto, homeowners and other personal lines in 2010 contributed $179 million favorable,$23 million favorable and $15 million unfavorable, respectively, compared to prior year reserve reestimates in 2009 of $57 millionfavorable, $168 million favorable and $89 million unfavorable, respectively
– prior year reestimates in 2010 are attributable to favorable prior year catastrophe reestimates and severity development that was betterthan expected, partially offset by litigation settlements
• Property-Liability underwriting income was $495 million in 2010 compared to $995 million in 2009. Underwriting income, a measure not basedon GAAP, is defined below.
• Property-Liability investments as of December 31, 2010 were $35.05 billion, an increase of 1.5% from $34.53 billion as of December 31, 2009.Net investment income was $1.19 billion in 2010, a decrease of 10.5% from $1.33 billion in 2009.
• Net realized capital losses were $321 million in 2010 compared to $168 million in 2009.
PROPERTY-LIABILITY OPERATIONS
Overview Our Property-Liability operations consist of two business segments: Allstate Protection and Discontinued Lines and Coverages. AllstateProtection comprises two brands, the Allstate brand and Encompass® brand. Allstate Protection is principally engaged in the sale of personal propertyand casualty insurance, primarily private passenger auto and homeowners insurance, to individuals in the United States and Canada. DiscontinuedLines and Coverages includes results from insurance coverage that we no longer write and results for certain commercial and other businesses in run-off. These segments are consistent with the groupings of financial information that management uses to evaluate performance and to determine theallocation of resources.
Underwriting income, a measure that is not based on GAAP and is reconciled to net income below, is calculated as premiums earned, less claimsand claims expense ("losses"), amortization of DAC, operating costs and expenses and restructuring and related charges, as determined using GAAP.We use this measure in our evaluation of results of operations to analyze the profitability of the Property-Liability insurance operations separately frominvestment results. It is also an integral component of incentive compensation. It is useful for investors to evaluate the components of incomeseparately and in the aggregate when reviewing performance. Net income is the GAAP measure most directly comparable to underwriting income.Underwriting income should not be considered as a substitute for net income and does not reflect the overall profitability of the business.
The table below includes GAAP operating ratios we use to measure our profitability. We believe that they enhance an investor's understanding ofour profitability. They are calculated as follows:
• Claims and claims expense ("loss") ratio – the ratio of claims and claims expense to premiums earned. Loss ratios include the impact ofcatastrophe losses.
• Expense ratio – the ratio of amortization of DAC, operating costs and expenses, and restructuring and related charges to premiums earned.• Combined ratio – the ratio of claims and claims expense, amortization of DAC, operating costs and expenses, and restructuring and related
charges to premiums earned. The combined ratio is the sum of the loss ratio and the
42

expense ratio. The difference between 100% and the combined ratio represents underwriting income as a percentage of premiums earned, orunderwriting margin.
We have also calculated the following impacts of specific items on the GAAP operating ratios because of the volatility of these items betweenfiscal periods.
• Effect of catastrophe losses on combined ratio – the percentage of catastrophe losses included in claims and claims expense to premiumsearned. This ratio includes prior year reserve reestimates of catastrophe losses.
• Effect of prior year reserve reestimates on combined ratio – the percentage of prior year reserve reestimates included in claims and claimsexpense to premiums earned. This ratio includes prior year reserve reestimates of catastrophe losses.
• Effect of restructuring and related charges on combined ratio – the percentage of restructuring and related charges to premiums earned.• Effect of Discontinued Lines and Coverages on combined ratio – the ratio of claims and claims expense and other costs and expenses in the
Discontinued Lines and Coverages segment to Property-Liability premiums earned. The sum of the effect of Discontinued Lines and Coverageson the combined ratio and the Allstate Protection combined ratio is equal to the Property-Liability combined ratio.
43

Summarized financial data, a reconciliation of underwriting income to net income, and GAAP operating ratios for our Property-Liability operationsare presented in the following table.
ALLSTATE PROTECTION SEGMENT
Overview and strategy The Allstate Protection segment sells primarily private passenger auto and homeowners insurance to individualsthrough Allstate Exclusive Agencies and directly through call centers and the internet under the Allstate brand. We also sell auto and homeownersinsurance through independent agencies under both the Allstate brand and the Encompass brand.
Our operating priorities for the Protection segment include achieving profitable market share growth for our auto business as well as earningacceptable returns on our homeowners business. Key goals include:
• Improving customer loyalty and retention• Deepening customer product relationships• Improving competitive position through pricing sophistication, claims efficiency and expense management
44
($ in millions, except ratios) 2010 2009 2008 Premiums written $ 25,907 $ 25,971 $ 26,584
Revenues Premiums earned $ 25,957 $ 26,194 $ 26,967 Net investment income 1,189 1,328 1,674 Realized capital gains and losses (321) (168) (1,858)
Total revenues 26,825 27,354 26,783
Costs and expenses Claims and claims expense (18,951) (18,746) (20,064)Amortization of DAC (3,678) (3,789) (3,975)Operating costs and expenses (2,800) (2,559) (2,742)Restructuring and related charges (33) (105) (22)
Total costs and expenses (25,462) (25,199) (26,803)
Gain on disposition of operations 5 — — Income tax (expense) benefit (314) (612) 248
Net income $ 1,054 $ 1,543 $ 228
Underwriting income $ 495 $ 995 $ 164 Net investment income 1,189 1,328 1,674 Income tax expense on operations (426) (558) (401)Realized capital gains and losses, after-tax (207) (222) (1,209)Gain on disposition of operations, after-tax 3 — —
Net income $ 1,054 $ 1,543 $ 228
Catastrophe losses (1) $ 2,207 $ 2,069 $ 3,342
GAAP operating ratios Claims and claims expense ratio 73.0 71.6 74.4 Expense ratio 25.1 24.6 25.0
Combined ratio 98.1 96.2 99.4
Effect of catastrophe losses on combined ratio (1) 8.5 7.9 12.4
Effect of prior year reserve reestimates on combined ratio (1) (0.6) (0.4) 0.7
Effect of restructuring and related charges on combined ratio 0.1 0.4 0.1
Effect of Discontinued Lines and Coverages on combined ratio 0.1 0.1 0.1
Prior year reserve reestimates included in catastrophe losses totaled $163 million favorable in 2010, $169 million favorable in 2009 and $125 millionunfavorable in 2008.
(1)

• Investing in the effectiveness and reach of our multiple distribution channels• Maintaining a strong capital foundation through risk management and effective resource allocation
Our customer-focused strategy for the Allstate brand aligns targeted marketing, product innovation, distribution effectiveness, and pricing towardacquiring and retaining an increased share of our target customers, which generally refers to consumers who want to purchase multiple products fromone insurance provider including auto, homeowners and financial products, who have better retention and potentially present more favorable prospectsfor profitability over the course of their relationships with us.
The Allstate brand utilizes marketing delivered to target customers to promote our strategic priorities, with messaging that continues tocommunicate affordability and ease of doing business with Allstate, as well as the importance of having proper coverage by highlighting ourcomprehensive product and coverage options.
At Allstate we differentiate ourselves from competitors by offering a comprehensive range of innovative product options and features as well asproduct customization, including Allstate Your Choice Auto® with options such as accident forgiveness, safe driving deductible rewards and a safedriving bonus. We will continue to focus on developing and introducing products and services that benefit today's consumers and further differentiateAllstate and enhance the customer experience. We will deepen customer relationships through value-added customer interactions and expanding ourpresence in households with multiple products by providing financial protection for customer needs.
Within our multiple distribution channels we are undergoing a focused effort to enhance our capabilities by implementing uniform processes andstandards to elevate the level and consistency of our customer experience.
We continue to enhance technology to integrate our distribution channels, improve customer service, facilitate the introduction of new productsand services and reduce infrastructure costs related to supporting agencies and handling claims. These actions and others are designed to optimizethe effectiveness of our distribution and service channels by increasing the productivity of the Allstate brand's exclusive agencies and our directchannel.
Our pricing and underwriting strategies and decisions, made in conjunction within a program called Strategic Risk Management, are designed toenhance both our competitive position and our profit potential. Pricing sophistication, which underlies our Strategic Risk Management program, uses anumber of risk evaluation factors including insurance scoring, to the extent permissible by regulations, based on information that is obtained from creditreports. Our updated auto risk evaluation pricing model was implemented for 9 states in 2010 and these implementations will continue in other statesthroughout 2011. Our pricing strategy involves marketplace pricing and underwriting decisions that are based on these risk evaluation models and anevaluation of competitors.
We will also continue to provide a range of discounts to attract more target customers. For Allstate brand auto and homeowners business, wecontinue to improve our mix of customers towards those customers that have better retention and thus potentially present more favorable prospects forprofitability over the course of their relationships with us. For homeowners, we will address rate adequacy and improve underwriting and claimeffectiveness.
Our strategy for the Encompass brand includes enhancing our premier package policy (providing customers with the ability to simplify theirinsurance needs by consolidating their coverage into one policy, with one bill, one premium and one renewal date) to appeal to customers with broadpersonal lines coverage needs and that value an independent agent. Additionally, Encompass is focused on increasing distribution effectiveness andimproving agency technology interfaces to become the package carrier of choice for aligned agencies to generate stable, consistent earnings growth.
The Allstate Protection segment also includes a separate organization called Emerging Businesses which comprises Business Insurance(commercial products for small business owners), Consumer Household (specialty products including motorcycle, boat, renters and condominiuminsurance policies), Allstate Dealer Services (insurance and non-insurance products sold primarily to auto dealers), Allstate Roadside Services (retailand wholesale roadside assistance products) and Ivantage (insurance agency). Premiums written by Emerging Businesses, through all channelsincluding the direct channel, were $2.43 billion in 2010. We expect to accelerate profitable growth in Emerging Businesses during 2011.
We continue to manage our property catastrophe exposure in order to provide our shareholders an acceptable return on the risks assumed in ourproperty business and to reduce the variability of our earnings, while providing protection to our customers. Our property business includes personalhomeowners, commercial property and other property lines. As of December 31, 2010, we continue to be within our goal to have no more than a 1%likelihood of exceeding annual aggregate catastrophe losses by $2 billion, net of reinsurance, from hurricanes and earthquakes, based on modeledassumptions and applications currently available. The use of different assumptions and updates to industry models could materially change theprojected loss.
45

Property catastrophe exposure management includes purchasing reinsurance to provide coverage for known exposure to hurricanes,earthquakes, wildfires, fires following earthquakes and other catastrophes. We are also working for changes in the regulatory environment, includingrecognizing the need for and improving appropriate risk based pricing and promoting the creation of government sponsored, privately funded solutionsfor mega-catastrophes. While the actions that we take will be primarily focused on reducing the catastrophe exposure in our property business, wealso consider their impact on our ability to market our auto lines.
Pricing of property products is typically intended to establish returns that we deem acceptable over a long-term period. Losses, including lossesfrom catastrophic events and weather-related losses (such as wind, hail, lightning and freeze losses not meeting our criteria to be declared acatastrophe) are accrued on an occurrence basis within the policy period. Therefore, in any reporting period, loss experience from catastrophic eventsand weather-related losses may contribute to negative or positive underwriting performance relative to the expectations we incorporated into theproducts' pricing. We pursue rate increases where indicated using a newly re-designed methodology that appropriately addresses the changing costsof losses from catastrophes such as severe weather and the net cost of reinsurance.
Allstate Protection outlook
• Allstate Protection will emphasize attracting and retaining our target customers while maintaining pricing discipline.• We expect that volatility in the level of catastrophes we experience will contribute to variation in our underwriting results; however, this
volatility will be mitigated due to our catastrophe management actions, including the purchase of reinsurance.• We will continue to study the efficiencies of our operations and cost structure for additional areas where costs may be reduced.
Premiums written, an operating measure, is the amount of premiums charged for policies issued during a fiscal period. Premiums earned is aGAAP measure. Premiums are considered earned and are included in the financial results on a pro-rata basis over the policy period. The portion ofpremiums written applicable to the unexpired terms of the policies is recorded as unearned premiums on our Consolidated Statements of FinancialPosition. Since the Allstate brand policy periods are typically 6 months for auto and 12 months for homeowners, and the Encompass standard autoand homeowners policy periods are typically 12 months and non-standard auto policy periods are typically 6 months, rate changes will generally berecognized in premiums earned over a period of 6 to 24 months.
The following table shows the unearned premium balance as of December 31 and the timeframe in which we expect to recognize these premiumsas earned.
46
($ in millions) % earned after 2010 2009 90 days 180 days 270 days 360 days Allstate brand: Standard auto $ 4,103 $ 4,060 72.8% 97.7% 99.4% 100.0%Non-standard auto 239 250 69.5% 95.4% 99.0% 100.0%Homeowners 3,259 3,193 43.5% 75.6% 94.2% 100.0%Other personal lines (1) 1,276 1,295 40.0% 69.7% 87.9% 94.8%
Total Allstate brand 8,877 8,798 57.3% 85.6% 95.9% 99.2%
Encompass brand: Standard auto 327 399 44.0% 75.7% 94.2% 100.0%Non-standard auto 1 4 75.9% 100.0% 100.0% 100.0%Homeowners 206 233 44.0% 76.0% 94.3% 100.0%Other personal lines (1) 47 52 43.8% 75.7% 94.3% 100.0%
Total Encompass brand 581 688 44.1% 75.8% 94.2% 100.0%
Allstate Protection unearnedpremiums $ 9,458 $ 9,486 56.5% 85.0% 95.8% 99.3%
Other personal lines include commercial, condominium, renters, involuntary auto and other personal lines.(1)

A reconciliation of premiums written to premiums earned is shown in the following table.
Premiums written by brand are shown in the following table.
Allstate brand premiums written, excluding Allstate Canada, by the direct channel increased 19.8% to $745 million in 2010 from $622 million in2009, reflecting an impact by profitability management actions taken in New York, Florida, California and North Carolina, following a 25.4% increasefrom $496 million in 2008. The direct channel includes call centers and the internet.
Premiums earned by brand are shown in the following tables.
Premium operating measures and statistics that are used to analyze the business are calculated and described below. Measures and statisticspresented for Allstate brand exclude Allstate Canada, loan protection and specialty auto.
• PIF: Policy counts are based on items rather than customers. A multi-car customer would generate multiple item (policy) counts, evenif all cars were insured under one policy.
• Average premium-gross written: Gross premiums written divided by issued item count. Gross premiums written include the impactsfrom discounts and surcharges, and exclude the impacts from mid-term premium adjustments, ceded reinsurance premiums, andpremium refund accruals. Allstate brand average gross premiums represent the appropriate policy term for each line, which is 6 monthsfor standard and non-standard auto and 12 months for homeowners. Encompass brand average gross premiums represent theappropriate policy term for each line, which is 12 months for standard auto and homeowners and 6 months for non-standard auto.
• Renewal ratio: Renewal policies issued during the period, based on contract effective dates, divided by the total policies issued6 months prior for standard and non-standard auto (12 months prior for Encompass brand standard auto) or 12 months prior forhomeowners.
47
($ in millions) 2010 2009 2008 Premiums written: Allstate Protection $ 25,906 $ 25,972 $ 26,584 Discontinued Lines and Coverages 1 (1) —
Property-Liability premiums written 25,907 25,971 26,584 Decrease in unearned premiums 19 200 383 Other 31 23 —
Property-Liability premiums earned $ 25,957 $ 26,194 $ 26,967
Premiums earned: Allstate Protection $ 25,955 $ 26,195 $ 26,967 Discontinued Lines and Coverages 2 (1) —
Property-Liability $ 25,957 $ 26,194 $ 26,967
($ inmillions) Allstate brand Encompass brand Allstate Protection 2010 2009 2008 2010 2009 2008 2010 2009 2008 Standard
auto $ 15,842 $ 15,763 $ 15,918 $ 644 $ 800 $ 1,025 $ 16,486 $ 16,563 $ 16,943 Non-
standardauto 883 927 1,018 6 22 40 889 949 1,058
Homeowners 5,753 5,635 5,639 357 408 471 6,110 6,043 6,110 Other
personallines 2,331 2,317 2,358 90 100 115 2,421 2,417 2,473
Total $ 24,809 $ 24,642 $ 24,933 $ 1,097 $ 1,330 $ 1,651 $ 25,906 $ 25,972 $ 26,584
($ inmillions) Allstate brand Encompass brand Allstate Protection 2010 2009 2008 2010 2009 2008 2010 2009 2008 Standard
auto $ 15,814 $ 15,735 $ 15,957 $ 716 $ 907 $ 1,091 $ 16,530 $ 16,642 $ 17,048 Non-
standardauto 896 939 1,055 9 27 45 905 966 1,100
Homeowners 5,693 5,633 5,758 385 444 503 6,078 6,077 6,261 Other
personallines 2,348 2,402 2,434 94 108 124 2,442 2,510 2,558
Total $ 24,751 $ 24,709 $ 25,204 $ 1,204 $ 1,486 $ 1,763 $ 25,955 $ 26,195 $ 26,967

• New issued applications: Item counts of automobiles or homeowners insurance applications for insurance policies that were issuedduring the period. Does not include automobiles that are added by existing customers.
• Net items added to existing policies: Net increases in insured cars by policy endorsement activity.
Standard auto premiums written totaled $16.49 billion in 2010, a decrease of 0.5% from $16.56 billion in 2009, following a 2.2% decrease in 2009from $16.94 billion in 2008.
Allstate brand standard auto premiums written totaled $15.84 billion in 2010, an increase of 0.5% from $15.76 billion in 2009, following a 1.0%decrease in 2009 from $15.92 billion in 2008. Contributing to the Allstate brand standard auto premiums written increase were the following:
– decrease in PIF as of December 31, 2010 compared to December 31, 2009, due to fewer policies available to renew and a 0.7%decrease in net items added to existing policies to 1,498 thousand from 1,509 thousand, reflecting industry economic trends for declinesin the number of cars per household
– 0.2% decrease in new issued applications on a countrywide basis to 2,025 thousand in 2010 from 2,029 thousand in 2009 impacted bydecreases in Florida and California, due in part to rate actions that were approved in 2009 in these markets and other actions to improveprofitability. Excluding Florida and California, new issued applications on a countrywide basis increased 12.9% to 1,606 thousand in 2010from 1,423 thousand in 2009. New issued application increased in 40 states, most of which offer an auto discount (the PreferredPackage Discount) for our target customer.
– increased average gross premium in 2010 compared to 2009, primarily due to rate changes, partially offset by customers electing tolower coverage levels of their policy
– 0.2 point decrease in the renewal ratio in 2010 compared to 2009, reflects profit management actions in California, New York andGeorgia as well as the effects of the direct channel which has a lower renewal ratio. Excluding these items the renewal ratio had a 0.3point increase.
Allstate brand standard auto premiums written decreased in 2009 compared to 2008. Contributing to the Allstate brand standard auto premiumswritten decrease in 2009 compared to 2008 were the following:
– decrease in PIF as of December 31, 2009 compared to December 31, 2008, due to fewer policies available to renew and a 10.1%decrease in net items added to existing policies to 1,509 thousand from 1,678 thousand, reflecting industry economic trends for declinesin the number of cars per household
– 12.3% increase in new issued applications on a countrywide basis to 2,029 thousand in 2009 from 1,807 thousand in 2008– increase in average gross premium in 2009 compared to 2008, primarily due to rate changes, partially offset by customers electing to
change coverage levels of their policy
The level of Encompass premiums written continues to be impacted by comprehensive actions designed to improve Encompass brand profitability,which will continue through 2011. Some of the actions contributing to the Encompass brand standard auto premiums written decrease in 2010compared to 2009 were the following:
• Implemented rate increases where indicated• Strengthened underwriting guidelines• Revised renewal down payment requirements• Terminated relationships with certain independent agencies• Non-renewal of underperforming business segments• Discontinued writing the Special Value product (middle market auto product focused on segment auto) and
Deerbrook (non-standard auto) in certain states• Non-renewal of property in Florida
48
Allstate brand Encompass brand Standard Auto 2010 2009 2008 2010 2009 2008 PIF (thousands) 17,484 17,744 17,924 689 859 1,090 Average premium-gross written (1) $ 443 $ 434 $ 427 $ 979 $ 972 $ 961 Renewal ratio (%) (1) 88.7 88.9 88.9 69.2 69.6 73.9
Policy term is six months for Allstate brand and twelve months for Encompass brand.(1)

These actions have allowed Encompass to position itself with aligned agencies as the package policy carrier of choice for customers with broadpersonal lines coverage needs in order to drive stable, consistent earnings growth over time.
Rate changes that are indicated based on loss trend analysis to achieve a targeted return will continue to be pursued. The following table showsthe rate changes that were approved for standard auto and does not include rating plan enhancements, including the introduction of discounts andsurcharges, that result in no change in the overall rate level in the state. These rate changes do not reflect initial rates filed for insurance subsidiariesinitially writing business in a state.
Non-standard auto premiums written totaled $889 million in 2010, a decrease of 6.3% from $949 million in 2009, following a 10.3% decrease in2009 from $1.06 billion in 2008.
Allstate brand non-standard auto premiums written totaled $883 million in 2010, a decrease of 4.7% from $927 million in 2009, following a 8.9%decrease in 2009 from $1.02 billion in 2008. Contributing to the Allstate brand non-standard auto premiums written decrease in 2010 compared to2009 were the following:
– decrease in PIF as of December 31, 2010 compared to December 31, 2009, due to a decline in the number of policies available to renewand fewer new issued applications
– 14.9% decrease in new issued applications to 309 thousand in 2010 from 363 thousand in 2009– increase in average gross premium in 2010 compared to 2009– 1.1 point decrease in the renewal ratio in 2010 compared to 2009
Allstate brand non-standard auto premiums written decreased in 2009 compared to 2008. Contributing to the Allstate brand non-standard autopremiums written decrease in 2009 compared to 2008 were the following:
– decrease in PIF as of December 31, 2009 compared to December 31, 2008, due to new business production that was insufficient tooffset declines in the renewal ratio and polices available to renew
– 10.7% increase in new issued applications to 363 thousand in 2009 from 328 thousand in 2008– decrease in average gross premium in 2009 compared to 2008– decrease in the renewal ratio in 2009 compared to 2008
Rate changes that are indicated based on loss trend analysis to achieve a targeted return will continue to be pursued. The following table showsthe rate changes that were approved for non-standard auto and does not include rating plan enhancements, including the introduction of discounts andsurcharges, that result in no change in the
49
# of States Countrywide (%) (1) State Specific (%) (2)
(3) 2010 2009 2010 2009 2010 2009 Allstate brand (4) 45 (5) 36 1.4 4.6 2.2 7.2 Encompass brand 24 36 1.4 7.3 2.7 9.3
Represents the impact in the states where rate changes were approved during 2010 and 2009,respectively, as a percentage of total countrywide prior year-end premiums written.Represents the impact in the states where rate changes were approved during 2010 and 2009,respectively, as a percentage of its respective total prior year-end premiums written in thosestates.Based on historical premiums written in those states, rate changes approved for standard autototaled $218 million in 2010 compared to $784 million in 2009.Includes Washington D.C.Includes targeted rate decreases in certain markets to improve our competitive position fortarget customers.
(1)
(2)
(3)
(4)(5)
Allstate brand Encompass brand Non-Standard Auto 2010 2009 2008 2010 2009 2008 PIF (thousands) 640 719 745 5 20 39 Average premium-gross written
(6 months) $ 624 $ 616 $ 624 $ 426 $ 476 $ 479 Renewal ratio (%) (6 months) 71.4 72.5 73.7 46.9 67.1 68.3

overall rate level in the state. These rate changes do not reflect initial rates filed for insurance subsidiaries initially writing business in a state.
Homeowners premiums written totaled $6.11 billion in 2010, an increase of 1.1% from $6.04 billion in 2009, following a 1.1% decrease in 2009from $6.11 billion in 2008. Excluding the cost of catastrophe reinsurance, premiums written increased 0.6% in 2010 compared to 2009. For a moredetailed discussion on reinsurance, see the Property-Liability Claims and Claims Expense Reserves section of the MD&A and Note 9 of theconsolidated financial statements.
Allstate brand homeowners premiums written totaled $5.75 billion in 2010, an increase of 2.1% from $5.64 billion in 2009, following a 2009comparable to 2008. Contributing to the Allstate brand homeowners premiums written increase in 2010 compared to 2009 were the following:
– decrease in PIF of 4.1% as of December 31, 2010 compared to December 31, 2009, following a 3.9% decrease as of December 31,2009 compared to December 31, 2008, due to fewer policies available to renew and fewer new issued applications
– 3.6% decrease in new issued applications to 536 thousand in 2010 from 556 thousand in 2009. Our Castle Key Indemnity Companysubsidiary continues to have a favorable impact on new issued applications, due to a 2008 regulatory consent decree to sell 50,000 newhomeowners policies in Florida by November 2011. Excluding Florida, new issued applications on a countrywide basis decreased 12.4%to 487 thousand in 2010 from 556 thousand in 2009.
– increase in average gross premium in 2010 compared to 2009, primarily due to rate changes– 0.3 point increase in the renewal ratio in 2010 compared to 2009– decrease in the net cost of our catastrophe reinsurance program in 2010 compared to 2009
As of December 31, 2010, an increased Home and Auto discount is now available in 40 states. This has successfully shifted our mix of newbusiness towards target customers.
Actions taken to manage our catastrophe exposure in areas with known exposure to hurricanes, earthquakes, wildfires, fires following earthquakesand other catastrophes have had an impact on our new business writings and retention for homeowners insurance, and this impact will continue in2011, although to a lesser degree. For a more detailed discussion on exposure management actions, see the Catastrophe Management section of theMD&A.
Allstate brand homeowners premiums written in 2009 were comparable to 2008. Contributing to the Allstate brand homeowners premiums writtenin 2009 compared to 2008 were the following:
– decrease in PIF as of December 31, 2009 compared to December 31, 2008, due to fewer policies available to renew and fewer newissued applications
– 6.4% decrease in new issued applications to 556 thousand in 2009 from 594 thousand in 2008– increase in average gross premium in 2009 compared to 2008, primarily due to rate increases, partially offset by the impact of reduced
PIF in catastrophe management areas with higher average gross premiums and a state insurance department initiated rate reduction inCalifornia
50
# of States Countrywide (%) (1) State Specific (%) (2)
(3) 2010 2009 2010 2009 2010 2009 Allstate brand 11 (4) 11 4.6 2.6 9.6 6.5 Encompass
brand — 1 — 0.9 — 31.7
Represents the impact in the states where rate changes were approved during 2010 and 2009, respectively, as a percentage of totalcountrywide prior year-end premiums written.Represents the impact in the states where rate changes were approved during 2010 and 2009, respectively, as a percentage of itsrespective total prior year-end premiums written in those states.Based on historical premiums written in those states, rate changes approved for non-standard auto totaled $41 million in 2010 comparedto $25 million in 2009.Includes Washington D.C.
(1)
(2)
(3)
(4)
Allstate brand Encompass brand Homeowners 2010 2009 2008 2010 2009 2008 PIF (thousands) 6,690 6,973 7,255 314 371 446 Average premium-gross written
(12 months) $ 943 $ 883 $ 861 $ 1,298 $ 1,265 $ 1,206 Renewal ratio (%) (12 months) 88.4 88.1 87.0 78.1 78.9 80.6

– increase in the renewal ratio in 2009 compared to 2008 in part driven by less non-renewal activity in coastal states that are moresusceptible to major catastrophes
– decrease in the net cost of our catastrophe reinsurance program
Rate changes that are indicated based on loss trend analysis to achieve a targeted return will continue to be pursued. The following table showsthe rate changes that were approved for homeowners, including rate changes approved based on our net cost of reinsurance, and does not includerating plan enhancements, including the introduction of discounts and surcharges, that result in no change in the overall rate level in the state.
Underwriting results are shown in the following table.
Allstate Protection experienced underwriting income of $526 million in 2010 compared to $1.03 billion in 2009, primarily due to decreases instandard auto underwriting income and increases in homeowners underwriting losses, partially offset by increases in other personal lines underwritingincome. Standard auto underwriting income decreased 29.9% to an underwriting income of $692 million in 2010 from an underwriting income of$987 million in 2009 primarily due to increases in auto claim frequency and expenses and a $25 million litigation settlement, partially offset byfavorable reserve reestimates and decreases in catastrophe losses. Homeowners underwriting loss increased $210 million to an underwriting loss of$335 million in 2010 from an underwriting loss of $125 million in 2009 primarily due to a $75 million unfavorable prior year reserve reestimate related toa litigation settlement and increases in
51
# of States Countrywide (%) (1) State Specific (%) (2)
(3) 2010 2009 2010 2009 2010 2009 Allstate
brand (4) 32 40 7.0 8.4 10.0 10.7 Encompass
brand (4) 23 36 0.7 4.4 1.4 5.9
Represents the impact in the states where rate changes were approved during 2010 and 2009, respectively, as a percentage of totalcountrywide prior year-end premiums written.Represents the impact in the states where rate changes were approved during 2010 and 2009, respectively, as a percentage of itsrespective total prior year-end premiums written in those states.Based on historical premiums written in those states, rate changes approved for homeowners totaled $424 million in 2010 compared to$534 million in 2009.Includes Washington D.C.
(1)
(2)
(3)
(4)
($ in millions) 2010 2009 2008 Premiums written $ 25,906 $ 25,972 $ 26,584
Premiums earned $ 25,955 $ 26,195 $ 26,967 Claims and claims expense (18,923) (18,722) (20,046)Amortization of DAC (3,678) (3,789) (3,975)Other costs and expenses (2,795) (2,552) (2,735)Restructuring and related charges (33) (105) (22)
Underwriting income $ 526 $ 1,027 $ 189
Catastrophe losses $ 2,207 $ 2,069 $ 3,342
Underwriting income (loss) by line of business Standard auto (1) $ 692 $ 987 $ 1,247 Non-standard auto 74 76 136 Homeowners (335) (125) (1,175)Other personal lines (1) 95 89 (19)
Underwriting income $ 526 $ 1,027 $ 189
Underwriting income (loss) by brand Allstate brand $ 569 $ 1,022 $ 220 Encompass brand (43) 5 (31)
Underwriting income $ 526 $ 1,027 $ 189
During 2008, $45 million of IBNR losses were reclassified from standard auto to other personal lines to be consistent with the recording of excess liabilitypolicies' premiums and losses.
(1)

expenses and catastrophe losses, including prior year reestimates for catastrophes, partially offset by average earned premiums increasing faster thanloss costs. Other personal lines underwriting income increased 6.7% to an underwriting income of $95 million in 2010 from an underwriting income of$89 million in 2009 primarily due to lower unfavorable reserve reestimates. For further discussion and quantification of the impact of reserve estimatesand assumptions, see the Application of Critical Accounting Estimates and Property-Liability Claims and Claims Expense Reserves sections of theMD&A.
Allstate Protection experienced underwriting income of $1.03 billion during 2009 compared to $189 million in 2008 primarily due to decreases inhomeowners underwriting loss, partially offset by decreases in standard auto underwriting income. Homeowners underwriting loss decreased 89.4% toan underwriting loss of $125 million in 2009 from an underwriting loss of $1.18 billion in 2008, primarily due to lower catastrophes losses, partiallyoffset by increases in homeowner claim frequency and claim severities excluding catastrophes. Standard auto underwriting income decreased 20.9%to $987 million in 2009 from $1.25 billion in 2008, primarily due to increases in auto claim frequency and lower premiums earned.
Catastrophe losses in 2010 were $2.21 billion as detailed in the table below. This compares to catastrophe losses in 2009 of $2.07 billion.
We define a "catastrophe" as an event that produces pre-tax losses before reinsurance in excess of $1 million and involves multiple first partypolicyholders, or an event that produces a number of claims in excess of a preset, per-event threshold of average claims in a specific area, occurringwithin a certain amount of time following the event. Catastrophes are caused by various natural events including high winds, winter storms, tornadoes,hailstorms, wildfires, tropical storms, hurricanes, earthquakes and volcanoes. We are also exposed to man-made catastrophic events, such as certainacts of terrorism or industrial accidents. The nature and level of catastrophes in any future period cannot be reliably predicted.
Catastrophe losses related to events that occurred by the size of the event are shown in the following table.
Catastrophe losses incurred by the type of event are shown in the following table.
52
($ in millions) 2010
Number
of events
Claimsand claims
expense
Combinedratio
impact
Averagecatastrophe
loss per event Size of catastrophe Greater than $250 million 1 1.1% $ 355 16.1% 1.4 $ 355 $101 million to $250 million 4 4.4 610 27.6 2.3 153 $50 million to $100 million 8 8.9 511 23.2 2.0 64 Less than $50 million 77 85.6 894 40.5 3.4 12
Total 90 100.0% 2,370 107.4 9.1 26
Prior year reserve reestimates (163) (7.4) (0.6)
Total catastrophe losses $ 2,207 100.0% 8.5
($ in millions) 2010 2009 2008
Number
of events Number
of events Number
of events Hurricanes/Tropical storms $ 15 1 $ 48 1 $ 1,381 5 Tornadoes 174 7 384 4 628 19 Wind/Hail 1,908 74 1,561 67 960 81 Wildfires 15 1 83 5 169 9 Other events 258 7 162 5 79 9
Prior year reserve reestimates (163) (169) 125
Total catastrophe losses $ 2,207 90 $ 2,069 82 $ 3,342 123

Combined ratio Loss ratios are a measure of profitability. Loss ratios by product, and expense and combined ratios by brand, are shown in thefollowing table. These ratios are defined in the Property-Liability Operations section of the MD&A.
Standard auto loss ratio for the Allstate brand increased 1.4 points in 2010 compared to 2009 due to higher claim frequency and a $25 millionlitigation settlement, partially offset by favorable reserve reestimates and lower catastrophe losses. The increase is primarily driven by increases inFlorida and New York, which have higher loss ratios than the countrywide average. In 2010, claim frequencies in the bodily injury and physical damagecoverages have increased compared to 2009, but remain within historical norms. Bodily injury and physical damage coverages severity resultsincreased in line with historical Consumer Price Index ("CPI") trends. Standard auto loss ratio for the Allstate brand increased 1.2 points in 2009compared to 2008 due to higher claim frequencies. In 2009, claim frequencies in the physical damage and bodily injury coverages have returned tohistorical norms following exceptionally low levels in 2008. Bodily injury severity results in 2009 increased in line with historical CPI trends. Claimsseverity decreased in 2009 for the physical damage coverages, partially offsetting the increased frequencies.
Non-standard auto loss ratio for the Allstate brand increased 0.1 point in 2010 compared to 2009 due to higher claim frequencies, partially offsetby higher favorable reserve reestimates and lower catastrophe losses. Bodily injury and physical damage coverages severity results increased in linewith historical CPI trends. Non-standard auto loss ratio for the Allstate brand increased 4.8 points in 2009 compared to 2008 due to higher claimfrequencies. Claim frequencies increased for both physical damage and casualty coverages in 2009 compared to 2008. Bodily injury severity results in2009 increased in line with historical CPI trends. Claims severity decreased in 2009 for the physical damage coverages, partially offsetting theincreased frequencies.
Homeowners loss ratio for the Allstate brand increased 2.5 points to 82.1 in 2010 from 79.6 in 2009 due to a $75 million unfavorable prior yearreserve reestimate related to a litigation settlement and higher catastrophe losses including prior year reserve reestimates for catastrophes, partiallyoffset by average earned premiums increasing faster than loss costs. Homeowners loss ratio for the Allstate brand decreased 16.7 points to 79.6 in2009 from 96.3 in 2008 due to lower catastrophe losses, partially offset by higher frequencies excluding catastrophes and severities. Frequenciesexcluding catastrophes increased in 2009 compared to 2008, in part, due to inclement weather in 2009, including an
53
Loss ratio (2) Effect of catastrophe
losses on the loss ratio
Effect of pre-taxreserve reestimates
on the combined ratio 2010 2009 2008 2010 2009 2008 2010 2009 2008 Allstate brand loss ratio: Standard auto 70.7 69.3 68.1 1.0 1.2 1.5 (0.9) (0.3) 0.1 Non-standard auto 67.2 67.1 62.3 0.3 0.7 0.9 (3.6) (1.6) (0.1)Homeowners 82.1 79.6 96.3 31.3 29.0 46.5 (0.3) (2.6) 2.1 Other personal lines 66.4 67.3 69.3 7.2 7.0 10.6 0.7 3.5 0.6
Total Allstate brand loss ratio 72.8 71.4 74.4 8.5 8.1 12.6 (0.7) (0.5) 0.6 Allstate brand expense ratio 24.9 24.5 24.7
Allstate brand combined ratio 97.7 95.9 99.1
Encompass brand loss ratio: Standard auto (1) 75.4 75.4 66.3 0.8 0.3 0.9 — 0.7 (4.2)Non-standard auto 100.0 74.1 88.9 — — — — (11.1) — Homeowners 74.3 66.0 76.4 23.1 14.6 27.8 (1.3) (4.3) 0.4 Other personal lines (1) 73.4 75.9 112.9 4.3 1.9 8.9 (1.1) 5.6 33.1
Total Encompass brand lossratio 75.1 72.6 73.0 8.2 4.7 9.1 (0.5) (0.7) (0.2)
Encompass brand expenseratio 28.5 27.1 28.8
Encompass brand combinedratio 103.6 99.7 101.8
Allstate Protection loss ratio 72.9 71.5 74.3 8.5 7.9 12.4 (0.7) (0.5) 0.6 Allstate Protection expense
ratio 25.1 24.6 25.0
Allstate Protection combinedratio 98.0 96.1 99.3
During 2008, $45 million of IBNR losses were reclassified from standard auto to other personal lines to be consistent with the recording of excess liabilitypolicies' premiums and losses.Ratios are calculated using the premiums earned for the respective line of business.
(1)
(2)

increase in freeze related claims, driven by winter weather in the first quarter of 2009. Theft claims also drove part of the increase in frequencies in2009 compared to 2008. In 2009, homeowner claims severity, excluding catastrophes, increased compared to 2008.
Expense ratio for Allstate Protection increased 0.5 points in 2010 compared to 2009. Restructuring costs decreased 0.3 points in 2010 comparedto 2009, driven by prior year costs associated with claim office consolidations, reorganization of Business Insurance and technology prioritization andefficiency efforts. Excluding restructuring, the expense ratio for Allstate Protection increased 0.8 points in 2010 compared to 2009, driven by additionalmarketing expenses and increases in net costs of employee benefits, partially offset by reduced guaranty fund accrual levels and improved operationalefficiencies. The expense ratio for Allstate Protection decreased 0.4 points in 2009 compared to 2008 primarily due to the impact of lower earnedpremium offset by improved operational efficiencies and more focused spending, particularly on technology, and decreases in the net cost of benefitsdue to favorable investment results.
The impact of specific costs and expenses on the expense ratio are included in the following table.
The expense ratio for the standard auto and homeowners businesses generally approximates the total Allstate Protection expense ratio. Theexpense ratio for the non-standard auto business generally is lower than the total Allstate Protection expense ratio due to lower agent commissionrates and higher average premiums for non-standard auto as compared to standard auto. The Encompass brand DAC amortization is higher onaverage than Allstate brand DAC amortization due to higher commission rates.
DAC We establish a DAC asset for costs that vary with and are primarily related to acquiring business, principally agents' remuneration,premium taxes, certain underwriting costs and direct mail solicitation expenses. For the Allstate Protection business, DAC is amortized to income overthe period in which premiums are earned. The balance of DAC for each product type as of December 31 is included in the following table.
Catastrophe management
Historical catastrophe experience Since the beginning of 1992, the average annual impact of catastrophes on our Property-Liability loss ratiowas 7.5 points. However, this average does not reflect the impact of some of the more significant actions we have taken to limit our catastropheexposure. Consequently, it is useful to consider the impact of catastrophes after excluding losses that are now partially or substantially covered by theCalifornia Earthquake Authority ("CEA"), the Florida Hurricane Catastrophe Fund ("FHCF") or placed with a third party, such as hurricane coverage inHawaii. The average annual impact of all catastrophes, excluding losses from Hurricanes Andrew and Iniki and losses from California earthquakes, onour Property-Liability loss ratio was 6.5 points since the beginning of 1992.
54
Allstate brand Encompass brand Allstate Protection 2010 2009 2008 2010 2009 2008 2010 2009 2008 Amortization of DAC 14.0 14.2 14.4 18.3 18.5 19.9 14.2 14.5 14.7 Other costs and expenses 10.8 9.9 10.2 9.7 8.3 8.9 10.8 9.7 10.2 Restructuring and related
charges 0.1 0.4 0.1 0.5 0.3 — 0.1 0.4 0.1
Total expense ratio 24.9 24.5 24.7 28.5 27.1 28.8 25.1 24.6 25.0
($ in millions) Allstate brand Encompass brand Allstate Protection 2010 2009 2010 2009 2010 2009 Standard auto $ 541 $ 542 $ 55 $ 68 $ 596 $ 610 Non-standard auto 25 35 — — 25 35 Homeowners 437 426 36 42 473 468 Other personal lines 276 290 7 7 283 297
Total DAC $ 1,279 $ 1,293 $ 98 $ 117 $ 1,377 $ 1,410

Comparatively, the average annual impact of catastrophes on the homeowners loss ratio for the years 1992 through 2010 is shown in the followingtable.
Over time, we have limited our aggregate insurance exposure to catastrophe losses in certain regions of the country that are subject to high levelsof natural catastrophes. Limitations include our participation in various state facilities, such as the CEA, which provides insurance for Californiaearthquake losses; the FHCF, which provides reimbursements to participating insurers for certain qualifying Florida hurricane losses; and other statefacilities, such as wind pools. However, the impact of these actions may be diminished by the growth in insured values, and the effect of stateinsurance laws and regulations. In addition, in various states we are required to participate in assigned risk plans, reinsurance facilities and jointunderwriting associations that provide insurance coverage to individuals or entities that otherwise are unable to purchase such coverage from privateinsurers. Because of our participation in these and other state facilities such as wind pools, we may be exposed to losses that surpass thecapitalization of these facilities and to assessments from these facilities.
We continue to take actions to maintain an appropriate level of exposure to catastrophic events, including the following:
• We have increased our utilization of wind storm pools. For example, in Texas we are ceding significant wind exposure related to insuredproperty located in wind pool eligible areas along the coast including the Galveston Islands.
• We have ceased writing new homeowners business in California. We will continue to renew current policyholders and have a renewalratio of approximately 92% in California.
• Encompass Floridian Insurance Company and Encompass Floridian Indemnity Company ceased providing property insurance in theState of Florida.
• We ceased offering renewals on certain homeowners insurance policies in New York in certain down-state geographical locations. Thelevel of non-renewals in New York is limited by state statute.
Hurricanes
We consider the greatest areas of potential catastrophe losses due to hurricanes generally to be major metropolitan centers in counties along theeastern and gulf coasts of the United States. Usually, the average premium on a property policy near these coasts is greater than in other areas.However, average premiums are not considered commensurate with the inherent risk of loss. In addition and as explained in Note 13 of theconsolidated financial statements, in various states Allstate is subject to assessments from assigned risk plans, reinsurance facilities and jointunderwriting associations providing insurance for wind related property losses.
We have addressed our risk of hurricane loss by, among other actions, purchasing reinsurance for specific states and on a countrywide basis forour personal lines property insurance in areas most exposed to hurricanes; limiting personal homeowners new business writings in coastal areas insouthern and eastern states; and not offering continuing coverage on certain policies in coastal counties in certain states. We continue to seekappropriate returns for the risks we write. This may require further actions, similar to those already taken, in geographies where we are not gettingappropriate returns. However, we may maintain or opportunistically increase our presence in areas where we achieve adequate returns and do notmaterially increase our hurricane risk.
Earthquakes
Actions taken to reduce our exposure from earthquake coverage are substantially complete. These actions included purchasing reinsurance on acountrywide basis and in the state of Kentucky; no longer offering new optional earthquake coverage in most states; removing optional earthquakecoverage upon renewal in most states; and entering into arrangements in many states to make earthquake coverage available through other insurersfor new and renewal business.
55
Average annual impactof
catastrophes on thehomeowners loss ratio
Average annual impact of catastrophes onthe
homeowners loss ratio excluding lossesfrom
hurricanes Andrew and Iniki, and lossesfrom
California earthquakes Florida 97.9 47.5 Other hurricane exposure states 28.2 28.0 Total hurricane exposure states 33.8 29.6 All other 23.9 19.2 Total 29.2 24.8

We expect to retain approximately 30,000 PIF with earthquake coverage due to regulatory and other reasons. We also will continue to haveexposure to earthquake risk on certain policies that do not specifically exclude coverage for earthquake losses, including our auto policies, and to firesfollowing earthquakes. Allstate policyholders in the state of California are offered coverage through the CEA, a privately-financed, publicly-managedstate agency created to provide insurance coverage for earthquake damage. Allstate is subject to assessments from the CEA under certaincircumstances as explained in Note 13 of the consolidated financial statements.
Fires Following Earthquakes
Actions taken related to our risk of loss from fires following earthquakes include changing homeowners underwriting requirements in California andpurchasing reinsurance for Kentucky and purchasing nationwide occurrence reinsurance excluding Florida and New Jersey.
Wildfires
Actions we are taking to reduce our risk of loss from wildfires include changing homeowners underwriting requirements in certain states andpurchasing nationwide occurrence reinsurance. Catastrophe losses related to the Southern California wildfires occurred during 2009 and 2008 andtotaled $76 million and $166 million, respectively.
Reinsurance
A description of our current catastrophe reinsurance program appears in Note 9 of the consolidated financial statements and a description ofprogram changes as of June 1, 2011 appears in the Property-Liability Claims and Claims Expense Reserves section of the MD&A.
DISCONTINUED LINES AND COVERAGES SEGMENT
Overview The Discontinued Lines and Coverages segment includes results from insurance coverage that we no longer write and results forcertain commercial and other businesses in run-off. Our exposure to asbestos, environmental and other discontinued lines claims is reported in thissegment. We have assigned management of this segment to a designated group of professionals with expertise in claims handling, policy coverageinterpretation, exposure identification and reinsurance collection. As part of its responsibilities, this group is also regularly engaged in policy buybacks,settlements and reinsurance assumed and ceded commutations.
Summarized underwriting results for the years ended December 31 are presented in the following table.
Underwriting losses of $31 million in 2010 related to an $18 million unfavorable reestimate of environmental reserves and a $5 million unfavorablereestimate of asbestos reserves, partially offset by a $4 million favorable reestimate of other reserves, primarily as a result of our annual review usingestablished industry and actuarial best practices. The cost of administering claims settlements totaled $13 million for each of the years endedDecember 31, 2010, 2009 and 2008.
Underwriting losses of $32 million in 2009 were primarily related to a $13 million unfavorable reestimate of environmental reserves and a$28 million unfavorable reestimate of other reserves, partially offset by an $8 million favorable reestimate of asbestos reserves, primarily as a result ofour annual review using established industry and actuarial best practices.
Underwriting losses of $25 million in 2008 primarily related to an $8 million unfavorable reestimate of asbestos reserves and a $13 millionunfavorable reestimate of other reserves as a result of our annual 2008 review, partially offset by a $16 million reduction of our allowance for futureuncollectible reinsurance.
See the Property-Liability Claims and Claims Expense Reserves section of the MD&A for a more detailed discussion.
56
($ in millions) 2010 2009 2008 Premiums written $ 1 $ (1) $ —
Premiums earned $ 2 $ (1) $ — Claims and claims expense (28) (24) (18)Operating costs and expenses (5) (7) (7)
Underwriting loss $ (31) $ (32) $ (25)

Discontinued Lines and Coverages outlook
• We may continue to experience asbestos and/or environmental losses in the future. These losses could be due to the potential adverseimpact of new information relating to new and additional claims or the impact of resolving unsettled claims based on unanticipated eventssuch as litigation or legislative, judicial and regulatory actions. Environmental losses may also increase as the result of additional fundingfor environmental site cleanup. Because of our annual grounds up review, we believe that our reserves are appropriately establishedbased on available information, technology, laws and regulations.
• We continue to be encouraged that the pace of industry asbestos claim activity has slowed, perhaps reflecting various state legislativeand judicial actions with respect to medical criteria and increased legal scrutiny of the legitimacy of claims.
PROPERTY-LIABILITY INVESTMENT RESULTS
Net investment income decreased 10.5% or $139 million to $1.19 billion in 2010 from $1.33 billion in 2009, after decreasing 20.7% in 2009compared to 2008. The 2010 decrease was primarily due to lower yields and duration shortening actions taken to protect the portfolio from risinginterest rates, partially offset by higher average investment balances. The 2009 decrease was primarily due to reduced portfolio yields, actions toshorten duration and maintain additional liquidity in the portfolio, lower average investment balances and capital contributions to Allstate Life InsuranceCompany ("ALIC").
The following table presents the average pre-tax investment yields for the year ended December 31.
Net realized capital gains and losses are presented in the following table.
For a further discussion of net realized capital gains and losses, see the Investments section of the MD&A.
57
2010 (1)(2) 2009 (1)(2) 2008 (1)(2) Fixed income securities: tax-exempt 4.9% 5.1% 5.1%Fixed income securities: tax-exempt equivalent 7.1 7.4 7.4 Fixed income securities: taxable 3.5 4.1 5.6 Equity securities 2.3 2.1 3.0 Mortgage loans 5.7 4.7 6.1 Limited partnership interests (3)(4) 3.1 1.5 2.6 Total portfolio (4) 3.8 4.2 4.8
Pre-tax yield is calculated as investment income (including dividend income in the case of equity securities) divided by the average of the investmentbalances at the beginning and end of period and interim quarters.Amortized cost basis is used to calculate the average investment balance for fixed income securities and mortgage loans. Cost is used for equity securities.Cost or the equity method of accounting basis is used for limited partnership interests.Beginning in the fourth quarter of 2008, income from limited partnerships accounted for on the equity method of accounting ("EMA LP") is reported in realizedcapital gains and losses and is therefore excluded from the determination of pre-tax investment yields on limited partnership interests. EMA LP income forperiods prior to the fourth quarter of 2008 is reported in net investment income and included in the determination of pre-tax investment yields on limitedpartnership interests. For periods beginning with the fourth quarter of 2008, EMA LP's have been removed from the yield calculation.To conform to the current period presentation, prior periods have been reclassified.
(1)
(2)
(3)
(4)
($ in millions) 2010 2009 2008 Impairment write-downs $ (295) $ (534) $ (638)Change in intent write-downs (62) (89) (501)
Net other-than-temporary impairment losses recognized in earnings (357) (623) (1,139)Sales 455 611 (635)Valuation of derivative instruments (331) 52 (296)Settlements of derivative instruments (143) (203) 289 EMA limited partnership income 55 (5) (77)
Realized capital gains and losses, pre-tax (321) (168) (1,858)Income tax benefit (expense) 114 (54) 649
Realized capital gains and losses, after-tax $ (207) $ (222) $ (1,209)

PROPERTY-LIABILITY CLAIMS AND CLAIMS EXPENSE RESERVES
Property-Liability underwriting results are significantly influenced by estimates of property-liability claims and claims expense reserves. For adescription of our reserve process, see Note 7 of the consolidated financial statements and for a further description of our reserving policies and thepotential variability in our reserve estimates, see the Application of Critical Accounting Estimates section of the MD&A. These reserves are an estimateof amounts necessary to settle all outstanding claims, including IBNR claims, as of the reporting date.
The facts and circumstances leading to our reestimates of reserves relate to revisions to the development factors used to predict how losses arelikely to develop from the end of a reporting period until all claims have been paid. Reestimates occur because actual losses are likely different thanthat predicted by the estimated development factors used in prior reserve estimates. As of December 31, 2010, the impact of a reserve reestimationcorresponding to a one percent increase or decrease in net reserves would be a decrease or increase of approximately $113 million in net income.
The table below shows total net reserves as of December 31 for Allstate brand, Encompass brand and Discontinued Lines and Coverages lines ofbusiness.
The tables below show reserves, net of reinsurance, representing the estimated cost of outstanding claims as they were recorded at the beginningof years 2010, 2009 and 2008, and the effect of reestimates in each year.
58
($ in millions) 2010 2009 2008 Allstate brand $ 14,696 $ 14,123 $ 14,118 Encompass brand 921 1,027 1,133
Total Allstate Protection 15,617 15,150 15,251 Discontinued Lines and Coverages 1,779 1,878 1,931
Total Property-Liability $ 17,396 $ 17,028 $ 17,182
($ in millions) January 1 reserves 2010 2009 2008 Allstate brand $ 14,123 $ 14,118 $ 13,456 Encompass brand 1,027 1,133 1,129
Total Allstate Protection 15,150 15,251 14,585 Discontinued Lines and Coverages 1,878 1,931 2,075
Total Property-Liability $ 17,028 $ 17,182 $ 16,660
($ in millions, exceptratios) 2010 2009 2008
Reserve
reestimate (1)
Effect oncombined
ratio Reserve
reestimate (1)
Effect oncombined
ratio Reserve
reestimate (1)
Effect oncombined
ratio Allstate brand $ (181) (0.7) $ (126) (0.5) $ 155 0.6 Encompass brand (6) — (10) — (3) —
Total Allstate Protection (187) (0.7) (136) (0.5) 152 0.6 Discontinued Lines and
Coverages 28 0.1 24 0.1 18 0.1
Total Property-Liability $ (159) (0.6) $ (112) (0.4) $ 170 0.7
Reserve reestimates,after-tax $ (103) $ (73) $ 111
Net income (loss) $ 928 $ 854 $ (1,679)
Reserve reestimates as a% of net income (loss) 11.1% 8.5% (6.6)%
Favorable reserve reestimates are shown in parentheses.(1)

Allstate Protection
The tables below show Allstate Protection net reserves representing the estimated cost of outstanding claims as they were recorded at thebeginning of years 2010, 2009 and 2008, and the effect of reestimates in each year.
Auto reserve reestimates in 2010 and 2009 were primarily due to claim severity development that was better than expected. 2010 was alsoimpacted by a litigation settlement. Auto reserve reestimates in 2008 were primarily the result of a $45 million reclassification of IBNR losses fromstandard auto to other personal lines to be consistent with the recording of excess liability policies' premiums and losses.
Favorable homeowners reserve reestimates in 2010 were primarily due to favorable catastrophe reserve reestimates, partially offset by a litigationsettlement. Favorable homeowners reserve reestimates in 2009 were primarily due to favorable reserve reestimates from Hurricanes Ike and Gustavand a catastrophe related subrogation recovery. Unfavorable homeowners reserve reestimates in 2008 were primarily due to litigation filed inconjunction with a Louisiana deadline for filing suits related to Hurricane Katrina.
Other personal lines reserve reestimates in 2010 and 2009 were primarily the result of loss development different than anticipated in previousestimates. Other personal lines reserve reestimates in 2008 were primarily the result of a $45 million reclassification of IBNR losses from standardauto to other personal lines to be consistent with the recording of excess liability policies' premiums and losses.
59
($ in millions) January 1 reserves 2010 2009 2008 Auto $ 10,606 $ 10,220 $ 10,175 Homeowners 2,399 2,824 2,279 Other personal lines 2,145 2,207 2,131
Total Allstate Protection $ 15,150 $ 15,251 $ 14,585
($ in millions, except ratios) 2010 2009 2008
Reserve
reestimate
Effect oncombined
ratio Reserve
reestimate
Effect oncombined
ratio Reserve
reestimate
Effect oncombined
ratio Auto $ (179) (0.7) $ (57) (0.2) $ (27) (0.1)Homeowners (23) (0.1) (168) (0.6) 124 0.5 Other personal lines 15 0.1 89 0.3 55 0.2
Total Allstate Protection $ (187) (0.7) $ (136) (0.5) $ 152 0.6
Underwriting income $ 526 $ 1,027 $ 189
Reserve reestimates as a % ofunderwriting income 35.6% 13.2% (80.4)%

Pending, new and closed claims for Allstate Protection, for the years ended December 31, are summarized in the following table.
We believe the net loss reserves for Allstate Protection exposures are appropriately established based on available facts, technology, laws andregulations.
The following tables reflect the accident years to which the reestimates shown above are applicable for Allstate brand, Encompass brand andDiscontinued Lines and Coverages lines of business. Favorable reserve reestimates are shown in parentheses.
2010 Prior year reserve reestimates
2009 Prior year reserve reestimates
60
Number of claims 2010 2009 2008 Auto Pending, beginning of year 540,424 566,394 551,598 New 5,571,199 5,482,941 5,323,072 Total closed (5,621,164) (5,508,911) (5,308,276)
Pending, end of year 490,459 540,424 566,394
Homeowners Pending, beginning of year 59,685 74,772 80,229 New 991,962 997,954 1,242,007 Total closed (1,000,616) (1,013,041) (1,247,464)
Pending, end of year 51,031 59,685 74,772
Other personal lines Pending, beginning of year 36,537 41,001 39,951 New 282,137 278,978 301,363 Total closed (285,286) (283,442) (300,313)
Pending, end of year 33,388 36,537 41,001
Total Allstate Protection Pending, beginning of year 636,646 682,167 671,778 New 6,845,298 6,759,873 6,866,442 Total closed (6,907,066) (6,805,394) (6,856,053)
Pending, end of year 574,878 636,646 682,167
($ in millions) 2000 &prior 2001 2002 2003 2004 2005 2006 2007 2008 2009 Total
Allstate brand $ 262 $ (1) $ (7) $ (18) $ (15) $ (51) $ (106) $ (86) $ (45) $ (114) $ (181)Encompass brand 1 — 1 1 2 6 — (6) (1) (10) (6)
Total Allstate Protection 263 (1) (6) (17) (13) (45) (106) (92) (46) (124) (187)Discontinued Lines and
Coverages 28 — — — — — — — — — 28
Total Property-Liability $ 291 $ (1) $ (6) $ (17) $ (13) $ (45) $ (106) $ (92) $ (46) $ (124) $ (159)
($ in millions) 1999 &prior 2000 2001 2002 2003 2004 2005 2006 2007 2008 Total
Allstate brand $ 247 $ 46 $ 58 $ 44 $ 37 $ 85 $ 74 $ (149) $ (151) $ (417) $ (126)Encompass brand — 3 1 3 6 5 10 8 (7) (39) (10)
Total Allstate Protection 247 49 59 47 43 90 84 (141) (158) (456) (136)Discontinued Lines and
Coverages 24 — — — — — — — — — 24
Total Property-Liability $ 271 $ 49 $ 59 $ 47 $ 43 $ 90 $ 84 $ (141) $ (158) $ (456) $ (112)

2008 Prior year reserve reestimates
Allstate brand prior year reserve reestimates were $181 million favorable in 2010, $126 million favorable in 2009 and $155 million unfavorable in2008, respectively. In 2010, this was primarily due to favorable catastrophe reserve reestimates and severity development that was better thanexpected, partially offset by litigation settlements. The increased reserves in accident years 2000 & prior is due to the litigation settlements of$100 million, a reclassification of injury reserves to older years and reserve strengthening. In 2009, this was primarily due to favorable reservereestimates from Hurricanes Ike and Gustav and a catastrophe related subrogation recovery. The shift of reserves to older accident years isattributable to a reallocation of reserves related to employee postretirement benefits to more accident years, and a reclassification of injury and 2008non-injury reserves to older years. In 2008, this was primarily due to litigation filed in conjunction with a Louisiana deadline for filing suits related toHurricane Katrina.
These trends are primarily responsible for revisions to loss development factors, as previously described, used to predict how losses are likely todevelop from the end of a reporting period until all claims have been paid. Because these trends cause actual losses to differ from those predicted bythe estimated development factors used in prior reserve estimates, reserves are revised as actuarial studies validate new trends based on theindications of updated development factor calculations.
The impact of these reestimates on the Allstate brand underwriting income is shown in the table below.
Encompass brand Reserve reestimates in 2010, 2009 and 2008 were related to lower than anticipated claim settlement costs.
The impact of these reestimates on the Encompass brand underwriting (loss) income is shown in the table below.
Discontinued Lines and Coverages We conduct an annual review in the third quarter of each year to evaluate and establish asbestos,environmental and other discontinued lines reserves. Reserves are recorded in the reporting period in which they are determined. Using establishedindustry and actuarial best practices and assuming no change in the regulatory or economic environment, this detailed and comprehensive grounds upmethodology determines reserves based on assessments of the characteristics of exposure (e.g. claim activity, potential liability, jurisdiction, productsversus non-products exposure) presented by policyholders.
61
($ in millions) 1998 &prior 1999 2000 2001 2002 2003 2004 2005 2006 2007 Total
Allstate brand $ 56 $ (7) $ 9 $ 34 $ 1 $ (5) $ 13 $ 152 $ (71) $ (27) $ 155 Encompass brand 2 — 2 (1) 2 1 (1) 10 (20) 2 (3)
Total Allstate Protection 58 (7) 11 33 3 (4) 12 162 (91) (25) 152 Discontinued Lines and
Coverages 18 — — — — — — — — — 18
Total Property-Liability $ 76 $ (7) $ 11 $ 33 $ 3 $ (4) $ 12 $ 162 $ (91) $ (25) $ 170
($ in millions) 2010 2009 2008 Reserve reestimates $ (181) $ (126) $ 155 Allstate brand underwriting income 569 1,022 220 Reserve reestimates as a % of
underwriting income 31.8% 12.3% (70.5)%
($ in millions) 2010 2009 2008 Reserve reestimates $ (6) $ (10) $ (3)Encompass brand underwriting (loss)
income (43) 5 (31)Reserve reestimates as a % of underwriting
(loss) income 14.0% 200.0% 9.7%

Reserve reestimates for the Discontinued Lines and Coverages, as shown in the table below, were increased primarily for environmental in 2010and other discontinued lines in both 2009 and 2008.
Reserve additions for asbestos in 2010 totaling $5 million were primarily for products related coverage. Asbestos reserves reestimates in 2009were $8 million favorable. Reserve additions for asbestos in 2008 totaling $8 million were primarily for products-related coverage and were a result of acontinuing level of increased claim activity being reported by excess and primary insurance policyholders with existing active claims, excesspolicyholders with new claims, and reestimates of liabilities for increased assumed reinsurance cessions, as ceding companies (other insurancecarriers) also experienced increased claim activity. Higher claim activity over prior estimates has also resulted in an increased estimate for futureclaims reported. These trends are consistent with the trends of other carriers in the industry, which we believe are related to increased publicity andawareness of coverage, ongoing litigation and bankruptcy actions.
The reserve additions for environmental in 2010 and 2009 were primarily related to site-specific remediations where the clean-up cost estimatesand responsibility for the clean-up were more fully determined. Normal environmental claim activity resulted in essentially no change in estimatedreserves for 2008. IBNR now represents 62% of total net environmental reserves, 3 points lower than as of December 31, 2009.
62
($ in millions) 2010 2009 2008
January 1reserves
Reservereestimate
January 1reserves
Reservereestimate
January 1reserves
Reservereestimate
Asbestos Claims $ 1,180 $ 5 $ 1,228 $ (8) $ 1,302 $ 8 Environmental Claims 198 18 195 13 232 — Other Discontinued Lines 500 5 508 19 541 10
Total Discontinued Lines andcoverages $ 1,878 $ 28 $ 1,931 $ 24 $ 2,075 $ 18
Underwriting loss $ (31) $ (32) $ (25)
Reserve reestimates as a % ofunderwriting loss (90.3)% (75.0)% (72.0)%

The table below summarizes reserves and claim activity for asbestos and environmental claims before (Gross) and after (Net) the effects ofreinsurance for the past three years.
The survival ratio is calculated by taking our ending reserves divided by payments made during the year. This is a commonly used but extremelysimplistic and imprecise approach to measuring the adequacy of asbestos and environmental reserve levels. Many factors, such as mix of business,level of coverage provided and settlement procedures have significant impacts on the amount of environmental and asbestos claims and claimsexpense reserves, claim payments and the resultant ratio. As payments result in corresponding reserve reductions, survival ratios can be expected tovary over time. The 2009 net survival ratios in the table above have been adjusted to remove the claims and claims expense paid of $63 million forasbestos and $7 million for environmental attributable to commutation activity related to three reinsurers.
In both 2010 and 2009, the asbestos net 3-year survival ratio decreased due to lower reserve levels as the result of loss settlements. Theenvironmental net 3-year survival ratio increased in both 2010 and 2009 due to lower average annual payments.
63
($ in millions, except ratios) 2010 2009 2008 Gross Net Gross Net Gross Net Asbestos claims Beginning reserves $ 1,780 $ 1,180 $ 1,933 $ 1,228 $ 2,053 $ 1,302 Incurred claims and claims expense (7) 5 (3) (8) 4 8 Claims and claims expense paid (118) (85) (150) (40) (124) (82)
Ending reserves $ 1,655 $ 1,100 $ 1,780 $ 1,180 $ 1,933 $ 1,228
Annual survival ratio 14.0 12.9 11.9 11.5 15.4 15.1
3-year survival ratio 12.6 12.2 12.4 12.9 13.4 14.4
Environmental claims Beginning reserves $ 247 $ 198 $ 250 $ 195 $ 340 $ 232 Incurred claims and claims expense 19 18 16 13 (34) — Claims and claims expense paid (18) (15) (19) (10) (56) (37)
Ending reserves $ 248 $ 201 $ 247 $ 198 $ 250 $ 195
Annual survival ratio 13.8 13.4 12.7 12.1 4.5 5.2
3-year survival ratio 8.0 8.7 7.1 7.5 6.8 7.0
Combined environmental and asbestosclaims
Annual survival ratio 14.0 13.0 12.0 11.6 12.1 12.0
3-year survival ratio 11.7 11.6 11.4 11.7 12.1 12.6
Percentage of IBNR in ending reserves 60.1% 62.3% 63.8%

Our net asbestos reserves by type of exposure and total reserve additions are shown in the following table.
During the last three years, 56 direct primary and excess policyholders reported new claims, and claims of 79 policyholders were closed,decreasing the number of active policyholders by 23 during the period. The 23 decrease comprised 1 from 2010, (15) from 2009 and (9) from 2008.The increase of 1 from 2010 included 21 new policyholders reporting new claims and the closing of 20 policyholders' claims.
IBNR net reserves decreased by $72 million. As of December 31, 2010 IBNR represented 60% of total net asbestos reserves, 2 points lower thanas of December 31, 2009. IBNR provides for reserve development of known claims and future reporting of additional unknown claims from current andnew policyholders and ceding companies.
Pending, new, total closed and closed without payment claims for asbestos and environmental exposures for the years ended December 31, aresummarized in the following table.
Property-Liability reinsurance ceded For Allstate Protection, we utilize reinsurance to reduce exposure to catastrophe risk and managecapital, and to support the required statutory surplus and the insurance financial strength ratings of certain subsidiaries such as Castle Key InsuranceCompany and Allstate New Jersey Insurance Company. We purchase significant reinsurance to manage our aggregate countrywide exposure to anacceptable level. The price and terms of reinsurance and the credit quality of the reinsurer are considered in the purchase process, along with whetherthe price can be appropriately reflected in the costs that are considered in setting future rates charged to policyholders. We also participate in variousreinsurance mechanisms, including industry pools and facilities, which are backed by the financial resources of the property-liability insurancecompany market participants, and have historically purchased reinsurance to mitigate long-tail liability lines, including environmental, asbestos andother discontinued lines exposures. We retain primary liability as a direct insurer for all risks ceded to reinsurers.
64
($ in millions) December 31, 2010 December 31, 2009 December 31, 2008
Activepolicy-holders
Netreserves
% ofreserves
Activepolicy-holders
Netreserves
% ofreserves
Activepolicy-holders
Netreserves
% ofreserves
Direct policyholders: –Primary 51 $ 17 1% 51 $ 19 1% 54 $ 21 2%–Excess 319 261 24 318 256 22 330 216 17
Total 370 278 25 369 275 23 384 237 19
Assumed reinsurance 165 15 176 15 205 17 IBNR 657 60 729 62 786 64
Total net reserves $ 1,100 100% $ 1,180 100% $ 1,228 100%
Total reserve additions $ 5 $ (8) $ 8
Number of claims 2010 2009 2008 Asbestos Pending, beginning of year 8,252 8,780 9,256 New 788 814 601 Total closed (619) (1,342) (1,077)
Pending, end of year 8,421 8,252 8,780
Closed without payment 336 469 800
Environmental Pending, beginning of year 4,114 4,603 4,747 New 498 389 291 Total closed (315) (878) (435)
Pending, end of year 4,297 4,114 4,603
Closed without payment 181 416 307

The impacts of reinsurance on our reserve for claims and claims expense as of December 31 are summarized in the following table, net ofallowances we have established for uncollectible amounts.
Reinsurance recoverables include an estimate of the amount of property-liability insurance claims and claims expense reserves that may beceded under the terms of the reinsurance agreements, including incurred but not reported unpaid losses. We calculate our ceded reinsurance estimatebased on the terms of each applicable reinsurance agreement, including an estimate of how IBNR losses will ultimately be ceded under theagreement. We also consider other limitations and coverage exclusions under our reinsurance agreements. Accordingly, our estimate of reinsurancerecoverables is subject to similar risks and uncertainties as our estimate of reserve for property-liability claims and claims expense. We believe therecoverables are appropriately established; however, as our underlying reserves continue to develop, the amount ultimately recoverable may vary fromamounts currently recorded. We regularly evaluate the reinsurers and the respective amounts recoverable, and a provision for uncollectiblereinsurance is recorded if needed. The establishment of reinsurance recoverables and the related allowance for uncollectible reinsurance is also aninherently uncertain process involving estimates. Changes in estimates could result in additional changes to the Consolidated Statements ofOperations.
The allowance for uncollectible reinsurance relates to Discontinued Lines and Coverages reinsurance recoverables and was $142 million as ofboth December 31, 2010 and 2009. This amount represents 17.6% and 16.2% of the related reinsurance recoverable balances as of December 31,2010 and 2009, respectively. The allowance is based upon our ongoing review of amounts outstanding, length of collection periods, changes inreinsurer credit standing, and other relevant factors. In addition, in the ordinary course of business, we may become involved in coverage disputes withcertain of our reinsurers which may ultimately result in lawsuits and arbitrations brought by or against such reinsurers to determine the parties' rightsand obligations under the various reinsurance agreements. We employ dedicated specialists to manage reinsurance collections and disputes. We alsoconsider recent developments in commutation activity between reinsurers and cedants, and recent trends in arbitration and litigation outcomes indisputes between cedants and reinsurers in seeking to maximize our reinsurance recoveries.
Adverse developments in the insurance industry have led to a decline in the financial strength of some of our reinsurance carriers, causingamounts recoverable from them and future claims ceded to them to be considered a higher risk. There has also been consolidation activity in theindustry, which causes reinsurance risk across the industry to be concentrated among fewer companies. In addition, over the last several years theindustry has increasingly segregated asbestos, environmental, and other discontinued lines exposures into separate legal entities with dedicatedcapital. Regulatory bodies in certain cases have supported these actions. We are unable to determine the impact, if any, that these developments willhave on the collectability of reinsurance recoverables in the future.
65
($ in millions)
Reserve forproperty-liabilityinsurance claims
and claims expense Reinsurance
recoverables, net 2010 2009 2010 2009 Industry pools and facilities $ 1,990 $ 2,000 $ 1,419 $ 1,408 Asbestos and environmental 1,903 2,027 628 683 Other including allowance for future uncollectible
reinsurance recoverables 15,575 15,140 105 121
Total Property-Liability $ 19,468 $ 19,167 $ 2,152 $ 2,212

The largest reinsurance recoverable balances are shown in the following table as of December 31, net of the allowance we have established foruncollectible amounts.
The effects of reinsurance ceded on our property-liability premiums earned and claims and claims expense for the years ended December 31 aresummarized in the following table.
For the year ended December 31, 2010, ceded property-liability premiums earned increased $36 million when compared to prior year, primarilydue to the adoption of accounting guidance related to the consolidation of variable interest entities, which resulted in the consolidation of two insurancecompany affiliates, Allstate Texas Lloyds and Allstate County Mutual Insurance Company. For the year ended December 31, 2009, ceded property-liability premiums earned decreased $83 million when compared to prior year, primarily as a result of favorable market conditions which were reflectedin our catastrophe reinsurance pricing.
66
Standard& Poor'sfinancialstrengthrating (1)
Reinsurancerecoverable on paid
and unpaid claims, net
($ in millions)
2010 2009
Industry pools and facilities Michigan Catastrophic Claim Association ("MCCA") N/A $ 1,243 $ 1,173 North Carolina Reinsurance Facility N/A 65 60 New Jersey Unsatisfied Claim and Judgment Fund N/A 55 66 FHCF N/A 41 53 Other 15 56
Total 1,419 1,408
Asbestos, Environmental and Other Lloyd's of London ("Lloyd's") A+ 183 190 Westport Insurance Corporation (formerly Employers Reinsurance
Corporation) A+ 56 77 New England Reinsurance Corporation N/A 37 37 R&Q Reinsurance Company N/A 34 28 Clearwater Insurance Company BB+ 30 34 St. Paul Fire and Marine Insurance Company AA- 19 21 Other, including allowance for future uncollectible reinsurance recoverables 374 417
Total 733 804
Total Property-Liability $ 2,152 $ 2,212
N/A reflects no rating available.(1)
($ in millions) 2010 2009 2008 Ceded property-liability premiums
earned $ 1,092 $ 1,056 $ 1,139
Ceded property-liability claims and claimsexpense
Industry pool and facilities FHCF $ 10 $ 47 $ 28 National Flood Insurance Program 50 111 344 MCCA 142 133 148 Other 64 59 60
Subtotal industry pools and facilities 266 350 580 Asbestos, Environmental and Other 5 65 40
Ceded property-liability claims andclaims expense $ 271 $ 415 $ 620

Ceded property-liability claims and claims expense decreased in 2010 and 2009 primarily due to amounts ceded to National Flood InsuranceProgram.
For a detailed description of the MCCA, FHCF and Lloyd's, see Note 9 of the consolidated financial statements. As of December 31, 2010, otherthan the recoverable balances listed above, no other amount due or estimated to be due from any single Property-Liability reinsurer was in excess of$17 million.
We enter into certain intercompany insurance and reinsurance transactions for the Property-Liability operations in order to maintain underwritingcontrol and manage insurance risk among various legal entities. These reinsurance agreements have been approved by the appropriate regulatoryauthorities. All significant intercompany transactions have been eliminated in consolidation.
Catastrophe reinsurance
Our catastrophe reinsurance program was designed, utilizing our risk management methodology, to address our exposure to catastrophesnationwide. Our program provides reinsurance protection for catastrophes including storms named or numbered by the National Weather Service, firesfollowing earthquakes, earthquakes and wildfires including California wildfires. These reinsurance agreements are part of our catastrophemanagement strategy, which is intended to provide our shareholders an acceptable return on the risks assumed in our property business, and toreduce variability of earnings, while providing protection to our customers.
While our catastrophe management strategy remains substantially unchanged we have redesigned our catastrophe reinsurance program in 2011.Our new reinsurance program continues to support our goal to have no more than a 1% likelihood of exceeding annual aggregate catastrophe lossesby $2 billion, net of reinsurance, from hurricanes and earthquakes, based on modeled assumptions and applications currently available. Since the2006 inception of Allstate's catastrophe reinsurance program, our exposure to wind loss has been materially reduced and we have nearly eliminatedour exposure to earthquake loss. Our redesigned program for 2011 responds to these exposure changes by including coverage for multiple perils, inaddition to hurricanes and earthquakes, in all but one of the contracts comprising the program. In addition, the per occurrence structure effectiveJune 1, 2011 facilitates the program's administration while providing greater potential with respect to loss recovery.
The new program, as described below, provides $3.25 billion of reinsurance coverage, above the retention, with reinstatements of limits. Itincludes a Per Occurrence Excess Catastrophe Reinsurance agreement reinsuring our personal lines property and auto excess catastrophe lossesresulting from multiple perils, including those perils currently reinsured under our existing program, in every state other than New Jersey and Florida.For June 1, 2011 to May 31, 2012, the program consists of two agreements: a Per Occurrence Excess Catastrophe Reinsurance agreement providingcoverage in six layers and a Top and Drop Excess Catastrophe Reinsurance agreement which includes Coverage A and Coverage B.
The Per Occurrence Excess Catastrophe Reinsurance agreement provides an initial $3.25 billion per occurrence limit in excess of a $500 millionretention and after the Company has incurred $250 million in losses "otherwise recoverable." The $250 million in losses otherwise recoverable appliesonce each contract year to the First Layer only and losses from multiple qualifying occurrences can apply to this $250 million threshold in excess of$500 million per occurrence. The Top and Drop Excess Catastrophe Reinsurance agreement provides $250 million of reinsurance limits which may beused for Coverage A, Coverage B, or a combination of both. Coverage A reinsures the "Top" of the program and provides 50% of $500 million excessof a $3.25 billion retention. Coverage B allows the program limit to "Drop" and provides reinsurance for $250 million in limits excess of a $750 millionretention and after the Company has incurred $500 million in losses "otherwise recoverable" under the agreement. Losses from multiple qualifyingoccurrences, in excess of $750 million per occurence, can apply to this $500 million threshold.
The New Jersey and Florida components of the reinsurance program are designed separately from the other components of the program toaddress the distinct needs of our separately capitalized legal entities in those states. New Jersey catastrophe losses will be reinsured under a newlyplaced per occurrence agreement and under existing agreements which expire respectively on May 31, 2012 and 2013. The Florida component will beplaced in May of 2011. Allstate Protection's separate reinsurance programs in Pennsylvania and Kentucky will continue to address exposures
67

unique to those states. A description of the catastrophe reinsurance treaties that will reinsure Allstate Protection as of June 1, 2011 follows:
Nationwide excluding Florida and New Jersey
• The Per Occurrence Excess Catastrophe Reinsurance agreement reinsures personal lines property and auto excess catastrophe lossescaused by multiple perils under Six Layers of coverage as follows:
Coverage for the First through the Fifth Layers are 95% placed. Each Layer comprises three contracts, each contract providing one thirdof the total limit and expiring as of May 31, 2012, 2013 and 2014, respectively. Coverage for the 6th Layer is 47.5% placed and, unlikethe other layers, does not have a reinstatement limit. Reinsurance premium is subject to redetermination for exposure changes at eachanniversary.
• The Top and Drop Excess Catastrophe Reinsurance agreement reinsures personal lines property and auto excess catastrophe lossescaused by multiple perils. The reinsurance limit may be used for Coverage A, Coverage B or a combination of both and is not subject toreinstatement. Coverage A of the Top and Drop provides 47.5% of $500 million in limits in excess of a $3.25 billion retention. Coverage Bprovides 95% of $250 million in limits in excess of a $750 million retention. In addition to this retention, the Company must incur$500 million in losses, "otherwise recoverable", under Coverage B during the contract year before Coverage B attaches. Losses frommultiple qualifying occurrences can apply to this $500 million threshold. Coverage B essentially is a third limit for the Second Layer of thePer Occurrence Excess Catastrophe Reinsurance agreement described above. For June 1, 2011 to May 31, 2012, the placement of theTop and Drop Excess Catastrophe Reinsurance agreement consists of an annual contract and a three year term contract which in theaggregate provide 47.5% of the $500 million Coverage A limit and 95% of the $250 million Coverage B limit. For June 1, 2012 to May 31,2013, the three year term contract provides 12.66% of Coverage A's and 25% of Coverage B's placement and for June 1, 2013 toMay 31, 2014, it provides 6% of Coverage A's and 12.66% of Coverage B's placement. Reinsurance premium is subject toredetermination for exposure changes.
New Jersey
• The Excess Catastrophe Reinsurance contract reinsures personal lines property excess catastrophe losses in New Jersey caused bymultiple perils. The newly placed contract is effective June 1, 2011 to May 31, 2014 and provides 32% of $400 million of limits excess ofa $150 million retention and includes one reinstatement per contract year. In addition, the existing New Jersey agreement consisting oftwo contracts each providing two Layers of coverage will remain in place. The agreement expiring May 31, 2012 provides a First Layer of31% of $300 million of limits in excess of a $200 million retention, and a Second Layer of 26% of $200 million of limits in excess of a$500 million retention. The agreement expiring May 31, 2013 provides a First Layer of 32% of $300 million of limits in excess of a$184 million retention and a Second Layer of 42% of $200 million in limits excess of a $484 million retention. Each Layer includes onereinstatement per contract year. The reinsurance premium and retention are subject to redetermination for exposure changes at eachanniversary.
Pennsylvania
• The Excess Catastrophe Reinsurance Contract reinsures personal lines property losses in Pennsylvania caused by multiple perils. Thisagreement will remain in effect until May 31, 2012 and provides 95% of $100 million of limits in excess of a $100 million retention withtwo limits being available for the remaining term of the contract. The reinsurance premium and retention are not subject toredetermination for exposure changes.
Kentucky
• The Earthquake Excess Catastrophe Reinsurance Contract reinsures personal lines property losses in Kentucky caused by earthquakesor fires following earthquakes. The agreement is effective June 1, 2011 for three years and provides 95% of $25 million of limits inexcess of a $5 million retention. The agreement provides three limits over its three year term subject to two limits being available in anyone contract year. The reinsurance premium and retention are not subject to redetermination for exposure changes.
68
First Layer $250 million limit in excess of a $500 million retention and after an initial $250 million in losses "otherwise recoverable" hasbeen satisfied, 1 reinstatement
SecondLayer
$250 million limit in excess of a $750 million retention, 1 reinstatement
Third Layer $500 million limit in excess of a $1 billion retention, 1 reinstatement Fourth
Layer $750 million limit in excess of a $1.5 billion retention, 1 reinstatement
Fifth Layer $1 billion limit in excess of a $2.25 billion retention, 1 reinstatement Sixth Layer $500 million limit in excess of a $3.25 billion retention

The redesigned catastrophe reinsurance program for 2011 will require the cancellation of the contracts comprising the 2010 program with theexception of the Pennsylvania agreement which has one year remaining on its three year term and the New Jersey agreement which has two yearsremaining on its three year term. The current Kentucky and Texas agreements will expire respectively on May 31, 2011 and June 17, 2011. See Note 9for further details of the existing 2010 program.
We estimate that the total annualized cost of all catastrophe reinsurance programs for the year beginning June 1, 2011 will be approximately$550 million compared to $560 million annualized cost for the year beginning June 1, 2010. The total cost of our catastrophe reinsurance programs in2010 was $593 million compared to $626 million in 2009. We continue to attempt to capture our reinsurance cost in premium rates as allowed by stateregulatory authorities.
ALLSTATE FINANCIAL 2010 HIGHLIGHTS
• Net income was $58 million in 2010 compared to net loss of $483 million in 2009.• Premiums and contract charges on underwritten products, including traditional life, interest-sensitive life and accident and health insurance,
totaled $2.03 billion in 2010, an increase of 12.2% or $221 million from $1.81 billion in 2009.• Net realized capital losses totaled $517 million in 2010 compared to $431 million in 2009.• During 2010, amortization deceleration (credit to income) of $12 million was recorded related to our annual comprehensive review of the DAC
and DSI balances and assumptions for our interest-sensitive life, fixed annuities and other investment contracts. This compares to DAC andDSI amortization acceleration (charge to income) of $322 million in 2009.
• Investments as of December 31, 2010 totaled $61.58 billion, reflecting a decrease in carrying value of $634 million from $62.22 billion as ofDecember 31, 2009. Net investment income decreased 6.9% to $2.85 billion in 2010 from $3.06 billion in 2009.
• Contractholder funds as of December 31, 2010 totaled $48.19 billion, reflecting a decrease of $4.39 billion from $52.58 billion as ofDecember 31, 2009.
ALLSTATE FINANCIAL SEGMENT
Overview and strategy The Allstate Financial segment is a major provider of life insurance, retirement and investment products, and voluntaryaccident and health insurance. We serve our customers through Allstate exclusive agencies, workplace distribution and non-proprietary distributionchannels. Allstate Financial's strategic vision is to reinvent protection and retirement for the consumer and its purpose is to create financial value on astandalone basis and to add strategic value to the organization.
To fulfill its purpose, Allstate Financial's primary objectives are to deepen relationships with Allstate customers by adding financial services to theirsuite of products with Allstate, dramatically expand Allstate Benefits (our workplace distribution business) and improve profitability by decreasingearnings volatility, increasing our returns, and improving our capital position. Allstate Financial brings value to The Allstate Corporation (the"Corporation") in three principal ways: through profitable growth of Allstate Financial, improving the economics of the Protection business throughincreased customer loyalty and renewal rates by cross selling Allstate Financial products to existing customers, and by bringing new customers toAllstate. We continue to shift our mix of products in force by decreasing spread based products, principally fixed annuities and institutional products,and through growth of underwritten products having mortality or morbidity risk, principally life insurance and accident and health products. In additionto focusing on higher return markets, products, and distribution channels, Allstate Financial continues to emphasize capital efficiency and enterpriserisk and return management strategies and actions.
Allstate Financial's strategy provides a platform to profitably grow its business. Based upon Allstate's strong financial position and brand, we havea unique opportunity to cross-sell to our customers. Through our Allstate exclusive agencies we will leverage the trusted customer relationships toserve those who are looking for assistance in meeting their protection and retirement needs by providing them with the information, products andservices that they need. Our employer relationships through Allstate Benefits also afford opportunities to offer additional Allstate products.
Our products include interest-sensitive, traditional and variable life insurance; fixed annuities such as deferred and immediate annuities; voluntaryaccident and health insurance; and funding agreements backing medium-term notes, which we offer on an opportunistic basis. Banking products andservices have been offered to customers through the Allstate Bank. Our products are sold through multiple distribution channels including Allstateexclusive agencies, which include exclusive financial specialists, independent agents (including master brokerage agencies and workplace enrollingagents), and specialized structured settlement brokers. Our institutional product line consists primarily of funding agreements sold to unaffiliated truststhat use them to back medium-term notes issued to institutional and
69

individual investors. On February 8, 2011, we announced that we had reached an agreement to sell substantially all of the deposits of Allstate Bank toDiscover Bank and our plans to enter into a multi-year distribution and marketing agreement whereby Discover Bank will provide banking products andservices to Allstate customers in the future. Allstate Financial does not intend to originate banking products or services after the transaction closes,which is expected to be by mid-year 2011, pending regulatory approval.
Allstate Financial outlook
• We plan to continue to increase sales of underwritten insurance products and tailor the focus of product offerings to better serve the needs ofeveryday Americans.
• Our growth initiatives will be focused on increasing the number of customers served through our proprietary and Allstate Benefits (workplacedistribution) channels.
• We will continue to focus on improving returns and reducing our concentration in spread based products resulting in net reductions incontractholder funds obligations.
• We expect lower investment spread due to reduced contractholder funds and the continuing low interest rate environment. As interest ratesremain below the aggregate portfolio yield, the amount by which the low interest rate environment will reduce our investment spread iscontingent on our ability to maintain the portfolio yield and lower interest crediting rates on spread based products, which could be limited bymarket conditions, regulatory minimum rates or contractual minimum rate guarantees, and may not match the timing or magnitude of changesin asset yields. Also, a significant amount of our invested assets are used to support our capital and non-spread based products, which do notprovide this offsetting opportunity.
Summary analysis Summarized financial data for the years ended December 31 is presented in the following table.
Net income in 2010 was $58 million compared to a net loss of $483 million in 2009. The favorable change of $541 million was primarily due tolower amortization of DAC, decreased interest credited to contractholder funds and higher premiums and contract charges, partially offset by lower netinvestment income, higher contract benefits and increased net realized capital losses.
Net loss was $483 million in 2009 compared to $1.72 billion in 2008. The improvement of $1.24 billion in 2009 compared to 2008 was primarilydue to lower net realized capital losses and, to a lesser extent, decreased interest credited to contractholder funds and operating costs and expenses,partially offset by lower net investment income, higher amortization of DAC and a $142 million increase in the valuation allowance relating to thedeferred tax asset on capital losses that was recorded in the first quarter of 2009. This valuation allowance was released in connection with ouradoption of new OTTI accounting guidance on April 1, 2009; however, the release was recorded as an increase to retained income and therefore didnot reverse the amount recorded in income tax expense.
70
($ in millions) 2010 2009 2008 Revenues Life and annuity premiums and contract charges $ 2,168 $ 1,958 $ 1,895 Net investment income 2,853 3,064 3,811 Realized capital gains and losses (517) (431) (3,127)
Total revenues 4,504 4,591 2,579
Costs and expenses Life and annuity contract benefits (1,815) (1,617) (1,612)Interest credited to contractholder funds (1,807) (2,126) (2,411)Amortization of DAC (356) (965) (704)Operating costs and expenses (469) (430) (520)Restructuring and related charges 3 (25) (1)
Total costs and expenses (4,444) (5,163) (5,248)
Gain (loss) on disposition of operations 6 7 (6)Income tax (expense) benefit (8) 82 954
Net income (loss) $ 58 $ (483) $ (1,721)
Investments as of December 31 $ 61,582 $ 62,216 $ 61,499

Analysis of revenues Total revenues decreased 1.9% or $87 million in 2010 compared to 2009 due to lower net investment income and highernet realized capital losses, partially offset by higher premiums and contract charges. Total revenues increased 78.0% or $2.01 billion in 2009 comparedto 2008 primarily due to a $2.70 billion decrease in net realized capital losses, partially offset by a $747 million decline in net investment income.
Life and annuity premiums and contract charges Premiums represent revenues generated from traditional life insurance, immediate annuitieswith life contingencies, and accident and health insurance products that have significant mortality or morbidity risk. Contract charges are revenuesgenerated from interest-sensitive and variable life insurance and fixed annuities for which deposits are classified as contractholder funds or separateaccount liabilities. Contract charges are assessed against the contractholder account values for maintenance, administration, cost of insurance andsurrender prior to contractually specified dates.
The following table summarizes life and annuity premiums and contract charges by product for the years ended December 31.
Total premiums and contract charges increased 10.7% in 2010 compared to 2009 primarily due to higher sales of accident and health insurancethrough Allstate Benefits, with a significant portion of the increase resulting from sales to employees of one large company, and higher contractcharges on interest-sensitive life insurance products resulting from a shift in the mix of policies in force to contracts with higher cost of insurance ratesand policy administration fees. In addition, increased traditional life insurance premiums in 2010 were primarily due to lower reinsurance premiumsresulting from higher retention, partially offset by lower renewal premiums and decreased sales.
Total premiums and contract charges increased 3.3% in 2009 compared to 2008 due to higher sales of accident and health insurance throughAllstate Benefits and higher contract charges on interest-sensitive life insurance products resulting from increases in certain policy administration fees,partially offset by lower sales of immediate annuities with life contingencies.
Contractholder funds represent interest-bearing liabilities arising from the sale of individual and institutional products, such as interest-sensitive lifeinsurance, fixed annuities, funding agreements and bank deposits. The balance of contractholder funds is equal to the cumulative deposits receivedand interest credited to the contractholder less
71
($ in millions) 2010 2009 2008 Underwritten products Traditional life insurance premiums $ 420 $ 407 $ 399 Accident and health insurance premiums 621 460 412 Interest-sensitive life insurance contract
charges 991 944 896
Subtotal 2,032 1,811 1,707
Annuities Immediate annuities with life contingencies
premiums 97 102 132 Other fixed annuity contract charges 39 45 56
Subtotal 136 147 188
Life and annuity premiums and contractcharges (1) $ 2,168 $ 1,958 $ 1,895
Total contract charges include contract charges related to the cost of insurance totaling $637 million, $616 million and $595 million in 2010,2009 and 2008, respectively.
(1)

cumulative contract maturities, benefits, surrenders, withdrawals and contract charges for mortality or administrative expenses. The following tableshows the changes in contractholder funds for the years ended December 31.
Contractholder funds decreased 8.3%, 10.0% and 5.8% in 2010, 2009 and 2008, respectively. Average contractholder funds decreased 9.2% in2010 compared to 2009 and 7.8% in 2009 compared to 2008.
Contractholder deposits decreased 24.9% in 2010 compared to 2009 primarily due to lower deposits on fixed annuities. Deposits on fixedannuities decreased 52.5% in 2010 compared to 2009 due to our strategic decision to discontinue distributing fixed annuities through banks andbroker-dealers and our goal to reduce our concentration in spread based products and improve returns on new business.
Contractholder deposits decreased 56.0% in 2009 compared to 2008 because there were no issuances of institutional products in 2009 comparedto $4.16 billion in 2008 and due to lower deposits on fixed annuities in 2009. Sales of our institutional products vary from period to period based onmanagement's assessment of market conditions, investor demand and operational priorities such as our focus beginning in 2009 on reducing ourconcentration in spread based products. Deposits on fixed annuities decreased 48.3% in 2009 compared to 2008 due to pricing actions to improvereturns on new business and reduce our concentration in spread based products.
Maturities and retirements of institutional products decreased 61.6% to $1.83 billion in 2010 from $4.77 billion in 2009. During 2009, we retired allof our remaining outstanding extendible institutional market obligations totaling $1.45 billion. In addition, 2009 included the redemption of $1.39 billionof institutional product liabilities in conjunction with cash tender offers.
Maturities and retirements of institutional products decreased 44.5% to $4.77 billion in 2009 from $8.60 billion in 2008. The decrease was primarilydue to lower retirements of extendible institutional market obligations in 2009 compared to 2008, partially offset by the redemption in 2009 ofinstitutional product liabilities in accordance with the cash tender offers.
Surrenders and partial withdrawals on deferred fixed annuities, interest-sensitive life insurance products and Allstate Bank products (includingmaturities of certificates of deposit) increased 0.6% to $5.20 billion in 2010 from $5.17 billion in 2009, and decreased 2.7% in 2009 from $5.31 billion in2008. In 2010, the increase was primarily due to higher surrenders and partial withdrawals on fixed annuities, partially offset by lower surrenders andpartial withdrawals on Allstate Bank products. In 2009, the decrease was due to lower surrenders and partial withdrawals on traditional fixed annuities,partially offset by higher surrenders and partial withdrawals on market value adjusted
72
($ in millions) 2010 2009 2008 Contractholder funds, beginning balance $ 52,582 $ 58,413 $ 61,975
Deposits Fixed annuities 932 1,964 3,802 Institutional products (funding agreements) — — 4,158 Interest-sensitive life insurance 1,512 1,438 1,404 Bank and other deposits 994 1,178 1,038
Total deposits 3,438 4,580 10,402
Interest credited 1,794 2,025 2,405
Maturities, benefits, withdrawals and otheradjustments
Maturities and retirements of institutional products (1,833) (4,773) (8,599)Benefits (1,552) (1,588) (1,710)Surrenders and partial withdrawals (5,203) (5,172) (5,313)Contract charges (983) (918) (870)Net transfers from separate accounts 11 11 19 Fair value hedge adjustments for institutional products (196) 25 (56)Other adjustments (1) 137 (21) 160
Total maturities, benefits, withdrawals and otheradjustments (9,619) (12,436) (16,369)
Contractholder funds, ending balance $ 48,195 $ 52,582 $ 58,413
The table above illustrates the changes in contractholder funds, which are presented gross of reinsurance recoverables on the ConsolidatedStatements of Financial Position. The table above is intended to supplement our discussion and analysis of revenues, which are presented net ofreinsurance on the Consolidated Statements of Operations. As a result, the net change in contractholder funds associated with products reinsuredto third parties is reflected as a component of the other adjustments line.
(1)

annuities and interest-sensitive life insurance. The surrender and partial withdrawal rate on deferred fixed annuities, interest-sensitive life insuranceproducts and Allstate Bank products, based on the beginning of year contractholder funds, was 12.2% in 2010 compared to 11.8% in 2009 and 12.2%in 2008.
Net investment income decreased 6.9% or $211 million to $2.85 billion in 2010 from $3.06 billion in 2009 primarily due to lower yields, reducedaverage investment balances and risk reduction actions.
Net investment income decreased 19.6% or $747 million to $3.06 billion in 2009 from $3.81 billion in 2008. The decline was primarily due to loweryields, actions to shorten duration and maintain additional liquidity in the portfolio, along with reduced average investment balances resulting primarilyfrom reduced contractholder obligations.
Net realized capital gains and losses are presented in the following table for the years ended December 31.
For further discussion of realized capital gains and losses, see the Investments section of the MD&A.
Analysis of costs and expenses Total costs and expenses decreased 13.9% or $719 million in 2010 compared to 2009 primarily due to loweramortization of DAC and interest credited to contractholder funds, partially offset by higher contract benefits. Total costs and expenses decreased1.6% or $85 million in 2009 compared to 2008 primarily due to lower interest credited to contractholder funds and operating costs and expenses,partially offset by higher amortization of DAC and restructuring and related charges.
Life and annuity contract benefits increased 12.2% or $198 million in 2010 compared to 2009 primarily due to higher contract benefits on accidentand health insurance and interest-sensitive life insurance products, partially offset by lower contract benefits on immediate annuities with lifecontingencies. Higher contract benefits on accident and health insurance were proportionate to growth in premiums. The increase in contract benefitson interest-sensitive life insurance was primarily due to the reestimation of reserves for certain secondary guarantees on universal life insurancepolicies and higher mortality experience resulting from an increase in average claim size and higher incidence of claims. Lower contract benefits onimmediate annuities with life contingencies were due to the reestimation of reserves for benefits payable to certain annuitants to reflect currentcontractholder information.
The reserve reestimations utilized more refined policy level information and assumptions in the second quarter of 2010. The increase in reservesfor certain secondary guarantees on universal life insurance policies resulted in a charge to contract benefits of $68 million and a related reduction inamortization of DAC of $50 million. The decrease in reserves for immediate annuities resulted in a credit to contract benefits of $26 million. The netimpact was an increase to income of $8 million, pre-tax.
Life and annuity contract benefits increased 0.3% or $5 million in 2009 compared to 2008 due to higher contract benefits on life insuranceproducts and accident and health insurance business, partially offset by lower contract benefits on annuities. The increase in contract benefits on lifeinsurance products was primarily due to higher mortality experience on interest-sensitive life insurance products resulting from an increase in claimexperience and policy growth while higher contract benefits on accident and health insurance business was proportionate to growth in premiums. Thedecrease in contract benefits for annuities was due to improved mortality experience and the impact of lower sales of immediate annuities with lifecontingencies.
We analyze our mortality and morbidity results using the difference between premiums and contract charges earned for the cost of insurance andlife and annuity contract benefits excluding the portion related to the implied interest on immediate annuities with life contingencies ("benefit spread").This implied interest totaled $549 million, $558 million and $552 million in 2010, 2009 and 2008, respectively.
73
($ in millions) 2010 2009 2008 Impairment write-downs $ (501) $ (1,021) $ (1,256)Change in intent write-downs (142) (268) (1,247)
Net other-than-temporary impairment losses recognized in earnings (643) (1,289) (2,503)Sales 219 638 178 Valuation of derivative instruments (94) 315 (985)Settlements of derivative instruments (31) 41 197 EMA limited partnership income 32 (136) (14)
Realized capital gains and losses, pre-tax (517) (431) (3,127)Income tax benefit 180 14 1,093
Realized capital gains and losses, after-tax $ (337) $ (417) $ (2,034)

The benefit spread by product group is disclosed in the following table for the years ended December 31.
Benefit spread decreased 3.2% or $17 million in 2010 compared to 2009. The decrease was primarily due to higher mortality experience oninterest-sensitive life insurance, reestimations of reserves that increased contract benefits for interest-sensitive life insurance and decreased contractbenefits for immediate annuities, partially offset by growth in accident and health insurance sold through Allstate Benefits.
Benefit spread increased 10.0% or $48 million in 2009 compared to 2008 primarily due to improved mortality experience on annuities and higherpremiums on accident and health insurance business sold through Allstate Benefits.
Interest credited to contractholder funds decreased 15.0% or $319 million in 2010 compared to 2009 primarily due to lower average contractholderfunds and management actions to reduce interest crediting rates on deferred fixed annuities and interest-sensitive life insurance. In addition, thedecline in 2010 also reflects lower amortization of DSI.
Amortization of DSI in 2010 was $27 million compared to $129 million in 2009. The decline in amortization of DSI in 2010 was primarily due to a$46 million decrease in amortization relating to realized capital gains and losses and a $38 million reduction in amortization acceleration for changes inassumptions.
Interest credited to contractholder funds decreased 11.8% or $285 million in 2009 compared to 2008 primarily due to lower average contractholderfunds and, to a lesser extent, decreased weighted average interest crediting rates on deferred fixed annuities and institutional products, partially offsetby higher amortization of DSI. Amortization of DSI in 2009 and 2008 was $129 million and $53 million, respectively. The increase primarily relates to anunfavorable change in amortization relating to realized capital gains and losses of $132 million, partially offset by a $32 million decline in amortizationacceleration due to changes in assumptions, which in 2009 and 2008 increased interest credited to contractholder funds by $38 million and$70 million, respectively.
In order to analyze the impact of net investment income and interest credited to contractholders on net income, we monitor the difference betweennet investment income and the sum of interest credited to contractholder funds and the implied interest on immediate annuities with life contingencies,which is included as a component of life and annuity contract benefits on the Consolidated Statements of Operations ("investment spread").
The investment spread by product group is shown in the following table for the years ended December 31.
Investment spread increased 30.8% or $117 million in 2010 compared to 2009 as lower net investment income was more than offset by decreasedinterest credited to contractholder funds, which includes lower amortization of DSI. Excluding amortization of DSI, investment spread increased 2.9%or $15 million in 2010 compared to 2009.
Investment spread declined 55.2% or $468 million in 2009 compared to 2008. These declines reflect lower net investment income, partially offsetby decreased interest credited to contractholder funds.
74
($ in millions) 2010 2009 2008 Life insurance $ 282 $ 363 $ 363 Accident and health insurance 252 196 177 Annuities (25) (33) (62)
Total benefit spread $ 509 $ 526 $ 478
($ in millions) 2010 2009 2008 Annuities and institutional products $ 179 $ 126 $ 460 Life insurance 35 3 48 Allstate Bank products 31 30 22 Accident and health insurance 18 16 12 Net investment income on investments
supporting capital 234 205 306
Total investment spread $ 497 $ 380 $ 848
To further analyze investment spreads, the following table summarizes the weighted average investment yield on assets supporting productliabilities and capital, interest crediting rates and investment spreads for 2010, 2009 and 2008.
The following table summarizes our product liabilities as of December 31 and indicates the account value of those contracts and policies in whichan investment spread is generated.
The following table summarizes the weighted average guaranteed crediting rates and weighted average current crediting rates for certain fixedannuities and interest-sensitive life contracts where management has the ability to change the crediting rate, subject to a contractual minimum. Otherproducts, including equity-indexed, variable and immediate annuities, equity-indexed and variable life, institutional products and Allstate Bank productstotaling $13.74 billion of contractholder funds, have been excluded from the analysis because management does not have the ability to change thecrediting rate or the minimum crediting rate is not considering meaningful in this context.
75
Weighted averageinvestment yield
Weighted averageinterest crediting rate
Weighted averageinvestment spreads
2010 2009 2008 2010 2009 2008 2010 2009 2008 Interest-sensitive life insurance 5.5% 5.5% 6.0% 4.4% 4.6% 4.6% 1.1% 0.9% 1.4%Deferred fixed annuities and
institutional products 4.4 4.5 5.2 3.2 3.4 3.7 1.2 1.1 1.5 Immediate fixed annuities with and
without life contingencies 6.4 6.3 6.8 6.4 6.5 6.5 — (0.2) 0.3 Investments supporting capital,
traditional life and other products 3.7 3.7 5.3 n/a n/a n/a n/a n/a n/a
($ in millions) 2010 2009 2008 Immediate fixed annuities with life contingencies $ 8,696 $ 8,454 $ 8,355 Other life contingent contracts and other 4,786 4,456 4,526
Reserve for life-contingent contract benefits $ 13,482 $ 12,910 $ 12,881
Interest-sensitive life insurance $ 10,675 $ 10,276 $ 9,957 Deferred fixed annuities 29,367 32,194 33,766 Immediate fixed annuities without life contingencies 3,799 3,869 3,894 Institutional products 2,650 4,370 8,974 Allstate Bank products 1,091 1,085 949 Market value adjustments related to fair value hedges and other 613 788 873
Contractholder funds $ 48,195 $ 52,582 $ 58,413
($ in millions) As of December 31, 2010
Weightedaverage
guaranteedcrediting
rates
Weightedaveragecurrent
creditingrates
Contractholderfunds
Annuities with annual crediting rate resets 3.06% 3.08% $ 12,718 Annuities with multi-year rate guarantees: (1) Resetable in next 12 months 1.62 4.37 2,597 Resetable after 12 months 1.76 3.98 8,503 Interest-sensitive life 3.99 4.46 10,637
These contracts include interest rate guarantee periods which are typically 5 or 6 years.(1)

Amortization of DAC decreased 63.1% or $609 million in 2010 compared to 2009 and increased 37.1% or $261 million in 2009 compared to 2008.The components of amortization of DAC are summarized in the following table for the years ended December 31.
The decrease of $609 million in 2010 was primarily due to a favorable change in amortization acceleration/deceleration for changes inassumptions, lower amortization relating to realized capital gains and losses, a decreased amortization rate on fixed annuities and lower amortizationfrom decreased benefit spread on interest-sensitive life insurance due to the reestimation of reserves. The increase of $261 million in 2009 comparedto 2008 was primarily due to an unfavorable change in amortization relating to realized capital gains and losses, partially offset by the absence ofadditional amortization recorded in 2008 in connection with a premium deficiency assessment, lower amortization resulting from decreased investmentspread on deferred fixed annuities, and a decline in amortization acceleration due to changes in assumptions.
The impact of realized capital gains and losses on amortization of DAC is dependent upon the relationship between the assets that give rise to thegain or loss and the product liability supported by the assets. Fluctuations result from changes in the impact of realized capital gains and losses onactual and expected gross profits. In 2010, DAC amortization relating to realized capital gains and losses resulted primarily from realized capital gainson derivatives and sales of fixed income securities. In 2009, DAC amortization relating to realized capital gains and losses resulted primarily fromrealized capital gains on derivatives. Additionally, DAC amortization in 2010 and 2009 reflects our decision in the second half of 2009 not torecapitalize DAC for credit or derivative losses on investments supporting certain fixed annuities following concerns that an increase in the level ofexpected realized capital losses may reduce EGP and adversely impact the product DAC recoverability. In 2008, DAC accretion resulted primarily fromrealized capital losses on derivatives and other-than-temporary impairment losses.
Our annual comprehensive review of the profitability of our products to determine DAC balances for our interest-sensitive life, fixed annuities andother investment contracts covers assumptions for investment returns, including capital gains and losses, interest crediting rates to policyholders, theeffect of any hedges, persistency, mortality and expenses in all product lines. In the first quarter of 2010, the review resulted in a deceleration of DACamortization (credit to income) of $12 million. Amortization deceleration of $45 million related to variable life insurance and was primarily due toappreciation in the underlying separate account valuations. Amortization acceleration of $32 million related to interest-sensitive life insurance and wasprimarily due to an increase in projected realized capital losses and lower projected renewal premium (which is also expected to reduce persistency),partially offset by lower expenses.
In 2009, our annual comprehensive review resulted in the acceleration of DAC amortization (charge to income) of $277 million. $289 millionrelated to fixed annuities, of which $210 million was attributable to market value adjusted annuities, and $18 million related to variable life insurance.Partially offsetting these amounts was amortization deceleration (credit to income) for interest-sensitive life insurance of $30 million. The principalassumption impacting fixed annuity amortization acceleration was an increase in the level of expected realized capital losses in 2009 and 2010. Forinterest-sensitive life insurance, the amortization deceleration was due to a favorable change in our mortality assumptions, partially offset by increasedexpected capital losses.
In 2008, DAC amortization acceleration for changes in assumptions recorded in connection with comprehensive reviews of the DAC balancesresulted in an increase to amortization of DAC of $327 million. The principle assumption impacting the amortization acceleration in 2008 was the levelof realized capital losses impacting actual gross profits in 2008 and the impact of realized capital losses on EGP in 2009. During the fourth quarter of2008, our assumptions for EGP were impacted by a view of higher impairments in our investment portfolio.
76
($ in millions) 2010 2009 2008 Amortization of DAC before amortization relating to realized capital gains
and losses and changes in assumptions and premium deficiency $ (326) $ (472) $ (556)(Amortization) accretion relating to realized capital gains and losses (42) (216) 515 Amortization deceleration (acceleration) for changes in assumptions
("DAC unlocking") 12 (277) (327)Amortization charge relating to premium deficiency — — (336)
Total amortization of DAC $ (356) $ (965) $ (704)

During 2008, indicators emerged that suggested a study of mortality experience for our immediate annuities with life contingences was warranted.At the same time, the underlying profitability of the traditional life insurance business deteriorated due to lower investment returns and growth. Fortraditional life insurance and immediate annuities with life contingencies, an aggregate premium deficiency of $336 million resulted primarily from theexperience study indicating that the annuitants on certain life contingent contracts are projected to live longer than we anticipated when the contractswere issued and, to a lesser degree, a reduction in the related investment portfolio yield. The deficiency was recorded through a reduction in DAC.There was no similar charge to income recorded in 2010 or 2009.
The changes in the DAC asset are detailed in the following table.
Operating costs and expenses increased 9.1% or $39 million in 2010 compared to 2009 and decreased 17.3% or $90 million in 2009 compared to2008. The following table summarizes operating costs and expenses.
Non-deferrable acquisition costs increased 7.7% or $12 million in 2010 compared to 2009 primarily due to higher non-deferrable commissionsrelated to accident and health insurance business sold through Allstate Benefits. Other operating costs and expenses increased 9.9% or $27 million in2010 compared to 2009 primarily due to higher product development, marketing and technology costs, increased litigation expenses, lowerreinsurance expense allowances resulting from higher retention and increases in the net cost of employee benefits. In 2010, these increased costswere partially offset by our expense reduction actions, which resulted in lower employee, professional services and sales support expenses.
77
($ in millions)
Traditional lifeand
accident andhealth
Interest-sensitivelife insurance Fixed annuities Other Total
2010 2009 2010 2009 2010 2009 2010 2009 2010 2009 Beginning balance $ 650 $ 595 $ 2,246 $ 2,449 $ 1,159 $ 4,037 $ 5 $ 8 $ 4,060 $ 7,089 Acquisition costs deferred 156 162 275 230 52 103 — — 483 495 Impact of adoption of new OTTI
accounting before unrealized impact — — — (6) — (170) — — — (176)Impact of adoption of new OTTI
accounting effect of unrealized capitalgains and losses — — — 6 — 170 — — — 176
Amortization of DAC before amortizationrelating to realized capital gains andlosses and changes in assumptions (113) (107) (140) (176) (71) (186) (2) (3) (326) (472)
Accretion (amortization) relating torealized capital gains and losses — — 15 (4) (57) (212) — — (42) (216)
Amortization deceleration (acceleration)for changes in assumptions ("DACunlocking") — — 13 12 (1) (289) — — 12 (277)
Effect of unrealized capital gains andlosses — — (144) (265) (651) (2,294) — — (795) (2,559)
Ending balance $ 693 $ 650 $ 2,265 $ 2,246 $ 431 $ 1,159 $ 3 $ 5 $ 3,392 $ 4,060
(1)
(2)
(3)
(3)
(3)
(4)
The adoption of new OTTI accounting guidance resulted in an adjustment to DAC to reverse previously recorded DAC accretion related to realized capitallosses that were reclassified to other comprehensive income upon adoption on April 1, 2009. The adjustment was recorded as a reduction of the DACbalance and retained income.The adoption of new OTTI accounting guidance resulted in an adjustment to DAC due to the change in unrealized capital gains and losses that occurredupon adoption on April 1, 2009 when previously recorded realized capital losses were reclassified to other comprehensive income. The adjustment wasrecorded as an increase of the DAC balance and unrealized capital gains and losses.Included as a component of amortization of DAC on the Consolidated Statements of Operations.Represents the change in the DAC adjustment for unrealized capital gains and losses. The DAC adjustment balance was $75 million and $870 million as ofDecember 31, 2010 and 2009, respectively, and represents the amount by which the amortization of DAC would increase or decrease if the unrealized gainsand losses in the respective product portfolios were realized. Recapitalization of DAC is limited to the originally deferred policy acquisition costs plus interest.
(1)
(2)
(3)(4)
($ in millions) 2010 2009 2008 Non-deferrable acquisition costs $ 168 $ 156 $ 153 Other operating costs and expenses 301 274 367
Total operating costs and expenses $ 469 $ 430 $ 520
Restructuring and related charges $ (3) $ 25 $ 1

Non-deferrable acquisition costs increased 2.0% or $3 million in 2009 compared to 2008 primarily due to higher non-deferrable commissionsrelated to accident and health insurance business sold through Allstate Benefits. Other operating costs and expenses decreased 25.3% or $93 millionin 2009 compared to 2008 primarily due to our expense reduction actions, which resulted in lower employee, professional services and sales supportexpenses.
During 2009, restructuring and related charges of $25 million were recorded in connection with our previously announced plan to improveefficiency and narrow our focus of product offerings. In accordance with this plan, among other actions, we eliminated approximately 1,000 workforcepositions relative to December 31, 2008 levels through a combination of attrition, position elimination and outsourcing. This reduction reflectedapproximately 30% of Allstate Financial's work force at the time the plan was initiated. Through our actions completed as of December 31, 2010, weanticipate that we will exceed our targeted annual savings of $90 million beginning in 2011.
Income tax expense of $8 million was recognized for 2010 compared to income tax benefits of $82 million and $954 million in 2009 and 2008,respectively. Income tax benefit for 2009 included expense of $142 million attributable to an increase in the valuation allowance relating to the deferredtax asset on capital losses recorded in the first quarter of 2009. This valuation allowance was released in connection with the adoption of new OTTIaccounting guidance on April 1, 2009; however, the release was recorded as an increase to retained income and therefore did not reverse the amountrecorded in income tax benefit.
Reinsurance ceded We enter into reinsurance agreements with unaffiliated reinsurers to limit our risk of mortality and morbidity losses. Inaddition, Allstate Financial has used reinsurance to effect the acquisition or disposition of certain blocks of business. We retain primary liability as adirect insurer for all risks ceded to reinsurers. As of December 31, 2010 and 2009, 45% and 47%, respectively, of our face amount of life insurance inforce was reinsured. Additionally, we ceded substantially all of the risk associated with our variable annuity business and we cede 100% of themorbidity risk on substantially all of our long-term care contracts.
Our reinsurance recoverables, summarized by reinsurer as of December 31, are shown in the following table.
Certain of our reinsurers experienced rating downgrades in 2010 by S&P, including Security Life of Denver and Manulife Insurance Company. Wecontinuously monitor the creditworthiness of reinsurers in order to determine our risk
78
($ in millions)
Standard & Poor'sFinancial
Strength Rating (3)
Reinsurancerecoverable on paidand unpaid benefits
2010 2009 Prudential Insurance Company of America AA- $ 1,633 $ 1,507 Employers Reassurance Corporation A+ 853 745 Transamerica Life Group AA- 402 374 RGA Reinsurance Company AA- 360 352 Swiss Re Life and Health America, Inc. A+ 210 200 Paul Revere Life Insurance Company A- 140 146 Scottish Re Group (1) N/A 136 137 Munich American Reassurance AA- 124 119 Mutual of Omaha Insurance AA- 98 101 Security Life of Denver A 79 91 Manulife Insurance Company AA- 68 71 Lincoln National Life Insurance AA- 64 65 Triton Insurance Company N/A 58 61 American Health & Life Insurance Co. N/A 50 51 Other (2) 125 123
Total $ 4,400 $ 4,143
The reinsurance recoverable on paid and unpaid benefits related to the Scottish Re Group as of December 31, 2010 comprised $73 million related toScottish Re Life Corporation and $63 million related to Scottish Re (U.S.), Inc. The reinsurance recoverable on paid and unpaid benefits related to theScottish Re Group as of December 31, 2009 comprised $74 million related to Scottish Re Life Corporation and $63 million related to Scottish Re (U.S.), Inc.As of December 31, 2010 and 2009, the other category includes $106 million and $100 million, respectively, of recoverables due from reinsurers with aninvestment grade credit rating from Standard & Poor's ("S&P").N/A reflects no rating available.
(1)
(2)
(3)

of recoverability on an individual and aggregate basis, and a provision for uncollectible reinsurance is recorded if needed. No amounts have beendeemed unrecoverable in the three-years ended December 31, 2010.
We enter into certain intercompany reinsurance transactions for the Allstate Financial operations in order to maintain underwriting control andmanage insurance risk among various legal entities. These reinsurance agreements have been approved by the appropriate regulatory authorities. Allsignificant intercompany transactions have been eliminated in consolidation.
INVESTMENTS 2010 HIGHLIGHTS
• Investments as of December 31, 2010 totaled $100.48 billion, an increase of 0.7% from $99.83 billion as of December 31, 2009.• Unrealized net capital gains totaled $1.39 billion as of December 31, 2010, improving from unrealized net capital losses of $2.32 billion as of
December 31, 2009.• As of December 31, 2010, the fair value for our below investment grade fixed income securities with gross unrealized losses totaled
$3.29 billion compared to $3.51 billion as of December 31, 2009. The gross unrealized losses for these securities totaled $1.08 billion as ofDecember 31, 2010, an improvement of 40.4% from $1.81 billion as of December 31, 2009.
• Net investment income was $4.10 billion in 2010, a decrease of 7.7% from $4.44 billion in 2009.• Net realized capital losses were $827 million in 2010 compared to net realized capital losses of $583 million in 2009.• Derivative net realized capital losses totaled $601 million in 2010 compared to net realized capital gains of $205 million in 2009. Derivative net
realized capital losses in 2010 resulted primarily from our risk management actions.• During 2010, our fixed income and mortgage loan portfolio generated $10.19 billion of cash flows from interest and maturities.
INVESTMENTS
Overview and strategy The return on our investment portfolios is an important component of our financial results. Investment portfolios aresegmented between the Property-Liability, Allstate Financial and Corporate and Other operations. While taking into consideration the investmentportfolio in aggregate, we manage the underlying portfolios based upon the nature of each respective business and its corresponding liability structure.
We employ a strategic asset allocation approach which uses models that consider the nature of the liabilities and risk tolerances, as well as therisk and return parameters of the various asset classes in which we invest. This asset allocation is informed by our global economic and marketoutlook, as well as other inputs and constraints, including diversification effects, duration, liquidity and capital considerations. Within the ranges set bythe strategic asset allocation model, tactical investment decisions are made in consideration of prevailing market conditions. We continue to managerisks associated with interest rates, credit and credit spreads, equity markets, and real estate and municipal bonds.
The Property-Liability portfolio's investment strategy emphasizes protection of principal and consistent income generation, within a total returnframework. This approach, which has produced competitive returns over the long term, is designed to ensure financial strength and stability for payingclaims, while maximizing economic value and surplus growth.
The Allstate Financial portfolio's investment strategy focuses on the total return of assets needed to support the underlying liabilities, asset-liabilitymanagement and achieving an appropriate return on capital.
The Corporate and Other portfolio's investment strategy balances the pursuit of competitive returns with the unique liquidity needs of the portfolioin relation to the overall corporate capital structure. The portfolio is primarily invested in high quality, liquid fixed income and short-term securities withadditional investments in less liquid holdings in order to enhance overall returns.
Risk mitigation
We continue to focus our strategic risk mitigation efforts towards managing interest rate, credit and credit spreads, equity and real estate andmunicipal bond investment risks, while our return optimization efforts focus on investing in new opportunities to generate income and capitalappreciation. As a result, during 2010 we took the following actions:
• Reduced our municipal bond exposure by 25.3% or $5.48 billion of amortized cost primarily through targeted dispositions, prepaymentsand scheduled maturities.
79

• Reduced our commercial real estate exposure by 18.7% or $2.31 billion of amortized cost primarily through targeted dispositions andprincipal repayments from borrowers.
• Maintained hedges to protect our portfolio, primarily against interest rate spikes and equity price declines, which performed consistentlywith our positions in relation to the movement in the underlying market indices. The resulting realized capital losses from our interest rateand equity hedges were offset by the increase in fair value of our fixed income and equity securities, which is reflected in othercomprehensive income ("OCI").
Investments outlook
For 2011, we expect the U.S. and other developed economies to recover at a moderate pace, with greater growth in developing and emergingcountries. These increasing growth expectations should move equity prices higher. Expected tightening of monetary policy will drive interest ratesmoderately higher. With expected growth in the economy, credit markets should continue to improve, but challenges will remain in certain segmentssuch as municipal bonds. As a result, we plan to focus on the following priorities:
• Optimizing our allocation of assets to align with changes in Allstate Financial's liabilities.• Continuing to explore global investments in areas of emerging opportunity with higher prospects for growth.• Managing the impact of gradually rising rates on our fixed income portfolio.• Continuing to favor credit risk, while managing our municipal exposure.
As a result of these actions and market conditions:
• Invested assets and income are expected to decline in line with reductions in contractholder obligations for the Allstate Financialsegment.
• Our risk and return optimization actions will allow us to maintain portfolio yields comparable to 2010.
Portfolio composition The composition of the investment portfolios as of December 31, 2010 is presented in the table below. Also see Notes 2and 4 of the consolidated financial statements for investment accounting policies and additional information.
Total investments increased to $100.48 billion as of December 31, 2010, from $99.83 billion as of December 31, 2009, primarily due to highervaluations for fixed income securities, partially offset by net reductions in contractholder obligations. Valuations of fixed income securities are typicallydriven by a combination of changes in relevant risk-free interest rates and credit spreads over the period. Risk-free interest rates are typically definedas the yield on U.S. Treasury securities, whereas credit spread is the additional yield on fixed income securities above the risk-free rate that marketparticipants require to compensate them for assuming credit, liquidity and/or prepayment risks. The increase in valuation of fixed income securitiesduring 2010 was mainly due to declining risk-free interest rates and tightening of credit spreads in certain sectors.
80
Property-
Liability (5) Allstate
Financial (5) Corporate and
Other (5) Total
($ in millions) Percentto total
Percentto total
Percentto total
Percentto total
Fixed income securities (1) $ 27,413 78.2% $ 49,934 81.1% $ 2,265 58.8% $ 79,612 79.2%Equity securities (2) 4,578 13.1 233 0.4 — — 4,811 4.8 Mortgage loans 18 0.1 6,661 10.8 — — 6,679 6.6 Limited partnership
interests (3) 2,506 7.1 1,274 2.1 36 0.9 3,816 3.8 Short-term (4) 430 1.2 1,297 2.1 1,552 40.3 3,279 3.3 Other 103 0.3 2,183 3.5 — — 2,286 2.3
Total $ 35,048 100.0% $ 61,582 100.0% $ 3,853 100.0% $ 100,483 100.0%
Fixed income securities are carried at fair value. Amortized cost basis for these securities was $27.38 billion, $49.19 billion and $2.22 billion for Property-Liability, Allstate Financial and Corporate and Other, respectively.Equity securities are carried at fair value. Cost basis for these securities was $4.04 billion and $185 million for Property-Liability and Allstate Financial,respectively.We have commitments to invest in additional limited partnership interests totaling $740 million and $731 million for Property-Liability and Allstate Financial,respectively.Short-term investments are carried at fair value. Amortized cost basis for these investments was $430 million, $1.30 billion and $1.55 billion for Property-Liability, Allstate Financial and Corporate and Other, respectively.Balances reflect the elimination of related party investments between segments.
(1)
(2)
(3)
(4)
(5)

The Property-Liability investment portfolio increased to $35.05 billion as of December 31, 2010, from $34.53 billion as of December 31, 2009,primarily due to higher valuations for equity and fixed income securities and positive operating cash flows, partially offset by dividends paid by AllstateInsurance Company ("AIC") to its parent, The Allstate Corporation.
The Allstate Financial investment portfolio decreased to $61.58 billion as of December 31, 2010, from $62.22 billion as of December 31, 2009,primarily due to net reductions in contractholder obligations of $4.39 billion, partially offset by higher valuations for fixed income securities.
The Corporate and Other investment portfolio increased to $3.85 billion as of December 31, 2010, from $3.09 billion as of December 31, 2009,primarily due to dividends of $1.30 billion paid by AIC to the Corporation and higher valuations for fixed income securities, partially offset by dividendspaid to shareholders, interest paid on debt and share repurchases.
Fixed income securities by type are listed in the table below.
As of December 31, 2010, 91.6% of the consolidated fixed income securities portfolio was rated investment grade, which is defined as a securityhaving a rating of Aaa, Aa, A or Baa from Moody's, a rating of AAA, AA, A or BBB from S&P, Fitch, Dominion, or Realpoint, a rating of aaa, aa, a, orbbb from A.M. Best, or a comparable internal rating if an externally provided rating is not available.
81
($ in millions)
Fair value as ofDecember 31,
2010
Percent tototal
investments
Fair value as ofDecember 31,
2009
Percent tototal
investments U.S. government and agencies $ 8,596 8.6%$ 7,536 7.6%Municipal 15,934 15.9 21,280 21.3 Corporate 37,655 37.5 33,115 33.2 Foreign government 3,158 3.1 3,197 3.2 Residential mortgage-backed securities
("RMBS") 7,993 7.9 7,987 8.0 Commercial mortgage-backed securities
("CMBS") 1,994 2.0 2,586 2.6 Asset-backed securities ("ABS") 4,244 4.2 3,026 3.0 Redeemable preferred stock 38 — 39 —
Total fixed income securities $ 79,612 79.2%$ 78,766 78.9%

The following table summarizes the fair value and unrealized net capital gains and losses for fixed income securities by credit rating as ofDecember 31, 2010.
Municipal bonds, including tax exempt, taxable and ARS securities, totaled $15.93 billion as of December 31, 2010 with an unrealized net capitalloss of $267 million.
As of December 31, 2010, 45.8% or $7.29 billion of our municipal bond portfolio is insured by nine bond insurers and 45.7% of these securitieshave a credit rating of Aaa or Aa. 47.8% of our insured municipal bond portfolio was insured by National Public Finance Guarantee Corporation, Inc.,22.7% by Ambac Assurance Corporation, 21.7% by Assured Guaranty Municipal Corporation and 3.3% by Assured Guaranty Ltd. Given the effects ofthe economic crisis on bond insurers, the value inherent in this insurance has declined. We believe the fair value of our insured municipal bond
82
($ in millions) Aaa Aa A
Fair
value Unrealizedgain/(loss)
Fairvalue
Unrealizedgain/(loss)
Fairvalue
Unrealizedgain/(loss)
U.S. government and agencies $ 8,596 $ 276 $ — $ — $ — $ —
Municipal Tax exempt 1,384 81 4,357 76 2,454 (7) Taxable 193 (2) 2,619 (18) 1,110 (38) ARS 893 (51) 61 (6) 113 (16)
Corporate Public 1,604 21 2,771 98 7,939 367 Privately placed 936 14 1,881 50 3,917 169
Foreign government 1,766 257 479 22 537 36
RMBS U.S. government sponsored entities ("U.S. Agency") 4,728 147 — — — — Prime residential mortgage-backed securities ("Prime") 434 4 71 (1) 197 2 Alt-A residential mortgage-backed securities ("Alt-A") 40 (2) 62 (6) 102 (5)
Subprime residential mortgage-backed securities
("Subprime") 88 (3) 297 (67) 89 (23)
CMBS 1,134 42 241 (9) 151 (18)
ABS Collateralized debt obligations ("CDO") 30 (1) 628 (14) 481 (44)
Consumer and other asset-backed securities
("Consumer and other ABS") 1,343 22 405 3 363 —
Redeemable preferred stock — — 1 — 2 —
Total fixed income securities $ 23,169 $ 805 $ 13,873 $ 128 $ 17,455 $ 423
Baa Ba or lower Total
Fair
value Unrealizedgain/(loss)
Fairvalue
Unrealizedgain/(loss)
Fairvalue
Unrealizedgain/(loss)
U.S. government and agencies $ — $ — $ — $ — $ 8,596 $ 276
Municipal Tax exempt 1,342 (46) 577 (85) 10,114 19 Taxable 495 (74) 137 (47) 4,554 (179) ARS 101 (14) 98 (20) 1,266 (107)
Corporate Public 8,917 402 1,909 69 23,140 957 Privately placed 6,241 174 1,540 31 14,515 438
Foreign government 376 22 — — 3,158 337
RMBS U.S. Agency — — — — 4,728 147 Prime 8 — 517 (5) 1,227 — Alt-A 39 (4) 406 (96) 649 (113) Subprime 98 (24) 817 (433) 1,389 (550)
CMBS 331 (100) 137 (134) 1,994 (219)
ABS CDO 282 (72) 489 (70) 1,910 (201) Consumer and other ABS 198 — 25 (5) 2,334 20
Redeemable preferred stock 30 1 5 — 38 1
Total fixed income securities $ 18,458 $ 265 $ 6,657 $ (795) $ 79,612 $ 826

portfolio substantially reflects the decline in the value of the insurance, and further related valuation declines, if any, are not expected to be material.Our practice for acquiring and monitoring municipal bonds is predominantly based on the underlying credit quality of the primary obligor. We currentlyexpect to receive all contractual cash flows from the primary obligor and are not relying on bond insurers for payments.
Included in our municipal bond holdings as of December 31, 2010 are $925 million of municipal securities which are not rated by third party creditrating agencies, but are rated by the National Association of Insurance Commissioners ("NAIC") and are also internally rated. These holdings include$490 million of below investment grade municipal bonds, most of which were purchased to provide the opportunity to achieve incremental returns. Ourinitial investment decisions and ongoing monitoring procedures for these securities are based on a thorough due diligence process which includes, butis not limited to, an assessment of the credit quality, sector, structure, and liquidity risks of each issue.
ARS totaled $1.27 billion with an unrealized net capital loss of $107 million as of December 31, 2010. Our holdings primarily have a credit rating ofAaa. $1.23 billion of our holdings are collateralized by pools of student loans for which at least 85% of the collateral was insured by the U.S.Department of Education at the time we purchased the security. As of December 31, 2010, $840 million of our ARS backed by student loans was100% insured by the U.S. Department of Education, $223 million was 90% to 99% insured and $118 million was 80% to 89% insured. All of ourstudent loan ARS holdings are experiencing failed auctions and we receive the failed auction rate or, for those which contain maximum reset rateformulas, we receive the contractual maximum rate. We anticipate that failed auctions may persist and most of our holdings will continue to pay thefailed auction rate or, for those that contain maximum rate reset formulas, the maximum rate. Auctions continue to be conducted as scheduled for eachof the securities.
Corporate bonds, including publicly traded and privately placed, totaled $37.66 billion as of December 31, 2010 with an unrealized net capital gainof $1.40 billion. Privately placed securities primarily consist of corporate issued senior debt securities that are in unregistered form or are directlynegotiated with the borrower. 53.7% of the privately placed corporate securities in our portfolio are rated by an independent rating agency andsubstantially all are rated by the NAIC.
Our portfolio of privately placed securities is broadly diversified by issuer, industry sector and country. The portfolio is made up of 576 issuers.Privately placed corporate obligations contain structural security features such as financial covenants and call protections that provide investorsgreater protection against credit deterioration, reinvestment risk or fluctuations in interest rates than those typically found in publicly registered debtsecurities. Additionally, investments in these securities are made after extensive due diligence of the issuer, typically including direct discussions withsenior management and on-site visits to company facilities. Ongoing monitoring includes direct periodic dialog with senior management of the issuerand continuous monitoring of operating performance and financial position. Every issue not rated by an independent rating agency is internally ratedwith a formal rating affirmation at least once a year.
Foreign government securities totaled $3.16 billion, with 100% rated investment grade, as of December 31, 2010. Of these securities, 44.1% arebacked by the U.S. government, 18.7% are in Canadian governmental securities held in our Canadian subsidiary and the remaining 37.2% are highlydiversified in other foreign governments.
RMBS, CMBS and ABS are structured securities that are primarily collateralized by residential and commercial real estate loans and otherconsumer or corporate borrowings. The cash flows from the underlying collateral paid to the securitization trust are generally applied in a pre-determined order and are designed so that each security issued by the trust, typically referred to as a "class", qualifies for a specific original rating. Forexample, the "senior" portion or "top" of the capital structure, or rating class, which would originally qualify for a rating of Aaa typically has priority inreceiving principal repayments on the underlying collateral and retains this priority until the class is paid in full. In a sequential structure, underlyingcollateral principal repayments are directed to the most senior rated Aaa class in the structure until paid in full, after which principal repayments aredirected to the next most senior Aaa class in the structure until it is paid in full. Senior Aaa classes generally share any losses from the underlyingcollateral on a pro-rata basis after losses are absorbed by classes with lower original ratings. The payment priority and class subordination included inthese securities serves as credit enhancement for holders of the senior or top portions of the structures. These securities continue to retain thepayment priority features that existed at the origination of the securitization trust. Other forms of credit enhancement may include structural featuresembedded in the securitization trust, such as overcollateralization, excess spread and bond insurance. The underlying collateral can have fixedinterest rates, variable interest rates (such as adjustable rate mortgages ("ARM")) or may contain features of both fixed and variable rate mortgages.
RMBS, including U.S. Agency, Prime, Alt-A and Subprime, totaled $7.99 billion, with 78.2% rated investment grade, as of December 31, 2010. TheRMBS portfolio is subject to interest rate risk, but unlike other fixed income securities, is
83

additionally subject to significant prepayment risk from the underlying residential mortgage loans. The credit risk associated with our RMBS portfolio ismitigated due to the fact that 59.2% of the portfolio consists of securities that were issued by or have underlying collateral guaranteed by U.S.government agencies. The unrealized net capital loss of $516 million as of December 31, 2010 was the result of wider credit spreads than at initialpurchase on the non-U.S. Agency portion of our RMBS portfolio, largely due to higher risk premiums caused by macroeconomic conditions and creditmarket deterioration, including the impact of lower real estate valuations, which began to show signs of stabilization in certain geographic areas in2010. The following table shows our RMBS portfolio as of December 31, 2010 based upon vintage year of the issuance of the securities.
Prime are collateralized by residential mortgage loans issued to prime borrowers. As of December 31, 2010, $913 million of the Prime had fixedrate underlying collateral and $314 million had variable rate underlying collateral.
Alt-A includes securities collateralized by residential mortgage loans issued to borrowers who do not qualify for prime financing terms due to highloan-to-value ratios or limited supporting documentation, but have stronger credit profiles than subprime borrowers. As of December 31, 2010,$473 million of the Alt-A had fixed rate underlying collateral and $176 million had variable rate underlying collateral.
Subprime includes securities collateralized by residential mortgage loans issued to borrowers that cannot qualify for Prime or Alt-A financing termsdue in part to weak or limited credit history. It also includes securities that are collateralized by certain second lien mortgages regardless of theborrower's credit history. The Subprime portfolio consisted of $1.13 billion and $260 million of first lien and second lien securities, respectively. As ofDecember 31, 2010, $659 million of the Subprime had fixed rate underlying collateral and $730 million had variable rate underlying collateral.
CMBS totaled $1.99 billion, with 93.1% rated investment grade, as of December 31, 2010. The CMBS portfolio is subject to credit risk, but unlikecertain other structured securities, is generally not subject to prepayment risk due to protections within the underlying commercial mortgage loans. Ofthe CMBS investments, 94.8% are traditional conduit transactions collateralized by commercial mortgage loans, broadly diversified across propertytypes and geographical area. The remainder consists of non-traditional CMBS such as small balance transactions, large loan pools and singleborrower transactions.
The following table shows our CMBS portfolio as of December 31, 2010 based upon vintage year of the underlying collateral.
The unrealized net capital loss of $219 million as of December 31, 2010 on our CMBS portfolio was the result of wider credit spreads than at initialpurchase, largely due to the macroeconomic conditions and credit market deterioration, including the impact of lower real estate valuations, whichbegan to show signs of stabilization in certain geographic areas in 2010. While CMBS spreads tightened during 2009 and 2010, credit spreads in mostrating classes remain wider than at initial purchase, which is particularly evident in our 2005-2007 vintage year CMBS.
84
($ in millions)
U.S. Agency Prime Alt-A Subprime Total RMBS
Fair
value Unrealizedgain/(loss)
Fairvalue
Unrealizedgain/(loss)
Fairvalue
Unrealizedgain/(loss)
Fairvalue
Unrealizedgain/(loss)
Fairvalue
Unrealizedgain/(loss)
2010 $ 538 $ — $ 221 $ 6 $ 63 $ 2 $ — $ — $ 822 $ 8 2009 753 12 81 1 8 — — — 842 13 2008 737 16 — — — — — — 737 16 2007 434 8 242 6 101 (59) 315 (184) 1,092 (229)2006 310 10 212 — 188 (20) 397 (155) 1,107 (165)2005 618 23 191 (14) 134 (13) 416 (134) 1,359 (138)Pre-2005 1,338 78 280 1 155 (23) 261 (77) 2,034 (21)
Total $ 4,728 $ 147 $ 1,227 $ — $ 649 $ (113) $ 1,389 $ (550) $ 7,993 $ (516)
($ in millions)
Fairvalue
Unrealizedgain/(loss)
2010 $ 22 $ (1)2007 276 (17)2006 598 (166)2005 315 (40)Pre-2005 783 5
Total CMBS $ 1,994 $ (219)

ABS, including CDO and Consumer and other ABS, totaled $4.24 billion, with 87.9% rated investment grade, as of December 31, 2010. Credit riskis managed by monitoring the performance of the underlying collateral. Many of the securities in the ABS portfolio have credit enhancement withfeatures such as overcollateralization, subordinated structures, reserve funds, guarantees and/or insurance. The unrealized net capital loss of$181 million as of December 31, 2010 on our ABS portfolio was the result of wider credit spreads than at initial purchase.
CDO totaled $1.91 billion, with 74.4% rated investment grade, as of December 31, 2010. CDO consist primarily of obligations collateralized byhigh yield and investment grade corporate credits including $1.48 billion of cash flow collateralized loan obligations ("CLO") with unrealized losses of$80 million. The remaining $434 million of securities consisted of synthetic CDO, trust preferred CDO, market value CDO, project finance CDO,collateralized bond obligations and other CLO with unrealized losses of $121 million.
Cash flow CLO are structures collateralized primarily by below investment grade senior secured corporate loans. The underlying collateral isactively managed by external managers that monitor the collateral's performance and is well diversified across industries and among issuers. Atransaction will typically issue notes with various capital structure classes (i.e. Aaa, Aa, A, etc.) as well as equity-like tranches. In general, thesesecurities are structured with overcollateralization ratios and performance is impacted primarily by defaults and recoveries of the underlying collateralwithin the structures, which reduce overcollateralization ratios over time. A violation of the senior overcollateralization test could result in an event ofdefault of the structure which would give the controlling class, generally defined as the majority of the senior lenders, certain rights, including the abilityto divert cash flows or liquidate the underlying portfolio to pay off the senior liabilities.
Consumer and other ABS totaled $2.33 billion, with 98.9% rated investment grade, as of December 31, 2010. Consumer and other ABS consistsof $1.49 billion of auto and $847 million of other ABS with unrealized gains of $10 million and $10 million, respectively.
Equity securities Equity securities include common stocks, exchange traded funds, non-redeemable preferred stocks and real estateinvestment trust equity investments. The equity securities portfolio was $4.81 billion as of December 31, 2010 compared to $5.02 billion as ofDecember 31, 2009. Net unrealized gains totaled $583 million as of December 31, 2010 compared to $179 million as of December 31, 2009.
Mortgage loans Our mortgage loan portfolio, which is primarily held in the Allstate Financial portfolio, totaled $6.68 billion as of December 31,2010, compared to $7.94 billion as of December 31, 2009, and primarily comprises loans secured by first mortgages on developed commercial realestate. Key considerations used to manage our exposure include property type and geographic diversification by state and metropolitan area.
We recognized $65 million of realized capital losses related to net increases in the valuation allowance on impaired mortgage loans in 2010,primarily due to deteriorating debt service coverage resulting from a decrease in occupancy and the risk associated with refinancing near-termmaturities due to declining underlying collateral valuations. We recognized $97 million of realized capital losses related to net increases in the valuationallowance on impaired loans in 2009.
For further detail on our mortgage loan portfolio, see Note 4 to the consolidated financial statements.
Limited partnership interests consist of investments in private equity/debt funds, real estate funds, hedge funds and tax credit funds. The limitedpartnership interests portfolio is well diversified across a number of characteristics including fund sponsors, vintage years, strategies, geography(including international), and company/property types. The following table presents information about our limited partnership interests as ofDecember 31, 2010.
85
($ in millions)
Privateequity/debt
funds Real estate
funds Hedgefunds
Taxcreditfunds Total
Cost method of accounting ("Cost") $ 937 $ 320 $ 83 $ 8 $ 1,348 Equity method of accounting ("EMA") 658 309 1,266 235 2,468
Total $ 1,595 $ 629 $ 1,349 $ 243 $ 3,816
Number of sponsors 90 41 12 7 Number of individual funds 142 86 104 7 Largest exposure to single fund $ 49 $ 34 $ 87 $ 50

Our aggregate limited partnership exposure represented 3.8% and 2.8% of total invested assets as of December 31, 2010 and 2009, respectively.
The following table shows the results from our limited partnership interests by fund type and accounting classification for the years endedDecember 31.
Limited partnership interests, excluding impairment write-downs, produced income of $129 million in 2010 compared to losses of $124 million in2009. Income on EMA limited partnerships is recognized on a delay due to the availability of the related financial statements. The recognition ofincome on hedge funds is primarily on a one-month delay and the income recognition on private equity/debt funds, real estate funds and tax creditfunds are generally on a three-month delay. Income on Cost limited partnerships is recognized only upon receipt of amounts distributed by thepartnerships.
Short-term investments Our short-term investment portfolio was $3.28 billion and $3.06 billion as of December 31, 2010 and 2009,respectively.
Other investments Our other investments as of December 31, 2010 primarily comprise $1.14 billion of policy loans, $439 million of certainderivatives and $363 million of bank loans. Policy loans are carried at the unpaid principal balances. Bank loans are primarily senior secured corporateloans and are carried at amortized cost. For further detail on our use of derivatives, see the Net Realized Capital Gains and Losses section of theMD&A and Note 6 of the consolidated financial statements.
Unrealized net capital gains totaled $1.39 billion as of December 31, 2010 compared to unrealized net capital losses of $2.32 billion as ofDecember 31, 2009. The improvement since December 31, 2009 for fixed income securities was primarily a result of declining risk-free interest ratesand tightening of credit spreads in certain sectors. The
86
($ in millions) 2010 2009
Cost EMA Total
income Impairment
write-downs Cost EMA Total
income Impairment
write-downs Private equity/debt
funds $ 40 $ 76 $ 116 $ (9) $ 16 $ (61) $ (45) $ (79)Real estate funds 2 (34) (32) (35) 1 (181) (180) (223)Hedge funds — 47 47 (2) — 101 101 (6)Tax credit funds (2) — (2) — — — — —
Total $ 40 $ 89 $ 129 $ (46) $ 17 $ (141) $ (124) $ (308)
(1) (1)
Impairment write-downs related to Cost limited partnerships were $45 million and $297 million in 2010 and 2009, respectively. Impairment write-downsrelated to EMA limited partnerships were $1 million and $11 million in 2010 and 2009, respectively.
(1)
improvement for equity securities was primarily due to improved equity valuations. The following table presents unrealized net capital gains andlosses, pre-tax and after-tax as of December 31.
The unrealized net capital gains for the fixed income portfolio totaled $826 million and comprised $3.26 billion of gross unrealized gains and$2.43 billion of gross unrealized losses as of December 31, 2010. This is compared to unrealized net capital losses for the fixed income portfoliototaling $2.48 billion, comprised of $2.47 billion of gross unrealized gains and $4.95 billion of gross unrealized losses as of December 31, 2009.
87
($ in millions) 2010 2009 U.S. government and agencies $ 276 $ 203 Municipal (267) (403)Corporate 1,395 345 Foreign government 337 291 RMBS (516) (1,500)CMBS (219) (925)ABS (181) (488)Redeemable preferred stock 1 —
Fixed income securities (1) 826 (2,477)Equity securities 583 179 Derivatives (22) (23)
Unrealized net capital gains and losses, pre-tax 1,387 (2,321)Amounts recognized for: Insurance reserves (2) (41) — DAC and DSI (3) 97 990
Amounts recognized 56 990 Deferred income taxes (508) 461
Unrealized net capital gains and losses, after-tax $ 935 $ (870)
Unrealized net capital gains and losses for fixed income securities as of December 31, 2010 and 2009 comprise $(293) million and $(679) million,respectively, related to unrealized net capital losses on fixed income securities with other-than-temporary impairment and $1.12 billion and $(1.80) billion,respectively, related to other unrealized net capital gains and losses.The insurance reserves adjustment represents the amount by which the reserve balance would increase if the net unrealized gains in the applicable productportfolios were realized and reinvested at current lower interest rates, resulting in a premium deficiency. Although we evaluate premium deficiencies on thecombined performance of our life insurance and immediate annuities with life contingencies, the adjustment primarily relates to structured settlementannuities with life contingencies, in addition to annuity buy-outs and certain payout annuities with life contingencies.The DAC and DSI adjustment balance represents the amount by which the amortization of DAC and DSI would increase or decrease if the unrealized gainsor losses in the respective product portfolios were realized. Only the unrealized net capital gains and losses on the Allstate Financial fixed annuity andinterest-sensitive life product portfolios are used in this calculation. The DAC and DSI adjustment balance, subject to limitations, is determined by applyingthe DAC and DSI amortization rate to unrealized net capital gains or losses. Recapitalization of the DAC and DSI balances is limited to the originally deferredcosts plus interest.
(1)
(2)
(3)

Gross unrealized gains and losses as of December 31, 2010 on fixed income securities by type and sector are provided in the table below.
The banking, utilities, consumer goods, financial services and capital goods sectors had the highest concentration of gross unrealized losses inour corporate fixed income securities portfolio as of December 31, 2010. In general, credit spreads remain wider than at initial purchase for most of thesecurities with gross unrealized losses in these categories.
The unrealized net capital gain for the equity portfolio totaled $583 million and comprised $646 million of gross unrealized gains and $63 million ofgross unrealized losses as of December 31, 2010. This is compared to an unrealized net capital gain for the equity portfolio totaling $179 million,comprised of $381 million of gross unrealized gains and $202 million of gross unrealized losses as of December 31, 2009.
88
Gross unrealized
Amortizedcost as apercent of
par value (2)
Fair valueas a
percent ofpar value (2)
($ in millions)
Par
value (1) Amortized
cost Fair
value
Gains Losses Corporate: Banking $ 4,378 $ 4,282 $ 118 $ (154) $ 4,246 97.8% 97.0% Utilities 6,209 6,227 433 (58) 6,602 100.3 106.3
Consumer goods(cyclical and non-cyclical) 6,236 6,318 305 (53) 6,570 101.3 105.4
Financial services 3,619 3,553 141 (36) 3,658 98.2 101.1 Capital goods 3,862 3,867 238 (34) 4,071 100.1 105.4 Transportation 1,911 1,925 99 (29) 1,995 100.7 104.4 Basic industry 1,726 1,750 91 (14) 1,827 101.4 105.9 Technology 1,613 1,641 72 (14) 1,699 101.7 105.3 Energy 2,455 2,480 136 (9) 2,607 101.0 106.2 Communications 2,139 2,117 115 (9) 2,223 99.0 103.9 FDIC guaranteed 721 724 3 — 727 100.4 100.8 Other 1,502 1,376 65 (11) 1,430 91.6 95.2
Total corporate fixedincome portfolio 36,371 36,260 1,816 (421) 37,655 99.7 103.5
U.S. government andagencies 8,904 8,320 327 (51) 8,596 93.4 96.5
Municipal 20,323 16,201 379 (646) 15,934 79.7 78.4 Foreign government 3,270 2,821 347 (10) 3,158 86.3 96.6 RMBS 9,231 8,509 216 (732) 7,993 92.2 86.6 CMBS 2,227 2,213 58 (277) 1,994 99.4 89.5 ABS 4,796 4,425 113 (294) 4,244 92.3 88.5 Redeemable preferred
stock 38 37 1 — 38 97.4 100.0
Total fixed incomesecurities $ 85,160 $ 78,786 $ 3,257 $ (2,431) $ 79,612 92.5 93.5
Included in par value are zero-coupon securities that are generally purchased at a deep discount to the par value that is received at maturity. These primarilyincluded corporate, U.S. government and agencies, municipal and foreign government zero-coupon securities with par value of $723 million, $1.70 billion,$5.82 billion and $1.36 billion, respectively.Excluding the impact of zero-coupon securities, the percentage of amortized cost to par value would be 100.1% for corporates, 101.8% for U.S. governmentand agencies, 99.6% for municipals and 103.7% for foreign governments. Similarly, excluding the impact of zero-coupon securities, the percentage of fairvalue to par value would be 103.9% for corporates, 103.2% for U.S. government and agencies, 98.8% for municipals and 109.7% for foreign governments.
(1)
(2)

Gross unrealized gains and losses as of December 31, 2010 on equity securities are provided in the table below.
Within the equity portfolio, the losses were primarily concentrated in consumer goods, banking, financial services, technology and communicationssectors. The unrealized losses in these sectors were company and sector specific. As of December 31, 2010, we have the intent and ability to hold ourequity securities with unrealized losses until recovery.
We have a comprehensive portfolio monitoring process to identify and evaluate each fixed income and equity security that may be other-than-temporarily impaired. The process includes a quarterly review of all securities to identify instances where the fair value of a security compared to itsamortized cost (for fixed income securities) or cost (for equity securities) is below established thresholds. The process also includes the monitoring ofother impairment indicators such as ratings, ratings downgrades and payment defaults. The securities identified, in addition to other securities forwhich we may have a concern, are evaluated based on facts and circumstances for inclusion on our watch-list. All investments in an unrealized lossposition as of December 31, 2010 were included in our portfolio monitoring process for determining whether declines in value were other thantemporary.
The extent and duration of a decline in fair value for fixed income securities have become less indicative of actual credit deterioration with respectto an issue or issuer. While we continue to use declines in fair value and the length of time a security is in an unrealized loss position as indicators ofpotential credit deterioration, our determination of whether a security's decline in fair value is other than temporary has placed greater emphasis on ouranalysis of the underlying credit and collateral and related estimates of future cash flows.
The following table summarizes the fair value and gross unrealized losses of fixed income securities by type and investment grade classificationas of December 31, 2010.
We have experienced declines in the fair values of fixed income securities primarily due to wider credit spreads resulting from higher riskpremiums since the time of initial purchase, largely due to macroeconomic conditions and credit market deterioration, including the impact of lower realestate valuations, which began to show signs of
89
Gross unrealized
Amortized
cost Fair
value
($ in millions) Gains Losses Consumer goods (cyclical and non-cyclical) $ 832 $ 102 $ (16) $ 918 Banking 303 50 (13) 340 Financial services 349 35 (11) 373 Technology 370 54 (6) 418 Communications 217 37 (6) 248 Utilities 119 7 (4) 122 Capital goods 265 43 (3) 305 Energy 311 64 (1) 374 Basic industry 220 66 (1) 285 Real estate 110 11 (1) 120 Transportation 61 11 (1) 71 Other (1) 1,071 166 — 1,237
Total equity securities $ 4,228 $ 646 $ (63) $ 4,811
Other consists primarily of index-based securities.(1)
($ in millions) Investment grade Below
investment grade Total
Fair
value Unrealized
losses Fair
value Unrealized
losses Fair
value Unrealized
losses U.S. government andagencies $ 2,081 $ (51) $ — $ — $ 2,081 $ (51)Municipal 6,226 (480) 619 (166) 6,845 (646)Corporate 7,049 (356) 937 (65) 7,986 (421)Foreign government 287 (10) — — 287 (10)RMBS 1,320 (150) 1,202 (582) 2,522 (732)CMBS 858 (143) 135 (134) 993 (277)ABS 1,676 (161) 399 (133) 2,075 (294)
Total $ 19,497 $ (1,351) $ 3,292 $ (1,080) $ 22,789 $ (2,431)
stabilization in certain geographic areas in 2010. Consistent with their ratings, our portfolio monitoring process indicates that investment gradesecurities have a low risk of default. Securities rated below investment grade, comprising securities with a rating of Ba, B and Caa or lower, have ahigher risk of default.
As of December 31, 2010, 68% of our below investment grade gross unrealized losses were concentrated in RMBS, specifically Alt-A andSubprime, CMBS and ABS, specifically cash flow CLO. The fair value of these securities totaled $1.39 billion, an increase of 7.8%, compared to$1.29 billion as of December 31, 2009, due to improved valuations resulting from tighter credit spreads driven by lower risk premiums. Grossunrealized losses on these securities totaled $736 million as of December 31, 2010, a decrease of 42.6%, compared to $1.28 billion as ofDecember 31, 2009, due to improved valuations, impairment write-downs, sales and principal collections, partially offset by the downgrade of certainsecurities to below investment grade during 2010.
Fair values for our structured securities are obtained from third-party valuation service providers and are subject to review as disclosed in ourApplication of Critical Accounting Estimates. In accordance with GAAP, when fair value is less than the amortized cost of a security and we have notmade the decision to sell the security and it is not more likely than not we will be required to sell the security before recovery of its amortized costbasis, we evaluate if we expect to receive cash flows sufficient to recover the entire amortized cost basis of the security. We calculate the estimatedrecovery value by discounting our best estimate of future cash flows at the security's original or current effective rate, as appropriate, and compare thisto the amortized cost of the security. If we do not expect to receive cash flows sufficient to recover the entire amortized cost basis of the security, thecredit loss component of the impairment is recorded in earnings, with the remaining amount of the unrealized loss related to other factors ("non-credit-related") recognized in OCI.
The non-credit-related unrealized losses for our structured securities, including our below investment grade Alt-A, Subprime, CMBS and cash flowCLO, are heavily influenced by risk factors other than those related to our best estimate of future cash flows. The difference between these securities'original or current effective rates and the yields implied by their fair value indicates that a higher risk premium is included in the valuation of thesesecurities than existed at initial issue or purchase. This risk premium represents the return that a market participant requires as compensation toassume the risk associated with the uncertainties regarding the future performance of the underlying collateral. The risk premium is comprised of:default risk, which reflects the probability of default and the uncertainty related to collection of contractual principal and interest; liquidity risk, whichreflects the risk associated with exiting the investment in an illiquid market, both in terms of timeliness and cost; and volatility risk, which reflects thepotential valuation volatility during an investor's holding period. Other factors reflected in the risk premium include the costs associated withunderwriting, monitoring and holding these types of complex securities. Certain aspects of the default risk are included in the development of our bestestimate of future cash flows, as appropriate. Other aspects of the risk premium are considered to be temporary in nature and are expected to reverseover the remaining lives of the securities as future cash flows are received.
Other-than-temporary impairment assessment for below investment grade Alt-A and Subprime RMBS
As of December 31, 2010, the fair value of our below investment grade Alt-A securities with gross unrealized losses totaled $288 million, adecrease of 7.4% compared to $311 million as of December 31, 2009. As of December 31, 2010, gross unrealized losses for our below investmentgrade Alt-A portfolio totaled $116 million, a decrease of 45.3% compared to $212 million as of December 31, 2009. The improvement over prior yearwas primarily due to improved valuations resulting from lower risk premiums, impairment write-downs and principal collections. For our belowinvestment grade Alt-A securities with gross unrealized gains of $20 million, we have recognized cumulative write-downs in earnings totaling$45 million as of December 31, 2010.
As of December 31, 2010, the fair value of our below investment grade Subprime securities with gross unrealized losses totaled $796 million, anincrease of 10.2% compared to $722 million as of December 31, 2009. As of December 31, 2010, gross unrealized losses for our below investmentgrade Subprime portfolio totaled $438 million, a decrease of 48.4% compared to $849 million as of December 31, 2009. The improvement over prioryear was primarily due to improved valuations resulting from lower risk premiums, impairment write-downs, sales and principal collections, partiallyoffset by downgrades of certain Subprime securities to below investment grade during 2010. For our below investment grade Subprime with grossunrealized gains totaling $4 million, we have recognized cumulative write-downs in earnings totaling $95 million as of December 31, 2010.
The credit loss evaluation for Alt-A and Subprime securities with gross unrealized losses is performed in two phases. The first phase estimates thefuture cash flows of the entire securitization trust from which our security was issued. A critical part of this estimate involves forecasting default ratesand loss severities of the residential mortgage loans that collateralize the securitization trust. The factors that affect the default rates and loss severitiesinclude, but are
90
not limited to, historical collateral performance, collateral type, transaction vintage year, geographic concentrations, borrower credit quality, originationpractices of the transaction sponsor, and practices of the mortgage loan servicers. Current loan-to-value ratios of underlying collateral are notconsistently available and accordingly they are not a primary factor in our impairment evaluation. While our projections are developed internally andcustomized to our specific holdings, they are informed by and benchmarked against credit opinions obtained from third parties, such as industryanalysts, nationally recognized credit rating agencies and an RMBS loss modeling advisory service. The default rate and loss severity forecasts resultin an estimate of trust-level projected additional collateral loss.
We then analyze the actual cumulative collateral losses incurred to date by the securitization trust, our projected additional collateral lossesexpected to be incurred and the position of the class of securities we own in the securitization trust relative to the trust's other classes to determinewhether any of the collateral losses will be applied to our class. If our class has remaining credit enhancement sufficient to withstand the projectedadditional collateral losses, no collateral losses will be realized by our class and we expect to collect all contractual principal and interest of the securitywe own. Remaining credit enhancement is measured in terms of (i) subordination from other classes of securities in the trust that are contractuallyobligated to absorb losses before the class of security we own and (ii) the expected impact of other structural features embedded in the securitizationtrust beneficial to our class, such as overcollateralization and excess spread.
For securities where there is insufficient remaining credit enhancement for the class of securities we own, a recovery value is calculated based onour best estimate of future cash flows specific to that security. This estimate is based on the contractual principal payments and current interestpayments of the securities we own, adjusted for actual cumulative collateral losses incurred to date and the projected additional collateral lossesexpected to be incurred. This estimate also takes into consideration additional secondary sources of credit support, such as reliable bond insurance.For securities without secondary sources of credit support or for which the secondary sources do not fully offset the actual and projected additionalcollateral losses applied to them, a credit loss is recorded in earnings to the extent amortized cost exceeds recovery value.
98.8% and 1.2% of the fair value of our below investment grade Alt-A securities with gross unrealized losses were issued with Aaa and Aa originalratings and capital structure classifications, respectively. 87.4%, 10.7% and 1.9% of the fair value of our below investment grade Subprime securitieswith gross unrealized losses were issued with Aaa, Aa and A original ratings and capital structure classifications, respectively. As described previously,Alt-A and Subprime securities with higher original ratings typically have priority in receiving the principal repayments on the underlying collateralcompared to those with lower original ratings. While the projected cash flow assumptions for our below investment grade Alt-A and Subprimesecurities with gross unrealized losses have deteriorated since the securities were originated, as reflected by their current credit ratings, thesesecurities continue to retain the payment priority features that existed at the origination of the securitization trust.
91

The following tables show trust-level, class-level and security-specific detailed information for our below investment grade Alt-A securities withgross unrealized losses, by credit rating.
92
($ in millions) December 31, 2010
With other-than-temporaryimpairments recorded in
earnings
Without other-than-temporaryimpairments recorded in
earnings
Ba B Caa orlower Total Ba B
Caa orlower Total Total
Trust-level
Actual cumulative collateral lossesincurred to date (1) 0.5% 0.7% 8.1% 8.0% 0.1% 3.1% 3.7% 3.0% n/a
Projected additional collateral lossesto be incurred (2) 9.9% 22.5% 24.6% 24.5% 4.8% 16.6% 17.8% 15.4% n/a
Class-level
Average remaining creditenhancement (3) 9.9% 19.0% 6.8% 6.9% 5.3% 27.1% 23.9% 20.7% n/a
Security-specific Number of positions 1 1 27 29 2 2 8 12 41 Par value $ 4 $ 3 $ 439 $ 446 $ 16 $ 4 $ 68 $ 88 $ 534 Amortized cost $ 4 $ 2 $ 316 $ 322 $ 16 $ 4 $ 62 $ 82 $ 404 Fair value $ 1 $ 1 $ 220 $ 222 $ 13 $ 2 $ 51 $ 66 $ 288 Gross unrealized losses Total $ (3) $ (1) $ (96) $ (100) $ (3) $ (2) $ (11) $ (16) $ (116) 12-24 months (4) $ — $ — $ — $ — $ — $ — $ — $ — $ — Over 24 months (5) $ (3) $ (1) $ (90) $ (94) $ (3) $ (2) $ (10) $ (15) $ (109)
Cumulative write-downsrecognized (6) $ — $ (1) $ (92) $ (93) $ — $ — $ — $ — $ (93)
Principal payments received duringthe period (7) $ — $ — $ 59 $ 59 $ 1 $ 1 $ 6 $ 8 $ 67
December 31, 2009
With other-than-temporaryimpairments recorded in
earnings Without other-than-temporary
impairments recorded in earnings
Ba B Caa orlower Total Ba B
Caa orlower Total Total
Trust-level
Actual cumulative collaterallosses incurred to date (1) 0.2% 4.3% 4.2% 4.2% 0.8% 1.4% 2.5% 1.6% n/a
Projected additional collaterallosses to be incurred (2) 12.1% 26.1% 25.7% 25.6% 3.9% 23.8% 16.1% 10.6% n/a
Class-level
Average remaining creditenhancement (3) 11.3% 24.7% 7.6% 9.7% 7.1% 29.2% 16.6% 12.8% n/a
Security-specific Number of positions 1 4 24 29 6 5 5 16 45 Par value $ 4 $ 56 $ 413 $ 473 $ 90 $ 12 $ 79 $ 181 $ 654 Amortized cost $ 4 $ 52 $ 289 $ 345 $ 88 $ 12 $ 78 $ 178 $ 523 Fair value $ 1 $ 32 $ 158 $ 191 $ 62 $ 5 $ 53 $ 120 $ 311 Gross unrealized losses Total $ (3) $ (20) $ (131) $ (154) $ (26) $ (7) $ (25) $ (58) $ (212) 12-24 months (4) $ (3) $ (4) $ (33) $ (40) $ (20) $ — $ (24) $ (44) $ (84) Over 24 months (5) $ — $ (16) $ (98) $ (114) $ (6) $ (7) $ (1) $ (14) $ (128)
Cumulative write-downsrecognized (6) $ — $ (4) $ (92) $ (96) $ — $ — $ — $ — $ (96)
Principal payments receivedduring the period (7) $ — $ 5 $ 43 $ 48 $ 9 $ 2 $ 23 $ 34 $ 82
Weighted average actual cumulative collateral losses incurred to date as of period end are based on the actual principal losses incurred as a percentage ofthe remaining principal amount of the loans in the trust. The weighting calculation is based on the par value of each security. Actual losses on the securitieswe hold are less than the losses on the underlying collateral as presented in this table. Actual cumulative realized principal losses on the below investmentgrade Alt-A securities we own, as reported by the trust servicers, were $3 million as of December 31, 2010.
(1)
(2)

The above tables include information about our below investment grade Alt-A securities with gross unrealized losses as of each period presented.The par value and composition of securities included can vary significantly from period to period due to changes in variables such as credit ratings,principal payments, sales, purchases and realized principal losses.
As of December 31, 2010, our below investment grade Alt-A securities with gross unrealized losses and without other-than-temporary impairmentsrecorded in earnings had incurred actual cumulative collateral losses of 3.0%. Our impairment evaluation forecasts more severe assumptions than thetrusts are actually experiencing, including a projected weighted average underlying default rate of 33.7% and a projected weighted average lossseverity of 47.4%, which resulted in projected additional collateral losses of 15.4%. As the average remaining credit enhancement for these securitiesof 20.7% exceeds the projected additional collateral losses of 15.4%, these securities have not been impaired.
As of December 31, 2010, our below investment grade Alt-A securities with gross unrealized losses and with other-than-temporary impairmentsrecorded in earnings had incurred actual cumulative collateral losses of 8.0%. Our impairment evaluation forecasts more severe assumptions than thetrusts are actually experiencing, including a projected weighted average underlying default rate of 43.5% and a projected weighted average lossseverity of 55.3%, which resulted in projected additional collateral losses of 24.5%. As the average remaining credit enhancement for these securitiesof 6.9% is insufficient to withstand the projected additional collateral losses, we have recognized cumulative write-downs in earnings on thesesecurities as reflected in the table above using our calculated recovery value at the time of impairment. The current average recovery value of thesesecurities as a percentage of par was 74.0% and exceeded these securities' current average amortized cost as a percentage of par of 72.1%, whichdemonstrates our conclusion that the nature of the remaining unrealized loss on these securities is temporary and will reverse over time. Thecomparison indicates that recovery value exceeds amortized cost based on a comprehensive evaluation of financial, economic and capital marketsassumptions developed for this reporting period.
The following table shows actual trust-level key metrics specific to the trusts from which our below investment grade Alt-A securities with grossunrealized losses were issued, as reported by the trust servicers.
We believe the unrealized losses on our Alt-A securities, including those over 24 months, result from the current risk premium on these securities,which should continue to reverse over the securities' remaining lives, as demonstrated by improved valuations in 2010. We expect to receive ourestimated share of contractual principal and interest collections used to determine the securities' recovery value. As of December 31, 2010, we do nothave the intent to sell and it is not more likely than not we will be required to sell these securities before the recovery of their amortized cost basis. Webelieve that our valuation and impairment processes are comprehensive, employ the most current views about
93
Weighted average projected additional collateral losses to be incurred as of period end are based on our projections of future losses to be incurred by thetrust, taking into consideration the actual cumulative collateral losses incurred to date, as a percentage of the remaining principal amount of the loans in thetrust. Our projections are developed internally and customized to our specific holdings and are informed by and benchmarked against credit opinionsobtained from third parties, such as industry analysts, nationally recognized credit rating agencies and an RMBS loss modeling advisory service. Projectedadditional collateral losses to be incurred are compared to average remaining credit enhancement for each security. For securities where the projectedadditional collateral losses exceed remaining credit enhancement, a recovery value is calculated to determine whether impairment losses should be recordedin earnings. The weighting calculation is based on the par value of each security.Weighted average remaining credit enhancement as of period end is based on structural subordination and the expected impact of other structural featuresexisting in the securitization trust beneficial to our class and reflects our projection of future principal losses that can occur as a percentage of the remainingprincipal amount of the loans in the trust before the class of the security we own will incur its first dollar of principal loss. The weighting calculation is basedon the par value of each security.Includes total gross unrealized losses on securities in an unrealized loss position for a period of 12 to 24 consecutive months.Includes total gross unrealized losses on securities in an unrealized loss position for a period more than 24 consecutive months. As of December 31, 2010,$70 million of unrealized losses on securities with other-than-temporary impairments recognized in earnings and $11 million of unrealized losses onsecurities without other-than-temporary impairments recognized in earnings have been greater than or equal to 20% of those securities' amortized cost for aperiod of more than 24 consecutive months. As of December 31, 2009, there were no Alt-A securities with gross unrealized losses greater than or equal to20% for a period of more than 24 consecutive months.Includes cumulative write-downs recorded in accordance with GAAP.Reflects principal payments for the years ended December 31, 2010 and 2009, respectively.
(2)
(3)
(4)(5)
(6)(7)
December 31,
2010 September 30,
2010 June 30,
2010 March 31,
2010 December 31,
2009 Trust-level statistics Delinquency rates 29.4% 28.0% 27.9% 28.1% 25.9%
Actual cumulative collateral lossesincurred to date 7.2% 6.5% 5.5% 4.3% 3.5%

collateral and securitization trust financial positions, and demonstrate our recorded impairments and that the remaining unrealized losses on thesepositions are temporary.
The following tables show trust-level, class-level and security-specific detailed information for our below investment grade Subprime securities withgross unrealized losses that are not reliably insured, by credit rating.
94
($ in millions) December 31, 2010
With other-than-temporaryimpairments recorded in
earnings
Without other-than-temporaryimpairments recorded in
earnings
Ba B Caa orlower Total Ba B
Caa orlower Total Total
Trust-level
Actual cumulative collateral lossesincurred to date (1) —% 12.0% 16.1% 16.0% 13.2% 12.5% 12.6% 12.7% n/a
Projected additional collaterallosses to be incurred (2) —% 38.2% 43.2% 43.0% 46.5% 42.7% 40.8% 42.1% n/a
Class-level
Average remaining creditenhancement (3) —% 26.0% 22.6% 22.8% 72.7% 63.6% 50.5% 56.7% n/a
Security-specific Number of positions — 5 81 86 11 10 35 56 142 Par value $ — $ 42 $ 952 $ 994 $ 73 $ 69 $ 265 $ 407 $ 1,401 Amortized cost $ — $ 33 $ 650 $ 683 $ 73 $ 69 $ 265 $ 407 $ 1,090 Fair value $ — $ 21 $ 425 $ 446 $ 62 $ 54 $ 158 $ 274 $ 720 Gross unrealized losses Total $ — $ (12) $ (225) $ (237) $ (11) $ (15) $ (107) $ (133) $ (370) 12-24 months (4) $ — $ — $ (9) $ (9) $ — $ — $ — $ — $ (9) Over 24 months (5) $ — $ (12) $ (216) $ (228) $ (11) $ (15) $ (107) $ (133) $ (361)
Cumulative write-downsrecognized (6) $ — $ (9) $ (293) $ (302) $ — $ — $ — $ — $ (302)
Principal payments receivedduring the period (7) $ — $ 4 $ 62 $ 66 $ 18 $ 4 $ 11 $ 33 $ 99
December 31, 2009
With other-than-temporaryimpairments recorded in
earnings Without other-than-temporary
impairments recorded in earnings
Ba B Caa orlower Total Ba B
Caa orlower Total Total
Trust-level
Actual cumulative collaterallosses incurred to date (1) 15.0% 13.8% 17.2% 16.9% 8.8% 8.1% 9.5% 9.1% n/a
Projected additional collaterallosses to be incurred (2) 41.2% 33.5% 46.2% 45.2% 36.5% 35.3% 40.0% 38.2% n/a
Class-level
Average remaining creditenhancement (3) 38.1% 30.1% 38.6% 38.0% 49.6% 45.4% 42.6% 45.4% n/a
Security-specific Number of positions 1 4 53 58 20 13 37 70 128 Par value $ 30 $ 52 $ 798 $ 880 $ 213 $ 59 $ 315 $ 587 $ 1,467 Amortized cost $ 24 $ 48 $ 581 $ 653 $ 213 $ 59 $ 314 $ 586 $ 1,239 Fair value $ 10 $ 28 $ 230 $ 268 $ 112 $ 32 $ 144 $ 288 $ 556 Gross unrealized losses Total $ (14) $ (20) $ (351) $ (385) $ (101) $ (27) $ (170) $ (298) $ (683) 12-24 months (4) $ — $ (4) $ (53) $ (57) $ (2) $ (1) $ — $ (3) $ (60) Over 24 months (5) $ (14) $ (12) $ (294) $ (320) $ (99) $ (26) $ (170) $ (295) $ (615)
Cumulative write-downsrecognized (6) $ (6) $ (4) $ (217) $ (227) $ — $ — $ — $ — $ (227)
Principal payments receivedduring the period (7) $ — $ 13 $ 40 $ 53 $ 17 $ 11 $ 33 $ 61 $ 114
Weighted average actual cumulative collateral losses incurred to date as of period end are based on the actual principal losses incurred as a percentage ofthe remaining principal amount of the loans in the trust. The weighting calculation is based on the par value of each security. Actual
(1)

The above tables include information only about below investment grade Subprime securities with gross unrealized losses that are not reliablyinsured as of each period presented. As such, the par value and composition of securities included can vary significantly from period to period due tochanges in variables such as credit ratings, principal payments, sales, purchases and realized principal losses.
As of December 31, 2010, our Subprime securities that are reliably insured include 10 below investment grade Subprime securities with a total fairvalue of $76 million and aggregate gross unrealized losses of $68 million, all of which are rated B. These securities are insured by one bond insurerrated B that we estimate has sufficient claims paying capacity to service its obligations on these securities. The securitization trusts from which oursecurities were issued are currently receiving contractual payments from the bond insurer and considering the combination of expected futurepayments from the bond insurer and cash flows available from the underlying collateral, we expect the trust to have adequate cash flows to make allcontractual payments due to the class of securities we own. As a result, our security-specific estimates of future cash flows indicate that thesesecurities' estimated recovery values equal or exceed their amortized cost. Accordingly, no other-than-temporary impairments have been recognizedon these securities. As of December 31, 2009, our Subprime securities that were reliably insured by two bond insurers included 23 below investmentgrade securities with a total fair value of $166 million and aggregate gross unrealized losses of $166 million.
As of December 31, 2010, our below investment grade Subprime securities with gross unrealized losses that are not reliably insured and withoutother-than-temporary impairments recorded in earnings had incurred actual cumulative collateral losses of 12.7%. Our impairment evaluation forecastsmore severe assumptions than the trusts are actually experiencing, including a projected weighted average underlying default rate of 60.8% and aprojected weighted average loss severity of 70.0%, which resulted in projected additional collateral losses of 42.1%. As the average remaining creditenhancement for these securities of 56.7% exceeds the projected additional collateral losses of 42.1%, these securities have not been impaired.
As of December 31, 2010, our below investment grade Subprime securities with gross unrealized losses that are not reliably insured and withother-than-temporary impairments recorded in earnings had incurred actual cumulative collateral losses of 16.0%. Our impairment evaluation forecastsmore severe assumptions than the trusts are actually experiencing, including a projected weighted average underlying default rate of 57.1% and aprojected weighted average loss severity of 77.0%, which resulted in projected additional collateral losses of 43.0%. As the average remaining creditenhancement for these securities of 22.8% is insufficient to withstand the projected additional collateral losses, we have recognized cumulative write-downs in earnings on the securities as reflected in the table above using our calculated recovery value at the time of impairment. The current averagerecovery value of these securities as a percentage of par was 71.2% and exceeded these securities' current average amortized cost as a percentageof par of 68.7%, which demonstrates our conclusion that the nature of the remaining unrealized loss on these securities is temporary and will reverseover time. The comparison indicates that recovery value exceeds amortized cost based on a comprehensive evaluation of financial, economic andcapital markets assumptions developed for this reporting period.
95
losses on the securities we hold are less than the losses on the underlying collateral as presented in this table. Actual cumulative realized principal losses on thebelow investment grade Subprime securities we own, as reported by the trust servicers, were $20 million as of December 31, 2010.
Weighted average projected additional collateral losses to be incurred as of period end are based on our projections of future losses to be incurred by thetrust, taking into consideration the actual cumulative collateral losses incurred to date, as a percentage of the remaining principal amount of the loans in thetrust. Our projections are developed internally and customized to our specific holdings and are informed by and benchmarked against credit opinionsobtained from third parties, such as industry analysts, nationally recognized credit rating agencies and an RMBS loss modeling advisory service. Projectedadditional collateral losses to be incurred are compared to average remaining credit enhancement for each security. For securities where the projectedadditional collateral losses exceed remaining credit enhancement, a recovery value is calculated to determine whether impairment losses should be recordedin earnings. The weighting calculation is based on the par value of each security.Weighted average remaining credit enhancement as of period end is based on structural subordination and the expected impact of other structural featuresexisting in the securitization trust beneficial to our class and reflects our projection of future principal losses that can occur as a percentage of the remainingprincipal amount of the loans in the trust before the class of the security we own will incur its first dollar of principal loss. The weighting calculation is basedon the par value of each security.Includes total gross unrealized losses on securities in an unrealized loss position for a period of 12 to 24 consecutive months.Includes total gross unrealized losses on securities in an unrealized loss position for a period more than 24 consecutive months. As of December 31, 2010,$188 million of unrealized losses on securities with other-than-temporary impairments recognized in earnings and $108 million of unrealized losses onsecurities without other-than-temporary impairments recognized in earnings have been greater than or equal to 20% of those securities' amortized cost for aperiod of more than 24 consecutive months. As of December 31, 2009, $95 million of unrealized losses on securities with other-than-temporary impairmentsrecognized in earnings and $50 million of unrealized losses on securities without other-than-temporary impairments recognized in earnings had been greaterthan or equal to 20% of those securities' amortized cost for a period of more than 24 consecutive months.Includes cumulative write-downs recorded in accordance with GAAP.Reflects principal payments for the years ended December 31, 2010 and 2009, respectively.
(2)
(3)
(4)(5)
(6)(7)

The following table shows actual trust-level key metrics specific to the trusts from which our below investment grade Subprime securities withgross unrealized losses were issued, as reported by the trust servicers.
We believe the unrealized losses on our Subprime securities, including those over 24 months, result from the current risk premium on thesesecurities, which should continue to reverse over the securities' remaining lives, as demonstrated by improved valuations in 2010. We expect toreceive our estimated share of contractual principal and interest collections used to determine the securities' recovery value. As of December 31, 2010,we do not have the intent to sell and it is not more likely than not we will be required to sell these securities before the recovery of their amortized costbasis. We believe that our valuation and impairment processes are comprehensive, employ the most current views about collateral and securitizationtrust financial positions, and demonstrate our recorded impairments and that the remaining unrealized losses on these positions are temporary.
Other-than-temporary impairment assessment for below investment grade CMBS
As of December 31, 2010, the fair value of our below investment grade CMBS with gross unrealized losses totaled $135 million compared to$67 million as of December 31, 2009. As of December 31, 2010, gross unrealized losses for our below investment grade CMBS portfolio totaled$134 million, an increase of 9.8% compared to $122 million as of December 31, 2009. The increase over prior year was primarily due to downgradesof certain CMBS to below investment grade during 2010, partially offset by improved valuations and sales during 2010 in anticipation of negativecapital treatment by certain regulatory and rating agencies. There were no gross unrealized gains for this portfolio as of December 31, 2010.
The credit loss evaluation for CMBS with gross unrealized losses is performed in two phases. The first phase estimates the future cash flows ofthe entire securitization trust from which our security was issued. A critical part of this estimate involves forecasting the collateral losses of thecommercial mortgage loans that collateralize the securitization trust. Factors affecting these estimates include, but are not limited to, estimates ofcurrent and future commercial property prices, current and projected rental incomes, the propensity of the mortgage loans to default under theseassumptions and loss severities in cases of default. Estimates of future property prices and rental incomes consider specific property-type andgeographic economic trends such as employment, property vacancy and rental rates, and forecasts of new supply in the commercial real estatemarkets. Estimates of default rates and loss severities consider factors such as borrower payment history, the origination practices of the transactionsponsor, overall collateral quality and diversification, transaction vintage year, maturity date, overall transaction structure and other factors that mayinfluence performance. Realized losses in the CMBS market have historically been low and, we believe, are not predictive of future losses. Therefore,our projections of collateral performance rely on probability-weighted scenarios informed by credit opinions obtained from third parties, such asnationally recognized credit rating agencies, industry analysts and CMBS loss modeling advisory services.
We then analyze the actual cumulative collateral losses incurred to date by the securitization trust, our projected additional collateral lossesexpected to be incurred and the position of the class of securities we own in the securitization trust relative to the trust's other classes to determinewhether any of the collateral losses will be applied to our class. If our class has remaining credit enhancement sufficient to withstand the projectedadditional collateral losses, no collateral losses will be realized by our class and we expect to collect all contractual principal and interest of the securitywe own. Remaining credit enhancement is measured in terms of subordination from other classes of securities in the trust being contractuallyobligated to absorb losses before the class of security we own.
For securities where there is insufficient remaining credit enhancement for the class of securities we own, a recovery value is calculated based onour best estimate of future cash flows specific to that security. This estimate is based on the contractual principal payments and current interestpayments of the securities we own, adjusted for actual cumulative collateral losses incurred to date and the projected additional collateral lossesexpected to be incurred. In instances where the recovery value of the security is less than its amortized cost, a credit loss is recorded in earnings.
26.6%, 60.9% and 9.4% of the fair value of our below investment grade CMBS with gross unrealized losses were issued with Aaa, Aa and Aoriginal ratings and capital structure classifications, respectively. As described previously,
96
December 31,
2010 September 30,
2010 June 30,
2010 March 31,
2010 December 31,
2009 Trust-level statistics Delinquency rates 28.8% 28.6% 29.3% 31.7% 30.9%
Actual cumulative collateral lossesincurred to date 16.5% 15.4% 14.7% 14.4% 13.5%

CMBS with higher original ratings typically have priority in receiving the principal repayments on the underlying collateral compared to those with loweroriginal ratings. Tight credit markets and conservative underwriting standards continue to stress commercial mortgage borrowers' ability to refinanceobligations. While the projected cash flow assumptions for our below investment grade CMBS with gross unrealized losses have deteriorated since thesecurities were originated, as reflected by their current credit ratings, these securities continue to retain the payment priority features that existed at theorigination of the securitization trust.
The following tables show trust-level, class-level and security-specific detailed information for our below investment grade CMBS with grossunrealized losses, by credit rating.
97
($ in millions) December 31, 2010
With other-than-temporaryimpairments recorded in
earnings Without other-than-temporary
impairments recorded in earnings
Ba B Caa orlower Total Ba B
Caa orlower Total Total
Trust-level
Actual cumulative collaterallosses incurred to date (1) 0.6% 3.2% 2.5% 2.3% 1.1% 0.3% 0.4% 0.9% n/a
Projected additional collaterallosses to be incurred (2) 12.2% 7.0% 38.1% 29.2% 7.0% 4.4% 7.2% 6.4% n/a
Class-level
Average remaining creditenhancement (3) 12.5% 7.0% 25.5% 20.7% 9.1% 7.5% 9.0% 8.7% n/a
Security-specific Number of positions 2 1 5 8 14 5 2 21 29 Par value $ 22 $ 16 $ 79 $ 117 $ 138 $ 46 $ 7 $ 191 $ 308 Amortized cost $ 17 $ 15 $ 39 $ 71 $ 143 $ 47 $ 8 $ 198 $ 269 Fair value $ 13 $ 6 $ 13 $ 32 $ 75 $ 25 $ 3 $ 103 $ 135 Gross unrealized losses Total $ (4) $ (9) $ (26) $ (39) $ (68) $ (22) $ (5) $ (95) $ (134) 12-24 months (4) $ — $ — $ — $ — $ — $ — $ — $ — $ — Over 24 months (5) $ (4) $ (9) $ (26) $ (39) $ (68) $ (22) $ (5) $ (95) $ (134)
Cumulative write-downsrecognized (6) $ (5) $ (2) $ (41) $ (48) $ — $ — $ — $ — $ (48)
Principal payments receivedduring the period (7) $ — $ — $ 1 $ 1 $ — $ 1 $ — $ 1 $ 2

The above tables include information about below investment grade CMBS with gross unrealized losses as of each period presented. The parvalue and composition of securities included can vary significantly from period to period due to changes in variables such as credit ratings, principalpayments, sales and purchases.
Our impairment evaluation for CMBS forecasts more severe assumptions than the trusts are actually experiencing. We assume that all loansdelinquent 60 days or more default and project default rates on otherwise performing loans. Projected loss severities are then applied against theresulting default rates, arriving at our projected additional collateral loss rates. The projected additional collateral loss rates by vintage year of ourCMBS portfolio range from a low of 1.5% for holdings with a vintage year of 2001 to a high of 11.1% for holdings with a vintage year of 2005.
As of December 31, 2010, our below investment grade CMBS with gross unrealized losses and without other-than-temporary impairmentsrecorded in earnings had incurred actual cumulative collateral losses of 0.9%, and the projected additional collateral loss rate for these securities as ofDecember 31, 2010 was 6.4%. As the average remaining credit enhancement for these securities of 8.7% exceeds the projected additional collaterallosses of 6.4%, these securities have not been impaired.
98
December 31, 2009
With other-than-temporaryimpairments recorded in
earnings
Without other-than-temporaryimpairments recorded in
earnings
Ba B Caa orlower Total Ba B
Caa orlower Total Total
Trust-level
Actual cumulative collaterallosses incurred to date (1) 1.4% 0.6% —% 0.8% —% —% —% —% n/a
Projected additional collaterallosses to be incurred (2) 20.1% 13.5% —% 15.0% 6.1% 7.7% —% 6.7% n/a
Class-level
Average remaining creditenhancement (3) 17.4% 9.8% —% 11.5% 9.1% 8.5% —% 8.9% n/a
Security-specific Number of positions 1 5 — 6 6 6 — 12 18 Par value $ 20 $ 69 $ — $ 89 $ 87 $ 49 $ — $ 136 $ 225 Amortized cost $ 14 $ 41 $ — $ 55 $ 84 $ 50 $ — $ 134 $ 189 Fair value $ 9 $ 16 $ — $ 25 $ 29 $ 13 $ — $ 42 $ 67 Gross unrealized losses Total $ (5) $ (25) $ — $ (30) $ (55) $ (37) $ — $ (92) $ (122) 12-24 months (4) $ — $ — $ — $ — $ (13) $ — $ — $ (13) $ (13) Over 24 months (5) $ (5) $ (25) $ — $ (30) $ (42) $ (37) $ — $ (79) $ (109)
Cumulative write-downsrecognized (6) $ (7) $ (34) $ — $ (41) $ — $ — $ — $ — $ (41)
Principal payments receivedduring the period (7) $ 1 $ — $ — $ 1 $ 1 $ — $ — $ 1 $ 2
Weighted average actual cumulative collateral losses incurred to date as of period end are based on the actual principal losses incurred as a percentage ofthe remaining principal amount of the loans in the trust. The weighting calculation is based on the par value of each security. Actual losses on the securitieswe hold are less than the losses on the underlying collateral as presented in this table. There were no actual cumulative realized principal losses on thebelow investment grade CMBS we own, as reported by the trust servicers, as of December 31, 2010.Weighted average projected additional collateral losses to be incurred as of period end are based on our projections of future losses to be incurred by thetrust, taking into consideration the actual cumulative collateral losses incurred to date, as a percentage of the remaining principal amount of the loans in thetrust. Our projections are developed internally and customized to our specific holdings and are informed by and benchmarked against credit opinionsobtained from third parties, such as industry analysts, nationally recognized credit rating agencies and CMBS loss modeling advisory services. Projectedadditional collateral losses to be incurred are compared to average remaining credit enhancement for each security. For securities where the projectedadditional collateral losses exceed remaining credit enhancement, a recovery value is calculated to determine whether impairment losses should be recordedin earnings. The weighting calculation is based on the par value of each security.Weighted average remaining credit enhancement as of period end is based on structural subordination and reflects our projection of future principal lossesthat can occur as a percentage of the remaining principal amount of the loans in the trust before the class of the security we own will incur its first dollar ofprincipal loss. The weighting calculation is based on the par value of each security.Includes total gross unrealized losses on securities in an unrealized loss position for a period of 12 to 24 consecutive months.Includes total gross unrealized losses on securities in an unrealized loss position for a period more than 24 consecutive months. As of December 31, 2010,$39 million of unrealized losses on securities with other-than-temporary impairments recognized in earnings and $93 million of unrealized losses onsecurities without other-than-temporary impairments recognized in earnings have been greater than or equal to 20% of those securities' amortized cost for aperiod of more than 24 consecutive months. As of December 31, 2009, there were no CMBS with gross unrealized losses greater than or equal to 20% for aperiod of more than 24 consecutive months.Includes cumulative write-downs recorded in accordance with GAAP.Reflects principal payments for the years ended December 31, 2010 and 2009, respectively.
(1)
(2)
(3)
(4)(5)
(6)(7)

As of December 31, 2010, our below investment grade CMBS with gross unrealized losses and with other-than-temporary impairments recordedin earnings had incurred actual cumulative collateral losses of 2.3%. The projected additional collateral loss rate for these securities as ofDecember 31, 2010 was 29.2%. As the average remaining credit enhancement for these securities of 20.7% is insufficient to withstand the projectedadditional collateral losses, we have recognized cumulative write-downs in earnings on these securities as reflected in the table above using ourcalculated recovery value at the time of impairment. The current average recovery value of these securities as a percentage of par was 61.3% andexceeded these securities' current average amortized cost as a percentage of par of 61.2%, which demonstrates our conclusion that the nature of theremaining unrealized loss on these securities is temporary and will reverse over time. The comparison indicates that recovery value is in line withamortized cost as impairment write-downs were recorded in the reporting period based on a comprehensive evaluation of financial, economic andcapital markets assumptions developed for this reporting period.
The following table shows actual trust-level key metrics specific to the trusts from which our below investment grade CMBS with gross unrealizedlosses were issued, as reported by the trust servicers.
We believe the unrealized losses on our CMBS, including those over 24 months, result from the current risk premium on these securities, whichshould continue to reverse over the securities' remaining lives, as demonstrated by improved valuations during 2010. We expect to receive ourestimated share of contractual principal and interest collections used to determine the securities' recovery value. As of December 31, 2010, we do nothave the intent to sell and it is not more likely than not we will be required to sell these securities before the recovery of their amortized cost basis. Webelieve that our valuation and impairment processes are comprehensive, employ the most current views about collateral and securitization trustfinancial positions, and demonstrate our recorded impairments and that the remaining unrealized losses on these positions are temporary.
Other-than-temporary impairment assessment for below investment grade cash flow CLO ABS
As of December 31, 2010, the fair value for our below investment grade cash flow CLO portfolio with gross unrealized losses totaled $169 millioncompared to $188 million as of December 31, 2009. The gross unrealized losses for these securities totaled $48 million as of December 31, 2010, adecrease of 51.5%, compared to $99 million as of December 31, 2009, primarily due to higher valuations resulting from lower risk premiums andupgrades of certain cash flow CLO to investment grade during 2010. Gross unrealized gains for these securities were $53 million as of December 31,2010. For below investment grade cash flow CLO with gross unrealized gains, we have recognized cumulative write-downs in earnings totaling$85 million.
As of December 31, 2010, none of our below investment grade cash flow CLO portfolio with gross unrealized losses have other-than-temporaryimpairments recorded in earnings and all of the gross unrealized losses are aged over 24 months.
Cash flow CLO are collateralized primarily by below investment grade senior secured corporate loans and are structured with overcollateralizationwhich serves as credit enhancement for the class of securities we own. Overcollateralization ratios are based on the par value of the collateral in theunderlying portfolio as a percentage of the notes issued as cash flow CLO securities. The performance of these securities is impacted primarily bydefaults and recoveries of the underlying collateral within the structures, which reduce overcollateralization ratios over time. A violation of the seniorovercollateralization test could result in an event of default of the structure which would give the controlling class, generally defined as the majority ofthe senior lenders, certain rights, including the ability to divert cash flows or liquidate the underlying portfolio to pay off the senior liabilities.
The credit loss evaluation for cash flow CLO is performed in two phases. The first phase evaluates the overcollateralization that exists for the classof securities we own. A critical part of this estimate involves projections of future losses formulated through our assessment of the corporate loanmarkets, and considers opinions from third parties, such as industry analysts and strategists, credit rating agencies, our own participation in thesemarkets, as well as our overall economic outlook for indicators such as unemployment and GDP. The expected performance of each security considersanticipated collateral losses and credit enhancement levels, as well as factors including default rates,
99
December 31,
2010 September 30,
2010 June 30,
2010 March 31,
2010 December 31,
2009 Trust-level statistics Delinquency rates 7.2% 8.3% 8.5% 8.6% 5.2%
Actual cumulative collateral lossesincurred to date 1.4% 2.9% 1.6% 0.8% 0.3%

anticipated recoveries, prepayment rates, changes in interest rates and other characteristics. In addition, the performance of collateral underlyingcertain of our securities is actively monitored by external managers, allowing for enhanced collateral management actions which help mitigate the riskof loss. If the overcollateralization that exists for our class exceeds 100%, our class has remaining credit enhancement sufficient to withstand theprojected future losses, and we expect to collect all contractual principal and interest of the security we own.
For securities where there is insufficient remaining credit enhancement for the class of securities we own, a recovery value is calculated based onour best estimate of future cash flows specific to that security. This estimate is based on the contractual principal payments and current interestpayments of the securities we own, adjusted for actual cumulative collateral losses incurred to date and the projected future losses expected to beincurred. If we do not expect to receive cash flows sufficient to recover the entire amortized cost basis of the security, a credit loss is recorded to theextent amortized cost exceeds recovery value.
The weighted average overcollateralization ratio as reported by the trust servicers for our below investment grade cash flow CLO securities withgross unrealized losses was 117.0% as of December 31, 2010, compared to 117.5% at original issuance. As of December 31, 2009, the weightedaverage overcollateralization ratio for our below investment grade cash flow CLO securities with gross unrealized losses was 113.6%. As the averageovercollateralization ratios exceed 100%, this indicates that projected future collateral losses will be absorbed by lower classes and we expect thestructures to have adequate cash flows to make all contractual payments due to the class of securities we own. Our comprehensive evaluation offinancial, economic and capital markets assumptions developed for this reporting period, supported by the applicable overcollateralization ratios,indicates that the nature of the unrealized loss on these securities is temporary.
We believe the unrealized losses on our cash flow CLO securities, including those over 24 months, result from the current risk premium on thesesecurities, which should continue to reverse over the securities' remaining lives, as demonstrated by improved valuations in 2010. We expect toreceive our estimated share of contractual principal and interest collections used to determine the securities' recovery value. As of December 31, 2010,we do not have the intent to sell and it is not more likely than not we will be required to sell these securities before the recovery of their amortized costbasis. We believe that our valuation and impairment processes are comprehensive, employ the most current views about collateral and securitizationtrust financial positions, and demonstrate our recorded impairments and that the remaining unrealized losses on these positions are temporary.
Problem, restructured, or potential problem securities
We also monitor the quality of our fixed income and bank loan portfolios by categorizing certain investments as "problem," "restructured," or"potential problem." Problem fixed income securities and bank loans are in default with respect to principal or interest and/or are investments issued bycompanies that have gone into bankruptcy subsequent to our acquisition or loan. Fixed income and bank loan investments are categorized asrestructured when the debtor is experiencing financial difficulty and we grant a concession. Potential problem fixed income or bank loan investmentsare current with respect to contractual principal and/or interest, but because of other facts and circumstances, we have concerns regarding theborrower's ability to pay future principal and interest according to the original terms, which causes us to believe these investments may be classified asproblem or restructured in the future.
The following table summarizes problem, restructured and potential problem fixed income securities and bank loans, which are reported in otherinvestments, as of December 31.
100
($ in millions) 2010
Par
value (1) Amortized
cost (1)
Amortizedcost as apercent ofpar value
Fairvalue (2)
Fair value asa percent of
par value
Percent oftotal fixed
income andbank loanportfolios
Restructured $ 99 $ 83 83.8%$ 79 79.8% 0.1%Problem 665 214 32.2 188 28.3 0.2 Potential problem 3,441 1,485 43.2 1,171 34.0 1.5
Total $ 4,205 $ 1,782 42.4 $ 1,438 34.2 1.8%
Cumulative write- downsrecognized (3) $ 1,005

As of December 31, 2010, amortized cost for the problem category was $214 million and comprised $90 million of Subprime, $70 million ofmunicipal bonds, $40 million of Alt-A, $6 million of corporates (primarily privately placed), $5 million of CDO and $3 million of Consumer and otherABS.
As of December 31, 2010, amortized cost for the potential problem category was $1.49 billion and comprised $606 million of Subprime,$331 million of Alt-A, $213 million of Prime, $125 million of municipal bonds, $79 million of CDO, $71 million of CMBS, $41 million of corporates(primarily privately placed), $10 million of bank loans and $9 million of Consumer and other ABS.
Net investment income The following table presents net investment income for the years ended December 31.
Net investment income decreased 7.7% or $342 million in 2010 compared to 2009, after decreasing 21.0% or $1.18 billion in 2009 compared to2008. The 2010 decrease was primarily due to lower interest rates, risk reduction actions related to municipal bonds and commercial real estate,duration shortening actions taken to protect the portfolio from rising interest rates and lower average investment balances. The 2009 decrease wasprimarily due to lower yields, actions to shorten duration and maintain additional liquidity in the portfolio, along with reduced average investmentbalances. Also contributing to the decline in 2009 was lower income on limited partnership interests and decreased dividends on equity securities.
101
2009
Par
value (1) Amortized
cost (1)
Amortizedcost as apercent ofpar value
Fairvalue (2)
Fair value asa percent of
par value
Percent oftotal fixed
income andbank loanportfolios
Restructured $ 107 $ 85 79.4%$ 75 70.1% 0.1%Problem 823 321 39.0 221 26.9 0.3 Potential problem 2,630 1,651 62.8 977 37.1 1.2
Total $ 3,560 $ 2,057 57.8 $ 1,273 35.8 1.6%
Cumulative write- downsrecognized (3) $ 1,188
The difference between par value and amortized cost of $2.42 billion as of December 31, 2010 is primarily attributable to write-downs and a deep discountzero-coupon security. The difference between par value and amortized cost of $1.50 billion as of December 31, 2009 is primarily attributable to write-downs.Par value has been reduced by principal payments.Bank loans are reflected at amortized cost.Cumulative write-downs recognized only reflect impairment write-downs related to investments within the problem, potential problem and restructuredcategories.
(1)
(2)(3)
($ in millions) 2010 2009 2008 Fixed income securities $ 3,737 $ 3,998 $ 4,783 Equity securities 90 80 120 Mortgage loans 385 498 618 Limited partnership interests 40 17 62 Short-term investments 8 27 195 Other 19 (10) 54
Investment income, before expense 4,279 4,610 5,832 Investment expense (177) (166) (210)
Net investment income $ 4,102 $ 4,444 $ 5,622

Realized capital gains and losses The following table presents the components of realized capital gains and losses and the related tax effectfor the years ended December 31.
Impairment write-downs for the years ended December 31 are presented in the following table.
Impairment write-downs in 2010 were primarily driven by RMBS, which experienced deterioration in expected cash flows; investments withcommercial real estate exposure, including CMBS, mortgage loans, limited partnership interests and certain housing related municipal bonds, whichwere impacted by lower real estate valuations or experienced deterioration in expected cash flows; and privately placed corporate bonds andmunicipal bonds impacted by issuer specific circumstances. Impairment write-downs on below investment grade RMBS, CMBS and ABS in 2010 were$332 million, $118 million and $29 million, respectively.
Impairment write-downs that were related primarily to securities subsequently disposed were $99 million for the year ended December 31, 2010.Of the remaining write-downs in 2010, $386 million or 73.2% of the fixed income security write-downs related to impaired securities that wereperforming in line with anticipated or contractual cash flows but were written down primarily because of expected deterioration in the performance ofthe underlying collateral or our assessment of the probability of future default. For these securities, as of December 31, 2010, there were either nodefaults or defaults only impacted classes lower than our position in the capital structure. $138 million of the fixed income security write-downs in 2010related to securities experiencing a significant departure from anticipated cash flows; however, we believe they retain economic value. $3 million in2010 related to fixed income securities for which future cash flows are not anticipated.
Equity securities were written down primarily due to the length of time and extent to which fair value was below cost, considering our assessmentof the financial condition and near-term and long-term prospects of the issuer, including relevant industry conditions and trends.
Limited partnership impairment write-downs primarily related to Cost limited partnerships, which experienced declines in portfolio valuations andwe could not assert the recovery period would be temporary. To determine if an other-than-temporary impairment has occurred related to a Cost limitedpartnership, we evaluate whether an impairment indicator has occurred in the period that may have a significant adverse effect on the carrying value ofthe investment. Impairment indicators may include: significantly reduced valuations of the investments held by the limited partnerships; actual recentcash flows received being significantly less than expected cash flows; reduced valuations based on financing completed at a lower value; completedsale of a material underlying investment at a price significantly lower than expected; or any other adverse events since the last financial statementsreceived that might affect the fair value of the investee's capital.
102
($ in millions) 2010 2009 2008 Impairment write-downs $ (797) $ (1,562) $ (1,983)Change in intent write-downs (204) (357) (1,752)
Net other-than-temporary impairment losses recognized in earnings (1,001) (1,919) (3,735)Sales 686 1,272 (464)Valuation of derivative instruments (427) 367 (1,280)Settlements of derivative instruments (174) (162) 486 EMA limited partnership income 89 (141) (97)
Realized capital gains and losses, pre-tax (827) (583) (5,090)Income tax benefit (expense) 290 (45) 1,779
Realized capital gains and losses, after-tax $ (537) $ (628) $ (3,311)
($ in millions) 2010 2009 2008 Fixed income securities $ (626) $ (886) $ (1,507)Equity securities (57) (237) (328)Mortgage loans (65) (97) (4)Limited partnership interests (46) (308) (112)Other investments (3) (34) (32)
Impairment write-downs $ (797) $ (1,562) $ (1,983)

Impairment write-downs in 2009 were primarily the result of recovery assessments related to investments with commercial real estate exposure,including limited partnership interests, equity securities, mortgage loans and CMBS; RMBS which experienced deterioration in expected cash flows;ABS, including CDO squared, cash flow CDO and synthetic CDO, and hybrid corporate fixed income securities.
Change in intent write-downs for the years ended December 31 are presented in the following table.
The change in intent write-downs in 2010 and 2009 were primarily a result of ongoing comprehensive reviews of our portfolios resulting in write-downs of individually identified investments, primarily municipal bonds and RMBS.
Sales generated $686 million of net realized gains in 2010 primarily due to $595 million of net gains on sales of corporate, U.S. government,foreign government and municipal fixed income securities and $210 million of net gains on sales of equity securities, partially offset by $139 million ofnet losses on sales of CMBS and ABS. Net realized gains from sales of $1.27 billion in 2009 were primarily due to $445 million and $636 million ofgains on sales of equity and U.S. and foreign government fixed income securities, respectively. Sales of equity securities in 2009 were primarily inconnection with a change in strategy that uses a more passive portfolio management approach with a greater emphasis on asset allocation decisions.
Valuation and settlement of derivative instruments recorded as net realized capital losses totaling $601 million in 2010 included $427 million oflosses on the valuation of derivative instruments and $174 million of losses on the settlement of derivative instruments. In 2009, net realized capitalgains on the valuation and settlement of derivative instruments totaled $205 million.
Net realized capital gains and losses from our risk management derivative programs are primarily driven by changes in risk-free interest rates,equity market valuations, volatility and credit spreads during a given period. Net realized capital gains and losses from our income generationderivative programs are primarily driven by changes in the fair value of the reference entities or indices underlying the derivative instruments.
A changing interest rate environment will drive changes in our portfolio duration targets. A duration target and range is established with aneconomic view of liabilities relative to a long-term investment portfolio view. Tactical duration management is accomplished through both cash markettransactions, sales and new purchases, and derivative activities that generate realized gains and losses. As a component of our approach to managingportfolio duration, realized gains and losses on certain derivative instruments are most appropriately considered in conjunction with the unrealizedgains and losses on the fixed income portfolio. This approach mitigates the impacts of general interest rate changes to our overall financial condition.
As of December 31, 2010, our securities with embedded derivatives totaled $1.26 billion, a decrease in fair value of $152 million fromDecember 31, 2009, comprising realized capital losses on valuation of $3 million, net sales activity of $320 million, unrealized net capital gainsreported in OCI of $123 million for the host securities and an increase of $48 million due to the adoption of new accounting guidance. Unrealized netcapital gains were further decreased by $30 million due to amortization of the host securities. The change in fair value of embedded derivatives isbifurcated from the host securities, separately valued and reported in realized capital gains and losses, while the change in the difference between thefair value and the amortized cost of the host securities is reported in OCI. Total fair value exceeded total amortized cost by $41 million as ofDecember 31, 2010. Valuation gains and losses for securities with embedded derivatives are converted into cash upon our election to sell thesesecurities. In the event the economic value of the embedded options is not realized, we will recover the par value if held to maturity unless the issuer ofthe security defaults. In the event there are defaults by the referenced credit entities of the embedded credit default swap, our loss is limited to the parvalue of the combined fixed income security, net of applicable recoveries. Total par value exceeded fair value by $45 million as of December 31, 2010.
103
($ in millions) 2010 2009 2008 Fixed income securities $ (198) $ (318) $ (1,555)Equity securities — (27) (120)Mortgage loans (6) (6) (74)Other investments — (6) (3)
Change in intent write-downs $ (204) $ (357) $ (1,752)

The table below presents the realized capital gains and losses (pre-tax) on the valuation and settlement of derivative instruments shown byunderlying exposure and derivative strategy for the years ended December 31.
104
($ in millions) 2010 2009 2008 2010 Explanations Valuation Settlements Total Total Total Risk management Property–Liability Portfolio duration management
$
(96) $
(78) $
(174) $
33
$
(10)
Interest rate swaps, municipal interest rate swaps and short interest ratefutures are used to offset the effects of changing interest rates on aportion of the Property-Liability fixed income portfolio that is reported inunrealized net capital gains or losses in OCI. The futures contracts areexchange traded, daily cash settled and can be exited at any time forminimal additional cost. The 2010 losses, resulting from decreasinginterest rates are offset in unrealized net capital gains and losses in OCIto the extent it relates to changes in risk-free rates.
Interest rate spike exposure
(173)
(11)
(184)
(58)
(97) Interest rate swaption contracts, with terms of less than one year, and
exchange traded options on interest rate futures, with three to six monthterms, provide an offset to declines in fixed income market valuesresulting from potential rising interest rates. As of December 31, 2010, thenotional amount of our over-the-counter ("OTC") swaption positionstotaled $7.81 billion and the notional amount of our exchange tradedoptions totaled $800 million. Exchange traded options on interest ratefutures are utilized to supplement the protection provided by swaptioncontracts without increasing the counterparty risk associated with OTCcontracts. The 2010 losses on swaptions and options on interest ratefutures contracts relates to a decrease in interest rates and a decline involatility. Volatility represents the measure of variation of average valueover a specified time period. If interest rates do not increase above thestrike rate, the maximum loss on swaptions and options on interest ratefutures is limited to the amount of the premium paid. The program isroutinely monitored and revised as capital market conditions change.
Hedging unrealized gains on equity securities
(56)
(35)
(91)
(226)
420
Exchange traded put options and short equity index futures provide anoffset to significant declines in our equity portfolio from equity marketdeclines below a targeted level. Options can expire, terminate early or theoption can be exercised. If the price level of the equity index does not fallbelow the put's strike price, the maximum loss on purchased puts islimited to the amount of the premium paid. The futures contracts areexchange traded, daily cash settled and can be exited at any time forminimal additional cost. The 2010 losses on futures and options wereprimarily the result of an increase in the price levels of the equity indicesand a decrease in volatility and were partially offset by unrealized netcapital gains and losses of our equity portfolio to the degree they reflectthe changes in price levels of the equity indices, which is reflected in OCI.
Foreign currency contracts
6
(20)
(14)
4
(27) Currency forwards are used to protect our foreign bond and equityportfolios from changes in currency rates. The 2010 losses on foreigncurrency contracts are primary driven by the weakening of the U.S.currency versus the foreign currency.
Credit risk reduction
(7)
(10)
(17)
(45)
48
Valuation loss is the result of tightening credit spreads on referencedcredit entities.
Other
1
1
2
2
(29)
(1)
(1)
(1)
(1)

105
($ in millions) 2010 2009 2008 2010 Explanations Valuation Settlements Total Total Total Allstate Financial Duration gap management (111) (43) (154) 288 (503) Interest rate caps, floors, swaptions and swaps are used by Allstate
Financial to balance interest-rate sensitivities of its assets and liabilities. Thecontracts settle based on differences between current market rates and acontractually specified fixed rate through expiration. The contracts can beterminated and settled at any time with minimal additional cost. Themaximum loss on caps, floors and swaptions is limited to the amount ofpremiums paid. The change in valuation reflects the changing value ofexpected future settlements from changing interest rates, which may varyover the period of the contracts. The 2010 losses, resulting from decreasinginterest rates, are offset in unrealized capital gains and losses of our fixedincome securities in OCI to the extent it relates to changes in risk-free rates.
Anticipatory hedging
24
8
32
(18)
153
Futures and interest rate swaps are used to protect investment spread frominterest rate changes during mismatches in the timing of cash flows betweenproduct sales and the related investment activity. The futures contracts areexchange traded, daily cash settled and can be exited at any time forminimal additional cost. If the cash flow mismatches are such that a positivenet investment position is being hedged, there is an offset for the relatedinvestment's unrealized loss in OCI. The 2010 gains resulted from adecrease in risk-free interest rates over the life of the net short position asliability issuances exceeded asset acquisitions.
Hedging of interest rate exposure
in annuity contracts
(16)
—
(16)
10
(29) Value of expected future settlements on interest rate caps and the
associated value of future credited interest, which is reportable in futureperiods when incurred, decreased due to a decrease in interest rates.
Hedging unrealized gains on
equity indexed notes
—
—
—
—
7
Hedge ineffectiveness
7
—
7
(1)
(4) The hedge ineffectiveness of $7 million includes $74 million in realizedcapital losses on swaps that were offset by $81 million in realized capitalgains on the hedged risk.
Foreign currency contracts
(2)
6
4
3
(1) Currency forwards are used to protect our foreign bond portfolio fromchanges in currency rates.
Credit risk reduction
6
(13)
(7)
(50)
17
Valuation gain is the result of widening credit spreads on referenced creditentities.
Other
—
—
—
—
1
Total Risk management
$ (417) $ (195) $ (612) $ (58) $ (54)
Income generation
The 2010 changes in valuation on the Property-Liability segment are due tothe tightening of credit spreads on referenced credit entities. The gains areprimarily on single name credit default swaps ("CDS"). The 2010 changes invaluation on the Allstate Financial segment are due to the widening creditspreads on referenced credit entities. The losses are primarily on first-to-default CDS and credit derivative index CDS. The changes in valuationwould only be converted to cash upon disposition, which can be done at anytime, or if the credit event specified in the contract occurs. For furtherdiscussion on CDS, see Note 6 of the consolidated financial statements.
Asset replication — credit exposure Property-Liability $ 5 $ 10 $ 15 $ 13 $ (41) Allstate Financial (10) 11 1 64 (62)
Total (5) 21 16 77 (103)
Asset replication — equity exposure Property–Liability
— — — 66 (84)
Commodity derivatives —
Property–Liability — — — — (44)
Total Income generation $ (5) $ 21 $ 16 $ 143 $ (231)
(1)

106
($ in millions) 2010 2009 2008 2010 Explanations Valuation Settlements Total Total Total Accounting Equity indexed notes — Allstate
Financial
$ (17) $ —
$ (17) $ 28
$ (290)Equity-indexed notes are fixed income securities that contain embedded options. Thechanges in valuation of the embedded equity indexed call options are reported in realizedcapital gains and losses. The results generally track the performance of underlying equityindices. Valuation gains and losses are converted into cash upon sale or maturity. In theevent the economic value of the options is not realized, we will recover the par value of thehost fixed income security if held to maturity unless the issuer of the note defaults. Parvalue exceeded fair value by $21 million as of December 31, 2010. Equity-indexed notesare subject to our comprehensive portfolio monitoring and watchlist processes to identifyand evaluate when the carrying value may be other-than-temporarily impaired. Thefollowing table compares the December 31, 2010 and 2009 holdings, respectively.
($ in millions) December 31,
2010
Changein fairvalue
Change dueto net sale
activity December 31,
2009 Par value $ 300 $ — $ (175) $ 475
Amortized cost of hostcontract
$ 224 $ 15 $ (135) $ 344
Fair value of equity-indexedcall option
47 (17) (25) 89
Total amortized cost $ 271 $ (2) $ (160) $ 433
Total fair value $ 279 $ 22 $ (173) $ 430
Unrealized gain/loss $ 8 $ 24 $ (13) $ (3)
Conversion options in fixed
income securities
Property–Liability (11) — (11) 60 (143) Allstate Financial (11) — (11) 32 (77)
Total (22) — (22) 92 (220) Convertible bonds are fixed income securities that contain embedded options. Changes in
valuation of the embedded option are reported in realized capital gains and losses. Theresults generally track the performance of underlying equities. Valuation gains and lossesare converted into cash upon our election to sell these securities. In the event theeconomic value of the options is not realized, we will recover the par value of the hostfixed income security if held to maturity unless the issuer of the note defaults. Fair valueexceeded par value by $80 million as of December 31, 2010. Convertible bonds aresubject to our comprehensive portfolio monitoring and watchlist processes to identify andevaluate when the carrying value may be other-than-temporarily impaired. The followingtable compares the December 31, 2010 and 2009 holdings, respectively.
($ in millions) December 31,
2010
Changein fairvalue
Change dueto net sale
activity December 31,
2009 Par value $ 820 $ — $ (116) $ 936
Amortized cost of hostcontract
$ 619 $ 19 $ (64) $ 664
Fair value of conversionoption
236 (22) (54) 312
Total amortized cost $ 855 $ (3) $ (118) $ 976
Total fair value $ 900 $ 69 $ (147) $ 978
Unrealized gain/loss $ 45 $ 72 $ (29) $ 2

107
($ in millions) 2010 2009 2008 2010 Explanations Valuation Settlements Total Total Total CDS in fixed income securities Property–Liability — — — — — Allstate Financial 36 — 36 — —
Total 36 — 36 — — Synthetic CDO's are fixed income securities that contain embedded CDS. Effective
July 1, 2010, when new accounting guidance requiring bifurcation of these derivativeswas adopted, changes in valuation of the embedded credit default swap are reported inrealized capital gains and losses. The embedded credit default swap increases ordecreases in value as referenced credit entities' credit spreads tighten or widen,respectively. Credit events, changes in interest rates, correlations of the referencedentities and assumed recovery rates are among some of the other factors affecting thevalue of the embedded credit default swap. In the event a referenced credit entityexperiences a credit event, our loss is limited to the par value of the fixed income security.Losses on credit events are net of recovery. Par value exceeded fair value by $104 millionas of December 31, 2010. Synthetic CDO's are subject to our comprehensive portfoliomonitoring and watchlist processes to identify and evaluate when the carrying value maybe other-than-temporarily impaired. The following table compares the December 31, 2010and July 1, 2010 holdings, respectively.
($ in millions) December 31,
2010
Changein fairvalue
Change dueto net sale
activity July 1,2010
Par value $ 181 $ — $ — $ 181
Amortized cost of hostcontract
$ 177 $ (4) $ — $ 181
Fair value of credit defaultswap
(88) 36 — (124)
Total amortized cost $ 89 $ 32 $ — $ 57
Total fair value $ 77 $ 29 $ — $ 48
Unrealized gain/loss $ (12) $ (3) $ — $ (9)
Total Accounting $ (3) $ — $ (3) $ 120 $ (510)
Other (2) — (2) — 1
Total $ (427) $ (174) $ (601) $ 205 $ (794)
Total Property-Liability $ (331) $ (143) $ (474) $ (151) $ (7) Total Allstate Financial (94) (31) (125) 356 (788) Other (2) — (2) — 1
Total $ (427) $ (174) $ (601) $ 205 $ (794)
(2) (2)
(2) (2)
A portion of the risk mitigation ("macro hedge") program is contained within this line item.For the years ended December 31, 2010 and 2009, does not include $1 million of derivative gains related to the termination of fair value and cash flow hedges which areincluded in sales and reported with the hedged risk.
(1)(2)

Included in the risk management section of the table above are net realized capital gains and losses on the valuation and settlement of derivativeinstruments related to our macro hedge program. Additional information regarding our macro hedge program, including these realized capital gainsand losses, is included in the following table.
Our current macro hedge program consists of derivatives for which we pay a premium at inception and others that do not require an up frontpremium payment. The premium payment component includes over-the-counter interest rate swaptions, exchange traded options on interest ratefutures, and options on equity indices. These programs are designed to protect against the "tail risk" associated with both interest rate spikes above,and equity market declines below, targeted thresholds, so that derivative valuation gains will be realized to partially offset corresponding declines invalue for our fixed income and equity portfolios, respectively.
Premiums paid are reflected in realized capital losses as changes in valuation over the life of the derivative. The maximum loss on our premiumbased instruments is limited to the remaining fair value as of December 31, 2010. Scheduled expirations for our premium based instruments are$89 million in 2011 and $9 million in 2012.
The derivatives in our current macro hedge program that do not require an up front premium payment are related to interest rate and credit riskhedging. These positions currently include municipal interest rate swaps, eurodollar futures, and purchased CDS. Although interest rate swaps andpurchased CDS typically do not require up front premiums, they do involve periodic payments throughout the life of the contract. The fair value andresulting gains and losses from these instruments are dependent on the size of the notional amounts and direction of our positions relative to theperformance of the underlying markets and credit-referenced entities. As of December 31, 2010, our non-premium based interest rate hedges hadaggregate outstanding notional amounts of $125 million, decreasing from $200 million as of December 31, 2009. As of December 31, 2010, our non-premium based credit hedges had aggregate outstanding notional amounts of $125 million, decreasing from $678 million as of December 31, 2009. Asof December 31, 2010, we had 15,000 eurodollar futures contracts outstanding. Futures contracts were not utilized in our macro hedge program in2009.
The macro hedge program is routinely monitored and revised as capital market conditions change.
108
($ in millions)
Fair valueas of
December 31,2009
Net cashpaid
(received)for
premiums
Net cashpaid
(received)for
settlement
Gain (loss)on
valuation Gain (loss) onsettlement
Fair valueas of
December 31,2010
Premium based instruments Interest rate hedges Swaptions $ 114 $ 166 $ (57) $ (147) $ (12) $ 64 Options on interest rate futures 12 23 (7) (26) 1 3 Equity hedges Equity index options 50 83 (26) (47) (29) 31
176 272 (90) (220) (40) 98 Non-premium based instruments Interest rate hedges Futures — — 40 — (42) (2) Interest rate swaps (12) — (8) 21 (1) — Credit hedges Purchased CDS (40) — 32 7 (6) (7)
(52) — 64 28 (49) (9)
Total $ 124 $ 272 $ (26) $ (192) $ (89) $ 89
(1) (2)
In general, for premium based instruments, valuation gains and losses represent changes in fair value on open contracts and contracts that expired by theircontractual terms during the period. If a premium based instrument terminates prior to expiration, the inception to date change in fair value is reversed out ofvaluation and reclassified to settlement gain or loss. For non-premium based instruments, valuation gains and losses represent changes in fair value thatoccurred while the contract was open but do not include gains and losses on termination (represented by the change in fair value of a terminated contractsince its last month-end valuation).In general, for premium based instruments, settlement gains and losses represent the inception to date change in fair value for early-terminated contracts.For non-premium based instruments, settlement gains and losses represent the net realized capital gain or loss resulting from periodic payments required bythe contracts during the period, as well as any gain or loss on contract termination (represented by the change in fair value of a terminated contract since itslast month-end valuation).
(1)
(2)

MARKET RISK
Market risk is the risk that we will incur losses due to adverse changes in interest rates, credit spreads, equity prices, commodity prices, orcurrency exchange rates. Adverse changes to these rates and prices may occur due to changes in the liquidity of a market or market segment,insolvency or financial distress of key market makers or participants or changes in market perceptions of credit worthiness and/or risk tolerance. Ourprimary market risk exposures are to changes in interest rates, credit spreads and equity prices.
The active management of market risk is integral to our results of operations. We may use the following approaches to manage exposure tomarket risk within defined tolerance ranges: 1) rebalancing existing asset or liability portfolios, 2) changing the character of investments purchased inthe future and 3) using derivative instruments to modify the market risk characteristics of existing assets and liabilities or assets expected to bepurchased. For a more detailed discussion of our use of derivative financial instruments, see Note 6 of the consolidated financial statements.
Overview In formulating and implementing guidelines for investing funds, we seek to earn returns that enhance our ability to offer competitiverates and prices to customers while contributing to attractive and stable profits and long-term capital growth. Accordingly, our investment decisions andobjectives are a function of the underlying risks and product profiles of each business.
Investment policies define the overall framework for managing market and other investment risks, including accountability and controls over riskmanagement activities. Subsidiaries that conduct investment activities follow policies that have been approved by their respective boards of directors.These investment policies specify the investment limits and strategies that are appropriate given the liquidity, surplus, product profile and regulatoryrequirements of the subsidiary. Executive oversight of investment activities is conducted primarily through subsidiaries' boards of directors andinvestment committees. For Allstate Financial, its asset-liability management ("ALM") policies further define the overall framework for managing marketand investment risks. ALM focuses on strategies to enhance yields, mitigate market risks and optimize capital to improve profitability and returns forAllstate Financial. Allstate Financial ALM activities follow asset-liability policies that have been approved by their respective boards of directors. TheseALM policies specify limits, ranges and/or targets for investments that best meet Allstate Financial's business objectives in light of its product liabilities.
We manage our exposure to market risk through the use of asset allocation, duration, simulation, and as appropriate, through the use of stresstests. We have asset allocation limits that place restrictions on the total funds that may be invested within an asset class. We have duration limits onthe Property-Liability and Allstate Financial investment portfolios and, as appropriate, on individual components of these portfolios. These durationlimits place restrictions on the amount of interest rate risk that may be taken. Comprehensive day-to-day management of market risk within definedtolerance ranges occurs as portfolio managers buy and sell within their respective markets based upon the acceptable boundaries established byinvestment policies. For Allstate Financial, this day-to-day management is integrated with and informed by the activities of the ALM organization. Thisintegration is intended to result in a prudent, methodical and effective adjudication of market risk and return, conditioned by the unique demands anddynamics of Allstate Financial's product liabilities and supported by the continuous application of advanced risk technology and analytics.
Although we apply a similar overall philosophy to market risk, the underlying business frameworks and the accounting and regulatoryenvironments differ considerably between the Property-Liability and Allstate Financial businesses affecting investment decisions and risk parameters.
Interest rate risk is the risk that we will incur a loss due to adverse changes in interest rates relative to the interest rate characteristics of ourinterest bearing assets and liabilities. This risk arises from many of our primary activities, as we invest substantial funds in interest-sensitive assets andissue interest-sensitive liabilities. Interest rate risk includes risks related to changes in U.S. Treasury yields and other key risk-free reference yields.
We manage the interest rate risk in our assets relative to the interest rate risk in our liabilities. One of the measures used to quantify this exposureis duration. Duration measures the price sensitivity of the assets and liabilities to changes in interest rates. For example, if interest rates increase 100basis points, the fair value of an asset with a duration of 5 is expected to decrease in value by 5%. As of December 31, 2010, the difference betweenour asset and liability duration was (0.64) gap, compared to a (0.24) gap as of December 31, 2009. A negative duration gap indicates that the fairvalue of our liabilities is more sensitive to interest rate movements than the fair value of our assets. The Property-Liability segment generally maintainsa positive duration gap between its assets and liabilities due to the relatively short duration of auto and homeowners claims, which are its primaryliabilities. The Allstate Financial segment may have a positive or
109

negative duration gap, as the duration of its assets and liabilities vary with its product mix and investing activity. As of December 31, 2010, Property-Liability had a positive duration gap while Allstate Financial had a negative duration gap.
In the management of investments supporting the Property-Liability business, we adhere to an objective of emphasizing safety of principal andconsistency of income within a total return framework. This approach is designed to ensure our financial strength and stability for paying claims, whilemaximizing economic value and surplus growth.
For the Allstate Financial business, we seek to invest premiums, contract charges and deposits to generate future cash flows that will fund futureclaims, benefits and expenses, and that will earn stable spreads across a wide variety of interest rate and economic scenarios. To achieve thisobjective and limit interest rate risk for Allstate Financial, we adhere to a philosophy of managing the duration of assets and related liabilities withinpredetermined tolerance levels. This philosophy is executed using duration targets for fixed income investments in addition to interest rate swaps,futures, forwards, caps, floors and swaptions to reduce the interest rate risk resulting from mismatches between existing assets and liabilities, andfinancial futures and other derivative instruments to hedge the interest rate risk of anticipated purchases and sales of investments and product sales tocustomers.
We pledge and receive collateral on certain types of derivative contracts. For futures and option contracts traded on exchanges, we have pledgedsecurities and cash as margin deposits totaling $37 million as of December 31, 2010. For OTC derivative transactions including interest rate swaps,foreign currency swaps, interest rate caps, interest rate floors, CDS, forwards and certain options (including swaptions), master netting agreements areused. These agreements allow us to net payments due for transactions covered by the agreements and, when applicable, we are required to postcollateral. As of December 31, 2010, we held $58 million of cash and securities pledged by counterparties as collateral for OTC instruments, and wepledged $193 million of cash and securities as collateral to counterparties.
We performed a sensitivity analysis on OTC derivative collateral by assuming a hypothetical 100 basis point decline in interest rates. The analysisindicated that we would have to post an estimated $194 million in additional collateral with 55% attributable to Allstate Financial. The selection of thesehypothetical scenarios should not be construed as our prediction of future events, but only as an illustration of the estimated potential effect of suchevents. We also actively manage our counterparty credit risk exposure by monitoring the level of collateral posted by our counterparties with respect toour receivable positions.
To calculate the duration gap between assets and liabilities, we project asset and liability cash flows and calculate their net present value using arisk-free market interest rate adjusted for credit quality, sector attributes, liquidity and other specific risks. Duration is calculated by revaluing thesecash flows at alternative interest rates and determining the percentage change in aggregate fair value. The cash flows used in this calculation includethe expected maturity and repricing characteristics of our derivative financial instruments, all other financial instruments, and certain other itemsincluding unearned premiums, property-liability insurance claims and claims expense reserves, annuity liabilities and other interest-sensitive liabilities.The projections include assumptions (based upon historical market experience and our experience) that reflect the effect of changing interest rates onthe prepayment, lapse, leverage and/or option features of instruments, where applicable. The preceding assumptions relate primarily to mortgage-backed securities, municipal housing bonds, callable municipal and corporate obligations, and fixed rate single and flexible premium deferredannuities. Additionally, the calculations include assumptions regarding the renewal of property-liability policies.
Based upon the information and assumptions used in the duration calculation, and interest rates in effect as of December 31, 2010, we estimatethat a 100 basis point immediate, parallel increase in interest rates ("rate shock") would decrease the net fair value of the assets and liabilities by$1 million, compared to $378 million as of December 31, 2009, reflecting year to year changes in duration. Reflected in the duration calculation are theeffects of a program that uses swaps, eurodollar futures, options on Treasury futures and interest rate swaptions to manage interest rate risk. Incalculating the impact of a 100 basis point increase on the value of the derivatives, we have assumed interest rate volatility remains constant. Basedon the swaps, eurodollar futures, options on Treasury futures and interest rate swaptions in place as of December 31, 2010, we would recognizerealized capital gains totaling $327 million in the event of a 100 basis point immediate, parallel interest rate increase and $126 million in realizedcapital losses in the event of a 100 basis point immediate, parallel interest rate decrease on these derivatives. The selection of a 100 basis pointimmediate parallel change in interest rates should not be construed as our prediction of future market events, but only as an illustration of the potentialeffect of such an event. There are $8.71 billion of assets supporting life insurance products such as traditional and interest-sensitive life that are notfinancial instruments. These assets and the associated liabilities have not been included in the above estimate. The $8.71 billion of assets excludedfrom the calculation has increased from $8.12 billion as of December 31, 2009, due to an increase in interest-sensitive life contractholder funds andimproved fixed income valuations as a result of declining risk-free interest rates and
110

tightening of credit spreads in certain sectors. Based on assumptions described above, in the event of a 100 basis point immediate increase in interestrates, the assets supporting life insurance products would decrease in value by $549 million, compared to a decrease of $459 million as ofDecember 31, 2009.
To the extent that conditions differ from the assumptions we used in these calculations, duration and rate shock measures could be significantlyimpacted. Additionally, our calculations assume that the current relationship between short-term and long-term interest rates (the term structure ofinterest rates) will remain constant over time. As a result, these calculations may not fully capture the effect of non-parallel changes in the termstructure of interest rates and/or large changes in interest rates.
Credit spread risk is the risk that we will incur a loss due to adverse changes in credit spreads ("spreads"). This risk arises from many of ourprimary activities, as we invest substantial funds in spread-sensitive fixed income assets.
We manage the spread risk in our assets. One of the measures used to quantify this exposure is spread duration. Spread duration measures theprice sensitivity of the assets to changes in spreads. For example, if spreads increase 100 basis points, the fair value of an asset exhibiting a spreadduration of 5 is expected to decrease in value by 5%.
Spread duration is calculated similarly to interest rate duration. As of December 31, 2010, the spread duration of Property-Liability assets was4.45, compared to 5.02 as of December 31, 2009 and the spread duration of Allstate Financial assets was 4.97, compared to 4.79 as of December 31,2009. Based upon the information and assumptions we use in this spread duration calculation, and spreads in effect as of December 31, 2010, weestimate that a 100 basis point immediate, parallel increase in spreads across all asset classes, industry sectors and credit ratings ("spread shock")would decrease the net fair value of the assets by $3.61 billion, compared to $3.85 billion as of December 31, 2009. Reflected in the durationcalculation are the effects of our risk mitigation actions that use CDS to manage spread risk. Based on contracts in place as of December 31, 2010, wewould recognize realized capital gains totaling $64 million in the event of a 100 basis point immediate, parallel spread increase and $64 million inrealized capital losses in the event of a 100 basis point immediate, parallel spread decrease. The selection of a 100 basis point immediate parallelchange in spreads should not be construed as our prediction of future market events, but only as an illustration of the potential effect of such an event.
Equity price risk is the risk that we will incur losses due to adverse changes in the general levels of the equity markets. As of December 31,2010, we held $4.67 billion in common stocks and Exchange Traded Funds ("ETFs") and $4.88 billion in other securities with equity risk (includingprimarily convertible securities, limited partnership interests, non-redeemable preferred securities and equity-linked notes), compared to $4.77 billionand $3.86 billion, respectively, as of December 31, 2009. 95.5% and 63.1% of these totals, respectively, represented assets of the Property-Liabilityoperations as of December 31, 2010, compared to 97.3% and 57.1%, respectively, as of December 31, 2009. Additionally, we had 18,000 contracts inlong Standard & Poor's 500 Composite Price Index ("S&P 500") puts as of December 31, 2010 with a fair value of $34 million.
As of December 31, 2010, our portfolio of common stocks and other securities with equity risk had a cash market portfolio beta of 0.74, comparedto a beta of 0.73 as of December 31, 2009. Beta represents a widely used methodology to describe, quantitatively, an investment's market riskcharacteristics relative to an index such as the S&P 500. Based on the beta analysis, we estimate that if the S&P 500 increases or decreases by 10%,the fair value of our equity investments will increase or decrease by 7.4%, respectively. Based upon the information and assumptions we used tocalculate beta as of December 31, 2010, including the effect of the S&P 500 puts, we estimate that an immediate decrease in the S&P 500 of 10%would decrease the net fair value of our equity investments identified above by $695 million, compared to $605 million as of December 31, 2009, andan immediate increase in the S&P 500 of 10% would increase the net fair value by $708 million compared to $615 million as of December 31, 2009. Incalculating the impact of a 10% S&P index perturbation on the value of the puts, we have assumed index volatility remains constant. Based on theS&P 500 index put options in place as of December 31, 2010, we would recognize losses totaling $14 million in the event of a 10% increase in theS&P 500 index and $22 million in gains in the event of a 10% decrease. The selection of a 10% immediate decrease or increase in the S&P 500should not be construed as our prediction of future market events, but only as an illustration of the potential effect of such an event.
The beta of our common stocks and other securities with equity risk was determined by calculating the change in the fair value of the portfolioresulting from stressing the equity market up and down 10%. The illustrations noted above may not reflect our actual experience if the futurecomposition of the portfolio (hence its beta) and correlation relationships differ from the historical relationships.
As of December 31, 2010 and 2009, we had separate accounts assets related to variable annuity and variable life contracts with account valuestotaling $8.68 billion and $9.07 billion, respectively. Equity risk exists for contract charges
111

based on separate account balances and guarantees for death and/or income benefits provided by our variable products. In 2006, we disposed ofsubstantially all of the variable annuity business through reinsurance agreements with The Prudential Insurance Company of America, a subsidiary ofPrudential Financial Inc. and therefore mitigated this aspect of our risk. Equity risk for our variable life business relates to contract charges andpolicyholder benefits. Total variable life contract charges for 2010 and 2009 were $80 million and $85 million, respectively. Separate account liabilitiesrelated to variable life contracts were $775 million and $708 million in December 31, 2010 and 2009, respectively.
As of December 31, 2010 and 2009 we had $4.70 billion and $4.47 billion, respectively, in equity-indexed annuity liabilities that provide customerswith interest crediting rates based on the performance of the S&P 500. We hedge the risk associated with these liabilities using equity-indexed optionsand futures, interest rate swaps, and eurodollar futures, maintaining risk within specified value-at-risk limits.
Foreign currency exchange rate risk is the risk that we will incur economic losses due to adverse changes in foreign currency exchange rates.This risk primarily arises from our foreign equity investments, including real estate funds and private equity funds, and our Canadian and NorthernIreland operations. We also have certain funding agreement liabilities and fixed income securities that are denominated in foreign currencies; however,derivatives are used to hedge the foreign currency risk of these funding agreements and approximately 77% of the fixed income securities. As ofDecember 31, 2010 and 2009, we had $435 million and $713 million, respectively, in funding agreements denominated in foreign currencies.
As of December 31, 2010, we had $1.70 billion in foreign currency denominated equity investments, $773 million net investment in our foreignsubsidiaries, and $91 million in unhedged non-dollar pay fixed income securities. These amounts were $1.38 billion, $686 million, and $148 million,respectively, as of December 31, 2009. 90.5% of the foreign currency exposure is in the Property-Liability business.
Based upon the information and assumptions used as of December 31, 2010, we estimate that a 10% immediate unfavorable change in each ofthe foreign currency exchange rates to which we are exposed would decrease the value of our foreign currency denominated instruments by$257 million, compared with an estimated $222 million decrease as of December 31, 2009. The selection of a 10% immediate decrease in all currencyexchange rates should not be construed as our prediction of future market events, but only as an illustration of the potential effect of such an event.Our currency exposure is diversified across 32 currencies as of December 31, 2010, compared to 39 currencies as of December 31, 2009. Our largestindividual foreign currency exposures as of December 31, 2010 were to the Canadian dollar (37.0%) and the British Pound (13.3%). The largestindividual foreign currency exposures as of December 31, 2009 were to the Canadian dollar (35.5%) and the Euro (22.9%). Our primary regionalexposure is to Canada, with 37.0% as of December 31, 2010, compared to Western Europe, with 40.5% as of December 31, 2009.
The modeling technique we use to report our currency exposure does not take into account correlation among foreign currency exchange rates.Even though we believe it is very unlikely that all of the foreign currency exchange rates that we are exposed to would simultaneously decrease by10%, we nonetheless stress test our portfolio under this and other hypothetical extreme adverse market scenarios. Our actual experience may differfrom these results because of assumptions we have used or because significant liquidity and market events could occur that we did not foresee.
Commodity price risk is the risk that we will incur economic losses due to adverse changes in the prices of commodities. This risk arises fromcommodity linked investments, such as the Dow Jones AIG Commodity Index and Goldman Sachs Commodity Index which is a broad based, oildominated index. As of December 31, 2010 and 2009, we had no exposure to the indices.
PENSION PLANS
We have defined benefit pension plans, which cover most full-time and certain part-time employees and employee-agents. See Note 16 of theconsolidated financial statements for a complete discussion of these plans and their effect on the consolidated financial statements. The pension andother postretirement plans may be amended or terminated at any time. Any revisions could result in significant changes to our obligations and ourobligation to fund the plans.
We report unrecognized pension and other postretirement benefit cost in the Consolidated Statements of Financial Position as a component ofaccumulated other comprehensive income in shareholders' equity. It represents differences between the fair value of plan assets and the projectedbenefit obligation for pension plans and the accumulated postretirement benefit obligation for other postretirement plans that have not yet beenrecognized as a component of net periodic cost. The measurement of the unrecognized pension and other postretirement benefit cost can vary basedupon the fluctuations in the fair value of the plan assets and the actuarial assumptions used for the plans as discussed
112

below. The unrecognized pension and other postretirement benefit cost as of December 31, 2010 was $1.19 billion, a decrease of $94 million from$1.28 billion as of December 31, 2009. The decrease was the result of the recognition of a portion of unrecognized pension and other postretirementbenefit cost through pension expense during 2010, which was partially offset by actuarial losses incurred during the year.
The market-related value component of expected returns recognizes plan losses and gains on equity securities over a five-year period, which webelieve is consistent with the long-term nature of pension obligations. As a result, the effect of changes in fair value of equity securities on our netperiodic pension cost may be experienced in periods subsequent to those in which the fluctuations actually occur.
Net periodic pension cost in 2011 is estimated to be $293 million based on current assumptions, including settlement charges. This represents adecrease compared to 2010 due to favorable asset performance during 2010 and lower than expected salary increases. Net periodic pension costincreased in 2010 due to the effect of equity losses during the 2008 fiscal year and the decrease in discount rates experienced at the end of 2009. Netperiodic pension cost decreased in 2009 due to the increase in discount rate for each pension plan, which resulted in lower amortization of netactuarial loss. In 2010 and 2008, net pension cost included non-cash settlement charges primarily resulting from lump sum distributions made toagents. Settlement charges also occurred during 2010, 2009 and 2008 related to the Supplemental Retirement Income Plan as a result of lump sumpayments made from the plan. Settlement charges are likely to continue for some period in the future as we settle our remaining agent pensionobligations by making lump sum distributions to agents.
Amounts recorded for pension cost and accumulated other comprehensive income are significantly affected by fluctuations in the returns on planassets and the amortization of unrecognized actuarial gains and losses. Plan assets sustained net losses in prior periods primarily due to declines inequity and credit markets. These asset losses, combined with all other unrecognized actuarial gains and losses, resulted in amortization of netactuarial loss (and additional net periodic pension cost) of $160 million in 2010 and $15 million in 2009. We anticipate that the unrealized loss for ourpension plans will exceed 10% of the greater of the projected benefit obligations or the market-related value of assets in 2011 and into the foreseeablefuture, resulting in additional amortization and net periodic pension cost.
Amounts recorded for net periodic pension cost and accumulated other comprehensive income are also significantly affected by changes in theassumptions used to determine the weighted average discount rate and the expected long-term rate of return on plan assets. The weighted averagediscount rate is based on rates at which expected pension benefits attributable to past employee service could effectively be settled on a present valuebasis at the measurement date. We develop the assumed weighted average discount rate by utilizing the weighted average yield of a theoreticaldedicated portfolio derived from non-callable bonds available in the Barclays corporate bond universe having ratings of at least "AA" by S&P or at least"Aa" by Moody's on the measurement date with cash flows that match expected plan benefit requirements. Significant changes in discount rates, suchas those caused by changes in the credit spreads, yield curve, the mix of bonds available in the market, the duration of selected bonds and expectedbenefit payments, may result in volatility in pension cost and accumulated other comprehensive income.
Holding other assumptions constant, a hypothetical decrease of 100 basis points in the weighted average discount rate would result in an increaseof $43 million in net periodic pension cost and a $392 million increase in the unrecognized pension and other postretirement benefit cost liability of ourpension plans recorded as accumulated other comprehensive income as of December 31, 2010, compared to an increase of $43 million in net periodicpension cost and a $373 million increase in the unrecognized pension and other postretirement benefit cost liability as of December 31, 2009. Ahypothetical increase of 100 basis points in the weighted average discount rate would decrease net periodic pension cost by $38 million and woulddecrease the unrecognized pension and other postretirement benefit cost liability of our pension plans recorded as accumulated other comprehensiveincome by $331 million as of December 31, 2010, compared to a decrease in net periodic pension cost of $38 million and a $317 million decrease inthe unrecognized pension and other postretirement benefit cost liability of our pension plans recorded as accumulated other comprehensive income asof December 31, 2009. This non-symmetrical range results from the non-linear relationship between discount rates and pension obligations, andchanges in the amortization of unrealized net actuarial gains and losses.
The expected long-term rate of return on plan assets reflects the average rate of earnings expected on plan assets. While this rate reflects long-term assumptions and is consistent with long-term historical returns, sustained changes in the market or changes in the mix of plan assets may lead torevisions in the assumed long-term rate of return on plan assets that may result in variability of pension cost. Differences between the actual return onplan assets and the expected long-term rate of return on plan assets are a component of unrecognized gains or losses, which may be amortized as acomponent of net actuarial gains and losses and recorded in accumulated other comprehensive income.
113

As a result, the effect of changes in fair value on our pension cost may be experienced in results of operations in periods subsequent to those in whichthe fluctuations actually occur.
Holding other assumptions constant, a hypothetical decrease of 100 basis points in the expected long-term rate of return on plan assets wouldresult in an increase of $44 million in pension cost as of December 31, 2010, compared to $39 million as of December 31, 2009. A hypotheticalincrease of 100 basis points in the expected long-term rate of return on plan assets would result in a decrease in net periodic pension cost of$44 million as of December 31, 2010, compared to $39 million as of December 31, 2009.
We target funding levels that do not restrict the payment of plan benefits in our domestic plans and were within our targeted range as ofDecember 31, 2010. In 2010, we contributed $443 million to our pension plans. We expect to contribute $263 million for the 2011 plan year to maintainthe plans' funded status. This estimate could change significantly following either a dramatic improvement or decline in investment markets.
Other post employment benefits
In 2010, the Patient Protection and Affordable Care Act was signed into law. One aspect of this legislation is the introduction of an excise tax,effective in 2018, on "high cost" plans. The liabilities as of December 31, 2010 for the postretirement medical plans include an estimate of thisadditional liability, which amounts to $3 million.
DEFERRED TAXES
The total deferred tax valuation allowance was $6 million as of December 31, 2010 compared to $11 million as of December 31, 2009. Weevaluate whether a valuation allowance for our deferred tax assets is required each reporting period. A valuation allowance is established if, based onthe weight of available evidence, it is more likely than not that some portion or all of the deferred income tax asset will not be realized. In determiningwhether a valuation allowance is needed, all available evidence is considered. This includes the potential for capital and ordinary loss carryback, futurereversals of existing taxable temporary differences, tax planning strategies that we may employ to avoid a tax benefit from expiring unused and futuretaxable income exclusive of reversing temporary differences.
With respect to our evaluation of the need for a valuation allowance related to the deferred tax asset on capital losses that have been realized buthave not yet been recognized for tax purposes, we utilize prudent and feasible tax planning strategies that optimize the ability to carry back capitallosses as well as the ability to offset future capital losses with unrealized capital gains that could be recognized for tax purposes. We have remainingcapital loss carryback capacity of $439 million and $9 million from 2009 and 2010, respectively.
With respect to our evaluation of the need for a valuation allowance related to the deferred tax asset on unrealized capital losses on fixed incomeand equity securities, our tax planning strategies first consider the availability of unrealized capital gains to offset future capital losses and then we relyon our assertion that we have the intent and ability to hold certain securities with unrealized losses to recovery. As a result, the unrealized losses onthese securities would not be expected to materialize and no valuation allowance on the associated deferred tax asset is needed.
CAPITAL RESOURCES AND LIQUIDITY 2010 HIGHLIGHTS
• Shareholders' equity as of December 31, 2010 was $19.02 billion, an increase of 13.9% from $16.69 billion as of December 31, 2009.• On January 5, 2010, April 1, 2010, July 1, 2010 and October 1, 2010, we paid a quarterly shareholder dividend of $0.20, respectively. On
November 9, 2010, we declared a quarterly shareholder dividend of $0.20 payable on January 3, 2011.• In November 2010, we commenced a $1.00 billion share repurchase program. As of December 31, 2010, this program had $840 million
remaining and is expected to be completed by March 31, 2012.
114

CAPITAL RESOURCES AND LIQUIDITY
Capital resources consist of shareholders' equity and debt, representing funds deployed or available to be deployed to support businessoperations or for general corporate purposes. The following table summarizes our capital resources as of December 31.
Shareholders' equity increased in 2010, primarily due to unrealized net capital gains on investments and net income, partially offset by dividendspaid to shareholders and share repurchases. Shareholders' equity increased in 2009, due primarily to decreases in unrealized net capital losses oninvestments and net income, partially offset by dividends paid to shareholders.
Debt decreased $2 million in 2010 due to decreases in long-term debt. Debt increased $251 million in 2009 due to net increases in long-term debt.In May 2009, we issued $300 million of 6.20% Senior Notes due 2014 and $700 million of 7.45% Senior Notes due 2019. The proceeds of thisissuance were used for general corporate purposes, including to facilitate the repayment of the $750 million of 7.20% Senior Notes that matured onDecember 1, 2009. Except for $42 million in long-term debt related to the synthetic leases scheduled to mature in 2011, we do not have any requiredprincipal payments until 2012 when $350 million of 6.125% Senior Notes are due. For further information on debt issuances, see Note 11 of theconsolidated financial statements.
As of December 31, 2010 and 2009, there were no outstanding commercial paper borrowings.
Share repurchases In November 2010, we commenced a $1.00 billion share repurchase program. As of December 31, 2010, this program had$840 million remaining and is expected to be completed by March 31, 2012.
Since 1995, we have acquired 463 million shares of our common stock at a cost of $19.25 billion, primarily as part of various stock repurchaseprograms. We have reissued 97 million shares since 1995, primarily associated with our equity incentive plans, the 1999 acquisition of AmericanHeritage Life Investment Corporation and the 2001 redemption of certain mandatorily redeemable preferred securities. Since 1995, total sharesoutstanding has decreased by 363 million shares or 40.5%, primarily due to our repurchase programs.
Financial ratings and strength The following table summarizes our debt, commercial paper and insurance financial strength ratings as ofDecember 31, 2010.
Our ratings are influenced by many factors including our operating and financial performance, asset quality, liquidity, asset/liability management,overall portfolio mix, financial leverage (i.e., debt), exposure to risks such as catastrophes and the current level of operating leverage.
On January 24, 2011, Moody's affirmed The Allstate Corporation's debt and commercial paper ratings of A3, and P-2, respectively, AIC's financialstrength rating of Aa3 and ALIC's financial strength rating of A1. The outlook for the Moody's ratings remained stable. On December 15, 2010, A.M.Best affirmed The Allstate Corporation's debt and commercial paper ratings of a- and AMB-1, respectively, as well as the A+ financial strength ratingsof AIC and ALIC. The outlook for The Allstate Corporation and AIC remained stable while the outlook for ALIC remained negative. On November 17,2010, S&P affirmed The Allstate Corporation's debt and commercial paper ratings of A- and A-2,
115
($ in millions) 2010 2009 2008 Common stock, retained income and other shareholders' equity items $ 19,200 $ 18,798 $ 17,442 Accumulated other comprehensive loss (184) (2,106) (4,801)
Total shareholders' equity 19,016 16,692 12,641 Debt 5,908 5,910 5,659
Total capital resources $ 24,924 $ 22,602 $ 18,300
Ratio of debt to shareholders' equity 31.1% 35.4% 44.8% Ratio of debt to capital resources 23.7% 26.1% 30.9%
Moody's Standard& Poor's A.M. Best
The Allstate Corporation (senior long-term debt) A3 A- a-The Allstate Corporation (commercial paper) P-2 A-2 AMB-1Allstate Insurance Company (insurance financial strength) Aa3 AA- A+Allstate Life Insurance Company (insurance financial strength) A1 A+ A+

respectively, as well as the AA- financial strength rating of AIC. S&P downgraded the financial strength rating for ALIC to A+ from AA-. The outlook forall S&P ratings was revised to stable from negative.
We have distinct and separately capitalized groups of subsidiaries licensed to sell property and casualty insurance in New Jersey and Florida thatmaintain separate group ratings. The ratings of these groups are influenced by the risks that relate specifically to each group. Many mortgagecompanies require property owners to have insurance from an insurance carrier with a secure financial strength rating from an accredited ratingagency. Allstate New Jersey Insurance Company and Encompass Insurance Company of New Jersey, which write auto and homeowners insurance,are rated A- by A.M. Best. Allstate New Jersey Insurance Company also has a Financial Stability Rating® of A" from Demotech. The outlook for theseratings is stable. Castle Key Insurance Company and its subsidiaries, which underwrite personal lines property insurance in Florida, are rated B-by A.M. Best. The outlook for the ratings of Castle Key Insurance Company and its subsidiaries is negative. Castle Key Insurance Company and itssubsidiaries also have Financial Stability Ratings® of A' from Demotech.
ALIC, AIC and the Corporation are party to the Amended and Restated Intercompany Liquidity Agreement ("Liquidity Agreement") which allows forshort-term advances of funds to be made between parties for liquidity and other general corporate purposes. The Liquidity Agreement does notestablish a commitment to advance funds on the part of any party. ALIC and AIC each serve as a lender and borrower and the Corporation serves onlyas a lender. AIC also has a capital support agreement with ALIC. Under the capital support agreement, AIC is committed to provide capital to ALIC tomaintain an adequate capital level. The maximum amount of potential funding under each of these agreements is $1.00 billion.
In addition to the Liquidity Agreement, the Corporation also has an intercompany loan agreement with certain of its subsidiaries, which include, butare not limited to, AIC and ALIC. The amount of intercompany loans available to the Corporation's subsidiaries is at the discretion of the Corporation.The maximum amount of loans the Corporation will have outstanding to all its eligible subsidiaries at any given point in time is limited to $1.00 billion.The Corporation may use commercial paper borrowings, bank lines of credit and repurchase agreements to fund intercompany borrowings.
Allstate's domestic property-liability and life insurance subsidiaries prepare their statutory-basis financial statements in conformity with accountingpractices prescribed or permitted by the insurance department of the applicable state of domicile. Statutory surplus is a measure that is often used asa basis for determining dividend paying capacity, operating leverage and premium growth capacity, and it is also reviewed by rating agencies indetermining their ratings. As of December 31, 2010, AIC's statutory surplus is approximately $15.38 billion compared to $15.03 billion as ofDecember 31, 2009. These amounts include ALIC's statutory surplus of approximately $3.34 billion as of December 31, 2010, compared to$3.47 billion as of December 31, 2009.
The ratio of net premiums written to statutory surplus is a common measure of operating leverage used in the property-casualty insurance industryand serves as an indicator of a company's premium growth capacity. Ratios in excess of 3 to 1 are typically considered outside the usual range byinsurance regulators and rating agencies. AIC's premium to surplus ratio was 1.6x on December 31, 2010 compared to 1.7x in the prior year.
State laws specify regulatory actions if an insurer's risk-based capital ("RBC"), a measure of an insurer's solvency, falls below certain levels. TheNAIC has a standard formula for annually assessing RBC. The formula for calculating RBC for property-liability companies takes into account assetand credit risks but places more emphasis on underwriting factors for reserving and pricing. The formula for calculating RBC for life insurancecompanies takes into account factors relating to insurance, business, asset and interest rate risks. As of December 31, 2010, the RBC for each of ourdomestic insurance companies was within the range that we target.
The NAIC has also developed a set of financial relationships or tests known as the Insurance Regulatory Information System to assist stateregulators in monitoring the financial condition of insurance companies and identifying companies that require special attention or actions by insuranceregulatory authorities. The NAIC analyzes financial data provided by insurance companies using prescribed ratios, each with defined "usual ranges".Generally, regulators will begin to monitor an insurance company if its ratios fall outside the usual ranges for four or more of the ratios. If an insurancecompany has insufficient capital, regulators may act to reduce the amount of insurance it can issue. The ratios of our domestic insurance companiesare within these ranges.
116

Liquidity sources and uses Our potential sources of funds principally include activities shown in the following table.
Our potential uses of funds principally include activities shown in the following table.
We actively manage our financial position and liquidity levels in light of changing market, economic, and business conditions. Liquidity is managedat both the entity and enterprise level across the Company, and is assessed on both base and stressed level liquidity needs. We believe we havesufficient liquidity to meet these needs. Additionally, we have existing intercompany agreements in place that facilitate liquidity management across theCompany to enhance flexibility.
Parent company capital capacity At the parent holding company level, we have deployable invested assets totaling $3.84 billion as ofDecember 31, 2010. These assets include investments that are generally saleable within one quarter totaling $3.43 billion. The substantial earningscapacity of the operating subsidiaries is the primary source of capital generation for the Corporation. In 2011, AIC will have the capacity to paydividends currently estimated at $1.54 billion without prior regulatory approval. We do not anticipate that ALIC will pay dividends to AIC in 2011. Inaddition, we have access to $1.00 billion of funds from either commercial paper issuance or an unsecured revolving credit facility. This provides fundsfor the parent company's relatively low fixed charges.
In 2010, dividends totaling $1.30 billion were paid by AIC to its parent, the Corporation. There were no dividends paid by AIC to the Corporation in2009. In 2008, dividends totaling $3.40 billion were paid by AIC to the Corporation. There were no capital contributions paid by the Corporation to AICin both 2010 and 2009. In 2008, capital contributions paid by the Corporation to AIC totaled $1.00 billion.
In 2010 and 2009, a return of capital by American Heritage Life Investment Corporation to the Corporation totaled $24 million and $13 million,respectively. There were no dividends paid by Allstate Financial in 2008.
117
Property-Liability
AllstateFinancial
Corporateand Other
Receipt of insurance premiums X X Contractholder fund deposits X Reinsurance recoveries X X Receipts of principal, interest and dividends on investments X X XSales of investments X X XFunds from securities lending, commercial paper and line of credit agreements X X XIntercompany loans X X XCapital contributions from parent X X Dividends from subsidiaries X XTax refunds/settlements X X XFunds from periodic issuance of additional securities XFunds from the settlement of our benefit plans X
Property-Liability
AllstateFinancial
Corporateand Other
Payment of claims and related expenses X Payment of contract benefits, maturities, surrenders and withdrawals X Reinsurance cessions and payments X X Operating costs and expenses X X XPurchase of investments X X XRepayment of securities lending, commercial paper and line of credit
agreements X X XPayment or repayment of intercompany loans X X XCapital contributions to subsidiaries X XDividends to shareholders/parent company X X XTax payments/settlements X X Share repurchases XDebt service expenses and repayment X X XSettlement payments of employee and agent benefit plans X X X

There were no capital contributions by AIC to ALIC in 2010. In 2009, capital contributions were paid in cash by AIC to ALIC totaling $250 million.2009 also included capital contributions to ALIC comprising the transfer to ALIC from AIC of non-cash assets totaling $448 million and the transfer of a$25 million surplus note to Kennett Capital Inc. from ALIC in exchange for a note receivable with a principal sum equal to that of the surplus note,which was originally issued to ALIC by a subsidiary of ALIC. In 2008, funds paid by AIC to ALIC totaled $1.41 billion. The $1.41 billion includes capitalcontributions paid in cash totaling $607 million and the issuance of two surplus notes, each with a principal sum of $400 million, to AIC in exchange forcash totaling $800 million. 2008 also included capital contributions to ALIC comprising the transfer to ALIC from AIC of non-cash assets totaling$342 million and the transfer of a $50 million surplus note to Kennett Capital Inc. from ALIC in exchange for a note receivable with a principal sumequal to that of the surplus note, which was originally issued to ALIC by a subsidiary of ALIC. One of the surplus notes issued to AIC in 2008 wassubsequently canceled and forgiven by AIC resulting in the recognition of a capital contribution equal to the outstanding principal balance of thesurplus note of $400 million.
The Corporation has access to additional borrowing to support liquidity as follows:
• A commercial paper facility with a borrowing limit of $1.00 billion to cover short-term cash needs. As of December 31, 2010, there were nobalances outstanding and therefore the remaining borrowing capacity was $1.00 billion; however, the outstanding balance can fluctuate daily.
• Our primary credit facility is available for short-term liquidity requirements and backs our commercial paper facility. Our $1.00 billion unsecuredrevolving credit facility has an initial term of five years expiring in 2012 with two optional one-year extensions that can be exercised at the end ofany of the remaining anniversary years of the facility upon approval of existing or replacement lenders providing more than two-thirds of thecommitments to lend. The program is fully subscribed among 11 lenders with the largest commitment being $185 million. The commitments ofthe lenders are several and no lender is responsible for any other lender's commitment if such lender fails to make a loan under the facility. Thisfacility contains an increase provision that would allow up to an additional $500 million of borrowing provided the increased portion could be fullysyndicated at a later date among existing or new lenders. This facility has a financial covenant requiring that we not exceed a 37.5% debt tocapital resources ratio as defined in the agreement. This ratio as of December 31, 2010 was 19.4%. Although the right to borrow under thefacility is not subject to a minimum rating requirement, the costs of maintaining the facility and borrowing under it are based on the ratings of oursenior, unsecured, nonguaranteed long-term debt. There were no borrowings under the credit facility during 2010. The total amount outstandingat any point in time under the combination of the commercial paper program and the credit facility cannot exceed the amount that can beborrowed under the credit facility.
• A universal shelf registration statement was filed with the Securities and Exchange Commission on May 8, 2009. We can use this shelfregistration to issue an unspecified amount of debt securities, common stock (including 367 million shares of treasury stock as of December 31,2010), preferred stock, depositary shares, warrants, stock purchase contracts, stock purchase units and securities of trust subsidiaries. Thespecific terms of any securities we issue under this registration statement will be provided in the applicable prospectus supplements.
Liquidity exposure Contractholder funds as of December 31, 2010 were $48.20 billion. The following table summarizes contractholder funds bytheir contractual withdrawal provisions as of December 31, 2010.
118
($ in millions) Percent to
total Not subject to discretionary withdrawal $ 6,998 14.5%Subject to discretionary withdrawal with adjustments: Specified surrender charges (1) 19,815 41.1 Market value adjustments (2) 7,805 16.2 Subject to discretionary withdrawal without adjustments (3) 13,577 28.2
Total contractholder funds (4) $ 48,195 100.0%
Includes $9.80 billion of liabilities with a contractual surrender charge of less than 5% of the account balance.$6.50 billion of the contracts with market value adjusted surrenders have a 30-45 day period at the end of their initial and subsequent interest rate guaranteeperiods (which are typically 5 or 6 years) during which there is no surrender charge or market value adjustment.67% of these contracts have a minimum interest crediting rate guarantee of 3% or higher.Includes $1.23 billion of contractholder funds on variable annuities reinsured to The Prudential Insurance Company of America, a subsidiary of PrudentialFinancial Inc., in 2006.
(1)(2)
(3)(4)

While we are able to quantify remaining scheduled maturities for our institutional products, anticipating retail product surrenders is less precise.Retail life and annuity products may be surrendered by customers for a variety of reasons. Reasons unique to individual customers include a current orunexpected need for cash or a change in life insurance coverage needs. Other key factors that may impact the likelihood of customer surrenderinclude the level of the contract surrender charge, the length of time the contract has been in force, distribution channel, market interest rates, equitymarket conditions and potential tax implications. In addition, the propensity for retail life insurance policies to lapse is lower than it is for fixed annuitiesbecause of the need for the insured to be re-underwritten upon policy replacement. Surrenders and partial withdrawals for our retail annuitiesincreased 2.2% in 2010 compared to 2009. The annualized surrender and partial withdrawal rate on deferred annuities, interest-sensitive life insuranceand Allstate Bank products, based on the beginning of year contractholder funds, was 12.2% and 11.8% in 2010 and 2009, respectively. AllstateFinancial strives to promptly pay customers who request cash surrenders; however, statutory regulations generally provide up to six months in moststates to fulfill surrender requests.
Our institutional products are primarily funding agreements sold to unaffiliated trusts used to back medium-term notes. As of December 31, 2010,total institutional products outstanding were $2.64 billion. The following table presents the remaining scheduled maturities for our institutional productsoutstanding as of December 31, 2010.
($ in millions) 2011 $ 760 2012 40 2013 1,750 2016 85
$ 2,635
Our asset-liability management practices limit the differences between the cash flows generated by our investment portfolio and the expected cashflow requirements of our life insurance, annuity and institutional product obligations.
Certain remote events and circumstances could constrain our liquidity. Those events and circumstances include, for example, a catastropheresulting in extraordinary losses, a downgrade in our long-term debt rating of A3, A- and a- (from Moody's, S&P and A.M. Best, respectively) to non-investment grade status of below Baa3/BBB-/bb, a downgrade in AIC's financial strength rating from Aa3, AA- and A+ (from Moody's, S&P and A.M.Best, respectively) to below Baa2/BBB/A-, or a downgrade in ALIC's financial strength ratings from A1, A+ and A+ (from Moody's, S&P and A.M. Best,respectively) to below A3/A-/A-. The rating agencies also consider the interdependence of our individually rated entities; therefore, a rating change inone entity could potentially affect the ratings of other related entities.
The following table summarizes consolidated cash flow activities by business segment.
Property-Liability Lower cash provided by operating activities for Property-Liability in 2010 compared to 2009 was primarily due to income taxpayments in 2010 compared to income tax refunds in 2009 and lower claim payments. Higher cash provided by operating activities for Property-Liability in 2009 compared to 2008 was primarily due to income tax refunds in 2009 compared to tax payments in 2008 and lower claim payments.
Lower cash used in investing activities in 2010 compared to 2009 was primarily due to decreased net purchases of fixed income and equitysecurities and higher net sales of fixed income and equity securities, partially offset by net change in short-term investments. Cash used in investingactivities in 2009 compared to cash provided by investing activities in 2008 was primarily due to increased net purchases of fixed income and equitysecurities, partially offset by net change in short-term investments.
119
($ in millions) Property-Liability Allstate Financial Corporate and Other Consolidated 2010 2009 2008 2010 2009 2008 2010 2009 2008 2010 2009 2008 Net cash provided by (used in): Operating activities $ 1,373 $ 2,183 $ 1,746 $ 2,407 $ 2,196 $ 2,203 $ (91) $ (78) $ (39) $ 3,689 $ 4,301 $ 3,910 Investing activities (44) (1,919) 2,012 3,096 4,755 2,779 (720) 604 (1,003) 2,332 3,440 3,788 Financing activities (8) (6) (16) (5,510) (7,246) (5,510) (553) (292) (2,179) (6,071) (7,544) (7,705)
Net (decrease) increase inconsolidated cash $ (50) $ 197 $ (7)
(1) (1) (1)
Business unit cash flows reflect the elimination of intersegment dividends, contributions and borrowings.(1)

Allstate Financial Operating cash flows for Allstate Financial in 2010 were higher than 2009 as higher premiums and tax refunds received werepartially offset by lower investment income and higher contract benefits paid. Operating cash flows for Allstate Financial in 2009 were consistent with2008 as higher income tax refunds and lower expenses were offset by lower net investment income. The increase in income tax refunds received in2009 was related to the carryback of 2008 ordinary losses to prior tax years.
Cash flows provided by investing activities in 2010 and 2009 were impacted by reductions of investments to fund reductions in contractholder fundliabilities.
Lower cash flows used in financing activities in 2010 compared to 2009 were primarily due to decreased maturities and retirements of institutionalproducts, partially offset by lower deposits on fixed annuities. Higher cash flows used in financing activities in 2009 compared to 2008 were primarilydue to the absence of issuances of institutional products in 2009 compared to $4.16 billion in 2008 and lower deposits on fixed annuities, partiallyoffset by lower maturities and retirements of institutional products. For quantification of the changes in contractholder funds, see the Allstate FinancialSegment section of the MD&A.
Corporate and Other Fluctuations in the Corporate and Other operating cash flows were primarily due to the timing of intercompany settlements.Investing activities primarily relate to investments in the portfolios of Kennett Capital Holdings, LLC. Financing cash flows of the Corporate and Othersegment reflect actions such as fluctuations in short-term debt, repayment of debt, proceeds from the issuance of debt, dividends to shareholders ofThe Allstate Corporation and share repurchases; therefore, financing cash flows are affected when we increase or decrease the level of theseactivities.
Contractual obligations and commitments Our contractual obligations as of December 31, 2010 and the payments due by period are shownin the following table.
Liabilities for collateral are typically fully secured with cash or short-term investments. We manage our short-term liquidity position to ensure the availability of a sufficientamount of liquid assets to extinguish short-term liabilities as they come due in the normal course of business, including utilizing potential sources of liquidity as disclosedpreviously.Contractholder funds represent interest-bearing liabilities arising from the sale of products such as interest-sensitive life, fixed annuities, including immediate annuities withoutlife contingencies, bank deposits and institutional products. The reserve for life-contingent contract benefits relates primarily to traditional life insurance, immediate annuitieswith life contingencies and voluntary accident and health insurance. These amounts reflect the present value of estimated cash payments to be made to contractholders andpolicyholders. Certain of these contracts, such as immediate annuities without life contingencies and institutional products, involve payment obligations where the amount andtiming of the payment is essentially fixed and determinable. These amounts relate to (i) policies or contracts where we are currently making payments and will continue to do soand (ii) contracts where the timing of a portion or all of the payments has been determined by the contract. Other contracts, such as interest-sensitive life, fixed deferredannuities, traditional life insurance, immediate annuities with life contingencies and voluntary accident and health insurance, involve payment obligations where a portion or allof the amount and timing of future payments is uncertain. For these contracts and bank deposits, we are not currently making payments and will not make payments until (i) theoccurrence of an insurable event such as death or illness or (ii) the occurrence of a payment triggering event such as the surrender or partial withdrawal on a policy or depositcontract, which is outside of our control. We have estimated the timing of payments related to these contracts based on historical experience and our expectation of futurepayment patterns. Uncertainties relating to these liabilities include mortality, morbidity, expenses, customer lapse and withdrawal activity, estimated additional deposits forinterest-sensitive life contracts, and renewal premium for life policies, which may significantly impact both the
120
($ in millions) Total Less than
1 year 1-3 years 4-5 years Over
5 years Liabilities for collateral (1) $ 484 $ 484 $ — $ — $ — Contractholder funds (2) 57,525 8,761 14,232 9,310 25,222 Reserve for life-contingent contract
benefits (2) 38,070 1,413 2,711 2,587 31,359 Long-term debt (3) 12,443 403 1,280 1,530 9,230 Capital lease obligations (3) 45 7 15 8 15 Operating leases (3) 632 199 260 109 64 Unconditional purchase obligations (3) 322 118 157 40 7 Defined benefit pension plans and other
postretirement benefit plans (3)(4) 3,035 299 266 274 2,196 Reserve for property-liability insurance
claims and claims expense (5) 19,468 8,388 5,886 2,224 2,970 Other liabilities and accrued expenses (6)(7) 3,351 3,076 202 43 30 Net unrecognized tax benefits (8) 25 25 — — —
Total contractual cash obligations $ 135,400 $ 23,173 $ 25,009 $ 16,125 $ 71,093
(1)
(2)

timing and amount of future payments. Such cash outflows reflect adjustments for the estimated timing of mortality, retirement, and other appropriate factors, but areundiscounted with respect to interest. As a result, the sum of the cash outflows shown for all years in the table exceeds the corresponding liabilities of $48.20 billion forcontractholder funds and $13.48 billion for reserve for life-contingent contract benefits as included in the Consolidated Statements of Financial Position as of December 31,2010. The liability amount in the Consolidated Statements of Financial Position reflects the discounting for interest as well as adjustments for the timing of other factors asdescribed above.
Our payment obligations relating to long-term debt, capital lease obligations, operating leases, unconditional purchase obligations and pension and other post employmentbenefits ("OPEB") contributions are managed within the structure of our intermediate to long-term liquidity management program. Amount differs from the balance presented onthe Consolidated Statements of Financial Position as of December 31, 2010 because the long-term debt amount above includes interest.The pension plans' obligations in the next 12 months represent our planned contributions, and the remaining years' contributions are projected based on the average remainingservice period using the current underfunded status of the plans. The OPEB plans' obligations are estimated based on the expected benefits to be paid. These liabilities arediscounted with respect to interest, and as a result the sum of the cash outflows shown for all years in the table exceeds the corresponding liability amount of $1.57 billionincluded in other liabilities and accrued expenses on the Consolidated Statements of Financial Position.Reserve for property-liability insurance claims and claims expense is an estimate of amounts necessary to settle all outstanding claims, including claims that have been IBNRas of the balance sheet date. We have estimated the timing of these payments based on our historical experience and our expectation of future payment patterns. However,the timing of these payments may vary significantly from the amounts shown above, especially for IBNR claims. The ultimate cost of losses may vary materially from recordedamounts which are our best estimates. The reserve for property-liability insurance claims and claims expense includes loss reserves related to asbestos and environmentalclaims as of December 31, 2010, of $1.66 billion and $248 million, respectively.Other liabilities primarily include accrued expenses and certain benefit obligations and claim payments and other checks outstanding. Certain of these long-term liabilities arediscounted with respect to interest, as a result the sum of the cash outflows shown for all years in the table exceeds the corresponding liability amount of $3.34 billion.Balance sheet liabilities not included in the table above include unearned and advance premiums of $10.59 billion and deferred tax liabilities of $1.71 billion netted in the netdeferred tax asset of $784 million. These items were excluded as they do not meet the definition of a contractual liability as we are not contractually obligated to pay theseamounts to third parties. Rather, they represent an accounting mechanism that allows us to present our financial statements on an accrual basis. In addition, other liabilities of$461 million were not included in the table above because they did not represent a contractual obligation or the amount and timing of their eventual payment was sufficientlyuncertain.Net unrecognized tax benefits represent our potential future obligation to the taxing authority for a tax position that was not recognized in the consolidated financial statements.We believe it is reasonably possible that the liability balance will be reduced by $25 million within the next twelve months upon the resolution of an outstanding issue resultingfrom the 2005-2006 Internal Revenue Service examination. The resolution of this obligation may be for an amount different than what we have accrued.
Our contractual commitments as of December 31, 2010 and the periods in which the commitments expire are shown in the following table.
Contractual commitments represent investment commitments such as private placements, limited partnership interests and other loans.
We have agreements in place for services we conduct, generally at cost, between subsidiaries relating to insurance, reinsurance, loans andcapitalization. All material intercompany transactions have appropriately been eliminated in consolidation. Intercompany transactions among insurancesubsidiaries and affiliates have been approved by the appropriate departments of insurance as required.
For a more detailed discussion of our off-balance sheet arrangements, see Note 6 of the consolidated financial statements.
ENTERPRISE RISK AND RETURN MANAGEMENT
Enterprise Risk and Return Management's ("ERRM") role is to support Allstate's continued financial health and success. ERRM is a disciplined,holistic, integrated and interactive approach to risk that:
• Identifies potential risks and events that could significantly impact the Company• Provides a shared viewpoint and thorough understanding of risks and opportunities• Creates value by providing analysis of risk-return interrelationships and tradeoff opportunities• Increases transparency and provides greater assurance of achieving objectives
At Allstate, we have ERRM programs, risk committees and control structures to manage our enterprise portfolio of risk and return. These programsinclude governance policies with established tolerances and risk limits, Board and
121
(3)
(4)
(5)
(6)
(7)
(8)
($ in millions) Total Less than
1 year 1-3 years 4-5 years Over
5 years Other commitments – conditional $ 196 $ 144 $ 1 $ 3 $ 48 Other commitments – unconditional 1,472 215 665 449 143
Total commitments $ 1,668 $ 359 $ 666 $ 452 $ 191

senior management involvement, enterprise modeling, risk-return analytics and communication and reporting. Our perspective of risk, return andcapital needs promotes capital and financial management.
Allstate's senior management risk committee, the Enterprise Risk & Return Council, drives ERRM by establishing enterprise risk tolerance andrisk-return requirements and directing integrated strategies and actions from a holistic enterprise perspective. Allstate's Board of Directors and AuditCommittee provide ERRM oversight by reviewing enterprise principles, guidelines and limits for Allstate's significant risks and by monitoring strategiesand actions management has taken to control these risks.
Managers, risk professionals and chief risk officers in the various business units design and execute individual risk-return strategies that align withour overall enterprise standards. These include managing exposure to hurricanes and other severe weather events; managing impacts to investedassets and liabilities related to changes in risk-free interest rates, credit spreads, and equity markets; optimizing liquidity levels in light of changingmarket, economic and business conditions; and implementing practices to effectively identify, monitor and control operational and strategic risks.
Our comprehensive enterprise stochastic model captures the unique and specific nature and interaction of risks inherent in our various businessesand serves as the foundation of our economic capital framework. We determine an appropriate level of enterprise economic capital to hold consideringa broad range of risk perspectives, including capital stress scenarios, risks of financial distress and insolvency, volatility, shareholder value, ratingagency constraints and regulatory RBC requirements. Strategic allocation of economic capital to lines of business is based on contribution toenterprise risk, expected return and diversification benefit, and is used for ongoing evaluation of business units and products.
We adapt our ERRM processes to be fluid and dynamic in changing business and market environments and evolve our risk strategies to targetreturn opportunities as they arise. For continuous ERRM validation and improvement, we benchmark and secure external perspectives on ourprocesses.
REGULATION AND LEGAL PROCEEDINGS
We are subject to extensive regulation and we are involved in various legal and regulatory actions, all of which have an effect on specific aspectsof our business. For a detailed discussion of the legal and regulatory actions in which we are involved, see Note 13 of the consolidated financialstatements.
PENDING ACCOUNTING STANDARDS
There are several pending accounting standards that we have not implemented either because the standard has not been finalized or theimplementation date has not yet occurred. For a discussion of these pending standards, see Note 2 of the consolidated financial statements.
The effect of implementing certain accounting standards on our financial results and financial condition is often based in part on market conditionsat the time of implementation of the standard and other factors we are unable to determine prior to implementation. For this reason, we are sometimesunable to estimate the effect of certain pending accounting standards until the relevant authoritative body finalizes these standards or until weimplement them.
Item 7A. Quantitative and Qualitative Disclosures About Market Risk
Information required for Item 7A is incorporated by reference to the material under the caption "Market Risk" in Part II, Item 7 of this report.
Item 8. Financial Statements and Supplementary Data
122
PageConsolidated Statements of Operations 123Consolidated Statements of Comprehensive Income 124Consolidated Statements of Financial Position 125Consolidated Statements of Shareholders' Equity 126Consolidated Statements of Cash Flows 127
Notes to Consolidated Financial Statements (Notes)
128
Report of Independent Registered Public Accounting Firm
207

THE ALLSTATE CORPORATION AND SUBSIDIARIES
CONSOLIDATED STATEMENTS OF OPERATIONS
See notes to consolidated financial statements.
123
($ in millions, except per share data) Year Ended December 31, 2010 2009 2008 Revenues
Property-liability insurance premiums (net of reinsurance ceded of$1,092, $1,056 and $1,139) $ 25,957 $ 26,194 $ 26,967
Life and annuity premiums and contract charges (net of reinsuranceceded of $804, $838 and $900) 2,168 1,958 1,895
Net investment income 4,102 4,444 5,622 Realized capital gains and losses: Total other-than-temporary impairment losses (937) (2,376) (3,735) Portion of loss recognized in other comprehensive income (64) 457 —
Net other-than-temporary impairment loss recognized in earnings (1,001) (1,919) (3,735) Sales and other realized capital gains and losses 174 1,336 (1,355)
Total realized capital gains and losses (827) (583) (5,090)
31,400 32,013 29,394
Costs and expenses
Property-liability insurance claims and claims expense (net ofreinsurance ceded of $271, $415 and $620) 18,951 18,746 20,064
Life and annuity contract benefits (net of reinsurance ceded of $702,$642 and $1,150) 1,815 1,617 1,612
Interest credited to contractholder funds (net of reinsurance ceded of$32, $32 and $43) 1,807 2,126 2,411
Amortization of deferred policy acquisition costs 4,034 4,754 4,679 Operating costs and expenses 3,281 3,007 3,273 Restructuring and related charges 30 130 23 Interest expense 367 392 351
30,285 30,772 32,413
Gain (loss) on disposition of operations 11 7 (6)
Income (loss) from operations before income tax expense (benefit) 1,126 1,248 (3,025)
Income tax expense (benefit) 198 394 (1,346)
Net income (loss) $ 928 $ 854 $ (1,679)
Earnings per share: Net income (loss) per share – Basic $ 1.72 $ 1.58 $ (3.06)
Weighted average shares – Basic 540.3 539.6 548.3
Net income (loss) per share – Diluted $ 1.71 $ 1.58 $ (3.06)
Weighted average shares – Diluted 542.5 540.9 548.3
Cash dividends declared per share $ 0.80 $ 0.80 $ 1.64

THE ALLSTATE CORPORATION AND SUBSIDIARIES
CONSOLIDATED STATEMENTS OF COMPREHENSIVE INCOME
See notes to consolidated financial statements.
124
($ in millions) Year Ended December 31, 2010 2009 2008 Net income (loss) $ 928 $ 854 $ (1,679)
Other comprehensive income (loss), after-tax
Changes in:
Unrealized net capital gains and losses 1,785 3,446 (4,626)
Unrealized foreign currency translation adjustments 23 41 (74)
Unrecognized pension and other postretirement benefit cost 94 (214) (724)
Other comprehensive income (loss), after-tax 1,902 3,273 (5,424)
Comprehensive income (loss) $ 2,830 $ 4,127 $ (7,103)

THE ALLSTATE CORPORATION AND SUBSIDIARIES
CONSOLIDATED STATEMENTS OF FINANCIAL POSITION
See notes to consolidated financial statements.
125
($ in millions, except par value data) December 31, 2010 2009 Assets Investments Fixed income securities, at fair value (amortized cost $78,786 and $81,243) $ 79,612 $ 78,766 Equity securities, at fair value (cost $4,228 and $4,845) 4,811 5,024 Mortgage loans 6,679 7,935 Limited partnership interests 3,816 2,744 Short-term, at fair value (amortized cost $3,279 and $3,056) 3,279 3,056 Other 2,286 2,308
Total investments 100,483 99,833
Cash 562 612 Premium installment receivables, net 4,839 4,839 Deferred policy acquisition costs 4,769 5,470 Reinsurance recoverables, net 6,552 6,355 Accrued investment income 809 864 Deferred income taxes 784 1,870 Property and equipment, net 921 990 Goodwill 874 875 Other assets 1,605 1,872 Separate Accounts 8,676 9,072
Total assets $ 130,874 $ 132,652
Liabilities Reserve for property-liability insurance claims and claims expense $ 19,468 $ 19,167 Reserve for life-contingent contract benefits 13,482 12,910 Contractholder funds 48,195 52,582 Unearned premiums 9,800 9,822 Claim payments outstanding 737 742 Other liabilities and accrued expenses 5,564 5,726 Long-term debt 5,908 5,910 Separate Accounts 8,676 9,072
Total liabilities 111,830 115,931
Commitments and Contingent Liabilities (Note 6, 7 and 13) Equity Preferred stock, $1 par value, 25 million shares authorized, none issued — — Common stock, $.01 par value, 2.0 billion shares authorized and 900 million issued,
533 million and 537 million shares outstanding 9 9 Additional capital paid-in 3,176 3,172 Retained income 31,969 31,492 Deferred ESOP expense (44) (47)Treasury stock, at cost (367 million and 363 million shares) (15,910) (15,828)Accumulated other comprehensive income: Unrealized net capital gains and losses: Unrealized net capital losses on fixed income securities with OTTI (190) (441) Other unrealized net capital gains and losses 1,089 (1,072) Unrealized adjustment to DAC, DSI and insurance reserves 36 643
Total unrealized net capital gains and losses 935 (870) Unrealized foreign currency translation adjustments 69 46 Unrecognized pension and other postretirement benefit cost (1,188) (1,282)
Total accumulated other comprehensive loss (184) (2,106)
Total shareholders' equity 19,016 16,692 Noncontrolling interest 28 29
Total equity 19,044 16,721
Total liabilities and equity $ 130,874 $ 132,652

THE ALLSTATE CORPORATION AND SUBSIDIARIES
CONSOLIDATED STATEMENTS OF SHAREHOLDERS' EQUITY
See notes to consolidated financial statements.
126
($ in millions, except per share data) Year Ended December 31, 2010 2009 2008
Common stock $ 9 $ 9 $ 9
Additional capital paid-in Balance, beginning of year 3,172 3,130 3,052 Equity incentive plans activity 4 42 78
Balance, end of year 3,176 3,172 3,130
Retained income Balance, beginning of year 31,492 30,207 32,796 Net income (loss) 928 854 (1,679)Dividends ($0.80, $0.80 and $1.64 per share) (433) (432) (897)Effects of changing pension plan measurement date — — (13)Cumulative effect of change in accounting principle (18) 863 —
Balance, end of year 31,969 31,492 30,207
Deferred ESOP expense Balance, beginning of year (47) (49) (55)Payments 3 2 6
Balance, end of year (44) (47) (49)
Treasury stock Balance, beginning of year (15,828) (15,855) (14,574)Shares acquired (166) (3) (1,323)Shares reissued under equity incentive plans, net 84 30 42
Balance, end of year (15,910) (15,828) (15,855)
Accumulated other comprehensive income Balance, beginning of year (2,106) (4,801) 623 Cumulative effect of change in accounting principle 20 (578) — Change in unrealized net capital gains and losses 1,785 3,446 (4,626)Change in unrealized foreign currency translation adjustments 23 41 (74)Change in unrecognized pension and other postretirement benefit cost 94 (214) (724)
Balance, end of year (184) (2,106) (4,801)
Total shareholders' equity 19,016 16,692 12,641
Noncontrolling interest Balance, beginning of year 29 32 51 Cumulative effect of change in accounting principle 10 — — Change in noncontrolling interest ownership (14) (3) (19)Noncontrolling gain 3 — —
Balance, end of year 28 29 32
Total Equity $ 19,044 $ 16,721 $ 12,673

THE ALLSTATE CORPORATION AND SUBSIDIARIES
CONSOLIDATED STATEMENTS OF CASH FLOWS
See notes to consolidated financial statements.
127
($ in millions) Year Ended December 31, 2010 2009 2008 Cash flows from operating activities Net income (loss) $ 928 $ 854 $ (1,679)Adjustments to reconcile net income (loss) to net cash provided by
operating activities: Depreciation, amortization and other non-cash items 94 (91) (376) Realized capital gains and losses 827 583 5,090 (Gain) loss on disposition of operations (11) (7) 6 Interest credited to contractholder funds 1,807 2,126 2,411 Changes in: Policy benefits and other insurance reserves 238 (577) 626 Unearned premiums (40) (247) (359) Deferred policy acquisition costs (94) 514 141 Premium installment receivables, net 10 26 18 Reinsurance recoverables, net (265) (85) (269) Income taxes 200 1,660 (1,864) Other operating assets and liabilities (5) (455) 165
Net cash provided by operating activities 3,689 4,301 3,910
Cash flows from investing activities Proceeds from sales Fixed income securities 22,881 21,359 22,936 Equity securities 4,349 6,894 9,535 Limited partnership interests 505 369 371 Mortgage loans 124 340 279 Other investments 121 520 171 Investment collections Fixed income securities 5,147 5,556 4,269 Mortgage loans 1,076 1,764 844 Other investments 137 117 98 Investment purchases Fixed income securities (25,745) (29,573) (14,448) Equity securities (3,564) (8,496) (9,477) Limited partnership interests (1,342) (784) (982) Mortgage loans (120) (26) (500) Other investments (181) (64) (140)Change in short-term investments, net (382) 5,981 (8,283)Change in other investments, net (519) (340) (474)Disposition (acquisition) of operations 7 12 (120)Purchases of property and equipment, net (162) (189) (291)
Net cash provided by investing activities 2,332 3,440 3,788
Cash flows from financing activities Proceeds from issuance of long-term debt — 1,003 20 Repayment of long-term debt (2) (752) (1)Contractholder fund deposits 2,980 4,150 9,984 Contractholder fund withdrawals (8,470) (11,406) (15,480)Dividends paid (430) (542) (889)Treasury stock purchases (152) (4) (1,323)Shares reissued under equity incentive plans, net 28 3 33 Excess tax benefits on share-based payment arrangements (7) (5) 3 Other (18) 9 (52)
Net cash used in financing activities (6,071) (7,544) (7,705)
Net (decrease) increase in cash (50) 197 (7)Cash at beginning of year 612 415 422
Cash at end of year $ 562 $ 612 $ 415

NOTES TO CONSOLIDATED FINANCIAL STATEMENTS
1. General
Basis of presentation
The accompanying consolidated financial statements include the accounts of The Allstate Corporation and its wholly owned subsidiaries, primarilyAllstate Insurance Company ("AIC"), a property-liability insurance company with various property-liability and life and investment subsidiaries, includingAllstate Life Insurance Company ("ALIC") (collectively referred to as the "Company" or "Allstate"). These consolidated financial statements have beenprepared in conformity with accounting principles generally accepted in the United States of America ("GAAP"). All significant intercompany accountsand transactions have been eliminated.
To conform to the current year presentation, certain amounts in the prior years' consolidated financial statements and notes have beenreclassified.
The preparation of financial statements in conformity with GAAP requires management to make estimates and assumptions that affect theamounts reported in the consolidated financial statements and accompanying notes. Actual results could differ from those estimates.
Nature of operations
Allstate is engaged, principally in the United States, in the property-liability insurance, life insurance, retirement and investment product business.Allstate's primary business is the sale of private passenger auto and homeowners insurance. The Company also sells several other personal propertyand casualty insurance products, life insurance, annuities, voluntary accident and health insurance, funding agreements, and select commercialproperty and casualty coverages. Allstate primarily distributes its products through exclusive agencies, financial specialists and independent agencies.Certain products are also sold through call centers and the internet.
The Allstate Protection segment principally sells private passenger auto and homeowners insurance, with earned premiums accounting for 83% ofAllstate's 2010 consolidated revenues. Allstate was the country's second largest insurer for both private passenger auto and homeowners insurance asof December 31, 2009. Allstate Protection, through several companies, is authorized to sell certain property-liability products in all 50 states, theDistrict of Columbia and Puerto Rico. The Company is also authorized to sell certain insurance products in Canada. For 2010, the top geographiclocations for premiums earned by the Allstate Protection segment were New York, California, Texas, Florida and Pennsylvania. No other jurisdictionaccounted for more than 5% of premiums earned for Allstate Protection.
Allstate has exposure to catastrophes, an inherent risk of the property-liability insurance business, which have contributed, and will continue tocontribute, to material year-to-year fluctuations in the Company's results of operations and financial position (see Note 7). The nature and level ofcatastrophic loss caused by natural events (high winds, winter storms, tornadoes, hailstorms, wildfires, tropical storms, hurricanes, earthquakes andvolcanoes) and man-made events (terrorism and industrial accidents) experienced in any period cannot be predicted and could be material to resultsof operations and financial position. The Company considers the greatest areas of potential catastrophe losses due to hurricanes to generally be majormetropolitan centers in counties along the eastern and gulf coasts of the United States. The Company considers the greatest areas of potentialcatastrophe losses due to earthquakes and fires following earthquakes to be major metropolitan areas near fault lines in the states of California,Oregon, Washington, South Carolina, Missouri, Kentucky and Tennessee. The Company also has exposure to asbestos, environmental and otherdiscontinued lines claims (see Note 13).
The Allstate Financial segment sells life insurance, retirement and investment products and voluntary accident and health insurance. The principalindividual products are interest-sensitive, traditional and variable life insurance; fixed annuities; and voluntary accident and health insurance. Theinstitutional product line, which the Company offers on an opportunistic basis, consists primarily of funding agreements sold to unaffiliated trusts thatuse them to back medium-term notes issued to institutional and individual investors. Banking products and services have been offered to customersthrough the Allstate Bank. On February 8, 2011, the Company announced that they reached an agreement to sell substantially all of the deposits ofAllstate Bank to Discover Bank and plan to enter into a multi-year distribution and marketing agreement whereby Discover Bank will provide bankingproducts and services to Allstate customers in the future. Allstate Financial does not intend to originate banking products or services after thetransaction closes, which is expected to be by mid-year 2011, pending regulatory approval.
Allstate Financial, through several companies, is authorized to sell life insurance and retirement products in all 50 states, the District of Columbia,Puerto Rico, the U.S. Virgin Islands and Guam. For 2010, the top geographic locations for statutory premiums and annuity considerations for theAllstate Financial segment were California, Florida, Texas, New York and Nebraska. No other jurisdiction accounted for more than 5% of statutorypremiums and annuity considerations for Allstate Financial. Allstate Financial distributes its products to individuals through multiple
128

distribution channels, including Allstate exclusive agencies, which include exclusive financial specialists, independent agents (including masterbrokerage agencies and workplace enrolling agents), and specialized structured settlement brokers.
Allstate has exposure to market risk as a result of its investment portfolio. Market risk is the risk that the Company will incur realized andunrealized net capital losses due to adverse changes in interest rates, credit spreads, equity prices, commodity prices, or currency exchange rates.The Company's primary market risk exposures are to changes in interest rates, credit spreads and equity prices. Interest rate risk is the risk that theCompany will incur a loss due to adverse changes in interest rates relative to the interest rate characteristics of its interest bearing assets andliabilities. This risk arises from many of the Company's primary activities, as it invests substantial funds in interest-sensitive assets and issues interest-sensitive liabilities. Interest rate risk includes risks related to changes in U.S. Treasury yields and other key risk-free reference yields. Credit spread riskis the risk that the Company will incur a loss due to adverse changes in credit spreads. This risk arises from many of the Company's primary activities,as the Company invests substantial funds in spread-sensitive fixed income assets. Equity price risk is the risk that the Company will incur losses dueto adverse changes in the general levels of the equity markets.
The Company monitors economic and regulatory developments that have the potential to impact its business. The ability of banks to affiliate withinsurers may have a material adverse effect on all of the Company's product lines by substantially increasing the number, size and financial strength ofpotential competitors. Furthermore, federal and state laws and regulations affect the taxation of insurance companies and life insurance and annuityproducts. Congress from time to time considers legislation that would reduce or eliminate the favorable policyholder tax treatment currently applicableto life insurance and annuities. Congress also considers proposals to reduce the taxation of certain products or investments that may compete with lifeinsurance or annuities. Legislation that increases the taxation on insurance products or reduces the taxation on competing products could lessen theadvantage or create a disadvantage for certain of the Company's products making them less competitive. Such proposals, if adopted, could have anadverse effect on the Company's financial position or Allstate Financial's ability to sell such products and could result in the surrender of some existingcontracts and policies. In addition, changes in the federal estate tax laws could negatively affect the demand for the types of life insurance used inestate planning.
2. Summary of Significant Accounting Policies
Investments
Fixed income securities include bonds, residential mortgage-backed securities ("RMBS"), commercial mortgage-backed securities ("CMBS"),asset-backed securities ("ABS") and redeemable preferred stocks. Fixed income securities, which may be sold prior to their contractual maturity, aredesignated as available for sale and are carried at fair value. The difference between amortized cost and fair value, net of deferred income taxes,certain life and annuity deferred policy acquisition costs ("DAC"), certain deferred sales inducement costs ("DSI") and certain reserves for life-contingent contract benefits, is reflected as a component of accumulated other comprehensive income. Cash received from calls, principal paymentsand make-whole payments is reflected as a component of proceeds from sales and cash received from maturities and pay-downs is reflected as acomponent of investment collections within the Consolidated Statements of Cash Flows.
Equity securities primarily include common stocks, exchange traded funds, non-redeemable preferred stocks and real estate investment trustequity investments. Equity securities are designated as available for sale and are carried at fair value. The difference between cost and fair value, netof deferred income taxes, is reflected as a component of accumulated other comprehensive income.
Mortgage loans are carried at outstanding principal balances, net of unamortized premium or discount and valuation allowances. Valuationallowances are established for impaired loans when it is probable that contractual principal and interest will not be collected. Valuation allowances forimpaired loans reduce the carrying value to the fair value of the collateral less costs to sell or the present value of the loan's expected future repaymentcash flows discounted at the loan's original effective interest rate.
Investments in limited partnership interests, including interests in private equity/debt funds, real estate funds, hedge funds and tax credit funds,where the Company's interest is so minor that it exercises virtually no influence over operating and financial policies, are accounted for in accordancewith the cost method of accounting; otherwise, investments in limited partnership interests are accounted for in accordance with the equity method ofaccounting.
Short-term investments, including money market funds, commercial paper and other short-term investments, are carried at fair value. Otherinvestments consist primarily of policy loans, derivatives and bank loans. Policy loans are carried at the unpaid principal balances and were$1.14 billion and $1.13 billion as of December 31, 2010 and 2009,
129

respectively. Derivatives are carried at fair value. Bank loans are primarily senior secured corporate loans and are carried at amortized cost.
Investment income consists primarily of interest, dividends, income from certain limited partnership interests and income from certain derivativetransactions. Interest is recognized on an accrual basis using the effective yield method and dividends are recorded at the ex-dividend date. Interestincome for certain RMBS, CMBS and ABS is determined considering estimated principal repayments obtained from third party data sources andinternal estimates. Actual prepayment experience is periodically reviewed and effective yields are recalculated when differences arise between theprepayments originally anticipated and the actual prepayments received and currently anticipated. For beneficial interests in securitized financialassets not of high credit quality, the effective yield is recalculated on a prospective basis. For all other RMBS, CMBS and ABS, the effective yield isrecalculated on a retrospective basis. For other-than-temporarily impaired fixed income securities, the effective yield method utilizes the differencebetween the amortized cost basis at impairment and the cash flows expected to be collected. Accrual of income is suspended for other-than-temporarily impaired fixed income securities when the timing and amount of cash flows expected to be received is not reasonably estimable. Accrual ofincome is suspended for mortgage loans and bank loans that are in default or when full and timely collection of principal and interest payments is notprobable. Cash receipts on investments on nonaccrual status are generally recorded as a reduction of carrying value. Income from investments inlimited partnership interests accounted for utilizing the cost method of accounting is recognized upon receipt of amounts distributed by the partnershipsas investment income. Subsequent to October 1, 2008, income from investments in limited partnership interests accounted for utilizing the equitymethod of accounting ("EMA limited partnerships") is reported in realized capital gains and losses.
Realized capital gains and losses include gains and losses on investment sales, write-downs in value due to other-than-temporary declines in fairvalue, adjustments to valuation allowances on mortgage loans, periodic changes in the fair value and settlements of certain derivatives includinghedge ineffectiveness, and income from EMA limited partnerships. Realized capital gains and losses on investment sales include calls andprepayments and are determined on a specific identification basis. Income from EMA limited partnerships is recognized based on the financial resultsof the partnership and the Company's proportionate investment interest, and is recognized on a delay due to the availability of the related financialstatements. Income recognition on hedge funds is generally on a one month delay and income recognition on private equity/debt funds, real estatefunds and tax credit funds is generally on a three month delay.
The Company recognizes other-than-temporary impairment losses on fixed income securities in earnings when a security's fair value is less thanits amortized cost and the Company has made the decision to sell or it is more likely than not the Company will be required to sell the fixed incomesecurity before recovery of its amortized cost basis. Additionally, if the Company does not expect to receive cash flows sufficient to recover the entireamortized cost basis of a fixed income security, the credit loss component of the impairment is recorded in earnings, with the remaining amount of theunrealized loss related to other factors recognized in other comprehensive income ("OCI"). The Company recognizes other-than-temporary impairmentlosses on equity securities in earnings when the decline in fair value is considered other than temporary including when the Company does not havethe intent and ability to hold the equity security for a period of time sufficient to recover its cost basis.
Derivative and embedded derivative financial instruments
Derivative financial instruments include interest rate swaps, credit default swaps, futures (interest rate, equity and commodity), options (includingswaptions), interest rate caps and floors, warrants and rights, forward contracts to hedge foreign currency risk, certain investment risk transferreinsurance agreements, forward sale commitments and certain bond forward purchase commitments. Derivatives required to be separated from thehost instrument and accounted for as derivative financial instruments ("subject to bifurcation") are embedded in certain fixed income securities, equity-indexed life and annuity contracts, reinsured variable annuity contracts and certain funding agreements (see Note 6).
All derivatives are accounted for on a fair value basis and reported as other investments, other assets, other liabilities and accrued expenses orcontractholder funds. Embedded derivative instruments subject to bifurcation are also accounted for on a fair value basis and are reported togetherwith the host contract. The change in fair value of derivatives embedded in certain fixed income securities and subject to bifurcation is reported inrealized capital gains and losses. The change in fair value of derivatives embedded in life and annuity product contracts and subject to bifurcation isreported in life and annuity contract benefits or interest credited to contractholder funds. Cash flows from embedded derivatives requiring bifurcationand derivatives receiving hedge accounting are reported consistently with the host contracts and hedged risks, respectively, within the ConsolidatedStatements of Cash Flows. Cash flows from other derivatives are reported in cash flows from investing activities within the Consolidated Statements ofCash Flows.
130

When derivatives meet specific criteria, they may be designated as accounting hedges and accounted for as fair value, cash flow, foreign currencyfair value or foreign currency cash flow hedges. The hedged item may be either all or a specific portion of a recognized asset, liability or anunrecognized firm commitment attributable to a particular risk for fair value hedges. At the inception of the hedge, the Company formally documentsthe hedging relationship and risk management objective and strategy. The documentation identifies the hedging instrument, the hedged item, thenature of the risk being hedged and the methodology used to assess the effectiveness of the hedging instrument in offsetting the exposure to changesin the hedged item's fair value attributable to the hedged risk. For a cash flow hedge, this documentation includes the exposure to changes in thevariability in cash flows attributable to the hedged risk. The Company does not exclude any component of the change in fair value of the hedginginstrument from the effectiveness assessment. At each reporting date, the Company confirms that the hedging instrument continues to be highlyeffective in offsetting the hedged risk. Ineffectiveness in fair value hedges and cash flow hedges, if any, is reported in realized capital gains and losses.
Fair value hedges For hedging instruments used in fair value hedges, when the hedged items are investment assets or a portion thereof, thechange in fair value of the derivatives is reported in net investment income, together with the change in the fair value of the hedged items. The changein fair value of hedging instruments used in fair value hedges of contractholder funds liabilities or a portion thereof is reported in interest credited tocontractholder funds, together with the change in the fair value of the hedged items. Accrued periodic settlements on swaps are reported together withthe changes in fair value of the swaps in net investment income or interest credited to contractholder funds. The amortized cost for fixed incomesecurities, the carrying value for mortgage loans or the carrying value of the hedged liability is adjusted for the change in the fair value of the hedgedrisk.
Cash flow hedges For hedging instruments used in cash flow hedges, the changes in fair value of the derivatives representing the effectiveportion of the hedge are reported in accumulated other comprehensive income. Amounts are reclassified to net investment income, realized capitalgains and losses or interest expense as the hedged or forecasted transaction affects net income. Accrued periodic settlements on derivatives used incash flow hedges are reported in net investment income. The amount reported in accumulated other comprehensive income for a hedged transactionis limited to the lesser of the cumulative gain or loss on the derivative less the amount reclassified to net income, or the cumulative gain or loss on thederivative needed to offset the cumulative change in the expected future cash flows on the hedged transaction from inception of the hedge less thederivative gain or loss previously reclassified from accumulated other comprehensive income to net income. If the Company expects at any time thatthe loss reported in accumulated other comprehensive income would lead to a net loss on the combination of the hedging instrument and the hedgedtransaction which may not be recoverable, a loss is recognized immediately in realized capital gains and losses. If an impairment loss is recognized onan asset or an additional obligation is incurred on a liability involved in a hedge transaction, any offsetting gain in accumulated other comprehensiveincome is reclassified and reported together with the impairment loss or recognition of the obligation.
Termination of hedge accounting If, subsequent to entering into a hedge transaction, the derivative becomes ineffective (including if the hedgeditem is sold or otherwise extinguished, the occurrence of a hedged forecasted transaction is no longer probable or the hedged asset becomes other-than-temporarily impaired), the Company may terminate the derivative position. The Company may also terminate derivative instruments orredesignate them as non-hedge as a result of other events or circumstances. If the derivative instrument is not terminated when a fair value hedge isno longer effective, the future gains and losses recognized on the derivative are reported in realized capital gains and losses. When a fair value hedgeis no longer effective, is redesignated as non-hedge or when the derivative has been terminated, the fair value gain or loss on the hedged asset,liability or portion thereof which has already been recognized in income while the hedge was in place and used to adjust the amortized cost for fixedincome securities, the carrying value for mortgage loans or the carrying value of the hedged liability, is amortized over the remaining life of the hedgedasset, liability or portion thereof, and reflected in net investment income or interest credited to contractholder funds beginning in the period that hedgeaccounting is no longer applied. If the hedged item in a fair value hedge is an asset which has become other-than-temporarily impaired, the adjustmentmade to the amortized cost for fixed income securities or the carrying value for mortgage loans is subject to the accounting policies applied to other-than-temporarily impaired assets.
When a derivative instrument used in a cash flow hedge of an existing asset or liability is no longer effective or is terminated, the gain or lossrecognized on the derivative is reclassified from accumulated other comprehensive income to net income as the hedged risk impacts net income. If thederivative instrument is not terminated when a cash flow hedge is no longer effective, the future gains and losses recognized on the derivative arereported in realized capital gains and losses. When a derivative instrument used in a cash flow hedge of a forecasted transaction is terminatedbecause it is probable the forecasted transaction will not occur, the gain or loss recognized on the derivative is
131

immediately reclassified from accumulated other comprehensive income to realized capital gains and losses in the period that hedge accounting is nolonger applied.
Non-hedge derivative financial instruments The Company has certain derivatives for which hedge accounting is not applied. The incomestatement effects, including fair value gains and losses and accrued periodic settlements, of these derivatives are reported on the ConsolidatedStatements of Operations either in realized capital gains and losses or in a single line item together with the results of the associated asset or liabilityfor which risks are being managed.
Securities loaned
The Company's business activities include securities lending transactions, which are used primarily to generate net investment income. Theproceeds received in conjunction with securities lending transactions are reinvested in short-term investments or fixed income securities. Thesetransactions are short-term in nature, usually 30 days or less.
The Company receives cash collateral for securities loaned in an amount generally equal to 102% and 105% of the fair value of domestic andforeign securities, respectively, and records the related obligations to return the collateral in other liabilities and accrued expenses. The carrying valueof these obligations approximates fair value because of their relatively short-term nature. The Company monitors the market value of securities loanedon a daily basis and obtains additional collateral as necessary under the terms of the agreements to mitigate counterparty credit risk. The Companymaintains the right and ability to redeem the securities loaned on short notice. Substantially all of the Company's securities loaned are placed withlarge banks.
Recognition of premium revenues and contract charges, and related benefits and interest credited
Property-liability premiums are deferred and earned on a pro-rata basis over the terms of the policies, typically periods of six or twelve months.The portion of premiums written applicable to the unexpired terms of the policies is recorded as unearned premiums. Premium installment receivables,net, represent premiums written and not yet collected, net of an allowance for uncollectible premiums. The Company regularly evaluates premiuminstallment receivables and adjusts its valuation allowance as appropriate. The valuation allowance for uncollectible premium installment receivableswas $75 million and $77 million as of December 31, 2010 and 2009, respectively.
Traditional life insurance products consist principally of products with fixed and guaranteed premiums and benefits, primarily term and whole lifeinsurance products. Premiums from these products are recognized as revenue when due from policyholders. Benefits are reflected in life and annuitycontract benefits and recognized in relation to premiums, so that profits are recognized over the life of the policy.
Immediate annuities with life contingencies, including certain structured settlement annuities, provide insurance protection over a period thatextends beyond the period during which premiums are collected. Premiums from these products are recognized as revenue when received at theinception of the contract. Benefits and expenses are recognized in relation to premiums. Profits from these policies come from investment income,which is recognized over the life of the contract.
Interest-sensitive life contracts, such as universal life and single premium life, are insurance contracts whose terms are not fixed and guaranteed.The terms that may be changed include premiums paid by the contractholder, interest credited to the contractholder account balance and contractcharges assessed against the contractholder account balance. Premiums from these contracts are reported as contractholder fund deposits. Contractcharges consist of fees assessed against the contractholder account balance for the cost of insurance (mortality risk), contract administration andsurrender of the contract prior to contractually specified dates. These contract charges are recognized as revenue when assessed against thecontractholder account balance. Life and annuity contract benefits include life-contingent benefit payments in excess of the contractholder accountbalance.
Contracts that do not subject the Company to significant risk arising from mortality or morbidity are referred to as investment contracts. Fixedannuities, including market value adjusted annuities, equity-indexed annuities and immediate annuities without life contingencies, and fundingagreements (primarily backing medium-term notes) are considered investment contracts. Consideration received for such contracts is reported ascontractholder fund deposits. Contract charges for investment contracts consist of fees assessed against the contractholder account balance formaintenance, administration and surrender of the contract prior to contractually specified dates, and are recognized when assessed against thecontractholder account balance.
Interest credited to contractholder funds represents interest accrued or paid on interest-sensitive life contracts and investment contracts. Creditingrates for certain fixed annuities and interest-sensitive life contracts are adjusted periodically by the Company to reflect current market conditionssubject to contractually guaranteed minimum rates. Crediting rates for indexed annuities and indexed funding agreements are generally based on aspecified interest rate index, such as LIBOR, or an equity index, such as the Standard & Poor's ("S&P") 500 Index. Interest credited also
132

includes amortization of DSI expenses. DSI is amortized into interest credited using the same method used to amortize DAC.
Contract charges for variable life and variable annuity products consist of fees assessed against the contractholder account balances for contractmaintenance, administration, mortality, expense and surrender of the contract prior to contractually specified dates. Contract benefits incurred forvariable annuity products include guaranteed minimum death, income, withdrawal and accumulation benefits. Substantially all of the Company'svariable annuity business is ceded through reinsurance agreements and the contract charges and contract benefits related thereto are reported net ofreinsurance ceded.
Deferred policy acquisition and sales inducement costs
Costs that vary with and are primarily related to acquiring property-liability insurance, life insurance and investment contracts are deferred andrecorded as DAC. These costs are principally agents' and brokers' remuneration, premium taxes, inspection costs, and certain underwriting and directmail solicitation expenses. DSI costs, which are deferred and recorded as other assets, relate to sales inducements offered on sales to newcustomers, principally on annuity and interest-sensitive life contracts. These sales inducements are primarily in the form of additional credits to thecustomer's account balance or enhancements to interest credited for a specified period which are in excess of the rates currently being credited tosimilar contracts without sales inducements. All other acquisition costs are expensed as incurred and included in operating costs and expenses on theConsolidated Statements of Operations. DAC associated with property-liability insurance is amortized into income as premiums are earned, typicallyover periods of six or twelve months, and is included in amortization of deferred policy acquisition costs on the Consolidated Statements of Operations.Future investment income is considered in determining the recoverability of DAC. Amortization of DAC associated with life insurance and investmentcontracts is included in amortization of deferred policy acquisition costs on the Consolidated Statements of Operations and is described in more detailbelow. DSI is amortized into income using the same methodology and assumptions as DAC and is included in interest credited to contractholder fundson the Consolidated Statements of Operations. DAC and DSI are periodically reviewed for recoverability and adjusted if necessary.
For traditional life insurance, DAC is amortized over the premium paying period of the related policies in proportion to the estimated revenues onsuch business. Assumptions used in the amortization of DAC and reserve calculations are established at the time the policy is issued and aregenerally not revised during the life of the policy. Any deviations from projected business in force resulting from actual policy terminations differing fromexpected levels and any estimated premium deficiencies may result in a change to the rate of amortization in the period such events occur. Generally,the amortization periods for these policies approximates the estimated lives of the policies.
For interest-sensitive life, fixed annuities and other investment contracts, DAC and DSI are amortized in proportion to the incidence of the totalpresent value of gross profits, which includes both actual historical gross profits ("AGP") and estimated future gross profits ("EGP") expected to beearned over the estimated lives of the contracts. The amortization is net of interest on the prior period DAC balance using rates established at theinception of the contracts. Actual amortization periods generally range from 15-30 years; however, incorporating estimates of the rate of customersurrenders, partial withdrawals and deaths generally results in the majority of the DAC being amortized during the surrender charge period, which istypically 10-20 years for interest-sensitive life and 5-10 years for fixed annuities. The cumulative DAC and DSI amortization is reestimated andadjusted by a cumulative charge or credit to results of operations when there is a difference between the incidence of actual versus expected grossprofits in a reporting period or when there is a change in total EGP. When DAC or DSI amortization or a component of gross profits for a quarterlyperiod is potentially negative (which would result in an increase of the DAC or DSI balance) as a result of negative AGP, the specific facts andcircumstances surrounding the potential negative amortization are considered to determine whether it is appropriate for recognition in the consolidatedfinancial statements. Negative amortization is only recorded when the increased DAC or DSI balance is determined to be recoverable based on factsand circumstances. Recapitalization of DAC and DSI is limited to the originally deferred costs plus interest.
AGP and EGP consist primarily of the following components: contract charges for the cost of insurance less mortality costs and other benefits;investment income and realized capital gains and losses less interest credited; and surrender and other contract charges less maintenance expenses.The principal assumptions for determining the amount of EGP are investment returns, including capital gains and losses on assets supporting contractliabilities, interest crediting rates to contractholders, and the effects of persistency, mortality, expenses, and hedges if applicable. For products whosesupporting investments are exposed to capital losses in excess of the Company's expectations which may cause periodic AGP to become temporarilynegative, EGP and AGP utilized in DAC and DSI amortization may be modified to exclude the excess capital losses.
133
The Company performs quarterly reviews of DAC and DSI recoverability for interest-sensitive life, fixed annuities and other investment contracts inthe aggregate using current assumptions. If a change in the amount of EGP is significant, it could result in the unamortized DAC and DSI not beingrecoverable, resulting in a charge which is included as a component of amortization of deferred policy acquisition costs or interest credited tocontractholder funds, respectively.
The DAC and DSI balances presented include adjustments to reflect the amount by which the amortization of DAC and DSI would increase ordecrease if the unrealized capital gains or losses in the respective product investment portfolios were actually realized. The adjustments are recordednet of tax in accumulated other comprehensive income. DAC, DSI and deferred income taxes determined on unrealized capital gains and losses andreported in accumulated other comprehensive income recognize the impact on shareholders' equity consistently with the amounts that would berecognized in the income statement on realized capital gains and losses.
Customers of the Company may exchange one insurance policy or investment contract for another offered by the Company, or make modificationsto an existing investment, life or property-liability contract issued by the Company. These transactions are identified as internal replacements foraccounting purposes. Internal replacement transactions determined to result in replacement contracts that are substantially unchanged from thereplaced contracts are accounted for as continuations of the replaced contracts. Unamortized DAC and DSI related to the replaced contracts continueto be deferred and amortized in connection with the replacement contracts. For interest-sensitive life insurance and investment contracts, the EGP ofthe replacement contracts are treated as a revision to the EGP of the replaced contracts in the determination of amortization of DAC and DSI. Fortraditional life and property-liability insurance policies, any changes to unamortized DAC that result from replacement contracts are treated asprospective revisions. Any costs associated with the issuance of replacement contracts are characterized as maintenance costs and expensed asincurred.
Internal replacement transactions determined to result in a substantial change to the replaced contracts are accounted for as an extinguishment ofthe replaced contracts, and any unamortized DAC and DSI related to the replaced contracts are eliminated with a corresponding charge toamortization of deferred policy acquisition costs or interest credited to contractholder funds, respectively.
The costs assigned to the right to receive future cash flows from certain business purchased from other insurers are also classified as DAC in theConsolidated Statements of Financial Position. The costs capitalized represent the present value of future profits expected to be earned over the livesof the contracts acquired. These costs are amortized as profits emerge over the lives of the acquired business and are periodically evaluated forrecoverability. The present value of future profits was $133 million and $158 million as of December 31, 2010 and 2009, respectively. Amortizationexpense of the present value of future profits was $23 million, $28 million and $21 million in 2010, 2009 and 2008, respectively.
Reinsurance
In the normal course of business, the Company seeks to limit aggregate and single exposure to losses on large risks by purchasing reinsurance(see Note 9). The Company has also used reinsurance to effect the acquisition or disposition of certain blocks of business. The amounts reported inthe Consolidated Statements of Financial Position as reinsurance recoverables include amounts billed to reinsurers on losses paid as well asestimates of amounts expected to be recovered from reinsurers on insurance liabilities and contractholder funds that have not yet been paid.Reinsurance recoverables on unpaid losses are estimated based upon assumptions consistent with those used in establishing the liabilities related tothe underlying reinsured contracts. Insurance liabilities are reported gross of reinsurance recoverables. Reinsurance premiums are generally reflectedin income in a manner consistent with the recognition of premiums on the reinsured contracts. For catastrophe coverage, the cost of reinsurancepremiums is recognized ratably over the contract period to the extent coverage remains available. Reinsurance does not extinguish the Company'sprimary liability under the policies written. Therefore, the Company regularly evaluates the financial condition of its reinsurers including their activitieswith respect to claim settlement practices and commutations, and establishes allowances for uncollectible reinsurance as appropriate.
Goodwill
Goodwill represents the excess of amounts paid for acquiring businesses over the fair value of the net assets acquired. The goodwill balanceswere $456 million and $418 million as of December 31, 2010 and $457 million and $418 million as of December 31, 2009 for the Allstate Protectionsegment and the Allstate Financial segment, respectively. The Company annually evaluates goodwill for impairment using a trading multiple analysis,which is a widely accepted valuation technique to estimate the fair value of its reporting units. If conditions warrant, a discounted cash flow analysismay also be used. The Company also reviews its goodwill for impairment whenever events or
134

changes in circumstances indicate that it is more likely than not that the carrying amount of goodwill may exceed its implied fair value. Goodwillimpairment evaluations indicated no impairment as of December 31, 2010 or 2009.
Property and equipment
Property and equipment is carried at cost less accumulated depreciation. Included in property and equipment are capitalized costs related tocomputer software licenses and software developed for internal use. These costs generally consist of certain external payroll and payroll related costs.Certain facilities and equipment held under capital leases are also classified as property and equipment with the related lease obligations recorded asliabilities. Property and equipment depreciation is calculated using the straight-line method over the estimated useful lives of the assets, generally 3 to10 years for equipment and 40 years for real property. Depreciation expense is reported in operating costs and expenses. Accumulated depreciationon property and equipment was $2.41 billion and $2.32 billion as of December 31, 2010 and 2009, respectively. Depreciation expense on property andequipment was $239 million, $256 million and $240 million in 2010, 2009 and 2008, respectively. The Company reviews its property and equipment forimpairment at least annually and whenever events or changes in circumstances indicate that the carrying amount may not be recoverable.
Income taxes
The income tax provision is calculated under the liability method. Deferred tax assets and liabilities are recorded based on the difference betweenthe financial statement and tax bases of assets and liabilities at the enacted tax rates. The principal assets and liabilities giving rise to such differencesare unrealized capital gains and losses on certain investments, differences in tax bases of invested assets, insurance reserves, unearned premiums,DAC, accrued compensation and other postretirement benefits. A deferred tax asset valuation allowance is established when there is uncertainty thatsuch assets will be realized (see Note 14).
Reserves for property-liability insurance claims and claims expense and life-contingent contract benefits
The reserve for property-liability insurance claims and claims expense is the estimate of amounts necessary to settle all reported and unreportedclaims for the ultimate cost of insured property-liability losses, based upon the facts of each case and the Company's experience with similar cases.Estimated amounts of salvage and subrogation are deducted from the reserve for claims and claims expense. The establishment of appropriatereserves, including reserves for catastrophes, is an inherently uncertain and complex process. Reserve estimates are regularly reviewed and updated,using the most current information available. Any resulting reestimates are reflected in current results of operations (see Note 7).
The reserve for life-contingent contract benefits payable under insurance policies, including traditional life insurance, life-contingent immediateannuities and voluntary accident and health products, is computed on the basis of long-term actuarial assumptions of future investment yields,mortality, morbidity, policy terminations and expenses (see Note 8). These assumptions, which for traditional life insurance are applied using the netlevel premium method, include provisions for adverse deviation and generally vary by characteristics such as type of coverage, year of issue andpolicy duration. To the extent that unrealized gains on fixed income securities would result in a premium deficiency if those gains were realized, therelated increase in reserves for certain immediate annuities with life contingencies is recorded net of tax as a reduction of unrealized net capital gainsincluded in accumulated other comprehensive income.
Contractholder funds
Contractholder funds represent interest-bearing liabilities arising from the sale of products such as interest-sensitive life, fixed annuities, bankdeposits and funding agreements. Contractholder funds are comprised primarily of deposits received and interest credited to the benefit of thecontractholder less surrenders and withdrawals, mortality charges and administrative expenses (see Note 8). Contractholder funds also includereserves for secondary guarantees on interest-sensitive life insurance and certain fixed annuity contracts and reserves for certain guarantees onreinsured variable annuity contracts.
Separate accounts
Separate accounts assets are carried at fair value. The assets of the separate accounts are legally segregated and available only to settleseparate account contract obligations. Separate accounts liabilities represent the contractholders' claims to the related assets and are carried at anamount equal to the separate accounts assets. Investment income and realized capital gains and losses of the separate accounts accrue directly tothe contractholders and therefore, are not included in the Company's Consolidated Statements of Operations. Deposits to and surrenders andwithdrawals from the separate accounts are reflected in separate accounts liabilities and are not included in consolidated cash flows.
135

Absent any contract provision wherein the Company provides a guarantee, variable annuity and variable life insurance contractholders bear theinvestment risk that the separate accounts' funds may not meet their stated investment objectives. Substantially all of the Company's variable annuitybusiness was reinsured beginning in 2006.
Deferred Employee Stock Ownership Plan ("ESOP") expense
Deferred ESOP expense represents the remaining unrecognized cost of shares acquired by the Allstate ESOP to pre-fund a portion of theCompany's contribution to the Allstate 401(k) Savings Plan (see Note 16).
Equity incentive plans
The Company currently has equity incentive plans that permit the Company to grant nonqualified stock options, incentive stock options, restrictedor unrestricted shares of the Company's stock and restricted stock units ("equity awards") to certain employees and directors of the Company (seeNote 17). The Company recognizes the fair value of equity awards computed at the award date over the period in which the requisite service isrendered. The Company uses a binomial lattice model to determine the fair value of employee stock options.
Off-balance-sheet financial instruments
Commitments to invest, commitments to purchase private placement securities, commitments to extend loans, financial guarantees and creditguarantees have off-balance-sheet risk because their contractual amounts are not recorded in the Company's Consolidated Statements of FinancialPosition (see Note 6 and Note 13).
Consolidation of variable interest entities ("VIEs")
The Company consolidates VIEs when it is the primary beneficiary. A primary beneficiary is the entity with both the power to direct the activities ofthe VIE that most significantly impact the economic performance of the VIE and the obligation to absorb losses, or the right to receive benefits, thatcould potentially be significant to the VIE (see Note 11).
Foreign currency translation
The local currency of the Company's foreign subsidiaries is deemed to be the functional currency of the country in which these subsidiariesoperate. The financial statements of the Company's foreign subsidiaries are translated into U.S. dollars at the exchange rate in effect at the end of areporting period for assets and liabilities and at average exchange rates during the period for results of operations. The unrealized gains and lossesfrom the translation of the net assets are recorded as unrealized foreign currency translation adjustments and included in accumulated othercomprehensive income in the Consolidated Statements of Financial Position. Changes in unrealized foreign currency translation adjustments areincluded in other comprehensive income. Gains and losses from foreign currency transactions are reported in operating costs and expenses and havenot been material.
Earnings per share
Basic earnings per share is computed using the weighted average number of common shares outstanding, including unvested participatingrestricted stock units. Diluted earnings per share is computed using the weighted average number of common and dilutive potential common sharesoutstanding. For the Company, dilutive potential common shares consist of outstanding stock options and unvested non-participating restricted stockunits.
136

The computation of basic and diluted earnings per share for the years ended December 31 is presented in the following table.
The effect of dilutive potential common shares does not include the effect of options with an anti-dilutive effect on earnings per share because theirexercise prices exceed the average market price of Allstate common shares during the period or for which the unrecognized compensation cost wouldhave an anti-dilutive effect. Options to purchase 26.7 million, 25.9 million and 27.1 million Allstate common shares, with exercise prices ranging from$27.36 to $64.53, $23.13 to $65.38 and $28.41 to $65.38, were outstanding for the years ended December 31, 2010, 2009 and 2008, respectively, butwere not included in the computation of diluted earnings per share in those years.
As a result of the net loss for the year ended December 31, 2008, weighted average dilutive potential common shares outstanding resulting fromstock options of 1.3 million were not included in the computation of diluted earnings per share since inclusion of these securities would have an anti-dilutive effect. In the absence of the net loss, weighted average common and dilutive potential common shares outstanding would have totaled549.6 million for the year ended December 31, 2008.
Adopted accounting standards
Disclosures about Fair Value Measurements
In January 2010, the Financial Accounting Standards Board ("FASB") issued new accounting guidance which expands disclosure requirementsrelating to fair value measurements. The guidance adds requirements for disclosing amounts of and reasons for significant transfers into and out ofLevels 1 and 2 and requires gross rather than net disclosures about purchases, sales, issuances and settlements relating to Level 3 measurements.The guidance also provides clarification that fair value measurement disclosures are required for each class of assets and liabilities. Disclosures aboutthe valuation techniques and inputs used to measure fair value for measurements that fall in either Level 2 or Level 3 are also required. The Companyadopted the provisions of the new guidance as of March 31, 2010, except for disclosures about purchases, sales, issuances and settlements in the rollforward of activity in Level 3 fair value measurements, which are required for fiscal years beginning after December 15, 2010. Disclosures are notrequired for earlier periods presented for comparative purposes. The new guidance affects disclosures only; and therefore, the adoption had no impacton the Company's results of operations or financial position.
Consolidation of Variable Interest Entities
In June 2009, the FASB issued new accounting guidance which requires an entity to perform a qualitative analysis to determine whether it holds acontrolling financial interest (i.e., is a primary beneficiary) in a VIE. The analysis identifies the primary beneficiary of a VIE as the entity that has boththe power to direct the activities of the VIE that most significantly impact the economic performance of the VIE and the obligation to absorb losses, orthe right to receive benefits, that could potentially be significant to the VIE. The Company adopted the new guidance as of January 1, 2010. Theadoption resulted in the consolidation of four VIEs for which the Company concluded it is the primary beneficiary as of January 1, 2010.
Two of the consolidated VIEs hold investments managed by Allstate Investment Management Company ("AIMCO"), a subsidiary of the Company.Consolidation as of January 1, 2010 resulted in an increase in total assets of $696 million, an increase in total liabilities of $679 million, an increase inretained income of $7 million and an increase in noncontrolling interest of $10 million. During the first quarter of 2010, the Company sold substantiallyall its variable
137
($ in millions, except per share data) 2010 2009 2008 Numerator: Net income (loss) $ 928 $ 854 $ (1,679)
Denominator:
Weighted average common sharesoutstanding 540.3 539.6 548.3
Effect of dilutive potential commonshares:
Stock options 2.0 1.3 — Restricted stock units (non-participating) 0.2 — —
Weighted average common and dilutivepotential common shares outstanding 542.5 540.9 548.3
Earnings per share – Basic $ 1.72 $ 1.58 $ (3.06)Earnings per share – Diluted $ 1.71 $ 1.58 $ (3.06)

interests in these two VIEs. As a result, the Company deconsolidated the VIEs as of March 26, 2010. The Consolidated Statement of Operations forthe year ended December 31, 2010 reflects the effect of the consolidation for the portion of the year the Company was the primary beneficiary, whichwas not material.
The adoption also resulted in the consolidation of two insurance company affiliates, Allstate Texas Lloyds and Allstate County Mutual InsuranceCompany, that underwrite homeowners and auto insurance policies, respectively, and reinsure all of their net business to AIC. Consolidation as ofJanuary 1, 2010 resulted in an increase in total assets of $38 million, an increase in total liabilities of $34 million, an increase in retained income of$3 million and an increase in unrealized net capital gains and losses of $1 million.
In the normal course of investing activities, the Company invests in variable interests issued by VIEs. These variable interests include structuredinvestments such as RMBS, CMBS and ABS as well as limited partnerships, special purpose entities and trusts. For these variable interests, theCompany concluded it is not the primary beneficiary due to the amount of the Company's interest in the VIEs and the Company's lack of power todirect the activities that are most significant to the economic performance of the VIEs. The Company's maximum exposure to loss on these interests islimited to the amount of the Company's investment, including future funding commitments, as applicable.
Embedded Credit Derivatives Scope Exception
In March 2010, the FASB issued accounting guidance clarifying the scope exception for embedded credit derivative features, including those incertain collateralized debt obligations and synthetic collateralized debt obligations. Embedded credit derivative features related to the transfer of creditrisk that is only in the form of subordination of one financial instrument to another continue to qualify for the scope exception. Other embedded creditderivative features must be analyzed for potential bifurcation and separate accounting as a derivative, with periodic changes in fair value recorded innet income. The adoption of the new guidance as of July 1, 2010 resulted in the bifurcation of the credit default swaps embedded in syntheticcollateralized debt obligations purchased after January 1, 2007, and the related net unrealized capital losses were reclassified from accumulated othercomprehensive income to retained income. The cumulative effect of adoption, net of related DAC, DSI and tax adjustments, was a $19 million increasein unrealized net capital gains and losses, a $9 million decrease in total assets and a $28 million decrease in retained income.
Disclosures about the Credit Quality of Financing Receivables and the Allowance for Credit Losses
In July 2010, the FASB issued guidance requiring expanded disclosures relating to the credit quality of financing receivables and the relatedallowances for credit losses. The new guidance requires a greater level of disaggregated information, as well as additional disclosures about creditquality indicators, past due information and modifications of its financing receivables. The new guidance is effective for reporting periods ending afterDecember 15, 2010, except for disclosures related to troubled debt restructurings which have been deferred until reporting periods ending afterDecember 15, 2011. The new guidance affects disclosures only; and therefore, the adoption as of December 31, 2010 had no impact on theCompany's results of operations or financial position.
Pending accounting standards
Consolidation Analysis Considering Investments Held through Separate Accounts
In April 2010, the FASB issued guidance clarifying that an insurer is not required to combine interests in investments held in a qualifying separateaccount with its interests in the same investments held in the general account when performing a consolidation evaluation. The guidance is effectivefor fiscal years and interim periods beginning after December 15, 2010 with early adoption permitted. The adoption of this guidance is not expected tohave a material impact on the Company's results of operations or financial position.
Accounting for Costs Associated with Acquiring or Renewing Insurance Contracts
In October 2010, the FASB issued guidance modifying the definition of the types of costs incurred by insurance entities that can be capitalized inthe acquisition of new and renewal contracts. The guidance specifies that the costs must be based on successful efforts. The guidance also specifiesthat advertising costs only should be included as deferred acquisition costs if the direct-response advertising accounting criteria are met. The newguidance is effective for reporting periods beginning after December 15, 2011 and should be applied prospectively, with retrospective applicationpermitted. The Company is in process of evaluating the impact of adoption on the Company's results of operations and financial position.
138

Disclosure of Supplementary Pro Forma Information for Business Combinations
In December 2010, the FASB issued disclosure guidance for entities that enter into business combinations that are material. The guidancespecifies that if an entity presents comparative financial statements, the entity should disclose proforma revenue and earnings of the combined entityas though the business combination that occurred during the current year had occurred as of the beginning of the comparable prior annual reportingperiod only. The guidance expands the supplemental pro forma disclosures to include a description of the nature and amount of material, nonrecurringpro forma adjustments directly attributable to the business combination. The guidance is effective prospectively for business combinations entered intoon or after the beginning of the first annual reporting period beginning on or after December 15, 2010, with early adoption permitted. The Company willadopt the guidance for any business combinations entered into on or after January 1, 2011.
3. Supplemental Cash Flow Information
Non-cash investment exchanges, including modifications of certain mortgage loans, fixed income securities, limited partnerships and otherinvestments, as well as mergers completed with equity securities, totaled $664 million, $485 million and $37 million for the years ended December 31,2010, 2009 and 2008, respectively.
Liabilities for collateral received in conjunction with the Company's securities lending activities were $461 million, $449 million and $320 million asof December 31, 2010, 2009 and 2008, respectively, and are reported in other liabilities and accrued expenses in the Consolidated Statements ofFinancial Position. Obligations to return cash collateral for over-the-counter ("OTC") derivatives were $23 million, $209 million and $20 million as ofDecember 31, 2010, 2009 and 2008, respectively, and are reported in other liabilities and accrued expenses or other investments. The accompanyingcash flows are included in cash flows from operating activities in the Consolidated Statements of Cash Flows along with the activities resulting frommanagement of the proceeds, which for the years ended December 31 are as follows:
4. Investments
Fair values
The amortized cost, gross unrealized gains and losses and fair value for fixed income securities are as follows:
139
($ in millions) 2010 2009 2008 Net change in proceeds managed Net change in fixed income securities $ — $ — $ 559 Net change in short-term investments 171 (316) 2,562
Operating cash flow provided (used) 171 (316) 3,121 Net change in cash 3 (2) —
Net change in proceeds managed $ 174 $ (318) $ 3,121
Net change in liabilities Liabilities for collateral, beginning of year $ (658) $ (340) $ (3,461)Liabilities for collateral, end of year (484) (658) (340)
Operating cash flow (used) provided $ (174) $ 318 $ (3,121)
($ in millions)
Gross unrealized
Amortized
cost Fair
value
Gains Losses December 31, 2010 U.S. government and agencies $ 8,320 $ 327 $ (51) $ 8,596 Municipal 16,201 379 (646) 15,934 Corporate 36,260 1,816 (421) 37,655 Foreign government 2,821 347 (10) 3,158 RMBS 8,509 216 (732) 7,993 CMBS 2,213 58 (277) 1,994 ABS 4,425 113 (294) 4,244 Redeemable preferred stock 37 1 — 38
Total fixed income securities $ 78,786 $ 3,257 $ (2,431) $ 79,612

Scheduled maturities
The scheduled maturities for fixed income securities are as follows as of December 31, 2010:
Actual maturities may differ from those scheduled as a result of prepayments by the issuers. Because of the potential for prepayment on RMBSand ABS, they are not categorized by contractual maturity. CMBS are categorized by contractual maturity because they generally are not subject toprepayment risk.
Net investment income
Net investment income for the years ended December 31 is as follows:
140
($ in millions)
Gross unrealized
Amortized
cost Fair
value
Gains Losses December 31, 2009 U.S. government and agencies $ 7,333 $ 219 $ (16) $ 7,536 Municipal 21,683 537 (940) 21,280 Corporate 32,770 1,192 (847) 33,115 Foreign government 2,906 306 (15) 3,197 RMBS 9,487 130 (1,630) 7,987 CMBS 3,511 30 (955) 2,586 ABS 3,514 62 (550) 3,026 Redeemable preferred stock 39 1 (1) 39
Total fixed income securities $ 81,243 $ 2,477 $ (4,954) $ 78,766
($ in millions)
Amortizedcost
Fairvalue
Due in one year or less $ 3,147 $ 3,185 Due after one year through five years 23,905 24,688 Due after five years through ten years 16,551 17,484 Due after ten years 22,249 22,018
65,852 67,375 RMBS and ABS 12,934 12,237
Total $ 78,786 $ 79,612
($ in millions) 2010 2009 2008 Fixed income securities $ 3,737 $ 3,998 $ 4,783 Equity securities 90 80 120 Mortgage loans 385 498 618 Limited partnership interests 40 17 62 Short-term investments 8 27 195 Other 19 (10) 54
Investment income, before expense 4,279 4,610 5,832 Investment expense (177) (166) (210)
Net investment income $ 4,102 $ 4,444 $ 5,622

Realized capital gains and losses
Realized capital gains and losses by asset type for the years ended December 31 are as follows:
Realized capital gains and losses by transaction type for the years ended December 31 are as follows:
Gross gains of $819 million, $1.21 billion and $718 million and gross losses of $435 million, $373 million and $485 million were realized on salesof fixed income securities during 2010, 2009 and 2008, respectively.
Other-than-temporary impairment losses by asset type for the years ended December 31 are as follows:
The total amount of other-than-temporary impairment losses included in accumulated other comprehensive income at the time of impairment forfixed income securities as of December 31, which were not included in earnings, are presented in the following table. The amount excludes$322 million and $192 million as of December 31, 2010 and
141
($ in millions) 2010 2009 2008 Fixed income securities $ (366) $ (302) $ (2,781)Equity securities 153 181 (1,149)Mortgage loans (71) (144) (94)Limited partnership interests 57 (446) (194)Derivatives (600) 206 (821)Other — (78) (51)
Realized capital gains and losses $ (827) $ (583) $ (5,090)
($ in millions) 2010 2009 2008 Impairment write-downs $ (797) $ (1,562) $ (1,983)Change in intent write-downs (204) (357) (1,752)
Net other-than-temporary impairment ("OTTI") losses recognized inearnings (1,001) (1,919) (3,735)
Sales 686 1,272 (464)Valuation of derivative instruments (427) 367 (1,280)Settlements of derivative instruments (174) (162) 486 EMA limited partnership income 89 (141) (97)
Realized capital gains and losses $ (827) $ (583) $ (5,090)
($ in millions) 2010 2009
Gross Included
in OCI Net Gross Included
in OCI Net Fixed income securities: Municipal $ (203) $ 24 $ (179) $ (140) $ 10 $ (130) Corporate (68) 2 (66) (213) (13) (226) Foreign government — — — (17) — (17) RMBS (381) (47) (428) (672) 384 (288) CMBS (94) (27) (121) (411) 102 (309) ABS (14) (16) (30) (208) (26) (234)
Total fixed incomesecurities (760) (64) (824) (1,661) 457 (1,204)
Equity securities (57) — (57) (264) — (264)Mortgage loans (71) — (71) (103) — (103)Limited partnership interests (46) — (46) (308) — (308)Other (3) — (3) (40) — (40)
Other-than-temporaryimpairment losses $ (937) $ (64) $ (1,001) $ (2,376) $ 457 $ (1,919)

2009, respectively, of net unrealized gains related to changes in valuation of the fixed income securities subsequent to the impairment measurementdate.
Rollforwards of the cumulative credit losses recognized in earnings for fixed income securities held as of December 31 are as follows:
The Company uses its best estimate of future cash flows expected to be collected from the fixed income security, discounted at the security'soriginal or current effective rate, as appropriate, to calculate a recovery value and determine whether a credit loss exists. The determination of cashflow estimates is inherently subjective and methodologies may vary depending on facts and circumstances specific to the security. All reasonablyavailable information relevant to the collectability of the security, including past events, current conditions, and reasonable and supportableassumptions and forecasts, are considered when developing the estimate of cash flows expected to be collected. That information generally includes,but is not limited to, the remaining payment terms of the security, prepayment speeds, foreign exchange rates, the financial condition and futureearnings potential of the issue or issuer, expected defaults, expected recoveries, the value of underlying collateral, vintage, geographic concentration,available reserves or escrows, current subordination levels, third party guarantees and other credit enhancements. Other information, such as industryanalyst reports and forecasts, sector credit ratings, financial condition of the bond insurer for insured fixed income securities, and other market datarelevant to the realizability of contractual cash flows, may also be considered. The estimated fair value of collateral will be used to estimate recoveryvalue if the Company determines that the security is dependent on the liquidation of collateral for ultimate settlement. If the estimated recovery value isless than the amortized cost of the security, a credit loss exists and an other-than-temporary impairment for the difference between the estimatedrecovery value and amortized cost is recorded in earnings. The portion of the unrealized loss related to factors other than credit remains classified inaccumulated other comprehensive income. If the Company determines that the fixed income security does not have sufficient cash flow or otherinformation to estimate a recovery value for the security, the Company may conclude that the entire decline in fair value is deemed to be credit relatedand the loss is recorded in earnings.
142
($ in millions) 2010 2009 Municipal $ (27) $ (10)Corporate (31) (51)RMBS (467) (594)CMBS (49) (127)ABS (41) (89)
Total $ (615) $ (871)
($ in millions) 2010 2009 Beginning balance $ (1,187) $ — Beginning balance of cumulative credit loss for securities held as of April 1, 2009 — (1,357)Cumulative effect of change in accounting principle 81 — Additional credit loss for securities previously other-than-temporarily impaired (314) (136)Additional credit loss for securities not previously other-than-temporarily impaired (312) (518)Reduction in credit loss for securities disposed or collected 638 824 Reduction in credit loss for securities the Company has made the decision to sell or
more likely than not will be required to sell 43 — Change in credit loss due to accretion of increase in cash flows 5 —
Ending balance $ (1,046) $ (1,187)

Unrealized net capital gains and losses
Unrealized net capital gains and losses included in accumulated other comprehensive income are as follows:
143
Gross unrealized
Fair
value Unrealized netgains (losses)
($ in millions)December 31, 2010 Gains Losses Fixed income securities (1) $ 79,612 $ 3,257 $ (2,431) $ 826 Equity securities 4,811 646 (63) 583 Short-term investments 3,279 — — — Derivative instruments (2) (17) 2 (24) (22)
Unrealized net capital gains and losses, pre-tax 1,387 Amounts recognized for: Insurance reserves (3) (41) DAC and DSI (4) 97
Amounts recognized 56 Deferred income taxes (508)
Unrealized net capital gains and losses, after-tax $ 935
Unrealized net capital gains and losses for fixed income securities as of December 31, 2010 comprises $(293) million related to unrealized net capital losseson fixed income securities with OTTI and $1.12 billion related to other unrealized net capital gains and losses.Included in the fair value of derivative instruments are $2 million classified as assets and $19 million classified as liabilities.The insurance reserves adjustment represents the amount by which the reserve balance would increase if the net unrealized gains in the applicable productportfolios were realized and reinvested at current lower interest rates, resulting in a premium deficiency. Although the Company evaluates premiumdeficiencies on the combined performance of life insurance and immediate annuities with life contingencies, the adjustment primarily relates to structuredsettlement annuities with life contingencies, in addition to annuity buy-outs and certain payout annuities with life contingencies.The DAC and DSI adjustment balance represents the amount by which the amortization of DAC and DSI would increase or decrease if the unrealized gainsor losses in the respective product portfolios were realized.
(1)
(2)(3)
(4)
Gross unrealized
Fair
value Unrealized netgains (losses)
December 31, 2009 Gains Losses Fixed income securities (1) $ 78,766 $ 2,477 $ (4,954) $ (2,477)Equity securities 5,024 381 (202) 179 Short-term investments 3,056 — — — Derivative instruments (2) (20) 2 (25) (23)
Unrealized net capital gains and losses, pre-tax (2,321)Amounts recognized for: Insurance reserves — DAC and DSI 990
Amounts recognized 990 Deferred income taxes 461
Unrealized net capital gains and losses, after-tax $ (870)
Unrealized net capital gains and losses for fixed income securities as of December 31, 2009 comprises $(679) million related to unrealized net capital losseson fixed income securities with OTTI and $(1.80) billion related to other unrealized net capital gains and losses.Included in the fair value of derivative instruments are $(2) million classified as assets and $18 million classified as liabilities.
(1)
(2)

Change in unrealized net capital gains and losses
The change in unrealized net capital gains and losses for the years ended December 31 is as follows:
Portfolio monitoring
The Company has a comprehensive portfolio monitoring process to identify and evaluate each fixed income and equity security whose carryingvalue may be other-than-temporarily impaired.
For each fixed income security in an unrealized loss position, the Company assesses whether management with the appropriate authority hasmade the decision to sell or whether it is more likely than not the Company will be required to sell the security before recovery of the amortized costbasis for reasons such as liquidity, contractual or regulatory purposes. If a security meets either of these criteria, the security's decline in fair value isconsidered other than temporary and is recorded in earnings.
If the Company has not made the decision to sell the fixed income security and it is not more likely than not the Company will be required to sellthe fixed income security before recovery of its amortized cost basis, the Company evaluates whether it expects to receive cash flows sufficient torecover the entire amortized cost basis of the security. The Company calculates the estimated recovery value by discounting the best estimate offuture cash flows at the security's original or current effective rate, as appropriate, and compares this to the amortized cost of the security. If theCompany does not expect to receive cash flows sufficient to recover the entire amortized cost basis of the fixed income security, the credit losscomponent of the impairment is recorded in earnings, with the remaining amount of the unrealized loss related to other factors recognized in othercomprehensive income.
For equity securities, the Company considers various factors, including whether it has the intent and ability to hold the equity security for a periodof time sufficient to recover its cost basis. Where the Company lacks the intent and ability to hold to recovery, or believes the recovery period isextended, the equity security's decline in fair value is considered other than temporary and is recorded in earnings. For equity securities managed by athird party, the Company has contractually retained its decision making authority as it pertains to selling equity securities that are in an unrealized lossposition.
The Company's portfolio monitoring process includes a quarterly review of all securities to identify instances where the fair value of a securitycompared to its amortized cost (for fixed income securities) or cost (for equity securities) is below established thresholds. The process also includesthe monitoring of other impairment indicators such as ratings, ratings downgrades and payment defaults. The securities identified, in addition to othersecurities for which the Company may have a concern, are evaluated for potential other-than-temporary impairment using all reasonably availableinformation relevant to the collectability or recovery of the security. Inherent in the Company's evaluation of other-than-temporary impairment for thesefixed income and equity securities are assumptions and estimates about the financial condition and future earnings potential of the issue or issuer.Some of the factors considered in evaluating whether a decline in fair value is other than temporary are: 1) the financial condition, near-term and long-term prospects of the issue or issuer, including relevant industry specific market conditions and trends, geographic location and implications of ratingagency actions and offering prices; 2) the specific reasons that a security is in an unrealized loss position, including overall market conditions whichcould affect liquidity; and 3) the length of time and extent to which the fair value has been less than amortized cost or cost.
144
($ in millions) 2010 2009 2008 Fixed income securities $ 3,303 $ 6,019 $ (9,452)Equity securities 404 511 (1,322)Short-term investments — (3) 3 Derivative instruments 1 (34) 44
Total 3,708 6,493 (10,727)
Amounts recognized for: Insurance reserves (41) 378 681 DAC and DSI (893) (2,510) 2,988
(Decrease) increase in amounts recognized (934) (2,132) 3,669 Deferred income taxes (969) (1,493) 2,432
Increase (decrease) in unrealized net capital gains and losses $ 1,805 $ 2,868 $ (4,626)

The following table summarizes the gross unrealized losses and fair value of fixed income and equity securities by the length of time that individualsecurities have been in a continuous unrealized loss position.
As of December 31, 2010, $1.12 billion of unrealized losses are related to securities with an unrealized loss position less than 20% of amortizedcost or cost, the degree of which suggests that these securities do not pose a high risk of being other-than-temporarily impaired. Of the $1.12 billion,$853 million are related to unrealized losses on investment grade fixed income securities. Investment grade is defined as a security having a rating ofAaa, Aa, A or Baa from Moody's, a rating of AAA, AA, A or BBB from Standard & Poor's ("S&P"), Fitch, Dominion or Realpoint, a rating of aaa, aa, a orbbb from A.M. Best, or a comparable internal rating if an externally provided rating is not available. Unrealized losses on investment grade securitiesare principally related to widening credit spreads or rising interest rates since the time of initial purchase.
As of December 31, 2010, the remaining $1.37 billion of unrealized losses are related to securities in unrealized loss positions greater than orequal to 20% of amortized cost or cost. Investment grade fixed income securities comprising $498 million of these unrealized losses were evaluatedbased on factors such as expected cash flows and the financial
145
($ in millions) Less than 12 months 12 months or more
Number
of issues Fair
value Unrealized
losses Number
of issues Fair
value Unrealized
losses
Totalunrealized
losses December 31, 2010 Fixed income securities U.S. government and agencies 32 $ 2,081 $ (51) — $ — $ — $ (51) Municipal 847 4,130 (175) 411 2,715 (471) (646) Corporate 438 5,994 (186) 150 1,992 (235) (421) Foreign government 33 277 (9) 1 10 (1) (10) RMBS 280 583 (12) 422 1,939 (720) (732) CMBS 14 158 (3) 114 835 (274) (277) ABS 68 762 (8) 133 1,313 (286) (294)
Total fixed income securities 1,712 13,985 (444) 1,231 8,804 (1,987) (2,431)Equity securities 773 610 (48) 44 91 (15) (63)
Total fixed income and equity
securities 2,485 $ 14,595 $ (492) 1,275 $ 8,895 $ (2,002) $ (2,494)
Investment grade fixed incomesecurities 1,607 $ 13,280 $ (408) 857 $ 6,217 $ (943) $ (1,351)
Below investment grade fixed incomesecurities 105 705 (36) 374 2,587 (1,044) (1,080)
Total fixed income securities 1,712 $ 13,985 $ (444) 1,231 $ 8,804 $ (1,987) $ (2,431)
December 31, 2009 Fixed income securities U.S. government and agencies 38 $ 3,523 $ (16) — $ — $ — $ (16) Municipal 761 3,646 (123) 747 5,024 (817) (940) Corporate 399 5,072 (178) 421 5,140 (669) (847) Foreign government 50 505 (15) 1 1 — (15) RMBS 387 1,092 (23) 453 2,611 (1,607) (1,630) CMBS 25 232 (4) 259 1,790 (951) (955) ABS 39 352 (20) 173 1,519 (530) (550) Redeemable preferred stock 1 — — 1 21 (1) (1)
Total fixed income securities 1,700 14,422 (379) 2,055 16,106 (4,575) (4,954)Equity securities 1,665 1,349 (113) 28 450 (89) (202)
Total fixed income and equity
securities 3,365 $ 15,771 $ (492) 2,083 $ 16,556 $ (4,664) $ (5,156)
Investment grade fixed incomesecurities 1,587 $ 13,891 $ (293) 1,561 $ 13,127 $ (2,848) $ (3,141)
Below investment grade fixed incomesecurities 113 531 (86) 494 2,979 (1,727) (1,813)
Total fixed income securities 1,700 $ 14,422 $ (379) 2,055 $ 16,106 $ (4,575) $ (4,954)
(1)
(1)
Gross unrealized losses resulting from factors other than credit on fixed income securities with other-than-temporary impairments for which the Company hasrecorded a credit loss in earnings total $10 million for the less than 12 month category and $408 million for the 12 months or greater category as ofDecember 31, 2010 and $20 million for the less than 12 month category and $729 million for the 12 months or greater category as of December 31, 2009.
(1)

condition and near-term and long-term prospects of the issue or issuer and were determined to have adequate resources to fulfill contractualobligations. Of the $1.37 billion, $868 million are related to below investment grade fixed income securities and $11 million are related to equitysecurities. Of these amounts, $794 million of the below investment grade fixed income securities had been in an unrealized loss position for a period oftwelve or more consecutive months as of December 31, 2010. Unrealized losses on below investment grade securities are principally related toRMBS, CMBS and ABS and were the result of wider credit spreads resulting from higher risk premiums since the time of initial purchase, largely due tomacroeconomic conditions and credit market deterioration, including the impact of lower real estate valuations.
RMBS, CMBS and ABS in an unrealized loss position were evaluated based on actual and projected collateral losses relative to the securities'positions in the respective securitization trusts, security specific expectations of cash flows, and credit ratings. This evaluation also takes intoconsideration credit enhancement, measured in terms of (i) subordination from other classes of securities in the trust that are contractually obligated toabsorb losses before the class of security the Company owns, (ii) the expected impact of other structural features embedded in the securitization trustbeneficial to the class of securities the Company owns, such as overcollateralization and excess spread, and (iii) for RMBS and ABS in an unrealizedloss position, credit enhancements from reliable bond insurers, where applicable. Municipal bonds in an unrealized loss position were evaluated basedon the quality of the underlying securities, taking into consideration credit enhancements from reliable bond insurers, where applicable. Unrealizedlosses on equity securities are primarily related to equity market fluctuations.
As of December 31, 2010, the Company has not made the decision to sell and it is not more likely than not the Company will be required to sellfixed income securities with unrealized losses before recovery of the amortized cost basis. As of December 31, 2010, the Company had the intent andability to hold equity securities with unrealized losses for a period of time sufficient for them to recover.
Limited partnerships
As of December 31, 2010 and 2009, the carrying value of equity method limited partnership interests totaled $2.47 billion and $1.64 billion,respectively. The Company recognizes an impairment loss for equity method investments when evidence demonstrates that the loss is other thantemporary. Evidence of a loss in value that is other than temporary may include the absence of an ability to recover the carrying amount of theinvestment or the inability of the investee to sustain a level of earnings that would justify the carrying amount of the investment. In 2010, 2009 and2008, the Company had write-downs related to equity method limited partnership interests of $1 million, $11 million and $29 million, respectively.
As of December 31, 2010 and 2009, the carrying value for cost method limited partnership interests was $1.35 billion and $1.10 billion,respectively. To determine if an other-than-temporary impairment has occurred, the Company evaluates whether an impairment indicator has occurredin the period that may have a significant adverse effect on the carrying value of the investment. Impairment indicators may include: significantlyreduced valuations of the investments held by the limited partnerships; actual recent cash flows received being significantly less than expected cashflows; reduced valuations based on financing completed at a lower value; completed sale of a material underlying investment at a price significantlylower than expected; or any other adverse events since the last financial statements received that might affect the fair value of the investee's capital.Additionally, the Company's portfolio monitoring process includes a quarterly review of all cost method limited partnerships to identify instances wherethe net asset value is below established thresholds for certain periods of time, as well as investments that are performing below expectations, forfurther impairment consideration. If a cost method limited partnership is other-than-temporarily impaired, the carrying value is written down to fairvalue, generally estimated to be equivalent to the reported net asset value of the underlying funds. The Company had write-downs related to costmethod investments in 2010, 2009 and 2008 of $45 million, $297 million and $83 million, respectively.
Mortgage loans
The Company's mortgage loans are commercial mortgage loans collateralized by a variety of commercial real estate property types locatedthroughout the United States and totaled, net of valuation allowance, $6.68 billion and $7.94 billion as of December 31, 2010 and 2009, respectively.Substantially all of the commercial mortgage loans are non-recourse to the borrower. The following table shows the principal geographic distribution ofcommercial real estate
146

represented in the Company's mortgage portfolio. No other state represented more than 5% of the portfolio as of December 31.
The types of properties collateralizing the mortgage loans as of December 31 are as follows:
The contractual maturities of the mortgage loan portfolio as of December 31, 2010, excluding $62 million of mortgage loans in the process offoreclosure, are as follows:
Mortgage loans are evaluated for impairment on a specific loan basis through a quarterly credit monitoring process and review of key credit qualityindicators. Mortgage loans are considered impaired when it is probable that the Company will not collect the contractual principal and interest.Valuation allowances are established for impaired loans to reduce the carrying value to the fair value of the collateral less costs to sell or the presentvalue of the loan's expected future repayment cash flows discounted at the loan's original effective interest rate. Impaired mortgage loans may nothave a valuation allowance when the fair value of the collateral less costs to sell is higher than the carrying value. Mortgage loan valuation allowancesare charged off when there is no reasonable expectation of recovery.
Accrual of income is suspended for mortgage loans that are in default or when full and timely collection of principal and interest payments is notprobable. Cash receipts on mortgage loans on nonaccrual status are generally recorded as a reduction of carrying value.
Debt service coverage ratio is considered a key credit quality indicator when mortgage loans are evaluated for impairment. Debt service coverageratio represents the amount of estimated cash flows from the property available to the borrower to meet principal and interest payment obligations.Debt service coverage ratio estimates are updated annually or more frequently if conditions are warranted based on the Company's credit monitoringprocess. The
147
(% of mortgage portfolio carrying value) 2010 2009 California 23.2% 22.6%Illinois 9.4 9.4 New York 6.6 6.3 New Jersey 6.5 5.9 Pennsylvania 5.6 6.0 Texas 5.3 5.0
(% of mortgage portfolio carrying value) 2010 2009 Office buildings 32.1% 35.3%Retail 27.3 24.2 Warehouse 21.9 23.2 Apartment complex 12.8 11.9 Other 5.9 5.4
Total 100.0% 100.0%
($ in millions)
Number ofloans
Carryingvalue Percent
2011 55 $ 624 9.4%2012 85 806 12.2 2013 76 655 9.9 2014 77 1,029 15.5 Thereafter 347 3,503 53.0
Total 640 $ 6,617 100.0%

following table reflects the carrying value of non-impaired fixed rate and variable rate mortgage loans as of December 31, 2010, summarized by debtservice coverage ratio distribution:
Mortgage loans with a debt service coverage ratio below 1.0 that are not considered impaired primarily relate to instances where the borrower hasthe financial capacity to fund the revenue shortfalls from the properties for the foreseeable term, the decrease in cash flows from the properties isconsidered temporary, or there are other risk mitigating circumstances such as additional collateral, escrow balances or borrower guarantees.
The net carrying value of impaired mortgage loans as of December 31 is as follows:
The average balance of impaired loans was $278 million, $327 million and $44 million during 2010, 2009 and 2008, respectively.
The rollforward of the valuation allowance on impaired mortgage loans for the years ended December 31 is as follows:
Past due mortgage loans carrying value as of December 31, 2010 is as follows:
Municipal bonds
The Company maintains a diversified portfolio of municipal bonds. The following table shows the principal geographic distribution of municipalbond issuers represented in the Company's portfolio as of December 31. No other state represents more than 5% of the portfolio.
148
($ in millions)Debt service coverage ratiodistribution
Fixed ratemortgage loans
Variable ratemortgage loans Total
Below 1.0 $ 280 $ — $ 280 1.0 - 1.25 1,583 16 1,599 1.26 - 1.50 1,520 5 1,525 Above 1.50 2,540 546 3,086
Total non-impaired mortgageloans $ 5,923 $ 567 $ 6,490
($ in millions) 2010 2009 Impaired mortgage loans with a valuation
allowance $ 168 $ 367 Impaired loans without a valuation
allowance 21 16
Total impaired mortgage loans $ 189 $ 383
Valuation allowance on impaired mortgageloans $ 84 $ 95
($ in millions) 2010 2009 2008 Beginning balance $ 95 $ 4 $ — Net increase in valuation allowance 65 97 4 Charge offs (76) (6) —
Ending balance $ 84 $ 95 $ 4
($ in millions) Less than 90 days past due $ 12 90 days or greater past due 78
Total past due 90 Current loans 6,589
Total mortgage loans $ 6,679
(% of municipal bondportfolio carrying value) 2010 2009 California 12.3% 13.3%Texas 10.1 8.9 Florida 5.8 5.9 Illinois 4.4 5.3

Concentration of credit risk
As of December 31, 2010, the Company is not exposed to any credit concentration risk of a single issuer and its affiliates greater than 10% of theCompany's shareholders' equity.
Securities loaned
The Company's business activities include securities lending programs with third parties, mostly large banks. As of December 31, 2010 and 2009,fixed income securities with a carrying value of $448 million and $434 million, respectively, were on loan under these agreements. In return, theCompany receives cash that it invests and includes in short-term investments and fixed income securities, with an offsetting liability recorded in otherliabilities and accrued expenses to account for the Company's obligation to return the collateral. Interest income on collateral, net of fees, was$2 million in both 2010 and 2009 and $48 million in 2008.
Other investment information
Included in fixed income securities are below investment grade assets totaling $6.66 billion and $4.98 billion as of December 31, 2010 and 2009,respectively.
As of December 31, 2010, fixed income securities and short-term investments with a carrying value of $281 million were on deposit with regulatoryauthorities as required by law.
As of December 31, 2010, the carrying value of fixed income securities that were non-income producing was $35 million.
5. Fair Value of Assets and Liabilities
Fair value is defined as the price that would be received to sell an asset or paid to transfer a liability in an orderly transaction between marketparticipants at the measurement date. The hierarchy for inputs used in determining fair value maximizes the use of observable inputs and minimizesthe use of unobservable inputs by requiring that observable inputs be used when available. Assets and liabilities recorded on the ConsolidatedStatements of Financial Position at fair value are categorized in the fair value hierarchy based on the observability of inputs to the valuation techniquesas follows:
The availability of observable inputs varies by instrument. In situations where fair value is based on internally developed pricing models or inputsthat are unobservable in the market, the determination of fair value requires more judgment. The degree of judgment exercised by the Company indetermining fair value is typically greatest for instruments categorized in Level 3. In many instances, valuation inputs used to measure fair value fallinto different levels of the fair value hierarchy. The category level in the fair value hierarchy is determined based on the lowest level input that issignificant to the fair value measurement in its entirety. The Company uses prices and inputs that are current as of the measurement date, includingduring periods of market disruption. In periods of market disruption, the ability to observe prices and inputs may be reduced for many instruments.
The Company has two types of situations where investments are classified as Level 3 in the fair value hierarchy. The first is where quotes continueto be received from independent third-party valuation service providers and all significant inputs are market observable; however, there has been asignificant decrease in the volume and level of activity for the asset when compared to normal market activity such that the degree of marketobservability has declined to a point where categorization as a Level 3 measurement is considered appropriate. The indicators considered indetermining
149
Level 1: Assets and liabilities whose values are based on unadjusted quoted prices for identical assets or liabilities in an active market that theCompany can access.
Level 2: Assets and liabilities whose values are based on the following:
(a) Quoted prices for similar assets or liabilities in active markets;
(b) Quoted prices for identical or similar assets or liabilities in markets that are not active; or
(c) Valuation models whose inputs are observable, directly or indirectly, for substantially the full term of the asset or liability.
Level 3: Assets and liabilities whose values are based on prices or valuation techniques that require inputs that are both unobservable and significantto the overall fair value measurement. Unobservable inputs reflect the Company's estimates of the assumptions that market participantswould use in valuing the assets and liabilities.

whether a significant decrease in the volume and level of activity for a specific asset has occurred include the level of new issuances in the primarymarket, trading volume in the secondary market, the level of credit spreads over historical levels, applicable bid-ask spreads, and price consensusamong market participants and other pricing sources.
The second situation where the Company classifies securities in Level 3 is where specific inputs significant to the fair value estimation models arenot market observable. This occurs in two primary instances. The first relates to the Company's use of broker quotes. The second relates to auctionrate securities ("ARS") backed by student loans for which a key input, the anticipated date liquidity will return to this market, is not market observable.
Certain assets are not carried at fair value on a recurring basis, including investments such as mortgage loans, limited partnership interests, bankloans and policy loans. Accordingly, such investments are only included in the fair value hierarchy disclosure when the investment is subject toremeasurement at fair value after initial recognition and the resulting remeasurement is reflected in the consolidated financial statements. In addition,derivatives embedded in fixed income securities are not disclosed in the hierarchy as free-standing derivatives since they are presented with the hostcontracts in fixed income securities. As of December 31, 2010, 74.1% of total assets are measured at fair value and 0.9% of total liabilities aremeasured at fair value.
In determining fair value, the Company principally uses the market approach which generally utilizes market transaction data for the same orsimilar instruments. To a lesser extent, the Company uses the income approach which involves determining fair values from discounted cash flowmethodologies. For the majority of Level 2 and Level 3 valuations, a combination of the market and income approaches is used.
Summary of significant valuation techniques for assets and liabilities measured at fair value on a recurring basis
Level 1 measurements
• Fixed income securities: Comprise U.S. Treasuries. Valuation is based on unadjusted quoted prices for identical assets in activemarkets that the Company can access.
• Equity securities: Comprise actively traded, exchange-listed U.S. and international equity securities. Valuation is based on unadjustedquoted prices for identical assets in active markets that the Company can access.
• Short-term: Comprise actively traded money market funds that have daily quoted net asset values for identical assets that the Companycan access.
• Separate account assets: Comprise actively traded mutual funds that have daily quoted net asset values for identical assets that theCompany can access. Net asset values for the actively traded mutual funds in which the separate account assets are invested areobtained daily from the fund managers.
Level 2 measurements
• Fixed income securities:
U.S. government and agencies: The primary inputs to the valuation include quoted prices for identical or similar assets in markets thatare not active, contractual cash flows, benchmark yields and credit spreads.
Municipal: The primary inputs to the valuation include quoted prices for identical or similar assets in markets that are not active,contractual cash flows, benchmark yields and credit spreads.
Corporate, including privately placed: The primary inputs to the valuation include quoted prices for identical or similar assets in marketsthat are not active, contractual cash flows, benchmark yields and credit spreads. Also included are privately placed securities valuedusing a discounted cash flow model that is widely accepted in the financial services industry and uses market observable inputs andinputs derived principally from, or corroborated by, observable market data. The primary inputs to the discounted cash flow model includean interest rate yield curve, as well as published credit spreads for similar assets in markets that are not active that incorporate the creditquality and industry sector of the issuer.
Foreign government: The primary inputs to the valuation include quoted prices for identical or similar assets in markets that are notactive, contractual cash flows, benchmark yields and credit spreads.
RMBS – U.S. government sponsored entities ("U.S. Agency"), Prime residential mortgage-backed securities ("Prime") and Alt-Aresidential mortgage-backed securities ("Alt-A"); ABS – auto and student loans and other: The primary inputs to the valuation includequoted prices for identical or similar assets in markets that are not active, contractual cash flows, benchmark yields, prepayment speeds,collateral performance and credit spreads.
150

CMBS: The primary inputs to the valuation include quoted prices for identical or similar assets in markets that are not active, contractualcash flows, benchmark yields, collateral performance and credit spreads.
Redeemable preferred stock: The primary inputs to the valuation include quoted prices for identical or similar assets in markets that arenot active, contractual cash flows, benchmark yields, underlying stock prices and credit spreads.
• Equity securities: The primary inputs to the valuation include quoted prices or quoted net asset values for identical or similar assets inmarkets that are not active.
• Short-term: The primary inputs to the valuation include quoted prices for identical or similar assets in markets that are not active,contractual cash flows, benchmark yields and credit spreads. For certain short-term investments, amortized cost is used as the bestestimate of fair value.
• Other investments: Free-standing exchange listed derivatives that are not actively traded are valued based on quoted prices for identicalinstruments in markets that are not active.
OTC derivatives, including interest rate swaps, foreign currency swaps, foreign exchange forward contracts, and certain credit defaultswaps, are valued using models that rely on inputs such as interest rate yield curves, currency rates, and counterparty credit spreadsthat are observable for substantially the full term of the contract. The valuation techniques underlying the models are widely accepted inthe financial services industry and do not involve significant judgment.
Level 3 measurements
• Fixed income securities:
Municipal: ARS primarily backed by student loans that have become illiquid due to failures in the auction market are valued using adiscounted cash flow model that is widely accepted in the financial services industry and uses significant non-market observable inputs,including estimates of future coupon rates if auction failures continue, the anticipated date liquidity will return to the market and illiquiditypremium. Also included are municipal bonds that are not rated by third party credit rating agencies but are rated by the NationalAssociation of Insurance Commissioners ("NAIC"), and other high-yield municipal bonds. The primary inputs to the valuation of thesemunicipal bonds include quoted prices for identical or similar assets in markets that exhibit less liquidity relative to those marketssupporting Level 2 fair value measurements, contractual cash flows, benchmark yields and credit spreads.
Corporate, including privately placed: Primarily valued based on non-binding broker quotes. Also included are equity-indexed noteswhich are valued using a discounted cash flow model that is widely accepted in the financial services industry and uses significant non-market observable inputs, such as volatility. Other inputs include an interest rate yield curve, as well as published credit spreads forsimilar assets that incorporate the credit quality and industry sector of the issuer.
Foreign government: Valued based on non-binding broker quotes.
RMBS – Subprime residential mortgage-backed securities ("Subprime") and Alt-A: The primary inputs to the valuation include quotedprices for identical or similar assets in markets that exhibit less liquidity relative to those markets supporting Level 2 fair valuemeasurements, contractual cash flows, benchmark yields, prepayment speeds, collateral performance and credit spreads. Also includedare Subprime and Alt-A securities that are valued based on non-binding broker quotes. Due to the reduced availability of actual marketprices or relevant observable inputs as a result of the decrease in liquidity that has been experienced in the market for these securities,Subprime and certain Alt-A securities are categorized as Level 3.
CMBS: The primary inputs to the valuation include quoted prices for identical or similar assets in markets that exhibit less liquidityrelative to those markets supporting Level 2 fair value measurements, contractual cash flows, benchmark yields, collateral performanceand credit spreads. Also included are CMBS that are valued based on non-binding broker quotes. Due to the reduced availability ofactual market prices or relevant observable inputs as a result of the decrease in liquidity that has been experienced in the market forthese securities, certain CMBS are categorized as Level 3.
ABS – Collateralized debt obligations ("CDO"): Valued based on non-binding broker quotes received from brokers who are familiar withthe investments. Due to the reduced availability of actual market prices or
151

relevant observable inputs as a result of the decrease in liquidity that has been experienced in the market for these securities, all CDOare categorized as Level 3.
ABS – student loans and other: The primary inputs to the valuation include quoted prices for identical or similar assets in markets thatexhibit less liquidity relative to those markets supporting Level 2 fair value measurements, contractual cash flows, benchmark yields,prepayment speeds, collateral performance and credit spreads. Also included are ABS that are valued based on non-binding brokerquotes. Due to the reduced availability of actual market prices or relevant observable inputs as a result of the decrease in liquidity thathas been experienced in the market for these securities, certain ABS are categorized as Level 3.
• Other investments: Certain OTC derivatives, such as interest rate caps and floors, certain credit default swaps and OTC options(including swaptions), are valued using models that are widely accepted in the financial services industry. These are categorized asLevel 3 as a result of the significance of non-market observable inputs such as volatility. Other primary inputs include interest rate yieldcurves and credit spreads.
• Contractholder funds: Derivatives embedded in certain life and annuity contracts are valued internally using models widely accepted inthe financial services industry that determine a single best estimate of fair value for the embedded derivatives within a block ofcontractholder liabilities. The models primarily use stochastically determined cash flows based on the contractual elements of embeddedderivatives, projected option cost and applicable market data, such as interest rate yield curves and equity index volatility assumptions.These are categorized as Level 3 as a result of the significance of non-market observable inputs.
Assets and liabilities measured at fair value on a non-recurring basis
Mortgage loans written-down to fair value in connection with recognizing impairments are valued based on the fair value of the underlyingcollateral less costs to sell. Limited partnership interests written-down to fair value in connection with recognizing other-than-temporary impairmentsare valued using net asset values.
152

The following table summarizes the Company's assets and liabilities measured at fair value on a recurring and non-recurring basis as ofDecember 31, 2010:
Includes $111 million of mortgage loans and $9 million of limited partnership interests written-down to fair value in connection with recognizing other-than-temporaryimpairments.
153
($ in millions)
Quoted pricesin active
markets foridenticalassets
(Level 1)
Significantother
observableinputs
(Level 2)
Significantunobservable
inputs(Level 3)
Counterpartyand cashcollateralnetting
Balanceas of
December 31,2010
Assets Fixed income securities: U.S. government and agencies $ 4,976 $ 3,620 $ — $ 8,596 Municipal — 13,918 2,016 15,934 Corporate — 35,747 1,908 37,655 Foreign government — 3,158 — 3,158 RMBS — 6,199 1,794 7,993 CMBS — 1,071 923 1,994 ABS — 1,827 2,417 4,244 Redeemable preferred stock — 37 1 38
Total fixed income securities 4,976 65,577 9,059 79,612 Equity securities 4,316 432 63 4,811 Short-term investments 174 3,105 — 3,279 Other investments: Free-standing derivatives — 651 74 $ (286) 439 Separate account assets 8,676 — — 8,676 Other assets — — 1 1
Total recurring basis assets 18,142 69,765 9,197 (286) 96,818 Non-recurring basis — — 120 120
Total assets at fair value $ 18,142 $ 69,765 $ 9,317 $ (286) $ 96,938
% of total assets at fair value 18.7% 72.0% 9.6% (0.3)% 100.0%
Liabilities Contractholder funds:
Derivatives embedded in life and annuity
contracts $ — $ — $ (653) — $ (653) Other liabilities: Free-standing derivatives (2) (529) (95) $ 263 (363)
Total liabilities at fair value $ (2) $ (529) $ (748) $ 263 $ (1,016)
% of total liabilities at fair value 0.2% 52.1% 73.6% (25.9)% 100.0%
(1)
(1)

The following table summarizes the Company's assets and liabilities measured at fair value on a recurring and non-recurring basis as ofDecember 31, 2009:
Includes $211 million of mortgage loans and $24 million of limited partnership interests written-down to fair value in connection with recognizing other-than-temporaryimpairments.
154
($ in millions)
Quoted pricesin active
markets foridenticalassets
(Level 1)
Significantother
observableinputs
(Level 2)
Significantunobservable
inputs(Level 3)
Counterpartyand cashcollateralnetting
Balanceas of
December 31,2009
Assets Fixed income securities: U.S. government and agencies $ 4,415 $ 3,121 $ — $ 7,536 Municipal — 18,574 2,706 21,280 Corporate — 30,874 2,241 33,115 Foreign government — 3,177 20 3,197 RMBS — 6,316 1,671 7,987 CMBS — 1,182 1,404 2,586 ABS — 1,025 2,001 3,026 Redeemable preferred stock — 37 2 39
Total fixed income securities 4,415 64,306 10,045 78,766 Equity securities 4,821 134 69 5,024 Short-term investments 278 2,778 — 3,056 Other investments: Free-standing derivatives — 882 146 $ (482) 546 Separate account assets 9,072 — — 9,072 Other assets — — 2 2
Total recurring basis assets 18,586 68,100 10,262 (482) 96,466 Non-recurring basis — — 235 235
Total assets at fair value $ 18,586 $ 68,100 $ 10,497 $ (482) $ 96,701
% of total assets at fair value 19.2% 70.4% 10.9% (0.5)% 100.0%
Liabilities Contractholder funds:
Derivatives embedded in life and annuity
contracts $ — $ (217) $ (110) $ (327) Other liabilities: Free-standing derivatives (2) (596) (91) $ 276 (413)
Total liabilities at fair value $ (2) $ (813) $ (201) $ 276 $ (740)
% of total liabilities at fair value 0.3% 109.9% 27.1% (37.3)% 100.0%
(1)
(1)

The following table presents the rollforward of Level 3 assets and liabilities held at fair value on a recurring basis during the year endedDecember 31, 2010.
The effect to net income totals $(860) million and is reported in the Consolidated Statements of Operations as follows: $(901) million in realized capital gains and losses,$73 million in net investment income, $1 million in interest credited to contractholder funds and $31 million in life and annuity contract benefits.Comprises $74 million of assets and $95 million of liabilities.
Transfers between level categorizations may occur due to changes in the availability of market observable inputs, which generally are caused bychanges in market conditions such as liquidity, trading volume or bid-ask spreads. Transfers between level categorizations may also occur due tochanges in the valuation source. For example, in situations where a fair value quote is not provided by the Company's independent third-partyvaluation service provider and as a result the price is stale or has been replaced with a broker quote, the security is transferred into Level 3. Transfersin and out of level categorizations are reported as having occurred at the beginning of the quarter in which the transfer occurred. Therefore, for alltransfers into Level 3, all realized and changes in unrealized gains and losses in the quarter of transfer are reflected in the Level 3 rollforward table.
There were no transfers between Level 1 and Level 2 during 2010.
During 2010, certain CMBS and ABS were transferred into Level 2 from Level 3 as a result of increased liquidity in the market and the availabilityof market observable quoted prices for similar assets. When transferring these securities into Level 2, the Company did not change the source of fairvalue estimates or modify the estimates received from independent third-party valuation service providers or the internal valuation approach.Accordingly, for securities included within this group, there was no change in fair value in conjunction with the transfer resulting in a realized orunrealized gain or loss.
Transfers into Level 3 during 2010, including those related to Corporate fixed income securities, included situations where a fair value quote wasnot provided by the Company's independent third-party valuation service provider and as a result the price was stale or had been replaced with abroker quote resulting in the security being classified as Level 3. Transfers out of Level 3 during 2010, including those related to Corporate fixedincome securities, included situations where a broker quote was used in the prior period and a fair value quote became available from the Company'sindependent third-party valuation service provider in the current period. A quote utilizing the new pricing source was
155
Total realized andunrealized gains (losses)
included in:
($ in millions)
OCI onStatement of
FinancialPosition
Balance as ofDecember 31,
2009 Net
income
Purchases,sales,
issuances andsettlements, net
Transfersinto
Level 3
Transfersout of
Level 3
Balance as ofDecember 31,
2010 Assets Fixed income securities: Municipal $ 2,706 $ (40) $ 46 $ (588) $ 38 $ (146) $ 2,016 Corporate 2,241 5 115 (167) 444 (730) 1,908 Foreign government 20 — — (20) — — — RMBS 1,671 (421) 736 (135) — (57) 1,794 CMBS 1,404 (233) 592 (526) 107 (421) 923 ABS 2,001 55 275 553 — (467) 2,417
Redeemable preferred
stock 2 — — (1) — — 1
Total fixed income
securities 10,045 (634) 1,764 (884) 589 (1,821) 9,059 Equity securities 69 8 5 (12) — (7) 63 Other investments:
Free-standing
derivatives, net 55 (202) — 126 — — (21) Other assets 2 (1) — — — — 1
Total recurring
Level 3 assets $ 10,171 $ (829) $ 1,769 $ (770) $ 589 $ (1,828) $ 9,102
Liabilities Contractholder funds:
Derivatives embeddedin life and annuitycontracts $ (110) $ (31) $ — $ 3 $ (515) $ — $ (653)
Total recurring
Level 3 liabilities $ (110) $ (31) $ — $ 3 $ (515) $ — $ (653)
(1)
(2)
(1)
(2)

not available as of the prior period, and any gains or losses related to the change in valuation source for individual securities were not significant.
Transfers into Level 3 during 2010 also included derivatives embedded in equity-indexed life and annuity contracts due to refinements in thevaluation modeling resulting in an increase in significance of non-market observable inputs.
The following table provides the total gains and (losses) included in net income during 2010 for Level 3 assets and liabilities still held as ofDecember 31, 2010.
The amounts in the table above represent gains and losses included in net income during 2010 for the period of time that the asset or liability wasdetermined to be in Level 3. These gains and losses total $(349) million in 2010 and are reported in the Consolidated Statements of Operations asfollows: $(402) million in realized capital gains and losses, $86 million in net investment income, $2 million in interest credited to contractholder fundsand $31 million in life and annuity contract benefits.
156
($ in millions) Assets Fixed income securities: Municipal $ (33) Corporate 40 RMBS (292) CMBS (28) ABS 60
Total fixed income securities (253) Equity securities Other investments: (3) Free-standing derivatives, net (61) Other assets (1)
Total recurring Level 3 assets $ (318)
Liabilities Contractholder funds:
Derivatives embedded in life andannuity contracts $ (31)
Total recurring Level 3 liabilities $ (31)

The following table presents the rollforward of Level 3 assets and liabilities held at fair value on a recurring basis during the year endedDecember 31, 2009.
The effect to net income totals $(627) million and is reported in the Consolidated Statements of Operations as follows: $(889) million in realized capital gains and losses,$111 million in net investment income, $(3) million in interest credited to contractholder funds and $(148) million in life and annuity contract benefits.Comprises $146 million of assets and $91 million of liabilities.The amounts represent gains and losses included in net income for the period of time that the asset or liability was determined to be in Level 3. These gains and losses total$(226) million and are reported in the Consolidated Statements of Operations as follows: $(486) million in realized capital gains and losses, $106 million in net investmentincome, $(6) million in interest credited to contractholder funds and $(148) million in life and annuity contract benefits.
157
($ in millions)
Total realized andunrealized gains (losses)
included in:
Totalgains (losses)
included innet incomefor financial
instruments stillheld as of
December 31,2009
Balance as ofDecember 31,
2008 Net
income
OCI onStatement of
FinancialPosition
Purchases,sales,
issuancesand
settlements,net
Nettransfers inand/or (out)of Level 3
Balance as ofDecember 31,
2009 Assets
Fixed income
securities: Municipal $ 2,463 $ (34) $ 191 $ (202) $ 288 $ 2,706 $ (34) Corporate 10,195 (20) 1,216 (1,411) (7,739) 2,241 53
Foreign
government — — — 80 (60) 20 — RMBS 2,988 (179) 283 (470) (951) 1,671 (128) CMBS 457 (399) 804 (42) 584 1,404 (318) ABS 1,714 (202) 918 21 (450) 2,001 (122)
Redeemable
preferred stock 2 — — — — 2 (1)
Total fixedincomesecurities 17,819 (834) 3,412 (2,024) (8,328) 10,045 (550)
Equity securities 74 (4) 1 1 (3) 69 (5) Other investments:
Free-standing
derivatives, net (101) 62 — 94 — 55 180 Other assets 1 1 — — — 2 1
Total recurring
Level 3 assets $ 17,793 $ (775) $ 3,413 $ (1,929) $ (8,331) $ 10,171 $ (374)
Liabilities
Contractholder
funds:
Derivativesembedded inlife and annuitycontracts $ (265) $ 148 $ — $ 7 $ — $ (110) $ 148
Total recurringLevel 3liabilities $ (265) $ 148 $ — $ 7 $ — $ (110) $ 148
(3)(1)
(2)
(1)
(2)(3)

The following table presents the rollforward of Level 3 assets and liabilities held at fair value on a recurring basis during the year endedDecember 31, 2008.
The effect to net income totals $(2.79) billion and is reported in the Consolidated Statements of Operations as follows: $(2.65) billion in realized capital gains and losses,$134 million in net investment income, $6 million in interest credited to contractholder funds and $270 million in life and annuity contract benefits.Comprises $13 million of assets and $114 million of liabilities.The amounts represent gains and losses included in net income for the period of time that the asset or liability was determined to be in Level 3. These gains and losses total$(1.98) billion and are reported in the Consolidated Statements of Operations as follows: $(1.81) billion in realized capital gains and losses, $103 million in net investmentincome, $1 million in interest credited to contractholder funds and $270 million in life and annuity contract benefits.
Presented below are the carrying values and fair value estimates of financial instruments not carried at fair value.
Financial assets
The fair value of mortgage loans is based on discounted contractual cash flows or, if the loans are impaired due to credit reasons, the fair value ofcollateral less costs to sell. Risk adjusted discount rates are selected using current rates at which similar loans would be made to borrowers withsimilar characteristics, using similar types of properties as
158
($ in millions)
Total realized andunrealized gains (losses)
included in:
Totalgains (losses)
included innet incomefor financial
instruments stillheld as of
December 31,2008
Balance as ofJanuary 1,
2008 Net
income
OCI onStatement of
FinancialPosition
Purchases,sales,
issuancesand
settlements,net
Nettransfers inand/or (out)of Level 3
Balance as ofDecember 31,
2008 Assets
Fixed income
securities: Municipal $ 1,477 $ 3 $ (385) $ (205) $ 1,573 $ 2,463 $ (5) Corporate 12,868 (426) (1,402) (1,371) 526 10,195 (379)
Foreign
government 19 1 — (6) (14) — — RMBS 5,405 (971) (731) (1,058) 343 2,988 (708) CMBS 833 (479) (291) (383) 777 457 (202) ABS 3,769 (316) (1,106) (853) 220 1,714 (300)
Redeemablepreferredstock 1 1 — — — 2 —
Total fixedincomesecurities 24,372 (2,187) (3,915) (3,876) 3,425 17,819 (1,594)
Equity securities 129 (102) 5 20 22 74 (5)
Other
investments:
Free-standingderivatives,net 10 (235) — 124 — (101) (106)
Other assets 2 (1) — — — 1 (1)
Total recurringLevel 3assets $ 24,513 $ (2,525) $ (3,910) $ (3,732) $ 3,447 $ 17,793 $ (1,706)
Liabilities
Contractholder
funds:
Derivativesembedded inlife andannuitycontracts $ 4 $ (270) $ — $ 1 $ — $ (265) $ (270)
Total recurringLevel 3liabilities $ 4 $ (270) $ — $ 1 $ — $ (265) $ (270)
(3)(1)
(2)
(1)
(2)(3)
($ in millions) December 31, 2010 December 31, 2009
Carrying
value Fair
value Carrying
value Fair
value Mortgage loans $ 6,679 $ 6,439 $ 7,935 $ 6,336 Limited partnership interests – cost basis 1,348 1,481 1,103 1,098 Bank loans 363 355 420 391

collateral. The fair value of limited partnership interests accounted for on the cost basis is determined using reported net asset values of the underlyingfunds. The fair value of bank loans, which are reported in other investments on the Consolidated Statements of Financial Position, are based on brokerquotes from brokers familiar with the loans and current market conditions.
Financial liabilities
The fair value of contractholder funds on investment contracts is based on the terms of the underlying contracts utilizing prevailing market rates forsimilar contracts adjusted for the Company's own credit risk. Deferred annuities included in contractholder funds are valued using discounted cash flowmodels which incorporate market value margins, which are based on the cost of holding economic capital, and the Company's own credit risk.Immediate annuities without life contingencies and fixed rate funding agreements are valued at the present value of future benefits using marketimplied interest rates which include the Company's own credit risk.
The fair value of long-term debt is based on market observable data (such as the fair value of the debt when traded as an asset) or, in certaincases, is determined using discounted cash flow calculations based on current interest rates for instruments with comparable terms and considers theCompany's own credit risk. The liability for collateral is valued at carrying value due to its short-term nature.
6. Derivative Financial Instruments and Off-balance-sheet Financial Instruments
The Company primarily uses derivatives for risk management, to partially mitigate potential adverse impacts from changes in risk-free interestrates, negative equity market valuations and increases in credit spreads, and asset replication. In addition, the Company has derivatives embedded innon-derivative host contracts that are required to be separated from the host contracts and accounted for at fair value. With the exception of non-hedge derivatives used for asset replication and non-hedge embedded derivatives, all of the Company's derivatives are evaluated for their ongoingeffectiveness as either accounting hedge or non-hedge derivative financial instruments on at least a quarterly basis. The Company does not usederivatives for trading purposes. Non-hedge accounting is generally used for "portfolio" level hedging strategies where the terms of the individualhedged items do not meet the strict homogeneity requirements to permit the application of hedge accounting.
Property-Liability uses interest rate swaption contracts and exchange traded options on interest rate futures to offset potential declining fixedincome market values resulting from potential rising interest rates. Property-Liability also uses interest rate swaps to mitigate municipal bond interestrate risk within the municipal bond portfolio. Exchange traded equity put options are utilized by Property-Liability for overall equity portfolio protectionfrom significant declines in equity market values below a targeted level. Equity index futures are used by Property-Liability to offset valuation losses inthe equity portfolio during periods of declining equity market values. Credit default swaps are typically used to mitigate the credit risk within theProperty-Liability fixed income portfolio.
Portfolio duration management is a risk management strategy that is principally employed by Property-Liability wherein, depending on the currentportfolio duration relative to a designated target and the expectations of future interest rate movements, financial futures and interest rate swaps areutilized to change the duration of the portfolio in order to offset the economic effect that interest rates would otherwise have on the fair value of its fixedincome securities.
Property-Liability uses futures to hedge the market risk related to deferred compensation liability contracts and forward contracts to hedge foreigncurrency risk associated with holding foreign currency denominated investments and foreign operations.
Allstate Financial uses foreign currency swaps primarily to reduce the foreign currency risk associated with issuing foreign currency denominatedfunding agreements and holding foreign currency denominated investments. Credit default swaps are also typically used to mitigate the credit riskwithin the Allstate Financial fixed income portfolio.
159
($ in millions) December 31, 2010 December 31, 2009
Carrying
value Fair
value Carrying
value Fair
value Contractholder funds on investment contracts $ 36,163 $ 35,194 $ 40,943 $ 39,328 Long-term debt 5,908 6,325 5,910 6,016 Liability for collateral 484 484 658 658

Asset-liability management is a risk management strategy that is principally employed by Allstate Financial to balance the respective interest-ratesensitivities of its assets and liabilities. Depending upon the attributes of the assets acquired and liabilities issued, derivative instruments such asinterest rate swaps, caps, floors, swaptions and futures are utilized to change the interest rate characteristics of existing assets and liabilities to ensurethe relationship is maintained within specified ranges and to reduce exposure to rising or falling interest rates. Allstate Financial uses financial futuresand interest rate swaps to hedge anticipated asset purchases and liability issuances and futures and options for hedging the equity exposurecontained in its equity indexed life and annuity product contracts that offer equity returns to contractholders. In addition, Allstate Financial uses interestrate swaps to hedge interest rate risk inherent in funding agreements.
When derivatives meet specific criteria, they may be designated as accounting hedges and accounted for as fair value, cash flow, foreign currencyfair value or foreign currency cash flow hedges. Allstate Financial designates certain of its interest rate and foreign currency swap contracts andcertain investment risk transfer reinsurance agreements as fair value hedges when the hedging instrument is highly effective in offsetting the risk ofchanges in the fair value of the hedged item. Allstate Financial designates certain of its foreign currency swap contracts as cash flow hedges when thehedging instrument is highly effective in offsetting the exposure of variations in cash flows for the hedged risk that could affect net income. Amountsare reclassified to net investment income or realized capital gains and losses as the hedged item affects net income.
Asset replication refers to the "synthetic" creation of assets through the use of derivatives and primarily investment grade host bonds to replicatesecurities that are either unavailable in the cash markets or more economical to acquire in synthetic form. The Company replicates fixed incomesecurities using a combination of a credit default swap and one or more highly rated fixed income securities to synthetically replicate the economiccharacteristics of one or more cash market securities. The Company also creates "synthetic" exposure to equity markets through the use of exchangetraded equity index future contracts and an investment grade host bond.
The Company's primary embedded derivatives are conversion options in fixed income securities, which provide the Company with the right toconvert the instrument into a predetermined number of shares of common stock; equity options in Allstate Financial life and annuity product contracts,which provide equity returns to contractholders; equity-indexed notes containing equity call options, which provide a coupon payout that is determinedusing one or more equity-based indices; and credit default swaps in synthetic collateralized debt obligations, which provide enhanced coupon rates asa result of selling credit protection.
The notional amounts specified in the contracts are used to calculate the exchange of contractual payments under the agreements and aregenerally not representative of the potential for gain or loss on these agreements. However, the notional amounts specified in credit default swapswhere the Company has sold credit protection represent the maximum amount of potential loss, assuming no recoveries.
Fair value, which is equal to the carrying value, is the estimated amount that the Company would receive or pay to terminate the derivativecontracts at the reporting date. The carrying value amounts for OTC derivatives are further adjusted for the effects, if any, of legally enforceable masternetting agreements and are presented on a net basis, by counterparty agreement, in the Consolidated Statements of Financial Position. For certainexchange traded derivatives, the exchange requires margin deposits as well as daily cash settlements of margin accounts. As of December 31, 2010,the Company pledged $37 million of securities and cash in the form of margin deposits.
For those derivatives which qualify for fair value hedge accounting, net income includes the changes in the fair value of both the derivativeinstrument and the hedged risk, and therefore reflects any hedging ineffectiveness. For cash flow hedges, gains and losses are amortized fromaccumulated other comprehensive income and are reported in net income in the same period the forecasted transactions being hedged impact netincome. For embedded derivatives in fixed income securities, net income includes the change in fair value of the embedded derivative and accretionincome related to the host instrument. For non-hedge derivatives, net income includes changes in fair value and accrued periodic settlements, whenapplicable.
160

The following table provides a summary of the volume and fair value positions of derivative instruments as well as their reporting location in theConsolidated Statements of Financial Position as of December 31, 2010.
161
($ in millions, except number of contracts) Asset derivatives Volume
Balance sheet location Notionalamount
Numberof
contracts
Fairvalue,
net Grossasset
Grossliability
Derivatives designated as accounting hedginginstruments
Interest rate swap agreements Other investments $ 156 n/a $ (18) $ — $ (18) Foreign currency swap agreements Other investments 64 n/a 2 3 (1)
Total $ 220 n/a $ (16) $ 3 $ (19)
Derivatives not designated as accounting hedginginstruments
Interest rate contracts Interest rate swap agreements Other investments $ 1,469 n/a $ 65 $ 81 $ (16) Interest rate swaption agreements Other investments 4,161 n/a 50 50 — Interest rate cap and floor agreements Other investments 226 n/a (2) 1 (3) Financial futures contracts and options Other investments n/a 8,000 3 3 — Financial futures contracts and options Other assets n/a 1,420 — — — Equity and index contracts Options, futures and warrants Other investments 64 38,451 359 359 — Options, futures and warrants Other assets n/a 292 — — — Foreign currency contracts Foreign currency swap agreements Other investments 90 n/a 6 6 — Foreign currency forwards and options Other investments 257 n/a 6 7 (1) Embedded derivative financial instruments Conversion options Fixed income securities 820 n/a 236 238 (2) Equity-indexed call options Fixed income securities 300 n/a 47 47 — Credit default swaps Fixed income securities 181 n/a (88) — (88) Other embedded derivative financial instruments Other investments 1,000 n/a — — — Credit default contracts Credit default swaps – buying protection Other investments 299 n/a (5) 2 (7) Credit default swaps – selling protection Other investments 150 n/a (8) 2 (10) Other contracts Other contracts Other investments 13 n/a — — — Other contracts Other assets 5 n/a 1 1 —
Total $ 9,035 48,163 $ 670 $ 797 $ (127)
Total asset derivatives $ 9,255 48,163 $ 654 $ 800 $ (146)
(1)
(2)
Volume for OTC derivative contracts is represented by their notional amounts. Volume for exchange traded derivatives is represented by the number ofcontracts, which is the basis on which they are traded. (n/a = not applicable)
In addition to the number of contracts presented in the table, the Company held 2,768 stock rights and 1,379,932 stock warrants. Stock warrants can beconverted to cash upon sale of those instruments or exercised for shares of common stock.
(1)
(2)

162
Liability derivatives Volume
Balance sheet location Notionalamount
Numberof
contracts
Fairvalue,
net Grossasset
Grossliability
Derivatives designated as accounting hedginginstruments
Interest rate swap agreements Other liabilities & accruedexpenses $ 3,345 n/a $ (181) $ 20 $ (201)
Interest rate swap agreements Contractholder funds — n/a 2 2 — Foreign currency swap agreements Other liabilities & accrued
expenses 138 n/a (20) — (20) Foreign currency and interest rate swap
agreements Other liabilities & accrued
expenses 435 n/a 34 34 —
Foreign currency and interest rate swap
agreements
Contractholder funds — n/a 28 28 —
Total $ 3,918 n/a $ (137) $ 84 $ (221)
Derivatives not designated as accountinghedging instruments
Interest rate contracts Interest rate swap agreements Other liabilities & accrued
expenses $ 4,543 n/a $ 29 $ 97 $ (68) Interest rate swaption agreements Other liabilities & accrued
expenses 4,400 n/a 18 18 — Interest rate cap and floor agreements Other liabilities & accrued
expenses 3,216 n/a (22) 1 (23) Financial futures contracts and options Other liabilities & accrued
expenses n/a 15,150 (1) — (1) Equity and index contracts Options and futures Other liabilities & accrued
expenses 64 21,585 (168) 2 (170) Foreign currency contracts Foreign currency forwards and options Other liabilities & accrued
expenses 316 n/a 1 2 (1) Embedded derivative financial instruments Guaranteed accumulation benefits Contractholder funds 1,067 n/a (88) — (88) Guaranteed withdrawal benefits Contractholder funds 739 n/a (47) — (47)
Equity-indexed and forward starting options in
life and annuity product contracts
Contractholder funds 4,694 n/a (515) — (515)
Other embedded derivative financial
instruments
Contractholder funds 85 n/a (3) — (3) Credit default contracts Credit default swaps – buying protection Other liabilities & accrued
expenses 1,127 n/a (13) 6 (19) Credit default swaps – selling protection Other liabilities & accrued
expenses 482 n/a (66) 1 (67)
Total $ 20,733 36,735 $ (875) $ 127 $ (1,002)
Total liability derivatives $ 24,651 36,735 $ (1,012) $ 211 $ (1,223)
Total derivatives $ 33,906 84,898 $ (358)
(1)
Volume for OTC derivative contracts is represented by their notional amounts. Volume for exchange traded derivatives is represented by the number ofcontracts, which is the basis on which they are traded. (n/a = not applicable)
(1)

The following table provides a summary of the volume and fair value positions of derivative instruments as well as their reporting location in theConsolidated Statements of Financial Position as of December 31, 2009.
163
($ in millions, except number of contracts) Asset derivatives Volume
Balance sheet location Notionalamount
Numberof
contracts
Fairvalue,
net Grossasset
Grossliability
Derivatives designated as accounting hedginginstruments
Interest rate swap agreements Other investments $ 45 n/a $ (3) $ — $ (3) Foreign currency swap agreements Other investments 23 n/a (2) — (2)
Total $ 68 n/a $ (5) $ — $ (5)
Derivatives not designated as accounting hedginginstruments
Interest rate contracts Interest rate swap agreements Other investments $ 1,206 n/a $ 49 $ 62 $ (13) Interest rate swaption agreements Other investments 8,500 n/a 95 95 — Interest rate cap and floor agreements Other investments 52 n/a 2 2 — Financial futures contracts and options Other investments n/a 30,000 12 12 — Financial futures contracts and options Other assets n/a 404 — — — Equity and index contracts Options, futures and warrants Other investments 62 43,850 435 435 — Options, futures and warrants Other assets n/a 102 — — — Foreign currency contracts Foreign currency swap agreements Other investments 53 n/a 1 1 — Foreign currency forwards and options Other investments 476 n/a 5 8 (3) Embedded derivative financial instruments Conversion options Fixed income securities 936 n/a 312 316 (4) Equity-indexed call options Fixed income securities 475 n/a 89 89 — Other embedded derivative financial instruments Other investments 1,000 n/a 2 2 — Credit default contracts Credit default swaps – buying protection Other investments 329 n/a (6) 2 (8) Credit default swaps – selling protection Other investments 93 n/a (8) 2 (10) Other contracts Other contracts Other investments 75 n/a — — — Other contracts Other assets 6 n/a 2 2 —
Total $ 13,263 74,356 $ 990 $ 1,028 $ (38)
Total asset derivatives $ 13,331 74,356 $ 985 $ 1,028 $ (43)
(1)
(2)
Volume for OTC derivative contracts is represented by their notional amounts. Volume for exchange traded derivatives is represented by the number ofcontracts, which is the basis on which they are traded. (n/a = not applicable)
In addition to the number of contracts presented in the table, the Company held 101,255 stock rights and 1,352,432 stock warrants. Stock rights and stockwarrants can be converted to cash upon sale of those instruments or exercised for shares of common stock.
(1)
(2)

164
Liability derivatives Volume
Balance sheet location Notionalamount
Numberof
contracts
Fairvalue,
net Grossasset
Grossliability
Derivatives designated as accounting hedginginstruments
Interest rate swap agreements Other liabilities & accruedexpenses $ 2,443 n/a $ (230) $ — $ (230)
Foreign currency swap agreements Other liabilities & accruedexpenses 179 n/a (18) 3 (21)
Foreign currency and interest rate swapagreements
Other liabilities & accruedexpenses 870 n/a 231 231 —
Foreign currency and interest rate swap
agreements
Contractholder funds — n/a 44 44 —
Total $ 3,492 n/a $ 27 $ 278 $ (251)
Derivatives not designated as accountinghedging instruments
Interest rate contracts Interest rate swap agreements Other liabilities & accrued
expenses $ 6,187 n/a $ 28 $ 68 $ (40) Interest rate swaption agreements Other liabilities & accrued
expenses 2,000 n/a 34 34 — Interest rate cap and floor agreements Other liabilities & accrued
expenses 3,896 n/a (16) 9 (25)Equity and index contracts Options, futures and warrants Other liabilities & accrued
expenses 45 21,098 (214) 3 (217) Foreign currency contracts Foreign currency swap agreements Other liabilities & accrued
expenses 54 n/a 3 3 — Foreign currency forwards and options Other liabilities & accrued
expenses 185 n/a 2 2 — Embedded derivative financial instruments Guaranteed accumulation benefits Contractholder funds 1,113 n/a (66) — (66) Guaranteed withdrawal benefits Contractholder funds 810 n/a (41) — (41)
Equity-indexed and forward starting options in
life and annuity product contracts
Contractholder funds 4,321 n/a (217) — (217) Other embedded derivative financial instruments Contractholder funds 85 n/a (3) — (3) Credit default contracts Credit default swaps – buying protection Other liabilities & accrued
expenses 839 n/a (40) 5 (45) Credit default swaps – selling protection Other liabilities & accrued
expenses 1,195 n/a (65) 7 (72)
Total $ 20,730 21,098 $ (595) $ 131 $ (726)
Total liability derivatives $ 24,222 21,098 $ (568) $ 409 $ (977)
Total derivatives $ 37,553 95,454 $ 417
(1)
Volume for OTC derivative contracts is represented by their notional amounts. Volume for exchange traded derivatives is represented by the number ofcontracts, which is the basis on which they are traded. (n/a = not applicable)
(1)

The following table provides a summary of the impacts of the Company's foreign currency contracts in cash flow hedging relationships in theConsolidated Statements of Operations and the Consolidated Statements of Financial Position for the years ended December 31. Amortization of netgains from accumulated other comprehensive income related to cash flow hedges is expected to be $2 million during the next twelve months.
For cash flow hedges, unrealized net pre-tax gains and losses included in accumulated other comprehensive income were $(22) million and $(23)million as of December 31, 2010 and 2009, respectively. The net pre-tax changes in accumulated other comprehensive income due to cash flowhedges were $1 million, $(34) million and $44 million in 2010, 2009 and 2008, respectively.
The following tables present gains and losses from valuation, settlements and hedge ineffectiveness reported on derivatives used in fair valuehedging relationships and derivatives not designated as accounting hedging instruments in the Consolidated Statements of Operations for the yearsended December 31.
165
($ in millions)Effective portion 2010 2009 Gain (loss) recognized in OCI on derivatives during the period $ 3 $ (35)Loss recognized in OCI on derivatives during the term of the hedging
relationship (22) (23)Gain reclassified from AOCI into income (net investment income) — 2 Gain (loss) reclassified from AOCI into income (realized capital gains and
losses) 2 (3)Ineffective portion and amount excluded from effectiveness testing Gain recognized in income on derivatives (realized capital gains and
losses) — —
($ in millions) 2010
Netinvestment
income
Realizedcapital
gains andlosses
Life andannuitycontractbenefits
Interestcredited to
contractholderfunds
Operatingcosts andexpenses
Total gain(loss)
recognizedin net
income onderivatives
Derivatives in fair value accounting hedgingrelationships
Interest rate contracts $ (139) $ 9 $ — $ 11 $ — $ (119) Foreign currency and interest rate contracts — (2) — (18) — (20)
Subtotal (139) 7 — (7) — (139)
Derivatives not designated as accountinghedging instruments
Interest rate contracts — (496) — — — (496) Equity and index contracts — (91) — 113 18 40 Embedded derivative financial instruments — (3) (28) 34 — 3 Foreign currency contracts — (10) — — (3) (13) Credit default contracts — (8) — — — (8) Other contracts — — — 3 — 3
Subtotal — (608) (28) 150 15 (471)
Total $ (139) $ (601) $ (28) $ 143 $ 15 $ (610)

The hedge ineffectiveness reported in realized capital gains and losses amounted to gains of $7 million in 2010 and losses of $1 million and$4 million in 2009 and 2008, respectively.
The following tables provide a summary of the changes in fair value of the Company's fair value hedging relationships in the ConsolidatedStatements of Operations for the years ended December 31.
The Company manages its exposure to credit risk by utilizing highly rated counterparties, establishing risk control limits, executing legallyenforceable master netting agreements ("MNAs") and obtaining collateral where appropriate.
166
2009
Netinvestment
income
Realizedcapital
gains andlosses
Life andannuitycontractbenefits
Interestcredited to
contractholderfunds
Operatingcosts andexpenses
Total gain(loss)
recognizedin net
income onderivatives
Derivatives in fair value accounting hedgingrelationships
Interest rate contracts $ 30 $ 12 $ — $ (13) $ — $ 29 Foreign currency and interest rate contracts — (9) — 77 — 68
Subtotal 30 3 — 64 — 97
Derivatives not designated as accountinghedging instruments
Interest rate contracts — 255 — — — 255 Equity and index contracts — (160) — 115 24 (21) Embedded derivative financial instruments — 122 158 (184) — 96 Foreign currency contracts — 7 — — (10) (3) Credit default contracts — (18) — — — (18) Other contracts (1) — — 3 — 2
Subtotal (1) 206 158 (66) 14 311
Total $ 29 $ 209 $ 158 $ (2) $ 14 $ 408
($ in millions) 2010
Gain (loss) on
derivatives Gain (loss) on hedged risk
Location of gain or (loss) recognized in net income on derivatives
Interestrate
contracts
Foreigncurrency &interest rate
contracts Contractholder
funds Investments Interest credited to contractholder funds $ — $ (48) $ 48 $ — Net investment income (33) — — 33 Realized capital gains and losses 9 (2) — —
Total $ (24) $ (50) $ 48 $ 33
2009
Gain (loss) on
derivatives Gain (loss) on hedged risk
Location of gain or (loss) recognized in net income on derivatives
Interestrate
contracts
Foreigncurrency &interest rate
contracts Contractholder
funds Investments Interest credited to contractholder funds $ (26) $ 39 $ (13) $ — Net investment income 164 — — (164)Realized capital gains and losses 12 (9) — —
Total $ 150 $ 30 $ (13) $ (164)

The Company uses MNAs for OTC derivative transactions, including interest rate swap, foreign currency swap, interest rate cap, interest rate floor,credit default swap, forward and certain option agreements (including swaptions). These agreements permit either party to net payments due fortransactions covered by the agreements. Under the provisions of the agreements, collateral is either pledged or obtained when certain predeterminedexposure limits are exceeded. As of December 31, 2010, counterparties pledged $58 million in cash and securities to the Company, and the Companypledged $193 million in cash and securities to counterparties which includes $171 million of collateral posted under MNAs for contracts containingcredit-risk-contingent provisions that are in a liability position and $22 million of collateral posted under MNAs for contracts without credit-risk-contingent liabilities. The Company has not incurred any losses on derivative financial instruments due to counterparty nonperformance. Otherderivatives, including futures and certain option contracts, are traded on organized exchanges which require margin deposits and guarantee theexecution of trades, thereby mitigating any potential credit risk.
Counterparty credit exposure represents the Company's potential loss if all of the counterparties concurrently fail to perform under the contractualterms of the contracts and all collateral, if any, becomes worthless. This exposure is measured by the fair value of OTC derivative contracts with apositive fair value at the reporting date reduced by the effect, if any, of legally enforceable master netting agreements.
The following table summarizes the counterparty credit exposure as of December 31 by counterparty credit rating as it relates to interest rateswap, foreign currency swap, interest rate cap, interest rate floor, free-standing credit default swap, forward and certain option agreements (includingswaptions).
Market risk is the risk that the Company will incur losses due to adverse changes in market rates and prices. Market risk exists for all of thederivative financial instruments the Company currently holds, as these instruments may become less valuable due to adverse changes in marketconditions. To limit this risk, the Company's senior management has established risk control limits. In addition, changes in fair value of the derivativefinancial instruments that the Company uses for risk management purposes are generally offset by the change in the fair value or cash flows of thehedged risk component of the related assets, liabilities or forecasted transactions.
Certain of the Company's derivative instruments contain credit-risk-contingent termination events, cross-default provisions and credit supportannex agreements. Credit-risk-contingent termination events allow the counterparties to terminate the derivative on certain dates if AIC's, ALIC's orAllstate Life Insurance Company of New York's ("ALNY") financial strength credit ratings by Moody's or S&P fall below a certain level or in the eventAIC, ALIC or ALNY are no longer rated by both Moody's and S&P. Credit-risk-contingent cross-default provisions allow the counterparties to terminatethe derivative instruments if the Company defaults by pre-determined threshold amounts on certain debt instruments. Credit-risk-contingent creditsupport annex agreements specify the amount of collateral the Company must post to counterparties based on AIC's, ALIC's or ALNY's financialstrength credit ratings by Moody's or S&P, or in the event AIC, ALIC or ALNY are no longer rated by both Moody's and S&P.
167
($ in millions) 2010 2009
Rating
Numberof
counter-parties
Notionalamount
Creditexposure
Exposure,net of
collateral
Numberof
counter-parties
Notionalamount
Creditexposure
Exposure,net of
collateral AA- 2 $ 2,322 $ 43 $ 16 2 $ 3,269 $ 26 $ 1 A+ 5 3,189 16 10 5 12,359 204 57 A 3 3,479 17 17 3 2,551 62 30 A- 1 89 31 31 1 145 23 23
Total 11 $ 9,079 $ 107 $ 74 11 $ 18,324 $ 315 $ 111
(1) (2) (2) (2) (2) (2) (2)
Rating is the lower of S&P or Moody's ratings.Only OTC derivatives with a net positive fair value are included for each counterparty.
(1)(2)

The following summarizes the fair value of derivative instruments with termination, cross-default or collateral credit-risk-contingent features thatare in a liability position as of December 31, as well as the fair value of assets and collateral that are netted against the liability in accordance withprovisions within legally enforceable MNAs.
Credit derivatives – selling protection
Free-standing credit default swaps ("CDS") are utilized for selling credit protection against a specified credit event. A credit default swap is aderivative instrument, representing an agreement between two parties to exchange the credit risk of a specified entity (or a group of entities), or anindex based on the credit risk of a group of entities (all commonly referred to as the "reference entity" or a portfolio of "reference entities"), in return fora periodic premium. In selling protection, CDS are used to replicate fixed income securities and to complement the cash market when credit exposureto certain issuers is not available or when the derivative alternative is less expensive than the cash market alternative. CDS typically have a five-yearterm.
The following table shows the CDS notional amounts by credit rating and fair value of protection sold as of December 31, 2010:
168
($ in millions) 2010 2009 Gross liability fair value of contracts containing credit-risk-contingent features $ 448 $ 429 Gross asset fair value of contracts containing credit-risk-contingent features and subject
to MNAs (255) (265)Collateral posted under MNAs for contracts containing credit-risk-contingent features (171) (122)
Maximum amount of additional exposure for contracts with credit-risk-contingent featuresif all features were triggered concurrently $ 22 $ 42
($ in millions) Notional amount
AA A BBB BB andlower Total
Fairvalue
Single name Investment grade corporate debt $ 50 $ 148 $ 103 $ 25 $ 326 $ (4) High yield debt — — — 6 6 — Municipal 135 — — — 135 (14)
Subtotal 185 148 103 31 467 (18)Baskets Tranche Investment grade corporate debt — — — 65 65 (19) First-to-default Municipal — 100 — — 100 (37)
Subtotal — 100 — 65 165 (56)
Total $ 185 $ 248 $ 103 $ 96 $ 632 $ (74)
The following table shows the CDS notional amounts by credit rating and fair value of protection sold as of December 31, 2009:
In selling protection with CDS, the Company sells credit protection on an identified single name, a basket of names in a first-to-default ("FTD")structure or a specific tranche of a basket, or credit derivative index ("CDX") that is generally investment grade, and in return receives periodicpremiums through expiration or termination of the agreement. With single name CDS, this premium or credit spread generally corresponds to thedifference between the yield on the reference entity's public fixed maturity cash instruments and swap rates at the time the agreement is executed.With a FTD basket or a tranche of a basket, because of the additional credit risk inherent in a basket of named reference entities, the premiumgenerally corresponds to a high proportion of the sum of the credit spreads of the names in the basket and the correlation between the names. CDXindex is utilized to take a position on multiple (generally 125) reference entities. Credit events are typically defined as bankruptcy, failure to pay, orrestructuring, depending on the nature of the reference entities. If a credit event occurs, the Company settles with the counterparty, either throughphysical settlement or cash settlement. In a physical settlement, a reference asset is delivered by the buyer of protection to the Company, in exchangefor cash payment at par, whereas in a cash settlement, the Company pays the difference between par and the prescribed value of the reference asset.When a credit event occurs in a single name or FTD basket (for FTD, the first credit event occurring for any one name in the basket), the contractterminates at the time of settlement. When a credit event occurs in a tranche of a basket, there is no immediate impact to the Company untilcumulative losses in the basket exceed the contractual subordination. To date, realized losses have not exceeded the subordination. For CDX index,the reference entity's name incurring the credit event is removed from the index while the contract continues until expiration. The maximum payout ona CDS is the contract notional amount. A physical settlement may afford the Company with recovery rights as the new owner of the asset.
The Company monitors risk associated with credit derivatives through individual name credit limits at both a credit derivative and a combined cashinstrument/credit derivative level. The ratings of individual names for which protection has been sold are also monitored.
In addition to the CDS described above, the Company's synthetic collateralized debt obligations contain embedded credit default swaps which sellprotection on a basket of reference entities. The synthetic collateralized debt obligations are fully funded; therefore, the Company is not obligated tocontribute additional funds when credit events occur related to the reference entities named in the embedded credit default swaps. The Company'smaximum amount at risk equals the amount of its aggregate initial investment in the synthetic collateralized debt obligations.
Off-balance-sheet financial instruments
The contractual amounts of off-balance-sheet financial instruments as of December 31 are as follows:
169
($ in millions) Notional amount
AA A BBB BB andlower Total
Fairvalue
Single name Investment grade corporate debt $ 63 $ 86 $ 84 $ 30 $ 263 $ (12) High yield debt — — — 10 10 — Municipal 135 — — — 135 (10)
Subtotal 198 86 84 40 408 (22)Baskets Tranche Investment grade corporate debt — — — 65 65 (27) First-to-default Investment grade corporate debt — 45 15 — 60 — Municipal 20 135 — — 155 (28)
Subtotal 20 180 15 65 280 (55)Index Investment grade corporate debt 14 159 408 19 600 4
Total $ 232 $ 425 $ 507 $ 124 $ 1,288 $ (73)
($ in millions) 2010 2009 Commitments to invest in limited partnership interests $ $1,471 $ $1,432 Private placement commitments 159 7 Other loan commitments 38 19

In the preceding table, the contractual amounts represent the amount at risk if the contract is fully drawn upon, the counterparty defaults and thevalue of any underlying security becomes worthless. Unless noted otherwise, the Company does not require collateral or other security to support off-balance-sheet financial instruments with credit risk.
Commitments to invest generally represent commitments to acquire financial interests or instruments. The Company enters into these agreementsto allow for additional participation in certain limited partnership investments. Because the equity investments in the limited partnerships are notactively traded, it is not practical to estimate the fair value of these commitments.
Private placement commitments represent conditional commitments to purchase private placement debt and equity securities at a specified futuredate. The Company regularly enters into these agreements in the normal course of business. The fair value of these commitments generally cannot beestimated on the date the commitment is made as the terms and conditions of the underlying private placement securities are not yet final.
Other loan commitments are agreements to lend to a borrower provided there is no violation of any condition established in the contract. TheCompany enters into these agreements to commit to future loan fundings at predetermined interest rates. Commitments generally have fixed orvarying expiration dates or other termination clauses. The fair value of these commitments is insignificant.
7. Reserve for Property-Liability Insurance Claims and Claims Expense
As described in Note 2, the Company establishes reserves for claims and claims expense ("loss") on reported and unreported claims of insuredlosses. The Company's reserving process takes into account known facts and interpretations of circumstances and factors including the Company'sexperience with similar cases, actual claims paid, historical trends involving claim payment patterns and pending levels of unpaid claims, lossmanagement programs, product mix and contractual terms, changes in law and regulation, judicial decisions, and economic conditions. In the normalcourse of business, the Company may also supplement its claims processes by utilizing third party adjusters, appraisers, engineers, inspectors, andother professionals and information sources to assess and settle catastrophe and non-catastrophe related claims. The effects of inflation are implicitlyconsidered in the reserving process.
Because reserves are estimates of unpaid portions of losses that have occurred, including incurred but not reported ("IBNR") losses, theestablishment of appropriate reserves, including reserves for catastrophes, is an inherently uncertain and complex process. The ultimate cost of lossesmay vary materially from recorded amounts, which are based on management's best estimates. The highest degree of uncertainty is associated withreserves for losses incurred in the current reporting period as it contains the greatest proportion of losses that have not been reported or settled. TheCompany regularly updates its reserve estimates as new information becomes available and as events unfold that may affect the resolution ofunsettled claims. Changes in prior year reserve estimates, which may be material, are reported in property-liability insurance claims and claimsexpense in the Consolidated Statements of Operations in the period such changes are determined.
Activity in the reserve for property-liability insurance claims and claims expense is summarized as follows:
170
($ in millions) 2010 2009 2008 Balance as of January 1 $ 19,167 $ 19,456 $ 18,865 Less reinsurance recoverables 2,139 2,274 2,205
Net balance as of January 1 17,028 17,182 16,660
Incurred claims and claims expense related to: Current year 19,110 18,858 19,894 Prior years (159) (112) 170
Total incurred 18,951 18,746 20,064
Claims and claims expense paid related to: Current year 12,012 11,905 12,658 Prior years 6,571 6,995 6,884
Total paid 18,583 18,900 19,542
Net balance as of December 31 17,396 17,028 17,182 Plus reinsurance recoverables 2,072 2,139 2,274
Balance as of December 31 $ 19,468 $ 19,167 $ 19,456

Incurred claims and claims expense represents the sum of paid losses and reserve changes in the calendar year. This expense includes lossesfrom catastrophes of $2.21 billion, $2.07 billion and $3.34 billion in 2010, 2009 and 2008, respectively, net of reinsurance and other recoveries (seeNote 9). In 2008, losses from catastrophes included $1.31 billion, net of recoveries, related to Hurricanes Ike and Gustav. These estimates include netlosses in personal lines auto and property policies and net losses on commercial policies. Included in 2008 losses from catastrophes are accruals forassessments from the Texas Windstorm Insurance Association ("TWIA") (see Note 13).
Catastrophes are an inherent risk of the property-liability insurance business that have contributed to, and will continue to contribute to, materialyear-to-year fluctuations in the Company's results of operations and financial position.
The Company calculates and records a single best reserve estimate for losses from catastrophes, in conformance with generally acceptedactuarial standards. As a result, management believes that no other estimate is better than the recorded amount. Due to the uncertainties involved,including the factors described above, the ultimate cost of losses may vary materially from recorded amounts, which are based on management's bestestimates. Accordingly, management believes that it is not practical to develop a meaningful range for any such changes in losses incurred.
During 2010, incurred claims and claims expense related to prior years was primarily composed of net decreases in auto reserves of $179 millionprimarily due to claim severity development that was better than expected partially offset by a litigation settlement, net decreases in homeownersreserves of $23 million due to favorable catastrophe reserve reestimates partially offset by a litigation settlement, and net increases in other reservesof $15 million. Incurred claims and claims expense includes favorable catastrophe loss reestimates of $163 million, net of reinsurance and otherrecoveries.
During 2009, incurred claims and claims expense related to prior years was primarily composed of net decreases in homeowners and autoreserves of $168 million and $57 million, respectively, partially offset by increases in other reserves of $89 million. Incurred claims and claims expenseincludes favorable catastrophe loss reestimates of $169 million, net of reinsurance and other recoveries, primarily attributable to favorable reservereestimates from Hurricanes Ike and Gustav and a catastrophe related subrogation recovery.
During 2008, incurred claims and claims expense related to prior years was primarily composed of net decreases in auto reserves of $27 millionoffset by increases in homeowners reserves of $124 million due to catastrophe loss reestimates, and increases in other reserves of $55 million. The$27 million favorable decreases in auto reserves and $55 million unfavorable increases in other reserves includes $45 million of IBNR lossesreclassified from auto reserves to other reserves to be consistent with the recording of excess liability policy premiums and losses. Incurred claims andclaims expense includes unfavorable catastrophe loss reestimates of $125 million, net of reinsurance and other recoveries, primarily attributable toincreased claim loss and expense reserves for litigation filed in conjunction with a Louisiana deadline for filing suits related to Hurricane Katrina.
Management believes that the reserve for property-liability insurance claims and claims expense, net of reinsurance recoverables, is appropriatelyestablished in the aggregate and adequate to cover the ultimate net cost of reported and unreported claims arising from losses which had occurred bythe date of the Consolidated Statements of Financial Position based on available facts, technology, laws and regulations.
For further discussion of asbestos and environmental reserves, see Note 13.
8. Reserve for Life-Contingent Contract Benefits and Contractholder Funds
As of December 31, the reserve for life-contingent contract benefits consists of the following:
171
($ in millions) 2010 2009 Immediate fixed annuities: Structured settlement annuities $ 6,522 $ 6,406 Other immediate fixed annuities 2,215 2,048 Traditional life insurance 2,938 2,850 Accident and health insurance 1,720 1,514 Other 87 92
Total reserve for life-contingent contractbenefits $ 13,482 $ 12,910

The following table highlights the key assumptions generally used in calculating the reserve for life-contingent contract benefits:
To the extent that unrealized gains on fixed income securities would result in a premium deficiency had those gains actually been realized, apremium deficiency reserve is recorded for certain immediate annuities with life contingencies. A liability of $41 million is included in the reserve forlife-contingent contract benefits with respect to this deficiency as of December 31, 2010. The offset to this liability is recorded as a reduction of theunrealized net capital gains included in accumulated other comprehensive income. The liability was zero as of December 31, 2009.
As of December 31, contractholder funds consist of the following:
172
Product Mortality Interest rate Estimation methodStructured
settlementannuities
U.S. population with projected calendar year improvements; mortality ratesadjusted for each impaired life based on reduction in life expectancy
Interest rateassumptionsrange from 1.6%to 9.9%
Present value of contractuallyspecified future benefits
Otherimmediatefixedannuities
1983 group annuity mortality table with internal modifications; 1983 individualannuity mortality table; Annuity 2000 mortality table with internal modifications;1983 individual annuity mortality table with internal modifications
Interest rateassumptionsrange from 0.9%to 11.5%
Present value of expectedfuture benefits based onhistorical experience
Traditional lifeinsurance
Actual company experienceplus loading
Interest rateassumptionsrange from 4.0%to 11.3%
Net level premium reservemethod using the Company'swithdrawal experience rates
Accident andhealthinsurance
Actual company experienceplus loading
Unearned premium; additionalcontract reserves for mortalityrisk
Other: Variable
annuityguaranteedminimumdeathbenefits (1)
100% of Annuity 2000 mortality table Interest rateassumptionsrange from 4.2%to 5.2%
Projected benefit ratio appliedto cumulative assessments
In 2006, the Company disposed of substantially all of its variable annuity business through reinsurance agreements with The Prudential Insurance Company of America, asubsidiary of Prudential Financial, Inc. (collectively "Prudential").
(1)
($ in millions) 2010 2009 Interest-sensitive life insurance $ 10,675 $ 10,276 Investment contracts: Fixed annuities 33,166 36,063
Funding agreements backing medium-term notes 2,749 4,699
Other investment contracts 514 459 Allstate Bank deposits 1,091 1,085
Total contractholder funds $ 48,195 $ 52,582

The following table highlights the key contract provisions relating to contractholder funds:
Contractholder funds include funding agreements held by VIEs issuing medium-term notes. The VIEs are Allstate Life Funding, LLC, AllstateFinancial Global Funding, LLC, Allstate Life Global Funding and Allstate Life Global Funding II, and their primary assets are funding agreements usedexclusively to back medium-term note programs.
Contractholder funds activity for the years ended December 31 is as follows:
The Company offered various guarantees to variable annuity contractholders. Liabilities for variable contract guarantees related to death benefitsare included in the reserve for life-contingent contract benefits and the liabilities related to the income, withdrawal and accumulation benefits areincluded in contractholder funds in the Consolidated Statements of Financial Position. All liabilities for variable contract guarantees are reported on agross basis on the balance sheet with a corresponding reinsurance recoverable asset for those contracts subject to reinsurance. In 2006, theCompany disposed of substantially all of its variable annuity business through reinsurance agreements with Prudential.
173
Product Interest rate Withdrawal/surrender chargesInterest-sensitive life insurance Interest rates credited range from 0% to 11.5% for
equity-indexed life (whose returns are indexed tothe S&P 500) and 2.0% to 6.0% for all otherproducts
Either a percentage of account balance or dollaramount grading off generally over 20 years
Fixed annuities Interest rates credited range from 0% to 9.9% forimmediate annuities; (8.0)% to 14.0% for equity-indexed annuities (whose returns are indexed tothe S&P 500); and 0.2% to 8.5% for all otherproducts
Either a declining or a level percentage chargegenerally over nine years or less. Additionally,approximately 26.5% of fixed annuities are subjectto market value adjustment for discretionarywithdrawals
Funding agreements backing medium-termnotes
Interest rates credited range from 0% to 6.5%(excluding currency-swapped medium-term notes)
Not applicable
Other investment contracts: Guaranteed minimum income,
accumulation and withdrawal benefits onvariable annuities (1) and secondaryguarantees on interest-sensitive lifeinsurance and fixed annuities
Interest rates used in establishing reserves rangefrom 1.8% to 10.3%
Withdrawal and surrender charges are based onthe terms of the related interest-sensitive lifeinsurance or fixed annuity contract
Allstate Bank deposits Interest rates credited range from 0% to 5.5% A percentage of principal balance for time depositswithdrawn prior to maturity
In 2006, the Company disposed of substantially all of its variable annuity business through reinsurance agreements with Prudential.(1)
($ in millions) 2010 2009 Balance, beginning of year $ 52,582 $ 58,413 Deposits 3,438 4,580 Interest credited 1,794 2,025 Benefits (1,552) (1,588)Surrenders and partial withdrawals (5,203) (5,172)Maturities and retirements of institutional products (1,833) (4,773)Contract charges (983) (918)Net transfers from separate accounts 11 11 Fair value hedge adjustments for institutional products (196) 25 Other adjustments 137 (21)
Balance, end of year $ 48,195 $ 52,582

Absent any contract provision wherein the Company guarantees either a minimum return or account value upon death, a specified contractanniversary date, partial withdrawal or annuitization, variable annuity and variable life insurance contractholders bear the investment risk that theseparate accounts' funds may not meet their stated investment objectives. The account balances of variable annuities contracts' separate accountswith guarantees included $6.94 billion and $7.93 billion of equity, fixed income and balanced mutual funds and $1.09 billion and $568 million of moneymarket mutual funds as of December 31, 2010 and 2009, respectively.
The table below presents information regarding the Company's variable annuity contracts with guarantees. The Company's variable annuitycontracts may offer more than one type of guarantee in each contract; therefore, the sum of amounts listed exceeds the total account balances ofvariable annuity contracts' separate accounts with guarantees.
The liability for death and income benefit guarantees is equal to a benefit ratio multiplied by the cumulative contract charges earned, plus accruedinterest less contract benefit payments. The benefit ratio is calculated as the estimated present value of all expected contract benefits divided by thepresent value of all expected contract charges. The establishment of reserves for these guarantees requires the projection of future separate accountfund performance, mortality, persistency and customer benefit utilization rates. These assumptions are periodically reviewed and updated. Forguarantees related to death benefits, benefits represent the current guaranteed minimum death benefit payments in excess of the current accountbalance. For guarantees related to income benefits, benefits represent the present value of the minimum guaranteed annuitization benefits in excessof the current account balance.
Projected benefits and contract charges used in determining the liability for certain guarantees are developed using models and stochasticscenarios that are also used in the development of estimated expected gross profits. Underlying assumptions for the liability related to income benefitsinclude assumed future annuitization elections based on factors such as the extent of benefit to the potential annuitant, eligibility conditions and theannuitant's attained age. The liability for guarantees is re-evaluated periodically, and adjustments are made to the liability balance through a charge orcredit to life and annuity contract benefits.
Guarantees related to withdrawal and accumulation benefits are considered to be derivative financial instruments; therefore, the liability for thesebenefits is established based on its fair value.
174
($ in millions) December 31, 2010 2009 In the event of death Separate account value $ 8,029 $ 8,496 Net amount at risk (1) $ 1,402 $ 2,153 Average attained age of contractholders 66 years 65 years
At annuitization (includes income benefit guarantees) Separate account value $ 1,945 $ 2,101 Net amount at risk (2) $ 580 $ 906 Weighted average waiting period until annuitization options available 2 years 3 years
For cumulative periodic withdrawals Separate account value $ 735 $ 786 Net amount at risk (3) $ 21 $ 42
Accumulation at specified dates Separate account value $ 1,100 $ 1,113 Net amount at risk (4) $ 64 $ 97 Weighted average waiting period until guarantee date 7 years 8 years
Defined as the estimated current guaranteed minimum death benefit in excess of the current account balance as of the balance sheet date.Defined as the estimated present value of the guaranteed minimum annuity payments in excess of the current account balance.Defined as the estimated current guaranteed minimum withdrawal balance (initial deposit) in excess of the current account balance as of the balance sheetdate.Defined as the estimated present value of the guaranteed minimum accumulation balance in excess of the current account balance.
(1)(2)(3)
(4)

The following table summarizes the liabilities for guarantees:
175
($ in millions)
Liability forguaranteesrelated to
death benefitsand interest-sensitive life
products
Liability forguaranteesrelated toincomebenefits
Liability forguaranteesrelated to
accumulationand withdrawal
benefits Total Balance, December 31, 2009 (1) $ 155 $ 287 $ 108 $ 550 Less reinsurance recoverables 109 268 107 484
Net balance as of December 31, 2009 46 19 1 66 Incurred guaranteed benefits 97 (2) — 95 Paid guarantee benefits — — — —
Net change 97 (2) — 95 Net balance as of December 31, 2010 143 17 1 161 Plus reinsurance recoverables 93 210 135 438
Balance, December 31, 2010 (2) $ 236 $ 227 $ 136 $ 599
Balance, December 31, 2008 (3) $ 115 $ 220 $ 266 $ 601 Less reinsurance recoverables 81 201 266 548
Net balance as of December 31, 2008 34 19 — 53 Incurred guaranteed benefits 13 — 1 14 Paid guarantee benefits (1) — — (1)
Net change 12 — 1 13 Net balance as of December 31, 2009 46 19 1 66 Plus reinsurance recoverables 109 268 107 484
Balance, December 31, 2009 (1) $ 155 $ 287 $ 108 $ 550
Included in the total liability balance as of December 31, 2009 are reserves for variable annuity death benefits of $92 million, variable annuity income benefitsof $269 million, variable annuity accumulation benefits of $66 million, variable annuity withdrawal benefits of $41 million and other guarantees of $82 million.Included in the total liability balance as of December 31, 2010 are reserves for variable annuity death benefits of $85 million, variable annuity income benefitsof $211 million, variable annuity accumulation benefits of $88 million, variable annuity withdrawal benefits of $47 million and other guarantees of $168 million.Included in the total liability balance as of December 31, 2008 are reserves for variable annuity death benefits of $67 million, variable annuity income benefitsof $201 million, variable annuity accumulation benefits of $147 million, variable annuity withdrawal benefits of $119 million and other guarantees of$67 million.
(1)
(2)
(3)

9. Reinsurance
The effects of reinsurance on property-liability insurance premiums written and earned and life and annuity premiums and contract charges for theyears ended December 31 are as follows:
Property-Liability
The Company purchases reinsurance after evaluating the financial condition of the reinsurer, as well as the terms and price of coverage.Developments in the insurance and reinsurance industries have fostered a movement to segregate asbestos, environmental and other discontinuedlines exposures into separate legal entities with dedicated capital. Regulatory bodies in certain cases have supported these actions. The Company isunable to determine the impact, if any, that these developments will have on the collectability of reinsurance recoverables in the future.
Property-Liability reinsurance recoverable
Total amounts recoverable from reinsurers as of December 31, 2010 and 2009 were $2.15 billion and $2.21 billion, respectively, including$81 million and $72 million, respectively, related to property-liability losses paid by the Company and billed to reinsurers, and $2.07 billion and$2.14 billion, respectively, estimated by the Company with respect to ceded unpaid losses (including IBNR), which are not billable until the losses arepaid.
With the exception of the recoverable balances from the Michigan Catastrophic Claim Association ("MCCA"), Lloyd's of London and other industrypools and facilities, the largest reinsurance recoverable balance the Company had outstanding was $56 million and $77 million from WestportInsurance Corporation (formerly Employers' Reinsurance Company) as of December 31, 2010 and 2009, respectively. No other amount due orestimated to be due from any single property-liability reinsurer was in excess of $37 million as of both December 31, 2010 and 2009.
The allowance for uncollectible reinsurance was $142 million as of both December 31, 2010 and 2009, and is related to the Company'sDiscontinued Lines and Coverages segment. In 2010 there were no net recoveries and in 2009 there were $26 million of net recoveries.
Industry pools and facilities
Reinsurance recoverable on paid and unpaid claims including IBNR as of December 31, 2010 and 2009 includes $1.24 billion and $1.17 billion,respectively, from the MCCA. The MCCA is a mandatory reinsurance mechanism for personal injury protection losses over a retention level thatincreases each MCCA fiscal year. The retention levels are $480 thousand per claim and $460 thousand per claim for the fiscal years ending June 30,2011 and 2010, respectively. The MCCA is funded by assessments from member companies who, in turn, can recover assessments frompolicyholders.
Ceded premiums earned under the Florida Hurricane Catastrophe Fund ("FHCF") agreement were $15 million, $13 million and $26 million in2010, 2009 and 2008, respectively. Ceded losses incurred include $10 million, $47 million and $28 million in 2010, 2009 and 2008, respectively. TheCompany has access to reimbursement provided by the FHCF
176
($ in millions) 2010 2009 2008 Property-liability insurance premiums written Direct $ 26,984 $ 26,980 $ 27,667 Assumed 29 41 85 Ceded (1,106) (1,050) (1,168)
Property-liability insurance premiums written, net of reinsurance $ 25,907 $ 25,971 $ 26,584
Property-liability insurance premiums earned Direct $ 27,015 $ 27,200 $ 28,021 Assumed 34 50 85 Ceded (1,092) (1,056) (1,139)
Property-liability insurance premiums earned, net of reinsurance $ 25,957 $ 26,194 $ 26,967
Life and annuity premiums and contract charges Direct $ 2,935 $ 2,757 $ 2,754 Assumed 37 39 41 Ceded (804) (838) (900)
Life and annuity premiums and contract charges, net of reinsurance $ 2,168 $ 1,958 $ 1,895

for 90% of qualifying personal property losses that exceed its current retention of $70 million for the two largest hurricanes and $23 million for otherhurricanes, up to a maximum total of $272 million effective from June 1, 2010 to May 31, 2011. Reinsurance recoverables include $41 million and$53 million recoverable from the FHCF for qualifying property losses as of December 31, 2010 and 2009, respectively.
Allstate sells and administers policies as a participant in the National Flood Insurance Program ("NFIP"). The total amounts recoverable as ofDecember 31, 2010 and 2009 were $10 million and $43 million, respectively. Ceded premiums earned include $306 million, $298 million and$257 million in 2010, 2009 and 2008, respectively. Ceded losses incurred include $50 million, $111 million and $344 million in 2010, 2009 and 2008,respectively. Under the arrangement, the Federal Government is obligated to pay all claims.
Catastrophe reinsurance
The Company has the following catastrophe reinsurance treaties in effect as of December 31, 2010:
• an aggregate excess agreement comprising two contracts (one contract effective June 1, 2009 to May 31, 2011, and one contracteffective June 1, 2010 to May 31, 2012) for Allstate Protection personal lines auto and property business countrywide, except for Florida.The contracts cover losses from storms named or numbered by the National Weather Service, fires following earthquakes, and Californiawildfires in excess of $2.00 billion in aggregated losses per contract year. The contract expiring May 31, 2011 represents 47.5% of theplacement or $950 million of the $2.00 billion limit. The contract expiring May 31, 2012, represents the remaining 47.5% of the placementwith the Company retaining the option in 2011 to place up to the entire $2.00 billion limit. For the year June 1, 2010 to May 31, 2011, theCompany retains 5% of the $2.00 billion reinsurance limit;
The Company's multi-peril, California fires following earthquakes, Gulf States, Atlantic States, Texas Hurricane and Kentuckyagreements are deemed in place, and losses recoverable under these agreements, if any, are excluded when determining coverageunder the aggregate excess agreement.
• multi-year reinsurance treaties that cover Allstate Protection personal lines property excess catastrophe losses for multiple perils inConnecticut, Rhode Island, New Jersey, New York, Pennsylvania and California effective June 1, 2008 to May 31, 2013;
• a Gulf States agreement that covers Allstate Protection personal lines property excess catastrophe losses for storms named ornumbered by the National Weather Service in Texas, Louisiana, Mississippi and Alabama effective June 1, 2010 to May 31, 2013;
• an Atlantic States agreement that covers Allstate Protection personal lines property excess catastrophe losses for storms named ornumbered by the National Weather Service in Georgia, South Carolina, North Carolina, Virginia, Maryland, Delaware and the District ofColumbia effective June 1, 2010 to May 31, 2013;
• a Texas agreement for additional hurricane coverage for Allstate Protection personal lines property excess catastrophe losses in thestate effective June 18, 2008 to June 17, 2011;
• a California fires following earthquakes agreement that covers Allstate Protection personal lines property excess catastrophe losses inCalifornia, effective June 1, 2008 to May 31, 2012;
• a Kentucky agreement that provides coverage for Allstate Protection personal lines property excess catastrophe losses in the state forearthquakes and fires following earthquakes effective June 1, 2008 to May 31, 2011;
• a Pennsylvania agreement that covers Allstate Protection personal lines property excess catastrophe losses for multi-perils effectiveJune 1, 2009 through May 31, 2012; and
• Eight separate agreements for Castle Key Insurance Company and its subsidiaries ("Castle Key"), for personal property excesscatastrophe losses in Florida that coordinate coverage with the Company's participation in the FHCF, effective June 1, 2010 to May 31,2011.
The Company ceded premiums earned of $582 million, $616 million and $679 million under catastrophe reinsurance agreements in 2010, 2009and 2008, respectively.
Asbestos, environmental and other
Reinsurance recoverables include $183 million and $190 million from Lloyd's of London as of December 31, 2010 and 2009, respectively. Lloyd'sof London, through the creation of Equitas Limited, implemented a restructuring plan in 1996 to solidify its capital base and to segregate claims foryears prior to 1993.
177

Allstate Financial
The Company's Allstate Financial segment reinsures certain of its risks to other insurers primarily under yearly renewable term, coinsurance,modified coinsurance and coinsurance with funds withheld agreements. These agreements result in a passing of the agreed-upon percentage of risk tothe reinsurer in exchange for negotiated reinsurance premium payments. Modified coinsurance and coinsurance with funds withheld are similar tocoinsurance, except that the cash and investments that support the liability for contract benefits are not transferred to the assuming company andsettlements are made on a net basis between the companies. Allstate Financial cedes 100% of the morbidity risk on substantially all of its long-termcare contracts.
For certain term life insurance policies issued prior to October 2009, Allstate Financial ceded up to 90% of the mortality risk depending on the yearof policy issuance under coinsurance agreements to a pool of fourteen unaffiliated reinsurers. Effective October 2009, mortality risk on term businessis ceded under yearly renewable term agreements under which Allstate Financial cedes mortality in excess of its retention, which is consistent withhow Allstate Financial generally reinsures its permanent life insurance business. The following table summarizes those retention limits by period ofpolicy issuance.
In addition, Allstate Financial has used reinsurance to effect the acquisition or disposition of certain blocks of business. Allstate Financial hadreinsurance recoverables of $1.63 billion and $1.51 billion as of December 31, 2010 and 2009, respectively, due from Prudential related to the disposalof substantially all of its variable annuity business that was effected through reinsurance agreements. In 2010, life and annuity premiums and contractcharges of $171 million, contract benefits of $152 million, interest credited to contractholder funds of $29 million, and operating costs and expenses of$31 million were ceded to Prudential. In 2009, life and annuity premiums and contract charges of $170 million, contract benefits of $44 million, interestcredited to contractholder funds of $27 million, and operating costs and expenses of $28 million were ceded to Prudential. In 2008, life and annuitypremiums and contract charges of $238 million, contract benefits of $467 million, interest credited to contractholder funds of $36 million, and operatingcosts and expenses of $47 million were ceded to Prudential. In addition, as of December 31, 2010 and 2009 Allstate Financial had reinsurancerecoverables of $170 million and $175 million, respectively, due from subsidiaries of Citigroup (Triton Insurance and American Health and LifeInsurance), and Scottish Re (U.S.) Inc. in connection with the disposition of substantially all of the direct response distribution business in 2003.
As of December 31, 2010, the gross life insurance in force was $532.89 billion of which $238.75 billion was ceded to the unaffiliated reinsurers.
Allstate Financial's reinsurance recoverables on paid and unpaid benefits as of December 31 are summarized in the following table.
As of December 31, 2010 and 2009, approximately 94% and 93%, respectively, of Allstate Financial's reinsurance recoverables are due fromcompanies rated A- or better by S&P.
178
Period Retention limitsJuly 2007 through current $5 million per life, $3 million age 70 and over, and $10 million for
contracts that meet specific criteria
September 1998 through June 2007 $2 million per life, in 2006 the limit was increased to $5 million forinstances when specific criteria were met
August 1998 and prior Up to $1 million per life
($ in millions) 2010 2009 Annuities $ 1,785 $ 1,667 Life insurance 1,569 1,535 Long-term care insurance 957 851 Other 89 90
Total Allstate Financial $ 4,400 $ 4,143

10. Deferred Policy Acquisition and Sales Inducement Costs
Deferred policy acquisition costs for the years ended December 31 are as follows:
179
2010
($ in millions) Allstate
Financial Property-Liability Total
Balance, beginning of year $ 4,060 $ 1,410 $ 5,470 Acquisition costs deferred 483 3,645 4,128 Amortization charged to income (356) (3,678) (4,034)Effect of unrealized gains and losses (795) — (795)
Balance, end of year $ 3,392 $ 1,377 $ 4,769
2009
Allstate
Financial Property-Liability Total
Balance, beginning of year $ 7,089 $ 1,453 $ 8,542 Impact of adoption of new OTTI accounting guidance before unrealized
impact (1) (176) — (176)Impact of adoption of new OTTI accounting guidance effect of unrealized
capital gains and losses (2) 176 — 176 Acquisition costs deferred 495 3,746 4,241 Amortization charged to income (965) (3,789) (4,754)Effect of unrealized gains and losses (2,559) — (2,559)
Balance, end of year $ 4,060 $ 1,410 $ 5,470
2008
Allstate
Financial Property-Liability Total
Balance, beginning of year $ 4,291 $ 1,477 $ 5,768 Acquisition costs deferred 684 3,951 4,635 Amortization charged to income (704) (3,975) (4,679)Effect of unrealized gains and losses 2,818 — 2,818
Balance, end of year $ 7,089 $ 1,453 $ 8,542
The adoption of new OTTI accounting guidance on April 1, 2009 resulted in an adjustment to DAC to reverse previously recorded DAC accretion related torealized capital losses that were reclassified to other comprehensive income upon adoption.The adoption of new OTTI accounting guidance resulted in an adjustment to DAC due to the change in unrealized capital gains and losses that occurredupon adoption on April 1, 2009 when previously recorded realized capital losses were reclassified to other comprehensive income. The adjustment wasrecorded as an increase of the DAC balance and unrealized capital gains and losses.
(1)
(2)

DSI activity for Allstate Financial, which primarily relates to fixed annuities and interest-sensitive life contracts, for the years ended December 31was as follows:
11. Capital Structure
Debt outstanding
Total debt outstanding as of December 31 consisted of the following:
180
($ in millions) 2010 2009 2008 Balance, beginning of year $ 195 $ 453 $ 295 Impact of adoption of new OTTI accounting guidance before unrealized
impact (1) — (35) — Impact of adoption of new OTTI accounting guidance effect of unrealized
capital gains and losses (2) — 35 — Sales inducements deferred 14 28 47 Amortization charged to income (27) (129) (53)Effect of unrealized gains and losses (96) (157) 164
Balance, end of year $ 86 $ 195 $ 453
The adoption of new OTTI accounting guidance on April 1, 2009 resulted in an adjustment to DSI to reverse previously recorded DSI accretion related torealized capital losses that were reclassified to other comprehensive income upon adoption.The adoption of new OTTI accounting guidance resulted in an adjustment to DSI due to the change in unrealized capital gains and losses that occurred uponadoption on April 1, 2009 when previously recorded realized capital losses were reclassified to other comprehensive income. The adjustment was recordedas an increase of the DSI balance and unrealized capital gains and losses.
(1)
(2)
($ in millions) 2010 2009 6.125% Senior Notes, due 2012 (1) $ 350 $ 350 7.50% Debentures, due 2013 250 250 5.00% Senior Notes, due 2014 (1) 650 650 6.20% Senior Notes, due 2014 (1) 300 300 6.75% Senior Debentures, due 2018 250 250 7.45% Senior Notes, due 2019 (1) 700 700 6.125% Senior Notes, due 2032 (1) 250 250 5.350% Senior Notes due 2033 (1) 400 400 5.55% Senior Notes due 2035 (1) 800 800 5.95% Senior Notes, due 2036 (1) 650 650 6.90% Senior Debentures, due 2038 250 250 6.125% Junior Subordinated Debentures, due 2067 500 500 6.50% Junior Subordinated Debentures, due 2067 500 500 Synthetic lease VIE obligations, floating rates, due 2011 42 42 Federal Home Loan Bank ("FHLB") advances, due 2018 16 18
Total long-term debt 5,908 5,910 Short-term debt (2) — —
Total debt $ 5,908 $ 5,910
Senior Notes are subject to redemption at the Company's option in whole or in part at any time at the greater of either 100% of the principal amount plusaccrued and unpaid interest to the redemption date or the discounted sum of the present values of the remaining scheduled payments of principal andinterest and accrued and unpaid interest to the redemption date.The Company classifies any borrowings which have a maturity of twelve months or less at inception as short-term debt.
(1)
(2)

Total debt outstanding by maturity as of December 31 consisted of the following:
In May 2009, the Company issued $300 million of 6.20% Senior Notes due 2014 and $700 million of 7.45% Senior Notes due 2019. The proceedsof this issuance were used for general corporate purposes, including to facilitate the repayment of the $750 million of 7.20% Senior Notes that maturedon December 1, 2009.
The Company has outstanding $500 million of Series A 6.50% and $500 million of Series B 6.125% Fixed-to-Floating Rate Junior SubordinatedDebentures (together the "Debentures"). The scheduled maturity dates for the Debentures are May 15, 2057 and May 15, 2037 for Series A andSeries B, respectively, with a final maturity date of May 15, 2067. The Debentures may be redeemed (i) in whole or in part, at any time on or afterMay 15, 2037 or May 15, 2017 for Series A and Series B, respectively, at their principal amount plus accrued and unpaid interest to the date ofredemption, or (ii) in certain circumstances, in whole or in part, prior to May 15, 2037 and May 15, 2017 for Series A and Series B, respectively, at theirprincipal amount plus accrued and unpaid interest to the date of redemption or, if greater, a make-whole price.
Interest on the Debentures is payable semi-annually at the stated fixed annual rate to May 15, 2037 and May 15, 2017 for Series A and Series B,respectively, and then payable quarterly at an annual rate equal to the three-month LIBOR plus 2.12% and 1.935% for Series A and Series B,respectively. The Company may elect at one or more times to defer payment of interest on the Debentures for one or more consecutive interestperiods that do not exceed 10 years. Interest compounds during such deferral periods at the rate in effect for each period. The interest deferral featureobligates the Company in certain circumstances to issue common stock or certain other types of securities if it cannot otherwise raise sufficient fundsto make the required interest payments. The Company has reserved 75 million shares of its authorized and unissued common stock to satisfy thisobligation.
In connection with the issuance of the Debentures, the Company entered into replacement capital covenants. These covenants are not intendedfor the benefit of the holders of the Debentures and may not be enforced by them. Rather, they are for the benefit of holders of one or more otherdesignated series of the Company's indebtedness, initially the 6.90% Senior Debentures due 2038. Pursuant to these covenants, the Company hasagreed that it will not repay, redeem, or purchase the Debentures on or before May 15, 2067 and May 15, 2047 for Series A and Series B, respectively,unless, subject to certain limitations, the Company has received proceeds in specified amounts from the issuance of specified securities. Thesecovenants terminate in 2067 and 2047 for Series A and Series B, respectively, or earlier upon the occurrence of certain events, including anacceleration of the Debentures of the particular series due to the occurrence of an event of default. An event of default, as defined by the supplementalindentures, includes default in the payment of interest or principal and bankruptcy proceedings.
The Company is the primary beneficiary of a consolidated VIE used to acquire up to 38 automotive collision repair stores ("synthetic lease"). In2006, the Company renewed the synthetic lease for a five-year term at a floating rate due 2011. The Company's Consolidated Statements of FinancialPosition include $42 million of property and equipment, net, and long-term debt as of both December 31, 2010 and 2009.
The Allstate Bank received a $10 million long-term advance from the FHLB in April 2008, and another $10 million advance in September 2008.The FHLB advances are secured with fixed income securities pledged to the FHLB. During 2010, 2009 and 2008, $2 million, $1 million and $1 millionwas repaid on the advances, respectively.
To manage short-term liquidity, the Company maintains a commercial paper program and a credit facility as a potential source of funds. Theseinclude a $1.00 billion unsecured revolving credit facility and a commercial paper program with a borrowing limit of $1.00 billion. The credit facility hasan initial term of five years expiring in 2012 with two optional one-year extensions that can be exercised at the end of any of the remaining anniversaryyears of the facility upon approval of existing or replacement lenders providing more than two-thirds of the commitments to lend. This facility alsocontains an increase provision that would allow up to an additional $500 million of borrowing provided the increased portion could be fully syndicatedat a later date among existing or new lenders. This facility has a financial
181
($ in millions) 2010 2009 Due within one year or less $ 42 $ — Due after one year through 5 years 1,550 1,592 Due after 5 years through 10 years 966 968 Due after 10 years through 20 years — — Due after 20 years 3,350 3,350
Total debt $ 5,908 $ 5,910

covenant requiring the Company not to exceed a 37.5% debt to capital resources ratio as defined in the agreement. Although the right to borrow underthe facility is not subject to a minimum rating requirement, the costs of maintaining the facility and borrowing under it are based on the ratings of theCompany's senior, unsecured, nonguaranteed long-term debt. The total amount outstanding at any point in time under the combination of thecommercial paper program and the credit facility cannot exceed the amount that can be borrowed under the credit facility. No amounts wereoutstanding under the credit facility as of December 31, 2010 and 2009. The Company had no commercial paper outstanding as of December 31,2010 and 2009.
The Company paid $363 million, $383 million and $347 million of interest on debt in 2010, 2009 and 2008, respectively.
During 2009, the Company filed a universal shelf registration statement with the Securities and Exchange Commission ("SEC") that expires in2012. The registration statement covers an unspecified amount of securities and can be used to issue debt securities, common stock, preferred stock,depositary shares, warrants, stock purchase contracts, stock purchase units and securities of trust subsidiaries.
Capital stock
The Company had 900 million shares of issued common stock of which 533 million shares were outstanding and 367 million shares were held intreasury as of December 31, 2010. In 2010, the Company reacquired 5 million shares at an average cost of $30.59 and reissued 2 million sharesunder equity incentive plans.
12. Company Restructuring
The Company undertakes various programs to reduce expenses. These programs generally involve a reduction in staffing levels, and in certaincases, office closures. Restructuring and related charges include employee termination and relocation benefits, and post-exit rent expenses inconnection with these programs, and non-cash charges resulting from pension benefit payments made to agents in connection with the 1999reorganization of Allstate's multiple agency programs to a single exclusive agency program. In 2010, restructuring programs primarily relate to AllstateProtection's claim and field sales office consolidations and realignment of litigation services. The expenses related to these activities are included inthe Consolidated Statements of Operations as restructuring and related charges, and totaled $30 million, $130 million and $23 million in 2010, 2009and 2008, respectively.
The following table presents changes in the restructuring liability during the year ended December 31, 2010.
The payments applied against the liability for employee costs primarily reflect severance costs, and the payments for exit costs generally consist ofpost-exit rent expenses and contract termination penalties. As of December 31, 2010, the cumulative amount incurred to date for active programstotaled $161 million for employee costs and $45 million for exit costs.
13. Commitments, Guarantees and Contingent Liabilities
Leases
The Company leases certain office facilities and computer equipment. Total rent expense for all leases was $256 million, $267 million and$294 million in 2010, 2009 and 2008, respectively.
182
($ in millions) Employee
costs Exit
costs Total
liability Balance as of December 31, 2009 $ 45 $ 6 $ 51 Expense incurred 20 2 22 Adjustments to liability (16) (1) (17)Payments applied against liability (36) (4) (40)
Balance as of December 31, 2010 $ 13 $ 3 $ 16

Minimum rental commitments under noncancelable capital and operating leases with an initial or remaining term of more than one year as ofDecember 31, 2010 are as follows:
Shared markets and state facility assessments
The Company is required to participate in assigned risk plans, reinsurance facilities and joint underwriting associations in various states thatprovide insurance coverage to individuals or entities that otherwise are unable to purchase such coverage from private insurers. Underwriting resultsrelated to these arrangements, which tend to be adverse, have been immaterial to the Company's results of operations. Because of the Company'sparticipation, it may be exposed to losses that surpass the capitalization of these facilities and/or assessments from these facilities.
Castle Key is subject to assessments from Citizens Property Insurance Corporation in the state of Florida ("FL Citizens"), which was initiallycreated by the state of Florida to provide insurance to property owners unable to obtain coverage in the private insurance market. FL Citizens, at thediscretion and direction of its Board of Governors ("FL Citizens Board"), can levy a regular assessment on assessable insurers and assessableinsureds for a deficit in any calendar year up to a maximum of the greater of 6% of the deficit or 6% of Florida property premiums industry-wide for theprior year. Prior to July 2008, the assessment rate was 10%. The base of assessable insurers includes all property and casualty premiums in the state,except workers' compensation, medical malpractice, accident and health insurance and policies written under the NFIP. An insurer may recoup aregular assessment through a surcharge to policyholders. In order to recoup this assessment, an insurer must file for a policy surcharge with theFlorida Office of Insurance Regulation ("FL OIR") at least fifteen days prior to imposing the surcharge on policies. If a deficit remains after the regularassessment, FL Citizens can also levy emergency assessments in the current and subsequent years. Companies are required to collect theemergency assessments directly from residential property policyholders and remit to FL Citizens as collected.
FL Citizens reported losses from Hurricane Wilma in 2005, which followed a deficit for the 2004 plan year. The FL Citizens Board certified the2005 FL Citizens deficit at $1.73 billion of which $920 million was to be funded through a regular assessment. The Company paid its portion of thedeficit assessment totaling $14 million during 2006 and has recouped $12 million as of December 31, 2010. The remainder of the deficit was funded bybonds issued in 2006.
The Company is also subject to assessments from Louisiana Citizens Property Insurance Corporation ("LA Citizens"). LA Citizens can levy aregular assessment on participating companies for a deficit in any calendar year up to a maximum of the greater of 10% of the calendar year deficit or10% of Louisiana direct property premiums industry-wide for the prior calendar year.
Florida Hurricane Catastrophe Fund
Castle Key participates in the mandatory coverage provided by the FHCF and therefore has access to reimbursements on certain qualifyingFlorida hurricane losses from the FHCF (see Note 9), has exposure to assessments and pays annual premiums to the FHCF for this reimbursementprotection. The FHCF has the authority to issue bonds to pay its obligations to insurers participating in the mandatory coverage in excess of its capitalbalances. Payment of these bonds is funded by emergency assessments on all property and casualty premiums in the state, except workers'compensation, medical malpractice, accident and health insurance and policies written under the NFIP. The FHCF emergency assessments are limitedto 6% of premiums per year beginning the first year in which reimbursements require bonding, and up to a total of 10% of premiums per year forassessments in the second and subsequent years, if required to fund additional bonding. The FHCF issued $625 million in bonds in 2008, and the FLOIR ordered an emergency assessment of 1% of premiums collected for all policies renewed after January 1, 2007. The FHCF issued $676 million inbonds in 2010 and the FL OIR ordered an emergency assessment of 1.3% of premiums collected
183
($ in millions) Capitalleases
Operatingleases
2011 $ 7 $ 199 2012 7 157 2013 8 103 2014 6 62 2015 2 47 Thereafter 15 64
Total $ 45 $ 632
Present value of minimum capital leasepayments $ 35

for all policies written or renewed after January 1, 2011. As required, companies will collect the FHCF emergency assessments directly frompolicyholders and remit them to the FHCF as they are collected.
Facilities such as FL Citizens, LA Citizens and the FHCF are generally designed so that the ultimate cost is borne by policyholders; however, theexposure to assessments and the availability of recoupments or premium rate increases from these facilities may not offset each other in theCompany's financial statements. Moreover, even if they do offset each other, they may not offset each other in financial statements for the same fiscalperiod due to the ultimate timing of the assessments and recoupments or premium rate increases, as well as the possibility of policies not beingrenewed in subsequent years.
California Earthquake Authority
Exposure to certain potential losses from earthquakes in California is limited by the Company's participation in the California Earthquake Authority("CEA"), which provides insurance for California earthquake losses. The CEA is a privately-financed, publicly-managed state agency created toprovide insurance coverage for earthquake damage. Insurers selling homeowners insurance in California are required to offer earthquake insurance totheir customers either through their company or by participation in the CEA. The Company's homeowners policies continue to include coverages forlosses caused by explosions, theft, glass breakage and fires following an earthquake, which are not underwritten by the CEA.
As of October 31, 2010, the CEA's capital balance was approximately $3.68 billion. Should losses arising from an earthquake cause a deficit in theCEA, additional funding would be obtained from the proceeds of revenue bonds the CEA may issue, an existing $3.12 billion reinsurance layer, andfinally, if needed, assessments on participating insurance companies. The authority of the CEA to assess participating insurers extends throughDecember 1, 2018. Participating insurers are required to pay an assessment, currently estimated not to exceed $1.56 billion, if the capital of the CEAfalls below $350 million. Participating insurers are required to pay a second additional assessment, currently estimated not to exceed $1.09 billion, ifaggregate CEA earthquake losses exceed $9.77 billion and the capital of the CEA falls below $350 million. Within the limits previously described, theassessment could be intended to restore the CEA's capital to a level of $350 million. There is no provision that allows insurers to recover assessmentsthrough a premium surcharge or other mechanism. The CEA's projected aggregate claim paying capacity is $9.77 billion as of October 31, 2010 and ifan event were to result in claims greater than its capacity, affected policyholders would be paid a prorated portion of their covered losses.
All future assessments on participating CEA insurers are based on their CEA insurance market share as of December 31 of the preceding year. Asof April 1, 2010, the Company's share of the CEA was 17.2%. The Company does not expect its CEA market share to materially change. At this level,the Company's maximum possible CEA assessment would be $456 million during 2011. Accordingly, assessments from the CEA for a particularquarter or annual period may be material to the results of operations and cash flows, but not the financial position of the Company. Managementbelieves the Company's exposure to earthquake losses in California has been significantly reduced as a result of its participation in the CEA.
Texas Windstorm Insurance Association
The Company participates in the mandatory coverage provided by the TWIA, for losses relating to hurricane activity. Amounts assessed to eachcompany are allocated based upon its proportion of business written. In September 2008, TWIA assessed the Company $66 million for losses relatingto Hurricane Ike. The assessment was based on 2007 direct voluntary writings in the State of Texas. The Company expects to recoup $35 million ofthe assessment via premium tax offsets over a five year period. $7 million of the total recoupable amount was realized via premium tax offsets in both2009 and 2010. The remaining $31 million of the assessment was eligible for cession under the Company's reinsurance program. The TWIA board hasnot indicated the likelihood of any possible future assessments to insurers at this time. However, assessments from the TWIA for a particular quarter orannual period may be material to the results of operations and cash flows, but not the financial position of the Company. Management believes theCompany's exposure to losses in Texas has been significantly reduced as a result of its participation in the TWIA.
Guaranty funds
Under state insurance guaranty fund laws, insurers doing business in a state can be assessed, up to prescribed limits, for certain obligations ofinsolvent insurance companies to policyholders and claimants. Amounts assessed to each company are typically related to its proportion of businesswritten in each state. The Company's policy is to accrue assessments when the entity for which the insolvency relates has met its state of domicile'sstatutory definition of insolvency, the amount of the loss is reasonably estimable and the related premium upon which the assessment is based iswritten. In most states, the definition is met with a declaration of financial insolvency by a court of competent
184

jurisdiction. In certain states there must also be a final order of liquidation. As of December 31, 2010 and 2009, the liability balance included in otherliabilities and accrued expenses was $46 million and $106 million, respectively. The related premium tax offsets included in other assets were$25 million and $28 million as of December 31, 2010 and 2009, respectively.
PMI runoff support agreement
The Company has certain limited rights and obligations under a capital support agreement ("Runoff Support Agreement") with PMI MortgageInsurance Company ("PMI"), the primary operating subsidiary of PMI Group, related to the Company's disposition of PMI in prior years. Under theRunoff Support Agreement, the Company would be required to pay claims on PMI policies written prior to October 28, 1994 if PMI fails certain financialcovenants and fails to pay such claims. The agreement only covers these policies and not any policies issued on or after that date. In the event anyamounts are so paid, the Company would receive a commensurate amount of preferred stock or subordinated debt of PMI Group or PMI. The RunoffSupport Agreement also restricts PMI's ability to write new business and pay dividends under certain circumstances. Management does not believethis agreement will have a material adverse effect on results of operations, cash flows or financial position of the Company.
Guarantees
The Company owns certain fixed income securities that obligate the Company to exchange credit risk or to forfeit principal due, depending on thenature or occurrence of specified credit events for the reference entities. In the event all such specified credit events were to occur, the Company'smaximum amount at risk on these fixed income securities, as measured by the amount of the aggregate initial investment, was $64 million as ofDecember 31, 2010. The obligations associated with these fixed income securities expire at various dates on or before July 26, 2016.
Related to the disposal through reinsurance of substantially all of Allstate Financial's variable annuity business to Prudential in 2006, the Companyand its consolidated subsidiaries, ALIC and ALNY, have agreed to indemnify Prudential for certain pre-closing contingent liabilities (including extra-contractual liabilities of ALIC and ALNY and liabilities specifically excluded from the transaction) that ALIC and ALNY have agreed to retain. Inaddition, the Company, ALIC and ALNY will each indemnify Prudential for certain post-closing liabilities that may arise from the acts of ALIC, ALNYand their agents, including in connection with ALIC's and ALNY's provision of transition services. The reinsurance agreements contain no limitations orindemnifications with regard to insurance risk transfer, and transferred all of the future risks and responsibilities for performance on the underlyingvariable annuity contracts to Prudential, including those related to benefit guarantees. Management does not believe this agreement will have amaterial adverse effect on results of operations, cash flows or financial position of the Company.
The Company provides residual value guarantees on Company leased automobiles. If all outstanding leases were terminated effectiveDecember 31, 2010, the Company's maximum obligation pursuant to these guarantees, assuming the automobiles have no residual value, would be$10 million as of December 31, 2010. The remaining term of each residual value guarantee is equal to the term of the underlying lease that rangesfrom less than one year to three years. Historically, the Company has not made any material payments pursuant to these guarantees.
In the normal course of business, the Company provides standard indemnifications to contractual counterparties in connection with numeroustransactions, including acquisitions and divestitures. The types of indemnifications typically provided include indemnifications for breaches ofrepresentations and warranties, taxes and certain other liabilities, such as third party lawsuits. The indemnification clauses are often standardcontractual terms and are entered into in the normal course of business based on an assessment that the risk of loss would be remote. The terms ofthe indemnifications vary in duration and nature. In many cases, the maximum obligation is not explicitly stated and the contingencies triggering theobligation to indemnify have not occurred and are not expected to occur. Consequently, the maximum amount of the obligation under suchindemnifications is not determinable. Historically, the Company has not made any material payments pursuant to these obligations.
The aggregate liability balance related to all guarantees was not material as of December 31, 2010.
Regulation and Compliance
The Company is subject to changing social, economic and regulatory conditions. From time to time, regulatory authorities or legislative bodiesseek to influence and restrict premium rates, require premium refunds to policyholders, require reinstatement of terminated policies, restrict the abilityof insurers to cancel or non-renew policies, require insurers to continue to write new policies or limit their ability to write new policies, limit insurers'ability to change coverage terms or to impose underwriting standards, impose additional regulations regarding agent and broker compensation,regulate the nature of and amount of investments, and otherwise expand overall regulation of insurance products and the insurance industry. TheCompany has established procedures and policies to facilitate compliance
185

with laws and regulations, to foster prudent business operations, and to support financial reporting. The Company routinely reviews its practices tovalidate compliance with laws and regulations and with internal procedures and policies. As a result of these reviews, from time to time the Companymay decide to modify some of its procedures and policies. Such modifications, and the reviews that led to them, may be accompanied by paymentsbeing made and costs being incurred. The ultimate changes and eventual effects of these actions on the Company's business, if any, are uncertain.
Legal and regulatory proceedings and inquiries
Background
The Company and certain subsidiaries are involved in a number of lawsuits, regulatory inquiries, and other legal proceedings arising out of variousaspects of its business. As background to both the "Claims related proceedings" and "Other proceedings" subsections below, please note thefollowing:
• These matters raise difficult and complicated factual and legal issues and are subject to many uncertainties and complexities, includingthe underlying facts of each matter; novel legal issues; variations between jurisdictions in which matters are being litigated, heard, orinvestigated; differences in applicable laws and judicial interpretations; the length of time before many of these matters might be resolvedby settlement, through litigation, or otherwise; the fact that some of the lawsuits are putative class actions in which a class has not beencertified and in which the purported class may not be clearly defined; the fact that some of the lawsuits involve multi-state class actions inwhich the applicable law(s) for the claims at issue is in dispute and therefore unclear; and the current challenging legal environmentfaced by large corporations and insurance companies.
• The outcome of these matters may be affected by decisions, verdicts, and settlements, and the timing of such decisions, verdicts, andsettlements, in other individual and class action lawsuits that involve the Company, other insurers, or other entities and by other legal,governmental, and regulatory actions that involve the Company, other insurers, or other entities. The outcome may also be affected byfuture state or federal legislation, the timing or substance of which cannot be predicted.
• In the lawsuits, plaintiffs seek a variety of remedies which may include equitable relief in the form of injunctive and other remedies andmonetary relief in the form of contractual and extra-contractual damages. In some cases, the monetary damages sought may includepunitive or treble damages. Often specific information about the relief sought, such as the amount of damages, is not available becauseplaintiffs have not requested specific relief in their pleadings. When specific monetary demands are made, they are often set just below astate court jurisdictional limit in order to seek the maximum amount available in state court, regardless of the specifics of the case, whilestill avoiding the risk of removal to federal court. In Allstate's experience, monetary demands in pleadings bear little relation to theultimate loss, if any, to the Company.
• In connection with regulatory examinations and proceedings, government authorities may seek various forms of relief, includingpenalties, restitution, and changes in business practices. The Company may not be advised of the nature and extent of relief sought untilthe final stages of the examination or proceeding.
• For the reasons specified above, it is not possible to make meaningful estimates of the amount or range of loss that could result from thematters described below in the "Claims related proceedings" and "Other proceedings" subsections. The Company reviews these matterson an ongoing basis and follows appropriate accounting guidance when making accrual and disclosure decisions. When assessingreasonably possible and probable outcomes, the Company bases its decisions on its assessment of the ultimate outcome following allappeals.
• Due to the complexity and scope of the matters disclosed in the "Claims related proceedings" and "Other proceedings" subsectionsbelow and the many uncertainties that exist, the ultimate outcome of these matters cannot be reasonably predicted. In the event of anunfavorable outcome in one or more of these matters, the ultimate liability may be in excess of amounts currently reserved, if any, andmay be material to the Company's operating results or cash flows for a particular quarterly or annual period. However, based oninformation currently known to it, management believes that the ultimate outcome of all matters described below, as they are resolvedover time, is not likely to have a material adverse effect on the financial position of the Company.
Claims related proceedings
The Company is vigorously defending a number of matters in various stages of development filed in the aftermath of Hurricane Katrina, includingindividual lawsuits and a statewide putative class action in Louisiana. The Louisiana
186
Attorney General filed a putative class action lawsuit in state court against Allstate and other insurers on behalf of Road Home fund recipients allegingthat the insurers have failed to pay all damages owed under their policies. The insurers removed the matter to federal court. The district court deniedplaintiffs' motion to remand the matter to state court and the U.S. Court of Appeals for the Fifth Circuit ("Fifth Circuit") affirmed that ruling. Thedefendants filed a motion to dismiss and the plaintiffs filed a motion to remand the claims involving a Road Home subrogation agreement. In March2009, the district court denied the State's request that its claims be remanded to state court. As for the defendant insurers' motion, the judge granted itin part and denied it in part. Dismissal of all of the extra-contractual claims, including the bad faith and breach of fiduciary duty claims, was granted.Dismissal also was granted of all claims based on the Valued Policy Law and all flood loss claims based on the levee breaches finding that the insurersflood exclusions precluded coverage. The remaining claims are for breach of contract and for declaratory relief on the alleged underpayment of claimsby the insurers. The judge did not dismiss the class action allegations. The defendants also had moved to dismiss the complaint on grounds that theState had no standing to bring the lawsuit as an assignee of insureds because of anti-assignment language in the insurers' policies. The judge deniedthe defendants' motion for reconsideration on the assignment issue but found the matter was ripe for consideration by the federal appellate court. Thedefendants have filed a petition for permission to appeal to the Fifth Circuit. The Fifth Circuit has accepted review. After the Fifth Circuit acceptedreview, plaintiffs filed a motion to remand the case to state court, asserting that the class claims on which federal jurisdiction was premised have noweffectively been dismissed as a result of a ruling in a related case. The Fifth Circuit has denied the motion for remand, without prejudice to plaintiffs'right to refile the motion for remand after the Fifth Circuit disposes of the pending appeal. On July 28, 2010, the Fifth Circuit issued an order statingthat since there is no controlling Louisiana Supreme Court precedent on the issue of whether an insurance policy's anti-assignment clause prohibitspost-loss assignments, the Fifth Circuit is certifying that issue to the Louisiana Supreme Court. The issue has been briefed to the Louisiana SupremeCourt. That court will hold oral argument on the appeal on March 14, 2011.
There are one nationwide and several statewide class action lawsuits pending against Allstate alleging that it failed to properly pay generalcontractors overhead and profit on many homeowner structural loss claims. Most of these lawsuits contain counts for breach of contract, as well asone or more counts asserting other theories of liability such as bad faith, fraud, unjust enrichment, or unfair claims practices. General contractorsoverhead and profit is an amount that is added to payments on claims where the services of a general contractor are reasonably likely to be required.To a large degree, these lawsuits mirror similar lawsuits filed against other carriers in the industry, some of which have settled. These lawsuits arepending in various state and federal courts, and they are in different stages of development. The Company has reached an agreement to settle on a48-state basis the nationwide class action. This settlement received preliminary approval from the court on December 6, 2010, and the case wascertified as a class for settlement purposes only. The settlement was accrued as a prior year reserve reestimate in property-liability insurance claimsand claims expense in 2010. No other classes have been certified against Allstate on this issue. The hearing for final approval of the settlement isscheduled for May 6, 2011.
Allstate has been vigorously defending a lawsuit in regards to certain claims employees involving worker classification issues. This lawsuit is acertified class action challenging a state wage and hour law. In this case, plaintiffs sought monetary relief, such as penalties and liquidated damages,and non-monetary relief, such as injunctive relief. In December 2009, the liability phase of the case was tried, and, on July 6, 2010, the court issued itsdecision finding in favor of Allstate on all claims. The plaintiffs are appealing the decision.
Other proceedings
The Company is defending certain matters relating to the Company's agency program reorganization announced in 1999. These matters are invarious stages of development.
• These matters include a lawsuit filed in 2001 by the U.S. Equal Employment Opportunity Commission ("EEOC") alleging retaliation underfederal civil rights laws (the "EEOC I" suit) and a class action filed in 2001 by former employee agents alleging retaliation and agediscrimination under the Age Discrimination in Employment Act ("ADEA"), breach of contract and ERISA violations (the "Romero I" suit).In 2004, in the consolidated EEOC I and Romero I litigation, the trial court issued a memorandum and order that, among other things,certified classes of agents, including a mandatory class of agents who had signed a release, for purposes of effecting the court'sdeclaratory judgment that the release is voidable at the option of the release signer. The court also ordered that an agent who voids therelease must return to Allstate "any and all benefits received by the [agent] in exchange for signing the release." The court also statedthat, "on the undisputed facts of record, there is no basis for claims of age discrimination." The EEOC and plaintiffs asked the court toclarify and/or reconsider its memorandum and order and in January 2007, the judge denied their request. In June 2007, the court grantedthe Company's motions for summary judgment. Following plaintiffs' filing of a notice of appeal, the U.S. Court of
187

Appeals for the Third Circuit ("Third Circuit") issued an order in December 2007 stating that the notice of appeal was not taken from afinal order within the meaning of the federal law and thus not appealable at this time. In March 2008, the Third Circuit decided that theappeal should not summarily be dismissed and that the question of whether the matter is appealable at this time will be addressed by theThird Circuit along with the merits of the appeal. In July 2009, the Third Circuit vacated the decision which granted the Company'ssummary judgment motions, remanded the cases to the trial court for additional discovery, and directed that the cases be reassigned toanother trial court judge. In January 2010, the cases were assigned to a new judge for further proceedings in the trial court.
• A putative nationwide class action has also been filed by former employee agents alleging various violations of ERISA, including aworker classification issue. These plaintiffs are challenging certain amendments to the Agents Pension Plan and are seeking to haveexclusive agent independent contractors treated as employees for benefit purposes. This matter was dismissed with prejudice by the trialcourt, was the subject of further proceedings on appeal, and was reversed and remanded to the trial court in 2005. In June 2007, thecourt granted the Company's motion to dismiss the case. Following plaintiffs' filing of a notice of appeal, the Third Circuit issued an orderin December 2007 stating that the notice of appeal was not taken from a final order within the meaning of the federal law and thus notappealable at this time. In March 2008, the Third Circuit decided that the appeal should not summarily be dismissed and that thequestion of whether the matter is appealable at this time will be addressed by the Third Circuit along with the merits of the appeal. In July2009, the Third Circuit vacated the decision which granted the Company's motion to dismiss the case, remanded the case to the trialcourt for additional discovery, and directed that the case be reassigned to another trial court judge. In January 2010, the case wasassigned to a new judge for further proceedings in the trial court.
In these agency program reorganization matters, plaintiffs seek compensatory and punitive damages, and equitable relief. Allstate has beenvigorously defending these lawsuits and other matters related to its agency program reorganization.
Other Matters
Various other legal, governmental, and regulatory actions, including state market conduct exams, and other governmental and regulatory inquiriesare currently pending that involve the Company and specific aspects of its conduct of business. Like other members of the insurance industry, theCompany is the target of a number of class action lawsuits and other types of proceedings, some of which involve claims for substantial orindeterminate amounts. These actions are based on a variety of issues and target a range of the Company's practices. The outcome of these disputesis currently unpredictable.
One or more of these matters could have an adverse effect on the Company's operating results or cash flows for a particular quarterly or annualperiod. However, based on information currently known to it, management believes that the ultimate outcome of all matters described in this "OtherMatters" subsection, in excess of amounts currently reserved, if any, as they are resolved over time, is not likely to have a material effect on theoperating results, cash flows or financial position of the Company.
Asbestos and environmental
Allstate's reserves for asbestos claims were $1.10 billion and $1.18 billion, net of reinsurance recoverables of $555 million and $600 million, as ofDecember 31, 2010 and 2009, respectively. Reserves for environmental claims were $201 million and $198 million, net of reinsurance recoverables of$47 million and $49 million, as of December 31, 2010 and 2009, respectively. Approximately 60% and 62% of the total net asbestos and environmentalreserves as of December 31, 2010 and 2009, respectively, were for incurred but not reported estimated losses.
Management believes its net loss reserves for asbestos, environmental and other discontinued lines exposures are appropriately establishedbased on available facts, technology, laws and regulations. However, establishing net loss reserves for asbestos, environmental and otherdiscontinued lines claims is subject to uncertainties that are much greater than those presented by other types of claims. The ultimate cost of lossesmay vary materially from recorded amounts, which are based on management's best estimate. Among the complications are lack of historical data,long reporting delays, uncertainty as to the number and identity of insureds with potential exposure and unresolved legal issues regarding policycoverage; unresolved legal issues regarding the determination, availability and timing of exhaustion of policy limits; plaintiffs' evolving and expandingtheories of liability; availability and collectability of recoveries from reinsurance; retrospectively determined premiums and other contractualagreements; estimates of the extent and timing of any contractual liability; the impact of bankruptcy protection sought by various asbestos producersand other asbestos defendants; and other uncertainties. There are also complex legal issues concerning the interpretation of various insurance policyprovisions and whether those losses are covered, or were ever intended to be
188

covered, and could be recoverable through retrospectively determined premium, reinsurance or other contractual agreements. Courts have reacheddifferent and sometimes inconsistent conclusions as to when losses are deemed to have occurred and which policies provide coverage; what types oflosses are covered; whether there is an insurer obligation to defend; how policy limits are determined; how policy exclusions and conditions areapplied and interpreted; and whether clean-up costs represent insured property damage. Management believes these issues are not likely to beresolved in the near future, and the ultimate costs may vary materially from the amounts currently recorded resulting in material changes in lossreserves. In addition, while the Company believes that improved actuarial techniques and databases have assisted in its ability to estimate asbestos,environmental, and other discontinued lines net loss reserves, these refinements may subsequently prove to be inadequate indicators of the extent ofprobable losses. Due to the uncertainties and factors described above, management believes it is not practicable to develop a meaningful range forany such additional net loss reserves that may be required.
14. Income Taxes
The Company and its domestic subsidiaries file a consolidated federal income tax return. Tax liabilities and benefits realized by the consolidatedgroup are allocated as generated by the respective entities.
The Internal Revenue Service ("IRS") is currently examining the Company's 2007 and 2008 federal income tax returns. The IRS has completed itsexamination of the Company's federal income tax returns for 2005-2006 and the case is under consideration at the IRS Appeals Office. TheCompany's tax years prior to 2005 have been examined by the IRS and the statute of limitations has expired on those years. Any adjustments thatmay result from IRS examinations of tax returns are not expected to have a material effect on the results of operations, cash flows or financial positionof the Company.
The reconciliation of the change in the amount of unrecognized tax benefits for the years ended December 31 is as follows:
The Company believes it is reasonably possible that the liability balance will be reduced by $25 million within the next twelve months upon theresolution of an outstanding issue resulting from the 2005-2006 IRS examination. Because of the impact of deferred tax accounting, recognition ofpreviously unrecognized tax benefits is not expected to impact the Company's effective tax rate.
The Company recognizes interest accrued related to unrecognized tax benefits in income tax expense. The Company did not record interestincome or expense relating to unrecognized tax benefits in income tax expense in 2010. The Company recorded $0.1 million and $5 million of interestincome relating to unrecognized tax benefits in income tax expense in 2009 and 2008, respectively. As of December 31, 2010 and 2009, there was nointerest accrued with respect to unrecognized tax benefits. No amounts have been accrued for penalties.
189
($ in millions) 2010 2009 2008 Balance — beginning of year $ 22 $ 21 $ 76 Increase for tax positions taken in a prior
year 1 — 1 Decrease for tax positions taken in a prior
year — — — Increase for tax positions taken in the
current year 2 1 4 Decrease for tax positions taken in the
current year — — — Increase (decrease) for settlements — — (60)Reductions due to lapse of statute of
limitations — — —
Balance — end of year $ 25 $ 22 $ 21

The components of the deferred income tax assets and liabilities as of December 31 are as follows:
Although realization is not assured, management believes it is more likely than not that the deferred tax assets, net of valuation allowance, will berealized based on the Company's assessment that the deductions ultimately recognized for tax purposes will be fully utilized. The valuation allowancefor deferred tax assets decreased by $5 million in 2010.
The components of income tax expense (benefit) for the years ended December 31 are as follows:
As of December 31, 2010, the Company has tax credit carryforwards of $6 million which will be available to offset future tax liabilities. Thesecarryforwards will expire at the end of 2029 and 2030. In addition, the Company has an alternative minimum tax credit carryforward of $168 millionwhich will be available to offset future tax liabilities indefinitely.
Income tax expense for the year ended December 31, 2009 includes expense of $254 million attributable to an increase in the valuation allowancerelating to the deferred tax asset on capital losses recorded in the first quarter of 2009. This valuation allowance was released in connection with theadoption of new OTTI accounting guidance on April 1, 2009; however, the release was recorded as an increase to retained income and therefore didnot reverse the amount recorded in income tax expense. The release of the valuation allowance is related to the reversal of previously recorded other-than-temporary impairment write-downs that would not have been recorded under the new OTTI accounting guidance.
The Company received refunds of $8 million and $1.25 billion in 2010 and 2009, respectively, and paid income taxes of $511 million in 2008. TheCompany had a current income tax receivable of $129 million and $264 million as of December 31, 2010 and 2009, respectively.
190
($ in millions) 2010 2009 Deferred assets Unearned premium reserves $ 637 $ 642 Difference in tax bases of invested assets 521 346 Discount on loss reserves 310 328 Pension 229 289 Life and annuity reserves 227 375 Accrued compensation 201 199 Alternative minimum tax credit carryforward 168 99 Other postretirement benefits 157 173 Other assets 50 128 Unrealized net capital losses — 466
Total deferred assets 2,500 3,045 Valuation allowance (6) (11)
Net deferred assets 2,494 3,034 Deferred liabilities DAC (1,139) (1,095)Unrealized net capital gains (504) — Other liabilities (67) (69)
Total deferred liabilities (1,710) (1,164)
Net deferred asset $ 784 $ 1,870
($ in millions) 2010 2009 2008 Current $ 133 $ (18) $ (874)Deferred (including $208 million tax benefit
of operating loss carryforward in 2008) 65 412 (472)
Total income tax expense (benefit) $ 198 $ 394 $ (1,346)
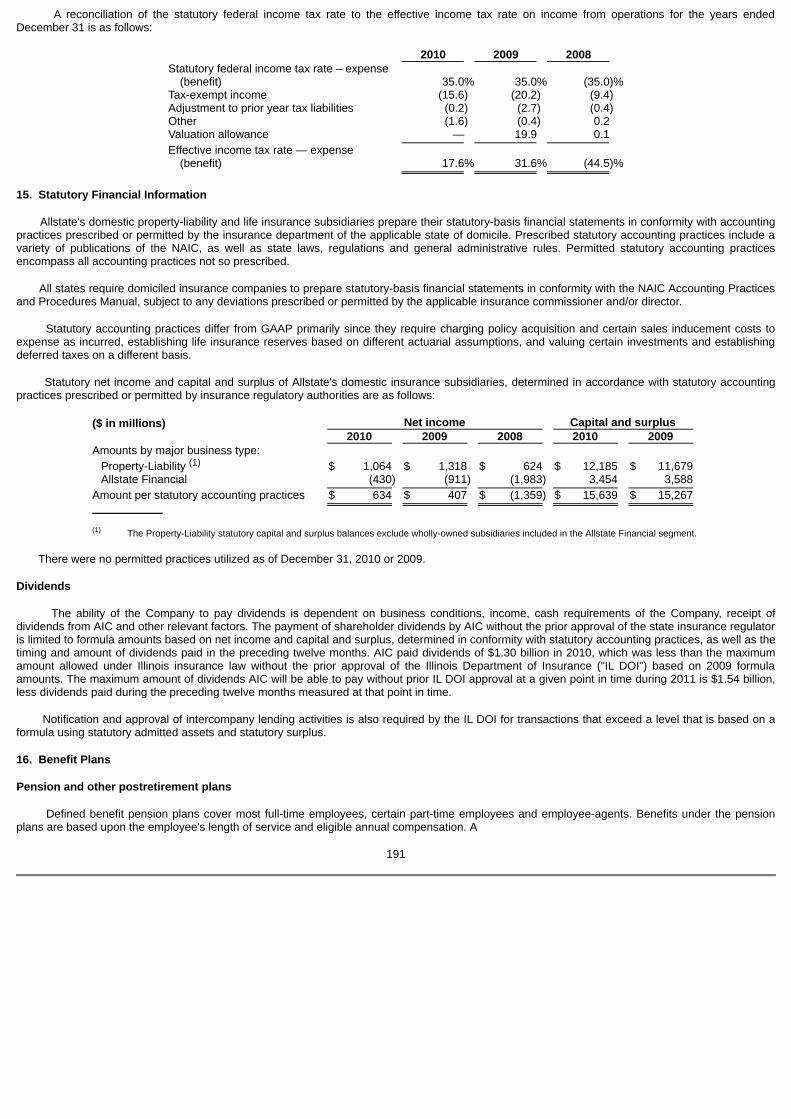
A reconciliation of the statutory federal income tax rate to the effective income tax rate on income from operations for the years endedDecember 31 is as follows:
15. Statutory Financial Information
Allstate's domestic property-liability and life insurance subsidiaries prepare their statutory-basis financial statements in conformity with accountingpractices prescribed or permitted by the insurance department of the applicable state of domicile. Prescribed statutory accounting practices include avariety of publications of the NAIC, as well as state laws, regulations and general administrative rules. Permitted statutory accounting practicesencompass all accounting practices not so prescribed.
All states require domiciled insurance companies to prepare statutory-basis financial statements in conformity with the NAIC Accounting Practicesand Procedures Manual, subject to any deviations prescribed or permitted by the applicable insurance commissioner and/or director.
Statutory accounting practices differ from GAAP primarily since they require charging policy acquisition and certain sales inducement costs toexpense as incurred, establishing life insurance reserves based on different actuarial assumptions, and valuing certain investments and establishingdeferred taxes on a different basis.
Statutory net income and capital and surplus of Allstate's domestic insurance subsidiaries, determined in accordance with statutory accountingpractices prescribed or permitted by insurance regulatory authorities are as follows:
There were no permitted practices utilized as of December 31, 2010 or 2009.
Dividends
The ability of the Company to pay dividends is dependent on business conditions, income, cash requirements of the Company, receipt ofdividends from AIC and other relevant factors. The payment of shareholder dividends by AIC without the prior approval of the state insurance regulatoris limited to formula amounts based on net income and capital and surplus, determined in conformity with statutory accounting practices, as well as thetiming and amount of dividends paid in the preceding twelve months. AIC paid dividends of $1.30 billion in 2010, which was less than the maximumamount allowed under Illinois insurance law without the prior approval of the Illinois Department of Insurance ("IL DOI") based on 2009 formulaamounts. The maximum amount of dividends AIC will be able to pay without prior IL DOI approval at a given point in time during 2011 is $1.54 billion,less dividends paid during the preceding twelve months measured at that point in time.
Notification and approval of intercompany lending activities is also required by the IL DOI for transactions that exceed a level that is based on aformula using statutory admitted assets and statutory surplus.
16. Benefit Plans
Pension and other postretirement plans
Defined benefit pension plans cover most full-time employees, certain part-time employees and employee-agents. Benefits under the pensionplans are based upon the employee's length of service and eligible annual compensation. A
191
2010 2009 2008 Statutory federal income tax rate – expense
(benefit) 35.0% 35.0% (35.0)%Tax-exempt income (15.6) (20.2) (9.4)Adjustment to prior year tax liabilities (0.2) (2.7) (0.4)Other (1.6) (0.4) 0.2 Valuation allowance — 19.9 0.1
Effective income tax rate — expense(benefit) 17.6% 31.6% (44.5)%
($ in millions) Net income Capital and surplus 2010 2009 2008 2010 2009 Amounts by major business type: Property-Liability (1) $ 1,064 $ 1,318 $ 624 $ 12,185 $ 11,679 Allstate Financial (430) (911) (1,983) 3,454 3,588
Amount per statutory accounting practices $ 634 $ 407 $ (1,359) $ 15,639 $ 15,267
The Property-Liability statutory capital and surplus balances exclude wholly-owned subsidiaries included in the Allstate Financial segment.(1)

cash balance formula was added to the Allstate Retirement Plan effective January 1, 2003. All eligible employees hired before August 1, 2002 wereprovided with a one-time opportunity to choose between the cash balance formula and the final average pay formula. The cash balance formulaapplies to all eligible employees hired after August 1, 2002.
The Company also provides certain health care subsidies for eligible employees hired before January 1, 2003 when they retire and their eligibledependents and certain life insurance benefits for eligible employees hired before January 1, 2003 when they retire ("postretirement benefits").Qualified employees may become eligible for these benefits if they retire in accordance with the Company's established retirement policy and arecontinuously insured under the Company's group plans or other approved plans in accordance with the plan's participation requirements. TheCompany shares the cost of retiree medical benefits with non Medicare-eligible retirees based on years of service, with the Company's share beingsubject to a 5% limit on annual medical cost inflation after retirement. During 2009, the Company decided to change its approach for delivering benefitsto Medicare-eligible retirees. The Company no longer offers medical benefits for Medicare-eligible retirees but instead provides a fixed Companycontribution (based on years of service and other factors), which is not subject to adjustments for inflation.
The Company has reserved the right to modify or terminate its benefit plans at any time and for any reason.
Obligations and funded status
The Company calculates benefit obligations based upon generally accepted actuarial methodologies using the projected benefit obligation ("PBO")for pension plans and the accumulated postretirement benefit obligation ("APBO") for other postretirement plans. The determination of pension costsand other postretirement obligations as of December 31, 2010 and 2009 are determined using a December 31 measurement date. The benefitobligations represent the actuarial present value of all benefits attributed to employee service rendered as of the measurement date. The PBO ismeasured using the pension benefit formula and assumptions as to future compensation levels. A plan's funded status is calculated as the differencebetween the benefit obligation and the fair value of plan assets. The Company's funding policy for the pension plans is to make annual contributions ata level that is in accordance with regulations under the Internal Revenue Code ("IRC") and generally accepted actuarial principles. The Company'spostretirement benefit plans are not funded.
The components of the plans' funded status that are reflected in the Consolidated Statements of Financial Position as of December 31 are asfollows:
The decrease of $131 million in the pension net actuarial loss during 2010 is related to higher than expected returns and higher unrecognized lossamortization through pension expense, partially offset by a decrease in the discount rate. The majority of the $2.31 billion net actuarial pension benefitlosses not yet recognized as a component of net periodic pension cost in 2010 reflects the effect of unfavorable equity market conditions on the valueof the pension plan assets in prior years, and to a lesser extent decreases in the discount rate. The increase of $36 million in the OPEB net actuarialgain during 2010 is primarily related to a decrease in enrollment of Medicare-eligible retirees and lower claim costs of future retirees. The decrease of$22 million in the OPEB prior service credit is primarily related to amortization of prior service cost.
192
($ in millions)
Pensionbenefits
Postretirementbenefits
2010 2009 2010 2009 Fair value of plan assets $ 4,669 $ 4,127 $ — $ — Less: Benefit obligation 5,545 5,233 628 666
Funded status $ (876) $ (1,106) $ (628) $ (666)
Items not yet recognized as a component of net periodiccost:
Net actuarial loss (gain) $ 2,311 $ 2,442 $ (322) $ (286)Prior service credit (5) (8) (175) (197)
Unrecognized pension and other postretirement benefitcost, pre-tax 2,306 2,434 (497) (483)
Deferred income tax (807) (852) 186 183
Unrecognized pension and other postretirement benefitcost $ 1,499 $ 1,582 $ (311) $ (300)

The change in 2010 in items not yet recognized as a component of net periodic cost, which is recorded in unrecognized pension and otherpostretirement benefit cost, is shown in the table below.
The net actuarial loss (gain) is recognized as a component of net periodic cost amortized over the average remaining service period of activeemployees expected to receive benefits. Estimates of the net actuarial loss (gain) and prior service credit expected to be recognized as a componentof net periodic benefit cost during 2011 are shown in the table below.
The accumulated benefit obligation ("ABO") for all defined benefit pension plans was $4.82 billion and $4.50 billion as of December 31, 2010 and2009, respectively. The ABO is the actuarial present value of all benefits attributed by the pension benefit formula to employee service rendered at themeasurement date. However, it differs from the PBO due to the exclusion of an assumption as to future compensation levels.
The PBO, ABO and fair value of plan assets for the Company's pension plans with an ABO in excess of plan assets were $4.48 billion,$3.79 billion and $3.54 billion, respectively, as of December 31, 2010 and $4.99 billion, $4.28 billion and $3.85 billion, respectively, as of December 31,2009. Included in the accrued benefit cost of the pension benefits are certain unfunded non-qualified plans with accrued benefit costs of $132 millionand $156 million for 2010 and 2009, respectively.
The changes in benefit obligations for all plans for the years ended December 31 are as follows:
193
($ in millions)
Pensionbenefits
Postretirementbenefits
Items not yet recognized as a component of net periodic cost —December 31, 2009 $ 2,434 $ (483)
Net actuarial loss (gain) arising during the period 74 (58)Net actuarial (loss) gain amortized to net periodic benefit cost (208) 22 Prior service cost arising during the period — — Prior service credit amortized to net periodic benefit cost 2 22 Translation adjustment and other 4 —
Items not yet recognized as a component of net periodic cost —December 31, 2010 $ 2,306 $ (497)
($ in millions)
Pensionbenefits
Postretirementbenefits
Net actuarial loss (gain) $ 154 $ (30)Prior service credit (2) (23)
($ in millions) Pension benefits
Postretirementbenefits
2010 2009 2010 2009 Benefit obligation, beginning of year $ 5,233 $ 4,566 $ 666 $ 762 Service cost 150 125 12 13 Interest cost 320 331 40 52 Participant contributions 1 1 22 38 Actuarial loss (gain) 239 537 (58) 105 Benefits paid (1) (407) (356) (57) (77)Plan amendment (2) — — — (232)Translation adjustment and other 9 29 3 5
Benefit obligation, end of year $ 5,545 $ 5,233 $ 628 $ 666
Benefits paid include lump sum distributions, a portion of which may trigger settlement accounting treatment.
In 2009, the Company amended its postretirement benefits plan offering and financial subsidy for Medicare-eligible retiree medical benefits.
(1)
(2)

Components of net periodic cost
The components of net periodic cost for all plans for the years ended December 31 are as follows:
Assumptions
Weighted average assumptions used to determine net pension cost and net postretirement benefit cost for the years ended December 31 are:
Weighted average assumptions used to determine benefit obligations as of December 31 are listed in the following table.
The weighted average health care cost trend rate used in measuring the accumulated postretirement benefit cost is 7.40% for 2011, graduallydeclining to 4.5% in 2024 and remaining at that level thereafter.
Assumed health care cost trend rates have a significant effect on the amounts reported for the postretirement health care plans. A onepercentage-point increase in assumed health care cost trend rates would increase the total of the service and interest cost components of net periodicbenefit cost of other postretirement benefits and the APBO by $3 million and $27 million, respectively. A one percentage-point decrease in assumedhealth care cost trend rates would decrease the total of the service and interest cost components of net periodic benefit cost of other postretirementbenefits and the APBO by $2 million and $19 million, respectively.
Pension plan assets
The change in pension plan assets for the years ended December 31 is as follows:
In general, the Company's pension plan assets are managed in accordance with investment policies approved by pension investment committees.The purpose of the policies is to ensure the plans' long-term ability to meet benefit obligations by prudently investing plan assets and Companycontributions, while taking into consideration regulatory and legal requirements and current market conditions. The investment policies are reviewedperiodically and specify
194
Pension benefits Postretirement benefits ($ in millions) 2010 2009 2008 2010 2009 2008 Service cost $ 150 $ 125 $ 145 $ 12 $ 13 $ 18 Interest cost 320 331 313 40 52 58 Expected return on plan assets (331) (398) (397) — — — Amortization of: Prior service (credit) cost (2) (3) (2) (22) (6) 2 Net actuarial loss (gain) 160 15 37 (22) (29) (24)Settlement loss 48 22 57 — — —
Net periodic cost $ 345 $ 92 $ 153 $ 8 $ 30 $ 54
($ in millions) Pension benefits Postretirement benefits 2010 2009 2008 2010 2009 2008 Weighted average discount rate 6.25% 7.50% 6.50% 6.25% 6.50% 6.75%Rate of increase in compensation levels 4.0-4.5 4.0-4.5 4.0-4.5 n/a n/a n/a Expected long-term rate of return on plan
assets 8.5 8.5 8.5 n/a n/a n/a
Pension benefits Postretirement benefits 2010 2009 2010 2009 Discount rate 6.00% 6.25% 6.00% 6.25%Rate of increase in
compensation levels 4.0-4.5 4.0-4.5 n/a n/a
($ in millions) 2010 2009 Fair value of plan assets, beginning of year $ 4,127 $ 3,399 Actual return on plan assets 496 531 Employer contribution 443 526 Benefits paid (407) (356)Translation adjustment and other 10 27
Fair value of plan assets, end of year $ 4,669 $ 4,127

target plan asset allocation by asset category. In addition, the policies specify various asset allocation and other risk limits. The pension plans' assetexposure within each asset category is tracked against widely accepted established benchmarks for each asset class with limits on variation from thebenchmark established in the investment policy. Pension plan assets are regularly monitored for compliance with these limits and other risk limitsspecified in the investment policies.
The pension plans' target asset allocation and the actual percentage of plan assets, by asset category as of December 31 are as follows:
In general, exposures to an asset category may be achieved either through direct investment holdings or through replication using derivativeinstruments (e.g., futures or swaps). The notional amount of derivatives used for replication is targeted at 10% and limited to 15% of total assets.
Outside the target asset allocation, the pension plans participate in a securities lending program to enhance returns. U.S. government fixedincome securities and U.S. equity securities are lent out and cash collateral is invested 35% in fixed income securities and 65% in short-terminvestments.
195
Target asset
allocation Actual percentage
of plan assets Asset category 2010 2010 2009 U.S. equity securities 25 - 33% 25% 25%International equity
securities 17 - 23 18 16 Fixed income securities 35 - 48 38 34 Real estate funds 3 - 7 4 3 Private equity funds 3 - 7 3 4 Hedge funds 6 - 9 8 9 Short-term investments and
other 1 - 3 4 9
Total (1) 100% 100%
Securities lending collateral reinvestment is excluded from target and actual percentage of plan assets.(1)
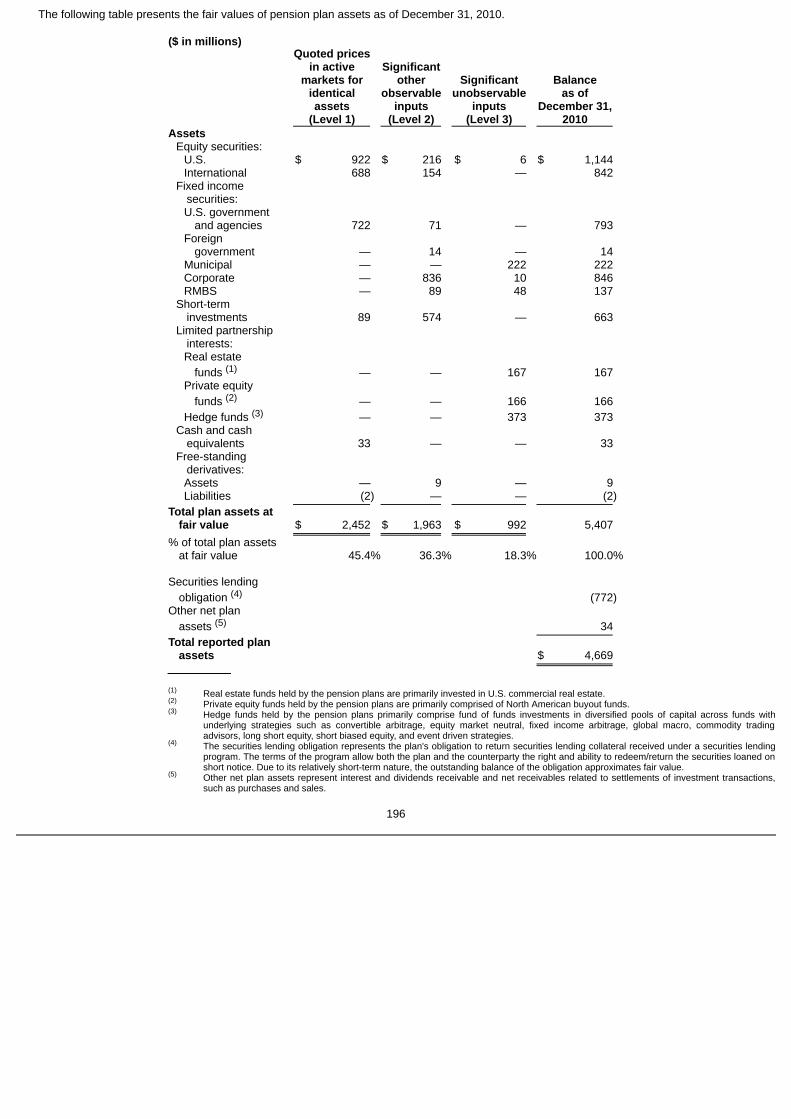
The following table presents the fair values of pension plan assets as of December 31, 2010.
196
($ in millions)
Quoted pricesin active
markets foridenticalassets
(Level 1)
Significantother
observableinputs
(Level 2)
Significantunobservable
inputs(Level 3)
Balanceas of
December 31,2010
Assets Equity securities: U.S. $ 922 $ 216 $ 6 $ 1,144 International 688 154 — 842
Fixed incomesecurities:
U.S. governmentand agencies 722 71 — 793
Foreigngovernment — 14 — 14
Municipal — — 222 222 Corporate — 836 10 846 RMBS — 89 48 137
Short-terminvestments 89 574 — 663
Limited partnershipinterests:
Real estatefunds (1) — — 167 167
Private equityfunds (2) — — 166 166
Hedge funds (3) — — 373 373
Cash and cashequivalents 33 — — 33
Free-standingderivatives:
Assets — 9 — 9 Liabilities (2) — — (2)
Total plan assets atfair value $ 2,452 $ 1,963 $ 992 5,407
% of total plan assetsat fair value 45.4% 36.3% 18.3% 100.0%
Securities lendingobligation (4) (772)
Other net planassets (5) 34
Total reported planassets $ 4,669
Real estate funds held by the pension plans are primarily invested in U.S. commercial real estate.Private equity funds held by the pension plans are primarily comprised of North American buyout funds.Hedge funds held by the pension plans primarily comprise fund of funds investments in diversified pools of capital across funds withunderlying strategies such as convertible arbitrage, equity market neutral, fixed income arbitrage, global macro, commodity tradingadvisors, long short equity, short biased equity, and event driven strategies.The securities lending obligation represents the plan's obligation to return securities lending collateral received under a securities lendingprogram. The terms of the program allow both the plan and the counterparty the right and ability to redeem/return the securities loaned onshort notice. Due to its relatively short-term nature, the outstanding balance of the obligation approximates fair value.Other net plan assets represent interest and dividends receivable and net receivables related to settlements of investment transactions,such as purchases and sales.
(1)(2)(3)
(4)
(5)

The following table presents the fair values of pension plan assets as of December 31, 2009.
197
($ in millions)
Quoted pricesin active
markets foridenticalassets
(Level 1)
Significantother
observableinputs
(Level 2)
Significantunobservable
inputs(Level 3)
Balanceas of
December 31,2009
Assets Equity securities: U.S. $ 888 $ 137 $ 4 $ 1,029 International 542 121 — 663
Fixed incomesecurities:
U.S. governmentand agencies 774 72 — 846
Municipal — — 344 344 Corporate — 565 10 575 RMBS — — 61 61 ABS — — 32 32
Short-terminvestments 60 657 — 717
Limited partnershipinterests:
Real estate funds — — 135 135
Private equityfunds — — 149 149
Hedge funds — — 368 368
Cash and cashequivalents 10 — — 10
Free-standingderivatives:
Assets 13 — — 13 Liabilities (7) — — (7)
Total plan assets atfair value $ 2,280 $ 1,552 $ 1,103 4,935
% of total plan assetsat fair value 46.2% 31.4% 22.4% 100.0%
Securities lendingobligation (840)
Other net plan assets 32
Total reported planassets $ 4,127

The fair values of pension plan assets are estimated using the same methodologies and inputs as those used to determine the fair values for therespective asset category of the Company. These methodologies and inputs are disclosed in Note 5.
The following table presents the rollforward of Level 3 plan assets for the year ended December 31, 2010.
The following table presents the rollforward of Level 3 plan assets for the year ended December 31, 2009.
The expected long-term rate of return on plan assets reflects the average rate of earnings expected on plan assets. The Company's assumptionfor the expected long-term rate of return on plan assets is reviewed annually giving consideration to appropriate financial data including, but not limitedto, the plan asset allocation, forward-looking expected returns for the period over which benefits will be paid, historical returns on plan assets and otherrelevant market data. Given the long-term forward looking nature of this assumption, the actual returns in any one year do not immediately result in achange. In giving consideration to the targeted plan asset allocation, the Company evaluated returns using the same sources it has used historicallywhich include: historical average asset class returns from an independent nationally recognized vendor of this type of data blended together using theasset allocation policy weights for the Company's pension plans; asset class return forecasts from a large global independent asset management firmthat specializes in providing multi-asset class index fund products which were blended together using the asset allocation policy weights; and expectedportfolio returns from a proprietary simulation methodology of a widely recognized external investment consulting firm that performs asset allocationand actuarial services for corporate pension plan sponsors. This same methodology has been applied on a consistent basis each year. All of thesewere consistent with the Company's long-term rate of return on plan assets assumption of 8.5% as of December 31, 2010 and 2009. As of the 2010measurement date, the arithmetic average of the annual actual return on plan assets for the most recent 10 and 5 years was 3.5% and 6.0%,respectively.
Pension plan assets did not include any of the Company's common stock as of December 31, 2010 or 2009.
198
($ in millions) Actual return on plan assets:
Balance as ofDecember 31,
2009
Relating toassets soldduring the
period
Relating toassets stillheld at thereporting
date
Purchases,sales,
issuances andsettlements,
net
Transfersinto
Level 3
Transfersout of
Level 3
Balance as ofDecember 31,
2010 Assets U. S. equity securities $ 4 $ — $ 2 $ — $ — $ — $ 6 Fixed income securities: Municipal 344 — (2) (114) — (6) 222 Corporate 10 — — — — — 10 RMBS 61 (10) 23 (26) — — 48 ABS 32 (1) — (31) — — — Limited partnership interests: Real estate funds 135 (4) 3 33 — — 167 Private equity funds 149 — 19 (2) — — 166 Hedge funds 368 (58) 73 (10) — — 373
Total Level 3 plan assets $ 1,103 $ (73) $ 118 $ (150) $ — $ (6) $ 992
($ in millions) Actual return on plan assets:
Balance as ofJanuary 1,
2009
Relating toassets soldduring the
period
Relating toassets stillheld at thereporting
date
Purchases,sales,
issuances andsettlements,
net
Nettransfers inand/or (out)of Level 3
Balance as ofDecember 31,
2009 Assets U. S. equity securities $ 5 $ — $ (3) $ 2 $ — $ 4 Fixed income securities: Municipal 408 — 22 (48) (38) 344 Corporate 10 2 — 17 (19) 10 RMBS 99 — 2 (40) — 61 ABS — — — 32 — 32 Limited partnership interests: Real estate funds 142 — (47) 40 — 135 Private equity funds 133 — 4 12 — 149 Hedge funds 341 10 37 (20) — 368
Total Level 3 plan assets $ 1,138 $ 12 $ 15 $ (5) $ (57) $ 1,103

Cash flows
There was no required cash contribution necessary to satisfy the minimum funding requirement under the IRC for the tax qualified pension plansas of December 31, 2010. The Company currently plans to contribute $263 million to its pension plans in 2011.
The Company contributed $35 million and $39 million to the postretirement benefit plans in 2010 and 2009, respectively. Contributions byparticipants were $22 million and $38 million in 2010 and 2009.
Estimated future benefit payments
Estimated future benefit payments expected to be paid in the next 10 years, based on the assumptions used to measure the Company's benefitobligation as of December 31, 2010 are presented in the table below. Effective January 1, 2010, the Company no longer participates in the RetireeDrug Subsidy program due to the change in the Company's retiree medical plan for Medicare-eligible retirees.
Allstate 401(k) Savings Plan
Employees of the Company, with the exception of those employed by the Company's international subsidiaries and Sterling Collision Centers("Sterling") subsidiary, are eligible to become members of the Allstate 401(k) Savings Plan ("Allstate Plan"). The Company's contributions are based onthe Company's matching obligation and certain performance measures. The Company is responsible for funding its anticipated contribution to theAllstate Plan, and may, at the discretion of management, use the ESOP to pre-fund certain portions. In connection with the Allstate Plan, the Companyhas a note from the ESOP with a principal balance of $22 million as of December 31, 2010. The ESOP note has a fixed interest rate of 7.9% andmatures in 2019. The Company records dividends on the ESOP shares in retained income and all the shares held by the ESOP are included in basicand diluted weighted average common shares outstanding.
The Company's contribution to the Allstate Plan was $36 million, $78 million and $48 million in 2010, 2009 and 2008, respectively. These amountswere reduced by the ESOP benefit computed for the years ended December 31 as follows:
The Company made no contributions to the ESOP in 2010 and 2009. The Company contributed $5 million to the ESOP in 2008. As ofDecember 31, 2010, total committed to be released, allocated and unallocated ESOP shares were 0.2 million, 34 million and 5 million, respectively.
Allstate has defined contribution plans for eligible employees of its Canadian insurance subsidiaries and Sterling. Expense for these plans was$5 million, $6 million and $2 million in 2010, 2009 and 2008, respectively.
17. Equity Incentive Plans
The Company currently has two equity incentive plans that permit it to grant nonqualified stock options, incentive stock options, restricted orunrestricted shares of the Company's stock and restricted stock units to certain employees
199
($ in millions) Postretirement benefits
Pensionbenefits
Grossbenefit
payments 2011 $ 292 $ 36 2012 313 38 2013 321 39 2014 356 42 2015 375 43 2016-2020 2,408 247
Total benefit payments $ 4,065 $ 445
($ in millions) 2010 2009 2008 Interest expense recognized by ESOP $ 2 $ 2 $ 2 Less: dividends accrued on ESOP shares (2) (2) (2)Cost of shares allocated 2 2 2
Compensation expense 2 2 2 Reduction of defined contribution due to
ESOP 11 22 12
ESOP benefit $ (9) $ (20) $ (10)

and directors of the Company. The total compensation expense related to equity awards was $68 million, $74 million and $85 million and the totalincome tax benefits were $23 million, $25 million and $29 million for the years ended December 31, 2010, 2009 and 2008, respectively. Total cashreceived from the exercise of options was $28 million, $3 million and $33 million for the years ended December 31, 2010, 2009 and 2008, respectively.Total tax benefit realized on options exercised and stock unrestricted was $11 million, $3 million and $12 million for the years ended December 31,2010, 2009 and 2008, respectively.
The Company records compensation expense related to awards under these plans over the vesting period of each grant. The Company recordscompensation expense for employees eligible for continued vesting upon retirement over the vesting period to the date that the employee is eligible forretirement. As of December 31, 2010, total unrecognized compensation cost related to all nonvested awards was $107 million, of which $63 millionrelated to nonqualified stock options which are expected to be recognized over the weighted average vesting period of 2.36 years and $44 million isrelated to restricted stock units which are expected to be recognized over the weighted average vesting period of 2.47 years.
Options are granted under the plans with exercise prices equal to the closing share price of the Company's common stock on the applicable grantdate. Options granted to employees under the Allstate plan generally vest 50% on the second anniversary of the grant date and 25% on each of thethird and fourth anniversaries of the grant date. Options granted prior to 2010 vest ratably over a four year period. Options may be exercised oncevested and will expire ten years after the date of grant unless the employee retires. For a retirement, employee stock options vest as scheduled. Whenthe options become vested, they may be exercised on or before the earlier of the option expiration date or the fifth anniversary of the employee'sretirement. Restricted stock units generally vest and unrestrict 50% on the second anniversary of the grant date and 25% on each of the third andfourth anniversaries of the grant date, except for directors which vest immediately and unrestrict after leaving the board. Restricted stock and restrictedstock units granted to employees prior to 2010 vest and unrestrict in full on the fourth anniversary of the grant date. Employee awards are subject toforfeiture upon termination. For terminations due to employee retirement, restricted stock units continue to unrestrict as provided for in the originalgrant.
A total of 71.0 million shares of common stock were authorized to be used for awards under the plans, subject to adjustment in accordance withthe plans' terms. As of December 31, 2010, 21.2 million shares were reserved and remained available for future issuance under these plans. TheCompany uses its treasury shares for these issuances.
The fair value of each option grant is estimated on the date of grant using a binomial lattice model. The Company uses historical data to estimateoption exercise and employee termination within the valuation model. In addition, separate groups of employees that have similar historical exercisebehavior are considered separately for valuation purposes. The expected term of options granted is derived from the output of the binominal latticemodel and represents the period of time that options granted are expected to be outstanding. The expected volatility of the price of the underlyingshares is implied based on traded options and historical volatility of the Company's common stock. The expected dividends for 2010 were based onthe current dividend yield of the Company's stock as of the date of the grant. The expected dividends for 2009 were based on a graded average of thecurrent and historical long-term dividend yield of the Company's stock as of the date of the grant. The expected dividends for 2008 were based on thecurrent dividend yield of the Company's stock as of the date of the grant. The risk-free rate for periods within the contractual life of the option is basedon the U.S. Treasury yield curve in effect at the time of grant. The assumptions used are shown in the following table.
200
2010 2009 2008 Weighted average expected term 7.8 years 8.1 years 8.1 years Expected volatility 23.7 - 52.3% 26.3 - 79.2% 16.9 - 58.6% Weighted average volatility 35.1% 38.3% 23.1% Expected dividends 2.4 - 2.8% 2.6% 3.1 - 5.8% Weighted average expected dividends 2.6% 2.6% 3.1% Risk-free rate 0.1 - 3.9% 0.0 - 3.7% 0.2 - 4.1%

A summary of option activity for the year ended December 31, 2010 is shown in the following table.
The weighted average grant date fair value of options granted was $9.89, $5.74 and $9.98 during the years ended December 31, 2010, 2009 and2008, respectively. The intrinsic value, which is the difference between the fair value and the exercise price, of options exercised was $16 million,$428 thousand and $9 million during the years ended December 31, 2010, 2009 and 2008, respectively.
The changes in restricted stock and restricted stock units are shown in the following table for the year ended December 31, 2010.
The fair value of restricted stock and restricted stock units is based on the market value of the Company's stock as of the date of the grant. Themarket value in part reflects the payment of future dividends expected. The weighted average grant date fair value of restricted stock and restrictedstock units granted was $31.32, $17.47 and $48.00 during the years ended December 31, 2010, 2009 and 2008, respectively. The total fair value ofrestricted stock and restricted stock units vested was $16 million, $11 million and $25 million during the years ended December 31, 2010, 2009 and2008, respectively.
The tax benefit realized in 2010, 2009 and 2008 related to tax deductions from stock option exercises and included in shareholders' equity was$4 million, zero and $3 million, respectively. The tax benefit realized in 2010, 2009 and 2008 related to all stock-based compensation and crediteddirectly to shareholders' equity was $0.5 million, $(6) million and $3 million, respectively.
18. Business Segments
Allstate management is organized around products and services, and this structure is considered in the identification of its four reportablesegments. These segments and their respective operations are as follows:
Allstate Protection sells principally private passenger auto and homeowners insurance in the United States and Canada. Revenues fromexternal customers generated outside the United States were $741 million, $619 million and $665 million in 2010, 2009 and 2008, respectively. TheCompany evaluates the results of this segment based upon underwriting results.
Discontinued Lines and Coverages consists of business no longer written by Allstate, including results from asbestos, environmental and otherdiscontinued lines claims, and certain commercial and other businesses in run-off. This segment also includes the historical results of the commercialand reinsurance businesses sold in 1996. The Company evaluates the results of this segment based upon underwriting results.
201
Number(in 000s)
Weightedaverageexercise
price
Aggregateintrinsic value
(in 000s)
Weightedaverage
remainingcontractualterm (years)
Outstanding as of January 1, 2010 34,910 $ 39.64 Granted 4,014 31.40 Exercised (1,403) 20.28 Forfeited (949) 28.68 Expired (1,276) 49.90
Outstanding as of December 31, 2010: 35,296 39.39 $ 124,033 5.3
Outstanding, net of expected forfeitures 34,968 39.51 121,995 5.3 Outstanding, exercisable ("vested") 21,470 45.92 22,910 3.7
Number(in 000s)
Weightedaverage
grant datefair value
Nonvested as of January 1, 2010 3,368 $ 34.83 Granted 1,143 31.32 Vested (527) 52.65 Forfeited (227) 30.66
Nonvested as of December 31, 2010 3,757 $ 31.50

Allstate Financial sells life insurance, retirement and investment products and voluntary accident and health insurance. The principal individualproducts are interest-sensitive, traditional and variable life insurance; fixed annuities; and voluntary accident and health insurance. The institutionalproduct line consists primarily of funding agreements sold to unaffiliated trusts that use them to back medium-term notes issued to institutional andindividual investors. Banking products and services have been offered to customers through the Allstate Bank. Allstate Financial had no revenues fromexternal customers generated outside the United States in 2010, 2009 and 2008. The Company evaluates the results of this segment based uponoperating income.
Corporate and Other comprises holding company activities and certain non-insurance operations.
Allstate Protection and Discontinued Lines and Coverages comprise Property-Liability. The Company does not allocate Property-Liabilityinvestment income, realized capital gains and losses, or assets to the Allstate Protection and Discontinued Lines and Coverages segments.Management reviews assets at the Property-Liability, Allstate Financial, and Corporate and Other levels for decision-making purposes.
The accounting policies of the business segments are the same as those described in Note 2. The effects of certain inter-segment transactionsare excluded from segment performance evaluation and therefore are eliminated in the segment results.
Measuring segment profit or loss
The measure of segment profit or loss used by Allstate's management in evaluating performance is underwriting income (loss) for the AllstateProtection and Discontinued Lines and Coverages segments and operating income for Allstate Financial and Corporate and Other segments. Areconciliation of these measures to net income (loss) is provided below.
Underwriting income (loss) is calculated as premiums earned, less claims and claims expenses ("losses"), amortization of DAC, operating costsand expenses, and restructuring and related charges as determined using GAAP.
Operating income (loss) is net income (loss) excluding:
• realized capital gains and losses, after-tax, except for periodic settlements and accruals on non-hedge derivative instruments, which arereported with realized capital gains and losses but included in operating income (loss),
• (amortization) accretion of DAC and DSI, to the extent they resulted from the recognition of certain realized capital gains and losses,
• gain (loss) on disposition of operations, after-tax, and
• adjustments for other significant non-recurring, infrequent or unusual items, when (a) the nature of the charge or gain is such that it isreasonably unlikely to recur within two years, or (b) there has been no similar charge or gain within the prior two years.
202

Summarized revenue data for each of the Company's business segments for the years ended December 31 are as follows:
203
($ in millions) 2010 2009 2008 Revenues Property-Liability Property-liability insurance premiums Standard auto $ 16,530 $ 16,642 $ 17,048 Non-standard auto 905 966 1,100
Total auto 17,435 17,608 18,148 Homeowners 6,078 6,077 6,261 Other personal lines 2,442 2,510 2,558
Allstate Protection 25,955 26,195 26,967 Discontinued Lines and Coverages 2 (1) —
Total property-liability insurance premiums 25,957 26,194 26,967 Net investment income 1,189 1,328 1,674 Realized capital gains and losses (321) (168) (1,858)
Total Property-Liability 26,825 27,354 26,783 Allstate Financial Life and annuity premiums and contract charges Traditional life insurance 420 407 399 Immediate annuities with life contingencies 97 102 132 Accident and health insurance 621 460 412
Total life and annuity premiums 1,138 969 943 Interest-sensitive life insurance 991 944 896 Fixed annuities 39 45 56
Total contract charges 1,030 989 952
Total life and annuity premiums and contract charges 2,168 1,958 1,895 Net investment income 2,853 3,064 3,811 Realized capital gains and losses (517) (431) (3,127)
Total Allstate Financial 4,504 4,591 2,579 Corporate and Other Service fees 11 9 10 Net investment income 60 52 137 Realized capital gains and losses 11 16 (105)
Total Corporate and Other before reclassification of service fees 82 77 42 Reclassification of service fees (1) (11) (9) (10)
Total Corporate and Other 71 68 32
Consolidated revenues $ 31,400 $ 32,013 $ 29,394
For presentation in the Consolidated Statements of Operations, service fees of the Corporate and Other segment are reclassified to operating costs andexpenses.
(1)

Summarized financial performance data for each of the Company's reportable segments for the years ended December 31 are as follows:
204
($ in millions) 2010 2009 2008 Net income Property-Liability Underwriting income (loss) Allstate Protection $ 526 $ 1,027 $ 189 Discontinued Lines and Coverages (31) (32) (25)
Total underwriting income 495 995 164 Net investment income 1,189 1,328 1,674 Income tax expense on operations (426) (558) (401) Realized capital gains and losses, after-tax (207) (222) (1,209) Gain on disposition of operations, after-tax 3 — —
Property-Liability net income 1,054 1,543 228 Allstate Financial Life and annuity premiums and contract charges 2,168 1,958 1,895 Net investment income 2,853 3,064 3,811
Periodic settlements and accruals on non-hedge derivative financialinstruments 51 14 20
Contract benefits and interest credited to contractholder funds (3,613) (3,655) (4,029)
Operating costs and expenses and amortization of deferred policyacquisition costs (755) (867) (1,051)
Restructuring and related charges 3 (25) (1) Income tax expense on operations (231) (149) (207)
Operating income 476 340 438 Realized capital gains and losses, after-tax (337) (417) (2,034)
DAC and DSI (amortization) accretion related to realized capital gainsand losses, after-tax (34) (177) 385
DAC and DSI unlocking related to realized capital gains and losses,after-tax (18) (224) (274)
Non-recurring items, after-tax (1) — — (219)
Reclassification of periodic settlements and accruals on non-hedgefinancial instruments, after-tax (33) (9) (13)
Gain (loss) on disposition of operations, after-tax 4 4 (4)
Allstate Financial net income (loss) 58 (483) (1,721)Corporate and Other Service fees (2) 11 9 10 Net investment income 60 52 137 Operating costs and expenses (2) (390) (419) (372) Income tax benefit on operations 128 141 107
Operating loss (191) (217) (118) Realized capital gains and losses, after-tax 7 11 (68)
Corporate and Other net loss (184) (206) (186)
Consolidated net income (loss) $ 928 $ 854 $ (1,679)
During the fourth quarter of 2008, for traditional life insurance and immediate annuities with life contingencies, an aggregate premium deficiency of$336 million, pre-tax ($219 million, after-tax) resulted primarily from an experience study indicating that the annuitants on certain life-contingent contracts areprojected to live longer than the Company anticipated when the contracts were issued, and, to a lesser degree, a reduction in the related investment portfolioyield. The deficiency was recorded through a reduction in DAC.For presentation in the Consolidated Statements of Operations, service fees of the Corporate and Other segment are reclassified to operating costs andexpenses.
(1)
(2)

Additional significant financial performance data for each of the Company's reportable segments for the years ended December 31 are as follows:
Interest expense is primarily incurred in the Corporate and Other segment. Capital expenditures for long-lived assets are generally made in theProperty-Liability segment. A portion of these long-lived assets are used by entities included in the Allstate Financial and Corporate and Othersegments and, accordingly, are charged expenses in proportion to their use.
Summarized data for total assets and investments for each of the Company's reportable segments as of December 31 are as follows:
The balances above reflect the elimination of related party investments between segments.
205
($ in millions) 2010 2009 2008 Amortization of DAC Property-Liability $ 3,678 $ 3,789 $ 3,975 Allstate Financial 356 965 704
Consolidated $ 4,034 $ 4,754 $ 4,679
Income tax expense (benefit) Property-Liability $ 314 $ 612 $ (248)Allstate Financial 8 (82) (954)Corporate and Other (124) (136) (144)
Consolidated $ 198 $ 394 $ (1,346)
($ in millions) 2010 2009 2008 Assets Property-Liability $ 47,573 $ 47,179 $ 45,967 Allstate Financial 79,069 81,968 84,929 Corporate and Other 4,232 3,505 3,902
Consolidated $ 130,874 $ 132,652 $ 134,798
Investments Property-Liability $ 35,048 $ 34,526 $ 30,837 Allstate Financial 61,582 62,216 61,499 Corporate and Other 3,853 3,091 3,662
Consolidated $ 100,483 $ 99,833 $ 95,998

19. Other Comprehensive Income
The components of other comprehensive income (loss) on a pre-tax and after-tax basis for the years ended December 31 are as follows:
20. Quarterly Results (unaudited)
206
($ in millions) 2010 2009 2008
Pre-tax Tax
After-tax
Pre-tax Tax
After-tax
Pre-tax Tax
After-tax
Unrealized net holdinggains (losses) arisingduring the period, net ofrelated offsets $ 2,523 $ (882) $ 1,641 $ 5,015 $ (1,754) $ 3,261 $ (10,567) $ 3,660 $ (6,907)
Less: reclassificationadjustment of realizedcapital gains and losses (221) 77 (144) (284) 99 (185) (3,509) 1,228 (2,281)
Unrealized net capital gainsand losses 2,744 (959) 1,785 5,299 (1,853) 3,446 (7,058) 2,432 (4,626)
Unrealized foreign currencytranslation adjustments 35 (12) 23 63 (22) 41 (114) 40 (74)
Unrecognized pension andother postretirementbenefit cost 142 (48) 94 (292) 78 (214) (1,103) 379 (724)
Other comprehensiveincome (loss) $ 2,921 $ (1,019) $ 1,902 $ 5,070 $ (1,797) $ 3,273 $ (8,275) $ 2,851 $ (5,424)
($ in millions, exceptper share data) First Quarter Second Quarter Third Quarter Fourth Quarter 2010 2009 2010 2009 2010 2009 2010 2009 Revenues $ 7,749 $ 7,883 $ 7,656 $ 8,490 $ 7,908 $ 7,582 $ 8,087 $ 8,058 Net income (loss) 120 (274) 145 389 367 221 296 518 Net income (loss)
earnings pershare — Basic 0.22 (0.51) 0.27 0.72 0.68 0.41 0.55 0.96
Net income (loss)earnings pershare — Diluted 0.22 (0.51) 0.27 0.72 0.68 0.41 0.55 0.96

REPORT OF INDEPENDENT REGISTERED PUBLIC ACCOUNTING FIRM
To the Board of Directors and Shareholders ofThe Allstate CorporationNorthbrook, IL 60062
We have audited the accompanying Consolidated Statements of Financial Position of The Allstate Corporation and subsidiaries (the "Company") as ofDecember 31, 2010 and 2009, and the related Consolidated Statements of Operations, Comprehensive Income, Shareholders' Equity, and CashFlows for each of the three years in the period ended December 31, 2010. We also have audited the Company's internal control over financialreporting as of December 31, 2010, based on criteria established in Internal Control-Integrated Framework issued by the Committee of SponsoringOrganizations of the Treadway Commission. The Company's management is responsible for these financial statements, for maintaining effectiveinternal control over financial reporting, and for its assessment of the effectiveness of internal control over financial reporting, included in theaccompanying Item 9A. Controls and Procedures. Our responsibility is to express an opinion on these financial statements and an opinion on theCompany's internal control over financial reporting based on our audits.
We conducted our audits in accordance with the standards of the Public Company Accounting Oversight Board (United States). Those standardsrequire that we plan and perform the audit to obtain reasonable assurance about whether the financial statements are free of material misstatementand whether effective internal control over financial reporting was maintained in all material respects. Our audits of the financial statements includedexamining, on a test basis, evidence supporting the amounts and disclosures in the financial statements, assessing the accounting principles used andsignificant estimates made by management, and evaluating the overall financial statement presentation. Our audit of internal control over financialreporting included obtaining an understanding of internal control over financial reporting, assessing the risk that a material weakness exists, andtesting and evaluating the design and operating effectiveness of internal control based on the assessed risk. Our audits also included performing suchother procedures as we considered necessary in the circumstances. We believe that our audits provide a reasonable basis for our opinions.
A company's internal control over financial reporting is a process designed by, or under the supervision of, the company's principal executive andprincipal financial officers, or persons performing similar functions, and effected by the company's board of directors, management, and otherpersonnel to provide reasonable assurance regarding the reliability of financial reporting and the preparation of financial statements for externalpurposes in accordance with generally accepted accounting principles. A company's internal control over financial reporting includes those policies andprocedures that (1) pertain to the maintenance of records that, in reasonable detail, accurately and fairly reflect the transactions and dispositions of theassets of the company; (2) provide reasonable assurance that transactions are recorded as necessary to permit preparation of financial statements inaccordance with generally accepted accounting principles, and that receipts and expenditures of the company are being made only in accordance withauthorizations of management and directors of the company; and (3) provide reasonable assurance regarding prevention or timely detection ofunauthorized acquisition, use, or disposition of the company's assets that could have a material effect on the financial statements.
Because of the inherent limitations of internal control over financial reporting, including the possibility of collusion or improper management override ofcontrols, material misstatements due to error or fraud may not be prevented or detected on a timely basis. Also, projections of any evaluation of theeffectiveness of the internal control over financial reporting to future periods are subject to the risk that the controls may become inadequate becauseof changes in conditions, or that the degree of compliance with the policies or procedures may deteriorate.
In our opinion, the consolidated financial statements referred to above present fairly, in all material respects, the financial position of The AllstateCorporation and subsidiaries as of December 31, 2010 and 2009, and the results of their operations and their cash flows for each of the three years inthe period ended December 31, 2010, in conformity with accounting principles generally accepted in the United States of America. Also, in our opinion,the Company maintained, in all material respects, effective internal control over financial reporting as of December 31, 2010, based on the criteriaestablished in Internal Control – Integrated Framework issued by the Committee of Sponsoring Organizations of the Treadway Commission.
In 2009, the Company changed its recognition and presentation for other-than-temporary impairments of debt securities.
/s/ Deloitte & Touche LLP
Chicago, IllinoisFebruary 24, 2011
207

Item 9. Changes in and Disagreements with Accountants on Accounting and Financial Disclosure
None.
Item 9A. Controls and Procedures
Evaluation of Disclosure Controls and Procedures. We maintain disclosure controls and procedures as defined in Rule 13a-15(e) under theSecurities Exchange Act of 1934. Under the supervision and with the participation of our management, including our principal executive officer andprincipal financial officer, we conducted an evaluation of the effectiveness of our disclosure controls and procedures as of the end of the periodcovered by this report. Based upon this evaluation, the principal executive officer and the principal financial officer concluded that our disclosurecontrols and procedures are effective in providing reasonable assurance that material information required to be disclosed in our reports filed with orsubmitted to the Securities and Exchange Commission under the Securities Exchange Act is recorded, processed, summarized and reported withinthe time periods specified by the Securities Exchange Act and made known to management, including the principal executive officer and the principalfinancial officer, as appropriate to allow timely decisions regarding required disclosure.
Management's Report on Internal Control over Financial Reporting. Management is responsible for establishing and maintaining adequateinternal control over financial reporting as defined in Rule 13a-15(f) under the Securities Exchange Act of 1934.
Under the supervision and with the participation of our management, including our principal executive officer and principal financial officer, weconducted an evaluation of the effectiveness of our internal control over financial reporting as of December 31, 2010 based on the criteria related tointernal control over financial reporting described in "Internal Control – Integrated Framework" issued by the Committee of Sponsoring Organizations ofthe Treadway Commission. Based on our evaluation, management concluded that our internal control over financial reporting was effective as ofDecember 31, 2010.
Deloitte & Touche LLP, the independent registered public accounting firm that audited the consolidated financial statements included in thisForm 10-K, has issued their attestation report on the Company's internal control over financial reporting, which is included herein.
Changes in Internal Control over Financial Reporting. During the fiscal quarter ended December 31, 2010, there have been no changes in ourinternal control over financial reporting that have materially affected, or are reasonably likely to materially affect, our internal control over financialreporting.
Item 9B. Other Information
The following disclosures relate to actions taken by the Board of Directors of The Allstate Corporation and its committees on February 22, 2011and would otherwise have been reported during the first fiscal quarter of 2011 on a Form 8-K under the heading "Item 5.02. Departure of Directors orCertain Officers; Election of Directors; Appointment of Certain Officers; Compensatory Arrangements of Certain Officers."
On February 22, 2011, the Board of Directors approved the amendments to the 2009 Equity Incentive Plan to provide for a revised retirementvesting provision and for beneficiary designations by participants; and approved revisions to form of option and restricted stock unit (RSU) awardagreements.
208

Part III
Item 10. Directors, Executive Officers and Corporate Governance
Information regarding directors of The Allstate Corporation standing for election at the 2011 annual stockholders meeting is incorporated in thisItem 10 by reference to the descriptions in the Proxy Statement under the captions "Management Proposals to be Voted On – Proposal 1. Election ofDirectors."
Information regarding our audit committee and audit committee financial experts is incorporated in this Item 10 by reference to the first paragraphof the discussion under the captions "Corporate Governance Practices and Code of Ethics – Board Committees – Audit Committee" in the ProxyStatement.
Information regarding compliance with Section 16(a) of the Securities Exchange Act of 1934 is incorporated in this Item 10 by reference to"Section 16(a) Beneficial Ownership Reporting Compliance" in the Proxy Statement.
Information regarding executive officers of The Allstate Corporation is incorporated in this Item 10 by reference to Part I, Item 1 of this report underthe caption "Executive Officers."
We have adopted a code of ethics that applies to all of our employees, including our principal executive officer, principal financial officer, andcontroller. The text of our code of ethics is posted on our Internet website, allstate.com.
Item 11. Executive Compensation
Information required for Item 11 is incorporated by reference to the sections of the Proxy Statement with the following captions:
• Corporate Governance Practices and Code of Ethics – Compensation Committee Interlocks and Insider Participation
• Director Compensation
• Executive Compensation
209

Item 12. Security Ownership of Certain Beneficial Owners and Management and Related Stockholder Matters
Information regarding security ownership of certain beneficial owners and management is incorporated in this Item 12 by reference to the sectionsof the Proxy Statement with the following captions:
• Security Ownership of Directors and Executive Officers
• Security Ownership of Certain Beneficial Owners
Equity Compensation Plan Information
The following table includes information as of December 31, 2010 with respect to The Allstate Corporation's equity compensation plans:
Item 13. Certain Relationships and Related Transactions, and Director Independence
Information required for Item 13 is incorporated by reference to the material in the Proxy Statement under the captions "Related PersonTransactions" and "Corporate Governance Practices and Code of Ethics – Determinations of Independence of Nominees for Election."
Item 14. Principal Accounting Fees and Services
Information required for Item 14 is incorporated by reference to the material in the Proxy Statement under the captions "Management Proposals tobe Voted On – Proposal 2. Ratification of Appointment of Independent Registered Public Accountant."
210
Plan Category
Number of Securitiesto
be Issued uponExercise
of OutstandingOptions,
Warrants and Rights
Weighted-AverageExercise Price of
OutstandingOptions,
Warrants andRights
Number of SecuritiesRemaining Available
forFuture Issuance
underEquity Compensation
Plans (ExcludingSecurities Reflected
inColumn (a))
(a) (b) (c)
Equity Compensation Plans Approved
by Security Holders (1) 39,052,350 (2)$ 35.60 21,028,660 (3)
Total 39,052,350 (2)$ 35.60 21,028,660 (3)
Consists of the Equity Incentive Plan; the 2009 Equity Incentive Plan, which amended and restated the 2001 Equity Incentive Plan; the Equity Incentive Planfor Non-Employee Directors; and the 2006 Equity Compensation Plan for Non-Employee Directors.Outstanding restricted stock units ("RSUs") convert to common stock without the payment of consideration. As of December 31, 2010, 3,756,637 RSUs wereoutstanding. The weighted-average exercise price of outstanding options, warrants, and rights excluding RSUs was $39.39.Includes 20,899,641 shares that may be issued in the form of stock options, unrestricted stock, restricted stock, restricted stock units, stock appreciationrights, performance units, performance stock, and stock in lieu of cash under the 2009 Equity Incentive Plan; and 313,189 shares that may be issued in theform of stock options, unrestricted stock, restricted stock, restricted stock units, and stock in lieu of cash compensation under the 2006 Equity CompensationPlan for Non-Employee Directors.
(1)
(2)
(3)

Part IV
Item 15. (a) (1) Exhibits and Financial Statement Schedules.
The following consolidated financial statements, notes thereto and related information of The Allstate Corporation (the "Company") are included inItem 8.
Consolidated Statements of OperationsConsolidated Statements of Comprehensive IncomeConsolidated Statements of Financial PositionConsolidated Statements of Shareholders' EquityConsolidated Statements of Cash FlowsNotes to the Consolidated Financial StatementsQuarterly ResultsReport of Independent Registered Public Accounting Firm
Item 15. (a) (2)
The following additional financial statement schedules and independent auditors' report are furnished herewith pursuant to the requirements ofForm 10-K.
All other schedules are omitted because they are not applicable, or not required, or because the required information is included in theConsolidated Financial Statements or in notes thereto.
Item 15. (a) (3)
The following is a list of the exhibits filed as part of this Form 10-K. The exhibit numbers followed by an asterisk (*) indicate exhibits that aremanagement contracts or compensatory plans or arrangements. A dagger (†) indicates an award form first used under The Allstate Corporation 2001Equity Incentive Plan, which was amended and restated as The Allstate Corporation 2009 Equity Incentive Plan. The SEC File Number for the exhibitsincorporated by reference is 1-11840.
211
The Allstate Corporation Page
Schedules required to be filed under the provisions of Regulation S-X Article 7:
Schedule I Summary of Investments – Other than Investments in Related Parties S-1Schedule II Condensed Financial Information of Registrant (The Allstate Corporation) S-2Schedule III Supplementary Insurance Information S-6Schedule IV Reinsurance S-7Schedule V Valuation Allowances and Qualifying Accounts S-8Schedule VI Supplementary Information Concerning Consolidated Property-Casualty Insurance Operations S-9Report of Independent Registered Public Accounting Firm S-10
3(i) Restated Certificate of Incorporation filed with the Secretary of State of Delaware on May 17, 2007, incorporated herein by reference toExhibit 3(i) to The Allstate Corporation current report on Form 8-K filed May 18, 2007
3(ii) Amended and Restated By-Laws of The Allstate Corporation effective September 15, 2008, incorporated herein by reference to Exhibit 3(ii)to The Allstate Corporation current report on Form 8-K filed September 19, 2008
4(iii) The Allstate Corporation hereby agrees to furnish to the Commission, upon request, the instruments defining the rights of holders of eachissue of long-term debt of it and its consolidated subsidiaries
10.1 Credit Agreement dated May 8, 2007, among The Allstate Corporation, Allstate Insurance Company and Allstate Life Insurance Company,as Borrowers; the Lenders party thereto, Wells Fargo Bank, National Association, as Syndication Agent; Bank of America, N.A. andCitibank, N.A., as Documentation Agents; Barclays Bank, PLC, Morgan Stanley Bank and William Street Commitment Corporation, as Co-Agents; and JPMorgan Chase Bank, N.A., as Administrative Agent; incorporated herein by reference to Exhibit 10.1 to The AllstateCorporation current report on Form 8-K filed May 9, 2007
10.2 Amendment No. 1 to Credit Agreement dated as of May 22, 2008, incorporated herein by reference to Exhibit 10.1 to The AllstateCorporation current report on Form 8-K filed May 27, 2008

212
10.3* The Allstate Corporation Annual Executive Incentive Plan incorporated herein by reference to Appendix B of The Allstate Corporation'sProxy Statement filed April 1, 2009
10.4* The Allstate Corporation Deferred Compensation Plan, as amended and restated as of January 1, 2011
10.5* The Allstate Corporation 2009 Equity Incentive Plan, as amended and restated effective February 22, 2011
10.6* Form of Option Award Agreement for awards granted on or after February 22, 2011 under The Allstate Corporation 2009 Equity IncentivePlan
10.7* Form of Option Award Agreement for awards granted on or after May 19, 2009 and prior to February 22, 2011 under The AllstateCorporation 2009 Equity Incentive Plan, incorporated herein by reference to Exhibit 10.3 to The Allstate Corporation current report onForm 8-K/A filed May 20, 2009
10.8* † Form of Option Award Agreement for awards granted on or after September 13, 2008 and prior to May 19, 2009 under The AllstateCorporation 2001 Equity Incentive Plan incorporated herein by reference to Exhibit 10.3 to The Allstate Corporation current report onForm 8-K filed September 19, 2008
10.9* † Form of Executive Officer Option Award Agreement for awards granted on or after July 18, 2006 and prior to September 13, 2008 underThe Allstate Corporation 2001 Equity Incentive Plan, incorporated herein by reference to Exhibit 10.1 to The Allstate Corporation currentreport on Form 8-K filed July 20, 2006
10.10* † Form of Executive Officer Option Award Agreement under The Allstate Corporation 2001 Equity Incentive Plan, incorporated herein byreference to Exhibit 10.19 to The Allstate Corporation annual report on Form 10-K for 2003
10.11* † Form of Executive Officer Option Award Agreement for awards dated May 15, 2001 under The Allstate Corporation 2001 Equity IncentivePlan, incorporated herein by reference to Exhibit 10.4 to The Allstate Corporation quarterly report on Form 10-Q for the quarter endedJune 30, 2001
10.12* Form of Restricted Stock Unit Award Agreement for awards granted on or after February 22, 2011 under The Allstate Corporation 2009Equity Incentive Plan
10.13* Form of Restricted Stock Unit Award Agreement for awards granted on or after February 22, 2010 and prior to February 22, 2011 underThe Allstate Corporation 2009 Equity Incentive Plan, incorporated herein by reference to Exhibit 10.17 to The Allstate Corporation annualreport on Form 10-K for 2009
10.14* † Form of amended and restated Restricted Stock Unit Award Agreement for certain retirement eligible/retired employees with regards toawards outstanding on September 13, 2008 under The Allstate Corporation 2001 Equity Incentive Plan, incorporated herein by referenceto Exhibit 10.1 to The Allstate Corporation current report on Form 8-K filed September 19, 2008
10.15* † Form of Restricted Stock Unit Award Agreement for awards granted on or after September 13, 2008 and prior to February 22, 2010 underThe Allstate Corporation 2001 Equity Incentive Plan incorporated herein by reference to Exhibit 10.2 to The Allstate Corporation currentreport on Form 8-K filed September 19, 2008
10.16* Allstate Insurance Company Supplemental Retirement Income Plan, as amended and restated effective December 31, 2008, incorporatedherein by reference to Exhibit 10.20 to The Allstate Corporation annual report on Form 10-K for 2008
10.17* First Amendment to Allstate Insurance Company Supplemental Retirement Income Plan, effective as of November 30, 2009, incorporatedherein by reference to Exhibit 10.22 to The Allstate Corporation annual report on Form 10-K for 2009
10.18* Form of Tier One Change of Control Employment Agreement, incorporated herein by reference to Exhibit 10.22 to The Allstate Corporationannual report on Form 10-K for 2008
10.19* Form of Amended and Restated Tier Two Change of Control Employment Agreement to be effective as of December 31, 2008,incorporated herein by reference to Exhibit 10.23 to The Allstate Corporation annual report on Form 10-K for 2008
10.20* Offer letter dated September 9, 2007 to Michele C. Mayes incorporated herein by reference to Exhibit 10 to The Allstate Corporationquarterly report on Form 10-Q for the quarter ended March 31, 2009

Item 15. (b)
The exhibits are listed in Item 15. (a)(3) above.
Item 15. (c)
The financial statement schedules are listed in Item 15. (a)(2) above.
213
10.21* The Allstate Corporation Deferred Compensation Plan for Non-Employee Directors, as amended and restated effective September 15,2008, incorporated herein by reference to Exhibit 10.7 to The Allstate Corporation current report on Form 8-K filed September 19, 2008
10.22* The Allstate Corporation Equity Incentive Plan for Non-Employee Directors as amended and restated effective September 15, 2008,incorporated herein by reference to Exhibit 10.5 to The Allstate Corporation current report on Form 8-K filed September 19, 2008
10.23* The Allstate Corporation 2006 Equity Compensation Plan for Non-Employee Directors, as amended and restated effective September 15,2008, incorporated herein by reference to Exhibit 10.6 to The Allstate Corporation current report on Form 8-K filed September 19, 2008
10.24* Form of Option Award Agreement under The Allstate Corporation 2006 Equity Compensation Plan for Non-Employee Directors,incorporated herein by reference to Exhibit 10.3 to The Allstate Corporation current report on Form 8-K filed May 19, 2006
10.25* Form of amended and restated Restricted Stock Unit Award Agreement with regards to awards outstanding on September 15, 2008 underThe Allstate Corporation 2006 Equity Compensation Plan for Non-Employee Directors, incorporated herein by reference to Exhibit 10.8 toThe Allstate Corporation current report on Form 8-K filed September 19, 2008
10.26* Form of Restricted Stock Unit Award Agreement for awards granted on or after September 15, 2008 under The Allstate Corporation 2006Equity Compensation Plan for Non-Employee Directors, incorporated herein by reference to Exhibit 10.9 to The Allstate Corporationcurrent report on Form 8-K filed September 19, 2008
10.27* Form of Indemnification Agreement between the Registrant and Director incorporated herein by reference to Exhibit 10.2 to The AllstateCorporation quarterly report on Form 10-Q for the quarter ended June 30, 2007
10.28* Resolutions regarding Non-Employee Director Compensation, incorporated herein by reference to Exhibit 10.37 to The AllstateCorporation annual report on Form 10-K for 2009
10.29* Resolutions regarding Non-Employee Director Compensation, incorporated herein by reference to Exhibit 10.1 to The Allstate Corporationquarterly report on Form 10-Q for the quarter ended September 30, 2010
12 Computation of Earnings to Fixed Charges Ratio
21 Subsidiaries of The Allstate Corporation
23 Consent of Independent Registered Public Accounting Firm
31 (i) Rule 13a-14(a) Certification of Principal Executive Officer
31 (i) Rule 13a-14(a) Certification of Principal Financial Officer
32 Section 1350 Certifications
101.INS XBRL Instance Document
101.SCH XBRL Taxonomy Extension Schema
101.CAL XBRL Taxonomy Extension Calculation Linkbase
101.DEF XBRL Taxonomy Extension Definition Linkbase
101.LAB XBRL Taxonomy Extension Label Linkbase
101.PRE XBRL Taxonomy Extension Presentation Linkbase

SIGNATURES
Pursuant to the requirements of Section 13 or 15(d) of the Securities Exchange Act of 1934, the registrant has duly caused this report to be signedon its behalf by the undersigned, thereunto duly authorized.
Pursuant to the requirements of the Securities Exchange Act of 1934, this report has been signed below by the following persons on behalf of theregistrant and in the capacities and on the dates indicated.
214
THE ALLSTATE CORPORATION(Registrant)
/s/ Samuel H. Pilch
By: Samuel H. Pilch(Controller)
February 22, 2011
Signature Title Date
/s/ Thomas J. Wilson
Thomas J. Wilson
Chairman of the Board, President, Chief Executive Officer and aDirector (Principal Executive Officer)
February 22, 2011
/s/ Don Civgin
Don Civgin
Senior Vice President and Chief Financial Officer(Principal Financial Officer)
February 22, 2011
/s/ F. Duane Ackerman
F. Duane Ackerman
Director February 22, 2011
/s/ Robert D. Beyer
Robert D. Beyer
Director February 22, 2011
/s/ W. James Farrell
W. James Farrell
Director February 22, 2011
/s/ Jack M. Greenberg
Jack M. Greenberg
Director February 22, 2011
/s/ Ronald T. LeMay
Ronald T. LeMay
Director February 22, 2011
/s/ Andrea Redmond
Andrea Redmond
Director February 22, 2011
/s/ H. John Riley, Jr.
H. John Riley, Jr.
Director February 22, 2011
/s/ Joshua I. Smith
Joshua I. Smith
Director February 22, 2011
/s/ Judith A. Sprieser
Judith A. Sprieser
Director February 22, 2011
/s/ Mary Alice Taylor
Mary Alice Taylor
Director February 22, 2011

THE ALLSTATE CORPORATION AND SUBSIDIARIESSCHEDULE I — SUMMARY OF INVESTMENTS
OTHER THAN INVESTMENTS IN RELATED PARTIESDECEMBER 31, 2010
S-1
($ in millions)
Cost/amortized
cost Fair
value
Amount atwhich shown
in theBalance Sheet
Type of investment Fixed maturities: Bonds: United States government, government agencies and authorities $ 8,320 $ 8,596 $ 8,596 States, municipalities and political subdivisions 16,201 15,934 15,934 Foreign governments 2,821 3,158 3,158 Public utilities 6,184 6,560 6,560 Convertibles and bonds with warrants attached 1,058 954 954 All other corporate bonds 29,019 30,142 30,142 Asset-backed securities 4,425 4,244 4,244 Residential mortgage-backed securities 8,509 7,993 7,993 Commercial mortgage-backed securities 2,213 1,994 1,994 Redeemable preferred stocks 36 37 37
Total fixed maturities 78,786 $ 79,612 79,612
Equity securities: Common stocks: Public utilities 119 $ 122 122 Banks, trusts and insurance companies 578 633 633 Industrial, miscellaneous and all other 3,398 3,910 3,910 Nonredeemable preferred stocks 133 146 146
Total equity securities 4,228 $ 4,811 4,811
Mortgage loans on real estate 6,679 $ 6,439 6,679
Real estate acquired in satisfaction of debt 109 109 Policy loans 1,141 1,141 Derivative instruments 437 $ 439 439
Limited partnership interests 3,816 3,816 Other long-term investments 597 597 Short-term investments 3,279 $ 3,279 3,279
Total investments $ 99,072 $ 100,483

THE ALLSTATE CORPORATION AND SUBSIDIARIESSCHEDULE II —
CONDENSED FINANCIAL INFORMATION OF REGISTRANTSTATEMENTS OF OPERATIONS
See accompanying notes to condensed financial information and notes to Consolidated Financial Statements.
S-2
($ in millions) Year Ended December 31, 2010 2009 2008 Revenues Investment income, less investment expense $ 14 $ 10 $ 42 Realized capital gains and losses (1) 1 1 Other income 11 21 11
24 32 54
Expenses Interest expense 365 389 347 Other operating expenses 22 18 16
387 407 363
Loss from operations before income tax benefit and equity in net income(loss) of subsidiaries (363) (375) (309)
Income tax benefit (135) (144) (120)
Loss before equity in net income (loss) of subsidiaries (228) (231) (189)
Equity in net income (loss) of subsidiaries 1,156 1,085 (1,490)
Net income (loss) 928 854 (1,679)
Other comprehensive income (loss), after-tax Changes in: Unrealized net capital gains and losses 1,785 3,446 (4,626) Unrealized foreign currency translation adjustments 23 41 (74) Unrecognized pension and other postretirement benefit cost 94 (214) (724)
Other comprehensive income (loss), after-tax 1,902 3,273 (5,424)
Comprehensive income (loss) $ 2,830 $ 4,127 $ (7,103)

THE ALLSTATE CORPORATION AND SUBSIDIARIESSCHEDULE II (CONTINUED) —
CONDENSED FINANCIAL INFORMATION OF REGISTRANTSTATEMENTS OF FINANCIAL POSITION
See accompanying notes to condensed financial information and notes to Consolidated Financial Statements.
S-3
($ in millions, except par value data) December 31, 2010 2009 Assets Investments in subsidiaries $ 22,806 $ 21,152 Fixed income securities, at fair value (amortized cost $809 and $807) 824 808 Short-term investments, at fair value (amortized cost $1,428 and $728) 1,428 728 Receivable from subsidiaries 269 299 Other assets 335 356
Total assets $ 25,662 $ 23,343
Liabilities Long-term debt $ 5,850 $ 5,850 Postretirement benefit obligation 376 404 Deferred compensation 232 219 Dividends payable to shareholders 109 108 Other liabilities 79 70
Total liabilities 6,646 6,651
Shareholders' equity Preferred stock, $1 par value, 25 million shares authorized, none issued — —
Common stock, $.01 par value, 2.0 billion shares authorized and 900 million issued,533 million and 537 million shares outstanding 9 9
Additional capital paid-in 3,176 3,172 Retained income 31,969 31,492 Deferred ESOP expense (44) (47) Treasury stock, at cost (367 million and 363 million shares) (15,910) (15,828) Accumulated other comprehensive income: Unrealized net capital gains and losses 935 (870) Unrealized foreign currency translation adjustments 69 46 Unrealized pension and other postretirement benefit cost (1,188) (1,282)
Total accumulated other comprehensive loss (184) (2,106)
Total shareholders' equity 19,016 16,692
Total liabilities and equity $ 25,662 $ 23,343

THE ALLSTATE CORPORATION AND SUBSIDIARIESSCHEDULE II (CONTINUED) —
CONDENSED FINANCIAL INFORMATION OF REGISTRANTSTATEMENTS OF CASH FLOWS
See accompanying notes to condensed financial information and notes to Consolidated Financial Statements.
S-4
($ in millions) Year Ended December 31, 2010 2009 2008 Cash flows from operating activities Net income (loss) $ 928 $ 854 $ (1,679)
Adjustments to reconcile net income (loss) to net cash provided byoperating activities:
Equity in net (income) loss of subsidiaries (1,156) (1,085) 1,490 Dividends received from subsidiaries 1,384 262 3,415 Realized capital gains and losses 1 — — Other operating assets and liabilities 102 133 (73)
Net cash provided by operating activities 1,259 164 3,153
Cash flows from investing activities Proceeds from sales and collections of investments 217 75 368 Investment purchases (219) (858) (125) Capital contributions to subsidiaries — (267) — Return of investment — 25 — Change in short-term investments, net (696) 1,159 (1,231)
Net cash (used in) provided by investing activities (698) 134 (988)
Cash flows from financing activities Repayment of long-term debt — (750) — Proceeds from issuance of long-term debt — 1,000 — Dividends paid to shareholders (430) (542) (889) Treasury stock purchases (152) (4) (1,323) Shares reissued under equity incentive plans, net 28 3 33 Excess tax benefits on share-based payment arrangements (7) (5) 3
Net cash used in financing activities (561) (298) (2,176)
Net decrease in cash — — (11)Cash at beginning of year — — 11
Cash at end of year $ — $ — $ —

THE ALLSTATE CORPORATION AND SUBSIDIARIESSCHEDULE II (CONTINUED) —
CONDENSED FINANCIAL INFORMATION OF REGISTRANTNOTES TO CONDENSED FINANCIAL INFORMATION
1. General
The financial statements of the Registrant should be read in conjunction with the Consolidated Financial Statements and notes thereto included inItem 8. The long-term debt presented in Note 11 "Capital Structure" are direct obligations of the Registrant, with the exception of the followingobligations as of December 31:
Effective September 30, 2009, the Registrant became the sponsor of the postretirement benefit plans presented in Note 16 "Benefit Plans". Priorto September 30, 2009, a subsidiary of the Registrant was the sponsor of the plans.
2. Supplemental Disclosures of Non-Cash Investing Activity and Cash Flow Information
The Registrant's assumption of the obligations associated with the postretirement benefit plans previously sponsored by a subsidiary of theRegistrant resulted in a non-cash increase in the Registrant's investment in subsidiaries of $448 million.
The Registrant paid $360 million, $380 million and $344 million of interest on debt in 2010, 2009 and 2008, respectively.
S-5
($ in millions) 2010 2009 Long-term: Federal Home Loan Bank ("FHLB")
advances, due 2018 $ 16 $ 18 Synthetic lease VIE obligations, floating
rates, due 2011 42 42

THE ALLSTATE CORPORATION AND SUBSIDIARIESSCHEDULE III — SUPPLEMENTARY INSURANCE INFORMATION
A single investment portfolio supports both Allstate Protection and Discontinued Lines and Coverages segments.
S-6
($ in millions) As of December 31, For the year ended December 31,
Segment
Deferredpolicy
acquisitioncosts
Reservesfor claims and
claimsexpense,contract
benefits andcontractholder
funds Unearnedpremiums
Premiumrevenue
andcontractcharges
Netinvestmentincome (1)
Claims andclaims
expense,contract
benefits andinterest
credited tocontractholders
Amortizationof deferred
policyacquisition
costs
Otheroperating
costsand
expenses
Premiumswritten
(excludinglife)
2010 Property-
Liabilityoperations
AllstateProtection $ 1,377 $ 17,046 $ 9,761 $ 25,955 $ 18,923 $ 3,678 $ 2,828 $ 25,906
DiscontinuedLines andCoverages — 2,422 — 2 28 — 5 1
Total Property-Liability 1,377 19,468 9,761 25,957 $ 1,189 18,951 3,678 2,833 25,907
AllstateFinancialoperations 3,392 61,677 39 2,168 2,853 3,622 356 466 624
Corporate andOther — — — — 60 — — 379 —
Total $ 4,769 $ 81,145 $ 9,800 $ 28,125 $ 4,102 $ 22,573 $ 4,034 $ 3,678 $ 26,531
2009 Property-
Liabilityoperations
AllstateProtection $ 1,410 $ 16,574 $ 9,780 $ 26,195 $ 18,722 $ 3,789 $ 2,657 $ 25,972
DiscontinuedLines andCoverages — 2,593 — (1) 24 — 7 (1)
Total Property-Liability 1,410 19,167 9,780 26,194 $ 1,328 18,746 3,789 2,664 25,971
AllstateFinancialoperations 4,060 65,492 42 1,958 3,064 3,743 965 455 465
Corporate andOther — — — — 52 — — 410 —
Total $ 5,470 $ 84,659 $ 9,822 $ 28,152 $ 4,444 $ 22,489 $ 4,754 $ 3,529 $ 26,436
2008 Property-
Liabilityoperations
AllstateProtection $ 1,453 $ 16,719 $ 9,980 $ 26,967 $ 20,046 $ 3,975 $ 2,757 $ 26,584
DiscontinuedLines andCoverages — 2,737 — — 18 — 7 —
Total Property-Liability 1,453 19,456 9,980 26,967 $ 1,674 20,064 3,975 2,764 26,584
AllstateFinancialoperations 7,089 71,294 44 1,895 3,811 4,023 704 521 419
Corporate andOther — — — — 137 — — 362 —
Total $ 8,542 $ 90,750 $ 10,024 $ 28,862 $ 5,622 $ 24,087 $ 4,679 $ 3,647 $ 27,003
(1)

THE ALLSTATE CORPORATION AND SUBSIDIARIESSCHEDULE IV – REINSURANCE
S-7
($ in millions)
Gross
amount
Ceded toother
companies (1)
Assumedfrom othercompanies
Netamount
Percentageof amountassumed
to net Year ended December 31, 2010 Life insurance in force $ 523,214 $ 238,745 $ 9,680 $ 294,149 3.3%
Premiums and contract charges: Life insurance $ 2,170 $ 659 $ 36 $ 1,547 2.3% Accident-health insurance 765 145 1 621 0.2% Property-liability insurance 27,015 1,092 34 25,957 0.1%
Total premiums and contract charges $ 29,950 $ 1,896 $ 71 $ 28,125 0.3%
Year ended December 31, 2009 Life insurance in force $ 525,381 $ 253,650 $ 10,230 $ 281,961 3.6%
Premiums and contract charges: Life insurance $ 2,142 $ 682 $ 38 $ 1,498 2.5% Accident-health insurance 615 156 1 460 0.2% Property-liability insurance 27,200 1,056 50 26,194 0.2%
Total premiums and contract charges $ 29,957 $ 1,894 $ 89 $ 28,152 0.3%
Year ended December 31, 2008 Life insurance in force $ 520,762 $ 251,655 $ 10,935 $ 280,042 3.9%
Premiums and contract charges: Life insurance $ 2,184 $ 743 $ 41 $ 1,482 2.8% Accident-health insurance 570 157 — 413 —% Property-liability insurance 28,021 1,139 85 26,967 0.3%
Total premiums and contract charges $ 30,775 $ 2,039 $ 126 $ 28,862 0.4%
No reinsurance or coinsurance income was netted against premium ceded in 2010, 2009 or 2008.(1)

THE ALLSTATE CORPORATION AND SUBSIDIARIESSCHEDULE V – VALUATION ALLOWANCES AND QUALIFYING ACCOUNTS
S-8
($ in millions) Additions
Description
Balance atbeginningof period
Chargedto costs
and expenses Other
additions Deductions
Balanceat end
of period Year ended December 31, 2010 Allowance for reinsurance recoverables $ 142 $ — $ — $ — $ 142 Allowance for premium installment
receivable 77 86 — 88 75 Allowance for deferred tax assets 11 — — 5 6 Allowance for estimated losses on
mortgage loans 95 65 — 76 84 Year ended December 31, 2009 Allowance for reinsurance recoverables $ 168 $ — $ — $ 26 $ 142 Allowance for premium installment
receivable 70 125 — 118 77 Allowance for deferred tax assets 49 250 — 288 11 Allowance for estimated losses on
mortgage loans 4 97 — 6 95 Year ended December 31, 2008 Allowance for reinsurance recoverables $ 185 $ — $ — $ 17 $ 168 Allowance for premium installment
receivable 68 89 — 87 70 Allowance for deferred tax assets 6 43 — — 49 Allowance for estimated losses on
mortgage loans — 4 — — 4

THE ALLSTATE CORPORATION AND SUBSIDIARIESSCHEDULE VI — SUPPLEMENTARY INFORMATION CONCERNING
CONSOLIDATED PROPERTY-CASUALTY INSURANCE OPERATIONS
S-9
($ in millions) As of December 31, 2010 2009 2008
Deferred policy acquisition costs $ 1,377 $ 1,410 $ 1,453 Reserves for insurance claims and
claims expense 19,468 19,167 19,456 Unearned premiums 9,761 9,780 9,980
Year Ended December 31, 2010 2009 2008 Earned premiums $ 25,957 $ 26,194 $ 26,967 Net investment income 1,189 1,328 1,674 Claims and claims adjustment
expense incurred Current year 19,110 18,858 19,894 Prior years (159) (112) 170 Amortization of deferred policy
acquisition costs 3,678 3,789 3,975 Paid claims and claims adjustment
expense 18,583 18,900 19,542 Premiums written 25,907 25,971 26,584

REPORT OF INDEPENDENT REGISTERED PUBLIC ACCOUNTING FIRM
To the Board of Directors and Stockholders ofThe Allstate CorporationNorthbrook, IL 60062
We have audited the consolidated financial statements of The Allstate Corporation and subsidiaries (the "Company") as of December 31, 2010 and2009, and for each of the three years in the period ended December 31, 2010, and the Company's internal control over financial reporting as ofDecember 31, 2010, and have issued our report thereon dated February 24, 2011 (which report expresses an unqualified opinion and includes anexplanatory paragraph relating to a change in the Company's recognition and presentation for other-than-temporary impairments of debt securities in2009); such consolidated financial statements and report are included elsewhere in this Form 10-K. Our audits also included the consolidated financialstatement schedules of the Company listed in the accompanying index at Item 15. These consolidated financial statement schedules are theresponsibility of the Company's management. Our responsibility is to express an opinion based on our audits. In our opinion, such consolidatedfinancial statement schedules, when considered in relation to the basic consolidated financial statements taken as a whole, present fairly, in all materialrespects, the information set forth therein.
/s/ Deloitte & Touche LLP
Chicago, IllinoisFebruary 24, 2011
S-10


EXHIBIT 10.4
THE ALLSTATE CORPORATION
DEFERRED COMPENSATION PLAN
AMENDED AND RESTATED AS OF
January 1, 2011
ARTICLE I
DESIGNATION OF PLAN AND DEFINITIONS
1.1 TITLE AND PURPOSE
(a) Title. This Plan shall be known as “The Allstate Corporation Deferred Compensation Plan.” (b) Purpose. This Plan was established by The Allstate Corporation for the purpose of providing deferred compensation for eligible employees. The
Plan is intended to be an unfunded plan maintained for a select group of management or highly compensated employees within the meaning ofthe Employee Retirement Income Security Act of 1974 (“ERISA”). With respect to amounts deferred on or after January 1, 2005, this Plan isintended to be a nonqualified deferred compensation plan maintained in conformity with the requirements of Internal Revenue CodeSection 409A and shall be interpreted accordi ngly.
(c) Effective Date and Plan History. The Plan was adopted by Allstate Insurance Company effective January 1, 1995. The Plan was amended and
restated by the Company, effective January 1, 1996, November 11, 1997, September 1, 1999, November 1, 2000, November 1, 2001, June 1,2002, October 7, 2002, May 28, 2004, December 31, 2008, and July 31 2009. The Plan was further amended and restated by the Company,effective January 1, 2011. The terms of this Plan are effective for all benefits under the Plan that are not fully distributed as of Janua ry 1, 2005,except that actions taken on or after January 1, 2005 and prior to December 31, 2008, are subject to the terms of the then existing Plan and, asapplicable, a reasonable and good faith interpretation of Code Section 409A and the transition guidance provided thereunder.
1.2 GENERAL DEFINITIONS
Unless expressly stated otherwise, the following definitions will apply:
(a) “Account” shall mean nominal bookkeeping entries made to state the balance of a Participant’s benefit under the Plan. A Participant’s benefitunder the Plan shall be comprised of the total of all sub-accounts, which may include a Pre-2005 Sub-
Page 2
Account and Post-2004 Sub-Account. “Account” shall also mean any amounts deferred by a Participant, as adjusted for earnings and debits,under The Allstate Corporation Deferred Compensation Plan for Employee Agents and The Allstate Corporation Deferred Compensation Plan forIndependent Contractor Exclusive Agents.
(b) “Beneficiary” or “Contingent Beneficiary” shall mean the person or persons last designated in writing by the Participant to the Committee, in
accordance with Section 8.4 of this Plan.
(c) “Board” shall mean the Board of Directors of the Company.
(d) “Code” shall mean the Internal Revenue Code of 1986, as amended from time to time, including regulations and guidance of general applicabilityissued thereunder.
(e) “Committee” shall mean the Committee appointed by the Board of Directors pursuant to Article VI of this Plan, and shall mean those persons to
whom the Committee has delegated administrative duties pursuant to Section 6.1(g).
(f) “Company” shall mean The Allstate Corporation.
(g) “Compensation” shall mean all of the items included in the term “Annual Compensation” as that term is defined in the Allstate Retirement Planwithout regard to the annual compensation limit imposed by Code Section 401(a)(17).
(h) “Compensation Floor” shall be the compensation limit in effect pursuant to Code Section 401(a)(17) for a Plan Year.
(i) “Controlled Group” shall mean any corporation or other business entity which is included in a controlled group of corporations, within the
meaning of section 1563(a)(i) of the Code, within which the Company is also included.
(j) “Current Plan Year” shall mean the Plan Year in which amounts are deferred pursuant to a valid deferral election, in accordance with Section 2.2.
(k) “Eligible Compensation” shall mean the greater of (i) an Employee’s projected Compensation based on his or her Compensation for the monthending on December 31 of the Prior Plan Year, annualized in such manner as the Committee shall determine; (ii) an Employee’s projectedannualized base salary based on his or her Compensation for the month ending on December 31 of the Prior Plan Year,

Page 3
annualized in such manner as the Committee shall determine; or (iii) an Employee’s Compensation for the calendar year two years before a PlanYear. For purposes of this definition, “Compensation” shall not include any bonus amounts paid on a monthly, quarterly or other nonannual basis.
(l) “Eligible Employee” shall mean any Employee who the Committee determines shall be eligible to participate in the Plan and whose (i) Eligible
Salary is expected to exceed the Compensation Floor, or (ii) Eligible Compensation is expected to exceed the Compensation Floor for the PlanYear and, therefore, is eligible to make a deferral under Article II of this Plan.
(m) “Eligible Salary” shall mean an Employee’s base salary during the Prior Plan Year annualized in such manner as the Committee shall determine,
plus any bonus amounts paid on a monthly, quarterly or other nonannual basis included as Compensation during the Prior Plan Year up throughthe date the Employee’s eligibility is determined, as set forth by the Committee.
(n) “Employee” shall mean any regular, full-time employee of the Employer, but shall in no event include persons classified as agents. If a person is
not considered to be an “Employee” for purposes of Plan eligibility, a later change in the person’s status, even if the change in status is applicableto prior years, will not have a retroactive effect for Plan purposes.
(o) “Employer” shall mean the Company, Allstate Insurance Company, Allstate New Jersey Insurance Company, Allstate Bank and any other entity
within the Controlled Group that adopts the terms of the Plan, as agreed to by the entity’s Board of Directors, with the approval of the Committee.
(p) “Hardship” shall apply only to a Participant’s Pre-2005 Sub-Account and shall mean the occurrence of a distribution that satisfies therequirements of Code section 401(k)(2)(B)(i)(IV) from a tax-qualified plan maintained by an Employer, with the approval of the Committee.
(q) “Incentive” shall mean the amount actually payable to a Participant under an annual cash incentive program sponsored by the employer. An
Incentive earned during a Plan Year becomes payable in the calendar year next following the Plan Year. Any bonus amounts earned for periods ofless than 12 months or that are payable to a
Page 4
Participant on a monthly, quarterly or any other nonannual basis under any cash incentive or award program shall not be considered an Incentiveunder this Plan.
(r) “Investment” shall mean the elections made by Participants, as allowed for in Section 4.3 of the Plan, to allocate and reallocate deferrals and
Account balances among the Investment Options described in Section 4.3(b), together with accruals and adjustments reflecting the hypotheticalexperience of the Investment Options.
(s) “Participant” shall mean an Eligible Employee who has an Account balance in the Plan.
(t) “Plan” shall mean The Allstate Corporation Deferred Compensation Plan as set forth herein, and as amended from time to time in accordance with
Article VII hereof.
(u) “Plan Year” shall mean the fiscal year of the Company, which is a calendar year.
(v) “Post-2004 Sub-Account” shall mean a nominal bookkeeping sub-account of the Participant’s Account established to state the balance of(i) Compensation deferred by a Participant under the Plan on or after January 1, 2005, as adjusted pursuant to Article IV of the Plan, (ii) any cashamounts automatically directed to this Plan on or after January 1, 2005 by action of the Board of Directors of The Allstate Corporation or acommittee thereof; and (iii) earnings and losses on amounts contributed pursuant to (i) and (ii) of this subsection, pursuant to Article IV. “Post-2004 Sub-A ccount shall refer to the total of the Participant’s benefit under this Plan with respect to amounts deferred or otherwise credited on orafter January 1, 2005, pursuant to Section 4.2.
(w) “Pre-2005 Sub-Account” shall mean a nominal bookkeeping sub-account of the Participant’s Account established to state the balance of
(i) Compensation that was fully earned and vested prior to January 1, 2005, and deferred by a Participant under the terms of the Plan then ineffect; (ii) any cash amounts automatically directed to this Plan and fully earned and vested prior to January 1, 2005 by action of the Board ofDirectors of The Allstate Corporation or a committee thereof; and (iii) subsequent earnings and losses on amounts contributed pursuant to (i) and(ii) of this subsection, pursuant to Article&nbs p;IV.
Page 5
(x) “Prior Plan Year” shall mean the Plan Year immediately preceding the Current Plan Year. (y) “Separation from Service” shall mean the termination of employment or cessation or reduction of services by a Participant that results in a
distribution as specifically defined and determined under Article V of the Plan. “Separation from Service” shall have distinct meanings withrespect to the Pre-2005 Sub-Account and the Post-2004 Sub-Account, as set forth in Article V of the Plan.
(z) “Unforeseeable Financial Emergency” shall apply only to a Participant’s Post-2004 Sub-Account and shall mean a severe financial hardship to the
Participant resulting from an illness or accident of the Participant, the Participant’s spouse, the Participant’s beneficiary, or the Participant’sdependent (as defined in Section 152 of the Code, without regard to Sections 152(b)(1), 152(b)(2) and 152(d)(1)(B) of the Code); loss of theParticipant’s property due to casualty; or other similar extraordinary and unforeseeable circumstances arising as a result of events beyond thecontrol of th e Participant; but shall not include any of the foregoing to the extent such emergency is or may be relieved through reimbursement orcompensation from insurance or otherwise, by liquidation of the Participant’s assets (to the extent the liquidation of such assets would not causesevere financial hardship), or by cessation of deferrals under the Plan. In making its determination, the Committee shall be guided by the

prevailing authorities applicable under the Code so as to result in the Participant not being in constructive receipt or subject to penalties underCode Section 409A with respect to any distribution or cancellation of a deferral due to an Unforeseeable Financial Emergency.
ARTICLE II
PARTICIPATION
2.1 PARTICIPATION AND DEFERRAL ELECTIONS
An Eligible Employee shall become a Participant upon the filing of an election to defer base salary or Incentive and shall continue as a Participant untilhis or her Account has been fully paid pursuant to the provisions of Article V. An election to defer base salary
Page 6
or Incentives shall specify the percentage of compensation to be deferred under the Plan for a Plan Year. An election to defer base salary or Incentiveshall be filed in the manner and at the time that the Committee may specify in its discretion from time to time.
2.2 TIMING OF DEFERRAL ELECTIONS
(a) In no event shall a Participant be permitted to make a deferral election with respect to his or her base salary after December 31 of the calendaryear preceding the Plan Year in which such deferral election shall take effect. All elections to defer base salary for a Plan Year shall beirrevocable as of December 31 of the preceding Plan Year (or such earlier date as may be determined by the Committee from time to time) and,therefore, may not be changed by either the Committee or the Participant after December 31 (or such earlier date, if applicable).
(b) An election to defer Incentive shall be filed no later than December 31 of the calendar year preceding the Plan Year in which services are first
performed with respect to such Incentive, unless the Committee determines that a Participant’s Incentive constitutes “performance-basedcompensation” within the meaning of Code Section 409A. In such case, the Committee may establish a later date for the filing of Incentivedeferral elections; provided that, as of such date established by the Committee, Incentive is not readily ascertainable within the meaning of CodeSection 409A, and further provided that such date shall in no event be later than 6 months prior to the end of the applicable performance periodfor such Incentive. Such deferral election shall be irrevocable as of the filing date established by the Committee. Notwithstanding the foregoing,a Participant’s election made in 2008 to defer Incentive earned in 2008 shall apply to the Participant’s entire Incentive earned in 2008, includingany amounts that may not constitute performance-based compensation. To the extent a Participant’s election made in 2008 results in a deferral ofany portion of the Participant’s Incentive that does not constitute performance-based compensation, such deferral election shall be deemed to be atransition relief election pursuant to Code Section 409A.
(c) “Evergreen” Deferral Elections. The Committee may in its discretion establish rules from time to time under which deferral elections provided in
this Section 2.2 shall remain in effect for all succeeding Plan Years in which the Participant is
Page 7
eligible to make a deferral election unless and until the Participant files a subsequent deferral election.
(d) Hardship and Unforeseeable Financial Emergency. Notwithstanding the other provisions of this section 2.2, the Committee may in its sole
discretion rescind a deferral election of a Participant if the Participant experiences a Hardship or upon the Committee’s determination that theParticipant has experienced an Unforeseeable Financial Emergency. Any subsequent election to defer shall be subject to the terms of thisSection 2.2(a) and (b).
ARTICLE III
DEFERRALS
3.1 AMOUNT OF DEFERRAL
(a) Elections made pursuant to Section 2.2(a) to defer base salary shall be made in whole number percentages up to eighty (80) percent and shallapply only to base salary payable on or after the Participant has earned Compensation in the Plan Year equal to the Compensation Floor for thePlan Year.
(b) Elections made pursuant to Section 2.2(b) to defer Incentive shall be made in whole number percentages up to one hundred (100) percent. If a
Participant’s Compensation (determined solely for this purpose on an annualized basis as of the date that such election becomes irrevocablepursuant to Section 2.2(b)) does not exceed the Compensation Floor, the election to defer Incentive shall be reduced dollar for dollar until the totalof such Compensation and the Incentive that is not deferred and is payable to the Participant equals the Compensation Floor.
3.2 EFFECTIVE DATE OF DEFERRAL
Compensation deferred shall be credited to a Participant’s Account by bookkeeping entry as set forth in Section 4.2.
Page 8
3.3 USE OF AMOUNTS DEFERRED
Amounts credited to Accounts shall be a part of the general funds of the Company, shall be subject to all the risks of the Company’s business, and maybe deposited, invested or expended in any manner whatsoever by the Company.

ARTICLE IV
ACCOUNTS AND VESTING
4.1 ESTABLISHMENT OF ACCOUNT
The Committee shall establish, by bookkeeping entry on the books of the Company, an Account for each Participant. Accounts shall not be funded inany manner.
4.2 CONTRIBUTIONS TO ACCOUNT
The Committee shall cause deferred Compensation to be credited by bookkeeping entry to each Participant’s Account as of the last day of the month inwhich the Compensation or any cash amounts automatically directed to this Plan otherwise would have been payable to the Participant, or as soonthereafter as is administratively practicable.
4.3 MAINTENANCE OF ACCOUNT BALANCES - INVESTMENT
(a) A Participant may make an Investment with respect to amounts in his or her Account. Each Investment shall be made in accordance withprocedures established by the Committee and shall specify that portion of the Participant’s deferrals on the date of such election to be invested ineach Investment Option (as defined in Section 4.3(b) below). In its sole discretion, the Committee may withhold one or more of the InvestmentOptions from Investment by Participants for a Plan Year or Years. Investments of deferrals must be made in whole percentage increments.
Each Account shall be adjusted, as applicable, to apply contributions, dividend equivalents, investment gains and losses net of any Planadministration and investment expenses, and distributions. All such adjustments shall be bookkeeping entries reflecting hypothetical experiencefor the Investment Options in which Investments are made.
Page 9
(b) The Investment Options in which Investments may be made are:
(1) Investment Option #1 — Stable Value Fund. The Stable Value Fund, managed by Invesco Advisors, Inc., (“Invesco”) includes a number of
investment contracts issued by a diversified group of high quality insurance companies, banks, and other financial institutions (excludingAllstate companies), each backed by a diversified bond portfolio.
The investment contracts are supported by use of investment portfolios holding a diversified mix of high quality fixed-income securities.The average credit quality of all of the investments backing the Stable Value Fund contracts is AA/Aa or better as measured by Standard &Poor’s or Moody’s credit rating services. The average credit quality of the issuers of investment contracts utilized in the fund is alsoAA/Aa. Derivative securities may be used for hedging and replication purposes only. U.S. Treasury securities and U.S. Treasury futuresmay be used to manage interest rate risk.
The credited rate of interest of the Stable Value Fund is the average return of all investments held in the fund.
(2) Investment Option #2 — Bond Fund. The Bond Fund invests in the U.S. Bond Index Non-Lending Series Fund - Class A (formerly named
the Passive Bond Market Index Non-Lending Series Fund — Class A), a collective fund managed by State Street Global Advisors (SSgA). The fund’s objective is to approximate as closely as practicable, before expenses, the performance of the Barclays Capital U.S. AggregateIndex (the “Barclays Index”). The Barclays Index is an index representative of well-diversified exposure to the overall U.S. bond market.  More specifically, it covers the dollar-denominated investment-grade fixed-rate taxable bond market, including U.S. Treasuries,government-related and corporate securities, mortgaged pass-through securities, asset-backed securities, and commercial mortgage-backedsecurities. The portfolio is managed duration-neutral to the Barclays Index at all times. Overall sector and quality weightings are alsomatched to the Barclays Index, with individual security selection based upon security availability and SSgA’s analysis of its impact on theportfolio’s weightings.
Page 10
The Bond Fund no longer invests in securities lending funds; it invests 100% in non-lending funds.
(3) Investment Option #3 — S&P 500 Fund(1). The S&P 500 Fund invests in the S&P 500 Index Non-Lending Series Fund — Class A(formerly named the S&P 500 Flagship Non-Lending Series Fund - Class A), a collective fund managed by SSgA. The fund’s objective isto approximate as closely as practicable, before expenses, the performance of the Standard & Poor’s (S&P) 500 (the “S&P 500 Index”)over the long term. The S&P 500 Index consists of large capitalization stocks across over 24 industry groups and 500 stocks chose n formarket size, liquidity and industry group representation. The fund seeks to maintain the returns of the S&P 500 Index by investing in aportfolio that replicates the S&P 500 Index by owning securities in the same capitalization weights as they appear in the S&P 500 Index.
The S&P 500 Fund no longer invests in securities lending funds; it invests 100% in non-lending funds.
(4) Investment Option #4 — International Equity Fund. The International Equity Fund invests in the Global Equity ex U.S. Index Non-
Lending Series Fund - Class A, a collective fund managed by SSgA. The fund’s objective is to approximate as closely as practicable,before expenses, the performance of the Morgan Stanley Capital International (MSCI) ACWI ex-USA Index (the “ACWI ex-USA Index”)over the long term. The ACWI ex-USA Index is a free float-adjusted market capitalization weighted index that is designed to measure theequity market performance of developed and emer ging markets. The ACWI ex-USA Index consists of approximately 1,800 stocks inselected markets with emerging markets representing approximately 20%. MSCI attempts to capture approximately 85% of the totalmarket capitalization in

(1) Standard & Poor’s ®, S&P®, S&P 500 Index and Standard & Poor’s 500 Index are trademarks of McGraw-Hill Companies, Inc., and have been licensed foruse by State Street Bank and Trust Company. The product is not sponsored, endorsed, listed, sold or promoted by Standard & Poor’s (“S&P”), and S&P makesno representation regarding the advisability of investing in this product.
Page 11
each country. The fund seeks to maintain the returns of the ACWI ex-USA Index by investing in a portfolio that replicates the ACWI ex-
USA Index.
The International Equity Fund no longer invests in securities lending funds; it invests 100% in non-lending funds.
Restrictions apply to reallocations of money into the International Equity Fund. This means that you are prohibited from using thereallocation feature to move money into the International Equity Fund within any 30-calendar day period following the date you movedmoney out of the International Equity Fund through reallocation. Any subsequent reallocation of money out of the International EquityFund during a 30-calendar day restriction period will start a new 30-day restriction period. The 30-calendar day restriction does not apply toemployee deferrals into the International Equity Fund or to hardship withdrawals from the International Equity Fund.
Reallocations or transfers of money out of the International Equity Fund are allowed at any time. The restriction applies only toreallocations into the International Equity Fund.
(5) Investment Option #5 — Russell 2000 Fund(2). The Russell 2000 Fund invests in the Russell Small Cap Index Non-Lending Series Fund
— Class A (formerly named the Russell 2000 Index Non-Lending Series Fund - Class A), a collective fund managed by SSgA. The fund’sobjective is to approximate as closely as practicable, before expenses, the performance of the Russell 2000 Index, over the long term. TheRussell 2000 Index is a subset of the Russell 3000 Index and includes approximately 2,000 of the smallest securities based on acombination of their market capitalization and current index memberships. The fund seeks to match the return of the Russell 2000 Indexby investing in a portfolio that holds the securities of the Russell 2000 Index.
The Russell 2000 Fund no longer invests in securities lending funds; it invests 100% in non-lending funds
(2) Russell Investment Group is the source and owner of the trademarks, service marks, and copyrights relating to the Russell Indexes. Russell 2000 Index is atrademark of the Russell Investment Group.
Page 12
(6) Investment Option #6 - The Mid-Cap Fund(3). The Mid-Cap Fund invests in the S&P Mid-Cap Index Non-Lending Series Fund —Class A, a collective fund managed by SSgA. The fund’s objective is to approximate as closely as practicable, before expenses, theperformance of the S&P Mid-Cap 400 (the “Mid-Cap Index”) over the long term. The Mid-Cap Index is a cap-weighted index thatmeasures the performance of the mid-range sector of the U.S. stock market. The fund seeks to match the return of the Mid-Cap Index byinvesting in a portfolio that holds the securities of the Mid-Cap Index.
(c) A Participant may change his Investment elections at such time and in such manner, and with respect to such existing Account balances and future
contributions, as the Committee shall determine; any such changes to be effective only in accordance with such procedures as established fromtime to time by the Committee. Any reallocations of existing Account balances must be made in whole percentage increments. A reallocationelection will become effective as set forth in Plan procedures. Any reallocations of existing Account balances made under this Plan willsimultaneously apply to any amounts the Participant may have defer red under either The Allstate Corporation Deferred Compensation Plan forEmployee Agents or The Allstate Corporation Deferred Compensation Plan for Independent Contractor Exclusive Agents.
4.4 VESTING
A Participant shall be fully vested in his or her Account at all times, subject to Sections 3.3, 8.2 and 8.3.
(3) S&P MidCap 400 Index is a trademark of Standard & Poor’s Financial Services LLC., and has been licensed for use by State Street Bank and Trust. Theproduct is not sponsored, endorsed, sold or promoted by Standard & Poor’s (S&P), and S&P makes no representation regarding the advisability of investing inthis product.
Page 13
ARTICLE V
PAYMENTS
5.1 EVENTS CAUSING ACCOUNTS TO BECOME DISTRIBUTABLE
(a) Pre-2005 Sub-Account. All references to “Account” in this Section 5.1(a) shall refer solely to the portion of a Participant’s Account, if any,that is the Pre-2005 Sub-Account.
(1) A Participant’s Account shall become distributable upon notification to the Plan of the Participant’s Separation from Service or, at the
election of the Participant pursuant to Section 5.3(a), in one of the first through fifth years after Separation from Service. In either event,the Participant may elect to receive payment in a lump sum or in annual installments as provided in Section 5.3(a).
®
®

For purposes of this Section 5.1(a), “Separation from Service” shall mean the termination of a Participant’s employment with anycompany in the Controlled Group for any reason whatsoever, including retirement, resignation, dismissal or death, but does not include atransfer of status to an employee agent or to an Exclusive Agent Independent Contractor or Exclusive Financial Specialist IndependentContractor for Allstate Insurance Company, Allstate New Jersey Insurance Company, Allstate Life Insurance Company or for any othermember of the Controlled Group. “Separation from Service” shall also mean the subsequent termination of any Exclusive AgentIndependent Contractor or Exclusive Financial Specialist Independent Contractor agreement, unless such termination results fromacceptance of employment with any member of the Controlled Group.< /p>
(2) That portion of a Participant’s Account determined to be necessary to alleviate a demonstrated Hardship shall become distributable upon
the date of such determination, subject to Section 5.2. (3) Special Distribution Rule for Participants Prior to September 1, 1999. For those Participants who irrevocably elected to do so on or
before September
Page 14
1, 1999, such Participants may receive a distribution as of the first day of any Plan Year prior to his or her Separation from Service. The
portion of the Participant’s Account attributable to Compensation deferred, and accruals thereon, shall be distributed on the date elected. Any balance in the Participant’s Account remaining after any payment under this paragraph and any balance in the Account attributableto participation in the Plan in any year subsequent to the year in which a payout on such date certain occurs, shall become distributableto the Participant as provided in paragraphs (1), (2) or (3) of this Section 5.1(a).
(4) Effective September 1, 1999, a Participant may at any time irrevocably elect to receive distribution of his or her entire Account balance,
subject to the forfeiture to the Company of 10% of such Account balance and subject to suspension of deferrals in the Plan by theParticipant for the remainder of the Plan Year and for the next succeeding Plan Year (“Suspension Period”). Such election will cause anypending election of Incentive deferrals payable during the Suspension Period to be voided. The Participant’s Account balance shallbecome distributable subject to Section 5.2 following t he date of such election.
(5) In the event of a Participant’s death prior to distribution of his or her entire Account balance, the remaining Account balance shall
become distributable following the date on which all events have occurred which entitle the Beneficiary or Beneficiaries to payment.
(b) Post-2004 Sub-Account. All references to “Account” in this Section 5.1(b) shall refer solely to the portion of a Participant’s Account, if any,that is the Post-2004 Sub-Account.
(1) Distributions of the Account shall be made (in the case of a lump sum) or commence (in the case of installments) on the first day of the
first calendar month that commences after the six (6) month anniversary of the Participant’s Separation from Service. Unless otherwisespecified pursuant to Section 5.3, distributions shall be in the form of a single lump sum payment. For purposes of this Section 5.1(b),“Separation from Service” shall mean a termination of employment upon which a Participant ceases
Page 15
performing services for all entities within the Controlled Group. Notwithstanding, a Separation from Service shall also include a
reduction in a Participant’s rate of services to any such entity that is reasonably anticipated to be a permanent reduction to a rate that is20 percent or less of the average rate of services performed by the Participant in the 36 months prior to such reduction. If a Participantceases or reduces services under a bona fide leave of absence, a Separation from Service occurs after the close of the 6-monthanniversary of such leave; provided, howe ver, that if the Participant has a statutory or contractual right to reemployment, the Separationfrom Service shall be delayed until the date that the Participant’s right ceases or, if the Participant resumes services, until the Participantsubsequently Separates from Service. For purposes of determining whether a Participant has a Separation from Service, services takeninto account shall include services performed for the Company as an independent contractor but not services performed as a non-employee member of the board of directors of any entity within the Controlled Group. Determination of whether a Separation fromService occurs shall be made in a manner that is consistent with Treas. Reg. 1.409A-1(h).
(2) In the event of a Participant’s death prior to the full distribution of his or her Account, the undistributed Account shall be distributed to
the Participant’s Beneficiary within 90 days of the Participant’s death. (3) The Committee retains sole discretion to determine whether and to what extent all or any portion of an Account may be payable on
account of an Unforeseeable Financial Emergency. If the Committee determines that such distribution shall be made, payment shall bemade within 30 days of the determination of Unforeseeable Financial Emergency and the Committee may, in its discretion, determinehow any partial distribution of the Account shall be allocated among the hypothetical Investment options applicable to such Account.
(4) Payment Dates. If a payment is due on a nonbusiness day or a federal or state holiday, such payment shall be due on the next
succeeding business day.
Page 16
5.2 NOTICE OF ACCOUNT PAYMENT AND COMMENCEMENT OF DISTRIBUTION FOR PRE-2005 SUB-ACCOUNTS
The Committee or its appointed representative shall notify a Participant or Beneficiary, as the case may be, as soon as practicable after the first day of themonth next following the date on which the Pre-2005 Sub-Account becomes distributable, that he or she is entitled to receive payment from the Pre-2005Sub-Account, the balance of which shall be computed as of the close of business on the last day of the month in which the Pre-2005 Sub-Account

becomes distributable. Distribution of Pre-2005 Sub-Account balances shall commence as soon as practicable after the first day of the month nextfollowing the date on which the Pre-2005 Sub-Account becomes distributable.
5.3 FORM OF PAYMENT
(a) Except as provided in paragraphs (c) and (d) of this Section 5.3 and Article VIII hereof, payments of Account balances to a Participant shall be inthe form of one lump sum payment or annual cash installment payments over a minimum of 2 and a maximum of 10 years, at the election of theParticipant. The provisions of this Section 5.3 apply separately to the Pre-2005 Sub-Account and the Post-2004 Sub-Account and, accordingly,different forms of payments may be made from each such sub-account.
(b) The amount of each annual installment payable to a Participant who has elected to receive installment payments shall be as follows: The first
annual installment payment shall, for a Participant who has elected to receive installment payments commencing upon his or her Separation fromService, be computed as of the close of business on the last day of the month in which the Account becomes distributable, and the amount of suchpayment shall equal his or her Account balance as of such date, divided by the number of installments including the one being paid. The firstannual installment payment shall, for a Participant who has elected to receive installment payments commencing in one of the first through fifthyears after Separation from Service, be computed as of the close of the first business day of the year preceding the year in which the Accountbalance becomes
Page 17
distributable, and the amount of such payment shall equal his or her Account balance as of such date, divided by the number of installments
including the one being paid. Each subsequent installment payment shall be computed as of the close of the last business day of the yearthereafter, and the amount of each subsequent payment shall equal his or her remaining Account balance, divided by the number of remaininginstallments including the one being paid. Investment gains or losses and other adjustments shall continue with respect to the entire unpaidAccount balance, as provided in Section ;4.3.
(c) In the event of a Participant’s death prior to distribution of his or her entire Account balance, the remaining Account balance shall be paid in a
lump sum to the Participant’s Beneficiary or Beneficiaries, subject to Sections 5.1(a)(5) and 5.1(b)(2).
(d) Notwithstanding the provisions of paragraphs (a) and (b) above, if the Account balance is $5,000 or less on any date a payment is to be made to aParticipant, the payment shall be the remaining unpaid Account balance.
5.4 DISTRIBUTION ELECTION
(a) Each Participant shall elect his or her desired form of payment, in accordance with procedures established by the Committee, at the time of his orher initial participation election set forth in Section 2.1.
(b) This Section 5.4(b) shall apply solely with respect to Pre-2005 Sub-Accounts. Except for distribution elections under Section 5.1(a)(3) and (4),
each Participant may from time to time revise the terms of distribution of the Participants Accounts, in accordance with the procedures establishedby the Committee, provided that (i) the revised notice of the desired form of payment shall be made by the Participant no less than twelve monthsprior to the date on which payment is to commence, but in any event no later than the day before the date of the Participant’s Separation fromService and (ii) in any event , distribution of the Participant’s Account shall not commence earlier than twelve months after the Participant’srevised notice of the desired form of payment is made.
Page 18
(c) This Section 5.4(c) shall apply solely with respect to Post-2004 Sub-Accounts. Installments shall be paid only if a Participant filed an irrevocable
election to receive installment payments in a manner acceptable to the Committee on or before the later of December 31, 2008, or the date of theParticipant’s initial election to defer base salary or Incentive under the Plan. Installment payments shall be treated as a right to a series of separatepayments for purposes of Code Section 409A.
ARTICLE VI
ADMINISTRATION
6.1 GENERAL ADMINISTRATION; RIGHTS AND DUTIES
The Board shall appoint the Committee, which, subject to the express limitations of the Plan, shall be charged with the general administration of the Planon behalf of the Participants. The Committee shall also be responsible for carrying out its provisions, and shall have all powers necessary to accomplishthose purposes, including, but not by way of limitation, the following:
(a) To construe and interpret the Plan;
(b) To compute the amount of benefits payable to Participants;
(c) To authorize all disbursements by the Company of Account balances pursuant to the Plan;
(d) To maintain all the necessary records for the administration of the Plan;
(e) To make and publish rules for administration and interpretation of the Plan and the transaction of its business;
(f) To make available to each Participant the current value of his or her Account;

(g) To delegate the administration of the Plan in accordance with its terms to officers or employees of the Company, of Allstate InsuranceCompany or of an independent consultant retained by the Committee who the Committee believes to be reliable and competent. TheCommittee may authorize officers or employees of the Company or of Allstate Insurance Company to whom it has delegated duties underthe Plan to appoint other persons to assist the delegate in
Page 19
administering the Plan; and
(h) To refuse to accept the deferral of amounts the Committee or its delegate considers too small to be administratively feasible.
The determination of the Committee as to any disputed question or controversy shall be conclusive.
6.2 CLAIMS PROCEDURES
Each Participant or Beneficiary (for purposes of this Section 6.2. referred to as a “Claimant”) may submit a claim for benefits to the Committee (or otherperson designated by the Committee) in writing in such form as is permitted by the Committee. A Claimant shall have no right to seek review of adenial of benefits, or to bring any action in any court to enforce a claim for benefits, prior to his filing a claim for benefits and exhausting his rights toreview in accordance with this Section 6.2. A properly filed claim for benefits shall be evaluated and the Claimant shall be notified in writing of the approval or the denial within ninety (90) daysafter the receipt of such claim unless special circumstances require an extension of time for processing the claim. If such an extension of time isrequired, written notice of the extension shall be furnished to the Claimant prior to the termination of the initial ninety (90) day period, and such noticeshall specify the special circumstances requiring an extension and the date by which a final decision will be reached (which date shall not be later thanone hundred and eighty (180) days after the date on which the claim was filed). Written notice to a Claimant shall advise whether the claim is granted ordenied, in whole or in part, and if denied, shall contain (1) the specific reasons for the denial, (2) re ferences to pertinent Plan provisions on which thedenial is based, (3) a description of any additional material or information necessary to perfect the claim and an explanation of why such material orinformation is necessary, and (4) the Claimant’s rights to seek a review of the denial. If a claim is denied, in whole or in part, the Claimant shall have the right to request that the Committee (or person designated by the Committee) reviewthe denial, provided that he files a written request for review with the Committee within sixty (60) days after the
Page 20
date on which he received written notice of the denial. A Claimant (or his duly authorized representative) may review pertinent documents and submitissues and comments in writing to the Committee. Within sixty (60) days after a request for review is received, the review shall be made and theClaimant shall be advised in writing of the decision on review, unless special circumstances require an extension of time for processing the review, inwhich case the Claimant shall, within such initial sixty (60) day period, be given a written notice specifying the reasons for the extension and when suchreview shall be completed (provided that such review shall be completed within one hundred and twenty (120) days after the date on which the requestfor review was filed). The decision on review shall be forwarded to the Claimant in writing and shall include specific reasons for the decision andreferences to Plan provisions upon which the decision is based. A decision on review shall be final and binding on all persons for all purposes.
ARTICLE VII
PLAN AMENDMENTS AND TERMINATION
7.1 AMENDMENTS
The Company shall have the right to amend this Plan from time to time by resolutions of the Board or by the Committee, and to amend or rescind anysuch amendments; provided, however, that no action under this Section 7.1 shall in any way reduce the amount of Compensation deferred or reduce thevalue of any Account. All amendments shall be in writing and shall be effective as provided subject to the limitations in this Section 7.1.
7.2 TERMINATION OF PLAN
The Company expects that the Plan will continue indefinitely but continuance of the Plan is not a contractual or other obligation of the Company. TheCompany reserves its right to discontinue the Plan at any time by resolution of the Board; however, no such action shall reduce the value of an Accountor result in a distribution that does not conform to the requirements of Code Section 409A.
Page 21
ARTICLE VIII
MISCELLANEOUS
8.1 NOTIFICATION TO COMMITTEE
Any election made or notification given by a Participant pursuant to this Plan shall be made in accordance with procedures established by the Committeeor its designated representative, and shall be deemed to have been made or given on the date received by the Committee or such representative.
8.2 PARTICIPANT’S EMPLOYMENT

Participation in this Plan shall not give any Participant the right to be retained in the employ of the Company, Allstate Insurance Company of anymember of the Controlled Group, or any other right or interest other than as herein provided. No Participant or Employee shall have any right to anypayment or benefit except to the extent provided in this Plan.
8.3 STATUS OF PARTICIPANTS
This Plan shall create only a contractual obligation on the part of the Company and shall not be construed as creating a trust or other fiduciaryrelationship with Participants. Participants will have only the rights of general unsecured creditors of the Company with respect to Compensationdeferred and investment gains and losses credited to their Accounts.
8.4 BENEFICIARIES AND CONTINGENT BENEFICIARIES
(a) Beneficiary Designation. Each Participant shall, in accordance with procedures established by the Committee, designate one or more persons orentities (including a trust or trusts or his or her estate) to receive distribution of his or her Account that are not distributed prior to theParticipant’s death. The Participant may also designate a person or persons as a Contingent Beneficiary who shall succeed to the rights of theperson or persons originally designated as Beneficiary, in case the latter should die. The Participant may from time to time ch ange any
Page 22
designation of Beneficiary or Contingent Beneficiary so made, by submitting a new designation in accordance with procedures established by
the Committee. The last valid designation made by a Participant under the Plan, in accordance with procedures established by the Committee,shall be controlling.
(b) Spousal Consent Required. In the event a Participant designates a person other than his or her spouse as Beneficiary of any interests under this
Plan, the Participant’s spouse shall sign a notarized statement specifically approving such designation and authorizing the Committee to makepayment of such interests in the manner provided in such designation. In the absence of such designation by the Participant, or in the absence ofspousal approval and authorization as herein above provided, or in the event of the death, prior to or simultaneous with the death of t heParticipant, of all Beneficiaries or Contingent Beneficiaries, as the case may be, to whom payments were to be made pursuant to a designationby the Participant, such payments or any balance thereof shall be paid to the Participant’s spouse or, if there is no surviving spouse, to theParticipant’s estate, or, if there is no estate, according to the Illinois laws of descent and distribution.
(c) Death of Beneficiary. In the event of the death, subsequent to the death of the Participant, of a Beneficiary or Contingent Beneficiary, as the
case may be, to whom such payments were to be made or were being made pursuant to a designation under this section, such payments or anybalance thereof shall be paid to the estate of such Beneficiary or Contingent Beneficiary.
8.5 TAXES AND OTHER CHARGES
To the extent permitted by law, if the whole or any part of a Participant’s Account shall become the subject of any federal, state or local tax which theCompany shall legally be required to withhold or pay, the Company shall reduce an Account with respect to such tax paid.
8.6 BENEFITS NOT ASSIGNABLE; OBLIGATIONS BINDING UPON SUCCESSORS
Benefits under this Plan and rights to receive the amounts credited to the Account of a Participant shall not be assignable or transferable and anypurported transfer, assignment, pledge or other encumbrance or attachment of any payments or benefits under this Plan
Page 23
shall not be permitted or recognized. Obligations of the Company under this Plan shall be binding upon successors of the Company.
8.7 ILLINOIS LAW GOVERNS; SAVING CLAUSE
The validity of this Plan or any of its provisions shall be construed and governed in all respects under and by the laws of the State of Illinois. If anyprovisions of this Plan shall be held by a court of competent jurisdiction to be invalid or unenforceable, the remaining provisions hereof shall continue tobe fully effective.
8.8 HEADINGS NOT PART OF PLAN
Headings and subheadings in this Plan are inserted for reference only, and are not to be considered in the construction of the provisions hereof.
Page 24

EXHIBIT 10.5
THE ALLSTATE CORPORATION2009 EQUITY INCENTIVE PLAN
Article 1. Establishment, Purpose and Duration
1.1 Establishment of the Plan. The Allstate Corporation, a Delaware corporation (hereinafter, together with any successor as provided inArticle 18 herein, referred to as the “Company”), hereby establishes an incentive compensation plan for employees, as set forth in this document. The Planpermits the grant of nonqualified stock options (NQSOs), incentive stock options (ISOs), stock appreciation rights (SARs), unrestricted stock, restricted stock,restricted stock units, performance units, performance stock and other awards.
The Plan was formerly known as “The Allstate Corporation 2001 Equity Incentive Plan.” The Plan was approved by the Board of Directors on
March 13, 2001 and became effective when approved by the Company’s stockholders on May 15, 2001 (the “Effective Date”). The Plan was amended by theBoard of Directors on March 9, 2004. On March 14, 2006 the Plan was amended and restated effective upon approval by stockholders at the 2006 AnnualMeeting of Stockholders on May 16, 2006. The Plan was further amended and restated by the Board at meetings held on September 10, 2006, February 20, 2007,and September 15, 2008. On March 10, 2009, the Plan was amended, restated and renamed as “The Allstate Corporation 2009 Equity Incentive Plan,” effectiveupon approval by stockholders at the 2009 Annual Meetin g of Stockholders on May 19, 2009. The Plan was further amended and restated on February 22, 2011and shall thereafter remain in effect as provided in Section 1.3 herein.
1.2 Purpose of the Plan. The primary purpose of the Plan is to provide a means by which employees of the Company and its Subsidiaries can
acquire and maintain stock ownership, thereby strengthening their commitment to the success of the Company and its Subsidiaries and their desire to remainemployed by the Company and its Subsidiaries. The Plan also is intended to attract and retain employees and to provide such employees with additional incentiveand reward opportunities designed to encourage them to enhance the profitable growth of the Company and its Subsidiaries.
1.3 Duration of the Plan. The Plan shall commence on the Effective Date, as described in Section 1.1 herein, and shall remain in effect subject to
the right of the Board of Directors to terminate the Plan at any time pursuant to Article 15 herein, until all Stock subject to it shall have been purchased oracquired according to the Plan’s provisions.
Article 2. Definitions
Whenever used in the Plan, the following terms shall have the meanings set forth below and, when such meaning is intended, the initial letter of the wordis capitalized:
2.1 Award means, individually or collectively, a grant under the Plan of NQSOs, ISOs, SARs, Unrestricted Stock, Restricted Stock, Restricted
Stock Units, Performance Units, Performance Stock or any other type of award permitted under Article 10 of the Plan. 2.2 Award Agreement means an agreement setting forth the terms and provisions applicable to an Award granted to a Participant under the Plan.
2.3 Base Value of an SAR means the Fair Market Value of a share of Stock on the date the SAR is granted. 2.4 Beneficiary means a person or entity designated as a beneficiary in accordance with Section 6.7. 2.5 Beneficiary Designation Form means a form provided by the Company for the purpose of designating a beneficiary in accordance with
Section 6.7. 2.6 Board or Board of Directors means the Board of Directors of the Company. 2.7 Code means the Internal Revenue Code of 1986, as amended from time to time. 2.8 Committee means the committee, as specified in Article 3, appointed by the Board to administer the Plan. 2.9 Company has the meaning provided in Section 1.1 herein. 2.10 Covered Employee means any Participant who would be considered a “covered employee” for purposes of Section 162(m) of the Code. 2.11 Disability means an impairment which renders a Participant disabled within the meaning of Code Section 409A(a)(2)(C). 2.12 Dividend Equivalent means, with respect to Stock subject to an Award (other than an Option or SAR), a right to be paid an amount equal to
cash dividends, other than large, nonrecurring cash dividends, declared on an equal number of outstanding shares of Stock. 2.13 Eligible Person means a Person who is eligible to participate in the Plan, as set forth in Section 5.1 herein. 2.14 Employee means an individual who is paid on the payroll of the Company or of one of the Company’s Subsidiaries, who is not covered by any
collective bargaining agreement to which the Company or any of its Subsidiaries is a party, and is classified on the employer’s human resource payroll system as aregular full-time or regular part-time employee.
2.15 Exchange Act means the Securities Exchange Act of 1934, as amended from time to time, or any successor act thereto. 2.16 Exercise Period means the period during which an SAR or Option is exercisable, as set forth in the related Award Agreement. 2.17 Fair Market Value means the price at which a share of the Stock was last sold in the principal United States market for the Stock as of the date
for which fair market value is being determined.

2
2.18 Family Member means any child, stepchild, grandchild, parent, stepparent, grandparent, spouse, domestic partner, or sibling, including
adoptive relationships, a trust in which these persons have more than fifty (50) percent of the beneficial interest, a foundation in which these persons (or theEmployee) control the management of assets, and any other entity in which these persons (or the Employee) own more than fifty (50) percent of the votinginterests.
2.19 Freestanding SAR means an SAR that is not a Tandem SAR. 2.20 Full-Value Award means an Award granted on or after May 19, 2009, other than an Option or a SAR. 2.21 Incentive Stock Option or ISO means an option to purchase Stock, granted under Article 6 herein, which is designated as an Incentive Stock
Option and satisfies the requirements of Section 422 of the Code. 2.22 Minimum Consideration means the $.01 par value per share or such larger amount determined pursuant to resolution of the Board to be capital
within the meaning of Section 154 of the Delaware General Corporation Law. 2.23 Nonqualified Stock Option or NQSO means an option to purchase Stock, granted under Article 6 herein, which is not intended to be an
Incentive Stock Option under Section 422 of the Code. 2.24 Option means an Incentive Stock Option or a Nonqualified Stock Option. 2.25 Option Exercise Price means the price at which a share of Stock may be purchased by a Participant pursuant to an Option, as determined by the
Committee and set forth in the Option Award Agreement. 2.26 Participant means an Eligible Person who has outstanding an Award granted under the Plan. 2.27 Performance-Based Compensation means an Award intended to qualify for the exemption from the limitation on deductibility imposed by
Section 162(m) of the Code as set forth in Section 162(m)(4)(C) of the Code. 2.28 Performance Goals means the performance goals established by the Committee, which shall be based on one or more of the following
measures: sales, revenues, premiums, financial product sales, earnings per share, stockholder return and/or value, funds from operations, operating income, grossincome, net income, combined ratio, underwriting income, cash flow, return on equity, return on capital, return on assets, values of assets, market share, netearnings, earnings before interest, operating ratios, stock price, customer satisfaction, customer retention, customer loyalty, strategic business criteria based onmeeting specified revenue goals, market penetration goals, investment performance goals, business expansion goals or cost targets, accomplishment of mergers,acquisitions, dispositions or similar extraordinary business transac tions, profit returns and margins,
3
financial return ratios, market performance and/or risk-based capital goals or returns. Performance Goals may be based solely on a corporate, subsidiary, businessunit or other grouping basis, or a combination thereof. Performance Goals may reflect absolute entity performance or a relative comparison of entity performanceto the performance of a peer group of entities or other external measure.
2.29 Performance Period means the time period during which Performance Unit/Performance Stock Performance Goals must be met. 2.30 Performance Stock means an Award described in Article 9 herein. 2.31 Performance Unit means an Award described in Article 9 herein. 2.32 Period of Restriction means the period during which the transfer of Restricted Stock or Restricted Stock Units is limited in some way, as
provided in Article 8 herein. 2.33 Person means any individual, sole proprietorship, partnership, joint venture, limited liability company, trust, unincorporated organization,
association, corporation, institution, public benefit corporation, entity or government instrumentality, division, agency, body or department. 2.34 Plan means The Allstate Corporation 2009 Equity Incentive Plan. 2.35 Qualified Restricted Stock means an Award of Restricted Stock designated as Qualified Restricted Stock by the Committee at the time of grant
and intended to qualify as Performance-Based Compensation. 2.36 Qualified Restricted Stock Unit means an Award of Restricted Stock Units designated as Qualified Restricted Stock Units by the Committee at
the time of grant and intended to qualify as Performance-Based Compensation. 2.37 Reload Option means an additional Option related to Options awarded prior to 2004 as described in Article 6 herein. 2.38 Restricted Stock means an Award described in Article 8 herein. 2.39 Restricted Stock Unit means an Award described in Article 8 herein.
4

2.40 Retirement means a Participant’s termination from employment with the Company or a Subsidiary at the Participant’s Early or NormalRetirement Date, as applicable.
(a) Early Retirement Date —
(i) For Awards granted before February 22, 2011, shall mean the date prior to the Participant’s Normal Retirement Date on whicha Participant terminates employment, if such termination date occurs on or after the Participant attains age fifty-five (55) withtwenty (20) years of service and such retirement is in accordance with the voluntary early retirement policy of the Companyor the Subsidiary with which the Participant is employed on the date of termination of employment.
(ii) For Awards granted on or after February 22, 2011, shall mean the date prior to the Participant’s Normal Retirement Date on
which a Participant terminates employment, if such termination date occurs on or after the Participant attains age fifty-five(55) with ten (10) years of service.
(b) Normal Retirement Date — shall have the meaning given to it by the Company or the Subsidiary with which the Participant is
employed on the date of termination of employment, provided that such termination is voluntary and occurs on or after the Participantattains age sixty (60) with at least one (1) year of service at termination of employment.
2.41 Section 409A shall have the meaning set forth in Section 19.5 herein. 2.42 Section 16 Officer means any Participant who was designated by the Board as an “executive officer” or as an officer for purposes ofSection 16 of the 1934 Act. 2.43 Securities Act means the Securities Act of 1933, as amended. 2.44 Stock means the common stock, $.01 par value, of the Company. 2.45 Stock Appreciation Right or SAR means a right, granted alone or in connection with a related Option, designated as an SAR, to receive a
payment on the day the right is exercised, 5
pursuant to the terms of Article 7 herein. Each SAR shall be denominated in terms of one share of Stock.
2.46 Subsidiary means any corporation, business trust, limited liability company or partnership with respect to which the Company owns, directly orindirectly, Voting Securities representing more than 50% of the aggregate Voting Power of the then-outstanding Voting Securities.
2.47 Tandem SAR means an SAR that is granted in connection with a related Option, the exercise of which shall require forfeiture of the right to
purchase Stock under the related Option (and when Stock is purchased under the Option, the Tandem SAR shall be similarly canceled). 2.48 Termination of Employment occurs the first day on which an individual is for any reason no longer employed by the Company or any of its
Subsidiaries, or with respect to an individual who is an Employee of a Subsidiary, the first day on which the Company no longer owns, directly or indirectly,Voting Securities possessing at least 50% of the Voting Power of such Subsidiary. For purposes of the Plan, transfer of employment of a Participant between theCompany and any one of its Subsidiaries (or between Subsidiaries) shall not be deemed a termination of employment. Notwithstanding anything herein to thecontrary, no issuance of Stock or payment of cash shall be made upon a Termination of Employment with respect to any Award that constitutes deferredcompensation for purposes of S ection 409A unless the Termination of Employment constitutes a “separation from service” as that term is used inSection 409A(a)(2)(A)(i) of the Code.
2.49 Unrestricted Stock means an Award of Stock not subject to restrictions described in Article 8 herein. 2.50 Voting Power for purposes of Sections 2.46 and 2.48 means the combined voting power of the then-outstanding Voting Securities entitled to
vote generally in the election of directors. 2.51 Voting Securities of a corporation means securities of such corporation that are entitled to vote generally in the election of directors of such
corporation.
Article 3. Administration
3.1 The Committee. The Plan shall be administered by the Compensation and Succession Committee or such other committee (the “Committee”)as the Board of Directors shall select, consisting solely of two or more nonemployee members of the Board. The members of the Committee shall be appointedfrom time to time by, and shall serve at the discretion of, the Board of Directors.
3.2 Authority of the Committee. The Committee shall have full power except as limited by law, the articles of incorporation or the bylaws of the
Company, subject to such other restricting limitations or directions as may be imposed by the Board and subject to the provisions herein, to determine the EligiblePersons to receive Awards; to determine when Awards may be granted and to grant Awards under the Plan; to determine the size and types of Awards; todetermine the terms and conditions of such Awards; to assess whether Performance Goals have been met; to construe and
6
interpret the Plan and any agreement or instrument entered into under the Plan; to establish, amend or waive rules and regulations for the Plan’s administration; toamend the terms and conditions of any outstanding Award, including but not limited to amendments with respect to exercisability and non-forfeitability of Awardsupon a Termination of Employment; to make such adjustments or modifications to Awards to Participants working outside the United States as are necessary oradvisable to fulfill the purposes of the Plan; to accelerate the exercisability of, and to accelerate or waive any or all of the restrictions and conditions applicable to,any Award; and to authorize any action of or make any determination by the Company as the Committee shall deem necessary or advisable for carrying out the

purposes of the Plan; provided, however, that the Committee may not amend the terms and con ditions of any outstanding Award so as to adversely affect in anymaterial way such Award without the written consent of the Participant holding such Award (or if the Participant is not then living, the Participant’s personalrepresentative or estate), unless such amendment is required by applicable law; and provided, further, that any discretion exercised by the Committee pursuant toSection 4.2 and the following paragraph of this Section 3.2 shall not be deemed to adversely affect in any material way an Award. The Committee may designatewhich Subsidiaries participate in the Plan and may authorize foreign Subsidiaries to adopt plans as provided in Article 14. Further, the Committee shall interpretand make all other determinations which may be necessary or advisable for the administration of the Plan. As permitted by law, the Committee may delegate itsauthorities as identified hereunder.
If the Committee determines it is in the best interest of the Company’s stockholders to cancel any Awards granted hereunder, it may, in its discretion,elect at any time to cancel all or any of the Awards granted hereunder and pay the holders of any such Awards an amount (payable in such proportion as theCommittee may determine in cash or in Stock (valued at the Fair Market Value of a share of Stock on the date of cancellation of such Award)) equal to (i) forOptions, the number of shares of Stock subject to such cancelled Option, multiplied by the amount (if any) by which the Fair Market Value of Stock on the date ofcancellation of the Option exceeds the Option Exercise Price; (ii) for Restricted Stock or Performance Stock, the number of shares of Restricted Stock orPerformance Stock multiplied by the Fair Market Value of Stock on the date of cancellation of the Award; and (i ii) for Restricted Stock Units or PerformanceUnits, the number of units multiplied by an amount not less than the initial value thereof; provided, however, the Committee shall not exercise discretion and paythe holder of any Award in cash or Stock to the extent such Award constitutes deferred compensation for purposes of Section 409A. Amounts payable may beprorated based upon the number of months elapsed in any related vesting period or Performance Period, in the sole discretion of the Committee. Except inconnection with a corporate transaction involving the Company (including, without limitation, any stock dividend, stock split, large, nonrecurring cash dividend,recapitalization, reorganization, merger, consolidation, spin-off or other transaction or event described in Section 4.2), the terms of outstanding Awards may notbe amended to reduce the exercise price of outstanding Options or SARs or to cancel outstanding Options or SARs in exchange for other Awards o r Options orSARs with an Option Exercise Price or Base Value, as applicable, that is less than the Option Exercise Price or Base Value of the original Options or SARs,without stockholder approval.
3.3 Delegation of Authority. Notwithstanding the general authority of the Committee to grant Awards under the Plan, the Board may, byresolution, expressly delegate to another committee, established by the Board and consisting of one or more employee or non-employee directors, the
7
authority, within parameters specified by the Board, to determine the Eligible Persons to receive Awards; to determine when Awards may be granted and to grantAwards under the Plan; to determine the size and types of Awards; and to determine the terms and conditions of such Awards; provided, however that suchcommittee may not grant Awards to Eligible Persons who (i) are subject to Section 16 of the Exchange Act at the time of grant, or (ii) are at the time of grant, orare anticipated to become during the term of the Award, “covered employees” as defined in Section 162(m)(3) of the Code. Such committee shall report regularlyto the Committee, who shall report to the Board, regarding any Awards so granted.
3.4 Delivery of Stock by Company; Restrictions on Stock. Notwithstanding any other provision of the Plan, the Company shall have no liability to
deliver any Stock or benefits under the Plan unless such delivery would comply with all applicable laws (including, without limitation, the Code, the SecuritiesAct, and the Exchange Act) and applicable requirements of any securities exchange or similar entity and unless the Participant’s tax obligations have beensatisfied as set forth in Article 16.
The Committee may impose such restrictions on any Stock acquired pursuant to Awards under the Plan as it may deem advisable, including, without
limitation, restrictions to comply with applicable Federal securities laws, with the requirements of any stock exchange or market upon which such Stock is thenlisted and/or traded and with any blue sky or state securities laws applicable to such Stock.
3.5 Decisions Binding. All determinations and decisions made by the Committee pursuant to the provisions of the Plan and all related orders or
resolutions of the Board shall be final, conclusive and binding on all persons, including the Company, its stockholders, Eligible Persons, Employees, Participantsand their Beneficiaries and estates. No member of the Committee shall be liable for any action or determination made in good faith with respect to the Plan orany Award.
3.6 Costs. The Company shall pay all costs of administration of the Plan.
Article 4. Stock Subject to the Plan
4.1 Number of Shares. Subject to Section 4.2 herein, the maximum number of shares of Stock available for grant under the Plan shall be70,380,000 shares (which includes the 37,000,000 shares originally provided in the Plan as approved by stockholders in 2001, as increased to 49,000,000 sharesas approved by stockholders in 2006) plus any shares of Stock remaining for awards pursuant to the terms of The Allstate Corporation Equity Incentive Plan. Thenumber of shares of Stock to which an Award pertains shall be counted against the maximum share limitation of this Section 4.1 as two and one-tenth (2.1) sharesof Stock for each Full Value Award and as one (1) share of Stock for each other type of Award. Shares of Stock underlying lapsed or forfeited Aw ards ofRestricted Stock shall not be treated as having been issued pursuant to an Award under the Plan. Shares of Stock that are potentially deliverable under an Awardthat expires or is cancelled, forfeited, settled in cash or otherwise settled without delivery of shares of Stock shall not be treated as having been issued under thePlan. With respect to an SAR that is settled in Stock, the full number of shares underlying the exercised portion of the SAR shall be treated as having been issuedunder the Plan, regardless of the number of shares used to settle the SAR upon exercise. Shares of
8
Stock that are tendered or withheld to satisfy tax withholding obligations related to an Award or to satisfy the Option Exercise Price related to an Option or otherAward shall be deemed to be shares of Stock issued under the Plan. If, before June 30, 2003, the Option Exercise Price is satisfied by tendering Stock, only thenumber of shares issued net of the shares tendered shall be deemed issued under the Plan. For avoidance of doubt, if a share of Stock that underlies an Awardother than a Full-Value Award was counted against the maximum share limitation of this Section 4.1 and pursuant to this Section 4.1 subsequently is treated ashaving not been issued under the Plan, the maximum share limitation of this Section 4.1 shall be credited with one share of Stock, and if a share of Stockpertaining to a Full-Value Award was counted against the maximum share limitation of this Sect ion 4.1 and pursuant to this Section 4.1 subsequently is treated ashaving not been issued under the Plan, the maximum share limitation of this Section 4.1 shall be credited with 2.1 shares of Stock. Stock granted pursuant to thePlan may be (i) authorized but unissued shares of common stock or (ii) treasury stock.
4.2 Adjustments in Authorized Stock and Awards. In the event of any equity restructuring (within the meaning of Financial Accounting StandardsNo. 123 (revised 2004)) that causes the per share value of shares of Stock to change, such as a stock dividend, stock split, spin off, rights offering, or

recapitalization through a large, nonrecurring cash dividend, the Committee shall cause there to be made an equitable adjustment to (i) the number and kind ofshares available for grant under the Plan, (ii) the number of shares or Awards that may be granted to any individual under the Plan or that may be granted pursuantto any Articles or types of Awards and (iii) the number and kind of shares or units subject to and the Option Exercise Price or Base Value (if ap plicable) of anythen outstanding Awards of or related to shares of Stock. In the event of any other change in corporate capitalization, such as a merger, consolidation, anyreorganization (whether or not such reorganization comes within the definition of such term in Section 368 of the Code) or any partial or complete liquidation ofthe Company, such equitable adjustments described in the foregoing sentence shall be made as may be determined to be appropriate and equitable by theCommittee, in its sole discretion, to prevent dilution or enlargement of rights. In either case, any such adjustment shall be conclusive and binding for all purposesof the Plan. Unless otherwise determined by the Board upon recommendation of the Committee, the number of shares of Stock subject to an Award shall alwaysbe a whole number. In no event shall an outstanding Option or SAR be amended for the sole purpose of reducing the Option Exercise Price or Base Valuethereof, without stockholder approval . Notwithstanding the foregoing, (i) each such adjustment with respect to an Incentive Stock Option shall comply with therules of Section 424(a) of the Code and (ii) in no event shall any adjustment be made which would render any Incentive Stock Option granted hereunder to beother than an incentive stock option for purposes of Section 422 of the Code.
4.3 Award Limitations. Subject to Section 4.2 above, the following limitations shall apply to Awards intended to qualify as Performance-Based
Compensation: (i) the total number of shares of Stock with respect to which Options or SARs may be granted in any calendar year to any Participant shall notexceed 4,000,000 shares; (ii) the total number of shares of Qualified Restricted Stock or Qualified Restricted Stock Units that may be granted in any calendar yearto any Participant shall not exceed 3,000,000 shares or Units, as the case may be; (iii) the total number of shares of Performance Stock that may be granted in anycalendar year to any Participant shall not exceed 4,000,000 shares and the maximum amount that may be paid pursuant to Performance Units gr anted in any onecalendar year to any Participant shall not exceed $10,000,000; (iv) the total number of
9
shares of Stock granted pursuant to Article 10 herein in any calendar year to any Participant shall not exceed 4,000,000 shares; (v) the total cash Award that maybe paid pursuant to an Award granted under Article 10 herein in any calendar year to any Participant shall not exceed $10,000,000; and (vi) the aggregate value ofcash dividends (other than large, nonrecurring cash dividends) or Dividend Equivalents that a Participant may receive in any calendar year shall not exceed$11,500,000.
The maximum number of shares of Stock that may be issued pursuant to Incentive Stock Options shall be 5,500,000 shares.
Article 5. Eligibility and Participation
5.1 Eligibility. Persons eligible to participate in the Plan (“Eligible Persons”) include all Employees of the Company and its Subsidiaries, asdetermined by the Committee.
5.2 Actual Participation. Subject to the provisions of the Plan, the Committee may, from time to time, select from all Eligible Persons those to
whom Awards shall be granted.
Article 6. Stock Options
6.1 Grant of Options. Subject to the terms and conditions of the Plan, Options may be granted to an Eligible Person at any time and from time totime, as shall be determined by the Committee.
The Committee shall have complete discretion in determining the number of shares of Stock subject to Options granted to each Eligible Person (subject
to Article 4 herein) and, consistent with the provisions of the Plan, in determining the terms and conditions pertaining to such Options. The Committee may grantISOs, NQSOs or a combination thereof.
6.2 Option Award Agreement. Each Option grant shall be evidenced by an Option Award Agreement that shall specify the Option Exercise Price,
the term of the Option (which shall not be greater than ten (10) years), the number of shares of Stock to which the Option pertains, the Exercise Period and suchother provisions as the Committee shall determine, including but not limited to special provisions relating to a change of control. The Option Award Agreementshall also specify whether the Option is intended to be an ISO or NQSO. The Option Exercise Price shall not be less than 100% of the Fair Market Value of theStock on the date of grant. No Dividend Equivalents shall be provided with respect to Options.
6.3 Exercise of and Payment for Options. Options granted under the Plan shall be exercisable at such times and shall be subject to such restrictions
and conditions as the Committee shall in each instance approve. A Participant may exercise an Option at any time during the Exercise Period. Options shall be exercised by the delivery of a written notice of exercise to
the Company, or such method acceptable to the Company, setting forth the number of shares of Stock with respect to which the Option is to be exercised,accompanied by provision for full payment of the Stock.
10
The Option Exercise Price shall be payable: (i) in cash or its equivalent, (ii) by tendering (by actual delivery of shares or by attestation) previously
acquired Stock (owned for at least six months) having an aggregate Fair Market Value at the time of exercise equal to the total Option Exercise Price, (iii) bybroker-assisted cashless exercise, (iv) with respect to Options granted on and after May 16, 2006, by share withholding or (v) by a combination of (i), (ii),(iii) and/or (iv).
Options may not be exercised for less than 25 shares of Stock unless the exercise represents the entire remaining balance of the Award. Stock received upon exercise of an Option may be granted subject to restrictions deemed appropriate by the Committee. 6.4 Reload Options Related to Options Granted Prior to 2004. The Committee may provide in an Award Agreement with respect to an Option
granted prior to 2004 that a Participant who exercises all or any portion of an Option with Stock which has a Fair Market Value equal to not less than 100% of theOption Exercise Price for such Option shall be granted, subject to Article 4, an additional option (“Reload Option”) for a number of shares of Stock equal to thesum (“Reload Number”) of the number of shares of Stock tendered in payment of the Option Exercise Price for the Options plus, if so provided by the

Committee, the number of shares of Stock, if any, retained by the Company in connection with the exercise of the Options to satisfy any federal, state or local taxwithholding requirements. Reload Options may not be included in any Option Awards granted in 2004 or later.
To the extent that a Reload Option is granted upon exercise of Options granted prior to 2004, the Reload Options shall be subject to the following terms
and conditions: (i) the grant date for each Reload Option shall be the date of exercise of the Option to which it relates; (ii) subject to (iii) below, the Reload Option, upon vesting, may be exercised at any time during the unexpired term of the Option to which it relates(subject to earlier termination thereof as provided in the Plan and in the applicable Award Agreement); and (iii) the terms of the Reload Option shall be the same as the terms of the Option to which it relates, except that (A) the Option Exercise Price shallbe the Fair Market Value of the Stock on the grant date of the Reload Option and (B) the Reload Option shall be subject to new vesting provisions,commencing one (1) year after the grant date of the Reload Option and vesting upon the same schedule as the Option to which it relates. Reload Options may not be granted to Participants who exercise Options after a Termination of Employment.
Stock subject to this Plan may be used for Reload Options granted under The Allstate Corporation Equity Incentive Plan.
11
6.5 Termination. Each Option Award Agreement shall set forth the extent to which the Participant shall have the right to exercise the Option
following termination of the Participant’s employment with the Company and its Subsidiaries. Such provisions shall be determined in the sole discretion of theCommittee (subject to applicable law), shall be included in the Option Award Agreement entered into with Participants, need not be uniform among all Optionsgranted pursuant to the Plan or among Participants and may reflect distinctions based on the reasons for termination.
To the extent the Option Award Agreement does not set forth termination provisions, the provisions of Article 13 shall control. 6.6 Transferability of Options. Except as otherwise determined by the Committee, all Options granted to a Participant under the Plan shall be
exercisable during his or her lifetime only by such Participant, and no Option granted under the Plan may be sold, transferred, pledged, assigned, or otherwisealienated or hypothecated, other than by will or by the laws of descent and distribution. ISOs are not transferable other than by will or by the laws of descent anddistribution. The Committee shall have the authority, in its discretion, to grant (or to sanction by way of amendment to an existing Award) Nonqualified StockOptions, the vested portions of which may be transferred by the Participant during his lifetime to any Family Member. A transfer of an Option pursua nt heretomay only be effected by the Company at the written request of a Participant and shall become effective only when recorded in the Company’s record ofoutstanding Options. In the event an Option is transferred as contemplated herein, any Reload Options associated with such transferred Option shall terminate,and such transferred Option may not be subsequently transferred by the transferee except by will or the laws of descent and distribution. Otherwise, a transferredOption shall continue to be governed by and subject to the terms and limitations of the Plan and the relevant Award Agreement, and the transferee shall be entitledto the same rights as the Participant, as if no transfer had taken place. In no event shall an Option be transferred for consideration.
6.7 Designation of Beneficiary. (a) Each Participant may designate a Beneficiary who shall have the right to exercise the Option in the event of
the Participant’s death. Participants shall designate a Beneficiary by executing a Beneficiary Designation Form. A Beneficiary designation is not binding on theCompany unless it receives a properly completed Beneficiary Designation Form prior to the Participant’s death. If no designation is made or no designatedBeneficiary is alive (or in the case of an entity designated as a Beneficiary, in existence) at the time of the Participant’s death, the executor or personalrepresentative of the Participant’s estate shall have the right to exercise the Option. If there is any question as to the legal right of any Beneficiary to exer cise theOption under the Plan, the Company may determine in its sole discretion whether to provide the right of exercise to the executor or personal representative of theParticipant’s estate. The Company’s determination shall be binding and conclusive on all persons and it will have no further liability to anyone with respect tosuch Option.
(b) Change of Beneficiary Designation. A Participant may change an earlier Beneficiary designation by executing a later Beneficiary Designation Form.The execution of a Beneficiary Designation Form revokes and rescinds any prior Beneficiary Designation Form.
12
Article 7. Stock Appreciation Rights
7.1 Grant of SARs. Subject to the terms and conditions of the Plan, an SAR may be granted to an Eligible Person at any time and from time totime as shall be determined by the Committee. The Committee may grant Freestanding SARs, Tandem SARs or any combination of these forms of SARs.
The Committee shall have complete discretion in determining the number of SARs granted to each Eligible Person (subject to Article 4 herein) and,
consistent with the provisions of the Plan, in determining the terms and conditions pertaining to such SARs. 7.2 SAR Award Agreement. Each SAR grant shall be evidenced by an SAR Award Agreement that shall specify the number of SARs granted, the
Base Value (which shall not be less than one hundred percent (100%) of the Fair Market Value of a share of Stock on the date of grant), the term of the SAR(which shall not be greater than ten (10) years), the Exercise Period and such other provisions as the Committee shall determine, including but not limited tospecial provisions relating to a change of control. No Dividend Equivalents shall be provided with respect to SARs.
7.3 Exercise and Payment of SARs. Tandem SARs may be exercised for all or part of the Stock subject to the related Option upon the surrender of
the right to exercise the equivalent portion of the related Option. A Tandem SAR may be exercised only with respect to the shares of Stock for which its relatedOption is then exercisable.
Notwithstanding any other provision of the Plan to the contrary, with respect to a Tandem SAR granted in connection with an ISO: (i) the Tandem SAR
will expire no later than the expiration of the underlying ISO; (ii) the value of the payout with respect to the Tandem SAR may be for no more than one hundredpercent (100%) of the difference between the Option Exercise Price of the underlying ISO and the Fair Market Value of the shares of Stock subject to theunderlying ISO at the time the Tandem SAR is exercised; (iii) the Tandem SAR may be exercised only when the Fair Market Value of the shares of Stock subject

to the ISO exceeds the Option Exercise Price of the ISO; and (iv) the Tandem SAR may be transferred only when the underlying ISO is transferable, and underthe same conditions.
Freestanding SARs may be exercised upon whatever terms and conditions the Committee, in its sole discretion, imposes upon them. A Participant may exercise an SAR at any time during the Exercise Period. SARs shall be exercised by the delivery of a written notice of exercise to the
Company, or such method acceptable to the Company, setting forth the number of SARs being exercised. Upon exercise of an SAR, a Participant shall be entitledto receive payment from the Company in an amount equal to the product of:
(a) the excess of (i) the Fair Market Value of a share of Stock on the date of exercise over (ii) the Base Value multiplied by (b) the number of shares of Stock with respect to which the SAR is exercised.
13
At the sole discretion of the Committee, the payment to the Participant upon SAR exercise may be in cash, in shares of Stock of equivalent value or in
some combination thereof. 7.4 Termination. Each SAR Award Agreement shall set forth the extent to which the Participant shall have the right to exercise the SAR following
termination of the Participant’s employment with the Company and its Subsidiaries. Such provisions shall be determined in the sole discretion of the Committee,shall be included in the SAR Award Agreement entered into with Participants, need not be uniform among all SARs granted pursuant to the Plan or amongParticipants and may reflect distinctions based on the reasons for termination.
To the extent the SAR Award Agreement does not set forth termination provisions, the provisions of Article 13 shall control. 7.5 Transferability of SARs. Except as otherwise determined by the Committee, all SARs granted to a Participant under the Plan shall be
exercisable during his or her lifetime only by such Participant or his or her legal representative, and no SAR granted under the Plan may be sold, transferred,pledged, assigned, or otherwise alienated or hypothecated, other than by will or by the laws of descent and distribution. To the extent the Committee permits thetransfer of an SAR, in no event shall an SAR be transferred for consideration.
Article 8. Unrestricted Stock, Restricted Stock and Restricted Stock Units
8.1 Grant of Unrestricted Stock, Restricted Stock and Restricted Stock Units. Subject to the terms and conditions of the Plan, Unrestricted Stock,Restricted Stock and/or Restricted Stock Units may be granted to an Eligible Person at any time and from time to time, as shall be determined by the Committee.
The Committee shall have complete discretion in determining the number of shares of Unrestricted Stock, Restricted Stock and/or Restricted Stock Units
granted to each Eligible Person (subject to Article 4 herein) and, consistent with the provisions of the Plan, in determining the terms and conditions pertaining tosuch Awards.
In addition, the Committee may, prior to or at the time of grant, designate an Award of Restricted Stock or Restricted Stock Units as Qualified Restricted
Stock or Qualified Restricted Stock Units, as the case may be, in which event it will condition the grant or vesting, as applicable, of such Qualified RestrictedStock or Qualified Restricted Stock Units, as the case may be, upon the attainment of the Performance Goals selected by the Committee.
8.2 Unrestricted Stock, Restricted Stock/Restricted Stock Unit Award Agreement. Each grant of Unrestricted Stock, Restricted Stock and/or
Restricted Stock Units shall be evidenced by an Award Agreement that shall specify the number of shares of Unrestricted Stock, Restricted Stock and/orRestricted Stock Units granted, the initial value (if applicable), the Period or Periods of Restriction (if applicable), and such other provisions as the Committeeshall determine, including but not limited to special provisions relating to a change of control.
14
8.3 Transferability. Restricted Stock and Restricted Stock Units granted hereunder may not be sold, transferred, pledged, assigned, or otherwise
alienated or hypothecated until the end of the applicable Period of Restriction established by the Committee and specified in the Award Agreement. During theapplicable Period of Restriction, all rights with respect to the Restricted Stock and Restricted Stock Units granted to a Participant under the Plan shall be availableduring his or her lifetime only to such Participant or his or her legal representative.
8.4 Certificates. No certificates representing Stock shall be delivered to a Participant until such time as all restrictions applicable to such shares
have been satisfied. 8.5 Removal of Restrictions. Restricted Stock shall become freely transferable by the Participant after the last day of the Period of Restriction
applicable thereto. Once Restricted Stock is released from the restrictions, the Participant shall be entitled to receive a certificate. Payment of Restricted Stock Units shall be made after the last day of the Period of Restriction applicable thereto. The Committee, in its sole discretion,
may pay Restricted Stock Units in cash or in shares of Stock of equivalent value (or in some combination thereof). 8.6 Voting Rights. During the Period of Restriction, Participants may exercise full voting rights with respect to the Restricted Stock. 8.7 Dividends and Other Distributions. Subject to the Committee’s right to determine otherwise at the time of grant, during the Period of
Restriction, Participants shall receive all cash dividends, other than large, nonrecurring cash dividends, paid with respect to the Restricted Stock while they are soheld. All other distributions paid with respect to such Restricted Stock shall be credited to Participants subject to the same restrictions on transferability andforfeitability as the Restricted Stock with respect to which they were paid and shall be paid to the Participant promptly after the full vesting of the RestrictedStock with respect to which such distributions were made.
Rights, if any, to Dividend Equivalents on Restricted Stock Units shall be established by the Committee at the time of grant and set forth in the Award
Agreement.

8.8 Termination. Each Restricted Stock/Restricted Stock Unit Award Agreement shall set forth the extent to which the Participant shall have the
right to receive Restricted Stock and/or a Restricted Stock Unit payment following termination of the Participant’s employment with the Company and itsSubsidiaries. Such provisions shall be determined in the sole discretion of the Committee, shall be included in the Award Agreement entered into withParticipants, need not be uniform among all grants of Restricted Stock/Restricted Stock Units or among Participants and may reflect distinctions based on thereasons for termination.
To the extent the Restricted Stock/Restricted Stock Unit Award Agreement does not set forth termination provisions, the provisions of Article 13 shall
control.
15
Article 9. Performance Units and Performance Stock
9.1 Grant of Performance Units and Performance Stock. Subject to the terms and conditions of the Plan, Performance Units and/or PerformanceStock may be granted to an Eligible Person at any time and from time to time, as shall be determined by the Committee.
The Committee shall have complete discretion in determining the number of Performance Units and/or shares of Performance Stock granted to each
Eligible Person (subject to Article 4 herein) and, consistent with the provisions of the Plan, in determining the terms and conditions pertaining to such Awards. 9.2 Performance Unit/Performance Stock Award Agreement. Each grant of Performance Units and/or shares of Performance Stock shall be
evidenced by a Performance Unit and/or Performance Stock Award Agreement that shall specify the number of Performance Units and/or shares of PerformanceStock granted, the initial value (if applicable), the Performance Period, the Performance Goals and such other provisions as the Committee shall determine,including but not limited to special provisions relating to a change of control and any rights to Dividend Equivalents.
9.3 Value of Performance Units/Performance Stock. Each Performance Unit shall have an initial value that is established by the Committee at the
time of grant. The value of a share of Performance Stock shall be equal to the Fair Market Value of the Stock. The Committee shall set Performance Goals in itsdiscretion which, depending on the extent to which they are met, will determine the number and/or value of Performance Units/Performance Stock that will bepaid out to the Participants.
9.4 Earning of Performance Units/Performance Stock. After the applicable Performance Period has ended, the Participant shall be entitled to
receive a payout with respect to the Performance Units/Performance Stock earned by the Participant over the Performance Period, to be determined as a functionof the extent to which the corresponding Performance Goals have been achieved.
9.5 Form and Timing of Payment of Performance Units/Performance Stock. Payment of earned Performance Units/Performance Stock shall be
made following the close of the applicable Performance Period. The Committee, in its sole discretion, may pay earned Performance Units/Performance Stock incash or in Stock (or in a combination thereof), which has an aggregate Fair Market Value equal to the value of the earned Performance Units/Performance Stockat the close of the applicable Performance Period. Such Stock may be granted subject to any restrictions deemed appropriate by the Committee.
9.6 Termination. Each Performance Unit/Performance Stock Award Agreement shall set forth the extent to which the Participant shall have the
right to receive a Performance Unit/Performance Stock payment following termination of the Participant’s employment with the Company and its Subsidiariesduring a Performance Period. Such provisions shall be determined in the sole discretion of the Committee, shall be included in the Award Agreement entered intowith Participants, need not be uniform among all grants of Performance Units/Performance Stock or among Participants and may reflect distinctions based onreasons for termination.
16
To the extent the Performance Unit/Performance Stock Award Agreement does not set forth termination provisions, the provisions of Article 13 shall
control. 9.7 Transferability. Except as otherwise determined by the Committee, a Participant’s rights with respect to Performance Units/Performance Stock
granted under the Plan shall be available during the Participant’s lifetime only to such Participant or the Participant’s legal representative and PerformanceUnits/Performance Stock may not be sold, transferred, pledged, assigned or otherwise alienated or hypothecated, other than by will or by the laws of descent anddistribution. To the extent the Committee permits the transfer of Performance Units/Performance Stock, in no event shall Performance Units/Performance Stockbe transferred for consideration.
Article 10. Other Awards
The Committee shall have the right to grant other Awards which may include, without limitation, the payment of Stock in lieu of cash, the payment ofcash based on attainment of Performance Goals established by the Committee and the payment of Stock in lieu of cash under other Company incentive or bonusprograms Payment under or settlement of any such Awards shall be made in such manner and at such times as the Committee may determine.
Article 11. Deferrals
The Committee may, in its sole discretion, permit a Participant to defer the Participant’s receipt of the payment of cash or the delivery of Stock thatwould otherwise be due to such Participant under the Plan. If any such deferral election is permitted, the Committee shall, in its sole discretion, establishrules and procedures for such payment deferrals.
Article 12. Rights of Participants
12.1 Termination. Nothing in the Plan shall interfere with or limit in any way the right of the Company or any Subsidiary to terminate anyParticipant’s employment or other relationship with the Company or any Subsidiary at any time, for any reason or no reason in the Company’s or the Subsidiary’ssole discretion, nor confer upon any Participant any right to continue in the employ of, or otherwise in any relationship with, the Company or any Subsidiary.

12.2 Participation. No Eligible Person shall have the right to be selected to receive an Award under the Plan, or, having been so selected, to beselected to receive a future Award.
12.3 Limitation of Implied Rights. Neither a Participant nor any other Person shall, by reason of the Plan, acquire any right in or title to any assets,
funds or property of the Company or any Subsidiary whatsoever, including, without limitation, any specific funds, assets or other property which the Company orany Subsidiary, in its sole discretion, may set aside in anticipation of a liability under the Plan. A Participant shall have only a contractual right to the Stock oramounts, if any, payable under the Plan, unsecured by any assets of the Company or any Subsidiary. Nothing contained in the Plan shall constitute a guaranteethat the assets of such companies shall be sufficient to pay any benefits to any Person.
17
Except as otherwise provided in the Plan, no Award under the Plan shall confer upon the holder thereof any right as a stockholder of the Company prior
to the date on which the individual fulfills all conditions for receipt of such rights. 12.4 Waiver. Each Participant, by acceptance of an Award, waives all rights to specific performance or injunctive or other equitable relief and
acknowledges that he has an adequate remedy at law in the form of damages.
Article 13. Termination of Employment
If a Participant has a Termination of Employment, then, unless otherwise provided by the Committee or in the Award Agreement, all Awards shallterminate and be forfeited on the date of such Termination of Employment.
Article 14. Equity Incentive Plans of Foreign Subsidiaries
The Committee may authorize any foreign Subsidiary to adopt a plan for granting Awards (“Foreign Equity Incentive Plan”) and awards granted undersuch Foreign Equity Incentive Plans may be treated as grants under the Plan, if the Committee so determines. Such Foreign Equity Incentive Plans shall havesuch terms and provisions as the Committee permits not inconsistent with the provisions of the Plan and which may be more restrictive than those contained in thePlan. Awards granted under such Foreign Equity Incentive Plans shall be governed by the terms of the Plan except to the extent that the provisions of the ForeignEquity Incentive Plans are more restrictive than the terms of the Plan, in which case such terms of the Foreign Equity Incentive Plans shall control.
Article 15. Amendment, Modification and Termination
The Board may, at any time and from time to time, alter, amend, suspend or terminate the Plan in whole or in part, provided that no amendment shall bemade which shall increase the total number of shares of Stock that may be issued under the Plan, materially modify the requirements for participation in the Plan,or materially increase the benefits accruing to Participants under the Plan, in each case unless such amendment is approved by the stockholders of the Company.
No termination, amendment or modification of the Plan shall adversely affect in any material way any Award previously granted under the Plan, without
the written consent of the Participant holding such Award, unless such termination, modification or amendment is required by applicable law and except asotherwise provided herein.
18
Article 16. Payment for Awards and Withholding
16.1 Payment for Awards. In the event a Participant elects to pay the Option Exercise Price or make payment for any other Award through tender ofpreviously acquired Stock, (i) only a whole number of share(s) of Stock (and not fractional shares of Stock) may be tendered in payment, (ii) such Participantmust present evidence acceptable to the Company that he has owned any such shares of Stock tendered in payment (and that such shares of Stock tendered havenot been subject to any substantial risk of forfeiture) for at least six months prior to the date of exercise and (iii) Stock must be tendered to the Company, either byactual delivery of the shares or by attestation. When payment is made by tender of Stock, the difference, if any, between the aggregate amount payable and theFair Market Value of the share(s) of Stock tendered in payment (plus any applicable taxes) shall be paid by check. No Participant may tender shares of Stockhaving a Fair Market Value exceeding the aggregate Option Exercise Price or other payment due.
16.2 Notification under Section 83(b). The Committee may, on the grant date or any later date, prohibit a Participant from making the election
described below. If the Committee has not prohibited such Participant from making such election, and the Participant shall, in connection with the exercise of anyOption, or the grant of any share of Restricted Stock, make the election permitted under Section 83(b) of the Code (i.e., an election to include in such Participant’sgross income in the year of transfer the amounts specified in Section 83(b) of the Code), such Participant shall notify the Company of such election within 10days of filing notice of the election with the Internal Revenue Service, in addition to any filing and notification required pursu ant to regulations issued under theauthority of Section 83(b) of the Code.
16.3 Tax Withholding. The Company shall have the power and the right to deduct or withhold, or require a Participant to remit to the Company, an
amount (including any Stock withheld as provided below) sufficient to satisfy Federal, state and local taxes (including the Participant’s FICA obligation) requiredby law to be withheld with respect to an Award made under the Plan.
16.4 Stock Withholding. With respect to tax withholding required upon the exercise of Options or SARs, upon the lapse of restrictions on Restricted
Stock or Restricted Stock Units, or upon any other taxable event arising out of or as a result of Awards granted hereunder, Participants may elect to satisfy thewithholding requirement, in whole or in part, by tendering Stock held by the Participant (by actual delivery of the shares or by attestation) or by having theCompany withhold Stock having a Fair Market Value equal to the minimum statutory total tax which could be imposed on the transaction. All elections shall beirrevocable, made in writing (or other method acceptable to the Company) and signed by the Participant. In the event a Participant fails to make an election bythe date required, the Participant will be deemed to have made an election to have the Company withhold Stock having a Fair Market Value equal to the minimumstatutory total tax which could be imposed on the transaction.
19

Article 17. Repayment of Awards and Non-Solicitation
17.1 Restatements. In the event of a restatement of the Company’s financial results to correct a material error or inaccuracy resulting in whole or inpart from the fraud or intentional misconduct of a Section 16 Officer, as determined by the Board or a committee thereof, the Board or the committee may, to theextent permitted by applicable law,
(i) cancel or cause to be cancelled any or all of the Section 16 Officer’s outstanding Awards granted after May 19, 2009; (ii) recover or cause to be recovered any or all “Proceeds” (as defined below) resulting from any sale or other disposition (including to theCompany) of shares of Stock issued or issuable upon vesting, settlement or exercise, as the case may be, of any Award granted after May 19, 2009, plus areasonable rate of interest; and/or (iii) recover or cause to be recovered any cash paid or shares of Stock issued to the Participant in connection with any vesting, settlement orexercise of an Award granted after May 19, 2009, plus a reasonable rate of interest. The term “Proceeds” means, with respect to any sale or other disposition (including to the Company) of shares of Stock acquired pursuant to an Award,
an amount determined by the Committee, (a) in the case of an Award other than an Option, SAR or cash-settled Award, up to the amount equal to the Fair MarketValue per share of Stock at the time of such sale or other disposition multiplied by the number of shares sold or disposed of, or (b) in the case of an Option orSAR, up to the amount equal to the number of shares of Stock sold or disposed of multiplied by the excess of the Fair Market Value per share of Stock at the timeof such sale or disposition over the Option Exercise Price or Base Value, as applicable. The return of Proceeds is in addition to and separate from any other reliefavailable to the Company or any other actions as may be taken by the Committee in it s sole discretion. Any determination by the Committee with respect to theforegoing shall be final, conclusive and binding on all interested parties.
17.2 Non-Solicitation. While employed and for the one-year period following termination of employment, any Participant who has received an
Award under the Plan shall not, directly or indirectly: (i) other than in connection with the good-faith performance of his or her normal duties and responsibilities as an employee of the Company orany Subsidiary, encourage any employee or agent of the Company or any Subsidiary to terminate his or her relationship with the Company or anySubsidiary; (ii) employ, engage as a consultant or adviser, or solicit the employment or engagement as a consultant or adviser of, any employee or agent of theCompany or Subsidiary (other than by the Company or its Subsidiaries), or cause or encourage any Person to do any of the foregoing;
20
(iii) establish (or take preliminary steps to establish) a business with, or encourage others to establish (or take preliminary steps to establish) abusiness with, any employee or exclusive agent independent contractor of the Company or its Subsidiaries; or
(iv) interfere with the relationship of the Company or its Subsidiaries with, or endeavor to entice away from the Company or its Subsidiaries, anyPerson who or which at any time since the Participant’s hire date was or is a material customer or material supplier of, or maintained a material businessrelationship with, the Company or its Subsidiaries. If a Participant violates any of the non-solicitation provisions set forth above, to the extent permitted by applicable law, the Board or a committee thereof
may, to the extent permitted by applicable law, (i) cancel or cause to be cancelled any or all of the Participant’s outstanding Awards granted after May 19, 2009; (ii) recover or cause to be recovered any or all Proceeds resulting from any sale or other disposition (including to the Company) of shares of Stockissued or issuable upon vesting, settlement or exercise, as the case may be, of any Award granted after May 19, 2009 if the sale or disposition waseffected on or after the date that is one year prior to the date on which the Participant first violated the non-solicitation provision(s); and/or (iii) recover or cause to be recovered any cash paid or shares of Stock issued to the Participant in connection with any vesting, settlement orexercise of an Award granted after May 19, 2009 if the vesting, settlement or exercise occurred on or after the date that is one year prior to the date onwhich the Participant first violated the non-solicitation provision(s). 17.3 No Limitation on Other Rights. Nothing contained in this Article 17 shall be deemed to (i) limit any additional legal or equitable rights or
remedies the Company may have under applicable law with respect to any Participant who may have caused or contributed to the Company’s need to restate itsfinancial results or who may have violated the non-solicitation provisions in the Plan or in any other plan, policy, agreement or arrangement or (ii) affect any othernon-solicitation or other restrictive covenants to which a Participant is subject.
Article 18. Successors
All obligations of the Company under the Plan, with respect to Awards granted hereunder, shall be binding on any successor to the Company, whetherthe existence of such successor is the result of a direct or indirect purchase, merger, consolidation or otherwise of all or substantially all of the business and/orassets of the Company.
21
Article 19. Legal Construction

19.1 Gender and Number. Except where otherwise indicated by the context, any masculine term used herein also shall include the feminine, theplural shall include the singular and the singular shall include the plural.
19.2 Severability. In the event any provision of the Plan shall be held illegal or invalid for any reason, the illegality or invalidity shall not affect theremaining parts of the Plan, and the Plan shall be construed and enforced as if the illegal or invalid provision had not been included.
19.3 Requirements of Law. The granting of Awards and the issuance of Stock under the Plan shall be subject to all applicable laws, rules and
regulations, and to such approvals by any governmental agencies or national securities exchanges as may be required. 19.4 Governing Law. To the extent not preempted by Federal law, the Plan, and all agreements hereunder, shall be construed in accordance with,
and governed by, the laws of the State of Delaware, except with regard to conflicts of law provisions. 19.5 Code Section 409A Compliance. To the extent applicable, it is intended that this Plan and any Awards granted hereunder comply with the
requirements of Section 409A of the Code and any related regulations or other guidance promulgated with respect to such Section by the U.S. Department of theTreasury or the Internal Revenue Service (“Section 409A”) and the Plan and any Awards granted under the Plan shall be interpreted and construed in a mannerconsistent with such intent.
22

EXHIBIT 10.6
THE ALLSTATE CORPORATION2009 EQUITY INCENTIVE PLANOPTION AWARD AGREEMENT
[Addressee]
In accordance with the terms of The Allstate Corporation 2009 Equity Incentive Plan (the “Plan”), pursuant to action of the Compensation and
Succession Committee of the Board of Directors, The Allstate Corporation (the “Company”) hereby grants to you (the “Participant”), subject to the terms andconditions set forth in this Option Award Agreement (including Annex A hereto and all documents incorporated herein by reference) the right and option (the“Option”) to purchase from the Company the number of shares of its common stock, par value $.01 per share, set forth below:
Type of Option Granted:
Nonqualified Number of Shares to which Option Pertains:
[ ] Date of Grant:
[ ] Option Exercise Price:
$ , which is the Fair Market Value on the Date of Grant Vesting:
[ ]
(subject to Sections 2 and 4 of Annex A) Expiration Date:
Close of business on [ ] Exercise Period:
Date of Vesting through Expiration Date (subject to Section 2 of Annex A)
THIS OPTION IS SUBJECT TO FORFEITURE AS PROVIDED IN THIS OPTION AWARD AGREEMENT AND THE PLAN.
Further terms and conditions of the Award are set forth in Annex A hereto, which is an integral part of this Option Award Agreement. All terms, provisions and conditions applicable to the Option Award Agreement set forth in the Plan and not set forth herein are hereby incorporated by
reference. To the extent any provision hereof is inconsistent with a provision of the Plan, the provision of the Plan will govern. By accepting this Award asprovided in the following sentence, the Participant hereby acknowledges the receipt of a copy of this Option Award Agreement including Annex A and a copy ofthe Prospectus and agrees to be bound by all the terms and provisions hereof and thereof. This Award and all prior Option Awards not previously accepted will bedeemed accepted if the participant does not decline this Award by accessing the Fidelity NetBenefits® website at www.NetBenefits.com and selecting the“Decline Grant” option for this Award within 30 days of the Date of Grant. [Note: ; The following language will be added to awards for Allstate InvestmentManagement Limited employees: Separate conditions apply to employees of Allstate Investment Management Limited.]
Thomas J. Wilson
Chairman, President and
Chief Executive Officer
THE ALLSTATE CORPORATION 1
ANNEX A
TO
THE ALLSTATE CORPORATION2009 EQUITY INCENTIVE PLANOPTION AWARD AGREEMENT
Further Terms and Conditions of Award. It is understood and agreed that the Award of the Option evidenced by this Option Award Agreement
to which this is annexed is subject to the following additional terms and conditions:
1. Exercise of Option. To the extent vested and subject to Section 2 below, the Option may be exercised in whole or in part from time to time bydelivery of written notice (or other method acceptable to the Company) of exercise and payment to Stock Option Record Office, The Allstate Corporation,2775 Sanders Road, Ste F5, Northbrook, Illinois 60062, unless the Company advises the Participant to send the notice and payment to a differentaddress or a designated representative. Such notice and payment must be received not later than the Expiration Date, specifying the number of shares of Stockto be purchased. The minimum number of Shares to be purchased in a partial exercise shall be the lesser of 25 shares and the number of shares rema iningunexercised under this Award.
The Option Exercise Price shall be payable: (a) in cash or its equivalent, (b) by tendering previously acquired Stock (owned for at least six months)
having an aggregate Fair Market Value at the time of exercise equal to the total Option Exercise Price, (c) by broker-assisted cashless exercise, (d) by sharewithholding or (e) by a combination of (a), (b), (c) and/or (d).
With respect to tax withholding required upon exercise of the Option, the Participant may elect to satisfy such withholding requirements in whole or in
part, by having Stock with a Fair Market Value equal to the minimum statutory total tax which could be imposed on the transaction withheld from the shares dueupon Option exercise.
2. Termination of Employment. Except as otherwise specifically provided in Section 4 below, upon the Participant’s Termination of
Employment, the following provisions of this Section 2 shall apply.

(A) If the Participant’s Termination of Employment is on account of death or Disability, then the Option, to the extent not vested, shall
vest, and the Option may be exercised, in whole or in part, by the Participant (or the Participant’s personal representative, Beneficiary, estate ortransferee, as the case may be) at any time on or before the earlier to occur of the Expiration Date of the Option and the second anniversary of the date ofsuch Termination of Employment.
(B) If the Participant’s Termination of Employment is on account of Retirement at the Normal Retirement Date or Early Retirement Date,
to the extent the Option is vested on the date of Termination of Employment, it may be exercised, in whole or in part, by the Participant at any time on orbefore the earlier to occur of the Expiration Date of the Option and the fifth anniversary of the date of such Termination of Employment.
1
(C) If the Participant’s Termination of Employment is on account of Retirement at the Normal Retirement Date,
(i) any Option granted more than twelve (12) months prior to the Normal Retirement Date to the extent it is not vested, and (ii) a prorated portion of any Option granted within twelve (12) months of the Normal Retirement Date to the extent it is not
vested (such proration to be determined by multiplying the Number of Shares to which Option Pertains by a fraction, the numerator of which isthe number of days the Participant was employed since the Date of Grant and the denominator of which is 365)
shall continue to vest in accordance with its terms, and when vested, may be exercised, in whole or in part, by the Participant at any time on or before theearlier to occur of the Expiration Date of the Option and the fifth anniversary of the date of such Termination of Employment. The remaining portion ofthe Option that is not vested shall be forfeited.
(D) If the Participant’s Termination of Employment is on account of Retirement at the Early Retirement Date, a prorated portion of theOption (such proration to be determined by multiplying the Number of Shares to which Option Pertains by a fraction, the numerator of which is thenumber of days the Participant was employed since the Date of Grant and the denominator of which is the number of days during the entire vestingperiod, and then subtracting the number of shares already vested), shall continue to vest in accordance with its terms, and when vested, may be exercised,in whole or in part, by the Participant at any time on or before the earlier to occur of the Expiration Date of the Option and the fifth anniversary of thedate of such Termination of Employment. The remaining portion of the Option that is not vested shall be forfeited.
(E) If the Participant’s Termination of Employment is for any other reason, any portion of the Option that is not vested shall be forfeited,
and the Option, to the extent it is vested on the date of Termination of Employment, may be exercised, in whole or in part, by the Participant at any timeon or before the earlier to occur of the Expiration Date of the Option and three months after the date of such Termination of Employment.
(F) If the Participant’s Termination of Employment is on account of Retirement at the Normal Retirement Date or Early Retirement Date
and if the Participant dies after such Termination of Employment but before the date the Option must be exercised as set forth in subsections (C) and(D) above, any portion of the Option that is not vested shall vest and the Option may be exercised, in whole or in part, by the Participant’s personalrepresentative, Beneficiary, estate, or transferee, as the case may be at any time on or before the earlier to occur of the Expiration Date of the Option, thesecond anniversary of the date of death, and the fifth anniversary of the date of such Termination of Employment. If the Participant’s Termination ofEmployment is for any reason other than death, Disability, No rmal Retirement, or Early Retirement and if the Participant dies after such Termination ofEmployment but before the date the Option must be exercised as set forth in subsection (E) above, the Option, to the extent it is vested on the date of theParticipant’s death, may be exercised, in whole or in part, by the Participant’s personal representative, Beneficiary, estate or transferee, as the case maybe, at any time on or before the earliest to occur of the Expiration Date of the Option and three months after the date of Termination of Employment.
2
3. Transferability of Options. Except as set forth in this Section 3, the Option shall be exercisable during the Participant’s lifetime only by the
Participant, and may not be assigned or transferred other than by will or the laws of descent and distribution. The Option, to the extent vested, may be transferredby the Participant during his lifetime to any “Family Member.” A transfer of the Option pursuant to this Section 3 may only be effected by the Company at thewritten request of a Participant and shall be effective only when recorded in the Company’s record of outstanding Options. Such transferred Option may not besubsequently transferred by the transferee except by will or the laws of descent and distribution. A transferred Option shall continue to be governed b y andsubject to the terms and limitations of the Plan and this Option Award Agreement, and the transferee shall be entitled to the same rights as the Participant, as if notransfer had taken place. In no event shall an Option be transferred for consideration.
4. Change of Control. Except as otherwise specifically provided in a written agreement with the Company to which the Participant is a party, theOption, to the extent not vested, shall vest on the date of a Change of Control, as defined in Section 8, and the Option may be exercised in whole or in part,subject to the time periods for exercise set forth in Section 2 of this Annex A.
5. Ratification of Actions. By accepting the Award or other benefit under the Plan, the Participant and each person claiming under or through
him shall be conclusively deemed to have indicated the Participant’s acceptance and ratification of, and consent to, any action taken under the Plan or the Awardby the Company, the Board or the Compensation and Succession Committee.
6. Notices. Any notice hereunder to the Company shall be addressed to its Stock Option Record Office and any notice hereunder to theParticipant shall be addressed to him at the address specified on this Option Award Agreement, subject to the right of either party to designate at any timehereafter in writing some other address.
7. Governing Law and Severability. To the extent not preempted by Federal law, this Option Award Agreement will be governed by and
construed in accordance with the laws of the State of Delaware, without regard to conflicts of law provisions. In the event any provision of the Option AwardAgreement shall be held illegal or invalid for any reason, the illegality or invalidity shall not affect the remaining parts of this Option Award Agreement, and thisOption Award Agreement shall be construed and enforced as if the illegal or invalid provision had not been included.
8. Definitions. In addition to the following definitions, capitalized terms not otherwise defined herein shall have the meanings given them in the
Plan.

“Board Turnover” — see clause (c) of the definition of “Change of Control.” “Change of Control” means, except as otherwise provided at the end of this definition, the occurrence of any one or more of the following: (a) (Voting Power) any Person or group (as such term is defined in Treasury Regulation Section 1.409A-3(i)(5)(v)(B)), other than aSubsidiary or any employee benefit plan (or any related trust) of the Company or any of its Subsidiaries, acquires or has acquired during the 12-month period ending on the date of the most recent acquisition by such Person or Persons, ownership of stock of the Company possessing 30%or more of the combined voting power of all Voting Securities of the Company (such a Person or group that is not a Similarly Owned Company(as defined below), a “More than 30% Owner”), except that no Change of Control shall be deemed to have occurred solely by reason of suchownership by a corporation with respect to which both more than 70% of the common stock of such corporation and Voting
3
Securities representing more than 70% of the combined voting power of the Voting Securities of such corporation are then owned, directly orindirectly, by the Persons who were the direct or indirect owners of the common stock and Voting Securities of the Company immediatelybefore such acquisition in substantially the same proportions as their ownership, immediately before such acquisition, of the common stock andVoting Securities of the Company, as the case may be (a “Similarly Owned Company”); or
(b) (Majority Ownership) any Person or group (as such term is defined in Treasury Regulation Section 1.409A-3(i)(5)(v)(B)), other
than a Subsidiary or any employee benefit plan (or any related trust) of the Company or any of its Subsidiaries, acquires ownership of more than50% of the voting power of all Voting Securities of the Company or of the total fair market value of the stock of the Company (such a Person orgroup that is not a Similarly Owned Company, a “Majority Owner”), except that no Change of Control shall be deemed to have occurred solelyby reason of such ownership by a Similarly Owned Company; or
(c) (Board Composition) a majority of the members of the Board is replaced during any 12-month period by directors whose
appointment or election is not endorsed by a majority of the members of the Board before the date of the appointment or election (“BoardTurnover”); or
(d) (Reorganization) the consummation of a merger, reorganization, consolidation, or similar transaction, or of a plan or agreement for
the sale or other disposition of all or substantially all of the consolidated assets of the Company, or a plan of liquidation of the Company (any ofthe foregoing, a “Reorganization Transaction”) that, does not qualify as an Exempt Reorganization Transaction.
Notwithstanding anything contained herein to the contrary: (i) no transaction or event shall constitute a Change of Control for purposes of thisAgreement unless the transaction or event constituting the Change of Control also constitutes a change in the ownership of a corporation (as defined inTreasury Regulation Section 1.409A-3(i)(5)(v)), a change in effective control of a corporation (as defined in Treasury Regulation Section 1.409A-3(i)(5)(vi)) or a change in the ownership of a substantial portion of the assets of a corporation (as defined in Treasury Regulation Section 1.409A- 3(i)(5)(vii));and (ii) no sale or disposition of one or more Subsidiaries (“Sale Subsidiary”) or the assets thereof shall constitute a Change of Control for purposes ofthis Agreement if the investments in and advances by the Company and its Subsidiaries (other than the Sale Subsidiari es) to such Sale Subsidiary as ofimmediately prior to the sale or disposition determined in accordance with Generally Accepted Accounting Principles (“GAAP”) (but after intercompanyeliminations and net of the effect of intercompany reinsurance) are less than 51% of the Consolidated Total Shareholders’ Equity of the Company as ofimmediately prior to the sale or disposition. Consolidated Total Shareholders’ Equity means, at any date, the total shareholders’ equity of the Companyand its Subsidiaries at such date, as reported in the consolidated financial statements prepared in accordance with GAAP.
“Exempt Reorganization Transaction” means a Reorganization Transaction that fails to result in (a) any Person or group (as such term is definedin Treasury Regulation Section 1.409A-3(i)(5)(v)(B)) becoming a More than 30% Owner or a Majority Owner, (b) Board Turnover, or (c) a sale ordisposition to any Person or group (as such term is defined in Treasury Regulation Section 1.409A-3(i)(5)(v)(B)) of the assets of the Company that havea total Gross Fair Market Value equal to at least forty percent (40%) of the total Gross Fair Market Value of all of the assets of the Company immediatelybefore such transaction.
4
“Gross Fair Market Value” means the value of the assets of the Company, or the value of the assets being disposed of, determined without
regard to any liabilities associated with such assets. “Majority Owner” — see clause (b) of the definition of “Change of Control.” “More than 30% Owner” — see clause (a) of the definition of “Change of Control.” “Reorganization Transaction” — see clause (d) of the definition of “Change of Control.” “Similarly Owned Company” — see clause (a) of the definition of “Change of Control.” “Voting Securities” of a corporation means securities of such corporation that are entitled to vote generally in the election of directors of such
corporation. 5

EXHIBIT 10.12
THE ALLSTATE CORPORATION2009 EQUITY INCENTIVE PLAN
RESTRICTED STOCK UNIT AWARD AGREEMENT
[Date] [Name][Address][City]
In accordance with the terms of The Allstate Corporation 2009 Equity Incentive Plan (the “Plan”), pursuant to action of the Compensation and
Succession Committee of the Board of Directors, The Allstate Corporation (the “Company”) hereby grants to you (the “Participant”), subject to the terms andconditions set forth in this Restricted Stock Unit Award Agreement (including Annex A hereto and all documents incorporated herein by reference), RestrictedStock Units (“RSUs”), as set forth below. Each RSU corresponds to one share of Stock. An RSU is an unfunded and unsecured promise to deliver one share ofStock on the Conversion Date or as otherwise provided herein. Until such delivery, you have only the rights of a general unsecured creditor of the Company andnot as a stockholder with respect to the shares of Stock underlying your RSUs.
Number of RSUs Granted:
Date of Grant:
Period of Restriction:
Date of Grant through the earlier of (i) the date of the Participant’s death, and (ii) [date]. Conversion Date:
Each RSU will convert to one share of Stock on the day following the date the restrictionslapse with respect to that RSU.
Dividend Equivalent Right:
Each RSU shall include a right to Dividend Equivalents.
RSUs ARE SUBJECT TO FORFEITURE AS PROVIDED IN THIS RESTRICTED STOCK UNIT AWARD AGREEMENT AND THE PLAN.
Further terms and conditions of the Award are set forth in Annex A hereto, which is an integral part of this RSU Award Agreement. 1
EXHIBIT 10.12
All terms, provisions, and conditions applicable to the Restricted Stock Unit Award set forth in the Plan and not set forth herein are hereby incorporatedby reference herein. To the extent any provision hereof is inconsistent with a provision of the Plan, the provisions of the Plan will govern. By accepting thisAward as provided in the following sentence, the Participant hereby acknowledges the receipt of a copy of this RSU Award Agreement including Annex A and acopy of the Prospectus and agrees to be bound by all the terms and provisions hereof and thereof. This Award and all prior RSU Awards not previously acceptedwill be deemed accepted if the participant does not decline this Award by accessing the Fidelity NetBenefits® website at www.NetBenefits.com and selecting the“Decline Grant” option for this Award within 30 days of the Date of Grant. [No te: The following language will be added to awards for Allstate InvestmentManagement Limited employees: Separate conditions apply to employees of Allstate Investment Management Limited.]
Thomas J. Wilson
Chairman, President and
Chief Executive Officer
THE ALLSTATE CORPORATION Attachment: Annex A
2
ANNEX A
TO
THE ALLSTATE CORPORATION2009 EQUITY INCENTIVE PLAN
RESTRICTED STOCK UNIT AWARD AGREEMENT
Further Terms and Conditions of Award. It is understood and agreed that the Award of RSUs evidenced by the RSU Award Agreement to which this isannexed is subject to the following additional terms and conditions:
1. Tax Withholding. With respect to the minimum statutory tax withholding required upon the lapse of restrictions on the RSUs, the Participant
may elect to satisfy such withholding requirements by tender of previously-owned shares of Stock or by having the Company withhold shares of Stock upon theConversion Date.

2. Termination of Employment. Except as otherwise specifically provided in Section 3 below, upon the Participant’s Termination ofEmployment, all unvested RSUs shall be treated as follows:
(A) If the Participant’s Termination of Employment is on account of death or Disability, then all unvested RSUs shall immediately become
nonforfeitable and the restrictions with respect to the RSUs shall lapse as of the date of such Termination of Employment. (B) If the Participant’s Termination of Employment is on account of Retirement at the Normal Retirement Date,
(i) any unvested RSUs granted more than twelve (12) months prior to the Normal Retirement Date, and (ii) a prorated portion of any unvested RSUs granted within twelve (12) months of the Normal Retirement Date (such proration
to be determined by multiplying the Number of RSUs Granted by a fraction, the numerator of which is the number of days the Participant wasemployed since the Date of Grant and the denominator of which is 365)
will remain subject to the restriction period set forth on the first page of this RSU Award Agreement. The remaining portion of the RSUs that do notremain subject to the restriction period shall be forfeited.
(C) If the Participant’s Termination of Employment is on account of Retirement at the Early Retirement Date, a prorated portion of theRSUs (such proration to be determined by multiplying the Number of RSUs Granted by a fraction, the numerator of which is the number of days theParticipant was employed since the Date of Grant and the denominator of which is the number of days during the entire Period of Restriction, and thensubtracting the number of RSUs already converted), will remain subject to the restriction period set forth on the first page of this RSU AwardAgreement. The remaining portion of the RSUs that do not remain subject to the restriction period shall be forfeited.
(D) If the Participant’s Termination of Employment is on account of any other reason, then all unvested RSUs shall be forfeited as of the
end of the day of such Termination of 1
Employment.
(E) If the Participant’s Termination of Employment is on account of Retirement at the Normal Retirement Date or Early Retirement Date
and if the Participant dies after such Termination of Employment but before the end of the restriction period, then all unvested RSUs that remain subjectto the restriction period shall immediately become nonforfeitable and the restrictions with respect to the RSUs shall lapse as of the date of death.
3. Change of Control. Except as otherwise specifically provided in a written agreement with the Company to which the Participant is a party, the
unvested RSUs shall become nonforfeitable and the restrictions to which the RSUs are then subject shall immediately lapse on the date of a Change of Control, asdefined in Section 9.
4. Conversion Date. Unless otherwise determined by the Board, a Participant shall be entitled to delivery of shares of Stock that underlie the
RSUs then outstanding on the day following the date the restrictions lapse with respect to such RSU. 5. Dividend Equivalent Right. Each RSU entitles a Participant to receive a cash amount (less applicable withholding) equal to the sum of all
regular dividend payments as would have been made in respect of each share of Stock underlying such RSUs if the Participant were the holder of such sharesduring the Period of Restriction. The dividend equivalent payments will accrue during the Period of Restriction for the underlying RSUs and will be paid within30 days of the Conversion Date of such RSUs.
Dividend equivalent payments shall be made only with respect to such RSUs that were outstanding on the applicable dividend record date.
6. Ratification of Actions. By accepting the RSU Award or other benefit under the Plan, the Participant and each person claiming under orthrough him shall be conclusively deemed to have indicated the Participant’s acceptance and ratification of, and consent to, any action taken under the Plan or theRSU Award by the Company, the Board, or the Compensation and Succession Committee.
7. Notices. Any notice hereunder to the Company shall be addressed to its Stock Option Record Office and any notice hereunder to theParticipant shall be addressed to him or her at the address specified on this RSU Award Agreement, subject to the right of either party to designate at any timehereafter in writing some other address.
8. Governing Law and Severability. To the extent not preempted by Federal law, the RSU Award Agreement will be governed by and construed
in accordance with the laws of the State of Delaware, without regard to conflicts of law provisions. In the event any provision of this RSU Award Agreementshall be held illegal or invalid for any reason, the illegality or invalidity shall not affect the remaining parts of this RSU Award Agreement, and this RSU AwardAgreement shall be construed and enforced as if the illegal or invalid provision had not been included.
9. Definitions. In addition to the following definitions, capitalized terms not otherwise defined herein shall have the meanings given them in the
Plan.
“Board Turnover” — see clause (c) of the definition of “Change of Control.” “Change of Control” means, except as otherwise provided at the end of this definition, the occurrence of any one or more of the following:
2
(a) (Voting Power) any Person or group (as such term is defined in Treasury Regulation Section 1.409A-3(i)(5)(v)(B)), other than a Subsidiary
or any employee benefit plan (or any related trust) of the Company or any of its Subsidiaries, acquires or has acquired during the 12-month period endingon the date of the most recent acquisition by such Person or Persons, ownership of stock of the Company possessing 30% or more of the combinedvoting power of all Voting Securities of the Company (such a Person or group that is not a Similarly Owned Company (as defined below), a “More than

30% Owner”), except that no Change of Control shall be deemed to have occurred solely by reason of such ownership by a corporation with respect towhich both more than 70% of the common stock of such corporation and Voting Securities representing more than 70% of the combin ed voting powerof the Voting Securities of such corporation are then owned, directly or indirectly, by the Persons who were the direct or indirect owners of the commonstock and Voting Securities of the Company immediately before such acquisition in substantially the same proportions as their ownership, immediatelybefore such acquisition, of the common stock and Voting Securities of the Company, as the case may be (a “Similarly Owned Company”); or
(b) (Majority Ownership) any Person or group (as such term is defined in Treasury Regulation Section 1.409A-3(i)(5)(v)(B)), other than aSubsidiary or any employee benefit plan (or any related trust) of the Company or any of its Subsidiaries, acquires ownership of more than 50% of thevoting power of all Voting Securities of the Company or of the total fair market value of the stock of the Company (such a Person or group that is not aSimilarly Owned Company, a “Majority Owner”), except that no Change of Control shall be deemed to have occurred solely by reason of suchownership by a Similarly Owned Company; or
(c) (Board Composition) a majority of the members of the Board is replaced during any 12-month period by directors whose appointment orelection is not endorsed by a majority of the members of the Board before the date of the appointment or election (“Board Turnover”); or
(d) (Reorganization) the consummation of a merger, reorganization, consolidation, or similar transaction, or of a plan or agreement for the saleor other disposition of all or substantially all of the consolidated assets of the Company, or a plan of liquidation of the Company (any of the foregoing, a“Reorganization Transaction”) that, does not qualify as an Exempt Reorganization Transaction.
Notwithstanding anything contained herein to the contrary: (i) no transaction or event shall constitute a Change of Control for purposes of this Agreementunless the transaction or event constituting the Change of Control also constitutes a change in the ownership of a corporation (as defined in TreasuryRegulation Section 1.409A-3(i)(5)(v)), a change in effective control of a corporation (as defined in Treasury Regulation Section 1.409A-3(i)(5)(vi)) or achange in the ownership of a substantial portion of the assets of a corporation (as defined in Treasury Regulation Section 1.409A-3(i)(5)(vii)); and (ii) nosale or disposition of one or more Subsidiaries (“Sale Subsidiary”) or the assets thereof shall constitute a Change of Control for purposes of thisAgreement if the investments in and advances by the Company and its Subsidiaries (other than the Sale Subsidiar ies) to such Sale Subsidiary as ofimmediately prior to the sale or disposition determined in accordance with Generally Accepted Accounting Principles (“GAAP”) (but after intercompanyeliminations and net of the effect of intercompany reinsurance) are less than 51% of the Consolidated Total Shareholders’ Equity of the Company as ofimmediately prior to the sale or disposition. Consolidated Total Shareholders’ Equity means, at any date, the total shareholders’ equity of the Companyand its Subsidiaries at such date, as reported in the consolidated financial statements prepared in accordance with GAAP.
“Exempt Reorganization Transaction” means a Reorganization Transaction that fails to result in (a) any Person or group (as such term is definedin Treasury Regulation Section 1.409A-3(i)(5)(v)(B)) becoming a More than 30% Owner or a Majority Owner, (b) Board Turnover, or (c) a
3
sale or disposition to any Person or group (as such term is defined in Treasury Regulation Section 1.409A-3(i)(5)(v)(B)) of the assets of the Companythat have a total Gross Fair Market Value (as defined below) equal to at least forty percent (40%) of the total Gross Fair Market Value of all of the assetsof the Company immediately before such transaction.
“Gross Fair Market Value” means the value of the assets of the Company, or the value of the assets being disposed of, determined without
regard to any liabilities associated with such assets.
“Majority Owner” — see clause (b) of the definition of “Change of Control.”
“More than 30% Owner” — see clause (a) of the definition of “Change of Control.”
“Reorganization Transaction” — see clause (d) of the definition of “Change of Control.”
“Similarly Owned Company” — see clause (a) of the definition of “Change of Control.”
“Voting Securities” of a corporation means securities of such corporation that are entitled to vote generally in the election of directors of suchcorporation.
4

Exhibit 12
THE ALLSTATE CORPORATION
COMPUTATION OF EARNINGS TO FIXED CHARGES RATIO
($ in millions) For the year ended December 31, 2010 2009 2008 2007 2006
1. Income from operations before income tax $ 1,126 $ 1,248 $ (3,025) $ 6,653 $ 7,178
Fixed Charges:
2. Interest on indebtedness $ 367 $ 392 $ 351 $ 333 $ 357
3. Interest factor of annual rental expense 26 31 43 41 38
4. Total fixed charges (2+3) $ 393 $ 423 $ 394 $ 374 $ 395
5. Income from continuing operations before income taxes andfixed charges (1+4)
$ 1,519 $ 1,671 $ (2,631) $ 7,027 $ 7,573
6. Ratio of earnings to fixed charges, excluding interestcredited to contractholder funds (A) (B) (C) (5/4)
3.9X 4.0X —X 18.8X 19.2X
7. Interest credited to contractholder funds $ 1,807 $ 2,126 $ 2,411 $ 2,681 $ 2,609
8. Total fixed charges including interest credited tocontractholder funds (4+7)
$ 2,200 $ 2,549 $ 2,805 $ 3,055 $ 3,004
9. Income from continuing operations before income taxes andfixed charges including interest credited to contractholderfunds (1+4+7)
$ 3,326 $ 3,797 $ (220) $ 9,708 $ 10,182
10. Ratio of earnings to fixed charges (C) (9/8) 1.5X 1.5X —X 3.2X 3.4X
(A) The Company has authority to issue up to 25,000,000 shares of preferred stock, par value $1.00 per share; however, there are currently no sharesoutstanding and the Company does not have a preferred stock dividend obligation. Therefore, the Ratio of Earnings to Fixed Charges and Preferred StockDividends is equal to the Ratio of Earnings to Fixed Charges and is not disclosed separately.
(B) In this presentation, interest credited to contractholder funds is excluded to promote transparency and allows users of this exhibit to quantify the impact ofinterest credited to contractholder funds on the ratio of earnings to fixed charges.
(C) Earnings for the year ended December 31, 2008 were insufficient to cover fixed charges by $3.03 billion.


Exhibit 21
Subsidiaries
Company Name
DomicileALFS, Inc.
DelawareALIC Reinsurance Company
South CarolinaALIC Reinsurance Company II
VermontAllstate Assignment Company
NebraskaAllstate Assurance Company
IllinoisAllstate Bank
Federal JurisdictionAllstate County Mutual Insurance Company
TexasAllstate Distributors, LLC
DelawareAllstate Enterprises, LLC
DelawareAllstate Equity Management, LLC
DelawareAllstate Finance Company, LLC
DelawareAllstate Financial Advisors, LLC
DelawareAllstate Financial Corporation
IllinoisAllstate Financial Services, LLC*
DelawareAllstate Financial, LLC
DelawareAllstate Fire and Casualty Insurance Company
IllinoisAllstate Indemnity Company
IllinoisAllstate Insurance Company
IllinoisAllstate Insurance Company of Canada
CanadaAllstate Insurance Holdings, LLC
DelawareAllstate International Insurance Holdings, Inc.
DelawareAllstate Investment Management Company
DelawareAllstate Investment Management Limited
United KingdomAllstate Investments, LLC
DelawareAllstate Life Insurance Company
IllinoisAllstate Life Insurance Company of Canada
CanadaAllstate Life Insurance Company of New York
New YorkAllstate Motor Club, Inc.
DelawareAllstate New Jersey Insurance Company
IllinoisAllstate New Jersey Property and Casualty Insurance Company
IllinoisAllstate Non-Insurance Holdings, Inc.
DelawareAllstate North American Insurance Company
IllinoisAllstate Northern Ireland Limited
Northern IrelandAllstate Property and Casualty Insurance Company
IllinoisAllstate Settlement Corporation
NebraskaAllstate Texas Lloyd’s
TexasAllstate Texas Lloyd’s, Inc.
TexasAmerican Heritage Life Insurance Company
FloridaAmerican Heritage Life Investment Corporation
DelawareAmerican Heritage Service Company
FloridaCastle Key Indemnity Company
IllinoisCastle Key Insurance Company
IllinoisCharter National Life Insurance Company
IllinoisCredit Card Sentinel, Inc.
CaliforniaDeerbrook General Agency, Inc.
Texas
* Doing business as LSA Securities in Pennsylvania 1
Deerbrook Insurance Company
IllinoisE.R.J. Insurance Group, Inc.†
FloridaEncompass Floridian Indemnity Company
IllinoisEncompass Floridian Insurance Company
IllinoisEncompass Home and Auto Insurance Company
IllinoisEncompass Indemnity Company
IllinoisEncompass Independent Insurance Company
IllinoisEncompass Insurance Company
IllinoisEncompass Insurance Company of America
IllinoisEncompass Insurance Company of Massachusetts
MassachusettsEncompass Insurance Company of New Jersey
IllinoisEncompass Property and Casualty Company
IllinoisEncompass Property and Casualty Insurance Company of New Jersey
IllinoisFirst Colonial Insurance Company
FloridaIntramerica Life Insurance Company
New YorkIvantage Select Agency, Inc.
IllinoisKennett Capital Holdings, LLC
DelawareKennett Capital, Inc.
DelawareKennett Capital Partners, LLC
Delaware

Lincoln Benefit Life Company NebraskaNorthbrook Indemnity Company
IllinoisNorth Light Specialty Insurance Company
IllinoisNorthbrook Services, Inc.
DelawareOcoma Industries, Inc.
DelawarePablo Creek Services, Inc.
IllinoisPafco Insurance Company
CanadaPembridge Insurance Company
CanadaRoad Bay Investments, LLC
DelawareSignature Agency, Inc.
DelawareSignature Motor Club, Inc.
DelawareSignature Motor Club of California, Inc.
CaliforniaSignature’s Nationwide Auto Club, Inc.
DelawareSignature Nationwide Auto Club of California, Inc.
CaliforniaSterling Collision Centers, Inc.
DelawareSurety Life Insurance Company
NebraskaTech-Cor, LLC
Delaware
† Doing business as American Heritage Insurance Services, ERJ Enterprises and ERJ Financial Services in Florida 2

Exhibit 23
CONSENT OF INDEPENDENT REGISTERED PUBLIC ACCOUNTING FIRM
We consent to the incorporation by reference in the following registration statements of our reports dated February 24, 2011, relating to thefinancial statements and financial statement schedules of The Allstate Corporation and the effectiveness of The Allstate Corporation's internal controlover financial reporting (which report expresses an unqualified opinion and includes an explanatory paragraph relating to a change in The AllstateCorporation's recognition and presentation for other-than-temporary impairments of debt securities in 2009), appearing in this Annual Report onForm 10-K of The Allstate Corporation for the year ended December 31, 2010, and to the reference to us under the heading "Experts" in Prospectus,which is part of the registration statements.
/s/ Deloitte & Touche LLP
Chicago, IllinoisFebruary 24, 2011
Forms S-3 Registration Statement Nos. Forms S-8 Registration Statement Nos.
333-34583 33-77928333-159071 33-93762 33-99136 333-04919 333-16129 333-40283 333-60916 333-120343 333-120344 333-134242 333-134243 333-144691 333-144692 333-158581 333-159343


EXHIBIT 31 (i)
CERTIFICATIONS
I, Thomas J. Wilson, certify that:
1. I have reviewed this report on Form 10-K of The Allstate Corporation;
2. Based on my knowledge, this report does not contain any untrue statement of a material fact or omit to state a material fact necessary to make thestatements made, in light of the circumstances under which such statements were made, not misleading with respect to the period covered by thisreport;
3. Based on my knowledge, the financial statements, and other financial information included in this report, fairly present in all material respects thefinancial condition, results of operations and cash flows of the registrant as of, and for, the periods presented in this report;
4. The registrant's other certifying officer(s) and I are responsible for establishing and maintaining disclosure controls and procedures (as defined inExchange Act Rules 13a-15(e) and 15d-15(e)) and internal control over financial reporting (as defined in Exchange Act Rule 13a-15(f) and 15d-15(f))for the registrant and have:
a) Designed such disclosure controls and procedures, or caused such disclosure controls and procedures to be designed under our supervision, toensure that material information relating to the registrant, including its consolidated subsidiaries, is made known to us by others within those entities,particularly during the period in which this report is being prepared;
b) Designed such internal control over financial reporting, or caused such internal control over financial reporting to be designed under our supervision,to provide reasonable assurance regarding the reliability of financial reporting and the preparation of financial statements for external purposes inaccordance with generally accepted accounting principles;
c) Evaluated the effectiveness of the registrant's disclosure controls and procedures and presented in this report our conclusions about theeffectiveness of the disclosure controls and procedures, as of the end of the period covered by this report based on such evaluation; and
d) Disclosed in this report any change in the registrant's internal control over financial reporting that occurred during the registrant's most recent fiscalquarter (the registrant's fourth fiscal quarter in the case of an annual report) that has materially affected, or is reasonably likely to materially affect, theregistrant's internal control over financial reporting; and
5. The registrant's other certifying officer(s) and I have disclosed, based on our most recent evaluation of internal control over financial reporting, to theregistrant's auditors and the audit committee of the registrant's board of directors (or persons performing the equivalent functions):
a) All significant deficiencies and material weaknesses in the design or operation of internal control over financial reporting which are reasonably likelyto adversely affect the registrant's ability to record, process, summarize and report financial information; and
b) Any fraud, whether or not material, that involves management or other employees who have a significant role in the registrant's internal control overfinancial reporting.
February 24, 2011
/s/ Thomas J. WilsonThomas J. WilsonChairman of the Board,President and Chief Executive Officer

EXHIBIT 31 (i)
CERTIFICATIONS
I, Don Civgin, certify that:
1. I have reviewed this report on Form 10-K of The Allstate Corporation;
2. Based on my knowledge, this report does not contain any untrue statement of a material fact or omit to state a material fact necessary to make thestatements made, in light of the circumstances under which such statements were made, not misleading with respect to the period covered by thisreport;
3. Based on my knowledge, the financial statements, and other financial information included in this report, fairly present in all material respects thefinancial condition, results of operations and cash flows of the registrant as of, and for, the periods presented in this report;
4. The registrant's other certifying officer(s) and I are responsible for establishing and maintaining disclosure controls and procedures (as defined inExchange Act Rules 13a-15(e) and 15d-15(e)) and internal control over financial reporting (as defined in Exchange Act Rule 13a-15(f) and 15(d)-15(f))for the registrant and have:
a) Designed such disclosure controls and procedures, or caused such disclosure controls and procedures to be designed under our supervision, toensure that material information relating to the registrant, including its consolidated subsidiaries, is made known to us by others within those entities,particularly during the period in which this report is being prepared;
b) Designed such internal control over financial reporting, or caused such internal control over financial reporting to be designed under our supervision,to provide reasonable assurance regarding the reliability of financial reporting and the preparation of financial statements for external purposes inaccordance with generally accepted accounting principles;
c) Evaluated the effectiveness of the registrant's disclosure controls and procedures and presented in this report our conclusions about theeffectiveness of the disclosure controls and procedures, as of the end of the period covered by this report based on such evaluation; and
d) Disclosed in this report any change in the registrant's internal control over financial reporting that occurred during the registrant's most recent fiscalquarter (the registrant's fourth fiscal quarter in the case of an annual report) that has materially affected, or is reasonably likely to materially affect, theregistrant's internal control over financial reporting; and
5. The registrant's other certifying officer(s) and I have disclosed, based on our most recent evaluation of internal control over financial reporting, to theregistrant's auditors and the audit committee of the registrant's board of directors (or persons performing the equivalent functions):
a) All significant deficiencies and material weaknesses in the design or operation of internal control over financial reporting which are reasonably likelyto adversely affect the registrant's ability to record, process, summarize and report financial information; and
b) Any fraud, whether or not material, that involves management or other employees who have a significant role in the registrant's internal control overfinancial reporting.
February 24, 2011
/s/ Don CivginDon CivginSenior Vice President and Chief Financial Officer


EXHIBIT 32
SECTION 1350 CERTIFICATIONS
Each of the undersigned hereby certifies that to his knowledge the report on Form 10-K for the fiscal year ended December 31, 2010 of TheAllstate Corporation filed with the Securities and Exchange Commission fully complies with the requirements of Section 13(a) or 15(d) of the SecuritiesExchange Act of 1934 and that the information contained in such report fairly presents, in all material respects, the financial condition and result ofoperations of The Allstate Corporation.
February 24, 2011 /s/ Thomas J. WilsonThomas J. WilsonChairman of the Board,President andChief Executive Officer
/s/ Don CivginDon CivginSenior Vice President and Chief Financial Officer