Understanding Space Debris - The Aerospace Corporation
64
C rosslink ® The Aerospace Corporation magazine of advances in aerospace technology Fall 2015 Understanding Space Debris Causes, Mitigations, and Issues
-
Upload
khangminh22 -
Category
Documents
-
view
7 -
download
0
Transcript of Understanding Space Debris - The Aerospace Corporation

Crosslink®
The Aerospace Corporation magazine of advances in aerospace technology
Fall 2015
Understanding Space Debris Causes, Mitigations, and Issues

CrosslinkFall 2015 Vol. 16 No. 1
2 Space Debris and The Aerospace Corporation
Ted Muelhaupt
The state of space debris—myths, facts, and Aerospace's work in the field.
4 A Space Debris Primer
Roger Thompson
Earth’s orbital environment is becoming increasingly crowded with debris, posing threats ranging from diminished capability to outright destruction of on-orbit assets.
8 Predicting the Future Space Debris Environment
Alan Jenkin, Marlon Sorge, Glenn Peterson, John McVey, and Bernard Yoo
The Aerospace Corporation’s ADEPT simulation is being used to assess the effectiveness of mitigation practices on reducing the future orbital debris population.
14 First Responders in Space: The Debris Analysis Response Team
Brian Hansen, Thomas Starchville, and Felix Hoots
Aerospace has been providing quick situational awareness to government decision-makers concerned about the effects of energetic space breakups.
22 Keeping Track: Space Surveillance for Operational Support
Felix Hoots
The proliferation of objects in space has made the job of monitoring them more challenging—and more essential.
IN THIS ISSUE
Contents
2 FEATURE ARTICLES
58 BOOKMARKS
60 BACK PAGE
On the cover: Mary Ellen Vojtek and Marlon Sorge examine a recently created debris cloud using an Aerospace visualization tool that displays cloud boundaries and density over time. In the days after an explosion or collision, the resulting debris cloud is at its most dense, presenting its biggest hazard to operational satellites.
Visit the Crosslink website at www.aerospace.org/publications/crosslink-
magazine
Copyright © 2015 The Aerospace Corporation. All rights re-served. Permission to copy or reprint is not required, but ap-propriate credit must be given to Crosslink and The Aerospace Corporation.
All trademarks, service marks, and trade names are the property of their respective owners.
Crosslink (ISSN 1527-5264) is published by The Aerospace Corporation, a California nonprofit corporation operating a federally funded research and development center that pro-vides objective expertise, analysis, and assessments in mul-tiple markets, including for government, civil, and commercial customers.
For more information about Aerospace, visit www.aero-space.org or write to Corporate Communications, P.O. Box 92957, M1-447, Los Angeles, CA 90009-2957.
Questions or comments about Crosslink may be sent via e-mail to [email protected] or write to The Aerospace Press, P.O. Box 92957, Los Angeles, CA 90009-2957.

CROSSLINK FALL 2015
1
Cour
tesy
of N
ASA
28 Look Before You Leap: Collision Avoidance for Launch Protection
Thomas Starchville, W. Todd Cerven, and Ted Muelhaupt
The Aerospace Corporation has been providing collision avoidance support for space launches since the mid-1990s.
34 Fragmentation Modeling: Assessing Breakups in Space
Marlon Sorge and Deanna Mains
Aerospace has honed expertise for more than 25 years in modeling space debris fragmentation events—from accidental to intentional collisions—leading to insights and predictions for future breakup events.
40 Seeing Through the Clutter: The Power of the TorusRyan McKennon-Kelly, Brian Hansen, and Felix Hoots
Methods developed at Aerospace quickly render intuitive pictures and interactive models of an evolving debris field.
46 How to Clean Space: Disposal and Active Debris RemovalMarlon Sorge and Glenn Peterson
Cleanup of the space environment is possible if post-mission disposal tactics are built into future space systems. Active debris removal techniques are also a means of mitigation.
52 Space Debris Mitigation PolicyMarlon Sorge, Mary Ellen Vojtek, and Charles Griffice
As awareness of space debris and its potential threats to operational satellites continues to evolve, so too do policies regarding its removal.
Space debris and the hazards it poses to satellites and other orbiting spacecraft has become a serious concern for the U.S. gov-ernment. Although the probability of satellites being struck and disabled by debris is somewhat low, it can happen, as a few high-profile events have illustrated in recent years. How to prevent debris from causing catastrophic damage and/or propagating further is now at the forefront of space management.
At the same time, space debris draws a lot of interest from the public. The topic and fantasy stories related to it has been featured in some recent blockbuster movies. Space debris is also an area of great interest to children. This fact makes for a nice tie into STEM (science, technology, engineering, and math). The topic can intro-duce kids to space in a way that is appealing, and can stimulate their interest in these fields.
For many of the early years of the space race, the focus was on what was being put into space, and whether each launched satel-lite, space capsule, or orbiting spacecraft could successfully achieve its mission goals. What would be done upon the eventual demise of these pieces of hardware was not of so much concern. Still, members of the engineering and scientific staff at The Aerospace Corporation have been studying space debris and reentry hazards for many years, stretching back to the early days of the company.
In this issue of Crosslink readers are introduced to the topic of space debris and the related areas of study at the corporation. Many proprietary studies have been written for space debris model-ing, simulation, and analysis, and the corporation’s expertise in the effects of space debris has grown over the years. Aerospace is one of the major contributors of orbital debris expertise to the Depart-ment of Defense community. This extends to real-time debris risk assessment, debris minimization planning, support for end-of-life on-orbit and reentry disposal, launch collision avoidance, debris threat management and assessment, and survivability analysis.
Please read on to learn about the capabilities and people who make this work happen at the company. We hope you’ll find this issue of Crosslink insightful, interesting, and timely.
From the Editors

CROSSLINK FALL 20152
Space Debris and The Aerospace CorporationTed Muelhaupt
If we ask people to think about “space,” many topics may come to mind. Their first thoughts may involve human space travel, the moon landings, the International Space
Station, and astronauts. They may think about the stars and planets, and perhaps conjure images of distant and alien worlds read about in popular science-fiction novels. Closer to home, they may think about rockets and satellites and big parabolic antennas pointed at the sky. Even at a cursory level, most people have some awareness that satellites are used every day for communications, weather forecasting, and navigation and location services, even if they do not understand the details of how these systems function.
Perhaps surprisingly though, in recent years, a fair per-centage of the public have also developed some awareness of space debris. There has been growing environmental aware-ness over the last several decades, and the topic of climate change/global warming, and humans’ effects on Earth’s envi-ronment is seldom far from mainstream public discussion.
These are the topics that seem to fuel a level of fascina-tion with space debris, as well as the fact that some outcomes could indeed result in significant problems. Space debris has even started to make a regular appearance in popular culture ranging from big- budget movies (Gravity), animated child-friendly fare (Wall-E), to television (Dead Like Me), in which a character was killed by falling space junk. Space debris is even featured in advertising and commercials.
The Aerospace Corporation is a technically focused organization that spans the work of “space,” particularly in regards to national security. The com-pany leads in virtually every aspect of space development
and analysis, including an understanding of the space envi-ronment. Aerospace has been involved with orbital debris and reentry hazard analysis from the start of the company 55 years ago, even if it has not always been called that. The corporate vision means striving to be:• Aworldleaderintheanalysisofspacedebrisandits
impact on space situational awareness and the operational environment
• Aworldleaderinguidingnationalandinternationalspacepolicy
• Aworldleaderintheanalysisoflaunchandon-orbitcolli-sion avoidance
• Aworldleaderintheanalysisofend-of-missiondisposal,reentry breakup, and the minimization of debris risk
• Anationalsecuritycommunityresourceforspacedebrisand reentry breakup issues
• ApublicresourceforspacedebrisandreentryhazardeducationThe capabilities of the corporation have been growing for
decades, and in 1997, Aerospace established the Center for Orbital and Reentry Debris Studies (CORDS) to focus and coordinate internal efforts and to provide a cen-tral contact point for external queries. Over time, Aerospace has developed world-class capabilities in these areas. Along with one of Aerospace’s customers and frequent partners—NASA—the corporation leads in national capabilities and technologies related to space debris.
Aerospace’s reach into all aspects of national security space allows for both insight and influence. In fact, Aero-space is the only national–security–space–related organi-
Disaster is not imminent, but the need for mitigation action is now.
Real money must be spent on real programs now to benefit a
somewhat vague future.

CROSSLINK FALL 2015 3
zation capable of providing debris-related expertise and analysis in all of the technical areas related to debris. In many ways, the corporation’s work on the national security side of space allows for a perspective that is not available to the rest of the debris community.
This issue of Crosslink showcases some of the breadth of the work and the issues that affect the space debris envi-ronment. It also introduces readers to some of the people who do the work, as well as offering insight into where the company is going and the challenges it is facing. Because of the prominence of space debris in popular culture, there may also be some misconceptions on the subject. Here are some broader areas that will be addressed in more detail:
The risk from space debris is of growing concern, especially over the long term. The risk from debris is growing by every measure, and it is not just awareness of the risk. The risk from human-made debris exceeds the threat from the natu-ral micrometeoroid environment for low Earth orbit (LEO), and it is growing in geosynchronous orbit too.
The debris population is rising to levels where it will direct-ly affect space systems architecture design and replenish-ment strategies. Space debris will not cause space to become unusable or space operations to become impossible for the foreseeable future. However, the risk will grow, and may make some orbits impractical, or more dangerous for human activity. This is particularly true for LEO.
An immediate impact will be a continuing increase in collision avoidance alerts that can cause operational difficul-ties. Spacecraft may require more shielding, and complying with end-of-mission disposal rules may also add costs.
Collisions are happening, and debris is self-generating at some altitudes. At LEO, there is consensus that the popula-tion density is very likely to grow from collisions between existing objects. The community expects approximately one catastrophic collision every 5–9 years over the next 40 years.
The cumulative probability that one of the approximately 100 Iridium satellites would be hit by another cataloged object was about 3 in 10 when Iridium 33 collided with Cosmos 2251 in February 2009. Statistically, a collision was no surprise. Debris can indeed beget more debris.
Short-term debris cascades are impossible. This may seem like a contradiction to the statement above, but one must consider the timescale. The predictions of the Kessler syn-drome are quite real and broadly based, but the timescale is in decades and centuries, not hours and days. Therefore, Kessler is right, but the movies are wrong. This is a slow-motion disaster, and the good news is that it can be stopped or slowed with immediate action by the space community.
Debris objects dominate space surveillance and complicate space situational awareness and protection. One of the big-gest problems facing space security practitioners is the sheer volume of stuff that needs to be tracked. The best way to deal with space debris is to avoid creating more of it, and one of those methods is collision avoidance. This means tracking
debris. Already, about 95 percent of the objects tracked are debris, and the percentage is expected to grow markedly with improvements in space situational awareness. These improvements and investments are needed, as well as an emphasis on gathering better-quality data, rather than more quantity.
Establishing proactive debris mitigation practices is vital. Every study in this area has shown that proper postmission disposal of satellites and upper stages is necessary to control debris growth and minimize long-term risk. To prevent or reduce the effects of this slow-motion disaster, the best approach is to stop creating additional debris and minimize future debris sources.
Active debris removal will be necessary to reduce current debris levels. The population of LEO will grow assuming a launch rate of new vehicles similar to that of last couple of decades. It will at best only stabilize if postmission disposal guidelines are strictly adhered to, with growth being by far the most likely outcome. The amount of growth will depend on the rate of compliance. What is unknown is what the “correct” population density/level should be. There is not yet consensus on the acceptable level of debris risk.
This is something of a quandary for the space debris community. Disaster is not imminent, but the need for mitigation action is now. Real money must be spent on real programs now to benefit a somewhat vague future. The immediate costs are very real, but the balancing benefits are extremely difficult to quantify. This is also a truly interna-tional issue—indeed an extraglobal one—but Aerospace and its partners can only directly affect U.S. national programs.
Politics and perception are also at play. An “acceptable” risk is largely based on human perception. For example, the perception of the risk to astronauts flying the space shuttle changed drastically after the Challenger and Columbia disasters.
At Aerospace, the job has always been to focus on the technical accuracy of the answers supplied to the space community. The goal is to understand the questions that the corporation’s customers have, to anticipate their problems, and to help them make the best decisions for success. These analyses can help shine light on murky areas, give a solid foundation for broader programmatic decisions and policy recommendations, and perhaps help prevent a manageable problem from becoming a serious one.

CROSSLINK FALL 20154
A Space Debris PrimerEarth’s orbital environment is becoming increasingly crowded with debris posing threats
ranging from diminished capability to outright destruction of on-orbit assets.
Roger Thompson

CROSSLINK FALL 2015 5
The term “space debris” can be misleading to a lay reader, and potentially conceals the very real dangers and complex problems those words describe. “Debris”
can conjure the image of earthbound litter, which lies on the ground and may only offend aesthetically.
In Earth orbit, however, debris is anything but motion-less, and while there is quite a bit of room in the various orbits humans place satellites, that room is becoming increasingly crowded with functioning and nonfunctioning spacecraft, and the bits and pieces leftover from collisions, explosions, and slippery-fingered astronauts.
The simple definition of space debris is any human-made object in orbit that is not in active use. Debris can be obsolete or inactive spacecraft, parts of satellites or launch vehicles, or fragments of spacecraft and rockets that have been broken up in some fashion. Space debris comes in all sizes, from microscopic particles to nonoperating satellite and rocket bodies tens of meters in length.
Debris OriginMost space debris comes from “breakup events” caused by explosions and collisions, many of them deliberate. In the 1960s several spacecraft were intentionally destroyed through self-destruct mechanisms or antisatellite tests. The two worst events in the growth of the space debris population were the deliberate destruction of the Chinese Fengyun-1C satellite on January 11, 2007, part of a Chinese antisatellite test; and the accidental collision of Iridium 33 and Cosmos 2251 on February 10, 2009. Those two events added more than 3300 and 2200 fragments, respectively, to the catalog of tracked objects, and perhaps hundreds of thousands of smaller fragments.
Of the numerous accidental explosions, residual onboard propellant is the principal cause, but it is unknown what caused that propellant to explode. Some explosions may have resulted from a collision with other space debris. On aver-age, there are four breakup events per year. Most breakups and explosions produce a relatively small number of debris objects (compared to collisions, which are more destructive), but these add up over the years and the events account for the bulk of the catalog.
Once debris is created from a breakup event, it moves in many different orbits, which change over time. Further, while all objects that are in orbit at the same altitude are moving at approximately the same speed (for nearly circular orbits), they are not necessarily moving in the same direction. For objects in low Earth orbit (LEO), the orbital speed is approximately 7.5 kilometers per second, or 17,000 miles per hour. However, when two objects move close to each other—an event called a conjunction—their relative velocity approaching each other from the side, or even head-on, can be as high as 14 kilo-meters per second (more than 31,000 miles per hour). Most conjunctions converge at about a 45-degree angle, which results in a relative velocity of approximately 10 kilometers per second—ten times faster than a rifle bullet.
At such velocities, the danger to satellites and space-based systems becomes obvious. The kinetic energy of even a small particle at these speeds can do tremendous dam-age. The potential damage imparted is proportional to the debris object’s mass; therefore, space debris is divided into categories based on size and mass according to that potential damage.
Debris Size Potential DangersThe first category includes objects that are approximately 10 centimeters in diameter (fist-sized) and larger, which can be tracked by the U.S. Space Surveillance Network (SSN), and are listed in a resident space object catalog. An impact from an object this size is the equivalent of a bomb blowing up inside the spacecraft. Because debris objects this size can be tracked, conjunctions with other bodies can be predicted, and in some cases, an at-risk satellite can be maneuvered to avoid a collision. The SSN can often track debris smaller than 10 centimeters, but that depends on the shape and com-position of the object, considered in concert with the size of the debris. The lower limit for reliable tracking of an object is somewhere between 5 and 10 centimeters. There are cur-rently more than 22,000 objects being tracked by the SSN.
The next category of space debris is objects smaller than 10 centimeters, down to 1 centimeter. An impact from a 5-centimeter object—the middle of the range—is the equiva-lent of being hit by a bus traveling at highway speed. Debris objects in this range cannot be tracked, but are large enough to destroy a satellite or rocket body if the debris collides with the main body of the spacecraft (collisions with solar arrays, booms, and antennas may not completely destroy a satellite).
This image was captured by the orbital debris collector experiment flown on the Russian space station Mir. The experiment was delivered and retrieved by NASA space shuttles STS-76 and STS-86. The collector used an aerogel—a very low-density material sometimes called "solid smoke"—to slow and capture the particles. The space debris shown in this image is a paint flake. In 1994, a paint flake about this size created a crater almost 1/2 inch in diameter in a shuttle side hatch window.
Cour
tesy
of N
ASA

CROSSLINK FALL 20156
It is currently estimated that there are approximately 500,000 of these fragments in orbit at LEO altitudes. Every one has the potential to cause catastrophic damage to an active satel-lite. Space debris larger than 1 centimeter has the potential to completely fragment any object it hits. If that object is a large mass such as a satellite or rocket body, the resulting collision will add tens of thousands of new space debris fragments to the population.
Debris objects between 3 millimeters and 1 centimeter make up the next category of space debris. An impact from an object this size ranges from the equivalent of being hit by a bullet (damaging but not necessarily destroying the satel-lite) up to being hit by an anvil falling from a height of two stories (in which destruction of the satellite is certain). These objects also cannot be tracked, and it is estimated that there are millions of them in LEO. However, because particles near the lower limit of this category are so small, they will usually cause only localized damage. Any such damage may still end a satellite’s mission if the debris hits a critical component such as a computer, sensor, or propellant tank, but the im-pact will usually not add a significant amount of space debris as would be the case if the debris fragment was larger.
The last category of space debris comprises objects that are smaller than 3 millimeters. An impact from a 1-milli-meter aluminum particle is the equivalent of being hit by a baseball thrown by a major league pitcher. These small particles cause localized damage, particularly in configura-tions where the surface condition of the impacted spacecraft is important to its function, such as solar arrays and opti-cal systems (telescopes, star trackers, cameras, etc.). Some spacecraft components can be shielded to prevent dam-age from debris this size, but not all of them. There are an estimated 10 million space debris objects in LEO that are smaller than 3 millimeters. They are still a risk to space-based assets, but one that can often be effectively dealt with through better designs and shielding.
Mitigating the HazardsAlthough improved spacecraft design and shielding can be effective in minimizing damage from orbital debris, it is far better to prevent an impact in the first place. Collision avoid-
ance (COLA, or CA) is a process where the time of closest approach and probability of collision are computed from orbital data (this is only possible for objects large enough to be tracked, which are 10 centimeters and larger). If the probability of collision is high and an avoidance maneuver is an option, satellite operators may choose to maneuver their satellite to reduce the risk of collision. Of course, this is only possible when one of the objects at risk is an active, maneu-verable satellite; only a few hundred of the more than 1000 active satellites have this capability.
Collision avoidance is an issue that can be easy to under-stand in the abstract—determine the likelihood a piece of debris will strike a satellite and take measures to avoid it—but difficult to apply, or even to decide to apply. This arises because the risk of a satellite being struck by a piece of debris is very low, on the order of one in tens of thousands, even one in a million or more. At the same time, the consequenc-es of both taking action and not taking action are extremely high. If a satellite operator decides the risk is too high and takes action to avoid a collision, valuable maneuvering fuel must be expended, shortening the useful life of the satellite. If the operator decides not to take action and an impact oc-curs, the satellite and its capability are lost; replacing it may take years and millions of dollars. For commercial operators, business losses could run into the billions. There is also the attendant increased risk to other satellites from the debris generated by this collision. Consequently, while there is risk in both taking COLA actions and not doing so, the implica-tions of a satellite loss are so great that COLA thresholds—in which a satellite is maneuvered out of harm’s way—may be very low, from one in 10,000 to one in a million.
The uncertainty inherent in COLA results from the physics of how debris is created and disbursed. Initially, a fragmentation event looks like an expanding, spherical vol-ume of debris, much like what is seen in high-speed photo-graphs of an explosion. However, each fragment is actually in a distinct orbit slightly different from the parent object, because the collision or explosion causes a small change in the velocity of each fragment. As the mechanics of orbital motion come into play over time, the cloud of fragments—the debris—spreads around the orbit close to the plane of the
Space debris comes in all sizes from microscopic particles to obsolete spacecraft and rocket bodies tens of meters in length. Pictured here is an Agena upper stage.
The average LEO impact speed of 10 kilometers per second means the high relative velocities of small fragments can be dangerous.
Cour
tesy
of N
ASA
Debris size
Mass (g)aluminum
sphereKinetic
Energy (J)
Equivalent TNT(kg)
Energysimilar to
1 mm 0.0014 71 0.0003 Baseball
3 mm 0.038 1910 0.008 Bullets
1 cm 1.41 70,700 0.3 Falling anvil
5 cm 176.7 8,840,000 37 Hit by bus
10 cm 1413.7 70,700,000 300 Large bomb

CROSSLINK FALL 2015 7
parent orbit. Eventually, however, all of the debris will return to the point of the collision, because that point is common to the orbits of all the debris created by the collision. This is called the pinch point.
Over time, orbital perturbations and the atmospheric drag characteristic of LEO will cause the debris to further expand and distribute around Earth until the cloud resem-bles a shell, causing it to become part of the new background flux of orbital debris. This causes a paradoxical situation in that the risk of any one piece of debris being involved in a collision becomes lower over time because the debris is spreading out; and the risk of collision in general becomes higher, as there are more pieces of debris out there and the volume they cover becomes larger.
The disparity between risk of collision and actual colli-sion can be seen in several actual on-orbit collision events. In 1991, the debris from the Russian Cosmos 1275 naviga-tion and communications satellite collided with Cosmos 1934. The predicted miss distance for the event was 512 me-ters, with a collision probability of one in 50,000; nonethe-less, the collision occurred. In 1996, Cerise, an active French reconnaissance satellite, collided with debris from an Ariane 1 rocket launch. In this incident, the predicted miss distance was 882 meters and the probability of collision one in two million. The most well-known such orbital collision, the 2009 Iridium 33-Cosmos 2251 event, had a predicted miss distance of 584 meters, a collision probability of one in five hundred thousand. Each of these events had low collision probabilities and estimated miss distances in the hundreds of meters. Because of the uncertainties of predicted orbital position, those miss distances were in fact zero.
In addition to determining cause, number, and risk of orbital debris, mitigation and remediation are also impor-tant issues. Mitigation concerns itself with the policies and methods that will, in the short term, lower the growth rate of space debris populations. Remediation is the process of removing space debris to clean up the orbital environment.
Mitigation efforts have been in use for more than 20 years. These include reducing or eliminating the release of mission-related debris; end-of-life passivation (eliminating energy sources such as pressurants, propellants, and charged
batteries); and postmission disposal—reentering or moving an obsolete object to a disposal orbit, or lowering its orbit such that it will reenter within 25 years.
Remediation is a long-term solution because a cost-effec-tive method does not currently exist. A number of concepts are in development and some technology demonstrators are expected to fly in the next few years, but it will be at least a decade before meaningful remediation can be relied upon to reduce the growth in space debris. It took decades for the problem of space debris to reach or at least approach a criti-cal phase. Awareness and willingness to address the prob-lem is the first step, and that has largely been accomplished through international efforts and cooperation. Solving the problem of space debris, however, has no easy answers.
Pinch point
As the mechanics of orbital motion come into play, the cloud of fragments—the debris—spreads around the orbit close to the plane of the parent orbit. Eventually, all of the debris will return to the point of the collision, because that point is com-mon to the orbits of all the debris. This is called the pinch point.
About the Author
Roger C. Thompson, Senior Engineer-ing Specialist, Mission Analysis and Op-erations Department, joined Aerospace in 1996. He works on a broad spectrum of space situational awareness projects, collision avoidance, orbital maneuvers, and analysis of satellite architectures. He has a B.S. in engineering science
and mechanics from North Carolina State University, and an M.S. and a Ph.D. in engineering mechanics from Virginia Polytechnic Institute and State University.
Debris size Quantity Impact
1 mm to 3 mm Millions •Cannotbetracked•Localizeddamage
3 mm to 1 cm Millions •Cannotbetracked•Localizeddamage•Upperlimitofshielding
1 cm to 5 cm 500,000 (estimated)
•Mostcannotbetracked•Majordamage
5 cm to 10 cm Thousands •Lowerlimitoftracking•Catastrophicdamage
10 cm or larger Hundreds to low thousands
•Trackedandcatalogedbyspace surveillance network
•Catastrophicdamage
The size and quantity of debris distributed from a given event are factors affecting the impact and potential damage caused by the occurrence.

CROSSLINK FALL 20158
Predicting the Future Space Debris EnvironmentThe Aerospace Corporation’s ADEPT simulation is being used to assess the effectiveness of
mitigation practices on reducing the future orbital debris population.
Alan Jenkin, Marlon Sorge, Glenn Peterson, John McVey, and Bernard Yoo

CROSSLINK FALL 2015 9
In a landmark 1978 publication, NASA scientists Donald Kessler and Burton Cour-Palais concluded that collisions of satellites and spent rocket bodies would eventually
form the dominant source of orbital debris in low Earth orbit (LEO). They predicted that debris from such collisions would collide with other satellites and rocket bodies and cre-ate even more debris. As a result of this chain reaction, the risk to satellites in certain regions of space would increase exponentially with time, even without further launches into those regions. In a 1991 paper, Kessler used the term “collisional cascading” to describe this process. Since then, the term “Kessler syndrome” has become widely used in the popular literature.
In February 2009, the first of the predicted catastrophic collisions occurred between the Iridium 33 satellite and the Russian Cosmos 2251 satellite. This single event generated more than 2200 trackable fragments and significantly more that were too small to track. An antisatellite test performed
by China in 2007 had already produced more than 3400 trackable fragments. Between the two, the number of tracked objects had increased by about 65 percent.
ADEPT BirthFollowing these events, the U.S. Air Force initiated a study in 2009 to assess the effects of an increasing debris population on the performance of future U.S. military space systems. To support this effort, the Air Force asked Aerospace to gener-ate discrete future LEO debris populations for input to its simulations. This resulted in a new capability at Aerospace to model the future debris environment in LEO. This initial capability was largely independent of models developed by other organizations, but still used a database of object masses supplied by NASA.
During the course of subsequent studies, Aerospace sig-nificantly enhanced its ability to model the future LEO de-bris environment. Portions of the process were reconfigured
The top graph shows future collisions for the “Business as Usual” scenario. Each point shows the altitude and date for each collision. Points from all 100 Monte Carlo ensembles are shown together. The bottom graph shows mean curves over 100 Monte Carlo cases of number of collisional debris objects down to 1 centimeter on orbit vs. time for both scenarios. The debris popula-tion grows more slowly in the "Compliance" scenario. This illustrates that existing international debris mitigation guidelines have a significant effect in reducing the growth rate of orbital debris.
These plots show the number of collisional debris objects down to 1 centi-meter on orbit vs. time for the “Business as Usual” (top) and “Compliance” (bottom) scenarios predicted by ADEPT as part of the 2012 MEO Debris Environment Projection Study. Each curve in the graph corresponds to a Monte Carlo case. A total of 100 Monte Carlo cases are shown.
x 106
Time (years)
Num
ber o
f obj
ects
(mill
ions
)
2
00 20 40 60 80 100 120 140 160 180
4
6
8
10
12
14
16
Time (years)
Num
ber o
f obj
ects
(mill
ions
)
2
00 20 40 60 80 100 120 140 160 180
4
6
8
10
12
14
16x 106
Time (years)
Num
ber o
f obj
ects
(mill
iions
)
2
1
00 20 40 60 80 100 120 140 160 180 200
3
4
5
6
7 Business as usualCompliance
8
9
Collision data
Colli
sion
alti
tude
(km
)
1/1/
2012
12/3
1/20
211/
1/20
3212
/31/
2041
1/1/
2052
12/3
1/20
611/
1/20
72
1/1/
2092
1/1/
2102
1/2/
2112
1/1/
2122
1/2/
2132
1/1/
2142
1/2/
2152
1/1/
2162
1/2/
2172
1/1/
2182
1/2/
2192
1/2/
2202
12/3
1/20
815000
0
10,000
15,000
20,000
25,000
30,000
35,000
40,000

CROSSLINK FALL 201510
to run on distributed high-performance computing clusters, and the system was made fully independent of other debris models by establishing an Aerospace-developed database of object masses, sizes, and ballistic areas. The capability became sufficiently mature to receive a name: the Aerospace Debris Environment Projection Tool (ADEPT).
In 2012, the Air Force Space and Missile Systems Center (SMC) requested a study to determine the effect of poten-tial changes to National Space Policy on the future debris environment in medium Earth orbit (MEO), with the goal of assessing the risk to the Global Positioning System (GPS). This was known as the MEO Debris Environment Projec-
tion Study. For this effort, ADEPT was extended to model not just LEO but all orbital regimes. This was necessary to account for possible cross-coupling between the LEO, MEO, and geosynchronous (GEO) populations via collisions in-volving objects on highly eccentric orbits. A number of other improvements have been made to ADEPT through internal research and development. These include faster generation of future collisions, extension of Monte Carlo processing, generation of future random solar cycles, greater fidelity of the original population, better modeling of active debris removal, assessment of modeling accuracy via comparison with actual data, and improved fragmentation modeling.
These flowcharts illustrate the ADEPT process for generating future debris popula-tion models. The first shows the high-level flow of the overall simulation, and the
second shows specific steps involved in generating debris from future collisions.
These images are based on the 2012 MEO Debris Environment Projection Study and show the future orbital debris population as predicted by ADEPT for the "Business as Usual" scenario in the years 2013, 2100, and 2200 (top to bottom).
Collision generator
Object masses, collision radii,
propagated mean elements
Fragment generation (IMPACT)
Down-sample to weighted population
Feedbacksubsequentfragment
generations
Orbit element history files for each object
Object propagation (MEANPROP)
Generation of future launched
objects and associated
debris Generation of debris from future explosions
(IMPACT)Generation of debris from
future collisionsObject propagation
(MEANPROP) Orbit element history files for
each object
Size/mass/area database
Initial population

CROSSLINK FALL 2015 11
ADEPT ProductsThe discrete populations generated by ADEPT can be used to derive a variety of products. For example, plots of the on-orbit population vs. time can measure the growth rate for the debris population—overall, or in specific orbital regions.
Plots of object spatial density vs. altitude and time indi-cate which regions of space will see higher debris growth. This information can influence where a satellite might be flown to minimize risk; it can also help show how different disposal practices might affect different regions of space.
Plots of probability vs. severity enable the user to rank orbital objects by the amount of debris they might cre-ate from collisions in various scenarios. This is useful in identifying objects for active removal that would achieve the greatest reduction in future debris growth.
The ADEPT discrete populations can also be used to predict the frequency of collision avoidance maneuvers on orbit, which could affect the amount of propellant needed on board and help forecast mission outages that might be induced by the maneuvers.
ADEPT is currently used at Aerospace to perform colli-sion probability analyses for space debris assessment reports, which are required by Air Force Instruction 91-217 (Space Safety). ADEPT has also been used by Aerospace to sup-port the NASA delegation at the Inter-Agency Space Debris Coordination Committee (IADC).
ADEPT ResultsThe 2012 MEO Debris Environment Projection Study used ADEPT to simulate two scenarios. In the first (compliance), all worldwide future launches comply with internationally recommended disposal guidelines. In the second (business as usual), all worldwide future launches move to disposal or-bits near their mission orbits and do nothing else to comply with any guidelines. Results showed that the rate of growth of the future collisional debris population in the business as usual scenario increases with time. The rate of growth also increases in the compliance scenario, but much more slowly.
ADEPT scenarios have also shown the effect of conserva-tion of mass. In essence, as collisions occur, the amount of mass in orbit is redistributed from large objects (for example, satellites) to smaller debris pieces. Smaller objects are less like-ly to collide, and when they do, they have less momentum and kinetic energy to impart to other objects. ADEPT runs start with an initial population and create “first-generation” debris, caused by collisions between objects in the initial population, and “second-generation” debris, caused by the collision of first-generation debris objects with both initial population ob-jects and other first-generation objects. ADEPT simulations over 200 years have shown that second-generation debris grows much more slowly than first-generation debris. So, al-though the future collisional debris population increases with time, it does not increase exponentially, at least for simulated time periods up to 200 years in the future.
ADEPT Steps
The process for generating the debris population in ADEPT consists of the following steps.
Step 1. Generate a population of current objects. This population includes the unclassified portion of the U.S. Strategic Command catalog of resident space objects along with a statistical filler population to represent objects not available in the catalog. It also includes a statistical population of debris from 10 centime-ters down to 1 centimeter, which is intended to represent debris that is too small to track but still considered lethal to operational satellites.
Step 2. Generate a population of future launched objects. The modeling of future launch traffic has a strong influence on the long-term generation of collisional debris. Studies to date have typically used the historical launch pattern 10 to 15 years prior to the start date. For specific constellations, such as Iridium, Orb-comm, and Globalstar, a fixed rate of replenishment is assumed. This step also simulates the disposal of satellites and rocket bodies at end of mission, which also has a strong influence on the result-ing collisional debris population. A primary goal of ADEPT has been to quantify the effect of disposal policy.
Step 3. Propagate current and future objects over the simulation period. This is done using MEANPROP, an Aerospace tool that ef-ficiently propagates the slowly varying orbital elements averaged
over complete orbital revolutions. This results in files containing orbital elements as a function of time for each object.
Step 4. Generate random explosions based on object type (e.g., satellite or rocket body) and apply the Aerospace breakup model-ing code IMPACT to generate fragments down to 1 centimeter. These fragments can then be propagated into the future using MEANPROP.
Step 5. Generate Monte Carlo ensembles of random future col-lisions. Each time the orbital traces of two objects intersect, the probability of collision is computed, and a random draw is taken to determine whether a collision occurs. Typically, 100 Monte Carlo ensembles are generated.
Step 6. Input the future collisions into IMPACT, which will gener-ate collisional debris objects down to 1 centimeter.
Step 7. Down-sample the number of objects (typically on the order of several billion) to a manageable size. Each of the resulting debris objects can be assigned a weighting factor that indicates the number of fragments that it represents. This down-sampled set of collisional debris objects can then be propagated into the future using MEANPROP.
Repeat steps 5 through 7 as needed to feed the new generation of collisional debris back into the previous population.

CROSSLINK FALL 201512
ADEPT Future StudiesStudies to date using ADEPT assume that historical launch patterns will continue into the future. While this has been the standard practice in the debris modeling community, the future launch pattern will almost certainly be different. Rus-sian launch patterns and orbits have changed significantly, and China is emerging as a dominant spacefaring nation. The French Space Operations Act of 2010 imposes more- stringent debris mitigation requirements than previous laws, and could significantly change the future distribution of Ariane upper stages.
The introduction of CubeSats has also brought a sig-nificant change in launch patterns. Typically, a relatively large number of CubeSats will hitch a ride on a launch of a standard satellite. Ultimately, CubeSats may form a large population occupying a wide range of orbits—but that will not necessarily result in a larger future debris population, because the effect of conservation of mass is present. Their small size reduces their probability of collision, while their small mass reduces their potential for creating large amounts of debris when they do collide with other objects. So, as with second-generation debris, the effect of their small size and mass on the creation of future debris may offset the effect of their greater numbers. Also, the ballistic coefficients of CubeSats are different from those of standard large satel-lites. This means they will lose altitude (if their orbits are low enough to be affected by drag) at different rates than larger satellites. ADEPT can be used to help quantify how these
opposing attributes of the CubeSat population will affect the future orbital debris population.
Future development plans for ADEPT include recon-structing the current debris population down to 1 centime-ter and smaller from all previous space activity. This will enable independent assessment of the debris risk posed to spacecraft by the existing small, untracked debris popula-tion. It will then be possible to improve current estimates of the cost of shielding (typically feasible only for debris up to 1 centimeter) or constellation replenishment to compensate for failures caused by debris impacts.
Compliance
0.0E+00
5.0E-07
1.0E-06
1.5E-06
2.0E-06
2.5E-06
Altitude (km)
Years
Business as Usual
Dens
ity (#
/km
3 )
0.0E+00
2.0E-06
4.0E-06
6.0E-06
8.0E-06
1.0E-05
1.2E-05
040
80120
160200
205 405 605 805 1005 1205 1405 1605 1805 2005
Altitude (km)
Years
Dens
ity (#
/km
3 )
040
80120
160200
205 405 605 805 1005 1205 140516051805 2005
These plots from the 2012 MEO Debris Environment Projection Study show the object spatial density in LEO, including debris down to 1 centimeter, as a function of altitude and time. The first figure shows the result for the “Busi-ness as Usual” scenario. The growth of the ridge between 800 and 1000 kilometers is limited by the effect of atmospheric drag. The growing ridge just above 1400 kilometers occurs because the simulation includes a con-stellation of satellites that is continually replenished. The disposed satellites accumulate because there is no atmospheric drag to remove them.
The second figure shows the result for the “Compliance” scenario. In this case, the ridge just above 1400 kilometers has been reduced significantly (note the different density axis scales) because the simulation moves the dis-posed constellation satellites to an altitude of 2000 kilometers in compliance with debris mitigation guidelines; however, a new ridge appears at 2000 kilometers. These plots illustrate the population growth that could occur in LEO if nondecaying disposal orbits are used.
ADEPT FeaturesADEPT differs from other debris environment projection models in several important ways. For example, it uses an Aerospace-developed tool, IMPACT, to model breakups from collisions and explosions. Other tools typically use variants of the NASA Standard Breakup Model.
ADEPT uses a Monte Carlo–based orbit trace crossing method to generate future random collisions. Other models typically use spatial density methods with Poisson statistical models. One advan-tage of the orbit trace crossing method is that it easily retains the correlation between the frequency of collision and the parameters that influence the fragmentation of the objects, including relative impact velocity, direction, and object masses.
ADEPT uses discrete weighted down-sampled populations to repre-sent the full population. Other models typically use spatial density to represent the full population, which is effectively a smoothed representation. The use of weighted down-sampled populations makes it easy to retain any correlations between orbital elements of different objects.
ADEPT uses an independently developed database of objects that includes size, mass, ballistic area, and weighting factors. Having control of this database permits the execution of sensitivity studies.

CROSSLINK FALL 2015 13
About the Authors
Alan B. Jenkin, Senior Engineering Specialist, System Analysis and Simulation Subdivision, joined Aerospace in 1985. He has worked for 24 years in the field of astrodynamics, specializing in collision risk analysis, orbital debris and meteoroid risk assessment, and postmission disposal of satellites and upper stages. He has a B.S. in aeronautical engineer-
ing and an M.S. in computer and systems engineering from Rensselaer Polytechnic Institute. He has also completed graduate course work at the University of California, Los Angeles. He has written 39 conference pa-pers, 10 journal articles, and one book chapter. He is an associate fellow of the American Institute of Aeronautics and Astronautics.
Marlon E. Sorge, Senior Project Engineer, Space Innovation Directorate, joined Aero-space in 1989. He has worked on space debris issues for more than 25 years, encompassing fragmentation modeling, risk assessments, debris environment projection, mitigation techniques, and policy development. He also coordinates Aerospace’s debris research pro-
gram. He has a B.S. in physics and an M.S. in aeronautical and astronauti-cal engineering from Purdue University.
John P. McVey, Engineering Spe-cialist, Astrodynamics Department, joined Aerospace in 2003. He has performed research on a variety of orbital mechanics topics including orbit dynamics and propagation, orbital debris studies, collision analysis, and orbit analysis of
small satellites. He has a B.S. in physics from the University of Florida and an M.S. in aerospace engineering from the Uni-versity of Colorado, Boulder. He is currently a Ph.D. candidate in the Astronautical Engineering Department at the University of Southern California.
Bernard B. Yoo, Engineering Specialist, Astrodynamics Depart-ment, joined Aerospace in 1993. He specializes in optimal resource allocation and scheduling of space and communications systems. Cur-rent projects include model-based systems engineering, architecture
performance analysis, and integrated atmospheric modeling. He has experience and general expertise in visibility analysis, constellation design, launch and on-orbit operations sup-port, and space-based weather monitoring. He has a B.S. in mechanical engineering from Rice University and an M.S. in aerospace engineering (astronautics) from the University of Southern California.
Glenn E. Peterson, Senior Engineering Special-ist, System Analysis and Simulation Subdivision, joined Aerospace in 1997. He works on a variety of topics including space debris, collision analy-sis, meteor showers, and satellite disposal. He has a B.S. and an M.S. in aerospace engineering from San Diego State University, and a Ph.D. from the University of Texas at Austin.
ADEPT ConclusionThe ADEPT simulation process enables projections of the future orbital debris environment resulting from various sce-narios. It can model the impact of changes in launch traffic patterns and identify effective debris mitigation approaches. The future debris environment representations generated by ADEPT can be used to determine satellite collision avoid-ance frequency and associated maneuver requirements and to support other types of mission utility analysis. Used ef-fectively, ADEPT studies can help identify debris mitigation approaches that maximize the long-term sustainability of space for future generations at reasonable cost to the current generation.
Cour
tesy
of N
ASA
A small piece of space debris traveling at 17,000 miles per hour carries a lot of energy. This photo depicts damage to the Hubble telescope caused by debris.

CROSSLINK FALL 201514
First Responders in Space: The Debris Analysis Response TeamAerospace has been providing quick situational awareness to government decision-makers
concerned about the effects of energetic space breakups.
Brian Hansen, Thomas Starchville, and Felix Hoots

CROSSLINK FALL 2015 15
On January 11, 2007, China tested an antisatellite weapon against the defunct Fengyun-1C weather sat-ellite. As sensors in the U.S. Space Surveillance Net-
work began to detect thousands of new objects where there had previously been only one, government leaders started grappling with a host of unanswered questions: Are any U.S. satellites at significant risk from the debris cloud? How long will the new debris stay in orbit? Will the risk dissipate, and if so, how long will it take?
These leaders turned to The Aerospace Corporation for answers, and the result was the formation of the Debris Analysis Response Team, or DART, a unique rapid-response capability for assessing the risk posed by space breakup debris. This team immediately set to work, applying a diverse set of skills and expertise in areas such as trajectory recon-struction algorithms, hypervelocity collision models, and fragment propagation and cloud density modeling.
Within a day of the Chinese antisatellite test, DART provided a report detailing the risk over time from the debris to a large list of satellites of interest. In the ensuing months, a process was established for Aerospace to provide opera-tional call-up support to multiple customer space operations centers. At the same time, the variety and quality of DART products were improved, and the total response timeline was brought down to just a few hours.
Inherent RiskTraditional collision avoidance risk analysis is inadequate for assessing the debris risk from energetic breakups for two important reasons. First, it can take weeks or months for the Space Surveillance Network to obtain enough tracking data to determine the orbits of the individual fragments. Second, the network can only track debris larger than about 10 centi-meters, but a fragment as small as 1 centimeter can destroy a satellite—and a high-energy collision produces exponentially more small fragments than large ones.
The DART process overcomes these limitations by using the IMPACT model to create a statistical cloud of breakup debris that includes fragments all the way down to 1 centi-meter. This information can then be used to model a variety of breakup types, including on-orbit collisions, spontaneous explosions, and even missile intercepts.
Space already contains a large quantity of debris, includ-ing the trackable objects in the Space Catalog as well as smaller debris that cannot be tracked. The amount of smaller debris is estimated from intense radar sampling and from examining objects that are retrieved from orbit (such as the space shuttle windshield). Each day, a spacecraft accumulates risk of collisions with these existing objects. This “back-ground risk” is an accepted part of space operations.
Initially, DART results were presented in absolute terms, but this led to confusion about the risk levels that should be considered significant. For instance, is a daily collision risk of one in a million something to worry about? To put these questions in context, Aerospace started to report the risk level relative to the background—that is, how much risk does a satellite experience after a nearby breakup compared to what it experienced before? For example, a relative risk level of 2 would mean that a satellite experiences the same level of risk in one day as it would have experienced in two days before the breakup.
DART ProductsOver the years, a set of standard DART products has been developed and refined through customer feedback. Risk timeline plots present the daily relative risk for a small set of satellites over the first two weeks following a breakup. This reveals risk trends and provides the most essential informa-tion for individual satellite operators. The same data is ag-gregated in risk scatter plots that show the risk to all satellites of interest at once, but just one day at a time. This format is intended to help senior decision-makers quickly visualize the
Space Catalog Number Name Relative Absolute
23546 ORBCOMM-FM-2 4.72 1.56e-6
14780 LANDSAT 5 3.33 2.00e-5
25480 ORBCOMM-FM-26 2.73 6.66e-7
25479 ORBCOMM-FM-25 2.20 4.64e-7
25476 ORBCOMM-FM-22 1.99 3.81e-7
25682 LANDSAT 7 1.94 1.83e-5
25481 ORBCOMM-FM-27 1.87 3.37e-7
25119 ORBCOMM-FM-7 1.82 3.19e-7
25112 ORBCOMM-FM-8 1.79 3.05e-7
25415 ORBCOMM-FM-19 1.75 2.90e-7
Highest Relative Risk Customer name: JSpOCEvent title: Collision Protected list: AllDebris from: both objects Day: 10-21-2012
Top-risk tables such as this display the ten sat-ellites facing the greatest risk on a given day.

CROSSLINK FALL 201516
risk to an entire fleet of satellites and easily identify the high-est levels of risk. Top-risk tables then provide the actual risk numbers for the ten satellites with the highest risk on a given day. Another set of DART products provide insight into the effect of the debris event on the space environment and the Space Surveillance Network. A fragment-distribution plot shows the number of fragments larger than a given cutoff size, highlighting thresholds of trackability. A debris-decay plot shows the percentage of fragments and total fragment mass remaining in orbit over time. A spatial density plot is similar to a decay plot, but uses color scales to show the
number of fragments remaining on orbit as a function of both time and altitude, highlighting altitude bands with the highest fragment density and revealing the persistence of these high-risk regions. Finally, the DART process produces a visualization file for animating the debris cloud evolution in Aerospace’s Satellite Orbit Analysis Program (SOAP). This gives unparalleled insight into the geometry of satellite-cloud encounters and reveals the way debris disperses over time.
The difficulty of maintaining scripts to paste these vari-ous tools together into an analysis flow spurred the develop-
January 2007
Relative RiskDebris from both objects
Event title: FY-1CType of event: satellite intercept
Object #1: ASAT interceptorDry mass: 35 kgFragmentation: 100%# of fragments ≥ 1 cm: 17,094
Object #2: (25730) Fengyun-1CDry mass: 958 kgFragmentation: 100%# of fragments ≥ 1 cm: 299,682
Risk
rela
tive
to b
ackg
roun
d
11 12 13 14 15 16 17 18 19 20 21 22 23 24
300
100
30
10
3
1
Time of event: 01/11/2007 22:26:09.066 ZRun time: 05/15/2014 13:38:46.834 Z
Aureole 3ClementineCosmos 2056Diademe 1EnvisatGlobal Star Mo25Iridium 43Iridium 54Molniya 1-53MOS 1B (MOMO 1B)OPS 5798 (Transit 5B-4)SJ-5Solrad 7ASpot 4
Risk timeline plots such as this present the daily relative risk for a small set of satellites during the first two weeks after a breakup. This reveals risk trends and provides the most critical information for individual satellite operators.
Relative RiskDebris from both objects
Event title: CollisionType of event: on-orbit collision
Risk
rela
tive
to b
ackg
roun
d
10
5
3
2
1
Time of event: 10/21/2012 20:57:26.000 ZAnalysis time: 11/09/2012 19:03:51.572 Z
Object #1: (20608) MACSAT 2 (M2)Dry mass: 68 kgFragmentation: 100%# of fragments ≥ 1 cm: 28,676
Object #2: (29107) CLOUDSATDry mass: 848 kgFragmentation: 100%# of fragments ≥ 1 cm: 291
HubbleISSIridiumNASA_HIORBCOMM
,286
Risk scatter plots such as this show the risk to all satellites of interest, one day at a time. This can help decision-makers quickly visual-ize the risk to an entire fleet of satellites and identify the areas of greatest concern.

CROSSLINK FALL 2015 17
Debris DecayDebris from: 29247
Event title: Cosmos 2421 explosion Type of event: satellite breakupType of breakup: explosion assumedTime of event: 3/14/2008 04:29:00.000 ZRun time: 10/23/2014 13:45:38.279 Z
Rem
aini
ng (%
)
100
90
80
70
60
50
40
30
20
10
0
Object: (29247) Cosmos 2421Dry mass: 3200 kgFragmentation: 100%# of fragments ≥ 1 cm: 198
2008
14 19 24 29 3 8 13 18 23 28 3 8 13April MayMarch
Fragment countFragment mass
Debris-decay plots such as this show the per-centage of fragments and total fragment mass remaining in orbit over time.
2009/02/12 00:07:39.7990 UTC
Iridium-17Envisat
Aureole S
Diademe 1Globalstar MO25
Iridium-32
Iridium-33 (debris)Iridium-7Iridium-57
Cosmos 2251 (debris)
Iridium-6
Using the Satellite Orbit Analysis Program (SOAP), analysts can visualize the geometry of satellite-cloud encounters and understand how debris disperses over time.
ment of an integrated tool consisting of a graphical user in-terface on the front end and a computing cluster on the back end to rapidly crunch the numbers. The tool is now simple enough that a single user with no technical debris knowledge can perform an analysis after just a few hours of training. In fact, the tool has mostly replaced the need for a full team, as it can now be run by a single operator. The tool has enabled extremely rapid response times, with the SOAP visualization being produced just minutes after an event, followed by the full risk reports a few hours later. One of the motivations for the tool was to serve as a prototype of an operational system
and to identify the requirements for a full acquisition. Over the years, Aerospace has continued to improve the
underlying components that make up DART. For example, one research effort developed an innovative method for obtaining the initial conditions for a spontaneous breakup by moving the resulting debris backward in time to estimate the explosion energy. Aerospace has also been participat-ing (along with NASA, the Air Force, and the University of Florida) in the DebriSat experiment, in which a satellite replica was destroyed in a hypervelocity collision in a labora-tory to characterize the effects; the resulting data is being

CROSSLINK FALL 201518
• Ballistic intercepts need external trajectory data
• Breakup and collision events areusually identified from observations of unexpected high object headcounts
• “What-if” and preplanned events analyses have other inputs
Trajectoryreconstruction(Fusion Center)
Target ID/eventcharacterization
NASAmay depend onDART for inputs
to SBRAM
Environmentdata
Orbitcatalog
Assetlists
Risk processing requiressignificant computing power;
front/back end is currently a single workstation
Debris generation(IMPACT breakup
modeling)
Collision riskassessment
(Debris prop)
Generate reports,visualization
(DART, SOAP)
Missionground
sites
Other customeroperations
centers
DART
JSpOC
The DART process uses Aerospace’s IMPACT model to create a statistical cloud of breakup debris that includes fragments down to 1 cen-timeter. The data can then be used to model a variety of breakup events and quantify the risks to active satellites. The SBRAM refers to NASA's satellite breakup risk assessment model.
(24946) Iridium 33
Estimate of trackable fragments:
size < 3 cm3 cm ≤ size < 10 cm
22,4341187
137279
94.435.000.5810 cm ≤ size
(22675) Cosmos 2251
Estimate of trackable fragments:
size < 3 cm3 cm ≤ size < 10 cm
128,0236945
7841588
94.315.120.5810 cm ≤ size
10 cm ≤ sizeCombined
Estimate of trackable fragments:
size < 3 cm3 cm ≤ size < 10 cm
150,4578132
9211867
94.325.100.58
Cloud Source Cutoff Number Percent
Cutoff size (cm)
Won’t betracked
May betracked
Should betracked
Num
ber o
f orb
ital f
ragm
ents
≥ c
utof
f siz
e
1 2 3 5 10 20 30 50 100 200 300 500 1000
107
106
105
104
103
102
101
100
Combined(22675) Cosmos 2251(24946) Iridium 33
Event title: Cosmos-IridiumType of event: On-orbit collisionTime of event: 2/10/2009 16:55:59.796 ZRun time: 9/4/2014 13:36:27.946 Z
Object #1: (24946) Iridium 33Dry mass: 556 kgFragmentation: 15%# of fragments ≥ 1 cm: 35,022
Object #2: (22675) Cosmos 2251Dry mass: 900 kgFragmentation: 55%# of fragments ≥ 1 cm: 171,886
Debris Fragment Size DistributionFragment-distribution plots such as this show the number of fragments based on size. The event depicted here produced significantly more untrackable fragments than trackable debris.
analyzed to improve the breakup models used for DART and other tools. Aerospace developed the groundbreaking covariance-based risk assessment (COBRA) model, which is the first method to formally incorporate the uncertainty of debris and satellite positions into the risk computation. The incorporation of orbital perturbation forces further extended the DART process to include breakups in middle and geosta-tionary orbits as well as low Earth orbits. Other investment has significantly improved the DART computing resources and allowed the development of a fully scalable framework
for predicting debris fragments forward in time. Recently, the spatial density plot was improved to more accurately depict the long-term dispersion of debris not just in altitude, but in all dimensions. Similarly, the SOAP visualization has been made progressively faster, with enhanced features to highlight when satellites fly through the most dangerous parts of a debris cloud, facilitating a quick rough estimate of satellite risk levels.
In addition to being used for actual debris event sup-port, DART has been used to support other requirements.

CROSSLINK FALL 2015 19
Often, the government will ask for a predictive analysis on a pending close approach with a high probability of collision. This type of “what-if ” analysis means that the government would have the debris risk results in hand immediately if the objects actually collide. It also can provide insight into what kinds of risk to expect from these types of events. DART is also used during government exercises and war games, providing realism to support decision-making and planning in the event of a hypothetical attack. Finally, DART is often used for parametric studies, investigating questions such as the dependence of debris risk on the breakup satellite’s mass or the interceptor’s velocity. One study looked at how the risk to a constellation of satellites was affected by the prox-imity of the disposal orbit of the breakup satellite.
Looking AheadSince the first DART analysis of the Fengyun-1C breakup in 2007, Aerospace has provided operational support to many major space events, exercises, and studies, including the USA-193 shoot-down in 2008, the Cosmos-Iridium colli-sion in 2009, a Briz-M explosion in 2012, and the Defense Meteorological Satellite Program 13 spontaneous breakup in 2015. The team also facilitated a number of major studies that were used to inform space policy. On average, the team is called up for analysis by the U.S. government three or four times per year, including exercises and studies in addition to actual events.
Although Aerospace has been providing operational DART support to the U.S. government for more than eight
There is something about space debris that strikes a chord with the general public, and this is especially true with children. The Aero-space Corporation’s CORDS (Center for Orbital and Reentry Debris Studies) team has found itself thrust into the spotlight because of this popularity, and represents the corporation in public settings where STEM (science, technology, engineering, and math) initiatives and an interest in space coincide.
A reentry of space debris or a collision of satellites (functioning or not) is an event that signals work firmly in the CORDS charter. This is likewise true for close approaches of asteroids that may impact Earth. When these events occur (or have the possibility of happen-ing), media attention garners further public interest. Indeed, the most visited portion of Aerospace’s web site is the CORDS reentry prediction page, which attracts public sightings of reentering debris. Space debris also inspires great visuals, and this too works well in our tech-savvy culture.
The topic of space debris offers a unique opportunity for Aerospace to support STEM education and outreach activities. A number of documentaries about the space debris problem, as well as the re-lease of the 2013 movie Gravity, also triggered greater public inter-est in, and knowledge of, space debris. Aerospace has participated in a number of collaborative efforts with public and private groups to address this interest, educate the public, and most important, help children understand and be inspired by the opportunities available to them for work in the STEM disciplines.
The corporation has recently initiated the Greater Los Angeles Education-Aerospace Partnership (Great-LEAP), which is focused on engaging with local middle and high school teachers and students. Aerospace volunteers work with Los Angeles–area teachers to demonstrate real-world applications for their math and science course material. The Aerospace East team has similarly partnered with Fairfax County Public Schools in Virginia through its Expanding Visions program, which helps bridge the gap between the classroom and the skills required for technical professions.
Throughout the year, Aerospace sponsors the U.S. FIRST Robotics competition on both the East and West Coasts, as well as in Colo-rado. Aerospace is also a member of Change the Equation, which brings together 100 companies across multiple sectors that are dedi-cated to preparing students for STEM-related careers.
MathCounts, a national enrichment club and competitive program, and the Mathematics, Engineering, Science Achievement (MESA) group, also work with thousands of educationally disadvantaged students. These too are places in which Aerospace employees volun-teer their time and energy each year. The Albuquerque, New Mexico, Aerospace office also sponsors STEM events, with employees visiting local schools and speaking with students about the space, satellite, and missile industry, sharing videos of actual launches, and discuss-ing local career opportunities that will be available to students as they progress through college.
Aerospace has sponsored the Robert H. Herndon Memorial Science Competition for 38 years. The competition invites middle and high school students to display their scientific prowess with live experi-ments and essays held on both the East and West Coast campuses for a day each year in May. The competition was established in memory of Robert H. Herndon, an Aerospace engineer and manager who served as a mentor for many people at the company. The com-petition is designed to stimulate interest among minority students in the STEM disciplines and increase diversity across the aerospace industry.
Sometimes unexpected events happen through the corporation’s STEM-related initiatives too. In 2005–2006, Aerospace collaborated with the Smithsonian’s National Air and Space Museum in Washing-ton, D.C., to sponsor activities for Space Day. The Aerospace display was rated a “top five” in visitor surveys. Later, the corporation developed material used in a short educational film, which remains on continual display today in the Space Hangar of the Udvar-Hazy Center.
– Roger Thompson
Space Debris, Corporate Outreach, and STEM

CROSSLINK FALL 201520
On January 11, 2007, the Chinese government destroyed one of its weather satellites, the Fengyun-1C (FY-1C), in a test and demon-stration of that country’s antisatellite capability. The debris cloud generated was the largest such event ever recorded, and created an estimated 300,000 objects of 1 centimeter or larger—big enough to be fatal to a satellite mission. Of those, approximately 3300 were 10 centimeters or greater in size, large enough to be tracked and added to the resident space object catalog.
The Fengyun (wind cloud) weather satellites were first deployed in the late 1980s. FY-1C was launched on May 10, 1999, into a polar, sun-synchronous, low Earth orbit, with an inclination of approxi-mately 99 degrees. This is one of the best orbits for science and Earth-observation missions, and is used by all spacefaring nations.
The debris cloud created by FY-1C poses significant and ongoing risks to satellites that share its heavily traveled orbit, and compli-
cates the launch and deployment of new satellite missions. Moreover, because of FY-1C’s base altitude, it will require many decades for atmospheric drag to slow the individual pieces of debris enough to cause reentry and clean them from orbit.
The combination of the high number of objects in FY-1C’s debris cloud, their orbits causing frequent conjunctions (close approaches) with other spacecraft, and the longevity of their presence on orbit all serves to highlight the extreme danger to space missions of orbit-al debris. Since the destruction of FY-1C, no nation has intentionally created significant long-lived orbital debris.
– Ted Muelhaupt
The Destruction of the FY-1C
2007
Maximum debris density over all inertial direction bins: log (particles/km3)Bin diameter/height = 46/50 km)
Debris from: both objectsSpatial Density Max
Event title: FY-1CType of event: Satellite interceptTime of event: 1/11/2007 22:26:09.066 ZRun time: 12/3/2014 16:06:12.630 Z
Object #1: ASAT interceptorDry mass: 35 kgFragmentation: 100%# of fragments ≥ 1 cm: 17,094
Object #2: (25730) Fengyun 1CDry mass: 958 kgFragmentation: 100%# of fragments ≥ 1 cm: 299,682
Altit
ude
(km
)
4000
3600
3200
2800
2400
2000
1600
1200
800
400
01/11 1/26 2/10 2/25 3/12 3/27 4/11 4/26 5/11 5/26 6/10 6/25 7/10
-8 -7 -6 -5 -4 -3 -2 -1 0
2012
Debris from: 35491Spatial Density
Event title: GOES_ASAT_From_StudyType of event: Satellite interceptTime of event: 1/30/2012 07:21:29.000 ZAnalysis time: 5/15/2013 15:12:22.248 Z
Object #1: ASAT interceptorDry mass: 50 kgFragmentation: 100%# of fragments ≥ 1 cm: 7792
Object #2: (35491) GOES 14Dry mass: 1300 kgFragmentation: 100%# of fragments ≥ 1 cm: 32,670
Altit
ude
(km
)
36,500
36,400
36,300
36,200
36,100
36,000
35,900
35,800
35,700
35,600
35,500
35,400
35,300
35,200
35,100
35,0001/30 2/4 2/9 2/14 2/19 2/24 2/29 3/5 3/10 3/15 3/20 3/303/25
Spatial density plots such as these use color scales to show the number of fragments remaining on orbit as a function of time and altitude, highlighting regions with the
highest fragment density and revealing the persistence of these high-risk regions.

CROSSLINK FALL 2015 21
years, the company is not well suited to this type of continu-ous duty. Ultimately, DART capability will be adapted for incorporation into the JSpOC mission, but in the meantime, the process is underway to get a version of the tools on the operations floor of the JSpOC. This way, the government will be able to apply DART resources more frequently. At the same time, Aerospace continues to improve its ability to assess the risk from space debris events, and the quick-response team will remain intact in one form or another to provide custom analyses and expert interpretation of any high-profile events. Given the accumulating probability of collision in space, the next Cosmos-Iridium event may only be a matter of time.
Acknowledgement
The authors would like to recognize some DART members who have participated in critical operational analysis over the years, including: Andrew Abraham, Todd Beltracchi, Ron Clifton, Gary Coldren, Jeff Cummings, Tom Gallini, Anne Gick, Alisa Hawkins, Alan Jenkin, Ragini Joshi, Jeff Meech, Glenn Peterson, George Pollock, Brad Shaffer, and Marlon Sorge.
About the AuthorsBrian W. Hansen, Engineering Special-ist, System Analysis and Simulation Subdivision, joined Aerospace in 2005. He conducts astrodynamics analyses for many government programs and leads DART. He has a B.S. and an M.S. in mechanical and aerospace engineering from Utah State University.
Thomas F. Starchville, Jr., Direc-tor, Mission Analysis and Operations Department, System Analysis and Simu-lation Subdivision, joined Aerospace in 1997. He leads and performs launch collision avoidance analyses for the Air Force, the National Reconnaissance Of-fice, and NASA. He also manages space
debris analysis response to real-time events. He has a B.S., M.S., and Ph.D. in aerospace engineering from Penn State University.
Felix R. Hoots, Distinguished Engineer, System Analysis and Simulation Subdivision, joined Aerospace in 2006. He leads astrodynamics and space surveillance operations analyses for government projects. He has a B.S. in physics and an M.S. in mathematics from Tennessee Tech University, and a
Ph.D. in mathematics from Auburn University.
Cour
tesy
of N
ASA
A pair of American astronauts on a space walk to service the Hubble Space Telescope are suddenly ordered to abort the mission and return to the space shuttle orbiter: A Russian missile has destroyed a satellite, setting up a chain reaction that destroys still more satellites in orbit and sends a cloud of fragments and debris hurtling toward them. Before they can return to their spacecraft, the debris field rips through it and tears it to shreds, leaving them stranded in space.
This has never happened in real life; it is the premise of the movie Gravity, which premiered in 2013. However, could it happen? Some of the plot elements are certainly plausible: NASA has indeed sent missions to service the Hubble, and China did use an antisatellite missile to destroy a satellite on orbit. Gravity is a movie, though, and it exaggerates and alters numerous facts to advance its plot. For example, actual space debris clouds are far more spread out than the one depicted on screen, and they move much too fast to be seen (which presents a problem for the visuals). More important, while a debris cascade is possible, the timescale for such an event would be decades and centuries, not minutes (which would make for a very long movie). Thus, the cascade depicted in the movie is impossible.
The producers of the movie also wanted to make a documentary on real space debris to package with the DVD version. In June 2013, they contacted Aerospace and interviewed several debris experts on staff. Bill Ailor of Aerospace’s Center for Orbital and Reentry Debris Studies (CORDS) was interviewed in El Segundo, California, and several shots of the company’s collection of reentered space debris were used in the film. Roger Thompson and Ted Muelhaupt were interviewed in Chantilly, Virginia, where they discussed collision avoidance and other operational impacts of space debris. Other national experts were also interviewed, including Donald Kessler, the NASA engineer whose 1978 paper first identified the cascade that came to be called the Kessler syndrome. The resulting documentary was released as Collision Point: The Race to Clean up Space.
Gravity caused a spike in public interest in the phenomenon of space debris. To help separate fact from fiction, CORDS expanded its public website (http://www.aerospace.org/cords), and in February 2014, Aerospace conducted its first-ever “tweet-up,” in which Ailor, Muelhaupt, Thompson, Kessler, and Hugh Lewis of Southampton University answered questions from the public live on Twitter.
A Starring Role for Aerospace

CROSSLINK FALL 201522
Keeping Track: Space Surveillance for Operational SupportThe proliferation of objects in space has made the job of monitoring them more challenging—
and more essential.
Felix Hoots

CROSSLINK FALL 2015 23
The launch of Sputnik on October 4, 1957, marked the beginning of the Space Age. It also marked the begin-ning of an intense space race that brought a remarkable
rate of rocket launches. In a very short time, the number of objects in orbit grew dramatically. This created a host of strategic challenges, including the need for space surveil-lance. In particular, the Air Force needed a way to prevent false alarms as satellites came within view of missile-warning radars, while the Navy needed a way to alert deployed units of possible reconnaissance by satellites overhead.
These needs led to the establishment of a military mis-sion to maintain a catalog of all Earth-orbiting objects—ac-tive payloads, rocket bodies, and debris—along with detailed information about trajectory and point of origin. Such a catalog could be used to filter normal orbital passages from potential incoming missiles and predict the passage of suspected spy satellites. The first catalog was relatively small in comparison with today’s version, which lists more than 22,000 items (as of May 2015). Also, the current version sup-ports much more than the original military mission—and Aerospace is helping to extend its utility even further.
The Space CatalogThe Space Catalog is maintained by the Joint Space Opera-tions Center (JSpOC) at Vandenberg Air Force Base, part of U.S. Strategic Command. One of the missions of JSpOC is to
detect, track, and identify all artificial objects in Earth orbit. A key component of this mission is the Space Surveillance Network, a worldwide system of ground-based radars along with ground-based and orbital telescopes. The radars are used primarily for tracking near-Earth satellites with orbital period of 225 minutes or less, as well as some eccentric orbits that come down to near-Earth altitudes as they go towards their perigee. Ground-based telescopes are used for tracking more distant satellites, with orbital period greater than 225 minutes, and space-based sensors are used to track both near and distant satellites.
The JSpOC tasks these sensors to track specific satellites and to record data such as time, azimuth, elevation, and range. This data is used to create orbital element sets or state vectors that represent the observed position of the satel-lite. The observed position can then be compared with the predicted position. The dynamic models used for predicting satellite motion are not perfect; factors such as atmospheric density variation caused by unmodeled solar activity can cause the predicted position to gradually stray from the true position. The observations are used to correct the predicted trajectory so the network can continue to track the satellite. This process of using observations to correct and refine an orbit in an ongoing feedback loop is called catalog main-tenance, and it continues as long as the satellite remains in orbit. Ideally, the process is automatic, with manual inter-
Thule
Fylingdales
Globus II
Moron OpticalSurveillance System(MOSS)
Ascension Diego Garcia(GEODSS)
Kwajalein(RTS)
ShemyaCobra Dane
Clear
Cavalier
Beale
Maui(GEODSS)
(MSSS)
Cape Cod
Millstone/Haystack/Auxilliary
Socorro(GEODSS)
Eglin
Dedicated ~25% ~90% Collateral ~70% ~5% Contributing ~5% ~5%
•••
Near Deep Earth (NE) Space (DS)
SensorCategory
The U.S. Space Surveillance Network is a global system of ground-based radars along with ground-based and orbital telescopes.

CROSSLINK FALL 201524
vention only required when satellites maneuver or get near to reentry due to atmospheric drag.
Sometimes, however, more effort is required. For example, a sensor may encounter a satellite trajectory that does not correspond well to anything in the catalog. Such observations are known as partially correlated observations if they are somewhat close to a known orbit or uncorrelated observations (or uncorrelated tracks) if they are far from any known orbit. Also, if a satellite is not tracked for five days, it is placed on an attention list for manual intervention. In that case, an analyst will attempt to match the wayward satellite to one of these partially correlated or uncorrelated tracks. If that effort succeeds, then the element sets are updated, and the object is returned to automatic catalog maintenance. On the other hand, if the satellite cannot be matched to a par-tially correlated or uncorrelated track, the satellite informa-tion continues to age. If it reaches 30 days without a match, the satellite is placed on the lost list.
Risk PredictionOne of the most visible uses of the catalog is to warn about collision risks for active payloads. This function predicts potential close approaches three to five days in advance to allow time to plan avoidance maneuvers, if necessary. Unplanned maneuvers may disturb normal operations and deplete resources for future maneuvers, so one would like to have high confidence in the collision-risk predictions. The reliability of the predictions depends directly on the accu-racy of the orbit calculation, which in turn depends on the quality and quantity of the tracking data, which is limited by the capability of the Space Surveillance Network. Simply put, there are not enough tracking resources in the network to achieve high-quality orbits for every object in the catalog. Furthermore, many smaller objects can only be tracked by the most sensitive radars, and this tracking is infrequent. Most objects in the catalog are considered debris, which can neither maneuver nor broadcast telemetry. On the other hand, some satellite operators depend exclusively on the sat-ellite catalog to know where their satellites are, and users of the satellite orbital data depend on the catalog to know when the satellites will be within view.
This situation creates a challenging problem in balanc-ing Space Surveillance Network resources to support the collision-warning task (tracking as many potential hazards as possible) while also providing highly accurate support to operational satellites (tracking the spacecraft as precisely as possible). The practical solution is to perform collision risk assessment using a large screening radius to ensure no close approaches are missed despite lower-quality predictions. Once an object is identified as having a potentially close approach, then the tasking level is raised, with the expecta-tion that more tracking data will be obtained to refine the collision risk calculations. When the danger has passed, the object reverts to a normal tracking level.
Collisions and spontaneous breakups do happen. The
first satellite breakup occurred on June 29, 1961, when residual fuel in an Ablestar rocket body exploded, creating 296 trackable pieces of debris. Since that time, there have been more than 200 satellite breakups, the most notable be-ing the missile intercept of the Fengyun-1C satellite, which created more than 3300 trackable fragments. In most cases, these breakups are first detected by the phased-array radars in the Space Surveillance Network. When multiple objects are observed where only one was expected, the downstream sensors are alerted, but no tasking is issued because specific debris orbits are not yet established. Tracks are taken and tagged as uncorrelated. Analysts at JSpOC then attempt to link uncorrelated tracks from different sensors to form a candidate orbit. Subsequent tracking improves the orbit to the point that the object can be named and numbered and moved into the catalog for automatic maintenance.
Although the JSpOC mission requires tracking of all or-biting objects, fragmentation events create a range of debris sizes, many of which are too small to track. A piece of debris (or even an active CubeSat) near the limit may or may not
To help predict possible collisions, mission operators rely on visualizations such as this, which shows the intersection of covariance ellipsoids for two orbiting objects (note: the satellites depicted are not to scale within the ellipsoids).
Space Surveillance by the Numbers(As of May 2015, according to U.S. Strategic Command)
16,140 Number of satellites in the Space Catalog
5000 Analyst catalog
5 percentPortion of the catalog that represents functioning payloads
8 percentPortion of the catalog that represents rocket bodies
87 percentPortion of the catalog that represents defunct payloads and debris
400,000Average number of daily observations collected by the Space Surveillance Network

CROSSLINK FALL 2015 25
be detected consistently—it depends on reflectivity (optical or radar) as well as the number of sensors that can track it (each has different sensitivity).
Network UpgradesAerospace is involved in several activities to create a more complete and accurate catalog. For example, recent Aero-space research in partnership with NASA has quantified the accuracy of the catalog “covariances,” or degrees of uncer-tainty about orbital position. Orbit prediction models do not perfectly follow the real world, and when dealing with ob-jects moving at hypervelocity, small differences can have big effects. If the covariance estimate is too large or too small, that can lower or raise the probability of collision by an or-der of magnitude or more. Hence, having the correct covari-ance is fundamental to making collision avoidance decisions. Aerospace has developed a process not only to properly size the covariance but also to provide a confidence assessment of the covariance. This technique is undergoing operational validation and will significantly improve collision avoidance decisions at NASA and other operational satellite centers.
Another effort is focused on processing uncorrelated tracks. Any uncorrelated track detected by the Space Sur-veillance Network is evidence that a real object has been detected, but not one that matches anything in the catalog. Aerospace is supporting an initiative sponsored by the Air Force Research Laboratory to evaluate modern approaches to processing uncorrelated tracks using techniques such as multihypothesis tracking and constrained admissible regions. These techniques process data sequentially, start-ing from a single track and looking for subsequent tracks that may be the same object. Multiple subsequent tracks
are assigned a likelihood of pairing with the original track. This process continues until each sequence of tracks can be determined to be dynamically consistent or not.
Perhaps the most significant change will arise through the procurement of better sensors. The Air Force has recently awarded a contract to develop a new surveillance
These plots show how the amount of cataloged debris from three fragmentation events expanded over time.
The Space Surveillance Telescope enables highly accurate detection, tracking, and identification of deep space objects. Extremely agile, it can scan an area in space the size of the United States in seconds and captures a terabyte of data each night. It has recently been deployed to a site in Western Australia. (Images courtesy of the Defense Advanced Research Projects Agency.)
0 365 730 1095 1460 1825 2190 2555 29200
500
1000
1500
2000
2500
3000
3500
4000
Days since December 31, 2006
99025 FY-1C97051 Iridium 3393036 Cosmos 2251
Obj
ect c
ount
Cour
tesy
of D
ARPA
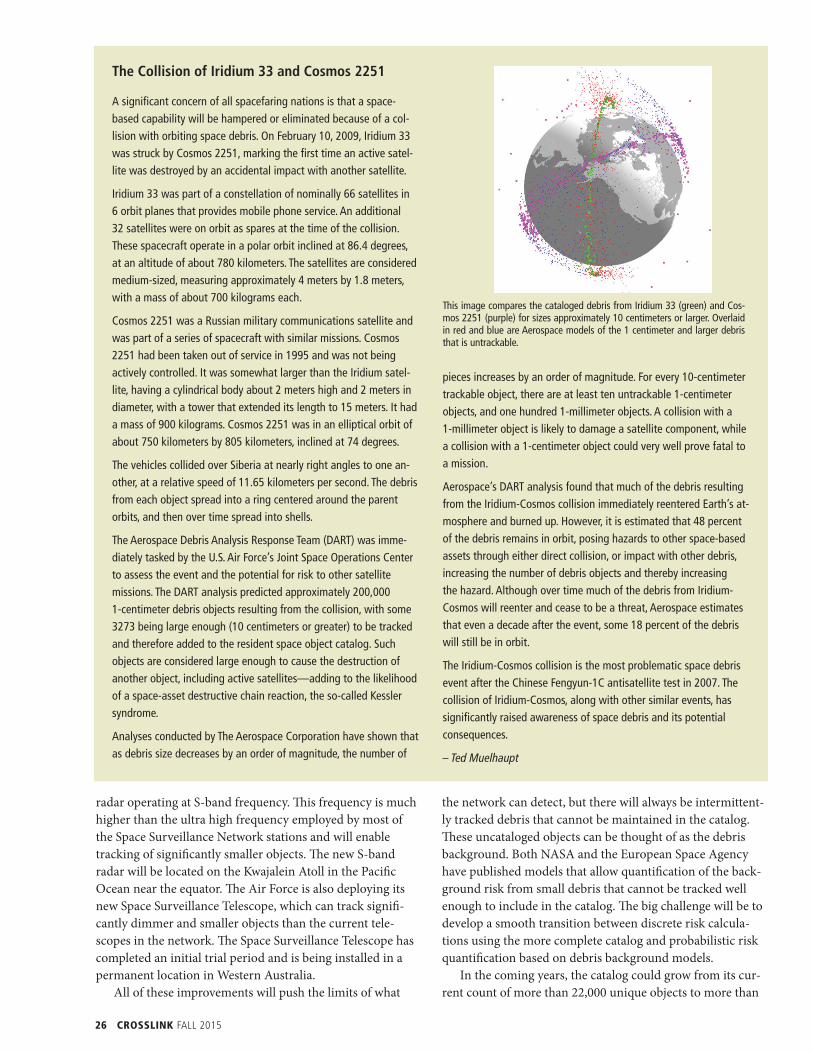
CROSSLINK FALL 201526
radar operating at S-band frequency. This frequency is much higher than the ultra high frequency employed by most of the Space Surveillance Network stations and will enable tracking of significantly smaller objects. The new S-band radar will be located on the Kwajalein Atoll in the Pacific Ocean near the equator. The Air Force is also deploying its new Space Surveillance Telescope, which can track signifi-cantly dimmer and smaller objects than the current tele-scopes in the network. The Space Surveillance Telescope has completed an initial trial period and is being installed in a permanent location in Western Australia.
All of these improvements will push the limits of what
the network can detect, but there will always be intermittent-ly tracked debris that cannot be maintained in the catalog. These uncataloged objects can be thought of as the debris background. Both NASA and the European Space Agency have published models that allow quantification of the back-ground risk from small debris that cannot be tracked well enough to include in the catalog. The big challenge will be to develop a smooth transition between discrete risk calcula-tions using the more complete catalog and probabilistic risk quantification based on debris background models.
In the coming years, the catalog could grow from its cur-rent count of more than 22,000 unique objects to more than
The Collision of Iridium 33 and Cosmos 2251
A significant concern of all spacefaring nations is that a space-based capability will be hampered or eliminated because of a col-lision with orbiting space debris. On February 10, 2009, Iridium 33 was struck by Cosmos 2251, marking the first time an active satel-lite was destroyed by an accidental impact with another satellite.
Iridium 33 was part of a constellation of nominally 66 satellites in 6 orbit planes that provides mobile phone service. An additional 32 satellites were on orbit as spares at the time of the collision. These spacecraft operate in a polar orbit inclined at 86.4 degrees, at an altitude of about 780 kilometers. The satellites are considered medium-sized, measuring approximately 4 meters by 1.8 meters, with a mass of about 700 kilograms each.
Cosmos 2251 was a Russian military communications satellite and was part of a series of spacecraft with similar missions. Cosmos 2251 had been taken out of service in 1995 and was not being actively controlled. It was somewhat larger than the Iridium satel-lite, having a cylindrical body about 2 meters high and 2 meters in diameter, with a tower that extended its length to 15 meters. It had a mass of 900 kilograms. Cosmos 2251 was in an elliptical orbit of about 750 kilometers by 805 kilometers, inclined at 74 degrees.
The vehicles collided over Siberia at nearly right angles to one an-other, at a relative speed of 11.65 kilometers per second. The debris from each object spread into a ring centered around the parent orbits, and then over time spread into shells.
The Aerospace Debris Analysis Response Team (DART) was imme-diately tasked by the U.S. Air Force’s Joint Space Operations Center to assess the event and the potential for risk to other satellite missions. The DART analysis predicted approximately 200,000 1-centimeter debris objects resulting from the collision, with some 3273 being large enough (10 centimeters or greater) to be tracked and therefore added to the resident space object catalog. Such objects are considered large enough to cause the destruction of another object, including active satellites—adding to the likelihood of a space-asset destructive chain reaction, the so-called Kessler syndrome.
Analyses conducted by The Aerospace Corporation have shown that as debris size decreases by an order of magnitude, the number of
pieces increases by an order of magnitude. For every 10-centimeter trackable object, there are at least ten untrackable 1-centimeter objects, and one hundred 1-millimeter objects. A collision with a 1-millimeter object is likely to damage a satellite component, while a collision with a 1-centimeter object could very well prove fatal to a mission.
Aerospace’s DART analysis found that much of the debris resulting from the Iridium-Cosmos collision immediately reentered Earth’s at-mosphere and burned up. However, it is estimated that 48 percent of the debris remains in orbit, posing hazards to other space-based assets through either direct collision, or impact with other debris, increasing the number of debris objects and thereby increasing the hazard. Although over time much of the debris from Iridium-Cosmos will reenter and cease to be a threat, Aerospace estimates that even a decade after the event, some 18 percent of the debris will still be in orbit.
The Iridium-Cosmos collision is the most problematic space debris event after the Chinese Fengyun-1C antisatellite test in 2007. The collision of Iridium-Cosmos, along with other similar events, has significantly raised awareness of space debris and its potential consequences.
– Ted Muelhaupt
This image compares the cataloged debris from Iridium 33 (green) and Cos-mos 2251 (purple) for sizes approximately 10 centimeters or larger. Overlaid in red and blue are Aerospace models of the 1 centimeter and larger debris that is untrackable.

CROSSLINK FALL 2015 27
100,000. Most of this growth will result from being able to track smaller objects that already exist. This growth presents yet another problem that stems from the current convention of using five-digit numbers to uniquely identify each cata-loged object. The Air Force is considering what to do when the catalog exceeds 99,999 objects. Although this seems like just a nuisance problem at first, the effects on operational systems will be just as far-reaching as the Y2K problem at the turn of the century.
ConclusionThe space catalog growth will certainly trigger a greater number of collision risk alerts. A proper response to these alerts will require greater confidence in predictions and their underlying covariance along with greater automation in decision making. Certainly, the space pioneers never en-visioned that the vast majority of orbiting objects would be debris—nor would they have envisioned that alerting satel-lite operators about potential collisions would be a full-time
job for some of the analysts at JSpOC. Nevertheless, this is the environment in which satellites currently operate. A robust Space Surveillance Network and the space situational awareness that it enables are the cornerstones to ensuring a safe operational environment.
External tank
Main propulsion unit
China’s Yinghuo-1 lander
TRUSS
Phobos lander
Return vehicle
Descent capsule
and
inopt
Maprouni
Exte
Cll
Mpu
Cll
pu
About the Author
Felix R. Hoots, Distinguished Engineer, System Analysis and Simulation Sub-division, joined Aerospace in 2006. He leads and performs astrodynamics and space surveillance operations analyses for various government projects. He has a B.S. in physics and an M.S. in math-ematics from Tennessee Tech University,
and a Ph.D. in mathematics from Auburn University.
Phobos-Grunt and Reentering Debris
During the fall of 2011, there was a series of high-profile reentries that raised public awareness about space debris. In September, the NASA Upper Atmosphere Research Satellite reentered Earth's at-mosphere, with the event closely watched by the media. In October, the European Space Agency's ROSAT satellite made a similar high-profile reentry, but in the end, no debris was observed or recovered from either spacecraft.
In November 2011, Russia launched a scientific mission intended to collect a soil sample from the Martian moon Phobos and return it to Earth. Unfortunately, the upper stage designed to send the spacecraft to Mars failed to ignite, and the Phobos-Grunt (Phobos soil) spacecraft was stranded in a rapidly decaying low Earth orbit. The vehicle stack contained approximately 11,000 kilograms of toxic fuel and oxidizer; if the fuel tank survived reentry and hit the ground, contamination from the fuel could affect an unknown loca-tion and population. Russian efforts to recover the spacecraft were unsuccessful, and a number of U.S. Strategic Command elements, including the U.S. Air Force's Joint Space Operations Center (JSpOC), conducted contingency operations in November and December.
Aerospace began a variety of analytical efforts soon after Phobos-Grunt became stranded, including a breakup analysis that exam-ined potential hazards from the reentry, and determined a possible debris footprint. The analysis showed a possibility that toxic fuel might survive the reentry. Once that fact was established, Aero-space became the primary analytical resource for the government’s response to the potential hazard.
From November to the January reentry, Aerospace conducted a continuing analysis of the potential reentry locations. New tools were developed to rapidly predict any surviving debris and estimate the impact location in real time. As the reentry drew closer, Aero-space provided on-site operational support at the JSpOC and other
locations to assist the Air Force’s final monitoring of the reentry. Phobos-Grunt reentered safely over the South Pacific on January 15, 2012. Aerospace predicted the possible survival of debris in the Andes Mountains and Argentina, but no debris has ever been reported.
– Ted Muelhaupt

CROSSLINK FALL 201528
Look Before You Leap: Collision Avoidance for Launch ProtectionThe Aerospace Corporation has been providing collision avoidance support for
space launches since the mid-1990s.
Thomas Starchville, W. Todd Cerven, and Ted Muelhaupt

CROSSLINK FALL 2015 29
Space is big, but far from empty. A vast array of objects are in orbit around Earth. Some of these are operational spacecraft, but most are considered debris—spent
rocket stages, defunct satellites, collision fragments, lens caps, even an astronaut’s tool bag. To get a payload to its mis-sion orbit, a launch vehicle must chart a course through this constantly shifting field of debris—and unlike a car, it cannot swerve around junk in its path.
Much of this debris is continuously tracked by the U.S. Space Surveillance Network, a global assemblage of radars, optical telescopes, and space-based sensors. The network can track items in low Earth orbit (LEO) and in geosynchronous orbit (GEO). All of these tracked objects make up the so- called Space Catalog.
Before a launch vehicle can lift off, its trajectory must be checked against the trajectories of objects in the Space Catalog—and with thousands of objects being tracked, that is no small task. Every launch must take place within a limited time frame, or launch window, based on mission objectives and launch constraints. This launch window can range from a few minutes to a few hours in duration, and liftoff can occur at any moment during that time. For gov-ernment customers, The Aerospace Corporation conducts collision avoidance screenings for every possible liftoff time throughout the window to ensure that launched objects—both rockets and payloads—have an acceptably low risk of collision with cataloged objects on orbit. While the risk of collision is actually low compared to other launch risks, the consequences are high.
When Aerospace first began this type of support, the launch opportunities were screened against a miss distance of at least 25 kilometers between a launch object and a cata-log object. As space became more crowded, this large thresh-old was tending to close too many opportunities across the available window. Aerospace analysts recognized the need to maximize the number of available launch opportunities within the window, and pioneered tools and methods for screening close approaches based on a probability of colli-sion instead of a strict separation distance. The result was that many additional launch opportunities became available. For example, while nearly 95 percent of the launch opportu-nities for a particular LEO mission could be blocked using a 25 kilometer separation threshold, only 30 percent are closed when a probability of collision threshold is used. Using the probability of collision is a little more complicated because it requires not only the position and velocity (states) of the objects for the entire time span, but also the level of uncer-tainty (or covariance) about those states. That uncertainty can be described as an ellipsoidal cloud; the distribution of the likely states is highest near the center of the cloud and gradually lessens as the distance from the center increases. Thus, the size and orientation of those ellipsoidal uncertainty clouds (described by the covariance) are just as important as the states themselves.
Aerospace’s software tool CollisionVision was developed specifically to compute the probability of collision for both launch and orbital operations. For each launch opportunity, the tool examines the launch vehicle trajectory against the
LEO GEOMEO
25
0
100
75
50
Laun
ch w
indo
w b
lock
age
(per
cent
)
25 km separation criteria> 10-7 probability criteria> 10-6 probability criteria
In the past, launches had to maintain a minimum separation distance from known space objects, but that was tending to close too many launch windows. Assessing launch risk according to collision probability opens many more launch opportunities.
Cour
tesy
of U
nite
d La
unch
Alli
ance
The level of uncertainty (or covariance) concerning a satellite’s position can be described as an ellipsoidal cloud; the distribution of the likely states is highest near the center of the cloud and gradually lessens with distance from the center. The size and orientation of these ellipsoids are just as important as the states themselves in predicting the probability of collision. The image here is from an early version of CollisionVision, a software tool developed at Aerospace to compute the probability of collision for both launch and orbital operations.

CROSSLINK FALL 201530
space object catalog, identifying potential conjunctions and assessing the risk. It has undergone a rigorous internal verification and validation effort and remains under strict configuration control because the results are used for mis-sion operations.
The Air Force Safety Center has published instructions to help prevent the creation of space debris. One important di-rective states that all objects in the catalog are to be screened for potential close approaches with all launch vehicle objects. If any launch object falls within a certain threshold for col-lision with a known space object (as determined by miss distance or collision probability), the launch must be held until the danger passes. This is known as a safety closure, and it is mandatory.
Another type of window closure—the mission assurance closure—reflects any additional risk reduction imposed on a particular mission. While the range safety closures are mandatory, mission assurance closures are at the discretion
of the launch mission director. These closures are computed by Aerospace analysts using the CollisionVision software, and the risk thresholds are typically one or two orders of magnitude lower than for safety closures.
Turning the results of the analysis into a standard prod-uct for the launch mission director has evolved since the 1990s. Early collision avoidance screening information was cumbersome and hard to interpret. Analysts at Aerospace now create an integrated collision avoidance report that summarizes the results in a clear and concise format. The safety closures and mission assurance closures computed by Aerospace are both included.
Typically, Aerospace analysts will generate these products 24 hours prior to a launch day and update them two hours before the launch window opens so that a decision for a tar-geted launch time can be made. This must be done for each day that has a window, so a scrub will result in a repeat of the entire process. The reports are also generated for all rehears-
T–O CLOS URE F lagged O b je c t O b j e c t N ame Distance Time Probability
S ta r t E n d O ppo r tu n i t i e s (km) (s MET)
A 1 8 : 01 : 00 18 : 01 : 00 18:01:00 Catalog Object 0.0 0.0 RNG SAFETY
B 1 8 : 08 : 00 18 : 08 : 00 18:08:00 10352 COSMOS 981 19.7 2013.5 0.3e–06
C 1 8 : 14 : 00 18 : 14 : 00 18:14:00 21512 DELTA 1 DEB 7.3 2052.8 1.3e–06
D 18 : 15 : 00 18 : 15 : 00 18:15:00 ISS 0.0 0.0 RNG SAFETY
E 18 : 19 : 00 18 : 19 : 00 18:19:00 14420 COSMOS 252 DEB 31.3 1899.2 0.4e–06
18:00:002
Open
Clos
e
02
04
06
08
10
12
14
16
18
BA C D E
Sample COLA ReportLauncher vs. RSO Cata log
S imulated L–2 hr for Launch on 01/01/10
INTEGR ATED COL A REPORT
UNCLASS I F I ED
Aerospace delivers a concise collision-avoid-ance assessment for each launch window.
Object type
Probability of collision Miss distance
Manned 1×10⁻⁶ 200 km sphere or 200 × 50 × 50 km ellipsoid
Active 1×10⁻⁵ 25 km sphere
Debris 1×10⁻⁵ 2.5 km sphere
AFI 91-217 provides at least two options for computing a closure threshold—collision probability and miss distance. Any approaches that fall within these thresholds impose a mandatory launch hold, where the mission is prohibited from launching.
Name Event date Comment
Cosmos 1934 23 Dec 1991Hit by debris,
catalog object #13475
Cerise 24 July 1996Hit by debris,
catalog object #18208
DMSP 5B F5 R/B 17 Jan 2005Hit by debris,
catalog object #26207
Iridium 33 10 Feb 2009 Hit by Cosmos 2251
In the past 25 years, a number of active payloads have suffered collisions with known orbital debris, including fragments and defunct satellites.

CROSSLINK FALL 2015 31
als. Collision avoidance support for a particular launch can span many months, and will usually overlap with collision avoidance activities for other launches. Analysts work in pairs for redundancy, and there are several teams active at any given time.
The Collision Avoidance GapIn 2006 a satellite launched as planned. To minimize orbital debris risk, the launch vehicle upper stage was placed on a trajectory that would reenter the atmosphere within three days. Shortly before the mission, Aerospace identified an is-sue with possible conjunctions between the upper stage and the International Space Station prior to reentry. The launch collision avoidance process only covers the launched objects for a few hours because position uncertainty grows over time—and this is particularly true for any secondary or up-per stages. As the covariance grows, sometimes to thousands of kilometers in-track, the computation of collision probabil-ity is diluted to the point that it is no longer mathematically greater than the standard closure thresholds. Simply put, the analytical processes are not capable of providing meaningful results past a certain time. To address this problem, some-thing new and different had to be developed.
At issue was the gap in situational awareness from the end of the collision avoidance screening time up until the point at which the newly launched objects would be tracked by the Space Surveillance Network and entered into the Space Catalog. This could take as long as 24 hours after launch. Added to this was the time it would take NASA to develop an evasive maneuver and upload the commands
through their Russian partners to the control module. This planning and execution could take an additional 12 hours, so the collision avoidance gap could be between 18 and 36 hours after launch. During this period, the International Space Station could be vulnerable to potential collisions from objects recently launched. As it turned out, the upper stage in question reentered as planned with no adverse ef-fects, but the event drew attention to the need for greater awareness in the critical period after launch.
Since that time, Aerospace has been developing tech-niques to determine any risk to the space station from a new launch during the collision avoidance gap. Usually, the greatest uncertainty in an orbit is along-track; the orbit itself may be well known, but the object’s position on that orbit is less certain. So, the first step is to determine the nodal separation, defined as the distance between the two points, or nodes, where the orbits of the space station and launch
On-Orbit Support
In 2009, the Iridium 33 satellite collided with a retired Russian satellite, Cosmos 2251, destroying them both. Routine flight-safety collision screenings had identified a close approach (or conjunction) of approximately 600 meters prior to the event, but no one took particular notice—that was not even the worst-case approach for the Iridium constellation that day. Every calculated orbit has some uncertainty, so in reviewing flight safety data, satellite operators set various thresholds to account for the margin of error. In the case of the Iridium-Cosmos collision, the predicted approach distance was below the threshold for attention.
The collision may have been a blow to Iridium, but the resulting debris affected everyone. The government understands that its interests in space are connected with those of the commercial sector. In fact, more than ten years ago, Air Force Space Command asked Aerospace to help develop a plan for providing collision avoidance services to commercial and foreign entities. The goal was to help minimize space debris by sharing space situational awareness information with those who could take action to prevent collisions. In answer to this request, Aerospace initiated a prototype collision avoidance service, which provided warnings to Intelsat and other customers about possible conjunctions. As part of this effort, the researchers developed many of the tools and techniques in use today for prediction of close approaches. The prototype service operated from 1999 to 2003; the Air Force assumed responsibility for the program in 2004, and Aerospace discontinued support. The service was transferred to U.S. Strategic Command in 2010 and continues under the auspices of the Joint Space Operations Center (JSpOC) at Vandenberg Air Force Base.
Over the years, Aerospace has provided on-orbit collision avoid-ance support to other customers as well. For example, NASA’s Conjunction Assessment Risk Analysis (CARA) team screens all of its Earth-orbiting robotic missions, and Aerospace has worked closely with them on tools, data, and methods.
L+0 L+3 L+6 L+18
Time from launch (hours)
L+24 L+36
Launch COLA safety process
JSpOC cataloging and assessment
COLA gap — part 1
Maneuver plan
COLA gap — part 2
Best-case gap time
Worst-case gap time
Maneuver execution
Collision-avoidance assessments for launches have a limited shelf life. The accu-racy of predicted positions for launched objects quickly degrades. This leads to a dangerous gap in situational awareness until the Space Surveillance Network can register and track the launched items.

CROSSLINK FALL 201532
object are closest. In other words, if each satellite on orbit is imagined as a bead on a wire, the orbital node separation looks at the separation of wires—not the position of the beads on those wires. If this separation is sufficiently small, then a dangerous conjunction could occur. Then, additional analyses for those small separations seek to evaluate the level of risk associated with a potential conjunction. Aerospace works with the launch program to choose launch periods when the nodal separation is unlikely to create the condi-tions for a dangerous conjunction.
Data Quality and ImprovementsCollision avoidance analyses such as these require high-qual-ity input data to produce reliable and actionable results. The input data consists of the ephemeris and the covariance in-formation for the two objects involved in the close approach.
For the ephemeris, several data sources are available: the general perturbations catalog, the high-accuracy catalog, and owner-operator data. The general perturbations catalog, which is provided free of charge to the public, is accept-able for propagation on the order of days, but the accuracy is generally more suspect when propagating over weeks. Moreover, the orbit data does not come with any covariance information. To resolve this problem, Aerospace developed the COVGEN routine in 2000, which uses historical archives of ephemeris data to estimate propagated errors as quadratic error-growth curves in three orbit-relative dimensions. The special perturbations catalog is based on a more accurate but slower algorithm than the general perturbations catalog, and
it includes covariance. Both catalogs are based on tracking from the Space Surveillance Network. In theory, owner-op-erator data would offer the highest quality because the opera-tor can calculate an orbit much more accurately using a satel-lite’s onboard ephemeris (which may include GPS receivers) and other telemetry and would have an accurate knowledge of maneuvers, orientation, vehicle size, and mass. In practice, however, most of this information is not published openly, and when it is, it typically does not include covariance. Furthermore, there is no widespread standardization of data formats, making broad use of such data challenging.
The covariances for any of these ephemeris sources pose their own sets of problems, as generating accurate covari-ances is a notoriously difficult thing to do because available data on sensor and modeling technique errors are not always sufficient. Furthermore, the relationship of covariance inac-curacy to probability of collision is nonlinear, so an error in covariance of a factor of 2 to 4 can result in an order of mag-nitude difference in the probability of collision. Most covari-ances are based on a priori assumptions on the error sources, and this approach usually overlooks unforeseen factors. Even COVGEN, which avoids that issue, is limited in that it uses a fixed covariance orientation.
Recognizing this issue, a group of government organi-zations worked with Aerospace to develop the Covariance Calibration and Error Estimation Tool (CCEET), which uses historical orbit data to calibrate errors in the scaling and ori-entation of covariances. This Aerospace-invented capability also provides confidence bounds on corrected covariances and other quality checks on orbit data that might otherwise
Potential conjunction
Launch object
ISS
Nodal separation distance
An illustration of the nodal separation distance between the orbit of the Interna-tional Space Station and the orbit of a spent upper stage.
-6 10-8
10-7
10-6
10-5
10-4
-5 -4 -3 -2 -1 0Time relative to conjunction (days)
Prob
abili
ty o
f col
lisio
n
Confidence intervals on probability estimates are useful tools for satellite opera-tors. In this graph, the circles indicate the probability of collision predicted for Day 0 using the best information available, with the error bar indicating the range of possible values. The yellow line indicates a user-selected threshold for action. The satellite operator can use this to understand the quality of the prediction and make a better decision by comparing it to an action threshold.

CROSSLINK FALL 2015 33
affect collision probability calculations. The combination of improved covariance and confidence intervals could lead to a new process that would help mission directors make better decisions when faced with collision risks. If successful, this capability will improve the utility of the entire catalog for flight safety purposes. The Aerospace-government partner-ship is evaluating and validating the process for operational use.
ConclusionThe best approach to dealing with space debris is to avoid creating more. Prelaunch screening for collisions can re-duce the risk of creating debris and helps ensure the newly launched space asset can reach its orbit safely. As tools and methods evolve and the quality of tracking data improves, better predictions of collisions will be possible. Aerospace continues to refine the collision avoidance process to protect space missions and preserve the utility of space itself.
Further Reading
W. T. Cerven, “Covariance Error Assessment, Correction, and Impact on the Probability of Collision,” 21st AAS/AIAA Spaceflight Mechanics Meeting, pp. 757–772 (New Orleans, LA, 2011).
HQ AFSEC/SES. Space Safety and Mishap Prevention Program. Kirtland AFB, NM: Department of the Air Force (2014).
N. L. Johnson, E. Stansbery, D. O. Whitlock and K. J. Aber-cromby, History of On-Orbit Satellite Fragmentations, 14th Edition, NASA Orbital Debris Program Office (Houston, TX, 2008).
D. Kaya and D. Snow, “Element Set Prediction Accuracy Assessment,” AAS/AIAA Astrodynamics Specialist Conference (Girdwood, Alaska, 1999).
NASA Orbital Debris Program Office, “Satellite Collision Leaves Significant Debris Clouds,” Orbital Debris Quarterly News, Vol. 13, No. 2 (2009).
G. E. Peterson, R. G. Gist and D. L. Oltrogge, “Covariance Generation for Space Objects using Public Data,” AAS/AIAA Space Flight Mechanics Meeting (Santa Barbara, California, 2001).
About the Authors
Thomas F. Starchville, Jr., Direc-tor, System Analysis and Simulation Subdivision, joined Aerospace in 1997. He leads and performs launch collision avoidance analyses for the Air Force, the National Reconnaissance Office, and NASA customers. He also man-ages space debris analysis response to
real-time events. He has a B.S., an M.S., and a Ph.D. in aerospace engineering from Pennsylvania State University.
W. Todd Cerven, Project Leader, System Analysis and Simulation Subdivision, joined Aerospace in 2003. He performs astrodynamics-related analyses and tool development for government customers. Recent efforts include membership in the Air Force Space Command Working Group on
Covariance Realism and leadership of the Satellite Covariance Improvement Interagency Project. He has a B.S., M.S., and Ph.D. in aerospace engineering from the University of Illinois.
Theodore (Ted) J. Muelhaupt, Associ-ate Principal Director, System Analysis and Simulation Subdivision, joined Aerospace in 1980. This subdivison is the primary Aerospace organization responsible for analysis of system-level performance expected from satellite systems, and oversight of astrodynamic
and system modeling specialists. He coordinates Aerospace’s efforts in space debris, space situational awareness, and collision risk assessment, and manages the Center for Orbital and Reentry Debris Studies. He has a B.S. in aerospace engineering and an M.S. in mechanics from the University of Minnesota.

CROSSLINK FALL 201534
Fragmentation Modeling: Assessing Breakups in SpaceAerospace has honed expertise for more than 25 years in modeling space debris fragmentation events—
from accidental to intentional collisions—leading to insights and predictions for future breakup events.
Marlon Sorge and Deanna Mains

CROSSLINK FALL 2015 35
More than 200 fragmentation events have occurred in orbit during the Space Age. These range from acci-dental explosions to intentional collisions and have
generated a wide range of large debris from a few pieces to well over 3000 fragments that can be tracked and cataloged by the U.S. Space Surveillance Network (SSN). The vast majority of these events have taken place in low Earth orbit (LEO) with the remainder in middle and geosynchronous Earth orbits.
Certain classes of satellites and upper stages tend to frag-ment. In the 1970s and 1980s a number of U.S. Delta second stages exploded, producing 100–300 cataloged fragments each. The Soviet/Russian Cosmos 699 series of ocean recon-naissance satellites’ explosion events from the 1970s through the 2000s has resulted in tens to hundreds of fragments per event. The collision between Cosmos 2251, an inactive satellite, and Iridium 33, an active communications satellite, in 2009, was the first accidental collision between two intact objects and generated more than 3000 cataloged pieces of debris. The largest debris-producing event has been the Chi-nese antisatellite test in 2007, during which an old Chinese weather satellite, Fengyun-1C, was intentionally impacted by an interceptor producing more than 3500 cataloged debris objects.
The majority of the objects being tracked by the SSN are fragmentation debris, easily outnumbering the active satel-lite population. Although the amount of trackable debris from an energetic event can be in the hundreds to thousands of pieces, the numbers of potentially mission-ending debris, approximately 1 centimeter and greater, can be in the tens to hundreds of thousands. This range of debris is not currently trackable by the SSN, making it an unseen hazard to active satellites.
Why Model Fragmentations?Approximately 95 percent of potentially mission-ending debris is untrackable. A fragmentation model of the unseen debris provides a representation of the debris cloud or clouds necessary to make short-term satellite risk assessments. Debris mitigation strategies are based on projecting the growth of the debris environment, which is largely caused by breakup events. A representation of the untrackable debris is needed so that satellites can be designed to survive within the orbital debris environment. The characteristics of un-trackable fragmentation debris can be estimated by model-ing historic breakups.
The cause of many fragmentation events is often unclear. Characteristics of debris from the event can be used with models to conduct a “forensic” analysis, determining the time, location, and energy of explosions, determining the de-bris risk to active satellites, and/or identifying a likely cause.
Data SourcesFragmentation events, especially hypervelocity collisions, involve complex physical processes acting on complicated
objects, making them difficult to model. The geometry of the event, object type and material composition, the cause of the breakup, intensity of the event, and the percentage of the vehicle involved, all affect the characteristics of the ensu-ing debris. This makes the acquisition of data particularly important as a means to validate models.
This is especially true for the empirical and semiempiri-cal models typically used in debris analysis, such as The Aerospace Corporation’s IMPACT model. There are two main sources of data used in modeling: on-orbit fragmenta-tion events and ground-based tests. Each has its advantages and disadvantages for study.
Explosions and collisions in orbit provide the most realistic conditions for modeling. The fragmenting objects are a realistic size, the energies involved are accurate, and the composition of the objects is representative of the on-orbit population. Historically there have been a series of events in-volving the same type of vehicle under similar circumstanc-es, providing repeated experiments to quantify for natural variability. Some parameters of the event such as spreading velocities—the velocity increment imparted to a fragment by the breakup—can be more easily determined than in ground tests. Finally, with the exception of some intentional break-ups, the events cost little money to conduct since they occur on their own.
However, there are several disadvantages to this class of data. The initial conditions—particularly for explosions—are not well known, and the events do not occur in a controlled environment. The detailed data collection is limited to the objects large enough to be cataloged. Detailed information on fragment dimensions, materials, and other characteristics can be difficult or impossible to obtain.
Ground-based tests can be used to fill in some of the gaps. The tests are conducted in a controlled environment with detailed knowledge of initial conditions. This enables a thorough interpretation of the debris data including size, material, and mass. It is also possible to count and measure small fragments down to millimeter sizes in the laboratory, which is not possible for orbital events.
One of the major disadvantages of ground tests is that the conditions are not entirely realistic. For example, it is not practical to use large operational satellites or upper stages as targets, and most probable relative velocities for collisions in LEO are not obtainable with large enough projectiles. The targets in ground tests must be realistically complex to properly produce representative debris distributions. A satel-lite’s complex internal structure makes it essentially a large container of already-made debris. Targets that lack this com-plexity will not produce representative debris distributions.
Because of the complexity of creating a semirealistic situation, ground tests can be expensive; the collection and analysis of the resulting debris is extremely labor-intensive too. Ground tests, though, are still significantly less expen-sive than dedicated orbital or suborbital tests.
Several aspects of observed fragmentation events such as Reto
uche
d im
age.
Orig
inal
pho
to c
ourt
esy
of N
ASA
/Ron
Gar
an

CROSSLINK FALL 201536
the Fengyun-1C antisatellite test and the collision between Cosmos 2251 and Iridium 33 were not consistent with model predictions. The detailed information available from a ground test was expected to shed light on these discrepan-cies and lead to improved models.
Aerospace, the Air Force, and the NASA Orbital De-bris Program Office recently teamed with the University of Florida to conduct DebriSat, a ground-based hypervelocity collision test on a realistic satellite mock-up. The goal was to characterize the debris down to 2 millimeters, resulting from a catastrophic hypervelocity collision of a satellite.
The DebriSat target satellite was designed to be represen-tative of a modern LEO satellite. Aerospace used the designs of more than 100 satellites to define typical characteristics of satellite subsystems and provided expertise on individual subsystem components, materials, and construction tech-niques to assist the University of Florida in producing its
final design. DebriSat, 56 kilograms when complete, was vibration tested at Kennedy Space Center in Florida to verify the integrity of the design and construction.
Part of standard collision test procedure is to conduct a “dress rehearsal” using the same conditions as the actual test. For this, another target was used that was of simpler con-struction than DebriSat, but would still be able to provide valuable data. Little information is available on the results of upper stage collisions, although there are many upper stages on orbit that could be future sources of debris. Thus, a target similar to an upper stage was chosen: DebrisLV was designed and built at Aerospace and represented a number of characteristics of launch vehicle upper stages.
The DebrisLV and DebriSat tests were conducted at the Arnold Engineering and Development Complex G Range, which has the largest light gas gun in the United States. The DebrisLV test was conducted on April 1, 2014, followed by
A cumulative mass distribution plot shows the total number of fragments of a given mass and larger. The more energetic the event, the steeper its mass distribution slope. Therefore a greater fraction of the mass is in smaller fragments, where the debris is more pulverized.
Cumulative AMR distributions show the fraction of the total number of fragments having a given AMR value or less. These distributions tend to reveal differences in the material composition of the objects. This is particularly noticeable when the fragmenting object contains an unusual material, such as composite, as opposed to metal. Denser materials tend to form as dense nugget-shaped fragments, while low-density materials form flake- or platelike fragments. Carbon fiber–reinforced polymer (CFRP) components may form needlelike fragments.
DataImpact
Mass (kg)
Cum
ulat
ive
num
ber o
f fra
gmen
ts
0.01 0.1 1 10 100 10001
10
100
1000
DataImpact
Area/mass (m /kg)
Cum
ulat
ive
perc
enta
ge o
f fra
gmen
ts
0 0.2 0.4 0.6 0.8 10
40
20
80
60
100
2
Spreading speed distributions show how the magnitudes of the changes in veloc-ity given the fragments by the event are distributed. The analysis of the Landsat 3 Delta II upper stage explosion, as seen in the mass, velocity distribution, and AMR distribution plots (top figures and this one) of its trackable debris, is a good example of how default assumptions within IMPACT can produce close approxi-mations to event characteristics.
The mass distribution of the Fengyun-1C (FY-1C) collision has a steep slope because of the high energy of the event. The Nimbus 4 explosion has a similarly steep slope, suggesting a high-energy density, whereas the PSLV mass distribution slope is lower, suggesting a lower energy density explosion. Collisions tend to be more energetic than explosions. However, events where the explosive energy is localized, as in some noncatastrophic explosions, may also result in mass distributions with fairly steep slopes.
DataImpact
Spreading velocity (m/s)
Num
ber o
f fra
gmen
ts
0 100 200 300 400 5000
20
10
40
30
50FY-1CNimbus 4PSLV
Fragment mass (kg)
Cum
ulat
ive
num
ber o
f fra
gmen
ts
1 10 100 10001
10
100
1000
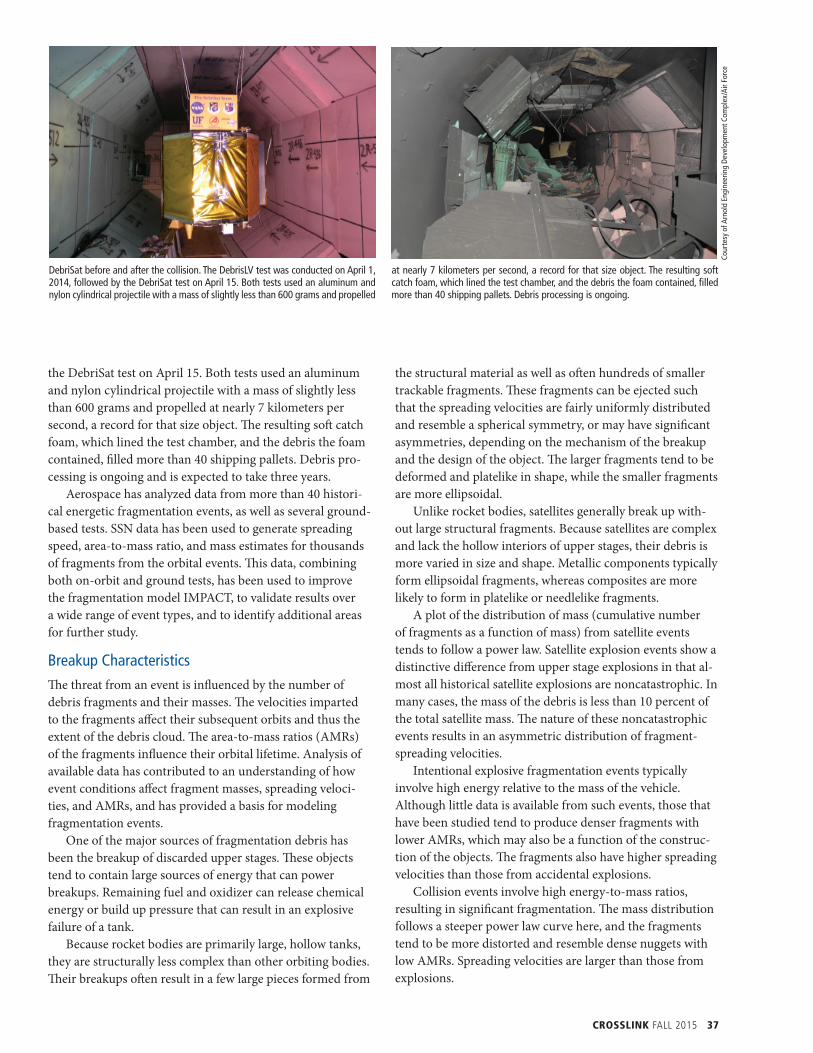
CROSSLINK FALL 2015 37
the DebriSat test on April 15. Both tests used an aluminum and nylon cylindrical projectile with a mass of slightly less than 600 grams and propelled at nearly 7 kilometers per second, a record for that size object. The resulting soft catch foam, which lined the test chamber, and the debris the foam contained, filled more than 40 shipping pallets. Debris pro-cessing is ongoing and is expected to take three years.
Aerospace has analyzed data from more than 40 histori-cal energetic fragmentation events, as well as several ground-based tests. SSN data has been used to generate spreading speed, area-to-mass ratio, and mass estimates for thousands of fragments from the orbital events. This data, combining both on-orbit and ground tests, has been used to improve the fragmentation model IMPACT, to validate results over a wide range of event types, and to identify additional areas for further study.
Breakup CharacteristicsThe threat from an event is influenced by the number of debris fragments and their masses. The velocities imparted to the fragments affect their subsequent orbits and thus the extent of the debris cloud. The area-to-mass ratios (AMRs) of the fragments influence their orbital lifetime. Analysis of available data has contributed to an understanding of how event conditions affect fragment masses, spreading veloci-ties, and AMRs, and has provided a basis for modeling fragmentation events.
One of the major sources of fragmentation debris has been the breakup of discarded upper stages. These objects tend to contain large sources of energy that can power breakups. Remaining fuel and oxidizer can release chemical energy or build up pressure that can result in an explosive failure of a tank.
Because rocket bodies are primarily large, hollow tanks, they are structurally less complex than other orbiting bodies. Their breakups often result in a few large pieces formed from
the structural material as well as often hundreds of smaller trackable fragments. These fragments can be ejected such that the spreading velocities are fairly uniformly distributed and resemble a spherical symmetry, or may have significant asymmetries, depending on the mechanism of the breakup and the design of the object. The larger fragments tend to be deformed and platelike in shape, while the smaller fragments are more ellipsoidal.
Unlike rocket bodies, satellites generally break up with-out large structural fragments. Because satellites are complex and lack the hollow interiors of upper stages, their debris is more varied in size and shape. Metallic components typically form ellipsoidal fragments, whereas composites are more likely to form in platelike or needlelike fragments.
A plot of the distribution of mass (cumulative number of fragments as a function of mass) from satellite events tends to follow a power law. Satellite explosion events show a distinctive difference from upper stage explosions in that al-most all historical satellite explosions are noncatastrophic. In many cases, the mass of the debris is less than 10 percent of the total satellite mass. The nature of these noncatastrophic events results in an asymmetric distribution of fragment-spreading velocities.
Intentional explosive fragmentation events typically involve high energy relative to the mass of the vehicle. Although little data is available from such events, those that have been studied tend to produce denser fragments with lower AMRs, which may also be a function of the construc-tion of the objects. The fragments also have higher spreading velocities than those from accidental explosions.
Collision events involve high energy-to-mass ratios, resulting in significant fragmentation. The mass distribution follows a steeper power law curve here, and the fragments tend to be more distorted and resemble dense nuggets with low AMRs. Spreading velocities are larger than those from explosions.
DebriSat before and after the collision. The DebrisLV test was conducted on April 1, 2014, followed by the DebriSat test on April 15. Both tests used an aluminum and nylon cylindrical projectile with a mass of slightly less than 600 grams and propelled
at nearly 7 kilometers per second, a record for that size object. The resulting soft catch foam, which lined the test chamber, and the debris the foam contained, filled more than 40 shipping pallets. Debris processing is ongoing.
Cour
tesy
of A
rnol
d En
gine
erin
g De
velo
pmen
t Com
plex
/Air
Forc
e

CROSSLINK FALL 201538
Modeling Fragmentation DebrisEstimates of short-term risks to satellites from fragmentation event debris, and its contribution to and effect on the space environment in the near and longterm, make it essential to have reliable predictions of the key characteristics of debris, including number of fragments, fragment mass, spread-ing velocity, and AMR. Mathematical approximations to the distributions observed from available data can provide good estimates of debris characteristics from fragmentation events.
A fragmentation event mass distribution model can be developed by evaluating collected data from past events and comparing the slope of the cumulative mass distribution to the kinetic energy per mass. This empirical data can be translated into a model that increases the slope of a mass dis-tribution curve as the kinetic energy per mass increases. This approach reflects the idea that collision and explosion events tend to differ because explosions generate fewer fragments than more energetic collision events.
Spreading velocity governs the initial orbit into which each debris fragment is injected after a breakup. Each object begins with the orbital velocity of the parent, and then adds a spreading velocity to form its own new orbit. The distribu-tion of spreading velocities determines the size of the initial debris cloud and the spread in altitude. This, combined with AMRs, dictates the orbital lifetime of the debris. Spreading velocities are the most direct observable manifestation of the amount of energy that caused the initial fragmentation event. In modeling actual collisions, the available energy to drive the fragmentation event can be determined by the relative kinetic energy of the colliding bodies. In model-ing explosion events, event energy must be estimated by considering the mass and type of exploding object, as well as the observed average spreading speed of the trackable fragments. The size of a fragment correlates to its lethality, while the AMR, or shape of the fragment, is directly related to the fragment’s ballistic coefficient, which affects its orbital lifetime.
AMR distributions can be used to detect unusual frag-mentation behavior if the composition of the fragmenting body is already fairly well understood. An AMR model derived from empirical data can be used to predict the distri-bution of sizes and shapes of fragments from an event, and thus provide an indication of the lethality and longevity of the results of a debris-creating event.
Aerospace’s IMPACT Fragmentation ModelAerospace is currently one of the major contributors of orbital debris expertise to the Department of Defense community. This expertise is used in near real-time debris risk assessment, debris minimization planning, support for end-of-life on-orbit and reentry disposal, launch collision avoidance, debris threat management and assessment, and survivability analyses. A cohesive set of analysis tools are used to meet the various debris-related needs.
A fundamental part of debris analysis is the accurate prediction of fragmentation debris characteristics. This information fuels environmental modeling and risk assess-ment efforts. For more than 25 years, Aerospace has used the fragmentation model IMPACT to estimate energetic debris-producing events. It combines empirical relation-ships derived from historical event data with conservation laws and boundary conditions to generate fragment number, mass, spreading velocity, and AMR distributions.
This investment in development of the IMPACT frag-mentation model and many other tools has provided Aero-space with an extensive risk analysis capability.
The DebrisLV collision before the event (top), at the moment of collision (middle), and after the experiment (bottom).
Cour
tesy
of A
rnol
d En
gine
erin
g De
velo
pmen
t Com
plex
/Air
Forc
eCo
urte
sy o
f Arn
old
Engi
neer
ing
Deve
lopm
ent C
ompl
ex/A
ir Fo
rce
Cour
tesy
of N
ASA

CROSSLINK FALL 2015 39
Fragmentation events, which may be difficult to charac-terize until long after an event, can be modeled quickly with these tools. Although the individual fragment orbits and bal-listic coefficients may be unavailable until days or weeks after an event, limited data available soon after a breakup can be used to produce an accurate model of the debris character-istics. This information is used for analysis of the lifetime of the trackable and untrackable fragments and distribution of and risk from lethal fragments, among other characteristics.
Sometimes there is an impetus to analyze a particular event to determine more about the mechanism behind its fragmentation. In such cases, comparison of the IMPACT analysis to observational data can provide clues to the nature of the event. Observational masses, spreading velocities, and AMRs, when compared to modeled characteristics from IMPACT analyses, can provide insights into the poten-tial causes of an event, and the materials involved in the breakup. IMPACT inputs can be adjusted to match the event characteristics, providing additional understanding about event circumstances.
Future Research Aerospace scientists and engineers continuously try to improve the quality of information that can be derived from observational data. Doing so decreases uncertainties in the orbital data and enables refinement to models. Acquisi-tion of additional fragment characterization data through ground testing of realistic objects, including the DebriSat test series, will also continue to further the understanding of fragmentation events. Continued evaluation of less-standard fragmentation events can provide an understanding about less-typical breakup mechanisms.
Improvements to predictive capability will continue to produce a better orbital fragmentation event understanding. The enhanced ability to match observed data by adjusting material and fragment information could assist future users in debris forensics, enabling further refinement and determi-nation of the circumstances surrounding events.
Further Reading
N. Johnson et al., “History of On-Orbit Satellite Fragmenta-tions 14th Edition,” NASA/TM-2008-214779 (Orbital Debris
Program Office, National Aeronautics and Space Adminis-tration, June 2008).
J. Liou, S. Clark, N. Fitz-Coy, T. Huynh, et al., “DebriSat—A Planned Laboratory-Based Satellite Impact Experiment for Breakup Fragment Characterization,” Proceedings of the Sixth European Conference on Space Debris (Darmstadt, Germany, April 22–25, 2013; ESA, Aug. 2013).
M. Rivero, I. Edhlund, N. Fitz-Coy, J.-C. Liou, M. Sorge, T. Huynh, and J. Opiela, “Hypervelocity Impact Testing of DebriSat to Improve Satellite Breakup Modeling,” Proceed-ings of the 65th International Astronautics Congress (Toronto, Canada, Sept. 29–Oct. 3, 2014).
M. Sorge and D. Mains, “IMPACT Fragmentation Model Improvements,” AIAA 2014-4228, AIAA/AAS Astrodynamics Specialist Conference (San Diego, CA, Aug. 2014).
About the Authors
The worst accidental debris-producing event occurred on February 10, 2009, when the inac-tive Cosmos 2251 satellite collided with and destroyed an active satellite, Iridium 33.
Marlon E. Sorge, Senior Project Engineer, Space Innovation Director-ate, joined Aerospace in 1989. He has worked on space debris issues for more than 25 years, encompassing fragmen-tation modeling, risk assessments, de-bris environment projection, mitigation techniques, and policy development. He
also coordinates Aerospace’s debris research program. He has a B.S. in physics and an M.S. in aeronautical and astronautical engineering from Purdue University.
Deanna L. Mains, Engineering Special-ist, Astrodynamics Department, joined Aerospace in 1993. She performs systems engineering and orbital analysis. She has more than 20 years of experience in space debris analysis, including breakup modeling. She has a B.S. in aeronautics and astronautics
and an M.S. in aeronautical and astronautical engineering from Purdue University.

CROSSLINK FALL 201540
Seeing Through the Clutter: The Power of the TorusMethods developed at Aerospace quickly render intuitive pictures and
interactive models of an evolving debris field.
Ryan McKennon-Kelly, Brian Hansen, and Felix Hoots

CROSSLINK FALL 2015 41
The destruction of the Chinese Fengyun-1C weather satellite in 2007 brought to light a new class of problem. While a large amount of trackable debris was gener-
ated, models showed that the explosion might also have produced tens of thousands of particles that were too small to track. Even small objects moving at speeds greater than 15,000 miles per hour can obliterate a much larger satellite. The danger was clear: these small “bullet” fragments were untrackable but deadly, and traditional collision avoidance methods would be unable to mitigate the risk to orbital assets.
Efforts to visualize the problem were hampered by the inherent limitation of popular techniques, which typically display every debris particle on a computer screen at the same time. Due to the design and scale of computer displays, this technique would show a debris fragment as a single dot roughly the size of Connecticut while in reality it was the size of a small bolt. In the case of tens of thousands of debris objects, the dots would block out the Earth and give the im-pression that “space was ruined” even though there was still a large distance between them.
The GenesisTo address these issues, the newly formed Debris Analysis Response Team (DART) at The Aerospace Corporation be-gan work on a visualization technique that would represent debris as an overall field rather than a collection of indi-vidual dots. By taking output from breakup models, such as Aerospace’s IMPACT tool, a 3-D surface could be calculated that would envelop the debris at a given time. Density, risk, or other appropriate information could be communicated intuitively by coloring individual regions of the surface or by rendering them as solid, translucent, or completely invisible.
The initial method assumed that debris had quickly spread around Earth into a ring and would calculate the boundary such that it would envelop all the particles over the entire day. The resulting shape resembled a donut, especially in the early phases of the breakup. The mathematical name for this shape is a torus, which over time became synony-mous with the visualization method: “The Debris Torus,” or simply, “The Torus.” Because the boundary was calculated as a continuous 3-D surface, simple geometric tests could be performed to determine when a satellite would enter and exit the debris field.
The Torus Evolved: Alpha-ShapesIn 2009, the first hypervelocity collision between two intact satellites in LEO was confirmed. The defunct Russian satellite Cosmos-2251 collided with an operational communication satellite, Iridium-33. The Iridium constellation suffered com-munication outages until the destroyed satellite was replaced, but more important, the resulting debris cloud posed a threat to other satellites in orbit. Aerospace created a set of Torus models to examine the event. From these, it was clear that the areas near the poles where the orbital traces intersected
remained highly concentrated throughout the evolution of the cloud. It was also clear that the 3-D model was still over-representing the scale of the debris cloud.
Due to the nature of hypervelocity impacts, the shape of the debris cloud is not necessarily uniform or easy to describe mathematically. Thus, the ring representation could not adequately model the shape of the cloud immediately following the breakup—a period when debris is highly con-centrated and therefore a greater threat. To create a bound-ing surface, valid from just after breakup until an arbitrary future time, a far more complex method would be required.
The Debris Torus provides a more useful sense of the concentration of space debris. This image shows a model of the Chinese Fengyun-1C breakup, 14 days after collision. Highly concentrated regions near the poles are shown as solid red sections, while less concentrated regions near the equator are shown as transpar-ent and blue.
The standard method of representing debris as individual dots on a computer screen gives a false impression of the extent of the debris hazard.

CROSSLINK FALL 201542
A Walker constellation that lies at the same orbital altitude as a debris field may have multiple crossings. The precise timing of these penetration intervals can be quickly calculated using Torus data and fed to operators, allowing them to make maneuver decisions. The Torus visualization makes it easier to grasp the nature of the problem.(Note that Earth has been scaled down to enable viewing of both sides of the orbit.)
The debris Torus was used to model the Iridium-Cosmos collision of 2009. Areas of higher risk are easy to identify.
The evolution of the Torus to the alpha-shape method improved upon earlier Torus models through better visualization and more precise modeling.

CROSSLINK FALL 2015 43
This new method would have to recognize when the debris field began to form rings around Earth and adjust accord-ingly. If features such as holes were to appear, it would also have to account for them. Eventually, a method was found, known as alpha-shapes (α-shapes), that could wrap a bound-ary to an arbitrary set of points and even calculate the area of the boundary (or volume in 3-D). This update to the Torus became known as the α-Torus, and it could model the debris field immediately following the breakup, to three days after the breakup, to even a year later, fol-lowing the debris field evolution from a dense cloud to a ring to a sparse shell.
A Quicker ResponseDART was involved in deliver-ing a standalone capability to the Joint Space Operations Center (JSpOC), and a requirement of that delivery was a visual-ization component. The Torus or α-Torus would be ideal; however, it lacked the requisite speed and simplicity. Even in compiled code, α-Torus needed several hours or a 1000-core supercomputer to run. Still, researchers believed that if the performance bottlenecks could be overcome, it could
become a useful tool. They started developing an updated version that would provide faster actionable data with mini-mal impact to accuracy. The result was QuickDART (Quick Debris Analysis Response Tool).
QuickDART was the culmination of many years of research into the characterization of space debris. Based on acquired expertise, developers made a few simplifying
assumptions (such as a stochastic treatment of the breakup velocity) to achieve faster performance with only a minimal drop in precision. Early in the development phase, it was discovered that a major component of the α-Torus com-putation time could be reduced to a single calculation per run. This particular simplification dramati-cally reduced the overall run time. New methods of calculating den-sity and applying colors were also
created along with a new method of determining penetra-tion intervals.
This invention has been prototyped extensively in C++ code and has also been developed and improved inside Aerospace’s Satellite Orbit Analysis Program (SOAP), an in-teractive 3-D orbit visualization and analysis tool. An analy-
QuickDART provides a comprehensive snapshot to help users quickly grasp the most critical elements. The views clockwise from the upper left depict 1) the risk volume with an orbit of interest passing through it, 2) a close-up view of the satel-lite of interest, 3) a color scale of relative debris density, 4) a dual-axis plot showing
the density profile over a 7.5 hour period with associated numerical integration and penetration intervals, and 5) instantaneous and integrated density values at the current simulation time.
The standard method of representing debris as individual dots on a computer screen gives
a false impression of the extent of the debris hazard. The debris Torus provides a more useful sense of the
concentration of space debris.

CROSSLINK FALL 201544
sis that took two days with α-Torus took only 5–10 minutes with the new prototype, creating a displayable model and providing entry and exit times for a watch list of satellites. The SOAP development team reduced that computational time even more, down to 2–5 minutes in testing. Moreover, additional inventions regarding penetration detection were applied in SOAP to not only shade and color the Torus model, but to shade and color a penetration timeline. This
timeline provides fast, intuitive information as to when penetration occurs and the risk level of the penetrated sec-tion. The user can select colors to match legacy models or to highlight risk levels specific to a single breakup.
SummaryOver the course of nearly a decade, Aerospace has applied considerable resources to developing methods for visualiz-
This SOAP visualization within the QuickDART tool conveys critical information in a fast and intuitive manner. The visualization graphics shown here and on the next
page depict the aftermath of the Cosmos-Iridium collision of 2009.
An example of an image generated by the Torus model that shows an analyst’s view of the space environment on a given day at a given perspective. Visualization is an
important tool for understanding and “fly along” views.

CROSSLINK FALL 2015 45
ing, characterizing, and analyzing space debris clouds. Three separate methods, with varying fidelity, are now available to communicate the extent of a debris cloud and its associated risk. These models can help determine whether and when a particular satellite crosses through a debris field through the volumetric representation of a cloud of discrete points. Its ability to apply color and transparency to specific regions
makes it easier to communicate areas of danger to decision-makers and the general public. The collective effort of many individuals across the corporation has extended the state of the art in performing analyses and providing mission assurance for assets operating in an increasingly perilous environment.
About the Authors
Brian W. Hansen, Engineering Special-ist, System Analysis and Simulation Subdivision, joined Aerospace in 2005. He conducts astrodynamics analyses for a variety of government programs and leads the Debris Analysis Response Team. He has a B.S. and an M.S. in mechanical and aerospace engineering
from Utah State University.
Felix R. Hoots, Distinguished Engineer, System Analysis and Simulation Sub-division, joined Aerospace in 2006. He leads and performs astrodynamics and space surveillance operations analyses for various government projects. He has a B.S. in physics and an M.S. in math-ematics from Tennessee Tech University,
and a Ph.D. in mathematics from Auburn University.
Ryan E. McKennon-Kelly, Project En-gineer, GEOINT Research and Technol-ogy, joined Aerospace in 2007. He holds a patent in space debris visualization, with other patents pending. He is the active sensor lead, providing technical support to the development of evolving active sensors as well as supporting and
guiding the architecture studies of the GEOINT Future Architec-ture Study Group. He earned a B.S. in mechanical engineering from The George Washington University, where he also received the Gamow Fellowship for his work in nuclear physics research, and an M.S. in aerospace engineering from the University of Michigan.

CROSSLINK FALL 201546
How to Clean Space: Disposal and Active Debris RemovalCleanup of the space environment is possible if postmission disposal tactics are built into future space systems.
Active debris removal techniques are also a means of mitigation.
Marlon Sorge and Glenn Peterson

CROSSLINK FALL 2015 47
One of the goals of space debris research is to de-termine how to prevent debris in Earth orbit from becoming so populous that it adversely affects
operational satellites. Research conducted at The Aerospace Corporation and NASA, and for other organizations includ-ing the Inter-Agency Space Debris Coordination Commit-tee (IADC) show that the major contributor to growth of the future debris environment is collisions, particularly in low Earth orbit (LEO), where there is the highest density of debris. The larger the colliding objects, the more debris generated.
The amount of mass from nonoperational objects left in orbit must be limited to prevent the generation of increasing amounts of debris and to slow or stop that debris from creat-ing cascading collisions (the Kessler effect or syndrome). This is especially true in the most populated regions of space, including the 800–1000 kilometer altitude in LEO.
Postmission DisposalPostmission disposal (PMD) is a method used for limiting the amount of unused mass in orbit. One PMD technique is controlled reentry, which is performed when an object is placed on a trajectory that causes it to reenter Earth’s atmosphere and impact in a particular region. This approach removes the object from orbit and limits hazards on the ground, but it may require a significant amount of fuel to complete the orbit change necessary for reentry. Controlled reentry is useful for launch vehicle upper stages because they have short mission time frames and may have enough remaining propellant to perform the required maneuvers.
If a satellite or upper stage is not capable of a controlled reentry, a limited lifetime disposal orbit may be used. In this scenario, the object is placed in a postmission orbit that will cause it to reenter Earth’s atmosphere over time from natural perturbations.
The most common rule for disposal time in LEO states that an object should not remain in orbit for more than 25 years beyond its end of mission. This is part of U.S. space policy and IADC debris mitigation guidelines. The rule attempts to limit the orbital lifetime of objects and lower their placement so that atmospheric drag eventually causes reentry.
Another means of disposal is through the use of a drag enhancement device that increases the cross-sectional area of an object. This technique employs inflatable or extendable spheres or large flat surface tethers that may use electrody-namic drag with Earth’s magnetic field to increase the rate of orbital decay.
If neither controlled reentry nor limited lifetime disposal orbits are an option because of fuel expense, which may be the case for higher altitude orbits, a long-term disposal orbit may be used. The strategy here is to remove satellites and upper stages from heavily used orbits and move them to less congested regions of space. Although this does not remove the mass from orbit, it does remove it from areas with the most operational satellites. Geosynchronous orbit (GEO), with its narrowly defined range of altitudes and inclinations, is where this approach is most often used.
The IADC guidelines define a disposal region sufficiently high above GEO so that even under the conditions of orbital perturbations, the disposed satellites will not recross the GEO region for at least 100 years. During the last ten years, the use of GEO long-term disposal orbits has significantly increased. In fact, most GEO satellites are now moved to long-term disposal orbits at the end of their missions.
Each of these PMD techniques is in use with today’s operational systems. Controlled reentry has been used to dispose of at least six evolved expendable launch vehicle (EELV) upper stages. The small satellite MSTI-3 used a controlled deorbit in 1997. Other larger satellites, such as
Cour
tesy
of E
SA
A conceptual rendering of a capture and deorbit device for space debris cleanup.

CROSSLINK FALL 201548
NASA’s Compton Gamma Ray Observatory, have undergone controlled reentries. The use of drag enhancement devices have also been tested on the ORS-3 mission upper stage and satellite using deployable membranes.
Mission orbits are often chosen where natural atmo-spheric drag will cause the satellite to reenter within 25 years. This is especially important for satellites that do not have maneuvering capabilities.
The use of PMD can be highly effective at reducing the buildup of mass in orbit and growth in the debris environ-ment. It employs the existing capabilities of satellites and up-per stages to remove them as possible sources of debris, but it must be conducted by all of the users of space to be truly effective at inhibiting future debris growth. Widespread use of PMD will control the future deposition of mass in orbit, but it will not address the existing debris problem.
19600
5000
10,000
15,000
20,000
1965 1970 1975 1980 1985 1990 1995 2000 2005 2010 2015
YearN
umbe
r of t
rack
ed o
bjec
ts
SatellitesRocket bodiesDebrisTotal
Iridium/Cosmos
Fengyun-1C
Pegasus
Ariane
This figure shows the number of objects being tracked by the SSN at any given year during the Space Era. Numbers of satellites and rocket bodies show steady increases and are moving in tandem with about one satellite being launched for every rocket body. This is changing with the advent of multiple small satellites being placed into orbit by a single launch vehicle. While the number of debris pieces also shows a steady increase, several events have occurred that produced sharp increases. Specifically, large increases were observed from the Pegasus and Ariane rocket body explosive events. The largest increases were observed from the Fengyun-1C and Iridium/Cosmos collision events. Note that the increase in 2012 was from additional Fengyun-1C and Iridium/Cosmos objects being added to the catalog.
An illustration of The Aerospace Corporation’s CubeSat with a drag-enhancing device.
Reto
uche
d im
age.
Orig
inal
pho
to c
ourt
esy
of N
ASA
/Ron
Gar
an

CROSSLINK FALL 2015 49
Active Debris RemovalAnother method for addressing existing large debris objects is active debris removal (ADR), which is similar in concept to PMD. One difference, though, is that in ADR an external vehicle is supplying the mechanism by which the disposal is performed. Another difference between PMD and ADR is that ADR can be applied to any objects that are floating in space, even ones that have been aloft for many years. PMD, on the other hand, can only be applied to missions that have capability for such acts built into them during the planning stage or through residual available capacity.
One example of ADR is a “space tug,” which can be used to rendezvous and grapple with a large object such as an up-per stage or inactive satellite. The object can then be boosted into a lower orbit that allows for a reentry compliant with the 25-year rule, or into a long-term disposal orbit. Another possibility is to attach a drag enhancement device to the object.
However, there are drawbacks to these techniques. For one, the cost of launch and operations of an ADR system only make it economical if it can service multiple objects during a single mission. This is possible at GEO, where many old objects are residing in similar orbits, making multiple rendezvous from a single ADR vehicle viable, but it is much more difficult to do in LEO.
There are also technical challenges to removing large debris via ADR. Rendezvous and grappling is difficult from both mission design and mechanical perspectives and re-quires extensive planning and the ability to perform sophis-ticated guidance and control during operations. The targeted object may also be tumbling, which can make attachment and stabilization difficult. A generic ADR system would also have to be robust enough to handle many different target object physical designs, including the presence of extended structures such as antennas and solar panels.
ADR can also be used for smaller objects, but the tech-niques are quite different. Unlike large objects, small ones cannot be tracked from the ground, nor targeted individual-
ly for collection from space. The objects that are most likely to disable a satellite are small at approximately 1 centimeter in size. It is estimated that there are hundreds of thousands of these objects in orbit, so any ADR method expected to have a significant impact on collision rates would have to re-move much of that debris. A single collision could generate enough debris to repopulate the environment, making small debris removal an ongoing effort.
One fix proposed for small objects involves ground-based lasers to either use pressure from photons or vaporize a small amount of material to “bump” the objects slowly over time into orbits where reentry can occur much earlier than within their existing orbits. Aerogels and other low-density materials have been proposed to “catch” small debris objects, in essence sweeping space clean. However, the benefits that
Internationally Recommended Disposal GuidelinesThe Inter-Agency Space Debris Coordination Committee (IADC) is an international technical body comprising various space agencies, including NASA, the European Space Agency (ESA), and the Japanese Space Agency (JAXA). The IADC recommends specific debris mitigation practices. End-of-life depletion of propellants and stored energy is one of the most important. These guidelines also include the following end-of-life disposal options that have been modeled in ADEPT studies.
Option 1: Placement in a disposal orbit with lifetime less than 25 years.
Option 2: Placement in a storage orbit above GEO (at least 235 kilometers above GEO, typically on the order of 300 kilometers).
Option 3: Placement in a storage orbit between LEO and GEO (lower boundary at 2000 kilometers, upper boundary at 200 kilometers below GEO).
1000
10,000
100,000
1,000,000Pr
obab
ility
-sev
erity
Top 100 probability-severity objects. US objects are shown in red.
This chart shows the impact of different objects on the evolution of the future debris environment. Each bar symbolically repre-sents the total number of debris objects generated by all modelled collisions involving this object in future projections. This number captures both the probability that the object will be involved in collisions and the severity of each collision in terms of the number of debris fragments each collision generates. Objects high on this list represent good targets for active debris removal. Note that many of the objects are not under the United States' control. This implies that international participation will be necessary for active debris removal to have a significant effect on future debris growth.

CROSSLINK FALL 201550
accrue by removing these particles must be balanced with the technique’s potential interference with operational satel-lites. To have any significant effect, this technique would also require many sweeper satellites operating at once.
Larger objects—intact satellites and upper stages—are much less likely to hit an active satellite, but studies at Aero-space and other organizations show collisions between large objects, infrequent though they may be, are likely to be the primary source of future debris. This debris may then collide with other medium- or large-size debris and go on to inca-pacitate other active satellites, generating even more debris. By targeting large satellites and upper stages now, ADR can prevent the generation of hundreds of thousands of mission-ending debris in the future.
Additional studies performed at Aerospace show that while ADR is effective at lowering the overall growth rate of future debris production, there is a limit to its cost/benefit effectiveness. Mission designers and space debris specialists
do not know exactly which objects will collide in the future. Therefore, target objects are chosen based on their likelihood of causing future debris growth, rather than any certainty that the specific object will increase the debris environment.
A number of techniques have been proposed to identify which objects are best to remove in ADR scenarios. These typically involve using probability to conduct a severity as-sessment where a combination of the chance of a collision occurring and the amount of debris generated (the severity) is determined. Probability is determined from the number of objects crossing a given target’s orbit and the area that target presents for a possible collision. The severity calculation is mainly a function of the target’s mass, which determines how much material is available to generate new fragments.
ConclusionBoth PMD and ADR are designed to control the growth of the debris environment by limiting the amount of mass in
Legal Issues for Active Debris Removal
Active debris removal (ADR) involves changing the orbit of a debris object via the actions of another system. This system may take dif-ferent forms: for example, a “space tug” that grapples with a piece of debris to relocate it or attach to it a drag-enhancing device to speed up its reentry; a ground-based laser that vaporizes a small part of the debris to shift its orbit; or a large sphere of aerogel that captures small debris.
Most debris mitigation actions—such as moving a satellite to a lower orbit at the end of its mission—involve only the object itself. ADR is different in that it involves an external actor. This puts ADR in a unique legal position.
The Outer Space Treaty (OST) of 1967 established international rules regarding the salvage of objects in space. Article VIII specifies that ownership of space objects stays with the original owner, no matter where the object is found, whether it is in orbit, or on Earth after reentry. This is binding to all states that are party to the OST, and any salvage of another owner’s object must happen only with permission. Nations that have signed and ratified this agreement include Brazil, Canada, China, Israel, Italy, Japan, Kazakhstan, France, Germany, India, the Republic of Korea, the Russian Federation, Ukraine, the United Kingdom, and the United States.
Article VI of the OST makes state parties responsible for the actions of their nongovernment entities, so private organizations are also bound to these rules. This also applies to fragmentation debris, which can make “ownership” even trickier to define. Ownership of the debris remains with the owner of the original satellite or rocket body per “…their component parts…” but the difficulties become murkier for debris that is too small to be cataloged, and whose specific originating source is unlikely to be determined. This adds another layer of making ADR concepts difficult to regulate, because it can be tough to determine which nation(s) need to grant permis-sion to remove certain objects.
Liability may be an issue even if the original owner of the debris ob-ject grants permission. For example, what if nation A rendezvouses with an old nation B rocket stage, moving it to a low orbit, where drag will cause it to reenter Earth’s atmosphere a few months later? Then the rocket breaks up on reentry, and its debris falls onto nation C, causing damage. Who is liable? Current international law states that the launching country, nation B, retains permanent owner-ship and liability of the rocket stage, yet the debris clearly would not have landed where it did if nation A had not moved it. This is the sort of liability issue that needs to be resolved prior to an ADR program that involves more than one party.
An additional hurdle that must be overcome for large-scale ADR to become practical is the possible misperception of ADR technologies. For example, a technology that can move a defunct object or piece of debris in orbit is also capable of disrupting, disabling, or destroy-ing an active satellite. This opens up the potential for one organiza-tion’s ADR development effort to be perceived by another’s as an attempt to develop an antisatellite (ASAT) capability, for example. The difficulty is that the majority of the ADR concepts considered do indeed contain most or all of the technologies that would be required to disrupt the functioning of a satellite. For example, a laser that is powerful enough to target and move a debris object is also likely capable of targeting and damaging an active satellite. One nation’s benign ADR system may be considered a threat by other nations.
Creating a practical ADR system requires the resolution of a number of engineering challenges, but it also requires the resolution of relevant legal and political issues at an international level. The legal issues may prove more difficult to resolve than the technological challenges.
– Marlon Sorge

CROSSLINK FALL 2015 51
space that may cause future collisions. PMD has the advan-tage of being significantly less expensive than ADR. If space missions are designed with PMD as a requirement, the cost to the mission can often be small to none. The widespread use of PMD built into future missions could nearly eliminate the buildup of debris in orbit and is a necessary component of any effective debris mitigation effort.
Although ADR is potentially much more expensive, it may become necessary if PMD is not performed with a suffi-ciently high percentage of objects and within a short enough timeframe. The longer PMD is not widely performed, the larger the buildup of mass in orbit and the more difficult it will be to remove. The most effective long-term ADR strat-egy is to focus on the larger objects, which will prevent the creation of future debris.
However, there are several issues with ADR as a debris-control option. The technique used must be cost-effective (i.e., the cost of removing the large object cannot be greater than the benefit it accrues to the space community). A legal and policy framework must also be established to effectively deal with international treaty–related ownership issues, as well as liability in the event of mishaps.
Earth orbit is a shared resource, so what one user does in it affects all other users. This is especially true with debris since there are no borders to keep it confined. As such, it is critical that all users of space follow best practices for maintaining the Earth orbit environment, such as PMD, particularly in the heavily used orbits of LEO and GEO. Organizations such as the IADC are attempting to bring the international community together to share best practices and encourage good stewardship of space.
About the Authors
Marlon E. Sorge, Senior Project Engineer, Space Innovation Director-ate, joined Aerospace in 1989. He has worked on space debris issues for more than 25 years, includ-ing fragmentation modeling, risk assessments, debris environment projection, mitigation techniques,
and policy development. He also coordinates Aerospace’s debris research program. He has a B.S. in physics and an M.S. in aero-nautical and astronautical engineering from Purdue University.
Glenn E. Peterson, Senior Engineer-ing Specialist, System Analysis and Simulation Subdivision, joined Aero-space in 1997. He works on a variety of topics including space debris, collision analysis, meteor showers, and satellite disposal. He has a B.S. and an M.S. in aerospace
engineering from San Diego State University, and a Ph.D. from the University of Texas at Austin.
A laser broom concept for space debris removal and cleanup.
Deorbitingengagement
1000
km30º
15º
577 km423 km
(58s @ 1000 km)
Laser fire
in thisregion
1414 km
Laser, telescope, andtracking system
Delta-V direction averagedover multiple pulses
Debris orbitSpinning target Debris
orientation
Laser site
Orbitalvelocity
Plasma directionsurface normal
Delta V

CROSSLINK FALL 201552
Space Debris Mitigation PolicyAs awareness of space debris and its potential threats to operational satellites continues to evolve,
so too do policies regarding its removal.
Marlon Sorge, Mary Ellen Vojtek, and Charles Griffice

CROSSLINK FALL 2015 53
Space debris mitigation policies are designed to limit or reduce the growth of the debris population in Earth orbit and reduce risks to satellites. These policies are
also designed to limit risks to people on the ground in the case of debris reentries. Space debris policy is developed by using observational and analytical information to identify the sources of debris, and within the constraints of cost and technical feasibility, to identify and codify the best means to maintain acceptable risk levels.
Space debris is defined as any nonfunctioning human-made object orbiting Earth. This distinguishes it from op-erational payloads and natural meteoroids that pass through Earth’s orbit. It can include debris from explosions and colli-sions, as well as dead satellites and used rocket upper stages.
Historically, the space debris environment is a product of launched objects (including satellites, spent stages, and operational debris) and fragments from on-orbit breakups and degradation. As the debris population increases, there is growing potential for on-orbit collisions, which increases the cost of satellite designs and operations. The larger the debris population, the greater the burden on systems such as the Space Surveillance Network (SSN), which tracks and catalogs Earth-orbiting objects.
In addition, the processes of conjunction assessment and collision avoidance become significantly more compli-cated with increases in the number of objects that must be analyzed. In the world of space today, more maneuvers are necessary for operational satellites to avoid potential col-lisions, which use precious fuel and interfere with mission operations.
Debris, particularly from explosions and collisions that cannot be tracked or avoided, pose hazards to operational satellites. Depending on its size and orbit, debris can degrade and even disable satellites. An example of this is the French Cerise satellite, which had a gravity gradient boom severed by impact with a piece of fragmentation debris. Although satellite control was recovered, operational lifetime was significantly reduced by the event. Another example is the Iridium 33 satellite, which was permanently disabled by a collision with the nonoperational satellite Cosmos 2251.
Understanding and Mitigating Debris SourcesGuidelines and policies for debris mitigation address the control of several broad classes of problems. One of the earliest recognized sources of debris was the release of operational debris, which is debris that is produced in the course of running a mission. This includes lens caps, explosive bolts, and debris from other separation and deployment mechanisms. These types of debris have proven to be easy to control through spacecraft design. For example, some satellites are now designed to retain their lens caps after deployment. Likewise, separation and deployment mechanisms have been redesigned to avoid releasing their component pieces. Most recently, hardware design modifications have identified ways to eliminate the release of
debris shed from launch vehicle upper stage motor nozzles. Collisions and accidental explosions of satellites and
upper stages have historically been one of the major sources of debris, particularly debris that can be mission-ending through secondary collisions with other space objects, but is too small to track by the SSN. Explosions occur for many reasons, but all had some type of residual energy source on board the vehicle after its end of mission. This may have been due to a valve failure between the residual fuel and oxi-dizer tanks, a charged battery, or propellant or gas in a sealed tank that was heated by the sun until it burst under pressure. Mitigation for this type of problem focuses on making safe space vehicles and upper stages at end of life by remov-ing any residual energy sources. This may involve shorting electrical systems, venting/depleting unused propellants and pressurants, and spinning down momentum wheels and other moving parts. Once the energy sources are removed, there is no means to initiate an explosive event.
Over the long term, it is collisions between objects on orbit that are likely to be the major source of debris. Space vehicle collision avoidance maneuvers may be conducted during a satellite’s mission lifetime, but this is not the case after it has been passivated at end of life. Assessments are now made during a satellite’s design to determine the prob-ability of damage—based on exposure to its operational orbit debris environment—to components critical to postmission disposal maneuvers. If components are found to be vulner-able, relatively inexpensive shielding can be added to the design, or components can be relocated to safer areas on the satellite. This helps to ensure that postmission disposal can be completed and the satellite can successfully conduct a controlled reentry or maneuver to its planned long-term disposal orbit.
For satellites that are unable to maneuver, collisions may occur, even during operations. In an effort to mitigate this threat, assessments are conducted prior to launch to deter-mine launch dates and orbital parameters that minimize the probability of collisions with large objects that could cause a catastrophic breakup.
Overall, to control the long-term growth of the debris environment, it is critical to limit the amount of nonopera-tional mass left in Earth orbit. Deorbiting an object such as a launch vehicle upper stage or placing a satellite on a limited lifetime orbit after end of mission, typically with a lifetime of 25 years or less, will remove objects from operational orbits and eliminate them as possible sources of debris. Long-term disposal orbits do not remove mass from orbit, but do move objects from the most populated regions of space, reducing the probability of debris generation in those critical opera-tional orbits.
History of Debris Mitigation and Prevention PolicyIn the early days of space programs, there was little or no concern about space debris—the entire focus was on accom-plishing the mission. However, as the use of space grew, so

CROSSLINK FALL 201554
did awareness of the impact debris has on the space environ-ment. A 1978 article by NASA’s Donald Kessler and Burton Cour-Palais first discussed the potential of orbital debris be-coming self-perpetuating, and NASA began to address these issues in the 1980s. Department of Defense (DOD) debris mitigation practices evolved in concert with NASA, perhaps most notably in attempts to prevent Delta rocket body break-ups. In fact, the original Delta program office was located at NASA’s Goddard Space Flight Center (GSFC). In May 1981, pieces from a Delta second stage explosion were recorded and later found to make up approximately 27 percent of the tracked objects with orbital periods under 225 minutes. GSFC notified the manufacturer, McDonnell Douglas Space Systems Company, of the explosion and requested a deter-mination of the cause. An assessment of the events found that the residual fuel and oxidizer on board were causing the explosions. The missions then began depleting or venting the excess fuel and oxidizer, which eliminated future explosions. This was one of the first debris mitigation efforts.
The United Nations Committee on the Peaceful Uses of Outer Space (UNCOPUOS) began considering space debris in the late 1980s. Studies by Aerospace, NASA, and other or-ganizations over the next decade increased knowledge of the potential manifestations of the growing space debris hazard and its effects on spacecraft and satellite architectures, result-ing in new requirements and changes to spacecraft design, operations, and end-of-life standard practices. In 1988, U.S. national space policy for the first time included statements on the need to minimize the creation of orbital debris. This was followed by a 1989 U.S. government interagency report on orbital debris.
The International Academy of Astronautics published a paper on space debris in 1992 that offered immediate debris mitigation recommendations. In 1993, the Inter-Agency Space Debris Coordination Committee (IADC) was established to provide a forum for spacefaring nations to exchange technical information related to the growth and mitigation of orbital debris.
On Sept. 14, 1996, a new U.S. national space policy was established, declaring that it was in the best interest of all nations to minimize debris, and that the United States would take a leading role in the international development of debris minimization policies and associated research. The initial U.S. Government Orbital Debris Mitigation Standard Prac-tices (USGODMSP) document, which contained specific guidelines for satellite operators for disposal and debris miti-gation, was developed in 1997, and formalized into practice by the U.S. government in 2001.
The IADC released its first set of debris mitigation guidelines in 2002 as an international consensus on ap-proaches to controlling debris growth. Many countries now regularly launch objects into space, and efforts are under way to standardize guidelines for such practices, including those of the IADC and the USGODMSP. The intent is to develop a consistent set of rules that apply to all countries and satellite
operators. Other nations have also implemented their own guidelines; France has even adopted many of these guide-lines into law.
The scientific and technical subcommittee of UN-COPUOS adopted a set of guidelines for orbital debris mitigation in 2007 that were largely based on the 2002 IADC guidelines. The General Assembly of the United Nations in-cluded mitigation guidelines in a general resolution in 2008.
In 2010, U.S. national space policy established require-ments that the United States continue to follow the USGOD-MSP, consistent with mission requirements and cost ef-fectiveness, in the procurement and operation of spacecraft, launch services, and testing and experiments in space. Each year, the U.S. Air Force’s Space and Missile Systems Center (SMC) develops an “exception to policy” package for the Office of the Secretary of Defense’s (OSD) approval, which provides the USGODMSP compliance status of each mission to be launched in the following calendar year, as well as an update on the strategy and progress for elimination of non-compliances within the next 5 to 7 years.
U.S. Air Force Instruction (AFI) 91-217 (first approved in 2010, with an update published in April 2014) provides de-tailed debris mitigation requirements for Air Force missions. It also requires SMC space program offices to prepare a mission-specific space debris assessment report and end-of-life plan for approval by the program executive officer prior to each launch. These documents are the results of required space debris mitigation assessments usually performed or validated by The Aerospace Corporation.
Aerospace published the SMC Space Debris Handbook in 2002, as well as later standards for satellite disposal in low Earth orbit (LEO) and geosynchronous Earth orbit (GEO), to ensure that space debris mitigation requirements are inte-grated into system designs early in the acquisition lifecycle. Aerospace continues to develop satellite disposal strategies for debris mitigation and prevention alternatives for the sustainability of space.
Policy/Guideline Scope and Comparison The primary international organization involved in debris guidelines development is the IADC. It is a forum repre-sented by thirteen multinational space agencies organized to coordinate mitigation activities related to human-made and natural space debris. The IADC is not a regulatory body, but provides consensus guidelines and supporting technical analyses to encourage effective debris mitigation practices worldwide. Aerospace has represented the DOD as a mem-ber of the NASA delegation to the IADC for 20 years.
The IADC advises the UNCOPUOS on space debris issues. IADC guidelines are frequently referenced as space-faring countries develop their own space debris policies and regulations.
NASA was the first organization within the United States to develop a set of guidelines specifically for space debris mitigation. The current NASA requirement, NPR

CROSSLINK FALL 2015 55
8715_006A, specifies compliance with a set of practices for limiting orbital debris, and applies to all NASA centers and contractors. The NASA Technical Standard 8719.14 specifies the detailed engineering and technical requirements associ-ated with NPR 8715_006A.
The DOD uses a number of different documents to govern its debris mitigation practices. The overarching rules come from the national space policy, which references the USGODMSP, with implementing instructions and directives for space policy (DODD 3100.10) and space support (DODI 3100.12). U.S. Strategic Command Instruction SI 505-4 specifies the need for satellite disposal and provides criteria and options for postmission disposal. AFI 91-217 defines ac-ceptable levels of risk, specifies associated debris mitigation measures, and requires documentation of implementation efforts throughout the acquisition lifecycle, operation, and disposal of the system.
Commercial launches are regulated by the Federal Avia-tion Administration (FAA), which is charged with ensur-ing the protection of public health, safety, and property, as well as the national security and foreign policy interests of the United States through its commercial launch licensing process. These regulations apply to all commercial launch vehicle stages and their components through insertion of the payload(s) into orbit. FAA certification requires that an applicant demonstrate that the risk level associated with
debris from a proposed launch meets the public risk criteria for unplanned explosions. Applicants must also show plans for keeping in contact with the payload after payload separa-tion. FAA certification also depends on applicants’ plans for the mitigation of risks from reusable and reentering vehicles. However, the FAA does not currently regulate orbiting launch vehicle upper stage disposal strategies, including defining long-term disposal orbits, and limiting human casualty expectation to less than one in ten thousand.
The Federal Communications Commission (FCC) has also developed orbital debris mitigation rules focused on communications satellites in Earth orbit. Applicants for FCC authorization to operate communication satellites that will transmit to U.S. receiver systems must submit documen-tation for their debris mitigation strategy, including limiting operational debris produced during the mission, and limit-ing the probability that the satellite will become a source of debris. An end-of-life plan (EOLP) is also required that details the postmission disposal strategy including the quan-tity of fuel, if any, that will be reserved to perform post-mis-sion disposal maneuvers. For GEO orbit satellites, the EOLP must disclose the altitude selected for a postmission disposal orbit, the calculations that are used in deriving the disposal altitude, and the expectation of casualty if planned postmis-sion disposal involves atmospheric reentry of the satellite.
On December 14, 2006, a national security satellite was launched into orbit aboard a Delta II launch vehicle from Vandenberg Air Force Base in California. The satellite, referred to as USA 193, failed shortly after deployment and was stranded in a low and decaying orbit.
The spacecraft was projected to make an uncontrolled reentry in the spring of 2008; its impact point was impossible to predict in advance, and thus could be anywhere on Earth. An analysis of the potential reentry debris conducted by The Aerospace Corpora-tion showed that a fuel tank containing 500 kilograms of toxic hydrazine fuel was likely to survive reentry and reach the ground, where it would almost certainly rupture. If the tank were to land in a populated area, the resulting toxic cloud could have sickened many people.
Numerous analyses by many agencies and organizations, includ-ing Aerospace, were conducted; based on these analyses, which considered intercept planning, debris risk analysis, and ground risk assessment, U.S. officials decided to attempt to mitigate the risk by breaking up the spacecraft and the hydrazine tank while still in orbit. On February 21, 2008, a modified SM-3 missile was fired from the guided missile cruiser USS Lake Erie near Hawaii. USA 193 was successfully destroyed and the hydrazine threat was eliminated.
Unlike the Chinese Fengyun-1C antisatellite test in January 2007, the destruction of USA 193 cre-ated almost no long-lasting space debris. Because the Fengyun-1C destruction occurred at an 850-ki-lometer altitude where there is little atmospheric drag, more than 3300 objects were created and cataloged as long-lasting orbital debris. By contrast, the intercept of USA 193 created 18 cataloged objects. Although a considerable amount of debris resulted from the intercept of USA 193, almost all of it reentered from atmo-spheric drag within weeks.
Aerospace participated in numerous analyses and activities related to the planning and the operations of the intercept, including all operational risk assessments for the Missile Defense Agency, which were conducted by Aerospace’s Debris Analysis Response Team.
USA 193
Cour
tesy
of U
.S. N
avy

CROSSLINK FALL 201556
Compliance Challenges and SolutionsBasic space debris mitigation and prevention practices can present difficult challenges for policy and government deci-sion makers. Space sustainability is considered a top priority by the international community, but it is a largely unfunded mandate. Regulations on commercial launches are not always in line with U.S. government requirements. The reso-lution of these conflicts and the compromises and trades that
must take place to satisfy as many requirements as possible drive a considerable amount of work in day-to-day debris mitigation efforts at SMC.
One of the major challenges is attempting to maximize mission performance of a space system while complying with space debris mitigation requirements within a limited budget. This is especially challenging with respect to the fuel budget of a satellite. For example, moving a given satellite to a postmission disposal orbit requires utilization of propellant that could otherwise be used to provide satellite station-keeping and increase the satellite’s mission lifetime. In terms of the entire space system architecture, going this route could increase the number of launches needed to meet user requirements, which would subsequently increase the overall risk associated with launch activities.
A conflict within the debris mitigation polices themselves is between the requirement to mitigate collision risk in LEO by reducing orbital lifetime or by controlled deorbiting of objects from LEO, and the requirement to limit the risk of human casualty on the ground from debris that survives reentry. Technological solutions include new satellite designs that have fewer components that survive reentry (design for demise) or that ensure that the satellite is able to conduct a controlled reentry into Earth’s atmosphere. In terms of policy, what is critical is to find the correct balance between the risk on the ground and the risk in space.
The increase in the launching of small satellites/CubeSats by both the commercial and government space industries is presenting a unique challenge because the small size of these satellites can make them difficult to track. They also frequently lack propulsion and maneuver capability and are often launched as high-risk missions with expected high fail-ure rates. Many small satellites, sometimes 20 to 30 CubeSats from one launch vehicle, are launched into LEO, a densely populated regime, and left on orbit at the end of their mis-sions with an expectation of reentering Earth’s atmosphere within 5 to 10 years. Although they are indeed capable of a catastrophic collision with highly valued assets, the overall incremental collision risk from small satellites has been assessed as low because of their low total mass and small col-lision areas. There is currently no specific debris mitigation and prevention guidelines for small satellites.
Because the field of orbital debris research is relatively new and mitigation approaches even more recent, there are many areas of this field that are not thoroughly under-stood, or can only be modeled with limited accuracy. This can add to the difficulty of identifying mitigation plans and assessing compliance. Some of these areas include estimation of orbital lifetime, prediction of debris quantity and char-acteristics generated from collisions and explosions, repre-sentation of the existing subtrackable debris environment, and projection of growth in the future debris population. Aerospace and NASA, as well as other organizations around the world, continue to conduct research to better understand these topics.
Orbital Debris Mitigation Guidelines
The National Space Policy of the United States seeks to minimize the growth of orbital debris. This is achieved via the U.S. Govern-ment Orbital Debris Mitigation Standard Practices (USGODMSP), which apply to all U.S. government space launches. U.S. commercial space missions are addressed by rules of U.S. regulatory agencies, which can follow the USGODMSP. Internationally, the Inter-Agency Debris Coordination Committee (IADC) has published a similar set of guidelines to minimize the growth of space debris.
The USGODMSP have four major rules, “consistent with mission requirements and cost”:
1. Minimize the release of debris during normal operations and en-sure that no debris greater than 5 millimeters will remain in orbit more than 25 years. This means that you do not just pop off a lens cap or hatch cover or let a clamp fly off during deployment.
2. Minimize accidental explosions. Demonstrate that there is no credible failure mode that results in an explosion. Deplete all energy sources at end–of–mission (passivation) so that none can contribute energy to an explosion—i.e., drain batteries, vent pressurized tanks, etc. Many breakup events have been caused by these unspent energy sources.
3. Minimize collisions. Choose operational orbits and trajectories to minimize the possibility of collisions with large objects and minimize the likelihood or mission impact of collisions with small objects that could disable a satellite and prevent postmission disposal. If you are using a tether system, minimize and assess the impact of both intact and severed tethers.
4. Dispose of retired spacecraft. Remove your vehicle by atmo-spheric reentry, move it to a storage disposal (“graveyard”) orbit, or retrieve it. If using atmospheric reentry, limit orbital life-time to less than 25 years after end–of–mission, and ensure that the human casualty expectation, the likelihood of hitting some-one on the ground, is less than 1 in 10,000. If using a graveyard orbit, move the satellite to orbits that do not cross LEO, GEO, or the semisynchronous orbit, where the Global Positioning System (GPS) operates.
Aerospace studies using ADEPT have focused on rule #4, which is considered the most critical with regard to reducing collisions and minimizing the long-term creation of space debris. It is also the most difficult, challenging, and expensive mode of operation.
— Ted Muelhaupt

CROSSLINK FALL 2015 57
One of the most effective ways to optimize space debris mitigation and prevention at SMC is to put hard require-ments on contracts for new system designs. The earlier that debris mitigation alternatives are considered, the more easily and less expensively they can be accommodated, and the more options that become available. However, long lead times result in significant delays in implementing debris mitigation procedures that require mission and/or hardware design changes. These changes can take many years to imple-ment because of costs and technical challenges. For example, there is a significant lead time in terms of procurement of launch services using existing launch vehicles.
An illustration of the effects of lead times and operational lifetimes can be seen with GEO satellites. The first guidelines for disposal of GEO satellites were issued in the early 2000s, but it was not until more than a decade later that substantial international compliance rates were achieved. This amount of time was needed to allow satellites that implemented the guidelines shortly after their creation to reach their end-of-life and require disposal.
Similar considerations can be given to legacy space systems. Frequently, one of the difficulties in meeting debris mitigation requirements is the need for the proper disposal of an upper stage. The mission of an upper stage is to deliver its payload to a particular orbit, which may leave it with insufficient fuel to be able to be disposed of properly. One means of accomplishing compliance could be a require-ment early in the launch vehicle procurement process (2 to 3 years prior to launch) that the payload be kept at a mass low enough so that the launch vehicle upper stage would have sufficient remaining fuel to perform a controlled reentry. Another option to consider is that the delivery of a given satellite and disposal of its upper stage be made require-ments of the mission. It would then be possible to reallocate the portion of the delivery of the satellite to its mission orbit so that both missions could be accomplished. In either of these scenarios, the compliance rate of Air Force payloads would be higher, and the risk of human casualty from reen-tering debris decreased. Aerospace is currently assisting the Air Force’s SMC Launch Systems Directorate and its space program offices with feasibility studies that consider these compliance alternatives.
ConclusionsThe goal of space debris mitigation guidelines is to ensure that safe and cost-effective space operations can be main-tained into the future. Space debris mitigation guidelines are developed based on analyses of existing patterns in satellite construction, operations, and patterns of use. As technologies change, new uses for satellites are found, new approaches for operating satellites are developed, and the requirements for debris mitigation will also change. Con-tinuing efforts are needed to evaluate the effects of changes in the satellite industry on the orbital debris environment and on the associated mitigation approaches. Policies then
need to be adapted to enable the most efficient and effective approaches to mitigation and prevention.
Over the last three decades, orbital debris has progressed from a nearly unknown problem to a recognized issue being addressed at the international level. As understand-ing grows, it has become clear that steps must be taken to control the growth of the debris environment and limit its effects on space operations. Policies have been established in the United States and around the world to codify the proper procedures to control debris environment growth. The most efficient way to control and reduce the effects of space debris is the strict adherence to mitigation policies. Because of the long lead times involved with developing space systems, implementation can be slow, but progress is being made. Researchers continue to better understand the problems in a rapidly evolving space operations environment. Aerospace has been heavily involved in these efforts since the early days of recognizing the orbital debris problem, and continues to be integral in developing the necessary technical mitigations and scientifically sound policy recommendations to control orbital debris for the sustainability of space.
About the Authors
Marlon E. Sorge, Senior Project Engineer, Space Innovation Director-ate, joined Aerospace in 1989. He has worked on space debris issues for more than 25 years, encompassing fragmen-tation modeling, risk assessments, de-bris environment projection, mitigation techniques, and policy development. He
also coordinates Aerospace’s debris research program. He has a B.S. in physics and an M.S. in aeronautical and astronautical engineering from Purdue University.
Mary Ellen Vojtek, Senior Project Engineer, Engineering and Integration Division, joined Aerospace in 2007. She supports the SMC Specialty Engineer-ing Division in the areas of space debris and environmental compliance assessments, and conducts policy in-terpretation for various SMC programs
and projects. She has a B.S. in chemical engineering from the University of Pittsburgh and an M.S. in civil and environmental engineering from the University of California, Los Angeles.
CROSSLINK FALL 201558
BOOKMARKS Recent Publications and Papers by the Technical Staff
Publications _____________________________D. R. Ardila et al., “Probing Stellar Accretion with Mid-
Infrared Hydrogen Lines,” Astrophysical Journal, Vol. 801, No. 1, p. 31 (2015).
B. Ayres et al., “Disaggregated Defense Weather System Follow-On (WSF) Conceptual Architecture Optimiza-tion,” AIAA Space 2014 Conference and Exposition, Vol. 25, p. 2265 (2014).
P. Belden, D. Chen, F. Di Teodoro, “Watt-Level, Gigahertz-Linewidth Difference-Frequency Generation in PPLN Pumped by a Nanosecond-Pulse Fiber Laser Source,” Optics Letters, Vol. 40, No. 6, pp. 958–961 (2015).
J. Betser, “Emerging Space Cyber Considerations for Resil-iency of IP-Enabled Space Architectures,” AIAA Space 2014 Conference and Exposition.
F. Bordi et al., “Space Missions Development: a Streamlined Approach,” AIAA Space 2014 Conference and Exposition.
B. M. Braun and D. Keenan, “Cloudsat’s A-Train Return: Solving the Orbital Dynamics Problem,” AAS/AIAA Astrodynamics Specialist Conference. Astrodynamics 2013. Vol. 150. Advances in the Astronautical Sciences. Proceed-ings (2014).
D. J. Buettner et al., “SHM of Galaxies Embedded within Condensed Neutrino Matter,” International Journal of Modern Physics, Vol. 24, No. 1 (2015).
G. Cates et al., “Use of DES Modeling for Determining Launch Availability for SLS,” 13th International Confer-ence on Space Operations (SpaceOps 2014).
W. T. Cerven, “Improved Empirical Covariance Estimation,” AAS/AIAA Astrodynamics Specialist Conference. Astro-dynamics 2013. Vol. 150. Advances in the Astronautical Sciences. Proceedings (2014).
J.-S. W. Chien, R. J. Duphily, and Y. T. Lee, “The Reliability, Availability, and Maintainability of Ground Systems in Support of Space Missions,” Proceedings of 2015 Annual Reliability and Maintainability Symposium (RAMS), pp. 6, 605 (2015).
C.-T. Chu, D.-L. Liu, Hyun Kim, and Diana R. Alaan, “Spacecraft Materials HCl Susceptibility Assessments,” Proceedings of SPIE 9196 (2014).
M. P. Easton, A. C. Labatete-Goeppinger, J. D. Fowler, and D-L. Liu, “Identification of Collected Volatile Condens-able Material (CVCM) from ASTM E595 of Silicone Damper Fluid,” Proceedings of SPIE 9196 (2014).
D. Ehrlich and J. A. Schwille, “Permeability of Space Vehicle Fibrous Thermal Protection Blankets in Viscous and Slip Flow Regimes,” Journal of Aerospace Engineering, Vol. 28, No. 3 (2015).
N. L. Encalada, B. Jaduszliwer, W. E. Lybarger Jr., J. C. Cam-paro, “Noble-Gas Loss in Alkali Rf-Discharge Lamps and Its Possible Dependence on Electron Temperature,” IEEE
Transactions on Instrumentation and Measurement, Vol. 63, No. 11, pp. 2642–2650 (2014).
M. P. Ferringer et al., “Internationally Coordinated Multi-Mission Planning Is Now Critical to Sustain the Space-Based Rainfall Observations Needed for Managing Floods Globally,” Environmental Research Letters, Vol. 10, No. 2 (2015).
J. W. Gangestad, D. W. Rowen, and B. S. Hardy, “Forest Fires, Sunglint, and a Solar Eclipse: Responsive Remote Sensing with AeroCube-4,” 2014 IEEE Geoscience and Remote Sensing Symposium. (IGARSS). Proceedings (2014).
E. Haas, F. De Luccia, and D. Moyer, “Maintaining SNPP VIIRS Reflective Solar Band Sensor Data Record Quality: On-Orbit Update of Screen Transmission and Solar Dif-fuser BRDF Parameters,” 95th American Meteorological Society Annual Meeting (2015).
G. A. Henning et al., “Design and Optimization of Interplan-etary Aerogravity-Assist Tours,” Journal of Spacecraft and Rockets, Vol. 51, No. 6, pp. 1849–1856 (2014).
D. E. Highsmith, W. T. Cerven, and L. F. Woods, “Refined Orbit Prediction for Catalog Objects,” AAS/AIAA Astro-dynamics Specialist Conference. Astrodynamics 2013. Vol. 150. Advances in the Astronautical Sciences. Proceedings (2014).
D. C. Judnick and D. G. Harvey, “Creation of Spacecraft Mass Confidence Levels through Use of a Simple Concur-rent Engineering Methodology Model,” AIAA Space 2014 Conference and Exposition (2014).
J. Kawamoto et al., “Design Integration of Hosted Payloads—Do No Harm Analysis,” Proceedings of 2015 Annual Reliability and Maintainability Symposium (RAMS), p. 5 (2015).
S. Kenderian, J. T. Case, K. Olson, et al., “Gamma Ray Dose and Operating Methodology,” Materials Evaluation, Vol. 73, No. 3, pp. 405–413 (2015).
H. I. Kim, B. A. Morgan, J. P. Nokes, and R. J. Zaldivar, “Quantitative Evaluation of Silicone Contamination Effect on Composite Bonding,” Journal of Adhesion, Vol. 91, No. 4, pp. 320–329 (2015).
A. S. Lee, R. J. Kinsey, S. C. Ringler, B. H. Kawauchi, J. F. McNeill, et al., “Star Tracker Anomalies: Root Causes and Mitigation Strategies,” AAS/AIAA Astrodynamics Special-ist Conference. Astrodynamics 2013. Vol. 150. Advances in the Astronautical Sciences. Proceedings (2014).
C. A. Lee, “A Design Space Review for General Federation Management Using Keystone,” Proceedings of 2014 IEEE/ACM 7th International Conference on Utility and Cloud Computing (UCC), pp. 720–725 (2014).
M. T. Lee, “Space-Based WiMAX MAC Protocol—Analysis of the Network Entry Procedure,” Proceedings of 2014 IEEE Military Communications Conference (MILCOM), pp. 1331–1337 (2014).

CROSSLINK FALL 2015 59
C. Lemon et al., “Review of Solar Wind Entry into and Transport Within the Plasma Sheet,” Space Science Re-views, Vol. 184, No. 1, pp. 33–86 (2014).
D. Luong et al., “Linear Quadratic Integral Control of an Organic Rankine Cycle for Waste Heat Recovery in Heavy-Duty Diesel Powertrain,” 2014 American Control Conference (2014).
A. J. Manzo and H. Helvajian, “Demonstration of Enhanced Surface Mobility of Adsorbate Cluster Species by Surface Acoustic Wave Excitation Induced by a Pulsed Laser,” Proceedings of SPIE—The International Society for Optical Engineering 8969 (2014).
D. H. McCasland, J. J. Vance, W. G. Yenne, B. L. Arnheim, et al., “Implementation of Mission Assurance Processes for Air Force Space Systems’ Operational Transitions,” 13th International Conference on Space Operations (SpaceOps 2014).
R. Ryan E. G. McKennon-Kelly and F. R. Hoots, “Space De-bris Visualization, Characterization and Volume Model-ing,” AAS/AIAA Astrodynamics Specialist Conference. Astrodynamics 2013. Vol. 150. Advances in the Astronauti-cal Sciences. Proceedings (2014).
T. McLaughlin et al., “Launch Vehicle Control Center Archi-tectures,” 13th International Conference on Space Opera-tions (SpaceOps 2014).
E. C. Mellquist et al., “Analysis of the Transonic Flutter of Su-personic Transport Wings,” 56th AIAA/ASCE/AHS/ASC Structures, Structural Dynamics, and Materials Conference (2015).
R. M. Moision, J. A. Chaney, Chris J. Panetta, and D.-L. Liu, “Analysis of Particulates on Tape Lift Samples,” Proceed-ings of SPIE—The International Society for Optical Engi-neering 9196 (2014).
A. Moore, R. W. Benson, A. S. Kremer, and R. M. Dolphus, “Prediction of Limit Cycles Using Describing Function Analysis and the Lugre Friction Model,” 37th Annual AAS Rocky Mountain Section Guidance and Control Confer-ence. Proceedings (2014).
J. P. Penn, J. P. Mayberry, C. L. Ranieri, and O. K. Rossi, “Re-Imagining SMC’s Fleet with High Power Solar Arrays and Solar Electric Propulsion,” AIAA Space 2014 Conference and Exposition (2014).
T. S. Rose, S. W. Janson, S. La Lumondiere, N. Werner, D. H. Hinkley, D. W. Rowen, R. A. Fields, and R. P. Welle, “LEO to Ground Optical Communications from a Small Satel-lite Platform,” Proceedings of SPIE 9354 (2015).
D. Roussel-Dupre et al., “The Cibola Flight Experiment,” ACM Transactions on Reconfigurable Technology and Systems, Vol. 8, No. 1, p. 3 (2015).
R. J. Rudy, R. W. Russell, D. K. Lynch, et al., “IR Study of Nova V2468 Cyg from Early Decline to the Coronal Phase,” Astronomical Journal, Vol. 136, No. 7 (2015).
A. J. Savas et al., “Thermal Analysis of a Cryogenic Liquid Acquisition Device under Autogenous and Non-Con-densable Pressurization Schemes,” International Journal of Heat and Mass Transfer, Vol. 74, pp. 403–413 (2014).
S. Sud, “Joint Time Delay and Carrier Frequency Offset Esti-mation for Near Equal Power Co-Channel OFDM Signals Using Low Rank Adaptive Filters,” IEEE SoutheastCon 2014.
R. C. Thompson et al., “Recommended Risk Assessment Techniques and Thresholds for Launch COLA Opera-tions,” AAS/AIAA Astrodynamics Specialist Conference. Astrodynamics 2013. Vol. 150. Advances in the Astronauti-cal Sciences. Proceedings (2014).
D. L. Turner et al., “Modeling CME-Shock-Driven Storms in 2012–2013: MHD Test Particle Simulations,” Journal of Geophysical Research: Space Physics, Vol. 120, No. 2, pp. 1168–1181 (2015).
J. C. Wang, W. W. Wang, and B. Higuera, “Investigations of a Self Sustained Vortex Flow System Inside a Confined Machinery Duct,” 44th AIAA Fluid Dynamics Conference, pp. 1–20, (2014).
D. W. Warren, “Optical Modeling of Fire Hazards Arising from Sunlight Focused by Water,” Fire Technology, Vol. 50, No. 6, pp. 1327–1334 (2014).
D. W. Webb, G. S. Williams, A. Q. Tu, R. W. Seibold, et al., “Market Demand Methodology for U.S. Suborbital Reus-able Launch Vehicle Industry,” AIAA Space 2014 Confer-ence and Exposition (2014).
C. M. Wong, R. M. Moision, J. D. Fowler, and D.-L. Liu, “Molecular Transport Modeling for Spaceborne Instru-ment Contamination Prediction,” Proceedings of SPIE 9196 (2014).
M. Xiaodong et al., “Laser Diode Pumped High Efficiency Yb:YAG Crystalline Fiber Waveguide Lasers,” Proceedings of SPIE (2015).
S. Yongkun, N. Presser, M. Brodie, Z. Lingley, B. Foran, and S. C. Moss, “Degradation Mechanisms in High-Power Multi-Mode InGaAs-AlGaAs Strained Quantum Well Lasers for High-Reliability Applications,” Proceedings of SPIE 9348 (2015).
H. T. Yura et al., “Selectivity and Balance of Spatial Filtering Velocimetry of Objective Speckles for Measuring Out-of-Plane Motion,” Optical Engineering, Vol. 54, No. 4 (2015).
R. J. Zaldivar, G. L. Steckel, J. P. Nokes, B. A. Morgan, and H. I. Kim, “Characterization of Atmospheric Plasma as a Surface Preparation Process for the Bonding of Space Composite Materials,” Journal of Strain Analysis for Engi-neering Design, Vol. 49, No. 3, pp. 171–178 (2014).

CROSSLINK FALL 201560
A Brief History of Space Debris and Reentry Events E V E N T DAT E T H E A E R O S PAC E C O R P O R AT I O N AC T I V I T Y
Late 1960s Aerospace leads planning of spacecraft reentry breakup testing.
First on-orbit breakup occurs when residual fuel in an Ablestar rocket body explodes.
1961 Val Chobotov, circa 1968. He was an early pioneer of space debris research at The Aerospace Corporation.
Starfish Prime experiment. The United States detonates a 1.4 megaton nuclear warhead 400 kilometers above the Pacific Ocean. The new and enhanced radiation belts cripple one-third of operational satellites.
1962
Project West Ford. The U.S. Air Force and DOD release half a billion whisker-thin copper wires into orbit in an attempt to create an artificial ionosphere (ring) around Earth to protect the nation’s long-range communications in case of war with the Soviets. Many of these whiskers are still in orbit today.
1963
Reentry of Apollo 13 lunar module. SNAP 27 radioisotope thermo-electric generator on board survived reentry (as designed) and landed in the Tonga Trench.
1970
The Russians deliberately blow up their nuclear-powered military satellites at end of mission for security purposes. In the process of ejecting nuclear reactor cores from Soviet military satellites into long-lifetime orbits, coolant leaks of liquid sodium-potassium droplets result in a significant numbers of lethal space debris.
1970s–1980s
1970s–Present Aerospace provides reentry breakup expertise to the White House on the safety of deep space missions that use decaying radioactive materials to generate power.
1971–1973 VASP/VAST ( Vehicle Atmospheric Survivability Project/Vehicle Atmospheric Survivability Tests).
Cosmos 954 reenters Earth’s atmosphere. This failed nuclear- powered Soviet reconnaissance satellite spreads radioactive debris across northern Canada.
1978 Aerospace participates on teams working to locate radioactive debris from Cosmos 954.
Donald Kessler, former NASA scientist known for his space debris studies, releases report on what becomes known as the Kessler syndrome.
Skylab makes an uncontrolled reentry and debris lands in Esperance, Australia. The town fines NASA $400 for littering.
1978–1979 Aerospace develops models to predict where debris from Skylab might be found.
Delta II tank explosions. 1980s Aerospace conducts research on space debris from the tanks and their potential effects on satellite operations.
P78-1 destroyed by ASM-135 antisatellite test. 1985 Aerospace begins initial development of breakup and debris cloud risk models (IMPACT and DEBRIS); Aerospace also supports orbital safety for antisatellite weapons test (ASAT).
Delta 180 satellite testing experiment for Strategic Defense Initiative.
1986 Aerospace supports debris safety analysis for Delta 180 test.
1990 Aerospace supports the Air Force Space Debris Research Program (Weapons and Phillips Laboratories) and the Space Test Range.
1991 Aerospace assists in the Strategic Defense Initiative/Ballistic Missile Defense Organization/Missile Defense Agency intercept safety testing and analysis.
First Gulf War, reentering missile debris. Ballistic missile debris shortfall study conducted.
Satellite Orbital Debris Characterization Impact Test (SOCIT). The first debris-focused ground test using a high-fidelity target.
1992 Aerospace receives the NASA Team Award for its work analyzing the reen-try breakup characteristics of the space shuttle’s external tank, removing a single point of failure for space shuttle missions.
Inter-Agency Space Debris Coordination Committee (IADC) established.
1993 Aerospace initiates work on the probability of collisions.
Titan II explosion. 1994 First “real time” debris risk analysis assessment.
Debris analysis workstation developed by Aerospace.
1995 Debris assessments conducted for large constellations.
Phot
o co
urte
sy o
f NAS
APh
oto
cour
tesy
of
Depa
rtm
ent o
f Def
ense

CROSSLINK FALL 2015 61
E V E N T DAT E T H E A E R O S PAC E C O R P O R AT I O N AC T I V I T Y
French Cerise satellite damaged by tracked debris. 1996
Large debris from Delta II launch vehicle lands in Texas. 1997 The Aerospace Corporation’s Center for Orbital and Reentry Debris Studies (CORDS) is established, providing a focal point for space debris and reentry hazard research.
Aerospace begins launch collision avoidance support to the Air Force and DOD.
Aerospace joins the NASA delegation at the Inter-Agency Space Debris Coordination Committee (IADC).
1998 The Space Operations Support Office (SOPSO) is established within CORDS to develop and prototype satellite collision avoidance services for commercial operators. Services are provided to approximately 50 commercial geosynchronous satellites.
1998, 1999 CORDS-led conferences on possible effects of projected Leonid meteor storm on satellites.
1998 CORDS testifies to Congress on possible effects of Leonid meteor storm on satellites.
2000 The reentry breakup recorder (REBR) is conceived to collect critical data on the breakup of space hardware during reentry. Aerospace is granted a patent for this device in 2005.
Establishment of U.S. orbital debris mitigation standards practices. 2001
The Soviet Union’s Mir space station reenters Earth’s atmosphere.
CORDS-led conference on improving reliability and efficiency of satellite operations.
IADC debris mitigation guidelines released. 2002
2002, 2003 CORDS-led symposiums on satellite radio frequency interference.
The space shuttle Columbia breaks up on reentry. 2003 Aerospace/CORDS testifies to Columbia Accident Investigation Board on what might be learned about the space shuttle accident based on the recovered debris.
SOPSO assists the Air Force in developing a plan for satellite collision warning services; SOPSO then discontinues operations.
2004 CORDS initiates a conference series on defending Earth from asteroid and comet impacts. Conferences held in 2004, 2007, 2009, 2011, 2013, 2015.
FY-1C Chinese antisatellite test. 2007 Aerospace establishes the Debris Analysis Response Team (DART).
USA-193 intercept of failed satellite by U.S. Navy.Aerospace plays key role in USA-193 planning and debris analysis.
2008
Cosmos 2251 and Iridium 33 satellites collide. 2009 Aerospace is granted a patent for the REBR-inspired spacecraft hardware tracker.
Rollout of the Aerospace Debris Environment Projection Tool (ADEPT).
Aerospace’s Debris Analysis Response Team (DART) conducts risk assessment for Cosmos–Iridium collision debris.
2010 The European Space Agency offers REBR a ride to space.
2011 First REBR mission aboard Japanese HTV-2 vehicle. The device records and forwards the first data ever recorded during breakup of an unprotected spacecraft.
Aerospace/CORDS participates on United Nations team developing recommendations for how nations should work together on defend-ing Earth from asteroids and comets. Recommendations approved 2013.
Phobos-Grunt fails, reenters Earth’s atmosphere. Aerospace leads analysis of reentry risk and location.
2012 Second and third successful REBR missions aboard HTV-3 and ATV-3.
2014 Ocean recovery testing of REBR-inspired Hypersonic Vehicle Onboard Recorder (HyVOR).
Aerospace, the Air Force’s Space and Missile Systems Center, and NASA conduct DebriSat and DebrisLV hypervelocity collision tests.
Phot
o co
urte
sy o
f NAS
APh
oto
cour
tesy
of N
ASA
Phot
o co
urte
sy o
f NAS
A
© The Aerospace Corporation 2015

The Crosslink Crossword
Across
3. Arrangement for living apart 6. Folksy cooking unit 9. Dropped some cash 11. Make murky 12. Garbage appliance 14. Obstacle 18. What's left behind 19. Summon a butler 21. Get together 24. How a couple might end 25. Power loss 26. Prominent retailer27. Tiny amount31. 24/7 L.A. hassle33. Captain America’s defense34. Film show35. Running/jumping venue36. Choke point
Most puzzle words and clues are from articles in this issue. The solution is on the Crosslink Web site: http://www.aerospace.org/publications/crosslink/.
Down 1. Downer 2. Rectangle on a screen 3. Oil company 4. _____ of foot, fast 5. Meeting in Marseilles? 7. Xmas midnight event 8. Boat that tows
Editor-in-ChiefNancy K. Profera
Guest EditorTed Muelhaupt
Contributing EditorsShane Glaseman
Gabriel Spera
Assistant Editors Ming Ballard
Velma Senaga
Staff EditorJon S. Bach
Research and Program Development Advisor
Terence S. Yeoh
Art Direction and DesignRichard M. Humphrey
IllustrationJason C. Perez
Joseph P. HidalgoStuart ArakiAllan Kung
PhotographyEric Hamburg Elisa Haber Kelly Hart
Editorial BoardJohn V. Langer, Chair
David A. BeardenKevin D. Bell
Walter F. BuellJohn E. Clark
Henry Helvajian Michael R. HiltonDiana M. Johnson
Jean L. MichaelRandy M. Villahermosa
Marilee J. Wheaton
Crosslink®
FALL 2015 VOL. 16 NO. 1
Board of TrusteesBarbara M. Barrett, Chair
George K. Muellner, Vice ChairWanda M. Austin
Charles A. BlanchardKevin P. Chilton
David M. DiCarloMichael B. Donley
Bonnie DunbarKeith P. Hall
Daniel E. HastingsTina W. Jonas
Michael Montelongo William L. Shelton Jeffrey H. SmithK. Anne StreetAlan C. Wade
Corporate OfficersWanda M. Austin, President and CEO
Ellen M. BeattyMalissia R. Clinton
Glenn A. DavisRand H. Fisher
Wayne H. GoodmanDavid J. Gorney
Charles L. GustafsonMalina M. Hills
Randy L. KendallWilliam C. Krenz
Howard J. MitchellCatherine J. Steele
Edward M. SwallowSherrie L. Zacharius
Space Debris - Crosslink 2015
1 2
3 4
5 6
7 8 9
10 11
12 13 14 15
16 17
18 19
20 21 22 23 24
25 26
27
28
29 30 31 32
33
34
35 36
Across3. Arrangement for living apart6. Folksy cooking unit9. Dropped some cash
11. Make murky12. Garbage appliance14. Obstacle18. What's left behind19. Summon a butler21. Get together24. How a couple might end25. Power loss26. Prominent retailer27. Tiny amount31. 24/7 L.A. hassle33. Captain America's defense34. Film show35. Running/jumping venue36. Choke point
Down1. Downer2. Rectangle on a screen3. Oil company4. ____ of foot, fast5. Meeting in Marseilles?7. Xmas midnight event8. Boat that tows
10. ____ in the wall: funky little joint11. Sears' was very famous13. Cat box contents15. "And," "but," or "or"16. Warning sign17. Not quite able to pay20. Fall end-over-end21. Pour, waterfall-style22. Bother; tease23. Generational divide24. Produce, biblically28. Thing29. It might be liquid30. Scour32. Where certain large mammals play
10. _____in the wall: funky little joint 11. Sears’ was very famous 13. Cat box contents 15. ”And,” “but,” or “or” 16. Warning sign 17. Not quite able to pay 20. Fall end-over-end 21. Pour, waterfall-style
22. Bother; tease 23. Generational divide 24. Produce, biblically28. Thing29. It might be liquid30. Scour32. Where certain large mammals play