Hydrometeorological threshold conditions for debris flow ...
15
Nat. Hazards Earth Syst. Sci., 12, 3059–3073, 2012 www.nat-hazards-earth-syst-sci.net/12/3059/2012/ doi:10.5194/nhess-12-3059-2012 © Author(s) 2012. CC Attribution 3.0 License. Natural Hazards and Earth System Sciences Hydrometeorological threshold conditions for debris flow initiation in Norway N. K. Meyer 1,2 , A. V. Dyrrdal 3 , R. Frauenfelder 4 , B. Etzelm ¨ uller 2 , and F. Nadim 1,4 1 International Centre for Geohazards (ICG), c/o NGI, P.O. Box 3930 Ullev˚ al Stadion, 0806 Oslo, Norway 2 University of Oslo (UiO), Department of Geoscience, P.O. Box 1047 Blindern, 0316 Oslo, Norway 3 Norwegian Meteorological Institute (met.no), P.O. Box 43 Blindern, 0313 Oslo, Norway 4 Norwegian Geotechnical Institute (NGI), P.O. Box 3930 Ullev˚ al Stadion, 0806 Oslo, Norway Correspondence to: N. K. Meyer ([email protected]) Received: 19 January 2012 – Revised: 13 August 2012 – Accepted: 28 August 2012 – Published: 11 October 2012 Abstract. Debris flows, triggered by extreme precipita- tion events and rapid snow melt, cause considerable dam- age to the Norwegian infrastructure every year. To define intensity-duration (ID) thresholds for debris flow initiation critical water supply conditions arising from intensive rain- fall or snow melt were assessed on the basis of daily hydro- meteorological information for 502 documented debris flow events. Two threshold types were computed: one based on absolute ID relationships and one using ID relationships normalized by the local precipitation day normal (PDN). For each threshold type, minimum, medium and maximum threshold values were defined by fitting power law curves along the 10th, 50th and 90th percentiles of the data popu- lation. Depending on the duration of the event, the absolute threshold intensities needed for debris flow initiation vary be- tween 15 and 107 mm day -1 . Since the PDN changes locally, the normalized thresholds show spatial variations. Depend- ing on location, duration and threshold level, the normalized threshold intensities vary between 6 and 250 mm day -1 . The thresholds obtained were used for a frequency analysis of over-threshold events giving an estimation of the exceedance probability and thus potential for debris flow events in differ- ent parts of Norway. The absolute thresholds are most often exceeded along the west coast, while the normalized thresh- olds are most frequently exceeded on the west-facing slopes of the Norwegian mountain ranges. The minimum thresh- olds derived in this study are in the range of other thresholds obtained for regions with a climate comparable to Norway. Statistics reveal that the normalized threshold is more reli- able than the absolute threshold as the former shows no spa- tial clustering of debris flows related to water supply events captured by the threshold. 1 Introduction A debris flow is a form of rapid mass movement in which a combination of loose soil, rock, organic matter and water mobilize as a slurry that flows downslope (Innes, 1983; Rick- enmann and Zimmermann, 1993; Hungr et al., 2008). Debris flows are commonly triggered by intense surface-water flow caused by heavy precipitation or rapid snow melt, leading to the erosion and mobilization of loose soil or rock on steep slopes. This means that three basic requirements have to be fulfilled simultaneously for them to occur: presence of steep slopes, availability of unconsolidated sediments and loose material, and unusually high supply of water (Innes, 1983; Iverson, 1997; Frattini et al., 2009). Debris flows start fre- quently as shallow slides in nearly-saturated soil that turn into flows. The high water supply causes saturation and loss of suction in unsaturated soils as well as a rapid increase in pore pressure in saturated soils, leading to a decrease in the shear strength of the sediments and triggering of the initial slide. It also plays a key role in the transition of the slide to flow. Nearly all debris flows are triggered by hydro- meteorological events, such as intense storms, prolonged rainfall and snow and glacier melt. However, on rare oc- casions, geological events such as earthquakes or volcanic disruptions also trigger debris flows (Innes, 1983; Keefer, 1984; Wieczorek, 1996; Rebetez et al., 1997; Crosta, 1998; Wieczorek and Glade, 2005). The most common triggers for debris flows in Norway are intense rainfall and rapid snow melt leading to high soil saturation and severe surface and subsurface runoff (Sandersen et al., 1996; Nadim et al., 2009). Published by Copernicus Publications on behalf of the European Geosciences Union.
-
Upload
khangminh22 -
Category
Documents
-
view
0 -
download
0
Transcript of Hydrometeorological threshold conditions for debris flow ...

Nat. Hazards Earth Syst. Sci., 12, 3059–3073, 2012www.nat-hazards-earth-syst-sci.net/12/3059/2012/doi:10.5194/nhess-12-3059-2012© Author(s) 2012. CC Attribution 3.0 License.
Natural Hazardsand Earth
System Sciences
Hydrometeorological threshold conditions for debris flowinitiation in Norway
N. K. Meyer1,2, A. V. Dyrrdal 3, R. Frauenfelder4, B. Etzelmuller2, and F. Nadim1,4
1International Centre for Geohazards (ICG), c/o NGI, P.O. Box 3930 Ulleval Stadion, 0806 Oslo, Norway2University of Oslo (UiO), Department of Geoscience, P.O. Box 1047 Blindern, 0316 Oslo, Norway3Norwegian Meteorological Institute (met.no), P.O. Box 43 Blindern, 0313 Oslo, Norway4Norwegian Geotechnical Institute (NGI), P.O. Box 3930 Ulleval Stadion, 0806 Oslo, Norway
Correspondence to:N. K. Meyer ([email protected])
Received: 19 January 2012 – Revised: 13 August 2012 – Accepted: 28 August 2012 – Published: 11 October 2012
Abstract. Debris flows, triggered by extreme precipita-tion events and rapid snow melt, cause considerable dam-age to the Norwegian infrastructure every year. To defineintensity-duration (ID) thresholds for debris flow initiationcritical water supply conditions arising from intensive rain-fall or snow melt were assessed on the basis of daily hydro-meteorological information for 502 documented debris flowevents. Two threshold types were computed: one based onabsolute ID relationships and one using ID relationshipsnormalized by the local precipitation day normal (PDN).For each threshold type, minimum, medium and maximumthreshold values were defined by fitting power law curvesalong the 10th, 50th and 90th percentiles of the data popu-lation. Depending on the duration of the event, the absolutethreshold intensities needed for debris flow initiation vary be-tween 15 and 107 mm day−1. Since the PDN changes locally,the normalized thresholds show spatial variations. Depend-ing on location, duration and threshold level, the normalizedthreshold intensities vary between 6 and 250 mm day−1. Thethresholds obtained were used for a frequency analysis ofover-threshold events giving an estimation of the exceedanceprobability and thus potential for debris flow events in differ-ent parts of Norway. The absolute thresholds are most oftenexceeded along the west coast, while the normalized thresh-olds are most frequently exceeded on the west-facing slopesof the Norwegian mountain ranges. The minimum thresh-olds derived in this study are in the range of other thresholdsobtained for regions with a climate comparable to Norway.Statistics reveal that the normalized threshold is more reli-able than the absolute threshold as the former shows no spa-tial clustering of debris flows related to water supply eventscaptured by the threshold.
1 Introduction
A debris flow is a form of rapid mass movement in whicha combination of loose soil, rock, organic matter and watermobilize as a slurry that flows downslope (Innes, 1983; Rick-enmann and Zimmermann, 1993; Hungr et al., 2008). Debrisflows are commonly triggered by intense surface-water flowcaused by heavy precipitation or rapid snow melt, leading tothe erosion and mobilization of loose soil or rock on steepslopes. This means that three basic requirements have to befulfilled simultaneously for them to occur: presence of steepslopes, availability of unconsolidated sediments and loosematerial, and unusually high supply of water (Innes, 1983;Iverson, 1997; Frattini et al., 2009). Debris flows start fre-quently as shallow slides in nearly-saturated soil that turninto flows. The high water supply causes saturation and lossof suction in unsaturated soils as well as a rapid increase inpore pressure in saturated soils, leading to a decrease in theshear strength of the sediments and triggering of the initialslide. It also plays a key role in the transition of the slide toflow.
Nearly all debris flows are triggered by hydro-meteorological events, such as intense storms, prolongedrainfall and snow and glacier melt. However, on rare oc-casions, geological events such as earthquakes or volcanicdisruptions also trigger debris flows (Innes, 1983; Keefer,1984; Wieczorek, 1996; Rebetez et al., 1997; Crosta, 1998;Wieczorek and Glade, 2005). The most common triggersfor debris flows in Norway are intense rainfall and rapidsnow melt leading to high soil saturation and severe surfaceand subsurface runoff (Sandersen et al., 1996; Nadim et al.,2009).
Published by Copernicus Publications on behalf of the European Geosciences Union.

3060 N. K. Meyer et al.: Hydrometeorological threshold conditions for debris flow initiation
On a regional scale, it is common to estimate the localdebris flow potential from statistical analysis of past trig-gering rainfall/snow melt events (Caine, 1980; Wieczorekand Glade, 2005; Guzzetti et al., 2007, 2008). Intensity-duration (ID) thresholds are based on the assumption that,for a given duration, there exists a specific minimum rain-fall intensity above which debris flows are likely to be trig-gered (Wieczorek and Glade, 2005). The so-called minimumthreshold, sometimes referred to as the “safety threshold”, isthe lowest level below which a process is very unlikely tooccur (Guzzetti et al., 2007; Baum and Godt, 2010). In mostcases the intensity needed to trigger a debris flow, however,substantially exceeds the minimum threshold (Innes, 1983).This is why the maximum ID threshold is also of interest.The maximum threshold defines the level above which a pro-cess almost always occurs (Guzzetti et al., 2007; Dahal andHasegawa, 2008).
Generally it can be observed that the wetter the region,the higher is the threshold for the intensity that is likelyto trigger debris flows (Innes, 1983; Guzzetti et al., 2007;Nadim et al., 2009). This relationship reflects the adjustmentof the slopes to the long-term precipitation regime (Wilsonand Jayko, 1997; Nadim et al., 2009). To account for thisspatial variability Cannon and Ellen (1985) introduced meanannual precipitation (MAP) to normalize the critical ID re-lationship. However, in recent years several studies showedthat the normalization with respect to MAP might be inad-equate. Even if the total amount of precipitation is higherin one region than in another, the average daily rainfall on arainy day might be less (Wieczorek and Glade, 2005). Wilsonand Jayko (1997) suggest, therefore, using the rainy day nor-mal (RDN), i.e., the amount of precipitation typically fallingon a day with precipitation. They show that the RDN is abetter normalization parameter since it reflects the commonintensities in a climatic region and correlates with moderatestorms that might trigger debris flows.
In many parts of Norway, debris flows pose a serious threatto buildings and transport infrastructure. The NorwegianPublic Road Administration (NPRA) reports that one third ofall registered mass movements (including snow avalanches)resulted in total or partial road closures. Among the differentmass movement types, debris flows had the largest conse-quences for road infrastructure (e.g., 25 % of all pavementdamages connected to mass movements were caused by de-bris flows). Debris flows are often related to extreme precip-itation and flood events. In autumn 2005, the two extremeprecipitation events “Kristin” and “Loke” triggered together,for example, almost 100 debris flows in Norway (Bjordal andHelle, 2011).
Using a small sample of 30 debris flow events, Sander-sen et al. (1996) derived an intensity-duration threshold fordebris flow initiation in Norway based on average intensitiescalculated from the total amount of precipitation over subjec-tively chosen critical durations. Their threshold indicates thatdebris flows initiate as soon as the precipitation sum equals
8 % of the mean annual precipitation (MAP) during 1 day. Inpractice, the threshold suggested by Sandersen et al. (1996)turns out to be too high for issuing warnings (T. Humstad,personal communication, 2011). Cepeda et al. (2010) deriveda threshold for debris flows in the small Norangselva catch-ment located at the northwestern coast of Norway. He foundthat rainfall intensities exceeding 17 mm in 1 day might trig-ger debris flows. However, this threshold is very local andcannot be extrapolated to the entire country.
The aim of this study was, therefore, to derive intensity-duration (ID) thresholds for debris flow initiation in Norwaybased on a large statistical data population. A comprehensivedatabase with over 600 debris flow events recently becameavailable as well as gridded data providing spatially continu-ous information on water supply for the entire country. Bothdata sets in combination provide the unique opportunity toestimate critical initiation conditions. We assume that the in-tegration of the factor snow for the definition of critical watersupply ID relationships will enhance the temporal accuracyof the hydro-meteorological information.
2 Data basis and method development
2.1 Digital elevation model (DEM)
The digital elevation model (DEM) used in this study isprovided by the Norwegian Mapping Authority (StatensKartverk, 2011) and has a resolution of 10 m× 10 m. Theelevation information is based on contour lines, elevationpoints, coast lines, river lines and water surface polygons. Inpopulated areas the underlying contour lines have a spacingof 5 m (corresponds to FKB-H5 map) while unsettled areasare covered by contour lines with a spacing of 20 m (corre-sponds to N50 map). The uncertainty in elevation informa-tion ranges between 2 m and 6 m depending on the locationand quality of the underlying data in settled and unsettled ar-eas, respectively. The DEM covers all of mainland Norwayincluding the coastal islands (Statens Kartverk, 2011).
2.2 Gridded hydro-meteorological data
All climate data used for this study are provided by the Nor-wegian Meteorological Institute (met.no) and the NorwegianWater and Energy Directorate (NVE) (Engeset et al., 2004;Tveito et al., 2005; available viawww.seNorge.no). The cli-mate grids extend in time back to 1957 and are updated on adaily basis. The maps are created from daily observations oftemperature and precipitation interpolated to a 1 km× 1 kmgrid (hereafter referred to as climate grids).
The temperature grid is interpolated from daily tempera-ture measurements reported by 235 meteorological stationsusing residual kriging. Since meteorological stations are un-derrepresented at higher elevations the interpolation methodincorporates assumptions about the temperature lapse rate.Residual kriging was found to be a good method to account
Nat. Hazards Earth Syst. Sci., 12, 3059–3073, 2012 www.nat-hazards-earth-syst-sci.net/12/3059/2012/

N. K. Meyer et al.: Hydrometeorological threshold conditions for debris flow initiation 3061
for the lack of information at higher elevations, except duringinversions in winter (Tveito et al., 2005).
The precipitation grid is interpolated from daily pre-cipitation measurements reported by approximately400 meteorological stations and corrected for the wind-related gauge undercatch of snow (Tveito et al., 2005).The spatial interpolation of precipitation was conductedby applying irregular triangular networks (TINs) for theparameters precipitation and elevation. Both TINs werecombined and transformed into 1 km× 1 km grids by addinga vertical precipitation gradient of 10 % for every 100 maltitude up to 1000 m a.s.l. At elevations higher than 1000 ma.s.l., the vertical precipitation gradient is estimated to be5 % for every 100 m altitude (Tveito et al., 2005). Thereare few meteorological stations at higher elevations and theprecipitation would be underestimated without accountingfor this altitude correction (Førland, 1979). The temperatureand the precipitation grids serve as input to a snow modelthat calculates the changes in the snow conditions due totemperature and precipitation (Engeset et al., 2004). Thesnow model uses a relatively simple process-based method tocalculate the snow water equivalent, snow depth, snow bulkdensity and liquid water in snowpack. Evaluation showedoverestimation of the snow water equivalent and snow bulkdensity. These systematic biases can be reduced by usingrelative units instead of absolute values. Generally, the snowmodel was found to be a good way to produce national snowmaps of high spatio-temporal resolution (Saloranta, 2012).
2.3 Derivation of water supply (WS) data
The hydro-meteorological conditions in advance of each de-bris flow are extracted from national grids showing informa-tion on “rain and snow melt”. This data will be referred to aswater supply (WS) throughout this paper. This water supplyrepresents the amount of available water on one day in mil-limeters [mm] derived from rainfall and snow melt “on-site”at a specific location (as compared to the flow accumulationwhich also considers run-off related supply from upstreamareas). Information on water supply is available on a dailybasis and sums up the actual amount of rainfall on that spe-cific day plus the amount of released snow melt water ondays with temperatures above 0◦C. However, on days withtemperatures below 0◦C, the amount of water provided byprecipitation is temporarily stored. This stored water is firstreleased to the cell when the temperature rises above 0◦C.Over an entire hydrological year, the sum of precipitationand the sum of water supply should be equal since all wa-ter stored in the form of snow is going to be released duringspring and summer. During the winter season, however, wa-ter provided by snow can be released with a significant timedelay (Wieczorek, 1996; Wieczorek and Glade, 2005; Jakoband Weatherly, 2003).
Raster information regarding the precipitation day normal(PDN) is used for normalization:
PDN = MAP/APD (1)
where MAP is the mean annual precipitation and APD theaverage number of precipitation days per year (Fig. 1).
The precipitation day normal is an indicator for the in-tensity with which water is supplied over a year and repre-sents the hydrological conditions the landscape of a region isadapted to. The main difference from the rainy day normal(RDN) is that, besides rainfall, also water supplied by snowmelt is considered. The PDN was calculated for the normalperiod 1961–1990 and extracted for all debris flow locations.
2.4 Slide database
The Norwegian slide database, which records instances ofall types of landslides as well as snow avalanches, consistsof almost 33 000 entries (Jaedicke et al., 2009, available viawww.skrednett.no). Information on the recorded slides wasgathered primarily from the national road and railway author-ities, but also from governmental organizations and consult-ing firms who are in charge of post-slide investigations. Alldata are stored within a GIS point layer providing informa-tion on time of occurrence, location and type of movement.For some of the slides more detailed information such as therun-out distance or the slide volume is also given. Within theslide database, 710 events are recorded as single debris flowevents at their point of deposition. The dates of the docu-mented events range from 1900 to 2008 with a clear peak ofrecorded events between 1979 and 2007. The accuracy of thereported event times is given as additional information anddiffers widely from event to event. In total, 648 events docu-mented between 1976 and 2008 were used for this study allof which had an event time accuracy of 30 minutes or less.Figure 2 shows the spatial distribution of these 648 debrisflows. A cluster of documented debris flows is clearly observ-able on the west coast of the country where the mean annualprecipitation is high and deeply incised fjords are prominent.
To extract the relevant information for the triggering con-ditions of a specific debris flow, the hydro-meteorologicalconditions at the initiation area in advance of the debris flowevent have to be known. Since the debris flow locations wereusually recorded at the area of deposition, it was necessaryto relocate these debris flow points to their potential initia-tion areas (Fig. 3). To identify the most likely initiation ar-eas, the watershed for each documented debris flow point(with a buffer of 100 m radius) was calculated. The criteriafor finding the likely initiation points within this watershedwere based on slope, elevation and flow length with respectto the documented deposition point. Cells with slope of morethan 25◦ were extracted from the watershed; 25◦ is knownas a likely minimum slope inclination for debris flow initi-ation (e.g., Rapp and Nyberg, 1981; Innes, 1983; Zimmer-mann, 1990; Rieckenmann and Zimmermann, 1993; Hungr
www.nat-hazards-earth-syst-sci.net/12/3059/2012/ Nat. Hazards Earth Syst. Sci., 12, 3059–3073, 2012

3062 N. K. Meyer et al.: Hydrometeorological threshold conditions for debris flow initiation
Fig. 1. Grids used for normalization of water supply data at debris flow locations: the precipitation day normal (PDN) is calculated bydividing the mean annual precipitation (MAP) by the average number of precipitation days per year (APD) and represents the typical amountof precipitation on a precipitation day.
et al., 2008). For the remaining potential initiation cells, theflow length to the reported deposition point was calculated.From the database, a travel distance of 2500 m was identifiedas the longest documented travel distance for a debris flowin Norway. However, only 6 of the 648 entries contained in-formation on travel distance. A literature review showed thattravel distances of debris flows exceeding 3000 m are ratherunlikely (Hungr et al., 2008). Cells with flow lengths of morethan 3000 m were, therefore, excluded. The highest point inthe extracted initiation area was then selected as the initiationpoint of the corresponding debris flow in this study.
From the 648 debris flow initiation points a number of502 could be used to extract water supply information for theevent day 4 weeks (28 days) before each debris flow event.146 records had to be discarded due to missing water supplyinformation or low data quality (see Sect. 5.1).
2.5 Definition of intensity-duration (ID) relationships
To define a valid intensity-duration (ID) threshold, it is nec-essary to determine the critical intensities related to durationsof the rainfall and/or snow melt events which triggered debrisflows. The choice of the duration is often done by a subjec-tive definition of the triggering events, e.g., from the approx-imate point in time where heavy rainfall started (Guzzetti et
al., 2007). In order to define event durations more objectively,we extracted the relevant time-dependent data directly fromthe gridded precipitation data (see Sect. 3.2). Thereby we ob-tained the critical water supply duration by using the maxi-mum average intensity [mm day−1] prior to each debris flowevent, also known as the maximum antecedent water sup-ply (Table 1).
ID = max(WSC/D) ∼ D (2)
where ID is the intensity-duration relationship used forthreshold definition, WSC is the cumulative water supply inthe time period prior to the debris flow and D is the corre-sponding duration in days. Intensity-duration relationshipswere calculated for each day in four weeks (28 days) in ad-vance of each debris flow event and the maximum value waschosen for threshold definition.
2.6 Threshold definition
The intensity-duration (ID) relationships for the 502 debrisflow events served as input for the definition of minimum,medium and maximum thresholds. All three threshold lev-els are calculated for the absolute and normalized intensi-ties over a range of 1 to 7 days and can only be appliedover this period of time. For longer durations the amount of
Nat. Hazards Earth Syst. Sci., 12, 3059–3073, 2012 www.nat-hazards-earth-syst-sci.net/12/3059/2012/

N. K. Meyer et al.: Hydrometeorological threshold conditions for debris flow initiation 3063
Fig. 2.Spatial distribution of the 648 debris flows analyzed in this study; temporal coverage of analyzed events= 1976–2008.
data is too low to achieve a reliable threshold curve. Powerlaws of the form I= a ∗ Db are the most common forms forID threshold curves described in the literature (Guzzetti etal., 2007; Brunetti et al., 2010). The ID relationships de-fined by this function are linear in a log-log plot. The abso-lute threshold plot shows the absolute water supply intensity[mm day−1] over the corresponding duration (Fig. 4), whilethe normalized plot shows the absolute water supply inten-sity [mm day−1] divided by the local precipitation day nor-mal (PDN) and plotted against the duration (Fig. 5). As notedbefore, normalization was carried out to account for differ-ences in local climate.
Data on non-events would have been of help to handle un-certainties related to the event database (see Sect. 5.1). Un-fortunately such data were not available and we decided toaim for a minimum threshold that captures approximately90 % of the 502 obtained ID relationships (allowing obtained
water supply intensities in the very low range to be poten-tially wrong for one or the other reason). The minimumthreshold was obtained by calculating the 5th and the 15thintensity percentiles for 1 to 7 days duration applying a 3-daymoving average filter to the intensity-duration relationships.The method used for the definition of the medium and max-imum thresholds was similar. The medium threshold aims tocapture 50 % of the obtained ID relationships. Accordingly,the threshold curve was fitted through the 3-day moving av-erage of the 45th and the 55th percentiles over 7 days of du-ration. The maximum threshold aims to capture 10 % of theID relationships and accordingly the 3-day moving averageof the 85th and the 95th percentiles are used. Comparableapproaches that use percentile regressions for threshold defi-nition are performed by, e.g., Guzzetti et al. (2007) and Saitoet al. (2010).
www.nat-hazards-earth-syst-sci.net/12/3059/2012/ Nat. Hazards Earth Syst. Sci., 12, 3059–3073, 2012

3064 N. K. Meyer et al.: Hydrometeorological threshold conditions for debris flow initiation
Table 1. Individual series of antecedent water supply data for a debris flow event that occurred near Vang (central Norway) on 04.05.2008:The cumulative water supply [mm] and the corresponding average intensities [mm day−1] are calculated for the 28 days in advance of anevent. The found maximal cumulative average intensity (WSC/D) and the corresponding duration (D) (printed bold) are used as input for thethreshold definition.
Duration [day] Water supply Cumulative water supply Cumulative average intensity(D) [mm] (WS) [mm] (WSC) [mm day−1] (WSC/D)
1Event 13 13 132 23 36 183 33 69 234 38 107 275 21 128 266 23 151 257 20 171 248 8 179 229 0 179 2010 0 179 18[. . . ] [. . . ] [. . . ] [. . . ]28 38 207 27
Fig. 3. Schematic illustration of the parameters used for the reloca-tion of recorded debris flows from the deposition to a likely initia-tion area.
In our study the minimum threshold is interpreted as thelowest intensity-duration relation that is able to trigger debrisflows. However, occurrences below this threshold are possi-ble as the lowest intensity values were left out due to uncer-tainties related to the data quality. The medium threshold isinterpreted as the intensity-duration relation that is likely totrigger debris flows, whereas the maximum threshold indi-cates the intensity above which debris flows will always oc-
Fig. 4. Absolute ID threshold curves for debris flow initiation ob-tained from the water supply (WS) intensity 3-day moving aver-age of the 5th and 15th percentiles (minimum threshold), the 45thand 55th percentiles (medium threshold) and the 85th and 95th per-centiles (maximum threshold) (n = 502).
cur. The three threshold levels are marked by the color codegreen, orange and red, which is common for indication ofdifferent warning levels in natural hazard research. Differentwarning levels in an early warning system are able to definedifferent levels of preparedness.
Nat. Hazards Earth Syst. Sci., 12, 3059–3073, 2012 www.nat-hazards-earth-syst-sci.net/12/3059/2012/

N. K. Meyer et al.: Hydrometeorological threshold conditions for debris flow initiation 3065
Fig. 5. Normalized ID threshold curves for debris flow initiation.Water supply (WS) intensities were normalized with the precipita-tion day normal (PDN). The curves were obtained from the 3-daymoving average of the 5th and 15th percentiles (minimum thresh-old), the 45th and 55th percentiles (medium threshold) and the 85thand 95th percentiles (maximum threshold) (n = 502).
3 Results
3.1 Absolute ID threshold
The obtained absolute ID thresholds are represented in Fig.4 and can be described with the following equations:
IMIN = 23.3× D−0.24day (3)
IMED = 60.1× D−0.52day (4)
IMAX = 107.2× D−0.57day (5)
where IMIN is the lowest threshold level of water supplyintensity in mm day−1 above which debris flow initiationbecomes possible, IMED is the intermediate threshold levelabove which debris flows become very likely, IMAX is thehighest threshold level above which triggering of debrisflows is almost assured and Dday is the corresponding dura-tion in days. Critical water supply intensities calculated fromthe three thresholds over durations of 1, 3 and 7 days are rep-resented in Table 2.
The negative exponent characterizing all three thresholdfunctions indicates that with increasing duration of watersupply, the intensity that is needed for debris flow initiationdecreases. Note that the three threshold curves show differentslope angles with the maximum threshold curve showing the
Table 2. Critical water supply (WS) intensity calculated from theabsolute minimum, medium and maximum ID threshold over dura-tions of 1, 3 and 7 days.
Duration [day] Critical WS intensity [mm day−1]Minimum Medium Maximum
1 23 60 1073 18 34 577 15 22 35
Table 3.Range of critical water supply (WS) intensities calculatedfrom the normalized minimum, medium and maximum ID thresh-old over durations of 1, 3 and 7 days. Different threshold intensitiesresult from spatial variation of the precipitation day normal (PDN)(see Fig. 1).
Duration [day] Critical WS intensity [mm day−1]Minimum Medium Maximum
1 9 – 63 18 – 131 35 – 2503 7 – 49 10 – 75 19 – 1377 6 – 40 7 – 48 12 – 86
steepest slope. This implies that the water supply intensity totrigger debris flows has to be significantly higher in the short-term than in the long-term. The medium threshold curve andthe minimum threshold curve imply smaller differences inthreshold intensity over time.
3.2 Normalized intensity-duration threshold
The obtained normalized ID thresholds are represented inFig. 5 can be described with the following equations:
IMIN/PDN= 2.18× D−0.24day (6)
IMED/PDN= 4.51× D−0.51day (7)
IMAX /PDN= 8.66× D−0.55day (8)
where IMIN is the lowest threshold level of water supply in-tensity [mm day−1], IMED is the intermediate threshold level,IMAX is the highest threshold level, PDN is the normaliza-tion parameter precipitation day normal and Dday is the cor-responding duration in days. Critical water supply intensitiescalculated from the three thresholds over durations of 1, 3and 7 days are represented in Table 3. Because of normaliza-tion with the local parameter PDN, the critical water supplyintensities obtained from the thresholds vary from location tolocation.
The spatial distribution of the normalized minimum,medium and maximum threshold over durations of 1, 3 and7 days is shown in Fig. 6. In accordance with the spatialdistribution of the PDN (see Fig. 1), these maps show that
www.nat-hazards-earth-syst-sci.net/12/3059/2012/ Nat. Hazards Earth Syst. Sci., 12, 3059–3073, 2012

3066 N. K. Meyer et al.: Hydrometeorological threshold conditions for debris flow initiation
Fig. 6.Spatial distribution of the water supply (WS) intensity needed for debris flow initiation after 1 day, 3 days and 7 days of water supplyaccording to the normalized minimum, medium and maximum ID threshold.
the intensity needed for debris flow initiation is consider-ably higher near the Norwegian west coast than in the driereastern part of the country. The normalized minimum thresh-old ranges from 6 to 63 mm day−1, the normalized mediumthreshold ranges from 7 to 131 mm day−1 and the normal-ized maximum threshold varies from 12 to 250 mm day−1,depending on the specific location and the considered dura-tion (see Table 3). Obviously, the variation of the minimum,medium and maximum threshold intensities in areas with lowPDN is not as strong as the variation of the threshold intensi-ties in areas with high PDN. This implies that the local PDNhas a stronger impact on the threshold conditions in wetterareas than in drier areas.
For all three threshold levels, the spatial differences in wa-ter supply intensity values become smaller for longer du-rations. Especially in eastern Norway, the normalized IDthresholds are very low due to low PDN values. Thus,some parts of eastern Norway are characterized by a min-imum threshold of less than 10 mm day−1. In comparison,
the absolute minimum ID threshold intensity ranges between23 mm day−1 over 1 day and 15 mm day−1 over 7 days. Incontrast, near the Norwegian west coast, the normalized IDthresholds are two to three times higher than the absoluteID thresholds. This is related to extremely high PDN valuesof up to 29 mm day−1. Thus, the average intensity on a nor-mal precipitation day on the west coast is occasionally higherthan the intensity needed for debris flow initiation given bythe absolute ID threshold for 1 day duration (23 mm day−1).This implies a very frequent debris flow activity or a thresh-old that is too low for this wet region. This topic will be fur-ther discussed in Sect. 4.2.
3.3 Frequency analysis of over-threshold events
In order to estimate the probability of threshold exceedance,the annual frequency of water supply events with valueshigher than the thresholds obtained was calculated for the pe-riod 1981–2010 (approximately the period of time for whichdebris flow data is available). Figure 7 shows the spatial
Nat. Hazards Earth Syst. Sci., 12, 3059–3073, 2012 www.nat-hazards-earth-syst-sci.net/12/3059/2012/

N. K. Meyer et al.: Hydrometeorological threshold conditions for debris flow initiation 3067
Fig. 7. Spatial distribution of the annual average frequency of over-threshold water supply events calculated from the absolute minimum,medium and maximum ID threshold for 1 day, 3 days and 7 days duration of water supply.
distribution of the annual average frequency of events abovethe absolute minimum, medium and maximum ID thresholdsfor durations of 1, 3 and 7 days. Obviously the absolute min-imum threshold is crossed most frequently. Furthermore, thethreshold is more often exceeded along the west coast (in thearea approximately from Stavanger in the south to Bodø inthe north) and over longer durations. The absolute minimumthreshold over 7 days can locally be exceeded as often as160 times a year. However, the annual average frequency ofover-threshold events decreases rapidly the higher the thresh-old level, the shorter the duration and the further east the lo-cation. Except at the very edge of the Norwegian west coast,the maximum threshold for the duration of 1 day is hardlyever exceeded.
Like the absolute thresholds, the exceedance probabilityof the normalized thresholds was estimated from the an-nual frequency of over-threshold events in the period 1981–2010 (Fig. 8). The annual frequency of water supply eventsthat exceed the minimum threshold varies between 5 and90 events depending on the location and the duration of watersupply. As the water supply intensity has to be considerably
higher for the medium threshold, the annual average num-ber of over-threshold events decreases and ranges between 0and 77 events. The frequency decreases further for the max-imum threshold and varies, depending on duration and loca-tion, between 0 and 51 over-threshold events. From Fig. 7 itbecomes clear that the threshold exceedance is more frequentover longer durations than over shorter durations. The fre-quency of over-threshold events is highest in western, north-ern and central Norway. Further differences in the spatialpattern of the exceedance frequency can be observed whencomparing the different threshold levels. Thus, the minimumand medium thresholds are most frequently crossed along thewest-facing slopes of the mountain ranges. The maximumthreshold has the highest exceedance farther east in the flat-ter interior as well as in the far north.
www.nat-hazards-earth-syst-sci.net/12/3059/2012/ Nat. Hazards Earth Syst. Sci., 12, 3059–3073, 2012

3068 N. K. Meyer et al.: Hydrometeorological threshold conditions for debris flow initiation
Fig. 8.Spatial distribution of the annual average frequency of over-threshold events calculated from the PDN-normalized minimum, mediumand maximum ID threshold for 1 day, 3 days and 7 days duration of water supply.
4 Discussion
4.1 Data reliability
Due to several limitations, 146 debris flow events had tobe excluded. The two main criteria for exclusion where:(1) Data extraction from the grids was not always possibledue to missing water supply information at correspondingdebris flow locations. This is mainly due to the coarse gridresolution of 1 km× 1 km and the fact that grid cells withadjoining open water surfaces were not processed in the gridinterpolation. As a result much of the coastal area is not cov-ered. (2) For several debris flows no water supply was regis-tered for the time of two days in advance of the debris flowevent. Debris flows occurring after two dry days were consid-ered as unlikely and therefore excluded. Possible reasons forweak correspondence between debris flow date/location andthe corresponding water supply can be related to errors re-garding the debris flow input data or to the water supply gridquality. The former can originate from (a) the fact that thedebris flow documentation is incorrect in time and/or space;
(b) the relocation of the event from the documented deposi-tion point to a potential initiation point is incorrect; or (c) thatthe assumption regarding the triggering factor for debris flowinitiation is incorrect. The latter is true for debris flows thatwere not induced by rainfall or snow melt but for example byhuman construction activities. However, the remaining dataon 502 debris flow event were randomly checked manuallyfor plausibility and showed good correspondences regardingtheir occurrence in time and space.
Generally, the quality of the water supply information isdirectly dependent on the quality of interpolation of the in-put grids for temperature and precipitation. Local gaps of thestation network, the complex topography and the frequent oc-currence of precipitation events in very local storm cells, aresources of uncertainty in the interpolated precipitation val-ues. In addition, the temporal duration of extreme weatherevents can be very short, occasionally lasting less than anhour (Keefer et al., 1987). It is well known that the longer theperiod for which rainfall intensity is averaged, the smaller arethe documented peak intensities (Guzzetti et al., 2007). Thus,
Nat. Hazards Earth Syst. Sci., 12, 3059–3073, 2012 www.nat-hazards-earth-syst-sci.net/12/3059/2012/

N. K. Meyer et al.: Hydrometeorological threshold conditions for debris flow initiation 3069
Fig. 9. The obtained absolute minimum threshold (1) and the ob-tained normalized minimum threshold (13) (both red) in com-parison to a selection of other global (gray), regional and local(black) minimum ID thresholds. References for absolute thresholdsin (a): Caine (1980) (2); Clarizia et al. (1996) (3); Crosta and Frat-tini (2001) (4); Guzetti et al. (2008) (5); Larsen and Simon (2003)for Puerto Rico (6); Ceriani et al. (1992) for Lombardy, Italy (7);Baum et al. (2005) for Seattle Area, US (8); Jakob and Weath-erly (2003) (9), Moser and Hohensinn 1983 for Eastern Tyrol, Aus-tria (10); Montgomery et al. (2000) for Oregon, US (11); Cepeda etal. (2010) for Norangselva, Western Norway (12). Reference fornormalized thresholds in(b): Guzzetti et al. (2007) for mild cli-mates (14) and Guzzetti et al. (2007) for highlands (15). Note thatdurations are given in hours [h].
the temporal resolution has a direct effect on the calculatedintensities: the lower the temporal resolution, the lower theaverage intensity. The spatial resolution of 1 km× 1 km andthe temporal resolution of 1 day might be limiting factors forthe purpose of threshold definition. However, at the presenttime the data used in this study are regarded as the best avail-able on a national level (H. O. Hygen, personal communica-tion, 2011).
4.2 Threshold performance
Both the absolute and the normalized thresholds are charac-terized by negative exponents and, thus, a log-linear decreaseof intensity over time. The requirement of high water supplyintensities over shorter durations corresponds to the com-mon observation that the short-term water supply has to beconsiderably higher than the long-term water supply causingdebris flow initiation (Wieczorek and Glade, 2005; Godt etal., 2006; Guzzetti et al., 2007; Dahal and Hasegawa, 2008).The relation between short-term and long-term water sup-ply causing debris flow initiation (expressed by the steepnessof the slope of a threshold curve) can be generally related
to the infiltration and saturation capacity of the underlyingsediments. Areas where the triggering short-term water sup-ply intensity is orders of magnitude higher than the thresholdintensity over longer periods should be characterized by arather thick soil cover. If the infiltration capacity is high sucha soil cover buffers high water supply intensities over shorterdurations. As soil becomes saturated after long-lasting watersupply, considerably lower triggering intensities are neededfor debris flow initiation as in an unsaturated stage. Thus, theinitiation of a debris flow is highly dependent on the duration.At locations with thinner soil cover intensities necessary fordebris flow initiation are lower over short durations but ap-proximate similar intensities over longer durations. Less wa-ter can be stored and, thus, antecedent water supply becomesless important. Here the difference between short-term andlong-term threshold intensity is not as large.
The minimum threshold levels obtained in this study are inthe range of other minimum intensity-duration (ID) thresh-olds described in literature (Fig. 9). In terms of the globalabsolute minimum thresholds, the threshold introduced byCaine (1980) is considerably higher than the threshold ob-tained in this study, while the thresholds from Crosta andFrattini (2001), and Guzzetti et al. (2008) are of comparablemagnitude and show a similar slope. The two regional thresh-olds obtained in tropical and Mediterranean regions (Ceri-ani et al., 1992; Larsen and Simon, 2003) are three to eighttimes higher than the minimum threshold obtained for Nor-way. However, our threshold compares well to the regionaland local minimum thresholds produced for temperate re-gions characterized by high annual precipitation, such aseast Tyrol in Austria, western Canada and the northwesternUS (Moser and Hohensinn, 1983, Montgomery et al., 2000;Jakob and Weatherly, 2003; Baum et al., 2005). The Nor-wegian west coast features a climate similar to northwesternNorth America. That our threshold is of comparable magni-tude as the thresholds obtained for these regions can act asconfirmation that the critical amount of rainfall/water sup-ply for debris flow initiation shows a relationship with thecommon regional climate. The low short-term intensities andthe lower slope of our threshold curve compared to other re-gional threshold curves can be related to a high percentageof bedrock area and a rather thin soil cover in large areasof mountain Norway, along with relatively coarse-grainedglacially-derived sediments (Bogen, 1996). Thus, the wa-ter storage capacity is inherently low and the difference inthreshold intensities over shorter and longer durations is rel-atively small. However, a limiting factor for the occurrenceof debris flows is the availability of unconsolidated sedi-ment and loose material. The magnitude of the minimumthreshold obtained in this study is further supported by thestudy conducted by Cepeda et al. (2010). For a small catch-ment on the Norwegian west coast, he found a threshold of17 mm day−1 to be critical for debris flow initiation (seeFig. 8a; hourly average value indicated by triangle symbol).Since his threshold does not account for water supplied by
www.nat-hazards-earth-syst-sci.net/12/3059/2012/ Nat. Hazards Earth Syst. Sci., 12, 3059–3073, 2012

3070 N. K. Meyer et al.: Hydrometeorological threshold conditions for debris flow initiation
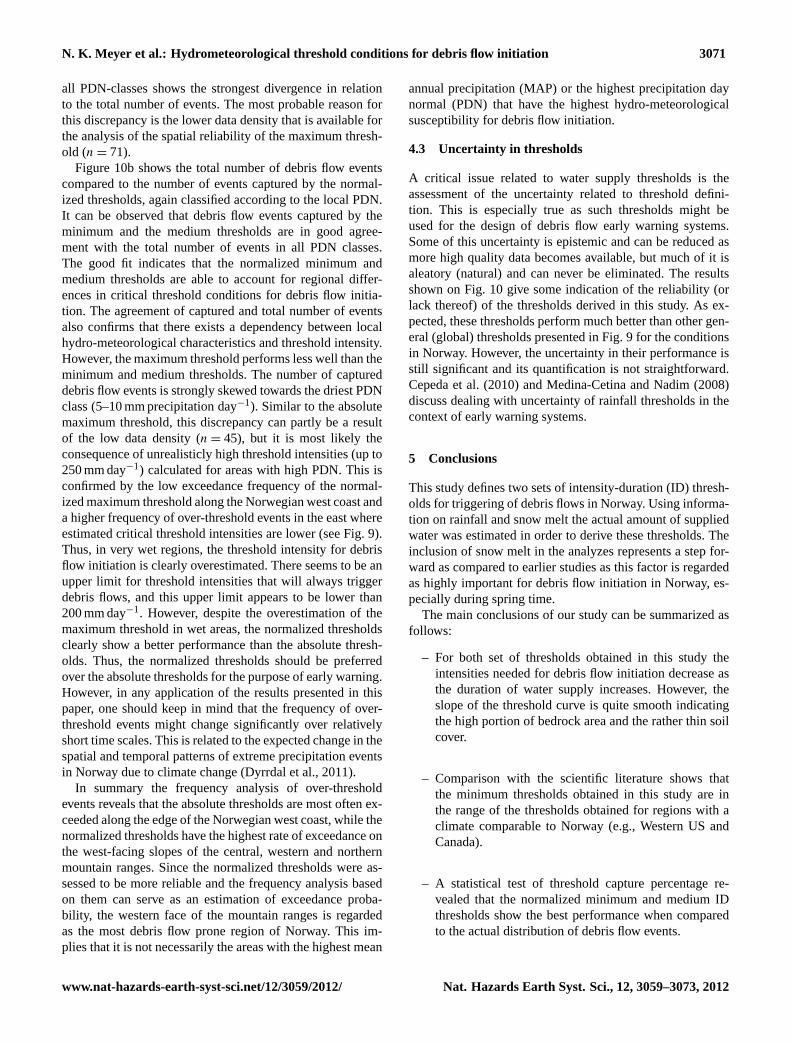
Fig. 10. Percentage of events captured by the absolute thresholds(a) and the normalized thresholds(b) according to precipitation daynormal (PDN) classes: 5–10 mm, 10–15 mm, 15–20 mm, 20–25 mm, 25–30 mm. Dark bars show the distribution of the entire number ofevents over the five classes, while the colored bars show the percentage of those events captured by the minimum, medium and maximumthresholds in each class respectively.
snow melt but merely for rainfall, it corresponds well withthe slightly higher threshold we obtained in this study.
The normalized minimum threshold obtained in this studyis considerably lower than the two thresholds Guzzetti etal. (2007) proposed for mild mid-latitude and for mountainclimates in central and southern Europe (see Fig. 8b). Itturns out that, despite normalization, significant differencesremain between regions. This mismatch is also assessedby Guzzetti et al. (2007). They point out that although therainy/precipitation day normal is a good normalization pa-rameter, regional differences in threshold levels might arisefrom true spatial variability, the lack of spatially equal datacoverage and discrepancies in the method used for thresholddefinition. However, it is observed that for longer durationsthe intensities needed for debris flow initiation become moresimilar. This tendency suggests that the local characteristicsbecome less important for debris flow initiation the longerthe duration of water supply lasts.
The comparison of the absolute and normalized minimumthreshold obtained in this study to other minimum ID thresh-olds extracted from literature reveals that the threshold levelsobtained are reasonable. A further test of threshold reliabilitywas conducted by statistical analyzes, as shown in the den-sity plots in Fig. 10. The minimum, medium and maximumthreshold levels calculated for the 502 debris flow events arecompared to the actual ID relationship extracted for each de-bris flow event to estimate the capture percentage of the dif-ferent thresholds. These data are spatially grouped into fivedifferent classes according to the local precipitation day nor-
mal (PDN) and plotted against the total number of events inthat specific class. The comparison of the number of cap-tured events with the entire event population (both presentedas density bars in the histograms) enables the estimation ofspatial clustering of captured and/or missed events for areascharacterized by a certain PDN.
Figure 10a shows the capture of debris flow events by theabsolute thresholds related to the corresponding PDN classof the event location. Compared to the total number of debrisflow events within the lowest PDN class (5–10 mm) it can beobserved that the captured debris flow events are clearly un-derrepresented by all three thresholds, which in turn impliesthat the threshold levels might be too high for those dry re-gions. On the other hand, debris flow events in areas witha higher PDN (15–20, 20–25 and 25–30 mm precipitationday−1) are captured over proportionally often by the mini-mum, medium and maximum thresholds and are, thus, over-represented in relation to the total number of events. Appar-ently, in these areas the threshold intensity is lower than thewater supply intensity that is actually needed to trigger debrisflows. The underestimation of the threshold intensity resultsin a higher number of captured events but will also lead toa higher number of false alarms. Only the absolute thresh-olds in the moderately wet areas (PDN class 10–15 mm) per-form well in accordance with the total number of debris flowevents. Here, the minimum, medium and maximum thresh-olds seem to fit the actual conditions that are needed fordebris flow initiation. It is further noted that the density ofdebris flow events captured by the maximum threshold for
Nat. Hazards Earth Syst. Sci., 12, 3059–3073, 2012 www.nat-hazards-earth-syst-sci.net/12/3059/2012/
N. K. Meyer et al.: Hydrometeorological threshold conditions for debris flow initiation 3071
all PDN-classes shows the strongest divergence in relationto the total number of events. The most probable reason forthis discrepancy is the lower data density that is available forthe analysis of the spatial reliability of the maximum thresh-old (n = 71).
Figure 10b shows the total number of debris flow eventscompared to the number of events captured by the normal-ized thresholds, again classified according to the local PDN.It can be observed that debris flow events captured by theminimum and the medium thresholds are in good agree-ment with the total number of events in all PDN classes.The good fit indicates that the normalized minimum andmedium thresholds are able to account for regional differ-ences in critical threshold conditions for debris flow initia-tion. The agreement of captured and total number of eventsalso confirms that there exists a dependency between localhydro-meteorological characteristics and threshold intensity.However, the maximum threshold performs less well than theminimum and medium thresholds. The number of captureddebris flow events is strongly skewed towards the driest PDNclass (5–10 mm precipitation day−1). Similar to the absolutemaximum threshold, this discrepancy can partly be a resultof the low data density (n = 45), but it is most likely theconsequence of unrealisticly high threshold intensities (up to250 mm day−1) calculated for areas with high PDN. This isconfirmed by the low exceedance frequency of the normal-ized maximum threshold along the Norwegian west coast anda higher frequency of over-threshold events in the east whereestimated critical threshold intensities are lower (see Fig. 9).Thus, in very wet regions, the threshold intensity for debrisflow initiation is clearly overestimated. There seems to be anupper limit for threshold intensities that will always triggerdebris flows, and this upper limit appears to be lower than200 mm day−1. However, despite the overestimation of themaximum threshold in wet areas, the normalized thresholdsclearly show a better performance than the absolute thresh-olds. Thus, the normalized thresholds should be preferredover the absolute thresholds for the purpose of early warning.However, in any application of the results presented in thispaper, one should keep in mind that the frequency of over-threshold events might change significantly over relativelyshort time scales. This is related to the expected change in thespatial and temporal patterns of extreme precipitation eventsin Norway due to climate change (Dyrrdal et al., 2011).
In summary the frequency analysis of over-thresholdevents reveals that the absolute thresholds are most often ex-ceeded along the edge of the Norwegian west coast, while thenormalized thresholds have the highest rate of exceedance onthe west-facing slopes of the central, western and northernmountain ranges. Since the normalized thresholds were as-sessed to be more reliable and the frequency analysis basedon them can serve as an estimation of exceedance proba-bility, the western face of the mountain ranges is regardedas the most debris flow prone region of Norway. This im-plies that it is not necessarily the areas with the highest mean
annual precipitation (MAP) or the highest precipitation daynormal (PDN) that have the highest hydro-meteorologicalsusceptibility for debris flow initiation.
4.3 Uncertainty in thresholds
A critical issue related to water supply thresholds is theassessment of the uncertainty related to threshold defini-tion. This is especially true as such thresholds might beused for the design of debris flow early warning systems.Some of this uncertainty is epistemic and can be reduced asmore high quality data becomes available, but much of it isaleatory (natural) and can never be eliminated. The resultsshown on Fig. 10 give some indication of the reliability (orlack thereof) of the thresholds derived in this study. As ex-pected, these thresholds perform much better than other gen-eral (global) thresholds presented in Fig. 9 for the conditionsin Norway. However, the uncertainty in their performance isstill significant and its quantification is not straightforward.Cepeda et al. (2010) and Medina-Cetina and Nadim (2008)discuss dealing with uncertainty of rainfall thresholds in thecontext of early warning systems.
5 Conclusions
This study defines two sets of intensity-duration (ID) thresh-olds for triggering of debris flows in Norway. Using informa-tion on rainfall and snow melt the actual amount of suppliedwater was estimated in order to derive these thresholds. Theinclusion of snow melt in the analyzes represents a step for-ward as compared to earlier studies as this factor is regardedas highly important for debris flow initiation in Norway, es-pecially during spring time.
The main conclusions of our study can be summarized asfollows:
– For both set of thresholds obtained in this study theintensities needed for debris flow initiation decrease asthe duration of water supply increases. However, theslope of the threshold curve is quite smooth indicatingthe high portion of bedrock area and the rather thin soilcover.
– Comparison with the scientific literature shows thatthe minimum thresholds obtained in this study are inthe range of the thresholds obtained for regions with aclimate comparable to Norway (e.g., Western US andCanada).
– A statistical test of threshold capture percentage re-vealed that the normalized minimum and medium IDthresholds show the best performance when comparedto the actual distribution of debris flow events.
www.nat-hazards-earth-syst-sci.net/12/3059/2012/ Nat. Hazards Earth Syst. Sci., 12, 3059–3073, 2012

3072 N. K. Meyer et al.: Hydrometeorological threshold conditions for debris flow initiation
– The calculated frequency of over-threshold events (de-fined by the normalized thresholds) in the period 1981–2010 was highest on the west-facing slopes of the Nor-wegian mountain ranges. This indicates that this areahas a hydro-meteorological regime that promotes theinitiation of debris flows.
Acknowledgements.The authors wish to thank Egil Syre (NGI)for his help with GIS tasks and Jose Mauricio Cepeda (NGI) forhis comments on the threshold issue. C. Huggel, one anonymousreviewer and editor D. Keefer provided constructive comments thathelped to enhance the quality of the paper. Funding for this studywas provided by the International Centre for Geohazards (ICG)and the InfraRisk project (http://infrarisk.ngi.no) financed bythe Norwegian Research Council, the Norwegian Public RoadsAdministration and the Norwegian National Rail Administration.
Edited by: D. KeeferReviewed by: C. Huggel and one anonymous referee
References
Baum, R. L. and Godt, J. W.: Early warning of rainfall-induced shal-low landslides and debris flows in the USA. Landslides 7, 259–272, 2010.
Baum, R. L., Godt, J. W., Harp, E. L., and McKenna, J. P.: Earlywarning of landslides for rail traffic between Seattle and Ev-erett, Washington. Proceedings 2005 International Conferenceon Landslide Risk Management, 731–740, 2005.
Bjordal, H. and Helle, T. E.: Skred og flom pa veg, Report of theNorwegian Public Road Authority, 5, 2011 (in Norwegian).
Bogen, J.: Erosion and sediment yield in Norwegian rivers. Pro-ceedings of the Exeter Symposium, 73–94, 1996.
Brunetti, M. T., Peruccacci, S., Rossi, M., Luciani, S., Valigi, D.,and Guzzetti, F.: Rainfall thresholds for the possible occurrenceof landslides in Italy, Nat. Hazards Earth Syst. Sci., 10, 447–458,doi:10.5194/nhess-10-447-2010, 2010.
Caine, N.: The rainfall intensity-duration control of shallow land-slides and debris flows. Geogr. Ann. A 62, 23–27, 1980.
Cannon, S. H. and Ellen, S.: Rainfall conditions for abundant debrisavalanches in the San Francisco Bay region, California, Califor-nia Geology 38, 267–272, 1985.
Cepeda, J., Høeg, K., and Nadim, F.: Landslide-triggering rainfallthresholds: A conceptual framework, Q. J. Eng. Geol. Hydro-geol., 43, 69–84, 2010.
Ceriani, M., Lauzi, S., and Padovan, N.: Rainfall and landslides inthe Alpine area of Lombardia Region, central Alps, Italy. Inter-praevent International Symposium 2, 9–20, 1992.
Crosta, G.: Regionalization of rainfall thresholds: an aid to landslidehazard evaluation. Environ. Geol. 35, 131–145, 1998.
Crosta, G. B. and Frattini, P.: Rainfall-thresholds for triggering soilslips and debris flow. Proceedings of the 2nd EGS Plinius Con-ference on Mediterranean Storms, 463–487, 2001.
Crosta, G. B. and Frattini, P.: Rainfall-induced landslides and debrisflows, Hydrol. Process., 22, 473–477, 2008.
Dahal, R. K. and Hasegawa, S.: Representative rainfall thresholdsfor landslides in the Nepal Himalaya, Geomorphology, 100, 429–443, 2008.
Dyrrdal, A. V., Isaksen, K., and Hygen, H. O.: Past changes in fre-quency, intensity, and spatial occurrence of meteorological trig-gering variables relevant for natural hazards in Norway, Met.noreport 3, 2011.
Engeset, R., Tveito, O.E., Alfnes, E., Mengistu, Z., Udnæs, H.-C.,Isaksen, K., and Førland, E. J.: Snow map system for Norway.NHP report 48, 112–121, 2004.
Frattini, P., Crosta, G., and Sosio, R.: Approaches for definingthresholds and return periods for rainfall-triggered shallow land-slides, Hydrol. Process., 23, 1444–1460, 2009.
Førland, E. J.: Nedbørens høydeavhengighet, Klima 1, 3–24, 1979(in Norwegian with English summary).
Godt, J. W., Baum, R. L., and Chleborad, A. F.: Rainfall character-istics for shallow landsliding in Seattle, Washington, USA, EarthSurf. Proc. Land., 31, 97–110, 2006.
Guzzetti, F., Peruccacci, S., Rossi, M., and Stark, C. P.: Rainfallthresholds for the initiation of landslides in central and southernEurope, Meteorol. Atmos. Phys., 98, 239–267, 2007.
Guzzetti, F., Peruccacci, S., Rossi, M., and Stark, C. P.: The rainfallintensity-duration control of shallow landslides and debris flows:an update, Landslides 5, 3–17, 2008.
Hungr, O., McDougall, S., Wise, M., and Cullen, M.: Magnitude-frequency relationship of debris flows and debris avalanches inrelation to slope relief, Geomorphology 96, 355–365, 2008.
Innes, J. L.: Debris flows, Prog. Phys. Geog., 7, 469–501, 1983.Jaedicke, C., Lied, K., and Kronholm, K.: Integrated database for
rapid mass movements in Norway, Nat. Hazards Earth Syst. Sci.,9, 469–479,doi:10.5194/nhess-9-469-2009, 2009.
Jakob, M. and Weatherly, H.: A hydroclimatic threshold for land-slide initiation on the North Shore Mountains of Vancouver,British Columbia, Geomorphology 54, 137–156, 2003.
Keefer, D. K.: Landslides caused by earthquakes, B. Geol. Soc.Am., 95, 406–421, 1984.
Keefer, D. K., Wilson, R. C., Mark, R. K., Brabb, E., Brown, W.M., Ellen, S. D., Harp, E. L., Wieczorek, G. F., Alger, C. S., andZatkin, R. S.: Real-time landslide warning during heavy rainfall,Science 238, 921–925, 1987.
Larsen, M. C. and Simon, A.: A rainfall intensity-duration thresh-old for landslides in a humid-tropical environment, Puerto Rico.Geogr. Ann. A, 75, 13–23, 1993.
Medina-Cetina, Z. and Nadim, F.: Stochastic design of an earlywarning system, Georisk Special Issue: Assessment and Man-agement of Risk for Engineered Systems and Geohazards, 2,223–236, 2008.
Montgomery, D. R., Schmidt, K. M., and Greenberg, H. M.: Forestclearing and regional landsliding, Geology, 28, 311–314, 2000.
Nadim, F., Cepeda, J., Sandersen, F., Jaedicke, C., and Heyerdahl,H.: Prediction of rainfall-induced landslides through empiricaland numerical models. Proceedings of the First Italian Workshopon Landslides (IWL 2009), Naples, Italy, 8–10 June, 206—215,2009.
Rapp, A. and Nyberg, R.: Alpine debris flows in northern Scandi-navia, Geogr. Ann. A, 63, 183–196, 1981.
Rebetez, M., Lugon, R., and Baeriswyl, P. A.: Climatic change anddebris flows in high mountain regions: The case study of theRitigraben torrent (Swiss Alps), Climatic Change, 36, 371–389,
Nat. Hazards Earth Syst. Sci., 12, 3059–3073, 2012 www.nat-hazards-earth-syst-sci.net/12/3059/2012/

N. K. Meyer et al.: Hydrometeorological threshold conditions for debris flow initiation 3073
1997.Rickenmann, D. and Zimmermann, M.: The 1987 debris flows in
Switzerland – documentation and analysis, Geomorphology 8,175–189, 1993.
Saito, H., Nakayama, D., and Matsuyama, H.: Relationship betweenthe initiation of a shallow landslide and rainfall intensity-durationthresholds in Japan, Geomorphology, 118, 167–175, 2010.
Saloranta, T. M.: Simulating snow maps for Norway: descrip-tion and statistical evaluation of the seNorge snow model, TheCryosphere Discuss., 6, 1337–1366,doi:10.5194/tcd-6-1337-2012, 2012.
Sandersen, F., Bakkehøi, S., Hestnes, E., and Lied, K.: The influ-ence of meteorological factors on the initiation of debris flows,rockfalls, rockslides and rockmass stability, edited by: Senneset,K., Landslides A. A. Balkema Publishers, Rotterdam, 97–114,1996.
Statens Kartverk: Terrengmodell – Landsdekkende digital terreng-modell i 10 eller 20 meters rutenett, Product sheet published bythe Norwegian Mapping Authority, 2011 (in Norwegian).
Tveito, O. E., Bjørdal, I., Skjelvag, A. O., and Aune, B.: A GIS-based agro-ecological decision system based on gridded clima-tology, Meteorol. Appl., 12, 57–68, 2005.
Wieczorek, G. F.: Landslide triggering mechanisms, in: Landslides– Investigation and Mitigation. Special Report 247, edited by:Turner, A. K. and Schuster, R. L., National Academy Press,Washington D.C., 76–90, 1996.
Wieczorek, G. F. and Glade, T.: Climatic factors influencing occur-rence of debris flows, in: Debris flows and related phenomena,edited by: Jakob, M. and O. Hungr, Springer Verlag, 325–362,2005.
Wilson, R. C. and Jayko, A. S.: Preliminary maps showing rain-fall thresholds for debris flow activity, San Francisco Bay region,California, Open File Report US, Geological Survey, 1997.
Zimmermann, M.: Debris flows 1987 in Switzerland: geomorpho-logical and meteorological aspects. Proceedings of the Hydrol-ogy in Mountainous Regions, Lausanne, IAHS publications 194,387–393, 1990.
www.nat-hazards-earth-syst-sci.net/12/3059/2012/ Nat. Hazards Earth Syst. Sci., 12, 3059–3073, 2012