Hydrometeorological threshold conditions for debris flow ...
Upload
khangminh22Category
view
0download
0
Nat. Hazards Earth Syst. Sci., 11, 2061–2074, 2011www.nat-hazards-earth-syst-sci.net/11/2061/2011/doi:10.5194/nhess-11-2061-2011© Author(s) 2011. CC Attribution 3.0 License.
Natural Hazardsand Earth
System Sciences
Rainfall threshold definition using an entropy decision approachand radar data
V. Montesarchio, E. Ridolfi, F. Russo, and F. Napolitano
Dipartimento di Ingegneria Civile, Edile e Ambientale, Sapienza Universita di Roma, Rome, Italy
Received: 19 June 2010 – Revised: 16 June 2011 – Accepted: 20 June 2011 – Published: 27 July 2011
Abstract. Flash flood events are floods characterised by avery rapid response of basins to storms, often resulting inloss of life and property damage. Due to the specific space-time scale of this type of flood, the lead time available fortriggering civil protection measures is typically short. Rain-fall threshold values specify the amount of precipitation fora given duration that generates a critical discharge in a givenriver cross section. If the threshold values are exceeded, itcan produce a critical situation in river sites exposed to al-luvial risk. It is therefore possible to directly compare theobserved or forecasted precipitation with critical referencevalues, without running online real-time forecasting systems.The focus of this study is the Mignone River basin, located inCentral Italy. The critical rainfall threshold values are eval-uated by minimising a utility function based on the infor-mative entropy concept and by using a simulation approachbased on radar data. The study concludes with a systemperformance analysis, in terms of correctly issued warnings,false alarms and missed alarms.
1 Introduction
Classical real-time flood forecasting systems generally mustrun hydrological models in real-time. The time required forthe model to run can be greater than the lead time availablefor issuing alerts in basins subject to flash flooding. A floodwarning system based on a comparison of observed or fore-casted precipitation and critical rainfall values could providedecision-makers with relatively simple, clear, and immediatemessages. Rainfall thresholds specify the amount of precipi-tation for a given duration that generates a critical dischargein a given river cross section. If the thresholds are exceeded,
Correspondence to:V. Montesarchio([email protected])
it can produce a critical situation in river sites exposed to al-luvial risk, triggering prevention operations and emergencysystem alerts (Georgakakos, 1995).
In this work the critical rainfall thresholds for the MignoneRiver cross section are defined using an entropy-based deci-sion approach and a simulation approach based on radar data,in order to establish rainfall warning values for critical floodevents. First, an overview of the entropy concept is given.Second, the methodology for rainfall thresholds estimation ispresented and applied to the case study of the Mignone River.Finally, the reliability of rainfall thresholds is evaluated andresults are discussed.
2 The entropy concept
The entropy concept was introduced by Clausius in 1864(from ancient Greek en, “inside”, and troph, “change”) to ex-plain heat behaviour at different temperatures. The entropyof a system is given by the sum of the entropy of each part ofthe system, so that form subsystems,H is
H =
m∑i=1
Hi =
m∑i=1
k lnpi, (1)
whereHi is the entropy of each subsystemi, pi is the prob-ability of being in the ith state andk is a positive constant.Assumingk = 1 and the base of logarithm as 2, the measureof entropy is in bit (as in this work). The most probable distri-bution of the energy in a system is one for which the entropyof the whole system would be equal to its maximum value:
H =
m∑i=1
k lnpi = max.
(2)
Heuristic entropy can be interpreted as a measure of the un-certainty about the occurrence of a certain event (Papoulis,1991). The probabilityP(A), for example, of an eventA,
Published by Copernicus Publications on behalf of the European Geosciences Union.

2062 V. Montesarchio et al.: Rainfall threshold definition using an entropy decision approach
can be defined as the measure of the uncertainty about theoccurrence or not-occurrence ofA. If Ai events are a parti-tion of the eventU , so that each event is incompatible withothers (AiAj =∅ for i 6= j), and the union of all the events isU itself (U = A1 ∪A2 ∪ ...An), then the measure of the un-certainty ofU is H(U) and it is the entropy of the partitionof U . The functionalH(U) was derived from a number ofpostulates, such as:
1. H(U) is a continuous function ofpi = P(Ai);
2. if p1=. . . =pN = 1/N , thenH(U) is an increasing func-tion of N ;
3. if a new partitionB is formed by subdividing one of thesets ofU , thenH(B) >H(U),
it can be shown that the sum:
H(U) = −p1log2p1− ...−pN log2pN (3)
satisfies the postulates and is unique within a constant factor.
2.1 Discrete random variable (RV) type
Suppose thatx is a discrete type of RV taking the valuexi
with probability
P {X = xi} = pi . (4)
The events{X = xi} are mutually exclusive and their unionis the certain event; hence they form a partition. This parti-tion will be denoted byUx .
The entropyH(X) of a discrete-type RVX is the entropyH(Ux) of its partitionUx (Papoulis, 1991):
H(X) = H(UX) = E[−log2p(X)
]= −
∑i
pi log2pi . (5)
2.2 Continuous random variable (RV) type
The entropy of a continuous-type RV cannot be so definedbecause the events{X = xi} do not form a partition. The en-tropy of a continuous type RVX is by definition the integral(Papoulis, 1991):
H(X) = −
∞∫−∞
f (x)log2f (x)dx. (6)
The integration extends only over the region wheref (x) 6= 0becausef (x)lnf (x) = 0 if f (x) = 0.
3 Flood rainfall thresholds
Generally, rainfall thresholds identify precipitation criticalvalues, which could be used in the context of landslides anddebris flow hazard forecasting (Neary and Swift, 1987; An-nunziati et al., 1999; Crosta and Frattini, 2000), as well as in
flood forecasting or warning (Carpenter et al., 1999; Manciniet al., 2002; Georgakakos, 2006; Martina et al., 2006). In thecontext of flood warning, when critical values are exceeded,flooding is expected. Rainfall thresholds specify the amountof precipitation for a given duration that generates a criticaldischarge in a given cross section.
There is a long tradition of rainfall threshold-basedmethodologies, although different approaches have beenadopted. The Flash Flood Guidance method (FFG) (Mogilet al., 1978) was developed by the US National Weather Ser-vice (NWS) for flash flood warning. FFG is based on theeffective depth of rain of a given duration, taken as uniformin space and time, necessary to cause minor flooding (e.g.,2 yr return time flow) at the outlet of the considered basin. Ifthe FFG is surpassed by rainfall amounts, then flooding in thebasin is considered likely to occur. FFG values are computedas the flow causing flooding divided by the catchment areatimes the Unit Hydrograph’s (Snyder’s or Geomorphologic)peak value for any specified duration. GIS support is used todetermine the main characteristics of the basin, and region-alization values are provided to extend the methodology toother locations (Carpenter et al., 1999).
The key advantage of FFG is that it is possible toissue warnings without the need to run entire hydro-meteorological forecasting chains. The limitations of FFGare in the assumptions of spatially/temporally uniform rain-fall and linear responses (i.e., that affect the size of thebasins), and the use of regional relationships to make infer-ences about ungauged locations. FFG performance in un-gauged basins is poor (Norbiato et al., 2008), because the hy-drological model parameters cannot be calibrated (Bloeschl,2005) and it is more difficult to estimate critical dischargevalues (Ntelekos et al., 2006).
A different approach was proposed by Mancini etal. (2002). Threshold values are estimated with an event-based rainfall-runoff model, which iteratively searches forthe rainfall amount that could produce a critical dischargeor water stage. As input of the rainfall runoff model, syn-thetic hyetographs with different shapes and durations areused. This is a deterministic approach and has been usedin previous work (e.g., Montesarchio et al., 2009); it will befurther discussed in Sect. 3.1.
Lastly, a utility function approach couples rainfall and dis-charge in a probabilistic way (Martina et al., 2006). Therainfall incorporates the dependence between the cumulatedrainfall volume for the storm duration and the possible con-sequences on the water level or discharge in a river section asperceived by the stakeholders. The thresholds therefore cor-respond to the minimum expected value of an opportunelychosen Bayesian cost utility function. This approach is usedas a probabilistic approach in the present work and will befurther discussed in Sect. 3.2. Moreover, this approach is ex-tended by employing an entropy-based decision function toovercome the subjectivity implied in the Bayesian approach(Sect. 3.2.2).
Nat. Hazards Earth Syst. Sci., 11, 2061–2074, 2011 www.nat-hazards-earth-syst-sci.net/11/2061/2011/

V. Montesarchio et al.: Rainfall threshold definition using an entropy decision approach 2063
3.1 Deterministic approach for rainfall thresholdevaluation
The deterministic approach needs an opportunely calibratedrainfall runoff model to simulate basin response to storms.The inverse hydrologic problem is iteratively solved to iden-tify, for a given durationd, the cumulative rainfall that cor-responds to the critical discharge. The identification of thecritical section is usually based on the flooding history ofthe river and its hydraulic geometry. When this informationis not available, the critical section can be identified as theoutlet of the basin, where all of the upstream contributionsconverge.
Given the hydraulic geometry and the marked critical wa-ter stage, the critical discharge is estimated by using thestage-discharge curve (Rosso, 2002). When the dischargedata are unavailable and a hydraulic simulation cannot becarried out, a regional model can be applied (e.g., the indexdischarge method; Darlymple, 1960) in order to identify thecritical discharge. This method is based on statistical region-alization and allows for the replacement of time with spaceand the use of a set of hydrometric observations from a ho-mogeneous area to replace the lack of hydrometric data in thecritical section. Given a certain return period, the maximumdischarge for the critical section is calculated as the productof two terms: a scaling factor which is characteristic of thesite, and a dimensionless growth factor which is characteris-tic of the homogenous region.
In the gauged sections it is clearly possible to calculatethe discharge index directly using the arithmetic mean of theavailable data. For the ungauged sections, indirect methods(e.g., Brath et al., 2001) must be used instead. With thisapproach, a critical rainfall threshold is obtained which nolonger refers to the critical discharge but to the different re-turn periods (i.e., 2, 5, 10, 20, 50, 100 yr). A description ofthe procedures which must be carried out in order to eval-uate the critical rainfall thresholds in different situations isreported in Montesarchio et al. (2009). The critical refer-ence discharge could be reached and surpassed for differentspace-time configurations of rainfall fields. To simplify, cu-mulative precipitation (P) can be evaluated globally over theentire basin, after a time (d) from the beginning of a thun-derstorm. Rainfall thresholds are generally a function of thecritical cross-section characteristics, but also of the bound-ary conditions (e.g., soil imbibition condition at the begin-ning of the event) and the type and temporal evolution of therain event. These dependencies can be summarised using theAMC (Antecedent Moisture Condition) index (SCS, 1971,1986) and standard hyetograph (Rosso, 2002).
Given hyetograph, rain duration (d) and initial soil imbibi-tion condition based on the AMC index, the critical depth canbe investigated. Independent simulations can be performedfor all combinations of rainfall durations (3, 6, 12 and 24 h),hyetographs and AMC classes. The rainfall thresholds are
iteratively identified by trial and error until the critical dis-charge value is reached.
3.2 Probabilistic approach for rainfall threshold evalu-ation
To evaluate the threshold values corresponding to the mini-mum expected value of an opportunely chosen function, thejoint cumulative distribution of cumulated rainfall and thecorresponding peak discharge must be defined. Also, whena probabilistic approach is used, the soil moisture conditionsaffect the threshold values. Using a hydrological simulationapproach, the peak discharge was evaluated for each AMCclass.
3.2.1 Bayesian approach
The “convenience” concept is introduced in relation to dam-age perception, and is measured by a Bayesian utility func-tion that also includes immeasurable damages derived bymissed alarms. The utility function is dependent on the criti-cal discharge value (Martina et al., 2006), such that:
U(q,v|VT,T )=
{a
1+be−c(q−Q∗)if v ≤ VT
C0+a′
1+b′e−c′(q−Q∗)if v ≥ VT
,
(7)
where:q is the discharge value;Q∗ is the critical dischargevalue for the river critical cross section;v is the cumulatedrainfall value; VT is the critical threshold value;T is thestorm duration (3, 6, 12, 24 h); anda, b, c andC0, a′, b′,c′ are proper parameters.
The utility functionU(q,v|VT,T ) for values ofv <VT ex-presses damage perception if the alert is missed. There arenegligible costs if the effective dischargeq is lower thanQ∗,while the cost increases rapidly ifq is higher thanQ∗. Forvalues ofv > VT, the function expresses damage perceptionif the alert is issued. Costs are initially higher in the lat-ter scenario than in the no-alarm case because of the oper-ative costs associated with triggering civil protection mea-sures; however, the costs grow slowly ifq is higher thanQ∗.
The parametersa, b, c andC0, a′, b′, c′ change with theimportance given to the possible combination of actions (i.e.,issuing an alert or not) and actual process (i.e., the criticaldischarge is surpassed or not).
Regarding the liability of the decision-maker in determin-ing whether or not to issue an alarm, three cases can be distin-guished (FLOODsite, 2008): the “real” case, the “risk prone”case and the “risk averse” case. A different set of parameters(a, b, c andC0,a
′, b′, c′) corresponds to each case, resultingin different costs. The parameters of the utility function aresummarized in Table 1.
In the “risk averse” case, since the costs associated witha false alarm are negligible, issuing false alarms is preferredover risking the possibility of a missed alarm. The costs offailing to issue an alarm can grow rapidly in a real emer-gency, and the difference in maximum cost between alarm
www.nat-hazards-earth-syst-sci.net/11/2061/2011/ Nat. Hazards Earth Syst. Sci., 11, 2061–2074, 2011

2064 V. Montesarchio et al.: Rainfall threshold definition using an entropy decision approach
Table 1. Utility function parameters (FLOODsite, 2008).
alarm no alarm
parameters (C) a b c a′ b′ c′ Co
“Risk averse” case 10× 106 2 0.020 3× 10⁶ 60 0.030 7× 10³
“Risk prone” case 10× 106 500 0.023 7× 10⁶ 1000 0.027 15× 103
“Real” case 10× 106 200 0.025 5× 10⁶ 800 0.030 10× 103
and no-alarm scenarios is great. In the “risk prone” casesome costs for flood events are considered more acceptablethan false alarm costs. Areas of low economic value can beaffected by low intensity floods, while more valuable areas(economically and socially) will be affected for a higher re-turn period. False alarm costs are higher than in the pre-vious case, because resources must be employed when thealarm is issued. In the “real” case, the real experiences ofdecision-makers in issuing alarms are evaluated. The costof a false alarm is evaluated operatively (e.g., 50 employeesand their equipment). The missed alarm cost grows when thedischarge exceeds the project reference value for structuralprotection measures. The functions corresponding to eachrisk case are shown in Fig. 1.
The most convenient threshold valueVT is identified (foreach durationT = 3, 6, 12, 24 hours) by minimising the ex-pected utility cost function:
VT = MinVT 〈E{U(q,v|VT,T )}〉 =
= MinVT
⟨+∞∫0
+∞∫0
U(q,v|VT,T )f (q,v|T )dqdv
⟩,
(8)
wheref (q,v|T ) is the joint distribution of cumulated rainfallvolume and peak discharge (as determined in Sect. 4.3) andU(q,v|VTT ) is the utility function.
3.2.2 Utility-entropy function
The definition of measure of risk based on the expectedvalues of utility and entropy (Yang and Qiu, 2005) is de-fined on the basis of the classical decision model under risk.Three parts are defined: the state space2 = {θ}, the ac-tion spaceA = {a}, and the payoff functionX = X(a,θ),defined forA × Q. The decision model is thereforeG =
(Q,A,u), whereu = u(X) is the decision maker’s utilityfunction. Suppose that at least two actions exist in actionspace, so the decision-maker’s utility function is nonnegativeand the meana ∈ A{|E[u(X(a,θ))]|} exists. When the meana ∈ A{|E[u(X(a,θ))]|} is nonzero, the measure of risk whentaking an actiona is defined as:
Fig. 1. Utility functions for different risk cases. The dotted linerepresents the function if the alert is issued, the solid line if not.
R(a) = λHa(θ)+(1−λ)E[(u(X(a,θ))]
/meana∈A{|E[u(X(a,θ))]|}, (9)
where λ is a constant (0< λ < 1), R(a) denotes therisk of taking an actiona, and Ha(θ) represents the en-tropy of the distribution of the corresponding state. Whenmeana∈A{|E[u(X(a,θ))]|} = 0, then for any actiona ∈ A →
E[u(X(a,θ))] = 0. In this caseR(a) = Ha(θ).This measure of risk is defined as the expected value of the
utility entropy (EU-E). The entropy is the objective measure
Nat. Hazards Earth Syst. Sci., 11, 2061–2074, 2011 www.nat-hazards-earth-syst-sci.net/11/2061/2011/

V. Montesarchio et al.: Rainfall threshold definition using an entropy decision approach 2065
of the uncertainty of the state of natureθ . The constantλis defined as the “tradeoff coefficient” and it reflects a trade-off between the subjective utility of a decision-maker’s ac-tion and the objective uncertainty of its corresponding state.When the decision-maker wants the expected utility to havea greater effect, thenλ = 0; when the decision-maker wantsan expected utility to have a smaller effect, thenλ = 1.
The EU-E measure is relative. It depends on the expectedfunction of entropy and utility and on the expected value ofevery action. The tradeoff coefficient provides a balance ofthese factors that can be used for the decision-maker’s sub-jective valuation. The expected value of utility reflects thesubjective preference, while the entropy represents the ob-jective uncertainty about a decision.
The utility function is introduced according to Bayesiandecisional theory and represents the cost of flood damages incases where an alarm was either issued or missed during aflood event (Martina et al., 2006), as shown in Eq. (7). Theparameters of the general decision model are explained inSect. 4.5.2.
4 Case study
4.1 Basin characteristics
The Mignone River in Italy originates at the confluence be-tween the Scatenato, Coriglione and Biscione ditches, at633 m a.s.l. The total length is 62 km, from the SabatiniMountains (northeast to Lake Bracciano) to the TyrrhenianSea (between Tarquinia and Civitavecchia).
Near Rota (from the hydrographical left), the MignoneRiver receives the Verginese ditch tributary and, near MonteRomano (from hydrographical right) it receives the VescaStream. The overall contribution is scarce and the hydraulicbehaviour is variable, which is typical of a torrential regimen.The basin area is characterized by hilly zones with some re-lief with steep slopes corresponding to the water-engravedvalley. The total area is about 560 km2, with an average ele-vation of 233 m a.s.l. The basin has an essentially horizontaldevelopment, bounded in the North by the Cimini Mountainsand hill relief towards the sea (near Tarquinia), and in theSouth by the Sabatini and Tolfa Mountains. Geologically,the Mignone River basin is characterized by volcanic rocks(25 %) in the mountainous areas, while further downstreamthere are sands and conglomerates (14 %), clay (9 %), and an-thropogenic rocks (2 %), but mainly flysch (41 %), as well as,of course, alluvial deposits along the river (9 %). There areno carbonates. The Mignone River area was influenced bythe explosive activity of the Vulsini, Vico Lake and Ciminocomplex, alternating layers of clay and marl. The MignoneRiver therefore has a low permeability which implies that theflows range from very low to very high values, depending onthe rain regimen.
Fig. 2. Study area and radar position. The red dot in the lowerright-hand corner represents the position of the Polar 55C radar. A2 km× 2 km grid was overlaid over the map of entire basin, locatedin the Northeast with respect to the radar. The green dots representsthe available rain gauge stations in the study area.
4.2 Data set
Information about historical Mignone River flood eventsis available on the Sistema Informativo Catastrofi Idrogeo-logiche (SICI) of the Consiglio Nazionale delle Ricerche-Gruppo Nazionale per la Difesa dalle Catastrofi Idrogeo-logiche CNR-GNDCI website. The preliminary historical-documentary analysis was used to identify the criticalhydraulic cross-section with the monitored cross-section“S.S. Aurelia” (drainage area 440 km2), near which theMignone River overflowed three times during the last century(8 November 1934, 27 December 1959, 16 November 1962).Given cross-section geometry and the stage-discharge curveused by the authorities, it was determined that the criticalreference dischargeQ∗
= 131.0 m3 s−1 (Montesarchio et al.,2009). To the critical reference discharge corresponds a re-turn period of 1.25 yr, evaluated with a partial duration se-ries method. It means that reaching critical conditions inMignone River basin is quite common, and having a skilledwarning system available would prevent damage and loss.
4.2.1 Hydrometric and pluviometric data
Hydrometric and pluviometric data (from 1999 until 2008)were used both for marginal and joint distribution fitting. Hy-drometric data were used also to perform the calibration andverification of the rainfall-runoff model, which is based onradar data. A summary of flood events affecting the MignoneRiver basin from 1999 to 2007 can be found in Montesarchioet al. (2009).
www.nat-hazards-earth-syst-sci.net/11/2061/2011/ Nat. Hazards Earth Syst. Sci., 11, 2061–2074, 2011

2066 V. Montesarchio et al.: Rainfall threshold definition using an entropy decision approach
Fig. 3. Joint probabilities distributions for rainfall depth-cumulated rainfall (3, 6, 12, 24 h), for soil AMCIII condition.
Hydrometric and pluviometric data of the years 2009 and2010 are used to add a short validation period to test the effi-ciency of rainfall thresholds based warning system.
4.2.2 Radar data
The Polar 55C radar is located 15 km southeast of Rome,Italy, in the Tor-Vergata research centre. The Polar 55C is aC-band Doppler weather radar with polarization agility anda 0.9◦ beam width. The radar is capable of transmitting andreceiving horizontally and vertically polarized signals on al-ternate pulses, which allows the reflectivity factor (Zh), thedifferential reflectivity (Zdr), and the differential phase shift(8dp) to be measured.
Radar measurements are obtained by averaging 64 pulseswith a range-bin resolution of 75 m covering a 120 km radiusfrom the radar site. The temporal resolution is 5 min. To re-move the spurious returns from the data, an algorithm basedon polarimetry is applied (Lombardo et al., 2006a).
The following Z − R relation was obtained for the C-band radar using a nonlinear regression analysis (Russo etal., 2005):
R = 7.27×10⁻²Z0.62h , (10)
whereZh is the reflectivity factor (mm6 m−3) andR is therainfall rate (mm h−1).
Radar data provide fine space-time resolution rainfall,useful for hazard nowcasting (Lombardo et al., 2006b,2009), flood forecasting (Russo et al., 2006; Montesarchioet al., 2009) and sewer system monitoring (Giulianelli et al.,2006). On the other hand, despite continuous technologi-cal progress, the available instruments used to measure rain-fall across several spatio-temporal scales remain inaccurate(Villarini et al., 2007), implying inaccuracies in rainfall esti-mates.
In this work we are assuming that uncertainties in radar-derived precipitation estimates are negligible, even if it iswell known that these estimates are affected by sources of un-certainty (Wilson and Brandes, 1979; Krajewski and Smith,2002; Habib et al., 2004; Germann et al., 2006; Ciach et al.,2007; Villarini and Krajewski, 2010a). However, in thesestudies operative radar networks are examined. The Polar55C is a research radar, with higher measuring performancethan operative network. So the radar-rainfall estimates areconsidered error-free (see also Ntelekos et al. (2006) for asimilar application).
After the transformation from polar to Cartesian coordi-nates was performed, a 2 km× 2 km grid was overlaid overthe map of entire basin (Fig. 2). For each temporal intervalthe values of the rainfall rate were obtained at each pixel,and thus it was possible to calculate the cumulative rainfall
Nat. Hazards Earth Syst. Sci., 11, 2061–2074, 2011 www.nat-hazards-earth-syst-sci.net/11/2061/2011/
V. Montesarchio et al.: Rainfall threshold definition using an entropy decision approach 2067
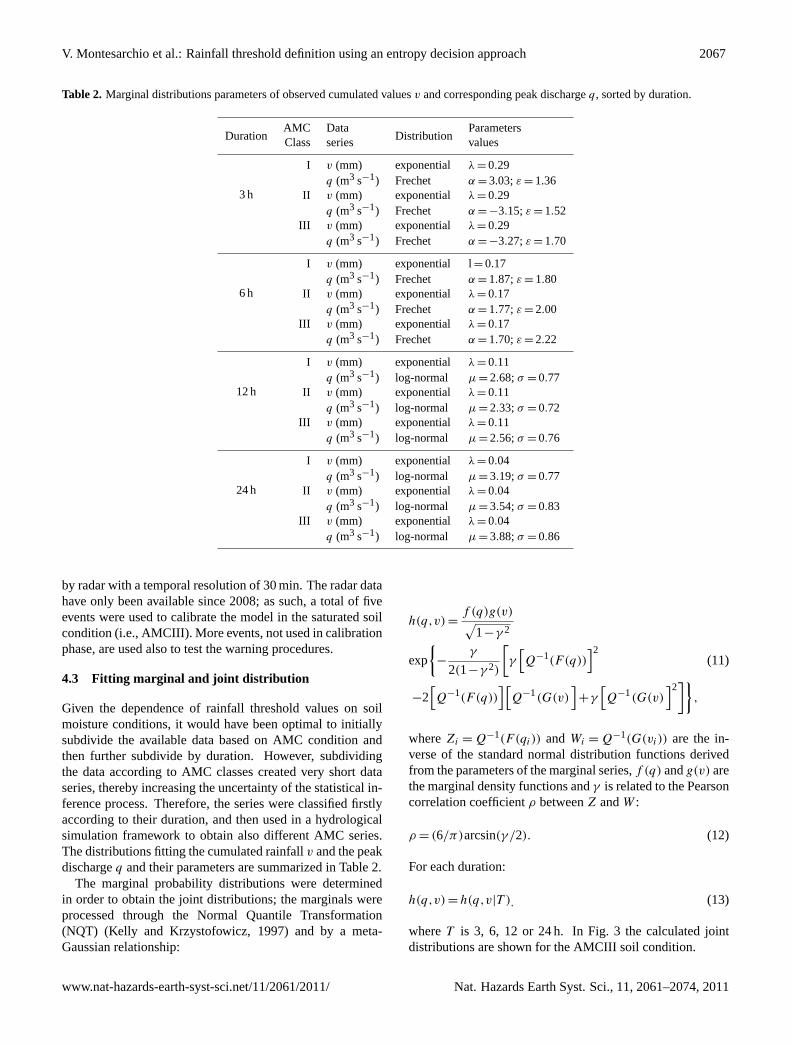
Table 2. Marginal distributions parameters of observed cumulated valuesv and corresponding peak dischargeq, sorted by duration.
DurationAMC Data
DistributionParameters
Class series values
3 h
I v (mm) exponential λ = 0.29q (m3 s−1) Frechet α = 3.03;ε = 1.36
II v (mm) exponential λ = 0.29q (m3 s−1) Frechet α = −3.15; ε = 1.52
III v (mm) exponential λ = 0.29q (m3 s−1) Frechet α = −3.27; ε = 1.70
6 h
I v (mm) exponential l= 0.17q (m3 s−1) Frechet α = 1.87; ε = 1.80
II v (mm) exponential λ = 0.17q (m3 s−1) Frechet α = 1.77; ε = 2.00
III v (mm) exponential λ = 0.17q (m3 s−1) Frechet α = 1.70; ε = 2.22
12 h
I v (mm) exponential λ = 0.11q (m3 s−1) log-normal µ = 2.68;σ = 0.77
II v (mm) exponential λ = 0.11q (m3 s−1) log-normal µ = 2.33;σ = 0.72
III v (mm) exponential λ = 0.11q (m3 s−1) log-normal µ = 2.56;σ = 0.76
24 h
I v (mm) exponential λ = 0.04q (m3 s−1) log-normal µ = 3.19;σ = 0.77
II v (mm) exponential λ = 0.04q (m3 s−1) log-normal µ = 3.54;σ = 0.83
III v (mm) exponential λ = 0.04q (m3 s−1) log-normal µ = 3.88;σ = 0.86
by radar with a temporal resolution of 30 min. The radar datahave only been available since 2008; as such, a total of fiveevents were used to calibrate the model in the saturated soilcondition (i.e., AMCIII). More events, not used in calibrationphase, are used also to test the warning procedures.
4.3 Fitting marginal and joint distribution
Given the dependence of rainfall threshold values on soilmoisture conditions, it would have been optimal to initiallysubdivide the available data based on AMC condition andthen further subdivide by duration. However, subdividingthe data according to AMC classes created very short dataseries, thereby increasing the uncertainty of the statistical in-ference process. Therefore, the series were classified firstlyaccording to their duration, and then used in a hydrologicalsimulation framework to obtain also different AMC series.The distributions fitting the cumulated rainfallv and the peakdischargeq and their parameters are summarized in Table 2.
The marginal probability distributions were determinedin order to obtain the joint distributions; the marginals wereprocessed through the Normal Quantile Transformation(NQT) (Kelly and Krzystofowicz, 1997) and by a meta-Gaussian relationship:
h(q,v) =f (q)g(v)√
1−γ 2
exp
{−
γ
2(1−γ 2)
[γ
[Q−1(F (q))
]2(11)
−2[Q−1(F (q))
][Q−1(G(v)
]+γ
[Q−1(G(v)
]2]}
,
whereZi = Q−1(F (qi)) andWi = Q−1(G(vi)) are the in-verse of the standard normal distribution functions derivedfrom the parameters of the marginal series,f (q) andg(v) arethe marginal density functions andγ is related to the Pearsoncorrelation coefficientρ betweenZ andW :
ρ = (6/π)arcsin(γ /2). (12)
For each duration:
h(q,v) = h(q,v|T ), (13)
whereT is 3, 6, 12 or 24 h. In Fig. 3 the calculated jointdistributions are shown for the AMCIII soil condition.
www.nat-hazards-earth-syst-sci.net/11/2061/2011/ Nat. Hazards Earth Syst. Sci., 11, 2061–2074, 2011

2068 V. Montesarchio et al.: Rainfall threshold definition using an entropy decision approach
Table 3. Parameters values for models calibrated with radar data.
AMCIII Class Subbasin Subbasin
S.S. Aurelia Rota
Initial Abstraction Ratio 1 1Potential Retention Scale Factor 0.35 0.35Time of Concentration (h) 6.11 3.55Storage Coefficient (h) 8.28 3.08Lag (min) 192.82 –
4.4 Simulation model
A rainfall-runoff model was implemented, through which thebehavior of the basin was simulated. The calibrated modelwas used to solve the inverse hydrological problem in thecritical section.
The rainfall-runoff model used in this work is semi-distributed, so that the spatial variability of the physical pro-cesses can be taken into account. Even though the criticalrainfall threshold is expressed in terms of cumulative rain-fall, it is important to assess the response of the basin in caseof a distributed spatial input, as the critical situation can alsobe caused by localized rainfall.
In order to outline the rainfall-runoff transformation inboth sub-basins, a modified Clark model was employed (Pe-ters and Easton, 1996; Kull and Feldmann, 1998); this per-mits a semi-distributed approach to be used, which takesinto account the spatial variability of the physical processes.In order to outline the hydrological losses, a SCS-CN gridmodel (SCS, 1971, 1986) and Lag model were used to out-line the propagation of the full flood wave (Pilgrim andCordery, 1993).
Figure 4 shows the calibration and verification of the hy-drological model for the AMCIII class. Table 3 summarizesthe values of the model’s parameters. In order to evaluatethe performance of the model, the following two indicatorswere considered: the Root Mean Squared Error (RMSE) andthe efficiency coefficient (CE). Their values are 59.46 m3 s−1
and 0.24, respectively.
4.5 Rainfall thresholds evaluation
4.5.1 Bayesian approach
The Bayesian approach is described in Martina et al. (2006).Here, only graphical and numerical results related to theMignone River case study are reported (Fig. 5, Table 4).For each AMC condition, three curves were obtained, corre-sponding to the various risk cases. Clearly, higher saturationwill result in lower corresponding threshold values.
Fig. 4. Calibration and validation of the AMCIII class hydrologicmodel for the Mignone River basin on the basis of the observedhydrographs at the “Aurelia” gauge station in December 2008 withradar data.
4.5.2 Utility-entropy approach
Given the measure of risk of Eq. (9), it is possible to eval-uate rainfall thresholds as follows. Given aVT value, let2be the space of possible state of nature,A the space of actionand X the space of consequences of associations betweenactions and state of nature. Hence,2i = {θ1, θ2} has twodimensions whereθ1 corresponds to the critical dischargebeing surpassed, andθ2 corresponds it not being surpassed.A = {a1,a2,} has two dimensions wherea1 corresponds to is-suing an alarm when the rainfall threshold is surpassed, anda2 corresponds to issuing an alarm when the rainfall thresh-old is not surpassed. Finally, spaceX = X(a,θ), defined inthe spaceA×2, has as componentsx11 (correctly issuedalarm),x12 (missed alarm),x21 (false alarm), andx22 (notevent, no alarm).
The conditional entropy is defined as:
H(x|y) =
+∞∫−∞
f (x|y)log2f (x|y)dx. (14)
Nat. Hazards Earth Syst. Sci., 11, 2061–2074, 2011 www.nat-hazards-earth-syst-sci.net/11/2061/2011/

V. Montesarchio et al.: Rainfall threshold definition using an entropy decision approach 2069
Table 4. Threshold values evaluated by each method for the Mignone river basin.
VT(mm)
MethodAMC Duration
3 6 12 24class (h)
“real” case 20.09 21.41 25.71 34.94I “prone” case 20.02 21.01 25.02 33.05
“averse” case 20.82 21.82 26.41 36.83
“real” case 18.27 19.28 20.54 24.94Bayesian II “prone” case 18.01 19.01 20.01 23.83
“averse” case 18.55 19.55 21.09 26.05
“real” case 16.27 17.28 19.99 22.97III “prone” case 16.01 17.01 19.80 22.02
“averse” case 16.55 17.55 20.18 23.92
“real” case 21.11 21.72 26.18 36.61I “prone” case 20.04 21.02 25.03 33.09
“averse” case 21.40 22.29 27.15 39.62
Utility- “real” case 18.28 19.28 20.93 25.92Entropy II “prone” case 18.03 19.01 20.02 23.85(λ = 0.5) “averse” case 18.91 19.86 21.70 27.68
“real” case 16.49 17.28 20.14 23.81III “prone” case 16.03 17.01 19.81 22.05
“averse” case 16.90 17.55 20.42 25.31
I 22.88 23.54 29.12 47.00Entropy II 19.89 20.69 23.35 32.00(λ = 1) III 17.85 18.66 21.07 29.00
Hyeto 1 32.50 33.00 35.50 42.50Model
IIIHyeto 2 32.20 32.40 33.50 36.20
Radar Hyeto 3 32.50 33.20 36.50 44.50Hyeto 4 32.30 32.80 34.80 40.00
In the rainfall threshold case it is:
Ha(ϑ |v) = H(q|v) = −
+∞∫−∞
f (q,v)
f (v)log2
(f (q,v)
f (v)
)dq, (15)
whereH(q|v) can assume:
H(q|v >VT) = −
+∞∫−∞
f (q,v)
f (v >VT)log2
(f (q,v)
f (v >VT)
)dq (16)
or
H(q|v <VT) = −
+∞∫−∞
f (q,v)
f (v <VT)log2
(f (q,v)
f (v <VT)
)dq. (17)
The parameterλ can be varied in order to adjust the weightsof the objective and subjective components. Let us considertwo cases. A total of nine threshold values are obtained in
the case of a perfect tradeoff between objective and subjec-tive components (λ = 0.5) (Table 4). In the second case, thetradeoff coefficientλ is equal to 1; therefore, in Eq. (9) onlythe component related to entropy is considered. The thresh-old values obtained are a minimization of Eq. (15), regardlessof the perception of the decision-maker. In this case a singlecurve of the threshold values for each AMC condition is ob-tained (Fig. 7).
4.5.3 Radar based simulation approach
The inverse hydrological problem was solved by identifyingthe configuration of the rainfall field that leads to exceed-ing the critical discharge (see Sect. 3.1). Table 4 summarisesrainfall threshold values corresponding to each rainfall con-figuration, for the AMCIII soil condition.
www.nat-hazards-earth-syst-sci.net/11/2061/2011/ Nat. Hazards Earth Syst. Sci., 11, 2061–2074, 2011

2070 V. Montesarchio et al.: Rainfall threshold definition using an entropy decision approach
Fig. 5. Threshold values evaluated by Bayesian approach for theMignone River basin: “real” case (solid line), “prone” case (dottedline) and “averse” case (dashed line) for the AMCIII soil condition(upper panel) and uncertainty associated with “real” case threshold(lower panel).
5 Reliability evaluation
To estimate the reliability of rainfall thresholds, it is neces-sary to investigate the presence of any missed or false alarms.A missed alarm (MA) is defined as when the flood eventexceeds the critical reference discharge in the critical cross-section, but the recorded precipitation does not exceed therainfall threshold. A false alarm (FA) is when the rainfallthreshold is surpassed, but the observed discharge is lowerthan the critical reference discharge.
Obviously, FAs and especially MAs, invalidate the reli-ability of rainfall thresholds as a warning tool. A possibleway to assess the performance of the proposed method isto use a two-by-two contingency table (Mason and Graham,1999). The table is structured as follows: the n observationsare divided in EventE (critical discharge surpassed) and NotEventE′ (critical discharge not surpassed). If an event oc-curred and a warning was issued the outcome is a hit (withh
being the total number of hits); if an event did not occur but
Fig. 6. Threshold values evaluated via the utility-entropy mea-sure of risk approaches (λ = 0.5) for the Mignone River basin:“real” case (solid line), “prone” case (dotted line) and “averse” case(dashed line) for AMCIII soil condition (upper panel) and uncer-tainty associated with “real” case AMCIII threshold (lower panel).
a warning was issued the outcome is a false alarm (withf
being the total number of false alarms); if an event occurredbut a warning was not issued the outcome is a missed alarm(with m being the total number of misses); if an event did notoccur and a warning was not issued the outcome is a correctrejection (withc being the total number if correct rejections).The total number of warnings isw, the total of no warningsw′, the total number of eventse and not-eventse′.
The performance can be evaluated in terms of the hit rate(proportion of events for which a warning is correctly pro-vided) and false alarm rate (proportion of not events forwhich a warning is incorrectly provided), defined as follows(Mason, 1982):
hit rate =h
h+m=
h
e= p(w|E) (18)
Nat. Hazards Earth Syst. Sci., 11, 2061–2074, 2011 www.nat-hazards-earth-syst-sci.net/11/2061/2011/
V. Montesarchio et al.: Rainfall threshold definition using an entropy decision approach 2071
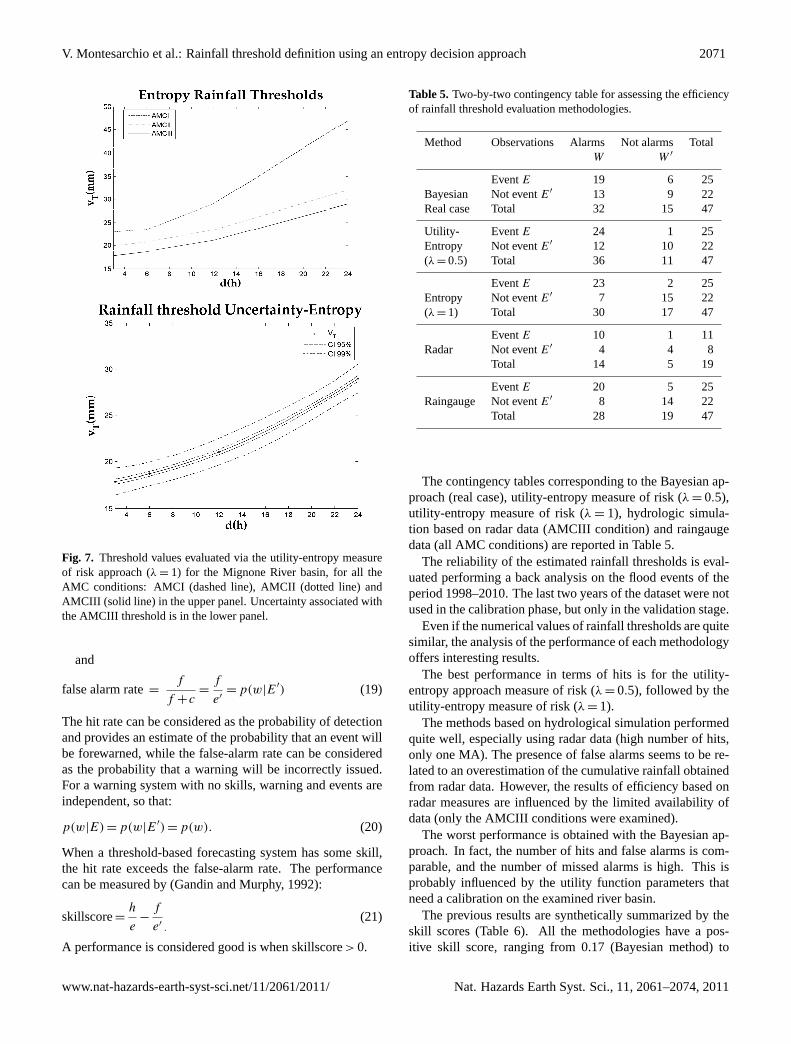
Fig. 7. Threshold values evaluated via the utility-entropy measureof risk approach (λ = 1) for the Mignone River basin, for all theAMC conditions: AMCI (dashed line), AMCII (dotted line) andAMCIII (solid line) in the upper panel. Uncertainty associated withthe AMCIII threshold is in the lower panel.
and
false alarm rate=f
f +c=
f
e′= p(w|E′) (19)
The hit rate can be considered as the probability of detectionand provides an estimate of the probability that an event willbe forewarned, while the false-alarm rate can be consideredas the probability that a warning will be incorrectly issued.For a warning system with no skills, warning and events areindependent, so that:
p(w|E) = p(w|E′) = p(w). (20)
When a threshold-based forecasting system has some skill,the hit rate exceeds the false-alarm rate. The performancecan be measured by (Gandin and Murphy, 1992):
skillscore=h
e−
f
e′.
(21)
A performance is considered good is when skillscore> 0.
Table 5. Two-by-two contingency table for assessing the efficiencyof rainfall threshold evaluation methodologies.
Method Observations Alarms Not alarms TotalW W ′
EventE 19 6 25Bayesian Not eventE′ 13 9 22Real case Total 32 15 47
Utility- Event E 24 1 25Entropy Not eventE′ 12 10 22(λ = 0.5) Total 36 11 47
EventE 23 2 25Entropy Not eventE′ 7 15 22(λ = 1) Total 30 17 47
EventE 10 1 11Radar Not eventE′ 4 4 8
Total 14 5 19
EventE 20 5 25Raingauge Not eventE′ 8 14 22
Total 28 19 47
The contingency tables corresponding to the Bayesian ap-proach (real case), utility-entropy measure of risk (λ = 0.5),utility-entropy measure of risk (λ = 1), hydrologic simula-tion based on radar data (AMCIII condition) and raingaugedata (all AMC conditions) are reported in Table 5.
The reliability of the estimated rainfall thresholds is eval-uated performing a back analysis on the flood events of theperiod 1998–2010. The last two years of the dataset were notused in the calibration phase, but only in the validation stage.
Even if the numerical values of rainfall thresholds are quitesimilar, the analysis of the performance of each methodologyoffers interesting results.
The best performance in terms of hits is for the utility-entropy approach measure of risk (λ = 0.5), followed by theutility-entropy measure of risk (λ = 1).
The methods based on hydrological simulation performedquite well, especially using radar data (high number of hits,only one MA). The presence of false alarms seems to be re-lated to an overestimation of the cumulative rainfall obtainedfrom radar data. However, the results of efficiency based onradar measures are influenced by the limited availability ofdata (only the AMCIII conditions were examined).
The worst performance is obtained with the Bayesian ap-proach. In fact, the number of hits and false alarms is com-parable, and the number of missed alarms is high. This isprobably influenced by the utility function parameters thatneed a calibration on the examined river basin.
The previous results are synthetically summarized by theskill scores (Table 6). All the methodologies have a pos-itive skill score, ranging from 0.17 (Bayesian method) to
www.nat-hazards-earth-syst-sci.net/11/2061/2011/ Nat. Hazards Earth Syst. Sci., 11, 2061–2074, 2011

2072 V. Montesarchio et al.: Rainfall threshold definition using an entropy decision approach
Table 6. Reliability summary analysis: values of hit rate, false alarm rate and skill score are presented in order to compare the methodologies.
Bayesian UE-Risk EntropyHydrologic Hydrologic
(λ = 0.5) (λ = 1)simulation simulation(radar data) (rain gauge)
Hit rate 0.76 0.96 0.92 0.91 0.80False alarm rate 0.59 0.55 0.32 0.50 0.36skill score 0.17 0.41 0.60 0.41 0.44
Fig. 8. Threshold values evaluated by hydrological model calibratedwith radar data for AMCIII soil conditions (upper panel) and uncer-tainty associated with hyeto 1 threshold for the Mignone River basin(lower panel).
0.60 (entropy approach). It is interesting to highlight thatthe thresholds evaluated via hydrological simulation (raingauge data) offer the same skill score as the utility-entropyapproach measure of risk.
Fig. 9. Threshold values evaluated by a hydrological model cali-brated with raingauge data for AMCIII soil conditions (upper panel)and uncertainty associated with hyeto1 threshold for the MignoneRiver basin (lower panel).
The skill scores are therefore encouraging for the effi-ciency of the proposed methodologies as flood warning toolsin a future operative framework. However, a wider data set isneed to achieve more accurate reliability evaluation of eachexamined methodology.
Nat. Hazards Earth Syst. Sci., 11, 2061–2074, 2011 www.nat-hazards-earth-syst-sci.net/11/2061/2011/

V. Montesarchio et al.: Rainfall threshold definition using an entropy decision approach 2073
6 Discussion and conclusions
This work presents a simplified model for the managementof alert systems used for flood events. Values in excess of athreshold trigger prevention actions and an emergency sys-tem alert. The definition of threshold values is obtained viaa probabilistic approach and by a simulation model based onweather radar data.
Two probabilistic methodologies were compared by backanalysis. In the Bayesian approach proposed by Martina etal. (2006), rainfall threshold values depend on the decision-maker’s perception of risk. Using the utility-entropy riskfunction approach, a combination of objective (representedby the entropy function) and subjective (represented by theexpected value of the utility function) components permitsthe evaluation of rainfall threshold values, weighing the sub-jective perception of the stakeholder by using the opportunevalue of the trade-off coefficient. By imposing a balanceparameterλ = 1, the subjective perception of the decision-maker does not affect the determination of threshold values,which are obtained exclusively by minimizing the informa-tion entropy. This methodology is thus more objective andoffers the best performance in terms of skill score. Thresh-olds obtained by hydrological simulation based on weatherradar data perform quite well, but there is still a need for moredata in order to achieve more accurate performance testing.
A question of growing importance is the study of uncer-tainty of estimated rainfall threshold values (Ntelekos et al.,2006; Villarini et al., 2010b). In fact, every proposed ap-proach to rainfall threshold evaluation is affected by varioussources of uncertainty. For example, considering the hydro-logical model, the uncertainties related to the inputs (rain-gauge data, radar data, discharge data evaluated with ratingcurve, basin characterization) influenced the outputs (cali-brated basin parameters and simulated discharges). In thiswork only an overall evaluation of uncertainty is performed.As shown in the lower panel of Figs. 5–9, the confidenceintervals (95 % and 99 %) of the proposed rainfall thresholdswere evaluated. Clearly, the greater the source of uncertainty,the wider the confidence intervals.
Future studies should investigate more carefully the influ-ence of each component on rainfall threshold values. Asso-ciating an uncertainty value to rainfall thresholds allows theusers to make optimal decisions about issuing or not issuingflood warnings.
Acknowledgements.The authors would like to thank Ufficio Idro-grafico e Mareografico of Lazio Region for providing hydrometricand pluviometric data and the Institute of Atmospheric Sciencesand Climate of the National Research Council for providing radardata. In addition, the authors would like to thank the reviewersfor their useful comments, which helped to improve the manuscript.
Edited by: G. BoniReviewed by: two anonymous referees
References
Annunziati, A., Focardi, A., Focardi, P., Martello, S., and Vannocci,P.: Analysis of the rainfall thresholds that induced debris flowsin the area of Apuan Alps – Tuscany, Italy, Plinius Conference’99: Mediterranean Storms, Ed. Bios., 485–493, 1999.
Bloeschl, G.: Rainfall-runoff modelling of ungauged catchments.Article 133 in: Encyclopedia of Hydrological Sciences, M.G. Anderson (Managing Editor), J. Wiley & Sons, Chichester,2061–2080, 2005.
Brath, A., Castellarin, A., Franchini, M., and Galeati, G.: Estimat-ing the index flood using indirect methods, Hydrolog. Sci. J.,46(3), 399–418, 2001.
Carpenter, T. M., Sperfslage J. A., Georgakakos K. P., Sweeney,T., and Fread, D. L.: National threshold runoff estimation utiliz-ing GIS in support of operational flash flood warning systems, J.Hydrol., 224, 21–44, 1999.
Ciach, G. J., Krajewski, W. F., and Villarini, G.: Product-error-driven uncertainty model for probabilistic quantitative precipi-tation estimation with NEXRAD data, J. Hydrometeorol., 8(5),1325–1347, 2007.
Crosta, G. B. and Frattini, P.: Rainfall thresholds for soil slip anddebris flow triggering, Proceedings of the EGS 2nd Plinius Con-ference on Mediterranean Storms, Ed. Bios, 2000.
Dalrymple, T.: Flood frequency analyses, Water Supply Paper1543-A, US Geol. Survey, Reston, Virginia, USA, 1960.
FLOODsite – Borga, M.: Realtime Guidance for flash flood riskmanagement, available at:http//www.floodsite.net(last access:May 2009), 2008.
Gandin, L. S. and Murphy, A. H.: Equitable skill scores for cate-gorical forecasts, Mon. Weather Rev., 120, 361–370, 1992.
Georgakakos, K. P.: Real time prediction for flood warning andmanagement, US-Italy Research Workshop on the Hydromete-orology, Impacts, and Management of Extreme Floods Perugia(Italy), November 1995, 1995.
Georgakakos, K. P.: Analytical results for operational flash floodguidance, J. Hydrol., 317, 81–103, 2006.
Germann, U., Galli, G., Boscacci, M., and Bolliger, M.: Radar pre-cipitation measurement in a mountainous region, Q. J. Roy. Me-teor. Soc., 132(618), 1669–1692, 2006.
Giulianelli, M., Miserocchi, F., Napolitano, F., and Russo, F.: Influ-ence of space-time rainfall variability on urban runoff, Proceed-ing of the 17th IASTED International Conference Modelling andSimulation, Montreal, QC, Canada, 546–551, 2006.
Habib, E., Ciach, G. J., and Krajewski, W. F.: A method for filter-ing out raingauge representativeness errors from the verificationdistributions of radar and raingauge rainfall, Adv. Water Resour.,27(7), 967–980, 2004.
Kelly, K. S. and Krzysztofowicz, R.: A bivariate meta-Gaussiandensity for use in hydrology, Stoch. Hydrol. Hydraul., 11, 17–31, 1997.
Krajewski, W. F. and Smith, J. A.: Radar hydrology: rainfall esti-mation, Adv. Water. Resour., 25(8–12), 1387–1394, 2002.
Kull, D. W. and Feldman, A. D.: Evolution of Clark’s unit graphmethod to spatially distributed runoff, J. Hydrol. Eng., 3(1), 9–19, 1998.
Lombardo, F., Napolitano, F., Russo, F., Scialanga, G., Baldini, L.,and Gorgucci, E.: Rainfall estimation and ground clutter rejec-tion with dual polarization weather radar, Adv. Geosci., 7, 127–130,doi:10.5194/adgeo-7-127-2006, 2006a.
www.nat-hazards-earth-syst-sci.net/11/2061/2011/ Nat. Hazards Earth Syst. Sci., 11, 2061–2074, 2011
2074 V. Montesarchio et al.: Rainfall threshold definition using an entropy decision approach
Lombardo, F., Napolitano, F., and Russo, F.: On the use of radarreflectivity for estimation of the areal reduction factor, Nat.Hazards Earth Syst. Sci., 6, 377–386,doi:10.5194/nhess-6-377-2006, 2006b.
Lombardo, F., Montesarchio, V., Napolitano, F., Russo, F., andVolpi, E.: Operational applications of radar rainfall data in ur-ban hydrology, IAHS-AISH Publication, 327, 258–266, 2009.
Mancini, M., Mazzetti, P., Nativi, S., Rabuffetti, D., Ravazzani,G., Amadio, P., and Rosso, R.: Definizione di soglie pluviomet-riche di piena per la realizzazione di un sistema di allertamentoin tempo reale per il bacino dell’Arno a monte di Firenze, Proc.XXVII Convegno di idraulica e Costruzione Idrauliche, 2, 497–505, Italy, 2002.
Martina, M. L. V., Todini, E., and Libralon, A.: A Bayesian deci-sion approach to rainfall thresholds based flood warning, Hydrol.Earth Syst. Sci., 10, 413–426,doi:10.5194/hess-10-413-2006,2006.
Mason, S. J.: A model for assessment of weather forecasts, Aust.Meteorol. Mag., 30, 291–303, 1982.
Mason, S. J. and Graham, N. E.: Conditional probabilities, relativeoperating characteristics and relative operating levels, WeatherForecast., 14, 713–725, 1999.
Mogil, H. M., Monro, J. C., and Groper, H. S.: NWS’s flash floodwarning and disaster preparedness programs, B. Am. Meteorol.Soc., 59, 690–699, 1978.
Montesarchio, V., Lombardo, F., and Napolitano, F.: Rainfallthresholds and flood warning: an operative case study, Nat.Hazards Earth Syst. Sci., 9, 135–144,doi:10.5194/nhess-9-135-2009, 2009.
Neary, D. G. and Swift, L. W.: Rainfall thresholds for trigger-ing a debris flow avalanching event in the southern AppalachianMountains, Rew. Eng. Geol., 7, 81–95, 1987.
Norbiato, D., Borga, M., Degli Esposti, S., Gaume, E. and An-quetin, S.: Flash flood warning based on rainfall thresholds andsoil moisture conditions: An assessment for gauged and un-gauged basins, J. Hydrol., 362, 274–290, 2008.
Ntelekos, A. A., Georgakakos, K. P., and Krajewski, W. F.: On theuncertainties of flash flood guidance: toward probabilistic fore-casting of flash floods, J. Hydrometeorol., 7, 896–915, 2006.
Papoulis, A.: Probability, random variables and stochastic pro-cesses, 3rd Edn., McGraw-Hill, New York, 1991.
Peters, J. C. and Easton, D. J.: Runoff simulation using radar rain-fall data, Water Resour. Bull., 32(3), 753–760, 1996.
Pilgrim, D. H. and Cordery, I.: Flood runoff, in: Handbook of hy-drology, edited by: Maidment, D. R., McGraw-Hill, New York,NY, USA, 9, 1–42, 1993.
Rosso, R.: Manuale di protezione idraulica del territorio, Cusl, Mi-lano, 2002.
Russo, F., Napolitano, F., and Gorgucci, E.: Rainfall monitoringsystems over an urban area: the city of Rome, Hydrol. Process.,19(4), 1007–1019, 2005.
Russo, F., Lombardo, F., Napolitano, F., and Gorgucci, E.: Rainfallstochastic modelling for runoff forecasting, Phys. Chem. Earth,31(18), 1251–1261, 2006.
Soil Conservation Service. Urban hydrology for small watersheds,Technical Release 55, US Department of Agriculture, Spring-field, VA, 1986.
Soil Conservation Service. National engineering handbook, Crosssection 4: Hydrology, US Department of Agriculture, Spring-field, VA, 1971.
Villarini, G., Lang, J. B., Lombardo, F., Napolitano, F., Russo, F.,and Krajewski, W. F.: Impact of different regression frameworkson the estimation of the scaling properties of radar rainfall, At-mos. Res., 86(3–4), 340–349, 2007.
Villarini, G. and Krajewski, W. F.: Review of the different sourcesof uncertainty in single polarization radar-based estimates ofrainfall, Surv. Geophys., 31(1), 107–129, doi:10.1007/s10712-009-9079-x, 2010a.
Villarini, G., Krajewski, W. F., Ntelekos, A. A., Georgakakos, K.P., and Smith, J. A.: Towards probabilistic forecasting of flashfloods: the combined effects of uncertainty in radar-rainfall andflash flood guidance, J. Hydrol., 394, 275–284, 2010b.
Wilson, J. W. and Brandes, E. A.: Radar measurement of rainfall –a summary, B. Am. Meteorol. Soc., 60(6), 1048–1058, 1979.
Yang, J. and Qiu, W.: A measure of risk and a decision-makingmodel based on expected utility and entropy, Eur. J. Oper. Res.,164, 792–799, 2005.
Nat. Hazards Earth Syst. Sci., 11, 2061–2074, 2011 www.nat-hazards-earth-syst-sci.net/11/2061/2011/
Copyright © 2022 FDOKUMEN