Catalogue of Rainfall Events with Shallow Landslides and New Rainfall Thresholds in Italy

Hurricane “Rainfall Potential” Derived from Satellite Observations Aids OverlandRainfall Prediction
HAIYAN JIANG*
Joint Center for Earth Systems Technology, University of Maryland, Baltimore County, Baltimore, and Mesoscale AtmosphericProcesses Branch, NASA Goddard Space Flight Center, Greenbelt, Maryland
JEFFREY B. HALVERSON
Joint Center for Earth Systems Technology, University of Maryland, Baltimore County, Baltimore, Maryland
JOANNE SIMPSON
Laboratory for Atmospheres, NASA Goddard Space Flight Center, Greenbelt, Maryland
EDWARD J. ZIPSER
Department of Meteorology, University of Utah, Salt Lake City, Utah
(Manuscript received 18 October 2006, in final form 29 June 2007)
ABSTRACT
The Tropical Rainfall Measuring Mission–based National Aeronautics and Space Administration God-dard Multisatellite Precipitation Analysis (MPA) product is used to quantify the rainfall distribution intropical cyclones that made landfall in the United States during 1998–2004. A total of 37 tropical cyclones(TC) are examined, including 2680 three-hourly MPA precipitation observations. Rainfall distributions foroverland and overocean observations are compared. It is found that the TC rainfall over ocean bears astrong relationship with the TC maximum wind, whereas the relationship for overland conditions is muchweaker. The rainfall potential is defined by using the satellite-derived rain rate, the satellite-derived stormsize, and the storm translation speed. This study examines the capability of the overocean rainfall potentialto predict a storm’s likelihood of producing heavy rain over land. High correlations between rain potentialsbefore landfall and the maximum storm total rain over land are found using the dataset of the 37 landfallingTCs. Correlations are higher with the average rain potential on the day prior to landfall than with averagesover any other time period. A TC overland rainfall index is introduced based on the rainfall potential study.This index can be used to predict the storm peak rainfall accumulation over land. Six landfalling stormsduring the 2005 Atlantic Ocean hurricane season are examined to verify the capability of using this indexto forecast the maximum storm total rain over land in the United States. The range of the maximum stormoverland rain forecast error for these six storms is between 2.5% and 24.8%.
1. Introduction
Predicting hurricane landfall precipitation is a majoroperational challenge. Inland flooding has become thepredominant cause of deaths associated with hurricanesin the United States (Rappaport 2000). Skill in tropical
cyclone (TC) track forecasting has improved by 20%over the last five years, achieving the first goal set bythe U.S. Weather Research Program Hurricane Land-fall program (HL). The HL (Elsberry 2005) focuses onimproving predictions of TC track, intensity change,and precipitation. However, the difficulties of improv-ing 72-h quantitative precipitation forecasts for TCs,thereby improving day-3 forecasts for inland flooding,have long been recognized (Elsberry 2002). The distri-bution of TC instantaneous and accumulated rainfall ismultiscale in nature. Mesoscale convective systemsmodulate a significant amount of TC rain, but theirspace and time variations are not well understood
* Current affiliation: Department of Meteorology, University ofUtah, Salt Lake City, Utah.
Corresponding author address: Dr. Haiyan Jiang, 135 S 1460 E,Rm. 819 WBB, Salt Lake City, UT 84112.E-mail: [email protected]
944 J O U R N A L O F A P P L I E D M E T E O R O L O G Y A N D C L I M A T O L O G Y VOLUME 47
DOI: 10.1175/2007JAMC1619.1
© 2008 American Meteorological Society
JAMC1619
(Heymsfield et al. 2001). Once a storm makes landfall,additional factors such as the presence of significanttopography and extratropical transition of the cycloneinvolving jet streak, trough, and frontal interactionscome into play (Carr and Bosart 1978; Atallah andBosart 2003). It has been noted that some of the mostdevastating floods are produced by tropical systems inthe weak end of the spectrum—for example, TropicalStorm Allison [2001; $6 billion in damages, 27 deaths,and 35–40 in. of rain (1 in. � 2.54 cm)] and TropicalStorm Claudette (1979; 42 in. of rain in 24 h).
Early precipitation studies of TCs over land havebeen confined to rain gauge and radar data. Miller(1958) examined the composite and frequency distribu-tion of hourly rain amounts for 16 Florida hurricaneswith respect to their center. He found that the meanrain rate in the 1° box directly surrounding the stormcenter was about a factor of 2 higher than the mean rainrate in the remaining outer domain. Significant asym-metric characteristics of the hurricane rainfall over landwere also recognized (Atallah and Bosart 2003).
Satellites provide the most common means for moni-toring TC rainfall over ocean. Satellite-based statisticalanalysis of TC rainfall characteristics is critical to un-derstanding and improving quantitative precipitationforecasts in TCs. With different satellite observationsand sample sizes, various studies have looked at radialdistributions of TC instantaneous rainfall. The obser-vations they used vary from the Nimbus-5 ElectricallyScanning Microwave Radiometer (ESMR-5; Rodgersand Adler 1981) to the Special Sensor Microwave Im-ager (SSM/I; Rao and MacArthur 1994; Rodgers andPierce 1995; Rodgers et al. 1994), to the Tropical Rain-fall Measuring Mission (TRMM) Microwave Imager(TMI; Lonfat et al. 2004). The sample size varies fromless than 100 satellite observations for several TCs inone or two basins to over 2000 TMI observations for260 TCs over the global oceans (Lonfat et al. 2004).Most of these studies analyzed overocean samples.Only one study (Rao and MacArthur 1994) analyzedthe land–ocean combined sample, but most observa-tions were over the ocean. Major findings of these stud-ies are that the instantaneous rainfall increases withstorm intensity and that the inner-core (within 100 kmof the storm center) mean rain rate of major hurricanesis about 2–3 times that of tropical storms.
The first goal of this study is to determine the differ-ences of TC rainfall distributions for conditions overocean versus conditions over land. This analysis uses a3-hourly instantaneous rainfall product, which is theNational Aeronautics and Space Administration(NASA) Multisatellite Precipitation Analysis (MPA)product (TRMM 3B42).
When the storm is over ocean, its rain is correlatedwell with storm maximum wind intensity; over land, thiskind of relationship might be much weaker because ofadditional factors. Hurricanes or typhoons, and eventropical storms, can produce torrential rains duringlandfall. Floods by TCs are associated not only with thestorm’s maximum wind intensity but also with its his-tory, its projected movement, and its size. Regardless ofthe complicated factors such as topography and troughinteractions that influence the hurricane landfall andinland rainfall, Malkus and Riehl (1960) found that thecloud–rain pattern of many storms was very similarfrom day to day. In addition, Griffith et al. (1978) notedgreat variability in storm total accumulated rainfallfrom system to system. Griffith et al. (1978) further pro-posed a hypothesis that known information about therainfall history or “wetness” of a storm as it evolvesover ocean may be used to predict the storm’s potentialfor catastrophic inland flooding. They defined a param-eter called rainfall potential, which is defined by usingan estimated average rain rate derived from infrared(IR) satellite observations, combined with the stormsize and translation speed information. The rainfall po-tential histories of a dozen TCs approaching landfallwere examined. Their method correctly predicted thehighest actual rainfall totals for the major flood hurri-canes Agnes (1972) and Fifi (1974) and the lowest po-tentials for the relatively dry hurricanes Celia (1970)and Edith (1971). A similar technique called the tropi-cal rainfall potential (TRaP) was developed at the Na-tional Oceanic and Atmospheric Administration/Na-tional Environmental Satellite, Data, and InformationService (NOAA/NESDIS; Kidder et al. 2005; Ferraroet al. 2005). TRaP uses the SSM/I, the Advanced Mi-crowave Sounding Unit (AMSU), and the TMI rainrates to predict tropical cyclone rainfall potential. Fer-raro et al. (2005) found that the TMI TRaPs performedbetter than the AMSU TRaPs and SSM/I TRaPs.
With the advantages of better physical connectionbetween microwave observations and precipitation andhigh spatial and temporal resolution of IR observa-tions, a combined microwave–IR rainfall product canprovide better precipitation estimates globally than anymicrowave- or IR-only products (Adler et al. 1993,1994, 2003; Huffman et al. 2001). In the framework ofthe TRMM project, MPA has produced gridded3-hourly precipitation rate estimates with relativelyhigh horizontal resolution (0.25° � 0.25° longitude/latitude) since January of 1998. These rainfall estimatesare based on microwave information provided by vari-ous low-orbiting satellites, merged with IR-based esti-mates from geostationary meteorological satellites(Huffman et al. 2007). TRMM products are used to
APRIL 2008 J I A N G E T A L . 945

calibrate the estimates. Applying the new real-timeMPA rainfall estimates to Griffith et al.’s (1978) tech-nique, Jiang et al. (2008a,b) examined the difference inrainfall potential history and water budget of Hurri-canes Isidore and Lili (both 2002). Isidore producedmuch heavier rain as a greatly weakened tropical stormthan did category-1 Hurricane Lili during landfall overthe same area. Jiang et al. (2008a) showed that theaverage rainfall potential during 4 days before landfallfor Isidore was a factor of more than 2.5 higher thanthat for Lili. Jiang et al. (2008b) explained that thedifference in the landfall rain amounts of these twostorms is partially due to the larger diameter of Isidore.More important, however, the water vapor budgetstudy in Jiang et al. (2008b) demonstrated that Isidorewas initially a wet storm (with higher storm total accu-mulated rainfall) and that its volumetric total precipi-table water was larger and extended to a larger radiusthan Lili’s during their whole lifetime. The second goalof this study is to examine the relationships between therain potential before landfall and maximum storm totalrainfall over land for the landfalling TCs over the NorthAtlantic Ocean during 1998–2004 by using the 3-hourlyMPA product.
Section 2 presents a description of MPA data, thedefinition of rain potential, the method used to analyzethe MPA rainfall parameters and case studies, and hur-ricane best-track and overland rain information. Sec-tion 3 uses the MPA rainfall product to determine therainfall distribution of North Atlantic TCs during 1998–2004 over ocean and land. Section 4 presents the rela-tionships between rain potentials before landfall andmaximum storm total rainfall over land, and it intro-duces an index for TC overland rain forecasting. Sec-tion 5 includes a summary, a discussion, and a descrip-tion of future work. The limitations of the predictionindex are discussed in both sections 4 and 5.
2. Data and methods
a. MPA product
The NASA Goddard MPA product used in this studyis based on two different sets of sensors. Microwavedata are collected by various low-orbit satellites, in-cluding the TMI, the SSM/I, the Advanced Micro-wave Scanning Radiometer for the Earth ObservingSystem (AMSR-E), and the AMSU. Precipitationestimates are derived from TMI, SSM/I, and AMSR-Emicrowave data by applying the Goddard profilingalgorithm (GPROF; Kummerow et al. 1996). AMSUmicrowave measurements are converted to rainfallestimates by using the AMSU-B algorithm (Zhao and
Weng 2002; Weng et al. 2003). High-quality (HQ)microwave estimates are produced by using the TRMMcombined instrument (TCI) to calibrate microwaveprecipitation estimates. The TCI utilizes the superiorhorizontal resolution of the TMI and TRMM pre-cipitation radar to produce an HQ merged microwaverainfall estimate. The IR data are collected by the in-ternational constellation of geosynchronous Earth or-bit (GEO) satellites. The IR estimates are calibratedwith the HQ microwave estimates. The microwaveand GEO–IR estimates are merged in a probability-matching method (Huffman et al. 2007). A post-real-time product called MPA (in the framework of TRMM,it is also called TRMM 3B42) is produced from themerged microwave–IR dataset. The MPA dataset con-sists of gridded 3-hourly precipitation rate files with0.25° � 0.25° longitude/latitude horizontal resolu-tion within the global latitude belt from 50°S to 50°N.The temporal resolution is 3 h, and the files are gener-ated on synoptic observations times (0000 UTC, 0300UTC, . . . , 2100 UTC). In this study, the TRMM ver-sion 6 of the MPA product is used.
b. Tropical cyclone best-track and overland raininformation
North Atlantic TC postanalysis best tracks for 1998–2004 were provided by the National Hurricane Center(NHC, now known as the Tropical Prediction Center).The extended best-track dataset for 1988–2004 was cre-ated by M. DeMaria at Colorado State University toinclude storm size information that was not in the stan-dard NHC best-track data (Demuth et al. 2006). Thepostanalysis merges available data to produce a (some-times smoothed) time history of the cyclone’s centerposition, maximum sustained winds, and minimum sealevel pressure for every 6 h. The available data sourcesinclude ship and other surface reports, aircraft recon-naissance data, and satellite imagery. At present, thereare no error estimates for these variables. These pa-rameters are generally more reliable west of 55° longi-tude, where aircraft reconnaissance data are usuallyavailable.
According to the best-track information, a datasetincluding 37 North Atlantic TCs that made landfallin the United States during 1998–2004 is constructed.For each landfalling TC, its maximum storm total rainaccumulation over land was provided by the tropicalcyclone rainfall data Internet page (http://www.hpc.ncep.noaa.gov/tropical/rain/tcrainfall.html) built byD. Roth at the NOAA Hydrometeorological Predic-tion Center. This TC overland rainfall database is basedon rain gauge observations from the National Climatic
946 J O U R N A L O F A P P L I E D M E T E O R O L O G Y A N D C L I M A T O L O G Y VOLUME 47
Data Center, National Weather Service River ForecastCenters, many local water management networks, andadditional NHC reports (D. Roth 2005, personalcommunication). The maximum storm total rain repre-sents the maximum value of the storm-accumulatedrains during the storm’s U.S. land-rain period (thedays on which the storm rains over the U.S. land) forall rain gauge stations. Table 1 lists the 37 landfallingTCs, their maximum surface wind during their wholelifetime, U.S. landfall time (when the storm center is
over land),1 maximum surface wind at the U.S. landfalltime, U.S. overland rain period, maximum storm totalrains during U.S. overland period, translation speed atthe day of landfall (the period of 24 h after the U.S.
1 Some storms had multiple landfalls in the United States. Inthis database, we include only one landfall time for each storm,with the landfall location closest to the station of the maximumstorm total rain over land.
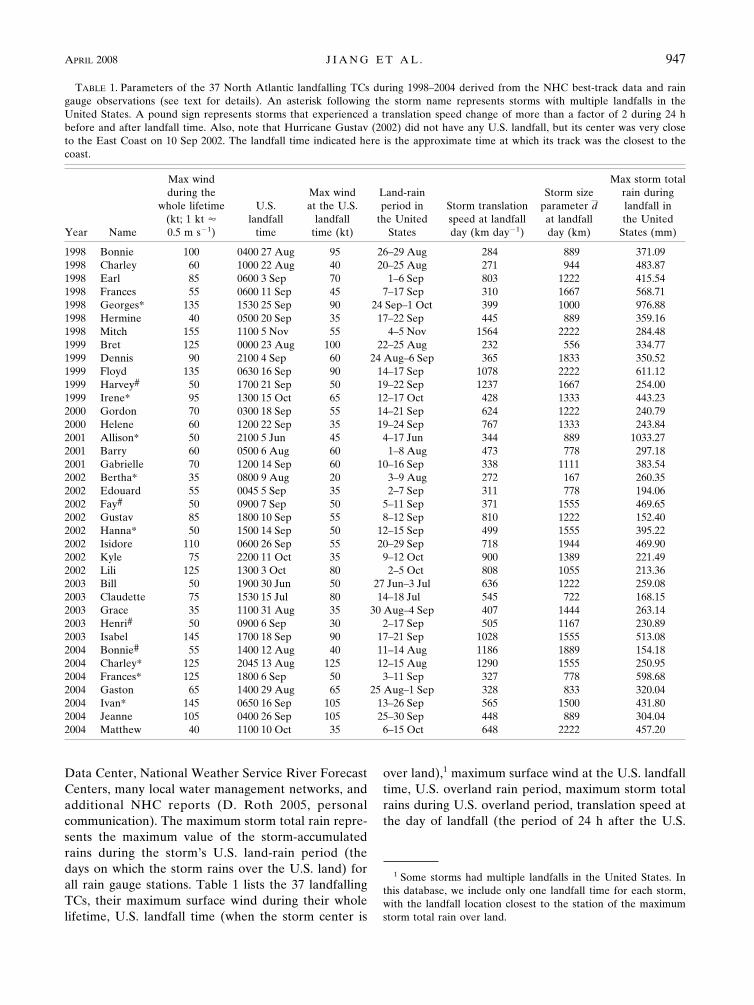
TABLE 1. Parameters of the 37 North Atlantic landfalling TCs during 1998–2004 derived from the NHC best-track data and raingauge observations (see text for details). An asterisk following the storm name represents storms with multiple landfalls in theUnited States. A pound sign represents storms that experienced a translation speed change of more than a factor of 2 during 24 hbefore and after landfall time. Also, note that Hurricane Gustav (2002) did not have any U.S. landfall, but its center was very closeto the East Coast on 10 Sep 2002. The landfall time indicated here is the approximate time at which its track was the closest to thecoast.
Year Name
Max windduring the
whole lifetime(kt; 1 kt �0.5 m s�1)
U.S.landfall
time
Max windat the U.S.
landfalltime (kt)
Land-rainperiod in
the UnitedStates
Storm translationspeed at landfallday (km day�1)
Storm sizeparameter dat landfallday (km)
Max storm totalrain duringlandfall inthe United
States (mm)
1998 Bonnie 100 0400 27 Aug 95 26–29 Aug 284 889 371.091998 Charley 60 1000 22 Aug 40 20–25 Aug 271 944 483.871998 Earl 85 0600 3 Sep 70 1–6 Sep 803 1222 415.541998 Frances 55 0600 11 Sep 45 7–17 Sep 310 1667 568.711998 Georges* 135 1530 25 Sep 90 24 Sep–1 Oct 399 1000 976.881998 Hermine 40 0500 20 Sep 35 17–22 Sep 445 889 359.161998 Mitch 155 1100 5 Nov 55 4–5 Nov 1564 2222 284.481999 Bret 125 0000 23 Aug 100 22–25 Aug 232 556 334.771999 Dennis 90 2100 4 Sep 60 24 Aug–6 Sep 365 1833 350.521999 Floyd 135 0630 16 Sep 90 14–17 Sep 1078 2222 611.121999 Harvey# 50 1700 21 Sep 50 19–22 Sep 1237 1667 254.001999 Irene* 95 1300 15 Oct 65 12–17 Oct 428 1333 443.232000 Gordon 70 0300 18 Sep 55 14–21 Sep 624 1222 240.792000 Helene 60 1200 22 Sep 35 19–24 Sep 767 1333 243.842001 Allison* 50 2100 5 Jun 45 4–17 Jun 344 889 1033.272001 Barry 60 0500 6 Aug 60 1–8 Aug 473 778 297.182001 Gabrielle 70 1200 14 Sep 60 10–16 Sep 338 1111 383.542002 Bertha* 35 0800 9 Aug 20 3–9 Aug 272 167 260.352002 Edouard 55 0045 5 Sep 35 2–7 Sep 311 778 194.062002 Fay# 50 0900 7 Sep 50 5–11 Sep 371 1555 469.652002 Gustav 85 1800 10 Sep 55 8–12 Sep 810 1222 152.402002 Hanna* 50 1500 14 Sep 50 12–15 Sep 499 1555 395.222002 Isidore 110 0600 26 Sep 55 20–29 Sep 718 1944 469.902002 Kyle 75 2200 11 Oct 35 9–12 Oct 900 1389 221.492002 Lili 125 1300 3 Oct 80 2–5 Oct 808 1055 213.362003 Bill 50 1900 30 Jun 50 27 Jun–3 Jul 636 1222 259.082003 Claudette 75 1530 15 Jul 80 14–18 Jul 545 722 168.152003 Grace 35 1100 31 Aug 35 30 Aug–4 Sep 407 1444 263.142003 Henri# 50 0900 6 Sep 30 2–17 Sep 505 1167 230.892003 Isabel 145 1700 18 Sep 90 17–21 Sep 1028 1555 513.082004 Bonnie# 55 1400 12 Aug 40 11–14 Aug 1186 1889 154.182004 Charley* 125 2045 13 Aug 125 12–15 Aug 1290 1555 250.952004 Frances* 125 1800 6 Sep 50 3–11 Sep 327 778 598.682004 Gaston 65 1400 29 Aug 65 25 Aug–1 Sep 328 833 320.042004 Ivan* 145 0650 16 Sep 105 13–26 Sep 565 1500 431.802004 Jeanne 105 0400 26 Sep 105 25–30 Sep 448 889 304.042004 Matthew 40 1100 10 Oct 35 6–15 Oct 648 2222 457.20
APRIL 2008 J I A N G E T A L . 947

landfall time), and MPA estimated storm size param-eter d (daily mean cross section; see section 2c for adetailed definition of d) at the day of landfall. Thesamples in Table 1 include all of the time periods duringwhich storms were reported in the NHC best track,including extratropical and subtropical stages.
c. Definition of rain potential
This study applies the hypothesis proposed by Grif-fith et al. (1978) to assess the flooding potential of ap-proaching TCs using a parameter called mean total rainpotential, defined as
mean total rain potential � D d��, �1�
where D is MPA daily average storm rainfall (mmday�1). We draw a circle around the rain area on theMPA daily rainfall accumulation image by excludingrain that is not associated with the tropical cyclone.Here, D is averaged inside the circle, and d is the meancross section (km) of the storm as measured from thesatellite image in the direction of motion according toGriffith et al.’s (1978) definition. In this study, d is de-termined subjectively from the MPA daily rain accu-mulation image, where a line is drawn and measuredfor continuous rain area in the direction of storm mo-tion. The � is the mean storm translation speed (kmday�1) derived from hurricane best-track data. It is re-alized that the expected duration of rainfall at a point asa tropical cyclone passes overhead is approximately d/�.The mean total rainfall, then, would be (D d)/�. Thisdefinition is the same as the TRaP used in Kidder et al.(2000, 2005). Equation (1) has a problem if the storm isstationary; however, there is not that kind of extremecase in the storm samples used in this study. Kidder etal. (2005) used an areal TRaP technique that seems tobe able to eliminate this problem. In their technique, asthe speed of the storm approaches zero, the mean rainpotential is simply the mean daily rain.
d. Analysis method
To determine the rainfall characteristics of TC overocean and land, a total of 2680 three-hourly MPA ob-servations for the whole lifetime of the 37 TCs aregrouped into overocean and overland categories. Thecriterion is if one observation contains 60% of rainpixels over ocean (land), then this observation is attrib-uted to the overocean (overland) category. Observa-tions that are not identified as either overland or over-ocean are called mixed. The data are also categorizedby the storm intensity stage: tropical depressions (TD)are defined as systems with maximum wind speed of
less than 17 m s�1, tropical storms (TS) are systems withmaximum wind speed between 18 and 33 m s�1, andhurricanes (HURs) are systems with maximum windspeed that is greater than 34 m s�1. Table 2 shows thenumber of MPA observations for each category. TheMPA rainfall parameters are derived in storm-relativecoordinates. The storm motion and intensity change areneglected during the MPA 3-h window. This couldcause some errors in analyzing the radial distribution ofTC rainfall for different intensity categories. The azi-muthal averages are calculated in 28-km-wide annuli(according to the 0.25°-resolution of MPA data) aroundthe storm center outward to the 1111-km radius forMPA-derived parameters. We choose this 10° radius tocapture extreme storm sizes. The resulting dataset al-lows us to examine the radial dependence of param-eters as a function of time. The conditional (only whenraining) probability density functions (PDF) of rainrate with radial distance can also be determined usingthe annular dataset. Using the annular PDFs, a con-toured diagram of frequency by radial distance (2D fre-quency) can be constructed as a function of storm in-tensity and location (e.g., over ocean or land).
3. Distribution of TC rainfall over land and ocean
In this section, the distribution of TC rainfall derivedfrom the MPA product is presented. The comparisonwith previous studies on the distribution of TC rainfallis also presented. The numerical study by Rogers et al.(2003) shows that the asymmetry could be significantlydifferent between instantaneous and accumulated TCrainfall depending on the relative orientation of theshear and storm motion vectors. However, because weare mainly comparing the distribution of azimuthallyaveraged rain, no asymmetric information could be re-solved.
a. PDF of rain rates
Figure 1 shows the PDF distributions of rain rates forall MPA rainfall observations within an area of 1111 km(10° radius) around the storm center. The mode is near1 mm h�1 but is not the same for different subsamples:the overocean PDF has a mode of 1 mm h�1 and the
TABLE 2. The number of MPA observations for each category.
TD TS HUR Total
Over ocean 482 790 713 1985Over land 284 117 20 421Mixed 116 105 53 274Total 882 1012 786 2680
948 J O U R N A L O F A P P L I E D M E T E O R O L O G Y A N D C L I M A T O L O G Y VOLUME 47
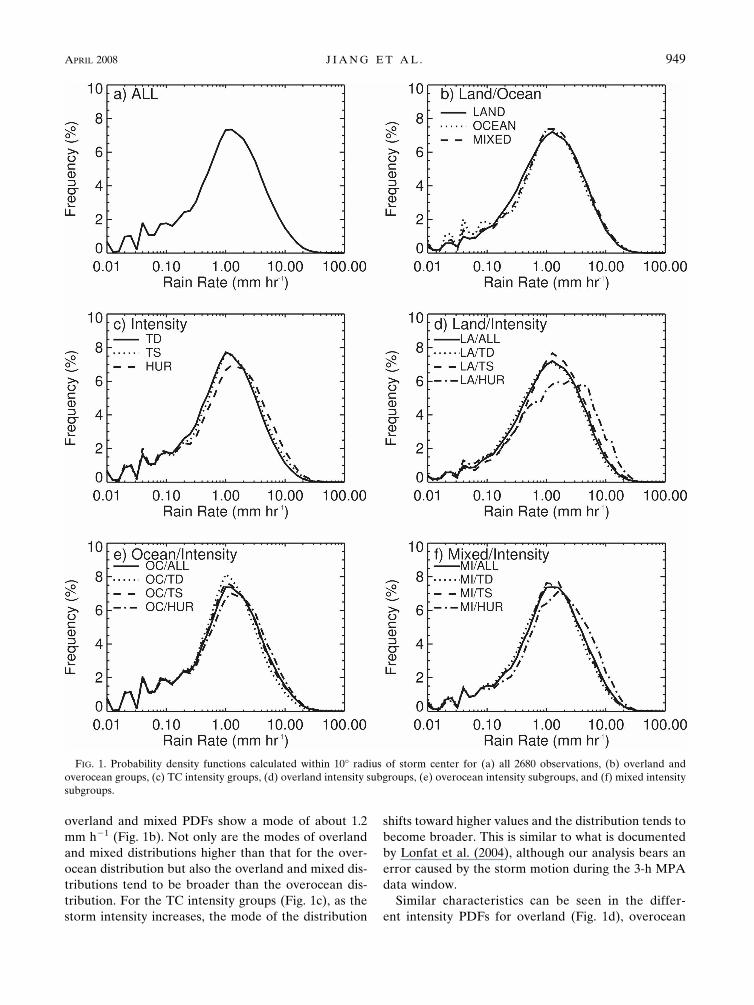
overland and mixed PDFs show a mode of about 1.2mm h�1 (Fig. 1b). Not only are the modes of overlandand mixed distributions higher than that for the over-ocean distribution but also the overland and mixed dis-tributions tend to be broader than the overocean dis-tribution. For the TC intensity groups (Fig. 1c), as thestorm intensity increases, the mode of the distribution
shifts toward higher values and the distribution tends tobecome broader. This is similar to what is documentedby Lonfat et al. (2004), although our analysis bears anerror caused by the storm motion during the 3-h MPAdata window.
Similar characteristics can be seen in the differ-ent intensity PDFs for overland (Fig. 1d), overocean
FIG. 1. Probability density functions calculated within 10° radius of storm center for (a) all 2680 observations, (b) overland andoverocean groups, (c) TC intensity groups, (d) overland intensity subgroups, (e) overocean intensity subgroups, and (f) mixed intensitysubgroups.
APRIL 2008 J I A N G E T A L . 949
(Fig. 1e), and mixed (Fig. 1f) groups. The land TD dis-tribution is similar to the overall overland PDF, whichis not surprising because a greater percentage of over-land observations are in depression stage as a result ofthe land interaction effect decreasing the storm inten-sity. Both land TS and land HUR PDFs have highermodes and broader distributions than those of overall
TS and HUR PDFs (Fig. 1c), which indicates that HURand TS peak rains tend to be stronger over land thanover ocean. All of the overocean TD, TS, and HURdistributions (Fig. 1e) are similar to the overall TD, TS,and HUR PDFs (Fig. 1c) because of the greater num-ber of overocean observations. In summary, for allstorm intensities, overocean PDFs are narrower thantheir overland counterparts and their modes are locatedat lower rain rates.
b. Azimuthal averages
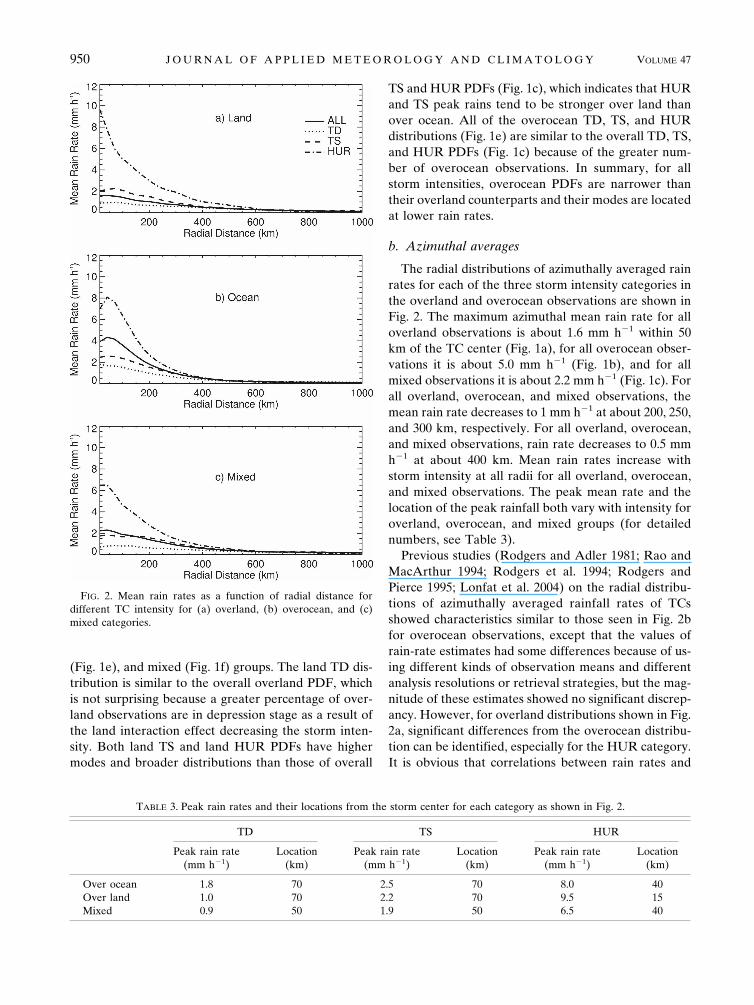
The radial distributions of azimuthally averaged rainrates for each of the three storm intensity categories inthe overland and overocean observations are shown inFig. 2. The maximum azimuthal mean rain rate for alloverland observations is about 1.6 mm h�1 within 50km of the TC center (Fig. 1a), for all overocean obser-vations it is about 5.0 mm h�1 (Fig. 1b), and for allmixed observations it is about 2.2 mm h�1 (Fig. 1c). Forall overland, overocean, and mixed observations, themean rain rate decreases to 1 mm h�1 at about 200, 250,and 300 km, respectively. For all overland, overocean,and mixed observations, rain rate decreases to 0.5 mmh�1 at about 400 km. Mean rain rates increase withstorm intensity at all radii for all overland, overocean,and mixed observations. The peak mean rate and thelocation of the peak rainfall both vary with intensity foroverland, overocean, and mixed groups (for detailednumbers, see Table 3).
Previous studies (Rodgers and Adler 1981; Rao andMacArthur 1994; Rodgers et al. 1994; Rodgers andPierce 1995; Lonfat et al. 2004) on the radial distribu-tions of azimuthally averaged rainfall rates of TCsshowed characteristics similar to those seen in Fig. 2bfor overocean observations, except that the values ofrain-rate estimates had some differences because of us-ing different kinds of observation means and differentanalysis resolutions or retrieval strategies, but the mag-nitude of these estimates showed no significant discrep-ancy. However, for overland distributions shown in Fig.2a, significant differences from the overocean distribu-tion can be identified, especially for the HUR category.It is obvious that correlations between rain rates and
FIG. 2. Mean rain rates as a function of radial distance fordifferent TC intensity for (a) overland, (b) overocean, and (c)mixed categories.
TABLE 3. Peak rain rates and their locations from the storm center for each category as shown in Fig. 2.
TD TS HUR
Peak rain rate(mm h�1)
Location(km)
Peak rain rate(mm h�1)
Location(km)
Peak rain rate(mm h�1)
Location(km)
Over ocean 1.8 70 2.5 70 8.0 40Over land 1.0 70 2.2 70 9.5 15Mixed 0.9 50 1.9 50 6.5 40
950 J O U R N A L O F A P P L I E D M E T E O R O L O G Y A N D C L I M A T O L O G Y VOLUME 47

storm intensity still hold for overland observations butare weaker than those for overocean observations. Forthe HUR category, the peak rain rate for overland ob-servations is higher and the location of this peak ismuch closer to the storm center than are those for over-ocean observations.
c. Rain-rate distribution with radial distance
Figures 3 and 4 show the rain-rate 2D frequency dis-tributions with radial distance to the storm center. The2D frequencies are computed outward to the 1111-kmradius from the TC center. Figure 3 shows the 2D fre-quencies for all of the observations and for overland,overocean, and mixed observations. From Fig. 3a, themode of the overall 2D frequency decreases from 4 mmh�1 in the inner 50 km to 1 mm h�1 by the 400-kmradius. At ranges of more than 400 km, the peak re-mains at 1 mm h�1. The overocean 2D frequency (Fig.3c) is very similar to the overall distribution shown inFig. 3a. Again, this is because the majority of the ob-
servations were over the ocean. The overland distribu-tion shown in Fig. 3b is “flat”; the mode remains atabout 1–1.5 mm h�1 for all radii. Overland observationshave a broader distribution than do overall and over-ocean observations in the inner 200 km. The width ofthe distribution is a measure of the variability of TCrain (Lonfat et al. 2004). TCs over land seem to have agreater variability in the inner core. In the region be-yond 200 km, the 2D frequency of overall and over-ocean TCs broadens, indicating an increase in the vari-ability. The 2D frequency for mixed observations asshown in Fig. 3d indicates a translation of the rainfalldistribution characteristics from over ocean to overland.
Figure 4 presents the 2D frequency distributionsgrouped by storm intensity for overland and overoceanobservations. The distributions vary with storm inten-sity. The mode of the land TD distribution (Fig. 4a)is around 1 mm h�1 for all radii, while the mode ofthe ocean TD distribution (Fig. 4b) decreases from
FIG. 3. Radial distribution of rainfall PDFs computed for (a) all 2680 observations, (b) overland observations, (c) overoceanobservations, and (d) mixed observations. The shading scale refers to the frequency of occurrence of rain rates at any radial distancefrom the storm center.
APRIL 2008 J I A N G E T A L . 951

2 mm h�1 in the inner 100 km to 1 mm h�1 for theranges of more than 100 km. The distribution of landTD is broader than that of ocean TD (note that the lowrain rates in the ocean TD distribution in the regionbeyond 100 km are due to data noise). The mode of theland TS (ocean TS) distribution as shown in Fig. 4c(Fig. 4d) decreases from 2.5 (2.5) mm h�1 in the inner100 km to 1.5 (0.9) mm h�1 for the ranges beyond 100
km. In general, the distribution of land HUR (Fig. 4e)is broader than that of ocean HUR (Fig. 4f) for all radii,indicating a greater variability of TC rainfall over landthan over ocean. Multiple modes in the land HUR 2Dfrequency distribution are caused by noise resultingfrom the small sample size. However, the trend of rainrate decreasing with radius is still obvious, with themaximum rain rate of 10.5 mm h�1 in the inner 50 km,
FIG. 4. Radial distribution of rainfall PDFs computed for (a) overland–TD, (b) overocean–TD, (c) overland–TS, (d) overocean–TS,(e) overland–HUR, and (f) overocean–HUR observations. The shading scale refers to the frequency of occurrence of rain rates at anyradial distance from the storm center.
952 J O U R N A L O F A P P L I E D M E T E O R O L O G Y A N D C L I M A T O L O G Y VOLUME 47
4 mm h�1 at 350-km radius, and around 0.5 mm h�1 at1000-km radius. The mode of ocean HUR displays asmooth decrease from 7–8 mm h�1 in the inner 100 kmto about 1 mm h�1 by the 400-km radius. The peakremains at 1 mm h�1 at ranges beyond 400 km.
d. Correlations with maximum wind intensity
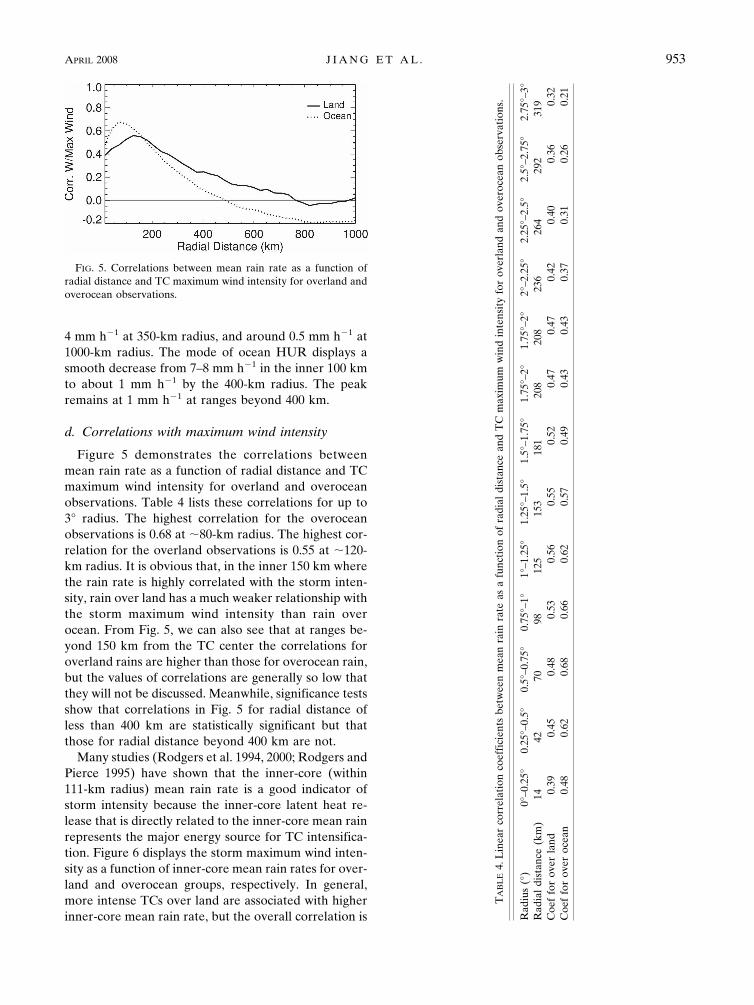
Figure 5 demonstrates the correlations betweenmean rain rate as a function of radial distance and TCmaximum wind intensity for overland and overoceanobservations. Table 4 lists these correlations for up to3° radius. The highest correlation for the overoceanobservations is 0.68 at �80-km radius. The highest cor-relation for the overland observations is 0.55 at �120-km radius. It is obvious that, in the inner 150 km wherethe rain rate is highly correlated with the storm inten-sity, rain over land has a much weaker relationship withthe storm maximum wind intensity than rain overocean. From Fig. 5, we can also see that at ranges be-yond 150 km from the TC center the correlations foroverland rains are higher than those for overocean rain,but the values of correlations are generally so low thatthey will not be discussed. Meanwhile, significance testsshow that correlations in Fig. 5 for radial distance ofless than 400 km are statistically significant but thatthose for radial distance beyond 400 km are not.
Many studies (Rodgers et al. 1994, 2000; Rodgers andPierce 1995) have shown that the inner-core (within111-km radius) mean rain rate is a good indicator ofstorm intensity because the inner-core latent heat re-lease that is directly related to the inner-core mean rainrepresents the major energy source for TC intensifica-tion. Figure 6 displays the storm maximum wind inten-sity as a function of inner-core mean rain rates for over-land and overocean groups, respectively. In general,more intense TCs over land are associated with higherinner-core mean rain rate, but the overall correlation is
FIG. 5. Correlations between mean rain rate as a function ofradial distance and TC maximum wind intensity for overland andoverocean observations.
TA
BL
E4.
Lin
ear
corr
elat
ion
coef
fici
ents
betw
een
mea
nra
inra
teas
afu
ncti
onof
radi
aldi
stan
cean
dT
Cm
axim
umw
ind
inte
nsit
yfo
rov
erla
ndan
dov
eroc
ean
obse
rvat
ions
.
Rad
ius
(°)
0°–0
.25°
0.25
°–0.
5°0.
5°–0
.75°
0.75
°–1°
1°–1
.25°
1.25
°–1.
5°1.
5°–1
.75°
1.75
°–2°
1.75
°–2°
2°–2
.25°
2.25
°–2.
5°2.
5°–2
.75°
2.75
°–3°
Rad
ial
dist
ance
(km
)14
4270
9812
515
318
120
820
823
626
429
231
9C
oef
for
over
land
0.39
0.45
0.48
0.53
0.56
0.55
0.52
0.47
0.47
0.42
0.40
0.36
0.32
Coe
ffo
rov
eroc
ean
0.48
0.62
0.68
0.66
0.62
0.57
0.49
0.43
0.43
0.37
0.31
0.26
0.21
APRIL 2008 J I A N G E T A L . 953

only 0.51 and there is a large amount of scatter in therelationship (Fig. 6a). In the overocean scatterplot (Fig.6b), although there are still many outliers, the correla-tion reaches 0.7, indicating that when TCs are overocean the inner-core mean rain rate is correlated wellwith TC intensity. When TCs are over land, however,the correlation is much weaker.
4. Relationships between rain potential and TClandfall rain
One of the main questions in this study asks whetherthe rainfall potential when the storm is over the oceancould be used as a good predictor of the storm’s ex-pected rainfall over land. To test this, the relationshipsbetween a set of rainfall potential parameters for dif-ferent time periods before landfall and the maximumstorm total rain during the U.S. overland rain periodare examined using the 1998–2004 Atlantic landfall TCdataset. A prediction index for TC overland rain is pro-posed and is verified by using an independent datasetincluding Atlantic landfall storms from 2005.
a. Relationships
The maximum storm total rain during the U.S. over-land-rain period is obtained from surface rain gaugemeasurements. (See section 2b for a detailed definitionof this parameter. For simplicity, in the following text,this parameter will be referred to as maximum stormtotal rain over land.) The rain gauge–based maximumstorm total rain is our main parameter as the indicator
of the TC rainfall over land. Rainfall potential derivedfrom MPA data according to Eq. (1) is our predictor tobe tested. Figure 7 shows the correlations between themaximum storm total rain over land and the rainfall
FIG. 6. Maximum wind intensity at the time of the MPA estimates as a function of inner-core (0°–1° radius) mean rain rate for (a)overland and (b) overocean observations.
FIG. 7. Correlations between the maximum storm total rain overland and rainfall potential for 0–4 days before landfall for alltropical cyclones, HUR only, and TS only. HUR and TS representthe storm stage during landfall. The maximum storm total rainover land and rainfall potentials are in logarithmic scale.
954 J O U R N A L O F A P P L I E D M E T E O R O L O G Y A N D C L I M A T O L O G Y VOLUME 47
potential for 0–4 days before TC landfall for all 37 TCsthat made landfall in the United States during 1998–2004 (see Table 1), subsamples that made landfall athurricane stage (HUR; 13 storms), and those that madelandfall at tropical storm stage (TS; 21 storms). Thesecorrelations are calculated in logarithm scale for bothindependent and dependent variables. Table 5 liststhese correlations. Figure 7 clearly implies that the rain-fall potential is highly correlated with the maximumstorm total rain over land. It is apparent that the highestof these correlations (0.84) emerges from the TSsample with the rain potential for 1 day before landfall.
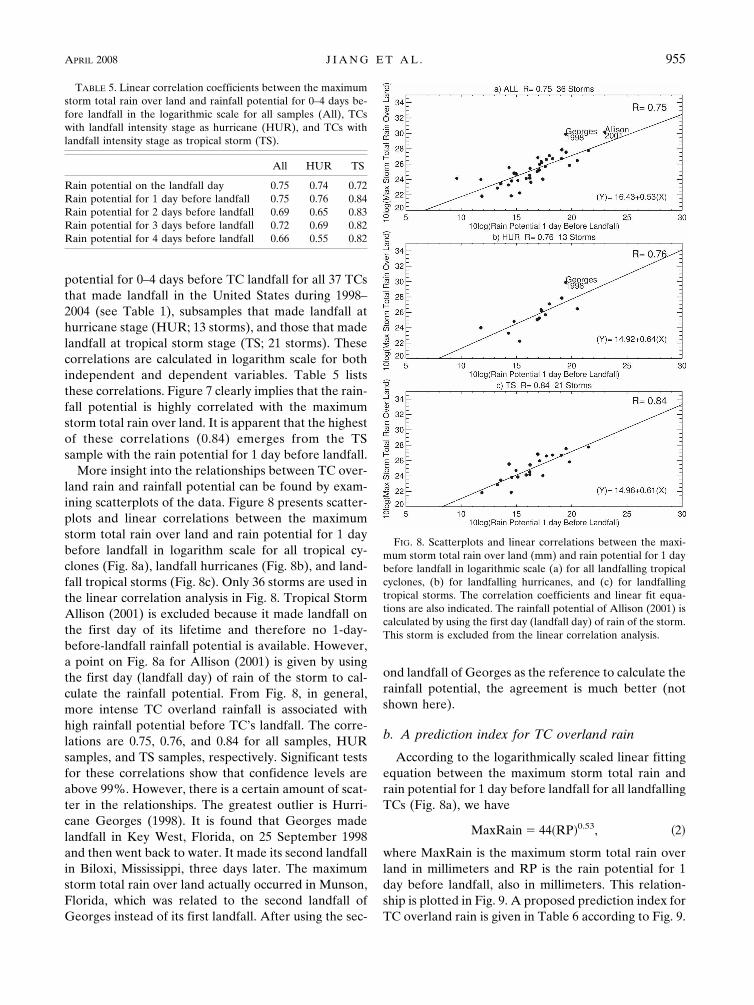
More insight into the relationships between TC over-land rain and rainfall potential can be found by exam-ining scatterplots of the data. Figure 8 presents scatter-plots and linear correlations between the maximumstorm total rain over land and rain potential for 1 daybefore landfall in logarithm scale for all tropical cy-clones (Fig. 8a), landfall hurricanes (Fig. 8b), and land-fall tropical storms (Fig. 8c). Only 36 storms are used inthe linear correlation analysis in Fig. 8. Tropical StormAllison (2001) is excluded because it made landfall onthe first day of its lifetime and therefore no 1-day-before-landfall rainfall potential is available. However,a point on Fig. 8a for Allison (2001) is given by usingthe first day (landfall day) of rain of the storm to cal-culate the rainfall potential. From Fig. 8, in general,more intense TC overland rainfall is associated withhigh rainfall potential before TC’s landfall. The corre-lations are 0.75, 0.76, and 0.84 for all samples, HURsamples, and TS samples, respectively. Significant testsfor these correlations show that confidence levels areabove 99%. However, there is a certain amount of scat-ter in the relationships. The greatest outlier is Hurri-cane Georges (1998). It is found that Georges madelandfall in Key West, Florida, on 25 September 1998and then went back to water. It made its second landfallin Biloxi, Mississippi, three days later. The maximumstorm total rain over land actually occurred in Munson,Florida, which was related to the second landfall ofGeorges instead of its first landfall. After using the sec-
ond landfall of Georges as the reference to calculate therainfall potential, the agreement is much better (notshown here).
b. A prediction index for TC overland rain
According to the logarithmically scaled linear fittingequation between the maximum storm total rain andrain potential for 1 day before landfall for all landfallingTCs (Fig. 8a), we have
MaxRain � 44�RP�0.53, �2�
where MaxRain is the maximum storm total rain overland in millimeters and RP is the rain potential for 1day before landfall, also in millimeters. This relation-ship is plotted in Fig. 9. A proposed prediction index forTC overland rain is given in Table 6 according to Fig. 9.
FIG. 8. Scatterplots and linear correlations between the maxi-mum storm total rain over land (mm) and rain potential for 1 daybefore landfall in logarithmic scale (a) for all landfalling tropicalcyclones, (b) for landfalling hurricanes, and (c) for landfallingtropical storms. The correlation coefficients and linear fit equa-tions are also indicated. The rainfall potential of Allison (2001) iscalculated by using the first day (landfall day) of rain of the storm.This storm is excluded from the linear correlation analysis.
TABLE 5. Linear correlation coefficients between the maximumstorm total rain over land and rainfall potential for 0–4 days be-fore landfall in the logarithmic scale for all samples (All), TCswith landfall intensity stage as hurricane (HUR), and TCs withlandfall intensity stage as tropical storm (TS).
All HUR TS
Rain potential on the landfall day 0.75 0.74 0.72Rain potential for 1 day before landfall 0.75 0.76 0.84Rain potential for 2 days before landfall 0.69 0.65 0.83Rain potential for 3 days before landfall 0.72 0.69 0.82Rain potential for 4 days before landfall 0.66 0.55 0.82
APRIL 2008 J I A N G E T A L . 955

This index uses the rainfall potential for 1 day beforelandfall derived from the satellite-based MPA productto predict the maximum storm total rain over land. Fivecategories of TC landfall rain intensity are defined us-ing this index. As the index increases from 1 to 5, thepredicted TC maximum storm total rain over land in-creases from less than 149 mm (6 in.) to greater than505 mm (20 in.). The index boundaries are chosen sothat the breakpoint values for the maximum storm totalrain over land (predicted parameter) are evenly spaced.
To verify this prediction index, independent casesthat include six landfalling TCs over the Atlantic duringthe 2005 hurricane season are examined. These stormsare Tropical Storm Arlene and Hurricanes Cindy, Den-nis, Katrina, Rita, and Wilma. All of them made land-fall in the U.S. Gulf Coast once except for Katrina,which made landfall twice: once over Florida on 26August and once over Louisiana on 29 August 2005.Table 7 gives rainfall potentials derived from MPA for1 day before landfall, predicted and observed maximumstorm total rains over land, and the prediction errors forthese six 2005 storms. By using Eq. (2), the averagepredicted maximum storm total rain over land of theseven landfalls is 367 mm; the corresponding observedvalue is 336 mm. The percentage error of this predictionis between 2.5% and 24.8%. Arlene, Katrina, and Ritaare the storms whose landfall rain is predicted veryaccurately. However, the prediction for Cindy producesa 24.8% error, which is the highest among 2005 cases.The prediction for Wilma produces the second highesterror, 18.1%. Also, the overland rain prediction indicesfor these two storms are predicted in the wrong cat-
egory. We are able to exclude extratropical transitionand topography interaction as the underlying reason. Itis noticed, however, that the major assumption of thisprediction technique is that the magnitude of rain ratesdoes not change over the days before and after landfall.For the Hurricane Cindy case, the daily mean rain ratewas 17.1 mm day�1 for 1 day before landfall and 9.8 mmday�1 on the landfall day, which represents a 43% de-crease. This is the main reason for the overestimate ofour prediction index for Cindy. For the HurricaneWilma case, the storm accelerated at landfall, with atranslation speed of 384 km day�1 on 1 day before land-fall and 1067 km day�1 on the day of landfall. Becausethe translation speed is one of the three parameters incalculating the rainfall potential and because our dailyaveraging could not take this rapid speed change intoaccount, an overestimate of Wilma’s landfall rain is notsurprising.
5. Summary, discussion, and future work
Rainfall distributions over land and ocean for Atlan-tic TCs have been studied using observations fromMPA. Between 1 January 1998 and 31 December 2004,2680 three-hourly MPA measurements were collectedin 37 Atlantic landfalling TCs with intensity rangingfrom a tropical depression to a category-5 hurricane.PDFs and azimuthal averages are constructed as a func-tion of TC intensity and location. Correlations betweenrain rate and maximum wind intensity for overland andoverocean observations are compared.
The PDF and azimuthal average analysis is used forcomparison of MPA TC rainfall distributions with pre-vious studies and to assess differences between over-land and overocean samples. It is found that overoceandistributions derived from the MPA product have char-acteristics that are similar to those results in previousstudies (Rodgers et al. 1994; Rodgers and Pierce 1995;Lonfat et al. 2004). However, peak value and locationof peak for overland distributions are significantly dif-ferent from those for overocean distributions, indicat-ing stronger rains for overland observations. Many pre-vious studies (Rodgers et al. 1994, 2000; Rodgers andPierce 1995) have shown that the inner-core mean rain
TABLE 6. TC overland rain prediction index.
IndexRainfall potential for 1 day
before landfall (mm)Max storm total rain
over land (mm)
1 10 1492 10–30 149–2673 30–60 267–3854 60–100 385–5055 �100 �505
FIG. 9. Relationship between the maximum storm total rainover land and rainfall potential 1 day before landfall.
956 J O U R N A L O F A P P L I E D M E T E O R O L O G Y A N D C L I M A T O L O G Y VOLUME 47
is correlated well with TC intensity. However, thisstudy found that this statement might only be true foroverocean observations. For TCs over land, the corre-lation is much weaker.
Using the same dataset, the relationships betweenrainfall potentials when the storm is over ocean andmaximum storm total rain over land have been exam-ined. A high correlation is found for the rainfall poten-tial for 1 day before TC landfall. A prediction index isproposed based on this finding. Six landfalling TCs dur-ing the 2005 Atlantic hurricane season are analyzed toverify this prediction index. A comparison with surfacerain gauge observations shows that the mean error ofthe forecast TC overland rain is 9.2%. According to thiscase study, the limitation of this technique is mainlyassociated with storms that show large changes in therainfall magnitude and storm translation speed beforeand after landfall.
This study only uses factors related to the storm itself(rainfall history, storm size, and translation speed) topredict the TC overland rain. No environmental factorsare considered. Two major environmental factors thatare known to significantly enhance rain production dur-ing storm landfall are surface orography and extratrop-ical transition. Many observational and modeling stud-ies have examined the interactions of tropical cycloneswith mountains (e.g., Geerts et al. 2000). Lonfat et al.(2007) developed a TC rainfall prediction model namedthe Parametric Hurricane Rainfall Model (PHRaM)that accounts for topography. The performance ofPHRaM for 2004 U.S. landfalling storms showed sig-nificant improvement when compared with nontopog-raphy models when the storm interacted with terrains.During the extratropical transition (ET) of landfallingtropical cyclones over the United States, timing con-trols the interaction of poleward-moving tropical cy-clones with westward-moving baroclinic disturbances,including upper-level troughs and jet streaks (Carr andBosart 1978; Maddox et al. 1979). As the tropical cy-clone remnants reintensify into a baroclinic extratrop-
ical cyclone, the precipitation distribution tends tobroaden and to shift to the north and west of center(Elsberry 2002; Atallah 2002). Hurricane Agnes (1972)produced widespread severe flooding through theNortheast, with enhancement of the storm’s high totalscaused by orographic uplift along the AppalachianMountains and coupled jet stream dynamics (DiMegoand Bosart 1982).
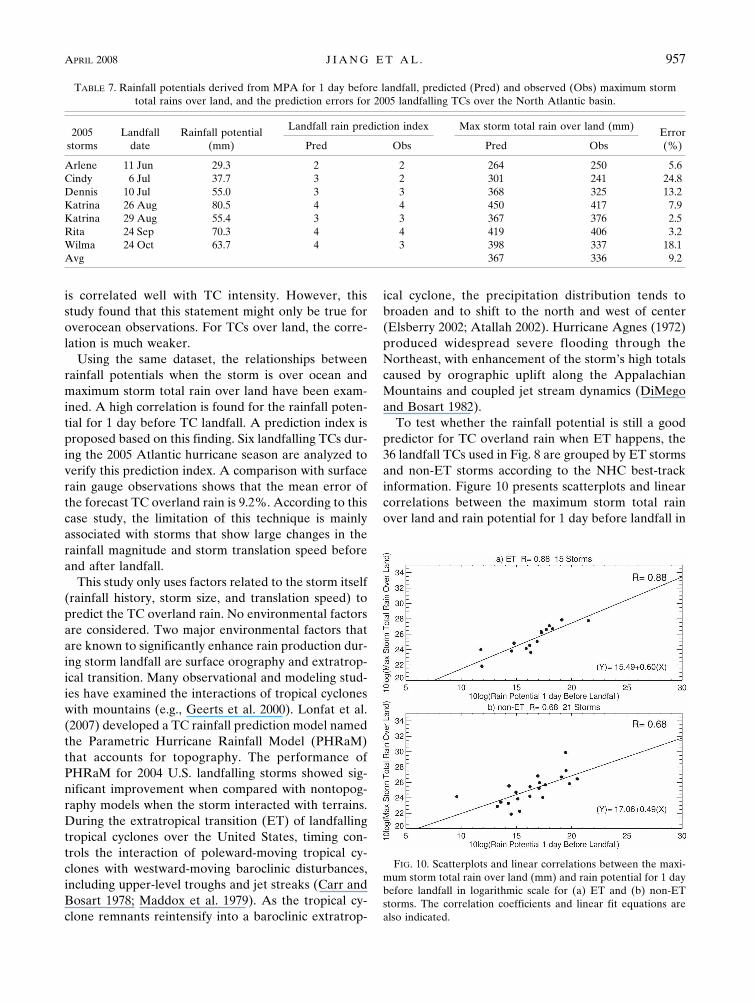
To test whether the rainfall potential is still a goodpredictor for TC overland rain when ET happens, the36 landfall TCs used in Fig. 8 are grouped by ET stormsand non-ET storms according to the NHC best-trackinformation. Figure 10 presents scatterplots and linearcorrelations between the maximum storm total rainover land and rain potential for 1 day before landfall in
FIG. 10. Scatterplots and linear correlations between the maxi-mum storm total rain over land (mm) and rain potential for 1 daybefore landfall in logarithmic scale for (a) ET and (b) non-ETstorms. The correlation coefficients and linear fit equations arealso indicated.
TABLE 7. Rainfall potentials derived from MPA for 1 day before landfall, predicted (Pred) and observed (Obs) maximum stormtotal rains over land, and the prediction errors for 2005 landfalling TCs over the North Atlantic basin.
2005storms
Landfalldate
Rainfall potential(mm)
Landfall rain prediction index Max storm total rain over land (mm)Error(%)Pred Obs Pred Obs
Arlene 11 Jun 29.3 2 2 264 250 5.6Cindy 6 Jul 37.7 3 2 301 241 24.8Dennis 10 Jul 55.0 3 3 368 325 13.2Katrina 26 Aug 80.5 4 4 450 417 7.9Katrina 29 Aug 55.4 3 3 367 376 2.5Rita 24 Sep 70.3 4 4 419 406 3.2Wilma 24 Oct 63.7 4 3 398 337 18.1Avg 367 336 9.2
APRIL 2008 J I A N G E T A L . 957

logarithmic scale for ET and non-ET storms. Surprisingis that the ET group produces a higher correlation(0.88) than the non-ET group (0.68). This result dem-onstrates that the rainfall potential–based TC overlandrain prediction index is robust enough to predict thepeak rainfall regardless of the ET condition. This mayreflect the fact that the peak rainfall in ET and non-ETcases is similar for similar overocean conditions in thestorm. However, in relation to flooding, another keyissue is where the rainfall occurs, and understanding ETis critical in that respect. Next, we plan to conduct in-dividual case studies to estimate the actual effect of ETon TC inland flooding on both rainfall maximum andon rainfall locations. Terrain interactions will also bepart of future work.
Acknowledgments. The authors thank Drs. RobertAdler and George Huffman for providing MPA data.Thanks are given to Drs. David Roth and James Frank-lin for their assistance on TC surface rainfall and best-track data. Thanks are given, too, for discussion andfeedback from Drs. Frank Marks and Scott Braun. Theconstructive suggestions from Dr. Manuel Lonfat andanother anonymous reviewer resulted in substantial im-provements to the manuscript. This research was sup-ported by the NASA Precipitation Measurement Mis-sions (PMM) Grant NNX07AL41G. The authors thankRamesh Kakar (NASA Headquarters) for his contin-ued support of PMM science.
REFERENCES
Adler, R. F., A. J. Negri, P. R. Keehn, and I. M. Hakkarinen,1993: Estimation of monthly rainfall over Japan and sur-rounding waters from a combination of low-orbit microwaveand geosynchronous IR data. J. Appl. Meteor., 32, 335–356.
——, G. J. Huffman, and P. R. Keehn, 1994: Global tropical rainestimates from microwave-adjusted geosynchronous IR data.Remote Sens. Rev., 11, 125–152.
——, and Coauthors, 2003: The version 2 Global PrecipitationClimatology Project (GPCP) monthly precipitation analysis(1979–present). J. Hydrometeor., 4, 1147–1167.
Atallah, E. H., 2002: An evaluation of precipitation distribution inlandfalling tropical cyclones. Preprints, 25th Conf. on Hurri-canes and Tropical Meteorology, San Diego, CA, Amer. Me-teor. Soc., 339–340.
——, and L. F. Bosart, 2003: The extratropical transition and pre-cipitation distribution of Hurricane Floyd (1999). Mon. Wea.Rev., 131, 1063–1081.
Carr, F. H., and L. F. Bosart, 1978: A diagnostic evaluation ofrainfall predictability for tropical storm Agnes, June 1972.Mon. Wea. Rev., 106, 363–374.
Demuth, J. L., M. DeMaria, and J. A. Knaff, 2006: Improvementof Advanced Microwave Sounding Unit tropical cyclone in-tensity and size estimation algorithms. J. Appl. Meteor. Cli-matol., 45, 1573–1581.
DiMego, G. J., and L. F. Bosart, 1982: The transformation of
Tropical Storm Agnes into an extratropical cyclone. Part II:Moisture, vorticity, and kinetic energy budgets. Mon. Wea.Rev., 110, 412–433.
Elsberry, R. L., 2002: Predicting hurricane landfall precipitation.Bull. Amer. Meteor. Soc., 83, 1333–1340.
——, 2005: Achievement of USWRP hurricane landfall researchgoal. Bull. Amer. Meteor. Soc., 86, 643–645.
Ferraro, R., and Coauthors, 2005: The tropical rainfall potential(TRaP) technique. Part II: Validation. Wea. Forecasting, 20,465–475.
Geerts, B., G. M. Heymsfield, L. Tian, J. B. Halverson, A. Guil-lory, and M. I. Mejia, 2000: Hurricane Georges’s landfall inthe Dominican Republic: Detailed airborne Doppler radarimagery. Bull. Amer. Meteor. Soc., 81, 999–1018.
Griffith, C. G., W. L. Woodley, P. G. Gube, D. W. Martin, J.Stout, and D. N. Sikdar, 1978: Rain estimates from geosyn-chronous satellite imagery: Visible and infrared studies. Mon.Wea. Rev., 106, 1153–1171.
Heymsfield, G. M., J. B. Halverson, J. Simpson, L. Tian, and T. P.Bui, 2001: ER-2 Doppler radar investigations of the eyewallof Hurricane Bonnie during the Convection and MoistureExperiment-3. J. Appl. Meteor., 40, 1310–1330.
Huffman, G. J., R. F. Adler, M. M. Morrissey, D. T. Bolvin, S.Curtis, R. Joyce, B. McGavock, and J. Susskind, 2001: Globalprecipitation at one-degree daily resolution from multisatel-lite observations. J. Hydrometeor., 2, 36–50.
——, and Coauthors, 2007: The TRMM Multisatellite Precipita-tion Analysis (TMPA): Quasi-global, multiyear, combined-sensor precipitation estimates at fine scales. J. Hydrometeor.,8, 38–55.
Jiang, H., J. B. Halverson, and J. Simpson, 2008a: On the differ-ence of storm rainfall of Hurricanes Isidore and Lili. Part I:Satellite observations and rain potential. Wea. Forecasting,23, 29–43.
——, ——, ——, and E. J. Zipser, 2008b: On the difference ofstorm rainfall of Hurricanes Isidore and Lili. Part II: Waterbudget. Wea. Forecasting, 23, 44–61.
Kidder, S. Q., M. D. Goldberg, R. M. Zehr, M. DeMaria, J. F. W.Purdom, C. S. Velden, N. C. Grody, and S. J. Kusselson,2000: Satellite analysis of tropical cyclones using the Ad-vanced Microwave Sounding Unit (AMSU). Bull. Amer. Me-teor. Soc., 81, 1241–1259.
——, J. A. Knaff, S. J. Kusselson, M. Turk, R. R. Ferraro, andR. J. Kuligowski, 2005: The tropical rainfall potential (TRaP)technique. Part I: Description and examples. Wea. Forecast-ing, 20, 456–464.
Kummerow, C., W. S. Olson, and L. Giglio, 1996: A simplifiedscheme for obtaining precipitation and vertical hydrometeorprofiles from passive microwave sensors. IEEE Trans.Geosci. Remote Sens., 34, 1213–1232.
Lonfat, M., F. D. Marks, and S. S. Chen, 2004: Precipitation dis-tribution in tropical cyclones using the Tropical RainfallMeasuring Mission (TRMM) Microwave Imager: A globalperspective. Mon. Wea. Rev., 132, 1645–1660.
——, R. Rogers, T. Marchok, and F. D. Marks Jr., 2007: A para-metric model for predicting hurricane rainfall. Mon. Wea.Rev., 135, 3086–3097.
Maddox, R. A., C. F. Chappell, and L. R. Hoxit, 1979: Synopticand mesoscale aspects of flash flood events. Bull. Amer. Me-teor. Soc., 60, 115–123.
Malkus, J., and H. Riehl, 1960: On the dynamics and energy trans-formations in steady-state hurricanes. Tellus, 12, 1–20.
958 J O U R N A L O F A P P L I E D M E T E O R O L O G Y A N D C L I M A T O L O G Y VOLUME 47

Miller, B. I., 1958: Rainfall rates in Florida hurricanes. Mon. Wea.Rev., 86, 258–264.
Rao, G. V., and P. D. MacArthur, 1994: The SSM/I estimatedrainfall amounts of tropical cyclones and their potential inpredicting the cyclone intensity changes. Mon. Wea. Rev.,122, 1568–1574.
Rappaport, E. N., 2000: Loss of life in the United States associ-ated with recent Atlantic tropical cyclones. Bull. Amer. Me-teor. Soc., 81, 2065–2074.
Rodgers, E. B., and R. F. Adler, 1981: Tropical cyclone rainfallcharacteristics as determined from a satellite passive micro-wave radiometer. Mon. Wea. Rev., 109, 506–521.
——, and H. F. Pierce, 1995: A satellite observational study ofprecipitation characteristics in western North Pacific tropicalcyclones. J. Appl. Meteor., 34, 2587–2599.
——, S. W. Chang, and H. F. Pierce, 1994: A satellite observa-
tional and numerical study of precipitation characteristics inwestern North Atlantic tropical cyclones. J. Appl. Meteor., 33,129–139.
——, W. Olson, J. Halverson, J. Simpson, and H. F. Pierce, 2000:Environmental forcing of Supertyphoon Paka’s (1997) latentheat structure. J. Appl. Meteor., 39, 1983–2006.
Rogers, R., S. Chen, J. Tenerelli, and H. Willoughby, 2003: Anumerical study of the impact of vertical shear on the distri-bution of rainfall in Hurricane Bonnie (1998). Mon. Wea.Rev., 131, 1577–1599.
Weng, F., L. Zhao, R. Ferraro, G. Poe, X. Li, and N. Grody, 2003:Advanced Microwave Sounding Unit cloud and precipitationalgorithms. Radio Sci., 38, 8068–8079.
Zhao, L., and F. Weng, 2002: Retrieval of ice cloud parametersusing the Advanced Microwave Sounding Unit. J. Appl. Me-teor., 41, 384–395.
APRIL 2008 J I A N G E T A L . 959
Copyright © 2022 FDOKUMEN