TEMPERATURE AND RAINFALL FLUCTUATION
25
1 TEMPERATURE AND RAINFALL FLUCTUATION (A Case Study of Udigram, Swat Valley, Northwest Pakistan) Saifullah Khan 1 and Dr. Mahmood-ul-Hassan 2 1. i. Ph.D Scholar, Department of Geography, University of Peshawar, NWFP, Pakistan. ii. Manager GIS and Mapping, USF CO, (MOITT) 5 th Floor, HBL Tower, Jinnah Avenue, Blue Area Islamabad Pakistan. Email: [email protected] , [email protected] [email protected] Cell No. 0092-300-5248325 2. Chairman and professor, Department of Geography Urban & Regional Planning, University of Peshawar, NWFP, Pakistan. Email: [email protected] Phone: 0092-91-9216681 Abstract A study of temperature and rainfall fluctuation of Udigram, Swat, reveals decrease in annual rainfall during the past 15 years. As a result climate has become sub-humid in 2000, as compared to the humid in 1980. The valley receives both summer and winter rainfall, but the annual share of winter rain is higher than summer season. January is the coldest month when the temperature falls to freezing point, and June is the hottest month when the temperature exceeds 30 degree Celsius. There are four rainy seasons i.e. winter, pre-monsoon, monsoon, and the post monsoon. The temperature of the valley increases at the rate of 1 o C per year since 1995. The summer rain shows little decrease, whereas the average winter rainfall declined at the rate of 7.3cm per year during the past six years since 1995. If the rainfall of the valley decreases at this rate, then the climate of the area will be semi-arid by 2020. This climatic fluctuation may be the result of the changes in the air pressure, wind speed and direction, and deforestation on global level, and the Gulf-Afghan crises that cause a northward shift in the western disturbances. However, due to rapid increase in temperature and decrease in pressure, it is hoped that this reduction in winter rains of the area will be recovered upto 2005 and may be reversed spell till 2010.
-
Upload
khangminh22 -
Category
Documents
-
view
0 -
download
0
Transcript of TEMPERATURE AND RAINFALL FLUCTUATION

1
TEMPERATURE AND RAINFALL FLUCTUATION
(A Case Study of Udigram, Swat Valley, Northwest Pakistan)
Saifullah Khan1 and Dr. Mahmood-ul-Hassan2
1. i. Ph.D Scholar, Department of Geography, University of Peshawar, NWFP, Pakistan.
ii. Manager GIS and Mapping, USF CO, (MOITT) 5th Floor, HBL Tower, Jinnah Avenue, Blue Area
Islamabad Pakistan.
Email: [email protected], [email protected]
Cell No. 0092-300-5248325
2. Chairman and professor, Department of Geography Urban & Regional Planning, University of
Peshawar, NWFP, Pakistan.
Email: [email protected]
Phone: 0092-91-9216681
Abstract A study of temperature and rainfall fluctuation of Udigram, Swat, reveals decrease in
annual rainfall during the past 15 years. As a result climate has become sub-humid in
2000, as compared to the humid in 1980. The valley receives both summer and winter
rainfall, but the annual share of winter rain is higher than summer season. January is the
coldest month when the temperature falls to freezing point, and June is the hottest month
when the temperature exceeds 30 degree Celsius. There are four rainy seasons i.e.
winter, pre-monsoon, monsoon, and the post monsoon. The temperature of the valley
increases at the rate of 1oC per year since 1995. The summer rain shows little decrease,
whereas the average winter rainfall declined at the rate of 7.3cm per year during the past
six years since 1995. If the rainfall of the valley decreases at this rate, then the climate of
the area will be semi-arid by 2020. This climatic fluctuation may be the result of the
changes in the air pressure, wind speed and direction, and deforestation on global level,
and the Gulf-Afghan crises that cause a northward shift in the western disturbances.
However, due to rapid increase in temperature and decrease in pressure, it is hoped that
this reduction in winter rains of the area will be recovered upto 2005 and may be
reversed spell till 2010.

2
1. Introduction:
Udigram, a historical place of evergreen land of Swat Valley, Northwest Pakistan, is
located at 72o-18` east longitude and 34o-47`north latitude, at an altitude of 961m above
the sea level. The Population of the village was 4402, in 1981, and increased to 12497, in
1998. The village is bounded by Balogram in the north, Raja Gira mountains in the east,
Gogdara in the south and the Swat river in the west. The tributaries of Swat and
Murghazar rivers cover the whole drainage of the tract (Figure-1).
The present paper deals with the rainfall and temperature variation of the Udigram valley
during the past fifteen years (1986 to 2000), and its possible causes in the background of
the global climatic changes.
A number of workers have studied the fluctuation of temperature and rainfall on regional
level in the past, including Kazi (1951), Kazi and Khan (1959), Shamshad (1966),
Nasrullah (1968), Khan (1990), and Khan (1993) etc. The present study is aimed at
Udigram only, where the reduction of rainfall has caused a number of environmental
problems.
2. Methods and Data: The work is based on the daily as well as monthly weather data, covering time duration of
fifteen years i.e. 1986-2000, published by Water Management Department, Agriculture
University Peshawar, and Agriculture Research Station, Takhta Band, Mingora, Swat.
The variables studied, are temperature and rainfall.
The monthly and annual averages have been calculated for the study. For each
parameter, deviation from the mean and regression has been calculated, which provides
a trend of annual as well as monthly fluctuation of rainfall and temperature. The year has
been divided into two main seasons i.e. summer and winter. Months of the year having
positive deviation from the mean condition of maximum and minimum temperature have
been considered as summer months, otherwise winter. The two main seasons are further
sub-divided into four sub-seasons i.e. winter rainfall (Mid-November to Mid-April), pre-
monsoon season (Mid-April to June), monsoon season (July to Mid-September), and the
post-monsoon season (Mid-September to Mid-November). The time duration of each
season has been decided on the basis of positive and negative deviation from the mean
condition. April, September, and November show increase, therefore, the total rainfall of
3
these months have been divided by two, and each half of the value is added to the both
seasons.
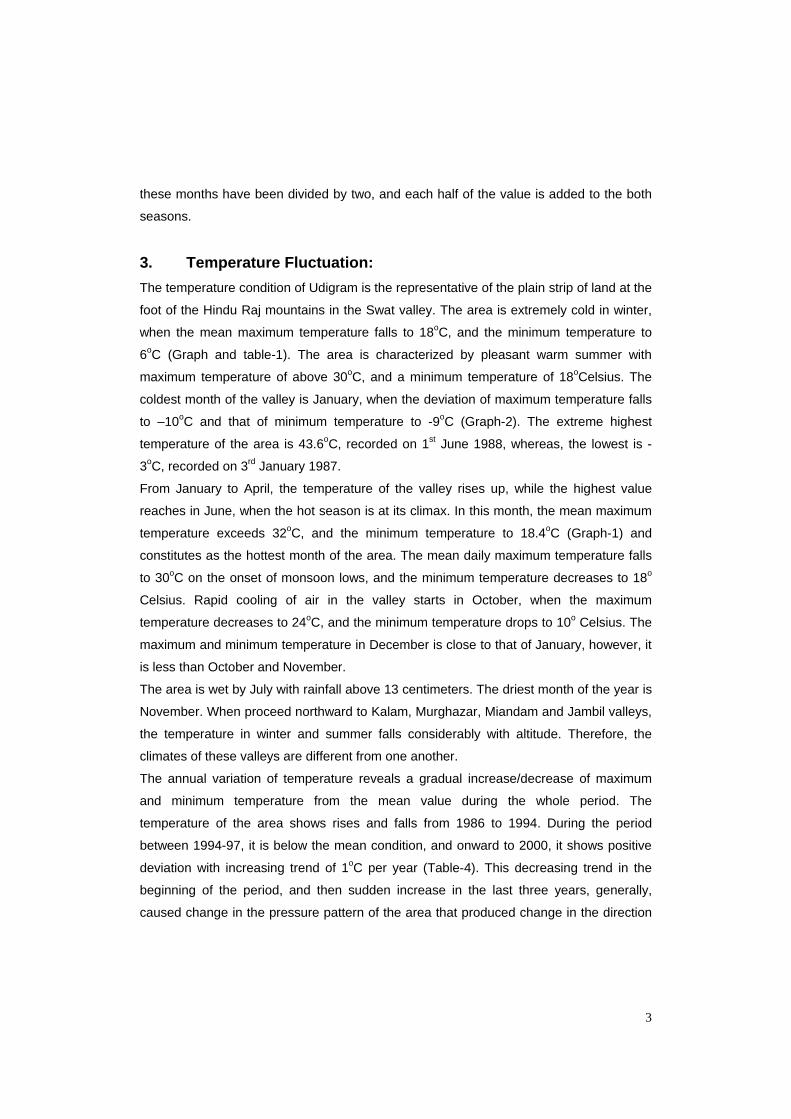
3. Temperature Fluctuation: The temperature condition of Udigram is the representative of the plain strip of land at the
foot of the Hindu Raj mountains in the Swat valley. The area is extremely cold in winter,
when the mean maximum temperature falls to 18oC, and the minimum temperature to
6oC (Graph and table-1). The area is characterized by pleasant warm summer with
maximum temperature of above 30oC, and a minimum temperature of 18oCelsius. The
coldest month of the valley is January, when the deviation of maximum temperature falls
to –10oC and that of minimum temperature to -9oC (Graph-2). The extreme highest
temperature of the area is 43.6oC, recorded on 1st June 1988, whereas, the lowest is -
3oC, recorded on 3rd January 1987.
From January to April, the temperature of the valley rises up, while the highest value
reaches in June, when the hot season is at its climax. In this month, the mean maximum
temperature exceeds 32oC, and the minimum temperature to 18.4oC (Graph-1) and
constitutes as the hottest month of the area. The mean daily maximum temperature falls
to 30oC on the onset of monsoon lows, and the minimum temperature decreases to 18o
Celsius. Rapid cooling of air in the valley starts in October, when the maximum
temperature decreases to 24oC, and the minimum temperature drops to 10o Celsius. The
maximum and minimum temperature in December is close to that of January, however, it
is less than October and November.
The area is wet by July with rainfall above 13 centimeters. The driest month of the year is
November. When proceed northward to Kalam, Murghazar, Miandam and Jambil valleys,
the temperature in winter and summer falls considerably with altitude. Therefore, the
climates of these valleys are different from one another.
The annual variation of temperature reveals a gradual increase/decrease of maximum
and minimum temperature from the mean value during the whole period. The
temperature of the area shows rises and falls from 1986 to 1994. During the period
between 1994-97, it is below the mean condition, and onward to 2000, it shows positive
deviation with increasing trend of 1oC per year (Table-4). This decreasing trend in the
beginning of the period, and then sudden increase in the last three years, generally,
caused change in the pressure pattern of the area that produced change in the direction

4
of westerly currents toward north and effected the winter rainfall of the valley. This
climatic fluctuation not only influenced the human activities but also caused change in the
evapotranspiration as well as relative humidity of the area.
4. Rainfall Fluctuation: Udigram had sub-humid climate with annual rainfall of 98.9cm (39.6inches) in 2000, as
has been shown in table-3. The area is highly moist in March, when the rainfall increases
upto 17cm, followed by the decrease in the rainfall, but in May an increase in the rainfall
above 5centimeters. The area receives both summer and winter rains, but the
contribution of winter rains is higher as compared to summer (Graph-1).
Graph-7: Percentage Departure of Annual Precipitation in Pakistan, Pakistan
Meteorological Department, 2001.
The recent fluctuation of rainfall, plotted on graph-3 and 4, shows a gradual decrease in
rainfall during the past fifteen years (1986-2000). The precipitation during 1986-90 shows
a decreasing trend. The area recorded 17.6cm rainfall in 1986 that dropped to –5.4cm, in
1990. In the period between 1991-95, the rainfall reveals a rapid increase from 9.3cm to

5
15.1cm, with negative deviation anomalies in 1993 and 1994 and then falls to –27cm, in
2000. As shown in graph-4 and 7, the rainfall of the valley in the last five years (1995-
2000) decreased at the rate of 7.3cm per year (Table-4). This rapid reduction in rainfall
not only influenced the crop growth and yield, but it also affects the human activities of
the area. Inspite of this, from 1931 to 1970, the average rainfall of the valley was above
40inches (100cm), and the area had a humid climate. But the reduction of rainfall in 1986
to 2000 that is in the past fifteen years (7.3cm/year) put the area in sub-humid climate. If
the rainfall decreases at this rate continuously, then the climate of the valley will change
from sub-humid to semi-arid by 2020 i.e. during the next twenty years.
Swat valley receives both summer and winter rains, and the annual rainfall is the average
of these two seasons. The deviation of rainfall from the mean condition of the seasons,
plotted on graph-5, shows that from 1986 to 1990, the summer rains increased from 11 to
18cm, and the winter rains from 12 to 18centimeters. From 1991-95, the summer rain
reveals positive deviation of 14 to 20cm, and the winter rainfall from 0.6 to zero
centimeters, with little increase of 7 to 9cm, in 1991 to 1992. From 1995 to 2000, the
summer rains decreased from 20 to 5cm, while the winter rains dropped from zero to –
26centimeters (Graph-5). In the last five years (1995 to 2000), the summer rains of the
area decreased at the rate of 3cm/year, whereas, the fall in winter rain is -4.9cm/year
(Table-4). The decrease in the winter rains of the valley is higher than summer, and due
to this rapid decrease, the area is continuously going towards aridity.
Based on annual cycle of rainfall, these two seasons have further been divided into four
sub-seasons i.e. winter, pre-monsoon, monsoon, and the post-monsoon seasons. The
general description of each season is as follow.
4.1. Winter Rainfall: The winter rainfall is associated with the passage of western disturbances, moving
eastwards from Iran and Afghanistan during Mid-November to Mid-April (Figure-2 and 3).
An active western disturbance can induce fairly heavy rain. In some of the heaviest falls
in winter, amount as high as 10.2cm has been recorded on 2nd February 1980.
The total rainfall of the area recorded in winter is 46centimeters. The rains, in this season
start with its lowest amount in December (5.1cm), and increase upto 17.4cm in March.

6
Figure-2: Map showing Western Disturbance,
3rd December, 2008, by Google, Earth
Figure-3: January (Winter Season), NCEP/NCAR, Reanalysis Project 1959-1997.
The rainfall variation plotted on graph-6, shows that the total rainfall of the area was
56.5cm in 1986, and dropped rapidly to 32.5cm in 1989. In 1990, the winter rains
increased to 70.2cm, and then decreased continuously to 25.2cm in 2000. In winter, the
rainfall shows a mark decrease, which may be the result of change in atmospheric
circulation, temperature, and air pressure. However, the rapid increase in temperature in
the last five years (1995 to 2000) will cause high rains due to low pressure in the area,
which may recover the deficiency in rains of winter quota upto 2005 and may be fall again
till 2010.

7
4.2. Pre-Monsoon Rainfall: The season generally lasts from Mid-April to June, when the temperature of the valley
reaches to its extreme. These rains are mostly the result of the ascending air currents,
due to local heating, and therefore, they are also designated by the name, “local
thunderstorms”. The total rainfall of the season is 15.8cm, with high rainfall of 10.2cm in
April, and lowest is 5.6cm in May.
The rainfall recorded in the pre-monsoon season is 30.6cm in 1986, which decreased to
2.5cm in 1990. Again there is an increase in the next 10 years and by the year 2000, it
has increased to 14.4centimeters. The variation of rainfall, generally, shows very minor
decrease, but the rate of decreases is less as compared to 1986. This minor fluctuation in
the area results in the increase in temperature particularly in May and June, and the
mountain slopes, help to activate the warm moist air parcels to condensation level and
bring rains. 4.3. Monsoon Rainfall: The monsoon precipitation is associated with the convergence of the Arabian sea and
Bay of Bengal currents in upper troposphere when a tropical depression is developed
over central part of the Indo-Pakistan sub-continent. The monsoon winds reach to the
area in the first week of July and are well-established upto mid of that month. The major
share of summer rains from these winds is 24.4cm, which is one-half of the winter rains.
July, with 13.7cm rainfall, is the leading month of the season, while it decreases to 6.3cm
in September, when the monsoon currents reverse from land to Arabian sea (Graph-6).
Figure-4: Summer (Southwesterly Monsoon) Clouds Flow towards Indian
Sub-Continent by NASA, 2007.

8
The fluctuation of monsoon rainfall for Swat valley shows that in 1986, the area recorded
a total rainfall of 25.9cm that reduced to 18.8cm in 1990. From 1991, it reveals an
increasing trend of 35.8cm and 38.9cm till 1995. Onward, the rainfall shows gradual
decrease to 23.3cm in 2000, with 3cm falls per year (Figure 4 and 5).
Figure-5: July (Summer Season), Surface NCEP/NCAR, Reanalysis Project 1959-1997. 4.4. Post- Monsoon Rainfall: In September, when the summer convergence zone shifts southwards, there is a marked
decrease in rainfall of the area. Rainfall decreases further, after the withdrawal of the
monsoon, and November is usually the driest month of the year. The post-monsoon
season remains from Mid-September to Mid-November. During this season, the total
rainfall of the area drops to 7.6cm, with 3.1cm in October and 0.5cm in November.
The area recorded 4.5cm rainfall in 1986, which decreased to 2cm in 1990, and then
increased to 7cm in 1995, and 9cm in 2000. The fluctuation in the 1986 to 2000 show a
marked increase in rainfall, but it is many times less than the decrease in winter rains and
does not fill the reduction of winter quota (Graph-6).

9
5. Causes of Temperature and Rainfall Fluctuation: The following are the possible causes of climatic change in the Swat valley.
1. The recent climatic fluctuation (1986 to 2000) seems to be the result of change in
the atmospheric pressure on global scale, particularly, between equator, tropics,
and polar region. According to Khan (1960), “The annual pressure was rising in
the South Asian low pressure belt and the Equatorial trough and falling in the
Siberian high pressure, since the beginning of the period from 1881 to 1915.
After this period the trend changed to one of the increase in the Siberian high
pressure and decrease in the South Asian low pressure and the Equatorial
trough. This trend continued upto 1941-50, after which it showed signs of
reversal to the previous trend.” This change in the pressure gradient on global
scale may be responsible for the present fluctuation of rainfall in the area.
2. Another main cause of low winter rain in Swat valley may be the change of speed
and direction of westerly currents (Western Disturbances). Khan (1960) is of the
opinion that, “The rainfall condition has been improving over the southwest
monsoon regime during the period of 1931-50 and has shown deterioration over
the northeast monsoon regime. The rainfall had been persistently decreasing
over Middle East and increasing over the Soviet Republics of Central Asia. The
trend seems to be most probably connected with a northerly shift of the track of
western disturbances. The deterioration of rainfall in the arid and semi-arid zone
of West-Pakistan and Baharat may also be due to a reduction in the winter quota
of the annual precipitation.” This northerly shift in the wind direction of westerly
currents may have increased the share of winter rain in Central Asia and
decreased it continuously in Indo-Pakistan sub-continent.
3. Deforestation is another main human activity, and most of the natural vegetation
of the valley has been cut for lumbering or farming, without immediate replanting
of new trees. The mountains slopes are barren and completely exposed to rain
and wind erosion. Such exposed terrain, generally, reflects high amount of
incoming radiation back to space and causes change in the atmospheric
temperature of the area.
4. The Middle East, Indo-Pakistan, and Afghanistan are the war zones for the past
36 years. These crises created serious problems due to the use of highly
explosive devices and burning of oil wells in Kuwait and Iraq, which produced a

10
huge amount of un-burned methane and ethane gases, particularly during Gulf
war that caused ozone depletion. Consequently, the rate of ultraviolet radiation
increased on the earth surface and this may be one of the causes of the
temperature fluctuation in the Indo-Pakistan sub-continent.
6. Recommendations: The following are the suggestions to ameliorate the climate condition of the region.
1. The global climatic change is mainly the result of various human activities like,
exhaust gases from industries, wars, deforestation, chloroflorocarbons, and the
use of fossil fuels. Therefore, it is needed to initiate programs to create
awareness among the people about the effects of these atmospheric pollutants
on the physical environment of the area.
2. Legislation is needed to prevent sever cutting of forests and also to ensure the
immediate replanting of trees, cut for lumbering or farming and also to provide
alternate sources of energy e.g. bio-gas, and natural gas for the domestic use.
However, the plantation of eucalyptus is not recommended, as it evaporates
more than 50liters of the groundwater into atmosphere per day and is more
dangerous to watertable of the mountainous region (Khan SU, USEPAM
International Conference, Hanoi, Vietnam, 26th March 2007).
3. Contourwise ploughing of the hill slopes should be carried out at right angle to
the hill slopes. This impedes the downward flow of the rainwater and checks soil
creep so that gullying does not develop. Much of water is also retained by the
furrows and absorbed by the plants that are grown in a contourwise pattern,
improving the crop. Therefore, for the proper surface run-off and control of soil
erosion, the awareness of people about the contourwise ploughing in the
catchments areas should be created.
4. For extensive afforestation, it is necessary to provide facilities to the inhabitants
of the mountainous areas and to encourage the community reforestation.
5. Further study is needed to findout the causes of modification in temperature,
pressure, wind speed and direction, and precipitation on global scale so that by
proper planning, the problems arising due to the shortage of water may be met
with.

11
6. The increase in temperature causes the melting of glaciers in the catchments
areas of different rivers in Pakistan that enhancing flood disaster in the Indus
Plains and effect agriculture production, industries, land and properties etc. So
that it is necessary to cover the banks of rivers with metals sheets or
embankments and to make sure the safety of land degradation and damages to
the human lives in the area during high floods in the Indus, Jhelum, Chanab,
Ravi, and Kabul rivers.
7. The decline in precipitation at Swat valley show signs of sever Agriculture,
Meteorological, and hydrological droughts in the region and will be effected the
human life, economical, and physical environment etc of Pakistan. So it is
recommended to craft proper planning for the safety of the human and livestock
lives, economical development, availability of water for domestic use etc
especially in the dry (desert) areas of Balochistan, Sind, and Punjab and also to
arrange environmental research for how to combat desertification and drought in
Pakistan.
8. Hypothesis is made here that the drying of springs and precipitation fluctuation
are also an evidence of plate tectonic moment in the area and after each 3 to 4
years of sever drought, the area hit by the earthquake disaster caused by
tectonic moment, especially at the mountainous north that also caused changes
in the weather and climates of the area, however it is needed further research to
find out the correlation between drought, drying of springs, decline in water table,
and tectonic moment. May be it provides a positive signs and base for the
forecasting of tectonic moment before its activation for the safety of the locals. 7. Conclusion: The area is cold in winters, and warm in summers. January is the coldest month, when
the minimum temperature drops to below freezing, whereas, June is the hottest month,
when the maximum temperature exceeds 30oC. The variation of temperature shows
marked increase of 1oC per year, particularly from 1995 to 2000.
The area receives both summer and winter rains. The summer rains are the result of pre-
monsoon and monsoon season, while the winter rains are the sum of the post-monsoon
and western depressions. The annual total rainfall of the area is 98.9cm (39.6inches)
currently and the climate has changed from humid (>40inches) to sub-humid. The highest

12
rainfall of the area is received in March (17.4cm), which decreases to 3.3cm in
November. The total winter rainfall of the valley is 82.9cm, whereas, that of summer as
57.5centimeters. Thus the major share of rainfall in the area is from winter season. The
rainfall of the valley recorded in pre-monsoon season is 15.8cm, while from monsoon it is
24.4cm, and from post monsoon it is 7.6centimeters. The pre-monsoon period shows
very little fluctuation, while the other three rainy seasons lead to rapid decrease in rainfall
from 1986 to 2000. The deviation of rainfall from the mean condition falls to negative
deviation from 1986 to 1990, and then it increased from 1990 to 1995, and again fell to
negative deviation upto 2000 at the rate of 7.3cm per year. The winter rains decreased
continuously for the last five years up to –29cm, while the summer rains decreased from
1995 to 1999, and then increased to 4.6cm in 2000 with average increase of 2.9cm. In
general, the winter rains of the area continuously decreased as compared to summer
rainfall. However, the rapid increase in temperature is a hopeful sign for the recovery of
winter rains upto 2005. This variation of rainfall generally triggers to change in air
pressure, wind speed and direction, increase in temperature, chloroflorocarbons, exhaust
gases from industries, and deforestation on global scale.
8. Acknowledgement: The authors are indebted to Dr. Roshan Ali, soil scientist, Agriculture Research Centre,
Mingora Swat, for providing the weather data, to Mr. Pervaz Iftikhar, CEO; USF CO, for
his encouragement, and to Mr. Mukhtar Bacha, School Mapping Consultant, British
Council, Peshawar, for providing financial support. We are thankful to Dr. Muhammad
Said and Dr Amir Nawaz Khan for their valuable suggestions during the course of work.
The authors also appreciated the cooperation of Dr. Amir Khan in the completion of this
case study during his Chairmanship period of the Geography department.

13
9. Bibliography: Amin M.M., Metorological Observations., Weather and Climatic Elements., NWFP
Agriculture University Peshawar., 1992-2000. Anwar M.M., 1993., A Geography of Pakistan., Publication of Book-World Islamabad
and Lahore., p. 10-30. Arnon I., 1972, Crop production in dry regions; A Publication of National Book
Foundation of Pakistan; and Great Britain by Cox & Wyman Ltd., P. 1-40. Bao Z. & Mikami T. Summer Rainfall Anomalies in the Yangtze Valley…. from 1951
to 1991., Vol. 71., No. 1., 1998., p.59-71. Blair T.A., 1942., Climatology., (General and Regional)., Publication of Prentice-Hall,
INC. New York., p. 1-200. Critchfield H.J., 1987., General Climatology., (4th eddition)., Prentice’ Hall of India New
Delhi-110001., p. 40-250. GOP, DCR of Swat., Pakistan Census Organization Statistics Division, Islamabad., June
1983., p.98. GOP, DCR of Swat., Pakistan Census Organization Statistics Division, Islamabad.,
November 1998., p.202. Karlen W., Climate Variation and the Enhanced Green House Effect., Ambio., A
Journal of the Human Environment., Vol. XXVII., No. 4., June 1998., P. 270-274. Kazi S.A. & Khan M.L., Variability of Rainfall and its Bearing on Agriculture in the
Arid and Semi-Arid zone of West-Pakistan., Pakistan Geographical Review., Vol. 16., No. 1., January 1961., p. 25-35.
Kazi S.A. & Khan M.l., Variations of Moisture types and their Bearing on Soil erosion in West-Pakistan., Pakistan Geographical Review., Vol. XIV., No.1., 1959., p.1-19.
Kazi S.A. 1951., Climatic Regions of West Pakistan., Pakistan Geographical Review., Vol. VI., No. 1.
Kazi S.A. etal, 1961., Variability of Rainfall & its Bearing on Agriculture., PGR, Vol. 16., No. 1.
Kendrew W.G., 1941., Climates of the Continents., Publication of Oxford University Press London., pp. 208.
Khan F.K. 1991(I) - 93(ii). A Geography of Pakistan (Environment, People Economy)., Oxford University Press Karachi, Pakistan.
Khan J.A. May 1993., The Climate of Pakistan., Rahber Publishers Karachi. Khan M.L., Recent Climatic Fluctuation Over South Asia and the Indian Ocean.,
Pakistan Geographical Review., Vol. 15., No. 2., June 1960., p.18-37. Khan S.U., Impact of Ozone., The Daily Frontier Post Peshawar., August 13th, 2000., p-
3. Khan S.U., Impact of Eucalyptus on the Underground Water, A Case Study of
Udigram Swat Valley Northwest Pakistan., USEPAM International Conference, Hanoi, Vietnam, March 26-29, 2007.
Morishima W. & Mikami T., Interannual Variations in Asian Summer Rainfall and their Association with Tropical Convective Activities and Global SST Anomalies., Geographical Review of Japan, Vol. 71., No. 2., 1998., p. 85-99.
Nasrullah .K., January 1968., Climate of West Pakistan According to Thornthwaite System of Classification of Climates., Pakistan Geographical Review., Vol. 23., No. 1., p. 12-25.
NCEP/NCAR., Climatology., Sea level Pressure and wind circulation, Reanalysis Project.,1959-1997.

14
Salim M., The Facts of Forestry in Swat Valley., Urdu Medium., Udyana Today, A Magazine of Environmental Protection Society Swat., Issue. 4., Vol. 7., Oct.-Dec. 2000., p. 14-18.
Suzuki H., World Precipitation Present and Hypsithermal., Bulletin of the Department of Geography University of Tokyo., No.7., March, 1975., p. 1-15.

15
Figure: 1 SWAT District Political

16
Udigram Mean Monthly Maximum, Minimum Temperature and Rainfall (1986-2000)
2.0
6.0
10.0
14.0
18.0
22.0
26.0
30.0
34.0
38.0
Months
Tem
pera
ture
(o C) a
nd R
ainf
all (
cm)
Rainfall 7.8 10.0 17.4 10.2 5.6 6.1 13.7 9.3 6.3 3.9 3.3 5.1 7.8 10.0
Maxi.T. 13.6 14.6 17.5 23.5 29.9 33.5 32.2 30.9 29.3 24.4 20.7 17.3 13.6 14.6
Mini.T. 1.8 3.3 6.5 10.4 15.2 18.4 20.9 20.1 16.8 10.5 5.0 2.0 1.8 3.3
Jan Feb Mar Apr May Jun Jul Aug Sep Oct Nov Dec Jan Feb
Graph: 1

17
Udigram Deviation of Mean Monthly Maximum, Minimum Temperature and Rainfall
-15.0
-10.0
-5.0
0.0
5.0
10.0
15.0
Months
Tem
pera
ture
(o C) a
nd R
ainf
all (
cm)
Rainfall -0.4 1.8 9.1 2.0 -2.6 -2.1 5.5 1.1 -1.9 -4.3 -4.9 -3.1
Maxi.T. -10.4 -9.3 -6.4 -0.4 6.0 9.5 8.2 6.9 5.3 0.5 -3.3 -6.7
Mini.T. -9.1 -7.6 -4.4 -0.5 4.3 7.5 10.0 9.2 5.9 -0.4 -5.9 -8.9
Jan Feb Mar Apr May Jun Jul Aug Sep Oct Nov Dec
Graph: 2

18
Udigram Mean Monthly Maximum, Minimum Temperature (oC) and Rainfall (cm)
0.0
5.0
10.0
15.0
20.0
25.0
30.0
Months
Tem
pera
ture
(o C)
0
20
40
60
80
100
120
140
Rai
nfal
l (cm
)
Maxi.T. 23.6 24.5 24.1 23.9 24.6 23.0 24.3 24.4 23.1 23.5 23.6 22.5 24.3 24.7 25.1
Mini.T. 11.7 11.5 11.8 11.4 11.4 10.7 11.1 10.8 10.2 10.0 9.7 10.5 10.4 11.5 11.0
Rainfall 116.47 73.05 115.35 58.78 93.48 108.21 110.65 97.11 80.85 113.94 94.05 81.84 96.47 90.99 71.9
1986 1987 1988 1989 1990 1991 1992 1993 1994 1995 1996 1997 1998 1999 2000
Graph: 3

19
Udigram Deviation of Mean Monthly Rainfall (1986-2000)
-50.0
-40.0
-30.0
-20.0
-10.0
0.0
10.0
20.0
30.0
Years
Rai
nfal
l (cm
)
Rainfall 17.6 -25.8 16.5 -40.1 -5.4 9.3 11.8 -1.8 -18.0 15.1 -4.8 -17.0 -2.4 -7.9 -27.0
1986 1987 1988 1989 1990 1991 1992 1993 1994 1995 1996 1997 1998 1999 2000
Graph: 4

20
U digramD eviation o f M ean M onth ly Sum m er and W in ter R ain fall (cm )
-30 .0
-20.0
-10.0
0.0
10.0
20.0
30.0
Year
Win
ter a
nd S
umm
er R
ainf
all (
cm)
W inter 12.3 4.3 3.1 -21.1 17.7 0.6 7.2 9.2 -3 .9 0.0 5.7 -10.6 2.6 -0.8 -26.2Sum m er 10.6 -24.8 18.7 -13.6 -17.8 14.1 9.9 -5 .6 -8 .7 20.4 -5 .2 -1 .1 0.3 -1.7 4.6
1986 1987 1988 1989 1990 1991 1992 1993 1994 1995 1996 1997 1998 1999 2000
Graph: 5

21
Udigram Seasonal Variation of Rainfall (cm)
0
10
20
30
40
50
60
70
80
Year
Rai
nfal
l (cm
)
Pre-Monsoon 30.56 7 10.15 15.4 2.5 20.97 12.54 16.31 13.2 27.87 17.83 25.55 14.48 7.65 14.44
Post-Monsoon 4.5 8.15 7.25 1.98 2.05 5.65 17.08 8.1 11.1 6.55 9.02 7.15 7.41 8.72 9.05
Winter 56.45 48.95 55 32.5 70.15 45.89 53.06 50.66 36.2 40.68 50.65 28.99 48.86 47.49 25.17
Monsoon 25.9 9.0 42.8 9.0 18.8 35.8 30.0 22.0 20.4 38.9 16.6 20.1 26.6 27.2 23.3
1986 1987 1988 1989 1990 1991 1992 1993 1994 1995 1996 1997 1998 1999 2000
Graph: 6

22
Table-1: Udigram Mean Monthly Temperature (0C) 1986-2000
Year January February March April May June July August September October November December Annual
1986 14.2 14.5 17.4 22.3 27.5 35.0 34.4 31.4 29.1 25.7 18.5 12.9 23.6
1987 13.7 16.0 18.5 23.3 26.2 33.7 35.0 31.8 31.5 23.8 22.5 18.0 24.5
1988 14.7 15.5 13.9 23.9 33.9 34.9 30.6 29.1 31.5 26.2 19.2 16.0 24.1
1989 14.5 14.3 19.1 22.5 32.6 35.7 33.0 29.2 31.0 19.8 19.7 15.1 23.9
1990 14.3 13.9 17.9 21.3 32.4 32.0 34.2 30.5 30.0 26.9 21.1 20.5 24.6
1991 12.7 14.0 19.8 22.0 28.7 31.0 32.6 31.2 28.9 26.8 11.5 16.5 23.0
1992 12.8 15.2 17.7 23.4 28.3 33.5 31.7 35.2 22.0 17.4 28.6 26.0 24.3
1993 13.4 18.7 16.0 26.0 31.1 32.7 28.8 30.2 29.3 26.1 21.5 18.5 24.4
1994 12.9 11.9 19.6 21.9 28.8 34.7 30.1 29.9 28.5 23.4 20.9 14.4 23.1
1995 13.5 14.6 16.3 21.3 29.5 35.9 31.7 29.8 29.2 23.9 21.9 14.4 23.5
1996 14.0 16.0 16.8 24.2 26.8 31.5 31.8 30.5 30.2 24.5 20.8 16.5 23.6
1997 14.2 14.8 17.3 21.6 26.8 30.9 32.0 30.5 29.7 19.4 18.9 13.7 22.5
1998 13.2 12.8 16.6 24.1 29.7 32.9 32.1 31.5 28.8 27.6 23.1 19.6 24.3
1999 11.8 14.1 18.2 26.8 32.9 34.0 32.3 30.9 30.1 26.9 19.7 19.0 24.7
2000 14.0 13.4 17.5 28.0 33.8 33.8 32.0 31.4 29.4 28.3 22.0 17.8 25.1
Average 13.6 14.6 17.5 23.5 29.9 33.5 32.2 30.9 29.3 24.4 20.7 17.3 23.9
Source: Pakistan Agriculture Research Station Mingora, Swat, 2000

23
Table-2: Udigram Mean Monthly Minimum Temperature (0C) 1986-200
Year January February March April May June July August September October November December Annual
1986 3.7 4.1 5.3 11.3 19.3 16.2 20.6 19.3 16.6 12.6 7.3 4.0 11.7
1987 2.9 5.0 8.2 11.2 13.7 18.2 19.4 20.4 17.6 12.5 6.0 2.5 11.5
1988 3.8 4.7 6.2 12.7 15.0 20.4 22.7 19.3 17.6 10.6 5.4 3.6 11.8
1989 4.3 5.6 9.2 9.5 14.1 17.6 19.2 19.2 20.1 8.4 5.0 4.2 11.4
1990 2.5 4.3 6.0 9.6 15.8 18.1 22.1 21.6 18.0 11.9 4.1 2.3 11.4
1991 1.8 3.7 7.4 9.5 13.9 17.1 19.0 20.1 15.7 11.5 4.2 4.5 10.7
1992 3.1 3.2 7.0 11.4 14.2 18.5 20.8 20.1 16.0 9.0 6.1 3.7 11.1
1993 1.2 4.7 5.2 11.8 16.2 18.9 20.3 18.4 16.3 8.5 5.3 2.6 10.8
1994 1.0 0.9 7.5 7.6 15.2 18.9 22.2 21.2 14.3 7.9 4.9 0.6 10.2
1995 1.7 1.9 4.6 7.6 15.9 19.0 21.2 20.6 14.3 10.0 2.8 0.4 10.0
1996 -1.3 2.0 7.0 10.4 13.7 17.5 19.8 19.8 16.4 9.7 2.7 -1.4 9.7
1997 0.0 1.1 6.2 10.3 12.6 18.1 22.6 20.5 17.2 11.9 4.9 0.7 10.5
1998 -0.1 2.3 4.5 10.7 15.6 18.2 21.9 20.7 17.0 11.3 3.9 -0.9 10.4
1999 0.9 5.0 7.3 12.2 16.3 18.6 21.3 20.1 18.5 10.7 6.8 0.7 11.5
2000 1.2 1.6 6.3 10.9 16.7 20.2 21.0 19.8 16.0 10.5 5.9 2.0 11.0
Average 1.8 3.3 6.5 10.4 15.2 18.4 20.9 20.1 16.8 10.5 5.0 2.0 10.9
Source: Pakistan Agriculture Research Station Mingora Swat, 2000

24
Table:3 Udigram Mean Monthly Total Precipitation (cm) 1986-2000
Source: Pakistan Agriculture Research Station Mingora Swat, 2000
Year January February March April May June July August September October November December Total
1986 4.5 3.8 35.2 18.1 1.6 19.5 14.4 9.5 4.0 0.2 4.6 1.2 116.5
1987 4.1 11.2 15.0 5.0 4.5 0 9.0 0 0 0 16.3 8.0 73.1
1988 7.5 9.0 25.0 2.5 1.5 7.5 21.0 16.5 10.5 2.0 0 12.4 115.4
1989 9.1 2.8 12.2 2.4 10.4 3.8 0 7.5 3.0 0.5 0 7.2 58.8
1990 7.7 19.6 26.2 4.0 0 0.5 3.5 14.0 2.5 0 1.6 13.9 93.5
1991 4.3 13.2 17.9 19.3 10.3 1.0 27.2 3.2 10.7 0 0.6 0.6 108.2
1992 24.5 7.0 15.8 0 8.6 3.9 15.7 8.7 11.2 9.4 2.1 3.7 110.7
1993 4.1 4.4 31.5 16.4 2.7 5.4 14.0 5.4 5.2 3.2 4.6 0.2 97.1
1994 4.6 5.8 7.7 12.4 4.9 2.2 10.8 7.5 4.3 8.8 0.3 11.8 80.9
1995 1.1 11.8 14.6 17.7 2.0 17.0 29.0 9.1 1.6 4.0 3.5 2.6 113.9
1996 8.2 22.0 15.3 6.7 8.5 6.0 7.8 6.8 4.1 6.8 0.4 1.5 94.1
1997 3.2 2.1 11.3 19.5 8.1 7.7 6.5 12.3 2.5 4.8 2.3 1.5 81.8
1998 7.2 23.8 11.3 12.1 6.9 1.1 10.5 12.1 8.0 3.3 0.3 0 96.5
1999 18.7 8.6 14.2 6.5 1.4 3.0 14.9 7.3 10.0 1.0 5.4 0 91.0
2000 8.8 5.7 7.6 0.6 7.0 7.2 7.5 10.3 11.0 3.1 0.9 2.4 71.9
Average 7.8 10.0 17.4 10.2 5.6 6.1 13.7 9.3 6.3 3.9 3.3 5.1 98.9

25
Table:4 Udigram Average/Sum of Increase/Decrease in
Mean Monthly Total Precipitation (cm), and Temperature (0C) 1995-2000
Precipitation (cm) Mean Maximum Temperature (0C)
Mean Minimum Temperature (0C)
Mean Monthly Temperature (0C)
Seasonal Decline in Precipitation (cm)
Year Annual Total
Mean Deviatio
n
Average
Fall Mean Mean
Deviation
Average
Increase
Mean Mean
Deviation
Decrease Mean Mean
Deviation
Increase
Winter Av.Fall Summe
r Av.Increas
e
1995 113.9 15.1 23.5 0.98 10.00 -0.52 16.75 0.97 0.0 20.4
1996 94.1 -4.6 23.6 0.99 9.70 -0.82 16.65 0.97 5.7 -5.2
1997 81.8 -17 22.5 0.94 10.50 -0.02 16.50 0.96 -10.6 -1.1
1998 96.5 -2.4 24.3 1.01 10.40 -0.12 17.35 1.01 2.6 0.3
1999 91 -7.9 24.7 1.03 11.50 0.98 18.10 1.05 -0.8 -1.7
2000 71.9 -27
-7.3
25.1 1.05
1.00
11.00 0.48
0.00
18.05 1.05
1.00019
-26.2 4.6 Sum
/Average
549.2 -43.8 -7.3 23.95 6.00 1.0 10.52 0.00 0.00 17.23 6.00 1.00019 -29.4
-4.9
17.3
2.89