World AIDS Day
87
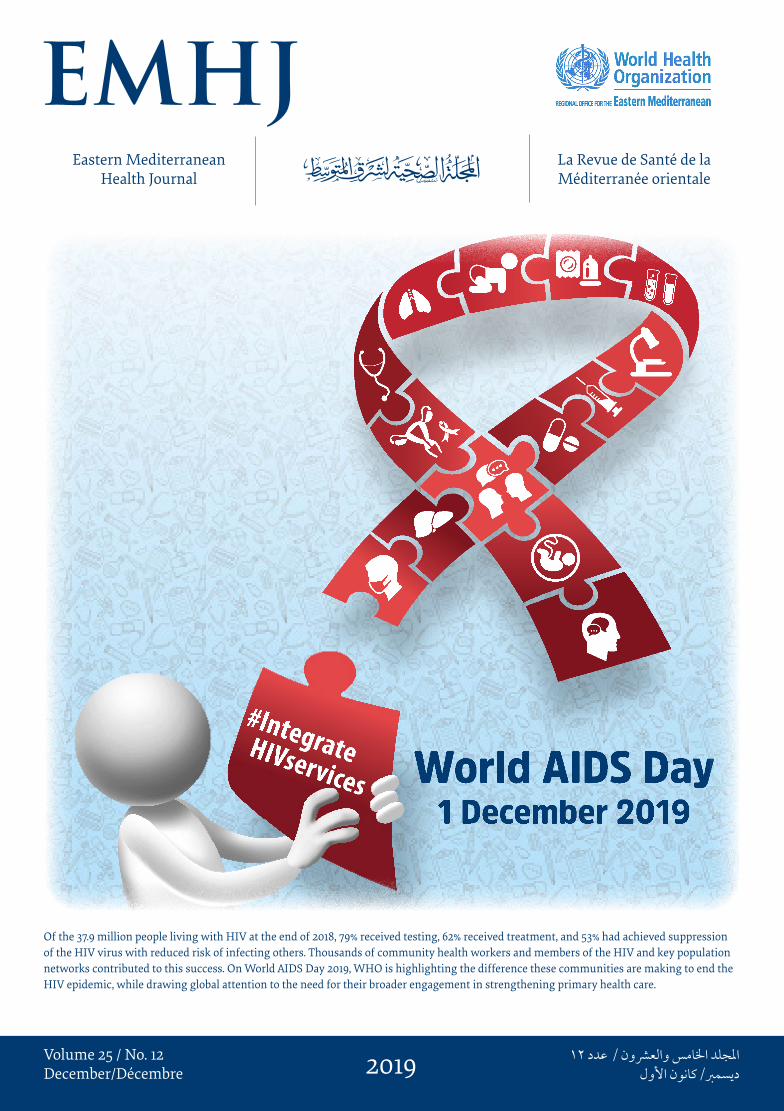
La Revue de Santé de la Méditerranée orientale Eastern Mediterranean Health Journal Volume 25 / No. 12 December/Décembre 12 دون / عدمس والعاجلد ا اولون ا/كان ديسم2019 Of the 37.9 million people living with HIV at the end of 2018, 79% received testing, 62% received treatment, and 53% had achieved suppression of the HIV virus with reduced risk of infecting others. Thousands of community health workers and members of the HIV and key population networks contributed to this success. On World AIDS Day 2019, WHO is highlighting the difference these communities are making to end the HIV epidemic, while drawing global attention to the need for their broader engagement in strengthening primary health care.
-
Upload
khangminh22 -
Category
Documents
-
view
0 -
download
0
Transcript of World AIDS Day
La Revue de Santé de la Méditerranée orientale
Eastern Mediterranean Health Journal
EMHJ – Vol. 25 No. 12 – 2019
Volume 25 / No. 12December/Décembre
املجلد اخلامس والعرشون / عدد 122019ديسمرب/كانون األول
Eastern Mediterranean H
ealth Journal Vol. 25 No. 12 – 2019
#Integrate HIVservices World AIDS Day1 December 2019
Of the 37.9 million people living with HIV at the end of 2018, 79% received testing, 62% received treatment, and 53% had achieved suppression of the HIV virus with reduced risk of infecting others. Thousands of community health workers and members of the HIV and key population networks contributed to this success. On World AIDS Day 2019, WHO is highlighting the difference these communities are making to end the HIV epidemic, while drawing global attention to the need for their broader engagement in strengthening primary health care.
EditorialEffective health information systems for delivering the Sustainable Development Goals and the universal health coverage agendaArash Rashidian ............................................................................................................................................................................................................................................849
Research articlesRole of climatic factors in the incidence of dengue in Port Sudan City, SudanElsiddig Noureldin and Lynn Shaffer ....................................................................................................................................................................................................852
Coût hospitalier des pneumococcies invasives chez les enfants âgés de moins de 15 ans en TunisieArwa Ben Salah, Sana El Mhamdi, Manel Ben Fredj, Chebil Ben Meriem, Jihen Bouguila, Khaled Ben Helel, Lamia Sfaihi, Rafiaa Mustapha, Mohamed Sfar et Mohamed Soltani...................................................................................................861
Fingernail length as a predisposing factor for perforations of latex gloves: a simulated clinical experimentSuhail Al-Amad, Ala’a El-Saleh, Shorouk Elnagdy, Fatimah Al-Nasser and Sarah Alsellemi ................................................................................................872
Workplace stress and its relation to cardiovascular disease risk factors among bus drivers in EgyptAmira Mohsen and Sally Hakim .............................................................................................................................................................................................................878
Quality of life outcomes in thalassaemia patients in Saudi Arabia: a cross-sectional studySoheir Adam ...................................................................................................................................................................................................................................................887
Mediterranean dietary patterns and risk of type 2 diabetes in Islamic Republic of IranMarjan Ramezan, Golaleh Asghari, Parvin Mirmiran, Zhale Tahmasebinejad and Fereidoun Azizi ..............................................................................896
Knockdown resistance mutations contributing to pyrethroid resistance in Aedes aegypti population, Saudi ArabiaOmer Dafalla, Adel Alsheikh, Waheed Mohammed, Khalid Shrwani, Feras Alsheikh, Yahya Hobani and Elsiddig Noureldin ..............................................................................................................................................................................................................................905
ReviewStrategies to reduce informal payments in health systems: a systematic reviewHamed Zandian, Atefeh Esfandiari, Minoo Sakha and Amirhossein Takian ..........................................................................................................................914
ReportMove for health: addressing the built environment and physical activity in OmanRuth Mabry, Huda Al Siyabi, Muhssen Kannan and Amal Al Siyabi ..........................................................................................................................................923
WHO events addressing public health prioritiesRegional consultative meeting on primary health care for universal health coverage ........................................................928
Eastern Mediterranean Health Journal
IS the official health journal published by the Eastern Mediterranean Regional Office of the World Health Organization. It is a forum for the presentation and promotion of new policies and initiatives in public health and health services; and for the exchange of ideas, concepts, epidemiological data, research findings and other information, with special reference to the Eastern Mediterranean Region. It addresses all members of the health profession, medical and other health educational institutes, interested NGOs, WHO Collaborating Centres and individuals within and outside the Region.
املجلة الصحية لرشق املتوسط هى املجلة الرسمية التى تصدر عن املكتب اإلقليمى لرشق املتوسط بمنظمة الصحة العاملية. وهى منرب لتقديم السياسات واملبادرات اجلديدة يف الصحة العامة واخلدمات الصحية والرتويج هلا، ولتبادل اآلراء واملفاهيم واملعطيات الوبائية ونتائج األبحاث وغري ذلك من املعلومات، وخاصة ما يتعلق منها بإقليم رشق املتوسط. وهى موجهة إىل كل أعضاء املهن الصحية، والكليات الطبية وسائر املعاهد التعليمية، وكذا املنظامت غري احلكومية املعنية، واملراكز املتعاونة مع منظمة
الصحة العاملية واألفراد املهتمني بالصحة ىف اإلقليم وخارجه.
La Revue de Santé de la Méditerranée Orientale
EST une revue de santé officielle publiée par le Bureau régional de l’Organisation mondiale de la Santé pour la Méditerranée orientale. Elle offre une tribune pour la présentation et la promotion de nouvelles politiques et initiatives dans le domaine de la santé publique et des services de santé ainsi qu’à l’échange d’idées, de concepts, de données épidémiologiques, de résultats de recherches et d’autres informa-tions, se rapportant plus particulièrement à la Région de la Méditerranée orientale. Elle s’adresse à tous les professionnels de la santé, aux membres des instituts médicaux et autres instituts de formation médico-sanitaire, aux ONG, Centres collaborateurs de l’OMS et personnes concernés au sein et hors de la Région.
Correspondence
Editor-in-chief
Eastern Mediterranean Health JournalWHO Regional Office for the Eastern MediterraneanP.O. Box 7608 Nasr City, Cairo 11371 Egypt Tel: (+202) 2276 5000 Fax: (+202) 2670 2492/(+202) 2670 2494 Email: [email protected]
Members of the WHO Regional Committee for the Eastern Mediterranean Afghanistan . Bahrain . Djibouti . Egypt . Islamic Republic of Iran . Iraq . Jordan . Kuwait . Lebanon Libya . Morocco . Oman . Pakistan . Palestine . Qatar . Saudi Arabia . Somalia . Sudan . Syrian Arab Republic Tunisia . United Arab Emirates . Yemen
البلدان أعضاء اللجنة اإلقليمية ملنظمة الصحة العاملية لرشق املتوسط األردن . أفغانستان . اإلمارات العربية املتحدة . باكستان . البحرين . تونس . ليبيا . مجهورية إيران اإلسالمية
اجلمهورية العربية السورية . جيبويت . السودان . الصومال . العراق . ُعامن . فلسطني . قطر . الكويت . لبنان . مرص . املغرباململكة العربية السعودية . اليمن
Membres du Comité régional de l’OMS pour la Méditerranée orientale Afghanistan . Arabie saoudite . Bahreïn . Djibouti . Égypte . Émirats arabes unis . République islamique d’Iran Iraq . Libye . Jordanie . Koweït . Liban . Maroc . Oman . Pakistan . Palestine . Qatar . République arabe syrienne Somalie . Soudan . Tunisie . Yémen
Subscriptions and Permissions
Publications of the World Health Organization can be obtained from Knowledge Sharing and Production, World Health Organization, Regional Office for the Eastern Mediterranean, PO Box 7608, Nasr City, Cairo 11371, Egypt (tel: +202 2670 2535, fax: +202 2670 2492; email: [email protected]). Requests for permission to reproduce, in part or in whole, or to translate publications of WHO Regional Office for the Eastern Mediterranean – whether for sale or for noncommercial distribution – should be addressed to WHO Regional Office for the Eastern Mediterranean, at the above address; email: [email protected].
EMHJ is a trilingual, peer reviewed, open access journal and the full contents are freely available at its website: http://www/emro.who.int/emhj.htm
EMHJ information for authors is available at its website: http://www.emro.who.int/emh-journal/authors/
EMHJ is abstracted/indexed in the Index Medicus and MEDLINE (Medical Literature Analysis and Retrieval Systems on Line), ISI Web of knowledge, the Cumulative Index to Nursing and Allied Health Literature (CINAHL), Embase, Lexis Nexis, Scopus and the Index Medicus for the WHO Eastern Mediterranean Region (IMEMR).
© World Health Organization (WHO) 2019. Some rights reserved.This work is available under the CC BY-NC-SA 3.0 IGO licence (https://creativecommons.org/licenses/by-nc-sa/3.0/igo).
Disclaimer The designations employed and the presentation of the material in this publication do not imply the expression of any opinion whatsoever on the part of WHO concerning the legal status of any country, territory, city or area or of its authorities, or concerning the delimitation of its frontiers or boundaries. Dotted and dashed lines on maps represent approximate border lines for which there may not yet be full agreement.
The mention of specific companies or of certain manufacturers’ products does not imply that they are endorsed or recommended by WHO in preference to others of a similar nature that are not mentioned. Errors and omissions excepted, the names of proprietary products are distinguished by initial capital letters.
All reasonable precautions have been taken by WHO to verify the information contained in this publication. However, the published material is being distributed without warranty of any kind, either expressed or implied. The responsibility for the interpretation and use of the material lies with the reader. In no event shall WHO be liable for damages arising from its use.
The authors alone are responsible for the views expressed in this publication and they do not necessarily represent the views, decisions or policies of the institutions with which they are affiliated.
If authors are staff members of the World Health Organization, the authors alone are responsible for the views expressed in this publication and do not necessarily represent the decisions, policy or views of the World Health Organization.
ISSN 1020-3397
Cover 25-03.indd 4-6 4/25/2019 11:15:19 AM

Editorial
Effective health information systems for delivering the Sustainable Development Goals and the universal health coverage agendaArash Rashidian ..................................................................................................................................................................................................................849
Research articlesRole of climatic factors in the incidence of dengue in Port Sudan City, SudanElsiddig Noureldin and Lynn Shaffer .........................................................................................................................................................................852
Coût hospitalier des pneumococcies invasives chez les enfants âgés de moins de 15 ans en TunisieArwa Ben Salah, Sana El Mhamdi, Manel Ben Fredj, Chebil Ben Meriem, Jihen Bouguila, Khaled Ben Helel, Lamia Sfaihi, Rafiaa Mustapha, Mohamed Sfar et Mohamed Soltani ........................................................................861
Fingernail length as a predisposing factor for perforations of latex gloves: a simulated clinical experimentSuhail Al-Amad, Ala’a El-Saleh, Shorouk Elnagdy, Fatimah Al-Nasser and Sarah Alsellemi......................................................................872
Workplace stress and its relation to cardiovascular disease risk factors among bus drivers in EgyptAmira Mohsen and Sally Hakim ..................................................................................................................................................................................878
Quality of life outcomes in thalassaemia patients in Saudi Arabia: a cross-sectional studySoheir Adam.........................................................................................................................................................................................................................887
Mediterranean dietary patterns and risk of type 2 diabetes in Islamic Republic of IranMarjan Ramezan, Golaleh Asghari, Parvin Mirmiran, Zhale Tahmasebinejad and Fereidoun Azizi ...................................................896
Knockdown resistance mutations contributing to pyrethroid resistance in Aedes aegypti population, Saudi ArabiaOmer Dafalla, Adel Alsheikh, Waheed Mohammed, Khalid Shrwani, Feras Alsheikh, Yahya Hobani and Elsiddig Noureldin ...................................................................................................................................................................................................905
ReviewStrategies to reduce informal payments in health systems: a systematic reviewHamed Zandian, Atefeh Esfandiari, Minoo Sakha and Amirhossein Takian ................................................................................................914
ReportMove for health: addressing the built environment and physical activity in OmanRuth Mabry, Huda Al Siyabi, Muhssen Kannan and Amal Al Siyabi ................................................................................................................923
WHO events addressing public health priorities
Regional consultative meeting on primary health care for universal health coverage ...........................................................928
Vol. 25.12 – 2019
La Revue de Santé de la Méditerranée orientale
Eastern Mediterranean Health Journal

Ahmed Al-Mandhari Editor-in-ChiefArash Rashidian Executive EditorAhmed Mandil Deputy Executive EditorPhillip Dingwall Managing Editor
Editorial Board Zulfiqar Bhutta Mahmoud Fahmy Fathalla Rita Giacaman Ahmed Mandil Ziad Memish Arash Rashidian Sameen Siddiqi Huda Zurayk
International Advisory Panel Mansour M. Al-Nozha Fereidoun Azizi Rafik Boukhris Majid Ezzati Hans V. Hogerzeil Mohamed A. Ghoneim Alan Lopez Hossein Malekafzali El-Sheikh Mahgoub Hooman Momen Sania Nishtar Hikmat Shaarbaf Salman Rawaf
Editorial assistantsNadia Abu-Saleh, Suhaib Al Asbahi (graphics), Diana Tawadros (graphics)
Editorial supportGuy Penet (French editor)Eva Abdin, Fiona Curlet, Cathel Kerr, Marie-France Roux (Technical editors)Ahmed Bahnassy, Abbas Rahimiforoushani (Statistics editors)
Administration Iman Fawzy, Marwa Madi
Web publishingNahed El Shazly, Ihab Fouad, Hazem Sakr
Library and printing supportHatem Nour El Din, Metry Al Ashkar, John Badawi, Ahmed Magdy, Amin El Sayed
Cover and internal layout designed by Diana Tawadros and Suhaib Al Asbahi Printed by WHO Regional Office for the Eastern Mediterranean, Cairo, Egypt

849
EMHJ – Vol. 25 No. 12 – 2019Editorial
Effective health information systems for delivering the Sustainable Development Goals and the universal health coverage agenda
1Director of Science, Information and Dissemination, WHO Regional Office for the Eastern Mediterranean, Cairo, Egypt. (Correspondence to: Arash Rashidian: [email protected]).
Citation: Rashidian A. Effective health information systems for delivering the Sustainable Development Goals and the universal health coverage agen-da. East Mediterr Health J. 2019;25(12):849–851. https://doi.org/10.26719/2019.25.12.849
Universal health coverage (UHC) and the health-related Sustainable Development Goals (SGDs) cannot be achieved without the appropriate measurement and monitoring mechanisms (1). At the global level, extensive attention is given to mechanisms that focus on measuring and reporting the status of SDG indicators, to help in shaping global priorities, and to steer political will and leverage for action at the national level. National decision-making, however, goes beyond accepting UHC and the SGDs as targets: it should also include specific policies that improve access to health services and health outcomes . The importance of such detail has been well documented before, including in the case of a major global policy for child health (2).
Unfortunately, most global comparisons and the summary indices developed from them are not sensitive enough to national policy change and may not help countries in this direction (3). It is hard to imagine that the phenomenal country successes witnessed in the post-Alma Ata primary health care implementation era would have been as successful as they were, if they had relied on global estimation and reporting processes as sources of data (4). The pivotal role of collecting data on a small set of locally-relevant and policy-oriented indicators, using the paper-based approaches of the time, in the success of primary health care implementation plans is well documented (5). The same is true today; countries cannot reach UHC objectives and the SDGs by relying only on international comparisons and estimation processes.
National health information systems that respond to national needs and are efficient are required. Such national systems provide the locally-relevant information from routine sources (e.g. civil registration and vital statistics systems and health care facilities), as well as from household surveys and census surveys, that is required for national planning and monitoring of implementation. The results framework of WHO’s Thirteenth General Programme of Work, 2019‒2023, is intended as an overarching approach to data and information for health (6). It is a WHO commitment that its work with countries, alongside other United Nations agencies and partners, results in improved health outcomes (7). The framework includes a set of key indicators that complements the SDG agenda, with a further focus on the triple objectives of improving UHC, enhancing safety and increasing population health (7). Alongside this, it includes a core set of activities to improve national data systems so that globally comparable data are valid, timely
and reliable, while countries benefit from the availability of the information needed for national and subnational planning, policy implementation and monitoring of health outcomes and equity objectives (8).
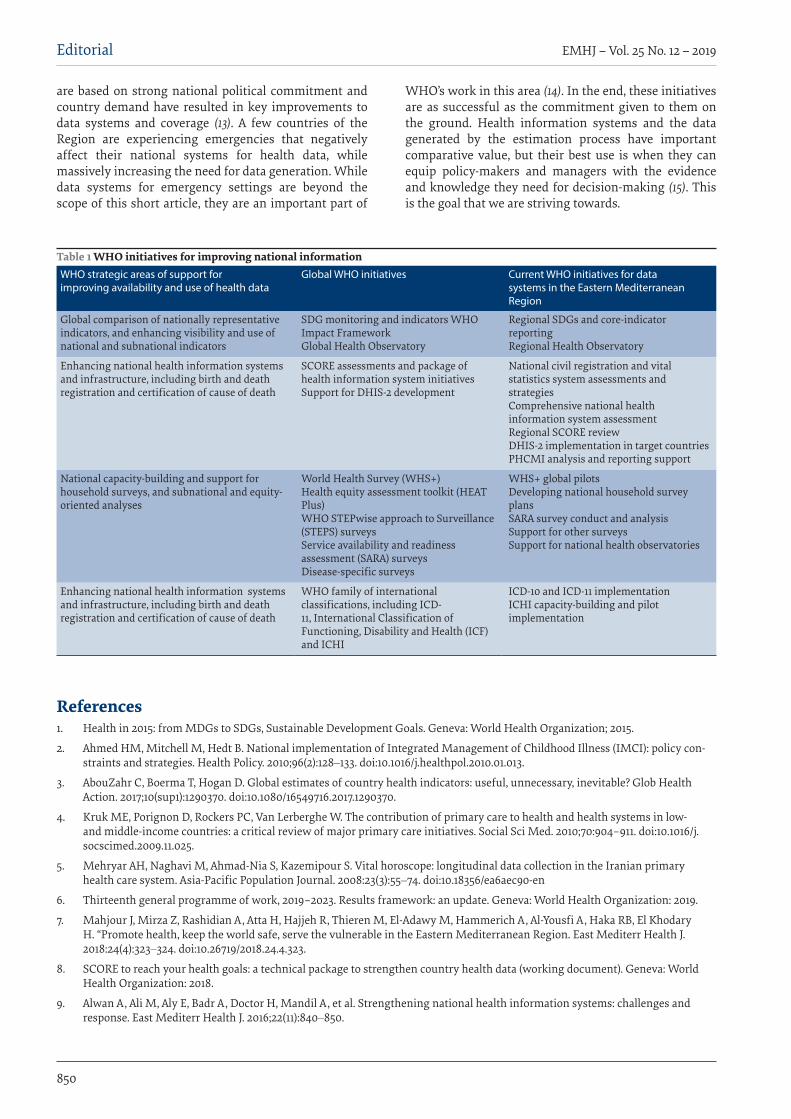
In countries of the Eastern Mediterranean Region, WHO work in this area is within the domains outlined in Table 1. The core health indicators agenda (including the health-related SGD indicators) (9), reflects the global approach to regular reporting of comparable data from countries. The regional civil registration and vital statistics systems agenda is a key initiative in response to the many limitations of the current systems in most countries of the Region, and is focused on timely and complete registration of deaths, and accurate certification of the cause of death (10). Regarding surveys, WHO supported the conduct of its first pilot of the new World Health Survey approach (WHS+) in 2016 in Tunisia and a model national survey plan has been developed for use by countries. This was a response to the observation that in many countries surveys were done as a response to global or donor requests rather than national needs, and that many surveys with considerable overlap were conducted too close to each other, while several years might pass with no national household survey undertaken in the country.
In terms of routine health information system development, regional initiatives have been developed to assess national health information systems (followed by strategy development), and a programme of capacity-building for countries in need of District Health Information Software 2 (DHIS-2) package implementation has been carried out (11). Recently, the agenda has been expanded to include the Primary Health Care Measurement and Improvement Initiative (PHCMI), and a similar approach is being developed for hospital information system support (12). Following the release of the 11th Revision of the International Classification of Diseases (ICD-11), extensive work has been undertaken to support its adoption in countries as the basic standard for data reporting on mortality and morbidity. This work is now being expanded to encompass the International Classification of Health Interventions (ICHI) due to be released in 2020, and technical support is being provided to ensure that all health-related data systems are based on these global approaches and WHO-sanctioned standards for health data.
While the Region faces many structural limitations on national data improvement, these programmes that
Arash Rashidian1
EMHJ – Vol. 25 No. 12 – 2019Editorial
850
are based on strong national political commitment and country demand have resulted in key improvements to data systems and coverage (13). A few countries of the Region are experiencing emergencies that negatively affect their national systems for health data, while massively increasing the need for data generation. While data systems for emergency settings are beyond the scope of this short article, they are an important part of
WHO’s work in this area (14). In the end, these initiatives are as successful as the commitment given to them on the ground. Health information systems and the data generated by the estimation process have important comparative value, but their best use is when they can equip policy-makers and managers with the evidence and knowledge they need for decision-making (15). This is the goal that we are striving towards.
References1. Health in 2015: from MDGs to SDGs, Sustainable Development Goals. Geneva: World Health Organization; 2015.
2. Ahmed HM, Mitchell M, Hedt B. National implementation of Integrated Management of Childhood Illness (IMCI): policy con-straints and strategies. Health Policy. 2010;96(2):128‒133. doi:10.1016/j.healthpol.2010.01.013.
3. AbouZahr C, Boerma T, Hogan D. Global estimates of country health indicators: useful, unnecessary, inevitable? Glob Health Action. 2017;10(sup1):1290370. doi:10.1080/16549716.2017.1290370.
4. Kruk ME, Porignon D, Rockers PC, Van Lerberghe W. The contribution of primary care to health and health systems in low- and middle-income countries: a critical review of major primary care initiatives. Social Sci Med. 2010;70:904–911. doi:10.1016/j.socscimed.2009.11.025.
5. Mehryar AH, Naghavi M, Ahmad-Nia S, Kazemipour S. Vital horoscope: longitudinal data collection in the Iranian primary health care system. Asia-Pacific Population Journal. 2008:23(3):55‒74. doi:10.18356/ea6aec90-en
6. Thirteenth general programme of work, 2019–2023. Results framework: an update. Geneva: World Health Organization: 2019.
7. Mahjour J, Mirza Z, Rashidian A, Atta H, Hajjeh R, Thieren M, El-Adawy M, Hammerich A, Al-Yousfi A, Haka RB, El Khodary H. “Promote health, keep the world safe, serve the vulnerable in the Eastern Mediterranean Region. East Mediterr Health J. 2018:24(4):323‒324. doi:10.26719/2018.24.4.323.
8. SCORE to reach your health goals: a technical package to strengthen country health data (working document). Geneva: World Health Organization: 2018.
9. Alwan A, Ali M, Aly E, Badr A, Doctor H, Mandil A, et al. Strengthening national health information systems: challenges and response. East Mediterr Health J. 2016;22(11):840‒850.
Table 1 WHO initiatives for improving national information WHO strategic areas of support for improving availability and use of health data
Global WHO initiatives Current WHO initiatives for data systems in the Eastern Mediterranean Region
Global comparison of nationally representative indicators, and enhancing visibility and use of national and subnational indicators
SDG monitoring and indicators WHO Impact FrameworkGlobal Health Observatory
Regional SDGs and core-indicator reportingRegional Health Observatory
Enhancing national health information systems and infrastructure, including birth and death registration and certification of cause of death
SCORE assessments and package of health information system initiativesSupport for DHIS-2 development
National civil registration and vital statistics system assessments and strategiesComprehensive national health information system assessmentRegional SCORE reviewDHIS-2 implementation in target countriesPHCMI analysis and reporting support
National capacity-building and support for household surveys, and subnational and equity-oriented analyses
World Health Survey (WHS+)Health equity assessment toolkit (HEAT Plus) WHO STEPwise approach to Surveillance (STEPS) surveysService availability and readiness assessment (SARA) surveysDisease-specific surveys
WHS+ global pilotsDeveloping national household survey plansSARA survey conduct and analysisSupport for other surveysSupport for national health observatories
Enhancing national health information systems and infrastructure, including birth and death registration and certification of cause of death
WHO family of international classifications, including ICD-11, International Classification of Functioning, Disability and Health (ICF) and ICHI
ICD-10 and ICD-11 implementationICHI capacity-building and pilot implementation
851
EMHJ – Vol. 25 No. 12 – 2019Editorial
10. Resolution EM/RC60/R.7. Regional strategy for the improvement of civil registration and vital statistics systems 2014–2019. Cai-ro: WHO Regional Office for the Eastern Mediterranean; 2013 (http://applications.emro.who.int/docs/RC60_Resolutions_2013_R7_15140_EN.pdf?ua=1, accessed 22 December 2019).
11. Sahay S, Rashidian A, Doctor HV. Challenges and opportunities of using DHIS2 to strengthen health information systems in the Eastern Mediterranean Region: A regional approach. Electronic Journal of Information Systems in Developing Countries. 2019. https://doi.org/10.1002/isd2.12108 (https://onlinelibrary.wiley.com/doi/full/10.1002/isd2.12108, accessed 22 December 2019).
12. Rashidian A, Doctor H, Aly E, Badr A. Health information in primary care and family practice: concept, status and a vision for the Eastern Mediterranean Region. In: Salah H, Kidd M, editors. Family practice in the Eastern Mediterranean Region: universal health coverage and quality primary care. Boca Raton FL: CRC Press; 2019:57‒73.
13. Eastern Mediterranean Region: framework for health information systems and core indicators for monitoring health situation and health system performance 2018. Cairo: WHO Regional Office for the Eastern Mediterranean; 2018 (https://rho.emro.who.int/sites/default/files/booklets/EMR-HIS-and-core-indicators-2018.pdf%20, accessed 22 December 2019).
14. Samhouri D, Ijaz K, Rashidian A, Chungong S, Flahault A, Babich SM, Mahjour J. Analysis of Joint External Evaluations in the WHO Eastern Mediterranean Region. East Mediterr Health J. 2018;24(5):477‒487. doi: 10.26719/2018.24.5.477.
15. Rashidian A, Mandil A, Mahjour J. Improving evidence informed policy-making for health in the Eastern Mediterranean Region. East Mediterr Health J. 2017:23(12):793‒794. doi:10.26719/2017.23.10.793.
852
EMHJ – Vol. 25 No. 12 – 2019Research article
Role of climatic factors in the incidence of dengue in Port Sudan City, SudanElsiddig Noureldin 1 and Lynn Shaffer 2
1National Center for Disease Control and Prevention (NCDC), Ministry of Health, Jazan, Saudi Arabia (Correspondence to: Elsiddig Noureldin: [email protected]). 2Trinity Health System, Mount Carmel Health System, Columbus, United States of America
AbstractBackground: Dengue fever outbreaks have occurred in Port Sudan City, Sudan, during the last 2 decades. Climatic factors may play a role in dengue incidence.Aims: This study aimed at discribing the relationship between climatic factors and dengue fever incidence in Port Sudan during 2008–2013.Methods: This ecological study entailed secondary data analysis of dengue fever cases and climate information to explore which climatic factors predict the incidence of dengue fever. The Wilcoxon rank sum test and multiple linear regression examined the association between number of dengue fever cases and climatic factors during lag times of 1–6 months. Results: Relative humidity and maximum and minimum temperatures were correlated with dengue incidence in Port Sudan at different time intervals during 2008–2010. Precipitation and relative humidity were correlated with dengue fever during 2011–2013. However, 3–5-month lagged relative humidity was the strongest explanatory variable for the incidence of dengue.Conclusion: Dengue transmission appears sensitive to climatic variability. Elucidating the role of climatic factors in dengue fever helps in risk assessment and prevention of epidemics.Keywords: dengue, infection control, incidence, climate, Port SudanCitation: Noureldin El; Shaffer L. Role of climatic factors in the incidence of dengue in Port Sudan City, Sudan. East Mediterr Health J. 2019;25(12):852–860. https://doi.org/10.26719/emhj.19.019Received: 29/08/17; accepted: 12/02/18Copyright © World Health Organization (WHO) 2019. Some rights reserved. This work is available under the CC BY-NC-SA 3.0 IGO license (https://creativecommons.org/licenses/by-nc-sa/3.0/igo).
IntroductionDengue is a viral disease transmitted to humans by the bite of infected females of the main mosquito vector Ae-des aegypti and to a lesser extent Aedes albopictus (1). Tradi-tionally, the World Health Organization (WHO) has clas-sified dengue into three categories according to severity: dengue fever, dengue haemorrhagic fever and dengue shock syndrome (2). The clinical characteristics of den-gue are sudden onset of severe fever, pain behind the eyes (retro-orbital), nausea, swollen lymph nodes (lym-phadenopathy), intense headache, muscle pain (myalgia), gastrointestinal problems, joint pain and rash (3). Dengue haemorrhagic fever and dengue shock syndrome cause lethal complications that include severe haemorrhage, plasma leakage, organ impairment, fluid accumulation, and respiratory distress (3).
Dengue fever is considered by WHO to be the most important mosquito-borne viral disease. Dengue incidence has increased > 10-fold throughout the last 3 decades, with a currently estimated 50–100 million annual cases distributed over > 100 countries. WHO has advocated the development of preventive and proactive measures to limit dengue transmission and outbreaks (4).
Previous investigators have examined factors that affect populations of Ae. aegypti and subsequent dengue fever incidence. Unplanned urbanization and climatic factors, including high temperatures and rainfall, might
contribute to epidemics of dengue (5,6). Aedes mosquitoes are found in urban settings, especially in tropical areas, where they maintain a sustainable relationship with humans, which has led to re-emergence of dengue virus infections (7). Climatic factors of temperature, rainfall and humidity are thought to have the most potential to affect the maturation periods, habitats, survival time and vectorial capacity of Aedes mosquitoes (8). Researchers from various geographic areas have reported significant associations between temperature, relative humidity, precipitation and dengue distribution and transmission, e.g., India (9), Thailand (10), Malaysia (11), Viet Nam (12), Philippines (13), Indonesia (14), and Singapore (15). For example, Karim et al. (16) in Dhaka, Bangladesh, found positive significant correlations between the 2-month-lagged relative humidity, rainfall, maximum temperature, and the reported monthly dengue cases. Other researchers reported no effect of climatic factors on the incidence of dengue fever/dengue haemorrhagic fever (15,17). Also, in Central Visayas, Philippines, Picardal and Elnar (18) found no correlation between dengue cases and rainfall or temperature. Given these variable findings, it is possible that the effects of climatic factors such as precipitation, temperature and relative humidity may depend on the normal conditions of a particular geographic area.
In the last 2 decades, Port Sudan City has witnessed several dengue outbreaks, and the incidence of dengue

853
Research article EMHJ – Vol. 25 No. 12 – 2019
was estimated as 94 cases per 10 000 during the 2010 outbreak in which 3765 cases were reported (19,20). There have been no ecological investigations of the role of climatic factors on the incidence of dengue fever in Sudan, particularly in Port Sudan, where most of the dengue fever/dengue haemorrhagic fever in the country has occurred. Since climatic factors are thought to affect the population of Ae. aegypti and dengue fever incidence, this information could be helpful in planning for public health preventive and control measures in this region.
The present study aimed to describe the temporal relationship between climatic factors (maximum and minimum temperatures, relative humidity or rainfall) and the incidence of dengue fever in Port Sudan City, Sudan, during 2008–2013.
MethodsStudy design and settingThis study was an ecological analysis of the association between climatic factors and dengue fever incidence in Port Sudan City, Sudan, for the period 2008–2013. Port Sudan is located on the Red Sea and has an arid (low precipitation) and humid (Mediterranean) climate. The mean maximum temperature is around 40°C in summer (June–September) and the mean minimum temperature is 20.5°C in winter (November–March). Total annual pre-cipitation is 76.1 mm in the rainy season (October–Jan-uary), and the annual average relative humidity is 63% (19,21).
Sampling frameThe sampling frame was the monthly secondary data (datasets) of the dengue fever/dengue haemorrhagic fe-ver cases and the climatic information from 2008 to 2013. The time period 2008–2013 was chosen because it con-tained complete information on dengue fever/dengue haemorrhagic fever cases. The sampling frame included the monthly number of dengue fever/dengue haemor-rhagic fever cases, relative humidity, temperature (max-imum and minimum), and rainfall (precipitation). The data of weekly dengue cases were obtained from the De-partment of Epidemiology, Ministry of Health, Red Sea State, Sudan. All dengue fever cases are required to be re-ported to the health authorities in Port Sudan, namely the Department of Epidemiology, and all suspected cases are sent to local laboratories for confirmation of dengue in-fection. Laboratory tests that are dengue positive are sent to the National Public Health Laboratory in Khartoum for confirmation. The data were captured in an electron-ic dataset. The climatic variables were obtained from the Sudan Meteorological Authority, which collects data on temperature, relative humidity and rainfall in real time through its widely distributed sentinel meteorological stations including one in Port Sudan.
Data analysisIt was noted from the preliminary graphic analysis that the number of dengue cases was higher during 2008
through to most of 2010 and then declined significantly in 2011–2013. The reason behind that was the strong epi-demiological and entomological surveillance and control measures undertaken by the Ministry of Health, Red Sea State to deal with the outbreak that started in June 2010 and continues to the present (Department of Epidemiolo-gy, Red Sea State, personal communication, 2014). There-fore, for the purposes of analysis the study period was split into 2008–2010 and 2011–2013.
Wilcoxon rank sum tests were utilized to examine the association between number of dengue fever/dengue haemorrhagic fever cases and the following factors: minimum temperature, maximum temperature, relative humidity, and rainfall for 1–6 months’ lag time, according to cutoff values for the climatic factors that were identified from preliminary graphic analysis, which indicated threshold relationships between the climatic factors and dengue fever incidence, rather than dose–response relationships. Lag time indicated the number of months between the time when dengue fever cases were reported and the pattern of the climatic factor of interest. The unit of time was months, as weather data were available only in monthly units. Multiple linear regression was used to determine which independent variables still influenced the monthly number of dengue fever/dengue haemorrhagic fever cases during lag time of 1–6 months after taking into account the other climatic factors. SPSS version 20 was used for statistical analysis.
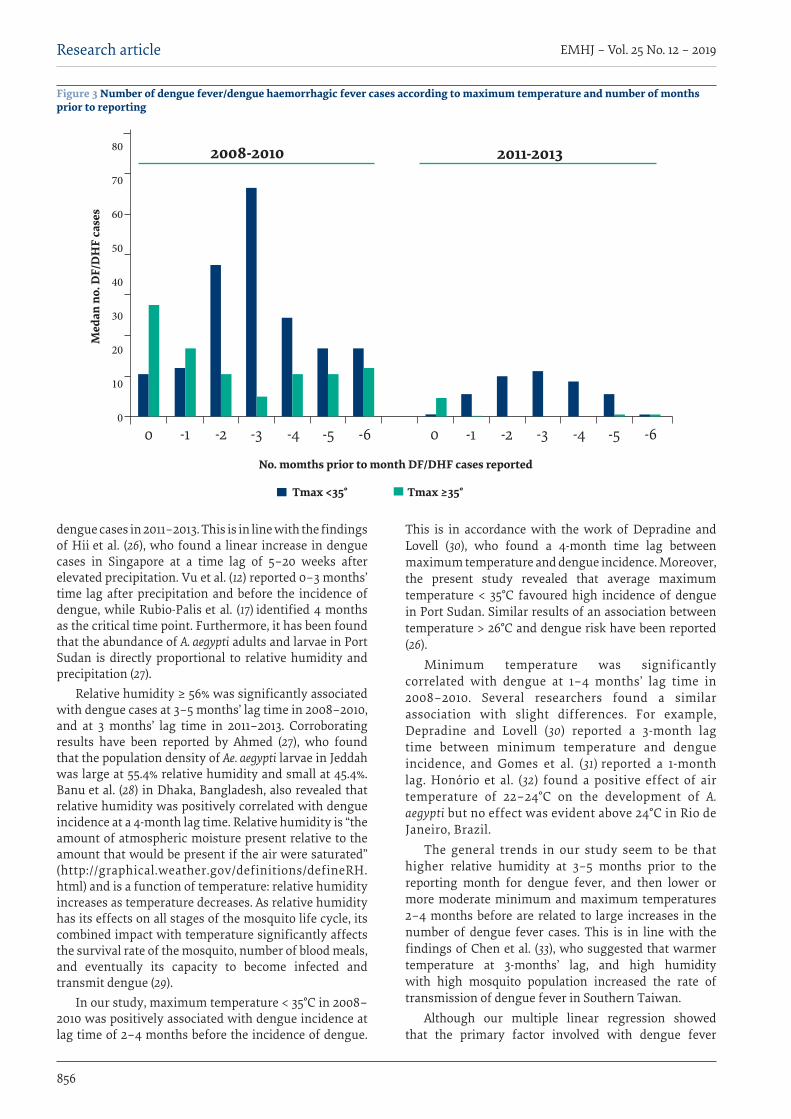
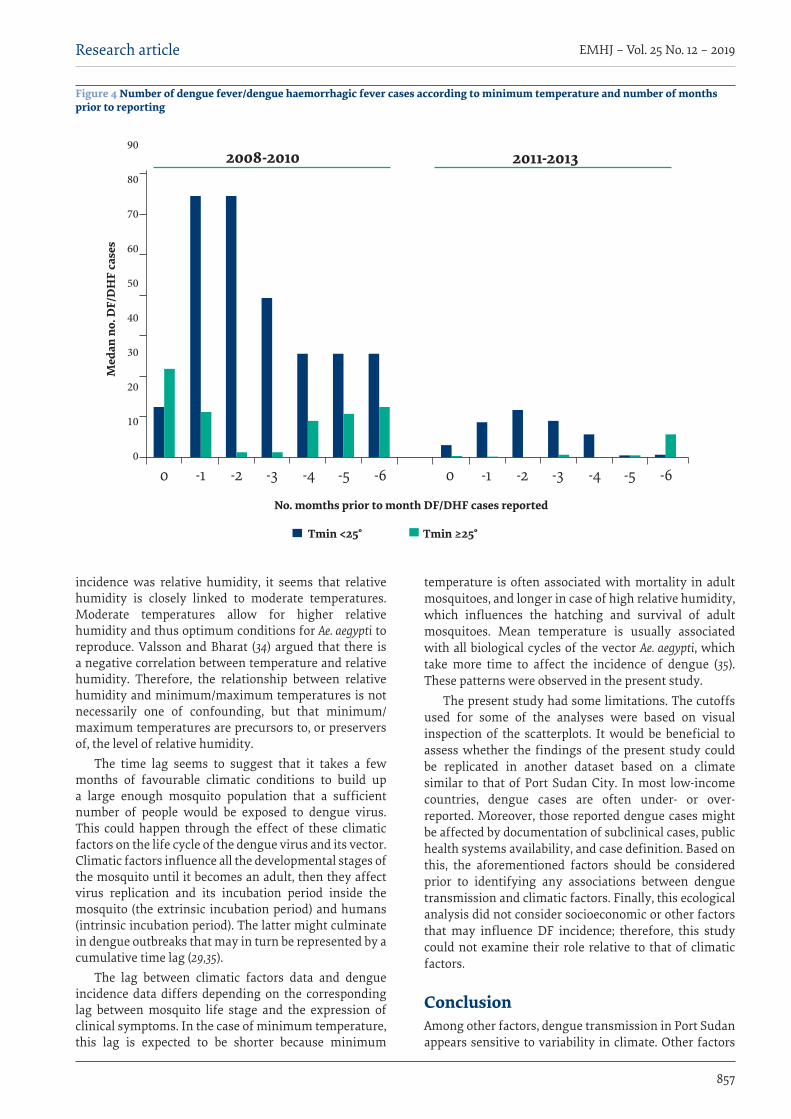
ResultsFigures 1–4 illustrate the relationships between precip-itation, relative humidity and maximum and minimum temperature and the number of dengue fever/dengue haemorrhagic fever cases for 2008–2010 and 2011–2013. For each climatic factor, the histogram bars show the me-dian number of dengue fever/dengue haemorrhagic fe-ver cases according to whether the monthly average fac-tor was above or below the threshold value derived from graphical analysis (vertical axis), and the time lag for that particular climatic factor (horizontal axis). The number on the horizontal axis represents the number of months between the measurement of the climatic factor and the reporting of the dengue fever/dengue haemorrhagic fever cases, with negative numbers to indicate that the climatic measurement took place prior to the occurrence of the dengue fever/dengue haemorrhagic fever cases. It should be noted that although the shape of the trends for Figures 1–4 are similar for the two time periods, the total number of cases was smaller during 2011–2013.
Precipitation Although there were some differences in the number of dengue fever/dengue haemorrhagic fever cases accord-ing to whether there was any rainfall 4–6 months prior to the dengue fever/dengue haemorrhagic fever reporting month, precipitation was not correlated with dengue inci-dence during any of the 6 months lag time during 2008–2010 (all P > 0.05, Figure 1). Nevertheless, the incidence of dengue cases at average precipitation > 0 exceeded that of

854
EMHJ – Vol. 25 No. 12 – 2019Research article
dengue incidence when there was no recorded precipita-tion in all months except 0 and 1 month prior to the dengue fever/dengue haemorrhagic fever reporting month during 2008–2010 (Figure 1). In contrast, for 2011–2013, although the total number of dengue fever cases was lower, the oc-currence of any precipitation during 5 or 6 months prior to the dengue fever reporting month was associated with a significantly elevated number of cases (P = 0.0433 and 0.0298, respectively). The shape of this trend is similar to that observed for the time period 2008–2010 in that the dif-ference in number of dengue fever/dengue haemorrhagic fever cases between conditions of no precipitation versus at least some precipitation was most extreme at 4, 5 and 6 months prior to the dengue fever/dengue haemorrhagic fever reporting period.
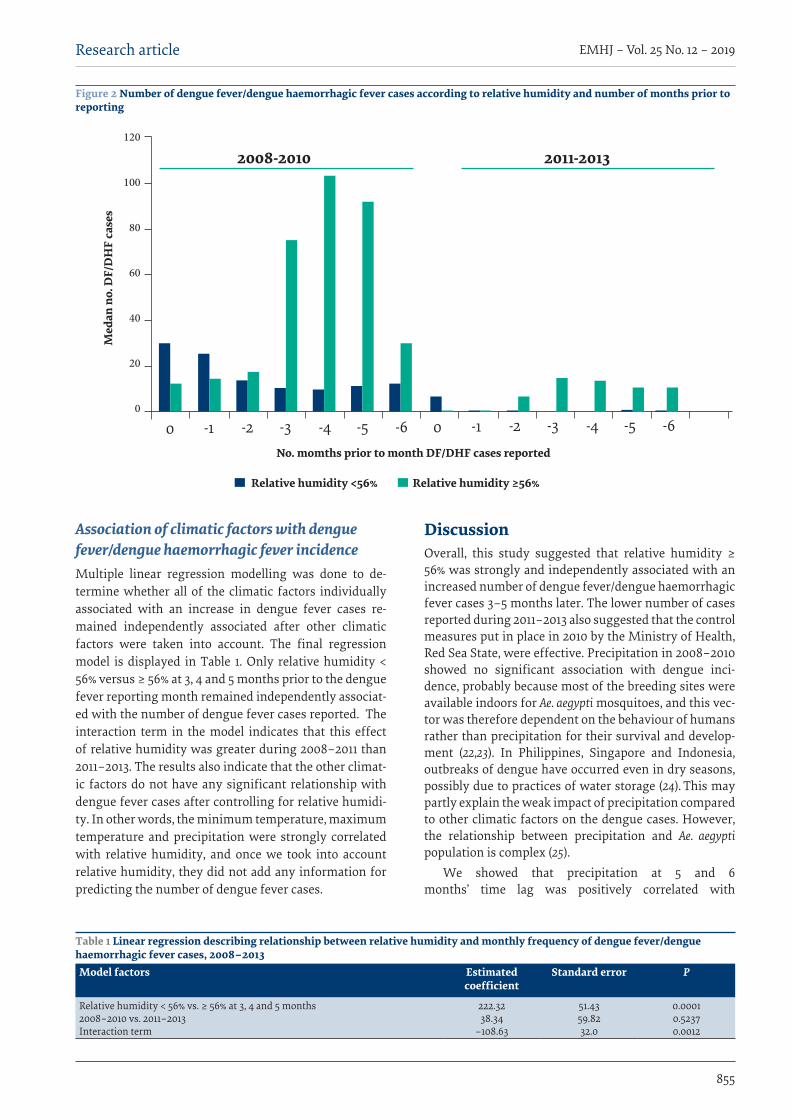
Relative humidity For 2008–2010, relative humidity started to show a positive association with dengue fever/den-gue haemorrhagic fever at the 3-month lag time (P = 0.0025) and continued at 4 months (P = 0.0003) and 5 months (P = 0.0037) (Figure 2). The highest occurrence of average (rather than median) number of dengue cases cor-related with high relative humidity at the 3-month (246.4), 4-month (253.8) and 5-month (226.4) lag times. Relative hu-midity < 56% compared to ≥ 56% during 3–5 months prior to the dengue fever/dengue haemorrhagic fever reporting month produced the largest difference between numbers of cases during 2008–2010. For 2011–2013, relative humid-
ity ≥ 56% was significantly associated with an increased number of dengue fever cases only at 3 months prior to the reporting of those cases, with 21.8 average (rather than median) monthly reported dengue cases compared to 6.2 cases when relative humidity was < 56% (P = 0.0202).
Maximum temperatureIn 2008–2010, maximum temperature was significantly correlated with dengue at the 2-, 3- and 4-month lag times (P = 0.0196, 0.0027 and 0.0365, respectively. (Figure 3). It appeared that average maximum temperature < 35°C fa-voured high incidence of dengue, with average (rather than median) numbers of dengue fever/dengue haemor-rhagic fever cases of 220.8, 217.4 and 186.2, respectively, compared to only 26.5, 18.7 and 49.1 when the average max-imum temperature was ≥ 35°C. No significant trends were seen with respect to maximum temperature for 2011–2013 (all P > 0.05).
Minimum temperature The minimum temperature was significantly correlat-ed with dengue at the 1-, 2-, 3- and 4-month lag times (P = 0.0427, 0.0012, 0.0024 and 0.0215, respectively) during 2008–2010 (Figure 4). The incidence of dengue was signif-icantly increased when the minimum temperature was < 25°C compared to ≥ 25°C. No significant trends were seen with respect to minimum temperature for 2011–2013 (all P > 0.05).
Figure 1 Number of dengue fever/dengue haemorrhagic fever cases according to the occurrence of precipitation and number of months prior to reporting
70
60
50
40
30
20
10
0
2008-2010 2011-2013
No. momths prior to month DF/DHF cases reported
Med
an n
o. D
F/D
HF
case
s
No precipitation Precipitation
0 -1 -2 -3 -4 -5 -6 0 -1 -2 -3 -4 -5 -6
855
Research article EMHJ – Vol. 25 No. 12 – 2019
Association of climatic factors with dengue fever/dengue haemorrhagic fever incidenceMultiple linear regression modelling was done to de-termine whether all of the climatic factors individually associated with an increase in dengue fever cases re-mained independently associated after other climatic factors were taken into account. The final regression model is displayed in Table 1. Only relative humidity < 56% versus ≥ 56% at 3, 4 and 5 months prior to the dengue fever reporting month remained independently associat-ed with the number of dengue fever cases reported. The interaction term in the model indicates that this effect of relative humidity was greater during 2008–2011 than 2011–2013. The results also indicate that the other climat-ic factors do not have any significant relationship with dengue fever cases after controlling for relative humidi-ty. In other words, the minimum temperature, maximum temperature and precipitation were strongly correlated with relative humidity, and once we took into account relative humidity, they did not add any information for predicting the number of dengue fever cases.
DiscussionOverall, this study suggested that relative humidity ≥ 56% was strongly and independently associated with an increased number of dengue fever/dengue haemorrhagic fever cases 3–5 months later. The lower number of cases reported during 2011–2013 also suggested that the control measures put in place in 2010 by the Ministry of Health, Red Sea State, were effective. Precipitation in 2008–2010 showed no significant association with dengue inci-dence, probably because most of the breeding sites were available indoors for Ae. aegypti mosquitoes, and this vec-tor was therefore dependent on the behaviour of humans rather than precipitation for their survival and develop-ment (22,23). In Philippines, Singapore and Indonesia, outbreaks of dengue have occurred even in dry seasons, possibly due to practices of water storage (24). This may partly explain the weak impact of precipitation compared to other climatic factors on the dengue cases. However, the relationship between precipitation and Ae. aegypti population is complex (25).
We showed that precipitation at 5 and 6 months’ time lag was positively correlated with
Figure 2 Number of dengue fever/dengue haemorrhagic fever cases according to relative humidity and number of months prior to reporting
120
100
80
60
40
20
0
2008-2010 2011-2013
No. momths prior to month DF/DHF cases reported
Med
an n
o. D
F/D
HF
case
s
Relative humidity <56% Relative humidity ≥56%
0 -1 -2 -3 -4 -5 -6 0 -1 -2 -3 -4 -5 -6
Table 1 Linear regression describing relationship between relative humidity and monthly frequency of dengue fever/dengue haemorrhagic fever cases, 2008–2013Model factors Estimated
coefficientStandard error P
Relative humidity < 56% vs. ≥ 56% at 3, 4 and 5 months2008–2010 vs. 2011–2013Interaction term
222.3238.34
−108.63
51.4359.8232.0
0.00010.52370.0012
856
EMHJ – Vol. 25 No. 12 – 2019Research article
dengue cases in 2011–2013. This is in line with the findings of Hii et al. (26), who found a linear increase in dengue cases in Singapore at a time lag of 5–20 weeks after elevated precipitation. Vu et al. (12) reported 0–3 months’ time lag after precipitation and before the incidence of dengue, while Rubio-Palis et al. (17) identified 4 months as the critical time point. Furthermore, it has been found that the abundance of A. aegypti adults and larvae in Port Sudan is directly proportional to relative humidity and precipitation (27).
Relative humidity ≥ 56% was significantly associated with dengue cases at 3–5 months’ lag time in 2008–2010, and at 3 months’ lag time in 2011–2013. Corroborating results have been reported by Ahmed (27), who found that the population density of Ae. aegypti larvae in Jeddah was large at 55.4% relative humidity and small at 45.4%. Banu et al. (28) in Dhaka, Bangladesh, also revealed that relative humidity was positively correlated with dengue incidence at a 4-month lag time. Relative humidity is “the amount of atmospheric moisture present relative to the amount that would be present if the air were saturated” (http://graphical.weather.gov/definitions/defineRH.html) and is a function of temperature: relative humidity increases as temperature decreases. As relative humidity has its effects on all stages of the mosquito life cycle, its combined impact with temperature significantly affects the survival rate of the mosquito, number of blood meals, and eventually its capacity to become infected and transmit dengue (29).
In our study, maximum temperature < 35°C in 2008–2010 was positively associated with dengue incidence at lag time of 2–4 months before the incidence of dengue.
This is in accordance with the work of Depradine and Lovell (30), who found a 4-month time lag between maximum temperature and dengue incidence. Moreover, the present study revealed that average maximum temperature < 35°C favoured high incidence of dengue in Port Sudan. Similar results of an association between temperature > 26°C and dengue risk have been reported (26).
Minimum temperature was significantly correlated with dengue at 1–4 months’ lag time in 2008–2010. Several researchers found a similar association with slight differences. For example, Depradine and Lovell (30) reported a 3-month lag time between minimum temperature and dengue incidence, and Gomes et al. (31) reported a 1-month lag. Honório et al. (32) found a positive effect of air temperature of 22–24°C on the development of A. aegypti but no effect was evident above 24°C in Rio de Janeiro, Brazil.
The general trends in our study seem to be that higher relative humidity at 3–5 months prior to the reporting month for dengue fever, and then lower or more moderate minimum and maximum temperatures 2–4 months before are related to large increases in the number of dengue fever cases. This is in line with the findings of Chen et al. (33), who suggested that warmer temperature at 3-months’ lag, and high humidity with high mosquito population increased the rate of transmission of dengue fever in Southern Taiwan.
Although our multiple linear regression showed that the primary factor involved with dengue fever
Figure 3 Number of dengue fever/dengue haemorrhagic fever cases according to maximum temperature and number of months prior to reporting
80
70
60
50
40
30
20
10
0
2008-2010 2011-2013
No. momths prior to month DF/DHF cases reported
Med
an n
o. D
F/D
HF
case
s
Tmax <35° Tmax ≥35°
0 -1 -2 -3 -4 -5 -6 0 -1 -2 -3 -4 -5 -6
857
Research article EMHJ – Vol. 25 No. 12 – 2019
Figure 4 Number of dengue fever/dengue haemorrhagic fever cases according to minimum temperature and number of months prior to reporting
incidence was relative humidity, it seems that relative humidity is closely linked to moderate temperatures. Moderate temperatures allow for higher relative humidity and thus optimum conditions for Ae. aegypti to reproduce. Valsson and Bharat (34) argued that there is a negative correlation between temperature and relative humidity. Therefore, the relationship between relative humidity and minimum/maximum temperatures is not necessarily one of confounding, but that minimum/maximum temperatures are precursors to, or preservers of, the level of relative humidity.
The time lag seems to suggest that it takes a few months of favourable climatic conditions to build up a large enough mosquito population that a sufficient number of people would be exposed to dengue virus. This could happen through the effect of these climatic factors on the life cycle of the dengue virus and its vector. Climatic factors influence all the developmental stages of the mosquito until it becomes an adult, then they affect virus replication and its incubation period inside the mosquito (the extrinsic incubation period) and humans (intrinsic incubation period). The latter might culminate in dengue outbreaks that may in turn be represented by a cumulative time lag (29,35).
The lag between climatic factors data and dengue incidence data differs depending on the corresponding lag between mosquito life stage and the expression of clinical symptoms. In the case of minimum temperature, this lag is expected to be shorter because minimum
temperature is often associated with mortality in adult mosquitoes, and longer in case of high relative humidity, which influences the hatching and survival of adult mosquitoes. Mean temperature is usually associated with all biological cycles of the vector Ae. aegypti, which take more time to affect the incidence of dengue (35).
These patterns were observed in the present study.The present study had some limitations. The cutoffs
used for some of the analyses were based on visual inspection of the scatterplots. It would be beneficial to assess whether the findings of the present study could be replicated in another dataset based on a climate similar to that of Port Sudan City. In most low-income countries, dengue cases are often under- or over-reported. Moreover, those reported dengue cases might be affected by documentation of subclinical cases, public health systems availability, and case definition. Based on this, the aforementioned factors should be considered prior to identifying any associations between dengue transmission and climatic factors. Finally, this ecological analysis did not consider socioeconomic or other factors that may influence DF incidence; therefore, this study could not examine their role relative to that of climatic factors.
ConclusionAmong other factors, dengue transmission in Port Sudan appears sensitive to variability in climate. Other factors
90
80
70
60
50
40
30
20
10
0
2008-2010 2011-2013
No. momths prior to month DF/DHF cases reported
Med
an n
o. D
F/D
HF
case
s
Tmin <25° Tmin ≥25°
0 -1 -2 -3 -4 -5 -6 0 -1 -2 -3 -4 -5 -6

858
EMHJ – Vol. 25 No. 12 – 2019Research article
Rôle des facteurs climatiques dans l'incidence de la dengue dans la ville de Port Soudan, SoudanRésuméContexte : Des flambées de dengue sont survenues dans la ville de Port Soudan (Soudan) au cours des deux dernières décennies. Les facteurs climatiques peuvent jouer un rôle dans l'incidence de cette maladie.Objectif : La présente étude avait pour objectif de décrire la relation entre les facteurs climatiques et l'incidence de la dengue à Port Soudan au cours de la période 2008-2013.Méthodes : La présente étude écologique comprenait l'analyse de données secondaires sur les cas de dengue et des informations climatiques afin d'étudier les facteurs climatiques qui permettent de prévoir l'incidence de la dengue. Le test de la somme des rangs de Wilcoxon et la régression linéaire multiple ont permis d’examiner l'association entre le nombre de cas de dengue et les facteurs climatiques pendant des périodes de 1 à 6 mois. Résultats : L'humidité relative et les températures maximales et minimales ont été corrélées avec l'incidence de la dengue à Port Soudan à différents intervalles de temps au cours de la période 2008-2010. Les précipitations et l'humidité relative ont été corrélées avec la dengue au cours de la période 2011-2013. Cependant, l’effet différé de l'humidité relative 3 à 5 mois plus tard était la variable explicative la plus forte pour l'incidence de la dengue.Conclusion : La transmission de la dengue semble sensible à la variabilité climatique. L'élucidation du rôle des facteurs climatiques dans la dengue contribue à l'évaluation des risques et à la prévention des épidémies.
دور العوامل املناخية يف اإلصابة بحمى الضنك يف مدينة بورتسودان يف السودانالصديق نور الدين، لني شافر
اخلالصةاخللفية: حدثت أوبئة محى الضنك يف مدينة بورتسودان بالسودان خالل العقدين األخريين. وربام يكون للعوامل املناخية دور يف اإلصابة بحمى
الضنك.هدفت هذه الدراسة إىل وصف العالقة بني العوامل املناخية ومعدالت اإلصابة بحمى الضنك يف مدينة بورتسودان خالل الفرتة من األهداف:
2008 إىل 2013طرق البحث: تطلبت هذه الدراسة البيئية حتليل بيانات ثانوية عن حاالت محى الضنك، ومعلومات مناخية الستكشاف العوامل املناخية التي تتنبأ باإلصابة بحمى الضنك. ونظر "اختبار ويلكوكُسن للَمْرَتبة واملجموع" واالنحدار اخلطي املتعدد يف العالقة بني عدد حاالت محى الضنك والعوامل
املناخية خالل فارق زمني يرتاوح من شهر إىل 6 أشهر. النتائج: وجد ارتباط بني الرطوبة النسبية ودرجات احلرارة القصوى والدنيا من جهة، ومعدالت اإلصابة بحمى الضنك يف بورتسودان من جهة أخرى يف فرتات زمنية خمتلفة خالل الفرتة من 2008 إىل 2010. كام وجد ارتباط بني هطول األمطار والرطوبة النسبية من جهة واإلصابة بحمى الضنك من جهة أخرى خالل الفرتة من 2011 إىل 2013. ومع ذلك، كانت الرطوبة النسبية املتأخرة ملدة ترتاوح من 3 إىل 5 أشهر أقوى متغري
تفسريي ملعدالت اإلصابة بحمى الضنك.تقدير الضنك عىل املناخية يف اإلصابة بحمى العوامل دور توضيح املناخ. ويساعد بتقلب يتأثر الضنك انتقال عدوى محى أن يبدو االستنتاج:
املخاطر والوقاية من األوبئة.
may include, but are not limited to, human population level, mobility, socioeconomic status, population’s im-mune status, and human–mosquito interaction. Increas-ing urbanization around Port Sudan has led to a rise in population. This suggests continued likelihood of den-gue fever outbreaks and the need to develop prevention and control mechanisms. As a port, dengue outbreaks in Port Sudan may represent dangers to surrounding cities, or of transporting dengue to other locations via ships. It is important to elucidate the role of climatic factors in dengue transmission because it helps in risk assessment of epidemics and facilitates preventive actions. This is especially relevant given that time lags of 2–5 months were identified, which allows for adequate planning. Fu-ture studies should integrate the analysis of climatic and
nonclimatic factors that maintain a sustainable viral cir-culation, such as human population size, human renewal rate, household infestation, and ratio of mosquito vectors per person.
The results of this study should help to strengthen dengue surveillance and control programs in Port Sudan City, and to establish climate-based outbreak alert and early warning systems for dengue in the city and Sudan as a whole. Health authorities can synchronize efforts across meteorological departments, research institutions, and national surveillance systems to develop and integrate a climate-based dengue forecasting system.
Funding: None.
Competing interests: None declared.

859
Research article EMHJ – Vol. 25 No. 12 – 2019
References1. Dengue: guidelines for diagnosis, treatment, prevention and control: new edition. Geneva: World Health Organization; 2009
(WHO/HTM/NTD/DEN/2009.1; https://apps.who.int/iris/bitstream/handle/10665/44188/9789241547871_eng.pdf;jsession-id=9D1A2B484148F3953ED915F732DC598C?sequence=1, accessed 16 April 2019).
2. Dengue haemorrhagic fever: diagnosis, treatment, prevention and control. 2nd edition. Geneva: World health Organization; 1997 (https://apps.who.int/iris/bitstream/handle/10665/41988/9241545003_eng.pdf?sequence=1&isAllowed=y, accessed 16 April 2019).
3. Dengue [website]. World Health Organization (http://apps.who.int/tdr/svc/diseases/dengue, accessed 16 April 2019).
4. Report of a WHO technical working group meeting on dengue prevention and control. Geneva: World Health Organization; 2012 (http://www.who.int/denguecontrol/Summary_Technical_working_group_meeting.pdf?ua=1 2012, accessed 16 April 2019).
5. Crowell G, Cazelles B, Broutin H, Munayco CV. The influence of geographic and climate factors on the timing of dengue epi-demics in Peru, 1994–2008. BMC Infect Dis. 2011 Jun 8;11:164. http://dx.doi.org/10.1186/1471-2334-11-164 PMID:21651779
6. Banu S, Hu W, Hurst C, Tong S. Dengue transmission in the Asia–Pacific region: impact of climate change and socio-environ-mental factors. Trop Med Int Health. 2011 May;16(5):598–607. http://dx.doi.org/10.1111/j.1365-3156.2011.02734 PMID:21320241
7. Su GL. Correlation of climatic factors and dengue incidence in Metro Manila, Philippines. Ambio. 2008 Jun;37(4):292–294. PMID:18686509
8. Wu PC, Lay JG, Guo HR, Lin CY, Lung SC, Su HJ. Higher temperature and urbanization affect the spatial patterns of dengue fever transmission in subtropical Taiwan. Sci Total Environ. 2009 Mar 15;407(7):2224–2233.
9. Sankari T, Hoti SL, Bhubonchandra Singh Th, Shanmugavel J. Outbreak of dengue virus serotype-2 (DENV-2) of Cambodian origin in Manipur, India – association with meteorological factors. Ind J Med Res. 2012 Oct;136(4):649–665. PMID:23168706
10. Promprou S, Jaroensutasinee M, Jaroensutasinee K. Climatic factors affecting dengue haemorrhagic fever incidence in Southern Thailand. Dengue Bull. 2005 Dec;29:41–48.
11. 11. Nazri CD, Abu Hassan A, Abd Latif Z, Rodziah I. Impact of climate and land use variability based on dengue epidemic outbreak in Subang Jaya. In: Proceedings of Humanities, Science and Engineering (CHUSER), 2011 IEEE Colloquium, Penang, Malaysia, 5–6 December, 2011.
12. Vu HH, Okumura J, Hashizume M, Tran DN, Yamamoto T. Regional differences in the growing incidence of dengue fever in Vietnam explained by weather variability. Trop Med Health. 2014 Mar;42(1):25–33. http://dx.doi,org/10.2149/tmh.2013-24 PMID:24808744
13. Opena ELL, Teves FG. Climate and the incidence of dengue fevers in Iligan City, the Philippines. Asia–Pacific J Soc Sci. 2011(Spe-cial Issue):114–131.
14. Zulfaidah PG, Nobukazu N. Climatic variability and dengue hemorrhagic fever incidence in Nganjuk district, East Java Indone-sia. Acta Biologica Malaysiana. 2013;2:31–39.
15. Wang ZC, Hoong MH, Martin LL, Gary KK. Delayed effects of climate variables on incidence of dengue in Singapore during 2000–2010. APCBEE Procedia 2012;1:22–26.
16. Karim MN, Munshi SU, Anwar N, Alam MS. Climatic factors influencing dengue cases in Dhaka city: A model for dengue pre-diction. Indian J Med Res. 2012 Jul;136(1):32–39. PMID:22885261
17. Rubio-Palis Y, Pérez-Ybarra LM, Infante-Ruíz M, Comach G, Urdaneta-Márquez L. Influence of climatic variables on dengue cases and abundance of Aedes aegypti (Diptera: Culicidae) in Maracay, Venezuela. Boletín de Malariología y Salud Ambiental. 2011 Dec;51(2):145–157.
18. Picardal JP, Elnar AR. Rainfall, temperature and the incidence of dengue in Central Visayas, Philippines are not correlated. CNU J Higher Educ. 2012;661–70.
19. Seidahmed OME, Hassan SA, Soghaier MA, Siam HAM, Ahmed FTA, Elkarsany MM et al. Spatial and temporal patterns of den-gue transmission along a Red Sea coastline: a longitudinal entomological and serological survey in Port Sudan City. PLoS Negl Trop Dis. 2012; 6(9):e1821. http://dx.doi.org/10.1371/journal.pntd.0001821 PMID:23029582
20. Seidahmed OME, Siam HAM, Soghaier MA, Abubakr M, Osman HA, Abd Elrhman LS, et al. Dengue vector control and surveillance during a major outbreak in a coastal Red Sea area in Sudan. East Mediterr Health J. 2012 Dec;18(12):1217–1224. PMID:23301396
21. Sudan [website] World Meteorological Organization (http://www.worldweather.org/085/c01535.htm, accessed 16 April 2019).
22. Saifur RGM, Dieng H, Hassan AA, Salmah MRC, Satho T, Miake F, et al. Changing domesticity of Aedes aegypti in Northern Peninsular Malaysia: reproductive consequences and potential epidemiological implications. PLoS One. 2012;7(2):e30919. http://dx.doi.org/10.1371/journal.pone.0030919 PMID:22363516
23. Moore CG, Cline BL, Ruiz-Tiben E, Lee D, Romney-Joseph H, Rivera-Correa E. Aedes aegypti in Puerto Rico: environmental determinants of larval abundance and relation to dengue virus transmission. Am J Trop Med Hyg. 1978 Nov; 27(6):1225–1231. PMID:727328
24. Aiken SR, Frost DB, Leigh CH. Dengue hemorrhagic fever and rainfall in Peninsular Malaysia: some suggested relationships. Soc
860
EMHJ – Vol. 25 No. 12 – 2019Research article
Sci Med D Med Geog. 1980 Sep;14(3):307–316. https://doi.org/10.1016/0160-8002(80)90043-X
25. Gage KL, Burkot TR, Eisen RJ, Hayes EB. Climate and vector-borne diseases. Am J Prev Med. 2008 Nov; 35(5):436–450. PMID: 18929970.
26. Hii YL, Rocklöv J, Nawi Ng, Tang CS, Pang FY, Sauerborn R. Climate variability and increase in intensity and magnitude of dengue incidence in Singapore. Glob Health Action. 2009 Nov 11;2 http://dx.doi.org/0.3402/gha.v2i0.2036 PMID:20052380
27. Ahmed YE. The effect of climatic factors on abundance of Aedes aegypti L. and transmission of dengue fever in Port Sudan (Sudan) and Jeddah (Saudi Arabia) [thesis]. University of Khartoum; 2014.
28. Banu S, Hu W, Hurst C, Tong S. Dengue transmission in the Asia–Pacific region: impact of climate change and socio-environ-mental factors. Trop Med Int Health. 2011 May;16(5):598–607. http://dx.doi,org/10.1111/j. 2011; 1365-3156.2011.02734 PMID:21320241
29. McMichael A, Haines A, Slooff R, Kovats R. Climate change and human health: an assessment by a task group on behalf of the World Health Organization. Geneva: World Health Organization, World Meteorological Association, United Nations Environ-ment Programme; 1996 (http://www.who.int/iris/handle/10665/62989, accessed 16 April 2019).
30. Depradine C, Lovell E. Climatological variables and the incidence of Dengue fever in Barbados. Int J Environ Health Res. 2004 Dec;14(6):429–441. PMID:15545038
31. Gomes AF, Nobre AA, Cruz OG. Temporal analysis of the relationship between dengue and meteorological variables in the city of Rio de Janeiro, Brazil, 2001–2009. Cad Saúde Pública. 2012 Nov;28(11):2189–97. PMID:23147960
32. Honório NA, Codeço CT, Alves FC, Magalhães M. Temporal distribution of Aedes aegypti in different districts of Rio de Janeiro, Brazil, measured by two types of traps. J Med Entomol. 2009 Sep;46(5):1001–14.
33. Chen SC, Liao CM, Chio CP, Chou HH, You SH, Cheng YH. Lagged temperature effect with mosquito transmission potential ex-plains dengue variability in Southern Taiwan: insights from a statistical analysis. Sci Total Environ. 2010 Sep 1;408(19):4069–75. http://dx.doi.org/10.1016/j.scitotenv.2010.05.021 PMID:20542536
34. Valsson S, Bharat A. Impact of air temperature on relative humidity – a study. Architecture Time Space People. 2011 Feb;38–41.
35. Gharbi M, Quenel P, Gustave J, Cassadou S, La Ruche G, Girdary L, et al. Time series analysis of dengue incidence in Guade-loupe, French West Indies: forecasting models using climate variables as predictors. BMC Infect Dis. 2011 Jun 9;11:166. http://dx.doi.org/10.1186/1471-2334-11-166 PMID:21658238

861
Research article EMHJ – Vol. 25 No. 12 – 2019
Coût hospitalier des pathologies invasives à pneumocoque chez les enfants âgés de moins de 15 ans en TunisieArwa Ben Salah,1,2 Sana El Mhamdi,1,2 Manel Ben Fredj,1 Chebil Ben Meriem,2,3 Jihen Bouguila,4 Khaled Ben Helel,5 Lamia Sfaihi,6 Rafiaa Mustapha,7 Mohamed Sfar 8 et Mohamed Soltani 1,2
1Service de Médecine préventive et d’Épidémiologie, Centre hospitalier universitaire (CHU), Monastir (Tunisie). 2Laboratoire de recherche, Épidémiologie appliquée à la santé de la mère et de l’enfant, CHU Monastir, Tunisie. 3Service de Pédiatrie, CHU, Monastir, Tunisie. 4Service de Pédiatrie, CHU Farhat Hached, Sousse, Tunisie. 5Service de Pédiatrie, CHU, Kairouan, Tunisie. 6Service de Pédiatrie, CHU Sfax, Tunisie. 7Service de Pédiatrie, Hôpital régional de Nabeul, Tunisie. 8Service de Pédiatrie, CHU, Mahdia, Tunisie. (Correspondance à Arwa Ben Salah à : [email protected] ).
RésuméContexte : Les infections à pneumocoque sont une cause importante de morbidité et de mortalité dans le monde et en Tunisie. Des données sur le fardeau économique de ces infections sont nécessaires pour éclairer la décision d'inclure le vaccin antipneumococcique dans la vaccination systématique des enfants. Objectifs : La présente étude visait à estimer le coût médical des hospitalisations causées par une pneumococcie invasive (pneumonie et méningite) chez les enfants de moins de 15 ans en Tunisie.Méthode : Une étude prospective multicentrique a été menée dans 15 services de pédiatrie, dans différentes zones socio-économiques de la Tunisie, de juin 2014 à mai 2015. Tous les enfants de moins de 15 ans hospitalisés pour une pneumonie à pneumocoque ou une méningite bactérienne confirmée ont été inclus. Un formulaire de rapport de cas a été rempli pour chaque cas éligible. La méthode des coûts à base d'activités (méthode ABC) a été utilisée pour estimer le coût hospitalier. La saisie des données et l'analyse statistique ont été effectuées à l'aide du logiciel SPSS 20.0.Résultats : Au cours de la période de l'étude, 727 enfants ont été hospitalisés pour une pneumonie à pneumocoque et 60 autres pour une méningite bactérienne, dont 21 (35 %) avaient une méningite à pneumocoque confirmée. Le coût hospitalier médian pour la pneumonie à pneumocoque était de TND 353, 910 et de TND 1680, 632 pour la méningite à pneumocoque. Par extrapolation globale des données, nous avons estimé que près de 1091 hospitalisations pour pneumonie à pneumocoque et 69 hospitalisations pour méningite à pneumocoque surviennent chaque année chez des enfants tunisiens de moins de 15 ans, pour un coût total de TND 502 079, 408.Conclusion : Le fardeau économique des infections à pneumocoque semble être important en Tunisie. Les coûts estimés ne reflètent pas les coûts réels de cette infection. Des études sur le rapport coût-efficacité seraient utiles pour aider les responsables de l'élaboration des politiques à prendre les décisions nécessaires.Mots clés : Pneumonie à pneumocoque ; méningite à pneumocoque ; coût hospitalier ; TunisieCitation : Ben Salah A; El Mhamdi S; Ben Fredj M; Ben Meriem C; Bouguila J; Ben Helel K; et al. Coût hospitalier des pathologies invasives à pneumocoque chez les enfants âgés de moins de 15 ans en Tunisie. East Mediterr Health J. 2018;25(12):861-871. https://doi.org/10.26719/emhj.19.036Reçu : 22/12/16 ; accepté : 27/03/18© Organisation mondiale de la Santé 2019. Certains droits réservés. La présente publication est disponible sous la licence Creative Commons Attribution–Pas d’utilisation commerciale – Partage dans les mêmes conditions 3.0 IGO (CC BY-NC-SA 3.0 IGO ; (https://creativecommons.org/licenses/by-nc-sa/3.0/igo).
IntroductionLe pneumocoque constitue l’un des principaux germes responsables de pneumonie, de méningite et de septicémie chez les enfants (1). Les infections causées par le pneumocoque Streptococcus pneumoniae constituent une cause importante de morbidité et de mortalité partout dans le monde. Chaque année, 826 000 enfants âgés de moins de cinq ans décèdent suite à une infection par le pneumocoque, ce qui correspond à 11 % de tous les décès dans ce groupe d’âge (1). Les progrès réalisés en matière de réanimation et de prise en charge diagnostique et thérapeutique ont certes contribué à la réduction de cette mortalité mais ceci aux dépens d’une charge morbide plus importante, et par conséquent d’un coût plus élevé.
Dans sa note de synthèse de 2012, l’Organisation mondiale de la Santé (OMS) a recommandé l’introduction des vaccins antipneumococciques conjugués dans les programmes nationaux de vaccination des différents pays du monde (2). Deux vaccins conjugués (10-valent
et 13-valent), ayant démontré leur innocuité et efficacité (3–8), sont actuellement disponibles et utilisés dans plus de 100 pays dans le monde entier, dont des pays à revenu faible ou intermédiaire (9). En outre, ces vaccins peuvent être facilement intégrés dans le Programme élargi de vaccination et co-administrés avec d’autres vaccins sans aucun risque d’interaction (2). Toutefois, le processus décisionnel doit se baser sur des données locales et des estimations objectives de la charge morbide et du coût de prise en charge des infections causées par le pneumocoque.
En Tunisie, les données disponibles montrent que ces infections constituent un problème réel de santé publique (10). En effet, l’étude réalisée par Khalifa et al. au Centre hospitalier universitaire (CHU) de Monastir en Tunisie a montré que S. pneumoniae était le germe le plus retrouvé dans les méningites des individus âgés de cinq ans et plus (11). De même, une étude communautaire réalisée par Maalej et al. a montré que S. pneumoniae

862
EMHJ – Vol. 25 No. 12 – 2019Research article
occupait la deuxième position dans les méningites du nourrisson et du petit enfant et la première position dans les méningites de l’enfant de plus de cinq ans (12). La même étude a montré que ce germe se caractérisait par des taux importants de résistance à la pénicilline. Cependant, l’ampleur de ce problème et de sa charge réelle sur le plan des dépenses de santé n’a pas été précisée, d’où l’intérêt de la présente étude.
L’objectif de cette étude était d’estimer le coût hospitalier des méningites et des pneumonies à pneumocoque chez les enfants âgés de moins de 15 ans en Tunisie.
MéthodesType, lieu et population d’étude Il s’agit d’une étude longitudinale prospective multicentrique réalisée entre le 1er juin 2014 et le 31 mai 2015 dans 15 services de pédiatrie, au niveau de huit centres hospitalo-universitaires et trois hôpitaux régionaux, répartis dans différentes régions socio-économiques du pays : district de Tunis (trois sites), régions du nord-ouest (deux sites), du nord-est (trois sites), du centre-est (trois sites), du centre-ouest (un site), du sud-ouest (un site) et du sud-est (trois sites).
Notre population d’étude était constituée de l’ensemble des enfants âgés de moins de 15 ans, hospitalisés dans l’un des sites de l’étude pour pneumonie ou pleuropneumonie à pneumocoque ou méningite bactérienne. Dans cette étude, nous avons exclu les otites à pneumocoque étant donné qu’elles sont souvent traitées en ambulatoire. Nous avons également exclu les septicémies à pneumocoque en raison de la difficulté d’obtention d’une confirmation bactériologique.
Le diagnostic de pneumonie ou pleuropneumonie à pneumocoque était basé sur un ensemble de critères cliniques (fièvre, toux, douleur thoracique, dyspnée, râles crépitants localisés, souffle tubaire, etc.), radiologiques (opacité systématisée pouvant être associée à un épanchement pleural, ou pleurésie sans foyer de pneumonie) et biologiques (hyperleucocytose à polynucléose, CRP [C-reactive protein ‒ protéine C réactive] supérieure à 20 mg/L et isolement de S. pneumoniae à l’hémoculture ou à la culture du liquide pleural). C’est ce dernier critère bactériologique qui permet de confirmer le diagnostic. Toutefois, étant donné que le germe n’est isolé par hémoculture que dans moins de 8 % des cas (13), nous avons inclus dans cette étude les cas « probables », définis comme étant toutes les situations répondant aux critères cliniques, radiologiques et biologiques sans confirmation bactériologique avec une évolution favorable du patient sous antibiothérapie visant S. pneumoniae.
Le diagnostic de méningite bactérienne repose aussi sur un ensemble de critères cliniques (apparition soudaine de fièvre, refus de téter, vomissements, troubles de la conscience, convulsions, hypotonie, fontanelle bombée, céphalée, raideur de la nuque, etc.), de critères biologiques (examen cytobactériologique du
liquide céphalo-rachidien : protéinorachie supérieure à 100 mg/dL, glucorachie inférieure à 50 % de la glycémie, pléiocytose à prédominance neutrophile, et identification du germe par examen direct et/ou culture et/ou recherche d’antigène [Ag] soluble). La confirmation du diagnostic se fait grâce au dernier critère biologique (identification du germe). Ainsi, le cas de méningite est classé en méningite bactérienne à pneumocoque confirmée, méningite bactérienne confirmée à d’autres germes ou méningite bactérienne à germe non identifié. Ce dernier groupe correspond aux cas probables de méningites bactériennes devant les signes cliniques évocateurs et l’examen cytologique du liquide céphalo-rachidien (protéinorachie élevée avec glucorachie diminuée et pléiocytose à prédominance neutrophile) sans confirmation bactériologique par identification du germe en cause. Ils correspondent aux cas de méningites décapitées par une antibiothérapie avant la pratique de la ponction lombaire.
Il convient de noter que les enfants dont le lieu de résidence n’appartient pas aux gouvernorats de l’étude étaient exclus de l’étude. Les méningites néonatales étaient également exclues.
Déroulement de la surveillance et collecte des données Les cas éligibles de chaque site ont été repérés par un médecin coordonnateur de l’enquête (désigné par le chef du service correspondant). Les différentes données sociodémographiques (date de naissance, sexe, lieu de résidence, service d’hospitalisation), ainsi que les données cliniques, biologiques et radiologiques ont été consignées sur une fiche de renseignement spécifique pour chaque type d’infection (pneumonie ou méningite). Ces enfants ont été suivis tout au long de l’hospitalisation afin de notifier les différents soins procurés et médicaments consommés ainsi que l’évolution clinique et la durée totale de séjour.
Calcul du coût Méthode de calcul Pour les besoins de cette étude, nous avons identifié la prise en charge hospitalière des méningites bactériennes et des pneumonies à pneumocoque comme un « service » fourni aux malades et ayant un coût de revient. Ce coût a été par la suite calculé selon la méthode basée sur les activités – méthode ABC (Activity Based Costing). Il s’agit d’une méthode de calcul du coût, issue du domaine industriel (14), qui repose sur une vision transversale de l’entreprise (ici l’hôpital), c’est-à-dire une vision par processus où le concept d’activité joue un rôle central. Partant du constat que ce sont les activités qui consomment les ressources, et que les produits ou services consomment des activités, la méthode ABC se propose, grâce à la description des activités qui sont effectivement réalisées, de comprendre comment les ressources sont effectivement consommées (15). Ainsi le processus de prise en charge hospitalière des méningites

863
Research article EMHJ – Vol. 25 No. 12 – 2019
bactériennes et des pneumonies à pneumocoque consomme différentes ressources qui peuvent être regroupées en trois grandes catégories, selon les activités produites : les ressources utilisées dans les activités de diagnostic biologique et radiologique ; les ressources utilisées dans les activités de soins et de prise en charge thérapeutique ; et les ressources utilisées lors des activités d’hébergement (Figure 1).
Calcul proprement dit
· Coût des activités de diagnostic biologique et radiologique
· Pour chaque patient, nous avons listé l’ensemble des activités de prélèvement de liquide biologique, d’analyse biologique et de diagnostic radiologique.
Ces activités ont été par la suite converties, selon une pondération prédéfinie par le ministère de la Santé, en un nombre d'APB (pour les Activités de Prélèvement de liquide biologique réalisées par un infirmier), de Ke (pour les activités de prélèvement de liquide biologique réalisées par un médecin), de (pour les tests biologiques réalisés aux laboratoires de biologie) et de R (pour les examens Radiologiques réalisés au service de radiologie) (16). En l’absence de données locales spécifiques pour chaque établissement, les coûts unitaires des APB, Ke, B et R utilisés dans cette étude étaient ceux élaborés par le ministère tunisien de la Santé, selon la méthode ABC, et utilisés actuellement pour la tarification des actes de soins : B = 0,16 dinar tunisien (TND) (USD 0,08) ;
Figure 1 Processus de prise en charge d’un enfant admis pour méningite bactérienne ou pneumonie à pneumocoque
Activités d'hébergementHÔtellerie, restauration, matériel et équipement multi-usage, élecricité, etc.
« B »Activités d'analyse
biologique
« APB »« Ke »
Activités de prélèvement
de liquide biologique
« Ke »« Kc »
« VM »Activités
réalisées par un médecin
« AMI »« AMM »
Activités réalisées par un personnel paramédical
Enfa
nt e
ntra
nt p
our P
EC
Enfa
nt so
rtan
t pri
s en
char
ge
« R »Activités de diagnostic
radiologique
Ressources : électricité, réactifs, dispositifs médicaux, personnel médical et paramédical, médicaments produits pharmaceutiques, bâtiments, etc.
PEC : prise en charge
Activités de diagnostic
biologique et radiologique
Activités de soins et de
prise en charge thérapeutique
864
EMHJ – Vol. 25 No. 12 – 2019Research article
R = TND 0,9 (USD 0,46) ; APB = TND 0,8 (USD 0,41) ; Ke = TND 1,2 (USD 0,61) (17). Le taux de change utilisé pour la conversion du dinar tunisien (TND) au dollar des États-Unis (USD) était celui moyen de l’année 2015 : 1 TND = 0,51 USD. Ainsi, pour chaque patient, le coût total des activités de prélèvement de liquide biologique, des activités d’analyse biologique et de diagnostic radiologique était calculé en multipliant le nombre d’APB, de Ke, de B et de R consommés par leurs coûts unitaires respectifs.
· Coût des activités de soins et de prise en charge thérapeutique
· Les différentes activités médicales et paramédicales ont été également listées puis converties en un nombre d'AMI (Activités de soins réalisées par un infirmier), d'AMM (Activités de soins réalisées par un technicien de physiothérapie), de Ke (actes spécialisés réalisés par un médecin et Kc (actes chirurgicaux réalisés par un médecin)(avec AMI = 0,5 TND [USD 0,25] ; AMM = TND 0,6 [USD 0,31] ; de Ke = 1,2 TND [USD 0,61]et1 Kc = 1,4 TND [USD 0,71]). Pour les visites médicales de routine (VM), un nombre moyen de deux visites par jour d’une durée de 15 minutes chacune a été comptabilisé pour chaque patient ; un coût moyen de 4 TND (USD 2) a été estimé par le service financier du CHU Fattouma Bourguiba de Monastir (en se référant au salaire annuel brut d’un médecin spécialiste en pédiatrie et le nombre d’heures travaillées par an) et a été utilisé pour l’ensemble des patients. Ainsi, le coût total de chaque activité était calculé pour chaque patient en multipliant le nombre d’AMI, d’AMM, de Ke, de Kc et de VM consommés par leurs coûts unitaires respectifs. Les dispositifs médicaux utilisés pour les soins et l’administration des médicaments (seringues, branules, perfuseurs, etc.) ainsi que les produits pharmaceutiques (solutés de remplissage, électrolytes, etc.) et médicaments (antibiotiques, antipyrétiques, etc.) consommés par chaque patient étaient également listés. Leurs coûts étaient calculés en multipliant le nombre d’unités consommées par le prix unitaire de chaque produit (prix d’achat de la pharmacie centrale ou prix du marché).
· Coût des activités d’hébergement : coût standard
· Le coût des activités d’hébergement incluant la restauration, la blanchisserie, l’électricité, l’amortissement des bâtiments et des dispositifs et matériels à usage multiple a également été pris en compte. Le coût total était estimé par la multiplication du nombre des journées d’hébergement par le coût unitaire d’une journée. Ce coût unitaire a été estimé par le service financier du CHU Fattouma Bourguiba de Monastir pour chaque catégorie de services : TND 40 (USD 20,4) pour le service de pédiatrie, 170 TND (USD 86,7) pour les unités de soins intensifs pédiatriques et TND 55 (USD 28) pour le service de chirurgie pédiatrique. Ces coûts
étaient calculés en divisant les dépenses annuelles du service correspondant par le nombre de journées d’hospitalisation au cours de cette même année.
Estimation du taux des méningites à pneumocoqueDans le but d’avoir une estimation plus correcte de ce taux, il a fallu inclure dans le numérateur le nombre de méningites dues probablement au pneumocoque. Ce nombre était estimé, dans chaque site, par la multiplication du nombre de méningites bactériennes à germe non identifié par la proportion des méningites à pneumocoque parmi les méningites bactériennes confirmées.
Analyse des donnéesL’ensemble des fiches de collecte des données remplies ont été acheminées au service de médecine préventive et d’épidémiologie du CHU de Monastir. À ce niveau, la saisie des données ainsi que leur analyse ont été effectuées par le logiciel SPSS 20.0. Le taux d’incidence (TI) est défini par le nombre de nouveaux cas d’une maladie (m) apparus pendant une durée donnée (∆t), rapporté au nombre de sujets à risque pendant la période considérée (18). Le TI était calculé pour les gouvernorats où le service de pédiatrie, inclus dans l’étude, est le seul service de pédiatrie qui hospitalise les cas de pneumonie et de méningite dans le gouvernorat, soit 10 gouvernorats. Le nombre de sujets à risque de chaque gouvernorat était estimé grâce aux données démographiques fournies par l’Institut National de la Statistique (19).
Résultats Pneumonies/pleuropneumonies à pneumocoqueCaractéristiques de la population étudiée
Entre juin 2014 et mai 2015, 727 enfants âgés de moins de 15 ans étaient hospitalisés pour pneumonie ou pleuropneumonie à pneumocoque dans les 15 services de pédiatrie inclus dans l’étude. L’âge médian des patients était de 17,3 mois (intervalle interquartile [IIQ] : 8,1-36) et leur sex ratio était de 1,33. La durée médiane de séjour était estimée à 4 jours (IIQ : 3-7) (Tableau 1).
Estimation du taux d’incidence hospitalière des pneumonies/pleuropneumonies à pneumocoque
Le taux d’incidence hospitalière global des pneumonies/pleuropneumonie à pneumocoque chez les enfants de moins de 15 ans dans les 10 gouvernorats a été estimé à 41,3 cas/100 000 enfants.
Estimation du coût hospitalier des pneumonies/pleuropneumonies à pneumocoque
Le coût hospitalier médian était de 353,910 TND (IIQ : 269,209-538,100) [USD 180,5 (IIQ : 137,3-274,4)], avec un coût minimal de 73,500 TND (USD 37,5) et un coût maximal de 6713,542 TND (USD 3423,9). Le coût total occasionné par les hospitalisations
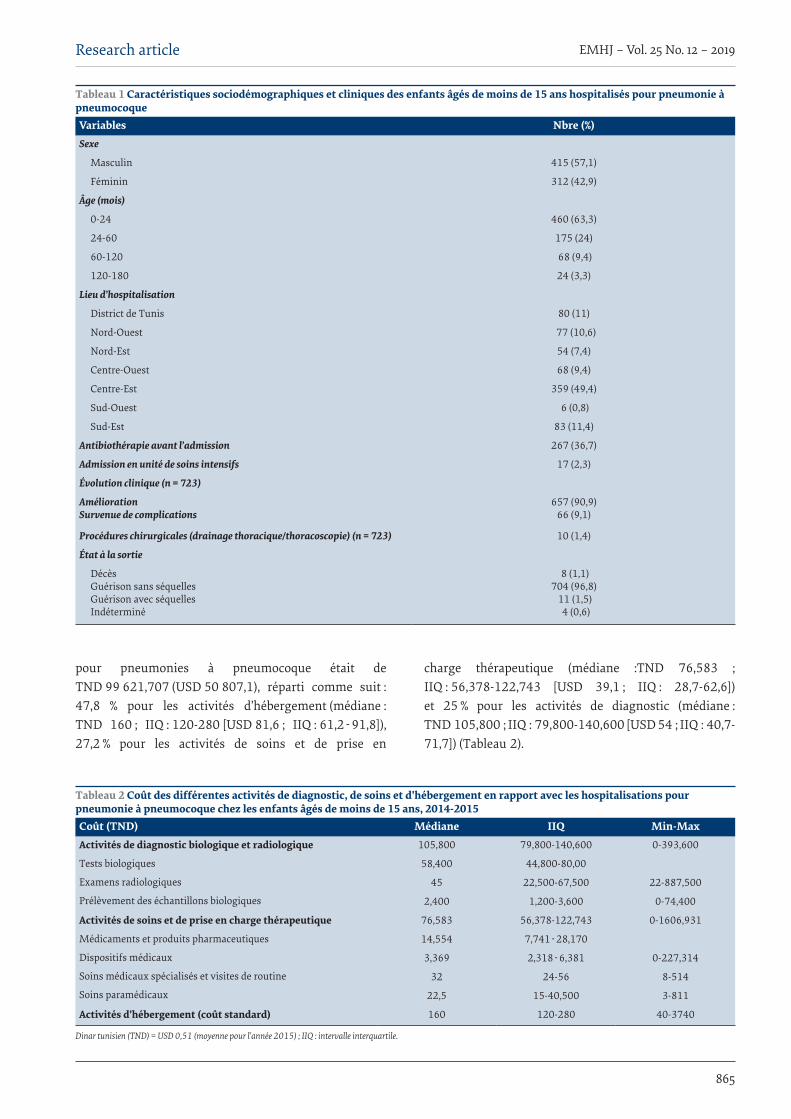
865
Research article EMHJ – Vol. 25 No. 12 – 2019
pour pneumonies à pneumocoque était de TND 99 621,707 (USD 50 807,1), réparti comme suit : 47,8 % pour les activités d’hébergement (médiane : TND 160 ; IIQ : 120-280 [USD 81,6 ; IIQ : 61,2-91,8]), 27,2 % pour les activités de soins et de prise en
charge thérapeutique (médiane :TND 76,583 ; IIQ : 56,378-122,743 [USD 39,1 ; IIQ : 28,7-62,6]) et 25 % pour les activités de diagnostic (médiane : TND 105,800 ; IIQ : 79,800-140,600 [USD 54 ; IIQ : 40,7-71,7]) (Tableau 2).
Tableau 1 Caractéristiques sociodémographiques et cliniques des enfants âgés de moins de 15 ans hospitalisés pour pneumonie à pneumocoqueVariables Nbre (%)Sexe
Masculin 415 (57,1)
Féminin 312 (42,9)
Âge (mois)
0-24 460 (63,3)
24-60 175 (24)
60-120 68 (9,4)
120-180 24 (3,3)
Lieu d’hospitalisation
District de Tunis 80 (11)
Nord-Ouest 77 (10,6)
Nord-Est 54 (7,4)
Centre-Ouest 68 (9,4)
Centre-Est 359 (49,4)
Sud-Ouest 6 (0,8)
Sud-Est 83 (11,4)
Antibiothérapie avant l’admission 267 (36,7)
Admission en unité de soins intensifs 17 (2,3)
Évolution clinique (n = 723)
Amélioration Survenue de complications
657 (90,9)66 (9,1)
Procédures chirurgicales (drainage thoracique/thoracoscopie) (n = 723) 10 (1,4)
État à la sortie
DécèsGuérison sans séquellesGuérison avec séquellesIndéterminé
8 (1,1)704 (96,8)
11 (1,5) 4 (0,6)
Tableau 2 Coût des différentes activités de diagnostic, de soins et d'hébergement en rapport avec les hospitalisations pour pneumonie à pneumocoque chez les enfants âgés de moins de 15 ans, 2014-2015 Coût (TND) Médiane IIQ Min-MaxActivités de diagnostic biologique et radiologique
Tests biologiques
Examens radiologiques
Prélèvement des échantillons biologiques
105,800 79,800-140,600 0-393,600
58,400 44,800-80,00
45 22,500-67,500 22-887,500
2,400 1,200-3,600 0-74,400
Activités de soins et de prise en charge thérapeutique
Médicaments et produits pharmaceutiques
Dispositifs médicaux
Soins médicaux spécialisés et visites de routine
Soins paramédicaux
76,583 56,378-122,743 0-1606,931
14,554 7,741-28,170
3,369 2,318-6,381 0-227,314
32 24-56 8-514
22,5 15-40,500 3-811
Activités d’hébergement (coût standard) 160 120-280 40-3740
Dinar tunisien (TND) = USD 0,51 (moyenne pour l’année 2015) ; IIQ : intervalle interquartile.
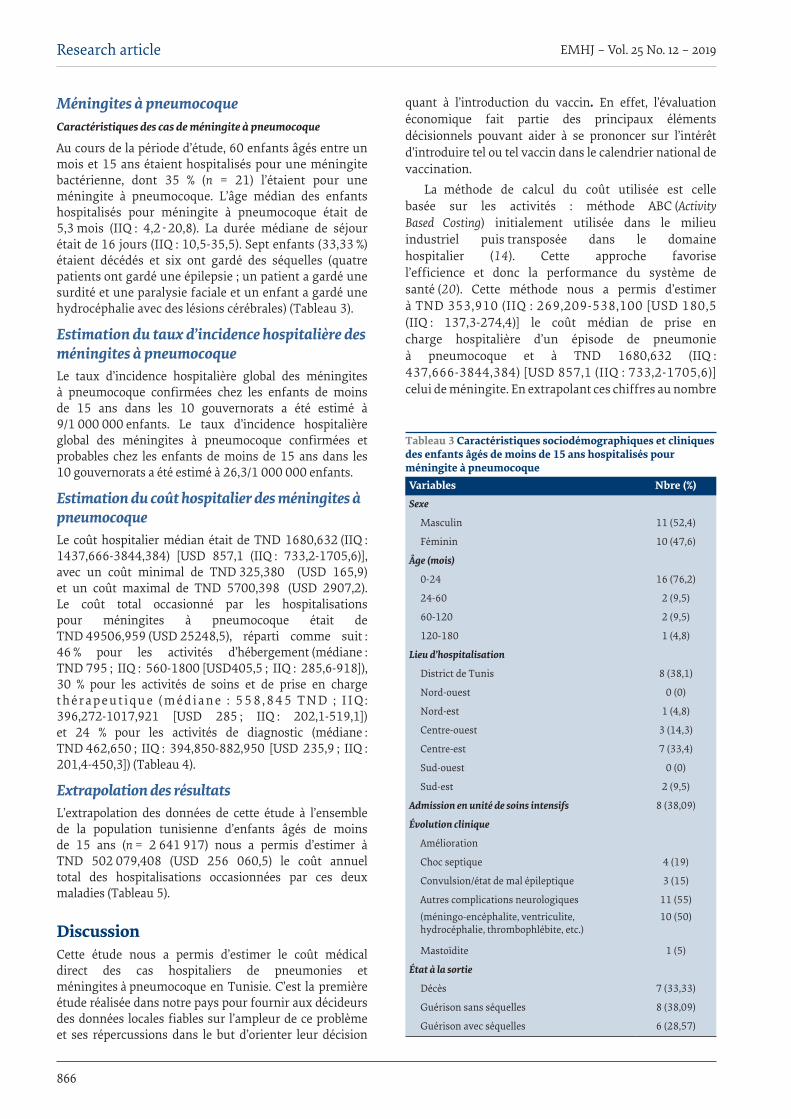
866
EMHJ – Vol. 25 No. 12 – 2019Research article
Méningites à pneumocoqueCaractéristiques des cas de méningite à pneumocoque
Au cours de la période d’étude, 60 enfants âgés entre un mois et 15 ans étaient hospitalisés pour une méningite bactérienne, dont 35 % (n = 21) l’étaient pour une méningite à pneumocoque. L’âge médian des enfants hospitalisés pour méningite à pneumocoque était de 5,3 mois (IIQ : 4,2-20,8). La durée médiane de séjour était de 16 jours (IIQ : 10,5-35,5). Sept enfants (33,33 %) étaient décédés et six ont gardé des séquelles (quatre patients ont gardé une épilepsie ; un patient a gardé une surdité et une paralysie faciale et un enfant a gardé une hydrocéphalie avec des lésions cérébrales) (Tableau 3).
Estimation du taux d’incidence hospitalière des méningites à pneumocoqueLe taux d’incidence hospitalière global des méningites à pneumocoque confirmées chez les enfants de moins de 15 ans dans les 10 gouvernorats a été estimé à 9/1 000 000 enfants. Le taux d’incidence hospitalière global des méningites à pneumocoque confirmées et probables chez les enfants de moins de 15 ans dans les 10 gouvernorats a été estimé à 26,3/1 000 000 enfants.
Estimation du coût hospitalier des méningites à pneumocoqueLe coût hospitalier médian était de TND 1680,632 (IIQ : 1437,666-3844,384) [USD 857,1 (IIQ : 733,2-1705,6)], avec un coût minimal de TND 325,380 (USD 165,9) et un coût maximal de TND 5700,398 (USD 2907,2). Le coût total occasionné par les hospitalisations pour méningites à pneumocoque était de TND 49506,959 (USD 25248,5), réparti comme suit : 46 % pour les activités d’hébergement (médiane : TND 795 ; IIQ : 560-1800 [USD405,5 ; IIQ : 285,6-918]), 30 % pour les activités de soins et de prise en charge t h é r a p e u t i q u e ( m é d i a n e : 5 5 8 , 8 4 5 T N D ; I I Q : 396,272-1017,921 [USD 285 ; IIQ : 202,1-519,1]) et 24 % pour les activités de diagnostic (médiane : TND 462,650 ; IIQ : 394,850-882,950 [USD 235,9 ; IIQ : 201,4-450,3]) (Tableau 4).
Extrapolation des résultatsL’extrapolation des données de cette étude à l’ensemble de la population tunisienne d’enfants âgés de moins de 15 ans (n = 2 641 917) nous a permis d’estimer à TND 502 079,408 (USD 256 060,5) le coût annuel total des hospitalisations occasionnées par ces deux maladies (Tableau 5).
DiscussionCette étude nous a permis d’estimer le coût médical direct des cas hospitaliers de pneumonies et méningites à pneumocoque en Tunisie. C’est la première étude réalisée dans notre pays pour fournir aux décideurs des données locales fiables sur l’ampleur de ce problème et ses répercussions dans le but d’orienter leur décision
quant à l’introduction du vaccin. En effet, l’évaluation économique fait partie des principaux éléments décisionnels pouvant aider à se prononcer sur l’intérêt d’introduire tel ou tel vaccin dans le calendrier national de vaccination.
La méthode de calcul du coût utilisée est celle basée sur les activités : méthode ABC (Activity Based Costing) initialement utilisée dans le milieu industriel puis transposée dans le domaine hospitalier (14). Cette approche favorise l’efficience et donc la performance du système de santé (20). Cette méthode nous a permis d’estimer à TND 353,910 (IIQ : 269,209-538,100 [USD 180,5 (IIQ : 137,3-274,4)] le coût médian de prise en charge hospitalière d’un épisode de pneumonie à pneumocoque et à TND 1680,632 (IIQ : 437,666-3844,384) [USD 857,1 (IIQ : 733,2-1705,6)] celui de méningite. En extrapolant ces chiffres au nombre
Tableau 3 Caractéristiques sociodémographiques et cliniques des enfants âgés de moins de 15 ans hospitalisés pour méningite à pneumocoqueVariables Nbre (%)Sexe
Masculin 11 (52,4)
Féminin 10 (47,6)
Âge (mois)
0-24 16 (76,2)
24-60 2 (9,5)
60-120 2 (9,5)
120-180 1 (4,8)
Lieu d’hospitalisation
District de Tunis 8 (38,1)
Nord-ouest 0 (0)
Nord-est 1 (4,8)
Centre-ouest 3 (14,3)
Centre-est 7 (33,4)
Sud-ouest 0 (0)
Sud-est 2 (9,5)
Admission en unité de soins intensifs 8 (38,09)
Évolution clinique
Amélioration
Choc septique 4 (19)
Convulsion/état de mal épileptique 3 (15)
Autres complications neurologiques 11 (55)(méningo-encéphalite, ventriculite, hydrocéphalie, thrombophlébite, etc.)
10 (50)
Mastoïdite 1 (5)
État à la sortie
Décès 7 (33,33)
Guérison sans séquelles 8 (38,09)
Guérison avec séquelles 6 (28,57)
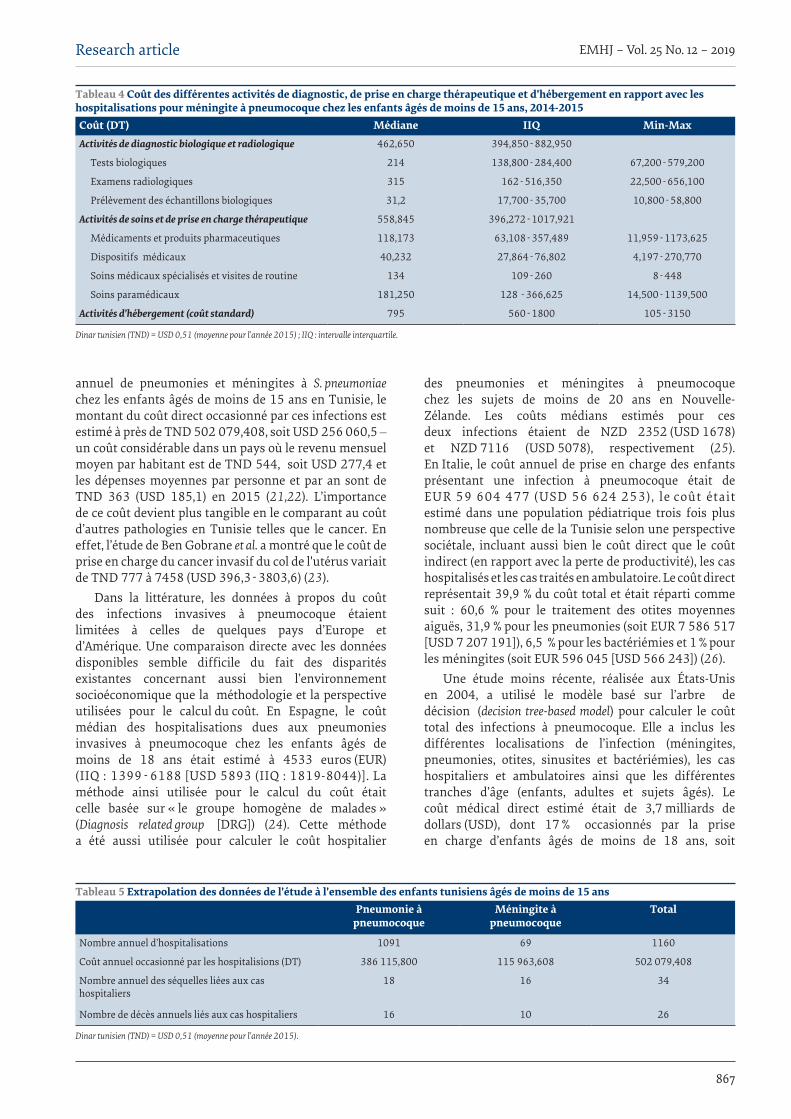
867
Research article EMHJ – Vol. 25 No. 12 – 2019
annuel de pneumonies et méningites à S. pneumoniae chez les enfants âgés de moins de 15 ans en Tunisie, le montant du coût direct occasionné par ces infections est estimé à près de TND 502 079,408, soit USD 256 060,5 ‒ un coût considérable dans un pays où le revenu mensuel moyen par habitant est de TND 544, soit USD 277,4 et les dépenses moyennes par personne et par an sont de TND 363 (USD 185,1) en 2015 (21,22). L’importance de ce coût devient plus tangible en le comparant au coût d’autres pathologies en Tunisie telles que le cancer. En effet, l’étude de Ben Gobrane et al. a montré que le coût de prise en charge du cancer invasif du col de l'utérus variait de TND 777 à 7458 (USD 396,3-3803,6) (23).
Dans la littérature, les données à propos du coût des infections invasives à pneumocoque étaient limitées à celles de quelques pays d’Europe et d’Amérique. Une comparaison directe avec les données disponibles semble difficile du fait des disparités existantes concernant aussi bien l’environnement socioéconomique que la méthodologie et la perspective utilisées pour le calcul du coût. En Espagne, le coût médian des hospitalisations dues aux pneumonies invasives à pneumocoque chez les enfants âgés de moins de 18 ans était estimé à 4533 euros (EUR)(IIQ : 1399-6188 [USD 5893 (IIQ : 1819-8044)]. La méthode ainsi utilisée pour le calcul du coût était celle basée sur « le groupe homogène de malades » (Diagnosis related group [DRG]) (24). Cette méthode a été aussi utilisée pour calculer le coût hospitalier
des pneumonies et méningites à pneumocoque chez les sujets de moins de 20 ans en Nouvelle-Zélande. Les coûts médians estimés pour ces deux infections étaient de NZD 2352 (USD 1678) et NZD 7116 (USD 5078), respectivement (25). En Italie, le coût annuel de prise en charge des enfants présentant une infection à pneumocoque était de EUR 59 604 477 (USD 56 624 253), le coût était estimé dans une population pédiatrique trois fois plus nombreuse que celle de la Tunisie selon une perspective sociétale, incluant aussi bien le coût direct que le coût indirect (en rapport avec la perte de productivité), les cas hospitalisés et les cas traités en ambulatoire. Le coût direct représentait 39,9 % du coût total et était réparti comme suit : 60,6 % pour le traitement des otites moyennes aiguës, 31,9 % pour les pneumonies (soit EUR 7 586 517 [USD 7 207 191]), 6,5 % pour les bactériémies et 1 % pour les méningites (soit EUR 596 045 [USD 566 243]) (26).
Une étude moins récente, réalisée aux États-Unis en 2004, a utilisé le modèle basé sur l’arbre de décision (decision tree-based model) pour calculer le coût total des infections à pneumocoque. Elle a inclus les différentes localisations de l’infection (méningites, pneumonies, otites, sinusites et bactériémies), les cas hospitaliers et ambulatoires ainsi que les différentes tranches d’âge (enfants, adultes et sujets âgés). Le coût médical direct estimé était de 3,7 milliards de dollars (USD), dont 17 % occasionnés par la prise en charge d’enfants âgés de moins de 18 ans, soit
Tableau 4 Coût des différentes activités de diagnostic, de prise en charge thérapeutique et d'hébergement en rapport avec les hospitalisations pour méningite à pneumocoque chez les enfants âgés de moins de 15 ans, 2014-2015 Coût (DT) Médiane IIQ Min-MaxActivités de diagnostic biologique et radiologique 462,650 394,850-882,950
Tests biologiques 214 138,800-284,400 67,200-579,200
Examens radiologiques 315 162-516,350 22,500-656,100
Prélèvement des échantillons biologiques 31,2 17,700-35,700 10,800-58,800
Activités de soins et de prise en charge thérapeutique 558,845 396,272-1017,921
Médicaments et produits pharmaceutiques 118,173 63,108-357,489 11,959-1173,625
Dispositifs médicaux 40,232 27,864-76,802 4,197-270,770
Soins médicaux spécialisés et visites de routine 134 109-260 8-448
Soins paramédicaux 181,250 128 -366,625 14,500-1139,500
Activités d’hébergement (coût standard) 795 560-1800 105-3150
Dinar tunisien (TND) = USD 0,51 (moyenne pour l’année 2015) ; IIQ : intervalle interquartile.
Tableau 5 Extrapolation des données de l'étude à l'ensemble des enfants tunisiens âgés de moins de 15 ansPneumonie à
pneumocoqueMéningite à
pneumocoqueTotal
Nombre annuel d’hospitalisations 1091 69 1160
Coût annuel occasionné par les hospitalisions (DT) 386 115,800 115 963,608 502 079,408
Nombre annuel des séquelles liées aux cas hospitaliers
18 16 34
Nombre de décès annuels liés aux cas hospitaliers 16 10 26
Dinar tunisien (TND) = USD 0,51 (moyenne pour l’année 2015).
868
EMHJ – Vol. 25 No. 12 – 2019Research article
USD 629 000 000. Ce coût s’élève à 1,2 milliard de dollars si on considère le coût indirect lié à la perte de productivité suite au décès ou handicap généré par la maladie (27) ‒ un coût total calculé pour les 61 027 947 enfants vivants aux États-Unis (23 fois la population pédiatrique de la Tunisie) (28).
Les études réalisées en Amérique Latine ont mis en évidence le fait que le coût médical direct moyen des cas hospitaliers de pneumonies à pneumocoque variait selon les pays, entre USD 372 au Brésil et USD 1147 en Uruguay (29–31) et atteignant USD 1995 pour les cas compliqués d’empyème au Chili (31). Pour les cas de méningites, le coût médical direct moyen était estimé à USD 5666,43 au Brésil chez les enfants âgés de moins de 13 ans et à USD 2590,4 au Chili chez les enfants âgés de moins de trois ans. Une revue systématique de la littérature en Amérique latine a estimé un coût direct moyen de USD 2062 pour les cas hospitaliers de pneumonie à pneumocoque et de USD 4692 pour les cas de méningites (32). Des résultats différents d’un pays à l’autre qui, en l’absence d’études dans des pays de niveau de revenu comparable au nôtre, doivent être interprétés avec prudence, d’autant plus qu’ils sont issus de pays comme l’Italie, la Nouvelle-Zélande et l’Espagne dont le revenu national brut (RNB) par habitant est 8 fois plus important que celui de la Tunisie, et les États-Unis d’Amérique dont le RNB est 13 fois plus important (33).
Il existe deux autres points à noter : la perspective utilisée et, par la suite, les coûts inclus dans le calcul. Dans notre étude, nous nous sommes limités au calcul du coût médical direct selon une perspective du système de soins, qui est à son tour sous-estimé du fait que les coûts unitaires utilisés, proposés par le Ministère de la Santé, n’ont pas été mis à jour depuis 1996. Ainsi, nous n’avons pas inclus les coûts indirects, représentés par la perte de productivité en raison du décès prématuré ou de l’incapacité générée par la maladie et la perte de productivité des parents à cause de l’hospitalisation de leurs enfants.
De plus, uniquement l’épisode aigu menant à l’hospitalisation est pris en considération. Le coût des pneumonies traitées en ambulatoire n’était pas calculé, le coût a été estimé, pour un épisode, à 18 % du coût de prise en charge d’un cas hospitalisé et peut atteindre 36% pour les pneumonies sévères (34), de même que le coût de la prise en charge des séquelles, en particulier celles de la méningite, estimé à 3 à 5 fois le coût de l’épisode aigu (32). Dans cette étude, les autres infections non invasives à pneumocoque, comme l’otite moyenne aiguë (OMA), la sinusite et la bronchite ainsi que leurs complications, n’étaient pas incluses. Ces infections représentent des motifs fréquents de recours aux soins en Tunisie. Pour les OMA, par exemple, le nombre d’épisodes par enfant et par an est estimé à 0,436 (35), dont environ 35 % sont dues au pneumocoque (36).
En présence d’un vaccin dont le prix est relativement élevé mais qui a démontré une efficacité protectrice de
97 % contre les infections invasives à pneumocoque (3) et de 52,6 % contre les OMA à pneumocoque (4), une analyse plus poussée des données de l’étude, entrant dans le cadre d’une analyse coût-efficacité, s’avère nécessaire pour la prise de décision. Dans ce cadre, des études d’analyse coût-efficacité ont montré une réduction des coûts après utilisation du vaccin anti-pneumococcique par rapport au coût de prise en charge de la maladie (37). Un effet réducteur de l’incidence de la survenue de la maladie serait également observé suite à l’usage de la vaccination (38).
Toutefois, il faut insister sur le fait que l’utilisation du vaccin anti-pneumococcique doit être considérée comme complémentaire à d’autres interventions essentielles pour lutter contre les infections à pneumocoques et en particulier celles des voies respiratoires, notamment la promotion de l’allaitement maternel exclusif pendant les six premiers mois de la vie, une nutrition adéquate et le recours aux antibiotiques pour la prise en charge des cas (2).
RemerciementsLes auteurs du présent article tiennent à remercier le personnel du service financier de l’hôpital Fattouma Bourguiba de Monastir et en particulier M. Tamboura Amara, le personnel du service Pharmacie de l’hôpital et son chef de service ainsi que les autres personnes ayant contribué à la collecte des données de cette étude, à savoir Dr Khalsi Fatma, Dr Nouira Nessrine, Dr Khelif Tarek, Dr Mnasri Syrine, Dr Mattoussi Nadia, Dr Ben Ameur Houssine, Dr Gargouri Lamia, Dr Hammami Olfa, Dr Rhayem Siwar, Dr Kechrid Amel et Dr Mezghani Sonda. Un hommage particulier doit être rendu à l’une des sommités de la médecine préventive et communautaire en Tunisie, le Professeur Mohamed Soussi Soltani, qui a coordonné ce projet et a veillé à communiquer ses résultats aux autorités sanitaires tunisiennes durant ses derniers jours de lutte ultime contre sa maladie, ce qui est d’autant plus héroïque qu’elle était tenue secrète. Que son âme repose en paix.
Financement : L'étude a été en partie financée par les Laboratoires Pfizer.
Conflits d’intérêt : Les Laboratoires Pfizer ont certes contribué au financement de ce projet, mais ceci s'est limité à la mise à disposition de l'Hôpital universitaire de Monastir d'une somme d'argent au profit de cette étude, qui a servi à fournir des primes incitatives aux différents intervenants dans le déroulement de l'enquête. Les représentants des laboratoires n'ont eu aucune relation directe avec les personnes qui ont assuré la collecte et l'analyse des données ni avec celles qui ont réalisé le calcul du coût. À la fin, une copie du rapport final de l'étude a été envoyée aux Laboratoires Pfizer.

869
Research article EMHJ – Vol. 25 No. 12 – 2019
Hospital cost of invasive pneumococcal disease in children aged under 15 years old in Tunisia
AbstractBackground: Pneumococcal infections are an important cause of morbidity and mortality in the world and in Tunisia. Data on the economic burden of these infections are needed to inform decision-making to include pneumococcal vaccinations in routine childhood immunization. Aims: This study aimed to estimate the medical cost of hospitalizations due to invasive pneumococcal disease (pneumonia and meningitis) among children aged under 15 years old in Tunisia.Methods: A prospective multicentre study was conducted in 15 paediatric departments, across different socio-economic areas of Tunisia, from June 2014 to May 2015. All children aged under 15 years old who were hospitalized for pneumococcal pneumonia or confirmed bacterial meningitis were enrolled. A case report form was completed for every eligible case. Activity Based Costing method was used to estimate the hospital cost. Data entry and statistical analysis were conducted using SPSS, version 20.0.Results: During the study period, 727 children were hospitalized for pneumococcal pneumonia and 60 children were hospitalized for bacterial meningitis, among them 21(35%) had confirmed pneumococcal meningitis. The median hospital cost for pneumococcal pneumonia was 353.910 Tunisian Dinars (TND) and TND 1680.632 for pneumococcal meningitis. Using overall data extrapolation, it was estimated that nearly 1091 hospitalizations for pneumococcal pneumonia and 69 hospitalizations for pneumococcal meningitis occurred each year in Tunisian children aged under 15 years of age, incurring total costs of TND 502 079.408.Conclusion: The economic burden of pneumococcal infections seems to be substantial in Tunisia. The estimated costs does not reflect the real costs of this infection. Cost–effectiveness studies would be helpful to inform policy-makers to take appropriate decisions.
تكلفة عالج مرض املكورات الرئوية الغزوي لدى األطفال دون سن اخلامسة عرش عامًا باملستشفيات يف تونسأروى بن صالح، سناء املحمدي، منال بن فرج، شبيل بن مريم، جيهان بوقيلة، خالد بن هالل، ملياء الصفائحي، رفيعة مصطفى، حممد صفر، حممد
السلطايناخلالصة
اخللفية: إن العدوى باملكورات الرئوية تعترب سببًا مهاًم للمراضة والوفيات يف العامل ويف تونس. هناك حاجة للبيانات حول العبء االقتصادي هلذه العدوى للمساعدة يف اختاذ القرار حول إضافة مصل )لقاح( املكورات الرئوية ضمن التطعيامت الروتينية لألطفال.
األهداف: هدفت هذه الدراسة إىل تقدير التكلفة الطبية لعالج مرض املكورات الرئوية الغزوي )االلتهاب الرئوي والتهاب السحايا( لدى األطفال دون سن اخلامسة عرش عامًا يف تونس، وذلك من أجل توفري بيانات كافية يمكن أن تساعد واضعي السياسات عىل تقييم احلاجة إىل اللقاح.
طرق البحث: ُأجريت دراسة استباقية متعددة املراكز يف 15 قساًم من أقسام طب األطفال عرب شتى املجاالت االجتامعية االقتصادية يف تونس، من يونيو/حزيران 2014 إىل مايو/أيار 2015. وشملت الدراسة مجيع األطفال دون سن 15 عامًا الذين دخلوا املستشفى للعالج من التهاب رئوي باملكورات الرئوية أو التهاب السحايا اجلرثومي املؤكد. وُملئ نموذج تقرير حالة لكل حالة مؤهلة. واسُتخدمت طريقة "تقدير التكاليف عىل أساس النشاط" من أجل تقدير تكلفة العالج يف املستشفى. واسُتخدم اإلصدار 20.0 من برنامج SPSS إلدخال البيانات وإجراء التحليل اإلحصائي.
النتائج: خالل مدة الدراسة، دخل 727 طفاًل املستشفى بسبب التهاب رئوي باملكورات الرئوية، ودخل 60 طفاًل بسبب التهاب السحايا اجلرثومي، منهم 21 طفاًل )35%( كانت قد تأكدت إصابتهم بالتهاب السحايا الناجم عن املكورات الرئوية. وبلغ متوسط تكلفة العالج يف املستشفى حوايل 354 دينار لاللتهاب الرئوي الناجم عن املكورات الرئوية، وحوايل 1680 دينار لاللتهاب السحائي الناجم عن املكورات الرئوية. ومن خالل االستقراء العام للبيانات، أشارت تقديراتنا إىل أن املستشفيات تستقبل كل عام ما يقرب من 1091 حالة التهاب رئوي باملكورات الرئوية و69 حالة
التهاب سحايا باملكورات الرئوية لدى أطفال تونسيني دون سن اخلامسة عرش عامًا، وذلك بتكاليف إمجالية قدرها 502079 دينار.االستنتاج: يبدو أن العبء االقتصادي ألمراض املكورات الرئوية كبري يف تونس. والتكاليف املقدرة هلذه العدوى أقل من تكاليفها الفعلية. وسوف
تكون دراسات فعالية التكلفة مفيدة إلرشاد راسمي السياسات إىل القرارات املناسبة.
870
EMHJ – Vol. 25 No. 12 – 2019Research article
Références 1. O’Brien KL, Wolfson LJ, Watt JP, Henkle E, Deloria-Knoll M, McCall N, et al. Burden of disease caused by Streptococcus
pneumoniae in children younger than 5 years: global estimates. Lancet. 2009 Sep 12;374(9693):893–902. https://doi.org/10.1016/S0140-6736(09)61204-6 PMID:19748398
2. World Health Organization. Pneumococcal vaccines. WHO position paper – 2012. Wkly Epidemiol Rec. 2012;87(14):129–44.
3. Black S, Shinefield H, Fireman B, Lewis E, Ray P, Hansen JR, et al. Efficacy, safety and immunogenicity of heptavalent pneumococcal conjugate vaccine in children. Northern California Kaiser Permanente Vaccine Study Center Group. Pediatr Infect Dis J. 2000 Mar;19(3):187–95. https:/doi.org/10.1097/00006454-200003000-00003 PMID:10749457
4. Prymula R, Peeters P, Chrobok V, Kriz P, Novakova E, Kaliskova E, et al. Pneumococcal capsular polysaccharides conjugated to protein D for prevention of acute otitis media caused by both Streptococcus pneumoniae and non-typable Haemophilus influenzae: a randomised double-blind efficacy study. Lancet. 2006 Mar 4;367(9512):740–8. https://doi.org/10.1016/S0140-6736(06)68304-9 PMID:16517274
5. Vesikari T, Wysocki J, Chevallier B, Karvonen A, Czajka H, Arsène JP, et al. Immunogenicity of the 10-valent pneumococcal non-typeable Haemophilus influenzae protein D conjugate vaccine (PHiD-CV) compared to the licensed 7vCRM vaccine. Pediatr Infect Dis J. 2009 Apr;28(4 Suppl):S66–76. https://doi.org/10.1097/INF.0b013e318199f8ef PMID:19325449
6. Bermal N, Szenborn L, Chrobot A, Alberto E, Lommel P Gatchalian S, et al. The 10-valent pneumococcal non-typeable Haemophilus influenzae protein D conjugate vaccine (PHiD-CV) coadministered with DTPw-HBV/Hib and poliovirus vaccines: assessment of immunogenicity. Pediatr Infect Dis J. 2009 Apr;28(4 Suppl):S89–96. https://doi.org/10.1097/INF.0b013e318199f901 PMID:19325451
7. Chevallier B, Vesikari T, Brzostek J, Knuf M, Bermal N, Aristegui J, et al. Safety and reactogenicity of the 10-valent pneumococcal non-typeable Haemophilus influenzae protein D conjugate vaccine (PHiD-CV) when coadministered with routine childhood vaccines. Pediatr Infect Dis J. 2009 Apr;28(4 Suppl):S109–18. https://doi.org/10.1097/INF.0b013e318199f62d PMID:19325447
8. Esposito S, Tansey S, Thompson A, Ferrera G, Maida A, Bona G, et al. [online]. Safety and immunologic non-inferiority of 13-valent pneumococcal conjugate vaccine given as a 3-dose series with routine vaccines in healthy children. Pediatr Infect Dis J. 2009;28(6);e169.
9. Sibak M, Moussa I, El-Tantawy N, Badr S, Chaudri I, Allam E, et al. Cost-effectiveness analysis of the introduction of the pneumococcal conjugate vaccine (PCV-13) in the Egyptian national immunization program, 2013. Vaccine. 2015 May 7;33 Suppl 1:A182–91. https://doi.org/10.1016/j.vaccine.2014.12.044 PMID:25919159
10. Khemiri M. Particularités des infections à pneumocoque chez l’enfant et leur prévention. 2010 (https://www.infectiologie.org.tn/pdf_ppt_docs/cmi/tunis300610/khemiri.pdf, consulté le 15 mars 2019)
11. Khalifa AB, Mastouri M, Abdallah HB, Noomen S, Kheder M. Les méningites purulentes dans la région de Monastir, Tunisie (1999-2006): aspects bactériologiques et état de résistance aux antibiotiques. Bull Soc Pathol Exot. 2011 Feb;104(1):42– 8. https://doi.org/10.1007/s13149-010-0077-5 PMID:20835902
12. Maalej SM, Kassis M, Rhimi FM, Damak J, Hammami A. Bactériologie des méningites communautaires dans la région de Sfax, Tunisie (1993-2001). Med Mal Infect. 2006 Feb;36(2):105–10. https://doi.org/10.1016/j.medmal.2005.10.011 PMID:16459040
13. Werno AM, Murdoch DR. Medical microbiology: laboratory diagnosis of invasive pneumococcal disease. Clin Infect Dis. 2008 Mar 15;46(6):926–32. https://doi.org/10.1086/528798 PMID:18260752
14. Dragos Z. Genèse et évolutions d’une innovation : la méthode ABC. 2010. (https://halshs.archives-ouvertes.fr/halshs-00460128/document, consulté le 15 mars 2019).
15. Briciu S, Căpuşneanu S. Effective cost analysis tools of the activity-based costing (ABC) method. Annales Universitatis Apulensis Series Oeconomica. 2010;12(1):25–35.
16. Arrêté du ministre de la santé publique du 1er juin 2006, fixant la nomenclature générale des actes professionnels des médecins, biologistes, médecins dentistes, psychologues cliniciens, sages-femmes et auxiliaires médicaux. Journal Officiel de la République Tunisienne. 2006;46:1514-7 (http://www.legislation.tn/sites/default/files/fraction-journal-officiel/2006/2006F/046/TF20062734.pdf, consulté le 21 avril 2019).
17. République Tunisienne. Ministère de la Santé. Tarifs de soins dans les structures sanitaires publiques (arrêté du 19 décembre 1996) – Tarifs des lettres clés des actes professionnels relatifs aux payants (http://www.santetunisie.rns.tn/fr/prestations/tarifications-des-prestations-hospitalieres, consulté le 4 avril 2019).
18. Bouyer J, Hemon D, Cordier S, Derriennic F. Épidémiologie –Principes et méthodes quantitatives. 1re éd. Paris: Inserm; 1995.
19. Institut National de la Statistique (INS). Indicateurs démographiques (http://www.ins.tn/fr/themes/population, consulté le 4 avril 2019).
20. Griveaux JM. Pilotage de l’activité par les coûts : application de la méthode A.B.C. en stérilisation [thèse]. Nancy, Université Henri Poincaré - Nancy, 2002.
21. Principaux indicateurs du développement social en Tunisie. Tunis : Ministère des Affaires sociales, Bureau des Études, de la Planification et de la Programmation; 2012 (http://www.social.gov.tn/fileadmin/user1/doc/PRINCIPAUX_INDICATEURS_DE_DEVELOPPEMENT2012-fr.pdf, consulté le 25 mars 2019).
871
Research article EMHJ – Vol. 25 No. 12 – 2019
22. Institut National de la Statistique. Enquête nationale sur le budget, la consommation et le niveau de vie des ménages, 2015 (http://www.ins.tn/sites/default/files/publication/pdf/consommation2016-V5-corrige%CC%81.pdf, consulté le 6 avril 2019) [en arabe].
23. Ben Gobrane H, Aounallah-Skhiri H, Oueslati F, Frikha H, Achour N, Hsairi M. Estimation du coût de la prise en charge du cancer invasif du col de l’utérus en Tunisie. Sante Publique. 2009 Nov-Dec;21(6):561–9. https://doi.org/10.3917/spub.096.0561
24. Brotons P, Gelabert G, Launes C, Sicuri E, Pallares R, Muñoz-Almagro C. Cost of hospitalizing children with invasive pneumococcal pneumonia. Vaccine. 2013 Feb4;31(7):1117–22. https://doi.org/10.1016/j.vaccine.2012.12.025 PMID:23262168
25. Milne RJ, Vander Hoorn S. Burden and cost of hospital admissions for vaccine-preventable paediatric pneumococcal disease and non-typable Haemophilus influenza otitis media in New Zealand. Appl Health Econ Health Policy. 2010;8(5):281–300. https://doi.org/10.2165/11535710-000000000-00000 PMID:20804222
26. Colombo GL. [Cost-of-illness study of pneumococcal disease in Italian children]. Ann Ig. 2002 Sep-Oct;14(5):373–88 [In Italian]. PMID:12508446
27. Huang SS, Johnson KM, Ray GT, Wroe P, Lieu TA, Moore MR, et al. Healthcare utilization and cost of pneumococcal disease in the United States. Vaccine. 2011 Apr 18;29(18):3398–412. https://doi.org/10.1016/j.vaccine.2011.02.088 PMID:21397721
28. Statistiques mondiales. États-Unis [Internet]. (http://www.statistiques-mondiales.com/etats_unis.htm, consulté le 15 mars 2019).
29. Constenla D. Evaluating the costs of pneumococcal disease in selected Latin American countries. Rev Panam Salud Publica. 2007 Oct;22(4):268–78. PMID:18078589
30. Alvis Guzmán N, de la Hoz Restrepo F, Higuera AB, Pastor D, Di Fabio JL. Costos económicos de las neumonías en niños menores de 2 años de edad, en Colombia [The economic costs of pneumonia in children under 2 years of age in Colombia]. Rev Panam Salud Publica. 2005;17(3) :178–83. PMID:15826397
31. Lagos R, Muñoz A, Espinoza A, Dowes A, Ruttimann R, Colindres R, et al. Costos médicos directos de enfermedades neumocócicas invasores y neumomías con diagnóstico radiológico en niños chilenos. [Direct medical costs of invasive pneumococcal disease and radiologically-diagnosed pneumonia among Chilean children]. Rev Panam Salud Publica. 2009 Aug;26(2):101–11. PMID:19814889
32. Bahia L, Toscano CM, Takemoto ML, Araujo DV. Systematic review of pneumococcal disease costs and productivity loss studies in Latin America and the Caribbean. Vaccine. 2013 Jul 2;31 Suppl 3:C33–44. https://doi.org/10.1016/j.vaccine.2013.05.030 PMID:23777689
33. Banque mondiale. RNB par habitant, méthode Atlas ($ US courants) [Internet]. (https://donnees.banquemondiale.org/indicateur/ny.gnp.pcap.cd, consulté le 15 mars 2019).
34. Hussain H, Waters H, Omer SB, Khan A, Baig IY, Mistry R, et al. The cost of treatment for child pneumonias and meningitis in the Northern Areas of Pakistan. Int J Health Plann Manage. 2006 Jul-Sep;21(3):229–38. PMID:17044548
35. Enquête nationale sur la santé et le bien-être de la mère et de l’enfant (Multiple Indicator Cluster Survey [MICS] II-2000). Tunis : Ministère de la Santé publique, Direction des Soins de Santé de Base/Fonds des Nations Unies pour l’Enfance (UNICEF) ; 2000.
36. Musher DM. Streptococcus pneumoniae. In: Mandell GL, Bennett JE, Dolin, eds. Mandell, Douglas, and Bennett’s Principles and Practice of Infectious Diseases, 5th ed. Philadelphia: Churchill Livingstone; 2000:2128–47.
37. Boccalini S, Bechini A, Levi M, Tiscione E, Gasparini R, Bonanni P. Cost-effectiveness of new adult pneumococcal vaccination strategies in Italy. Hum Vaccin Immunother. 2013 Mar 1;9(3):699–706. https://doi.org/10.4161/hv.23268 PMID:23295824
38. de Wals P, Black S, Borrow R, Pearce D. Modeling the impact of a new vaccine on pneumococcal and nontypable Haemophilus influenzae diseases: a new simulation model. Clin Ther. 2009 Oct;31(10):2152–69. https://doi.org/10.1016/j.clinthera.2009.10.014 PMID:19922887
872
EMHJ – Vol. 25 No. 12 – 2019Research article
Fingernail length as a predisposing factor for perforations of latex gloves: a simulated clinical experimentSuhail Al-Amad,1,2 Ala’a El-Saleh,2 Shorouk Elnagdy,2 Fatimah Al-Nasser 2 and Sarah Alsellemi 2
1College of Dental Medicine, University of Sharjah, Sharjah, United Arab Emirates (Correspondence to: S. Al-Amad: [email protected]). 2University Dental Hospital Sharjah, Sharjah, United Arab Emirates.
AbstractBackground: Concerns have been raised over the integrity of gloves and the longevity of their protective barrier function. Aims: This study aimed to assess the effect of clinicians’ fingernail length as a predisposing factor for perforation of latex gloves. Methods: We assessed 2006 latex examination gloves for perforations using the water inflation method after being used by 6 senior dental students who had fingernail lengths ranging from 0 to 3 mm. Four simulated clinical procedures repre-senting a variety of hand movements were used for this purpose and were repeated 30 times, followed by a water leakage assessment test. Data were analysed using the χ2 test, analysis of variance and logistic regression. Results: Leakage was detected in 222 (11.1%) gloves, and was most frequent with longer fingernails (odds ratio =1.431, 95% confidence interval 1.249–1.640; P < 0.001). This was independent from the simulated clinical procedure. Most perfora-tions were over the index fingers and thumbs (63.5% and 24.3%, respectively; P < 0.001). The simulated procedures with most perforations were wiping the scaler tip with gauze (20.8%) and placing the chamfer bur (15.3%). The procedure with the fewest perforations was placing the triple way syringe (3.5%). Conclusion: The length of the clinicians’ fingernails significantly compromises the integrity of latex gloves. Maintaining short fingernails is important in reducing the risk of damaging latex gloves intraoperatively, and hence maintaining the barrier function of the gloves.Keywords: dentistry, fingernails, gloves, infection control, perforation. Citation: Al-Amad S; El-Saleh A; Elnagdy S; Al-Nasser F; Alsellemi S. Fingernail length as a predisposing factor for perforations of latex gloves: a simu-lated clinical experiment. East Mediterr Health J. 2019;25(12):872–877. https://doi.org/10.26719/emhj.19.052Received: 24/12/17; accepted: 20/05/18Copyright © World Health Organization (WHO) 2019. Some rights reserved. This work is available under the CC BY-NC-SA 3.0 IGO license (https://creativecommons.org/licenses/by-nc-sa/3.0/igo).
IntroductionHealth care workers rely on latex gloves as an essential part of their personal protective equipment. Gloves are a physical barrier that prevents contact of dental health-care workers’ skin with bloodborne pathogenic microor-ganisms from patients’ oral cavities and biological fluids (1). Such pathogens include hepatitis C virus, which has been detected on the oral mucosal surface (2) and in sa-liva of infected patients (3), and human papilloma virus and Staphylococcus aureus, which have been cultured from clinicians’ gloves after treatment of patients (4,5).
The integrity of the gloves in medical and dental care is important in preventing the transmission of pathogenic microorganisms from patients to health care workers and vice versa. However, several researchers have raised concerns over this integrity (6–8). For example, Patel et al. found that 0–3% of unused gloves have pre-existing punctures (9), while Murray et al. found that 1.95–5.3% of gloves had defects following routine dental practice (10). The integrity of gloves as a physical barrier has been linked to a number of factors, such as the material of the gloves and their latex content, as well as the duration and nature of the clinical procedures (10–15). The role of fingernails in compromising glove integrity has not been previously assessed.
The aim of this study was to assess the effect of fingernail length on the rate of perforation of latex gloves when used in several simulated clinical procedures.
MethodsThis simulated clinical experiment of 2006 nonpowdered latex examination gloves took place at the University Dental Hospital Sharjah, United Arab Emirates, between January and April 2017. All gloves belonged to the same commercial brand and were used after visual assessment for gross manufacturer’s defects. Gloves with defects were excluded.
Four simulated clinical procedures were undertaken by 6 female final-year dental students who were fully acquainted with each of the procedures. The students were oriented and calibrated during a pilot phase of the study to ensure homogeneity of conduct of the simulated clinical procedures. The procedures were selected based on common hand movements during regular dental practice: 1) placing a triple-way syringe into a hand piece and removing it; 2) placing a local anaesthesia needle in a syringe and removing it; 3) placing a chamfer bur into a hand piece and removing it; and 4) wiping a scaler tip with gauze. Each of the simulated procedures was consecutively repeated 30 times.
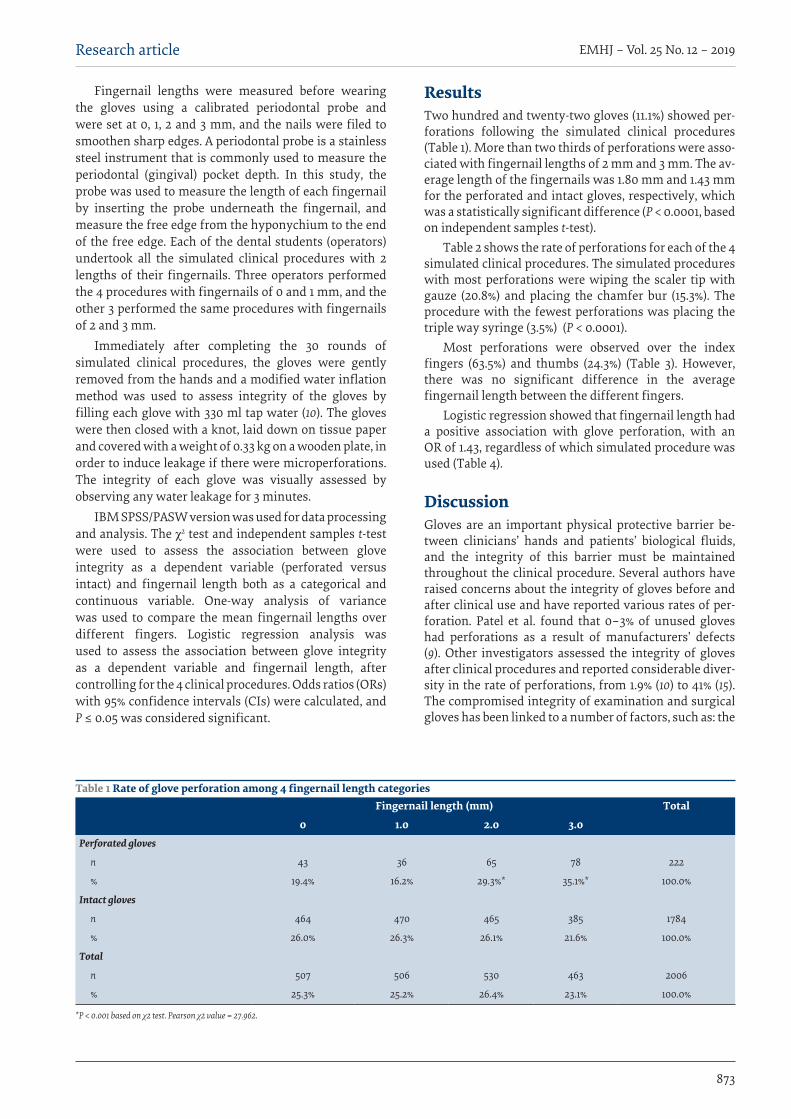
873
Research article EMHJ – Vol. 25 No. 12 – 2019
Fingernail lengths were measured before wearing the gloves using a calibrated periodontal probe and were set at 0, 1, 2 and 3 mm, and the nails were filed to smoothen sharp edges. A periodontal probe is a stainless steel instrument that is commonly used to measure the periodontal (gingival) pocket depth. In this study, the probe was used to measure the length of each fingernail by inserting the probe underneath the fingernail, and measure the free edge from the hyponychium to the end of the free edge. Each of the dental students (operators) undertook all the simulated clinical procedures with 2 lengths of their fingernails. Three operators performed the 4 procedures with fingernails of 0 and 1 mm, and the other 3 performed the same procedures with fingernails of 2 and 3 mm.
Immediately after completing the 30 rounds of simulated clinical procedures, the gloves were gently removed from the hands and a modified water inflation method was used to assess integrity of the gloves by filling each glove with 330 ml tap water (10). The gloves were then closed with a knot, laid down on tissue paper and covered with a weight of 0.33 kg on a wooden plate, in order to induce leakage if there were microperforations. The integrity of each glove was visually assessed by observing any water leakage for 3 minutes.
IBM SPSS/PASW version was used for data processing and analysis. The χ2 test and independent samples t-test were used to assess the association between glove integrity as a dependent variable (perforated versus intact) and fingernail length both as a categorical and continuous variable. One-way analysis of variance was used to compare the mean fingernail lengths over different fingers. Logistic regression analysis was used to assess the association between glove integrity as a dependent variable and fingernail length, after controlling for the 4 clinical procedures. Odds ratios (ORs) with 95% confidence intervals (CIs) were calculated, and P ≤ 0.05 was considered significant.
Results Two hundred and twenty-two gloves (11.1%) showed per-forations following the simulated clinical procedures (Table 1). More than two thirds of perforations were asso-ciated with fingernail lengths of 2 mm and 3 mm. The av-erage length of the fingernails was 1.80 mm and 1.43 mm for the perforated and intact gloves, respectively, which was a statistically significant difference (P < 0.0001, based on independent samples t-test).
Table 2 shows the rate of perforations for each of the 4 simulated clinical procedures. The simulated procedures with most perforations were wiping the scaler tip with gauze (20.8%) and placing the chamfer bur (15.3%). The procedure with the fewest perforations was placing the triple way syringe (3.5%) (P < 0.0001).
Most perforations were observed over the index fingers (63.5%) and thumbs (24.3%) (Table 3). However, there was no significant difference in the average fingernail length between the different fingers.
Logistic regression showed that fingernail length had a positive association with glove perforation, with an OR of 1.43, regardless of which simulated procedure was used (Table 4).
Discussion Gloves are an important physical protective barrier be-tween clinicians’ hands and patients’ biological fluids, and the integrity of this barrier must be maintained throughout the clinical procedure. Several authors have raised concerns about the integrity of gloves before and after clinical use and have reported various rates of per-foration. Patel et al. found that 0–3% of unused gloves had perforations as a result of manufacturers’ defects (9). Other investigators assessed the integrity of gloves after clinical procedures and reported considerable diver-sity in the rate of perforations, from 1.9% (10) to 41% (15). The compromised integrity of examination and surgical gloves has been linked to a number of factors, such as: the
Table 1 Rate of glove perforation among 4 fingernail length categoriesFingernail length (mm) Total
0 1.0 2.0 3.0 Perforated gloves
n 43 36 65 78 222
% 19.4% 16.2% 29.3%* 35.1%* 100.0%
Intact gloves
n 464 470 465 385 1784
% 26.0% 26.3% 26.1% 21.6% 100.0%
Total
n 507 506 530 463 2006
% 25.3% 25.2% 26.4% 23.1% 100.0%
*P < 0.001 based on χ2 test. Pearson χ2 value = 27.962.
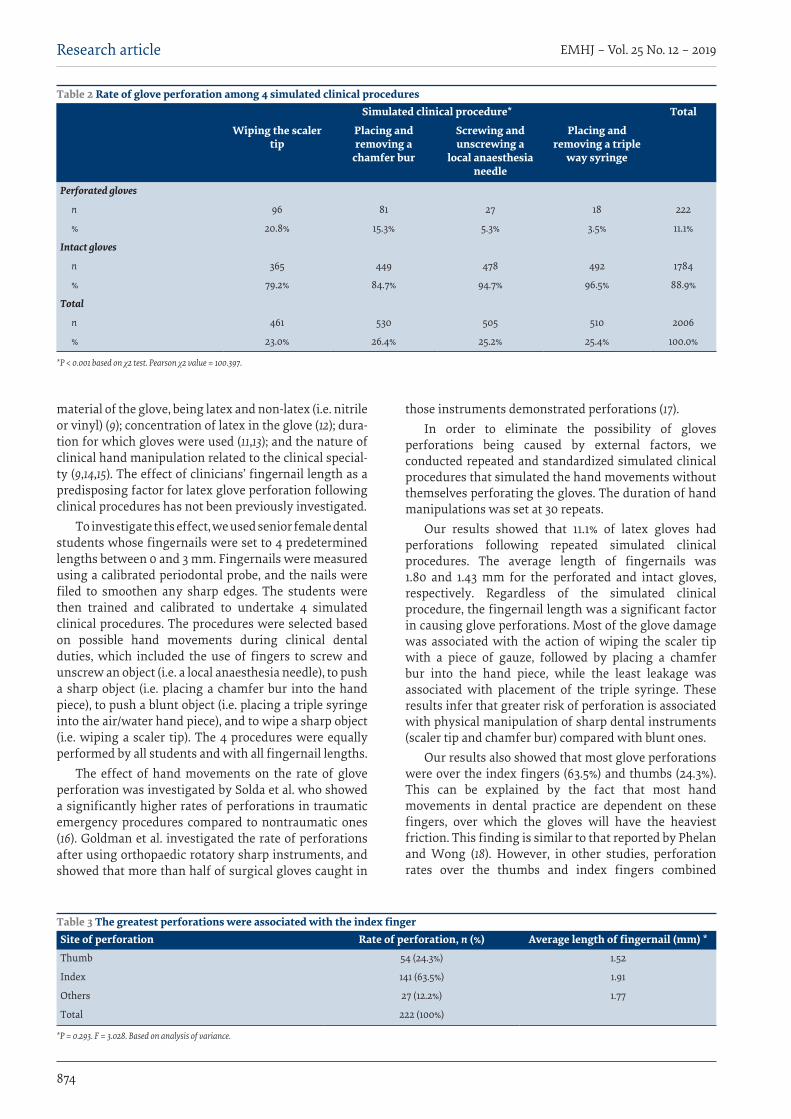
874
EMHJ – Vol. 25 No. 12 – 2019Research article
material of the glove, being latex and non-latex (i.e. nitrile or vinyl) (9); concentration of latex in the glove (12); dura-tion for which gloves were used (11,13); and the nature of clinical hand manipulation related to the clinical special-ty (9,14,15). The effect of clinicians’ fingernail length as a predisposing factor for latex glove perforation following clinical procedures has not been previously investigated.
To investigate this effect, we used senior female dental students whose fingernails were set to 4 predetermined lengths between 0 and 3 mm. Fingernails were measured using a calibrated periodontal probe, and the nails were filed to smoothen any sharp edges. The students were then trained and calibrated to undertake 4 simulated clinical procedures. The procedures were selected based on possible hand movements during clinical dental duties, which included the use of fingers to screw and unscrew an object (i.e. a local anaesthesia needle), to push a sharp object (i.e. placing a chamfer bur into the hand piece), to push a blunt object (i.e. placing a triple syringe into the air/water hand piece), and to wipe a sharp object (i.e. wiping a scaler tip). The 4 procedures were equally performed by all students and with all fingernail lengths.
The effect of hand movements on the rate of glove perforation was investigated by Solda et al. who showed a significantly higher rates of perforations in traumatic emergency procedures compared to nontraumatic ones (16). Goldman et al. investigated the rate of perforations after using orthopaedic rotatory sharp instruments, and showed that more than half of surgical gloves caught in
those instruments demonstrated perforations (17). In order to eliminate the possibility of gloves
perforations being caused by external factors, we conducted repeated and standardized simulated clinical procedures that simulated the hand movements without themselves perforating the gloves. The duration of hand manipulations was set at 30 repeats.
Our results showed that 11.1% of latex gloves had perforations following repeated simulated clinical procedures. The average length of fingernails was 1.80 and 1.43 mm for the perforated and intact gloves, respectively. Regardless of the simulated clinical procedure, the fingernail length was a significant factor in causing glove perforations. Most of the glove damage was associated with the action of wiping the scaler tip with a piece of gauze, followed by placing a chamfer bur into the hand piece, while the least leakage was associated with placement of the triple syringe. These results infer that greater risk of perforation is associated with physical manipulation of sharp dental instruments (scaler tip and chamfer bur) compared with blunt ones.
Our results also showed that most glove perforations were over the index fingers (63.5%) and thumbs (24.3%). This can be explained by the fact that most hand movements in dental practice are dependent on these fingers, over which the gloves will have the heaviest friction. This finding is similar to that reported by Phelan and Wong (18). However, in other studies, perforation rates over the thumbs and index fingers combined
Table 2 Rate of glove perforation among 4 simulated clinical proceduresSimulated clinical procedure* Total
Wiping the scaler tip
Placing and removing a
chamfer bur
Screwing and unscrewing a
local anaesthesia needle
Placing and removing a triple
way syringe
Perforated gloves
n 96 81 27 18 222
% 20.8% 15.3% 5.3% 3.5% 11.1%
Intact gloves
n 365 449 478 492 1784
% 79.2% 84.7% 94.7% 96.5% 88.9%
Total
n 461 530 505 510 2006
% 23.0% 26.4% 25.2% 25.4% 100.0%
*P < 0.001 based on χ2 test. Pearson χ2 value = 100.397.
Table 3 The greatest perforations were associated with the index fingerSite of perforation Rate of perforation, n (%) Average length of fingernail (mm) *Thumb 54 (24.3%) 1.52
Index 141 (63.5%) 1.91
Others 27 (12.2%) 1.77
Total 222 (100%)
*P = 0.293. F = 3.028. Based on analysis of variance.
875
Research article EMHJ – Vol. 25 No. 12 – 2019
ranged from 41% (14) to 60% (9,19). Despite this diversity, all reports are in agreement that these 2 sites account for the greatest incidence of perforations. The average length of fingernails in the gloves perforated over the thumbs and index fingers were 1.52 and 1.91 mm, respectively, compared with 1.43 mm for the intact gloves. This indicates a greater effect of the length of index fingernail on glove; however, this difference was not significant.
The method used in this study to detect leakage through water inflation is universally accepted (20). However different studies adopted various ways to assess this leakage visually. For example, Pieper et al. applied pressure to the wrist area of the water-filled gloves (21), while Murray et al. assessed the leakage from a suspended water-filled glove (10).
The high prevalence of glove perforation detected by this method raises concerns over the effectiveness of latex gloves in protecting clinicians’ hands. A similar concern was reported by 2 Cochrane reviews that found that double gloving significantly reduces perforations of the innermost gloves and percutaneous exposure of the clinicians’ hands (22,23). Further studies looking into the cost-effectiveness of using double, or even triple gloves are needed in order to modify the currently accepted
universal precautions with regards to glove wearing.Our study adds to current knowledge that fingernail
length is a significant factor in damaging gloves during clinical procedures and undermining their integrity as a physical barrier. The use of simulated rather than actual clinical procedures could have concentrated manipulations to the primary two fingers (index and thumb) with little involvement of the other fingers, which could limit our ability to generalize our results. Another possible limitation was that only 1 brand of latex gloves was used, and it is possible that other brands with different latex content would have produced different results. Moreover, microperforations could have been present as manufacturer’s defects that were not visually detectable, and these might have increased the rate of perforations following the water leakage test.
Nevertheless, our findings shed light on an inherent factor related to clinicians, rather than clinical procedures or the material composition of the gloves material, as a significant factor in causing glove perforations. It is therefore recommended that clinicians maintain fingernail lengths < 1 mm to reduce the likelihood of damage to gloves.
AcknowledgementsThe authors are thankful to Professor Manal Awad for her assistance in the statistical analysis and for Noor Al Mokhtar and Ghada Al Sakri for their assistance in conducting this study.
Funding: University of Sharjah College of Dental Medicine.
Competing interests: None declared.
Table 4 Logistic regression showing fingernail length as a significant factor in compromising glove integrity, regardless of other factorsVariable Odds ratio 95% CIFingernail length (mm) 1.431 1.249 1.640
Wiping the scaler tip* 7.752 4.585 13.107
Putting and removing the chamfer bur* 4.978 2.934 8.447
Putting and removing the local anesthesia needle* 1.545 0.838 2.848
*Reference group is the triple way syringe. CI = confidence interval.
Longueur de l'ongle comme facteur prédisposant à la perforation des gants latex : expérience clinique simuléeRésuméContexte : L’intégrité des gants et la longévité de leur protection en tant que barrière ont suscité des préoccupations. Objectif : La présente étude visait à évaluer l'effet de la longueur de l'ongle du clinicien en tant que facteur prédisposant à la perforation des gants latex. Méthodes : 2006 gants d'examen latex ont été évalués pour les perforations à l'aide de la méthode de gonflage à l'eau après utilisation par six étudiants de dernière année de faculté de médecine dentaire dont la longueur des ongles variait de 0 mm à 3 mm. Quatre procédures cliniques simulées représentant une variété de mouvements de la main ont été utilisées à cette fin et ont été répétées 30 fois, suivies d'un test d'évaluation de fuite d'eau. Les données ont été analysées à l'aide du test du χ2, de l'analyse de variance et de la régression logistique. Résultats : Des fuites ont été détectées dans 222 (11,1 %) des gants et étaient plus fréquentes avec des ongles plus longs (odds ratio =1,431, intervalle de confiance à 95 % : 1,249-1,640 ; p < 0,001), indépendamment de la procédure
876
EMHJ – Vol. 25 No. 12 – 2019Research article
بًا إلحداث ثقوب يف القفازات املصنوعة من الالتكس: جتربة حماكاة رسيرية طول األظافر بوصفه عاماًل ُمؤهِّسهيل العمد، آالء الصالح، رشوق النجدي، فاطمة النارص، ساره السلمي
اخلالصةاخللفية: ُأثريت خماوف بشأن سالمة القفازات وطول مدة احلامية التي توفرها القفازات بوصفها حائاًل.
األهداف: هدفت هذه الدراسة إىل تقييم تأثري طول أظافر األطباء الرسيريني بوصفه أحد العوامل املسببة النثقاب القفازات املصنوعة من الالتكس. طرق البحث: جرى تقييم 2006 قفازات فحص مصنوعة من الالتكس للوقوف عىل مدى قابليتها لالنثقاب باستخدام طريقة ضّخ املياه، وذلك بعد أن استخدم القفازات ستٌة من طالب السنة النهائية بكلية طب األسنان الذين كان طول أظافرهم يرتاوح من 0 ملم إىل 3 ملم. واسُتخدمت هلذا رت هذه اإلجراءات 30 مرة، وأعقبها اختبار لتقييم ترسب املياه. الغرض أربعة إجراءات حماكاة رسيرية متثل جمموعة متنوعة من حركات اليد، وُكرِّ
وخضعت البيانات للتحليل باستخدام اختبار كاي تربيع، وحتليل التباُين، واالنحدار اللوجستي. OR = 1.431; 95% CI = 1.249,[ ب يف 11.1% )العدد = 222( من القفازات، وكان أكثر شيوعًا مع األظافر األطول النتائج: حدث ترسُّp<0.001 ;1.64[. ومل يكن إلجراءات املحاكاة الرسيرية تأثري عىل الترسب. وكانت الغالبية العظمى من الثقوب فوق إصبعي السبابة واإلهبام بشاش األسنان ِمْقَلَحة رأس مسح هو الثقوب معظم معه حدثت الذي املحاكاة إجراء وكان . )24.3 ,%63.5% التوايل عىل <0.001P(
)43.2%( ووضع ِمْثَقب ذي حافة َمْشُطوَفة )36.5%(، بينام كان أقل إجراء حدثت معه ثقوب هو وضع املِحقنة الثالثية )%8.1(. االستنتاج: ُيعّد طول أظافر األطباء الرسيريني عاماًل مهاًم يرض بالقفازات املصنوعة من الالتكس. وتقصري األظافر أواًل بأول أمر مهم للحد من
احتاملية تعرض هذه القفازات للتلف يف أثناء العمليات، ومن ثمَّ تظل القفازات تؤدي وظيفتها بوصفها حائاًل.
clinique simulée. La grande majorité des perforations se situaient sur le bout de l'index et du pouce (63,5 % et 24,3 % respectivement ; p < 0,001). L’essuyage de la pointe du détartreur avec de la gaze (43,2 %) et le placement de la fraise à chanfreiner (36,5 %) représentaient les procédures simulées donnant lieu à la plupart des perforations tandis que l’installation de la seringue à trois voies (8,1 %) était celle ayant donné lieu au moindre nombre de perforations. Conclusion : La longueur des ongles des cliniciens est un facteur important qui compromet l'intégrité des gants latex. Il importe de garder les ongles courts pour réduire le risque d'endommager les gants latex pendant l'opération, et donc maintenir l'effet barrière des gants.
References1. Hayden MK, Blom DW, Lyle EA, Moore CG, Weinstein RA. Risk of hand or glove contamination after contact with patients
colonized with vancomycin-resistant enterococcus or the colonized patients’ environment. Infect Control Hosp Epidemiol. 2008 Feb;29(2):149–54. http://dx.doi.org/10.1086/524331. PMID:18179370
2. Carrozzo M, Quadri R, Latorre P, Pentenero M, Paganin S, Bertolusso G, et al. Molecular evidence that hepatitis C virus repli-cates in the oral mucosa. J Hepatol 2002 Sep;37(3):364–9. PMID:12175632
3. Hermida M, Ferreiro MC, Barral S, Laredo R, Castro A, Diz Dios P. Detection of HCV RNA in saliva of patients with hepatitis C virus infection by using a highly sensitive test. J Virol Methods. 2002 Mar;101(1–2):29–35. PMID:11849681
4. Negrini Tde C, Duque C, de Oliveira AC, Hebling J, Spolidorio LC, Spolidorio DM. Staphylococcus aureus contamination in a pediatric dental clinic. J Clin Pediatr Dent. 2009 Fall;34(1):13–8. PMID:19953803
5. Ilmarinen T, Auvinen E, Hiltunen-Back E, Ranki A, Aaltonen LM, Pitkäranta A. Transmission of human papillomavirus DNA from patient to surgical masks, gloves and oral mucosa of medical personnel during treatment of laryngeal papillomas and geni-tal warts. Eur Arch Otorhinolaryngol. 2012 Nov;269(11):2367–71. http://dx.doi.org/10.1007/s00405-012-2049-9. PMID:22588197
6. Tenorio AR, Badri SM, Sahgal NB, Hota B, Matushek M, Hayden MK, et al. Effectiveness of gloves in the prevention of hand carriage of vancomycin-resistant enterococcus species by health care workers after patient care. Clin Infect Dis. 2001 Mar 1;32(5):826–9. http://dx.doi.org/10.1086/319214. PMID:11229854
7. Picheansanthian W, Chotibang J. Glove utilization in the prevention of cross transmission: a systematic review. JBI Database System Rev Implement Rep. 2015 May 15;13(4):188–230. http://dx.doi.org/10.11124/jbisrir-2015-1817 PMID:26447080
8. Neal JG, Jackson EM, Suber F, Edlich RF. Latex glove penetration by pathogens: a review of the literature. J Long Term Eff Med Implants. 1998;8(3–4):233–40. PMID:10186969
9. Patel HB, Fleming GJ, Burke FJ. A preliminary report on the incidence of pre-existing pinhole defects in nitrile dental gloves. Br Dent J. 2003 Nov 8;195(9):509–12. http://dx.doli.org/10.1038/sj.bdj.4810667 PMID:14610561
10. Murray CA, Burke FJ, McHugh S. An assessment of the incidence of punctures in latex and non-latex dental examination gloves in routine clinical practice. Br Dent J. 2001 Apr 14;190(7):377–80. http://dxdoi.org/10.1038/sj.bdj.4800978a PMID:11338041
11. Korniewicz DM, Garzon L, Seltzer J, Feinleib M. Failure rates in nonlatex surgical gloves. Am J Infect Control. 2004 Aug;32(5):268–73. http://dx.doi.org/10.1016/j.ajic.2003.12.005 PMID:15292890

877
Research article EMHJ – Vol. 25 No. 12 – 2019
12. Muto CA, Sistrom MG, Strain BA, Farr BM. Glove leakage rates as a function of latex content and brand: caveat emptor. Arch Surg. 2000 Aug;135(8):982–5. PMID:10922263
13. Partecke LI, Goerdt AM, Langner I, Jaeger B, Assadian O, Heidecke CD, et al. Incidence of microperforation for surgical gloves depends on duration of wear. Infect Control Hosp Epidemiol. 2009 May;30(5):409–14. http://dx.doi.org/10.1086/597062 PMID:19335225
14. Taghavi Zenouz A, Mahdipour M, Pakravan R, Yazdani J, Nezafati S, Mesgarzaded AH, et al. Evaluation of glove damage during dental procedures among dental specialists in Tabriz. J Dent Res Dent Clin Dent Prospects. 2007 Summer;1(2):82–5. http://dx.doi.org/10.5681/joddd.2007.014 PMID:23277839
15. Bekele A, Makonnen N, Tesfaye L, Taye M. Incidence and patterns of surgical glove perforations: experience from Addis Ababa, Ethiopia. BMC Surg. 2017 Mar 20;17(1):26. http://dx.doi.org/10.1186/s12893-017-0228-8 PMID:2832037
16. SoldáI SC, Assef JC, Parreira III JG, Perlingeiro JAG, Candelária PAP, Cury MP, et al. Undetected perforations of surgical gloves during emergency procedures. Rev Assoc Med Bras. 2009 Sep–Oct;55(5):597–600. http://www.scielo.br/scielo.php?pid=S0104-42302009000500026&script=sci_arttext&tlng=en
17. Goldman AH, Haug E, Owen JR, Wayne JS, Golladay GJ. High risk of surgical glove perforation from surgical rotatory in-struments. Clinical Orthopaedics and Related Research. 2016 Nov;474(11):2513–7. http://dx.doi.org/10.1007/s11999-016-4948-3 PMID:27339122
18. Phelan RN, Wong WK. Integrity of disposable nitrile exam gloves exposed to simulated movement. J Occup Environ Hyg. 2011 May;8(5):289–99. http://dx.doi.org/10.1080/15459624.2011.569285 PMID:21476169
19. Albin MS, Bunegin L, Duke ES, Ritter RR, Page CP. Anatomy of a defective barrier: sequential glove leak detection in a surgical and dental environment. Crit Care Med. 1992 Feb;20(2):170–84. PMID:1737454
20. Opinion of the Scientific Committee on Medicinal Products and Medical Devices on the protection offered by natural rubber la-tex medical devices (medical gloves and condoms) against transmissible diseases. Brussels: European Commission; 2003 (http://ec.europa.eu/health/archive/ph_risk/committees/scmp/documents/out48_en.pdf, accessed 8 June 2019).
21. Pieper SP, Schimmele SR, Johnson JA, Harper JL. A prospective study of the efficacy of various gloving techniques in the applica-tion of Erich arch bars. J Oral Maxillofac Surg. 1995 Oct;53(10):1174–6. PMID:7562171
22. Tanner J, Parkinson H. Double gloving to reduce surgical cross-infection. Cochrane Database Syst Rev. 2006 Jul 19;(3):CD003087. http://dx.doi.org/10.1002/14651858.CD003087 PMID:12137673
23. Mischke C, Verbeek JH, Saarto A, Lavoie MC, Pahwa M, Ijaz S. Gloves, extra gloves or special types of gloves for preventing percutaneous exposure injuries in healthcare personnel. Cochrane Database Syst Rev. 2014 Mar 7;(3):CD009573. http://dx.doi.org/10.1002/14651858.CD009573 PMID:24610769
878
EMHJ – Vol. 25 No. 12 – 2019Research article
Workplace stress and its relation to cardiovascular disease risk factors among bus drivers in EgyptAmira Mohsen 1 and Sally Hakim2
1Department of Community Medicine, National Research Center, Cairo, Egypt. 2Department of Community Medicine, Environmental and Occupation-al Medicine, Faculty of Medicine, Ain Shams University, Cairo, Egypt (Correspondence to: S.A. Hakim: [email protected]; [email protected]).
AbstractBackground: Driving buses exposes the drivers to many stressors that can increase their cardiovascular risk factors.Aims: The objective of this study was to measure the prevalence of workplace stress and its association with cardiovascu-lar risk factors among bus drivers in Egypt.Methods: A cross-sectional study was conducted on 234 bus drivers in Cairo, Egypt. Data were collected over a period of 6 months from August 2016 to January 2017. For all drivers, blood pressure, body weight and height and random blood sugar were measured. Professional driving duration/age ratio was calculated. Comparison between cardiovascular risk factors and workplace stress score was made. Unadjusted and adjusted odds ratios and 95% confidence intervals were calculated using logistic regression models.Results: A high prevalence of workplace stress (83.3%) was observed among bus drivers. Moreover, a high prevalence of cardiovascular risk factors, particularly tobacco smoking (65.0%), physical inactivity (93.6%) and hypertension (33.3%), was noted. After adjustment for age and other confounding factors, the risk factors associated with workplace stress were overweight/obesity and hypertension.Conclusions: There is a positive association between workplace stress and some cardiovascular risk factors, such as hy-pertension and overweight/obesity, among bus drivers in Egypt.Keywords: tobacco, cardiovascular risk, hypertension, occupational stress, prevalence.Citation: Mohsen A; Hakim SA. Workplace stress and its relation to cardiovascular disease risk factors among bus drivers in Egypt. East Mediterr Health J. 2019;25(12):878–886. https://doi.org/10.26719/emhj.19.056Received: 07/01/18; accepted: 20/05/18Copyright © World Health Organization (WHO) 2019. Some rights reserved. This work is available under the CC BY-NC-SA 3.0 IGO license (https://creativecommons.org/licenses/by-nc-sa/3.0/igo).
IntroductionWork stress is usually related to an occupational environ-ment with high demands and little control in addition to low social support (1). All these factors are present in the daily working life of bus drivers. Bus or truck driving is considered one of the most stressful occupations and is associated with increased risk of chronic diseases, in par-ticular, cardiovascular risk factors and diseases (2). Occu-pational risk factors to which professional drivers are ex-posed may be shift work, long working hours, loud noise, carbon monoxide and chemical materials that may lead to cardiovascular diseases (CVD). Also, bus drivers face stressors such as inadequate cabin ergonomics, violence from passengers, and traffic congestion (3). Bus drivers are more prone to daily behavioural risk factors such as obesity, poor irregular diets, and working while sitting for long periods of time (4). These factors when accom-panied with job stress may worsen nonbehavioural risk factors such as blood pressure, lipid profile and diabetes, leading to a higher risk of cardiovascular events among professional drivers (5).
In Egypt, few studies have investigated the relationship between environmental hazards and
CVD. Negm et al. (6) found that different occupational environmental hazards might increase the incidence of coronary artery disease in young Egyptian male workers. In another study among Egyptian workers in a cigarette factory, the findings revealed that hypertension was the most prevalent stress-related disease (7). The Egyptian National Health Issues Survey in 2015 (8) showed that smoking was more prevalent in men, with 46% of men being current cigarette smokers, 34.3% were overweight and 26.4% were obese. The prevalence of hypertension among men aged 15–59 years was 16.7% and this increased to 26.8% among men aged 35–59 years. It is estimated that the prevalence of diabetes among Egyptians is around 15% among adults aged 20–70 years (9). The most common causes of death in Egypt are CVDs, mainly ischemic heart disease and cerebrovascular disease, which represent 46% of total deaths (10).
No research in Egypt has addressed both occupational and personal risk factors when investigating the association between occupational stress and CVD among bus drivers. Thus, the present study assessed the prevalence of workplace stress and its relation to CVD risk factors among bus drivers in Egypt.

879
Research article EMHJ – Vol. 25 No. 12 – 2019
MethodsStudy design and populationThis was a cross-sectional study of 234 bus drivers who attended periodic medical examination at a health insur-ance hospital in Cairo, Egypt. Data were collected for a period of 6 months from August 2016 to January 2017.
Sample sizeSample size was calculated using Epi Info version 7. Hy-pertension was used as an indicator for CVD risk factors. The following assumptions were made: the prevalence of hypertension among bus drivers with low score of stress was 20% (as reported in the National Health Issues Sur-vey of Egypt for a similar age group [8]); prevalence of hy-pertension for drivers with high stress was 40% (11); 95% confidence interval (CI) and 90% study power. According-ly, a sample of 234 bus drivers was required. This number was taken out of a total of 420 bus drivers attending for annual medical examination at the health insurance hos-pital. All bus drivers attending the clinic every Tuesday (10–12 drivers) for 6 months were included until the re-quired sample size was recruited.
Tools and definition of variablesBus drivers were interviewed by a questionnaire that included items about sociodemographic factors, occupa-tional characteristics, behavioural risk factors (smoking, low fruit/vegetable consumption and physical inactivity) and workplace stress. In addition, nonbehavioural risk factors as blood pressure, body mass index and random blood sugar were measured.
Two blood pressure readings were taken at an interval of 10–15 minutes. High blood pressure was defined as average systolic pressure ≥140 mmHg or diastolic pressure ≥90 mmHg. Bus drivers were considered to have hypertension if they had been diagnosed previously by a medical professional and were taking antihypertensive drugs (8).
According to World Health Organization classification, individuals with body mass index (BMI) ≥ 25 but < 30 kg/m2 are considered to be overweight and those with BMI ≥ 30 kg/ m2 are considered to be obese (12). Hyperglycaemia is diagnosed by blood sugar level ≥ 200 mg/dl in a random test and the person has symptoms of diabetes (e.g., frequency of urination and thirst sensation). All bus drivers who had random blood sugar levels ≥200 mg/dl were recommended to seek medical advice for further diagnosis and follow-up. Bus drivers were considered to have diabetes if they had been diagnosed previously by a medical professional and were receiving medication (8).
Tobacco use included those who currently smoked any type of tobacco product daily (e.g., cigarettes, cigars or pipes). Low fruit and vegetable consumption was defined as consumption of < 5 portions per day in a typical week (12). Low physical activity included those who practice < 150 minutes per week of different physical activities (e.g., jogging, walking and cycling) and similar activities
in a typical week, or those who practice ≤ 10 minutes continuously of any type of physical activity per day (12).
The workplace stress survey questionnaire was composed by the American Institute of Stress (13). The survey consisted of 10 questions, and the answers ranged from 1 (strongly disagree) to 10 (strongly agree). If the total score was 10–30, the participant handled stress well; if the score was 40–60, the participant handled stress moderately well; and if the score was 70–100, the participant encountered problems that needed to be resolved.
We used an operational definition for social conflict in the form of a simple question. Persons who perceived any social problems (e.g., struggles/disagreements) with any family members (wife, children, parents or parents-in-law) or neighbours at least once per week were considered to have social conflict.
Professional driving duration and age ratio (PDAR) was calculated as follows: duration of professional driving divided by age (14). PDAR reflected the extent of professional driving experience. PDAR was coded into ≥ 0.5 (more risk exposure) and < 0.5 (less exposure = reference).
Ethical considerationsAll participants were informed about the study objectives and signed informed consent before participating in the study. Participant confidentiality was assured by having an anonymous questionnaire. Before conducting the study, the protocol was approved by the Research Ethics Committee of the Faculty of Medicine, Ain Shams Uni-versity, Cairo, Egypt.
Statistical analysisDescriptive analyses for all study variables were con-ducted. The χ2 test or Fisher’s exact test was applied for bivariate analysis. Fisher’s exact test was applied when any expected value in the 2 × 2 contingency table was < 5. Variables associated with work stress were included in the multiple binary logistic regression analysis to cal-culate the odds ratio (OR) and 95% CI. All analyses were done using IBM-SPSS version 21. P = 0.05 was considered significant.
ResultsAll the bus drivers were male. The mean age was 37.4 ± 9.0 years and > 60% of them were aged 30–49 years (Ta-ble 1). Around two thirds were married and 61.1% achieved a low educational level. Social conflict reported was by 47%. One quarter of the drivers had worked as profes-sional drivers for > 20 years while one fifth had a PDAR ≥ 0.5. Around one third had reported 3–5 during the past 12 months. Regarding behavioural risk factors, 65% of bus drivers were current smokers, only 6.4% regularly practiced physical exercise, and only around 9.0% ate ≥ 5 portions of fruits and vegetables per day. As for nonbe-havioural risk factors, 61.5% of drivers were overweight or obese, one third experienced high blood pressure,
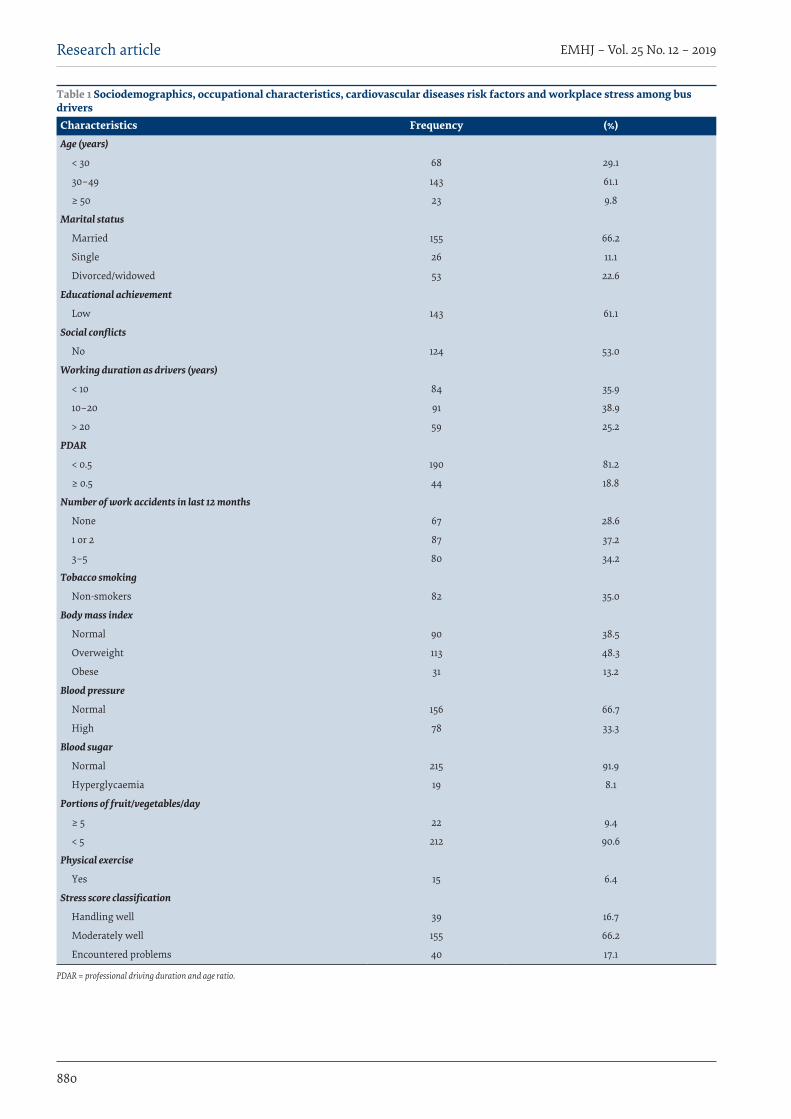
880
EMHJ – Vol. 25 No. 12 – 2019Research article
Table 1 Sociodemographics, occupational characteristics, cardiovascular diseases risk factors and workplace stress among bus driversCharacteristics Frequency (%)Age (years)
< 30 68 29.1
30–49 143 61.1
≥ 50 23 9.8
Marital status
Married 155 66.2
Single 26 11.1
Divorced/widowed 53 22.6
Educational achievement
Low 143 61.1
Social conflicts
No 124 53.0
Working duration as drivers (years)
< 10 84 35.9
10–20 91 38.9
> 20 59 25.2
PDAR
< 0.5 190 81.2
≥ 0.5 44 18.8
Number of work accidents in last 12 months
None 67 28.6
1 or 2 87 37.2
3–5 80 34.2
Tobacco smoking
Non-smokers 82 35.0
Body mass index
Normal 90 38.5
Overweight 113 48.3
Obese 31 13.2
Blood pressure
Normal 156 66.7
High 78 33.3
Blood sugar
Normal 215 91.9
Hyperglycaemia 19 8.1
Portions of fruit/vegetables/day
≥ 5 22 9.4
< 5 212 90.6
Physical exercise
Yes 15 6.4
Stress score classification
Handling well 39 16.7
Moderately well 155 66.2
Encountered problems 40 17.1
PDAR = professional driving duration and age ratio.

881
Research article EMHJ – Vol. 25 No. 12 – 2019
and 8.1% had hyperglycaemia. Around 17% of bus drivers could handle stress well, 66.2% moderately well and 17.1% encountered problems.
Occupational stress was significantly associated with age, as the percentage of bus drivers aged ≥ 50 years who encountered stress problems was 17.5% compared to none of those who handled stress well and 10.3% of those who handled stress moderately well (Table 2). The percentage of divorced/widowed drivers was higher among drivers who encountered stress problems compared to those who handled stress well or moderately well, but the difference was not significant. The percentage of those with low educational level (77.5%) who encountered problems was significantly higher than the corresponding figure among those who handled stress well (28.2%). The results revealed a strong association between social problems and workplace stress. Among those who encountered problems, the percentage of those working > 20 years was significantly higher (42.5%) than that among those
who handled stress well (10.2%). A significant association was found between PDAR and occupational stress score. There was an insignificant association between the number of accidents related to driving during the past year and occupational stress score.
There was an insignificant association between tobacco smoking and workplace stress (Table 3). The highest percentage of overweight/obesity (77.5%) was observed among bus drivers who encountered problems, while the corresponding figures among drivers who handled stress well and moderately well was 53.8% and 57.4%, respectively. The relationship between physical activity, consumption of fruit/vegetables, hyperglycaemia and stress score was insignificant. The prevalence of high blood pressure among bus drivers who encountered problems was 4 times higher than the corresponding figure among drivers who handled stress well and around 1.5 times the figure among those who handled stress moderately well.
Table 2 Association between workplace stress score and sociodemographic and job characteristicsCharacteristics Workplace stress score χ 2 test
P Handling well (n = 39)No. (%)
Moderately well (n = 155)No. (%)
Encountered problems (n = 40)No. (%)
Age (years)
< 30 18 (46.2) 45 (29.0) 5 (12.5) 14.822
30–49 21 (53.8) 94 (60.7) 28 (70.0) 0.005
≥ 50 0 (0.0) 16 (10.3) 7 (17.5)
Marital status
Married 31 (79.5) 101 (65.2) 23 (57.5) 7.242
Single 3 (11.5) 20 (12.9) 3 (7.5) 0.124
Othersa 5 (9.4) 34 (21.9) 14 (35.0)
Educational achievement
Low 11 (28.2) 101 (65.2) 31 (77.5) 23.360
High 28 (71.9) 54 (34.8) 9 (22.5) < 0.001
Social conflicts
No 36 (92.3) 78 (50.3) 10 (25.0) 37.225
Yes 3 (7.7) 77 (49.7) 30 (75.0) < 0.001
Professional driving duration (years)
< 10 20 (51.3) 57 (36.7) 7 (17.5) 14.623
10–20 15 (38.5) 60 (38.8) 16 (40.0) 0.006
> 20 4 (10.2) 38 (24.5) 17 (42.5)
PDAR
< 0.5 35 (89.7) 130 (83.9) 25 (62.5) 11.750
≥ 0.5 4 (10.3) 25 (16.1) 15 (37.5) 0.003
No. of work accidents (last 12 months)
No 18 (46.2) 39 (25.2) 10 (25.0) 7.058
1 or 2 11 (28.2) 60 (38.7) 16 (40.0) 0.133
3–5 times 10 (52.6) 56 (36.1) 14 (35.0)
aDivorced or widowed. PDAR = professional driving duration and age ratio.
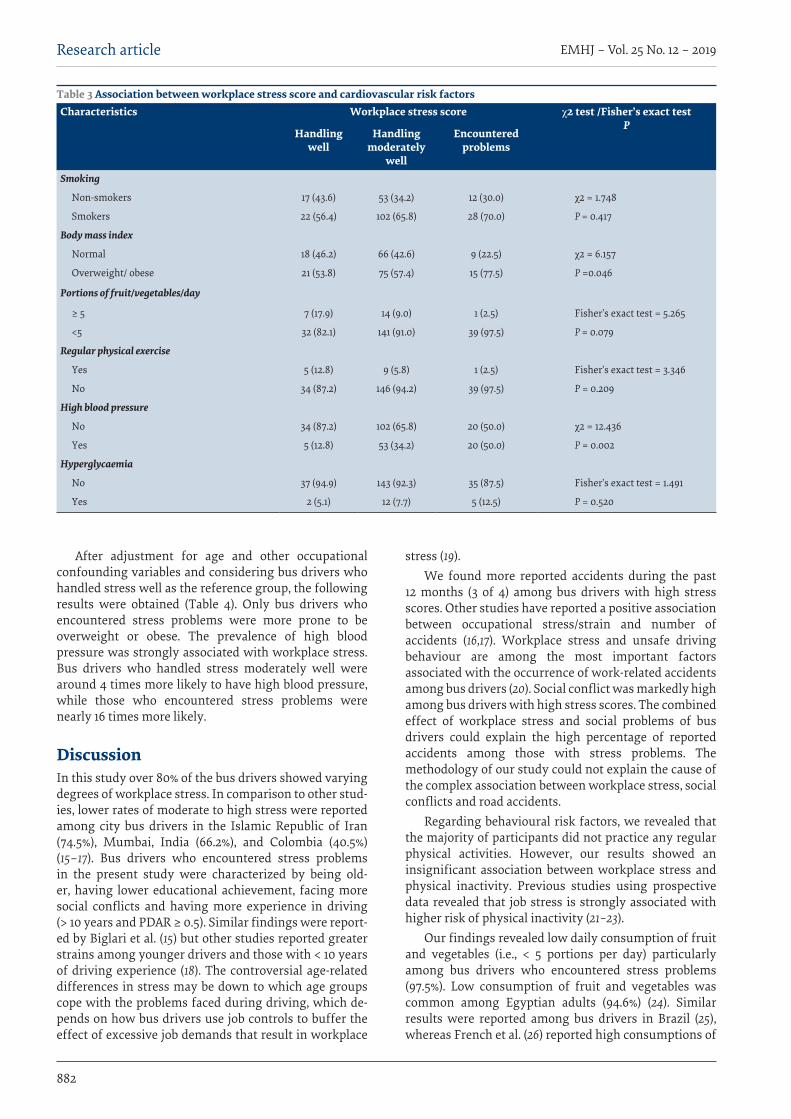
882
EMHJ – Vol. 25 No. 12 – 2019Research article
After adjustment for age and other occupational confounding variables and considering bus drivers who handled stress well as the reference group, the following results were obtained (Table 4). Only bus drivers who encountered stress problems were more prone to be overweight or obese. The prevalence of high blood pressure was strongly associated with workplace stress. Bus drivers who handled stress moderately well were around 4 times more likely to have high blood pressure, while those who encountered stress problems were nearly 16 times more likely.
DiscussionIn this study over 80% of the bus drivers showed varying degrees of workplace stress. In comparison to other stud-ies, lower rates of moderate to high stress were reported among city bus drivers in the Islamic Republic of Iran (74.5%), Mumbai, India (66.2%), and Colombia (40.5%) (15–17). Bus drivers who encountered stress problems in the present study were characterized by being old-er, having lower educational achievement, facing more social conflicts and having more experience in driving (> 10 years and PDAR ≥ 0.5). Similar findings were report-ed by Biglari et al. (15) but other studies reported greater strains among younger drivers and those with < 10 years of driving experience (18). The controversial age-related differences in stress may be down to which age groups cope with the problems faced during driving, which de-pends on how bus drivers use job controls to buffer the effect of excessive job demands that result in workplace
stress (19). We found more reported accidents during the past
12 months (3 of 4) among bus drivers with high stress scores. Other studies have reported a positive association between occupational stress/strain and number of accidents (16,17). Workplace stress and unsafe driving behaviour are among the most important factors associated with the occurrence of work-related accidents among bus drivers (20). Social conflict was markedly high among bus drivers with high stress scores. The combined effect of workplace stress and social problems of bus drivers could explain the high percentage of reported accidents among those with stress problems. The methodology of our study could not explain the cause of the complex association between workplace stress, social conflicts and road accidents.
Regarding behavioural risk factors, we revealed that the majority of participants did not practice any regular physical activities. However, our results showed an insignificant association between workplace stress and physical inactivity. Previous studies using prospective data revealed that job stress is strongly associated with higher risk of physical inactivity (21–23).
Our findings revealed low daily consumption of fruit and vegetables (i.e., < 5 portions per day) particularly among bus drivers who encountered stress problems (97.5%). Low consumption of fruit and vegetables was common among Egyptian adults (94.6%) (24). Similar results were reported among bus drivers in Brazil (25), whereas French et al. (26) reported high consumptions of
Table 3 Association between workplace stress score and cardiovascular risk factorsCharacteristics Workplace stress score χ2 test /Fisher’s exact test
P Handling
wellHandling
moderately well
Encountered problems
Smoking
Non-smokers 17 (43.6) 53 (34.2) 12 (30.0) χ2 = 1.748
Smokers 22 (56.4) 102 (65.8) 28 (70.0) P = 0.417
Body mass index
Normal 18 (46.2) 66 (42.6) 9 (22.5) χ2 = 6.157
Overweight/ obese 21 (53.8) 75 (57.4) 15 (77.5) P =0.046
Portions of fruit/vegetables/day
≥ 5 7 (17.9) 14 (9.0) 1 (2.5) Fisher’s exact test = 5.265
<5 32 (82.1) 141 (91.0) 39 (97.5) P = 0.079
Regular physical exercise
Yes 5 (12.8) 9 (5.8) 1 (2.5) Fisher’s exact test = 3.346
No 34 (87.2) 146 (94.2) 39 (97.5) P = 0.209
High blood pressure
No 34 (87.2) 102 (65.8) 20 (50.0) χ2 = 12.436
Yes 5 (12.8) 53 (34.2) 20 (50.0) P = 0.002
Hyperglycaemia
No 37 (94.9) 143 (92.3) 35 (87.5) Fisher’s exact test = 1.491
Yes 2 (5.1) 12 (7.7) 5 (12.5) P = 0.520
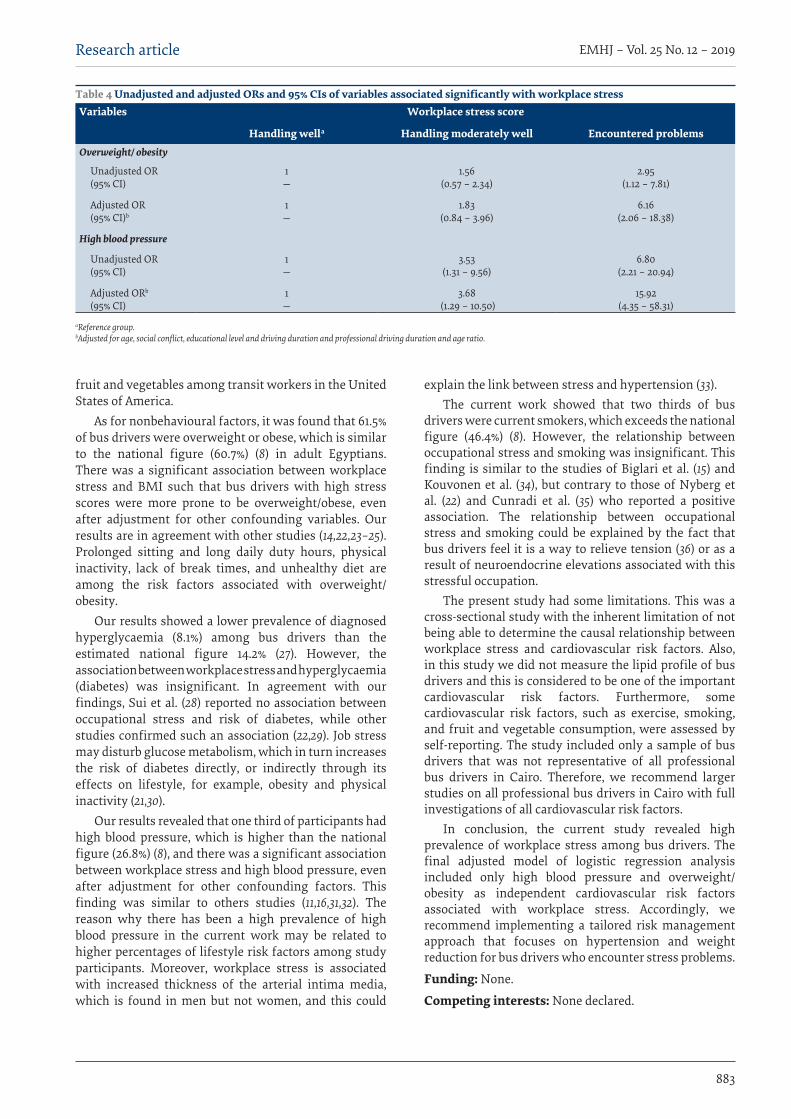
883
Research article EMHJ – Vol. 25 No. 12 – 2019
fruit and vegetables among transit workers in the United States of America.
As for nonbehavioural factors, it was found that 61.5% of bus drivers were overweight or obese, which is similar to the national figure (60.7%) (8) in adult Egyptians. There was a significant association between workplace stress and BMI such that bus drivers with high stress scores were more prone to be overweight/obese, even after adjustment for other confounding variables. Our results are in agreement with other studies (14, 22, 23–25). Prolonged sitting and long daily duty hours, physical inactivity, lack of break times, and unhealthy diet are among the risk factors associated with overweight/obesity.
Our results showed a lower prevalence of diagnosed hyperglycaemia (8.1%) among bus drivers than the estimated national figure 14.2% (27). However, the association between workplace stress and hyperglycaemia (diabetes) was insignificant. In agreement with our findings, Sui et al. (28) reported no association between occupational stress and risk of diabetes, while other studies confirmed such an association (22,29). Job stress may disturb glucose metabolism, which in turn increases the risk of diabetes directly, or indirectly through its effects on lifestyle, for example, obesity and physical inactivity (21,30).
Our results revealed that one third of participants had high blood pressure, which is higher than the national figure (26.8%) (8), and there was a significant association between workplace stress and high blood pressure, even after adjustment for other confounding factors. This finding was similar to others studies (11,16,31,32). The reason why there has been a high prevalence of high blood pressure in the current work may be related to higher percentages of lifestyle risk factors among study participants. Moreover, workplace stress is associated with increased thickness of the arterial intima media, which is found in men but not women, and this could
explain the link between stress and hypertension (33). The current work showed that two thirds of bus
drivers were current smokers, which exceeds the national figure (46.4%) (8). However, the relationship between occupational stress and smoking was insignificant. This finding is similar to the studies of Biglari et al. (15) and Kouvonen et al. (34), but contrary to those of Nyberg et al. (22) and Cunradi et al. (35) who reported a positive association. The relationship between occupational stress and smoking could be explained by the fact that bus drivers feel it is a way to relieve tension (36) or as a result of neuroendocrine elevations associated with this stressful occupation.
The present study had some limitations. This was a cross-sectional study with the inherent limitation of not being able to determine the causal relationship between workplace stress and cardiovascular risk factors. Also, in this study we did not measure the lipid profile of bus drivers and this is considered to be one of the important cardiovascular risk factors. Furthermore, some cardiovascular risk factors, such as exercise, smoking, and fruit and vegetable consumption, were assessed by self-reporting. The study included only a sample of bus drivers that was not representative of all professional bus drivers in Cairo. Therefore, we recommend larger studies on all professional bus drivers in Cairo with full investigations of all cardiovascular risk factors.
In conclusion, the current study revealed high prevalence of workplace stress among bus drivers. The final adjusted model of logistic regression analysis included only high blood pressure and overweight/obesity as independent cardiovascular risk factors associated with workplace stress. Accordingly, we recommend implementing a tailored risk management approach that focuses on hypertension and weight reduction for bus drivers who encounter stress problems.
Funding: None.
Competing interests: None declared.
Table 4 Unadjusted and adjusted ORs and 95% CIs of variables associated significantly with workplace stressVariables Workplace stress score
Handling well a Handling moderately well Encountered problemsOverweight/ obesity
Unadjusted OR (95% CI)
1 —
1.56(0.57 – 2.34)
2.95(1.12 – 7.81)
Adjusted OR (95% CI)b
1 —
1.83(0.84 – 3.96)
6.16(2.06 – 18.38)
High blood pressure
Unadjusted OR (95% CI)
1 —
3.53 (1.31 – 9.56)
6.80(2.21 – 20.94)
Adjusted ORb (95% CI)
1 —
3.68 (1.29 – 10.50)
15.92(4.35 – 58.31)
aReference group. bAdjusted for age, social conflict, educational level and driving duration and professional driving duration and age ratio.
884
EMHJ – Vol. 25 No. 12 – 2019Research article
References1. Byrne DG and Espnes GA. Occupational stress and cardiovascular disease. Stress Health. 2008;24:231–8. http://dx.doi.
org/10.1002/smi.1203
2. Thiese MS, Moffitt G, Hanowski RJ, Kales SN, Porter RJ, Hegmann KT. Commercial driver medical examinations: prevalence of obesity and comorbidities and certification outcomes. J Occup Environ Med. 2015 Jun;57(6):659–65. http://dx.doi.org/10.1097/JOM.0000000000000422 PMID:25710607
3. Tse JL, Flin R, Mearns K. Bus driver well-being review: 50 years of research. Transp Res F Traffic Psychol Behav. 2006 Mar;9(2):89–114. https://doi.org/10.1016/j.trf.2005.10.002
4. Robinson CF, Burnett CA. Truck drivers and heart disease in the United States, 1979–1990. Am J Ind Med. 2005 Feb;47(2):113–9. http://dx.doi.org/10.1002/ajim.20126 PMID:15662648
Évaluation du stress au travail et de sa relation avec les facteurs de risque de maladies cardio-vasculaires dans un échantillon de conducteurs de bus en ÉgypteRésuméContexte : La conduite de bus expose les conducteurs à de nombreux éléments stressants qui augmentent les facteurs de risque cardio-vasculaire. Objectif : La présente étude avait pour objectif de mesurer la prévalence du stress au travail et son association avec les facteurs de risque des maladies cardio-vasculaires chez les conducteurs de bus en Égypte. Méthodes : Une étude transversale a été menée auprès de 234 conducteurs de bus au Caire (Égypte). Les données ont été recueillies sur une période de six mois, d'août 2016 à janvier 2017. La tension artérielle, le poids, la taille et la glycémie aléatoire ont été mesurés pour tous les conducteurs de l'étude. Le ratio durée/âge de conduite professionnelle a été calculé. Une comparaison entre les facteurs de risque cardio-vasculaire et le score de stress en milieu de travail a été établie. Les odds ratios non ajustés et ajustés et les intervalles de confiance à 95 % ont été calculés à l'aide de modèles de régression logistique. Résultats : Une forte prévalence du stress au travail (83,3 %) a été constatée chez les conducteurs de bus. De plus, une prévalence élevée de facteurs de risque cardio-vasculaire, notamment le tabagisme (65,0 %), la sédentarité (93,6 %) et l'hypertension (33,3 %) a été observée. Après ajustement en fonction de l'âge et d'autres facteurs de confusion, les facteurs de risque associés au stress en milieu de travail étaient le surpoids ou l'obésité et l'hypertension. Conclusion : Il existe une association positive entre le stress en milieu de travail et un certain nombre de facteurs de risque cardio-vasculaire chez les conducteurs de bus en Égypte, notamment l'hypertension et le surpoids ou l'obésité.
تقييم إجهاد العمل وعالقته بعوامل خطر اإلصابة بأمراض القلب واألوعية الدموية لدى عينة من سائقي احلافالت يف مرص
أمرية حمسن، سايل حكيماخلالصة
ض السائقني لكثري من الضغوط التي تزيد من عوامل تعرضهم خلطر اإلصابة بأمراض القلب واألوعية الدموية. اخللفية: قيادة احلافالت ُتعرِّاألهداف: هدفت هذه الدراسة إىل قياس معدل انتشار إجهاد العمل، ومدى ارتباطه بعوامل خطر اإلصابة بأمراض القلب واألوعية الدموية.
طرق البحث: ُأجريت دراسة مقطعية عىل 234 سائق حافلة. وُجعت البيانات عىل مدار 6 أشهر ابتداًء من أغسطس/آب 2016. وجرى قياس ضغط الدم والوزن والطول والسكر العشوائي يف الدم جلميع السائقني املشمولني بالدراسة. كام ُحسبت نسبة مدة العمل يف مهنة القيادة إىل السن. وغري حة امُلصحَّ األرجحية نسبتا وُحسبت العمل. إجهاد ودرجة الدموية واألوعية القلب بأمراض اإلصابة خطر عوامل بني مقارنة وُعقدت
حة وفاصل ثقة قدره 95% باستخدام نامذج االنحدار اللوجستي. امُلصحَّالنتائج: ُلوحظ ارتفاع معدل انتشار إجهاد العمل )83.3%( يف صفوف سائقي احلافالت. وعالوة عىل ذلك، ُلوحظ ارتفاع معدل انتشار عوامل خطر اإلصابة بأمراض القلب واألوعية الدموية، ال سيام تدخني التبغ )65%(، واخلمول البدين )93.6%(، وارتفاع ضغط الدم )33.3%(. وبعد OR = 6.16; 95% CI = 2.06[ ضبط السن والعوامل املشوشة األخرى، كانت عوامل اخلطر املرتبطة بإجهاد العمل هي زيادة الوزن/السمنة
.]OR = 15.92; 95% CI = 4.35 58.31[ وارتفاع ضغط الدم ]18.38االستنتاج: يوجد ارتباط إجيايب بني إجهاد العمل وعدد من عوامل خطر اإلصابة بأمراض القلب واألوعية الدموية، مثل ارتفاع ضغط الدم وزيادة
الوزن أو السمنة.
885
Research article EMHJ – Vol. 25 No. 12 – 2019
5. Lee NS, Lee KJ, Kim JJ, Lee JW. The relationship between job stress and dyslipidemia in express bus drivers. Korean J Occup Environ Med. 2010 Sep;22(3):221–9. https://doi.org/10.35371/kjoem.2010.22.3.221
6. Negm H, Fayez M, El-Mahdy N, Youssef A. Effects of working environment on ischemic heart disease burden profile in young Egyptian males. Egypt J Occup Med 2013;37(2):195–216.
7. Zaghloul A, Ananian F, Siha M. The impact of work and family stress on workers health. Br J Appl Sci Technol. 2014;4(12):1869–81.
8. Egypt Health Issues Survey 2015. Cairo: Ministry of Health and Population; Rockville, MD: ICF International (https://dhspro-gram.com/publications/publication-fr313-dhs-final-reports.cfm, accessed 18 June 2019).
9. Hegazi R, El-Gamal M, Abdel-Hady N, Hamdy O. Epidemiology of and risk factors for type 2 diabetes in Egypt. Ann Glob Health. 2015 Nov–Dec;81(6):814–20. http://dx.doi.org/10.1016/j.aogh.2015.12.011 PMID:27108148:
10. Turk-Adawi K, Sarrafzadegan N, Fadhil I, Taubert K, Sadeghi M, Wenger NK, et al. Cardiovascular disease in the Eastern Mediterranean region: epidemiology and risk factor burden. Nat Rev Cardiol. 2018 Feb;15(2):106–19. http://dx.doi.org/10.1038/nrcardio.2017.138 PMID:28933782
11. Owolabi AO, Owolabi MO, OlaOlorun AD, Olofin A. Work-related stress perception and hypertension amongst health workers of a mission hospital in Oyo State, south-western Nigeria. Afr J Prm Health Care Fam Med. 2012;4(1):307. http://dx.doi.org/10.4102/phcfm.v4i1.307
12. The WHO STEPwise approach to non-communicable disease risk factor surveillance. WHO STEPS Surveillance Manual. World Health Organization; 2017 (https://www.who.int/ncds/surveillance/steps/STEPS_Manual.pdf?ua=1, accessed 26 June 2019).
13. Workplace stress survey. Weatherford, TX: American Institute of Stress (https://www.stress.org/wp-content/ uploads/2011/08/Workplace-Stress-Survey.pdf, accessed 18 June 2019).
14. Shin SY, Lee CG, Song HS, Kim HS, Lee HS, Jung MS, et al. Cardiovascular Disease Risk of Bus Drivers in a City of Korea. Ann Occup Environ Med. 2013 Nov 11;25(1):34. http://dx.doi.org/10.1186/2052-4374-25-34 PMID:24472511
15. Biglari H, Ebrahimi MH, Salehi M, Poursadeghryan M, Ahmadnezhad I, Abbasi M. Relationship between occupational stress and cardiovascular diseases risk factors in drivers. Int J Occup Med Environ Health. 2016 Nov 18;29(6):895–901. http://dx.doi.org/10.13075/ijomeh.1896.00125 PMID:27869240
16. Taklikar CS. Occupational stress and its associated health disorders among bus drivers. Int J Commun Med Public Health. 2016;3(1):208–11. http://dx.doi.org/10.18203/2394-6040.ijcmph20151564
17. Useche SA, Alonso F, Cendales BE, Autukeviciute R, Serge A. Burnout, Job strain and road accidents in the field of public trans-portation: the case of city bus drivers. J Environ Occup Sci. 2017;6(1):1–7. http://dx.doi.org/10.5455/jeos.20170202074636
18. Hlotova Y and Cats O. Measuring bus driver’s occupational stress under changing working conditions. Transp Res Record. 2014; 2415:13–20. https://doi.org/10.3141/2415-02
19. Shultz KS, Wang M, Crimmins EM, Fisher GG. Age differences in demand-control model of work stress. An examination of data from 15 European countries. J Appl Gerontol. 2010 Feb;29(1):21–47. http://dx.doi.org/10.1177/0733464809334286 PMID:20948986
20. Kontogiannis, T. Patterns of driver stress and coping strategies in a Greek sample and their relationship to aberrant behaviors and traffic accidents. Accid Anal Prev. 2006 Sep;38(5):913–24. http://dx.doi.org/10.1016/j.aap.2006.03.002 PMID:16620741
21. Fransson EI, Heikkila K, Nyberg ST, Zins M, Westerlund H, Westerholm P, et al. Job strain as a risk factor for leisure-time physical inactivity: an individual- participant meta-analysis of up to 170,000 men and women: the IPD-Work Consortium. Am J Epidemiol. 2012 Dec 15;176(12):1078–89. http://dx.doi.org/10.1093/aje/kws336 PMID:23144364
22. Nyberg ST, Fransson EI, Heikkila K, Alfredsson L, Casini A, Clays E, et al. Job strain and cardiovascular disease risk factors: Meta- Analysis of individual-participant data from 47,000 men and women. Plos One. 2012 Jun 20;8(6):e67323. http://dx.doi.org/10.1371/journal.pone.0067323 PMID:23840664
23. Oshio T, Tsutsumi A, Inoue A. The association between job stress and leisure-time physical inactivity adjusted for individual attributes: evidence from Japanese occupational cohort survey. Scand J Work Environ Health. 2016May 1;42(3):228–36. http://dx.doi.org/10.5271/sjweh.3555 PMID:26913937
24. Egypt STEPS survey 2011-2012. Fact Sheet. available at: http://www.who.int/ncds/surveillance/steps/2011-2012_Egypt_FactSheet.pdf. Accessed 21 January 2019
25. Balieiro LC, Rossato LT, Waterhouse J, Paim SL, Mota MC, Crispim CA. Nutritional status and eating habits of bus drivers during the day and night. Chronobiol Int. 2014 Dec;31(10):1123–9. http://dx.doi.org/10.3109/07420528.2014.957299 PMID:25231504
26. French SA, Harnack LG, Toomey TL and Hannan PJ. Association between body weight, physical activity and food choices among metropolitan transit workers. Int J Behav Nutr Phys Act. 2007 Nov 2;4:52. http://dx.doi.org/10.1186/1479-5868-4-52 PMID:17980026
27. World Health Organization: diabetes country profiles 2016. Egypt (http://www.who.int/diabetes/country-profiles/egy_en.pdf, accessed 18 June 2019).
28. Sui H, Sun N, Zhan L, Lu X, Chen T, Mao X. Association between work-related stress and risk of type 2 diabetes: a systematic review and meta-analysis of prospective cohort studies. PLoS One 2016 Aug 11;11(8):e0159978. http://dx.doi.org/10.1371/journal. pone.0159978 PMID:27513574
886
EMHJ – Vol. 25 No. 12 – 2019Research article
29. Nyberg ST, Fransson EI, Heikkila¨ K, Ahola K, Alfredsson L, Bjorner JB, et al. Job strain as a risk factors for type 2 diabetes: a pooled analysis of 124,808 men and women. Diabetes Care. 2014 Aug;37(8):2286–75. http://dx.doi.org/10.2337/dc13-2936 PMID:25061139
30. Heikkilä K, Fransson EI, Nyberg ST, Zins M, Westerlund H, Westerholm P, et al. Job strain and health-related lifestyle: findings from an individual participant meta-analysis of 118 000 working adults. Am J Public Health. 2013 Nov;103(11):2090–97. http://dx.doi.org/10.2105/AJPH.2012.301090 PMID:23678931
31. Rosenthal T, Alter A. Occupational stress and hypertension. J Am Soc Hypertens. 2012 Jan–Feb;6(1):2–22. http://dx.doi.org/10.1016/j.jash.2011.09.002 PMID:22024667
32. Landsbergis PA, Dobson M, Koutsouras G, Schnall P. Job strain and ambulatory blood pressure: a meta-analysis and systematic review. Am J Public Health. 2013 Mar;103(3):e61–71. http://dx.doi.org/10.2105/AJPH.2012.301153 PMID:23327240
33. Hintsanen M, Kivimäki M, Elovainio M, Pulkki-Råback L, Keskivaara P, Juonala M, et al. Job strain and early atherosclero-sis: The Cardiovascular Risk in Young Finns study. Psychosom Med. 2005 Sep–Oct;67(5):740–7. http://dx.doi.org/10.1097/01.psy.0000181271.04169.93 PMID:16204432
34. Kouvonen A, Kivimaki M, Pentti J, Vahtera J. Work stress, smoking status and smoking intensity: an observational study of 41690 employees. J Epidemiol Community Public Health. 2005 Jan;59(1):63–9. http://dx.doi.org/10.1136/jech.2004.019752 PMID:15598729
35. Cunradi CB, Lipton R, Banerjee A. Occupational correlates of smoking among urban transit operators: a prospective study. Subst Abuse Treat Prev Policy. 2007 Dec 20;2:36. http://dx.doi.org/10.1186/1747-597X-2-36 PMID:18096082
36. Goon S, Bipasha MS. Prevalence and pattern of smoking among bus drivers of Dhaka, Bangladesh. Tob Use Insights. 2014 Mar 9;7:21–5. http://dx.doi.org/10.4137/TUI.S13966 PMID:25741182
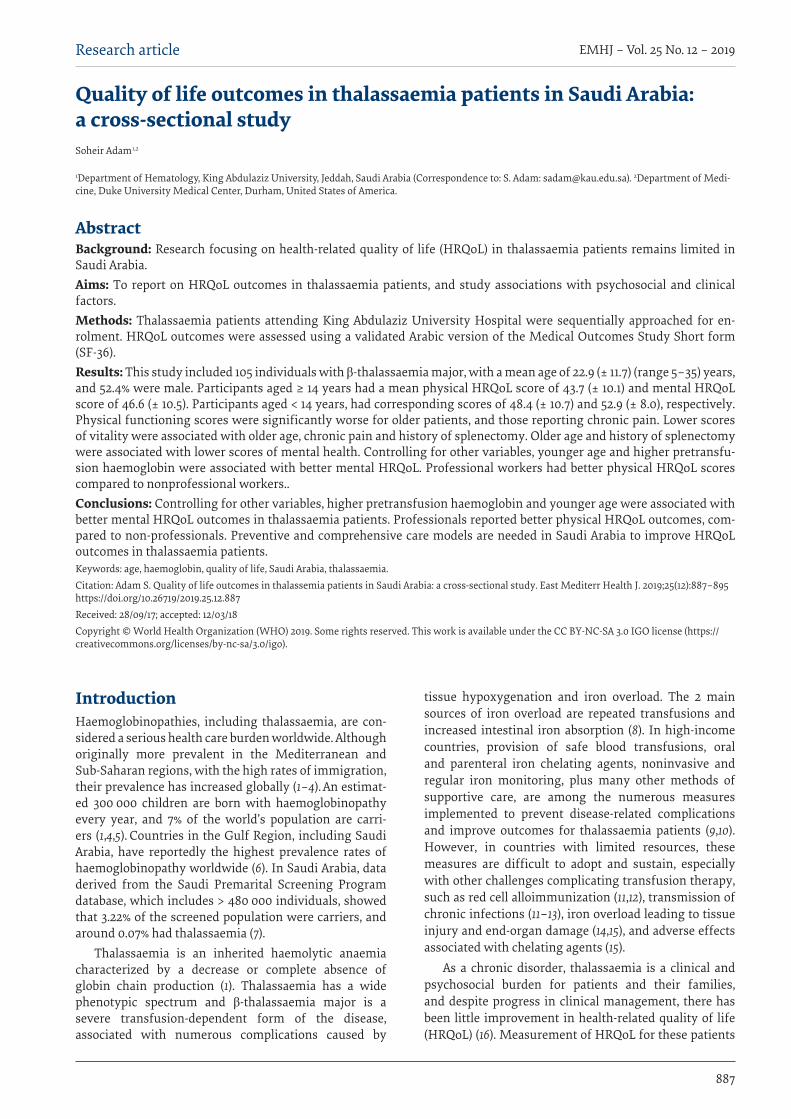
887
Research article EMHJ – Vol. 25 No. 12 – 2019
Quality of life outcomes in thalassaemia patients in Saudi Arabia: a cross-sectional studySoheir Adam 1,2
1Department of Hematology, King Abdulaziz University, Jeddah, Saudi Arabia (Correspondence to: S. Adam: [email protected]). 2Department of Medi-cine, Duke University Medical Center, Durham, United States of America.
AbstractBackground: Research focusing on health-related quality of life (HRQoL) in thalassaemia patients remains limited in Saudi Arabia.Aims: To report on HRQoL outcomes in thalassaemia patients, and study associations with psychosocial and clinical factors.Methods: Thalassaemia patients attending King Abdulaziz University Hospital were sequentially approached for en-rolment. HRQoL outcomes were assessed using a validated Arabic version of the Medical Outcomes Study Short form (SF-36).Results: This study included 105 individuals with β-thalassaemia major, with a mean age of 22.9 (± 11.7) (range 5–35) years, and 52.4% were male. Participants aged ≥ 14 years had a mean physical HRQoL score of 43.7 (± 10.1) and mental HRQoL score of 46.6 (± 10.5). Participants aged < 14 years, had corresponding scores of 48.4 (± 10.7) and 52.9 (± 8.0), respectively. Physical functioning scores were significantly worse for older patients, and those reporting chronic pain. Lower scores of vitality were associated with older age, chronic pain and history of splenectomy. Older age and history of splenectomy were associated with lower scores of mental health. Controlling for other variables, younger age and higher pretransfu-sion haemoglobin were associated with better mental HRQoL. Professional workers had better physical HRQoL scores compared to nonprofessional workers..Conclusions: Controlling for other variables, higher pretransfusion haemoglobin and younger age were associated with better mental HRQoL outcomes in thalassaemia patients. Professionals reported better physical HRQoL outcomes, com-pared to non-professionals. Preventive and comprehensive care models are needed in Saudi Arabia to improve HRQoL outcomes in thalassaemia patients.Keywords: age, haemoglobin, quality of life, Saudi Arabia, thalassaemia.Citation: Adam S. Quality of life outcomes in thalassemia patients in Saudi Arabia: a cross-sectional study. East Mediterr Health J. 2019;25(12):887–895 https://doi.org/10.26719/2019.25.12.887Received: 28/09/17; accepted: 12/03/18Copyright © World Health Organization (WHO) 2019. Some rights reserved. This work is available under the CC BY-NC-SA 3.0 IGO license (https://creativecommons.org/licenses/by-nc-sa/3.0/igo).
IntroductionHaemoglobinopathies, including thalassaemia, are con-sidered a serious health care burden worldwide. Although originally more prevalent in the Mediterranean and Sub-Saharan regions, with the high rates of immigration, their prevalence has increased globally (1–4). An estimat-ed 300 000 children are born with haemoglobinopathy every year, and 7% of the world’s population are carri-ers (1,4,5). Countries in the Gulf Region, including Saudi Arabia, have reportedly the highest prevalence rates of haemoglobinopathy worldwide (6). In Saudi Arabia, data derived from the Saudi Premarital Screening Program database, which includes > 480 000 individuals, showed that 3.22% of the screened population were carriers, and around 0.07% had thalassaemia (7).
Thalassaemia is an inherited haemolytic anaemia characterized by a decrease or complete absence of globin chain production (1). Thalassaemia has a wide phenotypic spectrum and β-thalassaemia major is a severe transfusion-dependent form of the disease, associated with numerous complications caused by
tissue hypoxygenation and iron overload. The 2 main sources of iron overload are repeated transfusions and increased intestinal iron absorption (8). In high-income countries, provision of safe blood transfusions, oral and parenteral iron chelating agents, noninvasive and regular iron monitoring, plus many other methods of supportive care, are among the numerous measures implemented to prevent disease-related complications and improve outcomes for thalassaemia patients (9,10).
However, in countries with limited resources, these measures are difficult to adopt and sustain, especially with other challenges complicating transfusion therapy, such as red cell alloimmunization (11,12), transmission of chronic infections (11–13), iron overload leading to tissue injury and end-organ damage (14,15), and adverse effects associated with chelating agents (15).
As a chronic disorder, thalassaemia is a clinical and psychosocial burden for patients and their families, and despite progress in clinical management, there has been little improvement in health-related quality of life (HRQoL) (16). Measurement of HRQoL for these patients
888
EMHJ – Vol. 25 No. 12 – 2019Research article
is essential to assess the true burden of thalassaemia. HRQoL can clearly define the individual needs of patients, and better inform their disease management plans (17).
Despite the high rates of thalassaemia in Saudi Arabia, research on HRQoL remains limited. This study aimed to assess HRQoL of children and adults with thalassaemia in Jeddah, Saudi Arabia, and its association with clinical and psychosocial characteristics.
MethodsStudy designThis cross-sectional study was conducted at a tertiary care academic hospital: King Abdulaziz University Hos-pital (KAUH) in Jeddah, Saudi Arabia. The study was ap-proved by KAUH Ethical Committee, and other admin-istrative authorization was obtained before the start of data collection. We approached all patients diagnosed with thalassaemia who attended haematology outpatient clinics at KAUH between March 2015 and July 2016 for enrolment. Patients were only excluded if they were una-ble or unwilling to participate in the study.
Ethical approvalAll procedures were in accordance with the ethical stand-ards of the institutional and/or national research com-mittee, and with the 1964 Helsinki Declaration and its later amendments or comparable ethical standards. After explaining the study design and objectives, informed consent was obtained from the participants or guardians of children aged < 16 years. The study size was based on the number of patients who were attending outpatient clinics regularly.
Data collectionThe Medical Outcomes Study Short Form (SF-36) is a 36-item tool for measuring health status and outcomes from the patient’s perspective, and the English version is considered a reliable measure for assessing HRQoL sub-scales (18). The same questionnaire was translated into Arabic, and tested for internal consistency and reliability in a sample from the Saudi Arabian population (19). Data were collected using the SF-36 questionnaire during an interview with a trained data collector. Questionnaires were distributed to patients, and interviewers explained the purpose and content of the questionnaire, and then reassured participants about the confidentiality of their personal data. Adult patients (≥ 14 years) filled in the questionnaires independently, whereas paediatric pa-tients (< 14 years) filled in the questionnaire jointly with their parents. The questionnaire covered 2 sections. Sec-tion A focused on 3 major domains of patient data: demo-graphic data, clinical characteristics and social data. Data about patient demographics included age, sex, education-al level, employment status and nature of occupation. For current disease characteristics, participants were asked to report on chronic pain, pain medication and chelation therapy. For the social domain, we collected data on pa-rental education and employment, family history, and
number of diseased siblings, if any. In section B, partic-ipants were asked to self-assess their HRQoL by rating their own perception and satisfaction about 10 compo-nents: physical functioning, physical role, bodily pain, general health, vitality, social functioning, emotional role, mental health, physical component summary and mental component summary. Data were scored based on the system adopted from the RAND study, in which each component was represented as a single variable, scaled from 0 (poor health) to 100 (good health) (18).
Potential recall bias was addressed by offering patients ample time and complete privacy while filling in the questionnaires. Any missing data were brought to the researcher’s attention and addressed individually by contacting participants or by review of electronic medical records.
Medical records were reviewed for clinical history, including: complete blood counts; pre-transfusion haemoglobin; serum ferritin as a marker of iron overload; liver function tests; urea and electrolytes; history of splenectomy; and echocardiographic evidence of pulmonary hypertension (defined as tricuspid regurgitation velocity ≥ 2.5 m/s). Each haematological and biochemical parameter was reported as a mean value over the last 3 months.
Statistical analysisThe data were analysed using IBM SPSS version 22 (SPSS, Chicago, IL, USA). Simple descriptive statistics were used to define the study variables; counts and percentages for categorical and nominal variables, and means and stand-ard deviations (SDs) for continuous variables. To estab-lish a relationship between patient characteristics and health outcomes, a χ2 test was used for categorical vari-ables, and independent t test for continues variables. P < 0.05 was considered to be statistically significant.
Linear regression analysisIn order to identify factors associated with physical and mental health and to control for confounders, we con-structed 2 multivariate linear regression models. The dependent variable in the first and second models was physical component summary and mental component summary, respectively. We used backwards elimination to select the variables for each regression model. We estimated the regression coefficients (β) and their 95% confidence intervals. For all statistical tests, P < 0.05 was defined as the level of significance.
ResultsPatient populationAll patients approached consecutively agreed to partic-ipate in the study. We enrolled 105 β-thalassaemia ma-jor patients [55 male, 50 female, mean (SD) age 22.2 (11.7) years, range 5–35 years] (Table 1). Seventy-six (72.4%) patients reported at least 1 sibling with thalassaemia. All participants completed questionnaires successfully and there were no missing data at the time of the analysis.
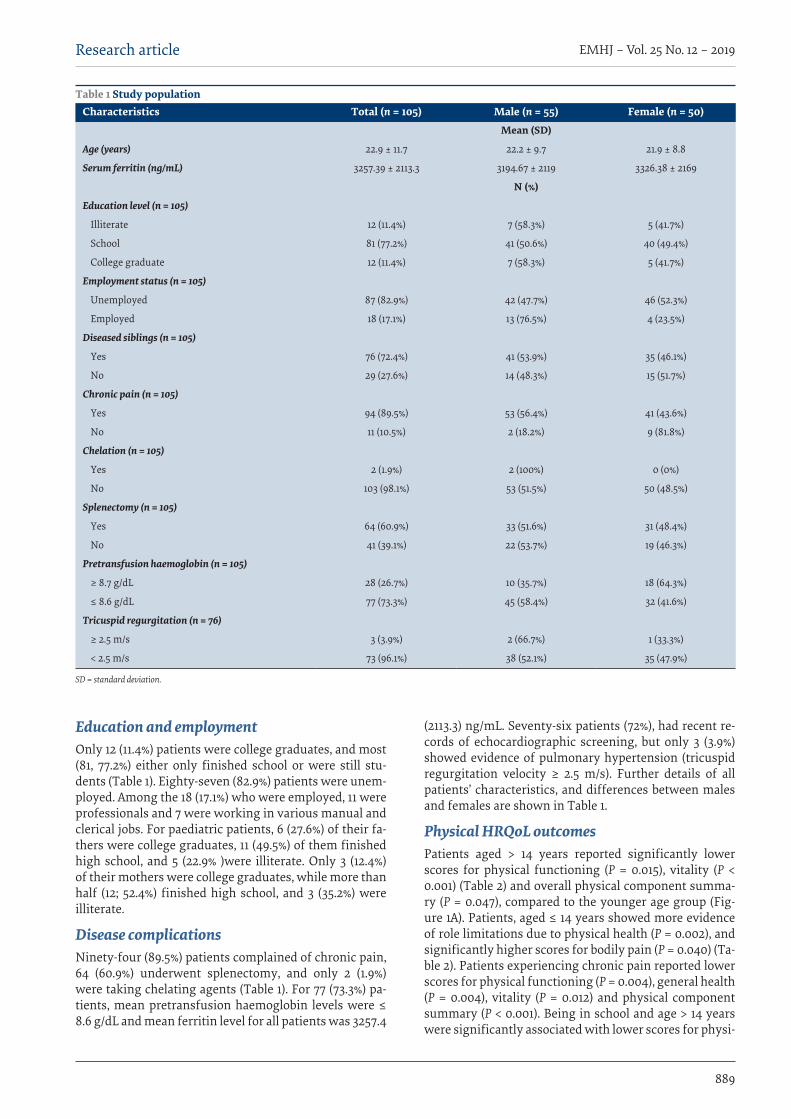
889
Research article EMHJ – Vol. 25 No. 12 – 2019
Education and employmentOnly 12 (11.4%) patients were college graduates, and most (81, 77.2%) either only finished school or were still stu-dents (Table 1). Eighty-seven (82.9%) patients were unem-ployed. Among the 18 (17.1%) who were employed, 11 were professionals and 7 were working in various manual and clerical jobs. For paediatric patients, 6 (27.6%) of their fa-thers were college graduates, 11 (49.5%) of them finished high school, and 5 (22.9% )were illiterate. Only 3 (12.4%) of their mothers were college graduates, while more than half (12; 52.4%) finished high school, and 3 (35.2%) were illiterate.
Disease complicationsNinety-four (89.5%) patients complained of chronic pain, 64 (60.9%) underwent splenectomy, and only 2 (1.9%) were taking chelating agents (Table 1). For 77 (73.3%) pa-tients, mean pretransfusion haemoglobin levels were ≤ 8.6 g/dL and mean ferritin level for all patients was 3257.4
(2113.3) ng/mL. Seventy-six patients (72%), had recent re-cords of echocardiographic screening, but only 3 (3.9%) showed evidence of pulmonary hypertension (tricuspid regurgitation velocity ≥ 2.5 m/s). Further details of all patients’ characteristics, and differences between males and females are shown in Table 1.
Physical HRQoL outcomesPatients aged > 14 years reported significantly lower scores for physical functioning (P = 0.015), vitality (P < 0.001) (Table 2) and overall physical component summa-ry (P = 0.047), compared to the younger age group (Fig-ure 1A). Patients, aged ≤ 14 years showed more evidence of role limitations due to physical health (P = 0.002), and significantly higher scores for bodily pain (P = 0.040) (Ta-ble 2). Patients experiencing chronic pain reported lower scores for physical functioning (P = 0.004), general health (P = 0.004), vitality (P = 0.012) and physical component summary (P < 0.001). Being in school and age > 14 years were significantly associated with lower scores for physi-
Table 1 Study population Characteristics Total (n = 105) Male (n = 55) Female (n = 50)
Mean (SD)
Age (years) 22.9 ± 11.7 22.2 ± 9.7 21.9 ± 8.8
Serum ferritin (ng/mL) 3257.39 ± 2113.3 3194.67 ± 2119 3326.38 ± 2169
N (%)
Education level (n = 105)
Illiterate 12 (11.4%) 7 (58.3%) 5 (41.7%)
School 81 (77.2%) 41 (50.6%) 40 (49.4%)
College graduate 12 (11.4%) 7 (58.3%) 5 (41.7%)
Employment status (n = 105)
Unemployed 87 (82.9%) 42 (47.7%) 46 (52.3%)
Employed 18 (17.1%) 13 (76.5%) 4 (23.5%)
Diseased siblings (n = 105)
Yes 76 (72.4%) 41 (53.9%) 35 (46.1%)
No 29 (27.6%) 14 (48.3%) 15 (51.7%)
Chronic pain (n = 105)
Yes 94 (89.5%) 53 (56.4%) 41 (43.6%)
No 11 (10.5%) 2 (18.2%) 9 (81.8%)
Chelation (n = 105)
Yes 2 (1.9%) 2 (100%) 0 (0%)
No 103 (98.1%) 53 (51.5%) 50 (48.5%)
Splenectomy (n = 105)
Yes 64 (60.9%) 33 (51.6%) 31 (48.4%)
No 41 (39.1%) 22 (53.7%) 19 (46.3%)
Pretransfusion haemoglobin (n = 105)
≥ 8.7 g/dL 28 (26.7%) 10 (35.7%) 18 (64.3%)
≤ 8.6 g/dL 77 (73.3%) 45 (58.4%) 32 (41.6%)
Tricuspid regurgitation (n = 76)
≥ 2.5 m/s 3 (3.9%) 2 (66.7%) 1 (33.3%)
< 2.5 m/s 73 (96.1%) 38 (52.1%) 35 (47.9%)
SD = standard deviation.
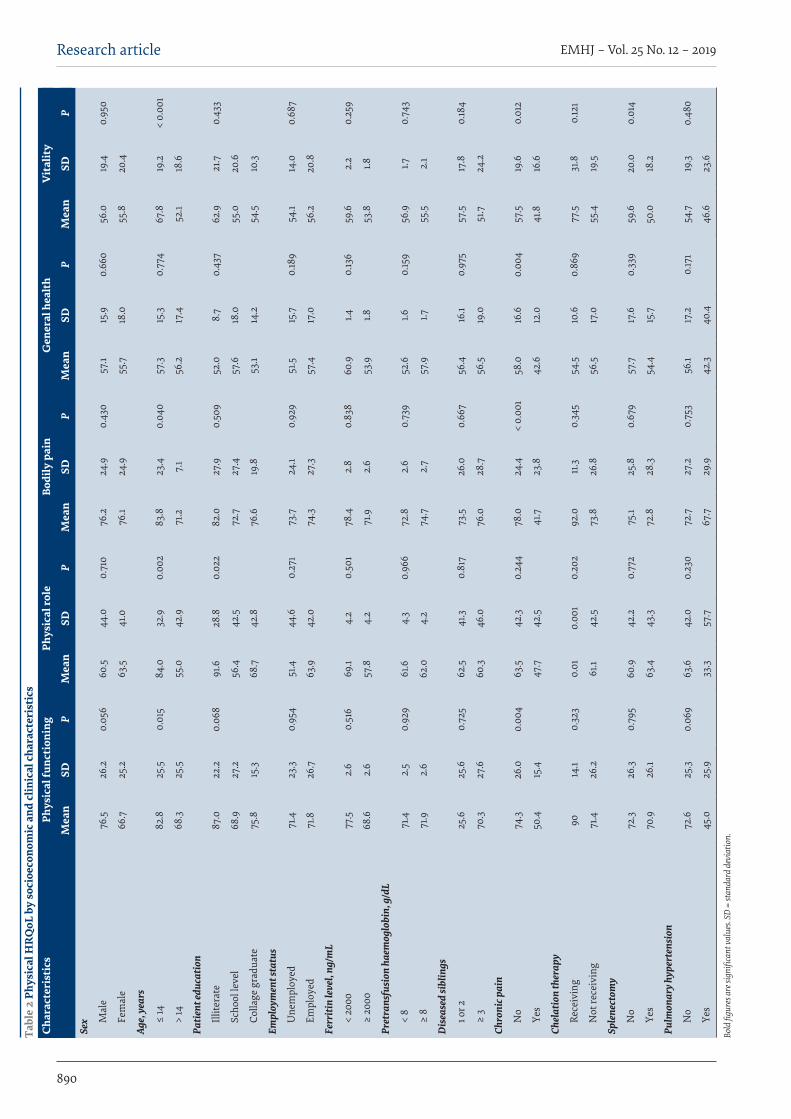
890
EMHJ – Vol. 25 No. 12 – 2019Research articleTa
ble
2 Ph
ysic
al H
RQ
oL b
y so
cioe
cono
mic
and
clin
ical
cha
ract
eris
tics
Char
acte
rist
ics
Phys
ical
func
tion
ing
Phys
ical
role
Bodi
ly p
ain
Gen
eral
hea
lth
Vit
alit
y
Mea
nSD
P M
ean
SDP
Mea
nSD
PM
ean
SDP
Mea
nSD
PSe
x Mal
e76
.526
.20.
056
60.5
44.0
0.71
076
.224
.90.
430
57.1
15.9
0.66
056
.019
.40.
950
Fem
ale
66.7
25.2
63.5
41.0
76.1
24.9
55.7
18.0
55.8
20.4
Age,
year
s
≤ 14
82
.825
.50.
015
84.0
32.9
0.00
283
.823
.40.
040
57.3
15.3
0.77
467
.819
.2<
0.00
1
> 14
68
.325
.555
.042
.971
.27.
156
.217
.452
.118
.6
Patie
nt ed
ucat
ion
Illite
rate
87
.022
.20.
068
91.6
28.8
0.02
282
.027
.90.
509
52.0
8.7
0.43
762
.921
.70.
433
Scho
ol le
vel
68.9
27.2
56.4
42.5
72.7
27.4
57.6
18.0
55.0
20.6
Colla
ge g
radu
ate
75.8
15.3
68.7
42.8
76.6
19.8
53.1
14.2
54.5
10.3
Empl
oym
ent s
tatu
s
Une
mpl
oyed
71.4
23.3
0.95
451
.444
.60.
271
73.7
24.1
0.92
951
.515
.70.
189
54.1
14.0
0.68
7
Empl
oyed
71.8
26.7
63.9
42.0
74.3
27.3
57.4
17.0
56.2
20.8
Ferr
itin
leve
l, ng
/mL
< 20
00
77.5
2.6
0.51
669
.14.
20.
501
78.4
2.8
0.83
860
.91.4
0.13
659
.62.
20.
259
≥ 20
00
68.6
2.6
57.8
4.2
71.9
2.6
53.9
1.853
.81.8
Pret
rans
fusi
on h
aem
oglo
bin,
g/d
L
< 8
71.4
2.5
0.92
961
.64.
30.
966
72.8
2.6
0.73
952
.61.6
0.15
956
.91.7
0.74
3
≥ 8
71.9
2.6
62.0
4.2
74.7
2.7
57.9
1.755
.52.
1
Dis
ease
d si
blin
gs
1 or 2
25.6
25.6
0.72
562
.541
.30.
817
73.5
26.0
0.66
756
.416
.10.
975
57.5
17.8
0.18
4
≥ 3
70.3
27.6
60.3
46.0
76.0
28.7
56.5
19.0
51.7
24.2
Chro
nic p
ain
No
74.3
26.0
0.00
463
.542
.30.
244
78.0
24.4
< 0.
001
58.0
16.6
0.00
457
.519
.60.
012
Yes
50.4
15.4
47.7
42.5
41.7
23.8
42.6
12.0
41.8
16.6
Chel
atio
n th
erap
y
Rece
ivin
g
9014
.10.
323
0.01
0.00
10.
202
92.0
11.3
0.34
554
.510
.60.
869
77.5
31.8
0.12
1
Not
rece
ivin
g 71
.426
.261
.142
.573
.826
.856
.517
.055
.419
.5
Sple
nect
omy
No
72.3
26.3
0.79
560
.942
.20.
772
75.1
25.8
0.67
957
.717
.60.
339
59.6
20.0
0.01
4
Yes
70.9
26.1
63.4
43.3
72.8
28.3
54.4
15.7
50.0
18.2
Pulm
onar
y hyp
erte
nsio
n
No
72.6
25.3
0.06
963
.642
.00.
230
72.7
27.2
0.75
356
.117
.20.
171
54.7
19.3
0.48
0
Yes
45.0
25.9
33.3
57.7
67.7
29.9
42.3
40.4
46.6
23.6
Bold
figu
res a
re si
gnifi
cant
valu
es. S
D =
stan
dard
dev
iatio
n.
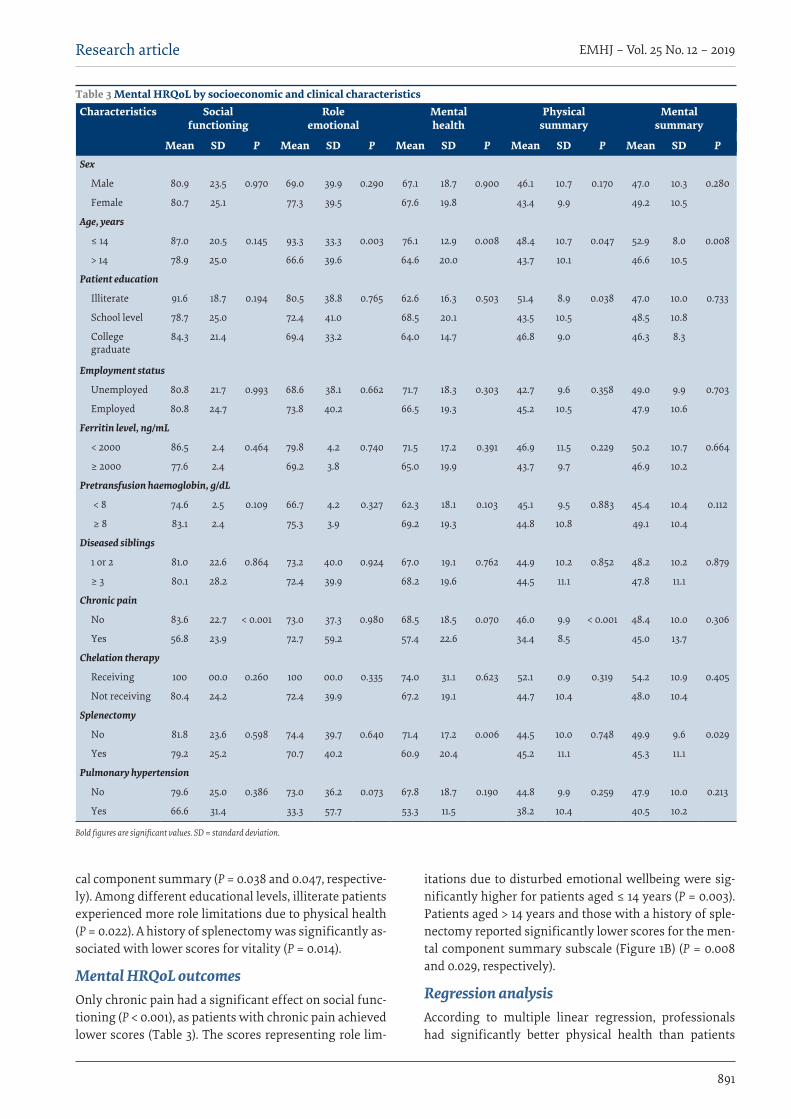
891
Research article EMHJ – Vol. 25 No. 12 – 2019
cal component summary (P = 0.038 and 0.047, respective-ly). Among different educational levels, illiterate patients experienced more role limitations due to physical health (P = 0.022). A history of splenectomy was significantly as-sociated with lower scores for vitality (P = 0.014).
Mental HRQoL outcomesOnly chronic pain had a significant effect on social func-tioning (P < 0.001), as patients with chronic pain achieved lower scores (Table 3). The scores representing role lim-
Table 3 Mental HRQoL by socioeconomic and clinical characteristicsCharacteristics Social
functioningRole
emotionalMentalhealth
Physicalsummary
Mentalsummary
Mean SD P Mean SD P Mean SD P Mean SD P Mean SD P Sex
Male 80.9 23.5 0.970 69.0 39.9 0.290 67.1 18.7 0.900 46.1 10.7 0.170 47.0 10.3 0.280
Female 80.7 25.1 77.3 39.5 67.6 19.8 43.4 9.9 49.2 10.5
Age, years
≤ 14 87.0 20.5 0.145 93.3 33.3 0.003 76.1 12.9 0.008 48.4 10.7 0.047 52.9 8.0 0.008
> 14 78.9 25.0 66.6 39.6 64.6 20.0 43.7 10.1 46.6 10.5
Patient education
Illiterate 91.6 18.7 0.194 80.5 38.8 0.765 62.6 16.3 0.503 51.4 8.9 0.038 47.0 10.0 0.733
School level 78.7 25.0 72.4 41.0 68.5 20.1 43.5 10.5 48.5 10.8
College graduate
84.3 21.4 69.4 33.2 64.0 14.7 46.8 9.0 46.3 8.3
Employment status
Unemployed 80.8 21.7 0.993 68.6 38.1 0.662 71.7 18.3 0.303 42.7 9.6 0.358 49.0 9.9 0.703
Employed 80.8 24.7 73.8 40.2 66.5 19.3 45.2 10.5 47.9 10.6
Ferritin level, ng/mL
< 2000 86.5 2.4 0.464 79.8 4.2 0.740 71.5 17.2 0.391 46.9 11.5 0.229 50.2 10.7 0.664
≥ 2000 77.6 2.4 69.2 3.8 65.0 19.9 43.7 9.7 46.9 10.2
Pretransfusion haemoglobin, g/dL
< 8 74.6 2.5 0.109 66.7 4.2 0.327 62.3 18.1 0.103 45.1 9.5 0.883 45.4 10.4 0.112
≥ 8 83.1 2.4 75.3 3.9 69.2 19.3 44.8 10.8 49.1 10.4
Diseased siblings
1 or 2 81.0 22.6 0.864 73.2 40.0 0.924 67.0 19.1 0.762 44.9 10.2 0.852 48.2 10.2 0.879
≥ 3 80.1 28.2 72.4 39.9 68.2 19.6 44.5 11.1 47.8 11.1
Chronic pain
No 83.6 22.7 < 0.001 73.0 37.3 0.980 68.5 18.5 0.070 46.0 9.9 < 0.001 48.4 10.0 0.306
Yes 56.8 23.9 72.7 59.2 57.4 22.6 34.4 8.5 45.0 13.7
Chelation therapy
Receiving 100 00.0 0.260 100 00.0 0.335 74.0 31.1 0.623 52.1 0.9 0.319 54.2 10.9 0.405
Not receiving 80.4 24.2 72.4 39.9 67.2 19.1 44.7 10.4 48.0 10.4
Splenectomy
No 81.8 23.6 0.598 74.4 39.7 0.640 71.4 17.2 0.006 44.5 10.0 0.748 49.9 9.6 0.029
Yes 79.2 25.2 70.7 40.2 60.9 20.4 45.2 11.1 45.3 11.1
Pulmonary hypertension
No 79.6 25.0 0.386 73.0 36.2 0.073 67.8 18.7 0.190 44.8 9.9 0.259 47.9 10.0 0.213
Yes 66.6 31.4 33.3 57.7 53.3 11.5 38.2 10.4 40.5 10.2
Bold figures are significant values. SD = standard deviation.
itations due to disturbed emotional wellbeing were sig-nificantly higher for patients aged ≤ 14 years (P = 0.003). Patients aged > 14 years and those with a history of sple-nectomy reported significantly lower scores for the men-tal component summary subscale (Figure 1B) (P = 0.008 and 0.029, respectively).
Regression analysisAccording to multiple linear regression, professionals had significantly better physical health than patients

892
EMHJ – Vol. 25 No. 12 – 2019Research article
with manual or clerical jobs (Table 4). Adults, female pa-tients and employed patients showed a tendency to have worse physical health. Adults had significantly worse mental health than children had, and patients with high-er pretransfusion haemoglobin level had significantly better mental health.
DiscussionThe rising rates of thalassaemia globally (20) have en-couraged more research to assess disease burden and HRQoL outcomes in this population (21). The present study focused on HRQoL outcomes in thalassaemia pa-tients followed in a tertiary care centre in Jeddah, Saudi Arabia, using the SF-36 questionnaire.
Thalassaemia patients reported low scores on all HRQoL subscales, in agreement with previous reports in other patients with thalassaemia (21–23). We found that age was significantly associated with HRQoL. Patients aged ≤ 14 years experienced more physical and emotional limitations, complained more of bodily pain, had lower vitality scores, and exhibited worse mental health features than those aged > 14 years. However, older patients had significantly lower scores for both the overall physical and mental summary components, which may have been due to the cumulative effects of long-standing disease-related complications. Children demonstrated worse HRQoL features than adults did in a global context (9). Only a few studies have reported on the effect of age on HRQoL. One study among Jordanian children with thalassaemia reported lower physical and emotional scores for those aged 8–12 years when compared to those aged 13–18 years; however, no significant difference was detected between the age groups (22). One explanation to this could be the difference in composition of the study population. In our study we investigated HRQoL
Table 4 Factors associated with HRQoL: results of multivariate linear regressionVariable Regression coefficient 95% CI PFactors associated with physical component summary outcome score
Age, years≤ 14> 14
1−0.18 −9.17 to 0.27
0.064
SexMaleFemale
1−0.17 −7.44 to 0.55
0.09
Employment statusUnemployedEmployed
1−0.24 −13.70 to 0.13
0.054
Occupational statusManual or clerical jobProfessional
10.26 1.10–20.79
0.03
Factors associated with mental component summary outcome score
Age, years≤ 14> 14
1−0.21 −11.45 to −2.29
0.004
Pretransfusion haemoglobin, g/dL≤ 8.6 ≥ 8.7
10.19 0.04–8.87
0.048
Bold values are significant. CI = confidence interval; HRQoL = health-related quality of life.
outcomes in children and adults with thalassaemia, whereas previous studies in Saudi Arabia or elsewhere in the Middle East either only included paediatric patients (21–25) or adults (26) with thalassaemia.
One clinical factor that was strongly associated with lower HRQoL outcomes, in almost all subscales in our study population, was the presence of chronic pain, which limited daily activity and affected social functioning. These findings agree with 2 other studies in the Middle East: one in Jordan where children complained of limiting pains and low energy when performing their daily activities (22), and another in the Syrian Arab Republic, which reported a significant association with lower physical health scores among children and adolescents with thalassaemia (27). Chronic pain in our study population was associated with lower social functioning, which echoes the findings of the Jordanian study, in which children felt physical inadequacy limited their interactions with their peers (22). While some of these studies were conducted using different HRQoL assessment instruments other than SF-36, all assessment instruments were previously validated in the corresponding population, which renders comparison of results across studies viable.
Although splenectomy is an effective measure to reduce transfusion requirements in thalassaemia, it does not prevent disfiguring skeletal changes, delayed growth and puberty, or chronic pain (28,29). Moreover, splenectomy increases the risk of infection and venous thromboembolism (28,29). In our study, patients who underwent splenectomy had significantly worse mental health and mental health component summary scores, which were most likely caused by the adverse effects of the operation.
Upon controlling for other variables, the association
893
Research article EMHJ – Vol. 25 No. 12 – 2019
between older age and worse mental HRQoL outcomes persisted. Higher levels of pretransfusion haemoglobin positively affected mental HRQoL, and participants holding professional jobs had better mental HRQoL scores compared to those working in clerical or manual jobs.
Several studies on HRQoL reported low psychological and mental health scores for thalassaemia patients, and identified different forms of mental health disorders such as depression, anxiety and stress (30–32). A study from Turkey found that thalassaemia patients and their caregivers suffered from depression and anxiety (32), which represented an additional burden for the families. Few studies have focused on the relationship between mental HRQoL outcomes and patients’ socioeconomic and clinical characteristics, despite the importance of psychological and mental integrity to improve disease outcomes (30). The psychological burden is often over looked in Middle Eastern populations, and there is a need to devote more resources to understand this important aspect of the disease.
Comprehensive management models should ideally be developed to cater for individual patient needs, empower patients and support family members. Raising awareness and education in the community will facilitate social integration of thalassaemia patients and ultimately
improve HRQoL outcomes.The following limitations to our study should be
acknowledged. The study focused only on patients and did not include HRQoL of their caregivers; a factor that significantly increased the disease burden. There was concern for potential bias, including patients’ report of pain and other symptoms. Patients were given complete privacy and an adequate time to fill in the forms in order to avoid recall bias. There was also concern for selection bias as we only included thalassaemia patients from a single centre, and most of the participants attended clinics regularly and were thus considered to be more compliant and vigilant about their health management. However, since KAUH has the largest number of thalassaemia patients in Saudi Arabia and all participants were approached consecutively at the time of their outpatient visits, we believe that they were representative of the thalassaemia population.
In conclusion, thalassaemia is a chronic disease with myriad complications, presenting serious challenges to patients and families. There is a need for comprehensive care centres in Saudi Arabia to improve HRQoL outcomes in thalassaemia through providing early preventive care, as well as social and psychological support to patient and families.
AcknowledgementsThe author would like to thank Drs. Hind Hussein, Anoud Omar and Abdulmoneim Mokhtar for their valuable input and statistical insight. The author is grateful for the support and contribution of patients and their families.
Funding: None.
Competing interests: None declared.
Résultats en matière de qualité de vie des patients thalassémiques en Arabie saoudite : étude transversaleRésumé Contexte : Les recherches sur la qualité de vie liée à la santé (QVLS) des patients thalassémiques restent limitées en Arabie saoudite. Objectifs : La présente étude visait à présenter les résultats du questionnaire sur la QVLS des patients thalassémiques ainsi qu’à étudier les associations avec les facteurs psychosociaux et cliniques.Méthodes : Les patients thalassémiques qui consultaient à l'Hôpital universitaire Roi Abdulaziz ont été contactés lors de leur visite pour participer à l’étude. Les résultats du questionnaire sur la QVLS ont été évalués à l'aide d'une version arabe validée de la forme abrégée du questionnaire généraliste SF-36 du Medical Outcomes Study. Résultats : L’étude a été menée auprès de 105 personnes atteintes de bêta-thalassémie majeure, dont l'âge moyen était de 22,9 ans (± 11,7) (âge compris entre 5 à 35 ans), et 52,4 % étaient des hommes. Les participants adultes âgés de 14 ans et plus ont obtenu un score moyen de 43,7 (±10,1) dans la sous-échelle physique du questionnaire sur la QVLS et un score de 46,6 (±10,5) dans la sous-échelle mentale du questionnaire. Les participants de moins de 14 ans ont obtenu des scores correspondants de 48,4 (±10,7) et 52,9 (±8,0) respectivement. Les scores pour le fonctionnement physique étaient significativement moindres chez les patients plus âgés ainsi que pour ceux qui signalaient une douleur chronique. Des scores plus faibles pour la sous-échelle vitalité étaient associés à un âge plus avancé, à la douleur chronique et aux antécédents de splénectomie. Un âge plus avancé et des antécédents de splénectomie étaient associés à des scores plus faibles pour la santé mentale. En tenant compte d'autres variables, un âge plus jeune et une hémoglobine pré-transfusionnelle plus élevée étaient associés à un meilleur score pour la sous-échelle mentale du questionnaire sur la QVLS. Les cadres ont obtenu de meilleurs scores pour la sous-échelle physique du questionnaire que les non-cadres.
894
EMHJ – Vol. 25 No. 12 – 2019Research article
نتائج جودة احلياة لدى مرىض الثالسيميا يف اململكة العربية السعودية: دراسة مقطعيةسهري آدم
اخلالصة اخللفية: ال تزال البحوث التي تركز عىل جودة احلياة الصحية لدى مرىض الثالسيميا حمدودة يف اململكة العربية السعودية.
األهداف: هدفت هذه الدراسة إىل تقديم تقرير عن نتائج جودة احلياة الصحية لدى مرىض الثالسيميا، ودراسة العالقات التي تربط بني العوامل النفسية االجتامعية والعوامل الرسيرية.
طرق البحث: ُأِخَذ رأي مرىض الثالسيميا بمستشفى جامعة امللك عبد العزيز يف أمر انضاممهم إىل الدراسة واحدًا تلو اآلخر. وخضعت نتائج جودة .)SF-36( "احلياة الصحية للتقييم باستخدام نسخة عربية ُمصدقة من "دراسة النتائج الطبية املخترصة
بيتا ثالسيميا الكربى، بلغ متوسط أعامرهم22.9+11.7 )املدى 35-5( سنة، شملت هذه الدراسة 105 أشخاص مصابني بمرض النتائج: وكان 52.4% منهم من الذكور. وكان متوسط درجة جودة احلياة الصحية البدنية للمشاركني البالغني من العمر 14 عامًا فأكثر 43.7±10.1، وكانت درجة جودة حياهتم الصحية النفسية 10.5±46.6. وأما املشاركون الذين تقل أعامرهم عن 14 عامًا، فقد كانت درجاهتم املناظرة تبلغ 10.7±48.4 و8.0±52.9 عىل التوايل. وكانت درجات األداء الوظيفي البدين أسوأ بكثري يف حالة املرىض املسنني )0.015P = ( وأولئك الذين يشكون أملًا مزمنًا )0.004P = (. وكان انخفاض درجات احليوية مقرونًا بالتقدم يف العمر )0.001P = ( واألمل املزمن )0.012P = ( واستئصال .) = 0.029P( واستئصال الطحال ) = 0.008P( وكان انخفاض درجات الصحة النفسية مقرونًا بالتقدم يف العمر .) = 0.014P( الطحالوعند التحكم يف املتغريات األخرى، كان حتسن جودة احلياة الصحية النفسية مقرونًا بصغر السن )0.004P = ( وارتفاع نسبة اهليموجلوبني قبل
.) = 0.03P( وكانت درجات جودة احلياة الصحية البدنية للعامل املهنيني أفضل مقارنًة باملهن األخرى .)نقل الدم )القيمة االحتاملية = 0.048ن نتائج جودة احلياة الصحية النفسية ملرىض الثالسيميا مقرونًا بارتفاع نسبة اهليموجلوبني االستنتاج: عند التحكم يف املتغريات األخرى، يكون حتسُّقبل نقل الدم وصغر السن. وتكون نتائج جودة احلياة الصحية البدنية للمهنيني أفضل مقارنًة بنتائج غري املهنيني. وتوجد حاجة إىل نامذج رعاية
وقائية وشاملة يف اململكة العربية السعودية لتحسني نتائج جودة احلياة الصحية ملرىض الثالسيميا.
Conclusion : En tenant compte d'autres variables, un taux d'hémoglobine pré-transfusionnelle plus élevé et un plus jeune âge étaient associés à de meilleurs scores pour la sous-échelle mentale du questionnaire sur la QVLS des patients thalassémiques. Les cadres faisaient état de meilleurs résultats physiques dans le questionnaire par rapport aux non-cadres. Des modèles de soins préventifs et complets sont nécessaires en Arabie saoudite pour améliorer les scores du questionnaire sur la QVLS des patients thalassémiques.
References1. Modell B, Darlison M. Global epidemiology of haemoglobin disorders and derived service indicators. Bull World Health Organ.
2008 Jun;86(6):480–7. PMID:18568278
2. Livingstone FB. Frequencies of hemoglobin variants : thalassemia, the glucose-6-phosphate dehydrogenase deficiency, G6PD variants, and ovalocytosis in human populations. New York: Oxford University Press; 1985.
3. Weatherall DJ. Phenotype–genotype relationships in monogenic disease: lessons from the thalassaemias. Nat Rev Genet. 2001 Apr;2(4):245–55. PMID:11283697
4. Weatherall DJ. The inherited diseases of hemoglobin are an emerging global health burden. Blood. 2010 Jun 3;115(22):4331–6. http://dx.doi.org/10.1182/blood-2010-01-251348 PMID:20233970
5. Weatherall DJ, Clegg JB. Inherited haemoglobin disorders: an increasing global health problem. Bull World Health Organ. 2001;79(8):704–12. PMID:11545326
6. Hamamy HA, Al-Allawi NA. Epidemiological profile of common haemoglobinopathies in Arab countries. J Community Genet. 2013 Apr;4(2):147–67. Http://dx.doi.org/10.1007/s12687-012-0127-8 PMID:23224852
7. Alhamdan NA, Almazrou YY, Alswaidi FM, Choudhry AJ. Premarital screening for thalassemia and sickle cell disease in Saudi Arabia. Genet Med. 2007 Jun;9(6):372–7. http://dx.doi.org/10.1097GIM.0b013e318065a9e8 PMID:17575503
8. Taher AT, Weatherall DJ, Cappellini MD. Thalassaemia. Lancet. 2018 Jan 13;391(10116):155–67. http://dx.doi.org/10.1016/S0140-6736(17)31822-6 PMID:28774421
9. Amid A, Saliba AN, Taher AT, Klaassen RJ. Thalassaemia in children: from quality of care to quality of life. Arch Dis Child. 2015 Nov;100(11):1051–7. http://dx.doi.org/10.1136/archdischild-2014-308112 PMID26289062
10. Rund D. Thalassemia 2016: Modern medicine battles an ancient disease. Am J Hematol. 2016 Jan;91(1):15–21. http://dx.doi.org/10.1002/ajh.24231 PMID:26537527
11. Vichinsky E, Neumayr L, Trimble S, Giardina PJ, Cohen AR, Coates T, et al. Transfusion complications in thalassemia patients: a report from the Centers for Disease Control and Prevention (CME). Transfusion. 2014 Apr;54(4):972–81. http://dx.doi.org/10.1111/trf.12348 PMID:23889533
895
Research article EMHJ – Vol. 25 No. 12 – 2019
12. Goss C, Giardina P, Degtyaryova D, Kleinert D, Sheth S, Cushing M. Red blood cell transfusions for thalassemia: results of a survey assessing current practice and proposal of evidence-based guidelines. Transfusion. 2014 Jul;54(7):1773–81. http://dx.doi.org/10.1111/trf.12571 PMID:24611697
13. Borgna-Pignatti C, Garani MC, Forni GL, Cappellini MD, Cassinerio E, Fidone C, et al. Hepatocellular carcinoma in thalassaemia: an update of the Italian Registry. Br J Haematol. 2014 Oct;167(1):121–6. http://dx.doi.org/10.1111/bjh.13009 PMID:24992281
14. Wood JC. Estimating tissue iron burden: current status and future prospects. Br J Haematol. 2015 Jul;170(1):15–28. http://dx.doi.org/10.1111/bjh.13374 PMID:25765344
15. Piga A, Longo F, Musallam KM, Cappellini MD, Forni GL, Quarta G, et al. Assessment and management of iron overload in β-thalassaemia major patients during the 21st century: a real-life experience from the Italian WEBTHAL project. Br J Haematol. 2013 Jun;161(6):872–83. http://dx.doi.org/10.1111/bjh.12340 PMID:23600689
16. Musallam K, Cappellini MD, Taher A. Challenges associated with prolonged survival of patients with thalassemia: transitioning from childhood to adulthood. Pediatrics. 2008 May;121(5):e1426–9.
17. Panepinto JA. Health-related quality of life in patients with hemoglobinopathies. Hematology Am Soc Hematol Educ Program. 2012;2012:284–9. http://dx.doi.org/10.1182/asheducation-2012.1.284 PMID:23233593
18. Ware JE Jr, Sherbourne CD. The MOS 36-item short-form health survey (SF-36). I. Conceptual framework and item selection. Med Care. 1992 Jun;30(6):473–83. PMID:1593914
19. Coons SJ, Alabdulmohsin SA, Draugalis JR, Hays RD. Reliability of an Arabic version of the RAND-36 Health Survey and its equiv-alence to the US-English version. Med Care. 1998 Mar;36(3):428–32. PMID:9520966
20. Mikelli A, Tsiantis J. Brief report: depressive symptoms and quality of life in adolescents with b-thalassaemia. J Adolesc. 2004 Apr;27(2):213–6. http://dx.doi.org/10.1016/j.adolescence.2003.11.011 PMID:15023520
21. Mevada ST, Al Saadoon M, Zachariah M, Al Rawas AH, Wali Y. Impact of burden of thalassemia major on health-related quality of life in Omani children. J Pediatr Hematol Oncol. 2016 Jul;38(5):384–8. http://dx.doi.org/10.1097/MPH.0000000000000565 PMID:27164523
22. Gharaibeh HF, Gharaibeh MK. Factors influencing health-related quality of life of thalassaemic Jordanian children. Child Care Health Dev. 2012 Mar;38(2):211–8. http://dx.doi.org/10.1111/j.1365-2214.2011.01224.x PMID:21426370
23. Caocci G, Efficace F, Ciotti F, Roncarolo MG, Vacca A, Piras E, et al. Health related quality of life in Middle Eastern children with beta-thalassemia. BMC Blood Disord. 2012 Jun 22;12:6. http://dx.doi.org/10.1186/1471-2326-12-6 PMID:22726530
24. Ayoub MD, Radi SA, Azab AM, Abulaban AA, Balkhoyor AH, Bedair SW, et al. Quality of life among children with beta-thalassem-ia major treated in Western Saudi Arabia. Saudi Med J. 2013 Dec;34(12):1281–6. PMID:24343469
25. Adam S, Afifi H, Thomas M, Magdy P, El-Kamah G. Quality of life outcomes in a pediatric thalassemia population in Egypt. Hemoglobin. 2017 Jan;41(1):16–20. http://dx.doi.org/10.1080/03630269.2017.1312434 PMID:28440111
26. Amoudi AS, Balkhoyor AH, Abulaban AA, Azab AM, Radi SA, Ayoub MD, et al. Quality of life among adults with beta-thalassemia major in western Saudi Arabia. Saudi Med J. 2014 Aug;35(8):882–5. PMID:25129193
27. Gharaibeh H, Amarneh BH, Zamzam SZ. The psychological burden of patients with beta thalassemia major in Syria. Pediatr Int. 2009 Oct;51(5):630–6. http://dx.doi.org/10.1111/j.1442-200X.2009.02833.x PMID:19419527
28. Mandal PK, Ghosh MK, Bhattacharyya M. Does profile of hemoglobin ebeta-thalassemia patients change after splenectomy? Experience of a tertiary thalassemia care centre in Eastern India. Indian J Hematol Blood Transfus. 2015 Dec;31(4):446–52. http://dx.doi.org/10.1007/s12288-014-0498-6 PMID:26306069
29. Cappellini MD, Grespi E, Cassinerio E, Bignamini D, Fiorelli G. Coagulation and splenectomy: an overview. Ann N Y Acad Sci. 2005;1054:317–24. http://dx.doi.org/10.1196/annals.1345.039 PMID:16339680
30. Adib-Hajbaghery M, Ahmadi M, S P. Health related quality of life, depression, anxiety and stress in patients with beta-thalas-semia major. Iran J Ped Hematol Oncol. 2015;5(4):193–205. PMID:26985352
31. Marvasti VE, Dastoori P, Karimi M. Is beta-thalassemia trait a risk factor for developing depression in young adults? Ann Hema-tol. 2006 Dec;85(12):873–4. http://dx.doi.org/10.1007/s00277-006-0154-9 PMID:16845515
32. Yengil E, Acipayam C, Kokacya MH, Kurhan F, Oktay G, Ozer C. Anxiety, depression and quality of life in patients with beta thalassemia major and their caregivers. Int J Clin Exp Med. 2014 Aug 15;7(8):2165–72. PMID:25232402
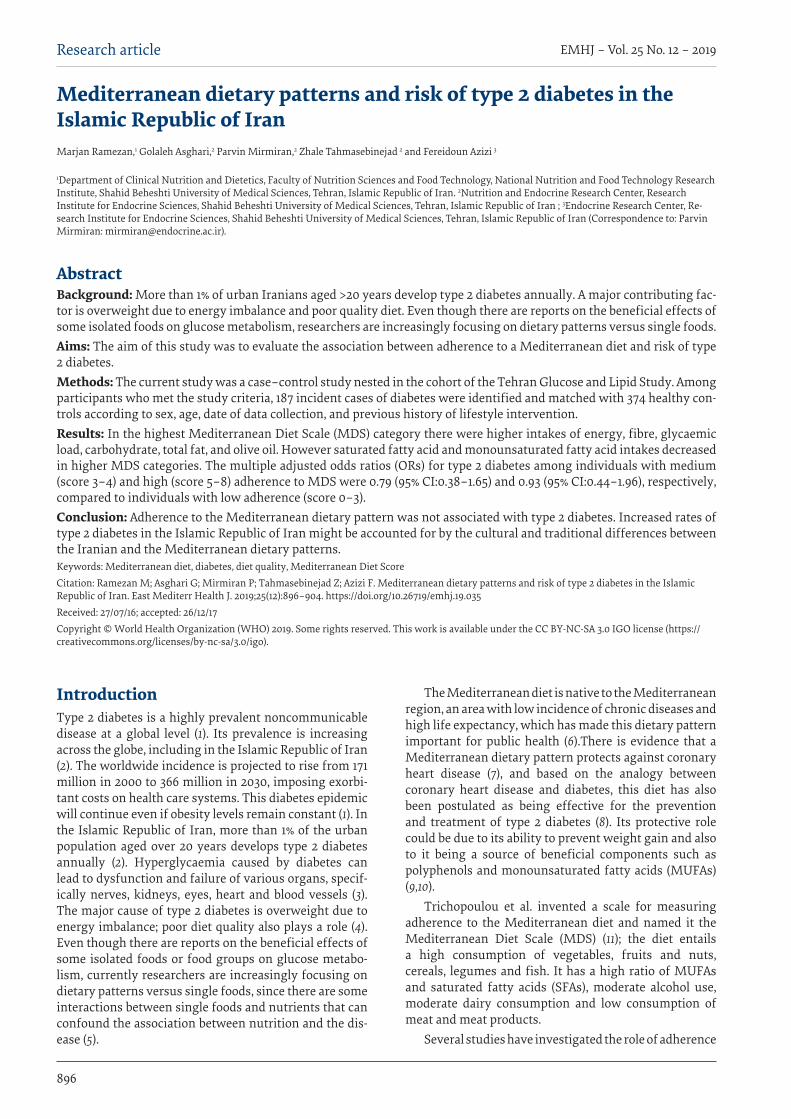
896
EMHJ – Vol. 25 No. 12 – 2019Research article
Mediterranean dietary patterns and risk of type 2 diabetes in the Islamic Republic of IranMarjan Ramezan,1 Golaleh Asghari,2 Parvin Mirmiran,2 Zhale Tahmasebinejad 2 and Fereidoun Azizi 3
1Department of Clinical Nutrition and Dietetics, Faculty of Nutrition Sciences and Food Technology, National Nutrition and Food Technology Research Institute, Shahid Beheshti University of Medical Sciences, Tehran, Islamic Republic of Iran. 2Nutrition and Endocrine Research Center, Research Institute for Endocrine Sciences, Shahid Beheshti University of Medical Sciences, Tehran, Islamic Republic of Iran ; 3Endocrine Research Center, Re-search Institute for Endocrine Sciences, Shahid Beheshti University of Medical Sciences, Tehran, Islamic Republic of Iran (Correspondence to: Parvin Mirmiran: [email protected]).
AbstractBackground: More than 1% of urban Iranians aged >20 years develop type 2 diabetes annually. A major contributing fac-tor is overweight due to energy imbalance and poor quality diet. Even though there are reports on the beneficial effects of some isolated foods on glucose metabolism, researchers are increasingly focusing on dietary patterns versus single foods.Aims: The aim of this study was to evaluate the association between adherence to a Mediterranean diet and risk of type 2 diabetes.Methods: The current study was a case–control study nested in the cohort of the Tehran Glucose and Lipid Study. Among participants who met the study criteria, 187 incident cases of diabetes were identified and matched with 374 healthy con-trols according to sex, age, date of data collection, and previous history of lifestyle intervention. Results: In the highest Mediterranean Diet Scale (MDS) category there were higher intakes of energy, fibre, glycaemic load, carbohydrate, total fat, and olive oil. However saturated fatty acid and monounsaturated fatty acid intakes decreased in higher MDS categories. The multiple adjusted odds ratios (ORs) for type 2 diabetes among individuals with medium (score 3–4) and high (score 5–8) adherence to MDS were 0.79 (95% CI:0.38–1.65) and 0.93 (95% CI:0.44–1.96), respectively, compared to individuals with low adherence (score 0–3).Conclusion: Adherence to the Mediterranean dietary pattern was not associated with type 2 diabetes. Increased rates of type 2 diabetes in the Islamic Republic of Iran might be accounted for by the cultural and traditional differences between the Iranian and the Mediterranean dietary patterns.Keywords: Mediterranean diet, diabetes, diet quality, Mediterranean Diet Score Citation: Ramezan M; Asghari G; Mirmiran P; Tahmasebinejad Z; Azizi F. Mediterranean dietary patterns and risk of type 2 diabetes in the Islamic Republic of Iran. East Mediterr Health J. 2019;25(12):896–904. https://doi.org/10.26719/emhj.19.035Received: 27/07/16; accepted: 26/12/17Copyright © World Health Organization (WHO) 2019. Some rights reserved. This work is available under the CC BY-NC-SA 3.0 IGO license (https://creativecommons.org/licenses/by-nc-sa/3.0/igo).
IntroductionType 2 diabetes is a highly prevalent noncommunicable disease at a global level (1). Its prevalence is increasing across the globe, including in the Islamic Republic of Iran (2). The worldwide incidence is projected to rise from 171 million in 2000 to 366 million in 2030, imposing exorbi-tant costs on health care systems. This diabetes epidemic will continue even if obesity levels remain constant (1). In the Islamic Republic of Iran, more than 1% of the urban population aged over 20 years develops type 2 diabetes annually (2). Hyperglycaemia caused by diabetes can lead to dysfunction and failure of various organs, specif-ically nerves, kidneys, eyes, heart and blood vessels (3). The major cause of type 2 diabetes is overweight due to energy imbalance; poor diet quality also plays a role (4). Even though there are reports on the beneficial effects of some isolated foods or food groups on glucose metabo-lism, currently researchers are increasingly focusing on dietary patterns versus single foods, since there are some interactions between single foods and nutrients that can confound the association between nutrition and the dis-ease (5).
The Mediterranean diet is native to the Mediterranean region, an area with low incidence of chronic diseases and high life expectancy, which has made this dietary pattern important for public health (6).There is evidence that a Mediterranean dietary pattern protects against coronary heart disease (7), and based on the analogy between coronary heart disease and diabetes, this diet has also been postulated as being effective for the prevention and treatment of type 2 diabetes (8). Its protective role could be due to its ability to prevent weight gain and also to it being a source of beneficial components such as polyphenols and monounsaturated fatty acids (MUFAs) (9,10).
Trichopoulou et al. invented a scale for measuring adherence to the Mediterranean diet and named it the Mediterranean Diet Scale (MDS) (11); the diet entails a high consumption of vegetables, fruits and nuts, cereals, legumes and fish. It has a high ratio of MUFAs and saturated fatty acids (SFAs), moderate alcohol use, moderate dairy consumption and low consumption of meat and meat products.
Several studies have investigated the role of adherence
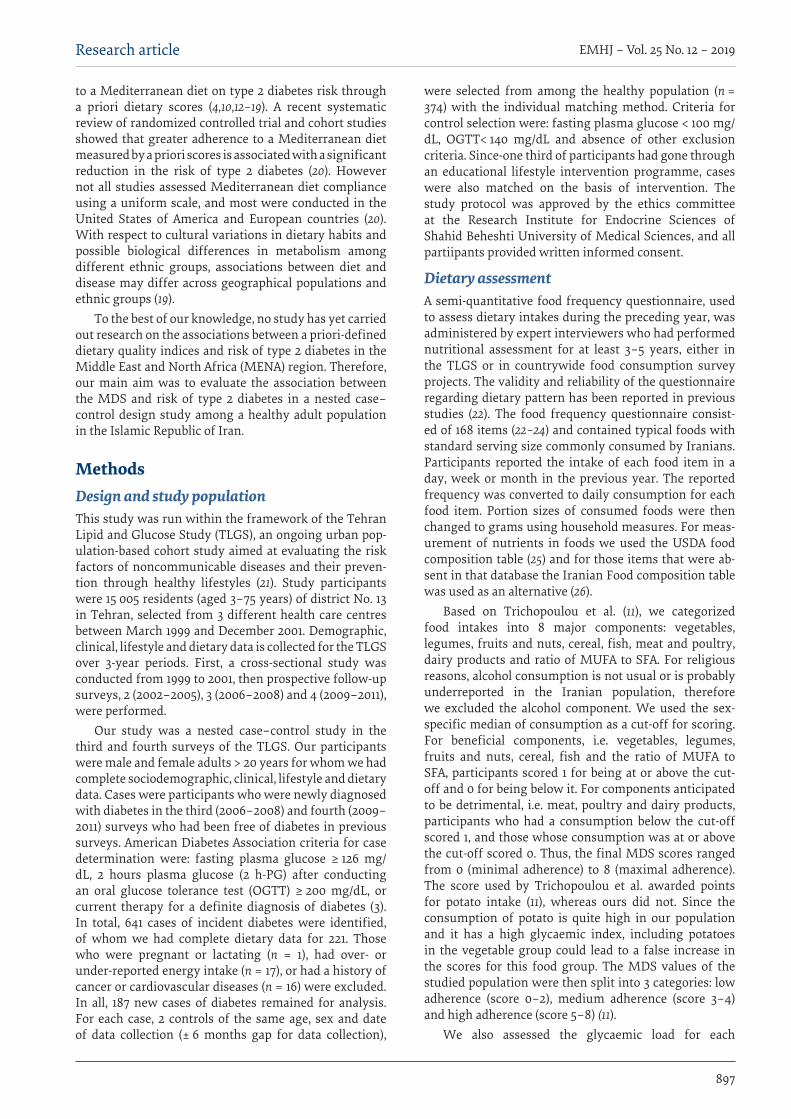
897
Research article EMHJ – Vol. 25 No. 12 – 2019
to a Mediterranean diet on type 2 diabetes risk through a priori dietary scores (4,10,12–19). A recent systematic review of randomized controlled trial and cohort studies showed that greater adherence to a Mediterranean diet measured by a priori scores is associated with a significant reduction in the risk of type 2 diabetes (20). However not all studies assessed Mediterranean diet compliance using a uniform scale, and most were conducted in the United States of America and European countries (20). With respect to cultural variations in dietary habits and possible biological differences in metabolism among different ethnic groups, associations between diet and disease may differ across geographical populations and ethnic groups (19).
To the best of our knowledge, no study has yet carried out research on the associations between a priori-defined dietary quality indices and risk of type 2 diabetes in the Middle East and North Africa (MENA) region. Therefore, our main aim was to evaluate the association between the MDS and risk of type 2 diabetes in a nested case–control design study among a healthy adult population in the Islamic Republic of Iran.
MethodsDesign and study populationThis study was run within the framework of the Tehran Lipid and Glucose Study (TLGS), an ongoing urban pop-ulation-based cohort study aimed at evaluating the risk factors of noncommunicable diseases and their preven-tion through healthy lifestyles (21). Study participants were 15 005 residents (aged 3–75 years) of district No. 13 in Tehran, selected from 3 different health care centres between March 1999 and December 2001. Demographic, clinical, lifestyle and dietary data is collected for the TLGS over 3-year periods. First, a cross-sectional study was conducted from 1999 to 2001, then prospective follow-up surveys, 2 (2002–2005), 3 (2006–2008) and 4 (2009–2011), were performed.
Our study was a nested case–control study in the third and fourth surveys of the TLGS. Our participants were male and female adults > 20 years for whom we had complete sociodemographic, clinical, lifestyle and dietary data. Cases were participants who were newly diagnosed with diabetes in the third (2006–2008) and fourth (2009–2011) surveys who had been free of diabetes in previous surveys. American Diabetes Association criteria for case determination were: fasting plasma glucose ≥ 126 mg/dL, 2 hours plasma glucose (2 h-PG) after conducting an oral glucose tolerance test (OGTT) ≥ 200 mg/dL, or current therapy for a definite diagnosis of diabetes (3). In total, 641 cases of incident diabetes were identified, of whom we had complete dietary data for 221. Those who were pregnant or lactating (n = 1), had over- or under-reported energy intake (n = 17), or had a history of cancer or cardiovascular diseases (n = 16) were excluded. In all, 187 new cases of diabetes remained for analysis. For each case, 2 controls of the same age, sex and date of data collection (± 6 months gap for data collection),
were selected from among the healthy population (n = 374) with the individual matching method. Criteria for control selection were: fasting plasma glucose < 100 mg/dL, OGTT< 140 mg/dL and absence of other exclusion criteria. Since-one third of participants had gone through an educational lifestyle intervention programme, cases were also matched on the basis of intervention. The study protocol was approved by the ethics committee at the Research Institute for Endocrine Sciences of Shahid Beheshti University of Medical Sciences, and all partiipants provided written informed consent.
Dietary assessmentA semi-quantitative food frequency questionnaire, used to assess dietary intakes during the preceding year, was administered by expert interviewers who had performed nutritional assessment for at least 3–5 years, either in the TLGS or in countrywide food consumption survey projects. The validity and reliability of the questionnaire regarding dietary pattern has been reported in previous studies (22). The food frequency questionnaire consist-ed of 168 items (22–24) and contained typical foods with standard serving size commonly consumed by Iranians. Participants reported the intake of each food item in a day, week or month in the previous year. The reported frequency was converted to daily consumption for each food item. Portion sizes of consumed foods were then changed to grams using household measures. For meas-urement of nutrients in foods we used the USDA food composition table (25) and for those items that were ab-sent in that database the Iranian Food composition table was used as an alternative (26).
Based on Trichopoulou et al. (11), we categorized food intakes into 8 major components: vegetables, legumes, fruits and nuts, cereal, fish, meat and poultry, dairy products and ratio of MUFA to SFA. For religious reasons, alcohol consumption is not usual or is probably underreported in the Iranian population, therefore we excluded the alcohol component. We used the sex-specific median of consumption as a cut-off for scoring. For beneficial components, i.e. vegetables, legumes, fruits and nuts, cereal, fish and the ratio of MUFA to SFA, participants scored 1 for being at or above the cut-off and 0 for being below it. For components anticipated to be detrimental, i.e. meat, poultry and dairy products, participants who had a consumption below the cut-off scored 1, and those whose consumption was at or above the cut-off scored 0. Thus, the final MDS scores ranged from 0 (minimal adherence) to 8 (maximal adherence). The score used by Trichopoulou et al. awarded points for potato intake (11), whereas ours did not. Since the consumption of potato is quite high in our population and it has a high glycaemic index, including potatoes in the vegetable group could lead to a false increase in the scores for this food group. The MDS values of the studied population were then split into 3 categories: low adherence (score 0–2), medium adherence (score 3–4) and high adherence (score 5–8) (11).
We also assessed the glycaemic load for each
898
EMHJ – Vol. 25 No. 12 – 2019Research article
participant: values assigned to individual food items were obtained from the Atkinson table using glucose as the reference (27). Serving size and carbohydrates available in each serving are presented in this table. We calculated the amount of available carbohydrate in each food item consumed by multiplying the available carbohydrate in each serving by the intake of that food item and divided by serving size. The glycaemic load for each item was then calculated according to Atkinson et al. by multiplying its glycaemic index by the available carbohydrate divided by 100 (27). The total glycaemic load for each person was then calculated by adding up the glycaemic load of all products with a carbohydrate content.
Other measurementsParticipants were interviewed by qualified interviewers using pretested questionnaires to gather data on sociode-mographics, anthropometrics, family history of diabetes, medical history, and smoking status. This was carried out during the third and fourth surveys of the TLGS, ac-cording to which survey the respondent participated in.
Height and weight were measured with light clothes and shoes removed according to the standard protocol, then body mass index (BMI) was calculated. Waist circumference (WC) was measured at the level of the umbilicus over light clothing (21). Blood pressure was also measured using a standardized mercury sphygmomanometer on the right arm while sitting. The mean of 2 measurements was considered the participant’s blood pressure. Physical activity during the preceding year was determined using the Modifiable Activity Questionnaire and calculating metabolic equivalent task (MET) minutes per week. The reliability and validity for the Farsi version of the questionnaire has been confirmed previously (28). The MET value of the activity was multiplied by the duration of each of the activities and all MET-minute products were summed to reach an estimate of daily physical activity, indicating energy expenditure per kilogram body weight during an average day. Levels of physical activity were then categorized as light (MET < 600 min/week), moderate (MET = 600–1499 min/week), and vigorous (MET ≥ 1500 min/week).
An overnight fasting blood sample was drawn from each participant for biochemical measurements. In addition to measuring fasting plasma glucose, another blood sample was obtained 120 minutes after the ingestion of 82.5 g glucose monohydrate solution, equivalent to 75 g hydrous glucose, for the OGTT. Glucose was assayed by an enzymatic colorimetric method (glucose oxidize technique) utilizing glucose kits (Pars Azmun Inc., Tehran). Total cholesterol concentrations were measured with cholesterol esterase and cholesterol oxidase using an enzymatic colorimetric method. The analysis of samples was performed using a Selectra 2 auto-analyser (Vital Scientific, Spankeren) (21).
DefinitionType 2 diabetes was defined as fasting plasma glucose ≥ 126 mg/dL, 2 h-PG after OGTT ≥ 200 mg/dL, or receiv-
ing current therapy for a definite diagnosis of diabetes, according to the American Diabetes Association criteria (3). Hypertension was determined if systolic blood pres-sure was ≥ 140 mmHg, diastolic blood pressure was ≥ 90 mmHg, or the person was under current treatment with antihypertensive medications, either at the time of inter-view or in the previous month, according to the JNC-VIII criteria (29). Hypercholesterolaemia was defined as plas-ma cholesterol > 200 mg/dL, according to NCEP-ATP III (30). Energy intake reports over 3500 kcal/day in women or 4200 kcal/day in men were considered over-reporting and energy intake reports under 500 kcal/day in women or 800 kcal/day in men were considered under-reporting (31).
Statistical analysisWe matched each case with 2 healthy controls according to age, sex, date of data collection and existence of life-style intervention, using an individual matching method. Means and standard deviations, or proportions of poten-tial diabetes risk factors were determined at baseline in cases and controls. The t-test and Chi-squared test were used to compare means and proportions for the case and control groups; P for trend was calculated by assigning the median value for each category of MDS treated as a continuous variable using linear (for continuous var-iables) or binary logistic (for dichotomous variables) re-gression. Conditional logistic regression models were used to estimate the OR and the 95% confidence interval (95% CI) in each quartile. We used SPSS, version 17.0, and STATA, version 13.0, for statistical analysis. P-values < 0.05 were considered statistically significant. Model 1 was adjusted for family history of diabetes, BMI, education level, smoking status, physical activity and total energy intake; model 2 was further adjusted for WC, hypercho-lesterolaemia and hypertension.
ResultsMean BMI and WC were significantly higher in the case group than the control group (Table 1). Cases were significantly more likely to be hypertensive and hyper-cholesterolaemic than controls. We compared glycaemic load, total fibre, trans-fatty acids (TFAs), MUFAs, PUFAs between cases and controls. Furthermore, we compared MDS and its components between the 2 groups. After performing the t-test, none of them differed significantly except the MUFA to PUFA ratio (Table 1).
Table 2 presents some demographic and lifestyle variables and some dietary factors. Study participants in the highest MDS category were slightly older compared to the lowest one. Energy, fibre, glycaemic load, carbohydrate, and total fat intake were also higher in the highest MDS category. The proportion of both SFA and MUFA decreased with higher MDS category; however intakes of olive oil shower an upward trend.
The associations between MDS and type 2 diabetes are presented in Table 3. Compared to the lowest, the risk of type 2 diabetes in the highest category of MDS was

899
Research article EMHJ – Vol. 25 No. 12 – 2019
0.95 (95% CI: 0.56, 1.61) in the crude model. When adjusted for known confounding factors including family history of diabetes, BMI, physical activity, education level, smoking status, and total energy intake (Model 1), the OR was lower but it was still not statistically significant (OR: 0.87, 95% CI: 0.43, 1.75). Further adjustment for WC, hypercholesterolaemia, and hypertension attenuated the association (OR: 0.93, 95% CI: 0.44, 1.96). None of the models showed significant association between MDS adherence and the risk of type 2 diabetes.
In a further analysis, we entered all 8 components of the score in the logistic regression separately. None of the components showed a significant relationship with diabetes risk except for the MUFA to SFA ratio, which
was associated with a 2-fold increase in diabetes risk only in the crude model (data not shown).
DiscussionIn this case–control study nested in a large cohort, ad-herence to a Mediterranean diet, assessed by an a priori dietary score was not associated with type 2 diabetes in adult men and women of an urban Iranian population.
Our results are in line with 2 previous prospective studies: the Multi-Ethnic Study of Atherosclerosis (MESA), which was conducted on different ethnicities, and the Whitehall II study, which found no significant association between MDS and incidence of type 2
Table 1 Distribution of demographic and dietary characteristics among cases with incident type 2 diabetes and their matched controls (2006–2008 and 2009–2011 Tehran Lipid and Glucose Study surveys)Characteristic Cases
(n = 187)Controls (n = 374)
P-value
Mean SD Mean SDAge (years) 51.0 13.0 50.8 12.7 0.871
Body mass index (kg/m2) 30.8 5.7 28.4 4.9 < 0.001
Waist circumference (cm) 101.2 12.4 94.7 11.9 < 0.001
Total fibre (g) 46.5 32.5 44.0 21.6 0.343
Glycaemic load 158.0 68.1 158.0 8.4 0.997
TFA (% of energy) 0.69 0.66 0.73 0.62 0.526
MUFA (% of energy) 25.5 11.5 25.2 10.3 0.219
PUFA (% of energy) 16.1 9.8 15.3 7.0 0.061
MDS score 4.04 1.53 4.02 1.49 0.874
Vegetables (g/day) 312 186 318 184 0.535
Legumes (g/day) 34 32 36 38 0.130
Fruits and nuts (g/day) 423 346 448 376 0.531
Cereals (g/day) 431 204 415 186 0.213
Fish (g/day) 10 12 11 15 0.196
Meat and poultry (g/day) 48 35 48 43 0.880
Dairy (g/day) 399 251 418 257 0.658
MUFA to SFA ratio 1.1 0.29 1.0 0.25 0.013
% %
Male (%) 42.8 42.2 0.904
Smoking (%)
Non-smoker 81.8 79.1 0.560
Past smoker 7.5 7.0
Smoker 10.7 13.9
Education (%)
Primary and under 21.9 24.9 0.558
Guidance school 13.9 15.5
High school 50.3 43.9
University 13.9 15.8
Hypertension (%) 44.9 29.1 < 0.001
Hypercholesterolaemia (%) 57.2 42.8 0.002
SD = standard deviation; TFA = trans-fatty acid; MUFA = monounsaturated fatty acid; PUFA = polyunsaturated fatty acid; MDS = Mediterranean Diet Scale; SFA = saturated fatty acid.
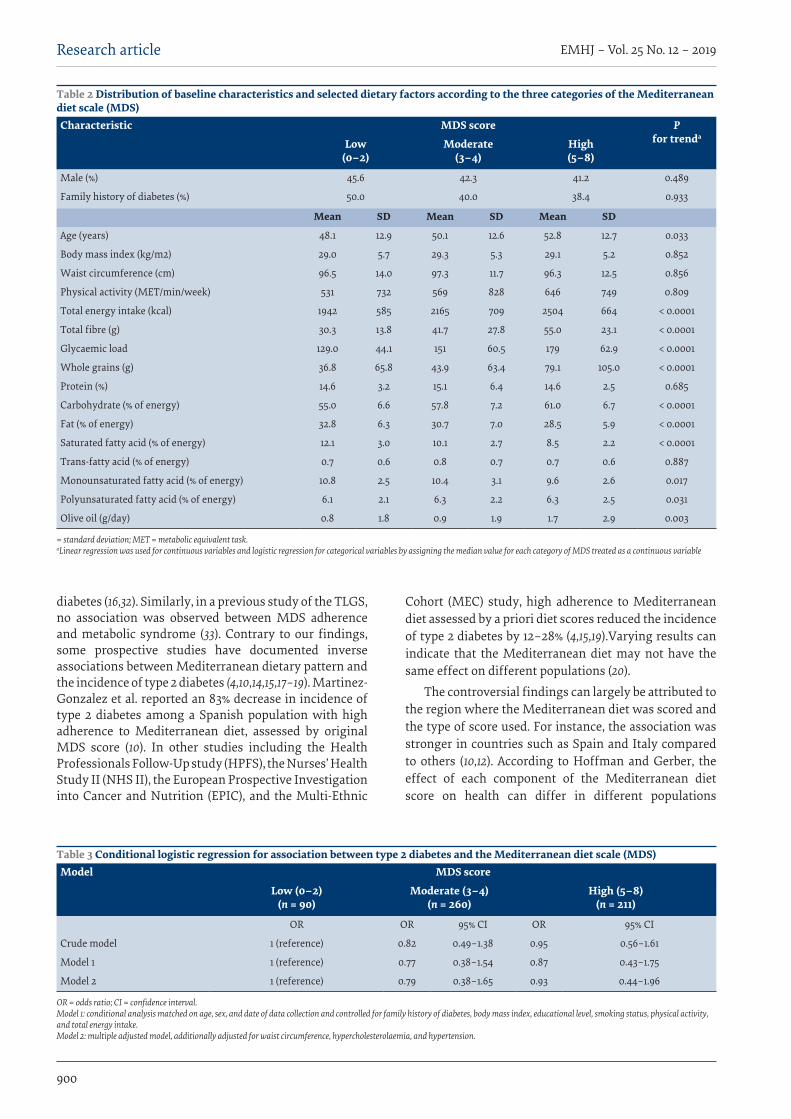
900
EMHJ – Vol. 25 No. 12 – 2019Research article
diabetes (16,32). Similarly, in a previous study of the TLGS, no association was observed between MDS adherence and metabolic syndrome (33). Contrary to our findings, some prospective studies have documented inverse associations between Mediterranean dietary pattern and the incidence of type 2 diabetes (4,10,14,15,17–19). Martinez-Gonzalez et al. reported an 83% decrease in incidence of type 2 diabetes among a Spanish population with high adherence to Mediterranean diet, assessed by original MDS score (10). In other studies including the Health Professionals Follow-Up study (HPFS), the Nurses’ Health Study II (NHS II), the European Prospective Investigation into Cancer and Nutrition (EPIC), and the Multi-Ethnic
Cohort (MEC) study, high adherence to Mediterranean diet assessed by a priori diet scores reduced the incidence of type 2 diabetes by 12–28% (4,15,19).Varying results can indicate that the Mediterranean diet may not have the same effect on different populations (20).
The controversial findings can largely be attributed to the region where the Mediterranean diet was scored and the type of score used. For instance, the association was stronger in countries such as Spain and Italy compared to others (10,12). According to Hoffman and Gerber, the effect of each component of the Mediterranean diet score on health can differ in different populations
Table 2 Distribution of baseline characteristics and selected dietary factors according to the three categories of the Mediterranean diet scale (MDS)Characteristic MDS score P
for trendaLow
(0–2)Moderate
(3–4)High(5–8)
Male (%) 45.6 42.3 41.2 0.489
Family history of diabetes (%) 50.0 40.0 38.4 0.933
Mean SD Mean SD Mean SD
Age (years) 48.1 12.9 50.1 12.6 52.8 12.7 0.033
Body mass index (kg/m2) 29.0 5.7 29.3 5.3 29.1 5.2 0.852
Waist circumference (cm) 96.5 14.0 97.3 11.7 96.3 12.5 0.856
Physical activity (MET/min/week) 531 732 569 828 646 749 0.809
Total energy intake (kcal) 1942 585 2165 709 2504 664 < 0.0001
Total fibre (g) 30.3 13.8 41.7 27.8 55.0 23.1 < 0.0001
Glycaemic load 129.0 44.1 151 60.5 179 62.9 < 0.0001
Whole grains (g) 36.8 65.8 43.9 63.4 79.1 105.0 < 0.0001
Protein (%) 14.6 3.2 15.1 6.4 14.6 2.5 0.685
Carbohydrate (% of energy) 55.0 6.6 57.8 7.2 61.0 6.7 < 0.0001
Fat (% of energy) 32.8 6.3 30.7 7.0 28.5 5.9 < 0.0001
Saturated fatty acid (% of energy) 12.1 3.0 10.1 2.7 8.5 2.2 < 0.0001
Trans-fatty acid (% of energy) 0.7 0.6 0.8 0.7 0.7 0.6 0.887
Monounsaturated fatty acid (% of energy) 10.8 2.5 10.4 3.1 9.6 2.6 0.017
Polyunsaturated fatty acid (% of energy) 6.1 2.1 6.3 2.2 6.3 2.5 0.031
Olive oil (g/day) 0.8 1.8 0.9 1.9 1.7 2.9 0.003
= standard deviation; MET = metabolic equivalent task. aLinear regression was used for continuous variables and logistic regression for categorical variables by assigning the median value for each category of MDS treated as a continuous variable
Table 3 Conditional logistic regression for association between type 2 diabetes and the Mediterranean diet scale (MDS)Model MDS score
Low (0–2) (n = 90)
Moderate (3–4) (n = 260)
High (5–8) (n = 211)
OR OR 95% CI OR 95% CI
Crude model 1 (reference) 0.82 0.49–1.38 0.95 0.56–1.61
Model 1 1 (reference) 0.77 0.38–1.54 0.87 0.43–1.75
Model 2 1 (reference) 0.79 0.38–1.65 0.93 0.44–1.96
OR = odds ratio; CI = confidence interval. Model 1: conditional analysis matched on age, sex, and date of data collection and controlled for family history of diabetes, body mass index, educational level, smoking status, physical activity, and total energy intake. Model 2: multiple adjusted model, additionally adjusted for waist circumference, hypercholesterolaemia, and hypertension.
901
Research article EMHJ – Vol. 25 No. 12 – 2019
(34) due to disparities between the Mediterranean and nonMediterranean countries in food availability, priority given to specific foods in each food group, and processing and preparation of foods all of which affect the overall health benefits of the Mediterranean diet in nonMediterranean countries (34). In addition, it seems that the protective effect of the Mediterranean diet against chronic diseases relates to dietary behaviours such as the order of meals, the time of eating each meal and the meal patterns or other potentially confounders such as genetics, sleeping and sunlight exposure (34,35). On the other hand, most of the studies used a modified MDS instead of the original one (4,12,14–16,32), which could result in differences in prediction of disease risk between studies.
One of the components of MDS known to be beneficial is cereal consumption, regardless of glycaemic load, amount of fibre or degree of processing. Both refined and unrefined cereals get positive points (36). According to Biesalski et al., high fibre dietary carbohydrates may lead to a lower risk for diabetes among a healthy population (37). Also, it has been shown that a diet with low glycaemic load and a high MDS can effectively reduce the incidence of type 2 diabetes whereas a high glycaemic load, high MDS diet showed no significant relationship with type 2 diabetes (17). Iranians have high intakes of grains as the main source of energy, but most grains are of the refined type (loaded with white rice and bread) (38), in the traditional Mediterranean diet, cereals were largely unrefined (11). Therefore cereal consumption, regardless of its quality (refined or unrefined) might be a factor in part for the lack of association between MDS and type 2 diabetes in our study.
Based on a review of data on dietary fat and diabetes, replacing SFA and TFA with unsaturated fatty acids (PUFA and/or MUFA) can enhance insulin sensitivity and is likely to protect against type 2 diabetes (39). This is in contrast with our findings where MUFA to SFA ratio was related to an increase in diabetes risk; this finding was not significant when we adjusted for confounding factors though. On the other hand, an outstanding feature of the original Mediterranean diet is the abundant use of olive oil, containing a high ratio of MUFA to SFA beside its antioxidant properties, which may play role in preventing chronic diseases (34). The mean total intake of olive oil in our sample (1.1 g in both sexes; data not shown) was much lower than the Greek sample (45.5 in men and 38.7 in women) in Trichopoulou’s study (11).
According to Hoffman and Gerber (34) the main source of MUFA intake in non-Mediterranean populations is animal fat rather than olive oil. This was confirmed in our study where olive oil consumption rose across categories of MDS, whereas MUFA intake declined. So the ratio of MUFA to SFA is not that highly affected by olive oil in our population and thus cannot be a predictor of diabetes risk.
In all diets, there are particular issues that cannot be seen in any comparisons. For instance, in our population daily median intake of fish was lower than that in the Greek population for which the MDS was originally designed (7.08 vs 23.7 g/day for men; 6.37 vs 18.8 g/day for women) (11). Besides the difference in quantity of fish consumed, the quality varies a great deal since the different methods of cooking affect the fatty acid content and the types of fish consumed also differ in the Islamic Republic of Iran and the Mediterranean countries (34). Red wine is another feature of the Mediterranean diet (37). Moderate alcohol consumption is hypothesized to have an enhancing effect on insulin sensitivity and thus to reduce the risk of diabetes (9).
One of the limitations of our study is the small sample size and case–control rather than prospective design, which is prone to reverse causality; however the nested case–control design allowed us to use only new cases of diabetes that were not diabetic or even pre-diabetic in past surveys of the cohort, so the risk of reverse causality is minimized substantially. Second, our study tried to draw a Mediterranean dietary pattern from usual diets of the participants, which may have led to imprecision of defining the Mediterranean diet. Last, but not least, due to the small sample size, subgroup analyses were not possible in our study.
There were several strengths to our study. This was the first study investigating the association between the Mediterranean dietary pattern, assessed by an a priori method, and type 2 diabetes among the MENA population. Precise case selection and use of objectively-identified diabetes (not self-reported per se), and the highly standardized serum processing, anthropometric measurements, and covariate assessment are among the other strengths.
In conclusion, we found no inverse association between the Mediterranean dietary pattern measured by MDS and type 2 diabetes, in this healthy adult Iranian population sample. The Iranian dietary pattern does not correspond closely to the Mediterranean dietary pattern, which might be responsible for the lack of significant association. Further large scale, prospective studies, especially in Asian and Middle Eastern populations, with modifications in the scoring to become more compliant with usual diets of the population, are needed to investigate the applicability of the Mediterranean dietary pattern to type 2 diabetes prevention.
Funding: This study was funded by a grant from the Re-search Institute for Endocrine Sciences, Shadid Beheshti University of Medical Sciences, Tehran, Islamic Republic of Iran.
Competing interests: None declared.
902
EMHJ – Vol. 25 No. 12 – 2019Research article
References1. Wild S, Roglic G, Green A, Sicree R, King H. Global prevalence of diabetes: estimates for the year 2000 and projections for 2030.
Diabetes Care. 2004;27(5):1047–53. PMID:15111519
2. Harati H, Hadaegh F, Saadat N, Azizi F. Population-based incidence of Type 2 diabetes and its associated risk factors: results from a six-year cohort study in Iran. BMC Public Health. 2009;9:186. doi:10.1186/1471-2458-9-186
3. American Diabetes Association. Diagnosis and classification of diabetes mellitus. Diabetes Care. 2014;37(Supplement 1):S81–90. doi:10.2337/dc14-S081
Habitudes alimentaires méditerranéennes et risque de diabète de type 2 en Répu-blique islamique d'IranRésuméContexte : Plus d'un pour cent (1 %) des Iraniens âgés de 20 ans et plus vivant en zones urbaines développent un diabète de type 2 chaque année. Le surpoids causé par le déséquilibre énergétique et l’alimentation de mauvaise qualité constitue l’un des principaux facteurs du diabète. Même s'il existe des rapports sur les effets bénéfiques de certains aliments isolés sur le métabolisme du glucose, les chercheurs se concentrent actuellement de plus en plus sur les habitudes alimentaires plutôt que sur la consommation d'aliments simples.Objectif : L'objectif de la présente étude était d'évaluer l'association entre l'adhésion à un régime méditerranéen et le risque de développer un diabète de type 2.Méthodes : La présente étude est une étude cas-témoins nichée dans la cohorte de l’étude de Téhéran sur le glucose et les lipides. Parmi les participants qui répondaient aux critères de l'étude, 187 cas incidents de diabète ont été identifiés et appariés avec 374 témoins en bonne santé en fonction du sexe, de l'âge, de la date de la collecte des données et des précédentes interventions liées au mode de vie. Résultats : La catégorie la plus élevée de l'échelle du régime méditerranéen était caractérisée par des apports en énergie, en fibres et en glucides élevés, un apport total en graisses élevé, une forte charge glycémique et une consommation importante d’huile d’olive, ainsi que par des apports en acides gras saturés et en acides gras monoinsaturés moins élevés. Les multiples odds ratio ajustés pour le diabète de type 2 chez les personnes présentant une adhésion moyenne (score 3-4) et élevée (score 5-8) à l'échelle du régime méditerranéen étaient de 0,79 (IC à 95 % : 0,38-1,65) et 0,93 (IC à 95 % :0,44-1,96), respectivement, comparativement aux personnes présentant une faible adhésion (score 0-3).Conclusion : L'adhésion au régime alimentaire méditerranéen n'était pas associée au diabète de type 2. L'augmentation des taux de diabète de type 2 en République islamique d'Iran pourrait être imputable aux différences culturelles et traditionnelles entre les régimes alimentaires iranien et méditerranéen.
األنامط الغذائية يف منطقة البحر املتوسط وخطر اإلصابة بالنمط الثاين من داء السكري يف مجهورية إيران اإلسالميةمرجان رمضان، كالله أصغري، بروين مريمريان، زاله طهامسبي نجاد، فريدون عزيزي
اخلالصةاخللفية: ُيصاب بالنمط الثاين من داء السكري سنويًا أكثر من 1% من اإليرانيني الذين يعيشون يف مناطق حرضية وتزيد سنهم عىل 20 عامًا. ومن العوامل الرئيسية املسامهة يف ذلك زيادة الوزن بسبب اختالل الطاقة ورداءة جودة النظام الغذائي. وعىل الرغم من وجود تقارير بأن بعض األغذية
هلا تأثريات مفيدة عىل استقالب اجللوكوز، يزداد حاليًا تركيز الباحثني عىل األنامط الغذائية بداًل من الرتكيز عىل أغذية بعينها.األهداف: هدفت هذه الدراسة إىل تقييم العالقة بني االلتزام بنظام غذائي متوسطي وخطر اإلصابة بالنمط الثاين من داء السكري.
"دراسة اجللوكوز والدهون يف املعنونة الدراسة األترابية املوجودة ضمن الدراسة إحدى دراسات احلاالت والشواهد البحث: كانت هذه طرق دت 187 حالة إصابة بداء السكري، وُطوبقت مع 374 حالة شاهدة سليمة وفقًا طهران". ومن بني املشاركني الذين استوفوا معايري الدراسة، ُحدِّ
للجنس والسن وتاريخ مجع البيانات وسوابق تدخالت أنامط احلياة. النتائج: يف أعىل فئة من فئات "مقياس النظم الغذائية املتوسطية" )MDS(، كانت هناك أغذية ذات قدر أكرب من الطاقة واأللياف واحلمل اجلاليسيمي والكربوهيدرات وإمجايل الدهون وزيت الزيتون. ومع ذلك، انخفضت كمية األمحاض الدهنية املشبعة واألمحاض الدهنية أحادية اإلشباع يف الفئات حة للنمط الثاين من داء السكري لدى أشخاص يلتزمون بالنظام الغذائي املتوسطي التزامًا متوسطًا )من العليا. وأما نسب األرجحية املتعددة امُلصحَّ aOR = 0.93; 95% CI = 0.44,[و ]aOR = 0.79; 95% CI = 0.38 1.65[ 3 إىل 4 درجات( ومرتفعًا )من 5 إىل 8 درجات( فكانت
1.96[، عىل التوايل، مقارنًة باألشخاص ذوي االلتزام املنخفض )من 0 إىل 3 درجات(.االستنتاج: مل يكن االلتزام بالنظام الغذائي املتوسطي مرتبطًا بالنمط الثاين من داء السكري، وهو ما يمكن عزوه إىل االختالفات الثقافية والتقليدية
بني أنامط الغذاء اإليرانية واملتوسطية.
903
Research article EMHJ – Vol. 25 No. 12 – 2019
4. de Koning L, Chiuve SE, Fung TT, Willett WC, Rimm EB, Hu FB. Diet-quality scores and the risk of type 2 diabetes in men. Diabe-tes Care. 2011;34(5):1150–6. doi:10.2337/dc10-2352
5. Panagiotakos DB, Tzima N, Pitsavos C, Chrysohoou C, Zampelas A, Toussoulis D, et al. The association between adherence to the Mediterranean diet and fasting indices of glucose homoeostasis: the ATTICA Study. J Am Coll Nutr. 2007;26(1):32–8. PMID:17353581
6. Bach-Faig A, Geleva D, Carrasco J, Ribas-Barba L, Serra-Majem L. Evaluating associations between Mediterranean diet adherence indexes and biomarkers of diet and disease. Public Health Nutr. 2006;9(8A):1110–7. doi:10.1017/S1368980007668499
7. Aljefree N, Ahmed F. Association between dietary pattern and risk of cardiovascular disease among adults in the Middle East and North Africa region: a systematic review. Food & nutrition research. 2015;59:27486. doi: 10.3402/fnr.v59.27486
8. Perez-Jimenez F, Lopez-Miranda J, Mata P. Protective effect of dietary monounsaturated fat on arteriosclerosis: beyond choles-terol. Atherosclerosis. 2002;163(2):385–98. PMID:12052487
9. Schroder H. Protective mechanisms of the Mediterranean diet in obesity and type 2 diabetes. J Nutr Biochem. 2007;18(3):149–60. doi:10.1016/j.jnutbio.2006.05.006
10. Martinez-Gonzalez MA, de la Fuente-Arrillaga C, Nunez-Cordoba JM, Basterra-Gortari FJ, Beunza JJ, Vazquez Z, et al. Adher-ence to Mediterranean diet and risk of developing diabetes: prospective cohort study. BMJ. 2008;336(7657):1348–51. doi:10.1136/bmj.39561.501007.BE
11. Trichopoulou A, Costacou T, Bamia C, Trichopoulos D. Adherence to a Mediterranean diet and survival in a Greek population. N Engl J Med. 2003;348(26):2599–608. doi:10.1191/1358863x04vm552xx
12. Mozaffarian D, Marfisi R, Levantesi G, Silletta MG, Tavazzi L, Tognoni G, et al. Incidence of new-onset diabetes and im-paired fasting glucose in patients with recent myocardial infarction and the effect of clinical and lifestyle risk factors. Lancet. 2007;370(9588):667–75. doi:10.1016/S0140-6736(07)61343-9
13. Panagiotakos DB, Pitsavos C, Arvaniti F, Stefanadis C. Adherence to the Mediterranean food pattern predicts the prevalence of hypertension, hypercholesterolemia, diabetes and obesity, among healthy adults; the accuracy of the MedDietScore. Prev Med. 2007;44(4):335–40. doi:10.1016/j.ypmed.2006.12.009
14. Romaguera D, Guevara M, Norat T, Langenberg C, Forouhi NG, Sharp S, et al. Mediterranean diet and type 2 diabetes risk in the European Prospective Investigation into Cancer and Nutrition (EPIC) study: the InterAct project. Diabetes Care. 2011;34(9):1913–8. doi:10.2337/dc11-0891
15. Tobias DK, Hu FB, Chavarro J, Rosner B, Mozaffarian D, Zhang C. Healthful dietary patterns and type 2 diabetes mellitus risk among women with a history of gestational diabetes mellitus. Arch Intern Med. 2012;172(20):1566–72. doi:10.2337/dc11-0891
16. Abiemo EE, Alonso A, Nettleton JA, Steffen LM, Bertoni AG, Jain A, et al. Relationships of the Mediterranean dietary pattern with insulin resistance and diabetes incidence in the Multi-Ethnic Study of Atherosclerosis (MESA). Br J Nutr. 2013;109(8):1490–7. doi:10.1017/S0007114512003339
17. Rossi M, Turati F, Lagiou P, Trichopoulos D, Augustin LS, La Vecchia C, et al. Mediterranean diet and glycaemic load in relation to incidence of type 2 diabetes: results from the Greek cohort of the population-based European Prospective Investigation into Cancer and Nutrition (EPIC). Diabetologia. 2013;56(11):2405–13. doi:10.1007/s00125-013-3013-y
18. Salas-Salvado J, Bullo M, Estruch R, Ros E, Covas MI, Ibarrola-Jurado N, et al. Prevention of diabetes with Mediterranean diets: a subgroup analysis of a randomized trial. Ann Intern Med. 2014;160(1):1–10. doi:10.7326/M13-1725
19. Jacobs S, Harmon BE, Boushey CJ, Morimoto Y, Wilkens LR, Le Marchand L, et al. A priori-defined diet quality indexes and risk of type 2 diabetes: the Multiethnic Cohort. Diabetologia. 2015;58(1):98–112. doi:10.1007/s00125-014-3404-8
20. Schwingshackl L, Missbach B, Konig J, Hoffmann G. Adherence to a Mediterranean diet and risk of diabetes: a systematic review and meta-analysis. Public Health Nutr. 2015;18(7):1292–9. doi:10.1017/S1368980014001542
21. Azizi F, Ghanbarian A, Momenan AA, Hadaegh F, Mirmiran P, Hedayati M, et al. Prevention of non-communicable disease in a population in nutrition transition: Tehran Lipid and Glucose Study, phase II. Trials. 2009;10:5. doi:10.1186/1745-6215-10-5
22. Asghari G, Rezazadeh A, Hosseini-Esfahani F, Mehrabi Y, Mirmiran P, Azizi F. Reliability, comparative validity and stability of dietary patterns derived from an FFQ in the Tehran Lipid and Glucose Study. Br J Nutr. 2012;108(6):1109–17.
23. Mirmiran P, Esfahani FH, Mehrabi Y, Hedayati M, Azizi F. Reliability and relative validity of an FFQ for nutrients in the Tehran lipid and glucose study. Public Health Nutr. 2010;13(5):654–62.
24. Hosseini-Esfahani F, Asghari G, Mirmiran P, Jalali Farahani S, Azizi F. Reproducibility and relative validity of food group intake in a food frequency questionnaire developed for the Tehran Lipid and Glucose Study. Razi J Med Sci. 2010;17(71):41–55.
25. Azar M, Sarkisian E. Food composition table of Iran. Islamic Republic of Iran: Institute of Nutrition Sciences and Food Technolo-gy, 1980.
26. Azar M, Sarkisian E. Food composition table of Iran. In: Editor Report No: 131. Tehran: Institute of Nutrition Sciences and Food Technology; 1980.
27. Atkinson FS, Foster-Powell K, Brand-Miller JC. International tables of glycemic index and glycemic load values: 2008. Diabetes Care. 2008;31(12):2281–3. PMID:18835944
28. Momenan AA, Delshad M, Sarbazi N, Rezaei Ghaleh N, Ghanbarian A, Azizi F. Reliability and validity of the Modifiable Activity Questionnaire (MAQ) in an Iranian urban adult population. Arch Iran Med. 2012;15(5):279–82. doi:012155/AIM.007.

904
EMHJ – Vol. 25 No. 12 – 2019Research article
29. James PA, Oparil S, Carter BL, Cushman WC, Dennison-Himmelfarb C, Handler J, et al. 2014 evidence-based guideline for the management of high blood pressure in adults: report from the panel members appointed to the Eighth Joint National Committee (JNC 8). JAMA. 2014;311(5):507–20. doi:10.1001/jama.2013.284427
30. Grundy SM. United States cholesterol guidelines 2001: expanded scope of intensive low-density lipoprotein–lowering therapy. American J Cardiol. 2001;88(7):23–7. PMID:11595195
31. Willett WC, Howe GR, Kushi LH. Adjustment for total energy intake in epidemiologic studies. American J Clinical Nutrition. 1997;65(4):1220S–8S. doi:10.1093/ajcn/65.4.1220S
32. Brunner EJ, Mosdol A, Witte DR, Martikainen P, Stafford M, Shipley MJ, et al. Dietary patterns and 15-y risks of major coronary events, diabetes, and mortality. Am J Clin Nutr. 2008;87(5):1414–21. doi:10.1093/ajcn/87.5.1414
33. Mirmiran P, Moslehi N, Mahmoudof H, Sadeghi M, Azizi F. A longitudinal study of adherence to the Mediterranean dietary pattern and metabolic syndrome in a non-Mediterranean population. Int J Endocrinol Metab. 2015 Jul 1;13(3):e26128. doi:10.5812/ijem.26128v2
34. Hoffman R, Gerber M. Evaluating and adapting the Mediterranean diet for non-Mediterranean populations: a critical appraisal. Nutr Rev. 2013;71(9):573–84. doi:10.1111/nure.12040
35. Sanchez-Villegas A, Martinez JA, De Irala J, Martinez-Gonzalez M Determinants of the adherence to an “a priori” defined Medi-terranean dietary pattern. Eur J Nutr. 2002;41(6):249–57. doi:10.1007/s00394-002-0382-2
36. Dominguez LJ, Bes-Rastrollo M, de la Fuente-Arrillaga C, Toledo E, Beunza JJ, Barbagallo M, et al. Similar prediction of total mor-tality, diabetes incidence and cardiovascular events using relative- and absolute-component Mediterranean diet score: the SUN cohort. Nutr Metab Cardiovasc Dis. 2013 May;23(5):451–8. doi:10.1016/j.
37. Biesalski HK. Diabetes preventive components in the Mediterranean diet. Eur J Nutr. 2004;43(Suppl. 1):I/26–30. doi:10.1007/s00394-004-1106-6
38. Esmaillzadeh A, Azadbakht L. Major dietary patterns in relation to general obesity and central adiposity among Iranian women. J Nutr. 2008;138(2):358–63. PMID:18203904
39. Brehm BJ, Lattin BL, Summer SS, Boback JA, Gilchrist GM, Jandacek RJ, et al. One-year comparison of a high-monounsaturated fat diet with a high-carbohydrate diet in type 2 diabetes. Diabetes Care. 2009;32(2):215–20. doi:10.2337/dc08-0687

905
Research article EMHJ – Vol. 25 No. 12 – 2019
Knockdown resistance mutations contributing to pyrethroid resistance in Aedes aegypti population, Saudi ArabiaOmmer Dafalla,1 Adel Alsheikh,1 Waheed Mohammed,1 Khalid Shrwani,1 Feras Alsheikh,2 Yahya Hobani 1 and Elsiddig Noureldin1.
1Saudi Centre for Disease Control & Prevention, Ministry of Health, Jazan, Saudi Arabia (Correspondence to: Omer Dafalla: [email protected]).2Faculty of Public Health & Tropical Medicine, Jazan University, Jazan, Saudi Arabia.
AbstractBackground: Dengue is endemic in Saudi Arabia especially in Jeddah, Makkah, Asir, and Jazan areas where pyrethroids are widely used to control the vector, Aedes aegypti. Resistance of Ae. aegypti to pyrethroid insecticides has been reported from most of these areas. Aims: The present study was carried out in Jazan region in south-west Saudi Arabia to explore the resistance status of Ae. aegypti to pyrethroids and the consequent underlying mechanisms. Methods: Three pyrethroids (permethrin, lambda-cyhalothrin, and cyfluthrin) were used to investigate the resistance status of Ae. aegypti adults following World Health Organization (WHO) standard methods: PCR and sequencing tech-niques were used to detect the S989P, V1016G and F1534C kdr mutations. Results: Ae. aegypti populations were susceptible to cyfluthrin and having a possibility of resistance to permethrin while resistant to lambda-cyhalothrin. Three potential kdr mutations were detected for the first time in Ae. aegypti population, F1534C, V106G, and S989P. It was found that F1534C often co-exists with V1016G and this haplotype was strongly associ-ated with permethrin and lambda-cyhalothrin resistance. On the other hand, S989P mutation was detected as RR in 18.8% with a low-frequency rate (R) of 18.8%, and in 55.5% as R with 58.3% frequency rate in permethrin and lambda-cyhalo-thrin-resistant female mosquitoes, respectively. Conclusions: Early detection of resistance alleles should be considered the essential tool for the successful implementa-tion of insecticide resistance management strategies by providing early warning of insect resistance. Keywords: dengue, pyrethroids, Aedes aegypti, resistance, mutationsCitation: Dafalla O; Alsheikh A; Mohammed W; Shrwani K; Alsheikh F; Hobani Y; Noureldin E. Knockdown resistance mutations contributing to pyre-throid resistance in Aedes aegypti population, Saudi Arabia. East Mediterr Health J. 2019;25(12):905–913. https://doi.org/10.26719/emhj.19.081Received: 27/12/17; accepted: 14/05/18Copyright © World Health Organization (WHO) 2019. Some rights reserved. This work is available under the CC BY-NC-SA 3.0 IGO license (https://creativecommons.org/licenses/by-nc-sa/3.0/igo).
IntroductionThe Aedes aegypti mosquito is by far the most competent vector of many arboviral diseases, including dengue, yellow fever, chikungunya, Zika and West Nile. Dengue fever and dengue haemorrhagic fever have consequent-ly spread through more than 100 countries in tropical and subtropical zones, resulting in more than half of the world population being at risk (1). Using insecticides to control vector-borne diseases is still the main interven-tion although efforts to introduce licensed vaccines have progressed greatly.
Dengue is endemic in Saudi Arabia, especially in the Jeddah, Mecca, Asir and Jazan areas. Around 12 131 confirmed cases were reported from Jeddah and Mecca between 2013 and 2015 (2). Likewise, 1790 confirmed cases were reported from Jazan region between 2005 and 2016, with a severe outbreak in 2016 (555 cases). The number of confirmed cases from Jazan region in 2017 was 320 (3).
Knockdown resistance (kdr) is a mechanism that describes cases of resistance to pyrethroid as a result of target site insensitivity due to point mutations in the insect voltage-gated sodium channel (VGSC) regulatory
protein, which block pyrethroid and DDT action (genetic makeup) (4). Several kdr mutations have been reported in Ae. aegypti populations worldwide; these include G923V, L982W, I1011M/V,S989P, V1016G/I, F1534C and D1763Y (5).
The majority of resistance-associated mutations are found in segment 6 of domain II (IIS6) and domain III (IIIS6) of the sodium channel gene. For instance, valine to glycine in domain II (V1016G) is associated with resistance to type I and type II pyrethroids, such as permethrin and deltamethrin (6), while phenylalanine to cysteine substitution at position 1534 within domain III (F1534C) is associated with resistance to type I pyrethroids (7). On the other hand, serine to proline (S989P) in domain II in VGSC has also been associated with pyrethroid resistance (8) and valine to isoleucine transversion in domain II (V1016I) contributed to Ae. Aegypti pyrethroids resistance in Latin America (9). However, S989P has not been found alone (10).
The kdr mutations in Ae. aegypti have been reported from Singapore (11), China (12,13) and Greece (13), and 1534Leu and 1534Ser have been found in the United States of America (14).
906
EMHJ – Vol. 25 No. 12 – 2019Research article
Few studies have been reported on the resistance status of Ae. aegypti to insecticides in Saudi Arabia (15–17). Furthermore, studies on mechanisms of resistance to pyrethroids in Ae. aegypti populations from Saudi Arabia are lacking. Only one has been conducted in Jeddah and Mecca, in the western region of Saudi Arabia (2). This study reported 2 mutations (V1016G and S989P) in Ae. aegypti, which were shown to be responsible for the resistance of permethrin and deltamethrin.
To the best of our knowledge, no studies have been carried out to investigate the resistance mechanisms of Ae. aegypti to pyrethroid insecticides in Jazan region. The aim of this study is therefore to explore the resistance status of Ae. aegypti to pyrethroids and the underlying mechanisms.
MethodologyStudy areaJazan region is situated in the subtropical zone, south-western Saudi Arabia, lies between 16° 12′, and 18° 25′ north. It is surrounded by the Red Sea (260 km) from the west, by Yemen (120 km) from the south and east and by Asir region from the north, with a total area of about 22 000 km2 and a population of 1.3 million (18).
Adult bioassayThis study was carried out in 2017. Larvae of Ae. aegypti were collected from Gizan City and were left to develop until adult under laboratory conditions, 25 ± 2 °C and 75% relative humidity with a constant photoperiod; 12 h light, 12 h dark.
About 100 sugar-fed, 3–5-day-old Ae. aegypti female mosquitoes were used for each of permethrin, lambda-cyhalothrin and cyfluthrin for bioassay testing. A batch of 25 adults was introduced into a holding tube before being exposed to insecticide-impregnated papers. Equal numbers of control tests were also carried out by exposing mosquitoes to insecticides–free papers. The experiment was replicated 4 times. After a period of exposure of 60 min under laboratory conditions (25 ±2 °C and 75% relative humidity with a constant photoperiod; 12 h light, 12 h dark), all mosquitoes were transferred to new tubes, provided with 10% sugar solution and held for 24 hours recovery period (19). Mortality was recorded and resistance status was determined as per WHO criteria, i.e., a population is considered susceptible if the mortality rate is (98–100%), having a possibility of resistance 90–97% and resistant < 90% (20).
InsecticidesThe insecticides used in this study for the adult bioassay tests were the diagnostic dosages as specified in the WHO standard methods. The insecticides were obtained from the WHO Collaborating Centre in Malaysia (Vec-tor Control Research Unit, School of Biological Sciences, Universiti Sains Malaysia, Penang). Adults were tested
against 3 pyrethroids (permethrin 0.75%, lambda-cyhalo-thrin 0.05% and cyfluthrin 0.15%).
Mosquito samplesAfter adult bioassay, we used the resistant and suscep-tible mosquitoes against the 3 pyrethroids to detect kdr mutations.
We used 16 permethrin-resistant mosquitoes, 18 lambda-cyhalothrin-resistant mosquitoes, 15 permethrin-susceptible mosquitoes, 20 lambda-cyhalothrin-susceptible mosquitoes and 20 cyfluthrin-susceptible mosquitoes as samples to detect the S989P, V1016G and F1534C kdr mutations.
DNA extractionAfter removing the mosquito abdomen, samples were ho-mogenized individually using a mortar and pestle (mini borosilicate glass chamber length 60 mm pestle, diame-ter 9.0 mm 3.0 mL, Fisherbrand) in 100 μL of Minimum Essential Media (EuroClone, UK).
We extracted DNA from the stored homogenate using RealLine DNA-Extraction 2 kit (BIORON Diagnostics, Ludwigshafen, Germany) following the manufacturer´s recommendations. The extracted DNA was stored at –86 °C till the next procedure.
Detection of S989P, V1016G and F1534C kdr mutationsTo detect S989P, V1016G and F1534C mutations, primers (Table 1) and AS-PCR were used according to the proce-dure described by Li et al. (21).
We carried out AS-PCR in 2 mix reactions for each sample to detect 1 mutation. The 2 mix reactions of 25 μL contained the same reagents [12.5 μl GoTag®G2 green master mix ready-to-use (Promega, Madison, Wisconsin), 3 μl DNA sample] except that 1 mix contained 25 μM of each of the mutant-specific primers and the other contained susceptible-specific primers.
The thermal cycling incubations were as follow: 94 °C initial denaturation for 5 min followed by 35 cycles of denaturation at 94°C for 30 s, annealing at 60 °C (for V1016G and F1534C) or 62 °C (S989P) for 30 s and extension at 72 °C for 60 s and a final extension at 72 °C for 5 min. The PCR products were analysed using gel electrophoresis (1.5 agarose in Tris-Acetate EDTA buffer) staining with ethidium bromide. The visualization was carried out using Gel Doc XR Imaging System (Bio-Rad, Hercules, California).
Sequencing and bioinformatics analysisPurification and standard sequencing for PCR products were performed by Macrogen, Korea. Sequencing reac-tions were performed in a MJ Research PTC-225 Peltier Thermal Cycler using a ABI PRISM BigDyeTM Termi-nator Cycle Sequencing Kits with Applied Biosystems AmpliTaq DNA polymerase (FS enzyme) (Thermo Fisher Scientific, Waltham, Massachusetts) following the proto-

907
Research article EMHJ – Vol. 25 No. 12 – 2019
cols recommended by the manufacturer. The sequences were searched for sequence similarity through BLAST (22), and compared to reference sequences in BLAST and downloaded from GenBank (www.ncbi.nlm.nih.gov/gen-bank/).
ResultsAdult bioassayAfter a 24-hour recovery period from the 60-min insecti-cide exposure, the adult bioassay showed that the popu-lation of Jazan Ae. aegypti mosquitoes was susceptible to cyfluthrin (100%) and resistant to permethrin (84%) and lambda-cyhalothrin (77%) (Table 2).
AS-PCR of kdr mutations in resistant Aedes aegypti mosquito samplesAS-PCR is considered effective in determining the kdr mutations S989P, V1016G and F1534C in individual mos-quitoes; these may be responsible for resistance to cy-fluthrin, permethrin and lambda-cyhalothrin pyrethroids in Jazan region. Figure 1 and Tables 3 and 4 summarize the presence of the 3 mutations and mutation frequen-cies (R% = RR% + (0.5 × RS%).
From all the resistant mosquito samples tested against lambda-cyhalothrin, 1 sample was observed as heterozygous [RS% = RS/(total samples) × 100] for the 3 mutations.
The S989P mutation was not detected [ND% = (ND/(total samples) × 100] in 13 samples (81.2%) resistant to permethrin and 7 samples (39%) resistant to lambda-cyhalothrin. This mutation was detected as homozygous [RR% = (RR/(total samples) × 100] in 3 out of 16 permethrin-resistant samples (with low frequency 18.8%), whereas in 18 lambda-cyhalothrin resistant samples it was detected in 1 sample (RS, 5.5%) and 10 samples (RR, 55.5%) with frequency 58.3%.
The V1016G and F1534C mutations presented in all resistant samples for the 3 pyrethroids used, with high frequency, sometimes reaching 100% as in the samples resistant to cyfluthrin and permethrin, and decreasing to 97.2% in the samples resistant to lambda-cyhalothrin because 1 sample expressed as RS.
AS-PCR of kdr mutations in susceptible Aedes aegypti mosquito samplesThe S989P and F1534C mutations were detected as RS with low frequency, ranging from 2.5–10.0% in the 3 py-rethroid-susceptible samples (Table 5).
Likewise, mutation V1016G was expressed as RS in 55% of the cyfluthrin-susceptible and lambda-cyhalothrin-susceptible samples, and 67% of the permethrin-susceptible samples. It was also detected as RR in 15% of the cyfluthrin-susceptible and 13% of the permethrin-susceptible-samples. The V1016G mutation frequency ranged from 22.5% to 46.5%.
Table 2 Bioassay test for susceptibility to three pyrethroids in adult Aedes aegypti mosquitoes, Jazan region of Saudi Arabia, 2017Insecticide No. mosquitoes tested Susceptibility (%) Resistance status
Cyfluthrin 100 100 Susceptible
Permethrin 100 84 Resistant
Lambda-cyhalothrin 100 77 Resistant
Table 1 Specific primers used to amplify sodium channel gene mutations in Aedes aegypti, Jazan region of Saudi Arabia, 2017 Mutation Primer Sequence 5 – 3 PCR product size
(bp)
S989P Outer M1 – For AATGATATTAACAAAATTGCGC 594
Outer M1 – Rev GCACGCCTCTAATATTGATGC
Inner M1 – S GCGGCGAGTGGATCGAAT 240
Inner M1 – P GCGGCGAGTGGATCGAAC 240
V1016G Outer M2- For GCCACCGTAGTGATAGGAAATC 592
Outer M2 – Rev CGGGTTAAGTTTCGTTTAGTAGC
Inner M1 – V GTTTCCCACTCGCACAGGT 348
Inner M1 – G GTTTCCCACTCGCACAGGG 348
F1534C Outer M3 – For GGAGAACTACACGTGGGAGAAC 517
Outer M3 – Rev CGCCACTGAAATTGAGAATAGC
Inner M1 – F GCGTGAAGAACGACCCGA 248
Inner M1 – C GCGTGAAGAACGACCCGC 248
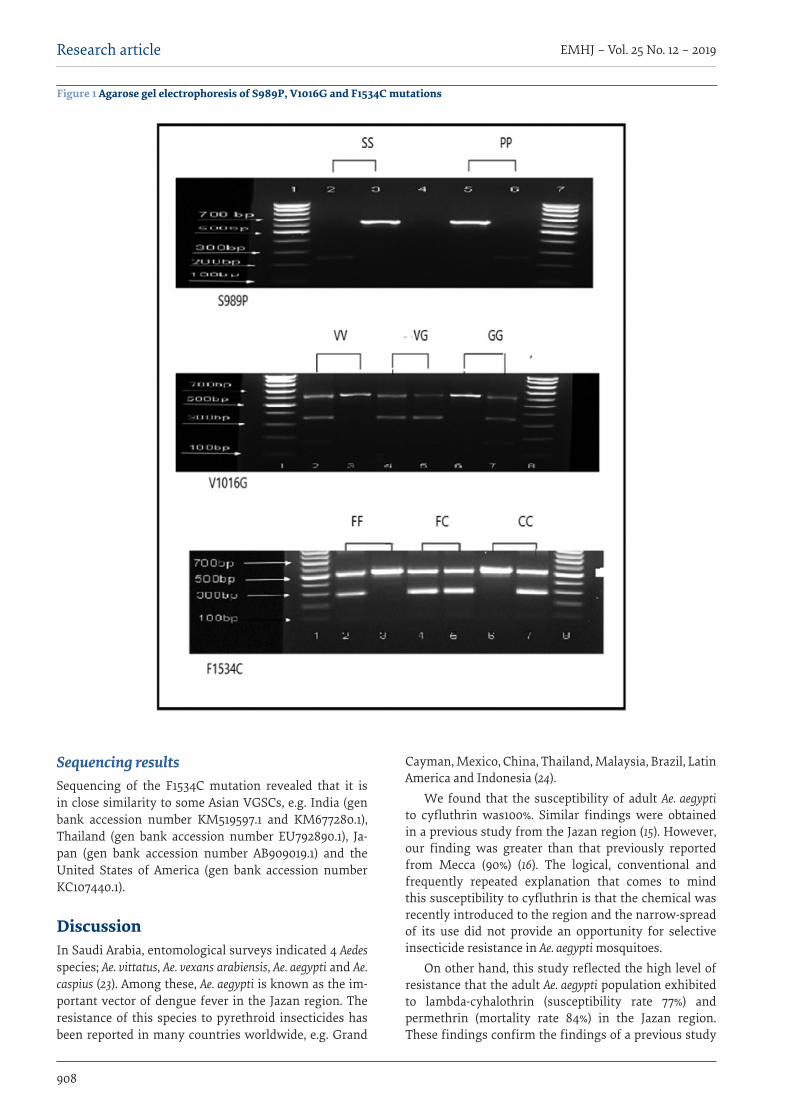
908
EMHJ – Vol. 25 No. 12 – 2019Research article
Sequencing resultsSequencing of the F1534C mutation revealed that it is in close similarity to some Asian VGSCs, e.g. India (gen bank accession number KM519597.1 and KM677280.1), Thailand (gen bank accession number EU792890.1), Ja-pan (gen bank accession number AB909019.1) and the United States of America (gen bank accession number KC107440.1).
DiscussionIn Saudi Arabia, entomological surveys indicated 4 Aedes species; Ae. vittatus, Ae. vexans arabiensis, Ae. aegypti and Ae. caspius (23). Among these, Ae. aegypti is known as the im-portant vector of dengue fever in the Jazan region. The resistance of this species to pyrethroid insecticides has been reported in many countries worldwide, e.g. Grand
Cayman, Mexico, China, Thailand, Malaysia, Brazil, Latin America and Indonesia (24).
We found that the susceptibility of adult Ae. aegypti to cyfluthrin was100%. Similar findings were obtained in a previous study from the Jazan region (15). However, our finding was greater than that previously reported from Mecca (90%) (16). The logical, conventional and frequently repeated explanation that comes to mind this susceptibility to cyfluthrin is that the chemical was recently introduced to the region and the narrow-spread of its use did not provide an opportunity for selective insecticide resistance in Ae. aegypti mosquitoes.
On other hand, this study reflected the high level of resistance that the adult Ae. aegypti population exhibited to lambda-cyhalothrin (susceptibility rate 77%) and permethrin (mortality rate 84%) in the Jazan region. These findings confirm the findings of a previous study
Figure 1 Agarose gel electrophoresis of S989P, V1016G and F1534C mutations

909
Research article EMHJ – Vol. 25 No. 12 – 2019
carried out in the Jazan region, (15) and were identical to the findings for lambda-cyhalothrin obtained in a study from Mecca (16). The resistance to permethrin agrees with finding obtained from Thailand (25), however, they contrast with the findings of a study from India in which adult Ae. aegypti and Ae. albopictus were found to be susceptible to permethrin (26).
Permethrin and lambda-cyhalothrin resistance could have resulted from the widespread, extensive and successive use of these pyrethroids for more than 10 years in control programmes to limit the population of the vectors in the region. Moreover, the use of pyrethroids to control agricultural pests has also accelerated the development of physiological resistance in these vectors. Likewise, the increased use of low concentration household pesticides aerosols has also accelerated resistance to this chemical (27). It is worth noting that resistance to pyrethroids may also have resulted from the use of DDT in the region as they share the same target in the voltage-gated sodium channel.
The primary target sites of pyrethroids are voltage-gated sodium channels (VGSCs) (28), and the kdr and its mutations are highly related to reducing neuronal sensitivity to pyrethroids in several insects, including mosquitoes (29). Detection of these mutations by molecular markers could provide a useful and rapid screening tool for monitoring resistance and helping to target chemical application for vector control (30). The kdr mutations have been reported in Ae. aegypti worldwide, e.g. G923V, L982W, I1011M/V, S989P, V1016G/I, F1534C and D1763Y (31) V1023G, F1565C, I1018M, I1018V, S996P and D1794Y (32).
Three of these mutations have a direct role in pyrethroid resistance, either individually or in
combination: V1016G/I (33), S989P (30) and F1534C (7).In the present study, 3 kdr mutations were detected
for the first time in the Ae. aegypti population of Jazan region: F1534C, S989P, and V1016G. We confirmed the presence of the combined mutations (F1534C and V1016G) which are responsible for resistance to permethrin and lambda-cyhalothrin in the adult Ae. aegypti population. It is known that the F1534C kdr mutation in the IIIS6 NaV segment is the most prevalent in the population of Ae. aegypti worldwide and its role in pyrethroids resistance is well defined, either alone or in combination with other kdr mutations (34).
Our results revealed that F1534C and V106G mutations were detected as homozygous (RR) in all female mosquitoes resistant to permethrin with 100% frequency, whereas 94.4% were RR with frequency 97.2% for the 2 mutations in lambda-cyhalothrin-resistant samples. This confirms that F1534C often co-exists with V1016G and this haplotype was strongly associated with permethrin and lambda-cyhalothrin resistance. Similar mutations were detected at high frequency for V1016G, S989P, and F1534C in Mecca and Jeddah (700 km north of Jazan) (2), while in Thailand the V1016G mutation appears to always co-occur with S989P (35).
The combined kdr mutations responsible for deltamethrin resistance in the Ae. aegypti populations in Jeddah and Mecca were V1016G and S989P (2), while in our study resistance to permethrin and lambda-cyhalothrin resulted from combined V1016G and F1534C mutations. This disparity may be related to the discrepancies in the insecticides used to control vector-borne diseases in the 3 areas. Additionally, it is widely accepted that F1534C mutation alone confers permethrin resistance (36). The combined V1016G and F1534C mutations have been
Table 3 Bioassay test: distribution of three mutations in resistant Aedes aegypti samples Insecticide No. of
samplesMutation
F1534C V1016G S989P
ND RR RS SS N.D RR RS SS ND RR RS SSCyfluthrin 0 0 0 0 0 0 0 0 0 0 0 0 0
Permethrin 16 0 16 0 0 0 16 0 0 13 3 0 0
Lambda-cyhalothrin 18 0 17 1 0 0 17 1 0 7 10 1 0
ND = not detected; RR = resistant mutant homozygote; RS = mutant heterozygote; SS = susceptible homozygote.
Table 4 Frequency of the S989P, V1016G and F1534C mutations in resistant mosquitoes for cyfluthrin, permethrin and lambda-cyhalothrinInsecticide No. of
samplesMutation
S989P (%) V1016G (%) F1534C (%)
SS + ND RS RR R SS + ND RS RR R SS + ND RS RR RCyfluthrin 0 0 0 0 0 0 0 0 0 0 0 0 0
Permethrin 16 81.2 0.0 18.8 18.8 0.0 0.0 100.0 100 0.0 0.0 100 100
Lambda-Cyhalothrin
18 39 5.5 55.5 58.3 0.0 5.6 94.4 97.2 0.0 5.6 94.4 97.2
SS = susceptible homozygote; ND = not detected; RS = mutant heterozygote; RR = resistant mutant homozygote; R = mutation frequencies.
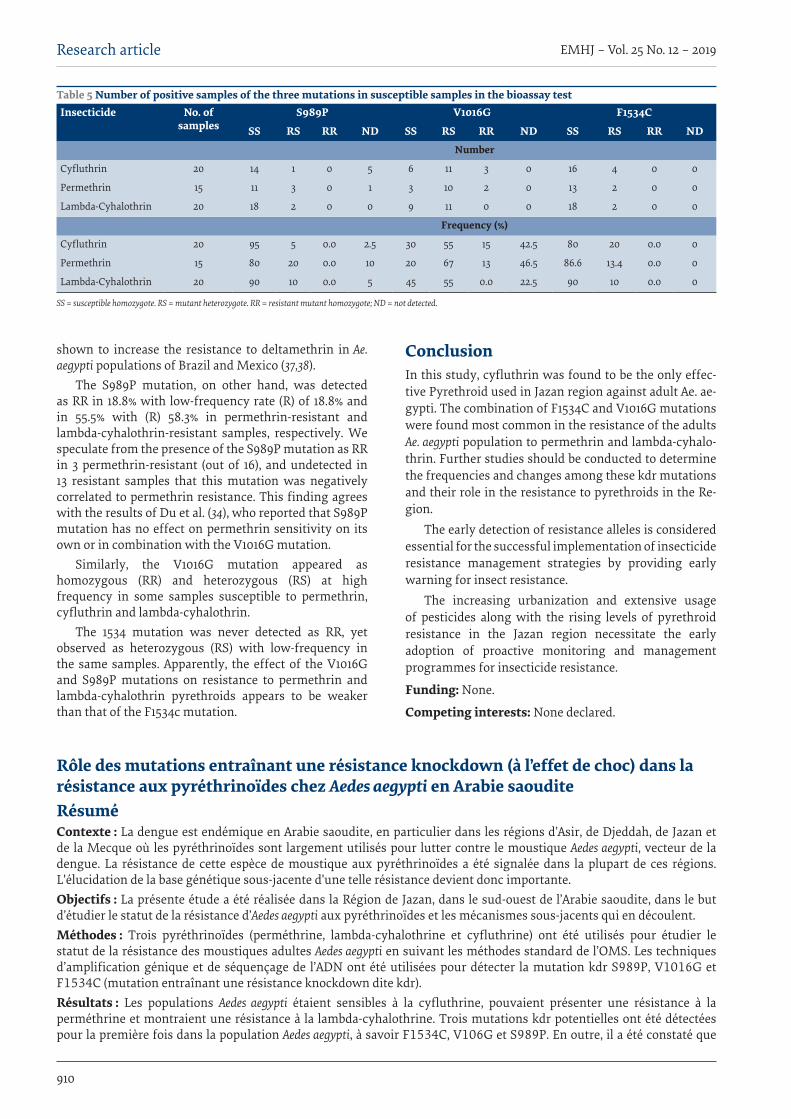
910
EMHJ – Vol. 25 No. 12 – 2019Research article
shown to increase the resistance to deltamethrin in Ae. aegypti populations of Brazil and Mexico (37,38).
The S989P mutation, on other hand, was detected as RR in 18.8% with low-frequency rate (R) of 18.8% and in 55.5% with (R) 58.3% in permethrin-resistant and lambda-cyhalothrin-resistant samples, respectively. We speculate from the presence of the S989P mutation as RR in 3 permethrin-resistant (out of 16), and undetected in 13 resistant samples that this mutation was negatively correlated to permethrin resistance. This finding agrees with the results of Du et al. (34), who reported that S989P mutation has no effect on permethrin sensitivity on its own or in combination with the V1016G mutation.
Similarly, the V1016G mutation appeared as homozygous (RR) and heterozygous (RS) at high frequency in some samples susceptible to permethrin, cyfluthrin and lambda-cyhalothrin.
The 1534 mutation was never detected as RR, yet observed as heterozygous (RS) with low-frequency in the same samples. Apparently, the effect of the V1016G and S989P mutations on resistance to permethrin and lambda-cyhalothrin pyrethroids appears to be weaker than that of the F1534c mutation.
ConclusionIn this study, cyfluthrin was found to be the only effec-tive Pyrethroid used in Jazan region against adult Ae. ae-gypti. The combination of F1534C and V1016G mutations were found most common in the resistance of the adults Ae. aegypti population to permethrin and lambda-cyhalo-thrin. Further studies should be conducted to determine the frequencies and changes among these kdr mutations and their role in the resistance to pyrethroids in the Re-gion.
The early detection of resistance alleles is considered essential for the successful implementation of insecticide resistance management strategies by providing early warning for insect resistance.
The increasing urbanization and extensive usage of pesticides along with the rising levels of pyrethroid resistance in the Jazan region necessitate the early adoption of proactive monitoring and management programmes for insecticide resistance.
Funding: None.
Competing interests: None declared.
Table 5 Number of positive samples of the three mutations in susceptible samples in the bioassay testInsecticide No. of
samplesS989P V1016G F1534C
SS RS RR ND SS RS RR ND SS RS RR NDNumber
Cyfluthrin 20 14 1 0 5 6 11 3 0 16 4 0 0
Permethrin 15 11 3 0 1 3 10 2 0 13 2 0 0
Lambda-Cyhalothrin 20 18 2 0 0 9 11 0 0 18 2 0 0
Frequency (%)
Cyfluthrin 20 95 5 0.0 2.5 30 55 15 42.5 80 20 0.0 0
Permethrin 15 80 20 0.0 10 20 67 13 46.5 86.6 13.4 0.0 0
Lambda-Cyhalothrin 20 90 10 0.0 5 45 55 0.0 22.5 90 10 0.0 0
SS = susceptible homozygote. RS = mutant heterozygote. RR = resistant mutant homozygote; ND = not detected.
Rôle des mutations entraînant une résistance knockdown (à l’effet de choc) dans la résistance aux pyréthrinoïdes chez Aedes aegypti en Arabie saouditeRésumé Contexte : La dengue est endémique en Arabie saoudite, en particulier dans les régions d’Asir, de Djeddah, de Jazan et de la Mecque où les pyréthrinoïdes sont largement utilisés pour lutter contre le moustique Aedes aegypti, vecteur de la dengue. La résistance de cette espèce de moustique aux pyréthrinoïdes a été signalée dans la plupart de ces régions. L'élucidation de la base génétique sous-jacente d'une telle résistance devient donc importante. Objectifs : La présente étude a été réalisée dans la Région de Jazan, dans le sud-ouest de l’Arabie saoudite, dans le but d’étudier le statut de la résistance d’Aedes aegypti aux pyréthrinoïdes et les mécanismes sous-jacents qui en découlent. Méthodes : Trois pyréthrinoïdes (perméthrine, lambda-cyhalothrine et cyfluthrine) ont été utilisés pour étudier le statut de la résistance des moustiques adultes Aedes aegypti en suivant les méthodes standard de l’OMS. Les techniques d’amplification génique et de séquençage de l’ADN ont été utilisées pour détecter la mutation kdr S989P, V1016G et F1534C (mutation entraînant une résistance knockdown dite kdr). Résultats : Les populations Aedes aegypti étaient sensibles à la cyfluthrine, pouvaient présenter une résistance à la perméthrine et montraient une résistance à la lambda-cyhalothrine. Trois mutations kdr potentielles ont été détectées pour la première fois dans la population Aedes aegypti, à savoir F1534C, V106G et S989P. En outre, il a été constaté que
911
Research article EMHJ – Vol. 25 No. 12 – 2019
الطفرات اجلينية املسامهة يف مقاومة بعوض الزاعجة املرصية لبعض املبيدات البريوثرويدية يف اململكة العربية السعوديةعمر دفع اهلل، عادل الشيخ، وحيد حممد، خالد رشواين، فراس الشيخ، حييى حباين، الصديق نور الدين
اخلالصة اخللفية: يعترب محى الضنك من األمراض املتوطنة يف اململكة العربية السعودية خصوصًا يف مناطق جدة ومكة وعسري وجازان حيث يتم استخدام
املبيدات البريوثرودية بكثافة وعىل نطاق واسع يف مكافحة بعوض االيدس اجيبتاي الذي يعترب الناقل الرئييس للفريوس املسبب للمرض. األهداف: مقاومة بعوض األيدس اجيبتاي للمبيدات البريوثرودية تم التوثيق هلا من قبل يف املناطق املذكورة.
طرق البحث: متت هذه الدراسة يف منطقة جازان جنوب غرب اململكة ملعرفة مدى مقاومة بعوض األيدس اجيبتاي لبعض املبيدات البريوثرودية مثل البريمثرين )0،75%( والالمبداسيهالوثرين )0،05%( والسيفلوثرين )0،15%( بإتباع الطرق القياسية ملنظمة الصحة العاملية. أيضًا تم استخدام البعوض املقاوم واحلساس لتلك املبيدات للكشف عن وجود الطفرات اجلينية S989P وF1534C و V1016G والتي يعتقد أن هلا ارتباط بمقاومة
احلرشات للمبيدات البريوثرودية.النتائج: كشفت نتائج اختبار احلساسية للمبيدات أن البعوض من نوع أيدس اجيبتاي يف منطقة جازان حساس بنسبة 100 % ملبيد السيفلوثرين مع وجود إمكانية مقاومة بنسبة حساسية 84% ملبيد البريمثرين وكان مقاوم بنسبة حساسية 77% ملبيد والالمبداسيهالوثرين. وأوضحت نتائج الكشف عن الطفرات اجلينية أن الطفرتني وF1534C و V1016G وجدتا ك RR يف كل البعوض املقاوم املقاوم البريمثرين وبمعدل تكرار 100% و وكانتا
بنسبة 94،4% وبمعدل تكرار 97،2% يف البعوض املقاوم لالمبداسيهالوثرين. أيضًا كشفت الدراسة بأن وجود الطفرة F1534C دائاًم ما تكون مرتبطة مع الطفرة V1016G وهذا املركب اظهر ارتباط قوي باملقاومة ملبيدات
البريمثرين والالمبداسيهالوثرين.االستنتاجات: من ناحية أخرى فإن الطفرة S989P تم الكشف عنها ك RR بنسبة 18،8% ومعدل تكرار متدين نسبيًا 18،8% يف البعوض املقاوم
للبريمثرين وبنسبة 55،5% ومعدل تكرار 58،3% يف البعوض املقاوم لالمبداسيهالوثرين.برامج تبني يتطلب األمراض نواقل يف املقاومة مستوى وارتفاع املكافحة برامج يف للمبيدات املكثف واالستخدام احلرضية املناطق يف الزيادة
استباقية لرصد وإدارة مقاومة النواقل للمبيدات املستخدمة.
References1. Dengue: guidelines for diagnosis, treatment, prevention and control: new edition. Geneva: World Health Organization; 2009
(WHO/HTM/NTD/DEN/2009.1).
2. Al Nazawi AM, Aqili J, Alzahrani M, McCall PJ, Weetman D. Combined target site (kdr) mutations play a primary role in highly pyrethroid resistant phenotypes of Aedes aegypti from Saudi Arabia. Parasit Vectors. 2017 Mar 27;10(1):161. doi:10.1186/s13071-017-2096-6
3. Dengue control programme. Jazan: Ministry of Health, Department of Vector-Borne and Zoonotic Diseases; 2018.
4. Soderlund DM, Knipple DC. The molecular biology of knockdown resistance to pyrethroid insecticides. Insect Biochem Mol Biol. 2003 Jun 30;33(6):563–77. doi:10.1016/s0965-1748 (03)00023-7
5. Vontas J, Moore S, Kleinschmidt I, Ranson H, Lindsay S, Lengeler C, et al. Framework for rapid assessment and adoption of new vector control tools. Trends Parasitol. 2014 Apr 30;30(4):191–204. do:10.1016/j.pt.2014.02.005
6. Brengues C, Hawkes NJ, Chandre F, McCarroll L, Duchon S, Guillet P, et al. Pyrethroid and DDT cross‐resistance in Aedes aegyp-ti is correlated with novel mutations in the voltage‐gated sodium channel gene. Medical and veterinary entomology. 2003 Mar 1;17(1):87–94. doi:10.1046/j.1365–2915.2003.00412.x
7. Yanola J, Somboon P, Walton C, Nachaiwieng W, Prapanthadara LA. A novel F1552/C1552 point mutation in the Aedes aegypti voltage-gated sodium channel gene associated with permethrin resistance. Pesticide Biochem Physiol. 2010 Mar 31;96(3):127–31. doi:10.1016/j.pestbp.2009.10.005
8. Kawada H, Oo SZ, Thaung S, Kawashima E, Maung YN, Thu HM, et al. Co-occurrence of point mutations in the voltage-gated
F1534C coexistait souvent avec V1016G et que cet haplotype était fortement associé à la résistance à la perméthrine et à la lambda-cyhalothrine. Par ailleurs, la mutation S989P a été détectée en tant que risque relatif dans 18,8 % des cas avec un taux de fréquence bas de 18,8 % et dans 55,5 % des cas avec un taux de 58,3 % chez les moustiques femelles résistantes à la perméthrine et à la lambda-cyhalothrine, respectivement. Conclusions : La détection précoce des allèles de résistance devrait être considérée comme l’outil essentiel et indispensable pour assurer le succès de la mise en œuvre de stratégies de gestion de la résistance aux insecticides, en fournissant une alerte précoce de la résistance des insectes.
912
EMHJ – Vol. 25 No. 12 – 2019Research article
sodium channel of pyrethroid-resistant Aedes aegypti populations in Myanmar. PLoS Negl Trop Dis.. 2014 Jul 31;8(7):e3032. doi.org/10.1371/journal.pntd.0003032
9. Alvarez LC, Ponce G, Oviedo M, Lopez B, Flores AE. Susceptibility status of Aedes aegypti (L.) (Diptera: Culicidae) to temephos in Venezuela. Pest Manag Sci. 2014 Aug 1;70(8):1262–6. doi:10.1002/ps.3688
10. Srisawat R, Komalamisra N, Eshita Y, Zheng M, Ono K, Itoh TQ, et al. Point mutations in domain II of the voltage-gated sodi-um channel gene in deltamethrin-resistant Aedes aegypti (Diptera: Culicidae). Appl Entomol Zool. 2010 May 25;45(2):275–82. doi:/10.1303/aez.2010.275
11. Kasai S, Ng LC, Lam-Phua SG, Tang CS, Itokawa K, Komagata O, et al. First detection of a putative knockdown resistance gene in major mosquito vector, Aedes albopictus. Japan J Infect Dis. 2011 May 1;64(3):217–21. doi: 10.1371/journal.pntd.0002948
12. Chen H, Li K, Wang X, Yang X, Lin Y, Cai F, et al. First identification of kdr allele F1534S in VGSC gene and its association with resistance to pyrethroid insecticides in Aedes albopictus populations from Haikou City, Hainan Island, China. Infect Dis Pover-ty. 2016 May 2;5(1):31. doi:10.1186/s40249-016-0125-x
13. Xu J, Bonizzoni M, Zhong D, Zhou G, Cai S, Li Y, et al. Multi-country survey revealed prevalent and novel F1534S mutation in voltage-gated sodium channel (VGSC) gene in Aedes albopictus. PLoS neglected tropical diseases. 2016 May 4;10(5):e0004696. doi.org/10.1371/journal.pntd.0004696
14. Marcombe S, Farajollahi A, Healy SP, Clark GG, Fonseca DM. Insecticide resistance status of United States populations of Aedes albopictus and mechanisms involved. PloS one. 2014 Jul 11;9(7):e101992. doi.org/10.1371/journal.pone.0101992
15. Alsheikh A, Mohammed W, Noureldin E, Daffalla O, Shrwani K, Hobani Y, et al. Resistance status of Aedes aegypti to insecti-cides in the Jazan Region of Saudi Arabia. Biosci, Biotech Res Asia. 2016;13(1):155–62. doi:10.13005/bbra/2018
16. Aziz A, Dieng H, Abu Hassan A, Satho T, Miake F, Salmah MRC, et al. Insecticide susceptibility of the dengue vector Aedes aegyp-ti (Diptera: culicidae) in Makkah City, Saudi Arabia. Asian Pacific J Trop Dis. 2011;1(2):94–9. doi:10.1016/s2222-1808(11)60044-3
17. Al-Ghamdi KM, Al-Fifi ZI, Saleh MS, Al-Qhtani HA, Mahyoub JA. Insecticide susceptibility of Aedes aegypti, the vector of dengue fever in Jeddah governorate, Saudi Arabia. Biosciences Biotechnol Res Asia. 2008 December;5(2):501–6.
18. Al-Sheik AA. Larval habitat, ecology, seasonal abundance and vectorial role in malaria transmission of Anopheles arabiensis in Jazan Region of Saudi Arabia. J Egypt Soc Parasitol. 2011 Dec;41(3):615–34.
19. Guidelines for testing mosquito adulticides for indoor residual spraying and treatment of mosquito nets. Geneva: World Health Organization; 2006.
20. Test procedures for insecticide resistance monitoring in malaria vector mosquitoes, 2nd ed. Geneva: World Health Organization; 2016.
21. Li CX, Kaufman PE, Xue RD, Zhao MH, Wang G, Yan T, et al. Relationship between insecticide resistance and kdr mutations in the dengue vector Aedes aegypti in Southern China. Parasit Vectors. 2015 Jun 12;8:325. doi:10.1186/s13071-015-0933-z
22. Altschul SF, Madden TL, Schäffer AA, Zhang J, Zhang Z, Miller W, et al. 1997. Gapped BLAST and PSI-BLAST: a new generation of protein database search programs. Nucleic Acids Res. 25(17):3389–402. doi:rg/10.1093/nar/25.17.3389
23. Alsheikh AA, Zafer MH, Anaami AG, Solan YM, Noureldin EM, Mohammed WS, et al. Potential mosquito vectors of arboviral diseases in Jazan Region, Saudi Arabia. Biosci Biotech Res Comm. 2013;6 (2),142–9.
24. Smith LB, Kasai S, Scott JG. Pyrethroid resistance in Aedes aegypti and Aedes albopictus: Important mosquito vectors of human diseases. Pesticide Biochem Physiol. 2016 Oct 1;133:1–2. doi10.1016/j.pestbp.2016.03.005
25. Thongwat D, Bunchu N. Susceptibility to temephos, permethrin and deltamethrin of Aedes aegypti (Diptera: Culicidae) from Muang district, Phitsanulok Province, Thailand. Asian Asian Pacific J Trop Med. 2015 Jan 1;8(1):14–8. doi:10.1016/s1995-7645(14)60180-2
26. Sharma SN, Saxena VK, Lal S. Study on susceptibility status in aquatic and adult stages of Aedes aegypti and Ae. albopictus against insecticides at international airports of south India. The Journal of communicable diseases. 2004 Sep;36(3):177–81. doi:10.24321/0019.5138.201720
27. Chareonviriyaphap T, Bangs MJ, Suwonkerd W, Kongmee M, Corbel V, Ngoen-Klan R. Review of insecticide resistance and behavioral avoidance of vectors of human diseases in Thailand. Parasit Vectors. 2013;6:280. doi:10.1186/1756-3305-6-280.
28. Narahashi T. Neuronal ion channels as the target sites of insecticides. Pharmacol Toxicol. 1996 Jul;79(1):1–14. https://doi.org/10.1111/j.1600-0773.1996.tb00234.x
29. Rinkevich FD, Du Y, Dong K. Diversity and convergence of sodium channel mutations involved in resistance to pyrethroids. Pestic Biochem Physiol. 2013 Jul 31;106(3):93–100. doi10.1016/j.pestbp.2013.02.007
30. Wuliandari JR, Lee SF, White VL, Tantowijoyo W, Hoffmann AA, Endersby-Harshman NM. Association between three muta-tions, F1565C, V1023G and S996P, in the voltage-sensitive sodium channel gene and knockdown resistance in Aedes aegypti from Yogyakarta, Indonesia. Insects. 2015 Jul 23;6(3):658–85. doi10.3390/insects6030658
31. Vontas J, Kioulos E, Pavlidi N, Morou E, Della Torre A, Ranson H. Insecticide resistance in the major dengue vectors Aedes albop-ictus and Aedes aegypti. Pestic Biochem Physiol. 2012 Oct 31;104(2):126–31. doi:10.1016/j.pestbp.2012.05.008
32. Du Y, Nomura Y, Satar G, Hu Z, Nauen R, He SY, et al. Molecular evidence for dual pyrethroid-receptor sites on a mosquito sodi-um channel. Proceedings of the National Academy of Sciences. 2013 Jul 16;110(29):11785–11790. doi:10.1073/pnas.1305118110
913
Research article EMHJ – Vol. 25 No. 12 – 2019
33. Saavedra‐Rodriguez K, Urdaneta‐Marquez L, Rajatileka S, Moulton M, Flores AE, Fernandez‐Salas I, et al. A mutation in the voltage‐gated sodium channel gene associated with pyrethroid resistance in Latin American Aedes aegypti. Insect molecular biology. 2007 Dec 1;16(6):785–98. doi:10.1111/j.1365-2583.2007.00774.x
34. Du Y, Nomura Y, Zhorov BS, Dong K. Sodium channel mutations and pyrethroid resistance in Aedes aegypti. Insects. 2016 Oct 31;7(4):60. doi:10.3390/insects7040060
35. Stenhouse SA, Plernsub S, Yanola J, Lumjuan N, Dantrakool A, Choochote W, et al. Detection of the V1016G mutation in the volt-age-gated sodium channel gene of Aedes aegypti (Diptera: Culicidae) by allele-specific PCR assay, and its distribution and effect on deltamethrin resistance in Thailand. Parasit Vectors. 2013 Aug 30;6(1):253. doi:10.1186/1756-3305-6-253
36. Hirata K, Komagata O, Itokawa K, Yamamoto A, Tomita T, Kasai S. A single crossing-over event in voltage-sensitive Na+ channel genes may cause critical failure of dengue mosquito control by insecticides. PLoS neglected tropical diseases. 2014 Aug 28;8(8):e3085. doi:10.1371/journal.pntd.0003085
37. Vera-Maloof FZ, Saavedra-Rodriguez K, Elizondo-Quiroga AE, Lozano-Fuentes S. Black IV WC. Coevolution of the Ile1, 016 and Cys1, 534 mutations in the voltage gated sodium channel gene of Aedes aegypti in Mexico. PLoS Negl Trop Dis. 2015 Dec 11;9(12):e0004263. doi:10.1371/journal.pntd.0004263
38. Linss JG, Brito LP, Garcia GA, Araki AS, Bruno RV, Lima JB, et al. Distribution and dissemination of the Val1016Ile and Phe-1534Cys Kdr mutations in Aedes aegypti Brazilian natural populations. Parasit Vectors. 2014 Jan 15;7:25. doi:10.1186/1756-3305-7-25
914
EMHJ – Vol. 25 No. 12 – 2019Review
Strategies to reduce informal payments in health systems: a systematic reviewHamed Zandian,1 Atefeh Esfandiari,2 Minoo Alipouri Sakha3 and Amirhossein Takian 4,5,6
1Social Determinants of Health Research Center, Ardabil University of Medical Sciences, Ardabil, Islamic Republic of Iran. 2Department of Health Pol-icy & Management, School of Medicine, Bushehr University of Medical Sciences, Bushehr, Islamic Republic of Iran. 3Department of Health Education & Promotion, Deputy of Health, Iran University of Medical Sciences, Tehran, Islamic Republic of Iran. 4Department of Healthcare Management & Economics; 5Department of Global Health and Public Policy, School of Public Health; 6Health Equity Research Center, Tehran University of Medical Sciences, Tehran, Islamic Republic of Iran (Correspondence to: Amirhossein Takian: [email protected]).
AbstractBackground: Informal payment is a major barrier to universal health coverage, particularly in low and middle-income countries. Aims: The aim of this study was to determine appropriate methods to reduce informal payments in health care via a systematic review.Methods: For this systematic review, we searched the Cochrane Library, PubMed and SCOPUS covering the period 2000–2014: 10 papers which considered reduction strategies for IP were finally included in the review. Three of the au-thors independently extracted data and assessed the papers against inclusion and exclusion criteria. Results: Improving public awareness and measures towards changing the culture were the main policies to combat in-formal payment. In addition, providing additional financial support to motivate physicians and other health service pro-viders, appropriate monitoring of legislation, and converting informal to formal payment through tailored new policies were other solutions mentioned towards reducing or removing informal payments.Conclusions: No unique strategy exists for reducing informal payments in any health system. Choosing an appropriate strategy depends on the context and financing structure of the health system in any particular setting.Keywords: informal payments, health care services, systematic reviewCitation: Zandian H; Esfandiari A; Sakha M; Takian A. Strategies to reduce informal payments in health systems: a systematic review. East Mediterr Health J. 2019;25(12):914–922. https://doi.org/10.26719/emhj.19.057Received: 01/05/17; accepted: 20/11/17Copyright © World Health Organization (WHO) 2019. Some rights reserved. This work is available under the CC BY-NC-SA 3.0 IGO license (https://creativecommons.org/licenses/by-nc-sa/3.0/igo).
IntroductionInformal paymentis defined as the cost of health care ser-vices paid by the patients to services providers which is outside the scope of official tariffs (1). Some studies de-fine informal payments as a tip for health staff, a bribe for access to better quality health care services, or pay-ment demanded from health staff or establishments (2). Emerging evidence suggests that informal payments are an important feature of many health care systems around the world (3).
These payments are a threat to public health since they are highly regressive compared to formal fees (4) and those who cannot afford to pay informally might forgo or delay seeking treatment (4,5); as a consequence efficiency, equity and quality of health care provision might be jeopardized. The custom of informal payments is inevitably linked with corruption (6) which may not only damage the relationship between doctor and patient seriously, but can lead to mistrust between the community and the health care team eventually (7).
Informal payment is one of the main barriers to achieving universal health coverage, particularly in the context of low middle-income countries. Available statistics from low-income countries indicate that 10–40% of out-of-pocket payment for health care services
come from informal payments (1). This indicates the considerable amount of financial resources that are wasted instead of being used for health promotion purposes (6). For example, IPs are estimated to be equal to twice the salaries of doctors in Poland (8), while the revenues obtained from IP are 10 times greater than the official income of health care providers in Bangladesh (9) and 5 times that of those in Cambodia (10).
Overall, 3 major possible solution areas are suggested: cultural perceptions, insufficient funding of the health care sector and lack of control and accountability in the health care system (5).
Setting up a national health insurance supervisory authority to oversee the efficient management of the health care system, increased transparency and accountability (11,12), punitive measures, higher salaries for health care workers and changes in attitudes of health care providers, consumers, and policy-makers via information campaigns (5,13) are some of the strategies and policy initiatives that different countries have taken to address the problem.
This study reports the findings of a systematic review to identify the main strategies to reducing informal payments in health care systems.

915
Review EMHJ – Vol. 25 No. 12 – 2019
MethodsTypes of studies and data sourcesAll published studies of any type of design (cross-sec-tional, cohort, qualitative, etc.) which reported data and suggested reduction strategies for informal payments in health systems were considered.
We performed a systematic literature search of 3 major databases during October 2015: PubMed, Cochrane Library, and Scopus, covering the period 2000–2014. We aimed to identify papers relevant to “reduction of informal payments”. To increase the comprehensiveness of our search, we also checked the reference lists of all
selected papers. Google Scholar was also used to find relevant technical documents and reports due to the lack of appropriate subheadings in Mesh. We did a preliminary search to identify common keywords that were used in the articles. In total, we identified 468 records, of which 10 fulfilled the eligibility criteria and were therefore included and assessed in our review (Figure 1).
Inclusion and exclusion criteriaWe included reviews and original articles that were writ-ten in English, used any keywords mentioned in Box 1, and provided evidence for the reduction of informal pay-ments in health system. Papers which were published
Figure 1 Summary of the data extraction process (PICO tool focuses on population, intervention, comparison and outcomes)
916
EMHJ – Vol. 25 No. 12 – 2019Review
prior to the year 2000, were not in English or did not mention or discuss ways to reduce informal payments were excluded.
Critical appraisal processThree authors (HZ, MAS and AE) each followed the de-fined search strategy separately. The studies included were evaluated based on the CASP Systematic Review Checklist (14,15). The quality of articles was assessed us-ing a checklist that has been used in previous studies (14). The checklist consists of several questions about the purpose of the study, method of sampling, data collec-tion strategy, population study, variables included, study method, method used for data analysis, outcomes, etc. Based on these questions, the quality of the studies was defined and the studies with high quality were included.
Data extractionAs explained in Figure 1, after deleting duplicates, 468 English language studies remained. The 3 authors screened these studies by title and abstract and reached agreement about 90% of articles. The eligible studies were then extracted and 31 papers remained. Following inclu-sion criteria and quality appraisal, we excluded 21 articles, and the 10 remaining papers were included in the review.
For the next step, we began to extract data from these 10 papers, i.e. authors’ names, title, year of the study, the country where the study was conducted, the structure of the country’s health system, the definition of informal payment, and the strategies mentioned to reduce informal payments.
FindingsDescription of studiesWe identified 10 studies that mentioned policies and actions to reduce informal payments, and these were included in the final synthesis. Four studies were qual-itative; 3 were quantitative and 3 used mixed methods. The characteristics of the studies are described in Table 1. While low-, lower middle-, upper middle- and high-in-come countries were present in the final list of studies,
the strongest evidence came from 6 studies conducted in 4 countries (Moldova, Albania, Hungary and Tanza-nia). Two studies were conducted in several countries simultaneously. Most studies were conducted during 2004–2015 and in the context of countries of the former Soviet Union (3,16–19). Two studies described the public’s beliefs and attitudes towards informal payments (13,16). One study considered IP as a barrier to essential health system reform, particularly universal health coverage (20). Another study reported the effects of health system reform on out-of-pocket payments through reducing in-formal payments (18) (Table 2).
In all, we synthesized 5 strategies and policies to reduce informal payments: cultural factors, quality factors, structural factors, legal factors and motivational factors. These are explained below and outlined in Table 3.
Legal factorsThe studies proposed reforms in health insurance law, the payment system (with emphasis on pay for perfor-mance), cost sharing and regulation and control of stand-ards as appropriate policies to reduce informal payments in health systems.
Vian et al. studied the extent of out-of-pocket payments and informal payments, analysed their trends over time, and identified driving factors for informal payments in Moldova. They documented the gradually decreasing rate of informal payment over time, yet informal payment was recorded for a variety of reasons, e.g. patients’ willingness to do informal payment as a gift to service providers, or their perception that informal payment may result in better quality and quicker care. Occasionally, informal payment existed because of irrational prescriptions for medications or ordering diagnostic tests, compelling health systems to implement effective strategies to reduce medicine prices and promote their rational use, strengthen administrative controls, and increase incentives for quality health care provision. Low payments to service providers (e.g. salaries) were another reason for informal payment, as indicated by data on salaries, so improved contracting
Table 1 Methodological quality of studies included in the review (CASP systematic review checklist)Item QuestionsValidity of the systematic review results 1. Is the systematic review focused on a clear question?
2. Were the authors looking for suitable articles?
3. Were important and relevant studies included in this study?
4. Did the authors assess the quality of articles adequately?
5. Are the results of the combined studies reasonable?
The results of the systematic review 6. What were the total results of the systematic review?
7. How much the results of the systematic review were accurate?
The applicability of the results for the local community
8. Whether the results of the included studies can be generalized to the study context?
9. Were all important outcomes considered?
10. Are the options due to the losses and costs worth enough?
CASP = Critical Appraisal Skills Programme.
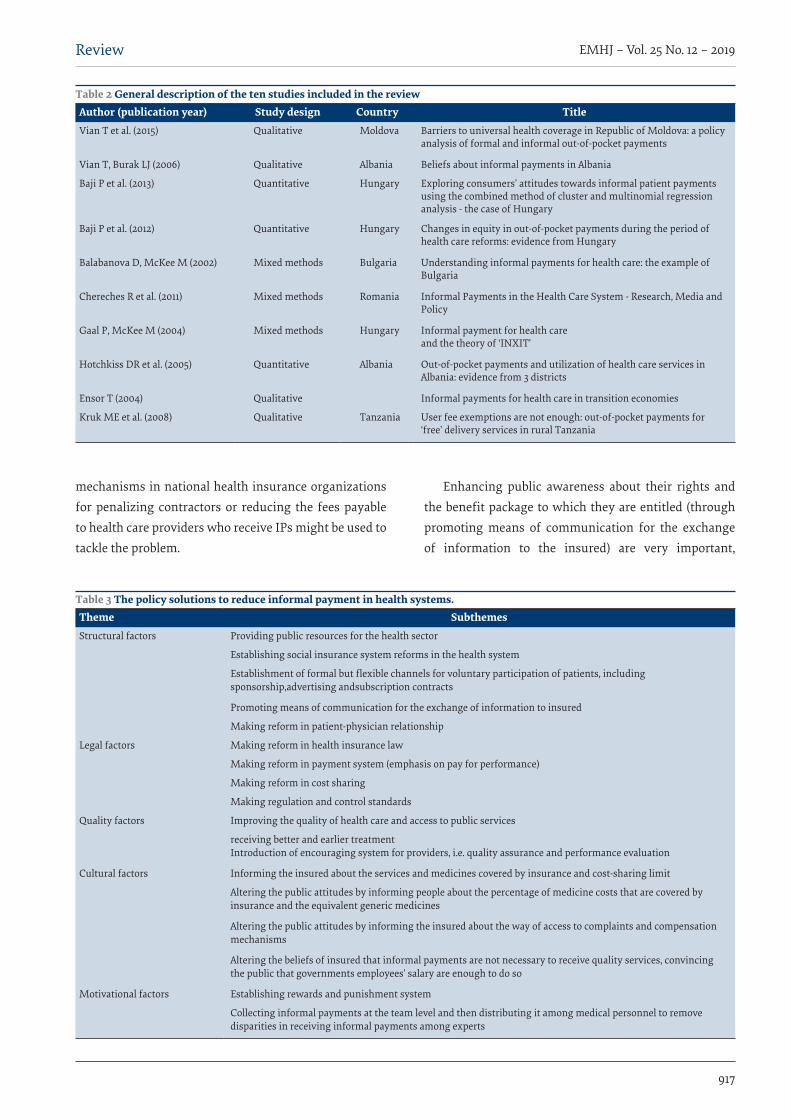
917
Review EMHJ – Vol. 25 No. 12 – 2019
mechanisms in national health insurance organizations for penalizing contractors or reducing the fees payable to health care providers who receive IPs might be used to tackle the problem.
Enhancing public awareness about their rights and the benefit package to which they are entitled (through promoting means of communication for the exchange of information to the insured) are very important,
Table 2 General description of the ten studies included in the reviewAuthor (publication year) Study design Country TitleVian T et al. (2015) Qualitative Moldova Barriers to universal health coverage in Republic of Moldova: a policy
analysis of formal and informal out-of-pocket payments
Vian T, Burak LJ (2006) Qualitative Albania Beliefs about informal payments in Albania
Baji P et al. (2013) Quantitative Hungary Exploring consumers’ attitudes towards informal patient payments using the combined method of cluster and multinomial regression analysis - the case of Hungary
Baji P et al. (2012) Quantitative Hungary Changes in equity in out-of-pocket payments during the period of health care reforms: evidence from Hungary
Balabanova D, McKee M (2002) Mixed methods Bulgaria Understanding informal payments for health care: the example of Bulgaria
Chereches R et al. (2011) Mixed methods Romania Informal Payments in the Health Care System - Research, Media and Policy
Gaal P, McKee M (2004) Mixed methods Hungary Informal payment for health careand the theory of ‘INXIT’
Hotchkiss DR et al. (2005) Quantitative Albania Out-of-pocket payments and utilization of health care services in Albania: evidence from 3 districts
Ensor T (2004) Qualitative Informal payments for health care in transition economies
Kruk ME et al. (2008) Qualitative Tanzania User fee exemptions are not enough: out-of-pocket payments for ‘free’ delivery services in rural Tanzania
Table 3 The policy solutions to reduce informal payment in health systems.Theme SubthemesStructural factors Providing public resources for the health sector
Establishing social insurance system reforms in the health system
Establishment of formal but flexible channels for voluntary participation of patients, including sponsorship,advertising andsubscription contracts
Promoting means of communication for the exchange of information to insured
Making reform in patient-physician relationship
Legal factors Making reform in health insurance law
Making reform in payment system (emphasis on pay for performance)
Making reform in cost sharing
Making regulation and control standards
Quality factors Improving the quality of health care and access to public services
receiving better and earlier treatmentIntroduction of encouraging system for providers, i.e. quality assurance and performance evaluation
Cultural factors Informing the insured about the services and medicines covered by insurance and cost-sharing limit
Altering the public attitudes by informing people about the percentage of medicine costs that are covered by insurance and the equivalent generic medicines
Altering the public attitudes by informing the insured about the way of access to complaints and compensation mechanisms
Altering the beliefs of insured that informal payments are not necessary to receive quality services, convincing the public that governments employees’ salary are enough to do so
Motivational factors Establishing rewards and punishment system
Collecting informal payments at the team level and then distributing it among medical personnel to remove disparities in receiving informal payments among experts
918
EMHJ – Vol. 25 No. 12 – 2019Review
especially within vulnerable groups. Revision of payment systems for increasing providers’ motivation, with an emphasis on pay for performance, is a good strategy to eliminate informal payment. In Mongolia and Vietnam, organizations were encouraged to provide grants for increasing transparency (20). In fact, strengthening governance and reducing expectations for informal payment in all sectors through government policies, i.e. enhanced transparency and accountability, with a particular focus on the supply side, including health care providers, are fundamental important policies in this area (20).
Reasonable copayments by people when receiving health care services, promoting the knowledge of the insured and informing them about complaint procedures are also crucial. Baji et al. studied prepayment household spending on health during the reform period, particularly the cost of medicines and medical equipment and official and unofficial payments. They concluded that implementing copayment in the Eastern European and Central European countries was an important strategy towards eradicating informal payment (13).
Cultural factorsImproving public education to enhance their knowledge about insurance coverage, services, medicines and the ex-tent of cost sharing, as well as their access to complaints and compensation mechanisms, may help users change their attitude and avoid informal payments, while still expecting to receive better quality services.
Through the lens of the theory of planned behaviour, Vain et al. studied people’s attitudes and beliefs to predict their intention to give informal payment. They compared people who intended to make informal payments with people who did not intend to do so in Albania. They found that most participants knew that informal payment was illegal. Hence, they found little effect on reducing informal payment through only saying to people that informal payment is wrong and a sign of corruption. The authors suggested behavioural change strategies as an alternative choice to modify the public’s beliefs about the need for informal payment to ensure quality services. This strategy attempts to convince people that government employees’ salaries are enough to ensure quality of services. They also suggest penalizing the recipients of informal payments, so asking for such payments may become a shameful act (16).
Baji et al. studied consumers’ opinion about informal payment in Hungary (13). Their findings identified some necessary steps to deal with informal payment, i.e. changing attitudes towards this phenomenon from positive to negative, improving quality of health care and enhancing access to public services through the provision of public resources to enjoy such services.
Quality factorsVian et al. advocated quality improvement programmes, e.g. having a clear reporting system in place as a useful policy to reduce informal payment. They concluded that
patients are willing to pay informal payment in expecta-tion of receiving better and timelier treatment (16). Im-proving the quality of health care and access to public services (13), and the introduction of a system of encour-agements for providers such as quality assurance and performance evaluation (17) were among the strategies that were proposed to reduce informal payment.
Structural factorsBalabanova et al. estimated the scale and determinants of informal payment in the health sector of Bulgaria (21). They identified the beneficiaries, characteristics and timing of payments as the main reasons for informal payment. They suggested wide reforms in the health sys-tem, i.e. a functioning social insurance system, official methods of payment by consumers, providing public re-sources for the health sector, establishment of formal but flexible channels for patients’ voluntary participation, e.g. sponsorship, advertisement, subscription contracts, promoting means of communication for the exchange of information to the insured and making reforms in patient–physician relationships (focus on removing the financial relationship) as effective policies to reduce in-formal payment.
Gaal et al. conducted a theoretical study of informal payment in the Hungarian health system and suggested some strategies on the basis of INXIT theory, which considers informal payment as an exit strategy within the organization (19). They include: voluntary declaration by physicians, prohibition and regulatory pressures imposed by the authorities, increased payments to physicians for appropriate financing, patients’ free choice for service provider, using various forms of partnership, employing output-based payments to providers, substantial restrictions on social security and providing pre-funded services.
Hotchkiss et al. indicated doctors’ monopoly as a main contributor to informal payment and found no difference between rich and poor nor between urban and rural people with regard to out-of-pocket payments in Albania, where informal payment comprised 24.7% of total health expenditure (17). Among those who made informal payments, 95% stated that they did so voluntarily and this involved up to 0.6% of the monthly household income. The study revealed significant differences between inpatient and outpatient services and identified some reasons for reducing informal payment, i.e. the effectiveness of Albania’s health insurance programme to increase access to primary health care services through salaries for doctors and family physicians along with providing subsidies for primary health care services, visits and medicines. The increased insurance coverage during recent years has led to reducing informal payment for services and medicines. However, the insurance coverage has not affected the number of visits to use basic health services. The study identified lack of awareness in insured people about their rights as an encouraging factor for informal payment and suggested some solutions for its reduction, including initiating informal
919
Review EMHJ – Vol. 25 No. 12 – 2019
payment reduction from hospitals and inpatients services, strengthening primary health care service and interrupting the financial relationship between doctors and patients. The relationship between socioeconomic status and the amount of informal payment indicates that the system should pay considerable attention to vulnerable people.
Kruk proposed payment for services provided to women, i.e. offering coupons (voucher) during a special programme and contracting with private providers to enhance care coverage and equity as effective solutions to reduce informal payment (22). In addition, subsidizing private facilities and services may enable them to reduce their fees, hence increasing the target population’s access to needed services.
Motivational factorsEstablishing a system of incentives and disincentives as well as collecting informal payment at the team level and then distributing it among involved personnel is a moti-vational initiative to remove disparities in IPs received by various health professionals. Hotchkiss et al. suggested a number of strategies for reducing informal payment: institutionalizing the capacity of identifying and pun-ishing physicians who are accused of receiving informal payment, formulating appropriate strategies for house-holds payments, introducing a motivational system for providers such as quality assurance and performance evaluation, promoting knowledge and awareness about the rights of patients and accountability, particularly on health insurance benefits (17).
Ensor proposed punishing doctors who are accused of receiving informal payment (23). This strategy needs
serious attention as it may lead to a reluctance to work in the public sector among physicians and encourage a greater willingness to join the private sector. Official recording of all payments made in the health system can help reduce informal payment. This strategy has a risk of increasing the cost of the formal sector. However, competition may be increased through effective legislation pathways. Developing a transparent system about patients’ rights, a simple complaints process, transparent contracts for physicians and targeting facilities are other useful strategies.
Governments should pay greater attention to the local characteristics of the health system to avoid implementing ineffective strategies. Ensor extracted 5 ways to reduce informal payment from various studies, and explained the advantages, disadvantages and different effects of each choice, as listed below (23):
· regulation and control standards to punish offenders;
· adjusting and legislation by specialized entities;
· encouraging increasing the share of market-based control to create positive incentives for good behav-iour;
· disclosing the names of violators;
· the rights and obligations of physician in patient rights laws.
DiscussionOur study sought to analyse key policies and strategies to reduce informal payment in health systems. Various studies show that demand-side informal payments have
Box 1 Electronic search strategyPubMed, October 2015Results: 145 hits: ((((“(informal payments“ OR “under-the-counter payments” OR “out-of-pocket payments”, OR “under-the-table payments” OR “envelope payments” OR gifts OR “illicit payments” OR “solicited payments” OR “gratuities” OR “illegal payments” OR “unofficial payments“ OR “ Unofficial fees“ OR bribes OR donations OR “ in cash“ OR “ in kind“ OR ” gratitude money” OR ” Unofficial healthcare fees” OR “ unauthorized fee payments“ OR “ quasi-official payments“ OR “ grey payments“ OR “ gift-in-kind“ OR “informal patient payments” OR “corruption in health care” OR “gratuity for doctors”)))) AND (((“health care“ OR“ Healthcare services receivers “OR “healthcare services providers“ OR ” health system”)))) AND ((((reduction OR elimination OR decrease OR reduce OR decline OR rebate OR scale down OR diminution OR eradication OR policy strategies))))
Scopus, October 2015Results: 193 hits (TITLE-ABS-KEY ("informal payments" OR "under-the-counter payments" OR "out-of-pocket payments", or "under-the-table payments" OR "envelope payments" OR gifts OR "illicit payments" OR "solicited payments") OR TITLE-ABS-KEY ("gratuities" OR "illegal payments" OR "unofficial payments" OR " Unofficial fees" OR bribes OR donations OR " in cash" OR " in kind" OR " gratitude money" OR " Unofficial healthcare fees" OR " unauthorized fee payments" OR " quasi-official payments") OR TITLE-ABS-KEY (" grey payments" OR " gift-in-kind" OR "informal patient payments" OR "corruption in health care" OR "gratuity for doctors") AND TITLE-ABS-KEY ("health care" OR " Healthcare services receivers" OR "healthcare services providers" OR " health system") AND TITLE-ABS-KEY (reduction OR elimination OR decrease OR reduce OR decline OR rebate OR scale down OR diminution OR eradication OR policy)) AND SUBJAREA (mult OR medi OR nurs OR vete OR dent OR heal OR mult OR arts OR busi OR deci OR econ OR psyc OR soci) AND PUBYEAR > 1999
Cochrane Library,Results: 106 hits: #1 "informal payments", #2"under-the-counter payments”, #3"out-of-pocket payments", #4"under-the-table payments", #5"envelope payments",#6" gifts", #7"illicit payments”, #8"solicited payments", #9"gratuities", #10"illegal payments", #11"unofficial payments", #12"Unofficial fees", #13"bribes", #14"donations", #15"in cash", #16,"in kind", #17 "gratitude money", #18 "Unofficial healthcare fees", #19 "unauthorized fee payments", #20 "quasi-official payments", #21" grey payments", #22"gift-in-kind", #23"informal patient payments", #24"corruption in health care", #25"gratitude for doctors",#26: #1 OR #2 OR #3 OR #4 OR #5 OR #6 OR #7 OR #8 OR #9 OR #10 OR #11 OR #12 OR #13 OR #14 OR #15 OR #16 OR #17 OR #18 OR #19 OR #20 OR #21 OR #22 OR #23 OR #24 OR #25, #27 "health care", #28 "health care services receivers", #29 "health care services providers", #30 "health system", #31: #27 OR #28 OR #29 OR #30, #32 reduction ,#33 elimination, #34 decrease, #35 decline, #36 rebate, #37 scale down, #38 diminution, #39 eradication, #40 policy strategies, #41 reduce, #42:#32 OR #33 OR #34 OR #35 OR #36 OR #37 OR #38 OR #39 OR #40 OR #41#43 #26 AND #31 AND #42

920
EMHJ – Vol. 25 No. 12 – 2019Review
different reasons such as: fear of poor quality, desire for faster care, patients’ wish to appreciate providers, health care providers’ low payment, lack of awareness of the in-sured with respect to their rights and positive attitude to this phenomenon. In a study by Amiresmaili et al., some reasons are found for demand-side informal payments such as cultural, quality-related and legal factors, and some reasons were identified for supply-side payments such as tariffs, structural and moral reasons, and to demonstrate competence (24). One of the main drivers of informal payment on the service provider’s side is mo-nopoly position of physicians. A study conducted in Al-bania suggests strategies such as strengthening primary health care and banning financial interactions between physicians and patients (19).
The main strategies mentioned in the studies were providing the insured with information on covered services and medicines, permitted copayments, percentage of the cost of services through the improvement of methods and instruments for communication of information, increasing knowledge of insured patients on how to access grievance redress mechanisms, enhance awareness of their rights and break the chains of their beliefs about the need to make unofficial payments to get quality care (20), and simplifying the process for complaints (17).
Most studies pointed out regulatory reforms and strengthening monitoring mechanisms as important strategies to reduce informal payment. Amending health insurance law to pose penalties on the demand for informal payment as an attempt on abusing the rights of the insured, and reassuring people of punishments for physicians who receive informal payment (20), regulatory pressures imposed by the authorities, prefunded services (25), and increasing the ability of stewardship to identify and punish physicians who are accused of receiving informal payment (19), were other solutions that were mentioned to tackle the problem.
Our findings showed that without adopting other required strategies, some solutions might result in inappropriate outcomes. For example, demand-side strategies such as simplifying the complaint process, to deal with physicians misusing of their monopoly position and banning their financial relationship with patients, require strengthening regulatory supervision. A study in Albania suggests that cutting the financial relationship between physicians and patients, along with with increasing the capacity of stewardship of the health system can identify and warn the physicians who are accused of receiving informal payment (20). The poor payment system and lack of contracting with doctors and other service providers are other causes of informal payment. In this regard, 6 studies pointed to payment systems reform for providers and strengthening contractual provisions as strategies to consider.
Making transparent contracts with physicians (17) and private health care providers (23), increasing incentives for service providers through the revision of payment structure with an emphasis on performance-based
payment (20,25), retaining informal payment at the team level and sharing it with other health care providers to remove disparities among experts (18), and implementing appropriate revisions in payment systems, e.g. increasing salaries (25), were other strategies that were proposed to reduce informal payment.
Some studies highlighted provision of services to reduce informal payment, i.e. improving quality of health care and access to public services (16), introducing a mechanism for promoting quality assurance and performance evaluation (19). Other studies emphasized financing and cost sharing areas to remove informal payment. For instance, formulating payments through appropriate and effective copayment household strategies (19,25); development of formal and flexible channels for voluntary participation to develop copayments (13,21); subsidizing primary health care (19) as well as private facilities and services to increase the target population’s access to services, hence eventually reducing informal payment (23).
Our review revealed the use of mixed solutions according to the contextual characteristics of various countries. A considerable portion of the research on informal payment comes from transitional economies in Eastern Europe,e.g. Albania, Hungary and Bulgaria, or low-income countries, e.g. Moldova and Tanzania. We found no evidence from high-income countries, or middle-income countries in parts of the world other than Eastern Europe, thus the implementation of these strategies in other contexts needs some caution.
The strengths of this systematic review include using a comprehensive search strategy and robust evaluation of extracted articles that accommodates a wide range of beliefs and attitudes about informal payment to investigate the means for its reduction. The major value of this study is in providing a summary of the most important strategies recommended or used to reduce informal payment. The study also sets out the appropriate options available to policy-makers to tackle informal payment and highlights that only one strategy may be ineffective, so a tailored mix of strategies is recommended. Country-specific features should be taken into account to in application of these strategies in different settings. The present review highlights that well-designed studies are required for the identification of main causes of informal payment and the impact of various factors such as context and social, cultural and health system structures. It is also necessary to study in the low-income countries in term of considering the main causes of informal payment in comparing with other middle- and high-income countries.
Our study has certain limitation. First, we collected only evidence that was published in English so we may have missed studies in other settings that were reported in other languages. Second, since informal payment is a sensitive issue, the amount of which is not usually reported in the health system, the extent of the research on policies and strategies to reduce IP might seem limited.

921
Review EMHJ – Vol. 25 No. 12 – 2019
ConclusionsWe found no unique strategy among the research we re-viewed for tackling IP; choosing an appropriate strategy depends on the context and financing structure of the health system in various settings. As a number of coun-tries have begun to move towards universal health cov-erage as a part of their commitment to comply with the Sustainable Development Goals by 2030, each country
has to implement strategies that accord with its contex-tual characteristics and roots to tackle IP as a main barri-er to financial protection and universal health care.
Funding: This study was funded by National Institutes of Health Research, Tehran University of Medical Scienc-es, grant number 241/4/93201.
Competing interests: None declared.
Stratégies visant à réduire les paiements informels dans les systèmes de santé : analyse systématiqueRésuméContexte : Les paiements informels représentent un obstacle majeur à la couverture sanitaire universelle, en particulier dans les pays à revenu faible et intermédiaire. Objectif : L’objectif de la présente étude était de déterminer des méthodes appropriées pour réduire les paiements informels dans les soins de santé par le biais d’une analyse systématique.Méthodes : Pour la présente analyse systématique, nous avons fait des recherches dans la Cochrane Library, PubMed et SCOPUS couvrant la période 2000-2014 : 10 articles de recherche qui envisageaient des stratégies de réduction des paiements informels ont finalement été inclus dans l’analyse. Trois des auteurs ont extrait les données et ont évalué ces articles de façon indépendante par rapport aux critères d’inclusion et d’exclusion. Résultats : L’amélioration de la sensibilisation du public et les mesures visant à changer la culture ont été les principales politiques de lutte contre les paiements informels. En outre, la fourniture d’un soutien financier supplémentaire pour motiver les médecins et les autres prestataires de services de santé, un suivi approprié de la législation et la conversion des paiements informels en paiements formels par le biais de nouvelles politiques adaptées sont d’autres solutions mentionnées pour réduire ou supprimer ce type de paiements.Conclusions : Il n’y a pas de stratégie unique pour réduire les paiements informels dans quelque système de santé que ce soit. Le choix d’une stratégie appropriée dépend du contexte et de la structure de financement du système de santé dans un contexte particulier.
اسرتاتيجيات لتقليل املدفوعات غري الرسمية يف النظم الصحية: استعراض منهجيحامد زنديان، عاطفة اسفندياري، مينوعيل بوري سخا، أمري حسني تقيان
اخلالصةاخللفية: ُيعّد دفع مبالغ مالية بصفة غري رسمية عائقًا كبريًا أمام التغطية الصحية الشاملة، ال سيام يف البلدان ذات الدخل املنخفض واملتوسط. األهداف: هدفت هذه الدراسة إىل حتديد طرق مناسبة لتقليل املدفوعات غري الرسمية يف نظام الرعاية الصحية من خالل استعراض منهجي.
طرق البحث: يف هذا االستعراض املنهجي، بحثنا يف "مكتبة كوكرين" وحمرك بحث PubMed وقاعدة بيانات SCOPUS عن بحوث ودراسات تغطي الفرتة من 2000 إىل 2014: ويف هناية املطاف، اشتمل االستعراض عىل 10 بحوث تناولت اسرتاتيجيات لتقليل املدفوعات غري الرسمية.
وقام ثالثة من املؤلفني عىل نحو مستقل بتقييم البحوث من حيث الشمول واجلودة، واستخراج البيانات، وتقييم خطر التحيز. النتائج: كانت السياسات الرئيسية ملكافحة املدفوعات غري الرسمية تتمثل يف إذكاء الوعي العام واختاذ تدابري هتدف إىل تغيري الثقافة. وإضافة إىل ذلك، ُذكرت حلول أخرى من أجل تقليل املدفوعات غري الرسمية أو القضاء عليها، أال وهي تقديم دعم مايل إضايف لتحفيز األطباء وغريهم من ُمقدمي اخلدمات الصحية، والرصد املناسب للترشيعات، وحتويل املدفوعات غري الرسمية إىل مدفوعات رسمية من خالل سياسات جديدة ُمعدة
خصوصًا لذلك.االستنتاجات: ال توجد اسرتاتيجية وحيدة لتقليل املدفوعات غري الرسمية يف أي نظام صحي. بل يعتمد اختيار االسرتاتيجية املناسبة عىل ظروف
النظام الصحي وهيكله املايل يف أي بيئة معينة.
922
EMHJ – Vol. 25 No. 12 – 2019Review
References1. Onwujekwe O, Dike N, Uzochukwu B, Ezeoke O. Informal payments for healthcare: differences in expenditures from
consumers and providers perspectives for treatment of malaria in Nigeria. Health Policy. 2010;96(1):72–9. doi: 10.1016/j.healthpol.2009.12.014
2. Stepurko T, Pavlova M, Gryga I, Groot W. Empirical studies on informal patient payments for health care services: a systematic and critical review of research methods and instruments. BMC Health Serv Res. 2010;10(1):273. doi:10.1186/1472-6963-10-273
3. Gaal P, Belli PC, McKee M, Szocska M. Informal payments for health care: definitions, distinctions, and dilemmas. J Health Polit, Policy Law. 2006;31(2):251–93. doi:10.1215/03616878-31-2-251
4. Szende A, Culyer AJ. The inequity of informal payments for health care: the case of Hungary. Health Policy. 2006;75(3):262–71. doi:10.1016/j.healthpol.2005.04.001
5. Pavlova M, Stepurko T, Gordeev VS, Tomini S, Gryga I, Groot W. Informal patient payments for health care services: policy challenges and strategies for solutions. Zdrowie Publiczne i Zarządzanie. 2010;8(1):5–11.
6. Liaropoulos L, Siskou O, Kaitelidou D, Theodorou M, Katostaras T. Informal payments in public hospitals in Greece. Health Policy. 2008;87(1):72–81. doi:10.1016/j.healthpol.2007.12.005
7. Bagheri A. Iranian medical ethics priorities: results of a national survey. Med Ethics and History Med. 2011;4(5):39–48 (http://ijme.tums.ac.ir/article-1-157-en.html, accessed 21 April 2019).
8. Chawla M, Berman P, Windak A, Kulis M. Provision of ambulatory health services in Poland: a case study from Krakow. Soc Sci Med. 2004;58(2):227–35. PMID:14604609
9. Killingsworth JR, Hossain N, Hedrick-Wong Y, Thomas SD, Rahman A, et al. Unofficial fees in Bangladesh: price, equity and institutional issues. Health Policy Plan. 1999;14(2):152–63. PMID:10538718
10. Barber S, Bonnet F, Bekedam H. Formalizing under-the-table payments to control out-of-pocket hospital expenditures in Cambodia. Health Policy Plan. 2004;19(4):199–208. PMID:15208276
11. Baji P, Pavlova M, Gulácsi L, Groot W. User fees for public health care services in Hungary: expectations, experience, and acceptability from the perspectives of different stakeholders. Health Policy. 2011;102(2):255–62. doi:10.1016/j.healthpol.2011.03.001
12. Gaitonde R, Bjørndal A, Oxman AD, Okebukola PO, Ongolo-Zogo P. Interventions to reduce corruption in the health sector. Cochrane Database Syst Rev. 2010;11. doi:10.1002/14651858.CD008856.pub2
13. Baji P, Pavlova M, Gulacsi L, Groot W. Exploring consumers’ attitudes towards informal patient payments using the combined method of cluster and multinomial regression analysis--the case of Hungary. BMC Health Serv Res. 2013;13:62. doi:10.1186/1472-6963-13-62
14. Systematic Review Study Group. CASP critical appraisal skill programme. 2018 (https://casp-uk.net/casp-tools-checklists/, Accessed 29 May 2019).
15. Zeng X, Zhang Y, Kwong JS, Zhang C, Li S, Sun F, et al. The methodological quality assessment tools for preclinical and clinical studies, systematic review and meta-analysis, and clinical practice guideline: a systematic review. J Evid Based Med. 2015;8(1):2–10. doi:10.1111/jebm.12141
16. Vian T, Burak LJ. Beliefs about informal payments in Albania. Health Policy Plan. 2006;21(5):392–401. doi:10.1093/heapol/czl022
17. Hotchkiss DR, Hutchinson PL, Malaj A, Berruti AA. Out-of-pocket payments and utilization of health care services in Albania: evidence from three districts. Health Policy. 2005;75(1):18–39. doi:10.1016/j.healthpol.2005.02.003
18. Baji P, Pavlova M, Gulacsi L, Groot W. Changes in equity in out-of-pocket payments during the period of health care reforms: evidence from Hungary. Int J Equity Health. 2012;11:36. doi:10.1186/1475-9276-11-36
19. Gaal P, McKee M. Informal payment for health care and the theory of ‘INXIT’. Int J Health Plan Manage. 2004;19(2):163–78. doi:10.1002/hpm.751
20. Vian T, Feeley FG, Domente S, Negruta A, Matei A, Habicht J. Barriers to universal health coverage in Republic of Moldova: a policy analysis of formal and informal out-of-pocket payments. BMC Health Serv Res. 2015;15:319. doi:10.1186/s12913-015-0984-z
21. Balabanova D, McKee M. Understanding informal payments for health care: the example of Bulgaria. Health Policy. 2002;62(3):243–73. PMID:12385850
22. Kruk ME, Mbaruku G, Rockers PC, Galea S. User fee exemptions are not enough: out-of-pocket payments for ‘free’ delivery services in rural Tanzania. Tropical Med Int Health. 2008;13(12):1442–51. doi:10.1111/j.1365-3156.2008.02173.x
23. Ensor T. Informal payments for health care in transition economies. Soc Sci Med. 2004;58(2):237–46. PMID:14604610
24. Amiresmaili M, Nekoeimoghadam M, Esfandiari A, Ramezani F, Salari H. Causes of informal payments in health sector: a qualitative study of viewpoints of physicians, policy makers and patients. Iranian J Med Ethics History Med. 2013;6(3):72–83.
25. Cherecheş R, Ungureanu M, Rus I, Baba C. Informal payments in the health care system-research, media and policy. Transylvanian Rev Administrative Sci. 2011;7(32):5–14.
923
Report EMHJ – Vol. 25 No. 12 – 2019
Move for health: addressing the built environment and physical activity in OmanRuth Mabry,1 Huda Al Siyabi,2 Muhssen Kannan 2 and Amal Al Siyabi 2
1World Health Organization Regional Office for the Eastern Mediterranean Region, Cairo, Egypt (Correspondence to: R. Mabry: [email protected]). 2Department of Community-based Initiatives, Directorate General of Primary Health Care, Ministry of Health, Oman.
AbstractRapid modernization in Oman has resulted in a massive population shift to the cities, urban sprawl, and a car-depend-ent culture associated with lowered levels of physical activity and elevated rates of noncommunicable diseases. Since the built environment is a major contributing factor to physical inactivity in the Region, this policy brief identifies key steps for creating an urban environment more supportive of physical activity. Such transformations would also have wide-ranging health, social and economic benefits. Design standards appropriate for the local terrain and social–cultural context should be developed using existing neighbourhoods that provide environmental support for physical activity (residential density, mixed land use and street connectivity) and a participatory approach to urban planning. When pol-icy-makers recognize the links between physical activity, urban planning and design, and transportation modalities, a national vision for promoting physical activity can be created and endorsed at the highest levels, thereby providing a government mandate for multisectoral action.Keywords: built environment, Oman, physical activity, physical inactivity, policyCitation: Mabry R; Al Siyabi H; Kannan M; Al Siyabi A. Move for health: addressing the built environment and physical activity in Oman. East Mediterr Health J. 2019;25(12):923–927. https://doi.org/10.26719/2019.25.12.923Received: 28/09/17; accepted: 20/05/18Copyright © World Health Organization (WHO) 2019. Some rights reserved. This work is available under the CC BY-NC-SA 3.0 IGO license (https://creativecommons.org/licenses/by-nc-sa/3.0/igo).
Statement of problem Physical inactivity is the fourth leading risk factor for noncommunicable diseases (NCDs) globally, with less than 1 in 4 adults meeting the World Health Organization (WHO) recommendation of 150 minutes of moderate-in-tensity physical activity per week (1). In some countries, the direct medical cost of physical inactivity is estimated at 1.5–3% of total medical costs (2), and as high as 15% in China (3); the economic burden is even higher when inn-direct costs are taken into account (2,3). Studies in Oman and neighbouring Gulf Cooperation Council (GCC) couno-tries have identified the key barrier to physical activity as the built environment (4,5), which has changed dramati-cally during the past 50 years and created a car-centred culture and sedentary lifestyle; it is projected to get even worse (5,6). Urgent action is required if the country is to meet its national goal of a 10% reduction in physical in-activity by 2025 (7). This will require transforming the urban environment to one supportive of physical activ-ity, which will also have wide-ranging health, social and economic benefits (2,3,8).
Background Noncommunicable diseases are a major health burden in GCC countries, costing US$ 36.2 billion in 2013 and a projected $67.9 billion by 2022 (9). More than 1 in 2 Omani adults are overweight or obese, 2 in 5 have hypertension and 1 in 8 have high blood glucose (7). These high rates are driven in part by physical inactivity, which is one of the top 5 contributors to health risk in the country (10). Nearly half of the adult population does not engage in
sufficient physical activity, while the rate is even higher among adolescents who fail to engage in at least 1 hour of physical activity daily (11–13) (Figure 1).
The benefits of physical activity are well documented: it extends life expectancy and reduces premature mortality related to NCDs like diabetes, cardiovascular disease and cancer; it also promotes mental health (14,15) and brings other demonstrable social and economic benefits (2,3,8). Research has identified poor access to appropriate places and facilities as a significant barrier to improved levels of physical activity, but health and education sectors can do little to address the problem of access (4,5).
The built environment – such as buildings, streets and public open spaces – has a demonstrable influence on the level of physical activity in a population (16–18). However, with cities, communities and neighbourhoods dominated by motorized vehicles, walking and cycling have been designed out of people’s lives. Thus, active forms of travel, the most common physical activity in Oman, are limited, while recreational activity (like walking) is virtually nonexistent (11). Thus, the problem of access can best be addressed by creating communities where physical activity can become part of people’s daily lives.
However, there are several constraints to building an environment supportive of physical activity (19). These constraints were identified in interviews with Omani urban planners, health experts and academics (20), replicating the findings of other studies in the region, including in the ground-breaking “Urban Oman, Trends
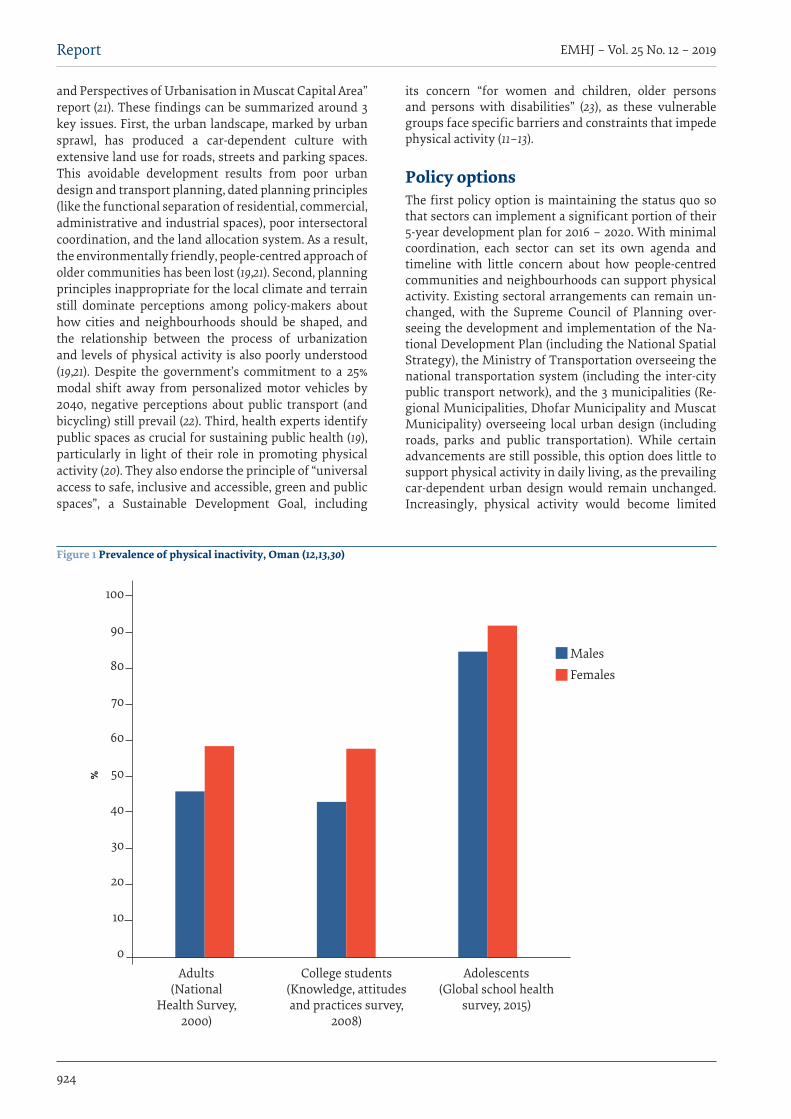
924
EMHJ – Vol. 25 No. 12 – 2019Report
100
90
80
70
60
50
40
30
20
10
0
%
Adults (National
Health Survey, 2000)
College students(Knowledge, attitudes and practices survey,
2008)
Adolescents (Global school health
survey, 2015)
MalesFemales
and Perspectives of Urbanisation in Muscat Capital Area” report (21). These findings can be summarized around 3 key issues. First, the urban landscape, marked by urban sprawl, has produced a car-dependent culture with extensive land use for roads, streets and parking spaces. This avoidable development results from poor urban design and transport planning, dated planning principles (like the functional separation of residential, commercial, administrative and industrial spaces), poor intersectoral coordination, and the land allocation system. As a result, the environmentally friendly, people-centred approach of older communities has been lost (19,21). Second, planning principles inappropriate for the local climate and terrain still dominate perceptions among policy-makers about how cities and neighbourhoods should be shaped, and the relationship between the process of urbanization and levels of physical activity is also poorly understood (19,21). Despite the government’s commitment to a 25% modal shift away from personalized motor vehicles by 2040, negative perceptions about public transport (and bicycling) still prevail (22). Third, health experts identify public spaces as crucial for sustaining public health (19), particularly in light of their role in promoting physical activity (20). They also endorse the principle of “universal access to safe, inclusive and accessible, green and public spaces”, a Sustainable Development Goal, including
its concern “for women and children, older persons and persons with disabilities” (23), as these vulnerable groups face specific barriers and constraints that impede physical activity (11–13).
Policy optionsThe first policy option is maintaining the status quo so that sectors can implement a significant portion of their 5-year development plan for 2016 – 2020. With minimal coordination, each sector can set its own agenda and timeline with little concern about how people-centred communities and neighbourhoods can support physical activity. Existing sectoral arrangements can remain un-changed, with the Supreme Council of Planning over-seeing the development and implementation of the Na-tional Development Plan (including the National Spatial Strategy), the Ministry of Transportation overseeing the national transportation system (including the inter-city public transport network), and the 3 municipalities (Re-gional Municipalities, Dhofar Municipality and Muscat Municipality) overseeing local urban design (including roads, parks and public transportation). While certain advancements are still possible, this option does little to support physical activity in daily living, as the prevailing car-dependent urban design would remain unchanged. Increasingly, physical activity would become limited
Figure 1 Prevalence of physical inactivity, Oman (12,13,30)
925
Report EMHJ – Vol. 25 No. 12 – 2019
to population groups with the interest, time, resources and social support (i.e., children, young people, men and wealthier groups).
A more strategic option involves developing a national vision for promoting physical activity while building national capacity; both endorsed by the draft WHO Technical Package (20). A national vision would increase the allocation of resources for the promotion of physical activity, and enable improved cross-sectoral communication, more efficient use of government resources, reduced duplication of work, and establish the basis for future transformation and growth. The mandate should build upon research evidence about urban design elements found to promote physical activity (residential density, mixed land use and street connectivity) (18,24,25), where compact, highly connected neighbourhoods provide easy access to work, services and leisure activities, resulting in higher levels of physical activity when compared to residential areas that are more dispersed and less connected. Omani neighbourhoods with these key design elements provide examples of a more deliberate and innovative urban planning and design process (19), including: Muttrah (high density, mixed land-use), Al Medinat Sultan Qaboos and Al Mouj (mixed land-use), and Al Khoud (high street connectivity). Easily accessible and environmentally friendly public spaces (such as the Wadi Al Athieba Park) can also be assessed for their value in promoting physical activity (19). Compared to maintaining the status quo, this option will require time to build consensus, allocate resources and revise plans (if necessary), which could delay the implementation of existing sectoral plans.
Recommendations A national vision for promoting physical activity should be developed (as per option 2 above), to be endorsed at the highest level possible. Policy-makers should incor-porate this vision into the Oman National Spatial Strat-egy, scheduled to be unveiled by the Supreme Council of
Planning in 2020. A national vision will provide a catalyst for implementing the National Plan on Action for the Promotion of Physical Activity endorsed by the National Multisectoral Noncommunicable Diseases Committee and ensure that sufficient resources are allocated for its full implementation.
Efforts should also be made to raise awareness among policy-makers of urban design and transportation modalities more appropriate for the Omani environment and social–cultural context. Policy-makers should recognize the human and economic burden of NCDs, the role of physical activity in reducing NCDs, and how the built environment can hinder or facilitate physical activity. Existing neighbourhoods in Oman (19) and neighbouring countries (26–28) provide a growing database to assess how the relevant urban design elements can be applied to the local context.
Planning at the city level should utilize a participatory approach, as exemplified by the Nizwa Healthy Lifestyle Initiative (29), to identify how best to address the key barriers at the community level, especially for the most vulnerable groups (19). The participatory approach is not just applicable to new developments but already existing communities where the majority of Omanis currently live (30).
ConclusionPhysical inactivity has significant direct and indirect economic costs to a country. The price of inaction has enormous consequences. Option 2, while requiring in-vestment in time and energy and possible delays in implementing existing plans, extends and deepens ini-tiatives already underway in the country, including the development of a National Spatial Strategy, expansion of the public transportation system, and growth of the tourism industry. The highly targeted steps of Option 2 would help ensure that Oman meets its physical activity target of a 10% reduction in physical inactivity by 2025.
AcknowledgementsThis policy brief is based on research conducted by the authors and a manuscript prepared as part of a Kuwait Programme Fellowship undertaken by RMM at the LSE Middle East Centre, LSE Cities in early 2017. The views expressed in this paper are those of the authors and do not necessarily reflect those of WHO.
Funding: None.
Competing interests: None declared.
Pour votre santé, bougez ! Note d'orientation sur l'environnement bâti et l'activité physique à OmanRésumé La modernisation rapide d'Oman a entraîné un déplacement massif de la population vers les villes, l'étalement urbain et une culture de dépendance à l'automobile associée à une baisse de l'activité physique et à des taux élevés de maladies non transmissibles. Étant donné que l'environnement bâti est l'un des principaux facteurs contribuant à la sédentarité dans la Région, la présente note d'orientation définit les principales mesures à prendre pour créer un environnement urbain plus propice à l'activité physique ; de telles transformations auraient également de nombreux avantages sur les
926
EMHJ – Vol. 25 No. 12 – 2019Report
References1. Global Status Report on noncommunicable diseases 2014. Geneva: World Health Organization; 2014 (https://www.who.int/nmh/
publications/ncd-status-report-2014/en/, accessed 24 June 2019).
2. Oldridge NB. Economic burden of physical inactivity: healthcare costs associated with cardiovascular disease. Eur J Cardiovasc Prev Rehabil. 2008 Apr;15(2):130–9. http://dx.doi.org/10.1097/HJR.0b013e3282f19d42 PMID:18391637
3. Zhang J, Chaaban, J. The economic cost of physical inactivity in China. Prev Med. 2013 Jan;56(1):75–8. http://dx.doi.org/10.1016/j.ypmed.2012.11.010 PMID:23200874
4. Mabry RM, Al-Busaidi ZQ, Reeves MM, Owen N, Eakin EG. Addressing physical inactivity in Omani adults: perceptions of pub-lic health managers. Public Health Nutr. 2013 Mar 17(3):1–8. http://dx.doi.org/10.1017/S1368980012005678 PMID:23347388
5. Mabry R, Koohsari MJ, Bull F, Owen N. A systematic review of physical activity and sedentary behaviour research in the oil-pro-ducing countries of the Arabian Peninsula. BMC Public Health, 2016 Sep 21;16(1):1003. http://dx.doi.org/10.1186/s12889-016-3642-4 PMID:27655373
6. Ng SW, Popkin BM. Time use and physical activity: a shift away from movement across the globe. Obes Rev. 2012 Aug. 13(8):659–80. http://dx.doi.org/10.1111/j.1467-789X.2011.00982.x PMID:22694051
7. National policy on the prevention and control of noncommunicable diseases. Muscat: Ministry of Health Oman; 2016.
8. Sallis JF, Spoon C, Cavill N, Engelberg JK, Gebel K, Parker M et al. Co-benefits of designing communities for active living: an exploration of literature. Int J Behav Nutr Phys Act. 2015;12:30. https://doi.org/10.1186/s12966-015-0188-2
9. The 68$ billion challenge, quanitifying and tackling the burden of chronic diseases in the GCC. Chicago: Strategy&; 2013.
10. Country profiles [website]. Seattle: Institute for Health Metrics and Evaluation. (http://www.healthdata.org/results/country-pro-files, accessed 24 June 2019).
11. Mabry RM, Morsi M, Al-Lawati JA, Owen N. Descriptive epidemiology of physical activity among Omani adults: the Oman World Health Survey, 2008. East Mediterr Health J, 2016 Apr 28;22(2):103–15. PMID:27180738
12. World Health Organization, US Centers for Disease Control and Prevention. Global School-based Student Health Survey, Oman Fact Sheet, 2015 [website]. (https://www.who.int/ncds/surveillance/gshs/2015_Oman_GSHS_Fact_Sheet.pdf, accessed 24 June 2019).
13. Mabry R, Owen N, Eakin E. A National Strategy for Promoting Physical Activity in Oman: A call for action. Sultan Qaboos Univ Med J, 2014 May;14(2):e170–5. PMID:24790738
14. Reducing risks, promoting healthy life. Geneva: World Health Organization; 2002 (https://www.who.int/whr/2002/en/, accessed 24 June 2019).
15. Promoting physical activity in the Eastern Mediterranean Region, a call for action. Cairo: World Health Organization Regional Office of the Eastern Mediterranean Region; 2014 (https://apps.who.int/iris/handle/10665/116901, accessed 24 June 2019).
16. Sallis JF, Floyd MF, Rodríguez DA, Saelens BE. Role of built environments in physical activity, obesity, and cardiovascular dis-
plans sanitaire, social et économique. Des normes de conception adaptées au terrain local et au contexte socioculturel devraient être élaborées en utilisant les quartiers existants qui fournissent un soutien environnemental à l'activité physique (densité résidentielle, utilisation mixte du sol et connectivité des rues) ainsi qu’une approche participative à la planification urbaine. Lorsque les responsables de l'élaboration des politiques reconnaissent les liens qui existent entre l'activité physique, l'aménagement urbain et les modalités de transport, une vision nationale pour la promotion de l'activité physique peut être élaborée et approuvée aux plus hauts niveaux, donnant ainsi un mandat gouvernemental pour une action multisectorielle.
احلركة من أجل الصحة: موجز سياسات يتناول البيئة العمرانية والنشاط البدين يف ُعامنروث ميربي، هدى السيايب، حمسن كنعان، أمل السيايب
اخلالصة ثقافة املتسارع، وانتشار املدن، والزحف احلرضي إىل السكان انتقال عدد هائل من إىل التي شهدهتا سلطنة ُعامن الرسيعة التحديث أدت موجة االعتامد عىل السيارات مما أسفر عن انخفاض مستويات النشاط البدين وارتفاع معدالت األمراض غري السارية. وألن البيئة العمرانية أحد العوامل الرئيسية التي تسهم يف اخلمول البدين يف إقليمنا، حيدد موجز السياسات هذا اخلطوات األساسية لتهيئة بيئة حرضية أكثر دعاًم للنشاط البدين. وسوف يكون هلذه التحوالت أيضًا فوائد صحية واجتامعية واقتصادية واسعة النطاق. وينبغي وضع معايري تصميم مالئمة للتضاريس املحلية والسياق االجتامعي والثقايف باالستعانة باألحياء احلالية التي تقدم دعاًم بيئيًا للنشاط البدين )الكثافة السكنية، وتنوع استخدامات األرايض، وترابط الشوارع( وباتباع هنج تشاركي يف التخطيط احلرضي. وحينام يدرك واضعو السياسات الصالت التي تربط بني النشاط البدين والتصميم احلرضي وطرائق
فة بالعمل املتعدد القطاعات. النقل، يمكن وضع رؤية وطنية لتشجيع النشاط البدين وإقرارها عىل أعىل املستويات، مما جيعل احلكومية ُمكلَّ
927
Report EMHJ – Vol. 25 No. 12 – 2019
ease. Circulation. 2012 Feb 7;125(5):729–37. http://dx.doi.org/10.1161/CIRCULATIONAHA.110.969022 PMID:22311885
17. Ding D, Gebel K. Built environment, physical activity, and obesity: what have we learned from reviewing the literature? Health Place. 2012 Jan. 18(1):100–5. http://dx.doi.org/10.1016/j.healthplace.2011.08.021 PMID:21983062
18. Durand CP, Andalib M, Dunton GF, Wolch J, Pentz MA. A systematic review of built environment factors related to physi-cal activity and obesity risk: implications for smart growth urban planning. Obes Rev. 2011;12(5):e173–82. http://dx.doi.org/ 10.1111/j.1467-789X.2010.00826.x PMID:21348918
19. Mabry R. Urbanization and physical activity in the GCC: a case study in Oman, in, L.K.P. London: LSE Middle East Centre, Kuwait Programme (LSE Kuwait Programme Paper Series; 21; http://eprints.lse.ac.uk/86875/1/__lse.ac.uk_storage_LIBRARY_Sec-ondary_libfile_shared_repository_Content_LSE%20Middle%20East%20Centre%20Papers_2018_Mabry_Urbanisation%20and%20physical%20activity.pdf, accessed 24 June 2019).
20. World Health Organization. Physical activity technical package, Key policies and interventions to promote physical activity (draft). Unpublished.
21. Nebel S, von Richthofen A, editors. Urban Oman, trends and perspectives of urbanisation in Muscat capital area. Zurich: LIT Verlag; 2016.
22. Jimenez JFG, Hernandez EH, Pecharroman CS. Planning the public transport system in Muscat (Oman). Universitat Politèc-nica de València; 2016 (Congress of Transport Engineering; Valencia (Spain); 7–9 June 2016; http://dx.doi.org/10.4995/CIT2016.2016.3457, accessed 24 June 2019).
23. Transforming our world: the 2030 Agenda for Sustainable Development. New York: United Nations General Assembly; 2015 (https://www.unfpa.org/sites/default/files/resource-pdf/Resolution_A_RES_70_1_EN.pdf, accessed 24 June 2019).
24. Christiansen LB, Cerin E, Badland H, Kerr J, Davey R, Troelsen J, et al. International comparisons of the associations between objective measures of the built environment and transport-related walking and cycling: IPEN adult study. J Transp Health. 2016 Dec;3(4):467–78. http://dx.doi.org/10.1016/j.jth.2016.02.010 PMID:28111613
25. Sallis JF, Cerin E, Conway TL, Adams MA, Frank LD, Pratt M, et al. Physical activity in relation to urban environments in 14 cities worldwide: a cross-sectional study. Lancet. 2016 May 28;387(10034):2207–17. http://dx.doi.org/10.1016/S0140-6736(15)01284-2 PMID:27045735
26. Brkovic MB, Milakovic M. Planning and designing urban places in response to climate and local culture: a case study of Mussa-fah district in Abu Dhabi. Spatium 2011 Sep;25:14–22.
27. Promoting physical activity in the Eastern Mediterranean Region through a life-course approach. Cairo: World Health Organiza-tion Regional Office of the Eastern Mediterranean Region; 2014 (https://apps.who.int/iris/bitstream/handle/10665/116901/EMRO-PUB_2014_EN_1603.pdf?sequence=1&isAllowed=y, accessed 24 June 2019).
28. Alawadi K. Rethinking Dubai’s urbanism: generating sustainable form-based urban design strategies for an integrated neighbor-hood. Cities, 2017 Feb;60:353–66. https://doi.org/10.1016/j.cities.2016.10.012
29. Nizwa Healthy Lifestyle Evaluation Report. Ministry of Health Oman; 2012.
30. National Health Survey. Volume 1, study of life style risk factors. Muscat: Ministry of Health Oman; 2000.
EMHJ – Vol. 25 No. 12 – 2019WHO events addressing public health priorities
928
Regional consultative meeting on primary health care for universal health coverage1
1This summary is extracted from the report on the Regional consultative meeting on primary health care for universal health coverage, Cairo, Egypt, 30 July–1 August 2019 (http://applications.emro.who.int/docs/IC_Meet_Rep_2019_PHC_175_EN.pdf?ua=1).
Citation: Regional consultative meeting on primary health care for universal health coverage. East Mediterr Health J. 2019;25(12):928–929 https://doi.org/10.26719/2019.25.12.928
Copyright © World Health Organization (WHO) 2019. Some rights reserved. This work is available under the CC BY-NC-SA 3.0 IGO license (https://creativecommons.org/licenses/by-nc-sa/3.0/igo).
Introduction A regional consultative meeting on primary health care (PHC) for universal health coverage (UHC) took place on 30 July–1 August 2019 in Cairo, Egypt (1). The meeting saw the formal launch of the Primary Health Care Measure-ment and Improvement (PHCMI) initiative (2), which follows from the launch of the Primary Health Care Per-formance Initiative (PHCPI) announced by Dr Ahmed Al-Mandhari, WHO Regional Director for the Eastern Mediterranean Region, at the celebration of World Health Day on 5 April 2019, in Cairo, Egypt (3). The initiative aims to support countries to fulfil the commitments made in the Astana Declaration on PHC (4).
The three-day meeting was attended by ministry of health focal persons for PHC and health information from 20 Eastern Mediterranean Region (EMR) countries, as well as PHCMI initiative partners, representatives from the Bill & Melinda Gates Foundation and the World Organization of Family Doctors (WONCA), as well as WHO country office health systems focal points.
The objectives of the meeting were to:
• share the current status of PHC implementation in the EMR as related to the recommendations of the Astana Declaration and the PHCMI initiative;
• disseminate the findings of the PHC assessment conducted in three pilot countries (Egypt, Jordan and Pakistan) as part of the Measurement Phase of the PHCMI initiative;
• establish a mechanism for integrating PHC services in the Region with the goal of attaining health for all; and
• explore the health system requirements – in terms of governance, workforce, financing, technologies, infrastructure and information – needed to ensure successful implementation of the PHCMI initiative to enhance UHC in the Region.Results from the initiative will be driven by three
primary goals: 1) building regional and national capacity and awareness for an enhanced evidence-based approach to PHC improvement; 2) institutionalizing PHC measurement in existing health system performance assessments; and 3) improving PHC performance/
scaling-up of family practice to help countries accelerate progress towards the achievement of UHC.
Summary of discussionsA series of presentations were delivered during the meet-ing regarding the health systems contribution to PHC. This included presentations on: financing frameworks and tools for effective implementation of PHC for UHC; the importance of investment in the health workforce for PHC; effective and quality essential medicines and tech-nologies; viewing hospital roles and operations through an integrated and people-centred lens; the challenges in quality and safety in health systems, with recommenda-tions for improvement; improving health service deliv-ery by implementing robust health information systems; and building resilient health systems as a prerequisite to achieving UHC.
It was noted that challenges to the health workforce remain, including maldistribution, brain drain and increased mobility. Benefits’ packages, in the context of a country, also need to take into account the scope of practice of the health workforce. The move to family-based practice PHC is another challenge for the Region, since training family physicians will take years and will require additional transitional measures. Participants agreed that bridging programmes to encourage general practitioners to become family physicians are needed, rather than relying on specialist family medicine programmes and financial incentives. However, this will not be sufficient; strengthening the health workforce to improve PHC will also require reliable and accurate data.
Recommendations To Member States
• Providing feedback on the Implementation Manual.
• Appointing a focal point for the remaining countries without one (Saudi Arabia and Kuwait).
• For the pilot countries (Egypt, Jordan and Pakistan), beginning the Improvement Phase and commenc-ing the action plans developed in the meeting. Egypt and Pakistan have been recommended for part-ner collaboration for PHC implementation, which will increase technical (and potentially increase
WHO events addressing public health priorities
929
EMHJ – Vol. 25 No. 12 – 2019
financial) support for PHC strengthening in the two countries.
• For Egypt and Jordan, beginning the Measurement Phase in close collaboration with WHO.
• Continuing close coordination with WHO and part-ner organizations towards a second regional work-shop.
To WHO
• Finalizing PHC quality indicators and disseminate to Member States.
• Continuing close coordination between the differ-ent levels of WHO and with countries and partner organizations towards a second regional workshop 3–5 December 2019.
References1. World Health Organization Regional Office for the Eastern Mediterranean (WHO/EMRO). Regional consultative meeting on
primary health care for universal health coverage, Cairo, Egypt, 30 July–1 August 2019 (http://applications.emro.who.int/docs/IC_Meet_Rep_2019_PHC_175_EN.pdf?ua=1).
2. World Health Organization. Assessing, measuring, improving PHC. Geneva: World Health Organization; 2019 (https://www.who.int/activities/assessing-measuring-improving-phc).
3. World Health Organization Regional Office for the Eastern Mediterranean (WHO/EMRO). World Health Day 2019: WHO and partners join hands in solidarity for universal health coverage. Cairo: WHO/EMRO; 2019 (http://www.emro.who.int/media/news/world-health-day-2019-who-and-partners-join-hands-in-solidarity-for-universal-health-coverage.html).
4. World Health Organization (WHO) and the United Nations Children’s Fund (UNICEF). Declaration of Astana. Geneva: WHO/UNICEF; 2018 (https://www.who.int/docs/default-source/primary-health/declaration/gcphc-declaration.pdf).
Eastern Mediterranean Health Journal
IS the official health journal published by the Eastern Mediterranean Regional Office of the World Health Organization. It is a forum for the presentation and promotion of new policies and initiatives in public health and health services; and for the exchange of ideas, concepts, epidemiological data, research findings and other information, with special reference to the Eastern Mediterranean Region. It addresses all members of the health profession, medical and other health educational institutes, interested NGOs, WHO Collaborating Centres and individuals within and outside the Region.
املجلة الصحية لرشق املتوسط هى املجلة الرسمية التى تصدر عن املكتب اإلقليمى لرشق املتوسط بمنظمة الصحة العاملية. وهى منرب لتقديم السياسات واملبادرات اجلديدة يف الصحة العامة واخلدمات الصحية والرتويج هلا، ولتبادل اآلراء واملفاهيم واملعطيات الوبائية ونتائج األبحاث وغري ذلك من املعلومات، وخاصة ما يتعلق منها بإقليم رشق املتوسط. وهى موجهة إىل كل أعضاء املهن الصحية، والكليات الطبية وسائر املعاهد التعليمية، وكذا املنظامت غري احلكومية املعنية، واملراكز املتعاونة مع منظمة
الصحة العاملية واألفراد املهتمني بالصحة ىف اإلقليم وخارجه.
La Revue de Santé de la Méditerranée Orientale
EST une revue de santé officielle publiée par le Bureau régional de l’Organisation mondiale de la Santé pour la Méditerranée orientale. Elle offre une tribune pour la présentation et la promotion de nouvelles politiques et initiatives dans le domaine de la santé publique et des services de santé ainsi qu’à l’échange d’idées, de concepts, de données épidémiologiques, de résultats de recherches et d’autres informa-tions, se rapportant plus particulièrement à la Région de la Méditerranée orientale. Elle s’adresse à tous les professionnels de la santé, aux membres des instituts médicaux et autres instituts de formation médico-sanitaire, aux ONG, Centres collaborateurs de l’OMS et personnes concernés au sein et hors de la Région.
Correspondence
Editor-in-chief
Eastern Mediterranean Health JournalWHO Regional Office for the Eastern MediterraneanP.O. Box 7608 Nasr City, Cairo 11371 Egypt Tel: (+202) 2276 5000 Fax: (+202) 2670 2492/(+202) 2670 2494 Email: [email protected]
Members of the WHO Regional Committee for the Eastern Mediterranean Afghanistan . Bahrain . Djibouti . Egypt . Islamic Republic of Iran . Iraq . Jordan . Kuwait . Lebanon Libya . Morocco . Oman . Pakistan . Palestine . Qatar . Saudi Arabia . Somalia . Sudan . Syrian Arab RepublicTunisia . United Arab Emirates . Yemen
البلدان أعضاء اللجنة اإلقليمية ملنظمة الصحة العاملية لرشق املتوسط األردن . أفغانستان . اإلمارات العربية املتحدة . باكستان . البحرين . تونس . ليبيا . مجهورية إيران اإلسالمية
اجلمهورية العربية السورية . جيبويت . السودان . الصومال . العراق . ُعامن . فلسطني . قطر . الكويت . لبنان . مرص . املغرباململكة العربية السعودية . اليمن
Membres du Comité régional de l’OMS pour la Méditerranée orientale Afghanistan . Arabie saoudite . Bahreïn . Djibouti . Égypte . Émirats arabes unis . République islamique d’Iran Iraq . Libye . Jordanie . Koweït . Liban . Maroc . Oman . Pakistan . Palestine . Qatar . République arabe syrienne Somalie . Soudan . Tunisie . Yémen
Subscriptions and Permissions
Publications of the World Health Organization can be obtained from Knowledge Sharing and Production, World Health Organization, Regional Office for the Eastern Mediterranean, PO Box 7608, Nasr City, Cairo 11371, Egypt (tel: +202 2670 2535, fax: +202 2670 2492; email: [email protected]). Requests for permission to reproduce, in part or in whole, or to translate publications of WHO Regional Office for the Eastern Mediterranean – whether for sale or for noncommercial distribution – should be addressed to WHO Regional Office for the Eastern Mediterranean, at the above address; email: [email protected].
EMHJ is a trilingual, peer reviewed, open access journal and the full contents are freely available at its website: http://www/emro.who.int/emhj.htm
EMHJ information for authors is available at its website: http://www.emro.who.int/emh-journal/authors/
EMHJ is abstracted/indexed in the Index Medicus and MEDLINE (Medical Literature Analysis and Retrieval Systems on Line), ISI Web of knowledge, the Cumulative Index to Nursing and Allied Health Literature (CINAHL), Embase, Lexis Nexis, Scopus and the Index Medicus for the WHO Eastern Mediterranean Region (IMEMR).
© World Health Organization (WHO) 2020. Open Access. Some rights reserved.This work is available under the CC BY-NC-SA 3.0 IGO licence (https://creativecommons.org/licenses/by-nc-sa/3.0/igo).
Disclaimer The designations employed and the presentation of the material in this publication do not imply the expression of any opinion whatsoever on the part of WHO concerning the legal status of any country, territory, city or area or of its authorities, or concerning the delimitation of its frontiers or boundaries. Dotted and dashed lines on maps represent approximate border lines for which there may not yet be full agreement.
The mention of specific companies or of certain manufacturers’ products does not imply that they are endorsed or recommended by WHO in preference to others of a similar nature that are not mentioned. Errors and omissions excepted, the names of proprietary products are distinguished by initial capital letters.
All reasonable precautions have been taken by WHO to verify the information contained in this publication. However, the published material is being distributed without warranty of any kind, either expressed or implied. The responsibility for the interpretation and use of the material lies with the reader. In no event shall WHO be liable for damages arising from its use.
The authors alone are responsible for the views expressed in this publication and they do not necessarily represent the views, decisions or policies of the institutions with which they are affiliated.
If authors are staff members of the World Health Organization, the authors alone are responsible for the views expressed in this publication and do not necessarily represent the decisions, policy or views of the World Health Organization.
ISSN 1020-3397
Cover 26-02.indd 4-6Cover 26-02.indd 4-6 2/23/2020 10:30:31 AM2/23/2020 10:30:31 AM

La Revue de Santé de la Méditerranée orientale
Eastern Mediterranean Health Journal
EMHJ – Vol. 25 No. 12 – 2019
Volume 25 / No. 12December/Décembre
املجلد اخلامس والعرشون / عدد 122019ديسمرب/كانون األول
Eastern Mediterranean H
ealth Journal Vol. 25 No. 12 – 2019
#Integrate HIVservices World AIDS Day1 December 2019
Of the 37.9 million people living with HIV at the end of 2018, 79% received testing, 62% received treatment, and 53% had achieved suppression of the HIV virus with reduced risk of infecting others. Thousands of community health workers and members of the HIV and key population networks contributed to this success. On World AIDS Day 2019, WHO is highlighting the difference these communities are making to end the HIV epidemic, while drawing global attention to the need for their broader engagement in strengthening primary health care.
EditorialEffective health information systems for delivering the Sustainable Development Goals and the universal health coverage agendaArash Rashidian ............................................................................................................................................................................................................................................849
Research articlesRole of climatic factors in the incidence of dengue in Port Sudan City, SudanElsiddig Noureldin and Lynn Shaffer ....................................................................................................................................................................................................852
Coût hospitalier des pneumococcies invasives chez les enfants âgés de moins de 15 ans en TunisieArwa Ben Salah, Sana El Mhamdi, Manel Ben Fredj, Chebil Ben Meriem, Jihen Bouguila, Khaled Ben Helel, Lamia Sfaihi, Rafiaa Mustapha, Mohamed Sfar et Mohamed Soltani...................................................................................................861
Fingernail length as a predisposing factor for perforations of latex gloves: a simulated clinical experimentSuhail Al-Amad, Ala’a El-Saleh, Shorouk Elnagdy, Fatimah Al-Nasser and Sarah Alsellemi ................................................................................................872
Workplace stress and its relation to cardiovascular disease risk factors among bus drivers in EgyptAmira Mohsen and Sally Hakim .............................................................................................................................................................................................................878
Quality of life outcomes in thalassaemia patients in Saudi Arabia: a cross-sectional studySoheir Adam ...................................................................................................................................................................................................................................................887
Mediterranean dietary patterns and risk of type 2 diabetes in Islamic Republic of IranMarjan Ramezan, Golaleh Asghari, Parvin Mirmiran, Zhale Tahmasebinejad and Fereidoun Azizi ..............................................................................896
Knockdown resistance mutations contributing to pyrethroid resistance in Aedes aegypti population, Saudi ArabiaOmer Dafalla, Adel Alsheikh, Waheed Mohammed, Khalid Shrwani, Feras Alsheikh, Yahya Hobani and Elsiddig Noureldin ..............................................................................................................................................................................................................................905
ReviewStrategies to reduce informal payments in health systems: a systematic reviewHamed Zandian, Atefeh Esfandiari, Minoo Sakha and Amirhossein Takian ..........................................................................................................................914
ReportMove for health: addressing the built environment and physical activity in OmanRuth Mabry, Huda Al Siyabi, Muhssen Kannan and Amal Al Siyabi ..........................................................................................................................................923
WHO events addressing public health prioritiesRegional consultative meeting on primary health care for universal health coverage ........................................................928