The logistics of household hurricane evacuation
18
(This is a sample cover image for this issue. The actual cover is not yet available at this time.) This article appeared in a journal published by Elsevier. The attached copy is furnished to the author for internal non-commercial research and education use, including for instruction at the authors institution and sharing with colleagues. Other uses, including reproduction and distribution, or selling or licensing copies, or posting to personal, institutional or third party websites are prohibited. In most cases authors are permitted to post their version of the article (e.g. in Word or Tex form) to their personal website or institutional repository. Authors requiring further information regarding Elsevier’s archiving and manuscript policies are encouraged to visit: http://www.elsevier.com/copyright
-
Upload
washington -
Category
Documents
-
view
0 -
download
0
Transcript of The logistics of household hurricane evacuation

(This is a sample cover image for this issue. The actual cover is not yet available at this time.)
This article appeared in a journal published by Elsevier. The attachedcopy is furnished to the author for internal non-commercial researchand education use, including for instruction at the authors institution
and sharing with colleagues.
Other uses, including reproduction and distribution, or selling orlicensing copies, or posting to personal, institutional or third party
websites are prohibited.
In most cases authors are permitted to post their version of thearticle (e.g. in Word or Tex form) to their personal website orinstitutional repository. Authors requiring further information
regarding Elsevier’s archiving and manuscript policies areencouraged to visit:
http://www.elsevier.com/copyright

Author's personal copy
Logistics of hurricane evacuation in Hurricanes Katrina and Rita
Hao-Che Wu, Michael K. Lindell ⇑, Carla S. PraterHazard Reduction and Recovery Center, Texas A&M University, College Station, TX 77843-3137, United States
a r t i c l e i n f o
Article history:Received 14 October 2011Received in revised form 16 February 2012Accepted 29 March 2012
Keywords:Hurricane evacuationEvacuation logisticsTraffic modelingRoute choice
a b s t r a c t
This study examines household hurricane evacuation logistics—the activities and associ-ated resources needed to reach a safe location and remain there until it is safe toreturn—during Hurricanes Katrina and Rita. Evacuation logistics variables include evacua-tion route information sources, evacuation departure dates, vehicles taken, evacuationroutes and destinations, travel distances and times, shelter accommodations, and costsof transportation, food, and lodging. This study confirmed previous findings that evacueestake multiple cars, rely on personal experience and traffic conditions to choose their evac-uation routes, and are most likely to choose the homes of friends/relatives as their shelteraccommodations. However, this study also produced new data on evacuation distances,durations, and costs—as well as associations with demographic and situational variablesthat are associated with household evacuation logistics. In addition, this study providesadditional data indicating that common assumptions about evacuation route choice areincorrect. More research is needed to understand evacuees’ choices of ultimate destina-tions and evacuation routes.
� 2012 Elsevier Ltd. All rights reserved.
1. Introduction
Hurricanes Katrina and Rita were two of the ten costliest hurricanes in US history. Hurricane Katrina (US$ 81.2 billion)made landfall at Buras-Triumph, LA around 6:00 am CDT on Monday, August 29, 2005, as a Category 3 hurricane. Despitethe evacuation of over 1.2 million people (National Hurricane Center, 2005), Katrina caused 1500 fatalities—mostly inLouisiana and Mississippi. Less than a month later, Hurricane Rita (US$ 10.5 billion) made landfall east of Sabine Pass, TXaround 3:00 am CDT on Saturday, September 24, also as a Category 3 hurricane. During Hurricane Rita, more than twomillion people evacuated the coastal areas of Texas and Louisiana. The storm caused 55 fatalities in Texas, most of them asso-ciated with the evacuation rather than the storm (National Hurricane Center, 2006).
In both hurricanes, the National Hurricane Center (NHC) issued hurricane warnings and local governments in the riskareas issued evacuation orders before landfall. For Hurricane Katrina, the NHC issued a hurricane watch at 10:00 am CDTon Saturday 27 August and a warning at 10:00 pm on the same day. For Hurricane Rita, the NHC issued a hurricane watchat 4:00 pm CDT on Wednesday 21 September and a warning at 10:00 am CDT on Thursday 22 September. St. Charles Parishissued a mandatory evacuation order effective at noon on Saturday 27 August (42 h before landfall) and, at the same time,Jefferson Parish issued an order that was mandatory for its coastal communities but voluntary for the rest of its population(see Fig. 1). Galveston issued a mandatory evacuation order at 6 pm, Thursday 21 August—58 h before Rita’s landfall (whicheventually occurred over 100 miles east of the island). Voluntary evacuation orders were issued in Chambers and Orangecounties at about the same time and similar orders were issued in Harris and Jefferson counties the next morning.
1369-8478/$ - see front matter � 2012 Elsevier Ltd. All rights reserved.http://dx.doi.org/10.1016/j.trf.2012.03.005
⇑ Corresponding author. Tel.: +1 979 862 3969; fax: +1 979 845 5121.E-mail addresses: [email protected] (H.-C. Wu), [email protected] (M.K. Lindell), [email protected] (C.S. Prater).
Transportation Research Part F 15 (2012) 445–461
Contents lists available at SciVerse ScienceDirect
Transportation Research Part F
journal homepage: www.elsevier .com/locate / t r f

Author's personal copy
Although local emergency managers had developed evacuation plans before the hurricanes struck, there were still prob-lems during the evacuations. The news media reported 100-mile highway queues during Rita, during which some evacueesran out of gas and water (Patrick, 2005). Problems such as these call attention to the need for emergency managers to under-stand household evacuation logistics. Based on definitions of logistics by Ballou (1987), Johnson and Wood (1996), andRushton, Oxley, and Croucher (2000), Lindell, Kang, and Prater (2011) defined household evacuation logistics as comprising‘‘the activities and associated resources needed to reach a safe location and remain there until it is safe to return.’’ A morecomplete understanding of household evacuation logistics requires an assessment of people’s evacuation route informationsources, departure times, vehicle usage, routes and destinations, distances and times, shelter accommodations, durations,and costs (see also Lindell, 2008; Lindell & Prater, 2007).
Some research on household evacuation logistics has focused on the first phase of this process—the time at which anevacuation decision is made (Dixit, Pande, Radwan, & Abdel-Aty, 2008; Fu & Wilmot, 2004, 2006; Fu, Wilmot, Zhang, & Baker,2007). Researchers have also analyzed some of the activities that take place during the time interval between an evacuationdecision and households’ departure from their homes (Kang, Lindell, & Prater, 2007; Lindell, Lu, & Prater, 2005). Moreover,there has been research on the development of evacuation models involving trip chaining (Murray-Tuite & Mahmassani,2003, 2004). However, this does not appear to be a major issue in most hurricane evacuations because there are usually daysof forewarning that allow families to reunite and prepare to leave the risk area.
The remaining research on evacuation logistics is summarized in Table 1 and discussed in the following paragraphs.Regarding evacuation departure times, the available evidence indicates that a few evacuees leave before local officials issuea warning but most leave on the day of the warning or the day after that (Baker, 2000; Dow & Cutter, 2002; Lindell et al.,2005). When they leave, relatively few evacuees rely on written materials received before the event or recommendationsduring the event from local officials or the news media. Instead, some rely on maps in their cars to choose their routesbut more rely on personal familiarity with their evacuation routes and on prior expectations about time, safety or conve-nience (Dow & Cutter, 2002; Lindell et al., 2005; Zhang, Prater, & Lindell, 2004). Significant, those who chose an evacuationroute based on previous experience were less likely to rely on other sources of route information (Lindell et al., 2005).
Evacuation vehicle usage is a relatively well-studied aspect of evacuation logistics, with studies finding consistently thatthe overwhelming majority of evacuees use their own vehicles and many of the rest get rides with peers who do have vehi-cles (Baker, 2000; Lindell et al., 2011; Perry, Lindell, & Greene, 1981; Siebeneck & Cova, 2008). Moreover, many evacuating
LouisianaTexas
Fig. 1. Surveyed jurisdictions in Texas and Louisiana.
446 H.-C. Wu et al. / Transportation Research Part F 15 (2012) 445–461

Author's personal copy
households take multiple vehicles, with the average number of vehicles per household ranging from 1.3–1.7 across studiesand as much as 1.10–2.15 across counties/parishes within a study (Dash & Morrow, 2001; Dow & Cutter, 2002; Lindell &Perry, 1992; Lindell & Prater, 2007; Lindell et al., 2011; Siebeneck & Cova, 2008).
There is little information about evacuees’ choices of evacuation routes but the available evidence indicates that evacueestend to rely principally on interstate highways, especially if these are readily available and connect to their expected evac-uation destinations (Dow & Cutter, 2002; Lindell et al., 2001). There are also few reports on evacuation destinations but theseindicate that a few evacuees remained within their home counties, many go elsewhere within state, and many evacuate outof state. (Dash & Morrow, 2001; Dow & Cutter, 2002). Because states vary significantly in their size, reports of evacuationdistance might be more reliable indicators and, indeed, the few reports of evacuation distances are relatively consistentin reporting distances of 286–319 km, i.e., 178–198 miles—although the average distances varied across counties from108 km (67 miles) to 212 km (132 miles) in one study (Lindell et al., 2011; Siebeneck & Cova, 2008; Whitehead, 2003).
Type of shelter accommodations is the most thoroughly studied aspect of evacuation logistics, with reports consistentlyindicating only about 15% of evacuees go to public shelters, although the percentage varies across studies from 1% to 43%(Baker, 2000; Lindell et al., 2011; Mileti, Sorensen & O’Brien, 1992; Whitehead, 2003). There are few reports about the
Table 1Summary of findings on evacuation logistics.
Variable Study/hazard Findings
Departure time Baker (2000) multiple hurricanes Less than 15% of evacuees leave before an official orderDow and Cutter (2002) Floyd 5% of evacuees left before an official order; 61% left the day of the order; 31% left the
day after the order was issuedLindell et al. (2005) Lili 29% of evacuees had decided to leave by the time of the NHC hurricane watch; 60% of
evacuees had decided to leave by the time of the NHC hurricane warning
Route information Dow and Cutter (2002) Floyd Evacuees carried maps but only half used them to determine their evacuation routesZhang et al. (2004) Bret 26% of risk area resident received evacuation route information from local emergency
managersLindell et al. (2005) Lili Evacuees relied much more on personal familiarity with their evacuation routes and
on prior expectations about time, safety, or convenience than on written materialsreceived before the event, or on local official or news media recommendationsreceived during the event
Vehicle usage Perry et al. (1981) Floods 74% of evacuees used their own vehicles during flood evacuations, 13% rode withpeers, and 13% took public transportation
Lindell and Perry (1992) Mt. St.Helens
Evacuees took 1.3 vehicles per household (vph)
Baker (2000) multiple hurricanes 5% of evacuees rode with peersDash and Morrow (2001) Georges Evacuees took 1.7 vphDow and Cutter (2002) Floyd 25% of the evacuees took two or more carsLindell and Prater (2007) multipleevacuations
Evacuees took 1.35 vph (range from 1.26 to 1.62 over studies)
Siebeneck and Cova (2008) Rita 91% of evacuees used their own vehicles; evacuees took 1.5 vphLindell et al. (2011) Lili 90% of evacuees took their own vehicles; evacuees took 1.6 vph with a range of 1.10–
2.15 vph across five counties/parishes
Evacuation route use Dow and Cutter (2002) Floyd Most evacuees used interstates.Lindell et al. (2001) Texashurricane evacuationexpectations
Coastal residents’ expected evacuation routes varied across regions; more expected touse interstates in a highly urbanized area but few expected to use interstates in a lessurbanized area
Evacuationdestinations
Dash and Morrow (2001) Georges 19% of evacuees remained within their home counties
Dow and Cutter (2002) Floyd 9% of evacuees went to other locations within their home counties, 32% evacuatedelsewhere within the state, and 56% evacuated out of state
Evacuation distances Whitehead (2003) Bonnie 286 km (178 miles)Siebeneck and Cova (2008) Rita 319 km (198 miles)Lindell et al. (2011) Lili 311 km (193 miles) with county averages ranging from 108 km (67 miles) to 212 km
(132 miles)
Shelteraccommodations
Mileti, Sorensen, and O’Brien(1992) Multiple events
15% of evacuees go to public shelters
Baker (2000) multiple hurricanes 15% of evacuees go to public sheltersWhitehead (2003) Bonnie 6% stayed in public shelters,16% stayed in hotels/motels, and 70% stayed with peersLindell et al. (2011) Lili 3% stayed in public shelters, 29% stayed in hotels/motels, and 54% stayed with peers
Evacuation durations Lindell et al. (2011) Lili Average of 2.33 days
Evacuation costs Whitehead (2003) Bonnie Evacuees in hotels/motels spent US$ 381, those staying with peers spent US$ 123, andthose in public shelters spent US$ 121
Siebeneck and Cova (2008) Rita Evacuees spent US$ 228 to evacuate, US$ 867 to stay, and US$ 148 to returnLindell et al. (2011) Lili Evacuees in hotels/motels spent US$ 319, those staying with peers spent US$ 161, and
those in public shelters spent US$ 277
H.-C. Wu et al. / Transportation Research Part F 15 (2012) 445–461 447

Author's personal copy
percentage of evacuees staying in hotels/motels or with friends/relatives but the former range from 16% to 29% and the latterfrom 54% to 70% (Lindell et al., 2011; Whitehead, 2003).
Evacuation durations have rarely been reported but Lindell et al. (2011) indicated that Hurricane Lili evacuees remainedaway from home for an average of 2.33 days. Finally, data on evacuation costs are also sparse and have been reported inincompatible ways. Whitehead (2003) reported that Hurricane Bonnie evacuees staying in hotels/motels spent an averageof US$ 381, those staying with friends/relatives spent US$ 123, and those staying in public shelters spent US$ 121. In Sieb-eneck and Cova’s (2008) study of Hurricane Rita, evacuees reported spending US$ 228 to evacuate, US$ 867 to stay, and US$148 to return. During Hurricane Lili, evacuees staying in hotels/motels spent US$ 319, those staying with friends/relativesspent US$ 161, and those staying in public shelters spent US$ 277 (Lindell et al., 2011).
In summary, a number of studies have addressed specific aspects of evacuation logistics, but few have examined this topiccomprehensively. This is an important oversight because a more complete understanding of households’ evacuation logisticscould lead to more effective management of evacuations, shelter operations, and reentry. Moreover, most studies of hurri-cane evacuation logistics have been limited by reporting only means and percentages aggregated across all jurisdictions.Thus, is has not been possible to identify the correlates of evacuation logistics variables. Nor has it been possible to deter-mine if there are systematic differences in household evacuation logistics between urban and rural counties or betweencoastal and inland counties. Therefore, this study will analyze household evacuation logistics in nine counties/parishes thatconducted evacuations during Hurricanes Katrina and Rita. The analyses will test four hypotheses, the first three of whichwere previously supported by data from the Hurricane Lili evacuation (Lindell et al., 2011). The fourth hypothesis providesan explanation for some of the differences among counties that Lindell et al. (2011) found.
H1: Household distance from the coast will be significantly related to evacuation departure time, route informationsources, vehicle use, and evacuation distance and travel times.H2: Demographic variables will be significantly related to evacuation vehicle access, evacuation vehicle use, and shelteraccommodation type.H3: Shelter accommodation type will be related to food and lodging cost.H4: County/parish distance from the coast will be significantly related to evacuation departure time, route informationsources, vehicle use, destination and route, distance and travel time, shelter accommodations, and evacuation durationand cost.
There are four research questions, all of which examine whether nonsignificant correlations in Hurricane Lili (Lindellet al., 2011) are significant in Hurricanes Katrina and Rita.
RQ1: Is distance from the coast significantly related to shelter accommodations, evacuation duration, and evacuationcosts?RQ2: Is evacuation departure time related to vehicle use, evacuation distance and travel time, shelter accommodations,evacuation duration, and cost?RQ3: Is evacuation distance related to evacuation travel time, additional travel time, evacuation duration, and evacuationcost?RQ4: Are demographic variables related to evacuation departure times, evacuation route information sources, evacuationdistances and travel times, evacuation durations, and evacuation costs?
2. Method
This research is based on surveys of Hurricane Katrina and Hurricane Rita evacuees conducted by the Texas A&M Univer-sity Hazard Reduction & Recovery Center during 2006, beginning approximately 4 months after those hurricanes struck.These questionnaires included demographic items, evacuation departure times, evacuation route information sources, evac-uation vehicle use, evacuation routes, evacuation destinations, evacuation distances and times, shelter accommodations,evacuation durations, and evacuation costs.
2.1. Sample
Hurricane Katrina questionnaires were mailed to two Louisiana parishes—Jefferson and St. Charles (see Fig. 1). HurricaneRita questionnaires were mailed to seven Texas counties—Galveston and Harris in the Galveston Study Area (GSA) andHardin, Jasper, Jefferson, Newton, and Orange in the Sabine Study Area (SSA). The sample was disproportionately stratifiedwith approximately 400 households per county/parish. Consistent with Dillman (2000), each household was sent an initialquestionnaire and non-respondents were sent a reminder postcard and as many as two replacement questionnaires. Ques-tionnaires were sent to a total of 3601 households and 1265 of them (30.9%) returned usable questionnaires. This responserate is higher than those obtained in some other studies of coastal residents (25.8% by Zhang et al. (2004); 22.4% by Lindell etal. (2001)), but lower than the 50.5% response rate for the survey used in the studies of Hurricane Lili evacuation decisions(Lindell et al., 2005) and logistics (Lindell et al., 2011).
448 H.-C. Wu et al. / Transportation Research Part F 15 (2012) 445–461

Author's personal copy
2.2. Measures
Respondents were asked to check the date they evacuated. After the questionnaires were received, the departure date wascompared to the date of hurricane landfall (29 August for Katrina and 24 September for Rita) and then recoded as 1 (= 3 daysbefore landfall), 2 (= 2 days before landfall), 3 (= 1 day before landfall), or 4 (= the day of landfall). The sources of evacuationroute information were measured by five items: (1) familiarity with the route based on past experience; (2) evacuation mapsor other written materials received before the hurricane; (3) recommendations by the news media during the event; (4)directions from police or transportation officials on the evacuation route; and (5) traffic conditions encountered on the evac-uation route. Each item was rated on a scale from 1 (= Not at all) to 5 (= Very great extent). Evacuation transportation wasmeasured by four variables: (1) number of registered vehicles; (2) number of vehicles taken; (3) number of trailers taken;and (4) evacuation transportation mode used if a household did not take its own vehicles (e.g. rode with someone else, usedpublic transit, or other). Respondents’ evacuation destinations and evacuation route were open-ended items. Evacuation des-tinations were recorded verbatim for Baton Rouge, Lafayette, Houston, or Dallas/Ft. Worth. Other destinations were coded byregion (see Fig. 2). Specifically, locations south of I-10 were coded as Coastal LA, locations north of US-84 were coded as NorthLA, and locations between I-10 and US-84 were coded as Central LA. Texas locations south of US-90 (east of Houston) andUS-59 (west of Houston) were coded as Coastal TX, locations east of I-45 between US-90 and US-80 were coded as EastTX, locations between I-45, US-281, and US-59 were coded as Central TX, locations north of US-80 and US-180 were codedas North TX, and other TX destinations were coded as West TX. All destinations outside these two states were coded as OtherStates.
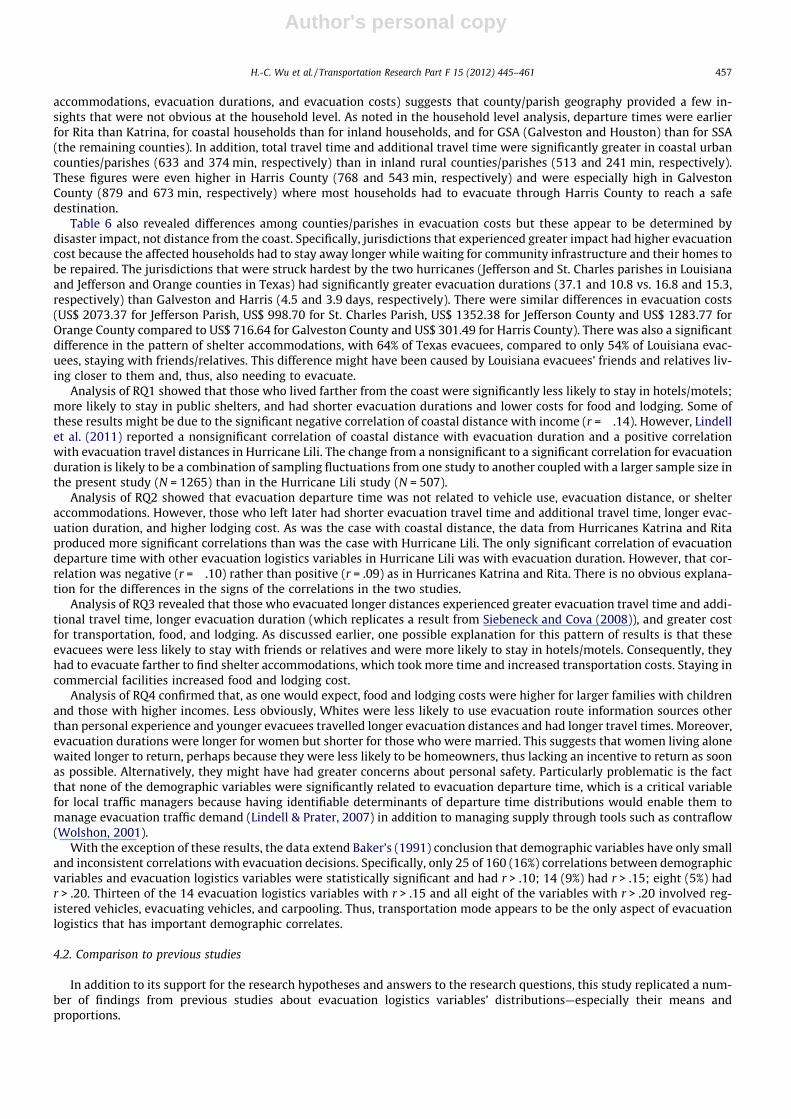
Evacuation routes were coded as the first major highway the respondent listed (see Fig. 3). Evacuation distance is theself-reported number of miles from the respondent’s home to the evacuation destination, evacuation travel time is theself-reported number of minutes that the household took to reach its ultimate destination, and additional travel time isthe self-reported number of minutes more than the normal travel time to that destination (regardless of the route taken)that were required during the evacuation. Evacuation duration is the number of days spent away from home. Evacuationshelter type was reported as the home of friend/relative, a commercial facility (hotel/motel), public shelter, or other. Evac-uation costs were reported separately for transportation, food, lodging, and other. Total cost was computed as the sum ofthese four entries.
Respondents reported their demographic characteristics at the end of the questionnaire. These were age, gender (Male = 0,Female = 1), ethnicity (African American, Asian/Pacific Islander, Caucasian, Hispanic, Native American, Mixed, Other), marital sta-
Fig. 2. Most common evacuation destinations.
H.-C. Wu et al. / Transportation Research Part F 15 (2012) 445–461 449

Author's personal copy
tus (married, single, widowed, divorced), household size, highest level of education (some high school = 1, high school graduate/GED = 2, some college/vocational school = 3, college graduate = 4, graduate school = 5), yearly household income (less than$15,000 = 1; $15,000–24,999 = 2; $25,000–34,999 = 3; $35,000–49,999 = 4; more than $50,000 = 5), and home ownership(renter = 0; owner = 1). After inspecting the ethnicity and marital status distributions, the former was recoded as White (=1) vs. Other (= 0) and the latter was recoded as Married (= 1) vs. Other (= 0).
3. Results
This section begins by describing evacuees’ typical responses to these hurricanes in terms of the means and proportionsfor the questionnaire variables. This is followed by a presentation of the tests of the research hypotheses and researchquestions.
3.1. Typical response to the hurricanes
Table 2 shows the mean (M), standard deviation (SD), and number of responses (N), for each variable. Similar to other mailsurveys, this one over-represented older, White, married, homeowners. However, household size, gender, education, and in-come were consistent with the demographic characteristics of these areas. On average, the respondents had at least somecollege/vocational school education level and yearly household income was US$ 25,000–34,999.
Twenty-one percent of the respondents evacuated 3 days before hurricane landfall (4% in Katrina; 25% in Rita), 51% evac-uated 2 days before hurricane landfall (43% in Katrina; 53% in Rita), 26% evacuated 1 day before (50% in Katrina; 19% in Rita),and only 1% evacuated on the day of hurricane landfall (.8% in Katrina; 1% in Rita).
Respondents chose their evacuation routes more by their familiarity with it based on past experience (M = 3.4) than ontraffic conditions encountered on the evacuation route (M = 3.2). They tended to rely significantly less on recommendationsby news media during the event (M = 2.3) and directions from police/transportation officials on their evacuation routes(M = 2.2) and least on evacuation maps/other written materials received before the hurricane (M = 1.9). Remarkably, 64%of the respondents chose ‘‘not at all’’ on the latter item.
Eighty-nine percent of evacuees took their own cars, for an average of 1.42 vehicles per household (i.e., 66% of the 2.15registered vehicles per household) and .12 trailers per household. For those households that did not take their own cars, 71%
Fig. 3. Most common evacuation routes.
450 H.-C. Wu et al. / Transportation Research Part F 15 (2012) 445–461

Author's personal copy
rode with someone else and 28% used another form of transportation. Only 3% of the evacuees took public transit toevacuate.
As Table 3 indicates, less than 1% of Louisiana evacuees stayed within their own parishes, 10% went to other locations inCoastal LA, 32% went to major cities (Baton Rouge, Lafayette, Houston), 14% went to Central LA, 5% went to North LA, and 39%went out of state. Thirty-four percent of Katrina evacuees took Interstate 10 as their major evacuation route but US 90 (16%)was also heavily used (see Fig. 3). As Table 4 indicates, less than 1% of Texas evacuees stayed within their own counties, 2%went to other locations in Coastal TX, 41% went to East TX, 20% went to Central TX, 11% went to North Texas, 6% went toDallas/Ft. Worth, 3% went to West TX, and 18% went out of state. The evacuation demand differed between GSA and SSA,with GSA evacuees taking I-45 (33%) as well as a variety of other routes (67%). SSA residents were scattered over I-10 (Jef-ferson and Orange counties), TX-87 (Newton and Orange counties), US-96 (Jasper and Hardin counties), and US-69 (Jeffersonand Hardin counties).
As Table 2 indicates, Louisiana evacuees travelled longer distances than Texas evacuees (426 km/266 miles vs. 319 km/199 miles, respectively). However, Louisiana evacuees took less time than did Texas evacuees to reach their evacuation des-tinations (508 min vs. 653 min, respectively). Moreover, Table 2 indicates that the difference between evacuation travel timeand normal travel time to the same destination was also substantially shorter for Louisiana evacuees than for those fromTexas (180 min vs. 417 min, respectively). However, Table 5 indicates that there were notable differences within states, withJefferson Parish evacuees encountering greater delays than St. Charles Parish evacuees and GSA (Galveston and Houstoncounty) evacuees encountering greater delays than SSA evacuees.
As Table 2 indicates, most evacuees stayed with friends or relatives (61%), but some stayed in hotels/motels (18%), a fewstayed in public shelters (3%), and the remainder stayed in other locations. Overall, evacuees averaged 13.8 days away fromhome, resulting in average evacuation costs of US$ 341 for transportation, US$ 333 for food, and US$ 405 for lodging. In total,evacuating households spent an average of US$ 1137 per household.
Table 2Means, standard deviations, and sample sizes.
Variable M SD N Description
1. Age 53.53 15.18 1258 Respondents’ age2. Female 0.48 0.50 1265 Female gender3. White 0.77 0.42 1242 Respondents’ ethnicity4. Married 0.69 0.46 1256 Respondents’ marital status5. HHSize 2.72 1.61 1201 Total number of persons in household6. Children 0.92 1.17 915 Number of children under 187. Educ 3.04 1.14 1245 Respondents’ education8. Income (US $1000) 37.85 12.94 1149 Annual household income in thousands of US dollars9. HmOwn 0.87 0.34 1237 Homeowner10. DistCst 32.75 23.35 1153 Straight line distance to coast11. EvacDay 2.08 0.72 1030 Date of evacuation12. PersExp 3.39 1.71 996 Personal experience with the route13. WritMat 1.86 1.35 955 Written materials received before the hurricane14. RecMed 2.28 1.48 967 News media recommendations during the hurricane15. RecOff 2.20 1.55 961 Officials’ recommendations during the hurricane16. TrfCon 3.16 1.67 973 Traffic conditions enroute17. RegVeh 2.15 0.99 1054 Number of registered vehicles18. VehNum 1.42 0.76 1056 Number of vehicles taken19. TrlrNum 0.12 0.36 1032 Number of trailers taken20. Pooled 0.71 0.46 116 Rode with someone else21. PubTrsp 0.03 0.18 116 Used public transportation22. EvacDist (km/miles) 344.67/214.17 264.35/164.26 1004 Direct distance from home to evacuation destination
EvacDist: LA/Katrina 428.76/266.42 292.48181.74 224EvacDist: TX/Rita 320.53199.17 250.74/155.80 780
23. TravTot (min) 620.12 494.49 987 Total evacuation travel timeTravTot: LA (min) 508.37 397.69 224TravTot: TX (min) 652.94 515.14 763
24. TravAdd(min) 363.59 541.40 960 Difference between evacuation and normal travel timeTravAdd: LA (min) 180.47 660.91 217TravAdd: TX (min) 417.07 488.89 743
25. FrRelHom 0.61 0.49 1031 Stayed with friends or relatives26. HotelMotel 0.18 0.38 1031 Stayed in a hotel or motel27. PubShltr 0.03 0.18 1031 Stayed in a public shelter28. EvacDur (days) 13.75 23.35 1029 Number of days evacuated29. CostTran (US$) 340.99 577.15 934 Transportation cost30. CostFood (US$) 333.48 391.55 883 Food cost31. CostLodg (US$) 405.16 668.31 615 Lodging cost32. CostTotal (US$) 1136.67 1848.29 947 Total evacuation cost
H.-C. Wu et al. / Transportation Research Part F 15 (2012) 445–461 451

Author's personal copy
3.2. Tests of the research hypotheses and research questions
Table 6 shows the intercorrelations among all the variables. Partially consistent with H1, household distance from thecoast was significantly correlated with two of the five evacuation route information sources—reliance on written materialsin advance (r = �.08) and media recommendations (r = �.07). Notably, most of the sources of evacuation routes informationwere positively correlated with each other (.02 6 r 6 .52). That is, evacuees tended to use multiple sources to choose theirevacuation routes. However, those who relied on past experience to choose their evacuation routes were less likely to seekinformation from other sources (.02 6 r 6 .13). Coastal distance was also significantly correlated with evacuation departuretime (r = .11), evacuation distance (r = �.08), evacuation travel time (r = �.11), and additional travel time (r = �.07).
H2 was partially supported by some significant correlations of demographic variables with the number of registeredvehicles, number of vehicles taken, carpooling with others, and shelter accommodations. Specifically, younger, male, White,married homeowners with larger households, higher educations, and higher incomes had more registered vehicles(.09 6 |r| 6 .38) and took more vehicles when evacuating (.06 6 |r| 6 .24). As one would expect, the reverse pattern was
Table 3Choice of evacuation destination and route by parish in Louisiana (Katrina).
Parish Destinations Routes
NorthLA (%)
CentLA (%)
CoastLA (%)
Houston(%)
Lafayette(%)
BatonRouge (%)
OwnParish (%)
OtherState (%)
MultDest (%)
Total(N)
I-10(%)
I-55(%)
I-49(%)
US-61(%)
US-90(%)
Other(%)
Total(N)
Jefferson 3 14 7 12 4 8 1 50 1 106 43 10 5 6 10 25 99St. Charles 7 13 13 13 10 15 0 28 1 120 26 14 10 12 22 16 120
Total 5 14 10 13 7 12 0 39 1 226 34 12 8 9 16 20 207v2 = 16.87, p < .01 v2 = 15.93, p < .01
Table 4Choice of evacuation destination and route by county in Texas.
County Destinations Routes
EastTX(%)
CentTX(%)
NorthTX (%)
WestTX(%)
CoastTX (%)
Dallas/FortWorth(%)
OwnCty(%)
OtherState(%)
MultDest(%)
Total(N)
I-10(%)
SH-87(%)
US-96(%)
US-69(%)
I-45(%)
Other(%)
Total(N)
Galveston 28 42 8 4 6 6 1 5 1 127 0 0 0 0 38 63 120Harris 27 40 10 6 2 6 2 8 0 52 0 0 0 0 20 80 49Hardin 47 14 12 3 1 5 0 17 1 138 2 3 35 34 0 26 116Jasper 44 8 9 4 0 7 0 25 3 106 0 11 59 9 0 21 95Jefferson 53 12 4 1 2 6 0 21 1 140 20 6 19 35 1 20 127Newton 46 12 14 2 2 1 0 22 0 85 5 43 12 11 0 29 75Orange 37 18 10 2 1 5 1 26 1 148 14 38 13 4 0 31 135
Total 41 20 9 3 2 5 0.3 18 1 796 7 14 21 15 8 35 717v2 = 120.52, p < .001 v2 = 679.50, p < .001
Table 5Variables with significant differences by county/parish.
County/parish Directions frompolice/officials
Evacuation distance(mile)
Additional travel time(min)
Evacuation duration(day)
Total evacuation cost(US $)
M SD N M SD N M SD N M SD N M SD N
Galveston County (CU) 2.2 1.6 120 184.46 142.32 126 673.33 655.74 120 4.48 2.02 129 716.64 1215.56 119Jefferson County (CU) 2.5 1.7 135 199.00 143.02 138 509.05 506.53 129 16.81 12.33 138 1352.38 1427.37 134Orange County (CU) 2.4 1.6 132 211.05 134.02 145 345.33 396.99 140 15.25 13.65 150 1283.77 1338.11 134Jefferson Parish (CU) 2.3 1.5 101 302.09 201.23 105 268.64 438.45 99 33.12 24.99 103 2073.37 1974.46 102Harris County (IU) 1.7 1.3 52 226.18 204.38 51 543.09 435.80 46 3.90 3.04 57 301.49 476.01 41Hardin County (IR) 2.4 1.6 128 205.82 164.65 135 370.20 432.01 128 13.37 23.34 137 937.75 1068.32 121Jasper County (IR) 1.8 1.4 95 204.16 191.13 102 187.96 314.69 99 11.54 13.92 108 1249.01 4110.02 100Newton County (IR) 2.2 1.6 82 167.49 130.71 83 298.98 397.76 79 9.83 11.22 86 746.52 928.27 81St. Charles Parish (IR) 1.8 1.2 114 234.95 156.84 119 106.95 799.20 117 10.79 17.22 121 998.70 932.01 115
Total 2.2 1.6 959 214.17 164.26 1004 364.18 542.06 957 13.66 17.48 1029 1136.67 1848.29 947F8,950 = 4.06,p < .001
F8,995 = 5.85, p < .001 F8,975 = 10.51, p < .001 F8,1020 = 29.96,p < .001
F8,938 = 6.44, p < .001
C = coastal, I = inland, U = urban, R = rural.
452 H.-C. Wu et al. / Transportation Research Part F 15 (2012) 445–461

Author's personal copy
Table 6Intercorrelations among variables.
1 2 3 4 5 6 7 8 9 10 11 12 13 14 15 16 17 18 19 20 21 22 23 24 25 26 27 28 29 30 31
1. Age –2. Female �12 –3. White 05 �09 –4. Married �09 �20 10 –5. HHSize �35 00 �04 31 –6. Children �41 01 �10 15 63 –7. Educ �14 �04 09 08 01 02 –8. Income �27 �15 23 41 12 11 43 –9. HmOwn 15 �07 08 24 02 02 02 17 –10. DistCst 06 02 �03 00 �03 �06 �10 �14 10 –11. EvacDay �01 �03 00 �02 01 �03 00 �04 01 11 –12. PersExp 07 �04 10 04 �08 �08 09 06 04 �01 04 –13. WritMat 02 01 �10 �02 �01 �05 04 �03 00 �08 �03 13 –14. RecMed 01 05 �15 �02 02 01 �05 �09 �06 �07 03 09 52 –15. RecOff �01 05 �11 �02 01 01 �04 �05 �04 02 03 02 37 52 –16. TrfCon 01 07 �04 02 03 09 �03 �08 �03 03 03 06 13 29 26 –17. RegVeh �15 �15 09 38 37 15 12 38 19 �02 02 04 05 02 03 00 –18. VehNum �16 �02 08 19 24 04 07 19 06 �05 �04 03 07 06 06 01 45 –19. TrlrNum �03 �08 03 08 04 09 00 07 04 �04 �03 01 07 00 00 01 17 22 –20. Pooled 44 19 03 �30 �15 �18 �22 �35 03 �19 �10 �16 �23 07 01 �15 �11 �19 00 –21. PubTrsp �12 �12 11 05 09 08 02 12 01 01 06 �16 �06 �14 �13 02 04 02 �04 �29 –22. EvacDist �10 01 06 �04 05 01 04 01 �07 �08 01 �07 02 �04 �07 �03 �01 �10 �03 �22 13 –23. TravTot �09 03 �06 01 08 08 03 �01 �10 �11 �09 �16 11 14 21 21 03 06 04 �15 06 33 –24. TravAdd �07 �01 �08 04 08 06 03 04 �08 �07 �11 �15 08 16 24 21 09 06 07 �09 03 12 80 –25. FrRelHom 05 03 05 �08 �11 �10 01 00 01 06 �04 08 �02 00 07 02 �09 00 �04 24 02 �07 �07 �04 –26. HotelMotel �08 �01 02 07 12 09 04 08 �06 �17 01 �09 01 �06 �05 �01 03 02 �06 �02 09 18 08 02 �58 –27. PubShltr �04 00 �16 �03 06 03 �09 �12 �01 08 01 �06 02 03 00 00 �02 �02 02 �20 �05 �02 00 03 �23 �08 –28. EvacDur �02 08 �01 �17 01 01 00 �10 �14 �10 09 05 �03 12 00 04 �10 �08 01 19 07 15 02 �02 00 00 06 –29. CostTran 00 �04 �03 03 00 04 01 02 03 �06 03 01 05 06 04 �01 01 06 03 �12 �05 08 02 �02 �10 10 �01 05 –30. CostFood �02 �04 00 07 12 11 10 12 01 �12 03 �01 06 04 06 �05 06 05 �02 �07 �05 15 �01 �05 �18 16 05 24 36 –31. CostLodg �06 �06 01 04 12 19 04 10 �02 �13 11 �05 00 08 06 01 00 00 �03 �08 �01 21 09 05 �32 30 03 34 31 47 –32. CostTotal �01 �07 02 06 05 07 05 05 01 �04 10 �01 01 03 02 �02 01 03 02 �06 �09 13 05 02 �16 17 �01 14 47 52 74
Italicized correlations are statistically significant at p < .05.
H.-C.W
uet
al./TransportationR
esearchPart
F15
(2012)445–
461453

Author's personal copy
associated with carpooling with others (.19 6 |r| 6 .44). Older evacuees (r = .44) were more likely, whereas married(r = �.30), more highly educated (r = �.22), and higher income (r = �.35) evacuees were less likely, to use carpools.
Married evacuees (r = �.08) and those with larger households (r = �.11) and children (r = �.10) were less likely to staywith friend/relatives, whereas younger (r = .08), married (r = .07) evacuees with larger households (r = .12) and children(r = .09), and those with higher incomes (r = .08) were more likely to stay in hotels/motels. Whites (r = �.16), and evacueeswith higher education (r = �.09) and income (r = �.13) tended to avoid public shelters. Married evacuees (r = .07), and thosewith larger households (r = .12), children (r = .11), and higher education (r = .10) and income (r = .12) spent more on food;those with larger households (r = .12), children (r = �.19) and higher income (r = .10) spent more on lodging; and females(r = �.07) reported lower total costs. Finally, there was a tendency for the different evacuation costs to have significant po-sitive correlations with each other (.05 6 r 6 .47).
In partial support of H3, those staying with friends and relatives paid less for transportation (r = �.10), food (r = �.18),lodging (r = �.32), and total cost (r = �.16). Conversely, those staying in hotels/motels paid more for transportation(r = .10), food (r = .16), lodging (r = .30), and total cost (r = .17). Surprisingly, there were no significant correlations for thosestaying in public shelters.
Tests of H4 revealed statistically significant differences among the counties on only one of the five items addressing evac-uation route information sources—directions from police or transportation officials (see Table 5). Jurisdictions reporting thelowest reliance on this source—Harris and Jasper counties and St. Charles Parish—are all inland jurisdictions. However, evac-uees in the other two inland jurisdictions, Hardin and Newton counties, relied on local officials just as much or more thanthose in the coastal jurisdictions, so there is no obvious pattern to explain the significant differences among counties.
Table 3 shows that evacuees from St. Charles Parish were similar to those from Jefferson Parish in many respects but theformer were more likely than the latter to evacuate to Lafayette and Baton Rouge (25% vs. 12%, respectively) and less likely toevacuate to other states (28% vs. 50%, respectively). They differed in their choice of evacuation routes. Almost half of theevacuees from Jefferson Parish chose I-10 as their major evacuation route (43%), whereas the evacuees from St. Charles Par-ish not only chose I-10 (26%), but also US-90 (22%) as their major evacuation routes. Twenty percent of the Louisiana evac-uees used only minor evacuation routes.
Table 4 shows that Texas evacuees’ choices of evacuation destinations and evacuation routes differed more by jurisdictionthan did evacuees in Louisiana—probably because of the 144 km (90 miles) distance from east (Orange and Jasper counties)to west (Galveston and Harris counties). As was the case in Hurricane Katrina, very few evacuees from SSA (Jefferson, Jasper,Newton, Hardin, and Orange counties) stayed in their own counties (<1%) or went to other coastal locations (1%). Instead,they were more likely to evacuate directly north to East Texas (45%) and, to a lesser extent, Central Texas (13%). Therewas a modest (22%) level of evacuation out of state. The evacuation routes used from SSA were quite variable, with no dis-cernible pattern evident among the major evacuation routes. However, many SSA evacuees did use minor evacuation routes(20–31%).
Like the SSA evacuees, few GSA evacuees went to other locations within their own counties (1%) but, unlike the SSA evac-uees, very few GSA evacuees went out of state (6%). GSA evacuees were most likely to go directly north to Central TX (41%)and, to a lesser extent, East TX (28%). Many GSA evacuees used I-45 (Harris—20% and Galveston—38%) but they used minorevacuation routes (Harris—80% and Galveston—63%) even more extensively.
There were significant differences among counties in the use of shelter accommodations. Table 7 shows that Louisianaevacuees were more likely to stay in hotels/motels whereas Texas evacuees were more likely to stay with friends/relatives.Many evacuees in both states stayed in other accommodations (e.g., vacation homes and recreational vehicles) and fewstayed in public shelters.
Table 5 shows there were also significant differences among counties in evacuation duration and evacuation cost. Jeffer-son Parish, a coastal county close to Katrina’s landfall, had the longest duration (M = 33.12 days) and highest cost (M = US$2073.37). Similarly, Jefferson and Orange counties, close to Rita’s landfall, had the next longest durations (M = 16.81 and
Table 7Choice of shelter accommodations by county/parish.
County/parish Shelter type
FrRelHom (%) HotelMotel (%) PubShltr (%) Other (%) Total (N)
Jefferson Parish 54 27 1 18 105St. Charles Parish 53 35 4 8 120Hardin County 63 12 1 23 134Jasper County 62 11 6 20 108Jefferson County 60 16 4 20 141Newton County 64 10 5 22 88Orange County 64 13 3 20 152Galveston County 67 21 1 11 126Harris County 70 7 4 19 54
Total 61 18 3 18 1028v2 = 66.71, p < .001
454 H.-C. Wu et al. / Transportation Research Part F 15 (2012) 445–461

Author's personal copy
15.25 days, respectively) and highest costs (M = US$ 1352.38 and 1283.77, respectively). Galveston and Harris counties,which were nearly 100 miles west of Rita’s landfall, had the shortest duration (M = 4.48 and 3.90 days, respectively) and cost(M = US$ 716.64 and 301.49, respectively). Moreover, Table 6 shows that, as one might expect, evacuation duration was sig-nificantly correlated with the cost of food and lodging but not transportation. An analysis of evacuation cost per day foundnonsignificant differences among counties/parishes.
As Table 6 indicates, the analysis of RQ1 showed that those who lived farther from the coast were less likely to stay in ahotel/motel (r = �.17) and more likely to stay in a public shelter (r = .08). Those who lived farther from the coast had shorterevacuation durations (r = �.10) and also lower expenses for food (r = �.12) and lodging (r = �.13).
The analysis of RQ2 showed that evacuees’ departure time was not significantly related to vehicle use or evacuation dis-tance, but was related to evacuation travel time (r = �.09), additional travel time (r = �.11), evacuation duration (r = .09), andlodging cost (r = .11). Moreover, evacuation departure time was significantly related to evacuation destination and routes inboth Louisiana (Table 8) and Texas (Table 9). Three days before landfall, Texas evacuees relied principally on I-45 and otherroutes to travel to Other Texas destinations. On the next 2 days, however, Texas evacuees primarily used SH-87, US-96, andUS-69 on their way to East Texas. These data reflect a shift in the focus of the evacuations from the Houston/Galveston areato the Lake Sabine area as Rita’s projected point of landfall moved eastward along the coast.
The analysis of RQ2 also showed differences in evacuees’ additional travel time and other evacuation cost as a function ofevacuation departure time. As Table 10 indicates, the relationship between evacuation departure time and additional traveltime was curvilinear, with those who evacuated 2 days before landfall (i.e., the day of the hurricane warning) having the lon-
Table 8Choice of evacuation destinations and routes by evacuation departure day in Louisiana.
Departureday
Destinations Routes
NorthLA(%)
CentralLA (%)
CoastalLA (%)
Houston(%)
Lafayette(%)
BatonRouge(%)
OwnParish(%)
OtherState(%)
MultiDest(%)
Total(N)
I-10(%)
I-55(%)
I-49(%)
US-61(%)
US-90(%)
Other(%)
Total(N)
3 days before 0 18 18 0 18 0 0 45 0 11 45 9 18 9 9 18 112 days before
(warning)3 18 10 15 3 12 0 38 0 97 39 15 8 9 17 29 97
1 day before 5 10 9 13 9 13 1 39 2 111 30 11 4 9 19 24 112Landfall 100 0 0 0 0 0 0 0 0 2 0 0 100 0 0 0 2
Total 5 14 10 13 7 12 0 38 1 221 34 12 7 8 17 25 222v2 = 53.92, p < .001 v2 = 38.57, p < .01
Table 9Choice of evacuation destinations and routes by evacuation departure day in Texas.
Departure day Destinations Routes
EastTX(%)
CentralTX (%)
NorthTX(%)
WestTX(%)
CoastalTX (%)
Dallas/FortWorth(%)
OwnCty(%)
OtherState(%)
MultiDest(%)
Total(N)
I-10(%)
SH-87(%)
US-96(%)
US-69(%)
I-45(%)
Other(%)
Total(N)
3 days before 33 32 9 3 2 8 0 11 1 201 7 7 10 11 21 45 1842 days before
(warning)44 14 9 3 1 4 0.5 22 1 414 7 19 21 18 4 31 383
1 day before 47 16 9 2 2 4 0 19 1 149 6 14 31 12 2 35 127Landfall 33 17 8 0 8 8 0 17 8 12 10 10 50 0 0 30 10
Total 42 19 9 3 2 5 0.3 19 1 776 7 14 21 15 8 35 704v2 = 55.06, p < .001 v2 = 97.08, p < .001
Table 10Variables that differed significantly by departure day.
Departure day Additional travel time (min) Other cost (US $)
M SD N M SD N
3 days before 404.6 551.4 199 400.5 671.0 732 days before (warning) 418.0 456.3 489 458.1 571.9 1941 day before 257.2 654.5 242 631.9 1004.2 92Landfall 189.7 176.4 12 8145.0 17808.3 5
Total 371.0 535.9 942 596.1 2194.0 364F3,938 = 5.64, p < .001 F3,360 = 24.03, p < .001
H.-C. Wu et al. / Transportation Research Part F 15 (2012) 445–461 455

Author's personal copy
gest additional travel time—418 min. Those who evacuated on the day of hurricane landfall spent substantially more onother costs (US$ 8145), but the number of respondents reporting cost data for this departure date is too small (N = 5) for thisfigure to be considered reliable.
The tests of RQ3 showed those who travelled greater evacuation distances had significantly greater evacuation travel time(r = .33) and additional travel time (r = .12). Moreover, those who travelled greater evacuation distances were significantlyless likely to stay with friends/relatives (r = �.07) and more likely to stay in hotels/motels (r = .18). In addition, they hadlonger evacuation durations (r = .15), and higher costs for transportation (r = .08), food (r = .15), lodging (r = .21), and totalcost (r = .13).
Finally, the correlations in Table 6 that address RQ4 revealed that none of the demographic variables were significantlyrelated to evacuation departure time, and only White ethnicity was consistently correlated with reliance on evacuation routeinformation sources—with more reliance on past experience (r = .10) and less reliance on written materials beforehand(r = �.10), news media (r = �.10), and local officials (r = �.15). Moreover, age was negatively related to having a registeredvehicle (r = �.15) and, thus, positively related to carpooling when evacuating (r = .44). Age was associated with smaller evac-uation distance, travel time, and additional travel time (r = �.10, �.09, and �.07, respectively), as was homeownership(r = �.07 �.10, and �.08, respectively). Married evacuees, larger households, and those with children were less likely to staywith friends/relatives (r = �.08, �.11, and �.10, respectively) and more likely to stay in hotel/motels (r = .07, .12, and .09,respectively). Females reported longer (r = .08) and married evacuees reported shorter (r = �.17) evacuation durations. Mar-ried evacuees (r = .07), larger households (r = .12), and those with children (r = .11), higher education (r = .10) and higher in-come (r = .12) had higher food costs. Larger households (r = .12), and those with children (r = .19), and higher income (r = .10)had higher lodging costs.
4. Discussion
This section is divided into two parts, the first of which discusses the results of the research hypotheses and researchquestions. This first part focuses on the correlations among variables. The second part focuses on the consistency of the re-sults of this study with the results of previous studies. Since previous studies of evacuation logistics did not address corre-lations among variables, this part focuses on variables’ means and proportions.
4.1. Research hypotheses and research questions
The support for H1 (household distance from the coast will be significantly related to evacuation departure time, evac-uation route information sources, vehicle use, and evacuation distance) is important for a number of reasons. The fact thatcoastal distance was positively correlated with evacuation departure time means that those who are farther inland tend toenter the evacuation route system later than those who are closer to the coast. Thus, there is a tendency for both sets of evac-uees to compete for the same inland sections of the evacuation route system at the same time. This is consistent with resultsfrom Lindell et al. (2011) and also with news media accounts of the Hurricane Rita evacuation in which miles of motionlesscars could be seen north of Houston where coastal and inland residents converged simultaneously on the freeways to inlandlocations. Although the traffic queues were unpleasant and, in some cases, lethal to people who succumbed to the heat, theywere far inland from areas affected by storm surge and the most severe wind speeds. The finding that those farther from thecoast were also less likely to heed pre-impact written materials and media recommendations has practical implicationsbecause those who are most likely to contribute to evacuation shadow will be less susceptible to outside influences that dis-courage unnecessary evacuation. These findings indicate that local authorities need strategies for discouraging spontaneousevacuees (Stein, Dueñas-Osorio, & Subramanian, 2010).
The support for H2 (demographic variables will be significantly related to evacuation vehicle access, evacuation vehicleuse, and shelter accommodation type) is potentially important because it identifies population segments that are most likelyto have difficulty in evacuation. By far the largest of these correlations involved the lack of vehicle access and, consequently,carpooling by older unmarried residents with low education and income. This finding complements the previously recog-nized problem of evacuating ethnic minorities from coastal cities (Litman, 2006; Wolshon, 2002) by indicating that the prob-lem of limited mobility extends to other categories of evacuees living in suburban and rural areas. Otherwise, thecorrelations, though statistically significant because of the large sample size (maximum N = 1265), are small.
The findings related to H3 (shelter accommodation type will be related to food and lodging cost) might seem to confirmthe obvious because food and lodging costs were negatively correlated with staying with friends/relatives and positively cor-related with staying in hotels/motels, household size, presence of children, and income. However, it was surprising that thecorrelation of shelter accommodations with food cost was lower than the correlation with lodging cost, which suggests thatsome people manage to economize on food costs when they stay in commercial lodging facilities. Nonetheless, food andlodging costs were significantly correlated with each other and also with transportation cost, evacuation distance, and evac-uation duration. Unexpectedly, however, food and lodging cost was higher for those who lived closer to the coast, whichappears to be due to the fact that these evacuees left earlier, evacuated farther, stayed in hotels/motels rather than withfriends/relatives, and stayed away longer.
The modest level of support for H4 (county/parish distance from the coast will be significantly related to evacuationdeparture times, evacuation route information sources, evacuation vehicle use, evacuation distances and travel times, shelter
456 H.-C. Wu et al. / Transportation Research Part F 15 (2012) 445–461
Author's personal copy
accommodations, evacuation durations, and evacuation costs) suggests that county/parish geography provided a few in-sights that were not obvious at the household level. As noted in the household level analysis, departure times were earlierfor Rita than Katrina, for coastal households than for inland households, and for GSA (Galveston and Houston) than for SSA(the remaining counties). In addition, total travel time and additional travel time were significantly greater in coastal urbancounties/parishes (633 and 374 min, respectively) than in inland rural counties/parishes (513 and 241 min, respectively).These figures were even higher in Harris County (768 and 543 min, respectively) and were especially high in GalvestonCounty (879 and 673 min, respectively) where most households had to evacuate through Harris County to reach a safedestination.
Table 6 also revealed differences among counties/parishes in evacuation costs but these appear to be determined bydisaster impact, not distance from the coast. Specifically, jurisdictions that experienced greater impact had higher evacuationcost because the affected households had to stay away longer while waiting for community infrastructure and their homes tobe repaired. The jurisdictions that were struck hardest by the two hurricanes (Jefferson and St. Charles parishes in Louisianaand Jefferson and Orange counties in Texas) had significantly greater evacuation durations (37.1 and 10.8 vs. 16.8 and 15.3,respectively) than Galveston and Harris (4.5 and 3.9 days, respectively). There were similar differences in evacuation costs(US$ 2073.37 for Jefferson Parish, US$ 998.70 for St. Charles Parish, US$ 1352.38 for Jefferson County and US$ 1283.77 forOrange County compared to US$ 716.64 for Galveston County and US$ 301.49 for Harris County). There was also a significantdifference in the pattern of shelter accommodations, with 64% of Texas evacuees, compared to only 54% of Louisiana evac-uees, staying with friends/relatives. This difference might have been caused by Louisiana evacuees’ friends and relatives liv-ing closer to them and, thus, also needing to evacuate.
Analysis of RQ1 showed that those who lived farther from the coast were significantly less likely to stay in hotels/motels;more likely to stay in public shelters, and had shorter evacuation durations and lower costs for food and lodging. Some ofthese results might be due to the significant negative correlation of coastal distance with income (r = �.14). However, Lindellet al. (2011) reported a nonsignificant correlation of coastal distance with evacuation duration and a positive correlationwith evacuation travel distances in Hurricane Lili. The change from a nonsignificant to a significant correlation for evacuationduration is likely to be a combination of sampling fluctuations from one study to another coupled with a larger sample size inthe present study (N = 1265) than in the Hurricane Lili study (N = 507).
Analysis of RQ2 showed that evacuation departure time was not related to vehicle use, evacuation distance, or shelteraccommodations. However, those who left later had shorter evacuation travel time and additional travel time, longer evac-uation duration, and higher lodging cost. As was the case with coastal distance, the data from Hurricanes Katrina and Ritaproduced more significant correlations than was the case with Hurricane Lili. The only significant correlation of evacuationdeparture time with other evacuation logistics variables in Hurricane Lili was with evacuation duration. However, that cor-relation was negative (r = �.10) rather than positive (r = .09) as in Hurricanes Katrina and Rita. There is no obvious explana-tion for the differences in the signs of the correlations in the two studies.
Analysis of RQ3 revealed that those who evacuated longer distances experienced greater evacuation travel time and addi-tional travel time, longer evacuation duration (which replicates a result from Siebeneck and Cova (2008)), and greater costfor transportation, food, and lodging. As discussed earlier, one possible explanation for this pattern of results is that theseevacuees were less likely to stay with friends or relatives and were more likely to stay in hotels/motels. Consequently, theyhad to evacuate farther to find shelter accommodations, which took more time and increased transportation costs. Staying incommercial facilities increased food and lodging cost.
Analysis of RQ4 confirmed that, as one would expect, food and lodging costs were higher for larger families with childrenand those with higher incomes. Less obviously, Whites were less likely to use evacuation route information sources otherthan personal experience and younger evacuees travelled longer evacuation distances and had longer travel times. Moreover,evacuation durations were longer for women but shorter for those who were married. This suggests that women living alonewaited longer to return, perhaps because they were less likely to be homeowners, thus lacking an incentive to return as soonas possible. Alternatively, they might have had greater concerns about personal safety. Particularly problematic is the factthat none of the demographic variables were significantly related to evacuation departure time, which is a critical variablefor local traffic managers because having identifiable determinants of departure time distributions would enable them tomanage evacuation traffic demand (Lindell & Prater, 2007) in addition to managing supply through tools such as contraflow(Wolshon, 2001).
With the exception of these results, the data extend Baker’s (1991) conclusion that demographic variables have only smalland inconsistent correlations with evacuation decisions. Specifically, only 25 of 160 (16%) correlations between demographicvariables and evacuation logistics variables were statistically significant and had r > .10; 14 (9%) had r > .15; eight (5%) hadr > .20. Thirteen of the 14 evacuation logistics variables with r > .15 and all eight of the variables with r > .20 involved reg-istered vehicles, evacuating vehicles, and carpooling. Thus, transportation mode appears to be the only aspect of evacuationlogistics that has important demographic correlates.
4.2. Comparison to previous studies
In addition to its support for the research hypotheses and answers to the research questions, this study replicated a num-ber of findings from previous studies about evacuation logistics variables’ distributions—especially their means andproportions.
H.-C. Wu et al. / Transportation Research Part F 15 (2012) 445–461 457

Author's personal copy
4.2.1. Evacuation departure timesThe evacuation departure time distribution for Hurricane Katrina is similar to that reported for most other hurricanes
(Baker, 2000; Dow & Cutter, 2002). This would seem to suggest that it is possible to predict evacuation departure timesin the aggregate even though there is only modest predictive accuracy at the household level. However, the evacuationdeparture time distribution for Hurricane Rita is shifted substantially toward earlier departures than in other hurricanes(see Table 6). Specifically, 25% of the Rita evacuees left 3 days before hurricane landfall, whereas only 4% did so for Katrina.Similarly, 53% of the Rita evacuees left 2 days before hurricane landfall, whereas only 43% did so for Katrina. One explanationfor the early evacuation for Hurricane Rita is that Texas coastal residents had seen the terrible loss of life that resulted fromHurricane Katrina—less than 4 weeks earlier and 560 km (350 miles) east. However, another explanation is that the Houstonmayor stated 4 days before landfall that as many as a million residents of Houston might need to evacuate areas that hadflooded in the past. Thus, people’s experience with Tropical Storm Allison, which generated approximately 90 cm (36 in.)of rain and extensive flooding in some parts of Houston (National Hurricane Center, 2001) might have been an even morepowerful motivation to evacuate (Stein et al., 2010). Moreover, Galveston authorities declared a mandatory evacuation onWednesday evening, shortly after the NHC issued its hurricane watch. Thus, it is possible that both Tropical Storm Allisonand Hurricane Katrina affected Texas evacuees’ departure times. However, it is not possible to determine what was the rel-ative importance of these two storms or the extent to which these storms affected Texas evacuees’ departure times directlyor indirectly via their impact on Texas officials’ evacuation recommendations.
4.2.2. Route choiceIt is noteworthy that this study replicated the Lindell et al. (2011) finding that people make minimal use of preimpact
written materials such as evacuation maps. This extends previous research on hurricane preparedness that found peopledon’t interpret risk area maps accurately (Arlikatti, Lindell, Prater, & Zhang, 2006; Zhang et al., 2004), don’t have evacuationroute maps (Zhang et al., 2004), and don’t use maps to plan their evacuation routes even when they have them (Dow &Cutter, 2002). Instead, these data replicate findings from Hurricane Lili that evacuees tend to rely on their past experi-ence—and, to a lesser extent, traffic conditions encountered enroute—much more than information from the news mediaor police or written materials distributed in advance. Indeed, the rank order of the evacuation route information sourcesin this study is the same as in the Hurricane Lili study.
The importance of past experience with evacuation routes indicates that evacuees learn from experience and, to someextent, suggests that repeated hurricane evacuations within a given area can begin to produce the development of the equi-librium traffic conditions associated with routine traffic patterns (Transportation Research Board, 2010). Moreover, the sig-nificance of conditions encountered enroute is broadly consistent with the assumption that evacuees respond adaptively(Sheffi, Mahmassani, & Powell, 1982). However, the fact that both of these sources were used extensively poses a problemfor evacuation modeling because the low correlation between them (r = .06) means that some evacuees rely primarily onpast experience whereas others rely primarily on traffic conditions encountered enroute. Moreover, those who rely on thesetwo sources have different demographic profiles (older Whites with smaller families and higher education levels vs. femaleswith children and lower incomes, respectively) and the significant demographic variables have relatively poor predictivevalidity (all |r| 6 .10). Consequently, it will be a challenge to develop evacuation models that incorporate route choices basedon (1) past experience, (2) recommendations received during the incident from the news media and local officials, and (3)traffic conditions encountered enroute in which some people use only one source but others use multiple sources. In themeantime, models that assume all evacuees make their route choices solely on the basis of traffic conditions encounteredenroute are incorrect (see Lindell and Prater (2007) for a review of this issue). This erroneous assumption will inevitablymake route allocation seem to be more efficient than it is in fact and, thus, underestimate the actual evacuation times. How-ever, assuming that people will rely only on past experience is probably incorrect, in this case because it assumes that peopleare insufficiently adaptive to differences between one hurricane and another. Finally, assuming that people will rely exclu-sively on recommendations received during the incident from the news media and local officials not only assumes completecompliance with their recommendations (hardly reasonable, given the research findings on evacuation timing and evacua-tion shadow—see Baker, 1991; Dash & Gladwin, 2007; Lindell & Prater, 2007), but also ignores the effects of time lags be-tween the assessment of traffic conditions and the dissemination of recommendations to motorists. Thus, considerableresearch is needed to develop models of household evacuation route choice that are mathematically tractable for traffic flowmodels but are also empirically justified.
One unexpected finding from the Katrina/Rita data is that evacuees who relied on personal experience had lower evac-uation travel times and additional travel times. By contrast, those who relied on other sources of information—especially offi-cials’ recommendations and traffic conditions encountered enroute—tended to have greater evacuation travel times andadditional travel times. These results are a bit puzzling because these three evacuation route information sources were unre-lated to coastal proximity and departure timing. Reliance on past experience was associated with a greater tendency to travelshorter evacuation distances and to stay with friends/relatives rather than in hotels/motels, which suggests that theseevacuees have routinized the entire evacuation process to a greater extent than other evacuees.
4.2.3. Evacuation transportation mode and number of vehiclesThe Katrina/Rita data once again confirm that the most common way for households to evacuate is to take their own vehi-
cles no matter where they are or when they leave. The one exception is that older evacuees are less likely to have a registered
458 H.-C. Wu et al. / Transportation Research Part F 15 (2012) 445–461
Author's personal copy
vehicle, which leads to reliance on carpooling rather than public transportation. Reliance on carpools seems to have had noadverse consequences for the carless respondents because they were no more likely to leave later than those who were ableto take their own vehicles. Indeed, they travelled shorter distances (r = �.22), were more likely to stay in the homes of friendsor relatives (r = .24), and less likely to stay in public shelters (r = �.20). All of these correlations raise interesting questionsabout the alternatives available to carless populations and the constraints they face.
The finding that evacuees took 1.42 vehicles to evacuate during Hurricanes Katrina and Rita is consistent with previousstudy results summarized by Lindell and Prater (2007) as well as more recent results from Siebeneck and Cova (2008) andLindell et al. (2011). In addition, evacuees also took an average of .12 registered trailers—which is much smaller than thereport of .35 trailers/household in Hurricane Lili (Lindell et al., 2011). As noted by Lindell and Prater (2007), it is importantto identify the number of evacuating trailers because these occupy space on the evacuation routes. If there are .35 trailersand 1.4 vehicles per household, this will increase the effective vehicle demand by 25% whereas adding .12 trailers would onlyincrease traffic demand by a third as much. Thus, it is important for local officials to have accurate estimates of the number oftrailers that are likely to be taken. However, the lack of consistency for Lili, Katrina, and Rita indicates the more research isneeded to provide this information.
4.2.4. Evacuation destinations and distancesThe evacuation destination data are significant because they revel three different patterns, one in Katrina and two dis-
tinctly different ones in Rita for SSA and GSA. In Katrina, only about 1% of the evacuees stayed in their own parishes, a resultthat contrasts sharply with the 19% Hurricane Georges in South Florida (Dash & Morrow, 2001) and is also lower than the 9%in Hurricane Floyd (Dow & Cutter, 2000). Moreover, only a small fraction of them (10%) stayed within coastal Louisiana,whereas 38% went inland to Lafayette, Baton Rouge, Central Louisiana or North Louisiana, and almost all of the remainderwent to Houston (13%) or other out of state locations (39%). This 52% level of out of state evacuees is quite similar to the56% observed in Hurricane Floyd (Dow & Cutter, 2002).
In Rita, the low level of residents evacuating to other locations within their own counties (less than 1% in SSA and GSA) issimilar to that in Hurricane Katrina, but there was an even lower level of Texas evacuees going to other coastal counties (1%in SSA and 5% in GSA) than in Katrina (10%). Instead, the primary evacuation destination of Rita evacuees was directly north—45% of SSA going to East Texas and 41% of GSA residents going to Central Texas. Only 13% of SSA evacuees went to CentralTexas whereas 40% of GSA evacuees went to East Texas. Equal percentages of SSA and GSA evacuees went to North Texas orDallas/Ft. Worth (15%) but 22% of SSA evacuees went out of state, whereas only 6% of GSA evacuees did so.
The differences in evacuation destinations for Floyd, Katrina, and Rita can be accounted for in part by the size of the statesinvolved and evacuees’ proximity to state borders. South Carolina is a small state (78,000 km2) compared to Louisiana(113,000 km2), and Texas (678,000 km2). South Carolina only extends about 322 km (200 miles) inland and the inland areaof this state has only two cities over 40,000 population, the largest of which is only 116,000. Thus, South Carolina appears tohave little capacity to house a substantial number of coastal evacuees in hotels/motels or public shelters. By contrast, Lou-isiana has seven inland cities with populations over 40,000 and two of these have approximately one quarter million people.However, most of Central and North Louisiana is northwest of the Katrina impact area and the highways leading directlynorth from that area go to Mississippi (e.g., I-55). This explains why there was also a relatively high proportion of out of stateevacuees in Louisiana.
Finally, Texas extends inland approximately 350 miles (560 km) from the Gulf coast to the Oklahoma border and has 46cities over 40,000 population that are inland from the coast—seven of which have populations exceeding one quarter million.There is little difference in SSA and GSA residents’ access to Dallas/Ft. Worth and North Texas, so it is unsurprising that 17% ofSSA and GSA residents evacuated to that region of the state. However, SSA residents—who are immediately adjacent to theTexas/Louisiana border—would find it easier to go to Louisiana (12% of SSA evacuees) than to Central Texas (7% of SSA evac-uees) because of the heavy traffic from GSA that had an earlier start because Rita was initially expected to make landfallthere. By contrast, GSA evacuees could travel north on I-45 into Central Texas (28%) and East Texas (17%). There wouldbe little reason for GSA evacuees to go to other states (4%) unless they had friends or relatives in Oklahoma or Arkansas.In summary, regional geography explains why the percentage of Louisianans who went out of state was substantial (33%)but smaller than the percentage of South Carolinians who did so (56%). Geography also explains why the percentage ofSSA evacuees from Rita going out of state (12%) was even smaller than the percentage of Louisiana evacuees from Katrinaand the percentage of SSA evacuees from Rita going out of state (4%) was smaller still.
As a result of their destination choices, Hurricane Rita evacuees travelled greater distances (321 km/199 miles) than werereported for Hurricane Bonnie (286 km/178 miles—Whitehead, 2003) or Hurricane Lili (311 km/193mi—Lindell et al., 2011)and Hurricane Katrina evacuees travelled even farther (429 km/266 miles).
4.2.5. Shelter accommodationsConsistent with Mileti, Sorensen, and O’Brien (1992) and more recent studies, most evacuees stayed with friends/relatives
(61%) or in hotels/motels (18%); only 3% of the evacuees stayed in public shelters. This is the same rank order of popularity asreported by Whitehead (2003) and Lindell et al. (2011). The results indicate that the use of shelter accommodations is notrelated to evacuation departure time, a result that is consistent with the findings from Hurricane Lili (Lindell et al., 2011). Onthe other hand, these data show that evacuees from Louisiana’s St. Charles and Jefferson parishes had higher proportionsstaying in hotels/motels than evacuees from Texas counties. It is possible that this occurred because Louisiana evacuees’
H.-C. Wu et al. / Transportation Research Part F 15 (2012) 445–461 459

Author's personal copy
friends/relatives lived too far away for convenient travel but it is also possible that their friends/relatives lived very near tothem, and thus also had to evacuate.
5. Conclusions
This study supports the Lindell et al. (2011) conclusion about the importance of county level analyses. Specifically, thesedata show that there are some phenomena for which a level of aggregation higher than the household can prove useful. Thisis most obvious in the case of evacuation routes and destinations, but was also helpful in the case of evacuation travel times,shelter accommodations, and evacuation costs. Such aggregate level analyses are most likely to be informative when thecounty/parish differences in evacuation response variables can be attributed to geographical and demographic conditionsthat evacuation planners can identify in advance.
The Katrina/Rita data replicate previous findings on the average number of evacuating vehicles per household and extendthese results by indicating the number of vehicles per household varies substantially across jurisdictions. In addition, thesedata replicate previous findings on the utilization of different types of shelter accommodations and evacuation costs. In addi-tion, with the exception of correlations between age and carpooling, these data extend Baker’s (1991) conclusion that demo-graphic variables have only small and inconsistent correlations with evacuation decisions.
However, the Katrina/Rita data show that evacuees tended to leave earlier for Rita than for Katrina and other hurricanes,probably due to the content and timing of warnings by local officials as well as the television coverage of the devastatingflooding in Hurricane Katrina.
Those who lived farther from the coast began their evacuations later, so they tended to enter the evacuation route systemat the same time as those who lived closer to the coast, thus creating traffic queues. Moreover, those who lived closer to thecoast evacuated farther, stayed in hotels/motels, stayed away longer, and had higher food and lodging costs. In choosing theirevacuation routes, evacuees relied either on previous experience or on traffic conditions enroute (and to a lesser extent, rec-ommendations by the news media and public officials). This is a significant issue for mathematical evacuation models thatassume evacuees choose their evacuation routes based exclusively on conditions enroute (Hobeika & Kim, 1998; Sheffi, Mah-massani, & Powell, 1981) because it suggests that evacuees will not distribute themselves optimally over the availableroutes.
Finally, all studies have their limitations and this study is no exception. The response rate was only moderate (31%) andthe sample was slightly biased toward older, White, married homeowners. However, moderate response rates do not appearto bias central tendency estimates (Curtin, Presser, & Singer, 2000; Keeter, Miller, Kohut, Groves, & Presser, 2000; Lindell &Perry, 2000) and are not likely to affect correlations (Lindell & Perry, 2000). Another limitation is that evacuation destinationsand shelter accommodations were each measured by single items. However, some respondents provided comments indicat-ing that they had multiple evacuation destinations and multiple shelter locations during their evacuations. In addition, someof the evacuees evacuated after hurricane landfall, which was not provided as a response option in the questionnaire. Finally,there was also a significant difference between the Louisiana and Texas evacuees in their pattern of shelter accommodations,which might have been caused by Louisiana evacuees’ friends and relatives living closer to them and thus also needing toevacuate. Because there were no items in the questionnaire that identified the locations of friends/relatives, further researchis needed to examine this issue.
Acknowledgements
This research was supported by the National Science Foundation under Grants SES0527699 and SES0838654. None of theconclusions expressed here necessarily reflects views other than those of the authors.
References
Arlikatti, S., Lindell, M. K., Prater, C. S., & Zhang, Y. (2006). Risk area accuracy and hurricane evacuation expectations of coastal residents. Environment andBehavior, 38, 226–247.
Baker, E. J. (1991). Hurricane evacuation behavior. International Journal of Mass Emergencies and Disasters, 9, 287–310.Baker, E. J. (2000). Hurricane evacuation in the United States. In R. Pielke, Jr. & R. Pielke, Sr. (Eds.). Storms (Vol. 1, pp. 308–319). London: Routledge.Ballou, R. H. (1987). Basic business logistics: Transportation, materials management, physical distribution (2nd ed.). Englewood Cliffs, NJ: Prentice-Hall.Curtin, R., Presser, S., & Singer, E. (2000). The effects of response rate changes on the index of consumer sentiment. Public Opinion Quarterly, 64, 413–428.Dash, N., & Gladwin, H. (2007). Evacuation decision making and behavioral responses: individual and household. Natural Hazards Review, 8, 69–77.Dash, N., & Morrow, B. H. (2001). Return delays and evacuation order compliance: The case of Hurricane Georges and the Florida Keys. Environmental
Hazards, 2, 119–128.Dillman, D. (2000). Mail and internet surveys: The tailored design method. New York: John Wiley & Sons.Dixit, V. V., Pande, A., Radwan, E., & Abdel-Aty, M. (2008). Understanding the impact of a recent hurricane on mobilization time during a subsequent
hurricane. Transportation Research Record, 2022, 94–102.Dow, K., & Cutter, S. L. (2000). Public orders and personal opinions: Household strategies for hurricane risk assessment. Environmental Hazards, 2, 143–155.Dow, K., & Cutter, S. L. (2002). Emerging hurricane evacuation issues: Hurricane Floyd and South Carolina. Natural Hazards Review, 3, 12–18.Fu, H., & Wilmot, C. G. (2004). Sequential logit dynamic travel demand model for hurricane evacuation. Transportation Research Record, 1882, 19–26.Fu, H., & Wilmot, C. G. (2006). Survival analysis-based dynamic travel demand models for hurricane evacuation. Transportation Research Record, 1964,
211–218.Fu, H., Wilmot, C. G., Zhang, H., & Baker, E. J. (2007). Modeling the hurricane response curve. Transportation Research Record, 2022, 94–102.Hobeika, A. G., & Kim, C. (1998). Comparison of traffic assignments in evacuation modeling. IEEE Transactions on Engineering Management, 45, 192–198.
460 H.-C. Wu et al. / Transportation Research Part F 15 (2012) 445–461

Author's personal copy
Johnson, J. C., & Wood, D. F. (1996). Contemporary logistics (6th ed.). Upper Saddle River, NJ: Prentice-Hall.Kang, J. E., Lindell, M. K., & Prater, C. S. (2007). Hurricane evacuation expectations and actual behavior in Hurricane Lili. Journal of Applied Social Psychology,
37, 881–897.Keeter, S., Miller, C., Kohut, A., Groves, R. M., & Presser, S. (2000). Consequences of reducing nonresponse in a national telephone survey. Public Opinion
Quarterly, 64, 125–148.Lindell, M. K. (2008). EMBLEM2: An empirically based large-scale evacuation time estimate model. Transportation Research Part A, 42, 140–154.Lindell, M. K., Prater, C. S., Sanderson, W. G., Jr., Lee, H. M., Zhang, Y., Mohite, A., et al. (2001). Texas Gulf Coast residents’ expectations and intentions regarding
hurricane evacuation. College Station, TX: Texas A&M University Hazard Reduction & Recovery Center. <www.txdps.state.tx.us/dem/documents.htm>.Lindell, M. K., Kang, J. E., & Prater, C. S. (2011). The logistics of household hurricane evacuation. Natural Hazards, 58, 1093–1109.Lindell, M. K., Lu, J. C., & Prater, C. S. (2005). Household decision making and evacuation in response to Hurricane Lili. Natural Hazards Review, 6, 171–179.Lindell, M. K., & Perry, R. W. (1992). Behavioral foundations of community emergency planning. Washington, DC: Hemisphere Press.Lindell, M. K., & Perry, R. W. (2000). Household adjustment to earthquake hazard. Environment and Behavior, 32, 590–630.Lindell, M. K., & Prater, C. S. (2007). Critical behavioral assumptions in evacuation analysis for private vehicles: Examples from hurricane research and
planning. Journal of Urban Planning and Development, 133, 18–29.Litman, T. (2006). Lessons from Katrina and Rita: What major disasters can teach transportation planners. Journal of Transportation Engineering, 132, 11–18.Mileti, D. S., Sorensen, J. H., & O’Brien, P. W. (1992). Toward an explanation of mass care shelter use in evacuations. International Journal of Mass Emergencies
and Disasters, 10, 25–42.Murray-Tuite, P. M., & Mahmassani, H. S. (2003). Model of household trip-chain sequencing in emergency evacuation. Transportation Research Record, 1831,
21–29.Murray-Tuite, P. M., & Mahmassani, H. S. (2004). Transportation network evacuation planning with household activity interactions. Transportation Research
Record, 1894, 150–159.National Hurricane Center (2001). Tropical cyclone report Tropical Storm Allison. <www.nhc.noaa.gov/2001allison.html> Retrieved 12.06.11.National Hurricane Center (2005). Tropical cyclone report Hurricane Katrina. <www.nhc.noaa.gov/pdf/TCR-AL122005_Katrina.pdf> Retrieved 04.12.09.National Hurricane Center (2006). Tropical cyclone report Hurricane Rita. <www.nhc.noaa.gov/pdf/TCR-AL182005_Rita.pdf> Retrieved 04.12.09.Patrick, O. (2005). The evacuation worked, but created a highway horror. USA today. <www.usatoday.com/news/nation/2005-09-25-evacuation-cover_x.htm>
Retrieved 17.11.09.Perry, R. W., Lindell, M. K., & Greene, M. R. (1981). Evacuation planning in emergency management. Lexington, MA: Heath Lexington Books.Rushton, A., Oxley, J., & Croucher, P. (2000). The handbook of logistics and distribution management. London: Kogan Page.Sheffi, Y., Mahmassani, H., & Powell, W. B. (1981). Evacuation studies for nuclear power plant sites: A new challenge for transportation engineers. ITE
Journal, 57, 25–28.Sheffi, Y., Mahmassani, H., & Powell, W. B. (1982). A transportation network evacuation model. Transportation Research Part A, 16, 209–218.Siebeneck, L. K., & Cova, T. J. (2008). An assessment of the return-entry process for Hurricane Rita 2005. International Journal of Mass Emergencies and
Disasters, 26, 91–111.Stein, R. M., Dueñas-Osorio, L., & Subramanian, D. (2010). Who evacuates when hurricanes approach? The role of risk, information, and location. Social
Science Quarterly, 91, 816–834.Transportation Research Board (2010). Highway capacity manual. Washington, DC: Author.Whitehead, J. C. (2003). One million dollars per mile? The opportunity costs of Hurricane evacuation. Ocean and Coastal Management, 46, 1069–1083.Wolshon, B. (2001). ‘‘One-way-out’’: Contraflow freeway operation for hurricane operation. Natural Hazards Review, 2, 105–112.Wolshon, B. (2002). Planning for the evacuation of New Orleans. ITE Journal, 72, 44–49.Zhang, Y., Prater, C. S., & Lindell, M. K. (2004). Risk area accuracy and evacuation from Hurricane Bret. Natural Hazards Review, 5, 115–120.
H.-C. Wu et al. / Transportation Research Part F 15 (2012) 445–461 461